Embed Size (px)
Citation preview
Western Michigan University Western Michigan University
ScholarWorks at WMU ScholarWorks at WMU
Dissertations Graduate College
8-2019
Using Novel Spectroscopy Tool to Study Organized Self-Using Novel Spectroscopy Tool to Study Organized Self-
Assemblies Assemblies
Mohammad Rafe M Bin Hatshan Western Michigan University, [email protected]
Follow this and additional works at: https://scholarworks.wmich.edu/dissertations
Part of the Chemistry Commons
Recommended Citation Recommended Citation Bin Hatshan, Mohammad Rafe M, "Using Novel Spectroscopy Tool to Study Organized Self-Assemblies" (2019). Dissertations. 3485. https://scholarworks.wmich.edu/dissertations/3485
This Dissertation-Open Access is brought to you for free and open access by the Graduate College at ScholarWorks at WMU. It has been accepted for inclusion in Dissertations by an authorized administrator of ScholarWorks at WMU. For more information, please contact [email protected].
USING NOVEL SPECTROSCOPY TOOL TO STUDY ORGANIZED
SELF-ASSEMBLIES
by
Mohammad Rafe M Bin Hatshan
A dissertation submitted to the Graduate College
in partial fulfillment of the requirements
for the degree of Doctor of Philosophy
Chemistry
Western Michigan University
August 2019
Doctoral Committee:
Ramakrishna Guda, Ph.D., Chair
Ekkehard Sinn, Ph.D.
Sherine Obare, Ph.D.
Pamela Hoppe, Ph.D.

Copyright by
Mohammad Rafe M Bin Hatshan
2019

ii
DEDICATION
This dissertation is lovingly dedicated to my mother and my father, for their support,
encouragement, prayer and constant love that has sustained me throughout my life. This
dedication is less than my parent right on me. Dear parent, you are the reasons behind my
success.
To my family - my wife and my kids - for their support, love, and for providing a good
environment in which to work. I know you were the most affected by my PhD journey, my
success is because your sacrifices and support. The dream of my life is to please you and make
you proud of me.

iii
ACKNOWLEDGEMENTS
I indeed could not have written this dissertation without the help of Allah “God
Almighty”, who is the best of helpers. I am indebted to my committee members for their
guidance, the prayers of my parents, and support from my family and friends. Without any of
these, it was beyond my capacity to finish this journey.
Foremost I would like to express my sincere and deepest gratitude and appreciation to my
advisor, Dr. Ramakrishna Guda for his excellent guidance, continuous unlimited support,
motivation, enthusiasm, patience and immense knowledge which enabled me to accomplish this
work. It has been an honor for me that I worked under a distinguished advisor who believes in
his students and encourages them to be a scientist. Dear Dr Guda, I have learned from you many
things that hard to list here, you were a great mentor and friend, I hope to be like you one day,
especially in your passion for teaching and your constant concern and care for those around you.
I would like to acknowledge with much appreciation my committee members Dr.
Ekkehard Sinn, Dr. Sherine Obare, Dr. Pamela Hoppe for their kind encouragement, great
thoughts and insightful comments that made this work the best it could be. Thanks for your
presence and cooperation despite your busy work.
My heartfelt appreciation goes out to Allah and then to my family members: my parent
my wife my kids, and my brothers and sisters for their prayers, endless love and extremely
supportive all over PhD journey.

iv
Acknowledgements—Continued
My appreciation goes to King Saud University for giving me the opportunity to pursue
this degree and to all my work colleagues who made it possible. I am grateful to the faculty and
staff of the Chemistry Department at Western Michigan University at Kalamazoo for being
supportive during my time here. Special thanks are due to Pamela A McCartney, Robin K
Lenkart, Michelle McBarnes and Lisah N Crall for their support regarding the administration
stuff.
In my daily work I have been blessed with a friendly and cheerful group of fellow
students. I am grateful for the past and present members of both Dr. Guda’s research group who
have been invaluable for practical help, support and suggestion, include: Dr. Ibtesam Alja’afreh
Dr. Jameel Hasan, Dr. Edwin Mghanga, Dr. Saad Alotaibi, Dr. Viraj Thanthirige, Dr. Abu Bakar
Abu Hagar. In addition, I have had a pleasure of working with undergraduate students (Amanda
Osborne, Jasmine Sarmiento, Arju Patel, Jason Hugan) and high school students (Natasha
Goenawan, Ziyan Mo, Nathaniel Goenawan, Liya Jin, Karthik Subramanian).
Finally, for anyone wished me success, thank you.
Mohammad Rafe Bin Hatashan
USING NOVEL SPECTROSCOPY TOOL TO STUDY ORGANIZED
SELF-ASSEMBLIES
Mohammad Rafe M Bin Hatshan, Ph.D.
Western Michigan University, 2019
Organized self-assemblies are the cornerstones for countless biological processes and are
integral parts of lipids, proteins, carbohydrates, nucleic acids, and cell membranes. Several man-
made organized assemblies also play a vital role in interdisciplinary sciences that include
micelles, reverse micelles, polymers, polyelectrolytes etc. Weak chemical interactions such as
hydrogen bonding, p-p stacking, hydrophilic-hydrophobic and electrostatics often result in
interesting organized self-assemblies. Understanding organized self-assemblies provides a huge
opportunity to mimic naturally occurring biological macromolecules, design materials and
develop strategies for specific applications. Several techniques are routinely used to understand
the organized self-assemblies, and optical techniques play an important role in most of them.
However, the search for novel optical techniques to monitor organized self-assemblies is on-
going, which is the main motivation behind the investigations carried out in this study. The
research approach is to use the power of two-photon absorption (2PA) spectroscopy to monitor
the organized assemblies.
The hypothesis is that specific non-canonical forms of organized self-assembly provide
unique local electric fields and the 2PA cross-sections of chromophores solubilized in this
environment can be altered by these local electric fields providing an efficient probe to study
them. To test the hypothesis, investigations were carried out using known DNA binders with two
non-canonical structures of DNA that were implicated for cancer, G-Quadruplex and G-Triplex
DNA, in an attempt to use the 2PA cross-sections of the binders to monitor the melting and
stability of these organized self-assemblies. The results have conclusively shown that 2PA cross-
sections of the chromophores were sensitive to monitor the melting transitions in G-Quadruplex
and G-Triplex with different enhancements that can be assigned to electrostatic and aromatic
interactions of the drug binders with DNA. These results have enabled us to use the power of
2PA spectroscopy to monitor protein folding and aggregation of a model protein, bovine-serum
albumin (BSA), and a protein implicated in Amyotrophic Lateral Sclerosis (ALS) disease
superoxide dismutase (SOD1). The results have shown that the 2PA cross-sections of
fluorescamine bound to these proteins is a valuable probe to monitor the folding and unfolding as
well as follow the early onset of aggregation in these proteins. To build on understanding the
organized self-assemblies using two-photon fluorescence spectroscopy, a novel one- and two-
photon fluorescence-based biosensor with a specific oligonucleotide that forms a G-Quadruplex
was developed to selectively and with sensitivity detect toxic metal ions such as Pb2+ and Hg2+.
Guanine-rich nucleotide T30695 was designed to bind to Pb2+ and Hg2+ selectively and used the
one- and two-photon fluorescence of cyanine chromophore to detect different levels of these
toxic metal ions, and a detection limit of 4.5 ppb for Pb2+ and 5.0 ppb for Hg2+ was realized from
the studies. We have also used the power of 2PA spectroscopy to monitor the local environment
in synthetic organized self-assemblies like polyelectrolytes. The electrostatic interactions
between the chromophore and polyelectrolytes were able to enhance the 2PA cross-sections of
chromophores and have shown that this technique is quite universal and can be used to monitor
several organized self-assemblies.

v
TABLE OF CONTENTS
ACKNOWLEDGEMENTS ........................................................................................................... iii
LIST OF TABLES ....................................................................................................................... xvi
LIST OF FIGURES .................................................................................................................... xvii
1. INTRODUCTION .......................................................................................................................1
1.1 Organized Self-Assemblies ...............................................................................................1
1.2 Chemical Interactions in Organized Self-Assemblies ......................................................3
1.2.1 Hydrogen Bonding ................................................................................................4
1.2.2 Ionic Bonds ...........................................................................................................5
1.2.3 π-π Stacking ..........................................................................................................5
1.2.4 Van der Walls Interaction .....................................................................................6
1.2.5 Hydrophilic/Hydrophobic Interactions .................................................................7
1.2.6 Electrostatic Interactions .......................................................................................8
1.3 Organized Self-Assemblies—Examples ...........................................................................9
1.3.1 Micelles .................................................................................................................9
1.3.2 Reverse Micelles .................................................................................................10
1.3.3 Lipid Bilayers......................................................................................................11
1.3.4 DNA ....................................................................................................................12
1.3.5 Proteins ...............................................................................................................13
1.3.6 Polymers and Polyelectrolytes ............................................................................15
1.4 Why Are Organized Self-Assemblies Important? ..........................................................15

vi
Table of Contents—Continued
CHAPTER
1.5 Existing Techniques to Monitor Organized Self-Assemblies .........................................16
1.5.1 Affinity Capillary Electrophoresis ......................................................................16
1.5.2 Enzyme-Linked Immunosorbent Assay ..............................................................17
1.5.3 Fluorescence Resonance Energy Transfer ..........................................................17
1.5.4 Isothermal Calorimetry .......................................................................................18
1.5.5 Ultraviolet Visible Spectroscopy ........................................................................19
1.5.6 Nuclear Magnetic Resonance .............................................................................19
1.5.7 Surface Plasmon Resonance ...............................................................................20
1.6 Research Motivation .......................................................................................................20
1.7 Sensing Organized Self-Assemblies with Dye Molecules and 2PA Spectroscopy ........21
1.8 Research Approach Using 2PA Cross-Sections .............................................................22
1.8.1 Principle ..............................................................................................................22
1.8.2 Applications of 2PA ............................................................................................23
1.9 Aims and Objectives of the Dissertation ........................................................................25
1.10 Outline of the Dissertation ............................................................................................26
1.11 Chapter 1 Summary ......................................................................................................28
1.12 References .....................................................................................................................30
2. EXPERIMENTAL TECHNIQUES ...........................................................................................44
2.1 Lasers ..............................................................................................................................44
2.1.1 Basic Components of Laser ................................................................................44
vii
Table of Contents—Continued
CHAPTER
2.1.1.1 Optical Cavity .........................................................................................45
2.1.1.2 Gain Medium ..........................................................................................46
2.1.1.3 Pumping Mechanism ..............................................................................46
2.1.2 Properties of Laser Light ....................................................................................47
2.1.2.1 Monochromaticity ...................................................................................47
2.1.2.2 Coherence ...............................................................................................48
2.1.2.3 Directionality ..........................................................................................49
2.1.2.4 Ultrashort Pulse Duration .......................................................................50
2.2 Steady-State Methods .....................................................................................................53
2.2.1 Optical Absorption ..............................................................................................53
2.2.2 Steady-State and Time-Resolved Fluorescence Measurements .........................54
2.3 Two-Photon Absorption..................................................................................................58
2.3.1 Measuring 2PA Cross-Sections ..........................................................................59
2.4 Circular Dichroism..........................................................................................................61
2.5 Dynamic Light Scattering ...............................................................................................64
2.5.1 How DLS Works.................................................................................................66
2.6 Chapter 2 Summary ........................................................................................................68
2.7 References .......................................................................................................................70
3. ANALYZING THE STABILITY AND INTERACTIONS OF G-QUADRUPLEX
AND G-TRIPLEX DNA IN DRUG SYSTEMS BY USING NOVEL OPTICAL
SPECTROSCOPY TECHNIQUES ...............................................................................................79
3.1 Introduction .....................................................................................................................79

viii
Table of Contents—Continued
CHAPTER
3.2 Materials and Methods ....................................................................................................86
3.2.1 Materials .............................................................................................................86
3.2.2 Optical Methods ..................................................................................................86
3.3 Results and Discussion ...................................................................................................87
3.3.1 Naked G-Quadruplex ..........................................................................................87
3.3.1.1 Optical Absorption Measurements .........................................................87
3.3.1.2 CD Measurements ...................................................................................87
3.3.2 Naked G-Triplex ................................................................................................89
3.3.2.1 Optical Absorption Measurements .........................................................89
3.3.2.2 CD Measurements ...................................................................................89
3.3.3 Interaction with ThT ..........................................................................................90
3.3.3.1 G-Quadruplex/ThT .................................................................................90
3.3.3.1.1 Optical Absorption Measurements .............................................90
3.3.3.1.2 Steady-State Fluorescence Measurements ..................................91
3.3.3.1.3 Two-Photon Fluorescence Measurements ..................................92
3.3.3.1.4 Relative 2PA Enhancements .......................................................93
3.3.3.2 G-Triplex/ThT.........................................................................................94
3.3.3.2.1 Optical Absorption Measurements .............................................94
3.3.3.2.2 Steady-State Fluorescence Measurements ..................................95
3.3.3.2.3 Two-Photon Fluorescence Measurements ..................................95

ix
Table of Contents—Continued
CHAPTER
3.3.3.2.4 Relative 2PA Measurements .......................................................97
3.3.4 Interaction with ThO ...........................................................................................98
3.3.4.1 G-Quadruplex/ThO .................................................................................98
3.3.4.1.1 Optical Absorption Measurements .............................................98
3.3.4.1.2 Steady-State Fluorescence Measurements ..................................99
3.3.4.1.3 Two-Photon Fluorescence Measurements ..................................99
3.3.4.1.4 Relative 2PA Cross-Sections ....................................................100
3.3.4.2 G-Triplex/ThO ......................................................................................101
3.3.4.2.1 Optical Absorption Measurements ...........................................101
3.3.4.2.2 One-Photon Fluorescence Measurements .................................102
3.3.4.2.3 Two-Photon Fluorescence Measurements ................................102
3.3.4.2.4 Relative 2PA Cross-Sections ....................................................104
3.3.5 Interaction with DAPI .......................................................................................105
3.3.5.1 G-Quadruplex/DAPI .............................................................................105
3.3.5.1.1 Optical Absorption Measurements ...........................................105
3.3.5.1.2 Steady-State Fluorescence Measurements ................................106
3.3.5.1.3 Two-Photon Fluorescence Measurements ................................106
3.3.5.1.4 Relative 2PA Cross-Sections ....................................................107
3.3.5.2 DAPI/Triplex ........................................................................................108
3.3.5.2.1 Optical Absorption Measurements ...........................................108

x
Table of Contents—Continued
CHAPTER
3.3.5.2.2 Steady-State Fluorescence Measurements ................................109
3.3.5.2.3 Two-Photon Fluorescence Measurements ................................109
3.3.5.2.4 Relative 2PA Cross-Sections ....................................................111
3.3.6 Interaction with EtBr.........................................................................................111
3.3.6.1 G-Triplex/EtBr ......................................................................................111
3.3.6.1.1 Optical Absorption Measurements ...........................................111
3.3.6.1.2 Steady-State Fluorescence Measurements ................................112
3.3.6.1.3 Two-Photon Fluorescence Measurements ................................113
3.3.6.1.4 Relative 2PA Cross-Sections ....................................................114
3.3.7 Interaction with TMPyP4 ..................................................................................115
3.3.7.1 G-Quadruplex/TMPyP4 ........................................................................115
3.3.7.1.1 Optical Absorption Measurements ...........................................115
3.3.7.1.2 Steady-State Fluorescence Measurements ................................116
3.3.7.1.3 Two-Photon Fluorescence Measurements ................................116
3.3.7.1.4 Relative 2PA Measurements .....................................................118
3.3.7.2 G-Triplex/TMPyP4 ...............................................................................118
3.3.7.2.1 Optical Absorption Measurements ...........................................118
3.3.7.2.2 Steady-State Fluorescence Measurements ................................119
3.3.7.2.3 Two-Photon Fluorescence Measurements ................................119
3.3.7.2.4 Relative 2PA Cross-Sections ....................................................121
xi
Table of Contents—Continued
CHAPTER
3.3.8 Interaction with Doxorubicin ............................................................................121
3.3.8.1 G-Triplex/Doxorubicin .........................................................................121
3.3.8.1.1 Optical Absorption Measurements ...........................................121
3.3.8.1.2 Steady-State Fluorescence Measurements ................................122
3.3.8.1.3 Two-Photon Fluorescence Measurements ................................123
3.3.8.1.4 Relative 2PA Cross-Sections ....................................................123
3.3.9 Mechanism Why Are 2PA Cross-Sections Showing Melting Transition? .......124
3.4 Conclusion ....................................................................................................................129
3.5 Chapter Summary .........................................................................................................130
3.6 References .....................................................................................................................132
4. MONITORING PROTEIN AGGREGATION VIA TWO-PHOTON SPECTROSCOPY:
EARLY DETECTION OF AGGREGATES ...............................................................................139
4.1 Introduction ...................................................................................................................139
4.2 Materials and Methods ..................................................................................................144
4.2.1 Materials ...........................................................................................................144
4.2.2 Optical Methods ................................................................................................144
4.3 Results and Discussion .................................................................................................145
4.3.1 Fluram Binding with BSA and SOD1 ..............................................................145
4.3.2 Protein Folding/Unfolding ................................................................................145
4.3.2.1 BSA-Fluram ..........................................................................................146
4.3.2.2 SOD1-Fluram ........................................................................................147
xii
Table of Contents—Continued
CHAPTER
4.3.3 Protein Aggregation ..........................................................................................149
4.3.3.1 BSA-Fluram with GuHCl and Temperature .........................................150
4.3.3.2 SOD1-Fluram with GuHCl ...................................................................151
4.3.4 Dynamic Light Scattering .................................................................................152
4.3.5 Time-Resolved Fluorescence Measurements ...................................................153
4.4 Conclusions ...................................................................................................................154
4.5 Chapter Summary .........................................................................................................155
4.6 References .....................................................................................................................157
5. SINGLE AND TWO-PHOTON DNA-BASED FLUORESCENCE SENSORS FOR
Pb2+ AND Hg2+ ............................................................................................................................163
5.1 Introduction ...................................................................................................................163
5.2 Materials and Methods ..................................................................................................168
5.2.1 Materials ...........................................................................................................168
5.2.2 Spectroscopic Methods .....................................................................................169
5.3 Results and Discussion .................................................................................................170
5.3.1 Interaction of G-Quadruplex DNA with Pb2+ ...................................................170
5.3.1.1 Optical Absorption Measurements .......................................................170
5.3.1.2 One-Photon Fluorescence Measurements .............................................171
5.3.1.3 Two-Photon Fluorescence Measurements ............................................172
5.3.2 Interaction of G-Quadruplex DNA with Hg2+ ..................................................173
5.3.2.1 Optical Absorption Measurements .......................................................173

xiii
Table of Contents—Continued
CHAPTER
5.3.2.2 One-Photon Fluorescence Measurements .............................................174
5.3.2.3 Two-Photon Fluorescence Measurements ............................................175
5.3.3 Relative 2PA Enhancements .............................................................................176
5.3.4 Selectivity .........................................................................................................178
5.3.5 Forming G-Quadruplex Structure .....................................................................180
5.4 Conclusions ...................................................................................................................181
5.5 Chapter Summary .........................................................................................................182
5.6 References .....................................................................................................................184
6. TWO-PHOTON ABSORPTION PROPERTIES OF CHROMOPHORES IN
POLYELECTROLYTES .............................................................................................................191
6.1 Introduction ...................................................................................................................191
6.2 Experimental .................................................................................................................195
6.2.1 Materials ...........................................................................................................195
6.2.2 Methods.............................................................................................................195
6.3 Results and Discussion .................................................................................................196
6.3.1 Interactions with AcrO ......................................................................................196
6.3.1.1 Interactions of MPS-PPV with AcrO ....................................................196
6.3.1.1.1 Optical Absorption Measurements ...........................................196
6.3.1.1.2 One- and Two-Photon Fluorescence Measurements ................197
6.3.1.1.3 Relative 2PA Cross-Sections Measurements ............................198
6.3.1.2 Interactions of PSS with AcrO ..............................................................198
xiv
Table of Contents—Continued
CHAPTER
6.3.1.2.1 Optical Absorption Measurements ...........................................198
6.3.1.2.2 One- and Two-Photon Fluorescence Measurements ................199
6.3.1.2.3 Relative 2PA Cross-Sections Measurements ............................200
6.3.2 Interactions with Hoe ........................................................................................201
6.3.2.1 Interactions of MPS-PPV with Hoe ......................................................201
6.3.2.1.1 Optical Absorption Measurements ...........................................201
6.3.2.1.2 One- and Two-Photon Fluorescence Measurements ................202
6.3.2.1.3 Relative 2PA Cross-Sections Measurements ............................203
6.3.2.2 Interactions of PSS with Hoe ................................................................203
6.3.2.2.1 Optical Absorption Measurements ...........................................203
6.3.2.2.2 One- and Two-Photon Fluorescence Measurements ................204
6.3.2.2.3 Relative 2PA Cross-Sections Measurements ............................205
6.3.3 Interactions of Polyelectrolytes with ThT.........................................................206
6.3.3.1 Interactions of MPS-PPV with ThT ......................................................206
6.3.3.1.1 Optical Absorption Measurements ...........................................206
6.3.3.1.2 One- and Two-Photon Fluorescence Measurements ................207
6.3.3.1.3 Relative 2PA Cross-Sections Measurements ............................208
6.3.3.2 Interaction of PSS with ThT .................................................................208
6.3.3.2.1 Optical Absorption Measurements ...........................................208
6.3.3.2.2 One- and Two-Photon Fluorescence Measurements ................209

xv
Table of Contents—Continued
CHAPTER
6.3.3.2.3 Relative 2PA Cross-Sections Measurements ............................210
6.3.4 Interactions with C-485.....................................................................................211
6.3.4.1 Interactions of MPS-PPV with C-485...................................................211
6.3.4.1.1 Optical Absorption Measurements ...........................................211
6.3.4.1.2 One- and Two-Photon Fluorescence Measurements ................212
6.3.4.1.3 Relative 2PA Cross-Sections Measurements ............................213
6.3.4.2 Interactions of PSS with C-485.............................................................213
6.3.4.2.1 Optical Absorption Measurements ...........................................213
6.3.4.2.2 One- and Two-Photon Fluorescence Measurements ................214
6.3.4.2.3 Relative 2PA Cross-Sections Measurements ............................215
6.3.5 Comparison of 2PA Cross-Sections..................................................................216
6.4 Conclusion ....................................................................................................................218
6.5 Chapter Summary .........................................................................................................220
6.6 References .....................................................................................................................221
7. OVERALL SUMMARY AND FUTURE OUTLOOK ...........................................................228
7.1 Overall Summary ..........................................................................................................228
7.2 Future Outlook ..............................................................................................................233

xvi
LIST OF TABLES
5.1 Possible health effects corresponding to lead and mercury metals ........................................165

xvii
LIST OF FIGURES
1.1 Schematic illustrations how large number of bonds can stabilize the organized self-
assemblies ........................................................................................................................................3
1.2 Hydrogen bonds between in the A·T nucleic acid- Watson-Crick DNA bases .........................4
1.3 Ionic bond is one of the important non-covalent bonds that stabilizes organized self-
assemblies ........................................................................................................................................5
1.4 Schematic illustration of possible orientations for π–π stacking interactions............................6
1.5 Schematic of van der Walls weak interaction ............................................................................7
1.6 The hydrophilic/hydrophobic interactions are highly important factor governed
organized self-assemblies ................................................................................................................8
1.7 Schematic illustrating the electrostatic interactions between Lysine and Glutamic acids.........9
1.8 Schematic representation the micellar structure in aqueous solution ......................................10
1.9 Reverse micelle structure in aqueous solution .........................................................................11
1.10 Schematic structure for lipid bilayers ....................................................................................12
1.11 The structure of DNA which consisted of nucleotide bases A, T, C and G, that are
linked to deoxyribose sugar units and phosphates group...............................................................13
1.12 Schematic for the native folded protein, unfolded protein, and aggregated protein ..............14
1.13 Schematic of the three classes of polyelectrolytes .................................................................15
1.14 Comparison between energy diagrams of two-photon absorption (2PA) and one-photon
absorption (1PA) ............................................................................................................................22
1.15 Illustration of the applications of 2PA ...................................................................................24
2.1 Schematic depicting the basic components of a laser ..............................................................45
xviii
List of Figures—Continued
2.2 This figure illustrates the advantage of laser light monochromatic properties over
ordinary light ..................................................................................................................................48
2.3 This figure shows how coherence is one of the unique properties of laser light
comparing to ordinary light source ................................................................................................49
2.4 Directionality of the beam displaying minor divergence of compact light waves...................50
2.5 Schematic diagram of depicting fluorescence. ........................................................................55
2.6 Schematic diagram of TCSPC setup ........................................................................................57
2.7 Schematic of the setup used to determine the 2PA cross-sections ..........................................61
2.8 Schematic representation of speckle pattern of the setup used to determine the DLS ............66
3.1 Biological roles of the telomeric DNA ....................................................................................81
3.2 Polymorphic G-Quadruplexes .................................................................................................81
3.3 Schematic representation of G-tetrad, G-Quadruplex, G-Triad, and G-Triplex ................82
3.4 G–Quadruplex and G–Triplex sequences, and it illustrates how the DNA folds due to
Guanin and forms these structures ..............................................................................................84
3.5 Molecular structures of the investigated drug molecules ........................................................85
3.6 Optical absorption spectrum of naked Quad DNA as a function of temperature ....................88
3.7 (A) Molar ellipsity of naked Quadruplex DNA as a function of temperature;
(B) Molar Ellipsity at 246 nm, 267 nm and 292 nm ..................................................................88
3.8 Absorption spectrum of Triplex as a function of temperature ............................................89
3.9 (A) Molar ellipsity of naked Triplex DNA as a function of temperature; (B) Molar
ellipsity change of Triplex DNA at 255 and 290 nm .................................................................90
3.10 (A) Absorption spectrum of ThT with and without Quadruplex, (B) Absorption
spectrum of ThT/Quadruplex as a function of temperature ...........................................................91
xix
List of Figures—Continued
3.11 One-photon fluorescence spectrum of ThT/Quadruplex as a function of temperature .........92
3.12 Two-photon fluorescence spectrum of ThT/Quad as a function of temperature .............93
3.13 Relative 2PA cross-sections enhancement of ThT/Quadruplex as a function of
temperature ...................................................................................................................................94
3.14 (A) Absorption spectrum of ThT with and without Triplex, (B) Absorption
spectrum of ThT/Triplex as a function of temperature ..............................................................95
3.15 One-photon fluorescence spectrum of ThT/Triplex at different temperatures ......................96
3.16 Two-photon fluorescence spectrum of ThT/Triplex as a function of temperature ..........96
3.17 Relative 2PA cross-sections enhancement for ThT/Triplex as a function of
temperature ...................................................................................................................................97
3.18 (A) Absorption spectrum of ThO with and without Quadruplex DNA,
(B) Absorption spectrum of ThO/Quadruplex as a function of temperature ...........................98
3.19 Steady-state fluorescence spectrum of ThO/Quadruplex as a function of
temperature ...................................................................................................................................99
3.20 Two-photon spectrum of ThO/Quadruplex as a function of temperature ......................100
3.21 Relative 2PA cross-sections of ThO/Quadruplex as a function of temperature ............101
3.22 (A) Absorption spectrum of ThO with and without Triplex, (B) Absorption
spectrum of ThO/Triplex with temperature dependence .........................................................102
3.23 One-photon fluorescence spectrum of ThO/Triplex as a function of temperature ........103
3.24 Two-photon fluorescence spectrum of ThO/Triplex as a function of temperature ...........103
3.25 Relative 2PA cross-sections for ThO/Triplex as a function of temperature ..................104
3.26 (A) Optical absorption spectrum of DAPI with and without Quad DNA,
(B) Absorption spectrum of DAPI/Quad as a function of temperature ..................................105
3.27 One-photon fluorescence spectrum of DAPI/Quadruplex as a function of
temperature .................................................................................................................................106
xx
List of Figures—Continued
3.28 Two-photon fluorescence spectrum of DAPI/Quadruplex as a function of
temperature .................................................................................................................................107
3.29 Relative 2PA cross-sections for DAPI/Quadruplex as a function of temperature ........108
3.30 (A) Absorption spectrum of DAPI with and without Triplex, (B) Absorbance
spectrum of DAPI/Triplex at different temperatures ...............................................................109
3.31 One-photon fluorescence spectrum of DAPI/Triplex ......................................................110
3.32 Two-photon fluorescence spectrum of DAPI/Triplex as a function of temperature .....110
3.33 Relative 2PA cross-sections for DAPI/Triplex as a function of temperature ................111
3.34 (A) Optical absorption spectrum of EtBr with and without Triplex, (B) Absorption
spectrum of EtBr/Triplex as a function of temperature ...........................................................112
3.35 One-photon fluorescence spectrum of EtBr/Triplex as a function of temperature ........113
3.36 Two-photon fluorescence spectrum of EtBr/Triplex as a function of temperature .......114
3.37 Relative 2PA cross-sections for EtBr/Triplex as a function of temperature ..................115
3.38 (A) Absorption spectrum for TMPyP4 with and without Quadruplex, (B) Optical
absorption spectrum of TMPyP4/Quadruplex as a function of temperature .........................116
3.39 One-photon fluorescence spectrum of TMPyP4/Quadruplex as a function of
temperature .................................................................................................................................117
3.40 Two-photon fluorescence spectrum of TMPyP4/Quadruplex as a function of
temperature .................................................................................................................................117
3.41 Relative 2PA cross-sections of TMPyP4/Quad ...............................................................118
3.42 (A) Absorption spectrum of TMPyP4 with and without Triplex, (B) Optical
absorption spectrum of TMPyP4/Triplex as a function of temperature .................................119
3.43 One-photon fluorescence spectrum of TMPyP4/Triplex as a function of
temperature .................................................................................................................................120
xxi
List of Figures—Continued
3.44 Two-photon fluorescence spectrum of TMPyP4/Triplex as a function of
temperature .................................................................................................................................120
3.45 Relative 2PA cross-sections of TMPyP4/Triplex as a function of temperature ............121
3.46 (A) Absorption spectrum of Doxorubicin with and without Triplex, (B) Optical
absorption spectrum of Doxo/Triplex as a function of temperature .......................................122
3.47 Fluorescence spectrum of Doxo/Triplex as a function of temperature ..........................123
3.48 Two-photon fluorescence spectrum of Doxo/Triplex as a function of temperature ......124
3.49 Relative 2PA cross-sections for Doxo/Triplex as a function of temperature ................124
3.50 Molecules interacting with ssDNA, dupDNA, quadDNA, tripDNA and also interacting
with each of the electric fields produced by the backbone of the DNA ......................................126
3.51 Relative 2PA cross-sections of molecules/drugs interacting with Quadruplex
and Triplex ...................................................................................................................................127
4.1 Schematic showing the binding of Fluram with primary amines leading to a fluorescent
product .........................................................................................................................................142
4.2 Schematic representation of the protein systems studied in the investigation .......................143
4.3 (A) Optical absorption and fluorescence spectrum of Fluram binding to BSA .....................146
4.4 Schematic illustration of protein unfolding mechanism ........................................................146
4.5 (A) One photon fluorescence for BSA-fluram after excitation at 370 nm, inset shows
changes in fluorescence intensity at 479 nm for BSA-fluram as a function of temperature
from 25 to 75 oC ...........................................................................................................................148
4.6 (A) One photon fluorescence spectrum of SOD1-fluram after excitation at 370 nm,
inset shows changes in fluorescence intensity at 482 nm for SOD1-fluram as a function of
temperature from 25 to 95 oC.......................................................................................................149
4.7 Schematic showing the aggregation mechanism ...................................................................150
xxii
List of Figures—Continued
4.8 (A) Normalized fluorescence with one- and two-photon excitation to monitor
aggregation of BSA; (B) Relative 2PA cross-sections for BSA-Fluram monitoring
aggregation of BSA......................................................................................................................151
4.9 (A) Normalized fluorescence intensities as a function of temperature with one- and two-
photon excitation; (B) Relative 2PA cross-sections for SOD1-Fluram monitoring
aggregation of SOD1 ...................................................................................................................152
4.10 DLS size distribution at different temperatures for BSA and SOD1 ...................................153
4.11 (A) Time-resolved fluorescence of SOD1 and BSA; (B) Average lifetimes for
BSA-fluram and SOD1-fluram as function of temperature .........................................................154
5.1 Various sources of lead and mercury pollutions in the environment .....................................165
5.2 Schematic representation of the use of G-Quadruplex based DNA sensors to detect
presence of Pb2+ and Hg2+ ions through quenching the fluorescence of the fluorophore ............167
5.3 Molecular structure of the fluorophore, diethylthiacyanine iodide .......................................170
5.4 Optical absorbance spectrum of T-30695/DTI at varying Pb2+ concentrations .....................171
5.5 Steady fluorescence spectrum of T30695/DTI upon exposure to different Pb2+
concentrations ..............................................................................................................................172
5.6 Two-photon spectrum of T30695/DTI upon exposure to different Pb2+ concentrations .......173
5.7 Optical absorbance spectrum of T-30695/DTI at varying Hg2+ concentrations ....................174
5.8 Steady fluorescence spectrum of T30695/DTI upon exposure to different Hg2+
concentrations ..............................................................................................................................175
5.9 Two-photon spectrum of T30695/DTI after exposure to different Hg2+ concentrations .......176
5.10 (A) A comparison of the change in the single and two-photon fluorescence sensing
of Pb2+ at different concentrations................................................................................................178
5.11 A demonstration of T30695’s selectivity of Pb2+ and Hg2+ over other common metals
for both one-photon fluorescence and two-photon fluorescence excitations ...............................179
xxiii
List of Figures—Continued
5.12 The circular dichroism measurements of the T30695 oligonucleotide with K+, Hg2+,
and Pb2+ shows the formation of a G-Quadruplex structure ........................................................180
6.1 Schematic illustration of the polyelectrolytes changing folding/unfolding conditions .........192
6.2 The chemical structure for the investigated anionic polymer in this chapter MPS-PPV
and PSS ........................................................................................................................................194
6.3 Molecular structures of the investigated chromophores ........................................................194
6.4 Optical absorption spectrum of AcrO with increasing MPS-PPV concentrations ................196
6.5 (A) One photon fluorescence spectrum of AcrO with increasing MPS-PPV
concentrations ..............................................................................................................................197
6.6 Relative 2PA cross-sections of AcrO at different MPS-PPV concentrations ........................198
6.7 Optical absorption spectrum of AcrO with increasing PSS concentrations ..........................199
6.8 (A) One photon fluorescence spectrum of AcrO with increasing PSS concentrations..........200
6.9 Relative 2PA cross-sections of AcrO at different PSS concentrations ..................................201
6.10 Optical absorption spectrum of Hoe with increasing MPS-PPV concentrations .................202
6.11 (A) One photon fluorescence spectrum of Hoe with increasing MPS-PPV
concentrations ..............................................................................................................................203
6.12 Relative 2PA cross-sections of Hoe at different MPS-PPV concentrations ........................204
6.13 Optical absorption spectrum of Hoe with increasing PSS concentrations ...........................204
6.14 (A) One photon fluorescence spectrum of Hoe with increasing PSS concentrations ..........205
6.15 Relative 2PA cross-sections of Hoe at different PSS concentrations ..................................206
6.16 Optical absorption spectrum of ThT with increasing MPS-PPV concentrations ................207
6.17 (A) One photon fluorescence spectrum of ThT with increasing MPS-PPV
concentrations ..............................................................................................................................208
xxiv
List of Figures—Continued
6.18 Relative 2PA cross-sections of ThT at different MPS-PPV concentrations ........................209
6.19 Optical absorption spectrum of ThT with increasing PSS concentrations ..........................209
6.20 (A) One photon fluorescence spectrum of ThT with increasing PSS concentrations..........210
6.21 Relative 2PA cross-sections of ThT at different PSS concentrations ..................................211
6.22 Optical absorption spectrum of C-485 with increasing MPS-PPV concentration ...............212
6.23 (A) One photon fluorescence spectrum of C-485 with increasing MPS-PPV
concentrations ..............................................................................................................................213
6.24 Relative 2PA cross-sections of C-485 at different MPS-PPV concentrations .....................214
6.25 Optical absorption spectrum of C-485 with increasing PSS concentration .........................214
6.26 (A) One photon fluorescence spectrum of C-485 with increasing PSS concentrations ......215
6.27 Relative 2PA cross-sections of C-485 at different MPS-PPV concentrations .....................216
1
CHAPTER 1
INTRODUCTION
Nature uses organized self-assemblies for most processes. Proteins, enzymes, membranes
all rely heavily on the weak chemical interactions that constitute the organized self-assemblies.
Understanding organized self-assemblies has been an integral part of research interest for
interdisciplinary areas of sciences that include chemistry and biology. Among several tools to
monitor organized self-assemblies, spectroscopy plays a huge role and especially optical
spectroscopic techniques are vital to probe them. Organized self-assemblies are interdisciplinary
between biology, chemistry, material science. Understanding how organized self-assemblies
interact with one another will allow us to understand several biologically important phenomena.
The main goal of this dissertation is to develop and establish novel optical spectroscopic tools to
probe organized self-assemblies, their interactions and aggregation via applying the power of two-
photon absorption (2PA) spectroscopy. Our hypothesis is that the 2PA cross-sections of
chromophores in organized self-assemblies are sensitive to the local electric fields and their
orientation, that can be used to monitor the formation and aggregation of organized self-
assemblies. In this Chapter, a brief introduction about organized self-assemblies and how they are
important is provided. It is followed by a description of the techniques that are used to study the
organized self-assemblies and need for newer techniques to study them. Finally, the research
motivation and the work carried out for the dissertation is outlined.
1.1 Organized Self-Assemblies
Organized self-assembly refers to a spontaneous process where components either form
or aggregate without any external interference1,2. Although, this spontaneous process occurs

2
by weak non-covalent interactions, the final structure is known to be stable. These chemical
bonds include van der Walls interactions, electrostatic, π-π stacking interactions, and hydrogen
bonding1. Organized self-assembly is diffuse everywhere with varying sizes between molecular,
mesoscopic, and macroscopic scales, whose components span from atomic, ionic, and molecular
crystals to solar system and galaxies3–5. Molecular and mesoscopic organized self-assemblies
have attracted scientists and received enormous researcher attention because of their practical
application and potential to be compatible with the needs of humans. Organized self-assemblies
are normally affected by surrounding microenvironment such as solvents, pH, co-assembled
molecules, salinity and temperature6,7.
Organized self-assemblies can be classified into two main groups: static and dynamic
based on thermodynamic equilibrium conditions. Static organized self-assembly is a system that
do not dissipate energy and attains local or global equilibrium. In contrast, dynamic organized
self-assembly is a system that is required to dissipate energy to form them8,9. Most researchers
have focused on static organized self-assemblies rather than the dynamic because it includes the
biologically important processes and components and can be used for therapeutics and
diagnostics10,11. Example of static organized self-assembly include: atomic, ionic, molecular
crystals, organized self-assembled monolayers, lipid bilayers, liquid crystals and colloidal
crystals. On the other hands dynamic organized self-assembly examples include light-matter
interactions, oscillating reactions, diffusion reactions, bacterial colonies, swarms and spools,
weather patterns, solar systems, galaxies among many others4,5,12,13.
For the research work carried out in this dissertation, we have focused on the interactions
in static organized self-assemblies. The greatest merit of the static organized self-assemblies is
that the structural features of the final assemblies can be readily and finely tuned by the
3
molecular chemistry, assembling environment (solvents, pH, co-assembling molecules, salinity
and temperature), and assembly kinetics.
1.2 Chemical Interactions in Organized Self-Assemblies
Different chemical interactions make organized self-assemblies that include hydrogen
bonding, ionic bonding, π-π stacking, van der Walls interaction, hydrophilic/hydrophobic
interactions and electrostatic interactions. These strong and weak interactions help create a
unique property that creates self-assembly. All these are associated with specific forces that
adhere to their specific functions. Some weaker systems such as van der Walls and electrostatic
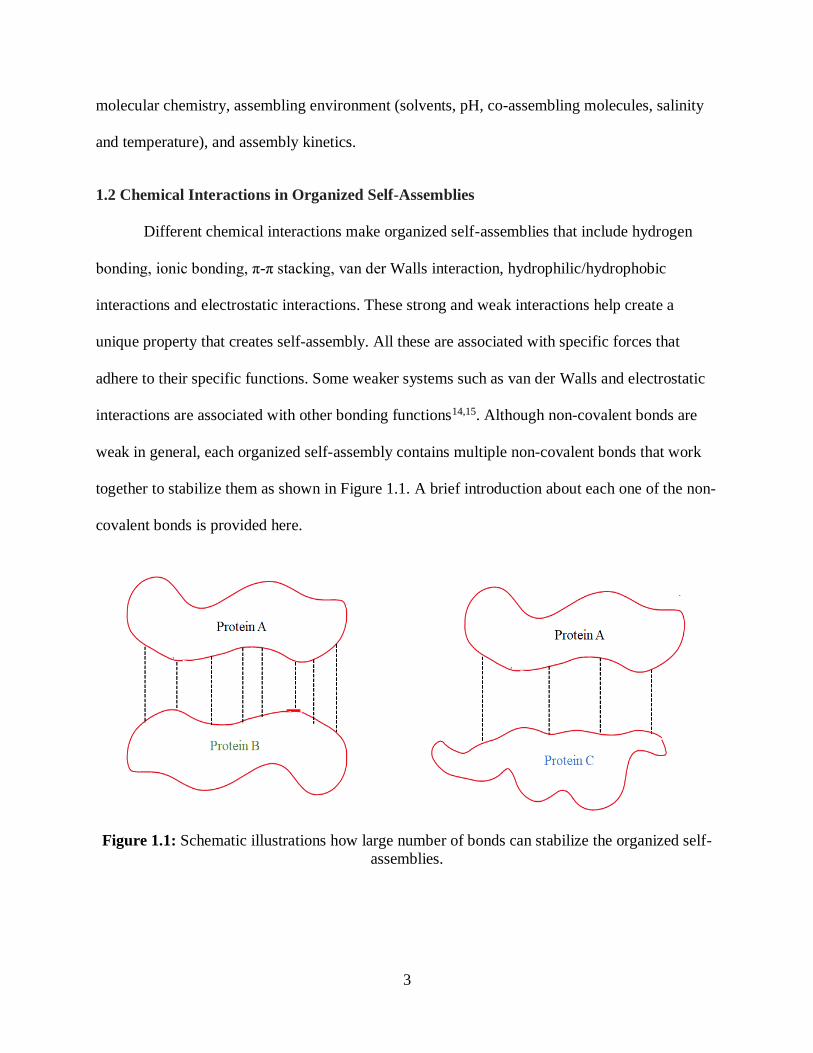
interactions are associated with other bonding functions14,15. Although non-covalent bonds are
weak in general, each organized self-assembly contains multiple non-covalent bonds that work
together to stabilize them as shown in Figure 1.1. A brief introduction about each one of the non-
covalent bonds is provided here.
Figure 1.1: Schematic illustrations how large number of bonds can stabilize the organized self-
assemblies.
4
1.2.1 Hydrogen Bonding
All life forms require hydrogen bonding to exist as water is a main component for life.
The hydrogen atom can bond covalently to a donor atom and also to an acceptor atom and is
considered a weaker bond with less energy. However, large number of these weak hydrogen
bonds make them important for many biological processed. The donor atoms are electronegative
producing a donor-to-hydrogen polar covalent bond. As for the acceptor atom, it too is
electronegative, has at least 1 bonding pair of electrons, and pulls a positive polar charge of a
hydrogen atom as describe by:14,15.
𝐷𝛿− − 𝐻𝛿+ +:𝐴𝛿− ⇄ 𝐷𝛿− − 𝐻𝛿+ ⋯𝐴𝛿− 1.1
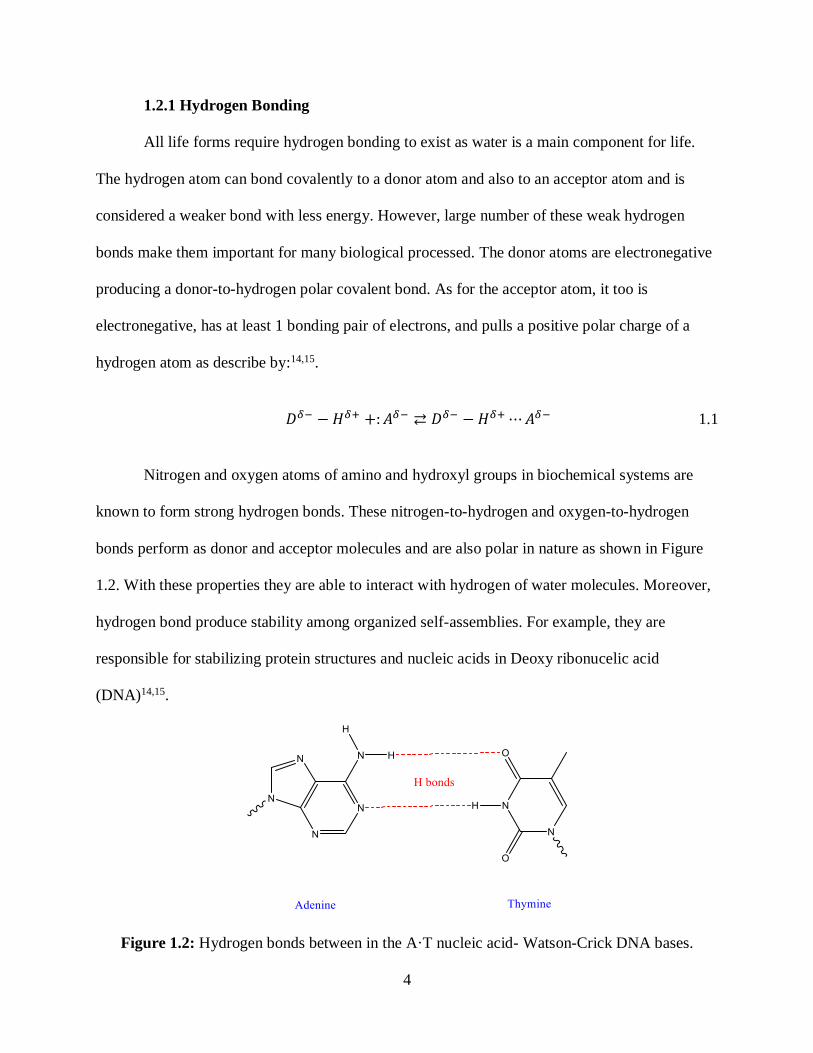
Nitrogen and oxygen atoms of amino and hydroxyl groups in biochemical systems are
known to form strong hydrogen bonds. These nitrogen-to-hydrogen and oxygen-to-hydrogen
bonds perform as donor and acceptor molecules and are also polar in nature as shown in Figure
1.2. With these properties they are able to interact with hydrogen of water molecules. Moreover,
hydrogen bond produce stability among organized self-assemblies. For example, they are
responsible for stabilizing protein structures and nucleic acids in Deoxy ribonucelic acid
(DNA)14,15.
Figure 1.2: Hydrogen bonds between in the A·T nucleic acid- Watson-Crick DNA bases.

5
1.2.2 Ionic Bonds
Ionic bonds form due to the electronegativity difference between atoms (example of ionic
interaction is shown in Figure 1.3). They are essentially the resultant of cation and anion
coulombic interactions. The lattice energy is the force responsible for the stabilization of the
crystal structure produced by ionically bonded atoms e.g. sodium chloride (NaCl). In biological
systems, cations and anions are stabilized by the surrounding water molecule via energy of
hydration which has a higher energy than most lattice energy forces formed by crystals15.
Figure 1.3: Ionic bond is one of the important non-covalent bonds that stabilizes organized self-
assemblies.
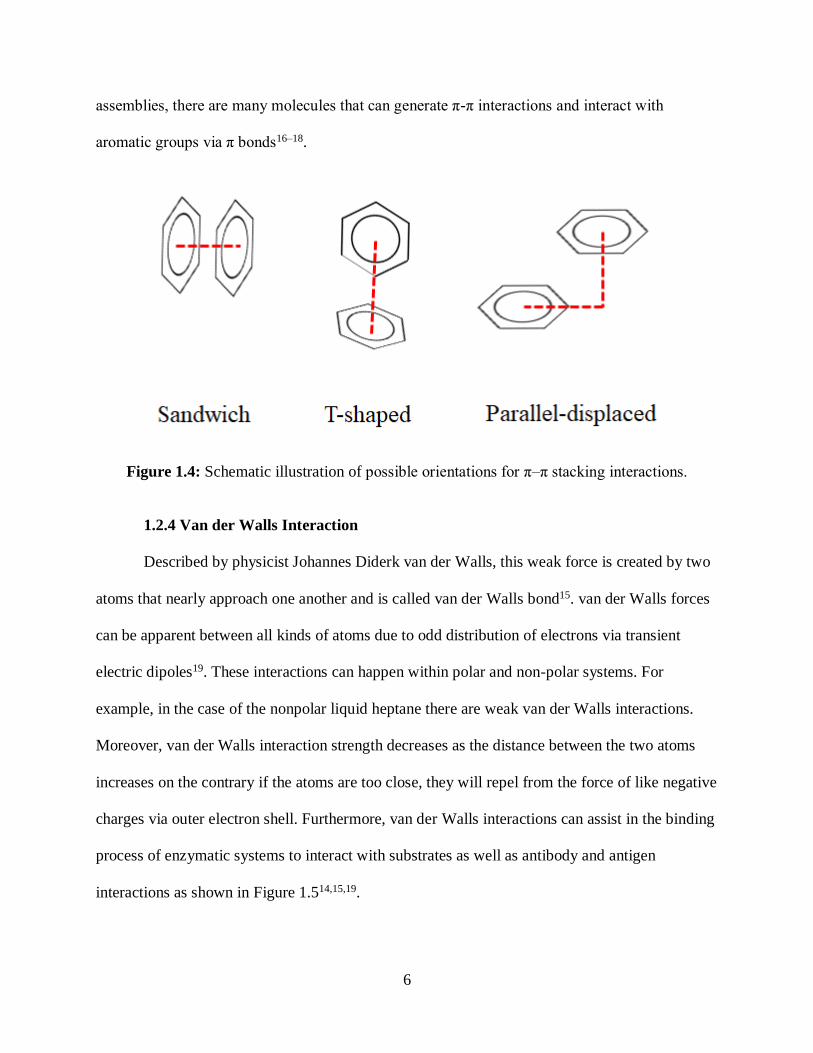
1.2.3 π-π Stacking
π-π stacking is a non-covalent interaction between aromatic groups containing π bonds.
π-π stacking can be classified into three main classes based on the geometry of aromatic
interactions: (1) edge-to-face stacked (T-shaped), (2) offset stacked (3) face-to-surface stacked as
shown in Figure 1.4. For understanding the fundamental structure properties of organized self-
6
assemblies, there are many molecules that can generate π-π interactions and interact with
aromatic groups via π bonds16–18.
Figure 1.4: Schematic illustration of possible orientations for π–π stacking interactions.
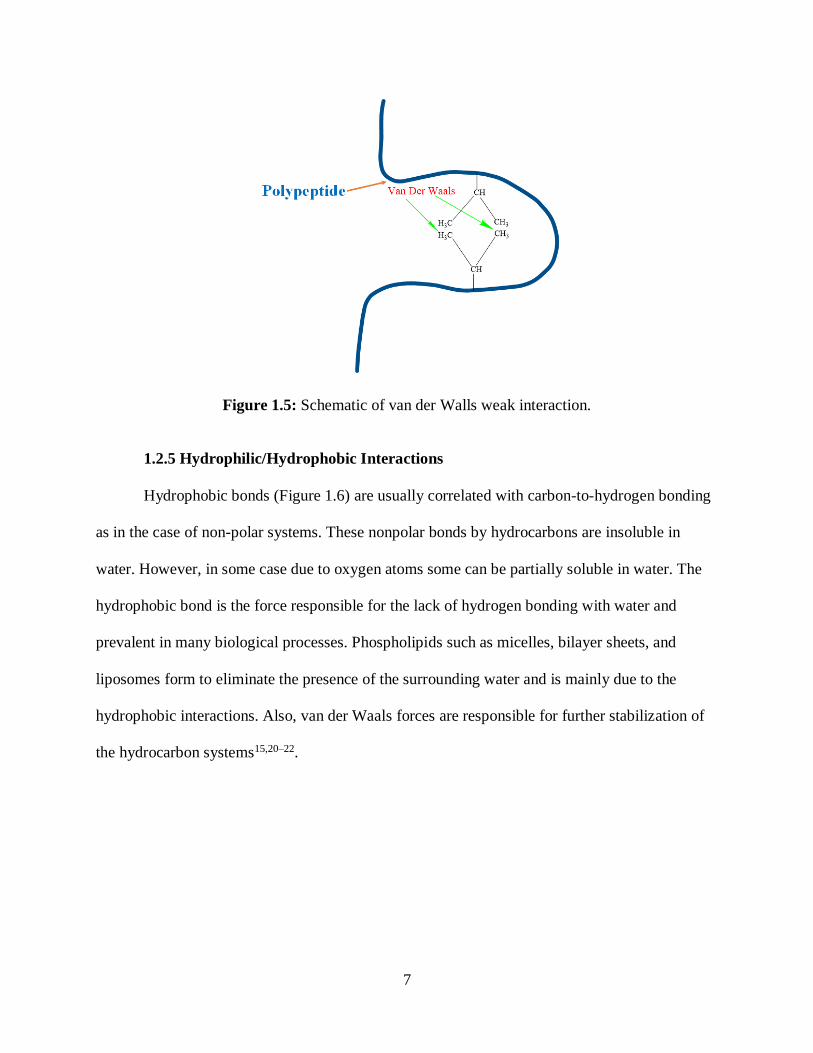
1.2.4 Van der Walls Interaction
Described by physicist Johannes Diderk van der Walls, this weak force is created by two
atoms that nearly approach one another and is called van der Walls bond15. van der Walls forces
can be apparent between all kinds of atoms due to odd distribution of electrons via transient
electric dipoles19. These interactions can happen within polar and non-polar systems. For
example, in the case of the nonpolar liquid heptane there are weak van der Walls interactions.
Moreover, van der Walls interaction strength decreases as the distance between the two atoms
increases on the contrary if the atoms are too close, they will repel from the force of like negative
charges via outer electron shell. Furthermore, van der Walls interactions can assist in the binding
process of enzymatic systems to interact with substrates as well as antibody and antigen
interactions as shown in Figure 1.514,15,19.
7
Figure 1.5: Schematic of van der Walls weak interaction.
1.2.5 Hydrophilic/Hydrophobic Interactions
Hydrophobic bonds (Figure 1.6) are usually correlated with carbon-to-hydrogen bonding
as in the case of non-polar systems. These nonpolar bonds by hydrocarbons are insoluble in
water. However, in some case due to oxygen atoms some can be partially soluble in water. The
hydrophobic bond is the force responsible for the lack of hydrogen bonding with water and
prevalent in many biological processes. Phospholipids such as micelles, bilayer sheets, and
liposomes form to eliminate the presence of the surrounding water and is mainly due to the
hydrophobic interactions. Also, van der Waals forces are responsible for further stabilization of
the hydrocarbon systems15,20–22.

8
Figure 1.6: The hydrophilic/hydrophobic interactions are highly important factor governed
organized self-assemblies.
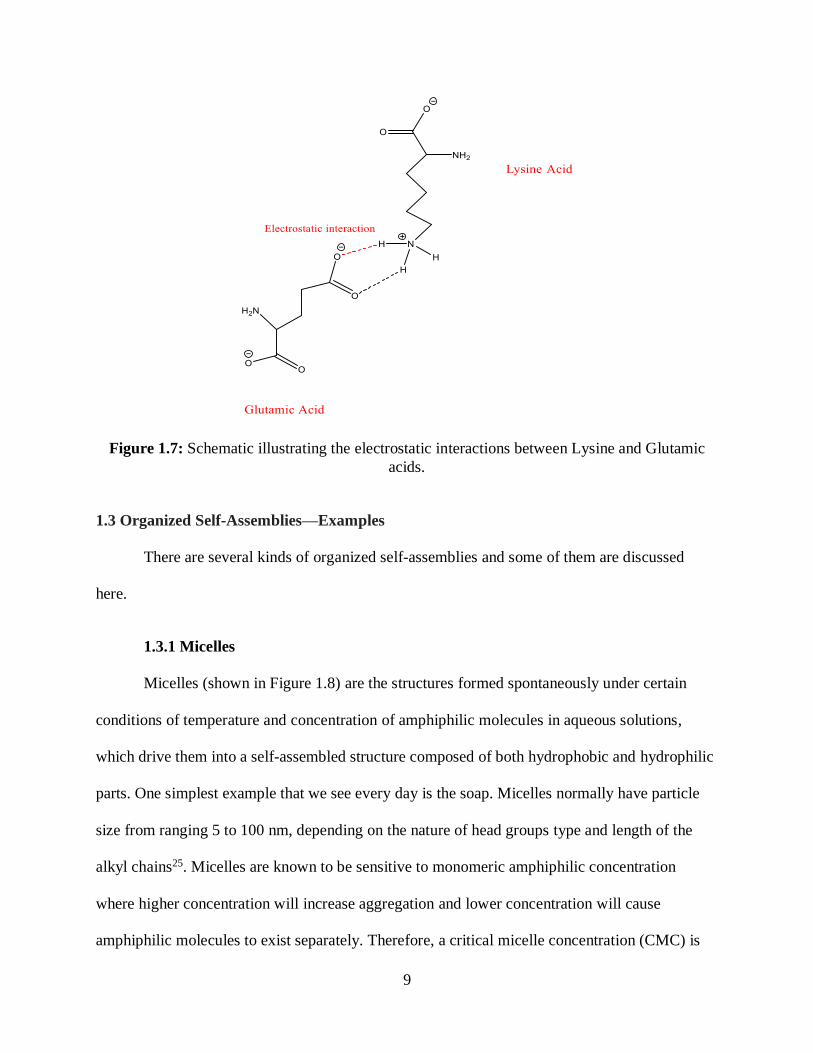
1.2.6 Electrostatic Interactions
The electrostatic interaction is non-covalent type of bond that is based on the electric
charges of an atom or bio-molecular entity (example of electrostatic interaction is provided in
Figure 1.7). It can be explained and understood by physics concepts. The Coulomb’s law can
define the electrostatic interaction with the formula:
𝐸 = 𝑘𝑞1𝑞2/𝐷𝑟 1.2
where the E is the energy; q1 and q2 are corresponding charges in the system or on the atoms via
electronic charge units. r is the distance between the two atoms in angstroms; D is the dielectric
constant (the effect of the intervening medium); k is the proportionality constant. Also, the
electrostatic interactions can happen between the two entities or atoms that have single opposing
charges and has a distance less than 3 angstroms between them 14,23,24.
9
Figure 1.7: Schematic illustrating the electrostatic interactions between Lysine and Glutamic
acids.
1.3 Organized Self-Assemblies—Examples
There are several kinds of organized self-assemblies and some of them are discussed
here.
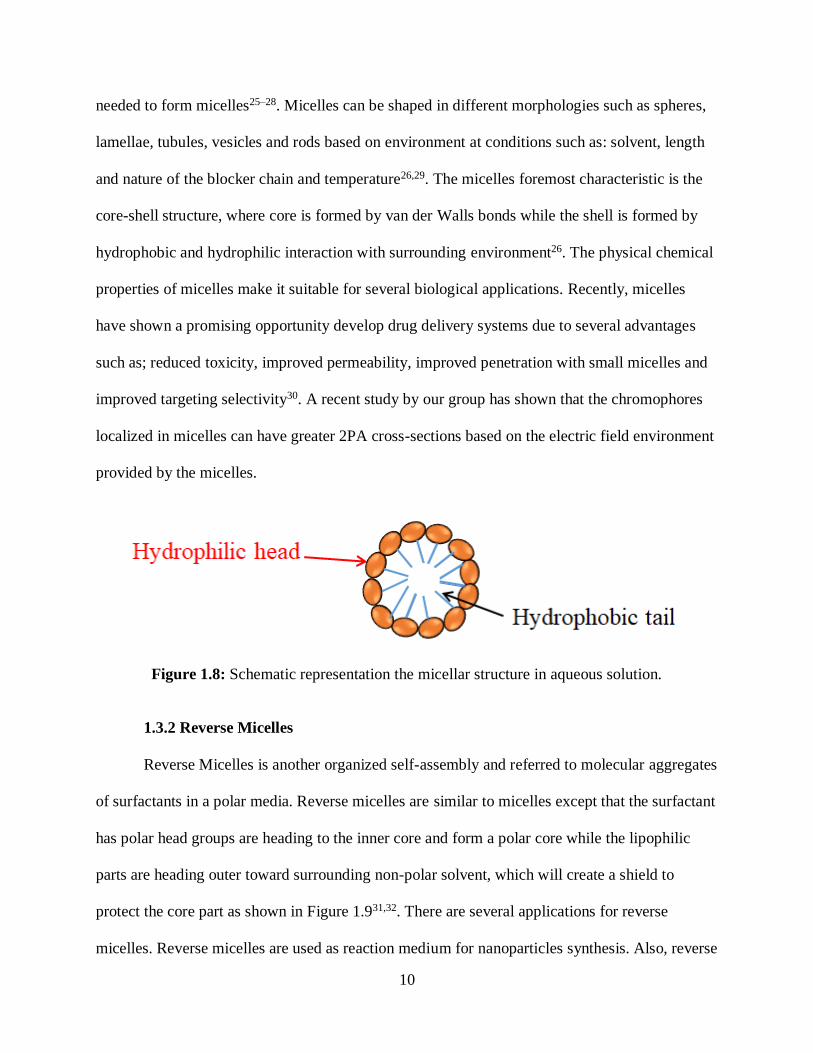
1.3.1 Micelles
Micelles (shown in Figure 1.8) are the structures formed spontaneously under certain
conditions of temperature and concentration of amphiphilic molecules in aqueous solutions,
which drive them into a self-assembled structure composed of both hydrophobic and hydrophilic
parts. One simplest example that we see every day is the soap. Micelles normally have particle
size from ranging 5 to 100 nm, depending on the nature of head groups type and length of the
alkyl chains25. Micelles are known to be sensitive to monomeric amphiphilic concentration
where higher concentration will increase aggregation and lower concentration will cause
amphiphilic molecules to exist separately. Therefore, a critical micelle concentration (CMC) is
10
needed to form micelles25–28. Micelles can be shaped in different morphologies such as spheres,
lamellae, tubules, vesicles and rods based on environment at conditions such as: solvent, length
and nature of the blocker chain and temperature26,29. The micelles foremost characteristic is the
core-shell structure, where core is formed by van der Walls bonds while the shell is formed by
hydrophobic and hydrophilic interaction with surrounding environment26. The physical chemical
properties of micelles make it suitable for several biological applications. Recently, micelles
have shown a promising opportunity develop drug delivery systems due to several advantages
such as; reduced toxicity, improved permeability, improved penetration with small micelles and
improved targeting selectivity30. A recent study by our group has shown that the chromophores
localized in micelles can have greater 2PA cross-sections based on the electric field environment
provided by the micelles.
Figure 1.8: Schematic representation the micellar structure in aqueous solution.
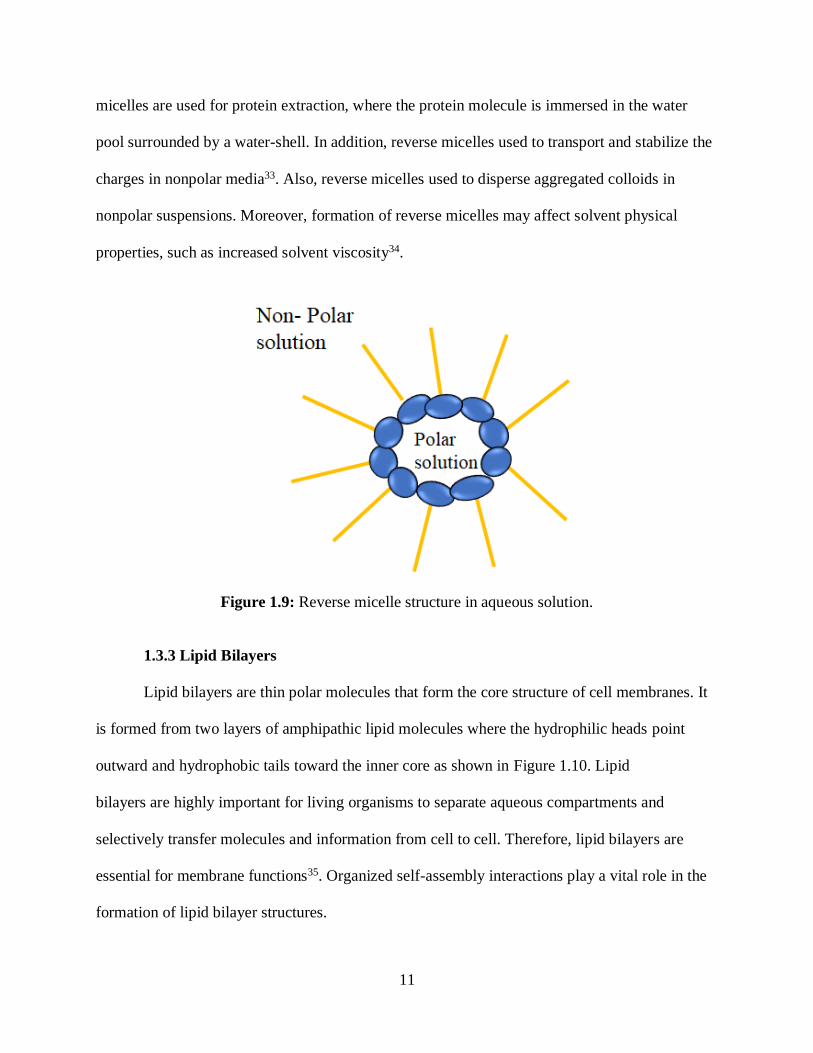
1.3.2 Reverse Micelles
Reverse Micelles is another organized self-assembly and referred to molecular aggregates
of surfactants in a polar media. Reverse micelles are similar to micelles except that the surfactant
has polar head groups are heading to the inner core and form a polar core while the lipophilic
parts are heading outer toward surrounding non-polar solvent, which will create a shield to
protect the core part as shown in Figure 1.931,32. There are several applications for reverse
micelles. Reverse micelles are used as reaction medium for nanoparticles synthesis. Also, reverse
11
micelles are used for protein extraction, where the protein molecule is immersed in the water
pool surrounded by a water-shell. In addition, reverse micelles used to transport and stabilize the
charges in nonpolar media33. Also, reverse micelles used to disperse aggregated colloids in
nonpolar suspensions. Moreover, formation of reverse micelles may affect solvent physical
properties, such as increased solvent viscosity34.
Figure 1.9: Reverse micelle structure in aqueous solution.
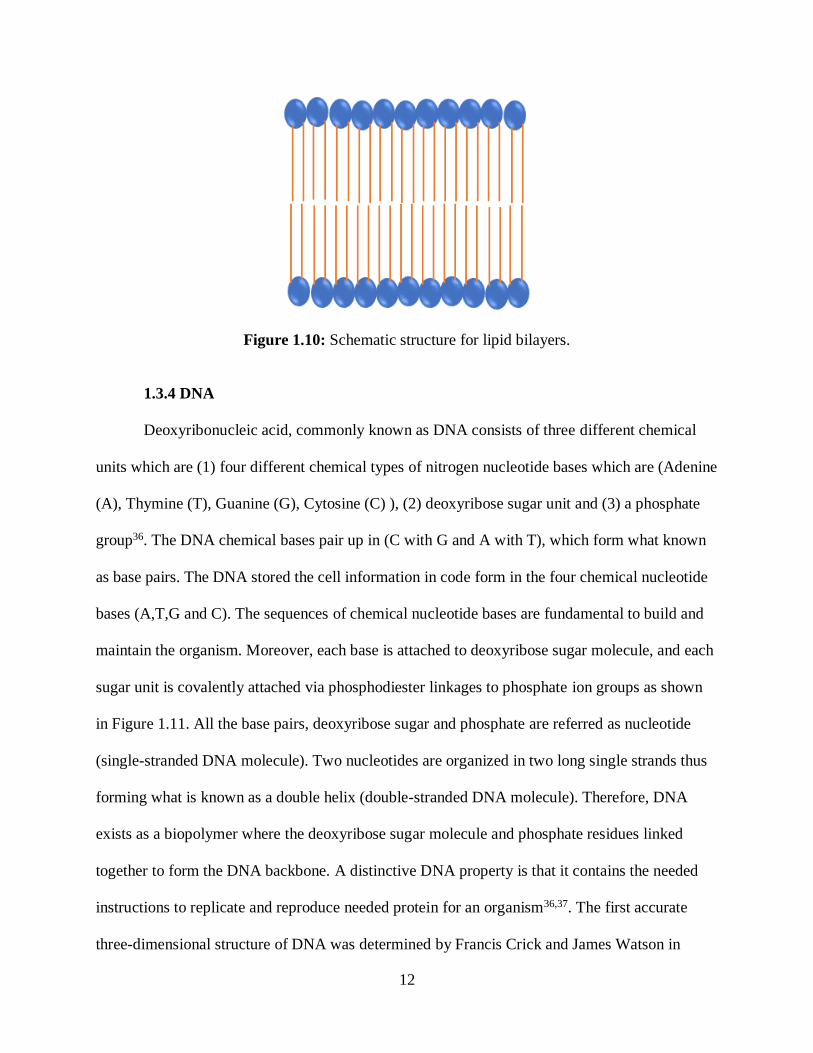
1.3.3 Lipid Bilayers
Lipid bilayers are thin polar molecules that form the core structure of cell membranes. It
is formed from two layers of amphipathic lipid molecules where the hydrophilic heads point
outward and hydrophobic tails toward the inner core as shown in Figure 1.10. Lipid
bilayers are highly important for living organisms to separate aqueous compartments and
selectively transfer molecules and information from cell to cell. Therefore, lipid bilayers are
essential for membrane functions35. Organized self-assembly interactions play a vital role in the
formation of lipid bilayer structures.
12
Figure 1.10: Schematic structure for lipid bilayers.
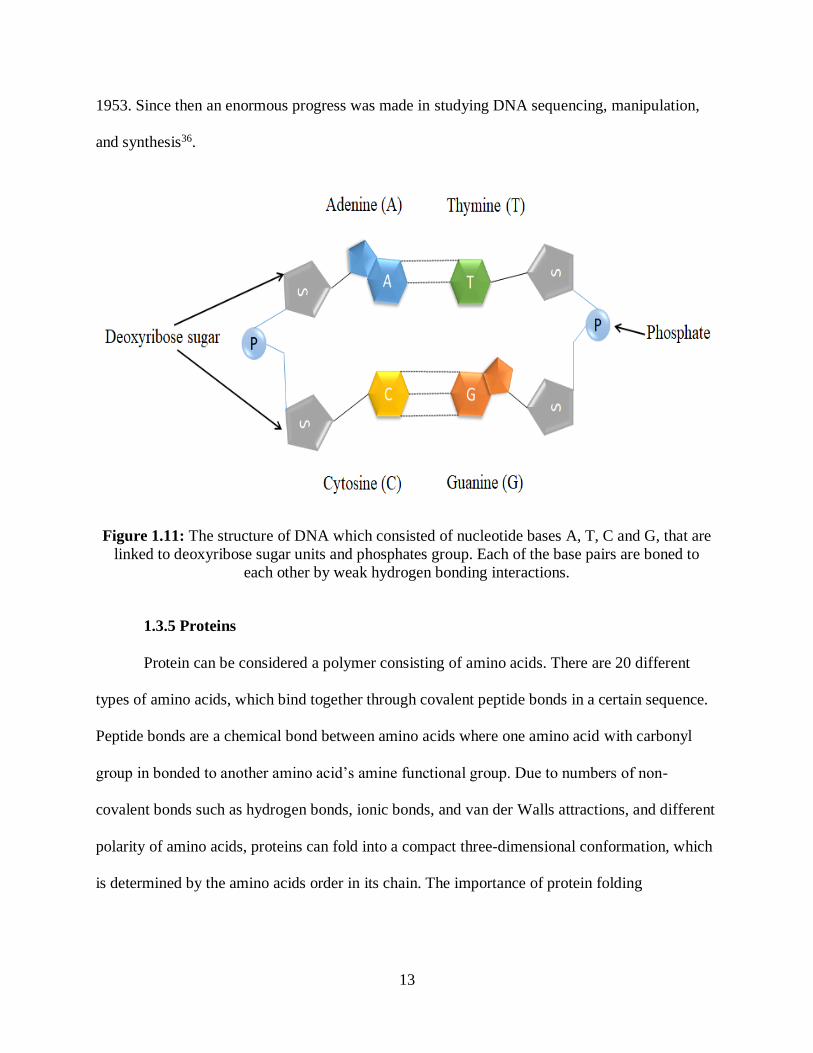
1.3.4 DNA
Deoxyribonucleic acid, commonly known as DNA consists of three different chemical
units which are (1) four different chemical types of nitrogen nucleotide bases which are (Adenine
(A), Thymine (T), Guanine (G), Cytosine (C) ), (2) deoxyribose sugar unit and (3) a phosphate
group36. The DNA chemical bases pair up in (C with G and A with T), which form what known
as base pairs. The DNA stored the cell information in code form in the four chemical nucleotide
bases (A,T,G and C). The sequences of chemical nucleotide bases are fundamental to build and
maintain the organism. Moreover, each base is attached to deoxyribose sugar molecule, and each
sugar unit is covalently attached via phosphodiester linkages to phosphate ion groups as shown
in Figure 1.11. All the base pairs, deoxyribose sugar and phosphate are referred as nucleotide
(single-stranded DNA molecule). Two nucleotides are organized in two long single strands thus
forming what is known as a double helix (double-stranded DNA molecule). Therefore, DNA
exists as a biopolymer where the deoxyribose sugar molecule and phosphate residues linked
together to form the DNA backbone. A distinctive DNA property is that it contains the needed
instructions to replicate and reproduce needed protein for an organism36,37. The first accurate
three-dimensional structure of DNA was determined by Francis Crick and James Watson in
13
1953. Since then an enormous progress was made in studying DNA sequencing, manipulation,
and synthesis36.
Figure 1.11: The structure of DNA which consisted of nucleotide bases A, T, C and G, that are
linked to deoxyribose sugar units and phosphates group. Each of the base pairs are boned to
each other by weak hydrogen bonding interactions.
1.3.5 Proteins
Protein can be considered a polymer consisting of amino acids. There are 20 different
types of amino acids, which bind together through covalent peptide bonds in a certain sequence.
Peptide bonds are a chemical bond between amino acids where one amino acid with carbonyl
group in bonded to another amino acid’s amine functional group. Due to numbers of non-
covalent bonds such as hydrogen bonds, ionic bonds, and van der Walls attractions, and different
polarity of amino acids, proteins can fold into a compact three-dimensional conformation, which
is determined by the amino acids order in its chain. The importance of protein folding
14
governs the biological function for cells such as maintenance, defense, replication, and
reproduction36,37.
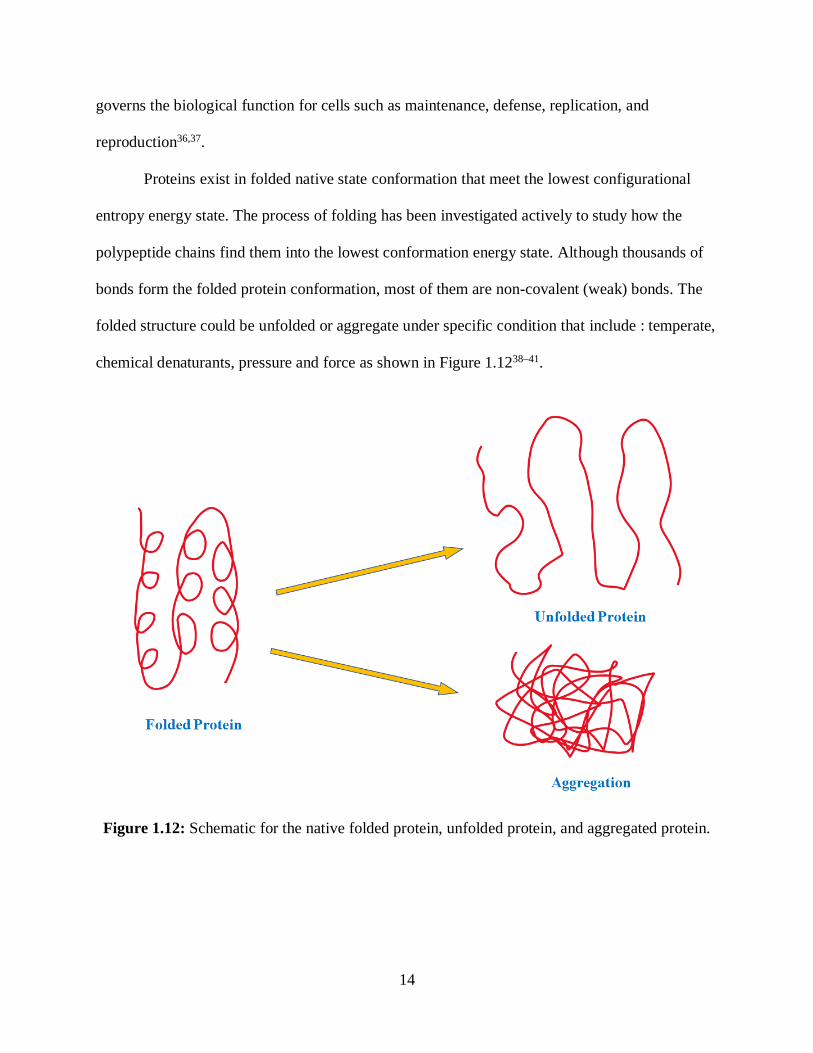
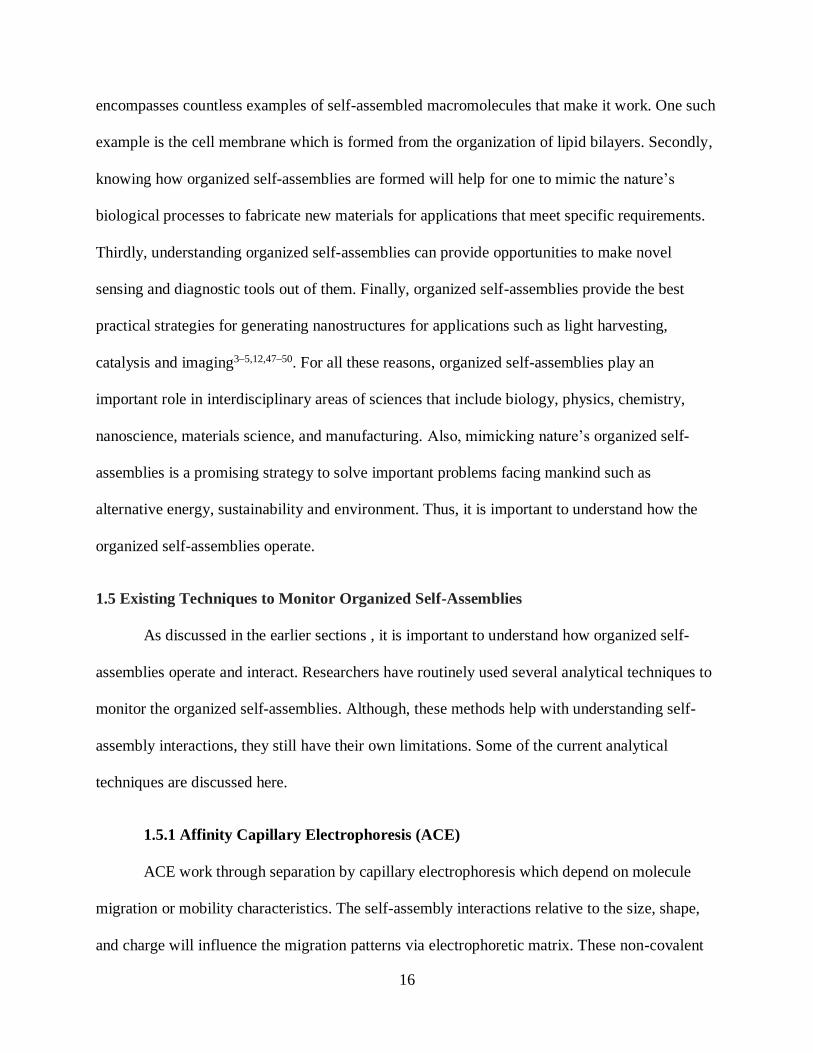
Proteins exist in folded native state conformation that meet the lowest configurational
entropy energy state. The process of folding has been investigated actively to study how the
polypeptide chains find them into the lowest conformation energy state. Although thousands of
bonds form the folded protein conformation, most of them are non-covalent (weak) bonds. The
folded structure could be unfolded or aggregate under specific condition that include : temperate,
chemical denaturants, pressure and force as shown in Figure 1.1238–41.
Figure 1.12: Schematic for the native folded protein, unfolded protein, and aggregated protein.
15
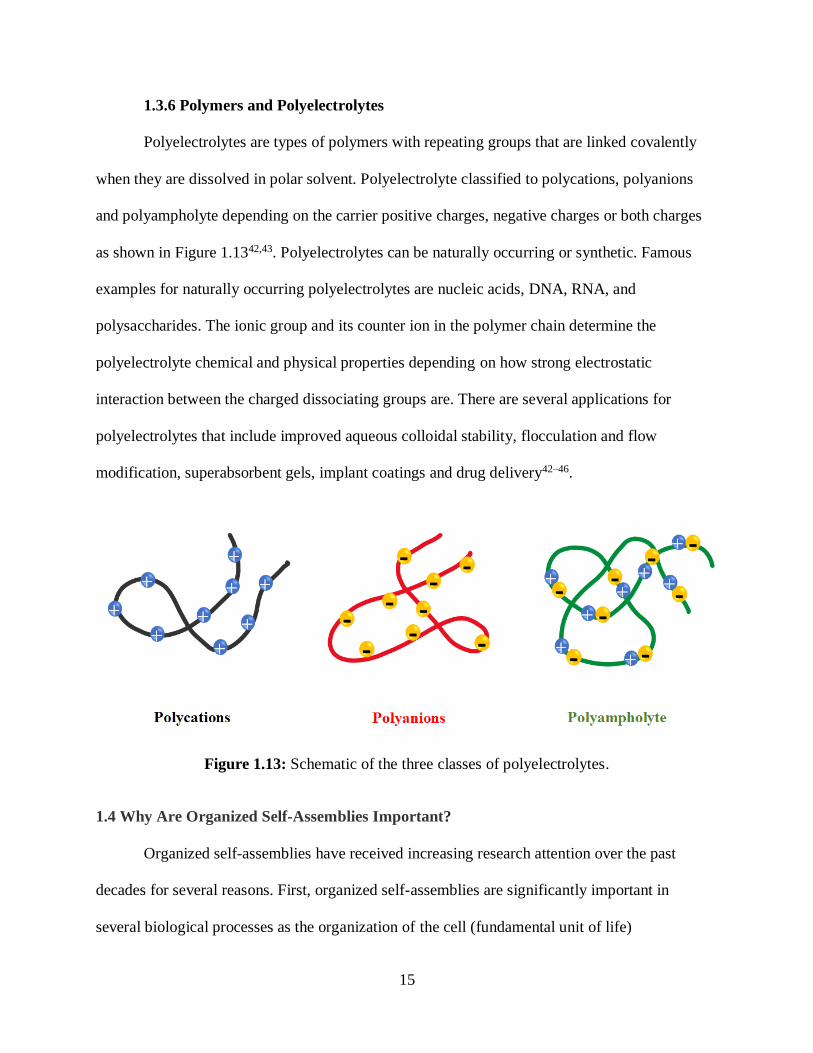
1.3.6 Polymers and Polyelectrolytes
Polyelectrolytes are types of polymers with repeating groups that are linked covalently
when they are dissolved in polar solvent. Polyelectrolyte classified to polycations, polyanions
and polyampholyte depending on the carrier positive charges, negative charges or both charges
as shown in Figure 1.1342,43. Polyelectrolytes can be naturally occurring or synthetic. Famous
examples for naturally occurring polyelectrolytes are nucleic acids, DNA, RNA, and
polysaccharides. The ionic group and its counter ion in the polymer chain determine the
polyelectrolyte chemical and physical properties depending on how strong electrostatic
interaction between the charged dissociating groups are. There are several applications for
polyelectrolytes that include improved aqueous colloidal stability, flocculation and flow
modification, superabsorbent gels, implant coatings and drug delivery42–46.
Figure 1.13: Schematic of the three classes of polyelectrolytes.
1.4 Why Are Organized Self-Assemblies Important?
Organized self-assemblies have received increasing research attention over the past
decades for several reasons. First, organized self-assemblies are significantly important in
several biological processes as the organization of the cell (fundamental unit of life)
16
encompasses countless examples of self-assembled macromolecules that make it work. One such
example is the cell membrane which is formed from the organization of lipid bilayers. Secondly,
knowing how organized self-assemblies are formed will help for one to mimic the nature’s
biological processes to fabricate new materials for applications that meet specific requirements.
Thirdly, understanding organized self-assemblies can provide opportunities to make novel
sensing and diagnostic tools out of them. Finally, organized self-assemblies provide the best
practical strategies for generating nanostructures for applications such as light harvesting,
catalysis and imaging3–5,12,47–50. For all these reasons, organized self-assemblies play an
important role in interdisciplinary areas of sciences that include biology, physics, chemistry,
nanoscience, materials science, and manufacturing. Also, mimicking nature’s organized self-
assemblies is a promising strategy to solve important problems facing mankind such as
alternative energy, sustainability and environment. Thus, it is important to understand how the
organized self-assemblies operate.
1.5 Existing Techniques to Monitor Organized Self-Assemblies
As discussed in the earlier sections , it is important to understand how organized self-
assemblies operate and interact. Researchers have routinely used several analytical techniques to
monitor the organized self-assemblies. Although, these methods help with understanding self-
assembly interactions, they still have their own limitations. Some of the current analytical
techniques are discussed here.
1.5.1 Affinity Capillary Electrophoresis (ACE)
ACE work through separation by capillary electrophoresis which depend on molecule
migration or mobility characteristics. The self-assembly interactions relative to the size, shape,
and charge will influence the migration patterns via electrophoretic matrix. These non-covalent
17
interactions can be studied by mapping the electrophoretic behavior of a molecular system
fashioned with a marked biomolecule along with a labeled affinity probe. This system typically
contains the electrophoresis buffer with a receptor. The receptor will interact among the marked
self-assembled analytes. Advantage of ACE include: automation, separation efficiency, ability to
use less reagent, studying system at varied conditions such pH levels and temperatures, and short
analysis time. 27,28,33,34 A disadvantage of ACE is that it cannot handle specification for
adsorption of proteins on capillaries, and also it requires a high purity samples51–54. This
technique cannot understand the micro-environments in organized self-assemblies.
1.5.2 Enzyme-Linked Immunosorbent Assay (ELISA)
ELISA is generally used to recognize how much antigen is within a sample and often can
probe biologically important self-assembled macromolecules. To do this, a sample is placed on a
solid motionless plate and incubated along with an antibody. This antibody will bind to an
antigen that is covalently conjugated to an enzyme giving an enhanced signal. The bound
enzyme gives a fluorogenic reaction with the substrates yield a signal indicating the
concentration of antigen in the sample. The advantage of ELISA includes easy to setup, rapid
detection and economical cost. However, ELISA cannot detect specific antigen immobilization
and so fails to detect low affinity antibodies 55–58. Also, ELISA is specific to certain kinds of
organized self-assemblies and is not quite general.
1.5.3 Fluorescence Resonance Energy Transfer (FRET)
(FRET) is a non-radiative process that can be used as a marker to study the distances,
protein folding and aggregation in biologically important systems. FRET requires the labelling of
the organized self-assemblies with different fluorophores marking one as donor and another as
acceptor. Emission wavelengths for the two labeling systems requires the excitation and
18
emission spectruml regions to overlap. Where the donating systems give fluorescence that can be
absorbed by acceptor and gives rise to emission from the acceptor. The ratio of donor
fluorescence to acceptor fluorescence can be used as a ruler to study several biological important
phenomena. This is mainly used for studying the distance between two biological entities. FRET
has its own advantages and disadvantages. FRET is powerful for imaging and following the
distances. However, it is limited to monitoring self-assembly interactions that are within 10 nm
of each other, and requires labeling of biological molecules which can be tedious. The major
limitation is it is insensitive to microenvironments such as changes in pH, temperature, oxidation
and ionic concentrations. In addition, FRET suffers from the low signal-to-noise ratio37,59–61.
1.5.4 Isothermal Calorimetry (ITC)
Theoretically, any reaction involves either generating or absorbing energy. ITC is a
technique that measures the thermodynamic change during a chemical reaction. The ITC
instrument contains two compartments. The two compartments must maintain the thermal
equilibrium in the solution. Fundamentally, one compartment is referred as the reference cell and
is maintained with water or buffer solution, while the other compartment contains a component
of the system that is being observed. The change in enthalpy occurs as reactions components are
placed in the sample cell. The change in temperature is noted via thermo-circuits in the system
and detect changes in cells37,62–65. ITC is used extensively because it easy to use with good
sensitivity. Although ITC is used to gather information from many systems such as ligand
binding, protein-protein, enzymatic activity, lipid-lipid, drug development and protein-receptor,
it has several limitations. The limitations include issues with precision in the temperature
changes as well as whether the interactions can be measured successfully via enthalpic effects,
19
concentration influence in data inaccuracy63,65,66. Also, ITC does not give specific information
about the microenvironments or the orientations.
1.5.5 Ultraviolet Visible Spectroscopy (UV-vis)
Another method that used to routinely used to study organized self-assembly is UV-vis
spectroscopy. UV-vis analyzes the absorption of a molecule or material. UV-vis works by using
the electron magnetic radiation from the visible to ultraviolet range to energize a sample and then
scan how much light is absorbed. The concentration of the absorbing species can be calculated
from Beer-Lamber Law. The changes in absorption are often associated with changes in
confirmations of organized self-assemblies. Also, information how a chemical molecule is
bonded to another molecule or self-assembled material can be studies. UV-vis spectroscopy is
routinely used for many applications as it is easy to use and affordable. However, it has low
resolution, the changes in spectruml shifts of the wavelength maximum can give low
specificity67,68.
1.5.6 Nuclear Magnetic Resonance (NMR)
NMR uses the chemical species information from the atomic nuclei to probe the structure
of organized self-assemblies. NMR spectroscopy is used to determine structures of proteins or
drug-protein or drug-DNA interactions. The frequency from the resonating atoms help produce
a code to compute the molecular formulations and structure, as well as the conformational and
intermolecular responses68–71. NMR is a powerful analytical method due to high resolution, deep
information on self-assemblies conformational changes and information on structure67. However,
for NMR to be used, the molecular weight for sample solutions should be less than 40 kDa. It
may requires 15N and 13C which is expensive and large amount of sample is required for the
process66,69,72. Also, the technique is expensive as well as difficult to use and analyze the data.
20
1.5.7 Surface Plasmon Resonance (SPR)
SPR is a powerful technique which is based on surface plasmon resonances of metal
nanomaterials. It is an optical-sensing method to detect the changes in refractive index of a thin-
metal-film surface component with the onset of binding of a biochemical species. In terms of the
refractive index, a change occurs of the resonance angle of light as cells surface change.
Understanding this allows SPR to monitor of organized self-assemblies that can be monitored by
analyzing the shift in resonance of the SPR absorption and which can be used to monitor the
concentration of biological samples. SPR has the ability to allow for label-free and sub-
nanogram detections. The functionalization of metal surface is desired for a specific biochemical
interaction and has real-time measurement capability to monitor steady-state and dynamic
processes73–77. SPR is a high sensitivity technique and can work with small amount of sample.
Although SPR has some great qualities, it is limited in its use except for studying antigen-
antibody interactions, concentrations of cells and so on. It cannot be used to study the
microenvironments in self-assembled systems66,67.
1.6 Research Motivation
As discussed above, there are several techniques that are currently in use to monitor the
organized self-assemblies. All of them have their merits but most suffer from inherent
disadvantages such as inability to probe micro-environments, lower sensitivity and ease of use.
We can point out following important characteristics that are needed for a spectroscopic tool to
be routinely used for probing organized self-assemblies. Firstly, they should be sensitive to
micro-environment changes such as pH, drug binding, structural change etc. Secondly, they
should be very easy to use and analyze. Thirdly, the technique should be general in the sense that
they can be used for variety of organized self-assemblies. Developing such an analytical tool and
21
using it to study organized self-assembled materials form the main motivation behind the work
carried out in this dissertation. In recent years, it was shown that two-photon absorption cross-
sections of chromophores can act as markers for local electric fields in proteins or micelles etc.
We propose to use this property of 2PA cross-sections of chromophore as a tool to study the
organized self-assemblies and their interactions. The main dissertation objective is to use two-
photon fluorescence and corresponding 2PA cross-sections to study organized self-assembly
interactions and probe micro-environmental changes in them, and use this tools to develop novel
sensing and diagnostic tools.
1.7 Sensing Organized Self-Assemblies with Dye Molecules and 2PA Spectroscopy
The development of novel spectroscopic tools is necessary for monitoring organized self-
assemblies. There two main analytical fundamental optical techniques that are used to sense
absorption and fluorescence techniques using dye molecules as probes. It is important to know
and study how self-organized assembly bind with the dyes and how such signals can be used to
monitor organized self-assemblies. Electrostatic interaction with dye molecules gives rise to
significant changes in fluorescence. For example, fluorescence enhancement has been used as a
tool to study the binding of molecule with DNA. The dyes can intercalate with the DNA and
rigidify it to give rise to enhanced signal. Intercalation is possible due a two the hydrophobic
energy as well as van der Waal forces producing noncovalent bondages where the dye molecule
is bound to self-assembled. Investigations of self-organized assembly sensing have limitations in
regard to scattering in complex sample mediums. However these boundaries can be breeched by
new analytical techniques such as two-photon fluorescence and 2PA cross-sections which is the
focus of the work carried out in this dissertation1,3,8,11,73,78–84.
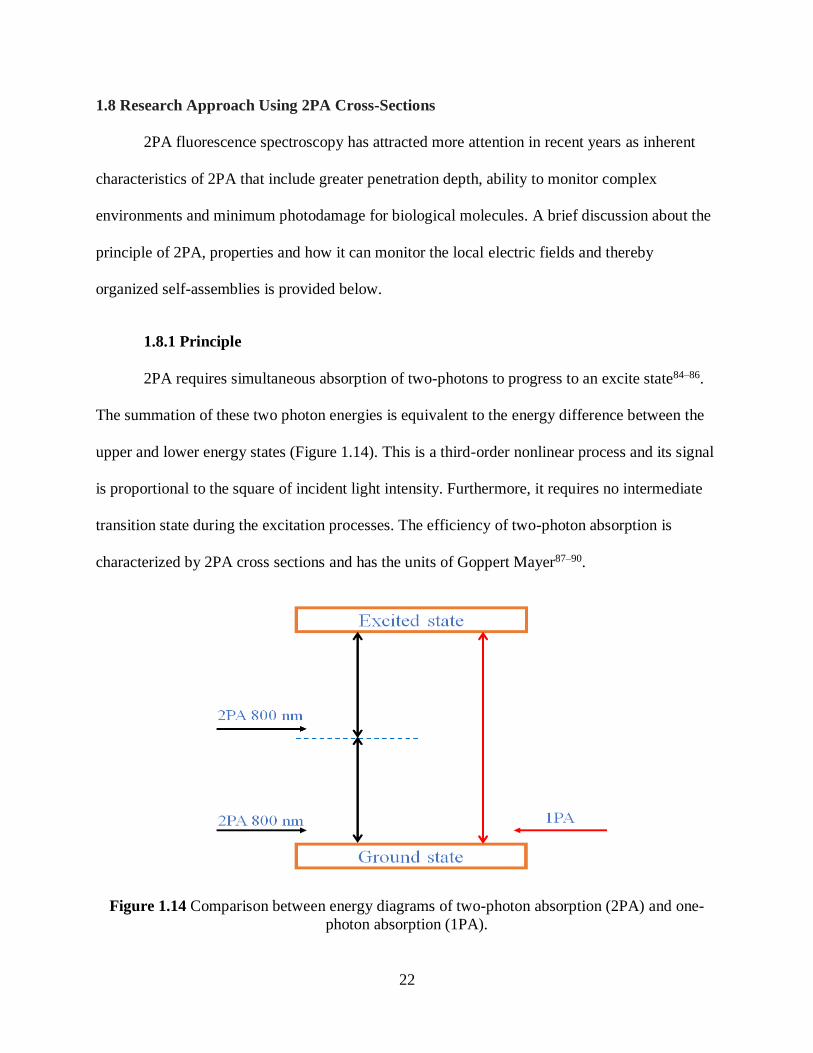
22
1.8 Research Approach Using 2PA Cross-Sections
2PA fluorescence spectroscopy has attracted more attention in recent years as inherent
characteristics of 2PA that include greater penetration depth, ability to monitor complex
environments and minimum photodamage for biological molecules. A brief discussion about the
principle of 2PA, properties and how it can monitor the local electric fields and thereby
organized self-assemblies is provided below.
1.8.1 Principle
2PA requires simultaneous absorption of two-photons to progress to an excite state84–86.
The summation of these two photon energies is equivalent to the energy difference between the
upper and lower energy states (Figure 1.14). This is a third-order nonlinear process and its signal
is proportional to the square of incident light intensity. Furthermore, it requires no intermediate
transition state during the excitation processes. The efficiency of two-photon absorption is
characterized by 2PA cross sections and has the units of Goppert Mayer87–90.
Figure 1.14 Comparison between energy diagrams of two-photon absorption (2PA) and one-
photon absorption (1PA).
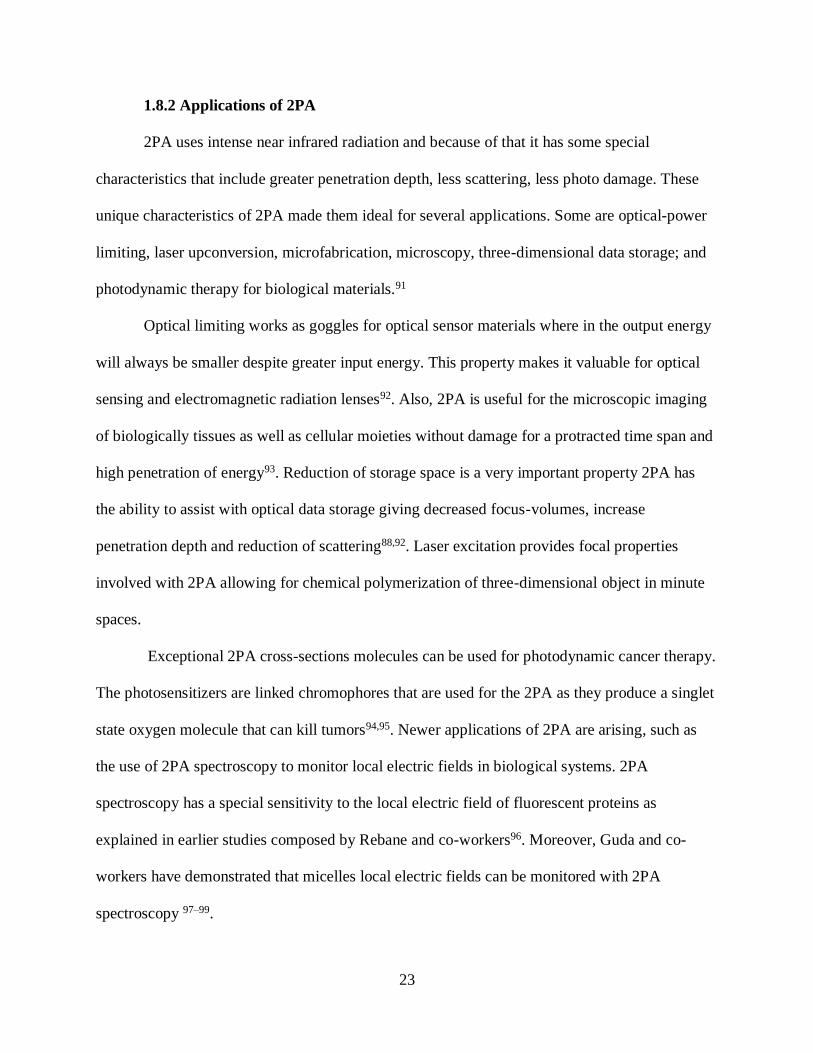
23
1.8.2 Applications of 2PA
2PA uses intense near infrared radiation and because of that it has some special
characteristics that include greater penetration depth, less scattering, less photo damage. These
unique characteristics of 2PA made them ideal for several applications. Some are optical-power
limiting, laser upconversion, microfabrication, microscopy, three-dimensional data storage; and
photodynamic therapy for biological materials.91
Optical limiting works as goggles for optical sensor materials where in the output energy
will always be smaller despite greater input energy. This property makes it valuable for optical
sensing and electromagnetic radiation lenses92. Also, 2PA is useful for the microscopic imaging
of biologically tissues as well as cellular moieties without damage for a protracted time span and
high penetration of energy93. Reduction of storage space is a very important property 2PA has
the ability to assist with optical data storage giving decreased focus-volumes, increase
penetration depth and reduction of scattering88,92. Laser excitation provides focal properties
involved with 2PA allowing for chemical polymerization of three-dimensional object in minute
spaces.
Exceptional 2PA cross-sections molecules can be used for photodynamic cancer therapy.
The photosensitizers are linked chromophores that are used for the 2PA as they produce a singlet
state oxygen molecule that can kill tumors94,95. Newer applications of 2PA are arising, such as
the use of 2PA spectroscopy to monitor local electric fields in biological systems. 2PA
spectroscopy has a special sensitivity to the local electric field of fluorescent proteins as
explained in earlier studies composed by Rebane and co-workers96. Moreover, Guda and co-
workers have demonstrated that micelles local electric fields can be monitored with 2PA
spectroscopy 97–99.
24
Figure 1.15 Illustration of the applications of 2PA.
Why 2PA spectroscopy can be sensitive to local electric fields can be explained as
follows. The 2PA cross-sections can be given by the following expression:100,
𝛿 =2(2𝜋)4𝑓𝐿
4
15(𝑛ℎ𝑐)2 (1 + 2𝑐𝑜𝑠2𝜃)|𝑀𝑔𝑒|
2|∆𝜇𝑔𝑒|
2𝑔(2𝜈) 1.3
where δ is the two-photon absorption cross-sections; Mge is the transition dipole moment vector
that exist between the ground state (g) and the excited ( e) states; θ is the angle between the
vector Mge and Δμge; Δμge is the difference between the permanent dipole moments that exist in
the ground and excites states; g(2ν) is the normalized line shape function; c is the speed of light;
n is the refractive index; h is the Plank’s constant; and fL is the local field factor which is shown
in the following equation97,100,
𝑓𝐿 =(𝑛2+2)
3 1.4

25
Furthermore, the resulting equation below represents the resulting change in the local
electric field in their respective dipole moments from the increase of the induced dipole moment
∆𝜇𝑔𝑒 = ∆𝜇𝑔𝑒° + 0.5∆𝜇𝑔𝑒
𝑖𝑛𝑑 = ∆𝜇𝑔𝑒° ± 0.5(∆𝛼 ). �� = ∆𝜇𝑔𝑒
° ± 0.5(∆𝛼)𝐸 cos 𝜃 1.5
for these functions, Δα = αe – αg is the change in the polarizability between the excited state and
the ground state; and θ represent the angle between the transition dipole and moment of the
molecule and the electric field vector. As Δμ°ge represents the change in the permanent dipole
moment in a zero-field outcome and E is presentative of the local electric filed vector than the
2PA cross-sections will be directly relational to the square of the change in the permanent dipole
moment along with the change in the dipole-moment.
The δ has a sensitivity to the electric field if the chromophore is localized in it.
Moreover, the orientation of the chromophore with respect to the electric field orientation can
alter the 2PA cross-sections96,99–101. For all these reasons, we feel that 2PA spectroscopy can be a
valuable tool to monitor the organized self-assemblies.
1.9 Aims and Objectives of the Dissertation
1. Development of 2PA spectroscopy as a tool to probe change in electrical fields in
organized self-assemblies.
2. Using 2PA spectroscopy as a tool to monitor melting and stabilization of non-canonical
structures of DNA.
3. Use of 2PA spectroscopy as to monitor folding/unfolding and aggregation of proteins.
4. Design and development of novel sensing platforms based on 2PA spectroscopy.
5. Using 2PA spectroscopy to monitor the micro-environment in synthetic organized
assemblies and obtain materials with enhanced 2PA cross-sections.
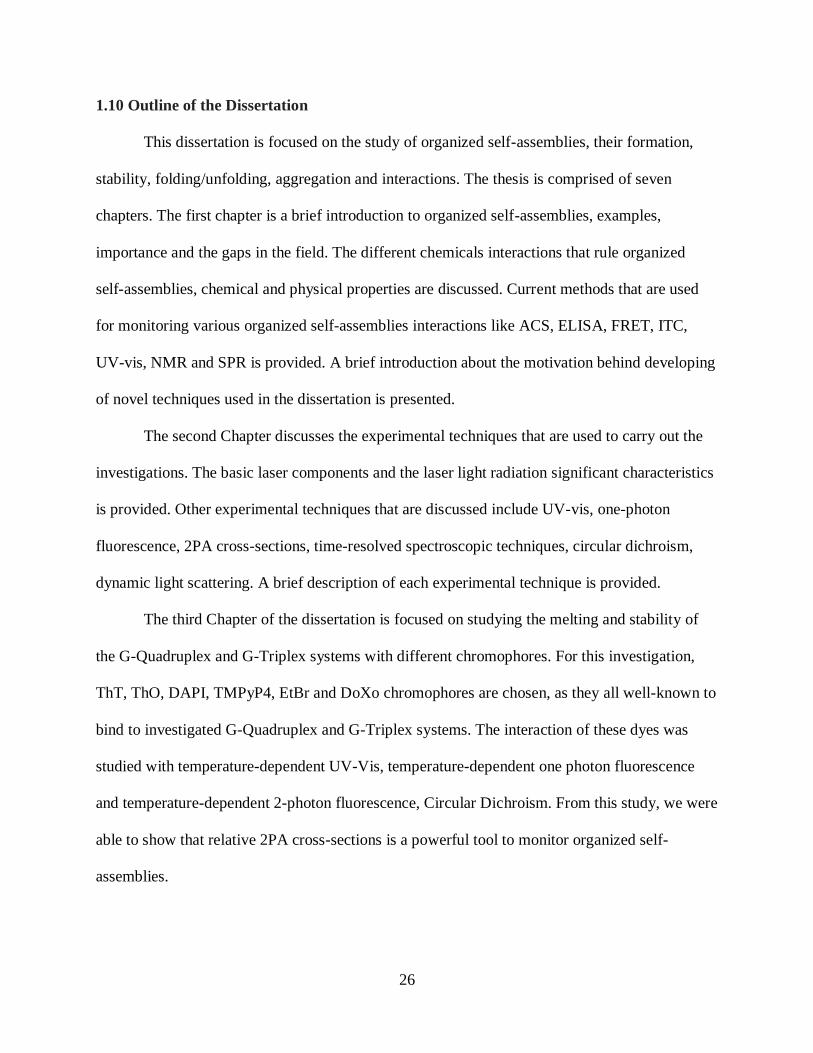
26
1.10 Outline of the Dissertation
This dissertation is focused on the study of organized self-assemblies, their formation,
stability, folding/unfolding, aggregation and interactions. The thesis is comprised of seven
chapters. The first chapter is a brief introduction to organized self-assemblies, examples,
importance and the gaps in the field. The different chemicals interactions that rule organized
self-assemblies, chemical and physical properties are discussed. Current methods that are used
for monitoring various organized self-assemblies interactions like ACS, ELISA, FRET, ITC,
UV-vis, NMR and SPR is provided. A brief introduction about the motivation behind developing
of novel techniques used in the dissertation is presented.
The second Chapter discusses the experimental techniques that are used to carry out the
investigations. The basic laser components and the laser light radiation significant characteristics
is provided. Other experimental techniques that are discussed include UV-vis, one-photon
fluorescence, 2PA cross-sections, time-resolved spectroscopic techniques, circular dichroism,
dynamic light scattering. A brief description of each experimental technique is provided.
The third Chapter of the dissertation is focused on studying the melting and stability of
the G-Quadruplex and G-Triplex systems with different chromophores. For this investigation,
ThT, ThO, DAPI, TMPyP4, EtBr and DoXo chromophores are chosen, as they all well-known to
bind to investigated G-Quadruplex and G-Triplex systems. The interaction of these dyes was
studied with temperature-dependent UV-Vis, temperature-dependent one photon fluorescence
and temperature-dependent 2-photon fluorescence, Circular Dichroism. From this study, we were
able to show that relative 2PA cross-sections is a powerful tool to monitor organized self-
assemblies.
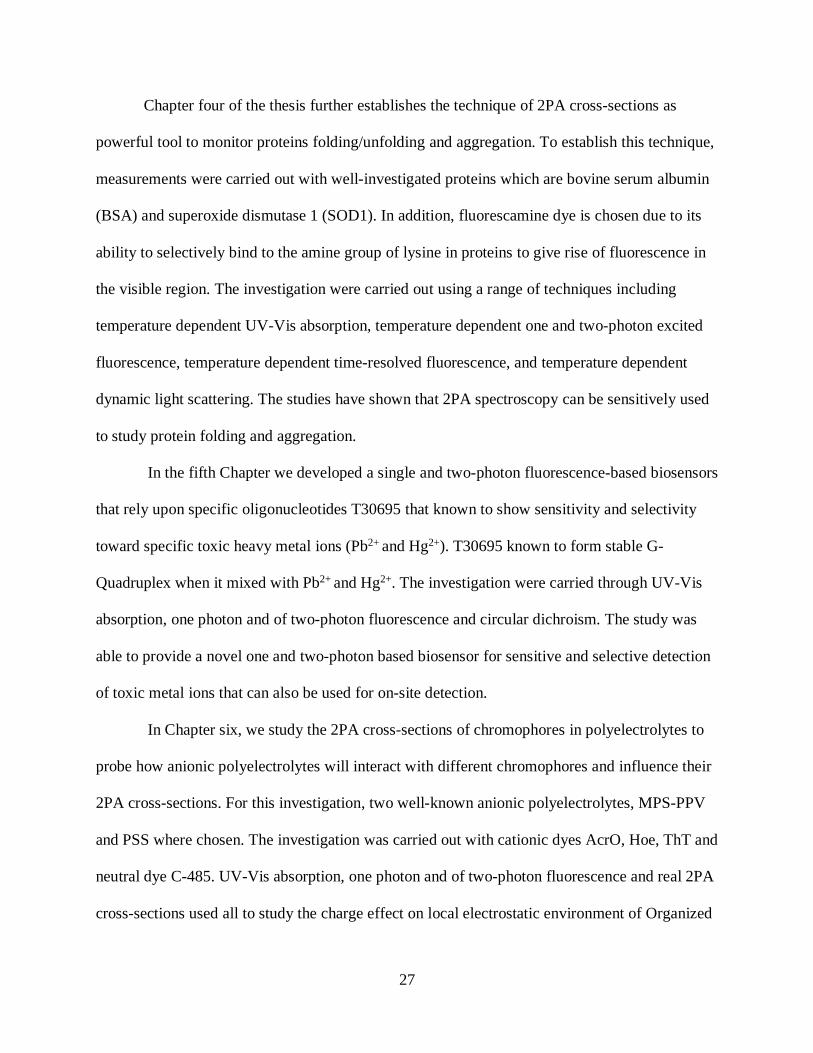
27
Chapter four of the thesis further establishes the technique of 2PA cross-sections as
powerful tool to monitor proteins folding/unfolding and aggregation. To establish this technique,
measurements were carried out with well-investigated proteins which are bovine serum albumin
(BSA) and superoxide dismutase 1 (SOD1). In addition, fluorescamine dye is chosen due to its
ability to selectively bind to the amine group of lysine in proteins to give rise of fluorescence in
the visible region. The investigation were carried out using a range of techniques including
temperature dependent UV-Vis absorption, temperature dependent one and two-photon excited
fluorescence, temperature dependent time-resolved fluorescence, and temperature dependent
dynamic light scattering. The studies have shown that 2PA spectroscopy can be sensitively used
to study protein folding and aggregation.
In the fifth Chapter we developed a single and two-photon fluorescence-based biosensors
that rely upon specific oligonucleotides T30695 that known to show sensitivity and selectivity
toward specific toxic heavy metal ions (Pb2+ and Hg2+). T30695 known to form stable G-
Quadruplex when it mixed with Pb2+ and Hg2+. The investigation were carried through UV-Vis
absorption, one photon and of two-photon fluorescence and circular dichroism. The study was
able to provide a novel one and two-photon based biosensor for sensitive and selective detection
of toxic metal ions that can also be used for on-site detection.
In Chapter six, we study the 2PA cross-sections of chromophores in polyelectrolytes to
probe how anionic polyelectrolytes will interact with different chromophores and influence their
2PA cross-sections. For this investigation, two well-known anionic polyelectrolytes, MPS-PPV
and PSS where chosen. The investigation was carried out with cationic dyes AcrO, Hoe, ThT and
neutral dye C-485. UV-Vis absorption, one photon and of two-photon fluorescence and real 2PA
cross-sections used all to study the charge effect on local electrostatic environment of Organized

28
self-assemblies. 2PA enhancement is observed for chromophores when they are soluble in
electrostatic environments. But the enhancement varied with the type of chromophore.
Chapter 7 presents the overall summary of the research results, along with an outlook of
the future work.
1.11 Chapter 1 Summary
• Organized self-assembly forms in a spontaneous manner where components either form
or aggregate without any external interference.
• Organized self-assemblies are sensitive to change in their microenvironment such as
polarity, pH, co-assembled molecules, salinity and temperature.
• Self-assemblies are formed mainly by weak noncovalent bonds; however, they are
considered stable due to numerous of noncovalent bonds that work together to increase
stability.
• Chemical interactions for organized self-assemblies include hydrogen bonding, ionic
bonding, π-π stacking, van der Walls interaction, hydrophilic/hydrophobic interactions
and electrostatic interactions.
• Examples of self-assemblies include micelles, reverse micelles, lipid bilayers, DNA,
RNA, protein, polymer and polyelectrolyte.
• Organized self-assemblies are studied and monitored through several techniques include
affinity capillary electrophoresis, enzyme-linked immunosorbent assay, fluorescence
resonance energy transfer, isothermal calorimetry, ultraviolet visible spectroscopy,
nuclear magnetic resonance and surface plasmon resonance.
• In search of novel spectroscopic techniques to monitor self-organized assembly
interactions and sensing, 2PA spectroscopy was introduced.

29
• The research approach is that self-assemblies possess aligned electric fields and the 2PA
cross-sections of chromophores whose dipolar orientation is parallel or perpendicular
with this electric field can be used to measure the change in the electrical fields and
monitor them.

30
1.12 References
(1) Kushner, D. J. Self-Assembly of Biological Structures. Bacteriol Rev 1969, 33 (2), 302–
345.
(2) Whitesides, G. M.; Grzybowski, B. Self-Assembly at All Scales. Science 2002, 295 (5564),
2418–2421. https://doi.org/10.1126/science.1070821.
(3) Whitesides, G. M.; Boncheva, M. Beyond Molecules: Self-Assembly of Mesoscopic and
Macroscopic Components. PNAS 2002, 99 (8), 4769–4774.
https://doi.org/10.1073/pnas.082065899.
(4) Self‐Assembly in Natural and Unnatural Systems - Philp - 1996 - Angewandte Chemie
International Edition in English - Wiley Online Library
https://onlinelibrary.wiley.com/doi/abs/10.1002/anie.199611541 (accessed May 8, 2019).
(5) Thomas, E. L. The ABCs of Self-Assembly. Science 1999, 286 (5443), 1307–1307.
https://doi.org/10.1126/science.286.5443.1307.
(6) Doty, D.; Patitz, M. J.; Summers, S. M. Limitations of Self-Assembly at Temperature 1.
Theoretical Computer Science 2011, 412 (1), 145–158.
https://doi.org/10.1016/j.tcs.2010.08.023.
(7) Nie, Z.; Petukhova, A.; Kumacheva, E. Properties and Emerging Applications of Self-
Assembled Structures Made from Inorganic Nanoparticles. Nature Nanotechnology 2010, 5
(1), 15–25. https://doi.org/10.1038/nnano.2009.453.
(8) Zhang, S. Molecular Self-Assembly. In Encyclopedia of Materials: Science and
Technology; Buschow, K. H. J., Cahn, R. W., Flemings, M. C., Ilschner, B., Kramer, E. J.,
Mahajan, S., Veyssière, P., Eds.; Elsevier: Oxford, 2001; pp 5822–5828.
https://doi.org/10.1016/B0-08-043152-6/01012-3.
31
(9) Rebek, J. Introduction to the Molecular Recognition and Self-Assembly Special Feature.
Proc Natl Acad Sci U S A 2009, 106 (26), 10423–10424.
https://doi.org/10.1073/pnas.0905341106.
(10) Boncheva, M.; Whitesides, G. M. Making Things by Self-Assembly. MRS Bulletin 2005,
30 (10), 736–742. https://doi.org/10.1557/mrs2005.208.
(11) Cui, H.; Webber, M. J.; Stupp, S. I. Self-Assembly of Peptide Amphiphiles: From
Molecules to Nanostructures to Biomaterials. Biopolymers 2010, 94 (1), 1–18.
https://doi.org/10.1002/bip.21328.
(12) Grantcharova, V.; Alm, E. J.; Baker, D.; Horwich, A. L. Mechanisms of Protein Folding.
Current Opinion in Structural Biology 2001, 11 (1), 70–82. https://doi.org/10.1016/S0959-
440X(00)00176-7.
(13) Kumar, A.; Abbott, N. L.; Biebuyck, H. A.; Kim, E.; Whitesides, G. M. Patterned Self-
Assembled Monolayers and Meso-Scale Phenomena. Accounts of Chemical Research 1995,
28 (5), 219–226. https://doi.org/10.1021/ar00053a003.
(14) Berg, J. M.; Tymoczko, J. L.; Stryer, L. Chemical Bonds in Biochemistry. Biochemistry.
5th edition 2002.
(15) Lodish, H.; Berk, A.; Zipursky, S. L.; Matsudaira, P.; Baltimore, D.; Darnell, J.
Noncovalent Bonds. Molecular Cell Biology. 4th edition 2000.
(16) Mishra, B. K.; Sathyamurthy, N. Π−π Interaction in Pyridine. J. Phys. Chem. A 2005, 109
(1), 6–8. https://doi.org/10.1021/jp045218c.
(17) Pecsi, I.; Leveles, I.; Harmat, V.; Vertessy, B. G.; Toth, J. Aromatic Stacking between
Nucleobase and Enzyme Promotes Phosphate Ester Hydrolysis in DUTPase. Nucleic Acids
Res 2010, 38 (20), 7179–7186. https://doi.org/10.1093/nar/gkq584.

32
(18) Hunter, C. A.; Sanders, J. K. M. The Nature of .Pi.-.Pi. Interactions. J. Am. Chem. Soc.
1990, 112 (14), 5525–5534. https://doi.org/10.1021/ja00170a016.
(19) Roth, C. M.; Neal, B. L.; Lenhoff, A. M. Van Der Waals Interactions Involving Proteins.
Biophys J 1996, 70 (2), 977–987.
(20) Privalov, P. L.; Gill, S. J. Stability of Protein Structure and Hydrophobic Interaction. In
Advances in Protein Chemistry; Anfinsen, C. B., Edsall, J. T., Richards, F. M., Eisenberg,
D. S., Eds.; Academic Press, 1988; Vol. 39, pp 191–234. https://doi.org/10.1016/S0065-
3233(08)60377-0.
(21) Jones, S.; Thornton, J. M. Principles of Protein-Protein Interactions. PNAS 1996, 93 (1),
13–20. https://doi.org/10.1073/pnas.93.1.13.
(22) Lynch, I.; Dawson, K. A. Protein-Nanoparticle Interactions. Nano Today 2008, 3 (1), 40–
47. https://doi.org/10.1016/S1748-0132(08)70014-8.
(23) Zhou, H.-X.; Pang, X. Electrostatic Interactions in Protein Structure, Folding, Binding, and
Condensation. Chem Rev 2018, 118 (4), 1691–1741.
https://doi.org/10.1021/acs.chemrev.7b00305.
(24) Neel, A. J.; Hilton, M. J.; Sigman, M. S.; Toste, F. D. Exploiting Non-Covalent π
Interactions for Catalyst Design. Nature 2017, 543 (7647), 637–646.
https://doi.org/10.1038/nature21701.
(25) Torchilin, V. P. Micellar Nanocarriers: Pharmaceutical Perspectives. Pharm Res 2006, 24
(1), 1. https://doi.org/10.1007/s11095-006-9132-0.
(26) Hanafy, N. A. N.; El-Kemary, M.; Leporatti, S. Micelles Structure Development as a
Strategy to Improve Smart Cancer Therapy. Cancers (Basel) 2018, 10 (7).
https://doi.org/10.3390/cancers10070238.

33
(27) Loppinet, B.; Monteux, C. Dynamics of Surfactants and Polymers at Liquid Interfaces. In
Soft Matter at Aqueous Interfaces; Lang, P., Liu, Y., Eds.; Lecture Notes in Physics;
Springer International Publishing: Cham, 2016; pp 137–157. https://doi.org/10.1007/978-3-
319-24502-7_5.
(28) L. Schramm, L.; N. Stasiuk, E.; Gerrard Marangoni, D. 2 Surfactants and Their
Applications. Annual Reports Sections “C” (Physical Chemistry) 2003, 99 (0), 3–48.
https://doi.org/10.1039/B208499F.
(29) Lukyanov, A. N.; Torchilin, V. P. Micelles from Lipid Derivatives of Water-Soluble
Polymers as Delivery Systems for Poorly Soluble Drugs. Advanced Drug Delivery Reviews
2004, 56 (9), 1273–1289. https://doi.org/10.1016/j.addr.2003.12.004.
(30) Zhang, Y.; Huang, Y.; Li, S. Polymeric Micelles: Nanocarriers for Cancer-Targeted Drug
Delivery. AAPS PharmSciTech 2014, 15 (4), 862–871. https://doi.org/10.1208/s12249-014-
0113-z.
(31) Melo, E. P.; Aires-Barros, M. R.; Cabral, J. M. S. Reverse Micelles and Protein
Biotechnology. In Biotechnology Annual Review; Elsevier, 2001; Vol. 7, pp 87–129.
https://doi.org/10.1016/S1387-2656(01)07034-X.
(32) Pawar, S. S.; Regupathi, I.; Prasanna, B. D. Reverse Micellar Partitioning of Bovine Serum
Albumin with Novel System. Resource-Efficient Technologies 2017, 3 (4), 491–494.
https://doi.org/10.1016/j.reffit.2017.06.004.
(33) Strubbe, F.; Neyts, K. Charge Transport by Inverse Micelles in Non-Polar Media. J. Phys.:
Condens. Matter 2017, 29 (45), 453003. https://doi.org/10.1088/1361-648X/aa8bf6.
(34) Khoshnood, A.; Firoozabadi, A. Polar Solvents Trigger Formation of Reverse Micelles.
Langmuir 2015, 31 (22), 5982–5991. https://doi.org/10.1021/la504658u.
34
(35) Albers, R. W. Phospholipid Bilayers. Basic Neurochemistry: Molecular, Cellular and
Medical Aspects. 6th edition 1999.
(36) Alberts, B.; Johnson, A.; Lewis, J.; Raff, M.; Roberts, K.; Walter, P. Molecular Biology of
the Cell, 4th ed.; Garland Science, 2002.
(37) Lakowicz, J. R. DNA Technology; Springer Science & Business Media, 2006.
(38) Mallamace, F.; Corsaro, C.; Mallamace, D.; Vasi, S.; Vasi, C.; Baglioni, P.; Buldyrev, S.
V.; Chen, S.-H.; Stanley, H. E. Energy Landscape in Protein Folding and Unfolding. Proc
Natl Acad Sci U S A 2016, 113 (12), 3159–3163. https://doi.org/10.1073/pnas.1524864113.
(39) Lapidus, L. J. Protein Unfolding Mechanisms and Their Effects on Folding Experiments.
F1000Res 2017, 6. https://doi.org/10.12688/f1000research.12070.1.
(40) Lapidus, L. J. Protein Unfolding Mechanisms and Their Effects on Folding Experiments.
F1000Res 2017, 6. https://doi.org/10.12688/f1000research.12070.1.
(41) Tyedmers, J.; Mogk, A.; Bukau, B. Cellular Strategies for Controlling Protein Aggregation.
Nature Reviews Molecular Cell Biology 2010, 11 (11), 777–788.
https://doi.org/10.1038/nrm2993.
(42) Hassan, P. A.; Verma, G.; Ganguly, R. 1 - Soft Materials — Properties and Applications. In
Functional Materials; Banerjee, S., Tyagi, A. K., Eds.; Elsevier: London, 2012; pp 1–59.
https://doi.org/10.1016/B978-0-12-385142-0.00001-5.
(43) Stuart, M. C.; de Vries, R.; Lyklema, H. Chapter 2 - Polyelectrolytes. In Fundamentals of
Interface and Colloid Science; Lyklema, J., Ed.; Soft Colloids; Academic Press, 2005; Vol.
5, pp 2.1-2.84. https://doi.org/10.1016/S1874-5679(05)80006-6.
(44) Borg, M.; Mittag, T.; Pawson, T.; Tyers, M.; Forman-Kay, J. D.; Chan, H. S.
Polyelectrostatic Interactions of Disordered Ligands Suggest a Physical Basis for
35
Ultrasensitivity. Proc Natl Acad Sci U S A 2007, 104 (23), 9650–9655.
https://doi.org/10.1073/pnas.0702580104.
(45) Rubinstein, M.; Papoian, G. A. Polyelectrolytes in Biology and Soft Matter. Soft Matter
2012, 8 (36), 9265–9267. https://doi.org/10.1039/C2SM90104H.
(46) Budd, P. M. 11 - Polyelectrolytes. In Comprehensive Polymer Science and Supplements;
Allen, G., Bevington, J. C., Eds.; Pergamon: Amsterdam, 1989; pp 215–230.
https://doi.org/10.1016/B978-0-08-096701-1.00011-2.
(47) Whitesides, G. M. Self-Assembling Materials. Scientific American 1995, 273 (3), 146–149.
(48) Rosa, C. D.; Park, C.; Thomas, E. L.; Lotz, B. Microdomain Patterns from Directional
Eutectic Solidification and Epitaxy. Nature 2000, 405 (6785), 433.
https://doi.org/10.1038/35013018.
(49) Ghosh, T.; Panicker, J. S.; Nair, V. C. Self-Assembled Organic Materials for Photovoltaic
Application. Polymers (Basel) 2017, 9 (3). https://doi.org/10.3390/polym9030112.
(50) Schmidt-Mende, L.; Fechtenkötter, A.; Müllen, K.; Moons, E.; Friend, R. H.; MacKenzie,
J. D. Self-Organized Discotic Liquid Crystals for High-Efficiency Organic Photovoltaics.
Science 2001, 293 (5532), 1119–1122. https://doi.org/10.1126/science.293.5532.1119.
(51) Danish, A.; Lee, S.-Y.; Müller, C. E. Quantification of Green Fluorescent Protein-(GFP-)
Tagged Membrane Proteins by Capillary Gel Electrophoresis. Analyst 2017, 142 (19),
3648–3655. https://doi.org/10.1039/C7AN00981J.
(52) Jing, M.; Bowser, M. T. A Review of Methods for Measuring Aptamer-ProteinEquilibria.
Anal Chim Acta 2011, 686 (1–2), 9–18. https://doi.org/10.1016/j.aca.2010.10.032.
(53) Chen, Z.; Weber, S. G. Determination of Binding Constants by Affinity Capillary
Electrophoresis, Electrospray Ionization Mass Spectrometry and Phase-Distribution
36
Methods. Trends Analyt Chem 2008, 27 (9), 738–748.
https://doi.org/10.1016/j.trac.2008.06.008.
(54) Wang, J.; Li, J.; Li, J.; Qin, Y.; Wang, C.; Qiu, L.; Jiang, P. In-Capillary Self-Assembly
Study of Quantum Dots and Protein Using Fluorescence Coupled Capillary Electrophoresis.
ELECTROPHORESIS 2015, 36 (14), 1523–1528. https://doi.org/10.1002/elps.201500073.
(55) Jager, S.; Eggeling, L. B. and C. New Fluorescence Techniques for High-Throughput Drug
Discovery http://www.eurekaselect.com/63362/article (accessed May 8, 2019).
(56) Burton-MacLeod, J. A.; Kane, E. M.; Beard, R. S.; Hadley, L. A.; Glass, R. I.; Ando, T.
Evaluation and Comparison of Two Commercial Enzyme-Linked Immunosorbent Assay
Kits for Detection of Antigenically Diverse Human Noroviruses in Stool Samples. Journal
of Clinical Microbiology 2004, 42 (6), 2587–2595. https://doi.org/10.1128/JCM.42.6.2587-
2595.2004.
(57) McClenahan, S. D.; Bok, K.; Sosnovtsev, S. V.; Neill, J. D.; Burek, K. A.; Beckmen, K. B.;
Smith, A. W.; Green, K. Y.; Romero, C. H. Expression and Self-Assembly of Virus-like
Particles from Two Genotypes of Marine Vesiviruses and Development of an ELISA for
the Detection of Antibodies. Vet Microbiol 2010, 142 (3–4), 184–192.
https://doi.org/10.1016/j.vetmic.2009.09.057.
(58) Cheng, C. I.; Chang, Y.-P.; Chu, Y.-H. Biomolecular Interactions and Tools for Their
Recognition: Focus on the Quartz Crystal Microbalance and Its Diverse Surface
Chemistries and Applications. Chem. Soc. Rev. 2012, 41 (5), 1947–1971.
https://doi.org/10.1039/C1CS15168A.
37
(59) Day, R. N. Measuring Protein Interactions Using Förster Resonance Energy Transfer and
Fluorescence Lifetime Imaging Microscopy. Methods 2014, 66 (2), 200–207.
https://doi.org/10.1016/j.ymeth.2013.06.017.
(60) Leavesley, S. J.; Rich, T. C. Overcoming Limitations of FRET Measurements. Cytometry A
2016, 89 (4), 325–327. https://doi.org/10.1002/cyto.a.22851.
(61) Carmona, F.; Poli, M.; Bertuzzi, M.; Gianoncelli, A.; Gangemi, F.; Arosio, P. Study of
Ferritin Self-Assembly and Heteropolymer Formation by the Use of Fluorescence
Resonance Energy Transfer (FRET) Technology. Biochimica et Biophysica Acta (BBA) -
General Subjects 2017, 1861 (3), 522–532. https://doi.org/10.1016/j.bbagen.2016.12.011.
(62) Hussain, S. A. An Introduction to Fluorescence Resonance Energy Transfer (FRET). 4.
(63) Weber, P. C.; Salemme, F. R. Applications of Calorimetric Methods to Drug Discovery and
the Study of Protein Interactions. Current Opinion in Structural Biology 2003, 13 (1), 115–
121. https://doi.org/10.1016/S0959-440X(03)00003-4.
(64) Yennawar, N. H.; Fecko, J. A.; Showalter, S. A.; Bevilacqua, P. C. A High-Throughput
Biological Calorimetry Core – Steps to Startup, Run, and Maintain a Multi-User Facility.
Methods Enzymol 2016, 567, 435–460. https://doi.org/10.1016/bs.mie.2015.07.024.
(65) Mazzei, L.; Ciurli, S.; Zambelli, B. Chapter Nine - Isothermal Titration Calorimetry to
Characterize Enzymatic Reactions. In Methods in Enzymology; Feig, A. L., Ed.;
Calorimetry; Academic Press, 2016; Vol. 567, pp 215–236.
https://doi.org/10.1016/bs.mie.2015.07.022.
(66) Cheng, C. I.; Chang, Y.-P.; Chu, Y.-H. Biomolecular Interactions and Tools for Their
Recognition: Focus on the Quartz Crystal Microbalance and Its Diverse Surface
38
Chemistries and Applications. Chem. Soc. Rev. 2012, 41 (5), 1947–1971.
https://doi.org/10.1039/C1CS15168A.
(67) Kabiri, M.; Unsworth, L. D. Application of Isothermal Titration Calorimetry for
Characterizing Thermodynamic Parameters of Biomolecular Interactions: Peptide Self-
Assembly and Protein Adsorption Case Studies. Biomacromolecules 2014, 15 (10), 3463–
3473. https://doi.org/10.1021/bm5004515.
(68) Engman, K. C.; Sandin, P.; Osborne, S.; Brown, T.; Billeter, M.; Lincoln, P.; Nordén, B.;
Albinsson, B.; Wilhelmsson, L. M. DNA Adopts Normal B-Form upon Incorporation of
Highly Fluorescent DNA Base Analogue TC: NMR Structure and UV-Vis Spectroscopy
Characterization. Nucleic Acids Res 2004, 32 (17), 5087–5095.
https://doi.org/10.1093/nar/gkh844.
(69) Carlomagno, T. Ligand-Target Interactions: What Can We Learn from NMR? Annual
Review of Biophysics and Biomolecular Structure 2005, 34 (1), 245–266.
https://doi.org/10.1146/annurev.biophys.34.040204.144419.
(70) Takahashi, H.; Nakanishi, T.; Kami, K.; Arata, Y.; Shimada, I. A Novel NMR Method for
Determining the Interfaces of Large Protein–Protein Complexes. Nature Structural Biology
2000, 7 (3), 220. https://doi.org/10.1038/73331.
(71) Marion, D. An Introduction to Biological NMR Spectroscopy. Mol Cell Proteomics 2013,
12 (11), 3006–3025. https://doi.org/10.1074/mcp.O113.030239.
(72) Minor, D. L. The Neurobiologist’s Guide to Structural Biology: A Primer on Why
Macromolecular Structure Matters and How to Evaluate Structural Data. Neuron 2007, 54
(4), 511–533. https://doi.org/10.1016/j.neuron.2007.04.026.
39
(73) Castner, D. G.; Ratner, B. D. Chapter 31 - Proteins Controlled With Precision at Organic,
Polymeric, and Biopolymer Interfaces for Tissue Engineering and Regenerative Medicine.
In Principles of Regenerative Medicine (Third Edition); Atala, A., Lanza, R., Mikos, A. G.,
Nerem, R., Eds.; Academic Press: Boston, 2019; pp 523–534.
https://doi.org/10.1016/B978-0-12-809880-6.00031-X.
(74) Moran, K. L. M.; Lemass, D.; O’Kennedy, R. Chapter 6 - Surface Plasmon Resonance–
Based Immunoassays: Approaches, Performance, and Applications. In Handbook of
Immunoassay Technologies; Vashist, S. K., Luong, J. H. T., Eds.; Academic Press, 2018;
pp 129–156. https://doi.org/10.1016/B978-0-12-811762-0.00006-2.
(75) Drescher, D. G.; Selvakumar, D.; Drescher, M. J. Chapter One - Analysis of Protein
Interactions by Surface Plasmon Resonance. In Advances in Protein Chemistry and
Structural Biology; Donev, R., Ed.; Protein-Protein Interactions in Human Disease, Part A;
Academic Press, 2018; Vol. 110, pp 1–30. https://doi.org/10.1016/bs.apcsb.2017.07.003.
(76) Stahelin, R. V. Surface Plasmon Resonance: A Useful Technique for Cell Biologists to
Characterize Biomolecular Interactions. Mol Biol Cell 2013, 24 (7), 883–886.
https://doi.org/10.1091/mbc.E12-10-0713.
(77) Beseničar, M.; Maček, P.; Lakey, J. H.; Anderluh, G. Surface Plasmon Resonance in
Protein–Membrane Interactions. Chemistry and Physics of Lipids 2006, 141 (1), 169–178.
https://doi.org/10.1016/j.chemphyslip.2006.02.010.
(78) Lakowicz, J. R. Principles of Fluorescence Spectroscopy; Springer Science & Business
Media, 2007.
40
(79) Li, Y.; Liu, T.; Liu, H.; Tian, M.-Z.; Li, Y. Self-Assembly of Intramolecular Charge-
Transfer Compounds into Functional Molecular Systems. Acc. Chem. Res. 2014, 47 (4),
1186–1198. https://doi.org/10.1021/ar400264e.
(80) F. Copeland, M.; B. Weibel, D. Bacterial Swarming: A Model System for Studying
Dynamic Self-Assembly. Soft Matter 2009, 5 (6), 1174–1187.
https://doi.org/10.1039/B812146J.
(81) Maiti, S.; Prins, L. J. A Modular Self-Assembled Sensing System for Heavy Metal Ions
with Tunable Sensitivity and Selectivity. Tetrahedron 2017, 73 (33), 4950–4954.
https://doi.org/10.1016/j.tet.2017.05.028.
(82) Stojanovic, M. N.; de Prada, P.; Landry, D. W. Fluorescent Sensors Based on Aptamer
Self-Assembly. J. Am. Chem. Soc. 2000, 122 (46), 11547–11548.
https://doi.org/10.1021/ja0022223.
(83) Stenken, J. A. Introduction to Fluorescence Sensing. J. Am. Chem. Soc. 2009, 131 (30),
10791–10791. https://doi.org/10.1021/ja903152j.
(84) Toseland, C. P. Fluorescent Labeling and Modification of Proteins. J Chem Biol 2013, 6
(3), 85–95. https://doi.org/10.1007/s12154-013-0094-5.
(85) Weinberg, D. R.; Gagliardi, C. J.; Hull, J. F.; Murphy, C. F.; Kent, C. A.; Westlake, B. C.;
Paul, A.; Ess, D. H.; McCafferty, D. G.; Meyer, T. J. Proton-Coupled Electron Transfer.
Chem. Rev. 2012, 112 (7), 4016–4093. https://doi.org/10.1021/cr200177j.
(86) Hanczyc, P. Applications of Chromophores and Multiphoton Techniques to Study Structure
and Interactions of Bio-Macromolecules in Assembled State; Doktorsavhandlingar vid
Chalmers Tekniska Högskola; Chalmers Univ. of Technology: Göteborg, 2013.
41
(87) Jechow, A.; Seefeldt, M.; Kurzke, H.; Heuer, A.; Menzel, R. Enhanced Two-Photon
Excited Fluorescence from Imaging Agents Using True Thermal Light. Nature Photonics
2013, 7 (12), 973–976. https://doi.org/10.1038/nphoton.2013.271.
(88) Toro, C.; De Boni, L.; Lin, N.; Santoro, F.; Rizzo, A.; Hernandez, F. E. Two-Photon
Absorption Circular Dichroism: A New Twist in Nonlinear Spectroscopy. Chemistry – A
European Journal 2010, 16 (11), 3504–3509. https://doi.org/10.1002/chem.200902286.
(89) Alja’afreh, I. Probing the Unfolding and the Stability of the Last Four Metal Binding
Domains of Wilson Disease Protein Using Circular Dichroism and Novel Spectroscopic
Techniques. Dissertations 2014.
(90) Alotaibi, S. Novel Spectroscopic Tools to Differentiate Molecule-DNA Binding
Interactions, Sense DNA and Track DNA Melting. Dissertations 2015.
(91) Gui, R.; Jin, H.; Wang, Z.; Tan, L. Recent Advances in Optical Properties and Applications
of Colloidal Quantum Dots under Two-Photon Excitation. Coordination Chemistry Reviews
2017, 338, 141–185. https://doi.org/10.1016/j.ccr.2017.02.007.
(92) Rumi, M.; Barlow, S.; Wang, J.; Perry, J. W.; Marder, S. R. Two-Photon Absorbing
Materials and Two-Photon-Induced Chemistry. In Photoresponsive Polymers I; Marder, S.
R., Lee, K.-S., Eds.; Advances in Polymer Science; Springer Berlin Heidelberg: Berlin,
Heidelberg, 2008; pp 1–95. https://doi.org/10.1007/12_2008_133.
(93) Lee, S.; Thomas, K. R. J.; Thayumanavan, S.; Bardeen, C. J. Dependence of the Two-
Photon Absorption Cross Sections on the Conjugation of the Phenylacetylene Linker in
Dipolar Donor−Bridge−Acceptor Chromophores. J. Phys. Chem. A 2005, 109 (43), 9767–
9774. https://doi.org/10.1021/jp053864l.
42
(94) Shen, Y.; Shuhendler, A. J.; Ye, D.; Xu, J.-J.; Chen, H.-Y. Two-Photon Excitation
Nanoparticles for Photodynamic Therapy. Chem. Soc. Rev. 2016, 45 (24), 6725–6741.
https://doi.org/10.1039/C6CS00442C.
(95) Bolze, F.; Jenni, S.; Sour, A.; Heitz, V. Molecular Photosensitisers for Two-Photon
Photodynamic Therapy. Chem. Commun. 2017, 53 (96), 12857–12877.
https://doi.org/10.1039/C7CC06133A.
(96) Drobizhev, M.; Makarov, N. S.; Tillo, S. E.; Hughes, T. E.; Rebane, A. Two-Photon
Absorption Properties of Fluorescent Proteins. Nat Methods 2011, 8 (5), 393–399.
https://doi.org/10.1038/nmeth.1596.
(97) Bhaskar, A.; Guda, R.; Haley, M. M.; Goodson. Building Symmetric Two-Dimensional
Two-Photon Materials. J. Am. Chem. Soc. 2006, 128 (43), 13972–13973.
https://doi.org/10.1021/ja062709x.
(98) Raymond, J. E.; Ramakrishna, G.; Twieg, R. J.; Goodson, T. Two-Photon Enhancement in
Organic Nanorods. J. Phys. Chem. C 2008, 112 (21), 7913–7921.
https://doi.org/10.1021/jp7118058.
(99) Bairu, S.; Ramakrishna, G. Two-Photon Absorption Properties of Chromophores in
Micelles: Electrostatic Interactions. J. Phys. Chem. B 2013, 117 (36), 10484–10491.
https://doi.org/10.1021/jp405416d.
(100) Pawlicki, M.; Collins, H. A.; Denning, R. G.; Anderson, H. L. Two-Photon Absorption
and the Design of Two-Photon Dyes. Angewandte Chemie International Edition 2009, 48
(18), 3244–3266. https://doi.org/10.1002/anie.200805257.

43
(101) Vivas, M. G.; Boni, L. D.; Bretonniere, Y.; Andraud, C.; Mendonca, C. R. Polarization
Effect on the Two-Photon Absorption of a Chiral Compound. Opt. Express, OE 2012, 20
(17), 18600–18608. https://doi.org/10.1364/OE.20.018600.
44
CHAPTER 2
EXPERIMENTAL TECHNIQUES
Chapter 2 covers different experimental techniques that were used to carry out the
investigations detailed in this dissertation. The main experimental techniques used are steady-
state, time-resolved and two-photon fluorescence measurements. Circular dichroism
measurements and dynamic light scattering measurements are used for additional
characterization. The majority of the analytical techniques are related to the emission of radiation
that use high-intensity laser pulses to perform the measurements. The overall objective of this
dissertation is to use all these novel spectroscopic techniques to study and understand micro-
environment in self-assembled systems. A brief description of the experimental techniques is
presented in this chapter.
2.1 Lasers
“Light Amplification by Stimulated Emission of Radiation” is the acronym for what is
now referred to as a laser. Lasers are defined as sources of radiation that result in a highly intense
light source1,2. To further describe them, they are constructed in such a way that they can result
in a highly intense light source with monochromaticity, directionality and ultrashort pulse
duration. The unique properties of this laser radiation that make them useful for studying
different optical phenomena is presented here1.
2.1.1 Basic Components of Laser
The intense light created by lasers is useful for studying the 2PA properties of
molecules3. Moreover, laser is a very powerful tool for probing both linear and nonlinear optical
properties of molecules and materials4,5. The basic makeup of a laser has three major
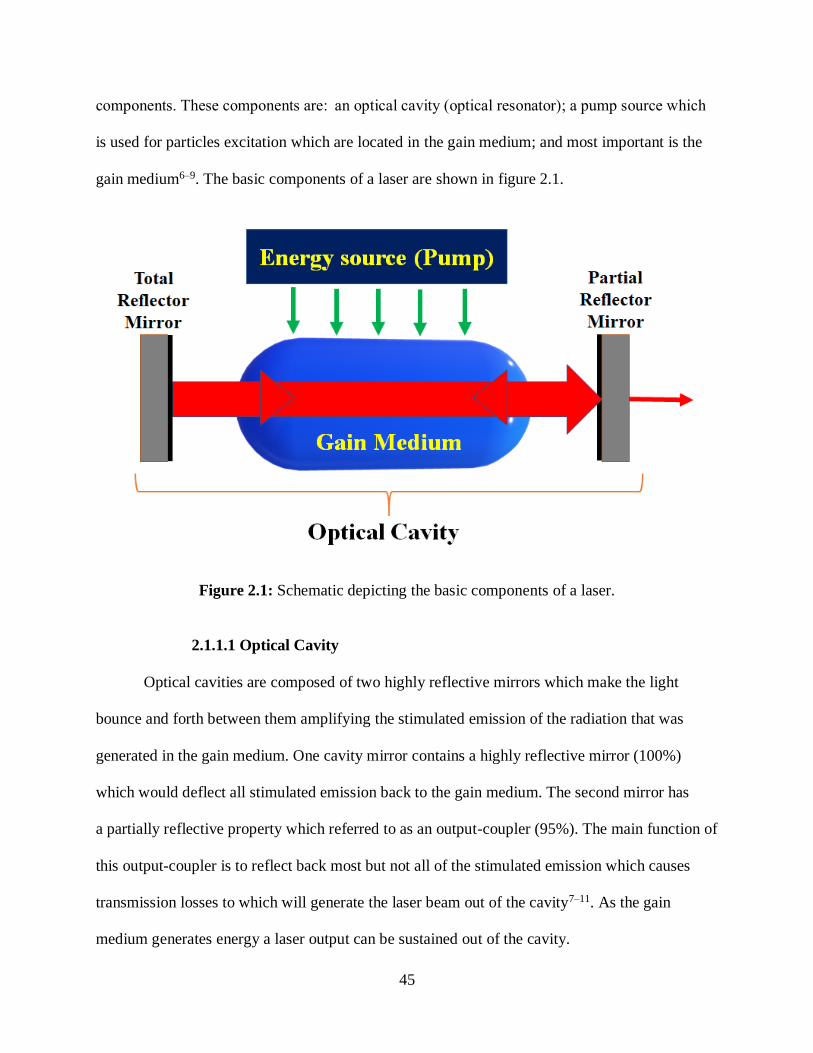
45
components. These components are: an optical cavity (optical resonator); a pump source which
is used for particles excitation which are located in the gain medium; and most important is the
gain medium6–9. The basic components of a laser are shown in figure 2.1.
Figure 2.1: Schematic depicting the basic components of a laser.
2.1.1.1 Optical Cavity
Optical cavities are composed of two highly reflective mirrors which make the light
bounce and forth between them amplifying the stimulated emission of the radiation that was
generated in the gain medium. One cavity mirror contains a highly reflective mirror (100%)
which would deflect all stimulated emission back to the gain medium. The second mirror has
a partially reflective property which referred to as an output-coupler (95%). The main function of
this output-coupler is to reflect back most but not all of the stimulated emission which causes
transmission losses to which will generate the laser beam out of the cavity7–11. As the gain
medium generates energy a laser output can be sustained out of the cavity.
46
2.1.1.2 Gain Medium
The stimulated emission is generated in the gain medium. The population inversion is
created in the gain medium using pumping mechanism. The generated stimulated emission is
amplified in the optical cavity when the light bounces back and forth inside it, and undergoes
amplification of number of times inside the gain medium so as to give rise to an intense laser
output9,12. The amplified light maintains the same direction and phase giving directionality and
coherence to the laser light output. This is due to the stimulated emission of the radiation which
was generated in the gain medium9,13. The particles located in the gain medium should be in a
state of population inversion as to attain an efficient laser output. For the population inversion to
take place a pumping mechanism in needed. An example of a gain medium can be Ti:Sapphire
or Nd:Yttrium Aluminum Garnet etc. In this dissertation Ti:Sapphire (Ti3+:Al2O3) was the gain
medium which is a transition-metal-doped widely used as gain medium for femtosecond solid-
state and tunable lasers.
Ti: Sapphire was first introduce in 198613. Sapphire has a great thermal
conductivity which improving the thermal effects for high laser intensities and powers. While the
titanium ion used due the large bandwidth which appropriate to generate a very short
pulses and wide wavelength tunability.
2.1.1.3 Pumping Mechanism
Pump Source is considering the energy source for the laser to populate a high energy
level of the laser. Therefore, pumping mechanism is essential to achieve appropriate and
adequate population inversion, which is a state where the population in the higher energy state
is higher than the lower energy state. The pump Source could be from optical, electrical or
chemical source. The laser that been used in this dissertation is based in optical pumping
47
mechanisms9,14. For the Ti:Sapphire laser, the pumping mechanism used was an optical pumping
by Nd:YVO4 laser. The Nd:YVO4 has a pumping source of a diode laser. The diode laser is
pumped by electrical input.
2.1.2. Properties of Laser Light
The laser radiation has several unique properties, which makes it a powerful
tool for probing linear and nonlinear optical phenomena. Some of the characteristics are
discussed here.
2.1.2.1 Monochromaticity
Monochromaticity is a perfectly functioning single wavelength of laser radiation. This
monochromatic radiation also possesses an extremely narrow bandwidth comparable to
conventional sources of radiation that can comprise of different variations of wavelengths of
radiation as shown in figure 2.2. Laser radiations not perfectly monochromatic; however, it has
capabilities of emitting a narrow bandwidth around a single wavelength9. The monochromaticity
characteristic is based on the gain mechanism that depends on stimulated emission of radiation.
There are several different laser sources that can produce an array of wavelengths and frequency
bandwidths. Because of the stimulated emission of radiation, one wavelength of radiation gets
amplified in the resonant cavity resulting in very narrow line bandwidth having a specific
wavelength or frequency 9,12.
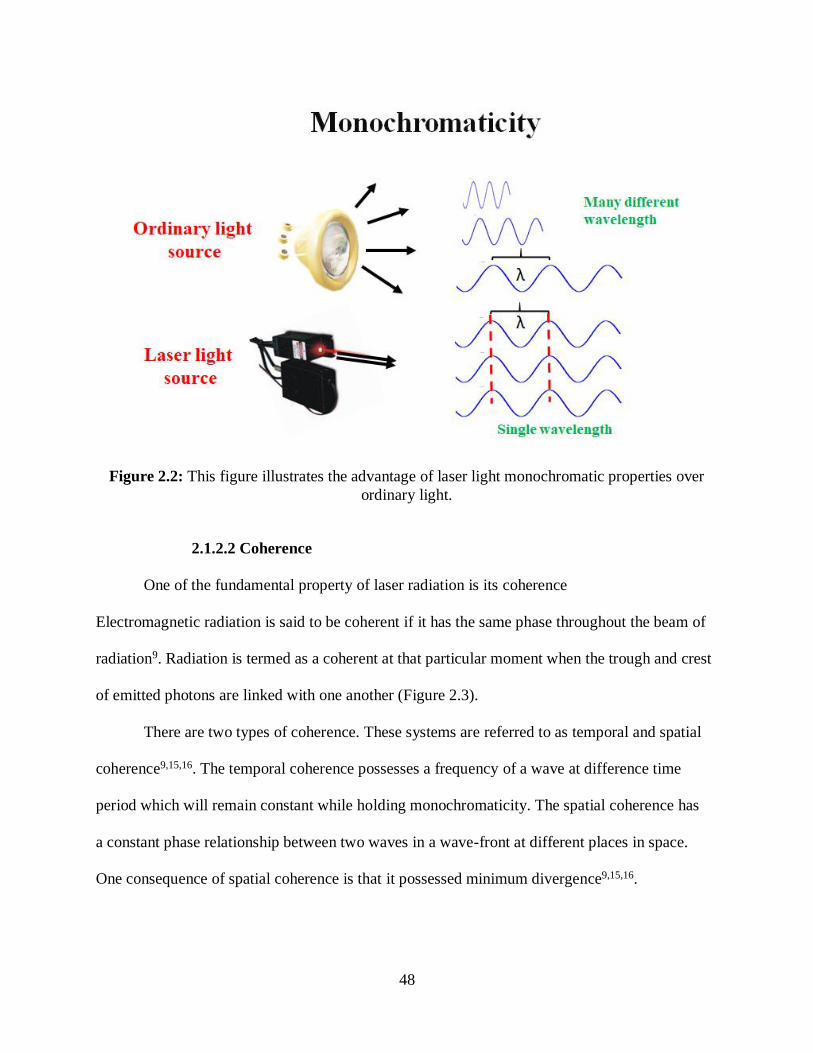
48
Figure 2.2: This figure illustrates the advantage of laser light monochromatic properties over
ordinary light.
2.1.2.2 Coherence
One of the fundamental property of laser radiation is its coherence
Electromagnetic radiation is said to be coherent if it has the same phase throughout the beam of
radiation9. Radiation is termed as a coherent at that particular moment when the trough and crest
of emitted photons are linked with one another (Figure 2.3).
There are two types of coherence. These systems are referred to as temporal and spatial
coherence9,15,16. The temporal coherence possesses a frequency of a wave at difference time
period which will remain constant while holding monochromaticity. The spatial coherence has
a constant phase relationship between two waves in a wave-front at different places in space.
One consequence of spatial coherence is that it possessed minimum divergence9,15,16.
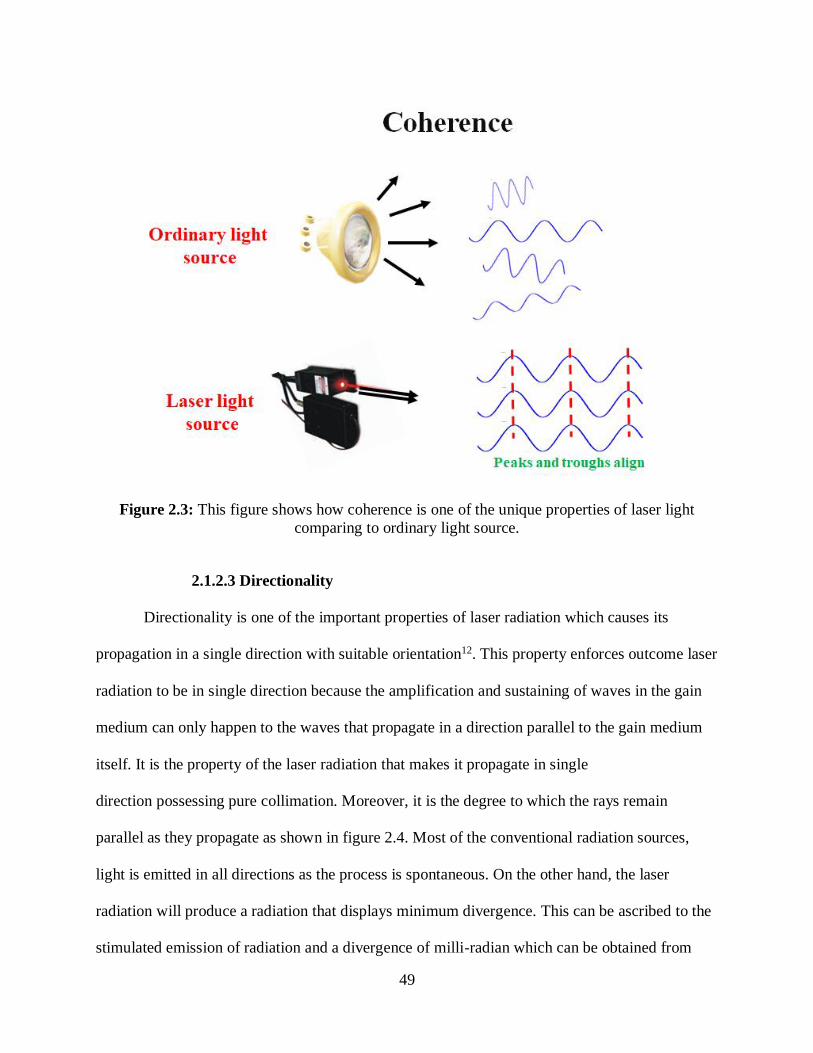
49
Figure 2.3: This figure shows how coherence is one of the unique properties of laser light
comparing to ordinary light source.
2.1.2.3 Directionality
Directionality is one of the important properties of laser radiation which causes its
propagation in a single direction with suitable orientation12. This property enforces outcome laser
radiation to be in single direction because the amplification and sustaining of waves in the gain
medium can only happen to the waves that propagate in a direction parallel to the gain medium
itself. It is the property of the laser radiation that makes it propagate in single
direction possessing pure collimation. Moreover, it is the degree to which the rays remain
parallel as they propagate as shown in figure 2.4. Most of the conventional radiation sources,
light is emitted in all directions as the process is spontaneous. On the other hand, the laser
radiation will produce a radiation that displays minimum divergence. This can be ascribed to the
stimulated emission of radiation and a divergence of milli-radian which can be obtained from
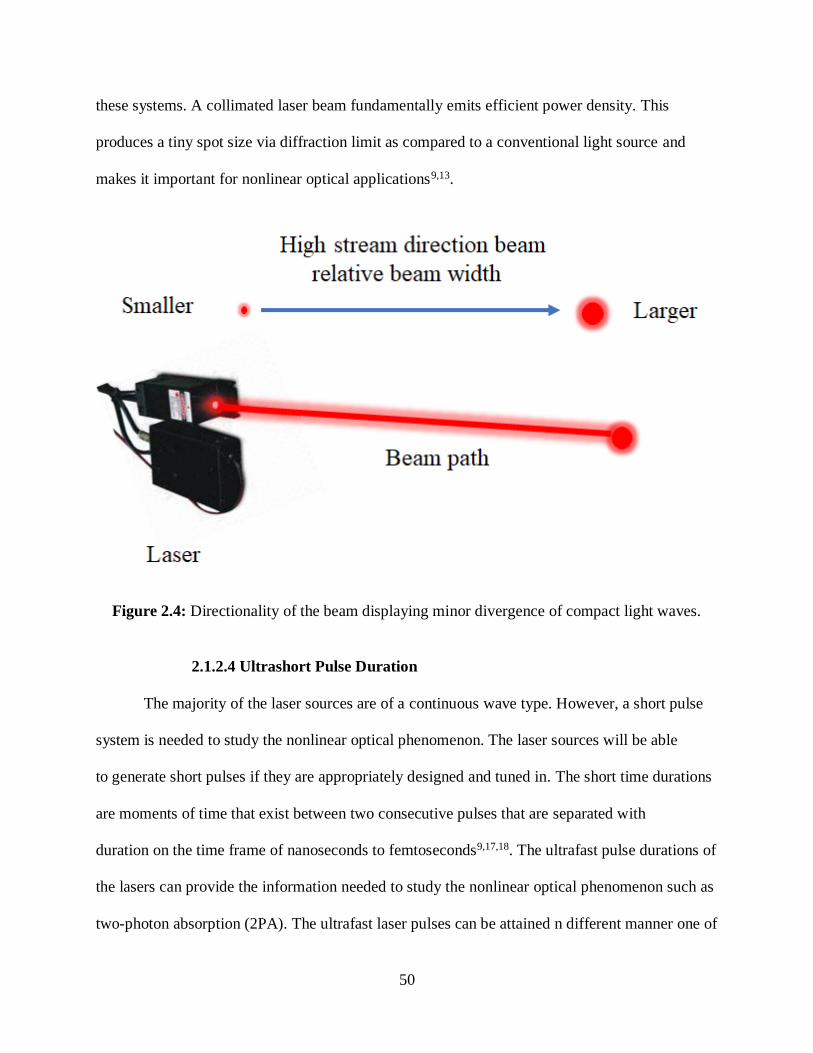
50
these systems. A collimated laser beam fundamentally emits efficient power density. This
produces a tiny spot size via diffraction limit as compared to a conventional light source and
makes it important for nonlinear optical applications9,13.
Figure 2.4: Directionality of the beam displaying minor divergence of compact light waves.
2.1.2.4 Ultrashort Pulse Duration
The majority of the laser sources are of a continuous wave type. However, a short pulse
system is needed to study the nonlinear optical phenomenon. The laser sources will be able
to generate short pulses if they are appropriately designed and tuned in. The short time durations
are moments of time that exist between two consecutive pulses that are separated with
duration on the time frame of nanoseconds to femtoseconds9,17,18. The ultrafast pulse durations of
the lasers can provide the information needed to study the nonlinear optical phenomenon such as
two-photon absorption (2PA). The ultrafast laser pulses can be attained n different manner one of
51
which is cavity dumping. Other forms include, Q-switching, mode locking, and
several others17,19. In this dissertation we used of mode-locking method which is employed for
the generation of ultrashort pulses.
The mode-locking technique is one of the routinely used methods for the production of
ultrashort laser radiation pulses. Overall, this technique is needed to provide a constant phase
correlation among various modes that are produced in the resonant cavity20. This system is
similar to phase-locking technique. As there is a generation of various frequencies due to the
emission coming from the active medium. The overall rate of locking of a certain mode has some
effects on the lasers’ pulse duration. The materials which need high intensity laser sources need
ultrashort laser pulses17,19–21.
If the longitudinal modes of a laser have a fixed and properly defined phase relationship,
then the laser is understood to be in a state of mode-locked21. The derivation of the mode-
locking procedure can be useful in comprehending how the technique works. Considering the
mode-locking where the oscillating modes all resonate at relative amplitudes in a resonation
cavity, where E0 refers to equal amplitude, Δω delta omega represents the change in
frequency, ωo represents the central frequency and N is the total number of modes which are
involved. The electromagnetic field which happens due to the 2n+1 mode which are equally
spaced and have a similar amplitude is obtained by :
E(t)=∑ = − nq n Eqei[(ω
o + q Δω) t + φ
q] 2.1
Equation 2.1 is a representation of the total summation of all possible nodes. In instances
where there locked phases exist and similar amplitudes equation 2.1 can be reduced to
E(t)=Eoeiωot ∑ =nq
− neiqΔωt 2.2
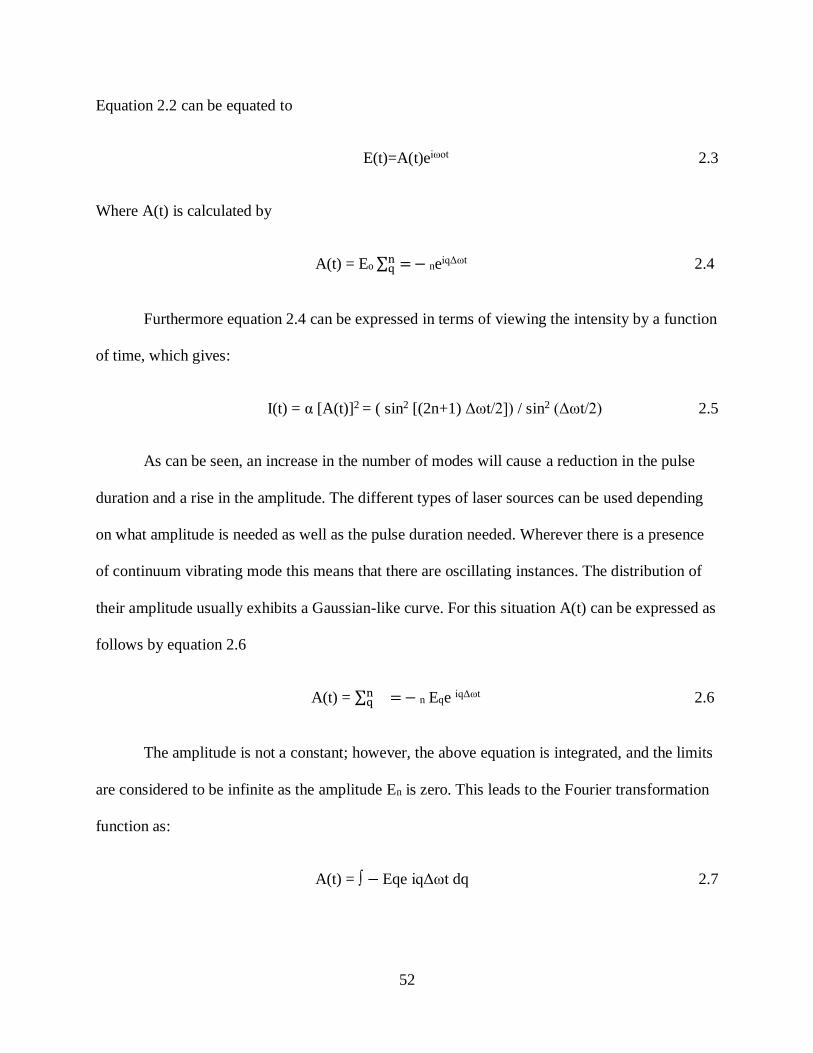
52
Equation 2.2 can be equated to
E(t)=A(t)eiωot 2.3
Where A(t) is calculated by
A(t) = Eo ∑ =n
q − neiqΔωt 2.4
Furthermore equation 2.4 can be expressed in terms of viewing the intensity by a function
of time, which gives:
I(t) = α [A(t)]2 = ( sin2 [(2n+1) Δωt/2]) / sin2 (Δωt/2) 2.5
As can be seen, an increase in the number of modes will cause a reduction in the pulse
duration and a rise in the amplitude. The different types of laser sources can be used depending
on what amplitude is needed as well as the pulse duration needed. Wherever there is a presence
of continuum vibrating mode this means that there are oscillating instances. The distribution of
their amplitude usually exhibits a Gaussian-like curve. For this situation A(t) can be expressed as
follows by equation 2.6
A(t) = ∑ nq = − n Eqe iqΔωt 2.6
The amplitude is not a constant; however, the above equation is integrated, and the limits
are considered to be infinite as the amplitude En is zero. This leads to the Fourier transformation
function as:
A(t) = ∫ − Eqe iqΔωt dq 2.7
53
The multi-mode output of the amplitude is obtained through the transformation of the
mode distribution in the frequency domain. Special characteristics of the laser sources will make
them ideal for monitoring the time-resolved and two-photon fluorescence measurements. The
measurements, time-resolved and two-photon fluorescence, use broadband 100 fs pulse width
Ti:Sapphire laser radiation that can be tunable between 710 to 900 nm with a fundamental
wavelength of 800 nm. Additionally the steady-state optical measurements used will be
discussed here.
2.2 Steady-State Methods
Optical absorption and steady-state fluorescence techniques are mostly used for the
analysis of molecules and the environments in organized self-assemblies. Steady-state
measurements work by exciting the molecules via the absorption of radiation to reach the higher
excited state then record the emitted radiation for fluorescence measurements.
2.2.1 Optical Absorption
The optical absorption spectroscopy (known also as s ultraviolet-visible spectroscopy) is
valuable technique to study the ground state (low energy state) absorption of the molecule or
material22,23. The absorption of radiation is often used to understand the transitions involved in
the molecule and the influence of environment on it. From Lambert-Beer's law (equation 2.8),
the absorbance can be used to calculate the concentration if the molar extinction coefficient is
known. Often absorption spectrum of a molecule is affect by solvent polarity, molecular
concentration, unclear or colloidal samples, compound functional group and electronic
arrangement of molecules22–25.
54
The absorbance of a molecule can be expressed by Lambert-Beer's law:
A = log(I0/I) = ελCl 2.8
where, I0 represent the intensity of the incident radiation while I represent the transmitted
radiation, the path length of the cuvette is l. In this dissertation, all optical absorption
measurement was carried out using Shimadzu UV-160 absorption spectrophotometer.
2.2.2 Steady-State and Time-Resolved Fluorescence Measurements
Fluorescence is a radiative decay from the excited state of a molecule to a lower energy
state of same spin state. Fluorescence process relies on three fundamental steps: excitation,
excited-state relaxation, and radiative decay (Figure 2.5). Upon excitation, the molecule absorbs
appropriate photon energy and will excite molecule’s valence electron to temporarily leave to a
higher electronic excited state. The electron stays in the excited state which usually lasts for few
nanoseconds, then the excited electron will lose acquired energy through radiative decay to relax
back to a lower energy state24,26–28 giving rise to fluorescence 28. The obtained fluorescence
emission spectrum has distinguishing characteristics for the molecule and its intensity will
change because fluorescence emission is proportional to concentration. Shifts in fluorescence are
often observed which is known as Stoke’s shift. The Stoke’s shift is referred to energy difference
between absorption spectrum and emission spectrum of radiation that is usually affected by self-
assembly interactions24.
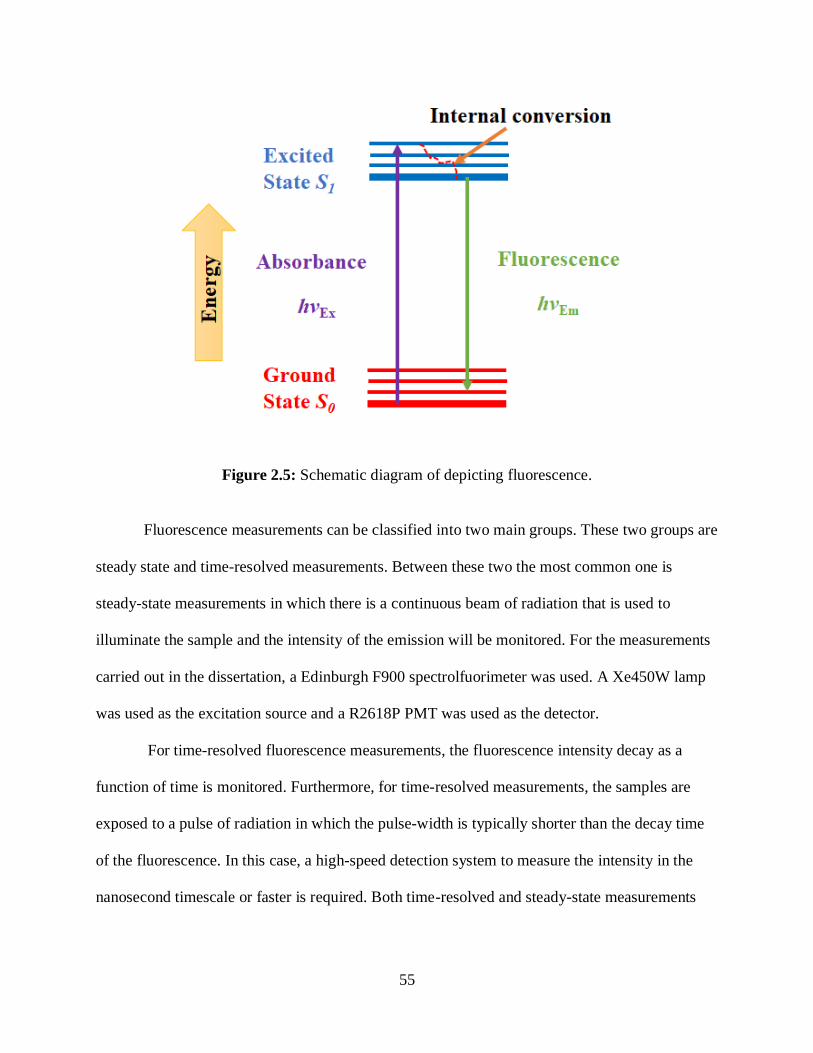
55
Figure 2.5: Schematic diagram of depicting fluorescence.
Fluorescence measurements can be classified into two main groups. These two groups are
steady state and time-resolved measurements. Between these two the most common one is
steady-state measurements in which there is a continuous beam of radiation that is used to
illuminate the sample and the intensity of the emission will be monitored. For the measurements
carried out in the dissertation, a Edinburgh F900 spectrolfuorimeter was used. A Xe450W lamp
was used as the excitation source and a R2618P PMT was used as the detector.
For time-resolved fluorescence measurements, the fluorescence intensity decay as a
function of time is monitored. Furthermore, for time-resolved measurements, the samples are
exposed to a pulse of radiation in which the pulse-width is typically shorter than the decay time
of the fluorescence. In this case, a high-speed detection system to measure the intensity in the
nanosecond timescale or faster is required. Both time-resolved and steady-state measurements
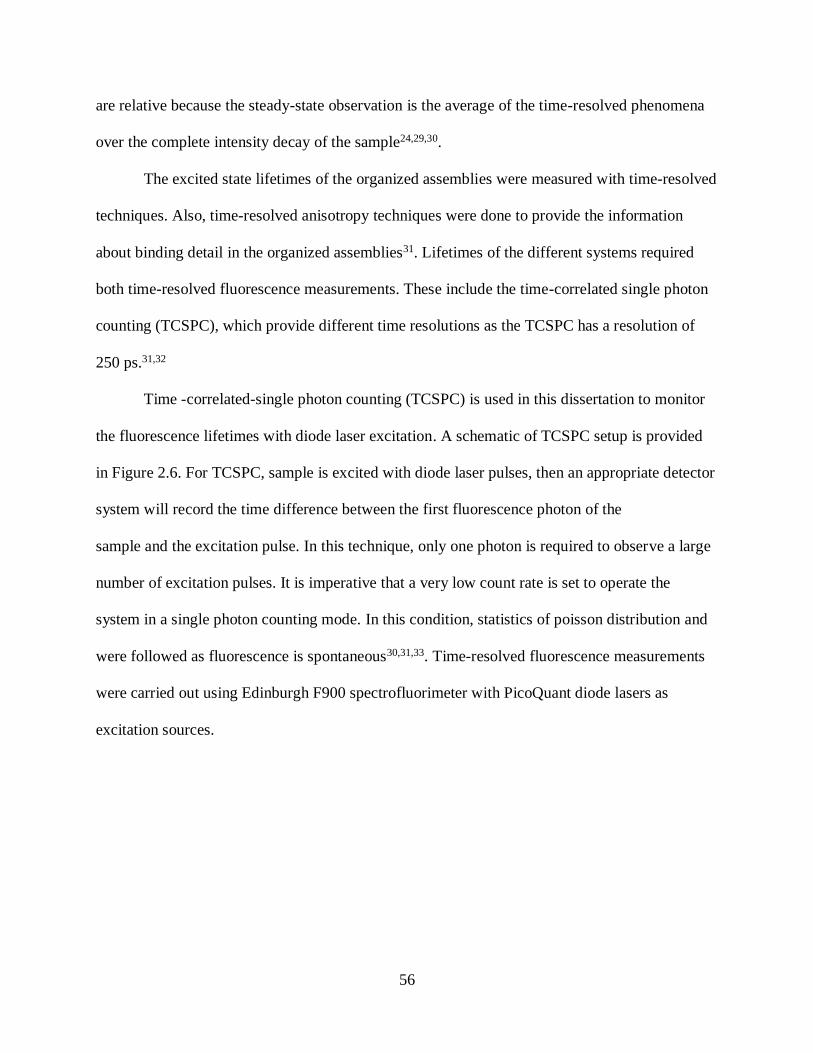
56
are relative because the steady-state observation is the average of the time-resolved phenomena
over the complete intensity decay of the sample24,29,30.
The excited state lifetimes of the organized assemblies were measured with time-resolved
techniques. Also, time-resolved anisotropy techniques were done to provide the information
about binding detail in the organized assemblies31. Lifetimes of the different systems required
both time-resolved fluorescence measurements. These include the time-correlated single photon
counting (TCSPC), which provide different time resolutions as the TCSPC has a resolution of
250 ps.31,32
Time -correlated-single photon counting (TCSPC) is used in this dissertation to monitor
the fluorescence lifetimes with diode laser excitation. A schematic of TCSPC setup is provided
in Figure 2.6. For TCSPC, sample is excited with diode laser pulses, then an appropriate detector
system will record the time difference between the first fluorescence photon of the
sample and the excitation pulse. In this technique, only one photon is required to observe a large
number of excitation pulses. It is imperative that a very low count rate is set to operate the
system in a single photon counting mode. In this condition, statistics of poisson distribution and
were followed as fluorescence is spontaneous30,31,33. Time-resolved fluorescence measurements
were carried out using Edinburgh F900 spectrofluorimeter with PicoQuant diode lasers as
excitation sources.
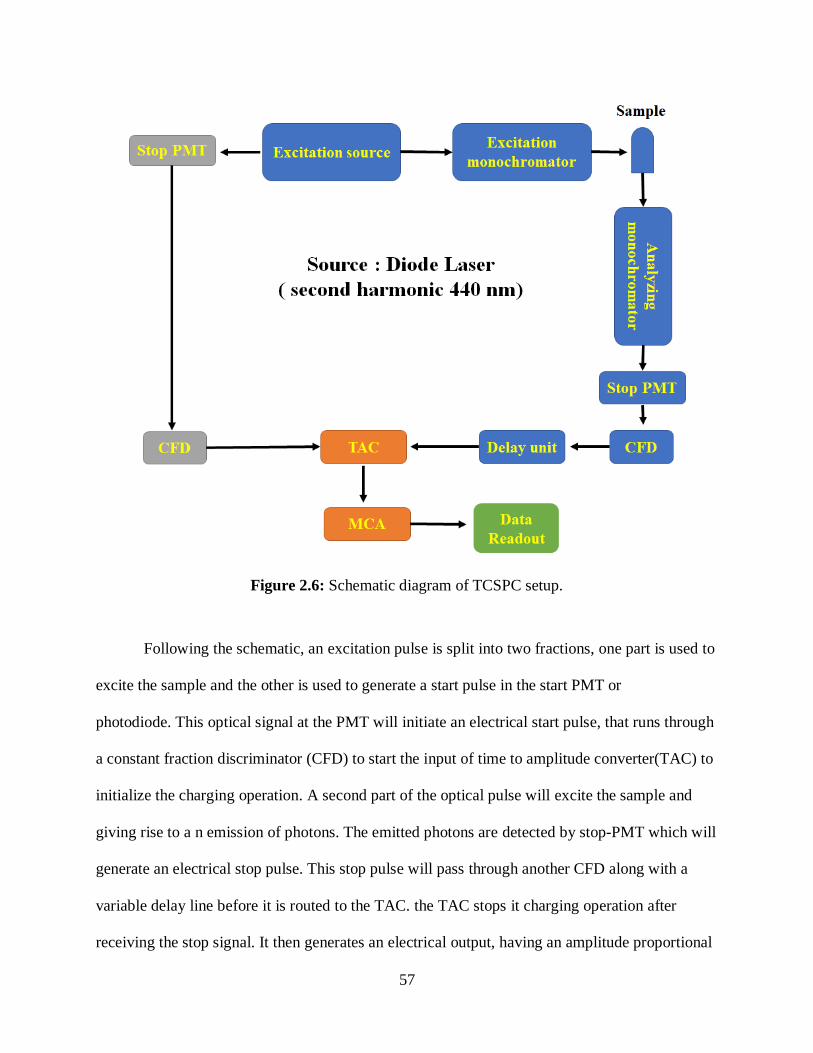
57
Figure 2.6: Schematic diagram of TCSPC setup.
Following the schematic, an excitation pulse is split into two fractions, one part is used to
excite the sample and the other is used to generate a start pulse in the start PMT or
photodiode. This optical signal at the PMT will initiate an electrical start pulse, that runs through
a constant fraction discriminator (CFD) to start the input of time to amplitude converter(TAC) to
initialize the charging operation. A second part of the optical pulse will excite the sample and
giving rise to a n emission of photons. The emitted photons are detected by stop-PMT which will
generate an electrical stop pulse. This stop pulse will pass through another CFD along with a
variable delay line before it is routed to the TAC. the TAC stops it charging operation after
receiving the stop signal. It then generates an electrical output, having an amplitude proportional
58
to the time difference (Δt) between the start and stop pulses extending to the TAC. this TAC
output pulse is then directed to the input of a multi-channel analyzer (MCA) through an analogue
into a digital converter (ADC).
This ADC will generate a numerical value that corresponds to the TAC output pulse
which is selected to an appropriate channel of the MCA and the count is added to the channel.
The circulation of the excitation-to-data-storage is repeated a large number of times. As
a result, a histogram of the counts-versus-the-channel-number of the MCA is produced. This
represents the true emission decay as the collection rate of emission of photons by the stop pulse
is very low this visible emission decay will then be deconvoluted with the instrument response to
get the corresponding lifetime. The instrument response function (IRF) is measured using a
scattered put into the place of the sample. Furthermore, the width of the IRF function is
dependent on excitation source and detection systems used14,34–39.
2.3 Two-Photon Absorption
The two-photon absorption process is a non-linear process where two photons
are absorbed simultaneously to excite the molecule from its ground state into a higher state, with
total energy is equal to the energy difference between the ground and excited state. This process
takes place at higher optical intensities and a femtosecond laser excitation is needed to observe
two-photon absorption and two-photon excited fluorescence. This phenomenon was first
introduced theoretically by Maria GöppertMayer in 1931 in her doctoral dissertation3,40. Soon
after laser innovation in 1961, two-photon absorption was first demonstrated experimentally by
Franken and others who experimentally demonstrated the process in a Europium-doped crystal
41,42. In honor of Göppert-Mayer, the unit for 2PA cross-sections is named GM after her, also she
was awarded Physics Nobel Prize in 196343–45.
59
The main advantage of two-photon absorption over conventional one-photon absorption
is it involves two photons absorbed simultaneously and uses much smaller energy photon. To
completely understand, two-photon absorption is a rare phenomenon that requires an intense
laser source to observe its effect. The rate equation for the 2PA is a second-order in the photon
flux and a first-order in the concentration of molecules, equation (2.9)
(dNTP /dt) = ½ δ Ngs F2 2.9
where, NTP is the number of molecules per unit volume in the excited state, t is the time.
δ represent the two-photon absorption cross sections, while Ngs is the number of molecules in the
ground state and finally F2 is the photon flux( the number of photons per unit are and time, light
intensity).
As discussed above, the 2PA has the advantage as it uses near infrared wavelength which
will lower the scattering effect when compared to 1PA. In Rayleigh’s law of scattering via
equation 2.10, the excitation wavelength (λ) can reduce the scattering effect (σs) by up to 16
times for two-photon excitation46–49.
σs α 1/λ4 2.10
Another advantage of 2PA over 1PA is the ability to penetrate deeper, so that it can be
used for 3D microfabrication and multi-photon imaging48,49.
2.3.1 Measuring 2PA Cross-Sections
There are several techniques that can be used to measure the 2PA cross sections s. The
most common way is to use nonlinear transmission techniques. For example, open-aperture-z-
scan. As researchers used this technique, they found that it can be erroneous because of overlap
60
from the excited state absorption. To overcome this issue researchers have used fluorescence-
based techniques. The absolute 2PA-cross-sections can be measured with knowing the incident
radiation power and the emitted radiation power. Moreover, measuring the 2PA-cross sections s
are difficult and complicated, therefore; measurements using a relative two-photon excited
fluorescence (TPEF) technique is used to determine the 2PA cross-sections, which is used
during this dissertation 50,51.
TPEF (Figure 2.7 gives a schematic of a TPEF setup) is one of the simplest methods
that can be employed to determine the 2PA cross-sections of molecules. It was originally used
for the determination of the 2PA properties of CaF2:Eu2+ crystal43. Directly measuring the 2PA
cross-sections is a difficult task due to the small portion of photons that undergo absorption in
the excitation process by two photons. To overcome this issue and facilitate measuring 2PA, the
measurement should be concluded through a particular chromophore that is quite fluorescent,
and must possess higher fluorescence quantum efficiency and known 2PA cross-sections . This
technique is definitely limited to the study of fluorescent molecules because fluorescence
quantum yield is a material intrinsic property31.
Rebane and associates, have carried out measurements of 2PA cross-sections for several
dyes in a broad wavelength region of 650 nm and 1500 nm which used as a reference for this the
measurements carried out in this dissertation51,52. For the two-photon fluorescence experiments
in this dissertation, Ti:Sapphire laser was used (Tsunami, 100 fs, 700 to 900 nm) as the
excitation source53. In addition, a rotating neutral density filter was used to change the excitation
power. The laser light was focused by a lens onto the sample cuvette placed in the Edinburgh
fluorimeter, then fluorescence was collected perpendicularly to the excitation direction using a
photomultiplier tube. The fluorescence produced after two-photon excitation was focused on the
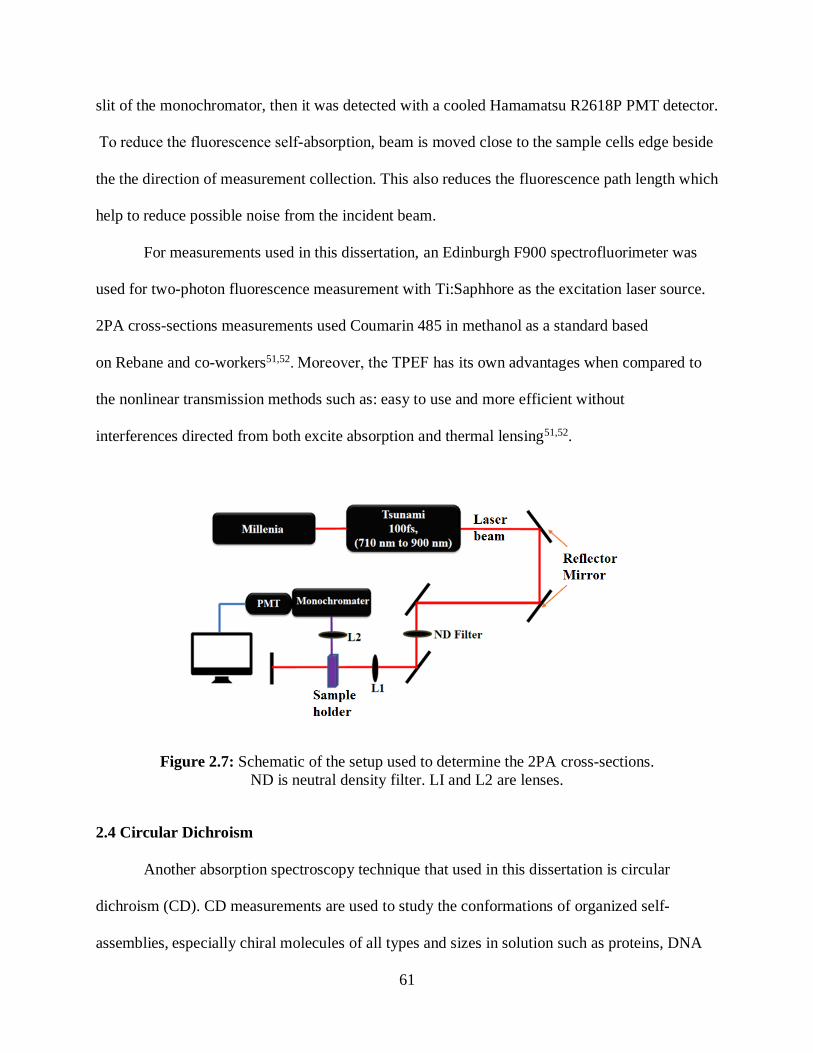
61
slit of the monochromator, then it was detected with a cooled Hamamatsu R2618P PMT detector.
To reduce the fluorescence self-absorption, beam is moved close to the sample cells edge beside
the the direction of measurement collection. This also reduces the fluorescence path length which
help to reduce possible noise from the incident beam.
For measurements used in this dissertation, an Edinburgh F900 spectrofluorimeter was
used for two-photon fluorescence measurement with Ti:Saphhore as the excitation laser source.
2PA cross-sections measurements used Coumarin 485 in methanol as a standard based
on Rebane and co-workers51,52. Moreover, the TPEF has its own advantages when compared to
the nonlinear transmission methods such as: easy to use and more efficient without
interferences directed from both excite absorption and thermal lensing51,52.
Figure 2.7: Schematic of the setup used to determine the 2PA cross-sections.
ND is neutral density filter. LI and L2 are lenses.
2.4 Circular Dichroism
Another absorption spectroscopy technique that used in this dissertation is circular
dichroism (CD). CD measurements are used to study the conformations of organized self-
assemblies, especially chiral molecules of all types and sizes in solution such as proteins, DNA
62
etc. CD primarily is used because it is sensitive to change in confirmation around organized
assemblies, pH and temperature. Also, CD is used to monitor the interactions of organized
assemblies with molecules. Moreover, CD can be used to study kinetic and thermodynamic
information. CD spectroscopy has advantages that include: ease of use, sensitivity,
nondestructive method for the sample, not consuming large amount of sample and ability to run
measurements in solution54–56. CD uses circularly polarized light and is the difference in the
absorption between the left-side and right-side of circularly polarized components. This is
represented in equation 2.11
ΔA(λ) = ALCPL – ARCPL 2.11
where A is the absorbance and λ is the wavelength. The CD technique is usually used in a range
of wavelengths to analyze the data. The CD signal can be positive or negative, depending on the
selective absorption of the circular polarized lighting source whether light absorbed is greater
extent to left circular polarized light (LCPL), where CD signal will be negative, or the right
circular polarized light (RCPL), where CD signal will be positive57–59.
This radiation source for CD is produced when two linear polarized radiations are mixed
with respect to each other phase by a quarter wave plate. By the use of a quarter wave plate, this
will slow one of the linear components with respect to the other by a quarter wave and change
their refractive indices. The will result in the left circular polarized light (LCPL) or the right
circular polarized light57.
Chiral molecules are known to be existed as pairs or mirror image isomers,
“enantiomers”, and are not superimposable mirror images. Enantiomers are identical in their
chemical physical properties; however, not for their interactions with polarized light and other
chiral molecules. The optical rotation is measured for chiral molecules as a function of
63
wavelength giving a result referred to as optical rotatory dispersion spectroscopy (ORD). ORD is
used to determine chiral molecules concentration and purity. However, CD has a better
spectruml resolution when compared to ORD, therefore, CD is used for understanding the
organized self assemblies24,60.
As the linear polarized light passes thought the optically active sample, amplitude of the
less absorbed component will be larger than the more strongly absorbed component. As the
amplitudes are combined an ellipse will form. The degree of ellipticity ө is than defined as the
tangent ratio between minor and major axes elliptic. The linearly polarized radiation possesses
zero degree of ellipticity while LCPL degrees will be + 45 and - 45 degrees for RCPL 30,61–65.
CD is relative to the change in the absorbances of LCPL and RCPL as is only observed at
the wavelengths were the chiral molecule absorbs light. The CD and ORD can be interconverted
by the Kramer-Kronig transformation relation equation.
ΔA = ө / 32.982 2.12
The molar ellipticity is valued in deg.cm2 by dmol-1 (deg.M-1 by m-1) and calculated as in
equation (2.13)
[ө]M = 10 (ө / C * l ) 2.13
where ө is in mdeg, C is the concentration is molar, and l is the path length in cm. Molar
values can be converted to a molar extinction coefficient from the equation:
Δε = [ө]M / 3298.2 2.14
Most biological self-assemblies consist of chiral structure and CD is often used to study
them. The CD spectrum can be influenced by the three dimensional structure of the protein or the
64
DNA, so the spectrum is not a simple reflection of the individual residues or bases23,61–63,66. The
CD signal can be used to identify the structure depending on the average of the molecule. In
addition, CD can be used as well to as well to monitor changes in self-assembly structure.
However, it is difficult to identify which specific residues are responsible in each structure60,67.
The CD signal for protein can be calculated through the mean residue ellipticity [ө]MR
from equation 2.15. [ө]MR is responsible for individual protein residues which could be used to
compare different proteins with different molecular weight.
[ө]MR = 100 ( ө / CMR * l ) 2.15
where CMR is the mean residue concentration which can be calculated in two different ways. It
is a product of the molar concentration of the protein and the number of residues (N). The other
calculation can be done is by dividing the concentration of protein in unit of gram per liter over
the average amino acid residue weight via 113 Daltons 60.
CMR = C (molar) / N or CMR = C ( g/l ) / 113 2.16
For the measurements carried out in the dissertation Jasco J-815 Circular Dichroism (CD)
Spectropolarimeter was used.
2.5 Dynamic Light Scattering
Dynamic light scattering (DLS), also known as photon correlation spectroscopy, is a
powerful technique for measuring particle sizes through monitor solution dynamics. Self-
assembly size information can be obtained within few minutes with a few nanometer sensitivity.
As the light interaction with matter, the affected electric fields of the energy source will induce
an oscillating polarization on the matter. These molecules would release secondary source of
65
light energy and scatter the radiation. The type of light source can definitely have an effect on
the molecule. For instance, if there is a monochromatic and coherent light source such as laser
source, the time dependent fluctuation will be observed in the scattered intensity.
The observed fluctuation is due an interaction called Brownian motion. The Brownian
motion creates the distance between the scattered molecules within a solution as they are
changing continuously with time. Brownian motion is understood to be the random
phenomenon of particles in a solution from collisions initiated by the bombardment of a solvent
molecules that surrounds the particles. This can result in a Doppler shift between the frequency
of incident light as well as the frequency of the scattered light which are all due to the particles
size68,69. The obtained data could be studied through electrodynamics and time
dependent statistical mechanics theories.
To measure the size of the particles much smaller than the wavelength of the light, a non-
invasive technique via DLS can be used. The Brownian motion of samples can be caused by the
size of the particle, sample viscosity, as well as the temperature68. In the Brownian motion, the
velocity can be described by the translational diffusion coefficient (D). This can then be
converted to particle size via Stokes-Einstein equation (Equation 2.17)
dh = KBT / 6 π η D 2.17
where dh is the hydrodynamic radius, kB is the Boltzmann’s constant, T is the temperature in the
Kelvin (K) and the viscosity is η 68. The translational diffusion coefficient (D) is essentially
determined by particle size, surface structure, with ions in the medium and their concentration.
Understanding further, ions in addition to their concentrations affect the thickness of the electric
double layers (Debye length, K-1), which reflect on particle diffusion speed and size.
Furthermore, the particle sizes defined from the amount of scattered light, while the particle
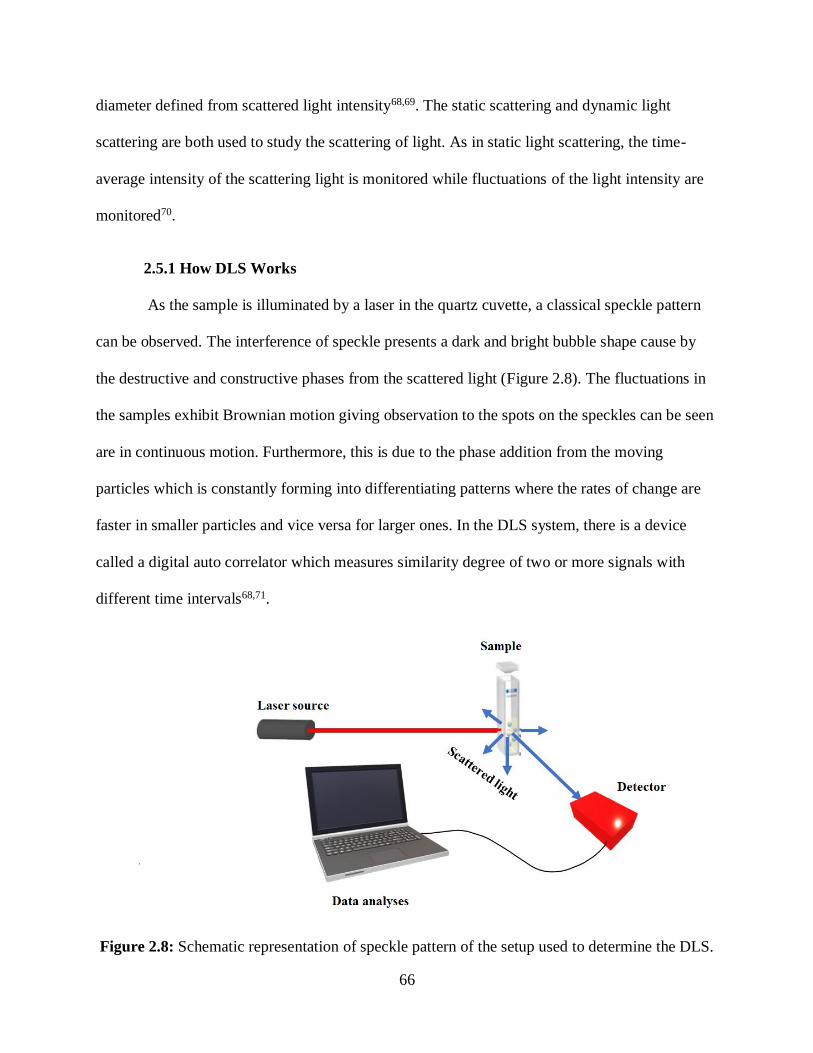
66
diameter defined from scattered light intensity68,69. The static scattering and dynamic light
scattering are both used to study the scattering of light. As in static light scattering, the time-
average intensity of the scattering light is monitored while fluctuations of the light intensity are
monitored70.
2.5.1 How DLS Works
As the sample is illuminated by a laser in the quartz cuvette, a classical speckle pattern
can be observed. The interference of speckle presents a dark and bright bubble shape cause by
the destructive and constructive phases from the scattered light (Figure 2.8). The fluctuations in
the samples exhibit Brownian motion giving observation to the spots on the speckles can be seen
are in continuous motion. Furthermore, this is due to the phase addition from the moving
particles which is constantly forming into differentiating patterns where the rates of change are
faster in smaller particles and vice versa for larger ones. In the DLS system, there is a device
called a digital auto correlator which measures similarity degree of two or more signals with
different time intervals68,71.
Figure 2.8: Schematic representation of speckle pattern of the setup used to determine the DLS.
67
The scattered intensity is proportional to the sixth power of the molecular radius making
DLS a useful sensitive technique to trace the sizes self-assembly aggregates. With the presence
of a small amount of aggregate, significant changes will occur in the mean hydrodynamic radius.
Also, DLS seems useful in thermal stability studies by the measuring the change in size and
scattering intensity as a temperature function. Furthermore, the heat influences the denaturation
of self-assembly which leads to larger aggregates which will leads to increase scattering intensity
and the size of the particle.
It’s crucial for DLS measurement to dispersed sample well in the suspending medium,
therefore; filtration the sample is required to eliminate large particles or contaminants that could
cause not representative scattering. In addition, the refractive-index has to be different between
the dispersed phase and suspending medium. Moreover, the solvent refractive index and
viscosity must also be known to apply the Stokes-Einstein relationship (2-17) to calculate the
hydrodynamic particle diameter24.
Another important condition to run DLS is the sample concentration. Chosen sample
concentration depends on other factors: laser power, particle size and refractive index. If the
sample exceed the concentration limit, that will cause multiple scattering phenomena where
scattered light from one particle is re-scattered by another particle. The concentrated
charged self-assembly may increase the repulsion forces among molecule due to the reduction
in the intermolecular distance. This enables to an increase in the diffusion speed decreasing the
apparent size. On the other hand, if the sample was below concentration limit, that will lead to
reduced number of particles in the scattering volume which could be insufficient to be
detected68,69. The scattered light is measured at a 90° angle by photomultiplier tube detector. The
68
particle sized carried-out through correlation analysis of the processed signal as previously
discussed. Furthermore, to avoid possible multiple scattering phenomena, it is necessary to use
dual photodetectors. The dynamic light scattering performed using a DynaPro Titan Batch
instrument from Wyatt Technology Corporation. It is operates using a micro cuvette.
2.6 Chapter 2 Summary
• In this dissertation, ultrafast laser spectroscopy used extensively to monitoring changes in
local electric field of self-organized assembly system. Therefore, the laser basic
components and properties was introduced.
• Laser main components are optical cavity, pump source and gain medium.
• Optical absorption and steady-state fluorescence techniques are generally used to study
self-organized assembly either by study the absorbance radiation for UV-vis or study the
emission radiation for fluorescence which will used to determining the energy of a
molecule's excited state and studying the interaction between self-organized assembly
and dye molecules
• Appling two photon absorption help to excite a biological marker (dye molecule). There
are several advantages for two photon absorption over single-photon absorption as a
means of exciting a molecule such allowed Some forbidden transitions, better spatial
resolution, less photodegradation, less scattering, 3D imaging, higher excitation energies
deep penetrate and work in complex environment.
• Circular dichroism is a tool that explores the interactions of chiral molecules with
circularly polarized light. CD used to study the conformations structure of organized self-
assemblies and monitor the interactions with dye molecules.

69
• Dynamic light scattering used to measure organized self-assemblies sizes through
monitor solution dynamics. It used in this dissertation to measure protein aggregation.
70
2.7 References
(1) Kaluza, M. C. Laser-Based Particle Acceleration. Optik & Photonik 2010, 5 (2), 56–59.
https://doi.org/10.1002/opph.201190102.
(2) Leahy-Hoppa, M. R.; Miragliotta, J.; Osiander, R.; Burnett, J.; Dikmelik, Y.; McEnnis, C.;
Spicer, J. B. Ultrafast Laser-Based Spectroscopy and Sensing: Applications in LIBS,
CARS, and THz Spectroscopy. Sensors 2010, 10 (5), 4342–4372.
https://doi.org/10.3390/s100504342.
(3) Keller, O. Theoretical Study of the Nonlinear Response Function Describing Optical
Second-Harmonic Generation in Nonlocal Metal Optics. Phys. Rev. B 1985, 31 (8), 5028–
5043. https://doi.org/10.1103/PhysRevB.31.5028.
(4) Crisafi, F.; Kumar, V.; Perri, A.; Marangoni, M.; Cerullo, G.; Polli, D. Multimodal
Nonlinear Microscope Based on a Compact Fiber-Format Laser Source. Spectrochimica
Acta Part A: Molecular and Biomolecular Spectroscopy 2018, 188, 135–140.
https://doi.org/10.1016/j.saa.2017.06.055.
(5) Yue, S.; Slipchenko, M. N.; Cheng, J.-X. Multimodal Nonlinear Optical Microscopy. Laser
Photon Rev 2011, 5 (4). https://doi.org/10.1002/lpor.201000027.
(6) Hecht, J. Short History of Laser Development. OE 2010, 49 (9), 091002.
https://doi.org/10.1117/1.3483597.
(7) Thomas, G.; Isaacs, R. Basic Principles of Lasers. Anaesthesia & Intensive Care Medicine
2011, 12 (12), 574–577. https://doi.org/10.1016/j.mpaic.2011.09.013.
(8) Haley, D.; Pratt, O. Basic Principles of Lasers. Anaesthesia & Intensive Care Medicine
2017, 18 (12), 648–650. https://doi.org/10.1016/j.mpaic.2017.10.001.
(9) Svelto, O.; Hanna, D. C. Principles of Lasers; Springer US, 1976.
71
(10) Wilson, S. M.; Wiberg, K. B.; Cheeseman, J. R.; Frisch, M. J.; Vaccaro, P. H. Nonresonant
Optical Activity of Isolated Organic Molecules. J. Phys. Chem. A 2005, 109 (51), 11752–
11764. https://doi.org/10.1021/jp054283z.
(11) Nafie, L. A. Vibrational Optical Activity: Principles and Applications; John Wiley & Sons,
2011.
(12) Levenson, M. Introduction to Nonlinear Laser Spectroscopy 2e; Elsevier, 2012.
(13) Moulton, P. F. Spectroscopic and Laser Characteristics of Ti:Al2O3. J. Opt. Soc. Am. B,
JOSAB 1986, 3 (1), 125–133. https://doi.org/10.1364/JOSAB.3.000125.
(14) Telle, H. H.; Ureña, Á. G. Laser Spectroscopy and Laser Imaging: An Introduction; CRC
Press, 2018.
(15) Cao, H.; Chriki, R.; Bittner, S.; Friesem, A. A.; Davidson, N. Complex Lasers with
Controllable Coherence. Nature Reviews Physics 2019, 1. https://doi.org/10.1038/s42254-
018-0010-6.
(16) Hädrich, S.; Klenke, A.; Rothhardt, J.; Krebs, M.; Hoffmann, A.; Pronin, O.; Pervak, V.;
Limpert, J.; Tünnermann, A. High Photon Flux Table-Top Coherent Extreme-Ultraviolet
Source. Nature Photonics 2014, 8 (10), 779–783.
https://doi.org/10.1038/nphoton.2014.214.
(17) Kuhn, A.; Blewett, I. J.; Hand, D. P.; French, P.; Richmond, M.; Jones, J. D. C. Optical
Fibre Beam Delivery of High-Energy Laser Pulses: Beam Quality Preservation and Fibre
End-Preparation. Optics and Lasers in Engineering 2000, 34 (4–6), 273–288.
https://doi.org/10.1016/S0143-8166(00)00082-8.
(18) 21_4_2.Pdf.
72
(19) Lee, J.; Koo, J.; Debnath, P.; Song, Y.-W.; Lee, J. H. AQ-Switched, Mode-Locked Fiber
Laser Using a Graphene Oxide-Based Polarization Sensitive Saturable Absorber. Laser
Phys. Lett. 2013, 10 (3), 035103. https://doi.org/10.1088/1612-2011/10/3/035103.
(20) Haus, H. A. Modelocking of Semiconductor Laser Diodes. Jpn. J. Appl. Phys. 1981, 20 (6),
1007. https://doi.org/10.1143/JJAP.20.1007.
(21) Jyu, S.-S.; Jiang, G.-H.; Lai, Y. Laser Dynamics of Asynchronous Rational Harmonic
Mode-Locked Fiber Soliton Lasers. Laser Phys. 2013, 23 (8), 085106.
https://doi.org/10.1088/1054-660X/23/8/085106.
(22) Jiang, J.; Lai, Z.; Wang, J.; Mukamel, S. Signatures of the Protein Folding Pathway in Two-
Dimensional Ultraviolet Spectroscopy. J. Phys. Chem. Lett. 2014, 5 (8), 1341–1346.
https://doi.org/10.1021/jz5002264.
(23) Li, J.; Deng, M.; Voronine, D. V.; Mukamel, S.; Jiang, J. Two-Dimensional Near
Ultraviolet (2DNUV) Spectroscopic Probe of Structural-Dependent Exciton Dynamics in a
Protein. J. Phys. Chem. B 2015, 119 (4), 1314–1322. https://doi.org/10.1021/jp509314y.
(24) Skoog, D. A.; Holler, F. J.; Crouch, S. R. Principles of Instrumental Analysis; Thomson
Brooks/Cole, 2007.
(25) Koenig, J.-F.; Martel, D. Applying UV–Vis Spectroscopy to Step-by-Step Molecular Self
Assembly on Surface: Does It Bring Pertinent Information? Thin Solid Films 2008, 516
(12), 3865–3872. https://doi.org/10.1016/j.tsf.2007.07.137.
(26) Gattuso, H.; Monari, A.; Marazzi, M. Photophysics of Chlorin E6: From One- and Two-
Photon Absorption to Fluorescence and Phosphorescence. RSC Adv. 2017, 7 (18), 10992–
10999. https://doi.org/10.1039/C6RA28616J.

73
(27) Liu, R.; Liu, M.; Hood, D.; Chen, C.-Y.; MacNevin, C. J.; Holten, D.; Lindsey, J. S.
Chlorophyll-Inspired Red-Region Fluorophores: Building Block Synthesis and Studies in
Aqueous Media. Molecules 2018, 23 (1), 130. https://doi.org/10.3390/molecules23010130.
(28) Robyt, J. F.; White, B. J. Biochemical Techniques: Theory and Practice; Waveland Press,
1987.
(29) Lakowicz, J. R.; Masters, B. R. Principles of Fluorescence Spectroscopy, Third Edition.
Journal of Biomedical Optics 2008, 13 (2), 029901. https://doi.org/10.1117/1.2904580.
(30) Marazzi, M.; Gattuso, H.; Monari, A.; Assfeld, X. Steady-State Linear and Non-Linear
Optical Spectroscopy of Organic Chromophores and Bio-Macromolecules. Front. Chem.
2018, 6. https://doi.org/10.3389/fchem.2018.00086.
(31) Berezin, M. Y.; Achilefu, S. Fluorescence Lifetime Measurements and Biological Imaging.
Chem Rev 2010, 110 (5), 2641–2684. https://doi.org/10.1021/cr900343z.
(32) Grellmann, K.-H. Excited State Lifetime Measurements. Von J. N. Demas. Academic
Press, New York 1983. VIII, 273 S., Geb. $ 45.00. – ISBN 0-12-208920-0. Angewandte
Chemie 1985, 97 (2), 138–139. https://doi.org/10.1002/ange.19850970227.
(33) Excited State Lifetime Measurements - 1st Edition
https://www.elsevier.com/books/excited-state-lifetime-measurements/demas/978-0-12-
208920-6 (accessed Jan 24, 2019).
(34) Berezin, M. Y.; Achilefu, S. Fluorescence Lifetime Measurements and Biological Imaging.
Chem Rev 2010, 110 (5), 2641–2684. https://doi.org/10.1021/cr900343z.
(35) Becker, W.; Bergmann, A.; Biskup, C. Multispectruml Fluorescence Lifetime Imaging by
TCSPC. Microscopy Research and Technique 2007, 70 (5), 403–409.
https://doi.org/10.1002/jemt.20432.
74
(36) Wahl, M.; Rahn, H.-J.; Röhlicke, T.; Kell, G.; Nettels, D.; Hillger, F.; Schuler, B.;
Erdmann, R. Scalable Time-Correlated Photon Counting System with Multiple Independent
Input Channels. Review of Scientific Instruments 2008, 79 (12), 123113.
https://doi.org/10.1063/1.3055912.
(37) O’Connor, D. V.; Ware, W. R.; Andre, J. C. Deconvolution of Fluorescence Decay Curves.
A Critical Comparison of Techniques. J. Phys. Chem. 1979, 83 (10), 1333–1343.
https://doi.org/10.1021/j100473a019.
(38) Wahl, M. Time-Correlated Single Photon Counting; 2009.
(39) Alja’afreh, I. Probing the Unfolding and the Stability of the Last Four Metal Binding
Domains of Wilson Disease Protein Using Circular Dichroism and Novel Spectroscopic
Techniques. Dissertations 2014.
(40) Diaspro, A.; Robello, M. Two-Photon Excitation of Fluorescence for Three-Dimensional
Optical Imaging of Biological Structures. Journal of Photochemistry and Photobiology B:
Biology 2000, 55 (1), 1–8. https://doi.org/10.1016/S1011-1344(00)00028-2.
(41) Schenke‐Layland, K. Non-Invasive Multiphoton Imaging of Extracellular Matrix
Structures. Journal of Biophotonics 2008, 1 (6), 451–462.
https://doi.org/10.1002/jbio.200810045.
(42) Campagnola, P. J.; Loew, L. M. Second-Harmonic Imaging Microscopy for Visualizing
Biomolecular Arrays in Cells, Tissues and Organisms. Nature Biotechnology 2003, 21 (11),
1356–1360. https://doi.org/10.1038/nbt894.
(43) Bayer, E.; Schaack, G. Two-Photon Absorption of CaF2:Eu2+. physica status solidi (b)
1970, 41 (2), 827–835. https://doi.org/10.1002/pssb.19700410239.
75
(44) Denk, W.; Strickler, J. H.; Webb, W. W. Two-Photon Laser Scanning Fluorescence
Microscopy. Science 1990, 248 (4951), 73–76. https://doi.org/10.1126/science.2321027.
(45) Jechow, A.; Seefeldt, M.; Kurzke, H.; Heuer, A.; Menzel, R. Enhanced Two-Photon
Excited Fluorescence from Imaging Agents Using True Thermal Light. Nature Photonics
2013, 7 (12), 973–976. https://doi.org/10.1038/nphoton.2013.271.
(46) Koops, S. E.; O’Regan, B. C.; Barnes, P. R. F.; Durrant, J. R. Parameters Influencing the
Efficiency of Electron Injection in Dye-Sensitized Solar Cells. J. Am. Chem. Soc. 2009, 131
(13), 4808–4818. https://doi.org/10.1021/ja8091278.
(47) Cox, A. J.; DeWeerd, A. J.; Linden, J. An Experiment to Measure Mie and Rayleigh Total
Scattering Cross Sections s. American Journal of Physics 2002, 70 (6), 620–625.
https://doi.org/10.1119/1.1466815.
(48) Sengul, O.; Boydas, E. B.; Pastore, M.; Sharmouk, W.; Gros, P. C.; Catak, S.; Monari, A.
Probing Optical Properties of Thiophene Derivatives for Two-Photon Absorption. Theor
Chem Acc 2017, 136 (6), 67. https://doi.org/10.1007/s00214-017-2094-y.
(49) Pawlicki, M.; Collins, H. A.; Denning, R. G.; Anderson, H. L. Two-Photon Absorption and
the Design of Two-Photon Dyes. Angewandte Chemie International Edition 2009, 48 (18),
3244–3266. https://doi.org/10.1002/anie.200805257.
(50) Bukowski, E. J.; Bright, F. V. Two-Photon-Excited Phase-Resolved Fluorescence
Spectroscopy. Appl Spectrosc 2002, 56 (12), 1588–1592.
https://doi.org/10.1366/000370202321115850.
(51) Lerch, S.; Stefanov, A. Observing the Transition from Quantum to Classical Energy
Correlations with Photon Pairs. Communications Physics 2018, 1 (1), 26.
https://doi.org/10.1038/s42005-018-0027-2.
76
(52) Makarov, N. S.; Drobizhev, M.; Rebane, A. Two-Photon Absorption Standards in the 550–
1600 Nm Excitation Wavelength Range. Opt. Express, OE 2008, 16 (6), 4029–4047.
https://doi.org/10.1364/OE.16.004029.
(53) High two-photon absorption efficiency promoted by intermolecular interactions | SPIE
Homepage: SPIE http://spie.org/newsroom/4395-high-two-photon-absorption-efficiency-
promoted-by-intermolecular-interactions?SSO=1 (accessed Jan 24, 2019).
(54) Kelly, S. M.; Jess, T. J.; Price, N. C. How to Study Proteins by Circular Dichroism.
Biochimica et Biophysica Acta (BBA) - Proteins and Proteomics 2005, 1751 (2), 119–139.
https://doi.org/10.1016/j.bbapap.2005.06.005.
(55) Greenfield, N. J. Using Circular Dichroism Spectrum to Estimate Protein Secondary
Structure. Nat Protoc 2006, 1 (6), 2876–2890. https://doi.org/10.1038/nprot.2006.202.
(56) Gray, D. M.; Ratliff, R. L.; Vaughan, M. R. [19] Circular Dichroism Spectroscopy of DNA.
In Methods in Enzymology; DNA Structures Part A: Synthesis and Physical Analysis of
DNA; Academic Press, 1992; Vol. 211, pp 389–406. https://doi.org/10.1016/0076-
6879(92)11021-A.
(57) Martin, S. R.; Schilstra, M. J. Circular Dichroism and Its Application to the Study of
Biomolecules. In Methods in Cell Biology; Biophysical Tools for Biologists, Volume One:
In Vitro Techniques; Academic Press, 2008; Vol. 84, pp 263–293.
https://doi.org/10.1016/S0091-679X(07)84010-6.
(58) Micsonai, A.; Wien, F.; Kernya, L.; Lee, Y.-H.; Goto, Y.; Réfrégiers, M.; Kardos, J.
Accurate Secondary Structure Prediction and Fold Recognition for Circular Dichroism
Spectroscopy. PNAS 2015, 112 (24), E3095–E3103.
https://doi.org/10.1073/pnas.1500851112.
77
(59) Greenfield, N. J. Analysis of the Kinetics of Folding of Proteins and Peptides Using
Circular Dichroism. Nature Protocols 2006, 1 (6), 2891–2899.
https://doi.org/10.1038/nprot.2006.244.
(60) Circular Dichroism: Principles and Applications, 2nd ed.; Berova, N., Nakanishi, K.,
Woody, R., Eds.; Wiley-VCH: New York, 2000.
(61) Greenfield, N. J. Determination of the Folding of Proteins as a Function of Denaturants,
Osmolytes or Ligands Using Circular Dichroism. Nature Protocols 2006, 1 (6), 2733–2741.
https://doi.org/10.1038/nprot.2006.229.
(62) Greenfield, N. J. Using Circular Dichroism Collected as a Function of Temperature to
Determine the Thermodynamics of Protein Unfolding and Binding Interactions. Nature
Protocols 2006, 1 (6), 2527–2535. https://doi.org/10.1038/nprot.2006.204.
(63) Greenfield, N. J. Using Circular Dichroism Spectrum to Estimate Protein Secondary
Structure. Nature Protocols 2006, 1 (6), 2876–2890.
https://doi.org/10.1038/nprot.2006.202.
(64) Ranjbar, B.; Gill, P. Circular Dichroism Techniques: Biomolecular and Nanostructural
Analyses- A Review. Chemical Biology & Drug Design 2009, 74 (2), 101–120.
https://doi.org/10.1111/j.1747-0285.2009.00847.x.
(65) O’Mahony, A. M.; Cronin, M. F.; Mcmahon, A.; Evans, J. C.; Daly, K.; Darcy, R.;
O’Driscoll, C. M. Biophysical and Structural Characterisation of Nucleic Acid Complexes
with Modified Cyclodextrins Using Circular Dichroism. Journal of Pharmaceutical
Sciences 2014, 103 (5), 1346–1355. https://doi.org/10.1002/jps.23922.
(66) Basu, P.; Suresh Kumar, G. Elucidation of the DNA Binding Specificity of the Natural
Plant Alkaloid Chelerythrine: A Biophysical Approach. Journal of Photochemistry and
78
Photobiology B: Biology 2014, 138, 282–294.
https://doi.org/10.1016/j.jphotobiol.2014.06.005.
(67) Kelly, S. M.; Jess, T. J.; Price, N. C. How to Study Proteins by Circular Dichroism.
Biochimica et Biophysica Acta (BBA) - Proteins and Proteomics 2005, 1751 (2), 119–139.
https://doi.org/10.1016/j.bbapap.2005.06.005.
(68) Linegar, K. L. Applications of Dynamic Light Scattering in Chemical Engineering:
Polymers, Proteins, and Liquid Crystals. M.S., University of Maryland, College Park:
United States -- Maryland, 2008.
(69) Yang, S.-T.; Marchio, J. L.; Yen, J.-W. A Dynamic Light Scattering Study of .Beta.-
Galactosidase: Environmental Effects on Protein Conformation and Enzyme Activity.
Biotechnology Progress 1994, 10 (5), 525–531. https://doi.org/10.1021/bp00029a011.
(70) Gast, K.; Fiedler, C. Dynamic and Static Light Scattering of Intrinsically Disordered
Proteins. In Intrinsically Disordered Protein Analysis: Volume 2, Methods and
Experimental Tools; Uversky, V. N., Dunker, A. K., Eds.; Methods in Molecular Biology;
Springer New York: New York, NY, 2012; pp 137–161. https://doi.org/10.1007/978-1-
4614-3704-8_9.
(71) Stetefeld, J.; McKenna, S. A.; Patel, T. R. Dynamic Light Scattering: A Practical Guide and
Applications in Biomedical Sciences. Biophys Rev 2016, 8 (4), 409–427.
https://doi.org/10.1007/s12551-016-0218-6.
79
CHAPTER 3
ANALYZING THE STABILITY AND INTERACTIONS OF G-QUADRUPLEX AND
G-TRIPLEX DNA IN DRUG SYSTEMS BY USING NOVEL OPTICAL
SPECTROSCOPY TECHNIQUES
3.1 Introduction
Among different organized self-assemblies, deoxy ribonucleic acid (DNA) is one of the
interesting self-assemblies that can organize into different canonical forms, most famous being
the double helical shape visualized by Watson and Crick. In this dissertation, we have studied
different canonical forms of DNA using optical spectroscopic techniques.
It is well known that DNA contains the genetic information needed for all known
organisms to function. These genetic codes consist of instruction that are needed by cells to
replicate, transcribe, and translate that then helps organisms regulate their bodily functions. But
when the DNA is altered through mutagenic factors, it may lead to the dysfunction of the cell.
This dysfunction of the cell can lead to diseases such as cancer1,2. With the development of drugs
and technology, treatments have evolved to better treat these conditions, targeting DNA and
lysing cells that have become cancerous. Though these anticancer drugs are effective in their
treatment, causing the tumor cells to die, they have adverse effects that increase the chance of
another tumor to grow due to these drugs’ toxicities3,4. Current chemotherapeutic drugs bind to
highly active duplex DNA in cancer cells which is non-specific binding, but these drugs can bind
to negatively charged backbone of DNA as well. This led to the development of targeting non-
canonical structures using properties of the DNA backbone. 5–7.
One recent strategy of cancer treatment relies on targeting telomeres. Telomeres are at the
ends of chromosomes, playing the role of protecting the genome from degradation8. After each
replication cycle, the telomere shortens and with this continued shortening, DN start to become
80
damaged, eventually leading to cell death. But in the case of cancer cells, an enzyme known as
telomerase becomes highly active, adding nucleic acids to the ends of the chromosomes and
prevent cell death9–11. These enzymes are usually active in germline and hemapoetic cells, but
not in somatic cells12. An ideal way to target most cancers is to stop the telomerase activity by
targeting it in the DNA within the cancerous cell. About 90% of cancers have elevated
telomerase activities13; therefore, by coming up with a therapeutic way to target the cells with
elevated telomerase activity, one can effectively destroy tumors through minimal adverse
effects11. The key to this is that the telomeres have a stretch of single stranded DNA (ssDNA)
that has been elongated by telomerase14. It is known that these ssDNA can develop into non-
canonical structures, thus increasing the capability of targeting these cancer cells specifically10.
A well-known non- canonical structure is the G-Quadruplex along with an intermediate folding
structure called a G-Triplex15,16. These structures are possible due to the high number of
guanines that are added in by the telomerase and can prevent telomerase from elongating the
DNA strand (Figure 3.1)17.
The structure of the DNA plays a key role on how these drugs bind to the DNA, and
furthermore how the stability of the structure is affected after such binding. In the case of G-
Quadruplex structures, they contain purine-rich strands, which are mostly guanine, allowing such
non-canonical structures to form18. Quadruplex DNA contains stacked tetrads that help with the
stabilization of the structure, which is done through cyclic hoogsteen binding arrangements that
aids with the current hydrogen bonds18. Adding monovalent cations such as sodium or potassium
has been shown to stabilize the structure further by “coordinating with eight carbonyl oxygen
atoms present between stacked tetrads.”19 It has also been shown through multiple studies that G-
Quadruplexes have multiple structures that they can take up and still be stable (Figure 3.2)17,20.
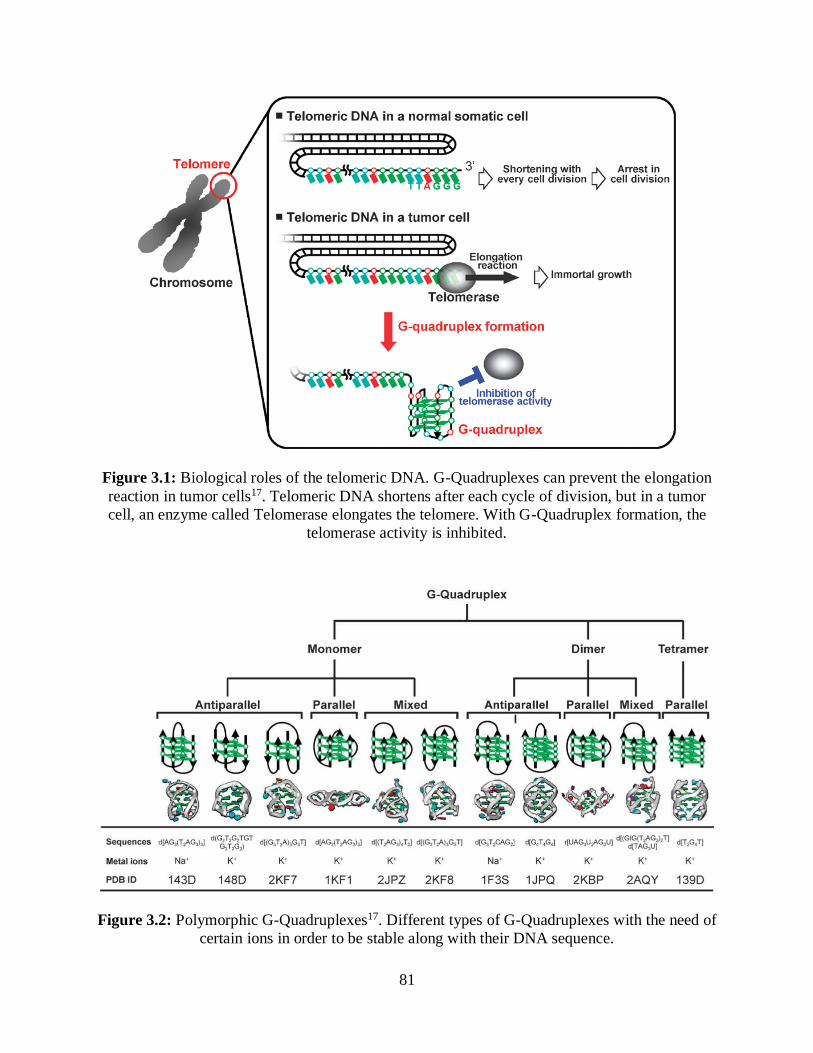
81
Figure 3.1: Biological roles of the telomeric DNA. G-Quadruplexes can prevent the elongation
reaction in tumor cells17. Telomeric DNA shortens after each cycle of division, but in a tumor
cell, an enzyme called Telomerase elongates the telomere. With G-Quadruplex formation, the
telomerase activity is inhibited.
Figure 3.2: Polymorphic G-Quadruplexes17. Different types of G-Quadruplexes with the need of
certain ions in order to be stable along with their DNA sequence.
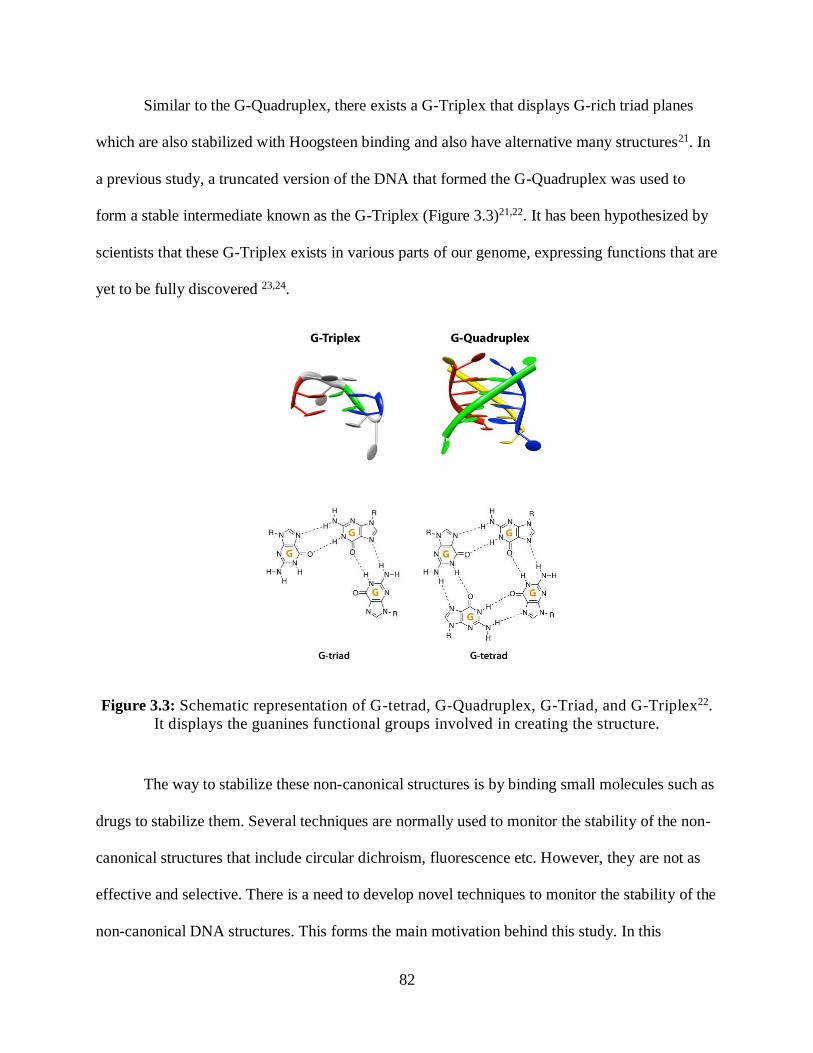
82
Similar to the G-Quadruplex, there exists a G-Triplex that displays G-rich triad planes
which are also stabilized with Hoogsteen binding and also have alternative many structures21. In
a previous study, a truncated version of the DNA that formed the G-Quadruplex was used to
form a stable intermediate known as the G-Triplex (Figure 3.3)21,22. It has been hypothesized by
scientists that these G-Triplex exists in various parts of our genome, expressing functions that are
yet to be fully discovered 23,24.
Figure 3.3: Schematic representation of G-tetrad, G-Quadruplex, G-Triad, and G-Triplex22.
It displays the guanines functional groups involved in creating the structure.
The way to stabilize these non-canonical structures is by binding small molecules such as
drugs to stabilize them. Several techniques are normally used to monitor the stability of the non-
canonical structures that include circular dichroism, fluorescence etc. However, they are not as
effective and selective. There is a need to develop novel techniques to monitor the stability of the
non-canonical DNA structures. This forms the main motivation behind this study. In this
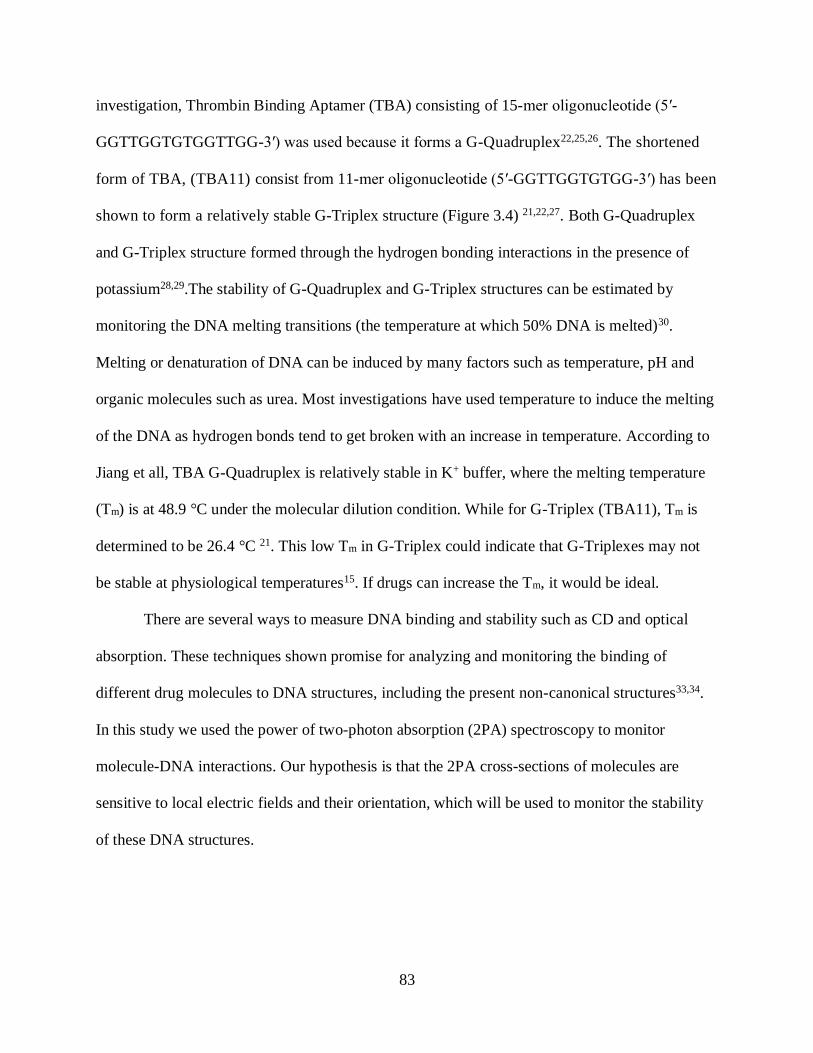
83
investigation, Thrombin Binding Aptamer (TBA) consisting of 15-mer oligonucleotide (5′-
GGTTGGTGTGGTTGG-3′) was used because it forms a G-Quadruplex22,25,26. The shortened
form of TBA, (TBA11) consist from 11-mer oligonucleotide (5′-GGTTGGTGTGG-3′) has been
shown to form a relatively stable G-Triplex structure (Figure 3.4) 21,22,27. Both G-Quadruplex
and G-Triplex structure formed through the hydrogen bonding interactions in the presence of
potassium28,29.The stability of G-Quadruplex and G-Triplex structures can be estimated by
monitoring the DNA melting transitions (the temperature at which 50% DNA is melted)30.
Melting or denaturation of DNA can be induced by many factors such as temperature, pH and
organic molecules such as urea. Most investigations have used temperature to induce the melting
of the DNA as hydrogen bonds tend to get broken with an increase in temperature. According to
Jiang et all, TBA G-Quadruplex is relatively stable in K+ buffer, where the melting temperature
(Tm) is at 48.9 °C under the molecular dilution condition. While for G-Triplex (TBA11), Tm is
determined to be 26.4 °C 21. This low Tm in G-Triplex could indicate that G-Triplexes may not
be stable at physiological temperatures15. If drugs can increase the Tm, it would be ideal.
There are several ways to measure DNA binding and stability such as CD and optical
absorption. These techniques shown promise for analyzing and monitoring the binding of
different drug molecules to DNA structures, including the present non-canonical structures33,34.
In this study we used the power of two-photon absorption (2PA) spectroscopy to monitor
molecule-DNA interactions. Our hypothesis is that the 2PA cross-sections of molecules are
sensitive to local electric fields and their orientation, which will be used to monitor the stability
of these DNA structures.
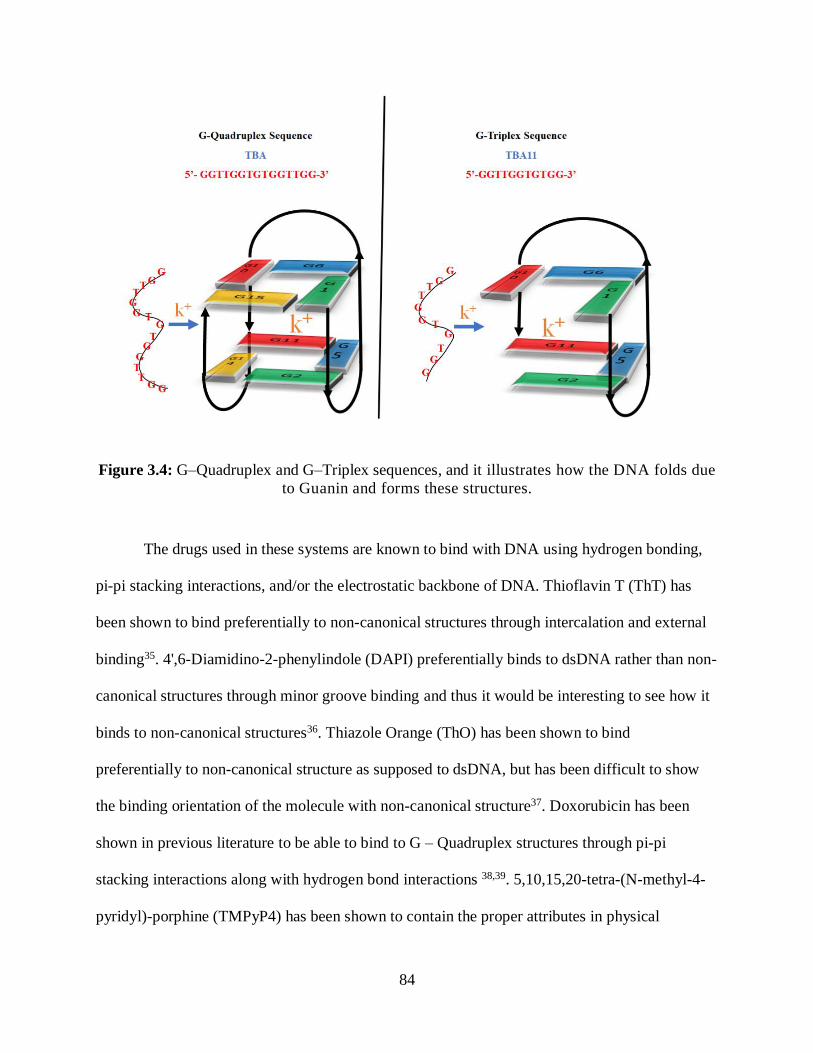
84
Figure 3.4: G–Quadruplex and G–Triplex sequences, and it illustrates how the DNA folds due
to Guanin and forms these structures.
The drugs used in these systems are known to bind with DNA using hydrogen bonding,
pi-pi stacking interactions, and/or the electrostatic backbone of DNA. Thioflavin T (ThT) has
been shown to bind preferentially to non-canonical structures through intercalation and external
binding35. 4',6-Diamidino-2-phenylindole (DAPI) preferentially binds to dsDNA rather than non-
canonical structures through minor groove binding and thus it would be interesting to see how it
binds to non-canonical structures36. Thiazole Orange (ThO) has been shown to bind
preferentially to non-canonical structure as supposed to dsDNA, but has been difficult to show
the binding orientation of the molecule with non-canonical structure37. Doxorubicin has been
shown in previous literature to be able to bind to G – Quadruplex structures through pi-pi
stacking interactions along with hydrogen bond interactions 38,39. 5,10,15,20-tetra-(N-methyl-4-
pyridyl)-porphine (TMPyP4) has been shown to contain the proper attributes in physical
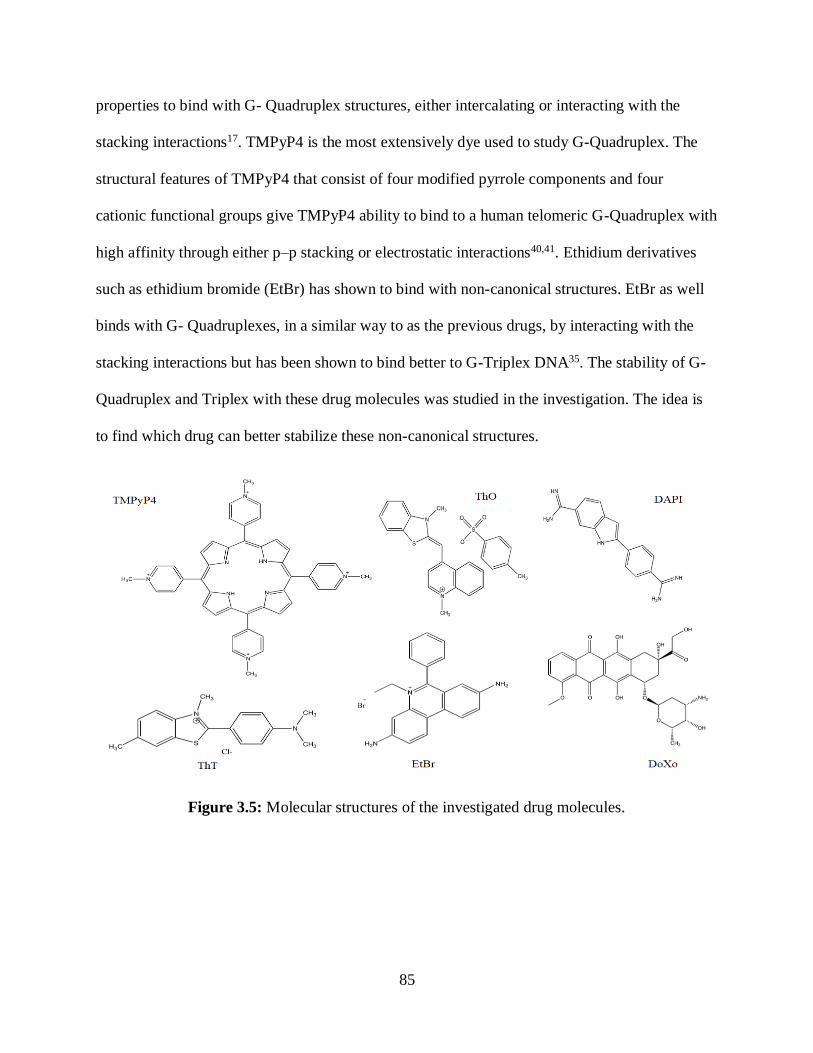
85
properties to bind with G- Quadruplex structures, either intercalating or interacting with the
stacking interactions17. TMPyP4 is the most extensively dye used to study G-Quadruplex. The
structural features of TMPyP4 that consist of four modified pyrrole components and four
cationic functional groups give TMPyP4 ability to bind to a human telomeric G-Quadruplex with
high affinity through either p–p stacking or electrostatic interactions40,41. Ethidium derivatives
such as ethidium bromide (EtBr) has shown to bind with non-canonical structures. EtBr as well
binds with G- Quadruplexes, in a similar way to as the previous drugs, by interacting with the
stacking interactions but has been shown to bind better to G-Triplex DNA35. The stability of G-
Quadruplex and Triplex with these drug molecules was studied in the investigation. The idea is
to find which drug can better stabilize these non-canonical structures.
Figure 3.5: Molecular structures of the investigated drug molecules.
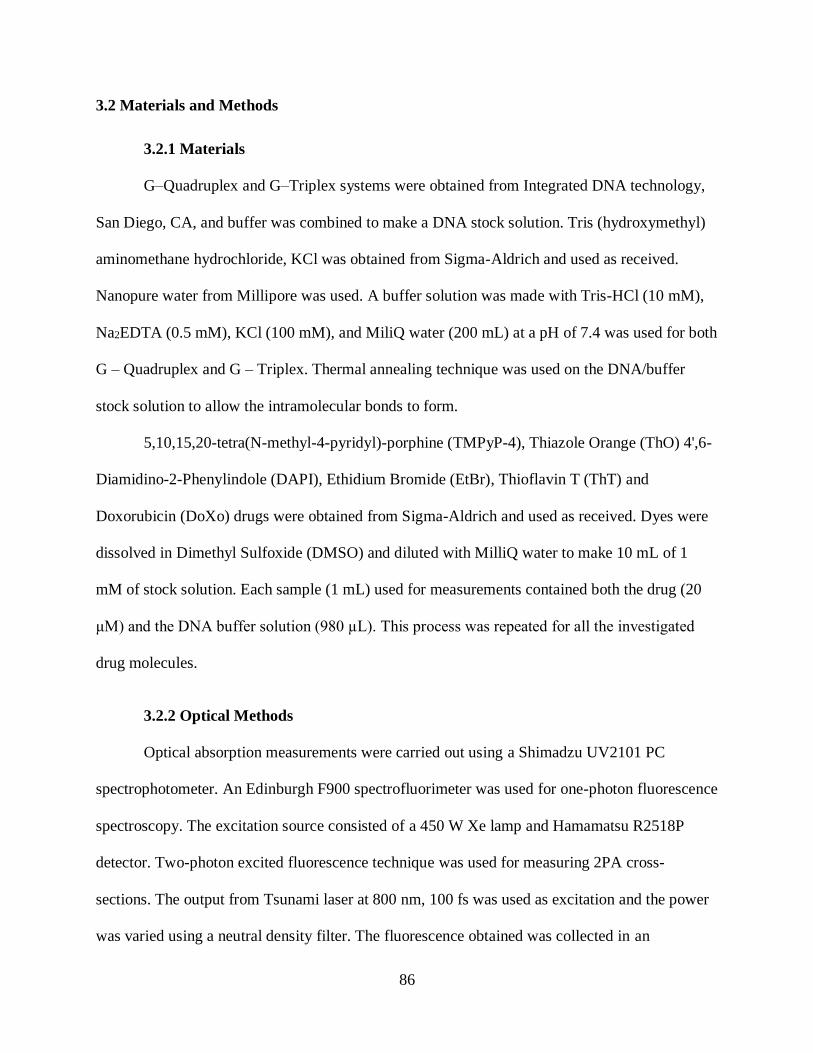
86
3.2 Materials and Methods
3.2.1 Materials
G–Quadruplex and G–Triplex systems were obtained from Integrated DNA technology,
San Diego, CA, and buffer was combined to make a DNA stock solution. Tris (hydroxymethyl)
aminomethane hydrochloride, KCl was obtained from Sigma-Aldrich and used as received.
Nanopure water from Millipore was used. A buffer solution was made with Tris-HCl (10 mM),
Na2EDTA (0.5 mM), KCl (100 mM), and MiliQ water (200 mL) at a pH of 7.4 was used for both
G – Quadruplex and G – Triplex. Thermal annealing technique was used on the DNA/buffer
stock solution to allow the intramolecular bonds to form.
5,10,15,20-tetra(N-methyl-4-pyridyl)-porphine (TMPyP-4), Thiazole Orange (ThO) 4',6-
Diamidino-2-Phenylindole (DAPI), Ethidium Bromide (EtBr), Thioflavin T (ThT) and
Doxorubicin (DoXo) drugs were obtained from Sigma-Aldrich and used as received. Dyes were
dissolved in Dimethyl Sulfoxide (DMSO) and diluted with MilliQ water to make 10 mL of 1
mM of stock solution. Each sample (1 mL) used for measurements contained both the drug (20
μM) and the DNA buffer solution (980 µL). This process was repeated for all the investigated
drug molecules.
3.2.2 Optical Methods
Optical absorption measurements were carried out using a Shimadzu UV2101 PC
spectrophotometer. An Edinburgh F900 spectrofluorimeter was used for one-photon fluorescence
spectroscopy. The excitation source consisted of a 450 W Xe lamp and Hamamatsu R2518P
detector. Two-photon excited fluorescence technique was used for measuring 2PA cross-
sections. The output from Tsunami laser at 800 nm, 100 fs was used as excitation and the power
was varied using a neutral density filter. The fluorescence obtained was collected in an
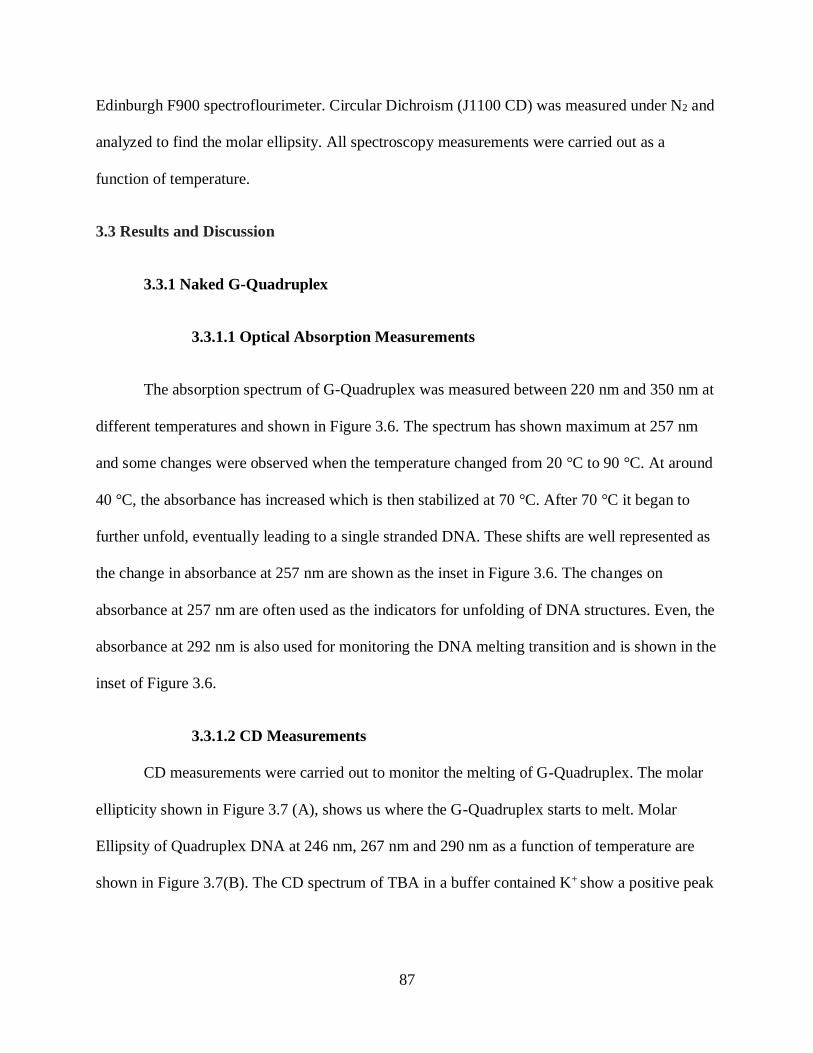
87
Edinburgh F900 spectroflourimeter. Circular Dichroism (J1100 CD) was measured under N2 and
analyzed to find the molar ellipsity. All spectroscopy measurements were carried out as a
function of temperature.
3.3 Results and Discussion
3.3.1 Naked G-Quadruplex
3.3.1.1 Optical Absorption Measurements
The absorption spectrum of G-Quadruplex was measured between 220 nm and 350 nm at
different temperatures and shown in Figure 3.6. The spectrum has shown maximum at 257 nm
and some changes were observed when the temperature changed from 20 °C to 90 °C. At around
40 °C, the absorbance has increased which is then stabilized at 70 °C. After 70 °C it began to
further unfold, eventually leading to a single stranded DNA. These shifts are well represented as
the change in absorbance at 257 nm are shown as the inset in Figure 3.6. The changes on
absorbance at 257 nm are often used as the indicators for unfolding of DNA structures. Even, the
absorbance at 292 nm is also used for monitoring the DNA melting transition and is shown in the
inset of Figure 3.6.
3.3.1.2 CD Measurements
CD measurements were carried out to monitor the melting of G-Quadruplex. The molar
ellipticity shown in Figure 3.7 (A), shows us where the G-Quadruplex starts to melt. Molar
Ellipsity of Quadruplex DNA at 246 nm, 267 nm and 290 nm as a function of temperature are
shown in Figure 3.7(B). The CD spectrum of TBA in a buffer contained K+ show a positive peak
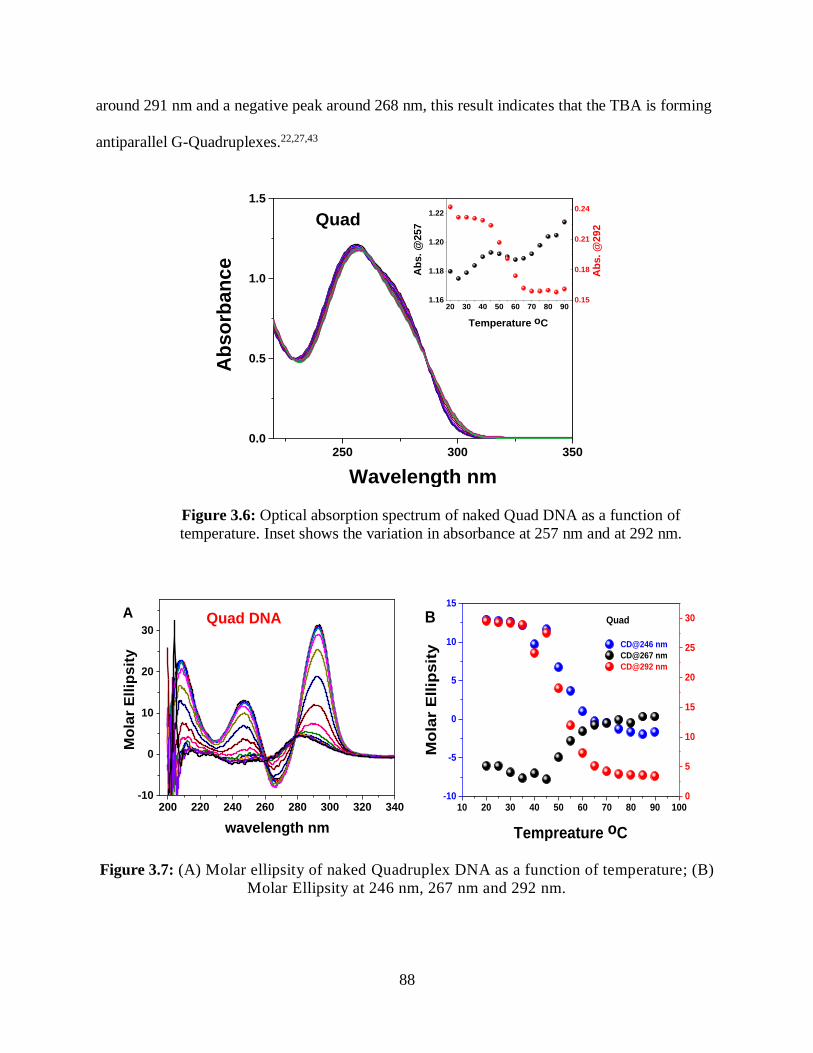
88
around 291 nm and a negative peak around 268 nm, this result indicates that the TBA is forming
antiparallel G-Quadruplexes.22,27,43
250 300 3500.0
0.5
1.0
1.5
Ab
so
rba
nc
e
Wavelength nm
Quad
20 30 40 50 60 70 80 901.16
1.18
1.20
1.22
Ab
s. @
257
Temperature oC
0.15
0.18
0.21
0.24
Ab
s. @
29
2
Figure 3.6: Optical absorption spectrum of naked Quad DNA as a function of
temperature. Inset shows the variation in absorbance at 257 nm and at 292 nm.
200 220 240 260 280 300 320 340-10
0
10
20
30
Mo
lar
Ell
ips
ity
wavelength nm
Quad DNAA
10 20 30 40 50 60 70 80 90 100-10
-5
0
5
10
15
CD@246 nm
CD@267 nm
CD@292 nm
Tempreature oC
Mo
lar
Ellip
sit
y
QuadB
0
5
10
15
20
25
30
Figure 3.7: (A) Molar ellipsity of naked Quadruplex DNA as a function of temperature; (B)
Molar Ellipsity at 246 nm, 267 nm and 292 nm.
89
The optical absorption and CD measurements show melting of G-Quadruplex at around
45 °C matched well with literature reports.
3.3.2 Naked G-Triplex
3.3.2.1 Optical Absorption Measurements
The optical absorption spectrum of G-Triplex as a function of temperature was measured
between 230 nm and 330 nm and shown in Figure 3.8. The spectrum has a maximum at 255 nm
and changes were observed as a function of temperature. Inset of Figure 3.8 shown changes at
255 nm and at 290 nm. From the data, melting transition of 26 °C was determined.
250 300 3500.0
0.3
0.6
0.9
1.2
Ab
so
rban
ce
Wavelength nm
Triplex DNA
0 20 40 60 80
1.10
1.15
1.20
Ab
s.
@29
0 n
m
Ab
s.
@25
5 n
m
Temperature o
C
0.08
0.10
0.12
0.14
Figure 3.8: Absorption spectrum of Triplex as a function of temperature. Inset shows the
variation in absorbance at 255 nm and at 290 nm.
3.3.2.2 CD Measurements
CD spectrum of naked G-Triplex DNA as a function of temperature are shown in Figure
3.9A. Figure 3.9B shows the decrease in molar ellipsities at 255 nm and 290 nm and both show
melting transition around 25 °C and matched well with literature reports of melting transition of
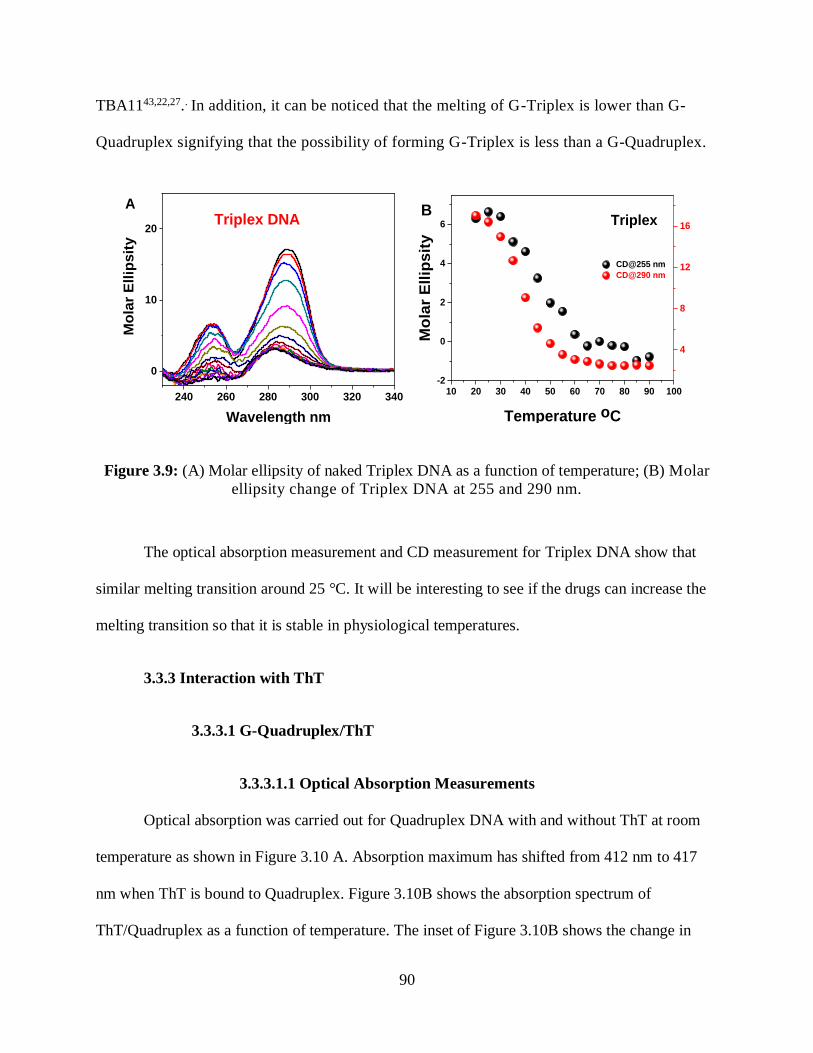
90
TBA1143,22,27.. In addition, it can be noticed that the melting of G-Triplex is lower than G-
Quadruplex signifying that the possibility of forming G-Triplex is less than a G-Quadruplex.
240 260 280 300 320 340
0
10
20
Mo
lar
Ell
ipsit
y
Wavelength nm
Triplex DNAA
10 20 30 40 50 60 70 80 90 100-2
0
2
4
6
CD@255 nm
CD@290 nm
Temperature oCM
ola
r E
llip
sit
y
TriplexB
4
8
12
16
Figure 3.9: (A) Molar ellipsity of naked Triplex DNA as a function of temperature; (B) Molar
ellipsity change of Triplex DNA at 255 and 290 nm.
The optical absorption measurement and CD measurement for Triplex DNA show that
similar melting transition around 25 °C. It will be interesting to see if the drugs can increase the
melting transition so that it is stable in physiological temperatures.
3.3.3 Interaction with ThT
3.3.3.1 G-Quadruplex/ThT
3.3.3.1.1 Optical Absorption Measurements
Optical absorption was carried out for Quadruplex DNA with and without ThT at room
temperature as shown in Figure 3.10 A. Absorption maximum has shifted from 412 nm to 417
nm when ThT is bound to Quadruplex. Figure 3.10B shows the absorption spectrum of
ThT/Quadruplex as a function of temperature. The inset of Figure 3.10B shows the change in
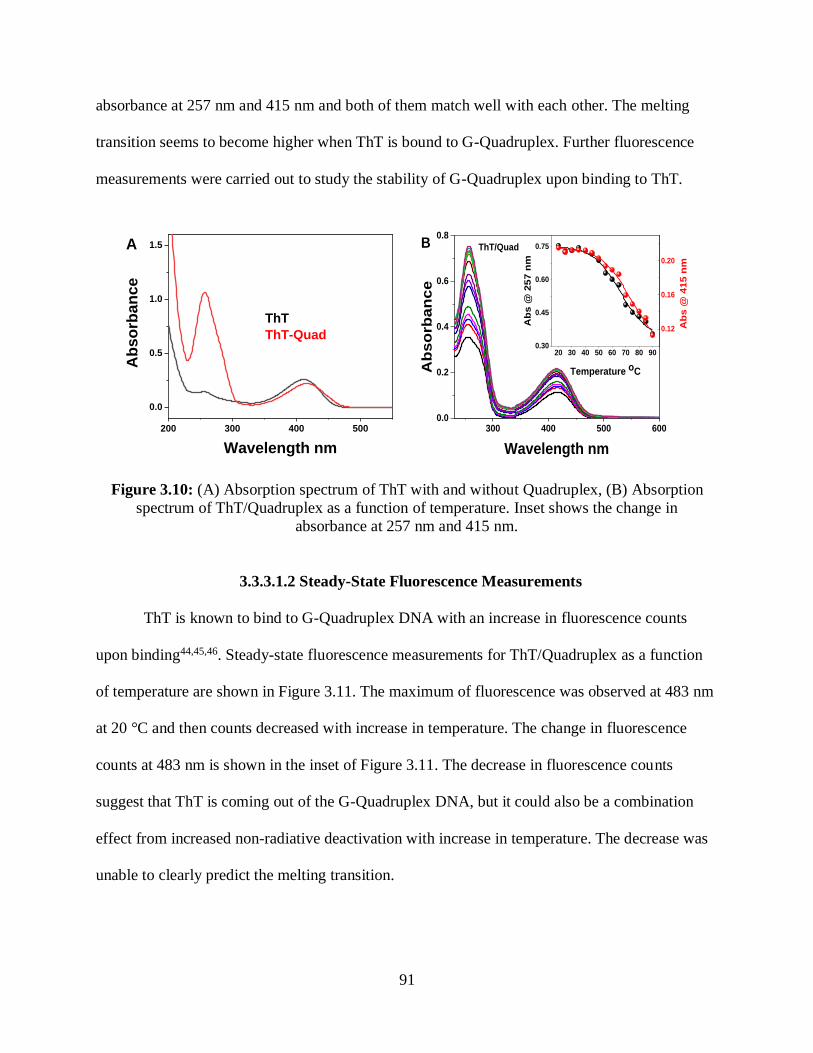
91
absorbance at 257 nm and 415 nm and both of them match well with each other. The melting
transition seems to become higher when ThT is bound to G-Quadruplex. Further fluorescence
measurements were carried out to study the stability of G-Quadruplex upon binding to ThT.
200 300 400 500
0.0
0.5
1.0
1.5
Ab
so
rba
nc
e
Wavelength nm
ThT
ThT-Quad
A
300 400 500 6000.0
0.2
0.4
0.6
0.8
Ab
so
rban
ce
Wavelength nm
ThT/QuadB
20 30 40 50 60 70 80 900.30
0.45
0.60
0.75
Ab
s @
415 n
m
Ab
s @
257 n
m
Temperature oC
0.12
0.16
0.20
Figure 3.10: (A) Absorption spectrum of ThT with and without Quadruplex, (B) Absorption
spectrum of ThT/Quadruplex as a function of temperature. Inset shows the change in
absorbance at 257 nm and 415 nm.
3.3.3.1.2 Steady-State Fluorescence Measurements
ThT is known to bind to G-Quadruplex DNA with an increase in fluorescence counts
upon binding44,45,46. Steady-state fluorescence measurements for ThT/Quadruplex as a function
of temperature are shown in Figure 3.11. The maximum of fluorescence was observed at 483 nm
at 20 °C and then counts decreased with increase in temperature. The change in fluorescence
counts at 483 nm is shown in the inset of Figure 3.11. The decrease in fluorescence counts
suggest that ThT is coming out of the G-Quadruplex DNA, but it could also be a combination
effect from increased non-radiative deactivation with increase in temperature. The decrease was
unable to clearly predict the melting transition.
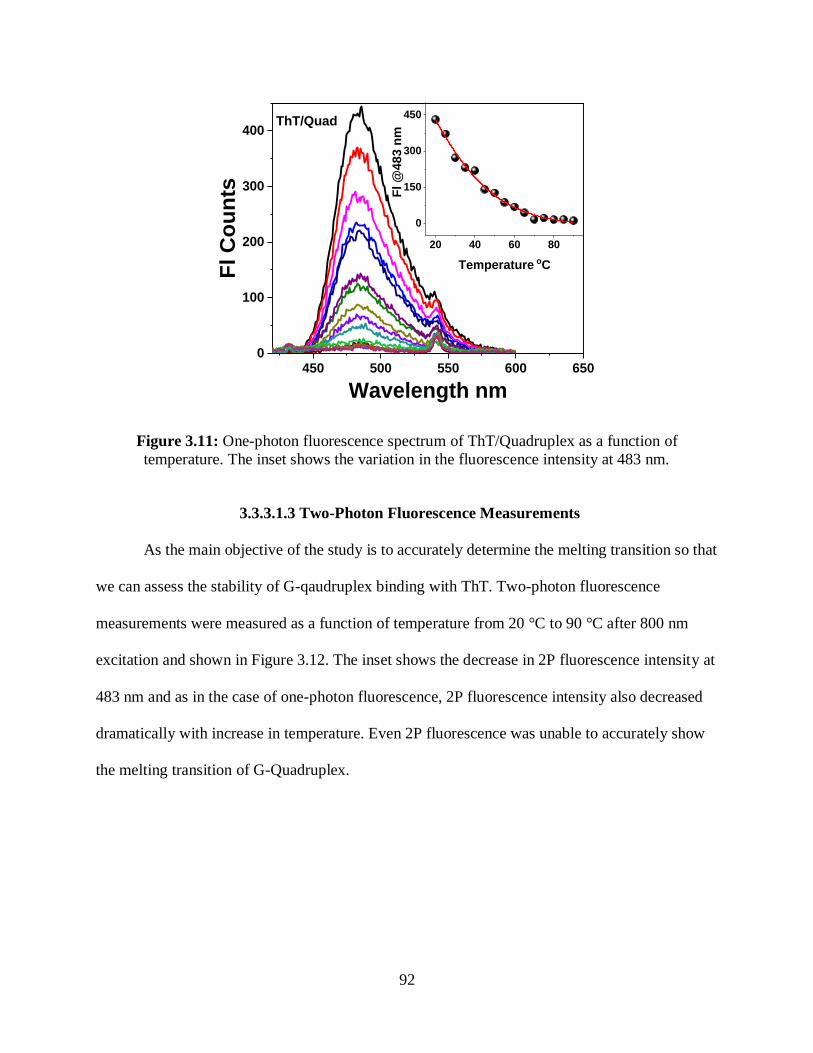
92
450 500 550 600 6500
100
200
300
400
Fl C
ou
nts
Wavelength nm
ThT/Quad
20 40 60 80
0
150
300
450
Fl @
48
3 n
m
Temperature oC
Figure 3.11: One-photon fluorescence spectrum of ThT/Quadruplex as a function of
temperature. The inset shows the variation in the fluorescence intensity at 483 nm.
3.3.3.1.3 Two-Photon Fluorescence Measurements
As the main objective of the study is to accurately determine the melting transition so that
we can assess the stability of G-qaudruplex binding with ThT. Two-photon fluorescence
measurements were measured as a function of temperature from 20 °C to 90 °C after 800 nm
excitation and shown in Figure 3.12. The inset shows the decrease in 2P fluorescence intensity at
483 nm and as in the case of one-photon fluorescence, 2P fluorescence intensity also decreased
dramatically with increase in temperature. Even 2P fluorescence was unable to accurately show
the melting transition of G-Quadruplex.
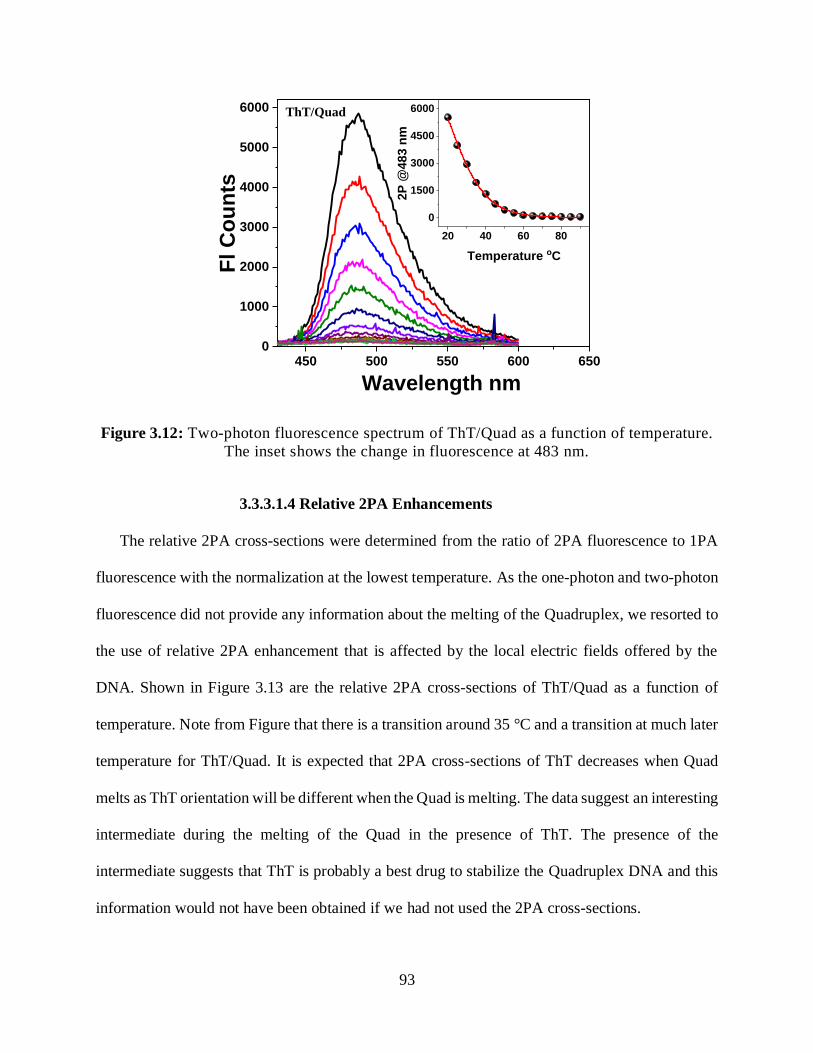
93
450 500 550 600 6500
1000
2000
3000
4000
5000
6000
Fl C
ou
nts
Wavelength nm
ThT/Quad
20 40 60 80
0
1500
3000
4500
6000
2P
@4
83
nm
Temperature oC
Figure 3.12: Two-photon fluorescence spectrum of ThT/Quad as a function of temperature.
The inset shows the change in fluorescence at 483 nm.
3.3.3.1.4 Relative 2PA Enhancements
The relative 2PA cross-sections were determined from the ratio of 2PA fluorescence to 1PA
fluorescence with the normalization at the lowest temperature. As the one-photon and two-photon
fluorescence did not provide any information about the melting of the Quadruplex, we resorted to
the use of relative 2PA enhancement that is affected by the local electric fields offered by the
DNA. Shown in Figure 3.13 are the relative 2PA cross-sections of ThT/Quad as a function of
temperature. Note from Figure that there is a transition around 35 °C and a transition at much later
temperature for ThT/Quad. It is expected that 2PA cross-sections of ThT decreases when Quad
melts as ThT orientation will be different when the Quad is melting. The data suggest an interesting
intermediate during the melting of the Quad in the presence of ThT. The presence of the
intermediate suggests that ThT is probably a best drug to stabilize the Quadruplex DNA and this
information would not have been obtained if we had not used the 2PA cross-sections.
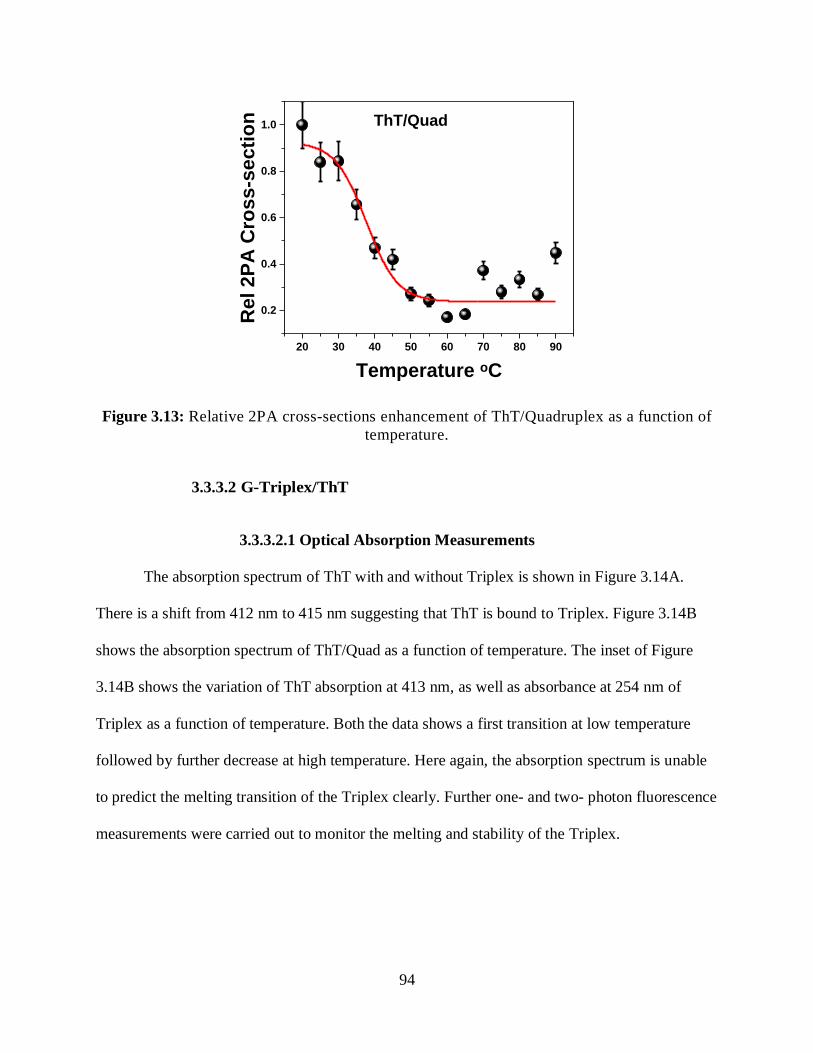
94
20 30 40 50 60 70 80 90
0.2
0.4
0.6
0.8
1.0
Rel 2P
A C
ross-s
ecti
on
Temperature oC
ThT/Quad
Figure 3.13: Relative 2PA cross-sections enhancement of ThT/Quadruplex as a function of
temperature.
3.3.3.2 G-Triplex/ThT
3.3.3.2.1 Optical Absorption Measurements
The absorption spectrum of ThT with and without Triplex is shown in Figure 3.14A.
There is a shift from 412 nm to 415 nm suggesting that ThT is bound to Triplex. Figure 3.14B
shows the absorption spectrum of ThT/Quad as a function of temperature. The inset of Figure
3.14B shows the variation of ThT absorption at 413 nm, as well as absorbance at 254 nm of
Triplex as a function of temperature. Both the data shows a first transition at low temperature
followed by further decrease at high temperature. Here again, the absorption spectrum is unable
to predict the melting transition of the Triplex clearly. Further one- and two- photon fluorescence
measurements were carried out to monitor the melting and stability of the Triplex.
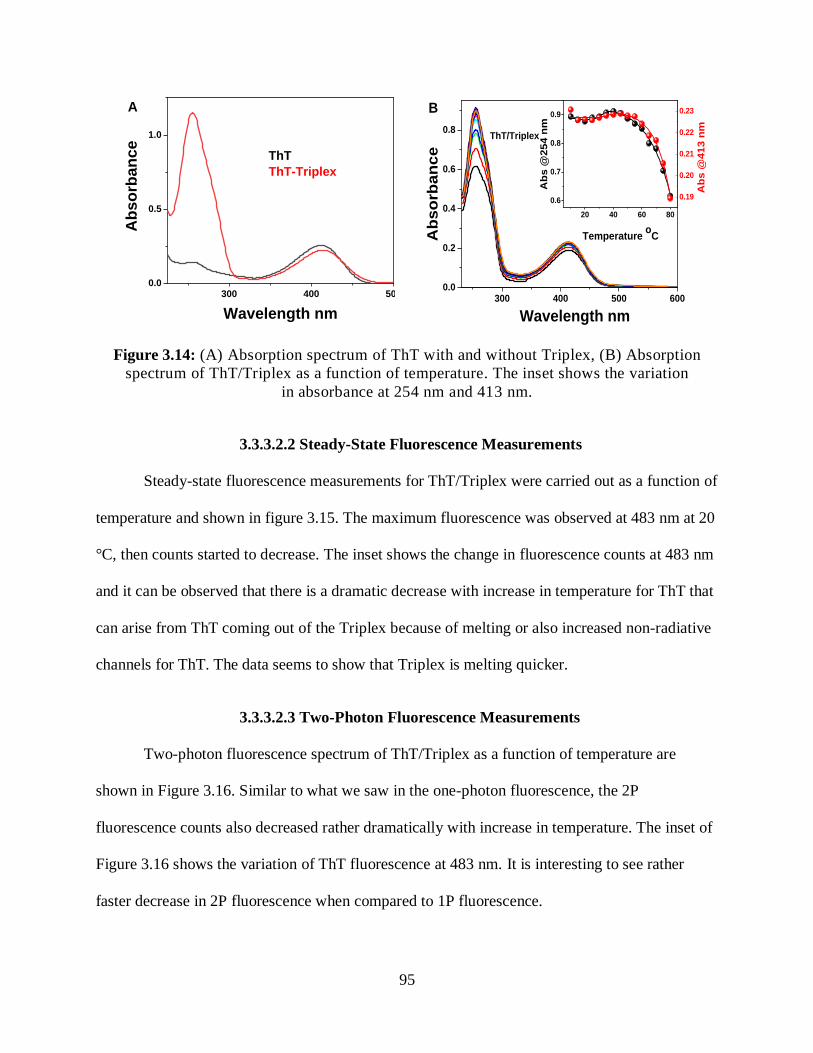
95
300 400 5000.0
0.5
1.0A
bs
orb
an
ce
Wavelength nm
ThT
ThT-Triplex
A
300 400 500 6000.0
0.2
0.4
0.6
0.8
Ab
so
rban
ce
Wavelength nm
ThT/Triplex
B
20 40 60 80
0.6
0.7
0.8
0.9
Ab
s @
41
3 n
m
Ab
s @
25
4 n
m
Temperature o
C
0.19
0.20
0.21
0.22
0.23
Figure 3.14: (A) Absorption spectrum of ThT with and without Triplex, (B) Absorption
spectrum of ThT/Triplex as a function of temperature. The inset shows the variation
in absorbance at 254 nm and 413 nm.
3.3.3.2.2 Steady-State Fluorescence Measurements
Steady-state fluorescence measurements for ThT/Triplex were carried out as a function of
temperature and shown in figure 3.15. The maximum fluorescence was observed at 483 nm at 20
°C, then counts started to decrease. The inset shows the change in fluorescence counts at 483 nm
and it can be observed that there is a dramatic decrease with increase in temperature for ThT that
can arise from ThT coming out of the Triplex because of melting or also increased non-radiative
channels for ThT. The data seems to show that Triplex is melting quicker.
3.3.3.2.3 Two-Photon Fluorescence Measurements
Two-photon fluorescence spectrum of ThT/Triplex as a function of temperature are
shown in Figure 3.16. Similar to what we saw in the one-photon fluorescence, the 2P
fluorescence counts also decreased rather dramatically with increase in temperature. The inset of
Figure 3.16 shows the variation of ThT fluorescence at 483 nm. It is interesting to see rather
faster decrease in 2P fluorescence when compared to 1P fluorescence.
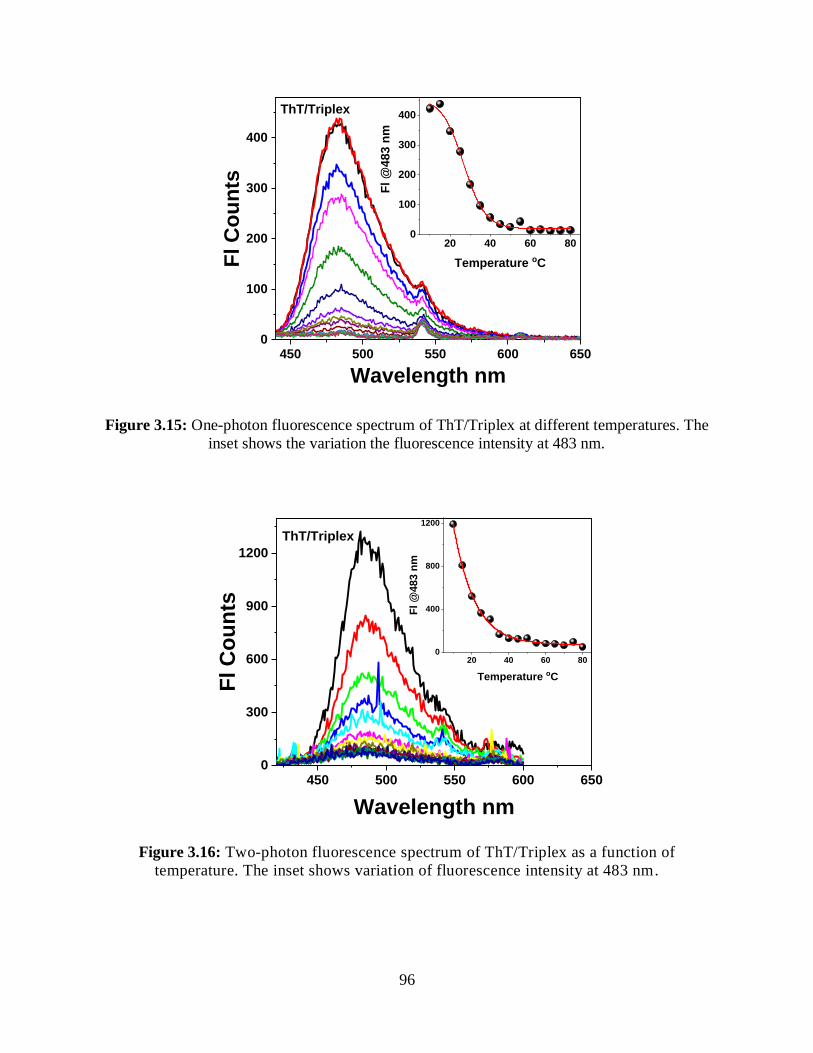
96
450 500 550 600 6500
100
200
300
400
Fl C
ou
nts
Wavelength nm
ThT/Triplex
20 40 60 800
100
200
300
400
Fl @
483
nm
Temperature oC
Figure 3.15: One-photon fluorescence spectrum of ThT/Triplex at different temperatures. The
inset shows the variation the fluorescence intensity at 483 nm.
450 500 550 600 6500
300
600
900
1200
Fl C
ou
nts
Wavelength nm
ThT/Triplex
20 40 60 800
400
800
1200
Fl @
483 n
m
Temperature oC
Figure 3.16: Two-photon fluorescence spectrum of ThT/Triplex as a function of
temperature. The inset shows variation of fluorescence intensity at 483 nm.
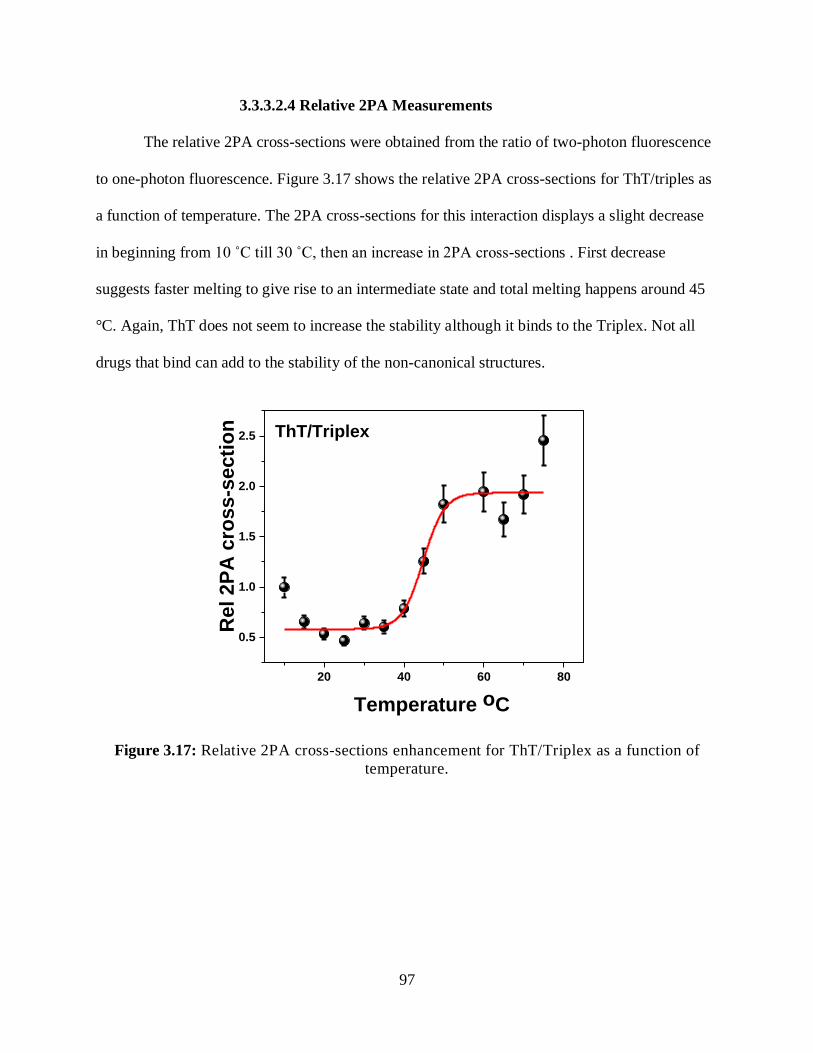
97
3.3.3.2.4 Relative 2PA Measurements
The relative 2PA cross-sections were obtained from the ratio of two-photon fluorescence
to one-photon fluorescence. Figure 3.17 shows the relative 2PA cross-sections for ThT/triples as
a function of temperature. The 2PA cross-sections for this interaction displays a slight decrease
in beginning from 10 ˚C till 30 ˚C, then an increase in 2PA cross-sections . First decrease
suggests faster melting to give rise to an intermediate state and total melting happens around 45
°C. Again, ThT does not seem to increase the stability although it binds to the Triplex. Not all
drugs that bind can add to the stability of the non-canonical structures.
20 40 60 80
0.5
1.0
1.5
2.0
2.5
Rel 2P
A c
ross-s
ecti
on
Temperature oC
ThT/Triplex
Figure 3.17: Relative 2PA cross-sections enhancement for ThT/Triplex as a function of
temperature.
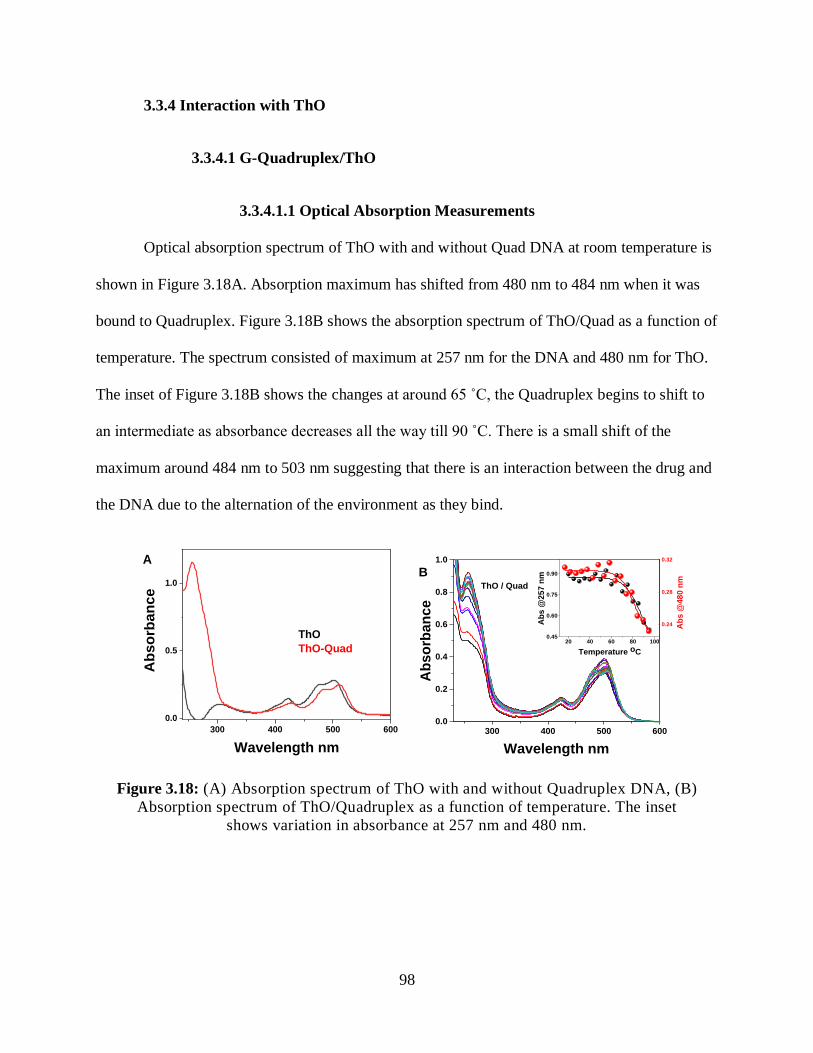
98
3.3.4 Interaction with ThO
3.3.4.1 G-Quadruplex/ThO
3.3.4.1.1 Optical Absorption Measurements
Optical absorption spectrum of ThO with and without Quad DNA at room temperature is
shown in Figure 3.18A. Absorption maximum has shifted from 480 nm to 484 nm when it was
bound to Quadruplex. Figure 3.18B shows the absorption spectrum of ThO/Quad as a function of
temperature. The spectrum consisted of maximum at 257 nm for the DNA and 480 nm for ThO.
The inset of Figure 3.18B shows the changes at around 65 ˚C, the Quadruplex begins to shift to
an intermediate as absorbance decreases all the way till 90 ˚C. There is a small shift of the
maximum around 484 nm to 503 nm suggesting that there is an interaction between the drug and
the DNA due to the alternation of the environment as they bind.
300 400 500 600
0.0
0.5
1.0
Ab
so
rba
nc
e
Wavelength nm
ThO
ThO-Quad
A
300 400 500 6000.0
0.2
0.4
0.6
0.8
1.0
Ab
so
rban
ce
Wavelength nm
ThO / Quad
20 40 60 80 1000.45
0.60
0.75
0.90
Ab
s @
48
0 n
m
Ab
s @
25
7 n
m
Temperature oC
B
0.24
0.28
0.32
Figure 3.18: (A) Absorption spectrum of ThO with and without Quadruplex DNA, (B)
Absorption spectrum of ThO/Quadruplex as a function of temperature. The inset
shows variation in absorbance at 257 nm and 480 nm.
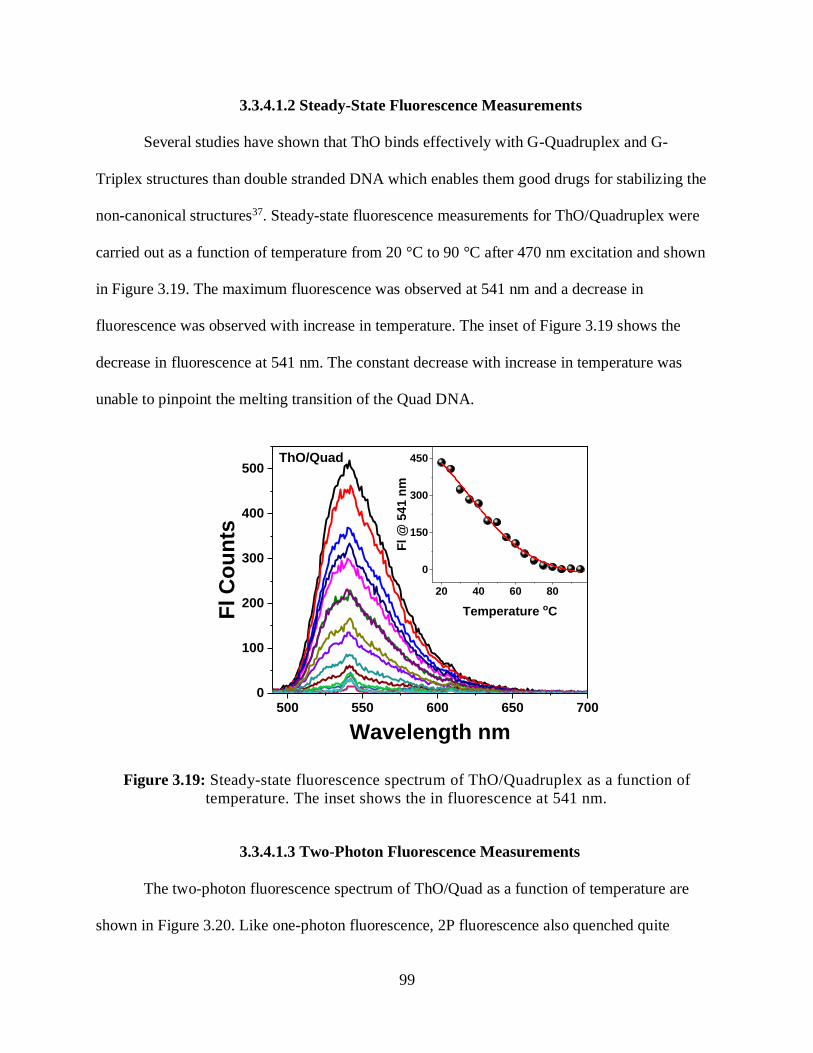
99
3.3.4.1.2 Steady-State Fluorescence Measurements
Several studies have shown that ThO binds effectively with G-Quadruplex and G-
Triplex structures than double stranded DNA which enables them good drugs for stabilizing the
non-canonical structures37. Steady-state fluorescence measurements for ThO/Quadruplex were
carried out as a function of temperature from 20 °C to 90 °C after 470 nm excitation and shown
in Figure 3.19. The maximum fluorescence was observed at 541 nm and a decrease in
fluorescence was observed with increase in temperature. The inset of Figure 3.19 shows the
decrease in fluorescence at 541 nm. The constant decrease with increase in temperature was
unable to pinpoint the melting transition of the Quad DNA.
500 550 600 650 7000
100
200
300
400
500
Fl C
ou
nts
Wavelength nm
ThO/Quad
20 40 60 80
0
150
300
450
Fl @
54
1 n
m
Temperature oC
Figure 3.19: Steady-state fluorescence spectrum of ThO/Quadruplex as a function of
temperature. The inset shows the in fluorescence at 541 nm.
3.3.4.1.3 Two-Photon Fluorescence Measurements
The two-photon fluorescence spectrum of ThO/Quad as a function of temperature are
shown in Figure 3.20. Like one-photon fluorescence, 2P fluorescence also quenched quite
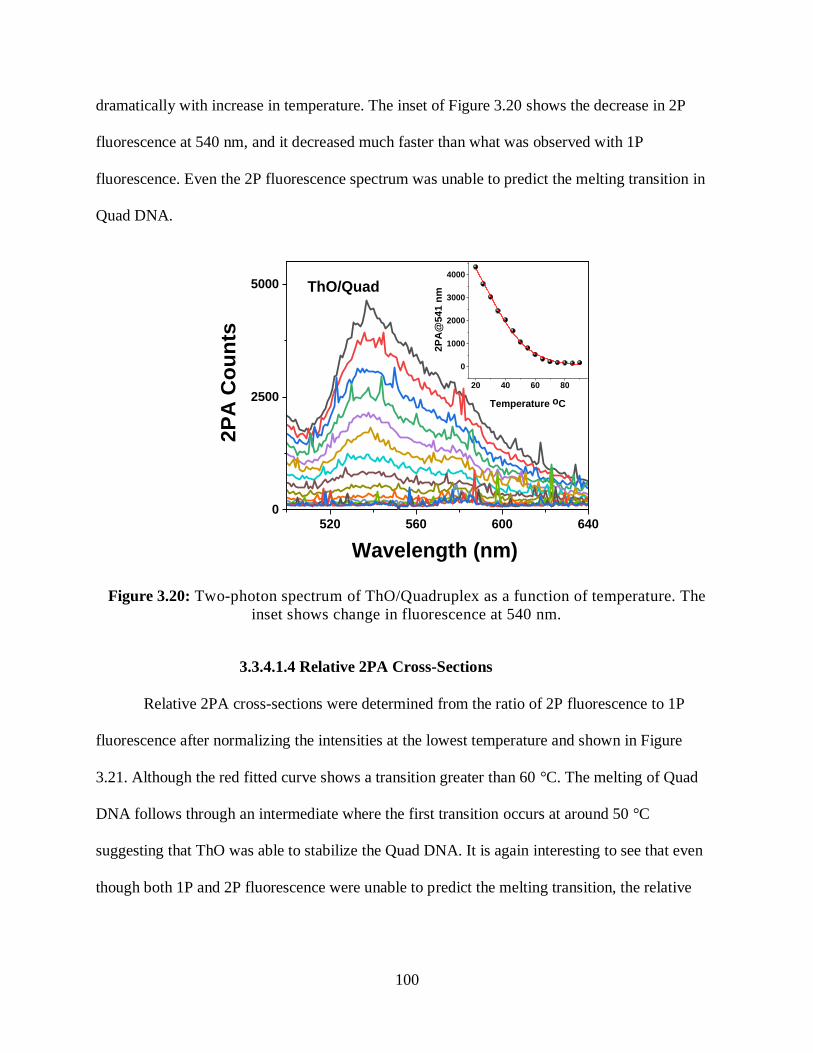
100
dramatically with increase in temperature. The inset of Figure 3.20 shows the decrease in 2P
fluorescence at 540 nm, and it decreased much faster than what was observed with 1P
fluorescence. Even the 2P fluorescence spectrum was unable to predict the melting transition in
Quad DNA.
520 560 600 6400
2500
5000
20 40 60 80
0
1000
2000
3000
4000
2P
A C
ou
nts
Wavelength (nm)
ThO/Quad
2P
A@
54
1 n
m
Temperature oC
Figure 3.20: Two-photon spectrum of ThO/Quadruplex as a function of temperature. The
inset shows change in fluorescence at 540 nm.
3.3.4.1.4 Relative 2PA Cross-Sections
Relative 2PA cross-sections were determined from the ratio of 2P fluorescence to 1P
fluorescence after normalizing the intensities at the lowest temperature and shown in Figure
3.21. Although the red fitted curve shows a transition greater than 60 °C. The melting of Quad
DNA follows through an intermediate where the first transition occurs at around 50 °C
suggesting that ThO was able to stabilize the Quad DNA. It is again interesting to see that even
though both 1P and 2P fluorescence were unable to predict the melting transition, the relative
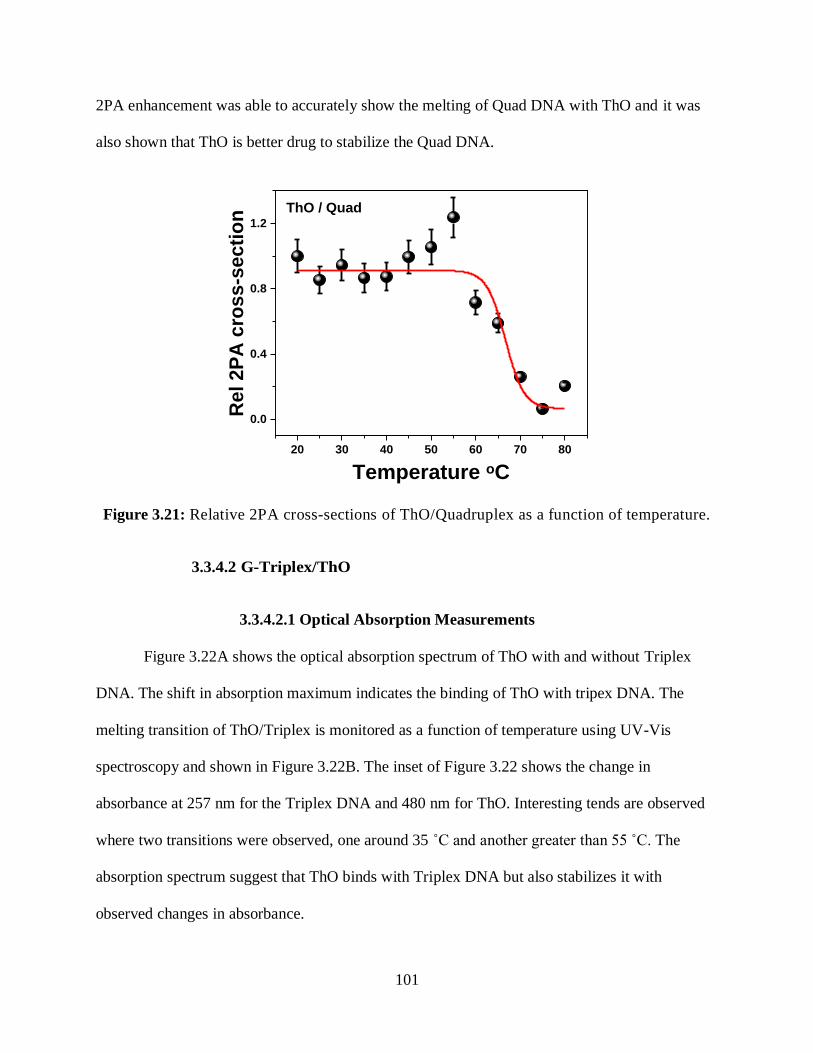
101
2PA enhancement was able to accurately show the melting of Quad DNA with ThO and it was
also shown that ThO is better drug to stabilize the Quad DNA.
20 30 40 50 60 70 80
0.0
0.4
0.8
1.2
ThO / Quad
Rel 2P
A c
ross-s
ecti
on
Temperature oC
Figure 3.21: Relative 2PA cross-sections of ThO/Quadruplex as a function of temperature.
3.3.4.2 G-Triplex/ThO
3.3.4.2.1 Optical Absorption Measurements
Figure 3.22A shows the optical absorption spectrum of ThO with and without Triplex
DNA. The shift in absorption maximum indicates the binding of ThO with tripex DNA. The
melting transition of ThO/Triplex is monitored as a function of temperature using UV-Vis
spectroscopy and shown in Figure 3.22B. The inset of Figure 3.22 shows the change in
absorbance at 257 nm for the Triplex DNA and 480 nm for ThO. Interesting tends are observed
where two transitions were observed, one around 35 ˚C and another greater than 55 ˚C. The
absorption spectrum suggest that ThO binds with Triplex DNA but also stabilizes it with
observed changes in absorbance.
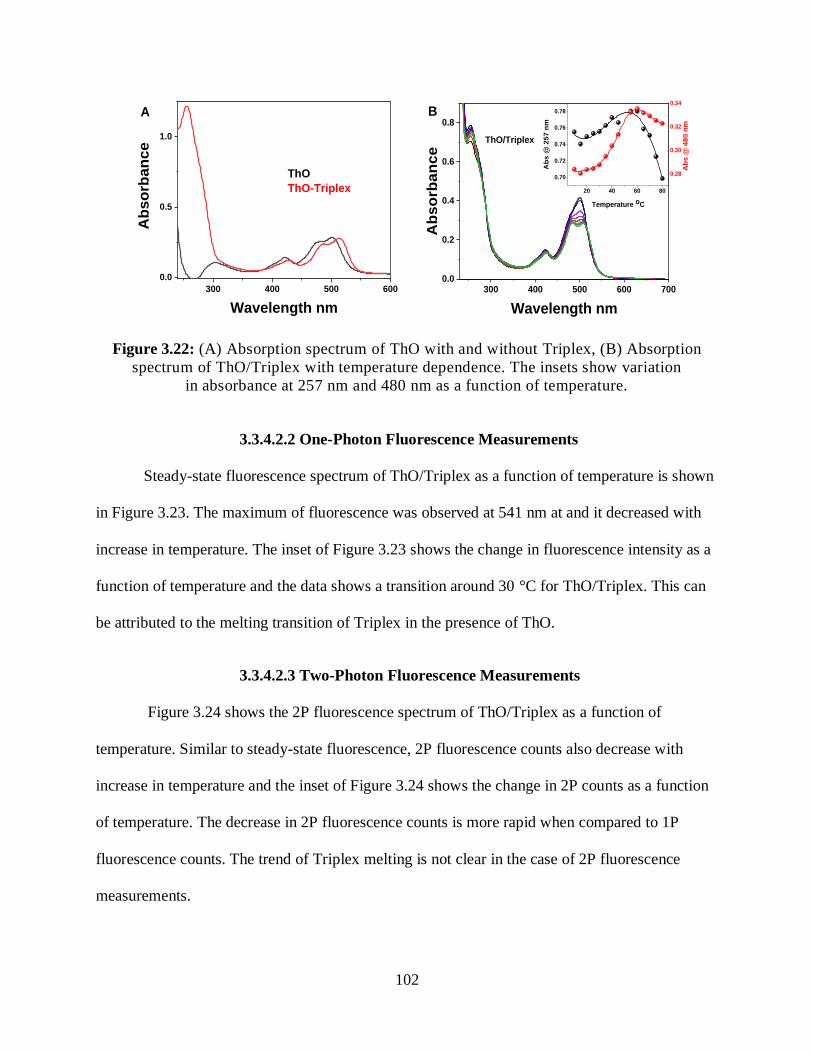
102
300 400 500 600
0.0
0.5
1.0A
bso
rban
ce
Wavelength nm
ThO
ThO-Triplex
A
300 400 500 600 7000.0
0.2
0.4
0.6
0.8
Ab
so
rba
nc
e
Wavelength nm
ThO/Triplex
B
20 40 60 80
0.70
0.72
0.74
0.76
0.78
Ab
s @
480 n
m
Ab
s @
25
7 n
m
Temperature oC
0.28
0.30
0.32
0.34
Figure 3.22: (A) Absorption spectrum of ThO with and without Triplex, (B) Absorption
spectrum of ThO/Triplex with temperature dependence. The insets show variation
in absorbance at 257 nm and 480 nm as a function of temperature.
3.3.4.2.2 One-Photon Fluorescence Measurements
Steady-state fluorescence spectrum of ThO/Triplex as a function of temperature is shown
in Figure 3.23. The maximum of fluorescence was observed at 541 nm at and it decreased with
increase in temperature. The inset of Figure 3.23 shows the change in fluorescence intensity as a
function of temperature and the data shows a transition around 30 °C for ThO/Triplex. This can
be attributed to the melting transition of Triplex in the presence of ThO.
3.3.4.2.3 Two-Photon Fluorescence Measurements
Figure 3.24 shows the 2P fluorescence spectrum of ThO/Triplex as a function of
temperature. Similar to steady-state fluorescence, 2P fluorescence counts also decrease with
increase in temperature and the inset of Figure 3.24 shows the change in 2P counts as a function
of temperature. The decrease in 2P fluorescence counts is more rapid when compared to 1P
fluorescence counts. The trend of Triplex melting is not clear in the case of 2P fluorescence
measurements.
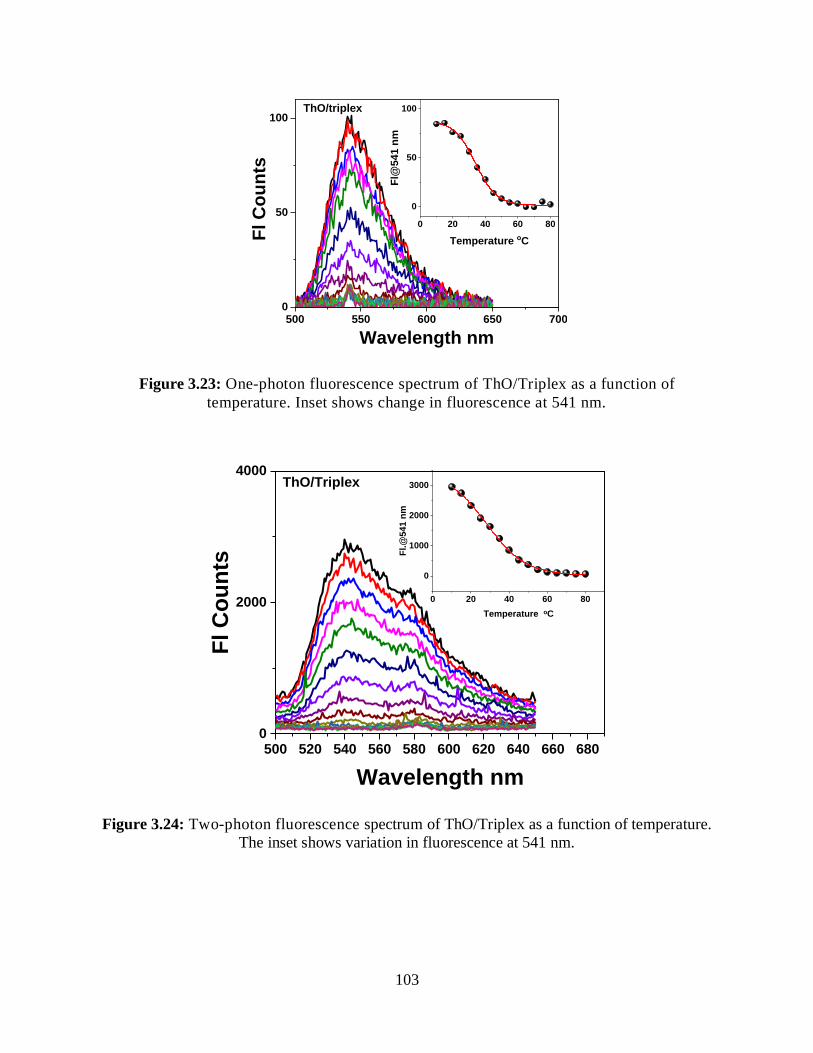
103
500 550 600 650 7000
50
100
Fl C
ou
nts
Wavelength nm
ThO/triplex
0 20 40 60 80
0
50
100
Fl@
541 n
m
Temperature oC
Figure 3.23: One-photon fluorescence spectrum of ThO/Triplex as a function of
temperature. Inset shows change in fluorescence at 541 nm.
500 520 540 560 580 600 620 640 660 6800
2000
4000
Fl C
ou
nts
Wavelength nm
ThO/Triplex
0 20 40 60 80
0
1000
2000
3000
Fl.@
54
1 n
m
Temperature oC
Figure 3.24: Two-photon fluorescence spectrum of ThO/Triplex as a function of temperature.
The inset shows variation in fluorescence at 541 nm.
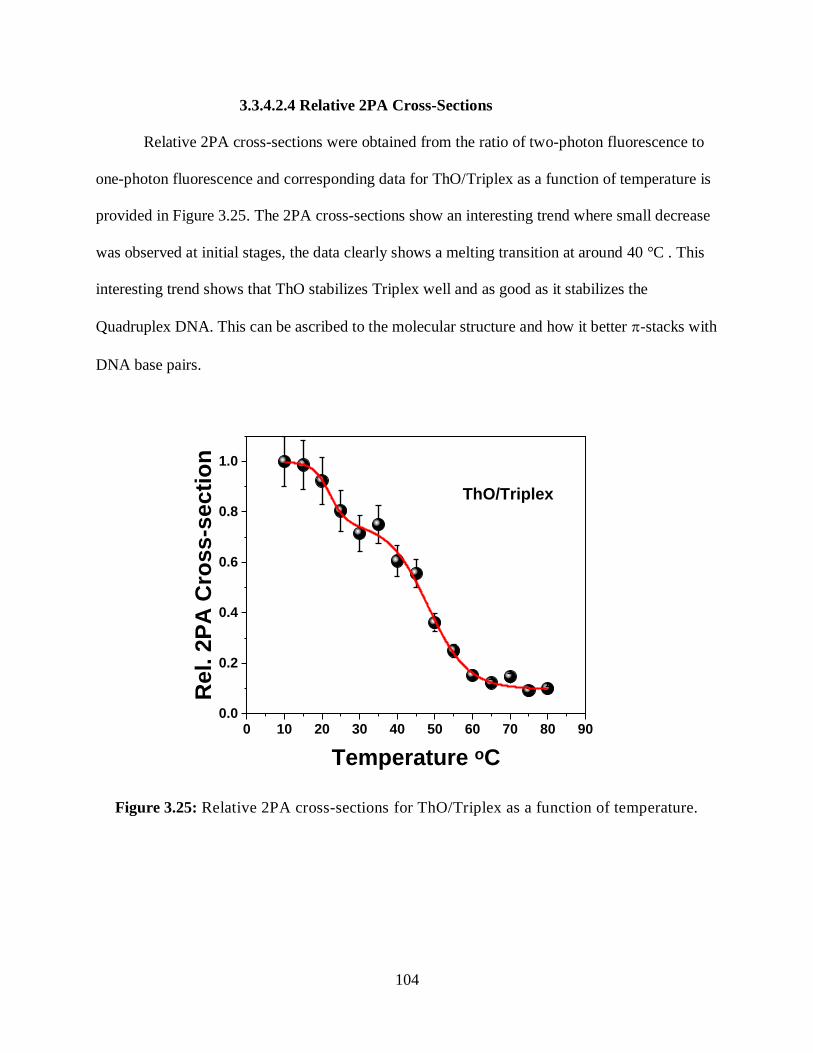
104
3.3.4.2.4 Relative 2PA Cross-Sections
Relative 2PA cross-sections were obtained from the ratio of two-photon fluorescence to
one-photon fluorescence and corresponding data for ThO/Triplex as a function of temperature is
provided in Figure 3.25. The 2PA cross-sections show an interesting trend where small decrease
was observed at initial stages, the data clearly shows a melting transition at around 40 °C . This
interesting trend shows that ThO stabilizes Triplex well and as good as it stabilizes the
Quadruplex DNA. This can be ascribed to the molecular structure and how it better -stacks with
DNA base pairs.
0 10 20 30 40 50 60 70 80 900.0
0.2
0.4
0.6
0.8
1.0
Re
l. 2
PA
Cro
ss
-se
cti
on
Temperature oC
ThO/Triplex
Figure 3.25: Relative 2PA cross-sections for ThO/Triplex as a function of temperature.
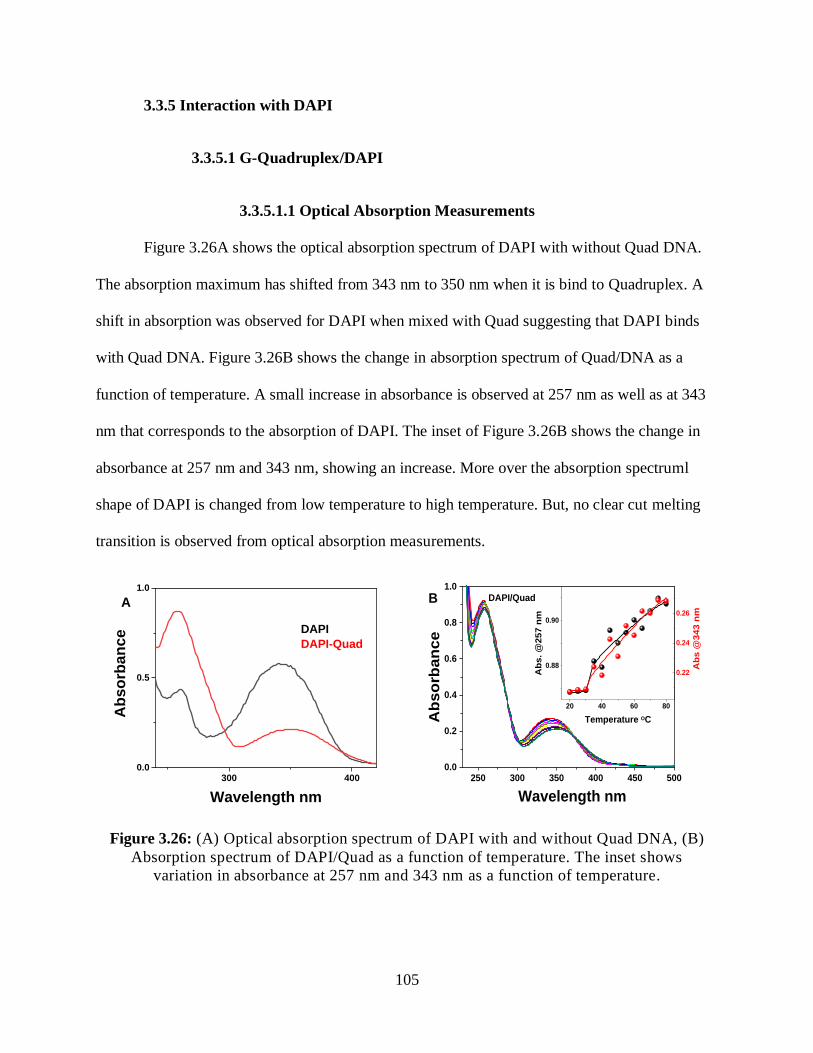
105
3.3.5 Interaction with DAPI
3.3.5.1 G-Quadruplex/DAPI
3.3.5.1.1 Optical Absorption Measurements
Figure 3.26A shows the optical absorption spectrum of DAPI with without Quad DNA.
The absorption maximum has shifted from 343 nm to 350 nm when it is bind to Quadruplex. A
shift in absorption was observed for DAPI when mixed with Quad suggesting that DAPI binds
with Quad DNA. Figure 3.26B shows the change in absorption spectrum of Quad/DNA as a
function of temperature. A small increase in absorbance is observed at 257 nm as well as at 343
nm that corresponds to the absorption of DAPI. The inset of Figure 3.26B shows the change in
absorbance at 257 nm and 343 nm, showing an increase. More over the absorption spectruml
shape of DAPI is changed from low temperature to high temperature. But, no clear cut melting
transition is observed from optical absorption measurements.
300 4000.0
0.5
1.0
Ab
so
rba
nc
e
Wavelength nm
DAPI
DAPI-Quad
A
250 300 350 400 450 5000.0
0.2
0.4
0.6
0.8
1.0
Ab
so
rban
ce
Wavelength nm
DAPI/QuadB
20 40 60 80
0.88
0.90
Ab
s @
34
3 n
m
Ab
s.
@2
57
nm
Temperature OC
0.22
0.24
0.26
Figure 3.26: (A) Optical absorption spectrum of DAPI with and without Quad DNA, (B)
Absorption spectrum of DAPI/Quad as a function of temperature. The inset shows
variation in absorbance at 257 nm and 343 nm as a function of temperature.
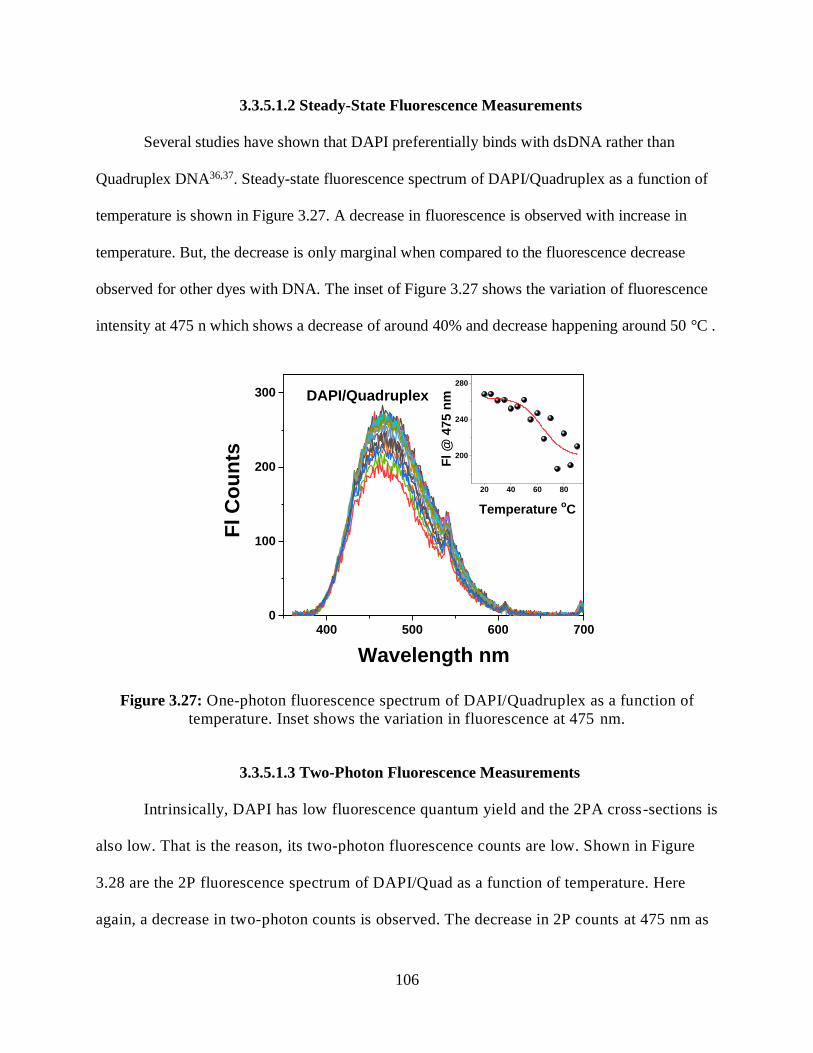
106
3.3.5.1.2 Steady-State Fluorescence Measurements
Several studies have shown that DAPI preferentially binds with dsDNA rather than
Quadruplex DNA36,37. Steady-state fluorescence spectrum of DAPI/Quadruplex as a function of
temperature is shown in Figure 3.27. A decrease in fluorescence is observed with increase in
temperature. But, the decrease is only marginal when compared to the fluorescence decrease
observed for other dyes with DNA. The inset of Figure 3.27 shows the variation of fluorescence
intensity at 475 n which shows a decrease of around 40% and decrease happening around 50 °C .
400 500 600 7000
100
200
300 DAPI/Quadruplex
Fl C
ou
nts
Wavelength nm
20 40 60 80
200
240
280
Fl @
475 n
m
Temperature oC
Figure 3.27: One-photon fluorescence spectrum of DAPI/Quadruplex as a function of
temperature. Inset shows the variation in fluorescence at 475 nm.
3.3.5.1.3 Two-Photon Fluorescence Measurements
Intrinsically, DAPI has low fluorescence quantum yield and the 2PA cross-sections is
also low. That is the reason, its two-photon fluorescence counts are low. Shown in Figure
3.28 are the 2P fluorescence spectrum of DAPI/Quad as a function of temperature. Here
again, a decrease in two-photon counts is observed. The decrease in 2P counts at 475 nm as
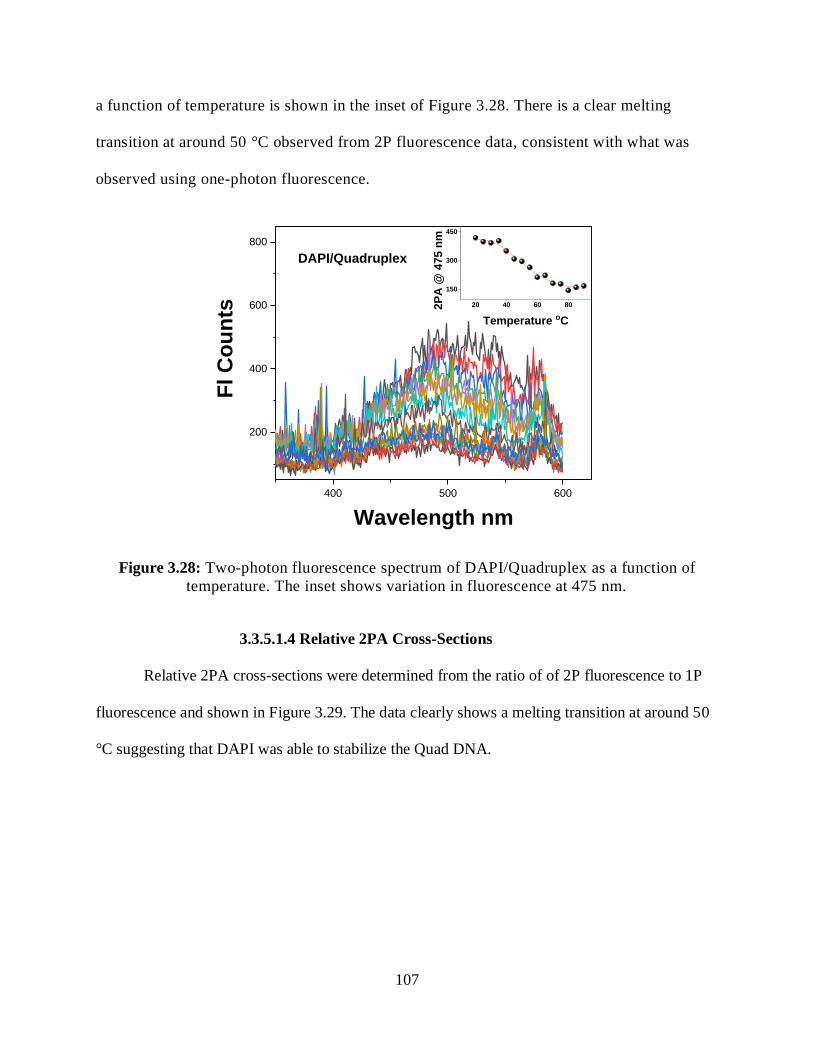
107
a function of temperature is shown in the inset of Figure 3.28. There is a clear melting
transition at around 50 °C observed from 2P fluorescence data, consistent with what was
observed using one-photon fluorescence.
400 500 600
200
400
600
800
Fl C
ou
nts
Wavelength nm
DAPI/Quadruplex
20 40 60 80
150
300
450
2P
A @
475 n
m
Temperature oC
Figure 3.28: Two-photon fluorescence spectrum of DAPI/Quadruplex as a function of
temperature. The inset shows variation in fluorescence at 475 nm.
3.3.5.1.4 Relative 2PA Cross-Sections
Relative 2PA cross-sections were determined from the ratio of of 2P fluorescence to 1P
fluorescence and shown in Figure 3.29. The data clearly shows a melting transition at around 50
°C suggesting that DAPI was able to stabilize the Quad DNA.
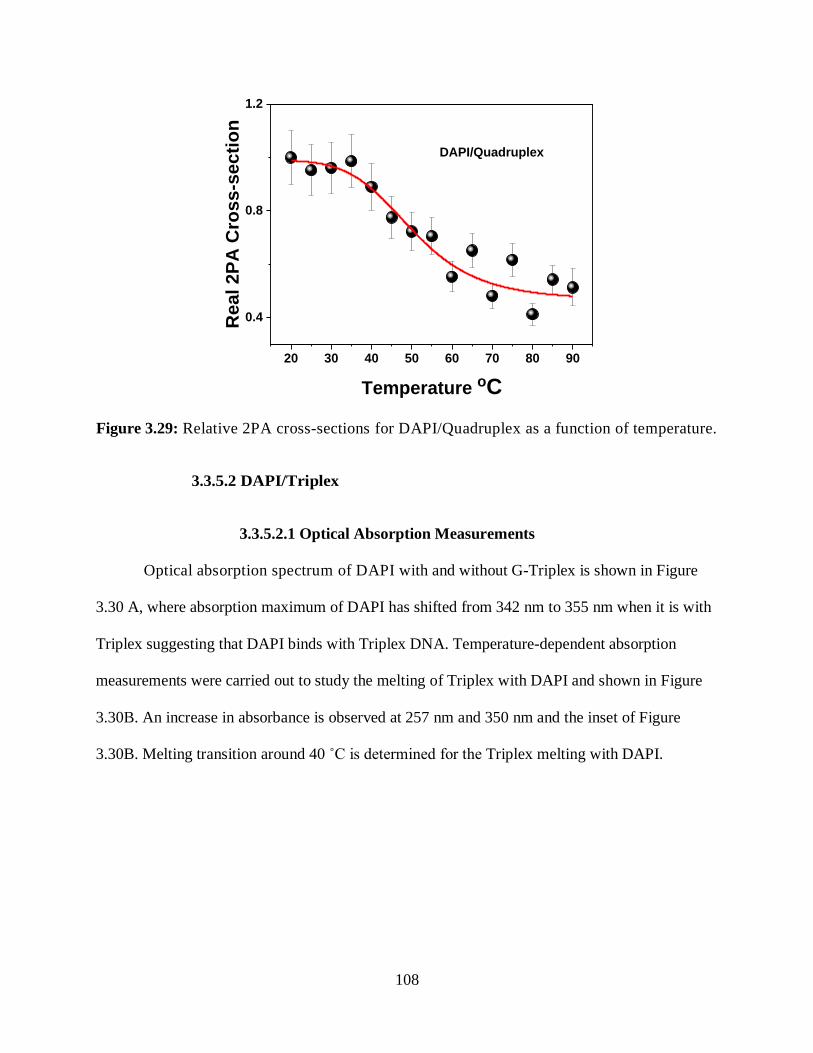
108
20 30 40 50 60 70 80 90
0.4
0.8
1.2
DAPI/Quadruplex
Real 2P
A C
ross-s
ecti
on
Temperature oC
Figure 3.29: Relative 2PA cross-sections for DAPI/Quadruplex as a function of temperature.
3.3.5.2 DAPI/Triplex
3.3.5.2.1 Optical Absorption Measurements
Optical absorption spectrum of DAPI with and without G-Triplex is shown in Figure
3.30 A, where absorption maximum of DAPI has shifted from 342 nm to 355 nm when it is with
Triplex suggesting that DAPI binds with Triplex DNA. Temperature-dependent absorption
measurements were carried out to study the melting of Triplex with DAPI and shown in Figure
3.30B. An increase in absorbance is observed at 257 nm and 350 nm and the inset of Figure
3.30B. Melting transition around 40 ˚C is determined for the Triplex melting with DAPI.
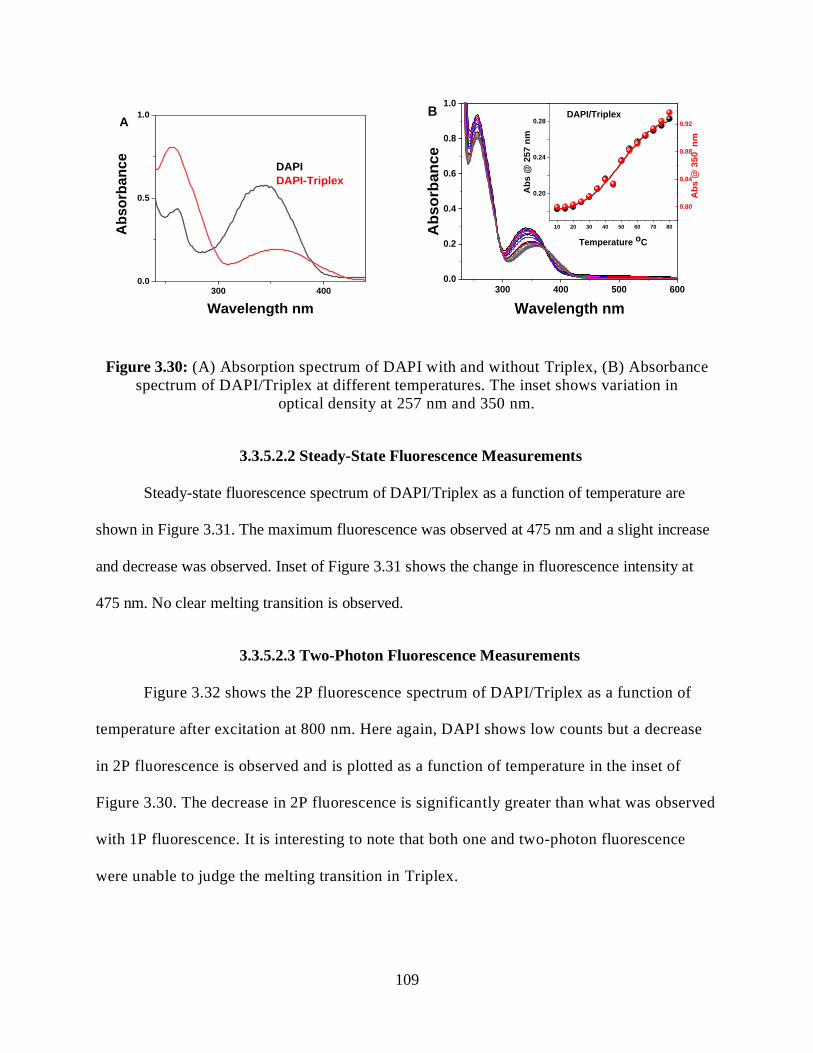
109
300 4000.0
0.5
1.0A
bs
orb
an
ce
Wavelength nm
DAPI
DAPI-Triplex
A
300 400 500 6000.0
0.2
0.4
0.6
0.8
1.0
Ab
so
rban
ce
Wavelength nm
DAPI/TriplexB
10 20 30 40 50 60 70 80
0.20
0.24
0.28
Ab
s @
35
0
nm
Ab
s @
25
7 n
m
Temperature oC
0.80
0.84
0.88
0.92
Figure 3.30: (A) Absorption spectrum of DAPI with and without Triplex, (B) Absorbance
spectrum of DAPI/Triplex at different temperatures. The inset shows variation in
optical density at 257 nm and 350 nm.
3.3.5.2.2 Steady-State Fluorescence Measurements
Steady-state fluorescence spectrum of DAPI/Triplex as a function of temperature are
shown in Figure 3.31. The maximum fluorescence was observed at 475 nm and a slight increase
and decrease was observed. Inset of Figure 3.31 shows the change in fluorescence intensity at
475 nm. No clear melting transition is observed.
3.3.5.2.3 Two-Photon Fluorescence Measurements
Figure 3.32 shows the 2P fluorescence spectrum of DAPI/Triplex as a function of
temperature after excitation at 800 nm. Here again, DAPI shows low counts but a decrease
in 2P fluorescence is observed and is plotted as a function of temperature in the inset of
Figure 3.30. The decrease in 2P fluorescence is significantly greater than what was observed
with 1P fluorescence. It is interesting to note that both one and two-photon fluorescence
were unable to judge the melting transition in Triplex.
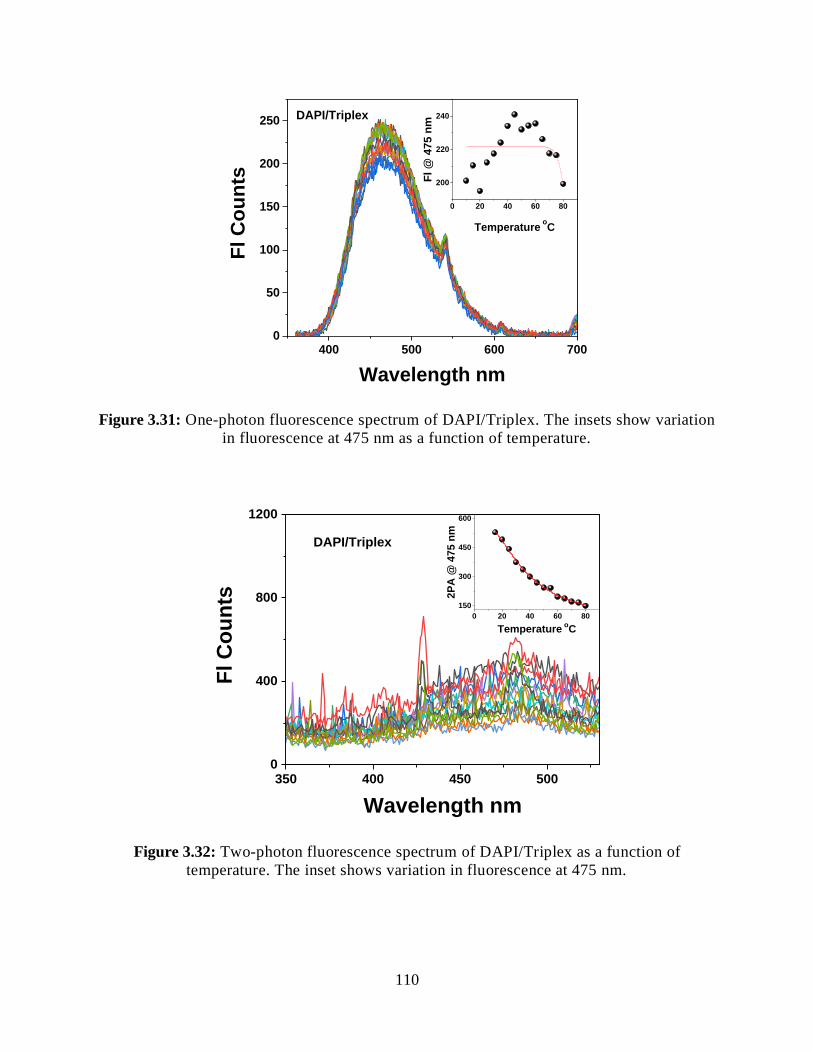
110
400 500 600 7000
50
100
150
200
250
Fl C
ou
nts
Wavelength nm
DAPI/Triplex
0 20 40 60 80
200
220
240
Fl @
475 n
m
Temperature o
C
Figure 3.31: One-photon fluorescence spectrum of DAPI/Triplex. The insets show variation
in fluorescence at 475 nm as a function of temperature.
350 400 450 5000
400
800
1200
DAPI/Triplex
Fl C
ou
nts
Wavelength nm
0 20 40 60 80
150
300
450
600
2P
A @
47
5 n
m
Temperature o
C
Figure 3.32: Two-photon fluorescence spectrum of DAPI/Triplex as a function of
temperature. The inset shows variation in fluorescence at 475 nm.
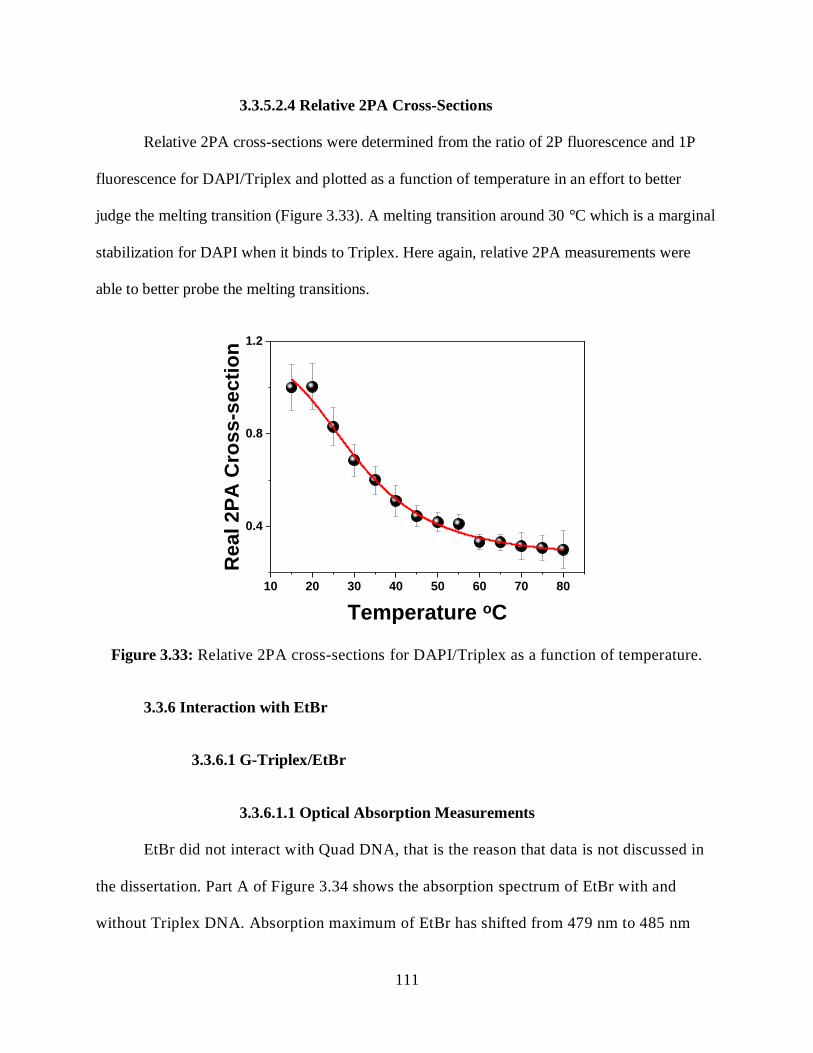
111
3.3.5.2.4 Relative 2PA Cross-Sections
Relative 2PA cross-sections were determined from the ratio of 2P fluorescence and 1P
fluorescence for DAPI/Triplex and plotted as a function of temperature in an effort to better
judge the melting transition (Figure 3.33). A melting transition around 30 °C which is a marginal
stabilization for DAPI when it binds to Triplex. Here again, relative 2PA measurements were
able to better probe the melting transitions.
10 20 30 40 50 60 70 80
0.4
0.8
1.2
Real 2P
A C
ross-s
ecti
on
Temperature oC
Figure 3.33: Relative 2PA cross-sections for DAPI/Triplex as a function of temperature.
3.3.6 Interaction with EtBr
3.3.6.1 G-Triplex/EtBr
3.3.6.1.1 Optical Absorption Measurements
EtBr did not interact with Quad DNA, that is the reason that data is not discussed in
the dissertation. Part A of Figure 3.34 shows the absorption spectrum of EtBr with and
without Triplex DNA. Absorption maximum of EtBr has shifted from 479 nm to 485 nm
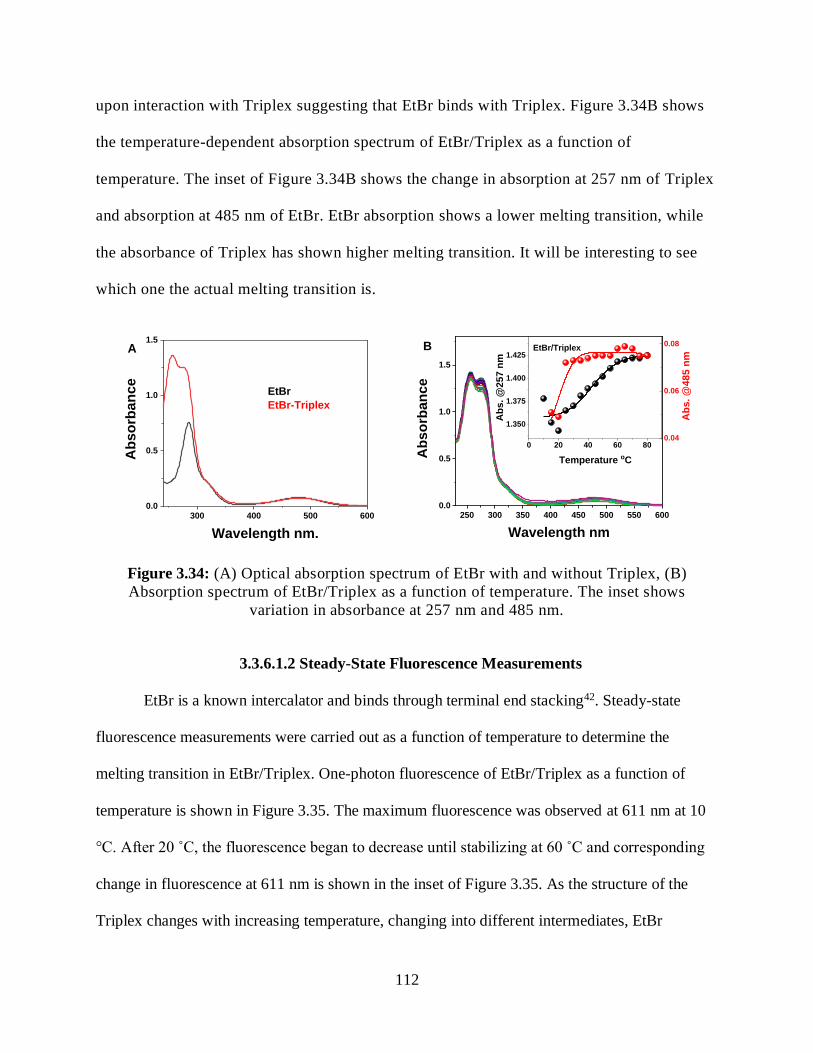
112
upon interaction with Triplex suggesting that EtBr binds with Triplex. Figure 3.34B shows
the temperature-dependent absorption spectrum of EtBr/Triplex as a function of
temperature. The inset of Figure 3.34B shows the change in absorption at 257 nm of Triplex
and absorption at 485 nm of EtBr. EtBr absorption shows a lower melting transition, while
the absorbance of Triplex has shown higher melting transition. It will be interesting to see
which one the actual melting transition is.
300 400 500 6000.0
0.5
1.0
1.5
Ab
so
rban
ce
Wavelength nm.
EtBr
EtBr-Triplex
A
250 300 350 400 450 500 550 6000.0
0.5
1.0
1.5
Ab
so
rba
nc
e
Wavelength nm
EtBr/TriplexB
0 20 40 60 80
1.350
1.375
1.400
1.425
Ab
s.
@257
nm
Temperature oC
0.04
0.06
0.08
Ab
s. @
485 n
m
Figure 3.34: (A) Optical absorption spectrum of EtBr with and without Triplex, (B)
Absorption spectrum of EtBr/Triplex as a function of temperature. The inset shows
variation in absorbance at 257 nm and 485 nm.
3.3.6.1.2 Steady-State Fluorescence Measurements
EtBr is a known intercalator and binds through terminal end stacking42. Steady-state
fluorescence measurements were carried out as a function of temperature to determine the
melting transition in EtBr/Triplex. One-photon fluorescence of EtBr/Triplex as a function of
temperature is shown in Figure 3.35. The maximum fluorescence was observed at 611 nm at 10
°C. After 20 ˚C, the fluorescence began to decrease until stabilizing at 60 ˚C and corresponding
change in fluorescence at 611 nm is shown in the inset of Figure 3.35. As the structure of the
Triplex changes with increasing temperature, changing into different intermediates, EtBr
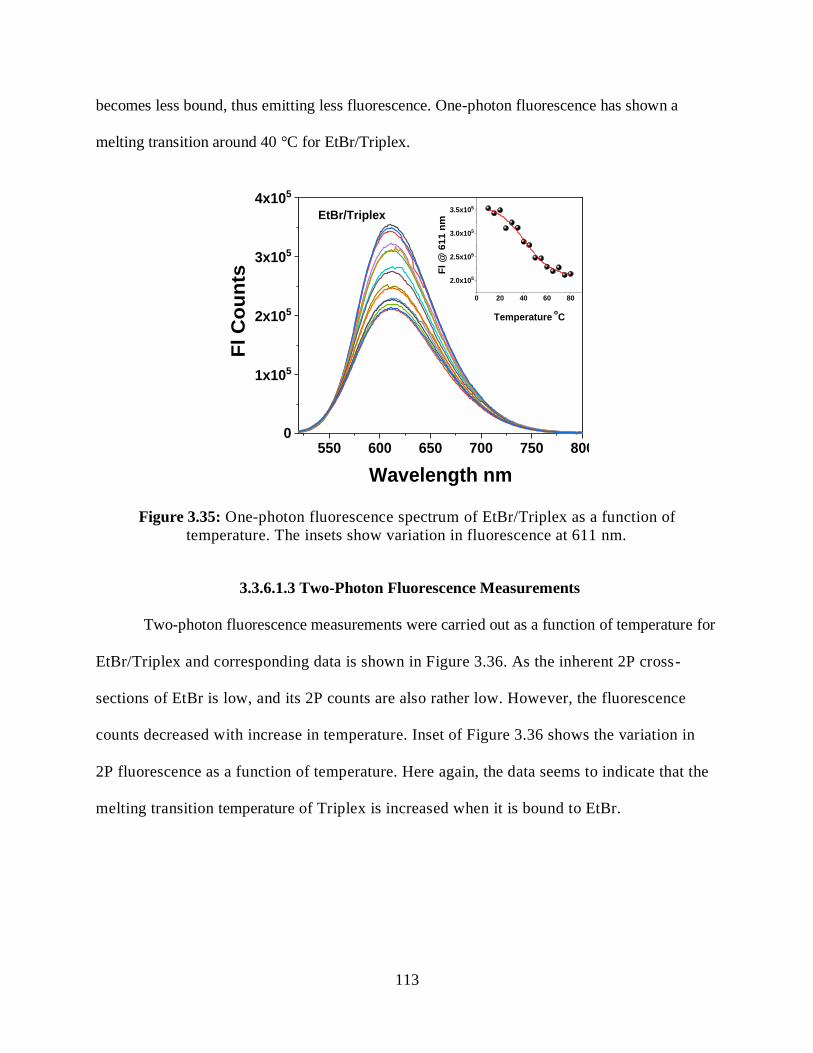
113
becomes less bound, thus emitting less fluorescence. One-photon fluorescence has shown a
melting transition around 40 °C for EtBr/Triplex.
550 600 650 700 750 8000
1x10⁵
2x10⁵
3x10⁵
4x10⁵
EtBr/Triplex
Fl C
ou
nts
Wavelength nm
0 20 40 60 80
2.0x10⁵
2.5x10⁵
3.0x10⁵
3.5x10⁵
Fl @
61
1 n
m
Temperature o
C
Figure 3.35: One-photon fluorescence spectrum of EtBr/Triplex as a function of
temperature. The insets show variation in fluorescence at 611 nm.
3.3.6.1.3 Two-Photon Fluorescence Measurements
Two-photon fluorescence measurements were carried out as a function of temperature for
EtBr/Triplex and corresponding data is shown in Figure 3.36. As the inherent 2P cross-
sections of EtBr is low, and its 2P counts are also rather low. However, the fluorescence
counts decreased with increase in temperature. Inset of Figure 3.36 shows the variation in
2P fluorescence as a function of temperature. Here again, the data seems to indicate that the
melting transition temperature of Triplex is increased when it is bound to EtBr.
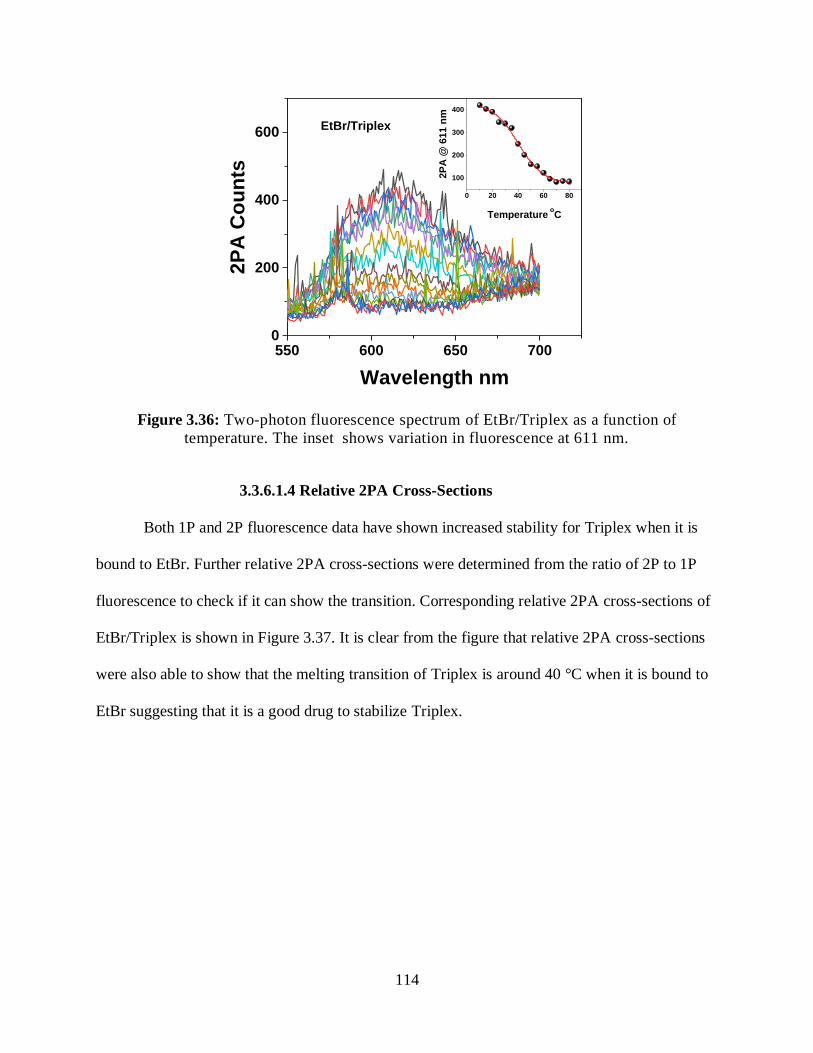
114
550 600 650 7000
200
400
600
2P
A C
ou
nts
Wavelength nm
EtBr/Triplex
0 20 40 60 80
100
200
300
400
2P
A @
611 n
m
Temperature o
C
Figure 3.36: Two-photon fluorescence spectrum of EtBr/Triplex as a function of
temperature. The inset shows variation in fluorescence at 611 nm.
3.3.6.1.4 Relative 2PA Cross-Sections
Both 1P and 2P fluorescence data have shown increased stability for Triplex when it is
bound to EtBr. Further relative 2PA cross-sections were determined from the ratio of 2P to 1P
fluorescence to check if it can show the transition. Corresponding relative 2PA cross-sections of
EtBr/Triplex is shown in Figure 3.37. It is clear from the figure that relative 2PA cross-sections
were also able to show that the melting transition of Triplex is around 40 °C when it is bound to
EtBr suggesting that it is a good drug to stabilize Triplex.
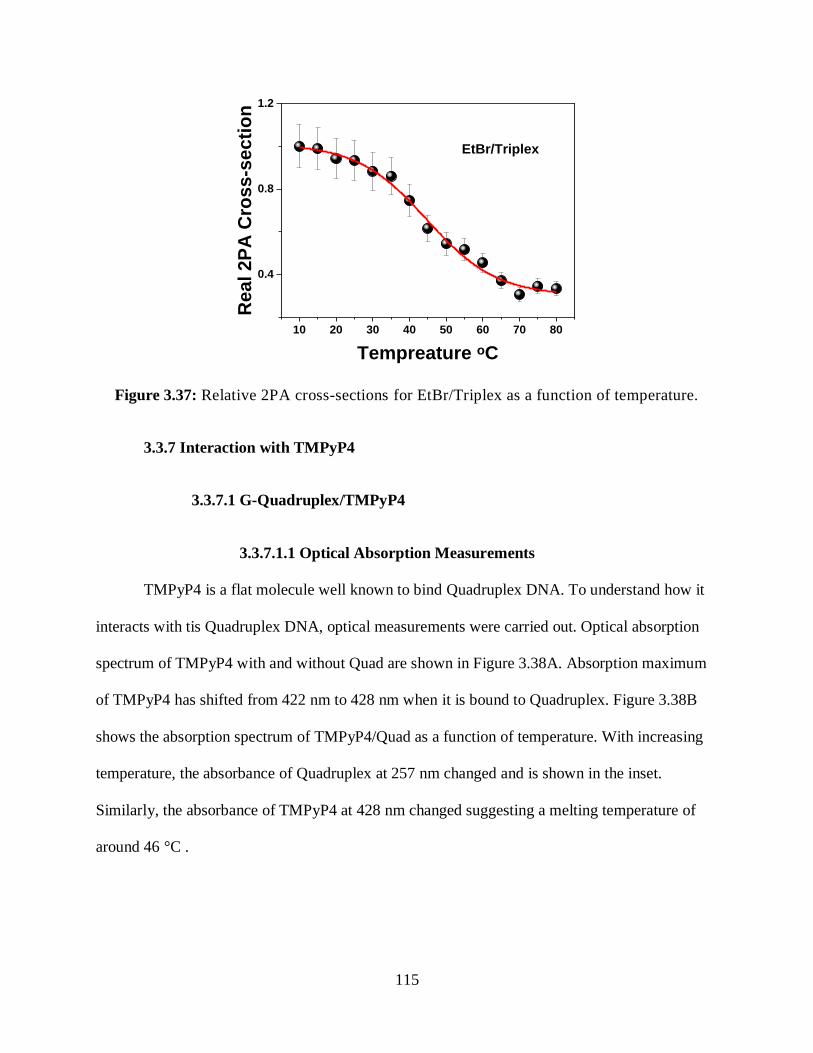
115
10 20 30 40 50 60 70 80
0.4
0.8
1.2
EtBr/Triplex
Real 2P
A C
ross-s
ecti
on
Tempreature oC
Figure 3.37: Relative 2PA cross-sections for EtBr/Triplex as a function of temperature.
3.3.7 Interaction with TMPyP4
3.3.7.1 G-Quadruplex/TMPyP4
3.3.7.1.1 Optical Absorption Measurements
TMPyP4 is a flat molecule well known to bind Quadruplex DNA. To understand how it
interacts with tis Quadruplex DNA, optical measurements were carried out. Optical absorption
spectrum of TMPyP4 with and without Quad are shown in Figure 3.38A. Absorption maximum
of TMPyP4 has shifted from 422 nm to 428 nm when it is bound to Quadruplex. Figure 3.38B
shows the absorption spectrum of TMPyP4/Quad as a function of temperature. With increasing
temperature, the absorbance of Quadruplex at 257 nm changed and is shown in the inset.
Similarly, the absorbance of TMPyP4 at 428 nm changed suggesting a melting temperature of
around 46 °C .

116
300 400 500 6000
1
2
3
Ab
so
rba
nc
e
Wavelength nm
TMPyP4
TMPyP4-Quad
A
300 400 500 600 7000.0
0.5
1.0
1.5
2.0
Ab
so
rban
ce
Wavelength nm
TMPyP4/QuadB
20 40 60 80
1.26
1.28
1.30
1.32
1.34
1.36
Ab
s. @
257 n
m
Temperature oC
1.40
1.45
1.50
1.55
1.60
Ab
s.
@4
28
nm
Figure 3.38: (A) Absorption spectrum for TMPyP4 with and without Quadruplex, (B)
Optical absorption spectrum of TMPyP4/Quadruplex as a function of temperature.
The inset shows variation in the optical density at different wavelengths.
3.3.7.1.2 Steady-State Fluorescence Measurements
TMPyP4 is known to bind well with Quadruplex DNA and has also been shown to act as
both an intercalator and an external binder40. Steady-state fluorescence measurements for
TMPyP4 /Quadruplex were carried out as a function of temperature and shown in figure 3.39. A
maximum at 650 nm is observed that decreased with increase in temperature and shown in the
inset. There is a clear melting transition from 1P fluorescent at a temperature of around 48 °C,
suggesting that TMPyP4 stabilizes the Quadruplex.
3.3.7.1.3 Two-Photon Fluorescence Measurements
Two-photon fluorescence spectrum of TMPyP4/Quadruplex as a function of
temperature are shown in figure 3.40. Here again, there is a decrease in 2P fluorescence with
increase in temperature at around 650 nm and shown in the inset. A melting transition of
around 45 °C is observed from the data.
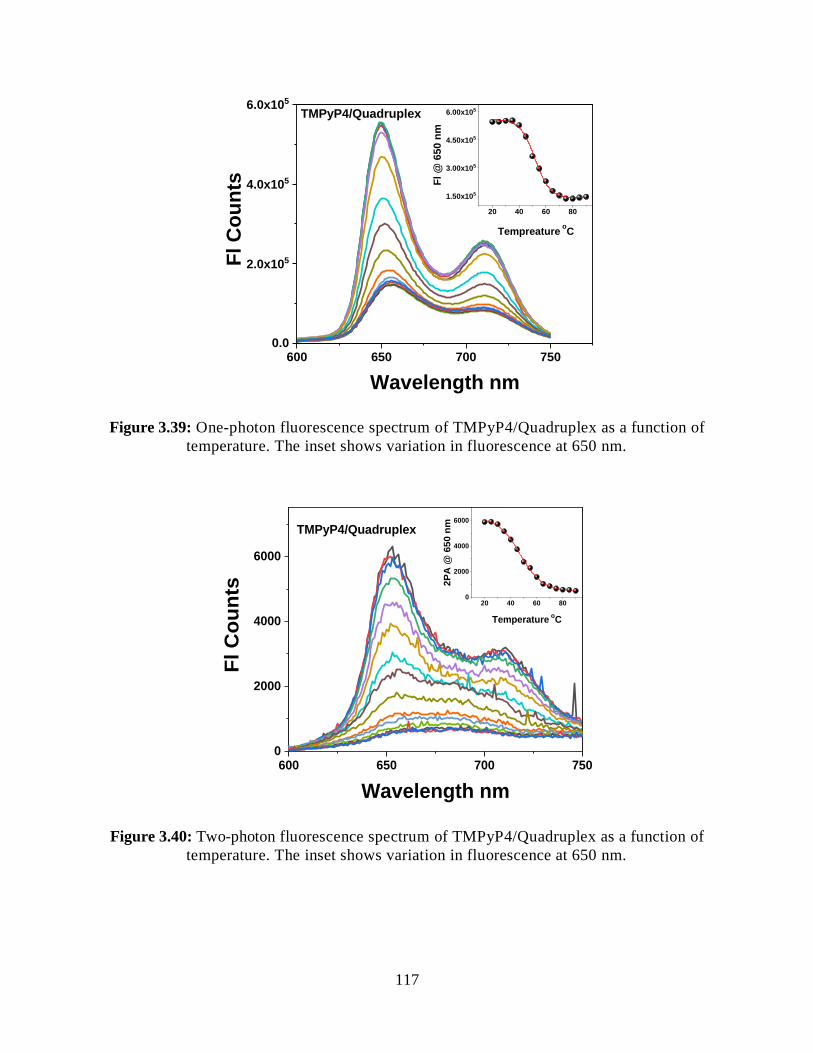
117
600 650 700 7500.0
2.0x10⁵
4.0x10⁵
6.0x10⁵
Fl C
ou
nts
Wavelength nm
TMPyP4/Quadruplex
20 40 60 80
1.50x10⁵
3.00x10⁵
4.50x10⁵
6.00x10⁵
Fl
@ 6
50
nm
Tempreature o
C
Figure 3.39: One-photon fluorescence spectrum of TMPyP4/Quadruplex as a function of
temperature. The inset shows variation in fluorescence at 650 nm.
600 650 700 7500
2000
4000
6000
TMPyP4/Quadruplex
Fl C
ou
nts
Wavelength nm
20 40 60 800
2000
4000
6000
2P
A @
650 n
m
Temperature o
C
Figure 3.40: Two-photon fluorescence spectrum of TMPyP4/Quadruplex as a function of
temperature. The inset shows variation in fluorescence at 650 nm.
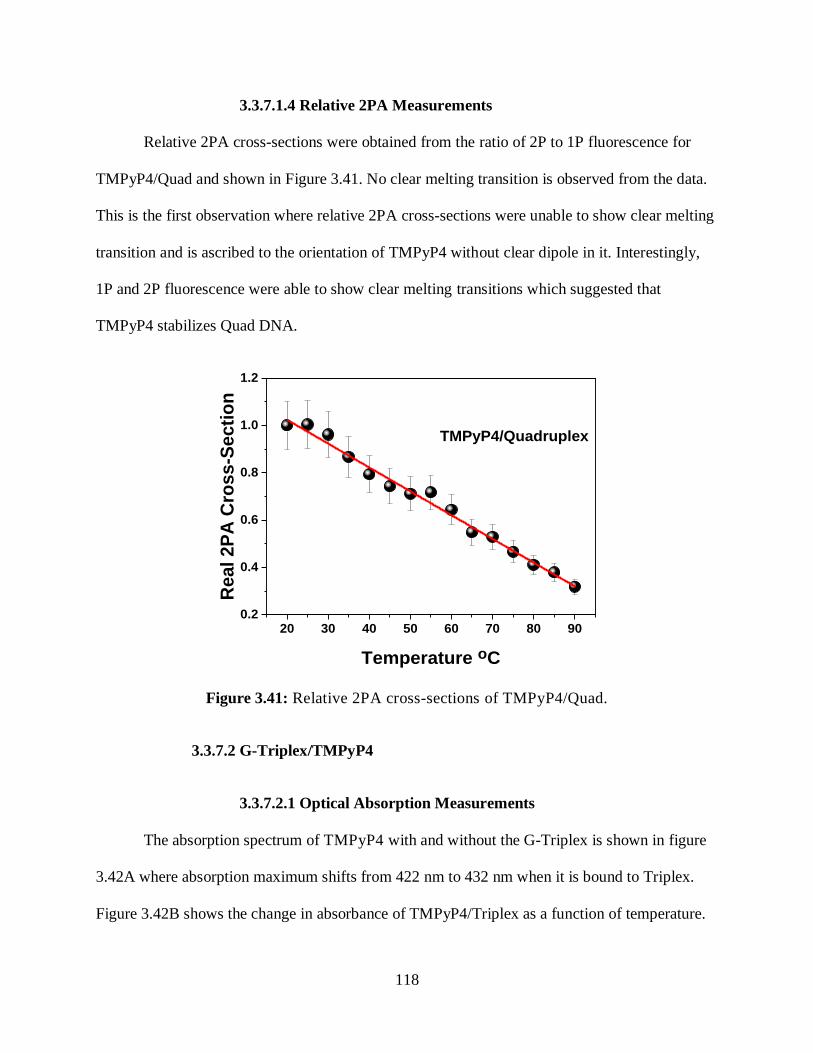
118
3.3.7.1.4 Relative 2PA Measurements
Relative 2PA cross-sections were obtained from the ratio of 2P to 1P fluorescence for
TMPyP4/Quad and shown in Figure 3.41. No clear melting transition is observed from the data.
This is the first observation where relative 2PA cross-sections were unable to show clear melting
transition and is ascribed to the orientation of TMPyP4 without clear dipole in it. Interestingly,
1P and 2P fluorescence were able to show clear melting transitions which suggested that
TMPyP4 stabilizes Quad DNA.
20 30 40 50 60 70 80 900.2
0.4
0.6
0.8
1.0
1.2
TMPyP4/Quadruplex
Real 2P
A C
ross-S
ecti
on
Temperature oC
Figure 3.41: Relative 2PA cross-sections of TMPyP4/Quad.
3.3.7.2 G-Triplex/TMPyP4
3.3.7.2.1 Optical Absorption Measurements
The absorption spectrum of TMPyP4 with and without the G-Triplex is shown in figure
3.42A where absorption maximum shifts from 422 nm to 432 nm when it is bound to Triplex.
Figure 3.42B shows the change in absorbance of TMPyP4/Triplex as a function of temperature.
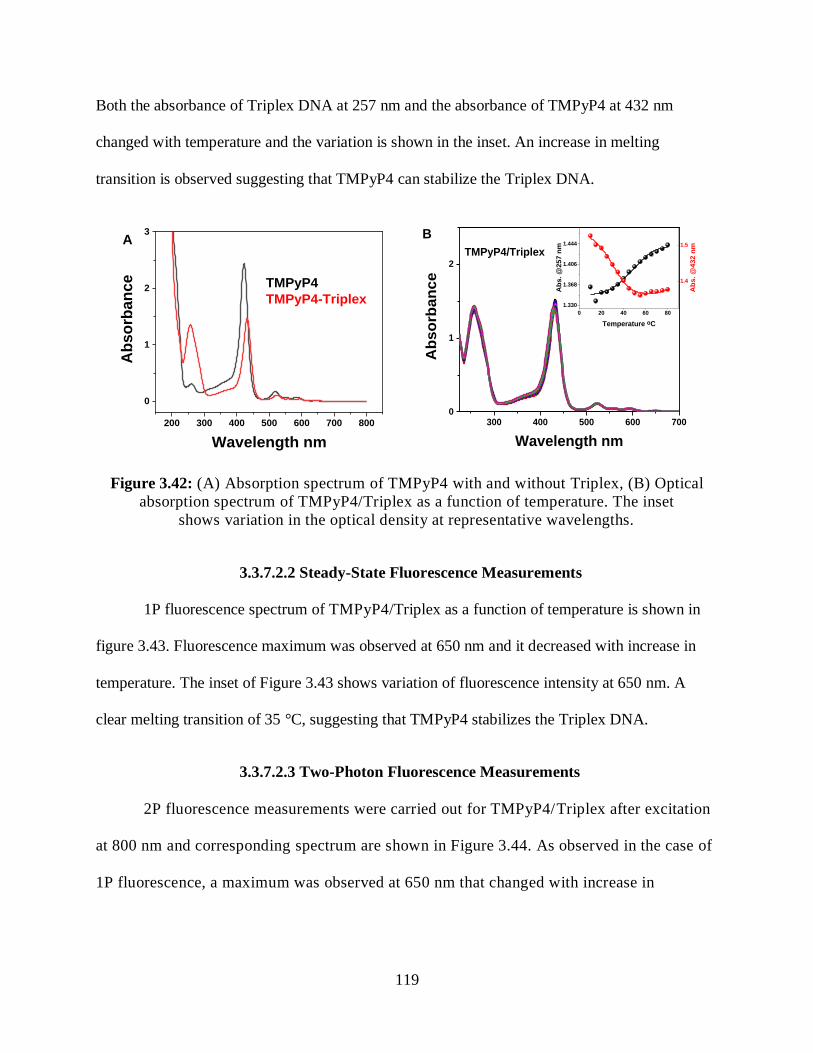
119
Both the absorbance of Triplex DNA at 257 nm and the absorbance of TMPyP4 at 432 nm
changed with temperature and the variation is shown in the inset. An increase in melting
transition is observed suggesting that TMPyP4 can stabilize the Triplex DNA.
200 300 400 500 600 700 800
0
1
2
3
Ab
so
rban
ce
Wavelength nm
TMPyP4
TMPyP4-Triplex
A
300 400 500 600 7000
1
2
Ab
so
rban
ce
Wavelength nm
TMPyP4/Triplex
B
0 20 40 60 80
1.330
1.368
1.406
1.444
Ab
s. @
257 n
m
Temperature oC
1.4
1.5
Ab
s. @
432 n
m
Figure 3.42: (A) Absorption spectrum of TMPyP4 with and without Triplex, (B) Optical
absorption spectrum of TMPyP4/Triplex as a function of temperature. The inset
shows variation in the optical density at representative wavelengths.
3.3.7.2.2 Steady-State Fluorescence Measurements
1P fluorescence spectrum of TMPyP4/Triplex as a function of temperature is shown in
figure 3.43. Fluorescence maximum was observed at 650 nm and it decreased with increase in
temperature. The inset of Figure 3.43 shows variation of fluorescence intensity at 650 nm. A
clear melting transition of 35 °C, suggesting that TMPyP4 stabilizes the Triplex DNA.
3.3.7.2.3 Two-Photon Fluorescence Measurements
2P fluorescence measurements were carried out for TMPyP4/Triplex after excitation
at 800 nm and corresponding spectrum are shown in Figure 3.44. As observed in the case of
1P fluorescence, a maximum was observed at 650 nm that changed with increase in
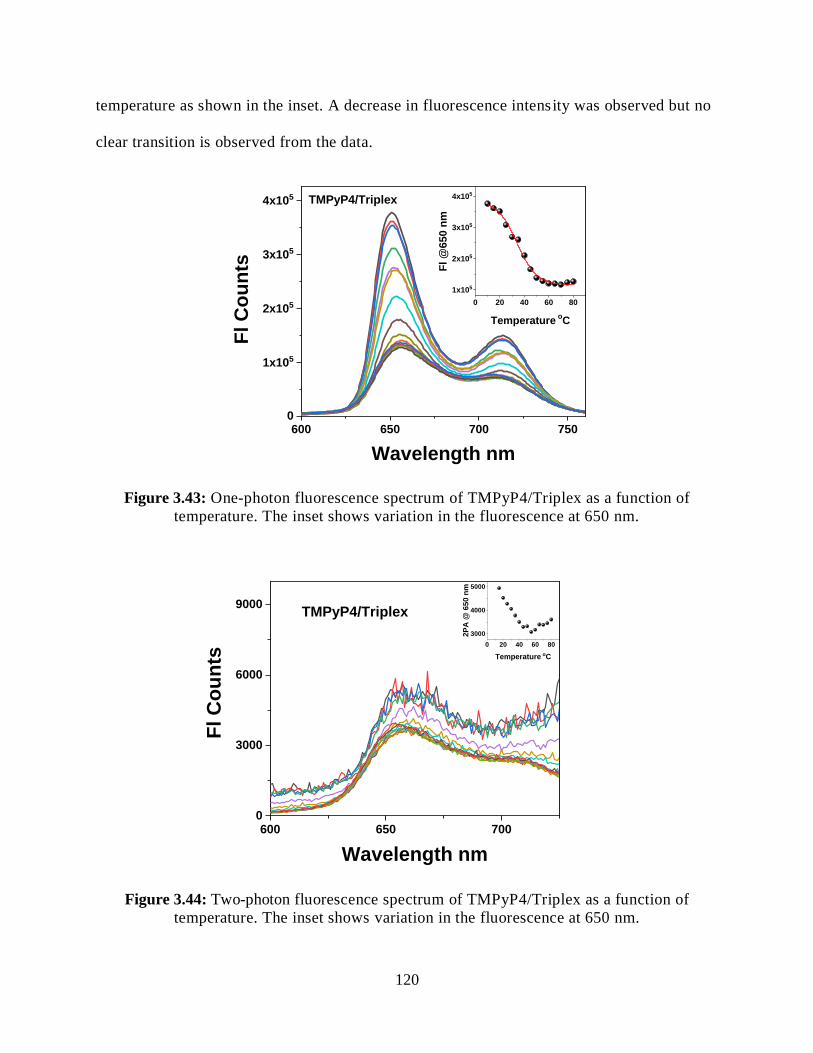
120
temperature as shown in the inset. A decrease in fluorescence intensity was observed but no
clear transition is observed from the data.
600 650 700 7500
1x10⁵
2x10⁵
3x10⁵
4x10⁵ TMPyP4/Triplex
Fl C
ou
nts
Wavelength nm
0 20 40 60 80
1x10⁵
2x10⁵
3x10⁵
4x10⁵
Fl @
650 n
m
Temperature o
C
Figure 3.43: One-photon fluorescence spectrum of TMPyP4/Triplex as a function of
temperature. The inset shows variation in the fluorescence at 650 nm.
600 650 7000
3000
6000
9000TMPyP4/Triplex
Fl C
ou
nts
Wavelength nm
0 20 40 60 80
3000
4000
5000
2P
A @
65
0 n
m
Temperature oC
Figure 3.44: Two-photon fluorescence spectrum of TMPyP4/Triplex as a function of
temperature. The inset shows variation in the fluorescence at 650 nm.
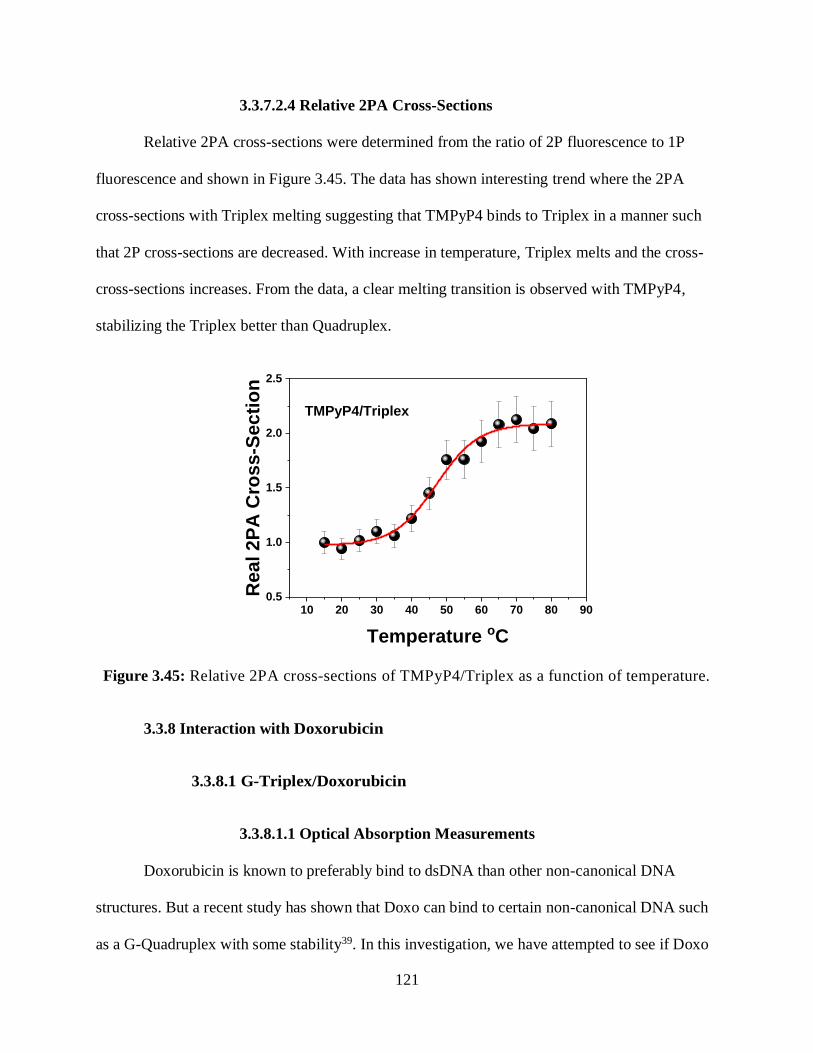
121
3.3.7.2.4 Relative 2PA Cross-Sections
Relative 2PA cross-sections were determined from the ratio of 2P fluorescence to 1P
fluorescence and shown in Figure 3.45. The data has shown interesting trend where the 2PA
cross-sections with Triplex melting suggesting that TMPyP4 binds to Triplex in a manner such
that 2P cross-sections are decreased. With increase in temperature, Triplex melts and the cross-
cross-sections increases. From the data, a clear melting transition is observed with TMPyP4,
stabilizing the Triplex better than Quadruplex.
10 20 30 40 50 60 70 80 900.5
1.0
1.5
2.0
2.5
TMPyP4/Triplex
Real 2P
A C
ross-S
ec
tio
n
Temperature oC
Figure 3.45: Relative 2PA cross-sections of TMPyP4/Triplex as a function of temperature.
3.3.8 Interaction with Doxorubicin
3.3.8.1 G-Triplex/Doxorubicin
3.3.8.1.1 Optical Absorption Measurements
Doxorubicin is known to preferably bind to dsDNA than other non-canonical DNA
structures. But a recent study has shown that Doxo can bind to certain non-canonical DNA such
as a G-Quadruplex with some stability39. In this investigation, we have attempted to see if Doxo
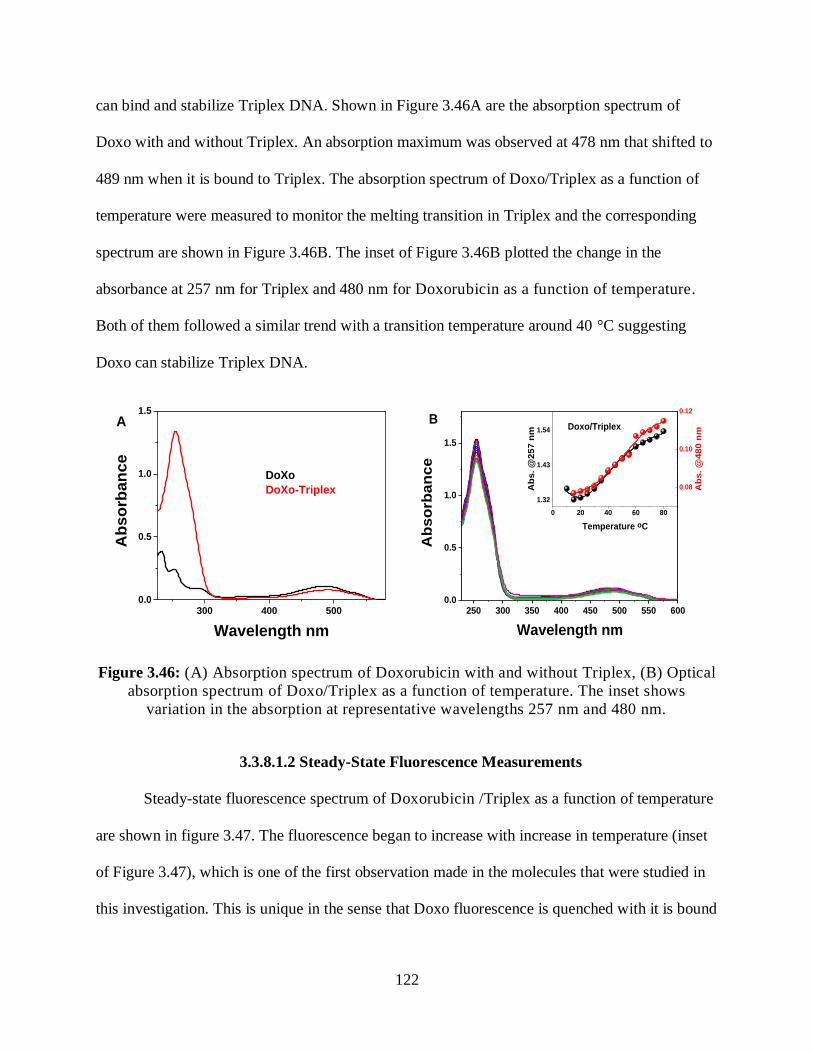
122
can bind and stabilize Triplex DNA. Shown in Figure 3.46A are the absorption spectrum of
Doxo with and without Triplex. An absorption maximum was observed at 478 nm that shifted to
489 nm when it is bound to Triplex. The absorption spectrum of Doxo/Triplex as a function of
temperature were measured to monitor the melting transition in Triplex and the corresponding
spectrum are shown in Figure 3.46B. The inset of Figure 3.46B plotted the change in the
absorbance at 257 nm for Triplex and 480 nm for Doxorubicin as a function of temperature.
Both of them followed a similar trend with a transition temperature around 40 °C suggesting
Doxo can stabilize Triplex DNA.
300 400 5000.0
0.5
1.0
1.5
Ab
so
rba
nc
e
Wavelength nm
DoXo
DoXo-Triplex
A
250 300 350 400 450 500 550 6000.0
0.5
1.0
1.5
Ab
so
rba
nc
e
Wavelength nm
Doxo/TriplexB
0 20 40 60 80
1.32
1.43
1.54
Ab
s. @
257
nm
Temperature oC
0.08
0.10
0.12
Ab
s. @
480
nm
Figure 3.46: (A) Absorption spectrum of Doxorubicin with and without Triplex, (B) Optical
absorption spectrum of Doxo/Triplex as a function of temperature. The inset shows
variation in the absorption at representative wavelengths 257 nm and 480 nm.
3.3.8.1.2 Steady-State Fluorescence Measurements
Steady-state fluorescence spectrum of Doxorubicin /Triplex as a function of temperature
are shown in figure 3.47. The fluorescence began to increase with increase in temperature (inset
of Figure 3.47), which is one of the first observation made in the molecules that were studied in
this investigation. This is unique in the sense that Doxo fluorescence is quenched with it is bound
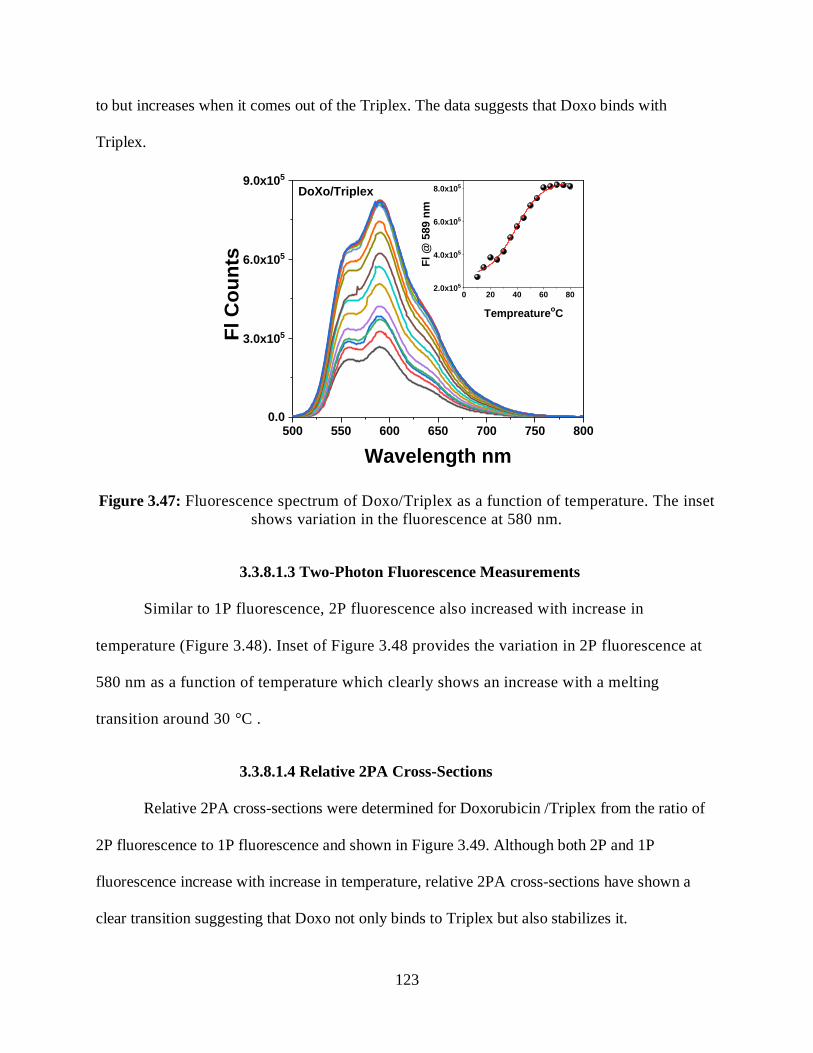
123
to but increases when it comes out of the Triplex. The data suggests that Doxo binds with
Triplex.
500 550 600 650 700 750 8000.0
3.0x10⁵
6.0x10⁵
9.0x10⁵
DoXo/Triplex
Fl C
ou
nts
Wavelength nm
0 20 40 60 802.0x10⁵
4.0x10⁵
6.0x10⁵
8.0x10⁵
Fl @
589
nm
TempreatureoC
Figure 3.47: Fluorescence spectrum of Doxo/Triplex as a function of temperature. The inset
shows variation in the fluorescence at 580 nm.
3.3.8.1.3 Two-Photon Fluorescence Measurements
Similar to 1P fluorescence, 2P fluorescence also increased with increase in
temperature (Figure 3.48). Inset of Figure 3.48 provides the variation in 2P fluorescence at
580 nm as a function of temperature which clearly shows an increase with a melting
transition around 30 °C .
3.3.8.1.4 Relative 2PA Cross-Sections
Relative 2PA cross-sections were determined for Doxorubicin /Triplex from the ratio of
2P fluorescence to 1P fluorescence and shown in Figure 3.49. Although both 2P and 1P
fluorescence increase with increase in temperature, relative 2PA cross-sections have shown a
clear transition suggesting that Doxo not only binds to Triplex but also stabilizes it.
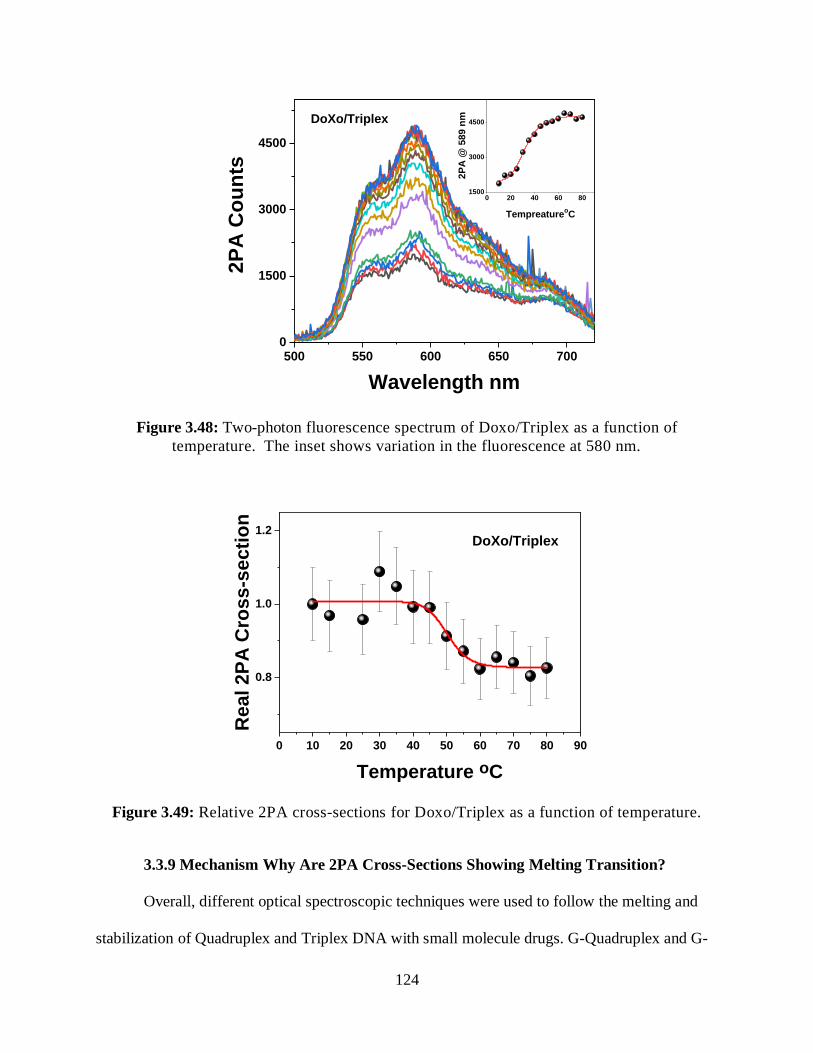
124
500 550 600 650 7000
1500
3000
4500
2P
A C
ou
nts
Wavelength nm
DoXo/Triplex
0 20 40 60 801500
3000
4500
2P
A @
58
9 n
m
TempreatureoC
Figure 3.48: Two-photon fluorescence spectrum of Doxo/Triplex as a function of
temperature. The inset shows variation in the fluorescence at 580 nm.
0 10 20 30 40 50 60 70 80 90
0.8
1.0
1.2
Real 2P
A C
ross-s
ecti
on
Temperature oC
DoXo/Triplex
Figure 3.49: Relative 2PA cross-sections for Doxo/Triplex as a function of temperature.
3.3.9 Mechanism Why Are 2PA Cross-Sections Showing Melting Transition?
Overall, different optical spectroscopic techniques were used to follow the melting and
stabilization of Quadruplex and Triplex DNA with small molecule drugs. G-Quadruplex and G-
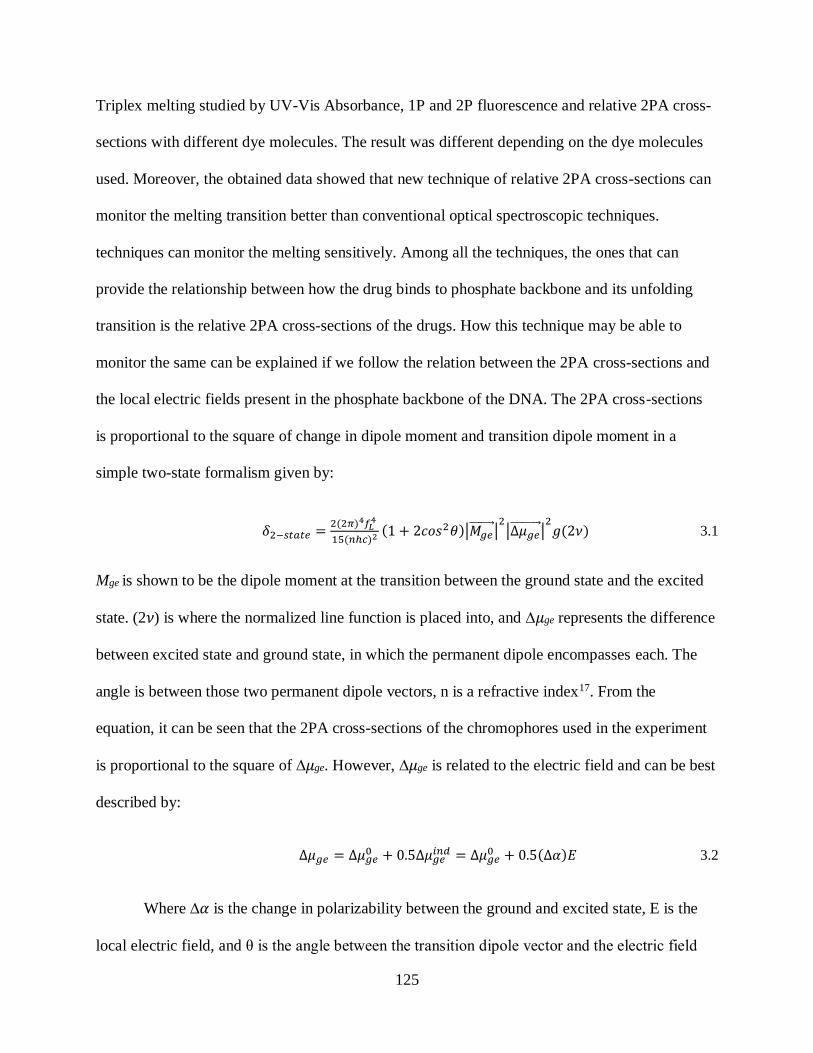
125
Triplex melting studied by UV-Vis Absorbance, 1P and 2P fluorescence and relative 2PA cross-
sections with different dye molecules. The result was different depending on the dye molecules
used. Moreover, the obtained data showed that new technique of relative 2PA cross-sections can
monitor the melting transition better than conventional optical spectroscopic techniques.
techniques can monitor the melting sensitively. Among all the techniques, the ones that can
provide the relationship between how the drug binds to phosphate backbone and its unfolding
transition is the relative 2PA cross-sections of the drugs. How this technique may be able to
monitor the same can be explained if we follow the relation between the 2PA cross-sections and
the local electric fields present in the phosphate backbone of the DNA. The 2PA cross-sections
is proportional to the square of change in dipole moment and transition dipole moment in a
simple two-state formalism given by:
𝛿2−𝑠𝑡𝑎𝑡𝑒 =2(2𝜋)4𝑓𝐿
4
15(𝑛ℎ𝑐)2(1 + 2𝑐𝑜𝑠2𝜃)|𝑀𝑔𝑒
|2|∆𝜇𝑔𝑒 |
2𝑔(2𝜈) 3.1
Mge is shown to be the dipole moment at the transition between the ground state and the excited
state. (2𝜈) is where the normalized line function is placed into, and ∆𝜇ge represents the difference
between excited state and ground state, in which the permanent dipole encompasses each. The
angle is between those two permanent dipole vectors, n is a refractive index17. From the
equation, it can be seen that the 2PA cross-sections of the chromophores used in the experiment
is proportional to the square of ∆𝜇ge. However, ∆𝜇ge is related to the electric field and can be best
described by:
∆𝜇𝑔𝑒 = ∆𝜇𝑔𝑒0 + 0.5∆𝜇𝑔𝑒
𝑖𝑛𝑑 = ∆𝜇𝑔𝑒0 + 0.5(∆𝛼)𝐸 3.2
Where ∆𝛼 is the change in polarizability between the ground and excited state, E is the
local electric field, and θ is the angle between the transition dipole vector and the electric field
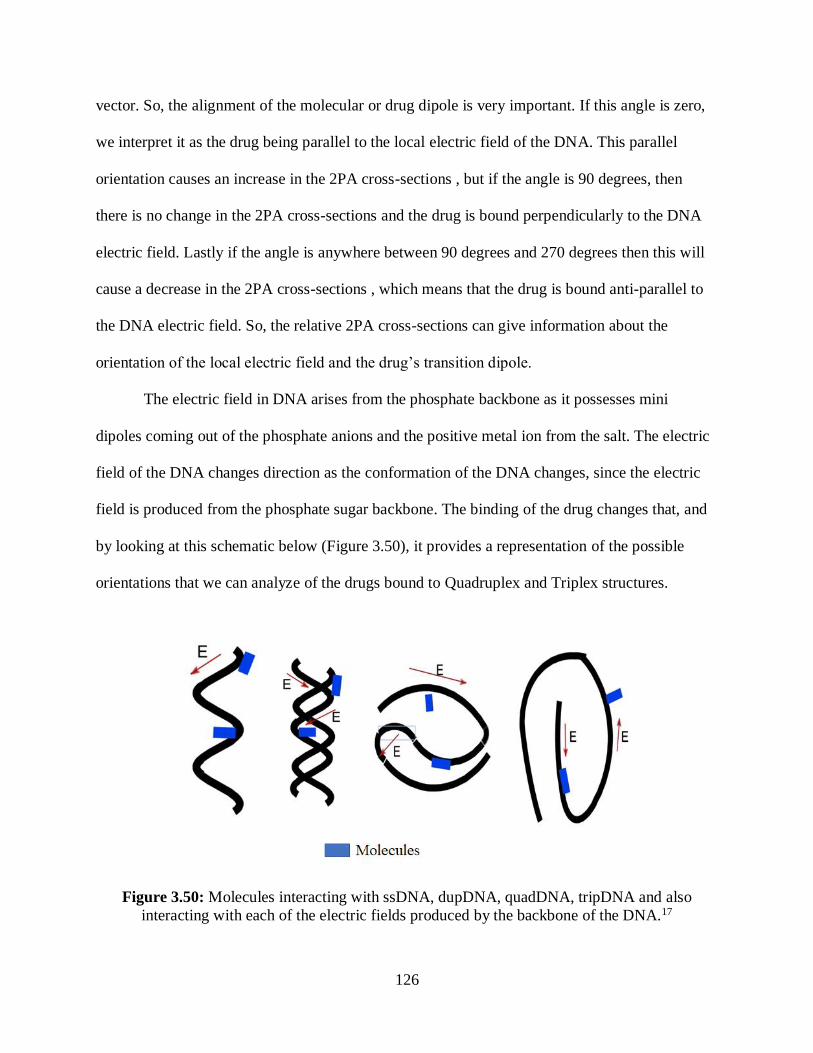
126
vector. So, the alignment of the molecular or drug dipole is very important. If this angle is zero,
we interpret it as the drug being parallel to the local electric field of the DNA. This parallel
orientation causes an increase in the 2PA cross-sections , but if the angle is 90 degrees, then
there is no change in the 2PA cross-sections and the drug is bound perpendicularly to the DNA
electric field. Lastly if the angle is anywhere between 90 degrees and 270 degrees then this will
cause a decrease in the 2PA cross-sections , which means that the drug is bound anti-parallel to
the DNA electric field. So, the relative 2PA cross-sections can give information about the
orientation of the local electric field and the drug’s transition dipole.
The electric field in DNA arises from the phosphate backbone as it possesses mini
dipoles coming out of the phosphate anions and the positive metal ion from the salt. The electric
field of the DNA changes direction as the conformation of the DNA changes, since the electric
field is produced from the phosphate sugar backbone. The binding of the drug changes that, and
by looking at this schematic below (Figure 3.50), it provides a representation of the possible
orientations that we can analyze of the drugs bound to Quadruplex and Triplex structures.
Figure 3.50: Molecules interacting with ssDNA, dupDNA, quadDNA, tripDNA and also
interacting with each of the electric fields produced by the backbone of the DNA.17
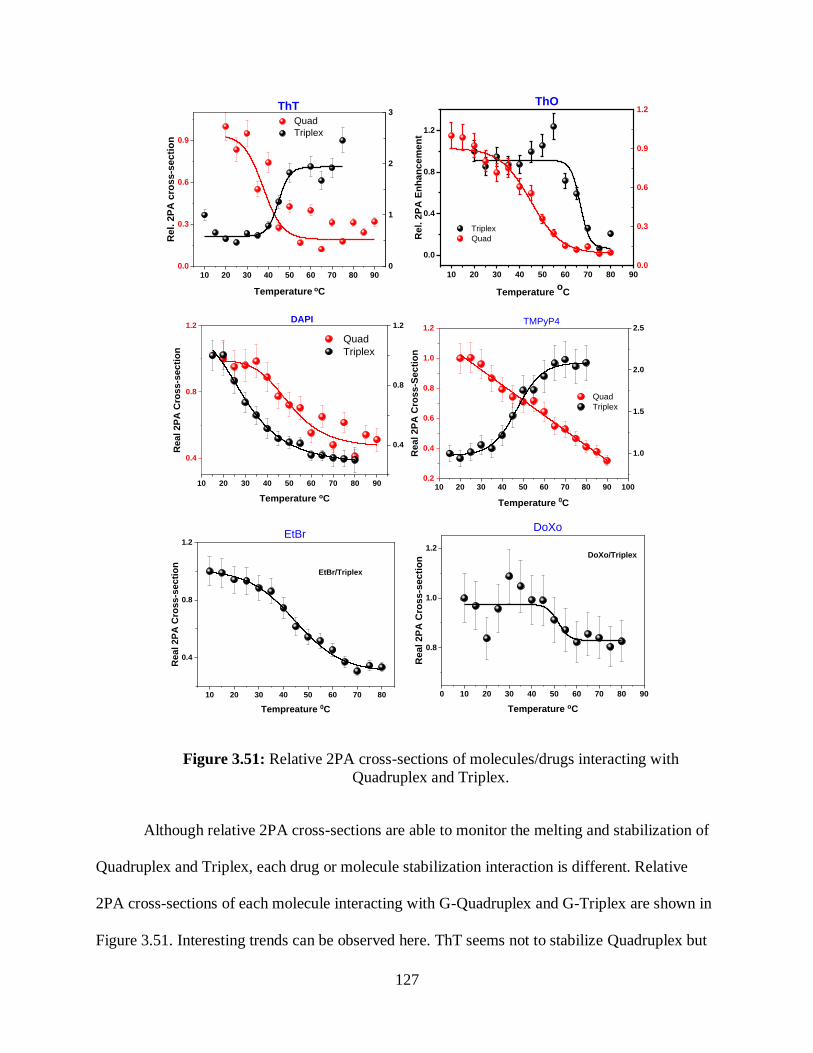
127
10 20 30 40 50 60 70 80 900.0
0.3
0.6
0.9
Re
l. 2
PA
cro
ss
-se
cti
on
Temperature oC
0
1
2
3 Quad
Triplex
ThT
10 20 30 40 50 60 70 80 90
0.0
0.4
0.8
1.2
Triplex
QuadRe
l. 2
PA
En
ha
nc
em
en
t
Temperature o
C
ThO
0.0
0.3
0.6
0.9
1.2
10 20 30 40 50 60 70 80 90
0.4
0.8
1.2
Quad
Triplex
Temperature oC
Rea
l 2P
A C
ross-s
ecti
on
DAPI
0.4
0.8
1.2
10 20 30 40 50 60 70 80 90 1000.2
0.4
0.6
0.8
1.0
1.2
Quad
Triplex
Temperature 0C
Re
al 2
PA
Cro
ss
-Se
cti
on
1.0
1.5
2.0
2.5TMPyP4
10 20 30 40 50 60 70 80
0.4
0.8
1.2
EtBr/Triplex
Rea
l 2P
A C
ross-s
ecti
on
Tempreature 0C
EtBr
0 10 20 30 40 50 60 70 80 90
0.8
1.0
1.2
Rea
l 2P
A C
ross-s
ecti
on
Temperature oC
DoXo/Triplex
DoXo
Figure 3.51: Relative 2PA cross-sections of molecules/drugs interacting with
Quadruplex and Triplex.
Although relative 2PA cross-sections are able to monitor the melting and stabilization of
Quadruplex and Triplex, each drug or molecule stabilization interaction is different. Relative
2PA cross-sections of each molecule interacting with G-Quadruplex and G-Triplex are shown in
Figure 3.51. Interesting trends can be observed here. ThT seems not to stabilize Quadruplex but
128
was able to stabilize Triplex. The melting temperature was found to 40 °C for ThT/Quadruplex
and 45 °C for ThT/Triplex. Interestingly, the interaction of ThT with Quadruplex and Triplex
seems to be different as there is a 2PA cross-sections decrease for ThT/Quadruplex while it
increased for ThT/Triplex when the DNA melted. This result suggests that ThT binds parallel
with phosphate backbone in the case of Quadruplex but anti-parallel in the case of Triplex.
In contrast, ThO seems to stabilize both Quadruplex and Triplex with melting
temperatures of around 40 oC and 52 oC for Triplex and Quadruplex, respectively. Both of them
are significantly better than individual melting temperatures of Quadruplex and Triplex. Also,
ThO alignment with phosphate backbone is parallel for both Quadruplex and Triplex as the
cross-sections decreased with melting of the non-canonical structures. DAPI, a drug molecule
that is known to bind to DNA seems to not to increase the stability of either the Triplex or
Quadruplex. The melting temperatures for DAPI/quad and DAPI/Triplex seems to be around 50
oC and 28 oC, marginally better than individual melting of Quadruplex and Triplex. However, the
orientation of DAPI binding to Quad and Triplex seems to be parallel to the backbone of the
DNA.
Among all molecules, TMPyP4 is an anomaly where the relative 2PA cross-sections of
TMPyP4 binding to Quadruplex did not produce a good melting temperature curve while
individual 1P and 2P fluorescence have shown a decrease in fluorescence consistent with melting
temperature of around 45 oC, which is not exceptional. On the other hand, TMPyP4/Triplex has
increased the melting temperature and stabilized the Triplex. Also, TMPyP4 orientation with
DNA backbone is similar to that of ThT where TMPyP4 binds anti-parallel with DNA backbone
in the case of Triplex but parallel in the case of Quadruplex. Increased stabilities were observed
for EtBr with Triplex (45 oC) as well as Doxo with Triplex (50 oC). Both EtBr and Doxo
129
stabilized the Triplex and the melting temperature is greater than the physiological temperature
suggesting, that these drugs can be used to stabilize the Triplex in-vivo. Overall, from the
investigations carried out in the study, we were able to show a new technique based on the
relative 2PA cross-sections to monitor melting and stabilization of DNA. Also, from the study
we can predict the orientation of molecule or drug with these non-canonical forms of DNA.17,39
3.4 Conclusions
A novel spectroscopic tool based on relative 2PA cross-sections is employed to study the
melting and stabilization of an organized self-assembly of non-canonical structures of DNA.
Two DNA oligonucleotide were selected for their ability to form a stable Quadruplex and
Triplex DNA canonical structures. Six drugs were studied that can bind to DNA at varying
interaction strengths that included ThT, ThO, TMPyP4, DAPI, EtBr and Doxo. One common
thing in all these dyes that they are cationic and can bind to the phosphate backbone of the DNA.
However, they vary by the structure of the drug, hydrogen bonding interactions, aromatic and
electrostatic interaction strengths. Due to DNA backbone’s local electrostatic environment after
interacted with dyes, it can be altered, and this alteration can be measured through several
spectroscopy techniques in order to understand how they bind, and also see the effect of each
drug on G-Quadruplex and G-Triplex DNA stability.
From all the studies, we have shown that relative 2PA cross-sections of molecules is a
better tool to monitor the melting and stability of Quadruplex and Triplex. This is because 2PA
cross-sections of molecules are sensitive to local electric fields and the phosphate backbone in
the DNA offers a local electrostatic environment and the orientation of the drug with the
backbone will be different in the organized self-assembly form when compared to un-folded
form. However different molecules stabilized the non-canonical structures at varying abilities.
130
ThT seems to stabilize Triplex while ThO stabilized both Quadruplex and Triplex significantly.
DAPI’s effect on the stabilizing Quadruplex and Triplex is marginal at best. In contrast, TMPyP4
did not stabilize Quadruplex better but was able to stabilize Triplex better. Also, the drugs EtBr
and Doxo were able to stabilize the Triplex much beyond the physiological temperature. In
addition, the new technique can also provide the orientation of the drug with the DNA backbone.
However, more investigations and better characterization of the intermediates are needed to
complete the understanding of the systems. This study was able to make inroads in the
development of novel 2PA cross-sections technique to monitor drug-DNA interactions.
3.5 Chapter Summary
• For this investigation, two DNA sequences used which are Thrombin Binding Aptamer
(TBA) and shortened form of TBA, (TBA11) to form two non-canonical structure G-
Quadruplex and G-Triplex structure.
• Six drugs were chosen to carry out the investigation which are ThT, ThO, TMPyP4,
DAPI, EtBr and Doxo. All chosen dyes are cationic and well known to bind to DNA at
varying interaction strengths.
• The interaction of these dyes was studied with temperature-dependent UV-Vis,
temperature-dependent one photon fluorescence and temperature-dependent 2-photon
fluorescence, Circular Dichroism.
• The stability trends were obtained for all drugs which correlated with drug structure and
DNA binding modes.
• The results show that relative 2PA cross-sections of all chosen chromophores is a
sensitive technique to monitor the melting transitions in G-Quadruplex and G-Triplex.

131
Also, this technique was able to provide the knowledge of orientation of the drugs or
molecules with respect to phosphate backbone of the DNA.
• ThO seems to stabilize both Quadruplex and Triplex better. But the stabilization offered
by DAPI is rather marginal. EtBr and Doxo drugs were able to stabilize Triplex beyond
physiological temperature.
132
3.6 References
(1) Poirier, M. C. Chemical-Induced DNA Damage and Human Cancer Risk. Nat. Rev.
Cancer 2004, 4 (8), 630–637. https://doi.org/10.1038/nrc1410.
(2) Gillet, L. C. J.; Schärer, O. D. Molecular Mechanisms of Mammalian Global Genome
Nucleotide Excision Repair. Chem. Rev. 2006, 106 (2), 253–276.
https://doi.org/10.1021/cr040483f.
(3) Gurova, K. New Hopes from Old Drugs: Revisiting DNA-Binding Small Molecules as
Anticancer Agents. Future Oncol. Lond. Engl. 2009, 5 (10), 1685.
https://doi.org/10.2217/fon.09.127.
(4) Davis, J. T. G-Quartets 40 Years Later: From 5′-GMP to Molecular Biology and
Supramolecular Chemistry. Angew. Chem. Int. Ed. 2004, 43 (6), 668–698.
https://doi.org/10.1002/anie.200300589.
(5) Bochman, M. L.; Paeschke, K.; Zakian, V. A. DNA Secondary Structures: Stability and
Function of G-Quadruplex Structures. Nat. Rev. Genet. 2012, 13 (11), 770–780.
https://doi.org/10.1038/nrg3296.
(6) W. Collie, G.; N. Parkinson, G. The Application of DNA and RNA G-Quadruplexes to
Therapeutic Medicines. Chem. Soc. Rev. 2011, 40 (12), 5867–5892.
https://doi.org/10.1039/C1CS15067G.
(7) Hänsel-Hertsch, R.; Di Antonio, M.; Balasubramanian, S. DNA G-Quadruplexes in the
Human Genome: Detection, Functions and Therapeutic Potential. Nat. Rev. Mol. Cell Biol.
2017, 18 (5), 279–284. https://doi.org/10.1038/nrm.2017.3.

133
(8) Shin, J.-S.; Hong, A.; Solomon, M. J.; Soon Lee, C. The Role of Telomeres and
Telomerase in the Pathology of Human Cancer and Aging. Pathology (Phila.) 2006, 38
(2), 103–113. https://doi.org/10.1080/00313020600580468.
(9) Neidle, S. Quadruplex Nucleic Acids as Targets for Anticancer Therapeutics. Nat. Rev.
Chem. 2017, 1 (5), 0041. https://doi.org/10.1038/s41570-017-0041.
(10) Shalaby, T.; Fiaschetti, G.; Nagasawa, K.; Shin-ya, K.; Baumgartner, M.; Grotzer, M. G-
Quadruplexes as Potential Therapeutic Targets for Embryonal Tumors. Molecules 2013,
18 (10), 12500–12537. https://doi.org/10.3390/molecules181012500.
(11) Schrank, Z.; Khan, N.; Osude, C.; Singh, S.; Miller, R. J.; Merrick, C.; Mabel, A.;
Kuckovic, A.; Puri, N. Oligonucleotides Targeting Telomeres and Telomerase in Cancer.
Molecules 2018, 23 (9), 2267. https://doi.org/10.3390/molecules23092267.
(12) Shammas, M. A. Telomeres, Lifestyle, Cancer, and Aging. Curr. Opin. Clin. Nutr. Metab.
Care 2011, 14 (1), 28–34. https://doi.org/10.1097/MCO.0b013e32834121b1.
(13) Shay, J. W.; Bacchetti, S. A Survey of Telomerase Activity in Human Cancer. Eur. J.
Cancer 1997, 33 (5), 787–791. https://doi.org/10.1016/S0959-8049(97)00062-2.
(14) Chhabra, G.; Wojdyla, L.; Frakes, M.; Schrank, Z.; Leviskas, B.; Ivancich, M.; Vinay, P.;
Ganapathy, R.; Ramirez, B. E.; Puri, N. Mechanism of Action of G-Quadruplex–Forming
Oligonucleotide Homologous to the Telomere Overhang in Melanoma. J. Invest.
Dermatol. 2018, 138 (4), 903–910. https://doi.org/10.1016/j.jid.2017.11.021.
(15) Das, K.; Srivastava, M.; Raghavan, S. C. GNG Motifs Can Replace a GGG Stretch during
G-Quadruplex Formation in a Context Dependent Manner. PLoS ONE 2016, 11 (7).
https://doi.org/10.1371/journal.pone.0158794.

134
(16) Rhodes, D.; Lipps, H. J. G-Quadruplexes and Their Regulatory Roles in Biology. Nucleic
Acids Res. 2015, 43 (18), 8627–8637. https://doi.org/10.1093/nar/gkv862.
(17) Yaku, H.; Fujimoto, T.; Murashima, T.; Miyoshi, D.; Sugimoto, N. Phthalocyanines: A
New Class of G-Quadruplex-Ligands with Many Potential Applications. Chem. Commun.
2012, 48 (50), 6203–6216. https://doi.org/10.1039/C2CC31037F.
(18) Largy, E.; Mergny, J.-L.; Gabelica, V. Role of Alkali Metal Ions in G-Quadruplex Nucleic
Acid Structure and Stability. In The Alkali Metal Ions: Their Role for Life; Sigel, A., Sigel,
H., Sigel, R. K. O., Eds.; Metal Ions in Life Sciences; Springer International Publishing:
Cham, 2016; pp 203–258. https://doi.org/10.1007/978-3-319-21756-7_7.
(19) Han, H.; Hurley, L. H. G-Quadruplex DNA: A Potential Target for Anti-Cancer Drug
Design. Trends Pharmacol. Sci. 2000, 21 (4), 136–142. https://doi.org/10.1016/S0165-
6147(00)01457-7.
(20) Liu, W.; Zhong, Y.-F.; Liu, L.-Y.; Shen, C.-T.; Zeng, W.; Wang, F.; Yang, D.; Mao, Z.-
W. Solution Structures of Multiple G-Quadruplex Complexes Induced by a Platinum(II)-
Based Tripod Reveal Dynamic Binding. Nat. Commun. 2018, 9 (1), 3496.
https://doi.org/10.1038/s41467-018-05810-4.
(21) Jiang, H.-X.; Cui, Y.; Zhao, T.; Fu, H.-W.; Koirala, D.; Punnoose, J. A.; Kong, D.-M.;
Mao, H. Divalent Cations and Molecular Crowding Buffers Stabilize G-Triplex at
Physiologically Relevant Temperatures. Sci. Rep. 2015, 5, 9255.
https://doi.org/10.1038/srep09255.
(22) Limongelli, V.; De Tito, S.; Cerofolini, L.; Fragai, M.; Pagano, B.; Trotta, R.; Cosconati,
S.; Marinelli, L.; Novellino, E.; Bertini, I.; et al. The G-Triplex DNA. Angew. Chem. Int.
Ed. 2013, 52 (8), 2269–2273. https://doi.org/10.1002/anie.201206522.
135
(23) Jenjaroenpun, P.; Wongsurawat, T.; Yenamandra, S. P.; Kuznetsov, V. A. QmRLFS-
Finder: A Model, Web Server and Stand-Alone Tool for Prediction and Analysis of R-
Loop Forming Sequences. Nucleic Acids Res. 2015, 43 (Web Server issue), W527–W534.
https://doi.org/10.1093/nar/gkv344.
(24) Kuznetsov, V. A.; Bondarenko, V.; Wongsurawat, T.; Yenamandra, S. P.; Jenjaroenpun,
P. Toward Predictive R-Loop Computational Biology: Genome-Scale Prediction of R-
Loops Reveals Their Association with Complex Promoter Structures, G-Quadruplexes and
Transcriptionally Active Enhancers. Nucleic Acids Res. 2018, 46 (15), 7566–7585.
https://doi.org/10.1093/nar/gky554.
(25) Russo Krauss, I.; Merlino, A.; Randazzo, A.; Novellino, E.; Mazzarella, L.; Sica, F. High-
Resolution Structures of Two Complexes between Thrombin and Thrombin-Binding
Aptamer Shed Light on the Role of Cations in the Aptamer Inhibitory Activity. Nucleic
Acids Res. 2012, 40 (16), 8119–8128. https://doi.org/10.1093/nar/gks512.
(26) Mao, X.; Marky, L. A.; Gmeiner, W. H. NMR Structure of the Thrombin-Binding DNA
Aptamer Stabilized by Sr2+. J. Biomol. Struct. Dyn. 2004, 22 (1), 25–33.
https://doi.org/10.1080/07391102.2004.10506977.
(27) Cerofolini, L.; Amato, J.; Giachetti, A.; Limongelli, V.; Novellino, E.; Parrinello, M.;
Fragai, M.; Randazzo, A.; Luchinat, C. G-Triplex Structure and Formation Propensity.
Nucleic Acids Res. 2014, 42 (21), 13393–13404. https://doi.org/10.1093/nar/gku1084.
(28) Ambrus, A.; Chen, D.; Dai, J.; Bialis, T.; Jones, R. A.; Yang, D. Human Telomeric
Sequence Forms a Hybrid-Type Intramolecular G-Quadruplex Structure with Mixed
Parallel/Antiparallel Strands in Potassium Solution. Nucleic Acids Res. 2006, 34 (9),
2723–2735. https://doi.org/10.1093/nar/gkl348.
136
(29) Unfolding mechanism of thrombin-binding aptamer revealed by molecular dynamics
simulation and Markov State Model | Scientific Reports
https://www.nature.com/articles/srep24065 (accessed Dec 30, 2018).
(30) Jiang, H.-X.; Cui, Y.; Zhao, T.; Fu, H.-W.; Koirala, D.; Punnoose, J. A.; Kong, D.-M.;
Mao, H. Divalent Cations and Molecular Crowding Buffers Stabilize G-Triplex at
Physiologically Relevant Temperatures. Sci. Rep. 2015, 5, 9255.
(31) Amos, M. Theoretical and Experimental DNA Computation; Natural Computing Series;
Springer-Verlag: Berlin Heidelberg, 2005.
(32) Asbury, C. L.; van den Engh, G. Trapping of DNA in Nonuniform Oscillating Electric
Fields. Biophys. J. 1998, 74 (2 Pt 1), 1024–1030.
(33) Alotaibi, S. Novel Spectroscopic Tools to Differentiate Molecule-DNA Binding
Interactions, Sense DNA and Track DNA Melting. Dissertations 2015.
(34) Alja’afreh, I. Probing the Unfolding and the Stability of the Last Four Metal Binding
Domains of Wilson Disease Protein Using Circular Dichroism and Novel Spectroscopic
Techniques. Dissertations 2014.
(35) Biancardi, A.; Biver, T.; Burgalassi, A.; Mattonai, M.; Secco, F.; Venturini, M.
Mechanistic Aspects of Thioflavin-T Self-Aggregation and DNA Binding: Evidence for
Dimer Attack on DNA Grooves. Phys Chem Chem Phys 2014, 16 (37), 20061–20072.
https://doi.org/10.1039/C4CP02838D.
(36) Laguerre, A.; Wong, J. M. Y.; Monchaud, D. Direct Visualization of Both DNA and RNA
Quadruplexes in Human Cells via an Uncommon Spectroscopic Method. Sci. Rep. 2016,
6, 32141. https://doi.org/10.1038/srep32141.
137
(37) Lubitz, I.; Zikich, D.; Kotlyar, A. Specific High-Affinity Binding of Thiazole Orange to
Triplex and G-Quadruplex DNA. Biochemistry 2010, 49 (17), 3567–3574.
https://doi.org/10.1021/bi1000849.
(38) Scaglioni, L.; Mondelli, R.; Artali, R.; Sirtori, F. R.; Mazzini, S. Nemorubicin and
Doxorubicin Bind the G-Quadruplex Sequences of the Human Telomeres and of the c-
MYC Promoter Element Pu22. Biochim. Biophys. Acta BBA - Gen. Subj. 2016, 1860 (6),
1129–1138. https://doi.org/10.1016/j.bbagen.2016.02.011.
(39) Yang, F.; Teves, S. S.; Kemp, C. J.; Henikoff, S. Doxorubicin, DNA Torsion, and
Chromatin Dynamics. Biochim. Biophys. Acta BBA - Rev. Cancer 2014, 1845 (1), 84–89.
https://doi.org/10.1016/j.bbcan.2013.12.002.
(40) Martino, L.; Pagano, B.; Fotticchia, I.; Neidle, S.; Giancola, C. Shedding Light on the
Interaction between TMPyP4 and Human Telomeric Quadruplexes. J. Phys. Chem. B
2009, 113 (44), 14779–14786. https://doi.org/10.1021/jp9066394.
(41) Han, F. X.; Wheelhouse, R. T.; Hurley, L. H. Interactions of TMPyP4 and TMPyP2 with
Quadruplex DNA. Structural Basis for the Differential Effects on Telomerase Inhibition.
J. Am. Chem. Soc. 1999, 121 (15), 3561–3570. https://doi.org/10.1021/ja984153m.
(42) Koeppel, F.; Riou, J.-F.; Laoui, A.; Mailliet, P.; Arimondo, P. B.; Labit, D.; Petitgenet, O.;
Hélène, C.; Mergny, J.-L. Ethidium Derivatives Bind to G-Quartets, Inhibit Telomerase
and Act as Fluorescent Probes for Quadruplexes. Nucleic Acids Res. 2001, 29 (5), 1087–
1096.
(43) Vorlíčková, M.; Kejnovská, I.; Sagi, J.; Renčiuk, D.; Bednářová, K.; Motlová, J.; Kypr, J.
Circular Dichroism and Guanine Quadruplexes. Methods 2012, 57 (1), 64–75.
https://doi.org/10.1016/j.ymeth.2012.03.011.

138
(44) Renaud de la Faverie, A.; Guédin, A.; Bedrat, A.; Yatsunyk, L. A.; Mergny, J.-L.
Thioflavin T as a Fluorescence Light-up Probe for G4 Formation. Nucleic Acids Res.
2014, 42 (8), e65. https://doi.org/10.1093/nar/gku111.
(45) Liu, X.; Hua, X.; Fan, Q.; Chao, J.; Su, S.; Huang, Y.-Q.; Wang, L.; Huang, W. Thioflavin
T as an Efficient G-Quadruplex Inducer for the Highly Sensitive Detection of Thrombin
Using a New Föster Resonance Energy Transfer System. ACS Appl. Mater. Interfaces
2015, 7 (30), 16458–16465. https://doi.org/10.1021/acsami.5b03662.
(46) Mohanty, J.; Barooah, N.; Dhamodharan, V.; Harikrishna, S.; Pradeepkumar, P. I.;
Bhasikuttan, A. C. Thioflavin T as an Efficient Inducer and Selective Fluorescent Sensor
for the Human Telomeric G-Quadruplex DNA. J. Am. Chem. Soc. 2013, 135 (1), 367–376.
https://doi.org/10.1021/ja309588h.
139
CHAPTER 4
MONITORING PROTEIN AGGREGATION VIA TWO-PHOTON SPECTROSCOPY:
EARLY DETECTION OF AGGREGATES
4.1 Introduction
In the previous Chapter, investigations have focused on an organized self-assembly of
non-canonical structures, G-Quadruplex and G-Triplex and their structure stabilization using
molecules and drugs monitored via relative two-photon absorption (2PA) cross-sections. In this
Chapter, the studies are focused on another interesting organized self-assembly- protein and in
particular, aspects of protein folding and unfolding, protein aggregation via the use of 2PA
spectroscopy.
Proteins are formed from several amino acids that linked to each other through peptide
bonds (also known as amide bonds) which form when two amino acids are attached by losing a
water molecule1,2. Proteins are classified as organized self-assemblies due to their spontaneous
well-ordered oligomers through multiple noncovalent bonds. Furthermore, the numbers and
sequences of amino acids play significant role in folding of polypeptide chains (protein)3.
Essentially, polypeptide the bond is planar. However, protein will fold into well-defined
conformation structures that has the lowest energy due to numerous hydrophobic and hydrophilic
interactions2. The remarkable mechanism of folding and unfolding protein is still under
investigation and not completely understood as different proteins behave differently4. There were
many different techniques used to monitor change in protein folding such as UV-vis, one photon
fluorescence, circular dichroism and NMR. In this project, we aim to apply the power of 2PA
cross-sections to monitor the protein folding as 2PA spectroscopy was proved to be more

140
sensitive than other optical techniques because it can sense minute changes in electric fields
around the fluorophore during unfolding5,6.
Protein folding/unfolding is a biophysical process that makes the proteins to fold in a
particular way that gives rise to their function. Misfolded proteins are often causing of diseases
and can cause aggregation of proteins. Protein aggregation is often implicated in several
neurodegenerative diseases. One among them is Amyotrophic lateral sclerosis, commonly known
as ALS, is a neurodegenerative disease that targets motor neurons7. As the motor neurons
degenerate, they can no longer relay impulses from the spinal cord and brain to the muscles,
eventually resulting in paralysis7,8. The most common form of ALS is sporadic which affects 90-
95% of all cases, the remaining 5-10% are familial ALS (FALS) which means that the disease is
inherited9–13. There is no cure for ALS; treatment focuses primarily on treating the symptoms
rather than the disease2. Furthermore, ALS is difficult to diagnose and it can take up to a year to
be certain of an ALS diagnosis13,14.
There are many genes that have to been found to be linked to ALS as well as aggregates
of proteins, starting with Superoxide dismutase 1 (SOD1) that was discovered in 19938,15,16.
SOD1 is a protein that destroys free radicals by converting toxic superoxide anions to hydrogen
peroxide17,18. Mutations in the SOD1 gene was implicated in 20-25% of all ALS cases11. These
mutations will alter the amino acid sequence of the SOD1 protein, causing the protein to
improperly fold and aggregate18. Once secreted, the SOD1 aggregates will provoke a neuro-
inflammatory response around the motor neurons19. Recognizing and detecting SOD1
aggregation can lead to an early diagnosis of ALS, which can in turn lead to a more efficient
treatment and result in a more positive prognosis18–22.
141
The harmful effects of SOD1 mutations in familial ALS does not result from a loss of
dismutase function of the enzyme, but rather from the gain of an adverse property of the mutant
protein12,23,24. The presence of SOD1 aggregates has been linked with ALS. The presence of
inclusion bodies, which are abnormal structures in the nucleus or cytoplasm of a cell, in
degenerating neurons and surrounding astrocytes is a pathological hallmark of ALS.
Furthermore, the results of a study involving transgenic mice expressing human mutant SOD1
revealed that SOD1 insoluble protein complexes (IPCs) are detectable in spinal cord extracts
from the mice several months before inclusion body formation and motor neuron degeneration
was apparent 25–27. If one can be able to identify the misfolded forms of SOD1 or the early
soluble aggregates form of SOD1, it is possible to detect ALS early and provide intervention at
this stage to cure the disease. Once the insoluble aggregates are formed, they tend to destroy the
neurons. This forms the main motivation behind the work carried out in this study.
The folding/unfolding and aggregation of SOD1 was investigated using fluorescence
technique 13,28–33. A myriad of techniques were used for monitoring folding/unfolding and
aggregation of proteins in literature34. Among them, fluorescence-based techniques are found to
be better and easier. Proteins are often mixed with chromophores to give rise to fluorescence
signals. There are two ways where chromophores are normally bound to proteins, covalent and
non-covalent binding. Non-covalent binding of chromophores cannot specifically target the
location of the chromophore. On the other hand, covalent binding allows one to know the
location of the chromophore that allows one to make better structure-function relationships. One
way of covalent binding is binding a dye (Fluram) to the protein and follows its fluorescence as a
function of protein aggregation and folding/unfolding35. Fluram is a non-fluorescent compound;
however, it will react with primary amines to form a highly stable fluorescent compound (Figure
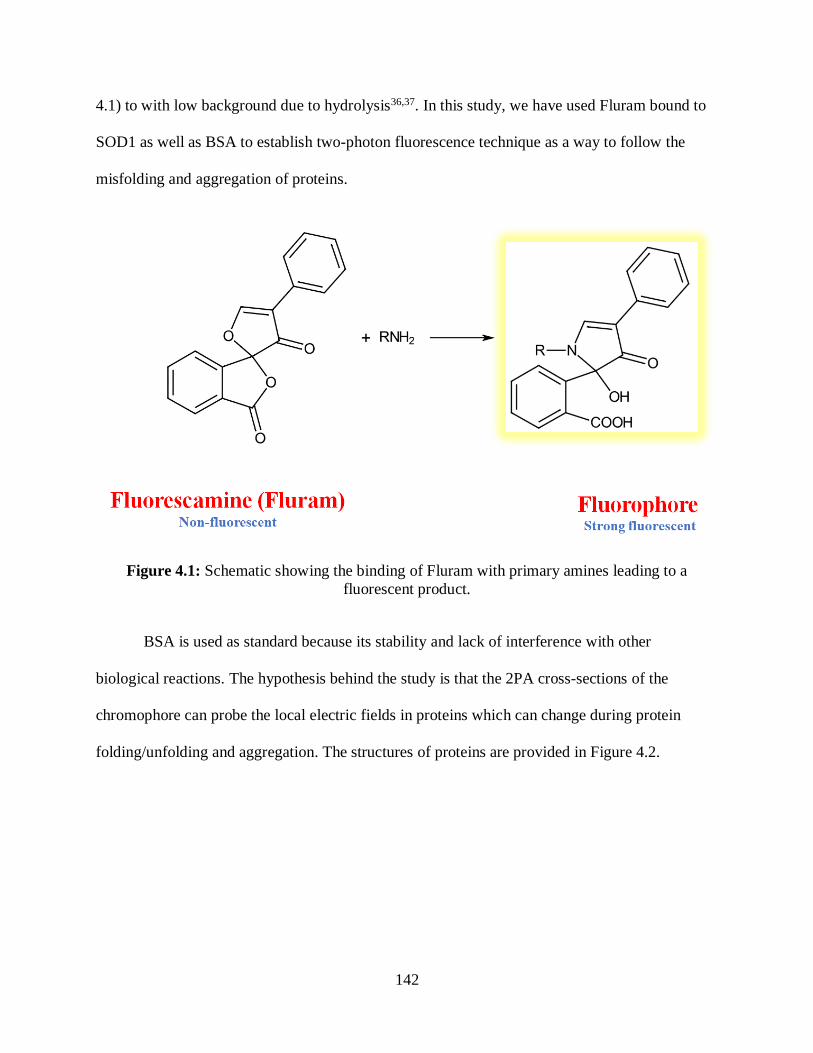
142
4.1) to with low background due to hydrolysis36,37. In this study, we have used Fluram bound to
SOD1 as well as BSA to establish two-photon fluorescence technique as a way to follow the
misfolding and aggregation of proteins.
Figure 4.1: Schematic showing the binding of Fluram with primary amines leading to a
fluorescent product.
BSA is used as standard because its stability and lack of interference with other
biological reactions. The hypothesis behind the study is that the 2PA cross-sections of the
chromophore can probe the local electric fields in proteins which can change during protein
folding/unfolding and aggregation. The structures of proteins are provided in Figure 4.2.
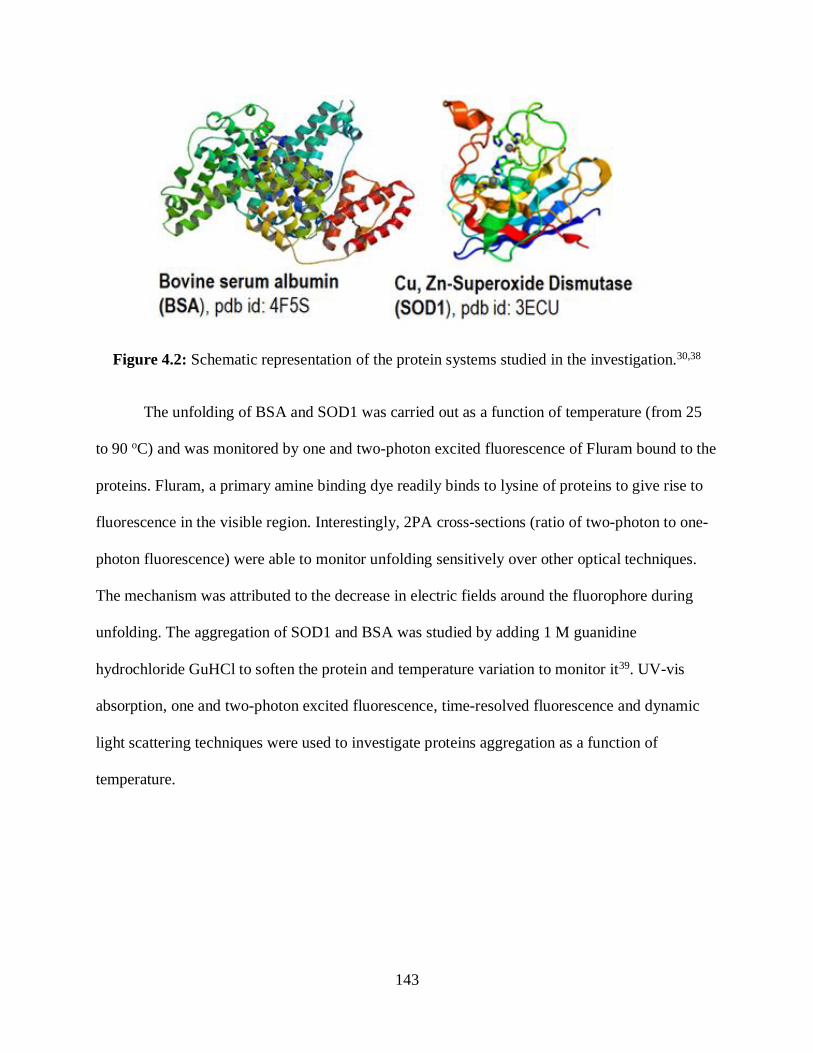
143
Figure 4.2: Schematic representation of the protein systems studied in the investigation.30,38
The unfolding of BSA and SOD1 was carried out as a function of temperature (from 25
to 90 oC) and was monitored by one and two-photon excited fluorescence of Fluram bound to the
proteins. Fluram, a primary amine binding dye readily binds to lysine of proteins to give rise to
fluorescence in the visible region. Interestingly, 2PA cross-sections (ratio of two-photon to one-
photon fluorescence) were able to monitor unfolding sensitively over other optical techniques.
The mechanism was attributed to the decrease in electric fields around the fluorophore during
unfolding. The aggregation of SOD1 and BSA was studied by adding 1 M guanidine
hydrochloride GuHCl to soften the protein and temperature variation to monitor it39. UV-vis
absorption, one and two-photon excited fluorescence, time-resolved fluorescence and dynamic
light scattering techniques were used to investigate proteins aggregation as a function of
temperature.
144
4.2 Materials and Methods
4.2.1 Materials
Superoxide Dismutase from bovine erythrocytes (SOD1) and Bovine serum albumin
(BSA) were obtained from Sigma Aldrich and used as received. A stock solution was prepared
using 50 mM sodium phosphate buffer (NaP buffer) at pH 8 with. A stock solution of the dye (1
mM), Fluorescamine (Fluram) was prepared in 1 mL of acetonitrile and diluted with Milli-Q
water to make 10 mL of 1 mM stock solution. For the unfolding of BSA and SOD1, several
sample solutions were made by adding 100 μL of the protein stock solution to10 μL of the
Fluram dye (10 μM) and 890 μL of the NaP buffer. GuHCl was obtained from Sigma Aldrich
and a 10 M stock solution was prepared.
4.2.2 Optical Methods
UV-Vis absorption spectroscopy was used to perform measurements through the use of
Shimadzu UV2101 PC spectrophotometer. Edinburgh F900 spectrofluorometer was used for
one-photon fluorescence measurements. The excitation source consisted of the 450 W Xe lamp
and Hamamatsu R2518P detector. The sample was excited at 370 nm and a fluorescence was
monitored from 380 nm to 600 nm. For two-photon fluorescence measurements, a Ti: Sapphire
laser at 800 nm was focused onto the sample and the resulting fluorescence was collected in an
Edinburgh F900 spectrofluorimeter. The relative 2PA cross-sections were obtained from the ratio
of two-photon to one-photon fluorescence of the sample. Time-resolved fluorescence
measurements were carried out in an Edinburgh FLS900 spectrofluorometer after excitation at
370 nm with a diode laser. Lastly, the Dynamic Light Scattering technique (DynaPro
Temperature-Controlled Microsampler) was used to measure the particle size of aggregates. The
sample solutions were initially filtered to remove any extraneous particles before DLS
145
measurements. All spectroscopy measurements were carried out under temperature dependence
to monitor BSA and SOD1 folding, unfolding and aggregation.
4.3 Results and Discussion
4.3.1 Fluram Binding with BSA and SOD1
The first step was to prove the Fluram is binding to investigated BSA and SOD1via
optical absorption and steady fluorescence measurements. Fluram is known to bind to the
Lysines in the protein and forms a covalent bond with the protein40. Therefore, the expected data
should show an increase in the absorbance and fluorescence when the dye is bonded to the
Lysine in the respective proteins. Parts A and B of Figure 4.3 shows the absorbance and
fluorescence data of Fluram binding to BSA and SOD1 respectively. Optical absorption
measurements were carried out for Fluram alone and with BSA and SOD1 at room temperature.
Fluram does not have any absorbance at 370 nm by itself but after binding to, a strong
absorbance with a maximum at 370 nm was seen for both BSA-fluram and SOD1-fluram (Figure
4.3A and B). In addition, the steady fluorescence data illustrate that the Fluram (which is non-
fluorescent reagent) has a strong luminescence after binding to BSA and SOD1 with maximum
at 470 nm and 478 nm, respectively. The result shows that the Fluram is covalently bound to
both BSA and SOD1.
4.3.2 Protein Folding/Unfolding
The folding and unfolding of BSA and SOD1 was studied in order to determine whether
2PA spectroscopy is an effective tool for monitoring the folding and unfolding of proteins. The
hypothesis is that the local electric fields are higher in the folded form and lower in the unfolded
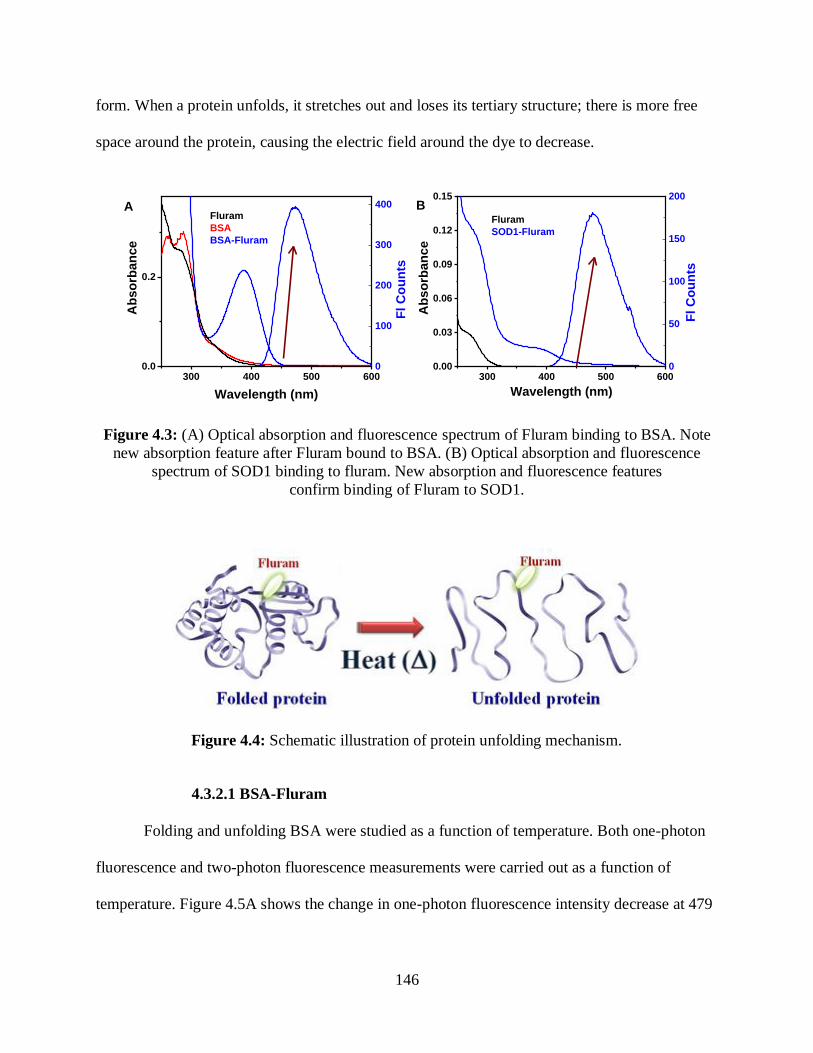
146
form. When a protein unfolds, it stretches out and loses its tertiary structure; there is more free
space around the protein, causing the electric field around the dye to decrease.
300 400 500 6000.0
0.2
Fl
Co
un
ts
Fluram
BSA
BSA-Fluram
Ab
so
rba
nc
e
Wavelength (nm)
A
0
100
200
300
400
300 400 500 6000.00
0.03
0.06
0.09
0.12
0.15B
Fl
Co
un
ts
Fluram
SOD1-Fluram
Ab
so
rba
nc
e
Wavelength (nm)
0
50
100
150
200
Figure 4.3: (A) Optical absorption and fluorescence spectrum of Fluram binding to BSA. Note
new absorption feature after Fluram bound to BSA. (B) Optical absorption and fluorescence
spectrum of SOD1 binding to fluram. New absorption and fluorescence features
confirm binding of Fluram to SOD1.
Figure 4.4: Schematic illustration of protein unfolding mechanism.
4.3.2.1 BSA-Fluram
Folding and unfolding BSA were studied as a function of temperature. Both one-photon
fluorescence and two-photon fluorescence measurements were carried out as a function of
temperature. Figure 4.5A shows the change in one-photon fluorescence intensity decrease at 479

147
nm for BSA-fluram as a function of temperature from 25 to75 oC. A similar trend was observed
for two-photon fluorescence as shown in Figure 4.5B.
The obtained data showed that fluorescence intensity decreased for both one and two-
photon excitation and did not show any special transition about the folding and unfolding of the
protein. On the other hand, the relative 2PA cross-sections that was determined from the ratio of
two-photon to one-photon fluorescence showed a clear indication of when folding and unfolding
occurred. The 2PA cross-sections were able to show the melting transition for BSA. From Figure
4.5C it is obvious that the BSA starts to unfold around 50-60 oC. This data matched well with the
unfolding transition monitored using circular dichroism measurements.
4.3.2.2 SOD1-Fluram
The folding and unfolding of SOD1-fluram was also monitored as a function of
temperature. The SOD1 result was shows similar outcomes to BSA, where both one and two-
photon excitation result didn’t show any interesting transition to monitor the unfolding state in
SODI. Both one and two-photon excitation show decrease in fluorescence as temperature
function Figure 4.6A and 4.6B. While the 2PA cross sections s showed a capability to monitor
SOD1 unfolding transition Figure 4.6C, which demonstrate the importance of using 2PA cross
sections s tool to study protein folding/unfolding states.
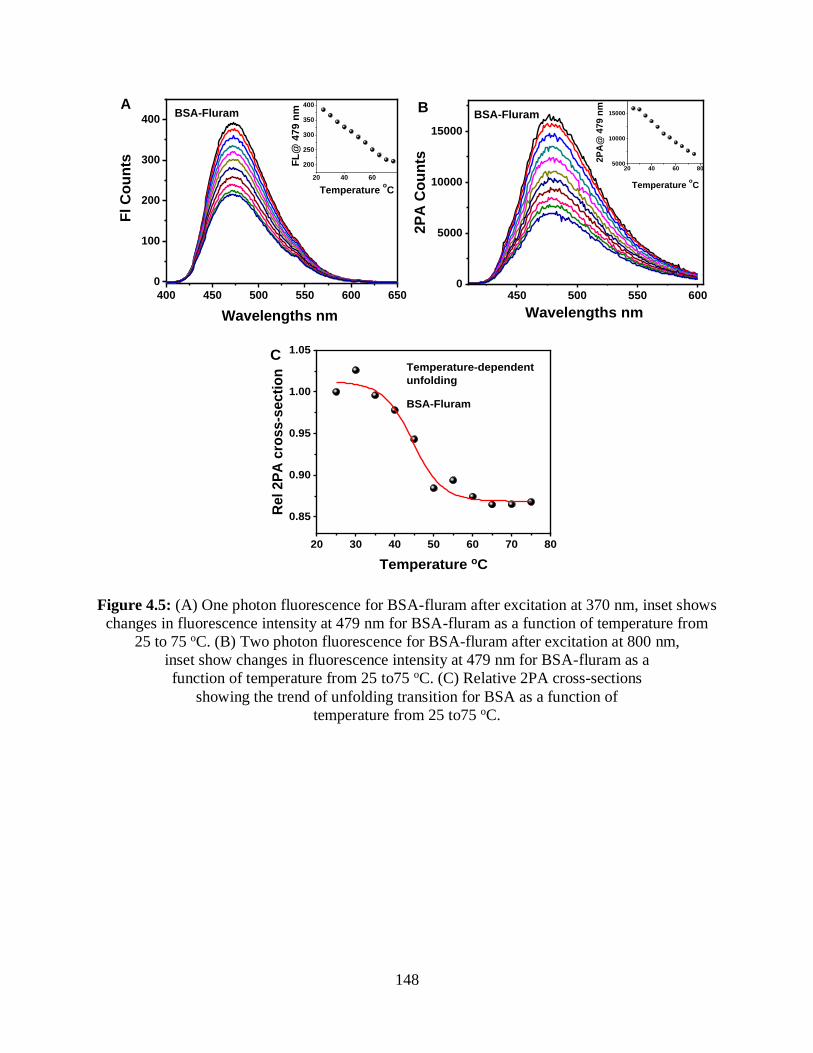
148
400 450 500 550 600 650
0
100
200
300
400BSA-Fluram
Fl
Co
un
ts
Wavelengths nm
A
20 40 60
200
250
300
350
400
FL
@ 4
79
nm
Temperature oC
450 500 550 6000
5000
10000
15000
BSA-Fluram
2P
A C
ou
nts
Wavelengths nm
B
20 40 60 805000
10000
15000
2P
A@
47
9 n
m
Temperature oC
20 30 40 50 60 70 80
0.85
0.90
0.95
1.00
1.05C
Rel
2P
A c
ross-s
ecti
on
Temperature oC
Temperature-dependent
unfolding
BSA-Fluram
Figure 4.5: (A) One photon fluorescence for BSA-fluram after excitation at 370 nm, inset shows
changes in fluorescence intensity at 479 nm for BSA-fluram as a function of temperature from
25 to 75 oC. (B) Two photon fluorescence for BSA-fluram after excitation at 800 nm,
inset show changes in fluorescence intensity at 479 nm for BSA-fluram as a
function of temperature from 25 to75 oC. (C) Relative 2PA cross-sections
showing the trend of unfolding transition for BSA as a function of
temperature from 25 to75 oC.
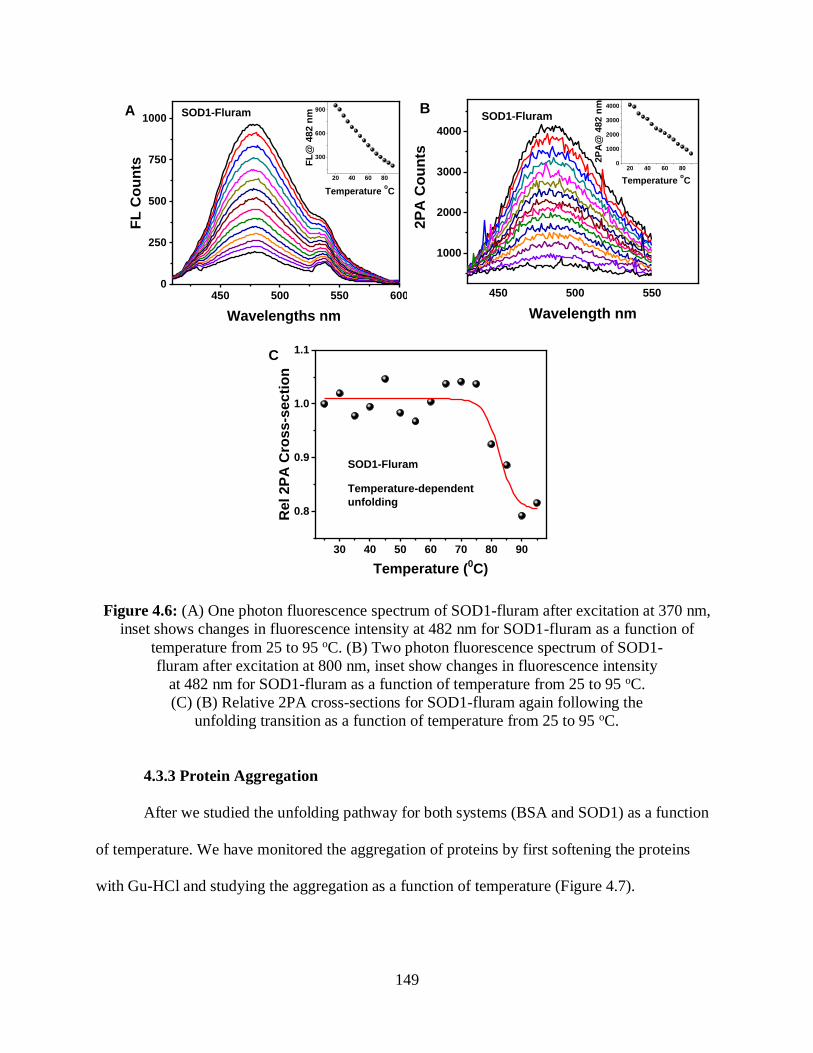
149
450 500 550 6000
250
500
750
1000SOD1-Fluram
FL
Co
un
ts
Wavelengths nm
A
20 40 60 80
300
600
900
FL
@ 4
82
nm
Temperature oC
450 500 550
1000
2000
3000
4000
BSOD1-Fluram
2P
A C
ou
nts
Wavelength nm
20 40 60 800
1000
2000
3000
4000
2P
A@
48
2 n
m
Temperature oC
30 40 50 60 70 80 90
0.8
0.9
1.0
1.1C
Rel
2P
A C
ross
-secti
on
Temperature (0C)
SOD1-Fluram
Temperature-dependent
unfolding
Figure 4.6: (A) One photon fluorescence spectrum of SOD1-fluram after excitation at 370 nm,
inset shows changes in fluorescence intensity at 482 nm for SOD1-fluram as a function of
temperature from 25 to 95 oC. (B) Two photon fluorescence spectrum of SOD1-
fluram after excitation at 800 nm, inset show changes in fluorescence intensity
at 482 nm for SOD1-fluram as a function of temperature from 25 to 95 oC.
(C) (B) Relative 2PA cross-sections for SOD1-fluram again following the
unfolding transition as a function of temperature from 25 to 95 oC.
4.3.3 Protein Aggregation
After we studied the unfolding pathway for both systems (BSA and SOD1) as a function
of temperature. We have monitored the aggregation of proteins by first softening the proteins
with Gu-HCl and studying the aggregation as a function of temperature (Figure 4.7).
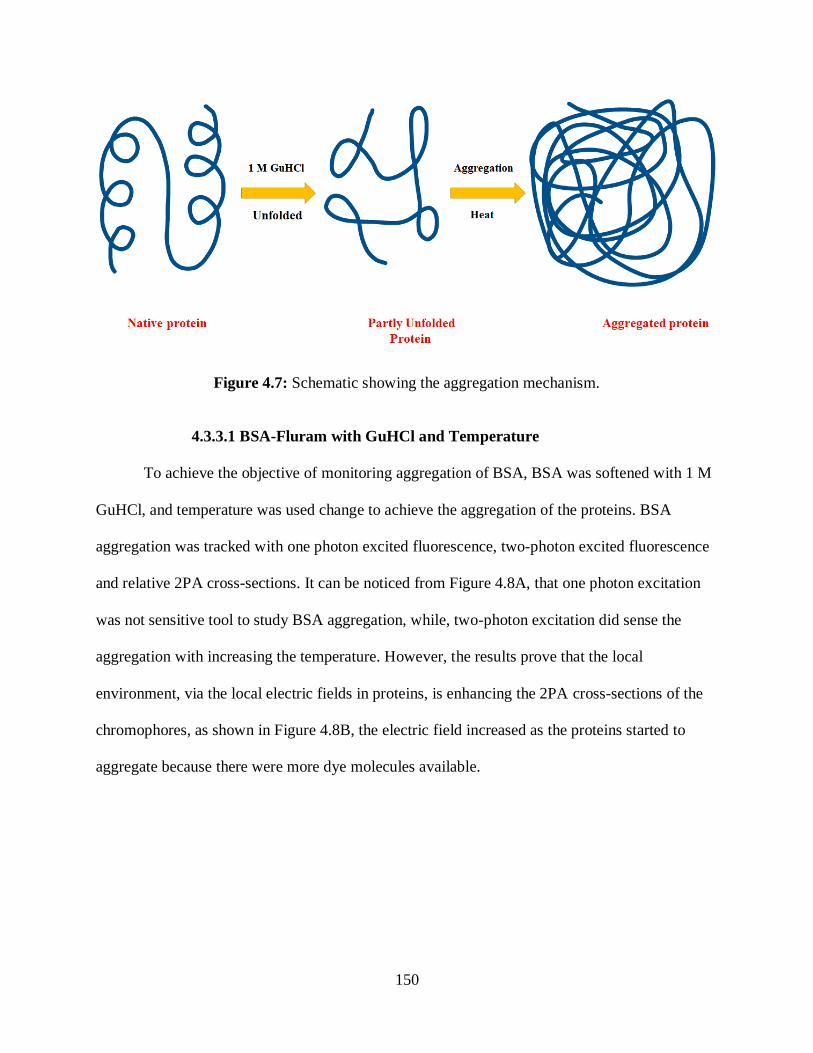
150
Figure 4.7: Schematic showing the aggregation mechanism.
4.3.3.1 BSA-Fluram with GuHCl and Temperature
To achieve the objective of monitoring aggregation of BSA, BSA was softened with 1 M
GuHCl, and temperature was used change to achieve the aggregation of the proteins. BSA
aggregation was tracked with one photon excited fluorescence, two-photon excited fluorescence
and relative 2PA cross-sections. It can be noticed from Figure 4.8A, that one photon excitation
was not sensitive tool to study BSA aggregation, while, two-photon excitation did sense the
aggregation with increasing the temperature. However, the results prove that the local
environment, via the local electric fields in proteins, is enhancing the 2PA cross-sections of the
chromophores, as shown in Figure 4.8B, the electric field increased as the proteins started to
aggregate because there were more dye molecules available.
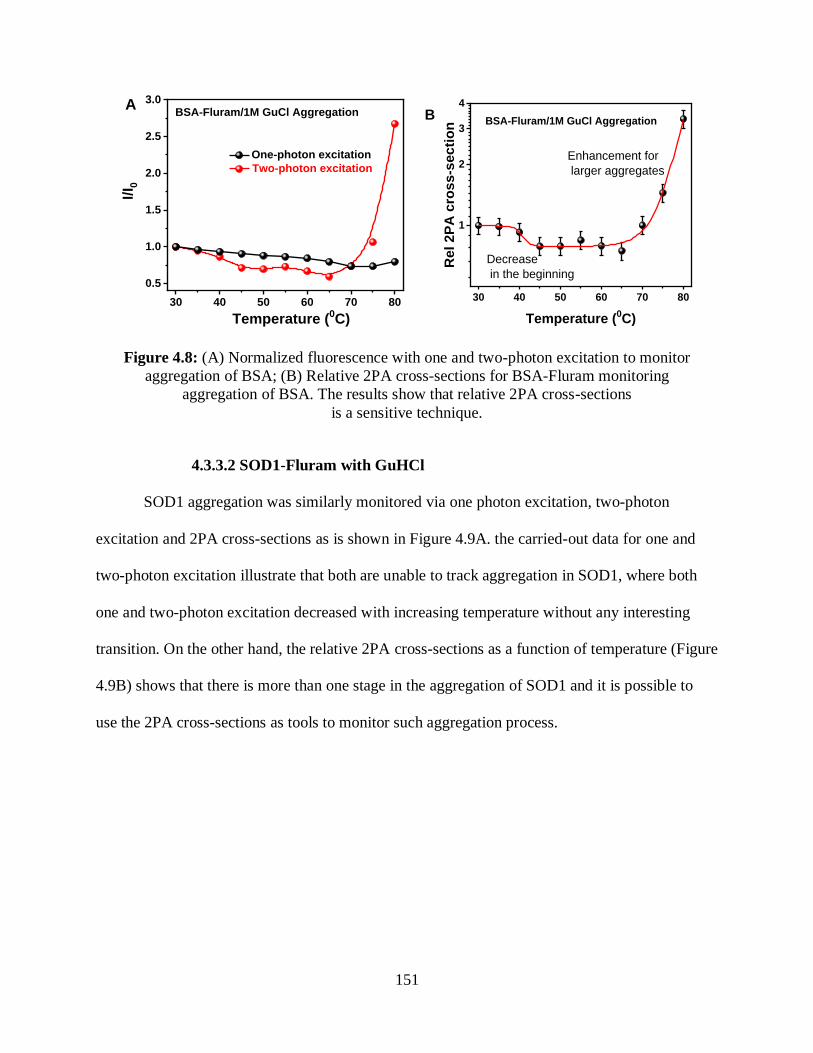
151
30 40 50 60 70 80
0.5
1.0
1.5
2.0
2.5
3.0BSA-Fluram/1M GuCl Aggregation
One-photon excitation
Two-photon excitation
I/I 0
Temperature (0C)
A
30 40 50 60 70 80
1
2
3
4
B
Enhancement for
larger aggregates
Re
l 2
PA
cro
ss
-se
cti
on
Temperature (0C)
BSA-Fluram/1M GuCl Aggregation
Decrease
in the beginning
Figure 4.8: (A) Normalized fluorescence with one and two-photon excitation to monitor
aggregation of BSA; (B) Relative 2PA cross-sections for BSA-Fluram monitoring
aggregation of BSA. The results show that relative 2PA cross-sections
is a sensitive technique.
4.3.3.2 SOD1-Fluram with GuHCl
SOD1 aggregation was similarly monitored via one photon excitation, two-photon
excitation and 2PA cross-sections as is shown in Figure 4.9A. the carried-out data for one and
two-photon excitation illustrate that both are unable to track aggregation in SOD1, where both
one and two-photon excitation decreased with increasing temperature without any interesting
transition. On the other hand, the relative 2PA cross-sections as a function of temperature (Figure
4.9B) shows that there is more than one stage in the aggregation of SOD1 and it is possible to
use the 2PA cross-sections as tools to monitor such aggregation process.
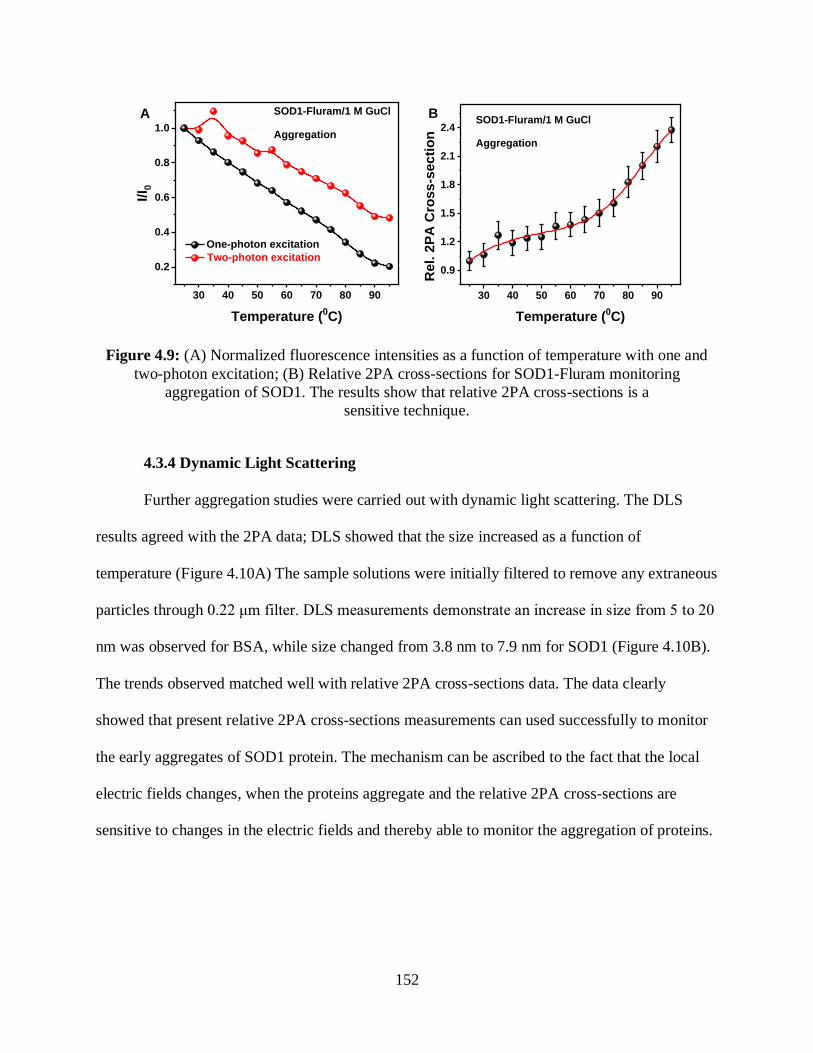
152
30 40 50 60 70 80 90
0.2
0.4
0.6
0.8
1.0
SOD1-Fluram/1 M GuCl
Aggregation
One-photon excitation
Two-photon excitation
I/I 0
Temperature (0C)
A
30 40 50 60 70 80 90
0.9
1.2
1.5
1.8
2.1
2.4
B
Rel.
2P
A C
ross
-secti
on
Temperature (0C)
SOD1-Fluram/1 M GuCl
Aggregation
Figure 4.9: (A) Normalized fluorescence intensities as a function of temperature with one and
two-photon excitation; (B) Relative 2PA cross-sections for SOD1-Fluram monitoring
aggregation of SOD1. The results show that relative 2PA cross-sections is a
sensitive technique.
4.3.4 Dynamic Light Scattering
Further aggregation studies were carried out with dynamic light scattering. The DLS
results agreed with the 2PA data; DLS showed that the size increased as a function of
temperature (Figure 4.10A) The sample solutions were initially filtered to remove any extraneous
particles through 0.22 μm filter. DLS measurements demonstrate an increase in size from 5 to 20
nm was observed for BSA, while size changed from 3.8 nm to 7.9 nm for SOD1 (Figure 4.10B).
The trends observed matched well with relative 2PA cross-sections data. The data clearly
showed that present relative 2PA cross-sections measurements can used successfully to monitor
the early aggregates of SOD1 protein. The mechanism can be ascribed to the fact that the local
electric fields changes, when the proteins aggregate and the relative 2PA cross-sections are
sensitive to changes in the electric fields and thereby able to monitor the aggregation of proteins.
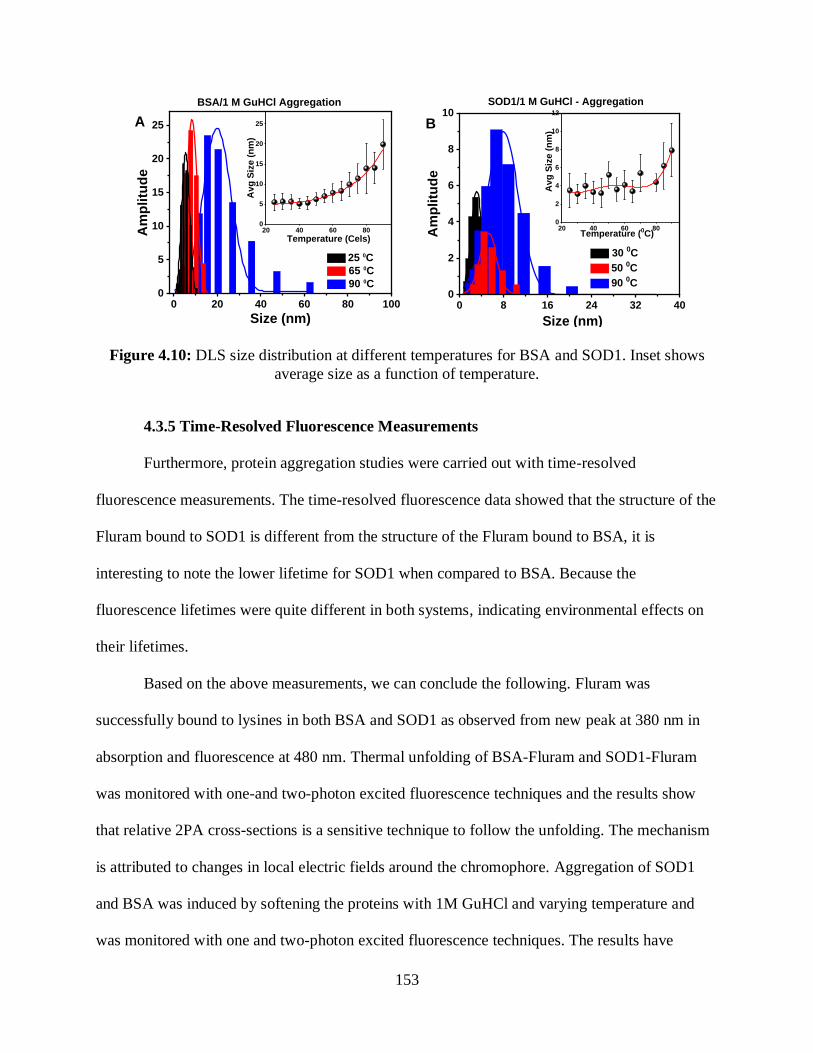
153
0 20 40 60 80 1000
5
10
15
20
25
25 0C
65 0C
90 0C
Am
pli
tud
e
Size (nm)
BSA/1 M GuHCl Aggregation
20 40 60 800
5
10
15
20
25
Av
g S
ize
(n
m)
Temperature (Cels)
A
0 8 16 24 32 400
2
4
6
8
10B
30 0C
50 0C
90 0C
Am
pli
tud
e
Size (nm)
SOD1/1 M GuHCl - Aggregation
20 40 60 800
2
4
6
8
10
12
Av
g S
ize
(n
m)
Temperature (0C)
Figure 4.10: DLS size distribution at different temperatures for BSA and SOD1. Inset shows
average size as a function of temperature.
4.3.5 Time-Resolved Fluorescence Measurements
Furthermore, protein aggregation studies were carried out with time-resolved
fluorescence measurements. The time-resolved fluorescence data showed that the structure of the
Fluram bound to SOD1 is different from the structure of the Fluram bound to BSA, it is
interesting to note the lower lifetime for SOD1 when compared to BSA. Because the
fluorescence lifetimes were quite different in both systems, indicating environmental effects on
their lifetimes.
Based on the above measurements, we can conclude the following. Fluram was
successfully bound to lysines in both BSA and SOD1 as observed from new peak at 380 nm in
absorption and fluorescence at 480 nm. Thermal unfolding of BSA-Fluram and SOD1-Fluram
was monitored with one-and two-photon excited fluorescence techniques and the results show
that relative 2PA cross-sections is a sensitive technique to follow the unfolding. The mechanism
is attributed to changes in local electric fields around the chromophore. Aggregation of SOD1
and BSA was induced by softening the proteins with 1M GuHCl and varying temperature and
was monitored with one and two-photon excited fluorescence techniques. The results have
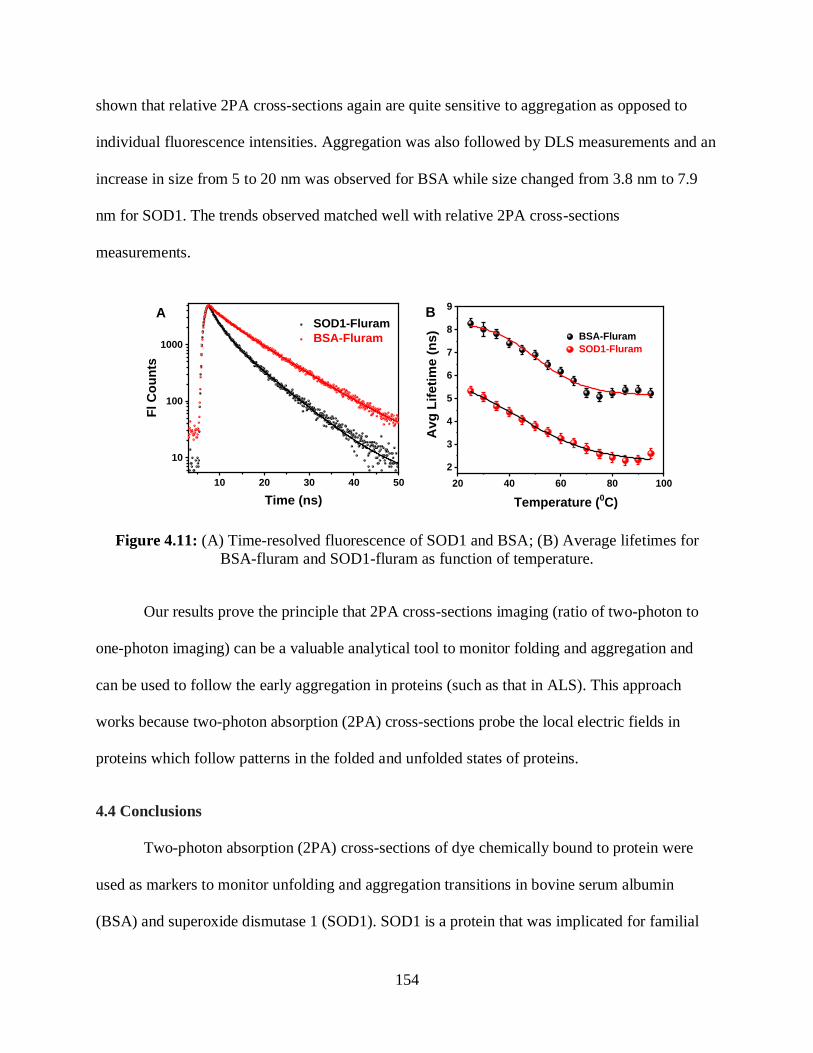
154
shown that relative 2PA cross-sections again are quite sensitive to aggregation as opposed to
individual fluorescence intensities. Aggregation was also followed by DLS measurements and an
increase in size from 5 to 20 nm was observed for BSA while size changed from 3.8 nm to 7.9
nm for SOD1. The trends observed matched well with relative 2PA cross-sections
measurements.
10 20 30 40 50
10
100
1000
A SOD1-Fluram
BSA-Fluram
Fl C
ou
nts
Time (ns)
20 40 60 80 100
2
3
4
5
6
7
8
9B
BSA-Fluram
SOD1-Fluram
Avg
Lif
eti
me (
ns)
Temperature (0C)
Figure 4.11: (A) Time-resolved fluorescence of SOD1 and BSA; (B) Average lifetimes for
BSA-fluram and SOD1-fluram as function of temperature.
Our results prove the principle that 2PA cross-sections imaging (ratio of two-photon to
one-photon imaging) can be a valuable analytical tool to monitor folding and aggregation and
can be used to follow the early aggregation in proteins (such as that in ALS). This approach
works because two-photon absorption (2PA) cross-sections probe the local electric fields in
proteins which follow patterns in the folded and unfolded states of proteins.
4.4 Conclusions
Two-photon absorption (2PA) cross-sections of dye chemically bound to protein were
used as markers to monitor unfolding and aggregation transitions in bovine serum albumin
(BSA) and superoxide dismutase 1 (SOD1). SOD1 is a protein that was implicated for familial
155
form of Amyotropic Lateral Scelrosis (ALS). Aggregation of SOD1 considered to be a major
reason for the death of neurons responsible for muscle function. In search of developing such
analytical tools, the feasibility of 2PA cross-sections of dyes bound to proteins was investigated
for probing the folding and aggregation of SOD1. The hypothesis behind the project is that two-
photon absorption (2PA) cross-sections probe the local electric fields in proteins which follow
patterns in the folded and unfolded states of proteins. Therefore, it can be used to probe different
conformations of proteins and can be used to image early aggregation in SOD1. The unfolding of
BSA and SOD1 was carried out by varying the temperature (from 25 to 90 0C) and was
monitored by one and two-photon excited fluorescence of Fluram bound to the proteins. Fluram,
a primary amine binding dye readily binds to lysine of proteins to give rise fluorescence in the
visible region. Interestingly, 2PA cross-sections (ratio of two-photon to one photon fluorescence)
were able to monitor unfolding sensitively over other optical techniques. The mechanism was
attributed to the decrease in electric fields around the fluorophore during unfolding. The
aggregations of SOD1 and BSA were studied by adding 1 M GuHCl to soften the protein and
temperature variation to monitor it. We used UV-vis absorption, one and two-photon excited
fluorescence, time-resolved fluorescence and dynamic light scattering techniques. The results
have shown that 2PA cross-sections of Fluram bound to proteins can selectively monitor the
aggregation of proteins and the mechanism is again ascribed to the changes in local electric
fields around the probe during aggregation.
4.5 Chapter Summary
• Two known protein were chosen for this investigation which are BSA and SOD1.
• Fluram is non-fluorescent dye but it will it will fluorescent when it binds with primary
amines.
156
• Fluram was successfully bound to Lysines in both BSA and SOD1 as observed from a
new peak in absorption at 380 nm and fluorescence at 480 nm.
• The Fluram bound to SOD1 is different from that of Fluram bound to BSA as the
fluorescence lifetimes are quite different in both systems, indicating that the environment
influences their lifetimes.
• Thermal unfolding of BSA-Fluram and SOD1-Fluram was monitored with one-and two-
photon excited fluorescence techniques and the results show that relative 2PA cross-
sections is a sensitive technique to follow the unfolding. The mechanism is attributed to
changes in local electric fields around the chromophore.
• Aggregation of SOD1 and BSA was induced by softening the proteins with
1M GuHCl and varying temperature and was monitored with one and two-photon excited
fluorescence techniques. The results have shown that relative 2PA cross-sections again
are quite sensitive to aggregation as opposed to individual fluorescence intensities.
• Aggregation was also followed by DLS measurements and an increase in size from 5 to
20 nm was observed for BSA while size changed from 3.8 nm to 7.9 nm for SOD1. The
trends observed matched well with relative 2PA cross-sections measurements
• Our results prove the principle that 2PA cross-sections imaging (ratio of two-photon to
one-photon imaging) can be a valuable analytical tool to monitor folding and
aggregation.

157
4.6 References
(1) Cooper, G. M. Protein Folding and Processing. The Cell: A Molecular Approach. 2nd
edition 2000.
(2) Berg, J. M.; Tymoczko, J. L.; Stryer, L. Primary Structure: Amino Acids Are Linked by
Peptide Bonds to Form Polypeptide Chains. Biochemistry. 5th edition 2002.
(3) Kister, A. Amino Acid Distribution Rules Predict Protein Fold: Protein Grammar for Beta-
Strand Sandwich-Like Structures. Biomolecules 2015, 5 (1), 41–59.
https://doi.org/10.3390/biom5010041.
(4) Jagannathan, B.; Marqusee, S. Protein Folding and Unfolding Under Force. Biopolymers
2013, 99 (11), 860–869. https://doi.org/10.1002/bip.22321.
(5) Leeson, D. T.; Gai, F.; Rodriguez, H. M.; Gregoret, L. M.; Dyer, R. B. Protein Folding and
Unfolding on a Complex Energy Landscape. PNAS 2000, 97 (6), 2527–2532.
https://doi.org/10.1073/pnas.040580397.
(6) Schanda, P.; Forge, V.; Brutscher, B. Protein Folding and Unfolding Studied at Atomic
Resolution by Fast Two-Dimensional NMR Spectroscopy. PNAS 2007, 104 (27), 11257–
11262. https://doi.org/10.1073/pnas.0702069104.
(7) Kaur, S. J.; McKeown, S. R.; Rashid, S. Mutant SOD1 Mediated Pathogenesis of
Amyotrophic Lateral Sclerosis. Gene 2016, 577 (2), 109–118.
https://doi.org/10.1016/j.gene.2015.11.049.
(8) Pansarasa, O.; Bordoni, M.; Diamanti, L.; Sproviero, D.; Gagliardi, S.; Cereda, C. SOD1 in
Amyotrophic Lateral Sclerosis: “Ambivalent” Behavior Connected to the Disease. Int J Mol
Sci 2018, 19 (5). https://doi.org/10.3390/ijms19051345.

158
(9) Chen, S.; Sayana, P.; Zhang, X.; Le, W. Genetics of Amyotrophic Lateral Sclerosis: An
Update. Molecular Neurodegeneration 2013, 8 (1), 28. https://doi.org/10.1186/1750-1326-
8-28.
(10) Acevedo-Arozena, A.; Kalmar, B.; Essa, S.; Ricketts, T.; Joyce, P.; Kent, R.; Rowe, C.;
Parker, A.; Gray, A.; Hafezparast, M.; et al. A Comprehensive Assessment of the
SOD1G93A Low-Copy Transgenic Mouse, Which Models Human Amyotrophic Lateral
Sclerosis. Dis Model Mech 2011, 4 (5), 686–700. https://doi.org/10.1242/dmm.007237.
(11) Andersen, P. M.; Al-Chalabi, A. Clinical Genetics of Amyotrophic Lateral Sclerosis: What
Do We Really Know? Nature Reviews Neurology 2011, 7 (11), 603–615.
https://doi.org/10.1038/nrneurol.2011.150.
(12) Rothstein, J. D. Current Hypotheses for the Underlying Biology of Amyotrophic Lateral
Sclerosis. Annals of Neurology 2009, 65 (S1), S3–S9. https://doi.org/10.1002/ana.21543.
(13) Sau, D.; De Biasi, S.; Vitellaro-Zuccarello, L.; Riso, P.; Guarnieri, S.; Porrini, M.; Simeoni,
S.; Crippa, V.; Onesto, E.; Palazzolo, I.; et al. Mutation of SOD1 in ALS: A Gain of a Loss
of Function. Hum Mol Genet 2007, 16 (13), 1604–1618.
https://doi.org/10.1093/hmg/ddm110.
(14) Zarei, S.; Carr, K.; Reiley, L.; Diaz, K.; Guerra, O.; Altamirano, P. F.; Pagani, W.; Lodin,
D.; Orozco, G.; Chinea, A. A Comprehensive Review of Amyotrophic Lateral Sclerosis.
Surg Neurol Int 2015, 6. https://doi.org/10.4103/2152-7806.169561.
(15) Fridovich, I. Superoxide Radical and Superoxide Dismutases. Annual Review of
Biochemistry 1995, 64 (1), 97–112. https://doi.org/10.1146/annurev.bi.64.070195.000525.
(16) Rosen, D. R.; Siddique, T.; Patterson, D.; Figlewicz, D. A.; Sapp, P.; Hentati, A.;
Donaldson, D.; Goto, J.; O’Regan, J. P.; Deng, H.-X.; et al. Mutations in Cu/Zn Superoxide
159
Dismutase Gene Are Associated with Familial Amyotrophic Lateral Sclerosis. Nature 1993,
362 (6415), 59–62. https://doi.org/10.1038/362059a0.
(17) Reddi, A. R.; Culotta, V. C. SOD1 Integrates Signals from Oxygen and Glucose to Repress
Respiration. Cell 2013, 152 (1–2), 224–235. https://doi.org/10.1016/j.cell.2012.11.046.
(18) Rotunno, M. S.; Bosco, D. A. An Emerging Role for Misfolded Wild-Type SOD1 in
Sporadic ALS Pathogenesis. Front. Cell. Neurosci. 2013, 7.
https://doi.org/10.3389/fncel.2013.00253.
(19) Paré, B.; Lehmann, M.; Beaudin, M.; Nordström, U.; Saikali, S.; Julien, J.-P.; Gilthorpe, J.
D.; Marklund, S. L.; Cashman, N. R.; Andersen, P. M.; et al. Misfolded SOD1 Pathology in
Sporadic Amyotrophic Lateral Sclerosis. Scientific Reports 2018, 8 (1), 14223.
https://doi.org/10.1038/s41598-018-31773-z.
(20) Shaw, B. F.; Valentine, J. S. How Do ALS-Associated Mutations in Superoxide Dismutase
1 Promote Aggregation of the Protein? Trends in Biochemical Sciences 2007, 32 (2), 78–
85. https://doi.org/10.1016/j.tibs.2006.12.005.
(21) Valentine, J. S.; Doucette, P. A.; Zittin Potter, S. Copper-Zinc Superoxide Dismutase and
Amyotrophic Lateral Sclerosis. Annual Review of Biochemistry 2005, 74 (1), 563–593.
https://doi.org/10.1146/annurev.biochem.72.121801.161647.
(22) Rakhit, R.; Robertson, J.; Velde, C. V.; Horne, P.; Ruth, D. M.; Griffin, J.; Cleveland, D.
W.; Cashman, N. R.; Chakrabartty, A. An Immunological Epitope Selective for
Pathological Monomer-Misfolded SOD1 in ALS. Nature Medicine 2007, 13 (6), 754–759.
https://doi.org/10.1038/nm1559.
160
(23) Chattopadhyay, M.; Valentine, J. S. Aggregation of Copper–Zinc Superoxide Dismutase in
Familial and Sporadic ALS. Antioxidants & Redox Signaling 2009, 11 (7), 1603–1614.
https://doi.org/10.1089/ars.2009.2536.
(24) Bosco, D. A.; Morfini, G.; Karabacak, N. M.; Song, Y.; Gros-Louis, F.; Pasinelli, P.;
Goolsby, H.; Fontaine, B. A.; Lemay, N.; McKenna-Yasek, D.; et al. Wild-Type and
Mutant SOD1 Share an Aberrant Conformation and a Common Pathogenic Pathway in
ALS. Nature Neuroscience 2010, 13 (11), 1396–1403. https://doi.org/10.1038/nn.2660.
(25) Grad, L. I.; Yerbury, J. J.; Turner, B. J.; Guest, W. C.; Pokrishevsky, E.; O’Neill, M. A.;
Yanai, A.; Silverman, J. M.; Zeineddine, R.; Corcoran, L.; et al. Intercellular Propagated
Misfolding of Wild-Type Cu/Zn Superoxide Dismutase Occurs via Exosome-Dependent
and -Independent Mechanisms. PNAS 2014, 111 (9), 3620–3625.
https://doi.org/10.1073/pnas.1312245111.
(26) Tokuda, E.; Anzai, I.; Nomura, T.; Toichi, K.; Watanabe, M.; Ohara, S.; Watanabe, S.;
Yamanaka, K.; Morisaki, Y.; Misawa, H.; et al. Immunochemical Characterization on
Pathological Oligomers of Mutant Cu/Zn-Superoxide Dismutase in Amyotrophic Lateral
Sclerosis. Molecular Neurodegeneration 2017, 12 (1), 2. https://doi.org/10.1186/s13024-
016-0145-9.
(27) Guo, Z.; Kindy, M. S.; Kruman, I.; Mattson, M. P. ALS-Linked Cu/Zn-SOD Mutation
Impairs Cerebral Synaptic Glucose and Glutamate Transport and Exacerbates Ischemic
Brain Injury. J Cereb Blood Flow Metab 2000, 20 (3), 463–468.
https://doi.org/10.1097/00004647-200003000-00004.

161
(28) Karch, C. M.; Prudencio, M.; Winkler, D. D.; Hart, P. J.; Borchelt, D. R. Role of Mutant
SOD1 Disulfide Oxidation and Aggregation in the Pathogenesis of Familial ALS. PNAS
2009, 106 (19), 7774–7779. https://doi.org/10.1073/pnas.0902505106.
(29) Wang, J.; Xu, G.; Li, H.; Gonzales, V.; Fromholt, D.; Karch, C.; Copeland, N. G.; Jenkins,
N. A.; Borchelt, D. R. Somatodendritic Accumulation of Misfolded SOD1-L126Z in Motor
Neurons Mediates Degeneration: ΑB-Crystallin Modulates Aggregation. Hum Mol Genet
2005, 14 (16), 2335–2347. https://doi.org/10.1093/hmg/ddi236.
(30) Banci, L.; Bertini, I.; Boca, M.; Calderone, V.; Cantini, F.; Girotto, S.; Vieru, M. Structural
and Dynamic Aspects Related to Oligomerization of Apo SOD1 and Its Mutants.
Proc.Natl.Acad.Sci.USA 2009, 106, 6980–6985. https://doi.org/10.2210/pdb3ecu/pdb.
(31) Shaw, B. F.; Valentine, J. S. How Do ALS-Associated Mutations in Superoxide Dismutase
1 Promote Aggregation of the Protein? Trends in Biochemical Sciences 2007, 32 (2), 78–
85. https://doi.org/10.1016/j.tibs.2006.12.005.
(32) Miller, L. M.; Bourassa, M. W.; Smith, R. J. FTIR Spectroscopic Imaging of Protein
Aggregation in Living Cells. Biochimica et Biophysica Acta (BBA) - Biomembranes 2013,
1828 (10), 2339–2346. https://doi.org/10.1016/j.bbamem.2013.01.014.
(33) Pedersen, J. T.; Heegaard, N. H. H. Analysis of Protein Aggregation in Neurodegenerative
Disease. Anal. Chem. 2013, 85 (9), 4215–4227. https://doi.org/10.1021/ac400023c.
(34) Agbas, A.; Hui, D.; Wang, X.; Tek, V.; Zaidi, A.; Michaelis, E. K. Activation of Brain
Calcineurin (Cn) by Cu-Zn Superoxide Dismutase (SOD1) Depends on Direct SOD1–Cn
Protein Interactions Occurring in Vitro and in Vivo. Biochem J 2007, 405 (Pt 1), 51–59.
https://doi.org/10.1042/BJ20061202.

162
(35) Yin Win, K.; Peng Teng, C.; Jin, M. L. B.; Ye, E.; C. Tansil, N.; Han, M.-Y. On-Site
Chemical Reaction Lights up Protein Assemblies in Cells. Analyst 2012, 137 (10), 2328–
2332. https://doi.org/10.1039/C2AN16123K.
(36) Flach, K.; Hilbrich, I.; Schiffmann, A.; Gärtner, U.; Krüger, M.; Leonhardt, M.;
Waschipky, H.; Wick, L.; Arendt, T.; Holzer, M. Tau Oligomers Impair Artificial
Membrane Integrity and Cellular Viability. J. Biol. Chem. 2012, 287 (52), 43223–43233.
https://doi.org/10.1074/jbc.M112.396176.
(37) Motoyoshiya, J.; Tomioka, S.; Kobayashi, D.; Fujimoto, T. A New Cyano-Substituted
Fluorescamine Superior to Its Original Form as a Fluorescent Probe for Amino Acid
Detection. Tetrahedron Letters 2018, 59 (12), 1104–1107.
https://doi.org/10.1016/j.tetlet.2018.02.011.
(38) Bujacz, A. Structures of Bovine, Equine and Leporine Serum Albumin. Acta
Crystallogr.,Sect.D 2012, 68, 1278–1289. https://doi.org/10.2210/pdb4f5s/pdb.
(39) Wingfield, P. T. Use of Protein Folding Reagents. Curr Protoc Protein Sci 2001,
APPENDIX 3, Appendix-3A. https://doi.org/10.1002/0471140864.psa03as00.
(40) Toro, T. B.; Watt, T. J. KDAC8 Substrate Specificity Quantified by a Biologically
Relevant, Label‐free Deacetylation Assay. Protein Sci 2015, 24 (12), 2020–2032.
https://doi.org/10.1002/pro.2813.
163
CHAPTER 5
SINGLE AND TWO-PHOTON DNA-BASED FLUORESCENCE SENSORS FOR Pb2+
AND Hg2+
5.1 Introduction
In Chapters 3 and 4, we have focused on the use of relative 2PA cross-sections of
chromophores solubilized in organized self-assemblies as a tool to monitor the stabilization of
non-canonical structures of DNA as well as following the protein folding and aggregation. In this
Chapter, we have focused on using this knowledge to develop a one- and two-photon
fluorescence-based biosensor for the detection of toxic heavy metal ions.
Heavy metals are abundant, naturally occurring elements with densities at least five times
greater than water1. Their many applications in various fields of modern science have led to their
abundant distribution, as well as for their widespread environmental contamination. Natural
events, such as volcanic activity, weathering, atmospheric deposition, and soil erosion of metal
ions all can contribute to heavy metal pollution and do so in significant respects2. But while often
heavy metals receive a negative reputation for their toxic nature, their contribution towards the
poisoning of various environments has been largely catalyzed by anthropogenic activities such as
mining, industrial production, industrial emissions from power plants and incinerators, fertilizer,
forest fires, and even the modern lifestyle consumables1,3,4. Whatever were the heavy metals
contamination reasons and sources, it is becoming an increasingly prominent ecological and
global health concern. The severity with which heavy metal ions pollute even in relatively small
concentrations, their impact is much more severe for human health. Some of these heavy metals
play vital biological functions in living organisms mechanisms such as iron, copper, manganese,
cobalt, zinc and molybdenum. However, all heavy metals are considered toxic at higher

164
concentrations1,5,6. Heavy metals impact living organisms in two ways: through their
accumulation in specific organ or binding to a protein and replacing the metal in their original
place6,7.
Some heavy metals, especially those such as lead (Pb2+) and mercury (Hg2+), have no
known beneficial effects on organic life, and can cause serious, even fatal illness over time as
shown in table 5.16,8–10. The degree of toxicity of lead and mercury result from their ability to
bind with cell components such as DNA and protein sites, by displacing other vital minerals
from their natural binding locations, and confusing the coherence of the system; such inorganic
heavy metals can readily cause cell malfunction, DNA damage, and very grave health
concerns2,6,8. With regards to lead, chronic exposure to and subsequent bioaccumulation been
proven to impact the body’s ability to function efficiently, effectively, and healthily, impacting
the mechanisms of the kidneys and liver as well as the central nervous, hematopoietic, endocrine,
and reproductive systems11–13. For an example, lead absorbed by a pregnant mother is readily
transferred to the developing fetus, and prenatal exposure to lead has been linked with lower
birth weights and early, preterm delivery alongside neuro-developmental abnormalities14. The
greatest danger; however, awaits children: due to their smaller blood capacity and biomass14.
Pb+2 has attracted more attention due to its variety of resources and consumption.
However, Hg+2 is very important because, despite its limited contaminated resources compared
to Pb+2, it remains highly hazardous because of its severity effect even at low concentrations.
Studies show that enzymatic activity within those exposed to mercury produce genotoxic
alterations and suggest that even relatively low levels of exposures to mercury inhibits enzyme
activity and induces oxidative stress in the cells. Many contests that mercurial exposure has a
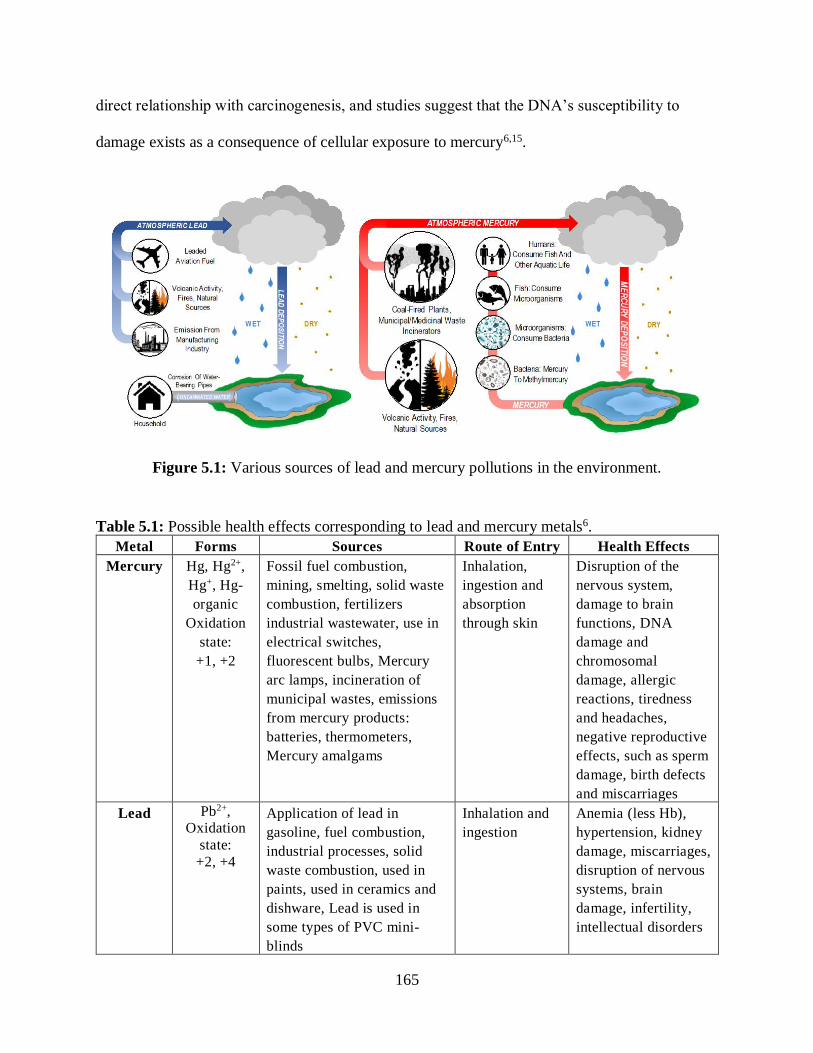
165
direct relationship with carcinogenesis, and studies suggest that the DNA’s susceptibility to
damage exists as a consequence of cellular exposure to mercury6,15.
Figure 5.1: Various sources of lead and mercury pollutions in the environment.
Table 5.1: Possible health effects corresponding to lead and mercury metals6.
Metal Forms Sources Route of Entry Health Effects
Mercury Hg, Hg2+,
Hg+, Hg-
organic
Oxidation
state:
+1, +2
Fossil fuel combustion,
mining, smelting, solid waste
combustion, fertilizers
industrial wastewater, use in
electrical switches,
fluorescent bulbs, Mercury
arc lamps, incineration of
municipal wastes, emissions
from mercury products:
batteries, thermometers,
Mercury amalgams
Inhalation,
ingestion and
absorption
through skin
Disruption of the
nervous system,
damage to brain
functions, DNA
damage and
chromosomal
damage, allergic
reactions, tiredness
and headaches,
negative reproductive
effects, such as sperm
damage, birth defects
and miscarriages
Lead Pb2+,
Oxidation
state:
+2, +4
Application of lead in
gasoline, fuel combustion,
industrial processes, solid
waste combustion, used in
paints, used in ceramics and
dishware, Lead is used in
some types of PVC mini-
blinds
Inhalation and
ingestion
Anemia (less Hb),
hypertension, kidney
damage, miscarriages,
disruption of nervous
systems, brain
damage, infertility,
intellectual disorders
166
Consequently, the need is there for developing sensitive, accurate, and selective method
of detecting the presence of heavy metal ions especially Pb2+ and Hg2+. While conventional
methods used for Pb2+ and Hg2+ detections such as inductively coupled plasma-mass
spectroscopy (ICP-MS), anodic stripping voltammetry (ASV) inductive coupled plasma atomic
emission spectrometry (ICP-AES) and atomic absorption spectroscopy have been proven to
demonstrate accuracy and sensitivity, these methods often require complicated multistage sample
preparation and sophisticated, expensive equipment, failing to account for the more realistic
aspects of on-site detection16–20. Therefore, there is a need to develop novel approaches for
sensitive, selective methods for the detection of Pb2+ and Hg2+ that can be used for on-site
detection.
In recent years, the use of functional nucleic acid-based sensors has shown increasing
potential in the detection of heavy metal ions, where specific oligonucleotide ligand is designed
for particular heavy metal ion selectively. This method of sensing is based primarily upon the
observation of shifts in the fluorescence spectrum that take place within the system of a G-
Quadruplex that forms at room temperature upon encounter with the particular metal ion20–24.
One of the most promising of non-canonical structure that is used in biosensor is G-Quadruplex,
as it is one of the rigid structures and needs a metal ion to form it. The binding of particular
heavy metal ions within the G-Quadruplex structure would thus provide an effective mode of
detection10,25,26. In G-Quadruplex, four guanine bases will form a guanine tetrad through
Hoogsteen hydrogen-bonding, then another guanine tetrads (based on the number and location of
guanine bases) will be form in the top of each other and form G-Quadruplex27,28. Due to the
unique structure of G-Quadruplex, it is extensively used as signal amplifier in numerous
biosensors28–31.
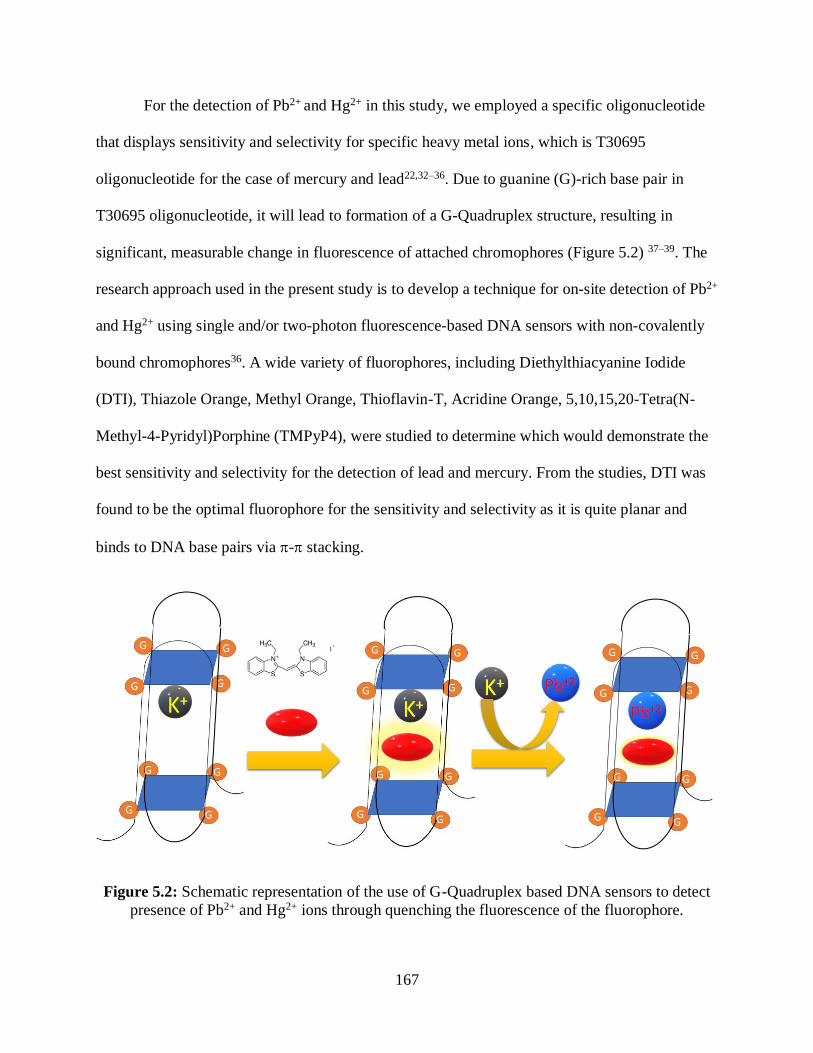
167
For the detection of Pb2+ and Hg2+ in this study, we employed a specific oligonucleotide
that displays sensitivity and selectivity for specific heavy metal ions, which is T30695
oligonucleotide for the case of mercury and lead22,32–36. Due to guanine (G)-rich base pair in
T30695 oligonucleotide, it will lead to formation of a G-Quadruplex structure, resulting in
significant, measurable change in fluorescence of attached chromophores (Figure 5.2) 37–39. The
research approach used in the present study is to develop a technique for on-site detection of Pb2+
and Hg2+ using single and/or two-photon fluorescence-based DNA sensors with non-covalently
bound chromophores36. A wide variety of fluorophores, including Diethylthiacyanine Iodide
(DTI), Thiazole Orange, Methyl Orange, Thioflavin-T, Acridine Orange, 5,10,15,20-Tetra(N-
Methyl-4-Pyridyl)Porphine (TMPyP4), were studied to determine which would demonstrate the
best sensitivity and selectivity for the detection of lead and mercury. From the studies, DTI was
found to be the optimal fluorophore for the sensitivity and selectivity as it is quite planar and
binds to DNA base pairs via - stacking.
Figure 5.2: Schematic representation of the use of G-Quadruplex based DNA sensors to detect
presence of Pb2+ and Hg2+ ions through quenching the fluorescence of the fluorophore.
168
5.2 Materials and Methods
5.2.1 Materials
For this investigation, T30695 primary oligonucleotides was selected due to its ability to
form a stable G-Quadruplex and bind with both Pb2+ and Hg2+. T30695 was synthesized by
Integrated DNA Technologies and the sequence is as follows:
T30695: 5'-GGGTGGGTGGGTGGGT-3'
In addition, a tris-acetate buffer (10 mM, pH 8.0) buffer was prepared from tris hydrochloride,
sodium acetate, and ultrapure water obtained from the Milli-Q system. The DNA stock solutions
were then prepared and annealed with 100 mM of KCl in tris buffer. Aqueous metal ion stock
solutions were also prepared in tris buffer for Pb2+, Hg2+, Zn2+, Cd2+, Na+, Fe2+, Cu2+, K+, Co2+,
Ni2+, and Mn2+.
Ultimately, diethylthiacyanine iodide (DTI, 1 mM) was determined to be the most
effective fluorophore and was consequently added to each of the examined samples, illuminating
the shifts or lack thereof in the fluorescence of the DNA sequences upon their exposure to both
Pb2+ and Hg2+ and the other prepared metals. For this investigation, three classes of samples were
prepared throughout the experiment: native T30695 DNA samples (those devoid of the heavy
metals) as a control, and Pb2+ and Hg2+ samples with T30695 used for the testing of the DNA
sensitivity, various metal ion samples used for selectivity tests. Each sample used for the
measurements was prepared to reach 1 mL, and contained both DTI (20 μM) and 100 μL of an
T30695 oligonucleotide solution and a certain volume of the prepared tris buffer, which was
introduced as a sample’s final component in order to bring the total volume of each to 1 mL. The
naked samples included no additional components besides the aforementioned three. The
standard metal ion samples; however, contained an additional 100 μL of a 1000 ppb metal ion
169
stock solution (a concentration of 100 ppb), changing the final volume of buffer added: these
solutions were formed with the cationic compounds Pb2+, Hg2+, Zn2+, Cd2+, Na+, Fe2+, Cu2+, K+,
Co2+, Ni2+, and Mn2+. Finally, the samples used for testing the system’s sensitivity incorporated
various concentrations of Pb2+ and Hg2+ (samples at 5, 10, 20, 30, 50, 80, 100, 200, 300 ppb),
which again changed the final volume of buffer added. This process was repeated for all the
investigated drugs molecules
5.2.2 Spectroscopic Methods
A shimadzu UV-2160 UV/Vis absorption spectrophotometer was used for the optical
absorption measurements. For one-photon fluorescence measurements, an Edinburgh F900
spectrofluorimeter was used with an Xe-450W lamp for excitation and R2158P as detector. For
two-photon fluorescence measurements, Ti:Sapphire laser centered on 800 nm was used as the
excitation source and the resulting fluorescence is collected on an Edinburgh F900
spectrofluorimeter. A Jasco J-815 Circular Dichroism (CD) Spectropolarimeter were used to
document the DNA’s structural change in the presence and absence of heavy metal ions,
especially in terms of G-Quadruplex formation. A wide variety of fluorophores, including DTI,
Thiazole Orange, Methyl Orange, Thioflavin-T, Acridine Orange, TMPyP4, were under
investigation to determine which would demonstrate the most evident alterations in magnitude of
fluorescence as the oligonucleotides bound with the toxic heavy metal ions. In determining
which dye was best suited for the system, all dyes were subjected to the UV/Vis absorbance
measurements as well as single and two-photon spectroscopy scans; these test samples contained
20 μM of the dye, 100 μL of an oligonucleotide (T30695), Pb2+ and Hg2+ concentrations of 100
ppb, and the appropriate volume of tris buffer to raise the sample’s volume to 1000 μL. DTI,
when coupled with the oligonucleotides, demonstrated highest change in fluorescence intensity
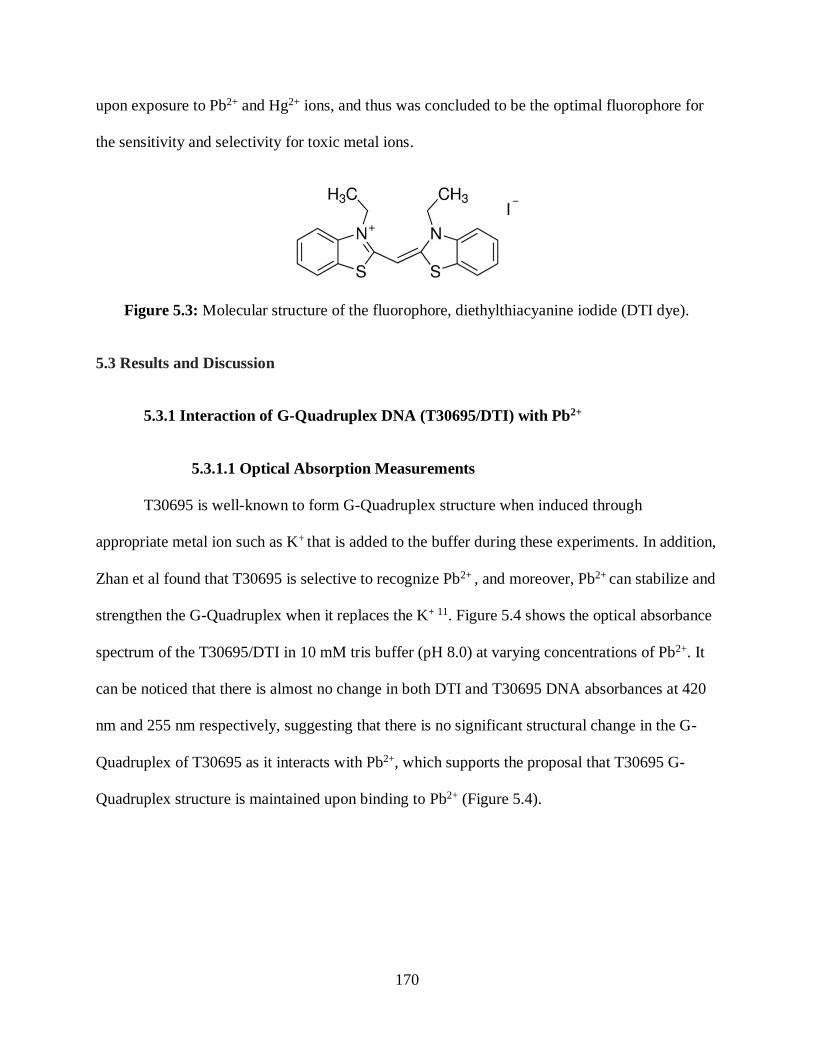
170
upon exposure to Pb2+ and Hg2+ ions, and thus was concluded to be the optimal fluorophore for
the sensitivity and selectivity for toxic metal ions.
Figure 5.3: Molecular structure of the fluorophore, diethylthiacyanine iodide (DTI dye).
5.3 Results and Discussion
5.3.1 Interaction of G-Quadruplex DNA (T30695/DTI) with Pb2+
5.3.1.1 Optical Absorption Measurements
T30695 is well-known to form G-Quadruplex structure when induced through
appropriate metal ion such as K+ that is added to the buffer during these experiments. In addition,
Zhan et al found that T30695 is selective to recognize Pb2+ , and moreover, Pb2+ can stabilize and
strengthen the G-Quadruplex when it replaces the K+ 11. Figure 5.4 shows the optical absorbance
spectrum of the T30695/DTI in 10 mM tris buffer (pH 8.0) at varying concentrations of Pb2+. It
can be noticed that there is almost no change in both DTI and T30695 DNA absorbances at 420
nm and 255 nm respectively, suggesting that there is no significant structural change in the G-
Quadruplex of T30695 as it interacts with Pb2+, which supports the proposal that T30695 G-
Quadruplex structure is maintained upon binding to Pb2+ (Figure 5.4).
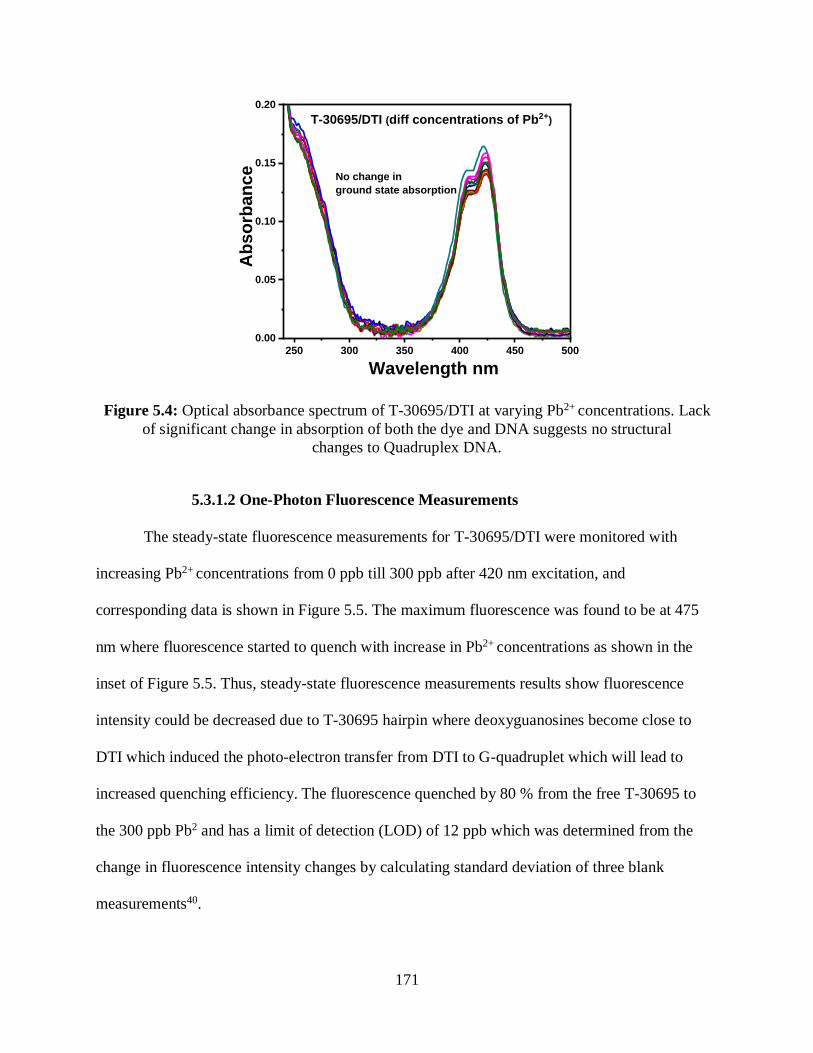
171
250 300 350 400 450 500
0.00
0.05
0.10
0.15
0.20
Ab
so
rban
ce
Wavelength nm
T-30695/DTI (diff concentrations of Pb2+)
No change in
ground state absorption
Figure 5.4: Optical absorbance spectrum of T-30695/DTI at varying Pb2+ concentrations. Lack
of significant change in absorption of both the dye and DNA suggests no structural
changes to Quadruplex DNA.
5.3.1.2 One-Photon Fluorescence Measurements
The steady-state fluorescence measurements for T-30695/DTI were monitored with
increasing Pb2+ concentrations from 0 ppb till 300 ppb after 420 nm excitation, and
corresponding data is shown in Figure 5.5. The maximum fluorescence was found to be at 475
nm where fluorescence started to quench with increase in Pb2+ concentrations as shown in the
inset of Figure 5.5. Thus, steady-state fluorescence measurements results show fluorescence
intensity could be decreased due to T-30695 hairpin where deoxyguanosines become close to
DTI which induced the photo-electron transfer from DTI to G-quadruplet which will lead to
increased quenching efficiency. The fluorescence quenched by 80 % from the free T-30695 to
the 300 ppb Pb2 and has a limit of detection (LOD) of 12 ppb which was determined from the
change in fluorescence intensity changes by calculating standard deviation of three blank
measurements40.
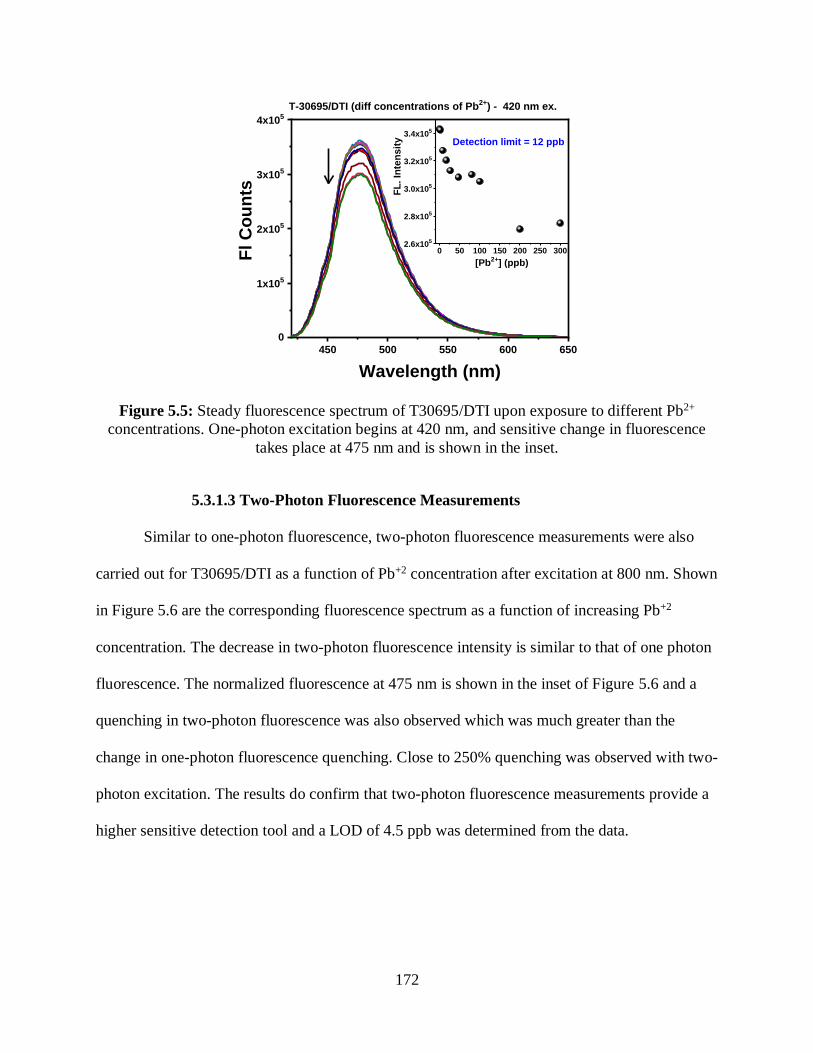
172
450 500 550 600 650
0
1x10⁵
2x10⁵
3x10⁵
4x10⁵
T-30695/DTI (diff concentrations of Pb2+) - 420 nm ex.
Fl
Co
un
ts
Wavelength (nm)
0 50 100 150 200 250 3002.6x10
5
2.8x10⁵
3.0x10⁵
3.2x10⁵
3.4x10⁵
Detection limit = 12 ppb
FL
. In
ten
sit
y
[Pb2+] (ppb)
Figure 5.5: Steady fluorescence spectrum of T30695/DTI upon exposure to different Pb2+
concentrations. One-photon excitation begins at 420 nm, and sensitive change in fluorescence
takes place at 475 nm and is shown in the inset.
5.3.1.3 Two-Photon Fluorescence Measurements
Similar to one-photon fluorescence, two-photon fluorescence measurements were also
carried out for T30695/DTI as a function of Pb+2 concentration after excitation at 800 nm. Shown
in Figure 5.6 are the corresponding fluorescence spectrum as a function of increasing Pb+2
concentration. The decrease in two-photon fluorescence intensity is similar to that of one photon
fluorescence. The normalized fluorescence at 475 nm is shown in the inset of Figure 5.6 and a
quenching in two-photon fluorescence was also observed which was much greater than the
change in one-photon fluorescence quenching. Close to 250% quenching was observed with two-
photon excitation. The results do confirm that two-photon fluorescence measurements provide a
higher sensitive detection tool and a LOD of 4.5 ppb was determined from the data.
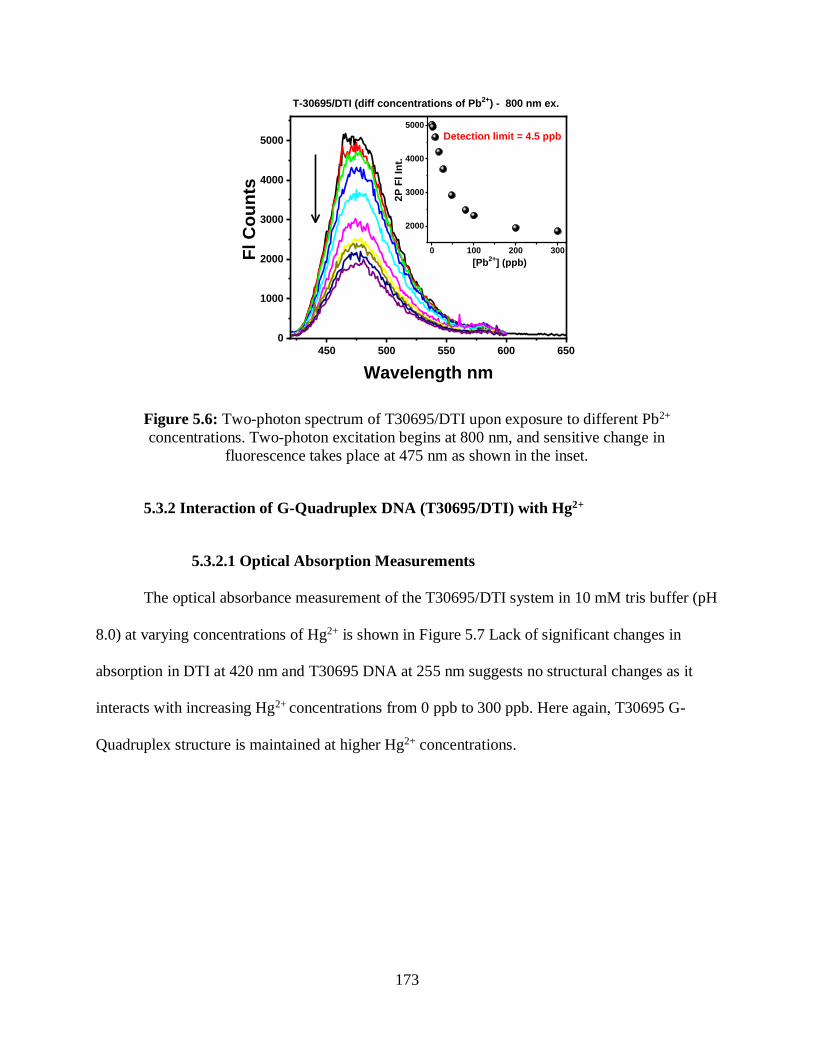
173
450 500 550 600 650
0
1000
2000
3000
4000
5000
T-30695/DTI (diff concentrations of Pb2+) - 800 nm ex.
Fl
Co
un
ts
Wavelength nm
0 100 200 300
2000
3000
4000
5000
2P
Fl
Int.
[Pb2+
] (ppb)
Detection limit = 4.5 ppb
Figure 5.6: Two-photon spectrum of T30695/DTI upon exposure to different Pb2+
concentrations. Two-photon excitation begins at 800 nm, and sensitive change in
fluorescence takes place at 475 nm as shown in the inset.
5.3.2 Interaction of G-Quadruplex DNA (T30695/DTI) with Hg2+
5.3.2.1 Optical Absorption Measurements
The optical absorbance measurement of the T30695/DTI system in 10 mM tris buffer (pH
8.0) at varying concentrations of Hg2+ is shown in Figure 5.7 Lack of significant changes in
absorption in DTI at 420 nm and T30695 DNA at 255 nm suggests no structural changes as it
interacts with increasing Hg2+ concentrations from 0 ppb to 300 ppb. Here again, T30695 G-
Quadruplex structure is maintained at higher Hg2+ concentrations.
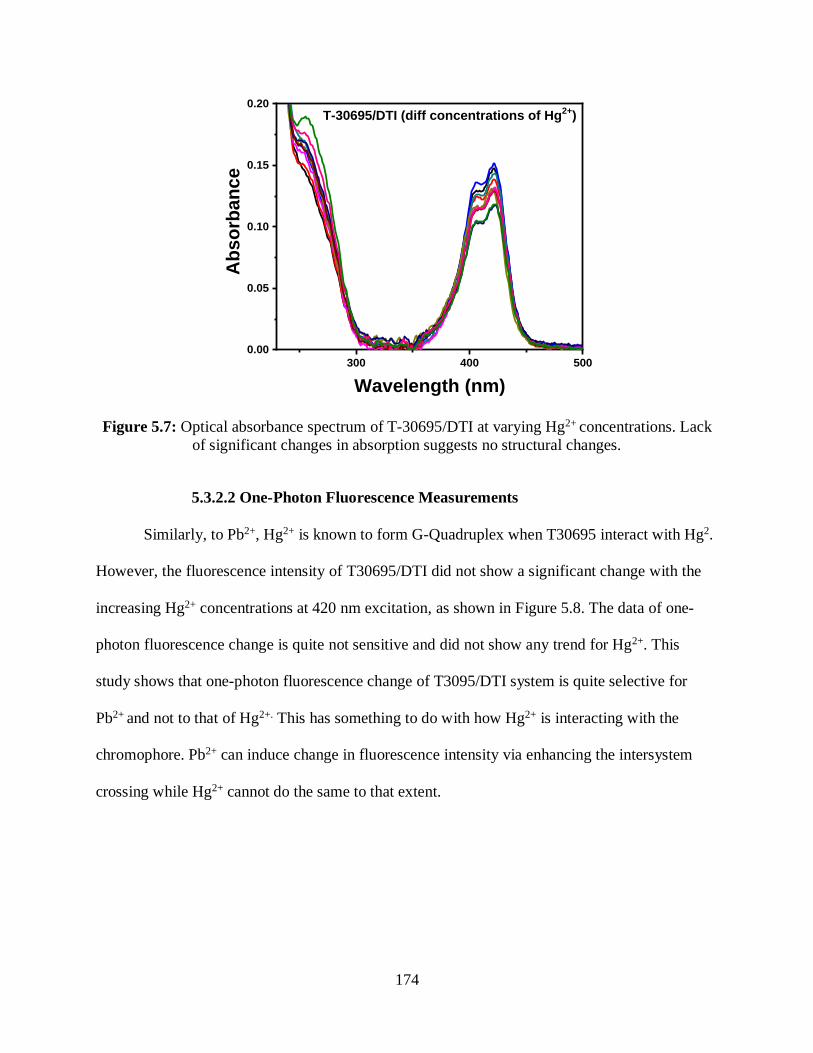
174
300 400 500
0.00
0.05
0.10
0.15
0.20T-30695/DTI (diff concentrations of Hg2+)
Ab
so
rban
ce
Wavelength (nm)
Figure 5.7: Optical absorbance spectrum of T-30695/DTI at varying Hg2+ concentrations. Lack
of significant changes in absorption suggests no structural changes.
5.3.2.2 One-Photon Fluorescence Measurements
Similarly, to Pb2+, Hg2+ is known to form G-Quadruplex when T30695 interact with Hg2.
However, the fluorescence intensity of T30695/DTI did not show a significant change with the
increasing Hg2+ concentrations at 420 nm excitation, as shown in Figure 5.8. The data of one-
photon fluorescence change is quite not sensitive and did not show any trend for Hg2+. This
study shows that one-photon fluorescence change of T3095/DTI system is quite selective for
Pb2+ and not to that of Hg2+. This has something to do with how Hg2+ is interacting with the
chromophore. Pb2+ can induce change in fluorescence intensity via enhancing the intersystem
crossing while Hg2+ cannot do the same to that extent.
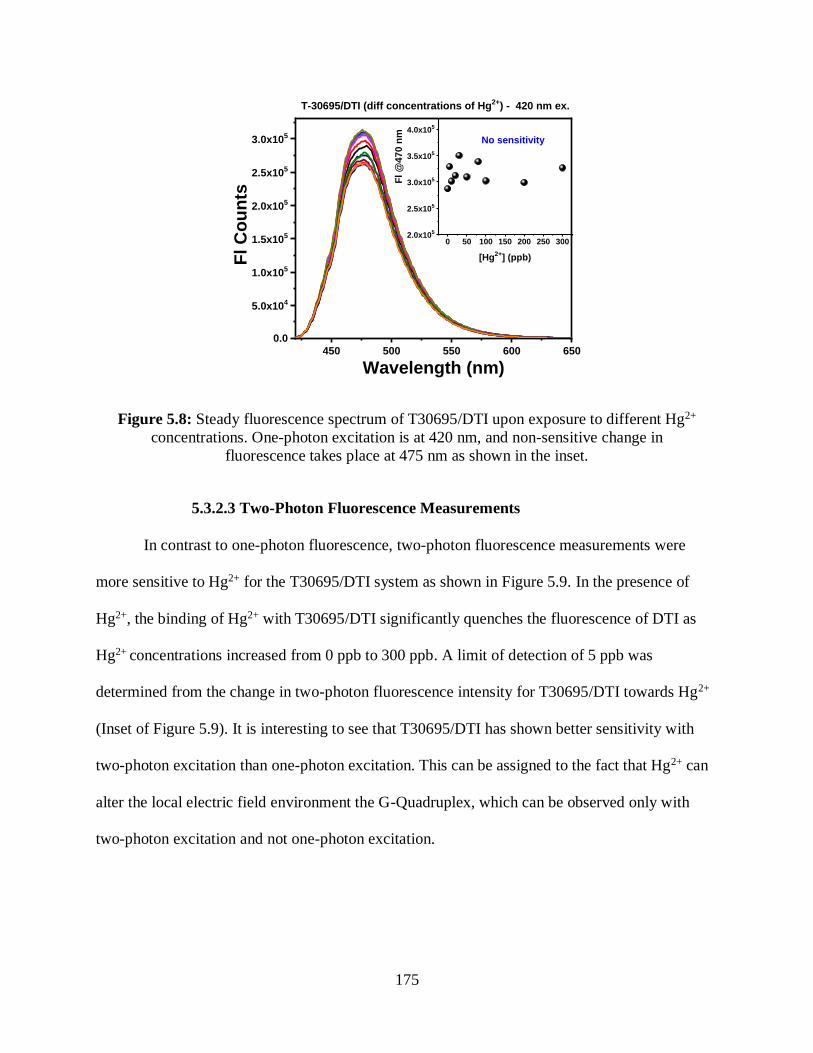
175
450 500 550 600 650
0.0
5.0x10⁴
1.0x10⁵
1.5x10⁵
2.0x10⁵
2.5x10⁵
3.0x10⁵
T-30695/DTI (diff concentrations of Hg2+) - 420 nm ex.
Fl
Co
un
ts
Wavelength (nm)
0 50 100 150 200 250 3002.0x105
2.5x10⁵
3.0x10⁵
3.5x10⁵
4.0x10⁵
Fl @
47
0 n
m
[Hg2+
] (ppb)
No sensitivity
Figure 5.8: Steady fluorescence spectrum of T30695/DTI upon exposure to different Hg2+
concentrations. One-photon excitation is at 420 nm, and non-sensitive change in
fluorescence takes place at 475 nm as shown in the inset.
5.3.2.3 Two-Photon Fluorescence Measurements
In contrast to one-photon fluorescence, two-photon fluorescence measurements were
more sensitive to Hg2+ for the T30695/DTI system as shown in Figure 5.9. In the presence of
Hg2+, the binding of Hg2+ with T30695/DTI significantly quenches the fluorescence of DTI as
Hg2+ concentrations increased from 0 ppb to 300 ppb. A limit of detection of 5 ppb was
determined from the change in two-photon fluorescence intensity for T30695/DTI towards Hg2+
(Inset of Figure 5.9). It is interesting to see that T30695/DTI has shown better sensitivity with
two-photon excitation than one-photon excitation. This can be assigned to the fact that Hg2+ can
alter the local electric field environment the G-Quadruplex, which can be observed only with
two-photon excitation and not one-photon excitation.
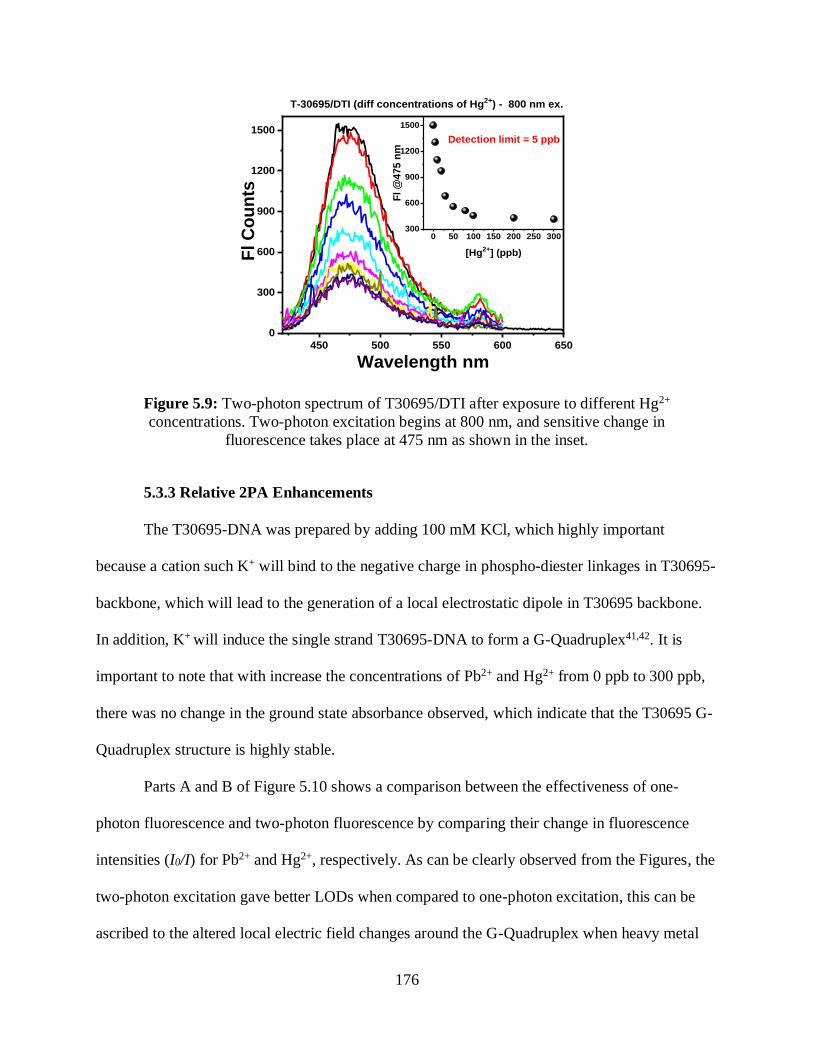
176
450 500 550 600 650
0
300
600
900
1200
1500
T-30695/DTI (diff concentrations of Hg2+) - 800 nm ex.
Fl C
ou
nts
Wavelength nm
0 50 100 150 200 250 300300
600
900
1200
1500
Fl @
475
nm
[Hg2+
] (ppb)
Detection limit = 5 ppb
Figure 5.9: Two-photon spectrum of T30695/DTI after exposure to different Hg2+
concentrations. Two-photon excitation begins at 800 nm, and sensitive change in
fluorescence takes place at 475 nm as shown in the inset.
5.3.3 Relative 2PA Enhancements
The T30695-DNA was prepared by adding 100 mM KCl, which highly important
because a cation such K+ will bind to the negative charge in phospho-diester linkages in T30695-
backbone, which will lead to the generation of a local electrostatic dipole in T30695 backbone.
In addition, K+ will induce the single strand T30695-DNA to form a G-Quadruplex41,42. It is
important to note that with increase the concentrations of Pb2+ and Hg2+ from 0 ppb to 300 ppb,
there was no change in the ground state absorbance observed, which indicate that the T30695 G-
Quadruplex structure is highly stable.
Parts A and B of Figure 5.10 shows a comparison between the effectiveness of one-
photon fluorescence and two-photon fluorescence by comparing their change in fluorescence
intensities (I0/I) for Pb2+ and Hg2+, respectively. As can be clearly observed from the Figures, the
two-photon excitation gave better LODs when compared to one-photon excitation, this can be
ascribed to the altered local electric field changes around the G-Quadruplex when heavy metal
177
ions like Hg2+ and Pb2+ have replaced the K+ ion. Relative 2PA cross-sections were monitored by
taking a ratio of two-photon intensity changes over one-photon fluorescence intensity changes
and plotted in Figure 5.10C. As the Figure depicts an extremely clear relationship between the
concentration of the heavy metal present and the relative two-photon fluorescence change in the
presence of both Pb2+ and Hg2+. Again, the relative 2P changes were shown to be better
indicators for the sensor response suggesting that the 2P spectroscopy can be used to monitor the
concentrations of toxic metal ions like Hg2+ and Pb2+. Moreover, with the inherent advantages of
two-photon excitation of greater penetration depth, low scattering and ability to work in cloudy
environments, this can be used for on-site detection.
In this chapter, we have developed a technique for continuous detection of Pb2+ and Hg2+
ions rely on single and two-photon fluorescence-based DNA sensors through significant changes
in fluorescence. The presence of Pb2+ and Hg2 ions is expected to open the hairpin T30695,
which will cause a change in fluorescence that can be measured. With increasing the
concentrations of Pb2+ and Hg2+ with T30695, one photon fluorescence and two-photon
fluorescence measurement and relative two-photon cross-sections carried out. The obtained data
demonstrate that two photon fluorescence is a superior technique in detection filed due to two
photon measurement ability to probe the small change in electrical field around DNA, which
make it a powerful tool that should be used in detection methods.
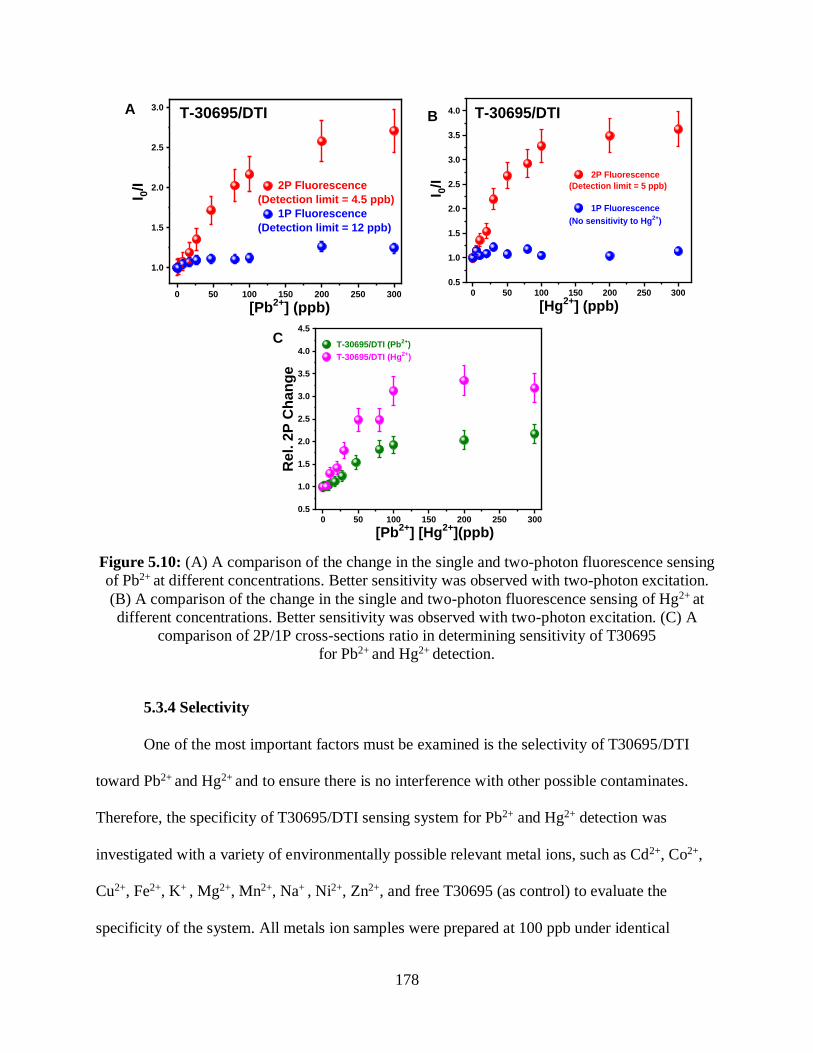
178
0 50 100 150 200 250 300
1.0
1.5
2.0
2.5
3.0T-30695/DTI
2P Fluorescence
(Detection limit = 4.5 ppb)
1P Fluorescence
(Detection limit = 12 ppb)
I 0/I
[Pb2+] (ppb)
A
0 50 100 150 200 250 300
0.5
1.0
1.5
2.0
2.5
3.0
3.5
4.0 T-30695/DTI
2P Fluorescence
(Detection limit = 5 ppb)
1P Fluorescence
(No sensitivity to Hg2+)
I 0/I
[Hg2+] (ppb)
B
0 50 100 150 200 250 300
0.5
1.0
1.5
2.0
2.5
3.0
3.5
4.0
4.5
T-30695/DTI (Pb2+)
T-30695/DTI (Hg2+)
Re
l. 2
P C
ha
ng
e
[Pb2+] [Hg2+](ppb)
C
Figure 5.10: (A) A comparison of the change in the single and two-photon fluorescence sensing
of Pb2+ at different concentrations. Better sensitivity was observed with two-photon excitation.
(B) A comparison of the change in the single and two-photon fluorescence sensing of Hg2+ at
different concentrations. Better sensitivity was observed with two-photon excitation. (C) A
comparison of 2P/1P cross-sections ratio in determining sensitivity of T30695
for Pb2+ and Hg2+ detection.
5.3.4 Selectivity
One of the most important factors must be examined is the selectivity of T30695/DTI
toward Pb2+ and Hg2+ and to ensure there is no interference with other possible contaminates.
Therefore, the specificity of T30695/DTI sensing system for Pb2+ and Hg2+ detection was
investigated with a variety of environmentally possible relevant metal ions, such as Cd2+, Co2+,
Cu2+, Fe2+, K+ , Mg2+, Mn2+, Na+ , Ni2+, Zn2+, and free T30695 (as control) to evaluate the
specificity of the system. All metals ion samples were prepared at 100 ppb under identical
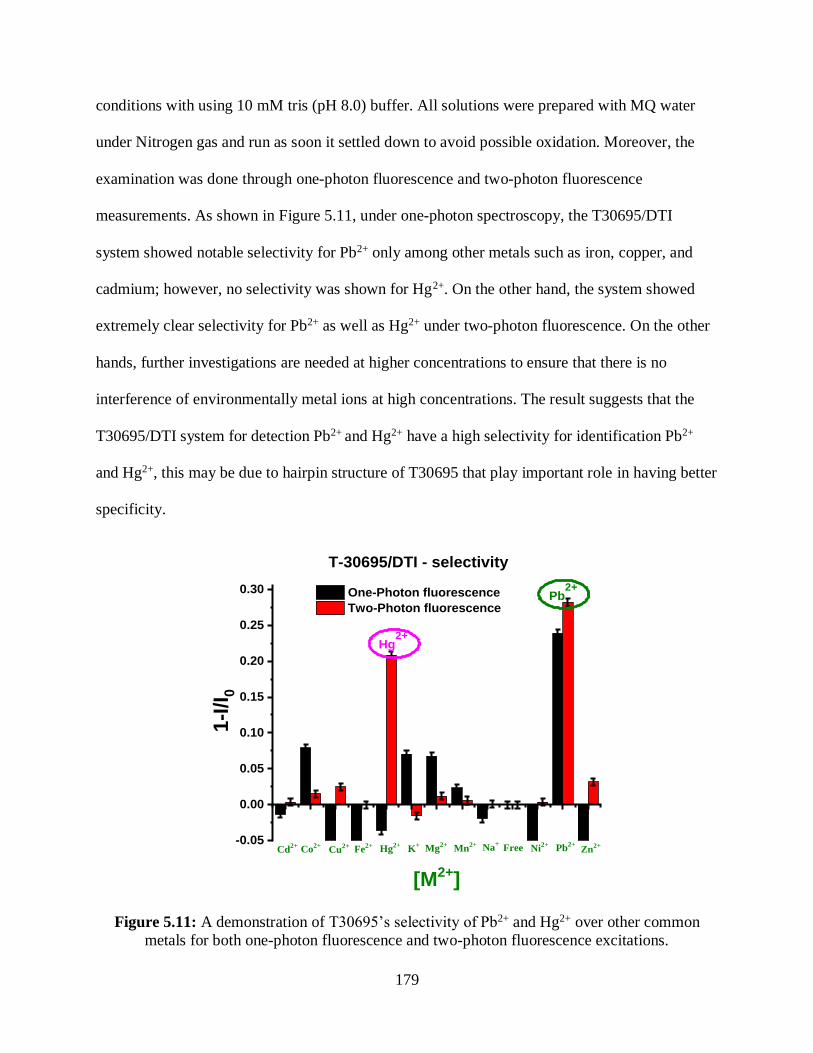
179
conditions with using 10 mM tris (pH 8.0) buffer. All solutions were prepared with MQ water
under Nitrogen gas and run as soon it settled down to avoid possible oxidation. Moreover, the
examination was done through one-photon fluorescence and two-photon fluorescence
measurements. As shown in Figure 5.11, under one-photon spectroscopy, the T30695/DTI
system showed notable selectivity for Pb2+ only among other metals such as iron, copper, and
cadmium; however, no selectivity was shown for Hg2+. On the other hand, the system showed
extremely clear selectivity for Pb2+ as well as Hg2+ under two-photon fluorescence. On the other
hands, further investigations are needed at higher concentrations to ensure that there is no
interference of environmentally metal ions at high concentrations. The result suggests that the
T30695/DTI system for detection Pb2+ and Hg2+ have a high selectivity for identification Pb2+
and Hg2+, this may be due to hairpin structure of T30695 that play important role in having better
specificity.
-0.05
0.00
0.05
0.10
0.15
0.20
0.25
0.30
Zn2+
Pb2+
Hg2+
1-I
/I0
[M2+]
One-Photon fluorescence
Two-Photon fluorescence
Pb2+
Ni2+FreeNa
+Mn
2+Mg
2+K
+Hg
2+Fe
2+Cu
2+Co2+
Cd2+
T-30695/DTI - selectivity
Figure 5.11: A demonstration of T30695’s selectivity of Pb2+ and Hg2+ over other common
metals for both one-photon fluorescence and two-photon fluorescence excitations.
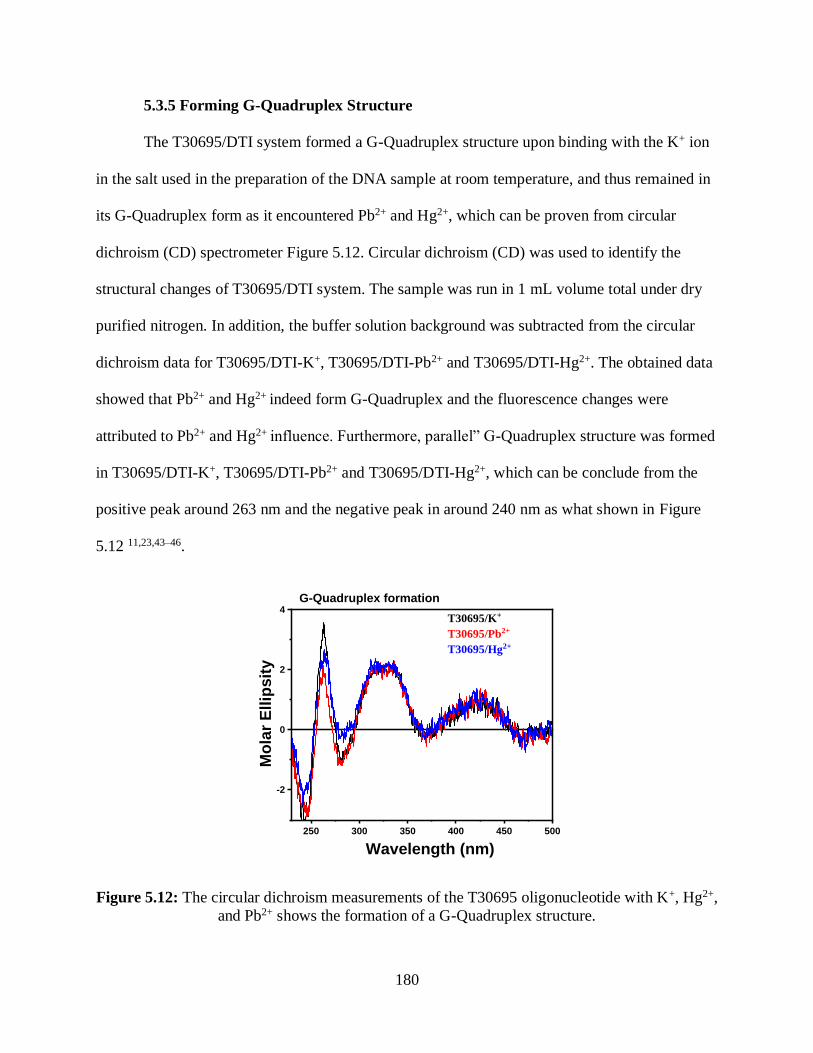
180
5.3.5 Forming G-Quadruplex Structure
The T30695/DTI system formed a G-Quadruplex structure upon binding with the K+ ion
in the salt used in the preparation of the DNA sample at room temperature, and thus remained in
its G-Quadruplex form as it encountered Pb2+ and Hg2+, which can be proven from circular
dichroism (CD) spectrometer Figure 5.12. Circular dichroism (CD) was used to identify the
structural changes of T30695/DTI system. The sample was run in 1 mL volume total under dry
purified nitrogen. In addition, the buffer solution background was subtracted from the circular
dichroism data for T30695/DTI-K+, T30695/DTI-Pb2+ and T30695/DTI-Hg2+. The obtained data
showed that Pb2+ and Hg2+ indeed form G-Quadruplex and the fluorescence changes were
attributed to Pb2+ and Hg2+ influence. Furthermore, parallel” G-Quadruplex structure was formed
in T30695/DTI-K+, T30695/DTI-Pb2+ and T30695/DTI-Hg2+, which can be conclude from the
positive peak around 263 nm and the negative peak in around 240 nm as what shown in Figure
5.12 11,23,43–46.
250 300 350 400 450 500
-2
0
2
4T30695/K+
T30695/Pb2+
T30695/Hg2+
Mo
lar
Ellip
sit
y
Wavelength (nm)
G-Quadruplex formation
Figure 5.12: The circular dichroism measurements of the T30695 oligonucleotide with K+, Hg2+,
and Pb2+ shows the formation of a G-Quadruplex structure.
181
From the studies carried out in this Chapter, we have designed and developed a two-
photon fluorescence-based biosensors that rely upon specific oligonucleotides, coupled with a
fluorophore, that form stable G-Quadruplex structures at room temperature. Upon exposure to
Pb2+ or Hg2+, the DNA’s existing metal ion is replaced by the heavy metal ion, quenching the
fluorescence of the dye; the degree of decrease in fluorescence intensity is the figure of merit for
assessing the sensitivity and the selectivity of the sensor. As such, the oligonucleotide T30695
demonstrated high selectivity for Pb2+ and Hg2+ ions with detection limits of 4.5 and 5 ppb
respectively. In addition, two-photon spectroscopy was shown to be better for sensitivity, and
due to its near-infrared excitation and low scattering, is still effective in muddy and opaque
waters. In summary, the carried-out result shows a significant promise for development of an
effective, single and two-photon, fluorescence-based DNA biosensor which will allow for
continuous monitoring of toxic heavy metal ions in water sources for the purpose of avoiding
potential disasters. Also, these results have proven again the powerful of two-photon,
fluorescence and relative 2PA cross sections as tool to monitor and measure the change in
electrical field around the self-assemblies in complex environments.
5.4 Conclusions
T30695 DNA oligonucleotide sequences was selected for it ability to form G-Quadruplex
structures in order to detect the toxic heavy metal ions Pb2+ and Hg2+ with greater sensitivity and
selectivity. DTI dye was found to be the most optimal fluorophore for this mode of detection,
with the ability to interact with the DNA via intercalation and to demonstrate notable
fluorescence changes upon binding to Pb2+ and Hg2+ especially with two-photon excitation. The
oligonucleotide structure demonstrated high sensitivity to Pb2+ through both one-photon (12 ppb)
and two-photon fluorescence (4.5 ppb); sensitivity under two-photon excitation was far better
182
than that under one-photon excitation, which may be ascribed to the enhancing of two- photon
cross-sections by aligning better with the DNA’s backbone electric field. The limit of detection
under two-photon spectroscopy, 4.5 ppb, falls below the World Health Organization’s minimum
for hazardous Pb2+ concentrations, which is 10 ppb47. T30695/DTI lacked sensitivity to Hg2+
under one-photon excitation; far better sensitivity was observed with two-photon excitation (5
ppb). This again can be ascribed to the orientation of the G-Quadruplex structures’ electric fields
along with the orientation of the fluorophore. The limit of detection under two-photon
spectroscopy, 5 ppb, also falls below the World Health Organization’s minimum for hazardous
Hg2+ concentrations, which is 6 ppb48. T30695/DTI was found to be highly selective for only the
heavy metal ions Pb2+ or Hg2+, and far more particularly through the two-photon method than the
one-photon method. Such selectivity may be attributed to the size of the mercury and lead metal
ions, which likely more effectively stabilized the G-Quadruplex structure. In conclusion,
T30695/DTI system show a great selectivity and specificity for Pb2+ or Hg2+ detection over other
ion metals. This approach shows significant promise for development of an effective, single and
two-photon, fluorescence-based DNA biosensor which will allow for on-site monitoring of toxic
heavy metal ions in water sources; however, further investigations are needed to study the
interferences with higher concentrations and under different pH levels.
5.5 Chapter Summary
• A novel DNA oligonucleotide sequence, T30695 was selected for its ability to form G-
Quadruplex structures in order detect toxic heavy metal ions, Pb2+ and Hg2+.
• DTI dye was found to be a good fluorophore for this mode of detection, with the ability
to both interact with the DNA via intercalation and to demonstrate notable fluorescence
changes upon binding to toxic heavy metal ions.
183
• T30695/DTI showed sensitivity to Pb2+ with both one-photon (12 ppb) and two-photon
excitation (4.5 ppb); sensitivity under two-photon excitation was far better than that
under one-photon excitation, which may be ascribed to changes in two-photon cross-
sections.
• T30695/DTI lacked sensitivity to Hg2+ under one-photon excitation; far better sensitivity
was observed with two-photon excitation (5 ppb). This—again—can be ascribed to the
orientation of the G-Quadruplex structures’ electric fields along with the orientation of
the fluorophore.
• T30695/DTI was found to be highly selective for only the heavy metal ions Pb2+ and
Hg2+. Such selectivity may be attributed to the size of the mercury and lead metal ions,
which more effectively stabilized the G-Quadruplex structure.

184
5.6 References
(1) Jaishankar, M.; Tseten, T.; Anbalagan, N.; Mathew, B. B.; Beeregowda, K. N. Toxicity,
Mechanism and Health Effects of Some Heavy Metals. Interdiscip Toxicol 2014, 7 (2), 60–
72. https://doi.org/10.2478/intox-2014-0009.
(2) Wen, Y.; Wang, L.; Li, L.; Xu, L.; Liu, G. A Sensitive and Label-Free Pb(II) Fluorescence
Sensor Based on a DNAzyme Controlled G-Quadruplex/Thioflavin T Conformation.
Sensors (Basel) 2016, 16 (12). https://doi.org/10.3390/s16122155.
(3) He, Z. L.; Yang, X. E.; Stoffella, P. J. Trace Elements in Agroecosystems and Impacts on
the Environment. Journal of Trace Elements in Medicine and Biology 2005, 19 (2), 125–
140. https://doi.org/10.1016/j.jtemb.2005.02.010.
(4) Shallari, S.; Schwartz, C.; Hasko, A.; Morel, J. L. Heavy Metals in Soils and Plants of
Serpentine and Industrial Sites of Albania. Science of The Total Environment 1998, 209 (2),
133–142. https://doi.org/10.1016/S0048-9697(98)80104-6.
(5) Tchounwou, P. B.; Yedjou, C. G.; Patlolla, A. K.; Sutton, D. J. Heavy Metals Toxicity and
the Environment. EXS 2012, 101, 133–164. https://doi.org/10.1007/978-3-7643-8340-4_6.
(6) Jan, A. T.; Azam, M.; Siddiqui, K.; Ali, A.; Choi, I.; Haq, Q. M. R. Heavy Metals and
Human Health: Mechanistic Insight into Toxicity and Counter Defense System of
Antioxidants. International Journal of Molecular Sciences 2015, 16 (12), 29592–29630.
https://doi.org/10.3390/ijms161226183.
(7) Flora, S. J. S.; Mittal, M.; Mehta, A. Heavy Metal Induced Oxidative Stress & Its Possible
Reversal by Chelation Therapy. Indian J. Med. Res. 2008, 128 (4), 501–523.
185
(8) Zhang, X.-B.; Kong, R.-M.; Lu, Y. Metal Ion Sensors Based on DNAzymes and Related
DNA Molecules. Annual Rev. Anal. Chem. 2011, 4 (1), 105–128.
https://doi.org/10.1146/annurev.anchem.111808.073617.
(9) Ran, X.; Sun, H.; Pu, F.; Ren, J.; Qu, X. Ag Nanoparticle -Decorated Graphene Quantum
Dots for Label-Free, Rapid and Sensitive Detection of Ag + and Biothiols. Chemical
Communications 2013, 49 (11), 1079–1081. https://doi.org/10.1039/C2CC38403E.
(10) Zhu, G.; Zhang, C. Functional Nucleic Acid-Based Sensors for Heavy Metal Ion Assays.
Analyst 2014, 139 (24), 6326–6342. https://doi.org/10.1039/C4AN01069H.
(11) Zhan, S.; Wu, Y.; Luo, Y.; Liu, L.; He, L.; Xing, H.; Zhou, P. Label-Free Fluorescent
Sensor for Lead Ion Detection Based on Lead(II)-Stabilized G-Quadruplex Formation.
Analytical Biochemistry 2014, 462, 19–25. https://doi.org/10.1016/j.ab.2014.01.010.
(12) Miao, X.-M.; Ling, L.-S.; Shuai, X.-T. Detection of Pb2+ at Attomole Levels by Using
Dynamic Light Scattering and Unmodified Gold Nanoparticles. Analytical Biochemistry
2012, 421 (2), 582–586. https://doi.org/10.1016/j.ab.2011.11.031.
(13) Yang, X.; Xu, J.; Tang, X.; Liu, H.; Tian, D. A Novel Electrochemical DNAzyme Sensor
for the Amplified Detection of Pb2+ Ions. Chemical Communications 2010, 46 (18), 3107–
3109. https://doi.org/10.1039/C002137G.
(14) Lead Screening During Pregnancy and Lactation - ACOG https://www.acog.org/Clinical-
Guidance-and-Publications/Committee-Opinions/Committee-on-Obstetric-Practice/Lead-
Screening-During-Pregnancy-and-Lactation?IsMobileSet=false (accessed Mar 7, 2019).
(15) Singh, R.; Gautam, N.; Mishra, A.; Gupta, R. Heavy Metals and Living Systems: An
Overview. Indian J Pharmacol 2011, 43 (3), 246–253. https://doi.org/10.4103/0253-
7613.81505.
186
(16) Ochsenkühn-Petropoulou, M.; Ochsenkühn, K.-M. Comparison of Inductively Coupled
Plasma–Atomic Emission Spectrometry, Anodic Stripping Voltammetry and Instrumental
Neutron-Activation Analysis for the Determination of Heavy Metals in Airborne Particulate
Matter. Fresenius J Anal Chem 2001, 369 (7), 629–632.
https://doi.org/10.1007/s002160100769.
(17) Bi, Z.; Chapman, C. S.; Salaün, P.; Berg, C. M. G. van den. Determination of Lead and
Cadmium in Sea- and Freshwater by Anodic Stripping Voltammetry with a Vibrating
Bismuth Electrode. Electroanalysis 2010, 22 (24), 2897–2907.
https://doi.org/10.1002/elan.201000429.
(18) Grinberg, P.; Willie, S.; Sturgeon, R. E. Determination of Thorium and Uranium in
Ultrapure Lead by Inductively Coupled Plasma Mass Spectrometry. Anal. Chem. 2005, 77
(8), 2432–2436. https://doi.org/10.1021/ac048539t.
(19) El-Gohary, Z. Radiation Trapping in Atomic Absorption Spectroscopy at Lead
Determination in Different Matricies. Journal of Quantitative Spectroscopy and Radiative
Transfer 2005, 94 (2), 265–272. https://doi.org/10.1016/j.jqsrt.2004.09.009.
(20) Wang, W.; Jin, Y.; Zhao, Y.; Yue, X.; Zhang, C. Single-Labeled Hairpin Probe for Highly
Specific and Sensitive Detection of Lead(II) Based on the Fluorescence Quenching of
Deoxyguanosine and G-Quartet. Biosensors and Bioelectronics 2013, 41, 137–142.
https://doi.org/10.1016/j.bios.2012.08.006.
(21) Yao, J.; Li, J.; Owens, J.; Zhong, W. Combing DNAzyme with Single-Walled Carbon
Nanotubes for Detection of Pb( Ii ) in Water. Analyst 2011, 136 (4), 764–768.
https://doi.org/10.1039/C0AN00709A.

187
(22) Yuan, Z.; Peng, M.; He, Y.; S. Yeung, E. Functionalized Fluorescent Gold Nanodots:
Synthesis and Application for Pb 2+ Sensing. Chemical Communications 2011, 47 (43),
11981–11983. https://doi.org/10.1039/C1CC14872A.
(23) Li, C.-L.; Liu, K.-T.; Lin, Y.-W.; Chang, H.-T. Fluorescence Detection of Lead(II) Ions
Through Their Induced Catalytic Activity of DNAzymes. Anal. Chem. 2011, 83 (1), 225–
230. https://doi.org/10.1021/ac1028787.
(24) Sen, D.; Gilbert, W. Formation of Parallel Four-Stranded Complexes by Guanine-Rich
Motifs in DNA and Its Implications for Meiosis. Nature 1988, 334 (6180), 364.
https://doi.org/10.1038/334364a0.
(25) Lin, Z.; Chen, Y.; Li, X.; Fang, W. Pb 2+ Induced DNA Conformational Switch from
Hairpin to G-Quadruplex: Electrochemical Detection of Pb 2+. Analyst 2011, 136 (11),
2367–2372. https://doi.org/10.1039/C1AN15080D.
(26) Smirnov, I. V.; Kotch, F. W.; Pickering, I. J.; Davis, J. T.; Shafer, R. H. Pb EXAFS Studies
on DNA Quadruplexes: Identification of Metal Ion Binding Site. Biochemistry 2002, 41
(40), 12133–12139. https://doi.org/10.1021/bi020310p.
(27) Murat, P.; Singh, Y.; Defrancq, E. Methods for Investigating G-Quadruplex DNA/Ligand
Interactions. Chem. Soc. Rev. 2011, 40 (11), 5293–5307.
https://doi.org/10.1039/C1CS15117G.
(28) Zhu, J.; Zhang, L.; Dong, S.; Wang, E. How to Split a G-Quadruplex for DNA Detection:
New Insight into the Formation of DNA Split G-Quadruplex †Electronic Supplementary
Information (ESI) Available: DNA Sequence, Fig. S1–S11, Tables S1–S4, Extended
Experimental Details and Discussions. See DOI: 10.1039/C5sc01287b Click Here for
188
Additional Data File. Chem Sci 2015, 6 (8), 4822–4827.
https://doi.org/10.1039/c5sc01287b.
(29) Willner, I.; Shlyahovsky, B.; Zayats, M.; Willner, B. DNAzymes for Sensing,
Nanobiotechnology and Logic Gate Applications. Chem. Soc. Rev. 2008, 37 (6), 1153–
1165. https://doi.org/10.1039/B718428J.
(30) Verga, D.; Welter, M.; Steck, A.-L.; Marx, A. DNA Polymerase-Catalyzed Incorporation of
Nucleotides Modified with a G-Quadruplex-Derived DNAzyme. Chem. Commun. 2015, 51
(34), 7379–7381. https://doi.org/10.1039/C5CC01387A.
(31) Zhang, L.; Zhu, J.; Guo, S.; Li, T.; Li, J.; Wang, E. Photoinduced Electron Transfer of
DNA/Ag Nanoclusters Modulated by G-Quadruplex/Hemin Complex for the Construction
of Versatile Biosensors. J. Am. Chem. Soc. 2013, 135 (7), 2403–2406.
https://doi.org/10.1021/ja3089857.
(32) Li, C.-L.; Liu, K.-T.; Lin, Y.-W.; Chang, H.-T. Fluorescence Detection of Lead(II) Ions
Through Their Induced Catalytic Activity of DNAzymes. Anal. Chem. 2011, 83 (1), 225–
230. https://doi.org/10.1021/ac1028787.
(33) Li, T.; Dong, S.; Wang, E. A Lead(II)-Driven DNA Molecular Device for Turn-On
Fluorescence Detection of Lead(II) Ion with High Selectivity and Sensitivity. J. Am. Chem.
Soc. 2010, 132 (38), 13156–13157. https://doi.org/10.1021/ja105849m.
(34) Li, T.; Wang, E.; Dong, S. Potassium−Lead-Switched G-Quadruplexes: A New Class of
DNA Logic Gates. J. Am. Chem. Soc. 2009, 131 (42), 15082–15083.
https://doi.org/10.1021/ja9051075.
189
(35) Xu, J.; Kong, D.-M. Specific Hg2+ Quantitation Using Intramolecular Split G-Quadruplex
DNAzyme. Chinese Journal of Analytical Chemistry 2012, 40 (3), 347–353.
https://doi.org/10.1016/S1872-2040(11)60536-7.
(36) Xu, H.; Zhan, S.; Zhang, D.; Xia, B.; Zhan, X.; Wang, L.; Zhou, P. A Label-Free
Fluorescent Sensor for the Detection of Pb2+ and Hg2+. Anal. Methods 2015, 7 (15), 6260–
6265. https://doi.org/10.1039/C5AY01282A.
(37) Burge, S.; Parkinson, G. N.; Hazel, P.; Todd, A. K.; Neidle, S. Quadruplex DNA:
Sequence, Topology and Structure. Nucleic Acids Res 2006, 34 (19), 5402–5415.
https://doi.org/10.1093/nar/gkl655.
(38) Lech, C. J.; Heddi, B.; Phan, A. T. Guanine Base Stacking in G-Quadruplex Nucleic Acids.
Nucleic Acids Res 2013, 41 (3), 2034–2046. https://doi.org/10.1093/nar/gks1110.
(39) Li, T.; Wang, E.; Dong, S. Potassium−Lead-Switched G-Quadruplexes: A New Class of
DNA Logic Gates. J. Am. Chem. Soc. 2009, 131 (42), 15082–15083.
https://doi.org/10.1021/ja9051075.
(40) Peng, S.; Zhong, T.; Guo, T.; Shu, D.; Meng, D.; Liu, H.; Guo, D. A Novel Fluorescent
Probe for Selective Detection of Hydrogen Sulfide in Living Cells. New J. Chem. 2018, 42
(7), 5185–5192. https://doi.org/10.1039/C7NJ04577H.
(41) Mathad, R. I.; Yang, D. G-Quadruplex Structures and G-Quadruplex-Interactive
Compounds. Methods Mol Biol 2011, 735, 77–96. https://doi.org/10.1007/978-1-61779-
092-8_8.
(42) Lin, C.; Yang, D. Human Telomeric G-Quadruplex Structures and G-Quadruplex-
Interactive Compounds. Methods Mol Biol 2017, 1587, 171–196.
https://doi.org/10.1007/978-1-4939-6892-3_17.
190
(43) Kypr, J.; Kejnovská, I.; Renčiuk, D.; Vorlíčková, M. Circular Dichroism and
Conformational Polymorphism of DNA. Nucleic Acids Res 2009, 37 (6), 1713–1725.
https://doi.org/10.1093/nar/gkp026.
(44) Jia, S.-M.; Liu, X.-F.; Li, P.; Kong, D.-M.; Shen, H.-X. G-Quadruplex DNAzyme-Based
Hg2+ and Cysteine Sensors Utilizing Hg2+-Mediated Oligonucleotide Switching.
Biosensors and Bioelectronics 2011, 27 (1), 148–152.
https://doi.org/10.1016/j.bios.2011.06.032.
(45) Lam, E. Y. N.; Beraldi, D.; Tannahill, D.; Balasubramanian, S. G-Quadruplex Structures
Are Stable and Detectable in Human Genomic DNA. Nature Communications 2013, 4,
1796. https://doi.org/10.1038/ncomms2792.
(46) Jin, R.; Gaffney, B. L.; Wang, C.; Jones, R. A.; Breslauer, K. J. Thermodynamics and
Structure of a DNA Tetraplex: A Spectroscopic and Calorimetric Study of the
Tetramolecular Complexes of d(TG3T) and d(TG3T2G3T). PNAS 1992, 89 (18), 8832–
8836. https://doi.org/10.1073/pnas.89.18.8832.
(47) WHO | Chemical hazards in drinking-water: Lead
http://www.who.int/water_sanitation_health/water-quality/guidelines/chemicals/lead/en/
(accessed Feb 14, 2019).
(48) WHO | Chemical hazards in drinking-water: Mercury
http://www.who.int/water_sanitation_health/water-
quality/guidelines/chemicals/mercury/en/ (accessed Feb 14, 2019).
191
CHAPTER 6
TWO-PHOTON ABSORPTION PROPERTIES OF CHROMOPHORES IN
POLYELECTROLYTES
6.1 Introduction
In previous Chapters, studies were carried out on organized self-assemblies that are natural.
Likewise there are self-assembled materials that are man-made. One among them are
polyelectrolytes. In this part of the dissertation, we have attempted to use the power of two-photon
absorption (2PA) to understand the interactions in polyelectrolytes.
Polyelectrolytes are polymers with multi electrolyte groups1. One of the important
properties for polyelectrolytes is their ability to dissociate their electrolyte groups in polar solution
which generates charges in the solution and opposite charge in the polymer chain1–4. As a result,
for dissociate electrolyte groups; changing in folding/unfolding polymer state will accrue. These
ions and counter ions created electrical field around the polymer. This electrical field is responsible
for optical properties for the polymers3,5–9. Important improvements in studying polyelectrolytes
interactions with diverse ions in solution had been studied for last two decades, because the
significance of polymer physics/biophysics properties10–14. One of the main reasons for studying
polyelectrolytes is that they resemble many biological molecules such as polypeptides, proteins
and DNA.
Polyelectrolytes are highly sensitive to any changes around their environment conditions;
therefore, polyelectrolytes give great promise for use as biosensors similar to DNA5,15–17.
However, Polyelectrolytes are difficult to monitor due to their high sensitivity for any change in
their environment that could cause a change in behaviors and characteristics of the polyelectrolytes
because of amphiphilic interactions between the polyelectrolyte and counterions15,18–21.
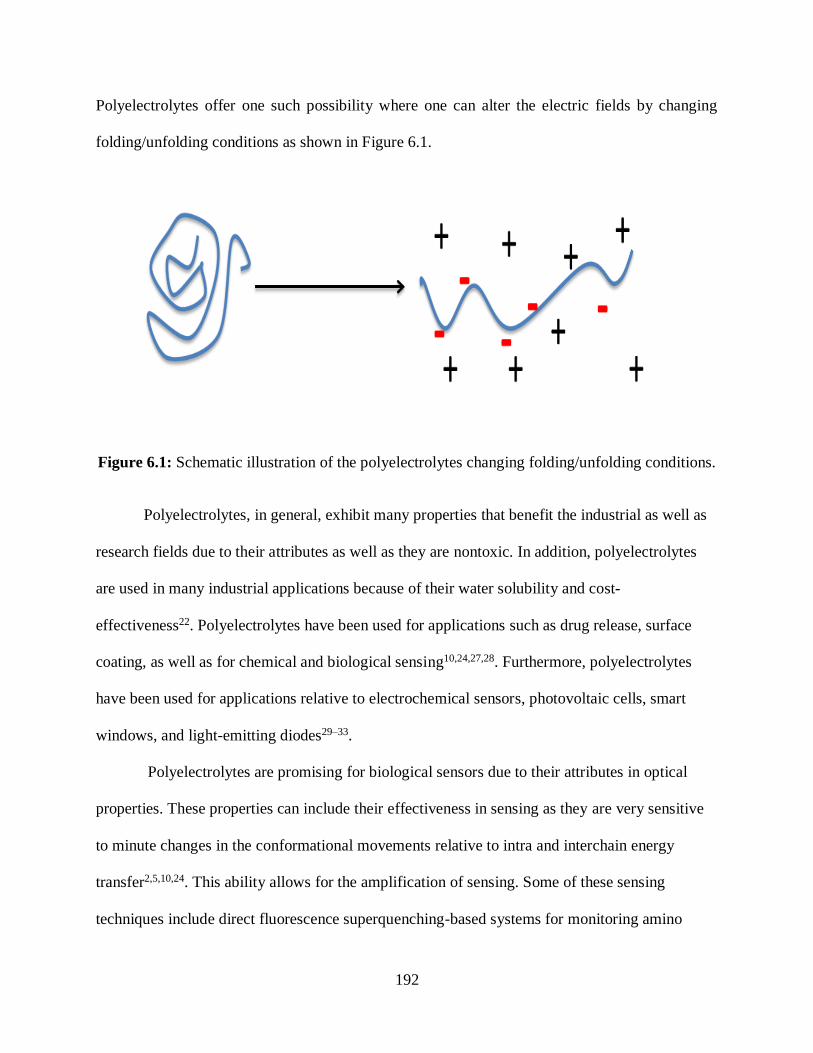
192
Polyelectrolytes offer one such possibility where one can alter the electric fields by changing
folding/unfolding conditions as shown in Figure 6.1.
Figure 6.1: Schematic illustration of the polyelectrolytes changing folding/unfolding conditions.
Polyelectrolytes, in general, exhibit many properties that benefit the industrial as well as
research fields due to their attributes as well as they are nontoxic. In addition, polyelectrolytes
are used in many industrial applications because of their water solubility and cost-
effectiveness22. Polyelectrolytes have been used for applications such as drug release, surface
coating, as well as for chemical and biological sensing10,24,27,28. Furthermore, polyelectrolytes
have been used for applications relative to electrochemical sensors, photovoltaic cells, smart
windows, and light-emitting diodes29–33.
Polyelectrolytes are promising for biological sensors due to their attributes in optical
properties. These properties can include their effectiveness in sensing as they are very sensitive
to minute changes in the conformational movements relative to intra and interchain energy
transfer2,5,10,24. This ability allows for the amplification of sensing. Some of these sensing
techniques include direct fluorescence superquenching-based systems for monitoring amino
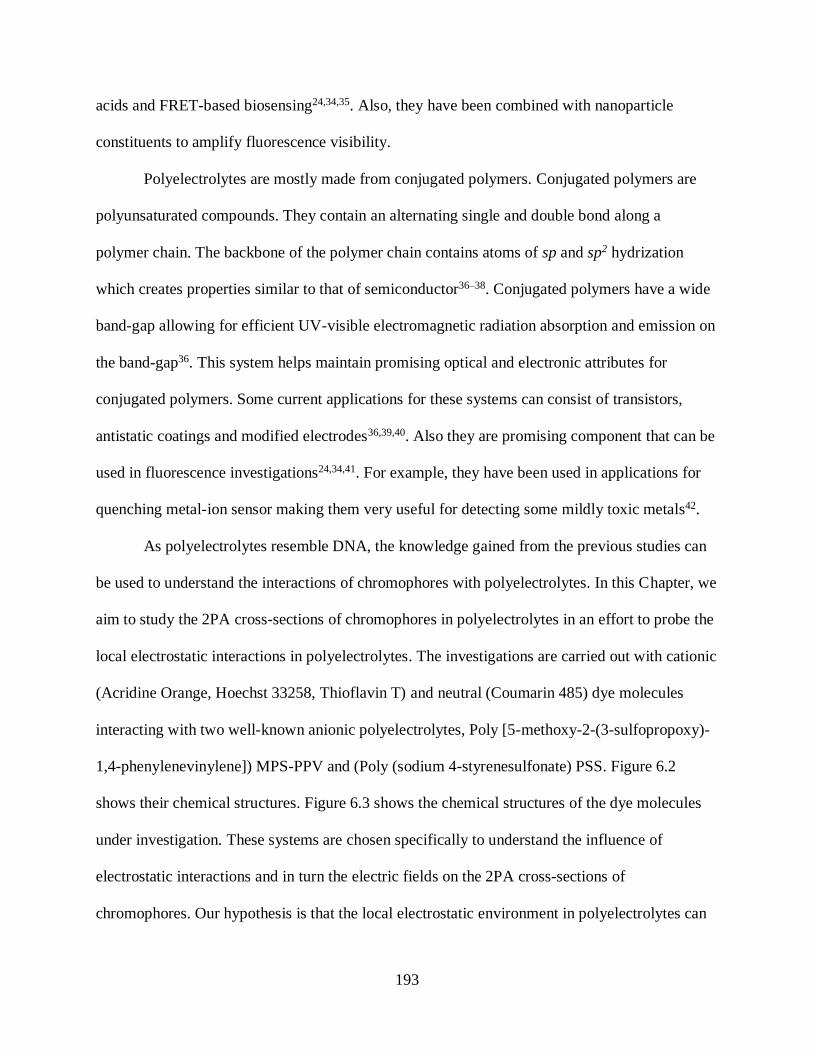
193
acids and FRET-based biosensing24,34,35. Also, they have been combined with nanoparticle
constituents to amplify fluorescence visibility.
Polyelectrolytes are mostly made from conjugated polymers. Conjugated polymers are
polyunsaturated compounds. They contain an alternating single and double bond along a
polymer chain. The backbone of the polymer chain contains atoms of sp and sp2 hydrization
which creates properties similar to that of semiconductor36–38. Conjugated polymers have a wide
band-gap allowing for efficient UV-visible electromagnetic radiation absorption and emission on
the band-gap36. This system helps maintain promising optical and electronic attributes for
conjugated polymers. Some current applications for these systems can consist of transistors,
antistatic coatings and modified electrodes36,39,40. Also they are promising component that can be
used in fluorescence investigations24,34,41. For example, they have been used in applications for
quenching metal-ion sensor making them very useful for detecting some mildly toxic metals42.
As polyelectrolytes resemble DNA, the knowledge gained from the previous studies can
be used to understand the interactions of chromophores with polyelectrolytes. In this Chapter, we
aim to study the 2PA cross-sections of chromophores in polyelectrolytes in an effort to probe the
local electrostatic interactions in polyelectrolytes. The investigations are carried out with cationic
(Acridine Orange, Hoechst 33258, Thioflavin T) and neutral (Coumarin 485) dye molecules
interacting with two well-known anionic polyelectrolytes, Poly [5-methoxy-2-(3-sulfopropoxy)-
1,4-phenylenevinylene]) MPS-PPV and (Poly (sodium 4-styrenesulfonate) PSS. Figure 6.2
shows their chemical structures. Figure 6.3 shows the chemical structures of the dye molecules
under investigation. These systems are chosen specifically to understand the influence of
electrostatic interactions and in turn the electric fields on the 2PA cross-sections of
chromophores. Our hypothesis is that the local electrostatic environment in polyelectrolytes can
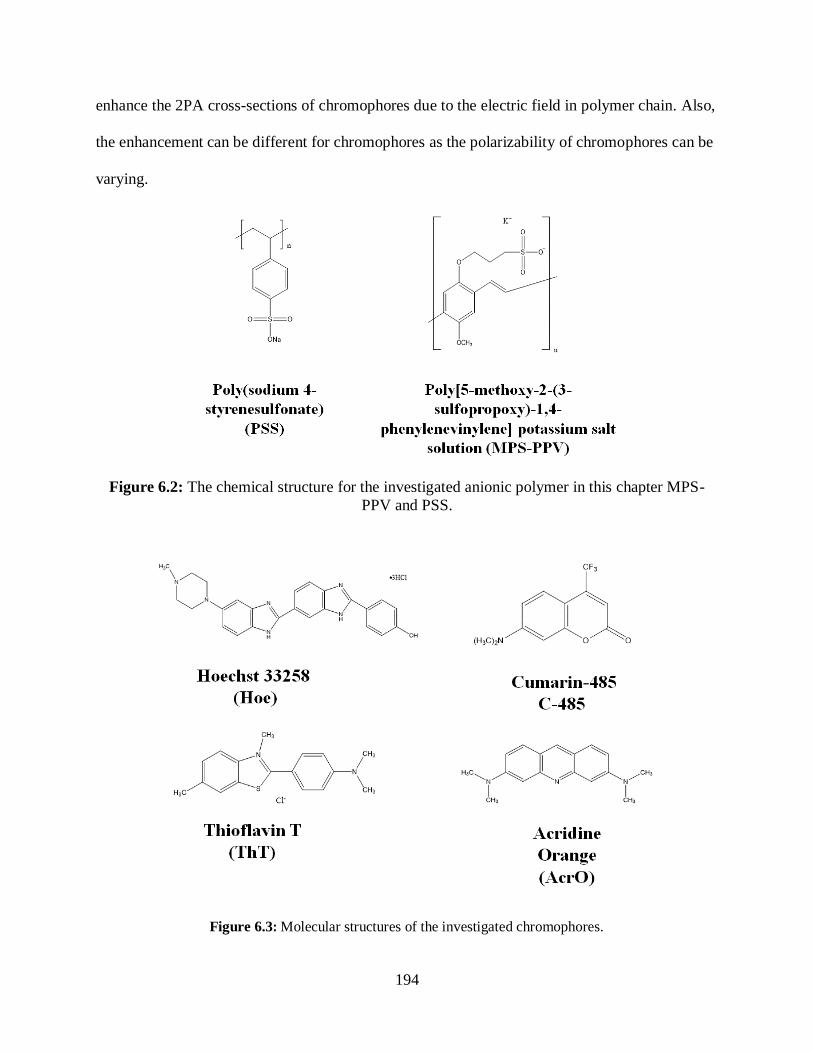
194
enhance the 2PA cross-sections of chromophores due to the electric field in polymer chain. Also,
the enhancement can be different for chromophores as the polarizability of chromophores can be
varying.
Figure 6.2: The chemical structure for the investigated anionic polymer in this chapter MPS-
PPV and PSS.
Figure 6.3: Molecular structures of the investigated chromophores.
195
6.2 Experimental
6.2.1 Materials
Poly [5-methoxy-2-(3-sulfopropoxy)-1,4-phenylenevinylene]) MPS-PPV and Poly
(sodium 4-styrenesulfonate) PSS were obtained from Sigma-Aldrich. Both MPS-PPV and PSS
dissolved in 1:1 DMSO/MilliQ water to prepare stock solutions. The investigated dyes: Acridine
Orange (AcrO), Hoechst 33258 (Hoe), Thioflavin T (ThT) and Coumarin 485 (C-485) dye
molecules were purchased from Sigma Aldrich. Each dye was dissolved in appropriate solvent and
then diluted to make 10 mL of 1 mM of stock solution. Fourteen samples were made from the
stock solutions with increasing concentrations of MPS-PPV and PSS placed in each( 0, 0.002,
0.01, 0.02, 0.03, 0.06, 0.07, 0.17, 0.26 mM for MPS-PPV) and (0, 0.001, 0.01, 0.02, 0.05, 0.17,
0.23, 0.3, 0.39 mM for PSS), while keeping dye concentration at 10 μM, then diluting the sample
volume to be 1 mL. This process was repeated for all the investigated dye molecules.
6.2.2 Methods
The UV/Vis absorption spectrometric measurements were performed using a Shimadzu
UV2101 PC spectrophotometer. Steady-state fluorescence measurements were performed on
Edinburgh spectofluorimeter. The 2PA cross-sections were obtained using the two-photon excited
fluorescence technique Tsunami (Spectrum-Physics), 720 nm to 900 nm, 100 fs, with C485 in
methanol as a standard. The relative 2PA cross-sections were obtained from the ratio of one and
two-photon fluorescence from the samples.
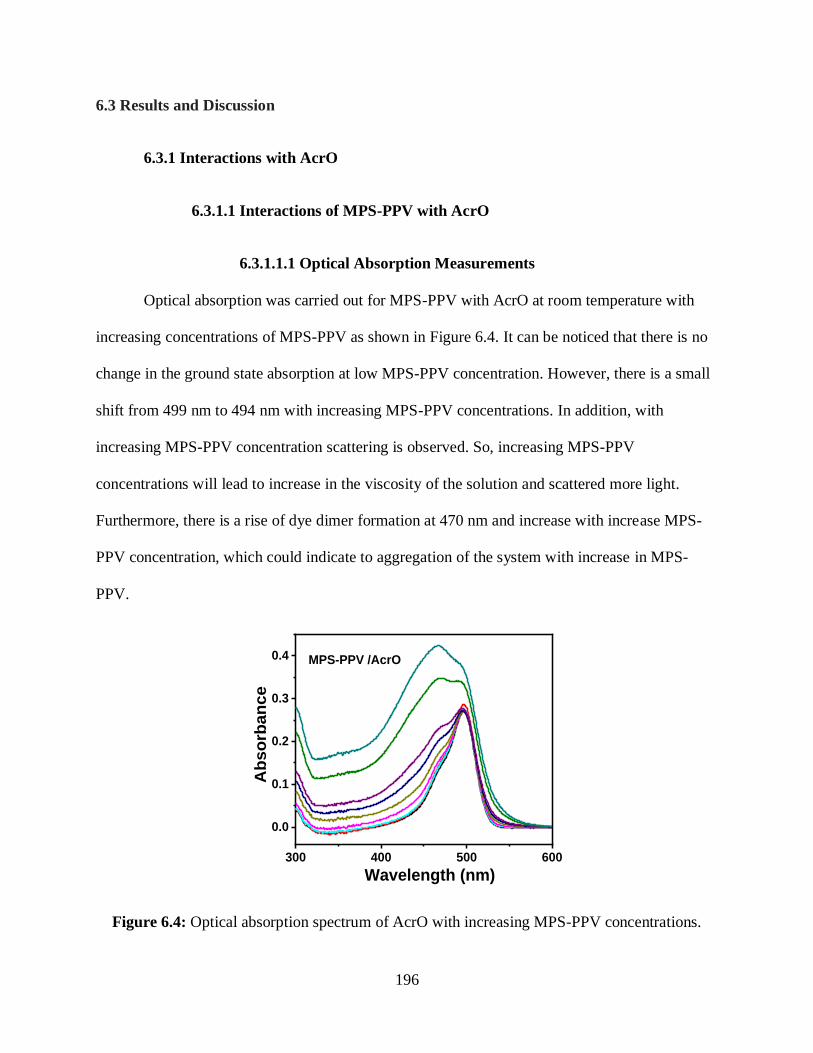
196
6.3 Results and Discussion
6.3.1 Interactions with AcrO
6.3.1.1 Interactions of MPS-PPV with AcrO
6.3.1.1.1 Optical Absorption Measurements
Optical absorption was carried out for MPS-PPV with AcrO at room temperature with
increasing concentrations of MPS-PPV as shown in Figure 6.4. It can be noticed that there is no
change in the ground state absorption at low MPS-PPV concentration. However, there is a small
shift from 499 nm to 494 nm with increasing MPS-PPV concentrations. In addition, with
increasing MPS-PPV concentration scattering is observed. So, increasing MPS-PPV
concentrations will lead to increase in the viscosity of the solution and scattered more light.
Furthermore, there is a rise of dye dimer formation at 470 nm and increase with increase MPS-
PPV concentration, which could indicate to aggregation of the system with increase in MPS-
PPV.
300 400 500 600
0.0
0.1
0.2
0.3
0.4
Ab
so
rba
nc
e
Wavelength (nm)
MPS-PPV /AcrO
Figure 6.4: Optical absorption spectrum of AcrO with increasing MPS-PPV concentrations.
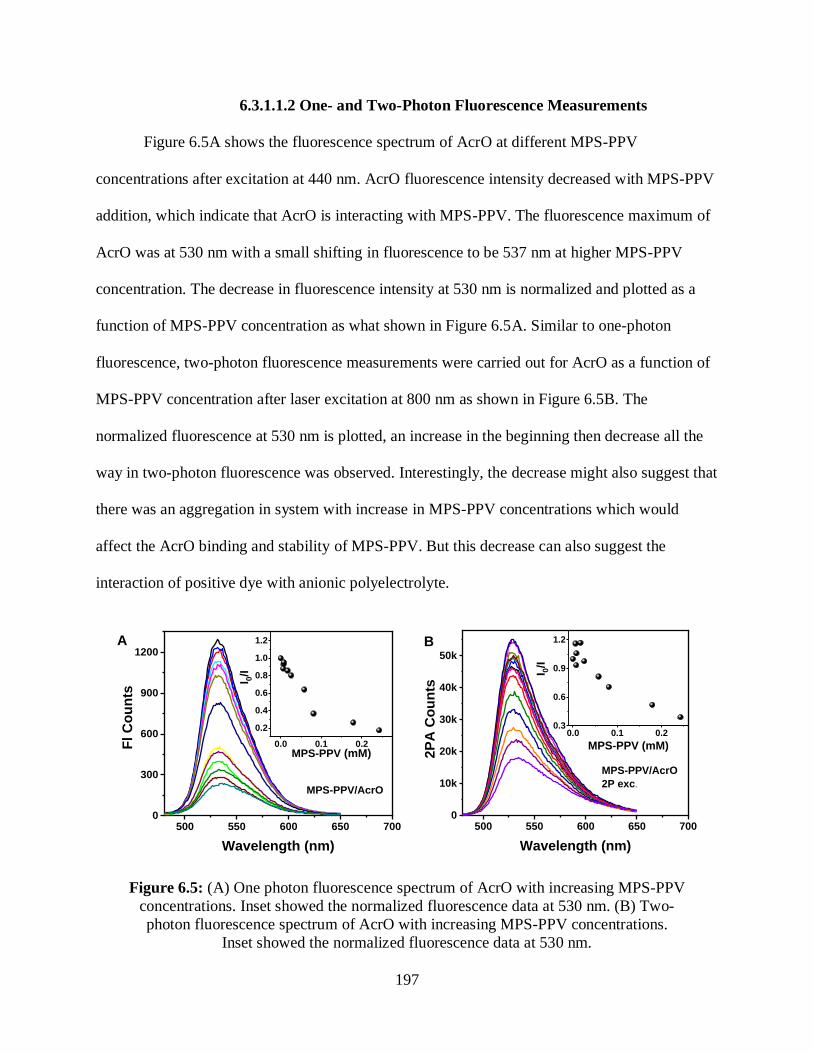
197
6.3.1.1.2 One- and Two-Photon Fluorescence Measurements
Figure 6.5A shows the fluorescence spectrum of AcrO at different MPS-PPV
concentrations after excitation at 440 nm. AcrO fluorescence intensity decreased with MPS-PPV
addition, which indicate that AcrO is interacting with MPS-PPV. The fluorescence maximum of
AcrO was at 530 nm with a small shifting in fluorescence to be 537 nm at higher MPS-PPV
concentration. The decrease in fluorescence intensity at 530 nm is normalized and plotted as a
function of MPS-PPV concentration as what shown in Figure 6.5A. Similar to one-photon
fluorescence, two-photon fluorescence measurements were carried out for AcrO as a function of
MPS-PPV concentration after laser excitation at 800 nm as shown in Figure 6.5B. The
normalized fluorescence at 530 nm is plotted, an increase in the beginning then decrease all the
way in two-photon fluorescence was observed. Interestingly, the decrease might also suggest that
there was an aggregation in system with increase in MPS-PPV concentrations which would
affect the AcrO binding and stability of MPS-PPV. But this decrease can also suggest the
interaction of positive dye with anionic polyelectrolyte.
500 550 600 650 7000
300
600
900
1200
Fl C
ou
nts
Wavelength (nm)
MPS-PPV/AcrO
0.0 0.1 0.2
0.2
0.4
0.6
0.8
1.0
1.2
I 0/I
MPS-PPV (mM)
A
500 550 600 650 7000
10k
20k
30k
40k
50k
2P
A C
ou
nts
Wavelength (nm)
MPS-PPV/AcrO
2P exc.
B
0.0 0.1 0.20.3
0.6
0.9
1.2
I 0/I
MPS-PPV (mM)
Figure 6.5: (A) One photon fluorescence spectrum of AcrO with increasing MPS-PPV
concentrations. Inset showed the normalized fluorescence data at 530 nm. (B) Two-
photon fluorescence spectrum of AcrO with increasing MPS-PPV concentrations.
Inset showed the normalized fluorescence data at 530 nm.
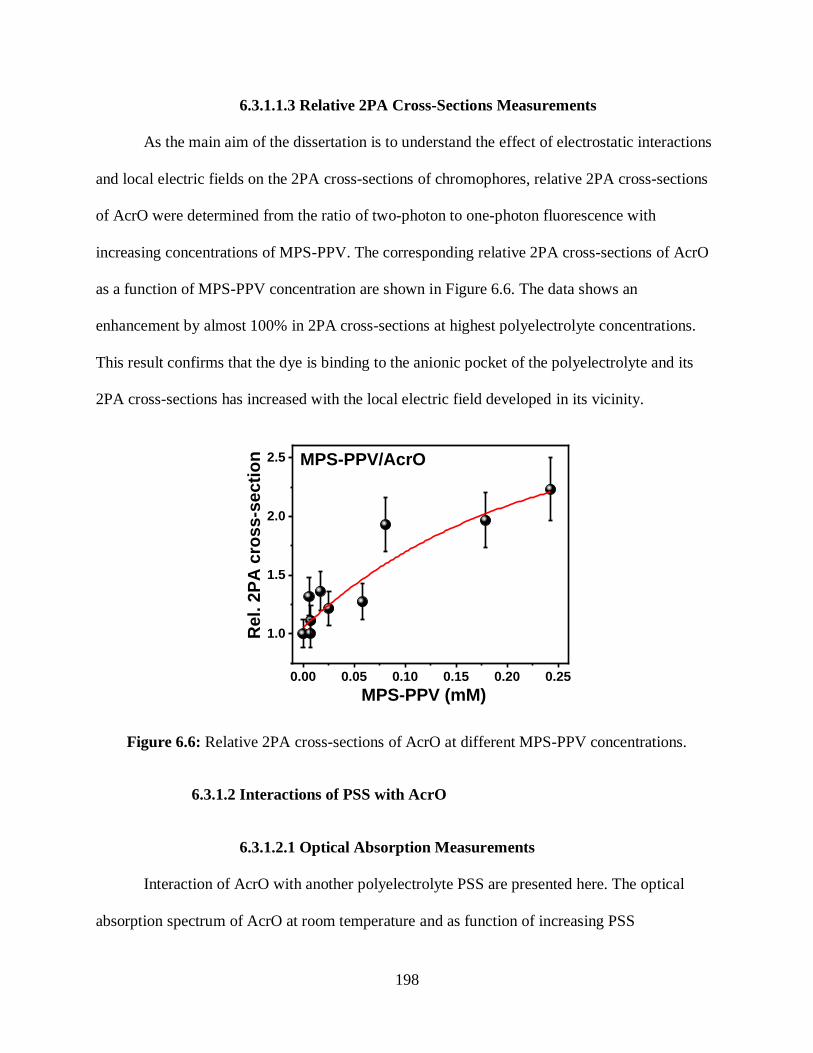
198
6.3.1.1.3 Relative 2PA Cross-Sections Measurements
As the main aim of the dissertation is to understand the effect of electrostatic interactions
and local electric fields on the 2PA cross-sections of chromophores, relative 2PA cross-sections
of AcrO were determined from the ratio of two-photon to one-photon fluorescence with
increasing concentrations of MPS-PPV. The corresponding relative 2PA cross-sections of AcrO
as a function of MPS-PPV concentration are shown in Figure 6.6. The data shows an
enhancement by almost 100% in 2PA cross-sections at highest polyelectrolyte concentrations.
This result confirms that the dye is binding to the anionic pocket of the polyelectrolyte and its
2PA cross-sections has increased with the local electric field developed in its vicinity.
0.00 0.05 0.10 0.15 0.20 0.25
1.0
1.5
2.0
2.5
Re
l. 2
PA
cro
ss-s
ecti
on
MPS-PPV (mM)
MPS-PPV/AcrO
Figure 6.6: Relative 2PA cross-sections of AcrO at different MPS-PPV concentrations.
6.3.1.2 Interactions of PSS with AcrO
6.3.1.2.1 Optical Absorption Measurements
Interaction of AcrO with another polyelectrolyte PSS are presented here. The optical
absorption spectrum of AcrO at room temperature and as function of increasing PSS
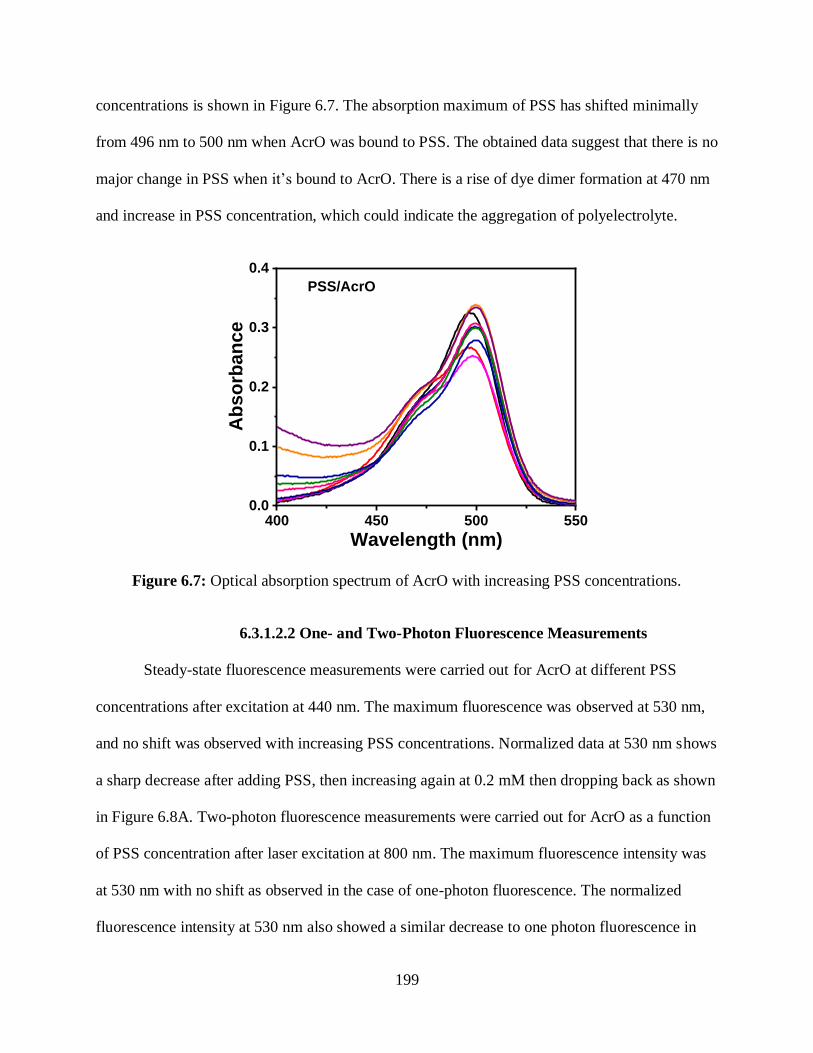
199
concentrations is shown in Figure 6.7. The absorption maximum of PSS has shifted minimally
from 496 nm to 500 nm when AcrO was bound to PSS. The obtained data suggest that there is no
major change in PSS when it’s bound to AcrO. There is a rise of dye dimer formation at 470 nm
and increase in PSS concentration, which could indicate the aggregation of polyelectrolyte.
400 450 500 5500.0
0.1
0.2
0.3
0.4
PSS/AcrO
Ab
so
rban
ce
Wavelength (nm)
Figure 6.7: Optical absorption spectrum of AcrO with increasing PSS concentrations.
6.3.1.2.2 One- and Two-Photon Fluorescence Measurements
Steady-state fluorescence measurements were carried out for AcrO at different PSS
concentrations after excitation at 440 nm. The maximum fluorescence was observed at 530 nm,
and no shift was observed with increasing PSS concentrations. Normalized data at 530 nm shows
a sharp decrease after adding PSS, then increasing again at 0.2 mM then dropping back as shown
in Figure 6.8A. Two-photon fluorescence measurements were carried out for AcrO as a function
of PSS concentration after laser excitation at 800 nm. The maximum fluorescence intensity was
at 530 nm with no shift as observed in the case of one-photon fluorescence. The normalized
fluorescence intensity at 530 nm also showed a similar decrease to one photon fluorescence in
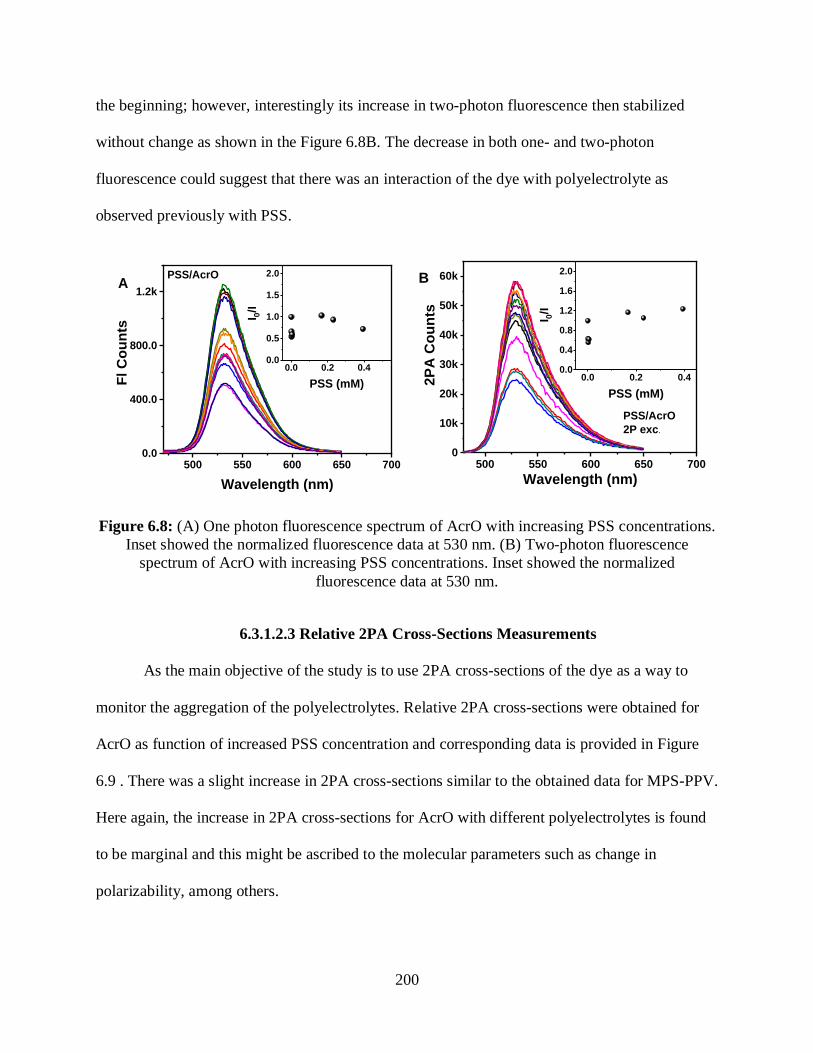
200
the beginning; however, interestingly its increase in two-photon fluorescence then stabilized
without change as shown in the Figure 6.8B. The decrease in both one- and two-photon
fluorescence could suggest that there was an interaction of the dye with polyelectrolyte as
observed previously with PSS.
500 550 600 650 7000.0
400.0
800.0
1.2kA
PSS/AcrO
Fl C
ou
nts
Wavelength (nm)
0.0 0.2 0.40.0
0.5
1.0
1.5
2.0
I 0/I
PSS (mM)
500 550 600 650 7000
10k
20k
30k
40k
50k
60k
PSS/AcrO
2P exc.
2P
A C
ou
nts
Wavelength (nm)
0.0 0.2 0.40.0
0.4
0.8
1.2
1.6
2.0B
I 0/I
PSS (mM)
Figure 6.8: (A) One photon fluorescence spectrum of AcrO with increasing PSS concentrations.
Inset showed the normalized fluorescence data at 530 nm. (B) Two-photon fluorescence
spectrum of AcrO with increasing PSS concentrations. Inset showed the normalized
fluorescence data at 530 nm.
6.3.1.2.3 Relative 2PA Cross-Sections Measurements
As the main objective of the study is to use 2PA cross-sections of the dye as a way to
monitor the aggregation of the polyelectrolytes. Relative 2PA cross-sections were obtained for
AcrO as function of increased PSS concentration and corresponding data is provided in Figure
6.9 . There was a slight increase in 2PA cross-sections similar to the obtained data for MPS-PPV.
Here again, the increase in 2PA cross-sections for AcrO with different polyelectrolytes is found
to be marginal and this might be ascribed to the molecular parameters such as change in
polarizability, among others.
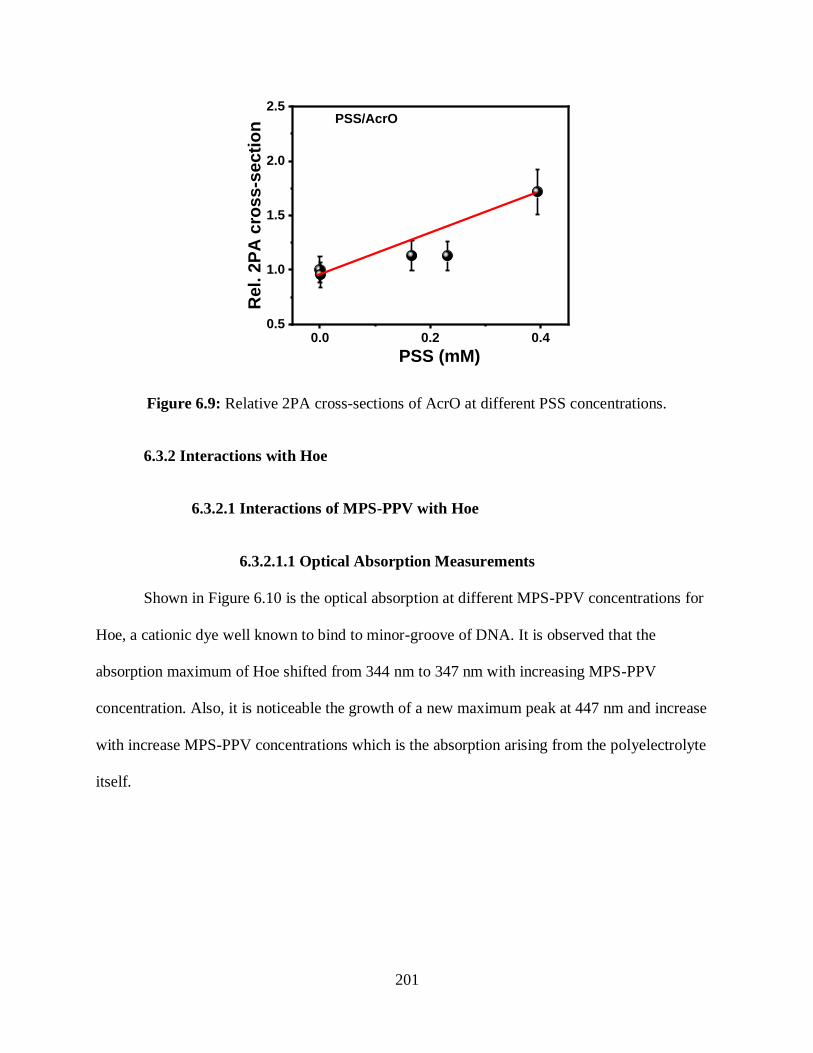
201
0.0 0.2 0.40.5
1.0
1.5
2.0
2.5PSS/AcrO
Re
l. 2
PA
cro
ss-s
ecti
on
PSS (mM)
Figure 6.9: Relative 2PA cross-sections of AcrO at different PSS concentrations.
6.3.2 Interactions with Hoe
6.3.2.1 Interactions of MPS-PPV with Hoe
6.3.2.1.1 Optical Absorption Measurements
Shown in Figure 6.10 is the optical absorption at different MPS-PPV concentrations for
Hoe, a cationic dye well known to bind to minor-groove of DNA. It is observed that the
absorption maximum of Hoe shifted from 344 nm to 347 nm with increasing MPS-PPV
concentration. Also, it is noticeable the growth of a new maximum peak at 447 nm and increase
with increase MPS-PPV concentrations which is the absorption arising from the polyelectrolyte
itself.
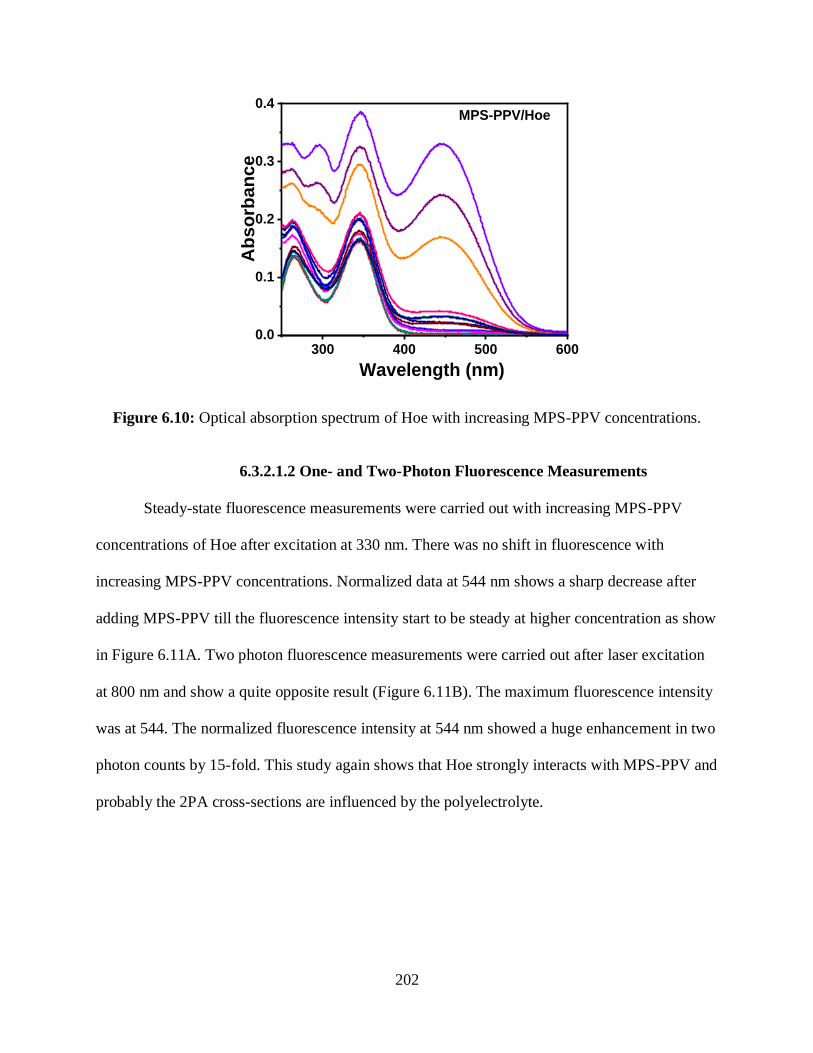
202
300 400 500 6000.0
0.1
0.2
0.3
0.4MPS-PPV/Hoe
Ab
so
rba
nc
e
Wavelength (nm)
Figure 6.10: Optical absorption spectrum of Hoe with increasing MPS-PPV concentrations.
6.3.2.1.2 One- and Two-Photon Fluorescence Measurements
Steady-state fluorescence measurements were carried out with increasing MPS-PPV
concentrations of Hoe after excitation at 330 nm. There was no shift in fluorescence with
increasing MPS-PPV concentrations. Normalized data at 544 nm shows a sharp decrease after
adding MPS-PPV till the fluorescence intensity start to be steady at higher concentration as show
in Figure 6.11A. Two photon fluorescence measurements were carried out after laser excitation
at 800 nm and show a quite opposite result (Figure 6.11B). The maximum fluorescence intensity
was at 544. The normalized fluorescence intensity at 544 nm showed a huge enhancement in two
photon counts by 15-fold. This study again shows that Hoe strongly interacts with MPS-PPV and
probably the 2PA cross-sections are influenced by the polyelectrolyte.
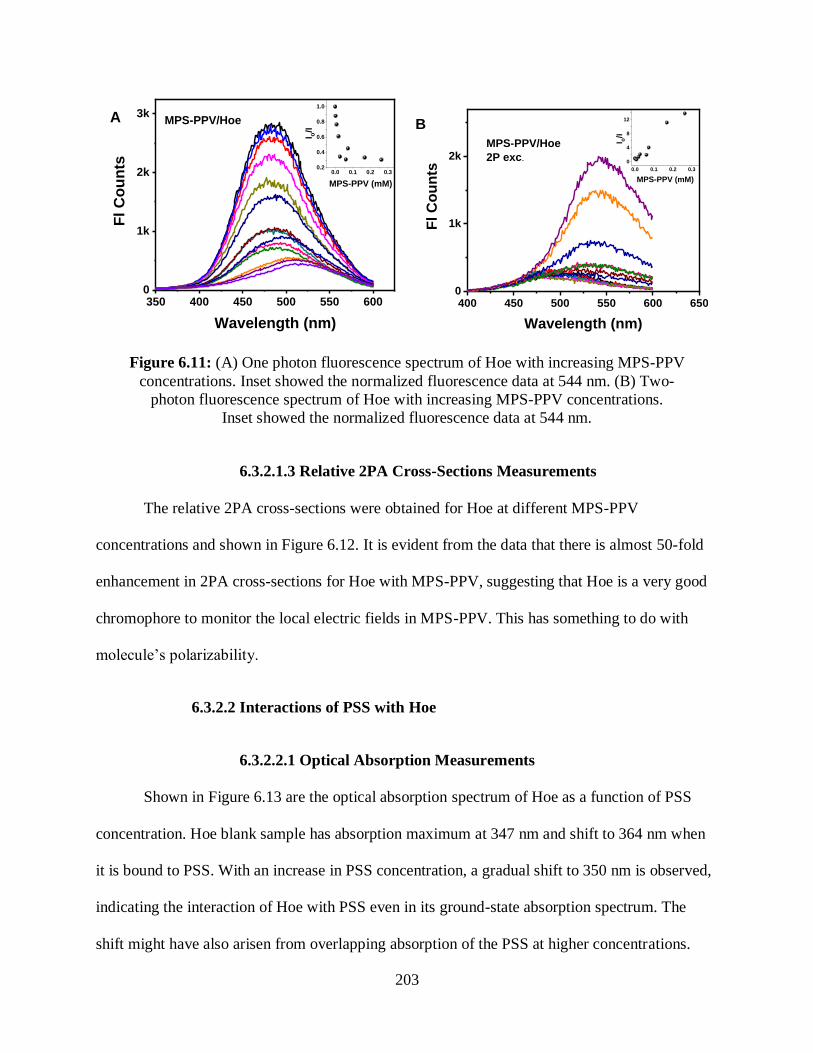
203
350 400 450 500 550 6000
1k
2k
3kMPS-PPV/Hoe
Fl C
ou
nts
Wavelength (nm)
A
0.0 0.1 0.2 0.30.2
0.4
0.6
0.8
1.0
I o/I
MPS-PPV (mM)
400 450 500 550 600 6500
1k
2k
B
MPS-PPV/Hoe
2P exc.
Fl C
ou
nts
Wavelength (nm)
0.0 0.1 0.2 0.3
0
4
8
12
I o/I
MPS-PPV (mM)
Figure 6.11: (A) One photon fluorescence spectrum of Hoe with increasing MPS-PPV
concentrations. Inset showed the normalized fluorescence data at 544 nm. (B) Two-
photon fluorescence spectrum of Hoe with increasing MPS-PPV concentrations.
Inset showed the normalized fluorescence data at 544 nm.
6.3.2.1.3 Relative 2PA Cross-Sections Measurements
The relative 2PA cross-sections were obtained for Hoe at different MPS-PPV
concentrations and shown in Figure 6.12. It is evident from the data that there is almost 50-fold
enhancement in 2PA cross-sections for Hoe with MPS-PPV, suggesting that Hoe is a very good
chromophore to monitor the local electric fields in MPS-PPV. This has something to do with
molecule’s polarizability.
6.3.2.2 Interactions of PSS with Hoe
6.3.2.2.1 Optical Absorption Measurements
Shown in Figure 6.13 are the optical absorption spectrum of Hoe as a function of PSS
concentration. Hoe blank sample has absorption maximum at 347 nm and shift to 364 nm when
it is bound to PSS. With an increase in PSS concentration, a gradual shift to 350 nm is observed,
indicating the interaction of Hoe with PSS even in its ground-state absorption spectrum. The
shift might have also arisen from overlapping absorption of the PSS at higher concentrations.
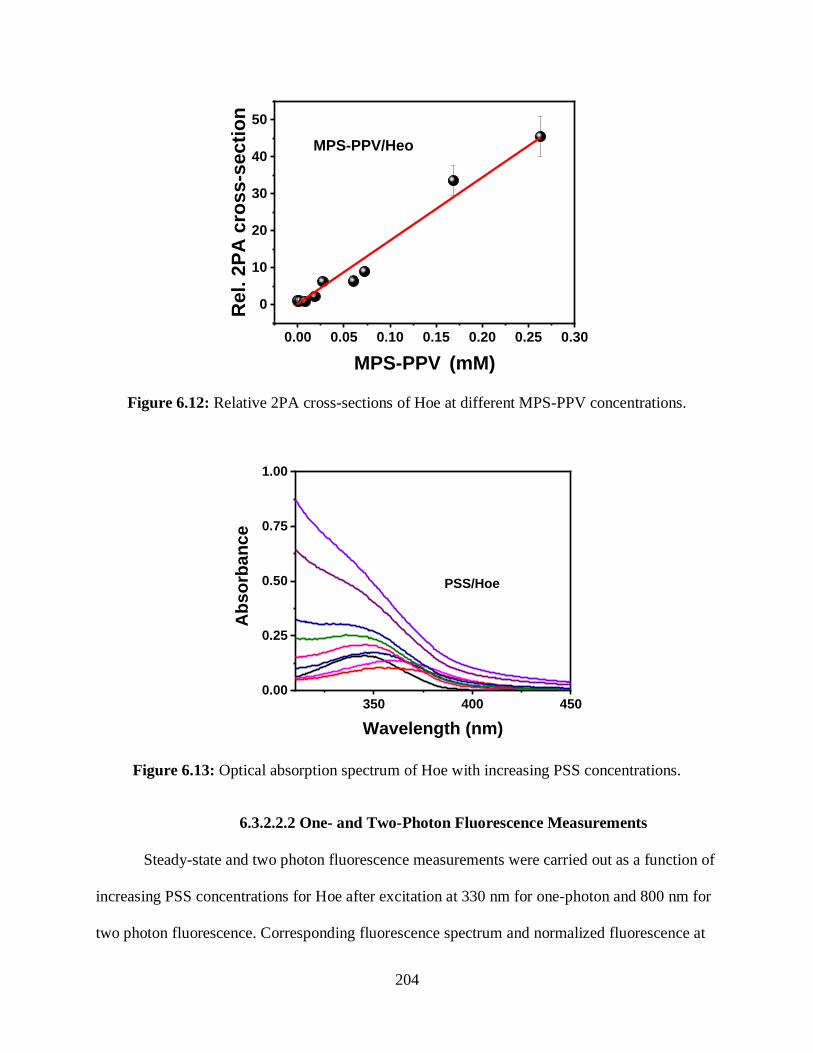
204
0.00 0.05 0.10 0.15 0.20 0.25 0.30
0
10
20
30
40
50
MPS-PPV/Heo
Re
l. 2
PA
cro
ss
-se
cti
on
MPS-PPV (mM)
Figure 6.12: Relative 2PA cross-sections of Hoe at different MPS-PPV concentrations.
350 400 4500.00
0.25
0.50
0.75
1.00
PSS/Hoe
Ab
so
rban
ce
Wavelength (nm)
Figure 6.13: Optical absorption spectrum of Hoe with increasing PSS concentrations.
6.3.2.2.2 One- and Two-Photon Fluorescence Measurements
Steady-state and two photon fluorescence measurements were carried out as a function of
increasing PSS concentrations for Hoe after excitation at 330 nm for one-photon and 800 nm for
two photon fluorescence. Corresponding fluorescence spectrum and normalized fluorescence at
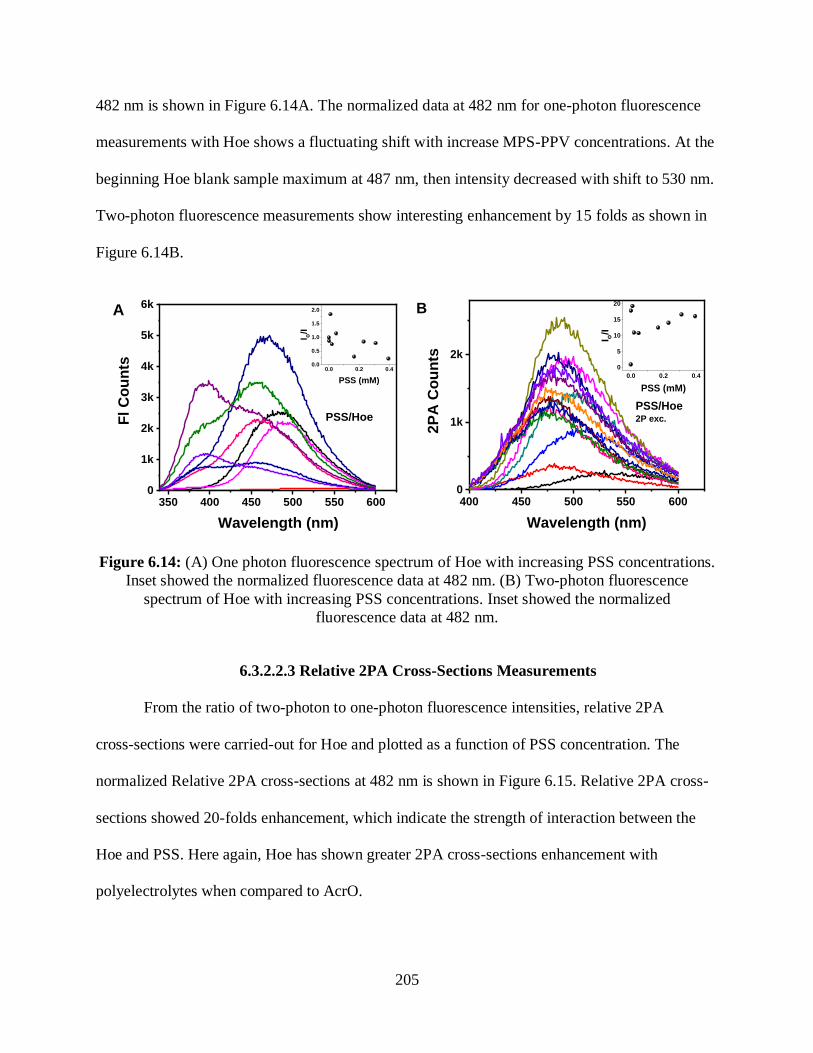
205
482 nm is shown in Figure 6.14A. The normalized data at 482 nm for one-photon fluorescence
measurements with Hoe shows a fluctuating shift with increase MPS-PPV concentrations. At the
beginning Hoe blank sample maximum at 487 nm, then intensity decreased with shift to 530 nm.
Two-photon fluorescence measurements show interesting enhancement by 15 folds as shown in
Figure 6.14B.
350 400 450 500 550 6000
1k
2k
3k
4k
5k
6k
PSS/Hoe
Fl
Co
un
ts
Wavelength (nm)
0.0 0.2 0.40.0
0.5
1.0
1.5
2.0I o
/I
PSS (mM)
A
400 450 500 550 6000
1k
2k
PSS/Hoe2P exc.
2P
A C
ou
nts
Wavelength (nm)
B
0.0 0.2 0.4
0
5
10
15
20
I o/I
PSS (mM)
Figure 6.14: (A) One photon fluorescence spectrum of Hoe with increasing PSS concentrations.
Inset showed the normalized fluorescence data at 482 nm. (B) Two-photon fluorescence
spectrum of Hoe with increasing PSS concentrations. Inset showed the normalized
fluorescence data at 482 nm.
6.3.2.2.3 Relative 2PA Cross-Sections Measurements
From the ratio of two-photon to one-photon fluorescence intensities, relative 2PA
cross-sections were carried-out for Hoe and plotted as a function of PSS concentration. The
normalized Relative 2PA cross-sections at 482 nm is shown in Figure 6.15. Relative 2PA cross-
sections showed 20-folds enhancement, which indicate the strength of interaction between the
Hoe and PSS. Here again, Hoe has shown greater 2PA cross-sections enhancement with
polyelectrolytes when compared to AcrO.
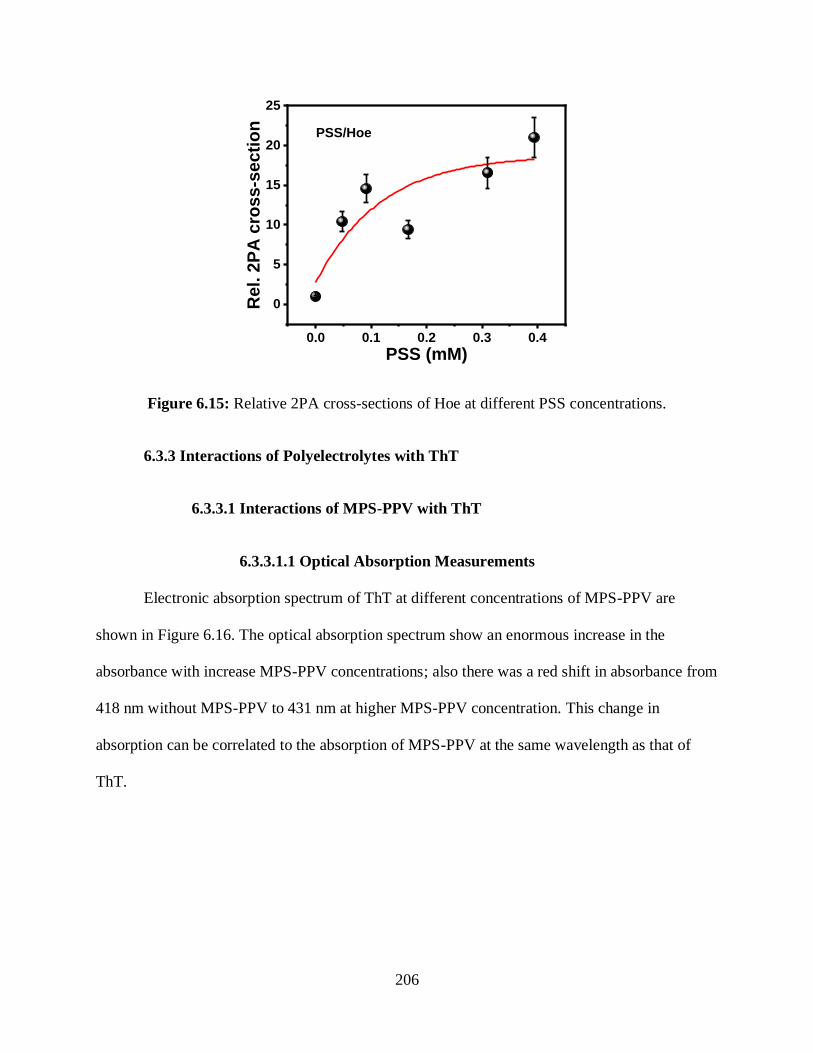
206
0.0 0.1 0.2 0.3 0.4
0
5
10
15
20
25
PSS/Hoe
Rel. 2
PA
cro
ss-s
ecti
on
PSS (mM)
Figure 6.15: Relative 2PA cross-sections of Hoe at different PSS concentrations.
6.3.3 Interactions of Polyelectrolytes with ThT
6.3.3.1 Interactions of MPS-PPV with ThT
6.3.3.1.1 Optical Absorption Measurements
Electronic absorption spectrum of ThT at different concentrations of MPS-PPV are
shown in Figure 6.16. The optical absorption spectrum show an enormous increase in the
absorbance with increase MPS-PPV concentrations; also there was a red shift in absorbance from
418 nm without MPS-PPV to 431 nm at higher MPS-PPV concentration. This change in
absorption can be correlated to the absorption of MPS-PPV at the same wavelength as that of
ThT.
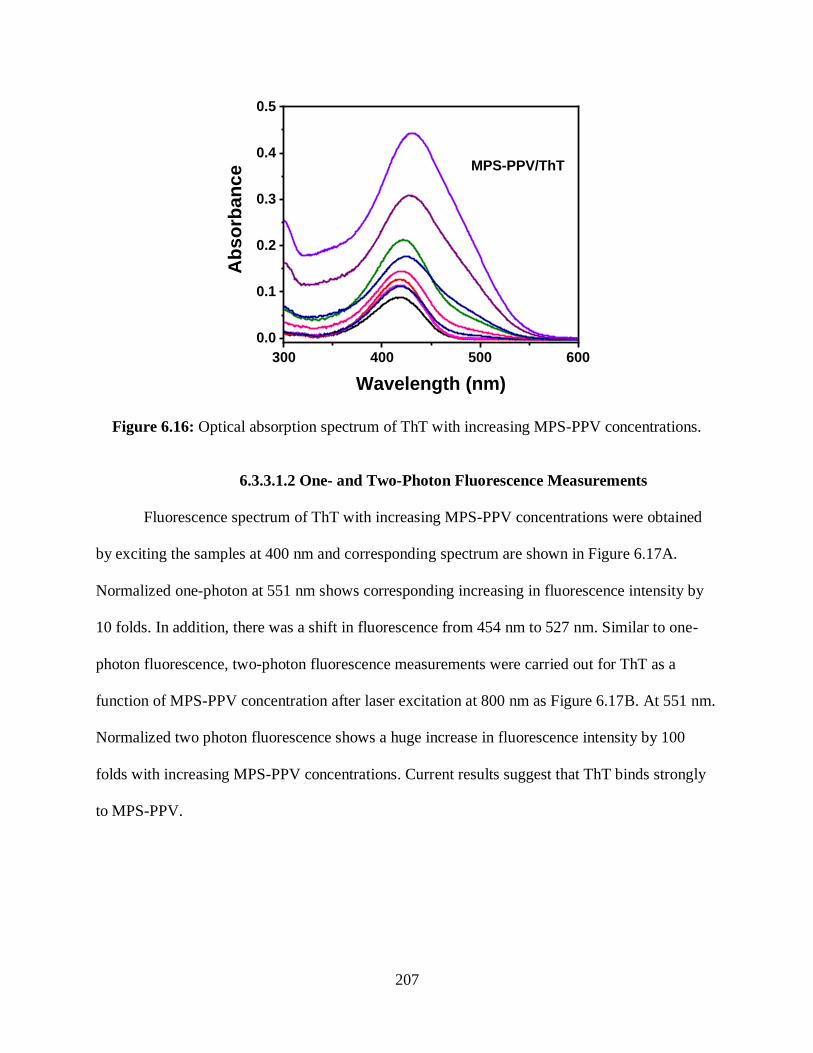
207
300 400 500 600
0.0
0.1
0.2
0.3
0.4
0.5
MPS-PPV/ThT
Ab
so
rban
ce
Wavelength (nm)
Figure 6.16: Optical absorption spectrum of ThT with increasing MPS-PPV concentrations.
6.3.3.1.2 One- and Two-Photon Fluorescence Measurements
Fluorescence spectrum of ThT with increasing MPS-PPV concentrations were obtained
by exciting the samples at 400 nm and corresponding spectrum are shown in Figure 6.17A.
Normalized one-photon at 551 nm shows corresponding increasing in fluorescence intensity by
10 folds. In addition, there was a shift in fluorescence from 454 nm to 527 nm. Similar to one-
photon fluorescence, two-photon fluorescence measurements were carried out for ThT as a
function of MPS-PPV concentration after laser excitation at 800 nm as Figure 6.17B. At 551 nm.
Normalized two photon fluorescence shows a huge increase in fluorescence intensity by 100
folds with increasing MPS-PPV concentrations. Current results suggest that ThT binds strongly
to MPS-PPV.
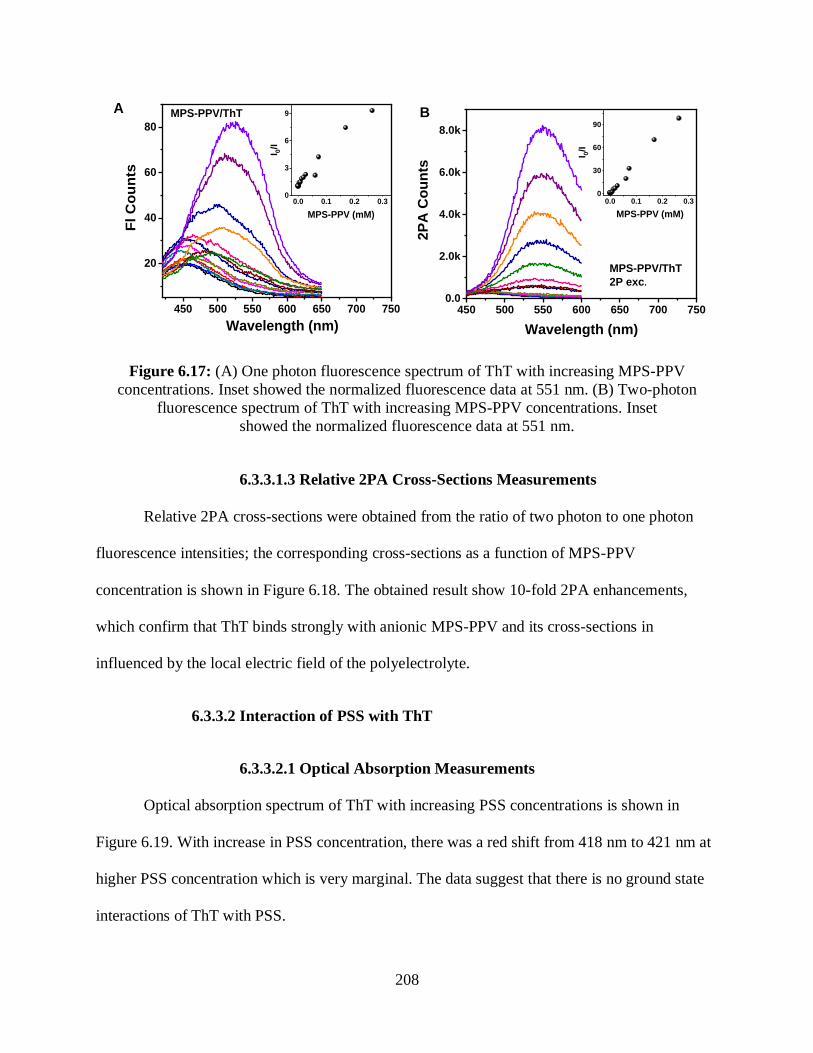
208
450 500 550 600 650 700 750
20
40
60
80
MPS-PPV/ThT
Fl C
ou
nts
Wavelength (nm)
A
0.0 0.1 0.2 0.30
3
6
9
I 0/I
MPS-PPV (mM)
450 500 550 600 650 700 7500.0
2.0k
4.0k
6.0k
8.0k
MPS-PPV/ThT
2P exc.
2P
A C
ou
nts
Wavelength (nm)
0.0 0.1 0.2 0.30
30
60
90
I 0/I
MPS-PPV (mM)
B
Figure 6.17: (A) One photon fluorescence spectrum of ThT with increasing MPS-PPV
concentrations. Inset showed the normalized fluorescence data at 551 nm. (B) Two-photon
fluorescence spectrum of ThT with increasing MPS-PPV concentrations. Inset
showed the normalized fluorescence data at 551 nm.
6.3.3.1.3 Relative 2PA Cross-Sections Measurements
Relative 2PA cross-sections were obtained from the ratio of two photon to one photon
fluorescence intensities; the corresponding cross-sections as a function of MPS-PPV
concentration is shown in Figure 6.18. The obtained result show 10-fold 2PA enhancements,
which confirm that ThT binds strongly with anionic MPS-PPV and its cross-sections in
influenced by the local electric field of the polyelectrolyte.
6.3.3.2 Interaction of PSS with ThT
6.3.3.2.1 Optical Absorption Measurements
Optical absorption spectrum of ThT with increasing PSS concentrations is shown in
Figure 6.19. With increase in PSS concentration, there was a red shift from 418 nm to 421 nm at
higher PSS concentration which is very marginal. The data suggest that there is no ground state
interactions of ThT with PSS.
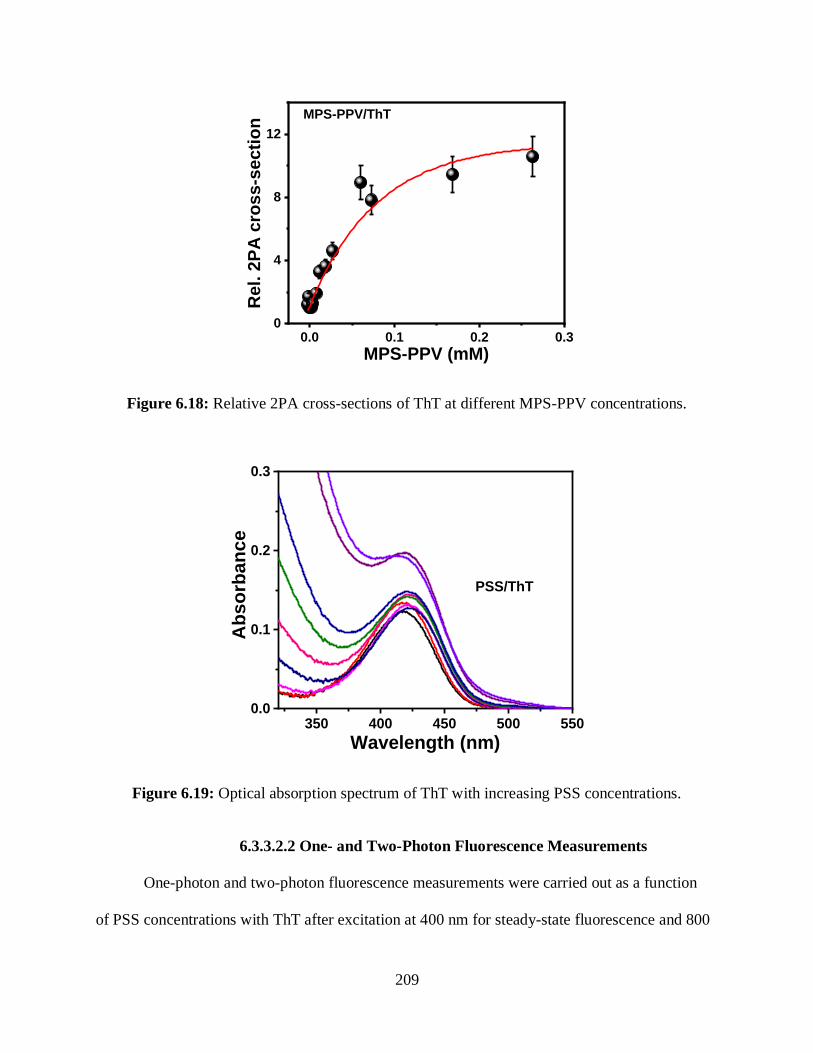
209
0.0 0.1 0.2 0.30
4
8
12
MPS-PPV/ThT
Rel. 2
PA
cro
ss-s
ecti
on
MPS-PPV (mM)
Figure 6.18: Relative 2PA cross-sections of ThT at different MPS-PPV concentrations.
350 400 450 500 5500.0
0.1
0.2
0.3
PSS/ThT
Ab
so
rban
ce
Wavelength (nm)
Figure 6.19: Optical absorption spectrum of ThT with increasing PSS concentrations.
6.3.3.2.2 One- and Two-Photon Fluorescence Measurements
One-photon and two-photon fluorescence measurements were carried out as a function
of PSS concentrations with ThT after excitation at 400 nm for steady-state fluorescence and 800
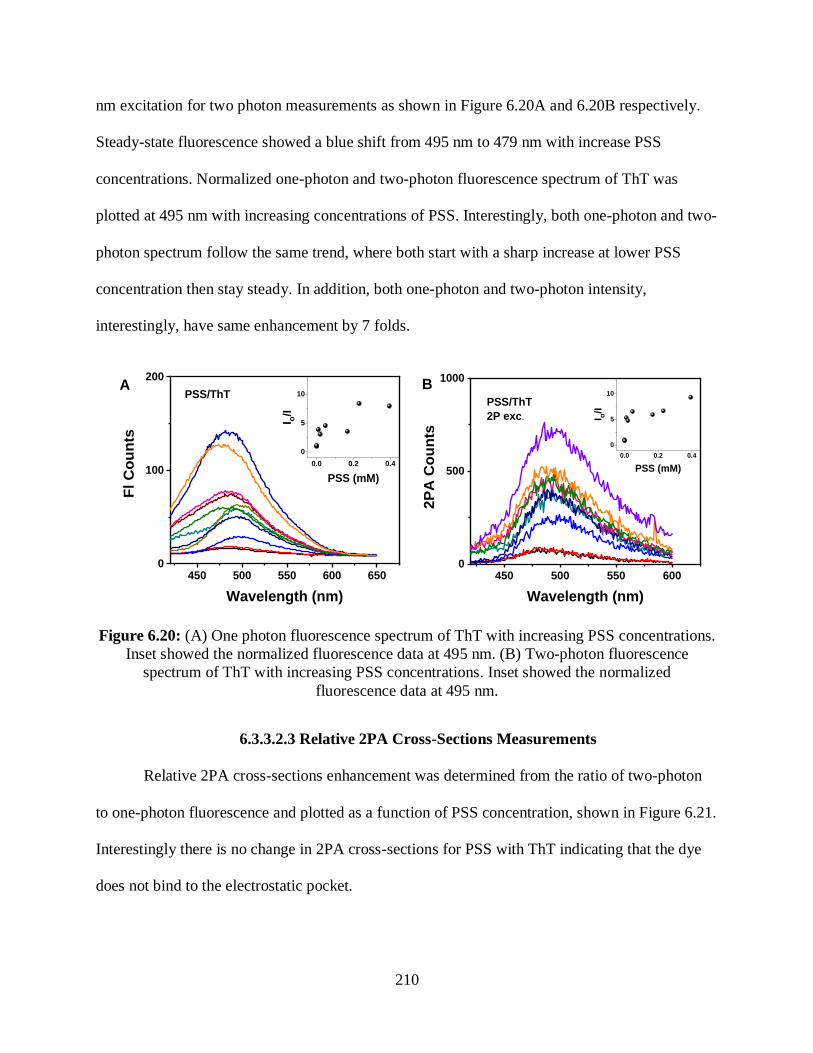
210
nm excitation for two photon measurements as shown in Figure 6.20A and 6.20B respectively.
Steady-state fluorescence showed a blue shift from 495 nm to 479 nm with increase PSS
concentrations. Normalized one-photon and two-photon fluorescence spectrum of ThT was
plotted at 495 nm with increasing concentrations of PSS. Interestingly, both one-photon and two-
photon spectrum follow the same trend, where both start with a sharp increase at lower PSS
concentration then stay steady. In addition, both one-photon and two-photon intensity,
interestingly, have same enhancement by 7 folds.
450 500 550 600 6500
100
200A
PSS/ThT
Fl
Co
un
ts
Wavelength (nm)
0.0 0.2 0.4
0
5
10
I o/I
PSS (mM)
450 500 550 6000
500
1000
PSS/ThT
2P exc.
2P
A C
ou
nts
Wavelength (nm)
B
0.0 0.2 0.4
0
5
10
I o/I
PSS (mM)
Figure 6.20: (A) One photon fluorescence spectrum of ThT with increasing PSS concentrations.
Inset showed the normalized fluorescence data at 495 nm. (B) Two-photon fluorescence
spectrum of ThT with increasing PSS concentrations. Inset showed the normalized
fluorescence data at 495 nm.
6.3.3.2.3 Relative 2PA Cross-Sections Measurements
Relative 2PA cross-sections enhancement was determined from the ratio of two-photon
to one-photon fluorescence and plotted as a function of PSS concentration, shown in Figure 6.21.
Interestingly there is no change in 2PA cross-sections for PSS with ThT indicating that the dye
does not bind to the electrostatic pocket.
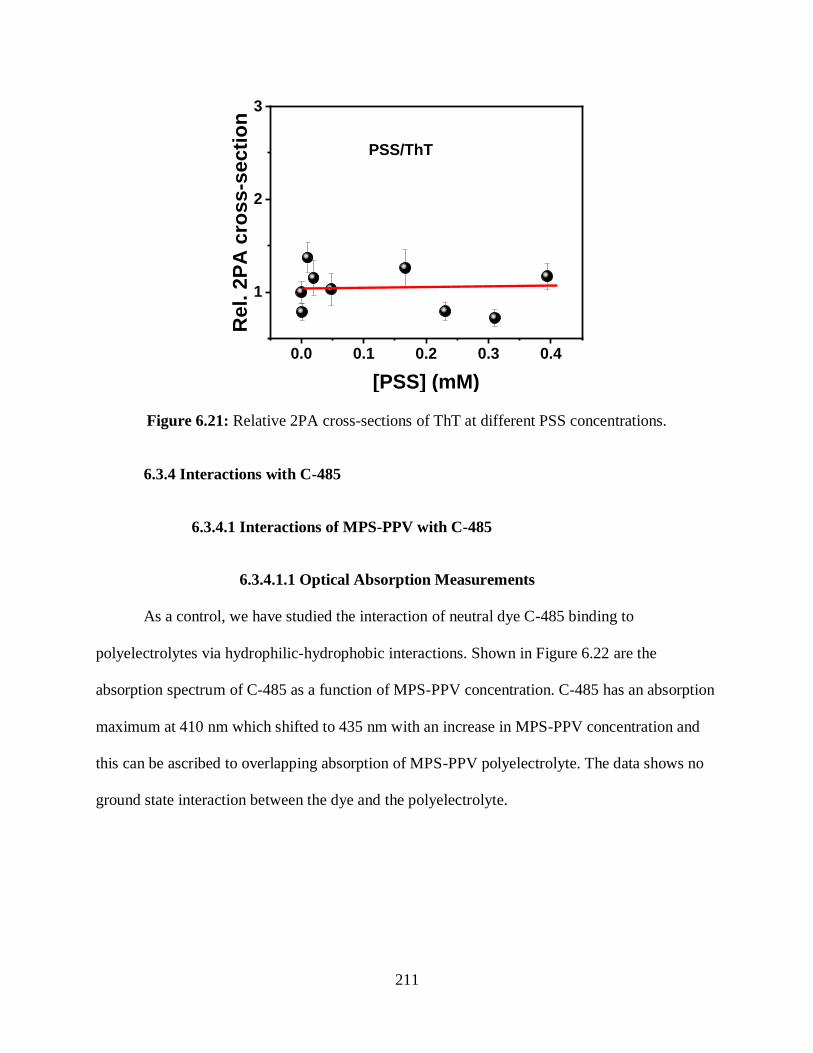
211
0.0 0.1 0.2 0.3 0.4
1
2
3
PSS/ThT
Re
l. 2
PA
cro
ss
-se
cti
on
[PSS] (mM)
Figure 6.21: Relative 2PA cross-sections of ThT at different PSS concentrations.
6.3.4 Interactions with C-485
6.3.4.1 Interactions of MPS-PPV with C-485
6.3.4.1.1 Optical Absorption Measurements
As a control, we have studied the interaction of neutral dye C-485 binding to
polyelectrolytes via hydrophilic-hydrophobic interactions. Shown in Figure 6.22 are the
absorption spectrum of C-485 as a function of MPS-PPV concentration. C-485 has an absorption
maximum at 410 nm which shifted to 435 nm with an increase in MPS-PPV concentration and
this can be ascribed to overlapping absorption of MPS-PPV polyelectrolyte. The data shows no
ground state interaction between the dye and the polyelectrolyte.
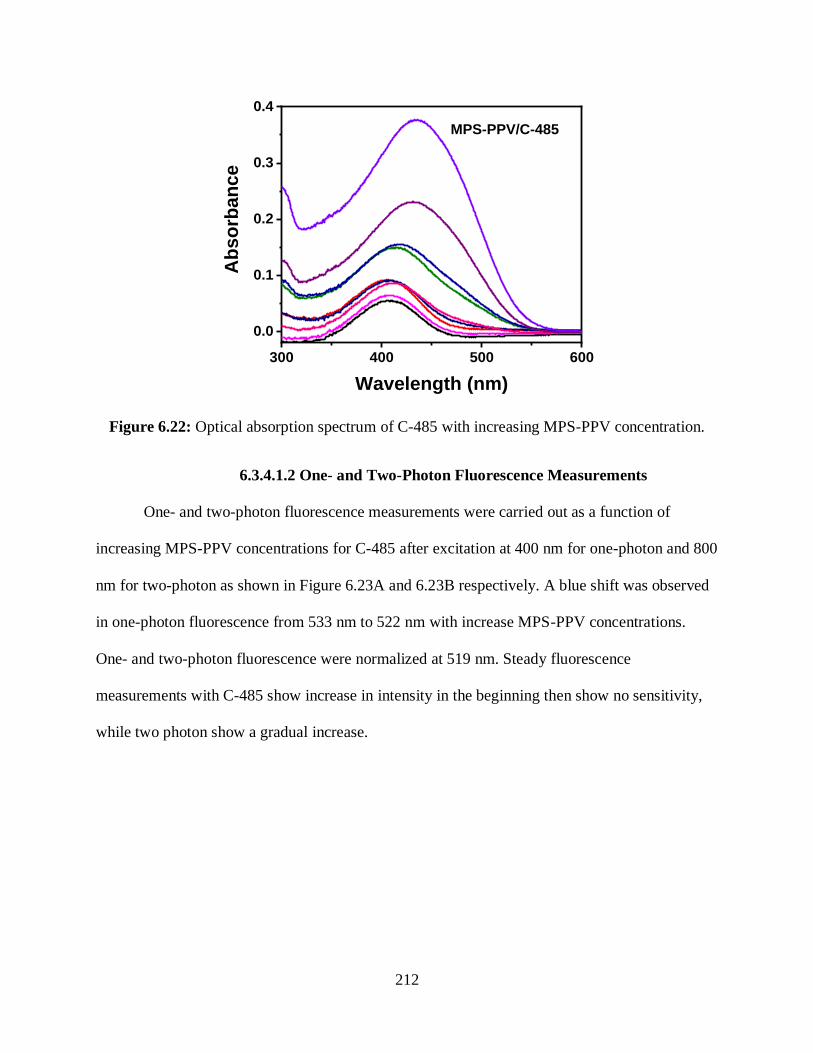
212
300 400 500 600
0.0
0.1
0.2
0.3
0.4
MPS-PPV/C-485
Ab
so
rban
ce
Wavelength (nm)
Figure 6.22: Optical absorption spectrum of C-485 with increasing MPS-PPV concentration.
6.3.4.1.2 One- and Two-Photon Fluorescence Measurements
One- and two-photon fluorescence measurements were carried out as a function of
increasing MPS-PPV concentrations for C-485 after excitation at 400 nm for one-photon and 800
nm for two-photon as shown in Figure 6.23A and 6.23B respectively. A blue shift was observed
in one-photon fluorescence from 533 nm to 522 nm with increase MPS-PPV concentrations.
One- and two-photon fluorescence were normalized at 519 nm. Steady fluorescence
measurements with C-485 show increase in intensity in the beginning then show no sensitivity,
while two photon show a gradual increase.
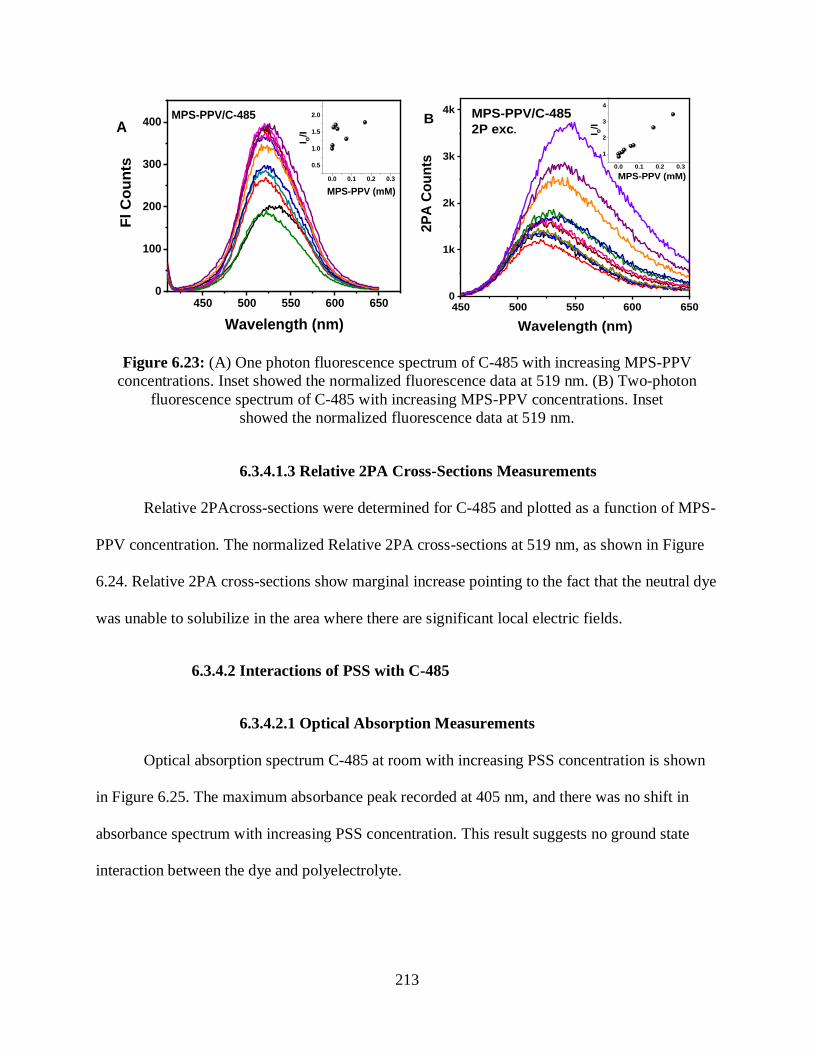
213
450 500 550 600 6500
100
200
300
400MPS-PPV/C-485
Fl C
ou
nts
Wavelength (nm)
A
0.0 0.1 0.2 0.3
0.5
1.0
1.5
2.0
I o/I
MPS-PPV (mM)
450 500 550 600 6500
1k
2k
3k
4k MPS-PPV/C-485
2P exc.
2P
A C
ou
nts
Wavelength (nm)
B
0.0 0.1 0.2 0.3
1
2
3
4
I o/I
MPS-PPV (mM)
Figure 6.23: (A) One photon fluorescence spectrum of C-485 with increasing MPS-PPV
concentrations. Inset showed the normalized fluorescence data at 519 nm. (B) Two-photon
fluorescence spectrum of C-485 with increasing MPS-PPV concentrations. Inset
showed the normalized fluorescence data at 519 nm.
6.3.4.1.3 Relative 2PA Cross-Sections Measurements
Relative 2PAcross-sections were determined for C-485 and plotted as a function of MPS-
PPV concentration. The normalized Relative 2PA cross-sections at 519 nm, as shown in Figure
6.24. Relative 2PA cross-sections show marginal increase pointing to the fact that the neutral dye
was unable to solubilize in the area where there are significant local electric fields.
6.3.4.2 Interactions of PSS with C-485
6.3.4.2.1 Optical Absorption Measurements
Optical absorption spectrum C-485 at room with increasing PSS concentration is shown
in Figure 6.25. The maximum absorbance peak recorded at 405 nm, and there was no shift in
absorbance spectrum with increasing PSS concentration. This result suggests no ground state
interaction between the dye and polyelectrolyte.
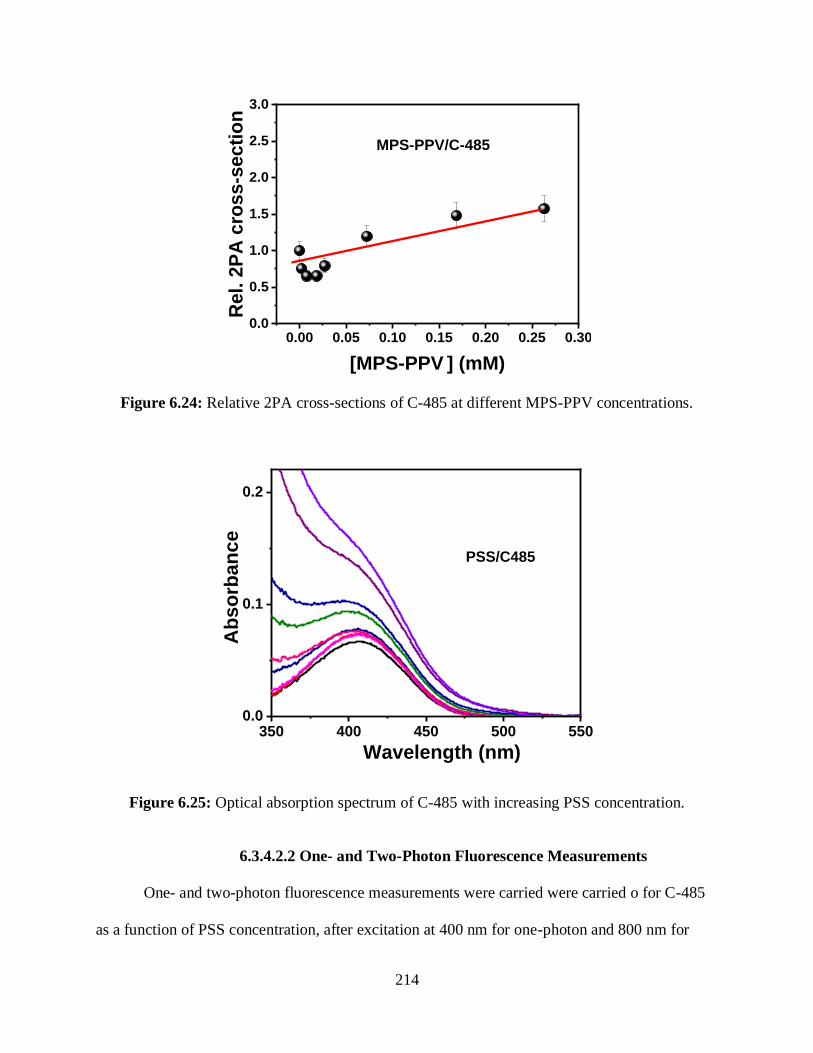
214
0.00 0.05 0.10 0.15 0.20 0.25 0.300.0
0.5
1.0
1.5
2.0
2.5
3.0
MPS-PPV/C-485
Re
l. 2
PA
cro
ss
-se
cti
on
[MPS-PPV ] (mM)
Figure 6.24: Relative 2PA cross-sections of C-485 at different MPS-PPV concentrations.
350 400 450 500 5500.0
0.1
0.2
PSS/C485
Ab
so
rban
ce
Wavelength (nm)
Figure 6.25: Optical absorption spectrum of C-485 with increasing PSS concentration.
6.3.4.2.2 One- and Two-Photon Fluorescence Measurements
One- and two-photon fluorescence measurements were carried were carried o for C-485
as a function of PSS concentration, after excitation at 400 nm for one-photon and 800 nm for
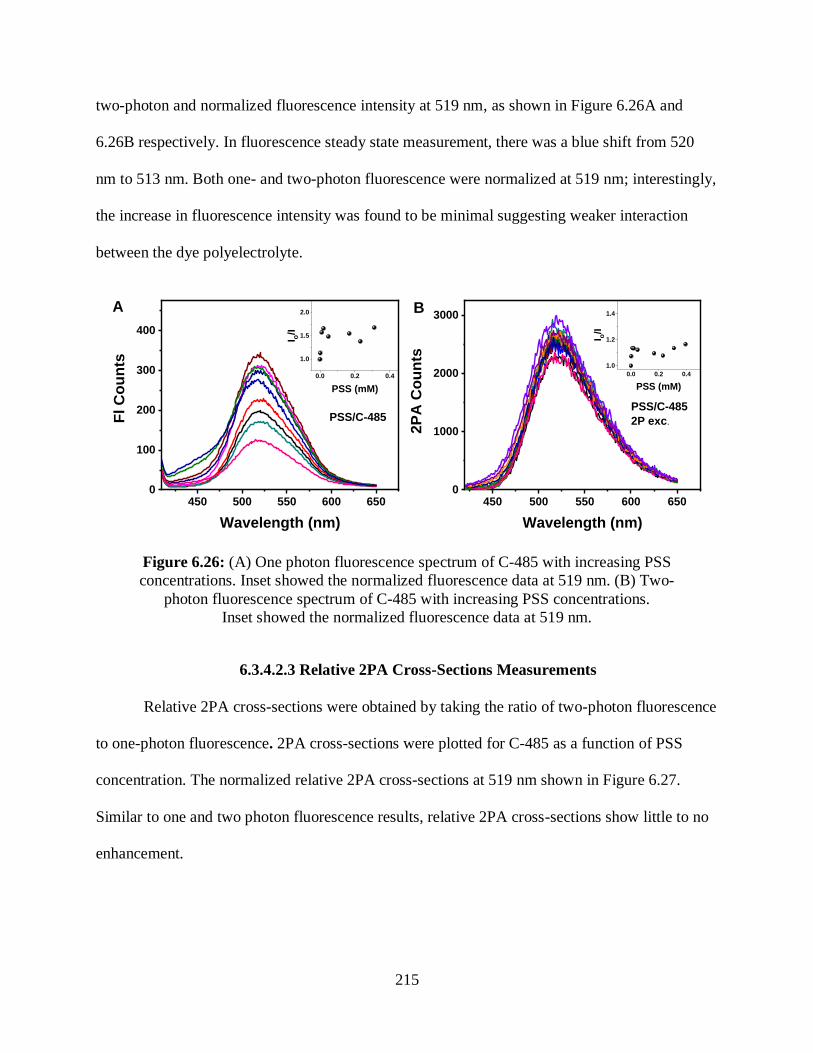
215
two-photon and normalized fluorescence intensity at 519 nm, as shown in Figure 6.26A and
6.26B respectively. In fluorescence steady state measurement, there was a blue shift from 520
nm to 513 nm. Both one- and two-photon fluorescence were normalized at 519 nm; interestingly,
the increase in fluorescence intensity was found to be minimal suggesting weaker interaction
between the dye polyelectrolyte.
450 500 550 600 6500
100
200
300
400
PSS/C-485
Fl
Co
un
ts
Wavelength (nm)
0.0 0.2 0.4
1.0
1.5
2.0
I o/I
PSS (mM)
A
450 500 550 600 6500
1000
2000
3000B
PSS/C-485
2P exc.
2P
A C
ou
nts
Wavelength (nm)
0.0 0.2 0.4
1.0
1.2
1.4
I o/I
PSS (mM)
Figure 6.26: (A) One photon fluorescence spectrum of C-485 with increasing PSS
concentrations. Inset showed the normalized fluorescence data at 519 nm. (B) Two-
photon fluorescence spectrum of C-485 with increasing PSS concentrations.
Inset showed the normalized fluorescence data at 519 nm.
6.3.4.2.3 Relative 2PA Cross-Sections Measurements
Relative 2PA cross-sections were obtained by taking the ratio of two-photon fluorescence
to one-photon fluorescence. 2PA cross-sections were plotted for C-485 as a function of PSS
concentration. The normalized relative 2PA cross-sections at 519 nm shown in Figure 6.27.
Similar to one and two photon fluorescence results, relative 2PA cross-sections show little to no
enhancement.
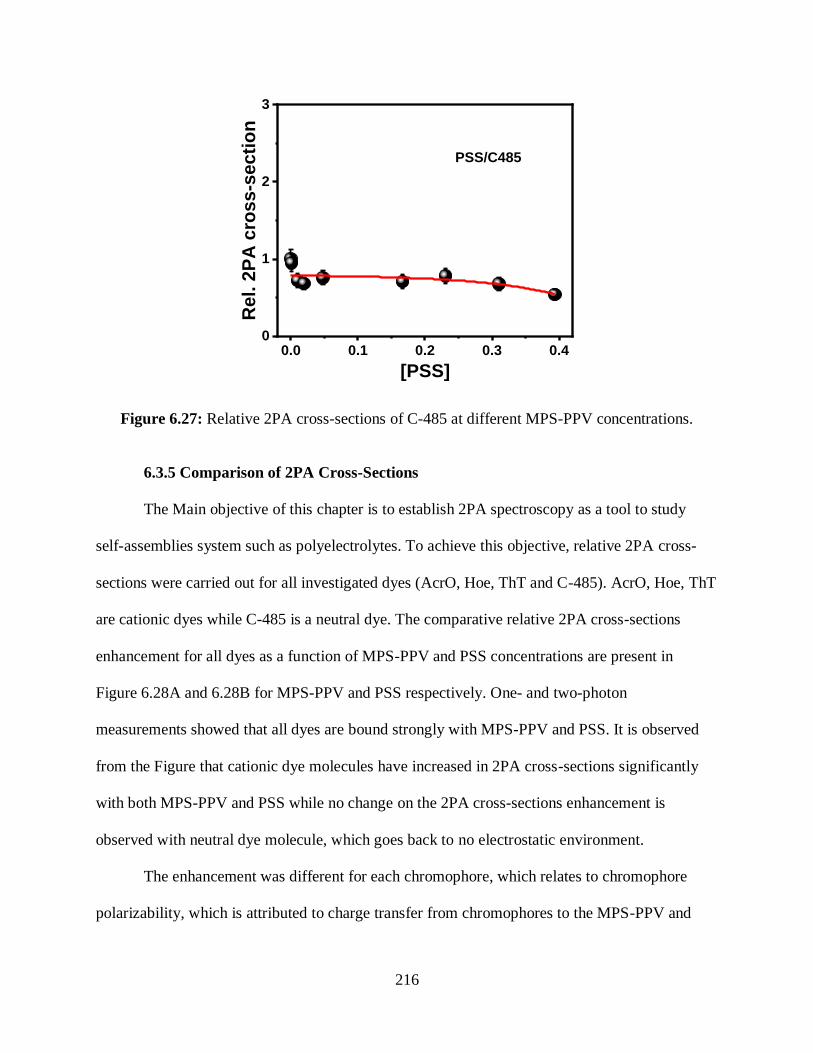
216
0.0 0.1 0.2 0.3 0.40
1
2
3
PSS/C485
Rel. 2
PA
cro
ss-s
ecti
on
[PSS]
Figure 6.27: Relative 2PA cross-sections of C-485 at different MPS-PPV concentrations.
6.3.5 Comparison of 2PA Cross-Sections
The Main objective of this chapter is to establish 2PA spectroscopy as a tool to study
self-assemblies system such as polyelectrolytes. To achieve this objective, relative 2PA cross-
sections were carried out for all investigated dyes (AcrO, Hoe, ThT and C-485). AcrO, Hoe, ThT
are cationic dyes while C-485 is a neutral dye. The comparative relative 2PA cross-sections
enhancement for all dyes as a function of MPS-PPV and PSS concentrations are present in
Figure 6.28A and 6.28B for MPS-PPV and PSS respectively. One- and two-photon
measurements showed that all dyes are bound strongly with MPS-PPV and PSS. It is observed
from the Figure that cationic dye molecules have increased in 2PA cross-sections significantly
with both MPS-PPV and PSS while no change on the 2PA cross-sections enhancement is
observed with neutral dye molecule, which goes back to no electrostatic environment.
The enhancement was different for each chromophore, which relates to chromophore
polarizability, which is attributed to charge transfer from chromophores to the MPS-PPV and
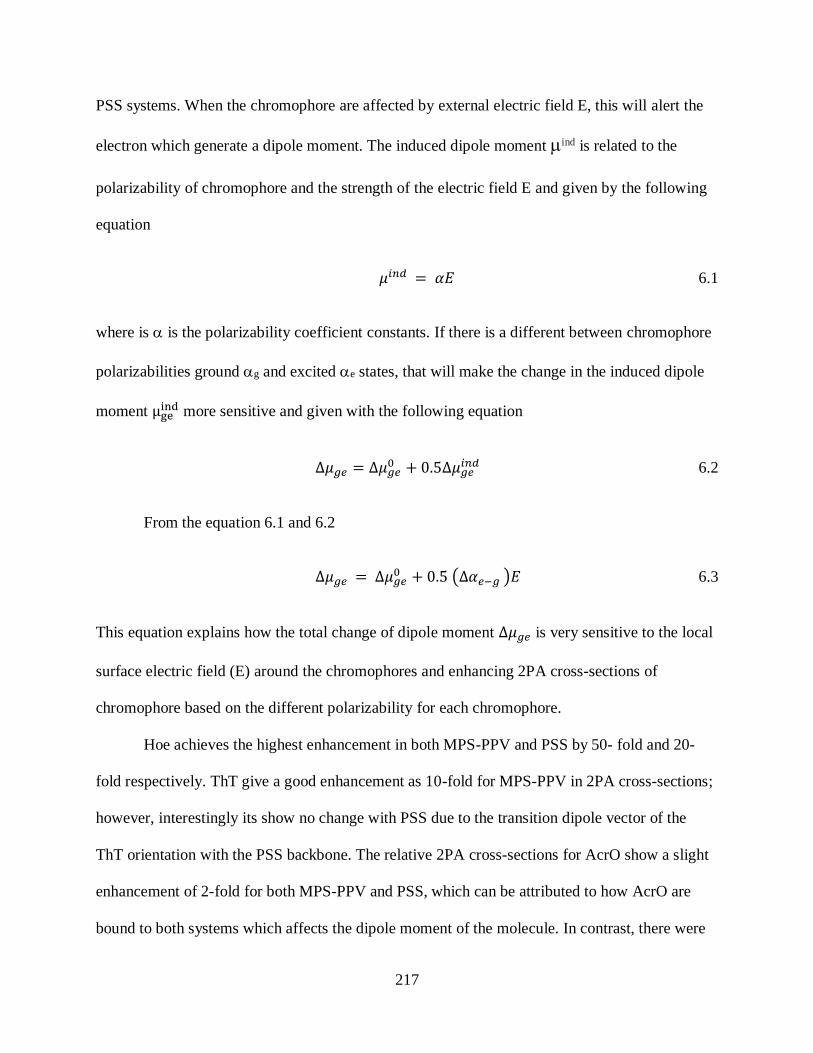
217
PSS systems. When the chromophore are affected by external electric field E, this will alert the
electron which generate a dipole moment. The induced dipole moment ind is related to the
polarizability of chromophore and the strength of the electric field E and given by the following
equation
𝜇𝑖𝑛𝑑 = 𝛼𝐸 6.1
where is is the polarizability coefficient constants. If there is a different between chromophore
polarizabilities ground g and excited e states, that will make the change in the induced dipole
moment μgeind more sensitive and given with the following equation
∆𝜇𝑔𝑒 = ∆𝜇𝑔𝑒0 + 0.5∆𝜇𝑔𝑒
𝑖𝑛𝑑 6.2
From the equation 6.1 and 6.2
∆𝜇𝑔𝑒 = ∆𝜇𝑔𝑒0 + 0.5 (Δ𝛼𝑒−𝑔 )𝐸 6.3
This equation explains how the total change of dipole moment ∆𝜇𝑔𝑒 is very sensitive to the local
surface electric field (E) around the chromophores and enhancing 2PA cross-sections of
chromophore based on the different polarizability for each chromophore.
Hoe achieves the highest enhancement in both MPS-PPV and PSS by 50- fold and 20-
fold respectively. ThT give a good enhancement as 10-fold for MPS-PPV in 2PA cross-sections;
however, interestingly its show no change with PSS due to the transition dipole vector of the
ThT orientation with the PSS backbone. The relative 2PA cross-sections for AcrO show a slight
enhancement of 2-fold for both MPS-PPV and PSS, which can be attributed to how AcrO are
bound to both systems which affects the dipole moment of the molecule. In contrast, there were
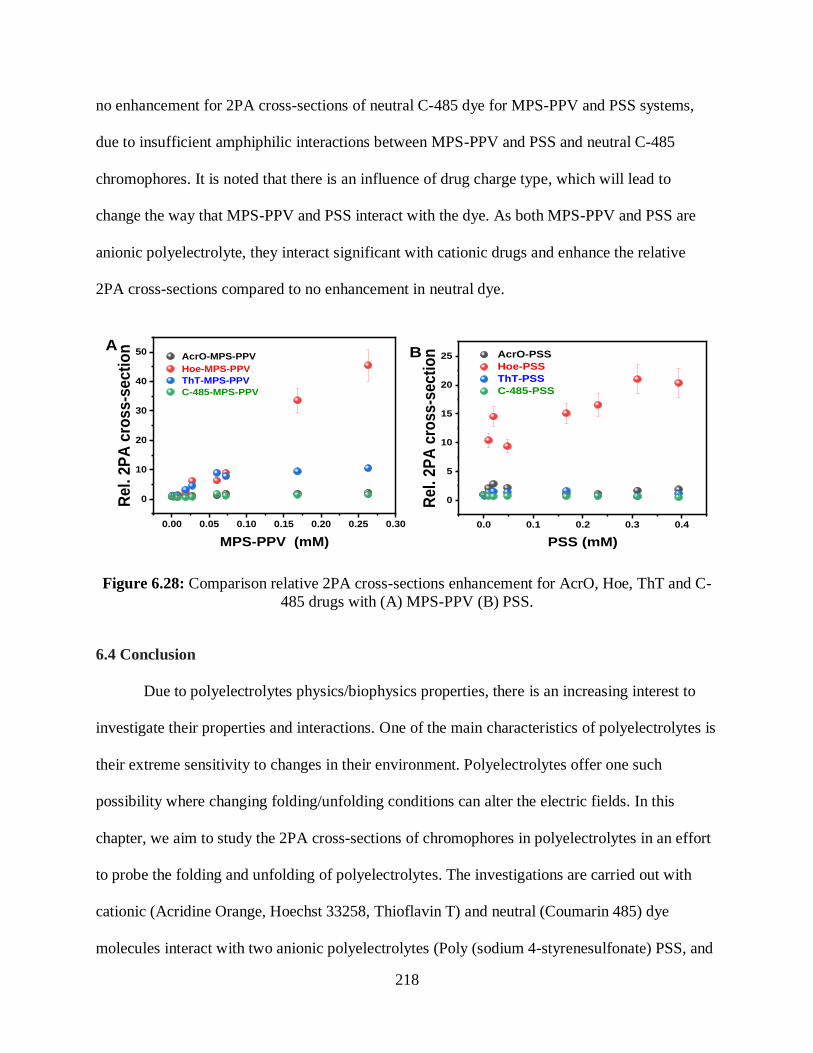
218
no enhancement for 2PA cross-sections of neutral C-485 dye for MPS-PPV and PSS systems,
due to insufficient amphiphilic interactions between MPS-PPV and PSS and neutral C-485
chromophores. It is noted that there is an influence of drug charge type, which will lead to
change the way that MPS-PPV and PSS interact with the dye. As both MPS-PPV and PSS are
anionic polyelectrolyte, they interact significant with cationic drugs and enhance the relative
2PA cross-sections compared to no enhancement in neutral dye.
0.00 0.05 0.10 0.15 0.20 0.25 0.30
0
10
20
30
40
50A
Re
l. 2
PA
cro
ss
-se
cti
on
MPS-PPV (mM)
AcrO-MPS-PPV Hoe-MPS-PPV
ThT-MPS-PPV
C-485-MPS-PPV
0.0 0.1 0.2 0.3 0.4
0
5
10
15
20
25 AcrO-PSS
Hoe-PSS
ThT-PSS
C-485-PSS
Re
l. 2
PA
cro
ss
-se
cti
on
PSS (mM)
B
Figure 6.28: Comparison relative 2PA cross-sections enhancement for AcrO, Hoe, ThT and C-
485 drugs with (A) MPS-PPV (B) PSS.
6.4 Conclusion
Due to polyelectrolytes physics/biophysics properties, there is an increasing interest to
investigate their properties and interactions. One of the main characteristics of polyelectrolytes is
their extreme sensitivity to changes in their environment. Polyelectrolytes offer one such
possibility where changing folding/unfolding conditions can alter the electric fields. In this
chapter, we aim to study the 2PA cross-sections of chromophores in polyelectrolytes in an effort
to probe the folding and unfolding of polyelectrolytes. The investigations are carried out with
cationic (Acridine Orange, Hoechst 33258, Thioflavin T) and neutral (Coumarin 485) dye
molecules interact with two anionic polyelectrolytes (Poly (sodium 4-styrenesulfonate) PSS, and
219
Poly [5-methoxy-2-(3-sulfopropoxy)-1,4-phenylenevinylene]) MPS-PPV. These systems are
chosen specifically to understand the influence of electrostatic interactions and in turn on the
electric fields on the 2PA cross-sections of chromophores. Our investigation focuses on the study
of MPS-PPV and PSS behavior with different dyes by monitoring the electric fields through
changing folding/unfolding conditions in polymer. Our approach is to use two-photon absorption
(2PA) cross-sections of chromophores as markers to study chromophore polyelectrolytes
behavior with different dyes, such ability to drug based on the orientation of the electric field
vector, if it is parallel to chromophore electrical field, there will be enhancement in 2PA cross-
sections. But no change on 2PA cross-sections will record if the transition dipole vector is
perpendicular to chromophore electrical field.
Investigated cationic dye molecules bound effectively with negatively charge
polyelectrolytes as evidenced from optical absorption and fluorescence measurements. 2PA
cross-sections of cationic dye molecules have increased significantly with both PSS and MPS-
PPV while no change in 2PA cross-sections was observed with neutral dye molecule. This is
assigned to the effect of electric field on the 2PA cross-sections. In the cationic dyes,
enhancement as high as 50-fold was observed with Hoe for MPS-PPV and 20-folds enhancement
for PSS . In ThT there was an enhancement by 10-fold for MPS-PPV while only 2-fold
enhancement was observed for AcrO in both MPS-PPV and PSS. This is assigned to the strength
of interaction between the dye molecules and polyelectrolytes. Whereas in neutral dye (C-485)
there was no enhancement in both MPS-PPV and PSS. The results shed lights on the role of the
electrostatic interactions in enhancing the nonlinear optical properties of chromophores.
220
6.5 Chapter Summary
• For this investigation two anionic polyelectrolytes, Poly [5-methoxy-2-(3-
sulfopropoxy)-1,4-phenylenevinylene]) MPS-PPV and (Poly (sodium 4-
styrenesulfonate) PSS were chosen to study the influence of electrostatic interactions
in turn the electric fields on the 2PA cross-sections of chromophores.
• The investigations are carried out with cationic (Acridine Orange, Hoechst 33258,
Thioflavin T) and neutral (Coumarin 485).
• Investigated cationic dye molecules bound effectively with negatively charge
polyelectrolytes as evidenced from optical absorption and fluorescence
measurements.
• 2PA cross-sections of cationic dye molecules has increased significantly with both
PSS and MPS-PPV while little change in 2PA cross-sections was observed with
neutral dye molecule. This is assigned to the effect of electric field on the 2PA cross-
sections.
• Enhancement as high as 40-fold was observed with Hoe while only 2-fold
enhancement was observed for AcrO. This is assigned to the strength of interaction
between the dye molecules and polyelectrolytes.
• In case of neutral dye (C-485), no enhancement were observed in both MPS-PPV and
PSS.
221
6.6 References
(1) Stuart, M. C.; de Vries, R.; Lyklema, H. Chapter 2 - Polyelectrolytes. In Fundamentals of
Interface and Colloid Science; Lyklema, J., Ed.; Soft Colloids; Academic Press, 2005; Vol.
5, pp 2.1-2.84. https://doi.org/10.1016/S1874-5679(05)80006-6.
(2) Ambade, A. V.; Sandanaraj, B. S.; Klaikherd, A.; Thayumanavan, S. Fluorescent
Polyelectrolytes as Protein Sensors. Polymer International 2007, 56 (4), 474–481.
https://doi.org/10.1002/pi.2185.
(3) Barrat, J.-L.; Joanny, F. Theory of Polyelectrolyte Solutions. In Advances in Chemical
Physics; John Wiley & Sons, Ltd, 2007; pp 1–66.
https://doi.org/10.1002/9780470141533.ch1.
(4) Radeva, T. Physical Chemistry of Polyelectrolytes; CRC Press, 2001.
(5) Alvarez, A.; Costa-Fernández, J. M.; Pereiro, R.; Sanz-Medel, A.; Salinas-Castillo, A.
Fluorescent Conjugated Polymers for Chemical and Biochemical Sensing. TrAC Trends in
Analytical Chemistry 2011, 30 (9), 1513–1525. https://doi.org/10.1016/j.trac.2011.04.017.
(6) Shi, X.; Cassagneau, T.; Caruso, F. Electrostatic Interactions between Polyelectrolytes and
a Titania Precursor: Thin Film and Solution Studies. Langmuir 2002, 18 (3), 904–910.
https://doi.org/10.1021/la011310d.
(7) Caruso, F.; Lichtenfeld, H.; Donath, E.; Möhwald, H. Investigation of Electrostatic
Interactions in Polyelectrolyte Multilayer Films: Binding of Anionic Fluorescent Probes to
Layers Assembled onto Colloids. Macromolecules 1999, 32 (7), 2317–2328.
https://doi.org/10.1021/ma980674i.
(8) Bordi, F.; Colby, R. H.; Cametti, C.; De Lorenzo, L.; Gili, T. Electrical Conductivity of
Polyelectrolyte Solutions in the Semidilute and Concentrated Regime: The Role of
222
Counterion Condensation. J. Phys. Chem. B 2002, 106 (27), 6887–6893.
https://doi.org/10.1021/jp020262i.
(9) Philipp, B.; Dautzenberg, H.; Linow, K.-J.; Kötz, J.; Dawydoff, W. Polyelectrolyte
Complexes — Recent Developments and Open Problems. Progress in Polymer Science
1989, 14 (1), 91–172. https://doi.org/10.1016/0079-6700(89)90018-X.
(10) Lankalapalli, S.; Kolapalli, V. R. M. Polyelectrolyte Complexes: A Review of Their
Applicability in Drug Delivery Technology. Indian J Pharm Sci 2009, 71 (5), 481–487.
https://doi.org/10.4103/0250-474X.58165.
(11) Webster, L.; Huglin, M. B. OBSERVATIONS ON COMPLEX FORMATION BETWEEN
POLYELECTROLYTES IN DILUTE AQUEOUS SOLUTION. European Polymer
Journal 1997, 33 (7), 1173–1177. https://doi.org/10.1016/S0014-3057(96)00295-9.
(12) Rondon, C.; Argillier, J.-F.; Leal-Calderon, F. Delivery of Functional Polyelectrolytes from
Complexes Induced by Salt Addition: Impact of the Initial Binding Strength. Journal of
Colloid and Interface Science 2014, 436, 154–159.
https://doi.org/10.1016/j.jcis.2014.08.073.
(13) Webster, L.; Huglin, M. B.; Robb, I. D. Complex Formation between Polyelectrolytes in
Dilute Aqueous Solution. Polymer 1997, 38 (6), 1373–1380. https://doi.org/10.1016/S0032-
3861(96)00650-7.
(14) Kramer, G.; Buchhammer, H.-M.; Lunkwitz, K. Surface Modification by Polyelectrolyte
Complexes: Influence of Different Polyelectrolyte Components and Substrates. Colloids
and Surfaces A: Physicochemical and Engineering Aspects 1997, 122 (1), 1–12.
https://doi.org/10.1016/S0927-7757(96)03771-5.
223
(15) Thomas, S. W.; Joly, G. D.; Swager, T. M. Chemical Sensors Based on Amplifying
Fluorescent Conjugated Polymers. Chem. Rev. 2007, 107 (4), 1339–1386.
https://doi.org/10.1021/cr0501339.
(16) Lankalapalli, S.; Kolapalli, V. R. M. Polyelectrolyte Complexes: A Review of Their
Applicability in Drug Delivery Technology. Indian J Pharm Sci 2009, 71 (5), 481–487.
https://doi.org/10.4103/0250-474X.58165.
(17) Real, D. A.; Martinez, M. V.; Frattini, A.; Soazo, M.; Luque, A. G.; Biasoli, M. S.;
Salomon, C. J.; Olivieri, A. C.; Leonardi, D. Design, Characterization, and In Vitro
Evaluation of Antifungal Polymeric Films. AAPS PharmSciTech 2012, 14 (1), 64–73.
https://doi.org/10.1208/s12249-012-9894-0.
(18) Xu, Q.-H.; Wang, S.; Korystov, D.; Mikhailovsky, A.; Bazan, G. C.; Moses, D.; Heeger, A.
J. The Fluorescence Resonance Energy Transfer (FRET) Gate: A Time-Resolved Study.
PNAS 2005, 102 (3), 530–535. https://doi.org/10.1073/pnas.0408568102.
(19) Gu, Z.; Bao, Y.-J.; Zhang, Y.; Wang, M.; Shen, Q.-D. Anionic Water-Soluble
Poly(Phenylenevinylene) Alternating Copolymer: High-Efficiency Photoluminescence and
Dual Electroluminescence. Macromolecules 2006, 39 (9), 3125–3131.
https://doi.org/10.1021/ma052741w.
(20) Wang, S.; C. Bazan, G. Solvent -Dependent Aggregation of a Water-Soluble
Poly(Fluorene) Controls Energy Transfer to Chromophore -Labeled DNA. Chemical
Communications 2004, 0 (21), 2508–2509. https://doi.org/10.1039/B410002F.
(21) Jiang, B.-P.; Guo, D.-S.; Liu, Y. Self-Assembly of Amphiphilic Perylene−Cyclodextrin
Conjugate and Vapor Sensing for Organic Amines. J. Org. Chem. 2010, 75 (21), 7258–
7264. https://doi.org/10.1021/jo1014596.
224
(22) Dobrynin, A. V.; Rubinstein, M. Theory of Polyelectrolytes in Solutions and at Surfaces.
Progress in Polymer Science 2005, 30 (11), 1049–1118.
https://doi.org/10.1016/j.progpolymsci.2005.07.006.
(23) Duarte, A.; Pu, K.-Y.; Liu, B.; Bazan, G. C. Recent Advances in Conjugated
Polyelectrolytes for Emerging Optoelectronic Applications. Chem. Mater. 2011, 23 (3),
501–515. https://doi.org/10.1021/cm102196t.
(24) Zhan, R.; Liu, B. Functionalized Conjugated Polyelectrolytes for Biological Sensing and
Imaging. The Chemical Record 2016, 16 (3), 1715–1740.
https://doi.org/10.1002/tcr.201500308.
(25) Almodóvar, J.; Bacon, S.; Gogolski, J.; Kisiday, J. D.; Kipper, M. J. Polysaccharide-Based
Polyelectrolyte Multilayer Surface Coatings Can Enhance Mesenchymal Stem Cell
Response to Adsorbed Growth Factors. Biomacromolecules 2010, 11 (10), 2629–2639.
https://doi.org/10.1021/bm1005799.
(26) Vehlow, D.; Schmidt, R.; Gebert, A.; Siebert, M.; Lips, K. S.; Müller, M. Polyelectrolyte
Complex Based Interfacial Drug Delivery System with Controlled Loading and Improved
Release Performance for Bone Therapeutics. Nanomaterials (Basel) 2016, 6 (3).
https://doi.org/10.3390/nano6030053.
(27) McLiesh, H.; Sharman, S.; Garnier, G. Effect of Cationic Polyelectrolytes on the
Performance of Paper Diagnostics for Blood Typing. Colloids and Surfaces B:
Biointerfaces 2015, 133, 189–197. https://doi.org/10.1016/j.colsurfb.2015.05.049.
(28) Mak, W. C.; Cheung, K. Y.; Trau, D. Influence of Different Polyelectrolytes on Layer-by-
Layer Microcapsule Properties: Encapsulation Efficiency and Colloidal and Temperature
Stability. Chem. Mater. 2008, 20 (17), 5475–5484. https://doi.org/10.1021/cm702254h.
225
(29) Cayre, O. J.; Chang, S. T.; Velev, O. D. Polyelectrolyte Diode: Nonlinear Current
Response of a Junction between Aqueous Ionic Gels. J. Am. Chem. Soc. 2007, 129 (35),
10801–10806. https://doi.org/10.1021/ja072449z.
(30) Lang, A. W.; Li, Y.; De Keersmaecker, M.; Shen, D. E.; Österholm, A. M.; Berglund, L.;
Reynolds, J. R. Transparent Wood Smart Windows: Polymer Electrochromic Devices
Based on Poly(3,4-Ethylenedioxythiophene):Poly(Styrene Sulfonate) Electrodes.
ChemSusChem 2018, 11 (5), 854–863. https://doi.org/10.1002/cssc.201702026.
(31) Seo, J. H.; Gutacker, A.; Sun, Y.; Wu, H.; Huang, F.; Cao, Y.; Scherf, U.; Heeger, A. J.;
Bazan, G. C. Improved High-Efficiency Organic Solar Cells via Incorporation of a
Conjugated Polyelectrolyte Interlayer. J. Am. Chem. Soc. 2011, 133 (22), 8416–8419.
https://doi.org/10.1021/ja2037673.
(32) Do, T. T.; Hong, H. S.; Ha, Y. E.; Park, J.; Kang, Y.-C.; Kim, J. H. Effect of
Polyelectrolyte Electron Collection Layer Counteranion on the Properties of Polymer Solar
Cells. ACS Appl. Mater. Interfaces 2015, 7 (5), 3335–3341.
https://doi.org/10.1021/am5082606.
(33) Ning, J.; Luo, X.; Wang, M.; Li, J.; Liu, D.; Rong, H.; Chen, D.; Wang, J. Ultrasensitive
Electrochemical Sensor Based on Polyelectrolyte Composite Film Decorated Glassy
Carbon Electrode for Detection of Nitrite in Curing Food at Sub-Micromolar Level.
Molecules 2018, 23 (10). https://doi.org/10.3390/molecules23102580.
(34) Liu, M.; Kaur, P.; Waldeck, D. H.; Xue, C.; Liu, H. Fluorescence Quenching Mechanism of
a Polyphenylene Polyelectrolyte with Other Macromolecules: Cytochrome c and
Dendrimers. Langmuir 2005, 21 (5), 1687–1690. https://doi.org/10.1021/la047434i.

226
(35) Höfig, H.; Otten, J.; Steffen, V.; Pohl, M.; Boersma, A. J.; Fitter, J. Genetically Encoded
Förster Resonance Energy Transfer-Based Biosensors Studied on the Single-Molecule
Level. ACS Sens. 2018, 3 (8), 1462–1470. https://doi.org/10.1021/acssensors.8b00143.
(36) Lee, W.; Seo, J. H.; Woo, H. Y. Conjugated Polyelectrolytes: A New Class of
Semiconducting Material for Organic Electronic Devices. Polymer 2013, 54 (19), 5104–
5121. https://doi.org/10.1016/j.polymer.2013.07.015.
(37) Schuetz, P.; Caruso, F. Semiconductor and Metal Nanoparticle Formation on Polymer
Spheres Coated with Weak Polyelectrolyte Multilayers. Chem. Mater. 2004, 16 (16), 3066–
3073. https://doi.org/10.1021/cm049957h.
(38) Zhao, X.; Jiang, H.; Schanze, K. S. Polymer Chain Length Dependence of Amplified
Fluorescence Quenching in Conjugated Polyelectrolytes. Macromolecules 2008, 41 (10),
3422–3428. https://doi.org/10.1021/ma800191q.
(39) Jeong, M.-Y.; Ahn, B.-Y.; Lee, S.-K.; Lee, W.-K.; Jo, N.-J. Antistatic Coating Material
Consisting of Poly (Butylacrylate-Co-Styrene) Core-Nickel Shell Particle. Transactions of
Nonferrous Metals Society of China 2009, 19, s119–s123. https://doi.org/10.1016/S1003-
6326(10)60258-0.
(40) Zeglio, E.; Eriksson, J.; Gabrielsson, R.; Solin, N.; Inganäs, O. Highly Stable Conjugated
Polyelectrolytes for Water-Based Hybrid Mode Electrochemical Transistors. Advanced
Materials 2017, 29 (19), 1605787. https://doi.org/10.1002/adma.201605787.
(41) Raj, V.; Kunnetheeri, S. Nonconjugated Polyelectrolyte as Efficient Fluorescence Quencher
and Their Applications as Biosensors: Polymer-Polymer Interaction
https://www.hindawi.com/journals/isrn/2014/841857/ (accessed Mar 27, 2019).
https://doi.org/10.1155/2014/841857.

227
(42) Mokhter, M. A.; Lakard, S.; Magnenet, C.; Euvrard, M.; Lakard, B. Preparation of
Polyelectrolyte-Modified Membranes for Heavy Metal Ions Removal. Environmental
Technology 2017, 38 (19), 2476–2485. https://doi.org/10.1080/09593330.2016.1267265.
228
CHAPTER 7
OVERALL SUMMARY AND FUTURE OUTLOOK
7.1 Overall Summary
A detailed summary of each study followed by a future outlook is provided in this
Chapter. The main goal in this dissertation is to use the power of two-photon spectroscopy to
understand the organized self-assemblies that are integral for several biological processes and
applications in interdisciplinary areas of sciences. The hypothesis is that the local electric fields
in organized self-assemblies can change the two-photon absorption (2PA) cross-sections of
chromophores stabilized in those environments and thereby providing a window to glean the
micro-environments as well as follow the organized self-assemblies.
In the first Chapter, a detailed introduction to several naturally available organized self-
assemblies, as well as synthetic organized self-assemblies, is provided. The need to monitor the
local environments in the self-assemblies is described, followed by the techniques that are
currently in use to monitor these organized self-assemblies. This led to understanding of the gap
in the field and the necessity to develop novel spectroscopic techniques to monitor the organized
self-assemblies, which is the main motivation behind the work carried out in this dissertation.
Chapter 2 covers different experimental techniques that were used to complete
experimental measurements presented in this dissertation. The analytical experimental
techniques that were carried out for this dissertation were optical absorbance, steady-state
fluorescence, time-resolved fluorescence, two-photon excited fluorescence to measure 2PA
cross-sections, dynamic light scattering to measure practical size and circular dichroism to
identify the secondary structure. A brief description of each of the experimental techniques is
provided.
229
In Chapter 3, the stability of the non-canonical structures of DNA, G-Quadruplex and G-
Triplex with different drugs was probed using the one- and two-photon fluorescence of the drugs
bound to these DNA structures. In the process of evaluating the stability of these DNA
structures, we established a new spectroscopic technique based on relative two-photon
absorption to monitor drug-DNA binding interactions as well as understanding the non-canonical
structures. For these investigations, two DNA oligonucleotides, were selected due to their ability
to form a stable Quadruplex and Triplex DNA, named TBA and TBA11, respectively. For these
studies, temperature-dependent UV-Vis, temperature-dependent one-photon fluorescence and
temperature-dependent 2-photon fluorescence, Circular Dichroism and relative 2-photon cross-
sections were carried out with different small molecules. ThT, ThO, DAPI, TMPyP4, EtBr and
DoXo are the chosen drugs to investigate the binding and stability for both DNA structures. The
drugs used in these systems have been known to bind with DNA using hydrogen bonding, pi-pi
stacking interactions, and/or the electrostatic interaction to backbone of DNA. Interesting
stability trends were obtained for the drugs which correlated with drug structure and DNA
binding modes. 2PA cross-sections changes were observed for ThT and ThO when the DNA
structures were melted using temperature and they seem to stabilize these non-canonical
structures that can be assigned to the molecular structure of the drugs. Although TMPyP4
stabilized both structures, the trend in 2PA cross-sections enhancement was an increase with G-
Triplex while decreased with G-Quadruplex, suggesting that the mode of binding of this drug
with DNA structures is different. DAPI was found to be the least efficient drug to stabilize G-
Quadruplex and G-Triplex structures. Both EtBr and DoXo stabilized only the G- Triplex
structure. From this study, we were able to show that the 2PA cross-section of the drug
molecules is a viable technique to monitor DNA melting transitions as well as probe the
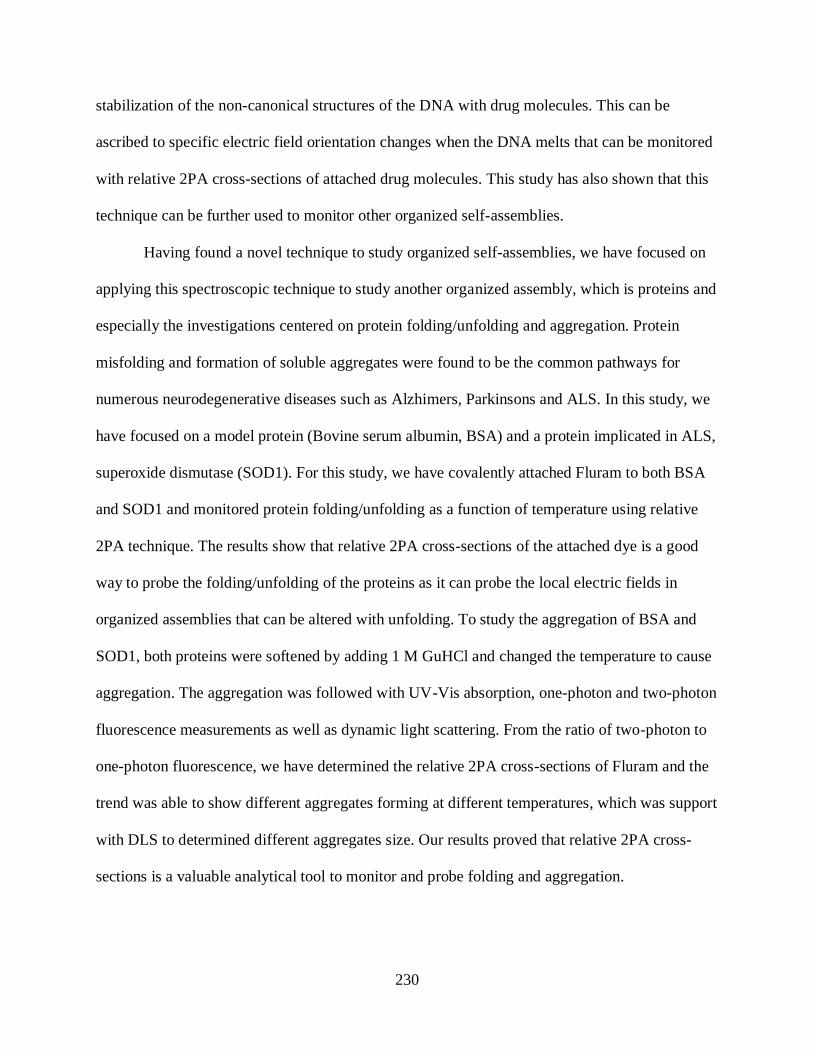
230
stabilization of the non-canonical structures of the DNA with drug molecules. This can be
ascribed to specific electric field orientation changes when the DNA melts that can be monitored
with relative 2PA cross-sections of attached drug molecules. This study has also shown that this
technique can be further used to monitor other organized self-assemblies.
Having found a novel technique to study organized self-assemblies, we have focused on
applying this spectroscopic technique to study another organized assembly, which is proteins and
especially the investigations centered on protein folding/unfolding and aggregation. Protein
misfolding and formation of soluble aggregates were found to be the common pathways for
numerous neurodegenerative diseases such as Alzhimers, Parkinsons and ALS. In this study, we
have focused on a model protein (Bovine serum albumin, BSA) and a protein implicated in ALS,
superoxide dismutase (SOD1). For this study, we have covalently attached Fluram to both BSA
and SOD1 and monitored protein folding/unfolding as a function of temperature using relative
2PA technique. The results show that relative 2PA cross-sections of the attached dye is a good
way to probe the folding/unfolding of the proteins as it can probe the local electric fields in
organized assemblies that can be altered with unfolding. To study the aggregation of BSA and
SOD1, both proteins were softened by adding 1 M GuHCl and changed the temperature to cause
aggregation. The aggregation was followed with UV-Vis absorption, one-photon and two-photon
fluorescence measurements as well as dynamic light scattering. From the ratio of two-photon to
one-photon fluorescence, we have determined the relative 2PA cross-sections of Fluram and the
trend was able to show different aggregates forming at different temperatures, which was support
with DLS to determined different aggregates size. Our results proved that relative 2PA cross-
sections is a valuable analytical tool to monitor and probe folding and aggregation.
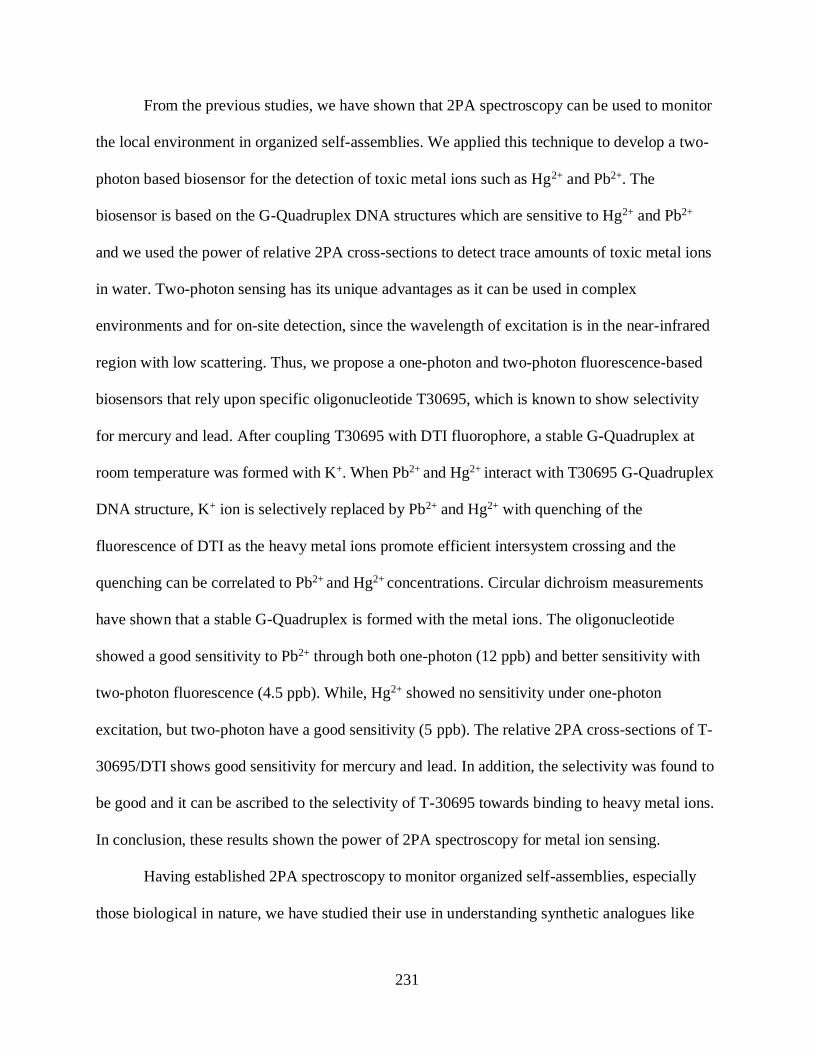
231
From the previous studies, we have shown that 2PA spectroscopy can be used to monitor
the local environment in organized self-assemblies. We applied this technique to develop a two-
photon based biosensor for the detection of toxic metal ions such as Hg2+ and Pb2+. The
biosensor is based on the G-Quadruplex DNA structures which are sensitive to Hg2+ and Pb2+
and we used the power of relative 2PA cross-sections to detect trace amounts of toxic metal ions
in water. Two-photon sensing has its unique advantages as it can be used in complex
environments and for on-site detection, since the wavelength of excitation is in the near-infrared
region with low scattering. Thus, we propose a one-photon and two-photon fluorescence-based
biosensors that rely upon specific oligonucleotide T30695, which is known to show selectivity
for mercury and lead. After coupling T30695 with DTI fluorophore, a stable G-Quadruplex at
room temperature was formed with K+. When Pb2+ and Hg2+ interact with T30695 G-Quadruplex
DNA structure, K+ ion is selectively replaced by Pb2+ and Hg2+ with quenching of the
fluorescence of DTI as the heavy metal ions promote efficient intersystem crossing and the
quenching can be correlated to Pb2+ and Hg2+ concentrations. Circular dichroism measurements
have shown that a stable G-Quadruplex is formed with the metal ions. The oligonucleotide
showed a good sensitivity to Pb2+ through both one-photon (12 ppb) and better sensitivity with
two-photon fluorescence (4.5 ppb). While, Hg2+ showed no sensitivity under one-photon
excitation, but two-photon have a good sensitivity (5 ppb). The relative 2PA cross-sections of T-
30695/DTI shows good sensitivity for mercury and lead. In addition, the selectivity was found to
be good and it can be ascribed to the selectivity of T-30695 towards binding to heavy metal ions.
In conclusion, these results shown the power of 2PA spectroscopy for metal ion sensing.
Having established 2PA spectroscopy to monitor organized self-assemblies, especially
those biological in nature, we have studied their use in understanding synthetic analogues like
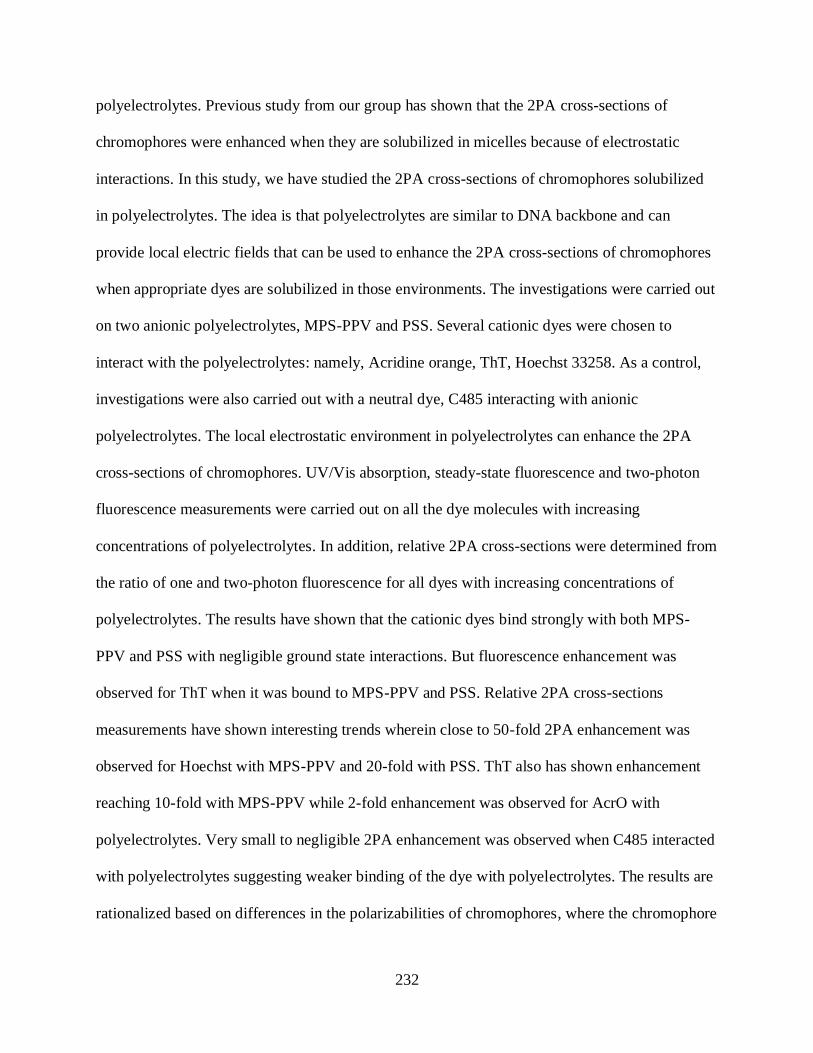
232
polyelectrolytes. Previous study from our group has shown that the 2PA cross-sections of
chromophores were enhanced when they are solubilized in micelles because of electrostatic
interactions. In this study, we have studied the 2PA cross-sections of chromophores solubilized
in polyelectrolytes. The idea is that polyelectrolytes are similar to DNA backbone and can
provide local electric fields that can be used to enhance the 2PA cross-sections of chromophores
when appropriate dyes are solubilized in those environments. The investigations were carried out
on two anionic polyelectrolytes, MPS-PPV and PSS. Several cationic dyes were chosen to
interact with the polyelectrolytes: namely, Acridine orange, ThT, Hoechst 33258. As a control,
investigations were also carried out with a neutral dye, C485 interacting with anionic
polyelectrolytes. The local electrostatic environment in polyelectrolytes can enhance the 2PA
cross-sections of chromophores. UV/Vis absorption, steady-state fluorescence and two-photon
fluorescence measurements were carried out on all the dye molecules with increasing
concentrations of polyelectrolytes. In addition, relative 2PA cross-sections were determined from
the ratio of one and two-photon fluorescence for all dyes with increasing concentrations of
polyelectrolytes. The results have shown that the cationic dyes bind strongly with both MPS-
PPV and PSS with negligible ground state interactions. But fluorescence enhancement was
observed for ThT when it was bound to MPS-PPV and PSS. Relative 2PA cross-sections
measurements have shown interesting trends wherein close to 50-fold 2PA enhancement was
observed for Hoechst with MPS-PPV and 20-fold with PSS. ThT also has shown enhancement
reaching 10-fold with MPS-PPV while 2-fold enhancement was observed for AcrO with
polyelectrolytes. Very small to negligible 2PA enhancement was observed when C485 interacted
with polyelectrolytes suggesting weaker binding of the dye with polyelectrolytes. The results are
rationalized based on differences in the polarizabilities of chromophores, where the chromophore

233
with greater change in polarizability has shown maximum 2PA enhancement. This study has
provided a framework for the design and development of chromophores that can show maximum
2PA enhancement with local electric fields.
Overall in the work carried out for the dissertation, a novel spectroscopic tool based on
relative 2PA cross-sections was developed to probe the local electrostatic fields in organized self-
assemblies. The 2PA cross-sections have changed with changing in microenvironment around self-
assembled materials. As the 2PA cross sections is proportional to the square of change in
permanent dipole moments and the change in permanent dipole moment is proportional to local
electric fields, they were able to probe the local environments in organized self-assemblies.
7.2 Future Outlook
The work carried out in the dissertation has shown the potential of 2PA spectroscopy to
understand organized self-assemblies with some examples. However, several biological important
organized self-assemblies are present that include vesicles, cell membranes and lipid bilayers.
Future studies can shed light on the use of this technique to probe them, and the holy grail of this
project is to develop a novel 2PA based imaging technique that will be powerful to probe the local
electric fields in organized self-assemblies with improved selectivity and sensitivity. This research
can be further extended to develop novel diagnostic tools as well as better sensors that can be work
in complex environments.