Embed Size (px)
Citation preview

Cornell University ILR SchoolDigitalCommons@ILR
CAHRS Working Paper Series Center for Advanced Human Resource Studies(CAHRS)
2-1-1996
Using Ownership as an Incentive: Does the "TooMany Chiefs" Rule Apply in Initial Public OfferingFirms?Theresa M. WelbourneCornell University
Follow this and additional works at: http://digitalcommons.ilr.cornell.edu/cahrswp
This Article is brought to you for free and open access by the Center for Advanced Human Resource Studies (CAHRS) at DigitalCommons@ILR. Ithas been accepted for inclusion in CAHRS Working Paper Series by an authorized administrator of DigitalCommons@ILR. For more information,please contact [email protected].

Using Ownership as an Incentive: Does the "Too Many Chiefs" RuleApply in Initial Public Offering Firms?
AbstractAgency theory is used to study the effectiveness of ownership proliferation throughout entrepreneurialorganizations. Hypotheses are developed to understand the effect of CEO, top management, and all employeeownership on firm performance. The research is conducted with a sample of IPO firms followed for five yearsto study ownership and firm performance (survival and stock performance). The results indicate that allemployee ownership has a positive effect on survival, while CEO and management ownership have no effect.However, CEO and top management ownership do affect stock price. Ownership significantly interacts withfirm risk, indicating riskier firms benefit less from ownership.
Keywordswork, business, organization, company, ownership, incentive, team, executive, employee, performance, CEO,stock, price
CommentsSuggested CitationWelbourne, T. M. (1996). Using ownership as an incentive: Does the "too many chiefs" rule apply in initial publicoffering firms? (CAHRS Working Paper #96-04). Ithaca, NY: Cornell University, School of Industrial andLabor Relations, Center for Advanced Human Resource Studies.http://digitalcommons.ilr.cornell.edu/cahrswp/175
This article is available at DigitalCommons@ILR: http://digitalcommons.ilr.cornell.edu/cahrswp/175

WW O R K I N G O R K I N G PP A P E R A P E R SS E R I E SE R I E S
Using Ownership as an Incentive:Does the “Too Many Chiefs” RuleApply in Initial Public Offering Firms?
Theresa M. Welbourne
Working Paper 9 6 - 0 4
Advancing the World of Work
CAHRS / Cornell University187 Ives HallIthaca, NY 14853-3901 USATel. 607 255-9358www.ilr.cornell.edu/CAHRS/

Using Ownership as an Incentive WP 96-04
Page 1
Using Ownership As An Incentive: Does The"Too Many Chiefs" Rule Apply In
Initial Public Offering Firms?
Theresa M. WelbourneCornell University
Center for Advanced Human Resource Studies393 Ives Hall
Ithaca, NY 14853-3901607/255-1139
FAX: 607/[email protected]
Working Paper 96-04
http://www.ilr.cornell.edu/cahrs
This paper has not undergone formal review or approval of the faculty of the ILR School. It isintended to make results of research, conferences, and projects available to others interested
in human resource management in preliminary form to encourage discussion andsuggestions.

Using Ownership as an Incentive WP 96-04
Page 2
ABSTRACT
Agency theory is used to study the effectiveness of ownership proliferation
throughout entrepreneurial organizations. Hypotheses are developed to understand the effect
of CEO, top management, and all employee ownership on firm performance. The research is
conducted with a sample of IPO firms followed for five years to study ownership and firm
performance (survival and stock performance). The results indicate that all employee
ownership has a positive effect on survival, while CEO and management ownership have no
effect. However, CEO and top management ownership do affect stock price. Ownership
significantly interacts with firm risk, indicating riskier firms benefit less from ownership.

Using Ownership as an Incentive WP 96-04
Page 3
INTRODUCTION
Agency theory assumes that the best organizational form is one where the leader
(CEO or president) owns 100 per cent of the company; in this case, the top executive is
also the principal (owner). When the top executive is not the sole owner, then that
individual becomes an agent (employee) of the firm, at which point agency problems begin
to ensue. Agency problems are said to occur when agents pursue individual goals, which
are not necessarily consistent with those of the organization. In addition, risk preferences
of agents are different from those of the principal, resulting in decision making that is less
than optimal. Agency theory differentiates principals from agents in a very simplistic
manner because it treats ownership as a dichotomous variable, and it also considers
ownership at the individual level. This had led to fairly basic notions about goal congruence
and risk taking behavior. Owners pursue organizational goals and are risk neutral, while
agents pursue personal goals and are risk averse.
In reality, ownership should be measured as a continuous variable because in many
cases, particularly in entrepreneurial firms, management continues to retain partial
ownership in the firm (through stock grants, options). Agency theory does specifically
recognize stocks for executives because it views these programs as a form of monitoring
(incentive alignment) that helps to mitigate the agency problem. However, the concept of a
continuous ownership variable is important because it also allows for consideration of
ownership level within the organization. Ownership is often extended beyond the CEO to the
top management team, and in many cases, to all employees. When this occurs, the
phenomenon is not how much one person is encouraged to act like an owner but how many
people within the firm are behaving like owners. Even though ownership is dispersed, a large
percentage of firm ownership might be retained within the organization rather than with
outside shareholders or with one executive. Thus, not only can the extent of CEO or top
management team ownership be studied, but proliferation of ownership throughout the
organization can also be investigated. In this case, the entire organization moves toward the
"principal" point on the continuum, and the focus of study is firm performance, which is
affected by ownership proliferation.
This paper extends agency theory research by considering the effect of three different
forms of ownership on firm performance. Rather than studying the degree of ownership of
only one person (such as the CEO), this research considers the proliferation of ownership
throughout the organization and how different levels of ownership affect short and long-term
firm performance. In addition, the moderating effect of firm level risk is investigated.

Using Ownership as an Incentive WP 96-04
Page 4
AGENCY THEORY AND OWNERSHIP
Agency theory has been used to understand situations where an individual delegates
responsibility for a task to other persons (Fama, 1980). Agency theory has been classically
applied to study the relationship between owners of an organization and the managers who
run those firms (Fama & Jensen, 1983). In practice, it has been most often employed in
research on the mechanisms used by owners to align CEO interests with those of the
organization (Gomez-Mejia, 1994). The exception has been a few studies that have extended
agency theory to other positions such as university faculty (Gomez-Mejia & Balkin, 1992),
sales representatives (Eisenhardt, 1985), and production workers (Welbourne, Balkin &
Gomez-Mejia, 1995).
In all cases, agency theory was used to explicate alternative ways of controlling
behavior of individuals who have been delegated work by someone. The person delegating
the work is called the principal, and the individual to whom tasks are assigned is referred to
as the agent. Since most agency theory research has involved top management, much of the
work has dealt with the study of incentive systems used to align the interests of executives
(agents) with those of the owners (shareholders). Executives have been the focal point of
study because their behavior is difficult to monitor through more traditional mechanisms (i.e.
direct supervision, close monitoring of behaviors). Agency theory assumes that the best way
of aligning employees' interests with those of the principal is through formal monitoring, and
only when the cost of monitoring is high should a company consider alternatives to formal
monitoring. In the case of executives, formal monitoring is assumed to be impossible,
therefore the study of executive compensation, as a form of monitoring, has been pursued by
a number of researchers from a variety of academic fields (e.g. organization behavior,
accounting, finance, human resource management) (for a review see Gomez-Mejia, 1994).
One form of incentive is firm ownership, which serves to create a situation where the
goals of the agent are identical to those of the principal (Tosi & Gomez-Mejia, 1994). By
aligning goals, stock plans help mitigate problems associated with risk taking propensities of
the agents. Agency theory assumes that principals are risk neutral because their portfolios
are not 100 per cent tied to one firm, however, agents, who cannot diversify their
employment portfolios, are considered to be risk averse. Being risk averse, agents will make
decisions that minimize risk in order to assure continued employment. According to Jones
and Butler (1992: 73), "risk aversion encourages managers to select safe projects that
provide normal rates of return." By providing executives with some form of ownership in the
firm, it is assumed that they might be more willing to take risks that optimize long-term

Using Ownership as an Incentive WP 96-04
Page 5
performance of the organization. Assuring an adequate level of risk taking is important in
entrepreneurial firms where risk taking is necessary in order to pursue opportunities.
Agency theory has been applied to the study of top executives because their behavior
is not easily monitored, but the theory should be equally applicable to any situation where
work is delegated, and particularly applicable when jobs are not easily monitored. In fact,
agency theory has been used to understand organizational control for the overall employee
population. According to Becker and Olson (1989: 247): "Two management strategies are
possible. First, managers can attempt to allocate some of the firm's business risk to labor,
with the aim of increasing workers incentive to act as owners. The current support for profit
sharing and employee stock ownership plans by firms is due, in part, to a belief that these
plans will reduce agency costs by aligning the interests of the workers with the current and
future profitability of the firm. A second strategy is to closely supervise and control
employees, allocating the greater share of the firm's business risk (and associated returns) to
the shareholders." These two forms of control parallel the types of control strategies that are
suggested by organizational theorists (Ouchi, 1979; 1980; Thompson, 1967). Organizational
theorists argue that control mechanisms can be described as focusing on behaviors versus
outcomes, where behavioral control results when policies and procedures (or compliance) are
used as the dominant method of operating, and outcome control ensues through the use of
incentives (alignment). Recently Eisenhardt (1985) combined the agency theory and
organizational theory approaches to organizational control and noted that two underlying
control strategies emerge from both theoretical perspectives.
As noted by Becker and Olson (1989), stock option programs, which provide a form of
ownership in the firm, can increase alignment among all employees within an organization.
These programs provide individual employees with incentives to work toward the
organization's goals in the same way that CEO stock plans are incentives for executives to
make decisions that will support the interests of the shareholders or owners. These systems
attempt to create an environment where employees are part owners of the business.
It has been suggested that in entrepreneurial firms, where rapid change is occurring
and bureaucratic structures have not been established, basically all jobs are difficult to
monitor (Jones & Butler, 1992). Entrepreneurism has been defined as the process by which
firms notice opportunities and act on those opportunities (Kirzner, 1993). If a firm (rather than
an individual) is to remain entrepreneurial, then all employees in the company need to pursue
and act upon opportunity, and this requires all personnel to be somewhat willing to take risks
and pursue opportunities that enhance the organization's goals. Thus, entrepreneurial firms

Using Ownership as an Incentive WP 96-04
Page 6
should be more successful if ownership is widely dispersed throughout the organization. The
argument is not that the CEO have an enhanced stake in the firm but that more employees
share in the ownership of the company. Thus, this paper suggests that as ownership is
expanded to others in the firm (top management and all employees), firm performance will
increase.
Hypothesis 1: Proliferation of ownership throughout the workforce positively affectsfirm performance in entrepreneurial organizations.
Ownership can only be dispersed if the CEO has less ownership in the firm,
therefore, it is expected that high levels of CEO ownership will have a negative impact on
firm performance.
Hypothesis 2: High levels of CEO ownership will have a negative effect onfirm performance in entrepreneurial organizations.
The advantage of ownership is that goal alignment will ensue and agents will be more
likely to take risks. Therefore, it seems that the "gain" from ownership should be more
significant in higher risk firms. In fact, research on strategic human resource management
suggests that newer, dynamic, growth firms are more successful when they use
compensation packages that have lower base pay and a higher incentive component
(Jackson, Schuler & Rivero, 1980; Miles & Snow, 1984).
Hypothesis 3: Proliferation of ownership will have a greater impact on firmperformance for higher risk firms.
Because agency theory focuses on problems that arise when ownership is separate
from management, most of the research done has been conducted within large, established
organizations where data on the top executives can be easily obtained and studied.
However, agency theory has unique and particularly interesting applications for the study of
smaller, entrepreneurial firms (Jones & Butler, 1992). In addition, smaller, newer
organizations present a unique opportunity in which to study the issue of ownership and
more adequately address causation. As Romanelli (1989: 369) notes, "new organizations are
notoriously poor at surviving their early years." Thus, samples of smaller and younger firms
have more variation in performance, including firm survival.
IPO firms are organizations that offer their stock to the public market for the first time;
they are moving from being a privately owned firm to a publicly owned company. The move is
not an easy one, and it requires at least one year of the company's time (particularly that of

Using Ownership as an Incentive WP 96-04
Page 7
the top management team) in preparing and "marketing" the company. In addition, the firm
undergoes numerous internal changes as it prepares to become "professional" and submit to
the scrutiny of shareholders, investment bankers, and the Securities and Exchange
Commission. IPO firms might be considered more successful than other small organizations
because they have survived to this stage. However, they still face a high risk of failure that is
comparable to that encountered by other start-up organizations. Of the 3,186 companies that
went public in the 1980s, with stock listed on the NYSE, AMEX, or NASDAQ, only 58% were
still listed by 12/31/89 (Zeune, 1993). Comparably, a Dunn and Bradstreet study showed that
53% of all failures and bankruptcies of firms in 1980 occurred less than five years after
founding, and 80% failed in less than ten years (Romanelli, 1989).
RESEARCH METHOD
The sample used for this study contains 128 non-financial companies that initiated
their IPO in 1988. A total of about 250 firms filed securities registrations with the Securities
and Exchange Commission (SEC) to conduct an IPO, and the list was pared down to 170 by
deleting those that were listed as closed-end funds, real estate investment trusts, and other
firms not producing a good or service. Upon receipt of the 170 prospectuses, those firs in the
"not producing a good or service" category were dropped. As a result, the final sample, after
deleting cases based on missing data, includes a total of 128 non-financial companies. The
year, 1988, was chosen because it allowed for five years of follow-up data, and because it
had a 60% survival rate as of 1993, permitting a comparison between survivors and
non-survivors.
Data were gathered from the prospectus of each firm. The prospectus is the
document provided to the Securities and Exchange Commission (SEC) prior to the public
offering, and it is also the document circulated by the underwriter to assess demand for
the firm's stock. The SEC requires firms to follow strict guidelines in the format. The
document itself is usually written by members of the management team, investment
bankers, and lawyers for both parties; it is then scrutinized by other lawyers and
accountants. While the potential for positive bias exists in the prospectus, the firm is liable
for any information that might mislead investors (O'Flaherty, 1984). The Securities and
Exchange Act of 1934 (with amendments) sets the requirements for the prospectus, thus
assuring consistency in the type of information that is included in the document. The SEC
also requires that the prospectus be accurate to the best knowledge of management.
Given this requirement and the fact that the SEC requires a tremendous amount of detail
Using Ownership as an Incentive WP 96-04
Page 8
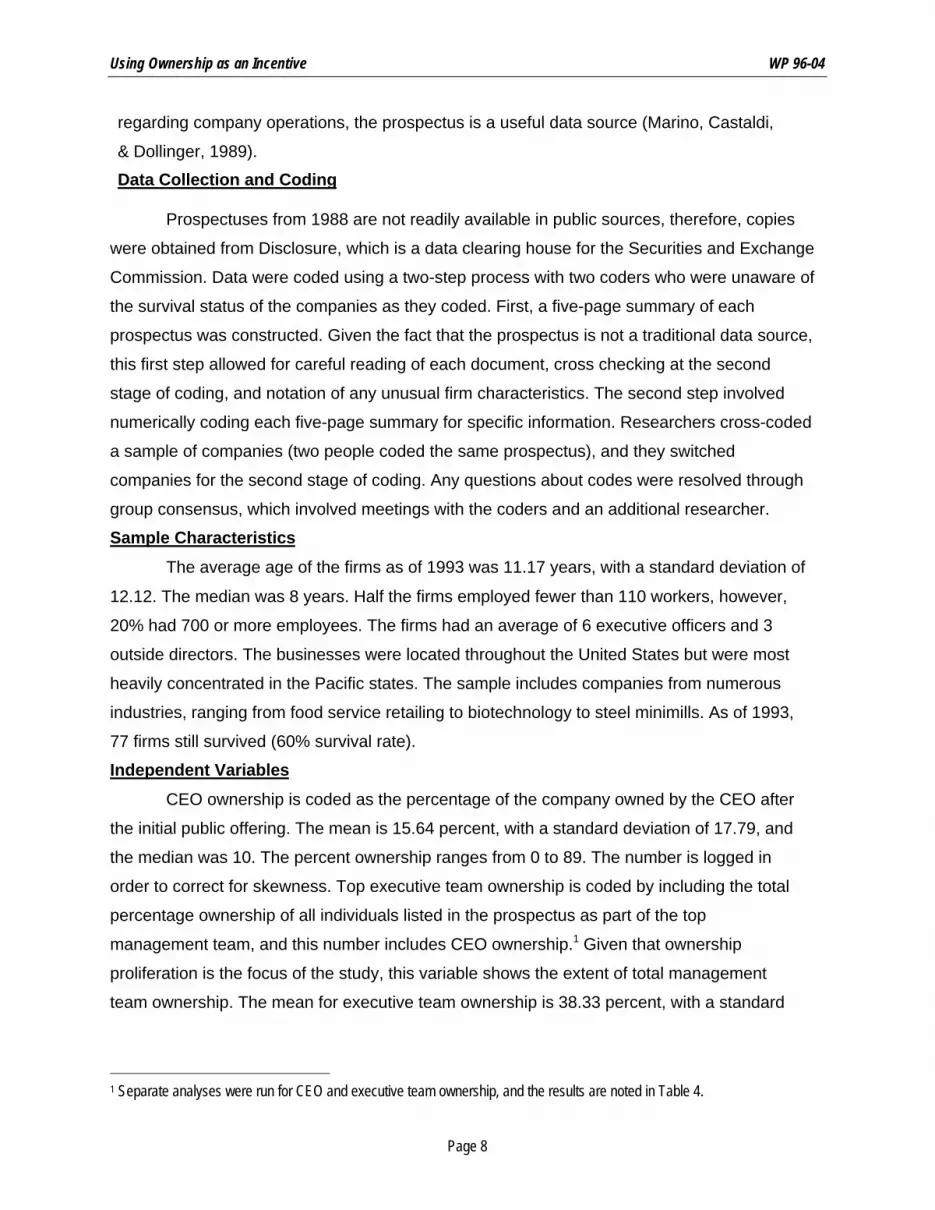
regarding company operations, the prospectus is a useful data source (Marino, Castaldi,
& Dollinger, 1989).
Data Collection and Coding
Prospectuses from 1988 are not readily available in public sources, therefore, copies
were obtained from Disclosure, which is a data clearing house for the Securities and Exchange
Commission. Data were coded using a two-step process with two coders who were unaware of
the survival status of the companies as they coded. First, a five-page summary of each
prospectus was constructed. Given the fact that the prospectus is not a traditional data source,
this first step allowed for careful reading of each document, cross checking at the second
stage of coding, and notation of any unusual firm characteristics. The second step involved
numerically coding each five-page summary for specific information. Researchers cross-coded
a sample of companies (two people coded the same prospectus), and they switched
companies for the second stage of coding. Any questions about codes were resolved through
group consensus, which involved meetings with the coders and an additional researcher.
Sample Characteristics
The average age of the firms as of 1993 was 11.17 years, with a standard deviation of
12.12. The median was 8 years. Half the firms employed fewer than 110 workers, however,
20% had 700 or more employees. The firms had an average of 6 executive officers and 3
outside directors. The businesses were located throughout the United States but were most
heavily concentrated in the Pacific states. The sample includes companies from numerous
industries, ranging from food service retailing to biotechnology to steel minimills. As of 1993,
77 firms still survived (60% survival rate).
Independent Variables
CEO ownership is coded as the percentage of the company owned by the CEO after
the initial public offering. The mean is 15.64 percent, with a standard deviation of 17.79, and
the median was 10. The percent ownership ranges from 0 to 89. The number is logged in
order to correct for skewness. Top executive team ownership is coded by including the total
percentage ownership of all individuals listed in the prospectus as part of the top
management team, and this number includes CEO ownership.1 Given that ownership
proliferation is the focus of the study, this variable shows the extent of total management
team ownership. The mean for executive team ownership is 38.33 percent, with a standard
1 Separate analyses were run for CEO and executive team ownership, and the results are noted in Table 4.

Using Ownership as an Incentive WP 96-04
Page 9
deviation of 22.39. The median is 38.90 per cent, and the range is between 0 and 89 per
cent.
All employee ownership is coded as a dichotomous variable, and companies that have
incentive stock options for all employees (including the CEO and management team) or
employee stock ownership plans for all employees are coded as a 1, and those without such
plans are coded as a zero. The mean is .61 with a standard deviation of 49 (See Table 1).
Dependent Variables
All firms still in business at year-end in 1993 were coded as survivors. Survival status is
not easily determined, therefore, several steps were taken to assure correct identification of
survivors. First, an on-line data base of current public firms was searched to find current
information on the companies. Supplemental information was gathered from Disclosure, a data
clearing-house for the Securities and Exchange Commission (SEC). Disclosure was able to
identify many of the active and inactive companies. The Directory of Obsolete Securities (1994)
also was searched to identify bankruptcy, name changes, recapitalization, and mergers. In
addition, phone calls were made to the numbers provided in the prospectus.
Fourteen firms (10%) changed their names. These firms were called to find out whether
the name changes were cosmetic, or whether the businesses had undergone other major
transformations. Mergers were considered non-survivors under the logic that the firm, as coded
in 1988, had been joined with another set of management and organizational culture (Aldrich &
Marsden, 1988; Kalleberg & Leicht, 1991). In addition, the stock price of the mergers was
tracked, and 7 out of 8 mergers had stock prices that had decreased prior to the merger. Eight
mergers (6%) occurred among the IPO firms. Overall, 77 companies, or 60% of the sample,
were coded as survivors.
Each company's year-end stock price (from 1989 to 1993) was obtained from
Disclosure. Given that these companies went public at different times (with some finalizing
in 1989), year-end 1990 was chosen as the first year for analysis in an effort to equalize all
firms.
Control Variables
Based on a review of the initial public offering and strategic human resource
management (due to risk hypotheses) literatures (e.g. Beatty & Zajac, 1994; Huselid, 1995)
several control variables were used in the analysis. The total number of employees, logged
to correct for skewness, was included as a measure of size. Net profit at the time of the IPO
was added as a performance measure. Net profit was used as a measure of performance
because many firms had net losses reported, which indicated variance in performance. Other

Using Ownership as an Incentive WP 96-04
Page 10
measures of performance, such as sales, presented the problem of zero sales for many
organizations in the sample. A dichotomous measure coded "1" for service industry and "0"
for manufacturing was used to control for industry. This code was limited to manufacturing
versus service firms in the analyses reported due to sample size restrictions. For the stock
analysis, an additional control variable, year-end stock price 1989, was included.
A final control variable indicated the level of risk of the firm. Each prospectus contains
a section listing all risk factors faced by the firm, which must be disclosed to meet the
requirements of the Securities and Exchange Commission. Prior research on initial public
offering firms found that this measure was a useful way to code risk (Beatty & Zajac, 1994;
Rasheed & Datta, 1994). The presence of the following risk factors were included in this
measure: technological obsolescence, new product, few or limited products, limited number
of years in operation, inexperienced management, technical risk, seasonality, customer
dependence, supplier dependence, inexperienced underwriters, competition, legal
proceedings against company, liability, and government regulation. The summated risk
measure ran from 1 to 11, with a mean of 4.18 and a standard deviation of 1.80. Table 1
includes the means and standard deviations for all of the dependent variables and control
variables. Table 2 includes the correlation matrix for all variables included in the
analyses. (See Table 2)
RESULTS
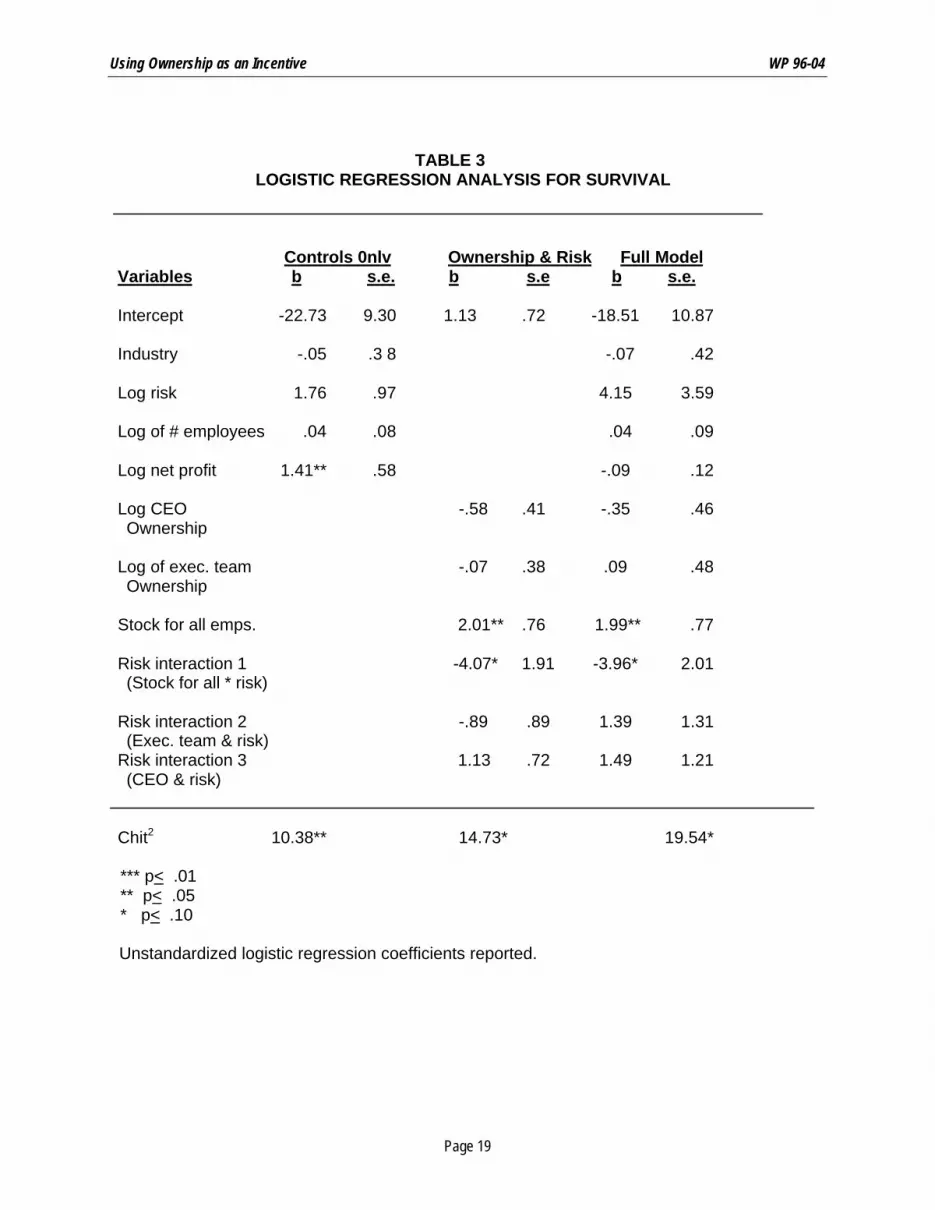
Table 3 includes the results of the analysis for survival, and as can be seen, the
overall model is significant, and the only significant terms in the full model are stock for all
employees and the interaction of employee stock and risk. The interaction was interpreted
by plotting the probability of survival for firms in the low, medium, and high-risk categories
(developed by dividing the risk variable into three categories). Figure 1 shows the results of
that analysis, and as can be seen, firms with low and medium risk benefit by having stock
plans for all employees, however, firms with high risk do not seem to receive a gain or loss
from stock programs for all employees. (See Table 3.)

Using Ownership as an Incentive WP 96-04
Page 11
FIGURE 1INTERACTION EFFECT FOR ALL EMPLOYEE STOCK AND RISK
ON THE PROBABILITY OF SURVIVAL
0.9
0.8
0.7
0.6
0.5
0.4
0.3
0.2
0.1 Low Risk Medium Risk High Risk
Table 4 includes the results of the regression analyses for stock price for years
1990 through 1993. Two interaction terms are significant for year end 1990, and those are
executive team and risk and CEO and risk. The data were plotted by creating two
categories of risk (high and low), and the results are shown in Figure 2. The results indicate
that both high and low risk firms obtain higher stock prices when the CEO and executive
team have lower levels of firm ownership. The benefit is greater for CEO ownership.
• 0.46• 0.49
♦ 0.84
♦ 0.69♦ 0.57
• No Stock♦Yes Stock

Using Ownership as an Incentive WP 96-04
Page 12
FIGURE 2INTERACTION EFFECT BETWEEN CEO OWNERSHIP AND RISK ON 1990 STOCK PRICE
14
12
10
8
6
4
2
0
INTERACTION EFFECT BETWEEN EXECUTIVE OWNERSHIP AND RISK ON 1990 STOCK PRICE
12
10
8
6
4
2
0
• 13.21
• 5.88
♦2.8 ♦ 2.81
• CEO Ownership ♦ CEO Ownership High
• 11
• EXEC Ownership Low ♦ EXEC Ownership High
Risk Low Risk High
• 5.75
♦7.45
♦ 4.67
Risk Low Risk High

Using Ownership as an Incentive WP 96-04
Page 13
DISCUSSION
The primary hypothesis of this study is that proliferation of ownership throughout the
organization has a positive effect on performance of entrepreneurial firms. The results of the
logistic regression support that hypothesis in that the only variables significantly predicting
survival are those related to employee ownership for all employees. The hypothesis that all
employee ownership should be most effective for high-risk firms, however, was not supported.
In fact, the results of the interaction effect seem to indicate that low and medium risk firms
benefit most from utilizing ownership throughout the business.
Perhaps the higher risk firms cannot really afford everyone in the organization taking
risks. In addition, employees in these companies might not view ownership as an incentive
because the likelihood of their ownership being worth anything might be perceived as very
low. Agency theory claims that agents are naturally risk averse, and it might be that the use
of ownership in high risk firms places too much risk with the employees, thus resulting in the
type of risk averse behavior that is not supportive of organizational goals.
The results of the analyses with stock price paint a very different picture, where stock
for all employees is not significant, but CEO ownership and top team ownership are both
significant for stock price in 1990. The interaction effects are also significant, and the results
seem to indicate that regardless of risk level faced by the firm, companies are better off with
CEOs and top management teams that have lower levels of ownership in the firm. These
results might be the reaction of investors who see CEO ownership, particularly, as a potential
problem for assuring firm growth. It might also be the result of these owners making
decisions that are best for long-term business performance while risking short-term quarterly
returns, which are rewarded by the stock market. The findings might also reflect the fact that
high CEO and management team ownership leave less stock for others in the company. If
this interpretation is correct, it supports the hypothesis that ownership proliferation, rather
than ownership concentration, is important for firm performance.
The longer-term stock results only show an effect for CEO ownership in 1991; after
that point in time, there is no effect for CEO or top management team ownership. Of course,
the data for later years become difficult to interpret because sample size begins to decrease
(companies begin to "die"), and the data utilized as the independent variables represent the
company at the time of the IPO. The present analysis includes no information on change that
took place between 1988 and the subsequent years.
There are, of course, several limitations that should be considered when interpreting
the findings. The sample of IPO firms might not be representative of all firms at this stage. In

Using Ownership as an Incentive WP 96-04
Page 14
fact, it could be argued that this particular sample is made up of companies with greater
chances of survival as the 1988 IPO companies were somewhat affected by the stock market
crash of 1987 (investors being more cautious). There is also a possibility of positive bias in
the reporting of data in the prospectus. In addition, the coding process, which has been
called "cruel and unusual punishment" (Marino et. al., 1989), could also be prone to errors in
interpretation even though measures were taken to minimize these problems.
There's a saying that "too many chiefs and not enough indians" is bad for business;
the results of this research suggest that many chiefs, at least many internal owners, is good
for business in entrepreneurial firms. Additional research that further evaluates the effect of
proliferation of ownership on firm performance in entrepreneurial firms and the process by
which this phenomenon helps or deters organizational growth should be pursued.

Using Ownership as an Incentive WP 96-04
Page 15
REFERENCES
Aldrich, H. E. & Marsden, P. V. 1988. Environments and Organizations, Handbook of Sociology:361-392.
Beatty, RP., & Zajac, E.J. 1994. Managerial incentives, monitoring, and risk bearing: A study ofexecutive compensation, ownership, and board structure in initial public offerings.Administrative Science Quarterly, 39: 313-335.
Becker, B. E. & Olson, C. A. 1989. Unionization and shareholder interests. Industrial and LaborRelations Review, 42(2), 246-261.
Eisenhardt, K. M. 1985. Organizational control: Organizational and economic approaches.Management Science, 31: 134-149.
Fama, E. F. 1980. Agency problems and the theory of the firm. Journal of Political Economy, 88:288-307.
Fama, E. F. & Jensen, M. L. 1983. Separation of ownership and control. Journal of Law andEconomics, 26: 301-325.
Gomez-Mejia, L. R 1994. Executive compensation: A reassessment and a future researchagenda. In K. M. Rowland & G. R Ferris (Eds.), Research in Personnel and HumanResources Management, 12, 161-222.
Gomez-Mejia, L. R. & Balkin, D. B. 1992. The determinants of faculty pay: An agency theoryperspective. Academy of Management Journal, 35: 921-955.
Huselid, M.A. 1995. The impact of human resource practices on turnover, productivity, andcorporate financial performance. Academy of Management Journal, 38(3): 635-672.
Jackson, S. E., Schuler, R S. & Rivero, J. C. 1989. Organizational characteristics as predictorsof personnel practices. Personnel Psychology, 42:729-786.
Jones, G. R & Butler, J. E. 1992. Managing internal corporate entrepreneurship: An agencytheory perspective. Journal of Management, 18(4), 733-749.
Kalleberg, A. L. & Leicht, K. 1991. Gender and organizational performance: Determinants ofsmall business survival and success. Academy of Management Journal, 34(1): 136-161.
Kirzner, I. M. 1973. Competition and entrepreneurship. Chicago: University of Chicago Press.
Marino, K.E., Castaldi, R.M., & Dollinger, M.J. 1989. Content analysis in entrepreneurshipresearch: The case of initial public offerings. Entrepreneurship Theory and Practice, Fall:51-66.
Miles, R & Snow, C. 1984. Designing strategic human resource systems. Organizational amics,Summer: 36-52.
O'Flaherty, J.S. 1984. Going public: The entrepreneur's guide. New York: John Wiley & Sons.

Using Ownership as an Incentive WP 96-04
Page 16
Ouchi, W. G. 1979. A conceptual framework for the design of organizational controlmechanisms. Management Science, 25(9), 833-848.
Rasheed, A., & Datta, D.K. 1994. Determinants of price premiums: A study of initial publicofferings in the medical diagnostics industry. Paper presented at the Academy ofManagement Annual Meeting, Dallas, TX.
Romanelli, E. 1989. Environments and strategies of organization start-ups: Effects on earlysurvival. Administrative Science Quarterly, 34: 369-387.
Thompson, J. D. 1967. Organizations in Action. New York, NY: McGraw-Hill.
Tosi, H. L. & Gomez-Mejia, L. R. 1994. CEO monitoring: A behavioral approach. Academy ofManagement Journal, 37(4), 1002-1016.
Welbourne, T. M., Ballcin, D. B. & Gomez-Mejia, L. R. 1985. Gainsharing and mutualmonitoring: A combined agency-organizational justice interpretation. Academy ofManagement Journal, 38(3), 881-899.
Zeune, G. D. 1993. Ducks in a row: Orchestrating the flawless stock offering. CorporateCashflow, 14: 18-21.

Using Ownership as an Incentive WP 96-04
Page 17
TABLE 1MEANS AND STANDARD DEVIATIONS
Variable Name Mean Standard Deviation
Industry (0=manufacturing,1= service) .47 .50
Log number of employees 4.53 2.69
Log of net profit 16.07 .53
Log of risk .28 .23
Log of CEO ownershipafter to the IPO 2.16 1.28
Log of top executive teamownership after IPO 3.32 1.12
All employee stock (0/1) .45 .50
Survive (0/1) .61 .49
Initial stock price 6.90 5.15
Seven day stock price 8.26 5.46
Stock price, year end 1988 8.29 5.39(n=107)
Stock price, year end 1989 8.94 14.67(n=100)
Stock price, year end 1990 8.01 9.57(n=98)
Stock price, year end 1991 10.40 11.23(n=86)
Stock price, year end 1992 10.40 10.76(n=76)
Stock price, year end 1993 12.29 11.94(n=71)

Using Ownership as an Incentive WP 96-04
Page 18
TABLE 2CORRELATIONS FOR VARIABLES USED IN THE ANALYSES
1 2 3 4 5 6 7 8 9 10 11 12 13
1. Industry 1.00
2. Log # of employees .02 1.00
3 . Log of Net profit -.08 .46 * * * 1.00
4. Log of Risk level -.02 -.47*** -.42*** 1.00
5. Log of CEO ownership .09 -.22** -.21 **.08 1.00
6. Log of team ownership .03 -.17 -.20* .04 .64*** 1.00
7. Stock for all employees -.04 -.04 -.16 .19* -.03 .00 1.00
8. Survival status -.11 .08 .21 * -.01 -.04 -.03 .12 1.00
9. Stock price year end 1989 .00 .29** .52*** -.24* -.29** -.31 -.07 .03 1.00
10. Stock price year end 1990 .02 .32*** .48*** -.23* -.25* -.18 .00 .13 .71*** 1.00
11. Stock price year end 1991 .16 .32** .34*** -.12 -.33*** -.21 .11 .26** .35*** .74*** 1.00
12. Stock price year end 1992 .02 .38*** .24* -.06 -.26* -.27 .17 .18 .11 .54*** .78*** 1.00
13. Stock price year end 1993 -.01 .32** .15 -.02 -.31 -.20 .21 .14 .08 .49*** .66** .85*** 1.00
* p < .05 ** p < .01 *** p<.001
Using Ownership as an Incentive WP 96-04
Page 19
TABLE 3LOGISTIC REGRESSION ANALYSIS FOR SURVIVAL
Controls 0nlv Ownership & Risk Full ModelVariables b s.e. b s.e b s.e.
Intercept -22.73 9.30 1.13 .72 -18.51 10.87
Industry -.05 .3 8 -.07 .42
Log risk 1.76 .97 4.15 3.59
Log of # employees .04 .08 .04 .09
Log net profit 1.41** .58 -.09 .12
Log CEO -.58 .41 -.35 .46Ownership
Log of exec. team -.07 .38 .09 .48Ownership
Stock for all emps. 2.01** .76 1.99** .77
Risk interaction 1 -4.07* 1.91 -3.96* 2.01(Stock for all * risk)
Risk interaction 2 -.89 .89 1.39 1.31(Exec. team & risk)
Risk interaction 3 1.13 .72 1.49 1.21(CEO & risk)
Chit2 10.38** 14.73* 19.54*
*** p< .01** p< .05* p< .10
Unstandardized logistic regression coefficients reported.

Using Ownership as an Incentive WP 96-04
Page 20
Table 4Results of Regression Analysis for Year End Stock Price
1990. n=100 1991. n=98 1992. n=86 1993. n=71Variables Beta Beta Beta Beta
Stock price 1989 .65*** .19 -.17 -.14
Industry .06 .22* .04 .02
Log of risk .30 .29 -.43 -.34
Log employees .06 .14 .35** .32*
Log net profit .11 .20 .18 .10
Stock for all employees -.02 .04 .01 .04
Risk interaction (stock all & risk) .14 .16 .27 .25
Log of executive team ownership .50** .36 -.42 -.26
Log of CEO ownership -.45* -.51* .05 .07
Risk interaction (team & risk) -.92** -.68 .66 .67
Risk interaction (CEO & risk) .60** .41 -.22 -.33
R2 .58 .32 .29 .2610.23*** 3.07** 2.29* 1.85
*** p < .01; ** p < .05; * p < .10 Note: Standardized regression coefficients are reported.
Note: Separate analyses were run for stock all and related interaction; CEO ownership and related interaction, and team ownershipand related interaction. In those equations, only executive team ownership was significantly related to 1990 stock price (positivedirection). It was unrelated to 1991 stock price, negatively related to 1992 stock price, and unrelated to 1993 stock price. CEOownership was unrelated to stock price in any year, and stock for all was also unrelated to stock prices.


