Embed Size (px)
Citation preview

Animal Feed Science and Technobgy, 36 ( 1992) 393-3 I8 Elsevier Science Publishers 3.V.. Amsterdam
303
Utilization of dietary energy and nutrients from soya bean products by growing pigs
J.A. Agunbiade, J. Wiseman and D.J.A. Cole Department o/Agricukure and Horlicukure, L’niversrly of Nottingham Sckool ofAgricukural and
FoodSciences. Surron Bonington. Lougkborougk LEIZ 5RD. UK
(Received 3 October 1990; accepted 5 July 1991)
ABSTRACT
Agunbiade, J.A., Wiseman, J. and Cole, D.J.A., 1992. Utilization ofdietary energy andnutrientsfrom soya bean products by growing pigs. Anim. Feed Sci’. Tecknol., 36: 303-318.
A metabolism trial with four periods was conducted with 13 gilts to determine apparent digestible energy and nutritive values of extruded fuil-fat soya beans (F’FSB) and of extracted soya bean meal (SBM) and soya bean oil (SBO) either separately or mixed, as affected by rate of inclusion, method ofdetemdnation, and weight or age of pigs. Each soya bean product was evaluated at levels to provide 40, 80 and 120 g kg-’ added oil in a basal diet. Their digestible energy (DE) content and apparent digestibility of oil (AOD-using two oil analytical methods) and nitrogen were estimated by singte- level way and by regression. Regression values for DE (MJ kg-’ dry matter (DM)) were: SBO. 38.4; FFSB, 18.3; OSBM (SBO plus SBM) 20.4: and SBM, 16.7. Dietary energy values and AOD were linearly related to rate of inclusion of test ingredients. Linear regression models were better than single-level assays, which gave high standard errors. Weight of pig (over the range 32-70 kg) did not affect dietary energy and AOD values of soya bean products. The method of oil analysis adopted could influence data for oil utilization of soya bean products. Although important, AOD may not be the major factor iniluencing the utilization of full-fat soya beans. The results suggested that soya bean products are variable feed ingredients, the nutritive value of which is influenced by many factors which need be taken into account for the effective use of these products in diet formulation.
INTRODUCTION
The use of full-fat soya beans for animal feeding has increased, particularly in countries where cereal grains are often in limited. supply, because their high oil and protein contents make them useful for inclusion in diets of high energy and high nutrient concentration. Use of the raw bean is limited by the pres- ence of heat-labile anti-nutritional factors, the most important of which are trypsin inhibitors, which seriously impair protein digestibility. However, the recent development and improvement of processing technology has resulted in considerable reduction in trypsin inhibitors (McNaughton and Reece, 1979; Falloun, 1980) and enhancement of nutritional quality (Wiseman, 1984;
0 1992 Elsevier Science Publishers B.V. All rights reserved 0377-8401/92/$05.00

304
McNab, 1985; Aoams and Jensen, 1985) of full-fat soya beans (FFSB) thus leading to their increased use in relation to soya bean meal (SBM) and soya bean oil (SBO) in animal diets.
A thorough evaluation of the dietary energy and nutritive value cf feed in- gredients may be impossible without taking account of a number oi factors known to be important. For example, whereas dietary energy values of cereits have been shown not to be influenced by rate of inclusion in the diet (Mor- gan, 1976; Kromann et al., 1976) the opposite has been reported for fats, for which the use of multi-level assays has been advocated for pigs and poultry (Sibbald and Slinger, 1963; Wiseman and Cole, 1987; Wiseman and Lessire, 1987). In addition, studies on the influence of age or weight of pigs on dietary energy and nutrient utilization of raw materials have generated conflicting results (Cunningham and Brisson, 1955; Lloyd et al., 1957, Saben et at., I97 la,b; Bayley and Summers, 1975 ). Furthermore, there are reports to sug- gest that the methods of estimation of dietary and faecal oil content of oil- bearing ingredients could influence their overall dietary energy and nutritive values (Renner and Hill. 1960: Just. 1982b: Wiseman and Lessire. 1987: Agunbiadeetal., 1991). ’ ’ ’ ’
, ,
These factors appear not to have been examined concurrently in the eval- uation of soya bean products for growing pigs. This study therefore deter- mined apparent digestible energy (DE), and nutritive values of extruded FFSB and of extracted SBM and SBO (either separately or mixed) as affected by method of estimation, weight or age of pigs and rate of inclusion.
MATERIALS ANL METHODS
Diets
The extruded FFSB, extracted SBM and SBO were all commercially pro- cessed samples obtained from the same source. The FFSB was a product of a dry extrusion process, and the SBM was processed by solvent extraction. The analytical details of the basal diet, FFSB and SBM are shown in Table 1.
The SBO, FFSB and OSBM (SBO and SBM recombined to simulate the composition of the FFSB) were incorporated into a basal diet at the expense of the energy-yielding ingredients to give levels of supplemental oil of approx- imately 40, 80 and 120 g kg-’ (Table 2). The SBM was also added to the basal diet at the same levels as in OSBM. All experimental diets were then supplemented with minerals and a premix (Table 2).
Experimental procedure
The experimental diets were given to 13 Landracex (Large WhitexLandrace) gilts from the University enzootic pneumonia-free herd

DIETARY ENERGY AND NUTRIENTS FROM SOYA BEAN PRODUCTS 305
TABLE I
Analytical details of basal diet, extruded full-fat soya bean and extracted soya bean meal (6 kg-’ dry matter,
Basal
diet
Full-fat Extracted soya bean soya bean meal
(FFSB) (SBM)
Dry matter 891.5 945.4 887.4 Crude protein 250.0 397.7 500. I E;ber extract 24.0 204.7 20.2 Acid ether extract 32.6 224.4 33.8 Ash 68.8 so.2 69.9 Crude tibre 42.5 48.2 63.4 Grossenergy (MJ kg-l DM) 18.1 21.0 19.3 Trypsin inhibitor’ (mg g-‘) 9.1 3.4
‘Trypsin inhibitor activity calculated as milligrams of trypsin Inhibited by I .O g of soya bean product
(DM basis). The raw soya bean contained 26.22 mg S-’ trypsin inhibitor.
TABLE 2
Proportions afbasal diet to soya bean products in expetimental diets (g kg-‘)
Diet Diet
compottents
1 2 3 4 5 6 7 8 9 10 II I2 I3
Basal’ 1000 960 920 880 803 607 410 803 607 410 840 679 518 FFSB’ - - - - 197 393 590 - - - - - -
SBM’ - - _ - _ _ - I61 321 482 161 321 482
SBO - 40 80 120 - - - 36 72 108 - - -
‘Comprised (g kg-‘) wheat meal, 5!0.5; wheat feed, 225.0: soya bean meal (440g kg-’ CP), 203.9,
and meat and bone meal (480 g kg-’ CP), 30.6. Each diet was subsequently supplemented (g kg-‘)
with: Betamix 314 premix, 4.0; limestone flour, 5.7; salt, 2.7; and t%-lysine, 8.0. *See Table I.
in a metabolism trial spanning four successive periods over the live-weight range 32-70 kg. Each collection period consisted of a IO-day acclimatization period to experimental diets followed by a 5-day collection period with pigs housed in metabolism crates. Faecal colk+ion was by the ‘marker-to-marker’ technique with indigo carmine added to the evening meal of days 1 and 6, and urine collection was on a timed basis and facilitated by the use of indwell- ing bladder catheters. Feed intake, adjusted at the beginning of each accli- matization period, was at a level of 0.8 of the ad libitum amount according to Agricultural Research Council ( 198 1). The full methodology was described by Wiseman et al. (1990).

306 IA. AGUNWADE ET AL.
Chemical analyses
The analyses of the basal diet, FFSB and SBM for dry matter (DM), crude protein (CP, Nx6.25), ether extract (EE), crude tibre (CF) and ash; of the freeze-dried farces ior all but the last two; and of fresh urine samples for ni- trogen (macro-KjelCahl technique) were all according to the methods out- lined by the Association of Official Analytical Chemists ( 1980). All the sam- ples except urine were also analysed for acid ether extract (AEE) by the modified Weibul acid hydrolysis technique (Anonymous, 1985 ) . Gross en- ergy of the basal diet and soya bean products was determined with a Parr adiabatic bomb calorimeter and that of freeze-dried faeces and urine samples with a Gallenkamp ballistic bomb calorimeter. Trypsin inhibitor activity of raw FFSB, extruded FFSB and extracted SBM was analysed by the method of Kakade et al. ( 1974). The calculation and statistical analysis of data were as described by Agunbiade et al. ( 1991). Two procedures, the conventional sin- gle-level by-difference and that based on regression analysis (of dietary en- ergy and nutrient values on rate of inclusion), were employed in the deter- mination of dietary energy and nutritive values of test ingredients. Oil utilization of diets and test ingredients was determined using the oil contents of diets and faeces measured by both the petroleum ether and acid hydrolysis ether extraction methods. The experimental data were analysed using a ran- domized complete block design with the 13 treatments being arranged in four blocks (time periods). For the analysis of variance and regression undertaken on the experimental data the Genstat V (Lawes Agricultural Trust, 1984) program was used.
RESULTS
Dietary energy and nutritive values: effects of inclusion rate of test ingredients
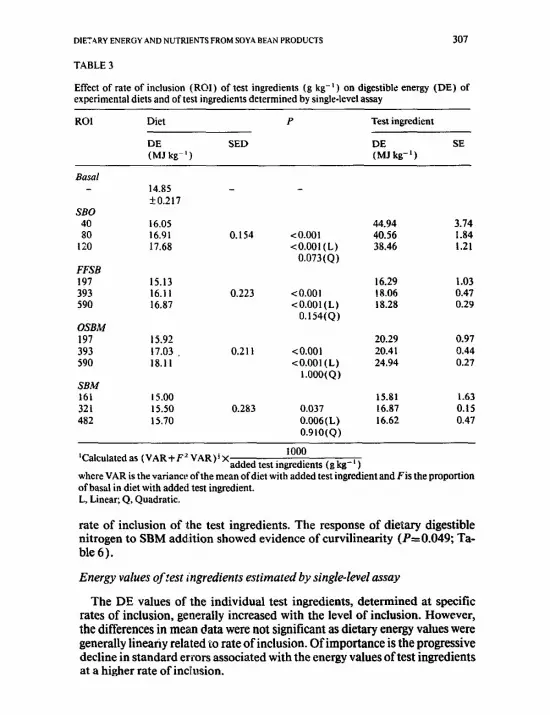
The DE values of the diets and test ingredients as affected by their rate of inclusion in the basal diet are presented in Table 3. Dietary energy values, generally, increased linearly (PcO.00 I, except for SBM, for which P=O.O06) with increasing rate of inclusion of the test ingredients. Metabolizable energy (ME and MEn, data not reported) followed similar trends to DE. The ME/ DE ratios of experimental diets increased linearly with the rate of inclusion of SBO (Table 4).
The patterns of AOD ( AEE ) and AOD( EE ) of experimental diets (Table 5) were similar to that of dietary energy values. However, rate of inclusion of SBM had no significant effect on AOD(AEE) and AOD(EE) of diets (Table 6). Whereas r&e of inclusion oftest ingredients had no significant effect (ex- cept for OSBM-added diet) on digestible DM of experimental diets (data not presented), the response of digestible nitrogen of the diets was linear (P<O.OOl; Tables 5 and 6). With the exception of SBO-supplemented diets, which followed a reverse trend, digestible nitrogen of diets increased with the
DlETkRY ENERGY AND NUTRIENTS FROM SOYA BEAN PRODUCTS 307
TABLE 3
Effect of rate of inclusion (ROI) of test ingredients (g kg-‘) on digestible energy (DE) of experimental diets and of test ingredients determined by single-level assay
ROI Diet P Test ingredient
DE SED DE SE (MJ kg-‘) (MI kg-‘)
SBO 40 SO
120
FFSB 197 ;93 590
OSBM 197 393 590
SBM 161 321 482
14.85 f0.217
16.05 16.91 17.68
15.13 16.11 16.87
15.92 17.03 18.11
15.00
15.50 15.70
0.154 <O.OOl 10.001 (L) 0.073(Q)
0.223 <O.OOl <0.001(L)
0.154(Q)
0.211 to.001 co.001 (L)
1.000(Q)
0.283 0.037 0.006(L) 0.910(Q)
44.94 3.74 40.56 1.84 38.46 1.21
16.29 1.03 ! 8.06 0.47 18.28 0.29
20.29 0.97 20.41 0.44 24.94 0.27
15.81 1.63 16.87 0.15 16.62 0.47
‘Calculated as (VAR+F’ VAR)‘X 1000
added test ingredients (gkg-‘) where VAR is the variance of the mean ofdiet with added test ingredient and Fis the proportion of basal in diet with added teat ingredient. L, Linear; Q, Quadratic.
rate of inclusion of ithe test ingredients. The response of dietary digestible nitrogen to SBM addition showed evidence of curvilinearity (ILO.049; Ta- ble 6).
Energy values of zest ingredients estimated by single-level assay
The DE values of the individual test ingredients, determined at specific rates of inclusion, generally increased with the level of inclusion. However, the differences in mean data were not significant as dietary energy values were generally lineariy related to rate of inclusion. Of importance is the progressive decline in standard errors associated with the energy values oftest ingredients at a higher rate of inchtsion.

308 ,.A. *GUNBlADE ET *I..
TABLE 4
Effect of level of inclusion of test ingredient (g kg-’ ) on ME/DE ratios of experimental diets
hclusion ME/DE SED P
rate
BC7.d
0.943
SBO
40 0.955 0.3133 0.053 80 0.963 0.009(L)
120 0.984
FFSB 197 0.930 0.0168
393 0.956 NS
590 0.939 OSBM
197 0.943 0.0193
393 0.956 NS
590 0.939
SBM
161 0.914 0.0227
321 0.931 NS
482 0.922 -
NS, Non-significant.
Energy and nutritive values of test ingredients estimated by linear regression
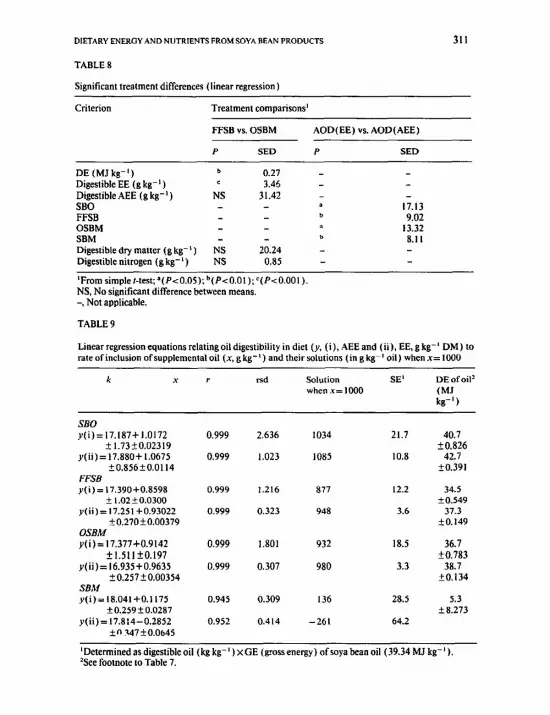
Table 7 presents linear regression equations relating energy value of diets to rate of inclusion of test ingredient. Their solutions when x= 1000 gave DE values of the test ingredients. The energy values of FFSB were significantly lower (P-zO.01) than those of OSBM (18.3 vs. 20.4 MJ kg-’ DM). The die- tary energy data for SRO and SBM from the regression equations were used to calculate the DE for FFSB (?0.7 MJ kg-’ DM) and OSBM with the aim of establishing the additivity of the energy contributions of SBO and SBM in both the FFSB and OSBM. There was reasonable agreement between the cal- culated and determined values only for OSBM (20.7 vs. 20.5 MJ kg-’ DM), whereas a considerable difference (of 2.4 MJ kg-r DM) occurred between the values for the FFSB (the calculated value being higher than the deter- mined value). Although a more accurate estimation of energy values was achieved with higher inclusion rate (Table 3), a further improvement in ac- curacy (evident from lower standard errors; Table 7) was attained by the adoption of regression techniques. Table 8 presents data on the significance of treatment differences for the various measurements from the regression analysis.
Table 9 shows the linear regression data of dietary oil digestibility on rate of inclusion of test ingredients. Incorporating soya bean oil as free oil yielded coefficients of AOD greater than one (averaging I .06), and DE for soya bean

Effect of rate of inclusion (ROI) of test ingredients (g kg-‘) on digestible oil (AOD(AEE) and AOD(EE)) and digestible nitrogen (DN) ofexperimental diets
ROI AOD(AEE)’ AOD(EE)’ DN’
@kg-‘) &kg-‘) &kg-‘) &kg-‘)
SBO 40
80
120 FFSB
197
393
590
OSBM
197
393
590 SBM 161 321 482
18.27f 1.70 17.12+2.10 35.12_?0.88
57.28f2.38 61.76+ 1.45 34.14* 1.05
96.45k3.26 103.20+ 1.42 32.09tO.82
140.84+ 1.08 145.64k 1.82 31.02+0.32
51 R2k3.27 52.97kl.39 40.20+0.X1 89.27k2.99 87.73C 1.69 45.65+ 1.65
125.28k4.51 123.46f 1.67 49.64k2.19
53.28f 1.99 54.25k1.21 39.98f 1.46
90.1lk2.86 91.56+0.68 45.31 ie 1.46
130.7lA2.03 129.532 1.45 49.02+1.17
18.25+0.91 16.51 + 1.59 40.00 k 0.42
19.20+1.10 15.81 k 1.20 46.84k2.10
19.84k2.10 15.38k2.10 54.32k0.51
‘Means of values over four periods and their standard deviations.
oil (an average of 41.7 MJ kg-’ DM, calculated as the product of gross energy and coefficient of oil digestibility) exceeding the gross energy of oil (39.3 MJ kg-‘). The apparent digestibility of oil and the resultant DE of oil in FFSB were 4.6% less than in OSBM and much lower ( 13.9%) than when added to the diets as free oil. Very low AQD and DE values (which were associated with very high standard errors) were obtained when oil was incorporated in diets in the form of SBM.
The AOD and DE values of oil in general were significantly higher when estimated by the EE procedure than by the AEE method. There was a consid- erable difference in the DE value of oil derived from AOD (41.7 MJ kg-‘, average of AEE and EE, Table 9) and that estimated directly (38.4 MJ kg-‘; Table 7 ) .
To examine a probable influence of supplemental oil on basal oil digestibil- ity, intercept values for AOD of the various test ingredients were compared with the determined value for the basal diet using the mean values of AOD(AEE) and AOD(EE) in all comparisons. The mean value of the di- rectly determined basal digestible oil ( 17.7 g kg- ’ ) was not substantially dif- ferent from the corresponding intercept values when evaluated together with SBO, FFSB, OSBM and SBM (17.521.29, 17.3kO.65, 17.2?0.88 and 17.620.30, respectively).

310 J.A. AGUNBIADE ET AL.
TABLE 6
Analysis of variance for effects of rate of inclusion on digestible oil and nitrogen values for expen- mental diets presented in Table 5
-
AOD(AEE) AOD(EE) DN
SED P SED P SED P
SBO 1.593
FFSB 2.314
0SBA-I 1.707
SBM I.111
<O.OOl 1.217 <O.OOl 0.575 <O.OOl <0.001(L) <0.001(L) <O.OOl (L)
0.035(Q) 0.224(Q) 0.918(Q)
co.001 1.223 x0.001 1.066 rO.001 <0.001(L) <0.001(L) <0.001(L)
0.467(Q) 1.000(Q) 0.487(Q)
<O.OOl 1.028 c0.001 0.895 <O.OOl <0.001(L) <0.001(L) <0.001(L)
0.081 (Q) 0.579(Q) 0.384(Q)
0.442 0.135(L) 0.683(Q)
1.276 0.560 0.171(L) 0.924(Q)
0.838 < 0.002 <0.001(L)
0.049(Q)
L, Linear;Q, quadratic.
TABLE 7
Linear regression equations relating digestible energy value of diet (v, DE, MJ kg-’ DM) to rateofinclttsionoftest ingredients (x,g kg-‘) and theirsolution (MJ kg-’ DM) whenx= 1000
k x r rsd Solution SE’ when x= 1000
SBO
y= 14.968-i-0.0234 0.994 0.157 38.4 1.65 +0.131+0.00175
FFSB y= 14.683+0.00359 0.981 0.222 18.3 0.37
+0.186+0.000506 OSBM
y= 14.843+0.00554 0.999 0.015 20.4 0.03 +0.208+_0.00119
SBM .v= 14.804+0.00191 0.978 0.104 16.7 0.23
+0.0870+0.000290
%alculatedas where n is the number of observations,
x is the numerical points of x and VAR is the variance or residual mean square.
DIETARY ENEROY AND NUTRENTS FROM SOY.4 BEAN PRODIJCTS 311
TABLE 8
Significant treatment differences (linear regression 1
ClilWiOll Treatment comparisons’
FFSB vs. OSBM AOD(EE) vs. AOD(AEE)
P SED P SED
DE (MJ kg-‘) b 0.27 -
Digestible EE (g kg-‘) c 3.46 -
Digestible AEE (g kg-‘) NS 31.42 -
SBO a 17.13
FFSB b 9.02 OSBM * 13.32 SBM b 8.11
Digestible dry matter (g kg-‘) NS 20.24 -
Digestible nitrogen (g kg-‘) NS 0.85 -
‘F~maimple~-test:~(PcO.OS);b(P~O.Ol);c(P~O.OOl).
NS, No significant difference between means.
-, Not applicable.
TABLE 9
Linear regression equations relating oil digestibility in diet (y, (i ), AEE and (ii), EE, g kg-’ DM) to rateoiinclusion ofsupplemental oil (x, gkg-‘) and their wlutions (in g kg-’ oil) whenx= ID00
k x I rsd Solution SE’ DE of oil’
whenx=tOOO (MJ
kg-‘)
SBO y(i)=l7.187+1.0172 0.999 2.636 I034 21.7 40.7
fl.73?0.02319 kO.826 y(ii)=17.880+ 1.0675 0.999 1.023 lOl75 10.8 42.7
y(ii)=17.251+0.93022
?0.856?0.0114
FFSB y(i)= 17.39O.tO.8598
+0.270+0.00379
OSBM
C 1.02?0.0300
0.999 1.216 877 12.2
kO.391
34.5
+0.549 0.999
0.999
0.323
1.801
948
932 18.5
3.6 37.3
36.7
f0.783
20.149
0.999 0.307 980 3.3 38.7
kO.134
0.945 0.309 136 28.5 5.3
kg.273
0.952 0.414 -261 64.2
y(i)= 17.377+0.9142
fl.511f0.197
y( ii)= 16.935+0.9635
?0.257f0.00354 SBM y(i)=16.041+0.1175
+0.259?0.0287
y(ii)=17.814-0.2852
+o 347iO.Ob45
‘Determinedas digestibleoil (kp kg-‘) xGE (grossenergy) ofsoyabeanoil(39.34 MJ kg-‘). *See footnote to Table 7.

312 IA. AWNBlADE ET AL.
TABLE 10
Linearregressionequations relatingdigestible dry matter (y= (i) g kg-’ DM) and digestible nitrogen
(y= (ii) g kg-’ DM) to rate of inclusion of test ingredients and their solution when x= 1000
k x r rsd Solution SE’ Coefficient2
when x= 1000
SBO y=(i)828.51+0.0890
+5.63_+0.0752 y=(ii)35.245-0.0359
+0.272?0.00364 FFSB
y=(i)819.38+0.0424
+8.26&0.0225
y= (ii)35301 +0.0249
~0.144f0.000826
OSBM y=(i)822.20+0.0343
*5.77+0.0157
v=(ii)35.303+0.0239 ?0.0239+00012
SBM
y=(i)822.32+0.0120
+_6.225+0.0207
y=(ii)34.404+0.0401
?0.789f0.002632
0.642 6.726 918
0.990 0.326 -0.635
0.800
0.998
0.840
0.998
0.378
0.997
9.869
0.482
6.899
0.524
7.434
0.943
862
60.2
857
59.2
834
74.5
70.8 0.92
3.4 0
16.6 0.91
0.8 0.95
11.6 0.94
il.9 0.97
16.2 0.94
2.0 0.93
‘See footnote to Table 7.
‘Coeficient ofapparent nitrogen or dry matter digestibility of test ingredient.
The digestible dry matter and digestible nitrogen of each test ingredient obtained by regression were expressed as proportions of dry matter and nitro- gen content of each test ingredient respectively to obtain the coefficients of apparent dry matter and nitrogen digestibility presented in Table 10. In gen- eral, both dry matter and nitrogen contents of the test ingredients were highly digestible. The apparent nitrogen digestibility coefficient obtained for SBO was, however, not different from zero and this was evidence that added oil, devoid of nitrogen, was not interacting with the utilization of nitrogen in the basal diet.
The mean data for individual periods of dietary energy, oil (AEE and EE), dry matter and nitrogen digestibility (not presented) showed no significant and consistent effect of weight, over the range 32-70 kg studied, on all the measurements. However, dietary nitrogen seemed to be slightly better di- gested during the last two collection periods of the trial.

DIETARY ENERGY AND NUTRIENTS FROM SOYA BEAN PRODUCTS 313
DISCUSSION
The linear response of dietary energy and AOD values to increased addi- tion of test ingredients indicated no differences in the utilization of energy and oil of the test ingredients over the range of inclusion rates studied. How- ever, dietary energy values and digestible oil (g kg-‘) of diets increased with addition of test ingredients because values were greater than the correspond- ing values for the basal diet. The increase in ME/DE with the addition of SBO in the basal diet supports the findings of May and Bell ( 1971), Morgan ct al. ( 1975) and Phillips and Ewan (1977), who reported a higher ratio with a decrease in crude protein concentration of the diet. Accordingly, as soya bean oil was added to the basal diet, the dietary protein level decreased (241 g kg~‘,230gkg-‘and218gkg-‘,for40gkg-’,8Ogkg-’and120gkg~‘SBO additions respectively) and the efficiency of DE utilization increased (Table 4). A similar increase in ME/DE was attributed to an increase in the propor- tion of fat absorbed in the small intestine and a decline in the proportion absorbed in the hind gut with increasing concentration of dietary fat (Just, 1982a,b). The consistent increase in ME/DE approached significance only with SBO supplementation.
The lack of significant and consistent differences between dietary AOD measured by the two oil analytical techniques is in accordance with a similar report on rapeseed products for growing pigs ( Agunbiade et al., I99 I ). As in the current study, Phillips and Ewan ( 1977) also observed no significant dif- ference in dry matter digestibility of diets with increased addition of soya bean oil. No similar information is available for the other test ingredients.
In contrast to the current trial, Phillips and Ewan (1977) found no effect of rate of inclusion of soya bean oil on dietary nitrogen digestibility. The lin- ear reduction in dietary digestible nitrogen observed in the current study may be related to a similar reduction in total dietary nitrogen and, consequently, its utilization as soya bean oil was added to the basal diet. The lack of major differences in dietary dry matter and nitrogen digestibility between OSBM- and FFSB-supplemented diets observed in this study agrees with the report of Faber and Zimmerman ( 1973), who also observed no significant differ- ences in digestibility coefftcients for dry matter and nitrogen between OSBM- and extruded-FFSB-supplemented diets for growing pigs.
The lack of effect of rate of inclusion on dietary energy values of the various test materials suggests no interaction between the added test ingredients and the basal diet; this agrees with the result of Lawrence ( 1978), who studied micronized full-fat soya bean meal at 200 and 400 g kg-’ basal diet. The re- duction in dietary energy value of soya bean oil was accompanied by a pro- gressive reduction in standard errors at a higher rate of inclusion and supports the findings of Phillips and Ewan ( 1977). This is a further demonstration that dietary energy values of oils based on a single low rate of inclusion are

314
liable to error multinhcation for chicks ( Sibbald and Slinger, 1963 ) and for pigs (Wiseman and-Cole, 1987), and, more recently, for rapeseed products given to pigs (Bourdon and Aumaitre, 1990; Agunbiade et al., 1991).
The large differences in dietary energy (P<O.Ol ) and AOD(EE) (P<O.OOl ) values between FFSB and OSBM (Table 6). and the sunerioritv of SBO in terms of dietary energy value and AbD, appear to indicate that thk form in which soya bean oil is incorporated in diets is an important factor influencing the utilization of various soya bean products. Similar responses with SBO compared with roasted FFSB (0.93 vs. 0.78) have been reported for young pigs by Adams and Jensen (1984), Cera et al. (1990) and Law- rence (1978), who studied micronized full-fat soya beans. These results sup- port trends observed with poultry (Renner and Hill, 1960; Carew et al., 196 I ; Hill and Renner, 1963; Kan et al., 1988).
The present study found the coefficient of AOD of extruded FFSB to be lower than that of OSBM (0.91 vs. O-96), in agreement with observations of Lawrence ( 1978) but contrary to those of Faber and Zimmerman (1973). This may suggest therefore that factors other than oil digestibility may be im- portant in the utilization of the FFSB. Trypsin inhibitor levels in the current study were 9.10 mg a:. city g-’ extruded FESB (about three times the amount in the extracted SBM), which is considerably higher than the value of 5.2 mg g-r regarded as being commercially acceptable for soya bean oil meal (Holmes, 1987). Although there is no consensus on what constitutes an ac- ceptable level of trypsin inhibitor activity, a reduction of between 90 and 95% of the activity in the raw bean is reported to indicate adequate processing (Monari, 1988). Trypsin inhibitor activity was reduced only by 65%, al- though the level found in the raw bean was somewhat low. This may indicate inadequate processing and perhaps partly explain the differences in nitrogen and energy digestibility between the FFSB and OSBM. However, in spite of this, the AOD value of 0.91 obtained for extruded EFSB in this study is still larger than the value of 0.8 I previously reported by Faber and Zimmerman ( 1973) and Bayley and Summers ( 1975). The DE of oil obtained by the AOD method was considerably higher than that estimated directly, which supports the observations of Renner and Hill (1960), who, however, concluded that the two methods were, in fact, closely related.
The significant differences in oil digestibility of the various soya bean prod- ucts observed between the two methods of oil analysis were unexpected as soya bean oil is predominantly unsaturated and thus faecal lipid saponitka- tion should be minimal. No such effect was observed in a previous study on rapeseed products (Agunbiade et al., 1991), although Thorbek and Henckel ( 1977) and Just ( 1982b) had earlier reported significant differences for more saturated fats. This observation, however, indicates that the method of oil analysis adopted could be important.
The negligible effect of age or live weight of pigs on dietary energy values

DIETARY ENERGY AND NUTRIENTS FROM SOYA BEAN PRODUCTS 315
and nutrient utilization agrees with the findings of Saben et al. (1971a) for younger pigs and Bayley and Summers ( 1975) for pigs of 30-70 kg body weight, but contrasts with those of Saben et al. ( 1971b), who reported a re- duction in DE and ME values for SBM with increased live weight from 33 to 65 kg. It has been suggested that the digestive and absorptive capacity of pigs for fats (Wiseman and Cole, 1987) and rapeseed products (Agunbiade et al., 199 1) is fully developed by 40 kg weight.
A comparison of the results of the current study with those published pre- viously reveals some striking similarities as well as some marked differences. Whereas the DE of soya bean oil obtained in the current investigation was close to the value of Wiseman et al. ( 1990) and that reported for the rat (Nel- son et al. ( 1974), it was considerably higher than other values obtained for the pig (Table 11). Explanations for this are not apparent although differ- ences between crude SBO and refined SE0 are possible (Renner and Hill, 1960). The DE values of SBM and FFSB obtained in this experiment are lower than many of those published previously for pigs (Table It ), even for products reported to be of lower oil content. Thus soya bean products are of considerable variability in terms of quality, probably as a result of their ori-
TABLE I1 Comoarison of published data on energy values of soya bean oroducts
Product OiI(EE) Animal DE Refcmnce content (MJ kg-’ DM) &kg-1)
SE0
SBM 8.0
11.0 15.7 19.0 34.0 20.2
FFSB (exmded) 204.7 177.0 FFSB (micronized) 185.0
Pig 31.6 Pig 31.7 Pig 31.8 Pig 35.3 Pig 35.7 Rat 38.8 Pig 38.1 Pig 38.4
Pig 15.2 Pig 16.6 Pig 18.4 Pig 20.1 Pig 17.9’ Pig 16.7
Pig 18.2 Pi8 18.8
Phillips and Ewao ( 1977) Ewan (1985) Diggselal. (1965) Bayley and Lewis ( 1965 ) Lawrence (1978) N&on et al. ( 1974) Wiseman et al. ( 1990) Current study
Ewan ( 1985 ) Ewan (198.5) D&s et al. ( 1965) Lawrence (1978) Bayley and Summers ( 1975) Current study
Current study Ewan (1985)
Pi8 21.9 Lawrence (1978)
‘Mean values for measurements at 30 and 70 kg body weight.

316 J.A. AG”NBlADE ET AL.
gin, the species of animals to which they are given and the processing tech- niques to which they are subjected. Some variation in dietary energy values could be related to method of determination.
The general conclusions from the results of this study are that: (i) Linear regression models were better than single-level assays for the
evaluation of soya bean products. Because of the high standard errors associ- ated with the latter, particularly at 11?w ratss of inclusion, the dietary energy and AOD values they generated could not be used reliably in diet formulation.
(ii) Live weight of pig (over the range 32-70 kg) had no influence on die- tary AOD and dietary energy values of soya bean products.
(iii) The method of oil analysis adopted could influence datagenerated on oil utilization of soya bean products.
(iv) AOD, although important, may not be the major factor influencing the utilization of full-fat soya beans.
In addition, the results of this study and those of previous investigations seem to indicate that soya bean products are highly variable raw materials, the nutritive value of which is influenced by many factors which need be taken into account for the effective use of these products in diet formulation.
ACKNOWLEDGEMENTS
The financial assistance of the Commonwealth Scholarship Commission in the UK and the Ogun State University, Ago-Iwoye (Nigeria) for J.A.A. and the technical support of the Animal Production Laboratory personnel are greatly appreciated.
REFERENCES
Adams, K.L. and Jensen, A.H., 1984. Comparative utilization of in-seed fats and the respective extracted fats by the young pig. J. Anim. Sci., 44: 1557-l 566.
Adams, K.L. and Jensen, A.H., 1985. Effects of processing on the utilization by young pigs of the fat in soya beans and sunflower seeds. Anim. Feed Sci. Technol., 12: 267-274.
Agricultural Research Council, 1981. The Nutrient F.equirements of Pigs. Commonwealth Ag- ricultural Bureaux, Slough, pp. 307.
Agunbiade, J.A., Wiseman, J. and Cole, D.J.A., 1991. Nurritional evaluation of triple low ra- peseed products for growing pigs. Anim. Prod., 52: 509-520.
Anonymous, 1985. The Feedingstuffs (Sampling and Analysis) (Amendment) Regulations. Statutory Instrument 1985 No. I1 19. Her Majesty’s Stationery Oflice, London.
Association of Official Analytical Chemists, 1980. Oflicial Methods of Analysis. AOAC, Wash- ington, DC.
Balloun, S.L.. 1980. Nutrient composition of soybean meal. Technical Report for American Soybean Association, St. Louis, MO.
Bayley, H.S. a.ld Lewis, D., 1965. The use of fats in pig feeding. II. The digestibility ofvarious fats and fatty acids. J. Agric. Sci. (Cambs.), 64: 373-378.
Bayley, H.S. and Summers, J.D., 1975. Nutritional evaluation ofextruded full-fat soybeans and rapeseeds usingpigsand chickens. Can. J. Anim. Sci., 55: 441-450.
Bourdon, D. and Aumaitre, A., 1990. Low-glucosinolate rapeseeds and rapeseed meals: effect

DIETARY ENERGY ANDNUTRIENTSFROM SOYA BEAN PRODUCTS 317
of technological treatments on chemical composition, digestible energy content and feeding value for growing pigs. Anim. Feed Sci. Technol., 30: 175-191.
Carcw, L.B., Jr., Hill, F.W. and Nesheim, M.C., 1961. The comparative valueofheatedground unextracted soybeans and heated dehulled soybean Bakes as a source of soybean oil and energy for the chick. J. Am. Oil Chem. Sot., 38: 249-253.
Cera, RR., Mahan, DC. and Rcinhan, GA., 1990. Evaluation of various extracted vegetable oils, roasted soybeans, medium-chain triglyceride and an animal-vegetable fat blend for postwcaningswine. J. Anim. Sci., 68: 2756-2765.
Cunningham, H.M. and Brisson, G.J., 1955. The utilization of lard by baby pigs. Can. J. Anim. Sci., 35: 371-376.
Diggs, B.G., Becker, D.E., Jensen,A.H.andNorton, A.W., 1965. Energyvalucsofvariousfceds for the young pig. J. Anim. Sei., 24: 555-558.
Ewan, R.C., 1985. Utilization of energy from soybean products by young pigs. Feed Compoun- der, June/July 1985: 35-41.
Faber, J.L. and Zimmerman, D.R., 1973. Evaluation of infrared-roasted and extruder-pro- cessed soybeans in baby pig diets. J. Anim. Sci., 36: 902-907.
Hill, F.W. and Renner, R., 1963. Effects of heat treatment on the metabolizable energy value of soybeans and extracted soybean flakes for the hen. J. Nutr.. SO: 375-380.
Holmes, B., 1987. Quality control of the raw material and end products in processing fullfat soybeans. Cited in Fullfat Soya Handbook, 1988. American Soybean Association. Ccntre International Rogier, Brussels, pp. 6-8.
Just, A., 1982a. The net energy value of crude (catabolised) protein for growth in pigs. Livest. Prod. Sci., 9: 349-360.
Just, A., l982h. The net energy value of crude fat for growing pigs. Livest. Prod. Sci., 9: 501- 509.
Kakade, ML., Rackis, J.J., McGhee, J.E. and Puski. G., 1974. Determination oftrypsin inhib- itor activity of soy products: a collaborative analysis of an improved procedure. Cereal Chettt., 51: 376-382.
Ran, C.A., She&, C.W. and Janssen, W.M.M.A., 1988. The energy content of full-fat soybeans
in meal and pelleted feeds for adult cocks and broilers. Anim. Feed Sci. Tcchnol., 19: 97- 104.
Kromann, R.P., Froseth, J.A. and Me&r, W.E., 1976 interactional digestible, metabolizable and net energy values ofwheat and barley in swine. J. Anim. Sci., 42: 1451-1459.
Lawes Agricultural Trust, 19&4. Genstat V, Mark 4.048. Rothamsted Experimental Station, Harpenden, Hertfordshire.
Lawrence, T.L.J., 1978. Effects of micronization on the digestibility of whole soya beans and rapeseeds for growing pig. Anim. Feed Sci. Technol., 3: 179-I 89.
Lloyd, L.E., Crampton, E.W. and Mackay, V.G., 1957. The digestibility of ration nutrients by three versus seven week old pigs. J. Anim. Sci.. 16: 383-388.
May, R.W. and Bell, J.M., 1971. Digestible and mctabolizable energy values of some feeds for the growing pig. Can. J. Anim. Sci., 5 I: 27 l-278.
McNab, J., 1985. Determination of the nutritional value of processed fullfat soybeans for poul- try. In: Proceedings of OnidoCCis Symposium, III Congress sur le Soja, Paris, 1985. Cited in Fullfat Soya Handbook. American Soybean Association. Centre International Rogier, Brtts- sels, pp. 3-5.
McNaughton, J.L. and Rccce, F.N., 1979. Effect of moisture conten! and cooking time o:: soy- bean urease index, trypsin inhibitor content and broiler growth. Poult. Sci., 59: 2300-2306.
Monari, S., 1988. Fullfat Soya Handbook. Americeo Soybean Association. Ccntre lntemational Rosier, Brussels, pp. 6-8.
Morgan, D.J., 1976. Energy values in pig nutrition. PhD thesis, University of Nottingham, 175 PP.
Morgan, D.J., Cole, D.J.A. and Lewis, D., 1975. Energy values in pig nutrition. 1. The rclation-

318 ,.A. ACUNBIADE ET AL.
ship between digestible energy, metabolizable energy and total digestible nutrient values of a range of feedstuffs. J. Agric. Sci., 84: 7-17.
Nelson, T.S., May, M.A. and Miles, R.D., 1974. Digestible and metabolizable energy content of feed ingredients for rats. J. Anim. Sci., 38: 554-558.
Phillips, B.C. and Ewan, R.C., 1977. Utilization of energy of mile and soyabean oil by young swine. J. Anim. Sci., 44: 990-997.
Renner, R. and Hill, F.W., 1960. Studies of the effect of heat treafmem on the metabolizable energy value of soybeans and extracted soybean flakes for the chick. J. Nutr., 70: 2 19-225.
Saben, H.S., Bowland, J.P. and Hardin, R.T., 197 la. Digestible and metabolizable energy val- ues for rapeseed meals and for soybean meal fed to growing pigs. Can. J. Anim. Sci., 5 1: 419- 425.
Saben, H.S., Bowland, J.P. and Hardin, R.T., 197 lb. Effect of method of determination on digestible energy and nitrogen and on metabolizable energy values of rapeseed meal and soyabean meals fed to growing pigs. Can. J. Anim. Sci., 51: 427-432.
Sibbald, I.R. and Slinger, S.J., 1963. A biological assay for metabolizable energy in poultry feed ingredients together with findings which demonstrate some of the problems associated with the evaluation offats. Poult. Sci., 42: 313-325.
Tborbek, G. and Henckel, S., 1977. Apparent digestibility of crude fat determined in trials with calves and pigs in relation to analytical methods applied (in German). 2. Tierphysiol. Tier- ernaehr. Futtermittelkd., 39: 48-55.
Wiseman, J., 1984. Developments in utilisation of full fat soybean meal for non-ruminants. Feed Int., February 1984: 14.
Wiseman, J. and Cole, D.J.A., 1987. The digestible and metabolizable energy of two fat blends for growing pigs as influenced by level of inclusion. Anim. Prod., 45: 117-122.
Wiseman, J. and Lessire, M., 1987. Interactions between fats of differing chemical content: apparent metabolizable energy values and apparent fat availability. Br. Poult. Sci., 28: 663- 676.
Wiseman, J., Cole, D.J.A. and Hardy, B., 1990. The dietary energy values of soyabean oil, tallow and their blends for growing, finishing pigs. Anim. Prod., 50: 513-518.


