Embed Size (px)
Citation preview

R E S EA RCH AR T I C L E
Utilizing ITS1 and ITS2 to study environmental fungal diversityusing pyrosequencing
C�ecile Monard1, Stephan Gantner1,2 & Jan Stenlid1
1Department of Forest Mycology and Plant Pathology, Uppsala BioCenter, Swedish University of Agricultural Sciences, Uppsala, Sweden and2Department of Ecology and Genetics, Limnology, Uppsala University, Uppsala, Sweden
Correspondence: C�ecile Monard,
Department of Forest Mycology and Plant
Pathology, Uppsala BioCenter, Swedish
University of Agricultural Sciences, PO Box
7026, SE-75007 Uppsala, Sweden. Tel.: +46
(0) 18 67 27 25; fax: +46 (0) 18 67 35 99;
e-mail: [email protected]
Present address: Stephan Gantner, Leibniz
Institute for Science and Mathematics
Education (IPN), Kiel, Germany
Received 8 May 2012; revised 9 November
2012; accepted 21 November 2012.
DOI: 10.1111/1574-6941.12046
Editor: Ian C. Anderson
Keywords
454 pyrosequencing; community structure;
species richness; Sørensen index; minimum
read length.
Abstract
The shorter reads generated by high-throughput sequencing has led to a focus
on either the ITS1 or the ITS2 sublocus in fungal diversity analyses. Our study
aimed to determine how making this choice would influence the datasets
obtained and our vision of environmental fungal diversity. DNA was extracted
from different environmental samples (water, sediments and soil) and the total
internal transcribed spacer (ITS) locus was amplified. 454-sequencing was per-
formed targeting both ITS1 and ITS2. No significant differences in the number
of sequences, operational taxonomic units (OTUs) and in the dominant OTUs
were detected but less diversity was observed in the ITS2 dataset. In the soil
samples, differences in the fungal taxonomic identification were observed, with
more Basidiomycota in the ITS1 dataset and more Ascomycota in the ITS2 data-
set. Only one-third of the OTUs were detected in both datasets which could be
due to (1) more short sequences removed in the ITS2 dataset, (2) different tax-
onomic affiliation depending on the sublocus used as BLASTn query and/or
(3) selectivity in how a primer amplifies the true community. Although ITS1
and ITS2 datasets led to similar results at the fungal community level, for fur-
ther in-depth diversity analysis this study suggests the analysis of both ITS
regions, as they provided different information and were complementary.
Introduction
While only a small part of fungal diversity can be
accessed using culture-based approaches, molecular tools
allow the study of uncultured fungi and so have signifi-
cantly improved our understanding of fungal ecology
during the last 20 years (Anderson & Cairney, 2004).
Direct DNA and/or RNA extraction followed by gene-spe-
cific amplification through PCR allows focusing on the
diverse fungal community or on a targeted function pres-
ent in a particular environmental sample. Community
fingerprinting and cloning-sequencing techniques have
been widely used to study fungal diversity in a broad
variety of samples (Anderson & Cairney, 2004). However,
recent developments in high-throughput sequencing tech-
niques may be more useful to study high-diversity fungal
systems. Their application to microbial ecology allows the
recovery of a huge number of sequences from different
environmental samples at the same time, and in-depth
analysis of microbial diversity (Cardenas & Tiedje, 2008).
Initially applied to study bacterial diversity (Roesch et al.,
2007; Acosta-Mart�ınez et al., 2008), these new sequencing
technologies have recently been applied to fungal ecology
(Wallander et al., 2010; Blaalid et al., 2012).
Fungal diversity is studied through analysis of either
the small subunit (SSU, 18S rRNA gene) or the internal
transcribed spacer (ITS) region of the nuclear ribosomal
RNA. Specific primers for amplification of these two
regions have been developed (White et al., 1990; Gardes
& Bruns, 1993) and used to study fungal diversity in
complex substrates such as soil or plant tissue (Peltoni-
emi et al., 2009; Vega et al., 2010). However, the 18S
rRNA gene region does not evolve rapidly enough to
identify fungi at low taxonomic levels. The ITS region,
which shows a high rate of evolution resulting in greater
sequence variation between closely related species, is thus
used as a DNA barcode for fungal identification (Horton
& Bruns, 2001; K~oljalg et al., 2005; Schoch et al., 2012).
FEMS Microbiol Ecol && (2012) 1–11 ª 2012 Federation of European Microbiological SocietiesPublished by Blackwell Publishing Ltd. All rights reserved
MIC
ROBI
OLO
GY
EC
OLO
GY

Moreover because the ITS region is multi-copy (Vilgalys
& Gonzalez, 1990), it allows amplification from samples
containing a low concentration of DNA. As a conse-
quence of its widespread use, many ITS sequences are
already available, providing a large reference database for
taxonomic identification (Nilsson et al., 2009) even if its
quality is critical to successful identification (Nilsson
et al., 2006; Bidartondo, 2008). Within the ITS region,
the ITS1 sublocus evolved slightly more rapidly with a
more variable length than the ITS2 sublocus, while the
5.8S fragment embedded by these two subloci is highly
conserved (Hillis & Dixon, 1991; Hershkovitz & Lewis,
1996). It has been shown that on average the variability
of ITS1 exceeds that of ITS2 (Nilsson et al., 2008), and
thus depending on which part of the ITS region is tar-
geted, the sequence analysis from fungal communities
may differ. Moreover, such differences may not always be
biologically relevant and could rely on methodological
biases specific to each ITS sublocus. This could be of con-
cern using pyrosequencing because, even if the new tech-
nology promises sequences up to 1000 bp in size, the
average maximum read length of the sequences obtained
until now is of 450 bp while the entire ITS region can
vary from 450 to 800 bp. Moreover, although Illumina/
Solexa technology, which allows cheaper and higher-
throughput sequencing, may be more frequently used in
fungal ecological studies in the future, it generates short
sequences that are unable to cover the entire ITS region.
As a consequence, most of the fungal diversity studies
using pyrosequencing technology have focused on either
ITS1 or ITS2. The ITS1F and ITS2 primers (White et al.,
1990; Gardes & Bruns, 1993) targeting the ITS1 region
were, for example, used to perform 454 high-throughput
pyrosequencing analyses of fungal communities in Quer-
cus macrocarpa phyllosphere and in other forest soils har-
bouring different plantations (Bu�ee et al., 2009;
Jumpponen & Jones, 2009). And the ITS2 region has
been used to analyse the vertical distribution of fungi in
prairie soil (Jumpponen et al., 2010) and to determine
the ectomycorrhizal diversity in spruce forest (Wallander
et al., 2010). In all these studies, the choice to focus on
either ITS1 or ITS2 regions seems to be more arbitrary
than based on their suitability to better investigate fungal
diversity in these particular environments. In dust sam-
ples spiked with known quantities and identities of fungi,
Amend et al. (2010) compared the pyrosequencing results
obtained from ITS1F and ITS4 primers (White et al.,
1990; Gardes & Bruns, 1993) and containing the ITS1 or
ITS2 sublocus, respectively. They concluded that the
sequencing orientation affected the operational taxonomic
unit (OTU) clustering for the species added. Nilsson et al.
(2009), using in silico analysis with the fungal sequences
annotated in the International Nucleotide Sequence
Databases, observed that fungal diversity determined by
analysing the whole ITS region or either the ITS1 or the
ITS2 sublocus may be different. These results underline
that comparison of fungal ecology studies using pyrose-
quencing technology are limited by the chosen sequencing
orientation. As proposed by Nilsson et al. (2009), there is
a need to standardize the targeted ITS sublocus in high-
throughput sequencing studies of fungal ecology.
The aim of the present study was to analyse and com-
pare the ITS1 and ITS2 datasets obtained using 454
pyrosequencing targeting ITS amplicons of fungal rDNA
extracted from different environmental samples (water,
sediments and soil). According to previous studies (Nils-
son et al., 2009; Amend et al., 2010; Orgiazzi et al.,
2012), we hypothesized that the two datasets generated
should be different. As the size of the ITS region is highly
variable among the fungal domain, we believed that the
minimum read length used to quality-check the sequences
should be an important factor influencing fungal taxo-
nomic identification. We first determined to what extent
the sequencing orientation (ITS1F – forward or ITS4 –reverse) and the minimum read length threshold influ-
enced the quantitative and qualitative yield of the
sequence analysis. We then compared the fungal diversity
detected by analysing the ITS1 and ITS2 subloci in differ-
ent soil samples.
Materials and methods
Environmental samples
Soil cores (22 cm depth 9 3 cm diameter) were sampled
in October 2009 at five different sites around Lake Erken
in Sweden (59°51′N, 18°36′E). The sites differed in their
vegetation and were named as ‘Dry hill’ (DH), ‘Conifer
forest’ (CF), ‘Flooded area’ (FL), ‘Shore’ (SH) and ‘Agri-
cultural soil’ (AS). For each site, three replicates were
sampled. According to the soil profile, each soil core was
subsampled either into: (1) a top (0–5 cm depth), a med-
ium (8–13 cm depth) and a lower (17–22 cm depth)
layer (DH, CF and FL-Top/-Med/-Low); and (2) a top
(0–5 cm depth) and a lower (17–22 cm depth) layer
(AS-Top/-Low). The FL-Low layer was visually a clay-rich
mineral soil. The SH cores were divided into five equal
layers as they were composed of a superposition of rich
organic layers (SH-1/-3/-5) and sandy layers (SH-2/-4).
Each subsample was homogenized by sieving (2-mm
mesh size).
Water samples were obtained from the lake side, and
from the surface (1 m depth) and at 10 m depth in the
middle of the lake. Three replicates of 500 mL of water
were immediately filtered through 0.22-lm pore-size
polycarbonate filters. Sediment samples (50 mL) were
ª 2012 Federation of European Microbiological Societies FEMS Microbiol Ecol && (2012) 1–11Published by Blackwell Publishing Ltd. All rights reserved
2 C. Monard et al.

sampled at the lake side and in the middle of the lake
(21 m depth) with three replications. All samples (soil
cores, filters and sediments) were stored at �20 °C for
subsequent molecular analysis. In summary, each site and
soil/water depth was replicated three times for subsequent
DNA extraction, amplification and sequencing as detailed
below.
DNA extraction
DNA from soil and pelleted sediments was extracted from
4 9 0.5 g extraction-replicates and DNA from water was
extracted by dividing the filters into four pieces and DNA
was independently extracted from each one. The Griffiths
protocol (Griffiths et al., 2000) was used with the follow-
ing modifications: (1) cell lysis was performed in the
presence of 0.5 g of 106-lm glass beads and two 2-mm
glass beads and using the Precellys 24® bead beating sys-
tem for 3 min with a freezing step in liquid nitrogen each
minute, (2) glycogen was added for the nucleic acids pre-
cipitation step performed overnight at �20 °C and (3)
nucleic acids were pelleted by centrifugation at 18 000 g
for 30 min at 4 °C and resuspended in DNase–RNase-free water. DNA quality and quantity were checked at
260 nm (NanoDrop Technologies). All four extraction-
replicates were pooled and stored at �70 °C.
PCR amplification and sequencing
The DNAs were diluted 100 and 1000 times and 4 lLwas used as template for PCR. The PCR mix consisted if
2.5 units of DreamTaq green DNA polymerase (Fermen-
tas), 1 9 PCR buffer supplied by the manufacturer,
1.6 mM MgCl2, 80 lM dNTP, 1.6 lg bovine serum albu-
min, 0.4 lM of each primer and H2O to a final volume
of 40 lL. Fungal ITS amplification was performed using
the ITS1F (Gardes & Bruns, 1993) and ITS4 (White et al.,
1990) primers containing a unique additional 6-bp bar-
code used to tag each PCR product according to the
original environmental sample (Supporting Information,
Table S1). Samples were initially denatured for 5 min at
94 °C, then amplified by using 26–31 cycles of 94 °C for
30 s, 55 °C for 30 s and 72 °C for 30 s. A final extension
of 7 min at 72 °C was added at the end of the pro-
gramme. The number of PCR cycles was determined
according to previous quantitative PCRs performed on
our DNA samples (data not shown). All diluted DNA
extracts were amplified in duplicate.
Each PCR sample was purified using the GeneJet puri-
fication kit (Fermentas) following the manufacturer’s
instructions and quantified using a Qubit Fluorometer
(Invitrogen) and an equal amount of DNA (25 ng) from
each sample and each DNA dilution was pooled. To
remove potential primer dimers, the pooled DNA was
finally gel purified using the Qiaquick gel extraction kit
(Qiagen). The final sample was sent to GATC Biotech for
the ligation of the 454-sequencing adaptors ‘A’ and ‘B’
and the sequencing from both ITS1F and ITS4 sides using
a 454 Genome Sequencer FLX (Roche) machine.
Processing of pyrosequencing data
Data were processed using the SCATA pipeline (http://
scata.mykopat.slu.se) looking for either the ITS1F or ITS4
primers. The quality check was performed using different
minimum read lengths varying from 100 to 250 bp.
Sequences missing valid primer sequence or DNA Tag
and sequences with low quality (average read quality
below 20) were removed. Homopolymers of > 3 bp were
collapsed. OTUs were defined at the 98.5% similarity level
(over at least 90% of the alignment length) using single
linkage clustering. The 98.5% sequence similarity level
was chosen according to Wallander et al. (2010) and to
the study performed by Blaalid et al. (2012) who showed
that below 99% similarity the number of non-singleton
OTUs does not change significantly. All singletons were
removed because they have been shown to contain a high
number of technical artefacts (Unterseher et al., 2011).
OTUs were taxonomically identified from their most
abundant sequence using NCBI-BLASTn and the Gen-
Bank database (Altschul et al., 1997). The ITS1 and ITS2
subloci were compared based on their closest NCBI data-
base match and after extraction with the ITS extractor
tool (Nilsson et al., 2010) using the same criterion as
those of the single linkage clustering.
Rarefaction curves were generated by aRarefactWin
(Analytic Rarefaction 1.3, http://strata.uga.edu/software/
index.html). Diversity in the different datasets and sam-
ples was estimated using the Shannon’s diversity index H′and the species richness S was expressed as the number
of OTUs. The similarity between replicates, depths and
sites was measured using the Sørensen index (Legendre &
Legendre, 1998).
Statistical analysis
The nonparametric Mann–Whitney test was used to com-
pare the ITS1 and ITS2 datasets (number of sequences
and OTUs for the different minimum read lengths) as
they presented fewer than 30 values. Non-parametric
MANOVAs (Anderson, 2001), performed with the PRIMER 6
software, were used to determine the impact of site, depth
and ITS dataset on H′ and S. Sørensen indexes were anal-
ysed with one-way ANOVA using MINITAB software (version
16). Detrented correspondence analysis (DCA) was per-
formed to analyse the fungal community structure in the
FEMS Microbiol Ecol && (2012) 1–11 ª 2012 Federation of European Microbiological SocietiesPublished by Blackwell Publishing Ltd. All rights reserved
ITS1 vs. ITS2 pyrosequencing 3
soil layers of the different sites (CANOCO software, Wagen-
ingen, the Netherlands). The Kendall tau rank correlation
test was performed using SAS (SAS Inc., Cary, NC).
Results
Total data analysis
According to the pyrosequencing strategy performed
herein, two datasets (ITS1 and ITS2) were generated for
each minimum read length tested (from 100 to 250 bp),
corresponding to the ITS1F and ITS4 sequencing orienta-
tion. By using 100–250 bp as minimum read length
threshold, 190 102 (4542 OTUs) to 67 246 sequences
(1563 OTUs) were retained in the ITS1 dataset and
194 711 (4671 OTUs) to 39 124 sequences (1239 OTUs)
were obtained in the ITS2 dataset. Both the number of
sequences and the number of OTUs decreased when the
minimum read length increased, but no significant differ-
ences were observed between the ITS1 and the ITS2 data-
sets (Mann–Whitney: W = 284, P = 0.462; W = 276,
P = 0.665, respectively). Significant lower diversity was
observed in the ITS2 dataset as Shannon’s diversity index
(H′) varied from 5.43 to 5.03 when the minimum read
length increased from 100 to 250 bp compared to a varia-
tion from 5.41 to 5.20 in the ITS1 dataset (Mann–Whit-
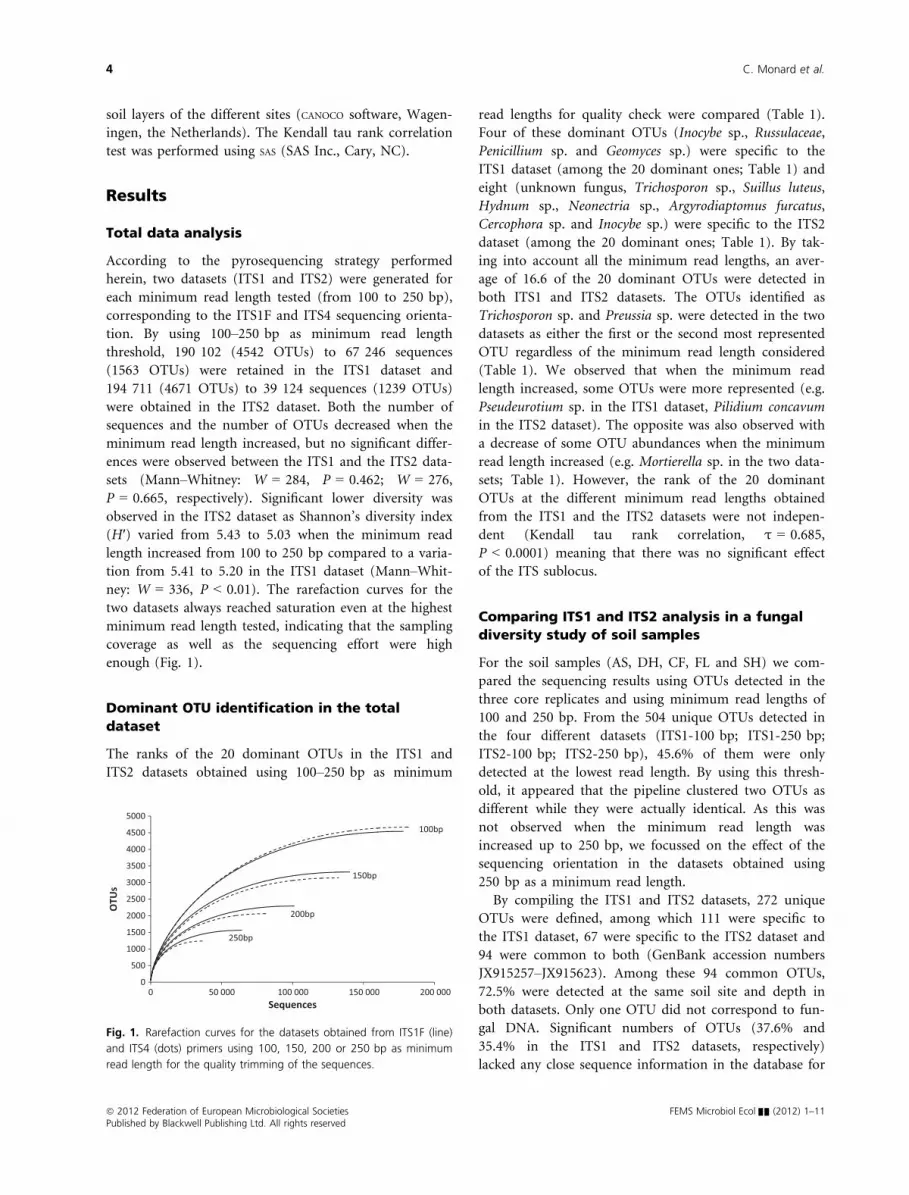
ney: W = 336, P < 0.01). The rarefaction curves for the
two datasets always reached saturation even at the highest
minimum read length tested, indicating that the sampling
coverage as well as the sequencing effort were high
enough (Fig. 1).
Dominant OTU identification in the total
dataset
The ranks of the 20 dominant OTUs in the ITS1 and
ITS2 datasets obtained using 100–250 bp as minimum
read lengths for quality check were compared (Table 1).
Four of these dominant OTUs (Inocybe sp., Russulaceae,
Penicillium sp. and Geomyces sp.) were specific to the
ITS1 dataset (among the 20 dominant ones; Table 1) and
eight (unknown fungus, Trichosporon sp., Suillus luteus,
Hydnum sp., Neonectria sp., Argyrodiaptomus furcatus,
Cercophora sp. and Inocybe sp.) were specific to the ITS2
dataset (among the 20 dominant ones; Table 1). By tak-
ing into account all the minimum read lengths, an aver-
age of 16.6 of the 20 dominant OTUs were detected in
both ITS1 and ITS2 datasets. The OTUs identified as
Trichosporon sp. and Preussia sp. were detected in the two
datasets as either the first or the second most represented
OTU regardless of the minimum read length considered
(Table 1). We observed that when the minimum read
length increased, some OTUs were more represented (e.g.
Pseudeurotium sp. in the ITS1 dataset, Pilidium concavum
in the ITS2 dataset). The opposite was also observed with
a decrease of some OTU abundances when the minimum
read length increased (e.g. Mortierella sp. in the two data-
sets; Table 1). However, the rank of the 20 dominant
OTUs at the different minimum read lengths obtained
from the ITS1 and the ITS2 datasets were not indepen-
dent (Kendall tau rank correlation, τ = 0.685,
P < 0.0001) meaning that there was no significant effect
of the ITS sublocus.
Comparing ITS1 and ITS2 analysis in a fungal
diversity study of soil samples
For the soil samples (AS, DH, CF, FL and SH) we com-
pared the sequencing results using OTUs detected in the
three core replicates and using minimum read lengths of
100 and 250 bp. From the 504 unique OTUs detected in
the four different datasets (ITS1-100 bp; ITS1-250 bp;
ITS2-100 bp; ITS2-250 bp), 45.6% of them were only
detected at the lowest read length. By using this thresh-
old, it appeared that the pipeline clustered two OTUs as
different while they were actually identical. As this was
not observed when the minimum read length was
increased up to 250 bp, we focussed on the effect of the
sequencing orientation in the datasets obtained using
250 bp as a minimum read length.
By compiling the ITS1 and ITS2 datasets, 272 unique
OTUs were defined, among which 111 were specific to
the ITS1 dataset, 67 were specific to the ITS2 dataset and
94 were common to both (GenBank accession numbers
JX915257–JX915623). Among these 94 common OTUs,
72.5% were detected at the same soil site and depth in
both datasets. Only one OTU did not correspond to fun-
gal DNA. Significant numbers of OTUs (37.6% and
35.4% in the ITS1 and ITS2 datasets, respectively)
lacked any close sequence information in the database for
0
500
1000
1500
2000
2500
3000
3500
4000
4500
5000
0 50 000 100 000 150 000 200 000
OTU
s
Sequences
250bp
200bp
150bp
100bp
Fig. 1. Rarefaction curves for the datasets obtained from ITS1F (line)
and ITS4 (dots) primers using 100, 150, 200 or 250 bp as minimum
read length for the quality trimming of the sequences.
ª 2012 Federation of European Microbiological Societies FEMS Microbiol Ecol && (2012) 1–11Published by Blackwell Publishing Ltd. All rights reserved
4 C. Monard et al.

Table
1.Ran
kofthe20dominan
tOTU
sdetectedin
theITS1
andITS2
datasetsbyincreasingtheminim
um
read
length
ofthesequen
cequalitycheck
FEMS Microbiol Ecol && (2012) 1–11 ª 2012 Federation of European Microbiological SocietiesPublished by Blackwell Publishing Ltd. All rights reserved
ITS1 vs. ITS2 pyrosequencing 5

Table
1.Continued
ª 2012 Federation of European Microbiological Societies FEMS Microbiol Ecol && (2012) 1–11Published by Blackwell Publishing Ltd. All rights reserved
6 C. Monard et al.

identification. The different number of reads obtained
among samples reflected the variations in 454-sequencing
performance and was not related to the amount of DNA
extracted from soil (Table 2).
The proportions of Ascomycota and Basidiomycota
detected in the ITS1 and ITS2 datasets were 62.1% and
19.9%, and 67.1% and 15.5%, respectively. Mucoromycoti-
na were represented by 4.9% and 3.7% of the sequences
in the ITS1 and ITS2 datasets, respectively, and Chytridio-
mycotina by 3.4% and 1.9%. In the ITS1 dataset, Tricho-
sporon sp. (ITS1_111) was dominant (11.4% of the ITS1
sequences) while the ITS2 dataset was dominated by
Davidiella sp. (ITS_192) (7.5% of the ITS2 sequences).
The AS and DH sites were dominated by the same OTU
in both ITS1 and ITS2 datasets [Phoma sp. (ITS_250)
and Preussia sp. (ITS_184), respectively; Table 2].
The total diversity expressed as Shannon’s diversity
index (H′) was similar in the two datasets (4.06 for ITS1
and 3.95 for ITS2). When comparing the different soil
samples (site and depth), no significant effect of the ITS
sublocus on H′ was observed (NPMANOVA: F = 1.46,
P = 0.2646; Tables 3 and 4). However, differences in H′between the two datasets became obvious for specific
samples (AS-Top, CF-Low and SH, Table 3) and, for
example, the negative depth impact on fungal diversity
was not observed for the AF samples in the ITS2 dataset
(Table 3). Species richness (S) was significantly different
between the ITS1 and ITS2 datasets (NPMANOVA: F = 3.81,
P = 0. 019; Tables 3 and 4). Considering the different soil
samples (site and depth), S was higher in the ITS1 dataset
(up to 2.8 times higher) except in DH-Top and FL-Top
(Table 3). However, compared with the impact of the
sampling site and depth on fungal diversity and species
richness (NPMANOVA for H′: F = 4.55, P < 0.001; F = 1.84,
P = 0.0114, respectively; NPMANOVA for S: F = 17.91,
P < 0.001; F = 4.59, P < 0.001, respectively; Table 4), the
impact of the ITS sublocus was lower, even if significant
for S.
Sørensen similarities of fungal OTUs between layers,
soil cores and sites were calculated from the total ITS1
and ITS2 datasets (Fig. S1). No differences were observed
between the two datasets (ANOVA: F = 2.52, P = 0.11),
and, in both of them, we observed the same tendencies
with a significantly higher variation of diversity between
layers than between soil cores (ANOVA: F = 14.76,
P < 0.001; F = 15.94, P < 0.001, in ITS1 and ITS2 data-
sets, respectively).
The structures of the fungal community were anal-
ysed using DCA (Fig. 2). They were similar in the
two datasets except for the SH3 sample (Fig. 2a). The
fungal communities recovered in this soil layer from
the ITS2 dataset were dominated by one OTU
(Tetracladium sp., ITS2_171) which was highly repre-
sented (1.7% of the total sequences) and exclusively
detected in this sample. When performing the DCA
excluding this sample, the fungal communities
obtained from the two datasets tended to group
together (Fig. 2b).
Table 2. Number of sequences and identification of the dominant OTU (closest NCBI database match) and its proportion in each soil site (AS,
DH, CF, FL, SH, ‘Shore’) for the ITS1 and the ITS2 datasets
AS DH CF FL SH
ITS1 Number of total sequences 1036 5978 12922 7223 1730
Main OTU Phoma sp. Preussia sp. Trichosporon sp. Pilidium sp. Phoma sp.
NCBI accession number AJ890436 GU062204 JF519094 AY487097 AJ890436
Proportion in the site (% of sequences) 21.4 27.7 19.7 7.1 20.6
ITS2 Number of total sequences 444 3450 4344 4687 1588
Main OTU Phoma sp. Preussia sp. Geomyces sp. Davidiella sp. Tetracladium sp.
NCBI accession number AJ890436 GU062204 JF439476 HM136631 GU055705
Proportion in the site (% of sequences) 33.8 22.4 58.6 15.0 46.7
Table 3. Species richness expressed as the number of OTUs (S) and
Shannon’s diversity index (H′) in the different soil samples (AS, DH,
CF, FL, SH, ‘Shore’) and the different depths calculated from the two
ITS1 and ITS2 datasets and S common to the two datasets
Samples S ITS1 S ITS1 & S ITS2 S ITS2 H′ ITS1 H′ ITS2
AS-Top 24 4 6 3.02 1.73
AS-Low 6 6 6 2.14 2.16
CF-Top 46 38 21 3.50 3.36
CF-Med 42 30 16 3.04 3.15
CF-Low 22 9 3 2.79 1.71
DH-Top 23 33 30 2.79 3.13
DH-Med 29 11 8 2.71 2.76
DH-Low 8 3 2 1.17 0.84
FL-Top 33 27 41 3.55 3.81
FL-Med 22 7 8 2.78 2.27
FL-Low 8 10 5 2.14 1.47
SH-1 6 1 2 0.96 0.18
SH-2 2 1 0 0.61 0.00
SH-3 2 1 2 1.05 0.29
SH-4 2 2 2 0.90 1.22
SH-5 11 4 3 2.25 1.73
FEMS Microbiol Ecol && (2012) 1–11 ª 2012 Federation of European Microbiological SocietiesPublished by Blackwell Publishing Ltd. All rights reserved
ITS1 vs. ITS2 pyrosequencing 7

Discussion
Fungal diversity analysis through the use of high-through-
put sequencing techniques is becoming more common
but most datasets now generated allow only short-length
sequences of the ITS region. Thus, at present, one has to
choose to focus on either the ITS1 or the ITS2 sublocus.
It has been shown in silico that fungal taxonomic identifi-
cation can differ depending on the ITS sublocus analysed
(Nilsson et al., 2009) and recently Orgiazzi et al. (2012)
proposed to independently target both ITS1 and ITS2
subloci to assess fungal biodiversity in environmental
samples. In the present study, we aimed to determine to
what extent the 454 pyrosequencing orientation of ITS
amplicons influenced both dataset recovery (quantitatively
and qualitatively) and detected fungal diversity in differ-
ent environmental samples. Moreover, because the ITS
sequences would be more or less informative for further
taxonomic identification depending on their length, we
chose to compare different minimum read lengths as
thresholds during the sequence quality check on a scale
varying from 100 to 250 bp. The choice of the minimum
read length is crucial as the reads should be long enough
to allow fungal identification at the genus level but not
too demanding in order to obtain enough sequences for
ecological analyses. Bu�ee et al. (2009) reported that a
mean read length of 252 bp for the ITS1 sublocus was
long enough and sufficiently polymorphic for fungal
identification. In the present study we examined the effect
of minimum read length on the 20 dominant OTUs in
the total dataset and observed that the rank of the five
most abundant OTUs was not affected. However, even if
no significant differences were observed, it seems that, by
increasing the minimum read length, the ranking tended
to be more accurate and stable, particularly in the ITS1
dataset, probably due to higher identification precision.
Moreover, the clustering process was not optimal when
the minimum read length was too low because the
sequences were not polymorphic enough. By choosing
250 bp for further analyses, we avoided such biases in
comparing ITS1 and ITS2 sequencing orientations and
considered that, even if some sequences were missed, the
information would be more robust. The same strategy
was followed when focusing on the OTUs present in the
three field replicates.
Our results showed that sequencing orientation influ-
enced fungal taxonomic identification in the different soil
samples (site and depth) even if the total dataset and the
entire fungal community structure were not deeply
affected. In the total dataset, the numbers of sequences
and OTUs were always lower in the ITS2 dataset but the
sampling and sequencing efforts were always high enough
to cover the entire fungal diversity found in such
environmental samples, so this should not impact fur-
4–1
5–1
5–1
4–1
ITS1 ITS2AS-TopDH-TopCF-Top
SH1-3-5FL-Top
AS-LowDH-LowCF-Low
SH-2-4
FL-Low
DH-MedCF-MedFL-Med
12.7%
7.3%
12.1%
8.1%
(a) (b)
Fig. 2. DCA of the fungal communities in the
ITS1 and ITS2 datasets before (a) and after (b)
removal of the SH3 sample of the ITS2
dataset.
Table 4. Non-parametric MANOVA on Bray–Curtis distances for Shannon’s
diversity index (a) and species richness (b) in the five sites at the different
depths and in the ITS1 and ITS2 datasets
Source df SS MS F P
(a)
Site 4 11 270 2818 4.55 0.0008
Depth (site) 11 12 557 1142 1.84 0.0114
ITS 1 902 902 1.46 0.2646
Residual 15 9288 619
Total 31 34 018
(b)
Site 4 27 144 6786 17.91 0.0002
Depth (site) 11 19 117 1738 4.59 0.0002
ITS 1 1442 1442 3.81 0.019
Residual 15 5683 379
Total 31 53 387
ª 2012 Federation of European Microbiological Societies FEMS Microbiol Ecol && (2012) 1–11Published by Blackwell Publishing Ltd. All rights reserved
8 C. Monard et al.

ther analyses. From the overall (total dataset – all the
minimum read lengths) to the specific (soil samples –250 bp) analysis, the mean fungal diversity in the ITS1
dataset was always higher than in the ITS2 dataset, in
accordance with the average higher sequence variation in
ITS1 than in ITS2 (Nilsson et al., 2008). Moreover, the
presence of a group I intron at the 3′ extremity of the
18S rRNA gene (Hibbett, 1996) and thus amplified by the
ITS1F primer may explain the higher fungal diversity
observed in the ITS1 dataset. As observed by Bellemain
et al. (2010), the ITS1F primer can generate a high pro-
portion of mismatches, which may also increase the
observed fungal diversity in the ITS1 dataset.
The higher variability of the ITS1 sublocus combined
with the higher variability of the Basidiomycota ITS
region compared with Ascomycota (Nilsson et al., 2008)
may explain the highest abundance of Basidiomycota
detected in the ITS1 dataset. Thus, for a fixed similarity
level for OTU determination (98.5% in our case), the
ITS1 sublocus would be more informative and precise in
the taxonomic identification towards Basidiomycota than
Ascomycota. With the ITS2 sublocus being shorter within
the Ascomycota than the Basidiomycota (Bellemain et al.,
2010), this should have led to higher hits for Ascomycota
in the ITS2 dataset than in the ITS1 dataset. These obser-
vations indicate that the analyses of both ITS1 and ITS2
sequences are complementary.
The complementarity of the ITS1 and ITS2 datasets in
fungal diversity analysis was also observed in the soil
samples although the diversity indexes were not signifi-
cantly different. The significant impact of the ITS dataset
on the species richness as well as the fact that only one-
third of the OTUs was detected in both ITS1 and ITS2
datasets reflected differences in the fungal diversity
observed in the two datasets. Additional to biological
variations, this un-matching between the two datasets
may be due to methodological biases such as (1) a greater
amount of short sequences removed in the ITS2 dataset
than in the ITS1 dataset, (2) a different taxonomic affilia-
tion of the sequences depending on the sublocus used as
BLASTn query as observed by Nilsson et al. (2009) and/
or (3) selectivity in how a primer amplifies the true com-
munity, which can be addressed partly by using different
sets of primers (Ihrmark et al., 2012; Toju et al., 2012).
These differences between the two datasets led to the
observation of a different fungal diversity in the soil sam-
ples. Only two soil sites (AS and DH) were dominated by
the same OTU in the two datasets. Moreover, it may
induce contradictory ecological conclusions such as the
depletion of fungal diversity with depth, as observed by
O’Brien et al. (2005), which was not observed in the AF
samples when using the ITS2 sublocus for analysis. How-
ever, even if significant, the impact of the ITS dataset on
the species richness was lower than that of site and depth
(lower mean square values) and, when agreements were
observed between the two datasets, the common OTUs
were frequently detected in exactly the same sample
(same site and depth) and their abundance changed with
depth in the same way. Analysis of either the ITS1 or the
ITS2 dataset independently allowed us to observe (1) the
same spatial diversification through similar fungal com-
munity structures, (2) the same specific diversity in the
highly selective mineral soils (FL-Low, SH-2 and SH-4,
dominated by two species: Davidiella sp. and Pilidium
sp.), (3) the highest fungal diversity in the CF and in the
FL and (4) the same variation of diversity between layers,
soil cores and sites.
Conclusion
Given the results of the present study, the choice of ITS
sequencing orientation would depend on the depth of the
final analysis because at the fungal community level, both
ITS1 and ITS2 datasets presented similar results while at
the species/genus level only one-third of the OTUs were
common to both datasets. When considering comparison
studies of the fungal diversity in different environmental
systems, the analysis of one of the two ITS subloci should
be adequate because the impact of the environmental
factors was higher then that of the ITS dataset analysed.
As we found higher diversity and greater number of
sequences in the ITS1 dataset, it appeared to be a better
choice for sequencing. However, given that the variabil-
ity among the two ITS subloci depends on the fungal
species (Nilsson et al., 2008) and according to the huge
fungal diversity we observed, the ITS1 and ITS2 datasets
appear to be complementary and, as proposed by Orgi-
azzi et al. (2012), analysis of both subloci in parallel
would give the best vision of fungal diversity in environ-
mental samples.
References
Acosta-Mart�ınez V, Dowd S, Sun Y & Allen V (2008) Tag-
encoded pyrosequencing analysis of bacterial diversity in a
single soil type as affected by management and land use.
Soil Biol Biochem 40: 2762–2770.Altschul SF, Madden TL, Sch€affer AA, Zhang J, Zhang Z,
Miller W & Lipman DJ (1997) Gapped BLAST and
PSI-BLAST: a new generation of protein database search
programs. Nucleic Acids Res 25: 3389–3402.Amend AS, Seifert KA & Bruns TD (2010) Quantifying
microbial communities with 454 pyrosequencing: does read
abundance count? Mol Ecol 19: 5555–5565.Anderson MJ (2001) A new method for non-parametric
multivariate analysis of variance. Austral Ecol 26: 32–46.
FEMS Microbiol Ecol && (2012) 1–11 ª 2012 Federation of European Microbiological SocietiesPublished by Blackwell Publishing Ltd. All rights reserved
ITS1 vs. ITS2 pyrosequencing 9

Anderson IC & Cairney JWG (2004) Diversity and ecology of
soil fungal communities: increased understanding through
the application of molecular techniques. Environ Microbiol
6: 769–779.Bellemain E, Carlsen T, Brochmann C, Coissac E, Taberlet P &
Kauserud H (2010) ITS as an environmental DNA barcode
for fungi: an in silico approach reveals potential PCR biases.
BMC Microbiol 10: 189.
Bidartondo MI (2008) Preserving accuracy in GenBank. Science
319: 1616.
Blaalid R, Carlsen TOR, Kumar S, Halvorsen R, Ugland KI,
Fontana G & Kauserud H (2012) Changes in the root-
associated fungal communities along a primary succession
gradient analysed by 454 pyrosequencing. Mol Ecol 21:
1897–1908.Bu�ee M, Reich M, Murat C, Morin E, Nilsson RH, Uroz S &
Martin F (2009) 454 Pyrosequencing analyses of forest soils
reveal an unexpectedly high fungal diversity. New Phytol
184: 449–456.Cardenas E & Tiedje JM (2008) New tools for discovering and
characterizing microbial diversity. Curr Opin Biotechol 19:
544–549.Gardes M & Bruns TD (1993) ITS primers with enhanced
specificity for Basidiomycetes – application to the identification
of mycorrhizae and rusts.Mol Ecol 2: 113–118.Griffiths RI, Whiteley AS, O’Donnell AG & Bailey MJ (2000)
Rapid method for coextraction of DNA and RNA from
natural environments for analysis of ribosomal DNA- and
rRNA-based microbial community composition. Appl
Environ Microbiol 66: 5488–5491.Hershkovitz MA & Lewis LA (1996) Deep-level diagnostic
value of the rDNA-ITS region. Mol Biol Evol 13: 1276–1295.Hibbett DS (1996) Phylogenetic evidence for horizontal
transmission of group I introns in the nuclear ribosomal DNA
of mushroom-forming fungi.Mol Biol Evol 13: 903–917.Hillis DM & Dixon MT (1991) Ribosomal DNA: molecular
evolution and phylogenetic inference. Q Rev Biol 66:
411–453.Horton TR & Bruns TD (2001) The molecular revolution in
ectomycorrhizal ecology: peeking into the black-box. Mol
Ecol 10: 1855–1871.Ihrmark K, B€odeker ITM, Cruz-Martinez K et al. (2012) New
primers to amplify the fungal ITS2 region – evaluation by
454-sequencing of artificial and natural communities. FEMS
Microbiol Ecol 82: 666–677.Jumpponen A & Jones KL (2009) Massively parallel 454
sequencing indicates hyperdiverse fungal communities in
temperate Quercus macrocarpa phyllosphere. New Phytol
184: 438–448.Jumpponen A, Jones KL & Blair J (2010) Vertical distribution
of fungal communities in tallgrass prairie soil. Mycologia
102: 1027–1041.K~oljalg U, Larsson K-H, Abarenkov K et al. (2005) UNITE: a
database providing web-based methods for the molecular
identification of ectomycorrhizal fungi. New Phytol 166:
1063–1068.
Legendre P & Legendre L (1998) Numerical Ecology. Elsevier,
BV, Amsterdam.
Nilsson RH, Ryberg M, Kristiansson E, Abarenkov K, Larsson
K-H & K~oljalg U (2006) Taxonomic reliability of DNA
sequences in public sequence databases: a fungal perspective.
PLoS ONE 1: e59.
Nilsson RH, Kristiansson E, Ryberg M, Hallenberg N &
Larsson K-H (2008) Intraspecific ITS variability in the
kingdom fungi as expressed in the international sequence
databases and its implications for molecular species
identification. Evol Bioinform Online 4: 193–201.Nilsson RH, Ryberg M, Abarenkov K, Sj€okvist E & Kristiansson
E (2009) The ITS region as a target for characterization of
fungal communities using emerging sequencing technologies.
FEMS Microbiol Lett 296: 97–101.Nilsson RH, Veldre V, Hartmann M, Unterseher M, Amend A,
Bergsten J, Kristiansson E, Ryberg M, Jumpponen A &
Abarenkov K (2010) An open source software package for
automated extraction of ITS1 and ITS2 from fungal ITS
sequences for use in high-throughput community assays and
molecular ecology. Fungal Ecol 3: 284–287.O’Brien HE, Parrent JL, Jackson JA, Moncalvo J-M & Vilgalys R
(2005) Fungal community analysis by large-scale sequencing of
environmental samples. Appl Environ Microbiol 71: 5544–5550.Orgiazzi A, Lumini E, Nilsson RH, Girlanda M, Vizzini A,
Bonfante P & Bianciotto V (2012) Unravelling soil fungal
communities from different Mediterranean land-use
backgrounds. PLoS ONE 7: e34847.
Peltoniemi K, Fritze H & Laiho R (2009) Response of fungal
and actinobacterial communities to water-level drawdown in
boreal peatland sites. Soil Biol Biochem 41: 1902–1914.Roesch LFW, Fulthorpe RR, Riva A, Casella G, Hadwin AKM,
Kent AD, Daroub SH, Camargo FAO, Farmerie WG &
Triplett EW (2007) Pyrosequencing enumerates and
contrasts soil microbial diversity. ISME J 1: 283–290.Schoch CL, Seifert KA, Huhndorf S, Robert V, Spouge JL,
Levesque CA, Chen W, Consortium FB (2012) Nuclear
ribosomal internal transcribed spacer (ITS) region as a
universal DNA barcode marker for Fungi. P Natl Acad Sci
USA 109: 6241–6246.Toju H, Tanabe AS, Yamamoto S & Sato H (2012) High-
coverage ITS primers for the DNA-based identification of
Ascomycetes and Basidiomycetes in environmental samples.
PLoS ONE 7: e40863.
Unterseher M, Jumpponen ARI, €OPik M, Tedersoo L, Moora
M, Dormann CF & Schnittler M (2011) Species abundance
distributions and richness estimations in fungal
metagenomics – lessons learned from community ecology.
Mol Ecol 20: 275–285.Vega FE, Simpkins A, Aime MC, Posada F, Peterson SW,
Rehner SA, Infante F, Castillo A & Arnold AE (2010)
Fungal endophyte diversity in coffee plants from Colombia,
Hawaii, Mexico and Puerto Rico. Fungal Ecol 3: 122–138.Vilgalys R & Gonzalez D (1990) Organization of ribosomal
DNA in the basidiomycete Thanatephorus praticola. Curr
Genet 18: 277–280.
ª 2012 Federation of European Microbiological Societies FEMS Microbiol Ecol && (2012) 1–11Published by Blackwell Publishing Ltd. All rights reserved
10 C. Monard et al.

Wallander H, Johansson U, Sterkenburg E, Brandstr€om
Durling M & Lindahl BD (2010) Production of
ectomycorrhizal mycelium peaks during canopy closure in
Norway spruce forests. New Phytol 187: 1124–1134.White TJ, Bruns TD, Lee SB & Taylor JW (1990) Amplification
and direct sequencing of fungal ribosomal RNA genes for
phylogenetics. PCR Protocols–A Guide to Methods and
Applications (Innis MA, Gelfand DH, Sninsky JJ & White TJ,
eds), pp. 315–322. Academic Press, San Diego, CA.
Supporting Information
Additional Supporting Information may be found in the
online version of this article:
Fig. S1. Similarity of fungal OTUs (Sørensen similarity
values) between layers (within one soil core), between soil
cores (within site) and between sites for the ITS1 (filled
circles) and ITS2 (open triangles) datasets.
Table S1. List of the barcodes used with the ITS1F and
ITS4 primers according to the different soil samples.
Table S2. Number of sequences in the ITS1 and ITS2
databases obtained for each soil sample using 100 and
250 bp as minimum read length.
Table S3. Identification of the fungal OTUs from the
ITS1 dataset, their abundance and distribution among the
AF, CF, DH, FL and SH sites at the different depths and
their proportion among the all dataset (ITS1 and ITS2)
and among the ITS1 dataset.
Table S4. Identification of the fungal OTUs from the
ITS2 dataset, their abundance and distribution among the
AF, CF, DH, FL and SH sites at the different depths and
their proportion among the all dataset (ITS1 and ITS2)
and among the ITS2 dataset.
FEMS Microbiol Ecol && (2012) 1–11 ª 2012 Federation of European Microbiological SocietiesPublished by Blackwell Publishing Ltd. All rights reserved
ITS1 vs. ITS2 pyrosequencing 11


