Embed Size (px)
Citation preview
Validation of Assessment for LearningQuestionnaires for teachers and students
Ron Jonathan Pat-El∗, Harm Tillema, Mien Segers†and Paul VedderDepartment of Education and Child Studies, Leiden University, The Netherlands
Background. Assessment can be a powerful force in promoting student learning. Still,few measures exist to gauge Assessment for Learning (AFL) in the classroom. Literatureon AFL suggests that it encompasses both a monitor to track student progress as wellas a scaffold to show or help students recognize in what areas they need to improve.
Aims. Based on a review of recent attempts to measure the AFL, we constructedAssessment for Learning Questionnaires for Teachers (TAFL-Q) and for students (SAFL-Q) for evaluating perceptions regarding AFL practices in classrooms using matchingitems.
Sample. The total sample included 1,422 students (49% girls, 51% boys) and 237teachers (43% females, 57% males) in lower vocational secondary education.
Methods. The 28-item questionnaires were examined by means of confirmatory factoranalysis (CFA) using EQS on one random half of the sample. The CFA was cross-validated on the second half. Measurement invariance tests were conducted to comparethe students and teacher versions of the questionnaires.
Results. CFA revealed a stable second-order two-factor structure that was cross-validated: perceived monitoring, and perceived scaffolding subsumed under a commonfactor: AFL. Tests for measurement invariance showed that the parallel constructs weremeasured similarly for both students and teachers.
Conclusion. The TAFL-Q and SAFL-Q capture the construct AFL in two subscales:Monitoring and Scaffolding, and allows for comparisons between teacher and studentperceptions. The instruments can be useful tools for teachers and students alike toidentify and scrutinize assessment practices in classroom.
Assessment for learningCurrent research into assessment as a tool to support student learning is increasinglyfocused on how this support is perceived. Studies focus either on the question of ‘how’
†Present address: School of Business and Economics, Maastricht University, The Netherlands.∗Correspondence should be addressed to Ron Jonathan Pat-El, Faculty of Social and Behavioral Sciences, Centre for the Studyof Learning and Instruction, Institute of Education and Child Studies, Leiden University, P.O. Box 9555, 2300 RB, Leiden, TheNetherlands (e-mail: [email protected]).
DOI:10.1111/j.2044-8279.2011.02057.x
British Journal of Educational Psychology (2013), 83, 98–113
©
www.wileyonlinelibrary.com
98
2011 The British Psychological Society
it is perceived or on ‘how much’ of it is perceived by students or instructors. Thereis evidence emerging that teachers and students differ in their perception of both theextent to which assessment is integrated in instruction as well as its content. However,quantitative instruments to properly compare student and teacher perceptions are stilllacking.
It is generally accepted that assessment is a powerful tool to inform and supportstudent learning. In this respect, the concept ‘AFL’ has been introduced to counterbal-ance the majority of the attention paid to ‘Assessment of Learning’, or performanceassessment, in classrooms and schools (e.g., Black & Wiliam, 1998a; Crooks, 2001;Stiggins, 2005). In the past decades, several models have been proposed that integratesummative testing within the learning processes in formative ways, such as formativeevaluations (Scriven, 2002) or informal feedback (Boud, 2000). Assessments havebecome a critical link between curriculum, teaching, and learning (National Councilof Teachers of Mathematics, 1995). Central to AFL is the integration of assessmentinto instruction as an ongoing process, where assessment information is used byteachers to adjust their teaching and by students to adjust their learning processes(Popham, 2008). The definition of assessment itself has become very broad and anumbrella term for any information that can help teachers gain better insights intostudents’ understanding. The notion of AFL integrates assessments of performance(process) and achievement (products) within the learning context (Segers, 2004).AFL is characteristic of an assessment culture, that builds on scaffolding, aligninginstruction in support of learning, and providing students with greater autonomy intheir learning processes (Black & Wiliam, 1998a). The AFL perspective revolves aroundrepeated, varied, and often informal assessments, which are informative to the learningprocess (Wiggins, 1993), and take place in authentic contexts (Darling-Hammond,2010).
Even though different scholars emphasize slightly different AFL principles (e.g., ARG,2002; Black & Wiliam, 1998a,b; James & Pedder, 2006), our focus here is on two factors,namely; a monitor to track student progress and a scaffold to show or help studentsrecognize in what areas they need to improve (Stiggins, 2005). The importance ofthese two factors is stressed and clarified in the ARG (2002) guidelines as well as bythe Council of Chief State School Officers (CCSSO; Darling-Hammond, 2010) and wereexplored in several grounding reports and studies (e.g., OECD, 2005; Prosser & Trigwell,1993).
Although there is a substantial body of quantitative research into effects of AFLon learning, the questionnaires used, especially those pertaining to the perception ofpractices of AFL as a tool to evaluate the promotion of learning through assessment, haverarely received detailed psychometric attention. This is the first challenge to be tackledin the current study.
Perceptions of AFLIn order to understand how assessment influences student learning, research hasaddressed conceptual attitudes towards assessment practices (e.g., Brown, 2008) andperceived/observed practice (e.g., Gibbs & Simpson, 2003). Hirschfeld and Brown(2008) showed that in secondary, as well as in higher education, general conceptionsof assessment purposes affect student attainment and well-being. Few studies haveevidenced the influence of students’ perceptions of applied assessment practices on
Construction and structural validation AFL-Q 99
their approach to learning (e.g., Entwistle, 1991; Scouller, 1998; Struyven, Dochy, &Janssens, 2005). Teachers’ perception of the assessment practice has received even lessattention and the scant studies available show that teachers’ and students’ perceptionshave very little overlap (Schultz, 2001). Such overlap, or alignment, may be difficultto achieve. Due to their different roles and expertise, students and teachers are likelyto differ in the opportunities and focus of assessment. Konings (2007) suggests thatteachers are more alert than their students to the perception of clarity of learninggoals, motivating subject matter, and engaging learning environments for learning.Misalignment in the perceptions of assessment practices between teachers and studentsis problematic because it is likely to lead to misunderstanding and misinterpretationof the assessment information, its meaning, and purpose (e.g., Bartholomew, Parcel,Kok, & Gottlieb, 2001). MacLellan (2001) and Loughran (2010) showed that in order tofacilitate student learning, teachers need to make sure that at least teachers’ and students’perception of assessment goals are in alignment. When the interactions between teachersand students are characterized by a misalignment, it is currently unclear the difficultiesinvolved in compensating or correcting this issue. To facilitate early detection or to makesure that teachers’ and students’ perception of assessment situations and interactionsare aligned, it is indispensable to measure both teacher and student perceptions ofAFL. Given these studies and the examples and arguments they present, we arguethat it is important to distinguish between and measure both teacher and studentperceptions of AFL practices in order to optimize the effects of assessment on studentlearning.
Measuring perceptions of assessment for learningCurrent instruments are, in our opinion, not adequate for the designed objectives.They either show a number of methodological shortcomings, such as lacking constructvalidity and low internal consistency of scales (e.g., Gibbs & Simpson, 2003), ordo not allow to match student and teacher perceptions (e.g., MacLellan, 2001).For example, the Assessment Experience Questionnaire (Gibbs & Simpson, 2003)is a Likert-type questionnaire for use in higher education. It measures a varietyof AFL constructs such as quantity, timing, and quality of feedback in addition tostudents’ study efforts as well as how students perceive the examination. However,this instrument showed low internal consistencies. Another example regards thequestionnaire developed by James and Pedder (2006), which was constructed tomeasure primary and secondary school teachers’ beliefs and appraisals of AFL practicesusing Likert-type responses. The instrument showed low-factor loadings. Furthermore,the discrimination between measured AFL constructs remains unclear. One can seethat measuring congruency in perception between teachers and students has provendifficult.
From a measurement perspective, structural confirmations of the dimensionality ofAFL constructs have not been tested. The key principles of AFL have not yet beencaptured instrumentally, nor were they quantitatively validated. Available instrumentson AFL practices do not comprehensively capture how students and teachers perceivethe interrelated AFL principles that are applied in their classrooms. This study aims todevelop and structurally validate a questionnaire designed to measure student and theteacher perceptions of AFL and which further allows direct comparisons of teacher andstudent perception of their AFL practice.
100 Ron Jonathan Pat-El et al.
MethodSampleThe target population consisted of students and teachers in lower vocational educationin the Netherlands. This educational track includes approximately 60% of the Dutchsecondary school students (CBS, 2007). Students in the upper secondary educationalsystem, those preparing for higher education, have a different pedagogical approach.This sample was chosen because review studies such as those from Black and Wiliam(1998a) indicate that the highest learning gains from using AFL are likely to be observedin the lower tracks. The individual students and teachers were the units of analysis. Thequestionnaire was administered in 80 schools to 1,422 students (49% girls, 51% boys).From each school, three teachers were selected along with a random selection of sixstudents from these classes. Teachers were selected from all disciplines, ranging fromarts to sciences. The median student age was 14 years old (range = 11–18). We sampled237 teachers (43% females, 57% males) who had a median age of 43 years old (range =22–65). The classroom response rate was 98.75%. On average, the teachers had beenactive in the field of teaching for 15.3 years (SD = 11.11) and active at their currentschool for 8.8 years (SD = 8.27). Male teachers (Median = 45, range = 23–65) wereslightly older than female teachers (median = 37, range = 22–63, U = 5,092.00, p =.001). The participating schools were spread across different regions in the Netherlandsto avoid a bias towards urban areas.
InstrumentThe Student Assessment for Learning Questionnaire (SAFL-Q) and the Teacher Assess-ment for Learning Questionnaire (TAFL-Q) consisted of 28 items divided into two scales:(1) perceived monitoring (16 items); (2) perceived scaffolding (12 items). The itemswere measured on a five-point Likert scale (1 = strongly disagree, and 5 = stronglyagree) (see Table 2 and Appendix for items).
ProcedureSchools were visited by research assistants who distributed the questionnaires inclassrooms. Prior to administering the SAFL-Q and the TAFL-Q, the purpose of thestudy was explained to teachers. The questionnaires started with a short instructionexplaining the purpose of the study, presenting some examples on how to work withLikert response scales and directing teachers’ and students’ attention to actual assessmentpractices in their current class. Completion took about 25 min.
Data analysisBecause of the large number of respondents needed to validate the questionnaire,confirmatory analyses were only conducted on the SAFL-Q. The validation was conductedin three steps: (1) confirmatory analysis to determine the robustness of the factorstructure on one randomly determined half of the dataset (training); (2) cross-validationusing multi-group invariance testing between the first half of the dataset and the unusedsecond half of the dataset; and (3) tests of multi-group invariance to determine whetherthe teacher and student questionnaires measure parallel constructs similarly.
Construction and structural validation AFL-Q 101
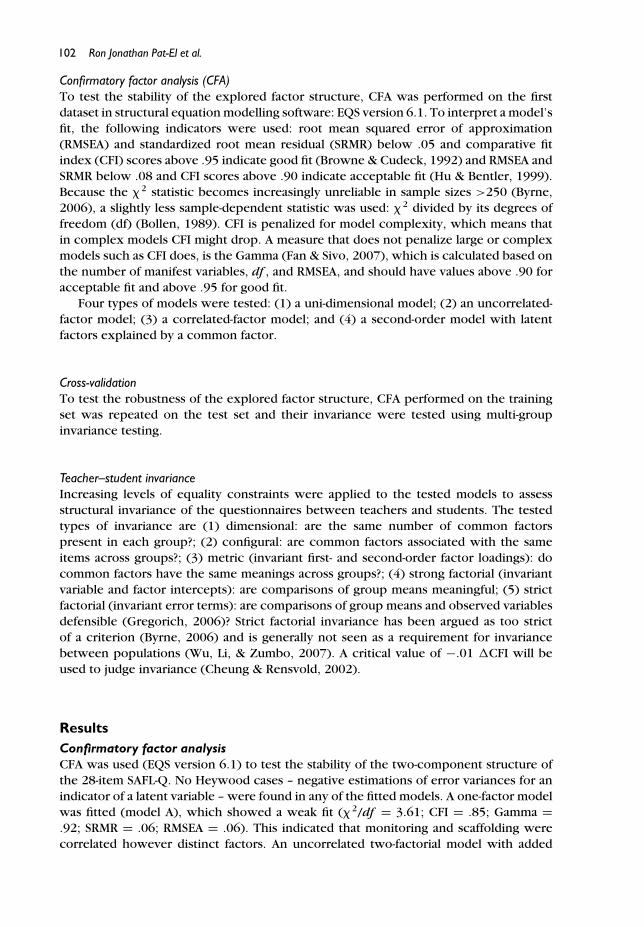
Confirmatory factor analysis (CFA)To test the stability of the explored factor structure, CFA was performed on the firstdataset in structural equation modelling software: EQS version 6.1. To interpret a model’sfit, the following indicators were used: root mean squared error of approximation(RMSEA) and standardized root mean residual (SRMR) below .05 and comparative fitindex (CFI) scores above .95 indicate good fit (Browne & Cudeck, 1992) and RMSEA andSRMR below .08 and CFI scores above .90 indicate acceptable fit (Hu & Bentler, 1999).Because the � 2 statistic becomes increasingly unreliable in sample sizes >250 (Byrne,2006), a slightly less sample-dependent statistic was used: � 2 divided by its degrees offreedom (df) (Bollen, 1989). CFI is penalized for model complexity, which means thatin complex models CFI might drop. A measure that does not penalize large or complexmodels such as CFI does, is the Gamma (Fan & Sivo, 2007), which is calculated based onthe number of manifest variables, df , and RMSEA, and should have values above .90 foracceptable fit and above .95 for good fit.
Four types of models were tested: (1) a uni-dimensional model; (2) an uncorrelated-factor model; (3) a correlated-factor model; and (4) a second-order model with latentfactors explained by a common factor.
Cross-validationTo test the robustness of the explored factor structure, CFA performed on the trainingset was repeated on the test set and their invariance were tested using multi-groupinvariance testing.
Teacher–student invarianceIncreasing levels of equality constraints were applied to the tested models to assessstructural invariance of the questionnaires between teachers and students. The testedtypes of invariance are (1) dimensional: are the same number of common factorspresent in each group?; (2) configural: are common factors associated with the sameitems across groups?; (3) metric (invariant first- and second-order factor loadings): docommon factors have the same meanings across groups?; (4) strong factorial (invariantvariable and factor intercepts): are comparisons of group means meaningful; (5) strictfactorial (invariant error terms): are comparisons of group means and observed variablesdefensible (Gregorich, 2006)? Strict factorial invariance has been argued as too strictof a criterion (Byrne, 2006) and is generally not seen as a requirement for invariancebetween populations (Wu, Li, & Zumbo, 2007). A critical value of −.01 �CFI will beused to judge invariance (Cheung & Rensvold, 2002).
ResultsConfirmatory factor analysisCFA was used (EQS version 6.1) to test the stability of the two-component structure ofthe 28-item SAFL-Q. No Heywood cases – negative estimations of error variances for anindicator of a latent variable – were found in any of the fitted models. A one-factor modelwas fitted (model A), which showed a weak fit (� 2/df = 3.61; CFI = .85; Gamma =.92; SRMR = .06; RMSEA = .06). This indicated that monitoring and scaffolding werecorrelated however distinct factors. An uncorrelated two-factorial model with added
102 Ron Jonathan Pat-El et al.
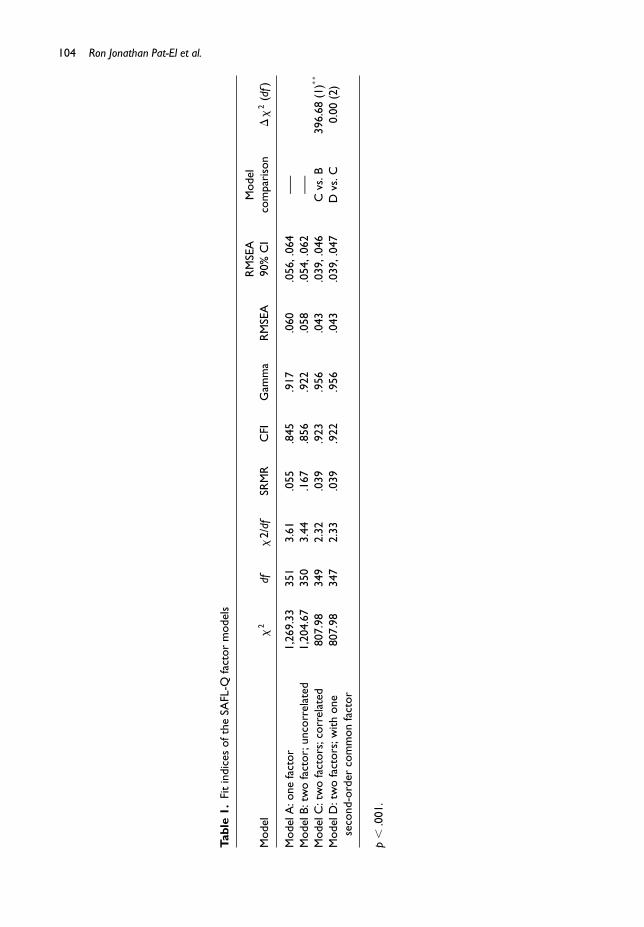
factor correlations was fitted (model B), which showed a weak fit (� 2/df = 3.44; CFI =.86; Gamma = .92; SRMR = .17; RMSEA = .06). A two-factor model with added factorcorrelations (model C) showed a significantly improved and good fit (�� 2(1) = 396.68,p < .001; CFI = .92; Gamma = .96; SRMR = .04; RMSEA = .04). Finally, a second-ordertwo-factorial model with a common AFL factor was fitted (model D), which showed anequally good fit (�� 2(2) = 0.00; p = 1.00; Gamma = .96; SRMR = .04; RMSEA = .04),which indicated that the two distinct factors monitoring and scaffolding were part ofa single underlying construct. Table 1 summarizes the fit of the tested models. Table 2shows the factor loadings of the common factor CFA.
Internal consistencyCronbach’s alpha of the two subscales in the teacher and student questionnaires providedconvincing support for the reliability of the subscales. Table 3 shows alphas and scalecharacteristics. The mean scores of teacher perceptions were almost a point higher thanstudent perception scores.
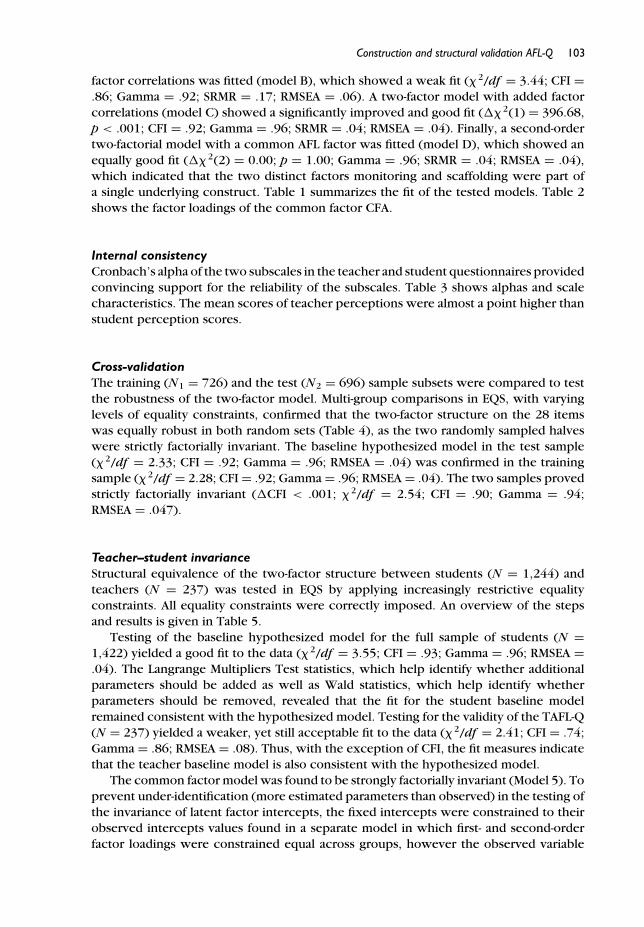
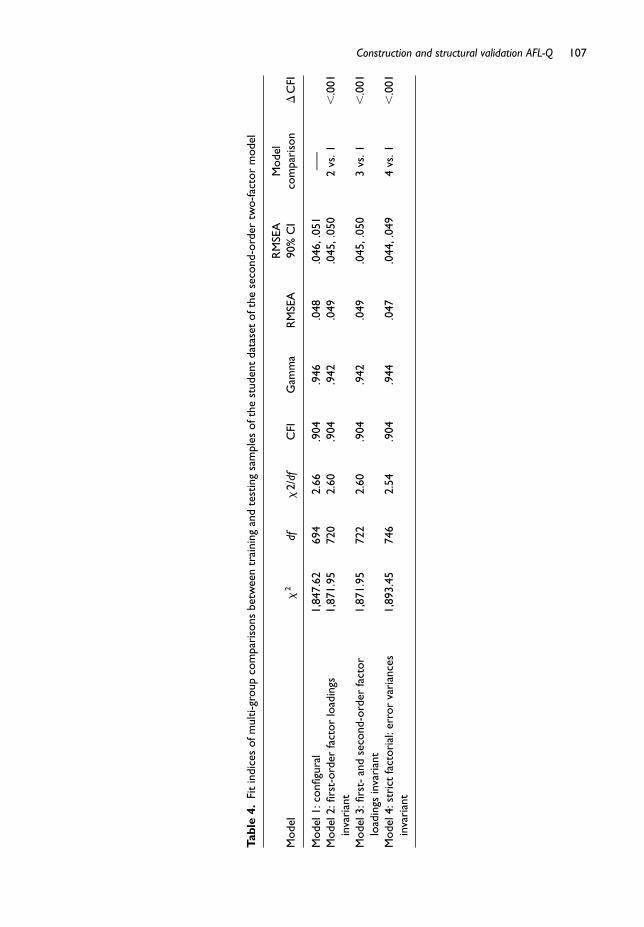
Cross-validationThe training (N1 = 726) and the test (N2 = 696) sample subsets were compared to testthe robustness of the two-factor model. Multi-group comparisons in EQS, with varyinglevels of equality constraints, confirmed that the two-factor structure on the 28 itemswas equally robust in both random sets (Table 4), as the two randomly sampled halveswere strictly factorially invariant. The baseline hypothesized model in the test sample(� 2/df = 2.33; CFI = .92; Gamma = .96; RMSEA = .04) was confirmed in the trainingsample (� 2/df = 2.28; CFI = .92; Gamma = .96; RMSEA = .04). The two samples provedstrictly factorially invariant (�CFI < .001; � 2/df = 2.54; CFI = .90; Gamma = .94;RMSEA = .047).
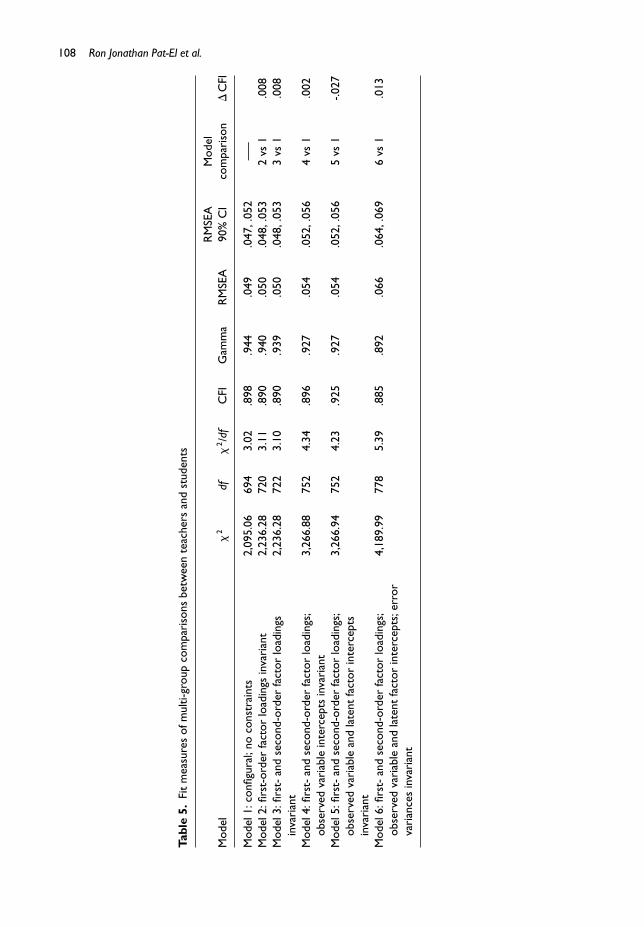
Teacher–student invarianceStructural equivalence of the two-factor structure between students (N = 1,244) andteachers (N = 237) was tested in EQS by applying increasingly restrictive equalityconstraints. All equality constraints were correctly imposed. An overview of the stepsand results is given in Table 5.
Testing of the baseline hypothesized model for the full sample of students (N =1,422) yielded a good fit to the data (� 2/df = 3.55; CFI = .93; Gamma = .96; RMSEA =.04). The Langrange Multipliers Test statistics, which help identify whether additionalparameters should be added as well as Wald statistics, which help identify whetherparameters should be removed, revealed that the fit for the student baseline modelremained consistent with the hypothesized model. Testing for the validity of the TAFL-Q(N = 237) yielded a weaker, yet still acceptable fit to the data (� 2/df = 2.41; CFI = .74;Gamma = .86; RMSEA = .08). Thus, with the exception of CFI, the fit measures indicatethat the teacher baseline model is also consistent with the hypothesized model.
The common factor model was found to be strongly factorially invariant (Model 5). Toprevent under-identification (more estimated parameters than observed) in the testing ofthe invariance of latent factor intercepts, the fixed intercepts were constrained to theirobserved intercepts values found in a separate model in which first- and second-orderfactor loadings were constrained equal across groups, however the observed variable
Construction and structural validation AFL-Q 103
Tabl
e1.
Fit
indi
ces
ofth
eSA
FL-Q
fact
orm
odel
s
RM
SEA
Mod
elM
odel
�2
df�
2/df
SRM
RC
FIG
amm
aR
MSE
A90
%C
Ico
mpa
riso
n�
�2
(df)
Mod
elA
:one
fact
or1,
269.
3335
13.
61.0
55.8
45.9
17.0
60.0
56,.
064
—–
Mod
elB:
two
fact
or;u
ncor
rela
ted
1,20
4.67
350
3.44
.167
.856
.922
.058
.054
,.06
2—
–M
odel
C:t
wo
fact
ors;
corr
elat
ed80
7.98
349
2.32
.039
.923
.956
.043
.039
,.04
6C
vs.B
396.
68(1
)∗∗
Mod
elD
:tw
ofa
ctor
s;w
ithon
ese
cond
-ord
erco
mm
onfa
ctor
807.
9834
72.
33.0
39.9
22.9
56.0
43.0
39,.
047
Dvs
.C0.
00(2
)
p�
.001
.
104 Ron Jonathan Pat-El et al.
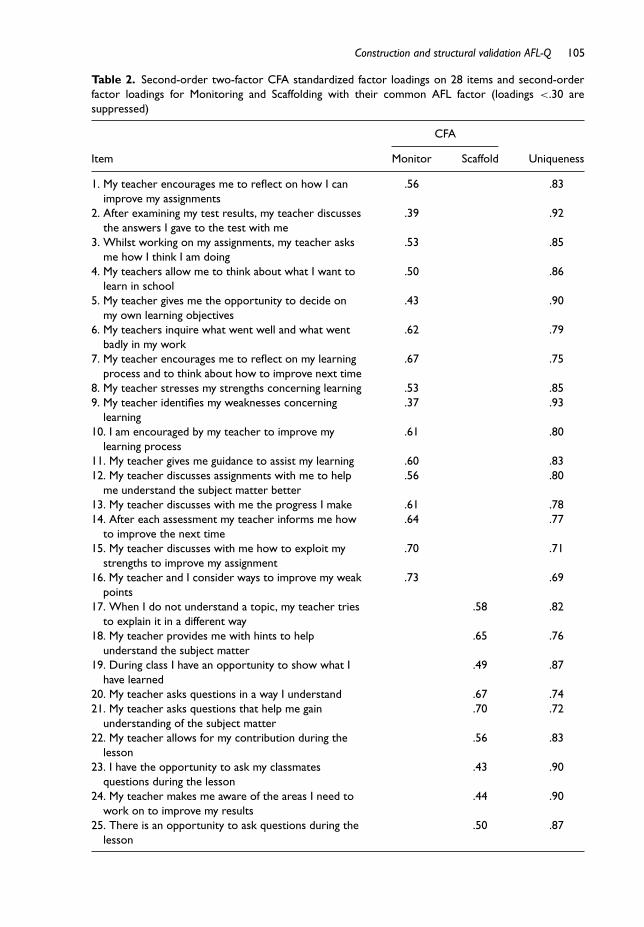
Table 2. Second-order two-factor CFA standardized factor loadings on 28 items and second-orderfactor loadings for Monitoring and Scaffolding with their common AFL factor (loadings <.30 aresuppressed)
CFA
Item Monitor Scaffold Uniqueness
1. My teacher encourages me to reflect on how I canimprove my assignments
.56 .83
2. After examining my test results, my teacher discussesthe answers I gave to the test with me
.39 .92
3. Whilst working on my assignments, my teacher asksme how I think I am doing
.53 .85
4. My teachers allow me to think about what I want tolearn in school
.50 .86
5. My teacher gives me the opportunity to decide onmy own learning objectives
.43 .90
6. My teachers inquire what went well and what wentbadly in my work
.62 .79
7. My teacher encourages me to reflect on my learningprocess and to think about how to improve next time
.67 .75
8. My teacher stresses my strengths concerning learning .53 .859. My teacher identifies my weaknesses concerning
learning.37 .93
10. I am encouraged by my teacher to improve mylearning process
.61 .80
11. My teacher gives me guidance to assist my learning .60 .8312. My teacher discusses assignments with me to help
me understand the subject matter better.56 .80
13. My teacher discusses with me the progress I make .61 .7814. After each assessment my teacher informs me how
to improve the next time.64 .77
15. My teacher discusses with me how to exploit mystrengths to improve my assignment
.70 .71
16. My teacher and I consider ways to improve my weakpoints
.73 .69
17. When I do not understand a topic, my teacher triesto explain it in a different way
.58 .82
18. My teacher provides me with hints to helpunderstand the subject matter
.65 .76
19. During class I have an opportunity to show what Ihave learned
.49 .87
20. My teacher asks questions in a way I understand .67 .7421. My teacher asks questions that help me gain
understanding of the subject matter.70 .72
22. My teacher allows for my contribution during thelesson
.56 .83
23. I have the opportunity to ask my classmatesquestions during the lesson
.43 .90
24. My teacher makes me aware of the areas I need towork on to improve my results
.44 .90
25. There is an opportunity to ask questions during thelesson
.50 .87
Construction and structural validation AFL-Q 105
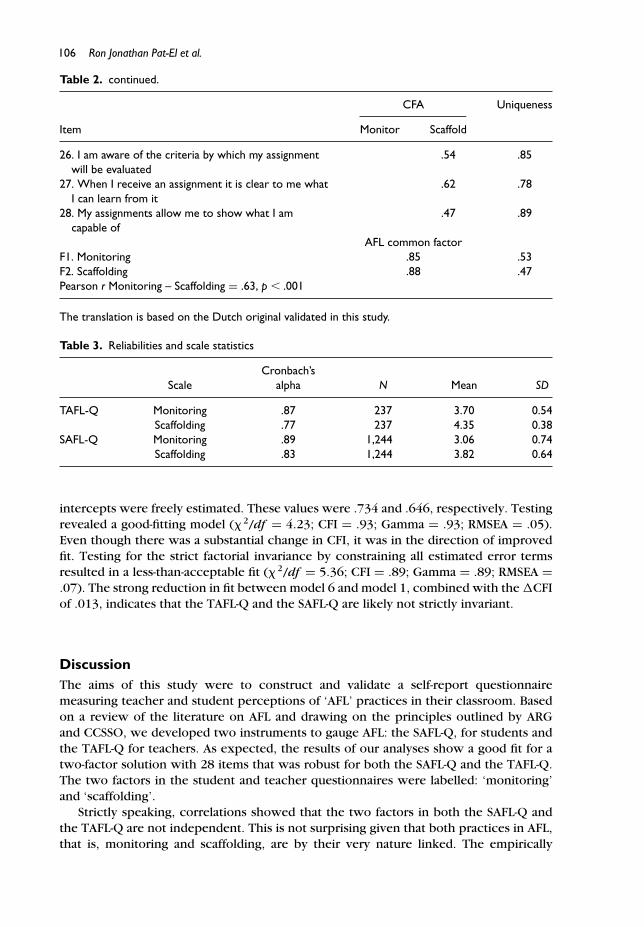
Table 2. continued.
CFA Uniqueness
Item Monitor Scaffold
26. I am aware of the criteria by which my assignmentwill be evaluated
.54 .85
27. When I receive an assignment it is clear to me whatI can learn from it
.62 .78
28. My assignments allow me to show what I amcapable of
.47 .89
AFL common factorF1. Monitoring .85 .53F2. Scaffolding .88 .47Pearson r Monitoring – Scaffolding = .63, p � .001
The translation is based on the Dutch original validated in this study.
Table 3. Reliabilities and scale statistics
Cronbach’sScale alpha N Mean SD
TAFL-Q Monitoring .87 237 3.70 0.54Scaffolding .77 237 4.35 0.38
SAFL-Q Monitoring .89 1,244 3.06 0.74Scaffolding .83 1,244 3.82 0.64
intercepts were freely estimated. These values were .734 and .646, respectively. Testingrevealed a good-fitting model (� 2/df = 4.23; CFI = .93; Gamma = .93; RMSEA = .05).Even though there was a substantial change in CFI, it was in the direction of improvedfit. Testing for the strict factorial invariance by constraining all estimated error termsresulted in a less-than-acceptable fit (� 2/df = 5.36; CFI = .89; Gamma = .89; RMSEA =.07). The strong reduction in fit between model 6 and model 1, combined with the �CFIof .013, indicates that the TAFL-Q and the SAFL-Q are likely not strictly invariant.
DiscussionThe aims of this study were to construct and validate a self-report questionnairemeasuring teacher and student perceptions of ‘AFL’ practices in their classroom. Basedon a review of the literature on AFL and drawing on the principles outlined by ARGand CCSSO, we developed two instruments to gauge AFL: the SAFL-Q, for students andthe TAFL-Q for teachers. As expected, the results of our analyses show a good fit for atwo-factor solution with 28 items that was robust for both the SAFL-Q and the TAFL-Q.The two factors in the student and teacher questionnaires were labelled: ‘monitoring’and ‘scaffolding’.
Strictly speaking, correlations showed that the two factors in both the SAFL-Q andthe TAFL-Q are not independent. This is not surprising given that both practices in AFL,that is, monitoring and scaffolding, are by their very nature linked. The empirically
106 Ron Jonathan Pat-El et al.
Tabl
e4.
Fit
indi
ces
ofm
ulti-
grou
pco
mpa
riso
nsbe
twee
ntr
aini
ngan
dte
stin
gsa
mpl
esof
the
stud
ent
data
set
ofth
ese
cond
-ord
ertw
o-fa
ctor
mod
el
RM
SEA
Mod
elM
odel
�2
df�
2/df
CFI
Gam
ma
RM
SEA
90%
CI
com
pari
son
�C
FI
Mod
el1:
confi
gura
l1,
847.
6269
42.
66.9
04.9
46.0
48.0
46,.
051
—–
Mod
el2:
first
-ord
erfa
ctor
load
ings
inva
rian
t1,
871.
9572
02.
60.9
04.9
42.0
49.0
45,.
050
2vs
.1�
.001
Mod
el3:
first
-an
dse
cond
-ord
erfa
ctor
load
ings
inva
rian
t1,
871.
9572
22.
60.9
04.9
42.0
49.0
45,.
050
3vs
.1�
.001
Mod
el4:
stri
ctfa
ctor
ial:
erro
rva
rian
ces
inva
rian
t1,
893.
4574
62.
54.9
04.9
44.0
47.0
44,.
049
4vs
.1�
.001
Construction and structural validation AFL-Q 107
Tabl
e5.
Fit
mea
sure
sof
mul
ti-gr
oup
com
pari
sons
betw
een
teac
hers
and
stud
ents
RM
SEA
Mod
elM
odel
�2
df�
2/d
fC
FIG
amm
aR
MSE
A90
%C
Ico
mpa
riso
n�
CFI
Mod
el1:
confi
gura
l;no
cons
trai
nts
2,09
5.06
694
3.02
.898
.944
.049
.047
,.05
2—
–M
odel
2:fir
st-o
rder
fact
orlo
adin
gsin
vari
ant
2,23
6.28
720
3.11
.890
.940
.050
.048
,.05
32
vs1
.008
Mod
el3:
first
-an
dse
cond
-ord
erfa
ctor
load
ings
inva
rian
t2,
236.
2872
23.
10.8
90.9
39.0
50.0
48,.
053
3vs
1.0
08
Mod
el4:
first
-an
dse
cond
-ord
erfa
ctor
load
ings
;ob
serv
edva
riab
lein
terc
epts
inva
rian
t3,
266.
8875
24.
34.8
96.9
27.0
54.0
52,.
056
4vs
1.0
02
Mod
el5:
first
-an
dse
cond
-ord
erfa
ctor
load
ings
;ob
serv
edva
riab
lean
dla
tent
fact
orin
terc
epts
inva
rian
t
3,26
6.94
752
4.23
.925
.927
.054
.052
,.05
65
vs1
-.027
Mod
el6:
first
-an
dse
cond
-ord
erfa
ctor
load
ings
;ob
serv
edva
riab
lean
dla
tent
fact
orin
terc
epts
;err
orva
rian
ces
inva
rian
t
4,18
9.99
778
5.39
.885
.892
.066
.064
,.06
96
vs1
.013
108 Ron Jonathan Pat-El et al.
established two factors in this study clearly represent the constructs found in theliterature. The factor ‘scaffolding’ has items that refer to clarification of learning goals andcriteria and to classroom questioning, which are largely instruction-related processes.The factor ‘monitoring’ has items that deal with feedback and self-monitoring, whichshare a common intent to optimize learning. However, the overlap is not complete.One reason might be that, although the important building blocks of AFL are relativelywell defined (ARG, 2002; Stiggins, 2005), they are not necessarily mutually exclusiveor orthogonal. Nevertheless, the two factors cover many of the conceptually statedprinciples of AFL. We opted for an open approach of Assessment for Learning. It isnot the assessment itself that determines whether assessment is summative or formativein nature (function), but rather how the assessment information is used (goal) (Black& Wiliam, 1998b). This means that feedback, even when summative in character, canbecome formative when its information is used to inform students how, and in whatway, their performance falls short of a goal, and how to improve (Kluger & DeNisi,1996). Although there is an ongoing debate as to which exact ingredients define AFL(Wiliam, 2011), this study adds evidence to the suggestion (Pat-El, Tillema, Segers, &Vedder, 2008; Stiggins, 2005) that the reduction of dimensionality of the AFL constructcan lead to more parsimonious overarching clusters, such as suggested by James andPedder (2006, p. 110). This suggestion finds further basis on the works of Gipps (1994)in which AFL is called distinctive by its focus in particular on “(1) learning as anexplicit focus of classroom activity and (2) students’ learning autonomy”, which we havesummarized as activities to monitor student progress, and scaffolding activities to realizegrowth.
Another aim of our study was to establish questionnaires that would measurethe perceptions of AFL practices in classrooms and could detect (possibly differing)perceptions of students and teachers. Previously available self-report research toolshave not convincingly compared evaluative perceptions of actual practices of bothpopulations – teacher and students – that are specifically related to promoting learning(e.g., MacLellan, 2001). The questionnaires in the current study used matching items andthe measurement invariance between the two questionnaire versions indicate that thetwo-factor structure is not only robust, but can be similarly interpreted for both teachersand students alike. Our findings that corresponding latent factor intercepts are invariantacross groups suggests that (1) group differences in estimated factor means are unbiasedand (2) group differences in observed means are directly related to group differences infactor means and not contaminated by differential response bias (Gregorich, 2006).This means that, when used to compare perceptions of both student and teacherpopulations, differing perception scores can be attributed to different perceptions andnot to different interpretation of the factors. The implication for researchers is thatmean scores of teachers and students can directly be compared and difference scorescan be used to measure the degree to which teachers’ and their students’ views aboutthe perceived same classroom practices match without bias. Due to observations thatstudents can perceive, for example, learning criteria to be more implicit and ‘hidden’than their teachers believe they are, comparing student and teacher perceptions ofAFL has become the focus of research trying to optimize the effects of assessment onstudent learning (Konings, 2007). If AFL is to integrate assessment with learning, it hasto be a process of continual interaction between teachers and individual learners, inwhich feedback provision and its acceptance and utilization are key elements (Black &Wiliam, 2009). In this respect, it is of great importance that students’ and teachers’perceptions on the nature and content of the assessment provided are congruent.
Construction and structural validation AFL-Q 109
Teachers may have to adapt word choice and complexity of the feedback information tohelp students understand the feedback (Vedder, 1985). Conversely, it is important thatstudent anticipate teacher instructions and feedback as personal expectations. In thismanner, congruency in teacher and student assessment and learning-related perceptionsare important for the success of classroom interventions (Bartholomew et al., 2001;Loughran, 2010; Norman, 1986). Seeking discrepancies between student and teacherperceptions of AFL can help detect why some instructional activities to foster learningsometimes have unexpected or contradictory effects (Olkinuora & Salonen, 1992).
The instrument(s) in this study are more context sensitive than overall measuresof assessment conceptions as the questionnaires are designed to elicit responses onactual assessment practices closely related to the (promotion of) learning going on inclassrooms. The results indicate much higher means in AFL perceptions for teachers overstudents. Reasons for this average misalignment could either be due to teachers beingmore knowledgeable about, or rather students being less aware of, the intent and purposeof their assessment. Students’ perceptions in this sample are nested within classroomsand as such global comparisons of perception means will be biased. Comparisons thataccount for the multi-level nature of the relationships between specific teachers andstudents are needed.
Confirming the robustness of the outcomes in additional populations or differenttypes of education would enhance the usefulness of the SAFL-Q and the TAFL-Q. Thepopulation in this sample (lower vocational secondary education) can generalize tolower track students, who are being prepared for vocational education, however thesample cannot provide evidence for generalizability to students in higher tracks, whoare prepared for higher education. Confirming invariance in the entirety of the Dutchsecondary education would indicate its usefulness in broader contexts, such as countrieswhere secondary education is less structurally diversified. At present we believe theinstrument is a valid representation of AFL principles and able to gauge how assessmentcan contribute to learning. Based on our results, we argue that the instruments canbe useful tools for teachers and students alike in identifying and scrutinizing assessmentpractices in classroom and eventually be supportive in establishing a common and sharedassessment approach to scaffold learning in classrooms.
AcknowledgementsThe authors would like to thank Dr. Jan-Willem Strijbos and all the research assistants fortheir help in coordinating the collection of data and administering the questionnaire.
ReferencesAssessment Reform Group. (2002). Assessment for learning: 10 principles. Retrieved from http:
//arg.educ.cam.ac.uk/CIE3.pdfBartholomew, L. K., Parcel, G. S., Kok, G., & Gottlieb, N. H. (2001). Intervention mapping:
Designing theory and evidence-based health promotion programs. Mountain View, CA:Mayfield.
Black, P., & Wiliam, D. (1998a). Assessment and classroom learning. Assessment in Education,21, 49–97. doi:10.1080/0969595980050102
Black, P., & Wiliam, D. (1998b). Inside the black box: Raising standards through classroomassessment. Phi Delta Kappan, 80, 139–148.
110 Ron Jonathan Pat-El et al.
Black, P., & Wiliam, D. (2009). Developing the theory of formative assessment. EducationalAssessment, Evaluation and Accountability, 21, 5–31. doi:10.1007/s11092-008-9068-5
Bollen, K. A. (1989). Structural equations with latent variables. New York: John Wiley & Sons.Boud, D. (2000). Sustainable assessment: Rethinking assessment for the learning society. Studies
in Continuing Education, 22, 151–167. doi:10.1080/713695728Brown, G. T. L. (2008). Conceptions of assessment: Understanding what assessment means to
teachers and students. New York: Nova Science Publishers.Browne, M. W., & Cudeck, R. (1992). Alternative ways of assessing model fit. Sociological Methods
and Research, 21, 230–258. doi:10.1177/0049124192021002005Byrne, B. M. (2006). Structural equation modeling with EQS. Mahwah, NJ: Erlbaum.Central Bureau of Statistics. (2007). Jaarboek onderwijs in cijfers [Yearbook education in
numbers]. Voorburg, the Netherlands: Central Bureau of Statistics.Cheung, G. W., & Rensvold, R. B. (2002). Evaluating goodness-of-fit indexes for
testing measurement invariance. Structural Equation Modeling, 9, 233–255.doi:10.1207/S15328007SEM0902_5
Crooks, T. (2001). The validity of formative assessments. Leeds, UK: British Educational ResearchAssociation.
Darling-Hammond, L. (2010). Performance counts: Assessment systems that support high-qualitylearning. Council of Chief State School Officers (CCSSO). Retrieved from http://www.ccsso.org/publications/details.cfm?PublicationID = 381
Entwistle, N. J. (1991). Approaches to learning and perceptions of the learning environment:Introduction to the special issue. Higher Education, 22, 201–204. doi:10.1007/BF00132287
Fan, X., & Sivo, S. A. (2007). Sensitivity of fit indices to model misspecification and model types.Multivariate Behavioral Research, 42, 509–529. doi:10.1080/00273170701382864
Gibbs, G., & Simpson, C. (2003). Measuring the response of students to assessment: TheAssessment Experience Questionnaire. Paper presented at the proceedings of the 11thInternational Improving Student Learning Symposium, Hinckley, UK.
Gipps, C. (1994). Beyond testing: Towards a theory of educational assessment. London, UK:Falmer Press.
Gregorich, S. E. (2006). Do self-report instruments allow meaningful comparisons across diversepopulation groups? Testing measurement invariance using the confirmatory analysis frame-work. Medical Care, 44, S78–S94. doi:10.1097/01.mlr.0000245454.12228.8f
Hirschfeld, G. H. F., & Brown, G. T. L. (2009). Students’ conceptions of assessment: Factorialand structural invariance of the SCoA across sex, age, and ethnicity. European Journal ofPsychological Assessment, 25, 30–38. doi:10.1027/1015-5759.25.1.30
Hu, L., & Bentler, P. M. (1999). Cutoff criteria for fit indexes in covariance structure analysis:Conventional criteria versus new alternatives. Structural Equation Modeling, 6 , 1–55.doi:10.1080/10705519909540118
James, M., & Pedder, D. (2006). Beyond method: Assessment and learning practices and values.Curriculum Journal, 17, 109–138. doi:10.1080/09585170600792712
Kluger, A. N., & DeNisi, A. (1996). The effects of feedback interventions on performance: A his-torical review, a meta-analysis, and a preliminary feedback intervention theory. PsychologicalBulletin, 119, 254–284. doi:10.1037/0033-2909.119.2.254
Konings, K. D. (2007). Student perspectives on education: Implications for instructionalredesign. Unpublished doctoral dissertation. Open University of the Netherlands, Heerlen,the Netherlands.
Loughran, J. J. (2010). What expert teachers do: Enhancing professional knowledge for classroompractice. Sydney, London: Allen & Unwin/Routledge.
MacLellan, E. (2001). Assessment for learning: The differing perceptions of tutorsand students. Assessment and Evaluation in Higher Education, 26 , 307–318.doi:10.1080/02602930120063466
National Council of Teachers of Mathematics. (1995). Assessment standards for school mathe-matics. Reston, VA: Author.
Construction and structural validation AFL-Q 111
Norman, D. A. (1986). Cognitive engineering. In D. A. Norman & S. W. Draper (Eds.), Newperspectives on human-computer interaction (pp. 31–62). Hillsdale, NJ: Lawrence ErlbaumAssociates.
OECD. (2005). Formative assessment: Improving learning in secondary classrooms. Paris,France: OECD/CERI.
Olkinuora, E., & Salonen, P. (1992). Adaptation, motivational orientation and cognition ina subnormally-performing child: A systematic perspective for training. In B. Wong (Ed.),Contemporary intervention research in learning disabilities (pp. 190–213). New York:Springer–Verlag.
Pat-El, R. J., Segers, M. S. R., Tillema, H. H., & Vedder, P. H. (2008). Constructing a newassessment for learning questionnaire. Paper presented at the meeting of the fourth biennialEarli/Northumbria Assessment Conference, Potsdam, Germany.
Popham, J. (2008). Transformative assessment. Alexandria, VA: Association for Supervision andCurriculum Development.
Prosser, M., & Trigwell, K. (1993). Development of an approaches to teaching questionnaire.Research and Development in Higher Education, 15, 468–473.
Schultz, R. A. (2001). Cultural differences in student and teacher perceptions concerning the roleof grammar instructions and corrective feedback. Modern Language Journal, 85, 244–258.doi:10.1111/0026-7902.00107
Scouller, K. (1998). The influence of assessment method on students’ learning approaches:Multiple choice examination versus assignment essay. Higher Education, 35, 453–472.doi:10.1023/A:1003196224280
Scriven, M. (2002). Evaluation ideologies. In D. L. Stufflebeam, G.F. Madaus, & T. Kellaghan (Eds.).Evaluation: Viewpoints on educational and human services evaluation models (2nd ed.,pp. 249–278). Boston, MA: Kluwer Academic Publishers.
Segers, M. (2004). Assessment en leren als een twee-eenheid: Onderzoek naar de impact vanassessment op leren [Assessment and learning as a duality, Research into the impact ofassessment on learning] (Inaugural address). Leiden, the Netherlands: Leiden University.
Stiggins, R. J. (2005). From formative assessment to assessment for learning: A path to success instandards-based schools. Phi Delta Kappan, 87, 324–328.
Struyven, K., Dochy, F., & Janssens, S. (2005). Students’ perceptions about evaluation andassessment in higher education: A review. Assessment and Evaluation in Higher Education,30, 325–341. doi:10.1080/02602930500099102
Vedder, P. (1985). Cooperative learning: A study on processes and effect of cooperation betweenprimary school children. Unpublished doctoral dissertation, Rijksuniversiteit Groningen.
Wiggins, G. (1993). Assessing student performance: Exploring the purpose and limits of testing.San Fransisco, CA: Jossey-Bass.
Wiliam, D. (2011). What is assessment for learning? Studies in Educational Evaluation, 37, 3–14.doi:10.1016/j.stueduc.2011.03.001
Wu, A. D., Li, Z., & Zumbo, B. D. (2007). Decoding the meaning of factorial invariance andupdating the practice of multi-group confirmatory factor analysis: A demonstration withTIMSS data. Practical Assessment Research and Evaluation, 12, 1–25. Retrieved from:http://pareonline.net/getvn.asp?v=12&n=3
Appendix: TAFL-Q items and subscales
Monitoring1. I encourage my students to reflect upon how they can improve their assignments.2. After a test, I discuss the answers given with each student.3. While working on their assignments, I ask my students how they think they are
doing.
112 Ron Jonathan Pat-El et al.

4. I involve my students in thinking about how they want to learn at school.5. I give my students the opportunity to decide on their learning objectives.6. I ask my students to indicate what went well and what went badly concerning their
assignments.7. I encourage students to reflect upon their learning processes and how to improve
their learning.8. I inform my students on their strong points concerning learning.9. I inform my students on their weak points concerning learning.
10. I encourage my students to improve on their learning processes.11. I give students guidance and assistance in their learning.12. I discuss assignments with my students to help them understand the content better.13. I discuss with my students the progress they have made.14. After an assessment, I inform my students on how to improve their weak points.15. I discuss with my students how to utilize their strengths to improve on their
assignment.16. Together with my students, I consider ways on how to improve on their weak
points.
Scaffolding1. I adjust my instruction whenever I notice that my students do not understand a
topic.2. I provide my students with guidance to help them gain understanding of the content
taught.3. During my class, students are given the opportunity to show what they have learned.4. I ask questions in a way my students understand.5. By asking questions during class, I help my students gain understanding of the
content taught.6. I am open to student contribution in my class.7. I allow my students to ask each other questions during class.8. I ensure that my students know what areas they need to work on in order to improve
their results.9. I give my students opportunities to ask questions.
10. My students know what the evaluation criteria for their work are.11. I ensure that my students know what they can learn from their assignments.12. I can recognize when my students reach their learning goals.
Note. This English translation is based on the Dutch original validated in this study.
Received 14 December 2010; revised version received 27 September 2011
Construction and structural validation AFL-Q 113


