Embed Size (px)
Citation preview
Page 1/16
Validity of Resting Strain/strain Rate in Prediction ofMyocardial ViabilityAmr Hanafy ( [email protected] )
Aswan University https://orcid.org/0000-0002-7663-7505Soliman Ghareb Ibrahim
Cairo UniversityHossam Eldein Mohamed Mohamed Mansour
Aswan UniversityAml Mohamed Soliman
Aswan University https://orcid.org/0000-0003-3715-3273Mohamed Kamal Salama
Kafr el-Sheikh University: Kafrelsheikh University
Research Article
Keywords: Resting Strain, strain Rate in Prediction, Myocardial Viability
Posted Date: July 19th, 2021
DOI: https://doi.org/10.21203/rs.3.rs-709287/v1
License: This work is licensed under a Creative Commons Attribution 4.0 International License. Read Full License
Page 2/16
AbstractPurpose
To evaluate the validity of the resting strain/strain rate measurements in predicting myocardial viabilitytaking delayed enhancement cardiac magnetic resonance imaging as the gold standard. Methods: Acohort of 60 patients at three months followed up after acute myocardial infarction were recruited for thisstudy. Resting echocardiography with o�ine analysis of deformation indices and gadolinium contrastenhanced cardiac magnetic resonance imaging were applied for all patients.
Results
For the �nal assessment, 268 segments with signi�cant resting wall motion abnormalities werepresented. Resting longitudinal strain was signi�cantly (p<0.05) higher in viable, compared with non-viable segments in all the studied individual myocardial segments (apical inferior, mid antro-lateral, mid-inferolateral, mid infero-septum, and all other segments). Likewise, resting longitudinal strain rate wassigni�cantly (p<0.05) higher in viable, compared with non-viable segments in almost all studied individualmyocardial segments apart from apical inferior, mid inferolateral and basal antro-septum (p=0.245,p=0.098, p=0.097 respectively).
Conclusion
Resting Strain and Resting Strain rate could be used as accurate predictors of myocardia viabilityfollowing acute myocardial infarction.
IntroductionPatients with ischemic heart disease (IHD) and left ventricular dysfunction (LVD) carry poor prognosis [1].In some patients, myocardial dysfunction improves signi�cantly with revascularization and thusprognosis improves [2]. Several non-invasive modalities (such as single photon emission computedtomography (SPECT), dobutamine stress echocardiography (DSE), positron emission tomography (PET)and Cardiac Magnetic Resonance Imaging (CMR)) [3] have been approved to determine patients withviable myocardium, who will most bene�t from revascularization [2].
Out of the newly validated methods for assessment of myocardial viability, DSE was the most widelyavailable approach [4] with an overall similar sensitivity compared with other non-invasive imagingmodalities and highest speci�city [5]. However, its subjectivity limits its diagnostic value as its liable forinter-observer and intra-observer variability [6]. Some researchers explored the potentiality of addingdeformation indices measurement to DSE protocol in the atrial function to overcome its subjectivity andthe results were promising [7–9].
In general, deformation indices allow for more direct assessment of myocardial muscle shortening andlengthening throughout the cardiac cycle by assessing regional myocardial strain and strain rate. Strain
Page 3/16
is de�ned as the change in length of a segment of myocardium relative to its resting length; strain rate isthe rate of this deformation. Longitudinal and circumferential shortening results in negative strain values,whereas radial thickening results in a positive strain value [10–11].
Resting Longitudinal Strain (RLS) and Longitudinal Strain Rate (RLSR) imaging can be measured basedon either tissue Doppler imaging or 2-dimensional speckle tracking (STE) [12]. Echocardiography andCMR can be used to quantify myocardial strain and strain rate [4, 13]. It was proposed that it is saver andeasier for diagnosis if resting strain/strain rate could accurately predict myocardial viability [13].
The current study aimed to evaluate the validity criteria of resting strain/strain rate in predictingmyocardial viability taking DE-CMR as gold standard.
Patients And MethodsA prospective follow-up design was adopted for this study. Sixty patients 3-months post-acutemyocardial infarction (AMI) were recruited for the current study after ful�lling the inclusion/exclusioncriteria from Aswan university hospitals and Aswan heart center (AHC). Patients were visiting the clinicsfor assessment of myocardial viability. The study period was from March 2019 to June 2020.
According to the power calculation via G*Power 3 software [14], a calculated minimum sample of 254segments with signi�cant resting wall motion abnormalities in patients with STEMI were needed to detectan effect size of 0.1 in the mean RLS/RLSR among viable vs. non-viable segments, with an errorprobability of 0.05 and 90% power on a two-tailed test.
Patients presented 3-months post-AMI, aged > 18 years with segmental wall motion abnormalities (WMA)as diagnosed by 2-D-Echocardiography were included. Exclusion criteria were, patients with early post-infarction unstable angina, severe hemodynamic instability, clinically evident congestive heart failure,mechanical complications of MI, signi�cant valvular/congenital heart disease/any myocardial diseaseapart from ischemia, atrial �brillation and bundle branch block and technically inadequateEchocardiographic imaging de�ned as more than two non-analyzable segments in the infarct zone.
Study tools
Baseline data including socio-demographics, history of chronic disease (hypertension and diabetesmellitus), family history of cardiac disease and smoking were obtained from the patients/or theircaregivers.
All patients were subjected to:
• 2-D speckle tracking based strain and strain rate (Fig. 1):Echocardiographic images were obtained using Philips 4D (GE Healthcare, Horton, Norway) with a 3.5-MHz transducer. 2-D echocardiography was used for assessment LV dimensions, resting wall motion
Page 4/16
abnormalities, LV function by Simpson's method. Apical 4-chamber, 3-chamber and 2-chamber viewswere recorded at baseline. Images were digitized in cine-loop format and saved for subsequent playbackand analysis.
Using the 17-segment model of the Philips Q lab. -10 software, myocardial RLS/SR with STE werecalculated o�ine individually for each segment. Of the 17 segments, only those segments that hadbaseline resting signi�cant WMA (Akinesia, dyskinesia or marked hypokinesia) were included in thisstudy. STE based S/SR were measured in 1 cardiac cycle per view. A machine-generated frame wasapplied to stored images in various views to generate results. The software then tracked speckles frame-by-frame throughout the entire cardiac cycle. Initially, automatic traces were applied by the machine andif traces were not corresponding with cardiac borders, they were manually corrected to match to get �nalobservation. The automated software then generated traces depicting regional strain and strain rate, fromwhich peak systolic strain and strain rate were recorded.
• DE- CMR (Fig. 2):DE-CMR was performed at least three months after STEMI occurrence. Magnetic resonance (MR) imageswere acquired using a Siemens IRA 1.5 T system. For DE-CMR analysis, a 17-segment LV model wasused. The protocol included scouts, short-axis, 4-chamber, 2-chamber, 3 chamber cine acquisitions, earlygadolinium enhancement (within the �rst 1–3 minutes after contrast infusion) to look for amicrovascular obstruction indicating a no re�ow as well as LV thrombi, and late gadoliniumenhancement using phase-sensitive inversion recovery sequences technique for the determination oftrans-murality. In accordance with the clinical de�nition, viability is deemed as present when trans-murality is below 50% of the area of the affected segment, and absent when greater than 50% [15].
Statistical analysis:Data were veri�ed, coded by the researcher, and analysed using IBM-SPSS 24.0 [16]. Descriptivestatistics: Means, standard deviations were calculated. Test of signi�cances: Independent sample t-testwas carried out to compare the means between groups. Validity statistics (sensitivity, speci�city, positiveand negative predictive value –PPV & NPV-) were calculated. Receiver operating characteristic (ROC)curve for the RLS/RLSR for every segment was calculated, analyzed as the area under the curve (AUC),standard error (SE) and 95% CI. A p-value < 0.05 was considered signi�cant.
Statement of Ethics
The IRB of the Medical Faculty, Aswan University approved the study (IRB No. 222/3/18). The study wascarried out in accordance with the guidelines of the Declaration of Helsinki [17]. Also, all participantscompleted a written consent form that indicate the aim and methods of the study, as well as the bene�tsand drawbacks of participation. Participants were given the freedom to withdraw at any time. Moreover,con�dentiality and anonymity were assured. Neither incentives nor rewards were offered for theparticipants.
Page 5/16
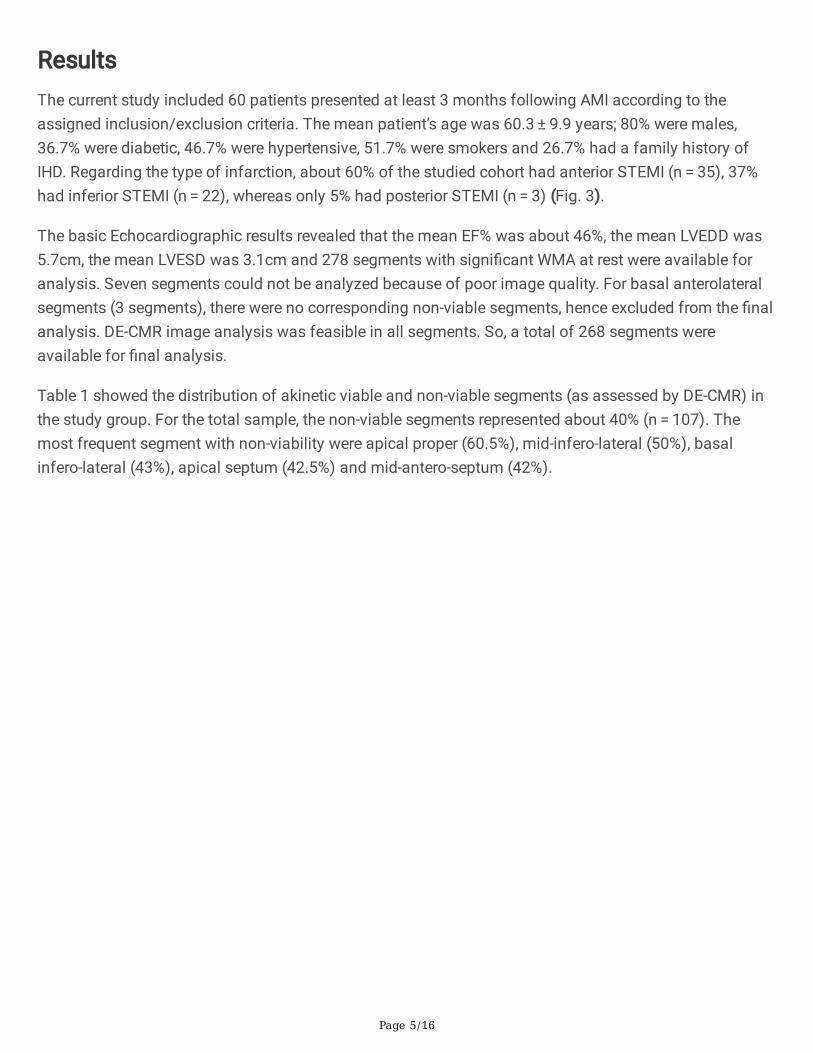
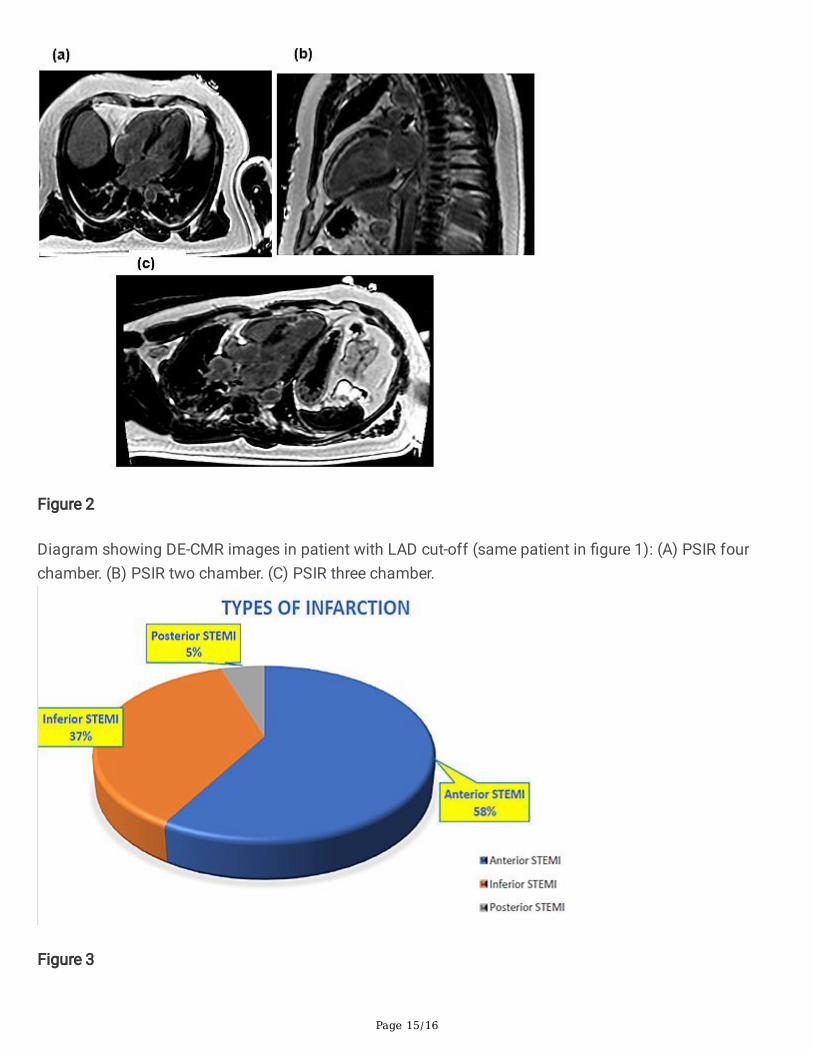
ResultsThe current study included 60 patients presented at least 3 months following AMI according to theassigned inclusion/exclusion criteria. The mean patient’s age was 60.3 ± 9.9 years; 80% were males,36.7% were diabetic, 46.7% were hypertensive, 51.7% were smokers and 26.7% had a family history ofIHD. Regarding the type of infarction, about 60% of the studied cohort had anterior STEMI (n = 35), 37%had inferior STEMI (n = 22), whereas only 5% had posterior STEMI (n = 3) (Fig. 3).
The basic Echocardiographic results revealed that the mean EF% was about 46%, the mean LVEDD was5.7cm, the mean LVESD was 3.1cm and 278 segments with signi�cant WMA at rest were available foranalysis. Seven segments could not be analyzed because of poor image quality. For basal anterolateralsegments (3 segments), there were no corresponding non-viable segments, hence excluded from the �nalanalysis. DE-CMR image analysis was feasible in all segments. So, a total of 268 segments wereavailable for �nal analysis.
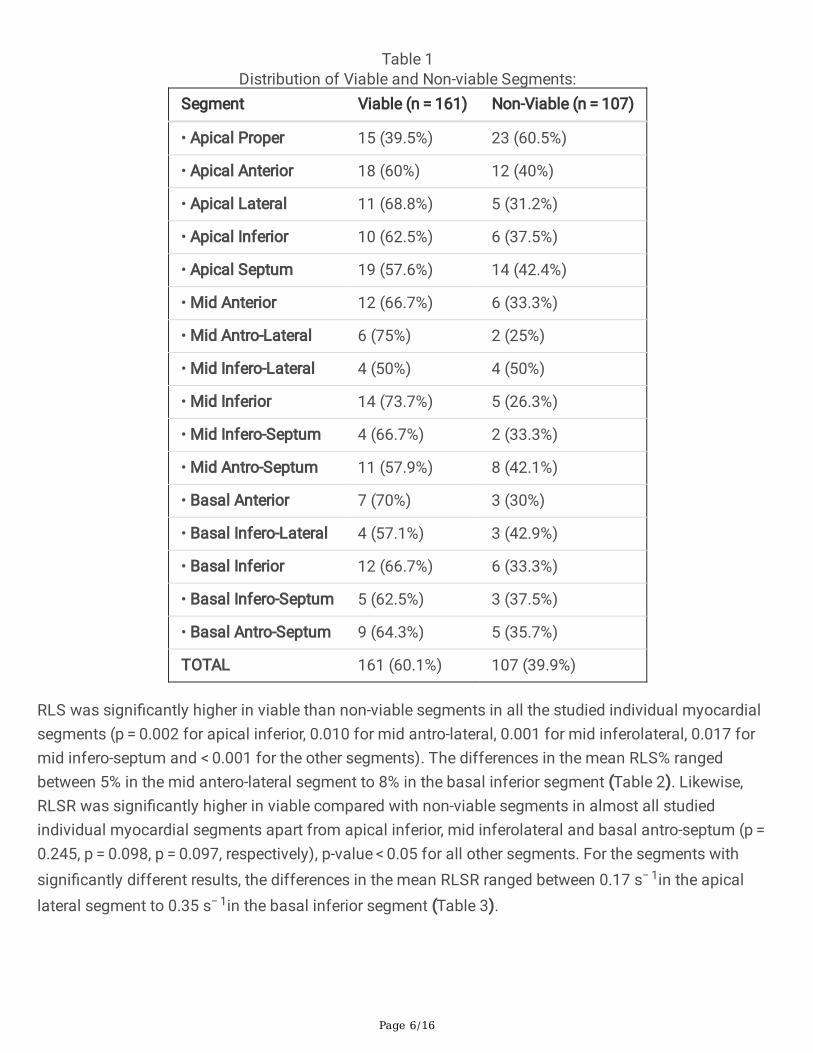
Table 1 showed the distribution of akinetic viable and non-viable segments (as assessed by DE-CMR) inthe study group. For the total sample, the non-viable segments represented about 40% (n = 107). Themost frequent segment with non-viability were apical proper (60.5%), mid-infero-lateral (50%), basalinfero-lateral (43%), apical septum (42.5%) and mid-antero-septum (42%).
Page 6/16
Table 1Distribution of Viable and Non-viable Segments:
Segment Viable (n = 161) Non-Viable (n = 107)
• Apical Proper 15 (39.5%) 23 (60.5%)
• Apical Anterior 18 (60%) 12 (40%)
• Apical Lateral 11 (68.8%) 5 (31.2%)
• Apical Inferior 10 (62.5%) 6 (37.5%)
• Apical Septum 19 (57.6%) 14 (42.4%)
• Mid Anterior 12 (66.7%) 6 (33.3%)
• Mid Antro-Lateral 6 (75%) 2 (25%)
• Mid Infero-Lateral 4 (50%) 4 (50%)
• Mid Inferior 14 (73.7%) 5 (26.3%)
• Mid Infero-Septum 4 (66.7%) 2 (33.3%)
• Mid Antro-Septum 11 (57.9%) 8 (42.1%)
• Basal Anterior 7 (70%) 3 (30%)
• Basal Infero-Lateral 4 (57.1%) 3 (42.9%)
• Basal Inferior 12 (66.7%) 6 (33.3%)
• Basal Infero-Septum 5 (62.5%) 3 (37.5%)
• Basal Antro-Septum 9 (64.3%) 5 (35.7%)
TOTAL 161 (60.1%) 107 (39.9%)
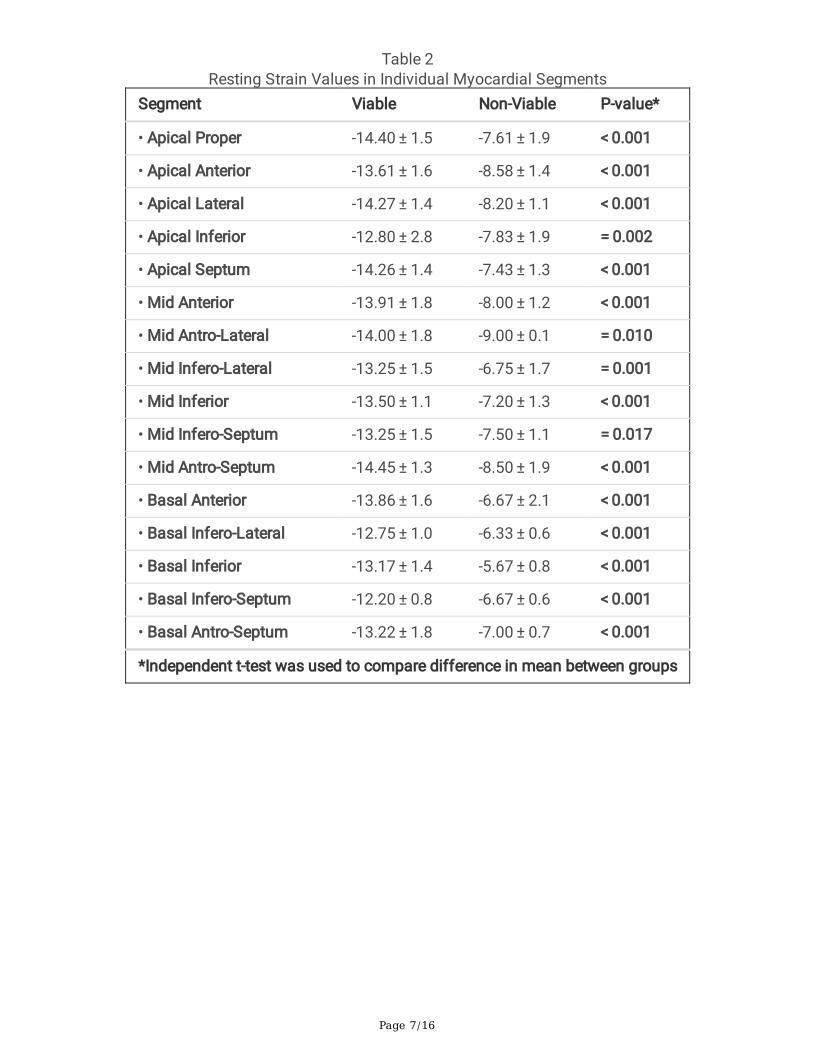
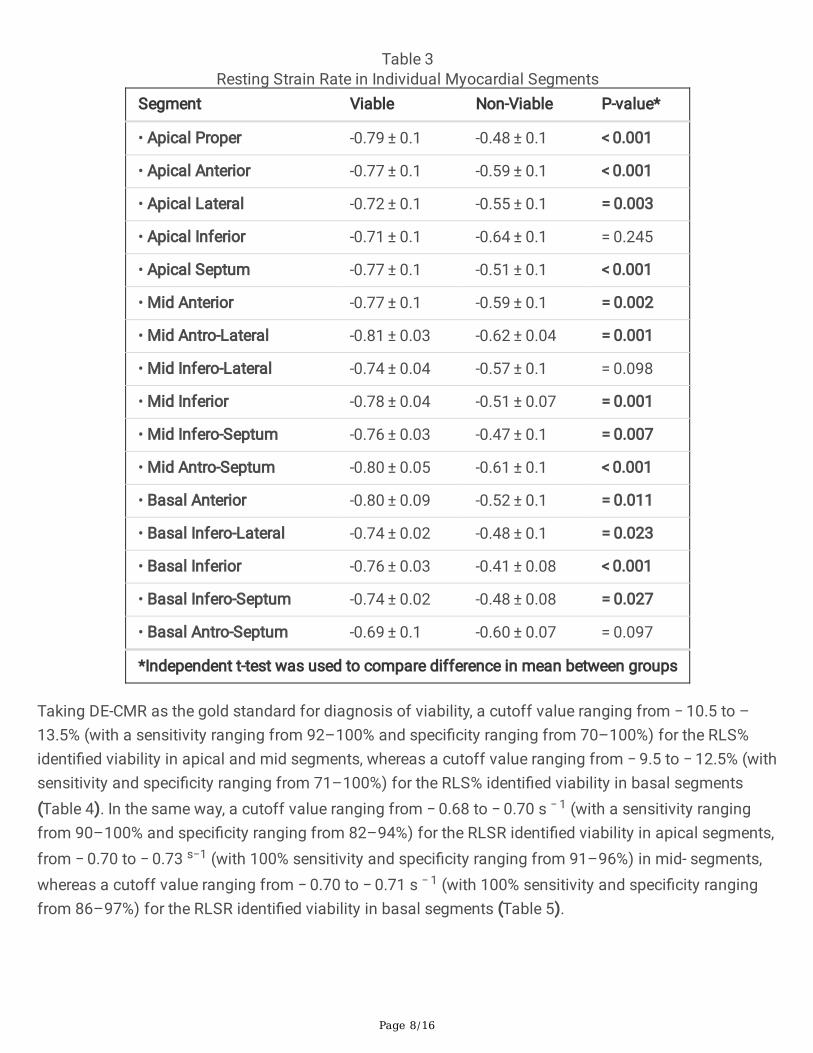
RLS was signi�cantly higher in viable than non-viable segments in all the studied individual myocardialsegments (p = 0.002 for apical inferior, 0.010 for mid antro-lateral, 0.001 for mid inferolateral, 0.017 formid infero-septum and < 0.001 for the other segments). The differences in the mean RLS% rangedbetween 5% in the mid antero-lateral segment to 8% in the basal inferior segment (Table 2). Likewise,RLSR was signi�cantly higher in viable compared with non-viable segments in almost all studiedindividual myocardial segments apart from apical inferior, mid inferolateral and basal antro-septum (p = 0.245, p = 0.098, p = 0.097, respectively), p-value < 0.05 for all other segments. For the segments withsigni�cantly different results, the differences in the mean RLSR ranged between 0.17 s− 1in the apicallateral segment to 0.35 s− 1in the basal inferior segment (Table 3).
Page 7/16
Table 2Resting Strain Values in Individual Myocardial Segments
Segment Viable Non-Viable P-value*
• Apical Proper -14.40 ± 1.5 -7.61 ± 1.9 < 0.001
• Apical Anterior -13.61 ± 1.6 -8.58 ± 1.4 < 0.001
• Apical Lateral -14.27 ± 1.4 -8.20 ± 1.1 < 0.001
• Apical Inferior -12.80 ± 2.8 -7.83 ± 1.9 = 0.002
• Apical Septum -14.26 ± 1.4 -7.43 ± 1.3 < 0.001
• Mid Anterior -13.91 ± 1.8 -8.00 ± 1.2 < 0.001
• Mid Antro-Lateral -14.00 ± 1.8 -9.00 ± 0.1 = 0.010
• Mid Infero-Lateral -13.25 ± 1.5 -6.75 ± 1.7 = 0.001
• Mid Inferior -13.50 ± 1.1 -7.20 ± 1.3 < 0.001
• Mid Infero-Septum -13.25 ± 1.5 -7.50 ± 1.1 = 0.017
• Mid Antro-Septum -14.45 ± 1.3 -8.50 ± 1.9 < 0.001
• Basal Anterior -13.86 ± 1.6 -6.67 ± 2.1 < 0.001
• Basal Infero-Lateral -12.75 ± 1.0 -6.33 ± 0.6 < 0.001
• Basal Inferior -13.17 ± 1.4 -5.67 ± 0.8 < 0.001
• Basal Infero-Septum -12.20 ± 0.8 -6.67 ± 0.6 < 0.001
• Basal Antro-Septum -13.22 ± 1.8 -7.00 ± 0.7 < 0.001
*Independent t-test was used to compare difference in mean between groups
Page 8/16
Table 3Resting Strain Rate in Individual Myocardial Segments
Segment Viable Non-Viable P-value*
• Apical Proper -0.79 ± 0.1 -0.48 ± 0.1 < 0.001
• Apical Anterior -0.77 ± 0.1 -0.59 ± 0.1 < 0.001
• Apical Lateral -0.72 ± 0.1 -0.55 ± 0.1 = 0.003
• Apical Inferior -0.71 ± 0.1 -0.64 ± 0.1 = 0.245
• Apical Septum -0.77 ± 0.1 -0.51 ± 0.1 < 0.001
• Mid Anterior -0.77 ± 0.1 -0.59 ± 0.1 = 0.002
• Mid Antro-Lateral -0.81 ± 0.03 -0.62 ± 0.04 = 0.001
• Mid Infero-Lateral -0.74 ± 0.04 -0.57 ± 0.1 = 0.098
• Mid Inferior -0.78 ± 0.04 -0.51 ± 0.07 = 0.001
• Mid Infero-Septum -0.76 ± 0.03 -0.47 ± 0.1 = 0.007
• Mid Antro-Septum -0.80 ± 0.05 -0.61 ± 0.1 < 0.001
• Basal Anterior -0.80 ± 0.09 -0.52 ± 0.1 = 0.011
• Basal Infero-Lateral -0.74 ± 0.02 -0.48 ± 0.1 = 0.023
• Basal Inferior -0.76 ± 0.03 -0.41 ± 0.08 < 0.001
• Basal Infero-Septum -0.74 ± 0.02 -0.48 ± 0.08 = 0.027
• Basal Antro-Septum -0.69 ± 0.1 -0.60 ± 0.07 = 0.097
*Independent t-test was used to compare difference in mean between groups
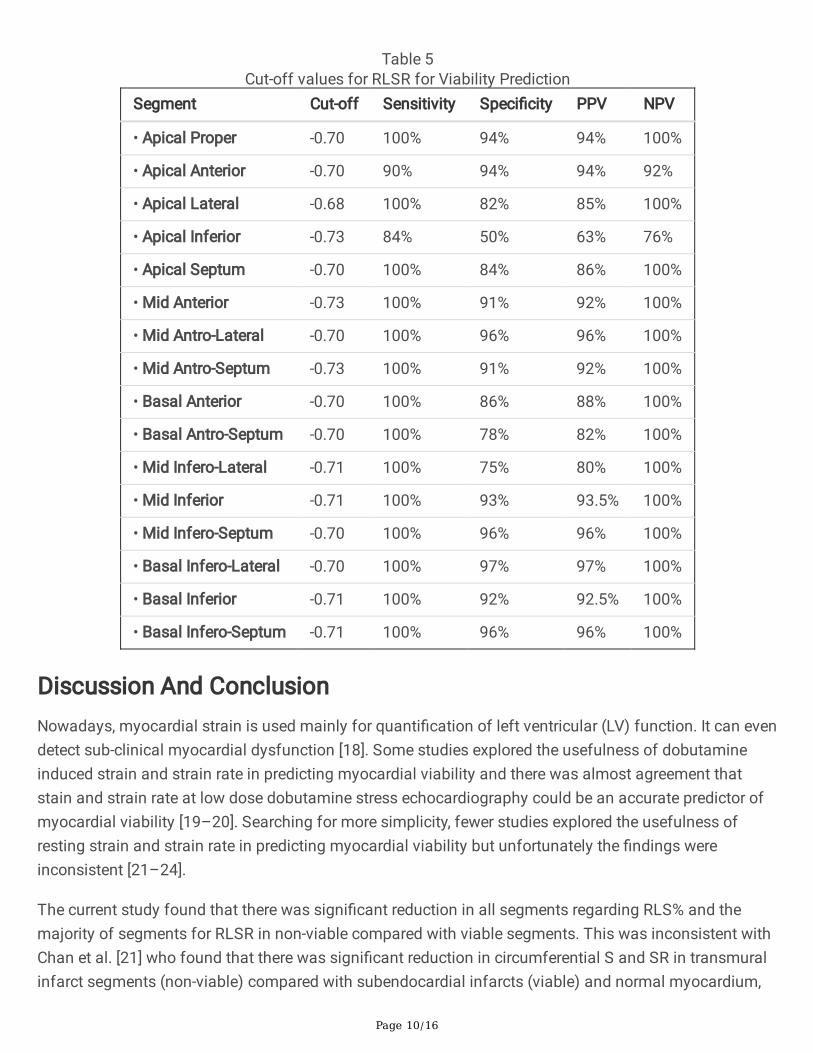
Taking DE-CMR as the gold standard for diagnosis of viability, a cutoff value ranging from − 10.5 to –13.5% (with a sensitivity ranging from 92–100% and speci�city ranging from 70–100%) for the RLS%identi�ed viability in apical and mid segments, whereas a cutoff value ranging from − 9.5 to − 12.5% (withsensitivity and speci�city ranging from 71–100%) for the RLS% identi�ed viability in basal segments(Table 4). In the same way, a cutoff value ranging from − 0.68 to − 0.70 s − 1 (with a sensitivity rangingfrom 90–100% and speci�city ranging from 82–94%) for the RLSR identi�ed viability in apical segments,from − 0.70 to − 0.73 s−1 (with 100% sensitivity and speci�city ranging from 91–96%) in mid- segments,whereas a cutoff value ranging from − 0.70 to − 0.71 s − 1 (with 100% sensitivity and speci�city rangingfrom 86–97%) for the RLSR identi�ed viability in basal segments (Table 5).
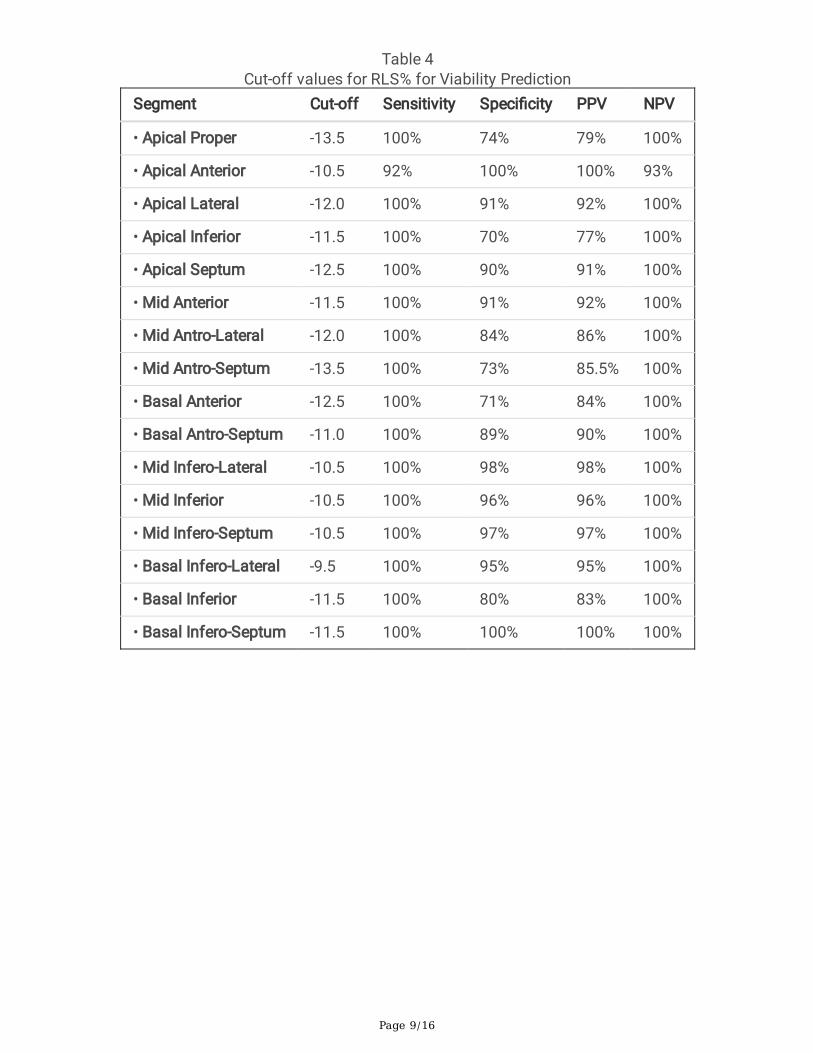
Page 9/16
Table 4Cut-off values for RLS% for Viability Prediction
Segment Cut-off Sensitivity Speci�city PPV NPV
• Apical Proper -13.5 100% 74% 79% 100%
• Apical Anterior -10.5 92% 100% 100% 93%
• Apical Lateral -12.0 100% 91% 92% 100%
• Apical Inferior -11.5 100% 70% 77% 100%
• Apical Septum -12.5 100% 90% 91% 100%
• Mid Anterior -11.5 100% 91% 92% 100%
• Mid Antro-Lateral -12.0 100% 84% 86% 100%
• Mid Antro-Septum -13.5 100% 73% 85.5% 100%
• Basal Anterior -12.5 100% 71% 84% 100%
• Basal Antro-Septum -11.0 100% 89% 90% 100%
• Mid Infero-Lateral -10.5 100% 98% 98% 100%
• Mid Inferior -10.5 100% 96% 96% 100%
• Mid Infero-Septum -10.5 100% 97% 97% 100%
• Basal Infero-Lateral -9.5 100% 95% 95% 100%
• Basal Inferior -11.5 100% 80% 83% 100%
• Basal Infero-Septum -11.5 100% 100% 100% 100%
Page 10/16
Table 5Cut-off values for RLSR for Viability Prediction
Segment Cut-off Sensitivity Speci�city PPV NPV
• Apical Proper -0.70 100% 94% 94% 100%
• Apical Anterior -0.70 90% 94% 94% 92%
• Apical Lateral -0.68 100% 82% 85% 100%
• Apical Inferior -0.73 84% 50% 63% 76%
• Apical Septum -0.70 100% 84% 86% 100%
• Mid Anterior -0.73 100% 91% 92% 100%
• Mid Antro-Lateral -0.70 100% 96% 96% 100%
• Mid Antro-Septum -0.73 100% 91% 92% 100%
• Basal Anterior -0.70 100% 86% 88% 100%
• Basal Antro-Septum -0.70 100% 78% 82% 100%
• Mid Infero-Lateral -0.71 100% 75% 80% 100%
• Mid Inferior -0.71 100% 93% 93.5% 100%
• Mid Infero-Septum -0.70 100% 96% 96% 100%
• Basal Infero-Lateral -0.70 100% 97% 97% 100%
• Basal Inferior -0.71 100% 92% 92.5% 100%
• Basal Infero-Septum -0.71 100% 96% 96% 100%
Discussion And ConclusionNowadays, myocardial strain is used mainly for quanti�cation of left ventricular (LV) function. It can evendetect sub-clinical myocardial dysfunction [18]. Some studies explored the usefulness of dobutamineinduced strain and strain rate in predicting myocardial viability and there was almost agreement thatstain and strain rate at low dose dobutamine stress echocardiography could be an accurate predictor ofmyocardial viability [19–20]. Searching for more simplicity, fewer studies explored the usefulness ofresting strain and strain rate in predicting myocardial viability but unfortunately the �ndings wereinconsistent [21–24].
The current study found that there was signi�cant reduction in all segments regarding RLS% and themajority of segments for RLSR in non-viable compared with viable segments. This was inconsistent withChan et al. [21] who found that there was signi�cant reduction in circumferential S and SR in transmuralinfarct segments (non-viable) compared with subendocardial infarcts (viable) and normal myocardium,
Page 11/16
but not in radial or longitudinal S and SR, in contrary. Zhang et al. [22] found that the peak longitudinalmyocardial deformation by strain rate imaging (SRI) can differentiate transmural (non-viable) from non-transmural (viable) myocardial infarction (MI), and it allows non-invasive determination of transmuralityof the scar after MI and thereby the extent of non-viable myocardium.
In current study, we assessed resting LS and LSR at each individual myocardial segment and �ndingswere stunning. We found that RLS were consistently signi�cantly higher in viable compared with non-viable segments. We also found that RLSR were signi�cantly higher in viable compared with non-viablesegments in almost all individual myocardial segment apart from apical inferior, mid inferolateral andbasal antro-septum.
To the best of our knowledge, Khaled et al. [23] was the �rst to assess usefulness of resting LS and LSRin predict myocardial viability at individual myocardial segments but unfortunately the results weredisappointing. They found that RLS was signi�cantly higher in viable as compared with non-viablesegments in the basal inferior, basal anteroseptal, basal posterior, as well as apical inferior positions.Otherwise, no signi�cant difference was found between the S of viable and non-viable segments in therest of positions. Similarly, RLSR was signi�cantly higher in viable as compared with non-viablesegments in the mid-lateral, mid- and apical anterior, apical inferior, as well as basal anteroseptalpositions. Otherwise, no signi�cant difference was found between the SR of viable and non-viablesegments in the rest of positions [23].
They utilized tissue doppler based RLS and RLSR in their study which is angel dependent, and this mayhave contributed to the inconsistency of their results. In the current study, 2D speckle tracking based RLSand RLSR was applied to overcome this shortcoming. In discordance with the current study, Khaled et al.,took 99m Tc-sestamibi scintigraphy as the gold standard for viability diagnosis, while CMR was assignedas gold standard for viability diagnosis in this study because of its availability in our institution.
Another point of disagreement, Kaled et al., performed RLS and RLSR at least one month following AMI,and this study was carried out at least three months following AMI. The bene�t of the current study timeselection was to give an adequate time for myocardial edema to resolve. This was reported by LøgstrupBB et al., who claimed that longitudinal systolic strain was signi�cantly correlated with myocardialedema [24]. Finally, in the current study, the cutoff values for RLSR that best discriminate viable from non-viable myocardium were higher than that of Khaled et al. while our cutoff value for RLS were more or lesslike that of Khaled et al. [23].
In conclusion, the �ndings of this work suggested that both RLS and RLSR can be easily added to routineechocardiographic protocol for quanti�cation of myocardial function and accurate prediction ofmyocardial viability. In the future, its simplicity, availability, safety, and cheap coast will make it the goldstandard modality for prediction of myocardial viability.
Declarations
Page 12/16
Acknowledgements: the authors would like to acknowledge the medical and administrative staff of thecardiology departments, Aswan University Hospital and radiology department, AHC for their keen helpand support. All praise and thanks to the study participants, for whom it was not possible to carry out thisresearch.
Disclosure Statement: The authors have no con�icts of interest to declare.
Funding Sources: no fund was received
Availability of data and material: Data is available as excel sheet and materials is available as DICOMimages.
Code availability: Custom code
Author Contributions: Amr H. Mahmoud (AHM); concept, design, literature search, clinical studies,manuscript preparation, editing and review. Soliman G. Ibrahim (SGI); design, literature search,manuscript preparation and review. Hosam-Eldein M Mohammed (HMM); literature search, clinicalstudies, manuscript editing and �nal draft. Aml M. Soliman (AMS); data analysis, clinical studies,manuscript preparation, editing and review. Mohammed K. Salama (MKS); statistical analysis,manuscript editing and �nal revision.
References1. Lö�er A, Kramer C (2018) Myocardial Viability Testing to Guide Coronary Revascularization. Interv
Cardiol Clin 7:355–365
2. Kim R, Shah D (2004) Fundamental concepts in myocardial viability assessment revisited: Whenknowing how much is “alive” is not enough. In: Heart. BMJ Publishing Group, pp 137–140
3. Khalaf S, Chamsi-Pasha M, Al-Mallah M (2019) Assessment of myocardial viability by PET. Curr OpinCardiol 34:466–472
4. El�gih I, Henein M (2014) Non-invasive imaging in detecting myocardial viability: Myocardialfunction versus perfusion. IJC Hear Vasc 5:51–56
5. Bax J, Wijns W, Cornel J, Visser F, Boersma E, Fioretti P (1997) Accuracy of currently availabletechniques for prediction of functional recovery after revascularization in patients with LVD due tochronic coronary artery disease: Comparison of pooled data. J Am Coll Cardiol 30:1451–1460
�. Ismail M, Nammas W (2015) Dobutamine-Induced Strain and Strain Rate Predict Viability FollowingFibrinolytic Therapy in Patients with ST-Elevation Myocardial Infarction. Front Cardiovasc Med 2:1–6
7. Lucignani G, Cuocolo A (2009) Recent advances in the assessment of myocardial viability. Eur JNucl Med Mol Imaging 36:1892–1895
�. Allman K (2013) Noninvasive assessment myocardial viability: Current Status and future directions.J Nucl Cardiol 20:618–637
Page 13/16
9. Shabana A, El-Menyar A (2012) "Myocardial Viability: What We Knew and What Is New?", CardiologyResearch and Practice, vol. 2012, Article ID 607486, 13 pages
10. Shah A, Solomon S (2012) Myocardial deformation imaging: Current status and future directions.Circulation 17(2):e244–e248. 125 125 )
11. Liberato C, Olegario N, Fernandes V, Montenegro A, Lima G, Batista L et al (2020) Early LeftVentricular Systolic Dysfunction Detected by Two-Dimensional Speckle-Tracking Echocardiographyin Young Patients with Congenital Generalized Lipodystrophy. Diab Metab Syndr Obes 13:13: 107–115
12. Textbook of Echocardiography-Oxford Medicine 2nd Edition (2011) Edited by Galiuto L, Badano L,Fox K, Sicari R, and Luis J Zamorano. Oxford University Press
13. Zghal F, Boudiche S, Haboubi S, Neji H, Ben-Halima M, Rekik B et al (2020) Diagnostic accuracy ofstrain imaging in predicting myocardial viability after an ST-elevation myocardial infarction.Medicine 99(19):e19528
14. Faul F, Erdfelder E, Lang A-G, Buchner A (2007) G*Power 3: A �exible statistical power analysisprogram for the social, behavioral, and biomedical sciences. Behav Res Methods 39:175–191
15. Souto A, Souto R, Teixeira I, Nacif M (2017) Myocardial viability on cardiac magnetic resonance. ArqBras Cardiol 108:458–468
1�. IBM_SPSS (2016) Statistical Package for Social Science. Ver.24. Standard version. Copyright ©SPSS Inc., 2012–2016. NY, USA
17. World Medical Association. ( 2001) . World Medical Association Declaration of Helsinki. Ethicalprinciples for medical research involving human subjects. Bulletin of WHO, 79 ( 4) , 373–374
1�. Smiseth O, Torp H, Opdahl A, Haugaa K, Urheim S (2016) Myocardial strain imaging: how useful is itin clinical decision making? European heart journal 37(15):1196–1207
19. Mehkiemer B, Al-Habba A, Mukarrab M, Al-Amin A (2020) Assessment of Myocardial Viability UsingLow Dose Dobutamine 3-d STE. Al-Azhar Medical Journal 49(3):1359–1368
20. Rumbinaitė E, Žaliaduonytė-Pekšienė D, Vieželis M, Čeponienė I, Lapinskas T, Žvirblytė R et al (2016)Dobutamine-stress echocardiography speckle-tracking imaging in the assessment of hemodynamicsigni�cance of coronary artery stenosis in patients with moderate and high probability of coronaryartery disease. Medicina 52(6):331–339
21. Chan J, Hanekom L, Wong C, Leano R, Cho G, Marwick T (2006) Differentiation of subendocardialand transmural infarction using two-dimensional strain rate imaging to assess short-axis and long-axis myocardial function. J Am Coll Cardiol 21(10):2026–2033 48 )
22. Zhang Y, Chan A, Yu C, Yip G, Fung J, Lam W et al (2005) Strain rate imaging differentiatestransmural from non-transmural myocardial infarction: a validation study using delayed-enhancement magnetic resonance imaging. J Am Coll Cardiol 6(5):864–871 46 )
23. haled SK, emerdash SD, Mallah WE-, Ismail M (2011) Usefulness of Resting Strain Rate Imaging toPredict Viability following Acute Myocardial Infarction Strain Rate Imaging and Myocardial Viability.Transl Med 01:1–4. https://doi.org/10.4172/2161-1025.1000101
Page 14/16
24. Løgstrup B, Nielsen J, Kim W, Poulsen S (2016) Myocardial oedema in acutemyocarditis detected byechocardiographic 2Dmyocardial deformation analysis. Eur Heart J Cardiovasc Imaging 17:1018–1026
Figures
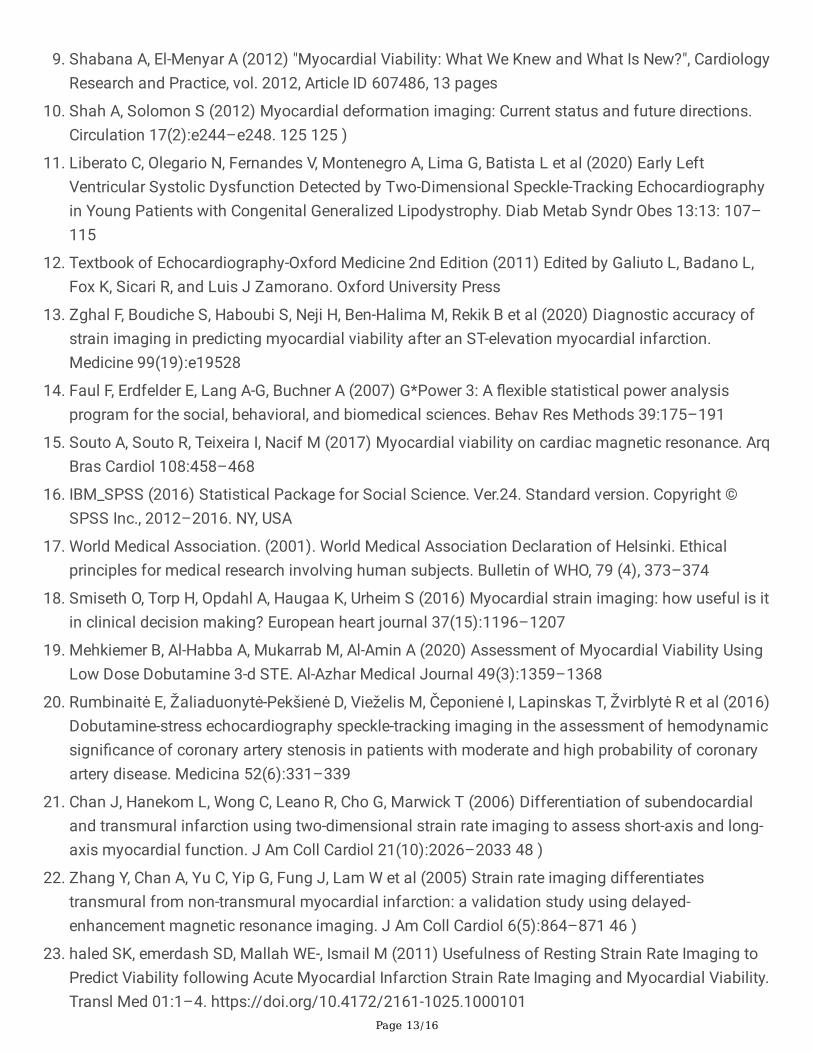
Figure 1
Diagram showing Measurement of Longitudinal Myocardial Strain using Speckle-tackingEchocardiography in patient with LAD cut-off: (A) Apical four chamber. (B) Apical two chamber. (C) Apicalthree chamber. (D) 17-segment bull's eye map for longitudinal strain.
Page 15/16
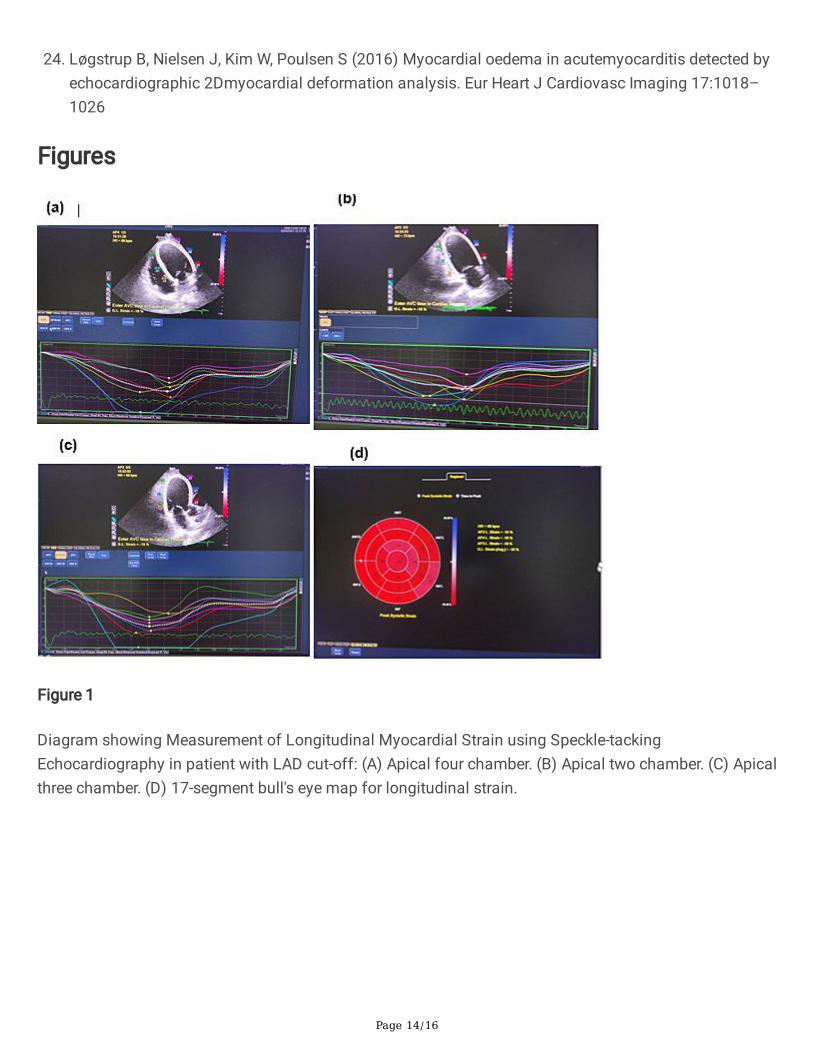
Figure 2
Diagram showing DE-CMR images in patient with LAD cut-off (same patient in �gure 1): (A) PSIR fourchamber. (B) PSIR two chamber. (C) PSIR three chamber.
Figure 3

Page 16/16
Types of Infarctions among the studied Cohort


