Embed Size (px)
Citation preview

VALUATION OF NORWEGIAN AIR SHUTTLE ASA
Master’s Thesis
Copenhagen Business School
MSc EBA: Finance and Strategic Management
Author: Supervisor:
Trond Sundquist Jens Borges
Student Number: 107008
Characters (incl. spacing): 181,991
Standard Pages: 80
Date of submission: 15.05.2018

1
Table of Contents
1. Executive Summary .......................................................................................................................... 4
2. Introduction ...................................................................................................................................... 5
2.1 Research Question ........................................................................................................................ 6
2.2 Methodology................................................................................................................................. 7
2.2.1 Data Collection and Validity ................................................................................................. 7
2.2.2 Thesis Structure ..................................................................................................................... 7
2.2.3 Delimitation ........................................................................................................................... 8
3. Norwegian Air Shuttle ASA............................................................................................................. 9
3.1 Company Overview ...................................................................................................................... 9
3.2 Vision, Strategy and Business Model ........................................................................................... 9
3.3 Organizational Structure ............................................................................................................. 10
3.4 Ownership Structure ................................................................................................................... 11
3.5 Share Performance ...................................................................................................................... 11
3.6 Competitive Environment – Peer Group .................................................................................... 12
4. Strategic Analysis ........................................................................................................................... 14
4.1 Macro-Environmental Analysis – PESTLE................................................................................ 14
4.1.1 Political and Legal Factors .................................................................................................. 14
4.1.2 Economic Factors ................................................................................................................ 16
4.1.3 Social ................................................................................................................................... 18
4.1.4 Technological ...................................................................................................................... 19
4.1.5 Environmental ..................................................................................................................... 19
4.2 Micro-Environmental Analysis – Porter’s Five Forces .............................................................. 20
4.2.1 Threat of New Entrants ........................................................................................................ 20
4.2.2 Threat of Substitutes ............................................................................................................ 21

2
4.2.3 Rivalry Among Competitors ............................................................................................... 23
4.2.4 Bargaining Power of Suppliers ............................................................................................ 24
4.2.5 Bargaining Power of Buyers ................................................................................................ 25
4.2.6 Overview of the Five Forces ............................................................................................... 25
4.3 Organizational Analysis – VRIO ................................................................................................ 26
4.3.1 Brand Name ......................................................................................................................... 26
4.3.2 Modern Fleet of Aircrafts .................................................................................................... 27
4.3.3 No-Frills Long-Haul Strategy .............................................................................................. 28
4.3.4 Overview and Competitive Advantage ................................................................................ 29
5. Financial Analysis ........................................................................................................................... 30
5.1 Quality of Data and Financial Statements .................................................................................. 30
5.2 Analytical Statements ................................................................................................................. 30
5.2.1 Analytical Income Statement ............................................................................................... 30
5.2.2 Analytical Balance Sheet ..................................................................................................... 32
5.3 Profitability Analysis .................................................................................................................. 33
5.3.1 Return on Invested Capital .................................................................................................. 33
5.3.2 Industry-Specific Ratios ...................................................................................................... 35
5.3.3 EBIT-Margin Decomposition .............................................................................................. 37
5.4 Liquidity and Solvency Risk Analysis ....................................................................................... 41
5.4.1 Liquidity Risk ...................................................................................................................... 41
5.4.2 Solvency Risk ...................................................................................................................... 42
5.4.3 Liquidity Efficiency ............................................................................................................. 44
5.4.4 Risk of default ..................................................................................................................... 45
5.5 Financial Analysis in Perspective ............................................................................................... 48
5.6 SWOT ......................................................................................................................................... 48
6. Estimating Cost of Capital ............................................................................................................. 49
6.1 Capital Structure ......................................................................................................................... 49
6.2 Cost of Equity ............................................................................................................................. 50

3
6.3 Beta ............................................................................................................................................. 51
6.4 Cost of Debt ................................................................................................................................ 54
6.5 Estimating WACC ...................................................................................................................... 55
7. Forecasting ...................................................................................................................................... 56
7.1 Pro Forma: Income Statement .................................................................................................... 56
7.1.1 ASK and Fleet Growth ........................................................................................................ 57
7.1.2 Revenues .............................................................................................................................. 58
7.1.3 Operating Expenses ............................................................................................................. 60
7.2 Pro Forma: Balance Sheet .......................................................................................................... 65
7.2.1 Net Working Capital ............................................................................................................ 65
7.2.2 Tangible Assets.................................................................................................................... 66
7.2.3 Intangible Assets.................................................................................................................. 67
7.2.4 Net Interest-Bearing Debt .................................................................................................... 67
8. Valuation ......................................................................................................................................... 68
8.1 Valuation Methods ..................................................................................................................... 68
8.1.1 Discounted Cash Flow ......................................................................................................... 68
8.1.2 Liquidation Value ................................................................................................................ 69
8.1.3 Relative Valuation Using Multiples .................................................................................... 71
8.1.4 Acquisition Valuation .......................................................................................................... 72
8.2 Scenario Analysis ....................................................................................................................... 74
8.2.1 Deviating Seasonal Demand ................................................................................................ 74
8.2.2 Surging Oil Price ................................................................................................................. 75
8.2.3 Access to the Siberian Corridor ........................................................................................... 75
8.3 Sensitivity Analysis .................................................................................................................... 76
8.3.1 Terminal Growth and WACC .............................................................................................. 76
8.3.2 Monte Carlo ......................................................................................................................... 77
9. Conclusion ....................................................................................................................................... 80
Bibliography ........................................................................................................................................ 81

4
1. Executive Summary
The subject matter of this thesis is to provide a comprehensive strategic and financial assessment of
Norwegian Air Shuttle ASA, with the purpose of estimating the airline’s fair share price per 01.05.2018.
The thesis applies diverse methods of analysis, such as recognized strategic frameworks and financial ratios
to gauge the airline’s performance. The strategic analysis is organized to reveal how the macro-environment
influences Norwegian Air Shuttle ASA’s strategic outlook through the use of the PESTLE framework. The
micro-environment consists of industry-specific forces in the airline’s close vicinity and is examined through
the Porter’s Five Forces model. Barney’s VRIO-framework investigates internal resources and capabilities
and evaluates whether core competencies enable competitive advantage and whether they are exploited. The
financial analysis investigates a wide array of ratios that indicate Norwegian Air Shuttle ASA’s financial
health and competitiveness, relative to a selected peer group. The core valuation model of the thesis is the
discounted cash flow model. The approach is stress-tested by a relative valuation and supplemented by a
liquidation- and acquisition valuation. Scenario- and sensitivity analyses gauge the share price volatility.
The findings of the thesis suggest that Norwegian Air Shuttle ASA operates in a highly competitive and
capital-intensive industry. The strategic analysis shows that the industry is characterized by homogeneous
products and services, while a low oil price has expedited major investments in capacity and increased the
financial risk in the industry. Norwegian Air Shuttle ASA is also delivering inferior financial performance,
relative to its peer group consisting of SAS, Ryanair and easyJet. The financial analysis highlights that the
airline has weak short- and long-term liquidity, and that it faces significant default risk. This is evident as
Norwegian Air Shuttle ASA is estimated to deliver significant negative cash flows in the short-term.
The core DCF-valuation estimates a share price equal to NOK 236 per 01.05.2018, which suggests an
overvalued share compared to the value on the Norwegian OBX of NOK 303. The relative valuation using
multiples also suggests an overvalued share, which indicates that the DCF-estimate is reasonable. The thesis
accentuates that NAS is exposed to default risk and the Liquidation Value method indicates that its equity
holders receive NOK 0, in the event of a default. Furthermore, the thesis values Norwegian Air Shuttle ASA
from the perspective of the International Airlines Group. This acquisition valuation indicates that its
maximum acquisition value of Norwegian Air Shuttle ASA is NOK 486 per share, while the acquiring price
is estimated to be located within the bargaining range of NOK 303 – NOK 468.
The core valuation is supplemented by scenario and sensitivity analyses, which show that the share price is
especially sensitive to the terminal growth rate, production growth and jet fuel costs. The scenario analyses
suggest a potential downside and upside in the range of NOK 138 – NOK 282. The analyses show that the
DCF-estimation of NOK 236 is reasonable, but highly volatile.
5
2. Introduction
Technological advances are changing how the world is perceived and experienced. The invention of the
airplane belongs in that category. Since its origin in the early 20th century, continuous strides in aviation
technology have altered the perception of distance, making the world a smaller place.
For a long time, the airline industry was characterized by a few major airlines called legacy carriers, who
dominated routes internationally. From the 1950s, commercial air travel was perceived as a luxury good,
reserved for wealthy individuals and prominent business travelers. The air travel itself was an experience and
is popularly called “the Golden Age of Air Travel”. The legacy carriers were profitable, as few competitors
competed by offering high-quality service and amenities. However, the legacy carriers were negatively
affected by the U.S. Airline Deregulation Act of 1978, which facilitated free competition by removing the
U.S. federal government’s control over routes and pricing. This spurred a new category of competitors,
namely low-cost airlines (LCCs). Competition increased as LCCs offered lower fares than legacy carriers,
removing all-inclusive features from its tickets, such as luggage and meals. Hence, LCCs took differentiation
to a new level.
Environmental sustainability has become the center of the airline industry’s attention in the past decade as
technological innovations reduce costs, but also limit the airlines’ environmental footprint. Hence, the
industry is under a constant threat of disruption. The industry is characterized by seasonal fluctuations. The
industry consensus is that the development in world GDP is a suitable indicator of air travel demand, as the
International Air Transport Association (IATA) predicts a doubling of air travelers in 20 years.1 Commercial
airlines are often highly leveraged with pressured margins. As travelers are perceived as price-sensitive, the
chief competitive tool is low fares.
The thesis examines the airline industry through a valuation of Norwegian Air Shuttle ASA (NAS). It
enables a comprehensive assessment of the challenges in the industry and serves as a framework of how
company value is created. NAS is chosen as the subject of this examination, because it is the third-largest
low-cost carrier (LCC) on the European short-haul market and is currently undergoing a phase of great
intercontinental expansion. NAS is positioning itself for the future by anchoring environmental sustainability
as a core strategic pillar underlying its push into low-cost long-haul operations. This makes the airline an
interesting investment case.
1 IATA (2017), Annual Review 2017, p. 33

6
2.1 Research Question
The goal of the thesis is to estimate the equity value of NAS. This is a comprehensive process that involves a
selection of strategic frameworks that examines the airline industry and financial analyses of the firm’s
historical performance. Hence, the principal aim of the thesis is to apply a selection of valuation techniques
to the obtained data, in order to estimate the share price of NAS.
The process is guided by the following overarching research question:
What is the estimated share price of Norwegian Air Shuttle ASA as of 01.05.2018?
The thesis acknowledges that the answer to the research question is associated with assumptions and
uncertainty. Hence, it emphasizes that the intrinsic value of NAS is an estimated value.
A number of guiding sub-questions are incorporated in each section of the thesis. They encourage coherent
analyses throughout the thesis and facilitate an extensive understanding of the factors that affect NAS’s
equity value. This is done in an effort to improve the accuracy of the valuation. The ensuing sub-sections
describe each part of the thesis and show how the sub-questions facilitate the process.
Company Overview
This section forms the foundation for the strategic- and financial analyses of NAS. Its purpose is to ensure
that the valuation is based on relevant data. Thus, it emphasizes how NAS is structured, how and where it
operates and its business model.
• How has NAS arranged its organization and what is the focus of its business model?
• Which airlines are NAS’ principal competitors?
Strategic Analysis
This section analyzes NAS’ internal capabilities and its external environment. It outlines how NAS is
exploiting its own resources to create value and how external factors affect NAS’ ability to do so.
• How robust is NAS’ competitive position in the airline industry?
• How do the competitive forces in the airline industry affect the profitability of NAS?
• How can NAS exploit its internal resources and capabilities to attain competitive advantage?
• In what way do macroeconomic forces affect the value drivers of NAS?
Financial Analysis
The purpose of this analysis is to reveal NAS’ financial state and expose its financial value drivers.
• What are the key financial value drivers in the airline industry?
• In what way do NAS’ financial value drivers influence profitability?

7
• How is the company performing relative to its peer group?
• How is NAS’ expansion strategy affecting liquidity?
Forecasting and Valuation
The forecasting section estimates NAS’ future cash flows and are used to estimate its share price.
• How will NAS’ value drivers develop and what is their impact on NAS’ cash flows?
• How will shifts in volatile factors influence NAS’ cash flows?
• What firm synergies exist and what is the value captured by NAS’ shareholders, if acquired by IAG?
• What is the residual value to NAS’ shareholders if all assets are sold and liabilities settled?
Scenario- and Sensitivity Analysis
This section examines the share price sensitivity and challenges core assumptions underlying the base case
scenario.
• How sensitive is the estimated share price to changes in key value drivers?
• How is NAS’ base case share price impacted by changes in core assumptions?
2.2 Methodology
2.2.1 Data Collection and Validity
The thesis is founded on publicly available information and contains both qualitative and quantitative data.
The former is principally incorporated in the strategic analysis, while the latter is rooted in the financial
section of the thesis. The main source of information are NAS and the peer group’s annual reports, which are
externally validated and considered as reliable sources of information. Hence, the thesis compares NAS to a
selected peer group as outlined in section 3.6. Moreover, it utilizes theoretical frameworks supplied from
certified academic literature and are thoroughly presented in their respective sections. A great number of
valuation methods exist, which derive value from different firm features. Present value (PV) and relative
valuation approaches are most commonly applied, while asset-based approaches and contingent claim
valuation methods could be viable alternatives. The thesis applies the discounted cash flow model (DCF) to
answer the overarching research question in detail and stress-test the estimate by performing a relative
valuation using multiples. A Liquidation Value estimation is also applied, which measures the residual value
to NAS’ shareholders in the event of a default. In addition, IAG’s recent interest in acquiring NAS is
examined through a DCF-model, which estimates the value of potential synergies from IAG’s perspective.
2.2.2 Thesis Structure
The thesis applies well-known frameworks and models to estimate the share price of NAS. It is not the scope
of this thesis to specifically challenge the existing valuation framework. Hence, the thesis aims to examine

8
and present alternative solutions and facilitate a deeper understanding of NAS’ value drivers, by challenging
company-specific assumptions. Figure 1 provides the recipient with a guiding framework of how the thesis
progresses. It is meant to facilitate a clear and coherent understanding of how the valuation is performed.
Hence, each section logically builds towards the next and are shown in Figure 1 below.
Figure 1: Thesis Structure
2.2.3 Delimitation
• The thesis is limited by scope. It assumes that the recipient has an understanding of financial theory.
• The valuation is based exclusively on publicly available data and secondary literature.
• All information published after the cutoff date of the thesis (01.05.2018) are discarded.
• The thesis keeps the Weighted Average Cost of Capital constant for NAS. In reality, this assumption
does not hold because it varies with shifts in the company’s capital structure.
• The DCF-model assumes that NAS operates as a going concern.
• The tax rate in Norway is set to the government’s signaled tax rate of 23%, in the terminal period.
Special Note
The International Airlines Group (IAG) purchased a 4.61% share in NAS, on 12.04.2018. NAS’ share price
responded by rising 69% until the cutoff date, landing at NOK 303. Given the unfortunate timing of this
event and the author’s time constraint, the thesis does not incorporate this development in the core valuation
of NAS. However, the thesis efforts to remedy the situation and incorporates a DCF-valuation in section
8.1.4, which estimates potential firm synergies and thus the potential value of NAS, from IAG’s perspective.
IAG’s maximum purchase price of NAS is estimated and the value captured by the NAS and IAG
shareholders, is discussed. Note that the thesis’ approach is limited and should be analyzed further.

9
3. Norwegian Air Shuttle ASA
A precise company valuation demands detailed knowledge about the subject company and its industry.
Hence, the following section introduces Norwegian Air Shuttle ASA and the industry it serves. The purpose
of the presentation is to secure a broad foundation for the valuation to mature from. Initially the emphasis is
on NAS’ history, organizational structure and peer group.
3.1 Company Overview
NAS is a Norwegian airline that was established in 1993. The company came into existence in the aftermath
of the bankruptcy of the airline Busy Bee of Norway2. Shortly after the collapse NAS assumed control over
Busy Bee’s regional routes on the West Coast of Norway, on behalf of Braathens SAFE. This relationship
was terminated in 2002, following the purchase of Braathens by Scandinavian Airlines Systems (SAS). NAS
responded by changing its strategy and rebranding itself as an LCC. NAS was able to compete with the
former monopolist full-service carrier (FSC) SAS Braathens, by focusing on profitable routes from Oslo to
large Norwegian cities. Less than a year after NAS lost its regional routes in the West Coast to SAS
Braathens, NAS had attained a considerable market share and operated 18 domestic routes in Norway.3
In 2003, the airline was listed on the Oslo Stock Exchange. The market showed significant interest in the
stock, which enabled NAS to expand internationally. During this time NAS reorganized its route network in
a strategic codeshare with FlyNordic and Sterling Airlines, while investing heavily in a modern fleet. NAS
delivered its first positive financial result in 2005.4 Managed by the CEO, Bjørn Kjos, NAS continued to
expand its European routes, primarily by focusing on Central European destinations, as well as Scandinavia.
This expansion was reinforced by the acquisition of the Swedish low-cost airline FlyNordic, in 2007. The
takeover sealed NAS’ position as the largest LCC in Scandinavia. The year 2012 marked the beginning of
NAS’ ongoing expansion. The airline placed an order of 222 aircrafts and signifies the cornerstone of the
company’s intercontinental strategy. NAS is currently the third-largest LCC in Europe in terms of passengers
and offers more than 500 routes to over 150 destinations.5 Its headquarters are located at Fornebu in Norway.
3.2 Vision, Strategy and Business Model
Vision, Strategy and Business Model
The business goal of NAS is to attract customers by offering high-quality low-fare travel. This is in
alignment with its vision statement, “affordable fares for all”.6 The airline states that exceptional service and
2 Verdens Gang (2015), Slik ramlet Kjos baklengs inn i flybransjen 3 Norwegian, NAS Annual Report 2003, p. 2 4 Norwegian, NAS Annual Report 2005, p. 4 5 Norwegian, NAS Annual Report 2017, p. 8 6 Norwegian, Vision and Values

10
low fares can be achieved in harmony and not only as a tradeoff, which arguably is a natural persuasion of an
LCC. NAS conducts its business guided by established values and operational priorities, which are anchored
in its core values; simplicity, directness and relevance.
The strategy of NAS is clear and follows a structured approach with a set of incorporated guidelines. It aims
to be the preferred LCC in selected markets, to be profitable and to create returns to its shareholders.7 First
and foremost, this is fulfilled by offering low fares and excellent service. Hence, NAS attempts to maintain
low operating costs through operational excellence and continue to offer high quality, yet cost-efficient travel
experiences. The result is a tailored low-cost product that attracts the homogeneous price sensitive customer.
The airline industry can be separated into segments that employ different business models with dissimilar
strategic focus. The industry is dominated by airlines that are either FSCs or LCCs. FSCs offer a different
travel experience than most LCCs. They are often large legacy airlines that are part of strategic hub-and-
spoke networks, which use feeder flights to connect the airlines’ hubs.8 The main advantage of these
networks is economies of density. The FSCs purposefully channel its passengers through its hubs at major
airports. This enables them to concentrate operations on larger aircrafts with lower operating costs per seat.
LCCs often operate out of secondary airports to reduce costs in a point-to-point network and targets high
load factors, which according to Mantin and Wang (2012) are positively correlated with airline profit
margins.9 In contrast, LCCs compete on price. Hence, maintaining the ability to offer low fares is the goal of
any LCC. A central strategic pillar is to maintain a high flight frequency to maximize the aircraft utilization.
It secures competitive prices, which according to Zuidberg (2014) and Brüggen & Klose (2010) contributes
to cost-efficiency and higher operating margins.
3.3 Organizational Structure
NAS is the parent company of the Norwegian Group (the Group) and has organized its operations and related
functions into several entities. In order to facilitate its growth ambition, the airline has focused on building a
flexible organization that is able to adapt to demand in new markets.10 NAS has divided its operational
activities into four segments called Assets, Aircraft Operations, People & Services and Other Business
Areas, which in total embody eight fully-owned subsidiaries and are depicted in Appendix A.1.
The commercial airline activities are organized in the parent company NAS, while four fully-owned
subsidiaries constitute the Group’s Aircraft Operations. The daughter companies are Norwegian Air
International (NAI), Norwegian Air Norway (NAN), Norwegian Air UK (NUK) and Norwegian Air
7 Norwegian, Vision and Values 8 DLR (2008), Analyses of the European Air Transport Market, p. 7 9 Manting and Wang (2012), Determinants of Profitability and Recovery From System-Wide Shocks: The Case of the
Airline Industry, p. 4 10 Norwegian, Corporate Structure
11
Argentina (NAA). These subsidiaries operate out of 23 international locations and constitute the Group’s
main revenue-generating segment and is the focus of this thesis.11 NAS also holds a 16.40% ownership in the
publicly noted firm Bank Norwegian AS, through its associated company Norwegian Finans Holding ASA
(NOFI).
3.4 Ownership Structure
NAS is a publicly listed company with 35,759,639 outstanding shares and the same amount of voting
rights.12 There were 16.456 shareholders as of 31.12.2017 and the NAS stock was included in the benchmark
index OBX, which comprises the 25 most liquid shares on the Oslo Stock Exchange.13 There are three equity
holders with an ownership share above 5%. The largest shareholder is HBK Invest AS at a 26.80%
ownership share. This is a holding company controlled by the CEO of NAS Bjørn Kjos, in partnership with
two members of NAS’ management team. The government-owned Norwegian company Folketrygdfondet
owns 6.10% of NAS, while J.P Morgan Securities holds 5.10%.14 The five largest shareholders own 47.20%
of NAS. This indicates a dispersed ownership structure, which is found in Appendix A.2.
3.5 Share Performance
The airline industry is believed to be pro-cyclical, which means that it correlates with the state of the global
economy. Hence, NAS’ share price experienced a stable growth until 2008, when the world’s financial
markets crumbled. The global recession led to a worldwide fall in demand for air travel. The economic
downturn hit employment in the airline industry directly and airports, manufacturers and airlines recorded
millions of job losses.15 Specifically, NAS’ share price was quoted at NOK 36.90 at year-end of 2008, which
corresponded to a 12-month fall in its share price of 78%. However, record-high profits the next year surged
the share price to its pre-2008 level. The large aircraft order in 2012 exerted confidence and the NAS stock
surged above NOK 300. However, airline stocks have been vulnerable since 2013. Industry analysts point at
market uncertainties, such as the prolonging Brexit speculations- and outcome as the main culprit. Moreover,
NAS’ stock has been influenced by heavier competition in Scandinavia, a severely delayed U.S. Foreign Air
Carrier Permit and teething problems concerning its new long-haul aircrafts.
NAS’ share price initiated 2017 at NOK 296.50, but concluded the year at NOK 176, following a financially
turbulent summer. The poor stock development can partially be attributed to the Norwegian government
establishing a Norwegian Passenger Tax on all domestic flights, as well as declining demand for air travel in
11 Norwegian, Corporate Structure 12 Norwegian, Investor Relations 13 Norwegian, Shares 14 Norwegian, NAS Annual Report (2017), p. 47 15 Goyal & Negi (2014), Impact of Global Economic Crisis on the Airline Industry, p. 297

12
the UK after Brexit. However, the stock rallied more than 70% in April 2018, as a result of IAG purchasing
4.61% of NAS. Following this surge, NAS’ market capitalization equals NOK 10.8 billion, per 01.05.2018.
Figure 2: NAS’ Historical Share Price
3.6 Competitive Environment – Peer Group
A proper strategic- and financial assessment of NAS necessitate that a peer group is established, which
exhibits similar risk profile, business model and size as NAS. The thesis argues that easyJet, Ryanair and
SAS are NAS’ closest competitors, which may serve as a valid benchmark. Note that SAS is not an LCC, but
is included as the airline is NAS’ main competitor on short-haul routes in the Nordics. The ensuing sub-
sections present each airline constituting NAS’ peer group.
easyJet
easyJet is a major low-cost airline based in the UK and operates out of its primary base at Luton Airport in
London, with a focus on the European short-haul market. It is listed on the London Stock Exchange and has
a market capitalization of GBP 5.0 billion. The airline operates a fleet of 279 aircrafts that carried 80 million
passengers on 862 routes in 2017.16 It is the second-largest LCC in Europe measured by passengers. The
airline’s strong financial position has enabled expansion into strategically important European countries. Its
network strategy is based on achieving number one position at primary and secondary airports, increasing its
presence with hubs in France and protecting its leadership in the UK. The airline focuses on high-traffic
point-to-point routes that facilitate high aircraft utilization and load factors. Contrary to NAS, easyJet
operates a uniform fleet of aircrafts from Airbus and is currently not engaged in the long-haul segment.
Ryanair
Ryanair is a LCC operating out of primary airports in Dublin and London. The airline is listed on three stock
exchanges; the Irish Stock Exchange, London Stock Exchange and the NASDAQ Stock Exchange. It is the
16 easyJet, easyJet Annual Report 2017, p. 32

13
largest LCC in Europe with a market capitalization of EUR 18.5 billion. It operates a uniform fleet of nearly
400 Boeing aircrafts, which carried 120 million passengers in the last fiscal year. Ryanair offered more than
2000 short-haul flights per day in 2017, serving over 210 airports in Europe.17 In addition, the airline has 110
aircrafts pending delivery throughout the period 2019 to 2023.18 Ryanair is popularly called an “ultra-LCC”,
due to its extreme cost control and standardization. Ryanair is the market leader in the European LCC
segment and its objective going forward is to become Europe’s largest scheduled passenger airline. Hence,
its strategy is to continue to offer low fares by focusing on frequent point-to-point flights on the short-haul
market, as well as constantly managing operational costs.19 Ryanair is not engaged in the long-haul segment.
SAS
Contrary to its peers, SAS is a FSC and operates out of its main airports in Stockholm, Copenhagen and
Oslo. The airline is listed on the stock exchanges in Sweden, Denmark and Norway and has a market
capitalization of SEK 8.5 billion. SAS operates 272 routes to 123 destinations and carried 30 million
passengers worldwide in 2017. It employs a uniform fleet of 158 Airbus aircrafts that operates the airline’s
large traffic flows and centers, while its regional traffic is flown by business partners. SAS’ strategy is to
concentrate on frequent travelers with a special focus on passengers traveling to, from and within
Scandinavia. It believes this group of passengers have the highest expectations to the travel experience and
builds its product portfolio accordingly. SAS is currently the largest operator of Scandinavian routes and its
current business model emphasizes a growing focus on leisure travelers, in the wake of its reputable attention
on business travelers. SAS is a network carrier and a co-founder of the global partner and network strategy
called Star Alliance. It is the largest airline alliance in the world and the cornerstone of the SAS Group’s
strategy.20 The main objective of the alliance is to offer seamless connections across a vast global network.21
It offers more than 20.000 daily flights across 28 partner airlines and gives passengers access to various
benefits at selected airports around the world.22
17 Ryanair, Ryanair Annual Report 2017, p. 67 18 Ryanair, Ryanair Annual Report 2017, p. 7 19 Ryanair, Ryanair Annual Report 2017, p. 68 20 SAS, Alliances and Partners – Star Alliance 21 Star Alliance, Star Alliance Leads the Way 22 United Airlines, Star Alliance Air Travel Awards

14
4. Strategic Analysis
In this section, the thesis attempts to qualitatively analyze and describe what external and internal factors
affect the performance of NAS. Its purpose is to examine NAS’ strategic drivers and determine how value
creation arises. The section initiates by examining NAS’ external environment, which consists of elements
NAS cannot control. The external analysis applies two well-established frameworks that investigate different
aspects of NAS’ environment. The PESTLE-framework describes the macro-environment of NAS, while
Porter’s (1979) framework analyzes the competitive forces in the industry. Finally, NAS’ internal resources
and capabilities are examined in an internal analysis founded on Barney’s (1991) VRIO-framework.
4.1 Macro-Environmental Analysis – PESTLE
The PESTLE-framework identifies key drivers in NAS’ macro-environment. It helps explain performance
and facilitates a deeper understanding of NAS’ strategic outlook. Decomposing the drivers enables a
strategically rooted forecast and construction of reasonable valuation-scenarios. In conjunction, they
facilitate an encompassing valuation of NAS. The PESTLE-framework comprises the factors Political (P),
Economic (E), Social (S), Technological (T), Legal (L) and Environmental (E).
4.1.1 Political and Legal Factors
The industry has changed considerably since its inception. The Airline Deregulation Act of 1978 ended the
legacy carriers’ monopoly on U.S. domestic aviation, while the inauguration of the EU has facilitated free
competition. The airline industry is global and is highly volatile to changes in the global political climate.
Domestic
The domestic airline industry in Norway is regulated by the state-owned organization Avinor. It operates 46
of Norway’s 52 airports, while controlling the issuance of flight permits, airport charges and tolls. Hence,
NAS is highly affected by domestically imposed government policies through Avinor. Other geopolitical
effects may include tax reforms, environmental policies, government- subsidies and elections. The
Norwegian government introduced a Passenger Seat Tax (PST) on domestic routes in 2016. It caused direct
losses in revenue of NOK 150 million for NAS and SAS the first quarter of 2017 and shows NAS’
vulnerability to geopolitical changes.23 The PST also stands a barrier-to-entry for potential competitors. A
direct consequence of the PST was Ryanair terminating its routes from the secondary airport in Sandefjord.
International
Traffic rights, airport slots and runways are often controlled by foreign governments that can interfere with
NAS’ objectives and strategy. In 2017, NAS acquired Argentinian traffic rights, which is afflicted with
23 E24 (2017), Kraftig Vekst Koster Kjos Dyrt: Flypassasjeravgiften Gjør Vondt Verre

15
regional legacy carriers that operate with high fares and less competition than in Europe. Historically,
national airlines have received preferential treatment and subsidies by their local governments in the region.
Specifically, Sweden, Denmark and Norway are the three largest shareholders of SAS, which is NAS’ main
competitor in the Nordics. In 2012, SAS received an emergency credit loan of SEK 3.5 billion, which was
financed by its three major shareholders.24 This credit facility received heavy international criticism,
advocating that it distorted the notion of free competition. NAS’ competitive position is thus vulnerable to
similar government involvement in the future.
Brexit resulted in a severe drop in demand for air travel out of the UK. The decline can be attributed to a
weakened British Pound and a loss of public confidence. Hence, NAS’ UK subsidiary realized a profound
loss in revenue, following Brexit. EU and U.S.-based airlines enjoy the “EU-U.S. Open Skies Agreement”,
which enables free appointment of routes and has lowered barriers to competition. However, it terminates in
2019, when the UK officially leaves the EU. This means that UK airlines like British Airways and easyJet
risk exclusion from international aviation. The UK’s aviation industry currently has no fallback option to the
agreement, but a transition deal is however being negotiated.25 While there is significant confidence that a
transition deal will materialize, NAS could capitalize on a less congested European market place.
NAS has a competitive disadvantage relative to SAS on European long-haul to Asia. NAS is not allowed to
fly over Russian airspace, called the Siberian Corridor, to reach major Asian business and leisure
destinations, such as Beijing, Tokyo and Shanghai. The disadvantage is the result of a 1956 agreement
between Denmark, Norway, Sweden and the Soviet Union. The accord states that only one airline per
Scandinavian country is allowed to use the Siberian Corridor. Since SAS is partly owned by all three
countries, SAS is the only Scandinavian airline allowed to use it. It is a major competitive disadvantage for
NAS, seeing as the Siberian Corridor is the fastest and cheapest route to the fast-growing Asian market. The
Norwegian Ministry of Trade met with Russian aviation and transport officials in November 2017 to discuss
a re-negotiation of the outdated deal. However, the talks were unsuccessful.
24 E24 (2012), Her er Planen Som Skal Redde SAS Fra Konkurs 25 CAPA (2017), The Great Aviation Debate. A Transition Deal is Needed to Avoid Disaster for UK Airlines

16
4.1.2 Economic Factors
Economic factors impact the state of the global economy and affect the airline industry.
Economic Growth and Air Traffic
Global economic growth, commonly measured
by gross domestic product (GDP), is the most
widely used indicator of future demand for air
travel. The market consensus is that air traffic
grows at a rate of approximately 1.5x that of
global GDP growth, as the two have never
diverged more than 3% during the last 25
years.26 However, research suggest that air
traffic growth is dependent on a number of other
statistics, including private consumption, employment rates, population growth and government
consumption.27 Moreover, the pace of global economic growth has been weakening in the aftermath of the
financial crisis. At the same time the demand for air travel has shown resilience to the decelerating global
trend in GDP, as shown in Figure 3.
The figure indicates that the GDP as a multiplier for air traffic is increasing, which means that the
relationship is skewing. Between 2001-2015 the factor was a mere 1.0x, which may explain the popular
notion that air traffic growth trails GDP growth. Subsequently, from 2011-2014 the GDP multiplier
increased to 1.5x and reached 2.0x in 2015.28 Moreover, The International Air Transport Association (IATA)
projects that global passenger traffic will double over the next 20 years.29 The data indicates a change in the
underlying air travel demand pattern. Hence, an airline’s ability to continuously improve its financial
planning may become a key success factor in the future.
26 Ishka Global (2016), Insights 27 Airbus (2017), Global Market Forecast 2017-2036 28 KFW IPEX-Bank (2016), The Correlation Between GDP Growth and the Increase in Airline Passengers 2001-2015 29 IATA (2017), Annual Review 2017, p. 33
Figure 3: Global PAX Growth vs GDP Growth (GDP Multiplier)

17
Interest Rate Risk
NAS has substantial debt and receives both floating and
fixed interest rates on its debt portfolio, which entail that
NAS is subject to interest rate fluctuation risk.
Moreover, its borrowings are denominated in USD, EUR
and NOK, which provides an operational hedge in NAS’
debt structure. NAS settles interest on its Norwegian
bond issues at the Norwegian Interbank Offered Rate
(NIBOR), plus a risk premium equal to the spread at the
reporting date.30 This means that NAS’ financial
performance may be affected by changes in NIBOR.
NIBOR consists of the anticipated interest rates defined by the Norwegian Central Bank, together with a risk
premium. The key policy rate in Norway declined from 2011 and has remained unchanged since early 2016.
The key policy rate in Norway is currently at 0.50%. The projected key policy rate indicates a growing rate
until 2020. Hence, NIBOR may increase in the short-term and negatively affect NAS’ financial performance.
Foreign Exchange Risk
NAS’ functional currency is the Norwegian krone (NOK). However, most of NAS’ operational expenses and
debt are denominated in USD and aircraft expenses in EUR. This entails that NAS is exposed to significant
foreign exchange risk and that it benefits from a stronger NOK compared to EUR and USD. NAS aims to
mediate its foreign exchange risk exposure by entering into forward currency contracts and flexible forwards.
NAS’ revenues are mainly obtained in NOK, EUR and USD. The U.S. is NAS’ fastest growing passenger
segment, which means that an increasing portion of its revenues is likely to benefit from a strong USD in the
future. Moreover, the NOK will slightly strengthen relative to USD in the short- and long-term, according to
SEB.31 However, with the current inflation level well below the target, the Norwegian Central Bank is
vigilant with its policies as it does not want the NOK to appreciate too rapidly.32 Still, NAS’ costs may be
positively affected as fundamental factors suggest a cheaper USD to NOK in the short- and long-term.
Jet Fuel Price
The single largest operational expense for NAS is the cost of jet fuel, which is traded in USD. Norway is a
major European exporter of crude oil and the state of the NOK is relatively dependent upon the oil price. In
addition, jet fuel is a product of refined crude oil, which stresses that the oil price is a significant external
factor. Today, NAS uses forward contracts that hedge fuel price exposure up to 25% of its total expected fuel
30 Norwegian, NAS Annual Report 2016, p. 55 31 SEB, Currency Strategy, p. 20 32 SEB, Currency Strategy, p. 20
Figure 4: Key Policy Rate in Norway
18
consumption.33 Historically, a close relationship exists between the price of oil and jet fuel, while the
USD/NOK appears negatively correlated with the two. It indicates that an increased oil price yields a higher
spot price on jet fuel, which in isolation is negative for NAS. In the short- to medium-term the oil price and
jet fuel price are expected to rise, although not to similar peak levels of the past.34 The relationship between
oil, jet fuel and USD/NOK are more thoroughly examined in section 7.1.3 in the forecasting section.
4.1.3 Social
The thesis emphasizes population growth and an expanding middle-class in the Asia-Pacific region as the
most important social factors that may be of significance to NAS.
Population- and Asia-Pacific Growth
IATA forecasts doubled air traffic demand the next 20 years, with the Asia-Pacific region being responsible
for more than half of the increase. Likewise, Airbus forecasts a global annual air traffic growth of 4.4%,
which significantly outpaces the estimated global population growth of 1.8%.35 There is an emerging middle-
class with increased means to travel in the Asia-Pacific region and China is expected to overtake the U.S. as
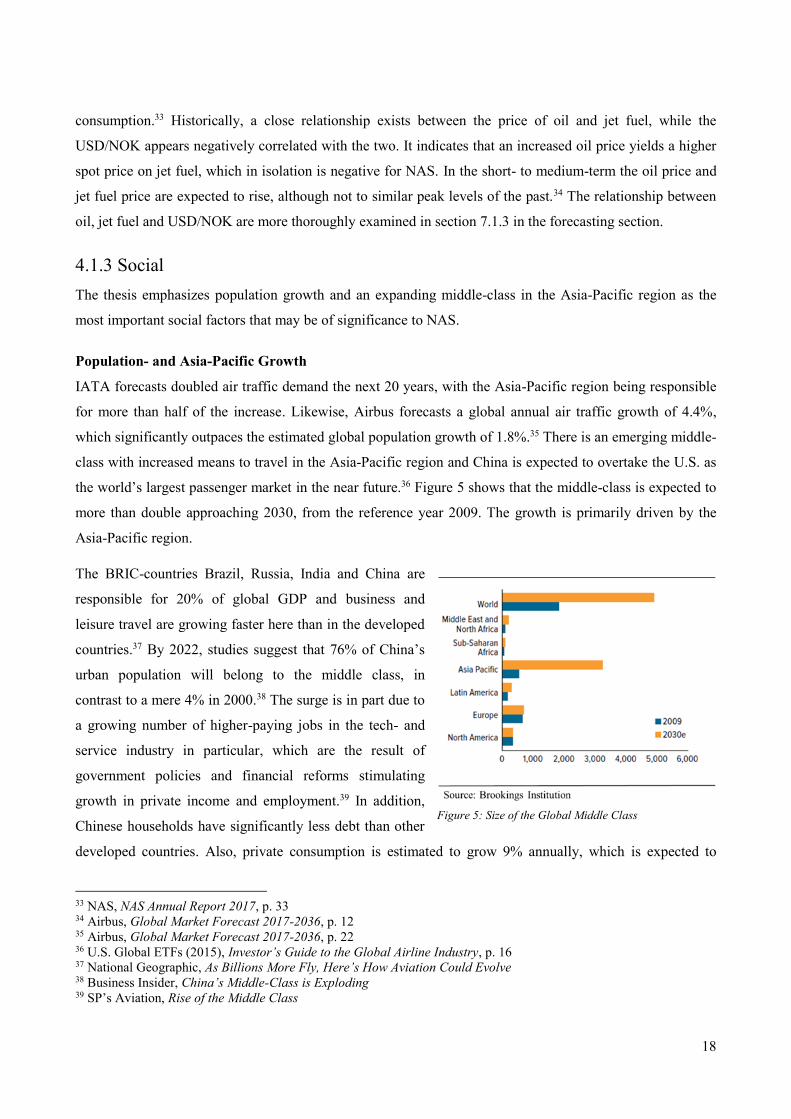
the world’s largest passenger market in the near future.36 Figure 5 shows that the middle-class is expected to
more than double approaching 2030, from the reference year 2009. The growth is primarily driven by the
Asia-Pacific region.
The BRIC-countries Brazil, Russia, India and China are
responsible for 20% of global GDP and business and
leisure travel are growing faster here than in the developed
countries.37 By 2022, studies suggest that 76% of China’s
urban population will belong to the middle class, in
contrast to a mere 4% in 2000.38 The surge is in part due to
a growing number of higher-paying jobs in the tech- and
service industry in particular, which are the result of
government policies and financial reforms stimulating
growth in private income and employment.39 In addition,
Chinese households have significantly less debt than other
developed countries. Also, private consumption is estimated to grow 9% annually, which is expected to
33 NAS, NAS Annual Report 2017, p. 33 34 Airbus, Global Market Forecast 2017-2036, p. 12 35 Airbus, Global Market Forecast 2017-2036, p. 22 36 U.S. Global ETFs (2015), Investor’s Guide to the Global Airline Industry, p. 16 37 National Geographic, As Billions More Fly, Here’s How Aviation Could Evolve 38 Business Insider, China’s Middle-Class is Exploding 39 SP’s Aviation, Rise of the Middle Class
Figure 5: Size of the Global Middle Class

19
further magnify the size of China’s consumer economy. China and India are the main drivers of the Asia-
Pacific air traffic growth, as the number of domestic travels has skyrocketed the last decade. The expected
population growth and expanding middle class in the Asia-Pacific suggest that the airline industry will
continue to grow at a rapid pace and airlines must adapt to changing market conditions.
4.1.4 Technological
The last decade presented innovative aircraft enhancements, while leaner operations changed airlines’
interaction with customers. The thesis emphasizes aircraft-specific technology that is disrupting the industry,
including aircraft systems, artificial intelligence (AI) and blockchain technology.
Jet engines have become 25% more fuel-efficient the last decade.40 As LCCs continue to challenge the
business model of legacy carriers and expanding operations to include intercontinental flights, fuel-efficiency
is critical to any successful low-cost strategy.
Aircraft safety is dependent on the aircraft system technology and regular maintenance. Airlines are
including AI and machine learning to continuously monitor and predict in-flight hazards, such as engine
malfunctions. Hence, AI may reduce maintenance costs by using predictive analytics to limit the need for
maintenance planning and repairs. Studies indicate that introducing AI to aircraft maintenance can boost fleet
availability 35% and reduce labor costs by 10%.41 Blockchain technology is entering the industry in various
forms and can alter how airlines handle privacy data and security, as sensitive data regarding passengers,
crew, and aircrafts may be stored in a safer manner.
4.1.5 Environmental
Airlines’ greatest operational cost is jet fuel, which leaves a significant carbon footprint. Meanwhile, air
travelers are more aware of the industry’s CO2 emissions and most airlines voluntarily employ corporate
social responsibility initiatives to address the issue. As the international community long have requested that
aviation be included in the United Nations’ (UN) climate agreements, CORSIA42 was signed in 2016 as a
continuation of the previously unmet goal of carbon-neutral growth by 2020. CORSIA is a market-based
agreement that aims to cut CO2 emissions from the airline industry by financially penalizing airlines not
adhering to agreed emission goals. NAS encourages production of sustainable bio fuels to make the airline
industry carbon-neutral within 2050 and emphasizes that the most important lever it can use is to continue to
invest in a fuel-efficient fleet.43
40 IATA, Operational Fuel Efficiency 41 Aviation Today, Four Commercial Trends Hitting Aviation in 2018 42 Carbon Offsetting and Reduction Scheme for International Aviation 43 Norwegian, NAS Annual Report 2016, p. 83

20
4.2 Micro-Environmental Analysis – Porter’s Five Forces
The focus of this section is to apply the Porter’s Five Forces (1979) framework to the airline industry, with
the goal of examining how predefined competitive forces affect the outlook for industry profitability. Unlike
the macro-environmental PESTLE analysis, Porter’s Five Forces emphasizes an explicit industry approach.
Each industry force is deliberated upon in relation to its influence on NAS and ascribed a customized rating
that expresses the intensity of each force in the industry.
4.2.1 Threat of New Entrants
New industry entrants can change the structure of an industry if the barriers to entry are weak or non-
existent. The threat of new entrants is thus decided by the industry’s barriers to entry, coupled with the
retribution exerted by the industry. The thesis emphasizes economies of scale, capital requirements, airport
capacity and regulation as the industry’s most relevant barriers to entry.
Capital requirements and Economies of Scale
The airline industry is often characterized as capital intensive due to heavy investments in fixed assets and
substantial cash flows from high-value depreciating assets. This notion fortifies the belief that capital
requirements are a great barrier to entry. However, PricewaterhouseCoopers (PwC) pressured this common
notion, saying that financing is available to aspiring air carriers because of high resale value on assets.44 In
addition, more than every third commercial aircraft is the world is leased. This is beneficial for aspiring air
carriers, as they most likely do not have the financials to invest in a bulk of aircrafts. Leasing enables them to
operate several aircrafts as opposed to just owning one. Moreover, leasing avoids the substantial
prepayments on undelivered aircrafts, which allows flexibility.
Economies of scale is the result of airlines taking advantage of their financial strength and acquiring bulks of
aircrafts. This lets them distribute fixed costs over a broad base of sales and lower unit costs. Economies of
scale thus enables cheaper fleet expansion. The cost advantage of a scale economy is further reinforced by
discounts to the list price on large aircraft orders by the major manufacturers. The capital requirements in the
airline industry are high. However, the relative ease of acquiring financing and the availability of leasing
indicate that capital requirements signify a low-to-moderate barrier to entry. Economies of scale leads to a
cost advantage that is hard to obtain for new air carriers in the short-term. Hence, economies of scale as a
barrier to entry is high.
Airport Slots and Regulators
Congested airports are popular due to their large flow of passengers, which translates into high load factors
for airlines. However, there are only a predefined number of slots at each airport. Global slot allocation is
44 PwC, Aviation Finance: Fasten Your Seatbelts, p. 4

21
subject to the guidelines of IATA, which practices a system using “grandfather rights”. This means that an
airline retains its current slots if it operates each slot at least 80% of its allocated slot time. Arguably, this
provides an unfair advantage to legacy carriers, who often received their slots for free decades ago.45 It
incentives airlines to operate slots simply to block competition. Hence, emerging air carriers face a
significant barrier to entry in the form of airport slot availability. However, slot availability- and capacity
differs significantly between airports. New air carriers may be forced to target less profitable regional
airports. Hence, airport slots are a high barrier to entry.
Whereas the industry deregulation initially lowered the barriers to entry, aviation agencies, governments and
political organizations have introduced broad social directives, such as safety and environmental regulations,
which have raised the barriers to entry.46 Considering the vast legislative terrain and political influence on
airline profitability, the role of regulators are considered as a moderate barrier to entry. The thesis thus
estimates that the threat of new entrants is moderate.
Figure 6: Threat of New Entry
4.2.2 Threat of Substitutes
A substitute is a similar product or service that accounts for the same needs as airline travel, which can make
consumers indifferent between them.47 The degree of threat that substitutes pose is high if the cost of
switching is low and is believed to offer equal or superior quality, utility, performance and price. The two
chief determinants of mode of transportation are cost and travel time, whereas comfort, service and
flexibility may also be included. However, the thesis emphasizes cost and travel time as the main variables.
Automobiles, trains and boats are nearly non-existent in medium- to long-haul, due to immense switching
costs. Due to the generally large distances covered by aircrafts, the thesis only evaluates high-speed trains
(HST) as a realistic substitution for air travel. The Journal of Advanced Transportation found that HSTs are
competitive with air travel for distances under 1,000 kilometers, but that air travel is preferred for longer
routes due to significant time savings.48 Figure 7 shows how key short-haul routes around the world by air
and HSTs are competing in terms of price and travel time.
45 Airlines International, Airport Slots – The Building Blocks of Air Travel 46 Eldad (2005), The Evolution of the U.S. Airline Industry: Theory, Strategy and Policy, p. 12 47 Investopedia, Substitutes 48 Bloomberg, Watch Out, Airlines. High Speed Rail Now Rivals Flying on Key Routes

22
Figure 7: High-Speed Trains versus Air Travel
Figure 7 suggests that HSTs may already be a substitute to air travel on popular short-haul routes. Moreover,
China possesses the world’s leading network of HSTs, fueled by a government with the means and ambition
to continue its expansion. More than 900 million Chinese traveled by train in 2015, whereas less than half
traveled by air.49 In contrast, the U.S.’ railroad service Amtrak transported just above 30 million passengers
in 2016.50 The necessary infrastructure and political ambition are missing in the rest of the world for HST to
be a substitute to air travel in the short- to medium-term. The EU is expanding the European High-Speed
Rails (HSR) network and is incorporating the existing trans-European transport network to link all HSRs on
the continent, into an integrated European high-speed network.51 The European Commission emphasizes that
HST are most competitive on journeys under three hours, as they offer better accessibility than air travel and
shorter travel time than automobiles.52 In addition, research suggest that some routes already have decreased
airlines’ market shares or volume supplied.53 This development suggests that HSTs may become a viable
substitute for air travel in the medium- to long-term in Europe and Asia-Pacific especially.
Air travel has the advantage of being unrestricted by geographical infrastructure, less airports and enjoys
supremacy in long-haul travel. Current technology is yet to present a feasible alternative to long-haul air
travel, even in the long-term. The market share of HSTs on short-haul routes, its political backing and long-
term potential suggest that its threat as a substitute may be high. Still, it lacks expensive- and time-
consuming infrastructure and is non-existent on long-haul travel. Seeing as global forecasts emphasize
demand growth for long-haul travel as the main profitability driver in the future, the thesis evaluates the
threat of substitutes as low.
49 Bloomberg (2018), Watch Out, Airlines. High Speed Rail Now Rivals Flying on Key Routes 50 Bloomberg (2018), Watch Out, Airlines. High Speed Rail Now Rivals Flying on Key Routes 51 European Commission, High-speed Europe, p. 6 52 European Commission, High-speed Europe, p. 16 53 Dobruszkes & Dehon (2014), Does European High-Speed Rail Affect the Current Level of Air Services? An EU-wide
Analysis, p. 461

23
Figure 8: Threat of Substitutes
4.2.3 Rivalry Among Competitors
Porter (1979) emphasized that competitiveness or degree of rivalry affect industry profitability and
attractiveness. Moreover, intense rivalry erodes profits and presents itself if there are many competitors, low
degree of differentiation, low switching costs and high exit barriers.54 The airline industry struggles with
inefficient differentiation of products and low switching costs. As more airlines achieve economies of scale,
they disrupt the industry’s supply and demand balance by proposing large increments of extra capacity to the
industry.55 It leads to overcapacity, which in turn yields price competition and pressured margins. The airline
industry has high fixed costs, which functions as an exit barrier. Hence, as the industry is experiencing weak
growth, airlines cut prices in an attempt to fill capacity and cover fixed costs. In addition, aircrafts are highly
specialized assets with low scrap value, no alternative use and they also depreciate fast, which means that
airlines have little incentive to keep them grounded. Even when earnings are negative, airlines are
incentivized to maintain activity, further reinforcing competition and poor industry profits.
Furthermore, the marginal costs of airlines are low. High fixed costs and low marginal costs are a potentially
powerful synergy that incentivize airlines to reduce fares towards their marginal cost of adding another
passenger, in order to cover more of their fixed costs.56 In addition, airlines have frequently taken advantage
of the "Chapter 11 Reorganization Plan" that outlines how unprofitable airlines can declare bankruptcy, but
continue operations as a going concern while reorganizing.57 Such behavior is an industry characteristic that
magnifies competition, by raising the barriers to exit. It yields an inefficient business environment by
preventing unprofitable airlines from leaving the industry. Instead, the industry is characterized by strategic
cooperation and increasing consolidation, as unprofitable airlines are absorbed by larger players. It is a
strategic maneuver that allow airlines to build scale, reduce costs and expand route networks to capture
market shares.58 Hence, FSC are most likely to use mergers and acquisitions (M&A) to benefit from potential
synergies between themselves and the acquired airline to achieve rapid growth. Strategic partnerships, such
as alliances and code-sharing are popular also among LCCs, because they yield much the same benefits, less
54 Porter (2008), The Five Competitive Forces That Shape Strategy, p. 85 55 MaRS, Industry Rivalry and Competition: Porter’s Five Forces 56 Porter (2008), The Five Competitive Forces That Shape Strategy, p. 9 57 McGill University, Airline Bankruptcy: The Post-Deregulation Epidemic, p. 22 58 Boston Consulting Group, Consolidation in Europe's Airline Industry

24
the complexities of integrating different organizations. However, the pool of attractive partners for any
European FSC or LCC is limited and the wave of industry consolidation affects them differently.
Fierce competition, low switching costs, high exit barriers and consolidation suggest that the airline industry
is characterized by aggressive rivalry. Hence, the rivalry among competitors is evaluated as very high.
Figure 9: Rivalry Among Competitors
4.2.4 Bargaining Power of Suppliers
Porter (1979) argues that supplier groups are powerful if they are dominated by a few companies exhibiting a
more concentrated industry than the one they serve.59 This means that there are few suppliers relative to
buyers. Switching costs, forward integration, product differentiation and product dependency also affect the
degree of bargaining power the suppliers hold.
Aircraft Manufacturers
Aircraft manufacturers Boeing and Airbus arguably have a focused duopoly on commercial medium- to
long-haul aircrafts. The cost of switching airline manufacturer is very high and destroy the advantages of a
uniform fleet strategy. In addition, it is normal for airlines to invest in personnel with aircraft-specific skills
and competencies. Hence, changing manufacturer forces costly hiring of new skilled personnel. This
indicates that aircraft manufacturers have high bargaining power. As the thesis established in section 4.2.2,
there are no substitutes for long-haul aircrafts. This is a major advantage for the suppliers. In addition, there
is little reason to fear forward integration from the manufacturers into the airline industry. They have major
backlogs, as well as immense R&D organizations. An integration would be complex and costly. Also, the
aircraft manufacturers have little incentive to integrate forward, as the aircraft manufacturing business is
more profitable than the airline business. The thesis estimates that the bargaining power of suppliers is high.
Labor Unions
Skilled labor constitutes a wide array of personnel that are necessary to operate and maintain aircrafts, as
well as servicing air travelers. There are unions for pilots, flight attendants and for mechanics. Hence,
airlines are particularly vulnerable to strikes. As airlines cannot build inventory in the highly seasonal
industry, unions may select an approaching seasonal peak as its time to exercise its bargaining power.60 As
the labor unions are fragmented, airlines are exposed to increased complexity when negotiating terms with
59 Corporate Finance Institute, Bargaining Power of Suppliers 60 O’Connor (2001), An Introduction to Airline Economics, p. 82

25
each labor group. Each labor group holds enough power alone to cause an airline downtime and severe losses
in revenue and public opinion. This suggests that labor unions have high bargaining power. Moreover,
Boeing’s 2017 Pilot and Technician Outlook expects the commercial airline industry to demand more than
two million pilots, maintenance technicians and cabin crew to operate the global fleet, the next 20 years.61
This development emphasizes the industry’s reliance on these labor groups, which magnifies the bargaining
power of labor unions relative to airlines. The bargaining power of labor unions is thus estimated to be high.
Figure 10: Bargaining Power of Suppliers
4.2.5 Bargaining Power of Buyers
In contrast to suppliers, buyers can force prices down or demand improved services and quality from an
airline. The degree of bargaining power the buyers hold in the airline industry is determined by the
consumers’ price sensitivity, switching costs, availability of substitutes and degree of differentiation. Product
differentiation is now negligible, as the switching costs of passengers are minimal. Air travel has arguably
become an increasingly standardized product with many providers offering the same basic service, which
make the costs of switching provider insignificant and lowers customer loyalty. This development is
facilitated by air traveling agencies, which have made the purchasing process transparent for the buyer.
Hence, a passenger may easily differentiate airlines purely on price, by directly comparing fares on a
selected route. This suggests that air travelers are price sensitive. The bargaining power of buyers is
estimated as high.
Figure 11: Bargaining Power of Buyers
4.2.6 Overview of the Five Forces
The Porter Five Forces analysis is summarized in Figure 12. The analysis merely serves as a basis for
examining the forces affecting profitability in the airline industry. Hence, the thesis emphasizes that the
analysis is not exhaustive.
61 Boeing (2017), Pilot and Technician Outlook 2017-2036

26
Figure 12: Overview of the Five Forces
4.3 Organizational Analysis – VRIO
The purpose of this section is to create a more complete understanding of NAS’ strategic position. This is
done by emphasizing the airline’s internal resources and capabilities, and whether they constitute a
competitive advantage for NAS. The thesis applies Barney’s (1991) widely adopted VRIO-framework for
this purpose, which also reveals whether they are being exploited.62 Barney emphasizes four conditions that
must be fulfilled for a resource or capability to symbolize a sustained competitive advantage. He outlines that
a resource must be valuable (V), rare (R), difficult to imitate (I) and organized to capture value (O). He
argues that a firm resource may be value-adding if it empowers the firm to exploit incoming opportunities
and/or neutralize threats.63 However, a valuable resource is not a source of competitive advantage, but rather
competitive parity, if it is common or controlled by a variety of other firms. Hence, firm resources are not
valuable in a vacuum and the management must constantly evaluate whether they continue to add value.64 A
resource that is difficult or impossible for competitors to copy may be a source of sustained competitive
advantage.65 Finally, a firm’s potential for competitive advantage is dependent upon whether the firm is
organized to exploit the value, rareness and in-imitability of the resource.66
4.3.1 Brand Name
A strong brand name is a potentially powerful intangible resource that is difficult to obtain and impossible to
imitate. NAS has built its brand by disrupting the European low-cost long-haul segment, by setting a price-
precedent on intercontinental flights, through fearless expansion. The airline has received industry appraisal
62 Barney (1991), Firm Resources and Sustained Competitive Advantage, p. 103 63 Barney (1995), Looking Inside for Competitive Advantage, p. 50 64 Barney (1995), Looking Inside for Competitive Advantage, p. 51 65 Barney (1995), Looking Inside for Competitive Advantage, p. 53 66 Barney (1995), Looking Inside for Competitive Advantage, p. 56

27
and several awards for its operations and services. Most notably is the Skytrax World Airline Awards, where
NAS has been celebrated as Europe’s best LCC for five consecutive years. It also won the world’s best long-
haul LCC in 2016 and 2017.67 However, NAS’ brand name is undeveloped in the strategically important
Asia-Pacific, but the airline has signaled future expansion in the region, following demand forecasts. Hence,
NAS must prepare to face competition from local LCCs that pursue the same no-frills long-haul strategy.
Doing so without a strong brand recognition in the region may be a competitive disadvantage. NAS has
developed a stronger brand in North America by offering low-cost long-haul flights between Europe and the
U.S. It employs North American pilots and cabin crew on these flights, which have prompted positive media
attention in an increasingly protectionist country. Moreover, NAS has recently opened its first long-haul
route between Europe and South America, which strengthens its brand name in the region.
NAS’ brand name is a valuable resource that is in-imitable. However, whether it is rare is debatable. It is
arguably not rare in the European low-cost short-haul market, due to the congested competition. However,
the thesis argues that the NAS brand is rare in the European low-cost long-haul segment, which is the
airline’s strategic focus going forward. NAS has no close low-cost long-haul competitor operating out of
Europe and the brand name is an intangible resource that takes years to develop and maintain. It demands a
well-functioning organization that relates to its customers and continues to add value in an industry with
pressured margins and low profitability. The thesis argues that NAS has excelled at leveraging its low-cost
long-haul brand and it is found strong enough to represent a competitive advantage.
4.3.2 Modern Fleet of Aircrafts
NAS operates a fleet of 144 aircrafts with an average fleet age of 3.6 years.68 The modern fleet is the result
of its 2012 order of more than 200 aircrafts. Hence, NAS operates a fleet that represents one of the most fuel-
and environmentally friendly fleets in the industry. NAS employs its state-of-the-art Boeing 787 Dreamliner
(Dreamliner) and the smaller Boeing 737 MAX (MAX), for long-haul routes to North America, South
America and Asia. The Dreamliner and MAX aircrafts are 20% more fuel-efficient compared to competing
models, which positively impacts operating expenses.69 NAS was the first European airline to operate them
and the only airline in the peer group with these aircrafts. This gives NAS cost advantages in transatlantic
operations compared to peer group competitor SAS and solidifies NAS’ position as the leading European
low-cost long-haul airline.
Boeing 737 MAX
The MAX aircraft is disrupting the entire long-haul segment because of its range. It is the first single-aisle
aircraft to have sufficient range for transatlantic flights. Its associated operating costs are substantially lower
67 Norwegian, Priser og Utmerkelser 68 Norwegian, Vår Historie 69 Norwegian, Flyene Våre

28
than that of large long-haul aircrafts like the Dreamliner or the Airbus Jumbo Jets. This means that NAS has
dictated a new industry standard for long-haul aviation. NAS placed a firm order on discounted aircrafts
when the industry was halting in 2012 and is currently realizing the gains of the investment. Several
competitors have since replicated the order, but are still years away from first delivery. NAS has a substantial
short-term advantage of operating this cost-efficient aircraft before its competitors, which is a valuable
strategic asset. Specifically, the Dreamliner and MAX aircrafts constitute a mix of favorable resources that is
currently rare and hard to acquire in the short-term, although the aircrafts are easily imitated in the long-term.
However, the thesis emphasizes that NAS has strategically primed its organization since 2012, by
establishing foreign subsidiaries and international hubs to broaden its route network to effectively absorb the
aircraft order. NAS thus appears to be appropriately organized to exploit its resources and harvest the value
of its long-haul operations. Hence, the thesis argues that NAS’ modern fleet of aircrafts provides a temporary
competitive advantage.
4.3.3 No-Frills Long-Haul Strategy
The no-frills long-haul strategy is not new and is yet to experience successful implementation in the long-
term. The strategy is rare in long-haul as it is predominantly employed in the short-haul segment. Close
competitors easyJet and Ryanair do not offer long-haul flights, but are built on the same LCC cost structure
that is necessary to imitate NAS. Hence, they could choose to imitate NAS by reorganizing their existing
strategies. However, both airlines have publicly denied this notion, stating that NAS’ no-frills long-haul
strategy is too risky and complex to successfully maintain in the long-term. Specifically, the strategy has not
been feasible to execute due to substantial operating costs and the difficulty of managing capacity
requirements to obtain sustainable unit costs. Most airlines pursuing this strategy have difficulty maintaining
a sufficient margin and cannot cope with the associated costs. The thesis argues that NAS is better situated to
handle these obstacles, compared to its predecessors. The airline enjoys superior aircraft technology that
significantly reduce fuel costs. Specifically, the advantage of operating the MAX aircraft in transatlantic
operations cannot be overstated and arguably signifies a rejuvenation of the no-frills long-haul strategy. It
has been critical for NAS to obtain smaller fuel-efficient aircrafts with the necessary range to expedite a
successful long-term implementation of the strategy. It enables NAS to target smaller secondary airports,
which regular long-haul legacy aircrafts cannot use, due to their size. This reduces NAS’ unit costs. Seeing
as NAS for years has created a low-cost foundation for its long-haul expansion, the airline is well-suited to
sustain and capitalize on the benefits of the strategy in the long-term. Hence, the thesis argues that NAS’ no-
frills long-haul strategy is a temporary competitive advantage.

29
4.3.4 Overview and Competitive Advantage
Figure 13: Summary of the VRIO Analysis
NAS has a lasting competitive advantage in the European low-cost long-haul segment, due to its disruptive
long-term strategy-implementation. Moreover, NAS has a temporary competitive advantage related to its
long-range single-aisle MAX aircrafts. This strategic asset may enable sustainable low-cost transatlantic
operations, which by extension facilitates the airline’s no-frills long-haul strategy. This distinctive strategy
enables cost reductions by using secondary airports unavailable to competing legacy carriers. This means
that NAS’ unique strategy has resulted in temporary competitive advantage. However, the thesis advocates
that some of these advantages are likely to dissipate when competitors receive aircrafts with similar function,
in the short- to medium-term.

30
5. Financial Analysis
The purpose of the financial analysis is to explore NAS’ financial position and gauge how it performs
relative to its peer group. It investigates a selection of financial ratios that indicate NAS’ financial health-
and competitiveness, as well as the airline’s ability to generate earnings in the future.70 The framework of
Petersen et al. (2017) prepares NAS’ financial statements for this purpose.71 The thesis proceeds to gauge
financial- and industry-specific ratios, and measure NAS’ financial risk in the short- and long term. The
strategic- and financial analysis thus form the base for estimating NAS’ future cash flows and share price.
5.1 Quality of Data and Financial Statements
Prior to reformulating the financial statements, they must be closely examined to certify their reliability and
validity. NAS and the peer group reports consolidated financial information compliant to the International
Financial Reporting Standards (IFRS) and IFRIC Interpretations, as adopted by the EU.72 A comprehensive
investigation of the validity of financial statements should ideally be performed. However, this is outside the
scope of the thesis. Hence, the thesis finds it suitable to place confidence in the independent audit report,
which states that NAS’ financial statements are a true representation of the airline’s economic state.73
5.2 Analytical Statements
The thesis reorganizes NAS and the peer group’s financial statements, as they are not organized for a robust
assessment of economic performance.74 Hence, it separates operations and investments in operations from
financing activities, as operations are the primary source of value creation.75 The procedure alleviates
financial noise and facilitates a meaningful profitability analysis. NAS’ analytical statements then reflect
how operating and financing activities are contributing separately. Hence, the thesis reformulates NAS’
financial statements into an analytical income statement and balance sheet, following the framework of
Petersen et al. (2017).76 The complete analytical statements for NAS and the peer group are found in
Appendix A.3-A.14.
5.2.1 Analytical Income Statement
The analytical income statement classifies every accounting item as either operational or financial, and thus
facilitates net operating profits after tax (NOPAT) to be found.77 NOPAT is a crucial measure in financial
70 Koller et al. (2010), Valuation – Measuring and Managing the Value of Companies, p. 161 71 Petersen et al. (2017), Financial Statement Analysis: Valuation - Credit Analysis - Performance Evaluation, p. 107 72 Norwegian, NAS Annual Report 2017, p. 25 73 Norwegian, NAS Annual Report 2017, p. 81 74 Koller et al. (2010), Valuation – Measuring and Managing the Value of Companies, p. 133 75 Petersen et al. (2017), Financial Statement Analysis: Valuation - Credit Analysis - Performance Evaluation, p. 107 76 Petersen et al. (2017), Financial Statement Analysis: Valuation - Credit Analysis - Performance Evaluation, p. 111 77 Petersen et al. (2017), Financial Statement Analysis: Valuation - Credit Analysis - Performance Evaluation, p. 111

31
analysis, as it excludes the effect of NAS’ financial leverage and items that are considered to be transitory in
nature.78 Furthermore, it enables a calculation of return on invested capital (ROIC) and its sub-components
that measure NAS’ overall profitability from operations. NOPAT isolates the value created by core operating
activities and the following subsections evaluate items not easily classified as part of NAS’ core activities.
Special Items
The airline industry is exposed to significant financial risk, such as credit risk, interest rate risk and
fluctuating currencies. NAS efforts to mediate such risks by diversifying its deposit portfolio and using
forward currency contracts, flexible forwards and fuel derivatives. Hedging activities necessitate that NAS’
income statement reports gains or losses associated with these contracts. The thesis does not consider these
activities to be value-creating and they are treated as non-operational. Moreover, share of profits from
associated companies comprises revenue derived by NAS’ investment in Bank Norwegian, through NOFI.
Petersen et al. (2017) argue that investments in associates that are clearly not part of a firm’s core business
should be considered as a financial investment and classified as a financial activity.79 Hence, this item is
classified as non-operational. Revenue from other income is categorized as financial, as it includes interest
income from available-for-sale securities.80 In addition, other losses/gains – net are denoted as a non-
operational item, because it relates to changes in the fair value of NAS’ financial assets.81
Operating Leases
Operational leasing is common in the airline industry because it avoids large capital investments related to
purchasing aircrafts. NAS and its peer group use operational leasing as an off-balance sheet type of financing
for their aircrafts. Koller et al. (2010) emphasize that operating leases bias nearly every financial ratio,
because it omits assets from the balance sheet.82 In addition, operational leasing yields artificially low
operating profits, due to interest on rental expenses as well as high capital productivity due to off-balance
sheet financing.83 The thesis remedies this by capitalizing NAS and the peer group’s operational leases,
following Moody’s approach84 and the procedure is shown in Appendix A.15. This means that NAS’ income
statement and balance sheet are adjusted. Deloitte also suggests capitalizing the operational lease payments
through a capitalization rate.85 The thesis corrects NAS’ balance sheet by increasing its assets and net
interest-bearing debt (NIBD), with an amount equal to the airline’s annual lease payment multiplied by an
industry multiple, or capitalization rate. Consequently, the balance sheet recognizes NAS’ lease payment as a
78 Koller et al. (2010), Valuation – Measuring and Managing the Value of Companies, p. 161 79 Petersen et al. (2017), Financial Statement Analysis: Valuation - Credit Analysis - Performance Evaluation, p. 118 80 Norwegian, NAS Annual Report 2016, p. 30 81 Norwegian, NAS Annual Report 2016, p. 30 82 Koller et al. (2010), Valuation – Measuring and Managing the Value of Companies, p. 575 83 Koller et al. (2010), Valuation – Measuring and Managing the Value of Companies, p. 575 84 Moody’s, Financial Statements Adjustments in the Analysis of Non-Financial Corporations, p. 9 85 Deloitte, Implications of the New Leasing Standard

32
proxy for lease-related debt and accounts for the entire economic lifetime of the leased aircrafts. NAS does
not disclose its capitalization rate or detailed lease obligations in its annual report. However, industry
analysts argue that a capitalization rate of seven (7x) functions as an appropriate multiple for the airline
industry and that it is the closest indicator of an industry norm.86 Moreover, SAS and easyJet’s annual reports
emphasize the same capitalization rate. Hence, the thesis finds it reasonable to employ a capitalization rate of
7x to NAS’ operational leases. This yields a capitalized lease value of NOK 27,227 billion in 2017. The
lease-related interest expense is noted as a special item in the analytical income statement and found by
multiplying the operational lease value with NAS’ cost of debt. The estimation of NAS’ cost of debt is
further deliberated upon in section 6.4, which concerns NAS’ cost of capital. The lease depreciation is
obtained as the difference between the annual lease payment and the lease-related interest expense. Hence,
NOPAT is obtained after classifying the depreciation as operational. The thesis emphasizes that the same
procedure is applied to the peer group to secure consistency. A detailed calculation of NOPAT is outlined in
Appendix A.3-A.14.
5.2.2 Analytical Balance Sheet
Certain items are easily related to operating activities and are not extensively examined. Hence, the thesis
evaluates line items that are not easily classified as part of NAS’ core operational activities.
Current Assets and Liabilities
Cash and cash equivalents is difficult to classify as NAS does not disclose detailed information about this
line item. Hence, it is hard to distinguish between operating cash that require a return and excess cash.
However, Petersen et al. (2017) argue that the consequences of reclassifying this item are likely to be
modest.87 Since NAS’ cash position has remained stable, the thesis argues that it is fair to treat it as a
financial item. Derivative financial instruments comprise gains and losses related to NAS’ hedging activities.
Petersen et al. (2017) argue that this hedging item is a strictly financial activity. They state that hedging is
financially motivated and that it is nearly impossible to accurately separate the gains or losses into
operational and financial activities.88 Hence, the thesis classifies derivative financial instruments as a
financial item. Short-term borrowings mainly covers NAS’ recent bond issue and is denoted as a financial
item. Air traffic settlement liabilities consists of prepaid passenger tickets and is thus operational. Petersen et
al. (2017) state that tax payable may be treated as operational, as long as it does not carry interest.89 Hence,
the thesis classifies tax payable as an operational item.
86 Deloitte, Implications of the New Leasing Standard 87 Petersen et al. (2017), Financial Statement Analysis: Valuation - Credit Analysis - Performance Evaluation, p. 118 88 Petersen et al. (2017), Financial Statement Analysis: Valuation - Credit Analysis - Performance Evaluation, p. 119 89 Petersen et al. (2017), Financial Statement Analysis: Valuation - Credit Analysis - Performance Evaluation, p. 117

33
Non-Current Assets and Liabilities
NAS’ investment in its associate is not connected to the airline’s core activities and is classified as a
financial item. Deferred tax assets and liabilities are the result of differences between accounting earnings
and taxable income.90 As they do not carry interest and are associated with tangible- and intangible assets,
they are classified as operational. Borrowings relate to financing and are thus financial, together with pension
obligations. Other long-term liabilities relate to NAS’ deposits on future aircraft leases and are considered
operational, with provisions for periodic maintenance.
5.3 Profitability Analysis
It is essential to understand the past performance of NAS to create a meaningful forecast of its future. Hence,
the thesis applies the analytical statements as the foundation for the profitability analysis. This analysis bases
its approach on the DuPont framework, which emphasizes the return on invested capital (ROIC) and the
weighted average cost of capital (WACC) as the key determinants of a firm’s ability to create abnormal
returns.91 The thesis emphasizes ROIC as the key measure of profitability, since it directly compares to
WACC. A ROIC in excess of WACC entails that a firm is creating value.92 The thesis examines industry-
specific ratios characteristic to airlines and decomposes NAS’ EBIT-margin to gauge airline profitability.
5.3.1 Return on Invested Capital
ROIC measures the overall profitability from a firm’s operations. Hence, it expresses how NAS manages to
distribute accessible funds to profitable projects. Koller et al. (2010) emphasize that any level of growth
yields increased value generation with concurrent improvements in ROIC. This means that, ceteris paribus,93
a higher ROIC is good.94 Petersen et al. (2017) support this notion, emphasizing that ROIC takes into
account invested capital, unlike nominal operating profit measures such as EBIT and NOPAT. Hence, they
argue that ROIC is more suitable for measuring the profitability of a firm’s operations and whether the return
is satisfactory, versus investors’ required return.95 Note that the thesis applies average balance sheet-values to
circumvent over-or underestimations of NAS’ aircraft expenses. The peer group’s historical ROIC is
depicted in Figure 14.
90 Petersen et al. (2017), Financial Statement Analysis: Valuation - Credit Analysis - Performance Evaluation, p. 117 91 Petersen et al. (2017), Financial Statement Analysis: Valuation - Credit Analysis - Performance Evaluation, p. 102 92 Petersen et al. (2017), Financial Statement Analysis: Valuation - Credit Analysis - Performance Evaluation, p. 144 93 All Else Equal 94 Koller et al. (2010), Valuation – Measuring and Managing the Value of Companies, p. 22 95 Petersen et al. (2017), Financial Statement Analysis: Valuation - Credit Analysis - Performance Evaluation, p. 142

34
Figure 14: Historical ROIC
It is clear that NAS is underperforming in terms of ROIC, relative to its peer group. It achieved a ROIC of
0.63% in 2017. For every NOK 1.00 NAS invested in operations, it produced 0.63 Øre. NAS’s relatively
poor development in ROIC may be explained by its two growth drivers. Operating profit margin (OPM)
emphasizes whether the development in ROIC is due to NAS’ revenue-cost relationship. In contrast, the
turnover rate (TR) measures how NAS utilizes its capital.
Operating Profit Margin
The OPM shows the relationship between NAS’ revenues and costs. Hence, it reveals the ability of the
airline to convert streams of revenue into operating profits.
Figure 15: Operating Profit Margin
The PESTLE-analysis emphasized how jet fuel prices sharply declined during 2014, which is evident as it
resulted in an improved OPM for the peer group going into 2015. Figure 15 also shows that Ryanair
seemingly has superior cost-management abilities. NAS is performing poor relative to its peers and the OPM
shows that NAS has trouble managing costs. NAS is steadily increasing passenger revenue due to its
intercontinental expansion, but Figure 15 demonstrates how NAS’ operating costs are growing at a faster

35
pace. The strategic analysis outlined that airlines have pressured margins and that expansion yields a higher
cost base to distribute revenues. Hence, NAS’ poor development in OPM is primarily attributed to greater
fuel- and payroll costs, related to its long-haul expansion. To facilitate a deeper understanding of the
development in NAS’ underlying revenue- and cost drivers, the thesis further examines operating line items
that affect the airline’s profitability, in section 5.3.3.
Turnover Rate of Invested Capital
TR expresses a firm’s effectiveness in managing its invested capital, or its ability to create revenues by
utilizing its net operating assets.96
Figure 16: Turnover Rate of Invested Capital
Figure 16 shows that NAS is less effective than its peers in converting invested capital into revenue.
However, NAS is more leveraged than its peers and has a larger aircraft order pending delivery. In addition,
NAS has substantial capital tied up in assets like prepayments to manufacturers, which are assets that
currently do not generate revenue. Hence, Figure 16 yields a slightly distorted picture of NAS’ capital
utilization, which is expected to improve as aircrafts are delivered and start generating revenue.
5.3.2 Industry-Specific Ratios
The thesis complements the profitability analysis with an analysis of airline industry-specific ratios. It
facilitates a more complete understanding of the underlying factors driving airline profitability.
ASK and RPK
Available seat kilometers (ASK) denotes the maximum capacity of an airline’s fleet. The ratio is found as the
number of available passenger seats multiplied by flight distance.97 NAS’ has increased its ASK in the period
96 Petersen et al. (2017), Financial Statement Analysis: Valuation - Credit Analysis - Performance Evaluation, p. 156

36
2013-2017 as it has grown capacity 21% annually on average and has doubled its ASK. It is the largest
growth in the peer group and is the result of scheduled deliveries of aircrafts. NAS is scheduled to receive 25
new aircrafts in 2018 and the ASK is thus expected to continue its upward trajectory. Note that ASK do not
incorporate passenger statistics, which means that a high ASK is only positive in conjunction with high load
factors. Furthermore, revenue passenger kilometers (RPK) emphasizes an airline’ ability to convert its ASK
into revenue and is found as the number of seats sold multiplied by total flight distance.98 Hence, it gauges
revenue in relation to the volume of actual passengers carried. The trend in the peer group is that RPK
closely trails ASK and both metrics are depicted in Appendix A.16-A.17. However, NAS has achieved a
higher growth in RPK than in ASK. This is a positive development that suggests an improved load factor.
RASK, Load Factor and Yield
In contrast to RPK, revenue per available seat kilometer (RASK) emphasizes the average revenue per seat
per kilometer flown by NAS’ entire fleet. RASK is found as the product of load factor and yield, where load
factor describes an airline’s utilization of its capacity.99 As the airline industry is characterized by high fixed
costs, airlines always seek to reduce unit costs. High load factors equal lower unit costs and is thus a key
performance ratio. Moreover, airline management bases pricing, frequency and capacity decisions upon the
load factor. It is found as RPK divided by seat capacity. Note that the metric does not explain an airline’s
financial performance, as prices are not included.
Figure 17: Load Factor and Yield
NAS and Ryanair have achieved the greatest growth in load factor in the period, where NAS has improved
its load factor from 78% to 88%. The increase in load factor is an impressive feat while simultaneously more
than doubling its capacity, or ASK. Ryanair has surpassed easyJet, while SAS is trailing the group, achieving
a load factor of 77%. However, it is normal for FSCs to achieve lower load factors than LCCs, as they apply
97 Norwegian, NAS Annual Report 2016, p. 98 98 Norwegian, NAS Annual Report 2016, p. 98 99 Norwegian, NAS Annual Report 2016, p. 98

37
higher ticket prices. The yield represents passenger revenue divided by RPK and is a measure of the average
fare per seat kilometer.100 It is a key performance indicator for airline management, as higher yield directly
translates into higher revenues and improved margins. SAS is consistently achieving a higher yield than the
rest of the group, due to higher average fares and thus higher revenue on identical routes. This explains how
SAS is able to compete with the peer group, when achieving consistently weaker load factors. Hence, LCCs
are much more dependent on high load factors than FSCs. NAS has experienced a 4% drop in yield in the
period and the declining trend may be explained by NAS’ long-haul expansion. Offering longer routes on
low fares translates into added seat kilometers, which in conjunction generate a lower yield. This means that
NAS is dependent upon accurate pricing, frequency and capacity decisions to achieve a satisfactory yield.
5.3.3 EBIT-Margin Decomposition
The thesis proceeds to decompose the OPM, or the EBIT Margin. The purpose of this section is thus to
increase the understanding of the sources of airline profitability. The thesis applies the framework outlined
by Koller et al. (2010), who argue that by evaluating operational drivers one can better assess whether
differences in financial performance between competitors are sustainable.101 The framework is depicted in
Figure 18 and decomposes the OPM’s value drivers, in conjunction with industry-specific ratios to examine
sources of airline profitability. The overall
structure is identical to a common-size analysis,
which reveals the relative size of line items in
relation to revenue.102 Payroll is arguably the
cost that NAS has the greatest chance to
influence, as the rest are heavily affected by
external factors. Hence, the thesis efforts to
further decompose Payroll, to reveal the impact
of employee productivity and wage variations.
Jet Fuel
The common-size analysis depicted in Figure 19 below, emphasizes Ryanair’s cost leadership in the peer
group. This may seem contradictory at first as Ryanair has the largest fuel costs, in relation to revenue.
However, LCCs necessarily should have a higher Fuel/Revenue ratio, compared to FSCs. This is because a
higher Fuel/Revenue ratio suggests that other more controllable operational costs are lower. Hence, it
indicates that Ryanair asserts control over other cost elements. Note that the cost of jet fuel cannot be
expected to be lower than management’s ability to hedge jet fuel risk.
100 Norwegian, NAS Annual Report 2016, p. 98 101 Koller et al. (2010), Valuation – Measuring and Managing the Value of Companies, p. 171 102 Petersen et al. (2017), Financial Statement Analysis: Valuation - Credit Analysis - Performance Evaluation, p. 161
Figure 18: EBIT Margin Decomposition

38
Figure 19: Development in Jet Fuel Costs
Figure 19 displays how jet fuel costs are distributed over ASK. The ratio reveals how many NOK are
required to yield a single ASK. The ratio shows that NAS has surpassed Ryanair in the period and is
currently achieving the lowest fuel costs per ASK. This is a positive development, which may be attributed
to NAS’ fuel-efficient Dreamliner and MAX aircrafts. As highlighted in the strategic analysis, fuel-efficient
aircrafts are pivotal in NAS’ long-haul strategy where maintaining low unit costs is key. Hence, the
Fuel/ASK ratio underlines that NAS has successfully implemented aircrafts as a tool to achieve lower jet fuel
costs, through high-ASK transatlantic flights.
Payroll
The Payroll/Revenue ratio is decomposed into Payroll/ASK to reveal workforce productiveness.
Payroll/ASK expresses how many NOK must be invested in the workforce to produce one ASK.
Figure 20: Development in Payroll Costs
Figure 20 shows that SAS must invest many times the amount of its competitors, to generate one ASK,
which is due to its comparatively high wage level. Ryanair is most efficient in terms of generating ASK from
its employees, while NAS has remained stable with easyJet. Payroll/ASK is a function of a workforce’s
efficiency and is decomposed in Figure 21.

39
Figure 21: Development in Employee Productivity
Payroll/ASK is determined by the productivity ratios ASK/Employee and Payroll/Employee. In conjunction,
they highlight the output and wage level of each airline’s workforce. Figure 21 combines the two and
reinforces that SAS has the highest wage level. The left Y-axis denotes the wage level of employees and the
right Y-axis depicts the workers’ ASK-efficiency. NAS’ employee productivity is declining with Ryanair,
while SAS and easyJets’ ASK-efficiency is growing.
Other Costs and Depreciation & Amortization
The item other costs covers every operational line item less jet fuel, payroll and depreciation & amortization.
Ryanair is outperforming the peer group due to its use of secondary airports, which alleviates its income
statement of large airport charges.
Figure 22: Devlopment in Other Costs
NAS’ increased costs are rooted in its route expansion into new markets and thus higher airport charges.
Hence, Other Costs/Revenue depicts that NAS is struggling to generate satisfactory revenue, as costs are
rapidly increasing. The next ratio conveys the same message, but is expected to improve for NAS, as aircraft
deliveries should spur ASK growth in excess of the growth in other costs. The rationale behind this statement
is that NAS awaits smaller single-aisle aircrafts (MAX) to operate transatlantic routes, which exhibit

40
tremendous potential for cheap ASK growth. Airport charges are significantly lower for smaller aircrafts
than for standard large long-haul aircrafts. Hence, the ratio is expected to improve in the short- to medium-
term.
Figure 23: Development in Depreciation & Amortization
Figure 23 indicates that easyJet is best at managing depreciation & amortization. NAS has a positive trend,
slightly reducing its ratio while SAS and Ryanair have increased theirs. Figure 23 also shows that NAS
generates more ASK per aircraft, relative to its competitors.
CASK and RASK/CASK
Cost per available seat kilometer (CASK) is the industry standard of measuring airlines’ unit costs. It
contains the operational cost items outlined throughout this section and is a summary overview of the
preceding statistics. Figure 24 emphasizes what the preceding analyses have indicated. Ryanair performs
markedly stronger than the peer group, delivering consistently lower unit costs. NAS has been able to
slightly decrease its CASK, while easyJet has been unable to stabilize its unit costs in the period. The FSC,
SAS, is unsurprisingly delivering highest unit costs.
Figure 24: Development in CASK

41
RASK/CASK is a function of the EBIT-margin and is shown in Figure 25.
Figure 25: Development in RASK/CASK
This means that a ratio in excess of one entails that the airline’s actual EBIT-margin is above zero. The entire
peer group have achieved EBIT-margins above one in the period. However, only Ryanair has experienced a
positive development in the RASK/CASK ratio. The RASK/CASK ratio shows that NAS’ EBIT-margin is
decreasing towards the critical value. Hence, Figure 25 underlines the difficulty and significant complexity
of managing operational airline costs.
5.4 Liquidity and Solvency Risk Analysis
Petersen et al. (2017) emphasize that without liquidity, a firm cannot settle its bills or carry out profitable
investments and in certain cases, lack of liquidity leads to bankruptcy.103 Short-term liquidity risk reveals the
default risk of not being able to settle short-term obligations, while long-term liquidity risk emphasizes NAS’
ability to satisfy all its future obligations.104 Hence, the thesis examines NAS’ short- and long-term liquidity
risk, together with an analysis of NAS’ default risk.
5.4.1 Liquidity Risk
Current Ratio and CFO to Current Liabilities Ratio
The current ratio compares the airlines’ current assets and current liabilities. It indicates their ability to use
short-term assets to satisfy short-term obligations. Hence, a large ratio indicates a higher probability that the
proceeds from a liquidation of current assets would satisfy short-term liabilities.105
103 Petersen et al. (2017), Financial Statement Analysis: Valuation - Credit Analysis - Performance Evaluation, p. 211 104 Petersen et al. (2017), Financial Statement Analysis: Valuation - Credit Analysis - Performance Evaluation, p. 211 105 Petersen et al. (2017), Financial Statement Analysis: Valuation - Credit Analysis - Performance Evaluation, p. 231

42
Figure 26: Current Ratio and CFO Ratio
NAS’ average current ratio in the period is 0.53, well below the peer group average of 1.02. Note that NAS’
current ratio decreased from 2015-2016, due to increases in trade payables and short-term part of
borrowings, while current assets experienced a modest increase. Figure 26 suggests that the current ratios in
the airline industry are volatile, with greater annual fluctuations and that NAS may risk not being able to
meet its short-term financial obligations.
Petersen et al. (2017) argue that the CFO to Current Liabilities ratio avoids the convertibility-to-cash
problem and that it is seemingly a better indicator of the amount of cash available to satisfy short-term
NIBD, compared to current assets. The ratio deviates from the current ratio by measuring whether the firm’s
actual cash flows from operations are sufficient to cover short-term liabilities, instead of the firm’s potential
cash flows, represented by current assets.106 NAS’ CFO ratio declined from 0.45 to 0.18 in the period. This
indicates that the airline’s cash flow from operations only satisfies 18% of short-term obligations. It
translates into a payback time of, ceteris paribus,107 nearly six years. NAS’ CFO ratio implies significant
liquidity risk in the short-term.
5.4.2 Solvency Risk
Long-term liquidity risk is also known as solvency risk and this section examines NAS’ equity ratio,
financial leverage, interest coverage ratio (ICR) and NIBD/EBITDA ratio.
Solvency Ratios
The equity ratio and financial leverage ratio are also called solvency ratios. Petersen et al. (2017) recommend
using market values of equity and debt, if they are available. However, it is not easy to obtain the peer
group’s market values of debt. This is because airlines are not only financed by publicly traded bonds that
have an associated market value, but they also employ a variety of non-traded debt arrangements, whose
106 Petersen et al. (2017), Financial Statement Analysis: Valuation - Credit Analysis - Performance Evaluation, p. 233 107 All Else Equal

43
market values are not easily estimated. Hence, the thesis applies book values for the peer group’s equity and
debt. A higher equity ratio entails a higher capital buffer that may protect the firm against unexpected events
and thus indicates a lower long-term liquidity risk. NAS is the most leveraged airline in the peer group, with
a 2017 financial leverage ratio of nearly 20. This indicates that NAS faces long-term liquidity risk.
Figure 27: Development in Solvency Ratios
The increase in leverage ratio is primarily due to NAS reversing its equity holding by NOK 2.1 billion. Also,
debt related to aircraft financing have surged, while profits have been modest. Ryanair and easyJet have also
become more indebted in the period, but they have retained earnings in excess of newly acquired debt. The
equity ratio yields the same picture. NAS has lost 75% of its equity and aircraft deliveries have increased the
airline’s assets by NOK 18 billion. This is negative for NAS’ equity ratio and suggests that NAS has a
diminishing capital buffer to fend off unexpected events, as well as indicating higher long-term liquidity risk.
Interest Coverage Ratio
The ICR ratio gauges a firm’s ability to settle its net financial expenses.108 A firm that achieves a higher ratio
has a larger financial buffer to mitigate periods of weaker operating profits. Hence, a higher ICR implies a
lower long-term liquidity risk. Ryanair and easyJet achieves superior ICRs and are capable of covering their
interest expenses multiple times.
Conversely, NAS and SAS struggle to
achieve sufficient operating profits,
compared to interest expenses. The root
cause of NAS’ weak ICR development is
its increasing leverage and associated
costs. NAS’ ratio drops in 2017, which is
due to the announcement that NAS is
108 Petersen et al. (2017), Financial Statement Analysis: Valuation - Credit Analysis - Performance Evaluation, p. 224
Figure 28: Development in Interest Coverage Ratio

44
reversing its gains from reducing its stake in NOFI. Hence, ICR implies that NAS will have trouble covering
its future interest expenses, which are also expected to increase in conjunction with NAS’ aircraft deliveries.
NIBD/EBITDA Ratio
This ratio ignores non-cash items by focusing on EBITDA and is often used by credit rating agencies
estimating the probability of a default. Hence, the ratio reveals the ability of a firm to service its current debt
level and by extension its ability to assume more debt.
Figure 29: Development in NIBD/EBITDA
Figure 29 shows that NAS’ ratio is consistently higher than the rest of the peer group. This is unsurprising, as
it supports the preceding long-term liquidity ratios, while the profitability analysis showed that NAS is
struggling to manage operational costs. The ratio more than doubled in 2014, due to a newly established
facility agreement concerning pre-delivery financing of aircrafts scheduled for delivery in 2015 and 2016.109
The EBITDA improved in 2015-2016, due to high revenue growth compared to operational costs. The 2017
increase is mainly due to higher fuel and payroll costs, in conjunction with added aircraft debt financing.
Hence, the NIBD/EBITDA ratio further testifies to NAS’ weak liquidity.
The knowledge obtained from this section indicates that NAS is subject to high solvency risk and suggests a
high probability that NAS will have problems settling its debt in the future.
5.4.3 Liquidity Efficiency
Liquidity efficiency reveals the firm’s ability to redeem outstanding payments in a timely manner and thus
benefit from interest-free credits, such as accounts payable.110 The thesis finds it beneficial to analyze
whether NAS is liquidity or cash efficient, in conjunction with the preceding liquidity risk analysis.
Liquidity Cycle
109 Norwegian, NAS Annual Report 2014, p. 56 110 Petersen et al. (2017), Financial Statement Analysis: Valuation - Credit Analysis - Performance Evaluation, p. 228

45
The liquidity cycle examines the number of days NAS needs to convert its working capital into cash. A low
liquidity cycle indicates good inventory management, control of receivables and/or beneficial terms from
suppliers. A low liquidity cycle is beneficial as it, ceteris paribus, increases cash flows.111
Figure 30: Development in Liquidity Cycle
Figure 30 shows that the entire peer group operates with negative liquidity cycles. It appears counterintuitive,
but may be explained by the way airlines collect revenues. Airline tickets are usually sold online, where
travelers prepay their tickets weeks or months in advance. Hence, an airline’s revenue and the related
expense of a specific flight normally occurs at different periods in time. This means that the prepayments are
noted as short-term liabilities, while also being larger than current operating assets for airlines. This
discrepancy yields negative liquidity cycles. NAS has an average liquidity cycle of -73 days. This is slightly
better compared to the industry average of -75 days. NAS’ development is poor and its liquidity cycle has
evolved from -66 days to -92 days, which negatively affects NAS’ cash flows. For instance, had NAS been
able to maintain its 2016 liquidity cycle of -77 days, it would have had a positive cash impact of
approximately NOK 700 million for NAS, which exposes the benefit of effective working capital
management. The negative development in liquidity efficiency suggests that NAS may experience liquidity
problems if it does not become more effective in converting working capital into sorely needed cash.
5.4.4 Risk of Default
A firm’s financial well-being was for a long time considered to be the individual assessment of ratios
examining profitability, turnover, leverage and liquidity. However, financial researchers have introduced
111 Petersen et al. (2017), Financial Statement Analysis: Valuation - Credit Analysis - Performance Evaluation, p. 229
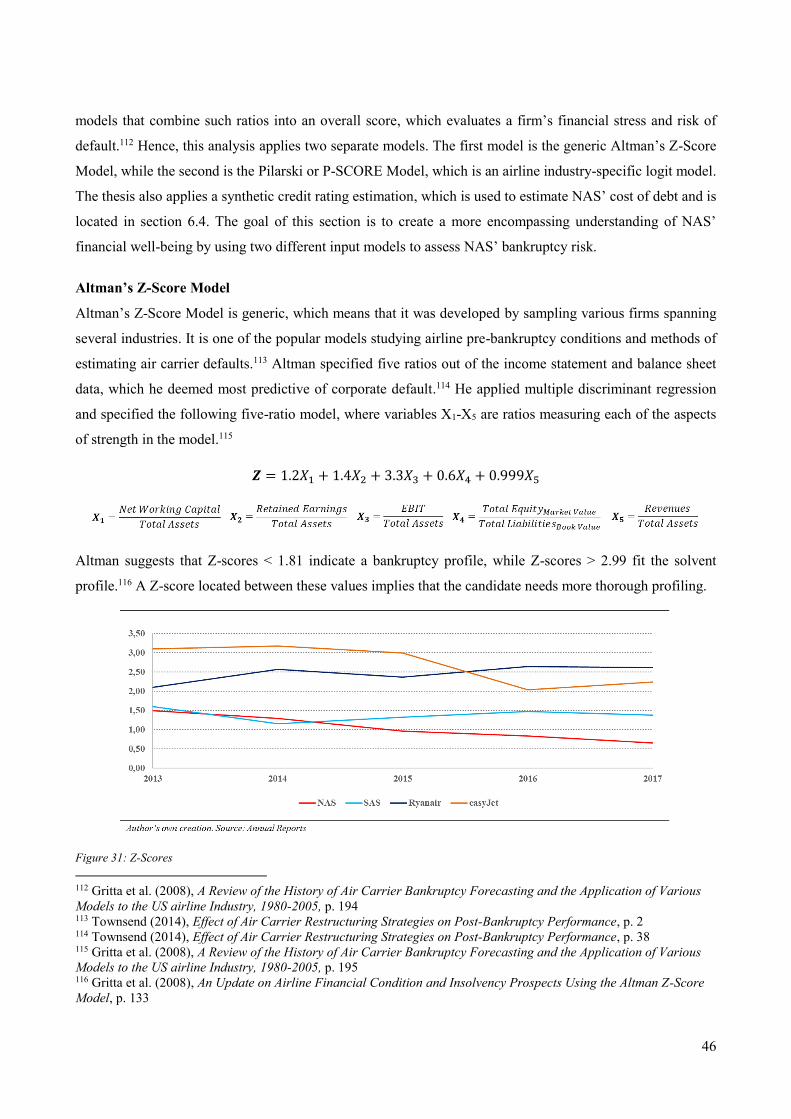
46
models that combine such ratios into an overall score, which evaluates a firm’s financial stress and risk of
default.112 Hence, this analysis applies two separate models. The first model is the generic Altman’s Z-Score
Model, while the second is the Pilarski or P-SCORE Model, which is an airline industry-specific logit model.
The thesis also applies a synthetic credit rating estimation, which is used to estimate NAS’ cost of debt and is
located in section 6.4. The goal of this section is to create a more encompassing understanding of NAS’
financial well-being by using two different input models to assess NAS’ bankruptcy risk.
Altman’s Z-Score Model
Altman’s Z-Score Model is generic, which means that it was developed by sampling various firms spanning
several industries. It is one of the popular models studying airline pre-bankruptcy conditions and methods of
estimating air carrier defaults.113 Altman specified five ratios out of the income statement and balance sheet
data, which he deemed most predictive of corporate default.114 He applied multiple discriminant regression
and specified the following five-ratio model, where variables X1-X5 are ratios measuring each of the aspects
of strength in the model.115
𝒁 = 1.2𝑋1 + 1.4𝑋2 + 3.3𝑋3 + 0.6𝑋4 + 0.999𝑋5
Altman suggests that Z-scores < 1.81 indicate a bankruptcy profile, while Z-scores > 2.99 fit the solvent
profile.116 A Z-score located between these values implies that the candidate needs more thorough profiling.
Figure 31: Z-Scores
112 Gritta et al. (2008), A Review of the History of Air Carrier Bankruptcy Forecasting and the Application of Various
Models to the US airline Industry, 1980-2005, p. 194 113 Townsend (2014), Effect of Air Carrier Restructuring Strategies on Post-Bankruptcy Performance, p. 2 114 Townsend (2014), Effect of Air Carrier Restructuring Strategies on Post-Bankruptcy Performance, p. 38 115 Gritta et al. (2008), A Review of the History of Air Carrier Bankruptcy Forecasting and the Application of Various
Models to the US airline Industry, 1980-2005, p. 195 116 Gritta et al. (2008), An Update on Airline Financial Condition and Insolvency Prospects Using the Altman Z-Score
Model, p. 133

47
None of the airlines in the peer group fit the solvent profile. Ryanair and easyJet are placed high in the grey
zone, which indicate that they should be more thoroughly analyzed. NAS fits the bankruptcy profile, as it
scores below 1.81 and has increased its insolvency risk in the period. Hence, the Altman Z-score model
indicates that NAS is a default candidate.
The Pilarski Score Model
The Pilarski Score Model is a logit model that is airline industry-specific. It uses logistic regression analysis,
which has the advantage of directly estimating the probability of default.117 It applies a similar set of input
variables as Altman, but produces a P-score that signifies the probability that the airline will default.
𝒁 = −1.98𝑋1 − 4.95𝑋2 − 1.96𝑋3 − 0.14𝑋4 − 2.38𝑋5
Figure 32: P-Scores
A higher P-value implies greater financial stress and higher estimated probability of default. NAS is the only
airline in the peer group that has increased its probability of default. The model indicates that NAS has a
probability of default of nearly 21%. This is high compared to the peer group, which achieves an average
default probability of just 1.6%. The Pilarski Score Model thus concurs with Altman’s Z-Score Model and
implies that NAS is a bankruptcy candidate.
The thesis emphasizes that there are certain limitations concerning the use of predictive models on
performance. Huang et al. (1994) argue that a sufficient hold-out sample required for data validation does not
exist. Moreover, the model’s sampling design inhibits the randomness assumption. The thesis thus
emphasizes that the two models are meant as supplements to the preceding financial analysis, with the
purpose of broadening the understanding of NAS’ financial health.
117 Gritta et al. (2008), A Review of the History of Air Carrier Bankruptcy Forecasting and the Application of Various
Models to the US airline Industry, 1980-2005, p. 200

48
5.5 Financial Analysis in Perspective
The profitability analysis demonstrates that NAS achieves weak operating profitability compared to its peers.
NAS struggles to cover its increasing costs related to its long-haul strategy, which is fortified by the
decomposed value drivers in the EBIT-margin analysis. The continuous delivery of aircrafts raises NAS’
fixed costs, which by extension necessitates that NAS expands its route network, to grow revenues and
decrease unit costs. However, NAS has not been able to grow revenues at the same pace as its costs, seeing
as NAS’ operating costs grew 33% in 2013-2017, versus a revenue growth of 20%, which is unsustainable.
Both the liquidity- and solvency analysis imply that NAS will face problems settling its financial obligations.
The analyses show a negative trend in the airline’s short- and long-term liquidity, which suggests that NAS
has a diminishing capital buffer to protect against unforeseen events. Section 5.4.3 revealed that NAS has
become less effective in converting working capital into sorely needed cash. Hence, improving its working
capital management may provide a crucial source of short-term liquidity. The short-term liquidity risk is very
high, seeing as NAS is only able to cover 33% of its current liabilities. The bankruptcy risk models both
indicate that NAS is a bankruptcy candidate and reinforce the preceding financial analyses, which indicate
that NAS may experience severe problems remaining solvent.
5.6 SWOT
The SWOT model communicates NAS’ internal strengths and weaknesses, while also revealing what
external factors constitute its opportunities and threats. Hence, the thesis applies the SWOT model to
reinforce the obtained knowledge from the strategic and financial analyses.
Figure 33: SWOT Model

49
6. Estimating Cost of Capital
A firm’s cost of capital (WACC) is a key underlying factor of a meaningful valuation. It consists of firm-
specific metrics, as well as industry- and macroeconomic variables. The thesis argues that a meaningful
WACC is decomposed into its individual components and evaluated separately. A precise estimation is
critical, as NAS’ projected cash flows are discounted by the estimated WACC.
𝑊𝐴𝐶𝐶 =𝑀𝑉𝐸
𝑁𝐼𝐵𝐷 + 𝑀𝑉𝐸∗ 𝑟𝐸 +
𝑁𝐼𝐵𝐷
𝑁𝐼𝐵𝐷 + 𝑀𝑉𝐸∗ 𝑟𝐷 ∗ (1 − 𝑇)
This section gauges each individual component with the purpose of estimating NAS’ cost of capital.
6.1 Capital Structure
NAS is highly leveraged, which entails a high debt ratio. Moreover, Koller et al. (2010) emphasize that a
firm’s current debt ratio not necessarily reflects the future. NAS pursues active management of its capital to
achieve an optimal capital structure.118 However, NAS’ management team is mute as to describing the
optimal allocation. Petersen et al. (2017) emphasize market values in the WACC-calculation, as they
represent the opportunity cost of investors and lenders.119 The thesis calculates NAS’ equity levels from
2013-2017, as the product of its outstanding shares and the respective year-end share price each year. Due to
the limited scope of the thesis, NIBD is applied as a proxy for the market value of debt. NAS and the peer
group’s capital structure from 2013-2017 is shown in Figure 34.
Figure 34: Development in Capital Structure
NAS has increased its debt ratio and exhibits a diverging trend relative to its peers. NAS’ decline in equity
ratio is due to aircraft investments and is thus an expected development. Also, it is problematic to assume a
target ratio for NAS, considering its vague management statements. The thesis argues that NAS’ debt ratio is
likely to increase and is set at 0.90 in the forecasting and terminal period, as shown in Appendix A.31.
118 Norwegian, NAS Annual Report 2017, p. 33 119 Petersen et al. (2017), Financial Statement Analysis: Valuation - Credit Analysis - Performance Evaluation, p. 341

50
6.2 Cost of Equity
The cost of equity (𝑟𝐸) gauges the investors’ required rate of return and is estimated using the Capital Asset
Pricing Model (CAPM), which convert risk into expected return.120 The thesis emphasizes that other models
could be used, such as the Fama-Frenh three factor model. However, they gauge systematic risk differently.
Hence, the thesis relies on academic finance literature endorsing the CAPM model. The CAPM model is
expressed by the following equation:
𝑟𝐸 = 𝑟𝐹 + 𝛽(𝑟𝑀 − 𝑟𝐹)
Cost of equity covers the risk-free rate (𝑟𝐹), systematic risk (𝛽) and market risk premium(𝑟𝑀 − 𝑟𝐹).
Risk-Free Rate
The 𝑟𝐹 indicates the return of investing in a risk-free security. Koller et al. (2010) accentuate that a zero-beta
portfolio represents a good estimate of the 𝑟𝐹. However, the approach is not adopted here, as it is costly and
complicated to implement. Treasury bills are commonly applied as a proxy for the 𝑟𝐹, as empirical evidence
suggest an insignificant risk associated with these securities. Hence, the thesis applies government bonds
noted in the same currency as NAS’ cash flows. As such, the thesis alleviates potential inflation issues.121
Koller et al. (2010) emphasize that each of NAS’ cash flows should be discounted, using a government bond
with equal maturity. However, it necessitates the cost of capital to be determined in each individual year.
Hence, the method is not applied. 10-year Norwegian government bonds are used as a proxy for the 𝑟𝐹. A
government bond with longer duration could arguably better match NAS’ cash flows. However, Petersen et
al. (2010) state that long-term government bonds are associated with illiquidity, which may result in yield
premiums. Major credit rating agencies, such as Moody’s and Standard & Poor’s, award Norway with an
AAA rating, which suggests very low default risk. In 2017, the average Norwegian 10-year government
bond was quoted at 1.64% and is used as a proxy for NAS’ 𝑟𝐹 throughout this thesis.
Market Risk Premium
The market risk premium (𝑟𝑀 − 𝑟𝐹) is the spread between the expected return of the market and the 𝑟𝐹.
Hence, it is the premium demanded by investors for investing in stocks, rather than risk-free securities.
Koller et al. (2010) state that the metric is hard to determine, because the market portfolio cannot be
observed. Aswath Damodaran, a professor and authority on investing and equity valuation, has collected
historical risk premiums for equity markets and advocates that the Norwegian risk premia stands at 5.08% in
2017.122 This is in accordance with Koller et al. (2010) who suggest that the reasonable spread of the market
risk premium to be located at 4.50-5.50%. In addition, the Norwegian Society of Financial Analysts and
120 Petersen et al. (2017), Financial Statement Analysis: Valuation - Credit Analysis - Performance Evaluation, p. 345 121 Petersen et al. (2017), Financial Statement Analysis: Valuation - Credit Analysis - Performance Evaluation, p. 346 122 Stern School of Business (2018), Country Default Spreads and Risk Premiums

51
PwC found in their annual co-survey that the Norwegian risk premium equated 5.00%.123 Hence, the thesis
applies the average of these estimated rates, which equals a Norwegian marked risk premium of 5.02%.
6.3 Beta
Beta is a measure of systematic risk and gauges a firm’s risk relative to the market portfolio. A beta of 1.00
implies perfect correlation with the market, whereas a beta in excess of 1.00 suggests that the firm is more
volatile than the market portfolio. Hence, beta gauges a company’s sensitivity to market fluctuations.
Estimating betas are associated with various limitations, which facilitate errors. To limit the estimation
errors, the thesis applies different approaches to determine NAS’ beta. The thesis applies a weighted average,
in an attempt to improve the accuracy of NAS’ beta.
Regression Beta
The regression beta is a common method of estimating a firm’s beta value. It performs a regression on the
stock’s historical return against the market portfolio’s return, in the same period. It is often called the beta
market model, and is expressed by the following equation:
𝑅𝑖 =∝ +𝛽𝑅𝑚 + 𝜖
Moreover, Table 1 shows the derived regression betas from four different indices. The thesis applied two
large well-diversified indices, in conjunction with two airline-specific indices. The result of the regression
method is highly affected by the thesis’
subjective considerations, such as the applied
time horizon.124 The procedure is located in
Appendix A.36-A.39. Another limitation of
this method is its inherent assumption of a
static beta over time. This is a weak
assumption, as it likely varies in the time-
dimension as macro- and microeconomic
factors can change a company’s risk profile. In
an attempt to remedy this weakness, the thesis
incorporates a time-varying beta estimation. In addition, Koller et al. (2010) suggest graphing the company’s
rolling betas over the time-dimension and inspect them for trends or significant changes in risk.125 Figure 35
thus incorporates a 12-month rolling beta estimation to validate the estimated adjusted regression beta. The
method yields an average dynamic beta in the time-dimension equal to 1.19.
123 PwC (2017), Risikopremien i det Norske Markedet 124 Stern School of Business (2018), A. Estimating Risk Parameters, p. 11 125 Koller et al. (2010), Valuation – Measuring and Managing the Value of Companies, p. 250
Table 1: Regression Beta

52
Figure 35: Rolling Beta OLS
Furthermore, the static ex-post regression estimate is in conflict with the ex-ante-based CAPM. Hence, any
deductions made from the forward-looking CAPM will be associated with a backwards-looking beta
estimation. In addition, Koller et al. (2010) advocate the use of monthly observations, as it avoids the
empirical problems of high-frequency beta estimations. Table 1 showed that the thesis assigns a higher
weight to the XAL- and AXGAL: Arca Airline Indices. This is because they track commercial international
passenger airlines. In comparison, S&P 500 and MSCI World are broad and well-diversified indices,
consisting of a multitude of unrelated industries. Consequently, they receive lower weights. Empirical
studies underline that betas over time tends towards the beta of the market, which equals 1.00. Hence, using
Bloomberg’s simple smoothing process alleviates the estimated beta of extreme values, and smooths the raw
beta regression towards the beta of the market portfolio.126 The method yields a Bloomberg-adjusted levered
beta of 0.924 for NAS.127
Industry Beta
The industry beta does not gauge individual companies. Instead, it attends to the risk of the entire industry.
As companies operating in the same industry are subjected to the same operating risks, and by extension
should have comparable betas, the metric should be a suitable measure to improve the accuracy of NAS’
estimated beta. However, airlines are also subject to financial risk, which varies considerably. Hence, the
industry beta is adjusted for NAS’ financial leverage. Damodaran (2017) presents 17 firms within the “Air
Transport” industry. Note that Damodaran’s industry encompasses participants in industries other than that
of commercial airlines, including package shippers like United Postal Service (UPS) and FedEx. This affects
the reliability of Damodaran’s industry beta, which is associated with an unlevered beta of 0.66.128 After
correcting for NAS’ financial leverage, the thesis estimates a levered industry beta for NAS equal to 1.111.
126 Koller et al. (2010), Valuation – Measuring and Managing the Value of Companies, p. 257 127 Appendix A.33-A.37: Regression Outputs and Rolling Window Do-File 128 Stern School of Business, (2018), Betas by Sector

53
Bottom-Up Beta
The bottom-up approach separates NAS’ operating risks from its financial risks in the beta estimate. It
facilitates an estimation of beta that excludes the historical share performance of NAS. The thesis initiates
the estimation by regressing the returns of NAS’ peers, against the performance of the four previously
mentioned indices. The derived beta-value of each airline are then un-levered and averaged. The un-levering
procedure is performed pursuant to the below equation.
𝛽𝑈 =𝛽𝐿
1 + (1 − 𝑇𝑚) ∗𝐷𝐸
Un-levering the betas remove the airlines’ financial leverage component and tax-shield advantages, whereas
the concurrent re-levering applies NAS’ D/E-ratio. Hence, the procedure resembles the industry beta method
and yields a bottom-up beta equal to 1.438 for NAS.
Service Betas
Financial institutions are another source of beta-estimations. Damodaran (2012) explains that all services use
the abovementioned regression beta, but adjust it and apply their own techniques for gauging risk. Hence,
their methods are also associated with the drawbacks of standard regression betas. An inherent problem with
using the service betas, is that most financial institutions do not reveal their estimation procedures.129 The
thesis applies the average beta provided by Bloomberg, Reuters and Financial Times. The approach yields a
levered service beta estimation equal to 1.009 for NAS.
Estimating NAS’ Beta
The thesis applies a weighted average of the estimated betas. Admittedly, there is no single most correct
method of estimating beta. Note that the beta-weights are prone to bias, as they rely on the thesis’ subjective
reasoning. The regression beta of 0.924 is associated with various drawbacks. However, the rolling beta plot
in Figure 35 showed that NAS’ beta has remained relatively stable in the time-dimension, varying between
1.05-1.35. The graph plot thus implies that NAS has not been subjected to fundamental changes in the
period. The rolling beta-estimation thus assigns credibility to the estimated regression beta. The regression
beta is given a relatively high weight of 30%.
The industry beta is not given much credibility. The data is overwhelmed by companies that are
incomparable to NAS. This flaw is due to Damodaran incorporating all air transport industries into one
aggregate metric. Hence, the industry beta receives a weight of 10%. It is difficult to properly ascertain the
validity of the service beta, due to the service firms’ unwillingness to reveal their estimation methods and
techniques. Hence, the service beta is given a weight of 10%.
129 Damodaran. (2012), Investment Valuation. Tools and Techniques for Determining the Value of Any Asset, p. 186

54
The bottom-up beta is associated with some of the same drawbacks as the regression beta and should ideally
be based on a greater sample size of airlines. Nonetheless, it receives the highest weight. This follows the
rationale of Damodaran (2018), who argues
that estimation errors are reduced by
averaging the fundamental risk of comparable
firms in the same industry.130 The thesis
assigns the bottom-up beta a weight of 50%.
The thesis’ estimation approach, in
conjunction with the deliberated weights and
NAS’ resulting beta, is expressed in Table 2.
6.4 Cost of Debt
The cost of debt (𝑟𝐷) is the creditors’ required rate of return for providing debt financing. Hence, it is the
effective interest rate on NIBD. Interest rates are compiled from NAS and the peer group’s annual reports
and are outlined in Appendix A.22-A.25. Due to NAS’ high leverage ratio, in conjunction with poor
development in liquidity and financial ratios, the thesis applies a synthetic credit rating estimation to obtain
an alternative measure of its cost of debt. It is done to facilitate a sound assessment of the cost of debt in
NAS’ annual report. The thesis compiles NAS’ effective borrowing rates and issue weights, relative to their
corresponding NIBD. NAS’ average rate is found and converted into a pre-tax cost of debt, by applying the
2017 Norwegian corporate tax rate of 24%. The pre-tax cost of debt in 2017 is estimated at 5.32%.
The thesis’ synthetic credit rating estimation follows the method outlined by Damodaran, with the goal of
assigning a credit rating to NAS’ debt.131 However, the thesis adjusts the framework by incurring the
previously discussed airline multiple of 7x, as a proxy for NAS’ lease-related debt. This method is an
alternative approach to discounting NAS’ impending lease obligations. For a detailed discussion of NAS’
lease-related debt, please see section 5.2.1. NAS’ interest coverage ratio gauges its ability to settle interest
commitments and yields a circular calculation problem, since the metric depends on NAS’ cost of debt. The
circular problem is overcome by enabling iterative calculations in Microsoft Excel. The procedure yields an
interest coverage ratio of 0.54, which indicates that NAS is able to settle 54% of the interest on its
outstanding debt. The final step in the procedure is to estimate the default spread of NAS’ debt. However, the
credit market in Norway is narrow and not readily available. Arguably, digging deeper into this subject is
outside the scope of the thesis. Hence, the thesis applies yield spreads over U.S. Treasuries as of 2017,
limited to mid-cap non-financial firms. The synthetic credit rating results in a default spread equal to 13.95%
130 Stern School of Business (2018), Ten Questions About Bottom-Up Beta 131 Stern School of Business (2018), Estimating a Synthetic Credit Rating and Cost of Debt
Table 2: NAS' Estimated Beta

55
and a concurrent credit rating of C. NAS’ cost of debt is estimated by adding the Norwegian 𝑟𝐹 of 1.64% to
the default spread, which yields a pre-tax cost of debt equal to 15.59%.
The two approaches yield varying pre-tax cost of debts. Recalling NAS’ poor financial development revealed
in the financial analysis, NAS’ own cost of debt appears low. Hence, the thesis applies the average of the two
methods, as NAS’ cost of debt. To secure consistency in all prospective calculations, the same procedure is
performed on NAS’ peers and is found in Appendix A.18-A.21. NAS’ cost of debt is set to 10.46%.
6.5 Estimating WACC
The thesis applies each estimated component of the WACC formula in Table 3.
Table 3: Weighted Average Cost of Capital
The thesis obtains a WACC equal to 8.02% for NAS, as of 31.12.2017.

56
7. Forecasting
The purpose of the forecasting section is to provide a meaningful and realistic estimation of NAS’ future free
cash flows, represented by pro forma statements. Hence, this section indicates a change of focus in the thesis,
going from a historical view to embracing a forward-looking perspective.
The pro forma statements incorporate the knowledge derived from the strategic and financial analyses. The
strategic value drivers are industry and firm-specific and may be perceived as the input factors that
ultimately create value and can be measured in the firm’s recorded financial performance. Similarly, NAS’
financial value drivers may be considered as the output factors from the strategic value drivers.132 The thesis
thus employs NAS’ strategic and financial value drivers collectively, to create a meaningful estimate of
NAS’ future free cash flows. To ensure transparent forecasting, Appendix A.26-A.29 contain NAS’
historical- and forecasted income statements and balance sheets, as well as forecasted value drivers.
The thesis splits the forecasting periods into three distinct periods. It follows the recommendation of Koller
et al. (2010) and applies a detailed short-term forecasting period of three years from 2018-2020. Note that the
choice of forecasting horizon, ceteris paribus, does not change the value of NAS. It merely alters the way
value is distributed between the forecasting period and the continuing period.133 The thesis argues that a long
forecasting period increases complexity and decreases precision, while the reliability of the underlying
forecasting assumptions diminishes with the timeframe. Subsequently, the medium-term forecast is
simplified and covers 2021-2023, while the final long-term forecast consists of the terminal period, which
relies on the rate at which NAS’ cash flows are assumed to grow in perpetuity.
It is not easy to determine what constitutes a reasonable terminal growth rate. NAS obtains its revenue in
different markets, which further complicates the estimation. Moreover, the European Central Bank has stated
that it aims to maintain inflation rates below, but close to 2%.134 The Federal Reserve operates with a 2%
target inflation rate for the U.S., while PwC estimated the long-term inflation rate in Norway at 2% in
2017.135136 These are core markets for NAS and the thesis thus applies a terminal growth rate of 2% for the
airline.
7.1 Pro Forma: Income Statement
The thesis proceeds to estimate how items in NAS’ income statement will develop. Academic literature on
firm valuations emphasize the importance of identifying appropriate value drivers that reflect underlying
firm economics. Petersen et al. (2017) favor sales-driven forecasting, which assumes that sales growth drive
132 Petersen et al. (2017), Financial Statement Analysis: Valuation - Credit Analysis - Performance Evaluation, p. 252 133 Koller et al. (2010), Valuation – Measuring and Managing the Value of Companies, p. 218 134 European Central Bank, The Definition of Price Stability 135 The Federal Reserve, Why Does the Federal Reserve Aim For 2 Percent Inflation Over Time? 136 PwC, Risikopremien i Det Norske Markedet

57
operating expenses.137 However, Koller et al. (2010) outline that airlines are partially exempted from the
traditional forecasting approach. They argue that a proper airline forecast should employ non-financial ratios,
to separate the effects of price from volume.138 Moreover, deteriorating fares during the early 2000s made
costs as a portion of revenues higher, but did not automatically entail that airlines had increased costs.
Hence, the thesis argues that revenues may be a misleading operational driver as it does not represent
underlying airline economics. Concurrently, volume translates into production levels measured by NAS’
ASK, which was outlined in section 5.3.2. The forecast should thus not use revenues to forecast expenses,
but rather apply expected ASK as the main operational driver. The complete pro forma income statement is
located in Appendix A.26.
7.1.1 ASK and Fleet Growth
ASK is determined by the type and number of aircrafts. NAS’ expected ASK growth is dependent upon the
committed fleet plan schedule, which governs the delivery of aircrafts. Aircrafts scheduled to be sold or
returned to their lessor are included in the schedule. The forecasted ASK production and related calculations
in the forecasting section thus incorporate the influx of new aircrafts, as well as outflux of older aircrafts.
The thesis applies detailed delivery data and rates of attrition extracted from NAS’ annual report from 2017,
to forecast NAS’ expected fleet size. NAS’ historical and forecasted fleet composition is in Appendix A.30.
The thesis differentiates NAS’ fleet into contribution levels from short-haul and long-haul respectively. The
output from the ASK calculations are used in section 7.1.2 to forecast revenues. Hence, a meaningful
revenue forecast necessitates each aircraft’s contribution to NAS’ total ASK. The key metrics behind ASK
are average sector length, in conjunction with aircraft model and total flight duration per day. The thesis
found the ASK contribution per short- and long-haul aircraft by applying the average sector length on NAS’
three most popular long-haul flights, while using the average sector length of 1,607 kilometers for the
airline’s short-haul fleet.139 Flight distances are multiplied by the respective average seat capacities of 186
seats for short-haul aircrafts, 189 and 290 seats for long-haul travel by the MAX and Dreamliner
respectively. For simplicity, the thesis assumes 350 operating days per year. The complete procedure
resulting in total ASK and ASK-contribution per aircraft is depicted in Table 4.
137 Petersen et al. (2017), Financial Statement Analysis: Valuation - Credit Analysis - Performance Evaluation, p. 254 138 Koller et al. (2010), Valuation – Measuring and Managing the Value of Companies, p. 208 139 Norwegian, NAS Interim Report Q4 – 2017, p. 3

58
Table 4: Total ASK
7.1.2 Revenues
The profitability analysis showed that NAS’ revenues are the product of RASK and total ASK. Section 5.3.2
detailed that the airline-specific revenue metric, RASK, is the product of NAS’ yield and load factor. Hence,
this section forecasts revenues based on these two key operating drivers.
Yield
NAS’ yield is a measure of the average fare per kilometer and is an important performance metric, as a
higher yield translates into higher revenues. Airlines are experiencing significant yield-pressure. This is true
in the European short-haul market, as the financial analysis revealed a falling yield trend in the peer group.
However, it is NAS’ long-haul operations that are expected to occupy its operative focus going forward.
NAS’ expansion strategy facilitates economies of scale and a larger revenue-base to distribute its fixed costs.
However, the thesis argues that much of the cost benefit that NAS may be able to achieve is likely to be
passed on to the passenger in the form of reduced ticket prices. In addition, NAS is dependent upon high load
factors, which also indicates low ticket prices. NAS’ increased emphasis on the long-haul segment is evident
from Table 4 above. The ambition is that the single-aisle MAX aircraft will fuel NAS’ low-cost long-haul
strategy. However, the issue is that the MAX aircraft will generate lower RPK, as it operates 101 fewer seats
than the Dreamliner. Hence, the Dreamliner delivers larger RPK and thus a greater yield. Also, the average
air fare is lower traveling with the MAX aircraft, which negatively impact yield. This price development
supports the Porter Five Forces analysis, which implied that price is the key source of differentiation in the
industry, as air travel is becoming standardized. In conjunction, these factors suggest that NAS will
experience a deteriorating yield going forward.
NAS has achieved an average drop in yield of 3.97% since 2013. Following the argumentation above, the
thesis supports a continued weak growth in yield in the short-term. The thesis applies a yield growth of -3%
in the short-term, due to continued implementation of MAX aircrafts, which generate lower RPK. The VRIO
analysis emphasized that NAS is conveniently organized to absorb the ensuing value of long-haul operations

59
in the long-term, while the PESTLE analysis revealed that IATA forecasts increasing air traffic demand. The
thesis argues that NAS is better situated in the medium- and long-term to exploit its increased resources to
improve the yield. For this reason, the simplified medium-term forecast and the terminal period assumes a
respective 0% and 1% stable growth rate in yield.
Load Factor
The load factor signifies the degree to which NAS is able to take advantage of its aircrafts. It thus depends on
NAS’ ability to manage the relationship between RPK and ASK. The load factor is also dependent upon the
expected air traffic growth, which the PESTLE analysis outlined to be historically correlated with global
GDP growth. ASK is expected to grow a considerable 134%, due to the delivery of more than 100 aircrafts,
most of which are destined for long-haul operations. This is an increase that NAS’ RPK is unlikely to match.
The load factor is affected by ticket prices and stage lengths through RPK. Thus, continuously low ticket
prices are expected to positively affect NAS’ ability to achieve satisfactory load factors, as highlighted in the
financial analysis. However, the VRIO analysis explained that NAS will incorporate aircrafts into operations
at such a high pace, that it may struggle to achieve sufficient load factors. This is supported by the PESTLE
analysis, which revealed that NAS is constantly seeking new markets and routes to employ its growing fleet.
To illustrate, NAS experienced a drop in overall load factor in 2017 of 0.22% due to the arrival of 28 new
aircrafts, which substantially increased ASK. Moreover, the projected annual average growth in ASK is
12.96%, while the annual average passenger growth has amounted to 12.49% since 2013. Hence, this
indicates that NAS’ RPK will not be able to keep up with the projected ASK, which negatively affects NAS’
load factor.
The thesis argues that NAS’ negative load factor development in 2017 is a viable indicator of its short-term
development. This is because 2017 were only the beginning of a period with large annual aircraft deliveries
which will need to be strategically maneuvered into operations each year, peaking in 2018. Hence, 2017
witnessed NAS’ inability to utilize the additional aircrafts in a satisfactory manner in the short-term, as load
factors decreased. For this reason, the thesis forecasts a short-term annual reduction in load factor of 1.50%
and 1% growth in the medium- and long-term.
Revenues and RASK
Section 5.3.2 in the financial analysis detailed that NAS’ revenue may be calculated as the product of the
industry-specific ratios ASK and RASK. The complete procedure is shown in Table 5.

60
Table 5: Total Revenues
Note that Koller et al. (2010) advocates that no firm should grow faster than the aggregate economy in the
long-term, as it would yield an unrealistically large firm.140 The thesis finds the preceding estimations to be
reasonable, as it is somewhat lower than the global 50- and 20-year GDP growth forecasts presented by
McKinsey and Boeing, which equal 2.10% and 2.90%, respectively.
7.1.3 Operating Expenses
The financial analysis showed that jet fuel, payroll and leasing costs dominate NAS’ cost structure. Hence,
the thesis gives special attention to these cost items in the following subsections. In accordance with section
7.1 and Koller et al (2010), NAS’ operational costs are based on production levels instead of revenues, as it
enables a separation of price and volume effects.141
Jet Fuel Expenses
The strategic analysis emphasized jet fuel as the biggest operational cost for NAS. Section 4.1.4 in the
PESTLE analysis pointed out that NAS employs fuel-efficient aircrafts as a key part of its low-cost strategy.
As the thesis efforts to forecast cost items in relation to production levels, NAS’ jet fuel cost may be found as
the product of its total ASK and its jet fuel cost per ASK. It may also be found as the product of the barrel
price of jet fuel and the number of demanded barrels, which is determined by ASK. The thesis applies the
latter method. Note that this is not a conventional approach of estimating jet fuel costs, as standard
approaches simply assume constant historical jet fuel rates in the forecasting- and terminal period. The thesis
efforts to forecast varying jet fuel costs subject to NAS’ fleet composition, as well as fluctuations in the oil
price and the USD/NOK exchange rate.
The first step is to estimate NAS’ ASK/Barrel ratio each year. It signifies the fuel efficiency of NAS’
aircrafts and is thus a critical variable. The fuel-efficiency estimation builds on NAS’ expected fleet
composition, the aircrafts’ individual capacity and their fuel consumption. Table 6 outlines the procedure and
results in the ASK/Barrel ratio per aircraft, which indicates each aircraft’s fuel-efficiency.
140 Koller et al. (2010), Valuation – Measuring and Managing the Value of Companies, p. 188 141 Koller et al. (2010), Valuation – Measuring and Managing the Value of Companies, p. 208

61
Table 6: ASK/Barrel per Aircraft
The calculation shows that the older B737-800 aircraft is the least fuel-efficient, as it produces less ASK per
barrel than NAS’ long-haul aircrafts. The next step is to use the above information to forecast NAS’ total
ASK/Barrel ratio each year. This is done using NAS’ fleet composition and ASK/Barrel per aircraft model,
as weights. Table 7 shows that NAS’ fuel efficiency improvement in the forecasting period equals 9%, which
will positively affect NAS’ jet fuel costs.
Table 7: Fuel Efficiency and Total ASK/Barrel
The next challenge is to forecast the jet fuel price and NAS’ barrel consumption each year, which require
several steps. A linear regression of historical jet fuel prices against the price of crude oil indicates a
correlation coefficient of 0.929.142 Hence, the regression output suggests that the jet fuel price tracks the oil
price. The PESTLE analysis emphasized this point and detailed how Airbus’ Global Forecast (2017)
suggests increasing oil prices the next two decades. A higher oil price indicates a higher spot price on jet
fuel, which in isolation is negative for NAS. The thesis utilizes the World Bank’s oil price projections, which
signal higher oil prices approaching 2030.143 Also, jet fuel is traded in U.S. Dollars and is subject to currency
risk. The PESTLE analysis clarified this risk and Figure 36 below suggests a negative correlation between
them. It is the visual representation of a Bloomberg regression on the relationship between the market price
of crude oil and the USD/NOK.
142 Bloomberg (2018) 143 The World Bank, Commodity Markets Outlook, p. 1

62
Figure 36: Crude Oil Price versus USD/NOK Exchange Rate
The figure indicates that a lower oil price weakens the NOK relative to USD, which harmonizes with the
strategic analysis. The analysis pointed out that the strength of the NOK is reliant upon the development in
the crude oil price, as oil and gas encompass approximately 25% of Norway’s exports. The regression output
yields a negative correlation coefficient of -0.65 and advocates a beta coefficient for the price of crude oil
equal to -0.22. The thesis proceeds to apply the obtained oil price beta to the projected USD/NOK
development in the forecasting period. The purpose is to create an estimate of how the USD/NOK exchange
rate develops alongside the market consensus of rising oil prices.
The jet fuel price is then estimated, following a regression analysis of crude oil price levels against the spot
price of jet fuel. The goal of the procedure is to obtain an equation that indicates how the jet fuel price may
evolve, following the fluctuations in oil price. The regressions are run using Bloomberg and the thesis
obtains the following approximate relationship:
𝐽𝑒𝑡 𝐹𝑢𝑒𝑙 𝑃𝑟𝑖𝑐𝑒 = −0.005 + 1.124 ∗ 𝐶𝑟𝑢𝑑𝑒 𝑂𝑖𝑙 𝑃𝑟𝑖𝑐𝑒
The regression output suggests that jet fuel trades at a price premium of 12.4%, relative to crude oil. This
translates into a jet fuel price of USD 62.94 in 2018 and NOK 7.98, by using the projected USD/NOK
exchange rate. The output of the procedure is depicted in Table 8.
Table 8: Total Fuel Costs

63
Table 8 shows the appreciation of the NOK relative to USD, following the World Bank’s projection of a
rising oil price. The jet fuel price per barrel in USD is multiplied with the estimated USD/NOK exchange
rate to obtain the jet fuel price per barrel in NOK. The forecasted ASK each year is then applied to the fuel
efficiency ratio, ASK/Barrel, to obtain NAS’ demand for jet fuel, based on the airline’s fleet composition in
Table 7. Finally, NAS’ forecasted jet fuel costs are estimated as the product of the fuel price per barrel in
NOK and NAS’ estimated fuel barrel demand.
This forecast was experimental. However, the goal of this section was to provide a forecast rooted in NAS’
drivers, while incorporating key variables underlying jet fuel costs. The thesis argues that the procedure
offers an encompassing alternative approach to forecasting jet fuel costs in the airline industry.
Payroll Expenses
NAS’ payroll expenses are the product of total ASK and the ratio Payroll/ASK and was shown in the
profitability analysis in section 5.3. The ratio has fluctuated between 0.069 and 0.073 from 2013-2017, but
the thesis argues that it is likely to decline in the future. This is rooted in NAS’ scheduled delivery of 94
MAX aircrafts from 2018-2023. These aircrafts are smaller and require less personnel, while still producing
comparable ASK levels as the large Dreamliner. This indicates that the Payroll/ASK ratio will decline.
Similarly, the production output per employee denoted by ASK/Employee increased almost 26% in 2017 and
is expected to grow as fewer workers will deliver more ASK per flight leg. The thesis estimates a continuing
growth in ASK/Employee equal to 10% in the short-term to be a reasonable estimate. A modest growth
similar to the historical growth rate of 5% is estimated in the medium- to long-term.
The PESTLE analysis highlighted that NAS will employ foreign cabin crew through its Irish subsidiary NAI,
to operate its transatlantic routes. NAS is thus able to reduce payroll costs by hiring personnel subject to less
strict wage regulations. This is shown by NAS’ portion of Norwegian man-labor years, which has declined
from 53%-26%. Seeing as NAS’ main strategic focus going forward is to phase aircrafts into long-haul
operations, it is likely that the portion of foreign workers with comparatively low wage levels will increase.
Hence, the thesis argues that NAS’ Payroll/Employee ratio should decline going forward, which positively
influences NAS’ total payroll expenses. The thesis estimates an annual reduction of 2.5% in the ratio.
Table 9: Total Payroll Costs

64
Leasing Expenses
NAS’ committed fleet plan extends to 2020 and reveals its expected fleet composition. NAS’ historical- and
forecasted fleet composition is disclosed in Appendix A.30. The fleet composition suggests that NAS is
planning to increase its portion of owned aircrafts, and thus limit its portion of leasing. NAS has not
disclosed specific information concerning leases in the medium- to long-term. However, NAS is scheduled
to receive the remainder of its outstanding aircraft order from 2012, within the forecasting period. NAS’
outstanding firm order per 31.12.2017 consists of 21 Dreamliners and 94 MAX aircrafts.
Table 10: Lease-Related Expenses
The thesis estimates that the Dreamliner order is fulfilled by 2020, while the 94 MAX aircrafts are estimated
to be fully delivered within 2023 and the order is assumed to be incorporated evenly over the short-to
medium-term. NAS’ forecasted lease expenses, lease depreciation and lease interest expenses are depicted in
Table 10, as well as its forecasted capitalized operational leases, which were discussed in the financial
analysis in section 5.2.1.
Other Costs
The PESTLE analysis revealed that NAS’ airport charges and handling charges are expected to increase as
NAS’ expansion strategy peaks in 2018. Airport charges compared to NAS’ production level have remained
stable between 5%-6%, while handling charges range between 4%-5%. For this reason, the thesis argues that
these items will continue to track NAS’ development in production and are set to their five-year averages.
Technical maintenance encompasses repairs and scheduled maintenance on NAS’ aircrafts. Sale and
distribution costs in conjunction with other operating expenses include the work in back-office functions,
marketing and general administrative activities that ensure NAS’ day-to-day operations. Neither of these cost
items have fluctuated in relation to ASK. The thesis argues that it is reasonable to estimate that these costs
continue to trace NAS’ production levels, as increased production requires more supporting activities.
Specifically, there are no information suggesting that the administrative activities should stop reflecting the
underlying production development. The thesis estimates that these cost items henceforth track NAS’ ASK

65
and are set to their respective five-year averages. Koller et al. (2010) argue that depreciation and
amortization should be projected based on tangible assets and definite intangible assets, as they easily
connect to each other. These items are set to track NAS’ production development, at a rate equal to their
respective five-year averages.
7.2 Pro Forma: Balance Sheet
The purpose of this section is to provide reasonable estimates of how NAS’ balance sheet will develop. It
deliberates upon net working capital (NWC), tangible assets and intangible assets. The complete pro forma
balance sheet is located in Appendix A.27.
7.2.1 Net Working Capital
NWC encompasses NAS’ inventories, trade and other receivables, trade and other payables and air traffic
settlement liabilities.
Inventory
NAS’ inventories comprise technical spare parts and various consumables on hand for scheduled
maintenance and unexpected repairs. NAS is subject to the safety regulations ensured by the European
Aviation Safety Agency (EASA) and must adhere to stipulated maintenance guidelines on all aircrafts, as
outlined in the PESTLE analysis. Hence, systematic aircraft maintenance is mandatory and are scheduled in
accordance with each aircraft’s accumulated flight distance, which indicates that ASK is a relevant driver.
The thesis finds it reasonable to associate the development in inventories to NAS’ production and estimates
it to equal its five-year average of 0.20% of ASK.
Trade and Other Receivables and Air Traffic Settlement Liabilities
The financial analysis detailed how NAS’ receivables encompass ticket revenues related to credit card
purchases. As section 7.1.2 estimated a reduction in NAS’ yield, the thesis finds it inappropriate to argue for
a link between receivables and production levels. Yield is an underlying driver of revenue, which by
extension entails that NAS’ receivables cannot be expected to follow NAS’ development in ASK. Koller et
al. (2010) suggest that NWC estimations should trail revenues, with the exception of inventories and trade
payables.144 The thesis thus argues that trade and other receivables follows NAS’ development in revenues.
The ratio has remained stable since 2013, while the thesis does not estimate the ratio to deviate from its
historical average. For this reason, the five-year average receivables equal to 11.73% of revenues is applied
in the forecasting period.
144 Koller et al. (2010), Valuation – Measuring and Managing the Value of Companies, p. 202

66
Air traffic settlement liabilities were also highlighted in the financial analysis. It is an accrual adjustment of
revenue, relating to ticket purchases bought prior to the booked flight taking place. It is thus outstanding on
NAS’ reporting date and directly relate to NAS’ revenues. Following the argumentation of Koller et al.
(2010) and the preceding section, the thesis estimates a constant ratio equal to its five-year average ratio of
17.71% of revenues.
Trade and Other Payables
Trade and other payables mainly comprise accrual modifications to operating costs and are non-interest
bearing. It is thus appropriate to connect this aggregate item to operating costs. NAS’ trade and other
payables have increased at a higher pace than operating expenses, increasing from 14.66%-20.30% the past
five years. The thesis believes that the 2017 ratio of 20.30% better reflects NAS’ projected cost development,
considering its progressively increasing operating costs, and is thus applied in the short- to long-term.
7.2.2 Tangible Assets
Tangible assets are items of a physical nature that can be touched, such as buildings and equipment.145 It
comprises prepayments, aircrafts, buildings and financial lease asset for NAS.
The financial implications of prepayments to aircraft manufacturers were discussed in section 5.3.1 in the
financial analysis. The practical implication is that NAS’ prepayments are relocated to the other line item,
aircraft, parts and installations, upon delivery of said aircrafts. NAS’ annual report states that the airline has
established a down-payment agreement with Boeing for undelivered aircrafts, which is not disclosed to the
public. Also, airlines are expected to sustain a 3%-5% pre-delivery charge to be settled at contract initiation,
according to Morrell (1997). The prepayments usually follow a quarterly schedule, with an increased
payment frequency approaching delivery. In addition, approximately 30% of the purchasing price is
normally due two years prior to the delivery date.146 NAS’ committed fleet plan and forecasted fleet growth
show a stable increase in NAS’ aircraft fleet in the forecasting period. Prepayments in relation to ASK has
historically resided between 7.21%-12.36%. Considering that the scheduled aircraft deliveries is expected to
peak in 2018, the thesis estimates this ratio to remain high equaling 15.36% in 2018. However, as NAS
receives the remaining aircrafts, the ratio steadily decreases. The ratio is estimated to decrease 1% annually
following 2018, to reflect the lower portion of prepayments.
The item aircrafts, parts and installations are easily related to the portion of NAS’ fleet that is not leased.
Hence, it is natural to connect the development in this driver to the number of aircrafts that NAS own at any
period in time. Moreover, the item has naturally increased since 2013, following NAS’ fleet expansion.
145 Petersen et al. (2017), Financial Statement Analysis: Valuation - Credit Analysis - Performance Evaluation, p. 676 146 Morrell (1997), Airline Finance, p. 111

67
Specifically, the short- and medium-term forecasts of NAS’ aircrafts, parts and installations are estimated as
the product of the average aircraft value and the projected number of owned aircrafts.
Buildings relate to housing of crews and administration. The thesis connects this item to ASK as NAS’
expansion strategy necessitates additional crews and administrative facilities. The ratio has been stable and
the thesis has no information suggesting extraordinary investments in this item. Buildings is estimated to
remain a constant portion of ASK, equal to its five-year average of 0.41%. The item financial lease asset is
not forecasted as it encompasses items that NAS discarded in 2015.
7.2.3 Intangible Assets
Intangible assets are identifiable non-monetary assets that cannot be seen, touched or physically measured.147
It comprises goodwill, software and other intangible assets with definite and indefinite life, relating to prior
investment activities. Other intangible assets include estimated fair value of the Norwegian brand name,
charter operations, slots and operating certificates, which are not amortized. Goodwill relates to the
acquisition of NAS Sweden AB in 2007 and is tested annually for impairment and carried at cost less
accumulated impairment losses.148149 These are declared indefinite assets, which have remained fixed the last
five years. Furthermore, the strategic analysis did not reveal impending adjustments. Hence, they are kept
constant at their respective 2017 levels of NOK 29.2 million and NOK 93.9 million. Software relates to
external consulting fees for developing NAS’ booking systems. NAS has made additions to its software each
fiscal year since 2013, which are amortized over an estimated useful life of three to five years per addition.150
The thesis finds it reasonable to assume that NAS will maintain its software investments as it expands
operations to new markets. Investments are expected to increase at the same pace as NAS’ production.
Software is thus estimated to remain at its five-year average ratio of ASK, equal to 0.17%.
7.2.4 Net Interest-Bearing Debt
The thesis estimates NAS’ NIBD as a portion of the forecasted Invested Capital. Hence, NAS’ NIBD
increases 54% in the period, which is needed to finance the increasing fleet of aircrafts and route expansion.
147 Petersen et al. (2017), Financial Statement Analysis: Valuation - Credit Analysis - Performance Evaluation, p. 674 148 Norwegian, NAS Annual Report 2016, p. 67 149 Norwegian, NAS Annual Report 2016, p. 29 150 Norwegian, NAS Annual Report 2016, p. 67

68
8. Valuation
The purpose of this section is to obtain a fair value estimate of NAS’ share price. The preceding analyses
thus form the foundation for this section.
8.1 Valuation Methods
In order to facilitate a robust fair value estimate of NAS’ share price, the thesis applies the Discounted Cash
Flow (DCF) method. In addition, the Liquidation Value method is applied to estimate the residual value to
NAS’ equity holders, in absence of the going concern assumption. The relative valuation approach is
popular, due its simplicity and quick execution. Specifically, the thesis applies the relative valuation using
multiples to stress-test the DCF-estimate. The rationale of applying different valuation approaches is that
they examine NAS from inherently different angles. The DCF-model uncovers NAS’ value as a going
concern. In contrast, the Liquidation Value method is asset-based and gauge NAS’ value as a bankruptcy
candidate. The thesis argues such an approach is appropriate, due to the findings of the strategic- and
financial analyses. Furthermore, the thesis investigates NAS as an acquisition target for IAG as a result of the
airline’s recent interest, as mentioned in the introduction. Hence, the thesis investigates the value of potential
firm synergies, the reservation price for NAS and IAG’ shareholders and assess what NAS is worth to IAG.
8.1.1 Discounted Cash Flow
The thesis specifies the DCF-model to estimate Enterprise Value (EV) and applies a two-stage model that
incorporates NAS’ cash flows in the forecasting- and terminal period. NAS’ estimated WACC is applied as
the discount rate in both stages of the model, and the terminal period is gauged in accordance with Gordon’s
Growth Model.
Table 11: Discounted Cash Flow

69
The DCF-model yields a share price equal to NOK 230 for NAS, per 31.12.2017. In order to obtain NAS’
share price on the cut-off date, the share price is discounted forward by applying the WACC. The thesis thus
estimates a share price for NAS equal to NOK 236, per 01.05.2018.
8.1.2 Liquidation Value
The Liquidation Value method only measures investments already made and is not concerned with future
growth potential. This is because the model assumes that a firm is no longer operating under the going
concern assumption or is going bankrupt.151 The Liquidation Value method measures the liquidation value of
selling the firm’s assets and settling its liabilities.
Liquidation Assumptions
The thesis assumes an orderly sales process, which usually facilitates higher liquidation values than
distressed sales processes.152 The goal of this section is to uncover the remaining value for equity holders
ensuing a liquidation of NAS, which is in contrast to obtaining the value obtained by the airline’s creditors.
NAS’ book value of liabilities is presumed as a proxy for market values, which entails that NAS must satisfy
its debt, equal to its current book value.
Assets
The greatest balance sheet items in relation to assets are aircrafts, parts and installations (59%) and
prepayment to aircraft manufacturers (12%). The PESTLE analysis outlined that used aircrafts are
considered liquid, which is due to an efficient secondary market caused by Boeing and Airbus’ full order
books and lead times of years. The analysis also detailed that the market consensus projects a strong growth
in air travel, especially driven by the Asia-Pacific. Considering the increasing demand for a modern fuel-
efficient fleet of aircrafts, NAS’ airport slots, lease agreements and prepayments are attractive assets for
other airlines. Hence, the thesis argues that NAS is able to liquidate these assets at book value. Specifically, a
detailed outline of NAS’ liquidated balance sheet is located in Appendix A.41.
NAS’ book value investment in NOFI, and by extension in Bank Norwegian, represents 2% of NAS’ assets,
equaling NOK 832 million. However, this carrying balance sheet amount is below the market value of NAS’
equity stake in NOFI, which stands at NOK 2.816 billion at its current share price. For this reason, the thesis
applies the estimated market value for liquidation purposes. However, the thesis argues that it is unlikely that
NAS will be able to realize the entire amount. This is because NAS and Bank Norwegian share mutual ties in
the form of shared board members, which may suggest that the value of NAS’ equity investment in NOFI is
warranted upon the assumption that NAS is a going concern. This means that NAS may not obtain the
151 Petersen et al. (2017), Financial Statement Analysis: Valuation - Credit Analysis - Performance Evaluation, p. 328 152 Petersen et al. (2017), Financial Statement Analysis: Valuation - Credit Analysis - Performance Evaluation, p. 328

70
complete market value of its equity ownership, as liquidation value. The thesis assumes that NAS is able to
obtain 80% of the market value, which indicates a liquidation value of NOK 2.523 billion.
The thesis assumes that NAS’ equipment and fixtures and financial assets are liquidated at a 20% and 50%
depreciation and inventory at 20%. Intangible assets, deferred tax assets and financial assets available for
sale are assumed to have no liquidation value. Buildings, receivables and cash & cash equivalents are
liquidated at book values.
Off-Balance Sheet Items and Liquidation Fees
NAS’ lease commitment is an off-balance sheet item that was estimated at NOK 27.227 billion, in section
5.2.1. An orderly liquidation process might renegotiate the lease commitments. NAS’ existing leasing
agreements would arguably be attained by competitors, following the argumentation above. Specifically, the
lease commitments represent NAS’ financial obligation of making future lease payments to its lessor, which
entails that this commitment is transferred along with the aircrafts, to the acquiror. This scenario alleviates
NAS’ liquidation value of significant liabilities. Hence, the thesis assumes that 90% of NAS’ future lease
commitments are transferred to an acquirer.
It is difficult to gauge and create a robust estimate of the additional liquidation costs that would ensue the
liquidation of NAS. Hence, the thesis applies the findings of Doherty and LoPucki (2004), who performed an
empirical study of 48 bankruptcy cases and concluded that fees and expenses averaged 1.40%, of book value
of assets. The thesis applies the same rate for NAS, which suggests additional liquidation costs of NOK 609
million. The aggregated liquidation inputs are found in Table 12 and Table 13.
Table 12: Liquidation Value
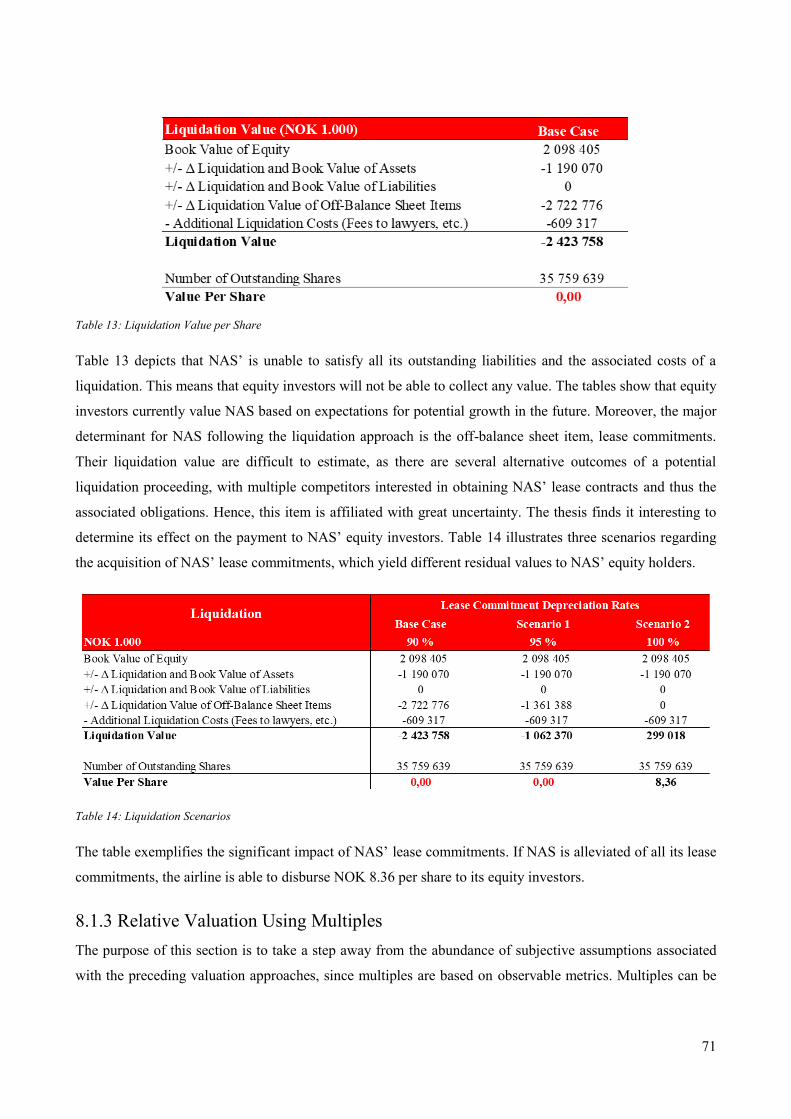
71
Table 13: Liquidation Value per Share
Table 13 depicts that NAS’ is unable to satisfy all its outstanding liabilities and the associated costs of a
liquidation. This means that equity investors will not be able to collect any value. The tables show that equity
investors currently value NAS based on expectations for potential growth in the future. Moreover, the major
determinant for NAS following the liquidation approach is the off-balance sheet item, lease commitments.
Their liquidation value are difficult to estimate, as there are several alternative outcomes of a potential
liquidation proceeding, with multiple competitors interested in obtaining NAS’ lease contracts and thus the
associated obligations. Hence, this item is affiliated with great uncertainty. The thesis finds it interesting to
determine its effect on the payment to NAS’ equity investors. Table 14 illustrates three scenarios regarding
the acquisition of NAS’ lease commitments, which yield different residual values to NAS’ equity holders.
Table 14: Liquidation Scenarios
The table exemplifies the significant impact of NAS’ lease commitments. If NAS is alleviated of all its lease
commitments, the airline is able to disburse NOK 8.36 per share to its equity investors.
8.1.3 Relative Valuation Using Multiples
The purpose of this section is to take a step away from the abundance of subjective assumptions associated
with the preceding valuation approaches, since multiples are based on observable metrics. Multiples can be

72
used to stress-test the thesis’ cash flow-based valuation. However, the approach assumes that the chosen peer
group is truly comparable. The chosen multiples include EV/EBITDA, which is selected because it is
unaffected by capital structure, depreciation schedules and tax. In addition, EV/Revenue is also measured
due to its focus on the seasonal airline revenues, while also excluding capital structure and the effects of
different accounting policies. P/B and P/E are also included, but the latter should be treated carefully as it is
volatile to different accounting methods and does not isolate the impact of financial leverage. Figure 37
below shows the multiples based on observable market data, provided by Bloomberg, Reuters and Pareto.
Figure 37: Relative Valuation Using Multiples
The table shows that NAS is traded above the harmonic mean on all multiples, except the P/E. This may
indicate that NAS’ share price is too optimistic and that NAS is overvalued. An alternative interpretation is
that the airline is believed to have a positive outlook compared to its peers. However, the findings of the
thesis suggest otherwise, as the strategic and financial analysis accentuate NAS’ poor performance relative to
its peers. This section thus supports the core DCF valuation in section 8.1.1, arguing that NAS is overvalued.
8.1.4 Acquisition Valuation
In April 2018, IAG expressed interest in acquiring NAS and purchased 4.61% of its shares, as outlined in the
introduction. The purpose of this section is to incorporate the recent development by valuing the potential
synergies that may occur if IAG acquires NAS. The approach applies the DCF-model and includes the
potential effect of firm synergies, while the cash flows are discounted by a new WACC that incorporates the
new capital structure. The thesis assumes that the capital structure changes as IAG finances the acquisition of
NAS by a bond issuance, while IAG makes an all-cash proposition to NAS’ shareholders.
Damodaran (2012) advocates that acquisition valuations are complex, because it entails subjective
assumptions of operational- and financial synergies and control.153 However, due to IAG’s timing and the
thesis’ concurrent time-restraint, only operational synergies are estimated. Moreover, the cost of capital will
153 Stern School of Business (2018), Acquisition Valuation

73
change as a result of a new capital structure and the thesis applies the weighted effective interest rates as cost
of debt, while cost of equity is estimated by un-levering and re-levering the airlines’ betas, to remove the
effects of gearing. The new WACC is thus estimated at 7.62%. The thesis argues that operational synergies
may emerge in the form of reduced costs through economies of scale. This includes the removal of overhead
costs, joint purchases, insourcing maintenance work, harmonizing IT organizations and increased gate
utilization. The procedure is outlined in Table 15 below, and in Appendix A.35.
Table 15: DCF Acquisition Valuation
The DCF-model discounts the new cash flows by the adopted WACC and estimates that the maximum price
IAG should be willing to pay NAS’ shareholders is NOK 486 per share. Note that this price would transfer
all synergy value to NAS’ shareholders, which the thesis finds unlikely. The two airlines will thus engage in
a negotiation of synergies, where NAS’ reservation price is the current market price on the Norwegian OBX
of NOK 303, and IAG’s reservation price equals NOK 486. The synergy spread, or the bargaining range,
equals NOK 183.
NAS is expected to experience heavy deficits in the short-term. Whether the airline has a plan to handle these
deficits may determine the synergy value NAS is able to capture for its shareholders. The thesis argues that
NAS can sell its ownership stake of nearly NOK 3.0 billion in NOFI to acquire short-term funding. In
addition, NAS has a substantial amount of pending aircraft deliveries, which are considered liquid assets in a

74
high-demand secondary market. Also, another quick short-term funding solution is to engage in sale &
leaseback transactions. However, these options are not analyzed in more detail. Instead, the thesis advocates
that NAS’ ability to obtain short-term liquidity and overcome its expected short-term deficits affect the
synergy value that NAS may capture if acquired by IAG.
The thesis admits that this section is speculative and should be rooted in more extensive analyses, which are
challenging to provide due to the apparent time-restraint. However, the acquisition valuation is an honest
attempt to incorporate recent events and to provide an assessment of NAS’ strategic and financial outlook.
8.2 Scenario Analysis
The strategic- and financial analysis suggested that NAS operates in an unsettled airline industry that is
vulnerable to macroeconomic changes, which successively may increase pressure on operating margins.
Hence, the purpose of this section is to challenge the assumptions underlying the thesis’ base case scenario,
to provide a reasonable and meaningful assessment of alternative outcomes. The thesis has developed
scenarios and incorporated new fundamental assumptions. The scenarios aim to gauge NAS’ performance,
but also how the assumptions affect NAS’ share price.
8.2.1 Deviating Seasonal Demand
The strategic analysis emphasized that NAS operates in a highly seasonal industry, where revenues are not
evenly distributed over the fiscal year. European airlines obtain the majority of the revenues in the second
and third quarter, due to extensive leisure travels. Since NAS’ has negative earnings in the off-season, it is
critical that the airline extract value from the market during the peak season.
The base case scenario assumes high seasonal demand in the short-, medium- and long-term. This follows
the market consensus of strong GDP growth driving increased air travel demand the next 20 years.154155
However, the macro-environmental analysis presented research exhibiting that air travel demand has shown
resilience to the decelerating global trend in GDP.156 This scenario assumes that air travel demand continues
its trajectory away from GDP growth, during the peak season. Hence, global supply drowns demand. As
global air travel demand halts, prices drop to attract passengers and cover high fixed aircraft costs, in an
effort to shield already pressured margins. The thesis assumes NAS will battle fiercely on price to retain
passengers, which yields lower profits. NAS’ ASK is not affected by this occurrence, as it is costlier to keep
aircrafts grounded and not generating revenue. As the production level is the main operational costs driver,
NAS’ operating profit will be affected by the low seasonal demand and declining fares. Moreover, the thesis
estimates that NAS will be compelled to raise capital, to continue operations. This is due to poor liquidity, as
154 IATA (2017), Annual Review 2017 155 Airbus (2017), Global Market Forecast 2017-2036 156 Ishka Global (2016), Insights

75
outlined in section 5.4. The natural course of action is to sell aircrafts to raise capital and engage in lease-
back agreements, which is a common industry trait. As NAS owns a large portion of its fleet, it can sustain
downturn periods like this to remain solvent and continue operations in the short-to medium-term. However,
the long-term consequences of this negative market outlook are likely to be fatal for airlines struggling with
high leverage ratios, such as NAS.
This scenario significantly impacts NAS, where global demand halts revenue generation in the peak season.
NAS’ production level remains high, while operational costs increase and revenue halts, putting further
stress on NAS’ margins. The scenario yields a share price of NOK 138 for NAS.
8.2.2 Surging Oil Price
The PESTLE analysis stressed that the airline industry is volatile to sudden changes in macroeconomic
factors. This is particularly relevant for transportation industries where operational costs are negatively
affected by a high oil price, while revenues and costs are subject to different currencies. This scenario
assumes that the oil price grows at a faster pace than projected by the market. The scenario assumes a rising
oil price in the short- to medium-term, approaching USD 75 in 2023. Following the currency estimation
procedure in section 7.1.3, the thesis estimates a cheaper USD in the short- to medium-term equal to NOK
6.35 in 2023. This has a significant effect on revenues and jet fuel costs. As a significant portion of NAS’
revenues are obtained in USD, a strong NOK is negative for revenues. Conversely, NAS’ costs in USD are
positively impacted by the higher oil price. NAS’ major operational cost is jet fuel, which is dependent upon
the jet fuel spot price per barrel. Specifically, the jet fuel price correlates with the oil price and thus increases
correspondingly. The thesis emphasizes that NAS hedges some of its jet fuel exposure and that this is
accounted for in the scenario. The net effect of a surging oil price, which increases jet fuel prices and
weakens the USD, negatively impacts NAS’ earnings and yield a share price of NOK 174.
8.2.3 Access to the Siberian Corridor
The strategic analysis advocated the benefit of accessing the Siberian Corridor in Russian airspace, the
fastest and cheapest route from Europe to the major Asian destinations. This scenario assumes that the
Norwegian Ministry of Trade, Industry and Fisheries is able to renegotiate the 1956 accord, signed by
Scandinavia and the Soviet Union. As NAS gains access to this route, it will cease to fly expensive routes
around Russia to reach its Asian destinations. Also, NAS has signaled new destinations like Beijing,
Shanghai and Tokyo, in this scenario. As NAS offers routes through the Siberian Corridor, it has added
incentive to deploy the increasing fleet of aircrafts to get a solid market position and compete in Asia. This
expedites a larger revenue-base where NAS’ ASK production can be exploited, which has been a key
challenge thus far. Forecasts indicate that NAS achieves high load factors and revenue on these routes, due to
its competitive price edge. Moreover, jet fuel costs related to NAS’ Asia destinations are reduced, due to

76
shorter stage lengths. The thesis also assumes that NAS establishes Asian subsidiaries and inter-Asian flights
to penetrate the short-haul segment, which can feed NAS’ intercontinental long-haul routes. The scenario
yields a share price for NAS equal to NOK 282.
8.3 Sensitivity Analysis
The DCF-model yielded a base case share price for NAS equal to NOK 236, which is reliant on subjective
assumptions and expectations of the development in NAS’ value drivers and WACC. However, these inputs
are affiliated with uncertainty. For this reason, the thesis incorporates two sensitivity analyses. The section
initiates by examining the interrelationship between two variables believed to have a large impact on NAS’
share price, the terminal growth rate and the WACC. In addition, the thesis examines how the forecasted
value driver assumptions impact NAS’ share price. This is done through a Monte Carlo simulation, where
subjective inputs are tested and NAS’ share price is inspected. This approach is supported by Koller et al.
(2010), who emphasize that a robust valuation includes a sensitivity analysis, when there is uncertainty
regarding the valuation inputs.157 Hence, the purpose of this section is to reveal how explicit value drivers
affect NAS’ estimated share price, by gauging the share price’s sensitivity to forecasted line items.
8.3.1 Terminal Growth and WACC
As the present value of NAS’ cash flows in the continuing period comprises 134% of its Enterprise Value,
the thesis investigates its pertinence for the share price. Specifically, the rate at which NAS can grow in
perpetuity is restricted, as Damodaran (2018) states that growth firms eventually grow at a rate less than- or
equal to the overall rate of the economy where the firm operates.158
Table 16: Sensitivity to Terminal Growth and WACC
Table 16 depicts how NAS’ share price fluctuates by varying the terminal growth rate in conjunction with
the WACC. Valuation literature emphasize that the share price is positively affected by a lower WACC and a
157 Koller et al. (2010), Valuation – Measuring and Managing the Value of Companies, p. 298 158 Stern School of Business (2018), Closure in Valuation: Estimating Terminal Value

77
higher terminal growth rate.159 In essence, it is more volatile to smaller changes in growth rate as the
estimated WACC decreases. Table 16 suggests that NAS’ realistic share price is located in the range NOK
193-282, equaling a spread of NOK 89. However, if applying greater intervals in the terminal growth rate
and WACC, the range rises drastically. It indicates that NAS’ share price is highly affected by the two.
8.3.2 Monte Carlo
Monte Carlo Simulation
The purpose of the Monte Carlo simulation is to provide meaningful insight into the thesis’ uncertain
variables and how they affect NAS’ estimated share price. It guides the thesis to ascertain which inputs are
affiliated with considerable volatility, and thus should be monitored more closely. In addition, it facilitates a
meaningful valuation range.160 The Monte Carlo simulation allows manipulation of multiple value drivers
simultaneously and models their corresponding effect on NAS’ share price. The influence of the simulated
value drivers is iterated and plotted around a normally distributed mean value, which corresponds to NAS’
estimated share price. The simulation performs 100,000 iterations, which create a 95% confidence interval
for the share price. The thesis defines each variable to be normally distributed with the forecasted input as
the mean value.
Monte Carlo Results
The share price distribution depicts that the Monte Carlo simulation plots a mean share price for NAS equal
to NOK 236 and is found in Appendix A.42. This is in line with the thesis’ base case scenario. Moreover, the
standard deviation of the estimated share price is NOK 105. The thesis acknowledges that the standard
deviation is significant, but it is unsurprising as the value drivers are associated with significant uncertainty.
The Monte Carlo simulation explicitly details that NAS’ share price is highly dependent upon the terminal
growth rate, which is consistent with the initial sensitivity analysis in section 8.3.1. The thesis argues that
this is reasonable. Specifically, Table 11 in section 8.1.1 showed that the present value of NAS’ free cash
flows in the forecasting horizon is negative. Hence, the discounted value of NAS’ continuing period equals
134% of NAS’ EV. This in line with valuation literature, arguing that a firm’s terminal value normally
accounts for a significant share of its value creation. This is especially true, as the thesis applies a relatively
short forecasting period, under the going concern assumption. Hence, the result of the Monte Carlo
simulation entails that NAS’ share price is volatile to minor fluctuations in its terminal growth rate.
159 Stern School of Business (2018), Growth Rates and Terminal Value 160 Koller et al. (2010), Valuation – Measuring and Managing the Value of Companies, p. 298

78
Table 17: Monte Carlo Simulation
The liquidity analyses revealed a high short- and long-term liquidity risk, in conjunction with an estimated
20.86% default probability. The thesis thus advocates that there may be a greater downside potential
connected to NAS’ share price, which is not unveiled by the analyses in this thesis.
Furthermore, ASK, RASK and jet fuel costs are the operational drivers that have the largest effect on the
share price and are shown in Appendix A.43. The thesis finds this natural, as ASK and RASK drive revenues
and jet fuel is the single greatest operational airline cost. Moreover, there is considerable uncertainty related
to this operational cost driver. It rests upon the thesis’ experimental approach of forecasting jet fuel costs
through projected demand for crude oil and foreign exchange rates. In turn, the thesis emphasizes that the
approach could expedite a prejudiced perception of NAS’ prospective jet fuel costs, and by extension not
properly expose the underlying volatility in this item. Hence, airline cost drivers derived from variables in
NAS’ macro-environment are subjected to high volatility and should be managed with caution. Also, the
strategic- and financial analyses revealed that jet fuel costs are expected to embody a greater piece of NAS’
total costs in the forecasting- and terminal period.
The Monte Carlo simulation indicates a 74.14% probability of NAS’ share price being below the closing
price on the Norwegian OBX on 01.05.2018. It suggests an 82.45% probability that NAS’ share price is
above the estimate of the low seasonal demand scenario (NOK 138), and a 72.07% possibility of it being
above the oil price scenario (NOK 174). If NAS gains access to the Siberian Corridor, the simulation
estimates a 67.52% probability that NAS’ share price is below the estimate of NOK 282. Each scenario’s
respective share price distribution and DCF-calculation is found in Appendix A.44-A.49 and A.50-A.53.
The base case scenario yields an 18.02% probability that NAS’ share price is located within 10% of the base
case estimate of NOK 236, and a 34.41% chance that it is within 20% of the estimate. The simulations

79
suggest that the estimated share price of NAS equal to NOK 236 is reasonable, but that it is afflicted with
considerable uncertainty.

80
9. Conclusion
The main objective of this thesis is to answer the overarching research question, which is to obtain a robust
estimate of NAS’ fair share price as of 01.05.2018. The process is guided by meaningful sub-questions,
which are incorporated into the analyses.
NAS is the third largest low-cost airline in Europe, where price-pressure is enormous and the stress on airline
margins are tough. The European airline industry is unsettled in the wake of Brexit and is undergoing a phase
of consolidation. FSCs increase their M&A activity to quickly increase scale, network routes and solve
structurally-rooted challenges, while NAS is responding to the changing climate by positioning itself for the
low-cost long-haul segment. Its strategy going forward is to phase cost-efficient single-aisle aircrafts into its
long-haul operations. It symbols the cornerstone in its intercontinental expansion, allowing NAS to reach
critical mass. NAS is volatile to macroeconomic risk factors, such as a rising oil price and a fluctuating
foreign exchange rate. NAS faces default risk in the short- to medium-term, due to its challenge of managing
debt- and lease-related costs. The pending delivery of 117 aircrafts promises rising capital investments in the
forecasting period and a concurrent surge in production.
The forecasted cash flows indicate the importance of acquiring short-term financing, so NAS may sustain
expected deficits in the short-term. The thesis accentuates that NAS may sell aircrafts on the presumed liquid
secondary market or engage in sale & leaseback transactions. These financing options help limit NAS’
exposure to financial risk. NAS’ shareholders should be wary of the airline’s liquidity and carefully gauge its
performance in the low-cost long-haul segment going forward.
As industry consolidation continues, NAS is an attractive acquisition target for legacy carriers and the
interest from IAG is apparent, as the two are in direct competition on several North-Atlantic routes. If IAG
approaches NAS with a cash proposition, the maximum value acquired by NAS’ shareholders are estimated
at NOK 486 per share. However, it is likely that the price is located inside the bargaining range of NOK 303
– NOK 486, and is determined by the negotiation of synergies between the two airlines.
The Liquidation Value method estimates that NAS’ shareholder receive NOK 0 in the event of a default.
However, should NAS be able to sell all of its lease commitments, the thesis estimates that the shareholders
receive NOK 8.36 per share. The thesis applies the DCF-model as the principal valuation method, which
estimates that NAS’ fair share price as of 01.05.2018 equals NOK 236. This represents an overvalued share
compared to the current market value on the Norwegian OBX of NOK 303. The relative valuation using
multiples concurs with the DCF-model and emphasizes an overvalued NAS share. In addition, the scenario
analysis yields a diverging share price from NOK 138 - NOK 282. The Monte Carlo simulation underlines
the major effect of NAS’ terminal growth rate, production growth and costs of jet fuel on NAS’ share price.

81
Bibliography
Books
Damodaran, A. (2012). Investment Valuation. Tools and Techniques for Determining the Value of Any Asset.
2012. Third Edition. Wiley Finance
Eldad, B-Y. (2005). The Evolution of the U.S. Airline Industry: Theory, Strategy and Policy. Springer
Elling,J. O., Sørensen, O. V. (2003). Regnskabsanalyse og værdiansættelse: En praktisk tilgang. København:
Gjellerup
Koller, T., Goedhart, M., Wessels, D. (2010). Valuation – Measuring and Managing the Value of
Companies. Fifth Edition. McKinsey & Company. John Wiley & Sons, Inc.
Morrell, P. (1997). Airline Finance. Ashgate Publishing Limited
Morrell, P. (2007). Airline Finance. Third Edition. Ashgate Publishing Limited
O’Connor, W. (2001). An Introduction to Airline Economics. Sixth Edition. Praeger Publishing
Petersen, C.V., Plenborg, T. (2012). Financial Statement Analysis: Valuation – Credit Analysis – Executive
Compensation. Harlow, England: Pearson Education Limited
Petersen, C.V., Plenborg, T., Kinserdal, F. (2017). Financial Statement Analysis: Valuation – Credit Analysis
– Performance Evaluation. Bergen: Fagbokforlaget

82
Online Resources
Accenture (2017). Beyond the Buzz: The Potential of Blockchain Technology For Airlines. Available at:
https://www.accenture.com/us-en/insight-potential-blockchain-technology-for-airlines (Visited: 14 February
2018)
Airbus (2017). Global Market Forecast 2017-2036. Available at:
http://www.airbus.com/content/dam/corporate-
topics/publications/backgrounders/Airbus_Global_Market_Forecast_2017-
2036_Growing_Horizons_full_book.pdf (Visited: 08 February 2018)
Airlines International (2010). Airport Slots – The Building Blocks of Air Travel. Available at:
http://airlines.iata.org/analysis/airport-slots-the-building-blocks-of-air-travel (Visited: 19 February 2018)
Airport Technology (2017). Countdown to CORSIA: A New Plan to Achieve Carbon Neutral Growth.
Available at: https://www.airport-technology.com/features/countdown-corsia-new-plan-achieve-carbon-
neutral-growth/ (Visited: 14 February 2018)
Aviation Today (2018). Four Commercial Trends Hitting Aviation in 2018. Available at:
http://www.aviationtoday.com/2018/01/01/digital-twins-ai-mobile-apps-drones-4-tech-developments-set-hit-
commercial-aviation-2018/ (Visited: 14 February 2018)
Bloomberg (2016). The World’s Richest Airlines Can’t Get Enough Hand-Me-Down Jets. Available at:
https://www.bloomberg.com/news/articles/2016-05-11/the-world-s-richest-airlines-can-t-get-enough-hand-
me-down-jets (Visited: 19 February 2018)
Bloomberg (2018). Watch Out, Airlines. High Speed Rail Now Rivals Flying on Key Routes. Available at:
https://www.bloomberg.com/news/articles/2018-01-09/high-speed-rail-now-rivals-flying-on-key-global-
routes (Visited: 20 February 2018)
Boeing (2016). Pilot and Technician Outlook 2017-2036. Available at:
http://www.boeing.com/commercial/market/pilot-technician-outlook/ (Visited: 26 February 2018)
Boston Consulting Group. (2016). Consolidation in Europe's Airline Industry. Available at:
https://www.bcg.com/publications/2016/mergers-acquisitions-divestitures-joint-ventures-alliances-
consolidation-in-europe-airline-industry.aspx (Visited: 26 March 2018)

83
Business Insider (2016). China’s Middle-Class is Exploding. Available at:
https://businessinsider.com/chinas-middle-class-is-exploding-2016-8?r=US&IR=T&IR=T (Visited: 14
February 2018)
CAPA (2017). The Great Brexit Aviation Debate. A Transition Deal is Needed to Avoid Disaster for UK
Airlines. Available at: https://centreforaviation.com/insights/analysis/the-great-brexit-aviation-debate-a-
transition-deal-is-needed-to-avoid-disaster-for-uk-airlines-380522 (Visited: 08 February 2018)
Corporate Finance Institute (2018). Bargaining Power of Suppliers. Available at:
https://corporatefinanceinstitute.com/resources/knowledge/strategy/bargaining-power-of-suppliers/ (Visited:
26 February 2018)
Deloitte (2016). Aircraft Leasing Sector. Implications of the New Leasing Standard. Available at:
https://www2.deloitte.com/content/dam/Deloitte/ie/Documents/FinancialServices/ie_2016_Aircraft_Leasing
_Sector_Brochure_Deloitte_Ireland.pdf (Visited: 02 March 2018)
E24 (2012). Her er Planen Som Skal Redde SAS Fra Konkurs. Available at: https://e24.no/boers-og-
finans/sas/her-er-sas-nye-kriseplan/20298545 (Visited: 07 February 2018)
E24 (2017). Kraftig Vekst Koster Kjos Dyrt: Flypassasjeravgiften Gjør Vondt Verre. Available at:
https://e24.no/boers-og-finans/norwegian-air-shuttle/saa-mye-taper-kjos-paa-flypassasjeravgiften/23983884
(Visited: 07 February 2018)
Eco-Business (2018). Report Reveals Enormous Gulf in Airline Fuel Efficiency. Eco-Business. Available at:
http://www.eco-business.com/news/report-reveals-enormous-gulf-in-airline-fuel-efficiency/ (Visited: 14
February 2018)
European Central Bank (2018). The Definition of Price Stability. Available at:
https://www.ecb.europa.eu/mopo/strategy/pricestab/html/index.en.html (Visited: 20 March 2018)
European Commission (2010). High.-speed Europe. A sustainable Link Between Citizens. Available at:
https://ec.europa.eu/transport/sites/transport/files/themes/infrastructure/studies/doc/2010_high_speed_rail_en
.pdf (Visited: 20 February 2018)

84
Federal Reserve (2015). Why Does the Federal Reserve Aim for 2 Percent Inflation Over Time? Available at:
https://www.federalreserve.gov/faqs/economy_14400.htm (Visited: 20 March 2018)
IATA (2017). Annual Review 2017. IATA. Available at: http://www.iata.org/publications/Documents/iata-
annual-review-2017.pdf (Visited: 08 February 2018)
IATA (2017). Operational Fuel Efficiency. IATA. Available at: http://www.iata.org/whatwedo/ops-
infra/Pages/fuel-efficiency.aspx (Visited: 14 February 2018)
IATA (2016). Carbon Offsetting Scheme For International Aviation (CORSIA). Available at:
http://www.iata.org/whatwedo/ops-infra/Pages/fuel-efficiency.aspx (Visited: 14 February 2018)
Investopedia (2018). Substitute. Available at: https://www.investopedia.com/terms/s/substitute.asp (Visited:
20 February 2018)
Ishka Global (2016). Insights. Available at: https://www.ishkaglobal.com/News/Article/5515/GDP-growth-
vs-air-travel-A-conscious-uncoupling (Visited: 09 February 2018)
KFW IPEX-Bank (2016). The Correlation Between GDP Growth and the Increase in Airline Passengers
2001-2015. Available at: https://www.kfw-ipex-bank.de/pdf/Analyses-and-views/Market-analyses/2017-01-
26-Blitz-Licht-Flugh%C3%A4fen-BIP-Faktor.pdf (Visited: 09 February 2018)
MaRS (2014). Industry Rivalry and Competition: Porter’s Five Forces. Available at:
https://www.marsdd.com/mars-library/industry-rivalry-and-competition-using-five-forces/ (Visited:
February 21 2018)
McKinsey & Company (2008). Enduring Ideas: The SCP Framework. Available at:
https://www.mckinsey.com/business-functions/strategy-and-corporate-finance/our-insights/enduring-ideas-
the-scp-framework (Visited: February 16 2018)
McGill University (2012). Airline Bankruptcy: The Post-Deregulation Epidemic. Available at:
https://www.mcgill.ca/iasl/files/iasl/aspl613_paul_dempsey_airlinebankruptcies2012.pdf (Visited: February
22 2018)

85
National Geographic (2017). As Billions More Fly, Here’s How Avitation Could Evolve. Case Study.
Available at: https://www.nationalgeographic.com/environment/urban-expeditions/transportation/air-travel-
fuel-emissions-environment/ (Visited: February 14 2018)
Norges Bank (2016). Hva Driver NIBOR Påslaget? Aktuelle kommentarer. Available at:
https://static.norges-
bank.no/contentassets/6b0804e7c1c24cfa86bdd6087fdb14b8/aktuell_kommentar_10_2016.pdf?v=03/09/201
7123423&ft=.pdf (Visited: February 12 2018)
Norwegian (2018). Corporate Structure. Norwegian Air Shuttle ASA. Available at:
https://www.norwegian.com/uk/about/company/corporate-structure/. (Visited: 30 January 2018)
Norwegian (2018). Flyene Våre. Norwegian Air Shuttle ASA. Available at: https://www.norwegian.no/om-
oss/var-historie/flyene/ (Visited: 28 February 2018)
Norwegian (2018). Investor Relations. Norwegian Air Shuttle ASA. Available at:
https://www.norwegian.com/dk/om-os/company/investor-relations/. (Visited: 30 January 2018)
Norwegian (2018). Priser og Utmerkelser. Norwegian Air Shuttle ASA. Available at:
https://www.norwegian.no/om-oss/var-historie/priser-og-utmerkelser/ (Visited: 28 February 2018)
Norwegian (2018). Shares. Norwegian Air Shuttle ASA. Available at: https://www.norwegian.com/dk/om-
os/company/investor-relations/shares/. (Visited: 30 January 2018)
Norwegian (2018). Vision and Values. Norwegian Air Shuttle ASA. Available at:
https://www.norwegian.com/uk/about/our-story/vision-and-values/. (Visited: 31 January 2018)
Norwegian (2018). Vår Historie. Norwegian Air Shuttle ASA. Available at: https://www.norwegian.no/om-
oss/var-historie/ (Visited: 28 February 2018)
PwC (2013). Aircraft Financing: Fasten Your Seatbelts. Available at:
https://www.google.com/url?sa=t&rct=j&q=&esrc=s&source=web&cd=1&cad=rja&uact=8&ved=0ahUKE
wjSnN7ygvzaAhVI3iwKHa3xA-
AQFggoMAA&url=https%3A%2F%2Fwww.pwc.com%2Fim%2Fen%2Fpublications%2Fassets%2Fshippin

86
g-aircraft-space%2Fpwc-aviation-finance-fastern-your-seat-belts-
pdf.pdf&usg=AOvVaw0eit0aLap_gQIXx7ETE2Jc (Visited: 21 March 2018)
PwC (2017). Risikopremien I Det Norske Markedet. Available at:
https://www.pwc.no/no/publikasjoner/pwc-markedsrisikopremie-2017.pdf (Visited: 20 March 2018)
SAS (2018). Alliances and Partners – Star Alliance. Scandinavian Airline Systems. Available at:
https://www.sasgroup.net/en/alliances-and-partners-star-alliance/ (Visited: 06 February 2018)
SEB (2017). Currency Strategy. SEB. Available at:
https://sebgroup.com/siteassets/large_corporates_and_institutions/prospectuses_and_downloads/research_rep
orts/currency_strategy/2017/cs_20170913.pdf (Visited: 13 February 2018)
SP’s Aviation (2015). Rise of the Middle Class. Regional Aviation. Available at: http://www.sps-
aviation.com/story/?id=1680 (Visited: 14 February 2018)
Star Alliance (2018). Star Alliance Leads the Way. Star Alliance. Available at:
http://www.staralliance.com/en/about (Visited: 06 February 2018)
Stern School of Business. (2012). Acquisition Valuation. Aswath Damodaran. Available at:
www.stern.nyu.edu/~adamodar/pdfiles/AcqValn.pdf (Visited: 05 May 2018)
Stern School of Business. (2018). Betas by Sector. Aswath Damodaran. Available at:
http://pages.stern.nyu.edu/~adamodar/New_Home_Page/datafile/Betas.html (Visited: 16 April 2018)
Stern School of Business. (2018). Closure in Valuation: Estimating Terminal Value. Aswath Damodaran
Available at: https://www.google.com/url?sa=t&rct=j&q=&esrc=s&source=web&cd=3&ved=0ahUKEwjslr-
R3c3aAhWiFZoKHbVtC_gQFgg_MAI&url=http%3A%2F%2Fwww.stern.nyu.edu%2F~adamodar%2Fpdfil
es%2Fpapers%2Ftermvalue.pdf&usg=AOvVaw0SF7Tg2PiTCGRYj3zUmcsO (Visited: 22 April 2018)
Stern School of Business (2018). Country Default Spreads and Risk Premiums. Aswath Damodaran.
Available at: http://pages.stern.nyu.edu/~adamodar/New_Home_Page/datafile/ctryprem.html (Visited: 11
April 2018)

87
Stern School of Business (2018). Estimating a Synthetic Rating and Cost of Debt. Aswath Damodaran.
Available at: http://pages.stern.nyu.edu/~adamodar/New_Home_Page/valquestions/syntrating.htm (Visited:
14 April 2018)
Stern School of Business (2018). Estimating Risk Parameters. Aswath Damodaran. Available at:
http://people.stern.nyu.edu/adamodar/pdfiles/papers/beta.pdf (Visited: 16 April 2018)
Stern School of Business (2018). Growth Rates and Terminal Value. Aswath Damodaran. Available at:
http://people.stern.nyu.edu/adamodar/pdfiles/ovhds/dam2ed/growthandtermvalue.pdf (Visited: 16 April
2018)
Stern School of Business (2018). Ten Questions About Bottom-Up Betas. Aswath Damodaran. Available at:
http://people.stern.nyu.edu/adamodar/New_Home_Page/TenQs/TenQsBottomupBetas.htm (Visited: 17 April
2018)
The Balance (2017). Advantages and Disadvantages of Composite Materials on Airplanes. Aviation.
Available at: https://www.thebalance.com/composite-materials-aircraft-structure-282777 (Visited: 14
February 2018)
The Guardian (2015). Global Population Set to Hit 9.7 Billion People by 2050 Despite Fall in Fertility. The
Guardian. Available at: https://www.theguardian.com/global-development/2015/jul/29/un-world-population-
prospects-the-2015-revision-9-7-billion-2050-fertility (Visited: 13 February 2018)
The World Bank (2017). Commodity Markets Outlook. Available at:
http://pubdocs.worldbank.org/en/678421508960789762/CMO-October-2017-Forecasts.pdf (Visited: 24
March 2018)
United Airlines (2018). Star Alliance Air Travel Awards. United Airlines. Available at:
https://www.united.com/web/en-US/content/mileageplus/awards/travel/starairawards.aspx (Visited: 06
February 2018)
U.S. Global ETFs (2015). Investor’s Guide to the Global Airline Industry. U.S. Global ETFs. Available at:
https://www.usglobaletfs.com/insights/investors-guide-to-global-airline-industry/ (Visited: 14 February
2018)
https://www.usglobaletfs.com/insights/investors-guide-to-global-airline-industry/

88
Verdens Gang (2015). Slik ramlet Kjos baklengs inn i flybransjen. Available at:
https://www.vg.no/nyheter/innenriks/luftfart/slik-ramlet-kjos-baklengs-inn-i-flybransjen/a/23549949/.
(Visited: 29 January 2018)

89
Articles
Barney, J. (1995). Firm Resources and Sustained Competitive Advantage. Journal of Management, Vol 17,
No (1), (1991). 99-120
Barney, J. (1995). Looking Inside For Competitive Advantage. Academy of Management Executive, 9.4
(1995)
Barrett, S. (2004). How do the Demands for Airport Services Differ Between Full-Service Carriers and Low-
Cost Carriers? Journal of Air Transport Management 10 (2004) 33-39
Brüggen, A., Klose, L. (2010). How Fleet Commonality Influences Low-Cost Airline Operating
Performance: Empirical Evidence. Journal of Air Transport Management 16 (2010) 299-303
Dae Ko, Y. (2016). An Airline’s Management Strategies in a Competitive Air Transport Market. Journal of
Air Transport Management 50 (2016). 53-61
DLR. Analyses of the European Air Transport Market. Air Transport and Airport Research
Dobruszkes, F., Dehon, C. (2014). Does Eurpean High-Speed Rail Affect the Current Level of Air Services?
An EU-wide Analysis. Transportation Research Part A 69 (2014) 461-475
Doherty, J.W., LoPucki, L.M. (2004). The Determinants of Professional Fees in Large Bankruptcy
Reorganization Cases. Journal of Empirical Legal Studies. Vol. 1. January 2004
Goyal, R., Negi, D. (2014). Impact of Global Economic Crisis on the Airline Industry. IRACST –
International Journal of Commerce, Business and Management (IJCBS), (2014), ISN: 2319-2828 Vol. 3, No.
2
Gritta, R., Adrangi, B., Adams, B., Tatyanina, N. (2008). An Update on Airline Financial Condition and
Insolvency Prospects Using the Altman Z-Score Model. Journal of the Transportation Research Forum, Vol.
47, No. 2 (Summer 2008), pp. 133-138
Gritta, R., Adrangi, B., Davalos, S., Bright, D. (2008). A Review of the History of Air Carrier Bankruptcy
Forecasting and the Application of Various Models to the US airline Industry, 1980-2005. In Gratzer, K. &
Stiefel, D. (Eds.) Södertörns Högskola: Huddinge

90
Huang, C-S., Dorsey, R.E., Boose, M.A. (1994). Life Insurer Financial Distress Prediction: A Neutral
Network Model. Journal of Insurance Regulation. Winter94, Vol 13, Issue 2, pp. 131-167
Mantin, B., Wang, E. (2012). Determinants of Profitability and recovery from system-Wide Shocks: The
Case of the Airline Industry. Journal of Airline and Airport Management 2 (1) (2012) 1-33
Moody's. (2016). Financial Statement Adjustments in the Analysis of Non-Financial Corporations. Credit
Strategy and Standards. (2016).
Porter, M. (1979). How Competitive Forces Shape Strategy. Harvard Business Review.
Porter, M. (2008). The Five Competitive Forces That Shape Strategy. Harvard Business Review.
Zuidberg, J. (2014). Identifying Airline Cost Economies: An Econometric Analysis of the Factors Affecting
Aircraft Operating Costs. Journal of Air Transport Management 40 (2014) 86-95

91
Reports
easyJet Annual Report (2013). Available at: http://corporate.easyjet.com/investors/reports-and-
presentations/2013 (Visited: 05 February 2018)
easyJet Annual Report (2014). Available at: http://corporate.easyjet.com/investors/reports-and-
presentations/2014 (Visited: 05 February 2018)
easyJet Annual Report (2015). Available at: http://corporate.easyjet.com/investors/reports-and-
presentations/2015 (Visited: 05 February 2018)
easyJet Annual Report (2016). Available at: http://corporate.easyjet.com/investors/reports-and-
presentations/2016 (Visited: 05 February 2018)
easyJet Annual Report (2017). Available at: http://corporate.easyjet.com/investors/reports-and-
presentations/2017 (Visited: 05 February 2018)
NAS Annual Report (2003). Available at: https://www.norwegian.no/globalassets/ip/documents/about-
us/company/investor-relations/reports-and-presentations/annual-reports/norwegian-annual-report-2003.pdf
(Visited: 29 January 2018)
NAS Annual Report (2005). Available at: https://www.norwegian.no/globalassets/ip/documents/about-
us/company/investor-relations/reports-and-presentations/annual-reports/norwegian-annual-report-2005.pdf
(Visited: 29 January 2018)
NAS Annual Report (2013). Available at: https://www.norwegian.no/globalassets/ip/documents/about-
us/company/investor-relations/reports-and-presentations/annual-reports/norwegian-annual-report-2013.pdf
(Visited: 31 January 2018)

92
NAS Annual Report (2014). Available at: https://www.norwegian.no/globalassets/ip/documents/about-
us/company/investor-relations/reports-and-presentations/annual-reports/norwegian-annual-report-2014.pdf
(Visited: 31 January 2018)
NAS Annual Report (2015). Available at: https://www.norwegian.no/globalassets/ip/documents/about-
us/company/investor-relations/reports-and-presentations/annual-reports/norwegian-annual-report-2015.pdf
(Visited: 31 January 2018)
NAS Annual Report (2016). Available at: https://www.norwegian.no/globalassets/ip/documents/about-
us/company/investor-relations/reports-and-presentations/annual-reports/norwegian-annual-report-2016.pdf
(Visited: 31 January 2018)
NAS Annual Report (2017). Available at: https://www.norwegian.no/om-oss/selskapet/investor-
relations/reports-and-presentations/annual-reports/ (Visited: 17 April 2018)
NAS Quarterly Report 2017 – Q3 2017. Available at:
https://www.norwegian.no/globalassets/documents/quarterly-results/norwegian-q3-2017-presentation.pdf
(Visited: 30 January 2018)
PwC. (2017). Risikopremien i Det Norske Markedet. Available at:
https://www.pwc.no/no/publikasjoner/risikopremien-2017.html (Visited: 11 April 2018)
Ryanair Annual Report (2013). Available at: https://investor.ryanair.com/results/ (Visited: 06 February 2018)
Ryanair Annual Report (2014). Available at: https://investor.ryanair.com/results/ (Visited: 06 February 2018)

93
Ryanair Annual Report (2015). Available at: https://investor.ryanair.com/results/ (Visited: 06 February 2018)
Ryanair Annual Report (2016). Available at: https://investor.ryanair.com/results/ (Visited: 06 February 2018)
Ryanair Annual Report (2017). Available at: https://investor.ryanair.com/results/ (Visited: 06 February 2018)
SAS Annual Report (2013). Available at: https://www.sasgroup.net/en/sas-annual-report-2013/ (Visited 01
February 2018)
SAS Annual Report (2014). Available at: https://www.sasgroup.net/en/sas-annual-report-20132014-2/
(Visited 01 February 2018)
SAS Annual Report (2015). Available at: https://www.sasgroup.net/en/sas-annual-report-20142015/ (Visited
01 February 2018)
SAS Annual Report (2016). Available at: https://www.sasgroup.net/en/sas-annual-report-20152016/ (Visited
01 February 2018)
SAS Annual Report (2017). Available at: https://www.sasgroup.net/en/sas-annual-report-2016-2017/
(Visited 01 February 2018)

1
Appendix
A.1 NAS Organizational Structure ...................................................................................................................... 4
A.2 NAS Ownership Structure ........................................................................................................................... 4
A.3 NAS Analytical Income Statement............................................................................................................... 5
A.4 NAS Analytical Balance Sheet: Operational ................................................................................................ 6
A.5 NAS Analytical Balance Sheet: Financial ..................................................................................................... 7
A.6 SAS Analytical Income Statement ............................................................................................................... 8
A.7 SAS Analytical Balance Sheet: Operational ................................................................................................. 9
A.8 SAS Analytical Balance Sheet: Financial .................................................................................................... 10
A.9 easyJet Analytical Income Statement ....................................................................................................... 11
A.10 easyJet Analytical Balance Sheet: Operational ....................................................................................... 12
A.11 easyJet Analytical Balance Sheet: Financial ............................................................................................ 13
A.12 Ryanair Analytical Income Statement ..................................................................................................... 14
A.13 Ryanair Analytical Balance Sheet: Operational ....................................................................................... 15
A.14 Ryanair Analytical Balance Sheet: Financial ............................................................................................ 16
A.15 Capitalized Leases for NAS and the Peer Group ..................................................................................... 17
A.16 Historical ASK .......................................................................................................................................... 18
A.17 Historical RPK .......................................................................................................................................... 18
A.18 NAS Cost of Debt ..................................................................................................................................... 19
A.19 SAS Cost of Debt ...................................................................................................................................... 20

2
A.20 easyJet Cost of Debt ................................................................................................................................ 21
A.21 Ryanair Cost of Debt ................................................................................................................................ 22
A.22 NAS Historical Borrowing Rates .............................................................................................................. 23
A.23 SAS Historical Borrowing Rates ............................................................................................................... 24
A.24 easyJet Historical Borrowing Rates ......................................................................................................... 25
A.25 Ryanair Historical Borrowing Rates ......................................................................................................... 26
A.26 NAS Forecasted Income Statement ........................................................................................................ 27
A.27 NAS Forecasted Balance Sheet ................................................................................................................ 28
A.28 NAS Historical and Forecasted IS Value Drivers ...................................................................................... 29
A.29 NAS Historical and Forecasted Balance Sheet Value Drivers .................................................................. 30
A.30 NAS Historical and Forecasted Fleet Composition .................................................................................. 31
A.31 NAS Target Capital Structure ................................................................................................................... 32
A.32 SAS Capital Structure ............................................................................................................................... 32
A.33 easyJet Capital Structure ......................................................................................................................... 32
A.34 Ryanair Capital Structure ........................................................................................................................ 32
A.35 Acquisition Valuation - Synergy Assumptions ......................................................................................... 33
A.36 Regression Result Against S&P 500 ......................................................................................................... 34
A.37 Regression Result Against MSCI World ................................................................................................... 34
A.38 Regression Against AXGAL ...................................................................................................................... 35
A.39 Regression Against XAL ........................................................................................................................... 35
A.40. Rolling Window R-Studio Do-File ........................................................................................................... 36

3
A.41 Liquidation Value Balance Sheet ............................................................................................................. 37
A.42 Base Case Share Price Distribution ......................................................................................................... 38
A.43 Base Case Share Price Sensitivity ............................................................................................................ 38
A.44 Probability of Share Price Being Below OBX Share Price ........................................................................ 39
A.45 Probability of Share Price Being Above Scenario 1 ................................................................................. 39
A.46 Probability of Share Price Being Above Scenario 2 ................................................................................. 40
A.47 Probability of Share Price Being Below Scenario 3 ................................................................................. 40
A.48 Probability of Share Price Being Within 10% of Base Case ..................................................................... 41
A.49 Probability of Share Price Being Within 20% of Base Case ..................................................................... 41
A.50 Scenario 1 – Discounted Cash Flow ......................................................................................................... 42
A.51 Scenario 2 – Discounted Cash Flow ......................................................................................................... 43
A.52 Scenario 3 – Discounted Cash Flow ......................................................................................................... 44
A.53 NAS Forecasted Cash Flow Statement .................................................................................................... 45

4
A.1 NAS Organizational Structure
A.2 NAS Ownership Structure

5
A.3 NAS Analytical Income Statement

6
A.4 NAS Analytical Balance Sheet: Operational

7
A.5 NAS Analytical Balance Sheet: Financial

8
A.6 SAS Analytical Income Statement

9
A.7 SAS Analytical Balance Sheet: Operational

10
A.8 SAS Analytical Balance Sheet: Financial

11
A.9 easyJet Analytical Income Statement

12
A.10 easyJet Analytical Balance Sheet: Operational

13
A.11 easyJet Analytical Balance Sheet: Financial
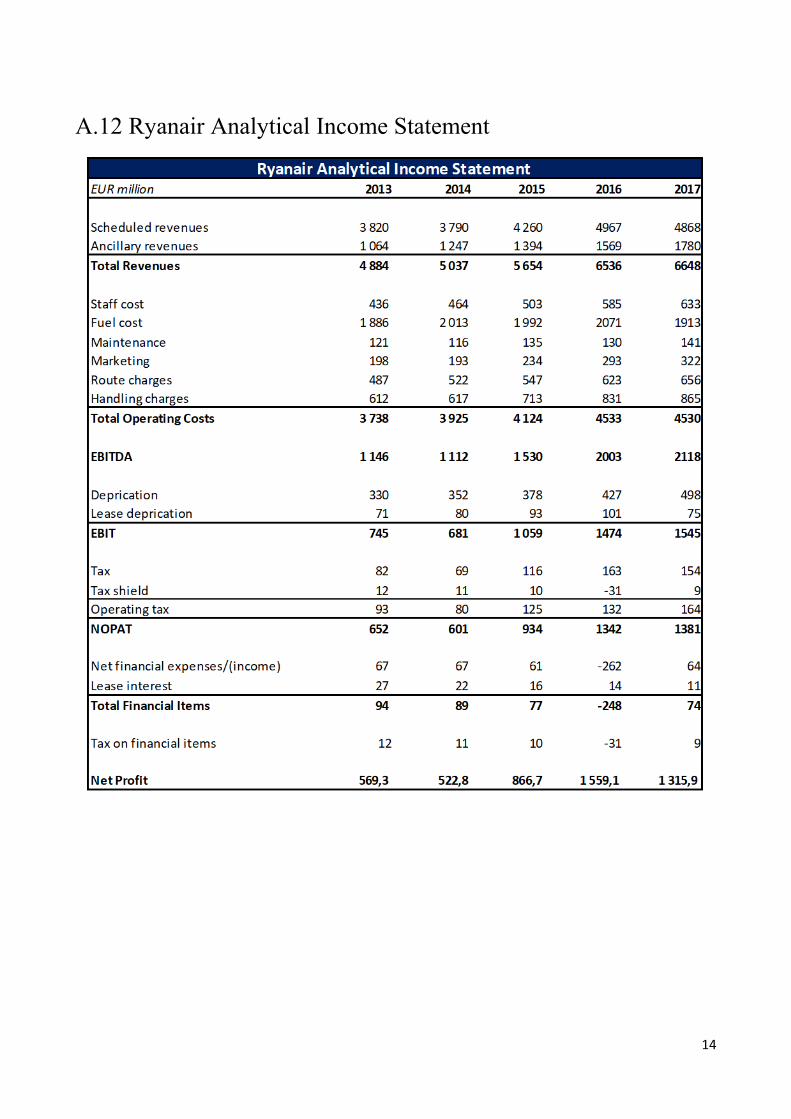
14
A.12 Ryanair Analytical Income Statement

15
A.13 Ryanair Analytical Balance Sheet: Operational

16
A.14 Ryanair Analytical Balance Sheet: Financial
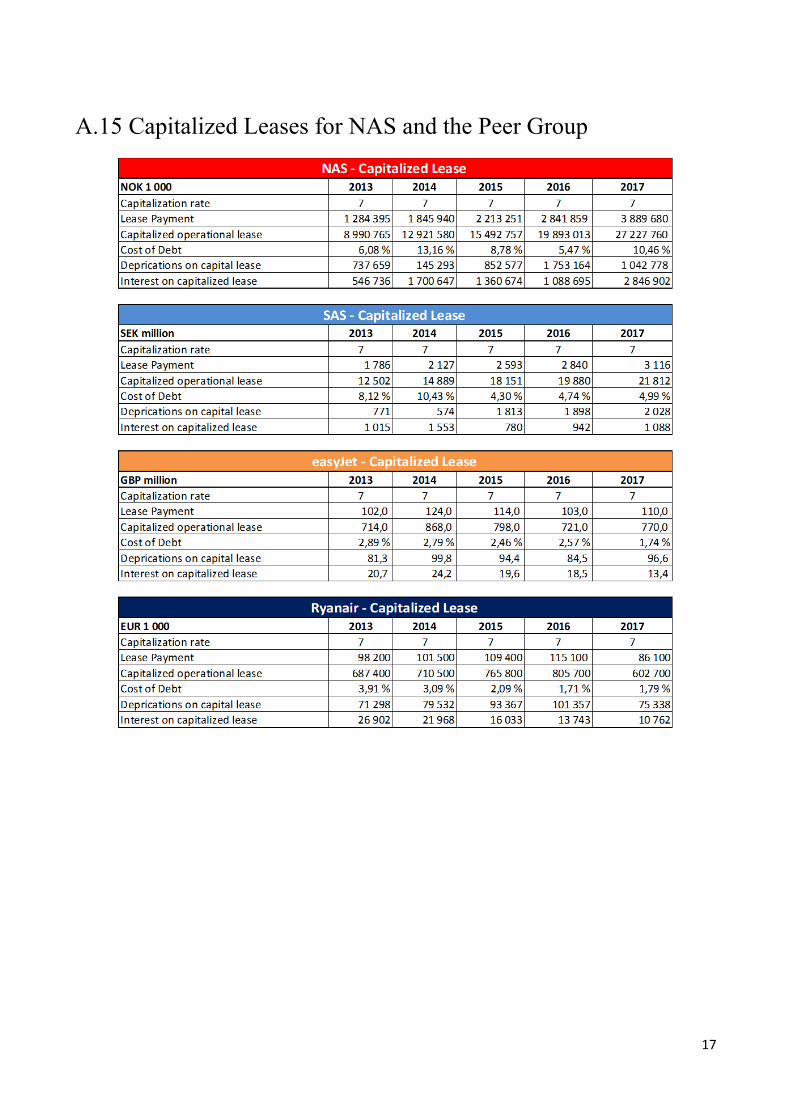
17
A.15 Capitalized Leases for NAS and the Peer Group

18
A.16 Historical ASK
A.17 Historical RPK

19
A.18 NAS Cost of Debt

20
A.19 SAS Cost of Debt

21
A.20 easyJet Cost of Debt

22
A.21 Ryanair Cost of Debt

23
A.22 NAS Historical Borrowing Rates

24
A.23 SAS Historical Borrowing Rates

25
A.24 easyJet Historical Borrowing Rates

26
A.25 Ryanair Historical Borrowing Rates

27
A.26 NAS Forecasted Income Statement

28
A.27 NAS Forecasted Balance Sheet

29
A.28 NAS Historical and Forecasted IS Value Drivers

30
A.29 NAS Historical and Forecasted Balance Sheet Value Drivers

31
A.30 NAS Historical and Forecasted Fleet Composition
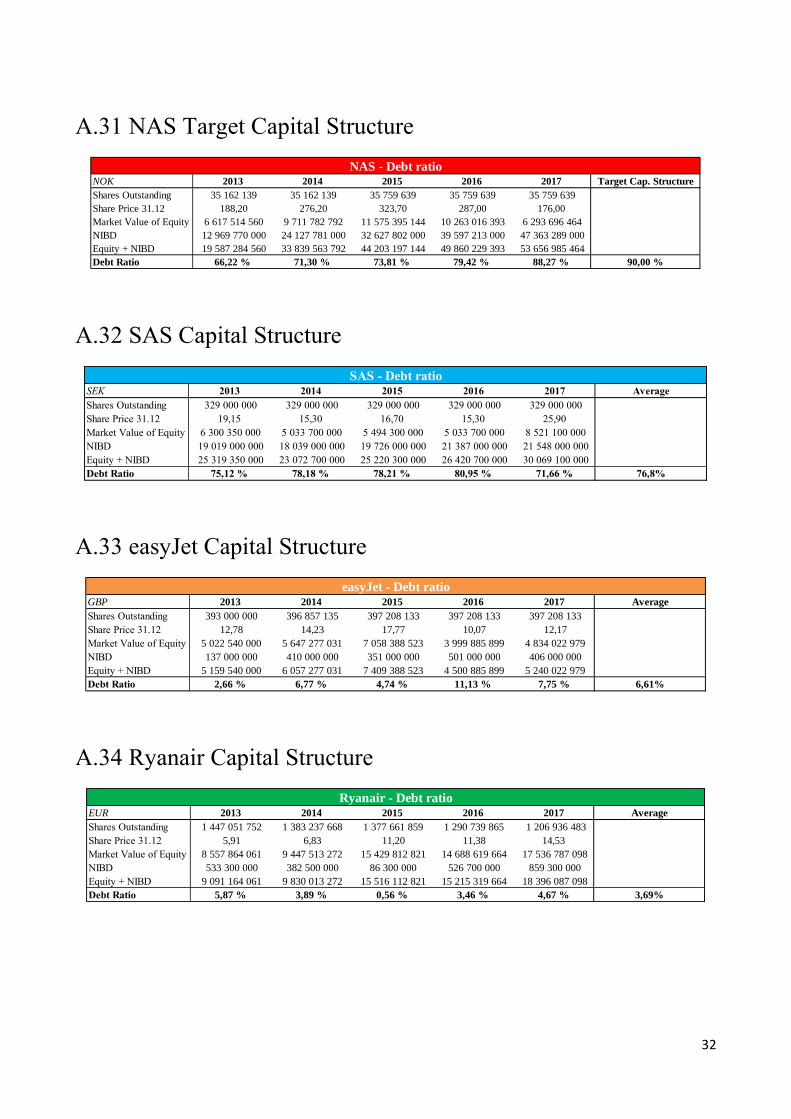
32
A.31 NAS Target Capital Structure
A.32 SAS Capital Structure
A.33 easyJet Capital Structure
A.34 Ryanair Capital Structure
NOK 2013 2014 2015 2016 2017 Target Cap. Structure
Shares Outstanding 35 162 139 35 162 139 35 759 639 35 759 639 35 759 639
Share Price 31.12 188,20 276,20 323,70 287,00 176,00
Market Value of Equity 6 617 514 560 9 711 782 792 11 575 395 144 10 263 016 393 6 293 696 464
NIBD 12 969 770 000 24 127 781 000 32 627 802 000 39 597 213 000 47 363 289 000
Equity + NIBD 19 587 284 560 33 839 563 792 44 203 197 144 49 860 229 393 53 656 985 464
Debt Ratio 66,22 % 71,30 % 73,81 % 79,42 % 88,27 % 90,00 %
NAS - Debt ratio
SEK 2013 2014 2015 2016 2017 Average
Shares Outstanding 329 000 000 329 000 000 329 000 000 329 000 000 329 000 000
Share Price 31.12 19,15 15,30 16,70 15,30 25,90
Market Value of Equity 6 300 350 000 5 033 700 000 5 494 300 000 5 033 700 000 8 521 100 000
NIBD 19 019 000 000 18 039 000 000 19 726 000 000 21 387 000 000 21 548 000 000
Equity + NIBD 25 319 350 000 23 072 700 000 25 220 300 000 26 420 700 000 30 069 100 000
Debt Ratio 75,12 % 78,18 % 78,21 % 80,95 % 71,66 % 76,8%
SAS - Debt ratio
GBP 2013 2014 2015 2016 2017 Average
Shares Outstanding 393 000 000 396 857 135 397 208 133 397 208 133 397 208 133
Share Price 31.12 12,78 14,23 17,77 10,07 12,17
Market Value of Equity 5 022 540 000 5 647 277 031 7 058 388 523 3 999 885 899 4 834 022 979
NIBD 137 000 000 410 000 000 351 000 000 501 000 000 406 000 000
Equity + NIBD 5 159 540 000 6 057 277 031 7 409 388 523 4 500 885 899 5 240 022 979
Debt Ratio 2,66 % 6,77 % 4,74 % 11,13 % 7,75 % 6,61%
easyJet - Debt ratio
EUR 2013 2014 2015 2016 2017 Average
Shares Outstanding 1 447 051 752 1 383 237 668 1 377 661 859 1 290 739 865 1 206 936 483
Share Price 31.12 5,91 6,83 11,20 11,38 14,53
Market Value of Equity 8 557 864 061 9 447 513 272 15 429 812 821 14 688 619 664 17 536 787 098
NIBD 533 300 000 382 500 000 86 300 000 526 700 000 859 300 000
Equity + NIBD 9 091 164 061 9 830 013 272 15 516 112 821 15 215 319 664 18 396 087 098
Debt Ratio 5,87 % 3,89 % 0,56 % 3,46 % 4,67 % 3,69%
Ryanair - Debt ratio

33
A.35 Acquisition Valuation - Synergy Assumptions

34
A.36 Regression Result Against S&P 500
A.37 Regression Result Against MSCI World

35
A.38 Regression Against AXGAL
A.39 Regression Against XAL

36
A.40. Rolling Window R-Studio Do-File

37
A.41 Liquidation Value Balance Sheet

38
A.42 Base Case Share Price Distribution
A.43 Base Case Share Price Sensitivity

39
A.44 Probability of Share Price Being Below OBX Share Price
A.45 Probability of Share Price Being Above Scenario 1

40
A.46 Probability of Share Price Being Above Scenario 2
A.47 Probability of Share Price Being Below Scenario 3

41
A.48 Probability of Share Price Being Within 10% of Base Case
A.49 Probability of Share Price Being Within 20% of Base Case

42
A.50 Scenario 1 – Discounted Cash Flow

43
A.51 Scenario 2 – Discounted Cash Flow

44
A.52 Scenario 3 – Discounted Cash Flow
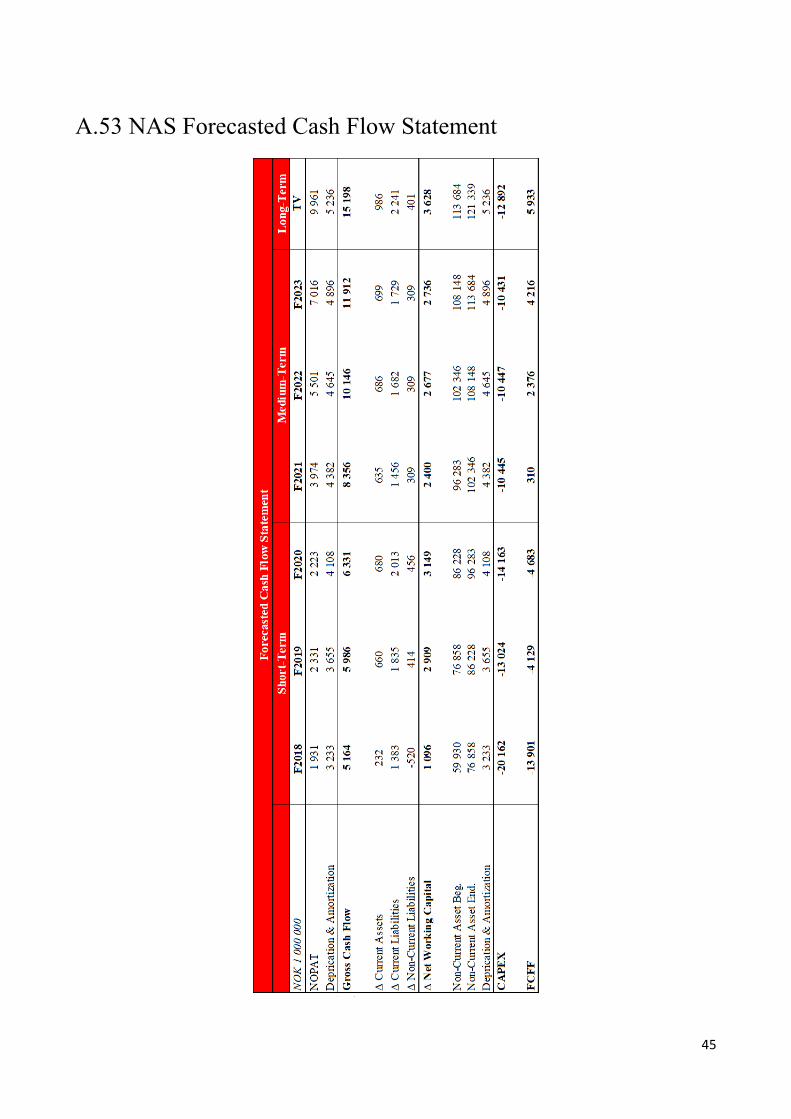
45
A.53 NAS Forecasted Cash Flow Statement


