Embed Size (px)
Citation preview
BOWNE OF LONDON 12/03/2000 15:16 BL/SM NO MARKS NEXT PCN: 003.00.00.00 -- Page/graphics valid (12/03/2000 15:55) X42481 002.00.00.00 29X
Telenor ASA372,151,899 Ordinary Shares
in the form of ordinary shares or American Depositary Shares
This is an initial public offering of ordinary shares of Telenor ASA, a public limited company organized under the laws ofthe Kingdom of Norway. The ordinary shares are being sold in the form of ordinary shares and American Depositary Shares,or ADSs. Each ADS represents three ordinary shares. This offering is part of a global offering of 372,151,899 ordinaryshares. In addition to this offering of ordinary shares to institutional investors outside of Norway and the United States, theglobal offering includes an offering to retail investors in Norway, an offering in the United States and an offering to institutionalinvestors in Norway. The offering to retail investors in Norway includes an offering of ordinary shares to Telenor employees inNorway. All of the 372,151,899 ordinary shares to be sold in the global offering are being offered by Telenor ASA.
Prior to this offering, there has been no public market for the ordinary shares or the ADSs. Retail investors in Norway areentitled to receive a discount from the initial public offering price, with Telenor employees entitled to a further discount, up tospecified limits. In addition, retail investors in Norway, including Telenor employees, are entitled to receive one additionalordinary share for every ten ordinary shares that they purchase and hold through December 3, 2001, up to specified limits.The ordinary shares have been approved for listing on the Oslo Stock Exchange under the symbol ‘‘TEL’’ and the ADSs havebeen approved for quotation on the Nasdaq National Market under the symbol ‘‘TELN’’.
See ‘‘Risk Factors’’ beginning on page 9 to read about factors you should consider before buying the ordinary shares orADSs.
This prospectus is intended for use only in connection with offers and sales of these securities outside theUnited States and is not to be sent or given to any person within the United States. These securities are not beingregistered under the U.S. Securities Act of 1933 for the purpose of sales outside the United States.
Offer price: NOK 42.00 per ordinary share and US$13.625 per ADSTelenor ASA and the Kingdom of Norway may, in their discretion, pay to some or all of the underwriters (other than the
U.S. underwriters) and the managers of the Norwegian retail offering after the closing an additional commission related topre-pricing performance in an aggregate amount of up to NOK 0.063 times the total number of ordinary shares sold in theglobal offering.
To the extent that the underwriters sell more than 344,058,509 ordinary shares, the underwriters have the option topurchase from the Kingdom of Norway, acting through the Norwegian Ministry of Trade and Industry, up to an additional51,608,776 ordinary shares (in the form of ordinary shares or ADSs), which represents 15% of the ordinary shares sold in theglobal offering (excluding the shares sold in the Norwegian retail offering), at the initial public offering price less the sellingconcession. Telenor ASA will not receive any of the proceeds from the sale of ordinary shares or ADSs being sold by theKingdom of Norway.
The underwriters expect to deliver the ordinary shares and ADSs to purchasers against payment on or aboutDecember 7, 2000.
Joint Global Coordinators
Goldman Sachs International DnB Markets
International Offering
Goldman Sachs International
Merrill Lynch International Credit Suisse First BostonDnB Markets HSBCDresdner Kleinwort Benson Schroder Salomon Smith Barney
Norwegian Institutional Offering
DnB Markets Christiania MarketsGoldman Sachs International Orkla Enskilda Sundal CollierFondsfinans ParetoAdvisor to the Norwegian Ministry of Trade and Industry Advisor to Telenor ASA
Deutsche Bank Lazard
Prospectus dated December 3, 2000

BOWNE OF LONDON 12/01/2000 19:56 BL/SM NO MARKS NEXT PCN: 004.00.00.00 -- Page is valid, no graphics X42481 003.00.00.00 34X
BOWNE OF LONDON 12/03/2000 09:59 BL/SM NO MARKS NEXT PCN: 005.00.00.00 -- Page is valid, no graphics X42481 004.00.00.00 27X
TABLE OF CONTENTS
Page Page
Prospectus Summary ********************* 1 Management***************************** 190Risk Factors ***************************** 9 Relationship between Telenor and theDividends and Dividend Policy ************* 15 Kingdom of Norway********************* 196Exchange Rates************************** 16 Description of the Shares andUse of Proceeds ************************* 17 Share Capital ************************** 198Capitalization **************************** 18 Nature of the Norwegian Trading Market **** 205Selected Consolidated Financial and Description of American Depositary
Statistical Data ************************* 19 Receipts******************************* 208Management’s Discussion and Analysis of Taxation ********************************* 216
Financial Condition and Results of Underwriting ***************************** 223Operations***************************** 23 Validity of Securities ********************** 227
Business ******************************** 85 Experts********************************** 227Regulation ******************************* 167 Index to Consolidated Financial Statements *** F-1
You should rely only on the information provided in this prospectus. We have not authorizedanyone to provide you with different information. We are not offering to sell or soliciting offers to buythe ordinary shares and ADSs in places where such offers are not permitted by applicable law. Youshould not assume that the information in this prospectus is accurate as of any date other than thedate on the front of this document.
Neither we, the selling shareholder nor any of the underwriters have done anything that wouldpermit a public offering of the ordinary shares or ADSs or possession or distribution of a prospectusin any jurisdiction where action for that purpose is required, other than in the United States andNorway. You are required to inform yourselves about and to observe any restrictions relating to thisoffering and the distribution of this prospectus.
There are restrictions on the offer and sale of the ordinary shares and ADSs offered hereby inthe United Kingdom. All applicable provisions of the Financial Services Act 1986 of Great Britain andthe Public Offers of Securities Regulations 1995 of Great Britain with respect to anything done byany person in relation to ordinary shares or ADSs offered hereby in, from or otherwise involving theUnited Kingdom must be complied with.
IN CONNECTION WITH THE GLOBAL OFFERING, THE JOINT GLOBAL COORDINATORSOR AFFILIATES OR AGENTS OF THE JOINT GLOBAL COORDINATORS MAY OVER-ALLOT OREFFECT TRANSACTIONS WHICH STABILIZE OR MAINTAIN THE MARKET PRICES OF THEORDINARY SHARES AND/OR ADSS AT LEVELS WHICH MIGHT OR MIGHT NOT OTHERWISEPREVAIL IN THE OPEN MARKET. SUCH TRANSACTIONS MAY BE EFFECTED ON THE OSLOSTOCK EXCHANGE OR THE NASDAQ NATIONAL MARKET OR OTHERWISE. SUCH STABILI-ZATION, IF COMMENCED, MAY BE DISCONTINUED AT ANY TIME AND, IN ANY EVENT, WILLBE DISCONTINUED 30 DAYS AFTER THE CLOSING OF THE OFFERING.
(i)

BOWNE OF LONDON 12/03/2000 11:50 BL/SM NO MARKS NEXT PCN: 006.00.00.00 -- Page is valid, no graphics X42481 005.00.00.00 12X
[THIS PAGE INTENTIONALLY LEFT BLANK]
BOWNE OF LONDON 12/01/2000 19:56 BL/SM NO MARKS NEXT PCN: 007.00.00.00 -- Page is valid, no graphics X42481 006.00.00.00 10X
PROSPECTUS SUMMARY
This summary highlights selected information from this prospectus and may not contain all ofthe information that is important to you. You should read the entire prospectus carefully.
Telenor
Overview
We are the leading telecommunications company in Norway, which is among the most advancedtelecommunications markets in the world. Norway has the highest or among the highest penetrationrates of mobile phone, fixed line digital telephony, personal computer and Internet usage worldwide.We also have substantial international operations and investments, particularly in mobilecommunications, Internet and Internet protocol-based communications services, satellite servicesand pay television services. In 1999, we had consolidated total revenues of NOK 33.5 billion and netincome of NOK 2.0 billion.
We operate in the following core business areas:
) Mobile Communications. We are the leading provider of mobile telecommunicationsservices in Norway with an estimated market share of 69% for digital service as ofSeptember 30, 2000. We also have extensive interests internationally with strategicinvestments in a number of mobile operators abroad, located in the Nordic region, the rest ofEurope and Southeast Asia. Including our proportionate share of subscriptions of ourassociated companies, we had 5.3 million mobile subscriptions at September 30, 2000.
) Telecom. We are the leading provider of fixed network telecommunications services inNorway, offering a full range of services to residential, business and wholesale customers.We have the highest penetration rate of digital, or ‘‘ISDN’’, access channels in the world. Wealso provide businesses with a range of managed telecommunications and informationtechnology services.
) Broadband Services. We are the leading provider of television-based broadband services toconsumers in the Nordic region, through home satellite dish (known as direct-to-home or‘‘DTH’’), cable and terrestrial broadcast transmission. We are also the leading provider ofsatellite broadcasting services in the Nordic region. In addition, we are among the leadingproviders of global satellite-based mobile communications within both the maritime and landmobile markets and the largest individual shareholder in the satellite operator INMARSAT.
) Internet. We are the leading Internet service provider in Norway within both the residentialand business segments. Under the ‘‘Nextra’’ brand, we provide Internet and other Internetprotocol, or ‘‘IP’’, -based communications services in Norway and twelve other Europeancountries (including sales offices in two countries), with a focus on small and medium-sizedbusinesses.
We also have significant operations in three related business areas:
) Media (on-line and printed directory services)
) Bravida (supplier of telecommunications installation, maintenance and operating services)
) EDB Business Partner (a leading information technology company in Norway)
1
BOWNE OF LONDON 12/03/2000 15:21 BL/SM NO MARKS NEXT PCN: 008.00.00.00 -- Page is valid, no graphics X42481 007.00.00.00 16X
Our Competitive Strengths
We benefit from a number of competitive strengths, including:
) We are an innovator with technologically-advanced networks and services. In our interna-tional expansion, we seek to build upon the capabilities we have developed in our homemarket.
) We operate in a highly advanced home market, with high per capita income andtelecommunications spending.
) In mobile communications, we are the market leader in Norway and have strategic interestsin a number of mobile operators internationally.
) We are in a strong position to capitalize on the development of television-based broadbandservices in the Nordic region and selected other European markets.
) We have already established a significant presence in several European countries in themarket for Internet and IP-based communications services for businesses.
) We are the leading Internet service provider in Norway with a strong market share.
) In our Telecom business area, we have already substantially re-balanced our domestic tariffsand operate profitably in a low-tariff environment.
Our Strategy
Our strategy is to increase shareholder value by focusing on the core business areas in whichwe believe we have competitive advantages. In particular, we intend to focus on businesses offeringthe potential for strong growth and international expansion. We have made international activities akey element of our strategy.
Our principal strategic objectives are to:
) Be a leading provider of mobile voice and mobile Internet services in the Nordic region andin selected countries elsewhere in Europe and in Southeast Asia. In our home market ofNorway, we intend to maintain and build upon our leading position in mobile communicationsand introduce new services, including third generation mobile communication services.
) Be the leading provider of pay television and television-based interactive broadband servicesin the Nordic region and selected other European markets.
) Become a leading pan-European provider of Internet and IP-based communications servicesto small and medium-sized businesses.
) Maintain and expand our position as a leading provider of global mobile satellitecommunications services worldwide.
) Build on our strong position in telecommunications and information technology services forbusinesses in the Nordic region by focusing on growing market segments.
) Maintain our leading position in Norway for fixed network telecommunications services bystrengthening our customer relationships and focusing on new service offerings.
) Enhance and realize value from our non-core operations.
Ownership by the Kingdom of Norway
Prior to the global offering, the Kingdom of Norway owned 100% of our outstanding ordinaryshares. After completion of the global offering, the Kingdom of Norway will own 79.00% of ouroutstanding ordinary shares, or 76.09% if the underwriters exercise the over-allotment option in full.
Our principal executive offices are located at Universitetsgaten 2, P.O. Box 6701, St. OlavsPlass, N-0130, Oslo, Norway. Our telephone number is (+47) 22 77 60 60.
2
BOWNE OF LONDON 12/03/2000 19:50 BL/SM NO MARKS NEXT PCN: 009.00.00.00 -- Page is valid, no graphics X42481 008.00.00.00 32X
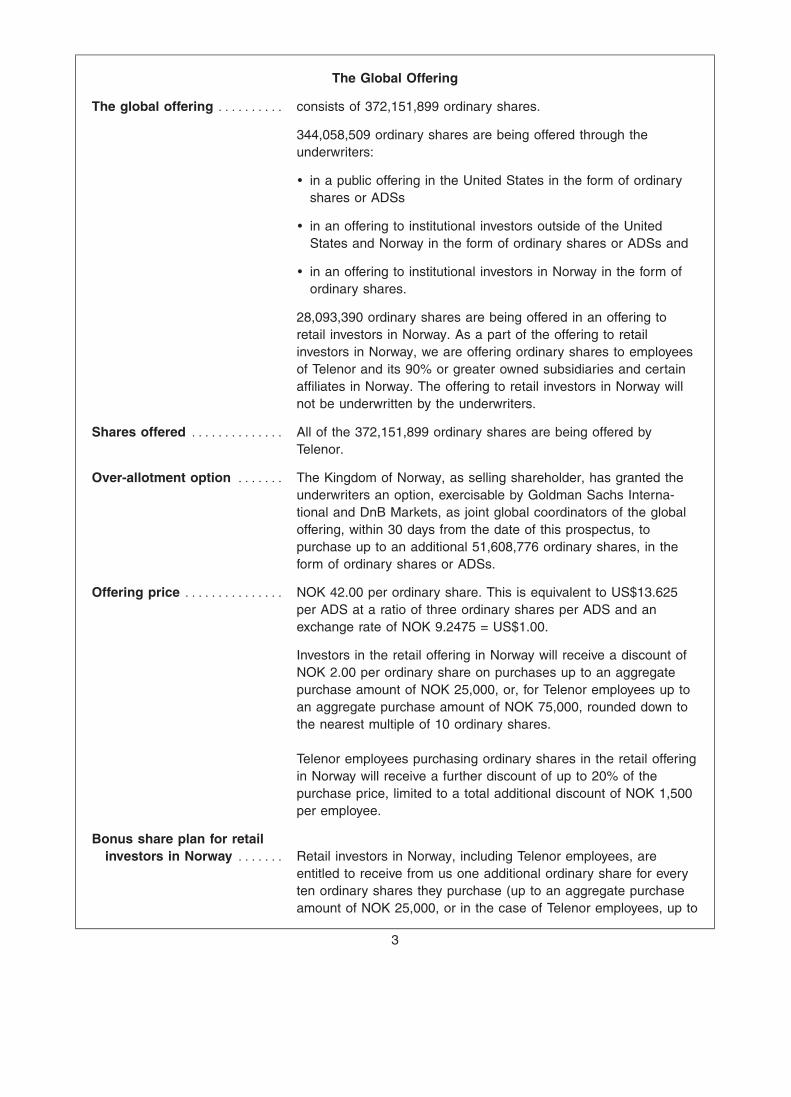
The Global Offering
The global offering ********** consists of 372,151,899 ordinary shares.
344,058,509 ordinary shares are being offered through theunderwriters:
) in a public offering in the United States in the form of ordinaryshares or ADSs
) in an offering to institutional investors outside of the UnitedStates and Norway in the form of ordinary shares or ADSs and
) in an offering to institutional investors in Norway in the form ofordinary shares.
28,093,390 ordinary shares are being offered in an offering toretail investors in Norway. As a part of the offering to retailinvestors in Norway, we are offering ordinary shares to employeesof Telenor and its 90% or greater owned subsidiaries and certainaffiliates in Norway. The offering to retail investors in Norway willnot be underwritten by the underwriters.
Shares offered ************** All of the 372,151,899 ordinary shares are being offered byTelenor.
Over-allotment option ******* The Kingdom of Norway, as selling shareholder, has granted theunderwriters an option, exercisable by Goldman Sachs Interna-tional and DnB Markets, as joint global coordinators of the globaloffering, within 30 days from the date of this prospectus, topurchase up to an additional 51,608,776 ordinary shares, in theform of ordinary shares or ADSs.
Offering price *************** NOK 42.00 per ordinary share. This is equivalent to US$13.625per ADS at a ratio of three ordinary shares per ADS and anexchange rate of NOK 9.2475 = US$1.00.
Investors in the retail offering in Norway will receive a discount ofNOK 2.00 per ordinary share on purchases up to an aggregatepurchase amount of NOK 25,000, or, for Telenor employees up toan aggregate purchase amount of NOK 75,000, rounded down tothe nearest multiple of 10 ordinary shares.
Telenor employees purchasing ordinary shares in the retail offeringin Norway will receive a further discount of up to 20% of thepurchase price, limited to a total additional discount of NOK 1,500per employee.
Bonus share plan for retailinvestors in Norway ******* Retail investors in Norway, including Telenor employees, are
entitled to receive from us one additional ordinary share for everyten ordinary shares they purchase (up to an aggregate purchaseamount of NOK 25,000, or in the case of Telenor employees, up to
3
BOWNE OF LONDON 12/03/2000 19:50 BL/SM NO MARKS NEXT PCN: 010.00.00.00 -- Page is valid, no graphics X42481 009.00.00.00 23X
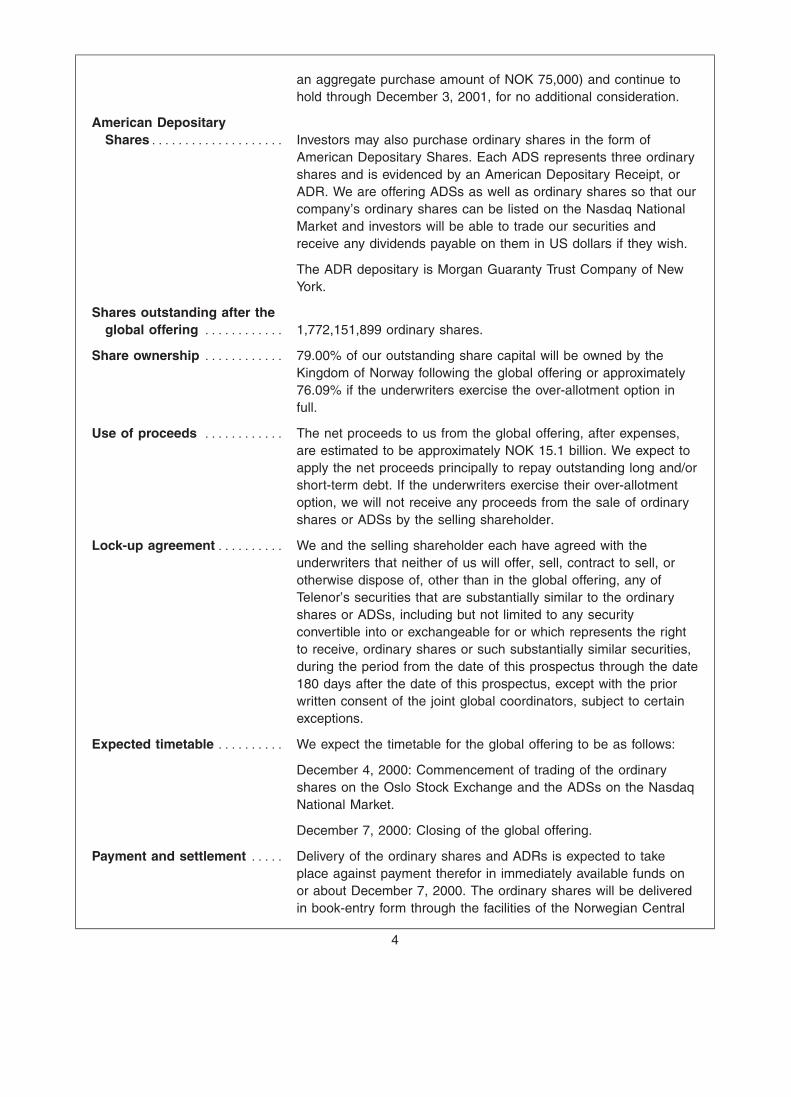
an aggregate purchase amount of NOK 75,000) and continue tohold through December 3, 2001, for no additional consideration.
American DepositaryShares******************** Investors may also purchase ordinary shares in the form of
American Depositary Shares. Each ADS represents three ordinaryshares and is evidenced by an American Depositary Receipt, orADR. We are offering ADSs as well as ordinary shares so that ourcompany’s ordinary shares can be listed on the Nasdaq NationalMarket and investors will be able to trade our securities andreceive any dividends payable on them in US dollars if they wish.
The ADR depositary is Morgan Guaranty Trust Company of NewYork.
Shares outstanding after theglobal offering ************ 1,772,151,899 ordinary shares.
Share ownership ************ 79.00% of our outstanding share capital will be owned by theKingdom of Norway following the global offering or approximately76.09% if the underwriters exercise the over-allotment option infull.
Use of proceeds ************ The net proceeds to us from the global offering, after expenses,are estimated to be approximately NOK 15.1 billion. We expect toapply the net proceeds principally to repay outstanding long and/orshort-term debt. If the underwriters exercise their over-allotmentoption, we will not receive any proceeds from the sale of ordinaryshares or ADSs by the selling shareholder.
Lock-up agreement********** We and the selling shareholder each have agreed with theunderwriters that neither of us will offer, sell, contract to sell, orotherwise dispose of, other than in the global offering, any ofTelenor’s securities that are substantially similar to the ordinaryshares or ADSs, including but not limited to any securityconvertible into or exchangeable for or which represents the rightto receive, ordinary shares or such substantially similar securities,during the period from the date of this prospectus through the date180 days after the date of this prospectus, except with the priorwritten consent of the joint global coordinators, subject to certainexceptions.
Expected timetable ********** We expect the timetable for the global offering to be as follows:
December 4, 2000: Commencement of trading of the ordinaryshares on the Oslo Stock Exchange and the ADSs on the NasdaqNational Market.
December 7, 2000: Closing of the global offering.
Payment and settlement ***** Delivery of the ordinary shares and ADRs is expected to takeplace against payment therefor in immediately available funds onor about December 7, 2000. The ordinary shares will be deliveredin book-entry form through the facilities of the Norwegian Central
4
BOWNE OF LONDON 12/03/2000 19:50 BL/SM NO MARKS NEXT PCN: 011.00.00.00 -- Page is valid, no graphics X42481 010.00.00.00 21X
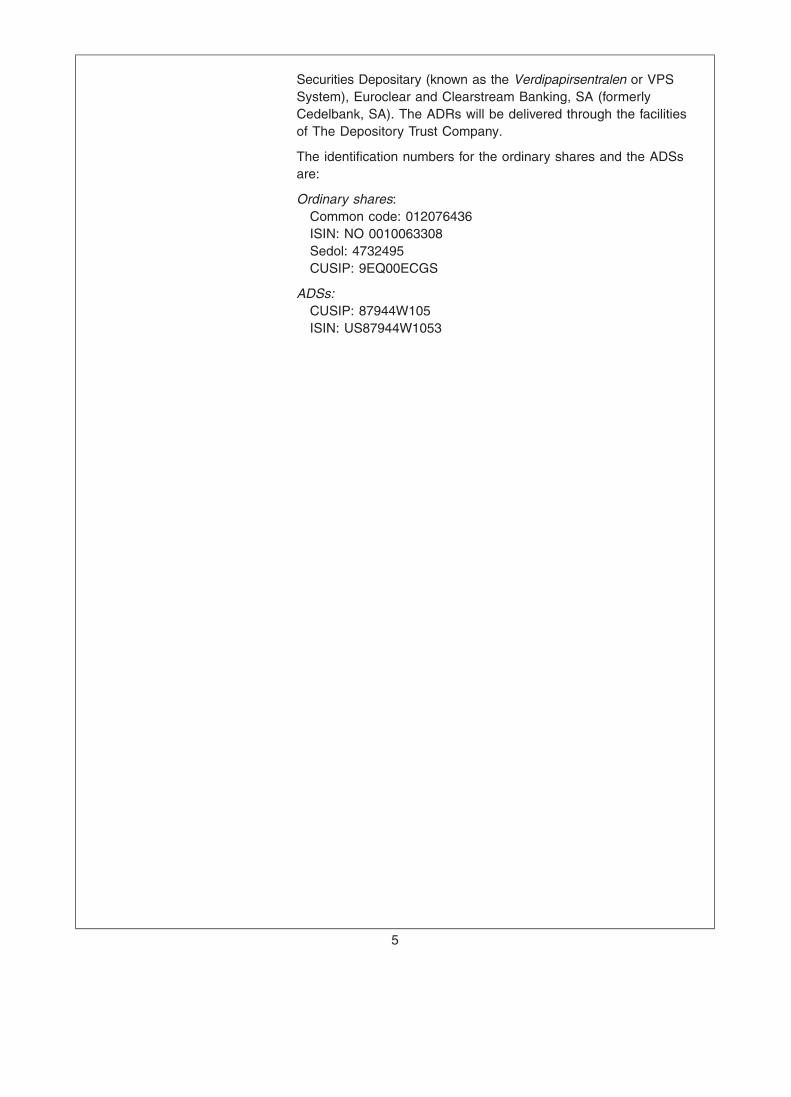
Securities Depositary (known as the Verdipapirsentralen or VPSSystem), Euroclear and Clearstream Banking, SA (formerlyCedelbank, SA). The ADRs will be delivered through the facilitiesof The Depository Trust Company.
The identification numbers for the ordinary shares and the ADSsare:
Ordinary shares:Common code: 012076436ISIN: NO 0010063308Sedol: 4732495CUSIP: 9EQ00ECGS
ADSs:CUSIP: 87944W105ISIN: US87944W1053
5
BOWNE OF LONDON 12/01/2000 19:56 BL/SM NO MARKS NEXT PCN: 012.00.00.00 -- Page is valid, no graphics X42481 011.00.00.00 8X
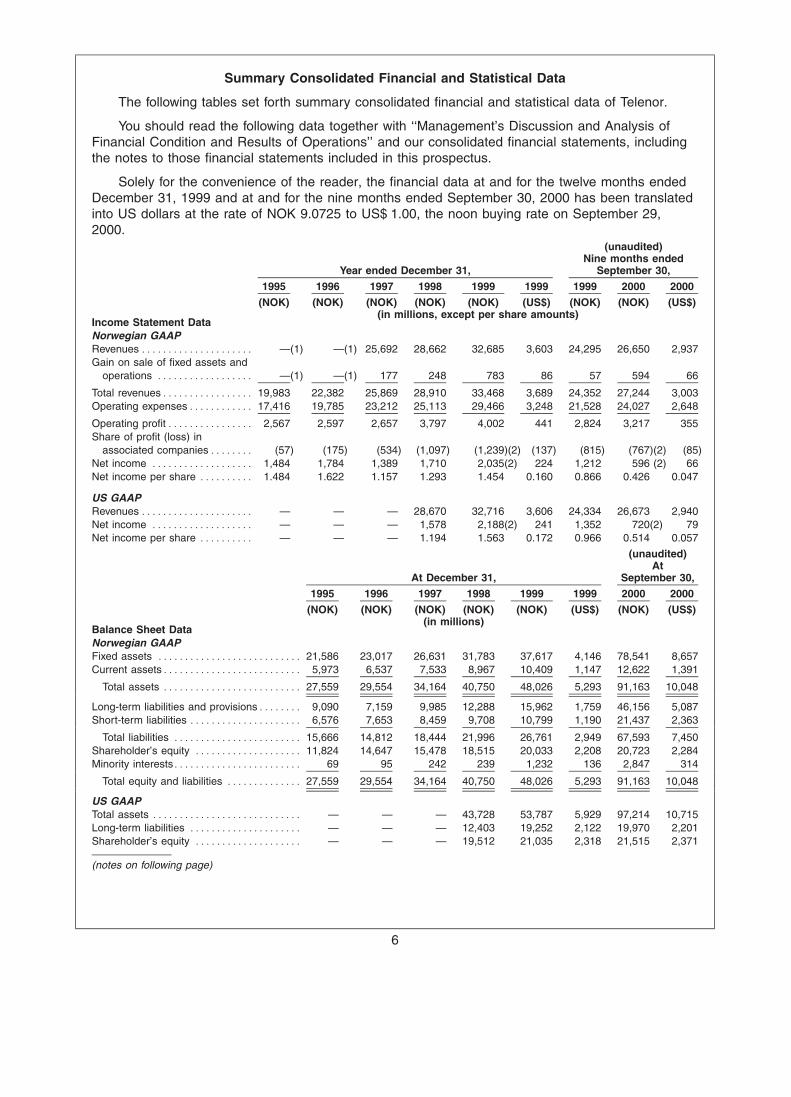
Summary Consolidated Financial and Statistical Data
The following tables set forth summary consolidated financial and statistical data of Telenor.
You should read the following data together with ‘‘Management’s Discussion and Analysis ofFinancial Condition and Results of Operations’’ and our consolidated financial statements, includingthe notes to those financial statements included in this prospectus.
Solely for the convenience of the reader, the financial data at and for the twelve months endedDecember 31, 1999 and at and for the nine months ended September 30, 2000 has been translatedinto US dollars at the rate of NOK 9.0725 to US$ 1.00, the noon buying rate on September 29,2000.
(unaudited)Nine months ended
Year ended December 31, September 30,
1995 1996 1997 1998 1999 1999 1999 2000 2000
(NOK) (NOK) (NOK) (NOK) (NOK) (US$) (NOK) (NOK) (US$)(in millions, except per share amounts)
Income Statement DataNorwegian GAAPRevenues ********************* —(1) —(1) 25,692 28,662 32,685 3,603 24,295 26,650 2,937Gain on sale of fixed assets and
operations ****************** —(1) —(1) 177 248 783 86 57 594 66
Total revenues***************** 19,983 22,382 25,869 28,910 33,468 3,689 24,352 27,244 3,003Operating expenses************ 17,416 19,785 23,212 25,113 29,466 3,248 21,528 24,027 2,648
Operating profit**************** 2,567 2,597 2,657 3,797 4,002 441 2,824 3,217 355Share of profit (loss) in
associated companies******** (57) (175) (534) (1,097) (1,239)(2) (137) (815) (767)(2) (85)Net income ******************* 1,484 1,784 1,389 1,710 2,035(2) 224 1,212 596 (2) 66Net income per share ********** 1.484 1.622 1.157 1.293 1.454 0.160 0.866 0.426 0.047
US GAAPRevenues ********************* — — — 28,670 32,716 3,606 24,334 26,673 2,940Net income ******************* — — — 1,578 2,188(2) 241 1,352 720(2) 79Net income per share ********** — — — 1.194 1.563 0.172 0.966 0.514 0.057
(unaudited)At
At December 31, September 30,
1995 1996 1997 1998 1999 1999 2000 2000
(NOK) (NOK) (NOK) (NOK) (NOK) (US$) (NOK) (US$)(in millions)
Balance Sheet DataNorwegian GAAPFixed assets *************************** 21,586 23,017 26,631 31,783 37,617 4,146 78,541 8,657Current assets************************** 5,973 6,537 7,533 8,967 10,409 1,147 12,622 1,391
Total assets ************************** 27,559 29,554 34,164 40,750 48,026 5,293 91,163 10,048
Long-term liabilities and provisions******** 9,090 7,159 9,985 12,288 15,962 1,759 46,156 5,087Short-term liabilities ********************* 6,576 7,653 8,459 9,708 10,799 1,190 21,437 2,363
Total liabilities ************************ 15,666 14,812 18,444 21,996 26,761 2,949 67,593 7,450Shareholder’s equity ******************** 11,824 14,647 15,478 18,515 20,033 2,208 20,723 2,284Minority interests************************ 69 95 242 239 1,232 136 2,847 314
Total equity and liabilities ************** 27,559 29,554 34,164 40,750 48,026 5,293 91,163 10,048
US GAAPTotal assets **************************** — — — 43,728 53,787 5,929 97,214 10,715Long-term liabilities ********************* — — — 12,403 19,252 2,122 19,970 2,201Shareholder’s equity ******************** — — — 19,512 21,035 2,318 21,515 2,371
(notes on following page)
6
BOWNE OF LONDON 12/01/2000 19:56 BL/SM NO MARKS NEXT PCN: 013.00.00.00 -- Page is valid, no graphics X42481 012.00.00.00 9X
(unaudited)Nine months ended
Year ended December 31, September 30,
1995 1996 1997 1998 1999 1999 1999 2000 2000
(NOK) (NOK) (NOK) (NOK) (NOK) (US$) (NOK) (NOK) (US$)(in millions)
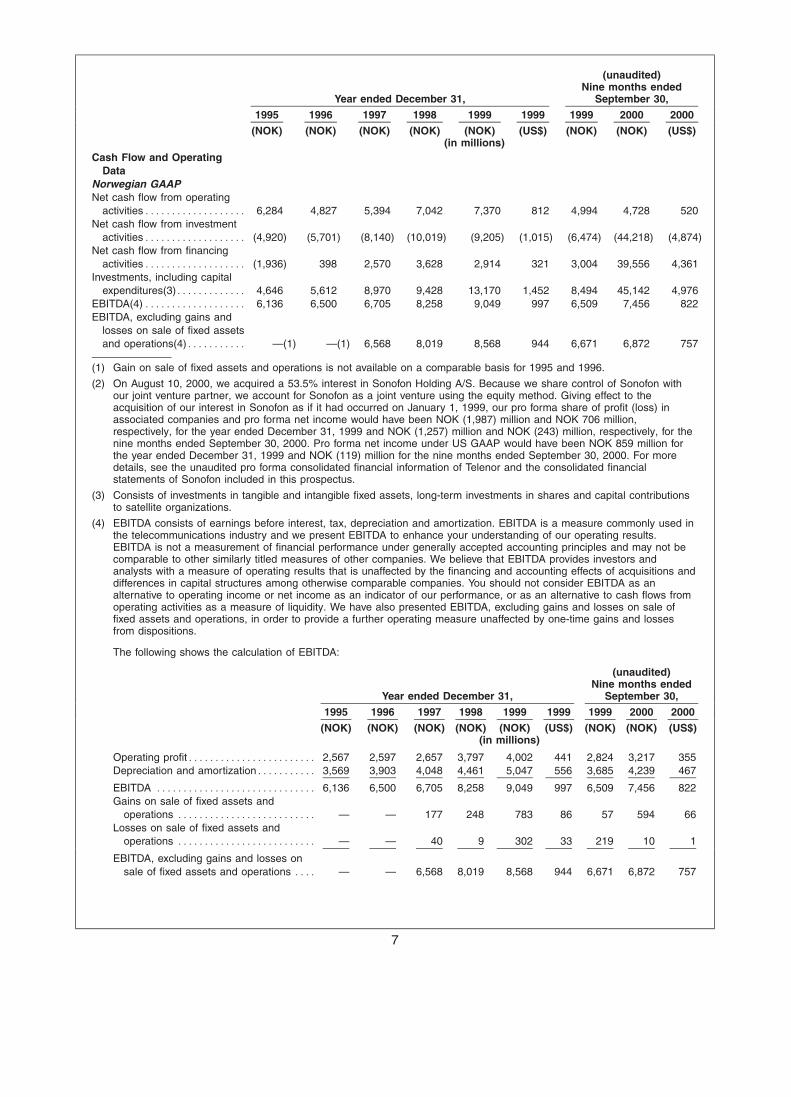
Cash Flow and OperatingData
Norwegian GAAPNet cash flow from operating
activities******************* 6,284 4,827 5,394 7,042 7,370 812 4,994 4,728 520Net cash flow from investment
activities******************* (4,920) (5,701) (8,140) (10,019) (9,205) (1,015) (6,474) (44,218) (4,874)Net cash flow from financing
activities******************* (1,936) 398 2,570 3,628 2,914 321 3,004 39,556 4,361Investments, including capital
expenditures(3)************* 4,646 5,612 8,970 9,428 13,170 1,452 8,494 45,142 4,976EBITDA(4)******************* 6,136 6,500 6,705 8,258 9,049 997 6,509 7,456 822EBITDA, excluding gains and
losses on sale of fixed assetsand operations(4)*********** —(1) —(1) 6,568 8,019 8,568 944 6,671 6,872 757
(1) Gain on sale of fixed assets and operations is not available on a comparable basis for 1995 and 1996.
(2) On August 10, 2000, we acquired a 53.5% interest in Sonofon Holding A/S. Because we share control of Sonofon withour joint venture partner, we account for Sonofon as a joint venture using the equity method. Giving effect to theacquisition of our interest in Sonofon as if it had occurred on January 1, 1999, our pro forma share of profit (loss) inassociated companies and pro forma net income would have been NOK (1,987) million and NOK 706 million,respectively, for the year ended December 31, 1999 and NOK (1,257) million and NOK (243) million, respectively, for thenine months ended September 30, 2000. Pro forma net income under US GAAP would have been NOK 859 million forthe year ended December 31, 1999 and NOK (119) million for the nine months ended September 30, 2000. For moredetails, see the unaudited pro forma consolidated financial information of Telenor and the consolidated financialstatements of Sonofon included in this prospectus.
(3) Consists of investments in tangible and intangible fixed assets, long-term investments in shares and capital contributionsto satellite organizations.
(4) EBITDA consists of earnings before interest, tax, depreciation and amortization. EBITDA is a measure commonly used inthe telecommunications industry and we present EBITDA to enhance your understanding of our operating results.EBITDA is not a measurement of financial performance under generally accepted accounting principles and may not becomparable to other similarly titled measures of other companies. We believe that EBITDA provides investors andanalysts with a measure of operating results that is unaffected by the financing and accounting effects of acquisitions anddifferences in capital structures among otherwise comparable companies. You should not consider EBITDA as analternative to operating income or net income as an indicator of our performance, or as an alternative to cash flows fromoperating activities as a measure of liquidity. We have also presented EBITDA, excluding gains and losses on sale offixed assets and operations, in order to provide a further operating measure unaffected by one-time gains and lossesfrom dispositions.
The following shows the calculation of EBITDA:
(unaudited)Nine months ended
Year ended December 31, September 30,
1995 1996 1997 1998 1999 1999 1999 2000 2000
(NOK) (NOK) (NOK) (NOK) (NOK) (US$) (NOK) (NOK) (US$)(in millions)
Operating profit************************ 2,567 2,597 2,657 3,797 4,002 441 2,824 3,217 355Depreciation and amortization*********** 3,569 3,903 4,048 4,461 5,047 556 3,685 4,239 467
EBITDA ****************************** 6,136 6,500 6,705 8,258 9,049 997 6,509 7,456 822Gains on sale of fixed assets and
operations ************************** — — 177 248 783 86 57 594 66Losses on sale of fixed assets and
operations ************************** — — 40 9 302 33 219 10 1
EBITDA, excluding gains and losses onsale of fixed assets and operations **** — — 6,568 8,019 8,568 944 6,671 6,872 757
7
BOWNE OF LONDON 12/01/2000 19:56 BL/SM NO MARKS NEXT PCN: 014.00.00.00 -- Page is valid, no graphics X42481 013.00.00.00 5X
Nine monthsended
Year ended December 31, September 30,1995 1996 1997 1998 1999 1999 2000
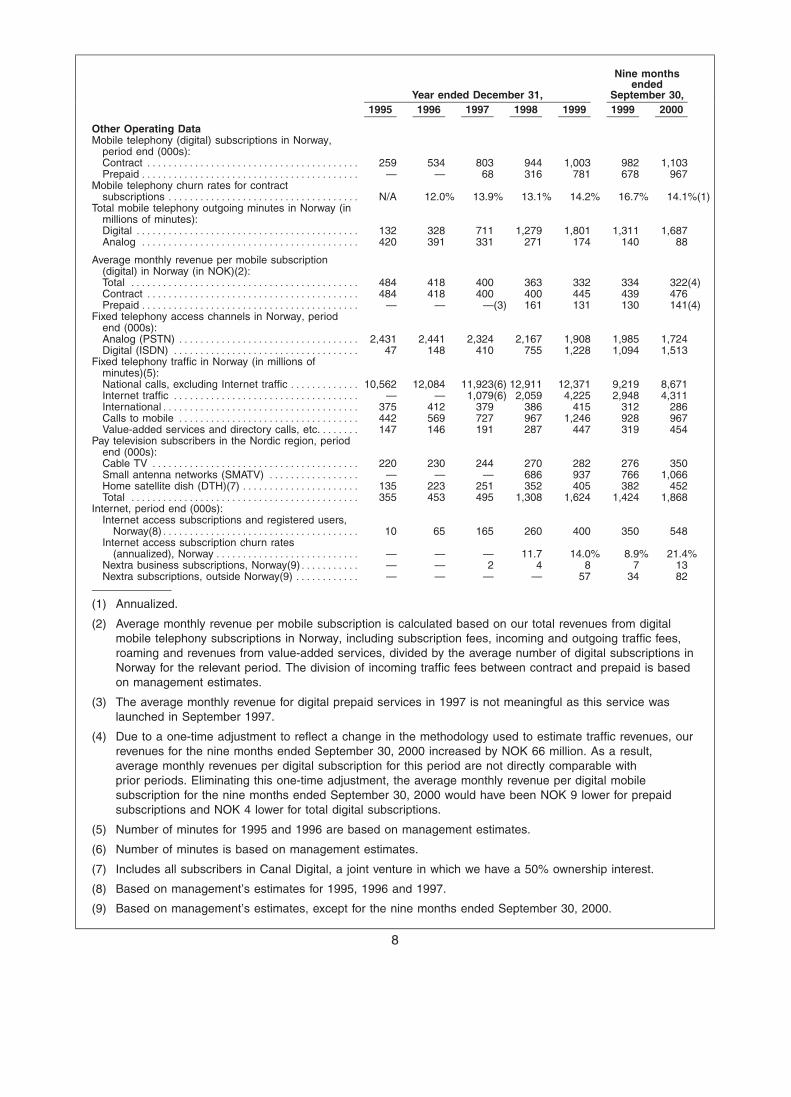
Other Operating DataMobile telephony (digital) subscriptions in Norway,
period end (000s):Contract **************************************** 259 534 803 944 1,003 982 1,103Prepaid ***************************************** — — 68 316 781 678 967
Mobile telephony churn rates for contractsubscriptions ************************************ N/A 12.0% 13.9% 13.1% 14.2% 16.7% 14.1%(1)
Total mobile telephony outgoing minutes in Norway (inmillions of minutes):Digital ****************************************** 132 328 711 1,279 1,801 1,311 1,687Analog ***************************************** 420 391 331 271 174 140 88
Average monthly revenue per mobile subscription(digital) in Norway (in NOK)(2):Total ******************************************* 484 418 400 363 332 334 322(4)Contract **************************************** 484 418 400 400 445 439 476Prepaid ***************************************** — — —(3) 161 131 130 141(4)
Fixed telephony access channels in Norway, periodend (000s):Analog (PSTN) ********************************** 2,431 2,441 2,324 2,167 1,908 1,985 1,724Digital (ISDN) *********************************** 47 148 410 755 1,228 1,094 1,513
Fixed telephony traffic in Norway (in millions ofminutes)(5):National calls, excluding Internet traffic ************* 10,562 12,084 11,923(6) 12,911 12,371 9,219 8,671Internet traffic *********************************** — — 1,079(6) 2,059 4,225 2,948 4,311International************************************* 375 412 379 386 415 312 286Calls to mobile ********************************** 442 569 727 967 1,246 928 967Value-added services and directory calls, etc.******* 147 146 191 287 447 319 454
Pay television subscribers in the Nordic region, periodend (000s):Cable TV *************************************** 220 230 244 270 282 276 350Small antenna networks (SMATV) ***************** — — — 686 937 766 1,066Home satellite dish (DTH)(7) ********************** 135 223 251 352 405 382 452Total ******************************************* 355 453 495 1,308 1,624 1,424 1,868
Internet, period end (000s):Internet access subscriptions and registered users,
Norway(8)************************************* 10 65 165 260 400 350 548Internet access subscription churn rates
(annualized), Norway *************************** — — — 11.7 14.0% 8.9% 21.4%Nextra business subscriptions, Norway(9)*********** — — 2 4 8 7 13Nextra subscriptions, outside Norway(9) ************ — — — — 57 34 82
(1) Annualized.
(2) Average monthly revenue per mobile subscription is calculated based on our total revenues from digitalmobile telephony subscriptions in Norway, including subscription fees, incoming and outgoing traffic fees,roaming and revenues from value-added services, divided by the average number of digital subscriptions inNorway for the relevant period. The division of incoming traffic fees between contract and prepaid is basedon management estimates.
(3) The average monthly revenue for digital prepaid services in 1997 is not meaningful as this service waslaunched in September 1997.
(4) Due to a one-time adjustment to reflect a change in the methodology used to estimate traffic revenues, ourrevenues for the nine months ended September 30, 2000 increased by NOK 66 million. As a result,average monthly revenues per digital subscription for this period are not directly comparable withprior periods. Eliminating this one-time adjustment, the average monthly revenue per digital mobilesubscription for the nine months ended September 30, 2000 would have been NOK 9 lower for prepaidsubscriptions and NOK 4 lower for total digital subscriptions.
(5) Number of minutes for 1995 and 1996 are based on management estimates.
(6) Number of minutes is based on management estimates.
(7) Includes all subscribers in Canal Digital, a joint venture in which we have a 50% ownership interest.
(8) Based on management’s estimates for 1995, 1996 and 1997.
(9) Based on management’s estimates, except for the nine months ended September 30, 2000.
8
BOWNE OF LONDON 12/03/2000 11:57 BL/SM NO MARKS NEXT PCN: 015.00.00.00 -- Page is valid, no graphics X42481 014.00.00.00 6X
RISK FACTORS
Risks Related to Our Business
We face increasing competition in the Norwegian telecommunications market which may result infurther reductions in tariffs and loss of market share.
We are experiencing increasing competition from competing service providers in the Norwegianmarket for telecommunications services. Generally, the Norwegian regulatory regime poses fewbarriers to entry for new competitors. In fixed network services, a number of measures have beenintroduced that may strengthen the position of our competitors. Pursuant to regulatory requirements,in 1999 we began providing customers the ability to pre-select an alternative service provider and toretain their telephone numbers if they change service providers, and in November 2000 we beganallowing customers to pre-select two alternative service providers, with one for national and anotherfor international calls. Pre-selecting an alternative service provider means that all of the customer’scalls are automatically routed through that service provider, without having to dial a prefix accesscode for each call. In addition, we are required to allow other operators to interconnect to ournetwork and transport traffic through our network at cost-oriented prices, and we have adopted astrategy of providing competing service providers with a range of interconnection capacity andwholesale services. In April 2000, we began offering interconnection services for our local accessnetwork, or local loop, at cost-oriented prices. Competitors may also use alternative technologies,such as cable or wireless local loop connections, to provide telecommunications, and the Norwegianregulator has recently awarded licenses to our competitors to provide wireless access service.
In the mobile market, the regulator has recently announced the award of licenses for thirdgeneration mobile services to us and three other operators, which will increase the number ofoperators providing service and open the market to more competition. In addition, several mobileservice providers utilizing our infrastructure, or that of our primary competitor, have recently enteredthe market and others are expected to follow in the near future.
As competition continues to intensify, we expect market pressures may require us to reducetariffs further and we also may lose further market share. Furthermore, this may adversely affect ourprofit margin, as the effect of lost market share in the retail market is unlikely to be fully offset byproviding interconnection services to competing service providers.
If we fail to successfully develop and market new mobile communications services, our ability toachieve further revenue growth in mobile communications services in the Norwegian market maybe limited.
Because of our high market share and the current high penetration rate in Norway for mobilecommunications, we expect that further revenue growth in mobile communications in the Norwegianmarket will depend on our ability to successfully develop and market new applications and services.
If we or international mobile operators in which we have invested fail to obtain licenses for thirdgeneration mobile services, we may be unable to achieve our strategy of being a leading providerof mobile voice and mobile Internet services in our target markets.
Our growth strategy in mobile communications depends to a large extent upon the ability toobtain licenses for third generation mobile services in markets in which we have significantinvestments, in order to allow us to offer Universal Mobile Telecommunications System, commonlyknown as UMTS, services, either directly or through our international associated companies. Afailure to establish ourselves or our associated companies among the providers of third generationmobile services is likely to limit our ability to introduce new products and services and achieverevenue growth in mobile communications. Even if we or our associated companies are successful inobtaining licenses, the cost of such licenses may be substantial, particularly in countries which
9
BOWNE OF LONDON 12/01/2000 19:56 BL/SM NO MARKS NEXT PCN: 016.00.00.00 -- Page is valid, no graphics X42481 015.00.00.00 6X
award licenses through an auction process, and we may not be able to earn an adequate return on,or to recover the cost of, our investment.
If the other owners of the international mobile operators in which we have invested fail to providenecessary financial or strategic support to such companies, the value of these companies may beimpaired.
We have made major investments in international mobile communications companies, and ourstrategy is to continue to aggressively expand our international mobile activities. In most of ourinvestments, we have a minority participation and the mobile companies rely on us and the othershareholders for strategic and financial support. In particular, in many cases these companies willneed to obtain funding from their shareholders in order to finance the license fees, infrastructure andother costs required to launch UMTS services. If the other shareholders fail to adequately supportthese companies, they may not be able to compete effectively and the value of our investment maybe impaired.
If the demand for mobile Internet services, television-based interactive services or Internetprotocol-based communications services does not grow strongly, we may not be able to earn anadequate return on, or to recover the costs of, our investments in these businesses.
Much of our strategy is based on the expectation of strong growth in the markets for serviceswe have recently introduced or are developing, including in particular mobile Internet services,television-based interactive services and IP-based communications services for businesses. If themarkets for these services do not grow as we expect, we may not be able to earn an adequatereturn on, or to recover the costs of, the investments we are making to develop and market theseservices.
Furthermore, we may be unable to take advantage of any growth in demand for these services ifwe fail to develop and market our own services, such as television-based interactive services, on atimely basis.
Continuing rapid changes in technologies could increase competition or require us to makesubstantial additional investments.
The services we offer are technology-intensive. The development of new technologies mayrender our services noncompetitive. We may have to make substantial additional investments in newtechnologies to remain competitive. New technologies we choose may not prove to be commerciallysuccessful. In addition, we may not receive necessary licenses to provide services based on newtechnologies, such as third generation mobile services. As a result, we could lose customers, fail toattract new customers or incur substantial costs in order to maintain our customer base.
The value of our international operations and investments may be adversely affected by political,economic and legal developments in foreign countries or by currency exchange rate fluctuations.
Some of the countries in which we have made significant equity investments in telecommunica-tions operators have political, economic and legal systems that are unpredictable. Political oreconomic upheaval or changes in laws or their application may harm the operations of thecompanies in which we have invested and impair the value of these investments to us. A significantrisk of operating in emerging market countries is that foreign exchange restrictions could beestablished. This could effectively prevent us from receiving profits from, or from selling ourinvestments in these countries. In addition, fluctuations in currency exchange rates between theNorwegian Krone and the currencies in which our international operations or investments operatecould adversely affect our reported earnings and the value of these businesses.
Russia has been an area of focus of our international investment. Since August 1998, Russiahas been undergoing a period of increased economic and political instability, marked by a currency
10
BOWNE OF LONDON 12/01/2000 19:56 BL/SM NO MARKS NEXT PCN: 017.00.00.00 -- Page is valid, no graphics X42481 016.00.00.00 5X
devaluation, hyperinflation, a severe banking crisis and changes of government. We also have madeimportant investments in Southeast Asia, including in particular Thailand and Malaysia. In recentyears, these countries have experienced sharp currency devaluations and an economic crisis.Prolonged economic or political crises in countries in which we have significant operations orinvestments may adversely affect the value of these businesses.
Failure to identify or complete acquisitions or investments necessary to pursue our plans forinternational expansion, in particular in our mobile communications and IP-based communicationsoperations, may significantly impair our international growth and competitive position.
An important part of our business strategy is to expand our operations internationally. This isparticularly true in respect of our mobile communications operations and our Internet and IP-basedcommunications operations. Although we continually explore opportunities to acquire or invest insuch operations, we do not know if we will be able to identify any such acquisitions or investments orbe able to successfully complete them. If we fail to identify or complete suitable transactions, we maynot achieve our desired growth in these areas and our competitive position internationally could beweakened.
Failure to retain and recruit skilled personnel would impair our ability to expand our business andremain competitive in our traditional business areas.
In order to develop, market and support our services, we must hire and retain highly skilledemployees with particular expertise. Competition for qualified telecommunications and informationtechnology personnel is intense. To a considerable extent, our ability to hire and retain skilledpersonnel in high growth businesses will depend on our ability to offer them competitive incentiveprograms. We do not currently have a stock option program in place and after this offering maycontinue not to have such a program. Although we plan to implement an incentive program for oursenior management, our program does not extend to all employees and may not be perceived ascompetitive with stock-based incentive programs offered by our competitors or other employers. As aresult, we may be unable to hire and retain skilled employees, which would limit our ability todevelop new business areas or remain competitive in our traditional business areas.
A delay in the adoption of a Nordic open broadcasting standard based on Multimedia HomePlatform could impair our development and marketing of a broad range of new television-basedbroadband services on a timely basis.
Our strategy in developing and marketing new television-based broadband services, such asZonavi, depends partly on broadcast-based application environments converging towards an openstandard, in particular the Multimedia Home Platform standard. This will enable us to distributeinteractive services in the same format through all of our available access technologies that possesssufficient bandwidth. A standardization committee in the Nordic region, Nordig, has been formed byrepresentatives of the national broadcasters and access providers, including us, to determine anopen standard. A delay in the adoption of an open standard could impair our ability to develop abroad range of services and market these services on a timely basis.
In-orbit satellite failure, or a launch delay or failure of a new satellite, may result in lost revenues inour satellite broadcasting business.
The operation of satellites is subject to the risk of in-orbit failure, which could arise from variouscauses, such as a failure of satellite components, solar or other astronomical events or space debris.It is not feasible to repair satellites in space. The satellites themselves are insured in such cases, butwe do not insure against lost revenues in the event of a total or partial loss of the communicationscapacity of a satellite while in orbit.
11
BOWNE OF LONDON 12/01/2000 19:56 BL/SM NO MARKS NEXT PCN: 018.00.00.00 -- Page is valid, no graphics X42481 017.00.00.00 5X
In addition, the deployment of a new satellite is subject to a risk of launch failure or delay. Whileour policy has been to procure launch insurance sufficient to substantially recover our investment ina new satellite, it is not practicable to obtain insurance to recover lost revenues or businessopportunities.
Actual or perceived health risks or other problems relating to mobile handsets or transmissionmasts could lead to decreased mobile communications usage.
Concern has been expressed that the electromagnetic signals from mobile handsets and basestations and chemical leaching from mobile handsets may pose health risks or interfere with theoperation of electronic equipment, including automobile braking and steering systems. Actual orperceived risks of mobile handsets or base stations and related publicity, regulation or litigation couldreduce our mobile telephone customer base, make it difficult to find attractive sites for base stationsor cause mobile telephone customers to use their mobile phones less.
Risks Related to Regulatory Matters
Regulatory requirements may impair our flexibility in setting tariff structures, require us to furtherreduce tariffs or provide advantages to our competitors.
Our fixed and mobile telecommunications operations, as well as our broadband servicesbusinesses, are subject to regulation under Norwegian law, and our international operations andinvestments are subject to the regulatory requirements of the countries in which they operate. As amember of the European Economic Area, Norway is additionally required to adapt its regulatoryframework to the legislative and regulatory framework established by the EU for the regulation of theEuropean telecommunications market as far as the directives are made relevant to the EEAAgreement.
We are considered by the Norwegian Post and Telecommunications Authority (PT) to havesignificant market power in the markets for both fixed and mobile voice telephony, transmissioncapacity and interconnection for both our fixed and mobile operations. As a result, we are subject tospecific obligations under the Norwegian Telecommunications Act and our licenses regarding pricing,accounting and reporting in respect of these services.
In particular, we must offer these services to our competitors and the public in general at cost-oriented prices. The requirement for cost-orientation means that prices must be calculated based oncosts, plus a reasonable rate of return. In practice, the PT reviews our compliance with therequirements for costing, pricing and transparency through its review of the annual report we arerequired to provide to the PT. Following its review of our report, the PT determines the reasonablerate of return, taking into account the ratio between our owners’ equity and long-term debt. The mostrecent year for which the PT has completed its review of our report is 1998. For 1998, thePT calculated our permitted rate of return to be 14%. The services subject to this restrictionamounted to 62% of our revenues and 94% of our operating profits in 1999. Telenor submitted thereport for 1999 in August 2000. Telenor expects the PT to complete its review of the report for 1999by the end of 2000 or early 2001.
The rate of return on the services that are subject to this restriction has exceeded thereasonable rate set by the PT. We have reduced the prices on these services several times in recentyears, but volumes of traffic have continuously increased more than expected. The PT has, however,to a large extent focused on the interconnection and wholesale market and less on the end-usermarket to ensure the promotion of competition.
In this respect, the PT, in a letter dated July 3, 2000, announced its intention to impose onTelenor Mobile a reduction of 15% of the mobile termination charge based on the PT’s view thatcertain expenses may not be included in the calculation of the termination charges. We have filed a
12
BOWNE OF LONDON 12/01/2000 19:56 BL/SM NO MARKS NEXT PCN: 019.00.00.00 -- Page is valid, no graphics X42481 018.00.00.00 5X
response challenging the proposed decision. We intend to reduce our mobile terminationinterconnection fees effective January 1, 2001.
On September 14, 2000, the PT decided that interconnection charges in our fixed networksystem must be reduced by 7%. We have filed an appeal with respect to this decision. The finaloutcome is still not clear.
We are also subject to a price cap on fixed public telephony services for both the private marketand the business market and for leased lines. The Ministry of Transport and Communications hasset the price cap at the consumer price index minus 3% annually through 2001.
The effect of these requirements may impair our flexibility in setting tariff structures or mayrequire us to further reduce tariffs, which may adversely affect our revenues and net income. Inaddition, if we are required to reduce interconnection prices as a result of our obligation to providecost-oriented pricing for interconnection, our competitors may be advantaged, depending on theservices provided.
In addition, our principal mobile competitor in Norway has instituted a legal action claiming that itis entitled to damages, in the amount of approximately NOK 97 million, for fees paid to us in pastyears for leased capacity that were allegedly in excess of cost-oriented prices.
The Ministry of Transport and Communications is currently preparing revisions to its regulationswhich will require us to offer other operators unbundled access to our local loop. The local looprefers to the infrastructure that connects subscribers to our network. Since April 1, 2000, we havebeen offering competitors the ability to lease capacity in our local loop, and we allow competingoperators to deploy technical equipment in connection with our installations. Our pricing structure forthese services is based on costs. However, the revised regulatory requirements may require us tochange the terms on which we provide local loop unbundling, which may provide a significantadvantage to our competitors.
Changes in laws, regulation or government policy affecting our business activities could affectus. A review of telecommunications regulation is currently underway by both EU and Norwegianregulators. It is uncertain what the result of these reviews will be. In particular, our ability to competeeffectively in our existing or new markets could be adversely affected if regulators decide to extendto new services and markets the restrictions to which we are currently subject or if regulators decideto subject telecommunications companies to more burdensome, sector-specific regulation in the faceof continuing convergence of information and communications services. Finally, changes in tax lawsin Norway or in other countries in which we operate could adversely affect our results of operations.
Risks Related to Our Ownership by the Kingdom of Norway
We could be influenced by the Kingdom of Norway whose interest may not always be aligned withthe interests of our other shareholders.
After the completion of the offering, the Kingdom of Norway will continue to hold more than atwo-thirds majority of our shares. Accordingly, the Kingdom of Norway will continue to have thepower to determine matters submitted for a vote of shareholders, including electing a majority of theCorporate Assembly which in turn has the power to elect our board of directors, as well as approvalof the annual financial statements, declarations of dividends and capital increases in connection withacquisitions, investments or otherwise. The interests of the Kingdom of Norway in deciding thesematters and the factors it considers in exercising its votes could be different from the interests of ourother shareholders.
13
BOWNE OF LONDON 12/03/2000 11:57 BL/SM NO MARKS NEXT PCN: 020.00.00.00 -- Page is valid, no graphics X42481 019.00.00.00 10X
Risks Related to the Global Offering
The price of our ordinary shares and ADSs may be volatile and fluctuate significantly due to manyfactors, including variations in our operating results and changes to the regulatory environment.
The trading price of our ordinary shares and ADSs could fluctuate widely in response toquarterly variations in our operating results, adverse business developments, interest rate changes,changes in financial estimates by securities analysts, announcements of technological or otherdevelopments by us or our major customers or competitors, changes to the regulatory environmentin which we operate or the actual or expected sale of a large block of shares by the Kingdom ofNorway. The initial offering price of the ordinary shares and ADSs has been determined, based onthe factors described in the section ‘‘Underwriting’’, by negotiation among the underwriters, theselling shareholder and us. You may not be able to resell your ordinary shares or ADSs at or abovethis price.
An ADS holder may not be able to exercise voting rights as readily as an ordinary shareholder.
Holders of ADSs may instruct the ADR depositary to vote the ordinary shares underlying theADSs. However, in order to exercise their voting rights at meetings, holders of ADSs must instructthe ADR depositary to cause the temporary transfer of the underlying ordinary shares so as toregister their ownership of such ordinary shares directly in our share register in the VPS Systemprior to the meeting. In addition, the ADR holder must cause the delivery of such holder’s ADSs to ablocked account with The Depository Trust Company for the account of the ADR depositary and tonotify the ADR depositary that such ADSs are being held in a blocked account. The ADSs mustremain in the designated account until the conclusion of the meeting at which such voting rights areto be exercised by the ADR depositary. There is no guarantee that you will receive voting materialsin time to instruct the ADR depositary to vote and it is possible that you, or persons who hold theirADSs through brokers, dealers or other third parties, will not have the opportunity to exercise a rightto vote.
Forward-looking Statements
This prospectus contains forward-looking statements, including statements about our beliefs andexpectations. These statements are based on our current plans, estimates and projections, as wellas our expectations of external conditions and events. Therefore, you should not place too muchreliance on them. Forward-looking statements involve inherent risks and uncertainties and speak onlyas of the date they are made. We will not necessarily update any of them in light of new informationor future events. We caution you that a number of important factors could cause actual results oroutcomes to differ materially from those expressed in any forward-looking statements. These factorscould include the following:
) the level of demand for our services, particularly with regard to mobile communicationsservices, fixed telephony, Internet and IP-based communications services, pay televisionservices, and other newer products and services;
) actions of our competitors;
) regulatory developments, including changes to our permitted tariffs, the terms of access toour network, the terms of interconnection and other issues; and
) the success of our international investments and expansion programs.
14
BOWNE OF LONDON 12/01/2000 19:56 BL/SM NO MARKS NEXT PCN: 021.00.00.00 -- Page is valid, no graphics X42481 020.00.00.00 7X
DIVIDENDS AND DIVIDEND POLICY
The newly issued ordinary shares will rank equal with our outstanding ordinary shares for anydividends that may be declared and paid in respect of 2000 and in any future years. Dividends inrespect of 2000, if any, will be declared at our annual general meeting in 2001. Under Norwegianlaw, dividends may only be paid in respect of a financial period as to which audited financialstatements have been approved by the annual general meeting of shareholders, and any proposal topay a dividend must be recommended by the directors, accepted by the Corporate Assembly andapproved by the shareholders at a general meeting. The shareholders at the annual general meetingmay vote to reduce, but may not increase, the dividend proposed by the directors.
Dividends may be paid in cash or in kind and are payable only out of distributable reserves.Distributable reserves consist of:
) annual profit according to the income statement approved for the preceding financial year,and
) retained profit from previous years,
after deduction for uncovered losses, the book value of research and development, goodwill, netdeferred tax assets recorded in the balance sheet for the preceding financial year, the aggregatevalue of treasury shares that we have purchased or been granted security in during precedingfinancial years and of credit and security given pursuant to sections 8-7 to 8-9 of the NorwegianPublic Limited Companies Act, and for any part of our annual profits that would be compatible withgood and careful business practice to retain with due regard to any losses which we may haveincurred after the last balance sheet date or which we may expect to incur. We cannot distribute anydividends if our equity, according to our balance sheet, amounts to less than 10% of the total assetsreflected on our balance sheet without following a creditor notice procedure as required for reducingthe share capital. These amounts are calculated on the basis of our unconsolidated financialstatements.
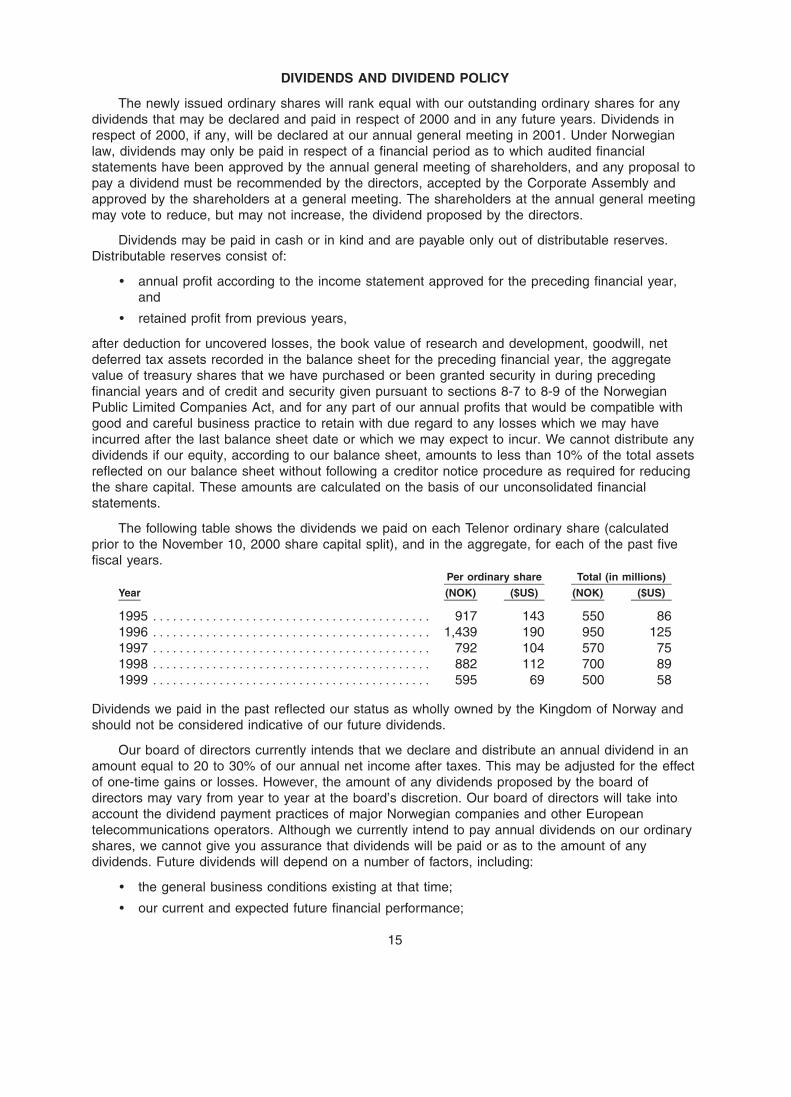
The following table shows the dividends we paid on each Telenor ordinary share (calculatedprior to the November 10, 2000 share capital split), and in the aggregate, for each of the past fivefiscal years.
Per ordinary share Total (in millions)
Year (NOK) ($US) (NOK) ($US)
1995 ****************************************** 917 143 550 861996 ****************************************** 1,439 190 950 1251997 ****************************************** 792 104 570 751998 ****************************************** 882 112 700 891999 ****************************************** 595 69 500 58
Dividends we paid in the past reflected our status as wholly owned by the Kingdom of Norway andshould not be considered indicative of our future dividends.
Our board of directors currently intends that we declare and distribute an annual dividend in anamount equal to 20 to 30% of our annual net income after taxes. This may be adjusted for the effectof one-time gains or losses. However, the amount of any dividends proposed by the board ofdirectors may vary from year to year at the board’s discretion. Our board of directors will take intoaccount the dividend payment practices of major Norwegian companies and other Europeantelecommunications operators. Although we currently intend to pay annual dividends on our ordinaryshares, we cannot give you assurance that dividends will be paid or as to the amount of anydividends. Future dividends will depend on a number of factors, including:
) the general business conditions existing at that time;
) our current and expected future financial performance;
15
BOWNE OF LONDON 12/03/2000 13:43 BL/SM NO MARKS NEXT PCN: 022.00.00.00 -- Page is valid, no graphics X42481 021.00.00.00 9X
) our funding and investment requirements; and
) other factors that our board of directors may consider to be relevant.
Because we will only pay dividends in Norwegian Kroner, exchange rate fluctuations will affectthe US dollar amounts received by holders of ADSs after the ADR depositary converts cashdividends into US dollars.
EXCHANGE RATES
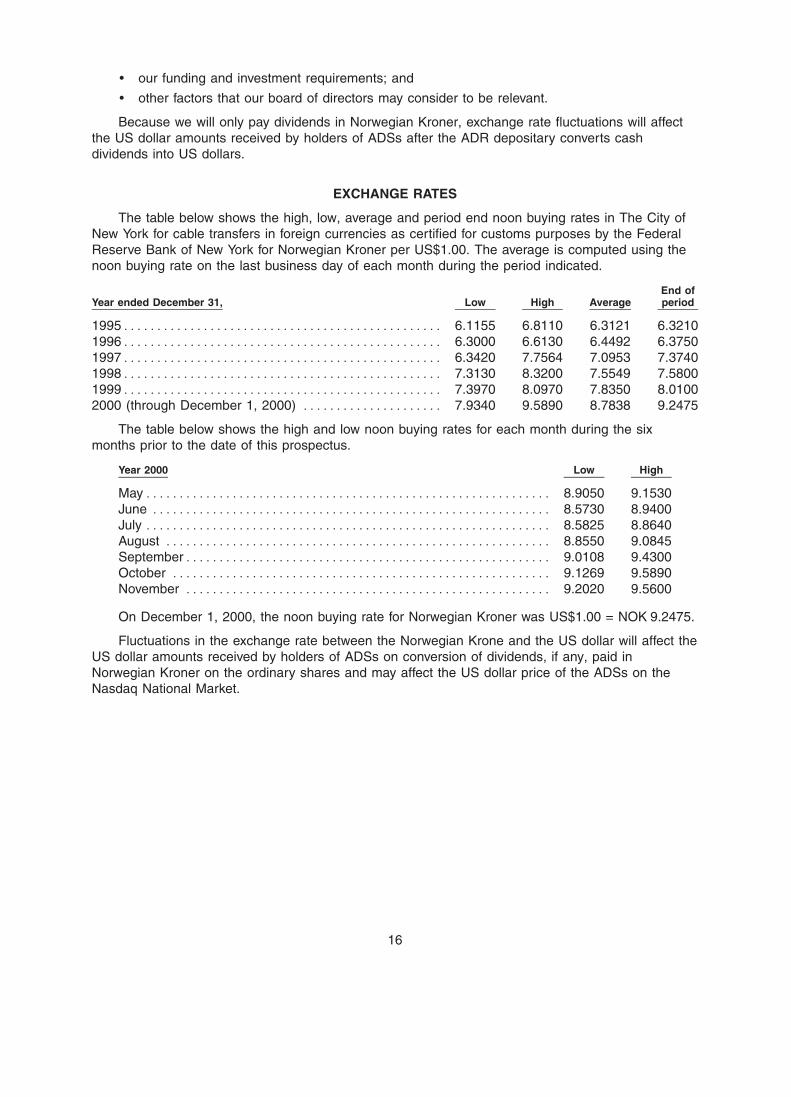
The table below shows the high, low, average and period end noon buying rates in The City ofNew York for cable transfers in foreign currencies as certified for customs purposes by the FederalReserve Bank of New York for Norwegian Kroner per US$1.00. The average is computed using thenoon buying rate on the last business day of each month during the period indicated.
End ofYear ended December 31, Low High Average period
1995************************************************ 6.1155 6.8110 6.3121 6.32101996************************************************ 6.3000 6.6130 6.4492 6.37501997************************************************ 6.3420 7.7564 7.0953 7.37401998************************************************ 7.3130 8.3200 7.5549 7.58001999************************************************ 7.3970 8.0970 7.8350 8.01002000 (through December 1, 2000) ********************* 7.9340 9.5890 8.7838 9.2475
The table below shows the high and low noon buying rates for each month during the sixmonths prior to the date of this prospectus.
Year 2000 Low High
May************************************************************* 8.9050 9.1530June ************************************************************ 8.5730 8.9400July ************************************************************* 8.5825 8.8640August ********************************************************** 8.8550 9.0845September******************************************************* 9.0108 9.4300October ********************************************************* 9.1269 9.5890November ******************************************************* 9.2020 9.5600
On December 1, 2000, the noon buying rate for Norwegian Kroner was US$1.00 = NOK 9.2475.
Fluctuations in the exchange rate between the Norwegian Krone and the US dollar will affect theUS dollar amounts received by holders of ADSs on conversion of dividends, if any, paid inNorwegian Kroner on the ordinary shares and may affect the US dollar price of the ADSs on theNasdaq National Market.
16
BOWNE OF LONDON 12/03/2000 15:17 BL/SM NO MARKS NEXT PCN: 023.00.00.00 -- Page is valid, no graphics X42481 022.00.00.00 9X
USE OF PROCEEDS
We expect to receive approximately NOK 15.1 billion (US$1.6 billion) in net proceeds from ourissue of 372,151,899 ordinary shares, after deducting underwriting discounts and commissions andestimated expenses payable by us.
We intend to use the net proceeds we receive in the global offering to repay outstanding longand/or short-term debt. We expect to repay debt as follows:
) approximately NOK 9.3 billion (US$1.0 billion) of the net proceeds to reduce the outstandingindebtedness under our syndicated multi-currency revolving credit facility of DKK 14.0 billionwhich has a 364 day maturity (with an option to extend one year) and an interest rate of5.44% at September 30, 2000;
) the remaining approximately NOK 5.8 billion (US$0.6 billion) of net proceeds to reduceoutstanding indebtedness under the following commercial paper programs:
) a portion of our US$500 million short-term Euro commercial paper program, which hadan average maturity of four months and an average interest rate (across five currencies)of 6.25% at September 30, 2000;
) a portion of our US$1,000 million US commercial paper program, which had an averagematurity of four months and an average fixed interest rate of 6.57% at September 30,2000; and
) a portion of our Norwegian commercial paper program, which had an average maturityof five months and an average interest rate of 7.0% at September 30, 2000.
This debt has been incurred primarily to finance strategic investments.
We will not receive any proceeds from the sale of the ordinary shares or ADSs by the sellingshareholder.
17
BOWNE OF LONDON 12/03/2000 17:15 BL/SM NO MARKS NEXT PCN: 024.00.00.00 -- Page is valid, no graphics X42481 023.00.00.00 9X
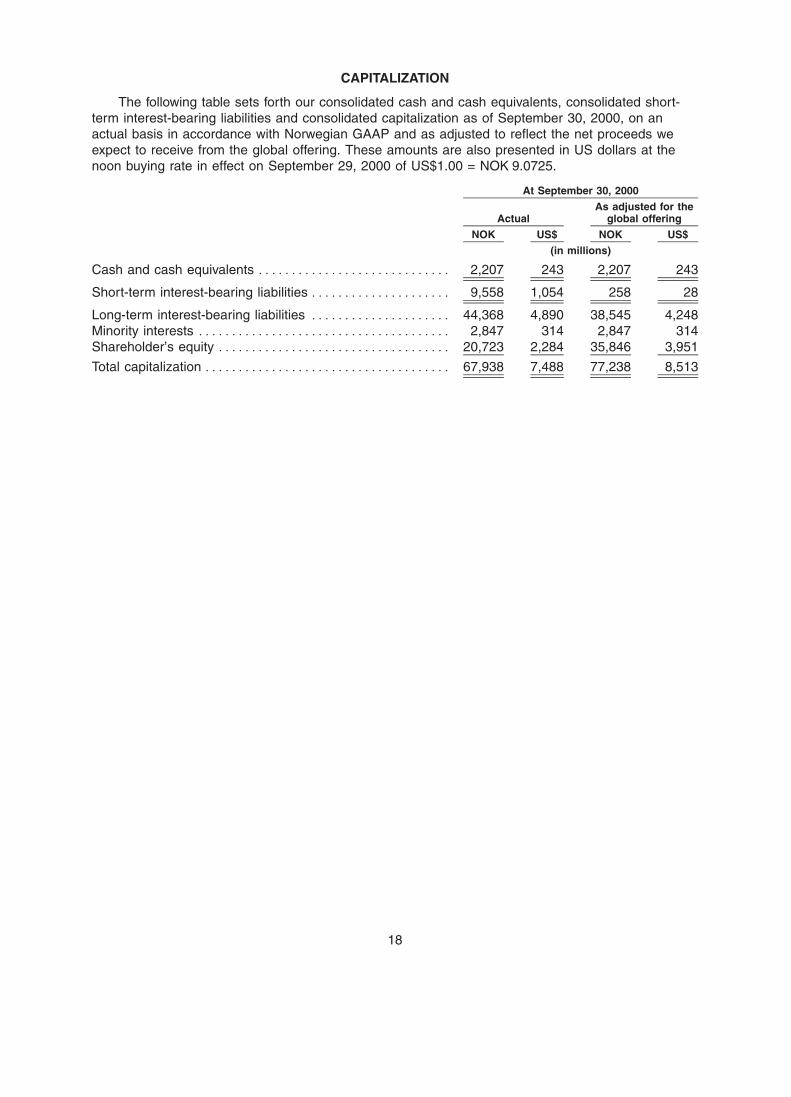
CAPITALIZATION
The following table sets forth our consolidated cash and cash equivalents, consolidated short-term interest-bearing liabilities and consolidated capitalization as of September 30, 2000, on anactual basis in accordance with Norwegian GAAP and as adjusted to reflect the net proceeds weexpect to receive from the global offering. These amounts are also presented in US dollars at thenoon buying rate in effect on September 29, 2000 of US$1.00 = NOK 9.0725.
At September 30, 2000
As adjusted for theActual global offering
NOK US$ NOK US$
(in millions)
Cash and cash equivalents ***************************** 2,207 243 2,207 243
Short-term interest-bearing liabilities ********************* 9,558 1,054 258 28
Long-term interest-bearing liabilities ********************* 44,368 4,890 38,545 4,248Minority interests ************************************** 2,847 314 2,847 314Shareholder’s equity *********************************** 20,723 2,284 35,846 3,951
Total capitalization ************************************* 67,938 7,488 77,238 8,513
18
BOWNE OF LONDON 12/01/2000 19:56 BL/SM NO MARKS NEXT PCN: 025.00.00.00 -- Page is valid, no graphics X42481 024.00.00.00 5X
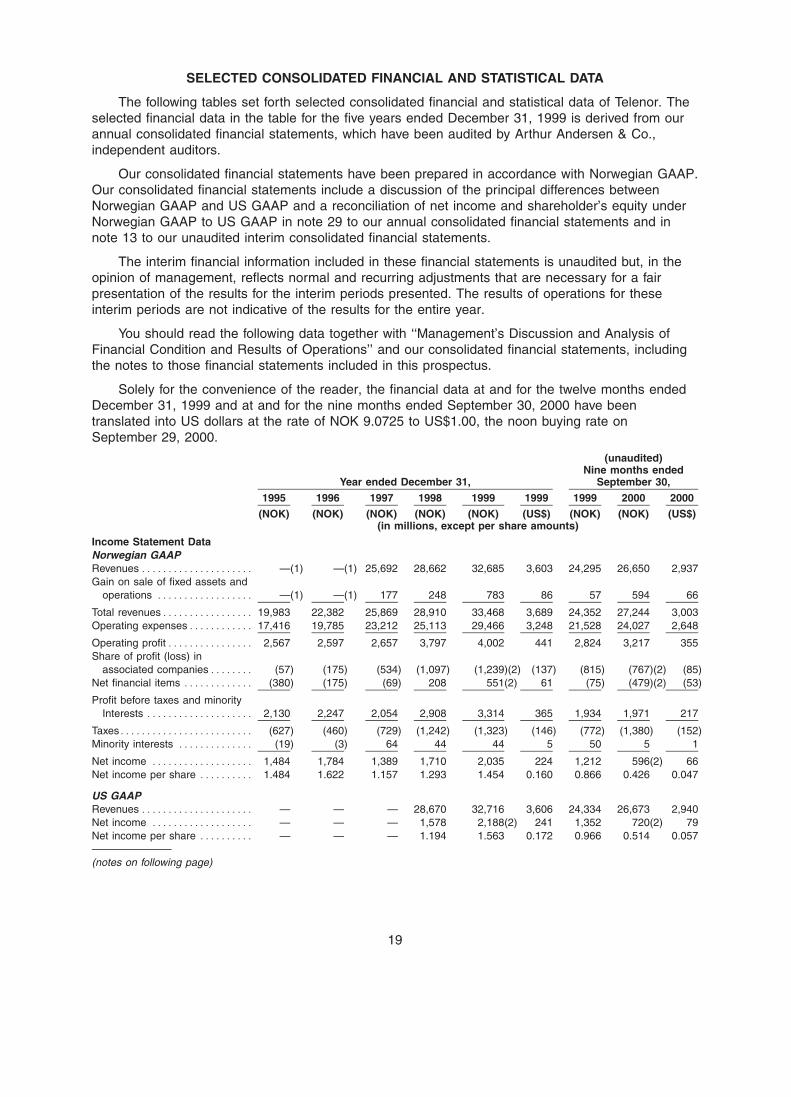
SELECTED CONSOLIDATED FINANCIAL AND STATISTICAL DATA
The following tables set forth selected consolidated financial and statistical data of Telenor. Theselected financial data in the table for the five years ended December 31, 1999 is derived from ourannual consolidated financial statements, which have been audited by Arthur Andersen & Co.,independent auditors.
Our consolidated financial statements have been prepared in accordance with Norwegian GAAP.Our consolidated financial statements include a discussion of the principal differences betweenNorwegian GAAP and US GAAP and a reconciliation of net income and shareholder’s equity underNorwegian GAAP to US GAAP in note 29 to our annual consolidated financial statements and innote 13 to our unaudited interim consolidated financial statements.
The interim financial information included in these financial statements is unaudited but, in theopinion of management, reflects normal and recurring adjustments that are necessary for a fairpresentation of the results for the interim periods presented. The results of operations for theseinterim periods are not indicative of the results for the entire year.
You should read the following data together with ‘‘Management’s Discussion and Analysis ofFinancial Condition and Results of Operations’’ and our consolidated financial statements, includingthe notes to those financial statements included in this prospectus.
Solely for the convenience of the reader, the financial data at and for the twelve months endedDecember 31, 1999 and at and for the nine months ended September 30, 2000 have beentranslated into US dollars at the rate of NOK 9.0725 to US$1.00, the noon buying rate onSeptember 29, 2000.
(unaudited)Nine months ended
Year ended December 31, September 30,
1995 1996 1997 1998 1999 1999 1999 2000 2000
(NOK) (NOK) (NOK) (NOK) (NOK) (US$) (NOK) (NOK) (US$)(in millions, except per share amounts)
Income Statement DataNorwegian GAAPRevenues ********************* —(1) —(1) 25,692 28,662 32,685 3,603 24,295 26,650 2,937Gain on sale of fixed assets and
operations ****************** —(1) —(1) 177 248 783 86 57 594 66
Total revenues***************** 19,983 22,382 25,869 28,910 33,468 3,689 24,352 27,244 3,003Operating expenses************ 17,416 19,785 23,212 25,113 29,466 3,248 21,528 24,027 2,648
Operating profit**************** 2,567 2,597 2,657 3,797 4,002 441 2,824 3,217 355Share of profit (loss) in
associated companies******** (57) (175) (534) (1,097) (1,239)(2) (137) (815) (767)(2) (85)Net financial items ************* (380) (175) (69) 208 551(2) 61 (75) (479)(2) (53)
Profit before taxes and minorityInterests ******************** 2,130 2,247 2,054 2,908 3,314 365 1,934 1,971 217
Taxes************************* (627) (460) (729) (1,242) (1,323) (146) (772) (1,380) (152)Minority interests ************** (19) (3) 64 44 44 5 50 5 1
Net income ******************* 1,484 1,784 1,389 1,710 2,035 224 1,212 596(2) 66Net income per share ********** 1.484 1.622 1.157 1.293 1.454 0.160 0.866 0.426 0.047
US GAAPRevenues ********************* — — — 28,670 32,716 3,606 24,334 26,673 2,940Net income ******************* — — — 1,578 2,188(2) 241 1,352 720(2) 79Net income per share ********** — — — 1.194 1.563 0.172 0.966 0.514 0.057
(notes on following page)
19
BOWNE OF LONDON 12/01/2000 19:56 BL/SM NO MARKS NEXT PCN: 026.00.00.00 -- Page is valid, no graphics X42481 025.00.00.00 6X
(unaudited)At
At December 31, September 30,
1995 1996 1997 1998 1999 1999 2000 2000
(NOK) (NOK) (NOK) (NOK) (NOK) (US$) (NOK) (US$)(in millions)
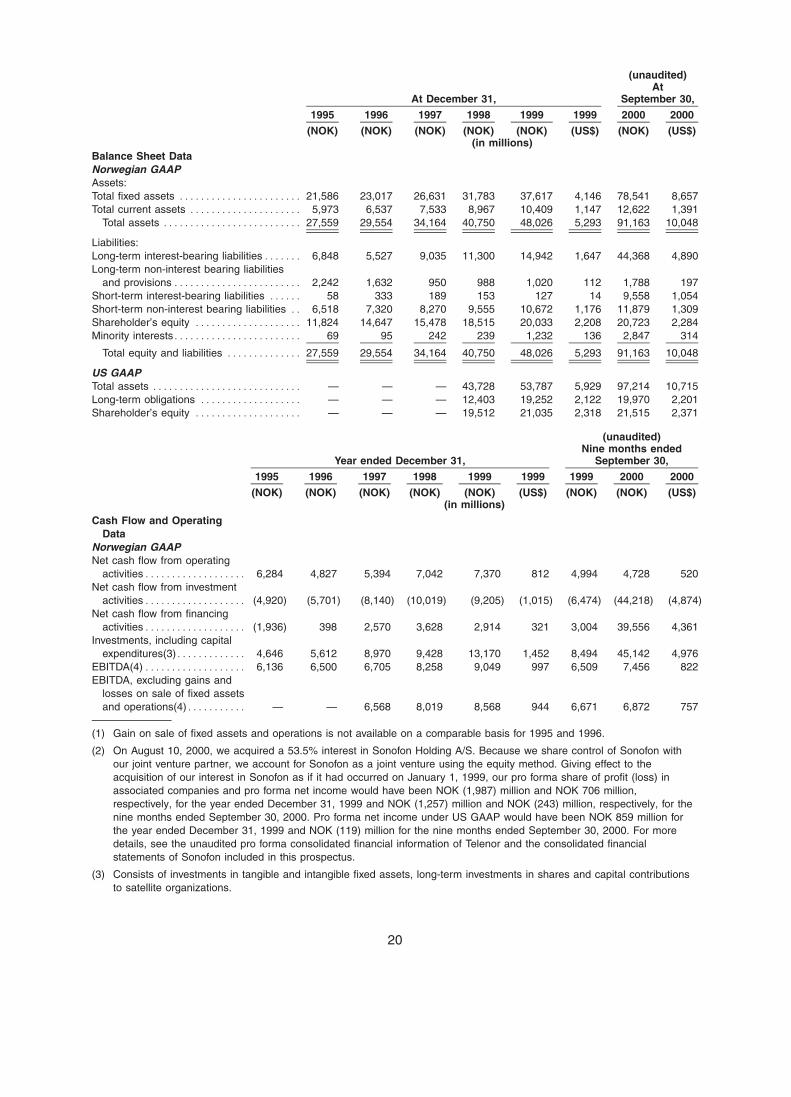
Balance Sheet DataNorwegian GAAPAssets:Total fixed assets *********************** 21,586 23,017 26,631 31,783 37,617 4,146 78,541 8,657Total current assets ********************* 5,973 6,537 7,533 8,967 10,409 1,147 12,622 1,391
Total assets ************************** 27,559 29,554 34,164 40,750 48,026 5,293 91,163 10,048
Liabilities:Long-term interest-bearing liabilities******* 6,848 5,527 9,035 11,300 14,942 1,647 44,368 4,890Long-term non-interest bearing liabilities
and provisions ************************ 2,242 1,632 950 988 1,020 112 1,788 197Short-term interest-bearing liabilities ****** 58 333 189 153 127 14 9,558 1,054Short-term non-interest bearing liabilities ** 6,518 7,320 8,270 9,555 10,672 1,176 11,879 1,309Shareholder’s equity ******************** 11,824 14,647 15,478 18,515 20,033 2,208 20,723 2,284Minority interests************************ 69 95 242 239 1,232 136 2,847 314
Total equity and liabilities ************** 27,559 29,554 34,164 40,750 48,026 5,293 91,163 10,048
US GAAPTotal assets **************************** — — — 43,728 53,787 5,929 97,214 10,715Long-term obligations ******************* — — — 12,403 19,252 2,122 19,970 2,201Shareholder’s equity ******************** — — — 19,512 21,035 2,318 21,515 2,371
(unaudited)Nine months ended
Year ended December 31, September 30,
1995 1996 1997 1998 1999 1999 1999 2000 2000
(NOK) (NOK) (NOK) (NOK) (NOK) (US$) (NOK) (NOK) (US$)(in millions)
Cash Flow and OperatingData
Norwegian GAAPNet cash flow from operating
activities******************* 6,284 4,827 5,394 7,042 7,370 812 4,994 4,728 520Net cash flow from investment
activities******************* (4,920) (5,701) (8,140) (10,019) (9,205) (1,015) (6,474) (44,218) (4,874)Net cash flow from financing
activities******************* (1,936) 398 2,570 3,628 2,914 321 3,004 39,556 4,361Investments, including capital
expenditures(3)************* 4,646 5,612 8,970 9,428 13,170 1,452 8,494 45,142 4,976EBITDA(4)******************* 6,136 6,500 6,705 8,258 9,049 997 6,509 7,456 822EBITDA, excluding gains and
losses on sale of fixed assetsand operations(4)*********** — — 6,568 8,019 8,568 944 6,671 6,872 757
(1) Gain on sale of fixed assets and operations is not available on a comparable basis for 1995 and 1996.
(2) On August 10, 2000, we acquired a 53.5% interest in Sonofon Holding A/S. Because we share control of Sonofon withour joint venture partner, we account for Sonofon as a joint venture using the equity method. Giving effect to theacquisition of our interest in Sonofon as if it had occurred on January 1, 1999, our pro forma share of profit (loss) inassociated companies and pro forma net income would have been NOK (1,987) million and NOK 706 million,respectively, for the year ended December 31, 1999 and NOK (1,257) million and NOK (243) million, respectively, for thenine months ended September 30, 2000. Pro forma net income under US GAAP would have been NOK 859 million forthe year ended December 31, 1999 and NOK (119) million for the nine months ended September 30, 2000. For moredetails, see the unaudited pro forma consolidated financial information of Telenor and the consolidated financialstatements of Sonofon included in this prospectus.
(3) Consists of investments in tangible and intangible fixed assets, long-term investments in shares and capital contributionsto satellite organizations.
20
BOWNE OF LONDON 12/01/2000 19:56 BL/SM NO MARKS NEXT PCN: 027.00.00.00 -- Page is valid, no graphics X42481 026.00.00.00 7X
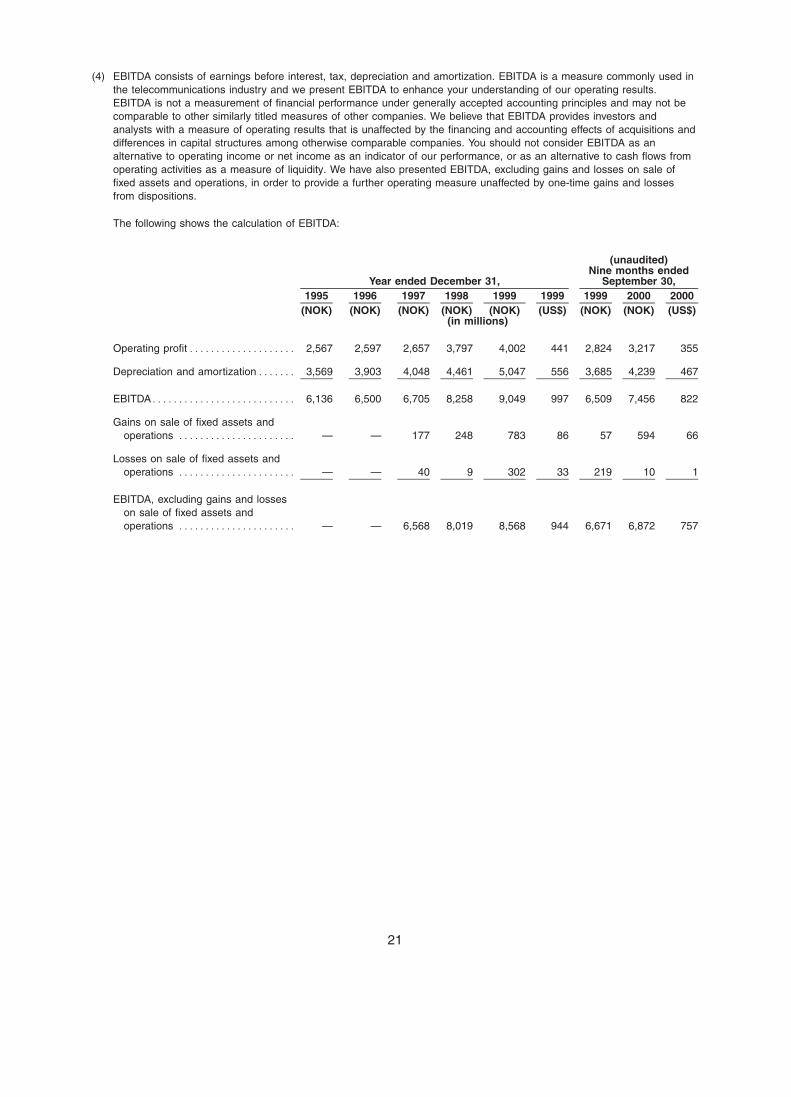
(4) EBITDA consists of earnings before interest, tax, depreciation and amortization. EBITDA is a measure commonly used inthe telecommunications industry and we present EBITDA to enhance your understanding of our operating results.EBITDA is not a measurement of financial performance under generally accepted accounting principles and may not becomparable to other similarly titled measures of other companies. We believe that EBITDA provides investors andanalysts with a measure of operating results that is unaffected by the financing and accounting effects of acquisitions anddifferences in capital structures among otherwise comparable companies. You should not consider EBITDA as analternative to operating income or net income as an indicator of our performance, or as an alternative to cash flows fromoperating activities as a measure of liquidity. We have also presented EBITDA, excluding gains and losses on sale offixed assets and operations, in order to provide a further operating measure unaffected by one-time gains and lossesfrom dispositions.
The following shows the calculation of EBITDA:
(unaudited)Nine months ended
Year ended December 31, September 30,1995 1996 1997 1998 1999 1999 1999 2000 2000
(NOK) (NOK) (NOK) (NOK) (NOK) (US$) (NOK) (NOK) (US$)(in millions)
Operating profit******************** 2,567 2,597 2,657 3,797 4,002 441 2,824 3,217 355
Depreciation and amortization******* 3,569 3,903 4,048 4,461 5,047 556 3,685 4,239 467
EBITDA*************************** 6,136 6,500 6,705 8,258 9,049 997 6,509 7,456 822
Gains on sale of fixed assets andoperations ********************** — — 177 248 783 86 57 594 66
Losses on sale of fixed assets andoperations ********************** — — 40 9 302 33 219 10 1
EBITDA, excluding gains and losseson sale of fixed assets andoperations ********************** — — 6,568 8,019 8,568 944 6,671 6,872 757
21
BOWNE OF LONDON 12/01/2000 19:56 BL/SM NO MARKS NEXT PCN: 028.00.00.00 -- Page is valid, no graphics X42481 027.00.00.00 5X
Nine monthsended
September 30,Year ended December 31,1995 1996 1997 1998 1999 1999 2000
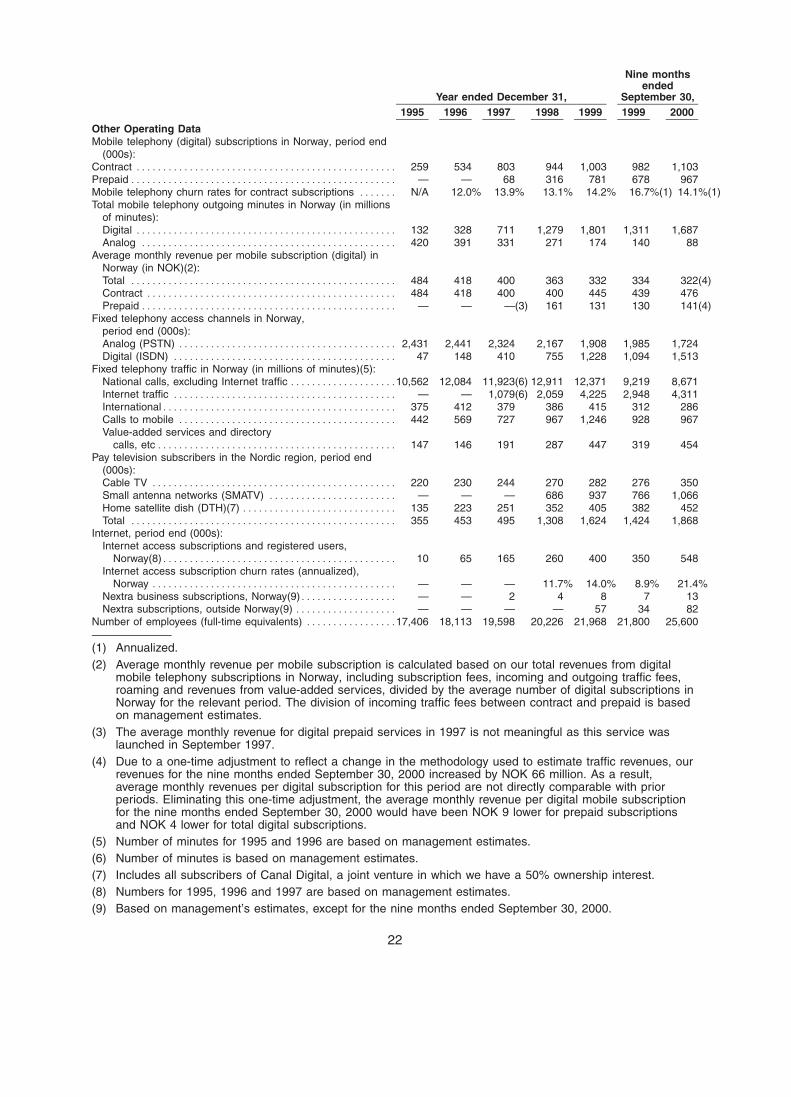
Other Operating DataMobile telephony (digital) subscriptions in Norway, period end
(000s):Contract ************************************************* 259 534 803 944 1,003 982 1,103Prepaid ************************************************** — — 68 316 781 678 967Mobile telephony churn rates for contract subscriptions ******* N/A 12.0% 13.9% 13.1% 14.2% 16.7%(1) 14.1%(1)Total mobile telephony outgoing minutes in Norway (in millions
of minutes):Digital ************************************************* 132 328 711 1,279 1,801 1,311 1,687Analog ************************************************ 420 391 331 271 174 140 88
Average monthly revenue per mobile subscription (digital) inNorway (in NOK)(2):Total ************************************************** 484 418 400 363 332 334 322(4)Contract *********************************************** 484 418 400 400 445 439 476Prepaid ************************************************ — — —(3) 161 131 130 141(4)
Fixed telephony access channels in Norway,period end (000s):Analog (PSTN) ***************************************** 2,431 2,441 2,324 2,167 1,908 1,985 1,724Digital (ISDN) ****************************************** 47 148 410 755 1,228 1,094 1,513
Fixed telephony traffic in Norway (in millions of minutes)(5):National calls, excluding Internet traffic ********************10,562 12,084 11,923(6) 12,911 12,371 9,219 8,671Internet traffic ****************************************** — — 1,079(6) 2,059 4,225 2,948 4,311International******************************************** 375 412 379 386 415 312 286Calls to mobile ***************************************** 442 569 727 967 1,246 928 967Value-added services and directory
calls, etc********************************************* 147 146 191 287 447 319 454Pay television subscribers in the Nordic region, period end
(000s):Cable TV ********************************************** 220 230 244 270 282 276 350Small antenna networks (SMATV) ************************ — — — 686 937 766 1,066Home satellite dish (DTH)(7) ***************************** 135 223 251 352 405 382 452Total ************************************************** 355 453 495 1,308 1,624 1,424 1,868
Internet, period end (000s):Internet access subscriptions and registered users,
Norway(8)******************************************** 10 65 165 260 400 350 548Internet access subscription churn rates (annualized),
Norway ********************************************** — — — 11.7% 14.0% 8.9% 21.4%Nextra business subscriptions, Norway(9)****************** — — 2 4 8 7 13Nextra subscriptions, outside Norway(9) ******************* — — — — 57 34 82
Number of employees (full-time equivalents) *****************17,406 18,113 19,598 20,226 21,968 21,800 25,600
(1) Annualized.(2) Average monthly revenue per mobile subscription is calculated based on our total revenues from digital
mobile telephony subscriptions in Norway, including subscription fees, incoming and outgoing traffic fees,roaming and revenues from value-added services, divided by the average number of digital subscriptions inNorway for the relevant period. The division of incoming traffic fees between contract and prepaid is basedon management estimates.
(3) The average monthly revenue for digital prepaid services in 1997 is not meaningful as this service waslaunched in September 1997.
(4) Due to a one-time adjustment to reflect a change in the methodology used to estimate traffic revenues, ourrevenues for the nine months ended September 30, 2000 increased by NOK 66 million. As a result,average monthly revenues per digital subscription for this period are not directly comparable with priorperiods. Eliminating this one-time adjustment, the average monthly revenue per digital mobile subscriptionfor the nine months ended September 30, 2000 would have been NOK 9 lower for prepaid subscriptionsand NOK 4 lower for total digital subscriptions.
(5) Number of minutes for 1995 and 1996 are based on management estimates.(6) Number of minutes is based on management estimates.(7) Includes all subscribers of Canal Digital, a joint venture in which we have a 50% ownership interest.(8) Numbers for 1995, 1996 and 1997 are based on management estimates.(9) Based on management’s estimates, except for the nine months ended September 30, 2000.
22
BOWNE OF LONDON 12/01/2000 19:56 BL/SM NO MARKS NEXT PCN: 029.00.00.00 -- Page is valid, no graphics X42481 028.00.00.00 7X
MANAGEMENT’S DISCUSSION AND ANALYSIS OFFINANCIAL CONDITION AND RESULTS OF OPERATIONS
You should read the following discussion together with our consolidated financial statements,including the notes to those financial statements, included in this prospectus. We have prepared ourfinancial statements under Norwegian generally accepted accounting principles. These differ in somerespects from US generally accepted accounting principles. We have described the principaldifferences between Norwegian GAAP and US GAAP as they relate to us and we have prepared areconciliation of net income and shareholder’s equity to US GAAP. These are included in note 29 toour annual consolidated financial statements and in note 13 to our unaudited interim consolidatedfinancial statements.
Overview
Group Structure
We have reorganized our group structure into seven business areas. The following four businessareas are core to our operations:
) Mobile Communications — includes our mobile operations in Norway and our strategicinvestments in a number of foreign mobile communications companies, primarily in theNordic region, Europe and Southeast Asia. Of our business areas, we consider MobileCommunications to comprise the largest part of our value.
) Telecom — includes network-based services for the business and residential market, networkservices for the wholesale market and advanced value-added services for businesses, suchas application service provisioning, or ‘‘ASP’’, and managed services.
) Broadband Services — consists of providing television services to consumers, primarily inthe Nordic region, through home satellite dish (direct to home or DTH), cable and terrestrialtransmission. This business area also provides satellite services to broadcasters in theNordic region and terrestrial transmission services to broadcasters in Norway. OurBroadband Services business area also provides global satellite-based mobile communica-tions services and satellite network services.
) Internet — includes our Internet service for the consumer market in Norway, our Internet andInternet protocol, or IP, -based communications services targeted primarily to small andmedium-sized businesses in Norway and a number of other European countries, as well asour interests in leading Norwegian and Scandinavian Internet portals.
We have also defined three additional business areas that are related to our core businesses.Our Media business area comprises our directory operations in Norway and nine other Europeancountries. Bravida is our installation and service operation, which in October 2000 we merged withanother company and in which, at the completion of this transaction, we will have a 48% stake andaccount for as an associated company. Our publicly-listed subsidiary, EDB Business Partner ASA,provides operating services, software and systems and consulting services in the field of informationtechnology.
We designed our organizational structure to concentrate our business activities on areas whereour core competencies enhance our opportunities to achieve revenue growth and increaseshareholder value. One objective of reorganizing our group structure was to allow us to provide toexternal customers services that were historically provided only between our own operations, suchas our Bravida operations and our wholesale network services. We also believe that our businessstructure provides us with better opportunities to enter into arrangements, particularly in our non-corebusiness areas, with partners that provide opportunities to increase the overall value of a particularbusiness.
23
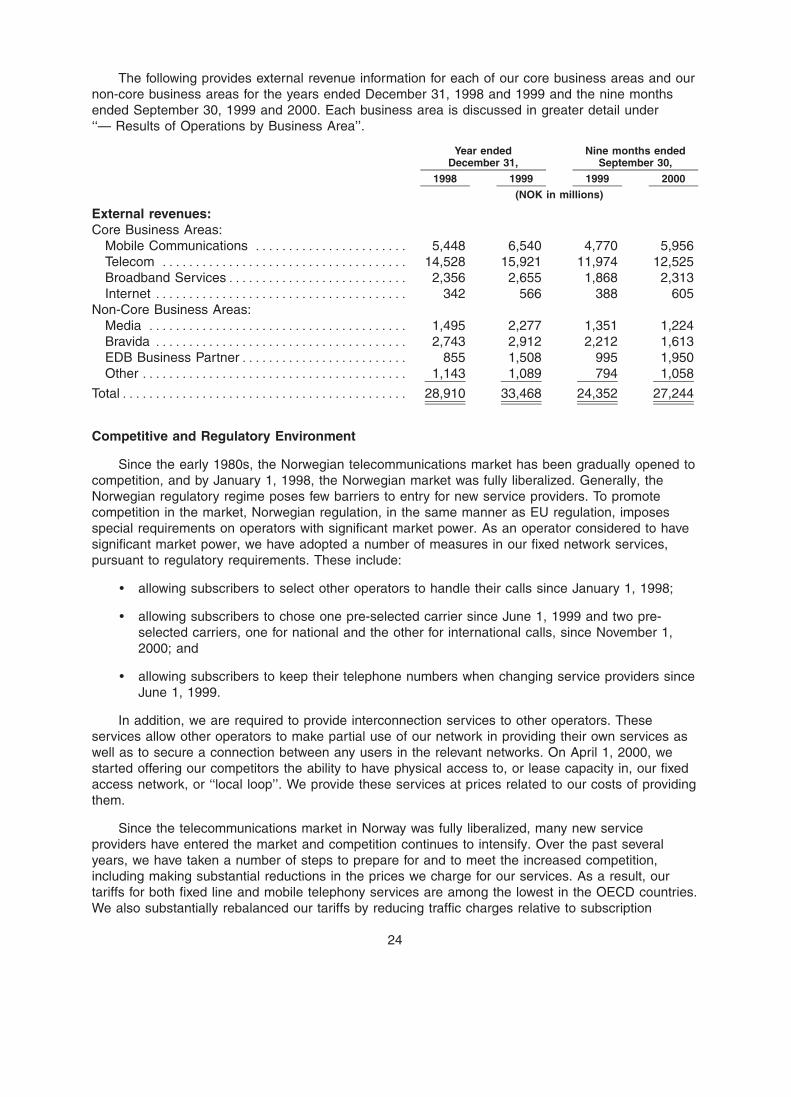
BOWNE OF LONDON 12/01/2000 19:56 BL/SM NO MARKS NEXT PCN: 030.00.00.00 -- Page is valid, no graphics X42481 029.00.00.00 5X
The following provides external revenue information for each of our core business areas and ournon-core business areas for the years ended December 31, 1998 and 1999 and the nine monthsended September 30, 1999 and 2000. Each business area is discussed in greater detail under‘‘— Results of Operations by Business Area’’.
Year ended Nine months endedDecember 31, September 30,
1998 1999 1999 2000
(NOK in millions)
External revenues:Core Business Areas:
Mobile Communications *********************** 5,448 6,540 4,770 5,956Telecom ************************************* 14,528 15,921 11,974 12,525Broadband Services*************************** 2,356 2,655 1,868 2,313Internet ************************************** 342 566 388 605
Non-Core Business Areas:Media *************************************** 1,495 2,277 1,351 1,224Bravida ************************************** 2,743 2,912 2,212 1,613EDB Business Partner************************* 855 1,508 995 1,950Other **************************************** 1,143 1,089 794 1,058
Total******************************************* 28,910 33,468 24,352 27,244
Competitive and Regulatory Environment
Since the early 1980s, the Norwegian telecommunications market has been gradually opened tocompetition, and by January 1, 1998, the Norwegian market was fully liberalized. Generally, theNorwegian regulatory regime poses few barriers to entry for new service providers. To promotecompetition in the market, Norwegian regulation, in the same manner as EU regulation, imposesspecial requirements on operators with significant market power. As an operator considered to havesignificant market power, we have adopted a number of measures in our fixed network services,pursuant to regulatory requirements. These include:
) allowing subscribers to select other operators to handle their calls since January 1, 1998;
) allowing subscribers to chose one pre-selected carrier since June 1, 1999 and two pre-selected carriers, one for national and the other for international calls, since November 1,2000; and
) allowing subscribers to keep their telephone numbers when changing service providers sinceJune 1, 1999.
In addition, we are required to provide interconnection services to other operators. Theseservices allow other operators to make partial use of our network in providing their own services aswell as to secure a connection between any users in the relevant networks. On April 1, 2000, westarted offering our competitors the ability to have physical access to, or lease capacity in, our fixedaccess network, or ‘‘local loop’’. We provide these services at prices related to our costs of providingthem.
Since the telecommunications market in Norway was fully liberalized, many new serviceproviders have entered the market and competition continues to intensify. Over the past severalyears, we have taken a number of steps to prepare for and to meet the increased competition,including making substantial reductions in the prices we charge for our services. As a result, ourtariffs for both fixed line and mobile telephony services are among the lowest in the OECD countries.We also substantially rebalanced our tariffs by reducing traffic charges relative to subscription
24
BOWNE OF LONDON 12/03/2000 12:01 BL/SM NO MARKS NEXT PCN: 031.00.00.00 -- Page is valid, no graphics X42481 030.00.00.00 8X
charges. In July 1999, we eliminated our national long-distance tariff for fixed telephony. All callswithin Norway are now charged at a ‘‘local’’ tariff rate.
As a consequence of being considered to have significant market power in the markets forpublic telephony, interconnection and transmission capacity (such as leased lines), we are obligatedto follow certain principles regarding pricing, accounting separation and reporting. These servicesmust be offered at cost-oriented prices determined in an objective and non-discriminatory manner.The requirement for cost-orientation means that prices must be based on costs, plus a reasonablerate of return. We are responsible for specifying, implementing and maintaining cost accounts as abasis for monitoring that our prices are cost-oriented, objective and non-discriminatory. For a moredetailed discussion of the regulatory environment in which we operate as well as prospects for futureregulatory reform, see ‘‘Regulation’’.
As competition intensifies, other service providers represent a growing share of the trafficvolume on our fixed network. In September 2000, approximately 22% of the traffic volume in minuteson our network was attributable to other service providers, compared to approximately 13% inDecember 1999. At the same time, the market as a whole has experienced strong volume growth, inparticular from Internet and data traffic and traffic to and from mobile telephones.
We are currently one of two licensed providers of digital mobile telephony services in Norway;the other licensed provider is NetCom GSM ASA. Both mobile operators have introduced wholesaleservices for mobile service providers this year, and to date we have entered into ten mobile serviceprovision agreements. NetCom was recently acquired by Telia of Sweden, which at the time held athird digital mobile telephony license but had not yet constructed a network. Due to regulatoryrequirements, Telia was not permitted to have an interest in both licenses and Telia’s license waswithdrawn. The additional frequencies that have become available as a consequence are expected tobe sold at auction in 2001.
On November 29, 2000, the Ministry of Transport and Communications announced that it hasawarded licenses for third generation mobile networks in Norway to us and three other operators.We expect that the introduction of third generation mobile services in Norway during the next severalyears will intensify competition in mobile services.
Areas of Strategic Focus
Over the past several years, we have pursued growth by focusing on advanced voice and dataservices and broadband services in the Norwegian market, as well as international expansion,primarily in the areas of mobile telephony and Internet services.
In mobile telephony, we have continued to improve on our strong market position in Norway. Ourmarket share of digital telephony subscriptions has risen to approximately 69% at September 30,2000 from 45% at January 1, 1995, while the total penetration rate of mobile subscriptions in Norwayrose to approximately 71% from 14% over the same period. Due to our high market share and thecurrent high penetration rate, we expect that further revenue growth in mobile communications willdepend on our ability to develop and market new applications and services.
We have also sought to expand our market for more advanced services. We have focused onexpanding the use of fixed line digital telephony or ISDN services. We believe that through ourefforts, Norway currently has the highest ISDN penetration rate in the world and that our rapiddeployment of ISDN is now contributing to strong Internet penetration. By familiarizing our customerswith higher bandwidth services and as a result of our investments in the roll out of ISDN and theresulting increased capacity in the access network, we expect to have a more effective roll out ofbroadband asymmetrical digital subscriber lines, or ADSL, services. We expect that increasingrevenues from broadband ADSL services will help offset reductions in prices and our market sharedue to increased competition in the Norwegian fixed line market.
25
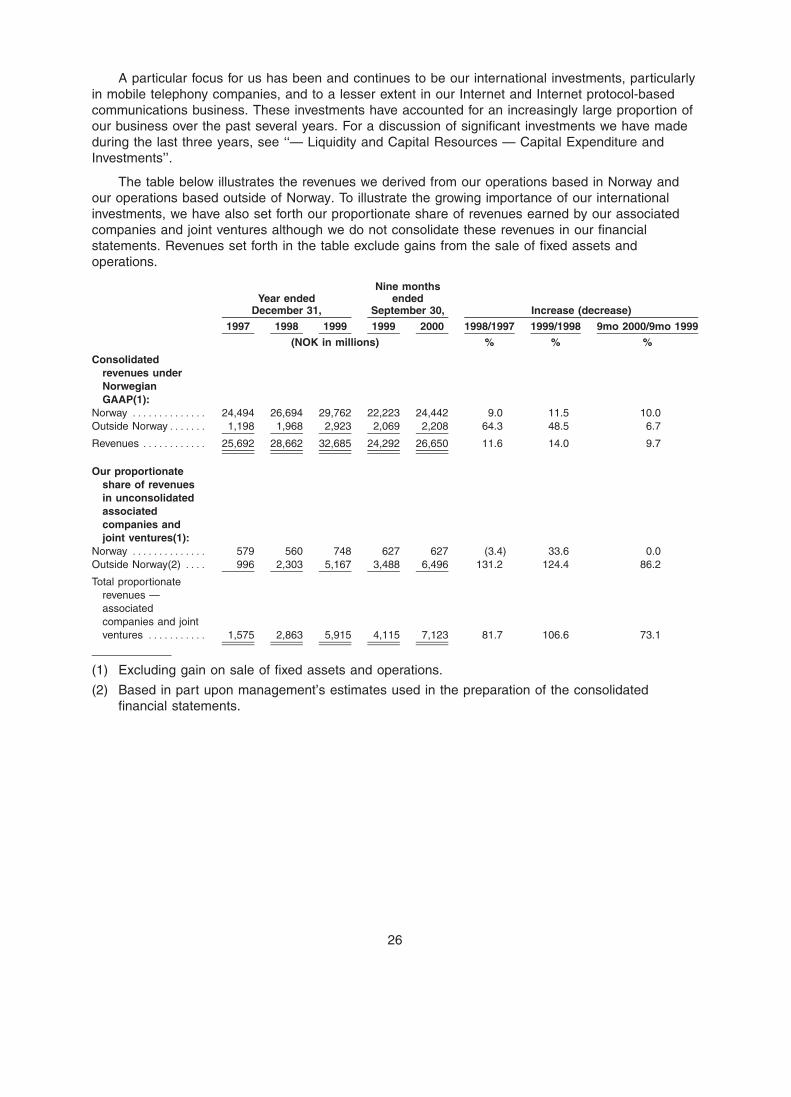
BOWNE OF LONDON 12/01/2000 19:56 BL/SM NO MARKS NEXT PCN: 032.00.00.00 -- Page is valid, no graphics X42481 031.00.00.00 5X
A particular focus for us has been and continues to be our international investments, particularlyin mobile telephony companies, and to a lesser extent in our Internet and Internet protocol-basedcommunications business. These investments have accounted for an increasingly large proportion ofour business over the past several years. For a discussion of significant investments we have madeduring the last three years, see ‘‘— Liquidity and Capital Resources — Capital Expenditure andInvestments’’.
The table below illustrates the revenues we derived from our operations based in Norway andour operations based outside of Norway. To illustrate the growing importance of our internationalinvestments, we have also set forth our proportionate share of revenues earned by our associatedcompanies and joint ventures although we do not consolidate these revenues in our financialstatements. Revenues set forth in the table exclude gains from the sale of fixed assets andoperations.
Nine monthsYear ended ended
December 31, September 30, Increase (decrease)
1997 1998 1999 1999 2000 1998/1997 1999/1998 9mo 2000/9mo 1999
(NOK in millions) % % %
Consolidatedrevenues underNorwegianGAAP(1):
Norway ************** 24,494 26,694 29,762 22,223 24,442 9.0 11.5 10.0Outside Norway******* 1,198 1,968 2,923 2,069 2,208 64.3 48.5 6.7
Revenues ************ 25,692 28,662 32,685 24,292 26,650 11.6 14.0 9.7
Our proportionateshare of revenuesin unconsolidatedassociatedcompanies andjoint ventures(1):
Norway ************** 579 560 748 627 627 (3.4) 33.6 0.0Outside Norway(2) **** 996 2,303 5,167 3,488 6,496 131.2 124.4 86.2
Total proportionaterevenues —associatedcompanies and jointventures *********** 1,575 2,863 5,915 4,115 7,123 81.7 106.6 73.1
(1) Excluding gain on sale of fixed assets and operations.
(2) Based in part upon management’s estimates used in the preparation of the consolidatedfinancial statements.
26
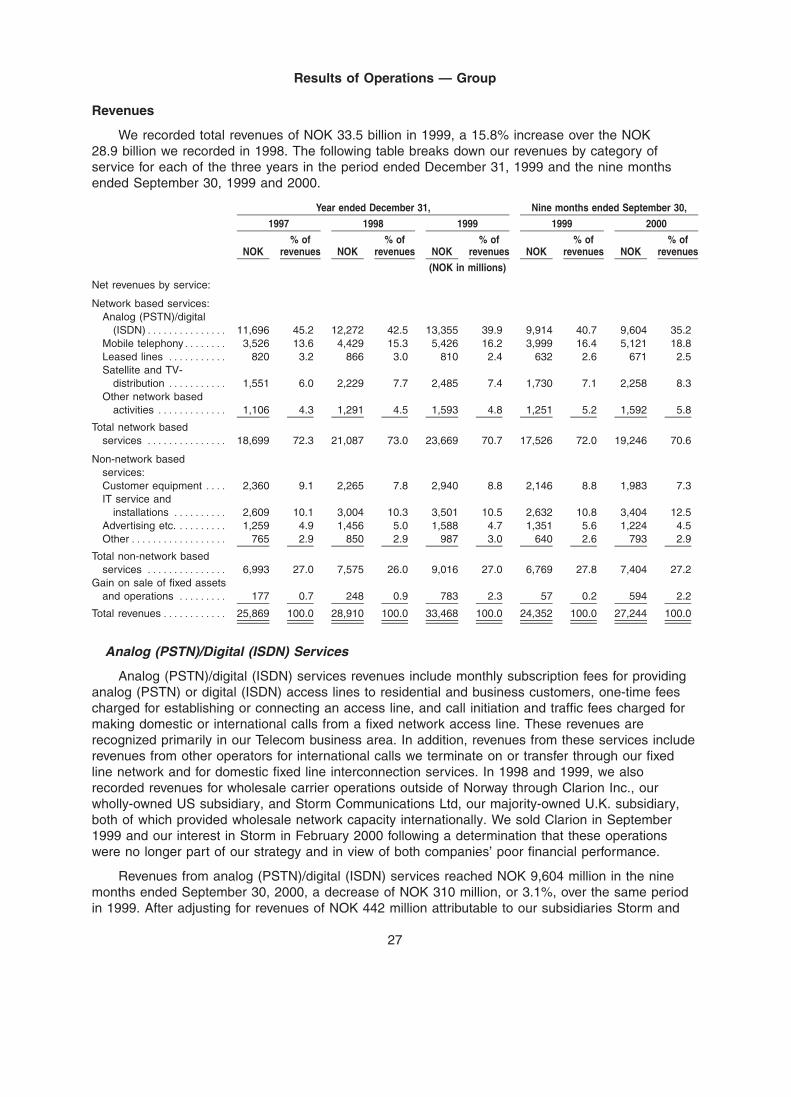
BOWNE OF LONDON 12/01/2000 19:56 BL/SM NO MARKS NEXT PCN: 033.00.00.00 -- Page is valid, no graphics X42481 032.00.00.00 5X
Results of Operations — Group
Revenues
We recorded total revenues of NOK 33.5 billion in 1999, a 15.8% increase over the NOK28.9 billion we recorded in 1998. The following table breaks down our revenues by category ofservice for each of the three years in the period ended December 31, 1999 and the nine monthsended September 30, 1999 and 2000.
Year ended December 31, Nine months ended September 30,
1997 1998 1999 1999 2000
% of % of % of % of % ofNOK revenues NOK revenues NOK revenues NOK revenues NOK revenues
(NOK in millions)
Net revenues by service:
Network based services:Analog (PSTN)/digital
(ISDN)*************** 11,696 45.2 12,272 42.5 13,355 39.9 9,914 40.7 9,604 35.2Mobile telephony******** 3,526 13.6 4,429 15.3 5,426 16.2 3,999 16.4 5,121 18.8Leased lines *********** 820 3.2 866 3.0 810 2.4 632 2.6 671 2.5Satellite and TV-
distribution *********** 1,551 6.0 2,229 7.7 2,485 7.4 1,730 7.1 2,258 8.3Other network based
activities ************* 1,106 4.3 1,291 4.5 1,593 4.8 1,251 5.2 1,592 5.8
Total network basedservices *************** 18,699 72.3 21,087 73.0 23,669 70.7 17,526 72.0 19,246 70.6
Non-network basedservices:Customer equipment **** 2,360 9.1 2,265 7.8 2,940 8.8 2,146 8.8 1,983 7.3IT service and
installations ********** 2,609 10.1 3,004 10.3 3,501 10.5 2,632 10.8 3,404 12.5Advertising etc. ********* 1,259 4.9 1,456 5.0 1,588 4.7 1,351 5.6 1,224 4.5Other****************** 765 2.9 850 2.9 987 3.0 640 2.6 793 2.9
Total non-network basedservices *************** 6,993 27.0 7,575 26.0 9,016 27.0 6,769 27.8 7,404 27.2
Gain on sale of fixed assetsand operations ********* 177 0.7 248 0.9 783 2.3 57 0.2 594 2.2
Total revenues************ 25,869 100.0 28,910 100.0 33,468 100.0 24,352 100.0 27,244 100.0
Analog (PSTN)/Digital (ISDN) Services
Analog (PSTN)/digital (ISDN) services revenues include monthly subscription fees for providinganalog (PSTN) or digital (ISDN) access lines to residential and business customers, one-time feescharged for establishing or connecting an access line, and call initiation and traffic fees charged formaking domestic or international calls from a fixed network access line. These revenues arerecognized primarily in our Telecom business area. In addition, revenues from these services includerevenues from other operators for international calls we terminate on or transfer through our fixedline network and for domestic fixed line interconnection services. In 1998 and 1999, we alsorecorded revenues for wholesale carrier operations outside of Norway through Clarion Inc., ourwholly-owned US subsidiary, and Storm Communications Ltd, our majority-owned U.K. subsidiary,both of which provided wholesale network capacity internationally. We sold Clarion in September1999 and our interest in Storm in February 2000 following a determination that these operationswere no longer part of our strategy and in view of both companies’ poor financial performance.
Revenues from analog (PSTN)/digital (ISDN) services reached NOK 9,604 million in the ninemonths ended September 30, 2000, a decrease of NOK 310 million, or 3.1%, over the same periodin 1999. After adjusting for revenues of NOK 442 million attributable to our subsidiaries Storm and
27
BOWNE OF LONDON 12/01/2000 19:56 BL/SM NO MARKS NEXT PCN: 034.00.00.00 -- Page is valid, no graphics X42481 033.00.00.00 5X
Clarion in the nine months ended September 30, 1999, revenues increased by NOK 132 million, or1.4%, in the nine months ended September 30, 2000 from the same period in 1999. Decreasedrevenues from traffic in the business and residential markets due to lower tariffs and a change intraffic patterns were partially offset by increased subscriptions and connection fees and increasedrevenues in the wholesale market.
Revenues from analog (PSTN)/digital (ISDN) services increased by NOK 1,083, or 8.8%, toNOK 13,355 million in 1999 from NOK 12,272 million in 1998. Of this increase, NOK 419 million wasrelated to Storm and Clarion. The remaining growth in revenues resulted from increased ISDNsubscriptions, which have higher subscription fees, higher revenues from international interconnec-tion, increased fixed to mobile traffic and Internet traffic, as well as increased domesticinterconnection revenues. These increases were offset in part by lower traffic tariffs for domestic andinternational telephony.
In 1998, analog (PSTN)/digital (ISDN) services revenues increased by NOK 576 million, or4.9%, to NOK 12,272 million in 1998 from NOK 11,696 million in 1997. The increase was dueprimarily to the increase in ISDN subscriptions, a higher volume of traffic on the fixed line network,especially Internet traffic, and increased revenues from domestic interconnection. In addition, of thisamount, NOK 133 million of the increase was related to Storm and Clarion.
Mobile Telephony
Revenues from mobile telephony include monthly subscription fees, one-time fees forestablishing or connecting a new contract subscription, and call initiation and traffic fees charged toour customers for making domestic or international calls from a mobile phone (including through theuse of prepaid cards). These revenues also include national incoming traffic, charges to mobileservice providers for network services, international roaming charges and fees charged for providingshort text messaging services, Mobile-Info services, a general information retrieval service thatallows a user to request and receive specific information in the form of a short text message overthe mobile phone, and other services. Revenues from national interconnection are the total amountwe bill to other domestic operators for calls made by customers of these operators that are incomingin our mobile network. International roaming revenues consist of the total amount we bill for callsmade outside Norway by our customers using another network and amounts paid to us by foreignmobile network operators for calls made by customers of these operations within Norway. Revenuesfrom our paging operations are also included under mobile telephony. Mobile telephony revenues arerecognized in our Mobile Communications business area.
Revenues from mobile telephony reached NOK 5,121 million in the nine months endedSeptember 30, 2000, an increase of NOK 1,122 million, or 28.1%, over the same period in 1999.The increase in revenues reflects higher traffic minutes resulting from an increase in the number ofdigital mobile telephony subscriptions as well as increased short text messaging revenues. Averagerevenues per subscription in mobile telephony, including incoming and outgoing traffic, declinedcompared to the nine months ended September 30, 1999 largely due to the higher proportion ofprepaid subscriptions, which have lower usage levels than contract subscriptions. Revenues fromroaming agreements increased due primarily to the increased traffic and number of subscriptions. Inaddition, external service providers who were given access to our mobile network for the first time in2000 contributed NOK 78 million to the increase in revenues.
Revenues from mobile telephony increased 22.5% to NOK 5,426 million in 1999 after increasing25.6% in 1998 from NOK 3,526 million in 1997. The increases reflected strong growth in revenuesfrom traffic charges and charges for short text messaging services due to higher numbers of digitalmobile telephony subscriptions as well as the increase in the use of short text messaging services,particularly from prepaid mobile subscriptions. Revenues from subscriptions were up only slightly,reflecting the transition toward a higher proportion of prepaid subscriptions. Traffic minutes persubscription, including incoming and outgoing traffic, were at the same level in 1999 as in 1998.
28
BOWNE OF LONDON 12/01/2000 19:56 BL/SM NO MARKS NEXT PCN: 035.00.00.00 -- Page is valid, no graphics X42481 034.00.00.00 5X
Average monthly revenue per subscription for outgoing and incoming traffic decreased due to tariffreductions and an increased number of prepaid subscriptions. Roaming revenues increased steadilyover the period, from NOK 432 million in 1997 to NOK 741 million in 1998 and NOK 824 million in1999.
Leased Lines
Revenues from leased lines consist of charges for the initial establishment/connection of leasedlines and subscription fees for analog or digital circuits. These revenues are recognized in ourTelecom business area.
Revenues from leased lines increased to NOK 671 million in the first nine months of 2000 fromNOK 632 million in the nine months ended September 30, 1999. The increase was due to anincreased number of digital leased lines that was only partly offset by lower prices on high capacitylines. In 1999, revenues from leased lines declined 6.5% to NOK 810 million compared to theprevious year, after having increased 5.6% in 1998 compared to 1997. In general, over this period,the number of analog leased lines decreased as customers migrated to digital leased lines, inparticular higher capacity leased lines. At the same time, prices for leased lines declinedsignificantly. We have also actively sought to migrate leased line customers to data services, whichare included in other network-based revenues.
Satellite and TV-Distribution
Revenues from satellite and TV-distribution include revenues from satellite broadcasting andtelevision distribution in the Nordic market, as well as revenues from payments by subscribers to ourcable television and small antenna network television services. We also realize revenues through thesale of program cards and the operation of Norkring, the terrestrial broadcasting network in Norway,as well as from satellite-based networks and mobile satellite services. We acquired control ofNorkring in June 1999. These revenues are recognized primarily in our Broadband Servicesbusiness area.
Revenues from satellite and TV-distribution increased NOK 528 million, or 30.5%, to NOK 2,258million in the nine months ended September 30, 2000 from NOK 1,730 million in the same period in1999. Our acquisition of Norkring accounted for NOK 171 million of our increased revenues in theperiod. Our revenues in the 9 months ended September 30, 2000 included a one-time terminationpayment of NOK 50 million received from a customer. Our revenues were also enhanced bychanges in traffic agreements with business partners. Increased revenues also reflect the highernumber of subscriber-based contracts and small antenna network television subscribers in the ninemonths ended September 30, 2000. At September 30, 2000, our total number of subscribers hadincreased to 1.9 million (including total subscribers in Canal Digital).
Revenues from satellite and TV-distribution increased NOK 256 million, or 11.5%, toNOK 2,485 million in 1999, from NOK 2,229 million in 1998. Of this amount, NOK 255 million isattributable to Norkring, which we began to consolidate in June 1999. Increased sales in satellitenetworks contributed to increased revenues. The higher revenues also reflect growth in cablesubscribers by 4.4% to 282,000 at December 31, 1999 compared with the prior year, and a 36.6%increase in the number of small antenna network television services to 850,000 households and87,000 hotel rooms. These factors more than offset the decrease in our revenues in 1999 whichresulted from the transfer of our DTH business, Telenor CTV, from our consolidated operations atyear end 1998 to our joint venture, Canal Digital, which we account for as an associated company.
Revenues from satellite and TV-distribution increased by NOK 678 million, or by 43.7%, toNOK 2,229 million in 1998 from NOK 1,551 million in 1997. The launch of our satellites Thor II (May1997) and Thor III (June 1998) increased broadcasting revenues. The number of cable subscribersincreased by 10.7% to 270,000 at December 31, 1998, compared to the prior year. Global mobilesatellite service revenues increased due to strong growth in traffic minutes. Higher traffic volumes via
29
BOWNE OF LONDON 12/01/2000 19:56 BL/SM NO MARKS NEXT PCN: 036.00.00.00 -- Page is valid, no graphics X42481 035.00.00.00 5X
INMARSAT were offset by lower prices for these services. Satellite networks also increasedrevenues related to acquired companies and increased sales in existing subsidiaries. Telenor Vision,which was acquired as of January 1, 1998, contributed revenues of NOK 126 million in 1998.
Other Network-Based Activities
Other network-based activities include revenues from value-added network services, datanetwork services and Internet subscriptions.
Revenues from other network-based activities increased by NOK 341 million, or 27.2%, toNOK 1,592 million in the nine months ended September 30, 2000 compared to NOK 1,251 million inthe nine months ended September 30, 1999. This increase was primarily due to Internet businessoutside Norway and, to a lesser extent, increased revenues in the domestic Internet market.Revenues from value added network services and data network services also increased.
Revenues from other network-based activities increased by NOK 302 million, or 23.4%, toNOK 1,593 million in 1999 compared to NOK 1,291 million in the previous year. Revenues fromother network-based activities increased by 16.7% to NOK 1,291 million in 1998, compared toNOK 1,106 million in 1997. The increase in both periods was due to strong growth in both ourInternet business and data network services.
Customer Equipment
Revenues from customer equipment consist of the sale of equipment to customers for use oncustomer premises, such as telephones, mobile handsets, private automated branch exchanges andcomputer equipment.
Revenues from the sale of customer equipment totaled NOK 1,983 million in the nine monthsended September 30, 2000, a decrease of NOK 163 million, or 7.5%, from the nine months endedSeptember 30, 1999. Decreased revenues reflect the period of low demand following the turn of themillennium, especially during for the first half of 2000. This decline was partly offset by increasedsales of customer equipment by the companies acquired in EDB Business Partner from May 1,1999.
Customer equipment revenues increased NOK 675 million, or 29.8%, to NOK 2,940 million in1999 due to higher demand in all areas. Revenues of NOK 307 million were related to the new EDBcompanies. In 1998, revenues from the sale of customer equipment declined NOK 95 million, or4.1%, to NOK 2,265 million from NOK 2,360 million in 1997. This reduction was partly due to thefact that 1997 revenues benefited from sales of home PCs to Statoil for an employee program.
Information Technology Service and Installations
Revenues from Information Technology (IT) service and installations consist primarily ofrevenues from installations, operational and support services connected to the remote operation oftelephony and data networks, consultancy and system integration.
In the nine months ended September 30, 2000, revenues from IT service and installations wereNOK 3,404 million, an increase of NOK 772 million, or 29.3%, over the nine months endedSeptember 30, 1999. This increase mainly related to acquired businesses in EDB Business Partnerand increased revenues from ASP and managed services in Business Solutions, which was partlyoffset by a decrease in market demand for traditional installation activities, combined with increasedcompetition among providers of installation services.
Revenues from IT service and installations increased by NOK 497 million, or 16.5%, toNOK 3,501 million in 1999 compared to 1998. Approximately NOK 340 million of the increaseresulted from the consolidation of the results of EDB ASA, which was acquired in May 1999 and
30
BOWNE OF LONDON 12/01/2000 19:56 BL/SM NO MARKS NEXT PCN: 037.00.00.00 -- Page is valid, no graphics X42481 036.00.00.00 5X
merged with our Telenor Programvare subsidiary. Excluding the effect of the EDB ASA acquisition,revenues from IT service and installations increased by 5% in 1999 compared to 1998.
In 1998, revenues from IT service and installations increased NOK 395 million, or 15.1%, toNOK 3,004 million from NOK 2,609 million in 1997. The growth was due to a higher volume ofoutsourcing services and higher sales activity as well as greater focus on installation services,including high voltage installations.
Advertising and Related Services
This item relates to revenues from directory advertising and related services, which arerecognized in our Media business area. All advertising revenues related to a directory are recordedwhen the directory is published.
Revenues from advertising and related services were NOK 1,224 million in the nine monthsended September 30, 2000, a decrease of NOK 127 million compared to the same period in 1999.We sold our Swedish subsidiaries, Lokaldelen AB and Telenor Foretagsinfo AB, in October 1999.These companies together contributed revenues of NOK 221 million in the nine months endedSeptember 30, 1999. Revenues in the nine months ended September 30, 2000 were negativelyimpacted by the postponement of the publication of a large annual directory until the fourth quarterof 2000. Increased sales of printed and on-line products resulted in increased revenues fromNorwegian directories in the nine months ended September 30, 2000.
In 1999, revenues from advertising and related services increased by NOK 132 million, or 9.1%,to NOK 1,588 million compared with the prior year, notwithstanding the sales of businesses whichhad the effect of reducing revenues by NOK 126 million in 1999. The increase in revenues isprimarily related to our directory activities in the Norwegian market. Revenues from advertising andrelated services increased by NOK 197 million, or 15.6%, in 1998 to NOK 1,456 million. Weexperienced revenue growth both in our foreign subsidiaries and from printed and electronic media inNorway during this period.
Other
Other revenues include revenues from build, operate and transfer services, maritime radioservices, rent and other services.
Gain on Sale of Fixed Assets and Operations
Under Norwegian GAAP, gain on sale of fixed assets and operations are recorded as a part ofrevenues and losses on such sale are recorded as operating expenses.
We realized gain of NOK 594 million from the sale of fixed assets and operations in the ninemonths ended September 30, 2000, compared to gain of NOK 57 million in the same period in 1999.Gain in the nine months ended September 30, 2000 included NOK 309 million from our sale ofStorm in February and NOK 75 million from our sale of Telenor Inkasso AS.
Gain on sale of fixed assets and operations totaled NOK 783 million in 1999, of which NOK 683million related to the sale in October 1999 of our interests in Lokaldelen AB and Telenor ForetagsinfoAB, which we sold in connection with our abandoned merger with Telia. In 1998 and 1997, werealized gain on sale of fixed assets and operations of NOK 248 million and NOK 177 million,respectively, mainly related to the sale of other operating assets.
31
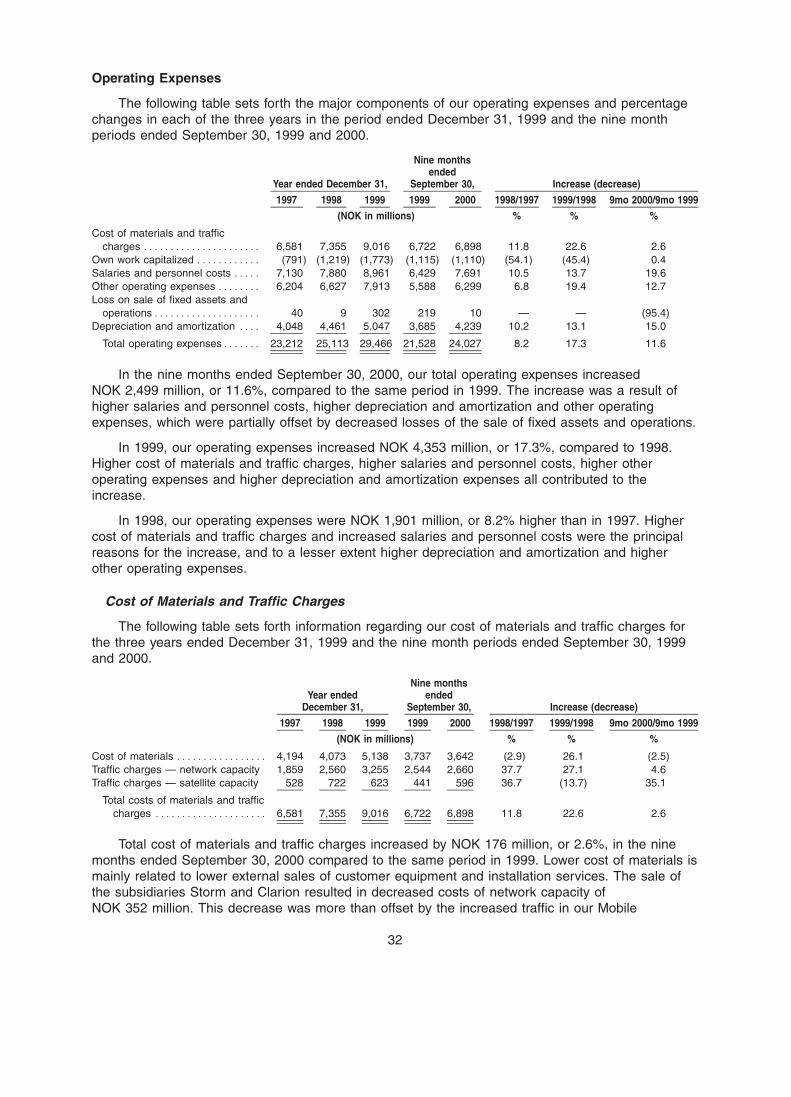
BOWNE OF LONDON 12/01/2000 19:56 BL/SM NO MARKS NEXT PCN: 038.00.00.00 -- Page is valid, no graphics X42481 037.00.00.00 6X
Operating Expenses
The following table sets forth the major components of our operating expenses and percentagechanges in each of the three years in the period ended December 31, 1999 and the nine monthperiods ended September 30, 1999 and 2000.
Nine monthsended
Year ended December 31, September 30, Increase (decrease)
1997 1998 1999 1999 2000 1998/1997 1999/1998 9mo 2000/9mo 1999
(NOK in millions) % % %
Cost of materials and trafficcharges ********************** 6,581 7,355 9,016 6,722 6,898 11.8 22.6 2.6
Own work capitalized ************ (791) (1,219) (1,773) (1,115) (1,110) (54.1) (45.4) 0.4Salaries and personnel costs ***** 7,130 7,880 8,961 6,429 7,691 10.5 13.7 19.6Other operating expenses ******** 6,204 6,627 7,913 5,588 6,299 6.8 19.4 12.7Loss on sale of fixed assets and
operations******************** 40 9 302 219 10 — — (95.4)Depreciation and amortization **** 4,048 4,461 5,047 3,685 4,239 10.2 13.1 15.0
Total operating expenses******* 23,212 25,113 29,466 21,528 24,027 8.2 17.3 11.6
In the nine months ended September 30, 2000, our total operating expenses increasedNOK 2,499 million, or 11.6%, compared to the same period in 1999. The increase was a result ofhigher salaries and personnel costs, higher depreciation and amortization and other operatingexpenses, which were partially offset by decreased losses of the sale of fixed assets and operations.
In 1999, our operating expenses increased NOK 4,353 million, or 17.3%, compared to 1998.Higher cost of materials and traffic charges, higher salaries and personnel costs, higher otheroperating expenses and higher depreciation and amortization expenses all contributed to theincrease.
In 1998, our operating expenses were NOK 1,901 million, or 8.2% higher than in 1997. Highercost of materials and traffic charges and increased salaries and personnel costs were the principalreasons for the increase, and to a lesser extent higher depreciation and amortization and higherother operating expenses.
Cost of Materials and Traffic Charges
The following table sets forth information regarding our cost of materials and traffic charges forthe three years ended December 31, 1999 and the nine month periods ended September 30, 1999and 2000.
Nine monthsYear ended ended
December 31, September 30, Increase (decrease)
1997 1998 1999 1999 2000 1998/1997 1999/1998 9mo 2000/9mo 1999
(NOK in millions) % % %
Cost of materials ***************** 4,194 4,073 5,138 3,737 3,642 (2.9) 26.1 (2.5)Traffic charges — network capacity 1,859 2,560 3,255 2,544 2,660 37.7 27.1 4.6Traffic charges — satellite capacity 528 722 623 441 596 36.7 (13.7) 35.1
Total costs of materials and trafficcharges ********************* 6,581 7,355 9,016 6,722 6,898 11.8 22.6 2.6
Total cost of materials and traffic charges increased by NOK 176 million, or 2.6%, in the ninemonths ended September 30, 2000 compared to the same period in 1999. Lower cost of materials ismainly related to lower external sales of customer equipment and installation services. The sale ofthe subsidiaries Storm and Clarion resulted in decreased costs of network capacity ofNOK 352 million. This decrease was more than offset by the increased traffic in our Mobile
32
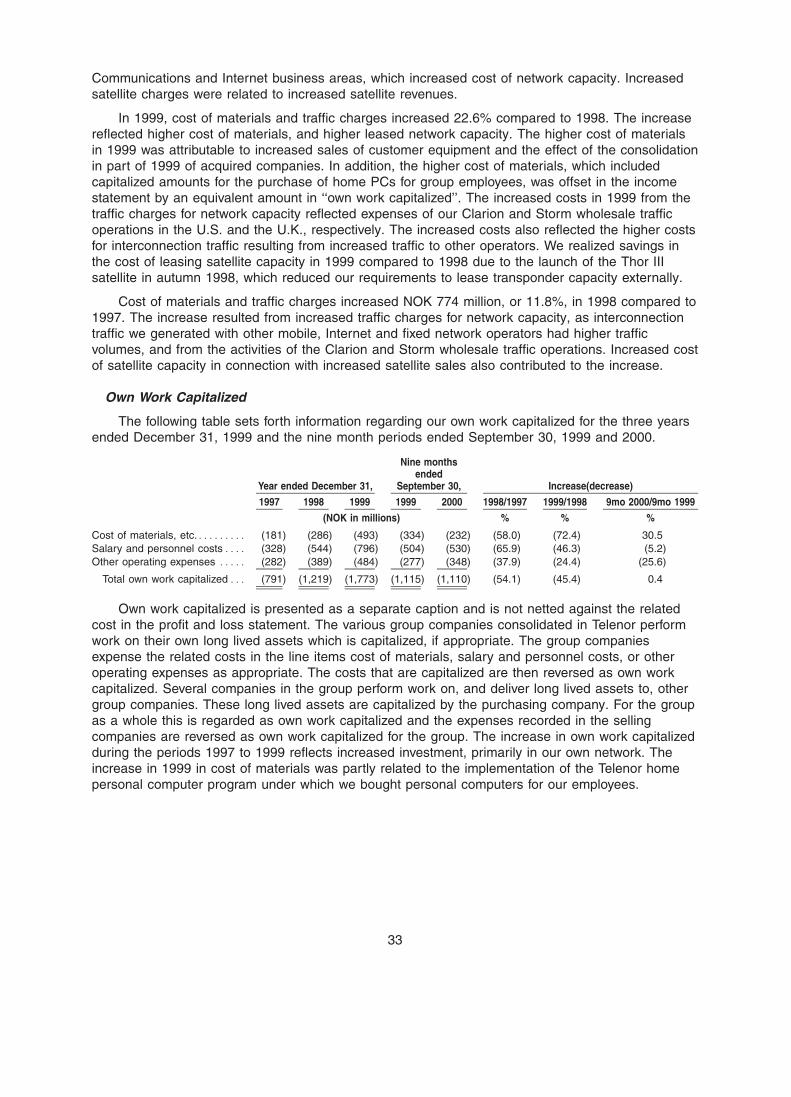
BOWNE OF LONDON 12/01/2000 19:56 BL/SM NO MARKS NEXT PCN: 039.00.00.00 -- Page is valid, no graphics X42481 038.00.00.00 5X
Communications and Internet business areas, which increased cost of network capacity. Increasedsatellite charges were related to increased satellite revenues.
In 1999, cost of materials and traffic charges increased 22.6% compared to 1998. The increasereflected higher cost of materials, and higher leased network capacity. The higher cost of materialsin 1999 was attributable to increased sales of customer equipment and the effect of the consolidationin part of 1999 of acquired companies. In addition, the higher cost of materials, which includedcapitalized amounts for the purchase of home PCs for group employees, was offset in the incomestatement by an equivalent amount in ‘‘own work capitalized’’. The increased costs in 1999 from thetraffic charges for network capacity reflected expenses of our Clarion and Storm wholesale trafficoperations in the U.S. and the U.K., respectively. The increased costs also reflected the higher costsfor interconnection traffic resulting from increased traffic to other operators. We realized savings inthe cost of leasing satellite capacity in 1999 compared to 1998 due to the launch of the Thor IIIsatellite in autumn 1998, which reduced our requirements to lease transponder capacity externally.
Cost of materials and traffic charges increased NOK 774 million, or 11.8%, in 1998 compared to1997. The increase resulted from increased traffic charges for network capacity, as interconnectiontraffic we generated with other mobile, Internet and fixed network operators had higher trafficvolumes, and from the activities of the Clarion and Storm wholesale traffic operations. Increased costof satellite capacity in connection with increased satellite sales also contributed to the increase.
Own Work Capitalized
The following table sets forth information regarding our own work capitalized for the three yearsended December 31, 1999 and the nine month periods ended September 30, 1999 and 2000.
Nine monthsended
Year ended December 31, September 30, Increase(decrease)
1997 1998 1999 1999 2000 1998/1997 1999/1998 9mo 2000/9mo 1999
(NOK in millions) % % %
Cost of materials, etc.********* (181) (286) (493) (334) (232) (58.0) (72.4) 30.5Salary and personnel costs**** (328) (544) (796) (504) (530) (65.9) (46.3) (5.2)Other operating expenses ***** (282) (389) (484) (277) (348) (37.9) (24.4) (25.6)
Total own work capitalized*** (791) (1,219) (1,773) (1,115) (1,110) (54.1) (45.4) 0.4
Own work capitalized is presented as a separate caption and is not netted against the relatedcost in the profit and loss statement. The various group companies consolidated in Telenor performwork on their own long lived assets which is capitalized, if appropriate. The group companiesexpense the related costs in the line items cost of materials, salary and personnel costs, or otheroperating expenses as appropriate. The costs that are capitalized are then reversed as own workcapitalized. Several companies in the group perform work on, and deliver long lived assets to, othergroup companies. These long lived assets are capitalized by the purchasing company. For the groupas a whole this is regarded as own work capitalized and the expenses recorded in the sellingcompanies are reversed as own work capitalized for the group. The increase in own work capitalizedduring the periods 1997 to 1999 reflects increased investment, primarily in our own network. Theincrease in 1999 in cost of materials was partly related to the implementation of the Telenor homepersonal computer program under which we bought personal computers for our employees.
33
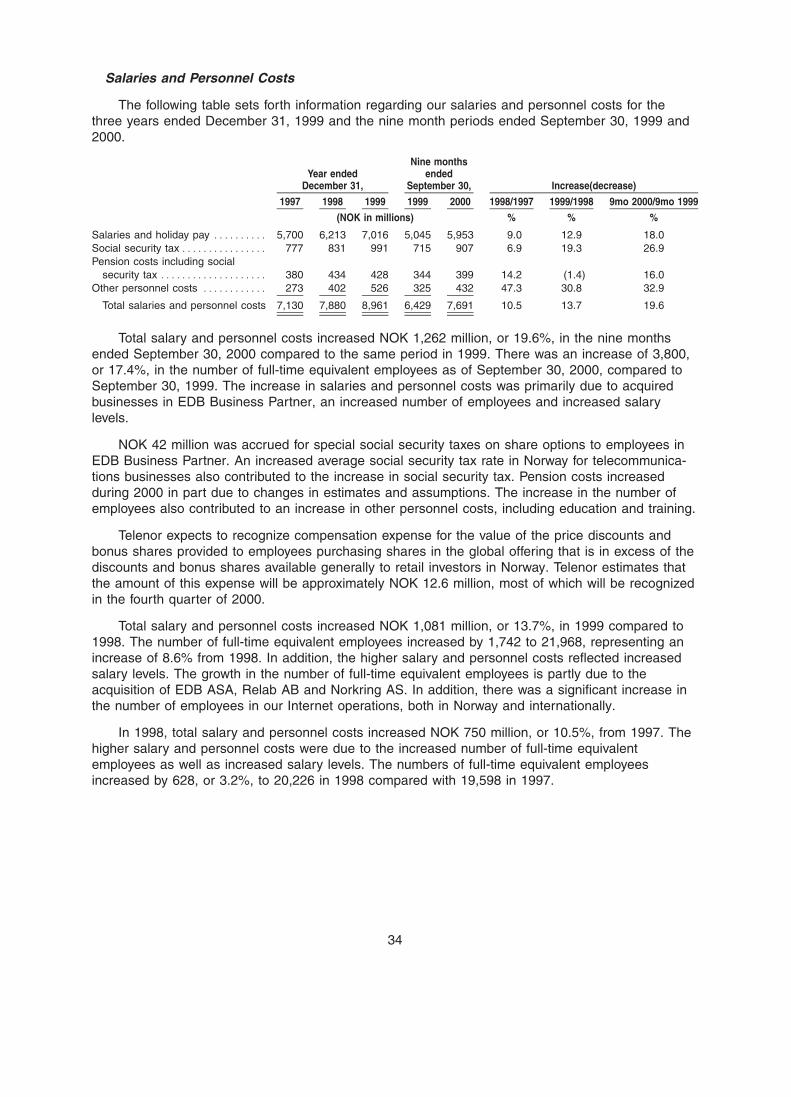
BOWNE OF LONDON 12/03/2000 15:18 BL/SM NO MARKS NEXT PCN: 040.00.00.00 -- Page is valid, no graphics X42481 039.00.00.00 8X
Salaries and Personnel Costs
The following table sets forth information regarding our salaries and personnel costs for thethree years ended December 31, 1999 and the nine month periods ended September 30, 1999 and2000.
Nine monthsYear ended ended
December 31, September 30, Increase(decrease)
1997 1998 1999 1999 2000 1998/1997 1999/1998 9mo 2000/9mo 1999
(NOK in millions) % % %
Salaries and holiday pay ********** 5,700 6,213 7,016 5,045 5,953 9.0 12.9 18.0Social security tax **************** 777 831 991 715 907 6.9 19.3 26.9Pension costs including social
security tax ******************** 380 434 428 344 399 14.2 (1.4) 16.0Other personnel costs ************ 273 402 526 325 432 47.3 30.8 32.9
Total salaries and personnel costs 7,130 7,880 8,961 6,429 7,691 10.5 13.7 19.6
Total salary and personnel costs increased NOK 1,262 million, or 19.6%, in the nine monthsended September 30, 2000 compared to the same period in 1999. There was an increase of 3,800,or 17.4%, in the number of full-time equivalent employees as of September 30, 2000, compared toSeptember 30, 1999. The increase in salaries and personnel costs was primarily due to acquiredbusinesses in EDB Business Partner, an increased number of employees and increased salarylevels.
NOK 42 million was accrued for special social security taxes on share options to employees inEDB Business Partner. An increased average social security tax rate in Norway for telecommunica-tions businesses also contributed to the increase in social security tax. Pension costs increasedduring 2000 in part due to changes in estimates and assumptions. The increase in the number ofemployees also contributed to an increase in other personnel costs, including education and training.
Telenor expects to recognize compensation expense for the value of the price discounts andbonus shares provided to employees purchasing shares in the global offering that is in excess of thediscounts and bonus shares available generally to retail investors in Norway. Telenor estimates thatthe amount of this expense will be approximately NOK 12.6 million, most of which will be recognizedin the fourth quarter of 2000.
Total salary and personnel costs increased NOK 1,081 million, or 13.7%, in 1999 compared to1998. The number of full-time equivalent employees increased by 1,742 to 21,968, representing anincrease of 8.6% from 1998. In addition, the higher salary and personnel costs reflected increasedsalary levels. The growth in the number of full-time equivalent employees is partly due to theacquisition of EDB ASA, Relab AB and Norkring AS. In addition, there was a significant increase inthe number of employees in our Internet operations, both in Norway and internationally.
In 1998, total salary and personnel costs increased NOK 750 million, or 10.5%, from 1997. Thehigher salary and personnel costs were due to the increased number of full-time equivalentemployees as well as increased salary levels. The numbers of full-time equivalent employeesincreased by 628, or 3.2%, to 20,226 in 1998 compared with 19,598 in 1997.
34
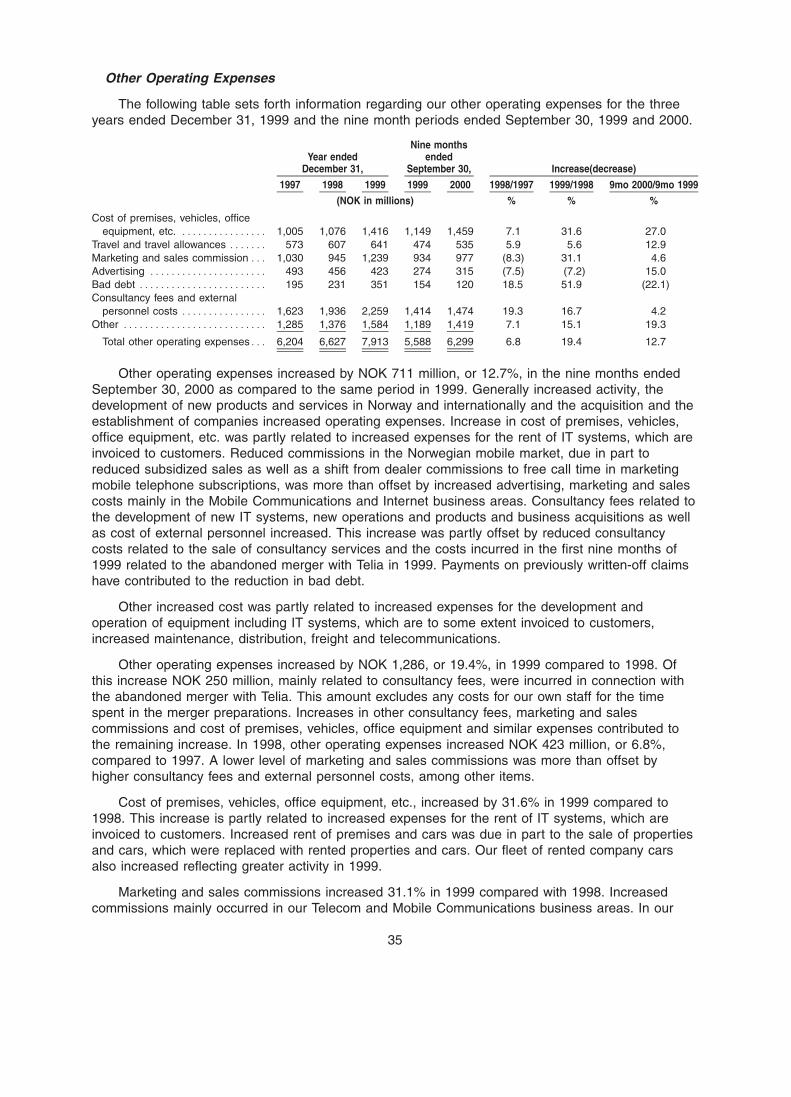
BOWNE OF LONDON 12/01/2000 19:56 BL/SM NO MARKS NEXT PCN: 041.00.00.00 -- Page is valid, no graphics X42481 040.00.00.00 5X
Other Operating Expenses
The following table sets forth information regarding our other operating expenses for the threeyears ended December 31, 1999 and the nine month periods ended September 30, 1999 and 2000.
Nine monthsYear ended ended
December 31, September 30, Increase(decrease)
1997 1998 1999 1999 2000 1998/1997 1999/1998 9mo 2000/9mo 1999
(NOK in millions) % % %
Cost of premises, vehicles, officeequipment, etc. **************** 1,005 1,076 1,416 1,149 1,459 7.1 31.6 27.0
Travel and travel allowances ******* 573 607 641 474 535 5.9 5.6 12.9Marketing and sales commission *** 1,030 945 1,239 934 977 (8.3) 31.1 4.6Advertising ********************** 493 456 423 274 315 (7.5) (7.2) 15.0Bad debt ************************ 195 231 351 154 120 18.5 51.9 (22.1)Consultancy fees and external
personnel costs **************** 1,623 1,936 2,259 1,414 1,474 19.3 16.7 4.2Other *************************** 1,285 1,376 1,584 1,189 1,419 7.1 15.1 19.3
Total other operating expenses*** 6,204 6,627 7,913 5,588 6,299 6.8 19.4 12.7
Other operating expenses increased by NOK 711 million, or 12.7%, in the nine months endedSeptember 30, 2000 as compared to the same period in 1999. Generally increased activity, thedevelopment of new products and services in Norway and internationally and the acquisition and theestablishment of companies increased operating expenses. Increase in cost of premises, vehicles,office equipment, etc. was partly related to increased expenses for the rent of IT systems, which areinvoiced to customers. Reduced commissions in the Norwegian mobile market, due in part toreduced subsidized sales as well as a shift from dealer commissions to free call time in marketingmobile telephone subscriptions, was more than offset by increased advertising, marketing and salescosts mainly in the Mobile Communications and Internet business areas. Consultancy fees related tothe development of new IT systems, new operations and products and business acquisitions as wellas cost of external personnel increased. This increase was partly offset by reduced consultancycosts related to the sale of consultancy services and the costs incurred in the first nine months of1999 related to the abandoned merger with Telia in 1999. Payments on previously written-off claimshave contributed to the reduction in bad debt.
Other increased cost was partly related to increased expenses for the development andoperation of equipment including IT systems, which are to some extent invoiced to customers,increased maintenance, distribution, freight and telecommunications.
Other operating expenses increased by NOK 1,286, or 19.4%, in 1999 compared to 1998. Ofthis increase NOK 250 million, mainly related to consultancy fees, were incurred in connection withthe abandoned merger with Telia. This amount excludes any costs for our own staff for the timespent in the merger preparations. Increases in other consultancy fees, marketing and salescommissions and cost of premises, vehicles, office equipment and similar expenses contributed tothe remaining increase. In 1998, other operating expenses increased NOK 423 million, or 6.8%,compared to 1997. A lower level of marketing and sales commissions was more than offset byhigher consultancy fees and external personnel costs, among other items.
Cost of premises, vehicles, office equipment, etc., increased by 31.6% in 1999 compared to1998. This increase is partly related to increased expenses for the rent of IT systems, which areinvoiced to customers. Increased rent of premises and cars was due in part to the sale of propertiesand cars, which were replaced with rented properties and cars. Our fleet of rented company carsalso increased reflecting greater activity in 1999.
Marketing and sales commissions increased 31.1% in 1999 compared with 1998. Increasedcommissions mainly occurred in our Telecom and Mobile Communications business areas. In our
35
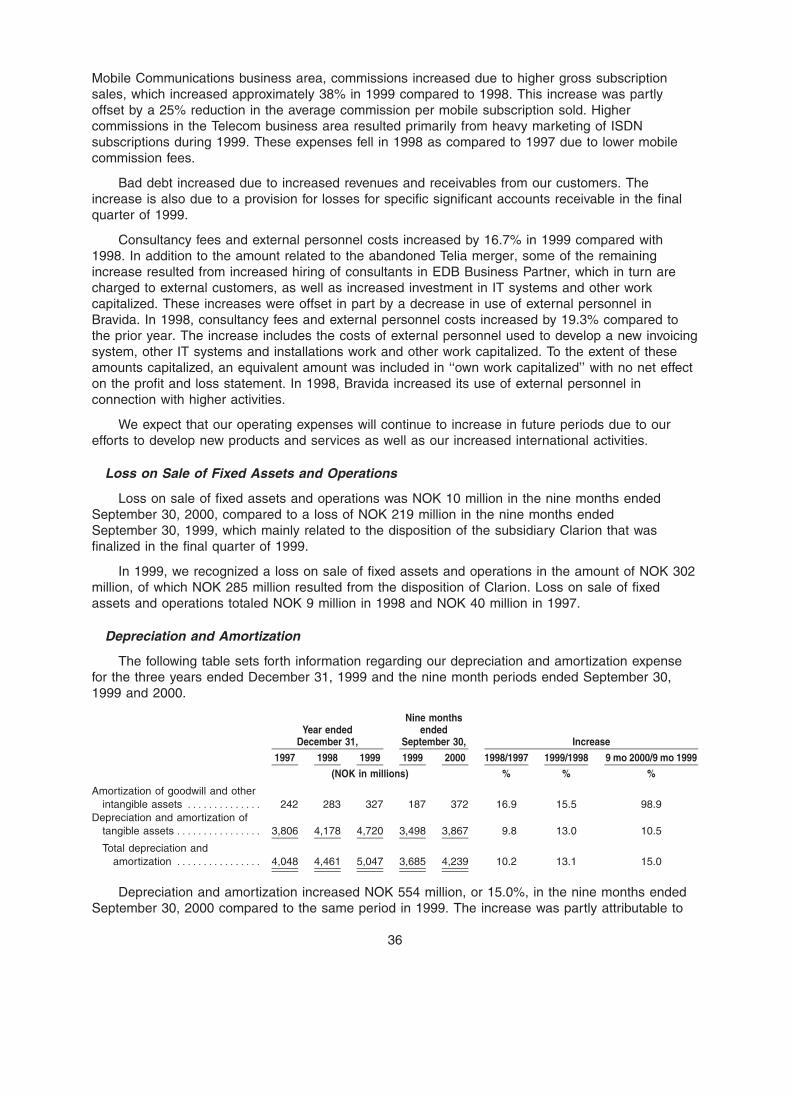
BOWNE OF LONDON 12/01/2000 19:56 BL/SM NO MARKS NEXT PCN: 042.00.00.00 -- Page is valid, no graphics X42481 041.00.00.00 5X
Mobile Communications business area, commissions increased due to higher gross subscriptionsales, which increased approximately 38% in 1999 compared to 1998. This increase was partlyoffset by a 25% reduction in the average commission per mobile subscription sold. Highercommissions in the Telecom business area resulted primarily from heavy marketing of ISDNsubscriptions during 1999. These expenses fell in 1998 as compared to 1997 due to lower mobilecommission fees.
Bad debt increased due to increased revenues and receivables from our customers. Theincrease is also due to a provision for losses for specific significant accounts receivable in the finalquarter of 1999.
Consultancy fees and external personnel costs increased by 16.7% in 1999 compared with1998. In addition to the amount related to the abandoned Telia merger, some of the remainingincrease resulted from increased hiring of consultants in EDB Business Partner, which in turn arecharged to external customers, as well as increased investment in IT systems and other workcapitalized. These increases were offset in part by a decrease in use of external personnel inBravida. In 1998, consultancy fees and external personnel costs increased by 19.3% compared tothe prior year. The increase includes the costs of external personnel used to develop a new invoicingsystem, other IT systems and installations work and other work capitalized. To the extent of theseamounts capitalized, an equivalent amount was included in ‘‘own work capitalized’’ with no net effecton the profit and loss statement. In 1998, Bravida increased its use of external personnel inconnection with higher activities.
We expect that our operating expenses will continue to increase in future periods due to ourefforts to develop new products and services as well as our increased international activities.
Loss on Sale of Fixed Assets and Operations
Loss on sale of fixed assets and operations was NOK 10 million in the nine months endedSeptember 30, 2000, compared to a loss of NOK 219 million in the nine months endedSeptember 30, 1999, which mainly related to the disposition of the subsidiary Clarion that wasfinalized in the final quarter of 1999.
In 1999, we recognized a loss on sale of fixed assets and operations in the amount of NOK 302million, of which NOK 285 million resulted from the disposition of Clarion. Loss on sale of fixedassets and operations totaled NOK 9 million in 1998 and NOK 40 million in 1997.
Depreciation and Amortization
The following table sets forth information regarding our depreciation and amortization expensefor the three years ended December 31, 1999 and the nine month periods ended September 30,1999 and 2000.
Nine monthsYear ended ended
December 31, September 30, Increase
1997 1998 1999 1999 2000 1998/1997 1999/1998 9 mo 2000/9 mo 1999
(NOK in millions) % % %
Amortization of goodwill and otherintangible assets ************** 242 283 327 187 372 16.9 15.5 98.9
Depreciation and amortization oftangible assets **************** 3,806 4,178 4,720 3,498 3,867 9.8 13.0 10.5
Total depreciation andamortization **************** 4,048 4,461 5,047 3,685 4,239 10.2 13.1 15.0
Depreciation and amortization increased NOK 554 million, or 15.0%, in the nine months endedSeptember 30, 2000 compared to the same period in 1999. The increase was partly attributable to
36
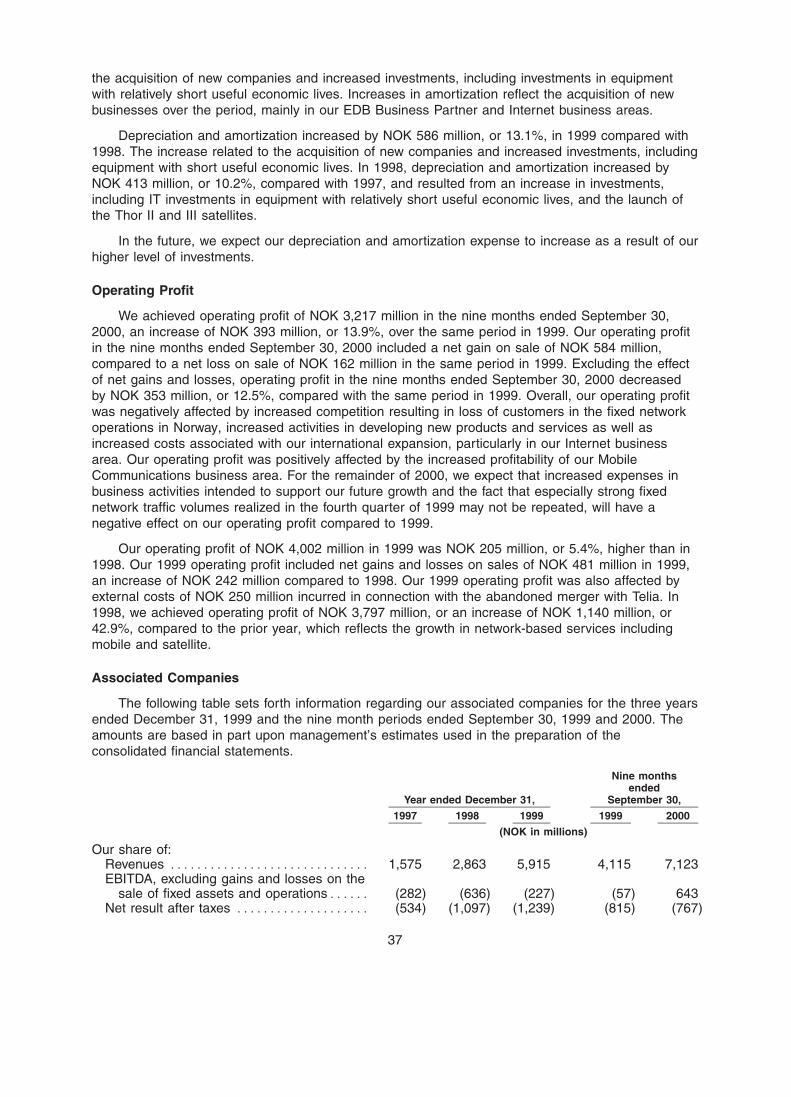
BOWNE OF LONDON 12/01/2000 19:56 BL/SM NO MARKS NEXT PCN: 043.00.00.00 -- Page is valid, no graphics X42481 042.00.00.00 5X
the acquisition of new companies and increased investments, including investments in equipmentwith relatively short useful economic lives. Increases in amortization reflect the acquisition of newbusinesses over the period, mainly in our EDB Business Partner and Internet business areas.
Depreciation and amortization increased by NOK 586 million, or 13.1%, in 1999 compared with1998. The increase related to the acquisition of new companies and increased investments, includingequipment with short useful economic lives. In 1998, depreciation and amortization increased byNOK 413 million, or 10.2%, compared with 1997, and resulted from an increase in investments,including IT investments in equipment with relatively short useful economic lives, and the launch ofthe Thor II and III satellites.
In the future, we expect our depreciation and amortization expense to increase as a result of ourhigher level of investments.
Operating Profit
We achieved operating profit of NOK 3,217 million in the nine months ended September 30,2000, an increase of NOK 393 million, or 13.9%, over the same period in 1999. Our operating profitin the nine months ended September 30, 2000 included a net gain on sale of NOK 584 million,compared to a net loss on sale of NOK 162 million in the same period in 1999. Excluding the effectof net gains and losses, operating profit in the nine months ended September 30, 2000 decreasedby NOK 353 million, or 12.5%, compared with the same period in 1999. Overall, our operating profitwas negatively affected by increased competition resulting in loss of customers in the fixed networkoperations in Norway, increased activities in developing new products and services as well asincreased costs associated with our international expansion, particularly in our Internet businessarea. Our operating profit was positively affected by the increased profitability of our MobileCommunications business area. For the remainder of 2000, we expect that increased expenses inbusiness activities intended to support our future growth and the fact that especially strong fixednetwork traffic volumes realized in the fourth quarter of 1999 may not be repeated, will have anegative effect on our operating profit compared to 1999.
Our operating profit of NOK 4,002 million in 1999 was NOK 205 million, or 5.4%, higher than in1998. Our 1999 operating profit included net gains and losses on sales of NOK 481 million in 1999,an increase of NOK 242 million compared to 1998. Our 1999 operating profit was also affected byexternal costs of NOK 250 million incurred in connection with the abandoned merger with Telia. In1998, we achieved operating profit of NOK 3,797 million, or an increase of NOK 1,140 million, or42.9%, compared to the prior year, which reflects the growth in network-based services includingmobile and satellite.
Associated Companies
The following table sets forth information regarding our associated companies for the three yearsended December 31, 1999 and the nine month periods ended September 30, 1999 and 2000. Theamounts are based in part upon management’s estimates used in the preparation of theconsolidated financial statements.
Nine monthsended
Year ended December 31, September 30,
1997 1998 1999 1999 2000
(NOK in millions)
Our share of:Revenues ****************************** 1,575 2,863 5,915 4,115 7,123EBITDA, excluding gains and losses on the
sale of fixed assets and operations****** (282) (636) (227) (57) 643Net result after taxes ******************** (534) (1,097) (1,239) (815) (767)
37
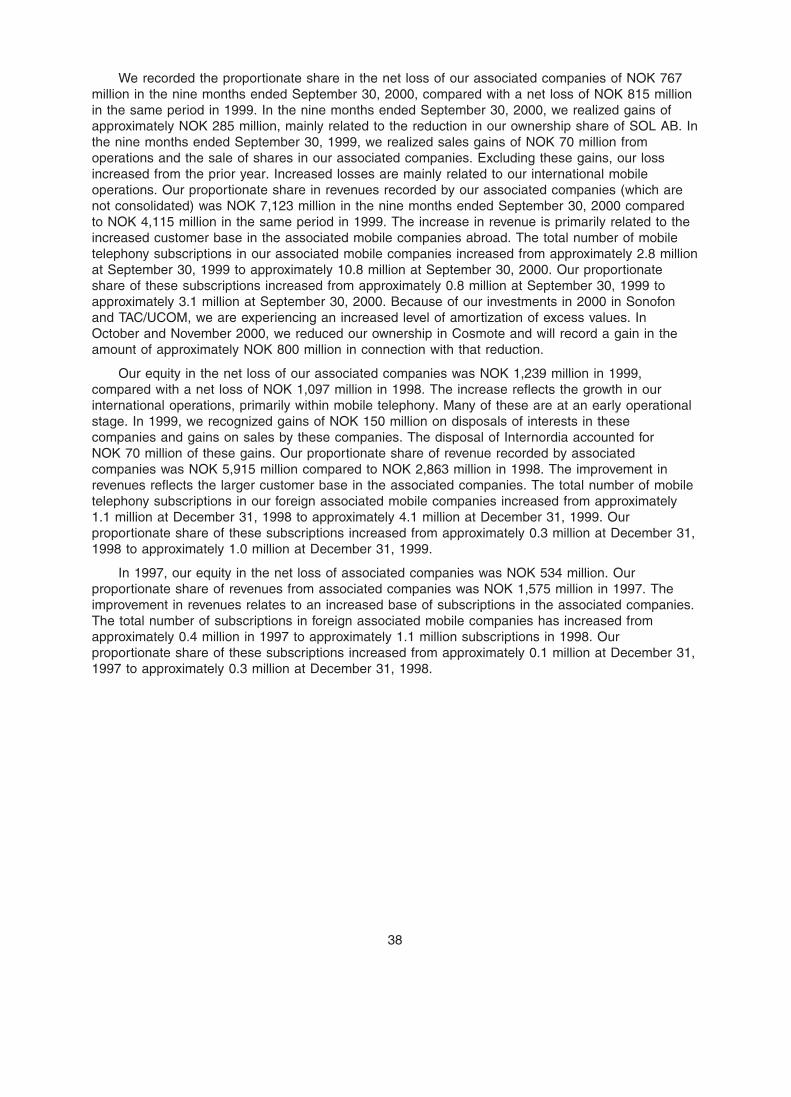
BOWNE OF LONDON 12/01/2000 19:56 BL/SM NO MARKS NEXT PCN: 044.00.00.00 -- Page is valid, no graphics X42481 043.00.00.00 5X
We recorded the proportionate share in the net loss of our associated companies of NOK 767million in the nine months ended September 30, 2000, compared with a net loss of NOK 815 millionin the same period in 1999. In the nine months ended September 30, 2000, we realized gains ofapproximately NOK 285 million, mainly related to the reduction in our ownership share of SOL AB. Inthe nine months ended September 30, 1999, we realized sales gains of NOK 70 million fromoperations and the sale of shares in our associated companies. Excluding these gains, our lossincreased from the prior year. Increased losses are mainly related to our international mobileoperations. Our proportionate share in revenues recorded by our associated companies (which arenot consolidated) was NOK 7,123 million in the nine months ended September 30, 2000 comparedto NOK 4,115 million in the same period in 1999. The increase in revenue is primarily related to theincreased customer base in the associated mobile companies abroad. The total number of mobiletelephony subscriptions in our associated mobile companies increased from approximately 2.8 millionat September 30, 1999 to approximately 10.8 million at September 30, 2000. Our proportionateshare of these subscriptions increased from approximately 0.8 million at September 30, 1999 toapproximately 3.1 million at September 30, 2000. Because of our investments in 2000 in Sonofonand TAC/UCOM, we are experiencing an increased level of amortization of excess values. InOctober and November 2000, we reduced our ownership in Cosmote and will record a gain in theamount of approximately NOK 800 million in connection with that reduction.
Our equity in the net loss of our associated companies was NOK 1,239 million in 1999,compared with a net loss of NOK 1,097 million in 1998. The increase reflects the growth in ourinternational operations, primarily within mobile telephony. Many of these are at an early operationalstage. In 1999, we recognized gains of NOK 150 million on disposals of interests in thesecompanies and gains on sales by these companies. The disposal of Internordia accounted forNOK 70 million of these gains. Our proportionate share of revenue recorded by associatedcompanies was NOK 5,915 million compared to NOK 2,863 million in 1998. The improvement inrevenues reflects the larger customer base in the associated companies. The total number of mobiletelephony subscriptions in our foreign associated mobile companies increased from approximately1.1 million at December 31, 1998 to approximately 4.1 million at December 31, 1999. Ourproportionate share of these subscriptions increased from approximately 0.3 million at December 31,1998 to approximately 1.0 million at December 31, 1999.
In 1997, our equity in the net loss of associated companies was NOK 534 million. Ourproportionate share of revenues from associated companies was NOK 1,575 million in 1997. Theimprovement in revenues relates to an increased base of subscriptions in the associated companies.The total number of subscriptions in foreign associated mobile companies has increased fromapproximately 0.4 million in 1997 to approximately 1.1 million subscriptions in 1998. Ourproportionate share of these subscriptions increased from approximately 0.1 million at December 31,1997 to approximately 0.3 million at December 31, 1998.
38
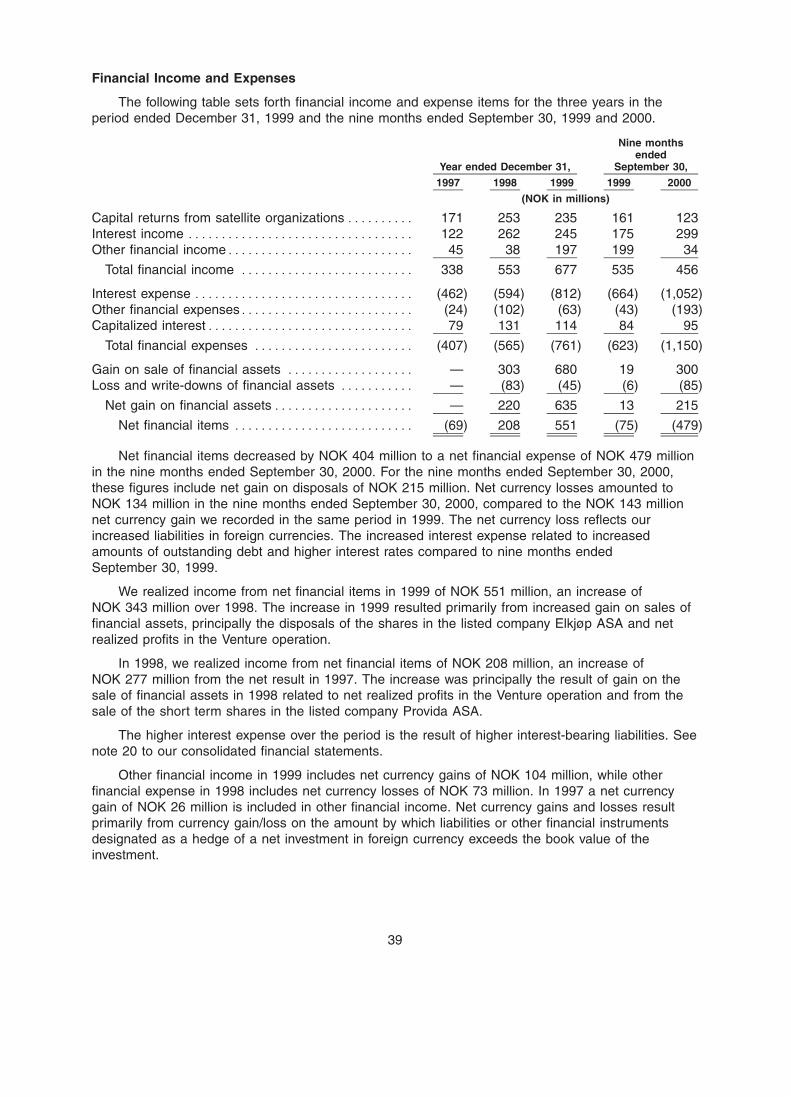
BOWNE OF LONDON 12/01/2000 19:56 BL/SM NO MARKS NEXT PCN: 045.00.00.00 -- Page is valid, no graphics X42481 044.00.00.00 7X
Financial Income and Expenses
The following table sets forth financial income and expense items for the three years in theperiod ended December 31, 1999 and the nine months ended September 30, 1999 and 2000.
Nine monthsended
Year ended December 31, September 30,
1997 1998 1999 1999 2000
(NOK in millions)
Capital returns from satellite organizations ********** 171 253 235 161 123Interest income ********************************** 122 262 245 175 299Other financial income**************************** 45 38 197 199 34
Total financial income ************************** 338 553 677 535 456
Interest expense ********************************* (462) (594) (812) (664) (1,052)Other financial expenses************************** (24) (102) (63) (43) (193)Capitalized interest******************************* 79 131 114 84 95
Total financial expenses ************************ (407) (565) (761) (623) (1,150)
Gain on sale of financial assets ******************* — 303 680 19 300Loss and write-downs of financial assets *********** — (83) (45) (6) (85)
Net gain on financial assets********************* — 220 635 13 215
Net financial items *************************** (69) 208 551 (75) (479)
Net financial items decreased by NOK 404 million to a net financial expense of NOK 479 millionin the nine months ended September 30, 2000. For the nine months ended September 30, 2000,these figures include net gain on disposals of NOK 215 million. Net currency losses amounted toNOK 134 million in the nine months ended September 30, 2000, compared to the NOK 143 millionnet currency gain we recorded in the same period in 1999. The net currency loss reflects ourincreased liabilities in foreign currencies. The increased interest expense related to increasedamounts of outstanding debt and higher interest rates compared to nine months endedSeptember 30, 1999.
We realized income from net financial items in 1999 of NOK 551 million, an increase ofNOK 343 million over 1998. The increase in 1999 resulted primarily from increased gain on sales offinancial assets, principally the disposals of the shares in the listed company Elkjøp ASA and netrealized profits in the Venture operation.
In 1998, we realized income from net financial items of NOK 208 million, an increase ofNOK 277 million from the net result in 1997. The increase was principally the result of gain on thesale of financial assets in 1998 related to net realized profits in the Venture operation and from thesale of the short term shares in the listed company Provida ASA.
The higher interest expense over the period is the result of higher interest-bearing liabilities. Seenote 20 to our consolidated financial statements.
Other financial income in 1999 includes net currency gains of NOK 104 million, while otherfinancial expense in 1998 includes net currency losses of NOK 73 million. In 1997 a net currencygain of NOK 26 million is included in other financial income. Net currency gains and losses resultprimarily from currency gain/loss on the amount by which liabilities or other financial instrumentsdesignated as a hedge of a net investment in foreign currency exceeds the book value of theinvestment.
39
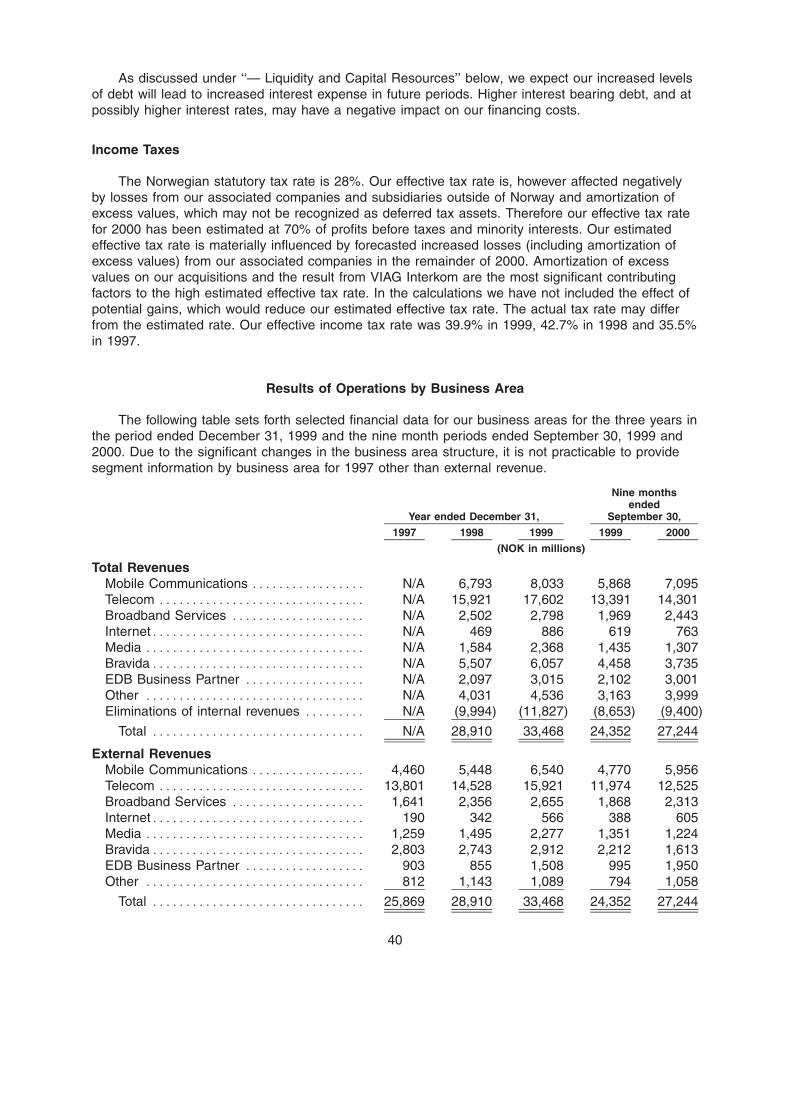
BOWNE OF LONDON 12/01/2000 19:56 BL/SM NO MARKS NEXT PCN: 046.00.00.00 -- Page is valid, no graphics X42481 045.00.00.00 6X
As discussed under ‘‘— Liquidity and Capital Resources’’ below, we expect our increased levelsof debt will lead to increased interest expense in future periods. Higher interest bearing debt, and atpossibly higher interest rates, may have a negative impact on our financing costs.
Income Taxes
The Norwegian statutory tax rate is 28%. Our effective tax rate is, however affected negativelyby losses from our associated companies and subsidiaries outside of Norway and amortization ofexcess values, which may not be recognized as deferred tax assets. Therefore our effective tax ratefor 2000 has been estimated at 70% of profits before taxes and minority interests. Our estimatedeffective tax rate is materially influenced by forecasted increased losses (including amortization ofexcess values) from our associated companies in the remainder of 2000. Amortization of excessvalues on our acquisitions and the result from VIAG Interkom are the most significant contributingfactors to the high estimated effective tax rate. In the calculations we have not included the effect ofpotential gains, which would reduce our estimated effective tax rate. The actual tax rate may differfrom the estimated rate. Our effective income tax rate was 39.9% in 1999, 42.7% in 1998 and 35.5%in 1997.
Results of Operations by Business Area
The following table sets forth selected financial data for our business areas for the three years inthe period ended December 31, 1999 and the nine month periods ended September 30, 1999 and2000. Due to the significant changes in the business area structure, it is not practicable to providesegment information by business area for 1997 other than external revenue.
Nine monthsended
Year ended December 31, September 30,
1997 1998 1999 1999 2000
(NOK in millions)
Total RevenuesMobile Communications ***************** N/A 6,793 8,033 5,868 7,095Telecom ******************************* N/A 15,921 17,602 13,391 14,301Broadband Services ******************** N/A 2,502 2,798 1,969 2,443Internet******************************** N/A 469 886 619 763Media ********************************* N/A 1,584 2,368 1,435 1,307Bravida******************************** N/A 5,507 6,057 4,458 3,735EDB Business Partner ****************** N/A 2,097 3,015 2,102 3,001Other ********************************* N/A 4,031 4,536 3,163 3,999Eliminations of internal revenues ********* N/A (9,994) (11,827) (8,653) (9,400)
Total ******************************** N/A 28,910 33,468 24,352 27,244
External RevenuesMobile Communications ***************** 4,460 5,448 6,540 4,770 5,956Telecom ******************************* 13,801 14,528 15,921 11,974 12,525Broadband Services ******************** 1,641 2,356 2,655 1,868 2,313Internet******************************** 190 342 566 388 605Media ********************************* 1,259 1,495 2,277 1,351 1,224Bravida******************************** 2,803 2,743 2,912 2,212 1,613EDB Business Partner ****************** 903 855 1,508 995 1,950Other ********************************* 812 1,143 1,089 794 1,058
Total ******************************** 25,869 28,910 33,468 24,352 27,244
40
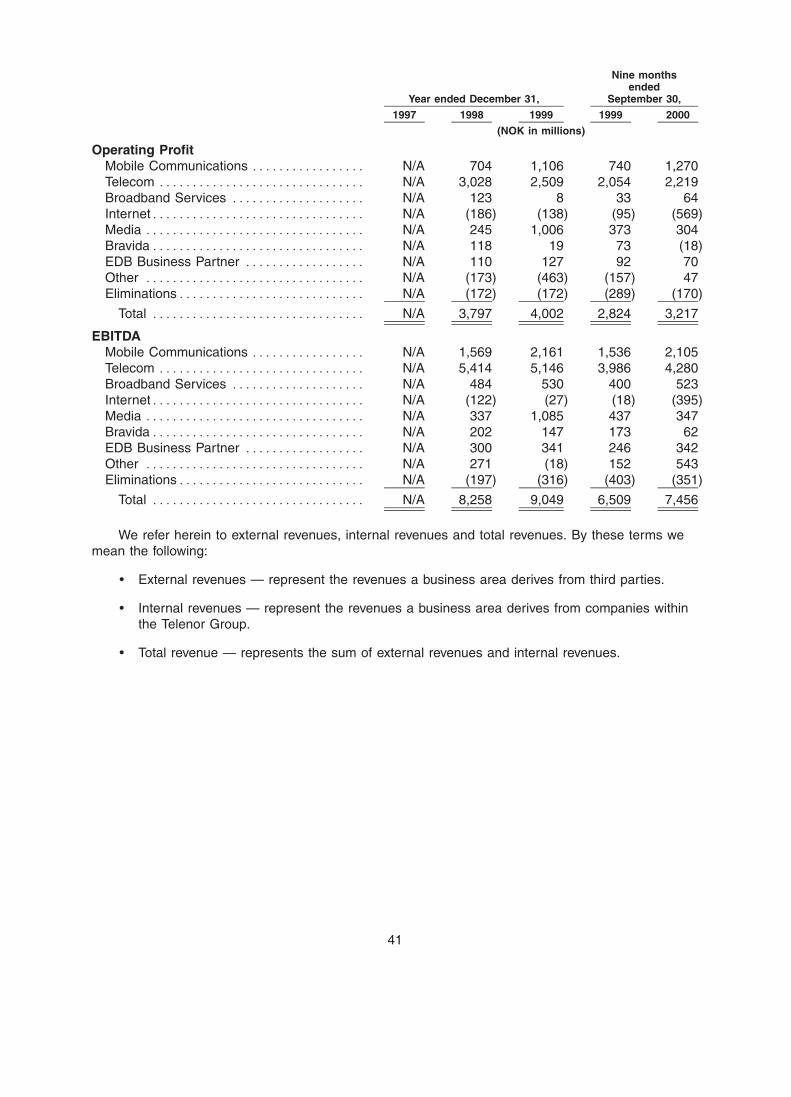
BOWNE OF LONDON 12/01/2000 19:56 BL/SM NO MARKS NEXT PCN: 047.00.00.00 -- Page is valid, no graphics X42481 046.00.00.00 7X
Nine monthsended
Year ended December 31, September 30,
1997 1998 1999 1999 2000
(NOK in millions)
Operating ProfitMobile Communications ***************** N/A 704 1,106 740 1,270Telecom ******************************* N/A 3,028 2,509 2,054 2,219Broadband Services ******************** N/A 123 8 33 64Internet******************************** N/A (186) (138) (95) (569)Media ********************************* N/A 245 1,006 373 304Bravida******************************** N/A 118 19 73 (18)EDB Business Partner ****************** N/A 110 127 92 70Other ********************************* N/A (173) (463) (157) 47Eliminations**************************** N/A (172) (172) (289) (170)
Total ******************************** N/A 3,797 4,002 2,824 3,217
EBITDAMobile Communications ***************** N/A 1,569 2,161 1,536 2,105Telecom ******************************* N/A 5,414 5,146 3,986 4,280Broadband Services ******************** N/A 484 530 400 523Internet******************************** N/A (122) (27) (18) (395)Media ********************************* N/A 337 1,085 437 347Bravida******************************** N/A 202 147 173 62EDB Business Partner ****************** N/A 300 341 246 342Other ********************************* N/A 271 (18) 152 543Eliminations**************************** N/A (197) (316) (403) (351)
Total ******************************** N/A 8,258 9,049 6,509 7,456
We refer herein to external revenues, internal revenues and total revenues. By these terms wemean the following:
) External revenues — represent the revenues a business area derives from third parties.
) Internal revenues — represent the revenues a business area derives from companies withinthe Telenor Group.
) Total revenue — represents the sum of external revenues and internal revenues.
41
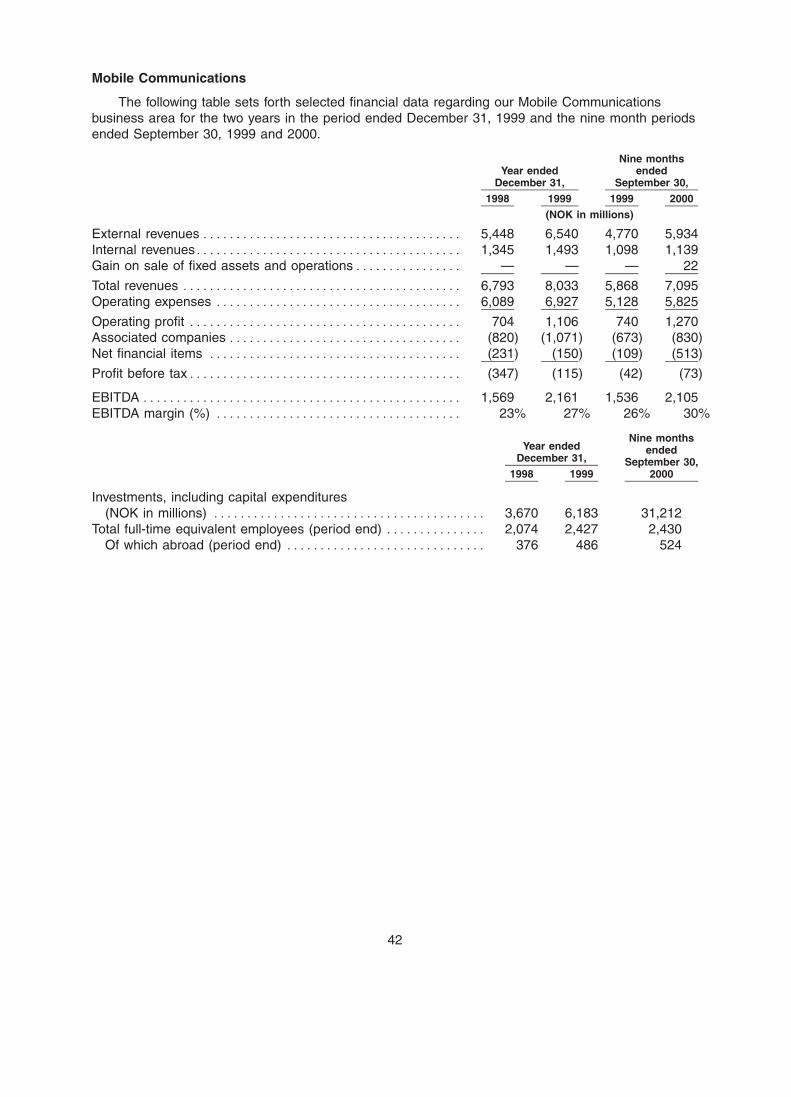
BOWNE OF LONDON 12/01/2000 19:56 BL/SM NO MARKS NEXT PCN: 048.00.00.00 -- Page is valid, no graphics X42481 047.00.00.00 6X
Mobile Communications
The following table sets forth selected financial data regarding our Mobile Communicationsbusiness area for the two years in the period ended December 31, 1999 and the nine month periodsended September 30, 1999 and 2000.
Nine monthsYear ended ended
December 31, September 30,
1998 1999 1999 2000
(NOK in millions)
External revenues *************************************** 5,448 6,540 4,770 5,934Internal revenues**************************************** 1,345 1,493 1,098 1,139Gain on sale of fixed assets and operations**************** — — — 22
Total revenues ****************************************** 6,793 8,033 5,868 7,095Operating expenses ************************************* 6,089 6,927 5,128 5,825
Operating profit ***************************************** 704 1,106 740 1,270Associated companies *********************************** (820) (1,071) (673) (830)Net financial items ************************************** (231) (150) (109) (513)
Profit before tax***************************************** (347) (115) (42) (73)
EBITDA ************************************************ 1,569 2,161 1,536 2,105EBITDA margin (%) ************************************* 23% 27% 26% 30%
Nine monthsYear ended ended
December 31, September 30,1998 1999 2000
Investments, including capital expenditures(NOK in millions) ***************************************** 3,670 6,183 31,212
Total full-time equivalent employees (period end) *************** 2,074 2,427 2,430Of which abroad (period end) ****************************** 376 486 524
42
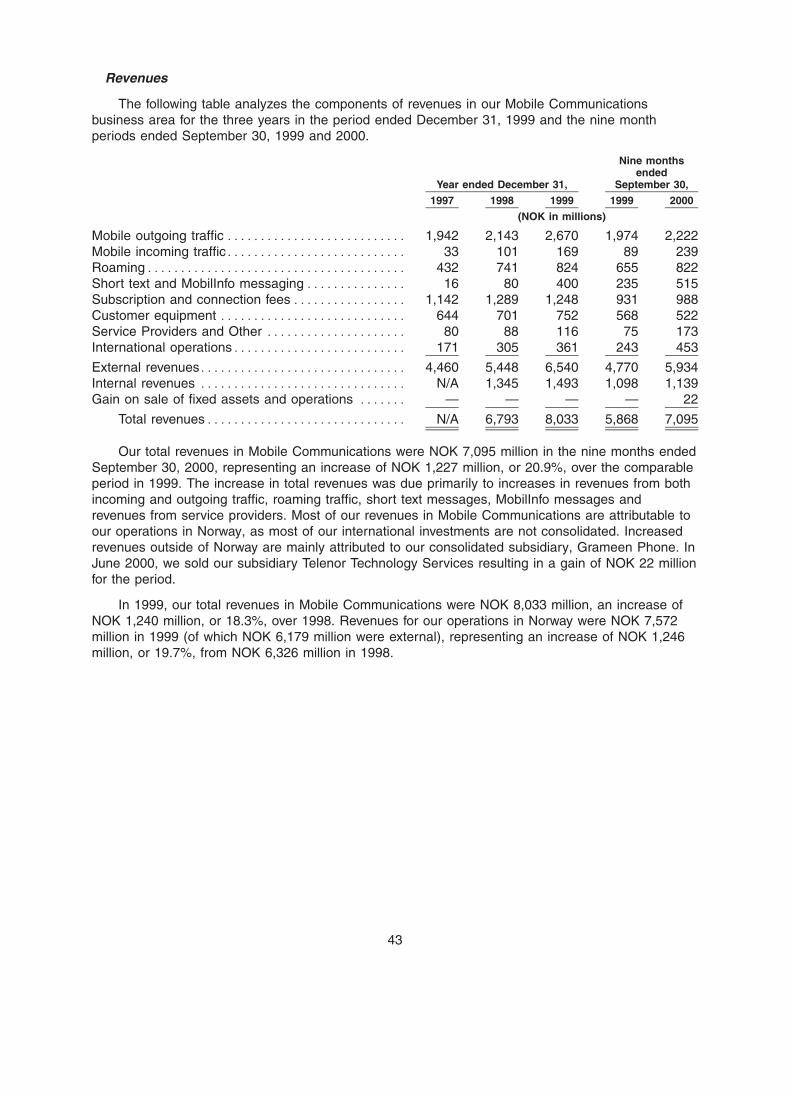
BOWNE OF LONDON 12/01/2000 19:56 BL/SM NO MARKS NEXT PCN: 049.00.00.00 -- Page is valid, no graphics X42481 048.00.00.00 6X
Revenues
The following table analyzes the components of revenues in our Mobile Communicationsbusiness area for the three years in the period ended December 31, 1999 and the nine monthperiods ended September 30, 1999 and 2000.
Nine monthsended
Year ended December 31, September 30,
1997 1998 1999 1999 2000
(NOK in millions)
Mobile outgoing traffic *************************** 1,942 2,143 2,670 1,974 2,222Mobile incoming traffic*************************** 33 101 169 89 239Roaming*************************************** 432 741 824 655 822Short text and MobilInfo messaging*************** 16 80 400 235 515Subscription and connection fees ***************** 1,142 1,289 1,248 931 988Customer equipment **************************** 644 701 752 568 522Service Providers and Other ********************* 80 88 116 75 173International operations************************** 171 305 361 243 453
External revenues******************************* 4,460 5,448 6,540 4,770 5,934Internal revenues ******************************* N/A 1,345 1,493 1,098 1,139Gain on sale of fixed assets and operations ******* — — — — 22
Total revenues****************************** N/A 6,793 8,033 5,868 7,095
Our total revenues in Mobile Communications were NOK 7,095 million in the nine months endedSeptember 30, 2000, representing an increase of NOK 1,227 million, or 20.9%, over the comparableperiod in 1999. The increase in total revenues was due primarily to increases in revenues from bothincoming and outgoing traffic, roaming traffic, short text messages, MobilInfo messages andrevenues from service providers. Most of our revenues in Mobile Communications are attributable toour operations in Norway, as most of our international investments are not consolidated. Increasedrevenues outside of Norway are mainly attributed to our consolidated subsidiary, Grameen Phone. InJune 2000, we sold our subsidiary Telenor Technology Services resulting in a gain of NOK 22 millionfor the period.
In 1999, our total revenues in Mobile Communications were NOK 8,033 million, an increase ofNOK 1,240 million, or 18.3%, over 1998. Revenues for our operations in Norway were NOK 7,572million in 1999 (of which NOK 6,179 million were external), representing an increase of NOK 1,246million, or 19.7%, from NOK 6,326 million in 1998.
43
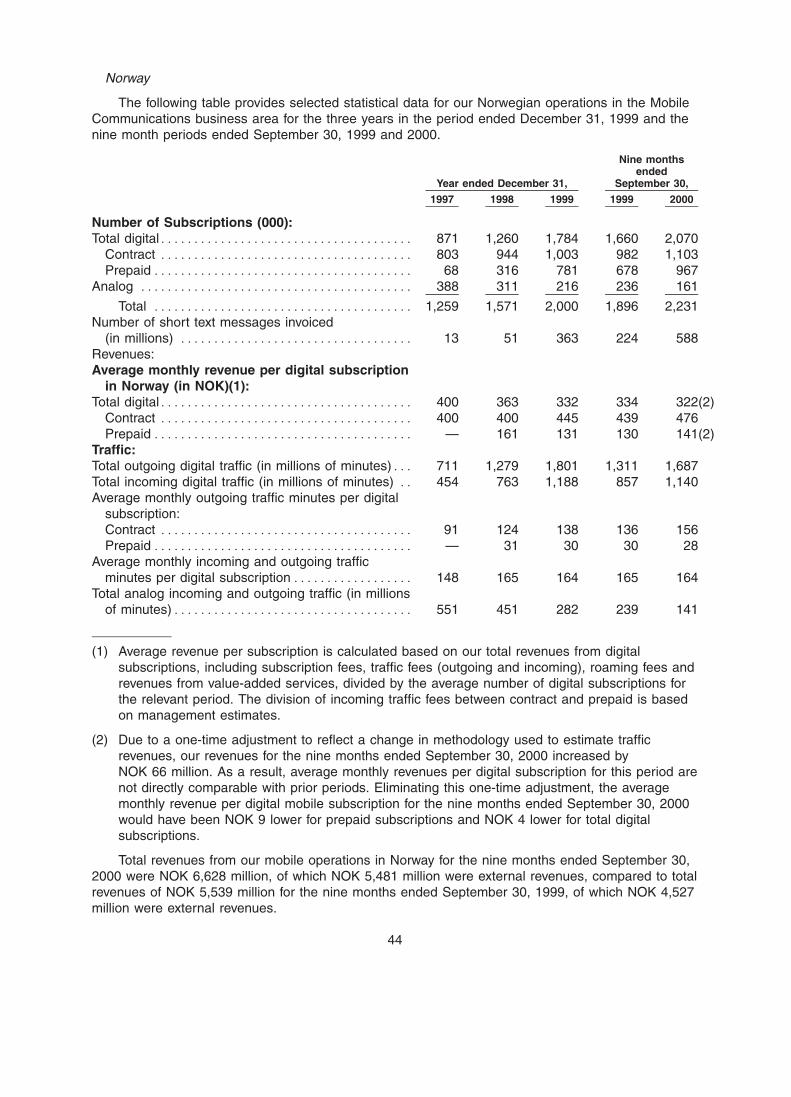
BOWNE OF LONDON 12/03/2000 09:59 BL/SM NO MARKS NEXT PCN: 050.00.00.00 -- Page is valid, no graphics X42481 049.00.00.00 7X
Norway
The following table provides selected statistical data for our Norwegian operations in the MobileCommunications business area for the three years in the period ended December 31, 1999 and thenine month periods ended September 30, 1999 and 2000.
Nine monthsended
Year ended December 31, September 30,
1997 1998 1999 1999 2000
Number of Subscriptions (000):Total digital************************************** 871 1,260 1,784 1,660 2,070
Contract ************************************** 803 944 1,003 982 1,103Prepaid*************************************** 68 316 781 678 967
Analog ***************************************** 388 311 216 236 161
Total *************************************** 1,259 1,571 2,000 1,896 2,231Number of short text messages invoiced
(in millions) *********************************** 13 51 363 224 588Revenues:Average monthly revenue per digital subscription
in Norway (in NOK)(1):Total digital************************************** 400 363 332 334 322(2)
Contract ************************************** 400 400 445 439 476Prepaid*************************************** — 161 131 130 141(2)
Traffic:Total outgoing digital traffic (in millions of minutes)*** 711 1,279 1,801 1,311 1,687Total incoming digital traffic (in millions of minutes) ** 454 763 1,188 857 1,140Average monthly outgoing traffic minutes per digital
subscription:Contract ************************************** 91 124 138 136 156Prepaid*************************************** — 31 30 30 28
Average monthly incoming and outgoing trafficminutes per digital subscription****************** 148 165 164 165 164
Total analog incoming and outgoing traffic (in millionsof minutes)************************************ 551 451 282 239 141
(1) Average revenue per subscription is calculated based on our total revenues from digitalsubscriptions, including subscription fees, traffic fees (outgoing and incoming), roaming fees andrevenues from value-added services, divided by the average number of digital subscriptions forthe relevant period. The division of incoming traffic fees between contract and prepaid is basedon management estimates.
(2) Due to a one-time adjustment to reflect a change in methodology used to estimate trafficrevenues, our revenues for the nine months ended September 30, 2000 increased byNOK 66 million. As a result, average monthly revenues per digital subscription for this period arenot directly comparable with prior periods. Eliminating this one-time adjustment, the averagemonthly revenue per digital mobile subscription for the nine months ended September 30, 2000would have been NOK 9 lower for prepaid subscriptions and NOK 4 lower for total digitalsubscriptions.
Total revenues from our mobile operations in Norway for the nine months ended September 30,2000 were NOK 6,628 million, of which NOK 5,481 million were external revenues, compared to totalrevenues of NOK 5,539 million for the nine months ended September 30, 1999, of which NOK 4,527million were external revenues.
44
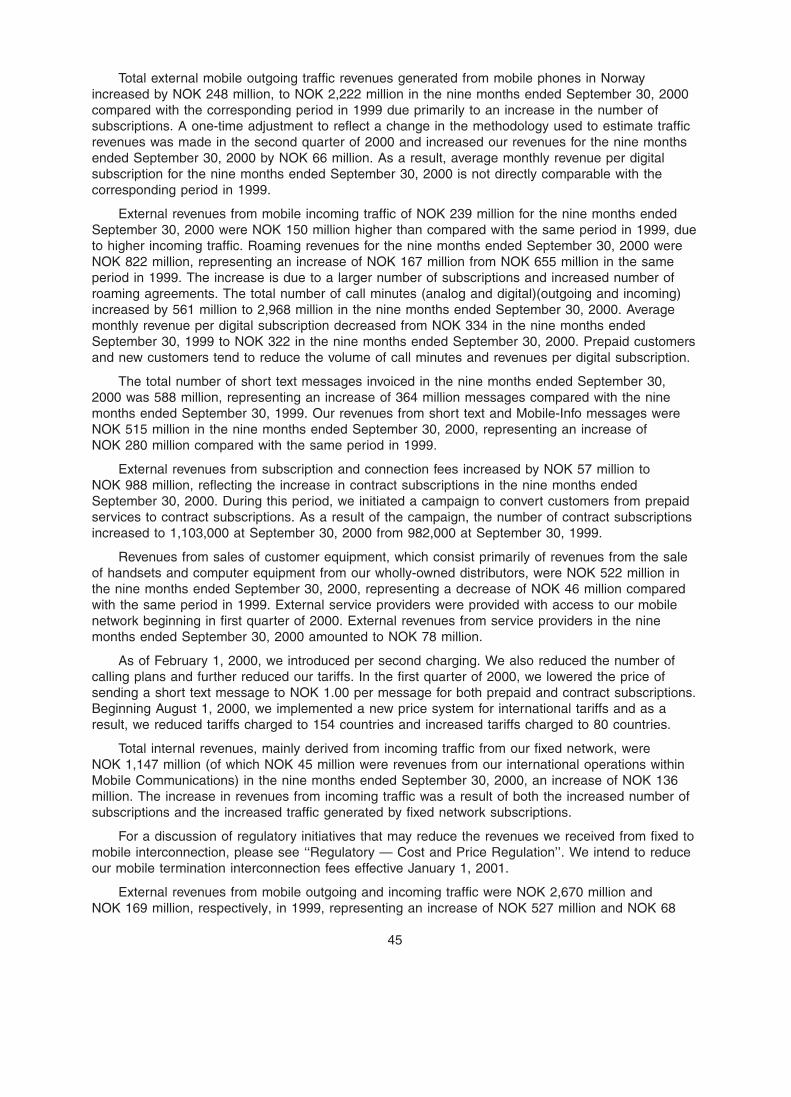
BOWNE OF LONDON 12/01/2000 19:56 BL/SM NO MARKS NEXT PCN: 051.00.00.00 -- Page is valid, no graphics X42481 050.00.00.00 5X
Total external mobile outgoing traffic revenues generated from mobile phones in Norwayincreased by NOK 248 million, to NOK 2,222 million in the nine months ended September 30, 2000compared with the corresponding period in 1999 due primarily to an increase in the number ofsubscriptions. A one-time adjustment to reflect a change in the methodology used to estimate trafficrevenues was made in the second quarter of 2000 and increased our revenues for the nine monthsended September 30, 2000 by NOK 66 million. As a result, average monthly revenue per digitalsubscription for the nine months ended September 30, 2000 is not directly comparable with thecorresponding period in 1999.
External revenues from mobile incoming traffic of NOK 239 million for the nine months endedSeptember 30, 2000 were NOK 150 million higher than compared with the same period in 1999, dueto higher incoming traffic. Roaming revenues for the nine months ended September 30, 2000 wereNOK 822 million, representing an increase of NOK 167 million from NOK 655 million in the sameperiod in 1999. The increase is due to a larger number of subscriptions and increased number ofroaming agreements. The total number of call minutes (analog and digital)(outgoing and incoming)increased by 561 million to 2,968 million in the nine months ended September 30, 2000. Averagemonthly revenue per digital subscription decreased from NOK 334 in the nine months endedSeptember 30, 1999 to NOK 322 in the nine months ended September 30, 2000. Prepaid customersand new customers tend to reduce the volume of call minutes and revenues per digital subscription.
The total number of short text messages invoiced in the nine months ended September 30,2000 was 588 million, representing an increase of 364 million messages compared with the ninemonths ended September 30, 1999. Our revenues from short text and Mobile-Info messages wereNOK 515 million in the nine months ended September 30, 2000, representing an increase ofNOK 280 million compared with the same period in 1999.
External revenues from subscription and connection fees increased by NOK 57 million toNOK 988 million, reflecting the increase in contract subscriptions in the nine months endedSeptember 30, 2000. During this period, we initiated a campaign to convert customers from prepaidservices to contract subscriptions. As a result of the campaign, the number of contract subscriptionsincreased to 1,103,000 at September 30, 2000 from 982,000 at September 30, 1999.
Revenues from sales of customer equipment, which consist primarily of revenues from the saleof handsets and computer equipment from our wholly-owned distributors, were NOK 522 million inthe nine months ended September 30, 2000, representing a decrease of NOK 46 million comparedwith the same period in 1999. External service providers were provided with access to our mobilenetwork beginning in first quarter of 2000. External revenues from service providers in the ninemonths ended September 30, 2000 amounted to NOK 78 million.
As of February 1, 2000, we introduced per second charging. We also reduced the number ofcalling plans and further reduced our tariffs. In the first quarter of 2000, we lowered the price ofsending a short text message to NOK 1.00 per message for both prepaid and contract subscriptions.Beginning August 1, 2000, we implemented a new price system for international tariffs and as aresult, we reduced tariffs charged to 154 countries and increased tariffs charged to 80 countries.
Total internal revenues, mainly derived from incoming traffic from our fixed network, wereNOK 1,147 million (of which NOK 45 million were revenues from our international operations withinMobile Communications) in the nine months ended September 30, 2000, an increase of NOK 136million. The increase in revenues from incoming traffic was a result of both the increased number ofsubscriptions and the increased traffic generated by fixed network subscriptions.
For a discussion of regulatory initiatives that may reduce the revenues we received from fixed tomobile interconnection, please see ‘‘Regulatory — Cost and Price Regulation’’. We intend to reduceour mobile termination interconnection fees effective January 1, 2001.
External revenues from mobile outgoing and incoming traffic were NOK 2,670 million andNOK 169 million, respectively, in 1999, representing an increase of NOK 527 million and NOK 68
45
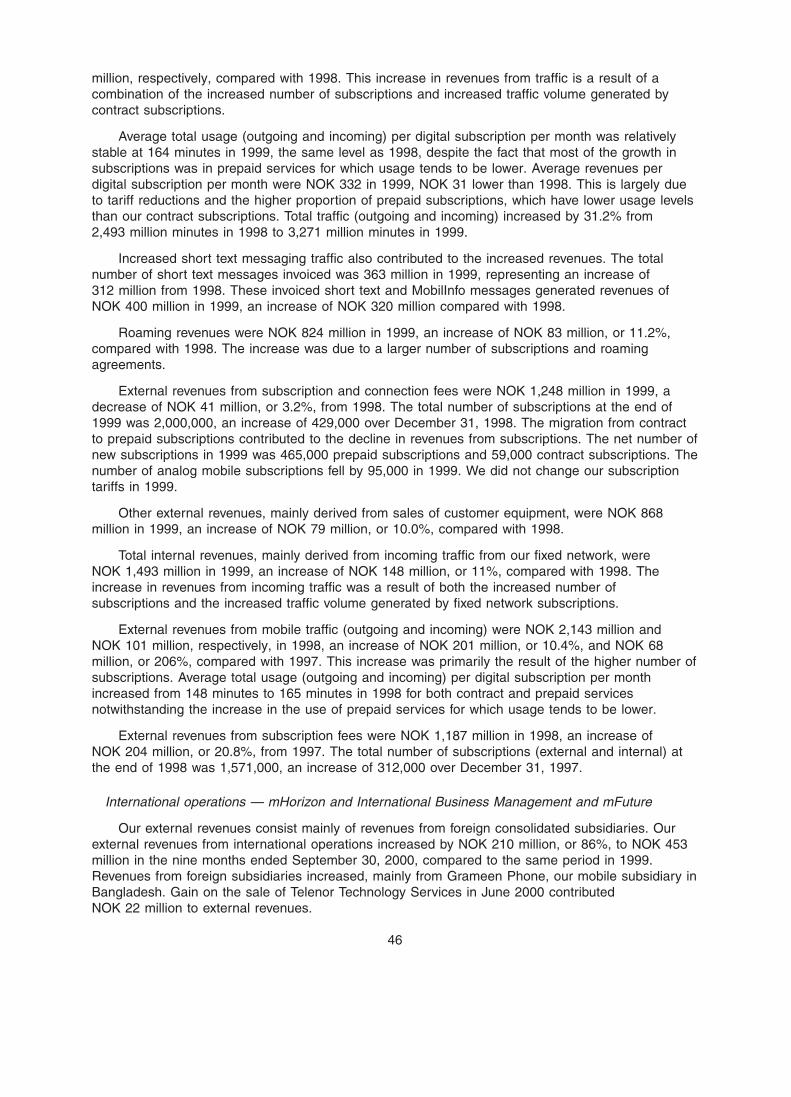
BOWNE OF LONDON 12/01/2000 19:56 BL/SM NO MARKS NEXT PCN: 052.00.00.00 -- Page is valid, no graphics X42481 051.00.00.00 5X
million, respectively, compared with 1998. This increase in revenues from traffic is a result of acombination of the increased number of subscriptions and increased traffic volume generated bycontract subscriptions.
Average total usage (outgoing and incoming) per digital subscription per month was relativelystable at 164 minutes in 1999, the same level as 1998, despite the fact that most of the growth insubscriptions was in prepaid services for which usage tends to be lower. Average revenues perdigital subscription per month were NOK 332 in 1999, NOK 31 lower than 1998. This is largely dueto tariff reductions and the higher proportion of prepaid subscriptions, which have lower usage levelsthan our contract subscriptions. Total traffic (outgoing and incoming) increased by 31.2% from2,493 million minutes in 1998 to 3,271 million minutes in 1999.
Increased short text messaging traffic also contributed to the increased revenues. The totalnumber of short text messages invoiced was 363 million in 1999, representing an increase of312 million from 1998. These invoiced short text and MobilInfo messages generated revenues ofNOK 400 million in 1999, an increase of NOK 320 million compared with 1998.
Roaming revenues were NOK 824 million in 1999, an increase of NOK 83 million, or 11.2%,compared with 1998. The increase was due to a larger number of subscriptions and roamingagreements.
External revenues from subscription and connection fees were NOK 1,248 million in 1999, adecrease of NOK 41 million, or 3.2%, from 1998. The total number of subscriptions at the end of1999 was 2,000,000, an increase of 429,000 over December 31, 1998. The migration from contractto prepaid subscriptions contributed to the decline in revenues from subscriptions. The net number ofnew subscriptions in 1999 was 465,000 prepaid subscriptions and 59,000 contract subscriptions. Thenumber of analog mobile subscriptions fell by 95,000 in 1999. We did not change our subscriptiontariffs in 1999.
Other external revenues, mainly derived from sales of customer equipment, were NOK 868million in 1999, an increase of NOK 79 million, or 10.0%, compared with 1998.
Total internal revenues, mainly derived from incoming traffic from our fixed network, wereNOK 1,493 million in 1999, an increase of NOK 148 million, or 11%, compared with 1998. Theincrease in revenues from incoming traffic was a result of both the increased number ofsubscriptions and the increased traffic volume generated by fixed network subscriptions.
External revenues from mobile traffic (outgoing and incoming) were NOK 2,143 million andNOK 101 million, respectively, in 1998, an increase of NOK 201 million, or 10.4%, and NOK 68million, or 206%, compared with 1997. This increase was primarily the result of the higher number ofsubscriptions. Average total usage (outgoing and incoming) per digital subscription per monthincreased from 148 minutes to 165 minutes in 1998 for both contract and prepaid servicesnotwithstanding the increase in the use of prepaid services for which usage tends to be lower.
External revenues from subscription fees were NOK 1,187 million in 1998, an increase ofNOK 204 million, or 20.8%, from 1997. The total number of subscriptions (external and internal) atthe end of 1998 was 1,571,000, an increase of 312,000 over December 31, 1997.
International operations — mHorizon and International Business Management and mFuture
Our external revenues consist mainly of revenues from foreign consolidated subsidiaries. Ourexternal revenues from international operations increased by NOK 210 million, or 86%, to NOK 453million in the nine months ended September 30, 2000, compared to the same period in 1999.Revenues from foreign subsidiaries increased, mainly from Grameen Phone, our mobile subsidiary inBangladesh. Gain on the sale of Telenor Technology Services in June 2000 contributedNOK 22 million to external revenues.
46
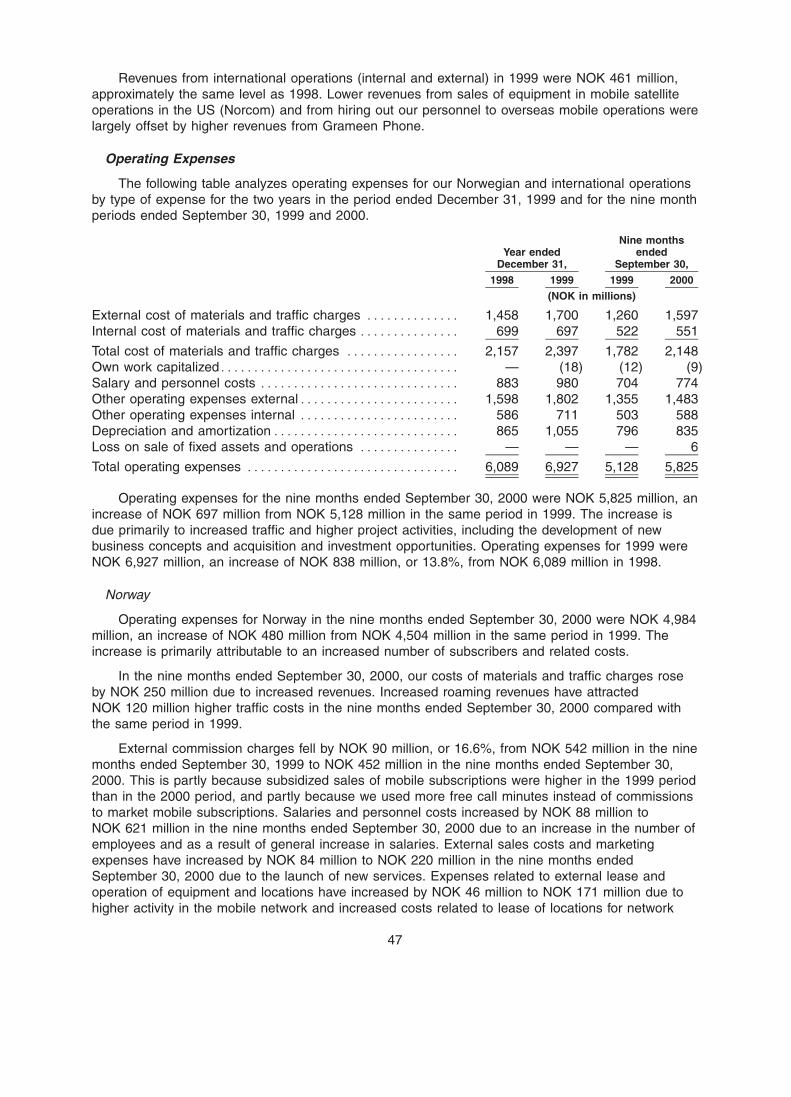
BOWNE OF LONDON 12/01/2000 19:56 BL/SM NO MARKS NEXT PCN: 053.00.00.00 -- Page is valid, no graphics X42481 052.00.00.00 5X
Revenues from international operations (internal and external) in 1999 were NOK 461 million,approximately the same level as 1998. Lower revenues from sales of equipment in mobile satelliteoperations in the US (Norcom) and from hiring out our personnel to overseas mobile operations werelargely offset by higher revenues from Grameen Phone.
Operating Expenses
The following table analyzes operating expenses for our Norwegian and international operationsby type of expense for the two years in the period ended December 31, 1999 and for the nine monthperiods ended September 30, 1999 and 2000.
Nine monthsYear ended ended
December 31, September 30,
1998 1999 1999 2000
(NOK in millions)
External cost of materials and traffic charges ************** 1,458 1,700 1,260 1,597Internal cost of materials and traffic charges *************** 699 697 522 551
Total cost of materials and traffic charges ***************** 2,157 2,397 1,782 2,148Own work capitalized************************************ — (18) (12) (9)Salary and personnel costs ****************************** 883 980 704 774Other operating expenses external************************ 1,598 1,802 1,355 1,483Other operating expenses internal ************************ 586 711 503 588Depreciation and amortization**************************** 865 1,055 796 835Loss on sale of fixed assets and operations *************** — — — 6
Total operating expenses ******************************** 6,089 6,927 5,128 5,825
Operating expenses for the nine months ended September 30, 2000 were NOK 5,825 million, anincrease of NOK 697 million from NOK 5,128 million in the same period in 1999. The increase isdue primarily to increased traffic and higher project activities, including the development of newbusiness concepts and acquisition and investment opportunities. Operating expenses for 1999 wereNOK 6,927 million, an increase of NOK 838 million, or 13.8%, from NOK 6,089 million in 1998.
Norway
Operating expenses for Norway in the nine months ended September 30, 2000 were NOK 4,984million, an increase of NOK 480 million from NOK 4,504 million in the same period in 1999. Theincrease is primarily attributable to an increased number of subscribers and related costs.
In the nine months ended September 30, 2000, our costs of materials and traffic charges roseby NOK 250 million due to increased revenues. Increased roaming revenues have attractedNOK 120 million higher traffic costs in the nine months ended September 30, 2000 compared withthe same period in 1999.
External commission charges fell by NOK 90 million, or 16.6%, from NOK 542 million in the ninemonths ended September 30, 1999 to NOK 452 million in the nine months ended September 30,2000. This is partly because subsidized sales of mobile subscriptions were higher in the 1999 periodthan in the 2000 period, and partly because we used more free call minutes instead of commissionsto market mobile subscriptions. Salaries and personnel costs increased by NOK 88 million toNOK 621 million in the nine months ended September 30, 2000 due to an increase in the number ofemployees and as a result of general increase in salaries. External sales costs and marketingexpenses have increased by NOK 84 million to NOK 220 million in the nine months endedSeptember 30, 2000 due to the launch of new services. Expenses related to external lease andoperation of equipment and locations have increased by NOK 46 million to NOK 171 million due tohigher activity in the mobile network and increased costs related to lease of locations for network
47
BOWNE OF LONDON 12/03/2000 10:16 BL/SM NO MARKS NEXT PCN: 054.00.00.00 -- Page is valid, no graphics X42481 053.00.00.00 6X
equipment. Other operating expenses increased in line with higher levels of activity. Depreciation andamortization increased to NOK 714 million in the nine months ended September 30, 2000 comparedto NOK 685 million for the same period in 1999.
Operating expenses for operations in Norway were NOK 6,048 million in 1999, an increase ofNOK 767 million, or 14.5%, compared with 1998.
Costs of materials and traffic charges were NOK 2,230 million in 1999. This represents anincrease of NOK 218 million, or 10.8%, over 1998. The charge for traffic terminating in otheroperators’ networks was lower in 1999 than in 1998. However, the increase in traffic volume in otheroperators’ networks more than compensated for this. Although short text messaging and mobile-incoming traffic did not generate traffic costs, they generated increased capacity costs. A higherproportion of traffic between our Mobil subscribers has also limited the increase in traffic costs.
Increased staff numbers and a general increase in salary levels resulted in an increase in salaryand personnel costs of NOK 119 million, or 18.8%, to NOK 752 million in 1999.
Other costs rose by NOK 264 million, mainly as a result of higher activity levels in 1999.Commission charges were NOK 680 million in 1999, which represents an increase of NOK 68million, or 11.1%, compared with 1998. The increase can be attributed primarily to gross subscriptionsales which were approximately 38% higher in 1999 than in 1998. This increase is partly offset by a25% reduction in the average commission cost per subscription sold from 1998 to 1999.
Depreciation and write-offs were NOK 913 million in 1999, an increase of NOK 184 million, or25.2%, compared with 1998. This was primarily the result of a high level of investment in our digitalnetwork, and write-offs on our Nordic Mobile Telephone 900 (analog) and pager networks.
International Operations — mHorizon and International Business Management and mFuture
Our operating expenses for our international operations consist of project costs and other costsof our consolidated foreign subsidiaries. Our operating expenses (including internal expenses forservices from our Norwegian operations within Mobile Communications) for the nine months endedSeptember 30, 2000 were NOK 886 million, an increase of NOK 259 million from NOK 627 million inthe nine months ended September 30, 1999. This increase was primarily attributable to increasedtraffic in subsidiaries and higher project costs, including the development of new concepts andpursuing acquisition and investment opportunities. We expect to incur substantial expenditures infuture periods in connection with these initiatives.
Our operating expenses for international operations were NOK 879 million in 1999, NOK 71million, or 8.8%, higher than in 1998. This increase was primarily attributable to higher project costsresulting from larger projects and marketing activities as well as higher administration costs inoverseas subsidiaries because of higher activity levels.
Operating Profits
Our operating profits for our Mobile Communications business area were NOK 1,270 million inthe nine months ended September 30, 2000, representing an increase of NOK 530 million, or 72%,over the same period in 1999. Operations within Norway increased operating profits by NOK 608million, or 59%, to NOK 1,643 million, due mainly to increased revenues. This includes Zalto whichhad an operating loss of NOK 46 million in the nine months ended September 30, 2000. Ouroperating loss in international operations — mHorizon and international business management andmFuture increased by NOK 78 million, or 27%, to NOK 373 million due to higher project costs.Higher marketing, personnel and other costs associated with the launch of djuice contributedNOK 56 million to the operating loss for the nine months ended September 30, 2000.
Our operating profits for Mobile Communications in 1999 were NOK 1,106 million, an increaseof NOK 402 million, or 57.1%, compared with 1998. The operating profits for operations in Norway
48
BOWNE OF LONDON 12/01/2000 19:56 BL/SM NO MARKS NEXT PCN: 055.00.00.00 -- Page is valid, no graphics X42481 054.00.00.00 5X
were NOK 1,524 million in 1999, an increase of NOK 479 million, or 45.8%, over 1998. Thisincrease was primarily attributable to higher revenues due to growth in subscriptions and theresulting growth in voice traffic, as well as a substantial increase in use of short text messaging.
In 1999, our international operations — mHorizon and international business management andmFuture recorded an operating loss of NOK 418 million, an increase of NOK 77 million, or 22.6%,compared with 1998. The change can be attributed to higher project-related costs resulting fromlarge-scale projects and an increased focus on international marketing activities.
Associated Companies Outside Norway
Our associated companies outside Norway recorded a loss of NOK 830 million in the ninemonths ended September 30, 2000. We recorded a loss in the nine months ended September 30,1999 of NOK 673 million. The increased loss is mainly a consequence of increased amortization ofexcess values related to our newly-acquired interests in TAC and UCOM in Thailand and Sonofon inDenmark.
Our proportionate share of revenues in associated mobile companies outside Norway wasapproximately NOK 5,735 million in the nine months ended September 30, 2000 compared toNOK 2,816 million in the same period of 1999. The improvement in revenues is attributable to thesuccessful commercial development of many of these investments. The customer base was generallyhigher and the infrastructure was more developed than in the nine months ended September 30,1999. Of the increase, an aggregate of NOK 895 million related to the acquired companiesDiGi.com, Sonofon and TAC/UCOM for the nine months ended September 30, 2000. Despite theincrease in revenues, average revenue per user decreased. The decline in average revenue per useris mainly due to the fact that the increase in the customer base to a large extent has been in theprepaid segment and these customers generally have a lower usage level than contract subscribers.
Our share of revenues for 1999 from associated companies outside Norway was NOK 4,186million. This represents an increase of NOK 2,557 million compared with 1998. Acquisitions accountfor NOK 561 million of the increase. Of the total revenues in 1999, NOK 1,704 million was derivedfrom companies in Western Europe, NOK 1,836 million from companies in Central Europe andNOK 646 million from companies in Eastern Europe.
During 1999, several of these companies experienced strong growth in subscriptions. Thisgrowth resulted in higher revenues. Cosmote in Greece, Connect Austria in Austria, Esat Digifone inIreland and Viag Interkom in Germany increased their combined number of subscriptions by2,358,000. Our share of revenues in these companies increased by NOK 1,926 million in 1999compared to 1998.
In 1999, associated companies recorded a loss of NOK 1,071 million, an increase of NOK 251million, or 30.6%, over the loss in 1998. The higher loss was primarily a result of many of thecompanies being in an early stage of development. Mobile operations in the early stage ofcommercial operations typically have lower revenues while costs associated with establishing andoperating the technical structure and developing the organization and customer service functionsare high.
49
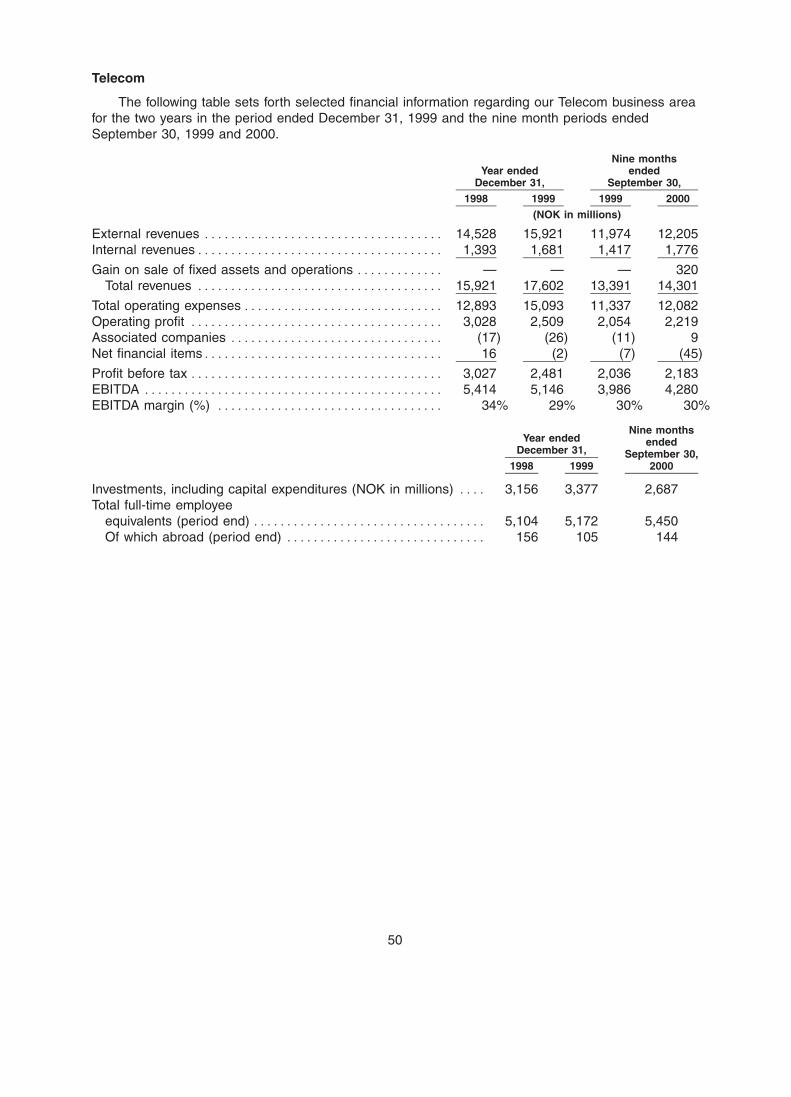
BOWNE OF LONDON 12/01/2000 19:56 BL/SM NO MARKS NEXT PCN: 056.00.00.00 -- Page is valid, no graphics X42481 055.00.00.00 5X
Telecom
The following table sets forth selected financial information regarding our Telecom business areafor the two years in the period ended December 31, 1999 and the nine month periods endedSeptember 30, 1999 and 2000.
Nine monthsYear ended ended
December 31, September 30,
1998 1999 1999 2000
(NOK in millions)
External revenues ************************************ 14,528 15,921 11,974 12,205Internal revenues************************************* 1,393 1,681 1,417 1,776
Gain on sale of fixed assets and operations ************* — — — 320Total revenues ************************************* 15,921 17,602 13,391 14,301
Total operating expenses ****************************** 12,893 15,093 11,337 12,082Operating profit ************************************** 3,028 2,509 2,054 2,219Associated companies ******************************** (17) (26) (11) 9Net financial items************************************ 16 (2) (7) (45)
Profit before tax ************************************** 3,027 2,481 2,036 2,183EBITDA ********************************************* 5,414 5,146 3,986 4,280EBITDA margin (%) ********************************** 34% 29% 30% 30%
Nine monthsYear ended ended
December 31, September 30,1998 1999 2000
Investments, including capital expenditures (NOK in millions) **** 3,156 3,377 2,687Total full-time employee
equivalents (period end) *********************************** 5,104 5,172 5,450Of which abroad (period end) ****************************** 156 105 144
50
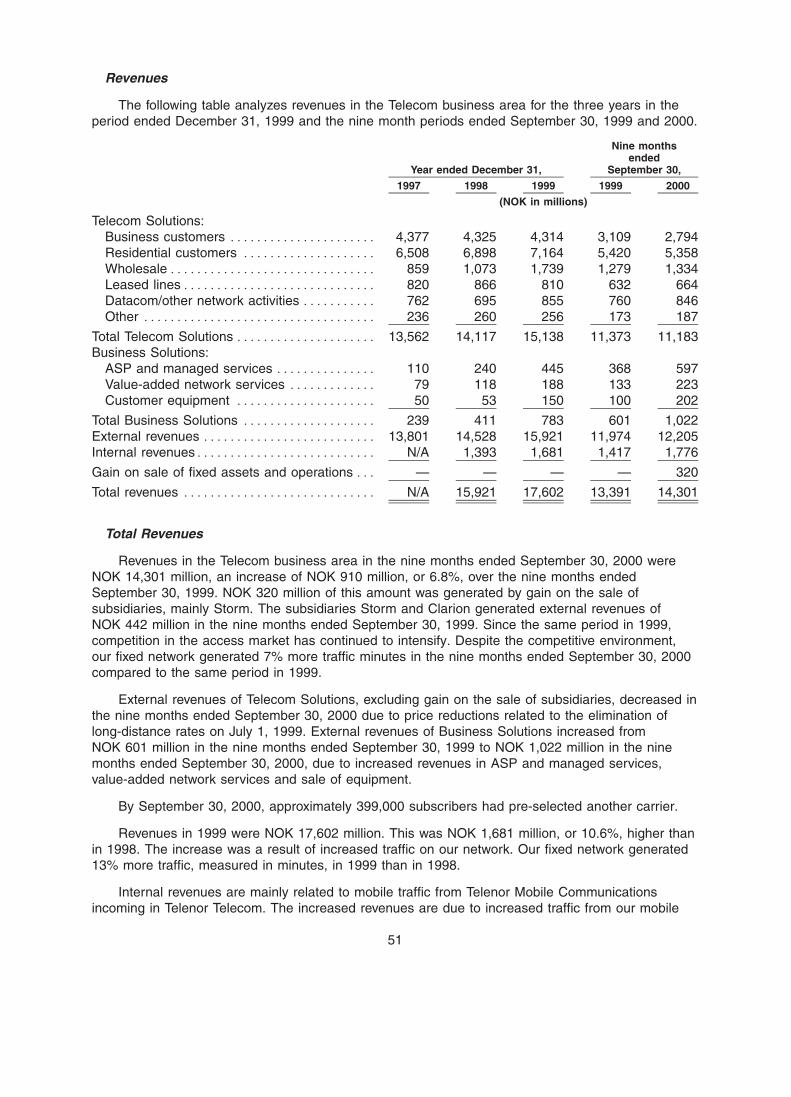
BOWNE OF LONDON 12/01/2000 19:56 BL/SM NO MARKS NEXT PCN: 057.00.00.00 -- Page is valid, no graphics X42481 056.00.00.00 5X
Revenues
The following table analyzes revenues in the Telecom business area for the three years in theperiod ended December 31, 1999 and the nine month periods ended September 30, 1999 and 2000.
Nine monthsended
Year ended December 31, September 30,
1997 1998 1999 1999 2000
(NOK in millions)
Telecom Solutions:Business customers ********************** 4,377 4,325 4,314 3,109 2,794Residential customers ******************** 6,508 6,898 7,164 5,420 5,358Wholesale******************************* 859 1,073 1,739 1,279 1,334Leased lines***************************** 820 866 810 632 664Datacom/other network activities *********** 762 695 855 760 846Other *********************************** 236 260 256 173 187
Total Telecom Solutions ********************* 13,562 14,117 15,138 11,373 11,183Business Solutions:
ASP and managed services *************** 110 240 445 368 597Value-added network services ************* 79 118 188 133 223Customer equipment ********************* 50 53 150 100 202
Total Business Solutions ******************** 239 411 783 601 1,022External revenues ************************** 13,801 14,528 15,921 11,974 12,205Internal revenues*************************** N/A 1,393 1,681 1,417 1,776
Gain on sale of fixed assets and operations *** — — — — 320
Total revenues ***************************** N/A 15,921 17,602 13,391 14,301
Total Revenues
Revenues in the Telecom business area in the nine months ended September 30, 2000 wereNOK 14,301 million, an increase of NOK 910 million, or 6.8%, over the nine months endedSeptember 30, 1999. NOK 320 million of this amount was generated by gain on the sale ofsubsidiaries, mainly Storm. The subsidiaries Storm and Clarion generated external revenues ofNOK 442 million in the nine months ended September 30, 1999. Since the same period in 1999,competition in the access market has continued to intensify. Despite the competitive environment,our fixed network generated 7% more traffic minutes in the nine months ended September 30, 2000compared to the same period in 1999.
External revenues of Telecom Solutions, excluding gain on the sale of subsidiaries, decreased inthe nine months ended September 30, 2000 due to price reductions related to the elimination oflong-distance rates on July 1, 1999. External revenues of Business Solutions increased fromNOK 601 million in the nine months ended September 30, 1999 to NOK 1,022 million in the ninemonths ended September 30, 2000, due to increased revenues in ASP and managed services,value-added network services and sale of equipment.
By September 30, 2000, approximately 399,000 subscribers had pre-selected another carrier.
Revenues in 1999 were NOK 17,602 million. This was NOK 1,681 million, or 10.6%, higher thanin 1998. The increase was a result of increased traffic on our network. Our fixed network generated13% more traffic, measured in minutes, in 1999 than in 1998.
Internal revenues are mainly related to mobile traffic from Telenor Mobile Communicationsincoming in Telenor Telecom. The increased revenues are due to increased traffic from our mobile
51
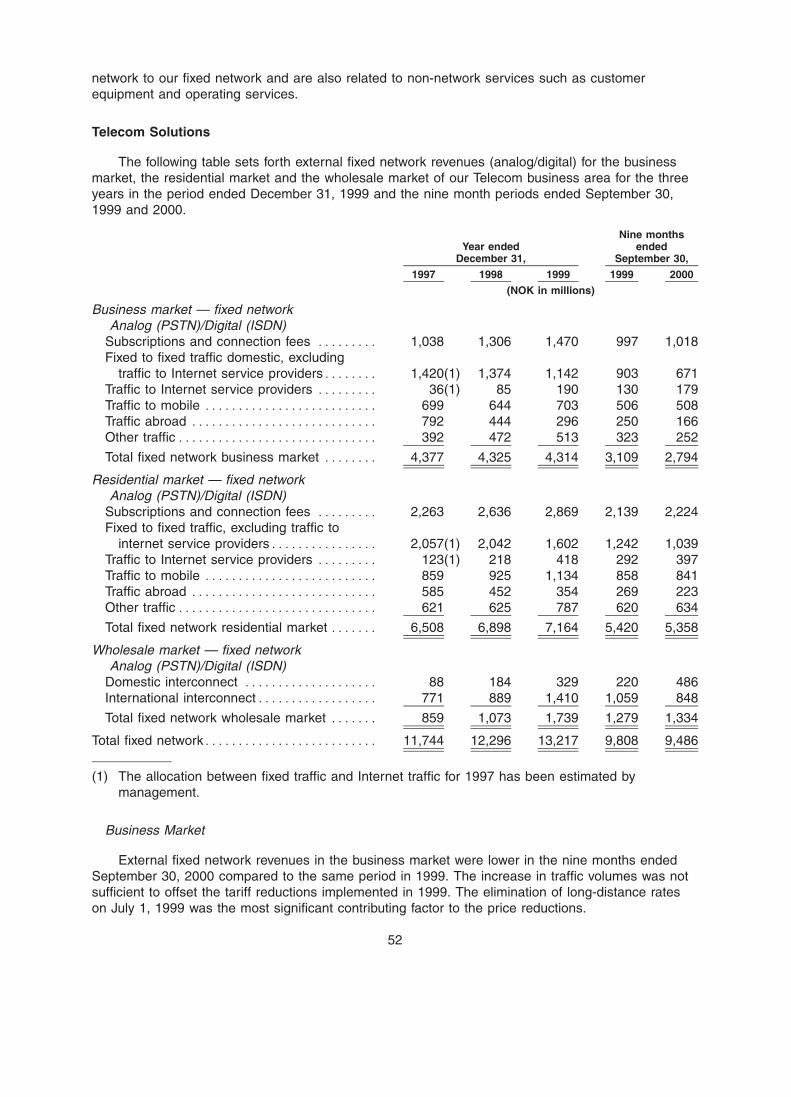
BOWNE OF LONDON 12/01/2000 19:56 BL/SM NO MARKS NEXT PCN: 058.00.00.00 -- Page is valid, no graphics X42481 057.00.00.00 5X
network to our fixed network and are also related to non-network services such as customerequipment and operating services.
Telecom Solutions
The following table sets forth external fixed network revenues (analog/digital) for the businessmarket, the residential market and the wholesale market of our Telecom business area for the threeyears in the period ended December 31, 1999 and the nine month periods ended September 30,1999 and 2000.
Nine monthsYear ended ended
December 31, September 30,
1997 1998 1999 1999 2000
(NOK in millions)
Business market — fixed networkAnalog (PSTN)/Digital (ISDN)
Subscriptions and connection fees ********* 1,038 1,306 1,470 997 1,018Fixed to fixed traffic domestic, excluding
traffic to Internet service providers******** 1,420(1) 1,374 1,142 903 671Traffic to Internet service providers ********* 36(1) 85 190 130 179Traffic to mobile ************************** 699 644 703 506 508Traffic abroad **************************** 792 444 296 250 166Other traffic****************************** 392 472 513 323 252
Total fixed network business market ******** 4,377 4,325 4,314 3,109 2,794
Residential market — fixed networkAnalog (PSTN)/Digital (ISDN)
Subscriptions and connection fees ********* 2,263 2,636 2,869 2,139 2,224Fixed to fixed traffic, excluding traffic to
internet service providers**************** 2,057(1) 2,042 1,602 1,242 1,039Traffic to Internet service providers ********* 123(1) 218 418 292 397Traffic to mobile ************************** 859 925 1,134 858 841Traffic abroad **************************** 585 452 354 269 223Other traffic****************************** 621 625 787 620 634
Total fixed network residential market ******* 6,508 6,898 7,164 5,420 5,358
Wholesale market — fixed networkAnalog (PSTN)/Digital (ISDN)
Domestic interconnect ******************** 88 184 329 220 486International interconnect****************** 771 889 1,410 1,059 848
Total fixed network wholesale market ******* 859 1,073 1,739 1,279 1,334
Total fixed network************************** 11,744 12,296 13,217 9,808 9,486
(1) The allocation between fixed traffic and Internet traffic for 1997 has been estimated bymanagement.
Business Market
External fixed network revenues in the business market were lower in the nine months endedSeptember 30, 2000 compared to the same period in 1999. The increase in traffic volumes was notsufficient to offset the tariff reductions implemented in 1999. The elimination of long-distance rateson July 1, 1999 was the most significant contributing factor to the price reductions.
52
BOWNE OF LONDON 12/01/2000 19:56 BL/SM NO MARKS NEXT PCN: 059.00.00.00 -- Page is valid, no graphics X42481 058.00.00.00 5X
During the nine months ended September 30, 2000, traffic minutes in the business marketincreased by 5.8% compared with the nine months ended September 30, 1999. Our market sharefell from approximately 96% in the nine month period ended September 30, 1999 to approximately81% for the nine month period ended September 30, 2000. In the business market, the competitionhas led to reduced prices in the form of price discounts. In order to secure longer-term contractswith our customers, we must offer greater price discounts. We may continue to lower our prices inthe future to respond to an increasingly competitive, price-driven market.
External revenues from subscription and connection fees increased by NOK 21 million in thenine months ended September 30, 2000 due to a migration of customers from traditional analog(PSTN) services to digital (ISDN), which has higher subscription fees.
External revenues from fixed network activities in the business market were NOK 4,314 millionin 1999. This was NOK 11 million, or 0.3%, lower than in 1998. Revenues from subscription andconnections fees increased by NOK 164 million, or 12.6%, to NOK 1,470 million in 1999.Conversions from analog (PSTN) to digital (ISDN) subscriptions, which have higher subscriptionprices, largely accounted for the increase.
Revenues from external traffic to the business market were NOK 2,844 million in 1999. This wasNOK 175 million, or 5.8%, lower than in 1998. Within fixed network telephony, new competitors havetaken market share by offering lower tariffs for traffic to business customers. We have continuouslyadjusted our services and prices to respond to these developments. Lower traffic revenues werelargely attributable to the elimination of long-distance rates on July 1, 1999. However, our marketshare in the business market, measured in total traffic minutes, fell from around 94% at thebeginning of 1999 to around 87% at the end of that year. In 1999, our network generated 13% moretraffic minutes. The largest increase was in Internet traffic, which grew by 115%, and in mobilenetworks, which increased by 20% over 1998. Growth in traffic minutes did not offset pricereductions made in 1999.
External revenues from fixed network activities in the business market decreased by NOK 52million, or 1%, in 1998 from NOK 4,377 million in 1997. Increases in subscription and connectionfees, which were NOK 268 million higher in 1998 than in 1997, were more than offset due toreduced tariffs, particularly for international calls.
Residential Market
We recorded external revenues from the residential market of NOK 5,358 million during thenine months ended September 30, 2000. External revenues for this period were NOK 62 millionlower than the corresponding period in 1999.
External revenues from subscription and connection fees increased as a result of thewidespread migration from analog (PSTN) to digital (ISDN) lines. In addition, we experiencedincreased subscription and connection fees resulting from the rebalancing of our price structure.Although traffic has continued to grow, this growth has been insufficient to offset the traffic pricereductions. In particular, revenues from external fixed to fixed traffic decreased in the period dueprincipally to the price reductions related to the elimination of long-distance rates on July 1, 1999. Inaddition, the change in product mix, lower prices and traffic trends resulted in reduced revenues fromtraffic.
During the nine months ended September 30, 2000, traffic minutes in the residential marketincreased 7.7% over the corresponding period in 1999. Our market share dropped fromapproximately 95% in the nine month period ended September 30, 1999 to approximately 79% in thenine month period ended September 30, 2000. Competition in the residential market has led todecreasing prices and, as a result, increasing traffic. In the residential market, we expect this trendto continue. To respond to these competitive pressures, we initiated a customer ‘‘win back’’ programin the summer of 2000.
53
BOWNE OF LONDON 12/01/2000 19:56 BL/SM NO MARKS NEXT PCN: 060.00.00.00 -- Page is valid, no graphics X42481 059.00.00.00 5X
Beginning November 1, 2000, we introduced the second phase of carrier pre-selection, in whichcalls to 8xx-numbers automatically are prefix traffic. This change gives customers the ability to selectdifferent carriers for domestic and international calls. Given traffic volume at September 30, 2000,had the change in 8xx-numbers been in effect at such time, we estimate that our market sharewould have been reduced to 74% compared to the actual level of 79%. The decrease in networktraffic will be partially offset by an increase in interconnect traffic. Approximately half of this decreaseis accounted for by traffic generated through our Internet business area.
External revenues from the residential market in 1999 were NOK 7,164 million, NOK 266 million,or 3.9%, higher than in 1998. Revenues from subscriptions and connection fees increased byNOK 233 million, or 8.8%, to NOK 2,869 million in 1999. Higher subscription prices starting in March1999 and conversions from analog to ISDN subscriptions accounted for the increase.
Revenues from external traffic to the residential market were NOK 4,295 million in 1999,NOK 33 million higher than in 1998. Growth in traffic minutes compensated for price reductionsmade in 1999. We substantially reduced price levels for telephone traffic, simplified price structures,and developed customer loyalty programs for different customer groups. In 1999, we reduced pricesfor overseas traffic by 26% and cut prices for traffic to mobile networks by 8%. We experienced 13%growth in total traffic minutes for the residential market in 1999, primarily driven by increased Internettraffic, increased traffic from fixed to mobile networks and the increased number of home personalcomputers and home office services.
External revenues to the residential market in 1998 were NOK 6,898 million, NOK 390 million,or 6%, higher than the NOK 6,508 million recorded in 1997. Virtually all of this increase was due tohigher subscription and connection fees, which increased by NOK 373 million. Higher revenues fromtraffic to the Internet, due to increased volume, were offset by a decrease in other traffic revenues.
Approximately 292,000 subscribers in the residential market have established carrier pre-selection with competing companies between the time we introduced this service on June 1, 1999and September 30, 2000. Telenor has entered into long-term agreements with housing cooperativesthrough which it provides service to 230,000 residents at special discounts. Compared toSeptember 30, 1999, this figure has grown slightly by 10,000 residents as of September 30, 2000.
Wholesale Market
Domestic interconnection revenues include the total amount we bill to other domestic fixed andmobile operators for interconnection with our fixed network. International interconnection revenuesinclude fees paid to us from international operators for interconnection with our fixed network as wellas revenues from our foreign subsidiaries, Storm and Clarion, in 1998 and 1999.
We recorded external fixed network revenues from the wholesale market of NOK 1,334 millionduring the nine months ended September 30, 2000. This was NOK 55 million, or 4.3%, higher thanthe corresponding period in 1999. International interconnection revenues decreased NOK 211million, or 19.9%, to NOK 848 million due to the sale of our subsidiaries Storm and Clarion andlower international tariffs during the nine months ended September 30, 2000. However, internationalinterconnection revenue excluding Storm and Clarion increased mainly due to increased transittraffic. During this period, revenues from domestic interconnection increased NOK 266 million, or120.9%, to NOK 486 million due to increased traffic from other domestic fixed and mobile operators.
External revenues from wholesale operations were NOK 1,739 million in 1999. This wasNOK 666 million, or 62.1%, higher than in 1998. The altered competitive situation resulted in atripling of interconnection traffic with external mobile and fixed network operators measured in trafficminutes. Of the increase in international interconnection, NOK 419 million was attributable to Stormand Clarion for the periods prior to their disposal.
External revenues from wholesale operations in 1998 were NOK 214 million higher than in 1997due to higher interconnection revenues from both domestic and international traffic.
54
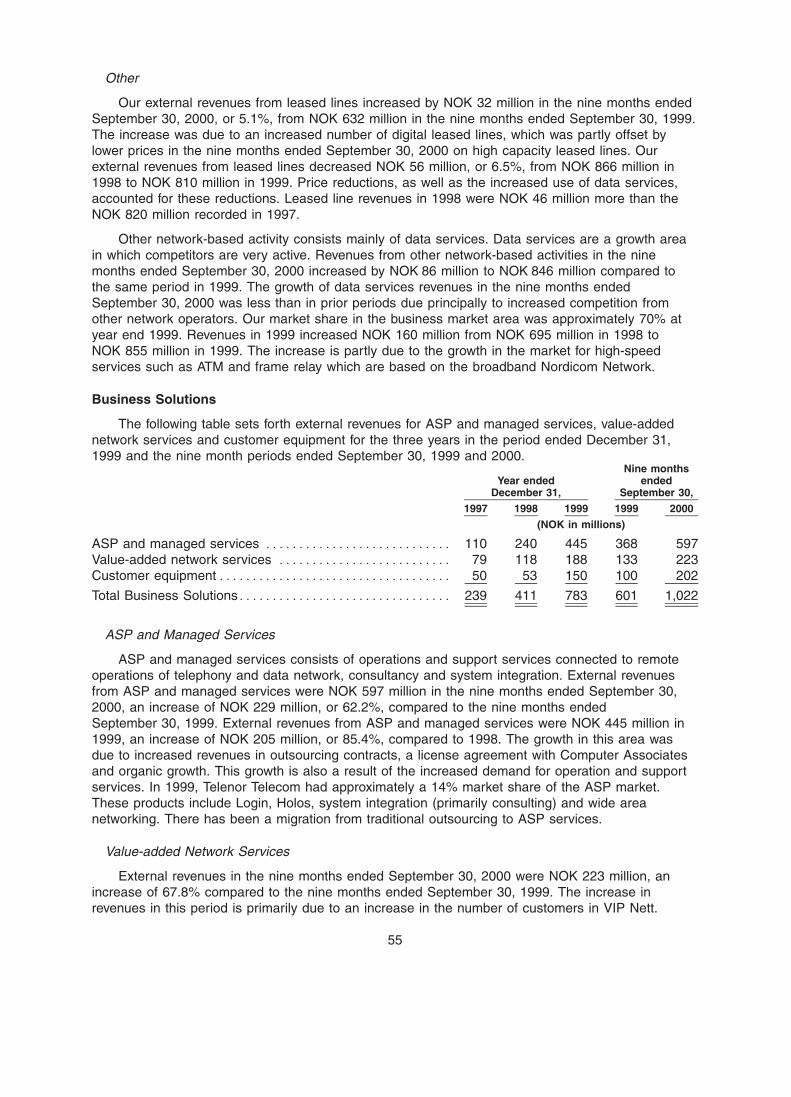
BOWNE OF LONDON 12/01/2000 19:56 BL/SM NO MARKS NEXT PCN: 061.00.00.00 -- Page is valid, no graphics X42481 060.00.00.00 5X
Other
Our external revenues from leased lines increased by NOK 32 million in the nine months endedSeptember 30, 2000, or 5.1%, from NOK 632 million in the nine months ended September 30, 1999.The increase was due to an increased number of digital leased lines, which was partly offset bylower prices in the nine months ended September 30, 2000 on high capacity leased lines. Ourexternal revenues from leased lines decreased NOK 56 million, or 6.5%, from NOK 866 million in1998 to NOK 810 million in 1999. Price reductions, as well as the increased use of data services,accounted for these reductions. Leased line revenues in 1998 were NOK 46 million more than theNOK 820 million recorded in 1997.
Other network-based activity consists mainly of data services. Data services are a growth areain which competitors are very active. Revenues from other network-based activities in the ninemonths ended September 30, 2000 increased by NOK 86 million to NOK 846 million compared tothe same period in 1999. The growth of data services revenues in the nine months endedSeptember 30, 2000 was less than in prior periods due principally to increased competition fromother network operators. Our market share in the business market area was approximately 70% atyear end 1999. Revenues in 1999 increased NOK 160 million from NOK 695 million in 1998 toNOK 855 million in 1999. The increase is partly due to the growth in the market for high-speedservices such as ATM and frame relay which are based on the broadband Nordicom Network.
Business Solutions
The following table sets forth external revenues for ASP and managed services, value-addednetwork services and customer equipment for the three years in the period ended December 31,1999 and the nine month periods ended September 30, 1999 and 2000.
Nine monthsYear ended ended
December 31, September 30,
1997 1998 1999 1999 2000
(NOK in millions)
ASP and managed services **************************** 110 240 445 368 597Value-added network services ************************** 79 118 188 133 223Customer equipment*********************************** 50 53 150 100 202
Total Business Solutions******************************** 239 411 783 601 1,022
ASP and Managed Services
ASP and managed services consists of operations and support services connected to remoteoperations of telephony and data network, consultancy and system integration. External revenuesfrom ASP and managed services were NOK 597 million in the nine months ended September 30,2000, an increase of NOK 229 million, or 62.2%, compared to the nine months endedSeptember 30, 1999. External revenues from ASP and managed services were NOK 445 million in1999, an increase of NOK 205 million, or 85.4%, compared to 1998. The growth in this area wasdue to increased revenues in outsourcing contracts, a license agreement with Computer Associatesand organic growth. This growth is also a result of the increased demand for operation and supportservices. In 1999, Telenor Telecom had approximately a 14% market share of the ASP market.These products include Login, Holos, system integration (primarily consulting) and wide areanetworking. There has been a migration from traditional outsourcing to ASP services.
Value-added Network Services
External revenues in the nine months ended September 30, 2000 were NOK 223 million, anincrease of 67.8% compared to the nine months ended September 30, 1999. The increase inrevenues in this period is primarily due to an increase in the number of customers in VIP Nett.
55
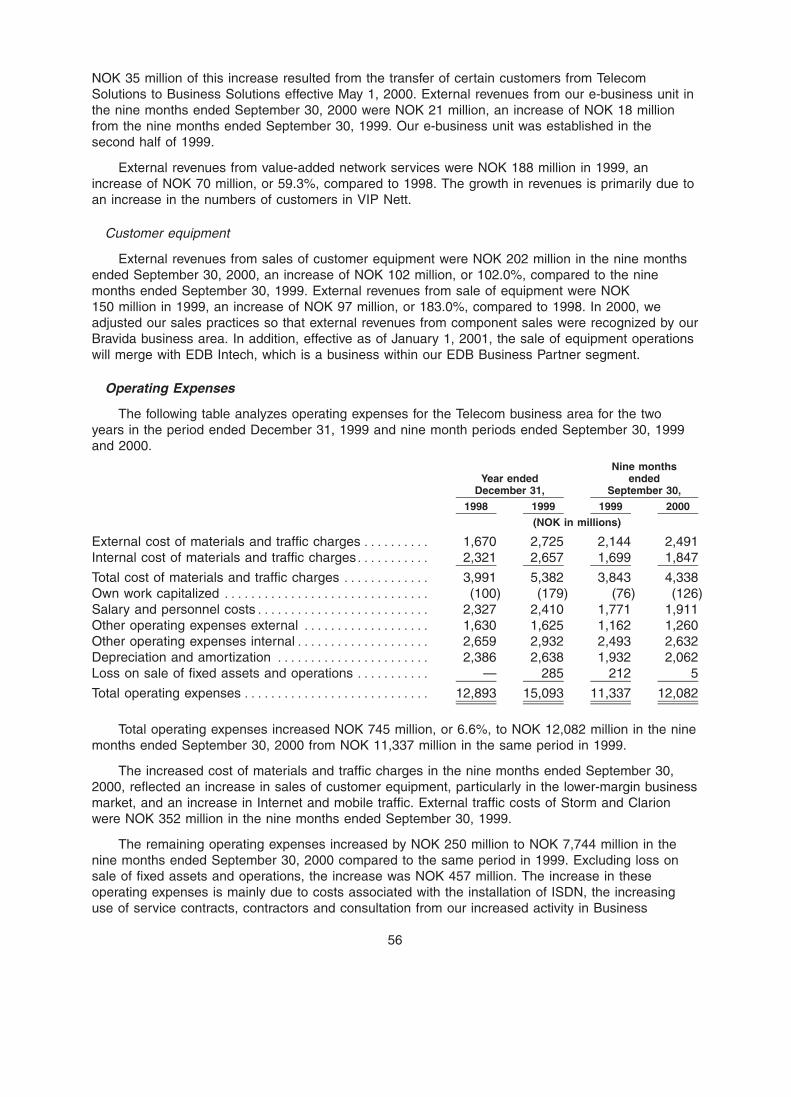
BOWNE OF LONDON 12/01/2000 19:56 BL/SM NO MARKS NEXT PCN: 062.00.00.00 -- Page is valid, no graphics X42481 061.00.00.00 5X
NOK 35 million of this increase resulted from the transfer of certain customers from TelecomSolutions to Business Solutions effective May 1, 2000. External revenues from our e-business unit inthe nine months ended September 30, 2000 were NOK 21 million, an increase of NOK 18 millionfrom the nine months ended September 30, 1999. Our e-business unit was established in thesecond half of 1999.
External revenues from value-added network services were NOK 188 million in 1999, anincrease of NOK 70 million, or 59.3%, compared to 1998. The growth in revenues is primarily due toan increase in the numbers of customers in VIP Nett.
Customer equipment
External revenues from sales of customer equipment were NOK 202 million in the nine monthsended September 30, 2000, an increase of NOK 102 million, or 102.0%, compared to the ninemonths ended September 30, 1999. External revenues from sale of equipment were NOK150 million in 1999, an increase of NOK 97 million, or 183.0%, compared to 1998. In 2000, weadjusted our sales practices so that external revenues from component sales were recognized by ourBravida business area. In addition, effective as of January 1, 2001, the sale of equipment operationswill merge with EDB Intech, which is a business within our EDB Business Partner segment.
Operating Expenses
The following table analyzes operating expenses for the Telecom business area for the twoyears in the period ended December 31, 1999 and nine month periods ended September 30, 1999and 2000.
Nine monthsYear ended ended
December 31, September 30,
1998 1999 1999 2000
(NOK in millions)
External cost of materials and traffic charges ********** 1,670 2,725 2,144 2,491Internal cost of materials and traffic charges*********** 2,321 2,657 1,699 1,847
Total cost of materials and traffic charges ************* 3,991 5,382 3,843 4,338Own work capitalized ******************************* (100) (179) (76) (126)Salary and personnel costs************************** 2,327 2,410 1,771 1,911Other operating expenses external ******************* 1,630 1,625 1,162 1,260Other operating expenses internal******************** 2,659 2,932 2,493 2,632Depreciation and amortization *********************** 2,386 2,638 1,932 2,062Loss on sale of fixed assets and operations *********** — 285 212 5
Total operating expenses **************************** 12,893 15,093 11,337 12,082
Total operating expenses increased NOK 745 million, or 6.6%, to NOK 12,082 million in the ninemonths ended September 30, 2000 from NOK 11,337 million in the same period in 1999.
The increased cost of materials and traffic charges in the nine months ended September 30,2000, reflected an increase in sales of customer equipment, particularly in the lower-margin businessmarket, and an increase in Internet and mobile traffic. External traffic costs of Storm and Clarionwere NOK 352 million in the nine months ended September 30, 1999.
The remaining operating expenses increased by NOK 250 million to NOK 7,744 million in thenine months ended September 30, 2000 compared to the same period in 1999. Excluding loss onsale of fixed assets and operations, the increase was NOK 457 million. The increase in theseoperating expenses is mainly due to costs associated with the installation of ISDN, the increasinguse of service contracts, contractors and consultation from our increased activity in Business
56
BOWNE OF LONDON 12/01/2000 19:56 BL/SM NO MARKS NEXT PCN: 063.00.00.00 -- Page is valid, no graphics X42481 062.00.00.00 5X
Solutions, increased depreciation and amortization expense related to increased investment in ISDN-related activities and increased wages. Salary and personnel costs increased by NOK 140 milliondue to an increase in full-time equivalent employees compared to September 30, 1999.
Costs of materials and traffic costs in our Telecom business area increased by NOK 1,391million, or 34.9%, to NOK 5,382 million in 1999 from 1998. This was primarily related to increasedcosts in traffic outgoing to mobile networks, in interconnection traffic with other operators and inInternet traffic. These products tend to generate relatively high traffic costs and therefore lowermargins. The growth in IT operations and outsourcing also led to higher costs.
In 1999, salary and personnel costs increased by NOK 83 million, or 3.6%, over 1998 toNOK 2,410 million. Of this increase, NOK 179 million was recorded as own work capitalized,representing an increase of NOK 79 million, or 79.0%, compared to 1998. Telecom’s workforceconsisted of 5,172 full-time equivalent employees at the end of 1999, an increase of 68 full-timeequivalent employees, or 1.3%, from the end of 1998.
Other operating expenses increased NOK 268 million, or 6.2%, to NOK 4,557 million in 1999.We are currently implementing a cost efficiency program that is focused on rationalization of networkoperations, improved planning processes for network expansion and improvements in purchasingprocedures. The increase in ISDN deliveries and costs associated with the relatively higher faultrates relating to ISDN compared to PSTN are the main causes for the increase in costs. Informationtechnology-related costs increased due to preparations for the year 2000 and initiatives to refineinformation technology systems that are crucial to operations.
Depreciation increased by NOK 252 million to NOK 2,638 million due to major investments inISDN over recent years and an increased proportion of fixed assets with short economic useful lives.
Operating Profits
The operating profits in our Telecom business area were NOK 2,219 million in the nine monthsended September 30, 2000, an increase of NOK 165 million, or 8%, over the same period in 1999.Eliminating gains and losses on sale of subsidiaries, operating profits fell by NOK 362 million. Thedecline in operating profits is primarily due to decreased prices and increased operating expenses.
As discussed above, competition in the market for fixed line telephony is intense and we expectit to continue. It will be necessary for the Telecom business area to continue to focus its efforts toslow the decline of its market share and to respond to competitive pricing pressures.
Our Telecom business area recorded operating profits in 1999 of NOK 2,509 million. This wasNOK 519 million, or 17.1%, lower than in 1998. The lower profits were attributable to traffic movingto services that have lower margins as well as increased installation costs, higher commissions forthe sale of ISDN, higher depreciation and losses of NOK 285 million relating to the sale of Clarion inlate 1999.
57
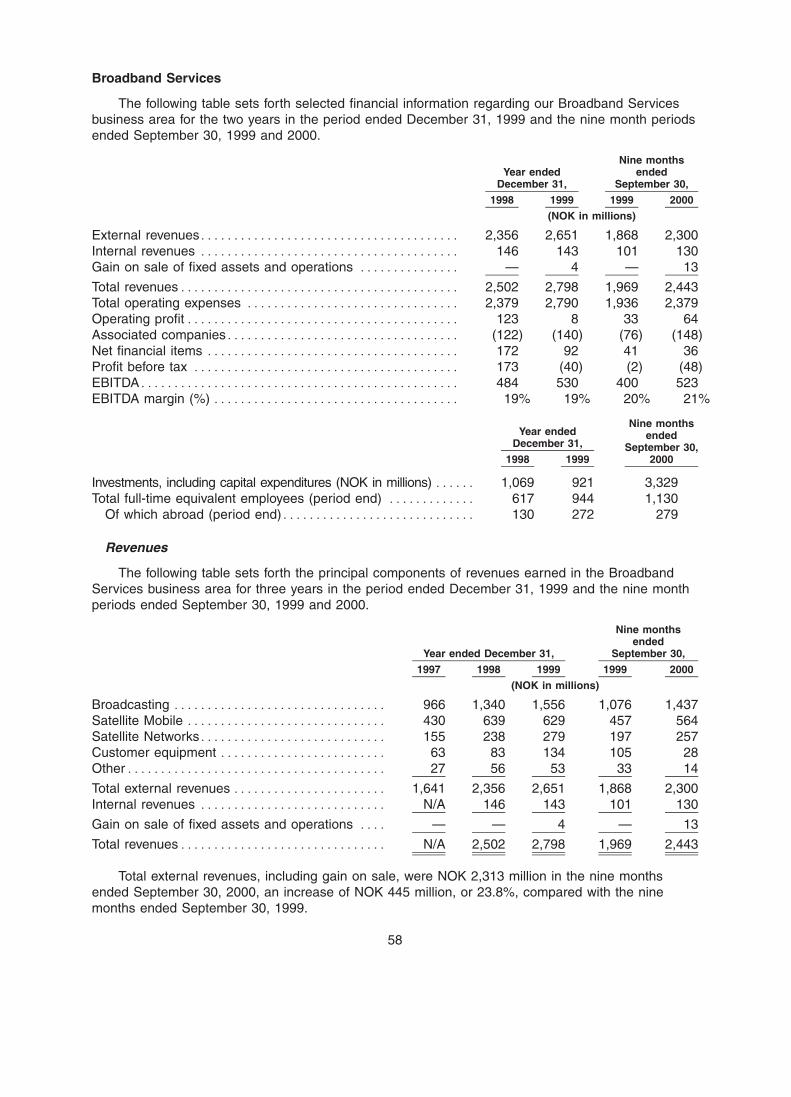
BOWNE OF LONDON 12/01/2000 19:56 BL/SM NO MARKS NEXT PCN: 064.00.00.00 -- Page is valid, no graphics X42481 063.00.00.00 5X
Broadband Services
The following table sets forth selected financial information regarding our Broadband Servicesbusiness area for the two years in the period ended December 31, 1999 and the nine month periodsended September 30, 1999 and 2000.
Nine monthsYear ended ended
December 31, September 30,
1998 1999 1999 2000
(NOK in millions)
External revenues*************************************** 2,356 2,651 1,868 2,300Internal revenues *************************************** 146 143 101 130Gain on sale of fixed assets and operations *************** — 4 — 13
Total revenues****************************************** 2,502 2,798 1,969 2,443Total operating expenses ******************************** 2,379 2,790 1,936 2,379Operating profit***************************************** 123 8 33 64Associated companies*********************************** (122) (140) (76) (148)Net financial items ************************************** 172 92 41 36Profit before tax **************************************** 173 (40) (2) (48)EBITDA************************************************ 484 530 400 523EBITDA margin (%) ************************************* 19% 19% 20% 21%
Nine monthsYear ended ended
December 31, September 30,1998 1999 2000
Investments, including capital expenditures (NOK in millions) ****** 1,069 921 3,329Total full-time equivalent employees (period end) ************* 617 944 1,130
Of which abroad (period end)***************************** 130 272 279
Revenues
The following table sets forth the principal components of revenues earned in the BroadbandServices business area for three years in the period ended December 31, 1999 and the nine monthperiods ended September 30, 1999 and 2000.
Nine monthsended
Year ended December 31, September 30,
1997 1998 1999 1999 2000
(NOK in millions)
Broadcasting ******************************** 966 1,340 1,556 1,076 1,437Satellite Mobile ****************************** 430 639 629 457 564Satellite Networks**************************** 155 238 279 197 257Customer equipment ************************* 63 83 134 105 28Other*************************************** 27 56 53 33 14
Total external revenues *********************** 1,641 2,356 2,651 1,868 2,300Internal revenues **************************** N/A 146 143 101 130
Gain on sale of fixed assets and operations **** — — 4 — 13
Total revenues******************************* N/A 2,502 2,798 1,969 2,443
Total external revenues, including gain on sale, were NOK 2,313 million in the nine monthsended September 30, 2000, an increase of NOK 445 million, or 23.8%, compared with the ninemonths ended September 30, 1999.
58
BOWNE OF LONDON 12/01/2000 19:56 BL/SM NO MARKS NEXT PCN: 065.00.00.00 -- Page is valid, no graphics X42481 064.00.00.00 5X
Broadcasting, which provides television-based services, recorded total external revenues ofNOK 1,437 million for the nine months ended September 30, 2000, an increase of NOK 361 million,or 33.6%, over the same period in 1999. Approximately 47.5% of the increase in our total externalbroadcasting revenues for the nine months ended September 30, 2000 was attributable to the fullconsolidation of Norkring, an operator of the terrestrial broadcasting network in Norway. Externalrevenues from the sale of satellite capacity increased by NOK 88 million, or 15.3%, reflecting anincrease in the number of subscriber-based contracts in the Nordic market. This includes aprepayment of NOK 50 million due to termination of a transponder contract that would otherwisehave generated revenues of NOK 24 million in the nine months ended September 30, 2000.Broadcasting (including all subscribers in Canal Digital, our associated company) had 1,867,514subscribers at September 30, 2000, an increase of 444,014 subscribers since September 30, 1999.
Our Telenor Avidi cable TV business recorded external revenues of NOK 235 million in the ninemonths ended September 30, 2000, an increase of NOK 39 million, or 19.8%, compared with thecorresponding period in 1999. We had 349,917 cable TV subscribers at September 30, 2000, anincrease of 74,417 over September 30, 1999. In September 2000, we completed the acquisition ofalfaNETT, which increased the number of subscribers by 34,800. Revenues from our small antennanetwork operations, which we conduct through Telenor Vision, increased external revenues byNOK 55 million to NOK 173 million in the nine months ended September 30, 2000, compared withthe nine months ended September 30, 1999. The increase is primarily due to companies acquiredwithin the Vision group. External revenues in Conax decreased by NOK 8 million to NOK 38 millionin the nine months ended September 30, 2000 from the comparable period in the prior year dueprimarily to lower market demand in the first half of 2000.
Satellite Mobile’s external revenues increased by NOK 107 million, or 23.4%, in the nine monthsended September 30, 2000 to NOK 564 million. Pricing and traffic modifications made during thisperiod to our traffic agreements with business partners resulted in higher revenues.
Including sales of customer equipment, Satellite Networks recorded external revenues ofNOK 269 million in the nine months ended September 30, 2000, a decrease of NOK 11 million, or3.9%, from the nine months ended September 30, 1999. The decline is primarily attributable to oursupply in the 1999 period of a very small-aperture terminal network to the Slovak Republic’s Ministryof the Interior, without a corresponding sale of the same magnitude in the same period in 2000.Excluding this transaction, our satellite network revenues in the nine months ended September 30,2000 were in line with revenues in the nine months ended September 30, 1999.
Gain on sale of subsidiaries in the nine months ended September 30, 2000 amounted toNOK 13 million and related to the reduction of our ownership interest in a subsidiary from 54.5% to23.8% in the second quarter of 2000.
Internal revenues consist mainly of traffic and satellite charges to companies within our Telecombusiness area. During the nine months ended September 30, 2000, our internal revenues increasedby NOK 29 million from NOK 101 million in the nine months ended September 30, 1999 to NOK 130million in the nine months ended September 30, 2000.
Total external revenues including gains from sales were NOK 2,655 million in 1999, an increaseof NOK 299 million, or 12.7%, compared to 1998.
Broadcasting recorded total external revenues of NOK 1,556 million in 1999, an increase ofNOK 216 million, or 16.1%, compared to 1998. Norkring provided external revenues ofNOK 238 million during 1999. Revenues from Telenor CTV decreased substantially in 1999 becausewe transferred most of its operations to Canal Digital, which we account for under the equity method.External revenues from Broadcasting to Canal Digital correspondingly increased. The net effect ofthese changes was a reduction in external revenues of NOK 130 million. The home satellite dishmarket in Norway is served primarily by Canal Digital.
59
BOWNE OF LONDON 12/01/2000 19:56 BL/SM NO MARKS NEXT PCN: 066.00.00.00 -- Page is valid, no graphics X42481 065.00.00.00 5X
Telenor Avidi’s external revenues increased by NOK 27 million, or 10.8%, to NOK 277 million in1999, while the number of cable TV subscribers increased by 12,000 to 282,000 during the sameperiod. Telenor Avidi had a 35% share of the Norwegian market for cable TV subscribers at the endof 1999. Telenor Vision’s revenues from small antenna networks increased by NOK 41 million toNOK 167 million in 1999. The total number of subscribers at the end of 1999 was 937,000,compared with 686,000 at the end of 1998. The total number of small antenna network subscribersat year end 1999 includes 87,000 hotel rooms served by Telenor Vision throughout the Nordicregion. External revenues from the sale of satellite capacity increased by NOK 161 million toNOK 784 million, primarily due to increased sales to Canal Digital. Telenor Conax revenuesdecreased by 13% from NOK 120 million in 1998 to NOK 104 million in 1999 due to lower new salesof smart cards in 1999 compared to 1998.
In the business market, including customer equipment and other, our Broadband Servicesbusiness area recorded total revenues of NOK 1,095 million in 1999, an increase of NOK 79 million,or 7.8%, over 1998. In 1999, Satellite Networks had revenues of NOK 413 million, includingcustomer equipment, an increase of NOK 92 million compared to 1998. This increase was due inpart to our supply of a very small aperture terminal network to the Slovak Republic’s Ministry of theInterior. In 1999, Satellite Mobile recorded revenues of NOK 629 million, NOK 10 million lower thanin 1998. This was due to lower traffic levels in the land-mobile segment, as well as the transitionfrom analog to digital traffic with lower prices. We maintained a market share of approximately 13%for traffic through the EIK terrestrial station in 1999, despite stronger competition.
External revenues in the Broadband Services business area in 1998 were NOK 715 millionhigher than in 1997. This increase in Broadcasting revenues of NOK 374 million accounted for thelargest portion of this increase. The increase related primarily to the launch of Thor II and Thor IIIsatellites. Our Broadband Services business area had 1,308,000 total subscribers at year end 1998(including all subscribers of Canal Digital), an increase of 164.2% from December 31, 1997.Including our proportionate share in Canal Digital, we had 1,132,000 subscribers at year end 1998,an increase of 763,000 subscribers from December 31, 1997.
Satellite Mobile revenues of NOK 639 million in 1998 were NOK 209 million, or 48.6%, higherthan in 1997 due to strong growth in traffic minutes during the year. Satellite Network revenues,including customer equipment, improved NOK 103 million, or 47.3%, from NOK 218 million in 1997to NOK 321 million in 1998 due to companies acquired during 1998.
60
BOWNE OF LONDON 12/01/2000 19:56 BL/SM NO MARKS NEXT PCN: 067.00.00.00 -- Page is valid, no graphics X42481 066.00.00.00 5X
Operating Expenses
The following table sets forth the principal components of operating expenses for the BroadbandServices business area for the two years in the period ended December 31, 1999 and thenine month periods ended September 30, 1999 and 2000.
Nine monthsYear ended ended
December 31, September 30,
1998 1999 1999 2000
(NOK in millions)
External cost of materials and traffic charges ************** 1,215 1,123 806 950Internal cost of materials and traffic charges *************** 136 129 112 115
Total cost of materials and traffic charges ***************** 1,351 1,252 918 1,065Own work capitalized************************************ (20) (31) (24) (18)Salary and personnel costs ****************************** 259 370 257 361Other operating expenses external************************ 300 498 279 355Other operating expenses internal ************************ 127 178 139 157Depreciation and amortization**************************** 361 522 367 459Loss on sale of fixed assets and operations *************** 1 1 — —
Total operating expenses ******************************** 2,379 2,790 1,936 2,379
Total operating expenses increased by NOK 443 million, or 22.9%, in the nine months endedSeptember 30, 2000 over the comparable period of 1999, principally due to acquisition andinvestment activities and the development of new projects and interactive services, including Zonavi.These expenses included increased salary and personnel costs, increased depreciation andamortization expense and increased other operating expenses. We expect to incur substantialexpenditures in the future in developing our interactive television services and subsidies of set-topboxes. We expect to invest in the digitalization of the Cable TV and small antenna networks as wellas increased satellite capacity.
The cost of materials and traffic charges in the nine months ended September 30, 2000increased by NOK 147 million primarily due to higher usage of satellite capacity from INMARSAT inSatellite Mobile and new companies in Vision.
Total operating expenses increased by NOK 411 million, or 17.3%, in 1999 compared to 1998.The costs of material and traffic charges in 1999 were lower than in 1998, primarily due to reducedpurchases of external satellite capacity. Salary and personnel costs of NOK 370 million in 1999 wereNOK 111 million, or 42.9%, higher than in 1998, principally due to the increase of 327 full-timeequivalent employees from the previous year. This increase was partly due to the acquisition ofNorkring.
Other operating expenses increased NOK 249 million, or 58.3%, to NOK 676 million in 1999,compared to NOK 427 million in 1998. We also recorded costs in connection with product andproject development in multimedia and the electronics market. Depreciation and amortizationamounted to NOK 522 million, an increase of NOK 161 million compared to 1998. This was relatedto an investment in Thor III and the consolidation of Norkring.
Operating Profits (Loss)
The operating profit in the nine months ended September 30, 2000 was NOK 64 million, anincrease of NOK 31 million compared with the nine months ended September 30, 1999. Theincrease is primarily due to higher external revenues within Satellite Broadcasting, including paymentof a termination fee, full consolidation of Norkring, the gain on sale of ownership in a subsidiary andthe reversal of cost accruals related to the obligations of this company in the second quarter of
61
BOWNE OF LONDON 12/01/2000 19:56 BL/SM NO MARKS NEXT PCN: 068.00.00.00 -- Page is valid, no graphics X42481 067.00.00.00 5X
2000. Higher operating expenses are attributed to the development of broadband and interactiveservices.
We are currently in a development and expansion phase in our broadband operations. As aresult we are experiencing high operating expenses and we are increasing our investments in ouroperations. As a result, our operating profit for 1999 was NOK 8 million, down NOK 115 million, or93.5%, from 1998.
Associated Companies
Associated companies recorded a loss of NOK 148 million in the nine months endedSeptember 30, 2000, compared with a loss of NOK 76 million in the nine months endedSeptember 30, 1999, representing an increased loss of NOK 72 million. The results of Canal Digitalaccounted for NOK 128 million of the loss in the nine months ended September 30, 2000, ascompared with a loss of NOK 77 million in the nine months ended September 30, 1999. Theincreased loss in the nine months ended September 30, 2000 is mainly the result of a one-time gainreceived in 1999 from Canal Digital’s partial termination of its operations in Denmark. In contrast tothe increased loss, in the nine months ended September 30, 2000, Canal Digital increased the totalnumber of its subscribers by 69,560 to 451,560, and recorded an increase in revenues of 33.7%compared to the same period in the prior year.
The associated companies recorded a loss of NOK 140 million in 1999, compared withNOK 122 million in 1998. Losses in Canal Digital were NOK 133 million in 1999, an increase ofNOK 3 million, or 2.3%, compared to 1998. Telenor’s share of revenues from Canal Digital in 1999,non-consolidated, increased by NOK 284 million, or 135.9%, from NOK 209 million in 1998 toNOK 493 million in 1999. During 1999, the number of subscribers increased by 53,000 householdsand by the year end, Canal Digital had 405,000 subscribers in the home satellite dish televisionmarket.
Internet
The following table sets forth selected financial information regarding our Internet business areafor the two years in the period ended December 31, 1999 and the nine month periods endedSeptember 30, 1999 and 2000.
Nine monthsYear ended ended
December 31, September 30,
1998 1999 1999 2000
(NOK in millions)
External revenues ****************************************** 342 566 388 605Internal revenues******************************************* 127 320 231 158
Total revenues ********************************************* 469 886 619 763Operating expenses **************************************** 655 1,024 714 1,332
Operating profit ******************************************** (186) (138) (95) (569)Associated companies ************************************** (51) 14 13 254Net financial items****************************************** (4) (4) (1) (16)Profit before tax******************************************** (241) (128) (83) (331)EBITDA *************************************************** (122) (27) (18) (395)
62
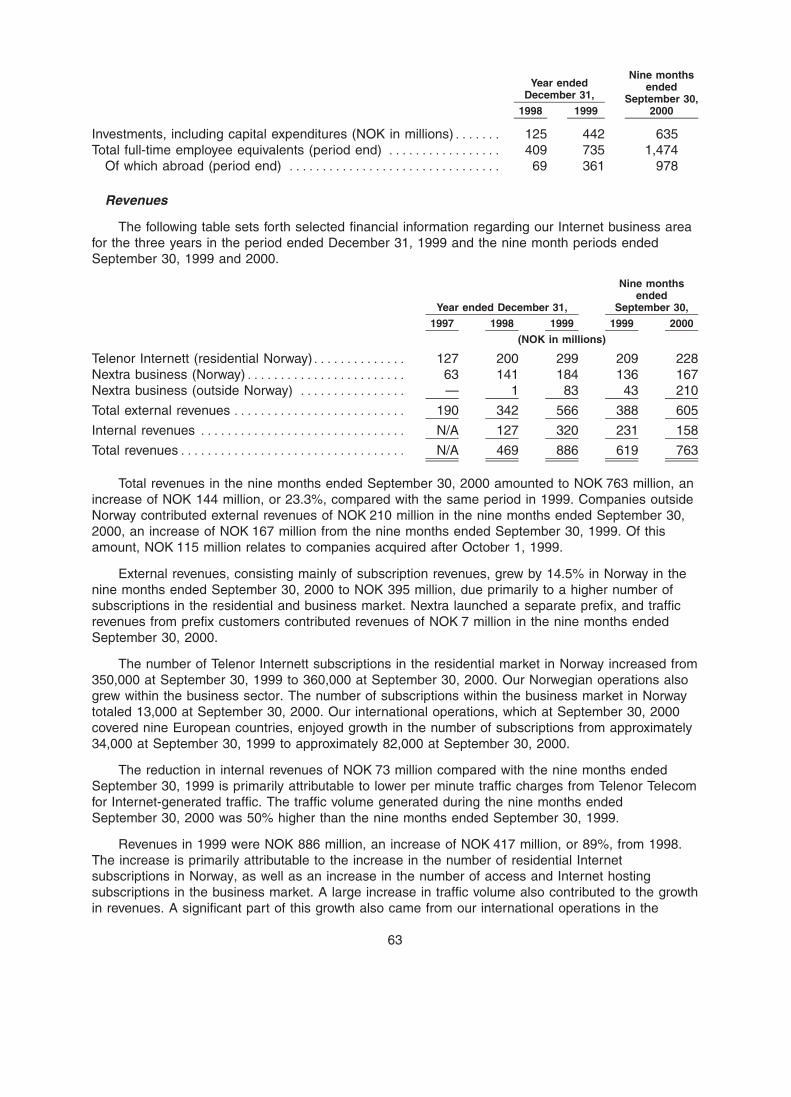
BOWNE OF LONDON 12/01/2000 19:56 BL/SM NO MARKS NEXT PCN: 069.00.00.00 -- Page is valid, no graphics X42481 068.00.00.00 5X
Nine monthsYear ended ended
December 31, September 30,1998 1999 2000
Investments, including capital expenditures (NOK in millions)******* 125 442 635Total full-time employee equivalents (period end) ***************** 409 735 1,474
Of which abroad (period end) ******************************** 69 361 978
Revenues
The following table sets forth selected financial information regarding our Internet business areafor the three years in the period ended December 31, 1999 and the nine month periods endedSeptember 30, 1999 and 2000.
Nine monthsended
Year ended December 31, September 30,
1997 1998 1999 1999 2000
(NOK in millions)
Telenor Internett (residential Norway)************** 127 200 299 209 228Nextra business (Norway)************************ 63 141 184 136 167Nextra business (outside Norway) **************** — 1 83 43 210
Total external revenues ************************** 190 342 566 388 605
Internal revenues ******************************* N/A 127 320 231 158
Total revenues********************************** N/A 469 886 619 763
Total revenues in the nine months ended September 30, 2000 amounted to NOK 763 million, anincrease of NOK 144 million, or 23.3%, compared with the same period in 1999. Companies outsideNorway contributed external revenues of NOK 210 million in the nine months ended September 30,2000, an increase of NOK 167 million from the nine months ended September 30, 1999. Of thisamount, NOK 115 million relates to companies acquired after October 1, 1999.
External revenues, consisting mainly of subscription revenues, grew by 14.5% in Norway in thenine months ended September 30, 2000 to NOK 395 million, due primarily to a higher number ofsubscriptions in the residential and business market. Nextra launched a separate prefix, and trafficrevenues from prefix customers contributed revenues of NOK 7 million in the nine months endedSeptember 30, 2000.
The number of Telenor Internett subscriptions in the residential market in Norway increased from350,000 at September 30, 1999 to 360,000 at September 30, 2000. Our Norwegian operations alsogrew within the business sector. The number of subscriptions within the business market in Norwaytotaled 13,000 at September 30, 2000. Our international operations, which at September 30, 2000covered nine European countries, enjoyed growth in the number of subscriptions from approximately34,000 at September 30, 1999 to approximately 82,000 at September 30, 2000.
The reduction in internal revenues of NOK 73 million compared with the nine months endedSeptember 30, 1999 is primarily attributable to lower per minute traffic charges from Telenor Telecomfor Internet-generated traffic. The traffic volume generated during the nine months endedSeptember 30, 2000 was 50% higher than the nine months ended September 30, 1999.
Revenues in 1999 were NOK 886 million, an increase of NOK 417 million, or 89%, from 1998.The increase is primarily attributable to the increase in the number of residential Internetsubscriptions in Norway, as well as an increase in the number of access and Internet hostingsubscriptions in the business market. A large increase in traffic volume also contributed to the growthin revenues. A significant part of this growth also came from our international operations in the
63
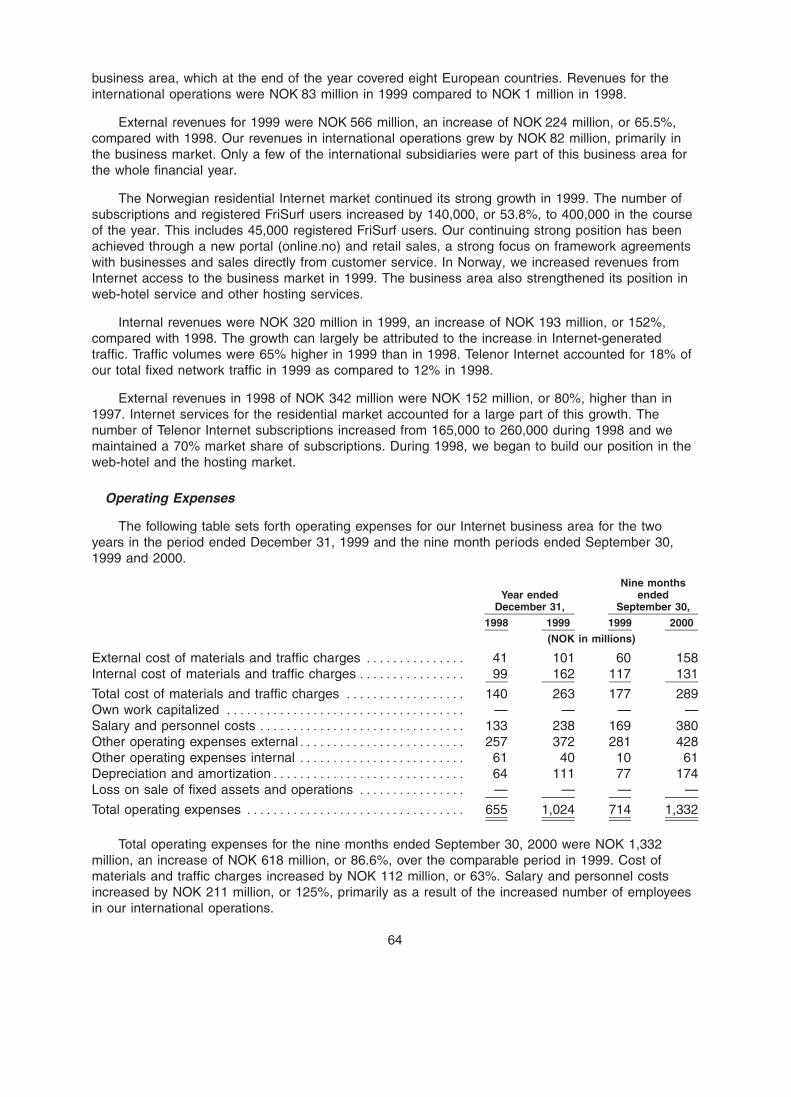
BOWNE OF LONDON 12/01/2000 19:56 BL/SM NO MARKS NEXT PCN: 070.00.00.00 -- Page is valid, no graphics X42481 069.00.00.00 5X
business area, which at the end of the year covered eight European countries. Revenues for theinternational operations were NOK 83 million in 1999 compared to NOK 1 million in 1998.
External revenues for 1999 were NOK 566 million, an increase of NOK 224 million, or 65.5%,compared with 1998. Our revenues in international operations grew by NOK 82 million, primarily inthe business market. Only a few of the international subsidiaries were part of this business area forthe whole financial year.
The Norwegian residential Internet market continued its strong growth in 1999. The number ofsubscriptions and registered FriSurf users increased by 140,000, or 53.8%, to 400,000 in the courseof the year. This includes 45,000 registered FriSurf users. Our continuing strong position has beenachieved through a new portal (online.no) and retail sales, a strong focus on framework agreementswith businesses and sales directly from customer service. In Norway, we increased revenues fromInternet access to the business market in 1999. The business area also strengthened its position inweb-hotel service and other hosting services.
Internal revenues were NOK 320 million in 1999, an increase of NOK 193 million, or 152%,compared with 1998. The growth can largely be attributed to the increase in Internet-generatedtraffic. Traffic volumes were 65% higher in 1999 than in 1998. Telenor Internet accounted for 18% ofour total fixed network traffic in 1999 as compared to 12% in 1998.
External revenues in 1998 of NOK 342 million were NOK 152 million, or 80%, higher than in1997. Internet services for the residential market accounted for a large part of this growth. Thenumber of Telenor Internet subscriptions increased from 165,000 to 260,000 during 1998 and wemaintained a 70% market share of subscriptions. During 1998, we began to build our position in theweb-hotel and the hosting market.
Operating Expenses
The following table sets forth operating expenses for our Internet business area for the twoyears in the period ended December 31, 1999 and the nine month periods ended September 30,1999 and 2000.
Nine monthsYear ended ended
December 31, September 30,
1998 1999 1999 2000
(NOK in millions)
External cost of materials and traffic charges *************** 41 101 60 158Internal cost of materials and traffic charges **************** 99 162 117 131
Total cost of materials and traffic charges ****************** 140 263 177 289Own work capitalized ************************************ — — — —Salary and personnel costs ******************************* 133 238 169 380Other operating expenses external************************* 257 372 281 428Other operating expenses internal ************************* 61 40 10 61Depreciation and amortization***************************** 64 111 77 174Loss on sale of fixed assets and operations **************** — — — —
Total operating expenses ********************************* 655 1,024 714 1,332
Total operating expenses for the nine months ended September 30, 2000 were NOK 1,332million, an increase of NOK 618 million, or 86.6%, over the comparable period in 1999. Cost ofmaterials and traffic charges increased by NOK 112 million, or 63%. Salary and personnel costsincreased by NOK 211 million, or 125%, primarily as a result of the increased number of employeesin our international operations.
64
BOWNE OF LONDON 12/01/2000 19:56 BL/SM NO MARKS NEXT PCN: 071.00.00.00 -- Page is valid, no graphics X42481 070.00.00.00 5X
The remaining increase in operating expenses in the nine months ended September 30, 2000,NOK 295 million was attributable to increased international activity through acquisitions and start-upoperations. Marketing and consultancy services in addition to amortization of goodwill increasedsignificantly due to acquisitions of international businesses.
Total operating expenses for 1999 were NOK 1,024 million, an increase of NOK 369 million, or56.3%, over 1998. Higher materials costs and traffic charges were in line with increased revenues forthe period. Salary and personnel costs increased by NOK 105 million, or 79%, primarily as a resultof increased international activity. At the end of 1999 almost half the workforce was working outsideof Norway. The total number of full-time equivalent employees was 735 at the end of 1999, of which361 were outside Norway. In 1998, the total number of full-time equivalent employees was 409, ofwhich 69 were outside of Norway. The total number of employees in Norway is now at a stable leveland future workforce growth will likely come from outside of Norway.
Other operating expenses in 1999 increased by NOK 94 million, or 29.6%, to NOK 412 million.This increase relates mainly to the business area’s subsidiaries abroad, including establishing andstarting up international operations. The remaining increase is primarily attributed to increasedactivity in our Norwegian operations.
Depreciation was NOK 111 million in 1999, an increase of NOK 47 million compared to 1998.The increase is primarily a result of increased investment outside of Norway.
Operating Profits (Loss)
We recorded an operating loss in our Internet business area of NOK 569 million in thenine months ended September 30, 2000, which is a loss of an additional NOK 474 million comparedto the same period in 1999. The loss is attributable to the extensive investments in internationaloperations where we recorded an operating loss from subsidiaries outside Norway (includingamortization of goodwill) of NOK 420 million, compared with an operating loss (includingamortization of goodwill) of NOK 65 million in the nine months ended September 30, 1999. Duringrecent months, operating expenses have increased due to the introduction of new initiatives.
Our Internet business area recorded an operating loss for 1999 of NOK 138 million. Thisrepresented an improvement of NOK 48 million compared to an operating loss of NOK 186 million in1998, and was attributable to an increase in revenues. The loss is attributable to the investments ininternational operations in which we recorded an operating loss from subsidiaries outside Norway(including amortization of goodwill) of NOK 113 million.
Associated Companies
During the first nine months of 2000, we transferred our ownership interest in ScandinaviaOnline AS (SOL AS) to Scandinavia Online AB (SOL AB). SOL AB completed an initial public listingof its shares in June 2000, and our ownership was reduced to approximately 17%. The net resultsfrom associated companies in our Internet business area for the nine months ended September 30,2000 amounted to NOK 254 million, an increase of NOK 241 million. The improvement in this resultis primarily related to the gain on reduced ownership in SOL AB and the sale of activities in SOL ASprior to the restructuring of our ownership, and gain on sale of Schibsted Interactive AB.
Our net results from associated companies in 1999 was NOK 14 million, an improvement ofNOK 65 million, or 127.5%, over 1998. This was mainly attributable to the SOL companies. Thisgrowth was due to extensive restructuring of the companies, and the realization of gains from thesale of businesses within SOL AS.
65
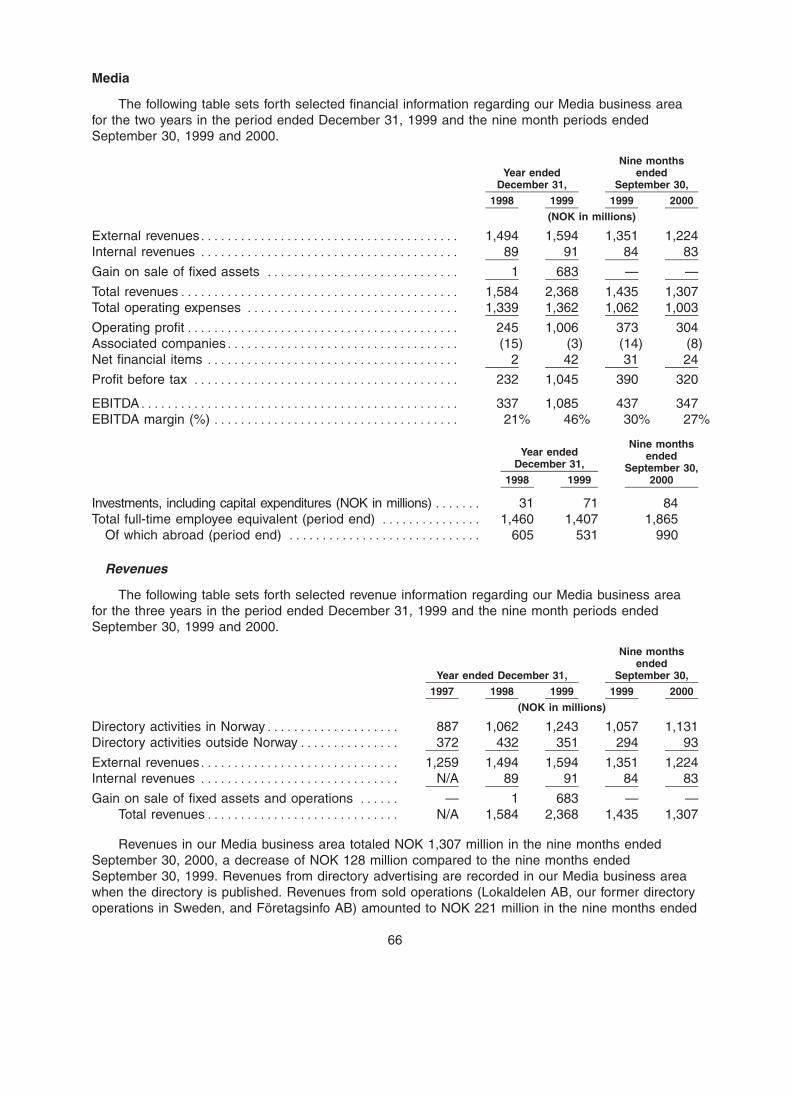
BOWNE OF LONDON 12/01/2000 19:56 BL/SM NO MARKS NEXT PCN: 072.00.00.00 -- Page is valid, no graphics X42481 071.00.00.00 5X
Media
The following table sets forth selected financial information regarding our Media business areafor the two years in the period ended December 31, 1999 and the nine month periods endedSeptember 30, 1999 and 2000.
Nine monthsYear ended ended
December 31, September 30,
1998 1999 1999 2000
(NOK in millions)
External revenues*************************************** 1,494 1,594 1,351 1,224Internal revenues *************************************** 89 91 84 83
Gain on sale of fixed assets ***************************** 1 683 — —
Total revenues****************************************** 1,584 2,368 1,435 1,307Total operating expenses ******************************** 1,339 1,362 1,062 1,003
Operating profit***************************************** 245 1,006 373 304Associated companies*********************************** (15) (3) (14) (8)Net financial items ************************************** 2 42 31 24
Profit before tax **************************************** 232 1,045 390 320
EBITDA************************************************ 337 1,085 437 347EBITDA margin (%) ************************************* 21% 46% 30% 27%
Nine monthsYear ended ended
December 31, September 30,1998 1999 2000
Investments, including capital expenditures (NOK in millions) ******* 31 71 84Total full-time employee equivalent (period end) *************** 1,460 1,407 1,865
Of which abroad (period end) ***************************** 605 531 990
Revenues
The following table sets forth selected revenue information regarding our Media business areafor the three years in the period ended December 31, 1999 and the nine month periods endedSeptember 30, 1999 and 2000.
Nine monthsended
Year ended December 31, September 30,
1997 1998 1999 1999 2000
(NOK in millions)
Directory activities in Norway******************** 887 1,062 1,243 1,057 1,131Directory activities outside Norway*************** 372 432 351 294 93
External revenues****************************** 1,259 1,494 1,594 1,351 1,224Internal revenues ****************************** N/A 89 91 84 83
Gain on sale of fixed assets and operations ****** — 1 683 — —Total revenues***************************** N/A 1,584 2,368 1,435 1,307
Revenues in our Media business area totaled NOK 1,307 million in the nine months endedSeptember 30, 2000, a decrease of NOK 128 million compared to the nine months endedSeptember 30, 1999. Revenues from directory advertising are recorded in our Media business areawhen the directory is published. Revenues from sold operations (Lokaldelen AB, our former directoryoperations in Sweden, and Foretagsinfo AB) amounted to NOK 221 million in the nine months ended
66
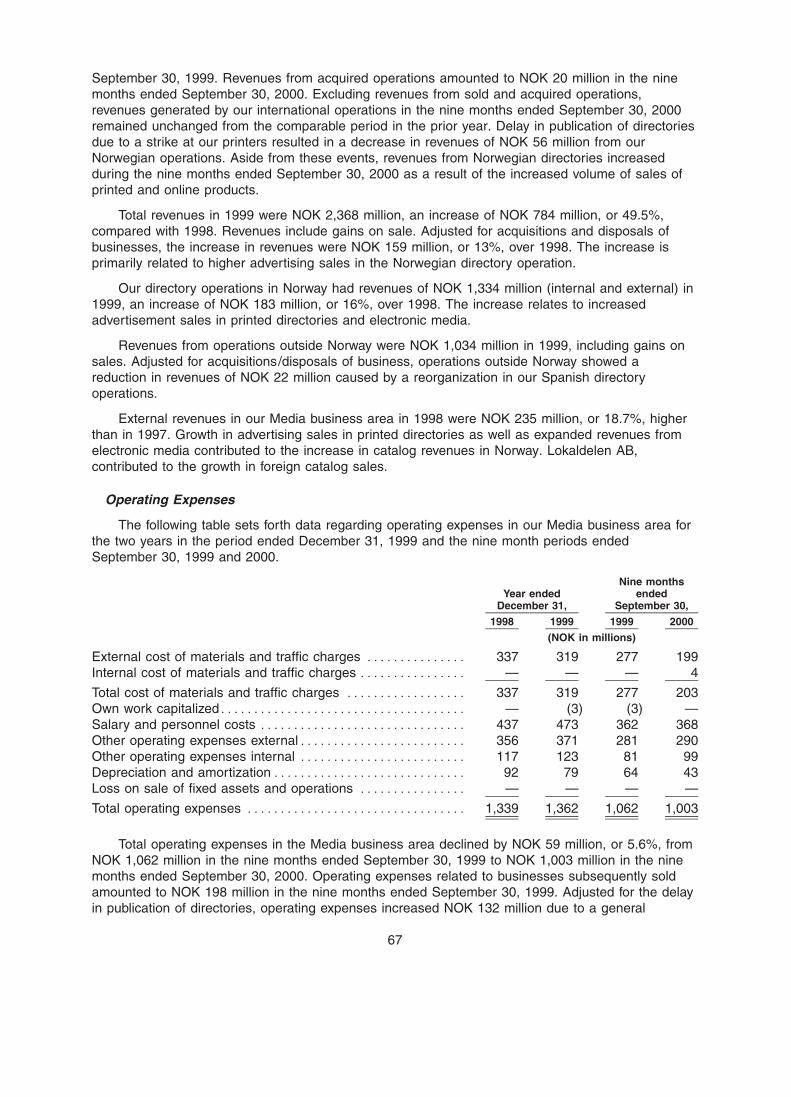
BOWNE OF LONDON 12/01/2000 19:56 BL/SM NO MARKS NEXT PCN: 073.00.00.00 -- Page is valid, no graphics X42481 072.00.00.00 5X
September 30, 1999. Revenues from acquired operations amounted to NOK 20 million in the ninemonths ended September 30, 2000. Excluding revenues from sold and acquired operations,revenues generated by our international operations in the nine months ended September 30, 2000remained unchanged from the comparable period in the prior year. Delay in publication of directoriesdue to a strike at our printers resulted in a decrease in revenues of NOK 56 million from ourNorwegian operations. Aside from these events, revenues from Norwegian directories increasedduring the nine months ended September 30, 2000 as a result of the increased volume of sales ofprinted and online products.
Total revenues in 1999 were NOK 2,368 million, an increase of NOK 784 million, or 49.5%,compared with 1998. Revenues include gains on sale. Adjusted for acquisitions and disposals ofbusinesses, the increase in revenues were NOK 159 million, or 13%, over 1998. The increase isprimarily related to higher advertising sales in the Norwegian directory operation.
Our directory operations in Norway had revenues of NOK 1,334 million (internal and external) in1999, an increase of NOK 183 million, or 16%, over 1998. The increase relates to increasedadvertisement sales in printed directories and electronic media.
Revenues from operations outside Norway were NOK 1,034 million in 1999, including gains onsales. Adjusted for acquisitions/disposals of business, operations outside Norway showed areduction in revenues of NOK 22 million caused by a reorganization in our Spanish directoryoperations.
External revenues in our Media business area in 1998 were NOK 235 million, or 18.7%, higherthan in 1997. Growth in advertising sales in printed directories as well as expanded revenues fromelectronic media contributed to the increase in catalog revenues in Norway. Lokaldelen AB,contributed to the growth in foreign catalog sales.
Operating Expenses
The following table sets forth data regarding operating expenses in our Media business area forthe two years in the period ended December 31, 1999 and the nine month periods endedSeptember 30, 1999 and 2000.
Nine monthsYear ended ended
December 31, September 30,
1998 1999 1999 2000
(NOK in millions)
External cost of materials and traffic charges *************** 337 319 277 199Internal cost of materials and traffic charges **************** — — — 4
Total cost of materials and traffic charges ****************** 337 319 277 203Own work capitalized************************************* — (3) (3) —Salary and personnel costs ******************************* 437 473 362 368Other operating expenses external************************* 356 371 281 290Other operating expenses internal ************************* 117 123 81 99Depreciation and amortization***************************** 92 79 64 43Loss on sale of fixed assets and operations **************** — — — —
Total operating expenses ********************************* 1,339 1,362 1,062 1,003
Total operating expenses in the Media business area declined by NOK 59 million, or 5.6%, fromNOK 1,062 million in the nine months ended September 30, 1999 to NOK 1,003 million in the ninemonths ended September 30, 2000. Operating expenses related to businesses subsequently soldamounted to NOK 198 million in the nine months ended September 30, 1999. Adjusted for the delayin publication of directories, operating expenses increased NOK 132 million due to a general
67
BOWNE OF LONDON 12/01/2000 19:56 BL/SM NO MARKS NEXT PCN: 074.00.00.00 -- Page is valid, no graphics X42481 073.00.00.00 5X
increase in the salary and personnel costs, due to an increased number of employees and expensesincurred related to the implementation of a new directory system in the organization.
The cost of materials and traffic charges were NOK 319 million in 1999, a reduction of NOK 18million compared with 1998. When adjusted for acquisitions/disposals of businesses, the increase incost of materials and traffic charges was NOK 4 million. The increase is primarily due to reprintingvolume 4 of the Norwegian telephone directory (NOK 7 million) and the increased price of paper andprinting costs for the Norwegian directory operations. Reduced activity in Spain led to lowerproduction costs.
Salary and personnel costs were NOK 473 million in 1999, an increase of NOK 36 million over1998. Adjusted for acquisition/disposals of operations, salary and personnel costs were NOK 365million in 1999, an increase of NOK 22 million, or 6%. The increase is a result of a general increasein salary levels, increased resource usage in sales resulting from higher activity levels and increasedproduct development in the Norwegian directory operation, although productivity improvements alsogenerated significant cost reductions in the same period for the Norwegian directory operation.
The number of full-time equivalent employees decreased by 53 to 1,407 in 1999. Adjusted foracquisitions/disposals of business, the total number of employees increased by 170 compared to1998. The increase is a result of higher activity in the Norwegian operations, as well as more part-time employees than in 1998.
Other operating expenses increased by NOK 21 million to NOK 494 million in 1999. Adjusted foracquisitions/disposals of business, the increase was NOK 32 million. The increase is a result ofgreater market activity, increased use of consultants, higher technical costs and an increased groupinternal charge for information technology costs to the Norwegian operations.
Depreciation and amortization were NOK 79 million in 1999, which was NOK 13 million lowerthan 1998. Adjusted for acquisitions/disposals of business, depreciation and amortization wereNOK 17 million lower than in 1998. The primary cause of this reduction is that the depreciation ofthe rebuilding costs of our head office in Oslo ended in 1998.
Operating Profits
The operating profit of our Media business area for the nine months ended September 30, 2000was NOK 304 million, a decrease of NOK 69 million, or 18.5%, compared to the nine months endedSeptember 30, 1999. The nine months ended September 30, 1999 includes operating profit ofNOK 23 million from operations subsequently sold. After adjusting for sold operations, the operatingprofit for Norwegian directories and the international operations was NOK 41 million and NOK 5million lower than last year, respectively. The delay in distribution of the directories in Norway had anegative effect of NOK 38 million on the operating profit for the nine months ended September 30,2000.
Our Swedish directory operations, Lokaldelen AB and Telenor Foretagsinfo AB, were sold, andour shareholding in the Baltic directory operation Interinfo increased from 40.5% in 1998 to 100% in1999. We acquired the directory operations Soleil Publicite during 1998. Operating profit in 1999from sold operations was NOK 19 million, a decrease of NOK 41 million, or 68.1%, excluding gainson disposal. Interinfo and Soleil had combined revenues of NOK 80 million and an operating loss ofNOK 27 million in 1999.
Media’s operating profit was NOK 1,006 million in 1999, an increase of NOK 761 million, or310.6%, compared with 1998. The gain on the disposal of operations was NOK 683 million. Theimprovement was due to considerably higher profitability in Norway.
68
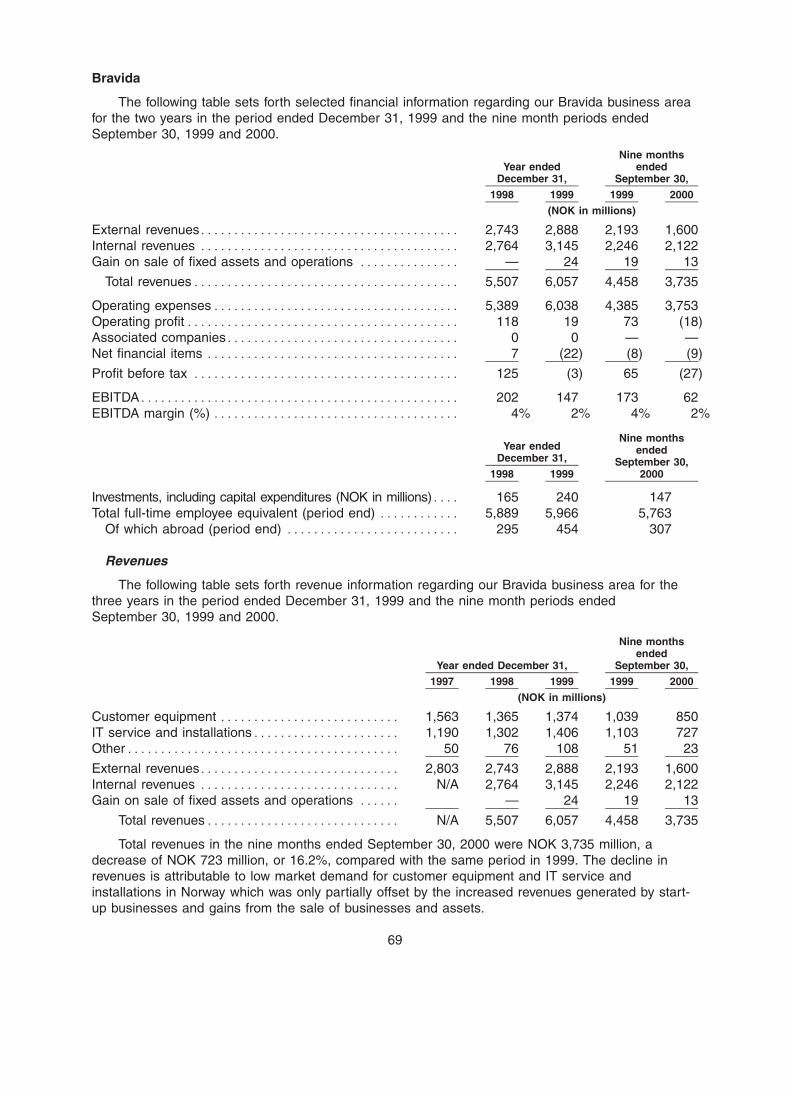
BOWNE OF LONDON 12/01/2000 19:56 BL/SM NO MARKS NEXT PCN: 075.00.00.00 -- Page is valid, no graphics X42481 074.00.00.00 5X
Bravida
The following table sets forth selected financial information regarding our Bravida business areafor the two years in the period ended December 31, 1999 and the nine month periods endedSeptember 30, 1999 and 2000.
Nine monthsYear ended ended
December 31, September 30,
1998 1999 1999 2000
(NOK in millions)
External revenues*************************************** 2,743 2,888 2,193 1,600Internal revenues *************************************** 2,764 3,145 2,246 2,122Gain on sale of fixed assets and operations *************** — 24 19 13
Total revenues**************************************** 5,507 6,057 4,458 3,735
Operating expenses************************************* 5,389 6,038 4,385 3,753Operating profit***************************************** 118 19 73 (18)Associated companies*********************************** 0 0 — —Net financial items ************************************** 7 (22) (8) (9)
Profit before tax **************************************** 125 (3) 65 (27)
EBITDA************************************************ 202 147 173 62EBITDA margin (%) ************************************* 4% 2% 4% 2%
Nine monthsYear ended ended
December 31, September 30,1998 1999 2000
Investments, including capital expenditures (NOK in millions)**** 165 240 147Total full-time employee equivalent (period end) ************ 5,889 5,966 5,763
Of which abroad (period end) ************************** 295 454 307
Revenues
The following table sets forth revenue information regarding our Bravida business area for thethree years in the period ended December 31, 1999 and the nine month periods endedSeptember 30, 1999 and 2000.
Nine monthsended
Year ended December 31, September 30,
1997 1998 1999 1999 2000
(NOK in millions)
Customer equipment *************************** 1,563 1,365 1,374 1,039 850IT service and installations********************** 1,190 1,302 1,406 1,103 727Other***************************************** 50 76 108 51 23
External revenues****************************** 2,803 2,743 2,888 2,193 1,600Internal revenues ****************************** N/A 2,764 3,145 2,246 2,122Gain on sale of fixed assets and operations ****** — 24 19 13
Total revenues***************************** N/A 5,507 6,057 4,458 3,735
Total revenues in the nine months ended September 30, 2000 were NOK 3,735 million, adecrease of NOK 723 million, or 16.2%, compared with the same period in 1999. The decline inrevenues is attributable to low market demand for customer equipment and IT service andinstallations in Norway which was only partially offset by the increased revenues generated by start-up businesses and gains from the sale of businesses and assets.
69
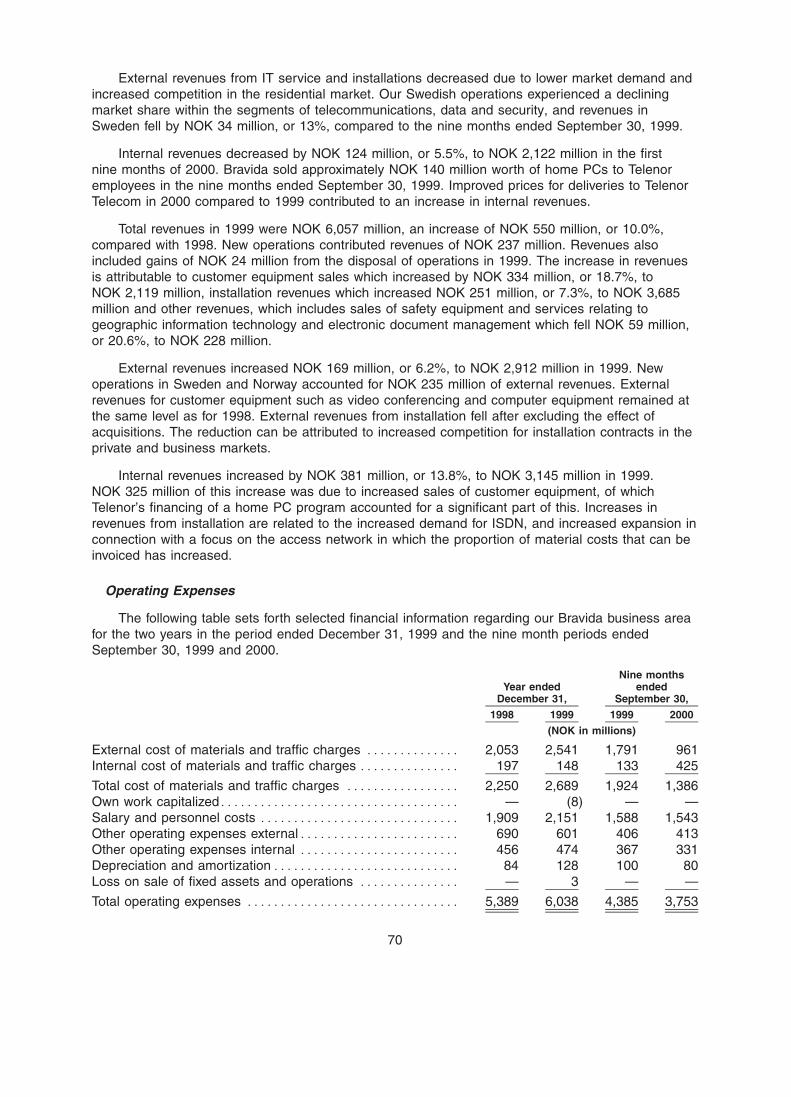
BOWNE OF LONDON 12/01/2000 19:56 BL/SM NO MARKS NEXT PCN: 076.00.00.00 -- Page is valid, no graphics X42481 075.00.00.00 5X
External revenues from IT service and installations decreased due to lower market demand andincreased competition in the residential market. Our Swedish operations experienced a decliningmarket share within the segments of telecommunications, data and security, and revenues inSweden fell by NOK 34 million, or 13%, compared to the nine months ended September 30, 1999.
Internal revenues decreased by NOK 124 million, or 5.5%, to NOK 2,122 million in the firstnine months of 2000. Bravida sold approximately NOK 140 million worth of home PCs to Telenoremployees in the nine months ended September 30, 1999. Improved prices for deliveries to TelenorTelecom in 2000 compared to 1999 contributed to an increase in internal revenues.
Total revenues in 1999 were NOK 6,057 million, an increase of NOK 550 million, or 10.0%,compared with 1998. New operations contributed revenues of NOK 237 million. Revenues alsoincluded gains of NOK 24 million from the disposal of operations in 1999. The increase in revenuesis attributable to customer equipment sales which increased by NOK 334 million, or 18.7%, toNOK 2,119 million, installation revenues which increased NOK 251 million, or 7.3%, to NOK 3,685million and other revenues, which includes sales of safety equipment and services relating togeographic information technology and electronic document management which fell NOK 59 million,or 20.6%, to NOK 228 million.
External revenues increased NOK 169 million, or 6.2%, to NOK 2,912 million in 1999. Newoperations in Sweden and Norway accounted for NOK 235 million of external revenues. Externalrevenues for customer equipment such as video conferencing and computer equipment remained atthe same level as for 1998. External revenues from installation fell after excluding the effect ofacquisitions. The reduction can be attributed to increased competition for installation contracts in theprivate and business markets.
Internal revenues increased by NOK 381 million, or 13.8%, to NOK 3,145 million in 1999.NOK 325 million of this increase was due to increased sales of customer equipment, of whichTelenor’s financing of a home PC program accounted for a significant part of this. Increases inrevenues from installation are related to the increased demand for ISDN, and increased expansion inconnection with a focus on the access network in which the proportion of material costs that can beinvoiced has increased.
Operating Expenses
The following table sets forth selected financial information regarding our Bravida business areafor the two years in the period ended December 31, 1999 and the nine month periods endedSeptember 30, 1999 and 2000.
Nine monthsYear ended ended
December 31, September 30,
1998 1999 1999 2000
(NOK in millions)
External cost of materials and traffic charges ************** 2,053 2,541 1,791 961Internal cost of materials and traffic charges *************** 197 148 133 425
Total cost of materials and traffic charges ***************** 2,250 2,689 1,924 1,386Own work capitalized************************************ — (8) — —Salary and personnel costs ****************************** 1,909 2,151 1,588 1,543Other operating expenses external************************ 690 601 406 413Other operating expenses internal ************************ 456 474 367 331Depreciation and amortization**************************** 84 128 100 80Loss on sale of fixed assets and operations *************** — 3 — —
Total operating expenses ******************************** 5,389 6,038 4,385 3,753
70
BOWNE OF LONDON 12/01/2000 19:56 BL/SM NO MARKS NEXT PCN: 077.00.00.00 -- Page is valid, no graphics X42481 076.00.00.00 5X
Total operating expenses in the Bravida business area were NOK 3,753 million in the ninemonths ended September 30, 2000, a decrease of NOK 632 million, or 14.4%, compared to the ninemonths ended September 30, 1999. Costs of materials and traffic charges were substantially lowerin the nine months ended September 30, 2000, reflecting the lower sales of customer equipment(external and internal sales) and lower sales of IT service and installations of which cost of materialconstitute a major part. Due to fewer employees in the nine months ended September 30, 2000compared to the same period in 1999 salary and personnel costs decreased in the nine monthsended September 30, 2000 from the nine months ended September 30, 1999. The reduction in otheroperating expenses is mainly due to lower sales, fewer employees and general cost savings.Depreciation and amortization also decreased as major investments were fully depreciated in 1999.
Total operating expenses were NOK 6,038 million in 1999, an increase of NOK 649 million, or12.0%, compared to 1998.
The cost of materials and traffic charges increased NOK 439 million, or 19.5%, toNOK 2,689 million in 1999 due to higher volumes of delivery of customer equipment and a higherpercentage cost of materials for services supplied. The cost of materials from new operations wasNOK 101 million.
Salary and personnel costs increased NOK 242 million, or 12.7%, to NOK 2,151 million in 1999.NOK 110 million of this increase was related to new operations, while the remaining increase wasattributable to overtime costs and salary increases.
Other operating expenses were NOK 71 million, or 6.2%, lower to NOK 1,075 million in 1999.The reduction reflects the reduced use of contract personnel and general cost-cutting.
Depreciation and amortization increased NOK 44 million, or 52.4%, to NOK 128 million in 1999.Depreciation related to new operations was NOK 13 million. Depreciation costs increased byNOK 10 million as a result of the participation of a large number of Bravida employees in a homepersonal computer program.
Operating Profits (Loss)
Bravida recorded an operating loss of NOK 18 million for the first nine months of 2000,compared to an operating profit of NOK 73 million for the same period in 1999. The reduction isattributable to lower revenues for both Bravida’s Norwegian and Swedish operations as well as costsassociated with restructuring the Swedish operations. New business contributed with a loss ofNOK 17 million (after amortization of goodwill). In addition, costs of NOK 31 million were incurred inconnection with branding of the new company and consultancy fees in the merger with BPA in thefirst nine months of 2000. Bravida expects to incur additional costs related to the merger with BPA,estimated to be a total of NOK 25 million in 2000.
Operating profit in 1999 was NOK 19 million, NOK 99 million lower than in 1998. Our newoperations contributed operating loss of NOK 17 million, while we recorded gains from disposals ofNOK 24 million. The operating margin was 0.3% in 1999, compared with 2.2% in 1998. Thedeteriorating result can be attributed to a fall in the price of services, increased material costs due toa change in the structure of contracts with Telenor Telecom and lower margins on computerequipment sales.
71
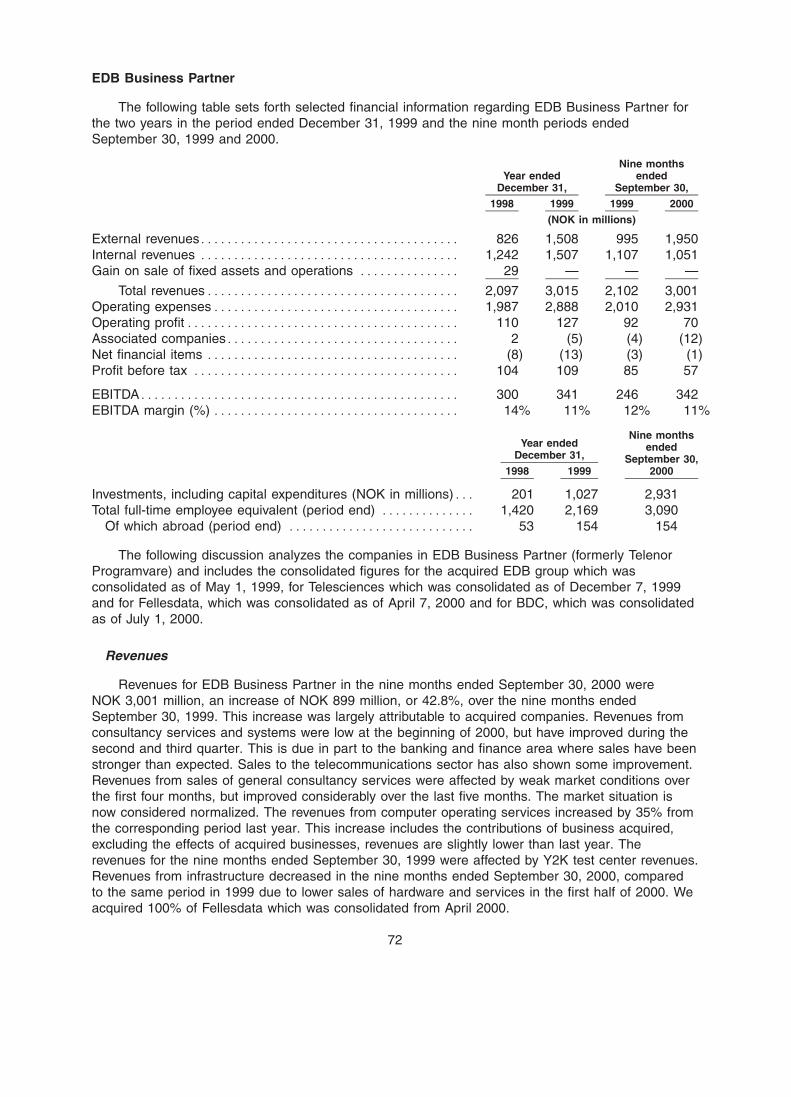
BOWNE OF LONDON 12/01/2000 19:56 BL/SM NO MARKS NEXT PCN: 078.00.00.00 -- Page is valid, no graphics X42481 077.00.00.00 5X
EDB Business Partner
The following table sets forth selected financial information regarding EDB Business Partner forthe two years in the period ended December 31, 1999 and the nine month periods endedSeptember 30, 1999 and 2000.
Nine monthsYear ended ended
December 31, September 30,
1998 1999 1999 2000
(NOK in millions)
External revenues*************************************** 826 1,508 995 1,950Internal revenues *************************************** 1,242 1,507 1,107 1,051Gain on sale of fixed assets and operations *************** 29 — — —
Total revenues************************************** 2,097 3,015 2,102 3,001Operating expenses************************************* 1,987 2,888 2,010 2,931Operating profit***************************************** 110 127 92 70Associated companies*********************************** 2 (5) (4) (12)Net financial items ************************************** (8) (13) (3) (1)Profit before tax **************************************** 104 109 85 57
EBITDA************************************************ 300 341 246 342EBITDA margin (%) ************************************* 14% 11% 12% 11%
Nine monthsYear ended ended
December 31, September 30,1998 1999 2000
Investments, including capital expenditures (NOK in millions)*** 201 1,027 2,931Total full-time employee equivalent (period end) ************** 1,420 2,169 3,090
Of which abroad (period end) **************************** 53 154 154
The following discussion analyzes the companies in EDB Business Partner (formerly TelenorProgramvare) and includes the consolidated figures for the acquired EDB group which wasconsolidated as of May 1, 1999, for Telesciences which was consolidated as of December 7, 1999and for Fellesdata, which was consolidated as of April 7, 2000 and for BDC, which was consolidatedas of July 1, 2000.
Revenues
Revenues for EDB Business Partner in the nine months ended September 30, 2000 wereNOK 3,001 million, an increase of NOK 899 million, or 42.8%, over the nine months endedSeptember 30, 1999. This increase was largely attributable to acquired companies. Revenues fromconsultancy services and systems were low at the beginning of 2000, but have improved during thesecond and third quarter. This is due in part to the banking and finance area where sales have beenstronger than expected. Sales to the telecommunications sector has also shown some improvement.Revenues from sales of general consultancy services were affected by weak market conditions overthe first four months, but improved considerably over the last five months. The market situation isnow considered normalized. The revenues from computer operating services increased by 35% fromthe corresponding period last year. This increase includes the contributions of business acquired,excluding the effects of acquired businesses, revenues are slightly lower than last year. Therevenues for the nine months ended September 30, 1999 were affected by Y2K test center revenues.Revenues from infrastructure decreased in the nine months ended September 30, 2000, comparedto the same period in 1999 due to lower sales of hardware and services in the first half of 2000. Weacquired 100% of Fellesdata which was consolidated from April 2000.
72
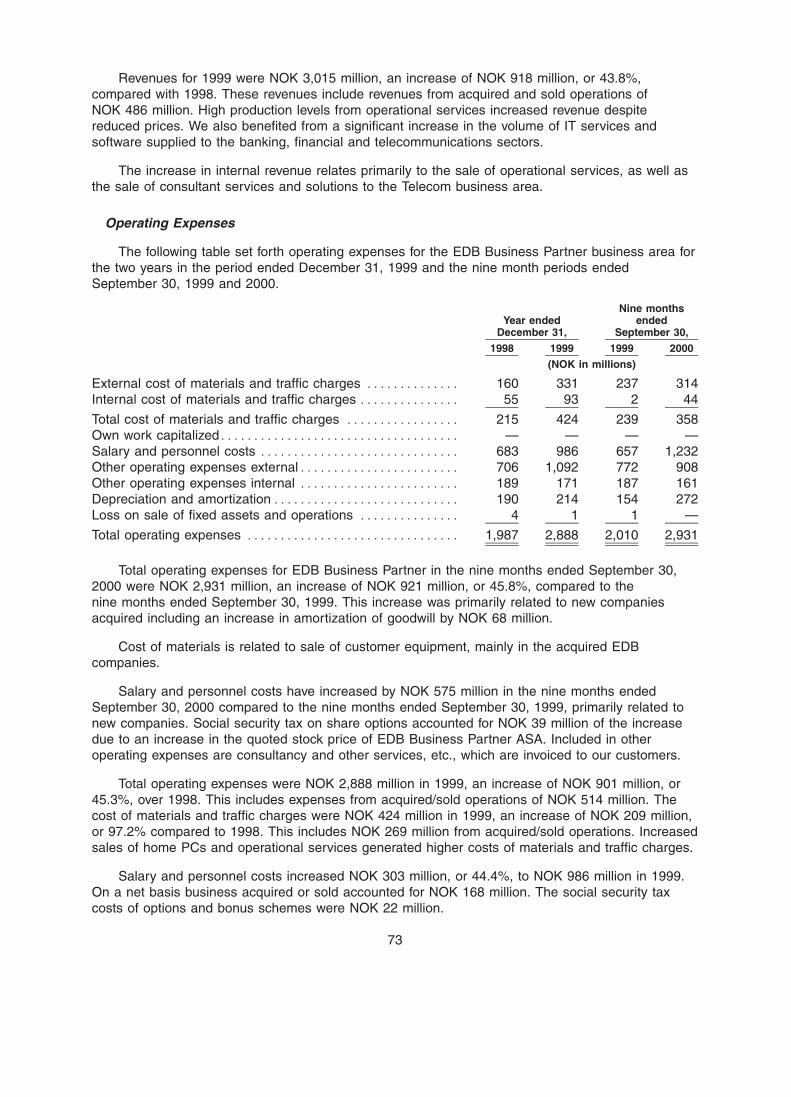
BOWNE OF LONDON 12/03/2000 10:00 BL/SM NO MARKS NEXT PCN: 079.00.00.00 -- Page is valid, no graphics X42481 078.00.00.00 6X
Revenues for 1999 were NOK 3,015 million, an increase of NOK 918 million, or 43.8%,compared with 1998. These revenues include revenues from acquired and sold operations ofNOK 486 million. High production levels from operational services increased revenue despitereduced prices. We also benefited from a significant increase in the volume of IT services andsoftware supplied to the banking, financial and telecommunications sectors.
The increase in internal revenue relates primarily to the sale of operational services, as well asthe sale of consultant services and solutions to the Telecom business area.
Operating Expenses
The following table set forth operating expenses for the EDB Business Partner business area forthe two years in the period ended December 31, 1999 and the nine month periods endedSeptember 30, 1999 and 2000.
Nine monthsYear ended ended
December 31, September 30,
1998 1999 1999 2000
(NOK in millions)
External cost of materials and traffic charges ************** 160 331 237 314Internal cost of materials and traffic charges *************** 55 93 2 44
Total cost of materials and traffic charges ***************** 215 424 239 358Own work capitalized************************************ — — — —Salary and personnel costs ****************************** 683 986 657 1,232Other operating expenses external************************ 706 1,092 772 908Other operating expenses internal ************************ 189 171 187 161Depreciation and amortization**************************** 190 214 154 272Loss on sale of fixed assets and operations *************** 4 1 1 —
Total operating expenses ******************************** 1,987 2,888 2,010 2,931
Total operating expenses for EDB Business Partner in the nine months ended September 30,2000 were NOK 2,931 million, an increase of NOK 921 million, or 45.8%, compared to thenine months ended September 30, 1999. This increase was primarily related to new companiesacquired including an increase in amortization of goodwill by NOK 68 million.
Cost of materials is related to sale of customer equipment, mainly in the acquired EDBcompanies.
Salary and personnel costs have increased by NOK 575 million in the nine months endedSeptember 30, 2000 compared to the nine months ended September 30, 1999, primarily related tonew companies. Social security tax on share options accounted for NOK 39 million of the increasedue to an increase in the quoted stock price of EDB Business Partner ASA. Included in otheroperating expenses are consultancy and other services, etc., which are invoiced to our customers.
Total operating expenses were NOK 2,888 million in 1999, an increase of NOK 901 million, or45.3%, over 1998. This includes expenses from acquired/sold operations of NOK 514 million. Thecost of materials and traffic charges were NOK 424 million in 1999, an increase of NOK 209 million,or 97.2% compared to 1998. This includes NOK 269 million from acquired/sold operations. Increasedsales of home PCs and operational services generated higher costs of materials and traffic charges.
Salary and personnel costs increased NOK 303 million, or 44.4%, to NOK 986 million in 1999.On a net basis business acquired or sold accounted for NOK 168 million. The social security taxcosts of options and bonus schemes were NOK 22 million.
73
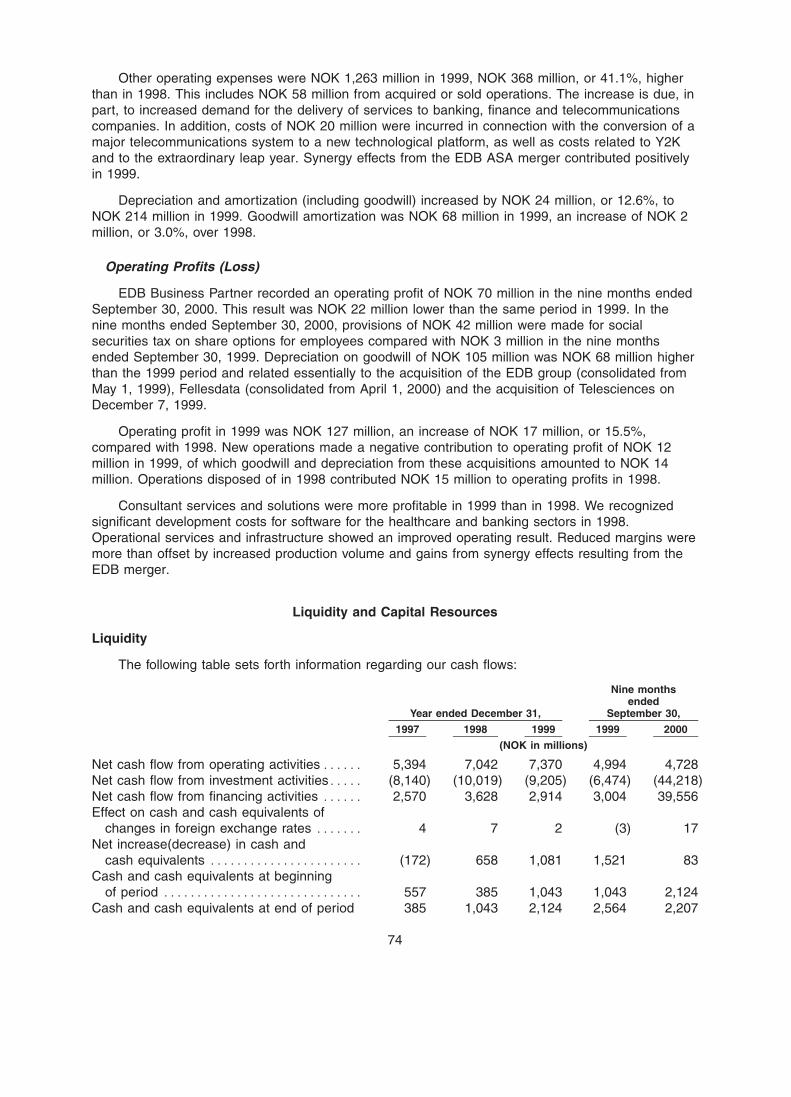
BOWNE OF LONDON 12/01/2000 19:56 BL/SM NO MARKS NEXT PCN: 080.00.00.00 -- Page is valid, no graphics X42481 079.00.00.00 5X
Other operating expenses were NOK 1,263 million in 1999, NOK 368 million, or 41.1%, higherthan in 1998. This includes NOK 58 million from acquired or sold operations. The increase is due, inpart, to increased demand for the delivery of services to banking, finance and telecommunicationscompanies. In addition, costs of NOK 20 million were incurred in connection with the conversion of amajor telecommunications system to a new technological platform, as well as costs related to Y2Kand to the extraordinary leap year. Synergy effects from the EDB ASA merger contributed positivelyin 1999.
Depreciation and amortization (including goodwill) increased by NOK 24 million, or 12.6%, toNOK 214 million in 1999. Goodwill amortization was NOK 68 million in 1999, an increase of NOK 2million, or 3.0%, over 1998.
Operating Profits (Loss)
EDB Business Partner recorded an operating profit of NOK 70 million in the nine months endedSeptember 30, 2000. This result was NOK 22 million lower than the same period in 1999. In thenine months ended September 30, 2000, provisions of NOK 42 million were made for socialsecurities tax on share options for employees compared with NOK 3 million in the nine monthsended September 30, 1999. Depreciation on goodwill of NOK 105 million was NOK 68 million higherthan the 1999 period and related essentially to the acquisition of the EDB group (consolidated fromMay 1, 1999), Fellesdata (consolidated from April 1, 2000) and the acquisition of Telesciences onDecember 7, 1999.
Operating profit in 1999 was NOK 127 million, an increase of NOK 17 million, or 15.5%,compared with 1998. New operations made a negative contribution to operating profit of NOK 12million in 1999, of which goodwill and depreciation from these acquisitions amounted to NOK 14million. Operations disposed of in 1998 contributed NOK 15 million to operating profits in 1998.
Consultant services and solutions were more profitable in 1999 than in 1998. We recognizedsignificant development costs for software for the healthcare and banking sectors in 1998.Operational services and infrastructure showed an improved operating result. Reduced margins weremore than offset by increased production volume and gains from synergy effects resulting from theEDB merger.
Liquidity and Capital Resources
Liquidity
The following table sets forth information regarding our cash flows:
Nine monthsended
Year ended December 31, September 30,
1997 1998 1999 1999 2000
(NOK in millions)
Net cash flow from operating activities****** 5,394 7,042 7,370 4,994 4,728Net cash flow from investment activities***** (8,140) (10,019) (9,205) (6,474) (44,218)Net cash flow from financing activities ****** 2,570 3,628 2,914 3,004 39,556Effect on cash and cash equivalents of
changes in foreign exchange rates ******* 4 7 2 (3) 17Net increase(decrease) in cash and
cash equivalents *********************** (172) 658 1,081 1,521 83Cash and cash equivalents at beginning
of period ****************************** 557 385 1,043 1,043 2,124Cash and cash equivalents at end of period 385 1,043 2,124 2,564 2,207
74
BOWNE OF LONDON 12/01/2000 19:56 BL/SM NO MARKS NEXT PCN: 081.00.00.00 -- Page is valid, no graphics X42481 080.00.00.00 6X
For the first nine months of 2000 net cash flow from operating activities decreased compared tothe first nine months of 1999 mainly on account of increased finance expenses.
In the first nine months of 2000, we increased our investments compared to 1999. We paidNOK 36.2 billion to acquire subsidiaries (net of cash acquired) and interests in, and contributedcapital to, associated companies; see ‘‘Capital Expenditure and Investments’’ below. Net cash flowfrom investment activities was also affected by other payments for investments in fixed assets andshares and positively affected by the sale of subsidiaries, operating assets and sale of otherinvestments and shares.
To finance parts of our investments we have drawn down net NOK 38.5 billion from debtfacilities, while minority interests have contributed capital of NOK 1.6 billion. We also paid dividendsof NOK 500 million.
Our primary source of liquidity has traditionally been cash generated from operating activities. In1999 we generated cash from operating activities of NOK 7,370 million, a 4.7% increase over theNOK 7,042 million generated in 1998. We generated cash from operating activities of NOK 5,394million in 1997. Cash flow in 1999 was enhanced by higher proceeds from sales of goods andservices, which were substantially offset by higher payments to suppliers and higher employee andother operating expenses. The increase in cash generated from operating activities in 1998 wasoffset to a lesser extent by higher payments to suppliers and employees.
Net cash flow used for investment activities fell 8.1% in 1999 as compared to 1998 despite asignificant increase in payments for investments in shares. Payment for purchases of tangible andintangible assets was NOK 6.8 billion in 1999 compared to NOK 6.4 billion in 1998 andNOK 6 billion in 1997. See ‘‘Capital Expenditure and Investments’’ below which also includes noncash investments and allocated value related to the purchase of subsidiaries. Cash flow for thepurchase of subsidiaries and associated companies was NOK 4.5 billion in 1999, compared toNOK 4.2 billion in 1998 and NOK 2.5 billion in 1997. Payment for the 1999 investment in VimpelComof NOK 1,215 million was made in 1998 through a transfer of funds to a restricted bank account andwas therefore recorded on 1998 cash flows. Disposals of subsidiaries and associated companiesresulted in net proceeds of NOK 1,063 million in 1999, mainly related to the sales of Lokaldelen,Foretagsinfo and shares in EDB.
Purchase and sale of other investments mainly relates to the purchase and sale of bonds usedin liquidity management, which are not classified as cash equivalents and short term shares. In 1999we increasingly used debt securities with maturities of less than three months to manage ourliquidity. These securities are not reported as a purchase, or sale, of securities but are classified ascash equivalents. In 1999, we realized NOK 660 million related to sale of Elkjøp. In 1998 and 1997,we made limited sales of shares, primarily in the Telenor Venture operation, and in 1998 we soldshares in the listed company Provida ASA.
We raised net cash of NOK 2,914 million from financing activities in 1999 as compared toNOK 3,628 million in 1998 and NOK 2,570 million in 1997. As a result of the substantialinvestments, we have steadily increased our long-term borrowings from NOK 9,035 at December 31,1997 to NOK 11,300 million at December 31, 1998 and NOK 14,942 million at December 31, 1999.In 1998, our sole shareholder contributed equity capital of NOK 2,000 million. In 1997, 1998 and1999 we paid dividends of NOK 950 million, NOK 570 million and NOK 700 million, respectively.
75
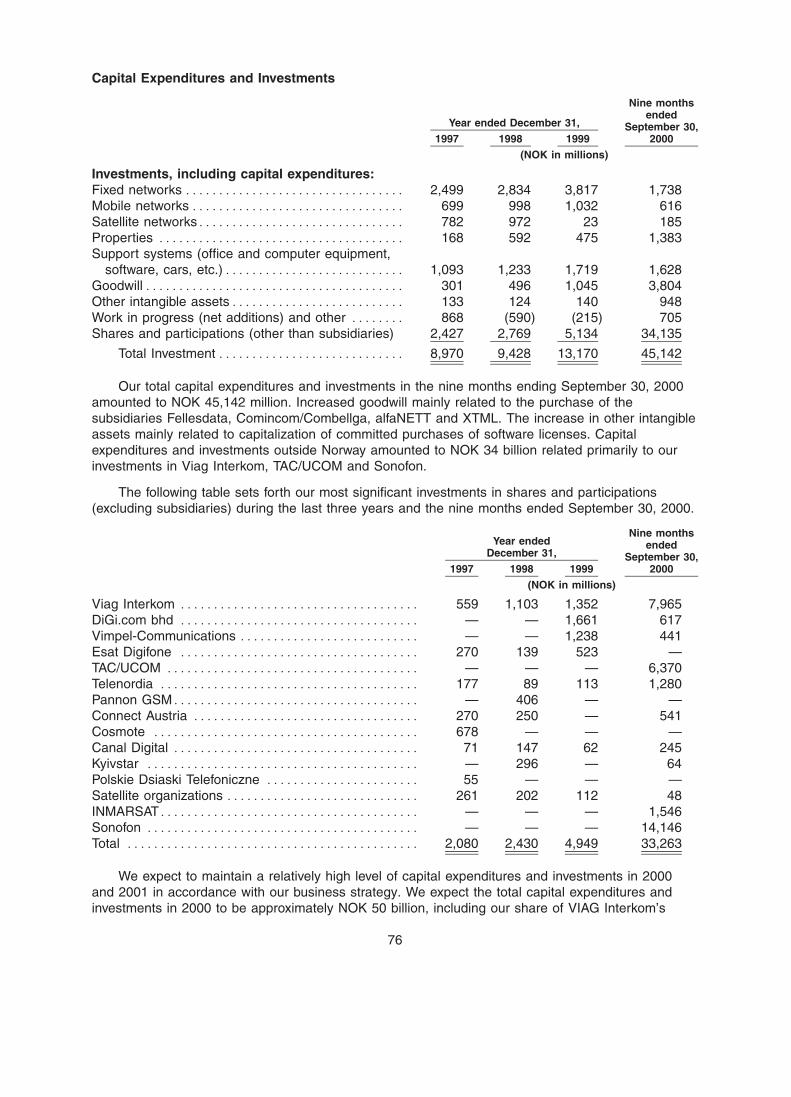
BOWNE OF LONDON 12/01/2000 19:56 BL/SM NO MARKS NEXT PCN: 082.00.00.00 -- Page is valid, no graphics X42481 081.00.00.00 5X
Capital Expenditures and Investments
Nine monthsended
Year ended December 31, September 30,1997 1998 1999 2000
(NOK in millions)
Investments, including capital expenditures:Fixed networks ********************************* 2,499 2,834 3,817 1,738Mobile networks******************************** 699 998 1,032 616Satellite networks******************************* 782 972 23 185Properties ************************************* 168 592 475 1,383Support systems (office and computer equipment,
software, cars, etc.)*************************** 1,093 1,233 1,719 1,628Goodwill*************************************** 301 496 1,045 3,804Other intangible assets************************** 133 124 140 948Work in progress (net additions) and other ******** 868 (590) (215) 705Shares and participations (other than subsidiaries) 2,427 2,769 5,134 34,135
Total Investment **************************** 8,970 9,428 13,170 45,142
Our total capital expenditures and investments in the nine months ending September 30, 2000amounted to NOK 45,142 million. Increased goodwill mainly related to the purchase of thesubsidiaries Fellesdata, Comincom/Combellga, alfaNETT and XTML. The increase in other intangibleassets mainly related to capitalization of committed purchases of software licenses. Capitalexpenditures and investments outside Norway amounted to NOK 34 billion related primarily to ourinvestments in Viag Interkom, TAC/UCOM and Sonofon.
The following table sets forth our most significant investments in shares and participations(excluding subsidiaries) during the last three years and the nine months ended September 30, 2000.
Nine monthsYear ended ended
December 31, September 30,1997 1998 1999 2000
(NOK in millions)
Viag Interkom ************************************ 559 1,103 1,352 7,965DiGi.com bhd ************************************ — — 1,661 617Vimpel-Communications *************************** — — 1,238 441Esat Digifone ************************************ 270 139 523 —TAC/UCOM ************************************** — — — 6,370Telenordia *************************************** 177 89 113 1,280Pannon GSM************************************* — 406 — —Connect Austria ********************************** 270 250 — 541Cosmote **************************************** 678 — — —Canal Digital ************************************* 71 147 62 245Kyivstar ***************************************** — 296 — 64Polskie Dsiaski Telefoniczne *********************** 55 — — —Satellite organizations ***************************** 261 202 112 48INMARSAT*************************************** — — — 1,546Sonofon ***************************************** — — — 14,146Total ******************************************** 2,080 2,430 4,949 33,263
We expect to maintain a relatively high level of capital expenditures and investments in 2000and 2001 in accordance with our business strategy. We expect the total capital expenditures andinvestments in 2000 to be approximately NOK 50 billion, including our share of VIAG Interkom’s
76
BOWNE OF LONDON 12/03/2000 10:03 BL/SM NO MARKS NEXT PCN: 083.00.00.00 -- Page is valid, no graphics X42481 082.00.00.00 6X
UMTS license payment which we made in September, 2000. At September 30, 2000, we have madecommitments to invest NOK 7 billion, including NOK 2 billion to be paid before December 31, 2000.These commitments exclude potential investments in future UMTS licenses. In 2001, we expect ourcapital expenditures and investments related to our current business areas to be between NOK 15 to20 billion, of which approximately one half is expected to be in our Mobile Communications businessarea. This amount does not include possible acquisitions of new businesses. The actual amountsand timing of expenditures may vary substantially from our estimates. We expect to incursubstantially lower levels of capital expenditures and investments in years following 2001.
Capital Resources
To date, we have financed our operations primarily by borrowing directly in the Norwegian andinternational capital markets. The availability of funds and our cost of funding depend in part on ourcredit ratings. We maintain an active dialog with the principal credit rating agencies. Standard &Poor’s has our short- and long-term credit rating on credit watch with negative implications pendingconsideration of this offering. Moody’s Investors Service has our long-term rating on review for apossible downgrade. To finance our future investments, we plan to use debt financing and net cashflows from operations, including possible sale of assets.
We have a US$500 million short-term Euro Commercial Paper program. We had NOK 3,325million outstanding under this program at September 30, 2000, with an average maturity of fourmonths. In August 2000 we established a US Commercial Paper Program of US$1,000 million. AtSeptember 30, 2000, outstanding commercial paper under this program totalled NOK 5,237 millionwith an average maturity of four months. Telenor Communication AS issued commercial paper in theNorwegian market in 2000. Outstanding Norwegian commercial paper totalled NOK 2,605 million atSeptember 30, 2000 with an average maturity of five months. All commercial paper is linked to anunderlying long-term credit facility with a US$1,000 million limit, established in 2000. The creditfacility matures in 2005.
We also have a US$4,000 million Euro Medium-Term Program. We had NOK 28,516 millionoutstanding under this program at September 30, 2000, with maturities between one and eightyears. In 1994 and 1995 we established loans with terms of 10 years with Japanese investors andas of September 30, 2000, we had NOK 1,304 million outstanding under these loans.
All Telenor Communication AS’s interest bearing debt (NOK 50,267 million as of September 30,2000) is unsecured and contains negative pledge provisions that restrict the pledge of assets tosecure future borrowings without granting a similar secured status to existing lenders.
With respect to our satellite operations, Telenor Satellite Services AS has established leasefinancing arrangements for the satellites, Thor II and III. In the aggregate, the lease agreementshave a nominal amount of NOK 1,373 million. The leasing agreements are amortized over 12 years,with a final maturity in 2010.
We have entered into cross border tax benefit leases with respect to digital telephony switchesand GSM mobile network equipment with a book value of approximately NOK 2,200 million atDecember 31, 1999. We are considering entering into similar transactions in respect of additionalnetwork assets.
As of September 30, 2000 our listed subsidiary EDB Business Partner and our foreignsubsidiaries had outstanding external financing amounting to NOK 2,008 million.
Telenor has established a syndicated multi-currency revolving credit facility of DKK 14,000 mil-lion (NOK 15,040 million, as of September 29, 2000) in July 2000. The loan facility has a 364-dayterm with a one year term out option for the outstanding amount on the execution date. As ofSeptember 30, 2000, there was NOK 9,280 million outstanding under the loan facility.
77
BOWNE OF LONDON 12/01/2000 19:56 BL/SM NO MARKS NEXT PCN: 084.00.00.00 -- Page is valid, no graphics X42481 083.00.00.00 5X
Other Issues
Year 2000
We established a comprehensive Year 2000 compliance program, including extensive analysis,examination, implementation and testing to ensure that our operations would be compliant with theYear 2000 changeover. We managed the Year 2000 changeover without material disruptions of ouroperations. In connection with our Year 2000 compliance program, we spent a total of approximatelyNOK 1.0 billion.
Inflation
Our results in recent years have not been substantially affected by inflation. Inflation in Norwayas measured by the consumer price index during the years ended December 31, 1997, 1998 and1999 was 2.6%, 2.3% and 2.3%, respectively.
Norwegian GAAP Compared with US GAAP
Our consolidated financial statements have been prepared under Norwegian GAAP, whichdiffers from US GAAP in several respects. We have prepared a reconciliation of our net income forthe years ended December 31, 1998 and 1999, and for the nine months ended September 30, 1999and 2000, and of our shareholder’s equity as of December 31, 1998 and 1999, and as ofSeptember 30, 2000.
The most significant differences between Norwegian GAAP and US GAAP affecting our netincome and shareholder’s equity are described in notes 29 and 13 to our audited and unauditedconsolidated financial statements, respectively.
Under US GAAP, net income for the years ended December 31, 1998 and 1999 would havebeen NOK 1,578 million and NOK 2,188 million, respectively, as compared to NOK 1,710 million andNOK 2,035 million, respectively, under Norwegian GAAP. Under US GAAP, net income for the ninemonths ended September 30, 1999 and 2000 would have been NOK 1,352 million andNOK 720 million, respectively, as compared to NOK 1,212 million and NOK 596 million, respectively,under Norwegian GAAP.
New Accounting Pronouncements
In June 1998, the Financial Accounting Standards Board the (‘‘FASB’’) issued SFAS No. 133,‘‘Accounting for Derivative Instruments and Hedging Activities’’ (‘‘SFAS 133’’). This pronouncementwas recently amended by SFAS No. 137, which had the effect of deferring the date of SFAS 133’seffectiveness, and SFAS No. 138, which addresses a limited number of implementation difficultiesinvolved in applying SFAS 133. The statement establishes accounting and reporting standardsrequiring that every derivative instrument (including certain derivative instruments embedded in othercontracts) be recorded in the balance sheet as either an asset or liability measured at its fair value.The statement also requires that changes in the derivative’s fair value be recognized currently inearnings unless specific hedge accounting criteria are met. SFAS 133 is effective for fiscal yearsbeginning after June 15, 2000 and cannot be applied retroactively. We have not yet determined theeffect of the application of SFAS 133 on our balance sheet or profit and loss statement.
Disclosures about Market Risk
We are exposed to interest rate risk, foreign exchange rate risk and equity price risk associatedwith our underlying assets, liabilities and anticipated transactions. To manage these risks we issuedebt in foreign currencies and enter into derivative financial contracts. These contracts are enteredinto with major financial institutions, with the objective of minimizing our credit risk. The activities of
78
BOWNE OF LONDON 12/01/2000 19:56 BL/SM NO MARKS NEXT PCN: 085.00.00.00 -- Page is valid, no graphics X42481 084.00.00.00 5X
our Group Treasury are subject to policies approved by our board of directors. These policiesaddress the use of derivative financial instruments, including the approval of counterparties, settingof limits and investment of excess liquidity. Our Group Treasury is responsible for supervising ourmarket risk, to which we are exposed by our operations and financial activities. The Group Treasuryacts as the internal bank with the responsibility for the foreign currency, interest rate risk and liquidityrisk management.
The following discussion and tables, which constitute forward-looking statements that involve riskand uncertainties, summarize our market-sensitive financial instruments including fair value, maturityand contract terms.
Interest Rate Risk Management
To manage our exposure to changes in interest rates and to lower the overall costs of financing,we use interest rate swaps, interest rate caps and forward rate agreements. We use interest rateswaps to exchange the real interest rate exposure on the underlying assets or liabilities from a fixedinterest rate to a 6 months floating interest rate in the same currency or vice versa.
We have increased our debt financing in NOK, SEK, DKK, EURO and USD in the nine monthsended September 30, 2000. The level of interest rates in the Norwegian market and in foreignexchange markets where we are exposed to changes in interest rates, have in general increasedsince year end 1999. This, together with a higher level of debt financing, has lead to increasedfinancing costs compared to last year.
79
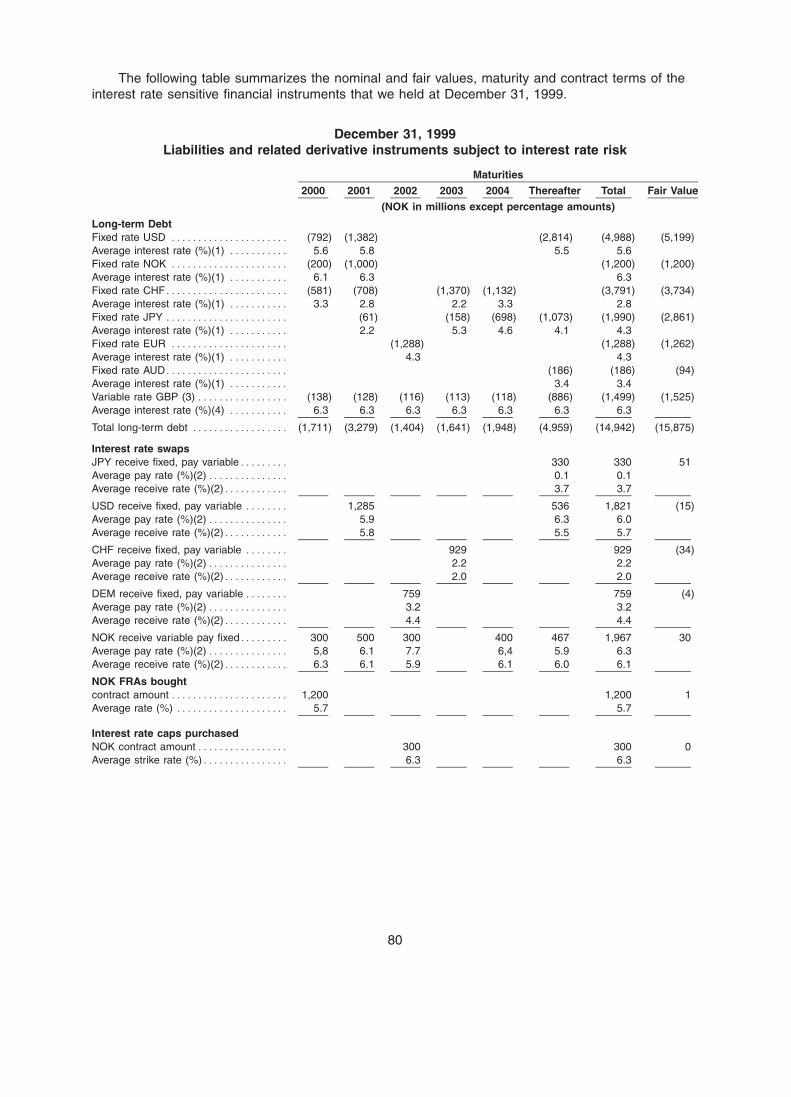
BOWNE OF LONDON 12/01/2000 19:56 BL/SM NO MARKS NEXT PCN: 086.00.00.00 -- Page is valid, no graphics X42481 085.00.00.00 5X
The following table summarizes the nominal and fair values, maturity and contract terms of theinterest rate sensitive financial instruments that we held at December 31, 1999.
December 31, 1999Liabilities and related derivative instruments subject to interest rate risk
Maturities
2000 2001 2002 2003 2004 Thereafter Total Fair Value
(NOK in millions except percentage amounts)
Long-term DebtFixed rate USD ********************** (792) (1,382) (2,814) (4,988) (5,199)Average interest rate (%)(1) *********** 5.6 5.8 5.5 5.6Fixed rate NOK ********************** (200) (1,000) (1,200) (1,200)Average interest rate (%)(1) *********** 6.1 6.3 6.3Fixed rate CHF*********************** (581) (708) (1,370) (1,132) (3,791) (3,734)Average interest rate (%)(1) *********** 3.3 2.8 2.2 3.3 2.8Fixed rate JPY *********************** (61) (158) (698) (1,073) (1,990) (2,861)Average interest rate (%)(1) *********** 2.2 5.3 4.6 4.1 4.3Fixed rate EUR ********************** (1,288) (1,288) (1,262)Average interest rate (%)(1) *********** 4.3 4.3Fixed rate AUD*********************** (186) (186) (94)Average interest rate (%)(1) *********** 3.4 3.4Variable rate GBP (3) ***************** (138) (128) (116) (113) (118) (886) (1,499) (1,525)Average interest rate (%)(4) *********** 6.3 6.3 6.3 6.3 6.3 6.3 6.3
Total long-term debt ****************** (1,711) (3,279) (1,404) (1,641) (1,948) (4,959) (14,942) (15,875)
Interest rate swapsJPY receive fixed, pay variable********* 330 330 51Average pay rate (%)(2)*************** 0.1 0.1Average receive rate (%)(2)************ 3.7 3.7
USD receive fixed, pay variable ******** 1,285 536 1,821 (15)Average pay rate (%)(2)*************** 5.9 6.3 6.0Average receive rate (%)(2)************ 5.8 5.5 5.7
CHF receive fixed, pay variable ******** 929 929 (34)Average pay rate (%)(2)*************** 2.2 2.2Average receive rate (%)(2)************ 2.0 2.0
DEM receive fixed, pay variable ******** 759 759 (4)Average pay rate (%)(2)*************** 3.2 3.2Average receive rate (%)(2)************ 4.4 4.4
NOK receive variable pay fixed********* 300 500 300 400 467 1,967 30Average pay rate (%)(2)*************** 5,8 6.1 7.7 6,4 5.9 6.3Average receive rate (%)(2)************ 6.3 6.1 5.9 6.1 6.0 6.1
NOK FRAs boughtcontract amount ********************** 1,200 1,200 1Average rate (%) ********************* 5.7 5.7
Interest rate caps purchasedNOK contract amount***************** 300 300 0Average strike rate (%)**************** 6.3 6.3
80
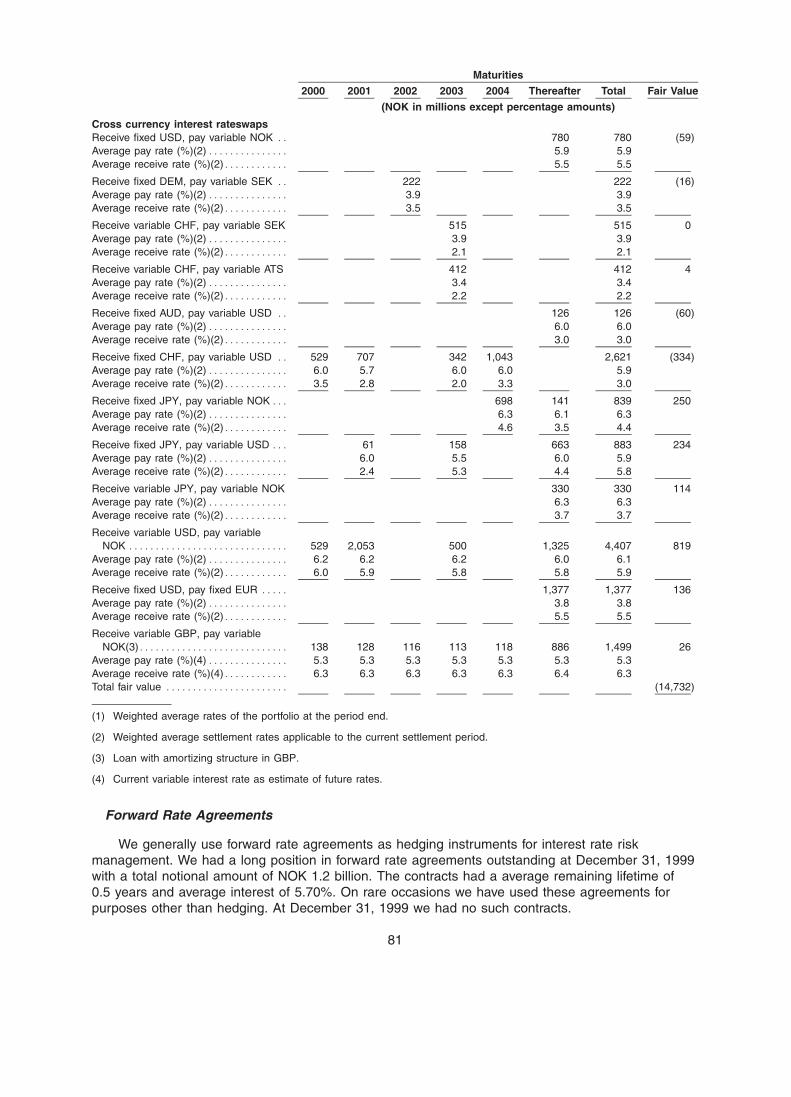
BOWNE OF LONDON 12/01/2000 19:56 BL/SM NO MARKS NEXT PCN: 087.00.00.00 -- Page is valid, no graphics X42481 086.00.00.00 5X
Maturities
2000 2001 2002 2003 2004 Thereafter Total Fair Value
(NOK in millions except percentage amounts)
Cross currency interest rateswapsReceive fixed USD, pay variable NOK ** 780 780 (59)Average pay rate (%)(2)*************** 5.9 5.9Average receive rate (%)(2)************ 5.5 5.5
Receive fixed DEM, pay variable SEK ** 222 222 (16)Average pay rate (%)(2)*************** 3.9 3.9Average receive rate (%)(2)************ 3.5 3.5
Receive variable CHF, pay variable SEK 515 515 0Average pay rate (%)(2)*************** 3.9 3.9Average receive rate (%)(2)************ 2.1 2.1
Receive variable CHF, pay variable ATS 412 412 4Average pay rate (%)(2)*************** 3.4 3.4Average receive rate (%)(2)************ 2.2 2.2
Receive fixed AUD, pay variable USD ** 126 126 (60)Average pay rate (%)(2)*************** 6.0 6.0Average receive rate (%)(2)************ 3.0 3.0
Receive fixed CHF, pay variable USD ** 529 707 342 1,043 2,621 (334)Average pay rate (%)(2)*************** 6.0 5.7 6.0 6.0 5.9Average receive rate (%)(2)************ 3.5 2.8 2.0 3.3 3.0
Receive fixed JPY, pay variable NOK*** 698 141 839 250Average pay rate (%)(2)*************** 6.3 6.1 6.3Average receive rate (%)(2)************ 4.6 3.5 4.4
Receive fixed JPY, pay variable USD *** 61 158 663 883 234Average pay rate (%)(2)*************** 6.0 5.5 6.0 5.9Average receive rate (%)(2)************ 2.4 5.3 4.4 5.8
Receive variable JPY, pay variable NOK 330 330 114Average pay rate (%)(2)*************** 6.3 6.3Average receive rate (%)(2)************ 3.7 3.7
Receive variable USD, pay variableNOK ****************************** 529 2,053 500 1,325 4,407 819
Average pay rate (%)(2)*************** 6.2 6.2 6.2 6.0 6.1Average receive rate (%)(2)************ 6.0 5.9 5.8 5.8 5.9
Receive fixed USD, pay fixed EUR ***** 1,377 1,377 136Average pay rate (%)(2)*************** 3.8 3.8Average receive rate (%)(2)************ 5.5 5.5
Receive variable GBP, pay variableNOK(3)**************************** 138 128 116 113 118 886 1,499 26
Average pay rate (%)(4)*************** 5.3 5.3 5.3 5.3 5.3 5.3 5.3Average receive rate (%)(4)************ 6.3 6.3 6.3 6.3 6.3 6.4 6.3Total fair value *********************** (14,732)
(1) Weighted average rates of the portfolio at the period end.
(2) Weighted average settlement rates applicable to the current settlement period.
(3) Loan with amortizing structure in GBP.
(4) Current variable interest rate as estimate of future rates.
Forward Rate Agreements
We generally use forward rate agreements as hedging instruments for interest rate riskmanagement. We had a long position in forward rate agreements outstanding at December 31, 1999with a total notional amount of NOK 1.2 billion. The contracts had a average remaining lifetime of0.5 years and average interest of 5.70%. On rare occasions we have used these agreements forpurposes other than hedging. At December 31, 1999 we had no such contracts.
81
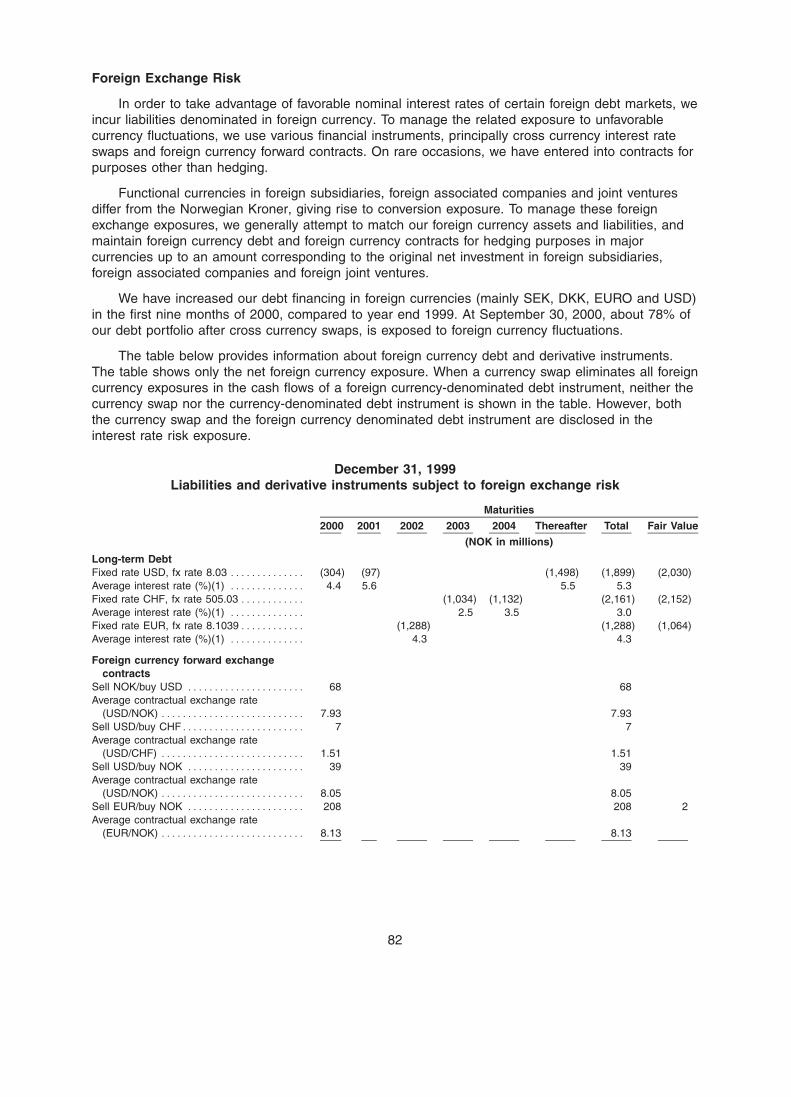
BOWNE OF LONDON 12/01/2000 19:56 BL/SM NO MARKS NEXT PCN: 088.00.00.00 -- Page is valid, no graphics X42481 087.00.00.00 5X
Foreign Exchange Risk
In order to take advantage of favorable nominal interest rates of certain foreign debt markets, weincur liabilities denominated in foreign currency. To manage the related exposure to unfavorablecurrency fluctuations, we use various financial instruments, principally cross currency interest rateswaps and foreign currency forward contracts. On rare occasions, we have entered into contracts forpurposes other than hedging.
Functional currencies in foreign subsidiaries, foreign associated companies and joint venturesdiffer from the Norwegian Kroner, giving rise to conversion exposure. To manage these foreignexchange exposures, we generally attempt to match our foreign currency assets and liabilities, andmaintain foreign currency debt and foreign currency contracts for hedging purposes in majorcurrencies up to an amount corresponding to the original net investment in foreign subsidiaries,foreign associated companies and foreign joint ventures.
We have increased our debt financing in foreign currencies (mainly SEK, DKK, EURO and USD)in the first nine months of 2000, compared to year end 1999. At September 30, 2000, about 78% ofour debt portfolio after cross currency swaps, is exposed to foreign currency fluctuations.
The table below provides information about foreign currency debt and derivative instruments.The table shows only the net foreign currency exposure. When a currency swap eliminates all foreigncurrency exposures in the cash flows of a foreign currency-denominated debt instrument, neither thecurrency swap nor the currency-denominated debt instrument is shown in the table. However, boththe currency swap and the foreign currency denominated debt instrument are disclosed in theinterest rate risk exposure.
December 31, 1999Liabilities and derivative instruments subject to foreign exchange risk
Maturities
2000 2001 2002 2003 2004 Thereafter Total Fair Value
(NOK in millions)
Long-term DebtFixed rate USD, fx rate 8.03 ************** (304) (97) (1,498) (1,899) (2,030)Average interest rate (%)(1) ************** 4.4 5.6 5.5 5.3Fixed rate CHF, fx rate 505.03 ************ (1,034) (1,132) (2,161) (2,152)Average interest rate (%)(1) ************** 2.5 3.5 3.0Fixed rate EUR, fx rate 8.1039************ (1,288) (1,288) (1,064)Average interest rate (%)(1) ************** 4.3 4.3
Foreign currency forward exchangecontracts
Sell NOK/buy USD ********************** 68 68Average contractual exchange rate
(USD/NOK) *************************** 7.93 7.93Sell USD/buy CHF*********************** 7 7Average contractual exchange rate
(USD/CHF) *************************** 1.51 1.51Sell USD/buy NOK ********************** 39 39Average contractual exchange rate
(USD/NOK) *************************** 8.05 8.05Sell EUR/buy NOK ********************** 208 208 2Average contractual exchange rate
(EUR/NOK) *************************** 8.13 8.13
82
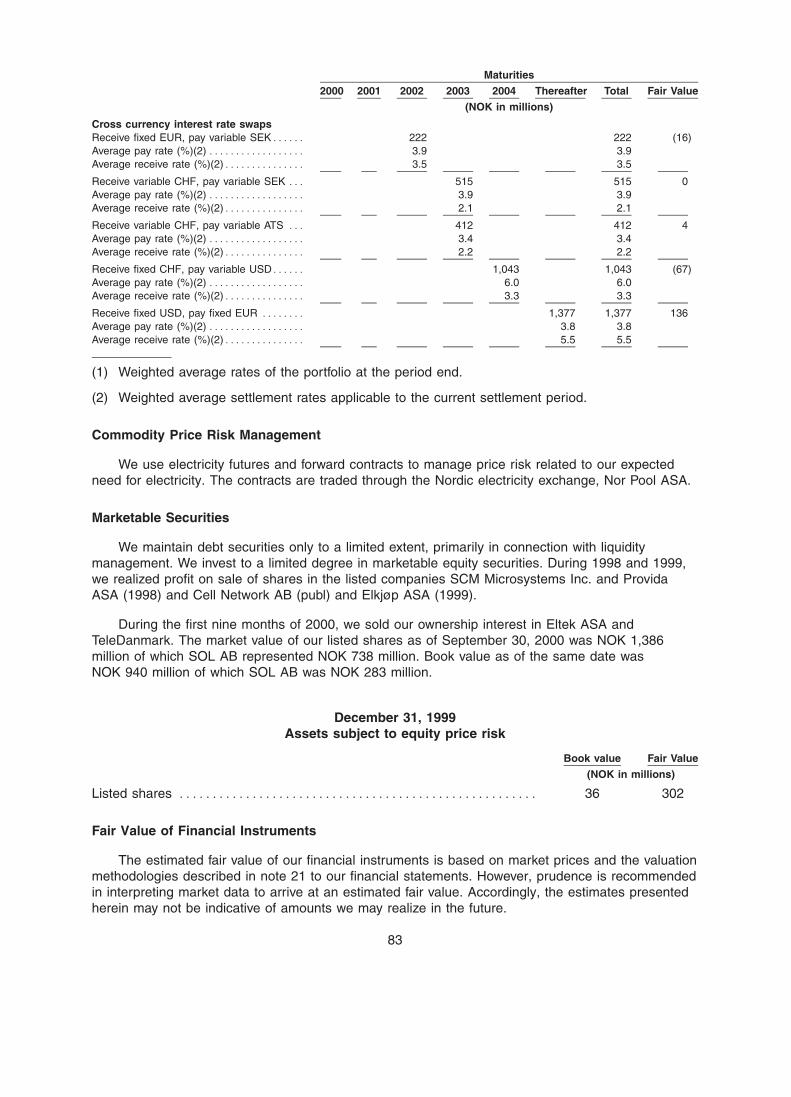
BOWNE OF LONDON 12/01/2000 19:56 BL/SM NO MARKS NEXT PCN: 089.00.00.00 -- Page is valid, no graphics X42481 088.00.00.00 5X
Maturities
2000 2001 2002 2003 2004 Thereafter Total Fair Value
(NOK in millions)
Cross currency interest rate swapsReceive fixed EUR, pay variable SEK****** 222 222 (16)Average pay rate (%)(2) ****************** 3.9 3.9Average receive rate (%)(2)*************** 3.5 3.5
Receive variable CHF, pay variable SEK *** 515 515 0Average pay rate (%)(2) ****************** 3.9 3.9Average receive rate (%)(2)*************** 2.1 2.1
Receive variable CHF, pay variable ATS *** 412 412 4Average pay rate (%)(2) ****************** 3.4 3.4Average receive rate (%)(2)*************** 2.2 2.2
Receive fixed CHF, pay variable USD****** 1,043 1,043 (67)Average pay rate (%)(2) ****************** 6.0 6.0Average receive rate (%)(2)*************** 3.3 3.3
Receive fixed USD, pay fixed EUR ******** 1,377 1,377 136Average pay rate (%)(2) ****************** 3.8 3.8Average receive rate (%)(2)*************** 5.5 5.5
(1) Weighted average rates of the portfolio at the period end.
(2) Weighted average settlement rates applicable to the current settlement period.
Commodity Price Risk Management
We use electricity futures and forward contracts to manage price risk related to our expectedneed for electricity. The contracts are traded through the Nordic electricity exchange, Nor Pool ASA.
Marketable Securities
We maintain debt securities only to a limited extent, primarily in connection with liquiditymanagement. We invest to a limited degree in marketable equity securities. During 1998 and 1999,we realized profit on sale of shares in the listed companies SCM Microsystems Inc. and ProvidaASA (1998) and Cell Network AB (publ) and Elkjøp ASA (1999).
During the first nine months of 2000, we sold our ownership interest in Eltek ASA andTeleDanmark. The market value of our listed shares as of September 30, 2000 was NOK 1,386million of which SOL AB represented NOK 738 million. Book value as of the same date wasNOK 940 million of which SOL AB was NOK 283 million.
December 31, 1999Assets subject to equity price risk
Book value Fair Value
(NOK in millions)
Listed shares ****************************************************** 36 302
Fair Value of Financial Instruments
The estimated fair value of our financial instruments is based on market prices and the valuationmethodologies described in note 21 to our financial statements. However, prudence is recommendedin interpreting market data to arrive at an estimated fair value. Accordingly, the estimates presentedherein may not be indicative of amounts we may realize in the future.
83

BOWNE OF LONDON 12/01/2000 19:56 BL/SM NO MARKS NEXT PCN: 090.00.00.00 -- Page is valid, no graphics X42481 089.00.00.00 5X
Liquidity Risk and Credit Risk
Group Treasury has established procedures to monitor the liquidity flows of the Telenor Group.In addition, we have a 5-year multi-currency credit facility, which was increased from US$ 500 millionto US$1.0 billion in May 2000. We rely on these established procedures and this credit facility toensure that liquidity risk is low.
The aggregate amount of the derivatives with positive market value as of December 31, 1999was NOK 2.2 billion. We enter into derivative transactions with a number of counterparties in orderto attempt to diversify and limit credit risk.
84
BOWNE OF LONDON 12/01/2000 19:56 BL/SM NO MARKS NEXT PCN: 091.00.00.00 -- Page is valid, no graphics X42481 090.00.00.00 5X
BUSINESS
Overview
We are the leading telecommunications company in Norway, which is among the most advancedtelecommunications markets in the world. Norway has the highest or among the highest penetrationrates of mobile phone, fixed line digital telephony, personal computer and Internet usage worldwide.We also have substantial international operations, particularly in mobile communications, Internetand Internet protocol-based, or ‘‘IP-based’’, communication services, satellite services and paytelevision services. In 1999, we had consolidated total revenues of NOK 33.5 billion and net incomeof NOK 2.0 billion.
Our core business areas are:
Mobile Communications. We are the leading provider of mobile telecommunications servicesin Norway, with approximately 2.23 million subscriptions at September 30, 2000. In October 1999,we were one of the first mobile companies in the world to launch wireless application protocol, astandard that links digital mobile telephony to the Internet. Wireless application protocol enables usto offer mobile Internet access, which we currently offer through our djuice portal. We have extensiveinterests internationally in mobile operations, consisting of strategic participations in 15 mobileoperators abroad as of September 30, 2000, located in the Nordic region, the rest of Europe andSoutheast Asia. The number of subscriptions in our international mobile operations, calculated onthe basis of our proportionate ownership interest in each company, was 3.1 million at September 30,2000. In August 2000 we acquired a 53.5% interest in Sonofon Holding A/S, the second largestmobile operator in Denmark, with approximately 930,000 mobile subscriptions (including serviceproviders) at September 30, 2000. Through acquisitions in May and August 2000, we acquired acombined direct and indirect interest of nearly 40% in Total Access Communication PCL, the secondlargest mobile operator in Thailand, with approximately 1.1 million mobile customers as of June 30,2000.
Telecom. We are the largest provider of fixed network telecommunications services in Norway,offering a full range of services to residential, business and wholesale customers. As ofSeptember 30, 2000, we provided 3.24 million fixed line access channels in the residential andbusiness markets. These included 1.51 million digital, or ISDN, access channels provided toapproximately 666,000 subscriptions, which is the highest rate of ISDN penetration in the world.ISDN refers to a digital technology that permits more than one stream of information (voice, text,data and image) to be transmitted on a single copper line and which provides higher bandwidthsthan dial-up modems. We provide interconnection and transit services to other carriers and serviceproviders in the wholesale market both in Norway and internationally. We also provide businesseswith a range of managed telecommunications and IT services, such as application serviceprovisioning, as well as systems integration and consulting services.
Broadband Services. We are the leading provider of television-based broadband services toconsumers in the Nordic region, through home satellite dish (DTH), cable networks and smallantenna networks, commonly known as SMATV systems. As of September 30, 2000, we hadapproximately 1.9 million subscribers to our pay television services, including all subscribers in CanalDigital, our 50% joint venture with Canal+. We also operate the national terrestrial broadcast networkin Norway. We are the leading provider of satellite broadcasting services in the Nordic region,utilizing four geostationary satellites. In addition, we are among the leading providers of globalsatellite-based mobile communications services within both the maritime and land mobile markets.These services utilize the global INMARSAT satellite system, in which we are the largest individualshareholder. We also provide satellite network services in selected European and African markets.
Internet. We are the leading Internet service provider in Norway with approximately548,000 subscriptions and registered users within the residential market as of September 30, 2000,and we also have interests in leading Norwegian and Scandinavian Internet portals. Using our
85
BOWNE OF LONDON 12/01/2000 19:56 BL/SM NO MARKS NEXT PCN: 092.00.00.00 -- Page is valid, no graphics X42481 091.00.00.00 6X
‘‘Nextra’’ brand, we are seeking to become a pan-European provider of Internet and other IP-basedcommunications services to small and medium-sized businesses, and currently have operations inNorway and ten other European countries, as well as sales offices in two additional countries.
We also have significant operations in three related business areas. Our Media business areaprovides on-line and printed directory services in Norway and nine other European countries.Bravida is a Norwegian supplier of telecommunication installation, maintenance and operatingservices. We recently merged Bravida with a Swedish company and at the completion of thetransaction, we will hold a minority interest in the combined business. EDB Business Partner, ourpublicly listed subsidiary, is a leading information technology company in Norway.
To support and facilitate our international activities, we have established an international centerat the corporate level. Our international center supports the international activities of our businessareas, as well as manages international activities falling outside of a particular business area.
We and our predecessors have been responsible for telecommunications in Norway since 1855.We were established in 1994 as a limited liability company, wholly owned by the Kingdom ofNorway. In 1988, the Norwegian government began opening sectors of the telecommunicationsmarket to competition, and on January 1, 1998, the market was opened to full competition.Liberalization of the market for telecommunications services in Norway has proceeded generally inline with the European Union, and in some respects ahead of the EU. For more informationconcerning the history of Telenor, see ‘‘Relationship Between Telenor and the Kingdom of Norway’’.
Competitive Strengths
We benefit from a number of competitive strengths, including:
We are an innovator with technologically-advanced networks and services.
We have been an innovator in the development of telecommunications products and services inour markets. We have been at the forefront in the development of each successive generation ofmobile telecommunications services since the 1960s. Recently, we were among the first mobileoperators in the world to introduce wireless application protocol services, which allow mobile phoneusers to access basic Internet services, and we have launched our own mobile Internet portal, calleddjuice. We were among the first national networks in the world to achieve full digitalization of ourfixed network, and we currently have the highest ISDN penetration rate in the world. We believe thatour high level of ISDN penetration gives us a significant advantage in our roll out of broadbandasymmetrical digital subscriber line, or ADSL, service to the residential and small business marketplanned for later this year. ADSL refers to technologies that use faster speeds downstream (to theuser) than upstream (from the user). ADSL was designed to exploit the one-way nature of mostmultimedia communications and is primarily used by residential customers for access to the Internet.We are aggressively deploying Internet protocol, or IP, technology in our fixed network and hope tobe among the first national operators to complete the deployment of IP technology throughout itsnetwork. We gained early experience in Internet protocol-based telephony through the developmentof innovative products. These include phone-to-phone Internet protocol telephony using a phone cardand PC-to-phone Internet protocol telephony service offered to our Internet access subscribers. Wehave also long been a leader in satellite communications, in particular in mobile communications forthe maritime industry through INMARSAT, a satellite system operator for maritime and land mobileand aeronautical mobile communications. Additionally, we have been a leader in satellitebroadcasting services to the Nordic region.
We operate in a highly advanced home market, with high per capita income and telecommunica-tions spending.
Norway is a world leader in the usage of personal computers, Internet and mobile phones, andNorwegian consumers have been early adopters of new digital products and services. Norway also
86
BOWNE OF LONDON 12/01/2000 19:56 BL/SM NO MARKS NEXT PCN: 093.00.00.00 -- Page is valid, no graphics X42481 092.00.00.00 5X
benefits from a high per capita gross domestic product and high per capita telecommunicationsspending. The Norwegian market often serves as a test ground for newly-developed telecommunica-tions products and services.
In mobile communications, we are the market leader in Norway with strategic interests in anumber of mobile operators internationally.
We are the leading mobile operator in Norway, with a record of competing successfully, havingincreased our market share for digital mobile telephony services from 45% at January 1, 1995 toapproximately 69% at September 30, 2000. Internationally, we have achieved strategic positions in anumber of operators located primarily in the Nordic region, Europe and Southeast Asia, that webelieve offer good prospects for growth. We have devoted considerable resources to strengtheningthe companies we participate in, often by providing them with our own managerial, technological andmarketing personnel, with the goal of achieving rapid network roll out, good network quality andsound marketing strategies. As a result, we believe we are well-positioned to participate in thegrowth of mobile communications in Norway and internationally, especially in the next generation ofmobile services, including Universal Mobile Telecommunications System, commonly referred to asUMTS, a third-generation mobile network.
We are in a strong position to capitalize on the development of television-based broadbandservices in the Nordic region and selected other European markets.
The high bandwidth transmission of television broadcasting, together with the ongoingconversion of these networks to digital transmission, is permitting the development of advancedinteractive broadband services that will be available through television sets. We believe our currentbase of approximately 1.9 million pay television subscribers as of September 30, 2000 in the Nordicregion, together with our expertise and success to date in introducing digital television services,place us in a strong position to develop and offer these new television-based interactive services. Webelieve our ability to provide and distribute television programming through multiple channels,including home satellite dish, cable and terrestrial broadcasting, offers us a significant advantage inachieving market penetration for our services. We also believe that our satellite position at 1™ Westoffers an advantageous position for transmitting satellite signals to the Nordic region and estimatethat over 90% of existing home satellite dishes in the Nordic region receive transmission fromour satellites.
We have already established a significant presence in several European countries in the marketfor Internet and IP-based communications services for businesses.
Since mid-1998, we have established Nextra operations in ten European countries in addition toNorway, through the acquisitions of 19 local Internet service providers and the start-up of our ownoperations in two countries. We have successfully rebranded our acquired operations as Nextracompanies and are currently evolving our operations from providers of Internet services to a broaderportfolio of IP-based communications services targeted at small and medium-sized businesses. Inaddition, we have established a pan-European IP backbone network with points of presence in tenEuropean cities and one in the U.S., connected by high capacity leased transmission links. Weexpect demand for IP-based services in Europe to increase dramatically over the next few years, andwe believe our early establishment of a significant presence in several European countries willprovide a significant advantage in participating in this market growth.
We are the leading Internet service provider in Norway with a strong market share.
We are the leading Internet service provider in Norway with approximately 548,000 subscriptionsand registered users of our Internet access services within the residential market, representing amarket share of approximately 57%. In addition, we have approximately 13,000 subscriptions for ourservices within the business market in Norway.
87
BOWNE OF LONDON 12/01/2000 19:56 BL/SM NO MARKS NEXT PCN: 094.00.00.00 -- Page is valid, no graphics X42481 093.00.00.00 5X
We have developed substantial expertise in higher value-added telecommunications and ITservices, such as application service provisioning, consulting and systems integration.
We have substantial expertise in providing value-added services such as application serviceprovisioning, or ASP, and other outsourcing services, consulting and systems integration, for whichdemand is increasing. ASP enables corporations to rent applications on an as-needed basis,together with management services.
Our Telecom business area has already substantially re-balanced our domestic tariffs andoperates profitably in a low-tariff environment.
Over the last few years, we have re-balanced our Norwegian tariffs between subscription andtraffic charges so that the prices charged for these services are more closely aligned with the cost ofproviding them. At the same time, we have lowered overall tariffs so that our prices for mobile andfixed telephony are now among the lowest in the OECD countries. In 1999, we abolished long-distance rates in Norway, so that all calls within the country are charged at the local rate. We havesuccessfully adjusted to the low tariff environment, and our fixed network services are currentlyprofitable.
Strategy
Our strategy is to increase shareholder value by focusing on the core business areas in whichwe believe we have competitive advantages, especially businesses offering the potential for stronggrowth and international expansion. We have made international activities a key element of ourstrategy, and revenues from our consolidated international subsidiaries represented 10.8% of ourNOK 33.5 billion consolidated revenues in 1999.
We intend to achieve our strategy by pursuing the following objectives:
Be a leading provider of mobile voice and mobile Internet services in the Nordic region and inselected countries elsewhere in Europe and in Southeast Asia.
We seek to become a leading provider of mobile voice and mobile Internet services in theNordic region and in selected countries elsewhere in Europe and in Southeast Asia, through oursubsidiaries as well as strategic participations. We have recently obtained a UMTS license inNorway, and intend to use our digital mobile telephony experience and infrastructure to support ourexisting and potential new associated companies in their pursuit of UMTS licenses. We intend tofurther aggressively expand our international operations while continuing to coordinate our domesticand international strategies. In Norway, we seek to be the first mobile operator to introducetechnological innovations and to use Norway as a showcase for services we intend to introduce inour international operations.
Become a leading pan-European provider of Internet and IP-based communications services tosmall and medium-sized businesses in Europe.
We expect the demand for Internet and IP-based services to businesses to grow dramatically,and that IP will eventually become the dominant platform for communication services for businessesand for e-commerce in general. Through our Nextra brand, we seek to participate in the growth ofthis market by becoming a provider of IP-based communications services, such as voice-over IP andvirtual private network services, on a pan-European basis with a focus on small and medium-sizedbusinesses. We currently provide Internet or IP-based services in Norway and twelve other Europeanmarkets (including sales offices in two countries) and we plan to further expand our coverage inEurope, through both acquisitions and organic growth. Our strategy will be to offer commonbranding, platforms and quality and to maintain operational control in each country, while operatingthrough a flexible, decentralized organizational structure to accommodate local market differences.
88
BOWNE OF LONDON 12/01/2000 19:56 BL/SM NO MARKS NEXT PCN: 095.00.00.00 -- Page is valid, no graphics X42481 094.00.00.00 6X
We also intend to develop new high quality technology and value-added services to respond toincreased Internet capabilities.
Be a leading distributor of pay television and television-based broadband services in the Nordicregion and selected other European markets.
We believe that if our customer base and subscription revenues are to continue to grow, wemust continually improve our services and be able to offer a broader range of television-basedbroadband services. As a result, we are developing a portal for television-based interactive services,branded ‘‘Zonavi’’. Zonavi will offer consumers advanced interactive digital services based initially onMedia Highway (MHy) Platform. The services will include video on demand, e-commerce, onlinegames and e-mail. As the process of standardization in the Nordic broadcasting market proceeds,our ambition is to base the services on the Multimedia Home Platform (MHP), using a subset of theprogramming language, Java. We are planning to make these services available through each of ourdigital service platforms, limited initially to one of our networks and, when MHP-based services areavailable, also on our other broadcasting access networks. Our objective is to be the first to establisha significant market position in the Nordic region. We also plan to further expand our broadcastingoperations in the Nordic region through acquisitions and strategic alliances to increase our customerbase. Furthermore, we intend to invest in satellite capacity to maintain our position and expand oursatellite transmission capabilities.
Maintain and expand our position as a leading provider of global mobile satellite communicationsservices.
We are seeking to maintain and expand our position as one of the leading operators of globalsatellite mobile communications services. We provide these services using the INMARSAT system,in which we recently became the largest owner. We are currently seeking to create an alliance in thePacific region that will allow us to secure future coverage in all four ocean areas. We also intend toexpand into the retail distribution market to capture a larger market share and to introduce value-added services to the maritime market.
Build on our strong position in telecommunications and IT business solutions in the Nordic region.
We intend to further develop our leading position as a provider of systems integration,outsourcing and consulting services in our home market by focusing on growing markets for servicessuch as application service provisioning and other managed services and e-business solutions. Webelieve the demand for these services will provide us with the opportunity to expand our operationsin the Nordic region.
Maintain our strong position in Norway for fixed network services.
We are responding to increasing competition in the Norwegian market by working to strengthenour customer relationships and focusing on new services such as broadband ADSL and contentportals. We are also aggressively deploying IP technology throughout our network in order to achievecost savings through more efficient network operations. In addition, we are following an ‘‘open valuechain’’ strategy, by which we offer attractive wholesale services to other service providers, in order toencourage market growth and maximize the traffic carried on our networks.
Enhance and realize value from our non-core operations.
In line with our objective to increase shareholder value, we are seeking ways to enhance thevalue of operations we do not consider core to our business, and to realize the value of thesebusinesses. For example, we recently combined our Bravida installation and maintenance businesswith BPA AB, a Swedish provider of electrical, plumbing, ventilation and telecommunicationssystems. As a result of this transaction, we and a consortium led by former shareholders of BPA willeach own 48%, and management will own 4%, of the combined business and we expect over time to
89
BOWNE OF LONDON 12/01/2000 19:56 BL/SM NO MARKS NEXT PCN: 096.00.00.00 -- Page is valid, no graphics X42481 095.00.00.00 6X
further reduce our ownership interest. Another example of this strategy was the 1999 merger of oursoftware operations with EDB AS, creating a publicly listed company, EDB Business Partner. Wealso intend to consider strategic alternatives to enhance the value of our Media business area, whichcould consist of, among other possibilities, a combination or alliance of Media with one or more thirdparties, the establishment of a public shareholding through a separate stock exchange listing oranother form of divestment.
Our Business Management Model
Our business management process is designed to develop and implement strategies that willachieve our overall goal of increasing shareholder value. We manage our company as a portfolio ofbusinesses, and for each business area:
) we identify both financial and non-financial factors we believe are the drivers of value in thatbusiness area, in view of the business area’s strategic goals;
) we agree with the business area managers on performance targets based on the identifiedvalue drivers, and link these targets to incentives; and
) through regular reviews, we monitor the business area’s progress versus the performancetargets for the value drivers.
In addition, we seek to achieve synergies by coordinating the activities of our various businessareas, in particular in our domestic market. The close co-operation between the research anddevelopment department and the technical and marketing resources in the business areas enablesus both to develop services and products that meet market demands and to commercialize newproducts.
Decisions regarding allocation of capital are integrated into the process. In addition, by focusingon non-financial value drivers, such as customer attraction, competence and innovation, our businessmanagement process encourages the development of our intellectual capital.
Mobile Communications
Overview
We are the largest mobile telecommunications operator in Norway and have strategicinvestments in 15 mobile operators abroad as of September 30, 2000. In 1999, our mobilecommunications business area generated external revenues of NOK 6.5 billion, representing 20% ofour total consolidated revenues. Of our mobile communications revenues in 1999, 94% was derivedfrom our operations in Norway and 6% was derived from our consolidated foreign subsidiaries. Atthe end of 1999 we had strategic positions in 12 companies abroad, primarily in the Nordic region,Europe and Southeast Asia. Our proportionate interest in the 1999 external revenues from thesecompanies, based on our percentage ownership interests at the end of 1999, amounted toNOK 4.2 billion. In the first nine months of 2000, we have made strategic investments in threeadditional companies outside of Norway representing in aggregate an investment of NOK 21 billion.
Our Mobile Communications business area currently consists of:
) mNorway — our Norwegian mobile operations;
) mHorizon — our international mobile operations, currently consisting of our strategicinvestments in 15 companies principally in the Nordic region, Europe and Southeast Asia;and
) mFuture — our initiatives to develop new mobile Internet and portal services internationally.
We offer a wide range of wireless services based on various technologies, including:
90
BOWNE OF LONDON 12/03/2000 12:12 BL/SM NO MARKS NEXT PCN: 097.00.00.00 -- Page is valid, no graphics X42481 096.00.00.00 7X
) digital mobile communications services based on Global System for Mobile (GSM)technology. GSM is the pan-European digital mobile telephone system.
) wireless application protocol, a standard that provides mobile access to the Internet. Wecurrently offer mobile Internet access including through our mobile Internet portal, djuice;
) m-commerce and other value-added services allowing the end user to make purchases usinga mobile phone; and
) analog mobile communications services based on Nordic Mobile Telephone systems and ourpaging system in Norway.
Our digital mobile telephony services in Norway were launched in 1993 and our market sharehas risen from 45% at the beginning of 1995 to approximately 69% at September 30, 2000. Wehave the highest domestic market share of any Nordic operator. The aggregate penetration rate ofdigital and analog mobile communications services in Norway was approximately 68% atSeptember 30, 2000 and, according to the European Mobile Communications Database, is currentlythe fourth highest in the world after Finland, Iceland and Hong Kong.
We were one of the first mobile operators in the world to launch mobile Internet services inOctober 1999 based on the wireless application protocol standard, which links digital mobiletelephony and the Internet together. This standard provides access via a mobile phone toinformation and services from the Internet, for example share trading, banking services, news andentertainment.
We have developed a fully open mobile Internet portal for the consumer market, called djuice.We launched djuice in Norway in March 2000 and are in the process of introducing djuice in othercountries.
On November 29, 2000, we were awarded one of four licenses for UMTS third generationmobile services in Norway.
On August 10, 2000, we acquired a 53.5% interest in Sonofon Holding A/S, the second largestmobile operator in Denmark, for consideration of approximately DKK 13.0 billion (NOK 14.1 billion).Through acquisitions in May and August 2000, we acquired a 29.5% ownership stake in Total AccessCommunication Company PCL (TAC), Thailand’s second largest mobile phone company, and a24.9% ownership stake in its former parent, United Communication Industry PCL, for totalconsideration of US$713.5 million (NOK 6.4 billion).
Strategy
Our objective is to become a leading provider of mobile voice and mobile Internet servicesprimarily in the Nordic region and in selected countries elsewhere in Europe and in Southeast Asia.We intend to expand our international operations aggressively while continuing to coordinate ourdomestic and international strategies.
) Norway. Domestically, we intend to maintain and build upon our leading position in themarket and introduce new services. We were recently awarded a license to offer UMTS thirdgeneration mobile services in Norway. In general we seek to be the first mobile operator tobring technological innovations to our domestic market and to use Norway as a showcase fortechnological solutions that we plan to bring to our international operations.
To facilitate the introduction of new wireless technologies, we seek to take advantage of ourstrengths in customer service and distribution. We enjoy a strong reputation for networkquality and coverage and for providing a high quality of customer service. We consider ourdistribution network to be a strong competitive advantage, with over 1,600 selling points forcontract mobile subscriptions in Norway and over 13,000 selling points in total.
) Nordic Region. We intend to pursue licenses to offer UMTS services in other Nordicmarkets, and also seek to offer services in these countries through our mobile Internet
91
BOWNE OF LONDON 12/01/2000 19:56 BL/SM NO MARKS NEXT PCN: 098.00.00.00 -- Page is valid, no graphics X42481 097.00.00.00 5X
portal, djuice, and service provider concepts, such as Zalto. In Denmark, we intend to furtherstrengthen our operations by building on our 53.5% interest in Sonofon, the second largestDanish mobile operator. In Sweden, our 50%-owned Telenordia joint venture has recentlysubmitted an application for a third generation mobile license in order to offer UMTS service.
) Other International Markets. In other international markets, our strategy is to expand ourpresence in focused geographical regions by acquiring ownership interests in operators thatwe believe offer strong prospects for providing market-leading UMTS services and where wewill have sufficient influence on operations. We also seek to acquire selected greenfieldUMTS licenses. Geographically, we are focusing on markets in Europe and Southeast Asiathat we believe offer strong prospects for growth. However, we may also consideropportunities to acquire interests in other geographic regions in particular cases.
In expanding internationally, we seek to take advantage of our core competencies, which webelieve are our ability to build wireless networks promptly and efficiently and to provideoperational support to improve existing companies. We attempt to apply the ‘‘best practices’’we have developed in each of our markets. We intend to continue to remain active in theownership and management of our international mobile investments.
We believe our experience developed in the advanced Norwegian market makes us anattractive partner in UMTS bidding consortia for third generation mobile service licenses. Weintend to support our foreign associated companies in their pursuit of UMTS licenses. Wealso may in the future consider forming partnerships with, or taking equity positions in,licensed UMTS operators on an opportunistic basis in order to provide third generationmobile services in their markets.
We are maintaining opportunities to enhance our strategic position within our core geographicalmarkets. Currently we are in different stages of analysis of a number of ongoing projects. Theseprojects primarily relate to increasing our ownership in mobile companies in which we already havean interest. We are also considering opportunities to enter new markets within our geographic focusareas if the right opportunity or partnership arises.
Our strategy emphasizes the Internet as a central platform for the development of new mobileservices. We intend to pursue an aggressive mobile Internet portal strategy over the next few years,with the objective of establishing our djuice portal as a strong Nordic, European and Asian brand.This portal will offer mobile Internet users access to informational, entertainment and value-addedservices on a local basis.
mNorway
We are a leading provider of mobile telecommunications services in Norway. The penetrationrate of mobile phones in Norway rose from 47% to 61% during 1999 and we estimate that thepenetration rate rose to approximately 68% as of September 30, 2000. We offer a broad range ofdigital services to the Norwegian corporate and consumer market and have extensive experience insupplying mobile services and operating mobile communication networks in Norway. We arerecognized as an innovator in the Nordic region, introducing new mobile telecommunications servicesin Norway, most recently including the launch of our Internet portal, djuice, in 2000 and mobileInternet services based on wireless application protocol in 1999. During the last quarter of 1999 weintroduced high-speed mobile data transmission capability which permits a mobile phone user toaccess data at the same speed as with a fixed-line modem connection (38.4 Kbps). We haverecently been awarded a UMTS license in Norway, and prior thereto have been participating in aUMTS trial network, which became operational in the fall of 1999. We have continued to expand ourportfolio of mobile services in 2000 to take advantage of the growing Norwegian market in mobiletelephony. In the first quarter of 2001, we expect to introduce general packet radio service, orGPRS, a technology that is part of the next phase of mobile communications development inNorway. GPRS will enable the transfer of data at a much higher speed than GSM.
92
BOWNE OF LONDON 12/01/2000 19:56 BL/SM NO MARKS NEXT PCN: 099.00.00.00 -- Page is valid, no graphics X42481 098.00.00.00 5X
Services
GSM Services
We are the leading provider of digital mobile telephony services in Norway. As of September 30,2000, we had 2.1 million GSM subscriptions in Norway for digital mobile telephone services, whichwe estimate represents approximately 69% of the total market in Norway for these services. Ourdigital network covers over 96% of Norway’s population. We and NetCom are currently the onlyoperators of digital mobile phone services in Norway. Telia, which held a third GSM 1800 license,had its license withdrawn after its recent acquisition of NetCom. The frequencies covered by thewithdrawn license are expected to be auctioned by the regulatory authority in spring 2001.
Our GSM 900 license is valid until 2005. In addition to our GSM 900 license, we hold one ofthree GSM 1800 licenses in Norway. This license is valid until 2010. Generally, our licenses may beextended and are subject to certain conditions. For a description of these conditions, please refer to‘‘Regulation — Regulations on the Provision of Networks Transmission Capacity and OtherTelecommunications Services in Norway — License Conditions’’. We launched our GSM 1800network in March 1998 primarily to provide a dual band service and to increase the capacity of ourdigital network in key regions. The launch of our GSM 1800 service has been particularly suited forurban areas, which have the highest mobile traffic volumes, and has enabled us to maintain highlevels of service and accessibility throughout our digital network.
We offer a range of mobile service packages designed to appeal to specific customer segments.mNorway offers subscribers five different tariff plans. These include four contract subscriptions(Nomade, Proff, Primær and Privat) and one prepaid subscription (RingKontant). All tariff plans offervalue-added services at the same price, including short text messaging services. Short textmessaging services permit users to send messages up to 160 characters in length to other mobilehandsets and communication devices. The price of sending a text message is NOK 1.00 (inclusive ofvalue-added tax). The following is a description of each of our service packages, including monthlyand per minute tariffs. All calls made under any plan are charged an initiation fee of NOK 0.45 percall.
) Nomade. We offer Nomade to our most advanced customers by combining digital mobiletelephony service with the features of the Internet. The subscription provides a range ofservices based on unified messaging technology and high-speed Internet connectivity. Weoffer two variations of this service package: Nomade and Nomade Plus. The Nomadesubscription offers these services for a monthly subscription fee of NOK 169. The NomadePlus subscription offers the same services, but also permits the customer to transfer datathrough the Internet at the same time as the customer is speaking on the phone. Themonthly subscription fee for Nomade Plus is NOK 189. For an additional NOK 30 per month,subscribers may access our messaging central service, which provides full display of sentand received text messages, facsimile and e-mail services. We have a dedicated customerservice team assigned exclusively to our Nomade customers.
) GSM Proff. We offer GSM Proff primarily to business customers and to customers whotypically use mobile phones more than average. This type of subscription has a highermonthly subscription fee (NOK 249), but lower fees per minute. Per minute charges areNOK 0.89 in our network and up to NOK 2.69 outside of our network in Norway.
) GSM Primær. We offer GSM Primær primarily to business customers with high callingvolumes. Similar to GSM Proff, the Primær subscriber will pay a higher monthly subscriptionfee (NOK 154), but relatively low fees per minute. Per minute charges range from NOK 0.89to NOK 1.18 in our network and up to NOK 2.99 outside of our network in Norway.
) GSM Privat. Subscribers with low calling volumes typically prefer the GSM Privat tariff plan.The monthly subscription fee is low (NOK 50), but the fees per minute are higher than the
93
BOWNE OF LONDON 12/01/2000 19:56 BL/SM NO MARKS NEXT PCN: 100.00.00.00 -- Page is valid, no graphics X42481 099.00.00.00 8X
other contract subscriptions that we offer. Per minute charges range from NOK 1.39 to 3.99in our network and up to NOK 4.99 outside of our network in Norway.
) GSM RingKontant. GSM RingKontant is our prepaid subscription, which is typicallypreferred by customers who use their mobile phone less than average. The tariff plan is alsopopular among young people as it is easy to recharge the RingKontant-card and permits thesubscriber to control the use of their mobile phone. Per minute charges range fromNOK 1.99 to NOK 5.99 in Norway. Subscribers may recharge their accounts using theircredit cards or by being a registered MobilHandel customer i.e. recharge directly by mobilephone. RingKontant customers can use the international roaming services, if they have atleast NOK 500 credit on the RingKontant-card.
Value-added Services
We offer an extensive portfolio of value-added services to our customers, including call waiting,caller identification, call forwarding, itemized invoicing, voicemail and short text messaging services.Our value-added services are becoming increasingly important to our customers. For example, wehave experienced substantial growth in the use of short text messaging by our customers. Short textmessaging is particularly significant to our value-added services, as we offer a range of otherservices that utilize short text messaging technology. The following table describes our portfolio ofvalue-added services and service packages. We also offer value-added services for our mobileInternet services. See ‘‘— Mobile Internet’’.
Service Description
Short Text Messaging Services A service that allows users to send messages up to160 characters in length to other mobile handsets andcommunication devices.
MobilInfo ******************** A general information retrieval service, which allows a user torequest specific information and receive the information in the formof a short text message over the mobile phone (such as stockquotes, weather and traffic).
Banking ********************* A broad range of banking services offered through voice, shorttext messaging and Internet mobile terminals developed in closecooperation with the banking industry.
Voicemail Service ************ A mailbox through which our mobile customers may receive voicemessages via their mobile phone. As of September 30, 2000, wehad over 1.7 million voicemail service subscriptions.
Faxmail Service ************** A virtual faxbox through which our mobile customers may receivefaxes via their mobile phone.
Unified Messaging Service **** A service that provides a web-based mailbox through which ourmobile customers may receive voice, fax and e-mail messagesand may send fax, e-mail and short text messages via their mobilephones.
Twin Subscription************* A service that enables the customer to have two mobile terminalsaccessed by the same telephone number.
MobilHandel ***************** A service that permits the user to purchase goods and servicesthrough a mobile phone, which is also supported by our highsecurity solutions. MobilHandel was the first service to launch thepurchase of tickets and soft drinks from vending machines usingmobile phones.
94
BOWNE OF LONDON 12/01/2000 19:56 BL/SM NO MARKS NEXT PCN: 101.00.00.00 -- Page is valid, no graphics X42481 100.00.00.00 9X
Service Description
InTouch ********************* A solution that provides a call diversion service from a fixed linenumber to a mobile number at discounted price levels.
MobilPost******************** A service that enables the customer to send and receive e-maildirectly from their mobile terminals.
SMS Large Account Service*** A service that allows our corporate customers to connect directlyto our short message service center, in order to send short textmessages directly from a PC or a fixed terminal. This service canbe used for sending text messages to a customer’s ownemployees, or for telemetric applications and machine to machinecommunications, among other things.
Content Provider Access ****** A service that allows content providers and third party providers tooffer short message service based information or entertainmentservices to our mobile customers. The end user requests theinformation in the form of a short text message.
To grow our customer base and increase our sources of revenues, we intend to continuedeveloping new advanced value-added services to add to our portfolio of services. In the future, weintend to focus, in particular, on Internet and mobile data services.
We also provide public key infrastructure, a secure identification number for mobile e-commerce,banking and other electronic transactions. Telenor Mobil has developed a solution that enables theuse of digital signatures from a mobile handset. Telenor Mobil’s security solution may proveimportant for electronic transactions as the use of digital signatures increases.
Mobile Internet
We have been a leader in developing innovative mobile Internet services, as shown through thelaunch of our wireless application protocol mobile information services in 1999 and the recent launchof our djuice portal. We believe that we have been in the forefront globally in the development ofinnovative mobile Internet services.
Wireless Application Protocol. We were among the first mobile operators in the world to launchwireless application protocol services in the autumn of 1999. Wireless application protocol is anindustry standard protocol that allows mobile phone users to access basic Internet services throughtheir mobile phones by means of various selection menus and directories. As of September 30,2000, over 150,000 mobile terminals compatible with wireless application protocol had been sold andwe had over 125,000 unique users accessing our djuice portal. Wireless application protocolservices can also be accessed from other electronic devices. We plan to make most of our currentshort text messaging-based content services compliant with wireless application protocol. Theseservices provide access to information and services from the Internet, such as share prices, bankingservices, news and entertainment. Electronic commerce via mobile telephony provides anopportunity to deliver a new range of services in mobile telephony. In the autumn of 1999, welaunched MobilHandel, a service that enables users to search for information on goods and services,select and pay for products directly from a mobile phone.
djuice.no. In March 2000, we launched a fully open mobile Internet portal in Norway targetingthe consumer market, called djuice. djuice is a mobile Internet portal with a web interface providingeasy configuration. The portal provides access to all Internet resources with content adapted tomobile devices and allows an individual user to personalize his or her own interface. djuice alsoprovides services, including an advanced search engine, calendar, mail and messaging services. Wehave chosen a completely open approach allowing our customers to access any website addressfrom djuice and allowing customers from other operators to access the portal. Users will therefore beable to use the djuice portal to access sites carrying local content. We believe this will encourage
95
BOWNE OF LONDON 12/02/2000 12:11 BL/SM NO MARKS NEXT PCN: 102.00.00.00 -- Page is valid, no graphics X42481 101.00.00.00 7X
users to adopt djuice as their primary Internet portal for wireless devices. As of September 30, 2000,we had over 7,000 users with a personalized web interface. We are currently in the initial stages ofintroducing our djuice portal outside Norway.
We intend to form alliances to develop a partnership network for our djuice portal, with theobjective of providing our partners the benefit of common platforms and functionality as well as acoordinated effort to develop a strong brand name. djuice is trademarked and we intend to establishit as a strong Nordic, European and Asian brand. Our goal is to provide an established presencewith djuice in several countries within the next few years. For further information concerning ourinitiative to launch djuice internationally, see ‘‘— mFuture’’.
Zalto
In November 1999, we launched Zalto, a new prepaid service for digital mobile telephonyoffering full web integration and simple, automated services. Purchasing, registration, sendingaccount statements and customer service all take place via the Internet. In an effort to increase ourcustomer base for mobile Internet services, we are introducing easier Internet access (throughauthentication procedures permitting Internet access without a password) and building a bettercustomer service organization for our mobile Internet services. Zalto is primarily targeted at users intheir late teens and early twenties who want a simple user interface for mobile Internet access. Zaltowill be a service provider with its initial focus on the Norwegian market and in the future is expectedto expand to other Nordic countries. In April 2000, we established a separate company, ZaltoCommunications AS, for our Zalto service. We have a 91.5% ownership interest in the company anda private investor holds the remaining 8.5% ownership interest.
Zalto offers two prepaid subscriptions: ZaltoBasis and ZaltoSmart. The price of sending a shorttext message from the phone is NOK 1.00 for ZaltoBasis and NOK 0.80 for ZaltoSmart. Per minutecharges range from NOK 1.75 to NOK 6.00 for ZaltoBasis and from NOK 1.50 to NOK 4.00 forZaltoSmart.
Analog Services
We are the only provider of analog mobile telephony services in Norway through our NordicMobile Telephone 450 and 900 networks. We will phase out our Nordic Mobile Telephone 900network by March 2001. At September 30, 2000, the Nordic Mobile Telephone 900 network had56,000 subscriptions. We do not believe that the phase-out will have a material effect on our resultsof operations. In recent years, we have experienced a significant decline in the number of our analogcustomers as well as their average monthly usage. This is largely due to the migration of ourcustomers to digital mobile telephony services. In some customer segments, analog servicesthrough our Nordic Mobile Telephone 450 network remain attractive to customers, as this networkprovides superior coverage for some remote areas. Subject to regulatory authorization, we expect tomaintain our Nordic Mobile Telephone 450 network to complement our digital mobiletelephony services.
New Service Initiatives
UMTS. A new third generation mobile telecommunications standard, Universal Mobile Telecom-munications System, commonly known as UMTS, will enable mobile communications networks totransfer data with the speed and capacity necessary for multimedia transmissions. On November 29,2000, the Norwegian regulator announced that we were awarded one of the four UMTS licensesgranted in Norway. We have been developing strategies and preparing market initiatives andtechnical rollout plans for UMTS services, and plan a commercial launch of UMTS services by theend of 2001. Our objective is to provide access to new mobile services within the next five years toall locations in Norway with a population of more than 200. We consider it important to be in the
96
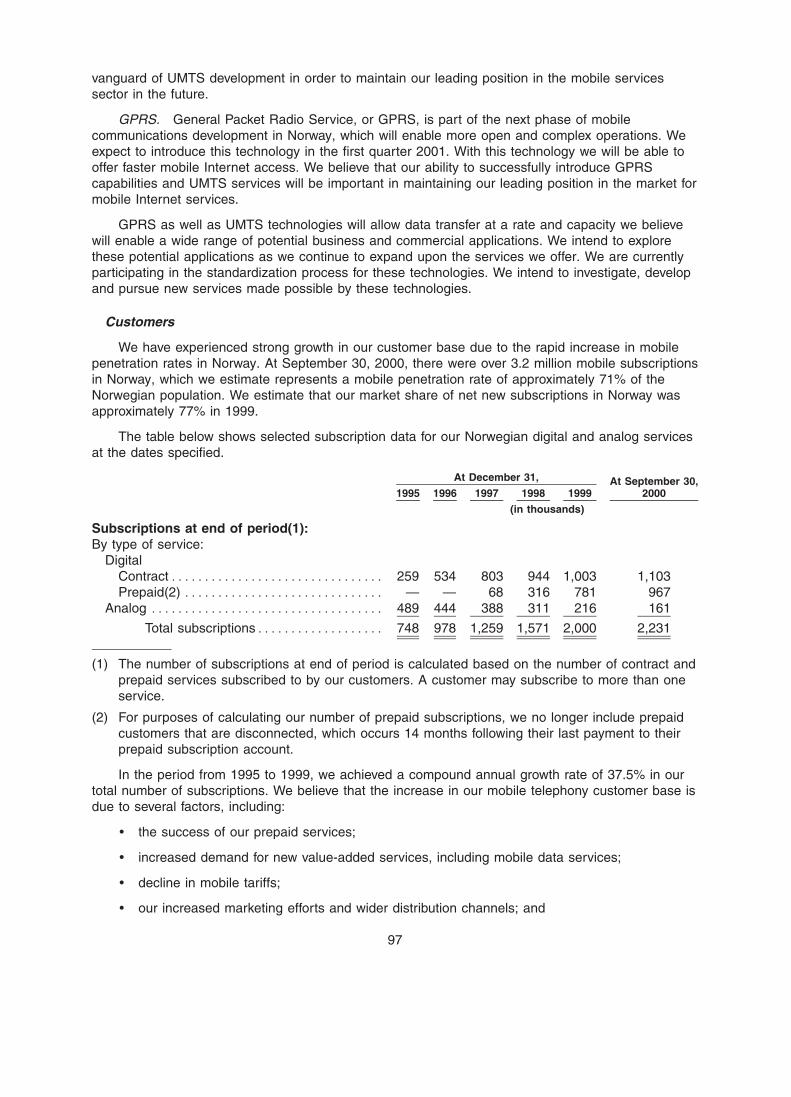
BOWNE OF LONDON 12/01/2000 19:56 BL/SM NO MARKS NEXT PCN: 103.00.00.00 -- Page is valid, no graphics X42481 102.00.00.00 6X
vanguard of UMTS development in order to maintain our leading position in the mobile servicessector in the future.
GPRS. General Packet Radio Service, or GPRS, is part of the next phase of mobilecommunications development in Norway, which will enable more open and complex operations. Weexpect to introduce this technology in the first quarter 2001. With this technology we will be able tooffer faster mobile Internet access. We believe that our ability to successfully introduce GPRScapabilities and UMTS services will be important in maintaining our leading position in the market formobile Internet services.
GPRS as well as UMTS technologies will allow data transfer at a rate and capacity we believewill enable a wide range of potential business and commercial applications. We intend to explorethese potential applications as we continue to expand upon the services we offer. We are currentlyparticipating in the standardization process for these technologies. We intend to investigate, developand pursue new services made possible by these technologies.
Customers
We have experienced strong growth in our customer base due to the rapid increase in mobilepenetration rates in Norway. At September 30, 2000, there were over 3.2 million mobile subscriptionsin Norway, which we estimate represents a mobile penetration rate of approximately 71% of theNorwegian population. We estimate that our market share of net new subscriptions in Norway wasapproximately 77% in 1999.
The table below shows selected subscription data for our Norwegian digital and analog servicesat the dates specified.
At December 31, At September 30,1995 1996 1997 1998 1999 2000
(in thousands)
Subscriptions at end of period(1):By type of service:
DigitalContract******************************** 259 534 803 944 1,003 1,103Prepaid(2) ****************************** — — 68 316 781 967
Analog *********************************** 489 444 388 311 216 161
Total subscriptions******************* 748 978 1,259 1,571 2,000 2,231
(1) The number of subscriptions at end of period is calculated based on the number of contract andprepaid services subscribed to by our customers. A customer may subscribe to more than oneservice.
(2) For purposes of calculating our number of prepaid subscriptions, we no longer include prepaidcustomers that are disconnected, which occurs 14 months following their last payment to theirprepaid subscription account.
In the period from 1995 to 1999, we achieved a compound annual growth rate of 37.5% in ourtotal number of subscriptions. We believe that the increase in our mobile telephony customer base isdue to several factors, including:
) the success of our prepaid services;
) increased demand for new value-added services, including mobile data services;
) decline in mobile tariffs;
) our increased marketing efforts and wider distribution channels; and
97
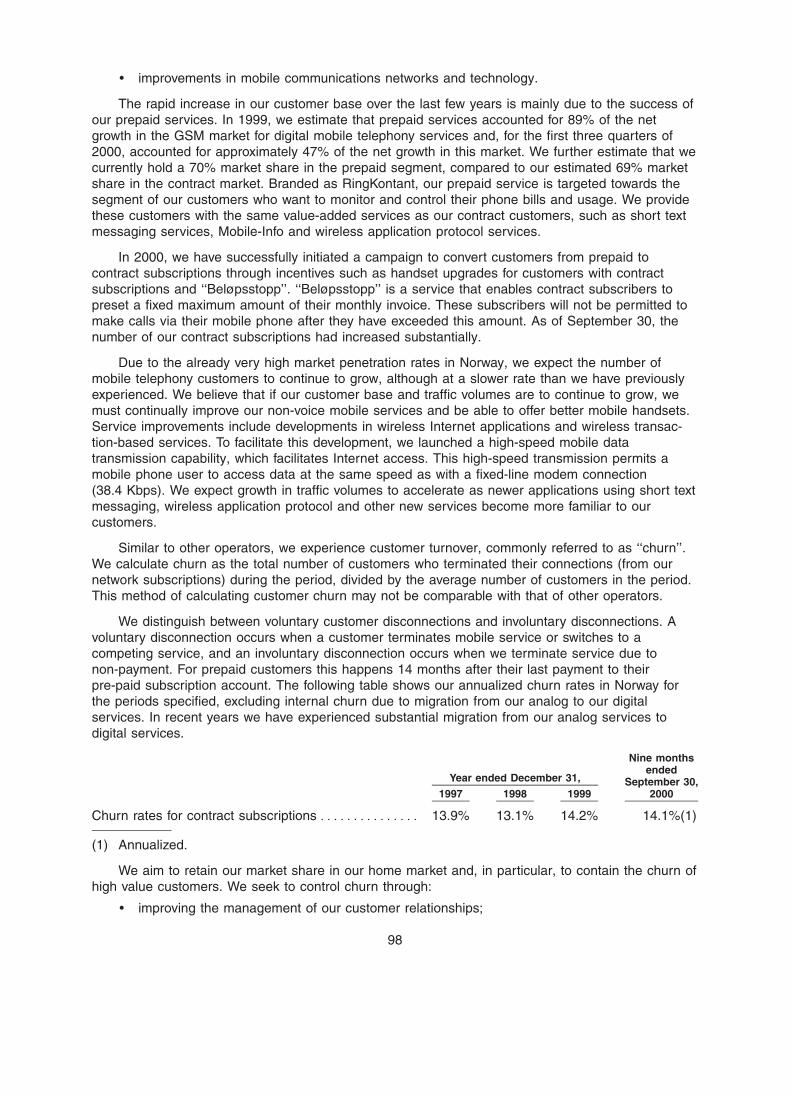
BOWNE OF LONDON 12/01/2000 19:56 BL/SM NO MARKS NEXT PCN: 104.00.00.00 -- Page is valid, no graphics X42481 103.00.00.00 5X
) improvements in mobile communications networks and technology.
The rapid increase in our customer base over the last few years is mainly due to the success ofour prepaid services. In 1999, we estimate that prepaid services accounted for 89% of the netgrowth in the GSM market for digital mobile telephony services and, for the first three quarters of2000, accounted for approximately 47% of the net growth in this market. We further estimate that wecurrently hold a 70% market share in the prepaid segment, compared to our estimated 69% marketshare in the contract market. Branded as RingKontant, our prepaid service is targeted towards thesegment of our customers who want to monitor and control their phone bills and usage. We providethese customers with the same value-added services as our contract customers, such as short textmessaging services, Mobile-Info and wireless application protocol services.
In 2000, we have successfully initiated a campaign to convert customers from prepaid tocontract subscriptions through incentives such as handset upgrades for customers with contractsubscriptions and ‘‘Beløpsstopp’’. ‘‘Beløpsstopp’’ is a service that enables contract subscribers topreset a fixed maximum amount of their monthly invoice. These subscribers will not be permitted tomake calls via their mobile phone after they have exceeded this amount. As of September 30, thenumber of our contract subscriptions had increased substantially.
Due to the already very high market penetration rates in Norway, we expect the number ofmobile telephony customers to continue to grow, although at a slower rate than we have previouslyexperienced. We believe that if our customer base and traffic volumes are to continue to grow, wemust continually improve our non-voice mobile services and be able to offer better mobile handsets.Service improvements include developments in wireless Internet applications and wireless transac-tion-based services. To facilitate this development, we launched a high-speed mobile datatransmission capability, which facilitates Internet access. This high-speed transmission permits amobile phone user to access data at the same speed as with a fixed-line modem connection(38.4 Kbps). We expect growth in traffic volumes to accelerate as newer applications using short textmessaging, wireless application protocol and other new services become more familiar to ourcustomers.
Similar to other operators, we experience customer turnover, commonly referred to as ‘‘churn’’.We calculate churn as the total number of customers who terminated their connections (from ournetwork subscriptions) during the period, divided by the average number of customers in the period.This method of calculating customer churn may not be comparable with that of other operators.
We distinguish between voluntary customer disconnections and involuntary disconnections. Avoluntary disconnection occurs when a customer terminates mobile service or switches to acompeting service, and an involuntary disconnection occurs when we terminate service due tonon-payment. For prepaid customers this happens 14 months after their last payment to theirpre-paid subscription account. The following table shows our annualized churn rates in Norway forthe periods specified, excluding internal churn due to migration from our analog to our digitalservices. In recent years we have experienced substantial migration from our analog services todigital services.
Nine monthsended
Year ended December 31, September 30,1997 1998 1999 2000
Churn rates for contract subscriptions *************** 13.9% 13.1% 14.2% 14.1%(1)
(1) Annualized.
We aim to retain our market share in our home market and, in particular, to contain the churn ofhigh value customers. We seek to control churn through:
) improving the management of our customer relationships;
98
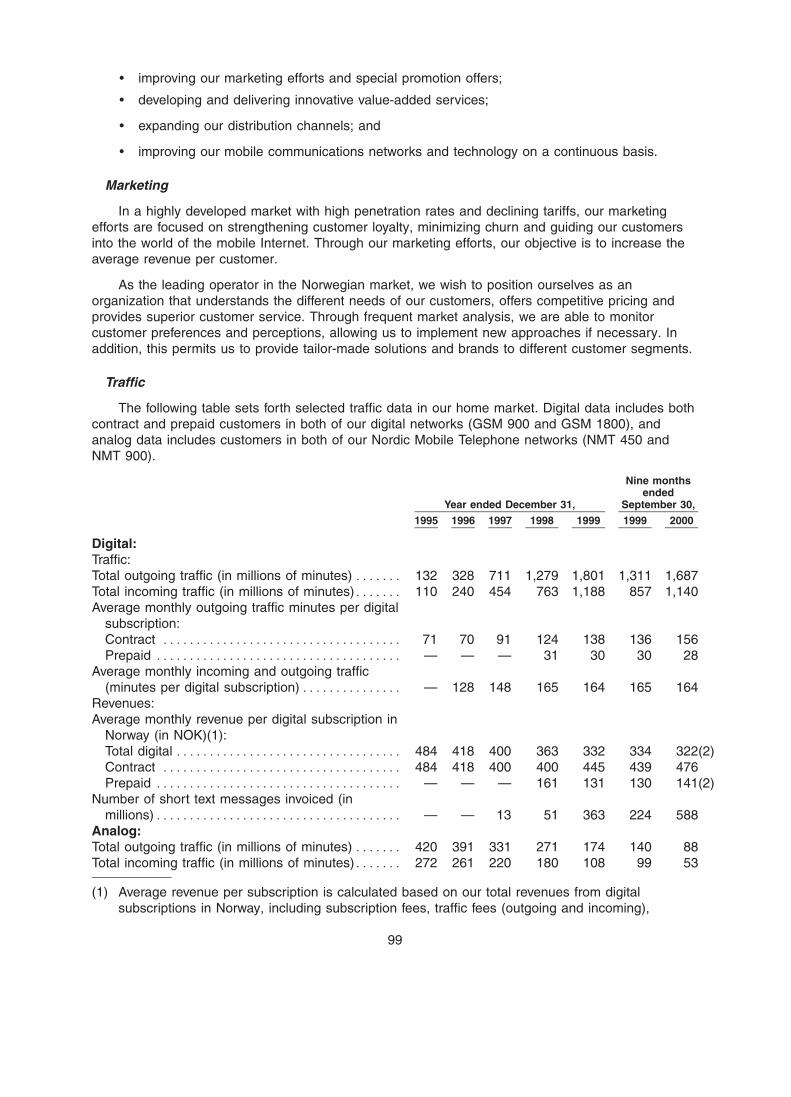
BOWNE OF LONDON 12/01/2000 19:56 BL/SM NO MARKS NEXT PCN: 105.00.00.00 -- Page is valid, no graphics X42481 104.00.00.00 5X
) improving our marketing efforts and special promotion offers;
) developing and delivering innovative value-added services;
) expanding our distribution channels; and
) improving our mobile communications networks and technology on a continuous basis.
Marketing
In a highly developed market with high penetration rates and declining tariffs, our marketingefforts are focused on strengthening customer loyalty, minimizing churn and guiding our customersinto the world of the mobile Internet. Through our marketing efforts, our objective is to increase theaverage revenue per customer.
As the leading operator in the Norwegian market, we wish to position ourselves as anorganization that understands the different needs of our customers, offers competitive pricing andprovides superior customer service. Through frequent market analysis, we are able to monitorcustomer preferences and perceptions, allowing us to implement new approaches if necessary. Inaddition, this permits us to provide tailor-made solutions and brands to different customer segments.
Traffic
The following table sets forth selected traffic data in our home market. Digital data includes bothcontract and prepaid customers in both of our digital networks (GSM 900 and GSM 1800), andanalog data includes customers in both of our Nordic Mobile Telephone networks (NMT 450 andNMT 900).
Nine monthsended
Year ended December 31, September 30,
1995 1996 1997 1998 1999 1999 2000
Digital:Traffic:Total outgoing traffic (in millions of minutes) ******* 132 328 711 1,279 1,801 1,311 1,687Total incoming traffic (in millions of minutes)******* 110 240 454 763 1,188 857 1,140Average monthly outgoing traffic minutes per digital
subscription:Contract ************************************ 71 70 91 124 138 136 156Prepaid ************************************* — — — 31 30 30 28
Average monthly incoming and outgoing traffic(minutes per digital subscription)*************** — 128 148 165 164 165 164
Revenues:Average monthly revenue per digital subscription in
Norway (in NOK)(1):Total digital ********************************** 484 418 400 363 332 334 322(2)Contract ************************************ 484 418 400 400 445 439 476Prepaid ************************************* — — — 161 131 130 141(2)
Number of short text messages invoiced (inmillions)************************************* — — 13 51 363 224 588
Analog:Total outgoing traffic (in millions of minutes) ******* 420 391 331 271 174 140 88Total incoming traffic (in millions of minutes)******* 272 261 220 180 108 99 53
(1) Average revenue per subscription is calculated based on our total revenues from digitalsubscriptions in Norway, including subscription fees, traffic fees (outgoing and incoming),
99
BOWNE OF LONDON 12/01/2000 19:56 BL/SM NO MARKS NEXT PCN: 106.00.00.00 -- Page is valid, no graphics X42481 105.00.00.00 5X
roaming fees and revenues from value-added services, divided by the average number of digitalcustomers for the relevant period. The division of incoming traffic between contract and prepaidis based on management estimates.
(2) Due to a one-time adjustment to reflect a change in the methodology used to estimate trafficrevenues, our revenues for the nine months ended September 30, 2000 increased by NOK 66million. As a result, average monthly revenues per digital subscription for this period are notdirectly comparable with prior periods. Eliminating this one-time adjustment, the average monthlyrevenue per digital mobile subscription for the nine months ended September 30, 2000 wouldhave been NOK 9 lower for prepaid subscriptions and NOK 4 lower for total digital subscriptions.
Our outgoing digital traffic minutes increased by 153% from 1997 to 1999, due primarily to thesignificant growth in our digital customer base for digital mobile telephony services, particularly in thenumber of our prepaid customers. Our outgoing digital traffic also increased due to reduced mobiletariffs. Future growth will depend on a number of factors, including pricing, the availability of newservices and the competitive environment. Our analog traffic has declined steadily since 1995primarily due to migration of our analog customers to digital services.
The decrease in average monthly revenue per customer over the periods indicated is the resultof the larger proportion of prepaid customers, which have lower usage levels than contractcustomers.
Mobile Tariffs
According to Eurodata and the OECD, we offer our business customers in Norway among thelowest tariffs available in any OECD country based on price baskets. We also believe that our tariffsfor residential customers are among the lowest in the world.
Although mobile tariffs in Norway have generally been among the lowest in the world, tariffshave continued to decline in recent years. In 1999, we reduced overall tariff levels by approximately5%. As of February 1, 2000, we made additional price cuts. At the same time we introduced persecond billing and a call initiation fee for all digital mobile telephony customers. During the firstquarter of 2000, we reduced the price of sending short text messages by 33% to NOK 1.00 permessage for both contract and prepaid customers. Norwegian telecommunications regulationsimpose cost-oriented pricing requirements for traffic terminating on mobile networks of operators withsignificant market power in the national market for interconnection. We have been found to havesuch a position. See ‘‘Regulation’’ for a discussion of these cost-oriented pricing requirements.
We do not charge customers for incoming calls within Norway. These calls are billed to thecaller as is customary for digital mobile telephony subscriptions in Europe. Typically, the mobileoperator terminating the call receives the majority of the tariff for the call. We also provide a range ofvalue-added services to our customers, including prepaid customers, at no additional monthlyservice fees. Our revenues from these services come from increased traffic generated by usersaccessing these services.
Tariffs for international calls generally vary by country and not by tariff plan. Rates for roamingoutside Norway vary depending on the terms of the various roaming agreements and the relevantforeign mobile operators. Beginning on August 1, 2000, we changed the international tariffs wecharge based on a new international price system. As a result, we reduced tariffs charged to154 countries and increased tariffs charged to 80 countries.
Distribution
We distribute our mobile telecommunications services through retail stores, the Internet andindependent distributors. Telenor Telehuset, MobilPartner Invest, MobilData Kjeden and Commit areour subsidiaries that operate retail chains engaged in the sale of terminal equipment and mobilephone subscriptions. All of these subsidiaries are 100% owned other than Commit, in which we have
100
BOWNE OF LONDON 12/01/2000 19:56 BL/SM NO MARKS NEXT PCN: 107.00.00.00 -- Page is valid, no graphics X42481 106.00.00.00 6X
a 51% ownership interest. Our ownership interest in MobilData Kjeden and Commit (a franchise) is,however, limited to the Head Office of those chains. Our total number of selling points for bothcontract and prepaid customers was approximately 13,000 at September 30, 2000. All of our sellingpoints offer prepaid cards, while approximately 1,600 offer contract subscriptions. Prepaid cards cannow be purchased in kiosks, petrol stations and supermarkets across Norway. For the ease of ourprepaid customers, they can use their credit card to make prepaid card purchases in any Telenorpublic phone booth. During 1999, we expanded our distribution network by adding 7,600 new sellingpoints.
We maintain high standards of training and performance for our sales personnel. We require ourselling agents to sign contracts certifying the competence and training of their sales personnel, thespace and prominence of our products in the retail space and the means of promoting our products.
Telenor Telehuset has implemented ‘‘Nettforhandler’’, a product offering customers the ability toorder subscriptions and additional services through Telehuset’s web stores. Further roll out ofNettforhandler to other distributors is planned in the future.
Customer Service
We believe that customer care, service and management are key factors that distinguish us fromour competitors in the mobile telephony market. We believe the provision of quality customer serviceis the foundation of long-term customer relationships and the expansion of our customer base. Weintend to focus on providing higher quality customer service than our competitors to distinguish us ina market characterized by increasing competition and reduced margins. Our customer service groupis divided into business teams responsible for each of our customer segments, with different teamshandling our business customers, our smaller business customers and our residential customers.Within Norway, our customer service may be used without any extra charge for the service.
We own and operate our customer service centers, which serve both our customers and ourdealers. The customer service centers provide customers and dealers with product information andguidance, maintain our subscriber database, answer billing inquiries, respond to customercomplaints, check customer credit, open new subscriptions and sell additional value-added servicesto existing customers.
In 1999, our customer service center in Norway handled, on average, 550,000 calls monthlyfrom our customers and 40,000 calls from dealers. Our customer service call centers operate24 hours a day, 365 days a year. In addition, our customers may use our automated customer careservice to check account balances and to activate additional value-added services. Our automatedservice is available both by phone as well as the Internet. We currently do not outsource theprovision of these services.
We have consistently achieved many of our key operating measures. Currently, these include:
) 66% of all customer calls are answered within 20 seconds;
) 98% of all customer requests are resolved at first point of contact;
) 130 seconds average handling time for customer calls;
) all new subscriptions are activated within 19 minutes for business customers and 25 minutesfor consumer customers; and
) 84% of the customers are classified as either ‘‘satisfied’’ or ‘‘highly satisfied’’ by our customerservice department. The level of customer satisfaction is verified through an independentmarket survey every four months.
101
BOWNE OF LONDON 12/01/2000 19:56 BL/SM NO MARKS NEXT PCN: 108.00.00.00 -- Page is valid, no graphics X42481 107.00.00.00 6X
Subscriber Management, Billing and Activation for Contract Subscriptions
Each customer applies in writing for a mobile subscription and authorizes us to conduct a creditcheck. Based on this information, we assess the credit risk of each customer and classify thecustomer accordingly. As a result of the credit analysis, we either activate a subscription after thepayment of any outstanding claims or we require the customer to pay a deposit. Subscribers receivebills including both subscription charges and airtime. We maintain continuous supervision ofcustomers with high usage as well as those involved in credit disputes. Outstanding claims are sentto external debt collecting agencies. We have recently developed and tested an electronic invoicingservice which would be provided through selected banks and financial institutions. Roll-out ispending ongoing negotiations with the banks and financial institutions.
We calculate a projected loss every month according to expected bad debt loss on the portfolio.Debt is written off when non-payment or insolvency is demonstrated, or there is no reason to expectpayment. The loss due to debt write-offs was approximately 0.7% of annual revenues in 1999 andfell to 0.3% of revenues for the nine months ended September 30, 2000.
Network
Historically, we believe a significant competitive advantage of our Norwegian operations hasbeen our quality of service, both in terms of coverage and capacity in our mobile network. Forexample, in 1999, we delivered a 98.2% success rate in completing all calls in our digital network.
We are currently taking several steps to improve the quality of our network and to expand uponthe services we offer. In addition to our launch of higher speed mobile data transmission capability inNovember 1999, we are enhancing our digital network with GPRS capability. In April 2000, weentered into an agreement with Nokia under which Nokia will supply infrastructure for our GPRSsystem. GPRS allows mobile phone users to run mobile Internet applications by permitting basestations to connect directly with the Internet. Depending on several factors, including the availabilityof GPRS handsets, we expect to launch this service in the first quarter of 2001.
The infrastructure of a mobile communications network includes the following components:
) a radio network comprised of base stations, which communicate by radio signal with mobilehandsets and antenna systems and masts;
) a switching network comprised of base station controllers, which control call set-up, signalingand maintenance functions, as well as the use of radio channels in one or more basestations, and other network management systems;
) mobile switching centers, which control the switching network;
) home location registers, which contain information about subscribers using the network andauthorize network usage; and
) cabling and other transmission devices connecting different components within the network.
Most of the costs associated with radio networks relate to base station infrastructure. AtSeptember 30, 2000, we had approximately 5,000 digital radio transmission cells in Norway. Inaddition to usage for our own mobile services, many of our sites are also used for other purposesincluding competitors’ networks and public mobile radio services.
Ericsson and Nokia are our primary suppliers of radio network equipment. We purchaseequipment from multiple sources to spread technology risk and retain influence over the developmentof new technology-related features. All of our radio base stations are connected via leased lines(cables or radio relay links) and are equipped with emergency back-up power.
Our mobile switching systems have been designed to provide high levels of service, quality andreliability. The switching systems have redundant central systems and are monitored 24 hours a day.
102
BOWNE OF LONDON 12/01/2000 19:56 BL/SM NO MARKS NEXT PCN: 109.00.00.00 -- Page is valid, no graphics X42481 108.00.00.00 5X
We keep network repair personnel on call at all times. We locate our switching centers in securefacilities with limited physical access.
Interconnection
Existing regulations require us to provide interconnection, directly or indirectly, to our mobilecommunications network for calls to and from all domestic and international operators of publictelephony. We have various agreements with other operators whose networks interconnect directlywith ours, through which we receive fees for terminating incoming calls, and pay fees for calls fromour network to other operators’ networks. The amount of these fees are based upon the networkwhere the call terminates and our agreement with that network. We charge an interconnection feebetween NOK 0.90 and NOK 1.00, on average, per minute for interconnection from national andinternational networks to our mobile network. We intend to reduce this fee to NOK 0.85 effectiveJanuary 1, 2001. Similarly, we are charged an interconnection fee between NOK 0.17 andNOK 1.30, on average, per minute for interconnection to networks owned by other domesticoperators. For traffic to international destinations, we are charged an interconnection fee betweenNOK 0.20 and NOK 40.00 per minute, depending on the actual destination of the call. In 1999, werecorded interconnection revenue of approximately NOK 1,378 million, which was offset by paymentsto other operators of approximately NOK 1,207 million (including revenue from and payments toother Telenor operating units).
Service Provision
We have entered into agreements with other providers of mobile telephony services throughwhich we grant access to our digital network. In 1999, we granted service providers access topurchase mobile traffic and SIM cards from Telenor Mobil to sell mobile services under their ownname in the Norwegian market. The service providers themselves are responsible for marketing,sales, invoicing and customer service. We expect this to further stimulate competition and contributeto the continued development of the Norwegian mobile market.
International Roaming
We have entered into international roaming agreements with a large number of telecommunica-tions operators outside Norway, enabling our subscribers to make and receive calls while travelingoutside our network area. These agreements also allow foreign network subscribers to use ournetwork while visiting Norway.
On September 30, 2000, we had international roaming agreements with 163 digital mobiletelephony operators in 86 countries and territories, including digital mobile telephony operators in allEuropean countries. We have also entered into roaming agreements with PCS 1900 providers inNorth and South America, allowing our customers to access foreign networks by using their own SIMcards and satellite or PCS 1900 compatible handsets.
Our analog systems offer international roaming in countries that have adopted the Nordic MobileTelephone standard. These include the Nordic and Baltic countries, Eastern Europe and Russia forNordic Mobile Telephone 450 users and Denmark and the Faroe Islands for Nordic Mobile Telephone900 users.
103
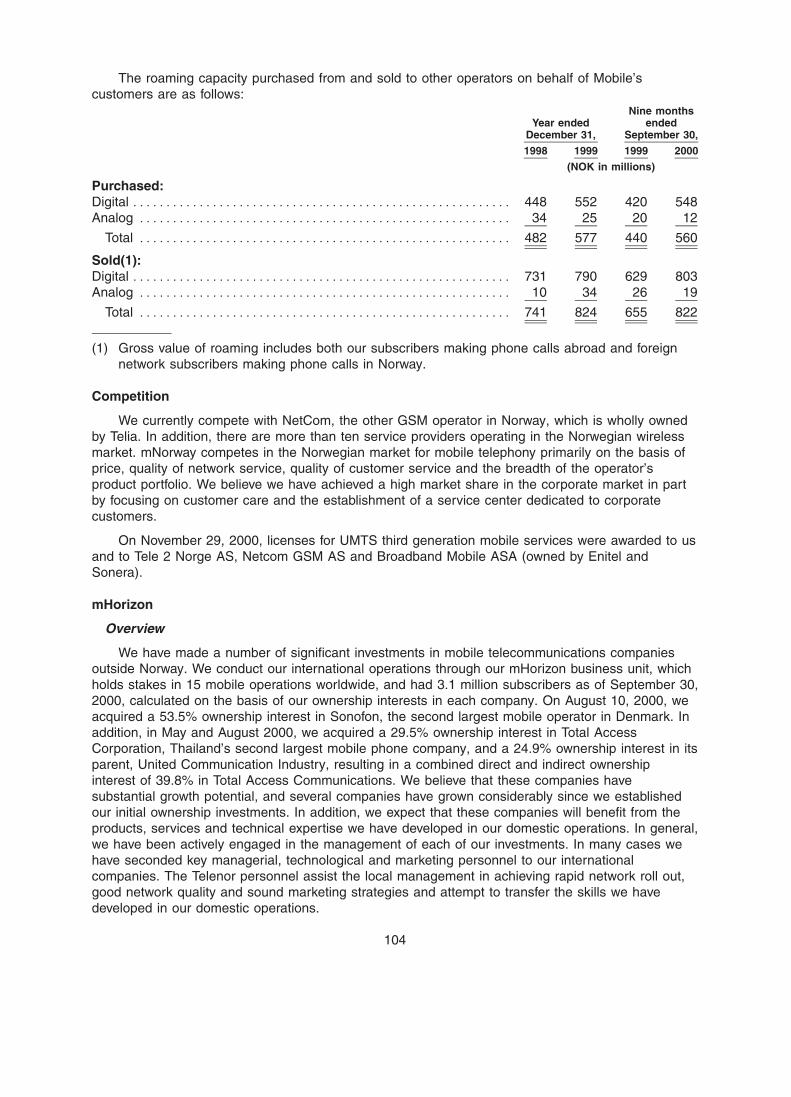
BOWNE OF LONDON 12/01/2000 19:56 BL/SM NO MARKS NEXT PCN: 110.00.00.00 -- Page is valid, no graphics X42481 109.00.00.00 6X
The roaming capacity purchased from and sold to other operators on behalf of Mobile’scustomers are as follows:
Nine monthsYear ended ended
December 31, September 30,
1998 1999 1999 2000
(NOK in millions)
Purchased:Digital ********************************************************* 448 552 420 548Analog ******************************************************** 34 25 20 12
Total ******************************************************** 482 577 440 560
Sold(1):Digital ********************************************************* 731 790 629 803Analog ******************************************************** 10 34 26 19
Total ******************************************************** 741 824 655 822
(1) Gross value of roaming includes both our subscribers making phone calls abroad and foreignnetwork subscribers making phone calls in Norway.
Competition
We currently compete with NetCom, the other GSM operator in Norway, which is wholly ownedby Telia. In addition, there are more than ten service providers operating in the Norwegian wirelessmarket. mNorway competes in the Norwegian market for mobile telephony primarily on the basis ofprice, quality of network service, quality of customer service and the breadth of the operator’sproduct portfolio. We believe we have achieved a high market share in the corporate market in partby focusing on customer care and the establishment of a service center dedicated to corporatecustomers.
On November 29, 2000, licenses for UMTS third generation mobile services were awarded to usand to Tele 2 Norge AS, Netcom GSM AS and Broadband Mobile ASA (owned by Enitel andSonera).
mHorizon
Overview
We have made a number of significant investments in mobile telecommunications companiesoutside Norway. We conduct our international operations through our mHorizon business unit, whichholds stakes in 15 mobile operations worldwide, and had 3.1 million subscribers as of September 30,2000, calculated on the basis of our ownership interests in each company. On August 10, 2000, weacquired a 53.5% ownership interest in Sonofon, the second largest mobile operator in Denmark. Inaddition, in May and August 2000, we acquired a 29.5% ownership interest in Total AccessCorporation, Thailand’s second largest mobile phone company, and a 24.9% ownership interest in itsparent, United Communication Industry, resulting in a combined direct and indirect ownershipinterest of 39.8% in Total Access Communications. We believe that these companies havesubstantial growth potential, and several companies have grown considerably since we establishedour initial ownership investments. In addition, we expect that these companies will benefit from theproducts, services and technical expertise we have developed in our domestic operations. In general,we have been actively engaged in the management of each of our investments. In many cases wehave seconded key managerial, technological and marketing personnel to our internationalcompanies. The Telenor personnel assist the local management in achieving rapid network roll out,good network quality and sound marketing strategies and attempt to transfer the skills we havedeveloped in our domestic operations.
104
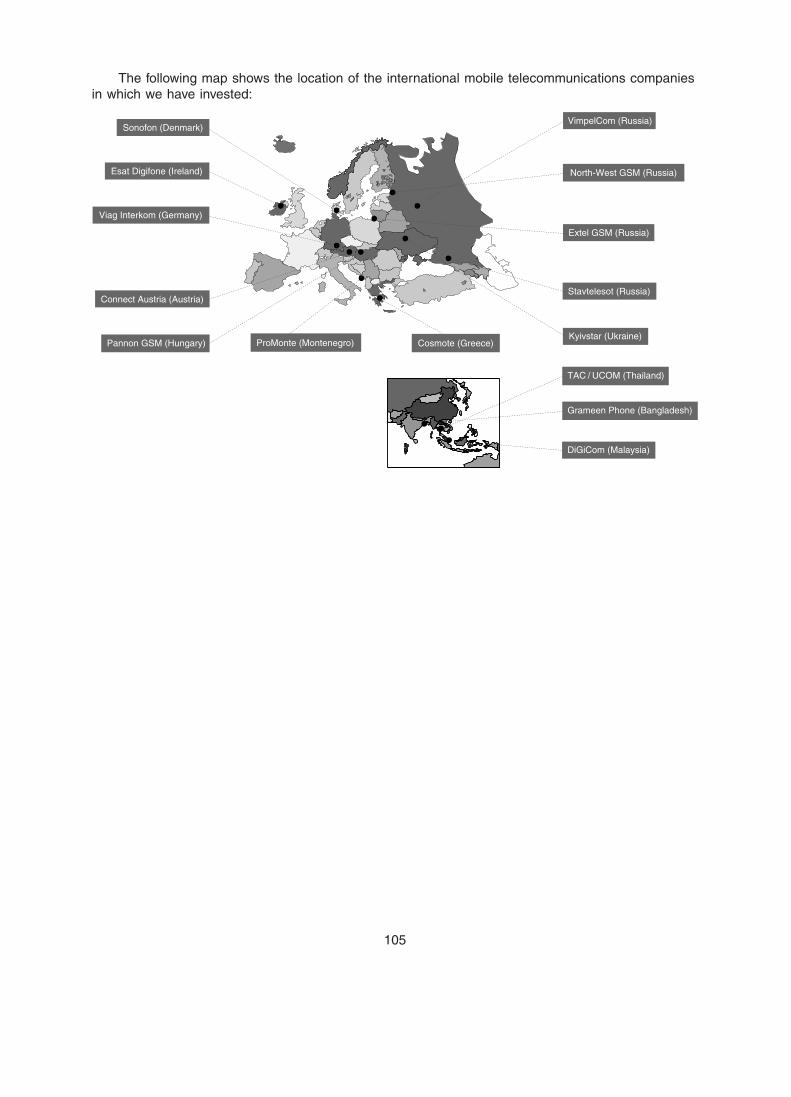
BOWNE OF LONDON 12/01/2000 19:56 BL/SM NO MARKS NEXT PCN: 111.00.00.00 -- Page/graphics valid (12/01/2000 20:23) X42481 110.00.00.00 6X
The following map shows the location of the international mobile telecommunications companiesin which we have invested:
Esat Digifone (Ireland)
Sonofon (Denmark)
Viag Interkom (Germany)
Connect Austria (Austria)
Pannon GSM (Hungary) ProMonte (Montenegro) Cosmote (Greece)
VimpelCom (Russia)
North-West GSM (Russia)
Extel GSM (Russia)
Stavtelesot (Russia)
Kyivstar (Ukraine)
DiGiCom (Malaysia)
Grameen Phone (Bangladesh)
TAC / UCOM (Thailand)
105
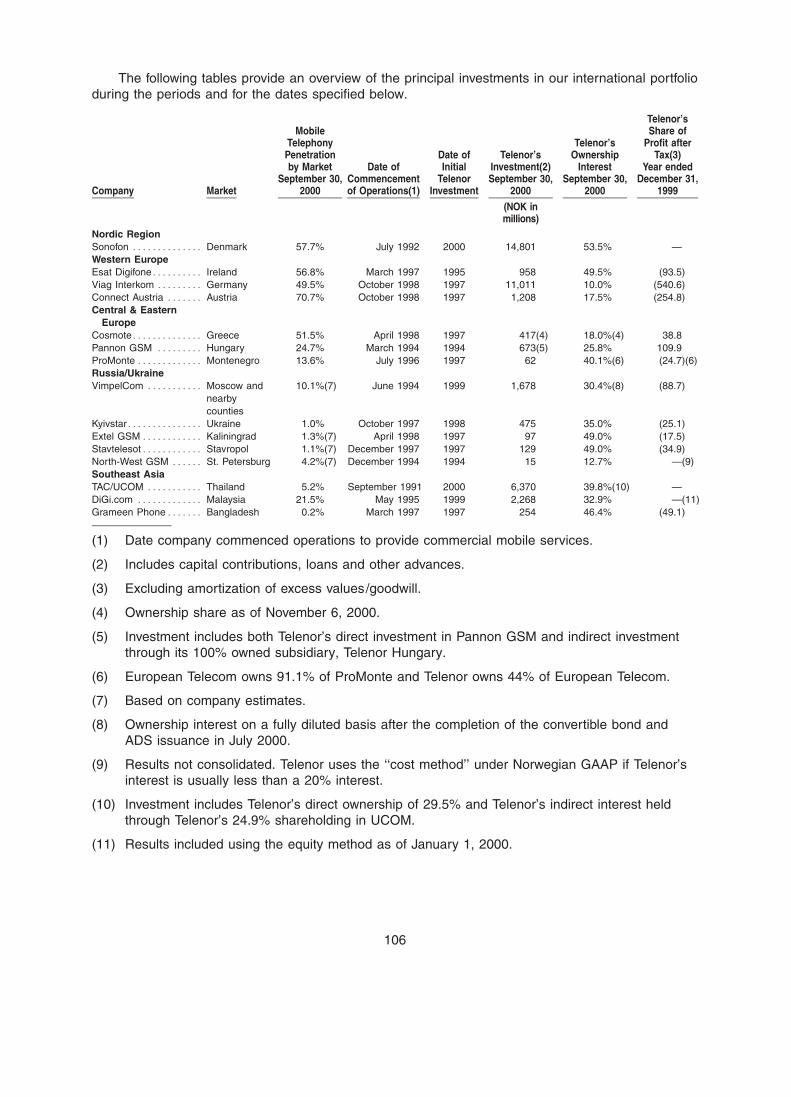
BOWNE OF LONDON 12/03/2000 12:05 BL/SM NO MARKS NEXT PCN: 112.00.00.00 -- Page is valid, no graphics X42481 111.00.00.00 7X
The following tables provide an overview of the principal investments in our international portfolioduring the periods and for the dates specified below.
Telenor’sMobile Share of
Telephony Telenor’s Profit afterPenetration Date of Telenor’s Ownership Tax(3)by Market Date of Initial Investment(2) Interest Year ended
September 30, Commencement Telenor September 30, September 30, December 31,Company Market 2000 of Operations(1) Investment 2000 2000 1999
(NOK inmillions)
Nordic RegionSonofon ************** Denmark 57.7% July 1992 2000 14,801 53.5% —Western EuropeEsat Digifone********** Ireland 56.8% March 1997 1995 958 49.5% (93.5)Viag Interkom ********* Germany 49.5% October 1998 1997 11,011 10.0% (540.6)Connect Austria ******* Austria 70.7% October 1998 1997 1,208 17.5% (254.8)Central & Eastern
EuropeCosmote************** Greece 51.5% April 1998 1997 417(4) 18.0%(4) 38.8Pannon GSM ********* Hungary 24.7% March 1994 1994 673(5) 25.8% 109.9ProMonte ************* Montenegro 13.6% July 1996 1997 62 40.1%(6) (24.7)(6)Russia/UkraineVimpelCom *********** Moscow and 10.1%(7) June 1994 1999 1,678 30.4%(8) (88.7)
nearbycounties
Kyivstar*************** Ukraine 1.0% October 1997 1998 475 35.0% (25.1)Extel GSM ************ Kaliningrad 1.3%(7) April 1998 1997 97 49.0% (17.5)Stavtelesot************ Stavropol 1.1%(7) December 1997 1997 129 49.0% (34.9)North-West GSM ****** St. Petersburg 4.2%(7) December 1994 1994 15 12.7% —(9)Southeast AsiaTAC/UCOM *********** Thailand 5.2% September 1991 2000 6,370 39.8%(10) —DiGi.com ************* Malaysia 21.5% May 1995 1999 2,268 32.9% —(11)Grameen Phone******* Bangladesh 0.2% March 1997 1997 254 46.4% (49.1)
(1) Date company commenced operations to provide commercial mobile services.
(2) Includes capital contributions, loans and other advances.
(3) Excluding amortization of excess values/goodwill.
(4) Ownership share as of November 6, 2000.
(5) Investment includes both Telenor’s direct investment in Pannon GSM and indirect investmentthrough its 100% owned subsidiary, Telenor Hungary.
(6) European Telecom owns 91.1% of ProMonte and Telenor owns 44% of European Telecom.
(7) Based on company estimates.
(8) Ownership interest on a fully diluted basis after the completion of the convertible bond andADS issuance in July 2000.
(9) Results not consolidated. Telenor uses the ‘‘cost method’’ under Norwegian GAAP if Telenor’sinterest is usually less than a 20% interest.
(10) Investment includes Telenor’s direct ownership of 29.5% and Telenor’s indirect interest heldthrough Telenor’s 24.9% shareholding in UCOM.
(11) Results included using the equity method as of January 1, 2000.
106
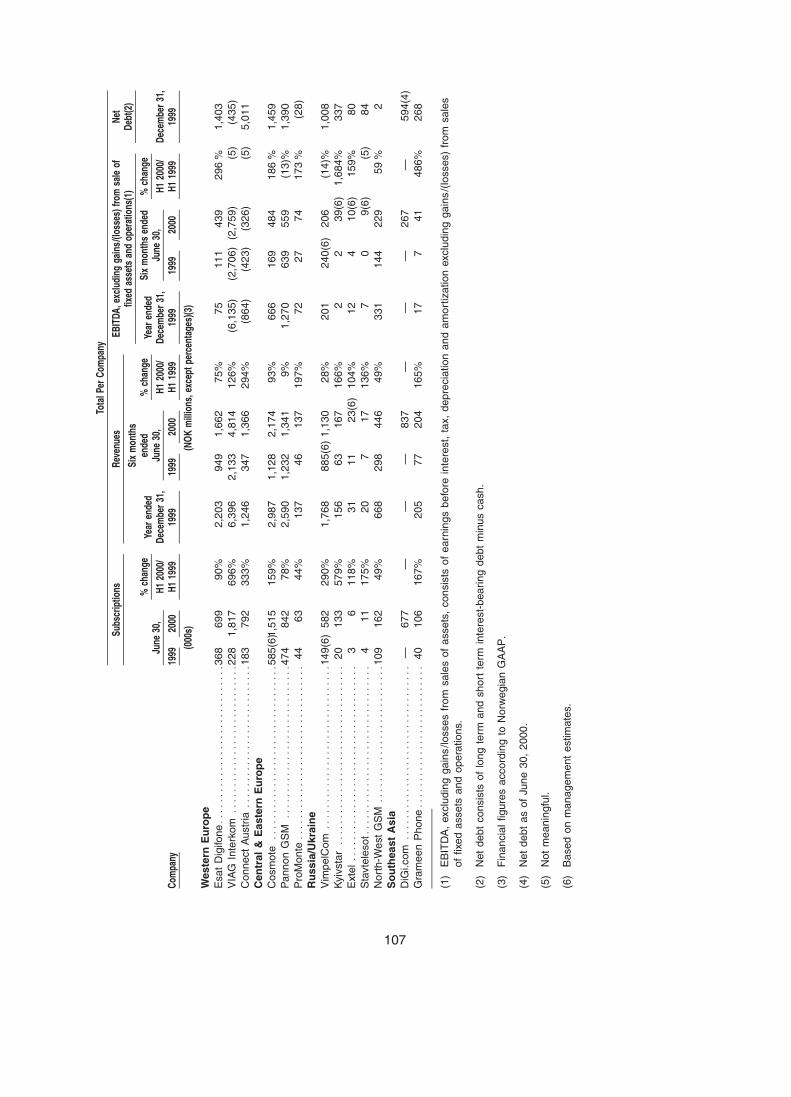
BOWNE OF LONDON 12/01/2000 19:56 BL/SM NO MARKS NEXT PCN: 113.00.00.00 -- Page is valid, no graphics X42481 112.00.00.00 6X
107
Tota
l Per
Com
pany
Subs
crip
tions
Reve
nues
EBIT
DA, e
xclu
ding
gai
ns/(l
osse
s) fr
om s
ale
ofNe
tfix
ed a
sset
s an
d op
erat
ions
(1)
Debt
(2)
Six
mon
ths
% c
hang
een
ded
% c
hang
eSi
x m
onth
s en
ded
% c
hang
eYe
ar e
nded
Year
end
edJu
ne 3
0,Ju
ne 3
0,Ju
ne 3
0,H1
200
0/H1
200
0/H1
200
0/De
cem
ber 3
1,De
cem
ber 3
1,De
cem
ber 3
1,Co
mpa
ny19
9920
00H1
199
919
9919
9920
00H1
199
919
9919
9920
00H1
199
919
99
(000
s)(N
OK m
illio
ns, e
xcep
t per
cent
ages
)(3)
Wes
tern
Eu
rop
eE
sat
Dig
ifone
******************************36
869
990
%2,
203
949
1,66
275
%75
111
439
296
%1,
403
VIA
G I
nter
kom
****************************22
81,
817
696%
6,39
62,
133
4,81
412
6%(6
,135
)(2
,706
)(2
,759
)(5
)(4
35)
Con
nect
Aus
tria
***************************18
379
233
3%1,
246
347
1,36
629
4%(8
64)
(423
)(3
26)
(5)
5,01
1C
entr
al &
Eas
tern
Eu
rop
eC
osm
ote
*********************************58
5(6)
1,51
515
9%2,
987
1,12
82,
174
93%
666
169
484
186
%1,
459
Pan
non
GS
M*****************************47
484
278
%2,
590
1,23
21,
341
9%1,
270
639
559
(13)
%1,
390
Pro
Mon
te*********************************
4463
44%
137
4613
719
7%72
2774
173
%(2
8)R
uss
ia/U
krai
ne
Vim
pelC
om*******************************14
9(6)
582
290%
1,76
888
5(6)
1,13
028
%20
124
0(6)
206
(14)
%1,
008
Kyi
vsta
r**********************************
2013
357
9%15
663
167
166%
22
39(6
)1,
684%
337
Ext
el*************************************
36
118%
3111
23(6
)10
4%12
410
(6)
159%
80S
tavt
eles
ot********************************
411
175%
207
1713
6%7
09(
6)(5
)84
Nor
th-W
est
GS
M**************************10
916
249
%66
829
844
649
%33
114
422
959
%2
So
uth
east
Asi
aD
iGi.c
om*********************************
—67
7—
——
837
——
—26
7—
594(
4)G
ram
een
Pho
ne***************************
4010
616
7%20
577
204
165%
177
4148
6%26
8
(1)
EB
ITD
A,
excl
udin
g ga
ins
/loss
es f
rom
sal
es o
f as
sets
, co
nsis
ts o
f ea
rnin
gs b
efor
e in
tere
st,
tax,
dep
reci
atio
n an
d am
ortiz
atio
n ex
clud
ing
gain
s/(
loss
es)
from
sal
esof
fixe
d as
sets
and
ope
ratio
ns.
(2)
Net
deb
t co
nsis
ts o
f lo
ng t
erm
and
sho
rt t
erm
inte
rest
-bea
ring
debt
min
us c
ash.
(3)
Fin
anci
al fi
gure
s ac
cord
ing
to N
orw
egia
n G
AA
P.
(4)
Net
deb
t as
of
June
30,
200
0.
(5)
Not
mea
ning
ful.
(6)
Bas
ed o
n m
anag
emen
t es
timat
es.
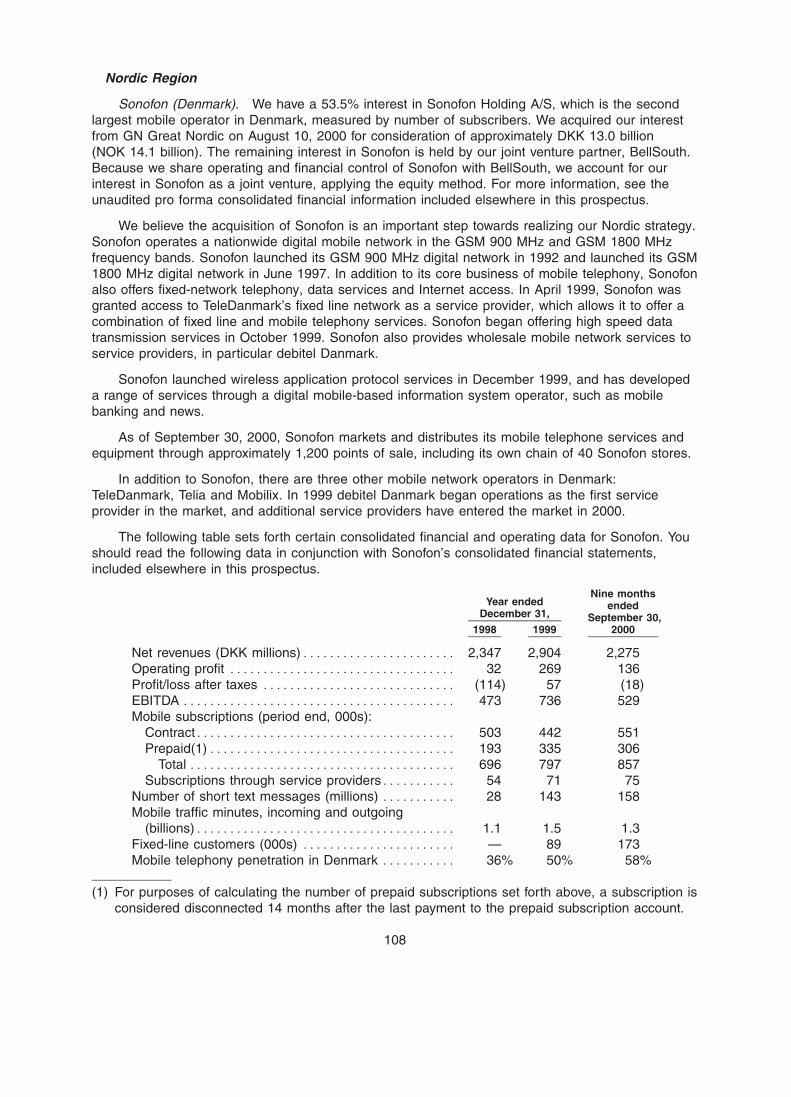
BOWNE OF LONDON 12/03/2000 12:06 BL/SM NO MARKS NEXT PCN: 114.00.00.00 -- Page is valid, no graphics X42481 113.00.00.00 7X
Nordic Region
Sonofon (Denmark). We have a 53.5% interest in Sonofon Holding A/S, which is the secondlargest mobile operator in Denmark, measured by number of subscribers. We acquired our interestfrom GN Great Nordic on August 10, 2000 for consideration of approximately DKK 13.0 billion(NOK 14.1 billion). The remaining interest in Sonofon is held by our joint venture partner, BellSouth.Because we share operating and financial control of Sonofon with BellSouth, we account for ourinterest in Sonofon as a joint venture, applying the equity method. For more information, see theunaudited pro forma consolidated financial information included elsewhere in this prospectus.
We believe the acquisition of Sonofon is an important step towards realizing our Nordic strategy.Sonofon operates a nationwide digital mobile network in the GSM 900 MHz and GSM 1800 MHzfrequency bands. Sonofon launched its GSM 900 MHz digital network in 1992 and launched its GSM1800 MHz digital network in June 1997. In addition to its core business of mobile telephony, Sonofonalso offers fixed-network telephony, data services and Internet access. In April 1999, Sonofon wasgranted access to TeleDanmark’s fixed line network as a service provider, which allows it to offer acombination of fixed line and mobile telephony services. Sonofon began offering high speed datatransmission services in October 1999. Sonofon also provides wholesale mobile network services toservice providers, in particular debitel Danmark.
Sonofon launched wireless application protocol services in December 1999, and has developeda range of services through a digital mobile-based information system operator, such as mobilebanking and news.
As of September 30, 2000, Sonofon markets and distributes its mobile telephone services andequipment through approximately 1,200 points of sale, including its own chain of 40 Sonofon stores.
In addition to Sonofon, there are three other mobile network operators in Denmark:TeleDanmark, Telia and Mobilix. In 1999 debitel Danmark began operations as the first serviceprovider in the market, and additional service providers have entered the market in 2000.
The following table sets forth certain consolidated financial and operating data for Sonofon. Youshould read the following data in conjunction with Sonofon’s consolidated financial statements,included elsewhere in this prospectus.
Nine monthsYear ended ended
December 31, September 30,1998 1999 2000
Net revenues (DKK millions)*********************** 2,347 2,904 2,275Operating profit ********************************** 32 269 136Profit/loss after taxes ***************************** (114) 57 (18)EBITDA ***************************************** 473 736 529Mobile subscriptions (period end, 000s):
Contract*************************************** 503 442 551Prepaid(1)************************************* 193 335 306
Total **************************************** 696 797 857Subscriptions through service providers*********** 54 71 75
Number of short text messages (millions) *********** 28 143 158Mobile traffic minutes, incoming and outgoing
(billions)*************************************** 1.1 1.5 1.3Fixed-line customers (000s) *********************** — 89 173Mobile telephony penetration in Denmark *********** 36% 50% 58%
(1) For purposes of calculating the number of prepaid subscriptions set forth above, a subscription isconsidered disconnected 14 months after the last payment to the prepaid subscription account.
108
BOWNE OF LONDON 12/01/2000 19:56 BL/SM NO MARKS NEXT PCN: 115.00.00.00 -- Page is valid, no graphics X42481 114.00.00.00 5X
The Danish mobile telephony market continued to experience strong competition in the ninemonths ended September 30, 2000, which resulted in a general reduction in tariffs and adverselyaffected Sonofon’s revenues. This decline in revenues was partly offset by a slight increase incustomer usage of mobile phones.
In 1999, Sonofon achieved higher revenues compared to 1998 due primarily to a markedincrease in customer usage and a significant number of new customers in both mobile and fixednetwork telephony. In response to intense competition in early 1999, Sonofon introduced significantsubsidies to contract subscriptions and prepaid cards. Although while Sonofon gained a largenumber of new subscribers in this period, expenses for sales and marketing increased considerably.For the remaining part of 1999, Sonofon lowered its level of subsidies, and gained new subscribersat a more measured pace, relying on the strength of its broad distribution network, strong productsand visible marketing.
At September 30, 2000, Sonofon estimates its market share in Denmark, based on number ofsubscriptions, at about 28%, excluding subscriptions of service providers.
In the spring of 2000, Sonofon launched a new mobile telephony pricing plan called ‘‘Variant’’,which was supported by a comprehensive marketing campaign. The success of the Variantcampaign has resulted in approximately 220,000 Variant subscribers as of September 30, 2000.Together with the new ‘‘Multiplan’’ service for the business market, Sonofon believes thesecampaigns represent an attractive investment in future business in both the residential and thebusiness markets.
Sonofon currently holds, through wholly-owned subsidiaries, two public licenses for the operationand provision of GSM 900 MHz and GSM/DCS 1800 MHz digital mobile telecommunicationsnetworks and associated services, which were granted under the Danish Public Mobile Communica-tions Act No. 468 of June 12, 1996 (as amended). The GSM 900 MHz license was granted inFebruary 1997 and currently expires in March 2002 and the GSM/DCS 1800 MHz license wasgranted in June 1997 and initially expires in June 2007. The Danish regulator has reserved the rightto withdraw either license on the initial expiration dates upon one year’s notice. Otherwise, bothlicenses will be automatically renewed for further ten-year periods subject to the regulator’s right towithdraw either license upon one year’s notice. Additionally, the regulator has discretion to conduct areview of both licenses every five years and to impose new, more stringent terms. It is possible thatSonofon’s licenses may be revised with effect from March 2002 (GSM 900 license) and June 2002(GSM/DCS 1800 license). However, in light of the current competitive environment in the Danishmobile market, Sonofon does not expect the regulator to impose more onerous license terms inconnection with such a review of its licenses.
Both mobile licenses contain conditions that impose obligations on Sonofon to provide certainservices and information, conditions on the prices and terms Sonofon offers to customers as well asgeographical network coverage requirements and specific roll out schedules. Sonofon believes it iscurrently in compliance with its coverage obligations. Furthermore, the Danish regulator hasdesignated Sonofon as an operator having significant market power in the market for mobilecommunications services, and as such, Sonofon must provide interconnection to other operators onobjective, transparent and non-discriminatory terms. In addition, under the terms of Sonofon’s GSM900 license, at least 40% of Sonofon’s financing requirements must be fulfilled through contributionsto be made each year by the owners of the licensee.
Sonofon expects the tender process for third generation mobile licenses in Denmark to occur in2001.
In addition, tender processes for seven wireless access (FWA) licenses, two national digitallicenses in the GSM 900 MHz frequency band, and two national digital licenses in the GSM1800 MHz frequency band are currently underway. Sonofon believes it has been granted one of thelicenses in the 1800 MHz frequency band and that the license will be issued in November 2000. The
109
BOWNE OF LONDON 12/03/2000 15:22 BL/SM NO MARKS NEXT PCN: 116.00.00.00 -- Page is valid, no graphics X42481 115.00.00.00 9X
licenses in the 900 MHz frequency band are expected to be awarded in January 2001. Sonofon hasapplied for two FWA licenses, one in the 3.5 GHz band and one in the 26 GHz band. Sonofonexpects the licenses to be awarded in December 2000.
Telenordia (Sweden). Telenordia, a Swedish telecommunications company owned 50% by us and50% by British Telecom or BT, submitted an application for a UMTS license in Sweden throughparticipation in a beauty contest. The Swedish regulator is expected to announce the winningapplicants in mid-December 2000. For more information on Telenordia, see ‘‘— Other Activities’’below.
Western Europe
Esat Digifone (Ireland). We hold a 49.5% ownership interest and BT controls a 50.5%ownership interest in Esat Digifone. Esat Digifone commenced commercial operations in March 1997and is the second provider of GSM 900 and 1800 mobile telephony services in Ireland. In November1998, the company launched prepaid services and in November 1999 launched short text messagingservices for prepaid customers. In June 2000, Esat Digifone launched its fax, mobile Internet andportal services. Esat Digifone began offering wireless application protocol services at the end of1999, and introduced mobile Internet services in September 1999. The Company plans to participatein the beauty contest for a UMTS license in Ireland, which is currently scheduled for May 2001.
There are currently two mobile network operators in Ireland, Eircell, and Esat Digifone. EsatDigifone estimates its market share at approximately 38.4% at June 30, 2000. A third operator,Meteor, is expected to launch operations in late 2000.
In January 2000, BT acquired Esat Telecom. Pursuant to our agreement with BT, we have theoption to sell our 49.5% stake in Esat Digifone to BT for US$1,237 million or to exchange our 49.5%interest in Esat Digifone for a 33% stake in Esat Telecom, with the option to increase our interest to49.9%. In the event that we do not exercise either option by December 7, 2000, the agreementrequires us to sell to Esat Telecom our 49.5% share in Esat Digifone for US$1,237 million. In theevent we exercise the option to exchange our interest in Esat Digifone for a 33% stake in EsatTelecom during the option period, we have an additional option available for a period of 270 days tosell our stake in Esat Telecom to BT for US$1,237 million, together with an amount equal to anyamounts we spend in increasing our stake up to 49.9%. We currently consider our option to sell ourinterest to BT, whether in the form of an interest in Esat Digifone or Esat Telecom, at the optionprice to be a valuable right. However, to date we have made no decision on whether or when toexercise this option. BT has recently informed us that it is prepared to extend the current optionperiod for two months beyond December 7, 2000, which would also reduce the subsequent 270-dayperiod by two months.
VIAG Interkom (Germany). We have a 10% ownership interest in VIAG Interkom, a jointventure in Germany with E.ON and BT, both of which own 45% of VIAG Interkom. VIAG Interkomprovides a full offering of standard and customized telecommunications products and services basedon the most advanced systems and integrated networks technology. VIAG Interkom is a GSM 1800mobile operator and estimates its market share at approximately 6% at June 30, 2000. In 1999 thecompany signed a national roaming agreement with Deutsche Telekom granting VIAG Interkomcustomers close to nationwide coverage. VIAG Interkom launched its mobile and Internet operationsin October 1998 and provides a full range of mobile services, including prepaid services andwireless application protocol services. A VIAG Interkom product was named the most innovativetelecom product in Germany in 1999 — VIAG Interkom’s FMC product, Genion, which makes mobiletelephony at a selected address (for example, a customer’s private home) possible at fixed-linetariffs. VIAG Interkom launched GPRS on a regional basis in September 2000 and intends to launchit on a national basis in the first quarter 2001. The company acquired a UMTS license in Germany inAugust 2000, at a cost of DEM 16.53 billion. Telenor’s share of that expense was DEM 1.65 billion(NOK 6.82 billion), which was provided in the form of a loan by Telenor to VIAG Interkom. One ofthe other companies that received a UMTS license in Germany has brought a legal proceedingchallenging the auction process, and it is not clear what the result of this challenge will be. VIAG
110
BOWNE OF LONDON 12/01/2000 19:56 BL/SM NO MARKS NEXT PCN: 117.00.00.00 -- Page is valid, no graphics X42481 116.00.00.00 6X
Interkom intends to focus on the major growth areas of the telecommunications market, includingmobile and broadband services.
To promote investment stability, the VIAG Interkom joint venture agreement provides that noparty is permitted to transfer its interest in VIAG Interkom to a non-shareholder prior to January2002. E.ON has negotiated an option to sell its stake in VIAG Interkom to BT for Euro 6.65 billion.We have an option to sell, subject to E.ON’s consent, our 10% stake in VIAG Interkom to BT by theend of 2000 for Euro 1.61 billion. BT has an option to buy our 10% stake in VIAG Interkom whichmay be exercised for a period of three months following the expiration of our option to sell at a 15%higher price. If we sell our stake in VIAG Interkom, VIAG Interkom will repay to us our loan that wasadvanced in respect of the recently acquired UMTS license. We currently consider our option to sellour VIAG Interkom stake at the option price to be a valuable right. We have recently entered intodiscussions with BT regarding not only the VIAG Interkom investment, but our other commoninvestments as well, and it is possible that our decision whether to exercise our VIAG Interkomoption could be affected by agreements, if any, reached with BT regarding our other relationships,which in part could include an acquisition by us of BT’s interest in Telenordia and may also involveour option to sell to BT our interest in Esat Digifone. Any decision on these matters will be madewith a view to maximizing the value to our shareholders in light of the opportunities available to us.
Connect Austria (Austria). We have a 17.45% ownership position in Connect Austria, one ofthe current four mobile operators in the fast-growing Austrian market. Connect Austria is a jointventure among E.ON (30%), RHI Telekom GmbH (20.1%), Orange (17.45%), TeleDanmark (15%)and Telenor. To promote investment stability, the shareholders’ agreement provides that no partymay transfer its interest to a non-shareholder prior to July 2001. Due to Mannesman’s acquisition ofOrange (completed February 2000), Orange was required to divest its interest in Connect Austriapursuant to the joint venture agreement. Orange, now owned by France Telecom, has protesteddivestiture and the matter is currently in arbitration. If Orange is required to divest its participation,the remaining parties to the joint venture agreement may acquire Orange’s stake in proportion totheir respective interests in Connect Austria. As a result, our ownership interest could increase to21.14%. E.ON has stated publicly that it intends to withdraw from the telecommunications industrywhich, if it did, would result in a change in the ownership structure of Connect Austria.
As of June 30, 2000, the Company estimates that it had a market share of approximately 16%in the Austrian mobile telecommunications market. Connect Austria offers a full range of mobileservices including prepaid, voice mail and short text messaging services. High speed datatransmission capability and wireless application protocol services were both launched in March 2000.Its services particularly appeal to the younger segment of the Austrian market. Connect Austriaparticipated in the UMTS license auction process in Austria, that closed on November 3, 2000.Connect Austria won a license consisting of two blocks. The price for the license wasATS 1.65 billion, of which ATS 288 million (NOK 167 million) represented Telenor’s 17.45% share.
Portugal. We have a 20% interest in a consortium in Portugal that has submitted an applicationfor the beauty contest for a UMTS license. Our partners in the consortium ONI Way are ONI SGPS(60%) and institutional investors (20%). Licenses are expected to be awarded in December 2000.
Central and Eastern Europe
Cosmote (Greece). We currently hold an 18.0% ownership position in Cosmote, the thirdmobile operator in Greece. In 1997, we were selected as the partner to OTE, the Greektelecommunications operator, when they were awarded the third digital mobile telephony license inGreece. Cosmote launched its operations in April 1998 and seeks to become the leading provider ofmobile services in Greece, and eventually in the Balkans. The company estimates that it had amarket share of approximately 31% as of June 30, 2000. The company is the second largestprovider of mobile telecommunications services in Greece based on total number of customers andhas the largest number of postpaid customers. Cosmote offers a full range of mobile services,
111
BOWNE OF LONDON 12/01/2000 19:56 BL/SM NO MARKS NEXT PCN: 118.00.00.00 -- Page is valid, no graphics X42481 117.00.00.00 6X
including prepaid subscriptions, voicemail, short text messaging and data services. A mobile internetportal ‘‘MyCosmos’’ was launched in September 2000. Telenor was involved in the development of aservice platform for content delivery through mobile banking as well as wireless application. HighSpeed Circuit Switched Data Services (HSCSD) will be launched later this year. Services based onGPRS technology are expected to be launched in the beginning of 2001. Cosmote intends toparticipate in the UMTS license auction in Greece, which is currently scheduled for the first quarterof 2001. We have been an active partner in Cosmote since our investment in 1997. We initiallyengaged 25 of our employees in Cosmote’s operations, including senior management. Over time,with rapid training of local staff, these employees have been replaced with local staff.
Cosmote recently conducted an initial public offering of its shares and is traded on the Londonand Athens stock exchanges. After the offering, investors in Cosmote are Telenor (18.0%), WR ComEnterprises Ltd (Cyprus) (7.3%), OTE (59%) and public shareholders (15.7%).
Pannon GSM (Hungary). Pannon GSM was the second operator to provide mobile telephonyservices in Hungary and launched commercial operations on its GSM 900 network in March 1994.We currently have a 25.8% ownership interest in Pannon. Other investors include Sonera (23%),KPN (44.7%) and TeleDanmark (6.6%). Pannon is one of three operators in the Hungarian marketand competes with Vodafone Hungary and Westel. As of September 30, 2000, Pannon estimatesthat it had a market share of approximately 39%. Vodafone Hungary operates GSM 900/1800networks and Westel operates NMT 450 and GSM 900 networks. Vodafone Hungary has been givennational roaming as of December 1999. Pannon and Westel are not permitted to operate theirGSM 1800 networks until December 2000.
Pannon currently offers prepaid and contract services, short text messaging services,international calls over Internet protocol and wireless application protocol services. Pannonintroduced ISP services in September 2000 and intends to offer limited roaming for prepaidsubscriptions later this year. Pannon expects to provide data services using the HSCSD network andplans to launch GPRS in 2001. Pannon also plans to participate in the UMTS license auction inHungary, which is currently scheduled for late 2001.
The chief executive officer of Pannon is seconded from Telenor.
ProMonte (Montenegro). We hold a 40.1% ownership interest in ProMonte, a mobile operatorin Montenegro, indirectly through ETL Luxembourg, which holds 91.1% of ProMonte. ProMontelaunched operations in July 1996, offers basic mobile telephony services and launched prepaidservices at the end of June 2000.
Russia, Ukraine and Baltics
VimpelCom (Russia). In 1999, we purchased a shareholding of 31.6% of the share capital and25.7% of the voting rights of Vimpel-Communications (VimpelCom) in Moscow. After an issue of newshares and convertible bonds in July 2000, we currently hold a 30.4% ownership interest in theshares of VimpelCom on a fully diluted basis. The remaining interests in VimpelCom are owned byits President and Chief Executive Officer (approximately 20.5%), the European Bank for Reconstruc-tion and Development (3%), and by public investors (approximately 46.1%). VimpelCom was the firstRussian company to be listed on the NYSE.
Pursuant to our agreement with VimpelCom entered into in connection with our initialinvestment, we granted VimpelCom an option to repurchase 250,000 of our shares. If this option isexercised, our ownership interest in VimpelCom will be reduced to 29.7% of the share capital and25.1% of the voting rights. VimpelCom has indicated that they intend to exercise this option.
VimpelCom estimates that it had a market share of approximately 44% at June 30, 2000 with551,500 subscribers in the Moscow license area and 30,800 elsewhere. VimpelCom operates aD-AMPS network as well as a dual-band GSM network (900 and 1800). The GSM network becamethe larger of VimpelCom’s networks during the third quarter of 2000. The company currently offers
112
BOWNE OF LONDON 12/01/2000 19:56 BL/SM NO MARKS NEXT PCN: 119.00.00.00 -- Page is valid, no graphics X42481 118.00.00.00 5X
both contract and prepaid services as well as short text messaging. VimpelCom launched a wirelessapplication portal, beeonline.ru on June 30, 2000. The company also expects to introduce GPRS inthe fourth quarter of 2000. VimpelCom operates primarily in the Moscow region of Russia andcompetes with a GSM 900 and 1800 operator as well as with an NMT 450 operator.
Seconded Telenor personnel are currently serving with VimpelCom as president and chiefoperating officer and in two other managerial positions.
In early September 2000, VimpelCom received a letter from Gosvyaznadzor, a committeesubordinate to the Russian Telecommunications Ministry, asking VimpelCom to surrender 30 of the45 channels in the 900 MHz band that VimpelCom holds in Moscow. VimpelCom contested theletter. On November 14, 2000, the Ministry issued a letter stating that the validity of the contestedfrequency channels had been restored.
North-West GSM (St. Petersburg). We have a 12.74% interest in North-West GSM, a digitalmobile telephony operator (GSM 900) in St. Petersburg. There are currently four operators in theSt. Petersburg and Leningrad Oblast area. North-West GSM currently offers contract subscriptions,and expects to launch prepaid services during spring 2001. The company also plans to launch GSM1800 in Kaliningrad, Pskow and Novgorod early in 2001.
Stavtelesot (Stavropol). We have a 49% interest in Stavtelesot, one of two operators inStavropol, the area between the Caspian and Black Sea.
Kyivstar (Ukraine). We have a 35% ownership interest in Kyivstar GSM, a mobile operator inthe Ukraine. Other owners include Storm (31%), Sputnik (14%) and Omega (20%). Kyivstaradditionally provides short text and voice messaging services. Kyivstar launched mobile Internetservices based on wireless application protocol in July 2000. Telenor personnel have been secondedto serve as the vice president and marketing director, the technical director and the finance director.
Extel GSM (Kaliningrad). We have a 49% interest in Extel GSM, one of three operators in theBaltic Sea region in Russia. Extel GSM is a GSM 900 operator and commenced operations inAugust 1997.
Southeast Asia
DiGi.com (Malaysia). We acquired 30.0% of DiGi.com at the end of 1999, expanding ourpresence in Southeast Asia. An additional 2.93% was bought June 1, 2000. The remaining sharesare held publicly (11.1%) and by private investors (56%). In 1995, DiGi.com was the first operator tocommercially launch and operate a fully digital mobile network. The company currently provides arange of mobile services, international carrier services, fixed-line services and fixed line accessservices. DiGi.com plans to launch an Internet service provider/portal service in fall 2000. DiGi.comis one of five mobile operators in the Malaysian market. Other operators include Cellcom (GSM 900,E-TACS), Maxis (GSM 900), Telecom Malaysia (GSM 1800, AMPS, D-AMPS, NMT450) and TimeWireless (GSM 1800). DiGi.com operates a GSM 1800 network and is the leading prepaid operatorin Malaysia. DiGi.com estimates its market share in the Malaysian market as 21% as of June 30,2000.
Seconded Telenor personnel are currently serving as the chief operating officer, chief technologyofficer, deputy chief financial officer, strategic director and managers/engineers in the technicaldepartment and international carrier business unit.
Grameen Phone (Bangladesh). We hold a 46.4% ownership interest and a majority votinginterest in Grameen Phone, the second mobile operator to provide mobile telephony services inBangladesh. Grameen Phone launched its GSM 900 network in March 1997. Other investors includeGrameen Telecom (31.9%), Marubeni Corporation (8.6%), Gonofone Development Corp., USA(4.1%) and syndicate banks (9%). As of August 31, 2000, Grameen Phone estimates that it had amarket share of approximately 59%. Besides Grameen Phone as the leading operator in the
113
BOWNE OF LONDON 12/03/2000 10:03 BL/SM NO MARKS NEXT PCN: 120.00.00.00 -- Page is valid, no graphics X42481 119.00.00.00 6X
Bangladeshi market, there are three other operators: Sheba (GSM 900), Aktel (GSM 900) andCitycell (AMPS and CDMA). Grameen Phone offers contract and prepaid services as well as value-added services, including short text and voice messaging services. The company pioneered theUnique Village Phone concept to promote connectivity to the rural areas of Bangladesh byestablishing a program that enables customers (especially women) to borrow money to buy cellphones.
Seconded Telenor personnel are currently serving as chief executive officer, chief operatingofficer and chief technical officer of Grameen Phone.
Total Access Communication Company PCL and United Communication Industry PCL(Thailand). In 2000, we acquired 29.5% of Total Access Communication Company PCL (TAC) and24.9% of its previous parent company, United Communication Industry PCL (UCOM) giving us acombined direct and indirect ownership interest in TAC of 39.8%. We purchased these interests intwo main tranches, in May and August 2000, at a total acquisition cost of US$713.5 million(NOK 6.4 billion). TAC is Thailand’s second largest mobile operator and its shares are listed on theSingapore Stock Exchange. UCOM is a major Thai telecommunications group and its shares arelisted on the Stock Exchange of Thailand. We recently increased our ownership in TAC to 29.9%.
UCOM owns 41.6% of TAC. The other holders of UCOM, are Somers (U.K.) (22.6%) and theBencharongkul family (22.4%). In connection with our acquisition, TAC received proceeds ofUS$262 million.
TAC launched its analog AMPS 800 cellular service in 1991 and launched digital GSM 1800service in 1994. At June 30, 2000, TAC had 1.1 million mobile subscribers, of which approximately640,800 were analog and 500,200 were digital. TAC estimates its market share in Thailand as ofJune 30, 2000 to be approximately 37%. Revenues for the six months ended June 30, 2000 wereBaht 10.4 billion of which Baht 7.5 billion was from phone services, with most of the remainderrepresenting sales of handsets. Operating income was Baht 2.9 billion and net profit Baht 0.3 billion.TAC reported total revenues for the year ended December 31, 1999 of Baht 18.2 billion, of whichBaht 12.1 billion was from mobile telephone services, with most of the remainder from sales ofhandsets.
The UCOM group is principally involved in the distribution of communications equipment andtelecommunications systems and provides related services, mainly in Thailand. UCOM wasestablished in 1960 and was the first private telecommunications company in Thailand. UCOMreported consolidated revenues for 1999 of Baht 25.9 billion. For the first half of the year 2000 thereported consolidated revenues were Baht 14.3 billion.
Philippines. Telenor is in discussions with the local telecom operator BayanTel and its mainshareholder Benpres to establish a joint venture to construct and operate a cellular network in thePhilippines based on the GSM standard. Telenor would have a 40% ownership interest in the jointventure, and BayanTel would have 60% under the terms of a non-binding Memorandum ofAgreement signed June 23, 2000.
mFuture
mFuture represents our initiatives to develop new mobile Internet and portal services in Norwayand internationally throughout our mobile operations. We intend to utilize our technologicalleadership to take advantage of future mobile communications business opportunities. Our objectiveis be a leader in applying mobility to the Internet by developing innovative business services todayas well as new services for UMTS, the next generation mobile system.
We launched djuice, our mobile Internet portal, in Norway in the spring of 2000 and arecurrently in the initial stages of rolling out the portal outside Norway. See ‘‘mNorway — djuice’’. Wesigned an ASP agreement with TAC in September 2000, and will launch the Thai version of djuice,djuice.co.th, on December 1, 2000. djuice will also be launched by DiGi.com, Malaysia in December
114
BOWNE OF LONDON 12/01/2000 19:56 BL/SM NO MARKS NEXT PCN: 121.00.00.00 -- Page is valid, no graphics X42481 120.00.00.00 5X
2000 and we intend to enter into agreements with two more Telenor associated companies by theend of 2000. In addition, we expect to have three independent versions of djuice running by year-end2000, and have already activated djuice’s URL in Portugal and The Netherlands with local contentcategorization and language. Later on, we intend to approach operators in these respective marketsto form closer partnership on customer offerings.
We intend to develop djuice into an international platform for mobile Internet access,incorporating local content and customers. We intend to aggressively market the djuice platform as apreferred source for Internet users everywhere by tailoring content region-by-region, whilemaintaining common features and functionality across regions. We believe the features that we areincorporating into djuice are readily exportable and can create a common platform for Internetaccess, content aggregation and transaction engines internationally. To support our initiative, we arecurrently seeking alliances with other mobile operators to develop a partnership network for ourdjuice portal. The partnership network is intended to provide our partners the benefit of commonplatforms and functionality as well as a coordinated effort to develop a strong brand name. Intargeted markets where partners are not initially available, we intend to launch djuice independently.Our objective is to provide an established presence in several countries within the next few years.
Telecom
Through our telecom business area, we are the leading provider of fixed network telecommuni-cations services in Norway. We provide telecom solutions to the residential and business markets,including analog and digital fixed line telephony services, value-added services, leased lines anddata communication services. We also provide telecom solutions to the wholesale market, includinginterconnection to our networks and domestic and international transit and capacity services. Inaddition, in order to focus on the growing markets for application service provisioning and othermanaged services that combine telecommunications and information technology, we have recentlyreorganized our application service provisioning, or ASP, systems integration, consulting ande-business services and customer premises equipment into a range of business solutions. In 1999,our Telecom business area had external revenues of NOK 15.9 billion.
Telecom Solutions
Overview and Background
We develop and supply telecommunications services for the residential and business markets inNorway and for the wholesale market in Norway and internationally. Our principal services in eachmarket are:
) Residential market. We provide traditional analog voice telephony service, digital fixedtelephony service, commonly known as ISDN, and value-added services such as calleridentification to homes throughout Norway. At September 30, 2000, we had approximately1.372 million analog and 408,000 ISDN access subscriptions in the residential market. InDecember 2000 we will begin offering high-speed asynchronous digital subscriber line, or‘‘ADSL’’, service to this market.
) Business market. We provide traditional analog, ISDN and ADSL service, leased lines anddata communications services to businesses in Norway, including public sector entities. Wewere the first operator in the Nordic region to offer ADSL service to businesses, which waslaunched in June 1999. At September 30, 2000, we had approximately 352,000 analog,251,000 ISDN and 350 ADSL access subscriptions in this market. We also providedapproximately 70,000 leased lines and had 35,000 data communications customers at thatdate.
) Wholesale market. We provide a range of interconnection and capacity services, includingleased lines, in the Norwegian market, allowing other network operators, Internet service
115
BOWNE OF LONDON 12/01/2000 19:56 BL/SM NO MARKS NEXT PCN: 122.00.00.00 -- Page is valid, no graphics X42481 121.00.00.00 5X
providers and other service providers to connect to our network or use our infrastructure inorder to facilitate their own service offering. We provide international operators with transitand capacity services for international voice and data traffic into or through Norway, and weare currently expanding our European and transatlantic international wholesale operations.
The Norwegian market for fixed network telecommunications has been open to full competitionin both domestic and international services since January 1, 1998. Since then, a number ofcompeting service providers have commenced operations in Norway. In addition, regulatorymeasures have been adopted to promote competition. Since January 1, 1998, we have beenrequired to provide access customers with the ability to select alternative operators to handle theircalls, which were provided on a call-by-call basis using prefix access codes. As of June 1, 1999, wewere required to offer customers the ability to pre-select a primary carrier for all their calls, as wellas the ability to keep their telephone numbers if they change service providers. Since November 1,2000, we have been required to offer customers the ability to pre-select two carriers for differenttypes of calls (e.g., one for national service and one for international service). Furthermore, as anoperator with ‘‘significant market power’’, we must make available interconnection and transmissioncapacity to competing operators at cost-oriented prices, and in a transparent and nondiscriminatorymanner.
The introduction of competition has inevitably resulted in a reduction in our market share.Measured by the percentage of traffic minutes carried over our network, our market share of trafficwas 79% in the residential market and 81% in the business market during the nine months endedSeptember 2000. These market shares do not take into account traffic carried over other operators’own access infrastructure.
Over the past several years we have made changes in our prices in order to become morecompetitive. We have rebalanced our tariffs by reducing call tariffs and increasing monthlysubscription fees, in order to align our prices more closely with the costs of providing the service. InJuly 1999, we eliminated our national long-distance tariff, so that all calls within Norway are nowcharged at the local tariff rate. Our tariffs are currently at a level that is among the lowest in OECDcountries. Nevertheless, we expect that increasing competition and technological development mayrequire us to further reduce prices in the future.
Although our market share has been declining, minutes of usage of fixed network services inNorway have been increasing strongly, and the amount of traffic carried on our network hascontinued to increase. Traffic minutes in our residential market and in our business market increased7.5% and 6.0%, respectively, in the nine months ended September 30, 2000 compared to the sameperiod in 1999. The total volume of traffic minutes in our network, including traffic generated by otheroperators, increased 25% in the third quarter of 2000 compared to the third quarter of 1999. Theprincipal driver of the increase in traffic minutes has been the high growth in usage of the Internet inNorway, while traffic to mobile phones and the increased use of home personal computers and tele-commuting have also contributed to the increase. Norway has among the highest penetration ratesof personal computers and Internet users in the world. According to an estimate by Jupiter StrategicPlanning Services, Internet users as a percentage of the population in Norway this year will reach45%.
The increased usage of the Internet and other data applications has led to increased demandfor access channels with higher capacity, or bandwidth, allowing data to be transmitted at higherspeeds. A basic rate ISDN line provides a capacity of 128 Kbps, which allows a subscriber todownload information from the Internet at a significantly higher rate than through the use of amodem with an analog line. Our network has the highest penetration rate of ISDN lines in the world,with 28% of our access subscribers using an ISDN line at September 30, 2000. In our experience,conversion from a traditional analog line to an ISDN line has typically resulted in a multiple-foldincrease in traffic minutes generated by the subscriber. In recent years we have made substantial
116
BOWNE OF LONDON 12/01/2000 19:56 BL/SM NO MARKS NEXT PCN: 123.00.00.00 -- Page is valid, no graphics X42481 122.00.00.00 5X
investments in our access network to increase capacity in order to accommodate ISDN lines, and atSeptember 30, 2000, over 95% of our local access lines were able to accommodate an ISDN line.
We introduced ADSL service in the business market in more densely populated areas in 1999and intend to launch ADSL service for the residential market in December 2000. ADSL providesbroadband capacity, which means that voice and data can be transmitted at much greater speedsthan analog or ISDN lines over the existing installed copper line without interfering with the normalvoice telephone connection. We currently offer ADSL lines with a capacity of up to 2,048 Kbps fordata transmitted to the subscriber and up to 448 Kbps for data transmitted from the subscriber. Asthe diversity and complexity of Internet and other data applications continue to increase, we expectthere to be strong demand in Norway for ADSL lines. Because of the investments made to increasethe capacity in our access network to accommodate ISDN, we believe that we are well-positioned forthe roll out of ADSL on a network-wide basis.
Strategy
Our objective is to maintain our leadership position in the Norwegian market. To achieve thatobjective and respond to increased competition in our markets, we intend to:
) Strengthen our customer relationships and market integrated solutions. We aim to developand manage long-term customer relationships by providing customized customer interactionand services. In December 1999, we reorganized our business structure to move from aproduct-oriented organization to a customer segment-oriented organization. We also areinvesting in advanced customer data information mastering tools to increase our focus oncustomer relationship management. To better meet the needs of specific customer segments,we plan to market bundled services under the Telenor brand, combining fixed-networkservices with other services such as mobile and Internet services.
) Focus on subscriptions and content portals. With declining prices expected to result in areduction in revenues from the carriage of switched traffic, we intend to focus our efforts,jointly with the Internet Business Area, on the development of new content-based servicesfor customers. We intend to offer these new services together with our access services.Together with the roll out of ADSL service to the residential market, we intend to launch abroadband portal for the consumer market. ADSL provides subscribers with an ‘‘always on’’data connection at a fixed price, which we believe will result in a dramatic change inconsumer usage of the Internet and other data services. To obtain content, we will seek toestablish strategic alliances with third party content providers. In order to promote a moreeffective roll out of ADSL, the Telecom business area has formed a common project teamwith Telenor Internet personnel to take advantage of additional expertise within Telenor.
) Aggressively deploy IP technology throughout our network. To effectively handle increaseddata applications and introduce innovative new technologies, we jointly with the InternetBusiness intend to aggressively deploy Internet protocol, or IP, technology throughout ournetwork over the next several years. Deploying IP technology in our network will allow us toachieve cost efficient transport and provide network services more suited to the needs ofInternet service providers and other large data traffic users, which represent a growingproportion of our network traffic. We believe the migration to IP based networks will becritical to our ability to maintain a leading position in the market for network services incoming years.
) Promote an open value chain. The introduction of competition has resulted in the rapiddevelopment of a wholesale market in Norway. We have adopted a strategy of ‘‘opening thevalue chain’’, by which we will provide service providers with a range of interconnection,capacity and wholesale services. In April 2000, we introduced local loop unbundling, allowingservice providers to lease the local loop for the purpose of providing access services tocustomers connected to our local access network. To date, leases of local loop connections
117
BOWNE OF LONDON 12/01/2000 19:56 BL/SM NO MARKS NEXT PCN: 124.00.00.00 -- Page is valid, no graphics X42481 123.00.00.00 6X
have not been significant. We also intend to develop a wholesale service for switchlessresellers in 2001, which will be marketed to virtual operators and resellers. We believe thisapproach will serve to stimulate growth in the Norwegian market and allow us to makegreater use of our network capacity.
) Focus on increased efficiency. We have been implementing a comprehensive efficiencyprogram, with the objective of achieving considerable savings in network operating costs andprocurement costs. Since 1998, we have made significant achievements in networkoperational efficiency, and we believe substantial additional savings are achievable.
Access
The following table sets forth information regarding our analog (PSTN) and digital (ISDN) accesslines and channels as of December 31, 1997, 1998 and 1999 and as of September 30, 1999 and2000.
As of
December 31, September 30,
1997 1998 1999 1999 2000
(in thousands, except percentages)
Access(1):Analog (PSTN) lines:
Residential customers ********************************** 1,761 1,670 1,502 1,557 1,372Business customers************************************ 563 497 406 428 352
Total analog lines **************************************** 2,324 2,167 1,908 1,985 1,724Digital (ISDN) lines:
Basic access lines:Residential customers ******************************** 60 151 304 252 408Business customers********************************** 86 154 217 201 251
Total basic access lines(2) ****************************** 146 305 521 453 659Primary access lines(2)********************************* 4 5 7 6 7
Digital (ISDN) access channels(2) ************************* 410 755 1,228 1,094 1,513Penetration(3):Analog lines********************************************* 53% 49% 43% 44% 38%Digital (ISDN) channels*********************************** 9% 17% 28% 25% 34%
Total penetration rate*********************************** 62% 66% 70% 69% 72%
(1) Includes courtesy and service lines and payphones.(2) A basic digital (ISDN) line provides two access channels and a primary digital (ISDN) line
provides 30 access channels.(3) Number of lines or channels as a percentage of the population of Norway. Figures may not add
due to rounding.
Approximately 399,000 access lines had carrier pre-selection with another carrier bySeptember 30, 2000.
The number of access customers at September 30, 2000 includes approximately 230,000residents of housing cooperatives, for which we provide service at special discounts through long-term agreements entered into with the housing cooperatives.
118
BOWNE OF LONDON 12/01/2000 19:56 BL/SM NO MARKS NEXT PCN: 125.00.00.00 -- Page is valid, no graphics X42481 124.00.00.00 5X
The following table sets forth information regarding the performance of our access lines for theperiods set out below.
Nine monthsended
September 30,
1997 1998 1999 1999 2000Target result result result result result
Unsuccessful calls (Generated testtrafic N-nett) ****** 1% 0.70% 0.80% 0.50% 0.40% 0.40%Unsuccessful calls (Generated testtrafic F-nett) ****** 2% 0.90% 1.20% 0.60% 0.50% 0.50%Faults per 100 lines (annualized)(analog (PSTN))***** 12.0 13.6 12.0 13.3 13.0 12.7Faults repair time 1 (% within 8 working hours)(analog
(PSTN)) *************************************** 80.0% 72.3% 84.0% 84.1% 84.6% 78.5%Faults repair time 2 (% within 16 working
hours)(analog (PSTN)) ************************** 93.6% 93.7% 92.5%Faults per 100 lines (annualized)(digital (ISDN)) ****** 30.0 43.1 36.0 33.3 33.5 31.9Faults repair time 1 (% within 8 working hours)(digital
(ISDN)) **************************************** 80.0% 72.6% 83.0% 81.8% 81.4% 77.8%Faults repair time 2 (% within 16 working hours
(digital (ISDN)) ********************************* 92.7% 92.4% 93.0%Calls waiting more than 2 sec for dial tone*********** 0.00% 0.10% 0.10% 0.05% 0.05% 0.03%
Residential Market
We are the leading provider of telecommunications services to the residential market in Norway.As of September 30, 2000, we had approximately 1.8 million residential customers.
Services
Our principal services in the residential market in Norway are analog access lines, ISDN accesslines and a broad range of value-added services.
Analog. We offer analog access service, which involves providing connections via copper wirebetween a customer’s premises and the fixed network for the provision of basic voice, facsimile anddial-up Internet services. Each analog access line provides a single telecommunications channel.Analog is the main access line for the residential market. Under the universal service obligation inour fixed telephony license, we are required to make analog services accessible at an affordableprice for all households and enterprises in Norway.
ISDN. We also offer ISDN access. ISDN allows a single copper wire access line to be used fora number of purposes simultaneously, including voice, data and facsimile transmission. ISDN alsoprovides a higher quality connection with faster transmission of signals, and increases the bandwidthcapacity. Basic rate ISDN, known as ISDN basic rate access, provides two digital channels. In 1999,we were the first in the world to launch automated ISDN delivery in retail stores, allowing customersto install their own ISDN lines on a ‘‘plug & play’’ basis. Most of our ISDN sales during the thirdquarter of 2000 were ‘‘plug & play’’ installations. We also sell ISDN as an ordered installationperformed by us if requested by the customer or necessary for technical reasons.
Approximately 23% of our residential access customers subscribed to an ISDN line atSeptember 30, 2000. Norway currently has the highest ISDN penetration rates in the world. In 1999,we sold over 272,000 new ISDN subscriptions. We launched ISDN text in December 1999, whichallows customers to send text messages between specially-equipped ISDN phones and mobilephones.
Value-Added Services. We offer a broad range of value-added services on a subscription orusage basis. Our subscription-based services, for which we charge a monthly fee of NOK 23
119
BOWNE OF LONDON 12/01/2000 19:56 BL/SM NO MARKS NEXT PCN: 126.00.00.00 -- Page is valid, no graphics X42481 125.00.00.00 5X
(including VAT) each, include caller identification, call waiting, voice mail and remote call diversion.Our usage-based services, for which we charge a per-minute fee of up to NOK 3 (including VAT) perusage, include a ‘‘call back when occupied’’ service, three-party conference calling and internationalcalling card service.
Payphones. We provide public payphones at locations throughout Norway and atSeptember 30, 2000 we operated approximately 20,000 payphones. The use of payphones hasdeclined in recent years as a result of the increased use of mobile phones. At the end of 1999, weintroduced a combination payphone that can accept coins, phone cards and credit cards. We arerequired to provide public payphones as part of the universal service obligation in our license.
ADSL (Broadband Services) Access. We expect to launch, as part of a joint project with theInternet business area, ADSL services for the residential market in December 2000. We believe thatthe use of ADSL will result in greater utilization and demand for functionality by customers. Weexpect that the increased focus on ADSL will enable us to provide integrated services of higherquality than we are able to offer today. We intend to offer ADSL as an extension or upgrade of ourcustomers’ analog or ISDN subscriptions, providing higher speed voice and data capabilities thantheir current analog/ISDN voice services. We intend to offer ADSL initially on a fixed price basis. Wecurrently expect to price the ADSL services we offer to the residential market between NOK 450 toNOK 820 per month (including value-added tax), depending upon the capacity provided. This fee willbe in addition to the monthly fee we currently charge for our ISDN and PSTN services.
Portals and Content. We expect the use of ADSL service in the residential market to result in adramatic change in the use of the Internet and other data services by consumers. To take advantageof this expected growth, we intend to focus on introducing new content-based services, which wecan market with our ADSL subscription service. Pursuant to a joint project, with the Internetbusiness area, we plan to develop portal and content services. We intend to form strategic alliancesand partnerships with third parties to further develop our content services. We plan to initially launchcontent comprising film, news, games, travel, music and other entertainment concepts, with anemphasis on the use of videostreaming technology.
We took an initial step in the development of content portals for the consumer market with ourSmartPhone service. SmartPhone is the world’s first ISDN-based web screen telephone service,which we launched in March 2000.
Other Initiatives. We have established a project team to develop services involving theconvergence of fixed network and mobile services. We launched our first service, a combined fixedand mobile voice mail service called ‘‘InTouch’’, in March 2000. This service provides a call diversionservice from a fixed line number to a mobile number at special traffic rates. We also expect tointroduce further security measures using SIM cards to ensure safe payment over fixed lines.
120
BOWNE OF LONDON 12/01/2000 19:56 BL/SM NO MARKS NEXT PCN: 127.00.00.00 -- Page is valid, no graphics X42481 126.00.00.00 6X
Fees and Tariffs
We have made fundamental structural price changes, and have aggressively reduced our pricesto remain competitive. Our tariffs are currently among the lowest in the OECD countries. Thefollowing table sets forth our historical price levels, excluding value-added tax, in the residentialmarket at the dates indicated.
December 31, September 30,1997 1998 1999 2000
(NOK)
National calls:Call initiation fee************************************ 0.325 0.325 0.366 0.398Traffic tariffs per minute:Local call (peak)************************************ 0.200 0.200 0.179 0.179Local call (off-peak) ********************************* 0.110 0.110 0.114 0.114Long distance (peak)******************************** 0.490 0.390 0.179 0.179Long distance (off-peak)***************************** 0.410 0.330 0.114 0.114Internet (810-numbers) (peak)(1) ********************* — — — 0.155Internet (810-numbers) (off-peak)(2) ****************** — — — 0.114Fixed to Telenor Mobile****************************** 1.95 1.50 1.37 1.163Fixed to external mobile networks ******************** 2.37 1.67 1.52 1.52International calls:Call initiation fee************************************ 0.325 0.325 0.366 0.398Per minute(3)*************************************** Varies with call destination
(1) Except for Internet calls, peak rates apply to calls made Monday to Friday between the hours of08:00 and 17:00. Off-peak rates apply to calls made at all other times. For Internet calls (810-numbers), peak rates apply to calls made Monday to Friday between the hours of 08:00 and15:00, and off-peak rates apply to calls made at all other times.
(2) A separate Internet tariff was introduced first quarter 2000.
(3) Tariffs on international calls are related to bilateral agreements with each network at eachdestination. The tariffs (NOK per minute) for calls to the five most frequently called countries (inranking order, as of September 30) are: Sweden (fixed) (NOK 0.50); Sweden (mobile)(NOK 2.85); Great Britain (fixed) (NOK 0.59); Great Britain (mobile) (NOK 2.85); Denmark(fixed) (NOK 0.63); Denmark (mobile) (NOK 2.03); Germany (fixed) (NOK 0.63); Germany(mobile) (NOK 2.03); USA (fixed) (NOK 0.74) and USA (mobile) (NOK 2.24).
We currently charge an initial fee of NOK 750 (including value-added tax) to install an analog orISDN access line. We currently charge a monthly subscription fee of NOK 149 (including value-added tax) for analog access and NOK 219 (including value-added tax) for basic rate ISDN access.
We currently offer competitive discounts with our Familie & Venner (family and friends)programs. For an additional monthly fee of NOK 10 each (including value-added tax), our ‘‘Norway’’plan offers up to a 20% discount on traffic fees for off-peak calls, our ‘‘Mobile’’ plan offers up to a20% discount on the three most called numbers to Telenor Mobile, our ‘‘International’’ plan offers upto a 20% discount on the five most called international numbers and our ‘‘Internet’’ plan offers adiscount of between 22-30% on calls to Internet-service providers based on Internet traffic. We alsomake available the ‘‘Total’’ discount plan for no monthly fee, which provides a discount of between 8-20% on all traffic, which is targeted and promoted to the largest residential customers and excludesall other Familie & Venner plan numbers. In addition, ‘‘Favoritt land’’ provides a 20% discount oncalls from a customer’s home phone to their favorite country for an additional fee of NOK 10 percountry.
121
BOWNE OF LONDON 12/01/2000 19:56 BL/SM NO MARKS NEXT PCN: 128.00.00.00 -- Page is valid, no graphics X42481 127.00.00.00 5X
Traffic
The following table sets forth information on minutes of traffic generated by residential analogand ISDN subscribers for each year in the three-year period ended December 31, 1999 and thenine months ended September 30, 1999 and 2000.
Nine monthsended Increase (decrease)
Year ended December 31, September 30, 9 mo 2000/1997 1998 1999 1999 2000 1998/1997 1999/1998 9 mo 1999
% % %
Traffic (millions of minutes):National calls, excluding Internet traffic(1) **** 7,969 8,435 7,898 5,867 5,528 5.8 (6.4) (5.8)Internet traffic(2)*************************** 856 1,542 3,143 2,201 3,087 80.1 103.8 40.3Calls to mobile phones********************* 393 549 746 555 582 39.7 35.9 4.9International ****************************** 198 207 221 164 160 4.5 6.8 (2.4)Other ************************************ 92 157 271 189 296 70.7 72.6 56.6
Total *************************************** 9,508 10,890 12,279 8,976 9,653 14.5 12.8 7.5Market share (based on minutes):
Total residential *************************** 100% 98% 93% 95% 79% — — —
(1) As of July 1, 1999, we eliminated national long-distance fixed-line rates, and now all calls withinNorway are billed under local rates.
(2) Estimated. Internet traffic is considered local area calls.
Distribution and Marketing
Our services are currently distributed to the residential market through several distributionchannels. Our customer service center receives orders by telephone and handles the largest portionof sales. We also engage in outbound telemarketing and sales activities using a call center, withapproximately 100 sales representatives. Several account managers are dedicated to bulk sales,primarily to housing associations. We also use retail stores as sales agents, with approximately1,200 retail locations including large and small retail chains. The distribution agents receive acommission on each subscription sold. In July 2000, we launched a new version of our self-servicechannel on our internet home page, where customers can get an overview of the current status oftheir subscription, order additional services including ISDN and review their bills. As a part of thenew service, we have started a pilot electronic billing program for customers.
Our marketing activities include television and newspaper/magazine advertising, telemarketing,radio, Internet, events, billboards and direct mail. In May 2000, we initiated a customer ‘‘win-back’’program using our call centers in which sales representatives contact former customers to informthem of our tariff reductions and encourage them to re-establish their subscription.
To promote customer satisfaction, we are making significant investments in data mining andcustomer behavior modeling technology. This technology will give us the capability to instantlyanalyze the demographics and behavior of our entire customer base, identifying customer segmentswith requested similarities and predicting customer segment behavior. We plan to apply these toolsto help avoid churn in our subscriber base, as well as in targeting and customizing our residentialmarket customer communications.
We believe our customer relationship management initiatives will make our marketing effortsmore effective. The principle objectives of our customer relationship management initiative in theresidential market segment include providing full and responsive service through dedicated callcenters, cost effectiveness and improved customer satisfaction. We strive to provide our customerswith a one stop contact center that is equipped to sell our full range of products and services,answer questions and solve problems, while recognizing the individuality of each customer. We
122
BOWNE OF LONDON 12/01/2000 19:56 BL/SM NO MARKS NEXT PCN: 129.00.00.00 -- Page is valid, no graphics X42481 128.00.00.00 5X
intend to continue to offer products that are easy to buy and use. We attempt to be proactive inidentifying and resolving faults and problems and in developing new products and services.
Business Market
We are the leading provider of telecommunications services to the business market in Norway.Our objective is to provide our business customers with innovative communications services. Similarto our objectives in the residential market, we are seeking to develop and manage long-termcustomer relationships with our business customers. Our business market currently consists of over40,000 medium-sized and large business customers and 125,000 small business customers.
Services
Basic network services. The principal products offered to our business customers are basicnetwork services. These include analog, ISDN basic rate access and ISDN primary rate access, amore advanced line that provides for 30 access channels. As of September 30, 2000, we hadapproximately 610,000 telephone subscriptions in the business market and 42% of our businesscustomers have an ISDN connection.
Our prices for analog and ISDN access subscriptions and call initiation and traffic charges forthe business market are the same as set forth above for the residential market, except that we offerbusinesses discounts from the basic traffic charges based on the volume of traffic. We offer threelevels of discount plans, for customers with annual traffic spending of up to NOK 100,000, betweenNOK 100,000 and NOK 2 million, and over NOK 2 million. The plans provide discounts ranging from10-33% on selected call types. Our ‘‘Telenor Mest Ringte’’ plan for the small business segment for amonthly fee of NOK 10 (including value-added tax) provides a 15% discount on the ten mostfrequently called numbers at any time, excluding fixed to external mobile network calls.
Leased Lines. We also provide leased lines to businesses throughout Norway. Under theuniversal service obligation in our fixed telephony license, we must offer leased lines with a capacityof 64 Kbps up to 2 Mbps (million bits per second) on equal terms to everyone in the market.Competitors have been permitted to offer leased lines since January 1, 1998, and competition hasincreased rapidly in 1999 and 2000. Demand for leased lines has generally increased, andcustomers are migrating from analog lines to digital lines and to higher capacity lines. However, theshift to digital technology and competitive pressure has led to decreases in prices. In 1999 the pricesfor digital leased lines larger than 64 Kbps were reduced by 5-25% compared with 1998, and afurther reduction of 25% was made at the beginning of 2000 on certain digital leased lines. We donot expect revenue from leased lines to increase significantly.
ADSL. We launched ADSL service to the business market in June 1999. As of September 30,2000, we had approximately 350 subscribers. For end-users, we offer a bundled ADSL and Internetaccess service through Nextra. With four levels of service, ranging from 394 Kbps to 2,048 Kbpsdownstream data capacity and 256 Kpbs to 448 Kbps upstream data capacity.
Data communications. We currently offer both low-speed and high-speed data communicationsservices based on a variety of technological platforms. In addition to traditional packet switched datatransmission services based on X.25 protocols, we offer data transmission services based on framerelay and ATM technologies.
Our low speed data communication services include:
) X.25 — a low speed packet-switched data service, primarily used for on-line gambling servicesand point of sale transactions;
) Electronic funds transfer at point of sale, referred to as EFTPOS — a simple and securepayment service;
) Mia S. — an ISDN-based service that provides customized real time data, telephony andtelefax on the same line; and
123
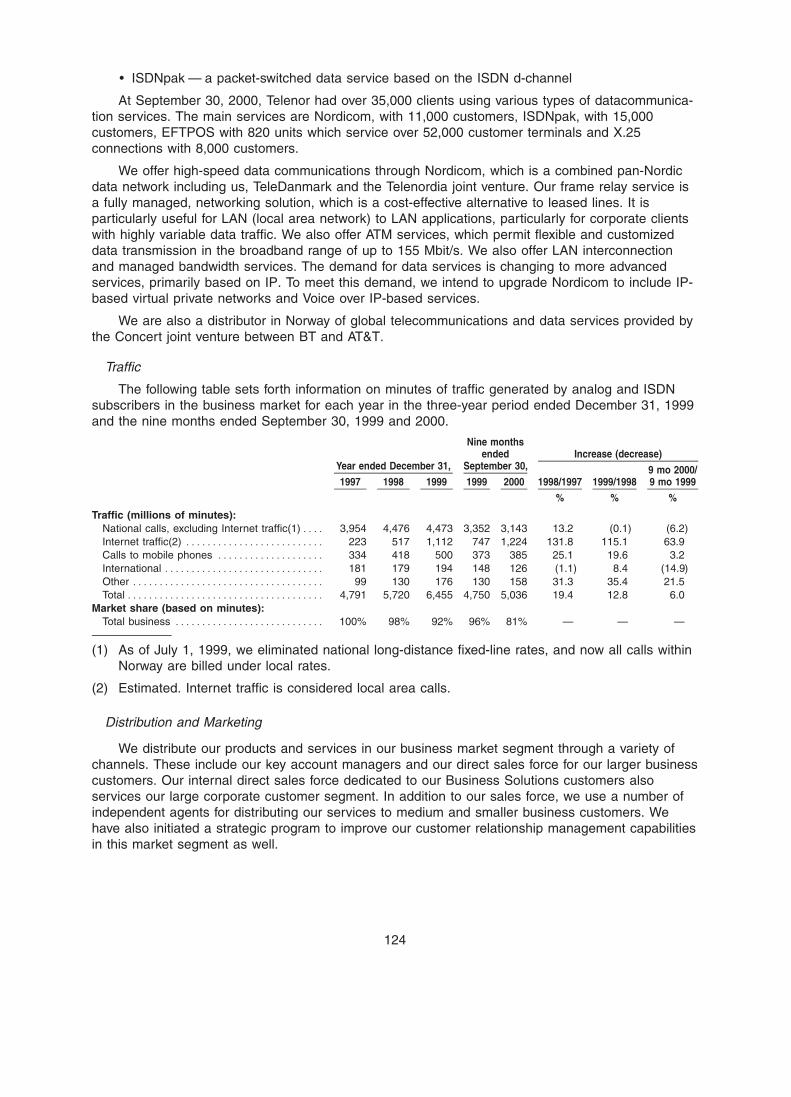
BOWNE OF LONDON 12/01/2000 19:56 BL/SM NO MARKS NEXT PCN: 130.00.00.00 -- Page is valid, no graphics X42481 129.00.00.00 5X
) ISDNpak — a packet-switched data service based on the ISDN d-channel
At September 30, 2000, Telenor had over 35,000 clients using various types of datacommunica-tion services. The main services are Nordicom, with 11,000 customers, ISDNpak, with 15,000customers, EFTPOS with 820 units which service over 52,000 customer terminals and X.25connections with 8,000 customers.
We offer high-speed data communications through Nordicom, which is a combined pan-Nordicdata network including us, TeleDanmark and the Telenordia joint venture. Our frame relay service isa fully managed, networking solution, which is a cost-effective alternative to leased lines. It isparticularly useful for LAN (local area network) to LAN applications, particularly for corporate clientswith highly variable data traffic. We also offer ATM services, which permit flexible and customizeddata transmission in the broadband range of up to 155 Mbit/s. We also offer LAN interconnectionand managed bandwidth services. The demand for data services is changing to more advancedservices, primarily based on IP. To meet this demand, we intend to upgrade Nordicom to include IP-based virtual private networks and Voice over IP-based services.
We are also a distributor in Norway of global telecommunications and data services provided bythe Concert joint venture between BT and AT&T.
Traffic
The following table sets forth information on minutes of traffic generated by analog and ISDNsubscribers in the business market for each year in the three-year period ended December 31, 1999and the nine months ended September 30, 1999 and 2000.
Nine monthsended Increase (decrease)
Year ended December 31, September 30, 9 mo 2000/1997 1998 1999 1999 2000 1998/1997 1999/1998 9 mo 1999
% % %
Traffic (millions of minutes):National calls, excluding Internet traffic(1)**** 3,954 4,476 4,473 3,352 3,143 13.2 (0.1) (6.2)Internet traffic(2) ************************** 223 517 1,112 747 1,224 131.8 115.1 63.9Calls to mobile phones ******************** 334 418 500 373 385 25.1 19.6 3.2International ****************************** 181 179 194 148 126 (1.1) 8.4 (14.9)Other ************************************ 99 130 176 130 158 31.3 35.4 21.5Total ************************************* 4,791 5,720 6,455 4,750 5,036 19.4 12.8 6.0
Market share (based on minutes):Total business **************************** 100% 98% 92% 96% 81% — — —
(1) As of July 1, 1999, we eliminated national long-distance fixed-line rates, and now all calls withinNorway are billed under local rates.
(2) Estimated. Internet traffic is considered local area calls.
Distribution and Marketing
We distribute our products and services in our business market segment through a variety ofchannels. These include our key account managers and our direct sales force for our larger businesscustomers. Our internal direct sales force dedicated to our Business Solutions customers alsoservices our large corporate customer segment. In addition to our sales force, we use a number ofindependent agents for distributing our services to medium and smaller business customers. Wehave also initiated a strategic program to improve our customer relationship management capabilitiesin this market segment as well.
124
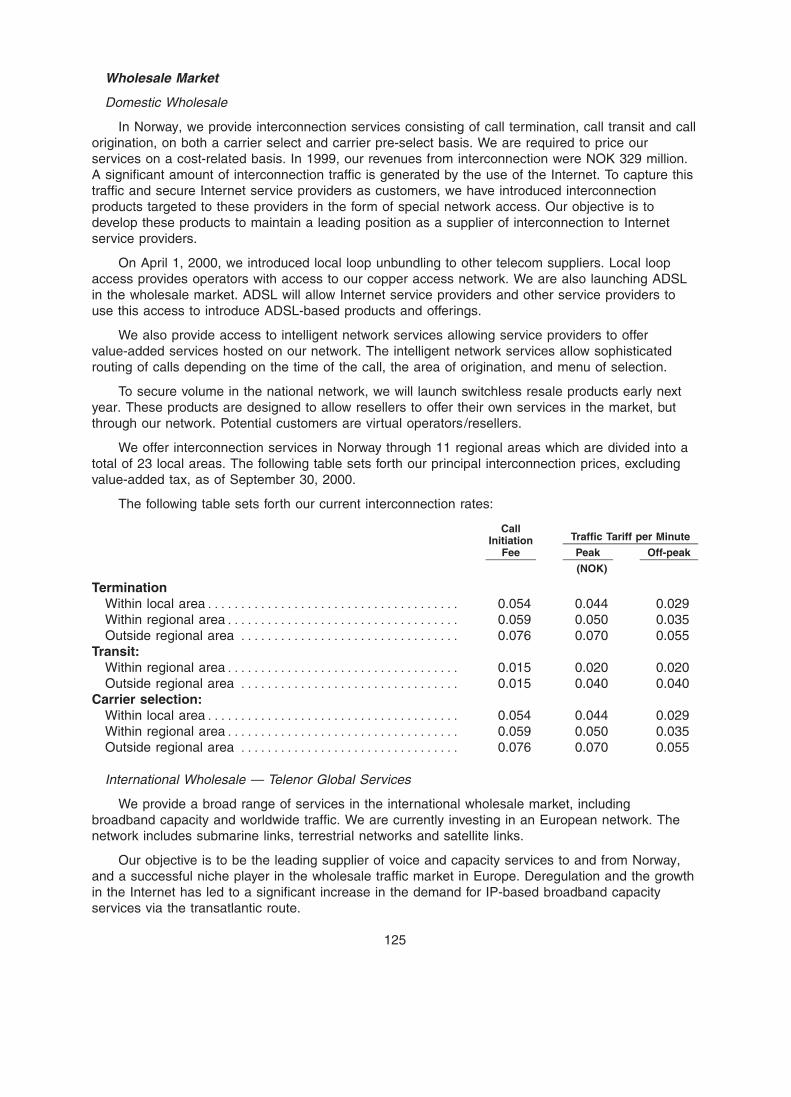
BOWNE OF LONDON 12/01/2000 19:56 BL/SM NO MARKS NEXT PCN: 131.00.00.00 -- Page is valid, no graphics X42481 130.00.00.00 5X
Wholesale Market
Domestic Wholesale
In Norway, we provide interconnection services consisting of call termination, call transit and callorigination, on both a carrier select and carrier pre-select basis. We are required to price ourservices on a cost-related basis. In 1999, our revenues from interconnection were NOK 329 million.A significant amount of interconnection traffic is generated by the use of the Internet. To capture thistraffic and secure Internet service providers as customers, we have introduced interconnectionproducts targeted to these providers in the form of special network access. Our objective is todevelop these products to maintain a leading position as a supplier of interconnection to Internetservice providers.
On April 1, 2000, we introduced local loop unbundling to other telecom suppliers. Local loopaccess provides operators with access to our copper access network. We are also launching ADSLin the wholesale market. ADSL will allow Internet service providers and other service providers touse this access to introduce ADSL-based products and offerings.
We also provide access to intelligent network services allowing service providers to offervalue-added services hosted on our network. The intelligent network services allow sophisticatedrouting of calls depending on the time of the call, the area of origination, and menu of selection.
To secure volume in the national network, we will launch switchless resale products early nextyear. These products are designed to allow resellers to offer their own services in the market, butthrough our network. Potential customers are virtual operators/resellers.
We offer interconnection services in Norway through 11 regional areas which are divided into atotal of 23 local areas. The following table sets forth our principal interconnection prices, excludingvalue-added tax, as of September 30, 2000.
The following table sets forth our current interconnection rates:
CallTraffic Tariff per MinuteInitiation
Fee Peak Off-peak
(NOK)
TerminationWithin local area************************************** 0.054 0.044 0.029Within regional area*********************************** 0.059 0.050 0.035Outside regional area ********************************* 0.076 0.070 0.055
Transit:Within regional area*********************************** 0.015 0.020 0.020Outside regional area ********************************* 0.015 0.040 0.040
Carrier selection:Within local area************************************** 0.054 0.044 0.029Within regional area*********************************** 0.059 0.050 0.035Outside regional area ********************************* 0.076 0.070 0.055
International Wholesale — Telenor Global Services
We provide a broad range of services in the international wholesale market, includingbroadband capacity and worldwide traffic. We are currently investing in an European network. Thenetwork includes submarine links, terrestrial networks and satellite links.
Our objective is to be the leading supplier of voice and capacity services to and from Norway,and a successful niche player in the wholesale traffic market in Europe. Deregulation and the growthin the Internet has led to a significant increase in the demand for IP-based broadband capacityservices via the transatlantic route.
125
BOWNE OF LONDON 12/01/2000 19:56 BL/SM NO MARKS NEXT PCN: 132.00.00.00 -- Page is valid, no graphics X42481 131.00.00.00 5X
International Direct Dialing. We offer inbound call termination for international traffic terminatingin our network. We receive payments from other carriers under a system of settlementarrangements. This business also purchases termination services from foreign carriers for outboundinternational traffic originating in our networks. We also provide wholesale services for traffic that istransited through our network, both switched traffic that is subject to the international settlementarrangements system and non-traditional transit traffic sold in the carrier-to-carrier market at apredetermined price. Our wholesale voice traffic services utilize state-of-the-art traffic managementsystems.
Leased Capacity Services. We offer leased capacity services which provide fixed anddedicated connections. Lease lines are available in both analog and digital interfaces and withdifferent capacities. We deliver these services within Norway through our own telecom network andin most other countries in the world in cooperation with reputable operators.
These services are well suited to users that generate a lot of traffic between fixed locations, forinstance, connections between different LANs or PBXs. Leased lines are also a basic element in theproduction of other service such as mobile phone and point of sale terminals.
Competition
We are currently facing increased competition in each of our market segments. In the residentialmarket, we compete primarily with Tele2 Norway, UPC Norway and Enitel. In the business market,we face competition from Tele2 Norway, Enitel, ElTele, UPC Norway and Tele1 Europe. We competeprimarily on the basis of price and are experiencing significant price pressure as new competitorsenter the market. We believe that competition for fixed telephony services will increasingly be basedon price.
Our most aggressive competitor in the residential market, Tele2 Norway offers fixed telephonyand Internet services and launched mobile services this year. UPC Norway is a subsidiary of UPC ofthe Netherlands and is one of the largest cable television companies in Norway. UPC Norway offersa bundled package of cable television, Internet access and fixed voice telephony. UPC Norway hasrecently launched fixed telephony and Internet services for the business market.
The competition in the business market is most significant in the central industrial regions ofNorway where Enitel, ElTele and Tele1 Europe are investing in new network infrastructures. In theseregions, Enitel, ElTele, Tele1 Europe and Tele2 are challenging Telenor with competitive offerings offixed line access, leased lines, broadband and datacommunication services. These companies areincreasingly offering bundled fixed line and mobile services. In addition to the major competitors, weface competition from a large number of focused local or niche providers specialized in smallermarket segments of both the residential and the business market. In the business market, theseniche players still represent a relatively small market share.
For the roll out of ADSL services to the residential market, we expect competition from anumber of new access and service providers. Bredbandsfabrikken, a subsidiary of the Swedishcompany Bredbandsbolaget (B2), is planning a large scale roll out of LAN/Ethernet infrastructure inthe highly populated areas surrounding Oslo. B2’s combined broadband and IP-based telephonyservices offering may increase competition, particularly in the housing associations market.
We also expect to face increased competition in access following the recent assignment ofwireless broadband access licenses by the PT. Using wireless access, operators can providetelecommunications connections to customers without having to use our fixed-line local loop. Inaddition to us, Tele2 Norway and NBBL/OBOS won 40 GHz wireless local loop licenses. ElTele andtwo U.S. companies, Formus and BroadNet, have been granted 26 GHz wireless local loop licenses.Tele1 Europe has purchased ElTele Rogaland, and UPC has purchased ElTele Østfold/Vestfold andtheir license in the area.
126
BOWNE OF LONDON 12/01/2000 19:56 BL/SM NO MARKS NEXT PCN: 133.00.00.00 -- Page is valid, no graphics X42481 132.00.00.00 5X
Network Operations
Domestic Infrastructure
Our domestic network is one of the most technologically advanced fixed-line networks in theworld, and supports our residential, business and wholesale service offerings, as well as providingservices to other Telenor business areas. We were one of the first national operators in the world tofully digitize our network, which was completed at the end of 1997.
Trunk Transmission Network. Our national trunk transmission network is comprised of nationaland regional network layers that are in turn connected to our local access network. The nationalnetwork uses a chained ring formation with 14 nodes, or connection or switching points, and 9chained ring structures. The trunk network includes two international switching exchanges.
In September 2000 we completed the restructuring of our national backbone network from amesh and point-to-point topology to a ring topology using synchronous digital hierarchy equipmenton fiber optic cables. Synchronous digital hierarchy provides faster and less expensive networkinterconnection than the traditional PDH technology. PDH is the conventional multiplexing technologyfor network transmission systems. We are installing a similar structure based on similar technologyfor the regional backbone network and it is expected to be completed in May 2001.
Our national network is nearly 100% based on optical dense wavelength division multiplexing.Dense wavelength division multiplexing is a transmission technology in which up to 200 opticalsignals are transmitted through the same fiber. We use systems based on this technology with 8 to16 optical channels at 2.5 Gbps (billion bits per second). New dense wavelength division multiplexingsystems will be prepared for 32 optical channels each with a capacity of either 2.5 or 10 Gbps. Thenational network is prepared to be the carrier for any transmission technology used on a higherlayer. This may include synchronous digital hierarchy, asynchronous transfer mode, or ATM, or IPtechnology.
Our regional network layer is comprised of 169 installed connection or switching points in 39ring structures out of a total of 72 planned ring structures. We expect to complete the remaining ringstructures over a period of 2-3 years. The implementation of ring topology in the regional networkimproves the quality of service of the network.
Access Network. Our local access network connects 4,000 digital telephony switches andconcentrators to virtually all homes and businesses in Norway. The network currently includesapproximately 5.8 million kilometers of installed twisted pair copper wire. At December 31, 1999, theaccess network connected 1,908,000 analog and 528,000 ISDN access lines and 39,000 analog and34,000 digital leased lines.
Subscribers are connected to the network through approximately 50 combined tandem andsubscriber exchanges, 150 subscriber exchanges and 3500 concentrators.
In larger cities in Norway, we also provide optical fiber connections directly to larger business,university and municipal locations.
We have made heavy investments in increasing ISDN capacity. Over 96% of our customers areable to have installed ISDN lines. The access network is well-positioned for the roll out of ADSLbroadband access services as a result of the investment in increased capacity made as a part ofexpanding the ISDN coverage of the network.
In April 2000, we were awarded a 40 GHz wireless local loop license.
Data Communications Networks. We operate switched digital networks supporting our datacommunications services. Our broadband Nordicom network in Norway includes nodes throughoutthe country with ATM connections to five countries and Frame Relay connections globally via theConcert alliance. The Nordicom network permits customers to transfer data at rates from 64Kbps to155Mbps. Our dedicated X.25 network consists of approximately 500 transit nodes, to which
127
BOWNE OF LONDON 12/01/2000 19:56 BL/SM NO MARKS NEXT PCN: 134.00.00.00 -- Page is valid, no graphics X42481 133.00.00.00 5X
Datapak customers’ terminals are connected. Our ISDNpak customers access X.25 packet-switchingservices through their ISDN lines.
International Infrastructure
We offer an international wholesale network in the Nordic region between Oslo, Stockholm andCopenhagen. Our network capacity is one wavelength and is upgradeable.
We are in the process of expanding our international wholesale network. In 2000, we willexpand from our switch in Oslo to include points of presence and offices in Amsterdam, New York,London, Copenhagen and Frankfurt. By the end of 2002 we plan to have 15 offices, 12 points ofpresence and switches internationally, principally in Europe.
Transatlantic Submarine Cable. As of September 30, 2000, we have invested approximatelyNOK 330 million in the new transatlantic submarine cable, TAT-14. In accordance with the TAT-14Construction and Maintenance Agreement, we have a 3.5% interest in the TAT-14 transatlanticsubmarine cable. This agreement extends for the lifetime of the cable system. The TAT-14 cable willprovide connection between five cable stations in Europe and two in the North America. Plannedservice launch is currently scheduled for December 2000. The cable network will provide total cablecapacity of 640 Gbit/s (billion bits per second) on four fiber pairs.
Business Solutions
Overview
We provide a broad range of business solutions consisting of advanced network services andapplication service provisioning, or ASP, services, supported by systems integration, consulting ande-business services as well as consumer premises equipment. Our information technology servicesfor businesses are generally provided to larger and small to medium-sized businesses and publicsector entities in Norway as well as other Nordic countries. We believe that our system integrations,e-commerce and ASP are among the best and most innovative in the Nordic marketplace. Weperform complex implementations and deliver cost efficient operations, based on a unique mix oftelecommunication experience and information technology competence. We intend to focus our IT-based services for businesses in Norway on ASP products and advanced network services inresponse to the growing ASP market.
We compete in the market for business solutions on the basis of several factors. These includeour expertise and competence, our pricing structure, the breadth of our products and services, thetechnological advancement and functionality of our solutions, the quality of our customer service andthe reliability and security of our products.
Strategy
Our objective is to further develop our leading position as a provider of IT services tobusinesses in the Nordic market. We currently intend to selectively pursue partnerships, acquisitionor alliance opportunities to target the small to medium-sized enterprise segment in the Nordic region.We expect that the European ASP market will continue to grow to become a substantial element ofthe telecom and IT industry in the coming years. We intend to achieve this strategy by leveraging ourcore competencies, which include:
) our ability to develop and implement concepts for ASP and managed services;
) our ability to integrate and bundle communication products, fixed as well as mobile, withtraditional information technology; and
) our ability to sell and implement large and complex outsourcing contracts.
128
BOWNE OF LONDON 12/01/2000 19:56 BL/SM NO MARKS NEXT PCN: 135.00.00.00 -- Page is valid, no graphics X42481 134.00.00.00 5X
Products and Services
Our advanced business services are categorized into the following three categories:
) ASP and Managed Services — including integrated IT services, outsourcing and systemsintegration and consulting.
) Network Based Activities — including value-added network services and e-commercesolutions for business customers.
) Sale of Equipment.
ASP and Managed Services
We offer a broad portfolio of application service provisioning and managed services to large andsmall to medium-sized businesses in the Norwegian market. ASP services permit small to medium-sized businesses and larger companies to outsource their IT resources and infrastructure. Our ASPservices provide cost efficient IT support and helpdesk functions at a fixed price for a package ofservices. These services may include communications, change management, workstation manage-ment, version control, standardized integration and office support.
In addition to traditional ASP services, we also offer more advanced ASP services, includingnetwork access, integration services, outsourcing/facility management, service provisioning withvalue-added services and related services based on information communications technology, whichallows for the bundling of data and speech services. The integration services we offer includedetailed design, implementation and management services to link applications and products to eachother or with existing/planned IT infrastructure.
We believe that demand for ASP services will provide us with the opportunity to expand ouroperations in the Nordic region. We intend to pursue this opportunity through acquisitions, alliancesand partnerships, in addition to internal growth. In the third quarter of 2000, we acquired 75% ofEurocom Holding Aps, a Danish company, as a part of our Nordic strategy. Eurocom Holding Apshas a base of approximately 125,000 end-users within the IT-support product area. Combining thiscustomer base with our existing ASP business may allow us to strengthen our revenues and mayprovide further possibilities for adding additional product lines.
In the third quarter of 2000 we renegotiated a license agreement with Computer Associates.The license agreement has a seven year term from June 30, 2000. Under the agreement, BusinessSolutions has responsibility for five of Computer Associate’s strategic customers and access to itsNordic strategic partners.
An example of the managed services we offer to our customers can be illustrated through theVesta project. In this project we managed and operated both information technology andtelecommunications services for Vesta Insurance Company in January 2000. We currently have athree year outsourcing agreement with Vesta to provide telecommunications and data communica-tions services, all information technology support systems and all help-desk and service functions forthe entire Vesta organization in Norway.
We market the following branded products and services:
Login. We launched Telenor Login at the end of 1999, primarily targeting the ASP market. Withthis service, customers’ software and data is stored on central servers in our secure undergroundfacility. Users will subscribe to a screen display and computing power through a variety of telecomconnection possibilities. We have entered into several strategic contracts for the distribution ofsoftware through our Login service, including an exclusive contract to lease a completeWindows 2000 based work area with MS Office 2000. Based on our number of connection points,we believe we are a major ASP provider in Norway by the end of 2000. As of September 30, 2000,the ASP-division has 2,214 login-seats.
129
BOWNE OF LONDON 12/01/2000 19:56 BL/SM NO MARKS NEXT PCN: 136.00.00.00 -- Page is valid, no graphics X42481 135.00.00.00 5X
Holos. Holos is our outsourcing and managed service concept, with which we are targeting thehigh-end, medium-sized business sector. Holos is designed to provide the following services:managed information technology and communications services; business support; distributedenterprise management projects and information technology and applications support, including call-center and customer relations management.
Outsourcing. We offer communications services to our target businesses and the public sector inthe Norway. We seek to use our competence and promote the advanced use of information andcommunication technology to bundle telecommunications services, including ASP and managedservices. IP-based services, e-commerce services and systems integration. We market theseproducts on the basis that these bundled services contribute to and promote the competitive positionof our customers.
We typically provide our services pursuant to long-term contracts with an average duration ofthree years. Typically these contracts are awarded through competitive bidding, and in recent yearswe have achieved a very high success rate in very large contracts. We believe that the award ofthese contracts provides us with a platform to develop longer-term contracts and stronger customerrelationships. In 1999, we were awarded several large contracts in which basic telecommunicationsservices were only a small part of the total contract. The majority of the new contacts awarded in1999 were for bundled IT and communications services.
A recent example of our provision of comprehensive business services is our project with SAS,the leading Scandinavian airline. We were given overall responsibility for a new integrated voice anddata system by SAS, in mid 1999. The system consists of a sophisticated telecom and data solutionin which SAS’s office in Norway, Sweden and Denmark are integrated into a single system. We haveprimary responsibility for the preparation, installation and operation management of the voice anddata solutions. We are operating the system under a contract extending until 2002.
Systems Integration and Consulting. We offer systems integration and consulting services toour target customers in the Nordic region. We believe that we provide our customers with a uniquemix of telecommunications and IT competence as well as the ability to design innovative solutions,perform complex implementations and cost efficient operations.
Network Based Activities. Business Solutions offers high end customers a portfolio of telephonyspeech services which offer basic functionality together with advanced routing and service access.The portfolio incorporates customer contact services as well as interactive services such asinteractive voice response and short text message and world-wide web services. The customercontact services consist of virtual call center solutions, traffic routing and toll-free numbers amongothers. Standard services or customer-specific services are available. We also offer virtual privatenetwork functionality to the business market, with fixed-mobile conversion.
E-business Solutions. We believe we are a leading provider of solutions to businesses in theNorwegian market that conduct transactions from the Internet which we refer to as e-business ore-commerce. Our objective is to provide a transaction platform that offers integration and consultingservices in the e-business marketplace. We offer a broad range of e-commerce solutions, including:
) an Internet-based procurement solution for our clients in the shipping sector;
) a Java-based procurement solution for our clients in the grocery retail sector;
) solutions for secure electronic data interchange and electronic mail;
) software solutions used in reporting over the Internet by Norwegian businesses to theinternal revenue service, the central bureau of statistics and the central register;
) solutions to ensure a secure environment for e-commerce on the Internet; and
) concepts and solutions for learning and knowledge management over the Internet.
130
BOWNE OF LONDON 12/03/2000 10:03 BL/SM NO MARKS NEXT PCN: 137.00.00.00 -- Page is valid, no graphics X42481 136.00.00.00 6X
Sale of Equipment
We offer customer premises equipment in close partnership with the leading manufacturers inthe world covering the complete range of data, Internet, voice and video solutions. We serveenterprises and small to medium-sized businesses throughout the Norwegian market.
In January 2000, due to significant loss from equipment activities, we initiated a restructuringplan for our customer premises equipment unit of our business, which includes a reduction of ourworkforce and implementation of efficiency improvements for purchasing, logistics and productfunctions. The costs relating to restructuring are approximately NOK 25 million, which was expensedin the first quarter of 2000.
Customers are demanding more complex solutions and Business Solutions and EDB ASA willform a unit to focus on these concerns. The new company will focus on large and medium sizedcompanies. The company will be able to combine data, video and telephony expertise. The newcompany will have a wide geographical reach in Norway. The CPS unit in Business Solutions is amajor systems integrator in the information and communications market, and has responsibility forTelenor’s large and medium sized companies.
EDB Intech AS, currently a 100% owned company of EDB Business Partner ASA, is a leadingsystem integrator with a focus on infrastructure services, communication services and managementof distributed solutions. From January 2001 the CPS unit will merge with EDB Intech with theresulting company being owned 50% by Business Solutions and 50% by EDB Business PartnerASA.
Marketing
We target our larger customers, the top 2,000 accounts in the business market, through ourdedicated sales force of 100 sales representatives in Norway who also serve our Telecom solutionsbusiness customers. Half of this sales force is dedicated to the sale of equipment. We target ourbusiness segment through indirect sales channels, including other business units within Telenor.
Competition
We compete in the market for business solutions with other major telecommunications andIT companies as well as smaller systems integrators and consultants. Within the ASP market, weface competition from a number of small competitors, each with slightly different solutions andproduct focus (e.g., application, networks, services and hardware). In the Norwegian market, wecompete with Client Computing, Intellnet, Metacess, Network Computing and Telecomputing. In oure-business solutions, our primary competitors are IBM, Posten/SDS and GEIS. In addition to thesetraditional competitors, we also compete with major business consultants, including AndersenConsulting, PricewaterhouseCoopers and Cap Gemini.
Broadband Services
Overview
We are the largest provider of analog and digital TV services in the Nordic region. We are alsoone of the world’s largest providers of satellite mobile communications and the largest individualshareholder of the INMARSAT satellite organization. In addition we are a provider of satellitenetworks and services based on very small aperture terminal, or VSAT, technology in selectedmarkets in Europe and Africa. We intend to use our leading position to develop and providebroadband access and services that stimulate and meet the rapidly increasing demand for theseservices.
131
BOWNE OF LONDON 12/01/2000 19:56 BL/SM NO MARKS NEXT PCN: 138.00.00.00 -- Page is valid, no graphics X42481 137.00.00.00 5X
Our Broadband Services business area comprises our activities in television distribution and theprovision of related value-added services through satellite, cable and terrestrial transmission, as wellas in satellite services generally. Satellite, cable and terrestrial broadcasting technologies allow thetransmission of information at larger bandwidths than are generally available with fixed or wirelesstelecommunications or Internet protocol, or IP-based technologies. These technologies currently arenot able to transmit high quality, live video programming. Furthermore, the ongoing conversion of ourservices to digital transmission provides a much greater transmission capacity and makes possiblethe introduction of advanced interactive services. In 1999, our Broadband Services business areagenerated revenues of NOK 2.8 billion.
Our Broadband Services business area includes the following business lines:
Broadcasting. Based on number of subscribers, we are the largest provider of televisionservices to consumers in the Nordic region, and we believe we are the largest provider of cabletelevision in Norway. We are also the largest reseller of television channels and services to smallantenna networks, or SMATV systems, and to hotels in the Nordic region. Through Canal Digital, our50%-owned joint venture with Canal+, we offer pay television and digital services distributed bysatellite throughout the Nordic region to home satellite dish, or DTH, consumers, small antennanetwork operators and cable television operators. We had a total of 1.87 million paying subscribersto our different pay television services, including all of the subscribers of Canal Digital, as ofSeptember 30, 2000, consisting of 452,000 home satellite dish subscribers, 350,000 cable televisionsubscribers and 1.066 million small antenna network subscribers.
Utilizing four geostationary satellites located at 1ƒ West, we are also a major provider of satellitebroadcasting of television channels and multimedia services for the Nordic region. In addition, weown and operate Norkring, the incumbent terrestrial television broadcast network operator in Norway.
Content and Interactive Services. We have recently established a new business line comprisingour activities within content management and interactive services. This includes a content rightscenter responsible for entering into strategic agreements with content providers through acquisitions,alliances and exclusive deals on behalf of the whole Telenor group as well as for Telenor BroadbandServices. The business line also encompasses our activities within the development and distributionof television-based interactive services in our subsidiary Zonavi, and digital rights managementsystems (which provide for banking, billing and conditional access-encryption) in our subsidiaryConax.
Satellite Mobile. We are one of the leading providers of global mobile communicationsservices, directed primarily at the maritime and land mobile market, using the INMARSAT satellitesystem in which we are the largest individual shareholder.
Satellite Networks. We also provide satellite networks using very small aperture terminaltechnology for government institutions, retail banking, multinational corporations and other nichemarkets in selected geographic regions, primarily in Europe and Africa. In addition, we also providesatellite network services for Internet service providers.
132
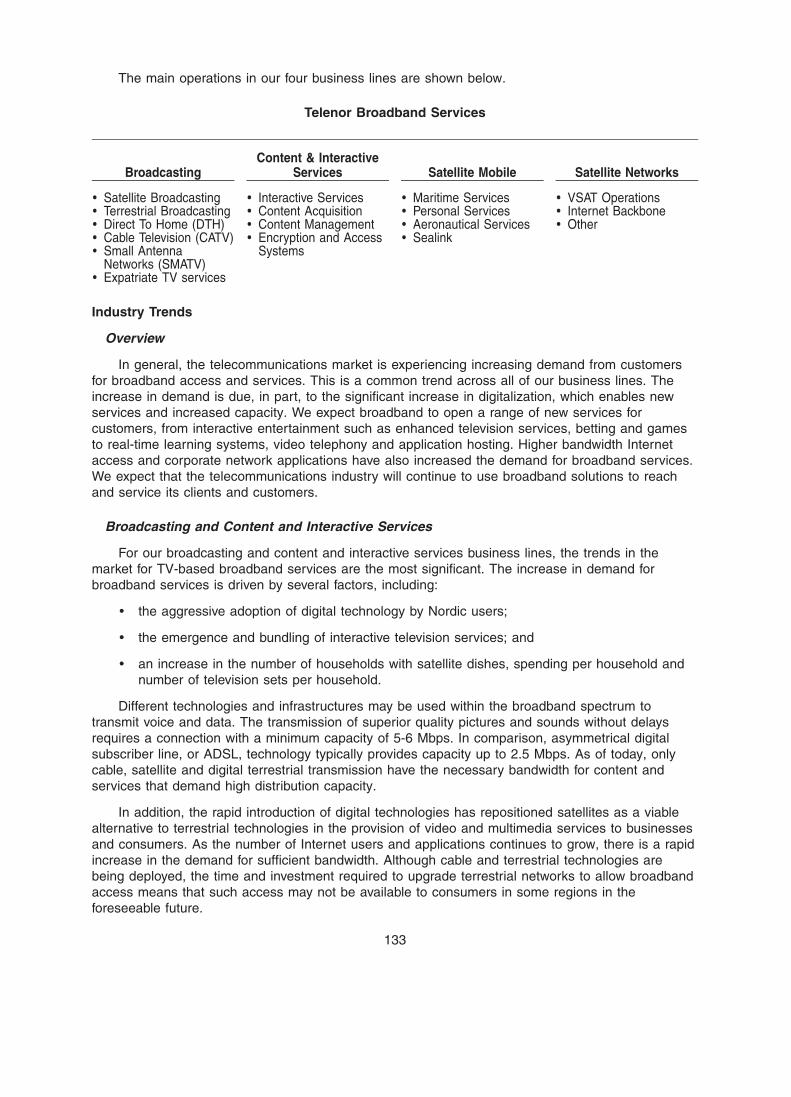
BOWNE OF LONDON 12/01/2000 19:56 BL/SM NO MARKS NEXT PCN: 139.00.00.00 -- Page is valid, no graphics X42481 138.00.00.00 5X
The main operations in our four business lines are shown below.
Telenor Broadband Services
Content & InteractiveBroadcasting Services Satellite Mobile Satellite Networks
) Satellite Broadcasting ) Interactive Services ) Maritime Services ) VSAT Operations) Terrestrial Broadcasting ) Content Acquisition ) Personal Services ) Internet Backbone) Direct To Home (DTH) ) Content Management ) Aeronautical Services ) Other) Cable Television (CATV) ) Encryption and Access ) Sealink) Small Antenna Systems
Networks (SMATV)) Expatriate TV services
Industry Trends
Overview
In general, the telecommunications market is experiencing increasing demand from customersfor broadband access and services. This is a common trend across all of our business lines. Theincrease in demand is due, in part, to the significant increase in digitalization, which enables newservices and increased capacity. We expect broadband to open a range of new services forcustomers, from interactive entertainment such as enhanced television services, betting and gamesto real-time learning systems, video telephony and application hosting. Higher bandwidth Internetaccess and corporate network applications have also increased the demand for broadband services.We expect that the telecommunications industry will continue to use broadband solutions to reachand service its clients and customers.
Broadcasting and Content and Interactive Services
For our broadcasting and content and interactive services business lines, the trends in themarket for TV-based broadband services are the most significant. The increase in demand forbroadband services is driven by several factors, including:
) the aggressive adoption of digital technology by Nordic users;
) the emergence and bundling of interactive television services; and
) an increase in the number of households with satellite dishes, spending per household andnumber of television sets per household.
Different technologies and infrastructures may be used within the broadband spectrum totransmit voice and data. The transmission of superior quality pictures and sounds without delaysrequires a connection with a minimum capacity of 5-6 Mbps. In comparison, asymmetrical digitalsubscriber line, or ADSL, technology typically provides capacity up to 2.5 Mbps. As of today, onlycable, satellite and digital terrestrial transmission have the necessary bandwidth for content andservices that demand high distribution capacity.
In addition, the rapid introduction of digital technologies has repositioned satellites as a viablealternative to terrestrial technologies in the provision of video and multimedia services to businessesand consumers. As the number of Internet users and applications continues to grow, there is a rapidincrease in the demand for sufficient bandwidth. Although cable and terrestrial technologies arebeing deployed, the time and investment required to upgrade terrestrial networks to allow broadbandaccess means that such access may not be available to consumers in some regions in theforeseeable future.
133
BOWNE OF LONDON 12/01/2000 19:56 BL/SM NO MARKS NEXT PCN: 140.00.00.00 -- Page is valid, no graphics X42481 139.00.00.00 5X
The cost of developing or upgrading access networks to high bandwidth makes it crucial tosecure sufficient attractive content to achieve a high penetration and usage of the services at anearly stage. This has led to a convergence and alliance development within the media anddistribution industries.
Another important trend in the growth of broadband is the increasing need for banking, billingand conditional access-encryption, also known as digital rights management. Today, it is critical tocontent providers that broadcasting operators are able to adequately safeguard their content andintellectual property rights. Traditional broadcasting networks use a technical infrastructure thatsecures the handling of proprietary content. If broadband providers are to succeed in attractingcontent providers to their network, it is essential to manage banking, billing and conditional access intheir networks in the future. This will be the only way of securing the handling of intellectual propertyrights and at the same time get paid for the provision of content to consumers.
Satellite Mobile
The satellite mobile industry is going through a period of major restructuring. Competition hasincreased in the last two years, resulting in lower prices and falling margins. The change in theownership structure of INMARSAT has increased pressure on cost minimization and effective trafficmanagement. This is expected to result in a decrease in the number of land earth station operatorsfrom 37 to 10 in the next few years. We believe that it is likely there will be further consolidation inthe industry. Examples of such consolidation are the joint venture between the satellite mobiledivisions of Station 12 and Telstra and BT’s sale of its satellite mobile operations to the Canadianoperator Stratos.
Satellite Networks
The market for VSAT services has been in steady, albeit moderate, growth in recent years andis characterized by large benefits of scale, within equipment acquisition, sales and installation,capacity leasing and service development. The market is characterized by large global players suchas Hughes and Gilat. With approximately 2000 terminals installed, Telenor is one of the smallerplayers in the European market. In the future, the market is expected to transform from narrowbandVSAT solutions to broadband solutions. This development and the speed of change will be mainlyinfluenced by the larger operators in the market.
Strategy
Our Broadband Services business area is the leading provider of television-based broadbandservices in the Nordic region today. Our objective is to become the leading participant in the marketfor broadband services within the Nordic region and within selected markets throughout Europe. Thebroadband industry is in an early phase of development and our Broadband Services business areawill pursue an aggressive strategy in order to achieve and sustain a leading role. This aggressivestrategy implies:
) Access — further expansion and streamlining of our different access platforms to secure auniform network operation and thereby strengthening our position on access in the Nordicregion.
) Content and services — we will invest in the development and launching of broadbandservices and focus on attracting a broad range of premium content. Through alliances withcontent providers we will seek to launch interactive broadband services with new content tosecure existing customer relationships and to attract new customers.
The key strengths in the Broadband Services business area are:
) Broadcasting — our leading position as a distributor of Pay-TV and digital-TV in NorthernEurope, our strong satellite position at 1o West, our early mover advantage in the
134
BOWNE OF LONDON 12/01/2000 19:56 BL/SM NO MARKS NEXT PCN: 141.00.00.00 -- Page is valid, no graphics X42481 140.00.00.00 5X
development of television-based digital services and our ownership of a large base ofexclusive analog and digital content rights.
) Content and Interactive Service — our early mover advantage in the development oftelevision-based interactive services and experience in the management of content rightsincluding encryption, conditional access and subscriber management and billing systems.
) Satellite Mobile — our track record as a provider of high quality services for the maritimeindustry and our understanding of the demands of this market, both for traditionaltelecommunications solutions and value-added services.
Broadcasting
Overview
We are a leading provider of broadcasting services and TV distribution in the Nordic region andhave a presence in selected markets in Northern Europe. We provide broadcasting services and TVdistribution to both consumers and businesses.
Strategy
To achieve our objective of becoming the leading provider of broadband services in the Nordicregion and in selected European markets, we plan to:
) further expand our broadcasting operations in the Nordic region through acquisitions andstrategic alliances to increase our customer base;
) upgrade existing networks, develop and launch new digital services to enhance customerrelationships;
) invest in satellite capacity to maintain our satellite position and expand our satellitecapabilities; and
) promote an attractive workplace environment.
In furtherance of our strategy, we are currently actively considering acquisitions of or jointventures with cable television companies in the Nordic region, which would increase the subscriberbase for our services. In connection with any such acquisition, it is likely that we would undertake toupgrade the acquired cable television networks in order to be able to offer a full range of two-waydigital services. In addition, in the market for SMATV services to housing associations and hotelchains, we are actively considering opportunities to acquire and/or enter into joint venturearrangements with operators that can enhance our market position. We recently agreed to acquire33% of Norwegian-listed company Otrum Electronics ASA for NOK 450 million. The purchase priceconsists of NOK 225 million in cash and the transfer of our hotel-TV business to Otrum.
Nordic Market for TV Services
As of December 31, 1999, there were approximately 10.3 million households with one or moretelevision sets in the Nordic region. These include households receiving:
) television broadcast via terrestrial antennas;
) service via small antenna networks by operators, such as housing associations and hotels,that serve a number of locations from a single satellite receiver;
) cable television; and
) broadcasting to homes via small private dishes.
The number of subscribers to pay television services in the Nordic market has been increasingrapidly, at a rate of 15-20% per year. As of September 30, 2000, our total number of payingtelevision subscribers in the Nordic region was approximately 1.9 million (including total subscribersin Canal Digital). In addition a large number of households receive TV services through ournetworks, including through Norkring, our terrestrial television transmission system in Norway. Wehave experienced strong growth in our customer base due to the rapid increase in penetration rates
135
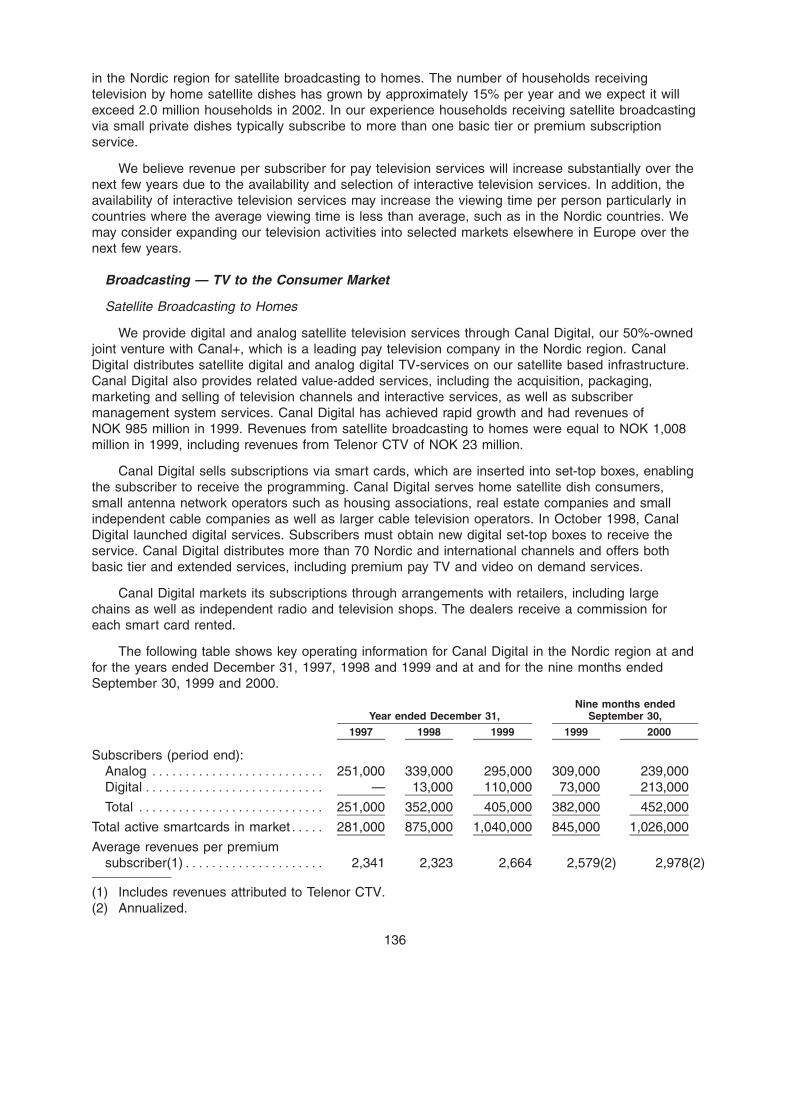
BOWNE OF LONDON 12/01/2000 19:56 BL/SM NO MARKS NEXT PCN: 142.00.00.00 -- Page is valid, no graphics X42481 141.00.00.00 5X
in the Nordic region for satellite broadcasting to homes. The number of households receivingtelevision by home satellite dishes has grown by approximately 15% per year and we expect it willexceed 2.0 million households in 2002. In our experience households receiving satellite broadcastingvia small private dishes typically subscribe to more than one basic tier or premium subscriptionservice.
We believe revenue per subscriber for pay television services will increase substantially over thenext few years due to the availability and selection of interactive television services. In addition, theavailability of interactive television services may increase the viewing time per person particularly incountries where the average viewing time is less than average, such as in the Nordic countries. Wemay consider expanding our television activities into selected markets elsewhere in Europe over thenext few years.
Broadcasting — TV to the Consumer Market
Satellite Broadcasting to Homes
We provide digital and analog satellite television services through Canal Digital, our 50%-ownedjoint venture with Canal+, which is a leading pay television company in the Nordic region. CanalDigital distributes satellite digital and analog digital TV-services on our satellite based infrastructure.Canal Digital also provides related value-added services, including the acquisition, packaging,marketing and selling of television channels and interactive services, as well as subscribermanagement system services. Canal Digital has achieved rapid growth and had revenues ofNOK 985 million in 1999. Revenues from satellite broadcasting to homes were equal to NOK 1,008million in 1999, including revenues from Telenor CTV of NOK 23 million.
Canal Digital sells subscriptions via smart cards, which are inserted into set-top boxes, enablingthe subscriber to receive the programming. Canal Digital serves home satellite dish consumers,small antenna network operators such as housing associations, real estate companies and smallindependent cable companies as well as larger cable television operators. In October 1998, CanalDigital launched digital services. Subscribers must obtain new digital set-top boxes to receive theservice. Canal Digital distributes more than 70 Nordic and international channels and offers bothbasic tier and extended services, including premium pay TV and video on demand services.
Canal Digital markets its subscriptions through arrangements with retailers, including largechains as well as independent radio and television shops. The dealers receive a commission foreach smart card rented.
The following table shows key operating information for Canal Digital in the Nordic region at andfor the years ended December 31, 1997, 1998 and 1999 and at and for the nine months endedSeptember 30, 1999 and 2000.
Nine months endedYear ended December 31, September 30,
1997 1998 1999 1999 2000
Subscribers (period end):Analog ************************** 251,000 339,000 295,000 309,000 239,000Digital *************************** — 13,000 110,000 73,000 213,000
Total **************************** 251,000 352,000 405,000 382,000 452,000
Total active smartcards in market***** 281,000 875,000 1,040,000 845,000 1,026,000
Average revenues per premiumsubscriber(1)********************* 2,341 2,323 2,664 2,579(2) 2,978(2)
(1) Includes revenues attributed to Telenor CTV.(2) Annualized.
136
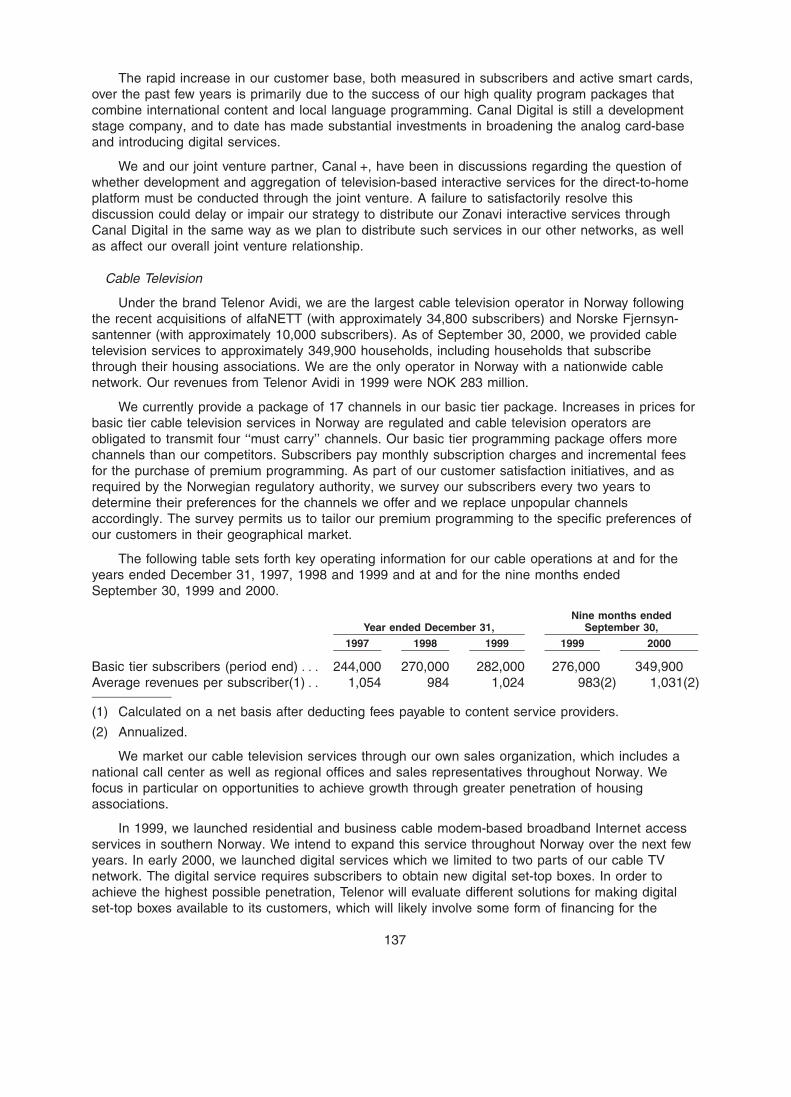
BOWNE OF LONDON 12/01/2000 19:56 BL/SM NO MARKS NEXT PCN: 143.00.00.00 -- Page is valid, no graphics X42481 142.00.00.00 6X
The rapid increase in our customer base, both measured in subscribers and active smart cards,over the past few years is primarily due to the success of our high quality program packages thatcombine international content and local language programming. Canal Digital is still a developmentstage company, and to date has made substantial investments in broadening the analog card-baseand introducing digital services.
We and our joint venture partner, Canal +, have been in discussions regarding the question ofwhether development and aggregation of television-based interactive services for the direct-to-homeplatform must be conducted through the joint venture. A failure to satisfactorily resolve thisdiscussion could delay or impair our strategy to distribute our Zonavi interactive services throughCanal Digital in the same way as we plan to distribute such services in our other networks, as wellas affect our overall joint venture relationship.
Cable Television
Under the brand Telenor Avidi, we are the largest cable television operator in Norway followingthe recent acquisitions of alfaNETT (with approximately 34,800 subscribers) and Norske Fjernsyn-santenner (with approximately 10,000 subscribers). As of September 30, 2000, we provided cabletelevision services to approximately 349,900 households, including households that subscribethrough their housing associations. We are the only operator in Norway with a nationwide cablenetwork. Our revenues from Telenor Avidi in 1999 were NOK 283 million.
We currently provide a package of 17 channels in our basic tier package. Increases in prices forbasic tier cable television services in Norway are regulated and cable television operators areobligated to transmit four ‘‘must carry’’ channels. Our basic tier programming package offers morechannels than our competitors. Subscribers pay monthly subscription charges and incremental feesfor the purchase of premium programming. As part of our customer satisfaction initiatives, and asrequired by the Norwegian regulatory authority, we survey our subscribers every two years todetermine their preferences for the channels we offer and we replace unpopular channelsaccordingly. The survey permits us to tailor our premium programming to the specific preferences ofour customers in their geographical market.
The following table sets forth key operating information for our cable operations at and for theyears ended December 31, 1997, 1998 and 1999 and at and for the nine months endedSeptember 30, 1999 and 2000.
Nine months endedYear ended December 31, September 30,
1997 1998 1999 1999 2000
Basic tier subscribers (period end) *** 244,000 270,000 282,000 276,000 349,900Average revenues per subscriber(1)** 1,054 984 1,024 983(2) 1,031(2)
(1) Calculated on a net basis after deducting fees payable to content service providers.
(2) Annualized.
We market our cable television services through our own sales organization, which includes anational call center as well as regional offices and sales representatives throughout Norway. Wefocus in particular on opportunities to achieve growth through greater penetration of housingassociations.
In 1999, we launched residential and business cable modem-based broadband Internet accessservices in southern Norway. We intend to expand this service throughout Norway over the next fewyears. In early 2000, we launched digital services which we limited to two parts of our cable TVnetwork. The digital service requires subscribers to obtain new digital set-top boxes. In order toachieve the highest possible penetration, Telenor will evaluate different solutions for making digitalset-top boxes available to its customers, which will likely involve some form of financing for the
137
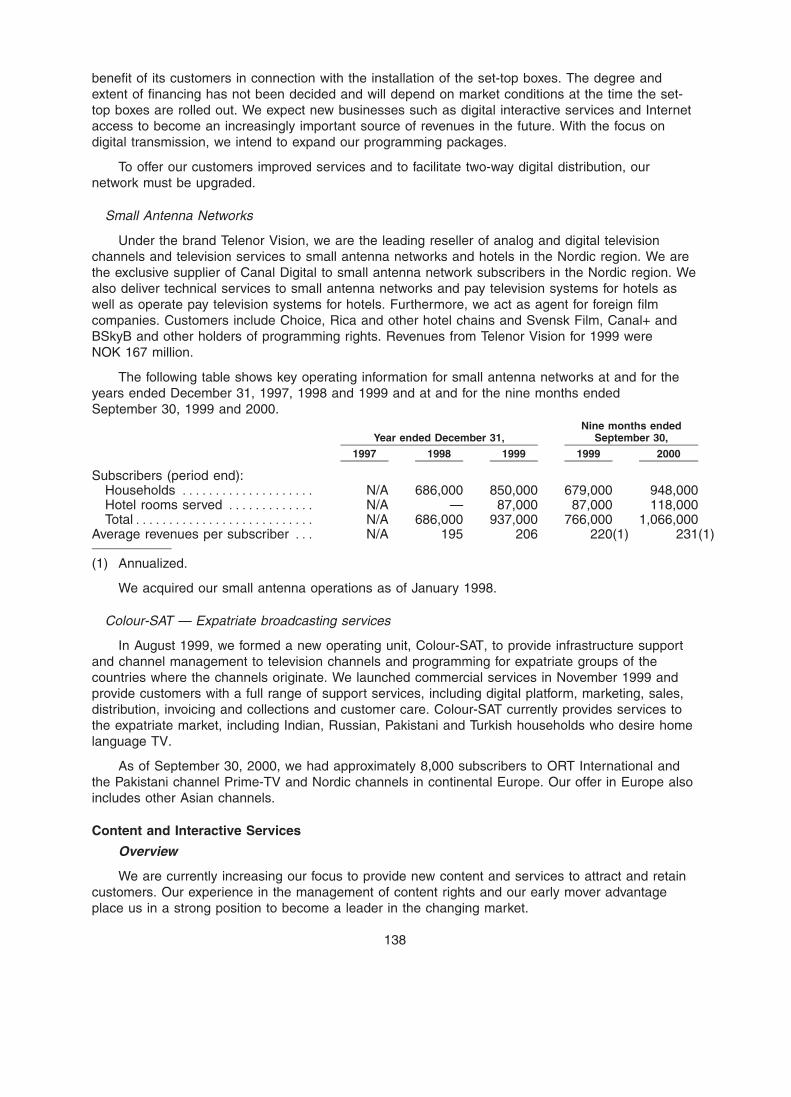
BOWNE OF LONDON 12/01/2000 19:56 BL/SM NO MARKS NEXT PCN: 144.00.00.00 -- Page is valid, no graphics X42481 143.00.00.00 6X
benefit of its customers in connection with the installation of the set-top boxes. The degree andextent of financing has not been decided and will depend on market conditions at the time the set-top boxes are rolled out. We expect new businesses such as digital interactive services and Internetaccess to become an increasingly important source of revenues in the future. With the focus ondigital transmission, we intend to expand our programming packages.
To offer our customers improved services and to facilitate two-way digital distribution, ournetwork must be upgraded.
Small Antenna Networks
Under the brand Telenor Vision, we are the leading reseller of analog and digital televisionchannels and television services to small antenna networks and hotels in the Nordic region. We arethe exclusive supplier of Canal Digital to small antenna network subscribers in the Nordic region. Wealso deliver technical services to small antenna networks and pay television systems for hotels aswell as operate pay television systems for hotels. Furthermore, we act as agent for foreign filmcompanies. Customers include Choice, Rica and other hotel chains and Svensk Film, Canal+ andBSkyB and other holders of programming rights. Revenues from Telenor Vision for 1999 wereNOK 167 million.
The following table shows key operating information for small antenna networks at and for theyears ended December 31, 1997, 1998 and 1999 and at and for the nine months endedSeptember 30, 1999 and 2000.
Nine months endedYear ended December 31, September 30,
1997 1998 1999 1999 2000
Subscribers (period end):Households ******************** N/A 686,000 850,000 679,000 948,000Hotel rooms served ************* N/A — 87,000 87,000 118,000Total*************************** N/A 686,000 937,000 766,000 1,066,000
Average revenues per subscriber *** N/A 195 206 220(1) 231(1)
(1) Annualized.
We acquired our small antenna operations as of January 1998.
Colour-SAT — Expatriate broadcasting services
In August 1999, we formed a new operating unit, Colour-SAT, to provide infrastructure supportand channel management to television channels and programming for expatriate groups of thecountries where the channels originate. We launched commercial services in November 1999 andprovide customers with a full range of support services, including digital platform, marketing, sales,distribution, invoicing and collections and customer care. Colour-SAT currently provides services tothe expatriate market, including Indian, Russian, Pakistani and Turkish households who desire homelanguage TV.
As of September 30, 2000, we had approximately 8,000 subscribers to ORT International andthe Pakistani channel Prime-TV and Nordic channels in continental Europe. Our offer in Europe alsoincludes other Asian channels.
Content and Interactive Services
Overview
We are currently increasing our focus to provide new content and services to attract and retaincustomers. Our experience in the management of content rights and our early mover advantageplace us in a strong position to become a leader in the changing market.
138
BOWNE OF LONDON 12/01/2000 19:56 BL/SM NO MARKS NEXT PCN: 145.00.00.00 -- Page is valid, no graphics X42481 144.00.00.00 5X
Strategy
To achieve our objective of becoming the leading provider of content and interactive broadbandservices in the Nordic region, we plan to:
) launch interactive broadband services across all service platforms and be the first toestablish a substantial customer base; and
) develop a Nordic content rights operation through acquisitions, alliances, and the pooling ofour resources.
Content Rights
Recognizing the importance of developing a Nordic content rights operation to further developour interactive services and attract customers, we actively manage and coordinate internally ourcontent rights portfolio. We currently have agreements with a broad range of national andinternational content providers. We manage and coordinate our content rights across all serviceplatforms and networks both within Telenor Broadband Services and on behalf of the whole Telenorgroup. This permits us to leverage the size of our subscriber base to secure favorable rates frominformation and content providers. We are also committed to adequately safeguarding the contentsto succeed in attracting content providers to our network. For a discussion of our digital rightsmanagement, please see ‘‘— Telenor Conax — Conditional Access Systems’’.
In furtherance of this strategy, we recently acquired a 29% interest and a 10% interest,respectively, in A-pressen and Sponsorservice. A-pressen is a majority owner of 45 local andregional newspapers, some local television channels, a 33% stake in Norwegian television channelTV2 and other related interests. Sponsorservice is a Norwegian based consulting company thatspecializes in the sponsoring of events, such as sports events and cultural arrangements. As a partof their deals, Sponsorservice acquires content distribution rights to some of the events that theysponsor. Sponsorservice has operations in Denmark, Finland and Sweden as well as in Norway.
Development of Television-Based Interactive Services — ‘‘Zonavi’’
We believe that if our customer base and subscription revenues are to continue to grow, wemust continually improve our services and be able to offer a broader range of television-basedservices. As a result, we intend to launch a portal of television-based interactive services, to bebranded as ‘‘Zonavi’’. As the development towards open MHP-based standards proceeds, we expectto make this offering available to both Telenor access networks as well as independent accessnetworks. We expect Zonavi to transform the TV into a unique information/entertainment platform.We aim to deliver the first television-based portal in Norway. Zonavi will offer consumers interactivedigital services through their televisions, including video-on-demand, e-commerce, online games,shopping and e-mail.
We will act as a content aggregator, bundling content from e-tailers and retailers, retail banking,games, video content and other services. On behalf of service providers, we will aggregate theservices offered aiming to bring all parties together on one standardized platform. Our objective willbe to continually aggregate and develop new, innovative services. To date, we have entered intopreliminary agreements with key content owners such as Norsk Tipping, Norway’s largest bettingprovider, Yatack, an online general retailer, and E-Line Group, an apparel retailer. We will continue toseek to establish partnerships with other key content owners. We expect to distribute our servicesthrough a range of network channels, including cable (through Avidi), satellite (through CanalDigital),terrestrial (through Norkring), broadband, ADSL and external access providers. We expect theZonavi Services to be introduced in three stages:
) first, on a single access platform using Media Highway (MHy)-based applications andservices;
139
BOWNE OF LONDON 12/01/2000 19:56 BL/SM NO MARKS NEXT PCN: 146.00.00.00 -- Page is valid, no graphics X42481 145.00.00.00 9X
) second, on all our other broadcast access networks using Multimedia Home Platform(MHP); and
) third, on all access platforms using TCP/IP and Internet technology and format (XML andHTML).
We intend to launch pilot versions of these services in the first half of 2001 and expectcommercial launch in the fourth quarter of 2001, subject to the factors discussed below.
We believe the Nordic region represents an especially favorable market for television-basedinteractive services. Nordic consumers are aggressive adopters of digital products and services, andthe Nordic region is the leader or among the leaders worldwide in PC, Internet and mobile phonepenetration. Furthermore, the Nordic region has a relatively high penetration of pay televisionservices.
The commercial introduction of the Zonavi service will require substantial capital investment. Weare currently in the process of negotiating with information and content providers as well as othercommercial third parties to secure necessary content rights and technological capabilities to launchcommercial services. Any technical or business delays in preparing for commercial launch may resultin significant additional investment. We may seek to develop and launch this service together withtechnology or content partners.
Telenor Conax — Conditional Access Systems
To meet the increasing demand for digital rights management, we provide encryption, conditionalaccess and subscriber management and billing systems for both our analog and digital services. Weprovide these systems through our wholly-owned subsidiary, Telenor Conax, both for broadcastingnetworks and the Internet/intranet and other types of systems, referred to as Conax systems. Thesesystems enable video broadcasters and content providers on the Internet to encrypt their digitalservices so that programming may only be viewed by a subscriber using an authorized smart cardcontained in the subscriber’s decoder, and to manage the base of subscribers and the programauthorization and billing processes. A smart card is a plastic card carrying an embedded computerchip which is inserted into a decoder or other smart card reader.
We are a leading supplier of these services in the Nordic region, and our principal customersinclude the two Norwegian television broadcasters NRK and TV2, in addition to the Swedishbroadcaster SVT and Canal Digital. This business originally grew out of expertise developed in ourresearch division beginning in the mid-1980s. Telenor Conax achieved revenues of NOK 104 millionin 1999, of which NOK 37 million was to other Telenor companies.
We are currently evaluating the possibility of seeking partnerships to further develop thecompany.
Competition in Broadcasting and Content and Interactive Services — Consumer Market
Our main competitors in our broadcasting — consumer market are the Swedish companyModern Times Group, a Swedish conglomerate with operations in TV, print, media and the Internet,and its subsidiary Viasat. We also compete with UPC, which operates within cable television,telephony and the Internet in Norway and Sweden. We also compete with Sweden Online, Comhemand Stofa, subsidiaries of Telia AB, Bredbandsfabrikken and TeleDanmark. We expect intensecompetition in the television broadcasting market and expect new entrants in the Nordic market overthe next few years. In the broadcasting market, we compete on the basis of the quality of servicesand programming we offer.
140
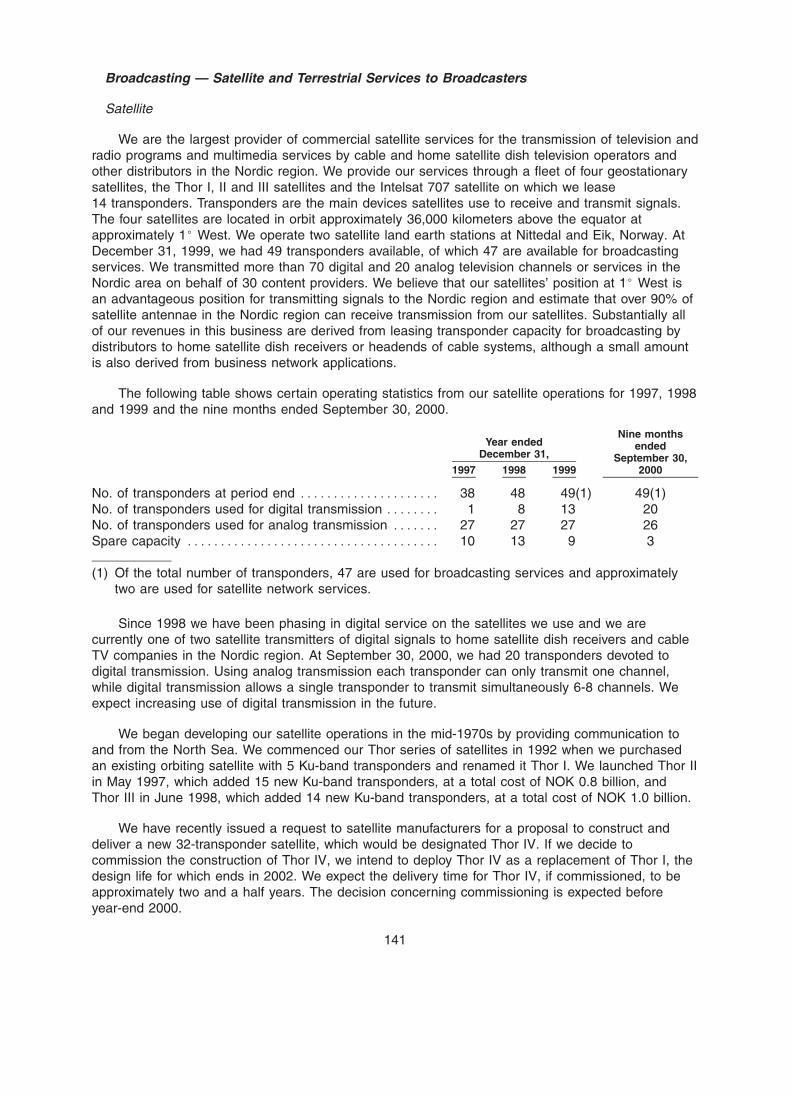
BOWNE OF LONDON 12/01/2000 19:56 BL/SM NO MARKS NEXT PCN: 147.00.00.00 -- Page is valid, no graphics X42481 146.00.00.00 5X
Broadcasting — Satellite and Terrestrial Services to Broadcasters
Satellite
We are the largest provider of commercial satellite services for the transmission of television andradio programs and multimedia services by cable and home satellite dish television operators andother distributors in the Nordic region. We provide our services through a fleet of four geostationarysatellites, the Thor I, II and III satellites and the Intelsat 707 satellite on which we lease14 transponders. Transponders are the main devices satellites use to receive and transmit signals.The four satellites are located in orbit approximately 36,000 kilometers above the equator atapproximately 1ƒ West. We operate two satellite land earth stations at Nittedal and Eik, Norway. AtDecember 31, 1999, we had 49 transponders available, of which 47 are available for broadcastingservices. We transmitted more than 70 digital and 20 analog television channels or services in theNordic area on behalf of 30 content providers. We believe that our satellites’ position at 1ƒ West isan advantageous position for transmitting signals to the Nordic region and estimate that over 90% ofsatellite antennae in the Nordic region can receive transmission from our satellites. Substantially allof our revenues in this business are derived from leasing transponder capacity for broadcasting bydistributors to home satellite dish receivers or headends of cable systems, although a small amountis also derived from business network applications.
The following table shows certain operating statistics from our satellite operations for 1997, 1998and 1999 and the nine months ended September 30, 2000.
Nine monthsYear ended ended
December 31, September 30,1997 1998 1999 2000
No. of transponders at period end ********************* 38 48 49(1) 49(1)No. of transponders used for digital transmission ******** 1 8 13 20No. of transponders used for analog transmission ******* 27 27 27 26Spare capacity ************************************** 10 13 9 3
(1) Of the total number of transponders, 47 are used for broadcasting services and approximatelytwo are used for satellite network services.
Since 1998 we have been phasing in digital service on the satellites we use and we arecurrently one of two satellite transmitters of digital signals to home satellite dish receivers and cableTV companies in the Nordic region. At September 30, 2000, we had 20 transponders devoted todigital transmission. Using analog transmission each transponder can only transmit one channel,while digital transmission allows a single transponder to transmit simultaneously 6-8 channels. Weexpect increasing use of digital transmission in the future.
We began developing our satellite operations in the mid-1970s by providing communication toand from the North Sea. We commenced our Thor series of satellites in 1992 when we purchasedan existing orbiting satellite with 5 Ku-band transponders and renamed it Thor I. We launched Thor IIin May 1997, which added 15 new Ku-band transponders, at a total cost of NOK 0.8 billion, andThor III in June 1998, which added 14 new Ku-band transponders, at a total cost of NOK 1.0 billion.
We have recently issued a request to satellite manufacturers for a proposal to construct anddeliver a new 32-transponder satellite, which would be designated Thor IV. If we decide tocommission the construction of Thor IV, we intend to deploy Thor IV as a replacement of Thor I, thedesign life for which ends in 2002. We expect the delivery time for Thor IV, if commissioned, to beapproximately two and a half years. The decision concerning commissioning is expected beforeyear-end 2000.
141
BOWNE OF LONDON 12/01/2000 19:56 BL/SM NO MARKS NEXT PCN: 148.00.00.00 -- Page is valid, no graphics X42481 147.00.00.00 6X
In September 2000, we entered into an agreement to purchase a quarter of the capacityavailable on the INTELSAT satellite that is to be launched in 2003, as replacement for the capacitywe currently lease on the Intelsat 707 satellite today.
Terrestrial
Norkring operates the incumbent terrestrial television transmission system in Norway. Norkring’snetwork consists of approximately 6,500 large and small transmitting stations in Norway and coversmore than 99% of the Norwegian population. The principal customers for Norkring’s services haveuntil now been the three national television broadcasters NRK, TV2 and SBS Broadcasting and thefive national radio broadcasters, as well as local television and radio stations. We were a founder ofNorkring and owned 40% of the company until the second half of 1999, when we increased ourholding from 40% to 100%. Norkring realized revenues in 1999 of NOK 427 million.
Norkring has recently introduced digital audio broadcasting which has achieved 50% terrestrialcoverage in Norway. Norkring intends to continue to roll out digital audio broadcasting throughoutNorway and expects to achieve a minimum of 95% coverage by 2004. Customer acceptance of thisservice however, depends also on the penetration of new receiver equipment in the marketplace.Over the next several years, we expect digital audio broadcasting to replace analog radiotransmission in Norway. The Norwegian government is currently evaluating the development of a digital terrestrial television network in Norway. Norkring has been allowed to develop digital terrestrialtelevision on a test basis in limited areas and wishes to further develop and build this networkthroughout Norway on a commercial basis. This development is, however, subject to governmentalapproval and will also require a substantial amount of investment by Norkring. Digital terrestrialtelevision broadcasting will increase the number of channels that can be broadcast over Norkring’snetwork.
Competition in Broadcasting — Satellite and Terrestrial
Our principal competitor in satellite broadcasting in the Nordic region is Nordiska Satellitaktiebo-laget, or NSAB. In the European market, our principal competitors are Intelsat, Eutelsat, and SES.NSAB is owned by the Swedish Space Corporation and Astra and operates three leased satellites,Sirius 1, 2 and 3 operating at 5Õ East. SES is based in Luxembourg and operates ASTRA, thelargest satellite system for home satellite dish transmission in Europe. For a discussion of Intelsatand Eutelsat and our participation in these satellite organizations, see ‘‘Satellite Holdings’’.
Satellite Mobile Communications
We provide global satellite mobile communications services for a full range of telephony anddata communications to and from mobile units all over the world, including communications to, fromand between units at sea or on land. We are one of the largest operators of this type of mobileservice worldwide. We provide our satellite mobile services mainly through our EIK land earth stationin Norway. Our customers include commercial and naval maritime vessels and oil installations.External revenues from our satellite mobile communication operations for 1999 were NOK 629million.
Our objective is to maintain and expand our leading position within satellite-based mobilecommunications. To achieve this objective, we will seek to:
) create an alliance to secure future coverage in all four ocean areas;
) expand our mobile satellite operations into the retail market to capture a larger marketshare; and
) introduce value-added services to the maritime market.
142
BOWNE OF LONDON 12/01/2000 19:56 BL/SM NO MARKS NEXT PCN: 149.00.00.00 -- Page is valid, no graphics X42481 148.00.00.00 5X
We are currently focusing on opportunities to expand our operations in satellite-based mobilecommunications. We are actively considering possible transactions, which could take the form of jointventures, acquisitions and/or partnerships with other satellite-based mobile communication compa-nies and/or land earth station operators. We are also considering acquisition opportunities arisingfrom the ongoing restructuring and consolidation of the satellite mobile industry, which couldenhance our market position. In addition, we intend to seek possibilities to enhance our capabilitiesin the area of billing and accounting services to support retail end users, which could allow us toboth capture a larger market share and introduce value-added services to a larger group ofcustomers.
We have over 20 years’ experience in the development of satellite communications, in particularfor the maritime industry. We participated in the discussions that began in 1975, which led to theestablishment of INMARSAT in 1984, and we started the Norsat A communications system for theNorth Sea in 1976. We continue to be a contributor to the INMARSAT international satelliteconsortium with 13% of worldwide traffic over INMARSAT being handled by our earth stations. Weare the largest individual shareholder in INMARSAT with a 15% interest as of September 2000, andhave appointed one member of the board of directors. INMARSAT, formally known as theInternational Maritime Satellite Organization, was founded in 1979 by an intergovernmental treaty toprovide global satellite communications for the maritime industry. INMARSAT was privatized in April1999.
Satellite Mobile Services
In addition to the traditional analog INMARSAT-A service, we offer three digital services thatprovide more efficient use of the INMARSAT satellite capacity and significantly lower the cost ofusing satellite communications.
In January 1997, in association with British Telecom, we launched a new personal satellitetelephone product, Mobiq, providing satellite telephone communications to and from locations at sea,in air or on land based on an INMARSAT Mini-M satellite service.
In the maritime end user market, INMARSAT services are branded Eik Global Communications.All known INMARSAT standards for the maritime market are included in this brand and allINMARSAT ocean regions are covered under this brand. Eik Global Communication is known for itshigh quality, reliable service, and highly skilled customer service personnel.
In addition to being a service provider for INMARSAT, we act as an accounting authority withinthe INMARSAT system. We bill for all ship-to-shore communications covering close to 100% of allNorwegian vessels and some vessels with foreign flag.
Heavy users of maritime communications are offered leased lines via INMARSAT spacesegment or our own total communication solution SeaLink. SeaLink is a permanent satellite line fordata transmissions and establishes customized communications solutions between a fleet of mobilesites and one or more land based sites. We assume to have close to 100% market share in theNorwegian part of the North Sea and delivers solutions as far as Africa.
In November 1999, we were the first satellite operator to complete beta testing and receivecertification to commence commercial operation of INMARSAT’s new M4 satellite service, which weare offering under the brand Global Area Network (GAN). A number of manufacturers are makingavailable the terminal equipment for this service. GAN services, together with an easy to operateGAN mobile satellite terminal, provide a user a high degree of flexibility and accessibility at all times.GAN services provide access at speeds up to 64 Kbps for data, comparable to a fixed network ISDNline.
143
BOWNE OF LONDON 12/01/2000 19:56 BL/SM NO MARKS NEXT PCN: 150.00.00.00 -- Page is valid, no graphics X42481 149.00.00.00 5X
Competition
Our main competitors are Station 12, Comsat, a subsidiary of Lockheed Martin GlobalTelecommunications and Stratos, which recently acquired British Telecom’s global satellite mobiletelecommunications business. Station 12 is the largest operator in this market and a subsidiary ofDutch PTT KPN. In 1999, Station 12 entered a formal joint venture with the satellite mobilesubsidiary of the Australian PTT Telstra. We also compete with a number of smaller operators withtheir own land earth station. The market is concentrated with the four largest operators (ourselves,Comsat, Station 12/Telstra and Stratos) accounting for a majority of the maritime market. Prices forsatellite mobile service have fallen in recent years due to competition, and we expect competition tocontinue to be strong. In addition, we may face competition from systems that will compete withINMARSAT, such as ICO/Globalstar.
A customer that places a call through the INMARSAT System can select any land earth stationthat serves the respective area. Competitors therefore compete on the basis of pricing, globalcoverage and brand name.
Satellite Networks
We provide services and solutions based on satellite communication equipment, satellitecapacity, operational services and a wide range of applications to meet the needs of customers invarious business segments. We expect that the future growth in this market will be within broadband,including satellite based Internet services. The VSAT market is characterized by benefits of scaleboth within sales, installation and equipment procurement. Due to strong growth in competition,profitability has been declining in recent years. As our revenue growth rate in this market during2000 has been lower than in previous years, we will need to realign operations to attain profitability.
We recently were awarded a contract for the installation of terminals and operation of asatellite-based network for on-line betting in Poland, and we are evaluating further opportunities forsuch systems in central and eastern Europe.
Satellite Backbone Services
Under the brand name NORSAT, we provide satellite networks for central and municipalgovernmental organizations and businesses, which are typically used by these customers for internalcommunications, but may also be used for communications between enterprises or with publictelecommunications networks. Our satellite networks are based largely on the use of very smallaperture terminal, or VSAT satellite dishes located at customer premises. VSAT technology enablesthe satellite communication solutions we provide to be independent of the existing infrastructure in aparticular country or region. In addition to using our own capacity, we lease most of the requiredcapacity from other satellite operators providing coverage for the relevant geographic area. Ourexternal revenues in 1999 from providing satellite backbone networks were NOK 413 million,including customer equipment.
Our main market for these services is Europe and we provide services principally for thefollowing types of customers:
) banking and financial institutions;
) governmental organizations for public administration purposes;
) retailers, including customized solutions for stores, gasoline suppliers and hotel chains;
) Internet service providers;
) gateway services for international access by telecommunications operators; and
) occasional services and internal business television networks.
144
BOWNE OF LONDON 12/01/2000 19:56 BL/SM NO MARKS NEXT PCN: 151.00.00.00 -- Page is valid, no graphics X42481 150.00.00.00 6X
Competition
We face strong competition in our European markets. Our main competitors in SatelliteNetworks are Hughes Networks, a publicly traded unit of General Motors and the largest operator ofsatellite networks worldwide, and Gilat Satellite Networks, an Israeli operator listed on the NasdaqNational Market. We also compete with Global Satellite Systems, a subsidiary of BT, Telespazio, ajoint venture between Telecom Italia and STET, Loral, an American operator listed on the NYSE, andTelefonica. We also compete with IBM, AT&T and South Spaceline, a subsidiary of Thussen-krupp.This market is characterized by economies of scale and size, both in equipment acquisition,installation, marketing and operations.
Satellite Holdings
The table below sets forth our satellite holdings as of September 30, 2000.
Book value ofTelenor’s Telenor’s
ownership ownershipinterest at interest at
September 30, September 30,Satellite Participation 2000 2000
(NOK in millions)
INMARSAT ************************************************ 15% 1,857INTELSAT ************************************************* 4.5% 443EUTELSAT ************************************************ 0.7% 45New Skies************************************************* 4.6% 225
INMARSAT was founded in 1979 to provide satellite communications for the maritime industry.
INTELSAT, an international satellite organization, was founded in 1964 to build a global satellitefleet. INTELSAT owns and operates a global communications satellite system with 19 satellitesproviding services to over 200 countries. It is the leading provider of satellite capacity worldwide. Ourequity participation at September 30, 2000 was 4.5%, after the sale of part of our interest.
EUTELSAT was founded to be a common satellite system for Western Europe. EUTELSAT,which is ranked as one of the world’s leading satellite operators, has a fleet of 15 satellites.
New Skies Satellites operates five geostationary communications satellites that provide direct-to-home TV broadcasting as well as data and voice transmission services. INTELSAT spun off NewSkies Satellites and it is currently owned by INTELSAT’s shareholders.
Internet
Overview
Our Internet business area includes the following businesses:
) Internet and IP-based Communications. Under the ‘‘Nextra’’ brand, we provide Internetservices and IP-based communication services in Norway and twelve other Europeancountries (including sales offices in two countries). We are the market leader for businessesin Norway for these services, and since 1998 we have been expanding our operations intoother European countries with the aim of becoming one of the leading pan-Europeanproviders of IP-based communication services to small and medium-sized businessesthroughout Europe.
) Internet Service Provider for the Residential Market in Norway. We are the leadingInternet service provider to the residential market in Norway, and at September 30, 2000, wehad approximately 360,000 paying subscribers to our ‘‘Telenor Internett’’ residential access
145
BOWNE OF LONDON 12/01/2000 19:56 BL/SM NO MARKS NEXT PCN: 152.00.00.00 -- Page is valid, no graphics X42481 151.00.00.00 5X
service and approximately 188,000 registered users of our ‘‘FriSurf’’ subscription-free accessservice. We also operate leading Norwegian Internet portals.
Our Internet business area has been growing rapidly. Total revenues for the Internet businessarea were NOK 763 million for the nine months ended September 30, 2000, an increase of 23%over the same period in 1999. Of the total revenues for the nine months ended September 30, 2000,NOK 605 million were external revenues and NOK 158 million were revenues from other Telenorbusiness areas.
Nextra — Internet and IP-based Communications Services for Businesses
Our Nextra business offers services for the business market in Norway and twelve otherEuropean countries (including sales offices in two countries). In the nine months endedSeptember 30, 2000 revenues from our Nextra business were NOK 423 million, of which NOK 15million were traffic charges from Telenor Telecom based on estimated generated traffic minutes fromNextra business services.
Strategy
As the capabilities offered by the Internet expand and more businesses seek to make use ofthese capabilities, we believe the market for business communications will change dramatically. Weexpect that Internet Protocol, or IP, will eventually become a dominant platform for communicationsservices for businesses and for e-commerce in general and that the demand for services offered tobusinesses over IP-based networks will grow rapidly in the next few years. In particular, we believesmall and medium-sized businesses will increasingly demand standardized, business criticalapplications delivered over IP-based networks, such as broadband access to the Internet, datacommunication and voice over IP, wireless applications, outsourcing services such as applicationsservice provisioning and e-commerce solutions.
We are seeking to capitalize on the growth of these services by evolving from being a providerof Internet services to being a provider of IP-based communications services with a focus on thesmall and medium-sized business market on a pan-European basis. Our concept is to develop into afull service-integrated service provider to medium-sized businesses. We intend to integrate ourservices with connectivity, hosting, communication and business process support. We intend toprovide our customers with fully integrated services that are fully managed, all with cross-borderconsistency.
Our goal is to be among the leading IP-based business communication service providers inEurope offering an integrated range of Internet services to our targeted small and medium-sizedbusiness market. To achieve this objective we intend to:
) expand our coverage in the European market, through both acquisitions and developing ourown businesses in our target countries;
) evolve our companies in each country from an Internet service provider to a communicationsservice provider;
) offer common branding, platforms and quality in each country;
) maintain operational control in each country;
) operate through a decentralized, flexible structure to accommodate differences in customerneeds, requirements and product expectations in each local market;
) develop new high quality technology products and value-added services to respond toincreased Internet capabilities; and
) be non-facility based, focusing on service integration rather than building a fiber-basedinfrastructure.
146
BOWNE OF LONDON 12/01/2000 19:56 BL/SM NO MARKS NEXT PCN: 153.00.00.00 -- Page is valid, no graphics X42481 152.00.00.00 5X
Markets
We are the largest provider of Internet services to businesses in our home market and as ofSeptember 30, 2000 we had 13,000 subscriptions by medium-sized and large business customersfor our Nextra services in Norway. In 1999 we strengthened our position in Norway in web-hotel andother hosting services and we are now one of the leading players in this market in Norway.
We have been expanding our operations into a pan-European business, and since mid-1998 wehave acquired 19 local Internet service providers in our target markets and have commenced ourown operations in two countries on a start-up basis. In the first half of 2000 we completed therebranding of all of our businesses acquired prior to that date as Nextra companies. The followingtable sets forth information about our operations in each country in which we have Nextracommunications service provider operations outside of Norway.
SubscriptionsEmployees(1) (000s)
as of as ofSeptember 30, September 30,
Country Date of acquisitions or start-up 2000(2) 2000(1)
Czech Republic **************** ) September 1998 — Acquisition 158 12.2) April 2000 — Acquisition
Austria************************ ) November 1998 — Acquisition 90 28.5) March 2000 — Acquisition
Slovak Republic**************** ) December 1998 — Acquisition 106 20.4) January 2000 — Acquisition) June 2000 — Acquisition
Switzerland******************** ) April 1999 — Start-up 90 0.3Italy ************************** ) July 1999 — Acquisition 90 12.0
) April 2000 — Acquisition) October 2000 — Acquisition
Hungary ********************** ) September 1999 — Acquisition 69 2.3
Sweden(2) ******************** ) November 1999 — Start-up 47 —) September 2000— Acquisition
Germany********************** ) November 1999 — Acquisition 200 5.7) December 1999 — Acquisition) January 2000 — Acquisition) March 2000 — Acquisition) June 2000 — Acquisition
United Kingdom**************** ) August 2000 — Acquisition 104 0.5) October 2000 — Acquisition 66 11.0
Russia ************************ ) October 2000 — Acquisition 64 —(3)
Total ********************************************************* 1,084(4) 92.9
(1) Includes full-time equivalent employees and subscribers as at such date for business acquiredafter September 30, 2000.
(2) Includes sales offices in Denmark and Finland.
(3) Among other services we sell approximately 30,000 prepaid IP-telephony cards per month.
(4) In addition to these employees, we have employees outside Norway in other start-up initiativesthat are not within the Nextra communications service provider operations.
All of our operations in the above-listed countries are wholly owned, except in Italy, the CzechRepublic, the United Kingdom and Russia, in which other companies hold minority interests.
147
BOWNE OF LONDON 12/01/2000 19:56 BL/SM NO MARKS NEXT PCN: 154.00.00.00 -- Page is valid, no graphics X42481 153.00.00.00 5X
Our ISP operations in each of these countries also include residential customers, and in somecountries our Nextra operation is also a significant supplier of Internet access services to theresidential market, such as in the Slovak Republic and Austria. Total subscriptions outside Norwayincludes 54,500 dial-up single user subscriptions.
In Sweden and Germany our ability to offer services is restricted due to other businessrelationships of Telenor. In Sweden we are restricted from offering services provided by ourTelenordia joint venture, and in Germany we are restricted from offering voice services due toagreements related to our interest in VIAG Interkom held through the Mobile Communicationsbusiness area.
We are continuing to focus on expanding our operations and expect to continue to make furtheracquisitions in the European market.
Services
We are providing an increasing number of products within our core services areas —connectivity, hosting and communication — while simultaneously developing platforms that willsupport increased integration to provide fully managed, integrated services.
Internet access
Our largest product is Internet access. We offer a range of solutions for Internet access, frombasic connection for a single computer, to an advanced and comprehensive solution for a largecompany with many users. Single-users can connect to Internet access either via a modem, or insome countries ISDN, and we target both professional users and small companies. We offercompanies and organizations several different methods to access the Internet. Multiple users andcustomers can choose between a leased line, ISDN, ADSL, asynchronous transfer mode or framerelay technology to connect their local network to the Internet. We also offer virtual private networksolutions, which provide for the safe communication of information between networks and betweenpersonal computers and networks and can be more cost-efficient than leased lines or dial-upsolutions for customers whose networks involve greater distances.
Messaging
Currently our most important communication service is our range of integrated, user-friendlycommunications packages for email service. Our range includes the market’s most advancedelectronic mail service which, in addition to being able to send and receive faxes, allows users tosend messages to mobile phones and pagers. In Norway, we recently launched a service withtailored points of presence and IMAP mailboxes for the professional market, including severaladditional value-added services, which facilitates users’ access to e-mail, faxes, cellular phones andpagers. When the customer’s e-mailbox is centrally located, messages can be written and read fromany location of the user’s whereabouts.
Hosting
Our hosting solutions allow businesses to outsource their own server maintenance, and ourInternet hosting portfolio varies from the storage of simple web pages to advanced multimedia ande-commerce solutions. With both NT and Unix servers placed centrally in our IP-net, companies canuse this service to post materials on the Internet as well as to establish closed web services orcompany intranets. We are building a central hosting platform at our Frankfurt operations.
An increasingly common use of web hosting allows the video and sound broadcasting of popularevents over the Internet. Several of our European operations have participated in broadcastingstreaming video using our web hosting solutions.
148
BOWNE OF LONDON 12/01/2000 19:56 BL/SM NO MARKS NEXT PCN: 155.00.00.00 -- Page is valid, no graphics X42481 154.00.00.00 5X
On August 21, 2000, we acquired an 80.9% ownership interest in XTML Ltd for GBP 17.4million (NOK 234 million). XTML provides Internet services to the business market, with a strategicfocus on complex web hosting. As of September 30, 2000, XTML had over 120 server customersand over 180 leased line customers. The company incurred a loss of GBP 6.3 million (NOK 85million) for the nine-month period ended September 30 mainly as a result of expenses related to thebuild-up of its network infrastructure.
Voice over IP
IP telephony is now a core business for us, and has been recently launched in five countries inEurope: Switzerland, the Czech Republic, the Slovak Republic, Italy and Norway. We intend to be aleader in the development and launch of further IP-based products, such as multi-media telephony,voice virtual private networks, and IP-based call centers.
In Switzerland we have launched local, national and international telephony — which can beeither stand alone, or be integrated in a data solution. We offer telephone connectivity to domesticand foreign locations at fixed, attractive prices.
Through the development of innovative products we have gained important experience inInternet-based telephony. Telenor was the first operator in Norway to provide phone-to-phone serviceover the Internet to the residential market in September 1998 by means of a phonecard. We alsolaunched PC-to-phone IP telephony for Telenor Internet subscribers, giving them the opportunity touse their personal computer as a telephone and make calls by clicking on the screen. Telenor wasthe first operator in the world to implement the H.323 standard for a nationwide network.
Infrastructure
Backbone Network. Currently we lease capacity for our backbone network through flexible,short-term contracts, rather than owning our own transmission infrastructure, as we believe leasingnetwork capacity is more cost-effective. Our objective is to link the Nextra business communicationservice providers in the various countries together in a seamless IP logical network supported byinformation systems with local sales and marketing as well as service offering development andimplementation skills.
To measure the quality of services we provide, we focus on such parameters as stability of ournetwork (% up-time), utilization of lines (%) and delays in the network response time. For TelenorInternett customer service, our response time is an important factor in measuring the quality of ourservices.
We expanded our backbone network in 1999 to secure high capacity and end-to-end control,allowing us to offer voice services over IP, virtual private networks and new value-added services toour customers. Our network, known as ‘‘Nextbone’’, has multi-megabit capacity with points ofpresence in Amsterdam, Bratislava, Frankfurt, London, Milan, New York, Oslo, Prague, Stockholm,Vienna and Zurich, where we maintain our own network routers. Our network connects to theU.S. Internet via several high-speed links. The network is based on a ring structure withsynchronous digital hierarchy circuits, which provides greater redundancy. The network is operatedand monitored continuously by our network operations center in Norway.
To satisfy increased demand for the network we are installing additional links and increasedcapacity. We are planning new points of presence and further high-speed lines between Europe andthe U.S., as well as expansive plans for further IP infrastructure within the United States.
We exchange traffic with other major IP networks in Europe and throughout the world at variousinterconnection points, and are an active partner in the further development of the Internet.
Czech Wireless Network. In September 2000, we were awarded one of three new Czechnetwork operator licenses for fixed wireless access, and we are currently rolling out the network in
149
BOWNE OF LONDON 12/01/2000 19:56 BL/SM NO MARKS NEXT PCN: 156.00.00.00 -- Page is valid, no graphics X42481 155.00.00.00 5X
the four largest cities in the Czech Republic. We expect to use this network to provide customerswith access to the Internet and other high capacity services, and we plan to sell capacity to thirdparties as well as making it available for use by Nextra service providers.
Competition
The industry and markets in which we provide Internet services are highly competitive.Incumbent carriers are our primary competitors in each of our target markets. In addition, we alsocompete with ISPs and other niche players in each market. Competitors that are seeking to competein the market for small and medium-sized businesses on a pan-European basis include KPNQwest,UUNet and PSINet. Companies compete on the basis of the range and quality of communicationsservices offered, network quality, prices and quality of customer services.
New Initiatives
We are implementing a new initiative to create additional value in our Nextra business byestablishing product-focused operating units that will operate independently from the Nextra country-based organizations. It is intended that the new units will both address the customer market directlyand make use of the Nextra country-based organizations as distribution channels. Our objective is toexpand our product offering, either directly or through outsourcing, to serve certain needs of ourcustomers.
As a first initiative pursuant to this strategy, we have recently established a new subsidiary tofocus on managed messaging services called TTYL (‘‘Talk To You Later’’). The new unit will marketmessaging service solutions to the small and medium-sized business market in Europe, initiallythrough the Nextra country organizations and other service providers and later, directly tobusinesses.
In Switzerland, we have recently expanded our hosting business into the area of applicationservice provisioning through the establishment of a new company, Aspectra. Aspectra will offere-business applications to medium and large businesses as well as dedicated hosting services forcomplex web sites, portals and e-business applications.
We are also investigating the formation of other product- or technology-centered units in theareas of hosting, horizontal e-commerce portals directed at the small and medium-sized businessmarket, and mobile Internet solutions for the small and medium-sized business market. We mayelect to pursue these initiatives through acquisitions or joint ventures. In addition, we are alsoconsidering establishing a business operation that will act as a source of funding and makeinvestments in ventures that we believe have potential strategic value for our core businesses. Whilethere is a competitive arena for providing high bandwidth at low cost, there is an increasing demandfor more value added services. As more and more business critical processes are being moved to IPthe demand for services such as security, hosting and unified messaging increases. Thisdevelopment plays into the Nextra strategy focusing on the integration of IP-based services, givingthe customer the opportunity to choose, change and benefit from the widest range of communica-tions solutions available. Unlike some of our competitors, we are not facility based.
Although we are focused primarily on the business market, we also plan to introduce newinitiatives within the residential market, seeking opportunities within mobile Internet and portals.
Internet Service Provider for the Residential Market in Norway
We provide both subscription and subscription-free dial-up Internet access services toconsumers in Norway. We are the leading Internet service provider to consumers in Norway with anestimated market share as of September 30, 2000 of 57% according to Norsk Gallup.
150
BOWNE OF LONDON 12/03/2000 10:00 BL/SM NO MARKS NEXT PCN: 157.00.00.00 -- Page is valid, no graphics X42481 156.00.00.00 6X
Strategy
Our strategy in the consumer Internet access market is to:
) aggressively compete for users in the subscription-free access market;
) continue to enhance the services we offer to the subscription market, in order to maintainand increase our subscriber base;
) offer access through broadband technologies such as ADSL, which we are implementing aspart of a common project with our Telecom business area and wireless technologies, and toseek partnering opportunities with other companies in this area;
) aggressively develop segmented portals for the Internet access market, including broadbandportals;
) offer Internet-based telecommunications services to the consumer market; and
) seek opportunities to expand internationally.
Our objective is to further develop our leading position as a provider of Internet services bydeveloping new product areas within communications, creating new services based on broadbandaccess and establishing a strong position within portals.
Services
Subscription Internet Services.
We offer three principal levels of access products:
) Telenor Internett Basis is our standard service, providing standard Internet access at amonthly subscription fee of NOK 98. The subscription fee includes free customer service.
) Telenor Internett Pluss is our main subscription product, with a monthly subscription fee ofNOK 129. Subscribers receive free customer service, anti-virus and other services.
) Telenor Internett Total is our premium service with a monthly subscription fee is NOK 225.Customers receive free priority customer service, free helpdesk MS office applications,firewall, anti-virus and other additional services.
Both our subscription Internet customers and our FriSurf users pay the same per minute chargefor accessing the Internet (digital or analog telephone traffic). We believe that as people spend moreon the Internet they also become more price sensitive. To meet this demand we have introducednew prefix services providing heavy users with an opportunity to surf the Internet for 150 hours permonth at a fixed rate of NOK 499 since June 2000.
Our access services generally include free e-mail service, which can be accessed through theInternet from any personal computer worldwide, with multiple e-mail addresses and storage spaceon our servers for a subscriber’s web page. We are hosting home pages for more than40,000 users. We also offer additional services such as telefaxing at a per page charge, permessage charges for SMS messages sent to GSM mobile phones in Norway or abroad, messagingto Minilink within Norway, and our premium services include Interfon PC capability.
Our Telenor Internett service is marketed through various retail channels (approximately1000 retailers across Norway), through our own customer service organization, and through ourportals. Bulk sales have in addition become an important sales channel as more and morebusinesses buy home PC’s with the Internet access for their employees (e.g. Statoil with more than10,000 home PC’s). We recently mailed a CD-ROM to all Norwegian households advertising ourthree principal access products (Basis, Pluss, and Total) as well as FriSurf (described below).
151
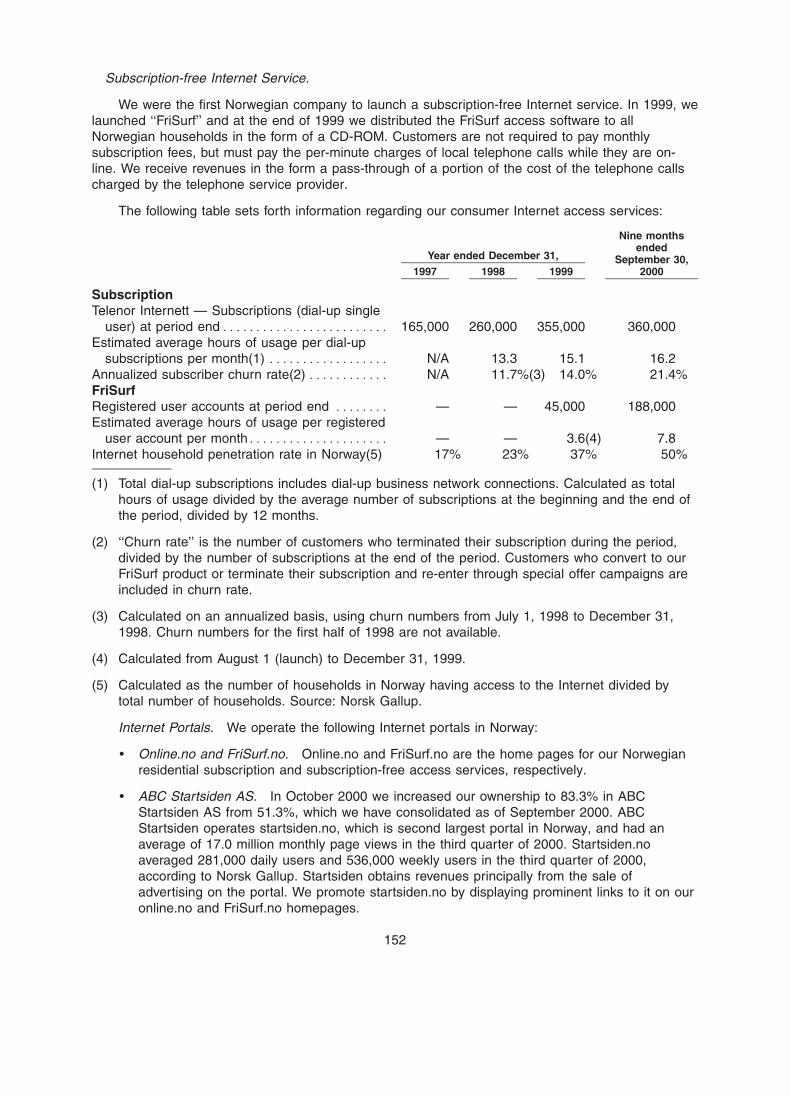
BOWNE OF LONDON 12/01/2000 19:56 BL/SM NO MARKS NEXT PCN: 158.00.00.00 -- Page is valid, no graphics X42481 157.00.00.00 6X
Subscription-free Internet Service.
We were the first Norwegian company to launch a subscription-free Internet service. In 1999, welaunched ‘‘FriSurf’’ and at the end of 1999 we distributed the FriSurf access software to allNorwegian households in the form of a CD-ROM. Customers are not required to pay monthlysubscription fees, but must pay the per-minute charges of local telephone calls while they are on-line. We receive revenues in the form a pass-through of a portion of the cost of the telephone callscharged by the telephone service provider.
The following table sets forth information regarding our consumer Internet access services:
Nine monthsended
Year ended December 31, September 30,1997 1998 1999 2000
SubscriptionTelenor Internett — Subscriptions (dial-up single
user) at period end************************* 165,000 260,000 355,000 360,000Estimated average hours of usage per dial-up
subscriptions per month(1) ****************** N/A 13.3 15.1 16.2Annualized subscriber churn rate(2) ************ N/A 11.7%(3) 14.0% 21.4%FriSurfRegistered user accounts at period end ******** — — 45,000 188,000Estimated average hours of usage per registered
user account per month********************* — — 3.6(4) 7.8Internet household penetration rate in Norway(5) 17% 23% 37% 50%
(1) Total dial-up subscriptions includes dial-up business network connections. Calculated as totalhours of usage divided by the average number of subscriptions at the beginning and the end ofthe period, divided by 12 months.
(2) ‘‘Churn rate’’ is the number of customers who terminated their subscription during the period,divided by the number of subscriptions at the end of the period. Customers who convert to ourFriSurf product or terminate their subscription and re-enter through special offer campaigns areincluded in churn rate.
(3) Calculated on an annualized basis, using churn numbers from July 1, 1998 to December 31,1998. Churn numbers for the first half of 1998 are not available.
(4) Calculated from August 1 (launch) to December 31, 1999.
(5) Calculated as the number of households in Norway having access to the Internet divided bytotal number of households. Source: Norsk Gallup.
Internet Portals. We operate the following Internet portals in Norway:
) Online.no and FriSurf.no. Online.no and FriSurf.no are the home pages for our Norwegianresidential subscription and subscription-free access services, respectively.
) ABC Startsiden AS. In October 2000 we increased our ownership to 83.3% in ABCStartsiden AS from 51.3%, which we have consolidated as of September 2000. ABCStartsiden operates startsiden.no, which is second largest portal in Norway, and had anaverage of 17.0 million monthly page views in the third quarter of 2000. Startsiden.noaveraged 281,000 daily users and 536,000 weekly users in the third quarter of 2000,according to Norsk Gallup. Startsiden obtains revenues principally from the sale ofadvertising on the portal. We promote startsiden.no by displaying prominent links to it on ouronline.no and FriSurf.no homepages.
152
BOWNE OF LONDON 12/01/2000 19:56 BL/SM NO MARKS NEXT PCN: 159.00.00.00 -- Page is valid, no graphics X42481 158.00.00.00 6X
We intend to expand our activities in the portal area, and we may make further investments oracquisitions in this area. In addition to further expanding our mass-market narrowband portalstartsiden.no, we intend to explore the development of mass-market niche narrowband portals.Under a common project with the Telecom business area, the Internet business area is currentlyimplementing an ADSL broadband portal. We also intend to explore opportunities for portal activitiesinternationally.
Ownership Interest in Other Nordic Portals
In the first half of 2000 we transferred our ownership interest in Scandinavia Online AS(SOL AS) to Scandinavia Online AB (SOL AB). SOL AB became a listed company on theOM Stockholm Exchange and the Oslo Stock Exchange in June 2000 and our ownership represents17%. SOL AB owns a pan-Nordic network of portals including sol.no the leading Norwegian portal,the leading portal in Sweden (passagen.se), the third leading portal in Denmark (sol.dk) and theFinnish portal (sirkus.fi). The portals generally provide a broad range of news, information,entertainment and shopping content tailored to the mass market in their home countries.
Competition
Telenor is by far the biggest ISP in the Norwegian residential market and the brands TelenorInternett and FriSurf together had a market share of 57% at September 30, 2000, according toNorsk Gallup. The main competitor within the residential market is Tele2 with a market share of24%. The remaining 19% is shared between many small competitors including Start, Enitel, Netcom,Liberty Surf, VG, Sense, Spray and World Online. The main bases of competition are price ofsubscriptions and usage, and the ability to bundle different services together as a single offering. Webelieve that Tele2 has been successful in the Norwegian residential market as a result of its pricefocus, direct marketing and policy of bundling Internet with telephone subscription.
Media
Overview
Through our Telenor Media business area, we are a leading provider of directory informationand directory advertising in Norway. Telenor Media publishes over 100 different directories in Norwayand a wide variety of directories in nine other European countries. Our total annual circulation ofdirectories in 1999 was 19.5 million, of which we circulated 9.0 million directories in Norway and10.5 million directories outside Norway. In addition to print directories, we also distribute the contentof our directories through a range of media, including the Internet, CD-ROM, telephone and wirelessapplication protocol.
We derive our revenues principally from advertising revenues generated by our directoryproducts and services. Our target market is small to medium-sized businesses. Over the years, wehave developed strong brand recognition and high penetration rates among Norwegian businesses.The Norwegian market accounts for approximately 79% of our revenues in this business area, whichin 1999 represented approximately NOK 1.2 billion of our total revenues. Our international operationsaccount for approximately 21% of our revenues, which in 1999 represented approximately NOK 0.3billion of our total revenues. Our international media operations are organized through subsidiaries orjoint ventures in nine European countries: Poland, Spain, the Baltic states, Russia, the CzechRepublic, France and Finland.
Strategy
Our goal is to be a leading provider of directory information and marketing services in Europe.We seek to continue to develop new products and services for users and advertisers and to furtherexpand the functionality of current brands for the Internet. We intend to continue to improve our
153
BOWNE OF LONDON 12/01/2000 19:56 BL/SM NO MARKS NEXT PCN: 160.00.00.00 -- Page is valid, no graphics X42481 159.00.00.00 5X
operating efficiency and profitability within our established businesses as well as to continue toexpand internationally through partnerships, start-ups and acquisitions. We expect to continue toleverage our experience in the Norwegian market to develop competencies in our operations abroad.We believe we are well positioned to achieve these objectives through:
) the bundling of our print and electronic products through the use of multiple technologies toexpand our product range;
) the development of new products and services to respond to the increased use of electronicmedia (i.e, the Internet);
) our strong brand recognition for Yellow Pages directories;
) our unique and exclusive databases in Norway; and
) our efficient and focused sales forces.
In particular, we expect to focus on the development of our Internet services. We currentlyoperate a number of customer and business-related web portals, many of which are designed tosupport and expand upon our print products. We expect to further develop our local and businessportals in Norway and abroad.
We may also consider strategic alternatives to enhance the value of our Media business area,which could consist of, among other possibilities, a combination or alliance of Media with one ormore third parties, the establishment of a public shareholding through a separate stock exchangelisting or another form of divestment.
Norway
In Norway, our largest directory market, we generated revenues of approximately NOK 1.2 billionin 1999. We are the leading provider of commercial directories in Norway, with more than 95% of thedirectory market and a 10% share of the national advertising market in Norway. Approximately1.3 million people use our printed products daily in Norway, although the use of Internet directoryservices have increased substantially. During the last five years, we have developed the market inNorway to become one of the most well-developed directory markets in Europe.
Our Principal Products
In Norway we produce a variety of directories in both print and electronic format for householdsand businesses. Our principal products are described below.
White and Pink Pages Directories
Our white pages directories list households and our pink pages directories list businesses, bothof which are available nationwide in print and on CD-ROM. Our pink pages directories are alsocurrently available on the Internet and we expect to launch our white pages directories on theInternet in December 2000. We are required to provide our White Pages directories in Norway underthe terms of our fixed telephony license.
Yellow Pages Directories and Services
Our yellow pages directories list businesses by subheadings and are available nationwide inprint, and on the Internet. We also operate an Internet portal, Yellow Pages Internet, which allows auser to view selected information from the yellow pages on the Internet. Yellow Pages Internet hasbecome one of the most popular web sites in Norway, with approximately 2.8 million page views permonth. Advertising on the Yellow Pages Internet accounts for approximately 25% of Norway’s totalsales on the Internet, which amounted to approximately NOK 170 million in 1999. An aggregate of
154
BOWNE OF LONDON 12/01/2000 19:56 BL/SM NO MARKS NEXT PCN: 161.00.00.00 -- Page is valid, no graphics X42481 160.00.00.00 6X
approximately 7.3 million copies of our white and yellow pages directories are circulated annually tohouseholds and businesses in Norway.
In October 1999, we launched Yellow Pages Operator Assisted Services, a telephone servicethat users can call to obtain information on advertisers. Advertisers can enter information, forexample, on brand names, hours of operations and directions to their location of business.
In November 1999, we launched GULeHANDEL, a website offering advertisers a platform topresent their products for a fee. Users can access the website to shop among various advertisers,creating a virtual shopping trolley. The service allows users to have the goods delivered in oneconsignment by courier or via the post office and pay with a single invoice. We expect to continue todevelop our Internet-related products as well as to optimize our print business by introducing newfeatures.
Local Directories
Our local directories in Norway list households and businesses and are distributed in printnationwide in 73 areas and on the Internet. Approximately 1.9 million copies are circulated annuallyto households in Norway.
Business to Business Directories.
Our business to business directories list businesses and are available nationwide in print, onCD-ROM and on the Internet. Approximately 300,000 copies of our business to business directoriesare circulated annually to businesses in Norway.
The Media business area has recently formed a joint venture with the Internet business area todevelop an electronic marketplace in the business to business segment, under the name BizKit.no.
Specialty Directories
We also publish specialty directories, such as the Fax Directory, the Golf Guide and Kvalex,which lists ISO certified companies in Norway. Approximately 100,000 copies of our specialtydirectories are circulated annually to households and businesses in Norway.
Competitors
Our main competitors are companies providing any form of media, including TV, radio,magazines, newspapers and portal/search engines on the Internet. We have no major competitors inthe Norwegian market for our print products. The market for electronic media, such as our Internetand on-line products, however, is quite competitive. There are many competing market players,including both national and international electronic media companies. These companies compete inthe directory area as well as in the general advertising business.
International Operations
We produce telephone and commercial directories for nine European markets in both print andelectronic formats. We began our expansion outside of Norway in 1995 and have continued to growthrough the formation of partnerships, start-ups and the acquisition of businesses. We plan toexpand further internationally and expect to selectively target countries with an under-developeddirectory market and strong growth potential. We intend to leverage the experience and competencewe have gained in the Norwegian and European markets to further develop our internationaloperations.
Our European operations focus on both directories and Internet portals designed primarily forlocal markets. Set forth below is a brief description of our international operations.
155
BOWNE OF LONDON 12/01/2000 19:56 BL/SM NO MARKS NEXT PCN: 162.00.00.00 -- Page is valid, no graphics X42481 161.00.00.00 5X
Spain
Our principal subsidiary in Spain is Telenor Media Espana, or TME. TME’s core products andservices in Spain include printed local telephone directories (white and yellow pages). We also havea 50% interest in a joint venture with Grupo Godo in Spain through which we produce printeddirectories for large cities (white and yellow pages). TME operates local Internet portals, whichincorporate editorial information, maps and directory information. TME’s market share of thedirectory industry in Spain is approximately 4%. As of September 30, 2000, we had four local portalson the web.
Our largest competitor in Spain is TPI, Telefonica’s subsidiary within the yellow pages industry.TPI currently has a market share in the directory industry in Spain of approximately 90%. As ofSeptember 30, 2000, we had over 27,000 customers, most of which were small to medium-sizedbusinesses. Our operations in Spain generated revenues of approximately NOK 44 million in 1999.
Poland
We have a 50% joint venture with Bell Atlantic in Poland in Polskie Ksiazki Telefoniczne, or PKT.PKT offers directory advertising in Poland in directories on CD-ROM, in print, and the Internet.Similar to our other operations, we expect that PKT’s products and services will gradually migrate toInternet-related products in response to the growth of electronic media. PKT currently hosts a website offering links, advertisement, e-mail, banners and web hosting services.
In 1999, we distributed over 4.3 million directories throughout Poland. PKT’s primary customersin Poland are small to medium-sized businesses. Poland is a rapidly emerging country with aburgeoning consumer market. PKT currently has over 68,000 customers and generated revenues ofapproximately NOK 208 million in 1999.
France
Soleil Publicite, our wholly-owned French subsidiary, produces printed yellow pages directoriescovering the greater Paris metropolitan area. Soleil Publicite produces nine local editions of thesedirectories and distributes approximately 2.7 million copies a year. Soleil Publicite’s market share inthe French directory advertising market is approximately 2.5%. As of September 30, 2000 we hadmore than 3,000 customers in France, all of which were small to medium-sized businesses. Wefocus primarily on offering business to customer products and services. Soleil Publicite competeswith France Telecom and small publishers of local directories. Our strategy is to expand ouroperations in France by the acquisition of small local directory companies that can serve as thebasis for future growth. In line with this strategy, we recently acquired a 75% ownership interest inAnnuaires Telephoniques de Bretagne, a publisher of yellow pages directories in France, with over600,000 directories circulated annually. We plan to launch an on-line directory in Fall 2000. Ouroperations in France generated revenues of approximately NOK 40 million in 1999.
Baltic States
We currently publish directory products in CD-ROM and print versions in Estonia, Latvia andLithuania. As of September 30, 2000 we had over 29,000 customers in the Baltic States. Ourprincipal products in Estonia include the Estonian Business Directory and the Tallin telephonedirectory. We began Internet operations in May 1999. Our principal products for the Latvian marketare five business to consumer directories and one business to business directory, each publishedannually. We introduced Internet related services in Latvia in June 2000. Our principal products inLithuania include business to business and business to consumer directories, which are available inprint, on CD-ROM and over the Internet.
In the Baltic States, we intend to seek alliances with selected telecommunications operators tobecome a leading directory company. In line with this strategy, we recently agreed to sell 25% of our
156
BOWNE OF LONDON 12/01/2000 19:56 BL/SM NO MARKS NEXT PCN: 163.00.00.00 -- Page is valid, no graphics X42481 162.00.00.00 6X
Latvian operations to Lattelekom to become the official directory publisher. The transaction is not yetclosed. We signed a contract with Lietuves Telekomas in September to become the official publisherin Lithuania. The operations of our subsidiaries in the Baltic States generated revenues ofapproximately NOK 40 million in 1999.
Russia
We currently produce three business to business and three business to consumer directories forseveral regions in Northern Russia. We also produce four business to consumer directories in St.Petersburg. We intend to produce CD-ROM and Internet versions of these directories. In this region,we compete with a large number of small publishers. As of September 30, 2000, we had over5,000 customers, 90% of which were small to medium-sized businesses. In Russia, we intend toseek alliances with selected telecommunications operators to become a leading directory company.In September 2000, our acquisition of 100% of Euro-Adress Moskva, the primary directory publisherin Moscow, was approved by the Russian competition authorities. The operations of our subsidiariesin Russia generated revenues of approximately NOK 5 million in 1999.
The Czech Republic
Inform Net Partners, our 50% joint venture with TeleDanmark, currently produces travel atlasesand business to business directories in print and on CD-ROM. Inform Net Partners also maintainsInternet databases supporting its publications and providing further information to consumers. As ofSeptember 30, 2000, we had over 7,000 customers. In this region, we compete primarily with a largenumber of small publishers. Inform Net Partners generated revenues of approximately NOK 14million in 1999.
Finland
In August 2000, Telenor Media acquired a 60% ownership interest in Telefakta TelemarketingOY, a Finnish provider of a business-to-business directory. Telefakta distributes its business-to-business directory primarily via the Internet. The directory includes Yellow pages information on allFinnish businesses, supplemented with general information and services.
Pursuant to the acquisition agreement, we have an option to purchase up to an additional 20%ownership interest in Telefakta. This option is exercisable between September 15, 2003 andNovember 15, 2003.
Bravida
Overview
On October 23, 2000, Bravida merged with a holding company of BPA AB, a Swedish providerof electrical, plumbing and ventilation systems. At the closing of the merger, we ownedapproximately 51% of the merged company but we expect that by the end of 2000, this will bereduced to 48%. For more information, see ‘‘— Merger with BPA’’ below.
Bravida is currently Norway’s largest provider of network installation, maintenance and operatingservices. Bravida targets network operators, of which Telenor is the most important, as well asbusinesses, public sector activities and contractors. While Norway is Bravida’s primary market,Bravida also offers similar services in Sweden. Bravida also operates Bravida Geomatikk, throughwhich it offers geographical information services and electronic filing systems. Bravida made over1 million customer visits in 1999 and its revenue in 1999 was NOK 6,057 million, of whichNOK 3,145 million was from other Telenor companies and NOK 2,912 million was from sales toexternal customers.
157
BOWNE OF LONDON 12/01/2000 19:56 BL/SM NO MARKS NEXT PCN: 164.00.00.00 -- Page is valid, no graphics X42481 163.00.00.00 5X
Historically, this business area’s primary activity was the installation and maintenance oftelecommunications and data services in Telenor’s networks. Bravida currently is seeking to expandits revenues by marketing these services to customers other than external customers of Telenor. Themarket for these services is expected to grow significantly and Bravida intends to take advantage ofthis trend by taking advantage of its high level of technical expertise and resources.
Set forth below is a summary of the current business of Bravida.
Services
Bravida currently provides a comprehensive range of products and services, includingconsultancy and planning, installation, maintenance and operation of telecom, data, electronic andsecurity solutions. The range of products and services is based on advanced technological solutions,combined with a high level of expertise among its personnel in a broad range of activities. Theprincipal categories of services provided by Bravida are:
Network Expansion
Bravida plans, designs and installs network infrastructure, access networks, switching facilities,transmission elements and GSM 900 and GSM 1800 mobile networks. Bravida can install anddeliver telecommunications networks on a turnkey basis. Bravida also provides project managementfor network expansion projects.
Network Service
Bravida provides installation and maintenance of analog, ISDN, ADSL and security systems. Inaddition, Telenor Nett refers fault reports from the Telenor network to Bravida.
Contracting Services
Bravida provides counseling/projecting and delivery of integrated solutions and structuredcabling for telecommunications, data, security/alarm and electrical systems, access control and BUStechnology.
Business Service
Bravida installs and operates, as well as provides remote and on-site service for, voice and dataequipment for the business market. In addition, Bravida sells customers premises equipment,computer and telecommunications equipment.
Historically, its services in the areas of network expansion and network service have beenprovided exclusively to customers within Telenor. It is expected that demand for these services willincrease from external customers, in part as competing telecommunications operators increase theirinfrastructure activities in Norway.
Bravida also includes our Bravida Geomatikk operation, through which it offers geographicalinformation services and electronic filing systems. Bravida Geomatikk also offers the Geowebsolution, which, in concept, is an electronic map of the underground infrastructure, such as electricalwires, telecommunication cables and pipes, within different geographical areas. To date theseservices have been primarily provided to Telenor Telecom, although Bravida has successfullycompeted for a number of contracts from external customers.
Recently, Bravida has successfully obtained several major contracts, including one with DetNorske Rikstrygdeverket for installation of a new IT-platform in a total of 514 locations throughoutNorway. In addition, Bravida will be providing project management and installation for Telenor’s newoffice complex at Fornebu.
158
BOWNE OF LONDON 12/01/2000 19:56 BL/SM NO MARKS NEXT PCN: 165.00.00.00 -- Page is valid, no graphics X42481 164.00.00.00 5X
Bravida and our Telecom business area this year entered into a five-year agreement, concerningexpansion, maintenance and service on the Telenor infrastructure in Norway. According to thisagreement, Telecom will buy and Bravida will make available certain capacity equaling 75% ofTelecom’s service demand in 2001. In 2002 the commitment of both parties is 67.5% and the lastthree years 60% of Telecom’s service demand.
Merger with BPA
We have merged Bravida with a holding company of BPA AB, a Swedish provider of electrical,plumbing and ventilation systems and a leading provider of contracting services throughout theNordic region. The merged company is the largest provider of installation and operating services inthe Nordic region. Prior to the merger, BPA operated in Norway, Sweden and Denmark with over6,592 full-time equivalent employees. At the completion of this transaction, Telenor and a consortiumled by former shareholders of BPA will each own 48% of the new company, which retains the nameBravida. The remaining 4% of the merged company will be held by management. Pursuant to themerger agreement, we are, subject to certain conditions, required to reduce our stake in Bravida toapproximately 33% within two years. The merged company is registered in Norway andheadquartered in Stockholm. We believe that the merger represents an attractive combination ofcomplementary businesses, including their products and geographic operations. We also expect themerger to generate cost synergies between the two companies. Upon completion of the transaction,we will treat Bravida as an associated company.
Under the merger agreement, Telenor and the former BPA shareholders have agreed to divestcertain non-core assets of BPA. If the proceeds received by the merged company from suchdivestments do not reach a certain level, the former shareholders of BPA have agreed tocompensate Telenor for the shortfall through either cash payments or by transferring a part of theirshares in the merged company to Telenor.
BPA’s operations are conducted through eight regional companies in 140 communities inSweden, Norway and Denmark. BPA’s installation expertise provides customers with cost-effectiveand co-ordinated installations solutions. Its customers include private industry and clients in thepublic sector as well as real estate and construction companies. In Sweden BPA is the largestprovider of heating and plumbing and ventilation installations, and the second largest in electricalinstallations and, overall, the largest installation company. BPA’s net sales in 1999 amounted toSEK 6,793 million (NOK 6,413 million).
Under the merger agreement between Bravida and BPA, the partners have agreed to restructurethe Bravida business, which may result in restructuring charges.
EDB Business Partner
Overview
Our 52.6%-owned subsidiary, EDB Business Partner ASA, is a leading Norwegian informationtechnology company providing consulting services, software solutions and computer operations. EDBBusiness Partner’s customers are principally large and medium-sized companies and organizationswith a special focus on banking and finance, telecommunications and the public sector. Although itsprimary market is Norway, EDB Business Partner also has operations in Sweden, Denmark, theNetherlands, Ireland, France, Poland and the United States. EDB Business Partner had totalrevenues in 1999 of NOK 3,015 million, of which NOK 1,508 million were external sales andNOK 1,507 million were sales to other Telenor businesses. EDB Business Partner’s shares are listedon the Oslo Stock Exchange.
159
BOWNE OF LONDON 12/01/2000 19:56 BL/SM NO MARKS NEXT PCN: 166.00.00.00 -- Page is valid, no graphics X42481 165.00.00.00 5X
EDB Business Partner was created by the May 1999 merger of our software and IT businesswith EDB, a publicly traded company. On April 1, 2000, EDB Business Partner acquired FellesdataAS, a major provider of traditional and Internet-based systems for financial institutions in Norway.
Strategy
EDB Business Partner’s objective is to be a leading expertise-based IT business, focusing onsystems (software and service), computer consultancy and computer operating services. EDBBusiness Partner expects the market for IT services to continue to grow as more businesses focuson their core activities and outsource their IT needs. EDB Business Partner, through its operatingunits, intends to take advantage of this trend as well as other opportunities arising from current ITtrends, such as the growth of Internet applications, application service provisioning, e-commerce,banking over the Internet, mobile telephony/wireless application protocol and business criticalapplications.
Operating Units and Services
EDB Business Partner operates through several operating units, each of which is discussedbelow.
IT Operating Services
EDB Business Partner is one of the largest suppliers of IT operating services in the Nordicregion, after the acquisition of Fellesdata. After the planned integration of Fellesdata andreorganization, the EDB Teamco operating unit will include the computer operations activities of bothEDB Novit and Fellesdata. EDB Novit is one of EDB’s operating units, and offers a wide range ofservices, including IT operating services. EDB Teamco’s current activities are focused in Norway but,in the future, EDB Teamco intends to target the Nordic region as its primary market.
EDB Teamco operates the largest computer center in Norway and provides computer operatingservices for large and medium-sized companies in both the private and public sector. EDB Teamcoprovides operation and monitoring services for both centralized computer systems and decentralizedlocal area network servers. In February 2000, EDB Teamco launched its ‘‘powerhost’’ concept forcomputer operating services for application service providers becoming one of the largest suppliersof these services in Norway.
IT Systems for Banking and Finance
EDB Fellesdata is a leading full service application, IT operating systems and consultancyprovider to the banking and finance sector in Norway. EDB Fellesdata combines Fellesdata’soperations in this sector with those of EDB Novit, EDB’s operating unit for these services,representing a combined revenue in 1999 of NOK 1,722 million. Novit offers an IT systems productrange designed for large, conventional banks covering all banking requirements. Novit also launchedits Novit Internettbank product, which was one of the first real-time banking systems offered on theInternet, becoming one of the few international suppliers of a complete, standardized Internetbanking product. During 1999, Novit launched the first service in Norway that allows users to makepayments through the banking system from their mobile telephones.
Software for Telecommunications Operators
EDB 4tel is a leading European software supplier specializing in the development of operationalsupport systems for the telecommunications industry, EDB 4tel also specializes in offering flexibleand advanced software systems, systems integration, implementation support and consultancyservices. EDB 4tel has designed an order management solution which reduces significantly the timeto market for new products and services for telecommunications operators. EDB 4tel’s revenues in1999 were approximately NOK 850 million. Telenor is EDB 4tel’s principal customer and accounted
160
BOWNE OF LONDON 12/01/2000 19:56 BL/SM NO MARKS NEXT PCN: 167.00.00.00 -- Page is valid, no graphics X42481 166.00.00.00 5X
for a majority of its 1999 revenues. Telenor and EDB 4tel have entered into multi-year agreementsconcerning pricing and minimum levels of purchases by Telenor. EDB 4tel was recently selected bySwisscom to supply elements of their customer care and billing support systems.
IT Systems for the Public Sector
Through its 50% owned joint venture, Ephorma AS, EDB Business Partner is the leadingsupplier of software and IT services to public sector organizations in Norway. Ephorma providesadvisory services, administrative applications for local authorities and the state, operations servicesand application service provisioning. Ephorma had revenues of NOK 362 million in 1999.
IT Consultancy
EDB Business Partner employs IT consultants in its various operating units, which include:
) EDB Fundator: provides ‘‘full service’’ project management and systems developmentservices related to IT infrastructure and IT efficiency, including implementing SAP systems.Its 1999 revenues were NOK 293 million.
) Business Data Consulting AS: EDB Business Partner owns Business Data Consulting AS,which provides project management and systems development consultancy services. Its1999 revenues were NOK 94 million.
) EDB Stradec AS: provides strategic consulting, project and enterprise management, ITapplications, e-commerce and case management systems. Its 1999 revenues wereNOK 35 million.
) EDB MaXware: provides high-tech solutions for directories, message exchange, Internetsystems and security. Its 1999 revenues were NOK 74 million.
) EDB Dolphin: provides development, marketing and support of call systems for theintegration of computing and telephony. Its 1999 revenues were NOK 45 million.
System Integration
EDB Intech is a system integrator, supplying IT hardware including infrastructure andcommunications systems. Intech focuses on consultancy advice, installation and upgrading,communications, e-commerce and the Internet for small and medium-sized companies.
In September 2000, we agreed that the EDB Intech business would be combined with the saleof equipment division of Telecom Business Solutions to form a single company fromJanuary 1, 2001.
IT Systems for the Health Care Sector
EDB Business Partner’s subsidiary, EDB InfoMedica, recently merged with Tieto Enator Medical.EDB Business Partner now owns 42% of the combined company which develops and marketssoftware for health care institutions in Norway and Sweden.
Competition
The market in which EDB Business Partner operates is highly competitive and is characterizedby the need for a high level of expertise and experience, as well as extensive capital investment. It isof critical importance that EDB Business Partner’s software products are seen to be competitive interms of system design, functionality, performance, interface, user friendliness and a high degree ofstandardization. It is also important that its products meet all the market requirements from time totime for interaction with industry standard software and hardware.
161
BOWNE OF LONDON 12/01/2000 19:56 BL/SM NO MARKS NEXT PCN: 168.00.00.00 -- Page is valid, no graphics X42481 167.00.00.00 6X
Other Activities
International Center
In order to support and facilitate our international activities, we have established an internationalcenter at the corporate level. The center’s resources are based in Oslo, with local offices in 12 citiesin Europe and South East Asia.
The main tasks of our international center are to maintain country offices in countries in whichmore than one business area is established, to provide technical and administrative support units toour foreign operations, to monitor international regulatory issues, and to provide analyses on politicalrisk issues and socio-cultural and macro-economical relationships.
Furthermore, the international center has business responsibilities outside the business areas instrategic projects, such as Comincom/Combellga and Telenordia. The international center also isinvolved in coordinating our Nordic strategy.
Comincom/Combellga (Russia)
In July 2000, we entered an agreement to acquire a majority interest in Comincom forUS$120 million. Comincom will own 100% of Combellga. Comincom, established in 1990, is analternative long distance carrier and international operator with operations in 22 regions. Comincomhas recently obtained a license to operate a so-called ‘‘non-geographical area code’’, which allows itto offer public long distance traffic in competition with the incumbent operator. Combellga,established in 1991, is the third largest competitive local exchange carrier in Moscow offering acomplete package of international, national and local telecommunication services. At present, itsmain revenues are derived from traditional voice-services, but it has commenced an extensiveroll out of ADSL and it expects that services based on IP-technology will, in time, account for themajority of its revenues.
Telenordia (Sweden)
Telenordia AB is a 50/50 joint venture between us and BT to provide telecommunicationsservices in Sweden. In September 2000, we and BT each increased our respective 33% interests inTelenordia to 50% through purchasing one-half of TeleDanmark’s interest. Telenor’s part of theacquisition cost in connection with the increase in its share was NOK 1.3 billion.
Telenordia is Sweden’s fourth-largest fixed network operator, supplying telephony, Internet anddata communications services to over 400,000 customers. Telenordia had revenues of NOK 1,440million in 1999. Telenordia, Tele Danmark and we have connected our national data communicationsnetworks to offer a common service platform in the Nordic region, called Nordicom. Telenordia hassubmitted an application for a UMTS license in Sweden, which is being awarded in a so-calledbeauty contest tender process. Licenses are expected to be awarded by November 30, 2000.
Norsk Data UK (United Kingdom)
Norsk Data UK provides hardware maintenance and support, enterprise management, networkmaintenance and management and other computer and Internet related management, training andsupport services. In 1999, Norsk Data UK had revenues of NOK 445 million. In September 2000Norsk Data acquired a majority stake in XTML, a provider of business critical Internet hosting andapplication service provisioning for businesses in the U.K. The results of operations of XTML will bereported in our Internet business area, see ‘‘Internet’’ above.
Other Group Activities
Other business units include:
162
BOWNE OF LONDON 12/01/2000 19:56 BL/SM NO MARKS NEXT PCN: 169.00.00.00 -- Page is valid, no graphics X42481 168.00.00.00 6X
Teleservice AS. Teleservice AS manages our directory inquiry services, telephone conferencingand call center services.
Telenor Venture AS. Telenor Venture AS is a venture capital enterprise seeking value creationthrough active ownership in profitable projects in the areas of telecommunications and informationtechnology. We currently own 63.7% of Telenor Venture AS. Telenor Venture AS is expected to bedissolved June 30, 2002.
Telenor Venture II ASA. We established Telenor Venture II ASA in September 2000 in order tocontinue and expand the successful venture capital investment activities pursued by the first fundTelenor Venture AS. We own 50.1% of Telenor Venture II ASA.
TeleVenture Management AS. In 1998, the management of Telenor Venture AS, together withTelenor Communication AS, formed TeleVenture Management AS, which is now acting as generalmanager for Telenor Venture AS and Telenor Venture II ASA. We own 23.85% of TeleVentureManagement AS.
E-Commerce Joint Venture
We have recently formed a joint venture with Den Norske Bank, the largest bank in Norway, tocapitalize on opportunities arising from the convergence of banking and telecommunications.
Research and Development
We are committed to maintaining our position as a leading innovator in deploying anddeveloping telecommunications technology. In order to do this we are investing in both short-termproduct development and medium- to long-term research activities. It is essential to provide thenecessary environment to obtain success of our research and development efforts. These includecreating new, innovative business units close to the market and at the same time performingresearch to build competence and investigate new areas.
Currently we have over 300 researchers working in the corporate R&D department with unitslocated throughout Norway and our employees in our business areas are actively involved in productresearch and development. We participate extensively in international as well as national researchprojects and collaborate with colleges and universities, other telecommunications companies anduser environments. Examples of organizations and companies involved in such cooperation are BT,Cisco, HP, Bang & Olufsen, Ericsson, Alcatel, MIT and most of the Norwegian universities. On ayearly basis, Telenor R&D is involved in some 40 projects in Europe and is also actively involved inefforts to standardize telecommunications technologies.
Our objective is to provide products and services that fulfill both the current and futureaccessibility and capacity requirements of our customers, while at the same time being able toprovide high-level services and applications.
Our development activities focus on providing integrated solutions to both the business, theresidential and the individuals markets. On top of Internet and the Internet protocols we will providevoice, data and video services. A full service network with quality of service over IP is being tested,and Europe’s first extensive VDSL trial for broadband access is being launched in Western Norway.The traditional separation of voice and data communication on the one hand, and radio and TVbroadcasting on the other hand is fading, and we are building both services and networks to supportthis development towards interactive multimedia. As mobility is becoming a commodity in the Nordiccountries in the traditional sense, we are working to extend mobility to include both fixed and mobilenetworks, e.g. providing mobile IP technology across heterogeneous networks to extend the currentUMTS definitions.
To implement these objectives, we are committed to allocating a significant portion of Telenor’sbudget on research and development. In 1999, we spent approximately NOK 528 million in R&D,
163
BOWNE OF LONDON 12/03/2000 12:04 BL/SM NO MARKS NEXT PCN: 170.00.00.00 -- Page is valid, no graphics X42481 169.00.00.00 6X
representing a 27.5% increase over 1998 spending. We expect approximately the same level ofresearch and development expenditure in 2000.
Legal Proceedings
We are involved in a number of judicial and regulatory proceedings (including those describedbelow) concerning matters arising in connection with the conduct of our business. We are currentlynot aware of any legal proceedings or claims that we believe will have, individually or in theaggregate, a material adverse effect on our business, financial condition or results of operations.
In July 2000, Enitel ASA filed a complaint against our subsidiary Telenor Nett AS before anarbitration court. Enitel ASA claims damages for loss of income, increased costs and damage tocustomers due to late implementation of carrier preselection as directed by the PT in 1999. On thebasis that carrier preselection is an interconnection service, Enitel ASA claims that Telenor Nett ASbreached the interconnection agreement, and that their maximum economic loss is NOK 120 million.However, in the event Telenor Nett is held liable by the arbitration court, we believe that thecompensation will be substantially less. In October 2000, Tele 2 Norge AS also filed a complaintagainst Telenor Nett AS before an arbitration court on similar grounds as Enitel ASA allegingdamages of NOK 78 million. Tele 1 Europe AS has also announced a similar claim allegingdamages of NOK 30 million.
In March 1998, NetCom filed a complaint against Telenor Nett AS before the Oslo City Court.NetCom claims that Telenor’s prices on leased lines in the years 1993 through 1996 were not inaccordance with the official telecommunications regulations requiring cost orientated pricing ofleased lines. NetCom claims approximately NOK 97 million in reimbursement, plus interest, allegingthat it paid excess fees for leased lines.
We originally filed a complaint against Nesset Kommune, a Norwegian municipality in the localcity court disputing real-estate taxes levied on Telenor Nett’s infrastructure. In late October 2000 wewon a judgment on this case in the appeals court after having initially lost in the lower court. Weexpect that Nesset Kommune will seek to have the decision by the appeals court reviewed by theNorwegian Supreme Court. Telenor Nett was incorporated in 1996, and the dispute relates to realestate tax after such incorporation. So far, approximately 20 municipalities have assessed real estatetax on Telenor Nett’s infrastructure. Real estate tax is not levied by all municipalities. If 80% ofNorway’s municipalities were to assess real estate tax on telecoms infrastructure, we have calculatedTelenor’s annual real estate tax cost to be NOK 45-65 million, based on current real estate tax rates.
A company we considered acquiring, but ultimately did not acquire, has informed us that itand/or its owners believe they have a claim against us in the amount of approximately NOK 194million due to our conduct of the acquisition negotiations. The company asserts that Telenor’salleged conduct damaged it due to lost opportunities. Telenor does not believe the claim has merit.To date, no legal proceedings have been instituted.
Provisions have been made to cover the expected outcome of the proceedings to the extent thatnegative outcomes are likely and reliable estimates can be made.
Properties
Our principal executive offices are located at Universitetsgaten, 2, P.O. Box 6701, St. OlavsPlass, Oslo, Norway, and comprise 45,000 square meters of office space. The total area of all ourproperties comprise 860,000 square meters. Substantially all of these properties are used fortelecommunications and computer installations, service outlets, research and design centers andoffices. Generally, we own most of our properties, although we also lease space in a number oflocations. We currently lease approximately 300,000 square meters of office space pursuant to leaseagreements which expire in 2002 and 2007.
164
BOWNE OF LONDON 12/03/2000 12:24 BL/SM NO MARKS NEXT PCN: 171.00.00.00 -- Page is valid, no graphics X42481 170.00.00.00 8X
Set forth below is a summary of our lease obligations through 2007:
2000 2001 2002 2003 2004 2005-2007
(in NOK millions)
Total lease obligations *************** 335 288 214 137 122 125
We are currently in the process of developing properties that will provide over 187,000 squaremeters of new office space for an aggregate purchase price of approximately NOK 5.3 billion. Onekey development site is our new headquarters at Fornebu, outside of Oslo. Our new headquarterswill be equipped with state of the art facilities and will comprise approximately 137,000 squaremeters of office space for over 6,000 employees. We expect that our new headquarters will becompleted in the fall of 2002 and will cost in the aggregate approximately NOK 4.4 billion. OnNovember 29, 2000, we entered into a letter of intent to sell our current headquarters site forapproximately NOK 550 million to Entra Eiendom AS, a Norwegian government-owned entity, andSelmer ASA. In connection with the planned sale, we intend to lease back the premises pending thecompletion of our new headquarters.
We are actively engaged in the management of our properties. Through our division TelenorEiendom, we ensure that we have the use of sufficient office premises and floor space to enable ourprincipal business activities to be carried out effectively and on favorable terms without substantialcapital expenditures.
Employees
As of December 31, 1999, we had 21,968 full-time equivalent employees, of whom we employed18,818 in Norway and 3,150 outside Norway. During the nine months ended September 30, 2000,we added 1,773 full-time equivalent employees to our operations in Norway and 1,859 full-timeequivalent employees to our operations outside Norway. Set forth below are the number of our full-time equivalent employees in each of our business areas and other companies at the datesindicated.
Number of Employees(1) Number of Employees(1) Number of Employees(1)
December 31, 1998 December 31, 1999 September 30, 2000
Outside Outside OutsideBusiness Area Norway Norway Total Norway Norway Total Norway Norway Total
Mobile Communications ******* 1,698 376 2,074 1,941 486 2,427 1,906 524 2,430Telecom ********************* 4,948 156 5,104 5,067 105 5,172 5,306 144 5,450Broadband Services*********** 487 130 617 672 272 944 851 279 1,130Internet ********************** 340 69 409 374 361 735 496 978 1,474Media *********************** 855 605 1,460 876 531 1,407 875 990 1,865Bravida(2)******************** 5,594 295 5,889 5,512 454 5,966 5,456 307 5,763EDB Business Partner********* 1,367 53 1,420 2,015 154 2,169 3,052 154 3,206Other(3) ********************* 2,437 816 3,253 2,361 787 3,148 2,649 1,633 4,282
Total************************* 17,726 2,500 20,226 18,818 3,150 21,968 20,591 5,009 25,600
(1) Full-time equivalents.
(2) Figures represent the number of employees prior to the merger of Bravida and BPA AB onOctober 23, 2000.
(3) Of the total as of September 30, 2000, 1,239 related to Teleservice AS; 1,373 related to TelenorCommunication AS; 634 related to Comincom/Combellga and 679 related to Norsk Data UK.
We are a member of the employers’ association NAVO (the Norwegian association of employersfor business activities with public connections). Joint consultation and cooperation with the tradeunions are governed through the Principal Agreement of NAVO, the central agreements ofcooperation and the agreements in the individual business units or companies. The cooperation is
165
BOWNE OF LONDON 12/01/2000 19:56 BL/SM NO MARKS NEXT PCN: 172.00.00.00 -- Page is valid, no graphics X42481 171.00.00.00 6X
also formalized through forums such as the group committee, the joint consultative committee andregular management forums.
Our employees are represented by four trade unions: EL & IT Forbundet, KTTL, NITO-TELE andTS. Approximately 64% of our employees are union members. The unions are entitled to appointthree members to our board of directors. Two members are elected from KTTL, NITO-TELE and TSand one from EL & IT Forbundet. Labor contracts with the unions are scheduled to be renewed in2002. We consider our relations with our employees as well as the unions to be good.
Since our transformation to a public limited company in 1994, we have been involved in onelabor dispute. This took place in connection with the wages settlement in 1998 when Tele- andDataforbundet, a labor federation association, led 1,172 members on a strike lasting 10 days andtotaling 9,778 member strike days. The strike ended following the Government’s resolution to agreeto compulsory arbitration due to the danger of telephone services being disconnected to hospitalsand emergency services. The strike affected primarily Telenor Installation and IT-Service (nowBravida) and resulted in the reduction or cessation of operation and maintenance of data andtelephone-systems for Telenor and Telenor’s customers. Employees in Telehuset (sales personnel),Telenor Nett (operating personnel), Telenor Bedrift (personnel engaged in long distance telephony)also participated in the strike. The strike had little impact on our relations with our customers.
The conflict occurred following disagreement on wages and working conditions. This formed partof the transformation from public wages and working conditions to competitive conditions for acompany in the private sector.
The State Wages Arbitration Council handled the dispute and reached a verdict in favor of Telenorin January 1999. The verdict did not affect the intermediary union wage negotiations in January 1999 orthe main union wage negotiations in 2000. We do not anticipate that the strike will adversely affect futurewage negotiations. The next wage negotiation, in 2001, will be subject to a no strike clause.
We seek to continually improve the skills and development of our employees in each of ourbusiness areas. Employees participate in various training programs. Our training organizationprovides different development programs and we cooperate with selected colleges and universitiesas well as other educational and research institutions in Norway and abroad. We place greatemphasis on promoting an atmosphere geared towards learning and sharing of knowledge, with astrong focus on our efforts to retain our employees, which are strategically important to our business.A major principle in Telenor’s personnel policy is to appear as an attractive and competitive employeras well as to establish value-added remuneration plans.
166
BOWNE OF LONDON 12/03/2000 10:01 BL/SM NO MARKS NEXT PCN: 173.00.00.00 -- Page is valid, no graphics X42481 172.00.00.00 6X
REGULATION
Overview — Norway
Since the early 1980s, Norwegian telecommunications markets have gradually been opened upto competition, and by January 1, 1998, the Norwegian market was fully liberalized and Telenor’sremaining monopoly was abolished. Although Norway is not an EU member, the Norwegianregulatory environment has been heavily influenced by the initiatives undertaken by the EuropeanUnion (EU). As a member of the European Economic Area, Norway is required to adapt itsregulatory framework to the legislative and regulatory framework established by the EU for theregulation of the European telecommunications market as far as the directives are made relevant tothe EEA Agreement. In practice, Norwegian policymakers and regulators follow the major aspects ofthe EU telecommunications framework.
As a result of the EEA Agreement our operations are subject to both Norwegian and Europeanregulation. The telecommunications sector is regulated by the Norwegian Telecommunications Act ofJune 23, 1995 and secondary legislation under this Act, which provides general rules and principlesfor all telecommunications activities, including our public networks and public telecommunicationsservices, terminal equipment and frequencies. The most important provisions are included in theRegulations on Public Telecommunications Networks and Public Telecommunications Services ofDecember 5, 1997. We are considered to have significant market power in the markets for voicetelephony (both fixed and mobile), transmission capacity and interconnection (both our fixed andmobile operations) and must adhere to the specific regulatory provisions applicable to operators withsignificant market power.
Our activities in our Broadband Services business area in Norway are regulated by the generalsector-specific regulations for public telecommunications networks and several other regulations,including the Norwegian Broadcasting Act of December 4, 1992 and secondary legislation.
In addition, several general regulations apply to our core activities, including, among otherthings, data protection, consumer protection, Norwegian competition law and EEA/EU competitionregulation.
The Norwegian Ministry of Transport and Communications has overall responsibility for thetelecommunications sector. The Ministry’s principal responsibilities include preparing legislation forthe Storting (the Norwegian parliament) and deciding on secondary legislation, including regulations.The Norwegian Post and Telecommunications Authority (PT) is the principal regulatory body underthe Telecommunications Act and is responsible for day-to-day supervision of the telecommunicationssector.
Important features of the Norwegian regulatory framework for the telecommunications sectorinclude:
) Service Licenses. Generally, the Norwegian regulatory regime poses few barriers to entryfor new service providers. Providers of public voice telephony services and transmissioncapacity services based on their own telecommunications infrastructure that have significantmarket power (normally presumed to be those having 25% or greater share of the relevantmarket) are required to obtain a license from the Ministry of Transport and Communications.The Ministry of Transport and Communications may also oblige other providers to obtain alicense (currently only required for mobile network providers). All other providers need onlyregister with the PT. The registration process is open, simple and expedient.
We currently hold the following service licenses:
) a license for fixed public telephony service and transmission capacity (e.g. leased lines);and
) licenses for mobile networks and services in the 450 and 900 MHz frequency band(analog systems) and the 900 and 1800 MHz frequency band (digital systems).
167
BOWNE OF LONDON 12/02/2000 12:12 BL/SM NO MARKS NEXT PCN: 174.00.00.00 -- Page is valid, no graphics X42481 173.00.00.00 6X
On November 29, 2000, the Ministry of Transport and Communications announced that licensesfor third generation mobile systems would be awarded to us and three other applicants.
) Universal Service Obligations (USO) and Special Service Obligations (SSO). USOprimarily apply to the fixed public voice telephony service, leased lines (connections up to2 Mbps) and some data services. We are the only licensee in the Norwegian market subject toUSO requirements. USO require that the public voice telephony service must be accessible ataffordable prices for all households and enterprises, while some leased lines and data servicesmust be accessible for all enterprises. Further, USO require us to provide public payphonesthroughout Norway and special services to the disabled. In 1999, the Storting restated that noexternal funding would be provided to finance costs associated with USO. We also have specialservice obligations (SSO), including defense-related services, coastal radio and services for thearctic island of Svalbard. The government compensates us for the incremental cost of providingSSO services on a case-by-case basis.
) Cost and Price Regulation. Public telephony services, interconnection and transmissioncapacity (e.g. leased lines) must be offered by Telenor at cost-oriented prices. We currentlybase our pricing of these services on the principle of fully distributed historical costs. Therequirement for cost orientation means that prices must be based on costs, plus a reasonablerate of return. In practice, the PT reviews our compliance with the requirements for costing,pricing, and transparency through its review of the annual ONP (Open Network Provision) reportwe are required to provide to the PT. Following review of the ONP report, the PT determines thereasonable rate of return, taking into account the ratio between our owners’ equity and long-term debt. The most recent year for which the PT has completed its review of our ONP report is1998. For 1998, the PT calculated our permitted rate of return to be 14%. In addition, we aresubject to a price cap for voice telephony services for both the residential and business marketsand leased lines.
) Interconnection and Access. Every operator of a public telecommunications network has aright and an obligation to negotiate interconnection. Operators without significant market powerare required to negotiate interconnection agreements with other telecommunication operators,but are under no obligation to enter into such interconnection agreements. This general rule alsoapplies to other types of access rights and obligations, including special network access,national roaming and co-location. Operators with significant market power must make publiclyavailable the terms of delivery for their network access and services, including interconnectionterms. In addition, operators with significant market power must adhere to the principles of costorientation and accounting separation, and are under an obligation to behave in a transparentand non-discriminatory manner. Operators with significant market power may not refuse arequest for interconnection or access if the request is technologically and economicallyreasonable. The scope of the regulatory restraint with regard to access has been delineated inseveral cases regarding different types of network access.
) Local Loop Unbundling. The Ministry of Transport and Communications is currently preparingrevisions to its regulations which will require us to offer unbundled access to the local loops. Therevised regulations are expected to be implemented early 2001. Local loop unbundling meansthat our competitors can have physical access to and lease the local loop, thus enabling them tohave the sole billing relationship with the end user. Our competitors may also installsupplementary equipment, such as xDSL, on leased local loops to offer higher bandwidthservices. Since April 1, 2000, we have been offering competitors the ability to lease capacity inthe local loop. Our leased capacity service does not include shared access to the local loopwhich will also be required by the revised regulation.
) Carrier Selection. Since January 1, 1998, all mobile and fixed network operators providingaccess to a network have been required to allow their customers to select other operators tohandle their calls. Fixed network carrier pre-selection was implemented on June 1, 1999,
168
BOWNE OF LONDON 12/01/2000 19:56 BL/SM NO MARKS NEXT PCN: 175.00.00.00 -- Page is valid, no graphics X42481 174.00.00.00 5X
requiring providers of access to the fixed network to offer their subscribers the ability to chooseone pre-selected carrier. Since November 1, 2000, fixed network access providers have beenrequired to offer their subscribers the ability to make two pre-selections, one for national traffic(within Norway) to geographical, non-geographical and mobile numbers and the other for trafficto all international numbers, which may be with two different carriers.
) Mobile National Roaming. Mobile operators with significant market power are required toprovide national roaming to other mobile operators. According to the licenses for GSM 1800, thelicensee must build a network covering the four largest cities in Norway (Oslo, Bergen,Trondheim and Stavanger) before it is entitled to have national roaming. 3G licensees will havethe right to have national roaming from GSM operators with significant market power, in areaswhere the 3G operator’s network does not have coverage. There will be no requirement for the3G operator to build its own network in specific areas before it is entitled to have nationalroaming. National roaming between 3G operators will not be mandated.
) Number Portability. The PT introduced number portability for telephone numbers in bothPSTN and ISDN fixed networks on June 1, 1999. Number portability allows subscribers to keeptheir telephone numbers when changing service providers. All public service providers must offernumber portability. The PT is currently considering introducing regulations for mobile numberportability, with a proposed implementation target date of September 1, 2001.
) Prospects for Regulatory Reform. Norwegian policy makers have indicated a need forrecurrent examination and a possible update of the regulatory framework due to the fast pace oftechnological and market developments. The Ministry of Transport and Communications hastherefore undertaken reviews of the Norwegian regulatory framework in several areas. At the EUlevel, a total review of the telecommunications regulatory framework has been undertaken,commonly known as the EU 1999 Communications Review. The intention is to develop aharmonized regulatory framework for electronic communications networks and services acrossthe EU starting in 2002. It is expected that the Norwegian authorities will follow the same scope,aim and timeframe as the EU as they further develop the Norwegian regulatory regime.
Regulatory Framework and Authorities
Norwegian Regulatory Framework
The Norwegian telecommunications market has been subject to continuous deregulation,beginning with the liberalization of terminal equipment and value-added services in the 1980s andending with full liberalization of voice telephony and infrastructure on January 1, 1998, thusabolishing the last legal monopoly in the telecommunications sector. The telecommunications sectorin Norway is regulated through both sector-specific and general laws and regulations, including theTelecommunications Act and secondary legislation under this Act and EU directives as implementedin the EEA agreement. Norwegian and EU/EEA competition law apply to our telecommunicationsactivities and our other core activities. In addition our core activities are governed by various otherlaws, such as intellectual property rights legislation, the Personal Register Act and other consumerprotection laws. The Broadcasting Act and secondary legislation under this Act is applicable to ourcable television activities.
International obligations such as the General Agreement on Trade in Services (including theAgreement on Basic Telecommunications) and International Telecommunications Union (ITU)regulations are also relevant to our activities. The following discussion focuses mainly on the sector-specific regulations governing our core telecommunications activities. However, we also refer to otherrules governing or affecting our other core activities.
169
BOWNE OF LONDON 12/01/2000 19:56 BL/SM NO MARKS NEXT PCN: 176.00.00.00 -- Page is valid, no graphics X42481 175.00.00.00 5X
Regulatory Authorities
Responsibility for regulation of and promotion of fair and open competition in the telecommuni-cations sector is allocated among several regulatory bodies. These include:
) The Ministry of Transport and Communications;
) The Norwegian Post and Telecommunications Authority (PT); and
) The Norwegian Telecommunications Authority Complaints and Advisory Board.
The PT is the principal regulatory body under the Telecommunications Act and is responsible forthe day-to-day supervision of the telecommunications sector, including authorizations, supervision ofthe telecommunications market and handling initial complaints and disputes related to telecommuni-cations law. The PT reports directly to the Ministry of Transport and Communications. Under theTelecommunications Act the PT exercises the functions within its authority independently of theMinistry of Transport and Communications, and the director general of the PT is not a politicalappointee and is not required to resign upon a change in government.
As a practical matter, the PT exercises considerable discretion in the interpretation of nationallegislation, and ‘‘soft law’’ from EU recommendations, communications and guidelines may influencethe PT’s decisions. The PT is represented in regulatory committees under the EuropeanCommission. The PT also participates in the Independent Regulators Group, which holds informalmeetings to discuss relevant issues from their national jurisdictions.
The Ministry of Transport and Communications has overall responsibility for the telecommunica-tions sector. The Ministry’s responsibilities mainly include preparing legislation for the Storting andissuing secondary legislation, including regulations. The Ministry also grants telecommunicationslicenses. Primary legislation is decided by the Storting, but the Ministry prepares most of theproposals to the Storting. The Ministry of Transport and Communications also acts as the finalappeal body for decisions made by the PT.
The appeal system for complaints against decisions made by the PT is at present allocatedamong two regulatory authorities: the Norwegian Telecommunications Authority Complaints andAdvisory Board; and the Ministry of Transport and Communications. In cases relating totelecommunications policy and competition, the Ministry of Transport and Communications exercisesfinal decision-making authority. In other cases, the Norwegian Telecommunications AuthorityComplaints and Advisory Board exercises final decision-making authority. A case can additionally bebrought before the Norwegian courts.
Other Regulators
In addition to the sector-specific regulatory authorities described above both our telecommunica-tions activities and our other activities are regulated by the following regulatory authorities, amongothers:
) The Ministry of Trade and Industry;
) The Ministry of Labor and Government Administration;
) The Norwegian Competition Authority
) The EFTA Surveillance Authority and the EU Commission;
) The Data Inspectorate;
) The Consumer Ombudsman and the Market Council; and
) The Ministry of Cultural Affairs; and
) The Mass Media Authority.
170
BOWNE OF LONDON 12/01/2000 19:56 BL/SM NO MARKS NEXT PCN: 177.00.00.00 -- Page is valid, no graphics X42481 176.00.00.00 6X
To some extent the PT, the Norwegian Competition Authority, and the EFTA SurveillanceAuthority/EU Commission have overlapping administrative powers. On a few occasions, complaintcases have been handled simultaneously by all three regulators.
Regulations on the Provision of Networks, Transmission Capacity and Other Telecommunica-tions Services in Norway
General
Generally, the Norwegian regulatory regime poses few barriers to entry for new serviceproviders. Unless a provider has been notified as having significant market power in the geographicalmarket in Norway in which it provides public voice telephony services or transmission capacityservices based on its own telecommunications infrastructure, or unless the Ministry of Transport andCommunications has required the provider to obtain a license (currently only required for mobileservice providers), a provider may provide such telecommunications services without a license, aslong as it registers with the PT. As a general rule, significant market power is deemed to exist if anoperator has a 25% or greater share in one of the markets for public telephony services, publicnetworks, transmission capacity and interconnection (both fixed and mobile services). For othertypes of services, no license or registration is required.
The regulations establish rules regarding registration, information on terms of subscription,prices, interconnection, special network access and appeal procedures and sanctions, among othermatters. The regulations also regulate number allocation, number portability and carrier selection,which are important elements of the regulatory regime for telecommunications operators.
The Norwegian authorization requirements are both liberal and low cost compared with otherEuropean authorization requirements. There is no maximum number of registrations or licenses thatmay be granted under the Telecommunications Act. However, since the radio spectrum is a limitedresource, frequencies may not be available in sufficient quantity. As a result, the number of licensesthat are granted may be limited. Before granting a mobile license, the Ministry of Transport andCommunications is required to announce publicly that there are new licenses available. ThePT prepares a frequency usage plan and the use of frequency bands is linked to the license. Whena network is closed down, the PT will review the corresponding frequency band to determinewhether it may be publicly reallocated.
Fees, set by regulation, apply to registrations and licenses as well as to frequencies and numberallocation. The fees are set to cover the administrative costs of the regulator. Certain standard feesapply, and in addition the PT may charge an estimated fee for networks and services on anindividual basis. The standard fees currently range from NOK 10,000 to NOK 30,000. The estimatedfee applies to us for our fixed and mobile licenses. In 2000, we paid NOK 32.3 million, including thestandard fee, for our fixed network license. We also paid NOK 24.2 million, including the standardand the frequencies fees, for our mobile licenses.
Service Licenses in Norway — Fixed and Mobile
We currently hold the following service licenses:
) a license for fixed public telephony service and transmission capacity (e.g., leased lines); and
) licenses for mobile networks and services in the 450 and 900 MHz frequency band (analogsystems) and the 900 and 1800 MHz frequency band (digital systems).
We are the only company that holds a license for fixed public telephony services andtransmission capacity, due to the fact that we are the only company deemed to have significantmarket power. Other license holders in the mobile market are NetCom GSM with one license forGSM 900 and one license for GSM 1800 and, until recently, Telia, the Swedish incumbenttelecommunications operator, with one license for GSM 1800. Telia recently acquired all of the share
171
BOWNE OF LONDON 12/01/2000 19:56 BL/SM NO MARKS NEXT PCN: 178.00.00.00 -- Page is valid, no graphics X42481 177.00.00.00 5X
capital of NetCom GSM. Due to regulatory requirements, Telia was not permitted to have an interestin both GSM licenses and consequently, Telia’s license has been withdrawn.
In addition to the service licenses, the PT also grants frequency licenses (e.g. in the 40 GHzband).
In the fixed network and public telephony service market, there are a total of 70 registeredoperators as of October 15, 2000. Of these registered operators, 16 have registered in allcategories; 29 have registered with the PT for transmission capacity provision; 38 have registered fornetworks; and 45 have registered with the PT for public telephony service provision. A number of theregistered operators, however, are currently not operating in Norway.
License Conditions
The principal requirements to be observed by all registered and licensed operators areestablished by secondary legislation. The individual licenses impose additional obligations and, incertain instances, specify the general rights and obligations of operators.
Our licenses contain conditions that impose obligations on us to provide certain services andinformation. Our license for the fixed network and public telephony service over the fixed networkcontains requirements concerning: nationwide geographic coverage (which we have fulfilled), theprovision of a stipulated number of required services (such as calling line identification), universalservice obligations (including services for disabled and public pay phones), the provision of directoryservices, special defense-related service obligations, the provision of emergency services, price capregulation, cost accounting, complaint system for customers, rights of way, fulfillment of obligationsregardless of corporate structure, right of inspection by the PT, our internal control procedures,revocation of the license, sanctions, penalties and appeal procedures, among others. We are theonly operator with universal service obligations. Our fixed network license expires in 2014, unless itis otherwise revised or revoked. Under our 40 GHz wireless local loop license valid from April 2000until April 2012, we are required to build out access in the cities specified in the license within twoyears.
Licenses granted for mobile communications systems also contain geographical coveragerequirements and specific roll-out schedules. We have fulfilled these requirements. The mobilelicenses also require, among other things, compliance with the relevant telecommunicationsregulations, international telecommunication standards, the use of frequencies as specified by thePT and numbering as assigned by the PT. The mobile license also specifies the requirements fornational roaming (applies only to GSM 1800), preparedness as specified by the telecommunicationauthorities and reporting and control. Our current license for NMT 450 (analog system) expiresNovember 1, 2003. However, there is reason to believe that the authorities will wish to see thecontinuation of analog mobile service after 2003 in the regions solely covered currently by NMT 450.The authorities have accepted Telenor’s proposal to phase out the NMT 900 (analog system) licenseby March 1, 2001. The frequency band allocated to NMT 900 is prescribed for use by the GSM onceNMT 900 has been phased out. Our current GSM 900 license expires on November 1, 2005, andour current GSM 1800 license expires on March 9, 2010. Operators may apply for additionalfrequencies in response to procedures established by the Ministry of Transport and Communicationsin conjunction with the PT. The Norwegian government has recently proposed to the Storting (theNorwegian Parliament) that the available 900 and 1800 MHz frequencies should be auctioned offin 2001.
Generally, licenses may be extended by the Ministry of Transport and Communications. Thelicense conditions may be subject to change, pursuant to administrative procedures. Theadministrative procedures require that operators be notified and have an opportunity to comment onproposed changes before the changes become effective. Our current license on the fixed networkand public voice telephony service was last amended on March 2, 1999. If an operator repeatedly ormaterially violates the terms of the license, enters into bankruptcy or in other ways becomes
172
BOWNE OF LONDON 12/03/2000 17:03 BL/SM NO MARKS NEXT PCN: 179.00.00.00 -- Page is valid, no graphics X42481 178.00.00.00 10X
incapable of fulfilling the terms of the license, the license may be revoked in whole or in part. Anydecision relating to licenses can be appealed within the administrative system or brought before theNorwegian courts for judicial review.
Our licenses have been issued to Telenor Communication AS (previously Telenor AS). Under theterms of the licences, we may exercise our rights under the licenses through Telenor CommunicationAS or through any of its wholly owned subsidiaries. Our licenses provide that we are not entitled tosell assets, equipment or rights which we need to comply with our obligations under the licenseswithout the consent of the Ministry of Transport and Communications. Our GSM 900 and 1800licenses include a change of control clause. This clause provides that changes in our ownershipwhich would lead to changes as to who has decisive influence over us must be formally approved bythe Ministry of Transport and Communications.
Allocation of Mobile Frequencies
The frequency allocations for Telenor’s mobile systems are:
Network Frequency bands No. of channels Channel bandwidth
NMT-450**************************** 453-457.5/ 180 25 kHz463-467.5 MHz
NMT-900**************************** 890.1-894.5/ 176 25 kHz935.1-939.5 MHz
GSM-900 *************************** 894.5-904.1/ 48 200 kHz939.5-949.1 MHz
GSM-1800 ************************** 1771.3-1781.3/ 50 200 kHz1866.3-1876.3 MHz
Third Generation Mobile Licenses
In June 1999 we were granted a license for the trial operation of a 3G mobile system based onUMTS, valid until August 31, 2000 with an option for renewal. This license is not valid for commercialpurposes. On November 29, 2000, after a so-called ‘‘beauty contest’’ selection procedure, theMinistry of Transport and Communications announced that licenses for 3G mobile systems will beawarded to us and three other applicants. Our license will be effective from December 1, 2000, for a12-year period. The frequency bands allocated for 3G technologies like UMTS are1900-1980/2110-2170 MHz. At a minimum, operators with a 3G license will be required to cover the12 major Norwegian city areas within five years. The general requirements of the regulatoryframework will also apply to the 3G operations, and operators building 3G systems like UMTS willhave the right to national roaming in the GSM network outside their own 3G networks. Each of the3G licenses to be granted will cost NOK 200 million and will be subject to a further annual spectrumfee of NOK 20 million which must be specified and may be changed as part of the government’sannual budget process.
Moreover, 3G licenses will be made available in all EU/EEA Member States based on the EU’sUMTS Decision of December 14, 1998. This decision provides for a coordinated licensing regulatoryframework for third generation mobile communication systems in the EU member states as well asEFTA/EEA countries and aims to ensure pan-European roaming similar to GSM today. Licenses aretherefore based on the coordinated allocation of frequencies and the use of European Telecommuni-cations Standards Institute (ETSI) and Third Generation Partnership Project standards. Theintroduction of UMTS services is dependent upon a number of factors, including the development ofcommercially viable technology and the ability of telecommunications operators to license suchtechnology on commercially acceptable terms. We intend to be active in submitting applications for3G licenses based on UMTS technology in several European countries.
173
BOWNE OF LONDON 12/03/2000 17:03 BL/SM NO MARKS NEXT PCN: 180.00.00.00 -- Page is valid, no graphics X42481 179.00.00.00 7X
Universal Service Obligations and Special Service Obligations
Universal Service Obligations (USO)
The regulatory framework for USO in Norway primarily covers the fixed public telephony service,leased lines (connections up to 2 Mbps) and certain data services. In practice, USO requires thatfixed public telephony services must be accessible at an affordable price for all households andenterprises, while leased lines and data services must be accessible for all enterprises. In addition,some specific services have been classified as USO in our fixed telephony license, including publicpay phones and services for the disabled. In 1999, the Storting restated that we are obliged tosatisfy our USO without compensation, unless our obligations are extended, our market sharedecreases substantially or if the USO becomes concentrated on the least profitable parts of themarket.
Special Service Obligations (SSO)
We are also required to provide special defense related services, coastal radio and services forthe arctic island of Svalbard. The government compensates us for the incremental cost of theseservices on a case by case basis.
Cost and Price Regulation
General
As an operator with significant market power, we are obliged to follow certain principles forpricing, accounting and reporting on public telephony service, interconnection and transmissioncapacity. These services must be offered to our competitors and the public in general at cost-oriented prices. Prices must be determined in an objective and non-discriminatory manner andindependent of the purpose for which the customer wishes to use the service. We are responsiblefor specifying, implementing and maintaining cost accounts as a basis for monitoring that our pricesare cost-oriented, objective and non-discriminatory.
The requirement for cost-orientation means that prices are calculated based on costs, plus areasonable rate of return. In practice, the PT reviews our compliance with the requirements forcosting, pricing, and transparency through its review of the annual ONP (Open Network Provision)report we are required to provide to the PT. Following review of the ONP report, the PT determinesthe reasonable rate of return, taking into account the ratio between our owners’ equity and long-termdebt. The most recent year for which the PT has completed its review of our ONP report is 1998.For 1998, the PT calculated our permitted rate of return to be 14% on public telephony,interconnection and transmission capacity services without violating the requirement for cost-orientation as defined by the PT. These services amounted to 62% of revenue and 94% of operatingprofit in 1999. Telenor submitted its annual ONP report for 1999 in August 2000. Telenor expects thePT to complete its review of the report for 1999 by the end of 2000 or early 2001.
The rate of return on these services has exceeded the reasonable rate set by the PT. We havereduced the prices on these services several times throughout the last years, but volumes of traffichave continuously increased more than expected. The PT has, however, to a large extent focused onthe interconnect and wholesale market and less on the end-user market to ensure promotion ofcompetition.
In this respect, the PT, in a letter dated July 3, 2000, announced its intention to impose onTelenor Mobile a reduction of 15% of the mobile termination charge based on the PT’s view thatcertain expenses may not be included in the calculation of the termination charges. We have filed aresponse challenging the proposed decision. We intend to reduce our mobile terminationinterconnection fees effective January 1, 2001.
174
BOWNE OF LONDON 12/03/2000 17:03 BL/SM NO MARKS NEXT PCN: 181.00.00.00 -- Page is valid, no graphics X42481 180.00.00.00 7X
On September 14, 2000, the PT decided that the interconnection charges in our fixed networksystem must be reduced by 7%, with effect from February 1, 2000. We have filed an appeal withrespect to this decision. The final outcome is still not clear.
Accounting Separation and Reporting
Our accounts for the provision of public telephony service, public networks, transmissioncapacity and interconnection are required to be maintained separately from our accounts for otherbusiness activities. We are obliged to supply the PT with an annual ONP report, includingdocumentation of the principles, assessments and data that comprise the basis for setting prices anddiscount arrangements. The accounts are subjected to a limited review by an external accountantand must be made publicly available. Based on the ONP report, the PT reviews our compliance withthe regulatory requirements for cost, pricing and transparency as well as to determine that our pricesare set in a non-discriminatory manner.
The PT may instruct operators with significant market power to abide by certain principles foraccounting. In this respect, the PT, in a letter dated July 13, 2000, announced its intention to requireus to implement a new model for accounting separation and reporting. The PT has informed us thatthe new model is intended to be implemented with effect from January 1, 2001.
Costing Methodology
The PT may instruct operators with significant market power to use certain cost calculationmethods when determining the price for public telephony services, transmission capacity andinterconnection services. We base our pricing of these services on the principle of fully distributedhistorical costs. The only exception to this principle is the price for the wholesale product providingaccess to the subscriber line (the local loop), which is priced on the basis of current cost, limited byour end-user prices. This was one of the conditions in the undertaking made to the EU Commissionin connection with the planned merger between us and Telia.
Price Cap Regulation
The Ministry of Transport and Communications has imposed a price cap on us for fixed publictelephony services for both the residential and business markets and for leased lines. For telephony,the regulated prices include a fixed rate and a tariff for calls within the country, calls to mobilenetworks, international calls and calls to the directory inquiry service. The regulated price structurefor leased lines consists of the tariff for both digital and analog lines for all rate categories.
The requirements for real price reduction (X) on telephony and leased lines are related to theconsumer price index (CPI). The nominal price changes from one year to the next are expressed asCPI – X. The Ministry of Transport and Communication has prolonged the price cap regulation andset the annual reduction in real prices at 3% for each of the periods from January 1, 2000 toJanuary 1, 2001 and from January 1, 2001 to January 1, 2002.
Interconnection and Access
General
The Telecommunications Act and secondary regulations impose specific obligations concerninginterconnection and access to networks. As a general principle, every operator of a publictelecommunications network, irrespective of the operator’s market position, has a right and, whenrequested, an obligation to negotiate interconnection agreements. This general rule also applies toother types of access, such as special network access, national roaming and space for hosting orusing co-location facilities. If the parties cannot reach an agreement, the PT may, upon request byeither of the parties, act as a mediator. The PT also has the power to order interconnection oraccess under certain criteria on such terms as the PT may determine. In addition to the general
175
BOWNE OF LONDON 12/03/2000 17:03 BL/SM NO MARKS NEXT PCN: 182.00.00.00 -- Page is valid, no graphics X42481 181.00.00.00 6X
rule, operators with significant market power have an obligation to meet any reasonable request foraccess or interconnection, as described in more detail below.
Interconnection
The Telecommunications Act and the secondary legislation incorporate the EU ONP directiveapplying to interconnection. Operators with significant market power, such as us, are required tomeet all reasonable requests for interconnection services; prepare and publish terms and conditionsfor interconnection services; provide information necessary for interconnection agreements uponrequest; offer standardized interconnection services, prices, points of interconnect, interfaces andterms; submit any interconnection agreements to the PT upon request; and keep revenue and costsfor interconnection services separate from revenue and costs for other operations.
Operators without significant market power are required to negotiate interconnection agreementswith other telecommunication operators, but they are under no obligation to enter into suchinterconnection agreements.
The rates that are charged for fixed network interconnection must be cost-oriented if theoperator has significant market power. Mobile network interconnection tariffs must also be cost-oriented if the PT has notified the mobile operator that it has significant market power in the‘‘national market for interconnection’’. The PT has the authority to investigate whether theinterconnection tariffs applied by operators with significant market power are cost-oriented andmandate that the tariffs be changed if they do not satisfy the cost-orientation requirement. Currently,we are the only operator of fixed or mobile services required to have cost-oriented interconnectiontariffs. Fixed network interconnection tariffs are calculated on the basis of forecasted costs andvolumes.
We have signed approximately 30 agreements regarding interconnection with our fixed network,some of which are categorized as special network access. We have entered into the majority of ourinterconnection agreements through commercial negotiations. The PT has mediated in some cases,upon request from the party requesting interconnection (we requested mediation in one case). Themediations have mainly related to disputes over the published prices for interconnection. Since 1997,we have continuously informed the PT of our interconnection costs and pricing and submitteddetailed accounts on our interconnection tariffs.
Telenor Mobile Communications has direct interconnection with NetCom GSM and our fixednetwork. National mobile Telenor traffic with other fixed operators goes in transit through the Telenorfixed network. At present, Telenor Mobile Communications uses one international carrier (TelenorGlobal Services) for all international traffic. Currently, changes to international interconnectionpractice, introducing different termination charges to fixed and mobile networks, are being effected.These changes are therefore likely to reduce the possibility of re-filing incoming traffic to our mobilenetwork, as a result of higher charges being introduced for such traffic terminating on our mobilenetwork.
Access
We are required to offer access to our competitors to the internal services we use to providecertain services in a particular market. As a result of this obligation, services are required to beprovided in a manner that avoids discrimination between an external and an internal provider ofservices, unless different conditions can be objectively justified.
Access for Mobile Virtual Network Operators
An MVNO provides mobile services without controlling radio spectrum or radio network facilities.The MVNO buys radio spectrum and access to core network components such as base stations, butkeeps control over traffic routing and SIM-card production. In August 1999, the Ministry of Transport
176
BOWNE OF LONDON 12/03/2000 17:03 BL/SM NO MARKS NEXT PCN: 183.00.00.00 -- Page is valid, no graphics X42481 182.00.00.00 6X
and Communications launched an industry review to address the question of access to mobilenetworks for MVNOs, among other matters. Following this review, the issue of MVNOs was handledin a report from the Ministry to the Storting in December 1999. Based on the argument thatregulated access for MVNOs could reduce the incentives for investing in mobile networkinfrastructure, the Ministry concluded that mobile operators are not currently required to give accessto their networks for MVNOs. The Storting has endorsed this conclusion. The scope of access tomobile networks will be governed by a revised regulation that is expected to be implemented early2001.
During the last six months, both Telenor and NetCom GSM have signed several wholesaleagreements with mobile service providers. Unlike MVNOs, service providers buy all networkservices, including SIM-cards, from the mobile operators. Some service providers have alreadylaunched their mobile services based on Telenor’s or NetCom’s infrastructure, and others areexpected to follow in the near future. It is expected that approximately 20 mobile service providerswill offer their services in the Norwegian market by the end of 2000.
Access for Value-Added Telephony Service Providers
The PT has decided that we are required to provide network access for external providers ofvalue-added telephony services. The terms and conditions must be non-discriminatory and similar towhat is offered to our internal providers of such services. An external service provider has requestedaccess to our network’s internal technical interfaces, but we have not been obligated to provide suchaccess. All external service providers are offered access via standardized network externalinterfaces. An external service provider has also requested access to our mobile network in order toproduce SMS and voice mail services. This request is now pending mediation by the PT, and theoutcome is still not clear.
Local Loop Unbundling
Unbundling of access to the copper (physically twisted metallic pair) local loop permits ourcompetitors to have physical access to as well as lease defined capacity in the copper local loop,thus enabling them to have the sole billing relationship with the end user. Local loop unbundling hasincreased the possibility for competition in the access network. Competitors may also installsupplementary equipment, such as xDSL, on leased local loops to offer higher bandwidth services.The Ministry of Transport and Communications is preparing revised regulations that will require us tooffer local loop unbundling, and which is expected to be in accordance with a proposed EURegulation of the European Parliament and of the Council. The proposed EU Regulation will be ofgeneral application and be binding in its entirety and directly applicable in all member states. TheEuropean Parliament approved the proposed Regulation on October 26, 2000 and the Council mustalso now confirm acceptance of proposed amendments for final adoption of the Regulation. If it isimplemented according to schedule, full local loop unbundling must be provided in the memberstates by year end 2000. The revised Norwegian regulation is expected to take effect from early2001 (probably February 1, 2001). Since April 1, 2000, we have been offering competitors the abilityto lease capacity in the local loop, and we allow competing operators to deploy technical equipmentin connection with our installations. Our pricing structure is based on costs. Our product does notinclude shared access (Telenor offering the telephony service and the new entrant offering thebroadband data service) to the local loop or access to local sub-loops, which is required by theproposed EU Regulation. We have currently signed 10 agreements regarding access to definedcapacity in the copper local loop.
Carrier Selection
Since January 1, 1998, all operators providing access to the fixed network have been requiredto allow their customers to select other operators to handle their calls. This can be done on a call-by-call basis by dialing a 4-digit prefix in addition to the called telephone number, or by means of
177
BOWNE OF LONDON 12/03/2000 17:03 BL/SM NO MARKS NEXT PCN: 184.00.00.00 -- Page is valid, no graphics X42481 183.00.00.00 8X
carrier pre-selection. With carrier pre-selection subscribers can decide that all or part of their trafficshall be processed through another telecommunication service provider. In this case, the user avoidsdialing the 4-digit prefix every time he or she makes a call. The user may still override the pre-selection by entering the prefix of another operator on a call-by-call basis.
In September 1998, the PT decided that carrier pre-selection should be introduced in twophases. The first phase was implemented on June 1, 1999, and providers of access to the fixednetwork were required to offer their subscribers the ability to choose one pre-selected carrier. Carrierpre-selection services included national traffic to geographical (local and long distance calls) andmobile numbers and international traffic. Traffic to non-geographical numbers (e.g., freephone andpremium rate services) was not included in this phase. The second phase, which was implementedon November 1, 2000, requires fixed network access providers to offer their subscribers the ability tomake two pre-selections, which may be with two different carriers. The first pre-selection includesnational traffic to geographical, most non-geographical and mobile numbers (traffic to numbers withextreme traffic fluctuations have been exempted) while the other pre-selection includes allinternational traffic.
There has been a regulatory requirement for call-by-call carrier selection in mobile networkssince January 1, 1998. However, at this time, no agreements exist between mobile operators andalternative carriers regarding carrier selection in mobile networks. In September 1998, thePT decided that carrier pre-selection was to be introduced in mobile networks by November 1, 2000.However, in March 2000 the Ministry of Transport and Communications informed the Storting thatthe current legal requirement for carrier pre-selection in mobile networks would be reconsidered inlight of recent developments in the EU based on the 1999 Communications Review. The PT hassince published a consultative document signalling that it will cancel the regulatory requirement forcarrier pre-selection in mobile networks. The PT restated this in September at a public meeting withthe industry on the issue. No formal decision has yet been made, but is expected shortly.
Mobile National Roaming
Mobile operators with significant market power (currently both us and NetCom GSM) arerequired to provide national roaming to other mobile operators, in areas where the requestingoperator’s network does not have geographical coverage. The Ministry of Transport and Communica-tions may prescribe the conditions and effective date for national roaming. GSM 1800 licensesrequire the licensee to build a network covering the four largest cities in Norway (Oslo, Bergen,Trondheim and Stavanger) before being entitled to have national roaming. Because there is not yet athird GSM 1800 network, national roaming between GSM networks has not yet been implemented inNorway.
The Ministry of Transport and Communications has indicated that the 3G licensees will have theright to have national roaming from GSM operators with significant market power in areas where the3G operator’s network does not have coverage. There will be no requirement for the 3G operator tobuild its own network in specific areas before it is entitled to have national roaming. National roamingbetween 3G operators will not be mandated for the time being.
Numbering and Number Portability
Numbering
The PT is responsible for managing national numbering plans for telecommunications networksand services, including telephone numbers. Providers of public telecommunications services areallocated numbering resources from the PT upon specific application and the payment of a fee. Thefees cover only the costs incurred by the PT in administering the relevant numbering resources. In2000, we paid approximately NOK 1.5 million in numbering fees related to fixed telephony andNOK 0.8 million related to mobile telephony.
178
BOWNE OF LONDON 12/03/2000 17:03 BL/SM NO MARKS NEXT PCN: 185.00.00.00 -- Page is valid, no graphics X42481 184.00.00.00 6X
Directory Inquiry Services
In August 2000, the PT issued a consultation document regarding numbering for directoryinquiry services. Two possible numbering options for such services were presented. The PT’sintention is to create more competition in the area of directory inquiry services by making shortnumbers available for new service providers. Up to now, we have been the only service provider withthree-digit numbers allocated for our directory enquiry services (180 and 181).
The numbering option favored by the PT in the consultation document, and supported by mostof the respondents, means that four-digit numbers will be used for directory inquiry services (18xx).If the PT adopts this solution we will have to change our numbers for directory inquiry services. It isexpected that the PT will decide on this matter by the end of 2000.
Number Portability
In October 1998, the PT decided to introduce number portability for telephone numbers in thefixed network (PSTN and ISDN) and for numbers for most non-geographical services (e.g.,freephone, shared cost and premium rate services). Number portability allows subscribers to keeptheir telephone numbers when changing service providers. All public service providers must supportnumber portability. Number portability in the fixed network will be introduced in two phases inNorway. On June 1, 1999, the first phase, a simple call forwarding solution was implemented. Thesecond phase, offering a better technical solution optimizing routing of calls, will be introduced byFebruary 1, 2001.
The PT is currently considering introducing regulations for mobile number portability, with aproposed implementation target date of September 1, 2001. It is expected that all licensed operatorsand service providers will be required to support mobile number portability, except for Telenor’s NMTservices. However, the PT has not made a final decision on mobile number portability and theimplementation date and conditions have yet to be determined.
Rights of Way
Under the Telecommunications Act, registered providers of public networks or public telephonyservices have a general right to install telecommunications networks and equipment on public orprivate property subject to a case-by-case approval by the Ministry of Transport and Communication.The Ministry may further decide to give such providers individual permission to claim the right to ownor use property for installing telecommunication networks or equipment. Currently only Telenor andNetCom GSM have been granted individual permissions. The Telecommunications Act and thegeneral Expropriations Act give us certain rights to compel the landowner to accept the necessarysteps to use his land for telecommunications purposes. The owner of the relevant premises is,however, entitled to compensation for any inconveniences caused, except where the right wasacquired in order to connect the property concerned to a public telecommunications network. Thelevel of compensation to be paid, if not agreed by the parties, is determined by official valuationaccording to applicable legal procedures. In the vast majority of cases, the parties independentlyagree on the level of compensation.
Data Protection
The Personal Register Act of June 9, 1978 and certain other regulations impose restrictions onthe use of electronically stored personal data. The Data Inspectorate is an independentadministrative body under the Norwegian Ministry of Justice and supervises the 1978 Act andsecondary legislation. The Storting has passed new legislation to replace the 1978 Act, and the newAct is expected to take effect by January 1, 2001. Under the current Act, a license is required toestablish personal data filing systems. One notable exception to the general rule is for customerdatabases. We have one license for mobile services, one for fixed network services and one for IPtelephony, allowing us to store traffic data for a certain period primarily for billing and customer care
179
BOWNE OF LONDON 12/03/2000 17:03 BL/SM NO MARKS NEXT PCN: 186.00.00.00 -- Page is valid, no graphics X42481 185.00.00.00 7X
purposes. Most telecommunications service providers in the Norwegian market are subject to similarlicensing obligations. As a result of the EU directive on data protection in the telecommunicationssector, the Data Inspectorate has issued a new license applicable to all telecommunications serviceproviders. The subscriber databases are primarily used by each of the licensees for its internal usein accordance with the license. In addition to internal use, the primary use of the subscriber data isprovision of telephone directories (white and pink pages) as well as a directory service (telephoneinquiries) in accordance with the Data Inspectorate licenses as well as the relevant telecommunica-tions licenses. Other telecommunications providers are obliged to transfer subscriber data (name,telephone number and address) to us for inclusion in the catalogue and inquiry services. The EFTASurveillance Authority is evaluating the implementation of the EU directives on Data Protection in thetelecommunications sector in Norway.
Consumer Protection
Generally, there are several Norwegian laws regarding consumer protection. The protection ofconsumer interests is also an additional objective of the Telecommunications Act and secondaryregulations. All registered and licensed operators are required to make consumer contracts, prices,price calculation parameters, quality of service details and compensation schemes publicly available.The Norwegian Consumer Ombudsman and the Consumer Council are actively engaged in severalissues relating to telecommunications services. Among other things, our standard terms andconditions for voice telephony services are determined in collaboration with the regulatory authorityin charge of consumer protection, the Norwegian Consumer Ombudsman.
Provision of Internet Services
Our Internet activities are regulated by various laws, including relevant provisions of theTelecommunications Act and the secondary legislation. The regulations applicable to operators withsignificant market power do not apply to our Internet activities.
Under mandatory statutory law in Norway, Internet service providers are liable if theythemselves provide illegal content on the Internet. Where the content is provided by third parties, theliability for the Internet service provider is unclear but an Internet service provider may be held liablefor such content. The applicability of existing laws governing issues such as intellectual propertyrights, freedom of speech, defamation and personal privacy with respect to the liability of an Internetservice provider is therefore uncertain. In the report on Convergence (NOU 1999:26), agovernmental working group has stated that the liability for unlawful expressions on the Internet forintermediary service providers should be limited due to freedom of speech.
At the European Union level the June 8, 2000 directive on certain legal aspects of informationsociety services, in particular electronic commerce, in the internal market contains regulations withrespect to Internet service provider liability. Additionally, the directive on copyright and related rightsin the information society is expected to have an impact on the liability for infringement of intellectualproperty rights. The electronic commerce directive is part of the EEA Agreement, and is currentlyunder implementation in Norway.
Regulation of Satellite, Cable Television, Terrestrial Broadcasting Networks and TelevisionDistribution
Norwegian laws, including, among others, the Telecommunications Act, the Broadcasting Actand secondary legislation under both Acts, and international commitments regulate our activitiesrelating to operations of networks for broadcasting over satellites, cable television and the terrestrialbroadcasting network and our activities relating to distribution and sales of pay television (broadbandservices). Generally, the rules cover technical regulations, including type approval of equipment andallocation of frequencies. To some extent the regulations also aim at securing specific public policygoals and market regulations (authorizations). All these activities must adhere to the specific
180
BOWNE OF LONDON 12/03/2000 17:03 BL/SM NO MARKS NEXT PCN: 187.00.00.00 -- Page is valid, no graphics X42481 186.00.00.00 6X
regulations regarding use of standards for transmission of broadcasting signals. The EU directive onthe legal protection of services based on, or consisting of, conditional access is not yet implementedin Norwegian law but it is expected that it will be implemented.
Our satellite activities are mainly governed by the regulations relating to technical requirementsand allocation of frequencies in the Telecommunications Act and the secondary legislation. Satelliteactivities are also governed by international rules, issued by the ITU. The ITU is the primaryinternational regulatory body through which radio regulations are determined and frequencyallocations coordinated and managed on a global basis (in conjunction with the telecommunicationsauthorities designated to deal with the ITU by each member state), in order to reduce the likelihoodof technical interference from neighbouring satellite systems. Once the coordination process hasbeen completed (which can take a number of years), the frequency (and associated orbit slot) isentered into a ‘‘master international frequency register’’ for the specified life of the satellite. The PTis formally responsible, on behalf of the Kingdom of Norway, for dealing with the ITU with regard tothe international coordination process.
In accordance with the terms of the Telecommunications Act, the PT has granted us atemporary license for operation of earth stations and radio systems for satellite communicationsissued in January 1996. The temporary license is valid until a new license is issued. PT is expectedto issue three new licenses, one for the space segment, one for land based installations andequipment in Norway, and one for land based installation and equipment operated on the territory ofthe arctic island of Svalbard. We expect that the new licenses will be issued in late 2000 or mid2001. The licenses will most likely be issued before the coordination process in ITU is completedand the licenses will therefore be amended accordingly at a later stage to adhere to the outcome ofthe ITU coordination process.
The temporary license is a general license and authorizes satellite communications, includingsatellite mobile communications in Norway, including authorization for Telenor to use the frequenciesand orbital slot at 1ÕW in respect of Thor I, II and III. In addition we have two separate licenses forradio systems for land mobile equipment in connection with our personal satellite telephone servicesusing INMARSAT services, issued by the PT. These two separate licenses relate to the Mini M andthe INMARSAT M 4. The Mini M system/service was issued in 1998 and is valid until December2003 and the INMARSAT M 4 was issued in 2000. Both licenses can be renewed, but as statedabove, we expect that new licenses will be issued prior to the expiry of these two licenses. Our otherINMARSAT services are covered by the general temporary license from 1996.
In the countries where we have satellite installations we must have licenses to operate radioequipment and use of frequencies from the national regulators and comply with technical rules,including rules for type approval in the relevant jurisdictions. In addition we follow the decisions andrecommendations from CEPT and ITU. We must also adhere to the general international space lawprinciples and conventions on liability and registration which Norway and/or Telenor is subject to, inconnection with ownership and operation of our Thor I, II and III satellites. Further, it is expected thatthe Norwegian regulatory authorities will consider implementing new regulations concerning ourliability towards the Kingdom of Norway in connection with Norway’s obligations under the 1972Convention on International Liability for Damage Caused by Space Objects.
Our cable television activities are governed by both the Telecommunications Act and theBroadcasting Act and secondary legislation to these Acts. The most important regulations relate tomust-carry rules for public broadcasters, subscriber choice for programs/channels, re-transmission ofbroadcast channels with an unlawful content and authorizations required for the cable televisionoperator’s own broadcasting activities.
Parties other than the Norwegian Broadcasting Corporation Ltd must obtain a licence in order toengage in national or local broadcasting. However, simultaneous and unaltered retransmission byway of cable networks of broadcasts that is sanctioned by law does not require a special licence.There are however, restrictions on cable network operators that prevent them from carrying out or
181
BOWNE OF LONDON 12/03/2000 17:03 BL/SM NO MARKS NEXT PCN: 188.00.00.00 -- Page is valid, no graphics X42481 187.00.00.00 6X
otherwise engaging in local broadcasting activities. Cable companies may not possess their ownlicence to operate local broadcasting services or possess a holding of more than 49 per cent of alocal broadcasting company.
Cable owners have a duty to retransmit the television broadcasts of the Norwegian BroadcastingCorporation (NRK), TV 2 and certain terrestrial local public television services. Programs subject toobligatory retransmission must be transmitted via channels that are available to every subscriber tothe network.
The Mass Media Authority may prohibit the retransmission of television channels which;broadcast advertising in contravention of Norwegian law, broadcast programs containing pornographyor violence in contravention of Norwegian law, broadcast programs which may have a harmful effecton children or young persons, broadcast programs which Norwegian courts have ruled to be incontravention of Section 135 a of the General Civil Penal Code (on racial discrimination). A cablenetwork operator, who wilfully or negligently violates a prohibition in this context, is liable to fines orimprisonment for a term not exceeding six months. A cable network operator may not otherwise beheld liable for the content of retransmitted broadcasts.
In connection with our terrestrial broadcasting network we have been granted, in accordancewith the Telecommunications Act, radio line and transmitter network licenses authorizing us, amongother things, to sell or lease capacity to broadcasting companies and to transmit programs forbroadcasting. These licenses are valid until November 2006 and can be renewed thereafter. Thelicenses may be withdrawn if numerous or substantial breaches of the terms of the license occur,subject to a fourteen-day prior notice period.
Regulation of interactive services for broadband networks is generally unclear. The regulation ofsuch services has been under debate and the governmental report on Convergence describes thecurrent applicable legislation and proposes amendments and changes to current legislation to bebetter suited for such interactive services. In general, we support the proposed changes as they maylead to more predictable and stable regulation.
A separate law relating to distribution of films and videos will have an impact on video-on-demand and near-video-on-demand services over our existing and future technological platformsregarding distribution of such content. There is a proposal to change the law in this respect to adaptthe existing rules to electronic distribution.
As a result of the governmental report on convergence it is likely that a harmonization andmodernization of the rules regarding our activities in the TV-distribution and media sector will takeplace.
Prospects for Regulatory Reform
At the EU level, a total review of the telecommunications regulations has been undertaken,commonly known as the 1999 Communications Review. The European Commission announced itsproposals based on this review on July 12, 2000. The objective is to develop a harmonizedregulatory framework for electronic communications networks and services across the EU, effectiveas of 2002. As a member of EEA, it is expected that the Norwegian policy makers will follow thesame scope, objective and timeframe as the EU in the further developments of the Norwegianregulatory regime. However, the Norwegian policy makers have indicated a need to actively re-examine, and possibly update, the regulatory framework due to the fast pace of technological andmarket developments. As a result, the Ministry of Transport and Communications has undertaken areview of several areas of the Norwegian regulatory framework. The recommendations made since1999 include the following:
) proposing a requirement for local loop unbundling in a report to the Storting which wasendorsed by the Storting;
182
BOWNE OF LONDON 12/03/2000 17:03 BL/SM NO MARKS NEXT PCN: 189.00.00.00 -- Page is valid, no graphics X42481 188.00.00.00 7X
) proposing conditions for 3G licenses and non-access for MVNOs in a report to the Stortingwhich was endorsed by the Storting;
) appointing a public committee, which has delivered a report on Convergence, (NOU1999:26), describing the convergence among the digital industries and the need for changesin the national regulations and laws to accommodate this market development; and
) appointing a working group with members from several Ministries who have delivered areport (‘‘Broadband Services Report’’) to the Minister of Transport and Communicationsproposing a national strategy for introducing broadband networks and services to the wholecountry.
The Broadband Services Report proposes to focus primarily on strengthening competition forbuilding and operating networks and services, supplemented by initiatives to stimulate demand forbroadband communications in the public sector. First, this is intended to ensure, by developing andmaintaining the regulatory framework, that dominant operators do not abuse their market position toimpede competition. Second, the Broadband Services Report proposes to stimulate systematicallydemand for broadband communications by requiring that broadband capacity be made available toall schools, libraries, hospitals and community administrations by the end of 2002. As a response theNorwegian government released a Broadband Action Plan in October 2000 stating its ambition toboth strengthen competition in this area and to contribute to an increased public demand. Thegovernment’s ambition is to promote the delivery of broadband access products to all primary andsecondary schools, public libraries, hospitals and community administrations by the end of 2002 andto all households by the end of 2004.
Furthermore, as a result of the report on Convergence, changes and amendments are expectedto the Telecommunications Act and the Broadcasting Act. We expect that new legislation concerninginformation services may be forthcoming. Finally, changes and amendments in the field ofintellectual property rights are also anticipated.
A new act on electronic signatures was proposed to the Storting on 29 September 2000. Theact has not yet been passed by the Storting. The Act is based on the EU directive on electronicsignatures to promote the effective and secure use of electronic signatures which is to beimplemented in member states by July 2001. The main principles and the regulations proposedwould require that a ‘‘qualified electronic signature’’ be accepted as a signature, assuming that thetransaction could be done electronically. It is currently proposed that the PT would act as thesupervising authority for certificate service providers that issue qualified certificates. The draft act willserve as a legal basis for more detailed regulation of certificate services and certificate serviceproviders.
The outcome of the European Commission’s proposed directives and the proposed Norwegianregulations are uncertain at this time and could result in significant changes to telecommunicationsregulation in the European Union and possibly Norway. Due to the uncertainty surrounding theseissues, we are not in a position to assess the impact of the possible changes to telecommunicationsregulation on our business.
Competition
We are subject to the competition rules of the Norwegian Competition Law and the competitionrules of the European Economic Area agreement. The competition rules of the European EconomicArea agreement contain identical competition rules to those of the Amsterdam Treaty (Article 81and 82 and the merger regulation).
The Norwegian Competition Authority is responsible for the surveillance and regulation of allaspects of competition in Norway, including the telecommunications industry. The NorwegianCompetition Authority has been involved in a number of cases concerning telecommunications andwe were involved in several of these cases. The Norwegian Competition Law was revised in
183
BOWNE OF LONDON 12/03/2000 17:03 BL/SM NO MARKS NEXT PCN: 190.00.00.00 -- Page is valid, no graphics X42481 189.00.00.00 6X
anticipation of Norway’s entry into the European Economic Area and became effective on January 1,1994. The Norwegian Competition Law was amended effective May 5, 2000 and applies to actionsthat have an effect in Norway, including mergers. The Competition Law applies fully to thetelecommunications, satellite, Internet and other related markets in which we operate. TheNorwegian Competition Law is based on, and generally conforms to, the rules of competition of theEuropean Union.
The Competition Law empowers the Competition Authority to intervene and declare a specificbehavior anti-competitive (similar to the prohibition of abuse of a dominant position in a market underEEA and EU competition rules). Contrary to EEA and EU rules (Articles 54 and 82), the behavior isnot considered illegal until the Competition Authority has made a formal decision, and only continuedanti-competitive behavior after a decision is made may be subject to fines. The Competition Authorityalso may intervene against acquisitions or mergers of enterprises, if such acquisition will create orstrengthen a significant restriction on competition. The law also contains several prohibitions andgeneral exceptions and grants discretionary power to the Competition Authority to grant individualexceptions from various prohibitions, including prohibitions against collaboration and influence onprices, markups and discounts, collaboration and influence on tenders, collaboration or use ofinfluence to achieve market sharing and prohibition against collaboration and influences which mayresult or encourage restraints on competition.
The competition rules in the European Economic Area agreement have a direct effect in theEEA area, and under certain conditions the rules of the Amsterdam Treaty apply to us. The primaryEEA and EU competition rules are contained in Articles 53/81 and 54/82 of the EEA Treaty andAmsterdam Treaty, respectively (formerly Articles 85 and 86 of the Treaty of Rome). Article 53/81 ofthe EEA/Amsterdam Treaty prohibits agreements or collusive behavior between companies that mayaffect trade between Members States and which restrict, are intended to restrict or have an affect ofrestricting, competition within the European Union. Article 54/82 of the EEA/Amsterdam Treatyprohibits any abuse of a dominant position within a substantial part of the European Union, whichmay affect trade between member states. The European Commission, in cooperation with thenational competition authorities, enforces these rules. The European Commission may impose finesin the event of a breach amounting to up to 10% of a company’s revenues on a consolidated basisin the preceding financial year. In addition, national courts have jurisdiction to apply European Unioncompetition law and award damages in the event of a breach.
From time to time, our competitors and customers file complaints with the NorwegianCompetition Authority and the EFTA Surveillance Authority alleging that we are abusing our dominantmarket position in various respects or in respect to mergers. Moreover, these authorities may alsostart investigations on their own initiative. Two cases are currently pending before the EFTASurveillance Authority (ESA) and the EU Commission. One relates to a complaint regarding accessto the fixed network, and one relates to a complaint regarding refusal to deliver subscriber data.There are three cases pending before the Norwegian Competition Authority. One relates to access tofunctionality that permits call transfer between the mobile and the fixed telecommunication network. Itis claimed that Telenor is preventing competition by strengthening its dominant position in both thefixed and mobile telecommunications markets. The second relates to a sales campaign regardingdiscounted ISDN access. It is claimed that Telenor is preventing competition by requiring a six monthlock-in period in which the subscriber is not permitted to apply carrier preselection. The third onerelates to pricing of satellite transponder capacity (a concurrent complaint is being made by theModern Times Group to the national competition authorities in Denmark and the EU Commission). Acomplaint on the same subject matter was handled by the Swedish Competition Authorities, whichfound no reason to intervene. In addition to these three cases, the Competition Authority is currently,on its own initiative, investigating the terms in Telenor’s Smartphone service. We do not believe thecases pending before the ESA and the cases before the Norwegian Competition Authority are likelyto have a material adverse effect on us.
184
BOWNE OF LONDON 12/03/2000 17:03 BL/SM NO MARKS NEXT PCN: 191.00.00.00 -- Page is valid, no graphics X42481 190.00.00.00 6X
Regulation Regarding Public Procurement
The EU directive on public procurement for the excluded sectors (93/38/EC) has beenimplemented in Norwegian law under the EEA agreement. The EU Commission exempted thetelecommunications sector in several Member States, including Sweden, Denmark, and othermarkets similar to the Norwegian market from these rules under Article 8 of this directive. The EFTAsurveillance authority is expected to evaluate the Norwegian market and make a formal decision inthe near future and we expect that the EFTA Surveillance authority will come to the same conclusionas the EU Commission.
WTO Obligations
Over 70 member countries of the World Trade Organization, or WTO, representing over 90% ofthe world’s basic telecommunications revenues, including the members of the European Union andthe United States, have entered into a Basic Telecommunications Agreement, or the BTA, to providemarket access to some or all of their basic telecommunications services. This agreement was signedby all the member states of the European Union as well as the United States and took effect onFebruary 5, 1998. The BTA is the fourth protocol of the General Agreement on Trade in Services,which is administered by the WTO. Under the BTA, Norway and the other signatories have madecommitments to provide market access, under which they are to refrain from imposing certain quotasor other quantitative restrictions in specified telecommunications services sectors. Signatories arealso to provide national treatment, under which they are to avoid treating foreign telecommunicationsservice suppliers differently from national service suppliers. In addition, a number of signatories,including Norway, agreed to abide by certain pro-competitive principles set forth in a reference paperrelating to the prevention of anti-competitive behavior, interconnection, universal service, trans-parency of licensing criteria, independence of the regulator and non-discriminatory allocation ofscarce resources.
Since Norway is a member of the EEA, EU/EEA regulations on telecommunications apply tointra-EEA operations. The WTO agreement is therefore mainly of importance to us when we wish toset up operations outside the EEA and of importance for companies outside of the EEA wishing toset up operations in Norway or any other country within the EEA.
Regulation of Communications Activities Outside Norway
To the extent we conduct operations or invest in the operations of mobile providers or othertelecommunications or Internet companies in other countries, we and the companies in which weinvest are subject to the licensing and other regulatory requirements of each relevant jurisdiction,including any restrictions placed on our operations by applicable competition and foreign ownershiplaws.
Our current strategy includes expanding our mobile operations in the Nordic region and inselected countries in Europe and in Southeast Asia and expanding our Internet operations inEurope. Most of these countries are members of the World Trade Organization and signatories tothe BTA, and their communications regulatory schemes must conform to the BTA.
European Union Regulation
Liberalization and harmonization of telecommunications regulation
To the extent we conduct our international operations in Europe, in most cases we will also besubject to the existing EU regulatory regime. Set forth below is a summary of the more significantregulations that may directly affect our operations or the operations of the companies in which wehave invested or may invest in the EU. EU legislation can take a number of forms. Regulations havegeneral application, and are binding in their entirety and directly applicable in EU member states.Directives are binding, but national authorities may choose the form and method of implementation.
185
BOWNE OF LONDON 12/03/2000 17:03 BL/SM NO MARKS NEXT PCN: 192.00.00.00 -- Page is valid, no graphics X42481 191.00.00.00 6X
As noted above in the discussion of our Norwegian operations, EU directives are generally alsomade applicable to Norway through the EEA Agreement.
Since 1987, the EU has adopted a substantial amount of legislation to liberalize and harmonizetelecommunications legislation in member states. The European Commission, through its powersunder Article 86 (3) of the Treaty of Rome, has addressed directives or decisions to member statesproviding for liberalization, i.e., abolishing monopoly rights of state owned telecommunicationsoperators in all markets (including the mobile market). Although the EU set January 1, 1998 as thedeadline for mandatory liberalization for the provision of voice telephony services, each memberstate had to enact its own laws to implement the EU’s mandate through its own processes.
The main harmonizing directives, the Open Network Provision Directives (ONP Directives)establish the basic rules for access to the public telecommunications network for users andcompetitors (including mobile operators and Internet service providers). Furthermore, the existingONP-framework may also be used in the future as a basis for further regulations that affect us andlocal operators from whom we lease capacity and enter into interconnection agreements with. TheONP Directives currently apply mostly to telecommunications operators with significant market powerover leased lines, mobile and/or fixed public telephony networks, and mobile and/or fixed public voicetelephony services. Operators with significant market power are generally required to provide accessto their network on an objective, transparent and non-discriminatory basis.
Following the outcome of the 1999 Communications Review on July 12, 2000, the EUCommission proposed a package of legislative reforms intended to consolidate, simplify and updatethe existing regulatory framework. These proposals include a new framework directive for electroniccommunications networks and services, four specific directives covering the authorization ofoperators and service providers, access and interconnection, universal service and data protectionand privacy as well as a regulation on the unbundling of the local loop. The directives are expectedto take effect in 2002 and the regulation is expected to enter into force by December 31, 2000. OnJuly 12, 2000, the EU Commission also proposed a draft Competition Directive aiming to replace bya single text all existing ‘‘liberalization’’ directives in the telecommunications sector. The draft hasbeen submitted to public consultation. As it develops, EU legislation will continue to have asignificant effect on our markets, including future developments relating to the convergence ofInternet, media and information technology.
Data Protection
The directive on the protection of individuals with regard to the processing of personal data andthe free movement of this data (the Data Protection Directive) was adopted by the EU onOctober 24, 1998. It established a regulatory framework to ensure both a high level of protection forthe privacy of individuals in all EU member states and the free movement of personal data within theEU. The Data Protection Directive lays down common rules for those who process, collect, hold ortransmit personal data as part of their economic or administrative activities. There is an obligation tocollect and process personal data only for specified, explicit and legitimate purposes, and to ensurethat this data is relevant, accurate and up-to-date.
The Data Protection Directive will, among other things, affect companies like us and ouraffiliates that collect and maintain information from and about individuals in EU member states.
The EU has also adopted a directive on the processing of personal data and the protection ofprivacy in the telecommunications sector (the Telecommunications Data Protection Directive). TheTelecommunications Data Protection Directive covers the processing of personal data in connectionwith publicly available telecommunications services and public telecommunications networks, andincludes provisions relating to the confidentiality of communications, the use of traffic and billing dataand the use of personal data for direct marketing. Under the Telecommunications Data ProtectionDirective, providers of public telecommunications services and networks are under specific legal
186
BOWNE OF LONDON 12/03/2000 17:03 BL/SM NO MARKS NEXT PCN: 193.00.00.00 -- Page is valid, no graphics X42481 192.00.00.00 6X
obligations to guarantee the security of their networks, to ensure the confidentiality of communica-tions and the deletion of traffic data after a specified period of time.
Electronic Commerce
On June 8, 2000, the directive on legal aspects of information society services, in particularelectronic commerce in the internal market (the Electronic Commerce Directive) was adopted by theEU. This directive aims to ensure the free movement of information, including electronic commerce,within the member states of the EU according to a country of origin principle. This directive regulatesthe legal recognition of electronic contracts, the formation of electronic contracts, the information tobe provided by the service provider to the consumer, and solicited and unsolicited commercialcommunications with consumers.
Liability of intermediary service providers. The directive also contains rules on liability ofintermediary service providers (such as Internet portals) for mere conduit and caching and hostingactivities. In principle, intermediary service providers cannot be held liable if they only act as a mereconduit, that is, as long as they do not initiate the transmission, select the receiver of thetransmission or select or modify the information contained in the transmission. In general, anintermediary service provider cannot be held liable for caching, provided it does not modify theinformation, complies with the conditions on access to and updating of information, does not interferewith the lawful use of technology to obtain data on the use of the information, and acts expeditiouslyto remove or disable access to information upon receiving knowledge that the information has beenremoved or access disabled at the initial source or this has been ordered by a court or administrativeauthority. An intermediary service provider cannot be held liable for hosting activities if it does nothave actual knowledge of illegal activity or information, was not aware of facts or circumstances fromwhich illegal activity or information is apparent and acts expeditiously to remove or disable access tothe information when he receives such knowledge.
Subscribers to our services may access content on our Internet portals, download this contentand transmit it to others over the Internet. They may also upload content onto our servers, eitheronto their individual web pages hosted by us, in chat rooms, bulletin boards or news groups. Inaddition, they may use the email accounts provided by us to send and receive content by email. Anyof these actions by subscribers could potentially result in claims against us, or our associatedcompanies, as service providers, based on the infringement of intellectual property rights of thirdparties, including copyright and trademark infringement, as well as defamation and publication ortransmission of obscene material. However, the implementation, by January 17, 2002, of theElectronic Commerce Directive will reduce the liability of intermediary service providers and thus theregulatory risk and uncertainty that surrounds this area today.
Furthermore, our portals may also contain a significant number of links to other websites. As aresult, we may be subject to claims alleging that by directly or indirectly providing links to otherwebsites, we are liable for intellectual property right infringement or the illegal or wrongful actions ofthird parties though their websites. The rules governing liability of intermediary service providers inthe Electronic Commerce Directive do not deal with the liability for hyperlinks, but do indicate thatthis is an issue for the European Commission to address in the future. We attempt to reduce ourexposure to this potential liability through, among other things, the general terms and conditions weapply to subscribers to our services and our portal disclaimers. However, the enforceability andeffectiveness of these measures is uncertain.
The Electronic Commerce Directive will have to be implemented by the EU member states byJanuary 17, 2002. The final impact of this directive on us is difficult to predict given the differentoptions that are open to member states for the implementation and also because Norway mustimplement the directive under the EEA Agreement.
Jurisdiction and Applicable Law. Due to the global nature of the Internet, it is possible that thegovernments of countries other than those in which our services are offered may attempt to regulate
187
BOWNE OF LONDON 12/03/2000 17:03 BL/SM NO MARKS NEXT PCN: 194.00.00.00 -- Page is valid, no graphics X42481 193.00.00.00 6X
or prosecute us for the content contained in our portals or transmitted using our services. As someof our content is available over the Internet all around the world, these jurisdictions may claim thatwe need to qualify to do business in their country or that we are required to notify governmentalauthorities of our activities, including, for example, those activities relating to the collection andprocessing of user data, or relating to the provision of financial services information.
Although the Electronic Commerce Directive stipulates that the home country of the serviceprovider controls its activities over the Internet, the directive also states that it does not set out newrules of private international law on jurisdiction or applicable law. On July 14, 1999, the EuropeanCommission adopted a proposal to amend the Brussels Convention on jurisdiction and enforcementof judgments in civil and commercial matters of September 27, 1968 and change it into a CouncilRegulation, thus aiming to make it part of EU legislation. As far as electronic commerce isconcerned, this proposal aims to clarify its applicability to electronic commerce and widens thescope of the special provision for consumer contracts. If the proposal were adopted in its currentform, it would allow consumers to sue a service provider in the consumer’s member state forcontracts concluded via an interactive website that is accessible in the consumer’s member state.The European Commission is also working on a similar proposal for the Rome Convention on thelaw applicable to contractual obligations. Both proposals are highly controversial and the industry istrying to block, or at least defer, their adoption.
Copyright
The Electronic Commerce Directive is closely linked to the proposed Directive on Copyright andRelated Rights in the Information Society, or the Copyright Directive. This proposed directive wasadopted by the European Commission on December 10, 1997, and the final version is expected tobe adopted by the end of 2000. The Copyright Directive is supposed to be implemented by EUmember states within one year of its entry into force.
The draft Copyright Directive grants right holders an exclusive right to make on-demandtransmissions available to the public and harmonizes reproduction and distribution rights. Forexample, right holders are granted the exclusive right to prohibit direct or indirect, temporary orpermanent reproductions by any means and in any form, in whole or in part. However, as acounterbalance to this enhanced level of protection, the Copyright Directive provides a number ofexceptions to the right holders’ exclusive rights, such as an exception for certain temporary copies.The scope of the exceptions to copyright protection, in particular for temporary copies, is currentlythe subject of a controversial debate. Thus, while we consider that certain acts such as cachingshould not fall within the exclusive rights of right holders or should at least be the subject of anexception, the Copyright Directive may materially adversely affect our business if the scope of theexceptions is reduced. The draft Copyright Directive also deals with technological measures toprotect against copyright infringements and attempts to provide legal protection against thecircumvention of these measures.
Electronic Signatures
Also closely connected with electronic commerce is the issue of electronic signatures. Thedirective on a Community Framework for Electronic Signatures of December 13, 1999, or theElectronic Signatures Directive, establishes a framework in which third parties, also known as‘‘certification service providers,’’ issue ‘‘qualified certificates’’ to enable the verification of electronicsignatures. It also sets out criteria for the legal recognition of electronic signatures. The ElectronicSignatures Directive is required to be implemented by EU member states by July 19, 2001.
Distance Selling
Our activities in the field of electronic commerce will also be subject to the Directive of May 20,1997 on the Protection of Consumers in respect of Distance Contracts, or the Distance Selling
188

BOWNE OF LONDON 12/03/2000 17:03 BL/SM NO MARKS NEXT PCN: 195.00.00.00 -- Page is valid, no graphics X42481 194.00.00.00 6X
Directive, which sets out rules for contracts concluded at a distance, including contracts for goodsand services sold over the Internet. The deadline for implementation of the Directive by EU memberstates was June 4, 2000.
The Distance Selling Directive requires suppliers to provide consumers with specific information,including their name, address, price and delivery costs, before the contract is concluded. Consumersgenerally have a seven-day right of withdrawal. The Distance Selling Directive prohibits ‘‘inertiaselling’’ (the supply of goods or services without prior request) and suppliers are restricted in theiruse of automatic calling or facsimile machines or unsolicited emails to communicate with consumers.Consumers must have effective means of redress.
The Directive does not apply to contracts such as those relating to financial services, contractsconcluded with telecommunications operators through the use of public pay phones, and contractsconcluded at an auction.
189
BOWNE OF LONDON 12/01/2000 19:56 BL/SM NO MARKS NEXT PCN: 196.00.00.00 -- Page is valid, no graphics X42481 195.00.00.00 7X
MANAGEMENT
Directors and Executive Officers
The management of Telenor is vested in our board of directors and our President and ChiefExecutive Officer. The President is responsible for the day-to-day management of our company inaccordance with the instructions, policies and operating guidelines set out by our board of directors.Our articles of association specify that our board of directors shall consist of between five andeleven members. Our board of directors currently consists of nine directors, of which three areemployee representatives.
The current board of directors (excluding employee representatives) has been elected by thegeneral meeting. In the future, the board of directors will be elected by the Corporate Assembly.
The directors and executive officers of the Company are identified below. The address of thedirectors and executive officers is c/o Telenor ASA, at the corporate headquarters in Oslo, Norway.
Board of Directors
Name Address Age Position
Eivind Reiten ****** Oslo 47 Chairman of the Board of Directors
Ashild M.Bendiktsen ****** Salangen 55 Deputy Chairman of the Board of Directors
Kari Broberg******* Østre Toten 44 Director
Mai Buch********** Copenhagen, Denmark 49 Director
Bente Halvorsen *** Skedsmo 46 Director
Inge K. Hansen **** Oslo 54 Director
Harald Stavn(1) **** Kongsberg 46 Director
Per GunnarSalomonsen(1)*** Skien 46 Director
Irma Tystad(1) ***** Trysil 57 Director
(1) Elected by the employees
Eivind Reiten. Eivind Reiten has served as the Chairman of the board of directors sinceMay 29, 2000 and as Deputy Chairman of the board of directors since December 20, 1999.Mr. Reiten is currently the Executive Vice President of Norsk Hydro ASA in charge of light metalsactivities. Previously, he served in the government of Norway as Minister of Oil and Energy, Ministerof Fisheries, and Under-Secretary in the Ministry of Finance.
Ashild M. Bendiktsen. Ashild M. Bendiktsen was elected to the board of directors the firsttime in June 1994 and served as a director until November 1999. She was again elected on May 29,2000, and was appointed the Deputy Chairman of the board of directors in July 2000. She is Vice-President of Finance at Bendiktsen & Aasen AS, Board Chairman of NHO (Confederation ofNorwegian Business and Industry) in Troms county, a board member of A-pressen ASA and amember of the national board of NHO. Ms. Bendiktsen has previously served as Under-Secretary inthe Ministry of Transport and Communications of Norway and has previously served on the board ofdirectors of Telenor.
Kari Broberg. Kari Broberg was elected to the board of directors on December 20, 1999 andwas re-elected to the board on May 29, 2000. She is a business consultant with HartmarkConsulting AS. Previously, Ms. Broberg has served as Vice-President at Jordan AS and Alcatel AS.She has served as a board member of Alcatel Telettra Norge AS, Norsk Regnesentral, Norsk forumfor ledelse og kvalitet (Norwegian forum for leadership and quality) and Nera ASA.
190
BOWNE OF LONDON 12/01/2000 19:56 BL/SM NO MARKS NEXT PCN: 197.00.00.00 -- Page is valid, no graphics X42481 196.00.00.00 5X
Mai Buch. Mai Buch was elected to the board of directors on May 29, 2000. She is Presidentof Competence House A/S, the chairman of Denmark’s Virtual University, and a board member ofthe Hovedstadens Sygehusfællesskab (The Copenhagen Hospital Corporation). She has previouslyserved as manager of the development office of the Ministry of the Environment, and head ofForskningsministeriet (the department of IT and research) and assistant director and financialdirector of Det Kongelige Teater (The Royal Theater) in Copenhagen.
Bente Halvorsen. Bente Halvorsen was elected to the board of directors on May 29, 2000.She is the Treasurer of LO (Norwegian Confederation of Trade Unions) and serves on a number ofboards and committees within the LO, including Var Bank og Forsikring (a banking and insurancecompany).
Inge K. Hansen. Inge K. Hansen was elected to the board of directors on May 29, 2000. He isan Executive Vice President at Statoil. He was previously president of Orkla Finans AS and servedat Bergen Bank and Den norske Bank.
Harald Stavn. Harald Stavn was elected to the board of directors on June 20, 2000. Mr Stavnis a board member of Telenor Pensjonskasse (Pension Foundation). He previously served as a boardmember of NITO (the Norwegian Association of Technical Employees). Mr. Stavn joined Telenor in1974 and has held various engineering positions.
Per Gunnar Salomonsen. Per Gunnar Salomonsen has served as an employee electedrepresentative on the board of directors since November 1, 2000. Since 1995 he has been anemployee representative on the board of Telenor Nett. Mr. Salomonsen joined Telenor in 1973 andspent the first two years studying for an engineering degree. He has held various positions inTelenor, most recently as operational engineer.
Irma Tystad. Irma Tystad was elected to the board of directors on June 20, 2000. She is anelected member of KTTL (the National Union Employees in Communication and Telecommunication).Ms. Tystad has held various positions in Telenor since 1962, most recently as head of a division inTelenor Media. Ms. Tystad has also served as a director in Telenor Plus AS since 1995 and of theTelenor pension fund since 1997.
Group Management
Name Address Age Position
Tormod Hermansen ********** Oslo 60 President and Chief Executive Officer
Torstein Moland ************** Lier 55 Senior Executive Vice President and ChiefFinancial Officer
Arve Johansen *************** Lier 51 Senior Executive Vice President, TelenorMobile Communications
Jon Fredrik Baksaas ********** Sandvika 46 Senior Executive Vice President, NorwegianOperations
Henrik Torgersen ************* Oslo 53 Executive Vice President, InternationalOperations
Berit Svendsen*************** Oslo 37 Executive Vice President and ChiefTechnology Officer
Jan Edvard Thygesen********* Nesbru 49 Executive Vice President, Telenor Telecom
Stig Eide Sivertsen *********** Oslo 41 Executive Vice President, Telenor BroadbandServices
Gun Bente Johansen ********* Oslo 39 Executive Vice President, CommunicationsHR and Framework
Morten Lundal *************** Oslo 36 Executive Vice President, Telenor Internet
191
BOWNE OF LONDON 12/01/2000 19:56 BL/SM NO MARKS NEXT PCN: 198.00.00.00 -- Page is valid, no graphics X42481 197.00.00.00 5X
Tormod Hermansen. Tormod Hermansen has served as the President and Chief ExecutiveOfficer of Telenor since 1991. Mr. Hermansen has previously served as assistant director of theCentral Committee for Norwegian Research, as director general in the Norwegian Ministry of Healthand Social Affairs, and as under-secretary of state in the Norwegian Ministry of Finance. In addition,Mr. Hermansen served as secretary general of the Norwegian Ministry of Local Government andLabor and as secretary general of the Norwegian Ministry of Finance. Mr. Hermansen has chairedthe Board of the Government Bank Insurance Fund, has been a member of the board of directors ofStatoil, and has been Chairman of the Board of the Norwegian Association of Publicly OwnedCompanies. Currently, he is also a member of the Board of Directors of DnB Holding ASA.
Torstein Moland. Torstein Moland has served as a Senior Executive Vice President and theChief Financial Officer of Telenor since 1997. Prior to joining the Company in 1997, Mr. Molandserved as the Governor of the Central Bank of Norway and as the Chief Financial Officer of NorskeSkog. He was previously employed at the Norwegian Ministry of Finance working on economic policyand later as the Under-Secretary of State. Mr. Moland received an honors degree in economics fromthe University of Oslo and completed additional studies at the Massachusetts Institute of Technology.
Arve Johansen. Arve Johansen has served as a Senior Executive Vice President since 1999and as Chief Executive Officer of Telenor Mobile Communication since 2000. Mr. Johansen joinedthe Company in 1989 and has held a number of positions, including Managing Director and ChiefExecutive Officer of Telenor International AS. Prior to joining Telenor, Mr. Johansen was employedby EB Telecom as a manager, by the Norwegian Institute of Technology as a research engineer andby ELAB. Mr. Johansen received a Master of Science in electrical engineering (telecommunications)from The Norwegian Institute of Technology and participated in the Program for ManagementDevelopment at the Harvard Business School.
Jon Fredrik Baksaas. Jon Fredrik Baksaas has served as an Senior Executive Vice Presidentsince 1997. Mr. Baksaas joined the Company in 1989 and previously served as the Chief FinancialOfficer. Prior to this, Mr. Baksaas was Financial Manager and Treasurer, Executive Vice President,and President at TBK AS. He has also held finance positions at Aker AS, Stolt-Nielsen Seaway andDet norske Veritas. Mr. Baksaas received a Bachelor of Science from The Norwegian School ofBusiness Administration and has attended the Program for Executive Development at IMD inLausanne, Switzerland.
Henrik Torgersen. Henrik Torgersen has served as Executive Vice President since July 1,2000. Mr. Torgersen joined the Company in 1998 and has served as President of Telenor East Investand Regional Director of Telenor. Previously, Mr Torgersen was regional operations manager withAndersen Consulting. Mr Torgersen received a Masters Degree in Cybernetics from the TechnicalUniversity of Norway and has completed a Management Training Program at IMD in Lausanne,Switzerland.
Berit Svendsen. Berit Svendsen was deputed Executive Vice President and Chief TechnologyOfficer of Telenor on September 15, 2000. Since joining Telenor in 1988 Ms. Svendsen has heldvarious positions, most recently Project-Director for FMC (Fixed-Mobile Convergence) and asmanaging director for data services. Ms. Svendsen holds a MSEE from the Norwegian University ofTechnology and Science and a Master of Technology Management from Norwegian University/Norwegian School of Business Administration/MIT.
Jan Edvard Thygesen. Jan Edvard Thygesen has served as an Executive Vice President andChief Executive Officer of Telenor Nett AS since 1998. Since joining the Company in 1979,Mr. Thygesen has held various positions, including Executive Vice President of Telenor Mobil,President of Telenor Invest AS, Executive Vice President of Telenor Bedrift AS and President ofTelenor Nett AS. He has also served as the President of Esat Digifone and Televerket. Mr. Thygesenreceived a Bachelor of Science in electronics and telecommunications from The Norwegian Instituteof Technology.
192
BOWNE OF LONDON 12/01/2000 19:56 BL/SM NO MARKS NEXT PCN: 199.00.00.00 -- Page is valid, no graphics X42481 198.00.00.00 7X
Stig Eide Sivertsen. Stig Eide Sivertsen is Executive Vice President and the Chief ExecutiveOfficer of Telenor Broadband Services. Mr. Sivertsen joined the Company in 1997 as the Director ofFinance and Chief Accountant for Telenor Link AS. Mr. Sivertsen previously held positions as CEOof Nettavisen AS and CFO of Petroleum Geo-Services ASA and Schibsted ASA. Mr. Sivertsen holdselementary and supplementary degrees in law at the University of Bergen and a Master of BusinessAdministration from Durham University.
Gun Bente Johansen. Gun Bente Johansen has served as an Executive Vice President sinceFebruary 2000. Ms. Johansen had served as the Director of Human Resources and as Director,Manager of Job Development, Information Manager and Director of Human Resources of TelenorNye Muligheter. Prior to joining Telenor, Ms. Johansen was previously employed at Ginco AS andSallma Personinvest/Norge AS. Ms. Johansen received a Bachelor of Science in sociology andpsychology from University of Oslo.
Morten Lundal. Morten Lundal is Executive Vice President and has been Chief ExecutiveOfficer of Telenor Internet since 1997. Prior to joining Telenor, Mr. Lundal held positions at GeminiConsulting, A.T. Kearney, and Dyno Industries. Mr. Lundal received a Bachelor of Commerce fromThe Norwegian Institute of Business Administration and an MBA from IMD in Lausanne, Switzerland.
Corporate Assembly
Our Corporate Assembly consists of 15 members. The general meeting elects 10 members withthree alternates. Our employees elect an additional 5 members and two observers, all withalternates.
The Corporate Assembly has a duty to supervise the board of directors and our President andChief Executive Officer in their management of the company, and under Norwegian law has afiduciary duty to the shareholders.
One of the principal functions of the Corporate Assembly is to elect and remove the board ofdirectors. Up to one-third of the members of the board of directors, but in no event less than twopersons, including alternates, shall be elected among our employees if one-third of the CorporateAssembly members demands it. Half of the members elected by the employees may request that theboard members shall be elected by the shareholder elected members and employee electedmembers of the assembly voting as separate groups.
The approval of our Corporate Assembly is required for significant investments as well as forsubstantial changes to our operations that affect the number or allocation of employees on therecommendation of our board of directors.
193
BOWNE OF LONDON 12/01/2000 19:56 BL/SM NO MARKS NEXT PCN: 200.00.00.00 -- Page is valid, no graphics X42481 199.00.00.00 6X
Set forth below is a list of the current members of our Corporate Assembly.
Name Address Position
Mona Røkke ************************ Tønsberg ChairmanGisle Handeland********************* Fedje Deputy ChairmanBrit Seim Jahre********************** Oslo MemberHilde Kinserdal ********************** Bergen MemberRagnar Klevaas ********************* Bærum MemberAnne Cathrine Høeg Rasmussen****** Oslo MemberEystein Gjelsvik ********************* Ski MemberBjørg Simonsen ********************* Rana MemberKristian Zachariassen **************** Arendal MemberErna Beate Støren******************* Porsgrunn MemberStein Erik Olsen ********************* Bergen MemberBerit Kopren ************************ Stavanger MemberKarstein Rystad ********************* Bodø MemberOle-Morten Olsen ******************* Steinkjer MemberJan Riddervold ********************** Lillehammer Member
Compensation to the Board of Directors, Corporate Assembly and Group Management
The board of directors currently receives in the aggregate annual remuneration ofNOK 1,400,000. Similarly, the aggregate annual remuneration paid to the Corporate Assembly isNOK 380,000.
The Chief Executive Officer for Telenor ASA receives an annual salary of NOK 3,000,000 andcertain other benefits including a company car.
The employment agreements for the Group Management were revised as of April 1, 2000.According to these new agreements, the members of the Group Management have the right toreceive salary for six months after the agreed period of notice if Telenor terminates the employment.The head of the business area Broadband Services has no right to receive salary beyond the agreedperiod of notice. The head of the Media business area has the right to receive salary for fifteenmonths beyond the agreed period of notice.
Incentive Programs
Telenor has established incentive arrangements that link remuneration and bonuses to theachievement of defined financial and non-financial goals. Examples include growth of income,EBIT/EBITDA-margins, market share, competence and innovation. The bonus arrangement includesour management group as well as the management of our business units and subsidiaries, totalingapproximately 400-500 managers. The amount of bonus compensation varies depending on theemployee’s management level. Certain business units and companies in specific business sectorsmay have other market competitive incentive plans for their management and key personnel.
We believe that these benefit plans, together with base salary, are competitive and in line withother companies in the industry.
Following the global offering, our board of directors may consider introducing such share-basedbenefit plans in order to link remuneration for key personnel to the market price of our shares.Proposed arrangements may include both management and key personnel and will, if introduced, bewithin the framework of common practices among Norwegian companies quoted on the OSE.
Pension Benefits
We provide pension benefits to substantially all of our employees in Norway through thefoundation Telenor Pension Fund (Telenor Pensjonskasse). The fund was established on January 1,
194
BOWNE OF LONDON 12/01/2000 19:56 BL/SM NO MARKS NEXT PCN: 201.00.00.00 -- Page is valid, no graphics X42481 200.00.00.00 7X
1988 and was established as a pension fund for Telenor since September 1, 1995. On that date, allof Telenor’s employees, who had previously been part of a Governmental pension scheme, wereplaced into a corporate pension scheme. Under an arrangement with the Government, theGovernment’s pension scheme will fund all pension entitlements that were accrued up toSeptember 1, 1995, without any recourse to Telenor.
The amount of benefits provided through the fund are based on the employee’s length ofservice and compensation. Full pension benefits through the fund are 66% (inclusive of Norwegiannational insurance) of the employee’s annual salary after 30 years of service. Parliament determinesannually the maximum amount of pension benefits based on an index linked to an employee’ssalary. We estimate that Parliament will increase pension benefits provided through the fund byapproximately 3% per year. Under Norwegian law, the Telenor pension fund is treated as a servicepension arrangement and, therefore, the premium for the plan is tax deductible.
The rules set out by the Telenor pension fund are used to calculate the value of thecommitments made. In addition to the standard benefits described above, a supplementaryfoundation, the Telenor pension fund II, was established on January 1, 1997 to provide additionalbenefits to eligible employees pursuant to their employment contracts. Full pension under thisscheme is 66% of the employee’s annual salary. Employees are eligible for full pension benefitsunder this scheme after 20 years of service. The additional premium payable under the Telenorpension fund II is not tax deductible according to Norwegian tax law.
The Top Management Pension Plan is based on the general pension plan with supplementarypensions through the Telenor pension fund II. The Top Management Pension Plan grants pensionlevels higher than those available under the general plan. There is no minimum required period ofemployment for an employee to qualify for membership in the Top Management Pension Plan.
Statutory Auditors
The following currently serve as our statutory auditors for purposes of the Norwegian PublicLimited Companies Act: Arthur Andersen & Co.
Remuneration to Accountants
For 1999 we paid our statutory auditors an audit fee of NOK 11.2 million and fees for additionalservices totaling NOK 16.1 million.
195
BOWNE OF LONDON 12/03/2000 12:15 BL/SM NO MARKS NEXT PCN: 202.00.00.00 -- Page is valid, no graphics X42481 201.00.00.00 8X
RELATIONSHIP BETWEEN TELENOR AND THE KINGDOM OF NORWAY
Background
We and our predecessors have been responsible for telecommunications in Norway since 1855when Telenor was founded as the Norwegian Telegraph Administration. Throughout much of ouroperating history we have been a state-owned monopoly telecommunications provider in Norway.Since the early 1980s, the Norwegian Telecommunications markets have been gradually opened upto competition, and by January 1, 1998 the Norwegian market was fully opened. As part of thederegulation process, we (the present Telenor Communications AS) were converted from a publicenterprise to a limited company owned 100% by the Kingdom of Norway in 1994. In 1995 we wererenamed Telenor. The Kingdom of Norway’s ownership of Telenor was previously administered bythe Ministry of Transport and Communications. On September 8, 2000, the administration of theKingdom of Norway’s ownership interest in Telenor was transferred to the Ministry of Trade andIndustry.
The Kingdom of Norway as a Shareholder
The following table shows how many shares of Telenor the Kingdom of Norway owns now andhow many shares it will own after the global offering is completed, if the underwriters exercise theirover-allotment option in full.
Number of shares tobe sold in offering
assuming fullexercise of the
Shares owned over-allotment Shares ownedprior to offering option after offering
Number % Number %
Kingdom of Norway ************* 1,400,000,000 100(1) 51,608,776 1,348,391,224 76.09
(1) Excluding the treasury shares that were issued on November 10, 2000. See ‘‘Description of the Shares and ShareCapital — Share Capital’’.
On June 14, 2000 the Storting (the Norwegian parliament) authorized the Norwegiangovernment to sell the Kingdom of Norway’s shares in Telenor, provided that it ensures that theKingdom of Norway’s ownership level in Telenor amounts to at least 51%.
As the Kingdom of Norway will own in excess of two-thirds of the shares in Telenor followingcompletion of the global offering, it will have the sole power to amend our articles of association. Inaddition, as long as the Kingdom of Norway owns more than one-third of the shares in Telenor, it willbe able to prevent any amendments to our articles of association. In addition, as a majorityshareholder, the Kingdom of Norway will have the power to control any decision at a meeting of ourshareholders requiring a majority vote, including electing a majority of the Corporate Assembly whichin turn has the power to elect our board of directors, as well as approval of the payment ofdividends.
The Norwegian government has noted that as one of several shareholders in Telenor, theKingdom of Norway will foremost concentrate on issues relating to return on capital, capital structureand dividend policy, emphasizing long-term profitable business development and the creation ofvalue for all shareholders. The Norwegian government plans to ensure that the Kingdom of Norway’sownership position will be exercised professionally and in accordance with usual businesslikepractices. Telenor will be expected to generate capital returns consistent with those of otherEuropean companies in the same industry and with an equivalent positioning to that of Telenor. Thecapital structure and the dividend policy should be conducive to the creation of shareholder value.
196
BOWNE OF LONDON 12/01/2000 19:56 BL/SM NO MARKS NEXT PCN: 203.00.00.00 -- Page is valid, no graphics X42481 202.00.00.00 5X
The Kingdom of Norway as a Regulator
Our telecommunications activities are regulated primarily by the Telecommunications Act and thesecondary regulations promulgated thereunder. Under the Telecommunications Act, the PT is theagency of the Norwegian government with day-to-day responsibility for overseeing the telecommuni-cations sector. The PT reports to the Ministry of Transport and Communications.
The question of the organization of ownership and regulatory roles in the telecommunicationssector has been considered in numerous proposals before the Storting. In order to be conducive tomarket confidence that the ownership and regulatory roles in the telecommunications sector areorganized in an acceptable manner, among other reasons, the Norwegian government transferredthe administration of the Kingdom of Norway’s ownership interest in Telenor to the Ministry of Tradeand Industry on September 8, 2000.
The Kingdom of Norway as a Customer
The departments and agencies of the Kingdom of Norway in the aggregate comprise our largestcustomer. Generally, we deal with the various departments and agencies of the Kingdom of Norwayas separate customers, except that the terms upon which we offer services to government entitiesare periodically established through a tender process in order to comply with the procurement rulesto which the government entities are subject. The provision of services to any one department oragency does not constitute a material part of our revenues.
197
BOWNE OF LONDON 12/03/2000 10:01 BL/SM NO MARKS NEXT PCN: 204.00.00.00 -- Page is valid, no graphics X42481 203.00.00.00 7X
DESCRIPTION OF THE SHARES AND SHARE CAPITAL
Set forth below is a summary of material information relating to our share capital, includingsummaries of certain provisions of our articles of association and the applicable Norwegian law ineffect at the date of this prospectus, including the Norwegian Public Limited Companies Act. Youshould refer to the full text of our articles of association in English, which is filed as an exhibit to theregistration statement of which this prospectus forms a part. Please refer to ‘‘Available Information’’to obtain a copy of our articles of association.
Telenor ASA is a public limited company organized under the laws of Norway. Its registrationnumber in the Norwegian Register of Business Enterprises is 982463718. Telenor ASA wasincorporated on July 21, 2000 and registered with the Norwegian Register of Business Enterpriseson October 6, 2000.
On October 3, 2000, Telenor ASA became the new ultimate parent company for the TelenorGroup, through a contribution of Telenor AS shares into Telenor ASA by the Norwegian Ministry ofTrade and Industry. Telenor AS subsequently changed its name to Telenor Communication AS.
In the near future, Telenor ASA intends to demerge Telenor Communication AS into a number ofholding companies in order to reflect the operational structure of the Group and to retain flexibility forfuture reorganization.
Share Capital
At our incorporation on July 21, 2000, our share capital was NOK 8,400,000,000 divided into840,000 ordinary shares of NOK 10,000 nominal value each. At an extraordinary general meetingheld on November 10, 2000, it was decided to split the shares into shares having a nominal value ofNOK 6 each, whereupon our share capital was NOK 8,400,000,000 divided into 1,400,000,000ordinary shares of NOK 6 nominal value each.
At the same time, it was resolved to increase the share capital by NOK 180,000,000 through theissuance of 30,000,000 ordinary shares through a transfer of capital from ‘‘other paid in capital’’ toshare capital (a bonus issue). The Kingdom of Norway waived its right to receive the new shares,which were issued to us as treasury shares. The treasury shares will be used to grant additionalbonus shares to retail investors in Norway pursuant to the global offering.
The general meeting further resolved to increase the share capital by a minimum of NOK 6 anda maximum of NOK 2,232,911,394 from NOK 8,580,000,000 to a minimum of NOK 8,580,000,006and a maximum of NOK 10,812,911,394 through the issuance of a minimum of one and a maximumof 372,151,899 new ordinary shares of NOK 6 nominal value each in the global offering describedherein.
Authorization to the board
At the extraordinary general meeting held on November 10, 2000 it was resolved to grantauthority to the board of directors to increase the share capital by up to NOK 1,063,291,134 throughthe issuance of up to 177,215,189 ordinary shares of NOK 6 nominal value each in connection withpossible future investments. Such authority lasts to July 1, 2002. The board of directors may waivethe pre-emptive rights of shareholders to such shares. The authority includes the issuance of sharesagainst consideration other than cash and the issuance of shares in a merger.
Shareholders’ Meetings
In accordance with Norwegian law, our annual general meeting of shareholders is required to beheld each year on or prior to June 30. Norwegian law requires that written notice of generalmeetings be sent to all shareholders whose addresses are known at least two weeks prior to the
198
BOWNE OF LONDON 12/01/2000 19:56 BL/SM NO MARKS NEXT PCN: 205.00.00.00 -- Page is valid, no graphics X42481 204.00.00.00 5X
date of the meeting. A shareholder may vote at the general meeting either in person or by proxy.Although Norwegian law does not require us to send proxy forms to our shareholders for generalmeetings, we plan to include a proxy form with future notices of general meetings.
In addition to the annual general meeting, extraordinary general meetings of shareholders maybe held if deemed necessary by the board of directors, the Corporate Assembly or the Chairman ofthe Corporate Assembly. An extraordinary general meeting must also be convened for theconsideration of specific matters at the written request of our auditors or of shareholdersrepresenting a total of at least 5% of the outstanding share capital.
Our general meetings are chaired by the Chairman of the Corporate Assembly.
Voting Rights
All the ordinary shares carry equal right to vote at general meetings.
Except as otherwise provided, decisions which shareholders are entitled to make pursuant toNorwegian law or our articles of association may be made by a simple majority of the votes cast. Incase of elections, the persons who obtain the most votes cast are deemed elected. However, certaindecisions, including resolutions to waive preferential rights in connection with any share issue, toapprove a merger or demerger, to amend our articles of association or to authorize an increase orreduction in our share capital must receive the approval of at least two-thirds of the aggregatenumber of votes cast as well as two-thirds of the share capital represented at a shareholder’smeeting. Norwegian law further requires that certain decisions which have the effect of substantiallyaltering the rights and preferences of any shares or class of shares receive the approval of at leasttwo-thirds of the holders of such shares or class of shares.
In order to attend and vote at our annual or extraordinary general meetings, shareholders mustnotify us of their attendance at least three days prior to the meeting. In general, in order to beentitled to vote, a shareholder must be registered as the owner of shares in the share register keptby the Norwegian Central Securities Depositary, referred to as the VPS System (described below),or, alternatively, report and show evidence of its share acquisition to us prior to the general meeting.Beneficial owners of shares which are registered in the name of a nominee are generally not entitledto vote under Norwegian law, nor are any persons who are designated in the register as holdingsuch shares as nominees. The beneficial owners of ADSs are therefore only able to vote atmeetings by surrendering their ADSs, withdrawing their ordinary shares from the ADS depositaryand registering their ownership of such ordinary shares directly in our share register in the VPSSystem.
The VPS System and Transfer of Shares
The VPS System is Norway’s paperless centralized securities registry. It is a computerizedbookkeeping system operated by an independent body in which the ownership of, and alltransactions relating to, Norwegian listed shares must be recorded. Our share register is operatedthrough the VPS System.
All transactions relating to securities registered with the VPS are made through computerizedbook entries. The VPS System confirms each entry by sending a transcript to the registeredshareholder regardless of beneficial ownership. To effect these entries, the individual shareholdermust establish a share account with a Norwegian account agent. Norwegian banks, the central bankof Norway, authorized securities brokers in Norway, bond issuing mortgage companies, unit trustmanaging companies and Norwegian branches of credit institutions established within the EuropeanEconomic Area are allowed to act as account agents.
199
BOWNE OF LONDON 12/01/2000 19:56 BL/SM NO MARKS NEXT PCN: 206.00.00.00 -- Page is valid, no graphics X42481 205.00.00.00 5X
The entry of a transaction in the VPS System is prima facie evidence in determining the legalrights of parties as against the issuing company or a third party claiming an interest in the subjectsecurity.
The VPS System is strictly liable for any loss resulting from an error in connection withregistering, altering or canceling a right, except in the event of contributory negligence, in whichevent compensation owed by the VPS System may be reduced or withdrawn.
A transferee or assignee of shares may not exercise the rights of a shareholder with respect tosuch shares unless such transferee or assignee has registered such shareholding or has reportedand shown evidence of such share acquisition and the acquisition of such shares is not prevented bylaw, our articles of association or otherwise.
Amendments to our Articles of Association, including Variation of Rights
The affirmative vote of two-thirds of the votes cast as well as two-thirds of the aggregate sharecapital represented at the general meeting is required to amend our articles of association. Anyamendment which would reduce any shareholder’s right in respect of dividends payments or rightsupon liquidation, or restrict the transferability of shares requires a majority vote of at least 90%. Anyamendment which will alter the legal relationship between shares that were previously equal or makeany issued shares redeemable need the consent of all shareholders affected thereby.
Additional Issuances and Preferential Rights
Any issuances of shares by us, including bonus issues, require an amendment to our articles ofassociation, which requires the same vote as other amendments to our articles of association. Inaddition, under Norwegian law, our shareholders have a preferential right to subscribe to issues ofnew shares by us. The preferential rights to subscribe to an issue may be waived by a resolution ina general meeting by the same majority required to approve amendments to our articles ofassociation. A waiver of the shareholders’ preferential rights in respect of bonus issues requires theapproval of all outstanding shares, regardless of class.
The general meeting may, with a majority vote as described above, authorize the board ofdirectors to issue new shares, and to waive the preferential rights of shareholders in connection withsuch issuances. Such authorization may be effective for a maximum of two years, and the par valueof the shares to be issued may not exceed 50% of the share capital when the authorization wasgranted.
The issuance of shares to holders who are citizens or residents of the United States upon theexercise of preferential rights may require us to file a registration statement in the United Statesunder United States securities laws. If we decide not to file a registration statement, these holdersmay not be able to exercise their preferential rights and therefore would be required to sell theserights to eligible Norwegian persons or other eligible non-US holders to realize the value of theserights.
Under Norwegian law, bonus issues may be distributed, subject to shareholder approval, bytransfer from Telenor’s free equity or from our share premium reserve. Any bonus issues may beeffected either by issuing shares or by increasing the par value of the shares outstanding.
Minority Rights
Norwegian law contains a number of protections for minority shareholders against oppression bythe majority. Any shareholder may petition the courts to have a decision of the board of directors orgeneral meeting declared invalid on the grounds that it unreasonably favors certain shareholders orthird parties at the detriment of other shareholders or the company itself. In certain gravecircumstances shareholders may require the courts to dissolve the company as a result of such
200
BOWNE OF LONDON 12/01/2000 19:56 BL/SM NO MARKS NEXT PCN: 207.00.00.00 -- Page is valid, no graphics X42481 206.00.00.00 5X
decisions. Minority shareholders holding 5% or more of our share capital have a right to demandthat we shall hold an extraordinary general meeting to discuss specific matters. In addition, anyshareholder may demand that we shall place an item on the agenda for any shareholders’ meeting ifwe are notified in time for such item to be included in the notice of the meeting.
Mandatory Bid Requirement
Norwegian law requires any person, entity or group acting in concert that acquires more than40% of the voting rights of a Norwegian company listed on the Oslo Stock Exchange, or OSE, tomake an unconditional general offer to acquire the whole of the outstanding share capital of thatcompany. The offer is subject to approval by the OSE before submission of the offer to theshareholders. The offer must be in cash or contain a cash alternative at least equivalent to any otherconsideration offered. The offering price per share must be at least as high as the highest price paidby the offeror in the six-month period prior to the date the 40% threshold was exceeded, but equal tothe market price if the market price was higher when the 40% threshold was exceeded. Ashareholder who fails to make the required offer must within four weeks dispose of sufficient sharesso that the obligation ceases to apply. Otherwise, the OSE may cause the shares exceeding the40% limit to be sold by public auction. A shareholder who fails to make such bid cannot, as long asthe mandatory bid requirement remains in force, vote his shares or exercise any rights of shareownership unless a majority of the remaining shareholders approve, other than the right to receivedividends and preferential rights in the event of a share capital increase. In addition, the OSE mayimpose a daily fine upon a shareholder who fails to make the required offer.
Compulsory Acquisition
If a shareholder, directly or via subsidiaries, acquires shares representing more than 90% of thetotal number of issued shares as well as more than 90% of the total voting rights attached to thoseshares, then the majority shareholder would have the right (and each remaining minority shareholderof that company would have the right to require the majority shareholder) to effect a compulsoryacquisition for cash of any shares not already owned by the majority shareholder (Section 4-25 ofthe Norwegian Public Limited Companies Act 1997 No. 45). The compulsory acquisition would resultin the majority shareholder becoming the owner of the shares of the minority shareholders withimmediate effect.
Upon effecting the compulsory acquisition, the majority shareholder would have to offer theminority shareholders a specific price per share. The determination of the price per share would beat the discretion of the majority shareholder. Should any minority shareholder not accept the offeredprice, such minority shareholder may, within a specified period of not less than two months, requestthat the price be set by the Norwegian courts. The cost of such court procedure would normally becharged to the account of the majority shareholder, and the courts would have full discretion indetermining the consideration due to the minority shareholder as a result of the compulsoryacquisition.
Election and Removal of Directors and Corporate Assembly
The general meeting of shareholders elects two thirds of the members of the CorporateAssembly, together with alternate members, while the remaining one third, together with alternatemembers, is elected by and among our employees. There is no quorum requirement, and nomineeswho receive the most votes are elected. Any shareholder at the meeting may place nominationsbefore the meeting. In practice, it is expected that nominations will be proposed by our managementand directors and placed before the meeting by the chairman of the meeting. A member of theCorporate Assembly (other than a member elected by employees) may be removed by theshareholders at any time without cause.
201
BOWNE OF LONDON 12/01/2000 19:56 BL/SM NO MARKS NEXT PCN: 208.00.00.00 -- Page is valid, no graphics X42481 207.00.00.00 5X
Our directors are elected and may be removed from office by our Corporate Assembly. TheCorporate Assembly makes decisions by majority vote, and more than half must be present for aquorum. If votes are tied, the chairman casts the deciding vote. However, half of the memberselected by the employees may demand that the board members shall be elected by members of theassembly elected by shareholders and members elected by employees of the assembly, each votingas a separate group. A director (other than a director elected directly by the employees members)may be removed at any time by the Corporate Assembly without cause.
The members of the Corporate Assembly and the board of directors have fiduciary duties to theshareholders, see ‘‘Management — Corporate Assembly’’ and ‘‘— Liability of Directors’’ below.
Payment of Dividends
For a discussion of the declaration and payment of dividends on our ordinary shares, see‘‘Dividends and Dividend Policy’’.
Rights of Redemption and Repurchase of Shares
Our articles of association do not authorize the redemption of shares. In the absence ofauthorization, the redemption of shares may still be decided by a general meeting of shareholders bya two-thirds majority under certain conditions, but the redemption would, for all practical purposes,depend on the consent of all shareholders whose shares are redeemed.
A Norwegian company may repurchase its own shares if their purchase has been authorized inadvance by a general meeting with the approval of at least two-thirds of the aggregate number ofvotes cast as well as two-thirds of the share capital represented at the meeting. The aggregate parvalue of the repurchased shares held must not exceed 10% of the share capital and suchrepurchase may only take place if, according to the latest adopted balance sheet, we havedistributable equity exceeding the amount to be paid for the shares. The authorization by the generalmeeting must be for a period not exceeding 18 months.
Shareholders’ Votes on Certain Reorganizations
If we were to merge with another company or to demerge, such decision requires a resolution ofour shareholders at a general meeting passed by a two-thirds majority of the aggregate votes castas well as two-thirds of the aggregate share capital represented at the general meeting. A mergerplan or demerger plan signed by the board of directors as well as certain other requireddocumentation must be sent to all shareholders at least one month prior to the shareholders’meeting.
Any agreement by which we acquire assets or services from a shareholder or a related partyagainst a consideration exceeding the equivalent of 5% of our share capital at such time is onlybinding if approved by the general meeting. This does not apply to acquisition of listed securities atmarket price and to agreements in the ordinary course of business entered into on normalcommercial terms.
Liability of Directors
Our directors, the President and Chief Executive Officer and the members of the CorporateAssembly owe a fiduciary duty to the company and its shareholders. Their principal task is tosafeguard the interest of shareholders. In addition, they may also have duties to other third parties,such as employees and creditors.
Our directors, the President and Chief Executive Officer and the members of the CorporateAssembly can each be held liable for any damage they negligently or willfully cause us. Norwegian
202
BOWNE OF LONDON 12/01/2000 19:56 BL/SM NO MARKS NEXT PCN: 209.00.00.00 -- Page is valid, no graphics X42481 208.00.00.00 5X
law permits the general meeting to exempt any such person from liability, but the exemption is notbinding if substantially correct and complete information was not provided to the general meetingwhen the decision was taken. In addition, if our general meeting has exempted such a person fromliability or decided not to hold such a person liable for a certain matter, shareholders representingmore than 10% of the share capital or (if there are more than 100 shareholders) more than 10% ofthe number of shareholders can raise the claim on our behalf and in our name. The cost of any suchaction is not our responsibility, but can be recovered by any proceeds we receive as a result of theaction. If the decision not to hold such person liable was adopted by the same majority as requiredfor amending the articles of association, such decision is binding on the minority shareholders.
Indemnification of Directors and Officers
Neither Norwegian law nor our articles of association contain any provision concerningindemnification by us of our board of directors.
Disclosures of Interests
A person, entity or group acting in concert that acquires or disposes of shares, options forshares or other rights to shares resulting in its beneficial ownership, directly or indirectly, in theaggregate, exceeding or falling below the respective thresholds of 1/10, 1/5, 1/3, 1/2, 2/3 or 9/10 ofour share capital has an obligation under Norwegian law to notify the Oslo Stock Exchangeimmediately. A corresponding disclosure obligation applies with respect to any holder of ADSs whois entitled upon surrender of the ADRs to acquire directly or indirectly the beneficial ownership of anumber of shares that, together with any other shares, additional ADSs representing shares oroptions to acquire shares held by such holder, in the aggregate, meets, exceeds or falls below thesethresholds.
Distribution of Assets on Liquidation
Under Norwegian law, a company may be wound-up by a resolution of the company’sshareholders in a general meeting passed by both a two-thirds majority of the aggregate votes castand two-thirds of the aggregate share capital represented at the meeting. The shares rank equal inthe event of a return on capital by the company upon a winding-up or otherwise.
Summary of our Articles of Association
Name of the Company
Our registered name is Telenor ASA. We are a public limited company.
Registered office
Our registered office is in Oslo, Norway.
Object of the company
The objects of our company are telecommunications activities and other related activities. Theactivities may be conducted by the company itself, by subsidiaries or through participation in or incooperation with other companies.
Share capital
Our share capital is NOK 8,580,000,000, divided into 1,430,000,000 ordinary shares.
203
BOWNE OF LONDON 12/01/2000 19:56 BL/SM NO MARKS NEXT PCN: 210.00.00.00 -- Page is valid, no graphics X42481 209.00.00.00 5X
Nominal value of shares
The nominal value of each ordinary share is NOK 6.
Board of directors
Our articles of association provide that our board of directors shall consist of between five andeleven members.
Corporate Assembly
We have a corporate assembly of 15 members who are elected for two-year terms. Tenmembers with three alternates are elected by the general meeting and five members and twoobservers, all with alternates, are elected by and among the employees.
Annual general meeting
Our annual general meeting is held before the end of June, upon two weeks’ written notice andwill be chaired by the chairman of the corporate assembly. Shareholders wishing to attend themeeting must give us three days’ written notice. The meeting will deal with the annual report andaccounts, including distribution of dividends, and any other matters as required by law or our articlesof association.
Exchange Controls and Other Limitations Affecting Shareholders of a Norwegian Company
Under Norwegian foreign exchange controls currently in effect, transfers of capital to and fromNorway are not subject to prior government approval except for the physical transfer of payments incurrency, which is restricted to licensed banks. This means that non-Norwegian residentshareholders may receive dividend payments without a Norwegian exchange control consent as longas the payment is made through a licensed bank.
There are presently no restrictions affecting the rights of non-residents or foreign owners to holdor vote our shares. However, in accordance with Norwegian law, the acquisition of shares or otherownership interests in companies in Norway exceeding certain thresholds, including Telenor, must benotified to the Norwegian Ministry of Trade and Industry if a purchaser or group of purchasers actingin concert, regardless of nationality, becomes the owner of shares, other ownership interests orvoting rights in the aggregate meeting or exceeding the respective thresholds of one-third, one-halfor two-thirds of the shares, other ownership interests or voting rights in such company. Foracquisitions requiring notifications, the Norwegian Ministry of Trade and Industry may refuse toapprove the acquisition or may approve it subject to certain conditions. These notificationrequirements apply to the acquisition of our shares.
204
BOWNE OF LONDON 12/01/2000 19:56 BL/SM NO MARKS NEXT PCN: 211.00.00.00 -- Page is valid, no graphics X42481 210.00.00.00 5X
NATURE OF THE NORWEGIAN TRADING MARKET
Introduction
The OSE was established in 1819 and is the principal market in which shares, bonds andderivative instruments are traded in Norway. The OSE is a non-profit institution regulated by theMinistry of Finance. As of December 31, 1999, the total capitalization of companies listed on theOSE amounted to approximately NOK 583 billion. As of December 31, 1999, a total of 195 domesticand 20 foreign companies were listed on the OSE.
The Norwegian stock market was characterized by limited volumes until the mid-1980s. Sincethen, the OSE has experienced significant growth. The All Share Index, based on all domesticshares listed on the Main List of the OSE, rose from 100 at its inception on January 1, 1983 to1,359.6 at the close of trading on December 31, 1999. Foreign shareholdings as a percentage oftotal market capitalization at December 31, 1999 amounted to approximately 31.5%.
Company Listing
There are three equity markets on the OSE, the Main List, the small and medium-sizedcompanies list (the ‘‘SMB List’’) and the primary capital certificate list. Larger companies in Norwayare listed on the Main List, which accounted for approximately 88% of the total market capitalizationof the OSE at December 31, 1999. The Main List is divided into ten sections: Real Estate, Finance,Trade, Manufacturing, IT and Communication, Media and Publishing, Offshore, Shipping, Transporta-tion and other businesses. As at December 31, 1999, the Manufacturing section accounted for thelargest share of market capitalization on the OSE at 43%, followed by Finance and Shipping stocks,which accounted for 12%, and 11% of the OSE’s market capitalization, respectively. As ofDecember 31, 1999, 78 Norwegian companies were listed on the Main List.
The SMB List was established in April 1992 to facilitate organized trading in shares of small andmedium-sized companies and to assist such companies in raising new equity capital. The SMB Listis divided into the same ten sections as the Main List. As of December 31 1999, 78 companies werelisted on the SMB List, which accounted for approximately 9% of the total market capitalization ofthe OSE.
Securities Registration
The VPS System was established by law in 1985 and is a self-financed, non-profit institution.The VPS System is a computerized registration system in which the ownership of, and alltransactions related to, Norwegian publicly-traded securities are recorded.
All transactions related to securities registered with the VPS System are executed throughcomputerized book-entries. The VPS System confirms each entry by sending a notification of thetransaction to the relevant investor. Investors also receive an annual statement of their holdings as ofDecember 31. In order to effect entries in the VPS System, the investor or its nominee mustestablish a securities account with a Norwegian account operator. Norwegian banks, Norwegianbranches of credit institutions established within the European Economic area, bond issuingmortgage companies, authorized securities brokers in Norway, the Central Bank of Norway and unittrust managing companies are permitted to act as account operators.
The broker and account operator effecting a securities transaction must report such transactionto the VPS System concurrently with any trade. The recording of a transaction in the VPS System isgenerally determinative of the legal rights of the parties to the transaction in relation to the legalrights of the issuer of the security or any third party claiming an interest in the security. Companiesregistered with the VPS System may not issue share certificates.
The VPS System is strictly liable for any loss suffered as a result of a faulty registration or anamendment to, or deletion of, rights in respect of registered securities. Damages payable by the
205
BOWNE OF LONDON 12/01/2000 19:56 BL/SM NO MARKS NEXT PCN: 212.00.00.00 -- Page is valid, no graphics X42481 211.00.00.00 5X
VPS System, however, are reduced in the event of contributory negligence on the part of theaggrieved party.
The VPS System must provide ongoing information to the Banking, Insurance and SecuritiesCommission of Norway (Kredittilsynet), or the BISC, as well as any information that the BISCrequests. Additionally, Norwegian tax authorities may demand certain information regarding anyindividual’s holdings of securities, including dividends and interest payment information.
Trading and Settlement
In February 1999, the OSE officially opened a decentralized fully automated order driventransaction system that facilitates continuous trading, replacing the system from 1988. With the newsystem, traders can place orders from their ordinary place of business and foreign brokerage housescan participate from their home country. The new system encompasses trade in shares, primarycapital certificates, bonds and interest rate futures.
Since the start of the trading and clearing co-operation among the OM Stockholm AB(OM), theOMLX Exchange in London, the Norwegian Futures & Options Clearing House, and the OSE onFebruary 14, 1997, trading in Norwegian equity derivatives has occurred electronically through OM’sClick Exchange System. In this system, market makers and brokers register their buying and sellinginterests, and deals are directly carried out using the system. Brokers who are not electronicallylinked to the Click Exchange System may still trade by using OSE’s Market Place Securities (MPS).MPS is managed by OSE staff who, acting on behalf of the brokers, registers their interests andtrades in the system.
Official trading takes place between 10:00 am and 4:00 pm each trading day. Orders may beplaced in the system beginning at 9:15 am. Transactions executed after 4:00 pm must be reportedby 9:50 am the next trading day. Other off-floor transactions must be reported within five minutes ofcompletion of the trade.
The settlement period for trading on the OSE is three days (T+3).
The ability of brokerage houses to trade for their own account is restricted to trading that occursas an integral part of either its investment services or its general capital management. Trading byindividual employees is restricted.
Norwegian brokerage houses must be credit institutions or public limited companies holding alicense or branches of brokerage houses from an EEA-state. EEA-state brokerage houses may alsoconduct cross-border investment services in Norway. Each Norwegian brokerage firm must provide aguarantee covering liabilities that are incurred when conducting investment services. The guaranteecovers NOK 200,000 per investor per incident, limited to a total amount of NOK 25 million.
It is possible for brokerage houses to undertake market-making activities in listed Norwegianshares if they have a license to do so under the Norwegian Securities Trading Act or, in the case ofEEA — state brokering houses, a license to carry out market making activities in their homejurisdiction. Such market-making activities will be governed by the regulations of the SecuritiesTrading Act covering broker’s trading on his or her own account. Such market-making activity,however, does not require notification of the BISC or the OSE.
Foreign Investment in Norwegian Shares
Foreign investors may trade shares listed on the OSE through any broker whether Norwegian orforeign.
Information, Control and Surveillance
Under Norwegian law, the OSE is required to perform a number of surveillance and controlfunctions. The Surveillance and Corporate Control unit monitors all market activity on a continuous
206
BOWNE OF LONDON 12/01/2000 19:56 BL/SM NO MARKS NEXT PCN: 213.00.00.00 -- Page is valid, no graphics X42481 212.00.00.00 5X
basis and is responsible for the dissemination of information from listed companies to the market.Market surveillance systems are largely automated, promptly warning department personnel ofabnormal market developments.
The OSE controls issuance of securities in both the equity and bond markets in Norway. TheOSE evaluates whether the issuance documentation contains the required information and whether itwould otherwise be illegal to carry out the issuance.
Each listed company must deliver to the OSE copies of all reports and communications sent toits shareholders. Each company must also release promptly to the OSE any other information thatmay have a not insignificant effect on the current pricing of the shares of the company. The OSEmay levy fines on companies which violate such requirements.
Insider Trading Legislation
Under Norwegian law, the subscription, purchase, sale or exchange of securities that are listedmust not be undertaken by anyone who has precise and confidential information about thesecurities, the issuer thereof, or other factors which may have a significant influence on the price ofthe securities. The same restriction applies to entering into the purchase, sale or exchange ofderivative rights connected to such securities. Insider trading laws also prohibit trading by directors,control committee members, certain key employees and auditors of a company for a certain periodimmediately prior to the publication of the quarterly and annual accounts of that company.
Membership in the OSE
Brokerage houses permitted to operate under the provisions of the Securities Trading Act areentitled to apply for membership in the OSE. The board of directors of the Exchange considers allapplications. The board of directors may withdraw membership or impose monetary penalties on anymember for a violation of the Stock Exchange Act of 1988 or regulations. Alternatively, the OSE mayissue an official warning or suspend a member for less serious violations.
Regulation
The regulation of the securities market in Norway is based primarily on the Stock Exchange Actof 1988, the Stock Exchange Regulations of 1994, as amended in 1999, the Financial InstitutionsAct of 1998, the Central Securities Depository Act of 1985 and the Securities Trading Act of 1997.
Indices
The OSE calculates yield indices for the Finance, Manufacturing and Shipping sections of theMain List. The base for each index is all the listed domestic shares in the relevant section. The OSEalso calculates an All Share Index using all the shares on the Main List. Separate indices areproduced for the SMB List and for primary capital certificates, respectively. There are also tradeindices that span lists for IT and for Real Estate. The OSE weights the shares according to marketcapitalization. Substantial state ownership interests which are considered not to be subject to ‘‘freetrading’’ are excluded when calculating market capitalization. For foreign companies, only the portionof the share capital which is listed in the VPS is included in the market capitalization. The indicesare adjusted for new listings, delistings, new issues and for payments of dividends. The OSEupdates these official indices every minute during trading.
The OSE is considering introducing a new global share classification structure and a new indexfamily, including a benchmark index to replace the All Share Index and new sector indices.
207
BOWNE OF LONDON 12/01/2000 19:56 BL/SM NO MARKS NEXT PCN: 214.00.00.00 -- Page is valid, no graphics X42481 213.00.00.00 5X
DESCRIPTION OF AMERICAN DEPOSITARY RECEIPTS
American Depositary Receipts
Morgan Guaranty Trust Company of New York as depositary will issue the ADSs which you willbe entitled to receive in the offering. Each ADS will represent an ownership interest in three shareswhich we will deposit with the custodian, as agent of the depositary, under the deposit agreementamong ourselves, the depositary and yourself as an ADR holder. In the future, each ADS will alsorepresent any securities, cash or other property deposited with the depositary but which they havenot distributed directly to you. Your ADSs will be evidenced by what are known as Americandepositary receipts or ADRs.
The depositary’s office is located at 60 Wall Street, New York, NY 10260.
You may hold ADSs either directly or indirectly through your broker or other financial institution.If you hold ADSs directly, by having an ADS registered in your name on the books of the depositary,you are an ADR holder. This description assumes you hold your ADSs directly. If you hold the ADSsthrough your broker or financial institution nominee, you must rely on the procedures of such brokeror financial institution to assert the rights of an ADR holder described in this section. You shouldconsult with your broker or financial institution to find out what those procedures are.
Because the depositary’s nominee will actually be the registered owner of the shares, you mustrely on it to exercise the rights of a shareholder on your behalf. The obligations of the depositaryand its agents are set out in the deposit agreement. The deposit agreement and the ADSs aregoverned by New York law.
The following is a summary of the material terms of the deposit agreement. Because it is asummary, it does not contain all the information that may be important to you. For more completeinformation, you should read the entire deposit agreement and the form of ADR which contains theterms of your ADSs. You can read a copy of the deposit agreement which is filed as an exhibit to theregistration statement of which this prospectus forms a part. You may also obtain a copy of thedeposit agreement at the SEC’s Public Reference Room which is located at 450 Fifth Street, N.W.,Washington, D.C. 20549. You may obtain information on the operation of the Public Reference Roomby calling the SEC at 1-800-732-0330.
Share Dividends and Other Distributions
How will I receive dividends and other distributions on the shares underlying my ADSs?
We may make various types of distributions with respect to our securities. The depositary hasagreed to pay to you the cash dividends or other distributions it or the custodian receives on sharesor other deposited securities, after deducting its expenses. You will receive these distributions inproportion to the number of underlying shares that your ADSs represent.
Except as stated below, to the extent the depositary is legally permitted it will deliver suchdistributions to ADR holders in proportion to their interests in the following manner:
) Cash. The depositary will distribute any US dollars available to it resulting from a cashdividend or other cash distribution or the net proceeds of sales of any other distribution orportion thereof (to the extent applicable), on an averaged or other practicable basis, subjectto (i) appropriate adjustments for taxes withheld, (ii) such distribution being impermissible orimpracticable with respect to certain registered holders, and (iii) deduction of the depositary’sexpenses in (1) converting any foreign currency to US dollars to the extent that it determinesthat such conversion may be made on a reasonable basis, (2) transferring foreign currencyor US dollars to the United States by such means as the Depositary may determine to theextent that it determines that such transfer may be made on a reasonable basis,(3) obtaining any approval or license of any governmental authority required for such
208
BOWNE OF LONDON 12/01/2000 19:56 BL/SM NO MARKS NEXT PCN: 215.00.00.00 -- Page is valid, no graphics X42481 214.00.00.00 5X
conversion or transfer, which is obtainable at a reasonable cost and within a reasonable timeand (4) making any sale by public or private means in any commercially reasonable manner.If exchange rates fluctuate during a time when the depositary cannot convert a foreigncurrency, you may lose some or all of the value of the distribution.
) Shares. In the case of a distribution in shares, the depositary will issue additional ADRs toevidence the number of ADSs representing such shares. Only whole ADSs will be issued.Any shares which would result in fractional ADSs will be sold and the net proceeds will bedistributed to the ADR holders entitled thereto.
) Rights to receive additional shares. In the case of a distribution of rights to subscribe foradditional shares or other rights, if we provide satisfactory evidence that the depositary maylawfully distribute such rights, the depositary may arrange for ADR holders to instruct thedepositary as to the exercise of such rights. However, if we do not furnish such evidence orif the depositary determines it is not practical to distribute such rights, the depositary may:
) sell such rights if practicable and distribute the net proceeds as cash; or
) allow such rights to lapse, in which case ADR holders will receive nothing.
We have no obligation to file a registration statement under the Securities Act in order tomake any rights available to ADR holders.
) Other Distributions. In the case of a distribution of securities or property other than thosedescribed above, the depositary may either (i) distribute such securities or property in anymanner it deems equitable and practicable, (ii) to the extent the depositary deemsdistribution of such securities or property not to be equitable and practicable, sell suchsecurities or property and distribute any net proceeds in the same way it distributes cash, or(iii) hold the distributed property in which case the ADSs will also represent the distributedproperty.
Any US dollars will be distributed by checks drawn on a bank in the United States for wholedollars and cents (fractional cents will be withheld without liability for interest and added to futurecash distributions).
The depositary may choose any practical method of distribution for any specific ADR holder,including the distribution of foreign currency, securities or property, or it may retain such items,without paying interest on or investing them, on behalf of the ADR holder as deposited securities.
The depositary is not responsible if it decides that it is unlawful or impractical to make adistribution available to any ADR holders.
There can be no assurances that the depositary will be able to convert any currency at aspecified exchange rate or sell any property, rights, shares or other securities at a specified price,nor that any of such transactions can be completed within a specified time period.
Deposit, Withdrawal and Cancellation
How does the depositary issue ADSs?
The depositary will issue ADSs if you or your broker deposit shares or evidence of rights toreceive shares with the custodian. In the case of the ADSs to be issued in connection with thisoffering, we, at the instruction of the underwriters named herein, will deposit such shares.
Ordinary shares or evidence of rights to receive shares may be deposited through (x) electronictransfer of such ordinary shares to the account of the depositary in our share registry on the VPSSystem, or (y) evidence satisfactory to the custodian of irrevocable instructions to cause suchordinary shares to be transferred to such account. Ordinary shares deposited in the future with the
209
BOWNE OF LONDON 12/01/2000 19:56 BL/SM NO MARKS NEXT PCN: 216.00.00.00 -- Page is valid, no graphics X42481 215.00.00.00 5X
custodian must also be accompanied by certain documents which the custodian or depositary mayrequest.
The custodian will hold all deposited ordinary shares (including those being deposited by us oron our behalf in connection with the offering to which this prospectus relates) for the account of thedepositary. ADR holders thus have no direct ownership interest in the ordinary shares and only havesuch rights as are contained in the deposit agreement. The custodian will also hold any additionalsecurities, property and cash received on or in substitution for the deposited shares. The depositedshares and any such additional items are referred to as ‘‘deposited securities’’.
Upon each deposit of ordinary shares, receipt of related delivery documentation and compliancewith the other provisions of the deposit agreement, including the payment of the fees and charges ofthe depositary and any taxes or other fees or charges owing, the depositary will issue an ADR orADRs in the name of the person entitled thereto evidencing the number of ADSs to which suchperson is entitled. Certificated ADRs will be delivered at the depositary’s principal New York office orany other location that it may designate as its transfer office.
How do ADR holders cancel an ADS and obtain deposited securities?
When you turn in your ADS at the depositary’s office, the depositary will, upon payment ofcertain applicable fees, charges and taxes, and upon receipt of proper instructions, deliver theunderlying ordinary shares to an account within the VPS System as directed by you. At your risk,expense and request, the depositary may deliver deposited securities at such other place as youmay request.
The depositary may only restrict the withdrawal of deposited securities in connection with:
) temporary delays caused by closing our transfer books or those of the depositary or thedeposit of shares in connection with voting at a shareholders’ meeting, or the payment ofdividends;
) the payment of fees, taxes and similar charges; or
) compliance with any U.S. or foreign laws or governmental regulations relating to the ADRs orto the withdrawal of deposited securities.
This right of withdrawal may not be limited by any other provision of the deposit agreement.
Voting Rights
How do I vote?
As soon as practicable after receipt from us of a notice of any meeting or solicitation ofconsents or proxies of our shareholders, the depositary shall mail to ADR holders a notice, whichshall contain (a) such information (or a summary thereof) as is contained in such notice of meetingreceived by the depositary from us, (b) a statement that such ADR holders as of the close ofbusiness on a specified record date set forth in such notice will be entitled, subject to any applicableprovisions of Norwegian law, our articles of association and any agreement which may be reachedwith, and according to the rules of the VPS System, to instruct the depositary as to the exercise ofthe voting rights, if any, pertaining to the deposited securities represented by the ADSs evidenced bysuch ADR holders if such ADR holder is registered as a shareholder of the Company in the VPSSystem not less than 14 days prior to such meeting, (c) a statement as to the shares and otherdeposited securities represented by the ADSs evidenced by such holders ADRs and a statement asto the manner in which such instruction may be given. Upon written request of a ADR holder onsuch record date received on or before the date established by the depositary for such purpose, thedepositary shall endeavor, insofar as practicable and permitted under Norwegian law, the DepositAgreement, the provisions of our articles of association, any agreement which may be reached withthe VPS System and the rules of the VPS System to cause the corresponding deposited securities
210
BOWNE OF LONDON 12/01/2000 19:56 BL/SM NO MARKS NEXT PCN: 217.00.00.00 -- Page is valid, no graphics X42481 216.00.00.00 5X
to be temporarily transferred in the VPS System to the account of the ADR holder, to cause noticeto be given to us and, as proxy, to vote or cause to be voted (or to grant a discretionary proxy to aperson designated by us to vote), or otherwise to give effect to such ADR holders written request byvoting or causing to be voted, the amount of shares or other deposited securities the right to receivewhich is represented by the ADSs evidenced by such holders ADR in accordance with instructionsset forth in such request.
There is no guarantee that ADR holders will receive voting materials in time to instruct thedepositary to vote and it is possible that ADR holders, or persons who hold their ADSs throughbrokers, dealers or other third parties, will not have the opportunity to exercise a right to vote.
Record Dates
The depositary may fix record dates for the determination of the ADR holders who will beentitled:
) to receive a dividend, distribution or rights, or
) to give instructions for the exercise of voting rights at a meeting of holders of ordinary sharesor other deposited securities subject to the limitations discussed under ‘‘— Voting Rights’’above,
all subject to the provisions of the deposit agreement.
Reports and Other Communications
Will I be able to view our reports?
The depositary will make available for inspection by ADR holders any written communicationsfrom us which are both received by the custodian or its nominee as a holder of deposited securitiesand made generally available to the holders of deposited securities. We will furnish thesecommunications in English when so required by any rules or regulations of the SEC.
Additionally, if we make any written communications generally available to holders of ourordinary shares, including the depositary or the custodian, and the depositary or the custodianactually receive those written communications, the depositary will mail copies of them, or, at itsoption, summaries of them to ADR holders.
Fees and Expenses
What fees and expenses will I be responsible for paying?
ADR holders will be charged a fee for each issuance of ADSs, including issuances resultingfrom distributions of ordinary shares, rights and other property, and for each surrender of ADSs inexchange for deposited securities. The fee in each case is $5.00 for each 100 ADSs (or any portionthereof) issued or surrendered. ADR holders or persons depositing ordinary shares may also becharged the following expenses:
) stock transfer or other taxes and other governmental charges;
) cable, telex and facsimile transmission and delivery charges incurred at your request;
) transfer or registration fees for the registration of transfer of deposited securities on anyapplicable register in connection with the deposit or withdrawal of deposited securities; and
) expenses of the depositary in connection with the conversion of foreign currency intoUS dollars.
211
BOWNE OF LONDON 12/01/2000 19:56 BL/SM NO MARKS NEXT PCN: 218.00.00.00 -- Page is valid, no graphics X42481 217.00.00.00 5X
We will pay all other charges and expenses of the depositary and any agent of the depositary(except the custodian) pursuant to agreements from time to time between us and the depositary.The fees described above may be amended from time to time.
Payment of Taxes
ADR holders must pay any tax or other governmental charge payable by the custodian or thedepositary on any ADS or ADR, deposited security or distribution. If an ADR holder owes any tax orother governmental charge, the depositary may (i) deduct the amount thereof from any cashdistributions, or (ii) sell deposited securities and deduct the amount owing from the net proceeds ofsuch sale. In either case the ADR holder remains liable for any shortfall. Additionally, if any tax orgovernmental charge is unpaid, the depositary may also refuse to effect any registration, registrationof transfer, split-up or combination of deposited securities or withdrawal of deposited securities(except under limited circumstances mandated by securities regulations). If any tax or governmentalcharge is required to be withheld on any non-cash distribution, the depositary may sell thedistributed property or securities to pay such taxes and distribute any remaining net proceeds to theADR holders entitled thereto.
Reclassifications, Recapitalizations and Mergers
If we take certain actions that affect the deposited securities, including (i) any change in parvalue, split-up, consolidation, cancellation or other reclassification of deposited securities or (ii) anyrecapitalization, reorganization, merger, consolidation, liquidation, receivership, bankruptcy or sale ofall or substantially all of our assets, then the depositary may choose to:
(1) amend the form of ADR;
(2) distribute additional or amended ADRs;
(3) distribute cash, securities or other property it has received in connection with such actions;
(4) sell any securities or property received and distribute the proceeds as cash; or
(5) none of the above.
If the depositary does not choose any of the above options, any of the cash, securities or otherproperty it receives will constitute part of the deposited securities and each ADS will then representa proportionate interest in such property.
Amendment and Termination
How may the deposit agreement be amended?
We may agree with the depositary to amend the deposit agreement and the ADSs without yourconsent for any reason. ADR holders must be given at least 30 days notice of any amendment thatimposes or increases any fees or charges (other than stock transfer or other taxes and othergovernmental charges, transfer or registration fees, cable, telex or facsimile transmission costs,delivery costs or other such expenses), or affects any substantial existing right of ADR holders. If anADR holder continues to hold an ADR or ADRs after being so notified, such ADR holder is deemedto agree to such amendment. Notwithstanding the foregoing, an amendment can become effectivebefore notice is given if this is necessary to ensure compliance with a new law, rule or regulation.
No amendment will impair your right to surrender your ADSs and receive the underlyingsecurities. If a governmental body adopts new laws or rules which require the deposit agreement orthe ADS to be amended, we and the depositary may make the necessary amendments, which couldtake effect before you receive notice thereof.
212
BOWNE OF LONDON 12/01/2000 19:56 BL/SM NO MARKS NEXT PCN: 219.00.00.00 -- Page is valid, no graphics X42481 218.00.00.00 5X
How may the deposit agreement be terminated?
The depositary may terminate the deposit agreement by giving the ADR holders at least30 days prior notice, and it must do so at our request. After termination, the depositary’s onlyresponsibility will be (i) to deliver deposited securities to ADR holders who surrender their ADRs, and(ii) to hold or sell distributions received on deposited securities. As soon as practicable after theexpiration of six months from the termination date, the depositary will sell the deposited securitieswhich remain and hold the net proceeds of such sales, without liability for interest, in trust for theADR holders who have not yet surrendered their ADRs. After making such sale, the depositary shallhave no obligations except to account for such proceeds and other cash. The depositary will not berequired to invest such proceeds or pay interest on them.
Limitations on Obligations and Liability to ADR holders
Limits on our obligations and the obligations of the depositary; limits on liability to ADRholders and holders of ADSs
The deposit agreement expressly limits the obligations and liability of the depositary, ourselvesand our respective agents. Neither we nor the depositary nor any such agent will be liable if:
) law, regulation, the provisions of or governing any deposited securities, act of God, war orother circumstance beyond its control shall prevent, delay or subject to any civil or criminalpenalty any act which the deposit agreement or the ADRs provide shall be done orperformed by it;
) it exercises or fails to exercise discretion under the deposit agreement or the ADR;
) it performs its obligations without gross negligence or bad faith;
) it takes any action or inaction by it in reliance upon the advice of or information from legalcounsel, accountants, any person presenting shares for deposit, any registered holder ofADRs, or any other person believed by it to be competent to give such advice or information;or
) it relies upon any written notice, request, direction or other document believed by it to begenuine and to have been signed or presented by the proper party or parties.
Neither the depositary nor its agents have any obligation to appear in, prosecute or defend anyaction, suit or other proceeding in respect of any deposited securities or the ADRs. We and ouragents shall only be obligated to appear in, prosecute or defend any action, suit or other proceedingin respect of any deposited securities or the ADRs, which in our opinion may involve us in expenseor liability, if indemnity satisfactory to us against all expense (including fees and disbursements ofcounsel) and liability is furnished as often as we require.
The depositary will not be responsible for failing to carry out instructions to vote the depositedsecurities or for the manner in which the deposited securities are voted or the effect of the vote.
The depositary may own and deal in deposited securities and in ADSs.
Disclosure of Interest in ADSs
From time to time we may request you and other holders and beneficial owners of ADSs toprovide information as to:
) the capacity in which you and other holders and beneficial owners own or owned ADSs;
) the identity of any other persons then or previously interested in such ADSs; and
) the nature of such interest and various other matters.
213
BOWNE OF LONDON 12/01/2000 19:56 BL/SM NO MARKS NEXT PCN: 220.00.00.00 -- Page is valid, no graphics X42481 219.00.00.00 6X
You agree to provide any information requested by us or the depositary pursuant to the depositagreement. The depositary has agreed to use reasonable efforts to comply with written instructionsreceived from us requesting that it forward any such requests to you and other holders andbeneficial owners and to forward to us any responses to such requests to the extent permitted byapplicable law.
Requirements for Depositary Actions
We, the depositary or the custodian may refuse to
) issue, register or transfer an ADR or ADRs;
) effect a split-up or combination of ADRs;
) deliver distributions on any such ADRs; or
) permit the withdrawal of deposited securities (unless the deposit agreement providesotherwise), until the following conditions have been met:
) the holder has paid all taxes, governmental charges, and fees and expenses as requiredin the deposit agreement;
) the holder has provided the depositary with any information it may deem necessary orproper, including, without limitation, proof of identity and the genuineness of anysignature; and
) the holder has complied with such regulations as the depositary may establish under thedeposit agreement.
The depositary may also suspend the issuance of ADSs, the deposit of shares, the registration,transfer, split-up or combination of ADRs, or the withdrawal of deposited securities (unless thedeposit agreement provides otherwise), if the register for ADRs or any deposited securities is closedor if we or the depositary decide it is advisable to do so.
Books of Depositary
The depositary or its agent will maintain a register for the registration, registration of transfer,combination and split-up of ADRs. You may inspect such records at such office during regularbusiness hours, but solely for the purpose of communicating with other holders in the interest ofbusiness matters relating to the deposit agreement.
The depositary will maintain facilities to record and process the issuance, cancellation,combination, split-up and transfer of ADRs. These facilities may be closed from time to time, to theextent not prohibited by law.
Pre-release of ADSs
The depositary may issue ADSs prior to the deposit with the custodian of shares (or rights toreceive shares). This is called a pre-release of the ADS. A pre-release is closed out as soon as theunderlying shares (or other ADSs) are delivered to the depositary. The depositary may pre-releaseADSs only if:
) the depositary has received collateral for the full market value of the pre-released ADSs; and
) each recipient of pre-released ADSs agrees in writing that he or she
) owns the underlying shares,
) assigns all rights in such shares to the depositary,
) holds such shares for the account of the depositary and
214

BOWNE OF LONDON 12/01/2000 19:56 BL/SM NO MARKS NEXT PCN: 221.00.00.00 -- Page is valid, no graphics X42481 220.00.00.00 6X
) will deliver such shares to the custodian as soon as practicable, and promptly if thedepositary so demands.
In general, the number of pre-released ADSs will not evidence more than 30% of all ADSsoutstanding at any given time (excluding those evidenced by pre-released ADSs). However, thedepositary may change or disregard such limit from time to time as it deems appropriate. Thedepositary may retain for its own account any earnings on collateral for pre-released ADSs and itscharges for issuance thereof.
The Depositary
Who is the depositary?
Morgan Guaranty Trust Company of New York, a New York banking corporation, is a commercialbank offering a wide range of banking and trust services to its customers in the New Yorkmetropolitan area, throughout the United States and around the world.
215
BOWNE OF LONDON 12/01/2000 19:56 BL/SM NO MARKS NEXT PCN: 222.00.00.00 -- Page is valid, no graphics X42481 221.00.00.00 5X
TAXATION
Norwegian Tax Matters
This section, in the opinion of Thommessen Krefting Greve Lund, Norwegian tax counsel toTelenor, describes the material Norwegian tax consequences that apply to shareholders resident inNorway as well as non-resident shareholders in connection with the acquisition, ownership, andrealization of the shares offered. This section does not provide a complete description of all taxregulations, which might be relevant (i.e., for investors for whom special regulations may beapplicable). This section is based on current law and practice. Shareholders should contact theirprofessional tax advisors for advice concerning individual tax consequences.
Taxation of Dividends
Dividends distributed are subject to taxation in Norway as general income at a flat rate, currently28%. According to an imputation method, shareholders who are residents of Norway for taxpurposes will effectively not be subject to tax on dividend distributions from Norwegian companies,as there will be available as a credit (‘‘godtgjørelse’’) against the Norwegian tax in an amount equalto the tax to be levied on the dividends received.
In its proposal for the state budget for 2001, the Norwegian government has proposed that thecredit against the Norwegian tax on dividends received, shall be reduced as from September 5,2000. According to the original proposal, this would mean that a shareholder receiving dividenddistributions normally would be effectively taxed at a rate of 14%. Political parties representing amajority in the Storting (the Norwegian Parliament) have entered into an agreement, where theeffective tax rate according to the proposal from the government, is reduced to 11%. The reducedcredit applies primarily to individuals and not to limited companies and other companies subject tosimilar tax treatment. As of the date of this prospectus, the Storting has not decided whether and inwhat form the proposal would be enacted.
Non-Norwegian shareholders are subject to a withholding tax at a rate of 25% on dividendsdistributed from Norwegian companies, unless the shareholder is carrying on business activities inNorway and such shares are effectively connected to such activities. In that case the rules describedin the foregoing paragraph are applicable. In other cases the withholding rate of 25% is normallylower according to tax treaties between Norway and the country in which the shareholder is resident.Generally, the treaty rate does not exceed 15%, and in cases where a corporate shareholder holds aqualifying percentage of the shares of the distributing company, the withholding tax rate on dividendsis in most cases reduced to 5% or even to zero. The treaty rate in the US-Norwegian treaty is 15%in all cases.
The 15% withholding rate under the tax treaty between Norway and the United States will applyto dividends paid on shares held directly by US Holders properly demonstrating to the company thatthey are entitled to the benefits of the convention.
Dividends paid to the depositary for redistribution to shareholders holding ADSs will at theoutset be subject to a withholding tax of 25%. The beneficial owners will in this case have to applyfor refund of the excess amount of tax with the Norwegian Directorate of Taxes. The bank(s) actingas depositary will, however, provided it is acting as a licensed custodian operating (a) nomineeaccount(s) in the Norwegian Registry of Securities (the VPS System) with approval from theNorwegian Banking, Insurance and Securities Commission and the Norwegian Directorate of Taxes,be entitled to receive dividends from us for redistribution to ADS holders who are beneficial ownersat the treaty withholding rate of 15%.
The above mentioned proposal from the Ministry of Finance for a higher effective tax rate fordividend distributions, will not have any influence on taxation of dividend distributions at source fornon-resident shareholders.
216
BOWNE OF LONDON 12/01/2000 19:56 BL/SM NO MARKS NEXT PCN: 223.00.00.00 -- Page is valid, no graphics X42481 222.00.00.00 24X
Wealth Tax
The value of the shares is included when computing the wealth tax imposed on individuals whofor tax purposes are considered resident in Norway. Norwegian joint stock companies and certainother companies in a similar position are not subject to wealth tax. Currently, the marginal wealth taxrate is 1.1% of the value assessed. The value for assessment purposes for shares listed on the OsloStock Exchange is 100% of the listed value of such shares as of January 1 in the year ofassessment. Shareholders who are resident outside of Norway are ordinarily not subject to wealthtax in Norway for shares in Norwegian joint stock companies.
Inheritance Tax and Gift Tax
Upon transfer of shares due to inheritance or gifts, such transfer may be subject to inheritanceor gift tax. The basis for the computation is the market value at the time the transfer takes place.Still, such transfer is not subject to Norwegian tax if the donor/deceased was neither a national norresident of Norway for tax purposes.
Taxation upon Realization of Shares and Subscription Rights
A holder of shares who exercises his subscription rights is not considered to realize any gain inconnection with such subscription of new shares. The taxable basis for the shares received is theamount paid in connection with the subscription.
Shareholders who sell or otherwise dispose of subscription rights are subject to tax on capitalgain obtained from the disposal.
A shareholder who is resident for tax purposes in Norway will realize a taxable gain or loss upona sale, redemption or other disposition of shares. Such capital gain or loss is included in or deductedfrom the computation of general income in the year of disposal at a flat tax rate of 28%. The gain issubject to tax and the loss is deductible irrespective of the length of the ownership and the numberof shares disposed of.
The taxable gain or loss is computed as the sales price adjusted for transactional expenses lessthe taxable basis. A shareholder’s taxable basis is adjusted according to the so-called RISK-rules(RISK is the Norwegian abbreviation for the variation in the company’s retained earnings after taxduring the ownership of the shareholder). The RISK amount is computed at the end of each fiscalyear. If the shareholder owns shares acquired at different points of time, the shares that wereacquired first will be regarded as the first to be sold, on a first-in first-out basis.
In its proposal for the state budget for 2001, the Norwegian government has also proposed tochange the rules for computing the RISK amount on shares owned by individuals when shares aresubject to redemption and when shares are sold to the company. According to this proposal, and theabove-mentioned agreement between political parties representing a majority in the Storting, suchshares will only receive a part of the positive RISK amount allocated to such shares at the time theshares are sold, redeemed or otherwise disposed of by an individual to the company.
Shareholders not resident in Norway are normally not subject to tax in Norway on capital gains,and losses are not deductible upon sale, redemption or other disposition of subscription rights,shares or ADSs in Norwegian companies, unless the shareholder has been resident for tax purposesin Norway and the disposal takes place within five years after the end of the calendar year in whichthe shareholder ceased to be a resident of Norway for tax purposes, or, alternatively, theshareholder is carrying on business activities in Norway and such subscription rights, shares orADSs are or have been effectively connected to such activities.
Transfer Tax
There is no transfer tax imposed in Norway in connection with the sale or purchase of shares.
217
BOWNE OF LONDON 12/01/2000 19:56 BL/SM NO MARKS NEXT PCN: 224.00.00.00 -- Page is valid, no graphics X42481 223.00.00.00 18X
United States Tax Matters
General
This section, in the opinion of Sullivan & Cromwell, United States federal income tax counsel toTelenor, describes the material United States federal income tax consequences of owning shares orADSs. It applies to you only if you acquire your shares or ADSs in this offering and hold them ascapital assets for tax purposes.
This section does not apply to you if you are a member of a special class of holders subject tospecial rules, including:
) dealers in securities,
) traders in securities that elect to use a mark-to-market method of accounting for theirsecurities holdings,
) tax-exempt organizations,
) life insurance companies,
) persons liable for alternative minimum tax,
) persons that actually or constructively own 10% or more of the voting stock of Telenor,
) persons that hold shares or ADSs through a partnership or other pass-through entity,
) persons that hold shares or ADSs as part of a straddle or a hedging or conversiontransaction, or
) persons whose functional currency is not the US dollar.
This section is based on the Internal Revenue Code of 1986, as amended, its legislative history,existing and proposed regulations, published rulings and court decisions, and the Conventionbetween the United States of America and the Kingdom of Norway for the Avoidance of DoubleTaxation and the Prevention of Fiscal Evasion with Respect to Taxes on Income and Property (the‘‘Treaty’’). These laws are subject to change, possibly on a retroactive basis. In addition, this sectionis based in part upon the representations of the depositary and the assumption that each obligationin the deposit agreement and any related agreement will be performed in accordance with its terms.
You are a ‘‘U.S. holder’’ if you are a beneficial owner of shares or ADSs and you are:
) an individual who is a citizen or resident of the United States,
) a corporation created or organized in or under the laws of the United States or any politicalsubdivision thereof,
) an estate whose income is subject to United States federal income tax regardless of itssource, or
) a trust if a United States court can exercise primary supervision over the trust’sadministration and one or more United States persons are authorized to control allsubstantial decisions of the trust.
A ‘‘non-U.S. holder’’ is a beneficial owner of shares or ADSs that is not a United States personfor United States federal income tax purposes.
You should consult your own tax advisor regarding the United States federal, state and local andother tax consequences of acquiring, owning and disposing of shares and ADSs in your particularcircumstances.
218
BOWNE OF LONDON 12/01/2000 19:56 BL/SM NO MARKS NEXT PCN: 225.00.00.00 -- Page is valid, no graphics X42481 224.00.00.00 14X
Taking into account the earlier assumptions, for United States federal income purposes, if youhold ADRs evidencing ADSs, you generally will be treated as the owner of the shares representedby those ADSs. Exchanges of shares for ADSs, and ADSs for shares, generally will not be subject toUnited States federal income tax.
Taxation of Dividends
U.S. Holders
Under the United States federal income tax laws, and subject to the passive foreign investmentcompany rules discussed below, if you are a U.S. holder, you must include in your gross income thegross amount of any dividend paid by Telenor out of its current or accumulated earnings and profits(as determined for United States federal income tax purposes). You must include any Norwegian taxwithheld from the dividend payment in this gross amount even though you do not in fact receive theamount withheld as tax. The dividend is ordinary income that you must include in income when you,in the case of shares, or the depository, in the case of ADSs, receive the dividend, actually orconstructively. The dividend will not be eligible for the dividends-received deduction generally allowedto United States corporations in respect of dividends received from other United States corporations.
The amount of the dividend distribution that you must include in your income as a U.S. holderwill be the US dollar value of the Norwegian Kroner payments made, determined at the spotNorwegian Kroner/US dollar rate on the date the dividend distribution is included in your income,regardless of whether the payment is in fact converted into US dollars. Distributions in excess ofcurrent and accumulated earnings and profits, as determined for United States federal income taxpurposes, will be treated as a non-taxable return of capital to the extent of your tax basis in theshares or ADSs and, to the extent in excess of your tax basis, will be treated as capital gain.
Subject to certain limitations, the 15% Norwegian tax withheld in accordance with the Treaty andpaid over to Norway will be creditable against your United States federal income tax liability.
Dividends will be income from sources outside the United States, but generally will be ‘‘passiveincome’’ or ‘‘financial services income’’ which is treated separately from other types of income forpurposes of computing the foreign tax credit allowable to you. Alternatively, you may elect to claim aU.S. tax deduction, instead of a foreign tax credit, for such Norwegian tax, but only for a year inwhich you elect to do so with respect to all foreign income taxes.
Any gain or loss resulting from currency exchange fluctuations during the period from the dateyou include the dividend payment in income to the date you convert the payment into US dollarsgenerally will be treated as ordinary income or loss. Such gain or loss generally will be income orloss from sources within the United States for foreign tax credit limitation purposes.
Non-U.S. Holders
If you are a non-U.S. holder, dividends paid to you in respect of shares or ADSs will not besubject to United States federal income tax unless the dividends are ‘‘effectively connected’’ withyour conduct of a trade or business within the United States and attributable to a permanentestablishment or fixed base that you maintain in the United States if that is required by an applicableincome tax treaty as a condition for subjecting you to United States taxation on a net income basis.In such cases, you will generally be taxed in the same manner as a U.S. holder. If you are acorporate non-U.S. holder, ‘‘effectively connected’’ dividends may, under certain circumstances, besubject to an additional ‘‘branch profits tax’’ at a 30% rate or at a lower rate if you are eligible for thebenefits of an income tax treaty that provides for a lower rate.
219
BOWNE OF LONDON 12/01/2000 19:56 BL/SM NO MARKS NEXT PCN: 226.00.00.00 -- Page is valid, no graphics X42481 225.00.00.00 10X
Taxation of Capital Gains
U.S. Holders
Subject to the passive foreign investment company rules discussed below, if you are aU.S. holder and you sell or otherwise dispose of your shares or ADSs, you will recognize capitalgain or loss for United States federal income tax purposes equal to the difference between theUS dollar value of the amount that you realize and your tax basis, determined in US dollars, in yourshares or ADSs. Capital gain of a non-corporate U.S. holder is generally taxed at a maximum rate of20% where the property has been held for more than one year. The gain or loss will generally beincome or loss from sources within the United States for foreign tax credit limitation purposes.
If you receive any foreign currency on the sale of shares or ADSs, you may recognizeU.S.-source ordinary income or loss as a result of currency fluctuations between the date of the saleof the shares or ADSs and the date the sales proceeds are converted into US dollars.
Non-U.S. Holders
If you are a non-U.S. holder, you will not be subject to United States federal income tax on gainrecognized on the sale or other disposition of your shares or ADSs unless:
) the gain is ‘‘effectively connected’’ with your conduct of a trade or business in the UnitedStates, and the gain is attributable to a permanent establishment or fixed base that youmaintain in the United States if that is required by an applicable income tax treaty as acondition for subjecting you to United States taxation on a net income basis or
) you are an individual, you are present in the United States for at least 183 days in thetaxable year of the sale, and certain other conditions exist.
If you are a corporate non-U.S. holder, ‘‘effectively connected’’ gains that you recognize mayalso, under certain circumstances, be subject to an additional ‘‘branch profits tax’’ at a 30% rate orat a lower rate if you are eligible for the benefits of an income tax treaty that provides for a lowerrate.
Passive Foreign Investment Company (PFIC) Rules
We believe that our shares and ADSs should not be treated as stock of a passive foreigninvestment company, or PFIC, for United States federal income tax purposes. However, thisconclusion is a factual determination that is made annually and may therefore be subject to change.
In general, if you are a U.S. holder, we will be a PFIC with respect to you if for any taxable yearin which you held our ADSs or shares:
) at least 75% of our gross income for the taxable year is passive income, or
) at least 50% of the value, determined on the basis of a quarterly average, of our assets isattributable to assets that produce or are held for the production of passive income.
Passive income generally includes dividends, interest, royalties, rents (other than certain rentsand royalties derived in the active conduct of a trade or business), annuities and gains from assetsthat produce passive income. If a foreign corporation owns at least 25% by value of the stock ofanother corporation, the foreign corporation is treated for purposes of the PFIC tests as owning itsproportionate share of the assets of the other corporation, and as receiving directly its proportionateshare of the other corporation’s income.
If we are treated as a PFIC, and you are a U.S. holder that did not make a QEF election or amark-to-market election, as described below, you will be subject to special rules with respect to:
) any gain you realize on the sale or other disposition of your shares or ADSs and
220
BOWNE OF LONDON 12/01/2000 19:56 BL/SM NO MARKS NEXT PCN: 227.00.00.00 -- Page is valid, no graphics X42481 226.00.00.00 12X
) any excess distribution that we make to you (generally, any distributions to you during asingle taxable year that are greater than 125% of the average annual distributions receivedby you in respect of the shares or ADSs during the three preceding taxable years or, ifshorter, your holding period for the shares or ADSs).
Under these rules:
) the gain or excess distribution will be allocated ratably over your holding period for theshares or ADSs,
) the amount allocated to the taxable year in which you realized the gain or excess distributionwill be taxed as ordinary income,
) the amount allocated to each prior year, with certain exceptions, will be taxed at the highesttax rate in effect for that year, and
) the interest charge generally applicable to underpayments of tax will be imposed in respectof the tax attributable to each such year.
Special rules apply for calculating the amount of the foreign tax credit with respect to excessdistributions by a PFIC or, in certain cases, QEF inclusions.
Following the listing and trading our ADSs on the Nasdaq National Market, you may also makea mark-to-market election. If you make this election, you will not be subject to the PFIC rulesdescribed above. Instead, in general, you will include as ordinary income each year the excess, ifany, of the fair market value of your shares or ADSs at the end of the taxable year over youradjusted basis in your shares or ADSs. You will also be allowed to take an ordinary loss in respectof the excess, if any, of the adjusted basis of your shares or ADSs over their fair market value at theend of the taxable year (but only to the extent of the net amount of previously included income as aresult of the mark-to-market election). Your basis in the shares or ADSs will be adjusted to reflectany such income or loss amounts.
The special PFIC tax rules described above will not apply to you if you elect to have us treatedas a qualified electing fund, or QEF, and we provide certain required information to you. We havenot yet decided, if we determine that we have become a PFIC, whether we would provideU.S. holders with the information that is required to make a QEF election effective.
If you are a U.S. holder that makes an effective QEF election, you will be currently taxable onyour pro rata share of our ordinary earnings and net capital gain, at ordinary income and capital gainrates, respectively, for each of our taxable years, regardless of whether or not you receivedistributions. Your basis in the shares or ADSs will be increased to reflect taxed but undistributedincome. Distributions of income that had been taxed previously will result in a correspondingreduction of basis in your shares or ADSs and will not be taxed again as a distribution to you.
If you own shares or ADSs during any year that we are a PFIC, you must file Internal RevenueService Form 8621.
Backup Withholding and Information Reporting
Dividend payments, or other taxable distributions, made within the United States to yougenerally will be subject to information reporting requirements and backup withholding tax at the rateof 31% if you are a non-corporate United States person and you:
) fail to provide an accurate taxpayer identification number,
) are notified by the Internal Revenue Service that you have failed to report all interest ordividends required to be shown on your federal income tax returns, or
) in certain circumstances, fail to comply with applicable certification requirements.
221
BOWNE OF LONDON 12/01/2000 19:56 BL/SM NO MARKS NEXT PCN: 228.00.00.00 -- Page is valid, no graphics X42481 227.00.00.00 13X
Persons that are not United States persons may be required to establish their exemption frominformation reporting and backup withholding by certifying their status on Internal Revenue ServiceForm W-8.
If you sell your shares or ADSs to or through a United States office of a broker, the payment ofthe proceeds is subject to both United States backup withholding and information reporting unlessyou certify that you are a non-U.S. person, under penalties of perjury, or you otherwise establish anexemption. If you sell your shares or ADSs outside the United States through a non-U.S. office of anon-U.S. broker, and the sale proceeds are paid to you outside the United States, then UnitedStates backup withholding and information reporting requirements generally will not apply to thatpayment. However, United States information reporting, but not backup withholding, will apply to apayment of sales proceeds, even if that payment is made outside the United States, if you sell yourshares or ADSs through a non-U.S. office of a broker that:
) is a United States person,
) derives 50% or more of its gross income for a specified three-year period from the conductof a trade or business in the United States,
) is a ‘‘controlled foreign corporation’’ as to the United States, or
) with respect to payments made after December 31, 2000, is a foreign partnership, if at anytime during its tax year:
) one or more of its partners are U.S. persons, as defined in U.S. Treasury regulations,who in the aggregate hold more than 50% of the income or capital interest in thepartnership or
) at any time during its tax year the foreign partnership is engaged in a United States tradeor business,
unless the broker has documentary evidence in its records that you are a non-United States personand does not have actual knowledge that you are a U.S. person or you otherwise establish anexemption.
You generally may obtain a refund of any amounts withheld under the backup withholding rulesthat exceed your income tax liability by filing a refund claim with the United States Internal RevenueService.
222
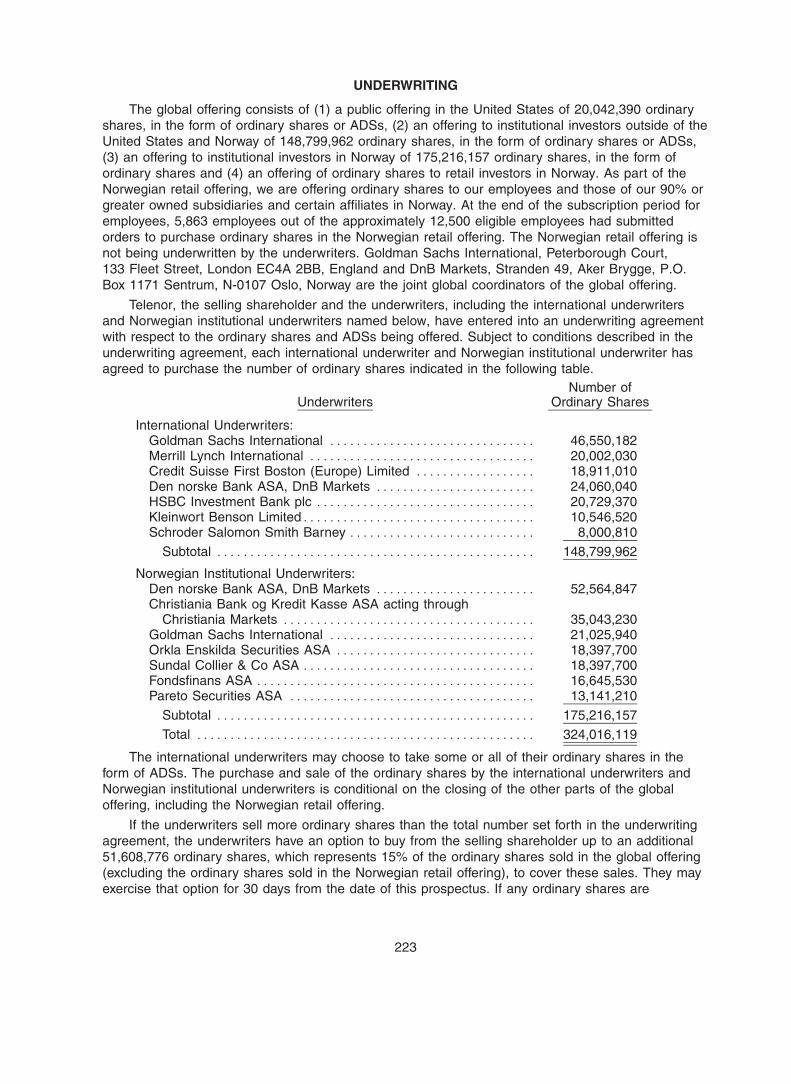
BOWNE OF LONDON 12/04/2000 07:00 NO MARKS NEXT PCN: 229.00.00.00 -- Page is valid, no graphics X42481 228.00.00.00 38
UNDERWRITING
The global offering consists of (1) a public offering in the United States of 20,042,390 ordinaryshares, in the form of ordinary shares or ADSs, (2) an offering to institutional investors outside of theUnited States and Norway of 148,799,962 ordinary shares, in the form of ordinary shares or ADSs,(3) an offering to institutional investors in Norway of 175,216,157 ordinary shares, in the form ofordinary shares and (4) an offering of ordinary shares to retail investors in Norway. As part of theNorwegian retail offering, we are offering ordinary shares to our employees and those of our 90% orgreater owned subsidiaries and certain affiliates in Norway. At the end of the subscription period foremployees, 5,863 employees out of the approximately 12,500 eligible employees had submittedorders to purchase ordinary shares in the Norwegian retail offering. The Norwegian retail offering isnot being underwritten by the underwriters. Goldman Sachs International, Peterborough Court,133 Fleet Street, London EC4A 2BB, England and DnB Markets, Stranden 49, Aker Brygge, P.O.Box 1171 Sentrum, N-0107 Oslo, Norway are the joint global coordinators of the global offering.
Telenor, the selling shareholder and the underwriters, including the international underwritersand Norwegian institutional underwriters named below, have entered into an underwriting agreementwith respect to the ordinary shares and ADSs being offered. Subject to conditions described in theunderwriting agreement, each international underwriter and Norwegian institutional underwriter hasagreed to purchase the number of ordinary shares indicated in the following table.
Number ofUnderwriters Ordinary Shares
International Underwriters:Goldman Sachs International ******************************* 46,550,182Merrill Lynch International ********************************** 20,002,030Credit Suisse First Boston (Europe) Limited ****************** 18,911,010Den norske Bank ASA, DnB Markets ************************ 24,060,040HSBC Investment Bank plc ********************************* 20,729,370Kleinwort Benson Limited*********************************** 10,546,520Schroder Salomon Smith Barney **************************** 8,000,810
Subtotal ************************************************ 148,799,962
Norwegian Institutional Underwriters:Den norske Bank ASA, DnB Markets ************************ 52,564,847Christiania Bank og Kredit Kasse ASA acting through
Christiania Markets ************************************** 35,043,230Goldman Sachs International ******************************* 21,025,940Orkla Enskilda Securities ASA ****************************** 18,397,700Sundal Collier & Co ASA *********************************** 18,397,700Fondsfinans ASA ****************************************** 16,645,530Pareto Securities ASA ************************************* 13,141,210
Subtotal ************************************************ 175,216,157
Total *************************************************** 324,016,119
The international underwriters may choose to take some or all of their ordinary shares in theform of ADSs. The purchase and sale of the ordinary shares by the international underwriters andNorwegian institutional underwriters is conditional on the closing of the other parts of the globaloffering, including the Norwegian retail offering.
If the underwriters sell more ordinary shares than the total number set forth in the underwritingagreement, the underwriters have an option to buy from the selling shareholder up to an additional51,608,776 ordinary shares, which represents 15% of the ordinary shares sold in the global offering(excluding the ordinary shares sold in the Norwegian retail offering), to cover these sales. They mayexercise that option for 30 days from the date of this prospectus. If any ordinary shares are
223
BOWNE OF LONDON 12/03/2000 18:21 BL/SM NO MARKS NEXT PCN: 230.00.00.00 -- Page is valid, no graphics X42481 229.00.00.00 38X
purchased pursuant to this option, the international underwriters and Norwegian institutionalunderwriters will severally purchase ordinary shares in approximately the same proportion as setforth in the table above. The international underwriters may choose to take some or all of theiradditional ordinary shares in the form of ADSs.
The joint global coordinators have entered into a share lending agreement with the sellingshareholder which provides that the joint global coordinators may borrow ordinary shares up to anumber equal to the maximum number covered by the over-allotment option.
The following tables show the per share, per ADS and total underwriting discounts andcommissions to be paid to the international underwriters and Norwegian institutional underwriters byTelenor and the selling shareholder. The selling shareholder will pay selling concessions only to theextent that the international underwriters and Norwegian institutional underwriters exercise theirover-allotment option. Such amounts are shown assuming both no exercise and full exercise of theinternational underwriters’ and Norwegian institutional underwriters’ option to purchase additionalshares.
Paid by Telenor No Exercise Full Exercise
Per ordinary share ********************* NOK 0.5670 NOK 0.5670Per ADS ****************************** US$ 0.1839 US$ 0.1839Total, at ordinary share price ************ NOK 183,717,139 NOK 183,717,139
Paid by the Selling Shareholder Full Exercise
Per ordinary share ********************* NOK 0.3402Per ADS ****************************** US$ 0.1103Total, at ordinary share price ************ NOK 16,534,542
The underwriting agreement among Telenor, the selling shareholder and the underwriters alsocontains an agreement with the underwriters for the sale of 20,042,390 ordinary shares in the UnitedStates. The terms and conditions of the offerings are the same. Goldman, Sachs & Co. is therepresentative of the underwriters for the offering in the United States.
The underwriters for each of the offerings have entered into an agreement in which they haveagreed to restrictions on where and to whom they and any dealer purchasing from them may offershares as part of the distribution of shares. The underwriters have also agreed that they may sellshares among each of the underwriting groups subject to certain restrictions.
We and the selling shareholder may, in our and its discretion, pay to some or all of theunderwriters (other than the U.S. underwriters) and the managers in the Norwegian retail offeringafter the closing an additional performance-related commission in an aggregate amount of up toNOK 0.0630 times the total number of ordinary shares sold in the global offering. We and the sellingshareholder will consider the following criteria in evaluating the pre-pricing performance of theunderwriters eligible to receive the performance-related commission: quality of preparation; quality ofpre-marketing; level and quality of demand; pricing and sizing; quality of cooperation within theunderwriting syndicate; and quality of interaction with and service to us and the selling shareholder.We and the selling shareholder will not take into account any trading, research or other activities ofany underwriter after the pricing of the offering. Notwithstanding the foregoing criteria, the decision topay any performance-related fee and the amount of any such fee remains entirely within ourdiscretion and the discretion of the selling shareholder.
Ordinary shares or ADSs sold by the underwriters to the public will initially be offered at theinitial public offering price set forth on the cover of this prospectus. Any ordinary shares sold by theunderwriters to securities dealers may be sold at a discount of up to NOK 0.3402 per ordinary shareor US$0.1103 per ADS from the initial public offering price. If all the ordinary shares or ADSs arenot sold at the initial offering price, the representatives may change the offering price and the other
224
BOWNE OF LONDON 12/03/2000 14:28 BL/SM NO MARKS NEXT PCN: 231.00.00.00 -- Page is valid, no graphics X42481 230.00.00.00 10X
selling terms. The initial offering price and the underwriting commission per share for each of theU.S. offering, the international offering and the Norwegian institutional offering are the same.
Buyers of ordinary shares and ADSs sold by the underwriters in this offering may be required topay stamp taxes and other charges in accordance with the laws and practices in the country ofpurchase in addition to the initial public offering price on the cover of this prospectus.
Telenor and the selling shareholder each have agreed with the underwriters that neither of themwill offer, sell, contract to sell, or otherwise dispose of, other than in the global offering, any ofTelenor’s securities that are substantially similar to the ordinary shares or ADSs, including but notlimited to any security convertible into or exchangeable for or which represents the right to receive,ordinary shares or such substantially similar securities, during the period from the date of thisprospectus continuing for a period of 180 days after the date of this prospectus, except with the priorwritten consent of the joint global coordinators (which consent shall not be unreasonably withheld ordelayed). This agreement does not apply to:
) ordinary shares, options on ordinary shares or other securities issued or sold on or after thedate 90 days after the date of this prospectus pursuant to incentive plans for employees ordirectors of us or our subsidiaries in an aggregate amount not exceeding 2% of our sharecapital, or
) the issuance or sale by us after the date 90 days after the date of this prospectus of ordinaryshares or securities convertible into ordinary shares in connection with a strategic alliance,joint venture or acquisition in an aggregate amount not to exceed 10% of our share capital,provided that the transferee of such ordinary shares or securities enters into an agreementcontaining substantially the same restrictions as described in this paragraph.
Prior to the offerings, there has been no public market for the ordinary shares or the ADSs. Theinitial public offering price was negotiated among the selling shareholder, the representatives andTelenor. Among the factors considered in determining the initial public offering price of the ordinaryshares and ADSs, in addition to prevailing market conditions, were Telenor’s historical performance,estimates of the business potential and earnings prospects of Telenor, an assessment of Telenor’smanagement and consideration of the above factors in relation to market valuation of companies inrelated businesses.
The ordinary shares have been approved for listing on the Oslo Stock Exchange under thesymbol ‘‘TEL’’ and the ADSs have been approved for quotation on the Nasdaq National Marketunder the symbol ‘‘TELN’’.
In connection with the offering, the underwriters may purchase and sell ordinary shares andADSs in the open market. These transactions may include short sales, stabilizing transactions andpurchases to cover positions created by short sales. Short sales involve the sale by the underwritersof a greater number of ordinary shares or ADSs than they are required to purchase in the offering.‘‘Covered’’ short sales are sales made in an amount not greater than the underwriters’ option topurchase additional ordinary shares from the selling shareholder in the offering. The underwritersmay close out any covered short position by either exercising their option to purchase additionalordinary shares or purchasing ordinary shares or ADSs in the open market. In determining thesource of ordinary shares or ADSs to close out the covered short position, the underwriters willconsider, among other things, the price of ordinary shares or ADSs available for purchase in theopen market as compared to the price at which they may purchase ordinary shares through theoverallotment option. ‘‘Naked’’ short sales are any sales in excess of such option. The underwritersmust close out any naked short position by purchasing ordinary shares or ADSs in the open market.A naked short position is more likely to be created if the underwriters are concerned that there maybe downward pressure on the price of the ordinary shares or ADSs in the open market after pricingthat could adversely affect investors who purchase in the offering. Stabilizing transactions consist of
225
BOWNE OF LONDON 12/03/2000 14:28 BL/SM NO MARKS NEXT PCN: 232.00.00.00 -- Page is valid, no graphics X42481 231.00.00.00 8X
various bids for or purchases of ordinary shares or ADSs made by the underwriters in the openmarket prior to the completion of the offering.
The underwriters also may impose a penalty bid. This occurs when a particular underwriterrepays to the underwriters a portion of the underwriting discount received by it because therepresentatives have repurchased ordinary shares or ADSs sold by or for the account of suchunderwriter in stabilizing or short covering transactions.
Purchases to cover a short position and stabilizing transactions may have the effect ofpreventing or retarding a decline in the market price of Telenor’s ordinary shares or ADSs, andtogether with the imposition of the penalty bid, may stabilize, maintain or otherwise affect the marketprice of the ordinary shares or ADSs. As a result, the price of the ordinary shares or ADSs may behigher than the price that otherwise might exist in the open market. If these activities arecommenced, they may be discontinued by the underwriters at any time. These transactions may beeffected on the Oslo Stock Exchange, on the Nasdaq National Market, in the over-the-countermarket or otherwise.
Each underwriter has also represented and agreed that:
) it has not offered or sold and prior to the date six months after the date of issue of theordinary shares will not offer or sell any ordinary shares or ADSs to persons in the UnitedKingdom, except to persons whose ordinary activities involve them in acquiring, holding,managing or disposing of investments (as principal or agent) for the purposes of theirbusinesses or otherwise in circumstances that have not resulted and will not result in an offerto the public in the United Kingdom within the meaning of the Public Offers of SecuritiesRegulations 1995;
) it has complied, and will comply with, all applicable provisions of the Financial Services Act1986 of Great Britain with respect to anything done by it in relation to the ordinary shares orADSs in, from or otherwise involving the United Kingdom; and
) it has only issued or passed on and will only issue or pass on in the United Kingdom anydocument received by it in connection with the issuance of the ordinary shares or ADSs to aperson who is of a kind described in Article 11(3) of the Financial Services Act 1986(Investment Advertisements) (Exemptions) Order 1996 (as amended) of Great Britain or is aperson to whom the document may otherwise lawfully be issued or passed on.
The ordinary shares and ADSs may not be offered, sold, transferred or delivered in or from TheNetherlands as part of their initial distribution or at any time thereafter, directly or indirectly, otherthan to banks, pension funds, insurance companies, securities firms, investment institutions, centralgovernments, large international and supranational institutions and other comparable entities,including, among others, treasuries and finance companies of large enterprises, which trade orinvest in securities in the conduct of a profession or trade. Individuals or legal entities who or whichdo not trade or invest in securities in the conduct of their profession or trade may not participate inthe offer and this communication may not be considered an offer or the prospect of an offer to sellthe ordinary shares or ADSs.
Each underwriter has acknowledged and agreed that the ordinary shares and ADSs have notbeen registered under the Securities and Exchange Law of Japan and are not being offered or soldand may not be offered or sold, directly or indirectly, in Japan or to or for the account of any residentof Japan, except (1) pursuant to an exemption from the registration requirements of the Securitiesand Exchange Law of Japan and (2) in compliance with any other applicable requirements ofJapanese law. As part of the offering, Goldman Sachs International only may offer ordinary sharesand ADSs in Japan to a list of 49 offerees in accordance with the above provisions.
No action has been or will be taken in any jurisdiction other than the United States and Norwaythat would permit a public offering of the ordinary shares or ADSs or the possession, circulation or
226
BOWNE OF LONDON 12/03/2000 14:28 BL/SM NO MARKS NEXT PCN: 233.00.00.00 -- Page is valid, no graphics X42481 232.00.00.00 8X
distribution of this prospectus in any jurisdiction where action for that purpose is required.Accordingly, the ordinary shares and ADSs may not be offered or sold, directly or indirectly, andneither this prospectus nor any other offering material or advertisements in connection with theordinary shares or ADSs may be distributed or published in or from any country or jurisdiction exceptunder circumstances that will result in compliance with any applicable rules and regulations of anysuch country or jurisdiction.
The underwriters do not expect sales to discretionary accounts to exceed five percent of thetotal number of ordinary shares (including ordinary shares in the form of ADSs) offered.
Telenor estimates that its total expenses of the offering, excluding underwriting discounts andcommissions, will be approximately US$25,760,586.
Telenor and the selling shareholder have agreed, to the extent permissible under Norwegian law,to indemnify the several underwriters against certain liabilities, including liabilities under theSecurities Act of 1933, as amended. Telenor and the selling shareholder also have agreed to pay therepresentatives an amount in reimbursement of some of their expenses.
Certain of the underwriters are providing, have provided or may in the future provide investmentbanking and other financial services to the selling shareholder and us in the ordinary course ofbusiness and will receive customary compensation in connection therewith. Affiliates of some of theunderwriters are lenders to Telenor under a DKK 14.0 billion credit agreement, a portion of whichmay be repaid from the proceeds of the offering.
The selling shareholder owns approximately 61% of the share capital of Den norske Bank,which is an underwriter and one of the joint global coordinators of the global offering. Also, TormodHermansen, our President and Chief Executive Officer, is a director of Den norske Bank.
VALIDITY OF SECURITIES
The validity of the ordinary shares will be passed upon by Thommessen Krefting Greve Lund,Haakon VII’s gate 10, P.O. Box 1484 Vika, N-0116 Oslo, Norway, our Norwegian counsel, and byWiersholm, Mellbye & Bech, Ruseløkveien 26, Post Boks 1400 Vika, N-0115 Oslo, Norway,Norwegian counsel for the underwriters. The validity of the ADSs will be passed upon by ourU.S. counsel, Sullivan & Cromwell, 9a Ironmonger Lane, London EC2V 8EY, England, and bySkadden, Arps, Slate, Meagher & Flom LLP, One Canada Square, Canary Wharf, London E14 5DS,U.S. counsel for the underwriters.
EXPERTS
The consolidated financial statements of Telenor ASA at December 31, 1998 and 1999 and foreach of the years in the three-year period ended December 31, 1999, appearing in this prospectushave been audited by Arthur Andersen & Co., Drammensveien 165, Post Boks 228 Skøyen, N-0212,Oslo, Norway, independent auditors, as set forth in their report thereon appearing elsewhere herein,and are included in reliance upon such report given on the authority of such firm as experts inaccounting and auditing.
The consolidated financial statements of Sonofon Holding A/S at December 31, 1998 and 1999and for each of the years in the two-year period ended December 31, 1999, appearing in thisprospectus have been audited by Deloitte & Touche, independent auditors, as set forth in their reportthereon appearing elsewhere herein, and are included in reliance upon such report given on theauthority of such firm as experts in accounting and auditing.
227

BOWNE OF LONDON 11/10/2000 11:27 BL/SM NO MARKS NEXT PCN: 501.00.00.00 -- Page is valid, no graphics X42481 500.00.00.00 2X
[THIS PAGE INTENTIONALLY LEFT BLANK]
BOWNE OF LONDON 12/01/2000 19:56 BL/SM NO MARKS NEXT PCN: 234.00.00.00 -- Page is valid, no graphics X42481 233.00.00.00 6X
TELENOR ASA
INDEX TO CONSOLIDATED FINANCIAL STATEMENTS
Page
TELENOR ASA
Annual consolidated financial statements:
Report of Independent Accountants*************************************************** F-2
Consolidated Statement of Profit and Loss ******************************************** F-3
Consolidated Balance Sheet ********************************************************* F-4
Consolidated Cash Flow Statement *************************************************** F-5
Consolidated Statements of Shareholder’s Equity ************************************** F-7
Summary of Significant Accounting Principles****************************************** F-8
Notes to the consolidated financial statements ***************************************** F-14
Unaudited interim consolidated financial statements:
Consolidated Statement of Profit and Loss ******************************************** F-54
Consolidated Balance Sheet ********************************************************* F-55
Consolidated Cash Flow Statement *************************************************** F-56
Consolidated Statements of Shareholder’s Equity ************************************** F-57
Notes to the unaudited interim consolidated financial statements ************************* F-58
Unaudited pro forma consolidated financial information:
Consolidated Statement of Profit and Loss for the Nine Months Ended September 30, 2000 *** F-72
Consolidated Statement of Profit and Loss for the Year Ended December 31, 1999 ******** F-73
Notes to the unaudited pro forma consolidated financial information ********************** F-74
SONOFON HOLDING A/S
Consolidated financial statements:
Report of Independent Accountants*************************************************** F-75
Consolidated Statement of Profit and Loss ******************************************** F-76
Consolidated Balance Sheet ********************************************************* F-77
Consolidated Cash Flow Statement *************************************************** F-79
Consolidated Statements of Shareholders’ Equity ************************************** F-80
Summary of Significant Accounting Principles****************************************** F-81
Notes to the consolidated financial statements ***************************************** F-86
F-1
BOWNE OF LONDON 12/01/2000 19:56 BL/SM NO MARKS NEXT PCN: 235.00.00.00 -- Page is valid, no graphics X42481 234.00.00.00 6X
REPORT OF INDEPENDENT ACCOUNTANTS
To the Shareholder ofTelenor ASA
We have audited the accompanying consolidated balance sheets of Telenor ASA (newly formedholding company — see ‘‘Summary of Significant Accounting Policies’’) and its subsidiaries (the‘‘Company’’) as of December 31, 1998 and 1999, and the related consolidated statements ofincome, shareholder’s equity and cash flows for each of the three years in the period endedDecember 31, 1999. These financial statements are the responsibility of the Company’s manage-ment. Our responsibility is to express an opinion on these financial statements based on our audits.
We conducted our audits in accordance with generally accepted auditing standards (‘‘GAAS’’) inNorway, which are substantially the same as GAAS in the United States. Those standards requirethat we plan and perform the audit to obtain reasonable assurance about whether the financialstatements are free of material misstatement. An audit includes examining, on a test basis, evidencesupporting the amounts and disclosures in the financial statements. An audit also includes assessingthe accounting principles used and significant estimates made by management, as well as evaluatingthe overall financial statement presentation. We believe that our audits provide a reasonable basis forour opinion.
In our opinion, the financial statements referred to above present fairly, in all material respects,the financial position of the Company as of December 31, 1998 and 1999, and the relatedconsolidated statements of income, shareholders’ equity and cash flows for each of the three yearsin the period ended December 31, 1999 in conformity with accounting principles generally acceptedin Norway.
Accounting practices used by the Company in preparing the accompanying financial statementsconform with generally accepted accounting principles in Norway, but do not conform withaccounting principles generally accepted in the United States. A description of these differences anda complete reconciliation of consolidated net income and shareholder’s equity to US generallyaccepted accounting principles is set forth in Note 29.
ARTHUR ANDERSEN & CO.Oslo, Norway, April 3, 2000,except for Note 29 which is as of June 29, 2000 andNote 28 which is as of November 10, 2000
F-2
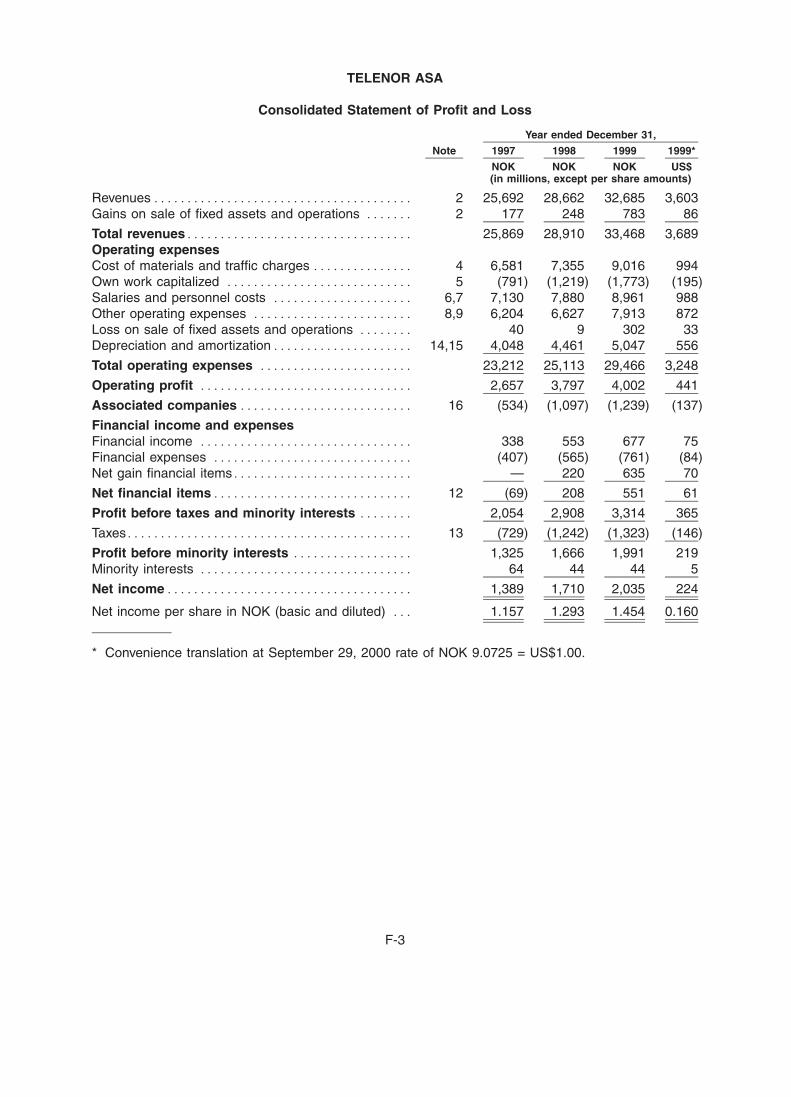
BOWNE OF LONDON 12/01/2000 19:56 BL/SM NO MARKS NEXT PCN: 236.00.00.00 -- Page is valid, no graphics X42481 235.00.00.00 6X
TELENOR ASA
Consolidated Statement of Profit and Loss
Year ended December 31,
Note 1997 1998 1999 1999*
NOK NOK NOK US$(in millions, except per share amounts)
Revenues*************************************** 2 25,692 28,662 32,685 3,603Gains on sale of fixed assets and operations ******* 2 177 248 783 86
Total revenues********************************** 25,869 28,910 33,468 3,689Operating expensesCost of materials and traffic charges *************** 4 6,581 7,355 9,016 994Own work capitalized **************************** 5 (791) (1,219) (1,773) (195)Salaries and personnel costs ********************* 6,7 7,130 7,880 8,961 988Other operating expenses ************************ 8,9 6,204 6,627 7,913 872Loss on sale of fixed assets and operations ******** 40 9 302 33Depreciation and amortization********************* 14,15 4,048 4,461 5,047 556
Total operating expenses *********************** 23,212 25,113 29,466 3,248
Operating profit ******************************** 2,657 3,797 4,002 441
Associated companies ************************** 16 (534) (1,097) (1,239) (137)
Financial income and expensesFinancial income ******************************** 338 553 677 75Financial expenses ****************************** (407) (565) (761) (84)Net gain financial items*************************** — 220 635 70
Net financial items****************************** 12 (69) 208 551 61
Profit before taxes and minority interests ******** 2,054 2,908 3,314 365
Taxes******************************************* 13 (729) (1,242) (1,323) (146)
Profit before minority interests ****************** 1,325 1,666 1,991 219Minority interests ******************************** 64 44 44 5
Net income************************************* 1,389 1,710 2,035 224
Net income per share in NOK (basic and diluted) *** 1.157 1.293 1.454 0.160
* Convenience translation at September 29, 2000 rate of NOK 9.0725 = US$1.00.
F-3
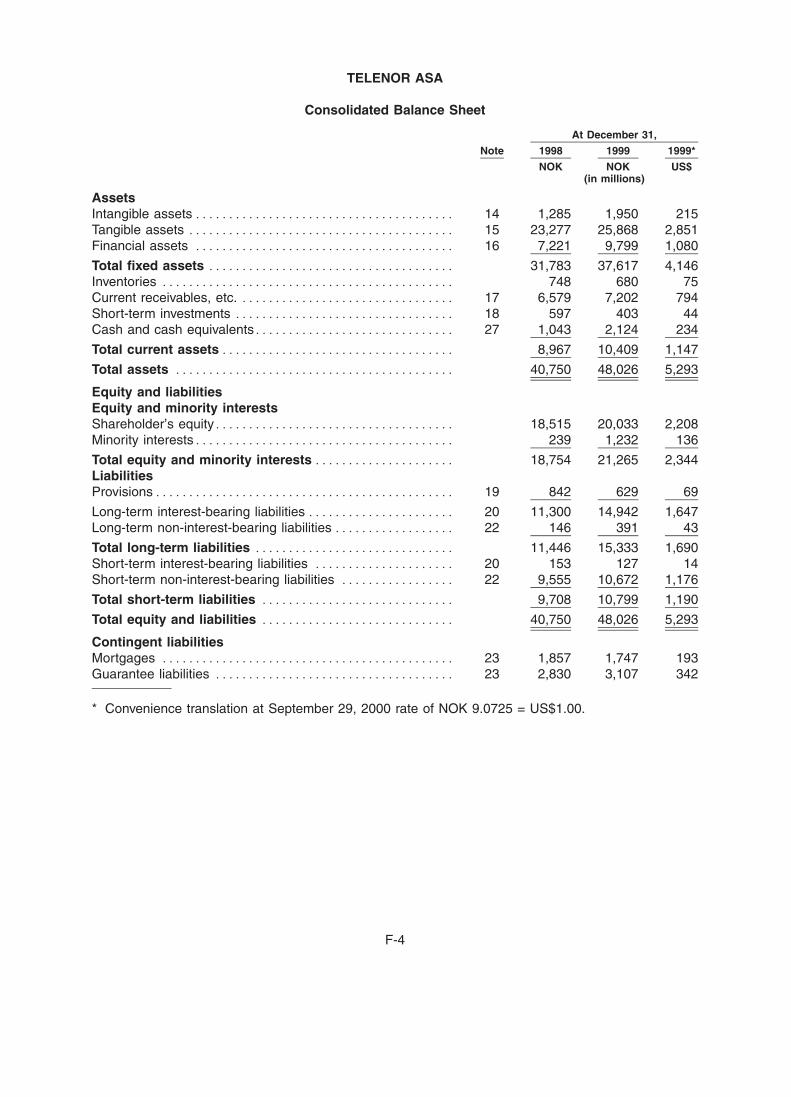
BOWNE OF LONDON 12/01/2000 19:56 BL/SM NO MARKS NEXT PCN: 237.00.00.00 -- Page is valid, no graphics X42481 236.00.00.00 6X
TELENOR ASA
Consolidated Balance Sheet
At December 31,
Note 1998 1999 1999*
NOK NOK US$(in millions)
AssetsIntangible assets*************************************** 14 1,285 1,950 215Tangible assets **************************************** 15 23,277 25,868 2,851Financial assets *************************************** 16 7,221 9,799 1,080
Total fixed assets ************************************* 31,783 37,617 4,146Inventories ******************************************** 748 680 75Current receivables, etc. ******************************** 17 6,579 7,202 794Short-term investments ********************************* 18 597 403 44Cash and cash equivalents****************************** 27 1,043 2,124 234
Total current assets*********************************** 8,967 10,409 1,147
Total assets ****************************************** 40,750 48,026 5,293
Equity and liabilitiesEquity and minority interestsShareholder’s equity************************************ 18,515 20,033 2,208Minority interests*************************************** 239 1,232 136
Total equity and minority interests ********************* 18,754 21,265 2,344LiabilitiesProvisions********************************************* 19 842 629 69
Long-term interest-bearing liabilities ********************** 20 11,300 14,942 1,647Long-term non-interest-bearing liabilities ****************** 22 146 391 43
Total long-term liabilities ****************************** 11,446 15,333 1,690Short-term interest-bearing liabilities ********************* 20 153 127 14Short-term non-interest-bearing liabilities ***************** 22 9,555 10,672 1,176
Total short-term liabilities ***************************** 9,708 10,799 1,190
Total equity and liabilities ***************************** 40,750 48,026 5,293
Contingent liabilitiesMortgages ******************************************** 23 1,857 1,747 193Guarantee liabilities ************************************ 23 2,830 3,107 342
* Convenience translation at September 29, 2000 rate of NOK 9.0725 = US$1.00.
F-4
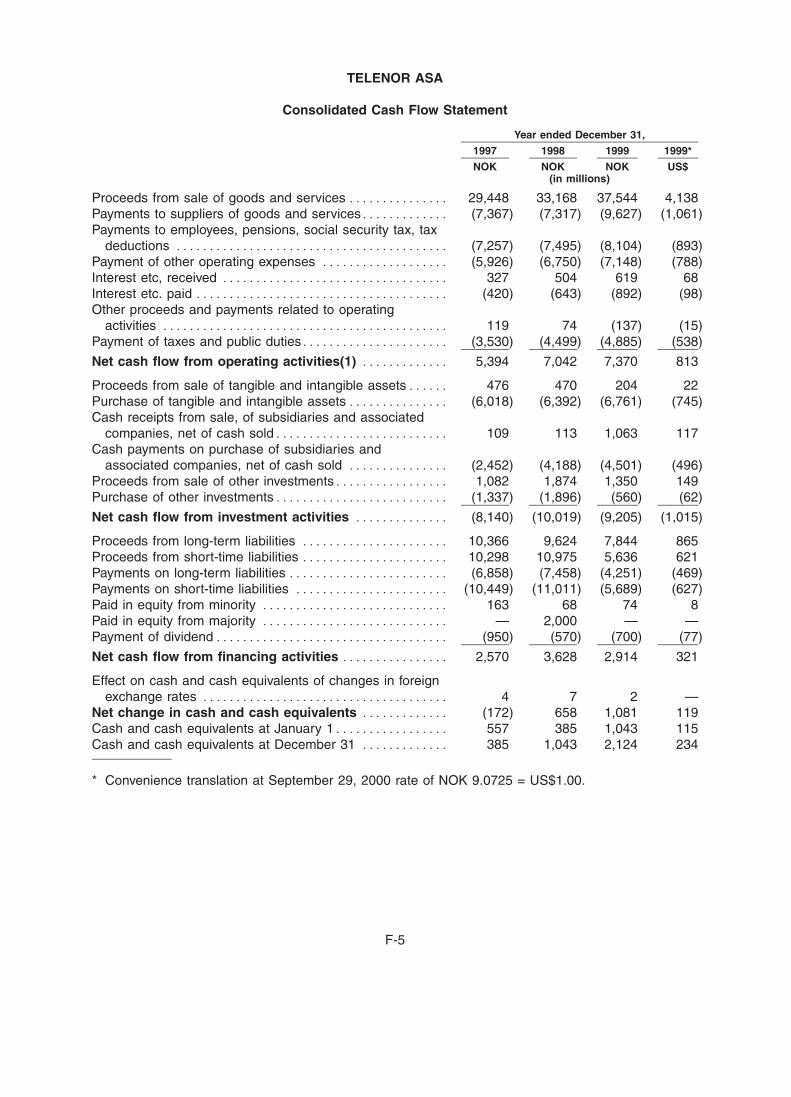
BOWNE OF LONDON 12/01/2000 19:56 BL/SM NO MARKS NEXT PCN: 238.00.00.00 -- Page is valid, no graphics X42481 237.00.00.00 6X
TELENOR ASA
Consolidated Cash Flow Statement
Year ended December 31,
1997 1998 1999 1999*
NOK NOK NOK US$(in millions)
Proceeds from sale of goods and services *************** 29,448 33,168 37,544 4,138Payments to suppliers of goods and services************* (7,367) (7,317) (9,627) (1,061)Payments to employees, pensions, social security tax, tax
deductions ***************************************** (7,257) (7,495) (8,104) (893)Payment of other operating expenses ******************* (5,926) (6,750) (7,148) (788)Interest etc, received ********************************** 327 504 619 68Interest etc. paid ************************************** (420) (643) (892) (98)Other proceeds and payments related to operating
activities ******************************************* 119 74 (137) (15)Payment of taxes and public duties********************** (3,530) (4,499) (4,885) (538)
Net cash flow from operating activities(1) ************* 5,394 7,042 7,370 813
Proceeds from sale of tangible and intangible assets****** 476 470 204 22Purchase of tangible and intangible assets*************** (6,018) (6,392) (6,761) (745)Cash receipts from sale, of subsidiaries and associated
companies, net of cash sold************************** 109 113 1,063 117Cash payments on purchase of subsidiaries and
associated companies, net of cash sold *************** (2,452) (4,188) (4,501) (496)Proceeds from sale of other investments***************** 1,082 1,874 1,350 149Purchase of other investments************************** (1,337) (1,896) (560) (62)
Net cash flow from investment activities ************** (8,140) (10,019) (9,205) (1,015)
Proceeds from long-term liabilities ********************** 10,366 9,624 7,844 865Proceeds from short-time liabilities ********************** 10,298 10,975 5,636 621Payments on long-term liabilities ************************ (6,858) (7,458) (4,251) (469)Payments on short-time liabilities *********************** (10,449) (11,011) (5,689) (627)Paid in equity from minority **************************** 163 68 74 8Paid in equity from majority **************************** — 2,000 — —Payment of dividend*********************************** (950) (570) (700) (77)
Net cash flow from financing activities **************** 2,570 3,628 2,914 321
Effect on cash and cash equivalents of changes in foreignexchange rates ************************************* 4 7 2 —
Net change in cash and cash equivalents ************* (172) 658 1,081 119Cash and cash equivalents at January 1***************** 557 385 1,043 115Cash and cash equivalents at December 31 ************* 385 1,043 2,124 234
* Convenience translation at September 29, 2000 rate of NOK 9.0725 = US$1.00.
F-5
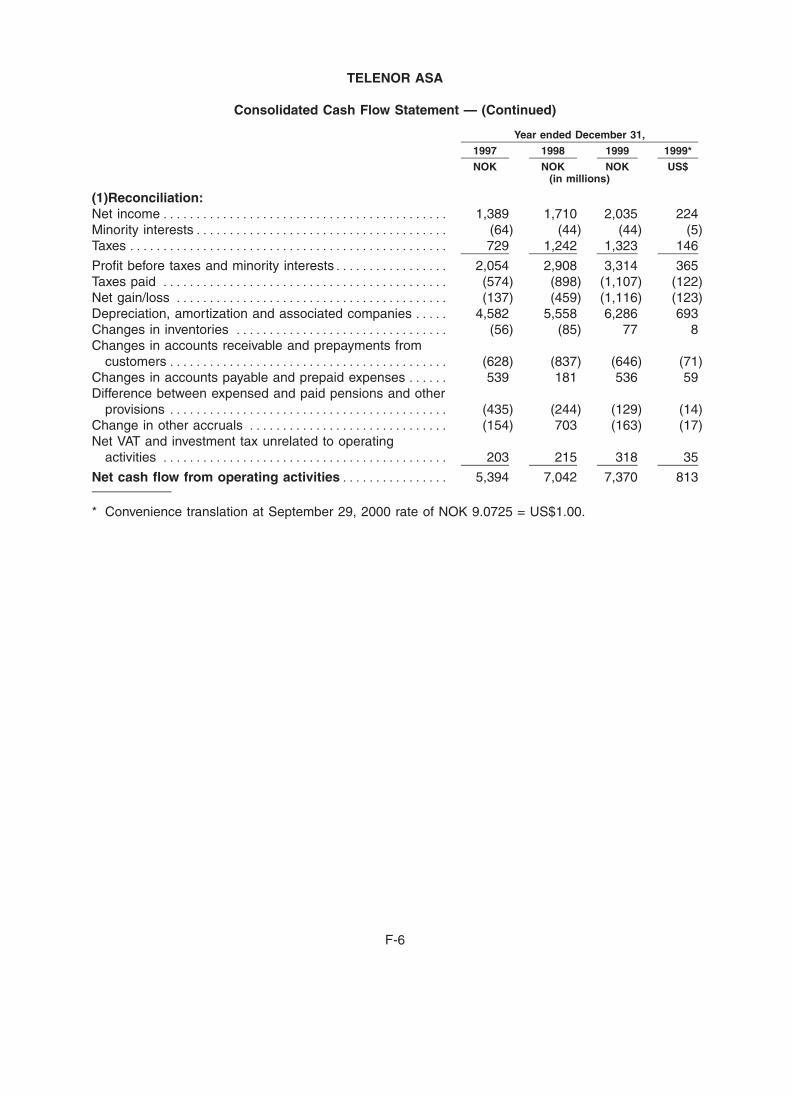
BOWNE OF LONDON 12/01/2000 19:56 BL/SM NO MARKS NEXT PCN: 239.00.00.00 -- Page is valid, no graphics X42481 238.00.00.00 6X
TELENOR ASA
Consolidated Cash Flow Statement — (Continued)
Year ended December 31,
1997 1998 1999 1999*
NOK NOK NOK US$(in millions)
(1)Reconciliation:Net income******************************************* 1,389 1,710 2,035 224Minority interests************************************** (64) (44) (44) (5)Taxes ************************************************ 729 1,242 1,323 146
Profit before taxes and minority interests***************** 2,054 2,908 3,314 365Taxes paid ******************************************* (574) (898) (1,107) (122)Net gain/loss ***************************************** (137) (459) (1,116) (123)Depreciation, amortization and associated companies ***** 4,582 5,558 6,286 693Changes in inventories ******************************** (56) (85) 77 8Changes in accounts receivable and prepayments from
customers****************************************** (628) (837) (646) (71)Changes in accounts payable and prepaid expenses ****** 539 181 536 59Difference between expensed and paid pensions and other
provisions ****************************************** (435) (244) (129) (14)Change in other accruals ****************************** (154) 703 (163) (17)Net VAT and investment tax unrelated to operating
activities ******************************************* 203 215 318 35
Net cash flow from operating activities**************** 5,394 7,042 7,370 813
* Convenience translation at September 29, 2000 rate of NOK 9.0725 = US$1.00.
F-6
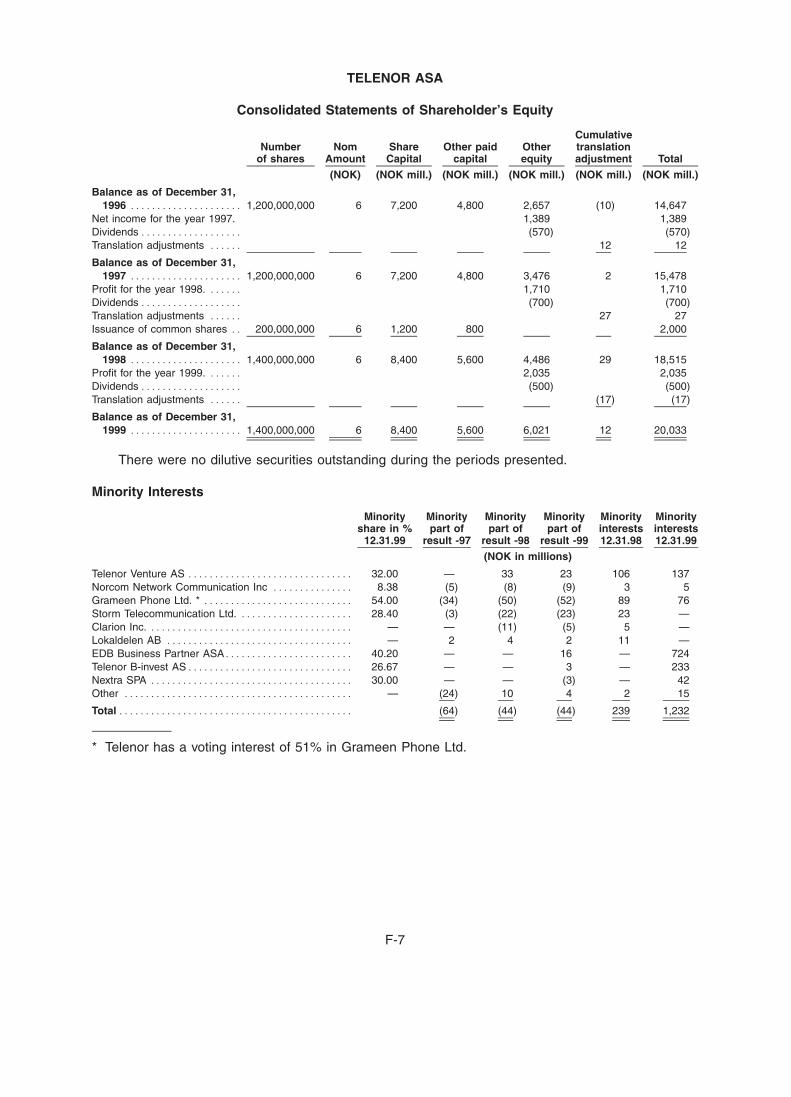
BOWNE OF LONDON 12/01/2000 19:56 BL/SM NO MARKS NEXT PCN: 240.00.00.00 -- Page is valid, no graphics X42481 239.00.00.00 6X
TELENOR ASA
Consolidated Statements of Shareholder’s Equity
CumulativeNumber Nom Share Other paid Other translation
of shares Amount Capital capital equity adjustment Total
(NOK) (NOK mill.) (NOK mill.) (NOK mill.) (NOK mill.) (NOK mill.)
Balance as of December 31,1996 ********************* 1,200,000,000 6 7,200 4,800 2,657 (10) 14,647
Net income for the year 1997. 1,389 1,389Dividends ******************* (570) (570)Translation adjustments ****** 12 12
Balance as of December 31,1997 ********************* 1,200,000,000 6 7,200 4,800 3,476 2 15,478
Profit for the year 1998. ****** 1,710 1,710Dividends ******************* (700) (700)Translation adjustments ****** 27 27Issuance of common shares ** 200,000,000 6 1,200 800 2,000
Balance as of December 31,1998 ********************* 1,400,000,000 6 8,400 5,600 4,486 29 18,515
Profit for the year 1999. ****** 2,035 2,035Dividends ******************* (500) (500)Translation adjustments ****** (17) (17)
Balance as of December 31,1999 ********************* 1,400,000,000 6 8,400 5,600 6,021 12 20,033
There were no dilutive securities outstanding during the periods presented.
Minority Interests
Minority Minority Minority Minority Minority Minorityshare in % part of part of part of interests interests
12.31.99 result -97 result -98 result -99 12.31.98 12.31.99
(NOK in millions)
Telenor Venture AS ******************************* 32.00 — 33 23 106 137Norcom Network Communication Inc *************** 8.38 (5) (8) (9) 3 5Grameen Phone Ltd. * **************************** 54.00 (34) (50) (52) 89 76Storm Telecommunication Ltd. ********************* 28.40 (3) (22) (23) 23 —Clarion Inc. ************************************** — — (11) (5) 5 —Lokaldelen AB *********************************** — 2 4 2 11 —EDB Business Partner ASA************************ 40.20 — — 16 — 724Telenor B-invest AS******************************* 26.67 — — 3 — 233Nextra SPA ************************************** 30.00 — — (3) — 42Other ******************************************* — (24) 10 4 2 15
Total ******************************************** (64) (44) (44) 239 1,232
* Telenor has a voting interest of 51% in Grameen Phone Ltd.
F-7
BOWNE OF LONDON 12/01/2000 19:56 BL/SM NO MARKS NEXT PCN: 241.00.00.00 -- Page is valid, no graphics X42481 240.00.00.00 6X
TELENOR ASA
Summary of Significant Accounting Principles
General
When Telenor AS was established as a public company on October 31, 1994, assets andliabilities were transferred at their carrying values as recorded in the final records of the NorwegianState Administration, except for required adjustments to comply with Norwegian generally acceptedaccounting principles (Norwegian GAAP).
Telenor ASA was formed by the Norwegian Government in July 2000 to act as the holdingcompany for the Telenor Group. In September 2000, the Norwegian Government contributed all ofthe shares of Telenor AS (subsequently renamed Telenor Communications AS), the former holdingcompany for the Telenor Group, to Telenor ASA in exchange for all of the issued shares of TelenorASA. Telenor ASA was formed with identical share capital as Telenor AS, and prior to its acquisitionof Telenor AS had no assets or liabilities and conducted no operations other than incidental to itsformation. For purposes of these financial statements, Telenor ASA is treated as if it had been theparent company of the Telenor Group for all periods presented.
The consolidated financial statements for Telenor ASA and its subsidiaries (the Group) areprepared in accordance with Norwegian GAAP. The Group’s accounting principles differ, in certainrespects, from United States generally accepted accounting principles (US GAAP). The differencesand the approximate related effects on the Group’s net income and shareholder’s equity are set forthin note 28.
All amounts are presented in millions of NOK or other specified currency unless otherwisestated. Solely for the convenience of the reader, the accompanying consolidated financial statementsas of and for the year ended December 31, 1999 have been translated into US dollars, using theend noon buying rates in The City of New York for cable transfers, which was NOK 9.0725 perUS dollar, as of September 29, 2000. The translations should not be construed as a representationthat the amounts could have been or could be converted into US dollars at that or any other rate.
Consolidation principles
The Group consolidated accounts include Telenor ASA and subsidiaries in which Telenor ASAhas effective control, which generally exists where Telenor ASA has more than 50% ownership.
All significant intercompany transactions and balances have been eliminated.
Investments in joint ventures and entities in which Telenor has an equity ownership interest of20 to 50% and exercises significant influence are accounted for using the equity method.
Investments considered to be of a temporary nature are accounted for at cost.
Increase in minority interest from a subsidiary’s equity transactions and sale of shares in asubsidiary are recorded at fair value as minority interest. The difference between the minority interestmeasured at fair value and the recorded equity in the subsidiary is amortized through allocatingresults to minority.
Basis of presentation
On March 30, 1999, the Norwegian Government and the Swedish Government agreed to form ajointly held company for the combination of Telenor AS with Telia AB. The Governments formed thecompany Newtel AB for this purpose. After obtaining necessary approval by the EU Commission, ina shareholders’ meeting for Newtel on October 18, 1999, the Norwegian Government and theSwedish Government contributed shares in Telenor AS and Telia AB, respectively, in exchange for
F-8

BOWNE OF LONDON 12/01/2000 19:56 BL/SM NO MARKS NEXT PCN: 242.00.00.00 -- Page is valid, no graphics X42481 241.00.00.00 6X
TELENOR ASA
Summary of Significant Accounting Principles — (Continued)
common shares of Newtel. In their capacity as shareholders of Telenor AS and Telia AB, theNorwegian and Swedish governments decided on December 16, 1999 to abandon the combination.
Telenor has not recognized for accounting purposes any of the effects of the abandonedcombination in the accompanying financial statements, other than its share of the direct costs ofNOK 250 million, which have been charged to operations in 1999.
On April 10, 2000, Telenor signed an agreement with Telia with respect to the unwinding of theabove transaction.
Net income per share
Net income per share have been retroactively adjusted for a share split. See Note 28.
Goodwill and license costs
Goodwill represents the excess of the purchase price over the fair value of net assets acquiredin business combinations accounted for under the purchase method. Goodwill is amortized on astraight-line basis over the estimated useful economic life, based on an individual assessment.
License cost and goodwill relating to business with licenses are amortized over the term ofthe license.
Revenue
Revenues are primarily comprised of traffic fees, subscription and connection fees, interconnec-tion fees, fees for leased lines, fees for leased networks, fees for data network services, fees for TVdistribution and satellite services, IT service, installation and software service fees and sale ofcustomer equipment and directory advertising.
For PSTN/ISDN, mobile telephony, leased lines, TV distribution, satellite services and othernetwork based services, traffic revenues and interconnection revenues are recognized based onactual traffic. Subscription fees are recognized as revenue over the subscription period. Revenuesrelated to prepaid phone cards are deferred and recorded as revenue based on the actual use of thecards.
Revenues from connection fees that are received from the sale of new subscriptions arerecognized at the time of sale to the extent of direct costs incurred. Direct costs incurred inconnection with mobile connection revenues consist primarily of the first payment of distributorcommission, costs for credit check, cost of the SIM card, and the cost of the printed new customerinformation package. For the fixed line connection revenues, the direct costs consist primarily ofinstallation work and the cost of a printed telephone directory given to each new subscriber. To date,direct costs associated with mobile and fixed line connection fees have exceeded such revenues.
Revenues from customer equipment and IT service and installation are recognized whenservices are rendered or products are delivered to customers.
Revenues from directory advertising are recognized when the directories are published.
Pensions
Defined benefit plans are valued at the present value of accrued future pension benefits at thebalance sheet date. Pension plan assets are valued at their fair value. Changes in the pensionobligations due to changes in pension plans are recognized over the estimated average remaining
F-9
BOWNE OF LONDON 12/01/2000 19:56 BL/SM NO MARKS NEXT PCN: 243.00.00.00 -- Page is valid, no graphics X42481 242.00.00.00 6X
TELENOR ASA
Summary of Significant Accounting Principles — (Continued)
service period. When the accumulated effect of changes in estimates, changes in assumptions anddeviations from actuarial assumptions exceed 10 percent of the higher of pension benefit obligationsand pension plan assets, the excess amount is recognized over the estimated average remainingservice period. The net pension cost for the period is classified as salaries and personnel costs.
Research and development costs
Research and development costs are expensed as incurred.
Software costs
Direct development costs associated with internal-use software are capitalized, includingexternal direct costs of material and services and payroll costs for employees devoting time to thesoftware projects.
Costs incurred during the preliminary project stage, as well as maintenance and training costs,are expensed as incurred.
Leases
Capital leases, which provide the Group with substantially all the rights and obligations ofownership are capitalized as fixed assets. Liabilities are valued at the present value of minimumlease payments.
Foreign currency transactions
Transactions involving foreign currencies are translated into Norwegian Kroner using exchangerates in effect at the time of the transactions. Financial instruments denominated in foreigncurrencies are translated using period end exchange rates. The resulting gain or loss is charged tofinancial items for the period, unless the financial instrument has been designated as a qualifyinghedge.
Foreign currency translation
The financial statements of the Group’s foreign operations are maintained in the currency inwhich the entity primarily conducts business. When translating financial statements for foreignentities (subsidiaries, associated companies and joint ventures) from local currencies to NorwegianKroner, assets and liabilities are translated using year-end exchange rates and results are translatedusing the average exchange rates for the reporting period. The resulting translation adjustments, andthe gains and losses on financial instruments designated as hedges of net foreign investments, arereported as a component of shareholder’s equity.
For entities located in countries defined as highly-inflationary and with financial reporting in localcurrency, fixed assets and related depreciation are remeasured using the exchange rate at the dateof acquisition. Other balance sheet items are remeasured at the year-end exchange rate. Other profitand loss items are translated using the average exchange rates for the reporting period. The gain orloss resulting from these remeasurements is charged to income for the period.
Derivatives
Telenor uses various derivatives (interest rate and foreign currency swaps and forwards, caps,FRAs and electricity contracts) primarily to manage its exposure to fluctuations in foreign exchangerates, interest rates and electricity.
F-10
BOWNE OF LONDON 12/01/2000 19:56 BL/SM NO MARKS NEXT PCN: 244.00.00.00 -- Page is valid, no graphics X42481 243.00.00.00 6X
TELENOR ASA
Summary of Significant Accounting Principles — (Continued)
To qualify for hedge accounting, the instruments must meet defined correlation and effectivenesscriteria, and be designated as hedges and generate financial statement effects, which substantiallyoffset those of the position being hedged.
Gains and losses on foreign exchange contracts that are designated as hedges of foreigncurrency liabilities are included in the value of the hedged item. In the case of forward contractsbeing used, the premium or discount is amortized over the term of the contract, and classified asinterest. Gains and losses on foreign exchange contracts that are designated as hedges of firmcommitments are deferred and recognized in income at the same time as the related transactions.
Amounts to be paid or received under interest rate swaps that are designated and effective as ahedge of interest bearing assets are accrued as interest income or expense, respectively.
Gains and losses on termination of hedge contracts are recognized in income when terminatedin conjunction with the termination of the hedged position, or to the extent that such position remainsoutstanding, deferred and amortized to income over the original hedging period.
The Group does not normally hold derivatives for trading purposes. Derivatives that do not meetthe hedging criteria are recorded at their market value with the resulting gain or loss reflected underfinancial items.
Taxes
Deferred tax assets and liabilities are calculated with full allocation for all temporary differencesbetween the carrying amount of assets and liabilities in the financial statements and for taxpurposes, including tax losses carried forward. The enacted tax rates at the balance sheet date andnominal amounts are used. Deferred tax assets are recorded in the balance sheet to the extent it ismore likely than not that the tax assets will be utilized.
Cash and cash equivalents
Cash and cash equivalents include cash, bank deposits, fixed rate bonds and commercial paperwith original maturity of three months or less.
Investments
For shares classified as current assets and managed as a whole, adjustments in the book valueare only made if the aggregated holdings have a lower estimated fair value than the original cost.Other current shares are valued at the lower of cost and estimated fair value.
Long-term shares and other investments, excluding shares in associated companies and jointventures activities, are valued at historical cost or estimated fair value if the fall in value is nottemporary.
Inventories
Inventories are valued at the lower of cost or market price. Cost is determined using theFIFO method.
Advertising costs, marketing and sales commissions
Advertising costs, marketing and sales commissions are expensed as incurred.
F-11
BOWNE OF LONDON 12/01/2000 19:56 BL/SM NO MARKS NEXT PCN: 245.00.00.00 -- Page is valid, no graphics X42481 244.00.00.00 6X
TELENOR ASA
Summary of Significant Accounting Principles — (Continued)
Tangible assets, intangible assets and depreciation
Tangible and intangible assets are carried at historical cost less accumulated depreciation andamortization. Impairment of tangible and intangible assets is assessed when changes incircumstances indicate that their carrying amount may not be recoverable. The assessment is madebased on estimated undiscounted future cash flows for those assets to be held and used and salesprice less cost to sell for assets to be disposed of. When such amounts are less than the carryingamount of the asset, a write down to fair value or sales price less cost to sell is recorded. Interesthas been capitalized on assets under construction.
Tangible assets are, for the most part, depreciated on a straight-line basis over their expectedeconomic useful lives using the following rates:
Office machinery and equipment, software: 20-33%Satellites, computer equipment, software at switches and other equipment: 10-20%Transmission and equipment related to switches: 10-20%Cable and power supply installations: 6-8%Buildings: 3-4%
Year 2000 expenses
Expenses related to modifications that have not produced improvements through increasedfunctionality or which have not extended the expected economic useful life are expensed.
Use of estimates
The preparation of financial statements in accordance with generally accepted accountingprinciples requires management to make estimates and assumptions that affect the reportedamounts of assets and liabilities, and disclosure of contingent assets and liabilities at the date of thefinancial statements and the reported amounts of revenue and expenses during the reporting period.
Actual results could differ from those estimates.
Changes in Accounting Principles
The following changes in accounting principles have been made:
1999
The new Norwegian accounting act came into effect January 1, 1999. Telenor has madechanges in accounting principles as a result of the new accounting act. Except for capitalizedinternal costs on software for internal use, all comparable figures in the profit and loss accounts,balance sheets and cash flow statements have been restated.
Under the old accounting act Telenor did not capitalize interest on assets under construction.Under the new accounting act interest is required to be capitalized on assets under construction.Capitalized interest was NOK 131 million in 1998, and NOK 79 million in 1997. Depreciation ofcapitalized interest was NOK 36 million and NOK 25 million for 1998 and 1997, respectively.
Internal cost for software is capitalized from January 1, 1999. Capitalized costs for softwarewere NOK 100 million in 1999.
Under the old accounting act a deferred tax asset could only be recognized to the extent it washighly probable that the tax asset could be utilized. A net deferred tax asset could not be recognized
F-12
BOWNE OF LONDON 12/01/2000 19:56 BL/SM NO MARKS NEXT PCN: 246.00.00.00 -- Page is valid, no graphics X42481 245.00.00.00 6X
TELENOR ASA
Summary of Significant Accounting Principles — (Continued)
in the balance sheet. Under the new accounting act deferred tax assets are recognized when it ismore likely than not that the tax asset will be utilized. Deferred tax assets amounting toNOK 652 million for 1998 and NOK 311 million for 1997 have been recognized in the balance sheet.Profit for the year for 1998 and 1997 has been increased by NOK 341 million and NOK 147 millionrespectively. Most of the deferred tax assets are recorded in associated companies.
Under the old accounting act properties for sale were valued as a group for assessment forimpairment. Under the new accounting act each property for sale is assessed for impairment on anindividual basis. Sales-type leases where Telenor is the lessor were previously recorded as rent ofassets. This is now recorded as a financial lease (sale). The effect on equity and profit is immaterial.
Classification and other
Roaming revenue from mobile telephony is now presented gross instead of net. Revenue andrelated traffic costs increased with NOK 483 million and NOK 325 million for 1998 and 1997respectively.
Own work capitalized is presented gross as a separate caption in the profit and loss statement.This mainly relates to salary for own personnel in the companies in the Group and for investmentpurchases between the companies in the Group.
The following table reconciles the equity as of December 31, 1998, with the restated equity afterchanges made in the accounting principles:
(in NOK millions)
Equity at December 31, 1998, before changes in accounting principles 17,626Capitalization of interest, net of depreciation and tax ******************** 238Write-down of properties, net of tax************************************ (16)Leasing, net of tax*************************************************** 15Recognition of deferred tax asset************************************** 652
Equity at December 31, 1998, restated ******************************* 18,515
1998
No change in accounting principles.
1997
In 1997 the Group implemented the equity method of accounting for associated companies andjoint ventures.
F-13
BOWNE OF LONDON 12/01/2000 19:56 BL/SM NO MARKS NEXT PCN: 247.00.00.00 -- Page is valid, no graphics X42481 246.00.00.00 6X
TELENOR ASA
Notes to the consolidated financial statements
1 ACQUISITIONS AND DISPOSALS
During the three years ended December 31, 1999, Telenor entered into the following significantacquisitions. Each acquisition was recorded using the purchase method of accounting. The summarydoes not include capital increases or other types of financing by Telenor. Disposals have beeninsignificant in 1998 and 1997.
1999 Acquisitions
Telenor acquired the following significant subsidiaries or significant interests in associatedcompanies and joint ventures:
Change Excessin Purchase value/ Amortization
Company Country interest % Business price goodwill period
(in NOK millions)
VimpelCommunication ************ Russia 31.6 Mobile telecommunication 1,239 409(*) 10 yearsEsat Digifone ******************** Ireland 4.5 Mobile telecommunication 444 436(*) 12 yearsDiGi.com bhd******************** Malaysia 30.0 Mobile telecommunication 1,661 1,327(*) 15 yearsNarrowband Telecomm.
Research Inc. ***************** Canada 100.0 Mobile telecommunication 80 79 3 yearsNextra SPA********************** Italy 70.0 Internet 84 84 5 yearsOMNILINK Internet Service Center
GmbH ************************ Germany 100.0 Internet 95 91 5 yearse-comp Engineering GmbH ******* Germany 100.0 Internet 81 78 5 yearsRelab AB *********************** Sweden 100.0 Installation and service 49 36 5 yearsEDB ASA *********************** Norway 66.0 Information Technology 547 414 20 yearsTelesciences Inc. **************** USA 100.0 Information Technology 105 96 20 yearsNorkring AS********************* Norway 60.0 TV distribution 579 —
(*) Excess value/goodwill of equity investments is included in the book value of associatedcompanies and joint ventures
1999 Disposals
In October 1999 Telenor sold its ownership in Lokaldelen AB, Telenor Foretagsinfo AB andInternordia AB. The total consideration was NOK 935 million. A gain of NOK 753 million wasrecorded.
In June 1999 Telenor reduced its ownership in Telenor Programvare AS (now EDB BusinessPartner ASA) by issuance of shares in a purchase business combination. Telenor later sold part ofthe shares in EDB Business Partner ASA. No gains were recorded on these transactions.
Telenor sold 26.67% of the subsidiary Telenor B-Invest AS that holds Telenor’s investment inCosmote S.A. The consideration was equivalent to the original cost price plus interest on theinvestment in Cosmote S.A. No gain was recorded.
Telenor disposed of its ownership in Clarion Inc. A loss of NOK 285 million was recorded.
F-14
BOWNE OF LONDON 12/01/2000 19:56 BL/SM NO MARKS NEXT PCN: 248.00.00.00 -- Page is valid, no graphics X42481 247.00.00.00 6X
TELENOR ASA
Notes to the consolidated financial statements — (Continued)
1998 Acquisitions
Telenor acquired the following significant subsidiaries or significant interests in associatedcompanies and joint ventures:
Change Excessin Purchase value/ Amortization
Company Country interest % Business price goodwill period
(in NOK millions)
Kyivstar J.S.C **************** Ukraine 35.0 Mobile telecommunication 257 243(*) 15 yearsPannon GSM RT************** Hungary 5.5 Mobile telecommunication 405 388(*) 10 yearsTelehuset AS ***************** Norway 30.0 Wholesales 109 53 5 yearsTelenor Magnet GmbH********* Austria 100.0 Internet 57 59 5 yearsSF Vision AB ***************** Sweden 100.0 TV distribution 85 81 10 yearsSoleil Publicite SA************* France 75.0 Directory services 44 56 5 years
(*) Excess value/goodwill of equity investments is included in the book value of associatedcompanies and joint ventures.
1997 Acquisitions
Telenor acquired the following significant subsidiaries or significant interests in associatedcompanies and joint ventures:
Change Excessin Purchase value/ Amortization
Company Country interest % Business price goodwill period
(in NOK millions)
Viag Intercom GmbH & Co. Germany 10.0 Wired and mobile 301 216(*) 18 yearstelecomm
Cosmote S.A.***************** Greece 30.0 Mobile telecommunication 678 267(*) 23 yearsPolskie Dsiakie Telefoniczne
sp z o o******************** Poland 50.0 Directory services 61 53(*) 5 yearsCanal Digital AS ************** Nordic 50.0 TV distribution 71 — —
countriesLokaldelen AB **************** Sweden 92.6 Directory services 174 123 5 years
(*) Excess value/goodwill of equity investments is included in the book value of associatedcompanies and joint ventures.
Pro forma information
Had the 1999 and 1998 purchase business combinations taken place on January 1, 1998 andJanuary 1, 1997, respectively, the pro forma effect on revenue, net income and income per sharewould not be material.
F-15
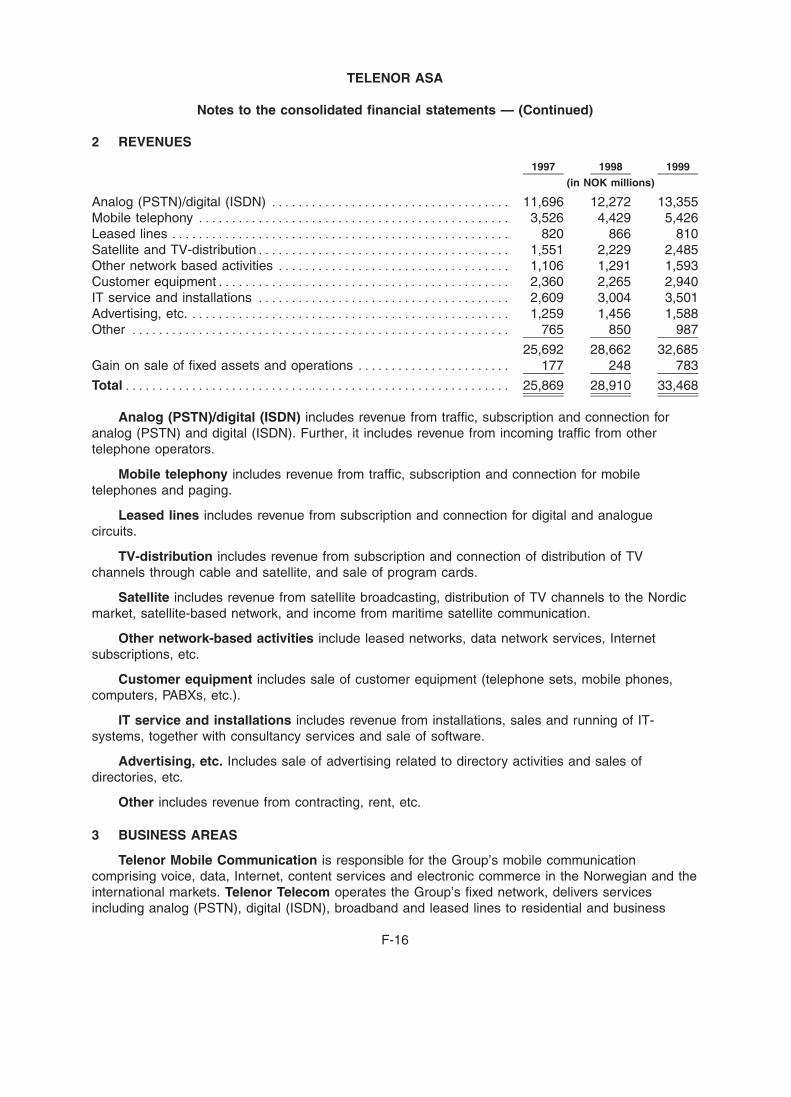
BOWNE OF LONDON 12/01/2000 19:56 BL/SM NO MARKS NEXT PCN: 249.00.00.00 -- Page is valid, no graphics X42481 248.00.00.00 6X
TELENOR ASA
Notes to the consolidated financial statements — (Continued)
2 REVENUES
1997 1998 1999
(in NOK millions)
Analog (PSTN)/digital (ISDN) ************************************ 11,696 12,272 13,355Mobile telephony *********************************************** 3,526 4,429 5,426Leased lines *************************************************** 820 866 810Satellite and TV-distribution************************************** 1,551 2,229 2,485Other network based activities *********************************** 1,106 1,291 1,593Customer equipment******************************************** 2,360 2,265 2,940IT service and installations ************************************** 2,609 3,004 3,501Advertising, etc. ************************************************ 1,259 1,456 1,588Other ********************************************************* 765 850 987
25,692 28,662 32,685Gain on sale of fixed assets and operations *********************** 177 248 783
Total********************************************************** 25,869 28,910 33,468
Analog (PSTN)/digital (ISDN) includes revenue from traffic, subscription and connection foranalog (PSTN) and digital (ISDN). Further, it includes revenue from incoming traffic from othertelephone operators.
Mobile telephony includes revenue from traffic, subscription and connection for mobiletelephones and paging.
Leased lines includes revenue from subscription and connection for digital and analoguecircuits.
TV-distribution includes revenue from subscription and connection of distribution of TVchannels through cable and satellite, and sale of program cards.
Satellite includes revenue from satellite broadcasting, distribution of TV channels to the Nordicmarket, satellite-based network, and income from maritime satellite communication.
Other network-based activities include leased networks, data network services, Internetsubscriptions, etc.
Customer equipment includes sale of customer equipment (telephone sets, mobile phones,computers, PABXs, etc.).
IT service and installations includes revenue from installations, sales and running of IT-systems, together with consultancy services and sale of software.
Advertising, etc. Includes sale of advertising related to directory activities and sales ofdirectories, etc.
Other includes revenue from contracting, rent, etc.
3 BUSINESS AREAS
Telenor Mobile Communication is responsible for the Group’s mobile communicationcomprising voice, data, Internet, content services and electronic commerce in the Norwegian and theinternational markets. Telenor Telecom operates the Group’s fixed network, delivers servicesincluding analog (PSTN), digital (ISDN), broadband and leased lines to residential and business
F-16
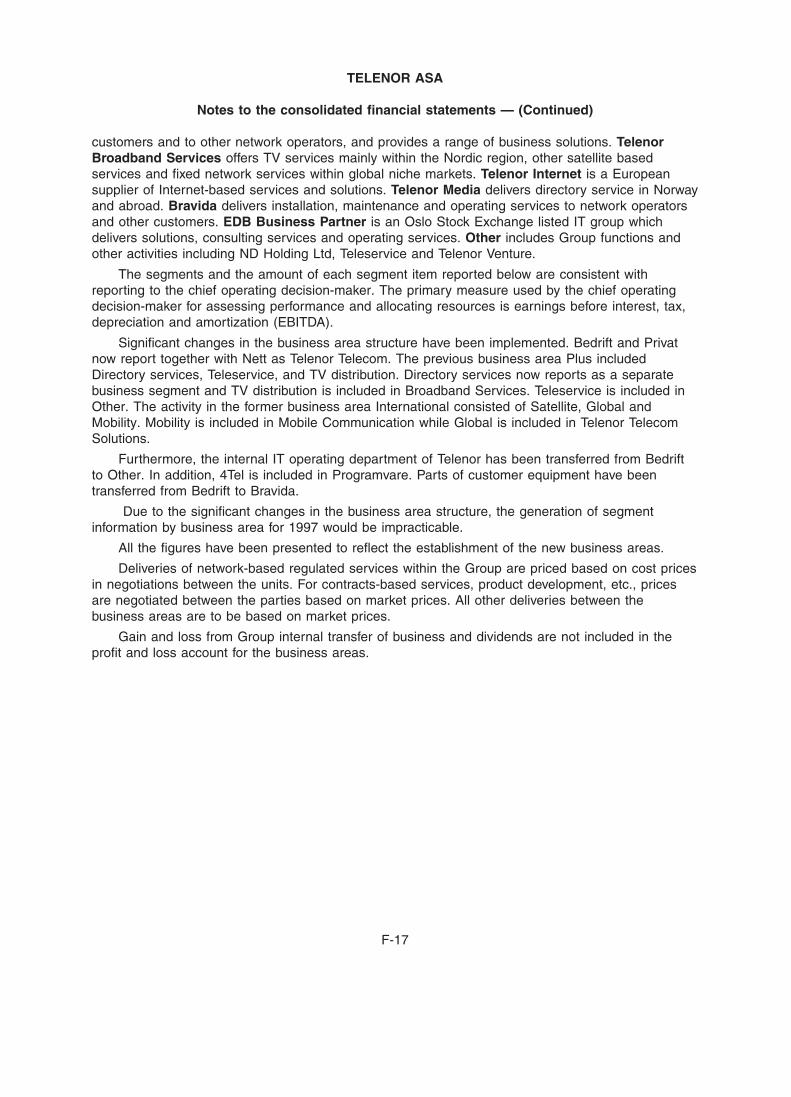
BOWNE OF LONDON 12/01/2000 19:56 BL/SM NO MARKS NEXT PCN: 250.00.00.00 -- Page is valid, no graphics X42481 249.00.00.00 6X
TELENOR ASA
Notes to the consolidated financial statements — (Continued)
customers and to other network operators, and provides a range of business solutions. TelenorBroadband Services offers TV services mainly within the Nordic region, other satellite basedservices and fixed network services within global niche markets. Telenor Internet is a Europeansupplier of Internet-based services and solutions. Telenor Media delivers directory service in Norwayand abroad. Bravida delivers installation, maintenance and operating services to network operatorsand other customers. EDB Business Partner is an Oslo Stock Exchange listed IT group whichdelivers solutions, consulting services and operating services. Other includes Group functions andother activities including ND Holding Ltd, Teleservice and Telenor Venture.
The segments and the amount of each segment item reported below are consistent withreporting to the chief operating decision-maker. The primary measure used by the chief operatingdecision-maker for assessing performance and allocating resources is earnings before interest, tax,depreciation and amortization (EBITDA).
Significant changes in the business area structure have been implemented. Bedrift and Privatnow report together with Nett as Telenor Telecom. The previous business area Plus includedDirectory services, Teleservice, and TV distribution. Directory services now reports as a separatebusiness segment and TV distribution is included in Broadband Services. Teleservice is included inOther. The activity in the former business area International consisted of Satellite, Global andMobility. Mobility is included in Mobile Communication while Global is included in Telenor TelecomSolutions.
Furthermore, the internal IT operating department of Telenor has been transferred from Bedriftto Other. In addition, 4Tel is included in Programvare. Parts of customer equipment have beentransferred from Bedrift to Bravida.
Due to the significant changes in the business area structure, the generation of segmentinformation by business area for 1997 would be impracticable.
All the figures have been presented to reflect the establishment of the new business areas.
Deliveries of network-based regulated services within the Group are priced based on cost pricesin negotiations between the units. For contracts-based services, product development, etc., pricesare negotiated between the parties based on market prices. All other deliveries between thebusiness areas are to be based on market prices.
Gain and loss from Group internal transfer of business and dividends are not included in theprofit and loss account for the business areas.
F-17
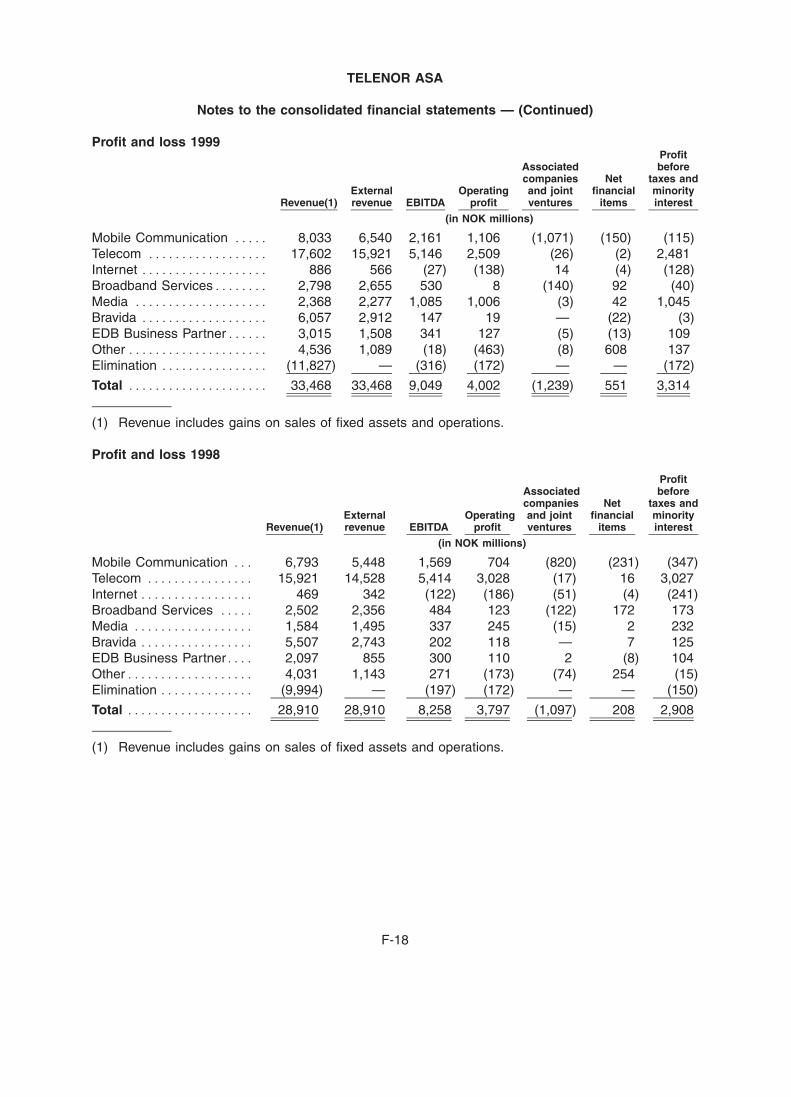
BOWNE OF LONDON 12/01/2000 19:56 BL/SM NO MARKS NEXT PCN: 251.00.00.00 -- Page is valid, no graphics X42481 250.00.00.00 7X
TELENOR ASA
Notes to the consolidated financial statements — (Continued)
Profit and loss 1999Profit
Associated beforecompanies Net taxes and
External Operating and joint financial minorityRevenue(1) revenue EBITDA profit ventures items interest
(in NOK millions)
Mobile Communication ***** 8,033 6,540 2,161 1,106 (1,071) (150) (115)Telecom ****************** 17,602 15,921 5,146 2,509 (26) (2) 2,481Internet ******************* 886 566 (27) (138) 14 (4) (128)Broadband Services******** 2,798 2,655 530 8 (140) 92 (40)Media ******************** 2,368 2,277 1,085 1,006 (3) 42 1,045Bravida ******************* 6,057 2,912 147 19 — (22) (3)EDB Business Partner****** 3,015 1,508 341 127 (5) (13) 109Other ********************* 4,536 1,089 (18) (463) (8) 608 137Elimination **************** (11,827) — (316) (172) — — (172)
Total ********************* 33,468 33,468 9,049 4,002 (1,239) 551 3,314
(1) Revenue includes gains on sales of fixed assets and operations.
Profit and loss 1998
ProfitAssociated beforecompanies Net taxes and
External Operating and joint financial minorityRevenue(1) revenue EBITDA profit ventures items interest
(in NOK millions)
Mobile Communication *** 6,793 5,448 1,569 704 (820) (231) (347)Telecom **************** 15,921 14,528 5,414 3,028 (17) 16 3,027Internet ***************** 469 342 (122) (186) (51) (4) (241)Broadband Services ***** 2,502 2,356 484 123 (122) 172 173Media ****************** 1,584 1,495 337 245 (15) 2 232Bravida ***************** 5,507 2,743 202 118 — 7 125EDB Business Partner**** 2,097 855 300 110 2 (8) 104Other******************* 4,031 1,143 271 (173) (74) 254 (15)Elimination ************** (9,994) — (197) (172) — — (150)
Total ******************* 28,910 28,910 8,258 3,797 (1,097) 208 2,908
(1) Revenue includes gains on sales of fixed assets and operations.
F-18
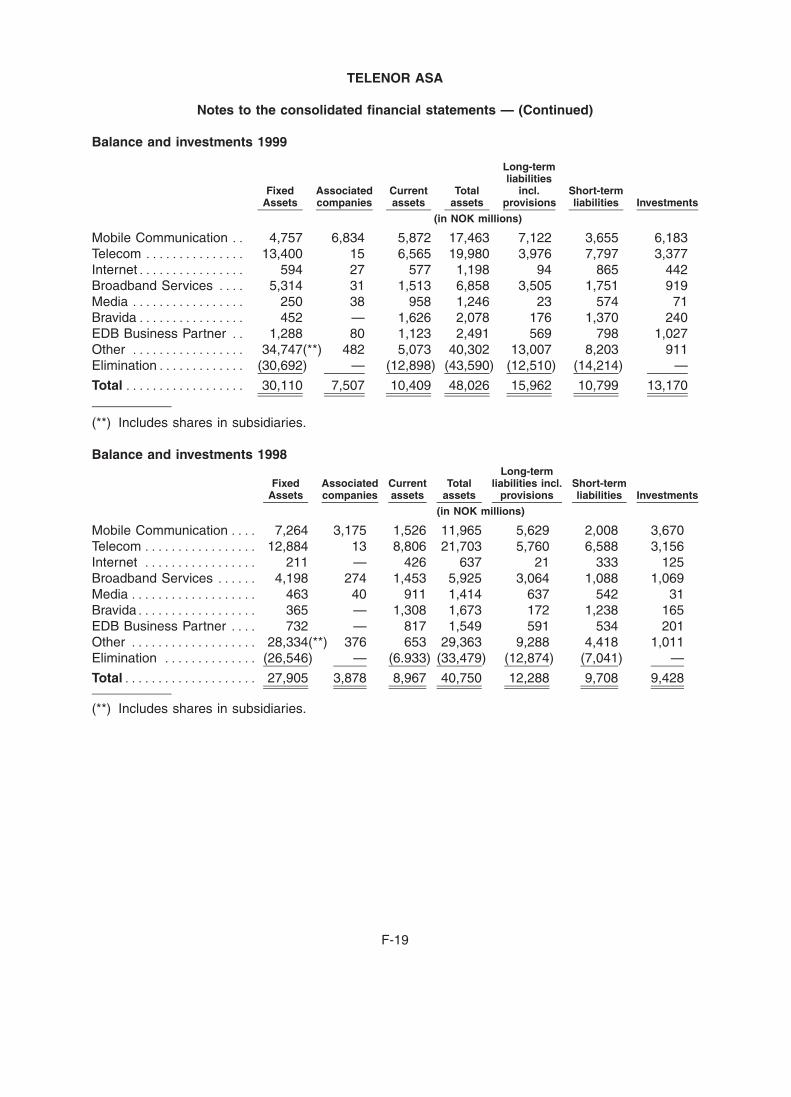
BOWNE OF LONDON 12/01/2000 19:56 BL/SM NO MARKS NEXT PCN: 252.00.00.00 -- Page is valid, no graphics X42481 251.00.00.00 6X
TELENOR ASA
Notes to the consolidated financial statements — (Continued)
Balance and investments 1999
Long-termliabilities
Fixed Associated Current Total incl. Short-termAssets companies assets assets provisions liabilities Investments
(in NOK millions)
Mobile Communication ** 4,757 6,834 5,872 17,463 7,122 3,655 6,183Telecom *************** 13,400 15 6,565 19,980 3,976 7,797 3,377Internet**************** 594 27 577 1,198 94 865 442Broadband Services **** 5,314 31 1,513 6,858 3,505 1,751 919Media ***************** 250 38 958 1,246 23 574 71Bravida**************** 452 — 1,626 2,078 176 1,370 240EDB Business Partner ** 1,288 80 1,123 2,491 569 798 1,027Other ***************** 34,747(**) 482 5,073 40,302 13,007 8,203 911Elimination************* (30,692) — (12,898) (43,590) (12,510) (14,214) —
Total ****************** 30,110 7,507 10,409 48,026 15,962 10,799 13,170
(**) Includes shares in subsidiaries.
Balance and investments 1998Long-term
Fixed Associated Current Total liabilities incl. Short-termAssets companies assets assets provisions liabilities Investments
(in NOK millions)
Mobile Communication **** 7,264 3,175 1,526 11,965 5,629 2,008 3,670Telecom ***************** 12,884 13 8,806 21,703 5,760 6,588 3,156Internet ***************** 211 — 426 637 21 333 125Broadband Services ****** 4,198 274 1,453 5,925 3,064 1,088 1,069Media ******************* 463 40 911 1,414 637 542 31Bravida****************** 365 — 1,308 1,673 172 1,238 165EDB Business Partner **** 732 — 817 1,549 591 534 201Other ******************* 28,334(**) 376 653 29,363 9,288 4,418 1,011Elimination ************** (26,546) — (6.933) (33,479) (12,874) (7,041) —
Total******************** 27,905 3,878 8,967 40,750 12,288 9,708 9,428
(**) Includes shares in subsidiaries.
F-19
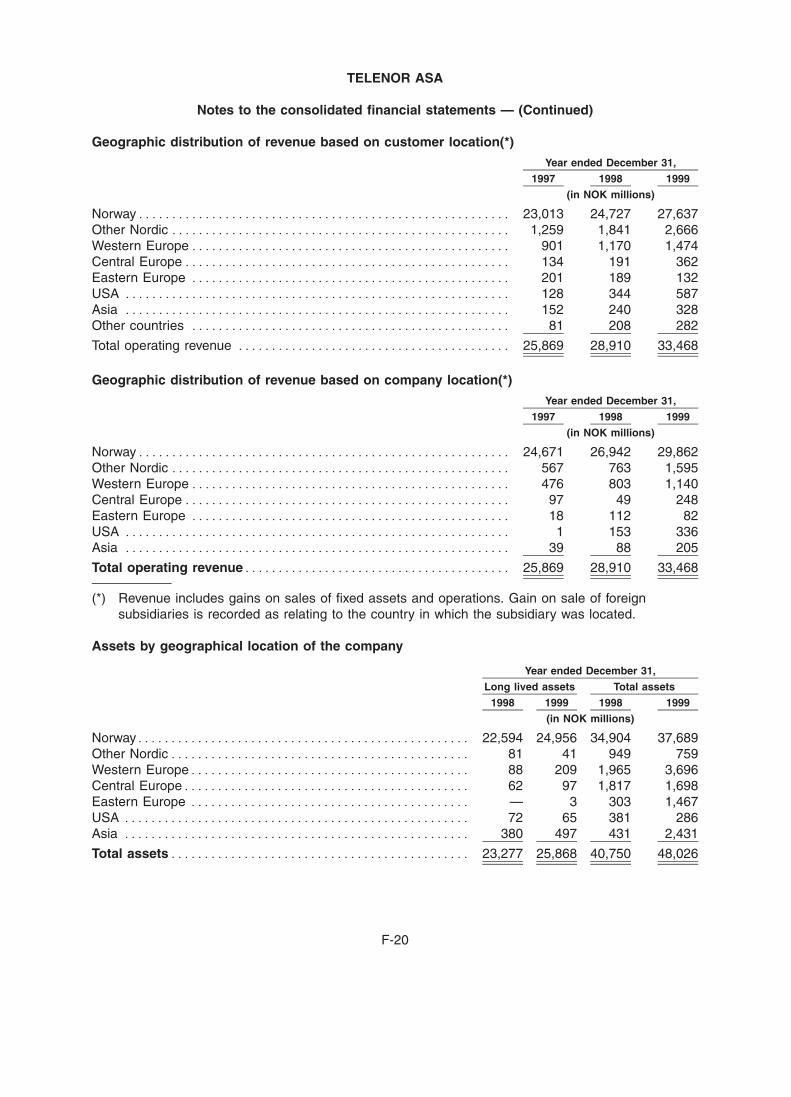
BOWNE OF LONDON 12/01/2000 19:56 BL/SM NO MARKS NEXT PCN: 253.00.00.00 -- Page is valid, no graphics X42481 252.00.00.00 6X
TELENOR ASA
Notes to the consolidated financial statements — (Continued)
Geographic distribution of revenue based on customer location(*)
Year ended December 31,
1997 1998 1999
(in NOK millions)
Norway******************************************************** 23,013 24,727 27,637Other Nordic *************************************************** 1,259 1,841 2,666Western Europe************************************************ 901 1,170 1,474Central Europe************************************************* 134 191 362Eastern Europe ************************************************ 201 189 132USA ********************************************************** 128 344 587Asia ********************************************************** 152 240 328Other countries ************************************************ 81 208 282
Total operating revenue ***************************************** 25,869 28,910 33,468
Geographic distribution of revenue based on company location(*)
Year ended December 31,
1997 1998 1999
(in NOK millions)
Norway******************************************************** 24,671 26,942 29,862Other Nordic *************************************************** 567 763 1,595Western Europe************************************************ 476 803 1,140Central Europe************************************************* 97 49 248Eastern Europe ************************************************ 18 112 82USA ********************************************************** 1 153 336Asia ********************************************************** 39 88 205
Total operating revenue**************************************** 25,869 28,910 33,468
(*) Revenue includes gains on sales of fixed assets and operations. Gain on sale of foreignsubsidiaries is recorded as relating to the country in which the subsidiary was located.
Assets by geographical location of the company
Year ended December 31,
Long lived assets Total assets
1998 1999 1998 1999
(in NOK millions)
Norway************************************************** 22,594 24,956 34,904 37,689Other Nordic********************************************* 81 41 949 759Western Europe****************************************** 88 209 1,965 3,696Central Europe******************************************* 62 97 1,817 1,698Eastern Europe ****************************************** — 3 303 1,467USA **************************************************** 72 65 381 286Asia **************************************************** 380 497 431 2,431
Total assets********************************************* 23,277 25,868 40,750 48,026
F-20
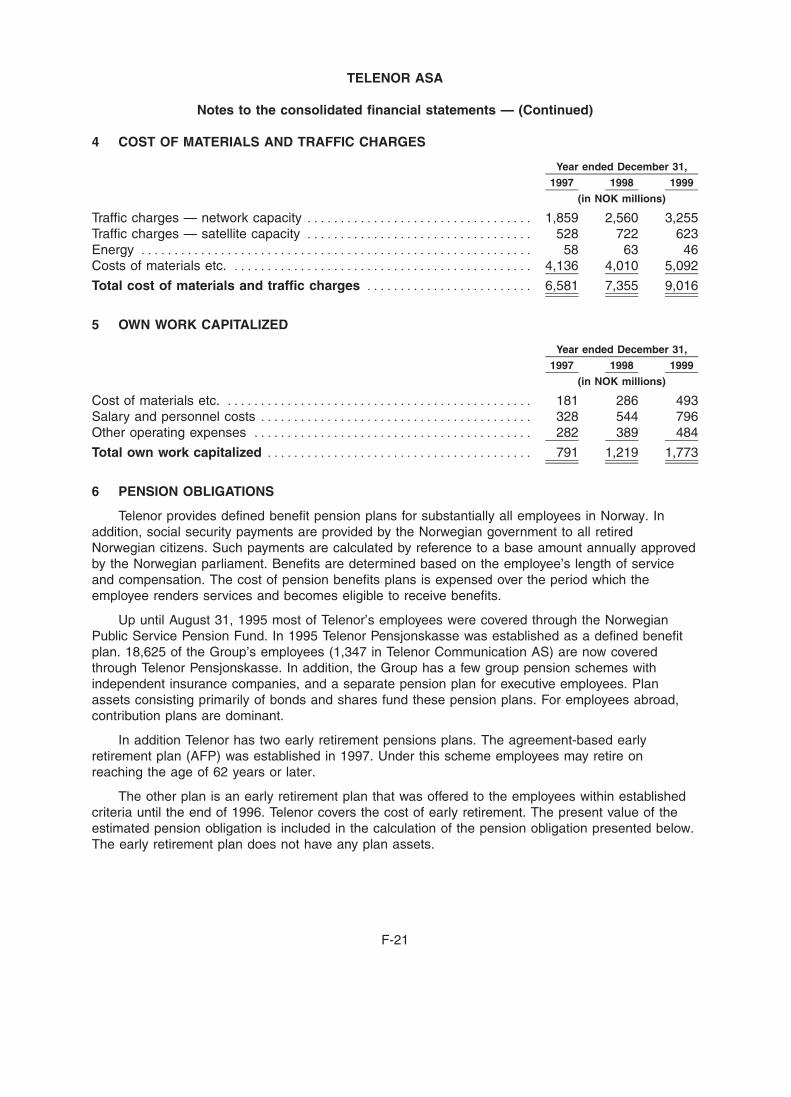
BOWNE OF LONDON 12/01/2000 19:56 BL/SM NO MARKS NEXT PCN: 254.00.00.00 -- Page is valid, no graphics X42481 253.00.00.00 6X
TELENOR ASA
Notes to the consolidated financial statements — (Continued)
4 COST OF MATERIALS AND TRAFFIC CHARGES
Year ended December 31,
1997 1998 1999
(in NOK millions)
Traffic charges — network capacity ********************************** 1,859 2,560 3,255Traffic charges — satellite capacity ********************************** 528 722 623Energy *********************************************************** 58 63 46Costs of materials etc. ********************************************* 4,136 4,010 5,092
Total cost of materials and traffic charges ************************* 6,581 7,355 9,016
5 OWN WORK CAPITALIZED
Year ended December 31,
1997 1998 1999
(in NOK millions)
Cost of materials etc. ********************************************** 181 286 493Salary and personnel costs ***************************************** 328 544 796Other operating expenses ****************************************** 282 389 484
Total own work capitalized **************************************** 791 1,219 1,773
6 PENSION OBLIGATIONS
Telenor provides defined benefit pension plans for substantially all employees in Norway. Inaddition, social security payments are provided by the Norwegian government to all retiredNorwegian citizens. Such payments are calculated by reference to a base amount annually approvedby the Norwegian parliament. Benefits are determined based on the employee’s length of serviceand compensation. The cost of pension benefits plans is expensed over the period which theemployee renders services and becomes eligible to receive benefits.
Up until August 31, 1995 most of Telenor’s employees were covered through the NorwegianPublic Service Pension Fund. In 1995 Telenor Pensjonskasse was established as a defined benefitplan. 18,625 of the Group’s employees (1,347 in Telenor Communication AS) are now coveredthrough Telenor Pensjonskasse. In addition, the Group has a few group pension schemes withindependent insurance companies, and a separate pension plan for executive employees. Planassets consisting primarily of bonds and shares fund these pension plans. For employees abroad,contribution plans are dominant.
In addition Telenor has two early retirement pensions plans. The agreement-based earlyretirement plan (AFP) was established in 1997. Under this scheme employees may retire onreaching the age of 62 years or later.
The other plan is an early retirement plan that was offered to the employees within establishedcriteria until the end of 1996. Telenor covers the cost of early retirement. The present value of theestimated pension obligation is included in the calculation of the pension obligation presented below.The early retirement plan does not have any plan assets.
F-21
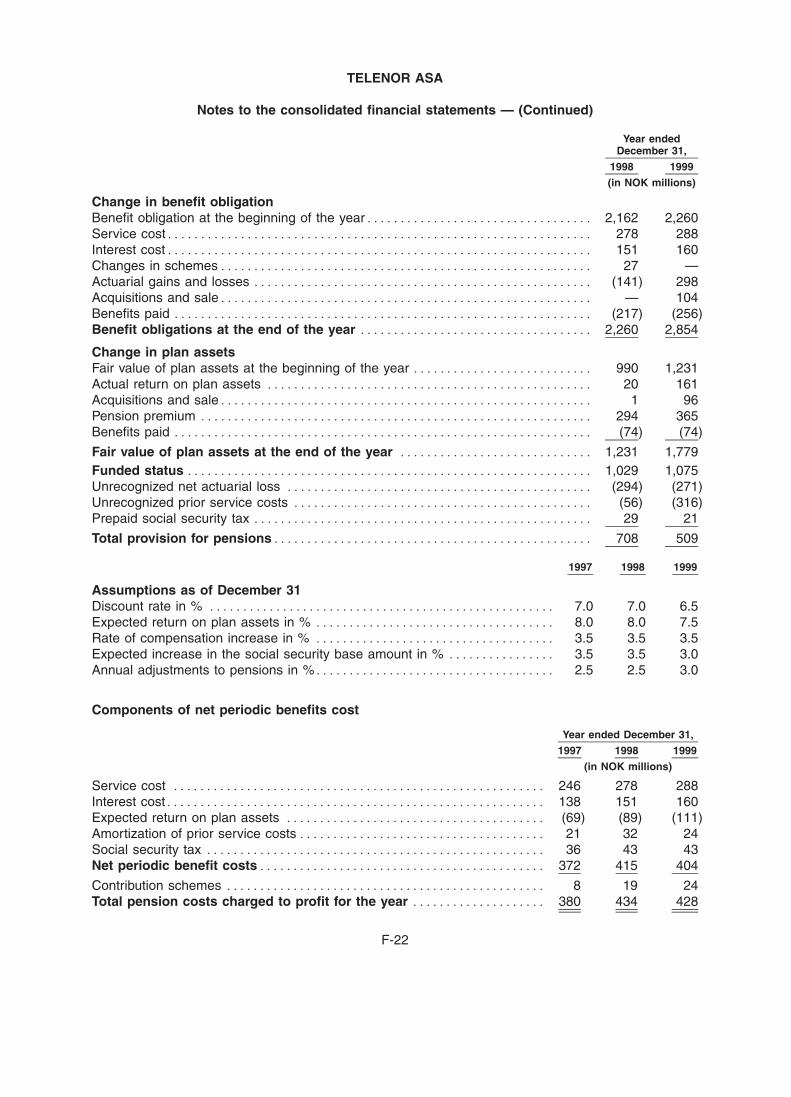
BOWNE OF LONDON 12/01/2000 19:56 BL/SM NO MARKS NEXT PCN: 255.00.00.00 -- Page is valid, no graphics X42481 254.00.00.00 6X
TELENOR ASA
Notes to the consolidated financial statements — (Continued)
Year endedDecember 31,
1998 1999
(in NOK millions)
Change in benefit obligationBenefit obligation at the beginning of the year********************************** 2,162 2,260Service cost**************************************************************** 278 288Interest cost**************************************************************** 151 160Changes in schemes******************************************************** 27 —Actuarial gains and losses *************************************************** (141) 298Acquisitions and sale******************************************************** — 104Benefits paid *************************************************************** (217) (256)Benefit obligations at the end of the year *********************************** 2,260 2,854
Change in plan assetsFair value of plan assets at the beginning of the year *************************** 990 1,231Actual return on plan assets ************************************************* 20 161Acquisitions and sale******************************************************** 1 96Pension premium *********************************************************** 294 365Benefits paid *************************************************************** (74) (74)
Fair value of plan assets at the end of the year ***************************** 1,231 1,779Funded status ************************************************************* 1,029 1,075Unrecognized net actuarial loss ********************************************** (294) (271)Unrecognized prior service costs ********************************************* (56) (316)Prepaid social security tax *************************************************** 29 21
Total provision for pensions************************************************ 708 509
1997 1998 1999
Assumptions as of December 31Discount rate in % **************************************************** 7.0 7.0 6.5Expected return on plan assets in % ************************************ 8.0 8.0 7.5Rate of compensation increase in % ************************************ 3.5 3.5 3.5Expected increase in the social security base amount in % **************** 3.5 3.5 3.0Annual adjustments to pensions in %************************************ 2.5 2.5 3.0
Components of net periodic benefits cost
Year ended December 31,
1997 1998 1999
(in NOK millions)
Service cost ******************************************************** 246 278 288Interest cost********************************************************* 138 151 160Expected return on plan assets *************************************** (69) (89) (111)Amortization of prior service costs ************************************* 21 32 24Social security tax *************************************************** 36 43 43Net periodic benefit costs******************************************* 372 415 404
Contribution schemes ************************************************ 8 19 24Total pension costs charged to profit for the year ******************** 380 434 428
F-22
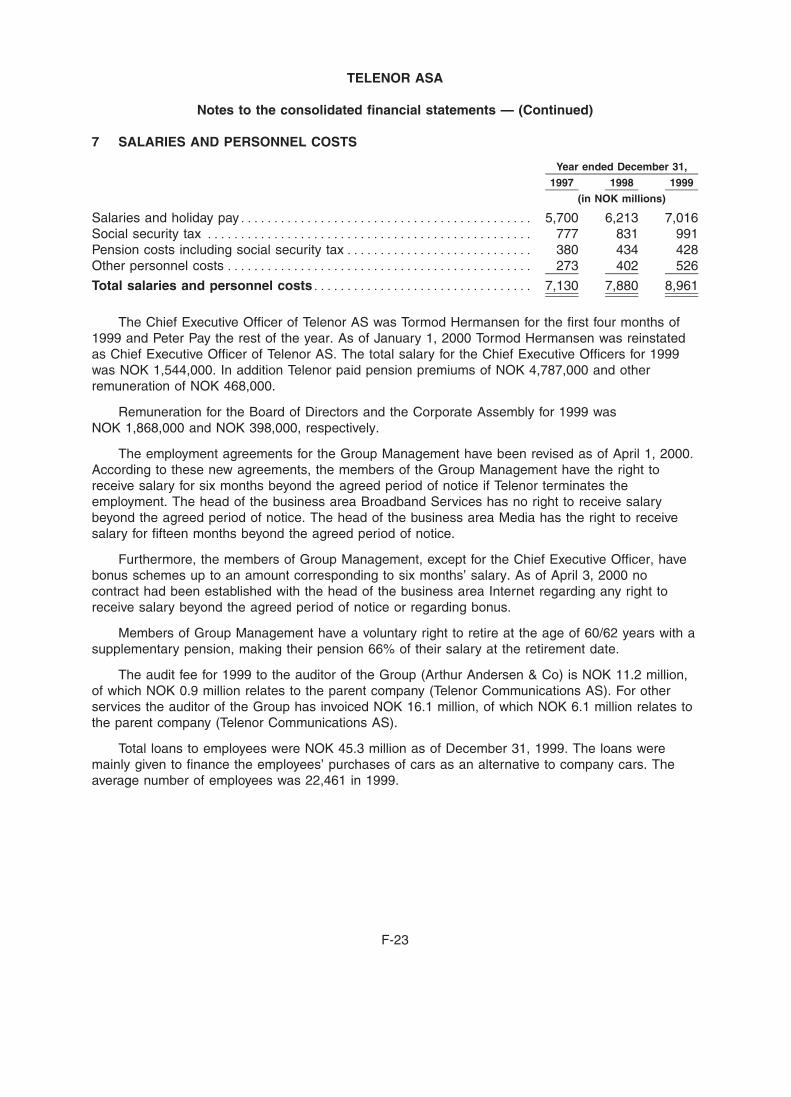
BOWNE OF LONDON 12/01/2000 19:56 BL/SM NO MARKS NEXT PCN: 256.00.00.00 -- Page is valid, no graphics X42481 255.00.00.00 6X
TELENOR ASA
Notes to the consolidated financial statements — (Continued)
7 SALARIES AND PERSONNEL COSTS
Year ended December 31,
1997 1998 1999
(in NOK millions)
Salaries and holiday pay******************************************** 5,700 6,213 7,016Social security tax ************************************************* 777 831 991Pension costs including social security tax**************************** 380 434 428Other personnel costs ********************************************** 273 402 526
Total salaries and personnel costs********************************* 7,130 7,880 8,961
The Chief Executive Officer of Telenor AS was Tormod Hermansen for the first four months of1999 and Peter Pay the rest of the year. As of January 1, 2000 Tormod Hermansen was reinstatedas Chief Executive Officer of Telenor AS. The total salary for the Chief Executive Officers for 1999was NOK 1,544,000. In addition Telenor paid pension premiums of NOK 4,787,000 and otherremuneration of NOK 468,000.
Remuneration for the Board of Directors and the Corporate Assembly for 1999 wasNOK 1,868,000 and NOK 398,000, respectively.
The employment agreements for the Group Management have been revised as of April 1, 2000.According to these new agreements, the members of the Group Management have the right toreceive salary for six months beyond the agreed period of notice if Telenor terminates theemployment. The head of the business area Broadband Services has no right to receive salarybeyond the agreed period of notice. The head of the business area Media has the right to receivesalary for fifteen months beyond the agreed period of notice.
Furthermore, the members of Group Management, except for the Chief Executive Officer, havebonus schemes up to an amount corresponding to six months’ salary. As of April 3, 2000 nocontract had been established with the head of the business area Internet regarding any right toreceive salary beyond the agreed period of notice or regarding bonus.
Members of Group Management have a voluntary right to retire at the age of 60/62 years with asupplementary pension, making their pension 66% of their salary at the retirement date.
The audit fee for 1999 to the auditor of the Group (Arthur Andersen & Co) is NOK 11.2 million,of which NOK 0.9 million relates to the parent company (Telenor Communications AS). For otherservices the auditor of the Group has invoiced NOK 16.1 million, of which NOK 6.1 million relates tothe parent company (Telenor Communications AS).
Total loans to employees were NOK 45.3 million as of December 31, 1999. The loans weremainly given to finance the employees’ purchases of cars as an alternative to company cars. Theaverage number of employees was 22,461 in 1999.
F-23

BOWNE OF LONDON 12/01/2000 19:56 BL/SM NO MARKS NEXT PCN: 257.00.00.00 -- Page is valid, no graphics X42481 256.00.00.00 6X
TELENOR ASA
Notes to the consolidated financial statements — (Continued)
8 OTHER OPERATING EXPENSES
Year ended December 31,
1997 1998 1999
(in NOK millions)
Cost of premises, vehicles, office equipment, etc ********************** 1,005 1,076 1,416Travel and travel allowances **************************************** 573 607 641Marketing and sales commission ************************************ 1,030 945 1,239Advertising******************************************************** 493 456 423Bad debt********************************************************** 195 231 351Consultancy fees and rent of personnel(1)(2) ************************* 1,623 1,936 2,259Other(2) ********************************************************** 1,285 1,376 1,584
Total other operating expenses************************************ 6,204 6,627 7,913
(1) Includes fees for consultations and hired personnel, which perform services that are sold toexternal customers or capitalized on fixed assets.
(2) Includes costs (mainly consultancy fees) related to the abandoned merger with Telia of NOK 250million in 1999.
9 BAD DEBT
Year ended December 31,
1997 1998 1999
(in NOK millions)
Provisions as of January 1 ******************************************** 254 271 371Provisions as of December 31 ***************************************** 271 371 538
Change in provisions for bad debt************************************** 17 100 167Realized losses for the year ******************************************* 210 163 230Recovered on amounts previously written off **************************** (32) (32) (46)
Total bad debt ****************************************************** 195 231 351
10 RESEARCH AND DEVELOPMENT COSTS
Research and development costs amounted to NOK 528 million, NOK 414 million and NOK 418million for 1999, 1998 and 1997, respectively.
Research and development activities relate mainly to new technologies, new products, securityin the network and new usages of the existing network.
It is expected that research and development costs will create future profitability.
11 BUSINESS RESTRUCTURING
In connection with the establishment of Telenor AS as a limited company in 1994, Telenorrecorded a restructuring provision of NOK 1,100 million. This provision was made to cover the costsof staff reductions and eliminate other operating redundancies. The provision has been utilizedduring the subsequent periods and had no balance remaining at December 31, 1998.
F-24
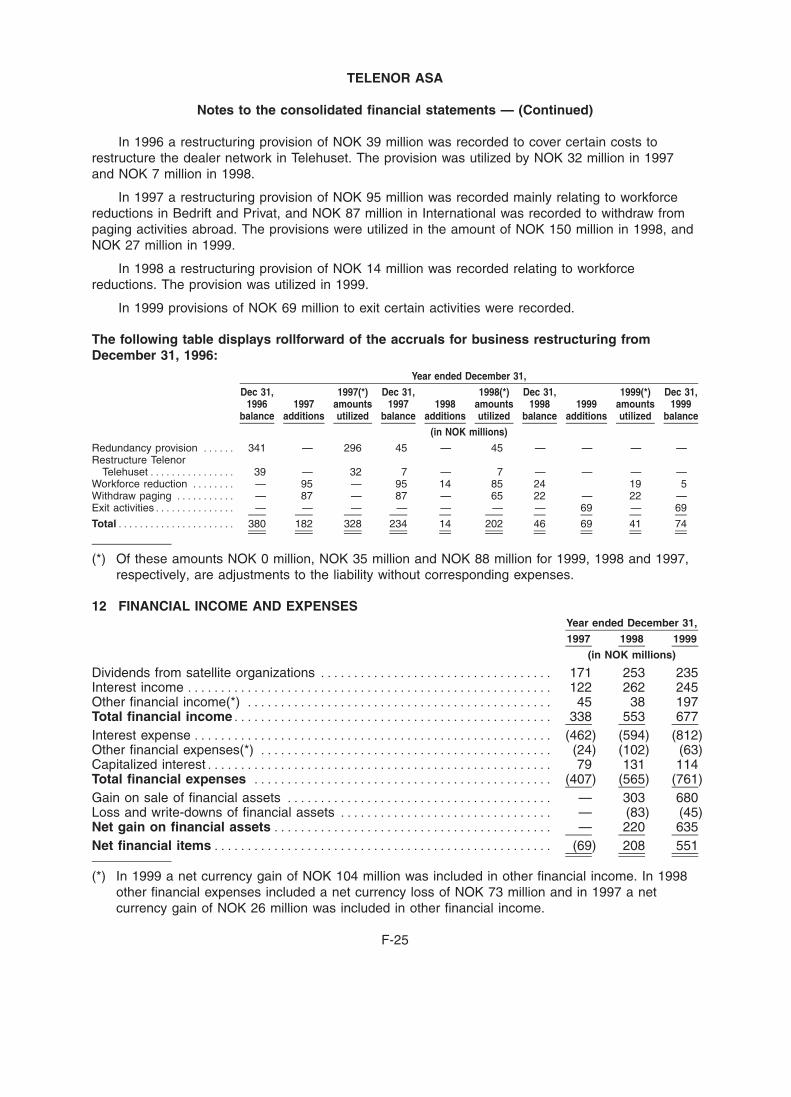
BOWNE OF LONDON 12/01/2000 19:56 BL/SM NO MARKS NEXT PCN: 258.00.00.00 -- Page is valid, no graphics X42481 257.00.00.00 6X
TELENOR ASA
Notes to the consolidated financial statements — (Continued)
In 1996 a restructuring provision of NOK 39 million was recorded to cover certain costs torestructure the dealer network in Telehuset. The provision was utilized by NOK 32 million in 1997and NOK 7 million in 1998.
In 1997 a restructuring provision of NOK 95 million was recorded mainly relating to workforcereductions in Bedrift and Privat, and NOK 87 million in International was recorded to withdraw frompaging activities abroad. The provisions were utilized in the amount of NOK 150 million in 1998, andNOK 27 million in 1999.
In 1998 a restructuring provision of NOK 14 million was recorded relating to workforcereductions. The provision was utilized in 1999.
In 1999 provisions of NOK 69 million to exit certain activities were recorded.
The following table displays rollforward of the accruals for business restructuring fromDecember 31, 1996:
Year ended December 31,
Dec 31, 1997(*) Dec 31, 1998(*) Dec 31, 1999(*) Dec 31,1996 1997 amounts 1997 1998 amounts 1998 1999 amounts 1999
balance additions utilized balance additions utilized balance additions utilized balance
(in NOK millions)
Redundancy provision ****** 341 — 296 45 — 45 — — — —Restructure Telenor
Telehuset**************** 39 — 32 7 — 7 — — — —Workforce reduction ******** — 95 — 95 14 85 24 19 5Withdraw paging *********** — 87 — 87 — 65 22 — 22 —Exit activities*************** — — — — — — — 69 — 69
Total********************** 380 182 328 234 14 202 46 69 41 74
(*) Of these amounts NOK 0 million, NOK 35 million and NOK 88 million for 1999, 1998 and 1997,respectively, are adjustments to the liability without corresponding expenses.
12 FINANCIAL INCOME AND EXPENSESYear ended December 31,
1997 1998 1999
(in NOK millions)
Dividends from satellite organizations *********************************** 171 253 235Interest income ******************************************************* 122 262 245Other financial income(*) ********************************************** 45 38 197Total financial income************************************************ 338 553 677Interest expense ****************************************************** (462) (594) (812)Other financial expenses(*) ******************************************** (24) (102) (63)Capitalized interest**************************************************** 79 131 114Total financial expenses ********************************************* (407) (565) (761)Gain on sale of financial assets **************************************** — 303 680Loss and write-downs of financial assets ******************************** — (83) (45)Net gain on financial assets****************************************** — 220 635Net financial items*************************************************** (69) 208 551
(*) In 1999 a net currency gain of NOK 104 million was included in other financial income. In 1998other financial expenses included a net currency loss of NOK 73 million and in 1997 a netcurrency gain of NOK 26 million was included in other financial income.
F-25
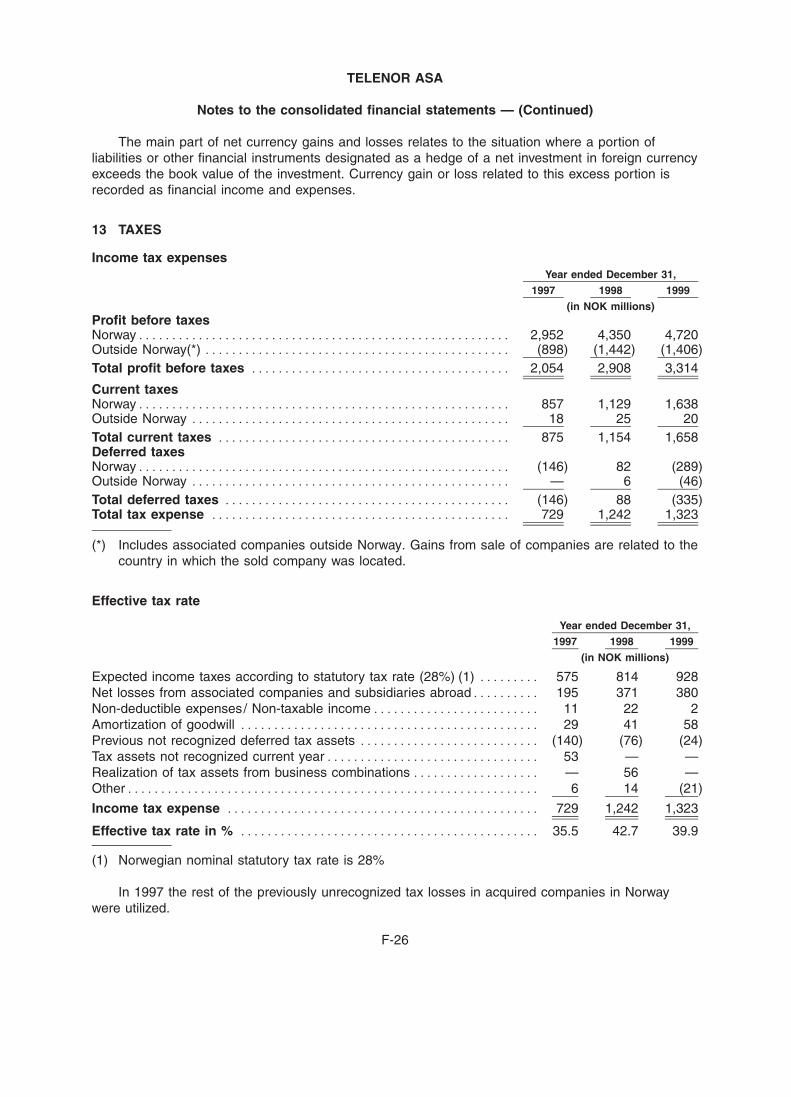
BOWNE OF LONDON 12/01/2000 19:56 BL/SM NO MARKS NEXT PCN: 259.00.00.00 -- Page is valid, no graphics X42481 258.00.00.00 6X
TELENOR ASA
Notes to the consolidated financial statements — (Continued)
The main part of net currency gains and losses relates to the situation where a portion ofliabilities or other financial instruments designated as a hedge of a net investment in foreign currencyexceeds the book value of the investment. Currency gain or loss related to this excess portion isrecorded as financial income and expenses.
13 TAXES
Income tax expensesYear ended December 31,
1997 1998 1999
(in NOK millions)Profit before taxesNorway******************************************************** 2,952 4,350 4,720Outside Norway(*) ********************************************** (898) (1,442) (1,406)Total profit before taxes *************************************** 2,054 2,908 3,314
Current taxesNorway******************************************************** 857 1,129 1,638Outside Norway ************************************************ 18 25 20Total current taxes ******************************************** 875 1,154 1,658Deferred taxesNorway******************************************************** (146) 82 (289)Outside Norway ************************************************ — 6 (46)Total deferred taxes ******************************************* (146) 88 (335)Total tax expense ********************************************* 729 1,242 1,323
(*) Includes associated companies outside Norway. Gains from sale of companies are related to thecountry in which the sold company was located.
Effective tax rate
Year ended December 31,
1997 1998 1999
(in NOK millions)
Expected income taxes according to statutory tax rate (28%) (1) ********* 575 814 928Net losses from associated companies and subsidiaries abroad********** 195 371 380Non-deductible expenses/ Non-taxable income************************* 11 22 2Amortization of goodwill ********************************************* 29 41 58Previous not recognized deferred tax assets *************************** (140) (76) (24)Tax assets not recognized current year******************************** 53 — —Realization of tax assets from business combinations ******************* — 56 —Other************************************************************** 6 14 (21)
Income tax expense *********************************************** 729 1,242 1,323
Effective tax rate in % ********************************************* 35.5 42.7 39.9
(1) Norwegian nominal statutory tax rate is 28%
In 1997 the rest of the previously unrecognized tax losses in acquired companies in Norwaywere utilized.
F-26
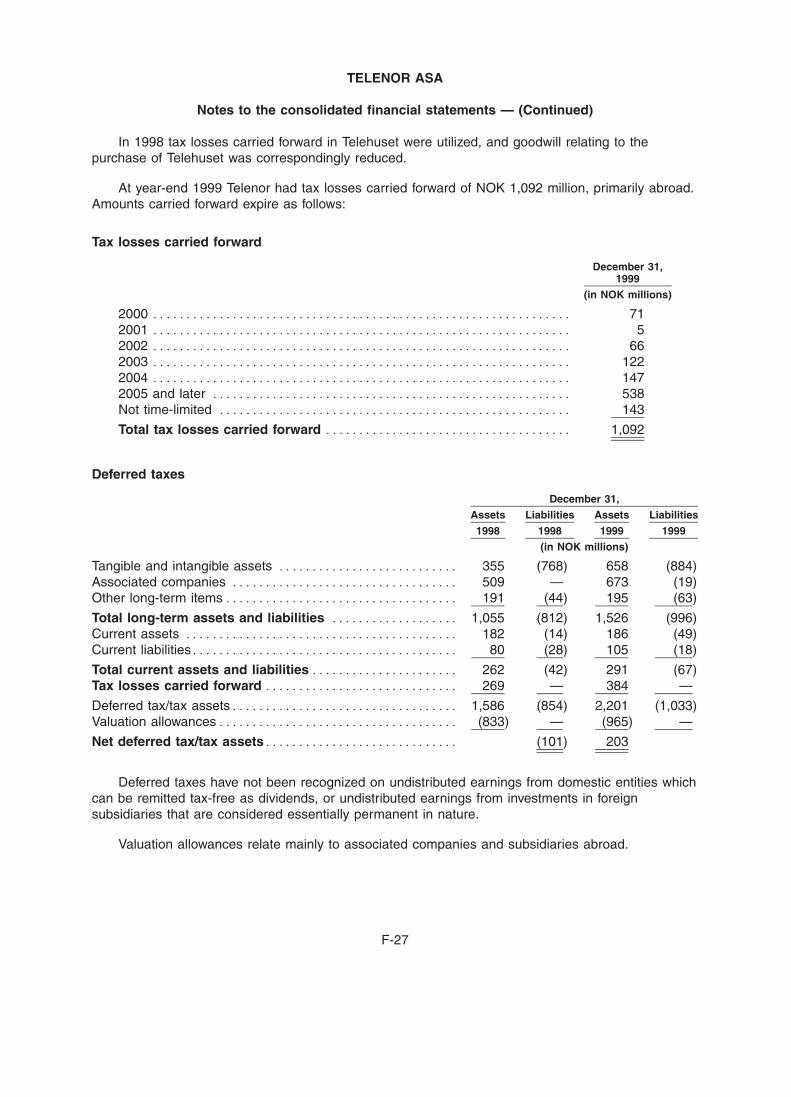
BOWNE OF LONDON 12/01/2000 19:56 BL/SM NO MARKS NEXT PCN: 260.00.00.00 -- Page is valid, no graphics X42481 259.00.00.00 6X
TELENOR ASA
Notes to the consolidated financial statements — (Continued)
In 1998 tax losses carried forward in Telehuset were utilized, and goodwill relating to thepurchase of Telehuset was correspondingly reduced.
At year-end 1999 Telenor had tax losses carried forward of NOK 1,092 million, primarily abroad.Amounts carried forward expire as follows:
Tax losses carried forward
December 31,1999
(in NOK millions)
2000 *************************************************************** 712001 *************************************************************** 52002 *************************************************************** 662003 *************************************************************** 1222004 *************************************************************** 1472005 and later ****************************************************** 538Not time-limited ***************************************************** 143
Total tax losses carried forward ************************************* 1,092
Deferred taxes
December 31,
Assets Liabilities Assets Liabilities
1998 1998 1999 1999
(in NOK millions)
Tangible and intangible assets *************************** 355 (768) 658 (884)Associated companies ********************************** 509 — 673 (19)Other long-term items*********************************** 191 (44) 195 (63)
Total long-term assets and liabilities ******************* 1,055 (812) 1,526 (996)Current assets ***************************************** 182 (14) 186 (49)Current liabilities**************************************** 80 (28) 105 (18)
Total current assets and liabilities ********************** 262 (42) 291 (67)Tax losses carried forward ***************************** 269 — 384 —
Deferred tax/tax assets********************************** 1,586 (854) 2,201 (1,033)Valuation allowances************************************ (833) — (965) —
Net deferred tax/tax assets***************************** (101) 203
Deferred taxes have not been recognized on undistributed earnings from domestic entities whichcan be remitted tax-free as dividends, or undistributed earnings from investments in foreignsubsidiaries that are considered essentially permanent in nature.
Valuation allowances relate mainly to associated companies and subsidiaries abroad.
F-27
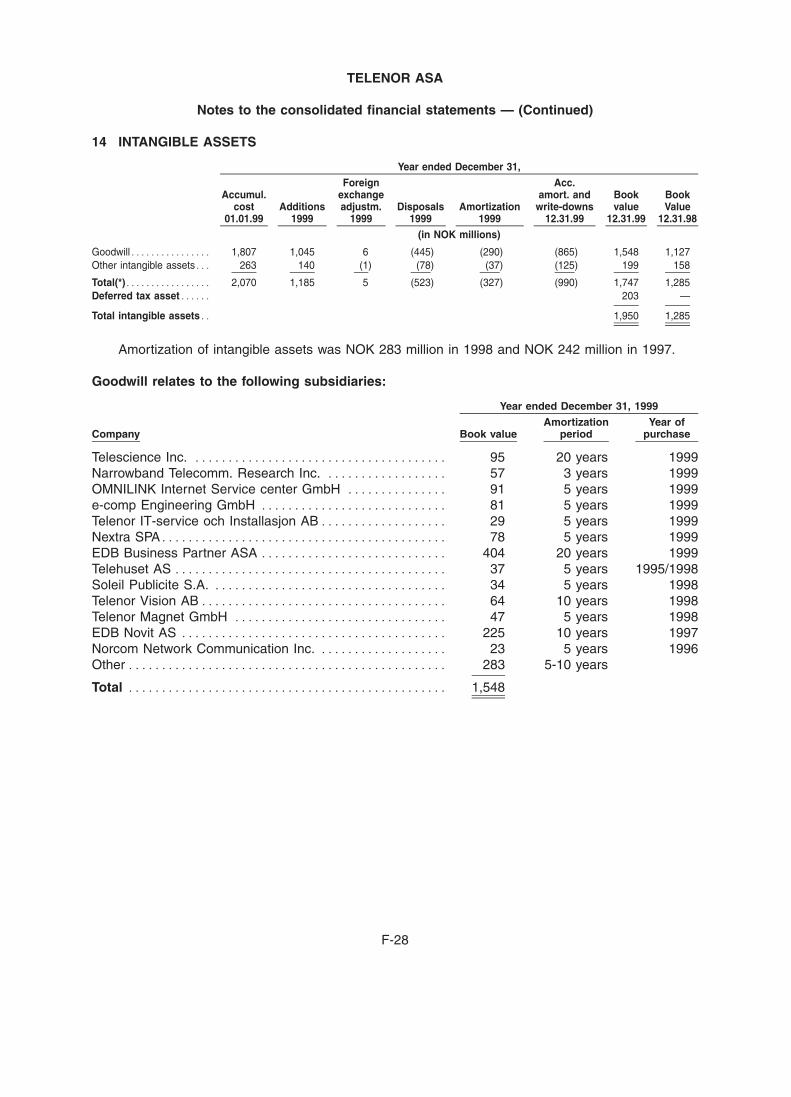
BOWNE OF LONDON 12/01/2000 19:56 BL/SM NO MARKS NEXT PCN: 261.00.00.00 -- Page is valid, no graphics X42481 260.00.00.00 6X
TELENOR ASA
Notes to the consolidated financial statements — (Continued)
14 INTANGIBLE ASSETS
Year ended December 31,
Foreign Acc.Accumul. exchange amort. and Book Book
cost Additions adjustm. Disposals Amortization write-downs value Value01.01.99 1999 1999 1999 1999 12.31.99 12.31.99 12.31.98
(in NOK millions)
Goodwill**************** 1,807 1,045 6 (445) (290) (865) 1,548 1,127Other intangible assets*** 263 140 (1) (78) (37) (125) 199 158
Total(*)***************** 2,070 1,185 5 (523) (327) (990) 1,747 1,285Deferred tax asset****** 203 —
Total intangible assets** 1,950 1,285
Amortization of intangible assets was NOK 283 million in 1998 and NOK 242 million in 1997.
Goodwill relates to the following subsidiaries:
Year ended December 31, 1999
Amortization Year ofCompany Book value period purchase
Telescience Inc. ************************************** 95 20 years 1999Narrowband Telecomm. Research Inc. ****************** 57 3 years 1999OMNILINK Internet Service center GmbH *************** 91 5 years 1999e-comp Engineering GmbH **************************** 81 5 years 1999Telenor IT-service och Installasjon AB******************* 29 5 years 1999Nextra SPA******************************************* 78 5 years 1999EDB Business Partner ASA **************************** 404 20 years 1999Telehuset AS ***************************************** 37 5 years 1995/1998Soleil Publicite S.A. *********************************** 34 5 years 1998Telenor Vision AB************************************* 64 10 years 1998Telenor Magnet GmbH ******************************** 47 5 years 1998EDB Novit AS **************************************** 225 10 years 1997Norcom Network Communication Inc. ******************* 23 5 years 1996Other ************************************************ 283 5-10 years
Total ************************************************ 1,548
F-28
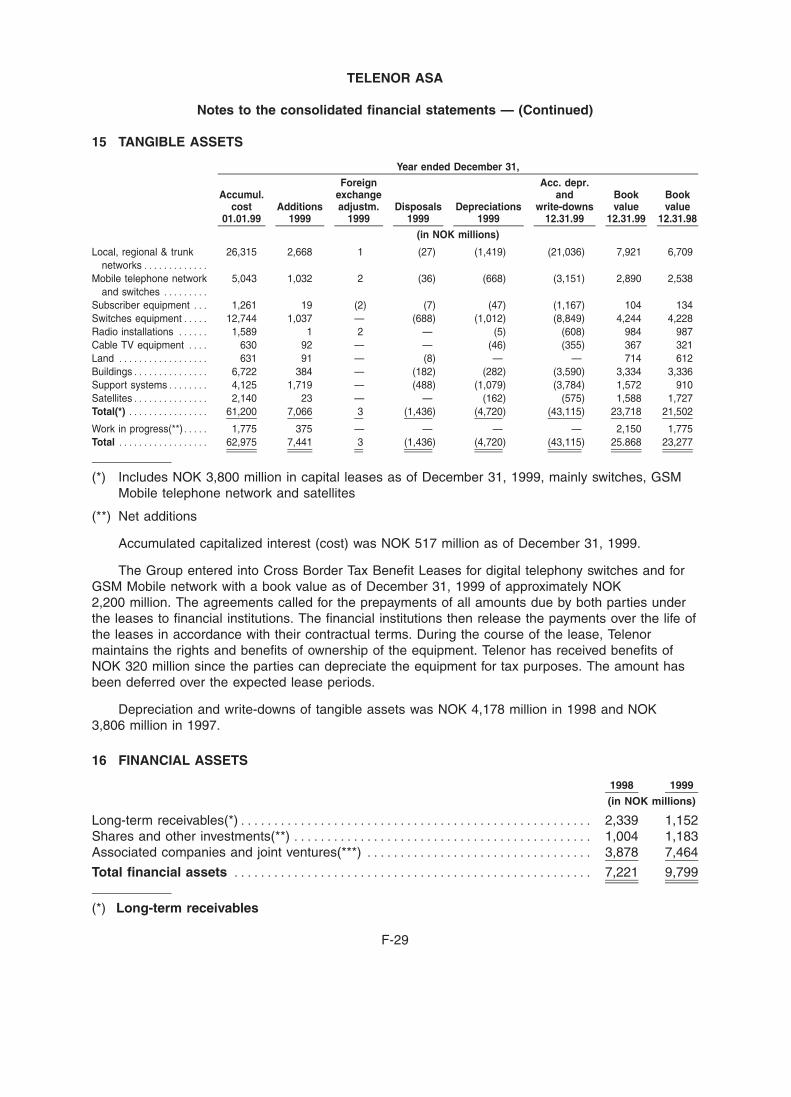
BOWNE OF LONDON 12/01/2000 19:56 BL/SM NO MARKS NEXT PCN: 262.00.00.00 -- Page is valid, no graphics X42481 261.00.00.00 6X
TELENOR ASA
Notes to the consolidated financial statements — (Continued)
15 TANGIBLE ASSETS
Year ended December 31,
Foreign Acc. depr.Accumul. exchange and Book Book
cost Additions adjustm. Disposals Depreciations write-downs value value01.01.99 1999 1999 1999 1999 12.31.99 12.31.99 12.31.98
(in NOK millions)
Local, regional & trunk 26,315 2,668 1 (27) (1,419) (21,036) 7,921 6,709networks*************
Mobile telephone network 5,043 1,032 2 (36) (668) (3,151) 2,890 2,538and switches *********
Subscriber equipment *** 1,261 19 (2) (7) (47) (1,167) 104 134Switches equipment***** 12,744 1,037 — (688) (1,012) (8,849) 4,244 4,228Radio installations ****** 1,589 1 2 — (5) (608) 984 987Cable TV equipment **** 630 92 — — (46) (355) 367 321Land ****************** 631 91 — (8) — — 714 612Buildings*************** 6,722 384 — (182) (282) (3,590) 3,334 3,336Support systems******** 4,125 1,719 — (488) (1,079) (3,784) 1,572 910Satellites*************** 2,140 23 — — (162) (575) 1,588 1,727Total(*) **************** 61,200 7,066 3 (1,436) (4,720) (43,115) 23,718 21,502
Work in progress(**)***** 1,775 375 — — — — 2,150 1,775Total ****************** 62,975 7,441 3 (1,436) (4,720) (43,115) 25.868 23,277
(*) Includes NOK 3,800 million in capital leases as of December 31, 1999, mainly switches, GSMMobile telephone network and satellites
(**) Net additions
Accumulated capitalized interest (cost) was NOK 517 million as of December 31, 1999.
The Group entered into Cross Border Tax Benefit Leases for digital telephony switches and forGSM Mobile network with a book value as of December 31, 1999 of approximately NOK2,200 million. The agreements called for the prepayments of all amounts due by both parties underthe leases to financial institutions. The financial institutions then release the payments over the life ofthe leases in accordance with their contractual terms. During the course of the lease, Telenormaintains the rights and benefits of ownership of the equipment. Telenor has received benefits ofNOK 320 million since the parties can depreciate the equipment for tax purposes. The amount hasbeen deferred over the expected lease periods.
Depreciation and write-downs of tangible assets was NOK 4,178 million in 1998 and NOK3,806 million in 1997.
16 FINANCIAL ASSETS
1998 1999
(in NOK millions)
Long-term receivables(*)***************************************************** 2,339 1,152Shares and other investments(**) ********************************************* 1,004 1,183Associated companies and joint ventures(***) ********************************** 3,878 7,464
Total financial assets ****************************************************** 7,221 9,799
(*) Long-term receivables
F-29
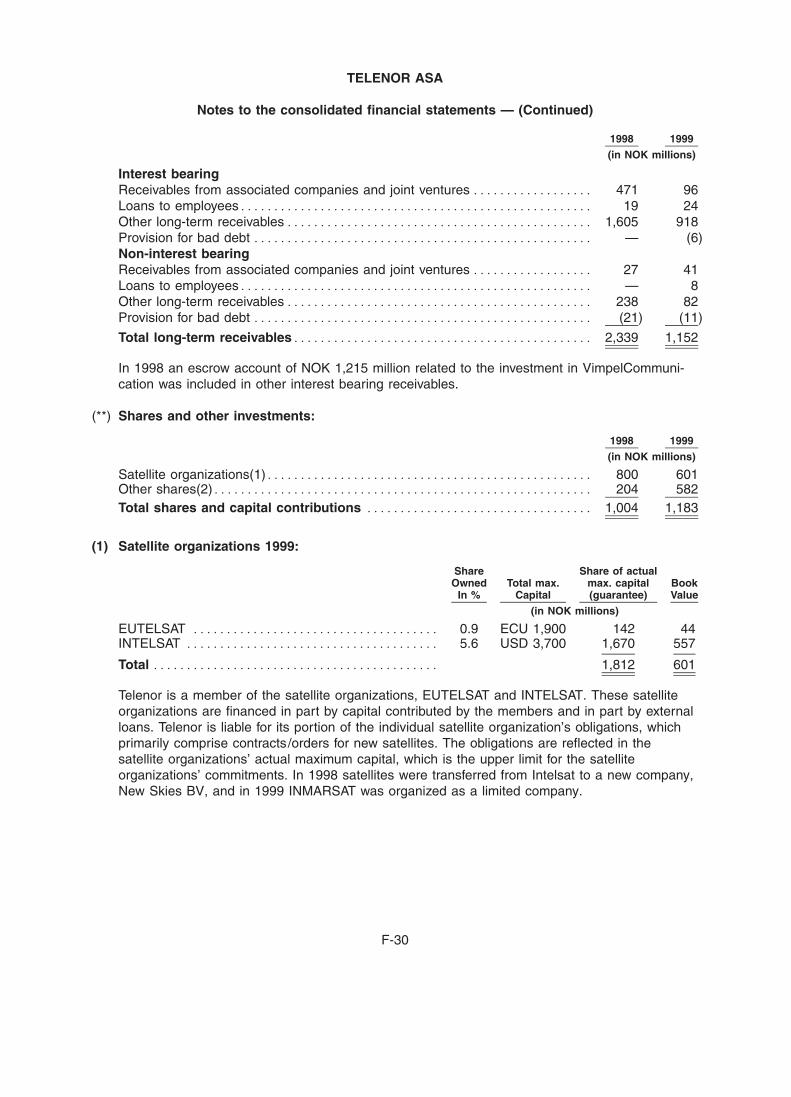
BOWNE OF LONDON 12/01/2000 19:56 BL/SM NO MARKS NEXT PCN: 263.00.00.00 -- Page is valid, no graphics X42481 262.00.00.00 6X
TELENOR ASA
Notes to the consolidated financial statements — (Continued)
1998 1999
(in NOK millions)
Interest bearingReceivables from associated companies and joint ventures ****************** 471 96Loans to employees***************************************************** 19 24Other long-term receivables********************************************** 1,605 918Provision for bad debt *************************************************** — (6)Non-interest bearingReceivables from associated companies and joint ventures ****************** 27 41Loans to employees***************************************************** — 8Other long-term receivables********************************************** 238 82Provision for bad debt *************************************************** (21) (11)
Total long-term receivables********************************************* 2,339 1,152
In 1998 an escrow account of NOK 1,215 million related to the investment in VimpelCommuni-cation was included in other interest bearing receivables.
(**) Shares and other investments:
1998 1999
(in NOK millions)
Satellite organizations(1)************************************************* 800 601Other shares(2)********************************************************* 204 582Total shares and capital contributions ********************************** 1,004 1,183
(1) Satellite organizations 1999:
Share Share of actualOwned Total max. max. capital Book
In % Capital (guarantee) Value
(in NOK millions)
EUTELSAT ************************************* 0.9 ECU 1,900 142 44INTELSAT ************************************** 5.6 USD 3,700 1,670 557
Total ******************************************* 1,812 601
Telenor is a member of the satellite organizations, EUTELSAT and INTELSAT. These satelliteorganizations are financed in part by capital contributed by the members and in part by externalloans. Telenor is liable for its portion of the individual satellite organization’s obligations, whichprimarily comprise contracts/orders for new satellites. The obligations are reflected in thesatellite organizations’ actual maximum capital, which is the upper limit for the satelliteorganizations’ commitments. In 1998 satellites were transferred from Intelsat to a new company,New Skies BV, and in 1999 INMARSAT was organized as a limited company.
F-30
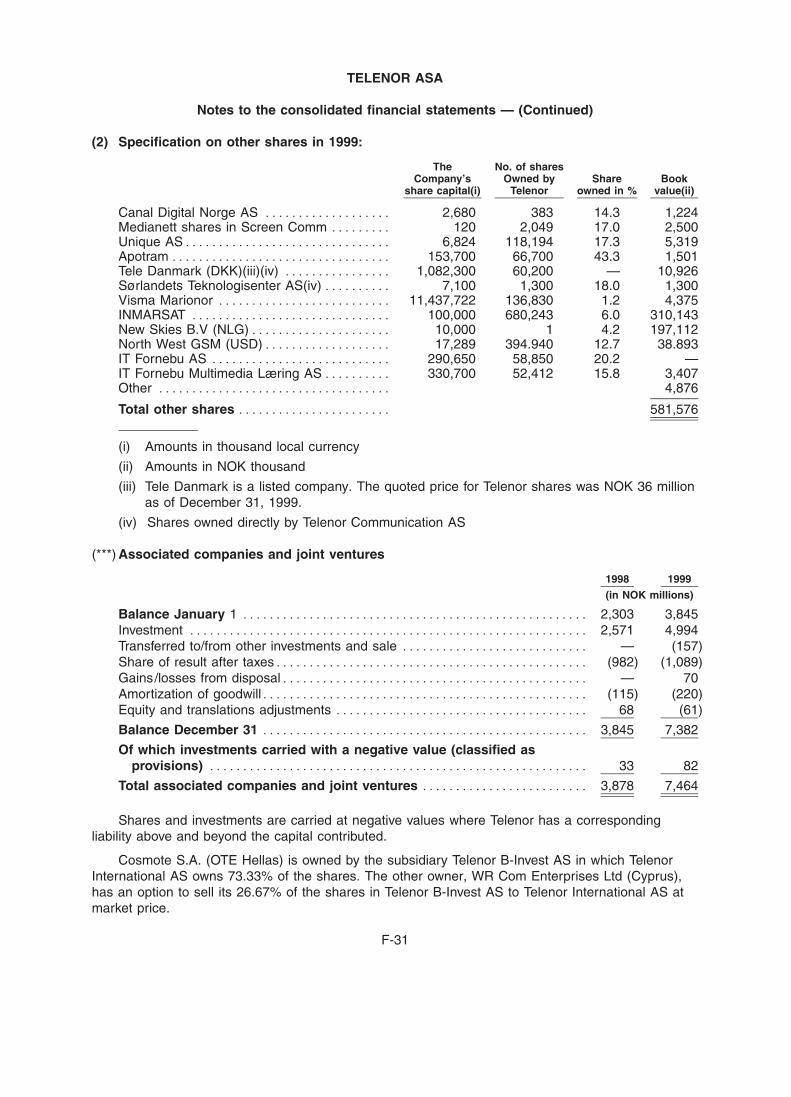
BOWNE OF LONDON 12/01/2000 19:56 BL/SM NO MARKS NEXT PCN: 264.00.00.00 -- Page is valid, no graphics X42481 263.00.00.00 6X
TELENOR ASA
Notes to the consolidated financial statements — (Continued)
(2) Specification on other shares in 1999:
The No. of sharesCompany’s Owned by Share Book
share capital(i) Telenor owned in % value(ii)
Canal Digital Norge AS ******************* 2,680 383 14.3 1,224Medianett shares in Screen Comm ********* 120 2,049 17.0 2,500Unique AS******************************* 6,824 118,194 17.3 5,319Apotram ********************************* 153,700 66,700 43.3 1,501Tele Danmark (DKK)(iii)(iv) **************** 1,082,300 60,200 — 10,926Sørlandets Teknologisenter AS(iv) ********** 7,100 1,300 18.0 1,300Visma Marionor ************************** 11,437,722 136,830 1.2 4,375INMARSAT ****************************** 100,000 680,243 6.0 310,143New Skies B.V (NLG)********************* 10,000 1 4.2 197,112North West GSM (USD)******************* 17,289 394.940 12.7 38.893IT Fornebu AS *************************** 290,650 58,850 20.2 —IT Fornebu Multimedia Læring AS********** 330,700 52,412 15.8 3,407Other *********************************** 4,876
Total other shares *********************** 581,576
(i) Amounts in thousand local currency
(ii) Amounts in NOK thousand
(iii) Tele Danmark is a listed company. The quoted price for Telenor shares was NOK 36 millionas of December 31, 1999.
(iv) Shares owned directly by Telenor Communication AS
(***) Associated companies and joint ventures
1998 1999
(in NOK millions)
Balance January 1 **************************************************** 2,303 3,845Investment ************************************************************ 2,571 4,994Transferred to/from other investments and sale **************************** — (157)Share of result after taxes*********************************************** (982) (1,089)Gains/losses from disposal********************************************** — 70Amortization of goodwill************************************************* (115) (220)Equity and translations adjustments ************************************** 68 (61)
Balance December 31 ************************************************* 3,845 7,382
Of which investments carried with a negative value (classified asprovisions) ********************************************************* 33 82
Total associated companies and joint ventures ************************* 3,878 7,464
Shares and investments are carried at negative values where Telenor has a correspondingliability above and beyond the capital contributed.
Cosmote S.A. (OTE Hellas) is owned by the subsidiary Telenor B-Invest AS in which TelenorInternational AS owns 73.33% of the shares. The other owner, WR Com Enterprises Ltd (Cyprus),has an option to sell its 26.67% of the shares in Telenor B-Invest AS to Telenor International AS atmarket price.
F-31

BOWNE OF LONDON 12/01/2000 19:56 BL/SM NO MARKS NEXT PCN: 265.00.00.00 -- Page is valid, no graphics X42481 264.00.00.00 6X
TELENOR ASA
Notes to the consolidated financial statements — (Continued)
Telenor and British Telecom (BT) have entered an agreement as of January 14, 2000 withregard to Esat Digifone. Under the agreement Telenor has the option to sell its 49.5% stake in EsatDigifone to BT for US$1,237 million or to exchange its 49.5% interest in Esat Digifone for a 33%stake in Esat Telecom, with the option to increase its interest to 49.9%. In the event that Telenordoes not exercise either option by December 7, 2000, the agreement requires Telenor to sell to EsatTelecom its 49.5% share in Esat Digifone for US$1,237 million. In the event Telenor exercises theoption to exchange its interest in Esat Digifone for a 33% stake in Esat Telecom during the optionperiod, Telenor has an additional option to sell its stake in Esat Telecom to BT for US$1,237 million,together with an amount equal to any amounts Telenor expends in increasing its stake up to 49.9%.
F-32
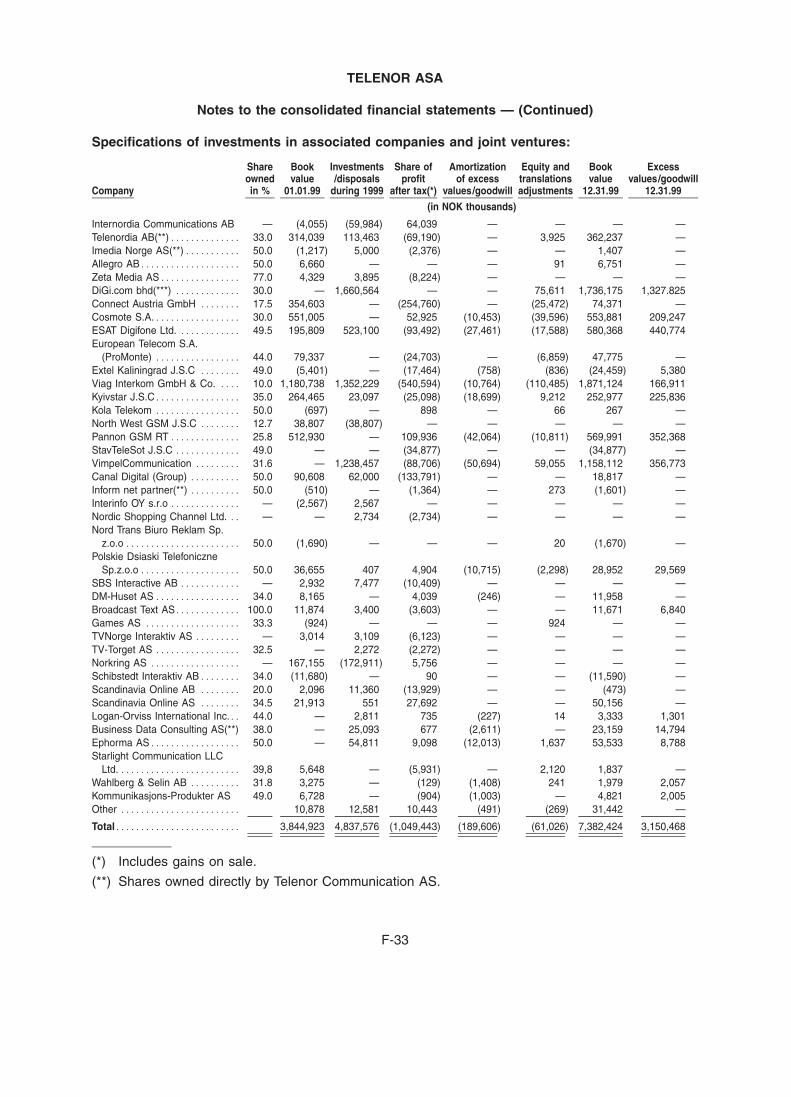
BOWNE OF LONDON 12/01/2000 19:56 BL/SM NO MARKS NEXT PCN: 266.00.00.00 -- Page is valid, no graphics X42481 265.00.00.00 6X
TELENOR ASA
Notes to the consolidated financial statements — (Continued)
Specifications of investments in associated companies and joint ventures:
Share Book Investments Share of Amortization Equity and Book Excessowned value /disposals profit of excess translations value values/goodwill
Company in % 01.01.99 during 1999 after tax(*) values/goodwill adjustments 12.31.99 12.31.99
(in NOK thousands)
Internordia Communications AB — (4,055) (59,984) 64,039 — — — —Telenordia AB(**)************** 33.0 314,039 113,463 (69,190) — 3,925 362,237 —Imedia Norge AS(**)*********** 50.0 (1,217) 5,000 (2,376) — — 1,407 —Allegro AB******************** 50.0 6,660 — — — 91 6,751 —Zeta Media AS**************** 77.0 4,329 3,895 (8,224) — — — —DiGi.com bhd(***) ************* 30.0 — 1,660,564 — — 75,611 1,736,175 1,327.825Connect Austria GmbH ******** 17.5 354,603 — (254,760) — (25,472) 74,371 —Cosmote S.A.***************** 30.0 551,005 — 52,925 (10,453) (39,596) 553,881 209,247ESAT Digifone Ltd. ************ 49.5 195,809 523,100 (93,492) (27,461) (17,588) 580,368 440,774European Telecom S.A.
(ProMonte) ***************** 44.0 79,337 — (24,703) — (6,859) 47,775 —Extel Kaliningrad J.S.C ******** 49.0 (5,401) — (17,464) (758) (836) (24,459) 5,380Viag Interkom GmbH & Co. **** 10.0 1,180,738 1,352,229 (540,594) (10,764) (110,485) 1,871,124 166,911Kyivstar J.S.C***************** 35.0 264,465 23,097 (25,098) (18,699) 9,212 252,977 225,836Kola Telekom ***************** 50.0 (697) — 898 — 66 267 —North West GSM J.S.C ******** 12.7 38,807 (38,807) — — — — —Pannon GSM RT************** 25.8 512,930 — 109,936 (42,064) (10,811) 569,991 352,368StavTeleSot J.S.C ************* 49.0 — — (34,877) — — (34,877) —VimpelCommunication ********* 31.6 — 1,238,457 (88,706) (50,694) 59,055 1,158,112 356,773Canal Digital (Group) ********** 50.0 90,608 62,000 (133,791) — — 18,817 —Inform net partner(**) ********** 50.0 (510) — (1,364) — 273 (1,601) —Interinfo OY s.r.o ************** — (2,567) 2,567 — — — — —Nordic Shopping Channel Ltd. ** — — 2,734 (2,734) — — — —Nord Trans Biuro Reklam Sp.
z.o.o *********************** 50.0 (1,690) — — — 20 (1,670) —Polskie Dsiaski Telefoniczne
Sp.z.o.o ******************** 50.0 36,655 407 4,904 (10,715) (2,298) 28,952 29,569SBS Interactive AB ************ — 2,932 7,477 (10,409) — — — —DM-Huset AS ***************** 34.0 8,165 — 4,039 (246) — 11,958 —Broadcast Text AS************* 100.0 11,874 3,400 (3,603) — — 11,671 6,840Games AS ******************* 33.3 (924) — — — 924 — —TVNorge Interaktiv AS ********* — 3,014 3,109 (6,123) — — — —TV-Torget AS ***************** 32.5 — 2,272 (2,272) — — — —Norkring AS ****************** — 167,155 (172,911) 5,756 — — — —Schibstedt Interaktiv AB******** 34.0 (11,680) — 90 — — (11,590) —Scandinavia Online AB ******** 20.0 2,096 11,360 (13,929) — — (473) —Scandinavia Online AS ******** 34.5 21,913 551 27,692 — — 50,156 —Logan-Orviss International Inc.** 44.0 — 2,811 735 (227) 14 3,333 1,301Business Data Consulting AS(**) 38.0 — 25,093 677 (2,611) — 23,159 14,794Ephorma AS****************** 50.0 — 54,811 9,098 (12,013) 1,637 53,533 8,788Starlight Communication LLC
Ltd. ************************ 39,8 5,648 — (5,931) — 2,120 1,837 —Wahlberg & Selin AB ********** 31.8 3,275 — (129) (1,408) 241 1,979 2,057Kommunikasjons-Produkter AS 49.0 6,728 — (904) (1,003) — 4,821 2,005Other ************************ 10,878 12,581 10,443 (491) (269) 31,442 —
Total************************* 3,844,923 4,837,576 (1,049,443) (189,606) (61,026) 7,382,424 3,150,468
(*) Includes gains on sale.
(**) Shares owned directly by Telenor Communication AS.
F-33
BOWNE OF LONDON 12/01/2000 19:56 BL/SM NO MARKS NEXT PCN: 267.00.00.00 -- Page is valid, no graphics X42481 266.00.00.00 6X
TELENOR ASA
Notes to the consolidated financial statements — (Continued)
(***) Digi.com was acquired on December 15, 1999. Because share of the profit after tax related toDigi.com and the amortization of the acquired goodwill was determined to be immaterial to the1999 financial statements, no amounts were recorded in 1999.
Summary financial information for our investment in Viag Interkom GmbH & Co accounted forby the equity method is as follows based on Norwegian GAAP (100% basis):
Year ended December 31,
1997 1998 1999
(in NOK millions)
Fixed assets **************************************************** 1,961 8,627 14,261Current assets ************************************************** 1,020 2,299 6,125Long-term liabilities ********************************************** 15 31 55Short-term liabilities ********************************************* 2,033 3,507 6,582Revenues ****************************************************** 863 1,629 6,397Operating profit ************************************************* (2,356) (5,611) (7,722)Profit for the year************************************************ (2,075) (3,927) (5,406)
17 CURRENT RECEIVABLES
Accounts receivable
1998 1999
(in NOK millions)
Accounts receivable********************************************************* 4,722 5,096Provision for bad debt ******************************************************* (327) (505)
Total accounts receivable ************************************************** 4,395 4,591
Due to the large volume and diversity of the Group’s customer base, concentrations of creditrisk with respect to trade accounts receivable are limited.
Other current receivables:
1998 1999
(in NOK millions)
Interest bearingReceivables from associated companies and joint ventures ********************** 90 193Receivables from others ***************************************************** 84 65
Non-interest bearingReceivables from associated companies and joint ventures ********************** 2 80Receivable on employees**************************************************** — 23Other short-term receivable ************************************************** 472 365Provision for bad debt ******************************************************* (23) (16)
Total other current receivables ********************************************* 625 710
F-34
BOWNE OF LONDON 12/01/2000 19:56 BL/SM NO MARKS NEXT PCN: 268.00.00.00 -- Page is valid, no graphics X42481 267.00.00.00 6X
TELENOR ASA
Notes to the consolidated financial statements — (Continued)
Prepaid expenses and accrued revenue:
1998 1999
(in NOK millions)
Prepaid expenses*********************************************************** 292 367Accrued revenue************************************************************ 1,267 1,534
Total prepaid expenses and accrued revenue ******************************* 1,559 1,901
Total current receivables, etc. ********************************************** 6,579 7,202
18 SHORT TERM INVESTMENTS
1998 1999
(in NOK millions)
Bonds/Commercial paper(*)************************************************** 241 13Shares(**) ***************************************************************** 356 390
Total short term investments *********************************************** 597 403
(*) Bonds and commercial paper are used for short-term placement of liquidity.
(**) Specification of shares classified as current assets.
No. of Share Bookshares owned in % value(*)
Agder Data AS(**) *************************************** 61,300 100.0 54,400MODE International BV ********************************** 3,979 46.2 31,581Telepost Holding Inc.************************************* 1,067,354 8.4 24,980Q-Free ASA********************************************* 217,545 15.0 12,042ComputerHouse ASA ************************************ 1,295,222 24.0 8,293Eltek ASA ********************************************** 618,500 4.4 14,108Incom AS*********************************************** 579,454 13.0 4,751Utel AS************************************************* 82,532 21.9 1,009Open World Distribution AS******************************* 90,680 22.7 —Cell Network AB (publ.) ********************************** 992,902 5.0 10,599Eye Control Technique AB ******************************** 3,519,958 37.0 18,253Incatel AS ********************************************** 75,740 71.8 14,933Hubshop AS ******************************************** 1,718,699 38.0 6,123Idonex AB ********************************************** 28,333 23.4 3,357Polydisplay ASA ***************************************** 3,079,515 24.0 12,573MRT Micro ASA ***************************************** 5,798,667 14.2 21,898MRT Mpire Inc.****************************************** 600,000 20.0 2,028Gran-Jansen AS***************************************** 644,720 25.0 9,339Maritech AS********************************************* 36,500 26.1 6,625ClustRa Invest AS *************************************** 46,434 65.3 13,533Telenostra AS ******************************************* 34,615 32.0 2,300Techno Venture AS ************************************** 1,500 100.0 18,175Hegel AS *********************************************** 63,120 49.9 5,338Data Respons AS *************************************** 417,100 34.0 11,540SevenMountains Software AS ***************************** 1,994,144 13.7 12,570Televenture AS ****************************************** 500 100.0 50
F-35
BOWNE OF LONDON 12/01/2000 19:56 BL/SM NO MARKS NEXT PCN: 269.00.00.00 -- Page is valid, no graphics X42481 268.00.00.00 6X
TELENOR ASA
Notes to the consolidated financial statements — (Continued)
No. of Share Bookshares owned in % value(*)
IT Industrikapital AS ************************************* 500 100.0 50First Class Sweden AB*********************************** 345 31.0 4,594Industriventure AS *************************************** 1,100 100.0 110Industribygger AS**************************************** 1,100 100.0 110Nordisk Sprakteknologi AS******************************** 23,440 20.6 15,767ZoomOn AB ******************************************** 847,200 11.8 6,448Melody Interactive Solutions AB *************************** 250,000 20.0 5,369MassMarket AS ***************************************** 66,667 17.2 9,999MagCom AS ******************************************** 150,000 17.2 15,000E-Hand AB ********************************************* 6,943 5.9 2,301Trøndelag Vekst AS(**) *********************************** 19,335 2.9 3,000Other*************************************************** 6,429
Total shares classified as current asset****************** 389,575
(*) Amount in NOK thousand.
(**) Shares owned directly by Telenor Communication AS.
Eltek ASA and Cell Network AB are listed companies. The quoted prices as of December 31,1999 were NOK 43.3 million and NOK 222.8 million respectively. The above shares are mainlyowned by Telenor Venture.
19 PROVISIONS1998 1999
(in NOK millions)
Provisions for pensions**************************************************** 708 509Deferred tax liability******************************************************* 101 —Other provisions(1) ******************************************************* 33 120
Total provisions ********************************************************* 842 629
(1) Other provisions include associated companies and joint ventures with a negative book value ofNOK 82 million and NOK 33 million at year-end 1999 and 1998, respectively.
20 INTEREST BEARING LIABILITIES1998 1999
(in NOK millions)
Euro Commercial paper loans********************************************** 1,559 829Norwegian Commercial paper loans **************************************** — 1,200EMTN loans ************************************************************* 5,902 9,500Loans from Japanese investors ******************************************** 1,304 1,304Subordinated loan ******************************************************** 609 —Satellite leasing ********************************************************** 1,611 1,499Other ******************************************************************* 315 610Long-term interest bearing liabilities ************************************* 11,300 14,942
Short-term interest bearing liabilities ************************************* 153 127
Total interest bearing liabilities******************************************* 11,453 15,069
F-36
BOWNE OF LONDON 12/01/2000 19:56 BL/SM NO MARKS NEXT PCN: 270.00.00.00 -- Page is valid, no graphics X42481 269.00.00.00 6X
TELENOR ASA
Notes to the consolidated financial statements — (Continued)
A short-term Euro Commercial Paper program (ECP) was established in 1996, with aUS$ 500 million limit. As of December 31, 1999, commercial paper outstanding under this programtotaled NOK 829 million, with an average maturity of 1.5 months. In addition, Telenor made threecommercial paper issuances in the Norwegian market in 1999, totaling NOK 1,200 million atDecember 31, 1999.
In 1996, Telenor established its Euro Medium Term Note Program (EMTN). The current programsize is US$2,000 million. At December 31, 1999, ordinary bonds issued under the program had abook value of NOK 9,500 million, with terms between 1 and 7 years.
Loans from Japanese private investors were established in 1994 and 1995. As of December 31,1999, the outstanding amount of these totaled NOK 1,304 million, with terms of 10 years.
All loans are unsecured but contain provisions restricting the pledge of assets to secure futureborrowings without granting a similar secured status to the existing lenders (negative pledges).
Telenor Satellite Services AS established lease financing agreements for the two satellites,Thor II and Thor III, in 1997 and 1998. The Thor II lease agreements were signed in March 1998,and have a nominal amount of NOK 567 million at December 31, 1999. The Thor III leasing wassigned in December 1997, and has a nominal amount of NOK 932 million at December 31, 1999.Both leasing transactions are amortized over 12 years, with a final maturity in 2010.
Telenor Nett AS entered into a Cross Border Tax Benefit Lease for digital telephony switches in1998. Telenor Mobil AS entered into a Cross Border Tax Benefit Lease agreement for GSM Mobiletelephone network in 1999. The agreement called for the prepayment of all amounts due by theparties under the lease to financial institutions. The leasing obligations and the unused prepaymentsare netted in the balance sheet, and are not reflected in the tables above and below.
The average weighted term (maturity) of the Group’s outstanding interest bearing (long-term)liabilities drawn up via the Group Treasury (NOK 12,833 million) was 3.6 years at December 31,1999 with corresponding average (interest) duration, including interest rate swaps of 1.13 years.
Maturities of the Group’s long-term interest bearing liabilities:
Year Installment
(in NOK millions)
2000 ************************************************************* 1,7112001 ************************************************************* 3,2792002 ************************************************************* 1,4042003 ************************************************************* 1,6412004 ************************************************************* 1,948After 2004 ******************************************************** 4,959
Total long-term interest bearing liabilities ************************** 14,942
F-37
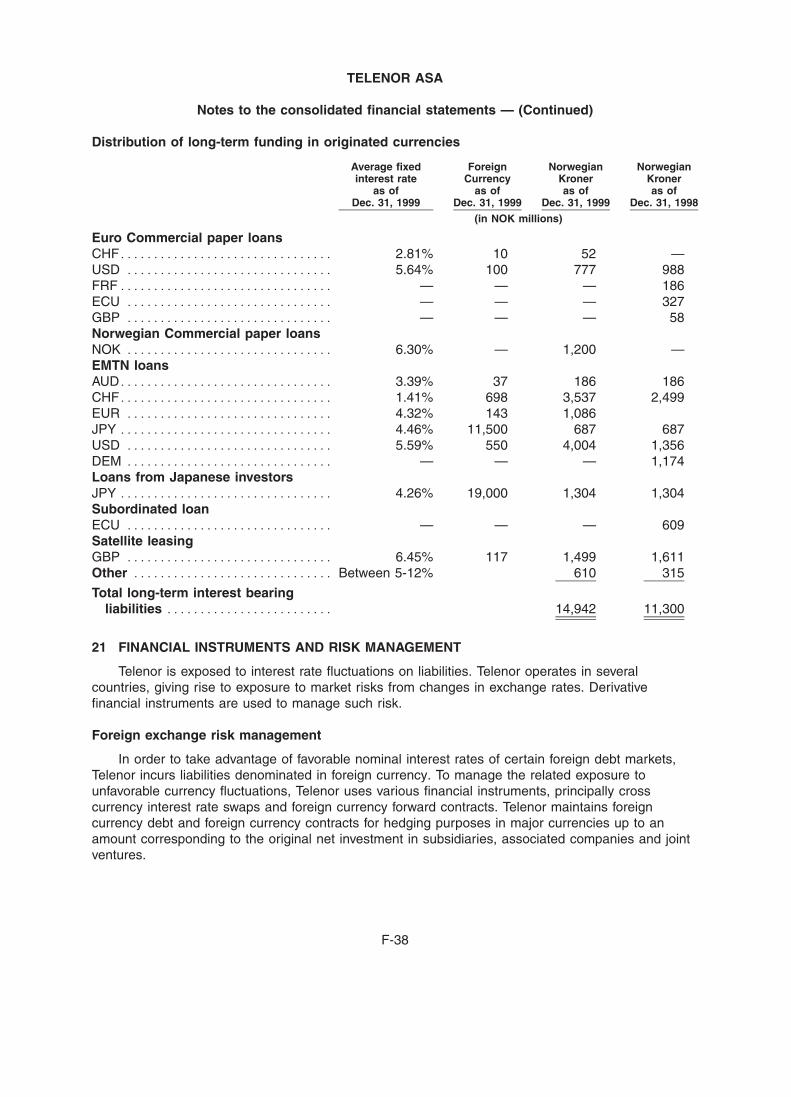
BOWNE OF LONDON 12/01/2000 19:56 BL/SM NO MARKS NEXT PCN: 271.00.00.00 -- Page is valid, no graphics X42481 270.00.00.00 6X
TELENOR ASA
Notes to the consolidated financial statements — (Continued)
Distribution of long-term funding in originated currencies
Average fixed Foreign Norwegian Norwegianinterest rate Currency Kroner Kroner
as of as of as of as ofDec. 31, 1999 Dec. 31, 1999 Dec. 31, 1999 Dec. 31, 1998
(in NOK millions)
Euro Commercial paper loansCHF******************************** 2.81% 10 52 —USD ******************************* 5.64% 100 777 988FRF******************************** — — — 186ECU ******************************* — — — 327GBP ******************************* — — — 58Norwegian Commercial paper loansNOK ******************************* 6.30% — 1,200 —EMTN loansAUD******************************** 3.39% 37 186 186CHF******************************** 1.41% 698 3,537 2,499EUR ******************************* 4.32% 143 1,086JPY ******************************** 4.46% 11,500 687 687USD ******************************* 5.59% 550 4,004 1,356DEM ******************************* — — — 1,174Loans from Japanese investorsJPY ******************************** 4.26% 19,000 1,304 1,304Subordinated loanECU ******************************* — — — 609Satellite leasingGBP ******************************* 6.45% 117 1,499 1,611Other ****************************** Between 5-12% 610 315
Total long-term interest bearingliabilities ************************* 14,942 11,300
21 FINANCIAL INSTRUMENTS AND RISK MANAGEMENT
Telenor is exposed to interest rate fluctuations on liabilities. Telenor operates in severalcountries, giving rise to exposure to market risks from changes in exchange rates. Derivativefinancial instruments are used to manage such risk.
Foreign exchange risk management
In order to take advantage of favorable nominal interest rates of certain foreign debt markets,Telenor incurs liabilities denominated in foreign currency. To manage the related exposure tounfavorable currency fluctuations, Telenor uses various financial instruments, principally crosscurrency interest rate swaps and foreign currency forward contracts. Telenor maintains foreigncurrency debt and foreign currency contracts for hedging purposes in major currencies up to anamount corresponding to the original net investment in subsidiaries, associated companies and jointventures.
F-38
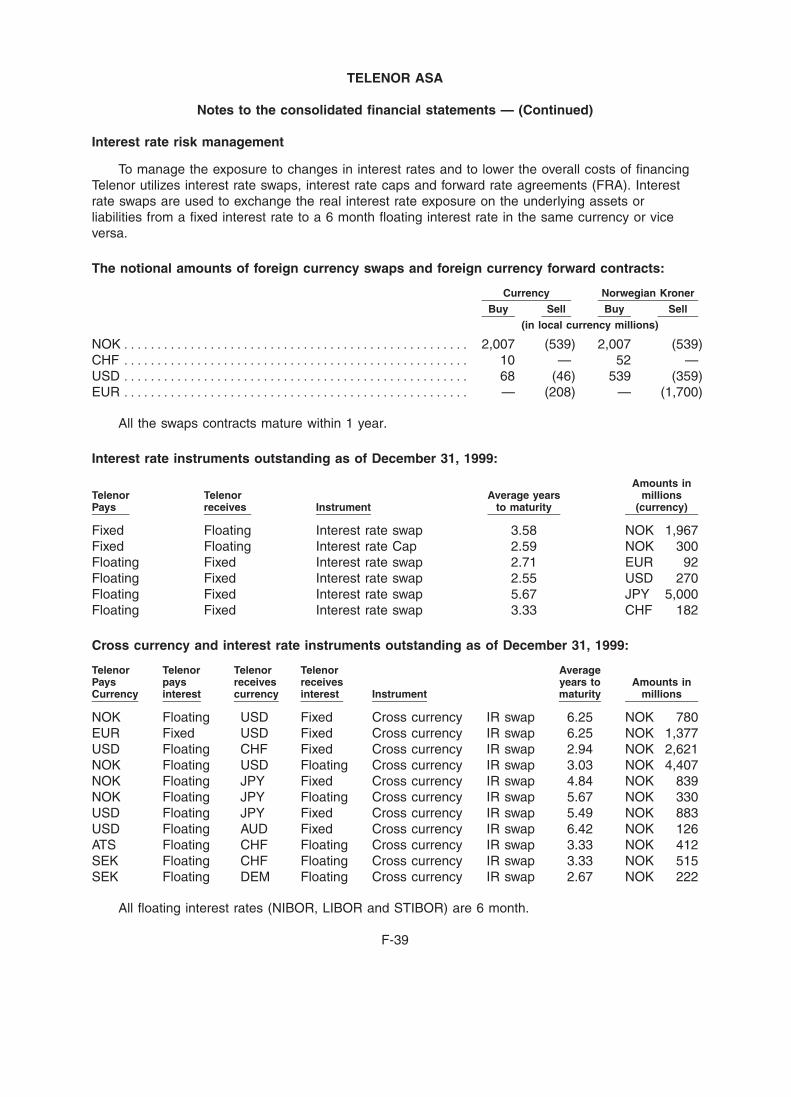
BOWNE OF LONDON 12/01/2000 19:56 BL/SM NO MARKS NEXT PCN: 272.00.00.00 -- Page is valid, no graphics X42481 271.00.00.00 6X
TELENOR ASA
Notes to the consolidated financial statements — (Continued)
Interest rate risk management
To manage the exposure to changes in interest rates and to lower the overall costs of financingTelenor utilizes interest rate swaps, interest rate caps and forward rate agreements (FRA). Interestrate swaps are used to exchange the real interest rate exposure on the underlying assets orliabilities from a fixed interest rate to a 6 month floating interest rate in the same currency or viceversa.
The notional amounts of foreign currency swaps and foreign currency forward contracts:
Currency Norwegian Kroner
Buy Sell Buy Sell
(in local currency millions)
NOK**************************************************** 2,007 (539) 2,007 (539)CHF **************************************************** 10 — 52 —USD **************************************************** 68 (46) 539 (359)EUR **************************************************** — (208) — (1,700)
All the swaps contracts mature within 1 year.
Interest rate instruments outstanding as of December 31, 1999:
Amounts inTelenor Telenor Average years millionsPays receives Instrument to maturity (currency)
Fixed Floating Interest rate swap 3.58 NOK 1,967Fixed Floating Interest rate Cap 2.59 NOK 300Floating Fixed Interest rate swap 2.71 EUR 92Floating Fixed Interest rate swap 2.55 USD 270Floating Fixed Interest rate swap 5.67 JPY 5,000Floating Fixed Interest rate swap 3.33 CHF 182
Cross currency and interest rate instruments outstanding as of December 31, 1999:
Telenor Telenor Telenor Telenor AveragePays pays receives receives years to Amounts inCurrency interest currency interest Instrument maturity millions
NOK Floating USD Fixed Cross currency IR swap 6.25 NOK 780EUR Fixed USD Fixed Cross currency IR swap 6.25 NOK 1,377USD Floating CHF Fixed Cross currency IR swap 2.94 NOK 2,621NOK Floating USD Floating Cross currency IR swap 3.03 NOK 4,407NOK Floating JPY Fixed Cross currency IR swap 4.84 NOK 839NOK Floating JPY Floating Cross currency IR swap 5.67 NOK 330USD Floating JPY Fixed Cross currency IR swap 5.49 NOK 883USD Floating AUD Fixed Cross currency IR swap 6.42 NOK 126ATS Floating CHF Floating Cross currency IR swap 3.33 NOK 412SEK Floating CHF Floating Cross currency IR swap 3.33 NOK 515SEK Floating DEM Floating Cross currency IR swap 2.67 NOK 222
All floating interest rates (NIBOR, LIBOR and STIBOR) are 6 month.
F-39
BOWNE OF LONDON 12/01/2000 19:56 BL/SM NO MARKS NEXT PCN: 273.00.00.00 -- Page is valid, no graphics X42481 272.00.00.00 6X
TELENOR ASA
Notes to the consolidated financial statements — (Continued)
Two interest rate swap contracts entered into in 1995 with total nominal amounts ofNOK 400 million, which were used for hedging, were sold in 1999. The net realized loss ofNOK 42 million is amortized over the original lifetime of the contracts. Deferred net losses (includingfive interest rate swap contracts sold in 1998) at December 31, 1999 were NOK 42 million.
Forward rate agreements (FRA)
FRA contracts are generally used as hedging instruments for interest rate risk management.Telenor had a long position in FRA contracts outstanding at December 31, 1999 with a total notionalamount of NOK 1.2 billion. The contracts had an average remaining lifetime of 0.5 years andaverage interest of 5.70%. Telenor occasionally uses FRA contracts which do not meet theestablished hedging criteria. At December 31, 1999 there were no such contracts.
Commodity price risk management
Telenor uses electricity futures and forward contracts to manage price risk related to theexpected use of electricity. The contracts are traded through the Nordic electricity exchange, NorPool ASA. The contracts are fulfilling the criteria of hedge accounting, and profit and loss from thecontracts are not recognized in the profit and loss account. The nominal amounts of the contractsare NOK 26 million for 2000 and NOK 12 million for 2001.
Liquidity and credit risk management
Telenor has limited surplus liquidity invested in short-term interest bearing instruments withlimited credit risk. The exposure limit for each counterpart is set according to the creditworthiness ofthat party.
Telenor accepts only creditworthy counterparts in financial transactions, such as swaps andderivatives. The exposure limit for each counterpart is set according to the rating of that party.
Fair value of financial instruments
The estimated fair value of the company’s financial instruments is based on market prices andthe valuation methodologies described below. However, prudence is recommended in interpretingmarket data to arrive at an estimated fair value. Accordingly, the estimates presented herein mayonly be indicative of the amounts the company could realize at this date.
F-40
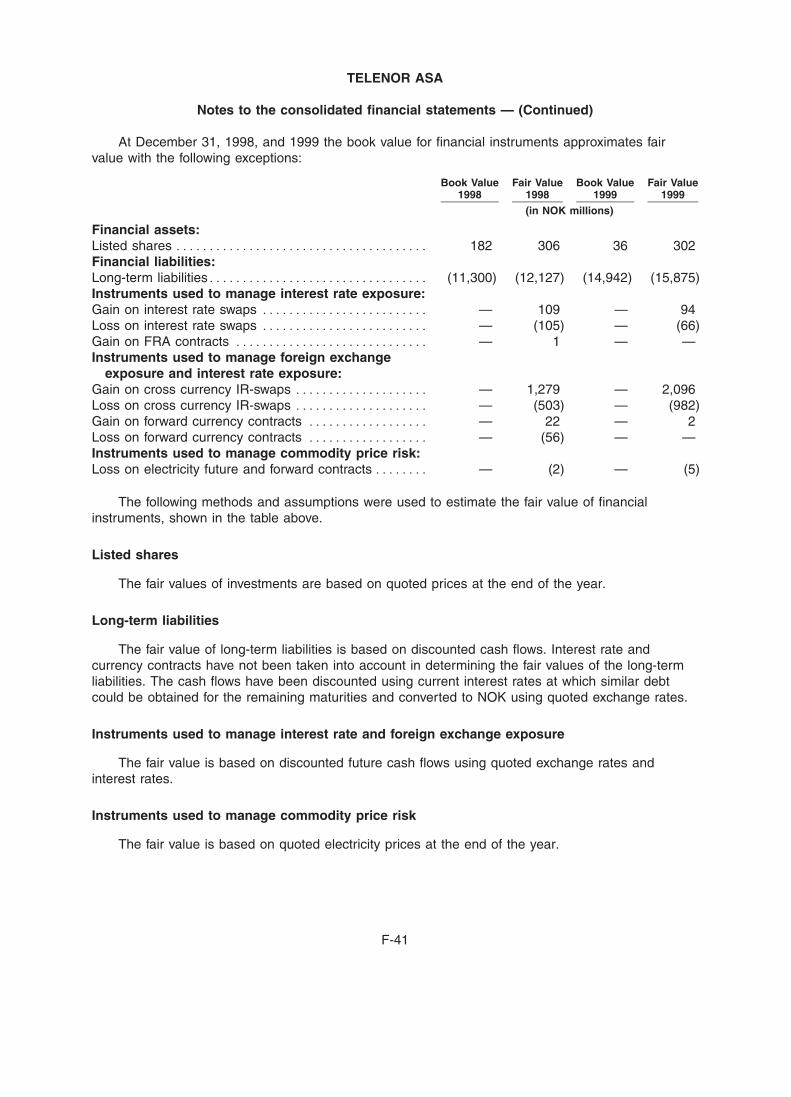
BOWNE OF LONDON 12/01/2000 19:56 BL/SM NO MARKS NEXT PCN: 274.00.00.00 -- Page is valid, no graphics X42481 273.00.00.00 6X
TELENOR ASA
Notes to the consolidated financial statements — (Continued)
At December 31, 1998, and 1999 the book value for financial instruments approximates fairvalue with the following exceptions:
Book Value Fair Value Book Value Fair Value1998 1998 1999 1999
(in NOK millions)
Financial assets:Listed shares ************************************** 182 306 36 302Financial liabilities:Long-term liabilities********************************* (11,300) (12,127) (14,942) (15,875)Instruments used to manage interest rate exposure:Gain on interest rate swaps ************************* — 109 — 94Loss on interest rate swaps ************************* — (105) — (66)Gain on FRA contracts ***************************** — 1 — —Instruments used to manage foreign exchange
exposure and interest rate exposure:Gain on cross currency IR-swaps ******************** — 1,279 — 2,096Loss on cross currency IR-swaps ******************** — (503) — (982)Gain on forward currency contracts ****************** — 22 — 2Loss on forward currency contracts ****************** — (56) — —Instruments used to manage commodity price risk:Loss on electricity future and forward contracts ******** — (2) — (5)
The following methods and assumptions were used to estimate the fair value of financialinstruments, shown in the table above.
Listed shares
The fair values of investments are based on quoted prices at the end of the year.
Long-term liabilities
The fair value of long-term liabilities is based on discounted cash flows. Interest rate andcurrency contracts have not been taken into account in determining the fair values of the long-termliabilities. The cash flows have been discounted using current interest rates at which similar debtcould be obtained for the remaining maturities and converted to NOK using quoted exchange rates.
Instruments used to manage interest rate and foreign exchange exposure
The fair value is based on discounted future cash flows using quoted exchange rates andinterest rates.
Instruments used to manage commodity price risk
The fair value is based on quoted electricity prices at the end of the year.
F-41
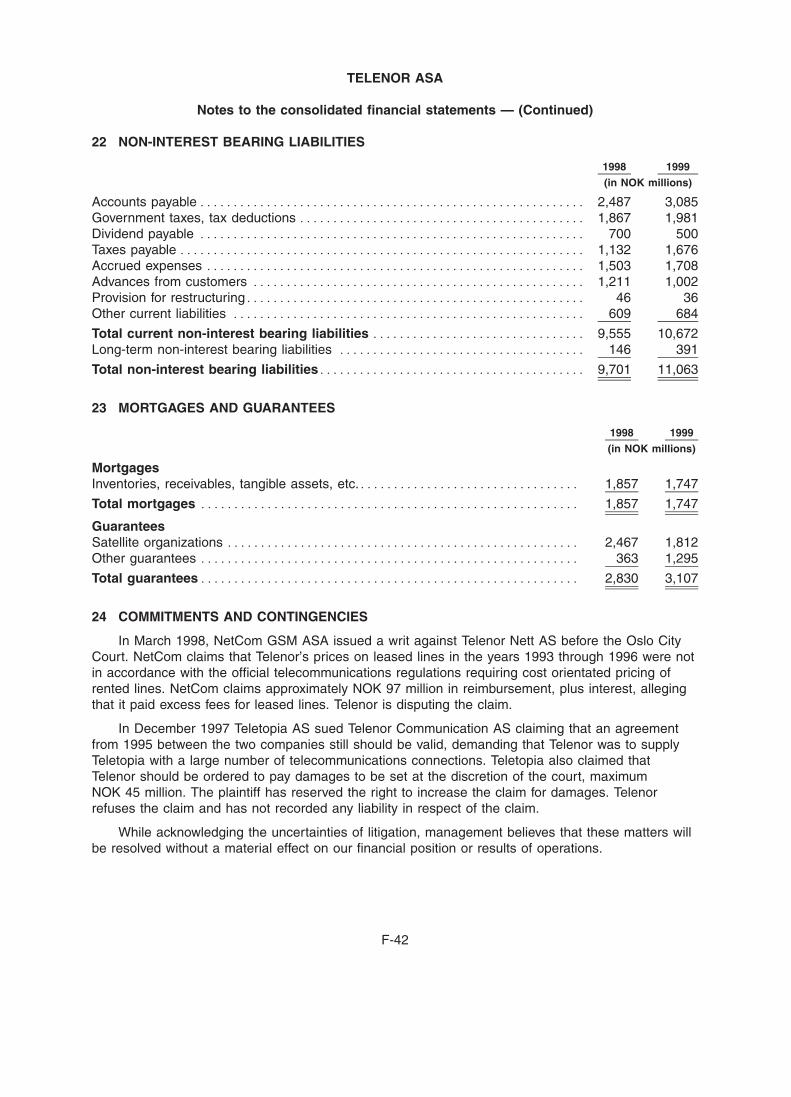
BOWNE OF LONDON 12/01/2000 19:56 BL/SM NO MARKS NEXT PCN: 275.00.00.00 -- Page is valid, no graphics X42481 274.00.00.00 6X
TELENOR ASA
Notes to the consolidated financial statements — (Continued)
22 NON-INTEREST BEARING LIABILITIES
1998 1999
(in NOK millions)
Accounts payable********************************************************** 2,487 3,085Government taxes, tax deductions ******************************************* 1,867 1,981Dividend payable ********************************************************** 700 500Taxes payable ************************************************************* 1,132 1,676Accrued expenses ********************************************************* 1,503 1,708Advances from customers ************************************************** 1,211 1,002Provision for restructuring*************************************************** 46 36Other current liabilities ***************************************************** 609 684
Total current non-interest bearing liabilities ******************************** 9,555 10,672Long-term non-interest bearing liabilities ************************************* 146 391
Total non-interest bearing liabilities**************************************** 9,701 11,063
23 MORTGAGES AND GUARANTEES
1998 1999
(in NOK millions)
MortgagesInventories, receivables, tangible assets, etc.********************************* 1,857 1,747
Total mortgages ********************************************************* 1,857 1,747
GuaranteesSatellite organizations ***************************************************** 2,467 1,812Other guarantees ********************************************************* 363 1,295
Total guarantees********************************************************* 2,830 3,107
24 COMMITMENTS AND CONTINGENCIES
In March 1998, NetCom GSM ASA issued a writ against Telenor Nett AS before the Oslo CityCourt. NetCom claims that Telenor’s prices on leased lines in the years 1993 through 1996 were notin accordance with the official telecommunications regulations requiring cost orientated pricing ofrented lines. NetCom claims approximately NOK 97 million in reimbursement, plus interest, allegingthat it paid excess fees for leased lines. Telenor is disputing the claim.
In December 1997 Teletopia AS sued Telenor Communication AS claiming that an agreementfrom 1995 between the two companies still should be valid, demanding that Telenor was to supplyTeletopia with a large number of telecommunications connections. Teletopia also claimed thatTelenor should be ordered to pay damages to be set at the discretion of the court, maximumNOK 45 million. The plaintiff has reserved the right to increase the claim for damages. Telenorrefuses the claim and has not recorded any liability in respect of the claim.
While acknowledging the uncertainties of litigation, management believes that these matters willbe resolved without a material effect on our financial position or results of operations.
F-42
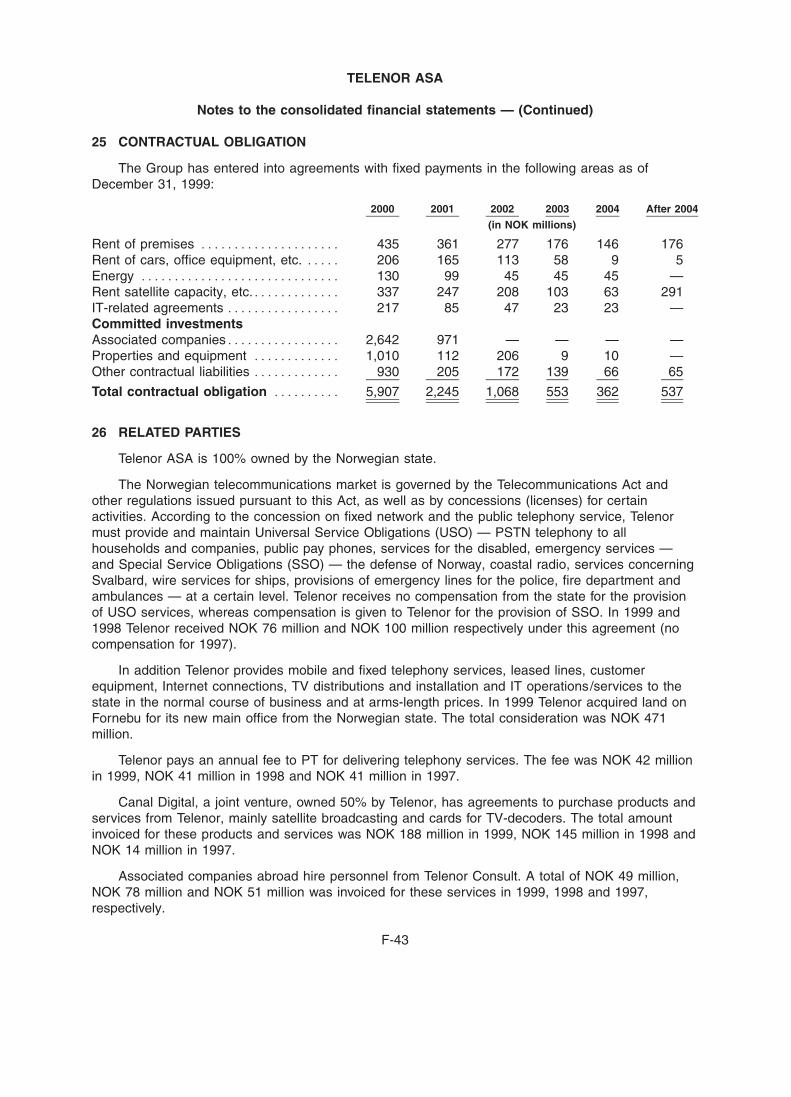
BOWNE OF LONDON 12/01/2000 19:56 BL/SM NO MARKS NEXT PCN: 276.00.00.00 -- Page is valid, no graphics X42481 275.00.00.00 6X
TELENOR ASA
Notes to the consolidated financial statements — (Continued)
25 CONTRACTUAL OBLIGATION
The Group has entered into agreements with fixed payments in the following areas as ofDecember 31, 1999:
2000 2001 2002 2003 2004 After 2004
(in NOK millions)
Rent of premises ********************* 435 361 277 176 146 176Rent of cars, office equipment, etc. ***** 206 165 113 58 9 5Energy ****************************** 130 99 45 45 45 —Rent satellite capacity, etc.************* 337 247 208 103 63 291IT-related agreements ***************** 217 85 47 23 23 —Committed investmentsAssociated companies***************** 2,642 971 — — — —Properties and equipment ************* 1,010 112 206 9 10 —Other contractual liabilities ************* 930 205 172 139 66 65
Total contractual obligation ********** 5,907 2,245 1,068 553 362 537
26 RELATED PARTIES
Telenor ASA is 100% owned by the Norwegian state.
The Norwegian telecommunications market is governed by the Telecommunications Act andother regulations issued pursuant to this Act, as well as by concessions (licenses) for certainactivities. According to the concession on fixed network and the public telephony service, Telenormust provide and maintain Universal Service Obligations (USO) — PSTN telephony to allhouseholds and companies, public pay phones, services for the disabled, emergency services —and Special Service Obligations (SSO) — the defense of Norway, coastal radio, services concerningSvalbard, wire services for ships, provisions of emergency lines for the police, fire department andambulances — at a certain level. Telenor receives no compensation from the state for the provisionof USO services, whereas compensation is given to Telenor for the provision of SSO. In 1999 and1998 Telenor received NOK 76 million and NOK 100 million respectively under this agreement (nocompensation for 1997).
In addition Telenor provides mobile and fixed telephony services, leased lines, customerequipment, Internet connections, TV distributions and installation and IT operations/services to thestate in the normal course of business and at arms-length prices. In 1999 Telenor acquired land onFornebu for its new main office from the Norwegian state. The total consideration was NOK 471million.
Telenor pays an annual fee to PT for delivering telephony services. The fee was NOK 42 millionin 1999, NOK 41 million in 1998 and NOK 41 million in 1997.
Canal Digital, a joint venture, owned 50% by Telenor, has agreements to purchase products andservices from Telenor, mainly satellite broadcasting and cards for TV-decoders. The total amountinvoiced for these products and services was NOK 188 million in 1999, NOK 145 million in 1998 andNOK 14 million in 1997.
Associated companies abroad hire personnel from Telenor Consult. A total of NOK 49 million,NOK 78 million and NOK 51 million was invoiced for these services in 1999, 1998 and 1997,respectively.
F-43
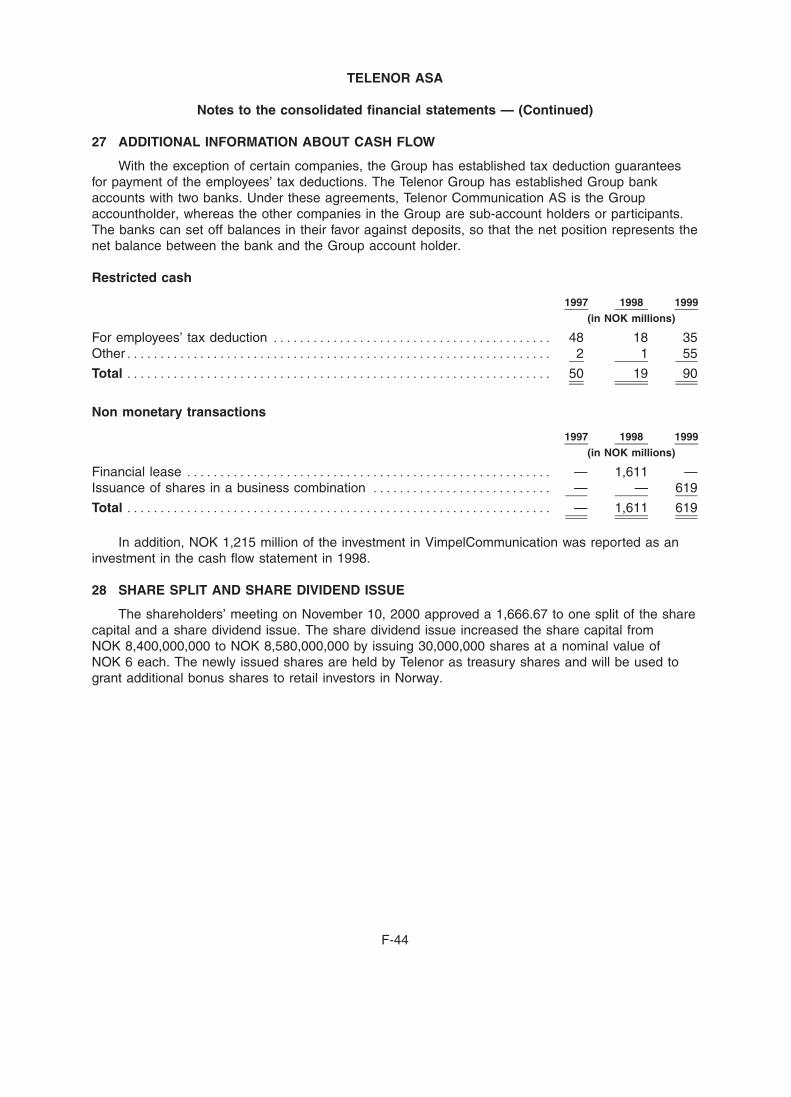
BOWNE OF LONDON 12/01/2000 19:56 BL/SM NO MARKS NEXT PCN: 277.00.00.00 -- Page is valid, no graphics X42481 276.00.00.00 6X
TELENOR ASA
Notes to the consolidated financial statements — (Continued)
27 ADDITIONAL INFORMATION ABOUT CASH FLOW
With the exception of certain companies, the Group has established tax deduction guaranteesfor payment of the employees’ tax deductions. The Telenor Group has established Group bankaccounts with two banks. Under these agreements, Telenor Communication AS is the Groupaccountholder, whereas the other companies in the Group are sub-account holders or participants.The banks can set off balances in their favor against deposits, so that the net position represents thenet balance between the bank and the Group account holder.
Restricted cash
1997 1998 1999
(in NOK millions)
For employees’ tax deduction ****************************************** 48 18 35Other**************************************************************** 2 1 55
Total **************************************************************** 50 19 90
Non monetary transactions
1997 1998 1999
(in NOK millions)
Financial lease ******************************************************* — 1,611 —Issuance of shares in a business combination *************************** — — 619
Total **************************************************************** — 1,611 619
In addition, NOK 1,215 million of the investment in VimpelCommunication was reported as aninvestment in the cash flow statement in 1998.
28 SHARE SPLIT AND SHARE DIVIDEND ISSUE
The shareholders’ meeting on November 10, 2000 approved a 1,666.67 to one split of the sharecapital and a share dividend issue. The share dividend issue increased the share capital fromNOK 8,400,000,000 to NOK 8,580,000,000 by issuing 30,000,000 shares at a nominal value ofNOK 6 each. The newly issued shares are held by Telenor as treasury shares and will be used togrant additional bonus shares to retail investors in Norway.
F-44
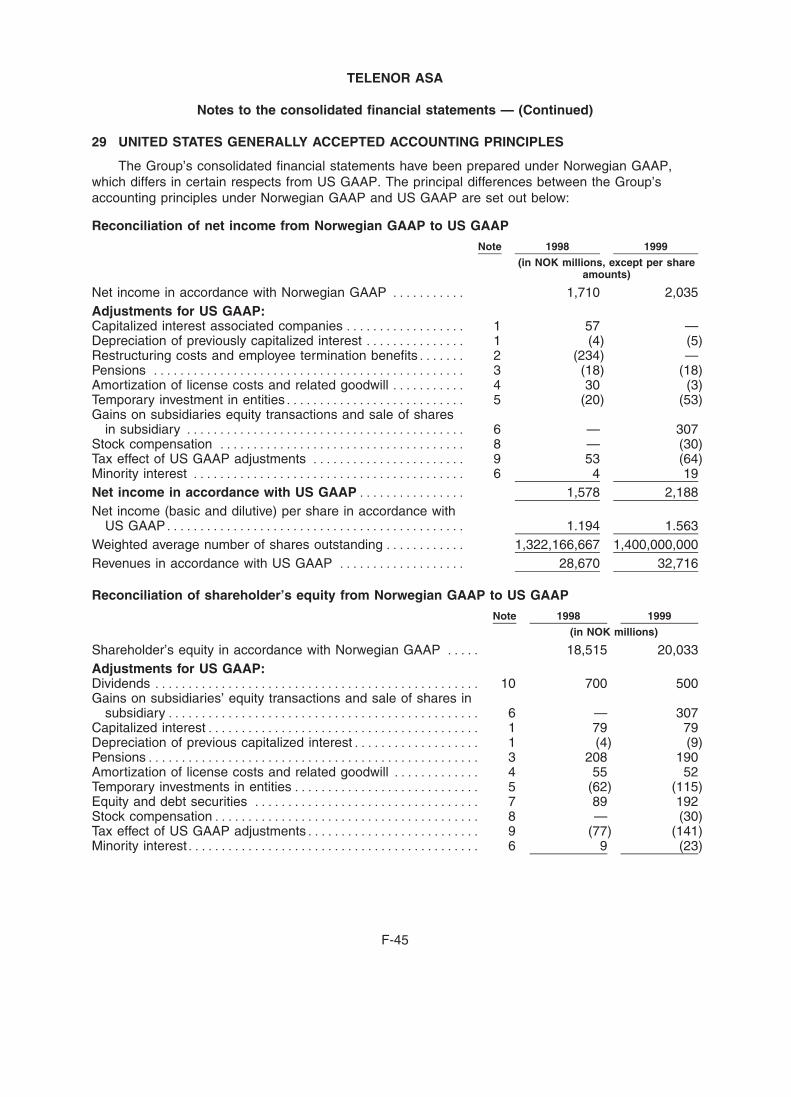
BOWNE OF LONDON 12/03/2000 10:02 BL/SM NO MARKS NEXT PCN: 278.00.00.00 -- Page is valid, no graphics X42481 277.00.00.00 7X
TELENOR ASA
Notes to the consolidated financial statements — (Continued)
29 UNITED STATES GENERALLY ACCEPTED ACCOUNTING PRINCIPLES
The Group’s consolidated financial statements have been prepared under Norwegian GAAP,which differs in certain respects from US GAAP. The principal differences between the Group’saccounting principles under Norwegian GAAP and US GAAP are set out below:
Reconciliation of net income from Norwegian GAAP to US GAAP
Note 1998 1999
(in NOK millions, except per shareamounts)
Net income in accordance with Norwegian GAAP *********** 1,710 2,035Adjustments for US GAAP:Capitalized interest associated companies ****************** 1 57 —Depreciation of previously capitalized interest *************** 1 (4) (5)Restructuring costs and employee termination benefits******* 2 (234) —Pensions *********************************************** 3 (18) (18)Amortization of license costs and related goodwill *********** 4 30 (3)Temporary investment in entities*************************** 5 (20) (53)Gains on subsidiaries equity transactions and sale of shares
in subsidiary ****************************************** 6 — 307Stock compensation ************************************* 8 — (30)Tax effect of US GAAP adjustments *********************** 9 53 (64)Minority interest ***************************************** 6 4 19Net income in accordance with US GAAP**************** 1,578 2,188Net income (basic and dilutive) per share in accordance with
US GAAP********************************************* 1.194 1.563Weighted average number of shares outstanding ************ 1,322,166,667 1,400,000,000Revenues in accordance with US GAAP ******************* 28,670 32,716
Reconciliation of shareholder’s equity from Norwegian GAAP to US GAAP
Note 1998 1999
(in NOK millions)
Shareholder’s equity in accordance with Norwegian GAAP ***** 18,515 20,033Adjustments for US GAAP:Dividends ************************************************* 10 700 500Gains on subsidiaries’ equity transactions and sale of shares in
subsidiary*********************************************** 6 — 307Capitalized interest***************************************** 1 79 79Depreciation of previous capitalized interest******************* 1 (4) (9)Pensions************************************************** 3 208 190Amortization of license costs and related goodwill ************* 4 55 52Temporary investments in entities**************************** 5 (62) (115)Equity and debt securities ********************************** 7 89 192Stock compensation**************************************** 8 — (30)Tax effect of US GAAP adjustments************************** 9 (77) (141)Minority interest******************************************** 6 9 (23)
F-45
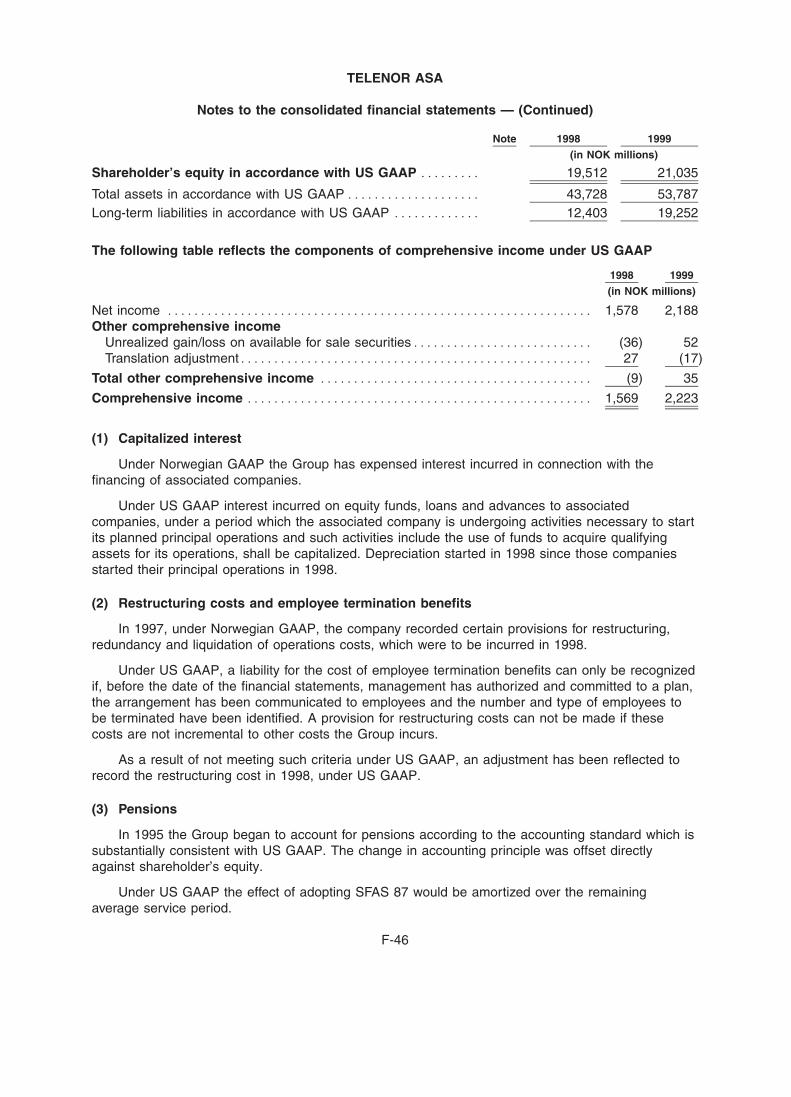
BOWNE OF LONDON 12/01/2000 19:56 BL/SM NO MARKS NEXT PCN: 279.00.00.00 -- Page is valid, no graphics X42481 278.00.00.00 6X
TELENOR ASA
Notes to the consolidated financial statements — (Continued)
Note 1998 1999
(in NOK millions)
Shareholder’s equity in accordance with US GAAP ********* 19,512 21,035
Total assets in accordance with US GAAP ******************** 43,728 53,787Long-term liabilities in accordance with US GAAP ************* 12,403 19,252
The following table reflects the components of comprehensive income under US GAAP
1998 1999
(in NOK millions)
Net income **************************************************************** 1,578 2,188Other comprehensive income
Unrealized gain/loss on available for sale securities*************************** (36) 52Translation adjustment***************************************************** 27 (17)
Total other comprehensive income ***************************************** (9) 35
Comprehensive income **************************************************** 1,569 2,223
(1) Capitalized interest
Under Norwegian GAAP the Group has expensed interest incurred in connection with thefinancing of associated companies.
Under US GAAP interest incurred on equity funds, loans and advances to associatedcompanies, under a period which the associated company is undergoing activities necessary to startits planned principal operations and such activities include the use of funds to acquire qualifyingassets for its operations, shall be capitalized. Depreciation started in 1998 since those companiesstarted their principal operations in 1998.
(2) Restructuring costs and employee termination benefits
In 1997, under Norwegian GAAP, the company recorded certain provisions for restructuring,redundancy and liquidation of operations costs, which were to be incurred in 1998.
Under US GAAP, a liability for the cost of employee termination benefits can only be recognizedif, before the date of the financial statements, management has authorized and committed to a plan,the arrangement has been communicated to employees and the number and type of employees tobe terminated have been identified. A provision for restructuring costs can not be made if thesecosts are not incremental to other costs the Group incurs.
As a result of not meeting such criteria under US GAAP, an adjustment has been reflected torecord the restructuring cost in 1998, under US GAAP.
(3) Pensions
In 1995 the Group began to account for pensions according to the accounting standard which issubstantially consistent with US GAAP. The change in accounting principle was offset directlyagainst shareholder’s equity.
Under US GAAP the effect of adopting SFAS 87 would be amortized over the remainingaverage service period.
F-46
BOWNE OF LONDON 12/01/2000 19:56 BL/SM NO MARKS NEXT PCN: 280.00.00.00 -- Page is valid, no graphics X42481 279.00.00.00 6X
TELENOR ASA
Notes to the consolidated financial statements — (Continued)
(4) Amortization of license costs and related goodwill
Up to the end of 1997 the Group amortized license costs and goodwill related to acquiredlicenses over a period not exceeding 10 years. With effect from 1998 the amortization period hasbeen changed to the term of the license. In accordance with Norwegian GAAP this change has beenaccounted for as a change of estimate, with no retroactive restatement of prior periods.
Under the US GAAP reconciliation, this revision in the amortization period was accounted forretroactively.
(5) Temporary investment in entities
Investments in entities in which the Group has an ownership that are considered to betemporary in nature are recorded at cost or written down to fair value. The Group invests periodicallyin companies for the purpose of making profits.
Under US GAAP, all temporary investments with an ownership greater or equal to 20% areaccounted for under the equity method or consolidated. The effect on the financial statements oftemporary investments consolidated under US GAAP are immaterial.
Total assets accounted for under the equity method for US GAAP was NOK 4,081 million for theyear ended December 31, 1998 and NOK 7,705 million for the year ended December 31, 1999.
Total assets accounted for under the cost method for US GAAP was NOK 50 million for the yearended December 31, 1998 and NOK 730 million for the year ended December 31, 1999.
(6) Gain from subsidiaries equity transactions, sale of shares in a subsidiary and minorityinterest
Under Norwegian GAAP, no gains from subsidiary’s equity transactions and sale of shares in asubsidiary are recognized.
Under US GAAP, the Group records gains from subsidiary equity transactions (SAB 51transactions) and sale of shares in a subsidiary through income.
Under Norwegian GAAP, the minority interest is measured at fair value of the consideration paidfrom the minority. The difference between the recorded equity in the subsidiary and value of theconsideration paid by the minority will be amortized through allocating results to minority.
This allocation is not consistent with US GAAP.
The following information relates to the issuance of subsidiary shares in 1999 under US GAAP:
Telenor’s 100% owned subsidiary Telenor Programvare AS (now EDB Business Partner ASA)and the listed company EDB ASA merged in a purchase business combination in 1999, where theshareholders in EDB ASA received 34% of the shares in Telenor Programvare AS in exchange for itsownership in EDB AS. The total consideration was NOK 547 million based on the quoted price ofEDB ASA at the date the transaction was announced. Recognized gain was NOK 192 million. InSeptember 1999 Telenor sold 4.1 million of its shares in EDB Business Partner ASA. The totalconsideration was NOK 144 million. The resulting gain was NOK 94 million. In November 1999,Telenor B Invest issued shares to a minority shareholder for cash, reducing Telenor’s ownershipstake in the company by 26.67%. The total consideration was NOK 230 million. Recognized gainwas NOK 21 million. Taxes have been accrued in the tax effect line item of US GAAP adjustments.
F-47
BOWNE OF LONDON 12/01/2000 19:56 BL/SM NO MARKS NEXT PCN: 281.00.00.00 -- Page is valid, no graphics X42481 280.00.00.00 6X
TELENOR ASA
Notes to the consolidated financial statements — (Continued)
(7) Marketable equity securities
For investments in marketable equity securities classified as current assets that are managed asa portfolio adjustments in the book value are only made if the aggregate holdings have a lowerestimated fair value than the original cost. Other marketable shares are valued at the lower of costor fair market value. Investment in marketable equity securities classified as long-term are valued athistorical cost or possibly fair value if the decline in value is not temporary.
Under US GAAP, marketable equity securities are valued at their fair value for each security.For marketable equity securities classified as available for sale, unrealized gains and losses after taxare recorded directly to shareholder’s equity. All listed shares are classified as available for sale inaccordance with SFAS 115.
As of December 31, 1998 and 1999, available for sale securities at cost amounted toNOK 182 million and NOK 36 million, respectively, with unrealized holding gains of NOK 124 millionand NOK 266 million, respectively. For the years ended December 31, 1998 and 1999, proceedsfrom the sale of available for sale securities was NOK 114 million and NOK 660 million, respectively,and the gross realized gain from such sales was NOK 54 million and NOK 509 million, respectively.
(8) Stock compensation
The subsidiary EDB Business Partner ASA has stock compensation plans for its employees.The exercise price is based on the share price when the option was granted and is increased by 1%for each subsequent month until the date of exercise. Most of the options that are not exercisedaccording to the plan can be carried forward to the next year.
In accordance with Norwegian GAAP, the Group did not recognize expense for stock optionswith no intrinsic value that were granted to employees.
In accordance with US GAAP, the measurement date for determining compensation costs forstock options is the first date at which the number of shares the employee is entitled to receive andthe exercise price of the options are known. When EDB Business Partner ASA granted stockoptions, the number of shares was known at the grant date; however, the exercise price to be paidwas not known because it was not known when the employee would exercise the option.Accordingly, variable plan accounting would apply under US GAAP and the intrinsic value of theoptions at the end of each reporting period, based on the presumed exercise price and the quotedmarked price of EDB Business Partner’s stock, would be calculated and recorded as compensationexpense over the vesting period.
The following information relates to the stock compensation plans for EDB Business Partner:
EDB Business Partner operates two stock incentive plans for its employees:
1. An ‘‘old’’ share option plan, established in 1997, by what was then EDB ASA, that wasconsolidated by EDB Business Partner as of May 1999, and
2. A new universal share option plan established in 1999 for all employees of EDB BusinessPartner ASA (including employees of recently acquired companies).
The old plan expired in May 2000, when the last exercise of options granted took place. Thenew universal share option plan has the approval of the shareholders of EDB Business Partner togrant options for the year ended December 31, 2000. The continuation of the plan in the years 2001and 2002 requires, and is subject to, additional shareholder approval. Norwegian law requiresshareholder approval of share issues, and the Board of Directors can not obtain power of attorney to
F-48
BOWNE OF LONDON 12/01/2000 19:56 BL/SM NO MARKS NEXT PCN: 282.00.00.00 -- Page is valid, no graphics X42481 281.00.00.00 8X
TELENOR ASA
Notes to the consolidated financial statements — (Continued)
execute such plans due to the longevity of the exercise period. For the purpose of these financialstatements these grants should be considered effective.
As of December 31, 1999, EDB Business Partner’s two stock incentive plans have authorizedthe grant of options to employees for up to 9,360,560 shares of EDB Business Partner’s commonshares. Options granted had one to five year terms, where one-third of the options under the oldplan may be exercised each year whereas one-third of vested options under the new plan becomeexercisable each year. Options vest over a one to three year period of continued employment.Vested but unexercised options can be carried forward to May 2004, with the exclusion of the oldplan options which must be exercised in May 2000, or expire. Of the total options outstanding atyear-end, options for 2.4 million shares have been accounted for as fixed plan awards. In fixed planawards, the measurement date occurs on the grant date when both the number of shares of stockthat may be acquired and the price to be paid by the employee are known. The options for theremaining 7.0 million shares of stock are considered variable plan grants because terms do notdefine the ultimate exercise price of the options.
EDB Business Partner has elected to continue to follow Accounting Principles Board OpinionNo. 25, ‘‘Accounting for Stock Issued to Employees’’ (APB 25) and related interpretations inaccounting for its employee stock options. However, pro forma information regarding net income andearnings per share is required by FASB Statement No. 123, ‘‘Accounting for Stock-BasedCompensation’’ (SFAS 123), and has been determined as if EDB Business Partner had accountedfor its employee stock options under the fair value method of that Statement. The fair value for theseoptions was estimated at the date of grant using a Black-Scholes option pricing model with thefollowing weighted-average assumptions. The assumptions for 1999 were risk-free interest rates of6.0%; dividend yield of zero; volatility factor of the expected market price of EDB Business Partner’scommon shares of 0.53; and a weighted-average expected life of the options of 4.1 years. TheBlack-Scholes option valuation model was developed for use in estimating the fair value of tradedoptions that have no vesting restrictions and are fully transferable. In addition, option valuationmodels require the input of highly subjective assumptions including the expected stock price volatility.Because EDB Business Partner’s employee stock options have characteristics significantly differentfrom those of traded options, and because changes in the subjective input assumptions canmaterially affect the fair value estimate, in management’s opinion, the existing models do notnecessarily provide a reliable single measure of the fair value of its employee stock options. Hadcompensation cost for these plans been determined consistent with SFAS 123, the Group’s netincome would have been reduced to the following:
1999
Pro forma net income based on US GAAP (in millions) ******************* NOK 2,199
EDB Business Partner recognized NOK 12.1 million in pro forma compensation expense underSFAS 123 for 1999.
The possible exercise of the stock options will have no dilutive effect on earnings per sharesince the options are only exercisable for EDB Business Partner ASA’s shares. Thus, the exercise ofoptions could not change the number of Telenor shares outstanding.
F-49
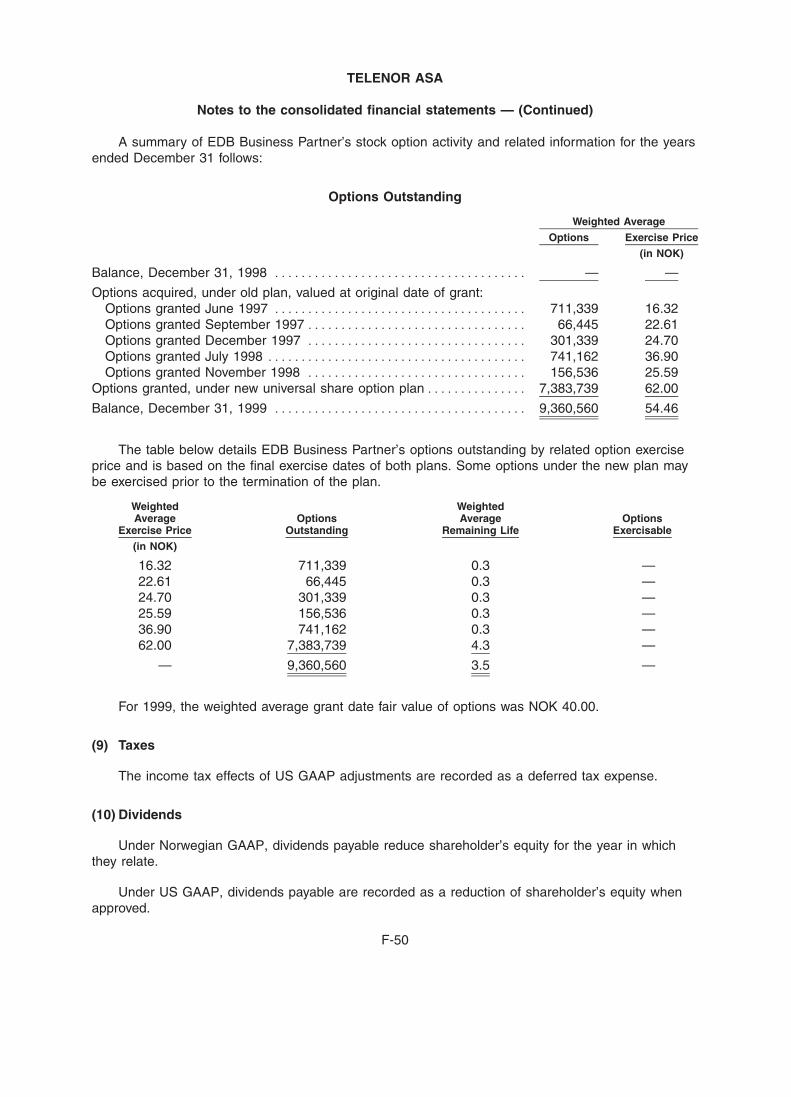
BOWNE OF LONDON 12/01/2000 19:56 BL/SM NO MARKS NEXT PCN: 283.00.00.00 -- Page is valid, no graphics X42481 282.00.00.00 11X
TELENOR ASA
Notes to the consolidated financial statements — (Continued)
A summary of EDB Business Partner’s stock option activity and related information for the yearsended December 31 follows:
Options Outstanding
Weighted Average
Options Exercise Price
(in NOK)
Balance, December 31, 1998 ************************************** — —
Options acquired, under old plan, valued at original date of grant:Options granted June 1997 ************************************** 711,339 16.32Options granted September 1997 ********************************* 66,445 22.61Options granted December 1997 ********************************* 301,339 24.70Options granted July 1998 *************************************** 741,162 36.90Options granted November 1998 ********************************* 156,536 25.59
Options granted, under new universal share option plan*************** 7,383,739 62.00
Balance, December 31, 1999 ************************************** 9,360,560 54.46
The table below details EDB Business Partner’s options outstanding by related option exerciseprice and is based on the final exercise dates of both plans. Some options under the new plan maybe exercised prior to the termination of the plan.
Weighted WeightedAverage Options Average Options
Exercise Price Outstanding Remaining Life Exercisable
(in NOK)
16.32 711,339 0.3 —22.61 66,445 0.3 —24.70 301,339 0.3 —25.59 156,536 0.3 —36.90 741,162 0.3 —62.00 7,383,739 4.3 —
— 9,360,560 3.5 —
For 1999, the weighted average grant date fair value of options was NOK 40.00.
(9) Taxes
The income tax effects of US GAAP adjustments are recorded as a deferred tax expense.
(10) Dividends
Under Norwegian GAAP, dividends payable reduce shareholder’s equity for the year in whichthey relate.
Under US GAAP, dividends payable are recorded as a reduction of shareholder’s equity whenapproved.
F-50
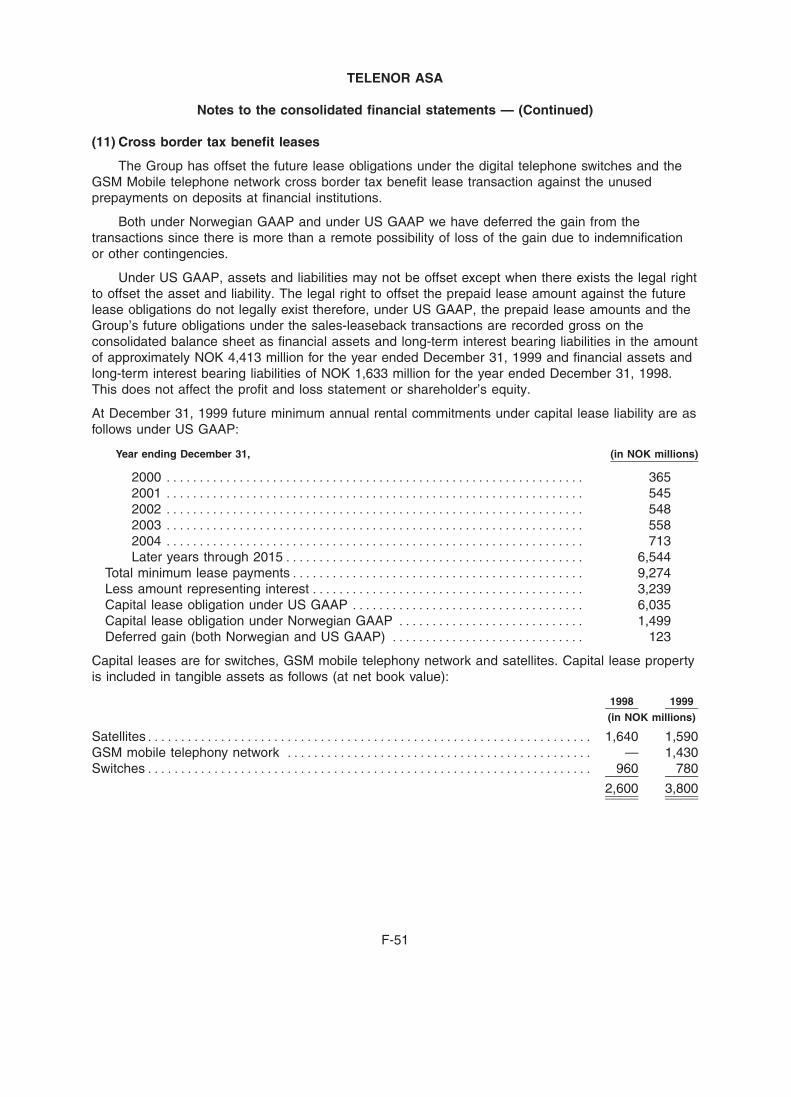
BOWNE OF LONDON 12/01/2000 19:56 BL/SM NO MARKS NEXT PCN: 284.00.00.00 -- Page is valid, no graphics X42481 283.00.00.00 7X
TELENOR ASA
Notes to the consolidated financial statements — (Continued)
(11) Cross border tax benefit leases
The Group has offset the future lease obligations under the digital telephone switches and theGSM Mobile telephone network cross border tax benefit lease transaction against the unusedprepayments on deposits at financial institutions.
Both under Norwegian GAAP and under US GAAP we have deferred the gain from thetransactions since there is more than a remote possibility of loss of the gain due to indemnificationor other contingencies.
Under US GAAP, assets and liabilities may not be offset except when there exists the legal rightto offset the asset and liability. The legal right to offset the prepaid lease amount against the futurelease obligations do not legally exist therefore, under US GAAP, the prepaid lease amounts and theGroup’s future obligations under the sales-leaseback transactions are recorded gross on theconsolidated balance sheet as financial assets and long-term interest bearing liabilities in the amountof approximately NOK 4,413 million for the year ended December 31, 1999 and financial assets andlong-term interest bearing liabilities of NOK 1,633 million for the year ended December 31, 1998.This does not affect the profit and loss statement or shareholder’s equity.
At December 31, 1999 future minimum annual rental commitments under capital lease liability are asfollows under US GAAP:
Year ending December 31, (in NOK millions)
2000 *************************************************************** 3652001 *************************************************************** 5452002 *************************************************************** 5482003 *************************************************************** 5582004 *************************************************************** 713Later years through 2015********************************************* 6,544
Total minimum lease payments******************************************** 9,274Less amount representing interest ***************************************** 3,239Capital lease obligation under US GAAP *********************************** 6,035Capital lease obligation under Norwegian GAAP **************************** 1,499Deferred gain (both Norwegian and US GAAP) ***************************** 123
Capital leases are for switches, GSM mobile telephony network and satellites. Capital lease propertyis included in tangible assets as follows (at net book value):
1998 1999
(in NOK millions)
Satellites******************************************************************* 1,640 1,590GSM mobile telephony network ********************************************** — 1,430Switches******************************************************************* 960 780
2,600 3,800
F-51
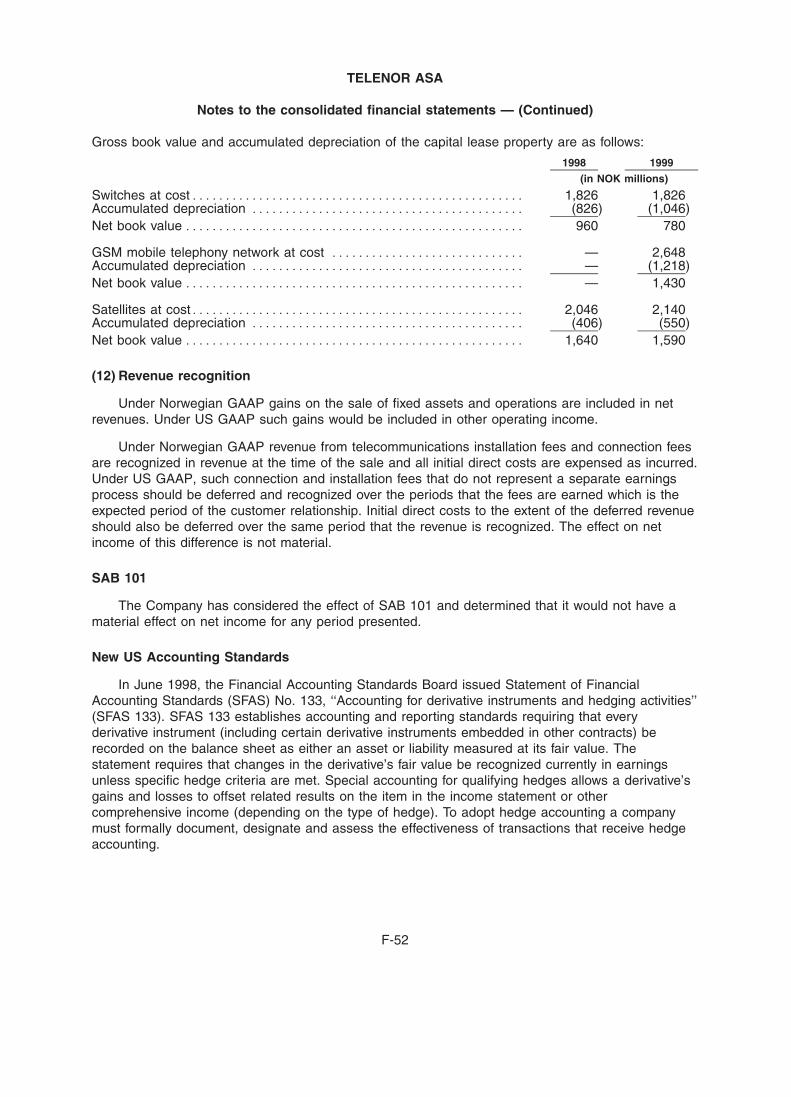
BOWNE OF LONDON 12/01/2000 20:50 BL/SM NO MARKS NEXT PCN: 285.00.00.00 -- Page is valid, no graphics X42481 284.00.00.00 8X
TELENOR ASA
Notes to the consolidated financial statements — (Continued)
Gross book value and accumulated depreciation of the capital lease property are as follows:
1998 1999
(in NOK millions)
Switches at cost************************************************** 1,826 1,826Accumulated depreciation ***************************************** (826) (1,046)Net book value *************************************************** 960 780
GSM mobile telephony network at cost ***************************** — 2,648Accumulated depreciation ***************************************** — (1,218)Net book value *************************************************** — 1,430
Satellites at cost************************************************** 2,046 2,140Accumulated depreciation ***************************************** (406) (550)Net book value *************************************************** 1,640 1,590
(12) Revenue recognition
Under Norwegian GAAP gains on the sale of fixed assets and operations are included in netrevenues. Under US GAAP such gains would be included in other operating income.
Under Norwegian GAAP revenue from telecommunications installation fees and connection feesare recognized in revenue at the time of the sale and all initial direct costs are expensed as incurred.Under US GAAP, such connection and installation fees that do not represent a separate earningsprocess should be deferred and recognized over the periods that the fees are earned which is theexpected period of the customer relationship. Initial direct costs to the extent of the deferred revenueshould also be deferred over the same period that the revenue is recognized. The effect on netincome of this difference is not material.
SAB 101
The Company has considered the effect of SAB 101 and determined that it would not have amaterial effect on net income for any period presented.
New US Accounting Standards
In June 1998, the Financial Accounting Standards Board issued Statement of FinancialAccounting Standards (SFAS) No. 133, ‘‘Accounting for derivative instruments and hedging activities’’(SFAS 133). SFAS 133 establishes accounting and reporting standards requiring that everyderivative instrument (including certain derivative instruments embedded in other contracts) berecorded on the balance sheet as either an asset or liability measured at its fair value. Thestatement requires that changes in the derivative’s fair value be recognized currently in earningsunless specific hedge criteria are met. Special accounting for qualifying hedges allows a derivative’sgains and losses to offset related results on the item in the income statement or othercomprehensive income (depending on the type of hedge). To adopt hedge accounting a companymust formally document, designate and assess the effectiveness of transactions that receive hedgeaccounting.
F-52

BOWNE OF LONDON 12/01/2000 20:50 BL/SM NO MARKS NEXT PCN: 286.00.00.00 -- Page is valid, no graphics X42481 285.00.00.00 8X
TELENOR ASA
Notes to the consolidated financial statements — (Continued)
SFAS No. 137 delayed the effective date of SFAS 133 to fiscal years beginning after June 15,2000. SFAS No. 138, ‘‘Accounting for Certain Derivative Instruments and Certain Hedging Activities’’,addresses a limited number of implementation difficulties involved in applying SFAS 133.
Telenor has not yet determined the effect of the application of SFAS 133 on the balance sheetor the profit and loss statement.
F-53
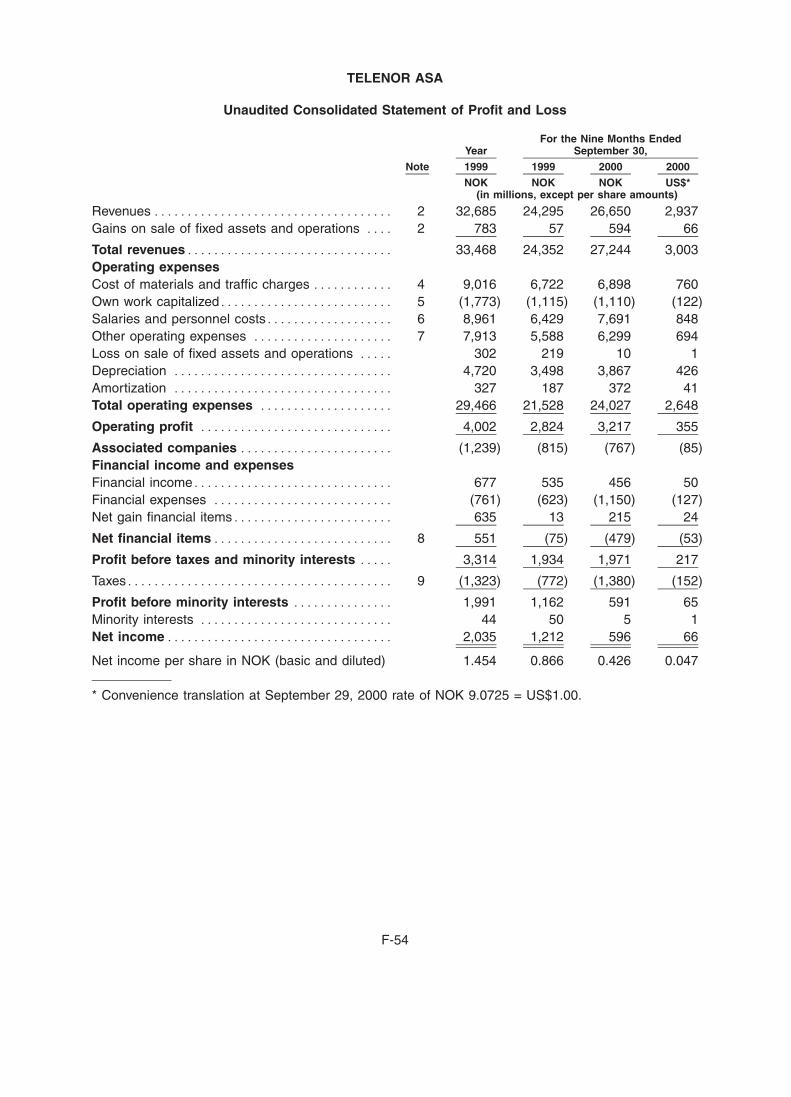
BOWNE OF LONDON 12/01/2000 19:56 BL/SM NO MARKS NEXT PCN: 287.00.00.00 -- Page is valid, no graphics X42481 286.00.00.00 7X
TELENOR ASA
Unaudited Consolidated Statement of Profit and Loss
For the Nine Months EndedYear September 30,
Note 1999 1999 2000 2000
NOK NOK NOK US$*(in millions, except per share amounts)
Revenues ************************************ 2 32,685 24,295 26,650 2,937Gains on sale of fixed assets and operations **** 2 783 57 594 66
Total revenues******************************* 33,468 24,352 27,244 3,003Operating expensesCost of materials and traffic charges ************ 4 9,016 6,722 6,898 760Own work capitalized************************** 5 (1,773) (1,115) (1,110) (122)Salaries and personnel costs******************* 6 8,961 6,429 7,691 848Other operating expenses ********************* 7 7,913 5,588 6,299 694Loss on sale of fixed assets and operations ***** 302 219 10 1Depreciation ********************************* 4,720 3,498 3,867 426Amortization ********************************* 327 187 372 41Total operating expenses ******************** 29,466 21,528 24,027 2,648
Operating profit ***************************** 4,002 2,824 3,217 355
Associated companies *********************** (1,239) (815) (767) (85)Financial income and expensesFinancial income****************************** 677 535 456 50Financial expenses *************************** (761) (623) (1,150) (127)Net gain financial items************************ 635 13 215 24
Net financial items*************************** 8 551 (75) (479) (53)
Profit before taxes and minority interests ***** 3,314 1,934 1,971 217
Taxes**************************************** 9 (1,323) (772) (1,380) (152)
Profit before minority interests *************** 1,991 1,162 591 65Minority interests ***************************** 44 50 5 1Net income********************************** 2,035 1,212 596 66
Net income per share in NOK (basic and diluted) 1.454 0.866 0.426 0.047
* Convenience translation at September 29, 2000 rate of NOK 9.0725 = US$1.00.
F-54
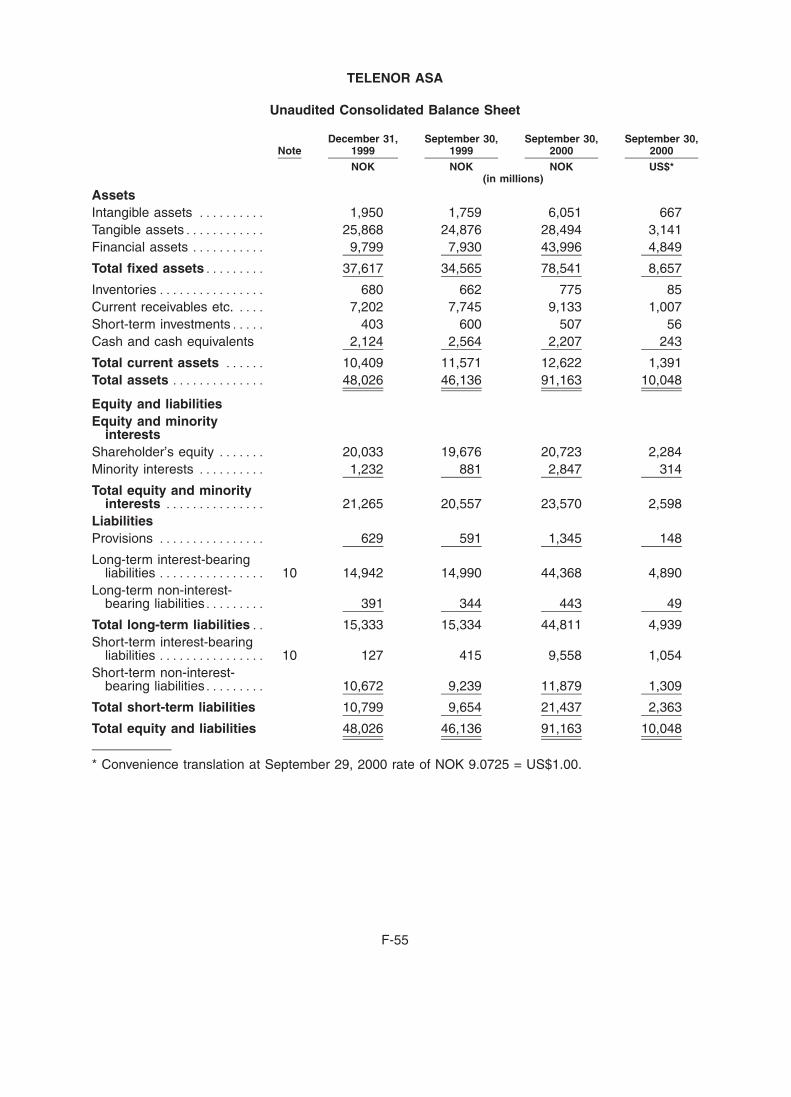
BOWNE OF LONDON 12/01/2000 19:56 BL/SM NO MARKS NEXT PCN: 288.00.00.00 -- Page is valid, no graphics X42481 287.00.00.00 7X
TELENOR ASA
Unaudited Consolidated Balance Sheet
December 31, September 30, September 30, September 30,Note 1999 1999 2000 2000
NOK NOK NOK US$*(in millions)
AssetsIntangible assets ********** 1,950 1,759 6,051 667Tangible assets************ 25,868 24,876 28,494 3,141Financial assets *********** 9,799 7,930 43,996 4,849
Total fixed assets********* 37,617 34,565 78,541 8,657
Inventories**************** 680 662 775 85Current receivables etc. **** 7,202 7,745 9,133 1,007Short-term investments***** 403 600 507 56Cash and cash equivalents 2,124 2,564 2,207 243
Total current assets ****** 10,409 11,571 12,622 1,391Total assets ************** 48,026 46,136 91,163 10,048
Equity and liabilitiesEquity and minority
interestsShareholder’s equity ******* 20,033 19,676 20,723 2,284Minority interests ********** 1,232 881 2,847 314
Total equity and minorityinterests *************** 21,265 20,557 23,570 2,598
LiabilitiesProvisions **************** 629 591 1,345 148
Long-term interest-bearingliabilities **************** 10 14,942 14,990 44,368 4,890
Long-term non-interest-bearing liabilities********* 391 344 443 49
Total long-term liabilities** 15,333 15,334 44,811 4,939Short-term interest-bearing
liabilities **************** 10 127 415 9,558 1,054Short-term non-interest-
bearing liabilities********* 10,672 9,239 11,879 1,309
Total short-term liabilities 10,799 9,654 21,437 2,363
Total equity and liabilities 48,026 46,136 91,163 10,048
* Convenience translation at September 29, 2000 rate of NOK 9.0725 = US$1.00.
F-55
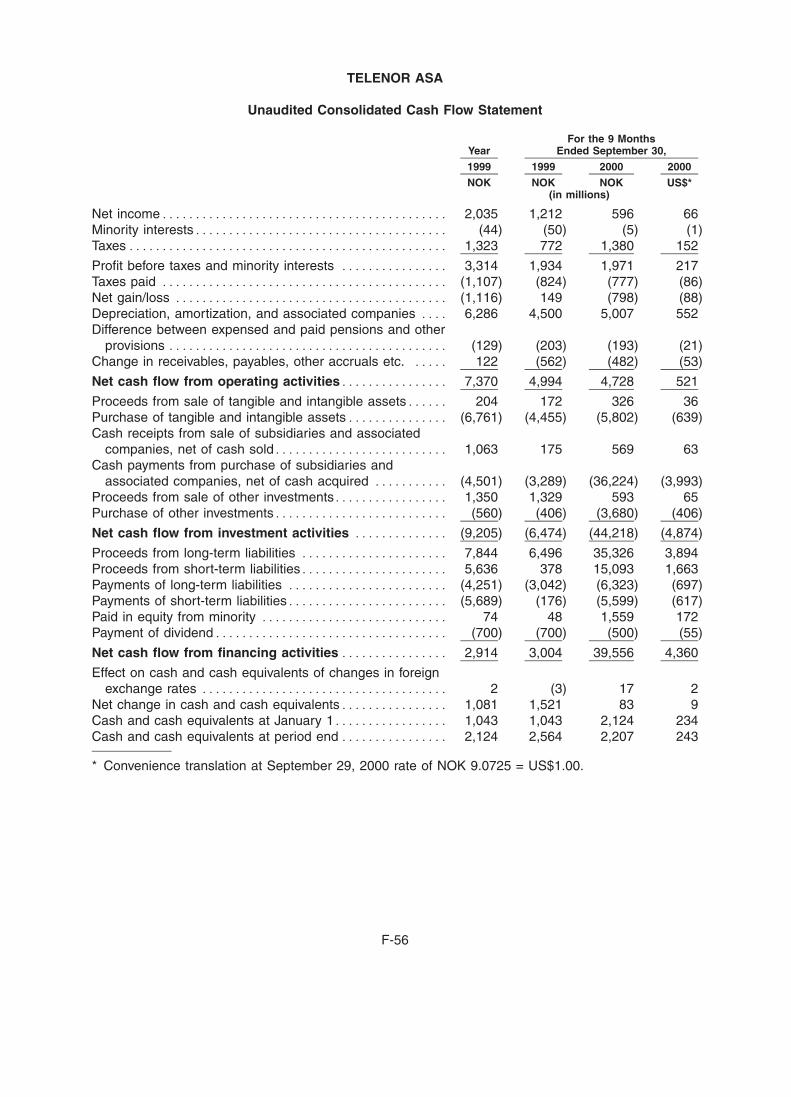
BOWNE OF LONDON 12/01/2000 19:56 BL/SM NO MARKS NEXT PCN: 289.00.00.00 -- Page is valid, no graphics X42481 288.00.00.00 7X
TELENOR ASA
Unaudited Consolidated Cash Flow Statement
For the 9 MonthsYear Ended September 30,
1999 1999 2000 2000
NOK NOK NOK US$*(in millions)
Net income******************************************* 2,035 1,212 596 66Minority interests************************************** (44) (50) (5) (1)Taxes************************************************ 1,323 772 1,380 152
Profit before taxes and minority interests **************** 3,314 1,934 1,971 217Taxes paid ******************************************* (1,107) (824) (777) (86)Net gain/loss ***************************************** (1,116) 149 (798) (88)Depreciation, amortization, and associated companies **** 6,286 4,500 5,007 552Difference between expensed and paid pensions and other
provisions ****************************************** (129) (203) (193) (21)Change in receivables, payables, other accruals etc. ***** 122 (562) (482) (53)
Net cash flow from operating activities**************** 7,370 4,994 4,728 521
Proceeds from sale of tangible and intangible assets****** 204 172 326 36Purchase of tangible and intangible assets*************** (6,761) (4,455) (5,802) (639)Cash receipts from sale of subsidiaries and associated
companies, net of cash sold************************** 1,063 175 569 63Cash payments from purchase of subsidiaries and
associated companies, net of cash acquired *********** (4,501) (3,289) (36,224) (3,993)Proceeds from sale of other investments***************** 1,350 1,329 593 65Purchase of other investments************************** (560) (406) (3,680) (406)
Net cash flow from investment activities ************** (9,205) (6,474) (44,218) (4,874)
Proceeds from long-term liabilities ********************** 7,844 6,496 35,326 3,894Proceeds from short-term liabilities********************** 5,636 378 15,093 1,663Payments of long-term liabilities ************************ (4,251) (3,042) (6,323) (697)Payments of short-term liabilities************************ (5,689) (176) (5,599) (617)Paid in equity from minority **************************** 74 48 1,559 172Payment of dividend*********************************** (700) (700) (500) (55)
Net cash flow from financing activities **************** 2,914 3,004 39,556 4,360
Effect on cash and cash equivalents of changes in foreignexchange rates ************************************* 2 (3) 17 2
Net change in cash and cash equivalents**************** 1,081 1,521 83 9Cash and cash equivalents at January 1***************** 1,043 1,043 2,124 234Cash and cash equivalents at period end **************** 2,124 2,564 2,207 243
* Convenience translation at September 29, 2000 rate of NOK 9.0725 = US$1.00.
F-56
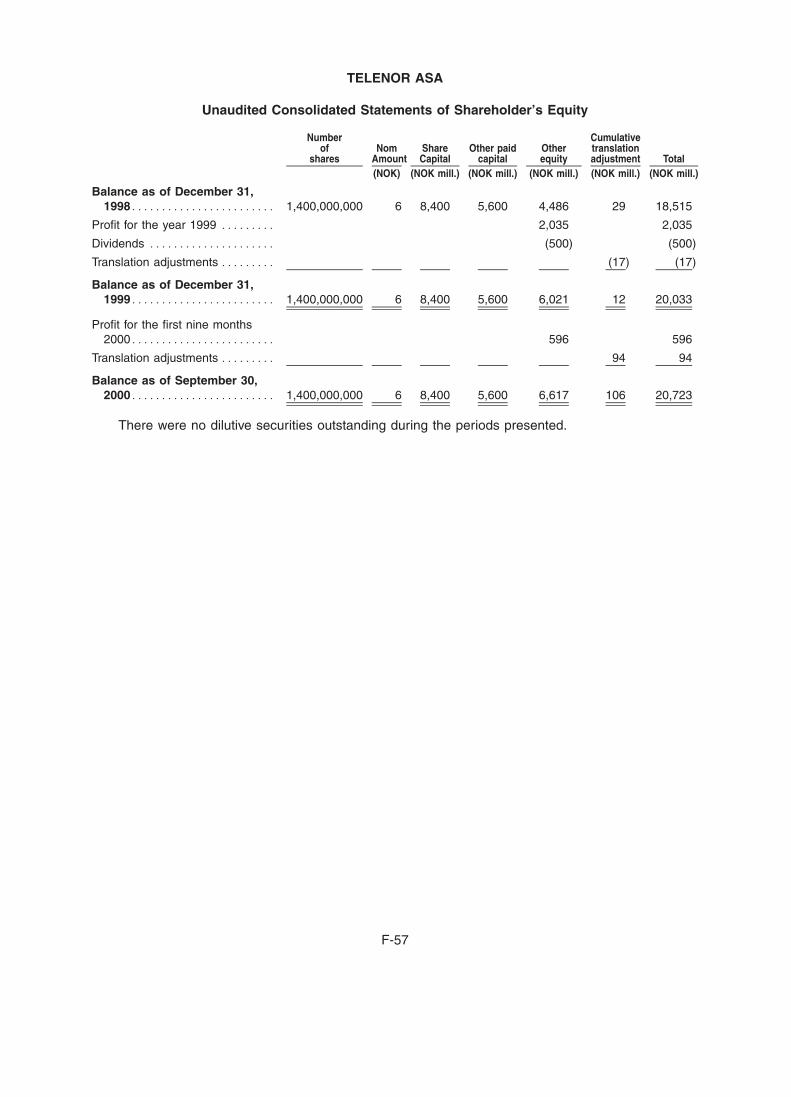
BOWNE OF LONDON 12/01/2000 19:56 BL/SM NO MARKS NEXT PCN: 290.00.00.00 -- Page is valid, no graphics X42481 289.00.00.00 7X
TELENOR ASA
Unaudited Consolidated Statements of Shareholder’s Equity
Number Cumulativeof Nom Share Other paid Other translation
shares Amount Capital capital equity adjustment Total(NOK) (NOK mill.) (NOK mill.) (NOK mill.) (NOK mill.) (NOK mill.)
Balance as of December 31,1998************************ 1,400,000,000 6 8,400 5,600 4,486 29 18,515
Profit for the year 1999 ********* 2,035 2,035
Dividends ********************* (500) (500)
Translation adjustments ********* (17) (17)
Balance as of December 31,1999************************ 1,400,000,000 6 8,400 5,600 6,021 12 20,033
Profit for the first nine months2000************************ 596 596
Translation adjustments ********* 94 94
Balance as of September 30,2000************************ 1,400,000,000 6 8,400 5,600 6,617 106 20,723
There were no dilutive securities outstanding during the periods presented.
F-57
BOWNE OF LONDON 12/01/2000 19:56 BL/SM NO MARKS NEXT PCN: 291.00.00.00 -- Page is valid, no graphics X42481 290.00.00.00 8X
TELENOR ASA
Notes to the unaudited interim consolidated financial statements
General
The interim consolidated balance sheet of Telenor ASA and its subsidiaries as of September 30,2000 and September 30, 1999, the consolidated statement of profit and loss and consolidated cashflow statements for each of the nine month periods ended September 30, 2000 and September 30,1999 and the consolidated statement of shareholder’s equity for the nine month period endedSeptember 30, 2000 are unaudited. In the opinion of management, the unaudited interimconsolidated financial statements have been prepared on a basis consistent with Telenor’s auditedconsolidated financial statements included in the prospectus and reflect all adjustments considerednecessary, consisting only of normal recurring accruals necessary to a fair statement of Telenor’sconsolidated financial position, results of operations and cash flows for such interim periods.
Telenor ASA was formed by the Norwegian Government in July 2000 to act as the holdingcompany for the Telenor Group. In September 2000, the Norwegian Government contributed all ofthe shares of Telenor AS (subsequently renamed Telenor Communications AS), the former holdingcompany for the Telenor Group, to Telenor ASA in exchange for all of the issued shares of TelenorASA. Telenor ASA was formed with identical share capital as Telenor AS, and prior to its acquisitionof Telenor AS had no assets or liabilities and conducted no operations other than incidental to itsformation. For purposes of these financial statements, Telenor ASA is treated as if it had been theparent company of the Telenor Group for all periods presented.
The interim consolidated financial statements have been prepared in accordance withNorwegian GAAP. For the purposes of these interim consolidated financial statements certaininformation and disclosures normally included in financial statements prepared in accordance withNorwegian GAAP have been condensed or omitted. These unaudited interim statements should beread together with the audited financial statements and notes thereto as of and for the year endedDecember 31, 1999.
These accounting principles may differ from US generally accepted accounting principles(US GAAP) and in such instances the material differences are reconciled in note 13.
The results of operations for these interim periods are not indicative of the results for the entireyear.
All amounts are presented in millions of NOK or other specified currency unless otherwisestated. Solely for the convenience of the reader, the accompanying consolidated financial statementsas of and for the nine months ended September 30, 2000 have been translated into US dollars,using the end noon buying rates in The City of New York for cable transfers, which was NOK 9.0725per US dollar, as of September 29, 2000. The translations should not be construed as arepresentation that the amounts could have been or could be converted into US dollars at that orany other rate.
The preparation of financial statements in accordance with generally accepted accountingprinciples requires management to make estimates and assumptions that affect the reportedamounts of assets and liabilities, and disclosure of contingent assets and liabilities at the date of thefinancial statements and the reported amounts of revenues and expenses in the reporting period.Actual results could differ from these estimates.
Net income per share
Net income per share has been retroactively adjusted for a share split, see note 12.
F-58
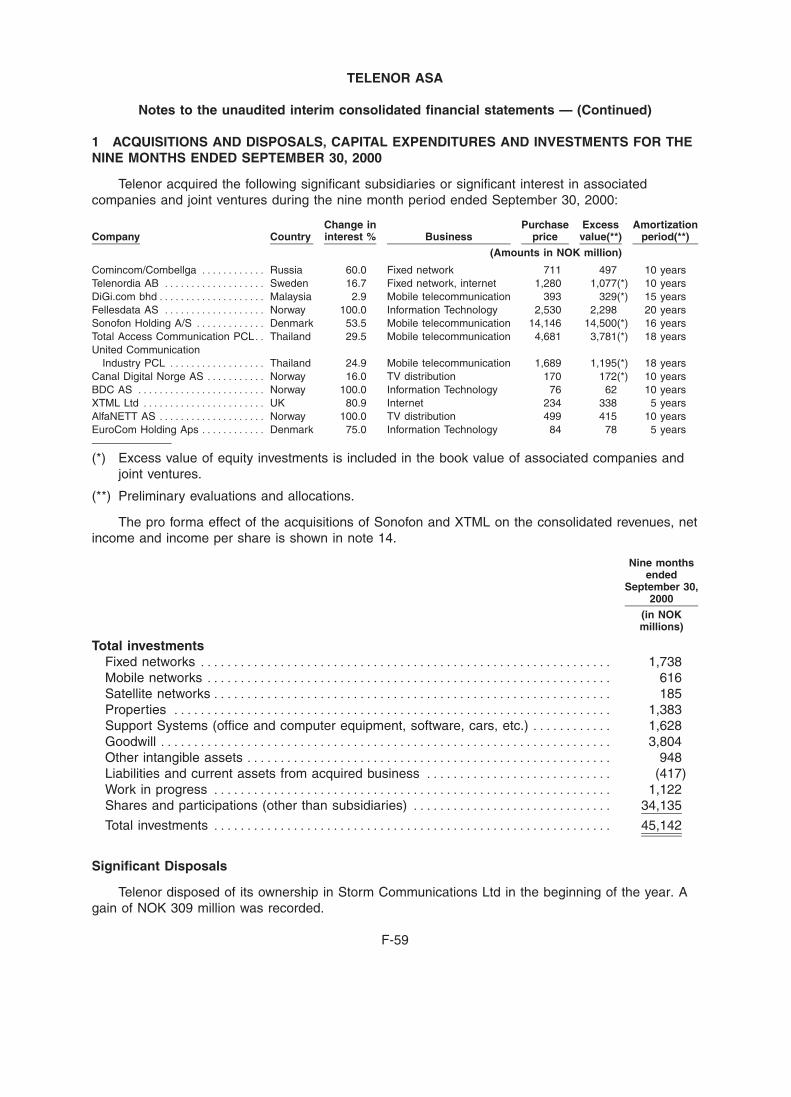
BOWNE OF LONDON 12/01/2000 19:56 BL/SM NO MARKS NEXT PCN: 292.00.00.00 -- Page is valid, no graphics X42481 291.00.00.00 7X
TELENOR ASA
Notes to the unaudited interim consolidated financial statements — (Continued)
1 ACQUISITIONS AND DISPOSALS, CAPITAL EXPENDITURES AND INVESTMENTS FOR THENINE MONTHS ENDED SEPTEMBER 30, 2000
Telenor acquired the following significant subsidiaries or significant interest in associatedcompanies and joint ventures during the nine month period ended September 30, 2000:
Change in Purchase Excess AmortizationCompany Country interest % Business price value(**) period(**)
(Amounts in NOK million)
Comincom/Combellga ************ Russia 60.0 Fixed network 711 497 10 yearsTelenordia AB ******************* Sweden 16.7 Fixed network, internet 1,280 1,077(*) 10 yearsDiGi.com bhd******************** Malaysia 2.9 Mobile telecommunication 393 329(*) 15 yearsFellesdata AS ******************* Norway 100.0 Information Technology 2,530 2,298 20 yearsSonofon Holding A/S ************* Denmark 53.5 Mobile telecommunication 14,146 14,500(*) 16 yearsTotal Access Communication PCL** Thailand 29.5 Mobile telecommunication 4,681 3,781(*) 18 yearsUnited Communication
Industry PCL ****************** Thailand 24.9 Mobile telecommunication 1,689 1,195(*) 18 yearsCanal Digital Norge AS *********** Norway 16.0 TV distribution 170 172(*) 10 yearsBDC AS ************************ Norway 100.0 Information Technology 76 62 10 yearsXTML Ltd *********************** UK 80.9 Internet 234 338 5 yearsAlfaNETT AS ******************** Norway 100.0 TV distribution 499 415 10 yearsEuroCom Holding Aps ************ Denmark 75.0 Information Technology 84 78 5 years
(*) Excess value of equity investments is included in the book value of associated companies andjoint ventures.
(**) Preliminary evaluations and allocations.
The pro forma effect of the acquisitions of Sonofon and XTML on the consolidated revenues, netincome and income per share is shown in note 14.
Nine monthsended
September 30,2000
(in NOKmillions)
Total investmentsFixed networks ************************************************************** 1,738Mobile networks ************************************************************* 616Satellite networks ************************************************************ 185Properties ****************************************************************** 1,383Support Systems (office and computer equipment, software, cars, etc.) ************ 1,628Goodwill ******************************************************************** 3,804Other intangible assets ******************************************************* 948Liabilities and current assets from acquired business **************************** (417)Work in progress ************************************************************ 1,122Shares and participations (other than subsidiaries) ****************************** 34,135
Total investments ************************************************************ 45,142
Significant Disposals
Telenor disposed of its ownership in Storm Communications Ltd in the beginning of the year. Again of NOK 309 million was recorded.
F-59
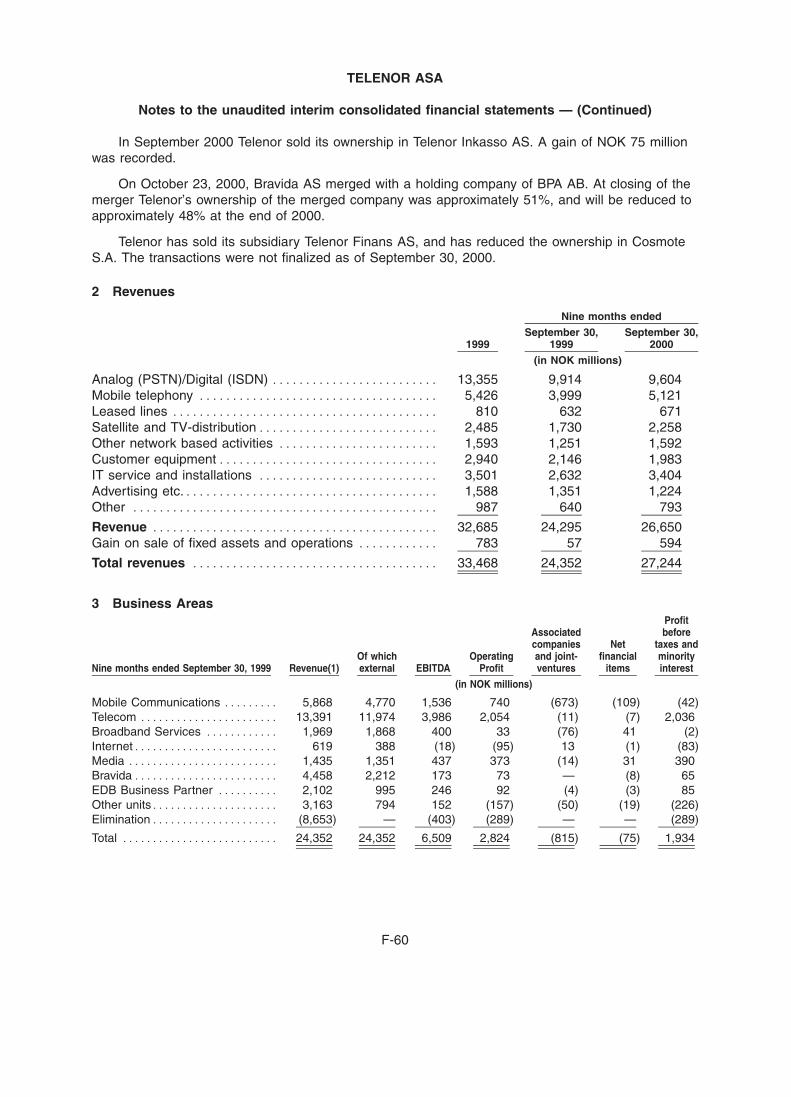
BOWNE OF LONDON 12/03/2000 13:38 BL/SM NO MARKS NEXT PCN: 293.00.00.00 -- Page is valid, no graphics X42481 292.00.00.00 8X
TELENOR ASA
Notes to the unaudited interim consolidated financial statements — (Continued)
In September 2000 Telenor sold its ownership in Telenor Inkasso AS. A gain of NOK 75 millionwas recorded.
On October 23, 2000, Bravida AS merged with a holding company of BPA AB. At closing of themerger Telenor’s ownership of the merged company was approximately 51%, and will be reduced toapproximately 48% at the end of 2000.
Telenor has sold its subsidiary Telenor Finans AS, and has reduced the ownership in CosmoteS.A. The transactions were not finalized as of September 30, 2000.
2 Revenues
Nine months ended
September 30, September 30,1999 1999 2000
(in NOK millions)
Analog (PSTN)/Digital (ISDN) ************************* 13,355 9,914 9,604Mobile telephony ************************************ 5,426 3,999 5,121Leased lines **************************************** 810 632 671Satellite and TV-distribution*************************** 2,485 1,730 2,258Other network based activities ************************ 1,593 1,251 1,592Customer equipment********************************* 2,940 2,146 1,983IT service and installations *************************** 3,501 2,632 3,404Advertising etc.************************************** 1,588 1,351 1,224Other ********************************************** 987 640 793
Revenue ******************************************* 32,685 24,295 26,650Gain on sale of fixed assets and operations ************ 783 57 594
Total revenues ************************************* 33,468 24,352 27,244
3 Business AreasProfit
Associated beforecompanies Net taxes and
Of which Operating and joint- financial minorityNine months ended September 30, 1999 Revenue(1) external EBITDA Profit ventures items interest
(in NOK millions)
Mobile Communications ********* 5,868 4,770 1,536 740 (673) (109) (42)Telecom *********************** 13,391 11,974 3,986 2,054 (11) (7) 2,036Broadband Services ************ 1,969 1,868 400 33 (76) 41 (2)Internet************************ 619 388 (18) (95) 13 (1) (83)Media ************************* 1,435 1,351 437 373 (14) 31 390Bravida************************ 4,458 2,212 173 73 — (8) 65EDB Business Partner ********** 2,102 995 246 92 (4) (3) 85Other units********************* 3,163 794 152 (157) (50) (19) (226)Elimination********************* (8,653) — (403) (289) — — (289)
Total ************************** 24,352 24,352 6,509 2,824 (815) (75) 1,934
F-60
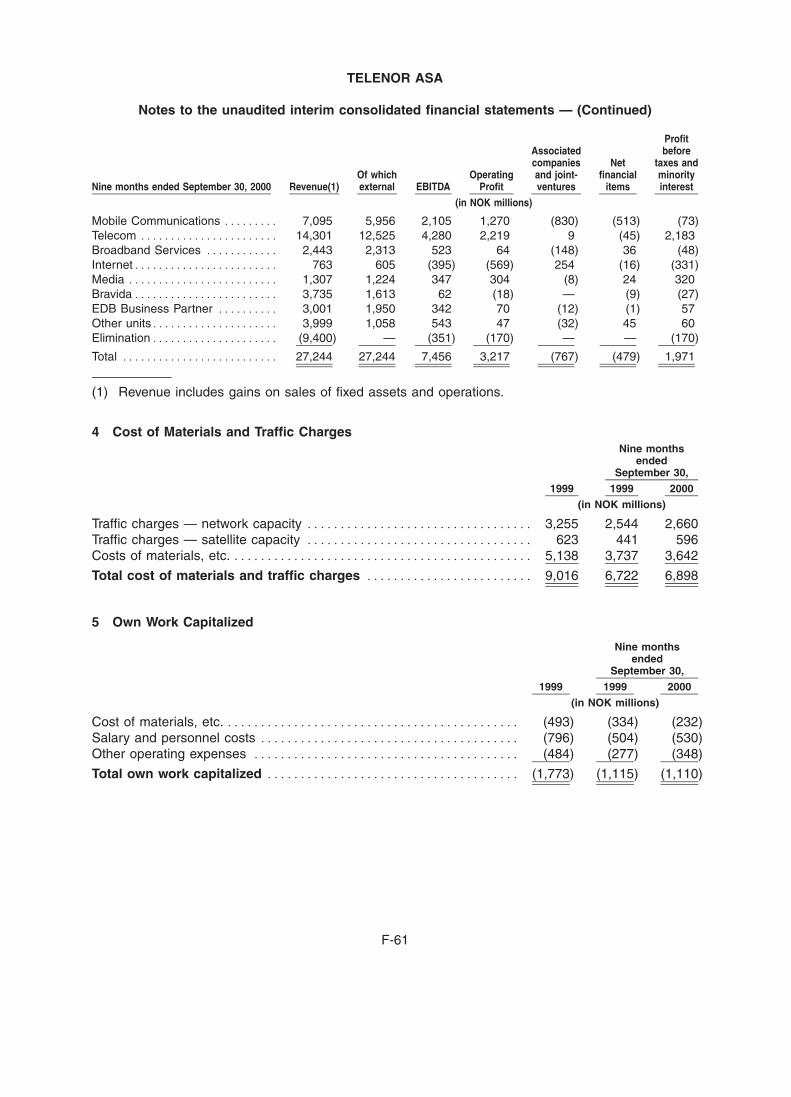
BOWNE OF LONDON 12/01/2000 19:56 BL/SM NO MARKS NEXT PCN: 294.00.00.00 -- Page is valid, no graphics X42481 293.00.00.00 7X
TELENOR ASA
Notes to the unaudited interim consolidated financial statements — (Continued)
ProfitAssociated beforecompanies Net taxes and
Of which Operating and joint- financial minorityNine months ended September 30, 2000 Revenue(1) external EBITDA Profit ventures items interest
(in NOK millions)
Mobile Communications ********* 7,095 5,956 2,105 1,270 (830) (513) (73)Telecom *********************** 14,301 12,525 4,280 2,219 9 (45) 2,183Broadband Services ************ 2,443 2,313 523 64 (148) 36 (48)Internet************************ 763 605 (395) (569) 254 (16) (331)Media ************************* 1,307 1,224 347 304 (8) 24 320Bravida************************ 3,735 1,613 62 (18) — (9) (27)EDB Business Partner ********** 3,001 1,950 342 70 (12) (1) 57Other units********************* 3,999 1,058 543 47 (32) 45 60Elimination********************* (9,400) — (351) (170) — — (170)
Total ************************** 27,244 27,244 7,456 3,217 (767) (479) 1,971
(1) Revenue includes gains on sales of fixed assets and operations.
4 Cost of Materials and Traffic ChargesNine months
endedSeptember 30,
1999 1999 2000
(in NOK millions)
Traffic charges — network capacity ********************************** 3,255 2,544 2,660Traffic charges — satellite capacity ********************************** 623 441 596Costs of materials, etc. ********************************************* 5,138 3,737 3,642
Total cost of materials and traffic charges ************************* 9,016 6,722 6,898
5 Own Work Capitalized
Nine monthsended
September 30,
1999 1999 2000
(in NOK millions)
Cost of materials, etc. ******************************************** (493) (334) (232)Salary and personnel costs *************************************** (796) (504) (530)Other operating expenses **************************************** (484) (277) (348)
Total own work capitalized ************************************** (1,773) (1,115) (1,110)
F-61
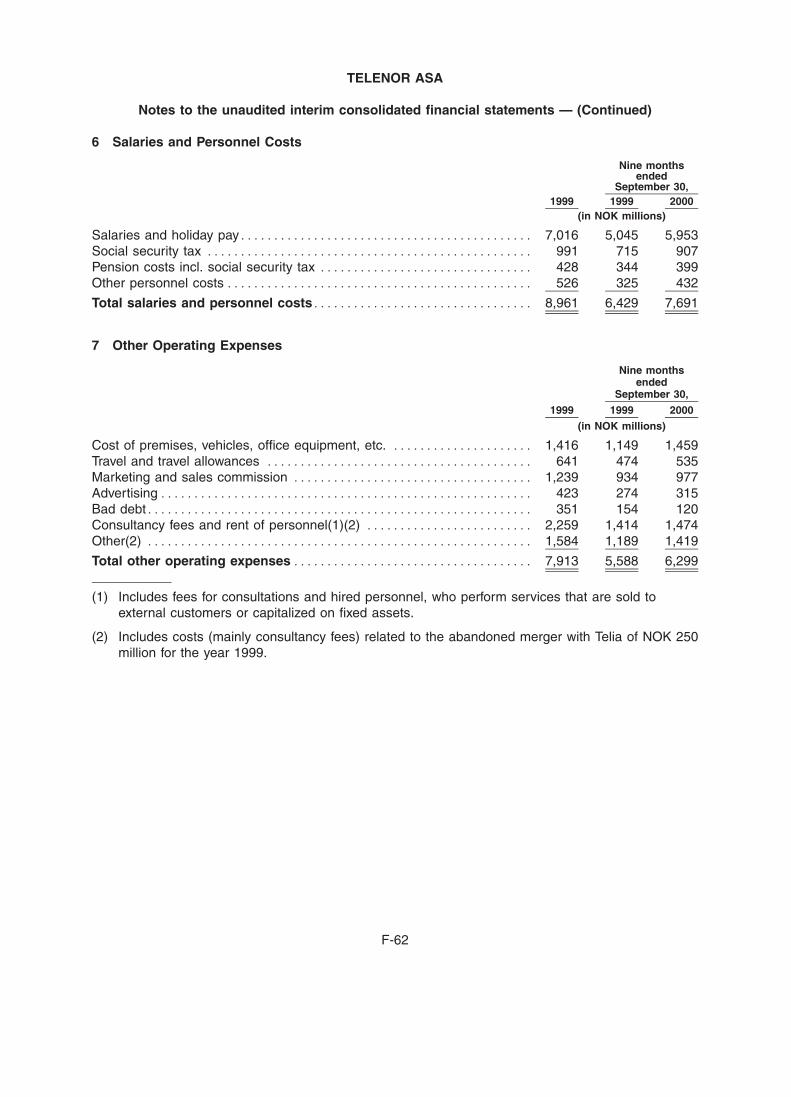
BOWNE OF LONDON 12/01/2000 19:56 BL/SM NO MARKS NEXT PCN: 295.00.00.00 -- Page is valid, no graphics X42481 294.00.00.00 7X
TELENOR ASA
Notes to the unaudited interim consolidated financial statements — (Continued)
6 Salaries and Personnel Costs
Nine monthsended
September 30,1999 1999 2000
(in NOK millions)
Salaries and holiday pay******************************************** 7,016 5,045 5,953Social security tax ************************************************* 991 715 907Pension costs incl. social security tax ******************************** 428 344 399Other personnel costs ********************************************** 526 325 432
Total salaries and personnel costs********************************* 8,961 6,429 7,691
7 Other Operating Expenses
Nine monthsended
September 30,
1999 1999 2000
(in NOK millions)
Cost of premises, vehicles, office equipment, etc. ********************* 1,416 1,149 1,459Travel and travel allowances **************************************** 641 474 535Marketing and sales commission ************************************ 1,239 934 977Advertising******************************************************** 423 274 315Bad debt********************************************************** 351 154 120Consultancy fees and rent of personnel(1)(2) ************************* 2,259 1,414 1,474Other(2) ********************************************************** 1,584 1,189 1,419
Total other operating expenses************************************ 7,913 5,588 6,299
(1) Includes fees for consultations and hired personnel, who perform services that are sold toexternal customers or capitalized on fixed assets.
(2) Includes costs (mainly consultancy fees) related to the abandoned merger with Telia of NOK 250million for the year 1999.
F-62
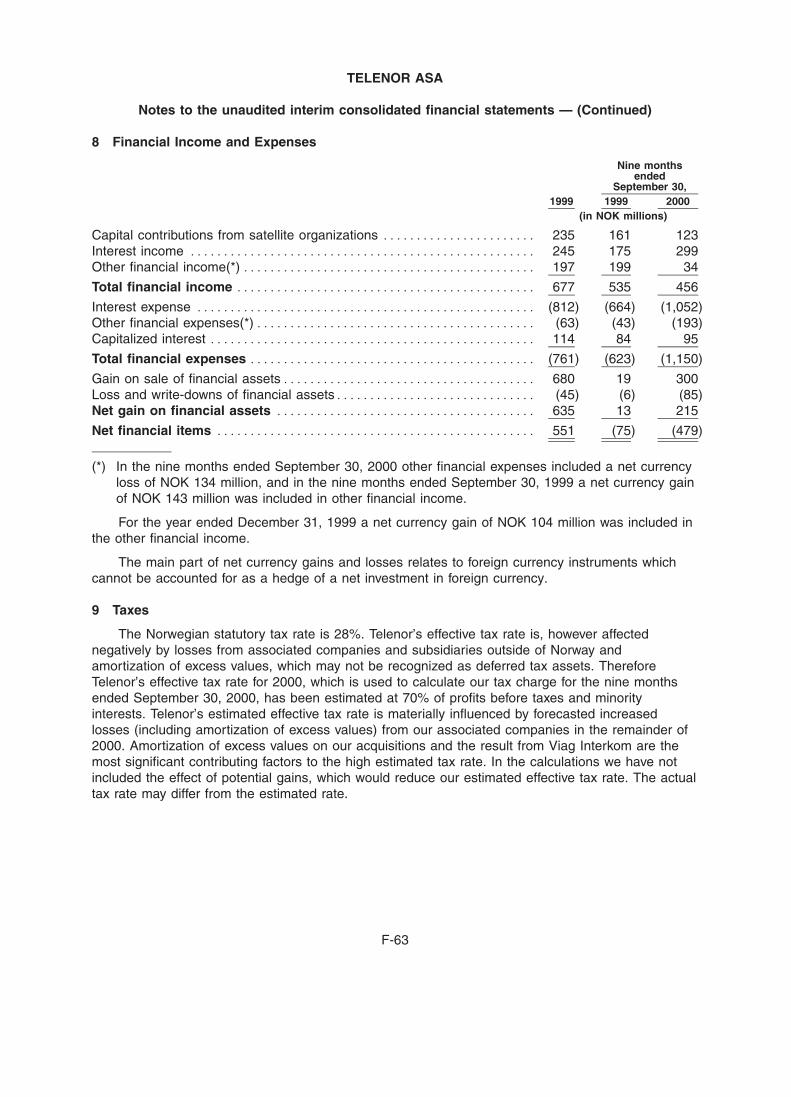
BOWNE OF LONDON 12/01/2000 19:56 BL/SM NO MARKS NEXT PCN: 296.00.00.00 -- Page is valid, no graphics X42481 295.00.00.00 7X
TELENOR ASA
Notes to the unaudited interim consolidated financial statements — (Continued)
8 Financial Income and Expenses
Nine monthsended
September 30,1999 1999 2000
(in NOK millions)
Capital contributions from satellite organizations *********************** 235 161 123Interest income **************************************************** 245 175 299Other financial income(*) ******************************************** 197 199 34
Total financial income ********************************************* 677 535 456
Interest expense *************************************************** (812) (664) (1,052)Other financial expenses(*)****************************************** (63) (43) (193)Capitalized interest ************************************************* 114 84 95
Total financial expenses ******************************************* (761) (623) (1,150)
Gain on sale of financial assets************************************** 680 19 300Loss and write-downs of financial assets****************************** (45) (6) (85)Net gain on financial assets *************************************** 635 13 215
Net financial items ************************************************ 551 (75) (479)
(*) In the nine months ended September 30, 2000 other financial expenses included a net currencyloss of NOK 134 million, and in the nine months ended September 30, 1999 a net currency gainof NOK 143 million was included in other financial income.
For the year ended December 31, 1999 a net currency gain of NOK 104 million was included inthe other financial income.
The main part of net currency gains and losses relates to foreign currency instruments whichcannot be accounted for as a hedge of a net investment in foreign currency.
9 Taxes
The Norwegian statutory tax rate is 28%. Telenor’s effective tax rate is, however affectednegatively by losses from associated companies and subsidiaries outside of Norway andamortization of excess values, which may not be recognized as deferred tax assets. ThereforeTelenor’s effective tax rate for 2000, which is used to calculate our tax charge for the nine monthsended September 30, 2000, has been estimated at 70% of profits before taxes and minorityinterests. Telenor’s estimated effective tax rate is materially influenced by forecasted increasedlosses (including amortization of excess values) from our associated companies in the remainder of2000. Amortization of excess values on our acquisitions and the result from Viag Interkom are themost significant contributing factors to the high estimated tax rate. In the calculations we have notincluded the effect of potential gains, which would reduce our estimated effective tax rate. The actualtax rate may differ from the estimated rate.
F-63
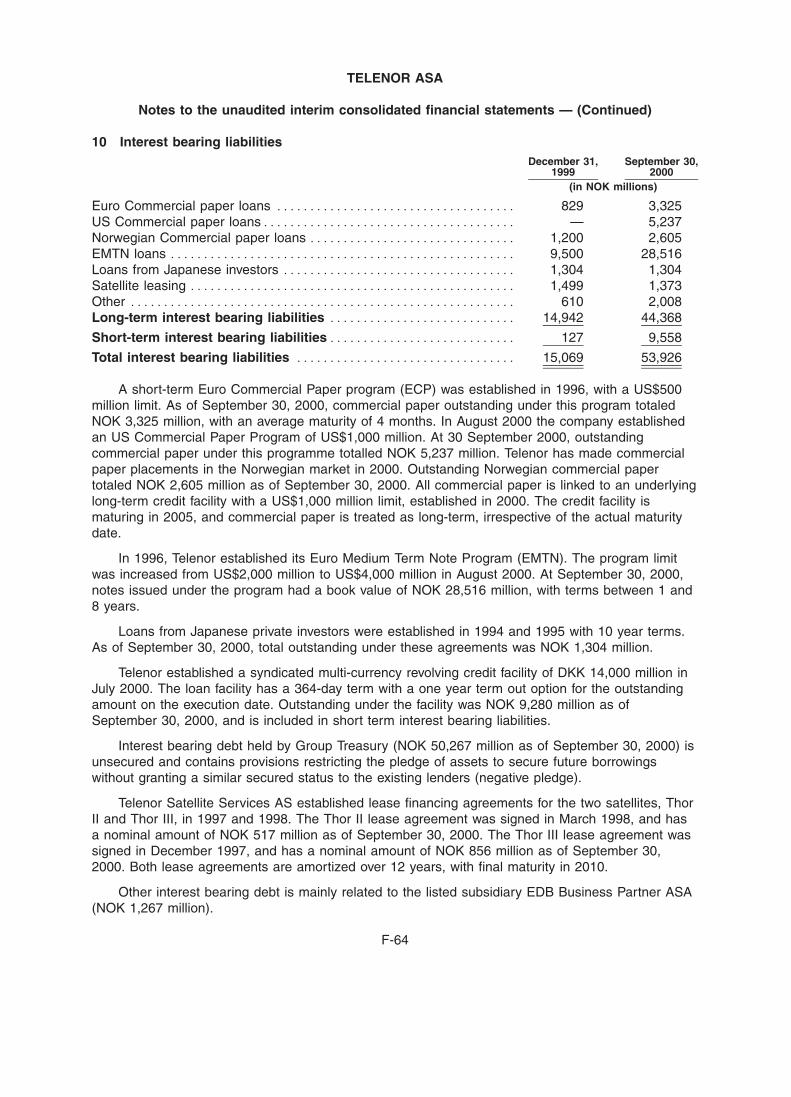
BOWNE OF LONDON 12/01/2000 19:56 BL/SM NO MARKS NEXT PCN: 297.00.00.00 -- Page is valid, no graphics X42481 296.00.00.00 8X
TELENOR ASA
Notes to the unaudited interim consolidated financial statements — (Continued)
10 Interest bearing liabilitiesDecember 31, September 30,
1999 2000(in NOK millions)
Euro Commercial paper loans ************************************ 829 3,325US Commercial paper loans************************************** — 5,237Norwegian Commercial paper loans ******************************* 1,200 2,605EMTN loans **************************************************** 9,500 28,516Loans from Japanese investors *********************************** 1,304 1,304Satellite leasing ************************************************* 1,499 1,373Other ********************************************************** 610 2,008Long-term interest bearing liabilities **************************** 14,942 44,368
Short-term interest bearing liabilities**************************** 127 9,558
Total interest bearing liabilities ********************************* 15,069 53,926
A short-term Euro Commercial Paper program (ECP) was established in 1996, with a US$500million limit. As of September 30, 2000, commercial paper outstanding under this program totaledNOK 3,325 million, with an average maturity of 4 months. In August 2000 the company establishedan US Commercial Paper Program of US$1,000 million. At 30 September 2000, outstandingcommercial paper under this programme totalled NOK 5,237 million. Telenor has made commercialpaper placements in the Norwegian market in 2000. Outstanding Norwegian commercial papertotaled NOK 2,605 million as of September 30, 2000. All commercial paper is linked to an underlyinglong-term credit facility with a US$1,000 million limit, established in 2000. The credit facility ismaturing in 2005, and commercial paper is treated as long-term, irrespective of the actual maturitydate.
In 1996, Telenor established its Euro Medium Term Note Program (EMTN). The program limitwas increased from US$2,000 million to US$4,000 million in August 2000. At September 30, 2000,notes issued under the program had a book value of NOK 28,516 million, with terms between 1 and8 years.
Loans from Japanese private investors were established in 1994 and 1995 with 10 year terms.As of September 30, 2000, total outstanding under these agreements was NOK 1,304 million.
Telenor established a syndicated multi-currency revolving credit facility of DKK 14,000 million inJuly 2000. The loan facility has a 364-day term with a one year term out option for the outstandingamount on the execution date. Outstanding under the facility was NOK 9,280 million as ofSeptember 30, 2000, and is included in short term interest bearing liabilities.
Interest bearing debt held by Group Treasury (NOK 50,267 million as of September 30, 2000) isunsecured and contains provisions restricting the pledge of assets to secure future borrowingswithout granting a similar secured status to the existing lenders (negative pledge).
Telenor Satellite Services AS established lease financing agreements for the two satellites, ThorII and Thor III, in 1997 and 1998. The Thor II lease agreement was signed in March 1998, and hasa nominal amount of NOK 517 million as of September 30, 2000. The Thor III lease agreement wassigned in December 1997, and has a nominal amount of NOK 856 million as of September 30,2000. Both lease agreements are amortized over 12 years, with final maturity in 2010.
Other interest bearing debt is mainly related to the listed subsidiary EDB Business Partner ASA(NOK 1,267 million).
F-64
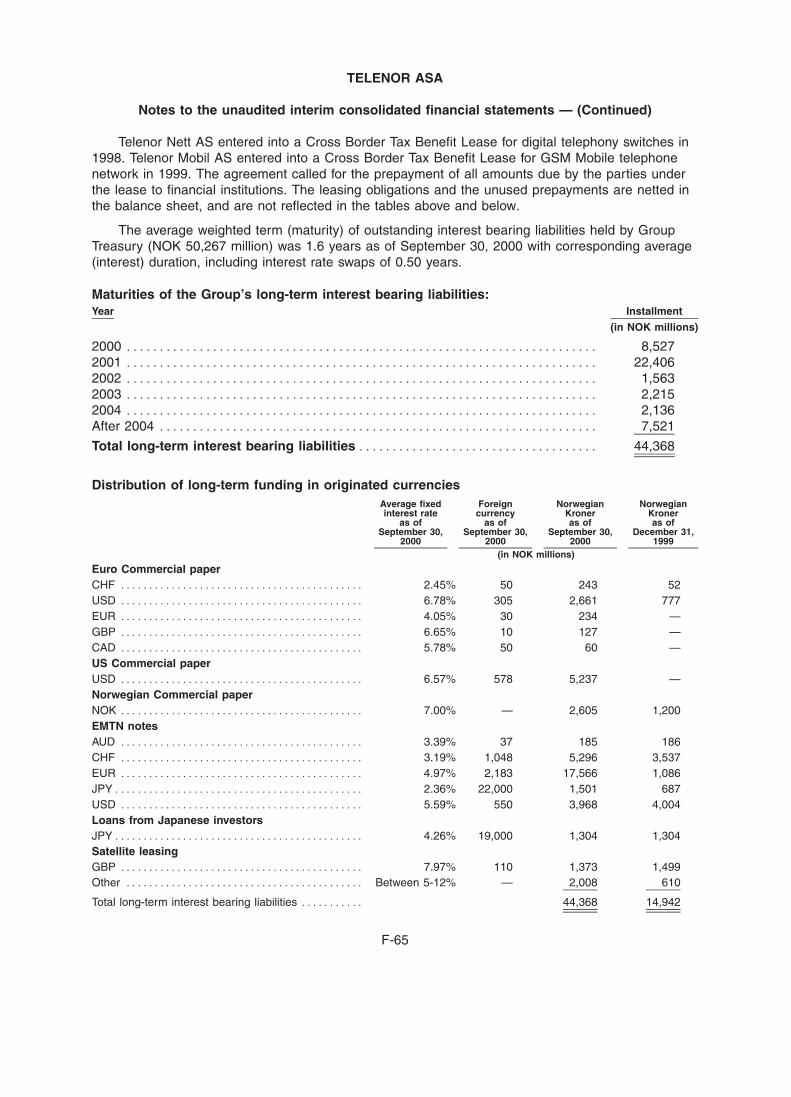
BOWNE OF LONDON 12/01/2000 19:56 BL/SM NO MARKS NEXT PCN: 298.00.00.00 -- Page is valid, no graphics X42481 297.00.00.00 10X
TELENOR ASA
Notes to the unaudited interim consolidated financial statements — (Continued)
Telenor Nett AS entered into a Cross Border Tax Benefit Lease for digital telephony switches in1998. Telenor Mobil AS entered into a Cross Border Tax Benefit Lease for GSM Mobile telephonenetwork in 1999. The agreement called for the prepayment of all amounts due by the parties underthe lease to financial institutions. The leasing obligations and the unused prepayments are netted inthe balance sheet, and are not reflected in the tables above and below.
The average weighted term (maturity) of outstanding interest bearing liabilities held by GroupTreasury (NOK 50,267 million) was 1.6 years as of September 30, 2000 with corresponding average(interest) duration, including interest rate swaps of 0.50 years.
Maturities of the Group’s long-term interest bearing liabilities:Year Installment
(in NOK millions)
2000 *********************************************************************** 8,5272001 *********************************************************************** 22,4062002 *********************************************************************** 1,5632003 *********************************************************************** 2,2152004 *********************************************************************** 2,136After 2004 ****************************************************************** 7,521
Total long-term interest bearing liabilities ************************************ 44,368
Distribution of long-term funding in originated currenciesAverage fixed Foreign Norwegian Norwegianinterest rate currency Kroner Kroner
as of as of as of as ofSeptember 30, September 30, September 30, December 31,
2000 2000 2000 1999(in NOK millions)
Euro Commercial paperCHF ******************************************* 2.45% 50 243 52USD ******************************************* 6.78% 305 2,661 777EUR ******************************************* 4.05% 30 234 —GBP ******************************************* 6.65% 10 127 —CAD ******************************************* 5.78% 50 60 —US Commercial paperUSD ******************************************* 6.57% 578 5,237 —Norwegian Commercial paperNOK ******************************************* 7.00% — 2,605 1,200EMTN notesAUD ******************************************* 3.39% 37 185 186CHF ******************************************* 3.19% 1,048 5,296 3,537EUR ******************************************* 4.97% 2,183 17,566 1,086JPY******************************************** 2.36% 22,000 1,501 687USD ******************************************* 5.59% 550 3,968 4,004Loans from Japanese investorsJPY******************************************** 4.26% 19,000 1,304 1,304Satellite leasingGBP ******************************************* 7.97% 110 1,373 1,499Other ****************************************** Between 5-12% — 2,008 610
Total long-term interest bearing liabilities *********** 44,368 14,942
F-65
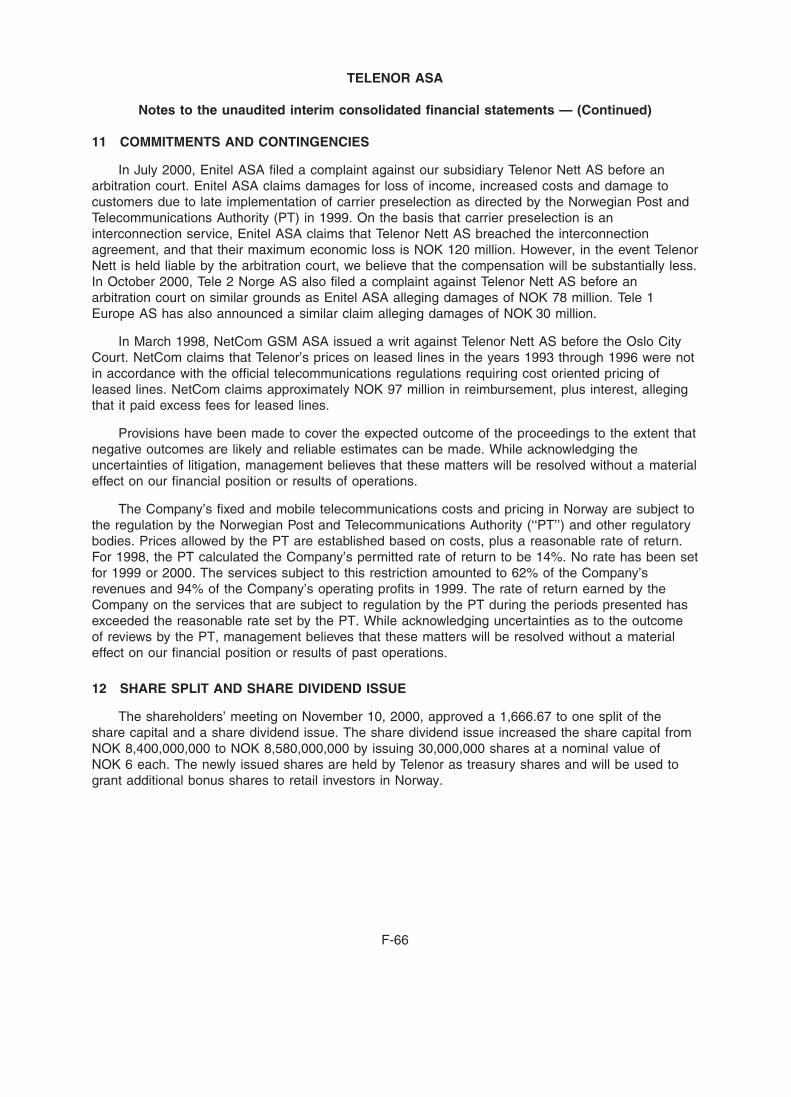
BOWNE OF LONDON 12/01/2000 19:56 BL/SM NO MARKS NEXT PCN: 299.00.00.00 -- Page is valid, no graphics X42481 298.00.00.00 9X
TELENOR ASA
Notes to the unaudited interim consolidated financial statements — (Continued)
11 COMMITMENTS AND CONTINGENCIES
In July 2000, Enitel ASA filed a complaint against our subsidiary Telenor Nett AS before anarbitration court. Enitel ASA claims damages for loss of income, increased costs and damage tocustomers due to late implementation of carrier preselection as directed by the Norwegian Post andTelecommunications Authority (PT) in 1999. On the basis that carrier preselection is aninterconnection service, Enitel ASA claims that Telenor Nett AS breached the interconnectionagreement, and that their maximum economic loss is NOK 120 million. However, in the event TelenorNett is held liable by the arbitration court, we believe that the compensation will be substantially less.In October 2000, Tele 2 Norge AS also filed a complaint against Telenor Nett AS before anarbitration court on similar grounds as Enitel ASA alleging damages of NOK 78 million. Tele 1Europe AS has also announced a similar claim alleging damages of NOK 30 million.
In March 1998, NetCom GSM ASA issued a writ against Telenor Nett AS before the Oslo CityCourt. NetCom claims that Telenor’s prices on leased lines in the years 1993 through 1996 were notin accordance with the official telecommunications regulations requiring cost oriented pricing ofleased lines. NetCom claims approximately NOK 97 million in reimbursement, plus interest, allegingthat it paid excess fees for leased lines.
Provisions have been made to cover the expected outcome of the proceedings to the extent thatnegative outcomes are likely and reliable estimates can be made. While acknowledging theuncertainties of litigation, management believes that these matters will be resolved without a materialeffect on our financial position or results of operations.
The Company’s fixed and mobile telecommunications costs and pricing in Norway are subject tothe regulation by the Norwegian Post and Telecommunications Authority (‘‘PT’’) and other regulatorybodies. Prices allowed by the PT are established based on costs, plus a reasonable rate of return.For 1998, the PT calculated the Company’s permitted rate of return to be 14%. No rate has been setfor 1999 or 2000. The services subject to this restriction amounted to 62% of the Company’srevenues and 94% of the Company’s operating profits in 1999. The rate of return earned by theCompany on the services that are subject to regulation by the PT during the periods presented hasexceeded the reasonable rate set by the PT. While acknowledging uncertainties as to the outcomeof reviews by the PT, management believes that these matters will be resolved without a materialeffect on our financial position or results of past operations.
12 SHARE SPLIT AND SHARE DIVIDEND ISSUE
The shareholders’ meeting on November 10, 2000, approved a 1,666.67 to one split of theshare capital and a share dividend issue. The share dividend issue increased the share capital fromNOK 8,400,000,000 to NOK 8,580,000,000 by issuing 30,000,000 shares at a nominal value ofNOK 6 each. The newly issued shares are held by Telenor as treasury shares and will be used togrant additional bonus shares to retail investors in Norway.
F-66
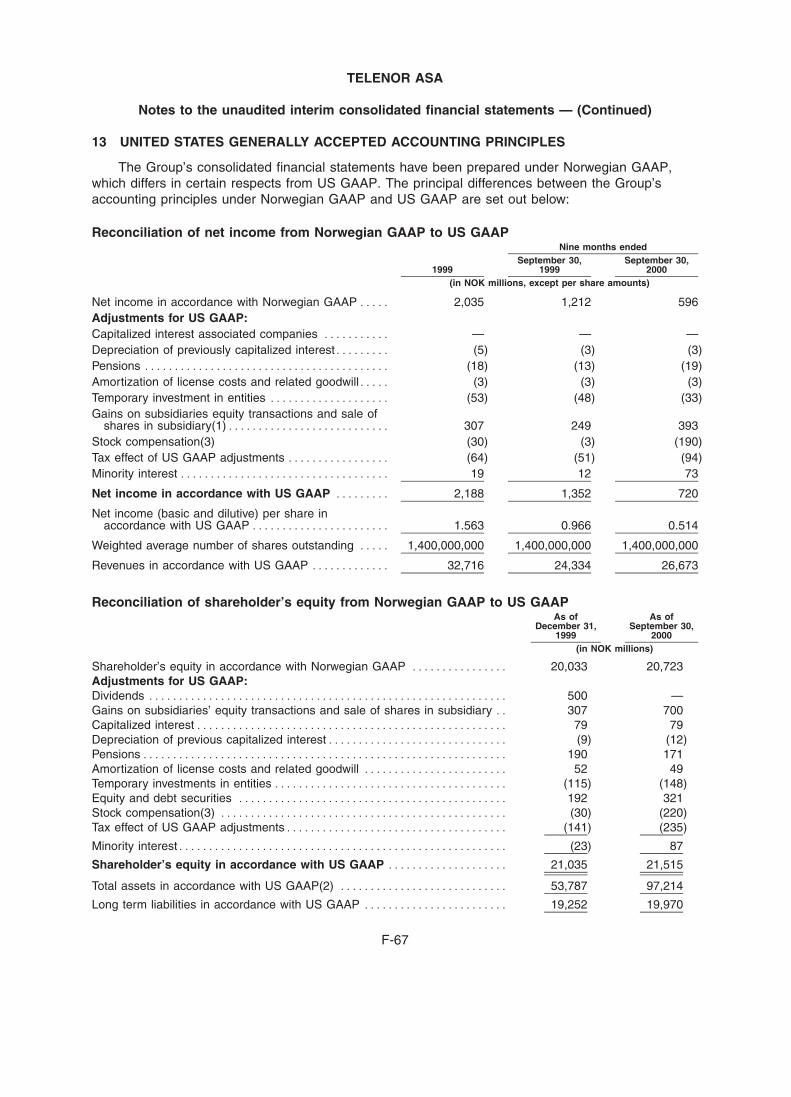
BOWNE OF LONDON 12/01/2000 19:56 BL/SM NO MARKS NEXT PCN: 300.00.00.00 -- Page is valid, no graphics X42481 299.00.00.00 8X
TELENOR ASA
Notes to the unaudited interim consolidated financial statements — (Continued)
13 UNITED STATES GENERALLY ACCEPTED ACCOUNTING PRINCIPLES
The Group’s consolidated financial statements have been prepared under Norwegian GAAP,which differs in certain respects from US GAAP. The principal differences between the Group’saccounting principles under Norwegian GAAP and US GAAP are set out below:
Reconciliation of net income from Norwegian GAAP to US GAAPNine months ended
September 30, September 30,1999 1999 2000
(in NOK millions, except per share amounts)
Net income in accordance with Norwegian GAAP ***** 2,035 1,212 596Adjustments for US GAAP:Capitalized interest associated companies *********** — — —Depreciation of previously capitalized interest********* (5) (3) (3)Pensions ***************************************** (18) (13) (19)Amortization of license costs and related goodwill***** (3) (3) (3)Temporary investment in entities ******************** (53) (48) (33)Gains on subsidiaries equity transactions and sale of
shares in subsidiary(1)*************************** 307 249 393Stock compensation(3) (30) (3) (190)Tax effect of US GAAP adjustments ***************** (64) (51) (94)Minority interest *********************************** 19 12 73
Net income in accordance with US GAAP ********* 2,188 1,352 720
Net income (basic and dilutive) per share inaccordance with US GAAP *********************** 1.563 0.966 0.514
Weighted average number of shares outstanding ***** 1,400,000,000 1,400,000,000 1,400,000,000
Revenues in accordance with US GAAP ************* 32,716 24,334 26,673
Reconciliation of shareholder’s equity from Norwegian GAAP to US GAAPAs of As of
December 31, September 30,1999 2000
(in NOK millions)
Shareholder’s equity in accordance with Norwegian GAAP **************** 20,033 20,723Adjustments for US GAAP:Dividends ************************************************************ 500 —Gains on subsidiaries’ equity transactions and sale of shares in subsidiary ** 307 700Capitalized interest**************************************************** 79 79Depreciation of previous capitalized interest****************************** (9) (12)Pensions************************************************************* 190 171Amortization of license costs and related goodwill ************************ 52 49Temporary investments in entities *************************************** (115) (148)Equity and debt securities ********************************************* 192 321Stock compensation(3) ************************************************ (30) (220)Tax effect of US GAAP adjustments************************************* (141) (235)
Minority interest******************************************************* (23) 87
Shareholder’s equity in accordance with US GAAP ******************** 21,035 21,515
Total assets in accordance with US GAAP(2) **************************** 53,787 97,214
Long term liabilities in accordance with US GAAP ************************ 19,252 19,970
F-67
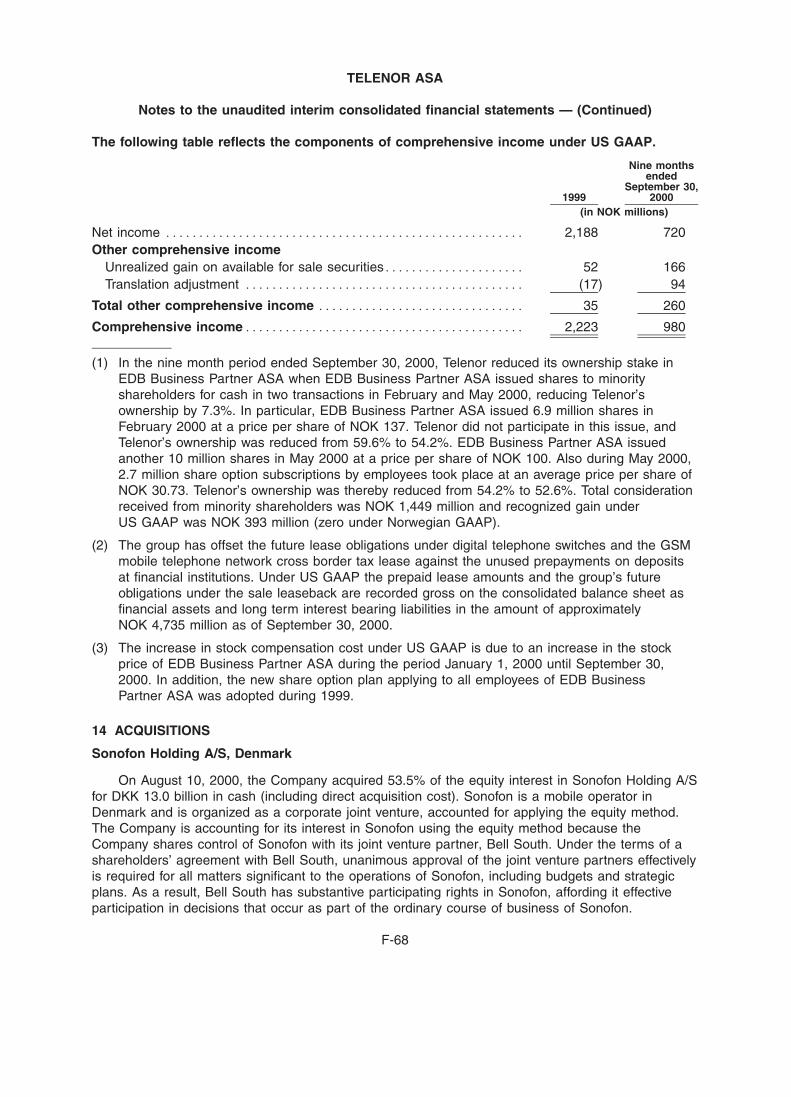
BOWNE OF LONDON 12/01/2000 19:56 BL/SM NO MARKS NEXT PCN: 301.00.00.00 -- Page is valid, no graphics X42481 300.00.00.00 9X
TELENOR ASA
Notes to the unaudited interim consolidated financial statements — (Continued)
The following table reflects the components of comprehensive income under US GAAP.
Nine monthsended
September 30,1999 2000
(in NOK millions)
Net income ****************************************************** 2,188 720Other comprehensive income
Unrealized gain on available for sale securities********************* 52 166Translation adjustment ****************************************** (17) 94
Total other comprehensive income ******************************* 35 260
Comprehensive income****************************************** 2,223 980
(1) In the nine month period ended September 30, 2000, Telenor reduced its ownership stake inEDB Business Partner ASA when EDB Business Partner ASA issued shares to minorityshareholders for cash in two transactions in February and May 2000, reducing Telenor’sownership by 7.3%. In particular, EDB Business Partner ASA issued 6.9 million shares inFebruary 2000 at a price per share of NOK 137. Telenor did not participate in this issue, andTelenor’s ownership was reduced from 59.6% to 54.2%. EDB Business Partner ASA issuedanother 10 million shares in May 2000 at a price per share of NOK 100. Also during May 2000,2.7 million share option subscriptions by employees took place at an average price per share ofNOK 30.73. Telenor’s ownership was thereby reduced from 54.2% to 52.6%. Total considerationreceived from minority shareholders was NOK 1,449 million and recognized gain underUS GAAP was NOK 393 million (zero under Norwegian GAAP).
(2) The group has offset the future lease obligations under digital telephone switches and the GSMmobile telephone network cross border tax lease against the unused prepayments on depositsat financial institutions. Under US GAAP the prepaid lease amounts and the group’s futureobligations under the sale leaseback are recorded gross on the consolidated balance sheet asfinancial assets and long term interest bearing liabilities in the amount of approximatelyNOK 4,735 million as of September 30, 2000.
(3) The increase in stock compensation cost under US GAAP is due to an increase in the stockprice of EDB Business Partner ASA during the period January 1, 2000 until September 30,2000. In addition, the new share option plan applying to all employees of EDB BusinessPartner ASA was adopted during 1999.
14 ACQUISITIONS
Sonofon Holding A/S, Denmark
On August 10, 2000, the Company acquired 53.5% of the equity interest in Sonofon Holding A/Sfor DKK 13.0 billion in cash (including direct acquisition cost). Sonofon is a mobile operator inDenmark and is organized as a corporate joint venture, accounted for applying the equity method.The Company is accounting for its interest in Sonofon using the equity method because theCompany shares control of Sonofon with its joint venture partner, Bell South. Under the terms of ashareholders’ agreement with Bell South, unanimous approval of the joint venture partners effectivelyis required for all matters significant to the operations of Sonofon, including budgets and strategicplans. As a result, Bell South has substantive participating rights in Sonofon, affording it effectiveparticipation in decisions that occur as part of the ordinary course of business of Sonofon.
F-68
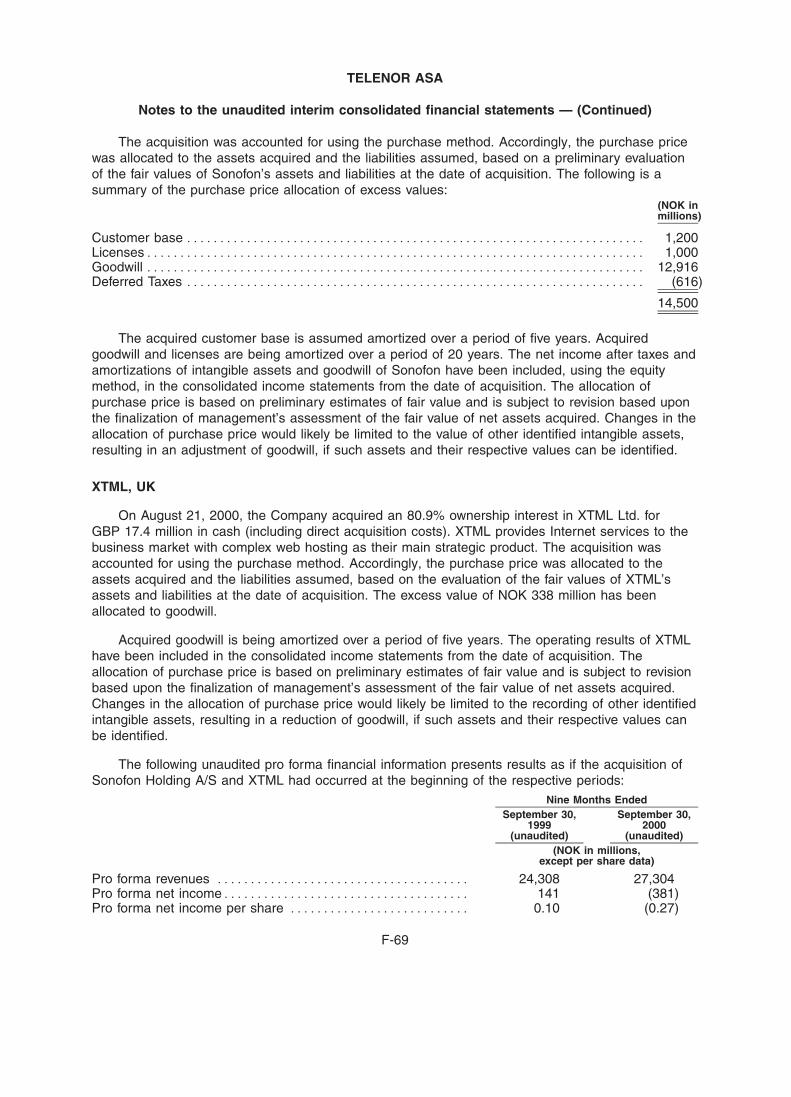
BOWNE OF LONDON 12/01/2000 19:56 BL/SM NO MARKS NEXT PCN: 302.00.00.00 -- Page is valid, no graphics X42481 301.00.00.00 8X
TELENOR ASA
Notes to the unaudited interim consolidated financial statements — (Continued)
The acquisition was accounted for using the purchase method. Accordingly, the purchase pricewas allocated to the assets acquired and the liabilities assumed, based on a preliminary evaluationof the fair values of Sonofon’s assets and liabilities at the date of acquisition. The following is asummary of the purchase price allocation of excess values:
(NOK inmillions)
Customer base ********************************************************************* 1,200Licenses*************************************************************************** 1,000Goodwill *************************************************************************** 12,916Deferred Taxes ********************************************************************* (616)
14,500
The acquired customer base is assumed amortized over a period of five years. Acquiredgoodwill and licenses are being amortized over a period of 20 years. The net income after taxes andamortizations of intangible assets and goodwill of Sonofon have been included, using the equitymethod, in the consolidated income statements from the date of acquisition. The allocation ofpurchase price is based on preliminary estimates of fair value and is subject to revision based uponthe finalization of management’s assessment of the fair value of net assets acquired. Changes in theallocation of purchase price would likely be limited to the value of other identified intangible assets,resulting in an adjustment of goodwill, if such assets and their respective values can be identified.
XTML, UK
On August 21, 2000, the Company acquired an 80.9% ownership interest in XTML Ltd. forGBP 17.4 million in cash (including direct acquisition costs). XTML provides Internet services to thebusiness market with complex web hosting as their main strategic product. The acquisition wasaccounted for using the purchase method. Accordingly, the purchase price was allocated to theassets acquired and the liabilities assumed, based on the evaluation of the fair values of XTML’sassets and liabilities at the date of acquisition. The excess value of NOK 338 million has beenallocated to goodwill.
Acquired goodwill is being amortized over a period of five years. The operating results of XTMLhave been included in the consolidated income statements from the date of acquisition. Theallocation of purchase price is based on preliminary estimates of fair value and is subject to revisionbased upon the finalization of management’s assessment of the fair value of net assets acquired.Changes in the allocation of purchase price would likely be limited to the recording of other identifiedintangible assets, resulting in a reduction of goodwill, if such assets and their respective values canbe identified.
The following unaudited pro forma financial information presents results as if the acquisition ofSonofon Holding A/S and XTML had occurred at the beginning of the respective periods:
Nine Months EndedSeptember 30, September 30,
1999 2000(unaudited) (unaudited)
(NOK in millions,except per share data)
Pro forma revenues ************************************** 24,308 27,304Pro forma net income************************************* 141 (381)Pro forma net income per share *************************** 0.10 (0.27)
F-69
BOWNE OF LONDON 12/03/2000 15:19 BL/SM NO MARKS NEXT PCN: 303.00.00.00 -- Page is valid, no graphics X42481 302.00.00.00 11X
TELENOR ASA
Notes to the unaudited interim consolidated financial statements — (Continued)
The proforma net loss for the period ending September 30, 2000 is mainly due to interest andamortization of excess value relating to the acquisition of Sonofon Holding A/S. These pro formaresults have been prepared for comparative purposes only and include certain adjustments such asadditional amortization expense as a result of excess value arising from the purchases and interestexpense on acquisition debt. The pro forma results are not necessarily indicative of the results ofoperations which actually would have resulted had the purchase been in effect at the beginning ofthe respective periods or of future results.
15 SUBSEQUENT EVENT
Telenor expects to recognize compensation expense for the value of the price discounts andbonus shares provided to employees purchasing shares in the global offering that is in excess of thediscounts and bonus shares available generally to retail investors in Norway. Telenor estimates thatthe amount of this expense will be approximately NOK 12.6 million, most of which will be recognizedin the fourth quarter of 2000.
F-70
BOWNE OF LONDON 12/01/2000 19:56 BL/SM NO MARKS NEXT PCN: 304.00.00.00 -- Page is valid, no graphics X42481 303.00.00.00 9X
UNAUDITED PRO FORMA CONSOLIDATED FINANCIAL INFORMATION
The unaudited pro forma financial information has been prepared by applying adjustmentsrelating to the acquisition of our 53.5% interest in Sonofon Holding A/S to our historical consolidatedstatements of profit and loss appearing elsewhere in this prospectus. The pro forma financialinformation is provided for illustrative purposes only. The pro forma financial information does notpurport to represent what our actual results of operations would have been had the acquisition of ourinterest in Sonofon occurred on the date assumed, nor is it necessarily indicative of our futureresults of operations.
The pro forma financial information should be read in conjunction with ‘‘Management’sDiscussion and Analysis of Financial Condition and Results of Operations’’, our consolidatedfinancial statements and the Sonofon consolidated financial statements appearing elsewhere in thisprospectus.
The pro forma financial information is presented in Norwegian GAAP. A reconciliation toU.S. GAAP of net income is also presented. The principal differences between Norwegian GAAPand U.S. GAAP are explained in note 29 to our annual consolidated financial statements and innote 13 to our interim consolidated financial statements.
The pro forma financial information gives effect to the acquisition of our 53.5% interest inSonofon for consideration of NOK 14.1 billion. Sonofon was included in our historical financialstatements as of August 10, 2000. Because we share control of Sonofon with a joint venture partner,Sonofon is accounted for as a joint venture under the equity method.
The pro forma statements of profit and loss for the year ended December 31, 1999 and for thenine months ended September 30, 2000 reflects the acquisition of our interest in Sonofon as if itoccurred on January 1, 1999. The purchase price has been allocated to the assets and liabilities ofSonofon in the pro forma information based on our preliminary estimates of the fair values of assetsand liabilities acquired. The actual allocation of the purchase price may differ from that reflected inthe pro forma financial statements.
The pro forma information does not give effect to the global offering.
F-71
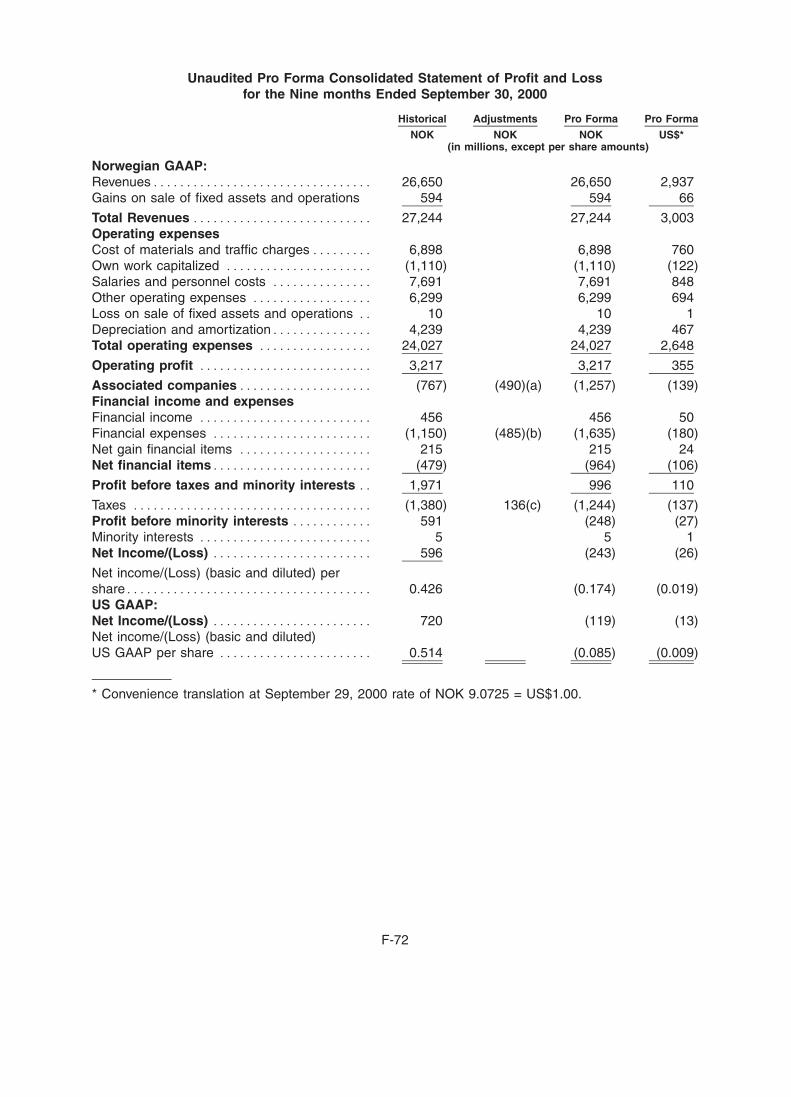
BOWNE OF LONDON 12/01/2000 19:56 BL/SM NO MARKS NEXT PCN: 305.00.00.00 -- Page is valid, no graphics X42481 304.00.00.00 8X
Unaudited Pro Forma Consolidated Statement of Profit and Lossfor the Nine months Ended September 30, 2000
Historical Adjustments Pro Forma Pro Forma
NOK NOK NOK US$*(in millions, except per share amounts)
Norwegian GAAP:Revenues********************************* 26,650 26,650 2,937Gains on sale of fixed assets and operations 594 594 66
Total Revenues *************************** 27,244 27,244 3,003Operating expensesCost of materials and traffic charges ********* 6,898 6,898 760Own work capitalized ********************** (1,110) (1,110) (122)Salaries and personnel costs *************** 7,691 7,691 848Other operating expenses ****************** 6,299 6,299 694Loss on sale of fixed assets and operations ** 10 10 1Depreciation and amortization*************** 4,239 4,239 467Total operating expenses ***************** 24,027 24,027 2,648
Operating profit ************************** 3,217 3,217 355
Associated companies******************** (767) (490)(a) (1,257) (139)Financial income and expensesFinancial income ************************** 456 456 50Financial expenses ************************ (1,150) (485)(b) (1,635) (180)Net gain financial items ******************** 215 215 24Net financial items************************ (479) (964) (106)
Profit before taxes and minority interests ** 1,971 996 110
Taxes ************************************ (1,380) 136(c) (1,244) (137)Profit before minority interests ************ 591 (248) (27)Minority interests ************************** 5 5 1Net Income/(Loss) ************************ 596 (243) (26)
Net income/(Loss) (basic and diluted) pershare************************************* 0.426 (0.174) (0.019)US GAAP:Net Income/(Loss) ************************ 720 (119) (13)Net income/(Loss) (basic and diluted)US GAAP per share *********************** 0.514 (0.085) (0.009)
* Convenience translation at September 29, 2000 rate of NOK 9.0725 = US$1.00.
F-72
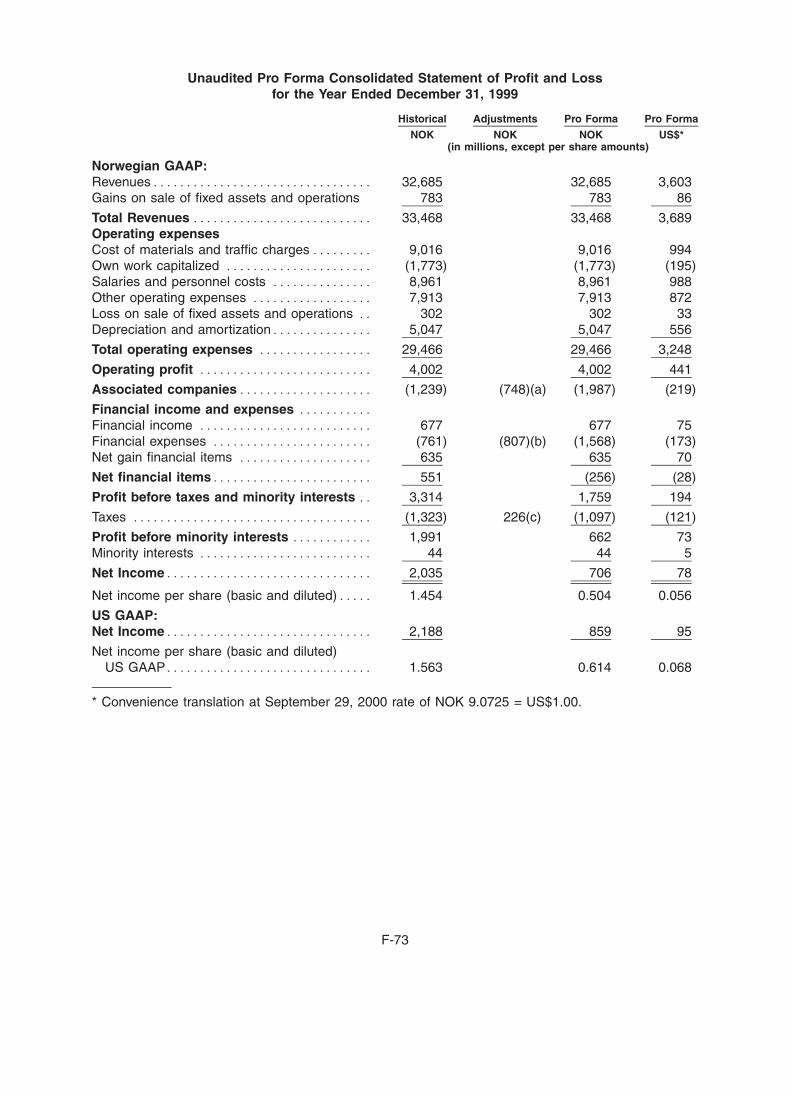
BOWNE OF LONDON 12/01/2000 19:56 BL/SM NO MARKS NEXT PCN: 306.00.00.00 -- Page is valid, no graphics X42481 305.00.00.00 10X
Unaudited Pro Forma Consolidated Statement of Profit and Lossfor the Year Ended December 31, 1999
Historical Adjustments Pro Forma Pro Forma
NOK NOK NOK US$*(in millions, except per share amounts)
Norwegian GAAP:Revenues********************************* 32,685 32,685 3,603Gains on sale of fixed assets and operations 783 783 86
Total Revenues *************************** 33,468 33,468 3,689Operating expensesCost of materials and traffic charges ********* 9,016 9,016 994Own work capitalized ********************** (1,773) (1,773) (195)Salaries and personnel costs *************** 8,961 8,961 988Other operating expenses ****************** 7,913 7,913 872Loss on sale of fixed assets and operations ** 302 302 33Depreciation and amortization*************** 5,047 5,047 556
Total operating expenses ***************** 29,466 29,466 3,248
Operating profit ************************** 4,002 4,002 441
Associated companies******************** (1,239) (748)(a) (1,987) (219)
Financial income and expenses ***********Financial income ************************** 677 677 75Financial expenses ************************ (761) (807)(b) (1,568) (173)Net gain financial items ******************** 635 635 70
Net financial items************************ 551 (256) (28)
Profit before taxes and minority interests ** 3,314 1,759 194
Taxes ************************************ (1,323) 226(c) (1,097) (121)
Profit before minority interests ************ 1,991 662 73Minority interests ************************** 44 44 5
Net Income******************************* 2,035 706 78
Net income per share (basic and diluted)***** 1.454 0.504 0.056
US GAAP:Net Income******************************* 2,188 859 95
Net income per share (basic and diluted)US GAAP******************************* 1.563 0.614 0.068
* Convenience translation at September 29, 2000 rate of NOK 9.0725 = US$1.00.
F-73
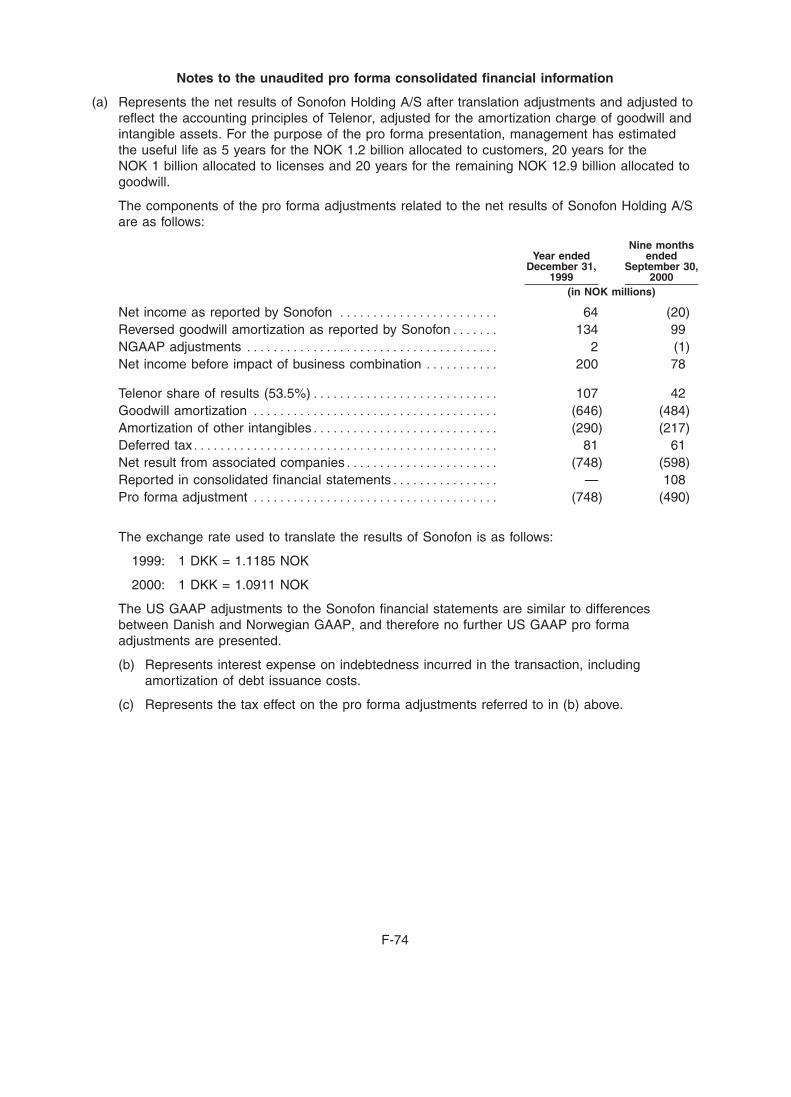
BOWNE OF LONDON 12/01/2000 19:56 BL/SM NO MARKS NEXT PCN: 307.00.00.00 -- Page is valid, no graphics X42481 306.00.00.00 8X
Notes to the unaudited pro forma consolidated financial information
(a) Represents the net results of Sonofon Holding A/S after translation adjustments and adjusted toreflect the accounting principles of Telenor, adjusted for the amortization charge of goodwill andintangible assets. For the purpose of the pro forma presentation, management has estimatedthe useful life as 5 years for the NOK 1.2 billion allocated to customers, 20 years for theNOK 1 billion allocated to licenses and 20 years for the remaining NOK 12.9 billion allocated togoodwill.
The components of the pro forma adjustments related to the net results of Sonofon Holding A/Sare as follows:
Nine monthsYear ended ended
December 31, September 30,1999 2000
(in NOK millions)
Net income as reported by Sonofon ************************ 64 (20)Reversed goodwill amortization as reported by Sonofon******* 134 99NGAAP adjustments ************************************** 2 (1)Net income before impact of business combination *********** 200 78
Telenor share of results (53.5%)**************************** 107 42Goodwill amortization ************************************* (646) (484)Amortization of other intangibles**************************** (290) (217)Deferred tax********************************************** 81 61Net result from associated companies*********************** (748) (598)Reported in consolidated financial statements**************** — 108Pro forma adjustment ************************************* (748) (490)
The exchange rate used to translate the results of Sonofon is as follows:
1999: 1 DKK = 1.1185 NOK
2000: 1 DKK = 1.0911 NOK
The US GAAP adjustments to the Sonofon financial statements are similar to differencesbetween Danish and Norwegian GAAP, and therefore no further US GAAP pro formaadjustments are presented.
(b) Represents interest expense on indebtedness incurred in the transaction, includingamortization of debt issuance costs.
(c) Represents the tax effect on the pro forma adjustments referred to in (b) above.
F-74
BOWNE OF LONDON 12/03/2000 10:02 BL/SM NO MARKS NEXT PCN: 308.00.00.00 -- Page is valid, no graphics X42481 307.00.00.00 9X
REPORT OF INDEPENDENT ACCOUNTANTS
As auditors to SONOFON Holding A/S we have audited the accompanying condensed consolidatedfinancial statements for the years 1998 and 1999, included on pages F-75 to F-91.
‘‘Auditor’s report
We have audited the consolidated financial statements of SONOFON Holding A/S for 1998 and1999 presented by the management.
Basis of opinion
We have planned and conducted our audit in accordance with generally accepted audit standards(‘‘GAAS’’) in Denmark, which are substantially the same as GAAS in the United States, to obtainreasonable assurance about whether the financial statements are free of material misstatements.Based on an evaluation of materiality and risk, our audit has included an examination of evidencesupporting the amounts and disclosures in the financial statements. We have assessed theaccounting policies applied and the estimates made by the management as well as evaluated theoverall financial statements presentation.
Our audit has not given rise to qualifications.
Opinion
In our opinion, the accompanying consolidated financial statements have been presented inaccordance with the accounting provisions of Danish legislation and give a true and fair view ofthe group’s assets and liabilities, financial position and result.’’
Interim financial statements for the period January 1 to September 30 2000, which are included onpages F-75 to F-91 are unaudited.
Copenhagen, November 9 2000
D E L O I T T E & T O U C H EStatsautoriseret Revisionsaktieselskab
Erik Holst Jørgensen Anni KlæbelState Authorized State AuthorizedPublic Accountant Public Accountant(Denmark) (Denmark)
F-75
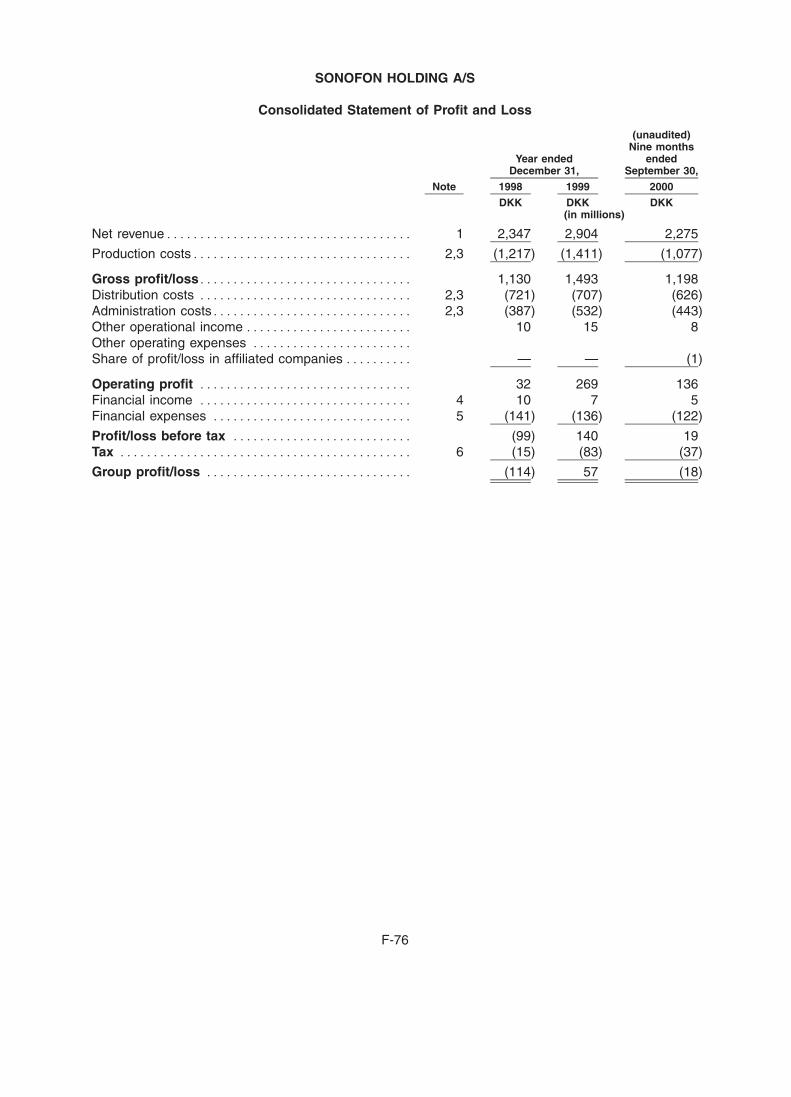
BOWNE OF LONDON 12/01/2000 19:56 BL/SM NO MARKS NEXT PCN: 309.00.00.00 -- Page is valid, no graphics X42481 308.00.00.00 8X
SONOFON HOLDING A/S
Consolidated Statement of Profit and Loss
(unaudited)Nine months
Year ended endedDecember 31, September 30,
Note 1998 1999 2000
DKK DKK DKK(in millions)
Net revenue************************************* 1 2,347 2,904 2,275
Production costs********************************* 2,3 (1,217) (1,411) (1,077)
Gross profit/loss******************************** 1,130 1,493 1,198Distribution costs ******************************** 2,3 (721) (707) (626)Administration costs****************************** 2,3 (387) (532) (443)Other operational income ************************* 10 15 8Other operating expenses ************************Share of profit/loss in affiliated companies ********** — — (1)
Operating profit ******************************** 32 269 136Financial income ******************************** 4 10 7 5Financial expenses ****************************** 5 (141) (136) (122)
Profit/loss before tax *************************** (99) 140 19Tax ******************************************** 6 (15) (83) (37)
Group profit/loss ******************************* (114) 57 (18)
F-76
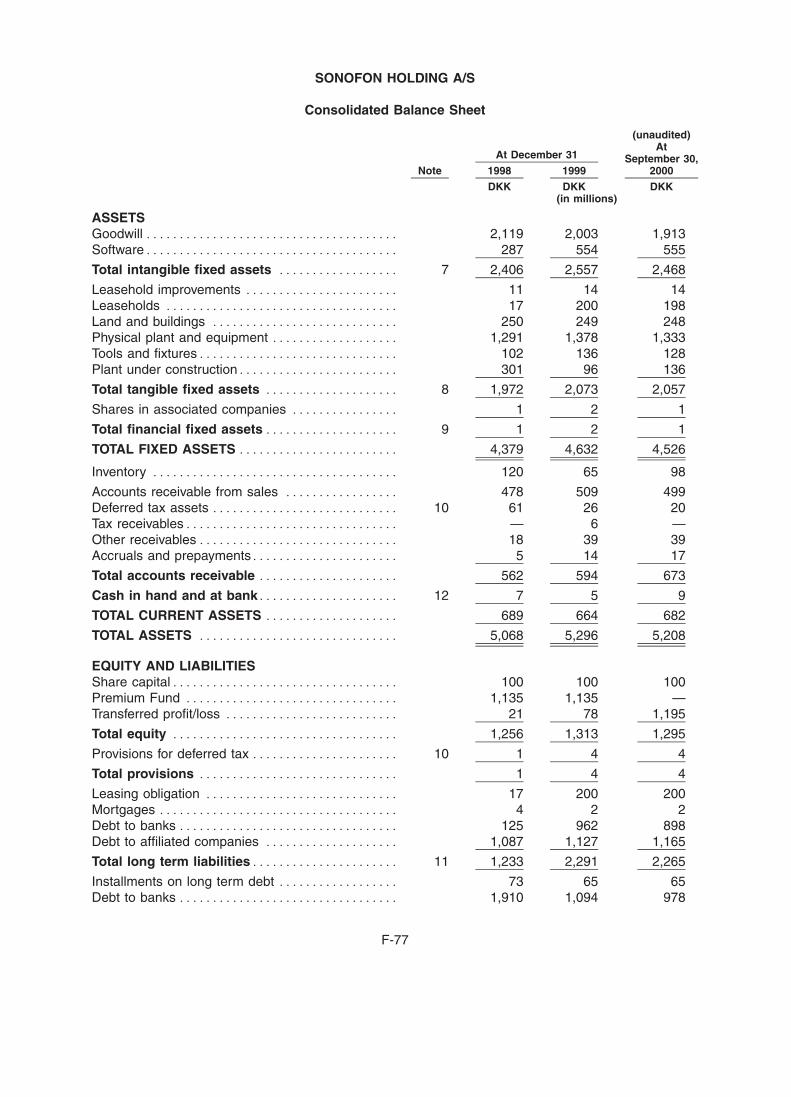
BOWNE OF LONDON 12/01/2000 19:56 BL/SM NO MARKS NEXT PCN: 310.00.00.00 -- Page is valid, no graphics X42481 309.00.00.00 8X
SONOFON HOLDING A/S
Consolidated Balance Sheet
(unaudited)At
At December 31 September 30,Note 1998 1999 2000
DKK DKK DKK(in millions)
ASSETSGoodwill ************************************** 2,119 2,003 1,913Software************************************** 287 554 555
Total intangible fixed assets ****************** 7 2,406 2,557 2,468
Leasehold improvements *********************** 11 14 14Leaseholds *********************************** 17 200 198Land and buildings **************************** 250 249 248Physical plant and equipment ******************* 1,291 1,378 1,333Tools and fixtures****************************** 102 136 128Plant under construction************************ 301 96 136
Total tangible fixed assets ******************** 8 1,972 2,073 2,057
Shares in associated companies **************** 1 2 1
Total financial fixed assets******************** 9 1 2 1
TOTAL FIXED ASSETS ************************ 4,379 4,632 4,526
Inventory ************************************* 120 65 98
Accounts receivable from sales ***************** 478 509 499Deferred tax assets **************************** 10 61 26 20Tax receivables******************************** — 6 —Other receivables****************************** 18 39 39Accruals and prepayments********************** 5 14 17
Total accounts receivable ********************* 562 594 673
Cash in hand and at bank********************* 12 7 5 9
TOTAL CURRENT ASSETS ******************** 689 664 682
TOTAL ASSETS ****************************** 5,068 5,296 5,208
EQUITY AND LIABILITIESShare capital********************************** 100 100 100Premium Fund ******************************** 1,135 1,135 —Transferred profit/loss ************************** 21 78 1,195
Total equity ********************************** 1,256 1,313 1,295
Provisions for deferred tax ********************** 10 1 4 4
Total provisions ****************************** 1 4 4
Leasing obligation ***************************** 17 200 200Mortgages ************************************ 4 2 2Debt to banks ********************************* 125 962 898Debt to affiliated companies ******************** 1,087 1,127 1,165
Total long term liabilities********************** 11 1,233 2,291 2,265
Installments on long term debt ****************** 73 65 65Debt to banks ********************************* 1,910 1,094 978
F-77
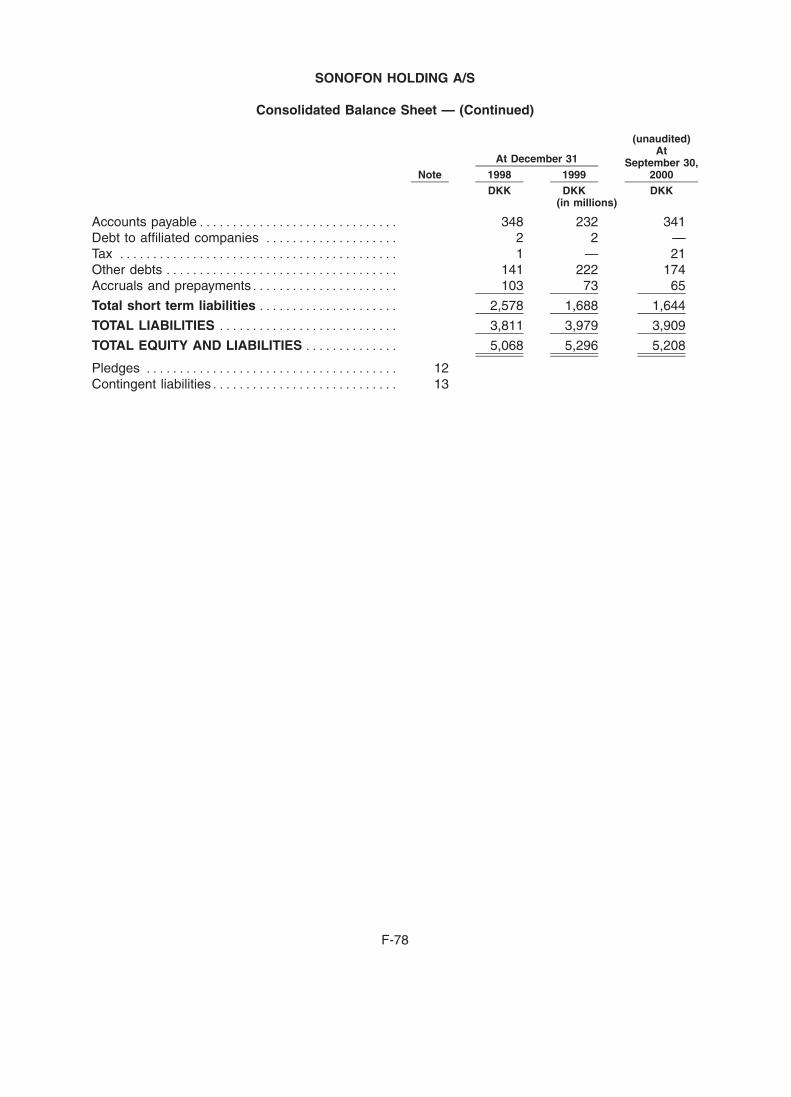
BOWNE OF LONDON 12/01/2000 19:56 BL/SM NO MARKS NEXT PCN: 311.00.00.00 -- Page is valid, no graphics X42481 310.00.00.00 8X
SONOFON HOLDING A/S
Consolidated Balance Sheet — (Continued)
(unaudited)At
At December 31 September 30,Note 1998 1999 2000
DKK DKK DKK(in millions)
Accounts payable****************************** 348 232 341Debt to affiliated companies ******************** 2 2 —Tax ****************************************** 1 — 21Other debts *********************************** 141 222 174Accruals and prepayments********************** 103 73 65
Total short term liabilities ********************* 2,578 1,688 1,644
TOTAL LIABILITIES *************************** 3,811 3,979 3,909
TOTAL EQUITY AND LIABILITIES ************** 5,068 5,296 5,208
Pledges ************************************** 12Contingent liabilities**************************** 13
F-78
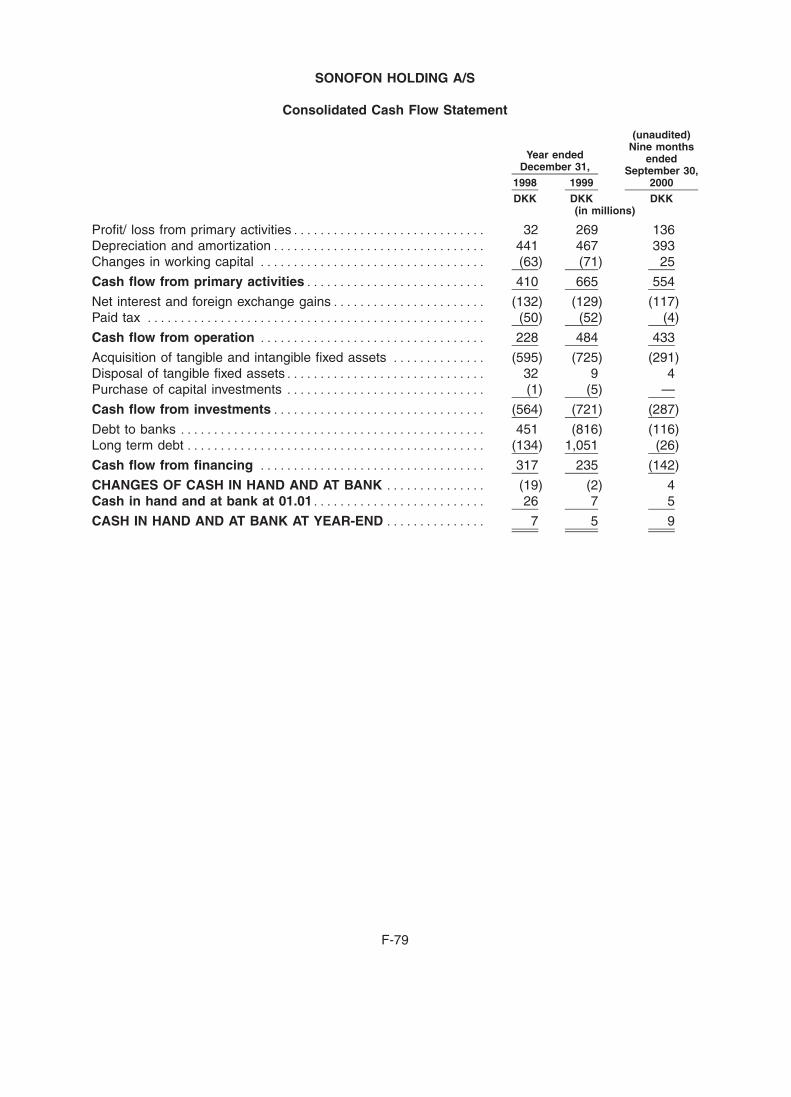
BOWNE OF LONDON 12/01/2000 19:56 BL/SM NO MARKS NEXT PCN: 312.00.00.00 -- Page is valid, no graphics X42481 311.00.00.00 8X
SONOFON HOLDING A/S
Consolidated Cash Flow Statement
(unaudited)Nine months
Year ended endedDecember 31, September 30,
1998 1999 2000
DKK DKK DKK(in millions)
Profit/ loss from primary activities***************************** 32 269 136Depreciation and amortization******************************** 441 467 393Changes in working capital ********************************** (63) (71) 25
Cash flow from primary activities*************************** 410 665 554
Net interest and foreign exchange gains*********************** (132) (129) (117)Paid tax *************************************************** (50) (52) (4)
Cash flow from operation ********************************** 228 484 433
Acquisition of tangible and intangible fixed assets ************** (595) (725) (291)Disposal of tangible fixed assets****************************** 32 9 4Purchase of capital investments ****************************** (1) (5) —
Cash flow from investments******************************** (564) (721) (287)
Debt to banks ********************************************** 451 (816) (116)Long term debt ********************************************* (134) 1,051 (26)
Cash flow from financing ********************************** 317 235 (142)
CHANGES OF CASH IN HAND AND AT BANK *************** (19) (2) 4Cash in hand and at bank at 01.01************************** 26 7 5
CASH IN HAND AND AT BANK AT YEAR-END *************** 7 5 9
F-79
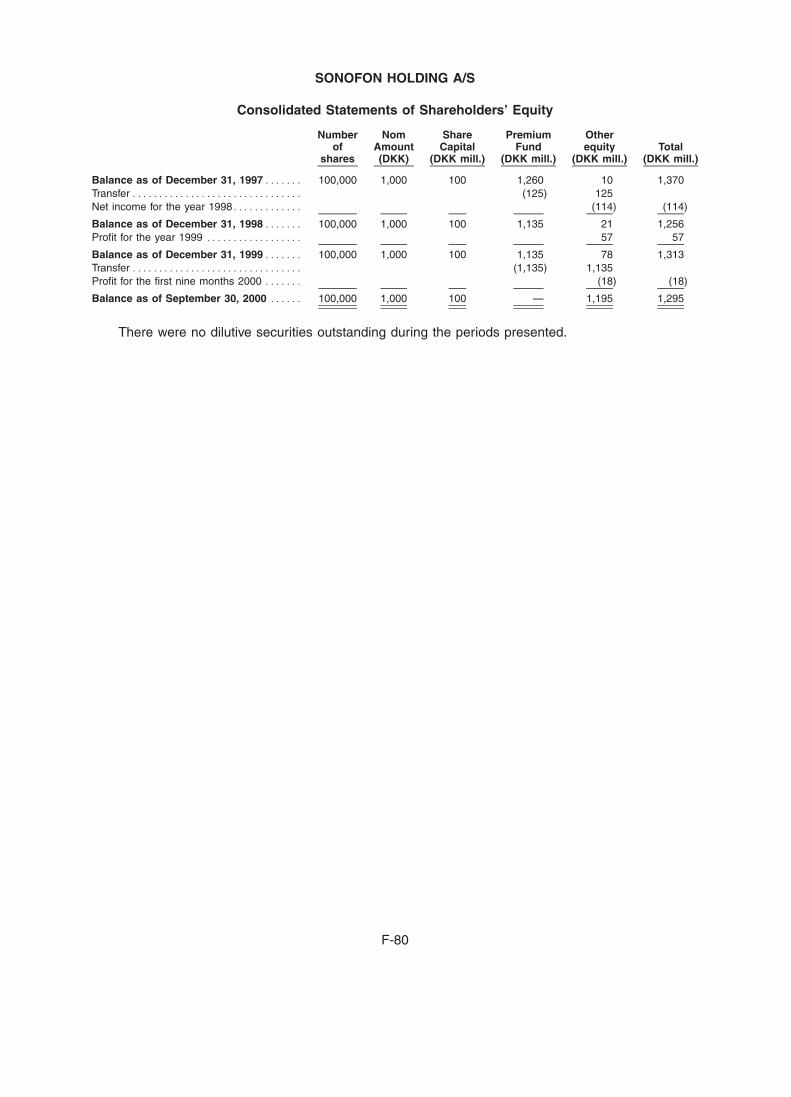
BOWNE OF LONDON 12/01/2000 19:56 BL/SM NO MARKS NEXT PCN: 313.00.00.00 -- Page is valid, no graphics X42481 312.00.00.00 8X
SONOFON HOLDING A/S
Consolidated Statements of Shareholders’ Equity
Number Nom Share Premium Otherof Amount Capital Fund equity Total
shares (DKK) (DKK mill.) (DKK mill.) (DKK mill.) (DKK mill.)
Balance as of December 31, 1997******* 100,000 1,000 100 1,260 10 1,370Transfer ******************************** (125) 125Net income for the year 1998************* (114) (114)
Balance as of December 31, 1998******* 100,000 1,000 100 1,135 21 1,256Profit for the year 1999 ****************** 57 57
Balance as of December 31, 1999******* 100,000 1,000 100 1,135 78 1,313Transfer ******************************** (1,135) 1,135Profit for the first nine months 2000 ******* (18) (18)
Balance as of September 30, 2000 ****** 100,000 1,000 100 — 1,195 1,295
There were no dilutive securities outstanding during the periods presented.
F-80
BOWNE OF LONDON 12/01/2000 19:56 BL/SM NO MARKS NEXT PCN: 314.00.00.00 -- Page is valid, no graphics X42481 313.00.00.00 8X
SONOFON HOLDING A/S
Summary of Significant Accounting Principles
General
The consolidated financial statements for Sonofon Holding A/S are prepared in accordance withthe provisions in the Danish Annual Account Act. The Group’s accounting principles differ, in certainrespects, from United States generally accepted accounting principles (US GAAP). The differencesand the approximate related effects on the Group’s net income and shareholders’ equity are set forthin note 14.
All amounts are presented in millions of DKK or other specified currency unless otherwisestated.
Consolidation principles
The consolidated financial statements relate to the parent company, Sonofon Holding A/S andthe companies (subsidiaries) in which the parent company directly or indirectly exercises acontrolling interest. Other companies in which the Group exercises a significant interest are regardedas associated. Affiliated companies are shown in the table in note 9.
The consolidated financial statements are prepared as a summary of the financial statements forthe parent company and those of the individual subsidiaries, all of which are presented inaccordance with the Group’s accounting policies. Intercompany income and expenses, outstandings,dividends and unrealized internal gains are eliminated.
In the consolidation, the book value of shares held by the parent company in subsidiaries is setoff against their equity.
The acquisition method is applied when acquiring new companies, according to which theidentifiable assets and liabilities acquired are measured at their fair value on the date of acquisition.
When the acquisition price exceeds the fair value of the net assets acquired the differential iscapitalized as goodwill. Goodwill is amortized systematically in the profit and loss account inaccordance with an individual assessment of the asset’s expected economic life, although notexceeding 20 years. In the year of acquisition, amortization is pro rata.
Acquired or divested Group companies are included in the consolidated financial statements forthe period they have been owned by the Group. Comparative figures are not adjusted to reflect theacquisition or divestment of Group companies.
Translation of foreign currencies
Foreign currency transactions are translated to local currencies at transaction date exchangerates.
Exchange differences arising from the date of transaction to the date of payment are recognizedin the profit and loss account as financial items.
Receivables and payables in foreign currencies and hedging contracts are measured at theyear-end exchange rate or the forward rate for hedging contracts. Exchange gains or losses arerecognized in the profit and loss account under financial items.
In the consolidated financial statements, the profit and loss accounts of foreign entities aretranslated to Danish Kroner at average rates of exchange for the year and assets and liabilities aretranslated at year-end exchange rates.
F-81
BOWNE OF LONDON 12/01/2000 19:56 BL/SM NO MARKS NEXT PCN: 315.00.00.00 -- Page is valid, no graphics X42481 314.00.00.00 8X
SONOFON HOLDING A/S
Summary of Significant Accounting Principles — (Continued)
Exchange differences arising from adjusting foreign entities’ equity at the beginning of the yearand from adjusting foreign entities’ profit and loss accounts from year-end rates are recognized asan adjustment to equity.
Revenue
Revenue is primarily comprised of traffic, subscription and connection fees, interconnection fees,and sale of customer equipment.
Mobile telephony traffic revenues and interconnection revenues are recognized based on theactual traffic. Subscription fees are recognized as revenue over the subscription period. Revenuesrelated to pre-paid phone cards are deferred and recorded as revenues based on the actual use ofthe cards.
Revenues from connection fees that are received from the sale of new subscriptions arerecognized at the time of sale to the extent of direct costs incurred. Direct costs incurred inconnection with mobile connection revenues consist primarily of the first payment of distributorcommission, cost of the SIM card, and the cost of the printed new customer information package. Todate direct costs associated with connection fees have exceeded such revenues. No revenues havebeen deferred.
Production costs
Production costs consist of the cost price of the goods and services sold during the year andcosts associated with the operation and maintenance of the network. Cost price includesdepreciation of plant, development projects and other intangible assets.
Development costs
Development costs cover the costs, salaries and depreciation of operating assets andequipment, which is directly or indirectly, ascribed to the Group’s development activities.
For development projects, which are clearly defined and identifiable, where the level of technicalexploitation, sufficient resources and a potential future market or business opportunity for thecompany can be demonstrated, and where the intention is to manufacture, market or exploit theresults of the project, costs are capitalized from the date at which the above mentioned conditionshave been satisfied, and when the discounted value of future earnings is expected to exceed thedevelopment costs. The cost price of such development projects includes direct payroll costs,materials and other direct and indirect costs which are attributable to the development project.
Other development costs are expensed in the year they incur.
Distribution costs
Distribution costs relate to the costs associated with the sale and distribution of products andservices, including salaries, commissions, advertising and marketing costs, depreciation, etc.
Administrative costs
Administrative costs relate to the costs of administrative personnel and management, officecosts, depreciation, amortization, etc.
F-82
BOWNE OF LONDON 12/01/2000 19:56 BL/SM NO MARKS NEXT PCN: 316.00.00.00 -- Page is valid, no graphics X42481 315.00.00.00 10X
SONOFON HOLDING A/S
Summary of Significant Accounting Principles — (Continued)
Other operating income/expenses
Other operating income/expenses include other operating gains/losses which arise fromactivities not considered part of the Group’s primary activities.
Sale of fixed assets
Gains/losses on the sale of fixed assets are stated as the difference between the sales priceand the carrying value at the date of disposal (historical cost price less accumulated depreciation).Gains/losses are stated under depreciation.
Financial items
Financial income and expenses include interest income and expense relating to the financialyear.
Financial items also include the costs of funding capital leases and impairment of financial fixedassets and realized and unrealized exchange adjustments for foreign exchange items.
Taxation
The parent company and a number of Danish subsidiaries are jointly taxed in Denmark. Theparent company makes provision for and pays the total Danish tax charge for these companies andthe parent company also makes provision for deferred tax for the Danish companies. Jointly taxedcompanies participate in the tax prepayment scheme.
The tax charge on taxable income for the year is charged to the profit and loss account togetherwith the adjustment of the deferred tax provision for the year.
Tax payable is stated under short-term debt and deferred tax under provisions.
Taxes receivable and negative deferred tax (deferred tax assets) are stated under accountsreceivable.
Provision for deferred tax is recognized according to liability method for all temporary differencesbetween the accounting and the tax values of assets and liabilities.
The tax value of tax loss carryforwards is included in the deferred tax provision if it is probablethat such deficits can be utilized within a few years.
Tax charges arising from the sale of shares in subsidiaries or associated companies are notincluded the deferred tax provision if the shares are not expected to be sold within a short period oftime.
No deferred tax liability is stated for goodwill unless it is amortizable/deductible for tax purposes.
Deferred tax is calculated on the basis of current tax rules and at the rate expected to applywhen temporary differences are equalized. Changes in deferred tax provisions due to amended taxrates are recognized in the profit and loss account.
The consolidated profit and loss account includes a proportional share of the pre-tax profits /losses reported by individual associated companies. The proportionate share of the tax charge insubsidiaries and associated companies is stated under taxation.
F-83
BOWNE OF LONDON 12/01/2000 19:56 BL/SM NO MARKS NEXT PCN: 317.00.00.00 -- Page is valid, no graphics X42481 316.00.00.00 9X
SONOFON HOLDING A/S
Summary of Significant Accounting Principles — (Continued)
Intangible and tangible fixed assets
Intangible and tangible fixed assets are carried at cost less accumulated amortization/depreciation and impairment losses.
Cost includes purchase price and costs of materials, components, subcontractor services, directpayroll and indirect production costs. Interest charges and other borrowing costs are not included inthe cost price.
Straight line depreciation of the individual fixed asset is made over the useful life of the asset. Incalculating depreciation on property, an estimated scrap value is included. Assets are amortized/depreciated over the following expected lives:
Goodwill************************************************* up to 20 yearsDevelopment projects ************************************* 2- 5 yearsSoftware************************************************* 5-10 yearsBuildings and equipment ********************************** 10-50 yearsLeasehold improvements ********************************** 5-20 yearsPlant and equipment ************************************** 3-15 yearsTools and fixtures***************************************** 2- 7 years
Assets with an acquisition price less than t.DKK 25 per unit are charged to the profit and lossaccount in the year of acquisition.
Until they become operational, projects are stated in the balance sheet under tangible fixedassets as ‘‘Plant under construction’’. After becoming operational, such projects are transferred totangible or intangible fixed assets, depending on the nature.
Land is not depreciated.
The cost price of finance leased assets is calculated as the market value or the net presentvalue of future lease payments at the date of purchase if this is lower. Finance leased assets arestated in the balance sheet and are depreciated as other tangible fixed assets.
Financial fixed assets
Holdings in associated companies are stated in the consolidated balance sheet according to theequity method as the proportionate share of the associated companies’ equity less a proportionateshare of unrealized intercompany profits.
Associated companies with negative equity for accounting purposes are stated at zero whilereceivables with these companies are written down by the Group’s share of the negative equity. Ifsuch negative equity exceeds receivables, the remaining balance is stated under Provisions.
Inventories
Inventories are carried at cost using the FIFO formula or at net realizable value if this is lowerthan cost. Depreciation is recognized on obsolete goods including goods with slow marketability.
Receivables
Receivables are carried at the value of the amounts expected to be received.
F-84
BOWNE OF LONDON 12/01/2000 19:56 BL/SM NO MARKS NEXT PCN: 318.00.00.00 -- Page is valid, no graphics X42481 317.00.00.00 9X
SONOFON HOLDING A/S
Summary of Significant Accounting Principles — (Continued)
Debt
Debt is carried at the nominal value of the outstanding balance at the balance sheet date,including interest due.
The net present value of the liabilities of finance leased assets are stated in the balance.Interest from lease payments is charged to the profit and loss account.
Other rental and leasing matters
When contracts for renting and leasing buildings and equipment are of an operational nature,rental and leasing charges are recognized in the profit and loss account for the period to which theyrelate.
The remaining rental and leasing obligations under such contracts are disclosed underContingent liabilities.
Cash flow statement
The consolidated cash flow statement is prepared according to the indirect method on the basisof the Group’s operating income. The cash flow statement shows the Group’s cash flow for the yeardivided into cash flow from operating activities, investing activities and financing activities and howthese cash flows have affected liquid funds.
Cash flow from operating activities relates to cash flow from the year’s operations, adjusted fornon-cash items and changes in working capital. Working capital covers current assets, excludingitems stated as liquid funds. It also includes short-term debt less repayment of long-term debt andbank debt.
Cash flow from investing activities includes the sale and purchase of fixed assets, includingholdings in companies.
Cash flow from financing activities includes payments to and from shareholders and raising andrepayment of long-term and short-term debt not included in working capital.
Cash funds relate to cash in hand and bank balances and include bonds and commercial paperhaving original maturities of three months or less.
Use of estimates
The preparation of financial statements in accordance with generally accepted accountingprinciples requires management to make estimates and assumptions that affect the reportedamounts of assets and liabilities, and disclosure of contingent assets and liabilities at the date of thefinancial statements and the reported amounts of revenue and expenses during the reporting period.
Actual results could differ from those estimates.
F-85
BOWNE OF LONDON 12/01/2000 19:56 BL/SM NO MARKS NEXT PCN: 319.00.00.00 -- Page is valid, no graphics X42481 318.00.00.00 19X
SONOFON HOLDING A/S
Notes to the consolidated financial statements
1. NET REVENUE(unaudited)
Year ended Nine months endedDecember 31, September 30,
1998 1999 2000
(in DKK million)
Mobile telephony ************************************** 2,036 2,600 2,014Customer equipment *********************************** 311 304 261Total ************************************************* 2,347 2,904 2,275
Mobile telephony includes revenue from traffic, subscription and connection for mobiletelephones.
Customer equipment includes sale of customer equipment (mobile phones).
2. EMPLOYMENT COSTS(unaudited)
Year ended Nine months endedDecember 31, September 30,
1998 1999 2000
(in DKK million)
Wages and salaries ************************************ 345 447 362Pensions and other social costs ************************* 12 13 33Total ************************************************* 357 460 395Hereof remuneration to parent company’s:Board of Management********************************** 3 4 29Supervisory Board ************************************* 1 1 —Average number of employees ************************ 1,153 1,487 1,549
3. DEPRECIATION(unaudited)
Year ended Nine months endedDecember 31, September 30,
1998 1999 2000
(in DKK million)
Production costs*************************************** 238 237 179Distribution costs ************************************** 6 12 12Administration costs************************************ 197 218 202Total ************************************************* 441 467 393
4. FINANCIAL INCOME
(unaudited)Year ended Nine months ended
December 31, September 30,
1998 1999 2000
(in DKK million)
Interest from banks ********************************* 7 — —Other interest ************************************** 3 7 5
Total ********************************************** 10 7 5
F-86
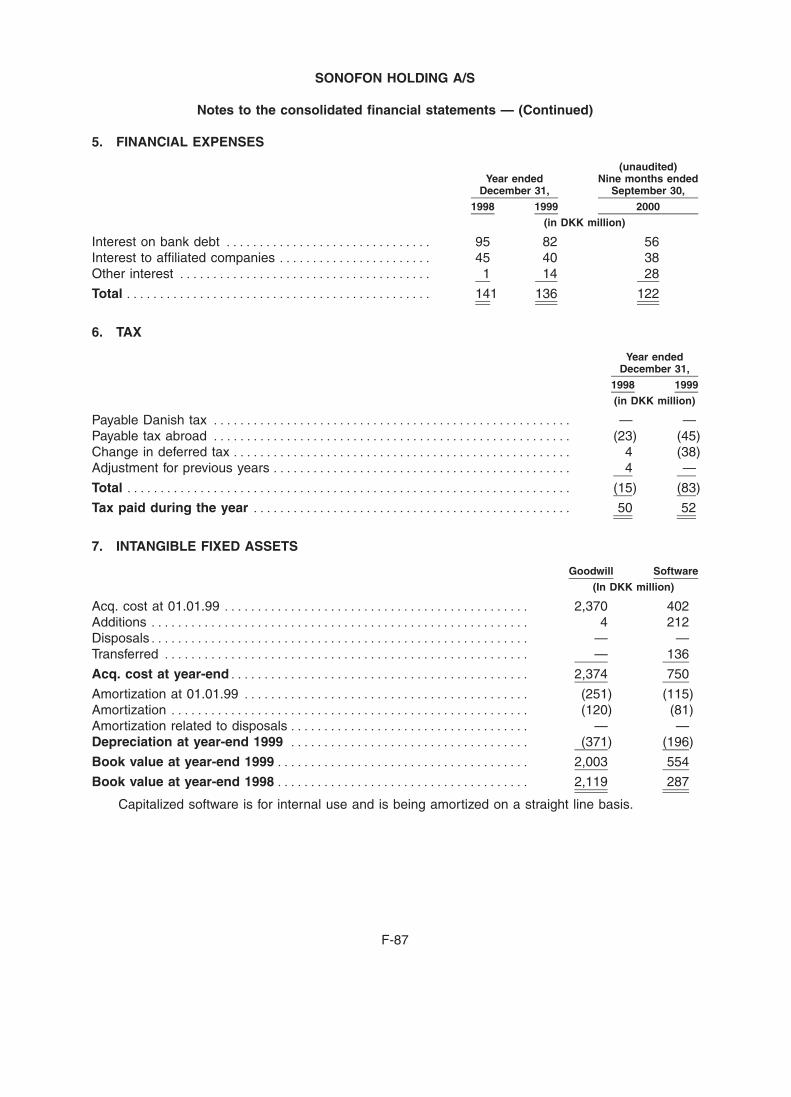
BOWNE OF LONDON 12/01/2000 19:56 BL/SM NO MARKS NEXT PCN: 320.00.00.00 -- Page is valid, no graphics X42481 319.00.00.00 8X
SONOFON HOLDING A/S
Notes to the consolidated financial statements — (Continued)
5. FINANCIAL EXPENSES
(unaudited)Year ended Nine months ended
December 31, September 30,
1998 1999 2000
(in DKK million)
Interest on bank debt ******************************* 95 82 56Interest to affiliated companies *********************** 45 40 38Other interest ************************************** 1 14 28
Total ********************************************** 141 136 122
6. TAX
Year endedDecember 31,
1998 1999
(in DKK million)
Payable Danish tax ****************************************************** — —Payable tax abroad ****************************************************** (23) (45)Change in deferred tax *************************************************** 4 (38)Adjustment for previous years ********************************************* 4 —
Total ******************************************************************* (15) (83)
Tax paid during the year ************************************************ 50 52
7. INTANGIBLE FIXED ASSETS
Goodwill Software
(In DKK million)
Acq. cost at 01.01.99 ********************************************** 2,370 402Additions ********************************************************* 4 212Disposals********************************************************* — —Transferred ******************************************************* — 136
Acq. cost at year-end********************************************* 2,374 750
Amortization at 01.01.99 ******************************************* (251) (115)Amortization ****************************************************** (120) (81)Amortization related to disposals ************************************ — —Depreciation at year-end 1999 ************************************ (371) (196)
Book value at year-end 1999 ************************************** 2,003 554
Book value at year-end 1998 ************************************** 2,119 287
Capitalized software is for internal use and is being amortized on a straight line basis.
F-87
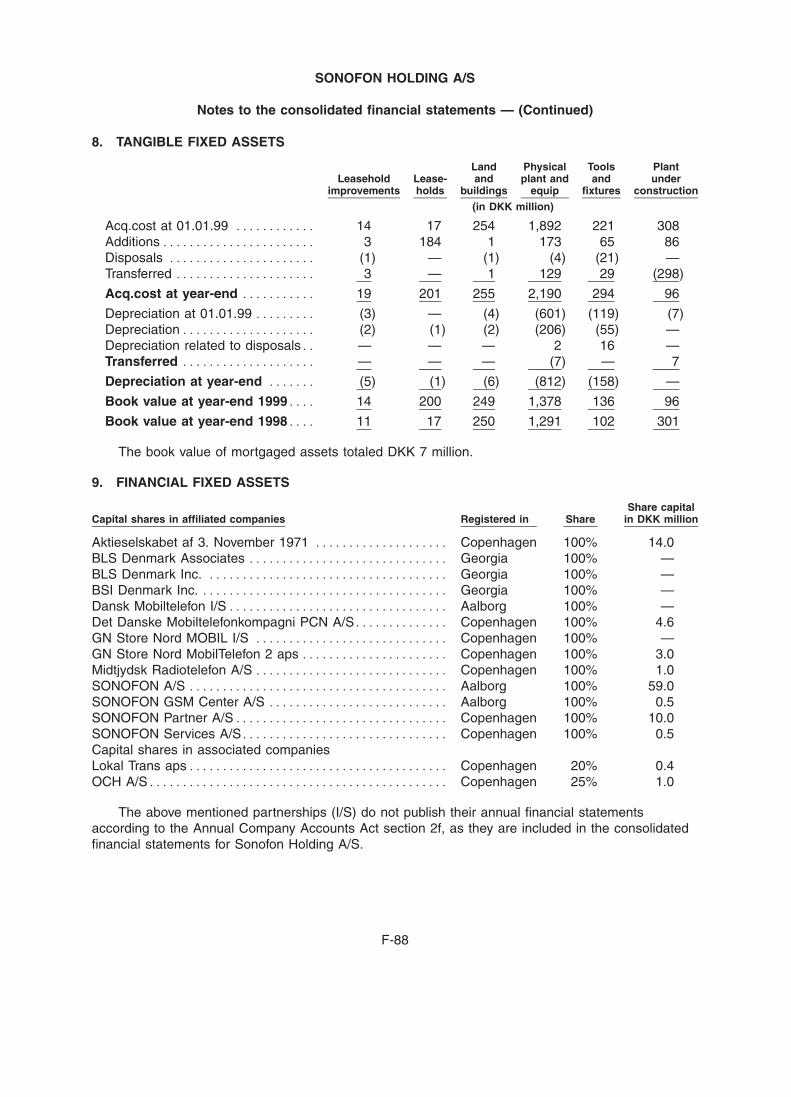
BOWNE OF LONDON 12/01/2000 19:56 BL/SM NO MARKS NEXT PCN: 321.00.00.00 -- Page is valid, no graphics X42481 320.00.00.00 8X
SONOFON HOLDING A/S
Notes to the consolidated financial statements — (Continued)
8. TANGIBLE FIXED ASSETS
Land Physical Tools PlantLeasehold Lease- and plant and and under
improvements holds buildings equip fixtures construction
(in DKK million)
Acq.cost at 01.01.99 ************ 14 17 254 1,892 221 308Additions*********************** 3 184 1 173 65 86Disposals ********************** (1) — (1) (4) (21) —Transferred ********************* 3 — 1 129 29 (298)
Acq.cost at year-end *********** 19 201 255 2,190 294 96
Depreciation at 01.01.99 ********* (3) — (4) (601) (119) (7)Depreciation******************** (2) (1) (2) (206) (55) —Depreciation related to disposals** — — — 2 16 —Transferred ******************** — — — (7) — 7
Depreciation at year-end ******* (5) (1) (6) (812) (158) —
Book value at year-end 1999**** 14 200 249 1,378 136 96
Book value at year-end 1998**** 11 17 250 1,291 102 301
The book value of mortgaged assets totaled DKK 7 million.
9. FINANCIAL FIXED ASSETS
Share capitalCapital shares in affiliated companies Registered in Share in DKK million
Aktieselskabet af 3. November 1971 ******************** Copenhagen 100% 14.0BLS Denmark Associates ****************************** Georgia 100% —BLS Denmark Inc. ************************************ Georgia 100% —BSI Denmark Inc. ************************************* Georgia 100% —Dansk Mobiltelefon I/S********************************* Aalborg 100% —Det Danske Mobiltelefonkompagni PCN A/S************** Copenhagen 100% 4.6GN Store Nord MOBIL I/S ***************************** Copenhagen 100% —GN Store Nord MobilTelefon 2 aps ********************** Copenhagen 100% 3.0Midtjydsk Radiotelefon A/S ***************************** Copenhagen 100% 1.0SONOFON A/S *************************************** Aalborg 100% 59.0SONOFON GSM Center A/S *************************** Aalborg 100% 0.5SONOFON Partner A/S******************************** Copenhagen 100% 10.0SONOFON Services A/S******************************* Copenhagen 100% 0.5Capital shares in associated companiesLokal Trans aps*************************************** Copenhagen 20% 0.4OCH A/S********************************************* Copenhagen 25% 1.0
The above mentioned partnerships (I/S) do not publish their annual financial statementsaccording to the Annual Company Accounts Act section 2f, as they are included in the consolidatedfinancial statements for Sonofon Holding A/S.
F-88
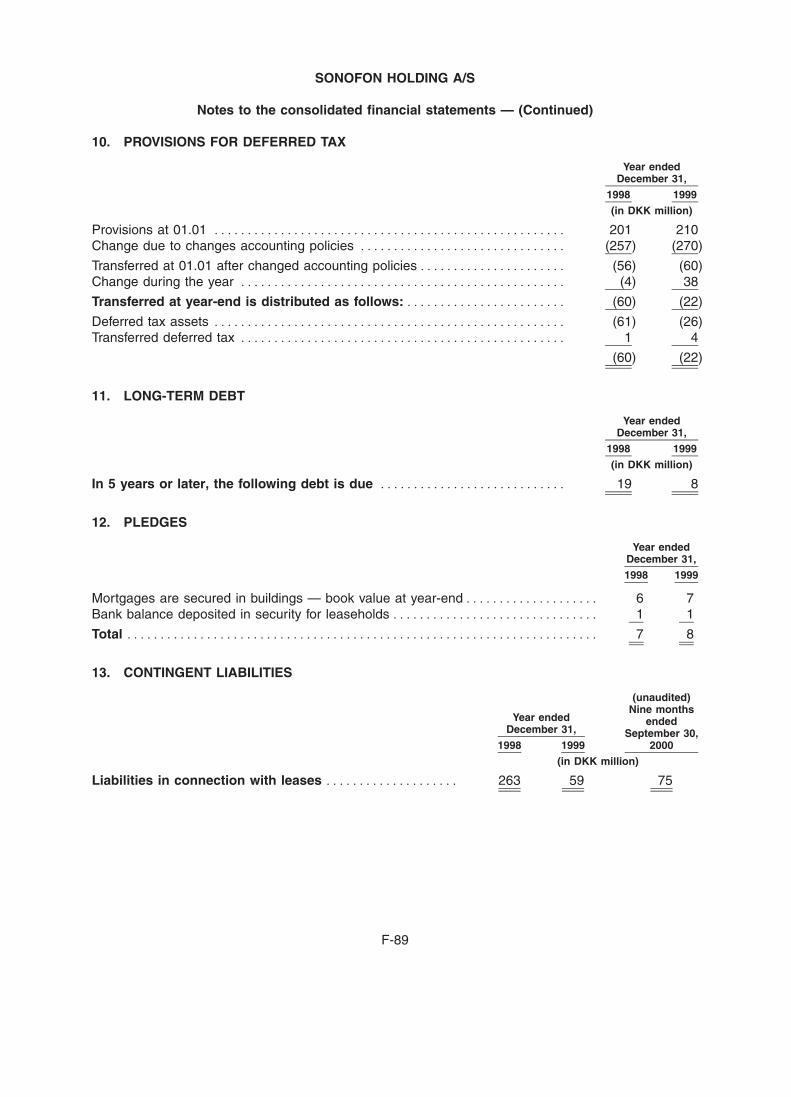
BOWNE OF LONDON 12/01/2000 19:56 BL/SM NO MARKS NEXT PCN: 322.00.00.00 -- Page is valid, no graphics X42481 321.00.00.00 10X
SONOFON HOLDING A/S
Notes to the consolidated financial statements — (Continued)
10. PROVISIONS FOR DEFERRED TAX
Year endedDecember 31,
1998 1999
(in DKK million)
Provisions at 01.01 ***************************************************** 201 210Change due to changes accounting policies ******************************* (257) (270)
Transferred at 01.01 after changed accounting policies********************** (56) (60)Change during the year ************************************************* (4) 38
Transferred at year-end is distributed as follows: ************************ (60) (22)
Deferred tax assets ***************************************************** (61) (26)Transferred deferred tax ************************************************* 1 4
(60) (22)
11. LONG-TERM DEBT
Year endedDecember 31,
1998 1999
(in DKK million)
In 5 years or later, the following debt is due **************************** 19 8
12. PLEDGES
Year endedDecember 31,
1998 1999
Mortgages are secured in buildings — book value at year-end******************** 6 7Bank balance deposited in security for leaseholds ******************************* 1 1
Total *********************************************************************** 7 8
13. CONTINGENT LIABILITIES
(unaudited)Nine months
Year ended endedDecember 31, September 30,
1998 1999 2000
(in DKK million)
Liabilities in connection with leases ******************** 263 59 75
F-89
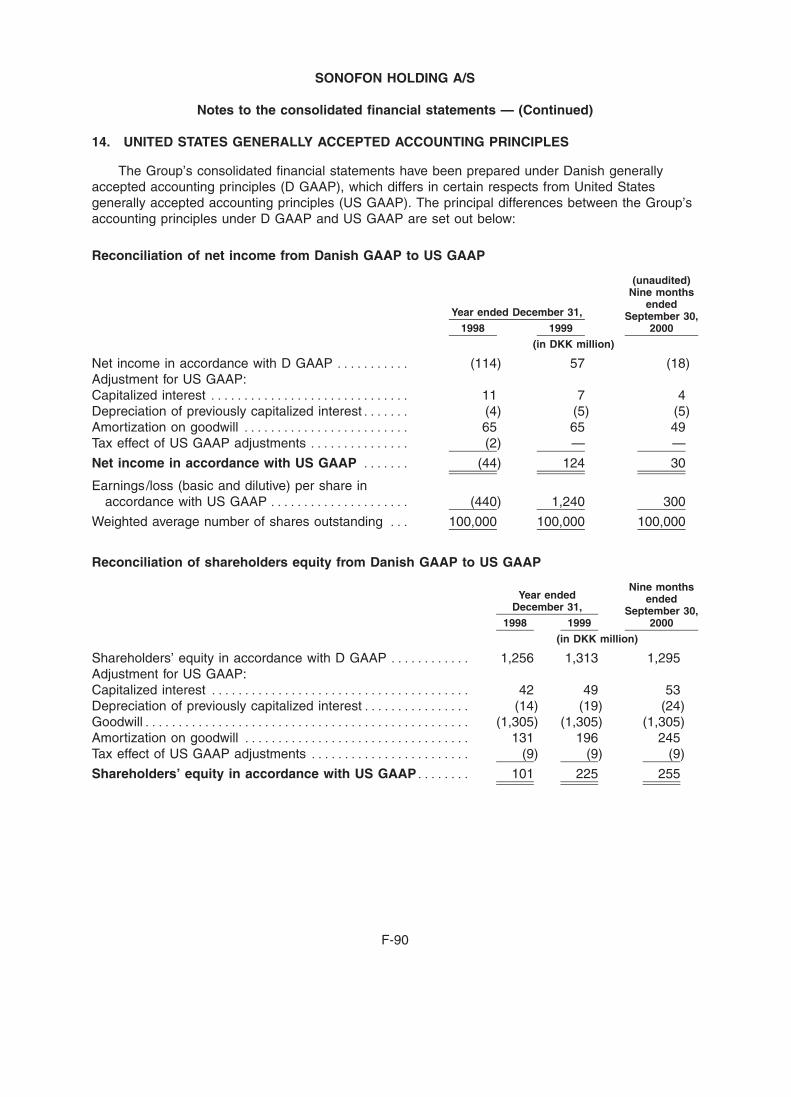
BOWNE OF LONDON 12/01/2000 19:56 BL/SM NO MARKS NEXT PCN: 323.00.00.00 -- Page is valid, no graphics X42481 322.00.00.00 11X
SONOFON HOLDING A/S
Notes to the consolidated financial statements — (Continued)
14. UNITED STATES GENERALLY ACCEPTED ACCOUNTING PRINCIPLES
The Group’s consolidated financial statements have been prepared under Danish generallyaccepted accounting principles (D GAAP), which differs in certain respects from United Statesgenerally accepted accounting principles (US GAAP). The principal differences between the Group’saccounting principles under D GAAP and US GAAP are set out below:
Reconciliation of net income from Danish GAAP to US GAAP
(unaudited)Nine months
endedYear ended December 31, September 30,
1998 1999 2000
(in DKK million)
Net income in accordance with D GAAP *********** (114) 57 (18)Adjustment for US GAAP:Capitalized interest ****************************** 11 7 4Depreciation of previously capitalized interest******* (4) (5) (5)Amortization on goodwill ************************* 65 65 49Tax effect of US GAAP adjustments *************** (2) — —
Net income in accordance with US GAAP ******* (44) 124 30
Earnings/loss (basic and dilutive) per share inaccordance with US GAAP ********************* (440) 1,240 300
Weighted average number of shares outstanding *** 100,000 100,000 100,000
Reconciliation of shareholders equity from Danish GAAP to US GAAP
Nine monthsYear ended ended
December 31, September 30,1998 1999 2000
(in DKK million)
Shareholders’ equity in accordance with D GAAP ************ 1,256 1,313 1,295Adjustment for US GAAP:Capitalized interest *************************************** 42 49 53Depreciation of previously capitalized interest**************** (14) (19) (24)Goodwill************************************************* (1,305) (1,305) (1,305)Amortization on goodwill ********************************** 131 196 245Tax effect of US GAAP adjustments ************************ (9) (9) (9)
Shareholders’ equity in accordance with US GAAP******** 101 225 255
F-90
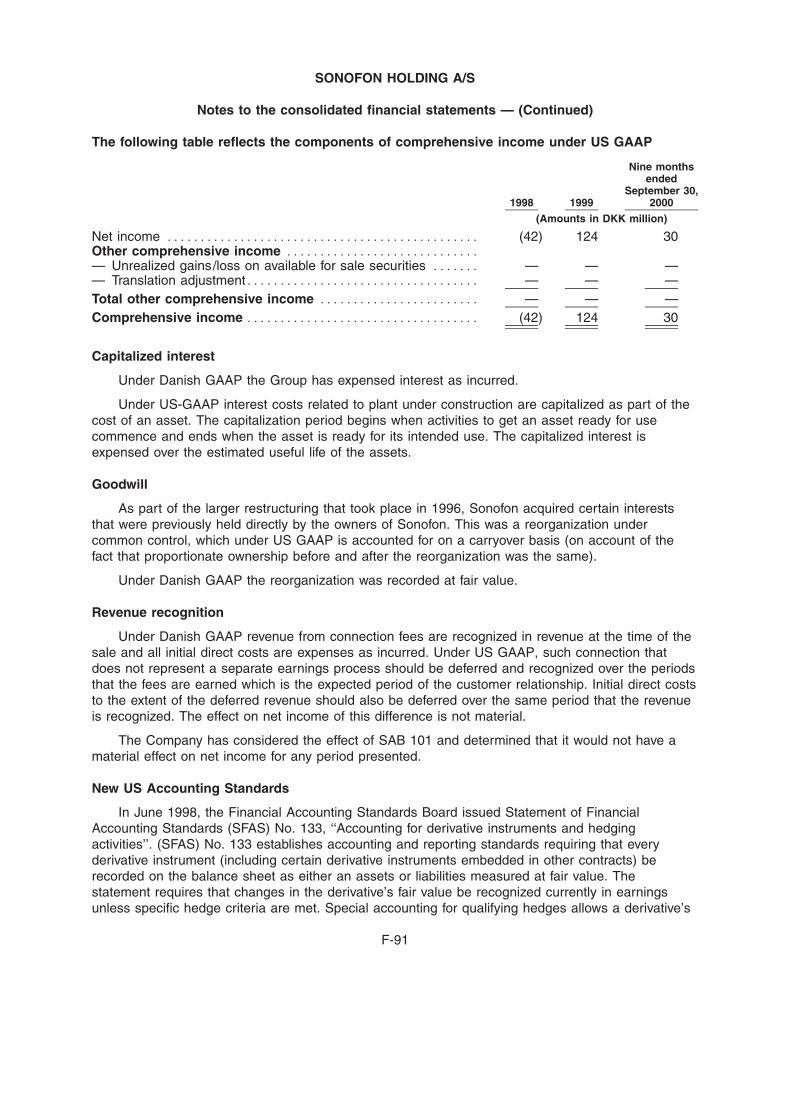
BOWNE OF LONDON 12/01/2000 19:56 BL/SM NO MARKS NEXT PCN: 324.00.00.00 -- Page is valid, no graphics X42481 323.00.00.00 8X
SONOFON HOLDING A/S
Notes to the consolidated financial statements — (Continued)
The following table reflects the components of comprehensive income under US GAAP
Nine monthsended
September 30,1998 1999 2000
(Amounts in DKK million)
Net income *********************************************** (42) 124 30Other comprehensive income *****************************— Unrealized gains/loss on available for sale securities ******* — — —— Translation adjustment*********************************** — — —Total other comprehensive income ************************ — — —Comprehensive income *********************************** (42) 124 30
Capitalized interest
Under Danish GAAP the Group has expensed interest as incurred.
Under US-GAAP interest costs related to plant under construction are capitalized as part of thecost of an asset. The capitalization period begins when activities to get an asset ready for usecommence and ends when the asset is ready for its intended use. The capitalized interest isexpensed over the estimated useful life of the assets.
Goodwill
As part of the larger restructuring that took place in 1996, Sonofon acquired certain intereststhat were previously held directly by the owners of Sonofon. This was a reorganization undercommon control, which under US GAAP is accounted for on a carryover basis (on account of thefact that proportionate ownership before and after the reorganization was the same).
Under Danish GAAP the reorganization was recorded at fair value.
Revenue recognition
Under Danish GAAP revenue from connection fees are recognized in revenue at the time of thesale and all initial direct costs are expenses as incurred. Under US GAAP, such connection thatdoes not represent a separate earnings process should be deferred and recognized over the periodsthat the fees are earned which is the expected period of the customer relationship. Initial direct coststo the extent of the deferred revenue should also be deferred over the same period that the revenueis recognized. The effect on net income of this difference is not material.
The Company has considered the effect of SAB 101 and determined that it would not have amaterial effect on net income for any period presented.
New US Accounting Standards
In June 1998, the Financial Accounting Standards Board issued Statement of FinancialAccounting Standards (SFAS) No. 133, ‘‘Accounting for derivative instruments and hedgingactivities’’. (SFAS) No. 133 establishes accounting and reporting standards requiring that everyderivative instrument (including certain derivative instruments embedded in other contracts) berecorded on the balance sheet as either an assets or liabilities measured at fair value. Thestatement requires that changes in the derivative’s fair value be recognized currently in earningsunless specific hedge criteria are met. Special accounting for qualifying hedges allows a derivative’s
F-91

BOWNE OF LONDON 12/01/2000 19:56 BL/SM NO MARKS NEXT PCN: 325.00.00.00 -- Page is valid, no graphics X42481 324.00.00.00 5X
SONOFON HOLDING A/S
Notes to the consolidated financial statements — (Continued)
gains and losses to offset related results in the income statement or other comprehensive income(depending on the type of hedge). To adopt hedge accounting a company must formally document,designate and assess the effectiveness of transactions that receive hedge accounting.
SFAS No. 137 delayed the effective date of SFAS No. 133 to fiscal years beginning afterJune 15, 2000. Sonofon Holdings A/S has not yet determined the effect of the implementation ofSFAS No. 133 on the balance sheet and on the profit and loss statement.
F-92
BOWNE OF LONDON 12/01/2000 19:56 BL/SM NO MARKS NEXT PCN: 401.00.00.00 -- Page/graphics valid (12/01/2000 20:32) X42481 325.00.00.00 8X
O
X42481


