Embed Size (px)
Citation preview

This is the author’s version of a work that was submitted/accepted for pub-lication in the following source:
Morrison, S., Cortes, N., Newell, K.M., Silburn, P.A., & Kerr, G.K. (2013)Variability, regularity and coupling measures distinguish PD tremor fromvoluntary 5Hz tremor. Neuroscience Letters, 534, pp. 69-74.
This file was downloaded from: http://eprints.qut.edu.au/55344/
c© Copyright 2012 Elsevier
This is the author’s version of a work that was accepted for publica-tion in Neuroscience Letters. Changes resulting from the publishing pro-cess, such as peer review, editing, corrections, structural formatting, andother quality control mechanisms may not be reflected in this document.Changes may have been made to this work since it was submitted for pub-lication. A definitive version was subsequently published in NeuroscienceLetters, [VOL 534, (2012)] DOI: 10.1016/j.neulet.2012.11.040
Notice: Changes introduced as a result of publishing processes such ascopy-editing and formatting may not be reflected in this document. For adefinitive version of this work, please refer to the published source:
http://dx.doi.org/10.1016/j.neulet.2012.11.040

Accepted Manuscript
Title: Variability, Regularity and Coupling MeasuresDistinguish PD Tremor from Voluntary 5 Hz Tremor
Authors: S. Morrison, N. Cortes, K.M. Newell, P.A. Silburn,G. Kerr
PII: S0304-3940(12)01509-1DOI: doi:10.1016/j.neulet.2012.11.040Reference: NSL 29416
To appear in: Neuroscience Letters
Received date: 30-7-2012Revised date: 22-10-2012Accepted date: 17-11-2012
Please cite this article as: S. Morrison, K.M. Newell, P.A. Silburn, G. Kerr, Variability,Regularity and Coupling Measures Distinguish PD Tremor from Voluntary 5<ce:hspsp=0.25/>Hz Tremor, Neuroscience Letters (2010), doi:10.1016/j.neulet.2012.11.040
This is a PDF file of an unedited manuscript that has been accepted for publication.As a service to our customers we are providing this early version of the manuscript.The manuscript will undergo copyediting, typesetting, and review of the resulting proofbefore it is published in its final form. Please note that during the production processerrors may be discovered which could affect the content, and all legal disclaimers thatapply to the journal pertain.

Page 1 of 21
Accep
ted
Man
uscr
ipt
Young adults were able to produce a tremor similar in frequency to PD tremor
PD tremor was more variable and irregular than voluntarily generated 5 Hz tremor
Stronger coupling between the arms was seen for voluntary tremor responses
Variability measures can be used to discern between different tremor forms
*Highlights (for review)

Page 2 of 21
Accep
ted
Man
uscr
ipt
Title: Variability, Regularity and Coupling Measures Distinguish PD Tremor from
Voluntary 5 Hz Tremor
Authors: S. Morrison1, N, Cortes
2, K.M. Newell
5, P.A. Silburn
3, 4, 6, G. Kerr3,4
Affiliations 1School of Physical Therapy, Old Dominion University, VA, USA
2Sports Medicine Assessment, Research & Testing Laboratory, George Mason
University, Manassas, VA, USA
3School of Exercise and Nutrition Sciences, Queensland University of Technology, QLD,
Australia
4Movement Neuroscience Program, Queensland University of Technology, QLD,
Australia
5Department of Kinesiology, Pennsylvania State University, PA, USA.
6Center for Clinical Research, University of Queensland, QLD, Australia
Resubmitted: 22nd
October 2012
Corresponding Author: Steven Morrison
Address: School of Physical Therapy
Old Dominion University
VA 23529
Phone: 757-683-6757
FAX: 757-683-4410
Email: smorriso @odu.edu
1

Page 3 of 21
Accep
ted
Man
uscr
ipt
2
Abstract 1
A characteristic of Parkinson’s disease (PD) is the development of tremor within the 4-6 Hz 2
range. One method used to better understand pathological tremor is to compare the responses to 3
tremor-type actions generated intentionally in healthy adults. This study was designed to 4
investigate the similarities and differences between voluntarily generated 4-6 Hz tremor and PD 5
tremor in regards to their amplitude, frequency and coupling characteristics. Tremor responses 6
for 8 PD individuals (on-and off-medication) and 12 healthy adults were assessed under postural 7
and resting conditions. Results showed that the voluntary and PD tremor were essentially 8
identical with regards to the amplitude and peak frequency. However, differences between the 9
groups were found for the variability (SD of peak frequency, proportional power) and regularity 10
(Approximate Entropy, ApEn) of the tremor signal. Additionally, coherence analysis revealed 11
strong inter-limb coupling during voluntary conditions while no bilateral coupling was seen for 12
the PD persons. Overall, healthy participants were able to produce a 5 Hz tremulous motion 13
indistinguishable to that of PD patients in terms of peak frequency and amplitude. However, 14
differences in the structure of variability and level of inter-limb coupling were found for the 15
tremor responses of the PD and healthy adults. These differences were preserved irrespective of 16
the medication state of the PD persons. The results illustrate the importance of assessing the 17
pattern of signal structure/variability to discriminate between different tremor forms, especially 18
where no differences emerge in standard measures of mean amplitude as traditionally defined. 19
20
Key Words: Tremor, Parkinson’s disease, Variability, Complexity, Bilateral Coupling 21
22

Page 4 of 21
Accep
ted
Man
uscr
ipt
3
Introduction 1
A general feature of pathological tremor forms is that they are characterized by increased 2
amplitude and a lower frequency in comparison to physiological tremor [1-3]. Typically, the 3
limb oscillations associated with neurological disorders like Parkinson’s disease (PD) and 4
essential tremor are restricted to a single dominant peak located between 4-6 Hz [2, 4]. In 5
contrast, tremulous motion in healthy adults is more broadband, with peaks commonly being 6
observed between 2-4 Hz, 8-12 Hz and, for finger tremor only, as high as 18-24 Hz [3, 5]. These 7
pronounced differences in frequency and amplitude facilitate the discrimination between 8
pathological and normal physiological tremor signals. However, how to accurately discriminate 9
between 4-6 Hz tremors arising from different neurological sources (e.g. PD, essential tremor) 10
from tremor generated voluntarily and/or related to psychogenic factors is a question of 11
continuing interest [6-8]. 12
One method used to assess the properties of tremor has been to compare the responses of 13
tremor-type actions generated voluntarily to those of pathologies [8-11]. While voluntarily 14
producing oscillatory motion within the 8-12 Hz range of physiological tremor is not achievable 15
for healthy individuals [12], producing rhythmical limb motion at or around the frequency of 16
many forms of pathological tremor (e.g. 4-6 Hz) is within the functional boundaries of the 17
voluntary movement [9-11]. Previous studies have reported that tremor generated voluntarily by 18
healthy adults under these conditions exhibits similar frequency characteristics, and is often 19
indistinguishable in regards to amplitude, from that observed in individuals with neurologic 20
disorders [8-11]. 21
Given the similarities in appearance between these tremor forms, there is an obvious interest 22
in how to discriminate between the different oscillatory outputs. One means by which to assess 23

Page 5 of 21
Accep
ted
Man
uscr
ipt
4
these differences is to identify the pattern of regularity and variability in the respective tremor 1
signals. Previous research has highlighted that, in addition to amplitude and frequency 2
differences, the tremor under pathological conditions is often less complex and variable than 3
physiological tremor assessed from healthy adults [13-15]. Another means by which to assess 4
tremor differences is to evaluate the level of coupling of tremor between limbs. Previous studies 5
have reported no coupling of tremor between the arms in healthy adults of differing ages[16-18] 6
or for persons with PD, irrespective of their medication state [19, 20]. However, increased 7
coupling between the limbs can be seen for other movement forms in healthy adults, persons 8
with PD[21, 22] and for patients with essential tremor [23]. One suggestion is that inter-limb 9
independence is an intrinsic feature of tremor production of healthy individuals and so 10
assessments of the degree of coupling can be used to distinguish between different tremor forms. 11
The aim of this study was to investigate the similarities and differences between voluntarily 12
generated 4-6 Hz tremulous movement and PD tremor in regards to their amplitude, frequency 13
and coupling characteristics. It was predicted that the voluntary tremor will exhibit similar 14
frequency and amplitude characteristics to that of the PD patients. Further, for the PD 15
individuals, these similarities will be preserved irrespective of their medication state [3, 24]. It 16
was also predicted that there will be notable differences in tremor regularity, variability and 17
coupling which will distinguish between the different individuals. 18
19
Methods 20
Subjects 21
Twelve young control subjects (six males, six females, age 24±5.1 yrs), and eight 22
Parkinsonian patients (two males, six females, 65.1±3.2 yrs) gave informed consent to participate 23

Page 6 of 21
Accep
ted
Man
uscr
ipt
5
in this study. All control participants were right-hand dominant, physically active, had normal 1
or corrected-to-normal vision, and reported no known neurological/cognitive disorders, or 2
history of neuromuscular injury that could influence performance. All Parkinson patients were 3
assessed using the UPDRS-motor section by a trained neurologist and all exhibited resting and 4
postural tremors bilaterally. Additional subject inclusion details and results have been reported 5
previously.[3] All participants provided written informed consent and completed a medical 6
history questionnaire prior to testing to determine health status. All experimental procedures 7
complied with University IRB guidelines and were in accordance with the Declaration of 8
Helsinki. 9
10
Experimental Design 11
For all participants, bilateral tremor responses were recorded under both resting and postural 12
conditions. For the PD patients, resting tremor was measured independently from both arms 13
which were allowed to hang relaxed and unsupported by their side [3, 25]. For the postural 14
tremor condition, participants performed a pointing task with both arms held parallel to the 15
ground [3]. For the upper limb, the shoulders were flexed 90° in the sagittal plane, elbows fully 16
extended, and forearms pronated. The index finger of each arm was extended at the 17
metacarpophalangeal joint with the thumb adducted and remaining fingers flexed to form a loose 18
fist. 19
For the simulated postural and resting tremor movements, healthy individuals were asked to 20
adopt the same postural or resting positions as described above. They were then instructed to 21
perform rapid alternating wrist flexion-extension movements with both arms. Prior to data 22
collection, subjects were given 4 trials of practice to generate the required frequency of tremor 23

Page 7 of 21
Accep
ted
Man
uscr
ipt
6
motion in each position. An auditory metronome set at 5 Hz was provided during this period to 1
allow each person to ensure they were aware of the required movement frequency. 2
3
Equipment 4
All testing procedures were performed while individuals adopted a standing position. Hand and 5
finger tremor were measured using four uniaxial Coulbourn accelerometers (V94-41) and 6
amplified through a Coulbourn transducer coupler (V75-25A, sample rate 100 Hz). The 7
accelerometers were attached to the hand (middle of third metacarpal) and index finger (dorsal 8
distal aspect) of each arm so the measurement axis was perpendicular to the ground during 9
pointing. Six 30 s trials were performed within each condition (total number of trials: 12). Rests 10
were provided between trials/conditions to reduce the effects of fatigue. 11
12
Data Analysis 13
The accelerometer data were filtered by a second-order Butterworth low-pass digital filter 14
(cutoff frequency 50 Hz). All data analysis was performed using custom software developed in 15
Matlab version 7.0 (Mathworks R14). 16
Time Series Analysis: Average tremor amplitude involved calculating the root mean square 17
(RMS) of the tremor signal (window size 100 ms). 18
Frequency Analysis: This was performed on the filtered tremor data between 0-40 Hz using 19
Welch's averaged, modified periodogram method (512 data point Hanning window). The 20
dependent measures calculated were; maximum amplitude of each signal (peak power), the 21
frequency at which the peak power was observed (peak power frequency, PPF), the variability of 22
PPF (SD PPF) and the distribution of power across the tremor signal (proportional power). The 23

Page 8 of 21
Accep
ted
Man
uscr
ipt
7
proportional power variable provides an estimate of the relative proportion of power (expressed 1
as a percentage of total power) that occurs within successive 1 Hz frequency bins. All dependent 2
measures were calculated for all trials per condition and across all subjects. 3
Signal Regularity: The degree of regularity of the accelerometer signals was assessed using 4
Approximate Entropy (ApEn) analysis. ApEn measures the conditional probability of the signal 5
by providing a measure of the (logarithmic) likelihood that runs of patterns that are close for m 6
observations remain close on the next incremental comparisons (m+1). This analysis returns a 7
single value for the tremor signal within the range of 0-2. Typically, a signal with higher ApEn 8
values is described as being less regular (or more complex). Conversely, a signal with a lower 9
ApEn would be described as more regular (less complex) [26]. 10
Coupling Analysis: Estimation of the degree of coupling of tremor between arms was 11
determined by applying cross correlation (Pearson product moment) and coherence analyses. 12
The correlation analysis was conducted over multiple time lags (range 5 s). The peak 13
correlation coefficient and the lag at which this peak was observed were recorded. Coherence 14
analysis was performed to assess the degree of coupling in the frequency domain and the 15
maximum (peak) coherence value determined. This analysis was performed within the range 0-16
20 Hz (window size 512 data points, binwidth 0.1953 Hz). To assess whether the coherence 17
values were significantly different from zero, a 95% confidence interval was calculated [27]. 18
19
Statistical Analysis 20
A repeated measures mixed generalized linear model (GLM) was used to assess for 21
differences in the dependent measures. A two-way model was used to identify differences in the 22
tremor measures between groups (young, PDON/OFF medication) and across tremor conditions 23

Page 9 of 21
Accep
ted
Man
uscr
ipt
8
(resting, postural). Where significant effects were reported, post hoc evaluations were performed 1
using Tukey’s Honestly Significant Difference (HSD) test. All statistical analyses were 2
performed using SAS statistical software (SAS Institute Inc., NC), with the risk of Type I error 3
set at p <0.05. 4
5
Results 6
Tremor Similarities 7
Tremor RMS Amplitude: No significant differences in mean RMS amplitude were observed 8
for the tremor responses between the PD patients and the healthy adults simulating a 5 Hz 9
tremor. No significant differences were found, for the PD group, between the on/off medication 10
state. 11
Tremor Frequency: The resting and postural tremor forms for all groups were characterised 12
by a single dominant frequency peak, present between 4-6 Hz. For the simulated group, the 13
resting tremor peak was 5.16 Hz and, under postural conditions, 4.98 Hz. For the PD patients, 14
the resting tremor peaks were at 5.26 Hz (on-medication) and 5.34 Hz (off-medication). The 15
postural tremor peaks for these same individuals were at 5.03 Hz (on-medication) and 5.18 Hz 16
(off-medication). No significant difference was observed between groups or conditions (resting, 17
postural) in regards to the frequency of peak power (PPF). Furthermore, no differences in peak 18
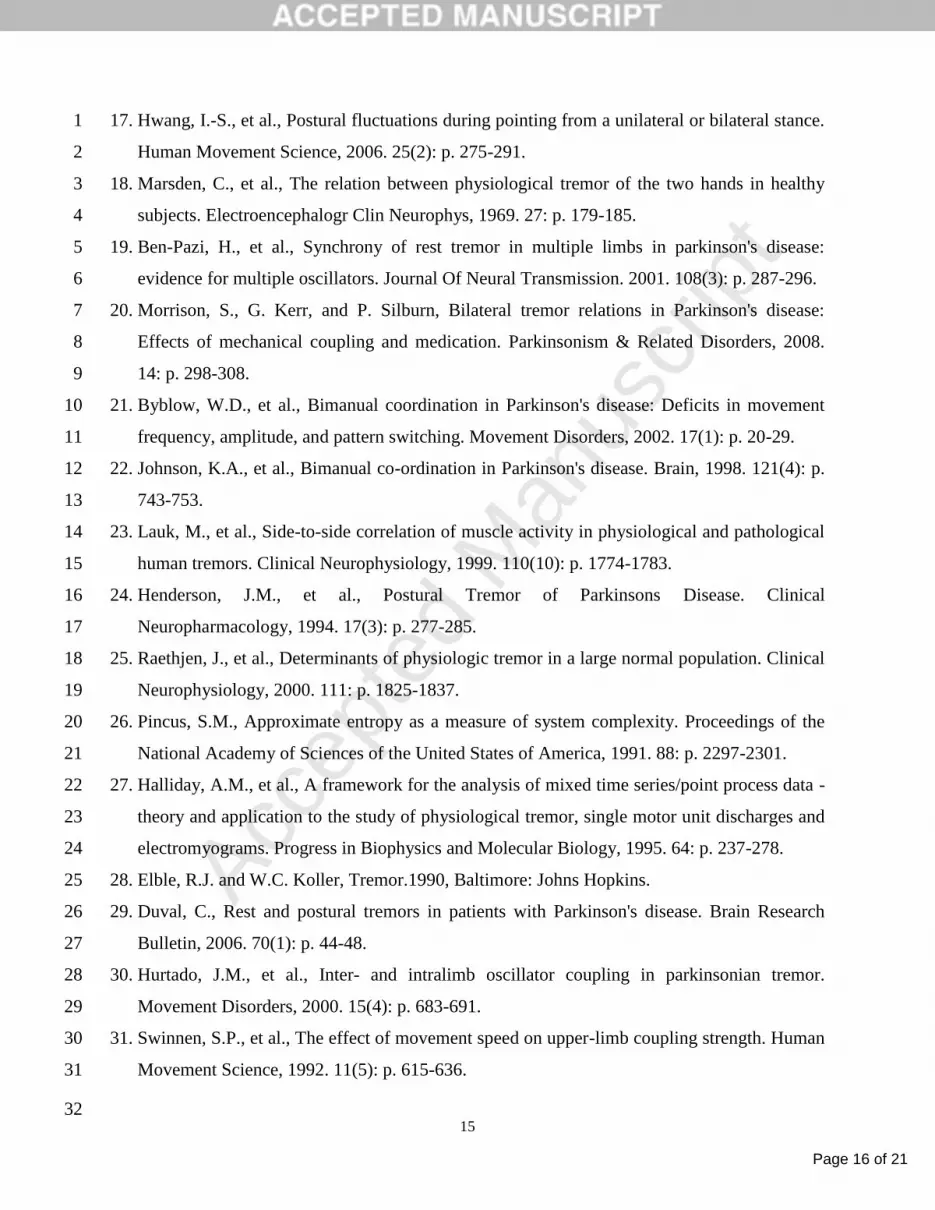
power or PPF were observed between the two simulated conditions for the healthy adults. Figure 19
1 illustrates the typical tremor responses, power spectral and proportional power profiles for a 20
single PDOFF individual and a healthy adult producing a 5 Hz tremor. The tremor responses 21
across the postural and resting conditions are shown in this figure. Figure 2 depicts the major 22

Page 10 of 21
Accep
ted
Man
uscr
ipt
9
similarities in mean tremor RMS amplitude and PPF between the different groups and 1
conditions. 2
-------------------------------------------- 3
Insert Figures 1 & 2 4
-------------------------------------------- 5
Differences in Tremor 6
Tremor Frequency: A significant group by condition interaction effect was observed for the 7
SD of PPF (F2,26=14.33; p<0.001) and proportional power measures (F2,26=22.67; p<0.001). For 8
the SD PPF results, post hoc analysis revealed that the tremor for the PDON/OFF patients was more 9
variable (higher SD) than for the simulated conditions (all p’s<0.001, see figure 3). This effect 10
was found across the resting and postural conditions. For the proportional power analysis, a 11
greater percentage of the total power (>60%) was observed within the 5-6 Hz range under 12
simulated conditions (all p’s<0.001, see figure 3). This effect was found across both conditions. 13
Tremor Regularity: A significant group by condition effect was observed for the ApEn 14
values for finger tremor (F2,26=26.25; p<0.001). Post hoc analysis revealed that the tremor for 15
the PDON/OFF patients, under both resting and postural conditions, was more complex (higher 16
ApEn) than the tremor produced under simulated conditions (all p’s<0.001, see figure 3). No 17
differences in ApEn scores were observed within each group between the resting and postural 18
tremor conditions. 19
-------------------------------------------- 20
Figure 3 21
------------------------------------------- 22
23
Coupling Relations 24

Page 11 of 21
Accep
ted
Man
uscr
ipt
10
For the correlation analysis, there was a significant group-by-condition effect for the strength 1
of the coupling relation between arms (F2,26=7.88; p<0.001). Post hoc analysis revealed that the 2
strength of the bilateral coupling was significantly greater under simulated conditions than for 3
the PDON/OFF individuals (all r values < 0.12; p <0.05; see figure 4). There was no evidence of 4
coupling of tremor between the arms for the PD individuals irrespective of the tremor form 5
assessed or their medication state (on/off). All peak correlation values were found at 0 s lag. 6
The coherence analysis provided a similar pattern of results with a significant group-by-7
condition effect being found (F2,26=23.15; p<0.001). Subsequent analysis highlighted significant 8
differences between the simulated and PDON/OFF tremor (all p’s<0.05). For the PDON/OFF tremor, 9
there was no evidence of any coupling of tremor between limbs or any differences as a function 10
of medication state. However, a significantly higher level of coupling was observed under 11
simulated conditions (figure 4). All significant coherence peaks were between 4-6 Hz. 12
-------------------------------------------- 13
Figure 4 14
------------------------------------------- 15
16
Discussion 17
This study was designed to examine the similarities and differences between Parkinsonian 18
tremor and that generated voluntary at 5 Hz by healthy adults. There were no differences in 19
modal frequency or overall amplitude of the tremor between the healthy participants and the 20
PDON/OFF persons. However, there were significant differences in the structure of variability of 21
the tremor responses between groups. The simulated tremor was more regular (lower ApEn), 22
less variable in frequency (lower SD of PPF, more power within a narrower frequency range) 23

Page 12 of 21
Accep
ted
Man
uscr
ipt
11
and was more strongly coupled between limbs than the tremor recorded from PD individuals. 1
These differences were preserved irrespective of the medication state of the PD persons. 2
3
Similarities between Voluntary and PD Tremor 4
One of the major distinguishing neurological features of Parkinson disease is the presence of 5
enhanced tremor under resting and/or postural conditions [28]. These tremulous oscillations are 6
typically observed between 4-6 Hz and reflect changes in the underlying neural mechanisms 7
driving tremorgenesis. Since PD tremor differs dramatically in both frequency and amplitude 8
from the physiological tremor observed in healthy adults, various studies have compared the 9
responses of tremor-type actions generated voluntarily to that of pathologies [8-11]. Such 10
comparisons are employed to provide additional information about the dynamics of pathological 11
tremor. For example, as the voluntary tremulous action can be generated within a similar 12
frequency range, comparisons can be made between two comparable oscillatory outputs. A 13
central finding of the current study is that, in terms of terms of peak frequency and amplitude, 14
there was no difference in the tremor for healthy adults and individuals with Parkinson’s disease. 15
The tremor response of all individuals was characterized by a single dominant frequency peak 16
between 4-6 Hz, irrespective of whether the tremor was recorded under postural or resting 17
conditions. 18
An additional finding of note was the lack of tremor differences for the PD patients between 19
their on and off medication state. Generally, the use of anti-parkinsonian medication produces a 20
decrease in the amplitude of resting/postural tremor with little concurrent change in tremor 21
frequency or inter-limb coupling [20, 24, 29]. However, the extent of any amplitude decline can 22

Page 13 of 21
Accep
ted
Man
uscr
ipt
12
be highly variable between PD individuals [3, 19, 28], an observation which may contribute to 1
the lack of any tremor differences between the on-off medication state in the current study. 2
3
Differences between Voluntary and PD Tremor 4
While there were no significant differences between the PDON/OFF and voluntary 5 Hz 5
tremulous movements with regards to peak frequency and mean RMS amplitude, fundamental 6
differences between the tremor in the two groups were observed for the pattern of regularity of 7
the variability. Of particular note, the voluntary generated tremor was more regular (lower 8
ApEn) and more tightly restricted around 5 Hz (lower SD of PPF, greater proportion of power 9
within 5-6 Hz) than the tremor for the PDON/OFF group, irrespective of their medication state. 10
This finding provides an interesting addition to reports which have focused on comparing PD 11
tremor to physiological tremor [13-15]. In these studies, PD tremor is typically less variable and 12
more regular than the tremor for healthy adults of a similar age. Taken together, these results 13
illustrate that even though the neuromotor driving signal for individuals with PD is constrained 14
to a very narrow frequency range, their tremor response still exhibits a moderate degree of 15
variability. Indeed, the PD tremor exhibited a higher degree of variability and was more 16
irregular (more complex) than the voluntary tremor responses. 17
One additional difference in tremor between the groups relates to the degree of coupling 18
between limbs. For the PD individuals, the results of the specific analyses (i.e., cross correlation, 19
coherence) showed no evidence of any inter-limb coupling. In contrast, under simulated 20
(voluntary) tremor conditions, there was a significantly high level of coupling between the arms. 21
For the coherence results, this strong bilateral relation was within 4-6 Hz, which coincided with 22
the frequency range at which the simulated tremor was performed. The bilateral differences in 23

Page 14 of 21
Accep
ted
Man
uscr
ipt
13
coupling strength probably reflect underlying variation in the neural mechanisms driving each 1
oscillatory output. In Parkinson’s disease (and assessments of tremor in healthy adults), the 2
prevailing view is the tremor within each limb is generated independently from uncoupled or 3
parallel oscillators within the CNS [3, 20, 30]. In contrast, during rhythmical actions generated 4
voluntarily, the level of coupling between contralateral limb segments tends to be strong [21, 5
31]. One hypothesis is that this coupling reflects the act of voluntarily increasing the neural drive 6
to selected muscle groups [31]. 7
Overall, our findings reveal that tremor in PD patients was more irregular, variable and 8
characterized by a lack of bilateral coupling compared to voluntary 5 Hz tremulous motion 9
performed by healthy adults. The results reveal the sensitivity of measures of signal 10
structure/variability to discriminate between groups and conditions in tremor analysis, beyond 11
that provided by standard measures of (mean) tremor amplitude. Further, comparisons between 12
healthy adults and patients with neurological disorders could incorporate assessments of 13
voluntary oscillatory 4-6 Hz movement in order to distinguish between various tremor forms. 14

Page 15 of 21
Accep
ted
Man
uscr
ipt
14
References
1. Elble, R.J., Origins of tremor. The Lancet, 2000. 355(9210): p. 1113-1114. 1
2. McAuley, J.H. and C.D. Marsden, Physiological and pathalogical tremors and rhythmic 2
central motor control. Brain, 2000. 123: p. 1545-1567. 3
3. Kerr, G., S. Morrison, and P. Silburn, Coupling between limb tremor and postural sway in 4
Parkinson's disease. Movement Disorders, 2008. 23(3): p. 386-394. 5
4. Deuschl, G., P. Bain, and M. Brin, Consensus statement of the Movement Disorder Society 6
on Tremor. Ad Hoc Scientific Committee. Movement Disorders, 1998. 13(Suppl 3): p. 2-23. 7
5. Elble, R.J., Characteristics of physiologic tremor in young and elderly adults. Clinical 8
Neurophysiology, 2003. 114(4): p. 624-635. 9
6. Lang, A.E. and V. Voon, Psychogenic movement disorders: Past developments, current 10
status, and future directions. Movement Disorders, 2011. 26(6): p. 1175-1186. 11
7. McAuley, J. and J. Rothwell, Identification of psychogenic, dystonic, and other organic 12
tremors by a coherence entrainment test. Movement Disorders, 2004. 19(3): p. 253-267. 13
8. Voon, V, et al., The involuntary nature of conversion disorder. Neurology, 2011. 74: p223-28 14
9. Pollok, B., et al., The cerebral oscillatory network of voluntary tremor. The Journal of 15
Physiology, 2004. 554(3): p. 871-878. 16
10. Burkhard, P., J. Langston, and J. Tetrud, Voluntarily simulated tremor in normal subjects. 17
Clinical Neurophysiology, 2002. 32(2): p. 119-26. 18
11. Kumru, H., et al., Transient arrest of psychogenic tremor induced by contralateral ballistic 19
movements. Neuroscience Letters, 2004. 370(2-3): p. 135-139. 20
12. Morrison, S., L. Hong, and K.M. Newell, Upper frequency limits of bilateral coordination 21
patterns. Neurosci Lett, 2009. 454: p. 233-238. 22
13. Deuschl, G., M. Lauk, and J. Timmer, Tremor classification and tremor time series analysis. 23
Chaos, 1995. 5: p. 48-51. 24
14. Morrison, S., et al., Differential time- and frequency-dependent structure of postural sway 25
and finger tremor in Parkinson’s disease. Neuroscience Letters, 2008. 443: p. 123-128. 26
15. Vaillancourt, D.E. and K.M. Newell, The dynamics of resting and postural tremor in 27
Parkinson's disease. Clinical Neurophysiology, 2000. 111: p. 2046-2056. 28
16. Daneault, J.-F., B. Carignan, and C. Duval, Bilateral effect of a unilateral voluntary 29
modulation of physiological tremor. Clinical Neurophysiology, 2010. 121: p. 734-743. 30
Page 16 of 21
Accep
ted
Man
uscr
ipt
15
17. Hwang, I.-S., et al., Postural fluctuations during pointing from a unilateral or bilateral stance. 1
Human Movement Science, 2006. 25(2): p. 275-291. 2
18. Marsden, C., et al., The relation between physiological tremor of the two hands in healthy 3
subjects. Electroencephalogr Clin Neurophys, 1969. 27: p. 179-185. 4
19. Ben-Pazi, H., et al., Synchrony of rest tremor in multiple limbs in parkinson's disease: 5
evidence for multiple oscillators. Journal Of Neural Transmission. 2001. 108(3): p. 287-296. 6
20. Morrison, S., G. Kerr, and P. Silburn, Bilateral tremor relations in Parkinson's disease: 7
Effects of mechanical coupling and medication. Parkinsonism & Related Disorders, 2008. 8
14: p. 298-308. 9
21. Byblow, W.D., et al., Bimanual coordination in Parkinson's disease: Deficits in movement 10
frequency, amplitude, and pattern switching. Movement Disorders, 2002. 17(1): p. 20-29. 11
22. Johnson, K.A., et al., Bimanual co-ordination in Parkinson's disease. Brain, 1998. 121(4): p. 12
743-753. 13
23. Lauk, M., et al., Side-to-side correlation of muscle activity in physiological and pathological 14
human tremors. Clinical Neurophysiology, 1999. 110(10): p. 1774-1783. 15
24. Henderson, J.M., et al., Postural Tremor of Parkinsons Disease. Clinical 16
Neuropharmacology, 1994. 17(3): p. 277-285. 17
25. Raethjen, J., et al., Determinants of physiologic tremor in a large normal population. Clinical 18
Neurophysiology, 2000. 111: p. 1825-1837. 19
26. Pincus, S.M., Approximate entropy as a measure of system complexity. Proceedings of the 20
National Academy of Sciences of the United States of America, 1991. 88: p. 2297-2301. 21
27. Halliday, A.M., et al., A framework for the analysis of mixed time series/point process data - 22
theory and application to the study of physiological tremor, single motor unit discharges and 23
electromyograms. Progress in Biophysics and Molecular Biology, 1995. 64: p. 237-278. 24
28. Elble, R.J. and W.C. Koller, Tremor.1990, Baltimore: Johns Hopkins. 25
29. Duval, C., Rest and postural tremors in patients with Parkinson's disease. Brain Research 26
Bulletin, 2006. 70(1): p. 44-48. 27
30. Hurtado, J.M., et al., Inter- and intralimb oscillator coupling in parkinsonian tremor. 28
Movement Disorders, 2000. 15(4): p. 683-691. 29
31. Swinnen, S.P., et al., The effect of movement speed on upper-limb coupling strength. Human 30
Movement Science, 1992. 11(5): p. 615-636. 31
32

Page 17 of 21
Accep
ted
Man
uscr
ipt
16
Figure Captions 1
2
Figure 1 Representative examples of the tremor signal for a single PDOFF participant and a 3
healthy subject voluntarily generating a 5 Hz tremor. The respective power spectral 4
and proportional power profiles for each tremor signal are also shown. Tremor 5
responses were recorded under postural and resting conditions. 6
7
Figure 2 Similarities in tremor amplitude (mean RMS) and modal frequency (peak power 8
frequency, PPF) between the PDON/OFF and healthy subjects. Overall group mean 9
results for the resting and postural conditions are shown. Error bars shown in each 10
figure represent one SE of the mean. 11
12
Figure 3 Differences in tremor regularity (mean ApEn) and variation (SD of PPF) between the 13
PDON/OFF and healthy subjects. Results are shown for both the resting and postural 14
conditions. Error bars represent one SE of the mean. Significant group differences 15
between the PD and the voluntary tremor responses are denoted with an asterisk (*). 16
17
Figure 4 Significant differences in level of inter-limb coupling between groups based upon 18
changes in mean peak correlation and coherence values. Error bars represent one SE 19
of the mean. Significant differences in the level of coupling between the PDON/OFF 20
and healthy groups are denoted with an asterisk (*). 21

Page 18 of 21
Accep
ted
Man
uscr
ipt
Frequency (Hz)
0 2 4 6 8 10
Tre
mor
Pow
er (
m.s
-2)2
0
2000
4000
6000
8000
10000
12000
PDOFF Tremor (postural)
-40
-20
0
20
40
Time (s)
0 1 2 3 4 5 6 7 8 9 10
Tre
mor
Am
pli
tude
(m.s
-2)
-40
-20
0
20
40PD
OFF Tremor (resting)
0
2000
4000
6000
8000
10000
12000
0
2000
4000
6000
8000
10000
12000
0
2000
4000
6000
8000
10000
12000
-40
-20
0
20
40
-40
-20
0
20
40
Simulated Tremor (resting)
Simulated Tremor (postural)
Pro
port
iona
l P
ow
er (
%)
0
10
20
30
40
50
60
0
10
20
30
40
50
60
Frequency (Hz)0
-1
1-2
2-3
3-4
4-5
5-6
6-7
7-8
9-1
0
10
-11
11
-12
0
10
20
30
40
50
60
0
10
20
30
40
50
60
Figure 1

Page 19 of 21
Accep
ted
Man
uscr
ipt
Simulated PDon PDoff
Mea
n R
MS
Tre
mo
r A
mp
litu
de
(m.s
-2)
0
1
2
3
4
5
6
Simulated PDon PDoff
0
1
2
3
4
5
6Postural Conditions
Simulated PDon PDoff
1
2
3
4
5
6
7 Right Finger
Left Finger
Resting Conditions
Simulated PDon PDoff
Fre
qu
ency
of
Pea
k P
ow
er (
Hz)
1
2
3
4
5
6
7
Figure 2

Page 20 of 21
Accep
ted
Man
uscr
ipt
Postural Conditions
Voluntary PDon PDoff
Mea
n A
pE
n
0.0
0.2
0.4
0.6
0.8
1.0
1.2
1.4
1.6
Right Finger
Left Finger
Resting Conditions
Voluntary PDon PDoff
0.0
0.2
0.4
0.6
0.8
1.0
1.2
1.4
1.6
SD
of
PP
F (
Hz)
0
1
2
3
4
0
1
2
3
4
*
*
*
*
*
*
*
*
Figure 3

Page 21 of 21
Accep
ted
Man
uscr
ipt
Voluntary PDon PDoff
Mea
n P
eak
Co
her
ence
0.0
0.2
0.4
0.6
0.8
1.0 Resting Condition
Postural Condition
Voluntary PDon PDoff
Mea
n P
eak
Co
rrel
atio
n
0.0
0.2
0.4
0.6
0.8
1.0
*
*
Figure 4