Embed Size (px)
Citation preview
© Oliver Wyman
VARIETY VALUE RETAIL MARKET STUDY IN RUSSIA
DECEMBER 2020
2© Oliver Wyman
Copyright ©2020, Oliver Wyman All rights reserved.
This report (the “Report”) has been prepared by Oliver Wyman LLC (“Oliver Wyman”) for Fix Price Group Ltd (“Fix Price”) and solely for the purpose and onthe terms agreed with Fix Price. We accept no liability (including for negligence) to anyone else in connection with this Report. Neither this Report nor anycopy or part thereof may be distributed in any jurisdiction where its distribution may be restricted by law and persons into whose possession this Reportcomes should inform themselves about, and observe, any such restrictions. This Report may not be reproduced or redistributed, in whole or in part, withoutthe written permission of Oliver Wyman and Oliver Wyman accepts no liability whatsoever for the actions of third parties in this respect.
This Report does not constitute a recommendation or an offer or solicitation to buy or sell any securities referred to herein. It should not be so construed,nor should it or any part of it form the basis of, or be relied on in connection with, any contract or commitment whatsoever. Further, this Report shall not beconsidered advice on the merits of acquiring or disposing of any particular investment or as an invitation or inducement to engage in any investmentactivity.
The information in this Report, or on which this Report is based, has been obtained from sources that Oliver Wyman believes to be reliable and accurate,including from Fix Price. However, it has not been independently verified and no representation or warranty, express or implied, is made as to the accuracyor completeness of any information obtained from third parties. The information and conclusions are provided as at the date of this Report and are subjectto change without notice and Oliver Wyman undertakes no obligation to update or revise any information or conclusions contained herein, whether as aresult of new information, future events, or otherwise. The information and conclusions provided in this Report take no account of the relevant persons'individual circumstances, should not be taken as specific advice on the merits of any investment decision, and should not be deemed to be a reasonablysufficient basis upon which to make an investment decision. Oliver Wyman and its affiliates accept no liability for any loss arising from any action taken orrefrained from as a result of information and conclusions contained in this Report or any reports or sources of information referred to herein, or for anyconsequential, special or similar damages even if advised of the possibility of such damages.
Oliver Wyman has given its consent for certain information in this Report (the “Information” ) to be referred to in the prospectus and the registrationdocument in relation to the admission of the shares of Fix Price on the London Stock Exchange and Moscow Exchange and accepted responsibility for theInformation in the prospectus and the registration document to the extent required by law. For the avoidance of doubt, Oliver Wyman has only acceptedresponsibility for the Information in the form and context in which it appears in the prospectus and the registration document. All representations OliverWyman has made and any responsibility Oliver has accepted in connection with the Information should be considered as limited to the contents of theprospectus and the registration document and not extending to the contents of this Report.
By accessing this Report, you agree to be bound by the foregoing limitations.
Disclaimer
3© Oliver Wyman, Preliminary version
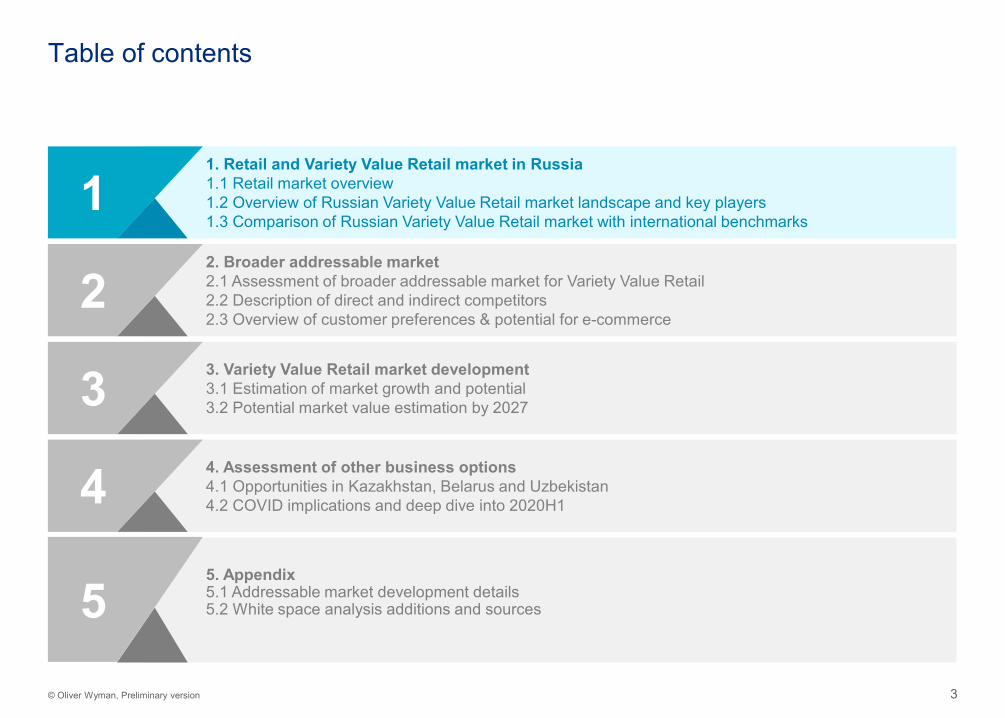
3. Variety Value Retail market development 553.1 Estimation of market growth and potential 573.2 Potential market value estimation by 2027 713
2. Broader addressable market 212.1 Assessment of broader addressable market for Variety Value Retail 232.2 Description of direct and indirect competitors 342.3 Overview of customer preferences & potential for e-commerce
2
1. Retail and Variety Value Retail market in Russia 21.1 Retail market overview 41.2 Overview of Russian Variety Value Retail market landscape and key players 121.3 Comparison of Russian Variety Value Retail market with international benchmarks 15
1
Table of contents
5. Appendix5.1 Addressable market development details5.2 White space analysis additions and sources5
4. Assessment of other business options 844.1 Opportunities in Kazakhstan, Belarus and Uzbekistan 864.2 COVID implications and deep dive into 2020H1 4
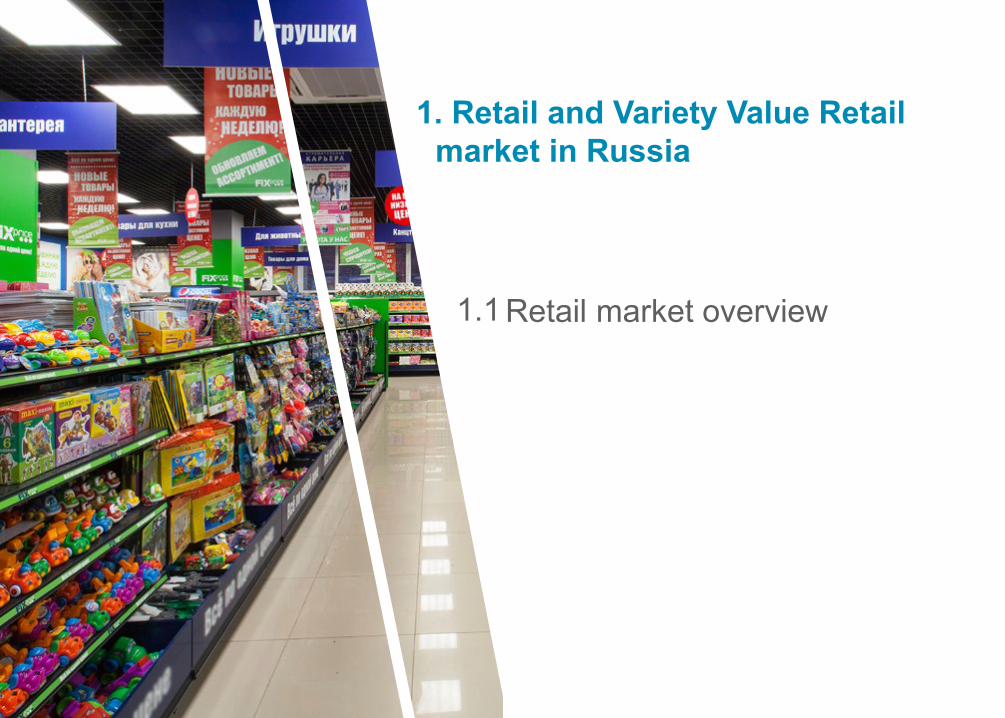
Retail market overview1.1
1. Retail and Variety Value Retail market in Russia
5© Oliver Wyman, Preliminary version
The Russian retail market has been significantly impacted by COVID-19 crisis, but expected to recover and turn to growth in the upcoming years
• The Russian retail market has been steadily growing for the past 5 years with 5.0% CAGR and reached 518 BN USD1 in 2019
• COVID-19 crisis caused a major decrease in sales of non-food assortment across all channels, which made the market lag behind the pre-COVID forecasts
• Variety Value Retail market is the fastest growing channel from a low base on the Russian retail accounting for 0.5% of total retail market in 2019 and expected to more than double its size by 2024
• E-commerce on of the fastest growing channels of Russian retail for the past 5 years. COVID-19 even accelerated this growth, which is expected to allow E-commerce to become one of the leading channels and more than double its size by 2024
1. Exchange rate: 1 USD = 64.9 RUB in 2019 as defined by Euromonitor
6© Oliver Wyman, Preliminary version
Estimated
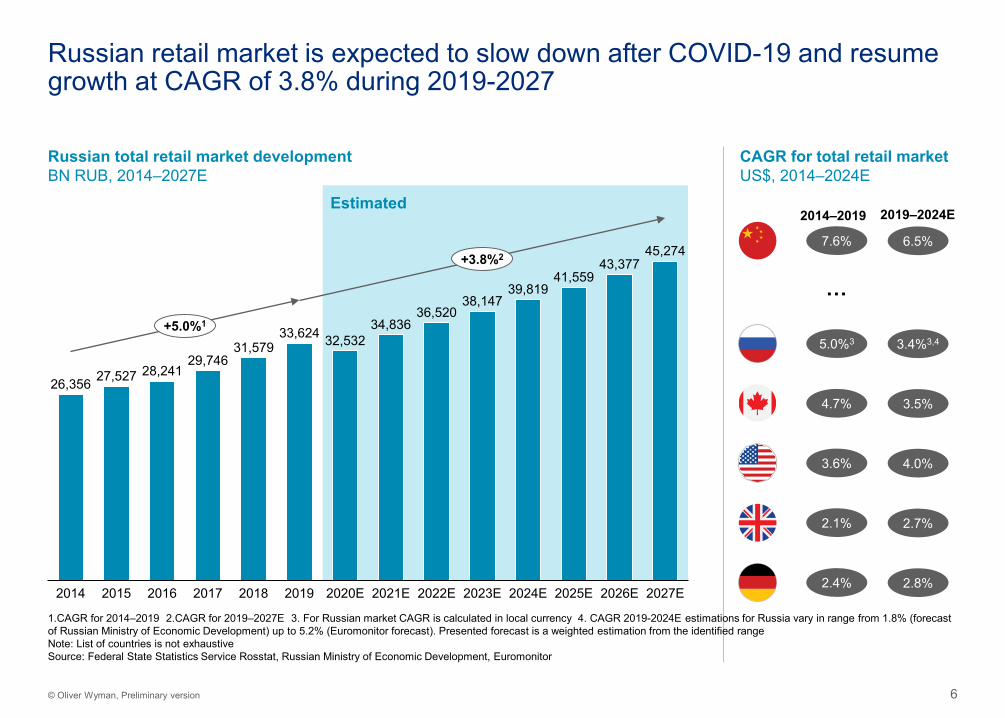
Russian retail market is expected to slow down after COVID-19 and resume growth at CAGR of 3.8% during 2019-2027
Russian total retail market developmentBN RUB, 2014–2027E
CAGR for total retail market US$, 2014–2024E
26,356 27,527 28,24129,746
31,57933,624 32,532
34,83636,520
38,14739,819
41,55943,377
45,274
2020E2014 2019 2026E2015 2018 2021E2017 2027E2016 2022E 2023E 2024E 2025E
+5.0%1
+3.8%2
1.CAGR for 2014–2019 2.CAGR for 2019–2027E 3. For Russian market CAGR is calculated in local currency 4. CAGR 2019-2024E estimations for Russia vary in range from 1.8% (forecast of Russian Ministry of Economic Development) up to 5.2% (Euromonitor forecast). Presented forecast is a weighted estimation from the identified rangeNote: List of countries is not exhaustive Source: Federal State Statistics Service Rosstat, Russian Ministry of Economic Development, Euromonitor
5.0%3
3.6%
2.4%
4.7%
2.1%
7.6%
…
3.4%3,4
4.0%
2.8%
3.5%
2.7%
6.5%
2014–2019 2019–2024E
7© Oliver Wyman, Preliminary version
Estimated
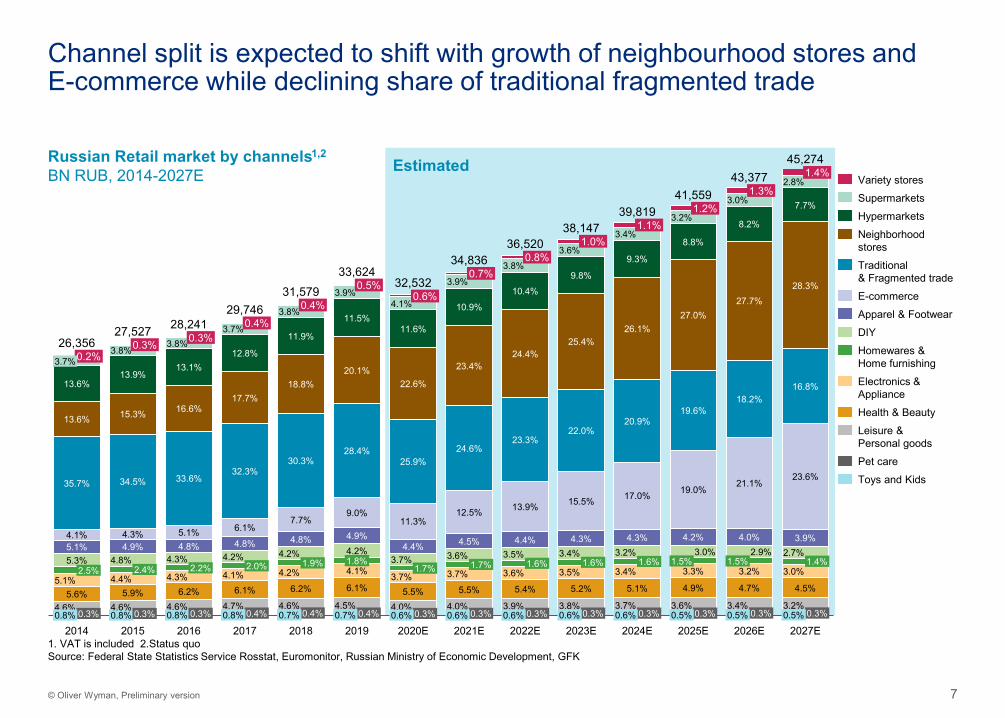
Channel split is expected to shift with growth of neighbourhood stores and E-commerce while declining share of traditional fragmented trade
Russian Retail market by channels1,2
BN RUB, 2014-2027E
35.7%
2021E
0.2%3.7%
2.5%
27,527
17.0%
5.3%
2016
5.1%
13.6%
13.6%
4.1%4.8%
2015
8.2%
5.1%
18.8%
13.9%
3.8%
5.6%
0.8%
1.4%
4.4%
4.0%4.6% 0.3%
23.6%
0.8%
0.8%
4.5%
4.9%
0.8%
3.0%
2014
1.9%
0.3%
4.2%
0.3%
2.4%
13.9%
15.3%
34.5%
4.3%
3.7%
4.8%
4.6%
32.3%
17.7%
0.3%
3.8%
2026E
13.1%
16.6%
33.6%
4.1%
5.1%
4.3%
26.1%
2.2% 2.0%
12.8%
4.3%4.5%6.2%
4.1%
2020E
4.6%
6.1%
0.3%
5.5%
0.4%
4.8%
10.9%
2017
3.2%6.1%
4.7%0.4%0.8%
4.6%
0.4%3.8%
11.9%
2024E
30.3%
7.7%
4.8%4.2%
4.2%
6.2%
0.4%
18.2%
0.7%
2018
0.5%3.9%
11.5%
20.1%
28.4%
9.0%
4.9%
1.4%
1.5%4.2%1.8%
3.6%4.1%
6.1%
0.4%0.7%
9.3%
2019
0.6%
11.6%
15.5%
22.6%
25.9%
11.3%
4.4%3.7%
1.7%3.7%
5.5%
0.3%0.6%
0.7%3.9%
23.4%
24.6%
5.2%
12.5%
4.5%3.6%
1.7%3.7%
4.0%
9.8%
0.3%
2027E0.6%
3.8%
2.8%
10.4%
24.4%
23.3%
4.4%3.5%
1.6%
5.4%
3.9%0.3%0.6%
2022E
4.7%
1.0%3.6%
25.4%
22.0%
4.3%3.4%
1.6%3.5%
3.8%0.3%0.6%
2023E
5.9%
3.4%
20.9%
4.3%3.2%
1.6%3.4%
5.1%
3.7%0.3%0.6%
1.2%
31,579
3.2%
8.8%
27.0%
19.6%
19.0%
4.2%3.0%
3.3%
4.9%
3.6%0.3%0.5%
2025E
36,520
1.3%
1.1%
27.7%
21.1%
4.0%2.9%
1.5%3.2%
3.4%0.3%0.5%
7.7%
28.3%
2.7%
16.8%
3.9%
0.3%0.5%
26,35628,241
29,746
33,62432,532
34,836
38,14739,819
41,55943,377
45,274
3.0%
1. VAT is included 2.Status quoSource: Federal State Statistics Service Rosstat, Euromonitor, Russian Ministry of Economic Development, GFK
SupermarketsVariety stores
Neighborhoodstores
Hypermarkets
Traditional& Fragmented trade
Electronics & Appliance
E-commerce
Leisure & Personal goods
Apparel & FootwearDIY
Toys and Kids
Homewares & Home furnishing
Health & Beauty
Pet care
8© Oliver Wyman, Preliminary version
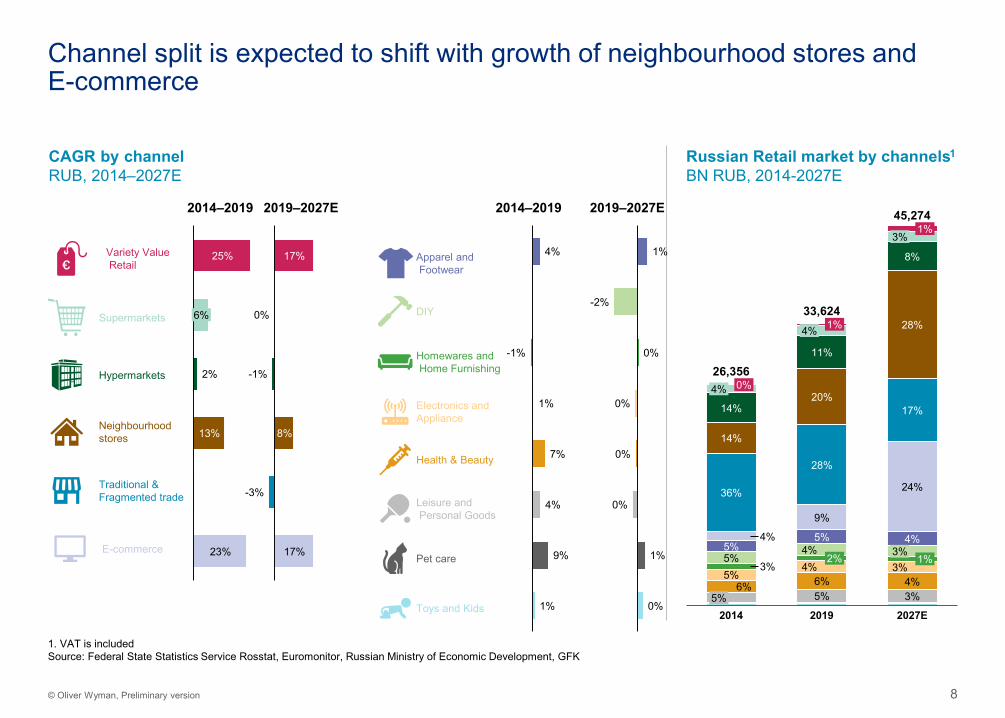
Russian Retail market by channels1
BN RUB, 2014-2027ECAGR by channelRUB, 2014–2027E
1. VAT is includedSource: Federal State Statistics Service Rosstat, Euromonitor, Russian Ministry of Economic Development, GFK
DIY
Homewares andHome Furnishing
Supermarkets
Electronics and Appliance
Hypermarkets
Health & Beauty
Neighbourhoodstores
Leisure andPersonal Goods
Apparel andFootwear
Toys and Kids
Pet care
Traditional &Fragmented trade
Variety ValueRetail
E-commerce
2014–2019 2019–2027E2014–2019 2019–2027E
2%
23%
13%
25%
6% 0%
-1%
-3%
17%
8%
17%
4%
-1%
1%
7%
4%
9%
1%
1%
-2%
0%
0%
0%
0%
1%
0%
26,356
6%
0%
5%
4%
3%
36%
4%
14%
28%
4%4%
5%5%
3%
1%
6%5%
2014
4%
11%
4%
20%
1%
28%
9%
5%
2%
5%
2019
3%
14%
4%
17%
24%
3%
8%
3%
2027E
33,624
45,274
1%
Channel split is expected to shift with growth of neighbourhood stores and E-commerce
1.2
1. Retail and Variety Value Retail market in Russia
Overview of Russian Variety Value Retail market landscape and key players
10© Oliver Wyman, Preliminary version
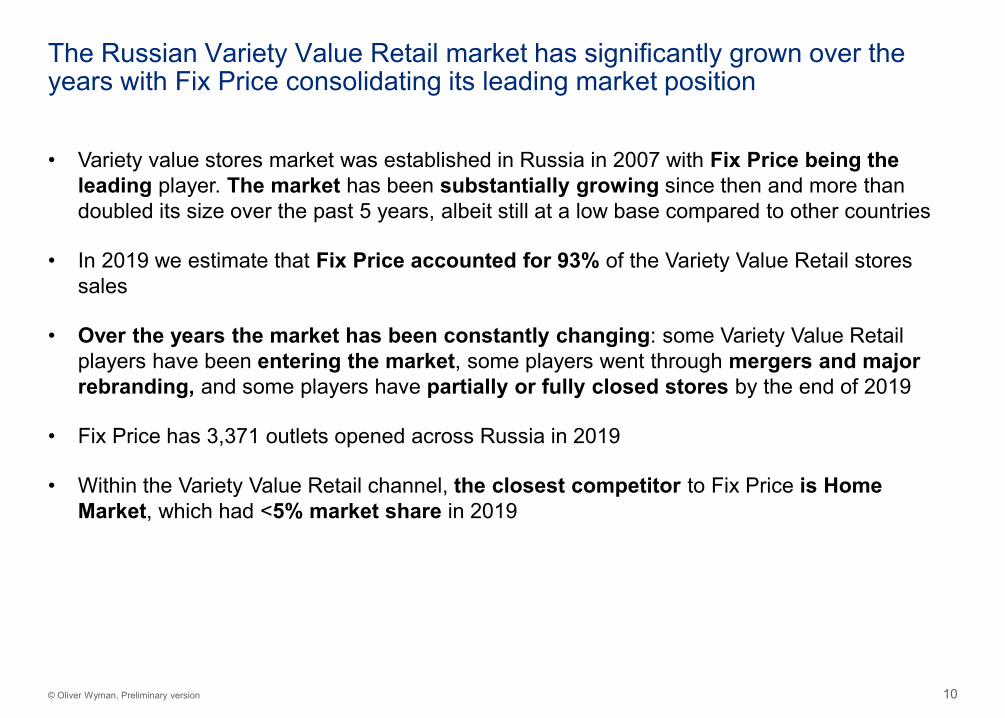
The Russian Variety Value Retail market has significantly grown over the years with Fix Price consolidating its leading market position
• Variety value stores market was established in Russia in 2007 with Fix Price being the leading player. The market has been substantially growing since then and more than doubled its size over the past 5 years, albeit still at a low base compared to other countries
• In 2019 we estimate that Fix Price accounted for 93% of the Variety Value Retail stores sales
• Over the years the market has been constantly changing: some Variety Value Retail players have been entering the market, some players went through mergers and major rebranding, and some players have partially or fully closed stores by the end of 2019
• Fix Price has 3,371 outlets opened across Russia in 2019
• Within the Variety Value Retail channel, the closest competitor to Fix Price is Home Market, which had <5% market share in 2019
11© Oliver Wyman, Preliminary version
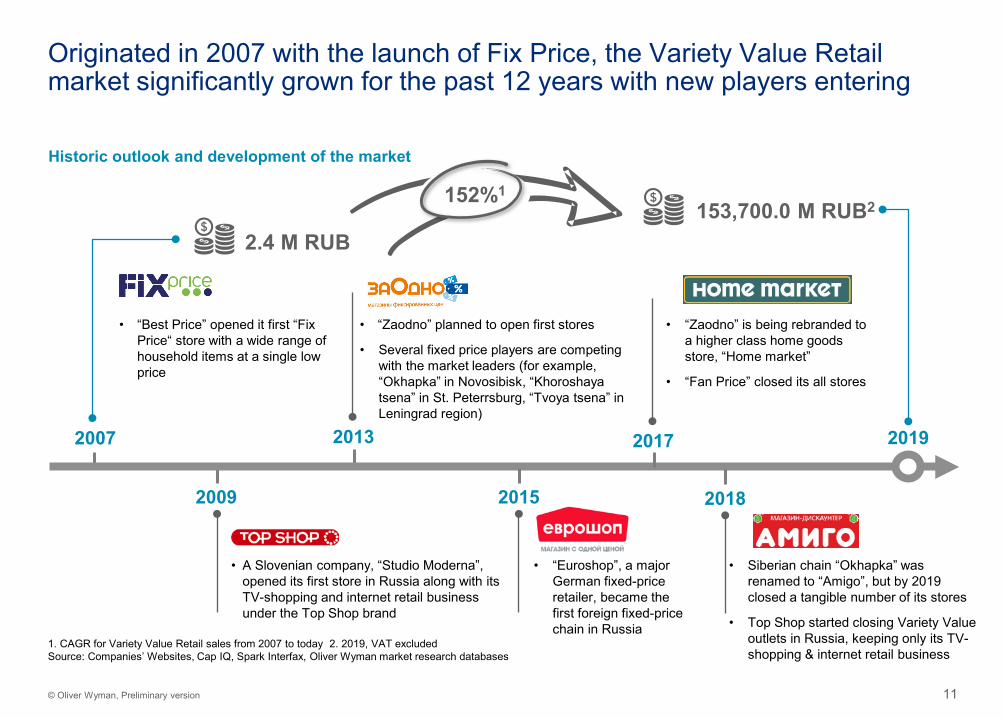
Historic outlook and development of the market
Originated in 2007 with the launch of Fix Price, the Variety Value Retail market significantly grown for the past 12 years with new players entering
• A Slovenian company, “Studio Moderna”, opened its first store in Russia along with its TV-shopping and internet retail business under the Top Shop brand
2019
2009
• “Best Price” opened it first “Fix Price“ store with a wide range of household items at a single low price
2007
2015
• “Zaodno” is being rebranded to a higher class home goods store, “Home market”
• “Fan Price” closed its all stores
2017
• “Euroshop”, a major German fixed-price retailer, became the first foreign fixed-price chain in Russia
• “Zaodno” planned to open first stores
• Several fixed price players are competing with the market leaders (for example, “Okhapka” in Novosibisk, “Khoroshaya tsena” in St. Peterrsburg, “Tvoya tsena” in Leningrad region)
2013
2.4 M RUB153,700.0 M RUB2
1. CAGR for Variety Value Retail sales from 2007 to today 2. 2019, VAT excludedSource: Companies’ Websites, Cap IQ, Spark Interfax, Oliver Wyman market research databases
69%152%1
2018
• Siberian chain “Okhapka” was renamed to “Amigo”, but by 2019 closed a tangible number of its stores
• Top Shop started closing Variety Value outlets in Russia, keeping only its TV-shopping & internet retail business
12© Oliver Wyman, Preliminary version
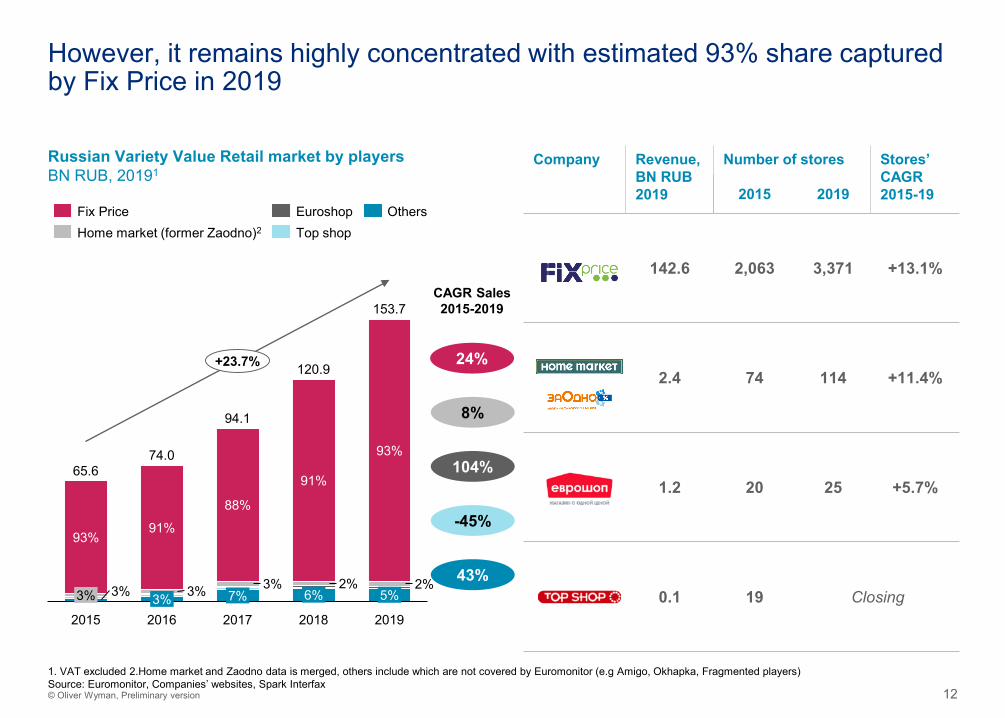
Company Revenue, BN RUB 2019
Number of stores Stores’CAGR 2015-192015 2019
142.6 2,063 3,371 +13.1%
2.4 74 114 +11.4%
1.2 20 25 +5.7%
0.1 19 Closing
However, it remains highly concentrated with estimated 93% share captured by Fix Price in 2019
93%
6%
93%
3% 3%
2015
3%
2016
88%
5%3%
153.7
7%
20173%
2%
2018
91%
2%
2019
91%65.6
74.0
94.1
120.9+23.7%
Russian Variety Value Retail market by playersBN RUB, 20191
1. VAT excluded 2.Home market and Zaodno data is merged, others include which are not covered by Euromonitor (e.g Amigo, Okhapka, Fragmented players) Source: Euromonitor, Companies’ websites, Spark Interfax
Fix PriceHome market (former Zaodno)2
Euroshop OthersTop shop
CAGR Sales 2015-2019
24%
8%
104%
-45%
43%
Comparison of Russian Variety Value Retail market with international benchmarks
1.3
1. Retail and Variety Value Retail market in Russia
14© Oliver Wyman, Preliminary version
Russian Variety Value Retail market is underpenetrated comparing to mature benchmarks and might have significant potential for further development
• The Russian Variety Value Retail market is one of the fastest growing retail channels in Russia and is still at the development stage comparing to mature international benchmarks
• Russian Variety Value Retail market is still lagging behind developed countries in volume and potential consumption per capita, suggesting further potential for growth
• We estimate that the market stays underpenetrated in terms of both number of stores and selling space per capita, flagging potential opportunity for expansion for Variety Value Retail players
• Countries with mature Variety Value Retail markets demonstrate higher level of competition with leading players generally occupying significantly lower share of the market than Fix Price has in Russia
15© Oliver Wyman, Preliminary version
Country1
VVR5
CAGR 09’-14’
VVR market size2, 2019 M USD
VVR CAGR 14’-19’
Retail CAGR 14’-19’
VVRmarket size2, 2024 M USD
VVR CAGR 19’-24’
Retail CAGR 19’-24’
VVRmarket size2, 2025 M USD
VVR CAGR 20’-25’
Retail CAGR 20’-25’
Consumption per capita, 2019 USD
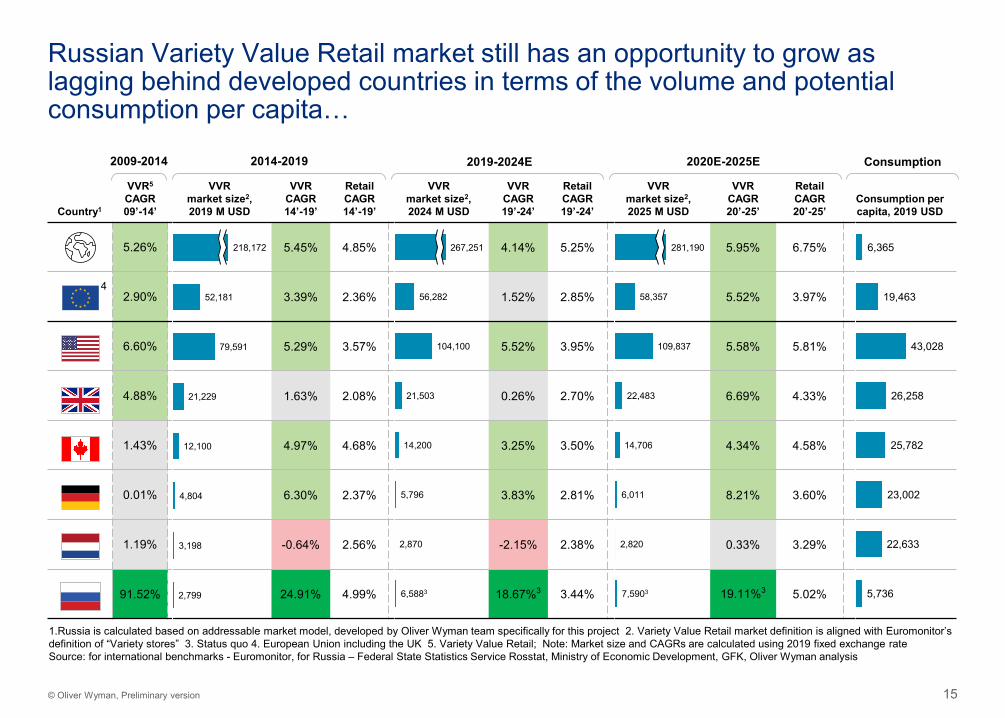
5.26% 5.45% 4.85% 4.14% 5.25% 5.95% 6.75%
2.90% 3.39% 2.36% 1.52% 2.85% 5.52% 3.97%
6.60% 5.29% 3.57% 5.52% 3.95% 5.58% 5.81%
4.88% 1.63% 2.08% 0.26% 2.70% 6.69% 4.33%
1.43% 4.97% 4.68% 3.25% 3.50% 4.34% 4.58%
0.01% 6.30% 2.37% 3.83% 2.81% 8.21% 3.60%
1.19% -0.64% 2.56% -2.15% 2.38% 0.33% 3.29%
91.52% 24.91% 4.99% 18.67%3 3.44% 19.11%3 5.02%
Russian Variety Value Retail market still has an opportunity to grow as lagging behind developed countries in terms of the volume and potential consumption per capita…
52,181
79,591
21,229
12,100
4,804
3,198
2,799
218,172
56,282
104,100
21,503
14,200
5,796
2,870
267,251
6,5883
6,365
19,463
43,028
26,258
25,782
23,002
22,633
5,736
1.Russia is calculated based on addressable market model, developed by Oliver Wyman team specifically for this project 2. Variety Value Retail market definition is aligned with Euromonitor’s definition of “Variety stores” 3. Status quo 4. European Union including the UK 5. Variety Value Retail; Note: Market size and CAGRs are calculated using 2019 fixed exchange rateSource: for international benchmarks - Euromonitor, for Russia – Federal State Statistics Service Rosstat, Ministry of Economic Development, GFK, Oliver Wyman analysis
4
Consumption2014-2019 2019-2024E2009-2014 2020E-2025E
58,357
109,837
22,483
14,706
6,011
2,820
281,190
7,5903
16© Oliver Wyman, Preliminary version
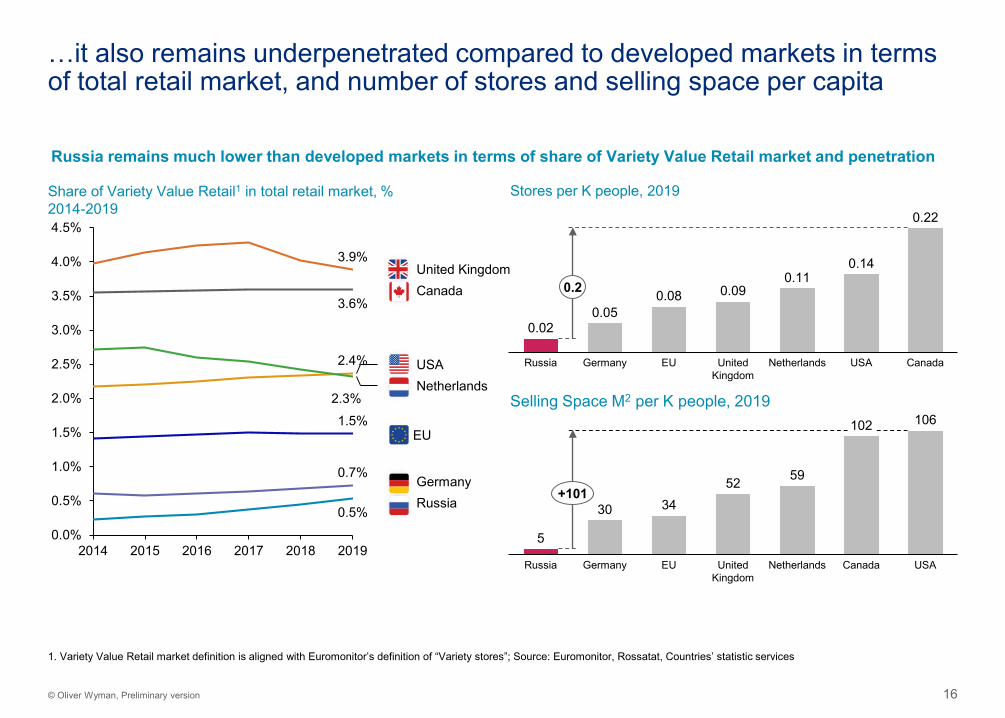
…it also remains underpenetrated compared to developed markets in terms of total retail market, and number of stores and selling space per capita
Share of Variety Value Retail1 in total retail market, %2014-2019
0.0%
0.5%
1.0%
1.5%
2.0%
2.5%
3.0%
3.5%
4.0%
4.5%
2014 2015 2016 2017 2018 2019
3.6%
0.5%
1.5%
2.4%
2.3%
3.9%
0.7%
Russia
Canada
USANetherlands
Germany
United Kingdom
Russia remains much lower than developed markets in terms of share of Variety Value Retail market and penetration
5
30 3452 59
102 106
GermanyRussia EU United Kingdom
Netherlands Canada USA
+101
0.020.05
0.08 0.090.11
0.14
0.22
Russia CanadaGermany EU NetherlandsUnited Kingdom
USA
0.2
Selling Space M2 per K people, 2019
Stores per K people, 2019
1. Variety Value Retail market definition is aligned with Euromonitor’s definition of “Variety stores”; Source: Euromonitor, Rossatat, Countries’ statistic services
EU
17© Oliver Wyman, Preliminary version
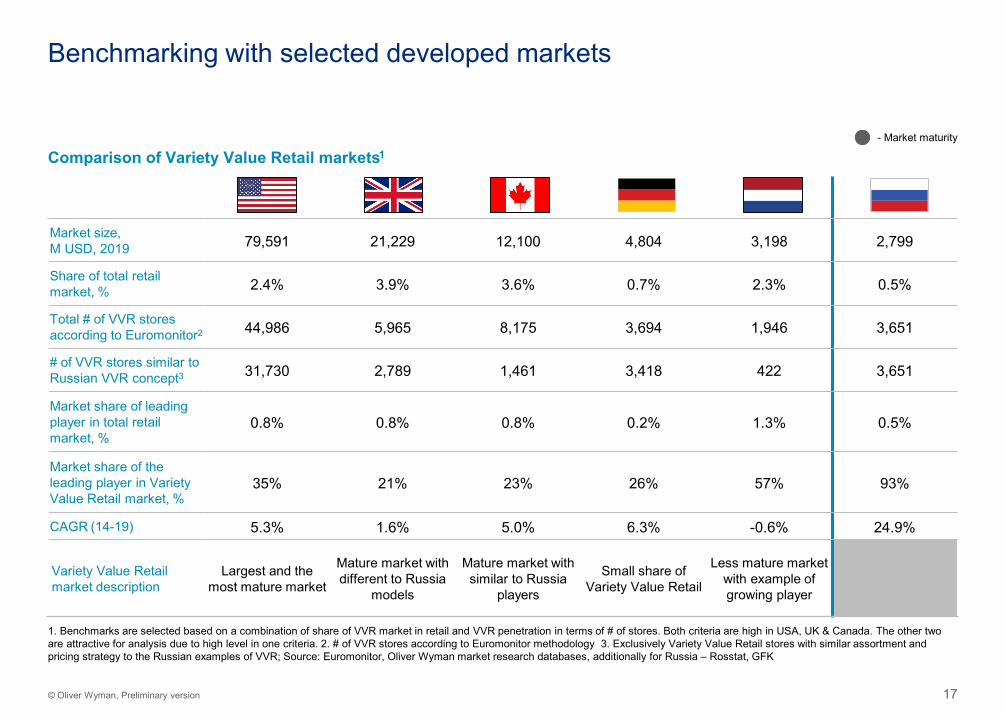
Benchmarking with selected developed markets
Comparison of Variety Value Retail markets1
Market size,M USD, 2019 79,591 21,229 12,100 4,804 3,198 2,799
Share of total retail market, % 2.4% 3.9% 3.6% 0.7% 2.3% 0.5%
Total # of VVR stores according to Euromonitor2 44,986 5,965 8,175 3,694 1,946 3,651
# of VVR stores similar to Russian VVR concept3 31,730 2,789 1,461 3,418 422 3,651
Market share of leading player in total retail market, %
0.8% 0.8% 0.8% 0.2% 1.3% 0.5%
Market share of the leading player in Variety Value Retail market, %
35% 21% 23% 26% 57% 93%
CAGR (14-19) 5.3% 1.6% 5.0% 6.3% -0.6% 24.9%
Variety Value Retail market description
Largest and the most mature market
Mature market with different to Russia
models
Mature market with similar to Russia
players
Small share of Variety Value Retail
Less mature market with example of growing player
- Market maturity
1. Benchmarks are selected based on a combination of share of VVR market in retail and VVR penetration in terms of # of stores. Both criteria are high in USA, UK & Canada. The other two are attractive for analysis due to high level in one criteria. 2. # of VVR stores according to Euromonitor methodology 3. Exclusively Variety Value Retail stores with similar assortment and pricing strategy to the Russian examples of VVR; Source: Euromonitor, Oliver Wyman market research databases, additionally for Russia – Rosstat, GFK
18© Oliver Wyman, Preliminary version
3. Variety Value Retail market development 553.1 Estimation of market growth and potential 573.2 Potential market value estimation by 2027 713
2. Broader addressable market 212.1 Assessment of broader addressable market for Variety Value Retail 232.2 Description of direct and indirect competitors 342.3 Overview of customer preferences & potential for e-commerce
2
1. Retail and Variety Value Retail market in Russia 21.1 Retail market overview 41.2 Overview of Russian Variety Value Retail market landscape and key players 121.3 Comparison of Russian Variety Value Retail market with international benchmarks 15
1
Table of contents
5. Appendix5.1 Addressable market development details5.2 White space analysis additions and sources5
4. Assessment of other business options 844.1 Opportunities in Kazakhstan, Belarus and Uzbekistan 864.2 COVID implications and deep dive into 2020H1 4
Assessment of broader addressable market for Variety Value Retail
2.1
2. Broader addressable market
20© Oliver Wyman, Preliminary version
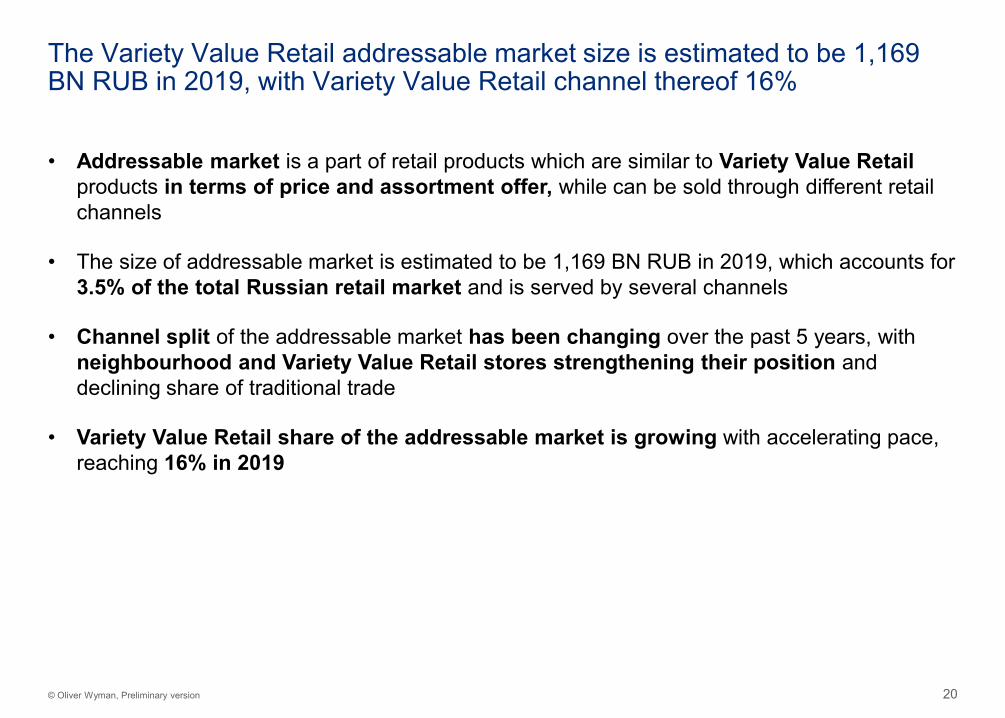
The Variety Value Retail addressable market size is estimated to be 1,169 BN RUB in 2019, with Variety Value Retail channel thereof 16%
• Addressable market is a part of retail products which are similar to Variety Value Retail products in terms of price and assortment offer, while can be sold through different retail channels
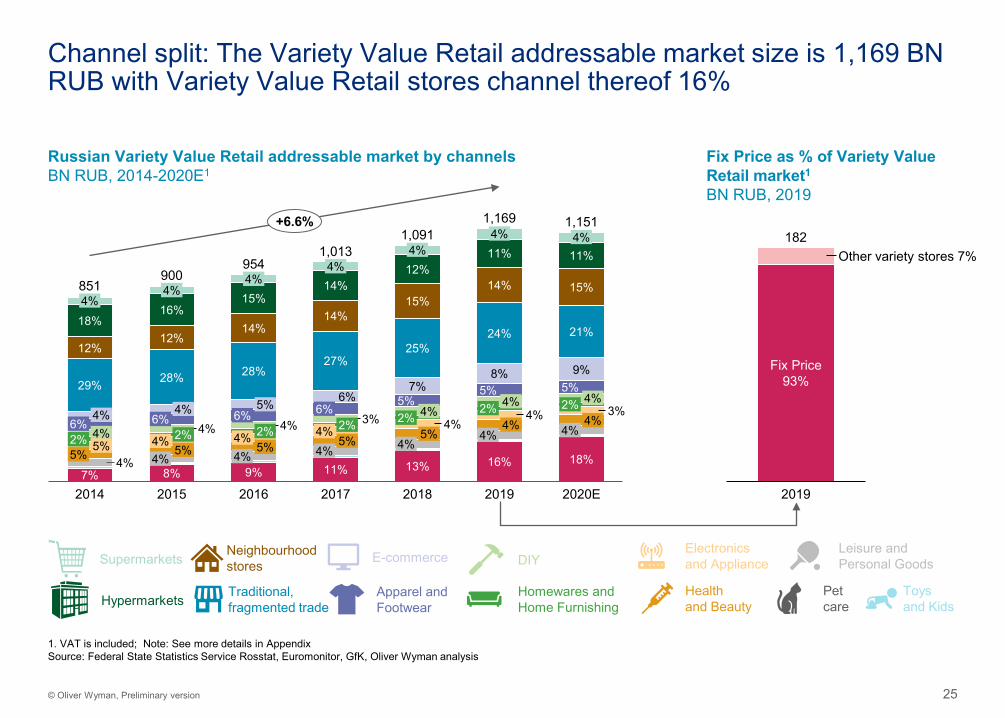
• The size of addressable market is estimated to be 1,169 BN RUB in 2019, which accounts for 3.5% of the total Russian retail market and is served by several channels
• Channel split of the addressable market has been changing over the past 5 years, withneighbourhood and Variety Value Retail stores strengthening their position and declining share of traditional trade
• Variety Value Retail share of the addressable market is growing with accelerating pace, reaching 16% in 2019
21© Oliver Wyman, Preliminary version
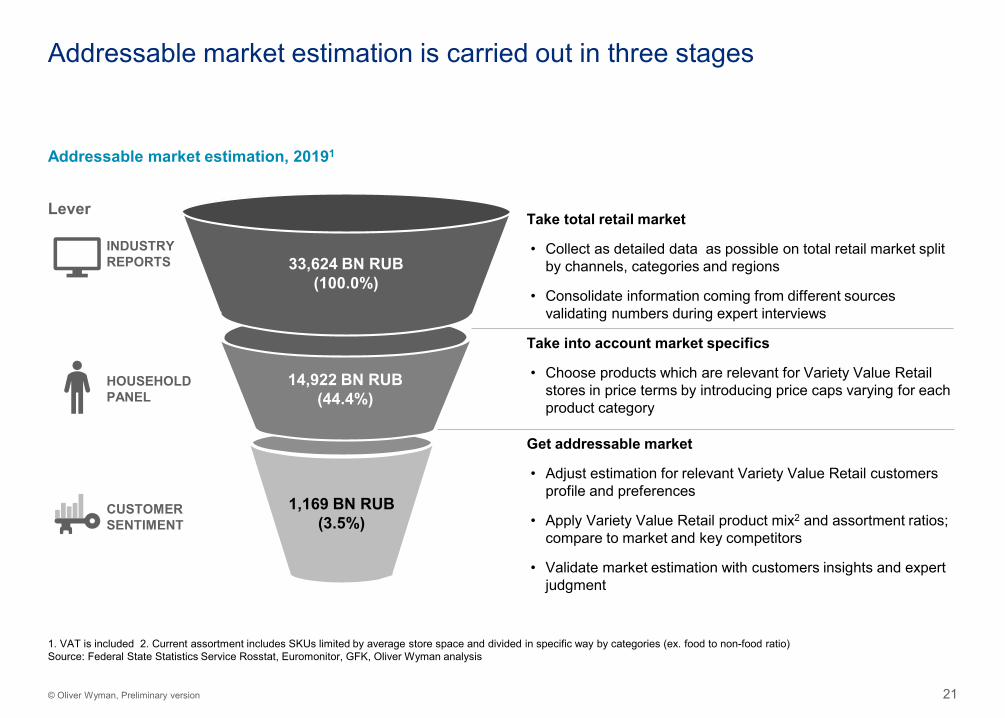
Addressable market estimation is carried out in three stages
Lever
1. VAT is included 2. Current assortment includes SKUs limited by average store space and divided in specific way by categories (ex. food to non-food ratio)Source: Federal State Statistics Service Rosstat, Euromonitor, GFK, Oliver Wyman analysis
1,169 BN RUB(3.5%)
14,922 BN RUB(44.4%)
33,624 BN RUB(100.0%)
Take total retail market
• Collect as detailed data as possible on total retail market split by channels, categories and regions
• Consolidate information coming from different sources validating numbers during expert interviews
Take into account market specifics
• Choose products which are relevant for Variety Value Retail stores in price terms by introducing price caps varying for each product category
Get addressable market
• Adjust estimation for relevant Variety Value Retail customers profile and preferences
• Apply Variety Value Retail product mix2 and assortment ratios; compare to market and key competitors
• Validate market estimation with customers insights and expert judgment
INDUSTRYREPORTS
HOUSEHOLD PANEL
CUSTOMERSENTIMENT
Addressable market estimation, 20191
22© Oliver Wyman, Preliminary version
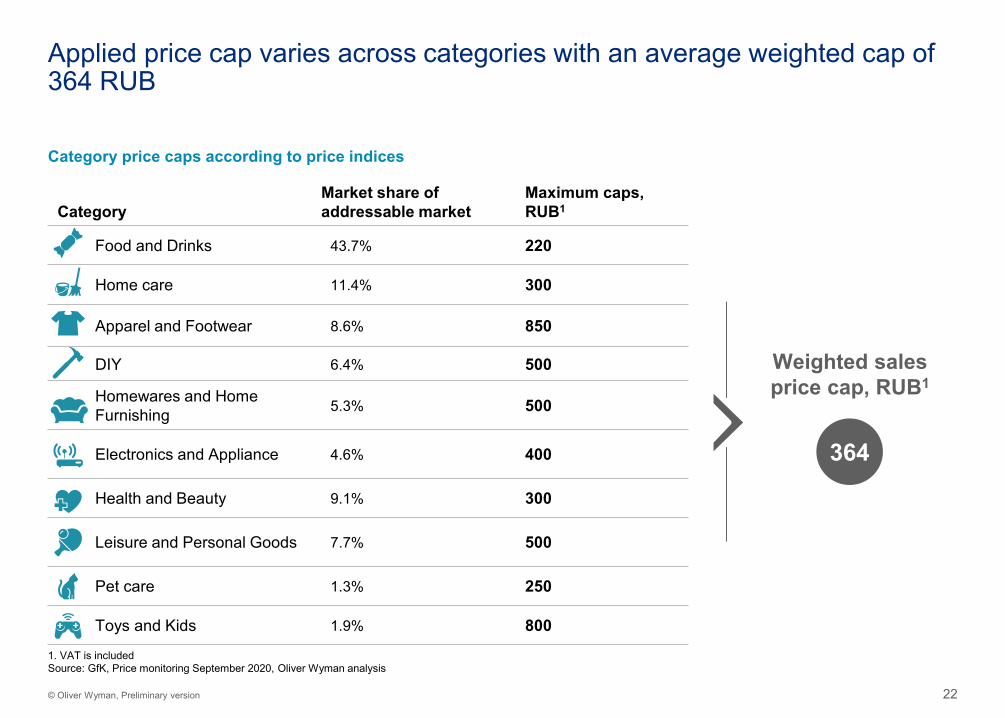
CategoryMarket share of addressable market
Maximum caps, RUB1
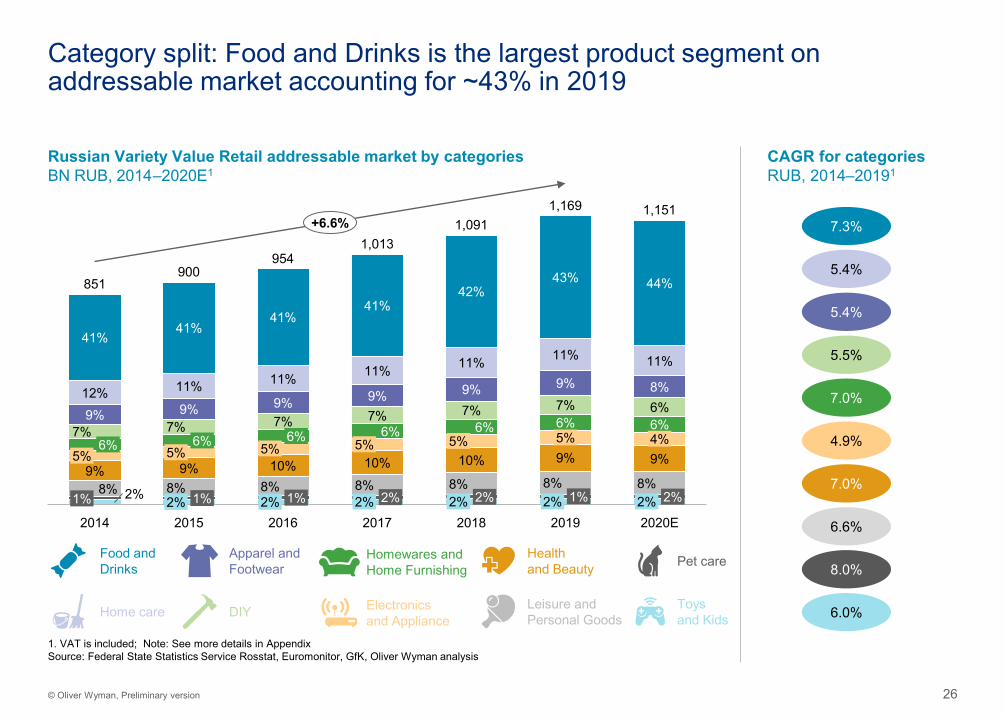
Food and Drinks 43.7% 220
Home care 11.4% 300
Apparel and Footwear 8.6% 850
DIY 6.4% 500
Homewares and Home Furnishing 5.3% 500
Electronics and Appliance 4.6% 400
Health and Beauty 9.1% 300
Leisure and Personal Goods 7.7% 500
Pet care 1.3% 250
Toys and Kids 1.9% 800
Category price caps according to price indices
1. VAT is includedSource: GfK, Price monitoring September 2020, Oliver Wyman analysis
Weighted sales price cap, RUB1
364
Applied price cap varies across categories with an average weighted cap of 364 RUB
23© Oliver Wyman, Preliminary version
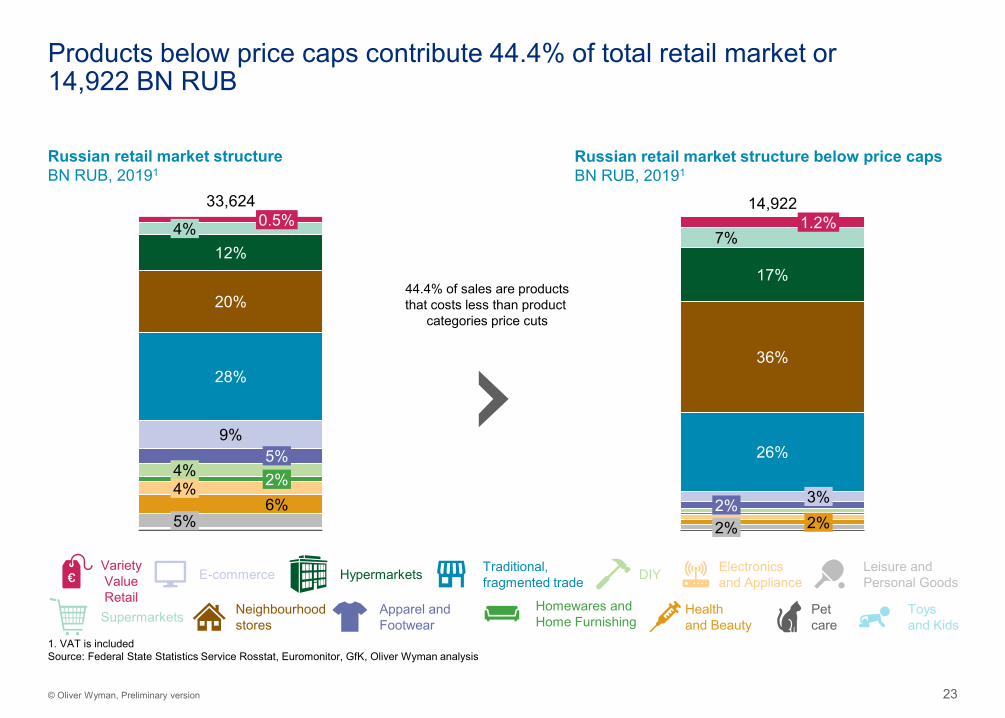
Products below price caps contribute 44.4% of total retail market or 14,922 BN RUB
Russian retail market structureBN RUB, 20191
Russian retail market structure below price capsBN RUB, 20191
44.4% of sales are productsthat costs less than product
categories price cuts
DIYE-commerce
Homewares andHome FurnishingSupermarkets
Electronicsand ApplianceHypermarkets
Health and Beauty
Neighbourhoodstores
Leisure andPersonal Goods
Apparel andFootwear
Toys and Kids
Petcare
Traditional,fragmented trade
1. VAT is includedSource: Federal State Statistics Service Rosstat, Euromonitor, GfK, Oliver Wyman analysis
VarietyValueRetail
4%12%
28%
0.5%
20%
9%
4%5%2%4%6%
5%
33,624
2%
17%
7%1.2%
26%
36%
2%3%
2%
14,922
24© Oliver Wyman, Preliminary version
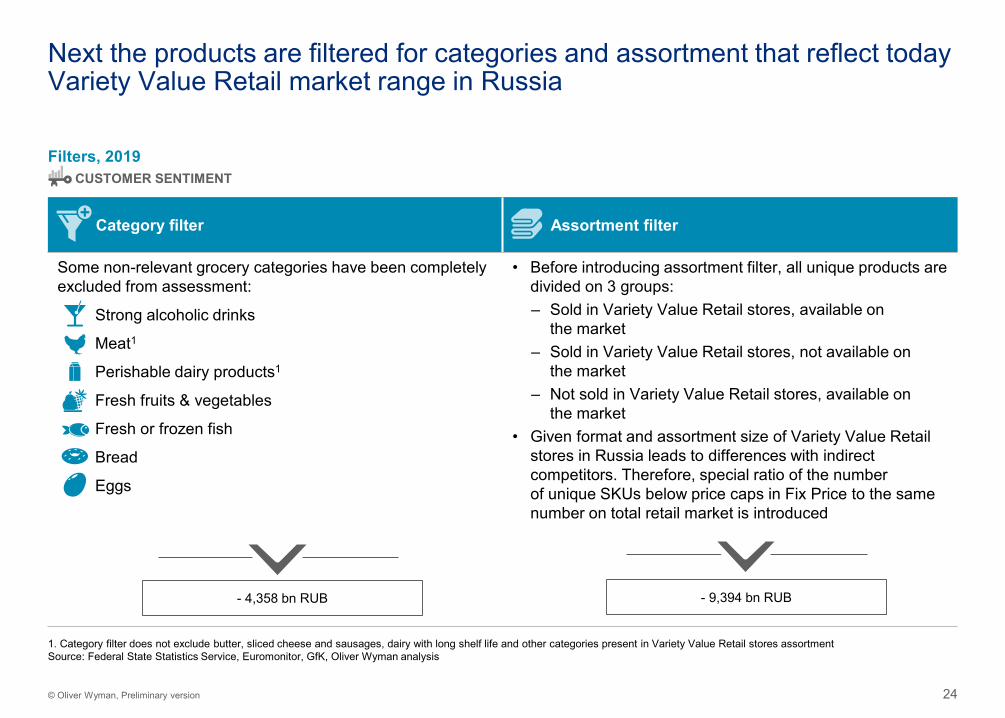
Category filter Assortment filter
Some non-relevant grocery categories have been completely excluded from assessment:
Strong alcoholic drinks
Meat1
Perishable dairy products1
Fresh fruits & vegetables
Fresh or frozen fish
Bread
Eggs
• Before introducing assortment filter, all unique products are divided on 3 groups: – Sold in Variety Value Retail stores, available on
the market– Sold in Variety Value Retail stores, not available on
the market– Not sold in Variety Value Retail stores, available on
the market• Given format and assortment size of Variety Value Retail
stores in Russia leads to differences with indirect competitors. Therefore, special ratio of the number of unique SKUs below price caps in Fix Price to the same number on total retail market is introduced
Next the products are filtered for categories and assortment that reflect today Variety Value Retail market range in Russia
Filters, 2019CUSTOMER SENTIMENT
- 4,358 bn RUB - 9,394 bn RUB
1. Category filter does not exclude butter, sliced cheese and sausages, dairy with long shelf life and other categories present in Variety Value Retail stores assortmentSource: Federal State Statistics Service, Euromonitor, GfK, Oliver Wyman analysis
25© Oliver Wyman, Preliminary version
Channel split: The Variety Value Retail addressable market size is 1,169 BN RUB with Variety Value Retail stores channel thereof 16%
Russian Variety Value Retail addressable market by channelsBN RUB, 2014-2020E1
2016
4%
18%
12%
6%
2018
2%
14%
2015
6%
5%
3%
7%
5%
12%
20149%
11%
4%16%
28%
14%
4%
8%
6%4%2%
2017
4%
11%5% 4%4%
5%
4%15%
4%
14%
4%
28%
5%
2%
16%
4%5%
4%
4%
27%
1,151
6%6%
4%5%
15%
4%
12%
25%
7%
4%2%2% 4%5%
4%
13%
4%11%
14%
24%
8%5%
4%29%
4%
4%4%
4%
2019
4%
15%
21%
9%5%
4%2%
1,091
3%4%
4%
18%
2020E
4%851
900954
1,013
1,169
2%
+6.6%
Fix Price as % of Variety Value Retail market1
BN RUB, 2019
182
2019
Fix Price93%
Other variety stores 7%
DIYE-commerceSupermarketsElectronicsand Appliance
HypermarketsHealth and Beauty
Neighbourhoodstores
Leisure andPersonal Goods
Apparel andFootwear
Toys and Kids
Petcare
Traditional,fragmented trade
Homewares andHome Furnishing
1. VAT is included; Note: See more details in AppendixSource: Federal State Statistics Service Rosstat, Euromonitor, GfK, Oliver Wyman analysis
26© Oliver Wyman, Preliminary version
Category split: Food and Drinks is the largest product segment on addressable market accounting for ~43% in 2019
Russian Variety Value Retail addressable market by categoriesBN RUB, 2014–2020E1
CAGR for categoriesRUB, 2014–20191
1. VAT is included; Note: See more details in AppendixSource: Federal State Statistics Service Rosstat, Euromonitor, GfK, Oliver Wyman analysis
10%
7%
41%
12%9%
8%
2018
7%7%
1%
6%
11%
9%
2%
5%
8%
5%
2%
2014 2016
11%
9%
5%7%
6%5%
9%
9%
1%2% 2%
11%
6%
2015 2017
41%
11%
9%
8%
6%
10%
2%8%
1%
41%
11%
7%9%
10%
6%
8%2%
42%
5%
7%6%
8%2%
43%
9%
6%
9%5%
2%2019
44%
11%
8%
6%4%9%
8%2%1%
2020E
41%
851900
9541,013
1,0911,169 1,151
2%
+6.6%
DIY Electronics and Appliance
Leisure andPersonal Goods
Toys and KidsHome care
Food andDrinks
Apparel andFootwear
Homewares and Home Furnishing Pet careHealth
and Beauty
5.4%
5.5%
7.0%
4.9%
7.0%
6.6%
8.0%
6.0%
7.3%
5.4%
27© Oliver Wyman, Preliminary version
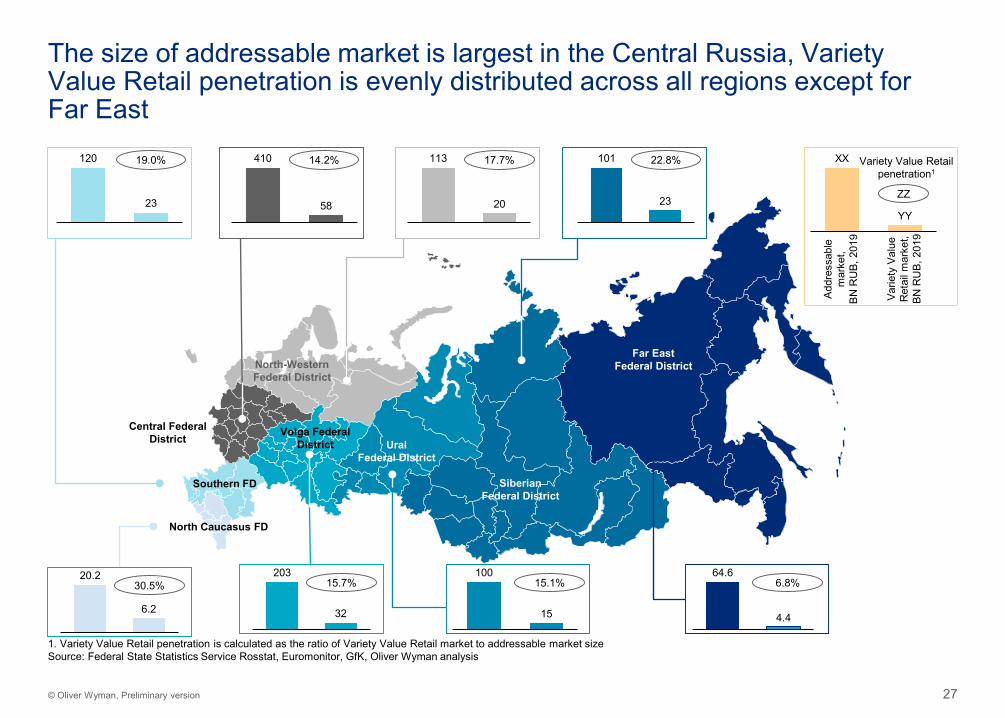
The size of addressable market is largest in the Central Russia, Variety Value Retail penetration is evenly distributed across all regions except for Far East
Central Federal District
410
58
120
23
100
15
101
23
203
32
113
20
Far EastFederal District
64.6
4.4
XX
YY
Addr
essa
ble
mar
ket,
BN R
UB,
201
9
Varie
ty V
alue
R
etai
l mar
ket,
BN R
UB,
201
9
ZZ
Variety Value Retail penetration1
19.0% 14.2% 17.7% 22.8%
6.8%15.1%15.7%
1. Variety Value Retail penetration is calculated as the ratio of Variety Value Retail market to addressable market sizeSource: Federal State Statistics Service Rosstat, Euromonitor, GfK, Oliver Wyman analysis
SiberianFederal District
UralFederal District
North-WesternFederal District
Central Federal District
North Caucasus FD
Volga Federal District
Southern FD
20.2
6.2
30.5%

2. Broader addressable market
Description of direct and indirect competitors
2.2
29© Oliver Wyman, Preliminary version
Fix Price has many indirect competitors on the Russian market, that have strong positioning and require additional strategic attention
• The current addressable market is mostly occupied by traditional trade and neighbourhood stores with discounters having 24% and 14% share respectively, while specialized Variety Value Retail stores have a 16% share as of 2019
• The share of traditional trade in the addressable market is rapidly declining over the years, mainly being crowded out by active growth of neighbourhood stores and Variety Value Retail
• Neighbourhood stores and discounters have the second highest share of the addressable market and show the most rapid expansion and sales growth over the recent years
• E-commerce channel also has high assortment relevance to Variety Value Retail in different product segments and is expected to continue growing with a strong pace accelerated by COVID-19
30© Oliver Wyman, Preliminary version
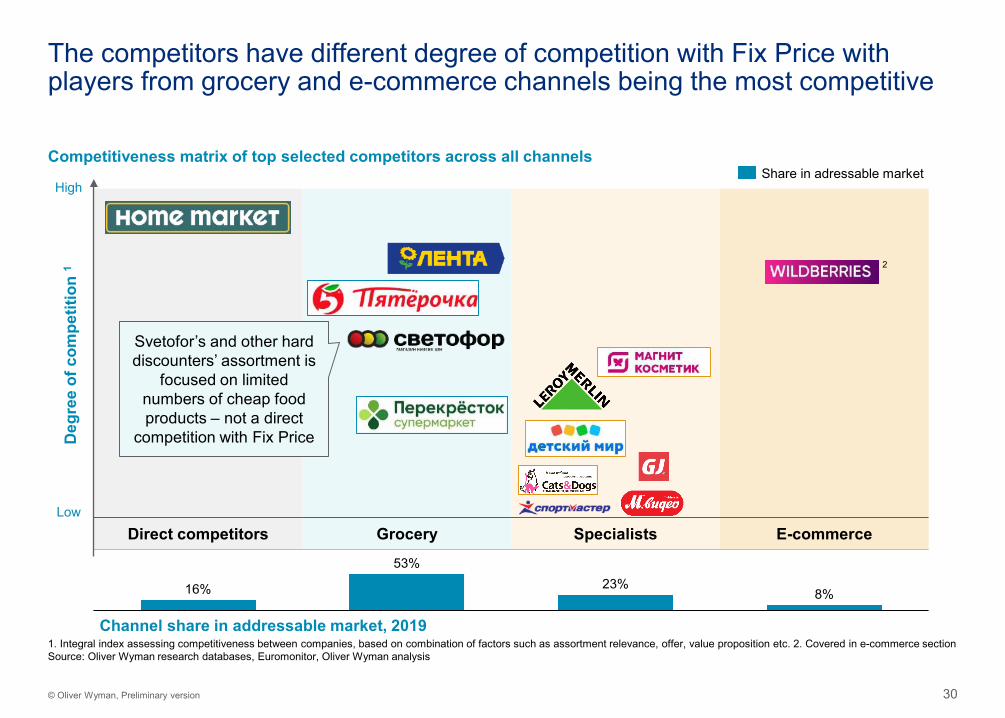
The competitors have different degree of competition with Fix Price with players from grocery and e-commerce channels being the most competitive
Competitiveness matrix of top selected competitors across all channels
Direct competitors Grocery Specialists E-commerce
16%
53%23%
8%
Share in adressable market
Deg
ree
of c
ompe
titio
n 1
High
Low
Channel share in addressable market, 2019
2
1. Integral index assessing competitiveness between companies, based on combination of factors such as assortment relevance, offer, value proposition etc. 2. Covered in e-commerce section Source: Oliver Wyman research databases, Euromonitor, Oliver Wyman analysis
Svetofor’s and other hard discounters’ assortment is
focused on limited numbers of cheap food products – not a direct
competition with Fix Price
2. Broader addressable market
Overview of customer preferences & potential for e-commerce
2.3
32© Oliver Wyman, Preliminary version
Variety Value Retail and neighbourhood stores compete for overlapping share of customer wallet
• Price and product quality remain the most important needs for customers
• All customer segments purchase at Variety Value Retail stores (including affluent)
• Most clients come to Fix Price in search of better price or to find specific products
• Fix Price is perceived as being convenient and having strong price offer, but weaker on assortment and quality side
• Fix Price customers perceive neighbourhood stores and hypermarkets as Fix Price alternatives but would also be willing to purchase additional categories at Fix Price
• Fix Price customers often purchase online and are as advanced as customers of other retailers
• E-commerce adoption is much higher in big cities, where customers are more digitallyadvanced, and logistics are cheaper
• There are still barriers for e-commerce adoption, limiting potential for growth in Variety Value Retail: inability to assess product quality before purchase, duration and cost of delivery in comparison to average ticket
• Leading e-commerce players have massive offer, but with bias towards “mainstream” product segment, not focusing on Variety Value Retail assortment
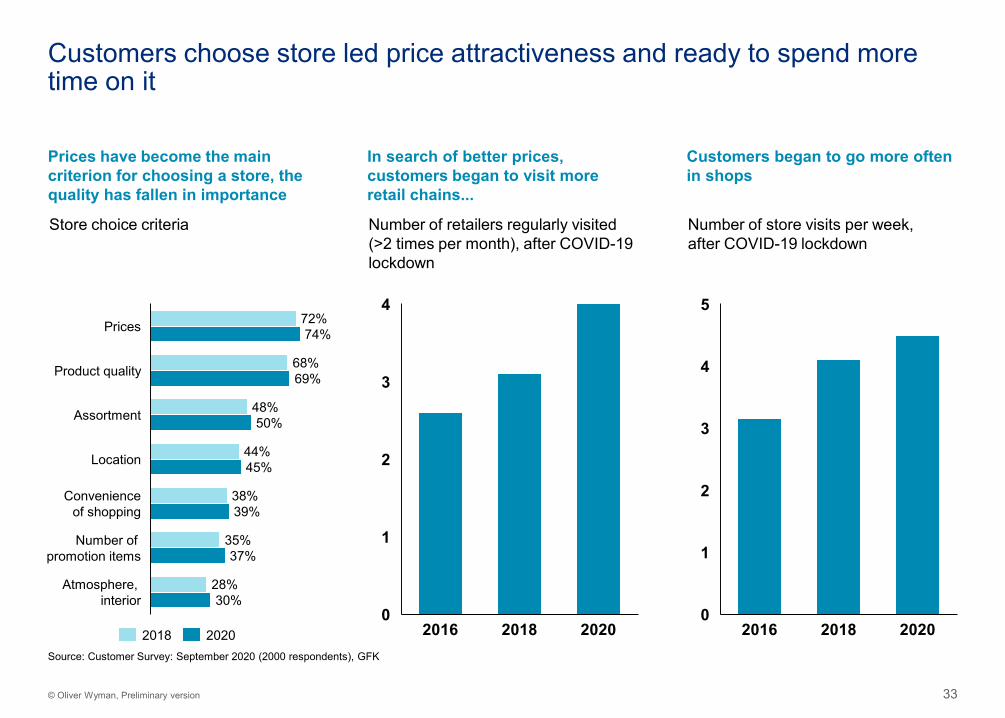
33© Oliver Wyman, Preliminary version
Prices have become the main criterion for choosing a store, the quality has fallen in importance
In search of better prices, customers began to visit more retail chains...
Customers began to go more often in shops
Number of store visits per week, after COVID-19 lockdown
Number of retailers regularly visited (>2 times per month), after COVID-19 lockdown
Store choice criteria
72%
68%
48%
44%
38%
35%
28%
74%
69%
50%
45%
39%
37%
30%
Assortment
Convenienceof shopping
Prices
Atmosphere, interior
Product quality
Location
Number of promotion items
2018 2020
4
0
1
2
3
20182016 20200
1
2
3
5
4
20182016 2020
Customers choose store led price attractiveness and ready to spend more time on it
Source: Customer Survey: September 2020 (2000 respondents), GFK
34© Oliver Wyman, Preliminary version
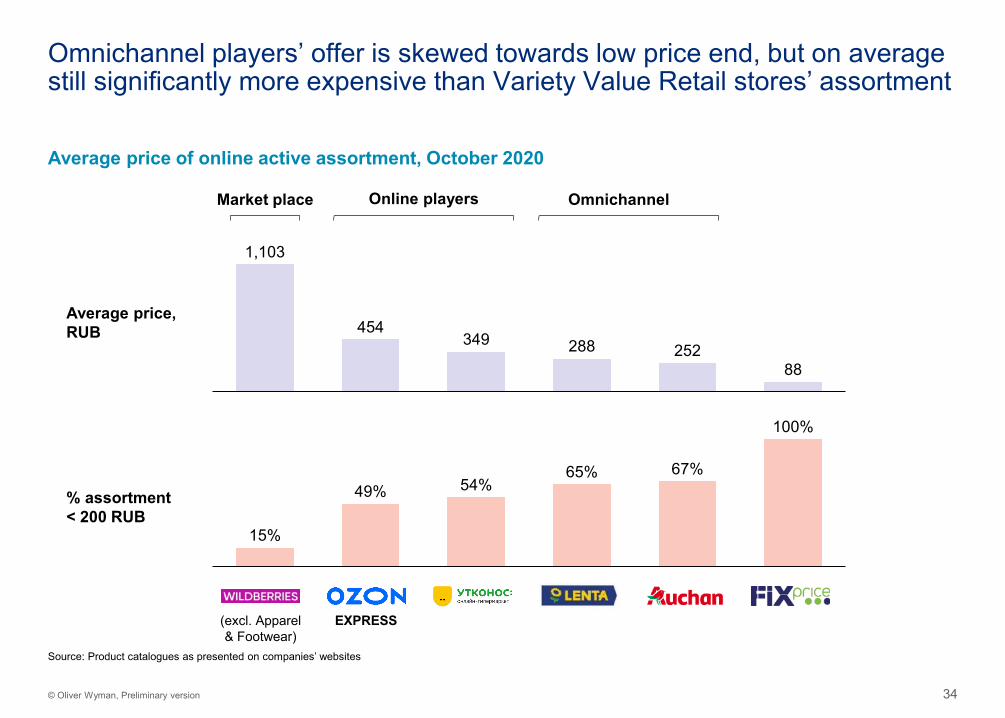
Omnichannel players’ offer is skewed towards low price end, but on average still significantly more expensive than Variety Value Retail stores’ assortment
Average price of online active assortment, October 2020
1,103
454349 288 252
88
15%
49% 54%65% 67%
100%
Average price,RUB
% assortment < 200 RUB
EXPRESS(excl. Apparel& Footwear)
Market place OmnichannelOnline players
Source: Product catalogues as presented on companies’ websites
35© Oliver Wyman, Preliminary version
3. Variety Value Retail market development 553.1 Estimation of market growth and potential 573.2 Potential market value estimation by 2027 713
2. Broader addressable market 212.1 Assessment of broader addressable market for Variety Value Retail 232.2 Description of direct and indirect competitors 342.3 Overview of customer preferences & potential for e-commerce
2
1. Retail and Variety Value Retail market in Russia 21.1 Retail market overview 41.2 Overview of Russian Variety Value Retail market landscape and key players 121.3 Comparison of Russian Variety Value Retail market with international benchmarks 15
1
Table of contents
5. Appendix5.1 Addressable market development details5.2 White space analysis additions and sources5
4. Assessment of other business options 844.1 Opportunities in Kazakhstan, Belarus and Uzbekistan 864.2 COVID implications and deep dive into 2020H1 4
Estimation of market growth and potential
3.1
3. Variety Value Retail market development
37© Oliver Wyman, Preliminary version
According to a bottom-up estimation, The Variety Value Retail market is underpenetrated, providing opportunity for expansion of this format
• Potential number of white spaces for Variety Value Retail stores is estimated leveraging experience of international benchmarks and applying methodology based on customer catchment areas with adjustments for high traffic places and economic viability
• The described approach results in estimation of Variety Value Retail market up to 11,700 stores across Russia - 3 times higher than the current number of opened stores
• Current market saturation level is different across regions, with Central and Volga districts being the most penetrated, while Far-East significantly lagging behind
• Moscow and Saint-Petersburg are the cities with highest absolute potential, together accounting for more than 1,500 additional white spaces currently not occupied by Variety Value stores
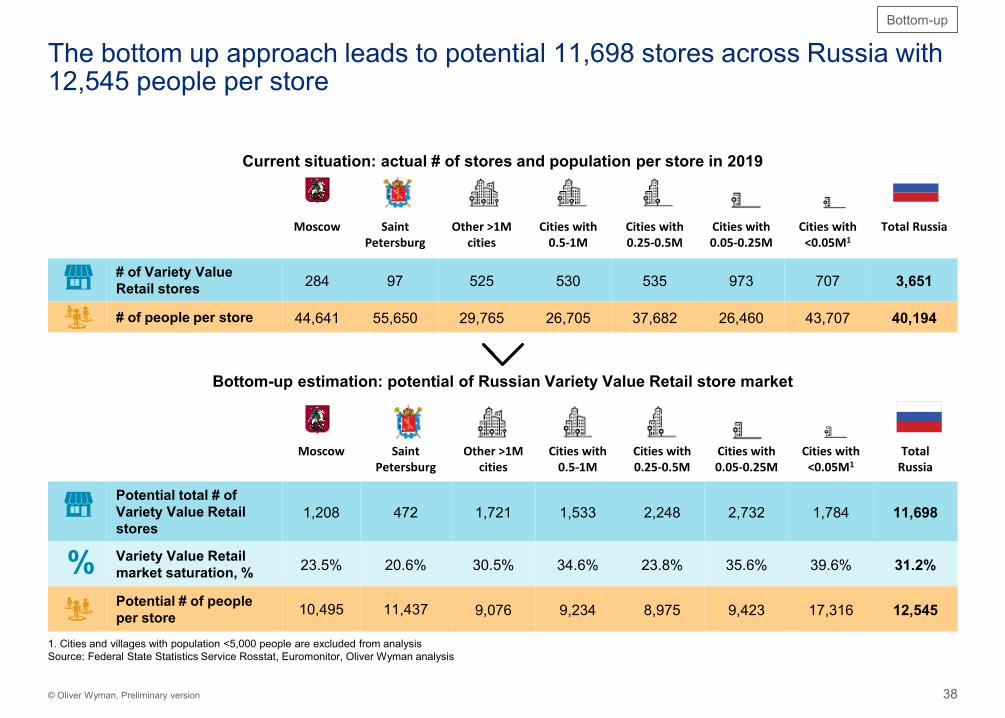
38© Oliver Wyman, Preliminary version
Current situation: actual # of stores and population per store in 2019
Moscow Saint Petersburg
Other >1M cities
Cities with 0.5-1M
Cities with 0.25-0.5M
Cities with 0.05-0.25M
Cities with <0.05M1
Total Russia
# of Variety Value Retail stores 284 97 525 530 535 973 707 3,651
# of people per store 44,641 55,650 29,765 26,705 37,682 26,460 43,707 40,194
The bottom up approach leads to potential 11,698 stores across Russia with 12,545 people per store
Bottom-up estimation: potential of Russian Variety Value Retail store market
Moscow Saint Petersburg
Other >1M cities
Cities with 0.5-1M
Cities with 0.25-0.5M
Cities with 0.05-0.25M
Cities with <0.05M1
Total Russia
Potential total # of Variety Value Retail stores
1,208 472 1,721 1,533 2,248 2,732 1,784 11,698
Variety Value Retail market saturation, % 23.5% 20.6% 30.5% 34.6% 23.8% 35.6% 39.6% 31.2%
Potential # of people per store 10,495 11,437 9,076 9,234 8,975 9,423 17,316 12,545
Bottom-up
1. Cities and villages with population <5,000 people are excluded from analysisSource: Federal State Statistics Service Rosstat, Euromonitor, Oliver Wyman analysis
%
39© Oliver Wyman, Preliminary version
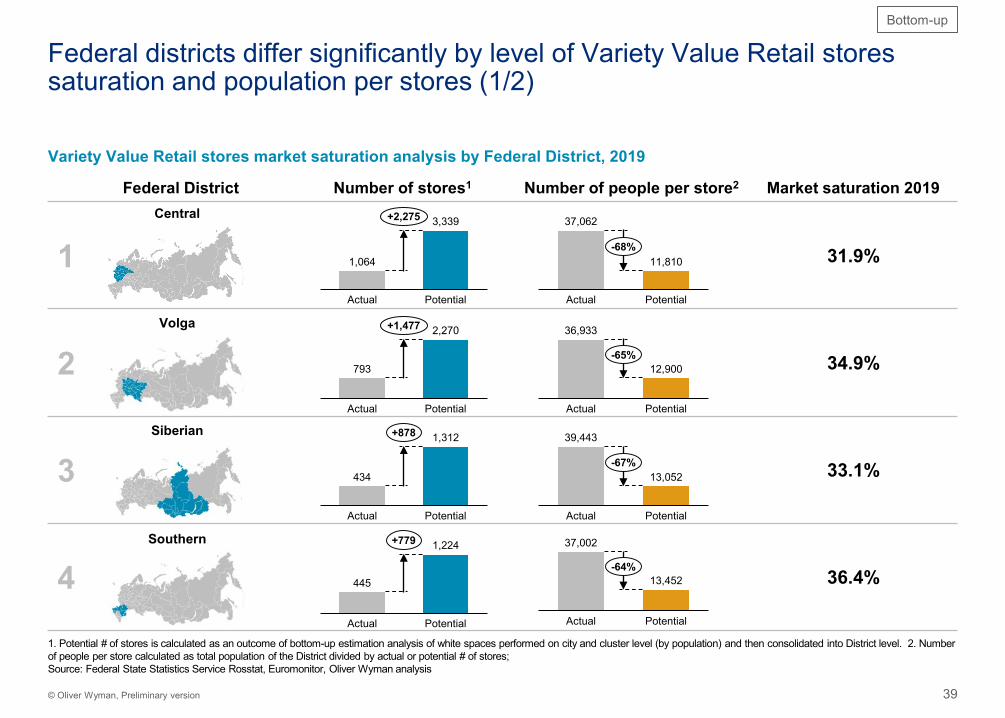
Federal districts differ significantly by level of Variety Value Retail stores saturation and population per stores (1/2)
Variety Value Retail stores market saturation analysis by Federal District, 2019
Federal District Number of stores1 Number of people per store2 Market saturation 2019
1 31.9%
2 34.9%
3 33.1%
4 36.4%
1,064
3,339
Actual Potential
+2,275 37,062
11,810
Actual Potential
-68%
Central
793
2,270
Actual Potential
+1,477
434
1,312
Actual Potential
+878
445
1,224
Actual Potential
+779
Bottom-up
Volga
Siberian
Southern
36,933
12,900
Actual Potential
-65%
39,443
13,052
Actual Potential
-67%
37,002
13,452
Actual Potential
-64%
1. Potential # of stores is calculated as an outcome of bottom-up estimation analysis of white spaces performed on city and cluster level (by population) and then consolidated into District level. 2. Number of people per store calculated as total population of the District divided by actual or potential # of stores; Source: Federal State Statistics Service Rosstat, Euromonitor, Oliver Wyman analysis
40© Oliver Wyman, Preliminary version
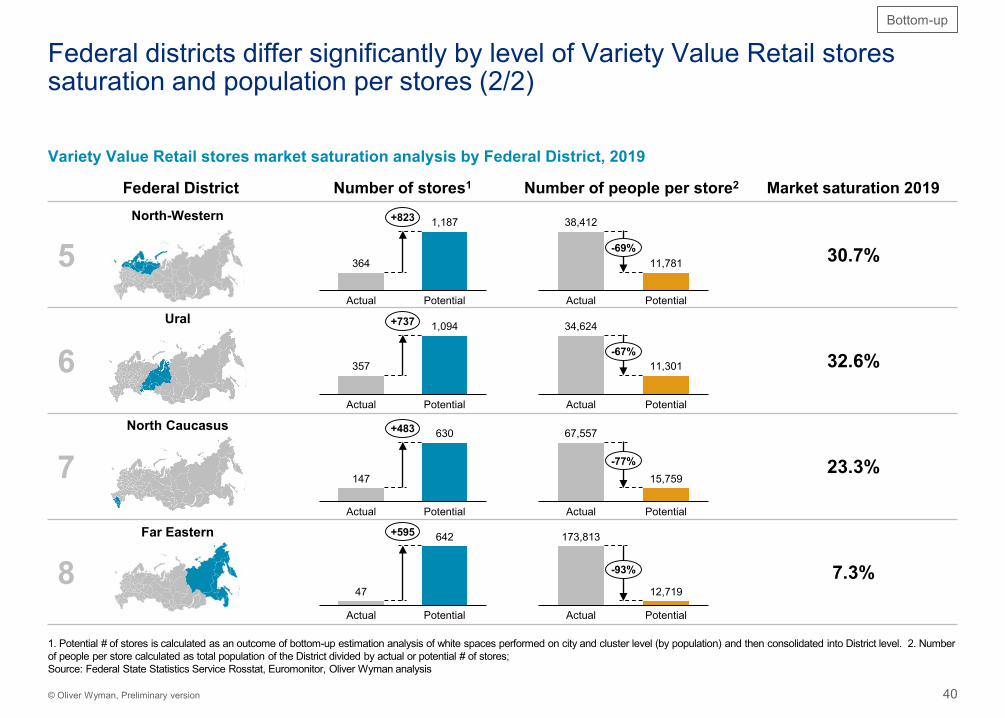
Federal District Number of stores1 Number of people per store2 Market saturation 2019
5 30.7%
6 32.6%
7 23.3%
8 7.3%
Federal districts differ significantly by level of Variety Value Retail stores saturation and population per stores (2/2)
Variety Value Retail stores market saturation analysis by Federal District, 2019
364
1,187
Actual Potential
+823
357
1,094
Actual Potential
+737
147
630
Actual Potential
+483
47
642
Actual Potential
+595
Bottom-up
Far Eastern
North-Western
Ural
North Caucasus
38,412
11,781
Actual Potential
-69%
34,624
11,301
Actual Potential
-67%
67,557
15,759
Actual Potential
-77%
173,813
12,719
Actual Potential
-93%
1. Potential # of stores is calculated as an outcome of bottom-up estimation analysis of white spaces performed on city and cluster level (by population) and then consolidated into District level. 2. Number of people per store calculated as total population of the District divided by actual or potential # of stores;Source: Federal State Statistics Service Rosstat, Euromonitor, Oliver Wyman analysis
41© Oliver Wyman, Preliminary version
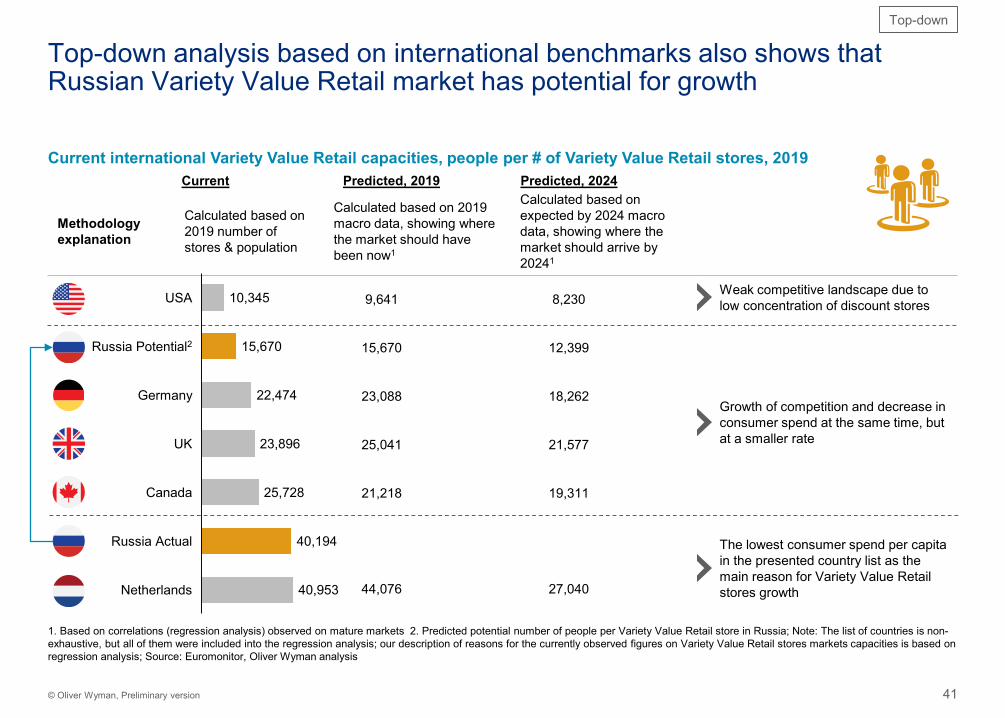
Top-down analysis based on international benchmarks also shows that Russian Variety Value Retail market has potential for growth
Current international Variety Value Retail capacities, people per # of Variety Value Retail stores, 2019
Weak competitive landscape due to low concentration of discount stores
Growth of competition and decrease in consumer spend at the same time, but at a smaller rate
The lowest consumer spend per capita in the presented country list as the main reason for Variety Value Retail stores growth
Current Predicted, 2019 Predicted, 2024
Methodology explanation
Calculated based on 2019 number of stores & population
Calculated based on 2019 macro data, showing where the market should have been now1
Calculated based on expected by 2024 macro data, showing where the market should arrive by 20241
10,345
15,670
22,474
23,896
25,728
40,194
40,953Netherlands
USA
Russia Potential2
Germany
UK
Canada
Russia Actual
9,641 8,230
25,041 21,577
44,076 27,040
15,670 12,399
23,088 18,262
21,218 19,311
Top-down
1. Based on correlations (regression analysis) observed on mature markets 2. Predicted potential number of people per Variety Value Retail store in Russia; Note: The list of countries is non-exhaustive, but all of them were included into the regression analysis; our description of reasons for the currently observed figures on Variety Value Retail stores markets capacities is based on regression analysis; Source: Euromonitor, Oliver Wyman analysis
3. Variety Value Retail stores market development
Potential market value estimation by 2027
3.2
43© Oliver Wyman, Preliminary version
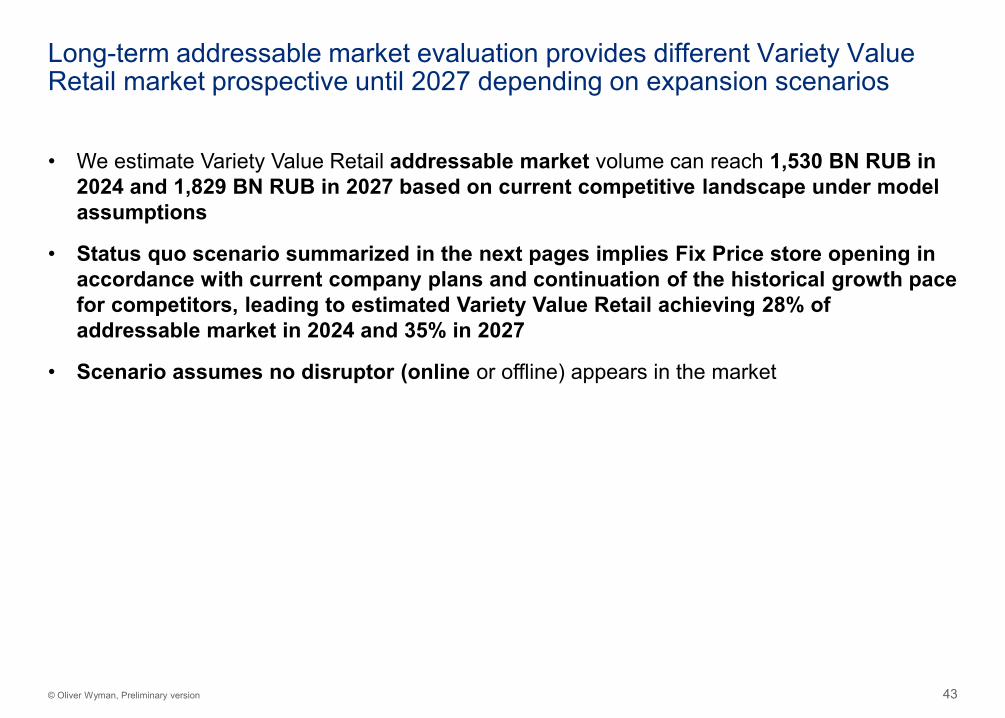
• We estimate Variety Value Retail addressable market volume can reach 1,530 BN RUB in 2024 and 1,829 BN RUB in 2027 based on current competitive landscape under model assumptions
• Status quo scenario summarized in the next pages implies Fix Price store opening in accordance with current company plans and continuation of the historical growth pace for competitors, leading to estimated Variety Value Retail achieving 28% of addressable market in 2024 and 35% in 2027
• Scenario assumes no disruptor (online or offline) appears in the market
Long-term addressable market evaluation provides different Variety Value Retail market prospective until 2027 depending on expansion scenarios
44© Oliver Wyman, Preliminary version
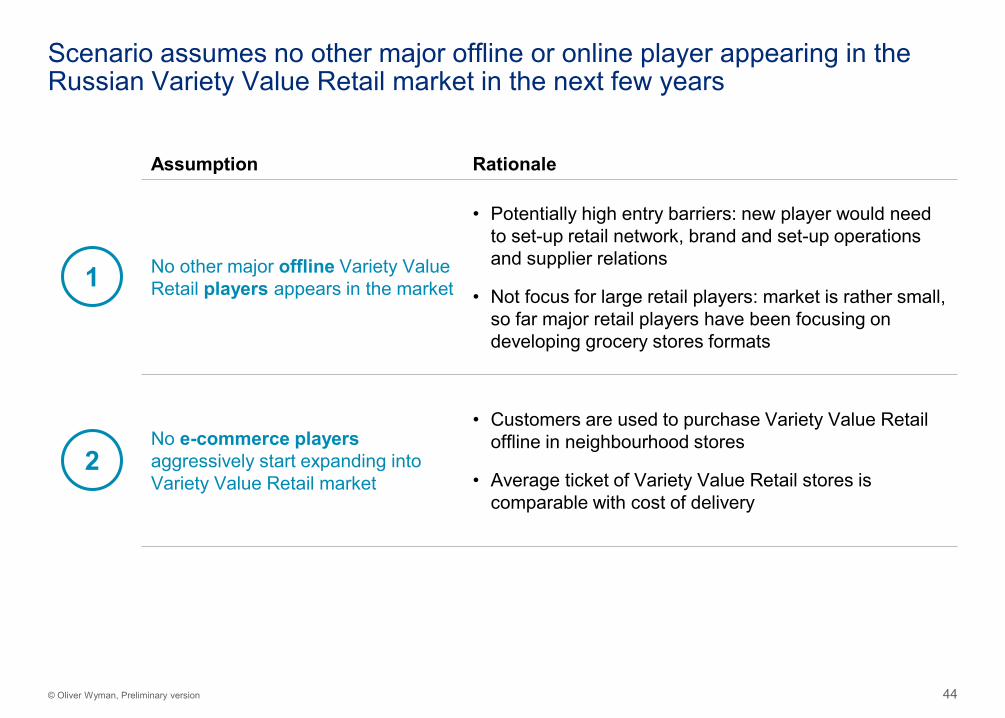
Scenario assumes no other major offline or online player appearing in the Russian Variety Value Retail market in the next few years
Assumption Rationale
No other major offline Variety Value Retail players appears in the market
• Potentially high entry barriers: new player would need to set-up retail network, brand and set-up operations and supplier relations
• Not focus for large retail players: market is rather small, so far major retail players have been focusing on developing grocery stores formats
No e-commerce players aggressively start expanding into Variety Value Retail market
• Customers are used to purchase Variety Value Retail offline in neighbourhood stores
• Average ticket of Variety Value Retail stores is comparable with cost of delivery
1
2
45© Oliver Wyman, Preliminary version
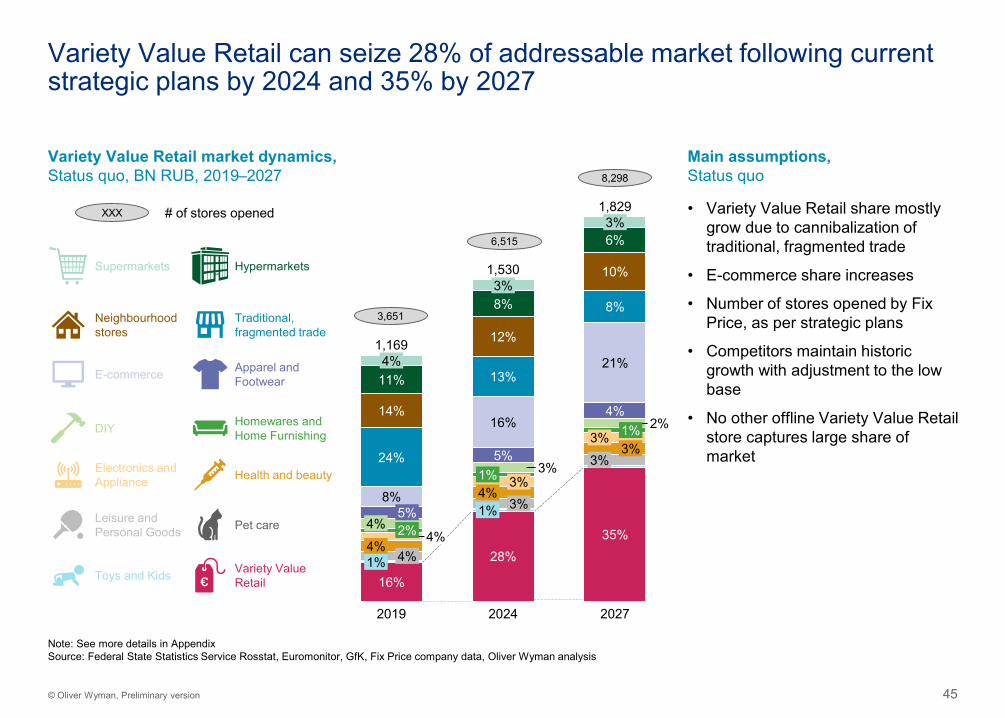
Variety Value Retail can seize 28% of addressable market following current strategic plans by 2024 and 35% by 2027
Variety Value Retail market dynamics,Status quo, BN RUB, 2019–2027
Main assumptions,Status quo
4%
24%
8%
2%4%
3%
4%4%1%
16%
3%
2019 2024
3%8%
12%
13%
1%16%
1,829
5%
4%
3%
5%
1% 3%4%
3%1%
28%
3%6%
10%
8%
21%
4%
11%
2%
3%
35%
1,530
2027
14%
1,169
3,651
6,515
DIY
E-commerce
Supermarkets
Electronics andAppliance
Hypermarkets
Health and beauty
Neighbourhood stores
Leisure andPersonal Goods
Apparel and Footwear
Toys and Kids
Pet care
Traditional, fragmented trade
Homewares and Home Furnishing
XXX # of stores opened
Variety Value Retail
• Variety Value Retail share mostly grow due to cannibalization of traditional, fragmented trade
• E-commerce share increases
• Number of stores opened by Fix Price, as per strategic plans
• Competitors maintain historic growth with adjustment to the low base
• No other offline Variety Value Retail store captures large share of market
Note: See more details in AppendixSource: Federal State Statistics Service Rosstat, Euromonitor, GfK, Fix Price company data, Oliver Wyman analysis
8,298
46© Oliver Wyman, Preliminary version
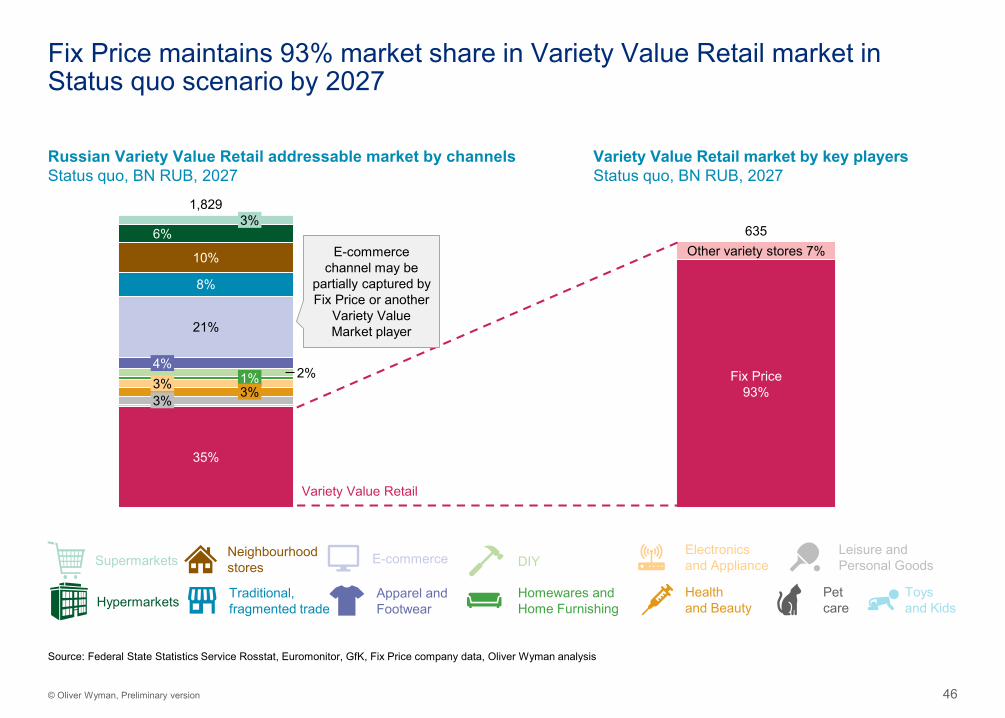
Fix Price maintains 93% market share in Variety Value Retail market in Status quo scenario by 2027
Russian Variety Value Retail addressable market by channelsStatus quo, BN RUB, 2027
3%
10%
4%
3%
6%
8%
21%
2%1%3% 3%
35%
1,829
Variety Value Retail market by key playersStatus quo, BN RUB, 2027
635
Fix Price93%
Other variety stores 7%
DIYE-commerceSupermarketsElectronicsand Appliance
HypermarketsHealth and Beauty
Neighbourhoodstores
Leisure andPersonal Goods
Apparel andFootwear
Toys and Kids
Petcare
Traditional,fragmented trade
Homewares andHome Furnishing
Variety Value Retail
Source: Federal State Statistics Service Rosstat, Euromonitor, GfK, Fix Price company data, Oliver Wyman analysis
E-commerce channel may be
partially captured by Fix Price or another
Variety Value Market player
47© Oliver Wyman, Preliminary version
45%
9%
43%
11%
20242019
9%7%
6%5%
8%1%2%
1,829
44%
9%
8%6%6%4%
9%
10%
8%2%2%
8%
6%
6%4%
10%
8%2%2%
2027
1,169
1,530
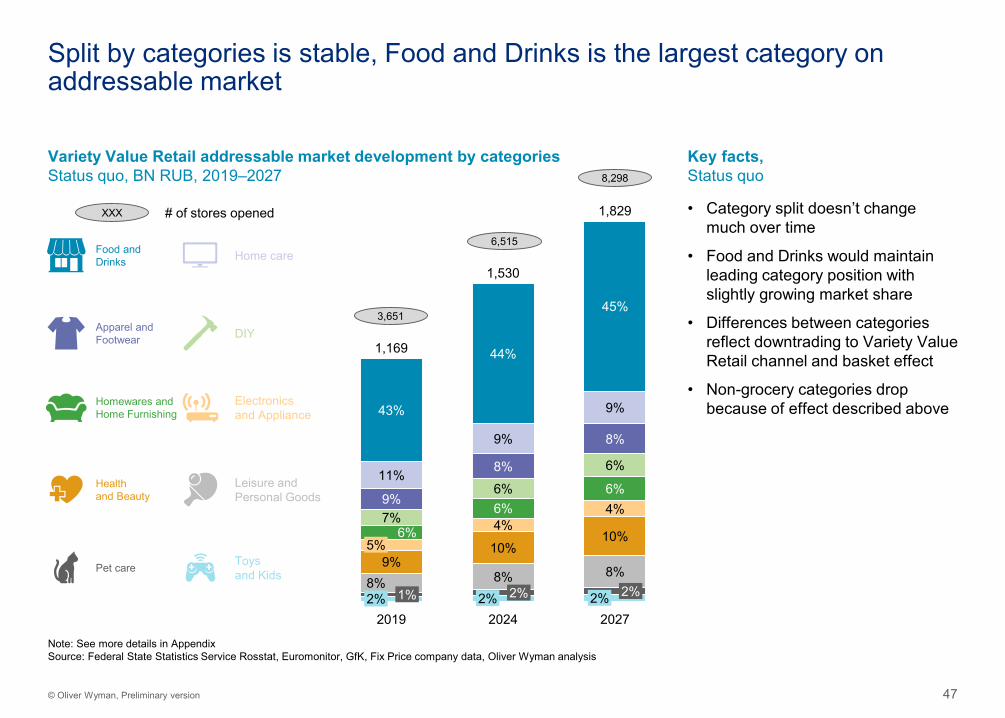
Split by categories is stable, Food and Drinks is the largest category on addressable market
Variety Value Retail addressable market development by categoriesStatus quo, BN RUB, 2019–2027
Note: See more details in AppendixSource: Federal State Statistics Service Rosstat, Euromonitor, GfK, Fix Price company data, Oliver Wyman analysis
DIY
Electronics and Appliance
Leisure andPersonal Goods
Toys and Kids
Home careFood andDrinks
Apparel andFootwear
Homewares and Home Furnishing
Pet care
Health and Beauty
XXX # of stores opened
Key facts,Status quo
• Category split doesn’t change much over time
• Food and Drinks would maintain leading category position with slightly growing market share
• Differences between categories reflect downtrading to Variety Value Retail channel and basket effect
• Non-grocery categories drop because of effect described above
3,651
6,515
8,298
48© Oliver Wyman, Preliminary version
3. Variety Value Retail market development 553.1 Estimation of market growth and potential 573.2 Potential market value estimation by 2027 713
2. Broader addressable market 212.1 Assessment of broader addressable market for Variety Value Retail 232.2 Description of direct and indirect competitors 342.3 Overview of customer preferences & potential for e-commerce
2
1. Retail and Variety Value Retail market in Russia 21.1 Retail market overview 41.2 Overview of Russian Variety Value Retail market landscape and key players 121.3 Comparison of Russian Variety Value Retail market with international benchmarks 15
1
Table of contents
5. Appendix5.1 Addressable market development details5.2 White space analysis additions and sources5
4. Assessment of other business options 844.1 Opportunities in Kazakhstan, Belarus and Uzbekistan 864.2 COVID implications and deep dive into 2020H1 4

4.1 Opportunities in Kazakhstan, Belarus and Uzbekistan
4. Assessment of other business options
50© Oliver Wyman, Preliminary version
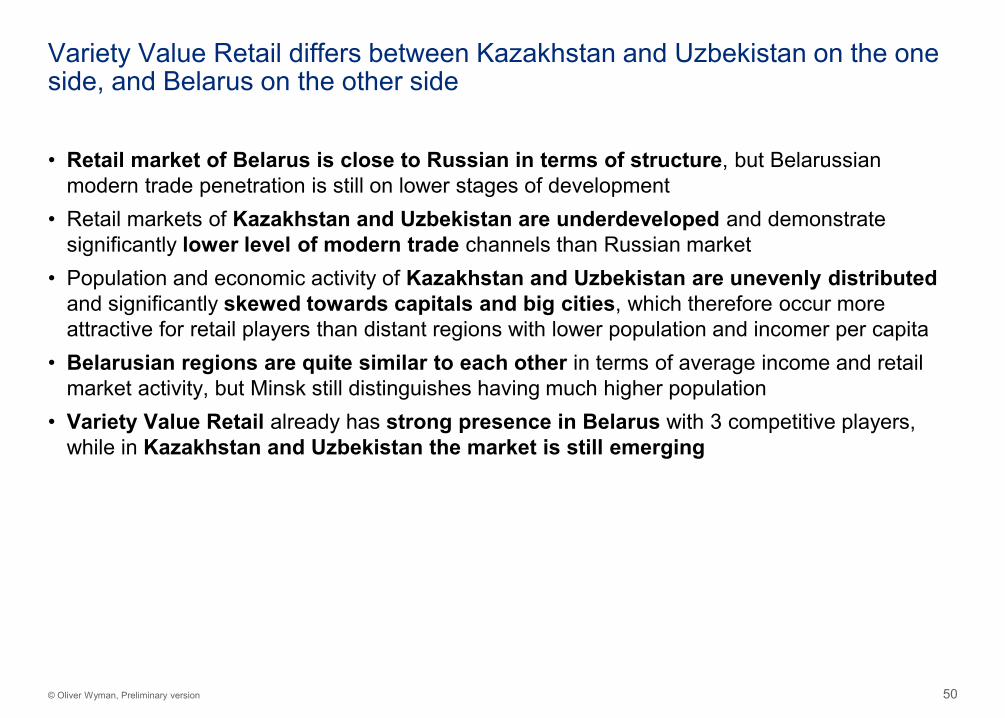
Variety Value Retail differs between Kazakhstan and Uzbekistan on the one side, and Belarus on the other side
• Retail market of Belarus is close to Russian in terms of structure, but Belarussian modern trade penetration is still on lower stages of development
• Retail markets of Kazakhstan and Uzbekistan are underdeveloped and demonstrate significantly lower level of modern trade channels than Russian market
• Population and economic activity of Kazakhstan and Uzbekistan are unevenly distributed and significantly skewed towards capitals and big cities, which therefore occur more attractive for retail players than distant regions with lower population and incomer per capita
• Belarusian regions are quite similar to each other in terms of average income and retail market activity, but Minsk still distinguishes having much higher population
• Variety Value Retail already has strong presence in Belarus with 3 competitive players, while in Kazakhstan and Uzbekistan the market is still emerging
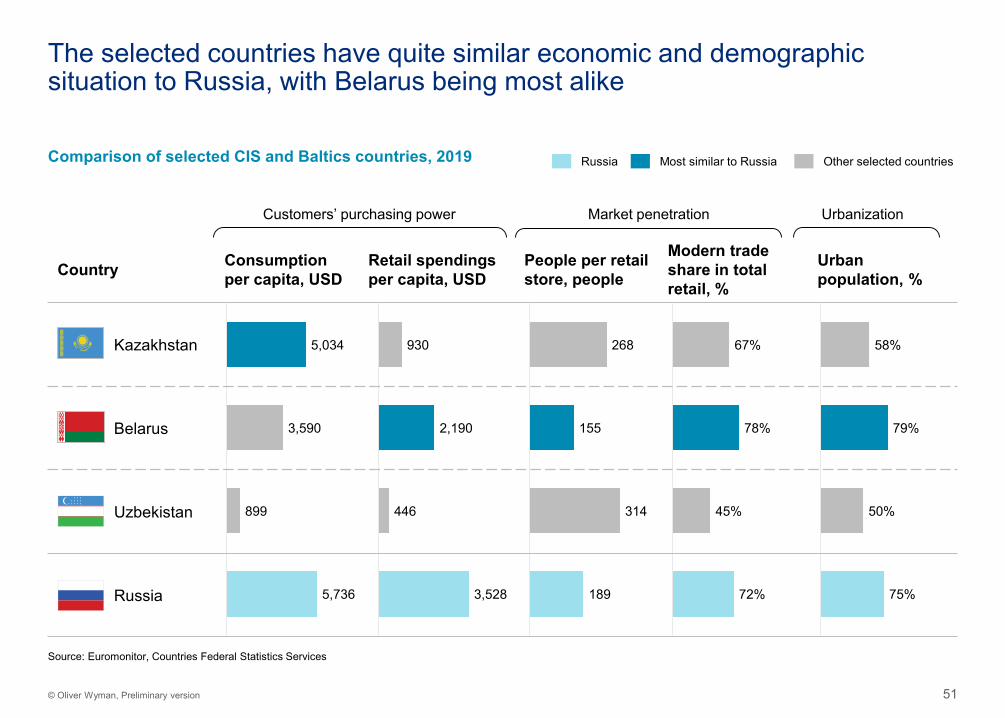
51© Oliver Wyman, Preliminary version
Country Consumption per capita, USD
Retail spendings per capita, USD
People per retail store, people
Modern trade share in total retail, %
Urban population, %
Kazakhstan
Belarus
Uzbekistan
Russia
Comparison of selected CIS and Baltics countries, 2019
5,034
3,590
899
5,736
58%
79%
50%
75%
Most similar to Russia
The selected countries have quite similar economic and demographic situation to Russia, with Belarus being most alike
Source: Euromonitor, Countries Federal Statistics Services
Russia Other selected countries
930
2,190
446
3,528
268
155
314
189
67%
78%
45%
72%
Customers’ purchasing power Market penetration Urbanization
52© Oliver Wyman, Preliminary version
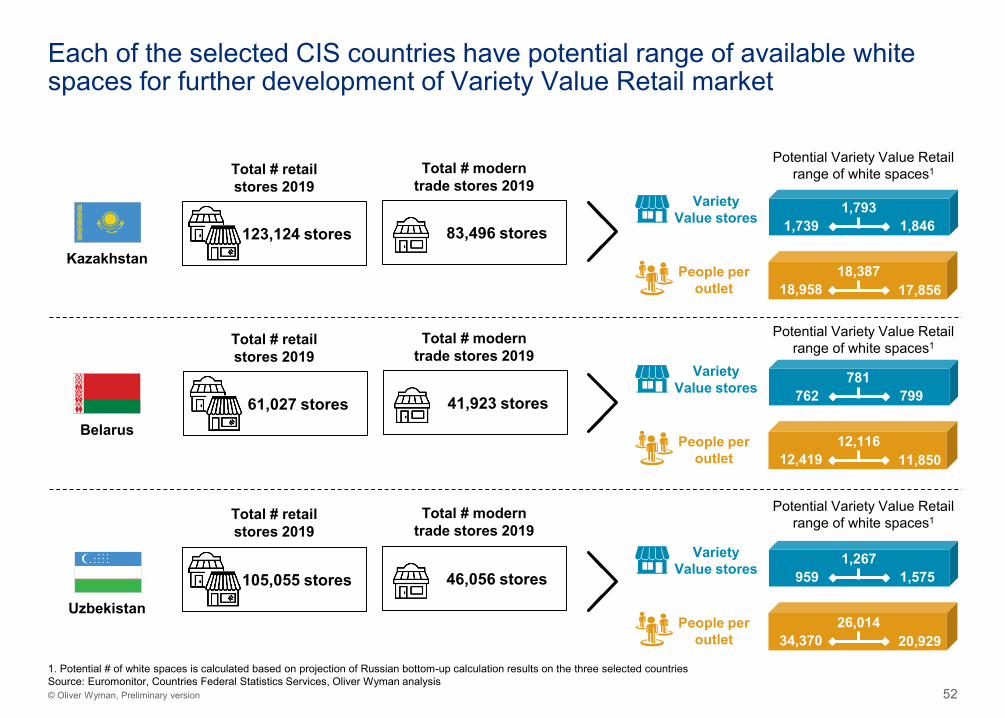
Each of the selected CIS countries have potential range of available white spaces for further development of Variety Value Retail market
Kazakhstan
Belarus
Uzbekistan
123,124 stores
Total # retail stores 2019
1 846stores
83,496 stores
Total # modern trade stores 2019
61,027 stores 41,923 stores
105,055 stores 46,056 stores 959 1,575Variety
Value stores
Potential Variety Value Retail range of white spaces1
34,370People per
outlet 20,929
Total # retail stores 2019
Total # modern trade stores 2019
Total # retail stores 2019
Total # modern trade stores 2019
1. Potential # of white spaces is calculated based on projection of Russian bottom-up calculation results on the three selected countriesSource: Euromonitor, Countries Federal Statistics Services, Oliver Wyman analysis
26,014
1,267
762 799Variety
Value stores
Potential Variety Value Retail range of white spaces1
12,419People per
outlet 11,85012,116
781
1,739 1,846Variety
Value stores
Potential Variety Value Retail range of white spaces1
18,958People per
outlet 17,85618,387
1,793
53© Oliver Wyman, Preliminary version
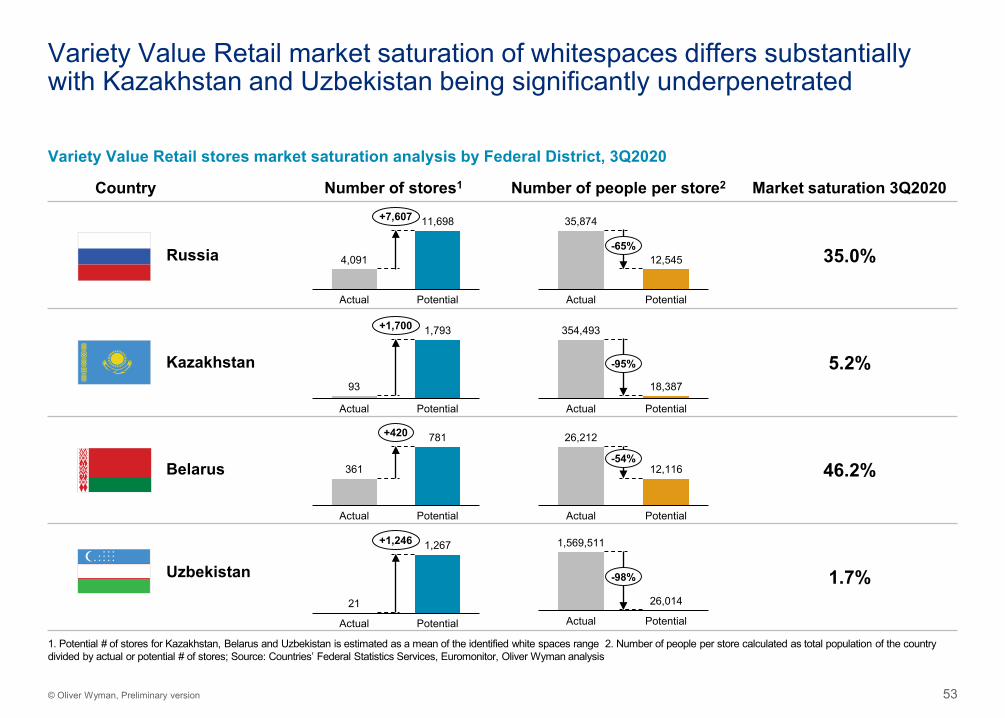
Country Number of stores1 Number of people per store2 Market saturation 3Q2020
35.0%
5.2%
46.2%
1.7%
Variety Value Retail market saturation of whitespaces differs substantially with Kazakhstan and Uzbekistan being significantly underpenetrated
Variety Value Retail stores market saturation analysis by Federal District, 3Q2020
4,091
11,698
Actual Potential
+7,607 35,874
12,545
Actual Potential
-65%
93
1,793
Actual Potential
+1,700
361
781
Actual Potential
+420
21
1,267
Actual Potential
+1,246
354,493
18,387
Actual Potential
-95%
26,212
12,116
Actual Potential
-54%
1,569,511
26,014
PotentialActual
-98%
1. Potential # of stores for Kazakhstan, Belarus and Uzbekistan is estimated as a mean of the identified white spaces range 2. Number of people per store calculated as total population of the country divided by actual or potential # of stores; Source: Countries’ Federal Statistics Services, Euromonitor, Oliver Wyman analysis
Kazakhstan
Belarus
Uzbekistan
Russia
4.2 COVID implications and deep dive into 2020H1
4. Assessment of other business options
55© Oliver Wyman, Preliminary version
Post first wave of COVID-19 we observe two main implications: behavioural shift and income impact
• COVID-19 has reinforced several consumer trends
• Many customers are reporting loss of income, which negatively impacts spending and further develops feeling of uncertainty
• Customers continue hunt for best prices and offers, advantaging discounters and increasing importance of promo and price-value comparison
• Customers tend to decrease time out of home, minimizing number of store visits and preferring proximity stores – also stocking up to avoid second visit in the future
• Variety Value Retail stores benefit from these changes of consumer trends, demonstrating positive dynamic during COVID-19 restrictions
56© Oliver Wyman, Preliminary version
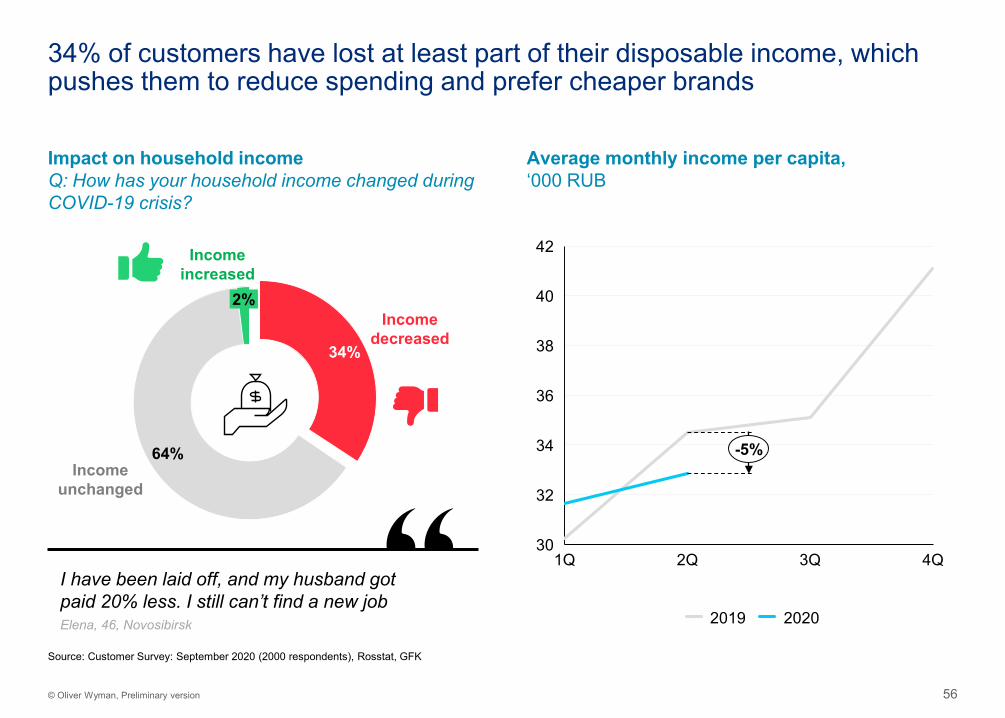
34% of customers have lost at least part of their disposable income, which pushes them to reduce spending and prefer cheaper brands
Impact on household incomeQ: How has your household income changed during COVID-19 crisis?
Average monthly income per capita, ‘000 RUB
30
32
34
38
36
40
42
1Q 2Q 3Q 4Q
-5%
2019 2020
I have been laid off, and my husband got paid 20% less. I still can’t find a new job
34%
64%
Incomedecreased
Incomeunchanged
2%
Incomeincreased
Elena, 46, Novosibirsk
Source: Customer Survey: September 2020 (2000 respondents), Rosstat, GFK
57© Oliver Wyman, Preliminary version
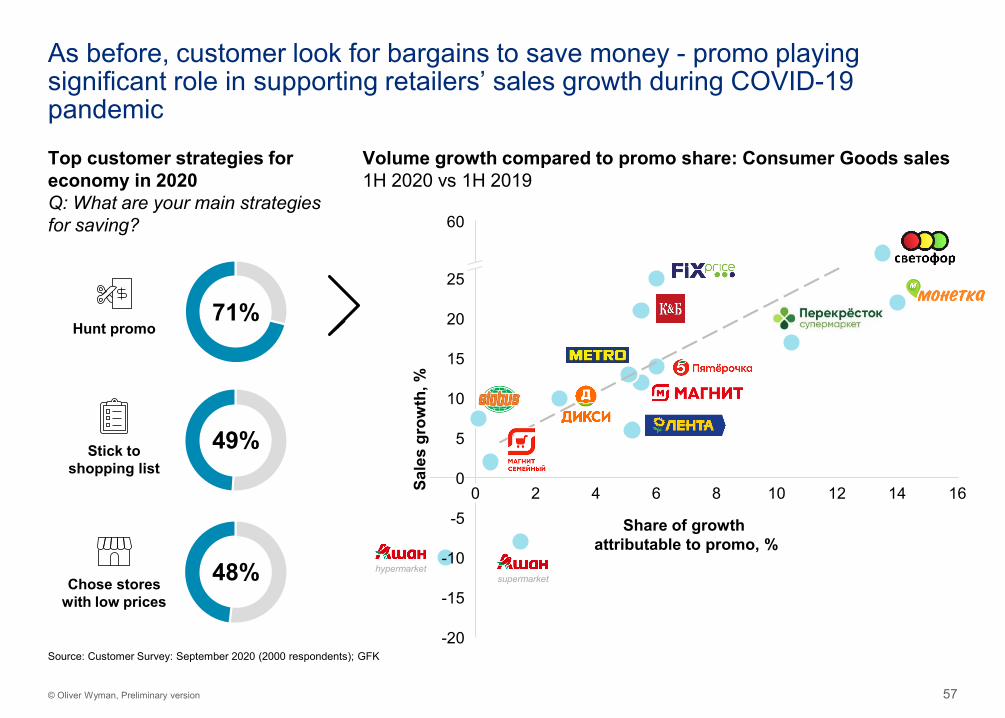
As before, customer look for bargains to save money - promo playing significant role in supporting retailers’ sales growth during COVID-19 pandemic
-5
10
15
140 2 4 6 8 10 12 16
-20
-15
-10
20
0
5
25
60
Share of growth attributable to promo, %
Sale
s gr
owth
, %
Volume growth compared to promo share: Consumer Goods sales1H 2020 vs 1H 2019
Source: Customer Survey: September 2020 (2000 respondents); GFK
Top customer strategies for economy in 2020Q: What are your main strategies for saving?
71%Hunt promo
49%Stick to shopping list
48%Chose stores with low prices
hypermarketsupermarket
58© Oliver Wyman, Preliminary version
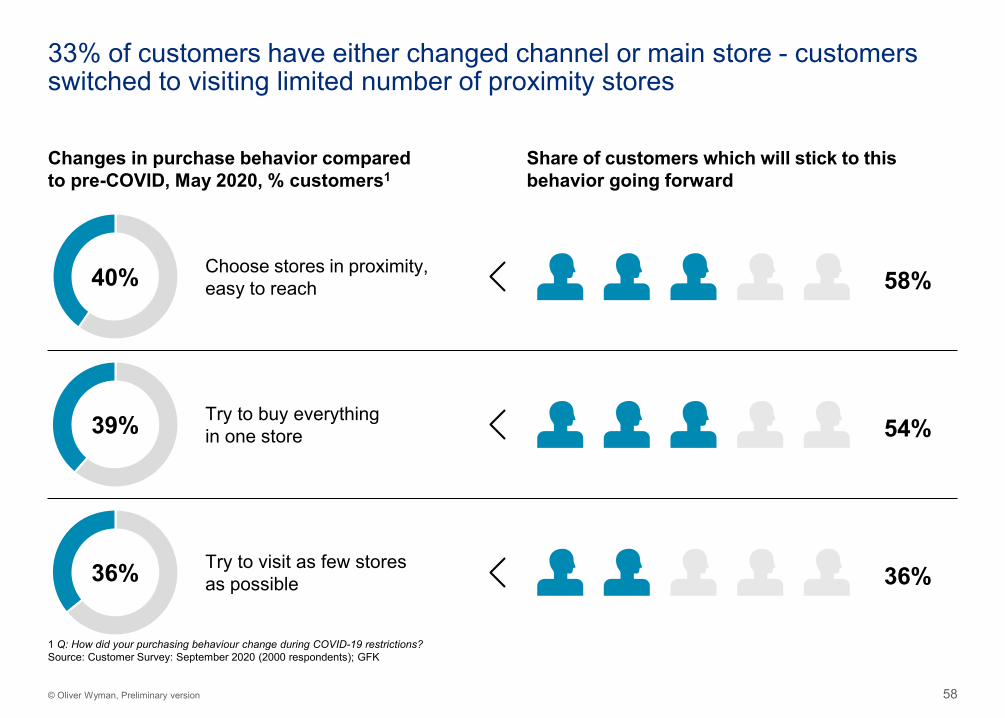
33% of customers have either changed channel or main store - customers switched to visiting limited number of proximity stores
Changes in purchase behavior compared to pre-COVID, May 2020, % customers1
Share of customers which will stick to this behavior going forward
Try to buy everything in one store
Try to visit as few stores as possible
54%
36%
40% Choose stores in proximity, easy to reach 58%
1 Q: How did your purchasing behaviour change during COVID-19 restrictions?Source: Customer Survey: September 2020 (2000 respondents); GFK
39%
36%
59© Oliver Wyman, Preliminary version
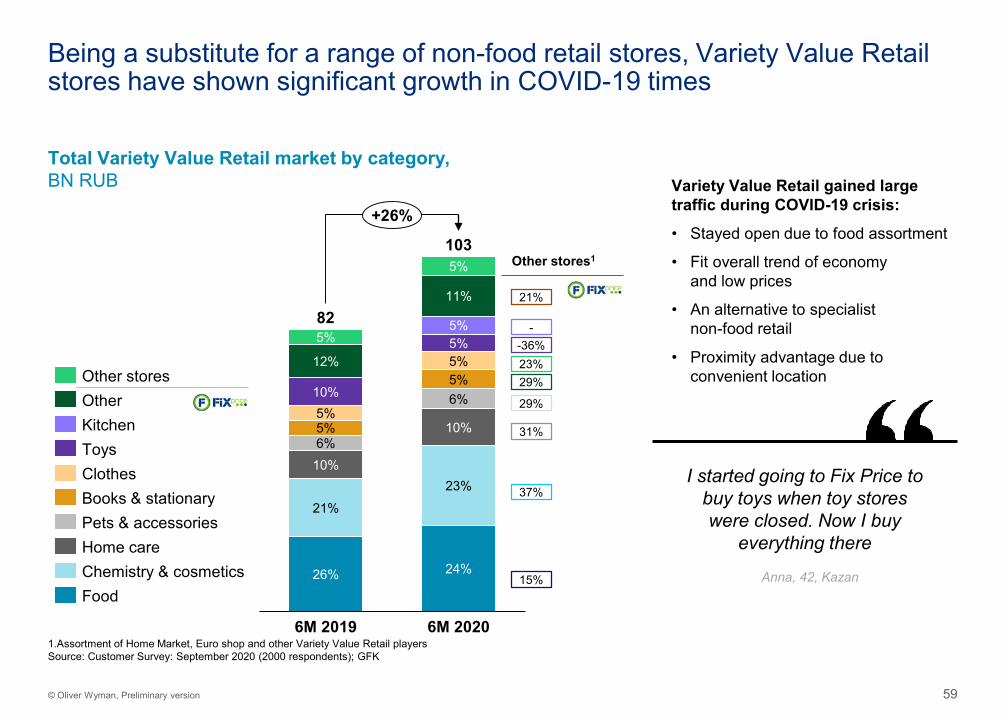
Being a substitute for a range of non-food retail stores, Variety Value Retail stores have shown significant growth in COVID-19 times
10% 6%
103
5%6%
6M 2019
26%
5%
5%
21%
10%
12%
11%
5%
24%
23%
5%
10%
82
5%5%
5%
6M 2020
+26%
Total Variety Value Retail market by category,BN RUB
Other stores1
15%
37%
31%
29%
29%23%-36%
-
21%
Clothes
OtherOther stores
KitchenToys
Books & stationary
Food
Pets & accessoriesHome careChemistry & cosmetics
Variety Value Retail gained large traffic during COVID-19 crisis:
• Stayed open due to food assortment
• Fit overall trend of economy and low prices
• An alternative to specialist non-food retail
• Proximity advantage due to convenient location
I started going to Fix Price to buy toys when toy stores were closed. Now I buy
everything there
Anna, 42, Kazan
1.Assortment of Home Market, Euro shop and other Variety Value Retail playersSource: Customer Survey: September 2020 (2000 respondents); GFK
60© Oliver Wyman, Preliminary version
3. Variety Value Retail market development 553.1 Estimation of market growth and potential 573.2 Potential market value estimation by 2027 713
2. Broader addressable market 212.1 Assessment of broader addressable market for Variety Value Retail 232.2 Description of direct and indirect competitors 342.3 Overview of customer preferences & potential for e-commerce
2
1. Retail and Variety Value Retail market in Russia 21.1 Retail market overview 41.2 Overview of Russian Variety Value Retail market landscape and key players 121.3 Comparison of Russian Variety Value Retail market with international benchmarks 15
1
Table of contents
5. Appendix5.1 Addressable market development details5.2 White space analysis additions and sources5
4. Assessment of other business options 844.1 Opportunities in Kazakhstan, Belarus and Uzbekistan 864.2 COVID implications and deep dive into 2020H1 4

Addressable market development details
5.1
5. Appendix
62© Oliver Wyman, Preliminary version
Estimated
3.7% 5.6%
3.9%
3.5%
4.2% 4.0%
11.7%
3.7%
2016
4.3%
17.8%
28.7%
3.9%
4.1%
5.9% 3.5%
2.4%
1,724
4.6%
10.8%
5.1%4.9%
3.9%
27.5%
12.2%
4.8%
7.0%
14.1%
2014
5.8%
2.9%
16.3%
12.5%
28.2%
25.3%
3.3%
5.0%2.3%
4.9%
4.3%
4.1%
3.3%
8.5%
3.7%
2015
4.0%
3.8%
11.5%
14.9%
2017
5.1%
4.0%
1,440
2020
14.0%
3.7% 32.6%4.9%
9.9%
3.6%5.7%
5.0%
2.2%
9.0%
12.9%
3.8%
14.2%
12.9%
26.9%
5.7%
2022
2.0% 3.6%3.7%
4.0%
14.6%
12.3%
4.0%
4.1%
6.9%5.3%
1.5%
1.8%4.6%
2018
4.3%
11.1%
23.9%
8.0%
1.6%
2023
3.6%
2.8%
5.0%
4.3%3.8%
2021
15.6%
2019
4.1%
8.7%
10.6%
14.7%
21.1%
9.2%
1,091
2.7%
1.5%
3.6% 1.6%4.2%
3.7%
17.9%
1.2%
3.9%
10.2%
3.4%
14.3%
18.3%
10.8%
3.5%1.6% 3.4%4.1%
3.7%
20.2%
9.4%
22.9%
13.6%
17.0%
2.6%
3.3%
3.5%
3.5%
15.1%
14.0%
4.7%
16.0%
3.1%3.2%
3.8%3.4%
25.5%
1,169
8.1%
17.5%
12.3%
4.6%3.0%
1.4%3.1%
3.2%
28.0%
2024
3.2%
7.5%
1,013
11.4%
4.4%2.8%
1.3%2.9%
3.5%3.1%
30.3%
2025
3.0%
7.0%
10.7%
19.1%
4.2%
12.6%
1.3%
2026
2.8%
6.4%
10.0%
8.2%
21.0%
4.0%2.4%
3.1%
34.7%
2027
3.8%
13.6%
1,530
851900
954
1,151
1,2651,354
1,624
1,829
2.6%
+6.6%
+5.8%
8.7% 0.2%
19’–27E
-1.2%-3.0%
1.3%10.5%
-7.5%2.7%
24.4% 19.3%
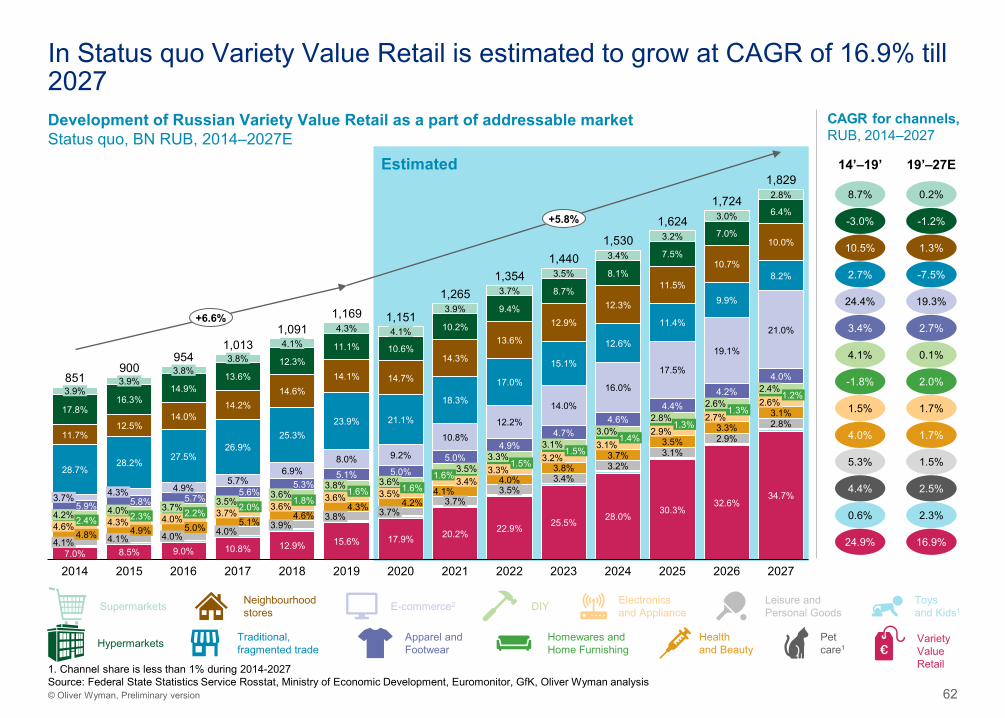
In Status quo Variety Value Retail is estimated to grow at CAGR of 16.9% till 2027Development of Russian Variety Value Retail as a part of addressable marketStatus quo, BN RUB, 2014–2027E
CAGR for channels, RUB, 2014–2027
14’–19’
DIYE-commerce2Supermarkets Electronicsand Appliance
Hypermarkets Health and Beauty
Neighbourhoodstores
Leisure andPersonal Goods
Apparel andFootwear
Toys and Kids1
Petcare1
Traditional,fragmented trade
Homewares andHome Furnishing
VarietyValue Retail
3.4% 2.7%
4.1% 0.1%
-1.8% 2.0%
1.5% 1.7%
4.0% 1.7%
5.3% 1.5%
4.4% 2.5%
0.6% 2.3%
16.9%24.9%
1. Channel share is less than 1% during 2014-2027Source: Federal State Statistics Service Rosstat, Ministry of Economic Development, Euromonitor, GfK, Oliver Wyman analysis
63© Oliver Wyman, Preliminary version
Estimated
41.1%
4.9%
11.6%
1.6%1.5%
9.2%
8.0%
9.5%4.8%5.6%
6.9%
5.0%
6.8%
9.2%
1.7%1.4%
41.9%
9.7%
1.5%2.0%
2014
44.1%
2018
41.1%
9.3%
11.5%
8.1%
2016
9.1%6.9%
4.6%
1.9%8.1%
9.0%
8.2%
4.3%
1.4%8.0%
2.0%
8.0%
2015
42.6%
11.0%
41.0%
11.1%
2017
9.7%
11.3%
9.1%6.8%
1,169
5.8%
954
2.0%
41.0%
5.9%4.7%
6.5%
8.3%1.5%2.0% 2.0%
8.8%
6.7%5.8%4.7%
1.9%
9.5%
11.0%
8.7%
6.6%5.7%
9.4%
1.5%2.0%
2019
44.2%
10.6%
7.8%
6.4%5.7%4.5%
9.4%
1.8%8.0%
1.5%1.9%
2020
43.4%
8.8%
10.4%
2027
6.0%
8.0%
6.4%
2021
5.9%
1.9%
4.5%
9.7%
8.2%
43.7%
10.1%
8.0%
6.3%
4.5%
9.7%
8.2%1.6%
2022
43.9%
8.0%
6.2%
6.1%4.4%
9.8%
8.3%1.7%1.8%
8.0%
2023
9.4%
6.1%
6.2%
4.3%
9.9%
8.3%
5.7%
2024
44.3%
9.1%
8.0%
6.0%
6.3%
10.0%
8.3%
1.8%1.7%
2025
44.6%
8.0%
5.9%
6.4%
4.2%
10.1%
8.4%
1.8%1.7%
2026
44.8%
8.5%
5.8%
4.2%
10.2%
8.4%
1,354
851900
1,0131,091
1,151
1,265
1,4401,530
1,6241,724
1,829
1.7%
+6.6%
+5.8%
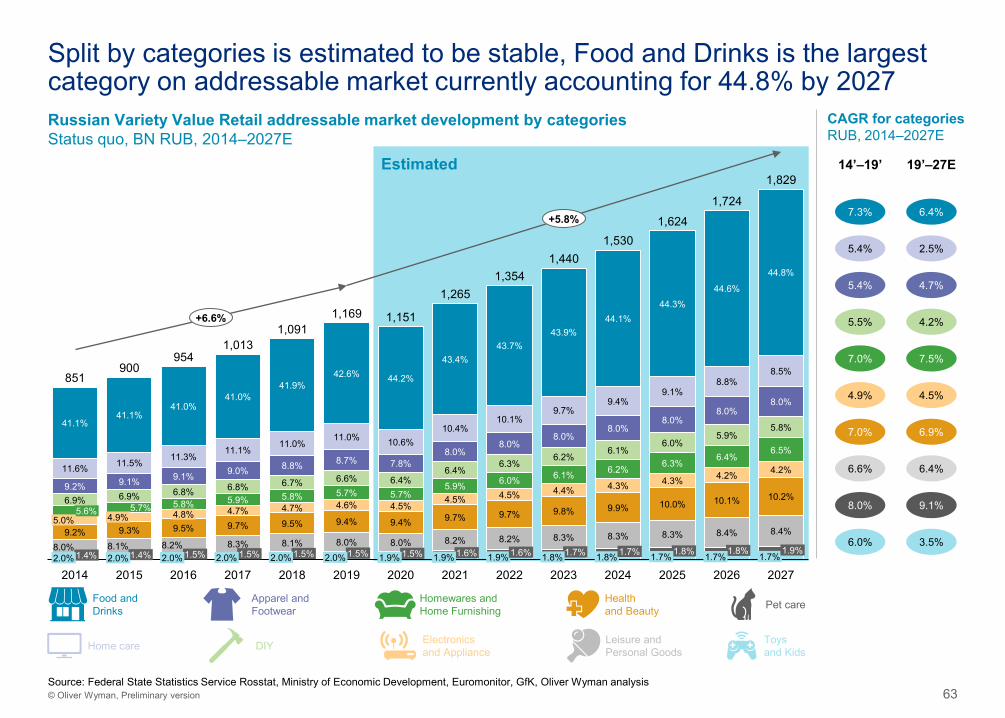
Russian Variety Value Retail addressable market development by categoriesStatus quo, BN RUB, 2014–2027E
Food andDrinks
Apparel andFootwear
Homewares and Home Furnishing Pet careHealth
and Beauty
DIY Electronics and Appliance
Leisure andPersonal Goods
Toys and KidsHome care
19’–27E
Split by categories is estimated to be stable, Food and Drinks is the largest category on addressable market currently accounting for 44.8% by 2027
CAGR for categoriesRUB, 2014–2027E
14’–19’
6.4%7.3%
5.4% 2.5%
5.4% 4.7%
5.5% 4.2%
7.0% 7.5%
4.9% 4.5%
7.0% 6.9%
6.6% 6.4%
8.0% 9.1%
6.0% 3.5%
Source: Federal State Statistics Service Rosstat, Ministry of Economic Development, Euromonitor, GfK, Oliver Wyman analysis

White space analysis additions and sources
5.2
65© Oliver Wyman, Preliminary version
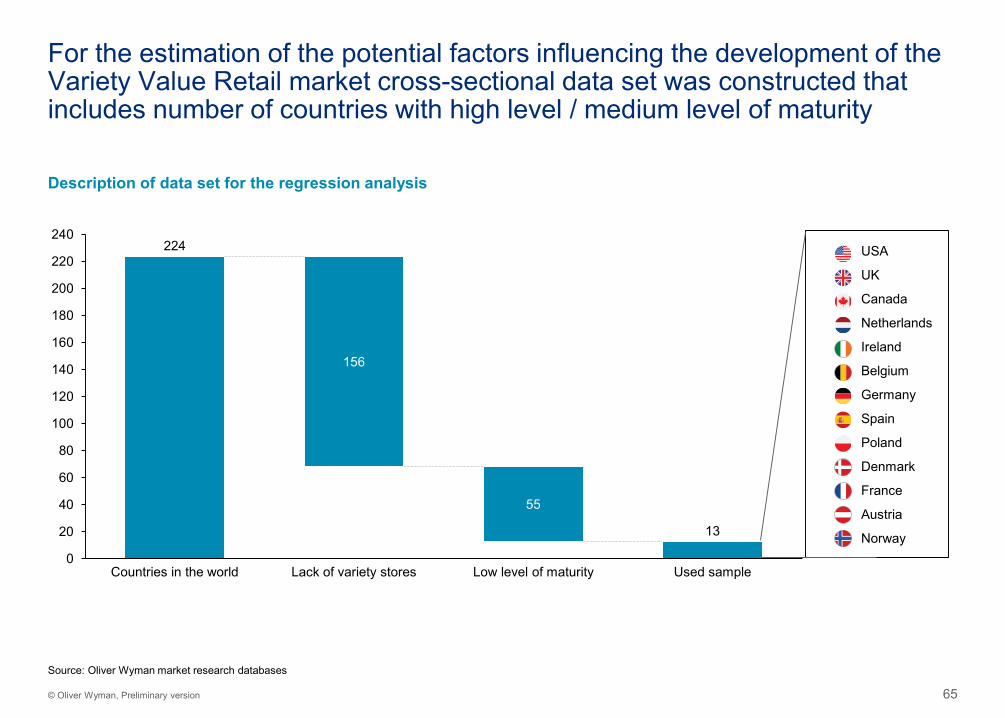
For the estimation of the potential factors influencing the development of the Variety Value Retail market cross-sectional data set was constructed that includes number of countries with high level / medium level of maturity
224
13
156
55
0
20
40
60
80
100
120
140
160
180
200
220
240
Low level of maturityCountries in the world Lack of variety stores Used sample
Description of data set for the regression analysis
USA
UK
Canada
Netherlands
Ireland
Belgium
Germany
Spain
Poland
Denmark
France
Austria
Norway
Source: Oliver Wyman market research databases
66© Oliver Wyman, Preliminary version
Primary non-exhaustive list of used sources
Market players official reports• Magnit Databook 2019• X5 Retail Group Annual reports, Operational and Financial Highlights, 2017-
2019• X5 Retail Group Investor presentations 2019-1H2020• Lenta Databook 2019• Lenta annual report 2019• Detsky Mir Company Presentations 2019• B&M Annual Report &2019• Dollarama Annual Information Form 2019• Dollar General 2019 Annual report• Poundland Group plc annual report 2019
Analytical agencies data and industry publications• Russian consumer market and FMCG retail chains rating, June 2020• Bloomberg• Euromonitor• РБК• Planet Retail• Retailer.RU• AKIT• Factiva• Capital IQ• e-commerce Europe• Fitch Solutions
Public Authorities Data• Nielsen “Post-quarantine customer shopping missions”, June 2020
• GfK Household Panel, 1H2020
• GFK market researches 09.2020: – FMCG trends– E-commerce development prospective– Shop selection– HoReCa in COVID– etc.
• Customer Perception Study (CPM), 09.2020
Customer behavior researches• Ministry of Economic Development of the Russian
Federation, 09.2020
• Federal State Statistics Service Rosstat up to 09.2020• National statistical bureaus 09.2020:
– National Statistical Committee of the Republic of Belarus– Ministry of National Economy of the Republic of
Kazakhstan– State Committee of the Republic of Uzbekistan on
Statistics