Embed Size (px)
Citation preview
Vectorial Crystal Growth of Oriented Vertically Aligned CarbonNanotubes Using Statistical AnalysisAmin T. Yousefi,*,† Hirofumi Tanaka,‡ Samira Bagheri,§ Fawzi Elfghi,† Mohammad R. Mahmood,∥
and Shoichiro Ikeda†
†ChECA IKohza, Dept. Environmental & Green Technology (EGT), Malaysia Japan International Institute of Technology (MJIIT),University Technology Malaysia (UTM), Kuala Lumpur, Malaysia‡Department of Human Intelligence Systems, Graduate School of Life Science and Systems Engineering, Kyushu Institute ofTechnology (Kyutech), Kitakyushu 808-0196, Japan§Nanotechnology & Catalysis Research Centre (NANOCAT), IPS Building, University of Malaya, 50603 Kuala Lumpur, Malaysia∥NANO-SciTech Centre, Institute of Science, Universiti Teknologi MARA (UiTM), Shah Alam, Selangor, Malaysia
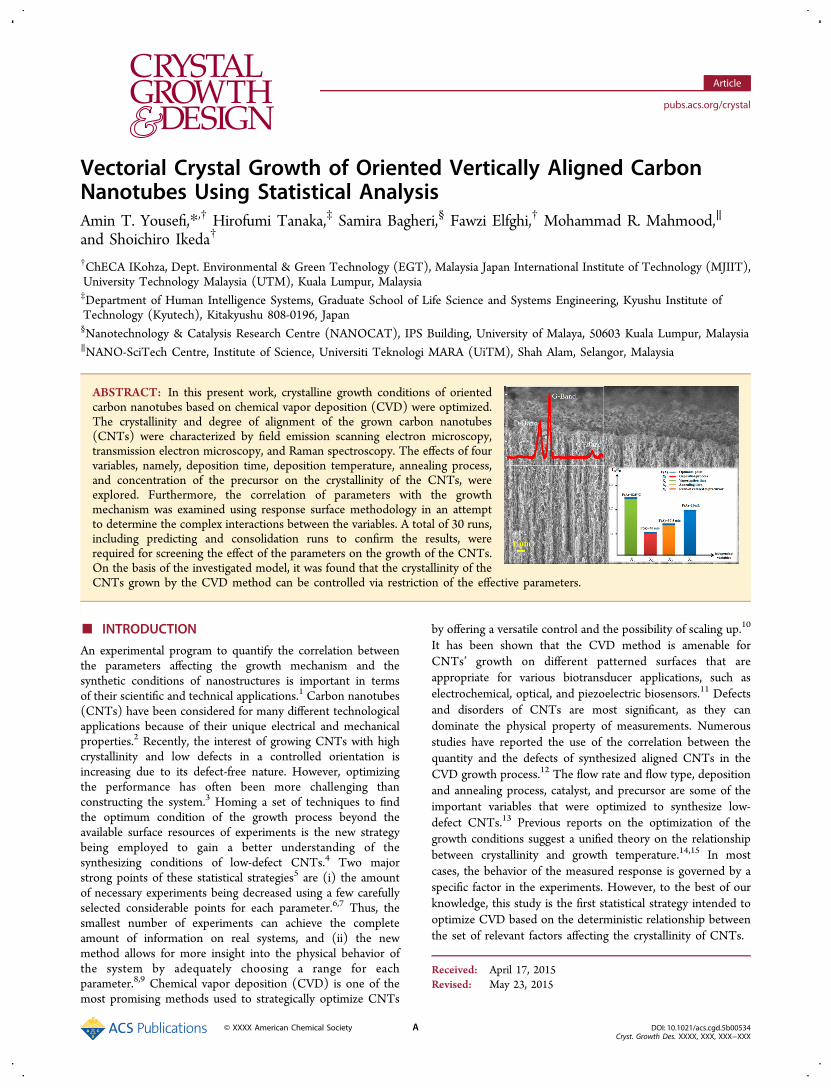
ABSTRACT: In this present work, crystalline growth conditions of orientedcarbon nanotubes based on chemical vapor deposition (CVD) were optimized.The crystallinity and degree of alignment of the grown carbon nanotubes(CNTs) were characterized by field emission scanning electron microscopy,transmission electron microscopy, and Raman spectroscopy. The effects of fourvariables, namely, deposition time, deposition temperature, annealing process,and concentration of the precursor on the crystallinity of the CNTs, wereexplored. Furthermore, the correlation of parameters with the growthmechanism was examined using response surface methodology in an attemptto determine the complex interactions between the variables. A total of 30 runs,including predicting and consolidation runs to confirm the results, wererequired for screening the effect of the parameters on the growth of the CNTs.On the basis of the investigated model, it was found that the crystallinity of theCNTs grown by the CVD method can be controlled via restriction of the effective parameters.
■ INTRODUCTION
An experimental program to quantify the correlation betweenthe parameters affecting the growth mechanism and thesynthetic conditions of nanostructures is important in termsof their scientific and technical applications.1 Carbon nanotubes(CNTs) have been considered for many different technologicalapplications because of their unique electrical and mechanicalproperties.2 Recently, the interest of growing CNTs with highcrystallinity and low defects in a controlled orientation isincreasing due to its defect-free nature. However, optimizingthe performance has often been more challenging thanconstructing the system.3 Homing a set of techniques to findthe optimum condition of the growth process beyond theavailable surface resources of experiments is the new strategybeing employed to gain a better understanding of thesynthesizing conditions of low-defect CNTs.4 Two majorstrong points of these statistical strategies5 are (i) the amountof necessary experiments being decreased using a few carefullyselected considerable points for each parameter.6,7 Thus, thesmallest number of experiments can achieve the completeamount of information on real systems, and (ii) the newmethod allows for more insight into the physical behavior ofthe system by adequately choosing a range for eachparameter.8,9 Chemical vapor deposition (CVD) is one of themost promising methods used to strategically optimize CNTs
by offering a versatile control and the possibility of scaling up.10
It has been shown that the CVD method is amenable forCNTs’ growth on different patterned surfaces that areappropriate for various biotransducer applications, such aselectrochemical, optical, and piezoelectric biosensors.11 Defectsand disorders of CNTs are most significant, as they candominate the physical property of measurements. Numerousstudies have reported the use of the correlation between thequantity and the defects of synthesized aligned CNTs in theCVD growth process.12 The flow rate and flow type, depositionand annealing process, catalyst, and precursor are some of theimportant variables that were optimized to synthesize low-defect CNTs.13 Previous reports on the optimization of thegrowth conditions suggest a unified theory on the relationshipbetween crystallinity and growth temperature.14,15 In mostcases, the behavior of the measured response is governed by aspecific factor in the experiments. However, to the best of ourknowledge, this study is the first statistical strategy intended tooptimize CVD based on the deterministic relationship betweenthe set of relevant factors affecting the crystallinity of CNTs.
Received: April 17, 2015Revised: May 23, 2015
Article
pubs.acs.org/crystal
© XXXX American Chemical Society A DOI: 10.1021/acs.cgd.5b00534Cryst. Growth Des. XXXX, XXX, XXX−XXX
Research reports on the utilization of response surfacemethodology (RSM) provided a model16 to synthesize low-defect CVD carbon nanotubes by designing a set ofexperiments to understand the overall response of eacheffective factor. Regression analyses, coupled with an analysisof variance (ANOVA) table, were used to construct amathematical model to obtain the correlation betweencrystallinity and other influential factors. However, to keepour discussion compact, four effective explanatory variables onthe crystallinity of CNTs during the CVD process were studiedand denoted by the deposition temperature, deposition time,annealing temperature, and the concentration of the precursor.The results not only provide a theoretical basis for synthesizinghighly crystalline CNTs via the RSM method but also establisha foundation for large-scale production and the systematicutilization of CNT-based electronic devices.
■ DESIGN OF EXPERIMENTAL MATRIXA complete description of any process of chemical reactionbehavior requires either a quadratic or higher order polynomialmodel.17 Hence, the full quadratic models were established byusing the method of least-squares, which includes all linear andinteraction terms, to calculate the predicted response.18 Thequadratic model is usually sufficient for industrial applications.For n-factors, the full quadratic model is shown in eq 1.
∑ ∑= + + =Y b b X b X X i j k( , 1, 2, 3, ....., )i i ij i jo
(1)
where Y is the predicted response or dependent variable, Xi andXj are the independent variables, and bi and bj are constants.
19
In this case, the number of independent factors is four, andtherefore, k = 4 and eq 1 becomes eq 2:
β β β β β β
β β β β β
β β β
= + + + + +
+ + + + +
+ + +
Yu X X X X X X
X X X X X X X X X
X X X
0 1 1 2 2 3 3 4 4 12 1 2
13 1 3 14 1 4 24 2 4 34 3 4 11 12
22 22 33 32 44 42 (2)
with Y being the predicted response, and X1, X2, X3, and X4 arethe coded form of the input variables for deposition time,vaporization time, deposition temperature, and concentrationof precursor, respectively. The term β0 is the intercept term; β1,β2, β3, and β4 are the linear terms; β11, β22, β33, and β44 are thesquared terms; and β12, β13, β23, β14, β24, and β34 are theinteraction terms between the four variables. The depositiontemperature, deposition time, annealing temperature, andconcentration of the precursor were selected as the influencingfactors. The selections of these variables with their definedexperimental ranges were carefully done based on prescreeningtests before start the optimization that are often described inthe literature.20,21
The lowest and highest levels of variables were coded as(−1) and (+1), respectively, and are given in Table 1, includingaxial star points of (−α and +α), where α is the distance of theaxial points from the center, making the design rotatable.In this study, the value of α was calculated using eq 3 and was
fixed at 0.5 (rotatable).
α = F( )1/4 (3)
where F is the number of points in the cube section of thedesign (F = 2k), and k is the number of factors, as we have fourfactors α equal to 2. Therefore, the total number ofexperimental combinations should be conducted based on a
similar concept of central composite rotatable design5 byapplying eq 4
= + +k nototal number of experiments 2 2k(4)
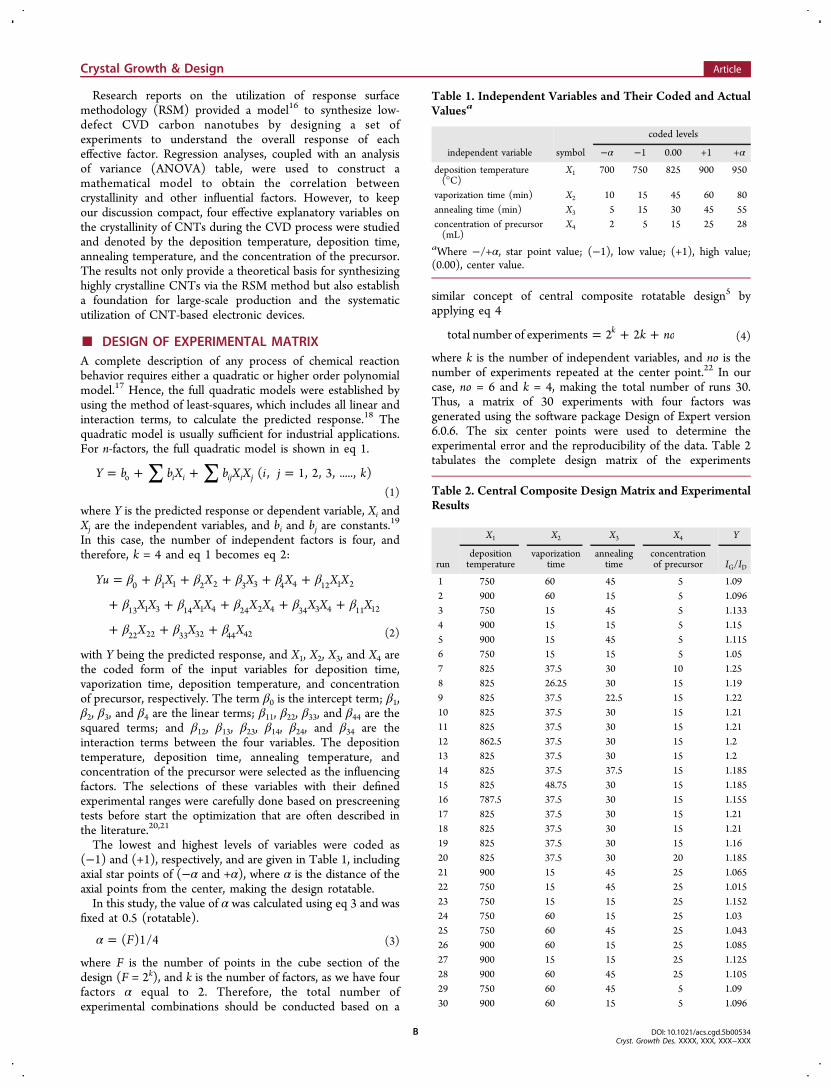
where k is the number of independent variables, and no is thenumber of experiments repeated at the center point.22 In ourcase, no = 6 and k = 4, making the total number of runs 30.Thus, a matrix of 30 experiments with four factors wasgenerated using the software package Design of Expert version6.0.6. The six center points were used to determine theexperimental error and the reproducibility of the data. Table 2tabulates the complete design matrix of the experiments
Table 1. Independent Variables and Their Coded and ActualValuesa
coded levels
independent variable symbol −α −1 0.00 +1 +α
deposition temperature(°C)
X1 700 750 825 900 950
vaporization time (min) X2 10 15 45 60 80annealing time (min) X3 5 15 30 45 55concentration of precursor(mL)
X4 2 5 15 25 28
aWhere −/+α, star point value; (−1), low value; (+1), high value;(0.00), center value.
Table 2. Central Composite Design Matrix and ExperimentalResults
X1 X2 X3 X4 Y
rundepositiontemperature
vaporizationtime
annealingtime
concentrationof precursor IG/ID
1 750 60 45 5 1.092 900 60 15 5 1.0963 750 15 45 5 1.1334 900 15 15 5 1.155 900 15 45 5 1.1156 750 15 15 5 1.057 825 37.5 30 10 1.258 825 26.25 30 15 1.199 825 37.5 22.5 15 1.2210 825 37.5 30 15 1.2111 825 37.5 30 15 1.2112 862.5 37.5 30 15 1.213 825 37.5 30 15 1.214 825 37.5 37.5 15 1.18515 825 48.75 30 15 1.18516 787.5 37.5 30 15 1.15517 825 37.5 30 15 1.2118 825 37.5 30 15 1.2119 825 37.5 30 15 1.1620 825 37.5 30 20 1.18521 900 15 45 25 1.06522 750 15 45 25 1.01523 750 15 15 25 1.15224 750 60 15 25 1.0325 750 60 45 25 1.04326 900 60 15 25 1.08527 900 15 15 25 1.12528 900 60 45 25 1.10529 750 60 45 5 1.0930 900 60 15 5 1.096
Crystal Growth & Design Article
DOI: 10.1021/acs.cgd.5b00534Cryst. Growth Des. XXXX, XXX, XXX−XXX
B

performed, together with the results obtained. The responseswere used to develop an empirical model for the crystallinity ofthe CNTs.After implementing the experimental design, the exper-
imental data were interpreted and analyzed using ANOVA at a5% level of significance using the Fisher F-test. The F-test is asimple arithmetical method which sorts the components ofvariation in a given set of data and provides the test forsignificance.23
■ EXPERIMENTAL METHODOLOGYThe total number of required experiments to screen the effect of theparameters on carbon nanotubes was 30, of which 24 were predictionruns, and 6 were consolidation runs to confirm the results. Typicalexperiments were performed in a horizontal quartz tube with an outerdiameter of 35 mm using a two-stage furnace. In each run, 0.06 g offerrocene was used to produce Fe catalyst particles for seedingnanotube growth in the presence of camphor oil as a precursor. Theexplanatory variables were adjusted to refine the growth process ofvertically aligned carbon nanotubes (VACNTs). The flow rate wasadjusted to 500 standard cubic centimeters per minute (sccm) topump the feedstock to the second furnace. As indicated in Table 2, thedeposition temperature of the growth process was performed in therange 750−900 °C and was restricted between 15 min and 1 h. Theconcentration of the camphor oil as a precursor was confined within arange of 5−25 mL. The annealing process was also done within 15−45min, and subsequently, the carrier gas was changed to oxygen duringthe postannealing process. Then, the CVD was cooled down for 5 min,followed by exposure to oxygen gas.14 The CVD process wascompleted with the removal of the grown CNTs from the quartz tubeat 400 °C to neutralize the intrinsic disorders constructed by themobile surface contaminants on the structure of carbon nanotubes.The synthesized CNTs were characterized by FESEM (ZEISS Supra40VP) operated at 5 kV to evaluate the structure and the aspect ratioof the sample. The Raman spectra were obtained using a micro-Ramanspectroscope (Horiba Jobin Yvon-DU420A-OE-325) with Ar+ ions(wavelength 514.5 nm) to determine the adsorption, desorption, andsurface area of the samples. TEM (Hitachi H-9500) equipped withelectron diffraction analysis, was used for the chemical characterizationof the specimens, as well as surface imaging.
■ RESULTS AND DISCUSSIONCrystallinity Model (IG/ID-Single-Response Optimiza-
tion). Investigations of the best variant of concentration ofcamphor oil, annealing process, deposition temperature, anddeposition time in the growth conditions of CNTs wereperformed for the purpose of increasing the crystallinity of theCNTs during the CVD process. An empirical relationship,represented as a mathematical model between the crystallinityof the CNTs and the test variables in the coded unit, is shownin eq 2. Indeed, the empirical model developed in eq 5 byapplying the multiple regression technique, fitted theexperimental results, indicating that the crystallinity model ofthe CNTs agreed with the experimental results.
= + −
− − −
− − +
+ + +
− −
Y X X
X X
X X
X X X X X X
X X X X X
1.20160602 0.014515152 0.00530303
0.009121212 0.019242424 0.101563342
0.061563342 0.001563342 0.058436658
0.0031875 0.0039375 0.0103125
0.0064375 0.0121875
IG/ID 1 2
3 12
22
32
42
1 3 1 4 2
3 2 4 3 4 (5)
where YIG/ID is the predicted value for the crystallinity of theCNTs during the CVD process.
A reasonable value of the determination coefficient R2 =0.8442 estimated the regression coefficients, which provides anindication of an acceptable agreement between the observedand predicted data.24 It is worth mentioning that thedetermination coefficient R2 is fairly lower than that of thecrystallinity model. Thus, the crystallinity model exhibits abetter fit than the aromatization activity model. The adequacyof the model was tested with the analysis of variance, as shownin Table 3, where the computed F-value of 6.67 exceeded thetabulated F-value.
Table 4 shows the multiple regression results and significanceof each regression coefficient of the crystallinity growth model.
The terms of the model were arranged based on the t- and p-values, signifying the variable effects on the crystallinity ofCNTs model. According to lowest p-values (less than 0.5) andthe highest student t test values, the deposition temperatureand concentration of the camphor oil (X1 and X4) are the mostinfluential parameters on the crystallinity growth of CNTs. Thequadratic term of deposition temperature, annealing time, andthe concentration of the precursor (X1
2, X32, and X4
2) alsoinfluenced the crystallinity of the CNTs, as well as theinteraction term of deposition time with annealing time and theconcentration of the precursor (X2 with X3, X4).The graphical representations of three-dimensional (3D)
response surface and two-dimensional (2D) contour plots wereemployed to present the crystallinity of CNTs, which couldaccomplish a better understanding of the relationship betweenthe responses and each effective variable. Figure 1a,b presents a3D plot and 2D plot of CNTs crystallinity for the depositiontemperature and annealing time at fixed deposition time andconcentration of the precursor, respectively. The maximumpredicted crystallinity is indicated by the surface confined in thesmallest circle in the contour diagram. The figure revealed aring of complete round profile, implying an interaction effectbetween both factors on the response (IG/ID). It is clearly
Table 3. ANOVA Results Table for CNTs Crystallinity
sourcessum ofsquares
degree offreedom mean squares F value
S.S. regression 0.098 13 7.548 × 10⁻³ 6.67S.S. error 0.018 16 1.131 × 10⁻³
S.S. total 0.12 29
Table 4. Multiple Regression Results and Sorted SignificanceEffect of Regression Coefficient for Crystallinity of CNTs
parameter term coefficient t-value p-value
β1 X1 0.015 3.62 0.0988β2 X2 −5.3 × 10⁻³ −1.28 5.31 × 10⁻¹
β3 X3 −9.12 × 10⁻³ −2.20 2.87 × 10⁻¹
β4 X4 −0.019 −4.59 0.0336β13 X1 X3 3.19 × 10⁻³ 7.58 × 10⁻¹ 0.7096β14 X1 X4 3.94 × 10⁻³ 9.37 × 10⁻¹ 0.6459β23 X2 X3 1.00 × 10⁻² 2.38 0.2378β24 X2 X4 −6.44 × 10⁻³ −1.53 0.4551β34 X3 X4 −1.20 × 10⁻² −2.85 0.1666β11 X1
2 −1.00 × 10⁻¹ −2.44 0.235β22 X2
2 −6.20 × 10⁻² 1.51 0.4647β33 X3
2 −1.76 × 10⁻³ −4.30 × 10⁻² 0.9832β44 X4
2 5.80 × 10⁻² 1.41 0.4901
Crystal Growth & Design Article
DOI: 10.1021/acs.cgd.5b00534Cryst. Growth Des. XXXX, XXX, XXX−XXX
C

Figure 1. (a−f) 3-D and 2-D Response surface plot for the design: crystallinity of CNTs as a function of independent variables.
Crystal Growth & Design Article
DOI: 10.1021/acs.cgd.5b00534Cryst. Growth Des. XXXX, XXX, XXX−XXX
D

highlighted that the crystallinity of CNTs reached near themaximum at a combination of coded level with 800−850 °Cand 30−37.5 min deposition time.Figure 1c,d shows the 3-D plot and 2-D plot of the CNTs
crystallinity, with the deposition temperature and theconcentration of precursor at a zero level of the other variables(fixed annealing and deposition time), respectively. As can beseen, the maximum predicted crystallinity is indicated by thesurface confined to the smallest circle in the contour diagram. Itis clear that the crystallinity growth reached its maximum at acombination of the coded level of 800−865 °C of thedeposition temperature, and 12−18 mL of the precursor.The study was also developed to determine the interaction of
annealing and vaporization times. Figure 1e,f show the 3-D plotand 2-D plot of the crystallinity of CNT with the annealing andvaporization time at a zero level of the other variables (fixedconcentration of the precursor and deposition temperature),respectively. The maximum predicted crystallinity was indicatedby the surface confined to the smallest circle in the contourdiagram. It is clear that crystallinity growth approached themaximum at a combination of the coded level 30−37.5 min ofvaporization time and 30 min of annealing time. The modelpredicted an optimum point for maximum isomerizationactivity for a vaporization time of 35 min and an annealingtime of 30 min.Verification of Effects on the Crystallinity Model of
CNTs: Morphological and Interfacial Characterization.The model was analyzed using statistical strategies to developan experimental analysis of synthesized CNTs. The optimalperformance of the growth CNTs was confirmed by Ramanspectroscopy and FESEM, and the effect of each parameter isdiscussed. Figure 2a shows the Raman spectroscopy results of
the grown CNTs at different deposition temperatures. Allspectra showed two mainly Raman peaks at ∼1300−1350 cm−1
(D band) and ∼1580−600 cm−1 (G band), and a second orderRaman signal around 2701 cm−1 (G*-band), which corre-sponds to the overtone mode of the D-band in graphite andCNTs.25 It was shown that by decreasing the growthtemperature, the D bands become stronger and broader,26
which means that a low deposition temperature leads tooverlapping D and G peaks, resulting in low crystalline CNTsin the form of D being explained as a disorder feature ofgraphitic sheets.27
In other words, the values of ID and IG, which are related tothe crystallite dimension of CNTs, are directly related to thetemperature and the growth of CNTs at higher temperaturesand were shown to lead to a higher intensity ratio of the D andG bands. Furthermore, as shown in Figure 2b, the FESEMimages corresponding to the same experiments indicated thatthe average diameter of CNTs also increased by enhancing thehigher deposition temperature, which leads to the experimentalgrowth of more crystalline CNTs with higher averagediameters.28 This phenomenon suggests that the catalystactivity in lower temperatures is not enough to support theinteraction in the CVD process, and the precursor failed todecompose at low temperatures, and led to CNTs with lowerdegrees of crystallinity.According to the growth mechanism of CNTs, carbon atoms
diffuse into the iron nanoparticles during the CVD process toform FeC. Therefore, the crystallinity of the CNTs was alsosignificantly affected by the different concentrations ofprecursor used to grow the CNTs,29 as shown in Figure 2c.Using a low amount of catalyst ratio to precursor yields fewercarbon nanotubes with lower crystallinity, resulting in the
Figure 2. Raman spectra (a) and FESEM (b) of CNTs grown by varying the deposition temperature at 650, 800, and 900 °C. (c, d) Raman spectraof CNTs grown by varying the concentration of camphor oil and annealing time, respectively.
Crystal Growth & Design Article
DOI: 10.1021/acs.cgd.5b00534Cryst. Growth Des. XXXX, XXX, XXX−XXX
E

CNTs growing in random directions. Achieving carbonaceouscrusts in small amounts that are not growth-oriented due to theincomplete evaporation process of ferrocene and the precursorduring synthesis is also possible. Figure 2d shows the Ramanspectra of CNTs obtained at different annealing temperatures.As expected, higher annealing temperatures improve thegraphitic structure of the CNTs. Improving the IG/ID ratiomay not affect the structure of the CNTs because such effectscould only be observed at significantly higher temperatures(>1500 °C), where carbon could alter its crystallinity, butcertain defects are initially present in the nanotubes, which arethen removed via annealing.14
The TEM results could also be a very useful tool todetermine the degree of crystallinity of the grown CNTs, aswell as the presence of amorphous carbon coating the outerlayers of the tubes. As shown in Figure 3a, the synthesized
CNTs using conversational CVD method display more diffusespots associated with amorphous carbon, which confirms alower degree of crystallinity than that shown in Figure 3b,which corresponds to the optimized conditions of predominantfactors affecting the CVD process. Furthermore, the TEMresults reveal that most of the tubes are closed containing ahollow inside that confirms the tubular structure of the grownCNTs. The TEM image also confirms the complete removal ofcatalyst particles.
■ CONCLUSIONSequential experimental strategies based on the centralcomposite design, coupled with RSM, were implemented byvarying the four predominant factors affecting the crystallinityof multiwalled CNTs. The highest interaction on thecrystallinity of CNTs was found between the depositiontemperature and the concentration of camphor oil during theCVD processes, which are influential parameters on thecrystallinity growth of CNTs. According to lowest p-valuesand highest student t-test values, and the quadratic term of thedeposition temperature, annealing time, and the concentrationof the precursor also showed significant influence on thecrystallinity of the CNTs, as well as the interaction term of thedeposition time and the concentration of the precursor. Thecounter plat results were confirmed by Raman spectroscopy,indicating that the crystallinity of CNTs was regularlyincreasing with increasing deposition temperature in the first
furnace, and the annealing time in the second furnace, at a fixedchamber pressure when the flow rates of Ar was 500 sccm. Thecrystallinity of the CNTs also varied from low to highcrystallinity via the simultaneous increase in the precursor ofup to 15 mL at an optimized level of the other variables.
■ AUTHOR INFORMATIONCorresponding Author*E-mail: [email protected] authors declare no competing financial interest.
■ ACKNOWLEDGMENTSThis work was supported by Grants-in-Aid for ScientificResearch (No. 24510150) and for Scientific Research onInnovative Areas (No. 25110002) from the Ministry ofEducation, Culture, Science, Sports, and Technology(MEXT) of Japan.
■ ABBREVIATIONSCNTs, carbon nanotubes; CVD, chemical vapor deposition;FESEM, field emission scanning electron microscopy; TEM,transmission electron microscopy; RSM, response surfacemethodology; VACNTs, vertically aligned carbon nanotubes;sccm, standard cubic centimeters per minute
■ REFERENCES(1) Wang, H.-C.; Wu, C.-Y.; Chung, C.-C.; Lai, M.-H.; Chung, T.-W.Ind. Eng. Chem. Res. 2006, 45, 8043−8048.(2) Chekin, F.; Bagheri, S.; Arof, A. K.; Hamid, S. B. A. Solid StateElectron. 2012, 16, 3245−3251.(3) Ko, H.; Tsukruk, V. V. Nano Lett. 2006, 6, 1443−1448.(4) Roy, R. K. Design of Experiments Using the Taguchi Approach;John Wiley & Sons: New York, 2001.(5) Kuo, C.-S.; Bai, A.; Huang, C.-M.; Li, Y.-Y.; Hu, C.-C.; Chen, C.-C. Carbon 2005, 43, 2760−2768.(6) Baron, R. M.; Kenny, D. A. J. Pers. Soc. Psychol. 1986, 51, 1173.(7) Dess, G. G.; Newport, S.; Rasheed, A. M. J. Manage. 1993, 19,775−795.(8) Harrell, F. E. Regression Modeling Strategies; Springer Science &Business Media: Berlin, 2001.(9) Davis, J. P.; Eisenhardt, K. M.; Bingham, C. B. J. Acad. Manage.Rev. 2007, 32, 480−499.(10) Termeh Yousefi, A.; Bagheri, S.; Kadri, N. A.; Mahmood, M. R.;Ikeda, S. Int. J. Electrochem. Sci. 2015, 10, 4183−4192.(11) Termeh Yousefi, A.; Bagheri, S.; Shinji, K.; Rusop Mahmood,M.; Ikeda, S. Mater. Res. Innov. 2014.(12) Jorio, A.; Dresselhaus, G.; Dresselhaus, M. S. In CarbonNanotubes; Springer Science & Business Media: Berlin, 2007; Vol. 111.(13) Kumar, M.; Ando, Y. J. Nanosci. Nanotechnol. 2010, 10, 3739−3758.(14) Termehyousefi, A.; Bagheri, S.; Kadri, N.; Elfghi, F. M.; Rusop,M.; Ikeda, S. J. Mater. Manuf Process. 2015, 30, 59−62.(15) Lee, C. J.; Park, J.; Huh, Y.; Yong Lee, J. Chem. Phys. Lett. 2001,343, 33−38.(16) Bezerra, M. A.; Santelli, R. E.; Oliveira, E. P.; Villar, L. S.;Escaleira, L. A. Talanta 2008, 76, 965−977.(17) Puretzky, A. A.; Geohegan, D. B.; Jesse, S.; Ivanov, I. N.; Eres,G. Appl. Phys. A: Mater. Sci. Process. 2005, 81, 223−240.(18) Myers, R. H.; Montgomery, D. C.; Anderson-Cook, C. M.Response Surface Methodology; John Wiley & Sons: New York, 2009;Vol. 705.(19) Jusoh, M.; Johari, A.; Ngadi, N.; Zakaria, Z. Y. Adv. Chem. Eng.2013, 2013.(20) Elfghi, F. M.; Amin, N. React. Kinet. Mech. Catal. 2013, 108,371−390.
Figure 3. TEM images of multiwalled carbon nanotubes correspond-ing to the nonoptimized (a) and optimized (b) conditions of thepredominant factors affecting the CVD process.
Crystal Growth & Design Article
DOI: 10.1021/acs.cgd.5b00534Cryst. Growth Des. XXXX, XXX, XXX−XXX
F

(21) Khan, M. J. H.; Hussain, M. A.; Mujtaba, I. M.Materials 2014, 7,2440−2458.(22) Elfghi, F. M.; Amin, N. React. Kinet. Mech. Catal. 2014, 111, 89−106.(23) Woolson, R. F.; Clarke, W. R. Statistical Methods for the Analysisof Biomedical Data; John Wiley & Sons: New York, 2011; Vol. 371.(24) Chatterjee, S.; Hadi, A. S. Regression Analysis by Example; JohnWiley & Sons: New York, 2013.(25) Dresselhaus, M. S.; Dresselhaus, G.; Saito, R.; Jorio, A. Phys. Rep.2005, 409, 47−99.(26) Yadav, R. M.; Dobal, P. S.; Shripathi, T.; Katiyar, R.; Srivastava,O. Nanoscale Res. Lett. 2009, 4, 197−203.(27) Lee, Y. T.; Kim, N. S.; Park, J.; Han, J. B.; Choi, Y. S.; Ryu, H.;Lee, H. J. Chem. Phys. Lett. 2003, 372, 853−859.(28) Teo, K.; Lee, S.; Chhowalla, M.; Semet, V.; Binh, V. T.;Groening, O.; Castignolles, M.; Loiseau, A.; Pirio, G.; Legagneux, P.Nanotechnology 2003, 14, 204.(29) Liu, J.; Webster, S.; Carroll, D. L. Phys. Chem. B 2005, 109,15769−15774.
Crystal Growth & Design Article
DOI: 10.1021/acs.cgd.5b00534Cryst. Growth Des. XXXX, XXX, XXX−XXX
G


