Embed Size (px)
Citation preview
Modeling the Characteristics and
Emissions of the Future Chinese
Passenger Vehicle Fleet
Jan 2013
Mo Chen*‡
Paul Fischbeck*†
*Department of Engineering and Public Policy†Department of Social and Decision Science
Carnegie Mellon UniversityPittsburgh, PA 15213
Abstract:
CO, HC, NOx and CO2 emissions for Chinese passenger vehicles foryears 2000-2020 are modeled using best available data, realisticassumptions about market relationships, and uncertaintyconsiderations. The timing of four policy options isinvestigated: early retirement of vehicles that do not meetcertain emission standards, adoption of a large fuel tax,implementation of new emissions standards, and the addition ofelectric vehicles. This work reflects a measureable improvementover previous studies. Estimated baseline scenario emissions ofCO, HC, NOx and CO2 are respectively 9.37, 1.04, 0.59 and 622million metric tons in 2020. Under strictest policy scenarios,the emissions of CO, HC, NOx and CO2 will decrease through 2020ending with reductions of 94%, 151%, 46%, and 8%, respectively.Using cost effectiveness metrics, increasing emission standards
1
are preferred over new fuel taxes, but fuel taxes are immediatelyavailable.
‡Corresponding author:Mo ChenDepartment of Engineering and Public Policy5000 Forbes AvenuePittsburgh, PA 15213
2
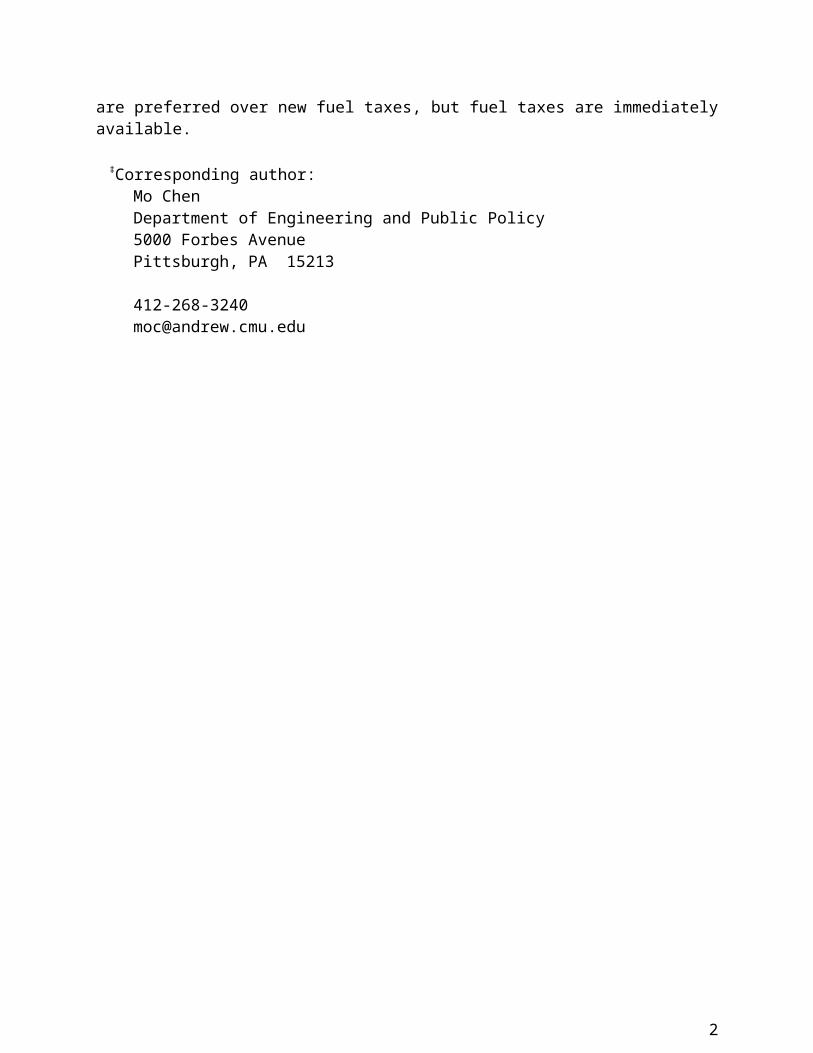
TOC/Abstract art
1. Introduction
China’s rapid economic growth over the past ten years, with
average GDP growth rate exceeding 10% (1), brought the
opportunity for vehicle ownership to an ever-increasing
proportion of the Chinese population. The Chinese passenger
vehicle fleet grew nearly tenfold in the last ten years (1) (2).
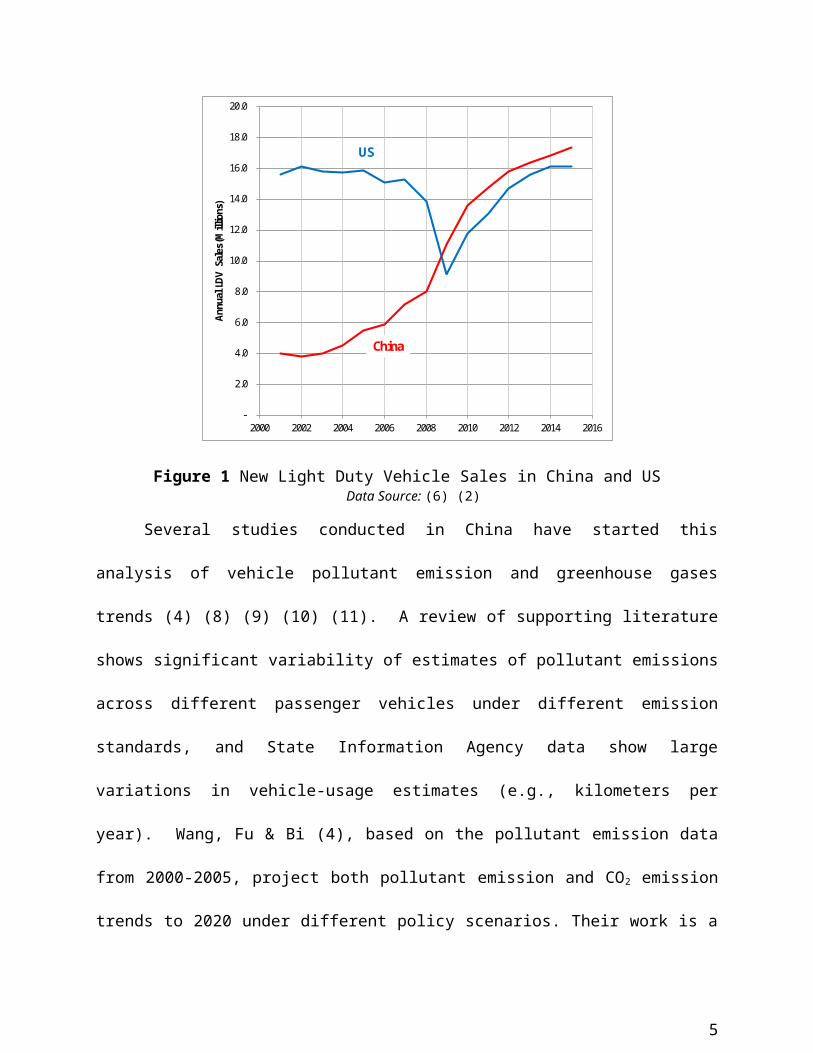
Annual passenger vehicle sales in China now surpass that of the
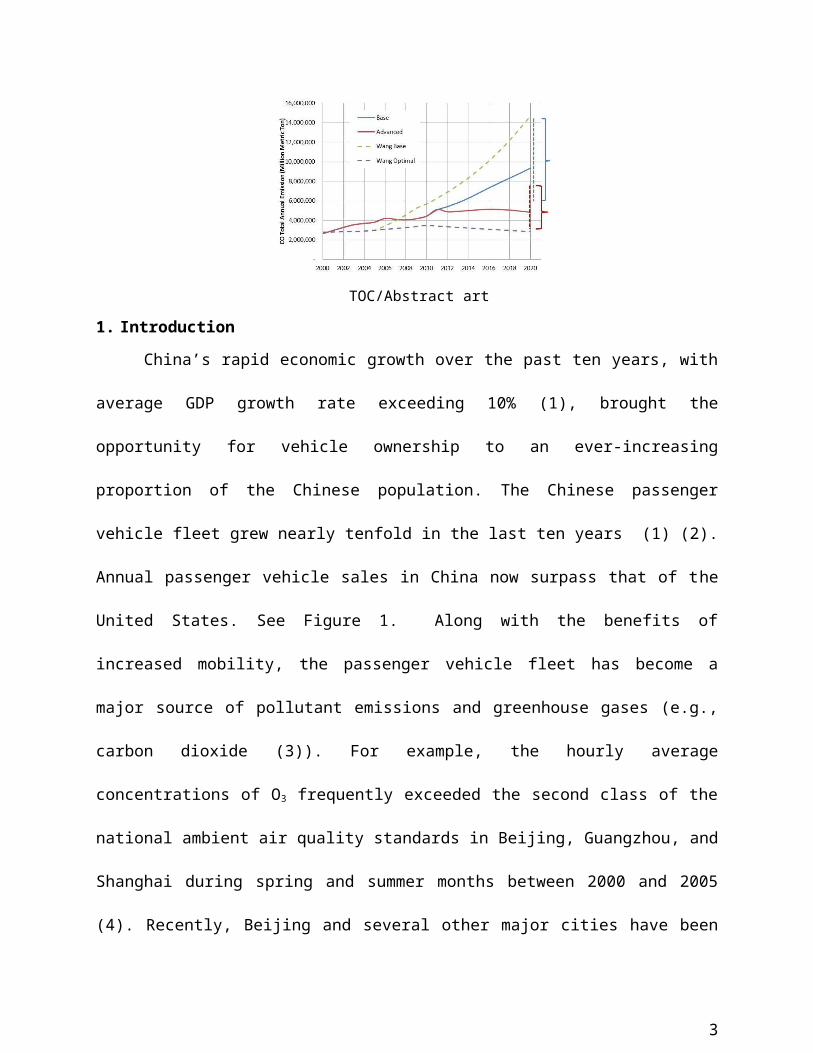
United States. See Figure 1. Along with the benefits of
increased mobility, the passenger vehicle fleet has become a
major source of pollutant emissions and greenhouse gases (e.g.,
carbon dioxide (3)). For example, the hourly average
concentrations of O3 frequently exceeded the second class of the
national ambient air quality standards in Beijing, Guangzhou, and
Shanghai during spring and summer months between 2000 and 2005
(4). Recently, Beijing and several other major cities have been
3
engulfed by smog and have raised worldwide concerns of vehicular
pollution control in China (1). With forecasts suggesting that
passenger vehicle sales will maintain their steady growth rate
(6), the impact of vehicle emissions will not be confined to
China but will have a negative influence on the whole Asia-
Pacific region (7). Because of these and global concerns about
greenhouse gas emissions, the Chinese government needs to
implement a well-informed, realistic emission-control policy.
Fundamental to the design and selection of appropriate policies
is an accurate, integrated forecasting model that accounts for
all of the major behavior, economic, and engineering factors and
acknowledges the inherent uncertainty that underlies such
forecasts.
4
-
2.0
4.0
6.0
8.0
10.0
12.0
14.0
16.0
18.0
20.0
2000 2002 2004 2006 2008 2010 2012 2014 2016
Annual LDV Sales (Millions)
China
US
Figure 1 New Light Duty Vehicle Sales in China and USData Source: (6) (2)
Several studies conducted in China have started this
analysis of vehicle pollutant emission and greenhouse gases
trends (4) (8) (9) (10) (11). A review of supporting literature
shows significant variability of estimates of pollutant emissions
across different passenger vehicles under different emission
standards, and State Information Agency data show large
variations in vehicle-usage estimates (e.g., kilometers per
year). Wang, Fu & Bi (4), based on the pollutant emission data
from 2000-2005, project both pollutant emission and CO2 emission
trends to 2020 under different policy scenarios. Their work is a
5
major step forward compared to previous studies because they
include 1) a policy analysis over emission projections, 2) CO2
emissions, and 3) emission factors based on data from PEMS
(portable emissions measurement system). However, despite
documented systematic uncertainty of critical variables, none of
the previous studies included a comprehensive uncertainty
analysis. In addition, the models to date do not include
important relationships of pollutant emissions with economic
factors (e.g., the price of new vehicles and fuel), consumer
behavior (e.g., vehicle-use, vehicle-retirement, and vehicle-
purchase decisions), and the performance of engineered systems
(e.g., fuel-economy and emission-control degradation rates). The
exclusion of these relationships and an uncertainty analysis can
lead policy makers to have misplaced confidence in
underperforming and cost-ineffective policies.
This work advances the field of study by adding some of the
necessary but missing model pieces. Specifically, we include: 1)
a systematic uncertainty analysis on pollutant emissions
estimations under different policy scenarios, 2) realistic and
updated emission-control system degradation rates based on
6
vehicle use, 3) market reactions (e.g., driving behavior, vehicle
scrap rates, and vehicle sales) to different policy options and
their associated price effects, 4) up-to-date information on
feasible policy scenarios including the implementation electric
vehicles, and 5) historical-trend comparisons between China and
US across multiple measures (e.g., emissions and fleet growth
rate) to provide a context for what has happened, and is likely
to happen in China. This research is a major step forward in
both sophistication and realism. By modeling the important
influencing factors and employing a thorough uncertainty analysis
(e.g., Monte Carlo simulation and parametric sensitivity
analysis), this work provides the platform needed to explore and
evaluate various regulatory policy options available to the
Chinese government.
2. Methodology
7
Total vehicle emissions are dependent on three factors:
emission rates, vehicle usage, and fleet size. In this section,
we detail our model’s approach and discuss the underlying data
and our assumptions.
2.1 Base Emission Factors
The current and future passenger vehicles in China can be
categorized into one of five different emission standards: 1)
pre-China I (China 0), 2) China I, 3) China II, 4) China III, and
5) China IV, which is equivalent to current European emission
standards (12). There have been regional differences in
standards-adoption timing. Beijing implemented China IV in 2008
and Shanghai implemented China IV in 2009, but the national
implementation date for China IV has been delayed for several
years because of gasoline-quality issues (13) (14). The national
implementation date of China IV is now set at the beginning of
2014 (2). The national implementation dates for each Chinese and
various US and EU standards along with the actual standards are
shown in Table 1. Published papers have used a variety of
emission rates. These are shown in Table 2. According to the
8
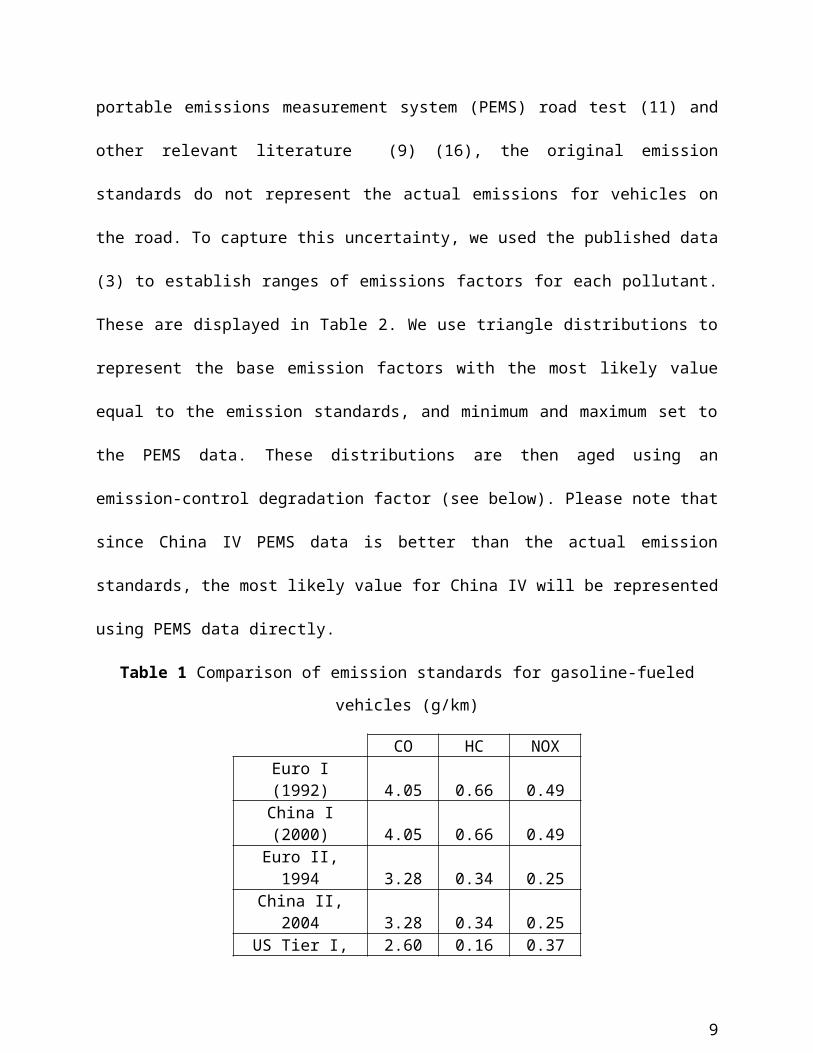
portable emissions measurement system (PEMS) road test (11) and
other relevant literature (9) (16), the original emission
standards do not represent the actual emissions for vehicles on
the road. To capture this uncertainty, we used the published data
(3) to establish ranges of emissions factors for each pollutant.
These are displayed in Table 2. We use triangle distributions to
represent the base emission factors with the most likely value
equal to the emission standards, and minimum and maximum set to
the PEMS data. These distributions are then aged using an
emission-control degradation factor (see below). Please note that
since China IV PEMS data is better than the actual emission
standards, the most likely value for China IV will be represented
using PEMS data directly.
Table 1 Comparison of emission standards for gasoline-fueled
vehicles (g/km)
CO HC NOXEuro I(1992) 4.05 0.66 0.49China I(2000) 4.05 0.66 0.49Euro II,1994 3.28 0.34 0.25
China II,2004 3.28 0.34 0.25
US Tier I, 2.60 0.16 0.37
9
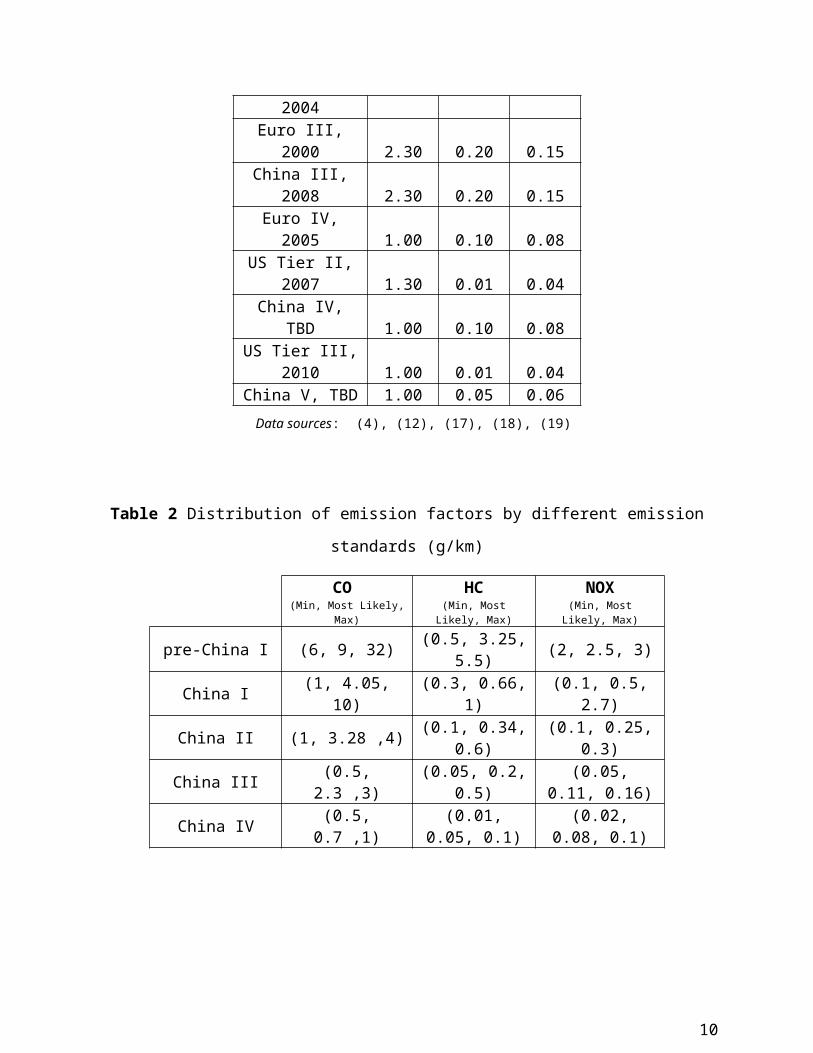
2004Euro III,
2000 2.30 0.20 0.15China III,
2008 2.30 0.20 0.15Euro IV,2005 1.00 0.10 0.08
US Tier II,2007 1.30 0.01 0.04
China IV,TBD 1.00 0.10 0.08
US Tier III,2010 1.00 0.01 0.04
China V, TBD 1.00 0.05 0.06Data sources: (4), (12), (17), (18), (19)
Table 2 Distribution of emission factors by different emission
standards (g/km)
CO (Min, Most Likely,
Max)
HC(Min, MostLikely, Max)
NOX(Min, Most
Likely, Max)
pre-China I (6, 9, 32) (0.5, 3.25,5.5) (2, 2.5, 3)
China I (1, 4.05,10)
(0.3, 0.66,1)
(0.1, 0.5,2.7)
China II (1, 3.28 ,4) (0.1, 0.34,0.6)
(0.1, 0.25,0.3)
China III (0.5,2.3 ,3)
(0.05, 0.2,0.5)
(0.05,0.11, 0.16)
China IV (0.5,0.7 ,1)
(0.01,0.05, 0.1)
(0.02,0.08, 0.1)
10
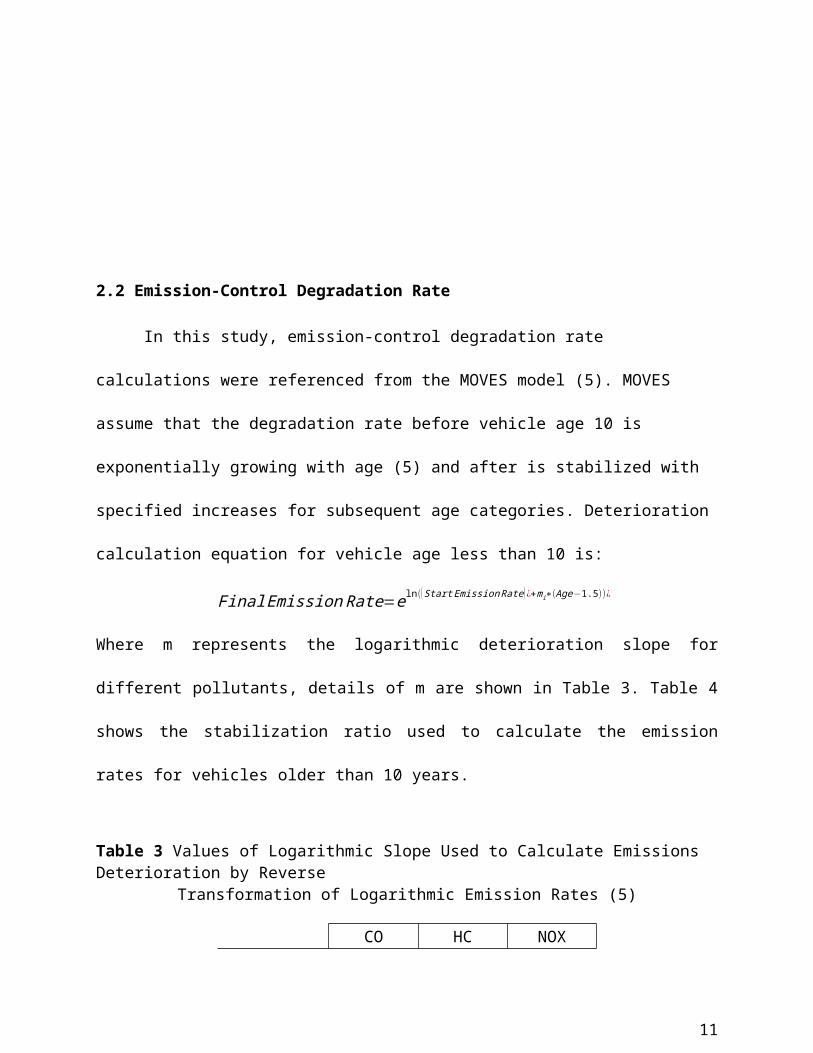
2.2 Emission-Control Degradation Rate
In this study, emission-control degradation rate
calculations were referenced from the MOVES model (5). MOVES
assume that the degradation rate before vehicle age 10 is
exponentially growing with age (5) and after is stabilized with
specified increases for subsequent age categories. Deterioration
calculation equation for vehicle age less than 10 is:
FinalEmissionRate=eln((StartEmissionRate)¿+mi∗(Age−1.5))¿
Where m represents the logarithmic deterioration slope for
different pollutants, details of m are shown in Table 3. Table 4
shows the stabilization ratio used to calculate the emission
rates for vehicles older than 10 years.
Table 3 Values of Logarithmic Slope Used to Calculate Emissions Deterioration by Reverse
Transformation of Logarithmic Emission Rates (5)
CO HC NOX
11
Logarithmic Slope 0.13 0.09 0.15
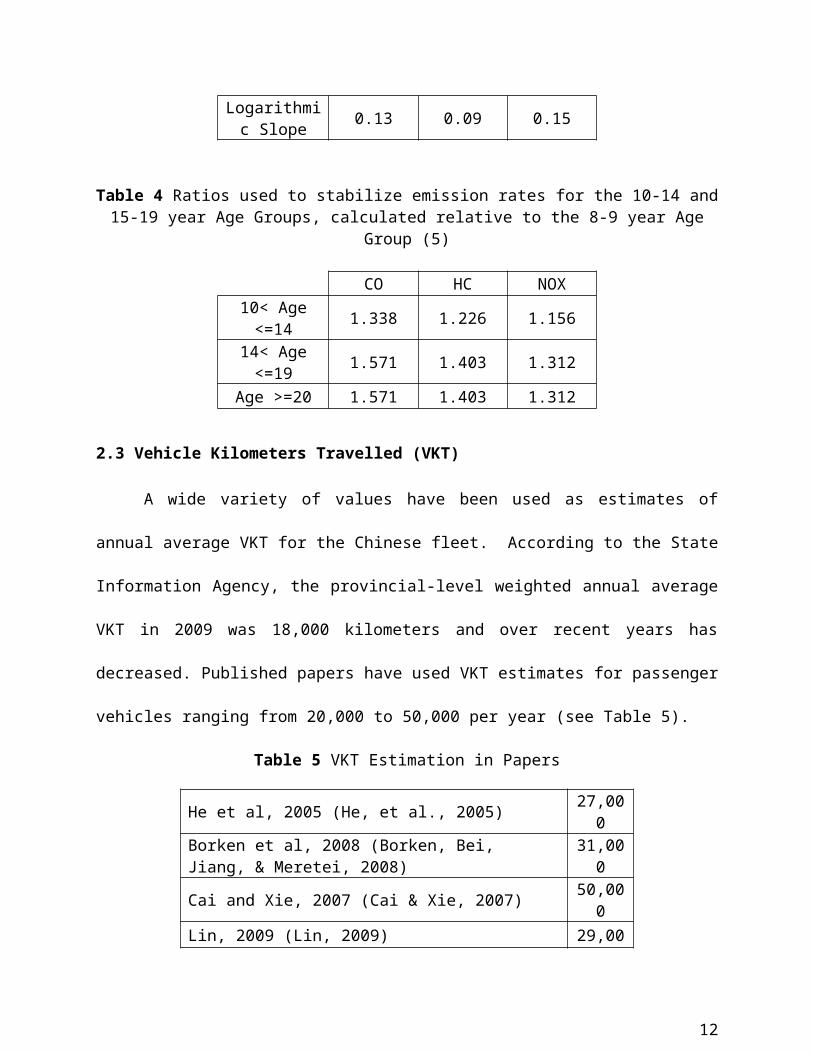
Table 4 Ratios used to stabilize emission rates for the 10-14 and15-19 year Age Groups, calculated relative to the 8-9 year Age
Group (5)
CO HC NOX10< Age<=14 1.338 1.226 1.156
14< Age<=19 1.571 1.403 1.312
Age >=20 1.571 1.403 1.312
2.3 Vehicle Kilometers Travelled (VKT)
A wide variety of values have been used as estimates of
annual average VKT for the Chinese fleet. According to the State
Information Agency, the provincial-level weighted annual average
VKT in 2009 was 18,000 kilometers and over recent years has
decreased. Published papers have used VKT estimates for passenger
vehicles ranging from 20,000 to 50,000 per year (see Table 5).
Table 5 VKT Estimation in Papers
He et al, 2005 (He, et al., 2005) 27,000
Borken et al, 2008 (Borken, Bei, Jiang, & Meretei, 2008)
31,000
Cai and Xie, 2007 (Cai & Xie, 2007) 50,000
Lin, 2009 (Lin, 2009) 29,00
12
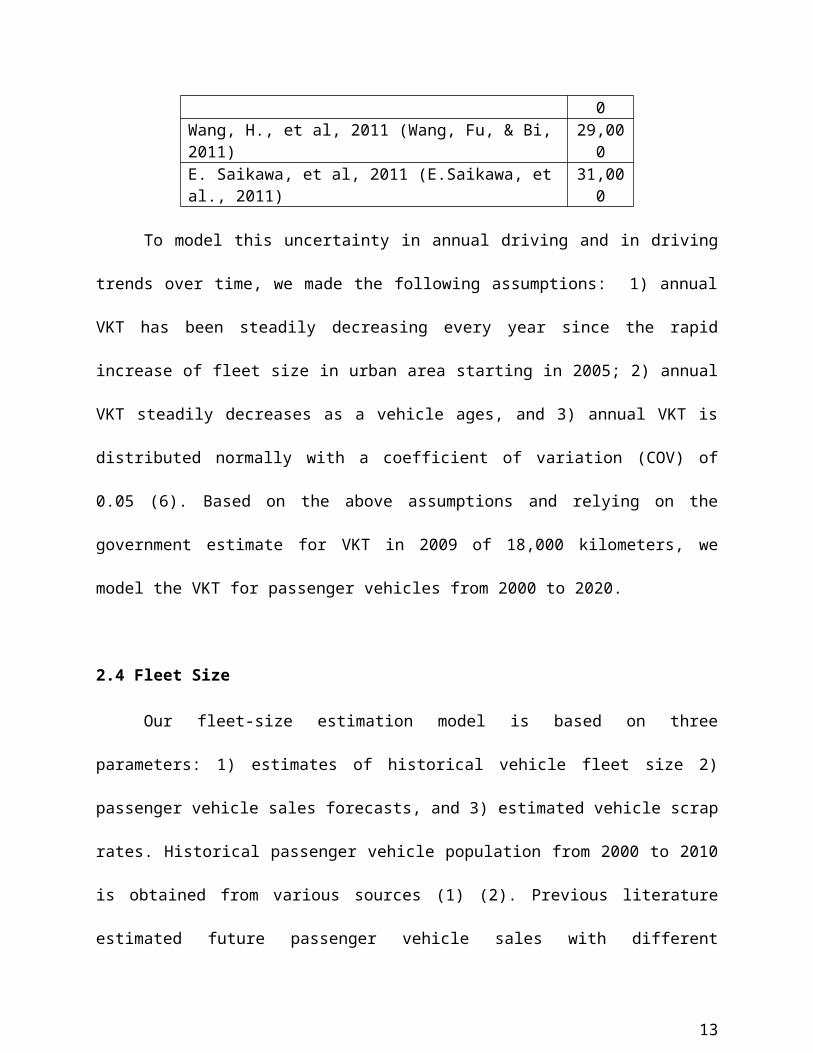
0Wang, H., et al, 2011 (Wang, Fu, & Bi,2011)
29,000
E. Saikawa, et al, 2011 (E.Saikawa, etal., 2011)
31,000
To model this uncertainty in annual driving and in driving
trends over time, we made the following assumptions: 1) annual
VKT has been steadily decreasing every year since the rapid
increase of fleet size in urban area starting in 2005; 2) annual
VKT steadily decreases as a vehicle ages, and 3) annual VKT is
distributed normally with a coefficient of variation (COV) of
0.05 (6). Based on the above assumptions and relying on the
government estimate for VKT in 2009 of 18,000 kilometers, we
model the VKT for passenger vehicles from 2000 to 2020.
2.4 Fleet Size
Our fleet-size estimation model is based on three
parameters: 1) estimates of historical vehicle fleet size 2)
passenger vehicle sales forecasts, and 3) estimated vehicle scrap
rates. Historical passenger vehicle population from 2000 to 2010
is obtained from various sources (1) (2). Previous literature
estimated future passenger vehicle sales with different
13
approaches (4) (16). However, in all cases, future estimates were
given as single values with no quantitative measures of
uncertainty. In this study, normal distributions with mean
values based on Polk (6) and Wang (4) and a coefficient of
variation of 0.05 are used to represent the future sales
estimation. Since there is no systematic analysis on Chinese
vehicle scrap rates, we relied on regression models developed for
the US (21) (22). In these models, scrap rates increase with
vehicle age and growing economy. To account for uncertainties,
the regression models were run multiple times under different
assumptions and a beta distribution was fitted to model for scrap
rates for vehicles at different ages.
By combining the above three parameters and their
uncertainties, distributions of vehicle fleet size for each year
from 2000 to 2020 can be calculated. Because transitions to new
emissions standards are assumed to occur nationwide with the
start of a new model year, these vehicle sales estimates and
subsequent scrap rates are used to determine the number of
vehicles in each emission standard category for each year through
2020.
14
In this analysis, it is assumed that the penetration of
diesel vehicles will be minimal through 2020. Currently, diesel
passenger vehicles make up less than 2% of the Chinese market
(4). A switch to diesels would require a significant
infrastructure change in both refining and distribution of fuel.
This is not anticipated over the next eight years. On the other
hand, Chinese government is now projecting at least 50,000
electric vehicle sales in 2015 (7). However, the prospect of
electric vehicles market in China has been questioned by various
studies (8) (9). Details of the electric vehicles market in China
will be discussed in later sections.
2.5 Dynamic Analysis of Policy Alternatives
For this paper, four policies available for China government
in the near future that have been discussed publically are
investigated: 1) nationwide implementation of China IV emission
standards, 2) increase in fuel taxes, 3) scrapping all pre-China
I vehicles that don’t meet the minimum emission standard, and 4)
introduction of electric vehicles in China. Our model allows for
the timing of these policies to be varied for any year from 2012
15
through 2020. As noted previously, China I, China II and China
III standards have been in place nationally since 2000, 2004, and
2008 respectively, and the China IV standard has been implemented
in a several major cities. An implementation date for China V has
not been announced. Previous research (4) investigated nationwide
adoption of China IV standards in 2012 and China V standards in
2015. However, recent news (2) (13) that nationwide
implementation of China IV standards will be delayed to 2014 or
2015 has shown these assumptions to be optimistic. Based on this,
we believe the possibility of nationwide implementation of China
V before 2020 is very low and, therefore, do not include its
possibility in this analysis. National fuel taxes were
introduced to China in 2009 (26) as a substitute for the original
annual road maintenance fee. It is anticipated that an increase
in the fuel tax may be necessary to generate funds needed to
improve the highway infrastructure.
The implementation of different policies not only will bring
direct impact on vehicular pollutant emission reduction, but also
will influence driving behaviors, consumer demands on passenger
vehicles, and vehicle scrap rates. According to the statistical
16
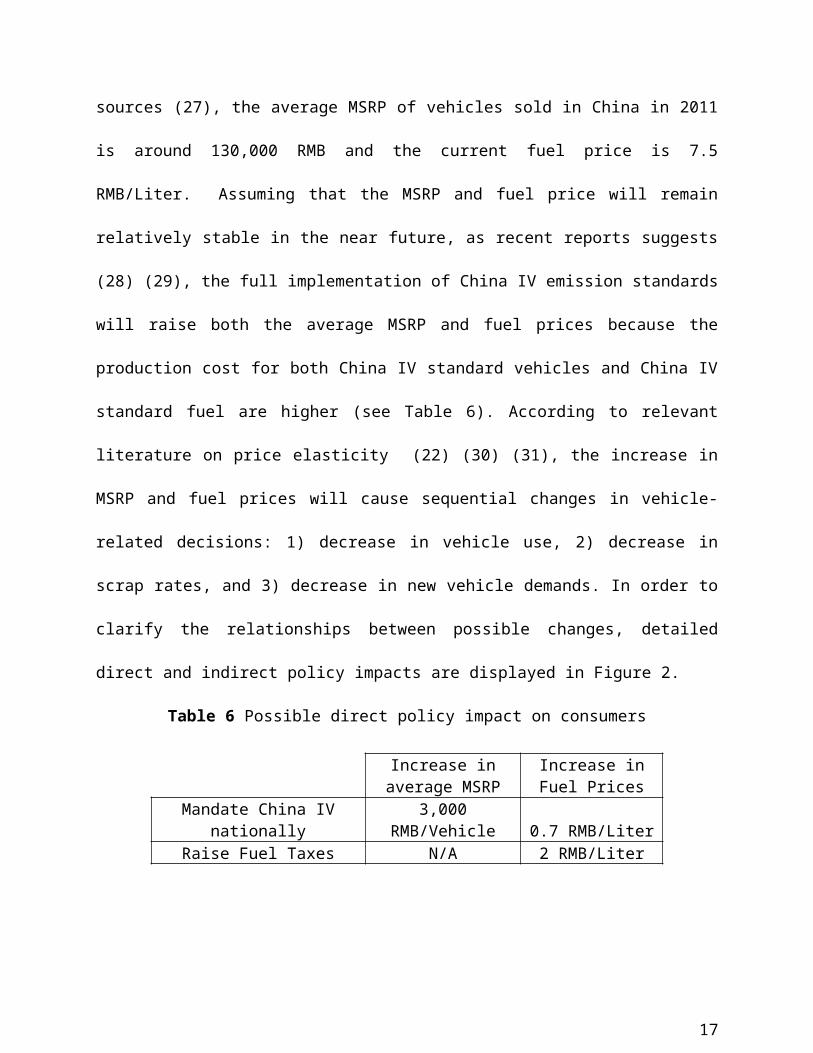
sources (27), the average MSRP of vehicles sold in China in 2011
is around 130,000 RMB and the current fuel price is 7.5
RMB/Liter. Assuming that the MSRP and fuel price will remain
relatively stable in the near future, as recent reports suggests
(28) (29), the full implementation of China IV emission standards
will raise both the average MSRP and fuel prices because the
production cost for both China IV standard vehicles and China IV
standard fuel are higher (see Table 6). According to relevant
literature on price elasticity (22) (30) (31), the increase in
MSRP and fuel prices will cause sequential changes in vehicle-
related decisions: 1) decrease in vehicle use, 2) decrease in
scrap rates, and 3) decrease in new vehicle demands. In order to
clarify the relationships between possible changes, detailed
direct and indirect policy impacts are displayed in Figure 2.
Table 6 Possible direct policy impact on consumers
Increase inaverage MSRP
Increase inFuel Prices
Mandate China IVnationally
3,000RMB/Vehicle 0.7 RMB/Liter
Raise Fuel Taxes N/A 2 RMB/Liter
17
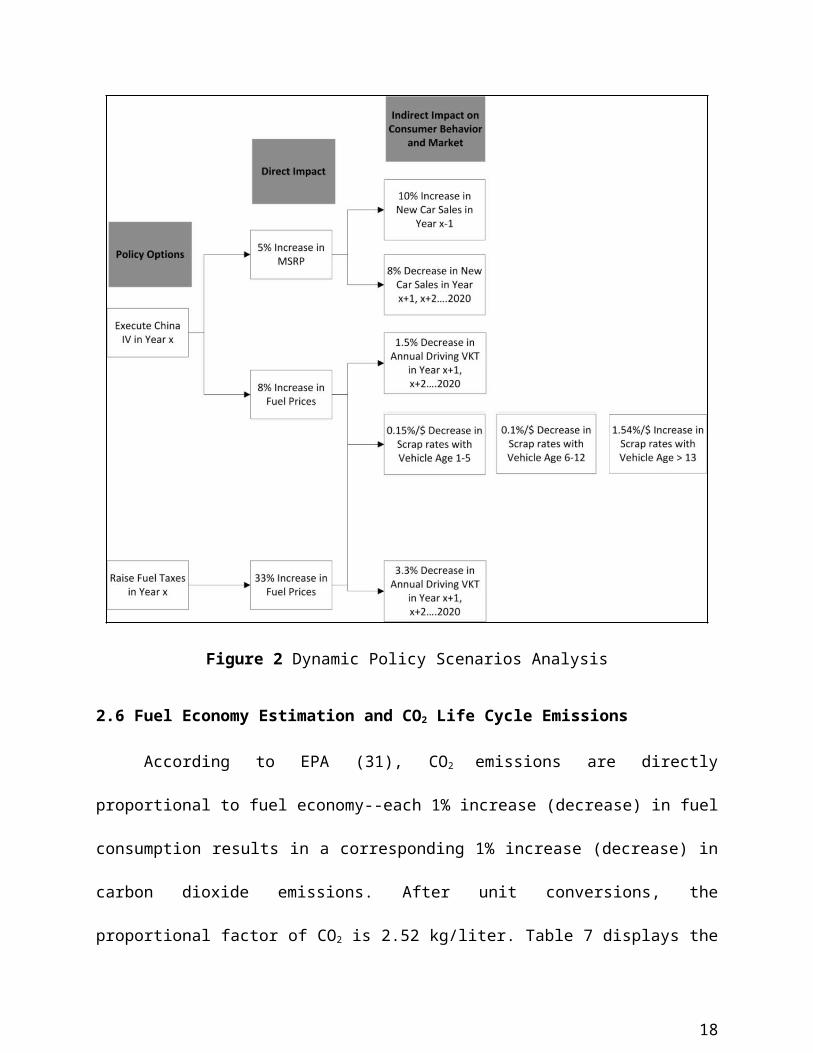
Figure 2 Dynamic Policy Scenarios Analysis
2.6 Fuel Economy Estimation and CO2 Life Cycle Emissions
According to EPA (31), CO2 emissions are directly
proportional to fuel economy--each 1% increase (decrease) in fuel
consumption results in a corresponding 1% increase (decrease) in
carbon dioxide emissions. After unit conversions, the
proportional factor of CO2 is 2.52 kg/liter. Table 7 displays the
18
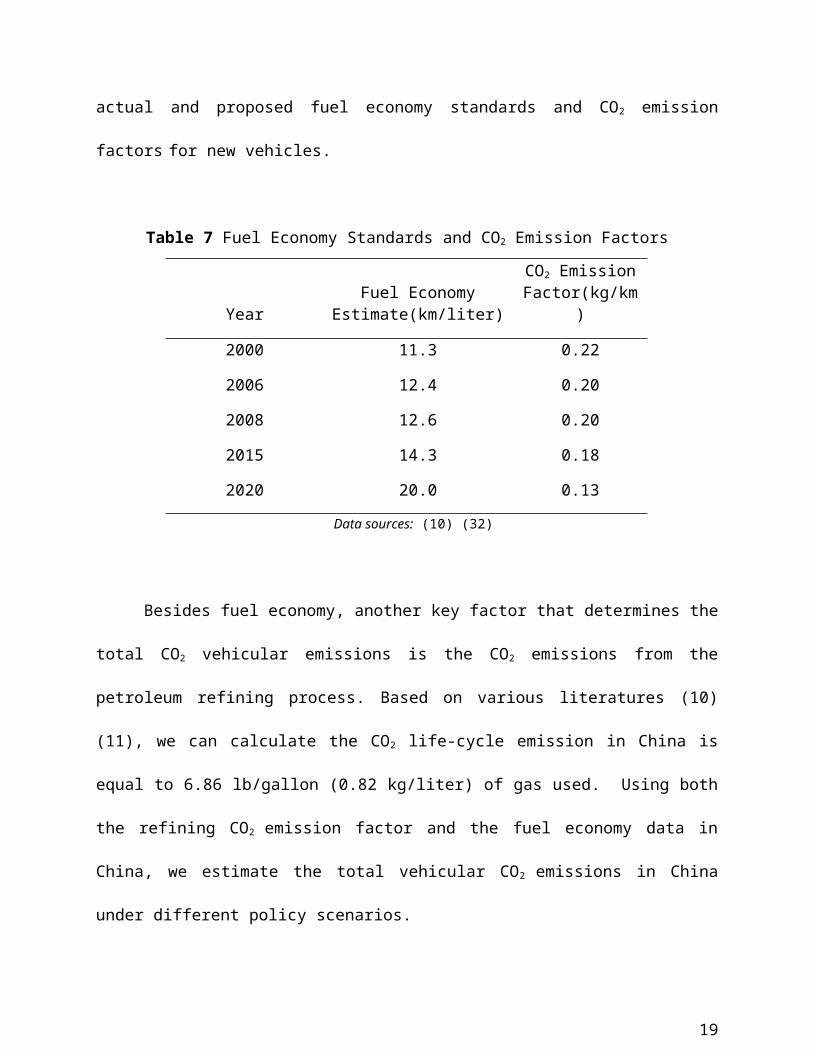
actual and proposed fuel economy standards and CO2 emission
factors for new vehicles.
Table 7 Fuel Economy Standards and CO2 Emission Factors
YearFuel Economy
Estimate(km/liter)
CO2 EmissionFactor(kg/km
)
2000 11.3 0.22
2006 12.4 0.20
2008 12.6 0.20
2015 14.3 0.18
2020 20.0 0.13
Data sources: (10) (32)
Besides fuel economy, another key factor that determines the
total CO2 vehicular emissions is the CO2 emissions from the
petroleum refining process. Based on various literatures (10)
(11), we can calculate the CO2 life-cycle emission in China is
equal to 6.86 lb/gallon (0.82 kg/liter) of gas used. Using both
the refining CO2 emission factor and the fuel economy data in
China, we estimate the total vehicular CO2 emissions in China
under different policy scenarios.
19
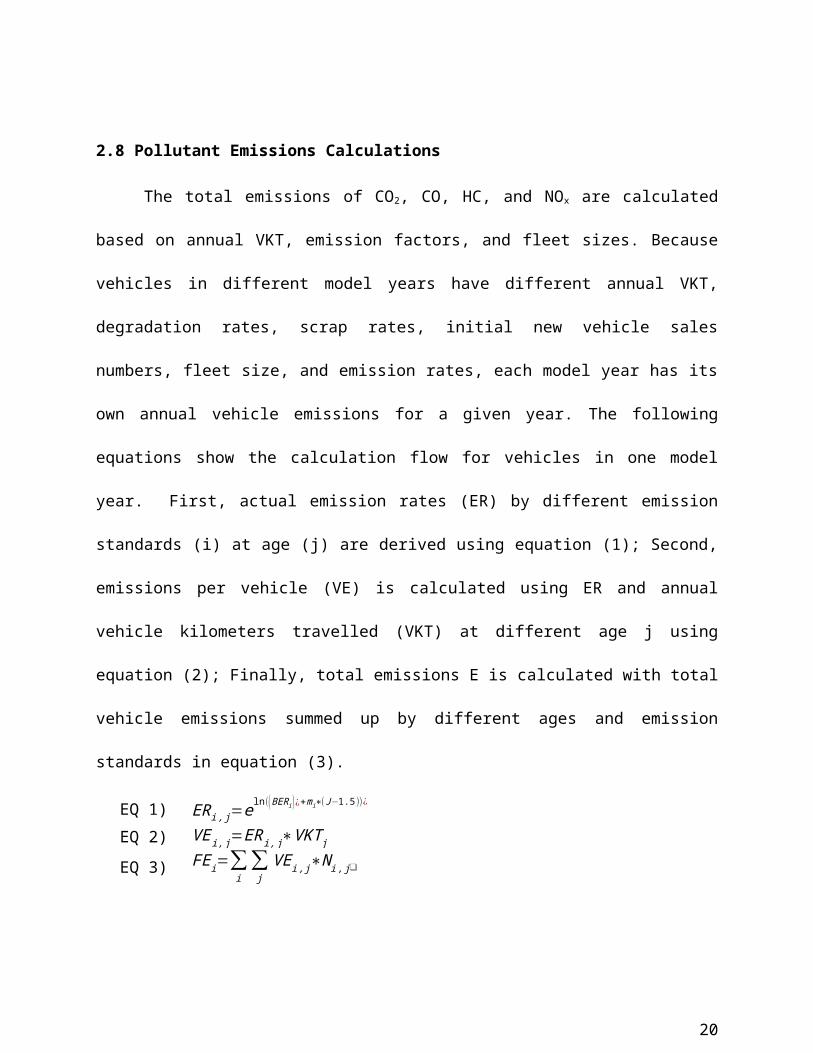
2.8 Pollutant Emissions Calculations
The total emissions of CO2, CO, HC, and NOx are calculated
based on annual VKT, emission factors, and fleet sizes. Because
vehicles in different model years have different annual VKT,
degradation rates, scrap rates, initial new vehicle sales
numbers, fleet size, and emission rates, each model year has its
own annual vehicle emissions for a given year. The following
equations show the calculation flow for vehicles in one model
year. First, actual emission rates (ER) by different emission
standards (i) at age (j) are derived using equation (1); Second,
emissions per vehicle (VE) is calculated using ER and annual
vehicle kilometers travelled (VKT) at different age j using
equation (2); Finally, total emissions E is calculated with total
vehicle emissions summed up by different ages and emission
standards in equation (3).
EQ 1) ERi,j=eln((BERi)¿+mi∗(J−1.5))¿
EQ 2) VEi,j=ERi,j∗VKTjEQ 3) FEi=∑
i∑jVEi,j∗Ni,j❑
20
where BERi represents base emission factors for new vehicles of
different emission standards from Table 2, ERi,j represents
emission rate at different car ages (i) by different emission
standards (j) from Table 4, VKTj represents cumulative mileage
travelled at that certain age interval,
As introduced in the previous section, uncertainties in the
values are represented by distributions, and the distribution
parameters change under different policy scenarios. Combining all
the total emissions for vehicles in different model years, the
total nationwide pollutant emissions for passenger cars is
obtained. The simulation modeling program @Risk was used to
determine the distributions of the output metrics of interest.
Simulations runs of 10,000 were used.
3. Results and Interpretations
3.1 Baseline Scenario
Assuming that the Chinese government maintains the
environmental policies of 2010 (i.e., China III emission
standards for all new vehicles after 2007 and does not implement
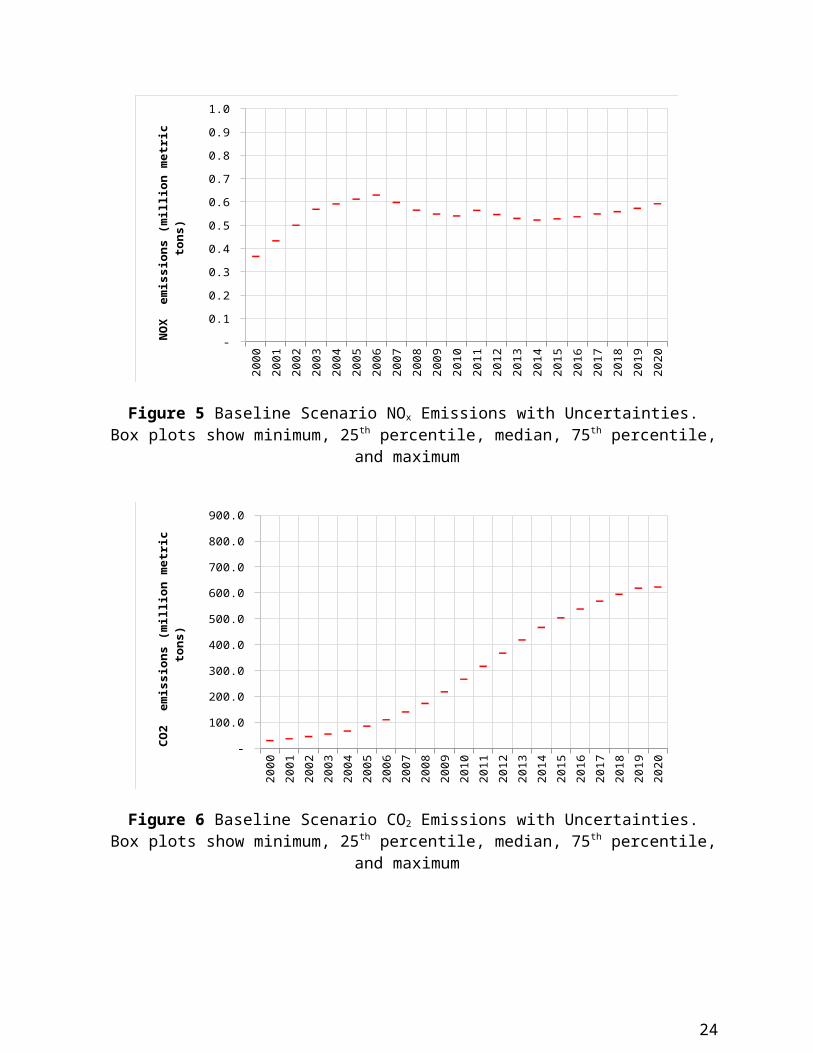
further emission reduction policies until after 2019), the
projected vehicular emissions of CO, HC, NOx and CO2 are
21
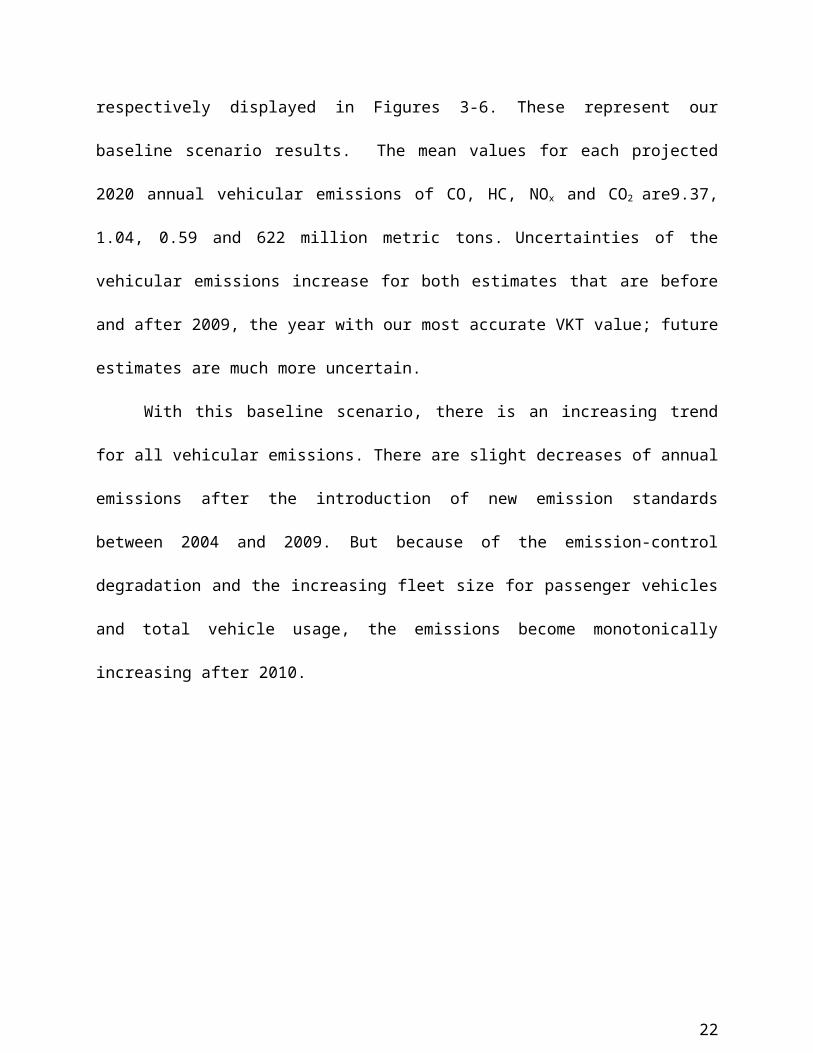
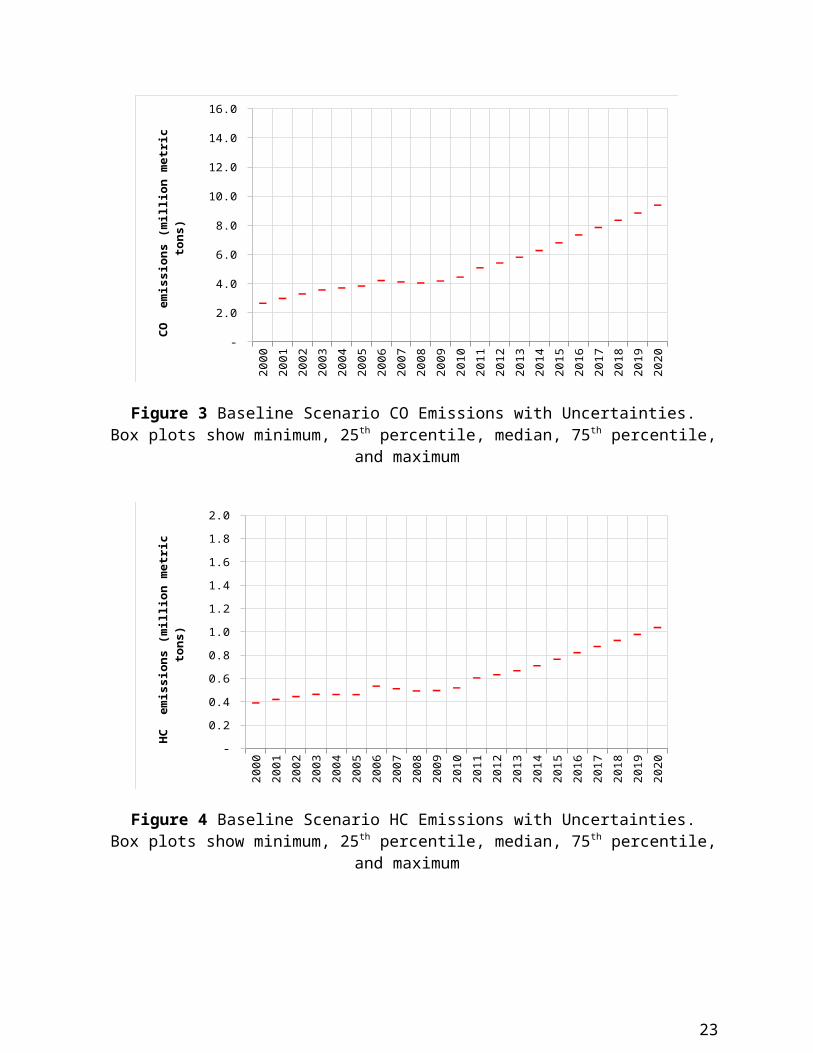
respectively displayed in Figures 3-6. These represent our
baseline scenario results. The mean values for each projected
2020 annual vehicular emissions of CO, HC, NOx and CO2 are9.37,
1.04, 0.59 and 622 million metric tons. Uncertainties of the
vehicular emissions increase for both estimates that are before
and after 2009, the year with our most accurate VKT value; future
estimates are much more uncertain.
With this baseline scenario, there is an increasing trend
for all vehicular emissions. There are slight decreases of annual
emissions after the introduction of new emission standards
between 2004 and 2009. But because of the emission-control
degradation and the increasing fleet size for passenger vehicles
and total vehicle usage, the emissions become monotonically
increasing after 2010.
22
2000
2001
2002
2003
2004
2005
2006
2007
2008
2009
2010
2011
2012
2013
2014
2015
2016
2017
2018
2019
2020
-
2.0
4.0
6.0
8.0
10.0
12.0
14.0
16.0
CO emissi
ons (million metric
tons)
Figure 3 Baseline Scenario CO Emissions with Uncertainties. Box plots show minimum, 25th percentile, median, 75th percentile,
and maximum
2000
2001
2002
2003
2004
2005
2006
2007
2008
2009
2010
2011
2012
2013
2014
2015
2016
2017
2018
2019
2020
-
0.2
0.4
0.6
0.8
1.0
1.2
1.4
1.6
1.8
2.0
HC emissi
ons (million metric
tons)
Figure 4 Baseline Scenario HC Emissions with Uncertainties. Box plots show minimum, 25th percentile, median, 75th percentile,
and maximum
23
2000
2001
2002
2003
2004
2005
2006
2007
2008
2009
2010
2011
2012
2013
2014
2015
2016
2017
2018
2019
2020
-
0.1
0.2
0.3
0.4
0.5
0.6
0.7
0.8
0.9
1.0
NOX emiss
ions (million metric
tons)
Figure 5 Baseline Scenario NOx Emissions with Uncertainties. Box plots show minimum, 25th percentile, median, 75th percentile,
and maximum
2000
2001
2002
2003
2004
2005
2006
2007
2008
2009
2010
2011
2012
2013
2014
2015
2016
2017
2018
2019
2020
-
100.0
200.0
300.0
400.0
500.0
600.0
700.0
800.0
900.0
CO2 emiss
ions (million metric
tons)
Figure 6 Baseline Scenario CO2 Emissions with Uncertainties. Box plots show minimum, 25th percentile, median, 75th percentile,
and maximum
24
3.2 Policy Scenario Analysis
Before beginning a detailed policy analysis, the feasibility of
each policy scenario was tested for significance. Because the
number of pre-China I vehicles after 2015 is very small compared
to the entire fleet, a policy of forced retirement has minimal
impact on total emissions in the long run (see Figure 7). In
fact our analysis shows that the reduction of emissions goes
nearly to zero after 2018 for a forced-retirement policy
implemented in 2012. We assume that vehicle sales will increase
in response to the disappearance of recalled vehicles. These
newly purchased vehicles replace sales that would have occurred
later when the pre-China vehicles would have been retired based
on market conditions and would potentially involve vehicles that
are of a lower standard than they otherwise would have purchased.
With the forced early retirement, the Chinese fleet in 2020 would
be older and more polluting than in the baseline scenario.
Because of this, this policy option is not included in further
analysis.
For the other two policies except electric vehicle
implementations, we investigated 64 different combinations of
25
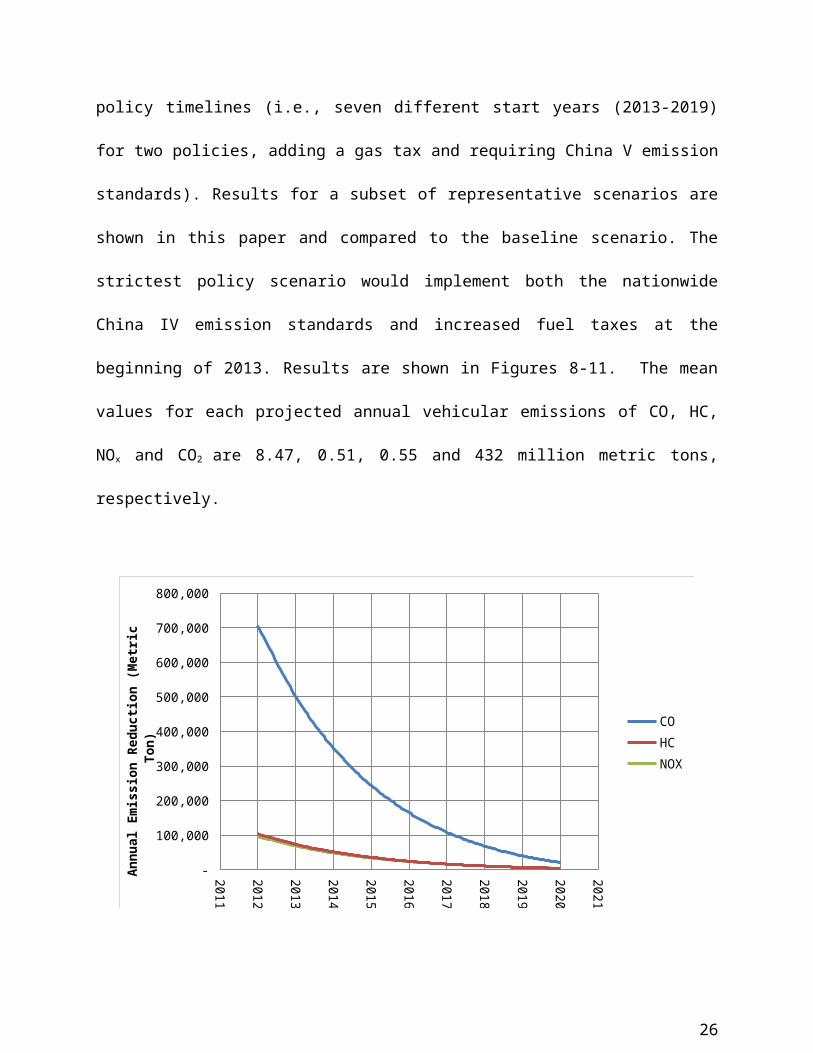
policy timelines (i.e., seven different start years (2013-2019)
for two policies, adding a gas tax and requiring China V emission
standards). Results for a subset of representative scenarios are
shown in this paper and compared to the baseline scenario. The
strictest policy scenario would implement both the nationwide
China IV emission standards and increased fuel taxes at the
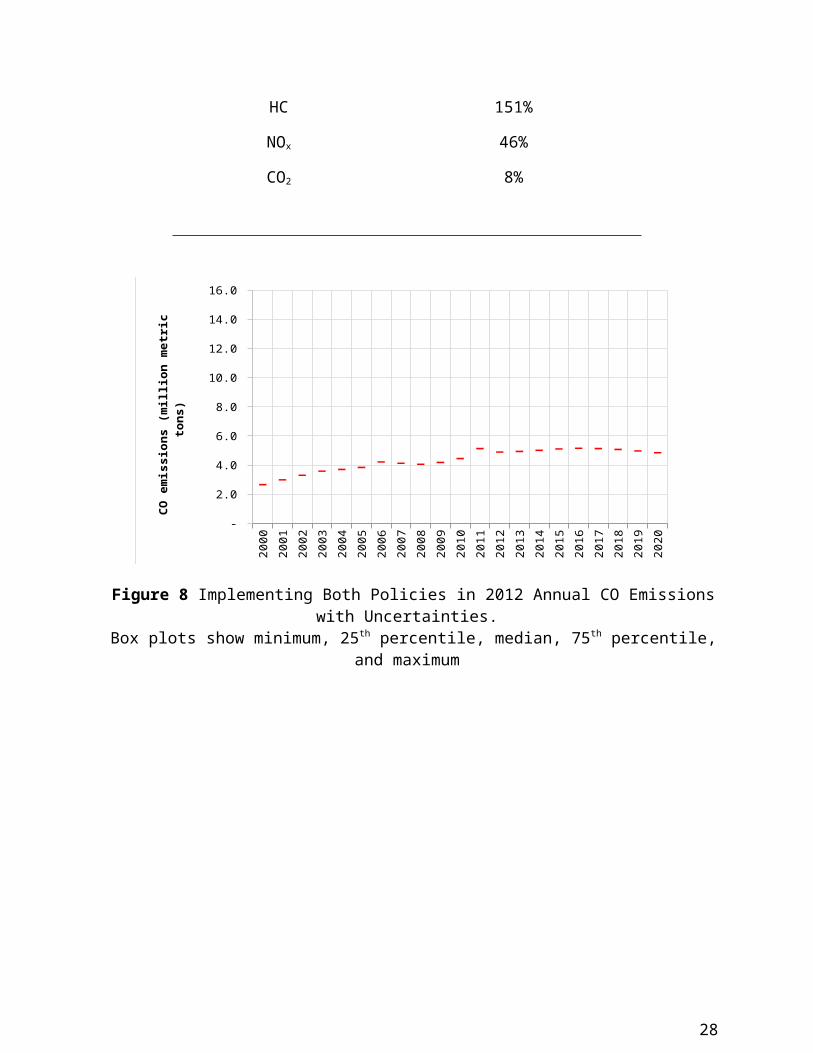
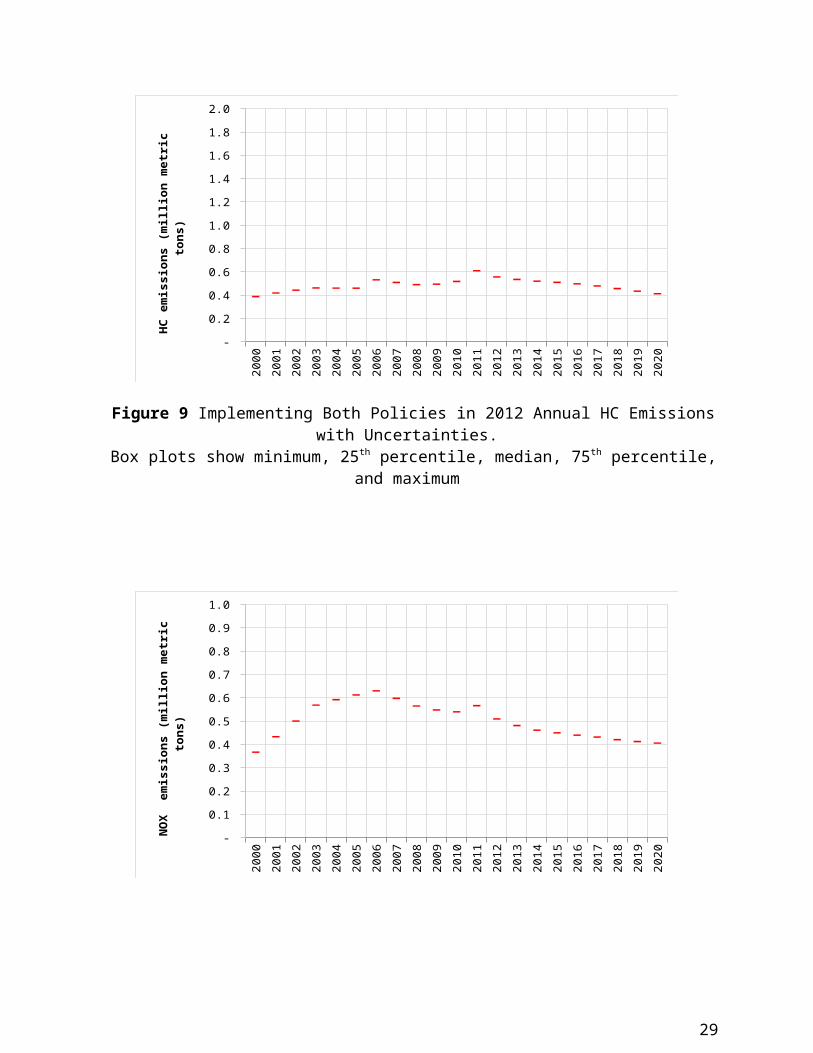
beginning of 2013. Results are shown in Figures 8-11. The mean
values for each projected annual vehicular emissions of CO, HC,
NOx and CO2 are 8.47, 0.51, 0.55 and 432 million metric tons,
respectively.
2011
2012
2013
2014
2015
2016
2017
2018
2019
2020
2021
-
100,000
200,000
300,000
400,000
500,000
600,000
700,000
800,000
COHCNOX
Annu
al Emiss
ion Re
ductio
n (Metri
c To
n)
26
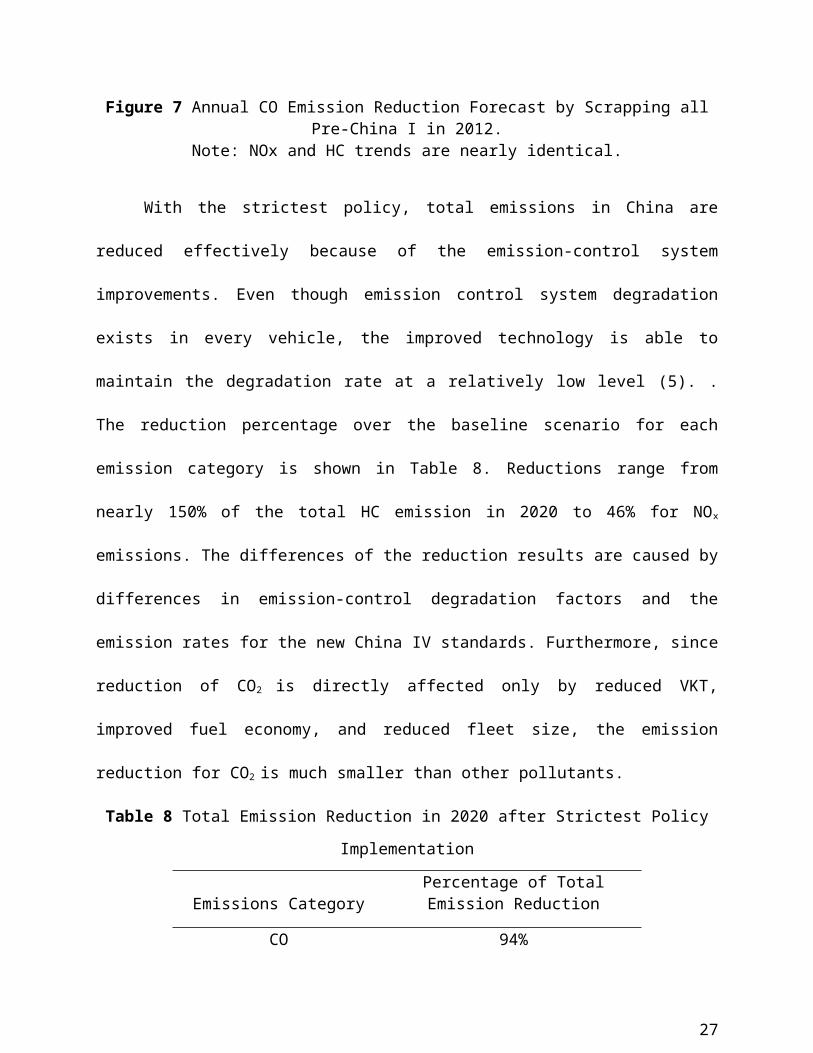
Figure 7 Annual CO Emission Reduction Forecast by Scrapping allPre-China I in 2012.
Note: NOx and HC trends are nearly identical.
With the strictest policy, total emissions in China are
reduced effectively because of the emission-control system
improvements. Even though emission control system degradation
exists in every vehicle, the improved technology is able to
maintain the degradation rate at a relatively low level (5). .
The reduction percentage over the baseline scenario for each
emission category is shown in Table 8. Reductions range from
nearly 150% of the total HC emission in 2020 to 46% for NOx
emissions. The differences of the reduction results are caused by
differences in emission-control degradation factors and the
emission rates for the new China IV standards. Furthermore, since
reduction of CO2 is directly affected only by reduced VKT,
improved fuel economy, and reduced fleet size, the emission
reduction for CO2 is much smaller than other pollutants.
Table 8 Total Emission Reduction in 2020 after Strictest Policy
Implementation
Emissions CategoryPercentage of TotalEmission Reduction
CO 94%
27
HC 151%
NOx 46%
CO2 8%
2000
2001
2002
2003
2004
2005
2006
2007
2008
2009
2010
2011
2012
2013
2014
2015
2016
2017
2018
2019
2020
-
2.0
4.0
6.0
8.0
10.0
12.0
14.0
16.0
CO emissio
ns (million metric
tons)
Figure 8 Implementing Both Policies in 2012 Annual CO Emissionswith Uncertainties.
Box plots show minimum, 25th percentile, median, 75th percentile,and maximum
28
2000
2001
2002
2003
2004
2005
2006
2007
2008
2009
2010
2011
2012
2013
2014
2015
2016
2017
2018
2019
2020
-
0.2
0.4
0.6
0.8
1.0
1.2
1.4
1.6
1.8
2.0
HC emissio
ns (million metric
tons)
Figure 9 Implementing Both Policies in 2012 Annual HC Emissionswith Uncertainties.
Box plots show minimum, 25th percentile, median, 75th percentile,and maximum
2000
2001
2002
2003
2004
2005
2006
2007
2008
2009
2010
2011
2012
2013
2014
2015
2016
2017
2018
2019
2020
-
0.1
0.2
0.3
0.4
0.5
0.6
0.7
0.8
0.9
1.0
NOX emiss
ions (million metric
tons)
29
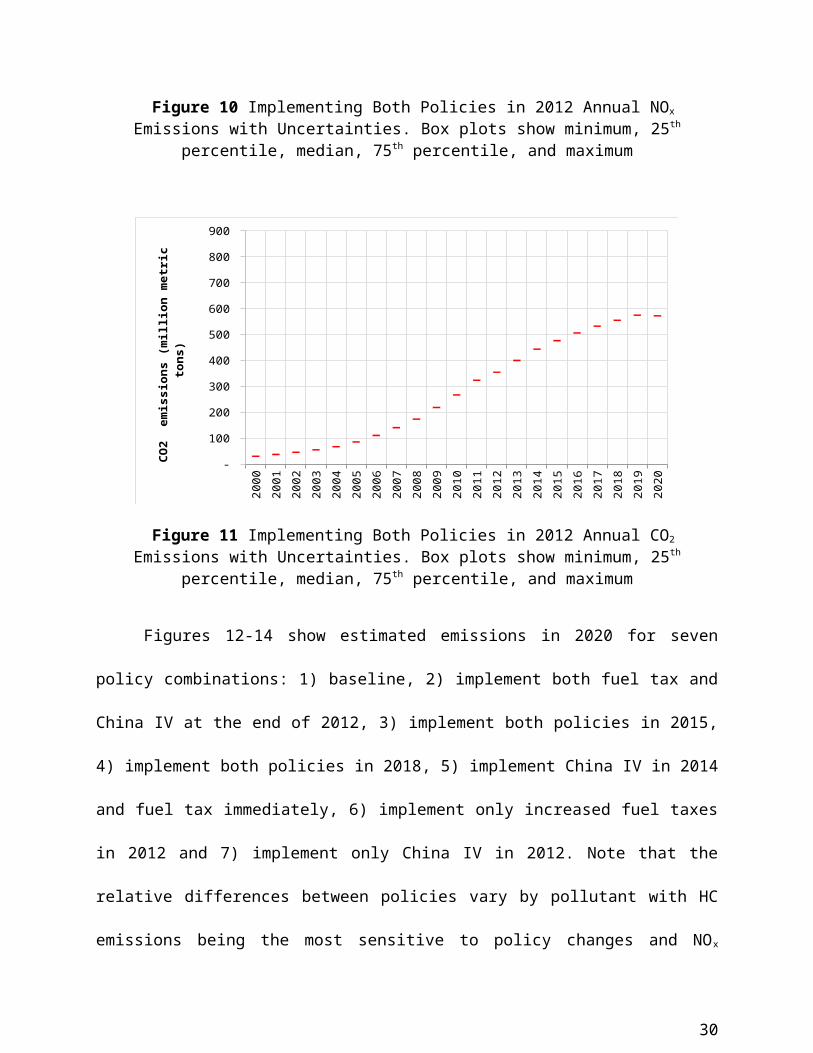
Figure 10 Implementing Both Policies in 2012 Annual NOx
Emissions with Uncertainties. Box plots show minimum, 25th
percentile, median, 75th percentile, and maximum
2000
2001
2002
2003
2004
2005
2006
2007
2008
2009
2010
2011
2012
2013
2014
2015
2016
2017
2018
2019
2020
-
100
200
300
400
500
600
700
800
900
CO2 emiss
ions (million metric
tons)
Figure 11 Implementing Both Policies in 2012 Annual CO2
Emissions with Uncertainties. Box plots show minimum, 25th
percentile, median, 75th percentile, and maximum
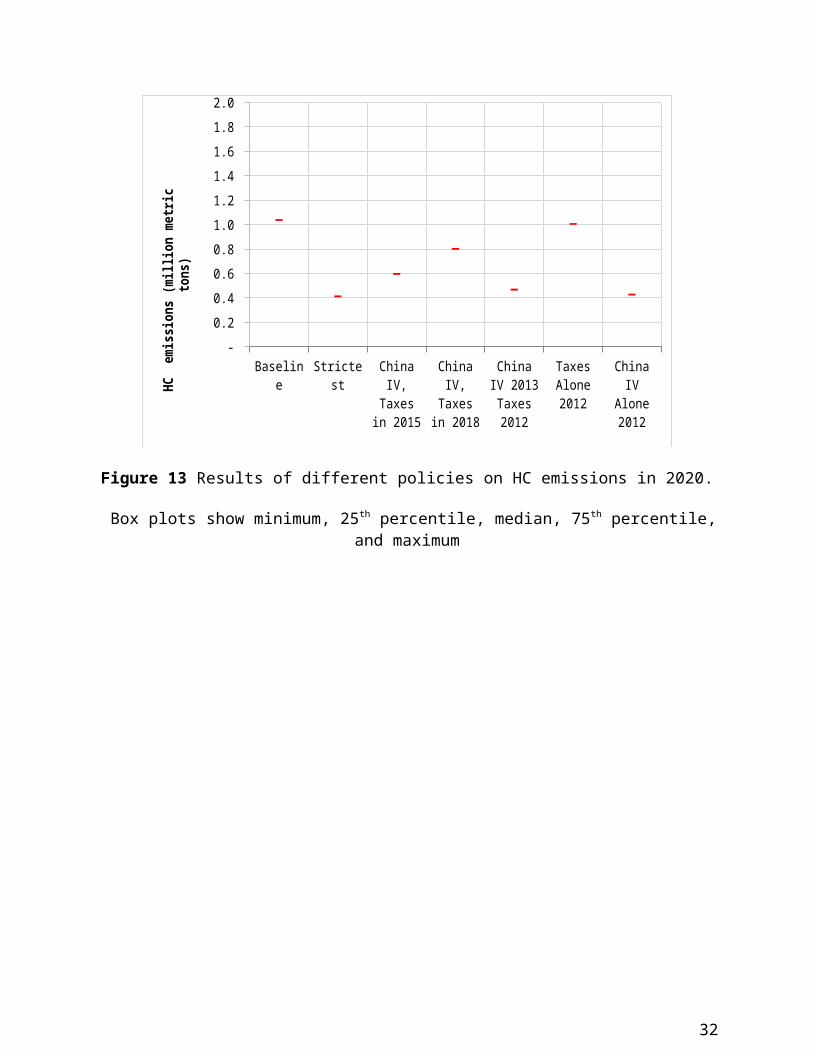
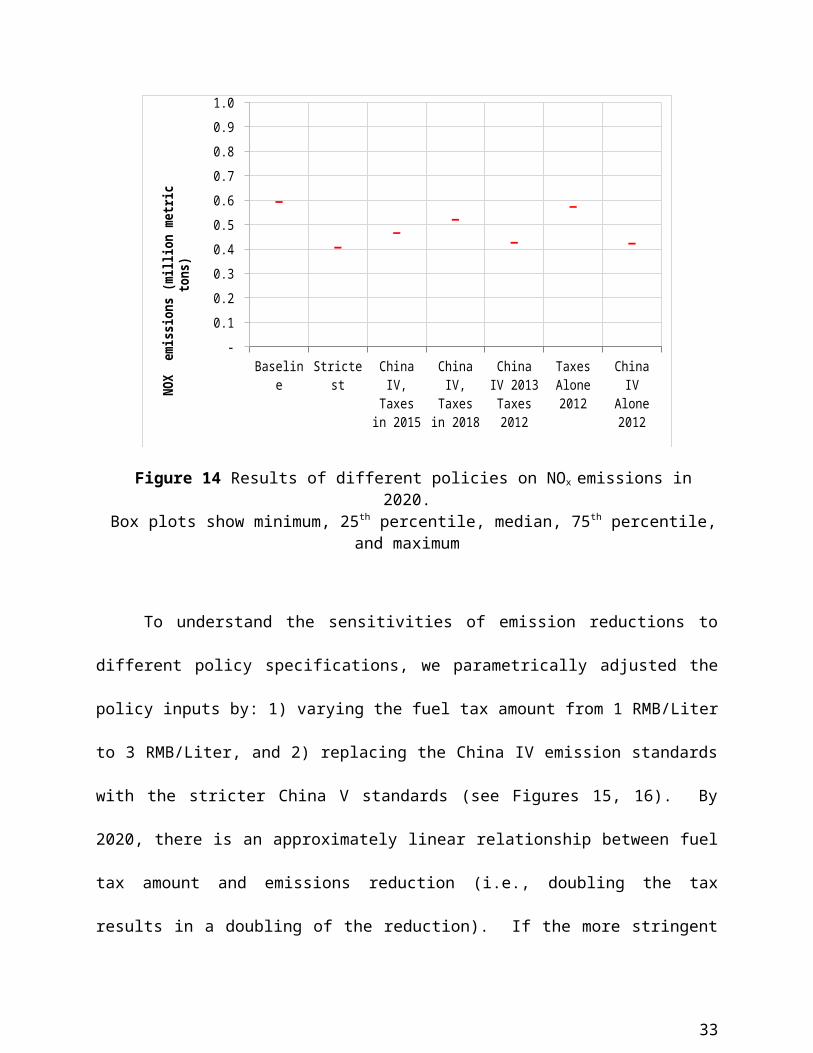
Figures 12-14 show estimated emissions in 2020 for seven
policy combinations: 1) baseline, 2) implement both fuel tax and
China IV at the end of 2012, 3) implement both policies in 2015,
4) implement both policies in 2018, 5) implement China IV in 2014
and fuel tax immediately, 6) implement only increased fuel taxes
in 2012 and 7) implement only China IV in 2012. Note that the
relative differences between policies vary by pollutant with HC
emissions being the most sensitive to policy changes and NOx
30
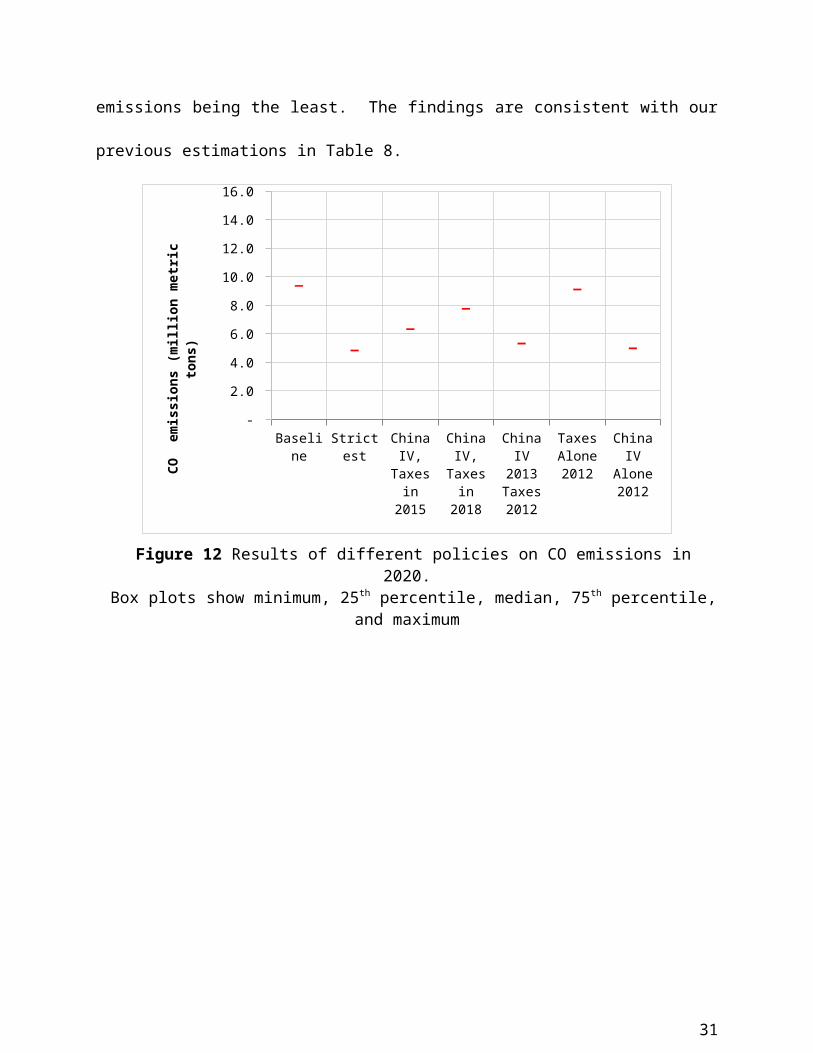
emissions being the least. The findings are consistent with our
previous estimations in Table 8.
Baseline
Strictest
China IV, Taxes in 2015
China IV, Taxes in 2018
China IV 2013 Taxes 2012
Taxes Alone 2012
China IV
Alone 2012
-
2.0
4.0
6.0
8.0
10.0
12.0
14.0
16.0 CO
em
issi
ons
(mil
lion
met
ric
tons
)
Figure 12 Results of different policies on CO emissions in2020.
Box plots show minimum, 25th percentile, median, 75th percentile,and maximum
31
Baseline
Strictest
China IV,
Taxes in 2015
China IV,
Taxes in 2018
China IV 2013 Taxes 2012
Taxes Alone 2012
China IV
Alone 2012
- 0.2 0.4 0.6 0.8 1.0 1.2 1.4 1.6 1.8 2.0
HC
emis
sions
(mil
lion m
etri
c tons)
Figure 13 Results of different policies on HC emissions in 2020.
Box plots show minimum, 25th percentile, median, 75th percentile,and maximum
32
Baseline
Strictest
China IV,
Taxes in 2015
China IV,
Taxes in 2018
China IV 2013 Taxes 2012
Taxes Alone 2012
China IV
Alone 2012
- 0.1 0.2 0.3 0.4 0.5 0.6 0.7 0.8 0.9 1.0
NOX
emi
ssions
(mi
llion
metr
ic
tons)
Figure 14 Results of different policies on NOx emissions in2020.
Box plots show minimum, 25th percentile, median, 75th percentile,and maximum
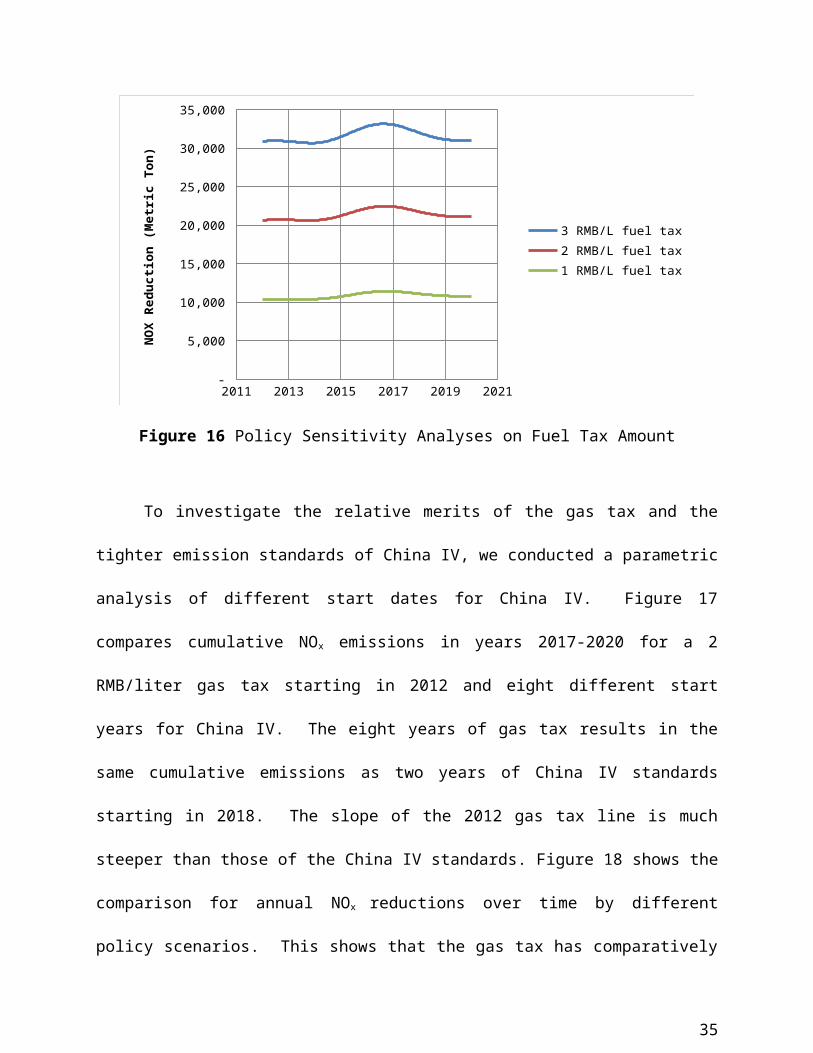
To understand the sensitivities of emission reductions to
different policy specifications, we parametrically adjusted the
policy inputs by: 1) varying the fuel tax amount from 1 RMB/Liter
to 3 RMB/Liter, and 2) replacing the China IV emission standards
with the stricter China V standards (see Figures 15, 16). By
2020, there is an approximately linear relationship between fuel
tax amount and emissions reduction (i.e., doubling the tax
results in a doubling of the reduction). If the more stringent
33
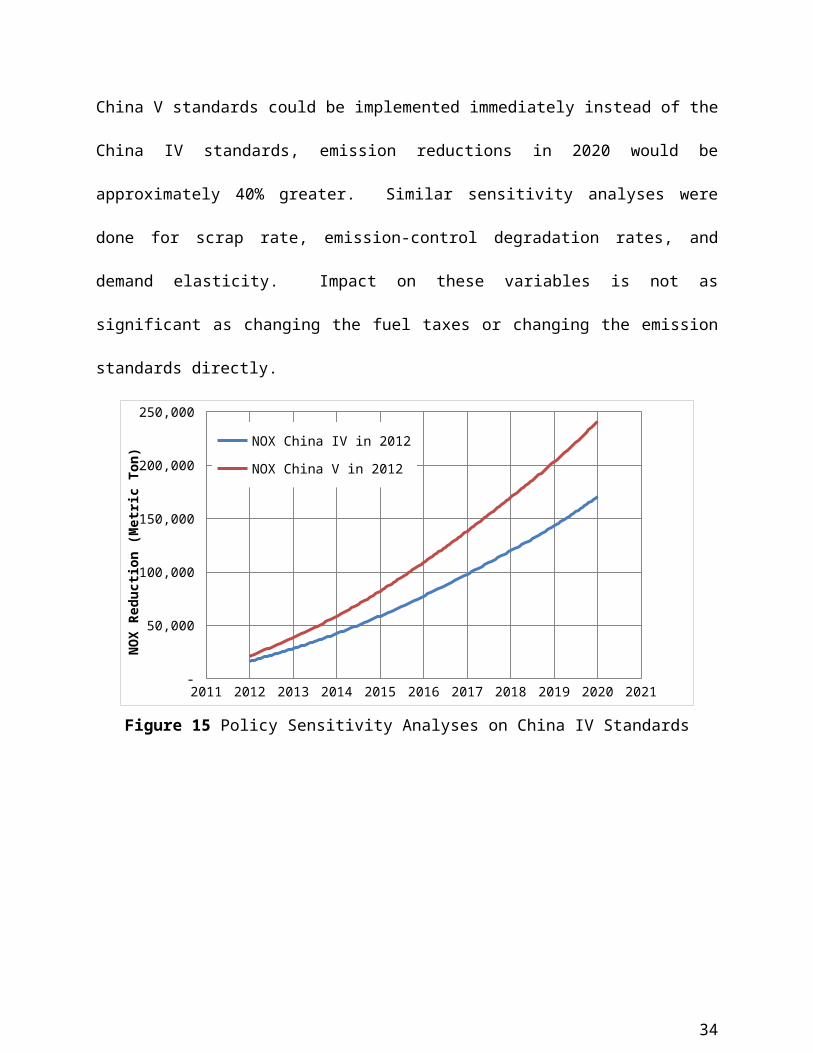
China V standards could be implemented immediately instead of the
China IV standards, emission reductions in 2020 would be
approximately 40% greater. Similar sensitivity analyses were
done for scrap rate, emission-control degradation rates, and
demand elasticity. Impact on these variables is not as
significant as changing the fuel taxes or changing the emission
standards directly.
2011 2012 2013 2014 2015 2016 2017 2018 2019 2020 2021 -
50,000
100,000
150,000
200,000
250,000
NOX China IV in 2012
NOX China V in 2012
NOX
Redu
ction
(Met
ric
Ton)
Figure 15 Policy Sensitivity Analyses on China IV Standards
34
2011 2013 2015 2017 2019 2021 -
5,000
10,000
15,000
20,000
25,000
30,000
35,000
3 RMB/L fuel tax2 RMB/L fuel tax1 RMB/L fuel tax
NOX
Redu
ctio
n (M
etri
c To
n)
Figure 16 Policy Sensitivity Analyses on Fuel Tax Amount
To investigate the relative merits of the gas tax and the
tighter emission standards of China IV, we conducted a parametric
analysis of different start dates for China IV. Figure 17
compares cumulative NOx emissions in years 2017-2020 for a 2
RMB/liter gas tax starting in 2012 and eight different start
years for China IV. The eight years of gas tax results in the
same cumulative emissions as two years of China IV standards
starting in 2018. The slope of the 2012 gas tax line is much
steeper than those of the China IV standards. Figure 18 shows the
comparison for annual NOx reductions over time by different
policy scenarios. This shows that the gas tax has comparatively
35
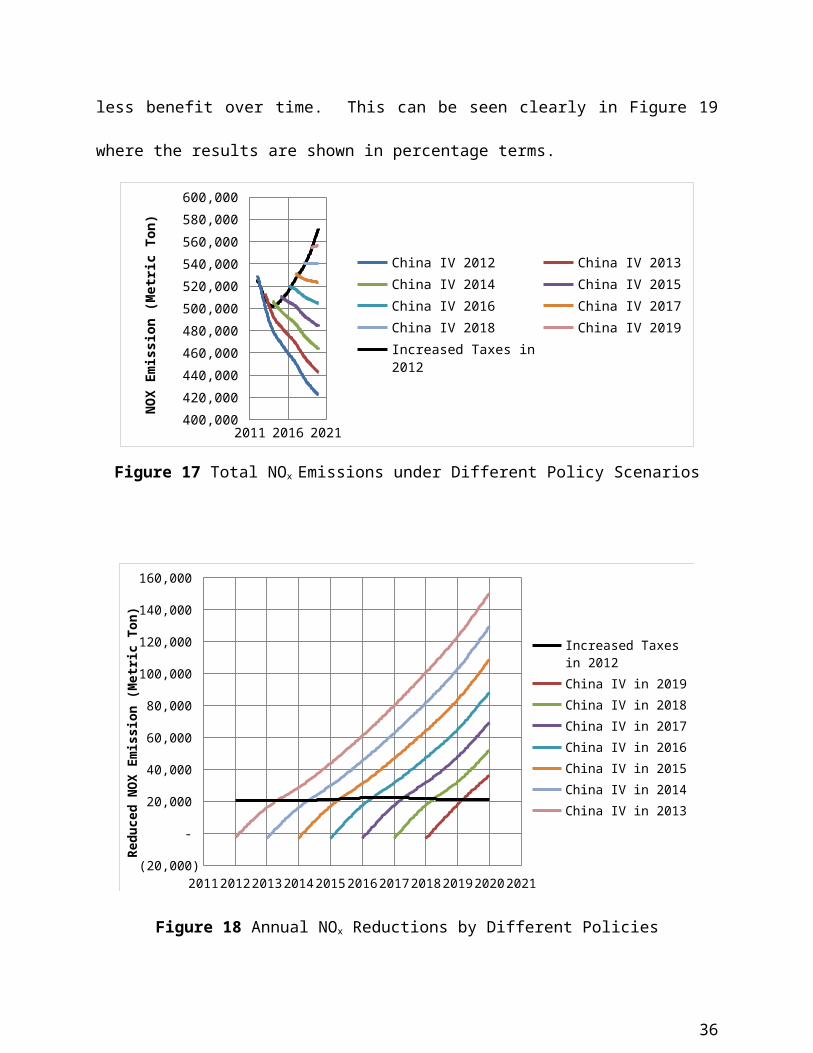
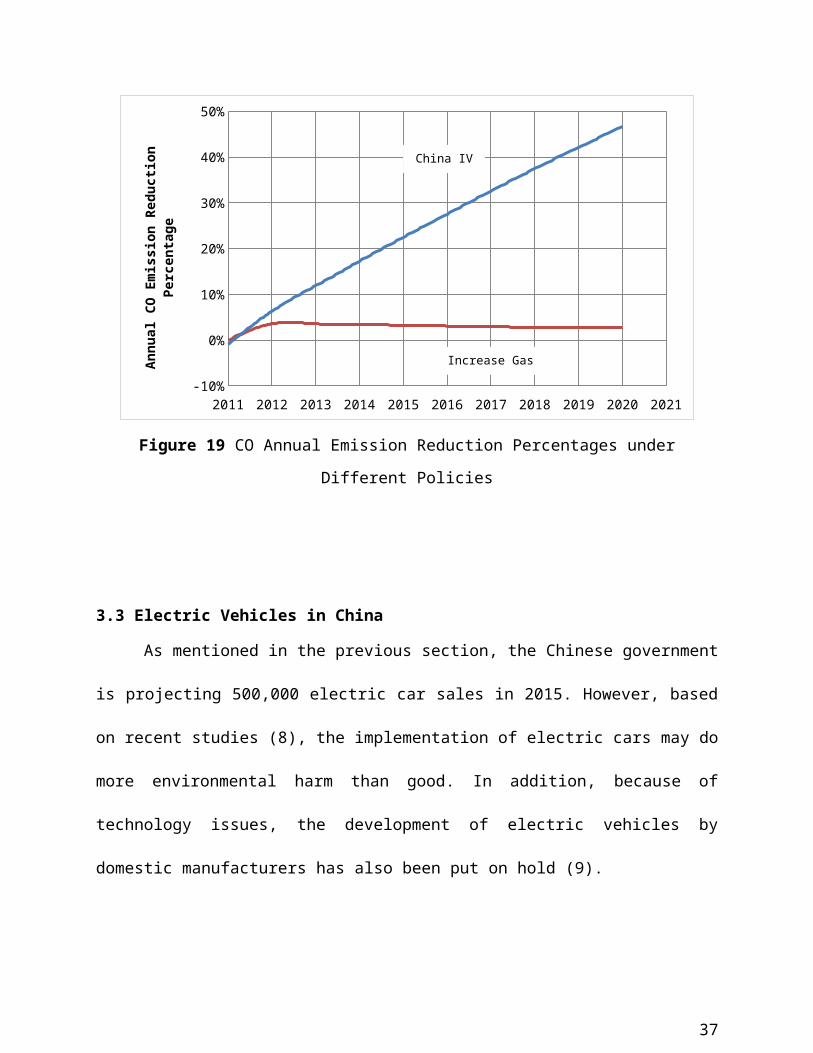
less benefit over time. This can be seen clearly in Figure 19
where the results are shown in percentage terms.
2011 2016 2021 400,000 420,000 440,000 460,000 480,000 500,000 520,000 540,000 560,000 580,000 600,000
China IV 2012 China IV 2013China IV 2014 China IV 2015China IV 2016 China IV 2017China IV 2018 China IV 2019Increased Taxes in 2012
NOX
Emissi
on (
Metric
Ton
)
Figure 17 Total NOx Emissions under Different Policy Scenarios
20112012201320142015201620172018201920202021 (20,000)
-
20,000
40,000
60,000
80,000
100,000
120,000
140,000
160,000
Increased Taxes in 2012China IV in 2019China IV in 2018China IV in 2017China IV in 2016China IV in 2015China IV in 2014China IV in 2013
Redu
ced NOX
Emissi
on (Me
tric Ton
)
Figure 18 Annual NOx Reductions by Different Policies
36
2011 2012 2013 2014 2015 2016 2017 2018 2019 2020 2021-10%
0%
10%
20%
30%
40%
50%
Annu
al CO
Emis
sion R
educ
tion
Pe
rcen
tage
Figure 19 CO Annual Emission Reduction Percentages under
Different Policies
3.3 Electric Vehicles in China
As mentioned in the previous section, the Chinese government
is projecting 500,000 electric car sales in 2015. However, based
on recent studies (8), the implementation of electric cars may do
more environmental harm than good. In addition, because of
technology issues, the development of electric vehicles by
domestic manufacturers has also been put on hold (9).
China IV
Increase Gas Taxes
37
According to Huo et al. (8), because of power plant
emissions and current electricity plant configurations, electric
vehicles in China will emit more NOx and SO2 per km than
conventional vehicles and emit nearly the same amount of CO2.
Table 8 shows the current electricity generation emissions
factors and configuration variables in China.
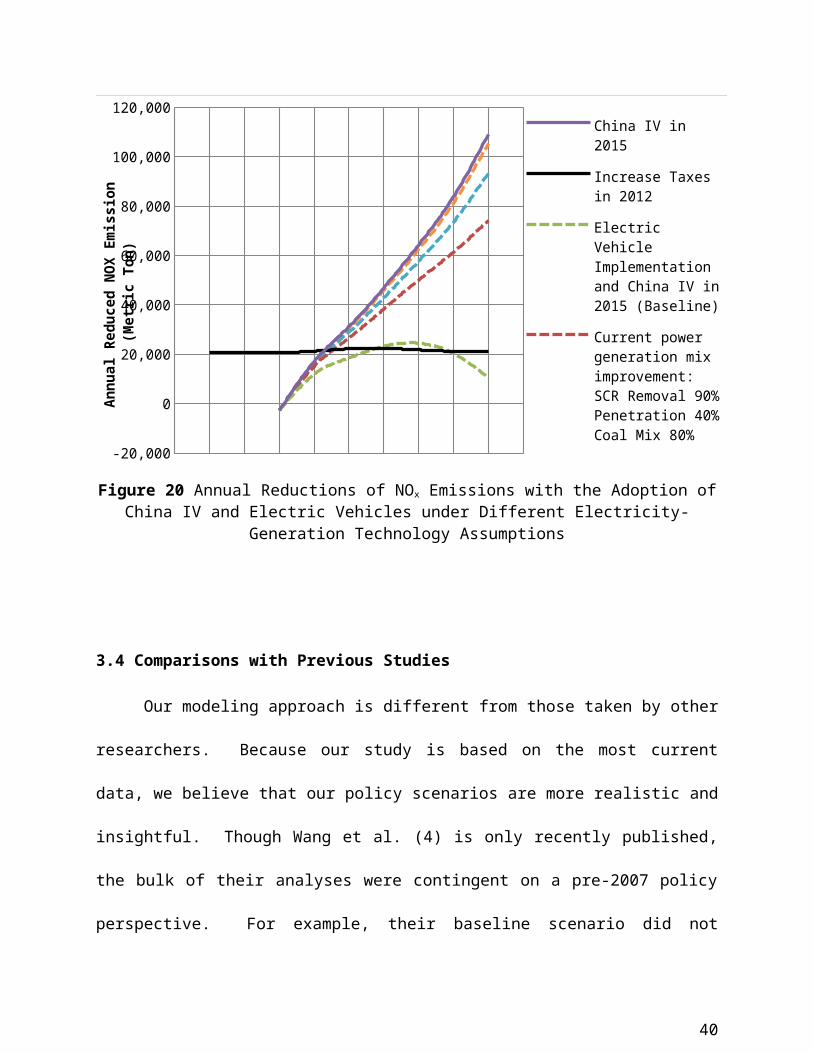
Based on government projections of electric vehicle sales
and emission factors provided by (8), we forecast NOx reduction
curves for different policies. See Figure 20. Based on current
Chinese electric power generation, introduction of electric
vehicles at the rate advocated by the Chinese government would
completely negate the benefits of a 2015 China IV emissions
standard adoption policy.
To investigate how improvement to the emissions controls on
power plants would affect these forecasts, we evolved the
characteristics of the Chinese generation technologies from
current values using three improvement scenarios by reducing the
percent of electricity that comes from coal and increasing the
use and efficiency of selective catalytic reduction (SCR)
systems. In order for electric vehicles not to have a negative
38
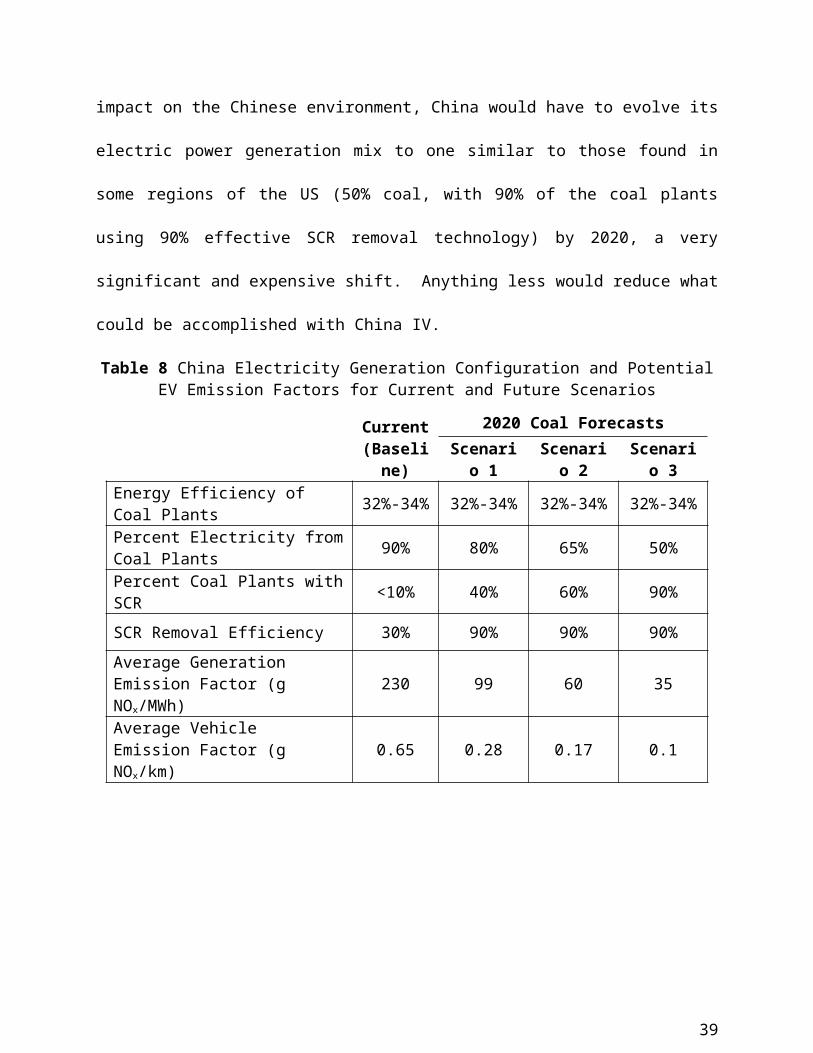
impact on the Chinese environment, China would have to evolve its
electric power generation mix to one similar to those found in
some regions of the US (50% coal, with 90% of the coal plants
using 90% effective SCR removal technology) by 2020, a very
significant and expensive shift. Anything less would reduce what
could be accomplished with China IV.
Table 8 China Electricity Generation Configuration and PotentialEV Emission Factors for Current and Future Scenarios
Current(Baseline)
2020 Coal ForecastsScenario 1
Scenario 2
Scenario 3
Energy Efficiency of Coal Plants 32%-34% 32%-34% 32%-34% 32%-34%
Percent Electricity fromCoal Plants 90% 80% 65% 50%
Percent Coal Plants withSCR <10% 40% 60% 90%
SCR Removal Efficiency 30% 90% 90% 90%Average GenerationEmission Factor (g NOx/MWh)
230 99 60 35
Average VehicleEmission Factor (g NOx/km)
0.65 0.28 0.17 0.1
39
20112012201320142015201620172018201920202021-20,000
0
20,000
40,000
60,000
80,000
100,000
120,000China IV in 2015
Increase Taxes in 2012
Electric Vehicle Implementation and China IV in 2015 (Baseline)
Current power generation mix improvement: SCR Removal 90% Penetration 40% Coal Mix 80%
Annu
al R
educ
ed N
OX Emi
ssion
(Met
ric
Ton)
Figure 20 Annual Reductions of NOx Emissions with the Adoption ofChina IV and Electric Vehicles under Different Electricity-
Generation Technology Assumptions
3.4 Comparisons with Previous Studies
Our modeling approach is different from those taken by other
researchers. Because our study is based on the most current
data, we believe that our policy scenarios are more realistic and
insightful. Though Wang et al. (4) is only recently published,
the bulk of their analyses were contingent on a pre-2007 policy
perspective. For example, their baseline scenario did not
40
include the nationwide adoption of China III standards in 2007.
Instead, they assume in some projections that all vehicles sold
through 2020 will only need to meet China II standards. In their
improved policy option, they modeled a government program of
continually improving emission standards with China III, China
IV, and China V being implemented in 2007, 2010, and 2013,
respectively. Based on the current situation, the earliest that
a nationwide China IV could realistically start is 2013, and it
is very unlikely for China V to start before 2020. In addition,
we allow for fuel and vehicle prices to affect miles driven,
vehicle scrap and sales rates, and we include emission-control
degradation. Wang et al. also included a significant influx of
hybrid electric vehicles by 2020 (i.e., 15-20% of the new car
sales). Based on current technology trends, we find this
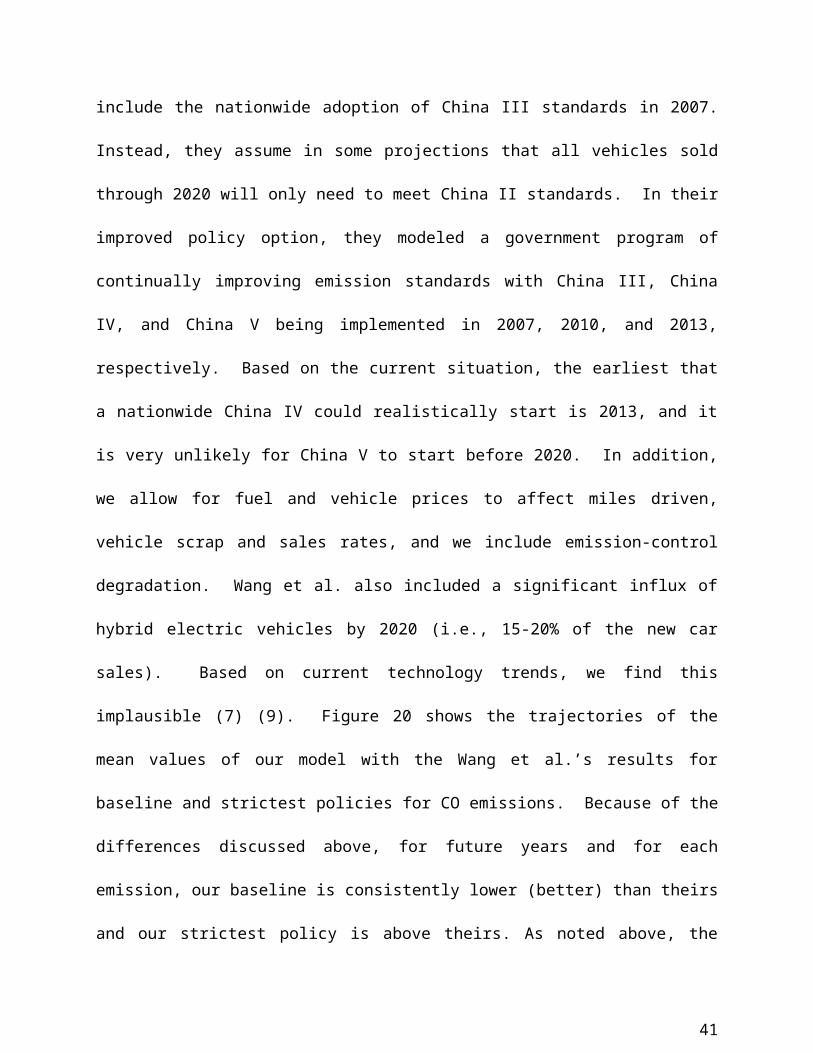
implausible (7) (9). Figure 20 shows the trajectories of the
mean values of our model with the Wang et al.’s results for
baseline and strictest policies for CO emissions. Because of the
differences discussed above, for future years and for each
emission, our baseline is consistently lower (better) than theirs
and our strictest policy is above theirs. As noted above, the
41
assumptions behind the similar trajectories (e.g., influx of
hybrids and the timing of China IV) are very different, so the
differences should be highlighted. Comparisons of HC, NOx and CO2
emissions are similar. Our study yields a much narrower range of
emission possibilities (i.e., the possible policy impacts are
more constrained). It is important to note that there are
significant uncertainties associated with the trajectories.
Figure 20 also shows a 95% confidence interval for the forecasts
in 2020. The high end of the base case scenario approaches the
Wang et al.’s base case, and the low end of our strict case
approaches their optimal scenario. It is possible that the
strictest policies could see an increase in emissions from the
transportation sector.
42
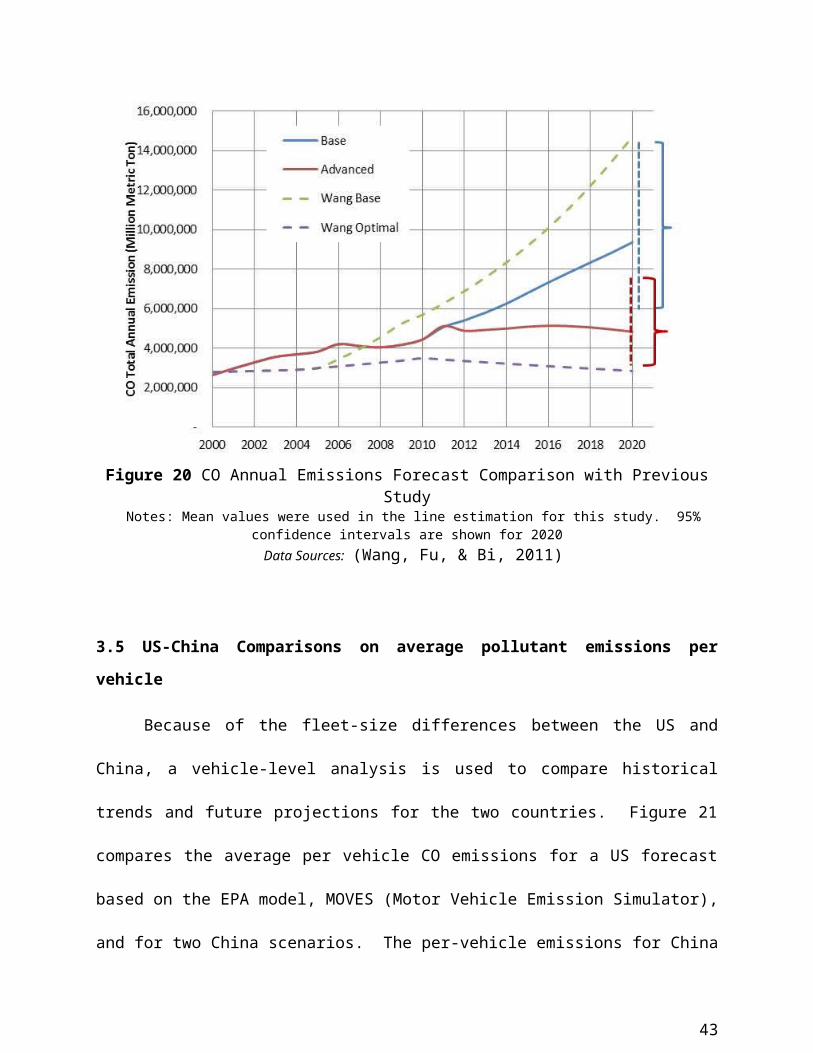
Figure 20 CO Annual Emissions Forecast Comparison with PreviousStudy
Notes: Mean values were used in the line estimation for this study. 95%confidence intervals are shown for 2020
Data Sources: (Wang, Fu, & Bi, 2011)
3.5 US-China Comparisons on average pollutant emissions per
vehicle
Because of the fleet-size differences between the US and
China, a vehicle-level analysis is used to compare historical
trends and future projections for the two countries. Figure 21
compares the average per vehicle CO emissions for a US forecast
based on the EPA model, MOVES (Motor Vehicle Emission Simulator),
and for two China scenarios. The per-vehicle emissions for China
43
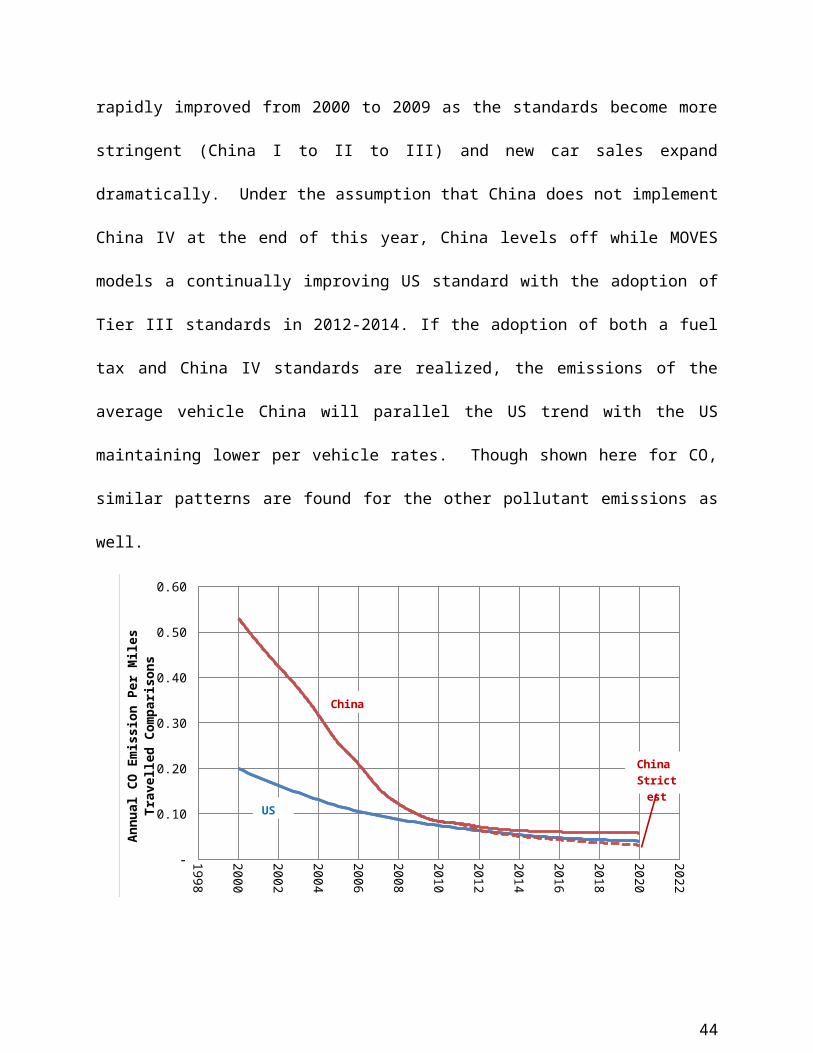
rapidly improved from 2000 to 2009 as the standards become more
stringent (China I to II to III) and new car sales expand
dramatically. Under the assumption that China does not implement
China IV at the end of this year, China levels off while MOVES
models a continually improving US standard with the adoption of
Tier III standards in 2012-2014. If the adoption of both a fuel
tax and China IV standards are realized, the emissions of the
average vehicle China will parallel the US trend with the US
maintaining lower per vehicle rates. Though shown here for CO,
similar patterns are found for the other pollutant emissions as
well.
1998
2000
2002
2004
2006
2008
2010
2012
2014
2016
2018
2020
2022
-
0.10
0.20
0.30
0.40
0.50
0.60
Annual CO Emission
Per Miles
Travelled Comparisons
China
China Strictest
US
44
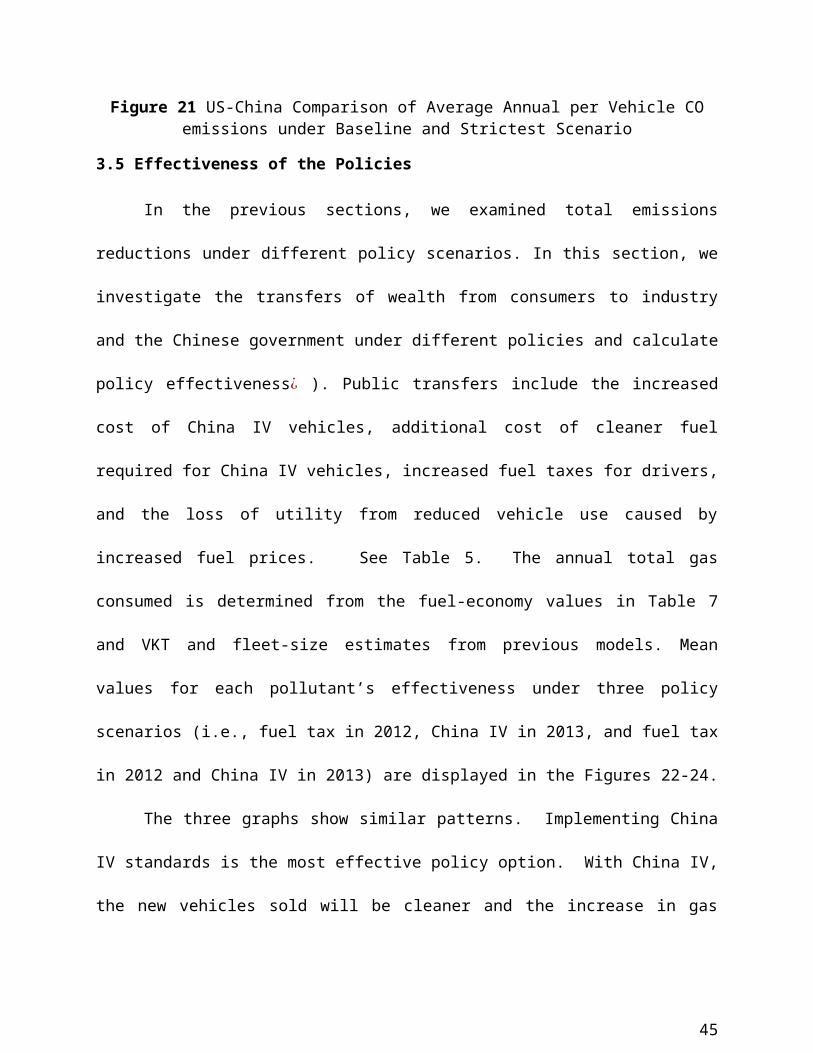
Figure 21 US-China Comparison of Average Annual per Vehicle COemissions under Baseline and Strictest Scenario
3.5 Effectiveness of the Policies
In the previous sections, we examined total emissions
reductions under different policy scenarios. In this section, we
investigate the transfers of wealth from consumers to industry
and the Chinese government under different policies and calculate
policy effectiveness¿ ). Public transfers include the increased
cost of China IV vehicles, additional cost of cleaner fuel
required for China IV vehicles, increased fuel taxes for drivers,
and the loss of utility from reduced vehicle use caused by
increased fuel prices. See Table 5. The annual total gas
consumed is determined from the fuel-economy values in Table 7
and VKT and fleet-size estimates from previous models. Mean
values for each pollutant’s effectiveness under three policy
scenarios (i.e., fuel tax in 2012, China IV in 2013, and fuel tax
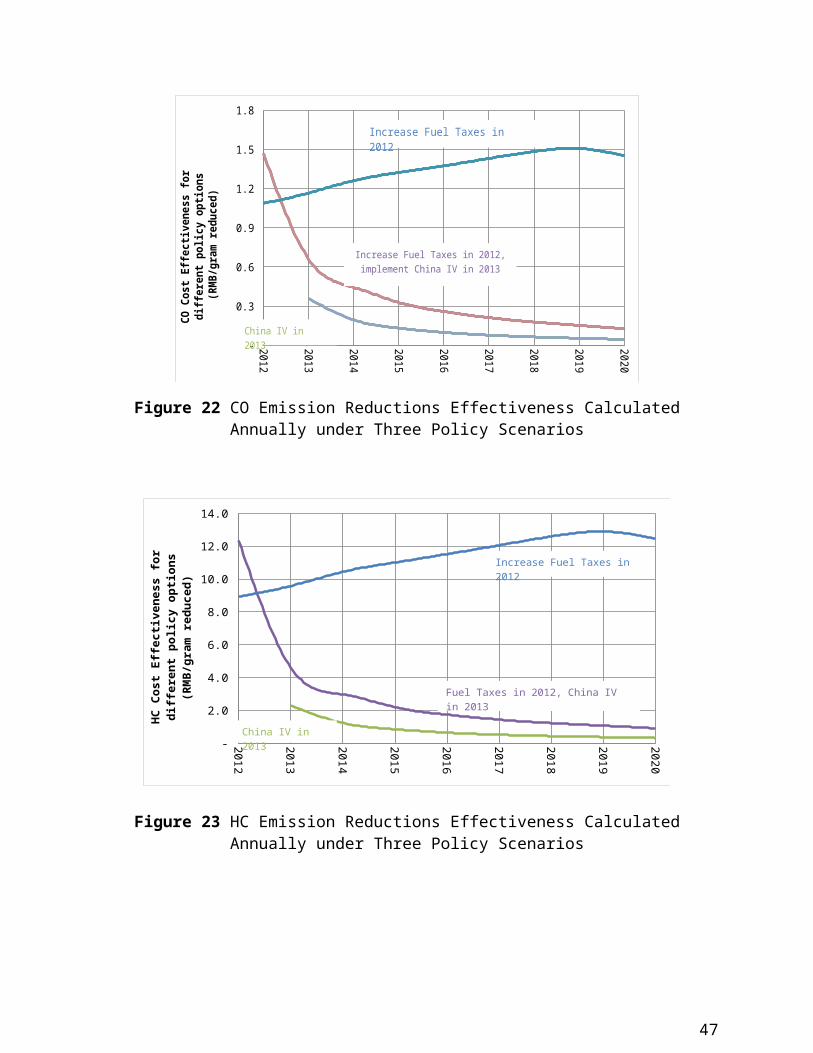
in 2012 and China IV in 2013) are displayed in the Figures 22-24.
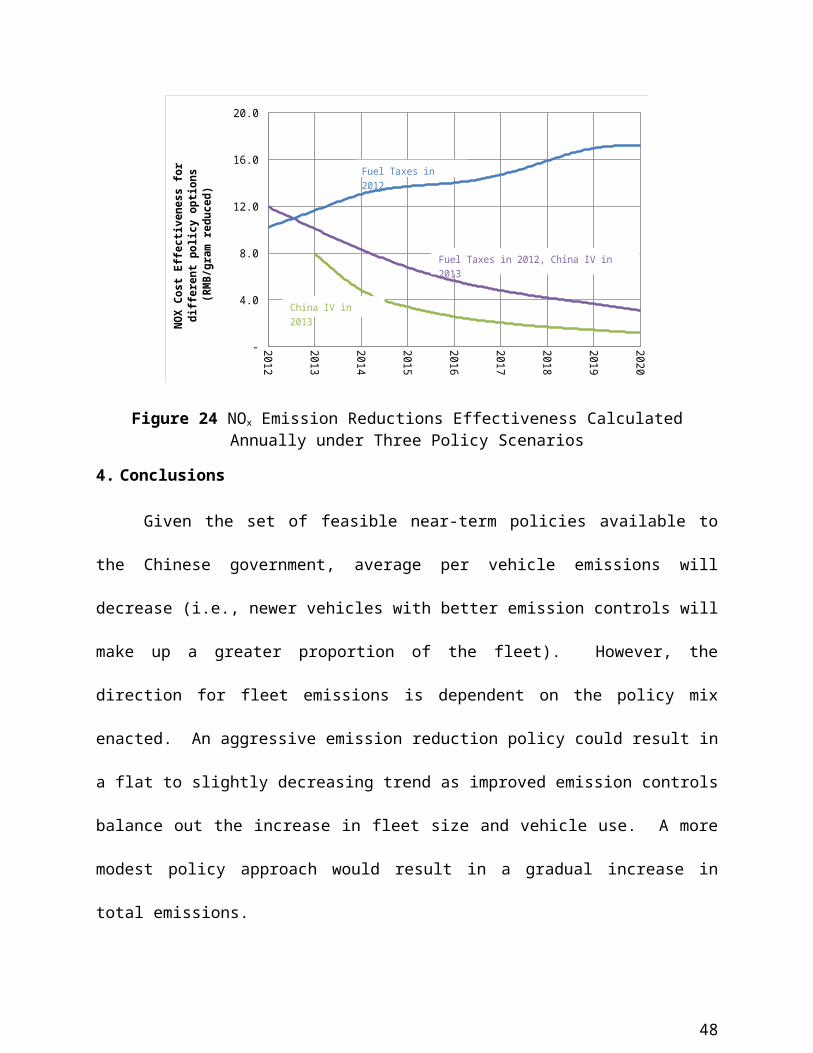
The three graphs show similar patterns. Implementing China
IV standards is the most effective policy option. With China IV,
the new vehicles sold will be cleaner and the increase in gas
45
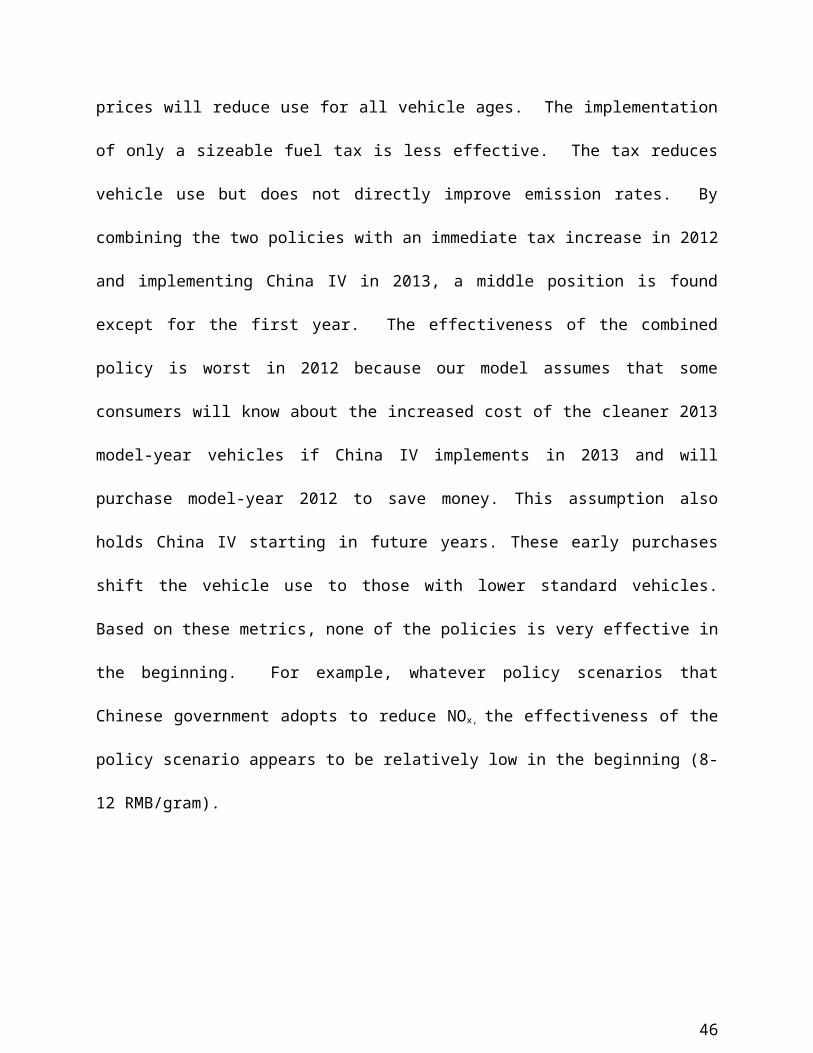
prices will reduce use for all vehicle ages. The implementation
of only a sizeable fuel tax is less effective. The tax reduces
vehicle use but does not directly improve emission rates. By
combining the two policies with an immediate tax increase in 2012
and implementing China IV in 2013, a middle position is found
except for the first year. The effectiveness of the combined
policy is worst in 2012 because our model assumes that some
consumers will know about the increased cost of the cleaner 2013
model-year vehicles if China IV implements in 2013 and will
purchase model-year 2012 to save money. This assumption also
holds China IV starting in future years. These early purchases
shift the vehicle use to those with lower standard vehicles.
Based on these metrics, none of the policies is very effective in
the beginning. For example, whatever policy scenarios that
Chinese government adopts to reduce NOx, the effectiveness of the
policy scenario appears to be relatively low in the beginning (8-
12 RMB/gram).
46
2012
2013
2014
2015
2016
2017
2018
2019
2020
-
0.3
0.6
0.9
1.2
1.5
1.8
CO C
ost Effe
ctivenes
s for
differ
ent poli
cy optio
ns
(RMB/gram
reduce
d)
Increase Fuel Taxes in 2012
Increase Fuel Taxes in 2012, implement China IV in 2013
China IV in 2013
Figure 22 CO Emission Reductions Effectiveness CalculatedAnnually under Three Policy Scenarios
2012
2013
2014
2015
2016
2017
2018
2019
2020
-
2.0
4.0
6.0
8.0
10.0
12.0
14.0
HC Cost Effectiveness for
different policy options
(RMB/gram reduced)
Increase Fuel Taxes in 2012
Fuel Taxes in 2012, China IV in 2013
China IV in 2013
Figure 23 HC Emission Reductions Effectiveness CalculatedAnnually under Three Policy Scenarios
47
2012
2013
2014
2015
2016
2017
2018
2019
2020
-
4.0
8.0
12.0
16.0
20.0
NOX Cost E
ffecti
veness for
different
policy options
(RMB/gram
reduced)
Fuel Taxes in 2012
Fuel Taxes in 2012, China IV in 2013
China IV in 2013
Figure 24 NOx Emission Reductions Effectiveness CalculatedAnnually under Three Policy Scenarios
4. Conclusions
Given the set of feasible near-term policies available to
the Chinese government, average per vehicle emissions will
decrease (i.e., newer vehicles with better emission controls will
make up a greater proportion of the fleet). However, the
direction for fleet emissions is dependent on the policy mix
enacted. An aggressive emission reduction policy could result in
a flat to slightly decreasing trend as improved emission controls
balance out the increase in fleet size and vehicle use. A more
modest policy approach would result in a gradual increase in
total emissions.
48
Our model shows that given current uncertainties about key
variables (e.g., annual sales, VKT, vehicle use response to
increase fuel taxes, emission degradation, and scrap rates),
output metrics are themselves widely uncertain. Predicting the
actual net impact from the implementation of a particular policy
is difficult. However, the comparison of different policies is
not as fuzzy. Because most of the critical uncertainties are
common to the policies (e.g., annual VKT and emission
degradation), a pairwise difference analysis would not result in
flipping the rank order of these policies. So while the exact
emissions associated with each policy are uncertain, the ranking
of the policies is much less so.
Our analysis of four policies options shows clear
differences. Early retirement of the oldest, highest-polluting
vehicles could have some immediate benefits but would have little
(or even negative) impact on emissions in 2020. Electric
vehicles, based on current and likely future Chinese electricity-
generation technologies, will have a negative impact on pollutant
reduction. Fuel taxes, though easy to implement quickly, are much
less effective than an increase to improved vehicle emission
49
standards (i.e., implementing China IV). In fact, eight years of
higher fuel taxes results in approximately the same benefit as
two years of tighter standards, but at much greater consumer
expenditures. However, for any policy analysis, how the revenue
generated from gas taxes is used must be considered. Using the
tax revenue to reduce congestion by improving traffic flows could
result a net benefit that compares more favorably with the early
adoption of China IV. China IV is the most effective approach to
reduce vehicular emissions, but to coordinate national China IV
(or China V in the future) vehicle standards with both vehicle
manufactures and oil suppliers is a difficult and time-consuming
task.
Just as our study added detail and clarified uncertainties
over previous work, follow-on studies are needed to evolve this
policy analysis. In several places in our model, we substituted
US values for unknown Chinese values (e.g., scrap rate).
Supporting data is needed and should be collected. In addition,
this work is based on a national-level perspective. There are
clear differences in vehicle selection and use between urban and
rural areas, across provinces and over different household
50
incomes. The next generation of models should explore these
differences and investigate the impact that they have on policies
evaluation.
Policy decisions about the passenger fleet are not made in a
vacuum; they must be placed in a larger context. Policy
alternatives that reduce emissions and improve air quality need
to be compared across multiple economic sectors. What are the
costs and benefits associated with restrictions on electric power
emissions as compared to vehicle emissions? Only by continually
improving detailed integrated models that combine engineering,
economic, and behavioral components can informative policy
analysis be implemented. To be comparable, models of similar
scope need to be developed for other sectors. Only then can an
effective, efficient, fair, and defensible portfolio of policy
options be constructed.
5. Acknowledgments
Prof. Erica Fuchs contributed to this project by introducing
her connections in China.
51
References
1. NBS. China Statistical Yearbook. Press : China Statistics Press, 2001-2011.
2. NTA. National Traffic Accident Statistics Annual Report. s.l. : National Transportation Administration, 2001-2011.
3. Yan, X and Crooks, R J. Study On Energy Use in China. Journal of The Energy Institute 40. 2007, pp. 110-115.
4. Wang, Haikun, Fu, Lixin and Bi, Jun. CO2 and pollutant emissions from passenger cars in China. Energy Policy. 2011.
5. Murphy, Victoria. China crisis: Beijing engulfed by smog TWENTY times above safe levels. Mirror. [Online] 1 29, 2013. http://www.mirror.co.uk/news/world-news/china-pollution-beijing-engulfed-by-smog-1561404.
6. Miller, Lonnie. Digital Killed the Auto Star...Not! s.l. : The Polk Blog, 2010.
52
7. E.Saikawa, et al., et al. The impact of China’s vehicle emissions on regional air quality. s.l. : Atmosphereic Chemistry and Physics Discussion, 2011.
8. Cai, H and Xie, S D. Estimation of vehicular emission inventories in China from 1980 to 2005. Atmospheric Environment 41. 2007, pp. 8963–8979.
9. Lin, Xiu Li. A Study on Emissions Index of Vehicles in China. Environmental Science and Management. 2009.
10. He, K B, et al., et al. Oil Consumption and CO2 Emissions in China's Road Transport: current status,future trends and policy implications. Energy Policy 33. 2005, pp. 1499-1507.
11. He, Ke Bin, Yao, Zhi Liang and Zhang, Ying Zhi. Characteristics of Vehicle Emissions in China Based on Portable Emission. 2010.
12. MEP. China Vehicle Emission Control Annual Report. s.l. : Ministry of Environmental Protection of the People's Republic of China, 2010.
13. Zhang, Hai Yan. Sina Finance. Sina. [Online] 2011. http://finance.sina.com.cn/chanjing/cyxw/20110927/093410546587.shtml.
14. C.Zhou, Shepard. China IV Standards Delayed? Sina. [Online] 9 19, 2011. http://finance.sina.com.cn/chanjing/sdbd/20110919/133510502524.shtml.
15. The Beijing News. The Beijing News. [Online] 2 1, 2013. http://epaper.bjnews.com.cn/html/2013-02/01/content_407796.htm?div=-1.
16. Road transportation in China: how big are fuel consumption and pollutant emissions. Borken, J, et al., et al. Washington, DC. : s.n., 2008. Proceedings ofthe TRB 87th annual meeting.
17. EPA. Control of Air Pollution from Motor Vehicles: Tier 3 Motor Vehicle Emission and Fuel Standards. 2011.
18. Gallagher, Sims Kelly. Limits to leapfrogging in energy technologies? Evidence from the. Energy Policy. 2006, Vol. 34, pp. 383–394.
19. EC. Emission Standards for Road Vehicles. s.l. : European Commission, 2001.
20. EPA. Development of Emission Rates for Light-Duty Vehicles in the Motor Vehicle Emissions Simulator (MOVES2010). 2011.
53
21. State Information Agency. Private Report of Annual VKT in China 2004-2011. 2011.
22. Miaou, Shaw-Pin. Factors Associated with Aggregate Car Scrappage Rate in the United States: 1966-1992. s.l. : National Academy Press, 1995.
23. Jacobsen, Mark R and Benthem, Arthur A. van. Elasticity in the Supply of Used Cars:Estimating the Scrap Decision. 2011.
24. Bradsher, Keith. In China, Power in Nascent Electric Car Industry. s.l. : New York Times, 2011.
25. Huo, Hong, Zhang, Qiang and Wang, Michael. Environmental Implication of Electric Vehicles in China. Environmental Science & Technology. 2010, pp. 4856-4861.
26. McDonald, Jeo. China's dream of electric car leadership elusive. s.l. : Associated Press, 2012.
27. Sina Finance. Sina. [Online] 2009. http://finance.sina.com.cn/focus/zgkzrys/index.shtml.
28. CARTARC. China Automotive Industry Yearbook. s.l. : China Automotive Association, 2001-2011.
29. Chai, Hua. Implemenation of China IV emission standards: increase in fuel prices. people.com.cn. [Online] 2011. http://energy.people.com.cn/GB/15696713.html.
30. HuBei ChengLi Group. [Online] 2010. http://www.cl567.com/NewsView487.html.
31. CBO. Effects of Gasoline Prices on Driving Behavior and Vehicle Markets. s.l. : Congressional Budget Office of United States, 2008.
32. Lipschultz, Jeffrey Thomas Shepherd. A Microeconomic Analysis of the Full-Size Automobile Market. Economics & Business Journal: Inquiries & Perspectives. 2008.
33. EPA. Emission Facts: Average Annual Emissions and Fuel Consumption for Passenger Cars and Light Trucks. s.l. : EPA, 2000.
54
34. ICCT. Global Light-duty Vehicles: Fuel Economy and Greenhouse Gas Emissions Standards. s.l. : International Council on Clean Transportation, 2011.
35. Life Cycle Associates. Assessment of Direct and Indirect GHG Emissions Associated with Petroleum Fuels. 2009.
36. Wang, M. GREET 1.5 - Transportation Fuel-Cycle Model, Vol.1:Methdology, Use and Results. s.l. : Argonne National Laboratory, 1999.
37. EPA. Determination of running emissions as a function of mileage for 1981-1993 model year light-duty cars and trucks. 2002.
55