Embed Size (px)
Citation preview

This article was downloaded by: [University of Calgary]On: 13 February 2015, At: 09:44Publisher: RoutledgeInforma Ltd Registered in England and Wales Registered Number: 1072954 Registeredoffice: Mortimer House, 37-41 Mortimer Street, London W1T 3JH, UK
Journal of Clinical and ExperimentalNeuropsychologyPublication details, including instructions for authors andsubscription information:http://www.tandfonline.com/loi/ncen20
Victoria symptom validity test:Efficiency for detecting feignedmemory impairment and relationshipto neuropsychological tests and MMPI-2validity scalesDaniel J. Slick a , Grace Hopp a , Esther Strauss a & Frank J. Spellacya
a University of VictoriaPublished online: 04 Jan 2008.
To cite this article: Daniel J. Slick , Grace Hopp , Esther Strauss & Frank J. Spellacy (1996) Victoriasymptom validity test: Efficiency for detecting feigned memory impairment and relationshipto neuropsychological tests and MMPI-2 validity scales, Journal of Clinical and ExperimentalNeuropsychology, 18:6, 911-922, DOI: 10.1080/01688639608408313
To link to this article: http://dx.doi.org/10.1080/01688639608408313
PLEASE SCROLL DOWN FOR ARTICLE
Taylor & Francis makes every effort to ensure the accuracy of all the information (the“Content”) contained in the publications on our platform. However, Taylor & Francis,our agents, and our licensors make no representations or warranties whatsoever as tothe accuracy, completeness, or suitability for any purpose of the Content. Any opinionsand views expressed in this publication are the opinions and views of the authors,and are not the views of or endorsed by Taylor & Francis. The accuracy of the Contentshould not be relied upon and should be independently verified with primary sourcesof information. Taylor and Francis shall not be liable for any losses, actions, claims,proceedings, demands, costs, expenses, damages, and other liabilities whatsoever orhowsoever caused arising directly or indirectly in connection with, in relation to or arisingout of the use of the Content.
This article may be used for research, teaching, and private study purposes. Anysubstantial or systematic reproduction, redistribution, reselling, loan, sub-licensing,systematic supply, or distribution in any form to anyone is expressly forbidden. Terms &

Conditions of access and use can be found at http://www.tandfonline.com/page/terms-and-conditions
Dow
nloa
ded
by [
Uni
vers
ity o
f C
alga
ry]
at 0
9:44
13
Febr
uary
201
5

Journal of Clinical and Experimental Neuropsychology 1996, Vol. 18, NO. 6, pp. 911-922
1380-3395/96/1806-9 1 1 $12.00 0 Swets & Zeitlinger
Victoria Symptom Validity Test: Efficiency for Detecting Feigned Memory Impairment and Relationship to Neuropsy-
chological Tests and MMPI-2 Validity Scales*
Daniel J. Slick, Grace Hopp, Esther Strauss, and Frank J. Spellacy University of Victoria
ABSTRACT
Error scores and response times from a computer-administered, forced-choice recognition test of symptom validity were evaluated for efficiency in detecting feigned memory deficits. Participants included controls (n = 95), experimental malingerers (n = 43), compensation-seeking patients (n = 206), and patients not seeking financial compensation (n = 32). Adopting a three-level cut-score system that classified participant performance as malingered, questionable, or valid greatly improved sensitivity with relatively little impact on specificity. For error scores, convergent validity was found to be adequate and divergent validity was found to be excellent. Although response times showed promise for assisting in the detection of feigned impairment, divergent and convergent validity were weaker, suggesting somewhat less utility than error scores.
Substantial growth in both the number and cost of claims within systems of limited resources have put psychologists under increasing pres- sure to provide evidence that deficits observed in assessments of compensation-seeking patients are not exaggerated or faked. In response to these demands, tests and procedures for detect- ing malingered deficits have proliferated. These methods of assessing validity of deficits have been born of two lines of research and develop- ment.
One approach to the development of methods for detecting feigned or exaggerated cognitive deficits has focused on the derivation and vali- dation of cutoff scores or other indices for use with standardized tests of cognitive function that were not originally designed for detecting dis- simulation. For example, recent research has evaluated the utility of malingering indices de- veloped for the Wechsler Memory Scale-Re- vised (Bernard, Houston, & Natoli, 1993;
Mittenberg, Azrin, Millsaps, & Heilbronner, 1993), the Rey Auditory Verbal Learning Test (Bernard, 1991; Bernard et al., 1993; Binder, Villanueva, Howieson, & Moore, 1993), the Paced Auditory Serial Addition Test (Strauss, Spellacy, Hunter, & Berry, 1994), simple reac- tion time (Strauss et al., 1994), Digit Span (Iverson & Franzen, 1994), and the Recognition Memory Test (Iverson & Franzen, 1994; Millis, 1992, 1994). Although thorough cross-valida- tion studies are generally lacking, these initial reports demonstrate the potential utility of ma- lingering scales derived from conventional mea- sures of cognitive function that are routinely used in neuropsychological assessments.
The other approach to detecting dissimulation has been to develop instruments specifically de- signed to detect feigned or exaggerated cogni- tive dysfunction. Perhaps the most popular in- struments of this kind are the various develop- ments of the symptom validity testing (SVT)
* This research was supported by grants from NSERC awarded to Esther Strauss. Address correspondence to: Daniel J. Slick, Department of Psychology, University of Victoria, Box 3050, Victo- ria, B.C., Canada V8W 3P5. Accepted for publication: May 23, 1996.
Dow
nloa
ded
by [
Uni
vers
ity o
f C
alga
ry]
at 0
9:44
13
Febr
uary
201
5

912 DANIEL J. SLICK ET AL. ~
method introduced to neuropsychology by Pankratz in 1983 (but see Lezak, 1995 ; Franzen & Iverson, 1995; and Nies & Sweet, 1994 for reviews of other widely used measures). These instruments have, for the most part, been de- signed to detect feigned memory impairment, and are thus presented to patients as tests of rec- ognition memory.
In two-choice recognition tests (i.e., SVT), overall performance approximates 50% in the most severe cases of memory impairment (i.e., given an adequate number of trials, overall scores are expected to be at chance level when patients cannot recall the target and have to guess on most items). Scores that are signifi- cantly below chance are therefore assumed to result from deliberate selection of incorrect responses. Ideally, tests of symptom validity should be maximally sensitive to feigned defi- cits and minimally sensitive to real deficits. To achieve that goal, such tests need to appear as difficult as possible while in fact maintaining a trivial level of difficulty for the majority of le- gitimate patients, thus encouraging malingering patients to overplay faked deficits. Recent de- velopments of the forced-choice paradigm have attempted to increase apparent difficulty by em- ploying more complex stimuli, increasingly dif- ficult distracter tasks, increasing delay intervals, and potentially deceptive instructions that stress the difficulty of the task (e.g., Binder, 1990; Hiscock & Hiscock, 1989; Iverson, Franzen, & McCracken, 1991). For example, Bickart, Meyer, and Connell (199 1) explored the effects of manipulating apparent difficulty of an SVT on rates of detecting malingering. Although the actual probability of choosing correctly re- mained the same for items on “easy” and “dif- ficult” versions of the test, subjects instructed to feign brain damage generally performed signifi- cantly worse when the test was apparently harder. As a result, the proportion of obvious malingering (i.e., detection hit-rate) among the subjects was higher when the difficult as op- posed to easy version of the test was employed. Thus, when feigning subjects believe a test to be difficult, they are more likely to overplay their “impairments.” Care must be taken, however, in designing more face-valid symptom validity
tests, as increases in real difficulty may lead to floor effects which can decrease the specificity of any normative based cutoff scores developed for such tests (Binder, 1993a; Iverson et al., 1991; Wiggens & Brandt, 1988). Nevertheless, increases in perceived or actual difficulty are associated with detecting higher proportions of malingerers by below-chance perfromance (Bickart et al., 1991; Binder, 1990, 1992, 1993a, 1993b; Prigatano & Amin, 1993; Slick et al., 1994). Unfortunately, the sensitivity of symp- tom validity tests still has considerable room for improvement, as a significant proportion of ma- lingerers in simulation studies do not obtain be- low-chance scores (Beetar & Williams, 1995; Binder & Willis, 1991; Fredrick & Foster, 1991; Guilmette, Hart, & Giuliano, 1993; Iverson & Franzen, 1996; Iverson et al., 1991; Prigatano & Amin, 1993; Slick et al., 1994; Wiggins & Brandt, 1988). Clearly, more potent approaches to detecting malingering need to be evaluated, including the derivation of additional, norm-sup- ported scoring systems to augment the standard probabilistic scoring systems for symptom va- lidity tests.
In the current study, clinical and experimen- tal populations were enlisted to (1) evaluate the efficiency (i.e., sensitivity when cut-scores are set to produce a low false-positive rate) of typi- cally applied cut-scores for the Victoria Symp- tom Validity Test; (2) evaluate the efficiency of other possible cut-scores; and (3) evaluate the divergent and convergent validity of the Victoria Symptom Validity Test.
METHOD
Participants
Controls (n = 136) These participants were primarily recruited from undergraduate psychology courses at the Univer- sity of Victoria, and received course credit for par- ticipating. Exclusion criteria included self-report of neurological dysfunction, audio- or visuo- perceptive disorder, or current treatment for psy- chological or psychiatric disorders. Ninety-three participants were pseudo-randomized into the non- feigning group, and the remaining 42 were placed
Dow
nloa
ded
by [
Uni
vers
ity o
f C
alga
ry]
at 0
9:44
13
Febr
uary
201
5

VICTORIA SYMPTOM VALIDITY TEST 913
into the feigned deficit group]. Participants in the feigned deficit group were heterogeneous with re- spect to knowledge about the behavior of brain- damaged persons.
Compensation-Seeking Patients (Comp: n = 206) These patients were consecutive referrals to the private practices of the authors (ES & FS) for med- ico-legal neuropsychological evaluations. At the time of testing, all patients were actively seeking monetary claims or litigating for damages includ- ing psychological distress and/or cognitive dys- function resulting from accidents (almost all in- volving automobiles). Ninety-four percent of the patients reported either momentary or no loss of consciousness at the time of the accident; 3% re- ported 5-60 min of unconsciousness; and 3% re- ported loss of consciousness in excess of 1 hr. At assessment, average time since accident was 27 months ( S D = 20). Eighty-six percent of these pa- tients reported their race as White; the remaining patients were roughly evenly distributed among Asian, Black, East Indian, First Nations, Hispanic, and other. Eighty-eight percent of the patients re- ported English as their native language; English was a second or third language among the remain- ing patients. Memory deficits as measured by stan- dard neuropsychological tests varied from mild to severe within this group. Data from 10 of the pa- tients were reported in a previous study (Slick et al., 1994).
Non- compensation-Seeking Patients (Non- Comp: n = 32) Data were obtained from patients in the research base of E. Strauss. Most of these patients (n = 20) were assessed as part of an evaluation of pharma-
' Forty-two participants were part of a previous study using nearly identical procedures (Slick et a]., 1994). Non-feigning ( n = 22) and feigning (n = 20) controls were recruited from the same population by the same means and tested with the original VSVT, which uses the same item set and nearly identical instructions. The non-feigning participants from the previous study did not differ from those who participated in the cur- rent study on scores for easy (F(1,41) = .95, p = .34) or hard items (F( 1,41) = .01 , p = .93). Feigning partic- ipants from the previous study also did not differ from feigning participants in the present study in scores on easy (F( 1,40) = 1.18, p = .29) or hard items (F( 1,40) = .07,p = 30) . Because of the similarity in constituency and procedures, it was decided to combine these groups to form larger groups of non-feigning and feigning participants, with the advantage that larger groups provide more reliable statistical findings.
cologically-refractory seizure disorder. The re- maining 12 patients were neurological referrals with a variety of disorders (e.g., head injury, de- mentia, stroke, etc.). All patients spoke English as a primary language or were fluent for the purposes of testing. All patients in this group presented with spontaneous complaints of significant everyday memory dysfunction. Memory deficits as mea- sured by standard neuropsychological tests varied from mild to severe within this group.
Materials
Victoria Symptom Validity Test (VSVT) The Victoria Symptom Validity Test (Slick, Hopp, & Strauss, 1995; previously described as the Vic- toria Revision of the Hiscock Digit Memory Test: Slick, Hopp, & Strauss, 1992; Slick, Hopp, Strauss, Hunter, & Pinch, 1994) is a computer-ad- ministered, forced-choice recognition memory test. The test represents a refinement of the method described by Pankratz (1 983) and further devel- oped by Hiscock and Hiscock (1989). Forty-eight, two-choice recognition trials are presented in three blocks of 16 items each. In each block, 5-digit numbers are individually presented on computer monitor for 5s of study. The presentation of study numbers is followed by a blank-screen retention interval (5s, lOs, & 15s in the first second and third blocks, respectively), after which the previ- ously shown study number and a 5-digit foil are displayed, one to each side of the center of the screen. Participants respond by striking one of two keys (left or right shift) on a conventional PC key- board.
Because all items have two response possibili- ties, overall error rates should be approximately 50% under conditions of random responding. Scores in this range would result from either (1) severe, attentional and/or memory disturbance or (2) symptom exaggeration. Error rates that depart from 50% are less likely to have occurred by chance alone, with an associated probability that is easily calculated. Performance below chance at a low probability (e.g., p < .05) is indicative of de- liberate choice of incorrect answers (i.e., malinger- ing). Thus, normative data is not required to draw conclusions about the meaning of very low scores on symptom validity tests such as the VSVT. Such data would, however, be essential for interpreta- tion of scores that do not differ from chance.
As stated previously, most current symptom validity tests are designed to make items appear more difficult than they actually are in the hope of encouraging malingering patients to overplay fab- ricated deficits. To that end, two manipulations of
Dow
nloa
ded
by [
Uni
vers
ity o
f C
alga
ry]
at 0
9:44
13
Febr
uary
201
5

914 DANIEL J. SLICK ET AL.
apparent item difficulty are incorporated in the VSVT. First, as suggested by Hiscock and Hiscock (1989), the retention interval is overtly increased by an amount (5s per block) that is presented as significant to patients, but which is assumed to have a minimal effect on actual item difficulty. A study using the HDMT (Prigatano & Amin, 1993) supported this assumption; increased retention in- tervals were not associated with lower scores among memory impaired patients who were not suspected of malingering. In Hiscock and His- cock’s protocol, examinees are told prior to start- ing the second and third blocks of items that the increase in retention interval makes the test harder. These instructions were also employed in the origi- nal Victoria Revision of the HDMT. However, Prigatano and Amin warned that such instructions are deceptive, and recommend removing refer- ences to increased difficulty from the instructions set of the HDMT. In light of these concerns, the instructions of the VSVT were therefore modified; the increase in delay interval is still pointed out to examinees, but references to increased difficulty have been changed from statements (“you will find the next section more difficult”), to sugges- tions (“you may find the next section more diffi- cult”).
The second manipulation of perceived item dif- ficulty involves target / foil discriminability. Easy items are those in which the foil and study number share no common digits (e.g.,34092 and 56187). Recognition of the first, last, or any other digit or pattern of digits from the study number will facili- tate a correct choice. Hard items are those in which the foil is identical to the study number with the exception of a transposition of the second and third, or third and fourth digits (e.g., 46923 and 46293). To choose correctly on hard items, the or- der of the middle digits must be remembered. Rec- ognition of the first or last digit of the study num- ber will not aid in choosing. Like the increase in retention interval, the difference in actual diffi- culty between easy and hard items is assumed to be small. All three sections contained an equal num- ber of easy and hard items.
Shortly after the development of the original Victoria Revision of the HDMT, the test was mod- ified to include another potentially useful measure of examinee motivation. Clinical observations with the VSVT suggested that examinees who exagger- ated error rates also tended to exaggerate the time needed to decide which stimulus was presented previously. Other research (Strauss et al., 1994) also suggested the utility of response time as a measure of motivation. Therefore, the VSVT was modified to incorporate measurement of response
time (RT: in ms). Examinees were not told that response time was being recorded, but were in- structed to respond as quickly as possible without making mistakes.
Procedure Feigning and non-feigning participants were tested in small groups and individually. The VSVT was administered first to all control and feigning par- ticipants, followed by the Minnesota Multiphasic Personality Inventory-2 (MMPI-2: Butcher, Dahlstrom, Graham, Tellegen, & Kaemmer, 1989) in some cases. Feigning participants were given the following additional instructions:
I want you to pretend that you were a passenger in a serious automobile accident six months ago. In the accident, you received a blow to the head resulting in a concussion and a momentary loss of consciousness. Now you are suing the insurance company for $250,000 in damages, which you plan to obtain by faking problems with headaches, fatigue, memory, concentra- tion, anxiety, and depression resulting from “brain damage” suffered in the accident. The two tests you are about to take are part of the examination by the insurance company psychol- ogist to determine the authenticity of your claim. Your goal is to appear realistically im- paired on these tests. It is very important that your performance on these tests does not make it obvious that you are faking as this will result in a loss of settlement and a $10,000 fine.
Compensation-seeking and non-compensation- seeking patients were tested individually in a clini- cal setting.
RESULTS
Group Demographics Basic demographic data from the four partici- pant groups are presented in Table 1.
Overall, age varied significantly among the groups; F(3,326) = 22.9, p < .0001. Post hoc analysis showed that both comp and non-comp patients were significantly older on average than control and feigning participants. Level of edu- cation also varied significantly among the groups; F(3,322) = 24.2, p < .0001. Post hoc analysis showed that compensation-seeking and non-compensation-seeking patients were less educated than the control and feigning groups, with slightly less than a full high-school educa-
Dow
nloa
ded
by [
Uni
vers
ity o
f C
alga
ry]
at 0
9:44
13
Febr
uary
201
5

VICTORIA SYMPTOM VALIDITY TEST 915
Table 1. Participant Group Demographics.
Control Feigning Non-comp Comp
n 95 43 32 206 Gender (M / F) 42 1 5 3 17 I26 141 18 120 I 86 Age (years) 22.7 (8.1)” 23.9 (7.3)a 35.3 (12.l)b 32.1 (12.4)b Education (years) 13.7 (1.4)” 14.5 (2.2)a 12.6 (3.0)b 11.9 (2.3)b
Note. SD in parentheses; a significantly different from (Tukey-HSD at .05 or less).
tion on average. Table 2 shows selected neuro- psychological test scores (Full Scale IQ and Digits Forward from the Wechsler Adult Intelli- gence Scale (WAIS-R: Wechsler, 1981); Logical Memory I and I1 from the Wechsler Memory Scale-Revised (WMS-R: Wechsler, 1987); total and recognition scores from the Rey Auditory Verbal learning Test (RAVLT: Spreen & Strauss, 1991), and Recall scores from the Rey Complex Figure Test (RCFT: Spreen & Strauss, 199 1)) for compensation-seeking and non-com- pensation-seeking patients. With the exception of scores for Digits Forward from the WAIS-R, the groups were indistinguishable in test perfor- mance; both groups contained patients who per- formed at the first percentile on tests of mem- ory.
VSVT Scores Table 3 presents VSVT performance broken down by group. To evaluate group differences, separate one-way ANOVAs were conducted on each of four measures from the VSVT (easy and hard items correct, and average response times
to easy and hard items). As recommended by Puri and Sen (1971), rank scores were used for statistical analyses of easy and hard item scores to ensure that between-group differences in vari- ance were not unduly affecting findings. Signifi- cant group effects were found for each VSVT measure (all p < .0001). Results of post hoc pairwise analyses are presented in Table 3. Compared to other groups, feigning participants obtained significantly lower scores on average for both easy and hard items. Control and non- comp participants performed near ceiling on both easy and hard items. Response times to easy and hard items did not differ between com- pensation-seeking and feigning participants.
VSVT Cut-Scores: Sensitivity and Specificity The traditional symptom validity test cutoff (performance below chance at approximately p < .05) was used to classify participants. Partici- pants whose VSVT scores on easy or hard items were below the cutoff (8/24 or less) were la- beled “malingerers.” Participants whose VSVT scores on both easy and hard item were above
Table 2. Clinical Groups: Selected Mean Scores with (SD) and Ranges.
Non-Comp Comp ~
sig.
WAIS-R FSIQ 97(12) 80-136 98 (14) 73-142 ns Digits Forward (WAIS-R) 8 (3) 4- 14 6 (1) 13- 12 ,006’ Logical Memory - I 17 (8) 3- 35 18 (6) 3- 35 ns Logical Memory - I1 12(10) 0- 34 14 (7) 12- 27 ns RAVLT Total 47 (12) 24- 67 47(10) 19- 68 ns RAVLT Recognition 12 (3) 5- 15 12 (3) 1- 15 ns RCFT Recall 17 (8) 4.5- 23 20 (7) 3.5- 35 ns
Note. RAVLT = Rey Auditory Verbal Learning Test; RCFT = Rey Complex Figure Recall Score. ’ dfadjusted for unequal variance.
Dow
nloa
ded
by [
Uni
vers
ity o
f C
alga
ry]
at 0
9:44
13
Febr
uary
201
5

916
Table 3. VSVT Scores by Group (Mean and SD).
DANIEL J. SLICK ET AL.
Control’ Feigning2 Non-Comp3 Comp4 Significant Group Differences?
Easy Items (max = 24) 24.0 (0.2) 20.2 (4.4) 23.5 (1.2) 23.3 (2.0) 1 > 2,3,4; 3,4 > 2 Hard Items (max = 24) 23.5 (1 .O) 10.5 (5.9) 22.6 (1.8) 20.1 (4.8) 1,3 > 2,4; 4 > 2 Response Time, Easy 1294 (380) 2483 (1047) 1661 (591) 2037 (996) 2,4 > 1; 2 > 3 Response Time, Hard 1925 (512) 3836 (2248) 2613 (1397) 3419 (1918) 2,4 > 1; 2 > 3
-
Note. Response time in ms. +Tukey-HSD at p 5 .05.
the cutoff were labeled “valid.” Results are presented in Table 4.
It is clear that the traditional cut-score was not efficient at distinguishing feigned from non- feigned protocols. That is, while it showed ex- cellent specificity, producing no false-positives within controls and non-compensation-seeking participants, sensitivity was poor, with less than half of the feigning participants correctly classi- fied. By evaluating the group distributions of scores, it became apparent that a more effective approach might be to adopt a three-category classification system for evaluating protocol validity. Under this system, below chance per- formance at p < .05 was labeled unequivocally invalid/malingered. Likewise, performance sig- nificantly above chance at p < .05 was labeled unequivocally valid. The new, third category applies to scores that fall within the remaining 90% confidence interval around chance level performance (e.g., scores between 9 and 15 in- clusive on easy or hard items). Protocols with this level of performance were labeled “ques- tionable,” as they represented a level of impair-
ment-equivalent to guessing-that should rarely occur in patients who have no substantiated, se- vere neurological impairment. Table 5 shows the results of application of the three-category cut- score to the number of easy and hard items cor- rect obtained by participants from the four groups.
Using the new three-category classification system, sensitivity was greatly improved with only relatively minor impact on specificity. Zero-level false-positive rates were obtained among the control and non-compensation-seek- ing participants (i.e., all performed above chance). This finding is unlikely to be an artifact of group constituency, as several of these pa- tients had severely impaired memory function (e.g., scores below the 1st percentile) as mea- sured at assessment and confirmed by indepen- dent report. Within the feigning group, 42% were labeled questionable. An additional 10% of compensation-seeking patients were labeled as questionable. To better quantify the usefulness of the three-level system, clinical judgments were obtained about status of the 20 compensa-
Table 4. Participant Classification by Group Using VSVT Scores.
Valid’ Invalid / Malingering2
Controls Feigning Non-Comp Comp
95 (100) 26( 61) 32 (100)
196 ( 95)
Note. Percentages in parentheses. ’ Performance above chance at or above chance on easy and hard items. Performance below chance on easy or hard items ( p < .05).
Dow
nloa
ded
by [
Uni
vers
ity o
f C
alga
ry]
at 0
9:44
13
Febr
uary
201
5

VICTORIA SYMPTOM VALIDITY TEST 917
Table 5. Three-Level Classifications of Participants by the VSVT.
Valid' Questionable2 Malingering3
Controls 95 (100) O ( 0) O ( 0)
Non-Comp 32 (100) O ( 0) O ( 0) Comp I76 ( 8s) 20 (10) l o ( 5)
Feigning 8 ( 19) 18 (42) 17 (39)
Nore. Percentages in parentheses. ' Performance above chance at p < .05. Performance within a 90% confidence interval around chance. Performance below chance at p < .OS.
tion-seeking patients who obtained scores in the questionable range. Based on all available data (including VSVT scores), 5 of these patients (25%) were judged to be non-malingerers. Defi- cits displayed by 4 patients (20%) were judged to be of questionable validity, but without suffi- cient evidence to make conclusive determina- tions. Eleven of the patients (55%) were judged to be cases of exaggeration or outright fabrica- tion of deficits.
Utility of VSVT Response Times as Measures of Symptom Validity Response times were evaluated by collapsing across participants as classified by the three- level VSVT criteria; the results are presented in Table 6. It can be seen by examining the 95% confidence intervals for the means that partici- pants who produced invalid protocols took ap- proximately twice as long to respond on average as those participants who produced valid proto- cols. Thus, response time may be a useful ad- junct measure of symptom validity.
Effects of Education on VSVT Scores of Feigning Participants To test the hypothesis that more educated partic- ipants are less likely to overplay memory defi- cits, the data from feigning participants was sub- mitted to correlational analyses. Years of educa- tion (range = 12-21 years) was not significantly correlated with number of easy items correct ( r = -.22, p = .16) or hard items correct ( r = -.04, p = .81). The pattern of correlations suggests that, within the range of education sampled, more educated participants do not perform dif- ferently than less educated participants when attempting to feign memory deficits on the VSVT.
Divergent Validity of the VSVT Divergent construct validity is demonstrated by small correlations between scores on tests that are designed to measure dissimilar constructs. This is particularly important for tests of symp- tom validity, which should be insensitive to ac- tual level of cognitive function. Table 7 presents Spearman rank correlations between VSVT scores and selected neuropsychological test scores (WAIS-R Full Scale IQ & Digits Forward
Table 6. Means, SD, and 95% Confidence Intervals for Response Times to Easy and Hard Items for Participants with Valid, Questionable, and Invalid Protocols.
Valid (n = 267) Questionable ( n = 24) Invalid ( n = 15)
Easy Items 1693 (711) 1608-1779 2878 (1453) 2265-3492 3155 (1150) 2600-3709 Hard Items 2716 (1282) 2562-2871 5670 (3397) 4235-7104 4709 (1890) 3799-5620
Nore. response time in ms
Dow
nloa
ded
by [
Uni
vers
ity o
f C
alga
ry]
at 0
9:44
13
Febr
uary
201
5

918 DANIEL J. SLICK ET AL.
(Wechsler, 198 1); North American Adult Read- ing Test (NAART: Blair & Spreen, 1989); Peter- son Trigrams total scores (Peterson & Peterson, 1959); Logical Memory I and I1 subtests from the WMS-R (Wechsler, 1987); total and recog- nition scores from the RAVLT (Spreen & Strauss, 1991); copy and recall scores from the RCFT (Spreen & Strauss, 1991); color, word, and color-word scores from the Stroop Test (Re- gard, 1981); the time scores from Trail Making Test, parts A and B (Reitan & Wolfson, 1985); number of categories and perseverative errors from the Wisconsin Card Sorting Test (WCST: Heaton, 1981); and 5 of the content scales from the MMPI-2 (Butcher et al., 1989)). Spearman correlations were chosen because scores for the VSVT were significantly positively skewed, and were therefore not suitable for Pearson corre- lational analyses. Because participants who per- formed below chance on the VSVT were clearly exaggerating or feigning deficits, other test sco- res from these participants were likely to be in-
valid. Additionally, some participants who ob- tained VSVT scores in the questionable range were probably also exaggerating deficits. There- fore only data from participants who performed above chance were included in the divergent validity analysis.
Small correlations (.29 or less; Cohen 1988) were considered evidence of divergent validity (i.e., low sensitivity to level of cognitive func- tion). Generally, easy and hard item scores from the VSVT showed excellent divergent validity, although borderline relationships were observed for scores from the Stroop Test. No memory test shared more than 5% of its variance with easy or hard items scores from the VSVT. Evidence for the divergent validity of response times was weaker however, as they correlated moderately with digit span and measures with heavy pro- cessing speed components such as the Stroop and Trail Making tests.
Table 7 . Divergent Validity: Spearman Correlations with Tests of Memory and Other Cognitive Functions.
Test
WAIS-R FSIQ NAART Digits Forward Peterson Trigrams WMS-R LM-I WMS-R LM-I1 RAVLT Total RAVLT Recognition RCFT Copy RCFT Recall Stroop Colors Stroop Word Stroop Color-Word Trail Making Test A Trail Making Test B WCST Categories WCST Pers. Errors MMPI-2: DEP MMPI-2: ANX MMPI-2: HEA MMPI-2: BIZ MMPI-2: TRT
Easy Correct Hard Correct Easy RT Hard RT
-.09 -.01
.04 -.02 -.08 -.07 -.04 -.18 -.04 -.01 -.22 -.29 -.23 -.14 -.05 -.07
.05 -.17 -.I4 -.01 .06 .01
.09 -.03
. I8
.10
.12 -.02
.08 -.01
.05
.07 -.24 -.21 -.27 -.I2 -.I6
.05 -.04
.05
.20
.08
.05
.2 1
-.27 .34
-.28 -.12 -.08
.17 -.09
.03 -.04 -.04
.15
.26
.19
.31
.27
.05
.24
.14
.18
.02
.15
-.09
-.IS .32
-. 32 -.20 -.07
.10 -.os
.08 -.03
.03
.16
.30
.26
.30
.24 -.02
.04
.28
.I8
.17
.05
.12
Note. Each subject received individually tailored assessment, therefore ns are not the same for all correlations in the table (n range = 47 - 130).
Dow
nloa
ded
by [
Uni
vers
ity o
f C
alga
ry]
at 0
9:44
13
Febr
uary
201
5
VICTORIA SYMPTOM VALIDITY TEST 919
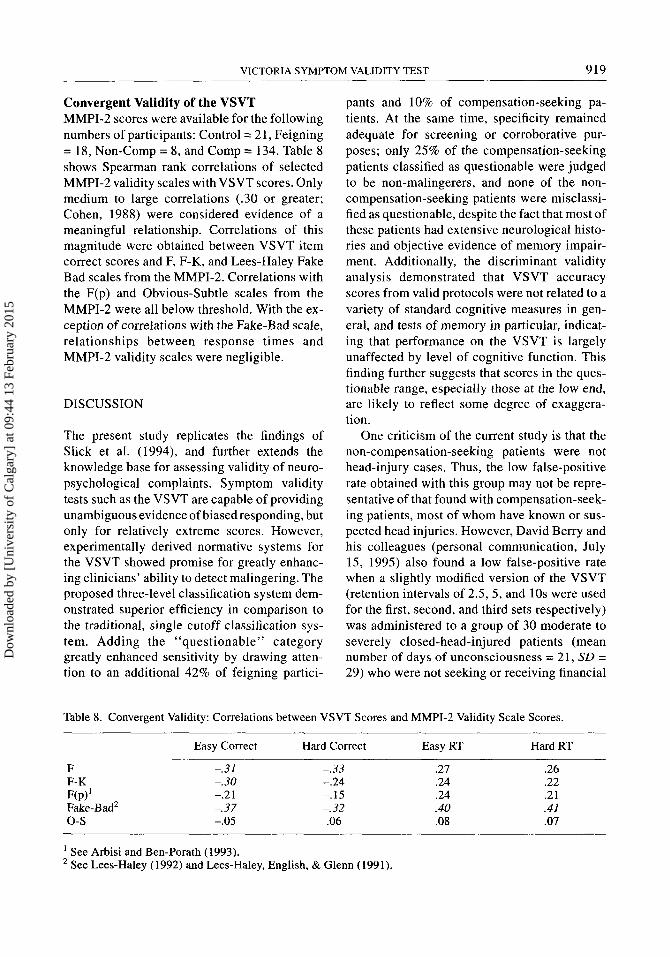
Convergent Validity of the VSVT MMPI-2 scores were available for the following numbers of participants: Control = 21, Feigning = 18, Non-Comp = 8, and Comp = 134. Table 8 shows Spearman rank correlations of selected MMPI-2 validity scales with VSVT scores. Only medium to large correlations (.30 or greater; Cohen, 1988) were considered evidence of a meaningful relationship. Correlations of this magnitude were obtained between VSVT item correct scores and F, F-K, and Lees-Haley Fake Bad scales from the MMPI-2. Correlations with the F(p) and Obvious-Subtle scales from the MMPI-2 were all below threshold. With the ex- ception of correlations with the Fake-Bad scale, relationships between response times and MMPI-2 validity scales were negligible.
DISCUSSION
The present study replicates the findings of Slick et al. (1994), and further extends the knowledge base for assessing validity of neuro- psychological complaints. Symptom validity tests such as the VSVT are capable of providing unambiguous evidence of biased responding, but only for relatively extreme scores. However, experimentally derived normative systems for the VSVT showed promise for greatly enhanc- ing clinicians’ ability to detect malingering. The proposed three-level classification system dem- onstrated superior efficiency in comparison to the traditional, single cutoff classification sys- tem. Adding the ‘‘questionable’’ category greatly enhanced sensitivity by drawing atten- tion to an additional 42% of feigning partici-
pants and 10% of compensation-seeking pa- tients. At the same time, specificity remained adequate for screening or corroborative pur- poses; only 25% of the compensation-seeking patients classified as questionable were judged to be non-malingerers, and none of the non- compensation-seeking patients were misclassi- fied as questionable, despite the fact that most of these patients had extensive neurological histo- ries and objective evidence of memory impair- ment. Additionally, the discriminant validity analysis demonstrated that VSVT accuracy scores from valid protocols were not related to a variety of standard cognitive measures in gen- eral, and tests of memory in particular, indicat- ing that performance on the VSVT is largely unaffected by level of cognitive function. This finding further suggests that scores in the ques- tionable range, especially those at the low end, are likely to reflect some degree of exaggera- tion.
One criticism of the current study is that the non-compensation-seeking patients were not head-injury cases. Thus, the low false-positive rate obtained with this group may not be repre- sentative of that found with compensation-seek- ing patients, most of whom have known or sus- pected head injuries. However, David Berry and his colleagues (personal communication, July 15, 1995) also found a low false-positive rate when a slightly modified version of the VSVT (retention intervals of 2.5, 5 , and 10s were used for the first, second, and third sets respectively) was administered to a group of 30 moderate to severely closed-head-injured patients (mean number of days of unconsciousness = 21, SD = 29) who were not seeking or receiving financial
Table 8. Convergent Validity: Correlations between VSVT Scores and MMPI-2 Validity Scale Scores.
Easy Correct Hard Correct Easy RT Hard RT
F F-K RP)‘ Fake-Bad2 0- s
-.31 -. 30 -.2 1 -.37 -.05
-. 33 -.24 -.15 -. 32 .06
.27
.24
.24
.40
.08
~
.26
.22
.21 .41 .07
See Arbisi and Ben-Porath (1993). * See Lees-Haley (1992) and Lees-Haley, English, & Glenn (1991).
Dow
nloa
ded
by [
Uni
vers
ity o
f C
alga
ry]
at 0
9:44
13
Febr
uary
201
5

DANIEL J. SLICK ET AL. -
920
compensation at the time of testing. Twenty- nine (97%) of the patients obtained scores in the valid range, whereas only I patient (3%) ob- tained a score in the questionable range. Scores in this sample did not vary across retention in- tervals, suggesting that these patients would have performed similarly on the standard VSVT. Thus, Berry et al.’s data support the contention that scores in the questionable range are uncom- mon in legitimately head-injured patients.
Scores in the questionable range should thus raise serious suspicion about the possibility of symptom exaggeration or poor effort due to other factors (e.g., depression, fatigue, etc.). Given a non-zero false-positive rate, however, caution is warranted when making clinical deter- minations about the status of patients who per- form within the questionable range, especially where scores are near the high end of the confi- dence interval. Therefore, scores within the questionable range should be treated as tentative indicators of symptom exaggeration to be con- firmed or disconfirmed by other clinical evi- dence (e.g., additional symptom validity testing or retesting, other indices of effort, behavioral observations, and collateral information). Clearly, legitimate cognitive deficits, such as severe attentional or memory problems should always be carefully considered as a first possi- bility whenever performance is found to be at chance level. When other possibilities have been ruled out, scores in the questionable range, by virtue of their low normative likelihood may be used as corroboratory evidence when other in- formation also suggests dissimulation.
Consistent with findings from other studies (Beetar & Williams, 1995; Rose, Hall, & Szalda-Petree, 1995; Strauss et al., 1994), response times from the VSVT also showed promise for helping differentiate feigned from real impairment, although modest convergent and divergent validity findings cautions against over-interpretation of response times at this point. Further studies will likely increase the confidence with which response time data may be factored into decisions about patient motiva- tion.
As expected, VSVT scores showed only mod- erate convergent validity with validity scales
and indices from the MMPI-2. However, this finding is not surprising, because the tests differ considerably in task (self-report vs. actual per- formance), and domain (memory vs. psychologi- cal adjustment). To successfully feign head-in- jury sequelae on the MMPI-2 requires knowl- edge or intuition about the type and extent of psychiatric and neurological symptoms that are likely following head injury, as well as those that are not. Successful feigning on the VSVT requires knowledge or intuition about the type and extent of memory deficits that might be ex- pected following head injury, as well as self- monitoring of actual test performance. The most sophisticated feigning participants were able to produce valid protocols on both the MMPI-2 and VSVT, while the least sophisticated participants produced suspect protocols on both tests. Be- tween these two extremes of feigning ability are the two groups of participants who were only able to “fool” either the MMPI-2 or the VSVT, but not both.
In sum, the results from this study strongly support the routine use of symptom validity tests in cases where patients are seeking compensa- tion, or have other motivation to exaggerate dys- function. Given the current state of the art, the use of multiple measures (e.g., VSVT, RMT, PDRT, Rey 15 Item) is recommended for clari- fying whether poor performance is intentional.
REFERENCES
Arbisi, P.A., & Ben-Porath, J.S. (March, 1993). Inter- pretation of F scales for inpatients: Moving from art to science. Paper presented at the 28th Annual Symposium on Recent Developments in MMPI (MMPI-2/MMPI-A) Research. St. Petersburg, FL.
Beetar, J.T., & Williams, J.M. (1995). Malingering response styles on the Memory Assessment Scales and symptom validity tests. Archives of Clinical Neuropsychology, 10, 57-72.
Bernard, L.C. (1991). The detection of faked deficits on the Rey Auditory Verbal Learning Test: The effect of serial position. Archives of Clinical Neu- ropsychology, 6, 8 1-88.
Bernard, L.C., Houton, W., & Natoli, L. (1993). Ma- lingering on neuropsychological memory tests: Potential objective indicators. Journal of Clinical Psychology, 49,45-53.
Dow
nloa
ded
by [
Uni
vers
ity o
f C
alga
ry]
at 0
9:44
13
Febr
uary
201
5

VICTORIA SYMPTOM VALIDITY TEST 92 1
Bickart, W.T., Meyer, R.G., & Connell, D. (1991). The symptom validity technique as a measure of feigned short-term memory deficit. American Jour- nal of Forensic Psychology, 9,3-11
Binder, L.M. (1990). Malingering following minor head trauma. The Clinical Neuropsychologist, 4 ,
Binder, L.M. (1992). Forced-choice testing provides evidence of malingering. Archives of Physical Medicine and Rehabilitation, 73, 377-380.
Binder, L.M. (1993a). Portland Digit Recognition Test Manual (2nd ed.). Portland, OR: Author.
Binder, L.M. (1993b). Assessment of malingering after mild head trauma with the Portland Digit Recognition Test. Journal of Clinical and Experi- mental Neuropsychology, I S , 170- 182.
Binder, L.M., & Willis, S.C. (1991). Assessment of motivation after financially compensable minor head trauma. Psychological Assessment, 3, 175- 181.
Binder, L.M., Villanueva, M.R., Howieson, D., & Moore, R.T. (1993). The Rey AVLT recognition memory task measures motivational impairment after mild head injury. Archives of Clinical Neuro-
Blair, J.R., & Spreen, 0. (1989). Predicting premorbid IQ: A revision of the National Adult reading Test. The Clinical Neuropsychologist, 3, 129-136.
Butcher, J. , Dahlstrom, W. G., Graham, J., Tellegen, A., & Kaemmer, B. (1989). Minnesota Multiphasic Personality Inventory (MMPI-2): Manual for ad- ministration and scoring. Minneapolis, MN: Uni- versity of Minnesota.
Cohen, J. (1988). Statistical power analysis for the behavioral sciences, (2nd ed.) Hillsdale, NJ: Law- rence Erlbaum.
Franzen, M.D., & Iverson, G.L. (1995). Biased responding: The detection of neuropsychological malingering in a hospital setting. Advances in Med- ical Psychotherapy, 8, 47-58.
Fredrick, R.I., & Foster, H.G., Jr. (1991). Multiple measures of malingering on a forced-choice test of cognitive ability. Psychological Assessment, 3,
Guilmette, T.J., Hart, K.J., & Giuliano, A.J. (1993). Malingering detection: The use of a forced-choice method in identifying organic versus simulated memory impairment. The Clinical Neuropsycholo- gist, 7, 59-69.
Heaton, R. K. (1981). Wisconsin Card Sorting Test Manual. Odessa, FL: Psychological Assessment Resources.
Hiscock, M., & Hiscock, C.K. (1989). Refining the forced choice method for the detection of malin- gering. Journal of Clinical and Experimental Neu- ropsychology, 1 I , 967-974.
Iverson, G.L., & Franzen, M.D. (1996). Using multi- ple objective memory procedures to detect simu-
25-36
psychology, 8, 137-148.
596-602.
lated malingering. Journal of Clinical and Experi- mental Neuropsychology, 18, 38-5 1.
Iverson, G.L., & Franzen, M.D. (1994). The Recogni- tion Memory Test, Digit Span, and Knox Cube Test as markers of malingered memory impair- ment. Assessment, I , 323-334.
verson, G.L., Franzen, M.D., & McCracken, L.M. (1991). Application of a forced-choice memory procedure designed to detect experimental malin- gering. Archives of Clinical Neuropsychology, I S ,
,ees-Haley, P. R. (1992). Efficacy of the MMPI-2 validity scales and MCMI-I1 modifier scales for detecting spurious PTSD claims: F, F-K, Fake Bas Scale, Ego Strength, Subtle-Obvious Subscales, DIS and DEB. Journal of Clinical Psychology, 48,
Lees-Haley, P. R., English, L. T., & Glenn, W. J. (1991) A fake bad scale on the MMPI-2 for per- sonal injury claimants. Psychological Reports, 68,
Lezak, M.D. (1995). Neuropsychological assessment (3rd ed.). New York: Oxford University Press.
Millis, S.R. (1992). The Recognition Memory Test in the detection of malingered and exaggerated mem- ory deficits. The Clinical Neuropsychologist, 6 ,
Millis, S.R. (1994). Assessment of motivation and memory with the Recognition Memory Test after financially compensable mild head injury. Journal of Clinical Psychology, SO, 601-605.
Mittenberg, W., Azrin, R., Millsaps, C., & Heil- bronner, R. (1993). Identification of malingered head injury on the Wechsler Memory Scale-Re- vised. Psychological Assessment, 5, 34-40.
Nies, K.J., & Sweet, J.L. (1994). Neuropsychological assessment and malingering: A critical review of past and present strategies. Archives of Clinical Neuropsychology, 9,501-552.
Pankratz, L. (1983). A new technique for the assess- ment and modification of feigned memory deficit. Perceptual and Motor Skills, 57, 367-372.
Peterson, L. R., & Peterson, M. J. (1959). Short-term retention of individual verbal items. Journal of Experimental Psychology, 58, 193-198.
Prigatano, G.P., & Amin, K. (1993). Digit Memory Test: Unequivocal cerebral dysfunction and sus- pected malingering. Journal of Clinical and Exper- imental Neuropsychology, I S , 537-546.
Puri, M.L., & Sen, P.K. (1971). Nonparametric meth- ods in multivariate analysis. New York: Wiley.
Regard, M. (1981). Cognitive rigidity andflexibility: A neuropsychological study. Unpublished Ph.D. dissertation, University of Victoria, Victoria, Brit- ish Columbia.
Reitan, R.M., & Wolfson, D. (1985). The Halstead- Reitan Neuropsychological Test Battery. Tucson: Neuropsychology Press.
667-676.
681-689.
203-210.
406-4 14.
Dow
nloa
ded
by [
Uni
vers
ity o
f C
alga
ry]
at 0
9:44
13
Febr
uary
201
5

922 DANIEL J. SLICK ET AL.
Rose, F.E., Hall, S., & Szalda-Pertree, A.D. (1995). Portland Digit Recognition Test - Computerized: Measuring response latency improves the detection of malingering. The Clinical Neuropsychologist, 9,
Slick, D., Hopp, G., Strauss, E., Hunter, M., & Pinch, D. (1994). Detecting dissimulation: Profiles of simulated malingerers, traumatic brain-injury pa- tients, and normal controls on a revised version of Hiscock and Hiscock’s Forced-Choice Memory Test. Journal of Clinical and Experimental Neuro- psychology, 16,472-48 1 .
Slick, D.J., Hopp, G.A., & Strauss, E.H. (1992). The Victoria Revision of the Hiscock Digit Memory Test. Victoria, British Columbia: Author.
Slick, D.J., Hopp, G.A., & Strauss, E.H. (1995). The Victoria Symptom Validity Test. Odessa, FL: PAR.
124- 134.
Spreen, O., & Strauss, E. (1991). A compendium of neuropsychological tests. New York: Oxford Uni- versity Press.
Strauss, E., Spellacy, F., Hunter, M., & Berry, T. (1994). Assessing believable deficits on measures of attention and information processing capacity. Archives of Clinical Neuropsychology, 9,483-490.
Wechsler, D. (1981). Wechsler Adult Intelligence Scale -Revised. New York: Psychological Corpo- ration.
Wechsler, D. (1987). Wechsler Memory Scale - Re- vised. New York: Psychological Corporation.
Wiggens, E.C., & Brandt, J. (1988). The detection of simulated amnesia. Law and Human Behaviol; 12( l), 57-78.
Dow
nloa
ded
by [
Uni
vers
ity o
f C
alga
ry]
at 0
9:44
13
Febr
uary
201
5


