Embed Size (px)
Citation preview
Business Address4900 TIEDEMAN ROADBROOKLYN OH 441446144708000
Mailing Address4900 TIEDEMAN ROADBROOKLYN OH 44144
SECURITIES AND EXCHANGE COMMISSION
FORM NPORT-EX
Filing Date: 2019-05-16 | Period of Report: 2019-03-31SEC Accession No. 0001752724-19-035567
(HTML Version on secdatabase.com)
FILERVICTORY PORTFOLIOSCIK:802716| IRS No.: 316364605 | State of Incorp.:DE | Fiscal Year End: 1031Type: NPORT-EX | Act: 40 | File No.: 811-04852 | Film No.: 19831377
Copyright © 2021 www.secdatabase.com. All Rights Reserved.Please Consider the Environment Before Printing This Document
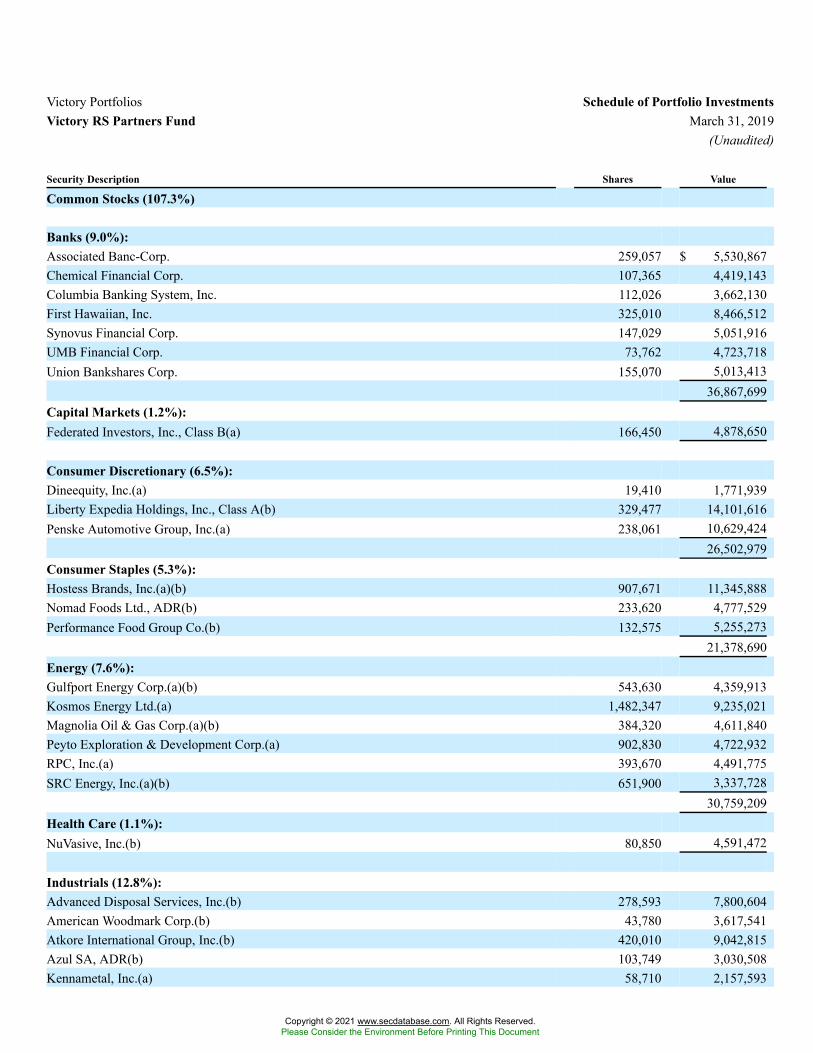
Victory Portfolios Schedule of Portfolio InvestmentsVictory RS Partners Fund March 31, 2019
(Unaudited)
Security Description Shares Value
Common Stocks (107.3%)
Banks (9.0%):Associated Banc-Corp. 259,057 $ 5,530,867Chemical Financial Corp. 107,365 4,419,143Columbia Banking System, Inc. 112,026 3,662,130First Hawaiian, Inc. 325,010 8,466,512Synovus Financial Corp. 147,029 5,051,916UMB Financial Corp. 73,762 4,723,718Union Bankshares Corp. 155,070 5,013,413
36,867,699Capital Markets (1.2%):Federated Investors, Inc., Class B(a) 166,450 4,878,650
Consumer Discretionary (6.5%):Dineequity, Inc.(a) 19,410 1,771,939Liberty Expedia Holdings, Inc., Class A(b) 329,477 14,101,616Penske Automotive Group, Inc.(a) 238,061 10,629,424
26,502,979Consumer Staples (5.3%):Hostess Brands, Inc.(a)(b) 907,671 11,345,888Nomad Foods Ltd., ADR(b) 233,620 4,777,529Performance Food Group Co.(b) 132,575 5,255,273
21,378,690Energy (7.6%):Gulfport Energy Corp.(a)(b) 543,630 4,359,913Kosmos Energy Ltd.(a) 1,482,347 9,235,021Magnolia Oil & Gas Corp.(a)(b) 384,320 4,611,840Peyto Exploration & Development Corp.(a) 902,830 4,722,932RPC, Inc.(a) 393,670 4,491,775SRC Energy, Inc.(a)(b) 651,900 3,337,728
30,759,209Health Care (1.1%):NuVasive, Inc.(b) 80,850 4,591,472
Industrials (12.8%):Advanced Disposal Services, Inc.(b) 278,593 7,800,604American Woodmark Corp.(b) 43,780 3,617,541Atkore International Group, Inc.(b) 420,010 9,042,815Azul SA, ADR(b) 103,749 3,030,508Kennametal, Inc.(a) 58,710 2,157,593
Copyright © 2021 www.secdatabase.com. All Rights Reserved.Please Consider the Environment Before Printing This Document
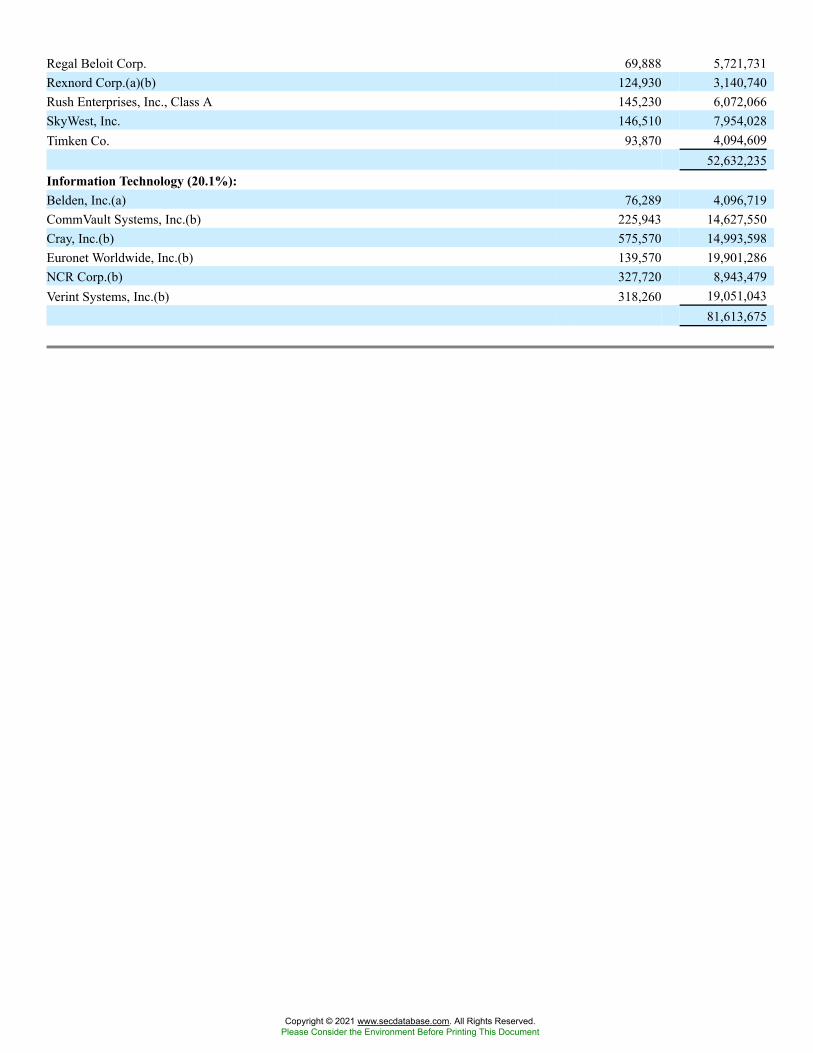
Regal Beloit Corp. 69,888 5,721,731Rexnord Corp.(a)(b) 124,930 3,140,740Rush Enterprises, Inc., Class A 145,230 6,072,066SkyWest, Inc. 146,510 7,954,028Timken Co. 93,870 4,094,609
52,632,235Information Technology (20.1%):Belden, Inc.(a) 76,289 4,096,719CommVault Systems, Inc.(b) 225,943 14,627,550Cray, Inc.(b) 575,570 14,993,598Euronet Worldwide, Inc.(b) 139,570 19,901,286NCR Corp.(b) 327,720 8,943,479Verint Systems, Inc.(b) 318,260 19,051,043
81,613,675
Copyright © 2021 www.secdatabase.com. All Rights Reserved.Please Consider the Environment Before Printing This Document
Security Description Shares Value
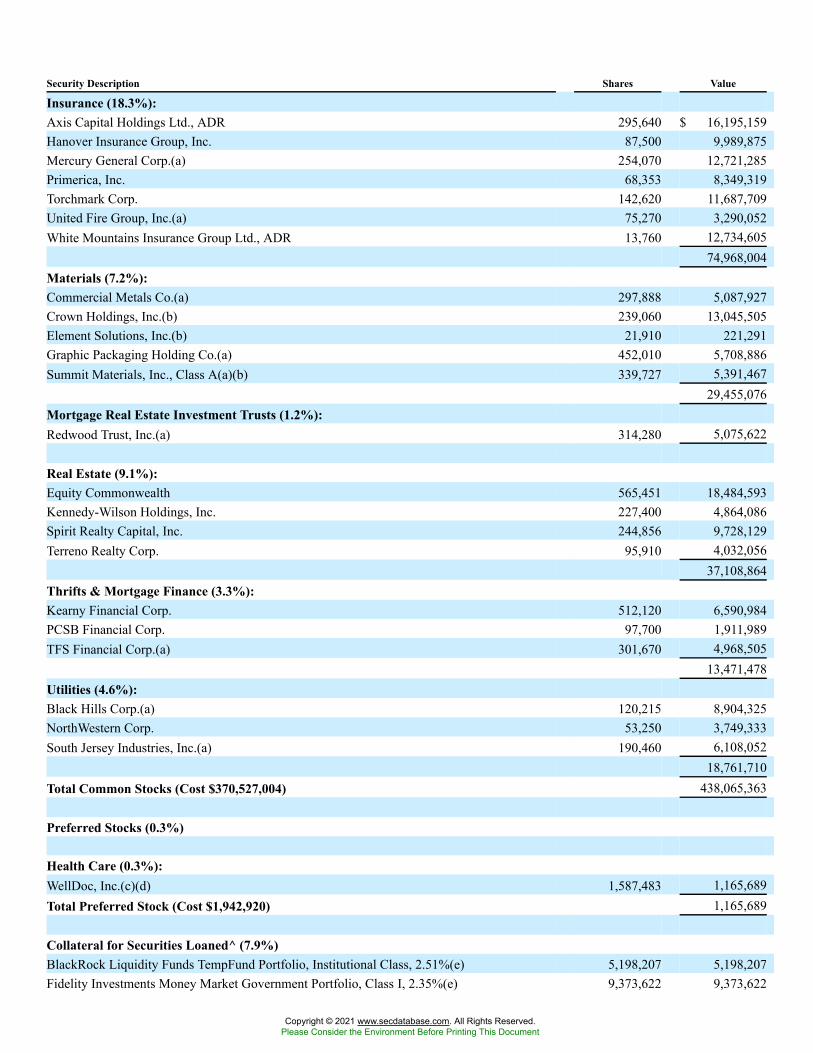
Insurance (18.3%):Axis Capital Holdings Ltd., ADR 295,640 $ 16,195,159Hanover Insurance Group, Inc. 87,500 9,989,875Mercury General Corp.(a) 254,070 12,721,285Primerica, Inc. 68,353 8,349,319Torchmark Corp. 142,620 11,687,709United Fire Group, Inc.(a) 75,270 3,290,052White Mountains Insurance Group Ltd., ADR 13,760 12,734,605
74,968,004Materials (7.2%):Commercial Metals Co.(a) 297,888 5,087,927Crown Holdings, Inc.(b) 239,060 13,045,505Element Solutions, Inc.(b) 21,910 221,291Graphic Packaging Holding Co.(a) 452,010 5,708,886Summit Materials, Inc., Class A(a)(b) 339,727 5,391,467
29,455,076Mortgage Real Estate Investment Trusts (1.2%):Redwood Trust, Inc.(a) 314,280 5,075,622
Real Estate (9.1%):Equity Commonwealth 565,451 18,484,593Kennedy-Wilson Holdings, Inc. 227,400 4,864,086Spirit Realty Capital, Inc. 244,856 9,728,129Terreno Realty Corp. 95,910 4,032,056
37,108,864Thrifts & Mortgage Finance (3.3%):Kearny Financial Corp. 512,120 6,590,984PCSB Financial Corp. 97,700 1,911,989TFS Financial Corp.(a) 301,670 4,968,505
13,471,478Utilities (4.6%):Black Hills Corp.(a) 120,215 8,904,325NorthWestern Corp. 53,250 3,749,333South Jersey Industries, Inc.(a) 190,460 6,108,052
18,761,710Total Common Stocks (Cost $370,527,004) 438,065,363
Preferred Stocks (0.3%)
Health Care (0.3%):WellDoc, Inc.(c)(d) 1,587,483 1,165,689Total Preferred Stock (Cost $1,942,920) 1,165,689
Collateral for Securities Loaned^ (7.9%)BlackRock Liquidity Funds TempFund Portfolio, Institutional Class, 2.51%(e) 5,198,207 5,198,207Fidelity Investments Money Market Government Portfolio, Class I, 2.35%(e) 9,373,622 9,373,622
Copyright © 2021 www.secdatabase.com. All Rights Reserved.Please Consider the Environment Before Printing This Document
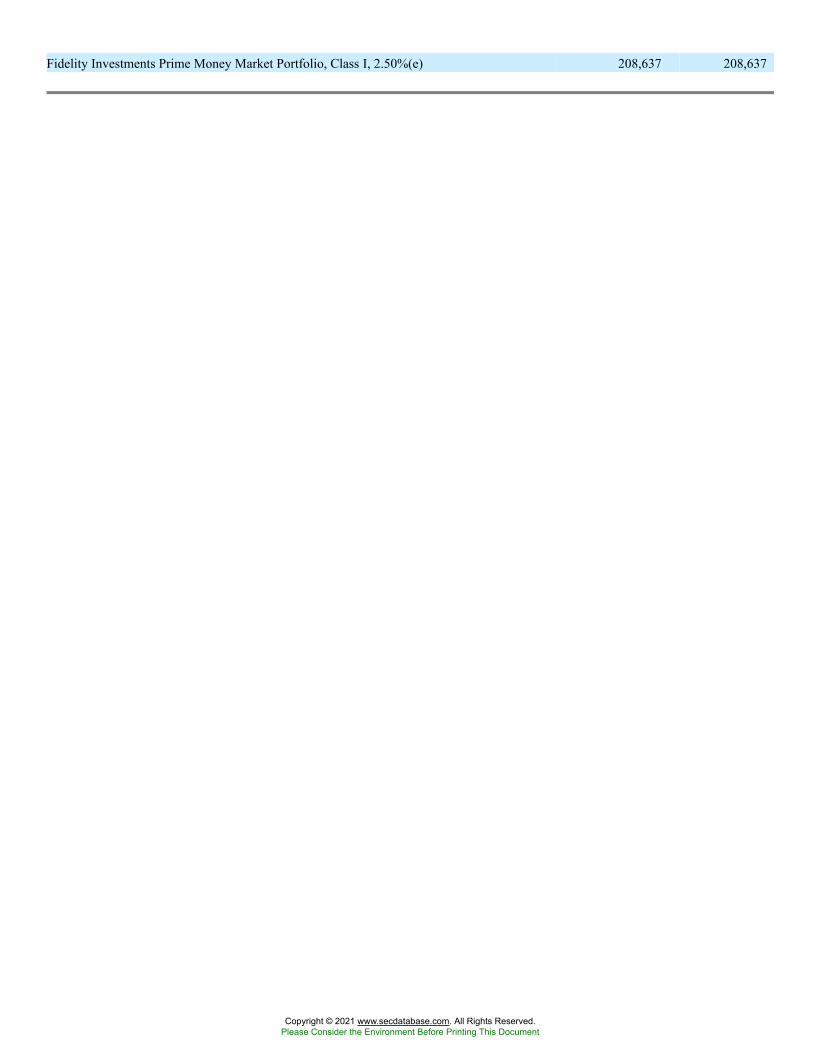
Fidelity Investments Prime Money Market Portfolio, Class I, 2.50%(e) 208,637 208,637
Copyright © 2021 www.secdatabase.com. All Rights Reserved.Please Consider the Environment Before Printing This Document
Security Description Shares Value
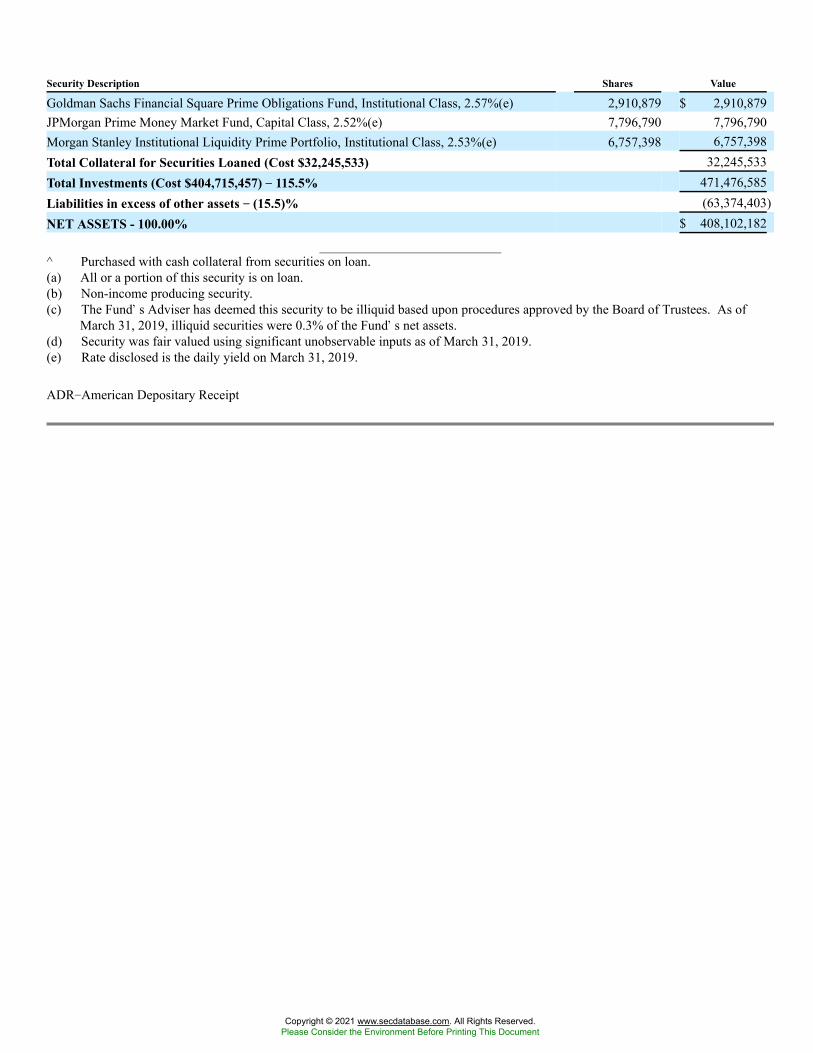
Goldman Sachs Financial Square Prime Obligations Fund, Institutional Class, 2.57%(e) 2,910,879 $ 2,910,879JPMorgan Prime Money Market Fund, Capital Class, 2.52%(e) 7,796,790 7,796,790Morgan Stanley Institutional Liquidity Prime Portfolio, Institutional Class, 2.53%(e) 6,757,398 6,757,398Total Collateral for Securities Loaned (Cost $32,245,533) 32,245,533Total Investments (Cost $404,715,457) �� 115.5% 471,476,585Liabilities in excess of other assets �� (15.5)% (63,374,403)NET ASSETS - 100.00% $ 408,102,182
^ Purchased with cash collateral from securities on loan.(a) All or a portion of this security is on loan.(b) Non-income producing security.(c) The Fund�s Adviser has deemed this security to be illiquid based upon procedures approved by the Board of Trustees. As of
March 31, 2019, illiquid securities were 0.3% of the Fund�s net assets.(d) Security was fair valued using significant unobservable inputs as of March 31, 2019.(e) Rate disclosed is the daily yield on March 31, 2019.
ADR�American Depositary Receipt
Copyright © 2021 www.secdatabase.com. All Rights Reserved.Please Consider the Environment Before Printing This Document
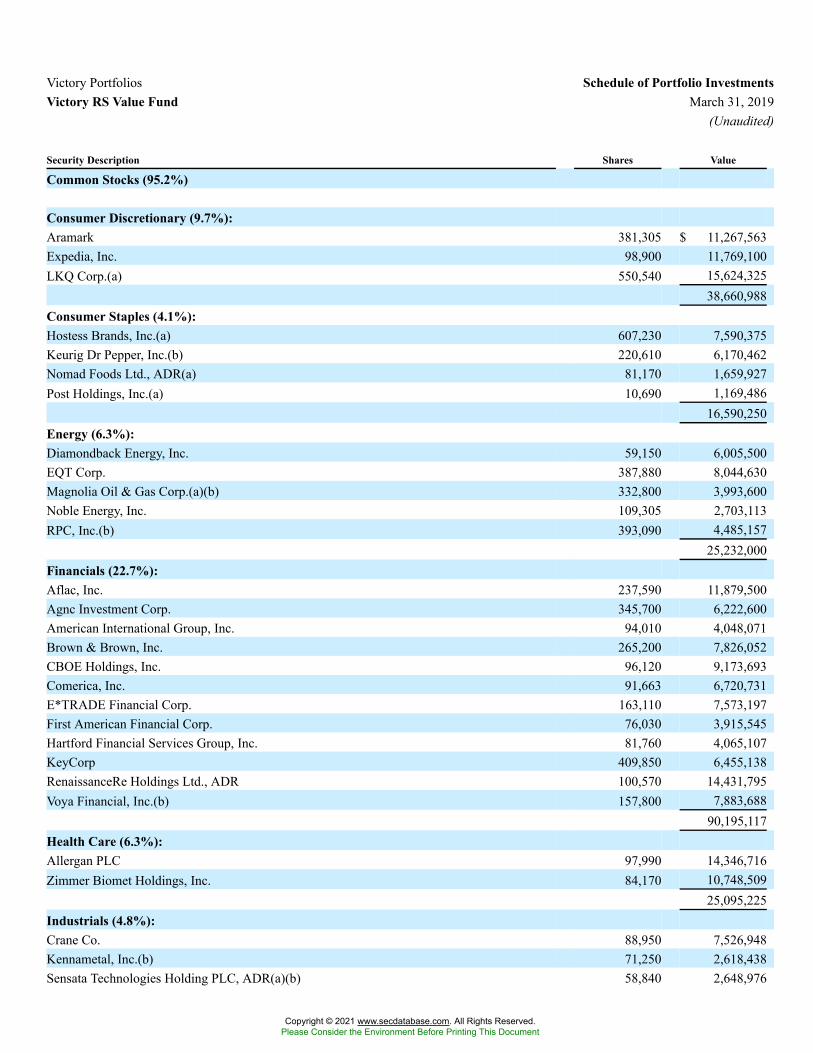
Victory Portfolios Schedule of Portfolio InvestmentsVictory RS Value Fund March 31, 2019
(Unaudited)
Security Description Shares Value
Common Stocks (95.2%)
Consumer Discretionary (9.7%):Aramark 381,305 $ 11,267,563Expedia, Inc. 98,900 11,769,100LKQ Corp.(a) 550,540 15,624,325
38,660,988Consumer Staples (4.1%):Hostess Brands, Inc.(a) 607,230 7,590,375Keurig Dr Pepper, Inc.(b) 220,610 6,170,462Nomad Foods Ltd., ADR(a) 81,170 1,659,927Post Holdings, Inc.(a) 10,690 1,169,486
16,590,250Energy (6.3%):Diamondback Energy, Inc. 59,150 6,005,500EQT Corp. 387,880 8,044,630Magnolia Oil & Gas Corp.(a)(b) 332,800 3,993,600Noble Energy, Inc. 109,305 2,703,113RPC, Inc.(b) 393,090 4,485,157
25,232,000Financials (22.7%):Aflac, Inc. 237,590 11,879,500Agnc Investment Corp. 345,700 6,222,600American International Group, Inc. 94,010 4,048,071Brown & Brown, Inc. 265,200 7,826,052CBOE Holdings, Inc. 96,120 9,173,693Comerica, Inc. 91,663 6,720,731E*TRADE Financial Corp. 163,110 7,573,197First American Financial Corp. 76,030 3,915,545Hartford Financial Services Group, Inc. 81,760 4,065,107KeyCorp 409,850 6,455,138RenaissanceRe Holdings Ltd., ADR 100,570 14,431,795Voya Financial, Inc.(b) 157,800 7,883,688
90,195,117Health Care (6.3%):Allergan PLC 97,990 14,346,716Zimmer Biomet Holdings, Inc. 84,170 10,748,509
25,095,225Industrials (4.8%):Crane Co. 88,950 7,526,948Kennametal, Inc.(b) 71,250 2,618,438Sensata Technologies Holding PLC, ADR(a)(b) 58,840 2,648,976
Copyright © 2021 www.secdatabase.com. All Rights Reserved.Please Consider the Environment Before Printing This Document
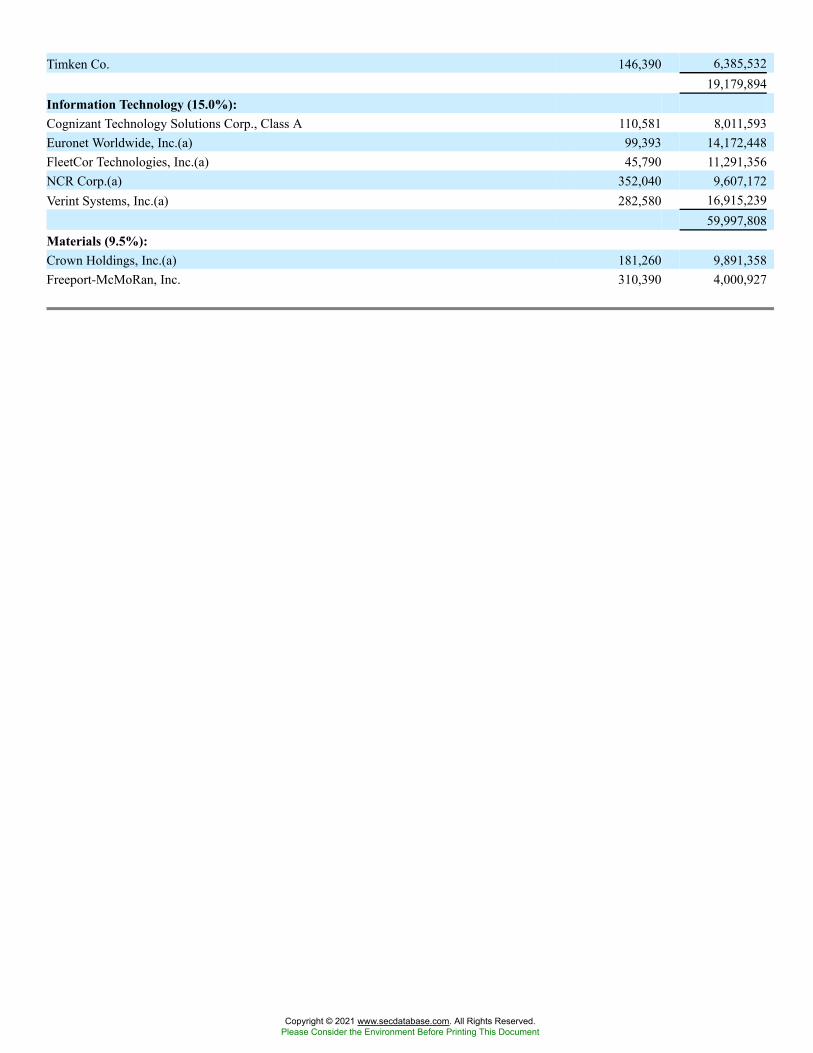
Timken Co. 146,390 6,385,53219,179,894
Information Technology (15.0%):Cognizant Technology Solutions Corp., Class A 110,581 8,011,593Euronet Worldwide, Inc.(a) 99,393 14,172,448FleetCor Technologies, Inc.(a) 45,790 11,291,356NCR Corp.(a) 352,040 9,607,172Verint Systems, Inc.(a) 282,580 16,915,239
59,997,808Materials (9.5%):Crown Holdings, Inc.(a) 181,260 9,891,358Freeport-McMoRan, Inc. 310,390 4,000,927
Copyright © 2021 www.secdatabase.com. All Rights Reserved.Please Consider the Environment Before Printing This Document
Security Description Shares Value
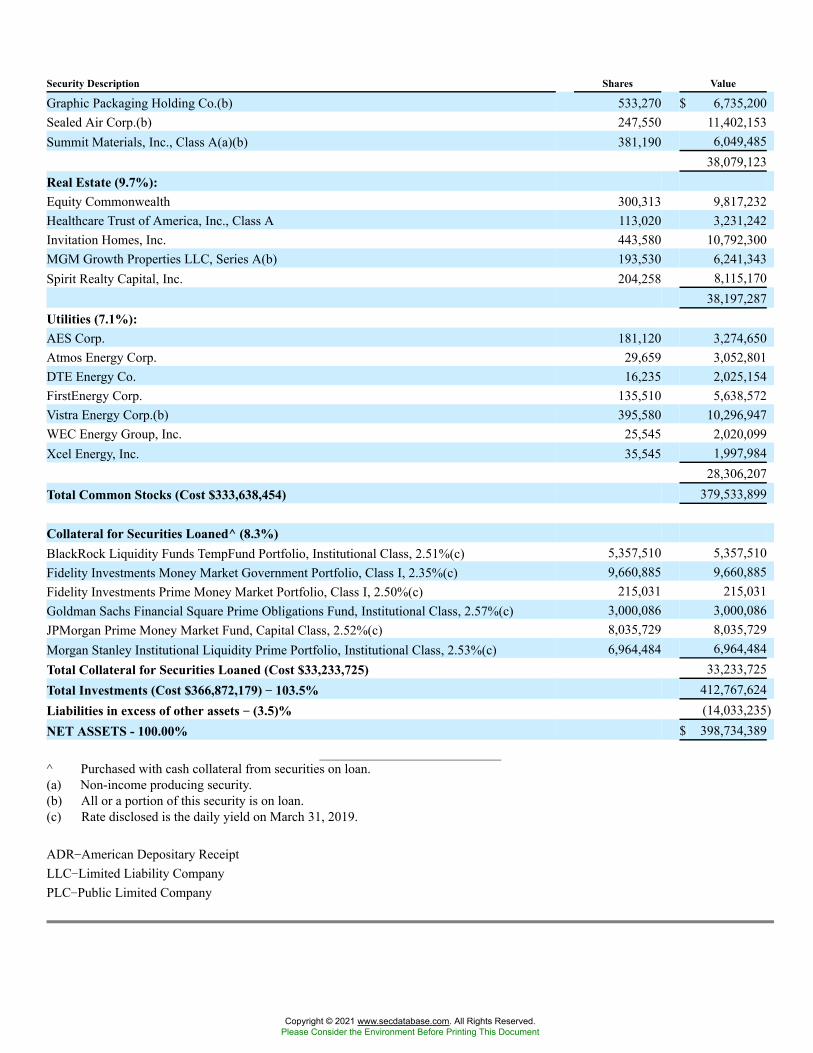
Graphic Packaging Holding Co.(b) 533,270 $ 6,735,200Sealed Air Corp.(b) 247,550 11,402,153Summit Materials, Inc., Class A(a)(b) 381,190 6,049,485
38,079,123Real Estate (9.7%):Equity Commonwealth 300,313 9,817,232Healthcare Trust of America, Inc., Class A 113,020 3,231,242Invitation Homes, Inc. 443,580 10,792,300MGM Growth Properties LLC, Series A(b) 193,530 6,241,343Spirit Realty Capital, Inc. 204,258 8,115,170
38,197,287Utilities (7.1%):AES Corp. 181,120 3,274,650Atmos Energy Corp. 29,659 3,052,801DTE Energy Co. 16,235 2,025,154FirstEnergy Corp. 135,510 5,638,572Vistra Energy Corp.(b) 395,580 10,296,947WEC Energy Group, Inc. 25,545 2,020,099Xcel Energy, Inc. 35,545 1,997,984
28,306,207Total Common Stocks (Cost $333,638,454) 379,533,899
Collateral for Securities Loaned^ (8.3%)BlackRock Liquidity Funds TempFund Portfolio, Institutional Class, 2.51%(c) 5,357,510 5,357,510Fidelity Investments Money Market Government Portfolio, Class I, 2.35%(c) 9,660,885 9,660,885Fidelity Investments Prime Money Market Portfolio, Class I, 2.50%(c) 215,031 215,031Goldman Sachs Financial Square Prime Obligations Fund, Institutional Class, 2.57%(c) 3,000,086 3,000,086JPMorgan Prime Money Market Fund, Capital Class, 2.52%(c) 8,035,729 8,035,729Morgan Stanley Institutional Liquidity Prime Portfolio, Institutional Class, 2.53%(c) 6,964,484 6,964,484Total Collateral for Securities Loaned (Cost $33,233,725) 33,233,725Total Investments (Cost $366,872,179) �� 103.5% 412,767,624Liabilities in excess of other assets �� (3.5)% (14,033,235)NET ASSETS - 100.00% $ 398,734,389
^ Purchased with cash collateral from securities on loan.(a) Non-income producing security.(b) All or a portion of this security is on loan.(c) Rate disclosed is the daily yield on March 31, 2019.
ADR�American Depositary ReceiptLLC�Limited Liability CompanyPLC�Public Limited Company
Copyright © 2021 www.secdatabase.com. All Rights Reserved.Please Consider the Environment Before Printing This Document
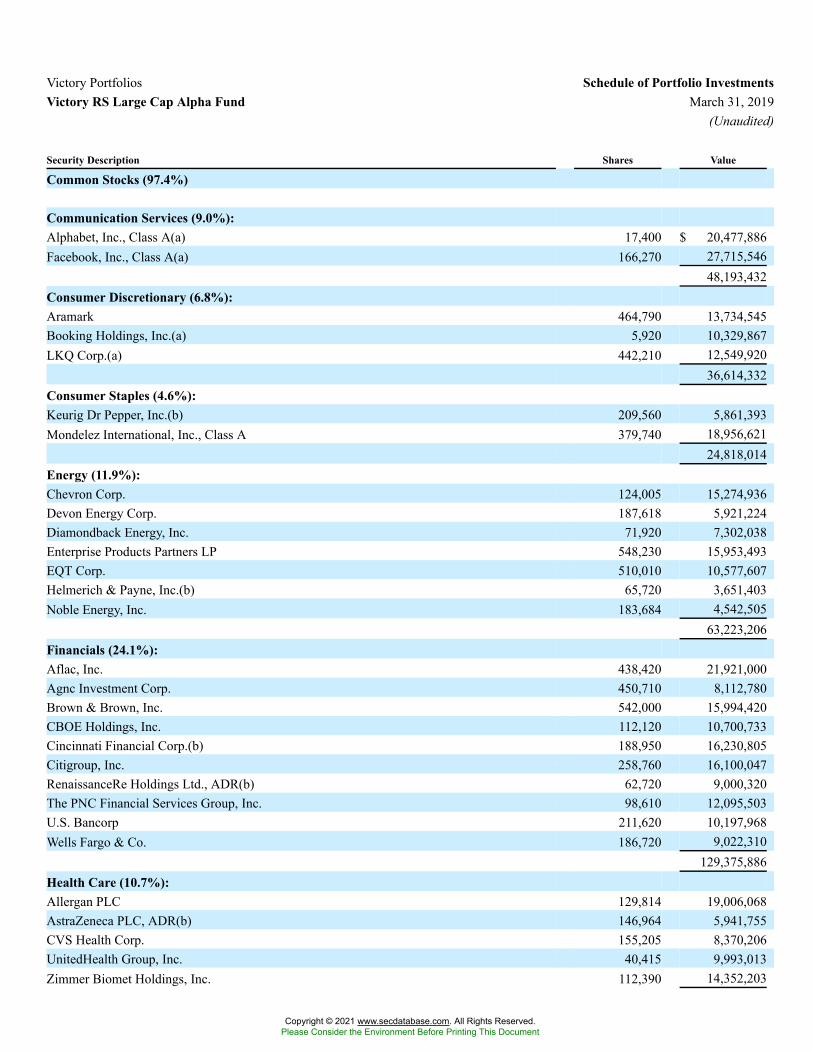
Victory Portfolios Schedule of Portfolio InvestmentsVictory RS Large Cap Alpha Fund March 31, 2019
(Unaudited)
Security Description Shares Value
Common Stocks (97.4%)
Communication Services (9.0%):Alphabet, Inc., Class A(a) 17,400 $ 20,477,886Facebook, Inc., Class A(a) 166,270 27,715,546
48,193,432Consumer Discretionary (6.8%):Aramark 464,790 13,734,545Booking Holdings, Inc.(a) 5,920 10,329,867LKQ Corp.(a) 442,210 12,549,920
36,614,332Consumer Staples (4.6%):Keurig Dr Pepper, Inc.(b) 209,560 5,861,393Mondelez International, Inc., Class A 379,740 18,956,621
24,818,014Energy (11.9%):Chevron Corp. 124,005 15,274,936Devon Energy Corp. 187,618 5,921,224Diamondback Energy, Inc. 71,920 7,302,038Enterprise Products Partners LP 548,230 15,953,493EQT Corp. 510,010 10,577,607Helmerich & Payne, Inc.(b) 65,720 3,651,403Noble Energy, Inc. 183,684 4,542,505
63,223,206Financials (24.1%):Aflac, Inc. 438,420 21,921,000Agnc Investment Corp. 450,710 8,112,780Brown & Brown, Inc. 542,000 15,994,420CBOE Holdings, Inc. 112,120 10,700,733Cincinnati Financial Corp.(b) 188,950 16,230,805Citigroup, Inc. 258,760 16,100,047RenaissanceRe Holdings Ltd., ADR(b) 62,720 9,000,320The PNC Financial Services Group, Inc. 98,610 12,095,503U.S. Bancorp 211,620 10,197,968Wells Fargo & Co. 186,720 9,022,310
129,375,886Health Care (10.7%):Allergan PLC 129,814 19,006,068AstraZeneca PLC, ADR(b) 146,964 5,941,755CVS Health Corp. 155,205 8,370,206UnitedHealth Group, Inc. 40,415 9,993,013Zimmer Biomet Holdings, Inc. 112,390 14,352,203
Copyright © 2021 www.secdatabase.com. All Rights Reserved.Please Consider the Environment Before Printing This Document
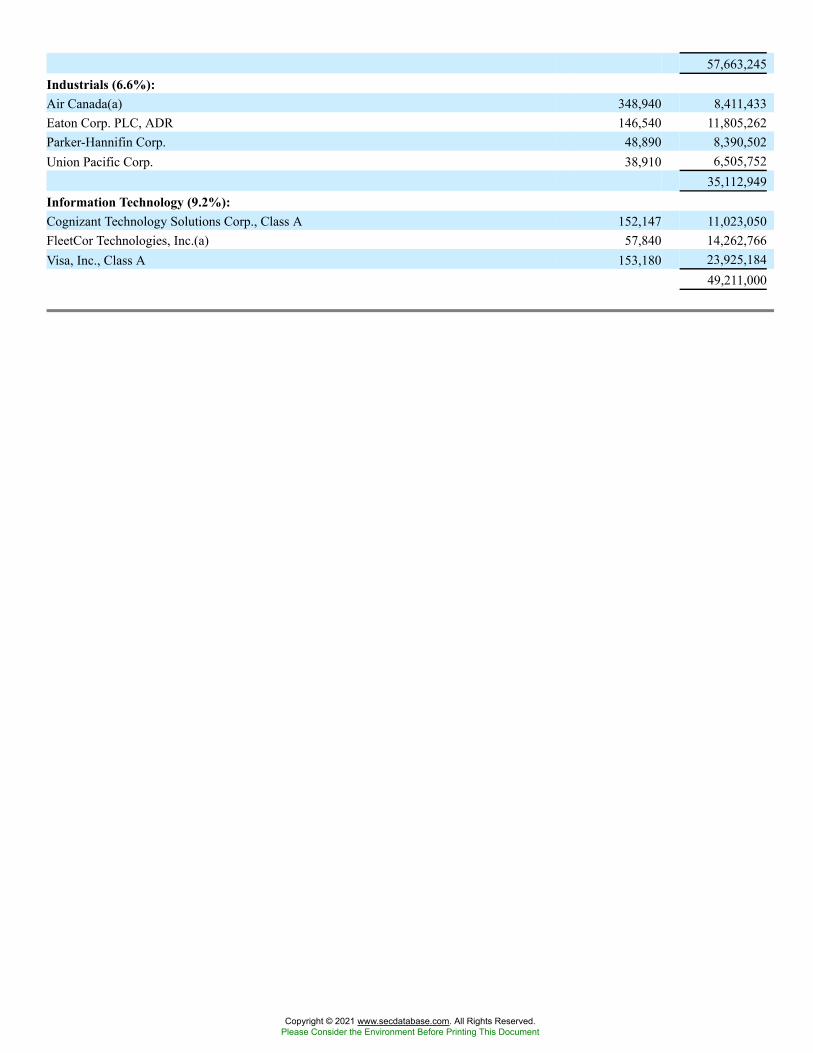
57,663,245Industrials (6.6%):Air Canada(a) 348,940 8,411,433Eaton Corp. PLC, ADR 146,540 11,805,262Parker-Hannifin Corp. 48,890 8,390,502Union Pacific Corp. 38,910 6,505,752
35,112,949Information Technology (9.2%):Cognizant Technology Solutions Corp., Class A 152,147 11,023,050FleetCor Technologies, Inc.(a) 57,840 14,262,766Visa, Inc., Class A 153,180 23,925,184
49,211,000
Copyright © 2021 www.secdatabase.com. All Rights Reserved.Please Consider the Environment Before Printing This Document
Security Description Shares Value
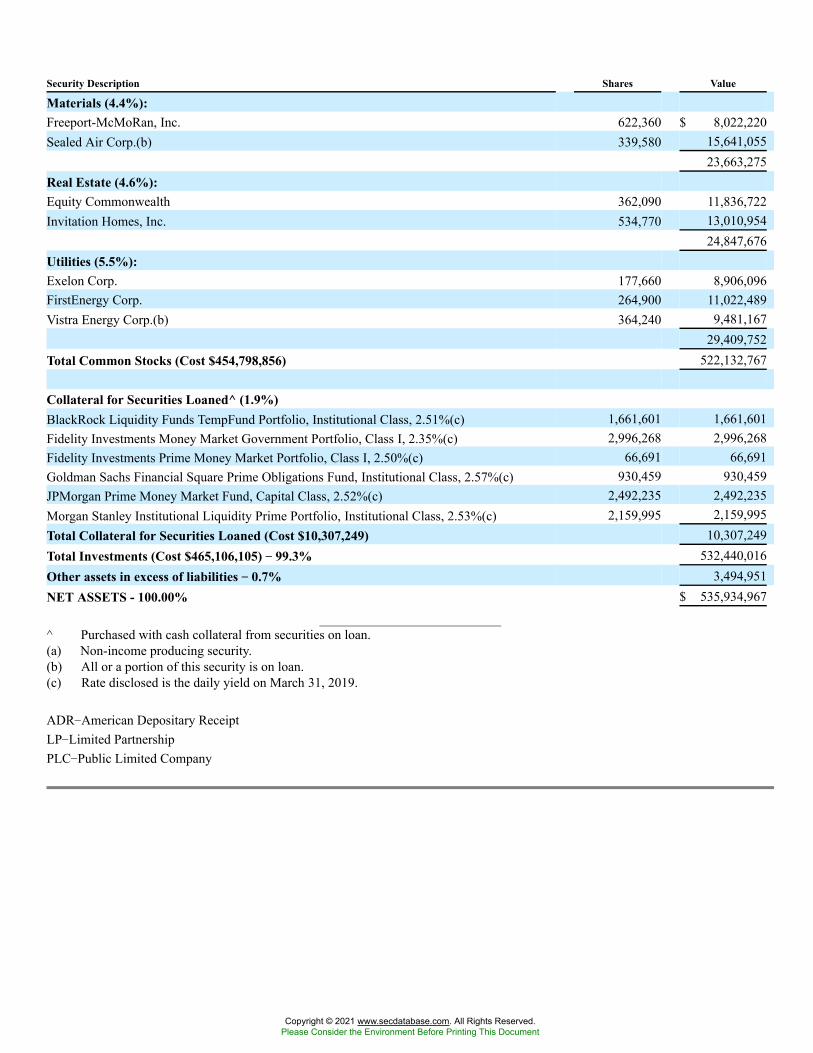
Materials (4.4%):Freeport-McMoRan, Inc. 622,360 $ 8,022,220Sealed Air Corp.(b) 339,580 15,641,055
23,663,275Real Estate (4.6%):Equity Commonwealth 362,090 11,836,722Invitation Homes, Inc. 534,770 13,010,954
24,847,676Utilities (5.5%):Exelon Corp. 177,660 8,906,096FirstEnergy Corp. 264,900 11,022,489Vistra Energy Corp.(b) 364,240 9,481,167
29,409,752Total Common Stocks (Cost $454,798,856) 522,132,767
Collateral for Securities Loaned^ (1.9%)BlackRock Liquidity Funds TempFund Portfolio, Institutional Class, 2.51%(c) 1,661,601 1,661,601Fidelity Investments Money Market Government Portfolio, Class I, 2.35%(c) 2,996,268 2,996,268Fidelity Investments Prime Money Market Portfolio, Class I, 2.50%(c) 66,691 66,691Goldman Sachs Financial Square Prime Obligations Fund, Institutional Class, 2.57%(c) 930,459 930,459JPMorgan Prime Money Market Fund, Capital Class, 2.52%(c) 2,492,235 2,492,235Morgan Stanley Institutional Liquidity Prime Portfolio, Institutional Class, 2.53%(c) 2,159,995 2,159,995Total Collateral for Securities Loaned (Cost $10,307,249) 10,307,249Total Investments (Cost $465,106,105) �� 99.3% 532,440,016Other assets in excess of liabilities �� 0.7% 3,494,951NET ASSETS - 100.00% $ 535,934,967
^ Purchased with cash collateral from securities on loan.(a) Non-income producing security.(b) All or a portion of this security is on loan.(c) Rate disclosed is the daily yield on March 31, 2019.
ADR�American Depositary ReceiptLP�Limited PartnershipPLC�Public Limited Company
Copyright © 2021 www.secdatabase.com. All Rights Reserved.Please Consider the Environment Before Printing This Document
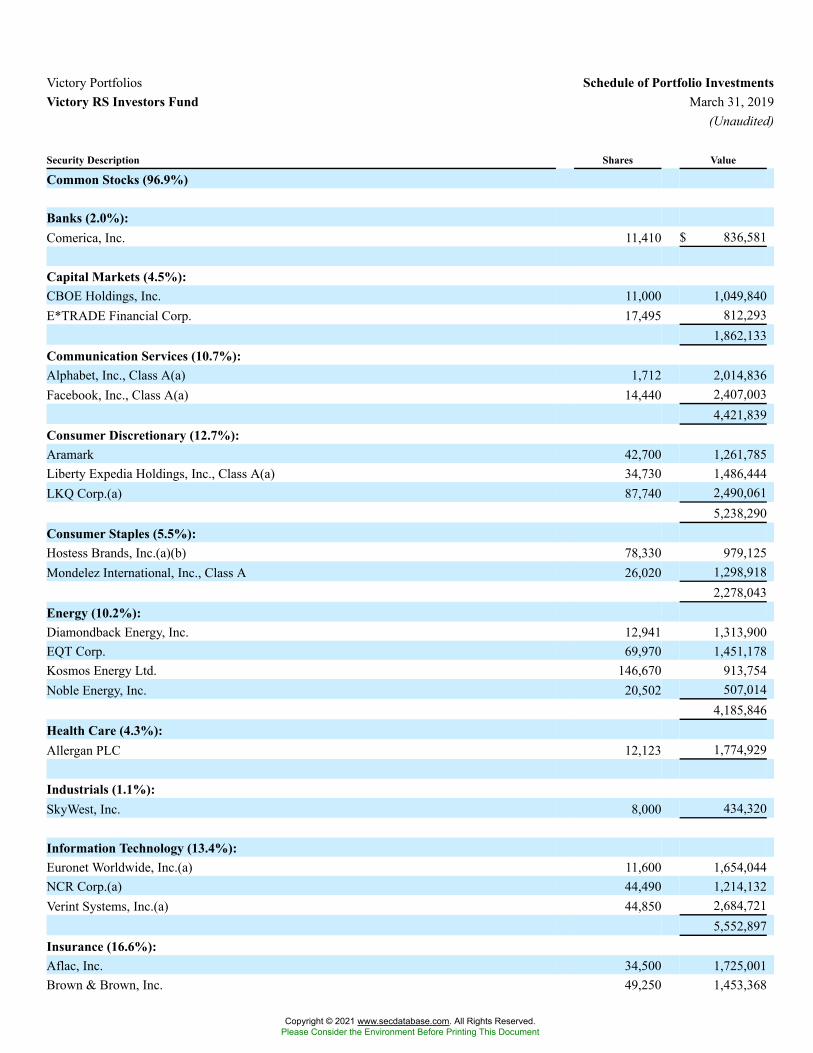
Victory Portfolios Schedule of Portfolio InvestmentsVictory RS Investors Fund March 31, 2019
(Unaudited)
Security Description Shares Value
Common Stocks (96.9%)
Banks (2.0%):Comerica, Inc. 11,410 $ 836,581
Capital Markets (4.5%):CBOE Holdings, Inc. 11,000 1,049,840E*TRADE Financial Corp. 17,495 812,293
1,862,133Communication Services (10.7%):Alphabet, Inc., Class A(a) 1,712 2,014,836Facebook, Inc., Class A(a) 14,440 2,407,003
4,421,839Consumer Discretionary (12.7%):Aramark 42,700 1,261,785Liberty Expedia Holdings, Inc., Class A(a) 34,730 1,486,444LKQ Corp.(a) 87,740 2,490,061
5,238,290Consumer Staples (5.5%):Hostess Brands, Inc.(a)(b) 78,330 979,125Mondelez International, Inc., Class A 26,020 1,298,918
2,278,043Energy (10.2%):Diamondback Energy, Inc. 12,941 1,313,900EQT Corp. 69,970 1,451,178Kosmos Energy Ltd. 146,670 913,754Noble Energy, Inc. 20,502 507,014
4,185,846Health Care (4.3%):Allergan PLC 12,123 1,774,929
Industrials (1.1%):SkyWest, Inc. 8,000 434,320
Information Technology (13.4%):Euronet Worldwide, Inc.(a) 11,600 1,654,044NCR Corp.(a) 44,490 1,214,132Verint Systems, Inc.(a) 44,850 2,684,721
5,552,897Insurance (16.6%):Aflac, Inc. 34,500 1,725,001Brown & Brown, Inc. 49,250 1,453,368
Copyright © 2021 www.secdatabase.com. All Rights Reserved.Please Consider the Environment Before Printing This Document
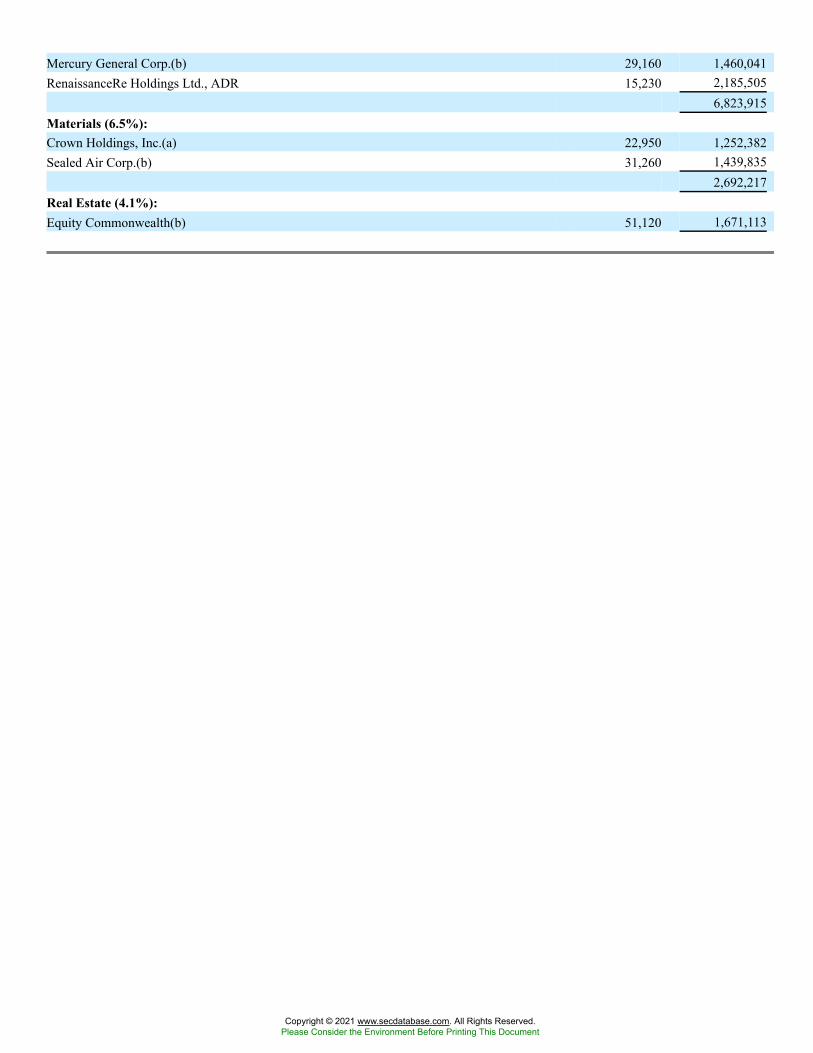
Mercury General Corp.(b) 29,160 1,460,041RenaissanceRe Holdings Ltd., ADR 15,230 2,185,505
6,823,915Materials (6.5%):Crown Holdings, Inc.(a) 22,950 1,252,382Sealed Air Corp.(b) 31,260 1,439,835
2,692,217Real Estate (4.1%):Equity Commonwealth(b) 51,120 1,671,113
Copyright © 2021 www.secdatabase.com. All Rights Reserved.Please Consider the Environment Before Printing This Document
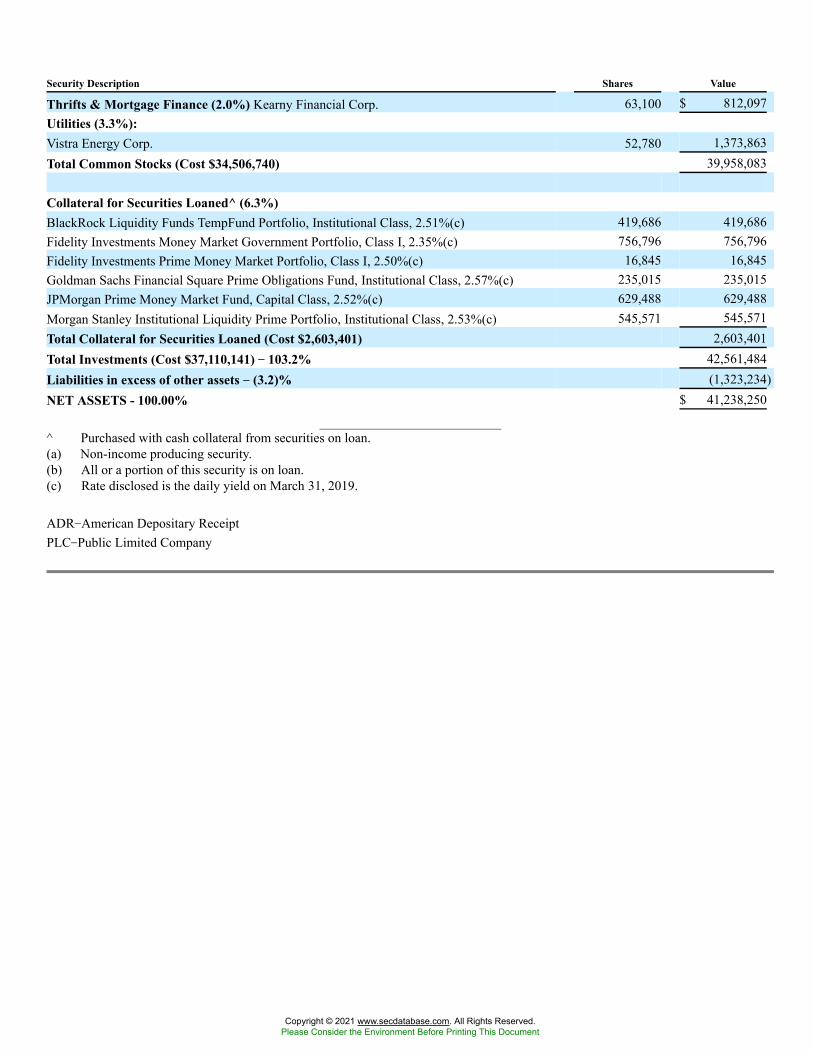
Security Description Shares Value
Thrifts & Mortgage Finance (2.0%) Kearny Financial Corp. 63,100 $ 812,097Utilities (3.3%):Vistra Energy Corp. 52,780 1,373,863Total Common Stocks (Cost $34,506,740) 39,958,083
Collateral for Securities Loaned^ (6.3%)BlackRock Liquidity Funds TempFund Portfolio, Institutional Class, 2.51%(c) 419,686 419,686Fidelity Investments Money Market Government Portfolio, Class I, 2.35%(c) 756,796 756,796Fidelity Investments Prime Money Market Portfolio, Class I, 2.50%(c) 16,845 16,845Goldman Sachs Financial Square Prime Obligations Fund, Institutional Class, 2.57%(c) 235,015 235,015JPMorgan Prime Money Market Fund, Capital Class, 2.52%(c) 629,488 629,488Morgan Stanley Institutional Liquidity Prime Portfolio, Institutional Class, 2.53%(c) 545,571 545,571Total Collateral for Securities Loaned (Cost $2,603,401) 2,603,401Total Investments (Cost $37,110,141) �� 103.2% 42,561,484Liabilities in excess of other assets �� (3.2)% (1,323,234)NET ASSETS - 100.00% $ 41,238,250
^ Purchased with cash collateral from securities on loan.(a) Non-income producing security.(b) All or a portion of this security is on loan.(c) Rate disclosed is the daily yield on March 31, 2019.
ADR�American Depositary ReceiptPLC�Public Limited Company
Copyright © 2021 www.secdatabase.com. All Rights Reserved.Please Consider the Environment Before Printing This Document
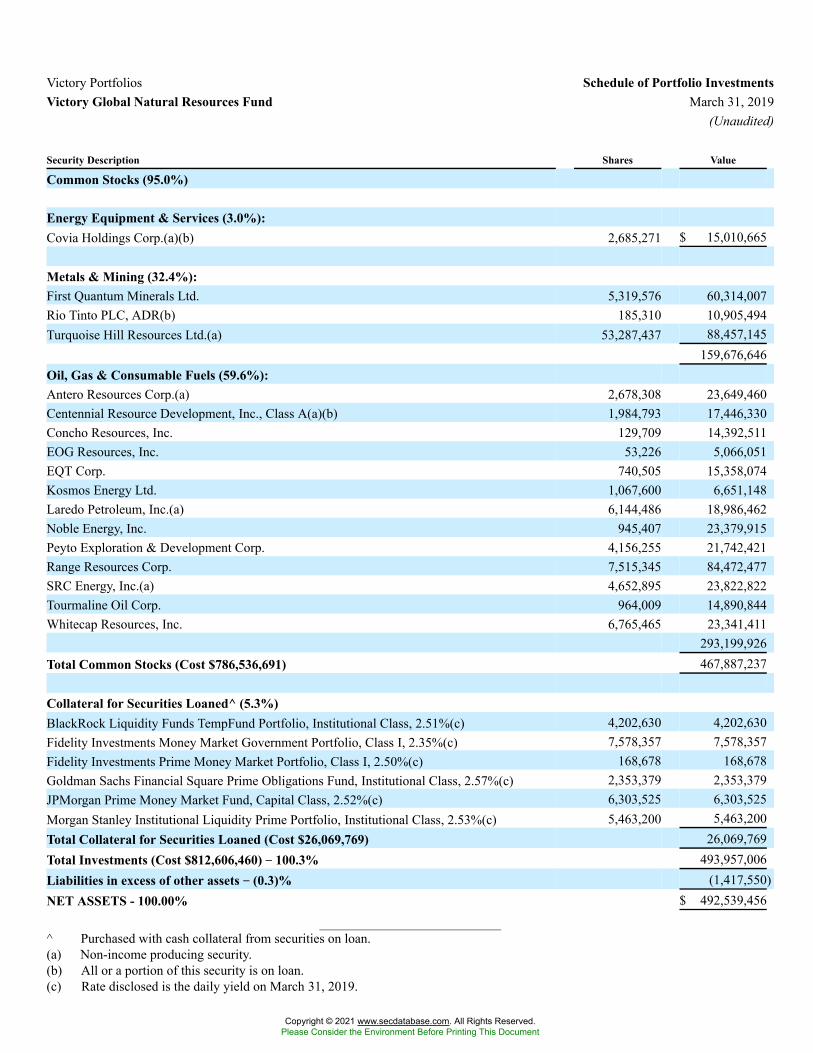
Victory Portfolios Schedule of Portfolio InvestmentsVictory Global Natural Resources Fund March 31, 2019
(Unaudited)
Security Description Shares Value
Common Stocks (95.0%)
Energy Equipment & Services (3.0%):Covia Holdings Corp.(a)(b) 2,685,271 $ 15,010,665
Metals & Mining (32.4%):First Quantum Minerals Ltd. 5,319,576 60,314,007Rio Tinto PLC, ADR(b) 185,310 10,905,494Turquoise Hill Resources Ltd.(a) 53,287,437 88,457,145
159,676,646Oil, Gas & Consumable Fuels (59.6%):Antero Resources Corp.(a) 2,678,308 23,649,460Centennial Resource Development, Inc., Class A(a)(b) 1,984,793 17,446,330Concho Resources, Inc. 129,709 14,392,511EOG Resources, Inc. 53,226 5,066,051EQT Corp. 740,505 15,358,074Kosmos Energy Ltd. 1,067,600 6,651,148Laredo Petroleum, Inc.(a) 6,144,486 18,986,462Noble Energy, Inc. 945,407 23,379,915Peyto Exploration & Development Corp. 4,156,255 21,742,421Range Resources Corp. 7,515,345 84,472,477SRC Energy, Inc.(a) 4,652,895 23,822,822Tourmaline Oil Corp. 964,009 14,890,844Whitecap Resources, Inc. 6,765,465 23,341,411
293,199,926Total Common Stocks (Cost $786,536,691) 467,887,237
Collateral for Securities Loaned^ (5.3%)BlackRock Liquidity Funds TempFund Portfolio, Institutional Class, 2.51%(c) 4,202,630 4,202,630Fidelity Investments Money Market Government Portfolio, Class I, 2.35%(c) 7,578,357 7,578,357Fidelity Investments Prime Money Market Portfolio, Class I, 2.50%(c) 168,678 168,678Goldman Sachs Financial Square Prime Obligations Fund, Institutional Class, 2.57%(c) 2,353,379 2,353,379JPMorgan Prime Money Market Fund, Capital Class, 2.52%(c) 6,303,525 6,303,525Morgan Stanley Institutional Liquidity Prime Portfolio, Institutional Class, 2.53%(c) 5,463,200 5,463,200Total Collateral for Securities Loaned (Cost $26,069,769) 26,069,769Total Investments (Cost $812,606,460) �� 100.3% 493,957,006Liabilities in excess of other assets �� (0.3)% (1,417,550)NET ASSETS - 100.00% $ 492,539,456
^ Purchased with cash collateral from securities on loan.(a) Non-income producing security.(b) All or a portion of this security is on loan.(c) Rate disclosed is the daily yield on March 31, 2019.
Copyright © 2021 www.secdatabase.com. All Rights Reserved.Please Consider the Environment Before Printing This Document

ADR�American Depositary ReceiptPLC�Public Limited Company
Copyright © 2021 www.secdatabase.com. All Rights Reserved.Please Consider the Environment Before Printing This Document
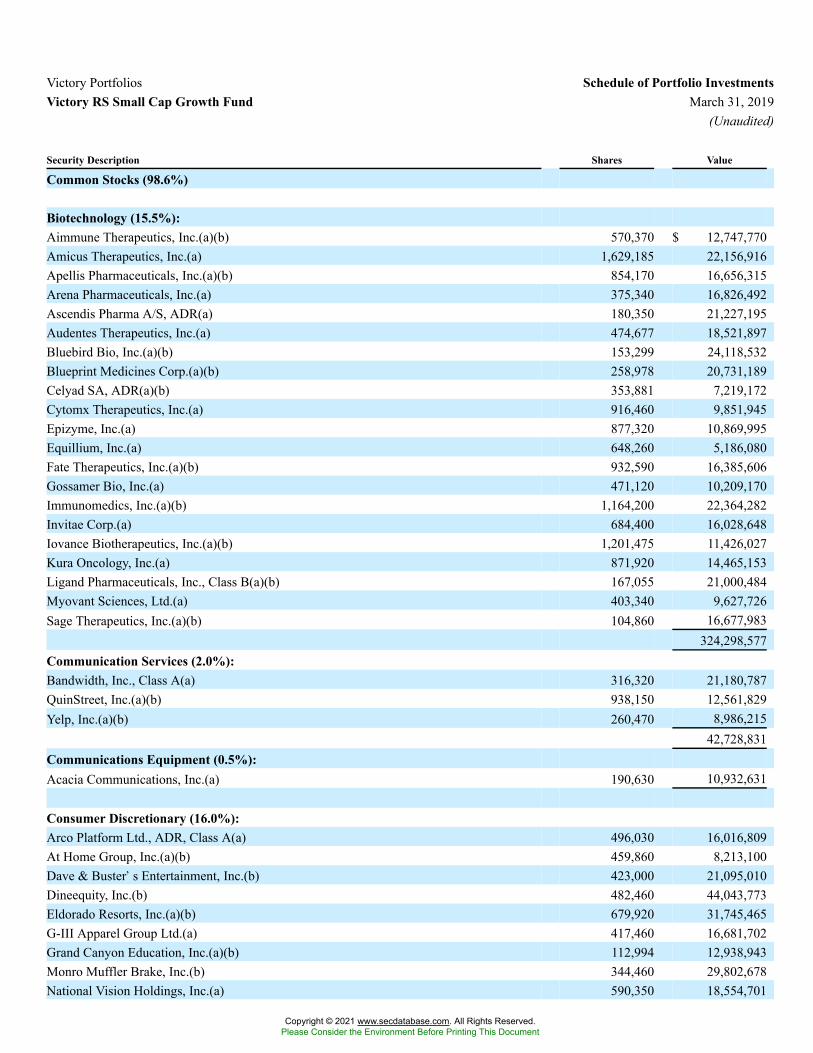
Victory Portfolios Schedule of Portfolio InvestmentsVictory RS Small Cap Growth Fund March 31, 2019
(Unaudited)
Security Description Shares Value
Common Stocks (98.6%)
Biotechnology (15.5%):Aimmune Therapeutics, Inc.(a)(b) 570,370 $ 12,747,770Amicus Therapeutics, Inc.(a) 1,629,185 22,156,916Apellis Pharmaceuticals, Inc.(a)(b) 854,170 16,656,315Arena Pharmaceuticals, Inc.(a) 375,340 16,826,492Ascendis Pharma A/S, ADR(a) 180,350 21,227,195Audentes Therapeutics, Inc.(a) 474,677 18,521,897Bluebird Bio, Inc.(a)(b) 153,299 24,118,532Blueprint Medicines Corp.(a)(b) 258,978 20,731,189Celyad SA, ADR(a)(b) 353,881 7,219,172Cytomx Therapeutics, Inc.(a) 916,460 9,851,945Epizyme, Inc.(a) 877,320 10,869,995Equillium, Inc.(a) 648,260 5,186,080Fate Therapeutics, Inc.(a)(b) 932,590 16,385,606Gossamer Bio, Inc.(a) 471,120 10,209,170Immunomedics, Inc.(a)(b) 1,164,200 22,364,282Invitae Corp.(a) 684,400 16,028,648Iovance Biotherapeutics, Inc.(a)(b) 1,201,475 11,426,027Kura Oncology, Inc.(a) 871,920 14,465,153Ligand Pharmaceuticals, Inc., Class B(a)(b) 167,055 21,000,484Myovant Sciences, Ltd.(a) 403,340 9,627,726Sage Therapeutics, Inc.(a)(b) 104,860 16,677,983
324,298,577Communication Services (2.0%):Bandwidth, Inc., Class A(a) 316,320 21,180,787QuinStreet, Inc.(a)(b) 938,150 12,561,829Yelp, Inc.(a)(b) 260,470 8,986,215
42,728,831Communications Equipment (0.5%):Acacia Communications, Inc.(a) 190,630 10,932,631
Consumer Discretionary (16.0%):Arco Platform Ltd., ADR, Class A(a) 496,030 16,016,809At Home Group, Inc.(a)(b) 459,860 8,213,100Dave & Buster�s Entertainment, Inc.(b) 423,000 21,095,010Dineequity, Inc.(b) 482,460 44,043,773Eldorado Resorts, Inc.(a)(b) 679,920 31,745,465G-III Apparel Group Ltd.(a) 417,460 16,681,702Grand Canyon Education, Inc.(a)(b) 112,994 12,938,943Monro Muffler Brake, Inc.(b) 344,460 29,802,678National Vision Holdings, Inc.(a) 590,350 18,554,701
Copyright © 2021 www.secdatabase.com. All Rights Reserved.Please Consider the Environment Before Printing This Document
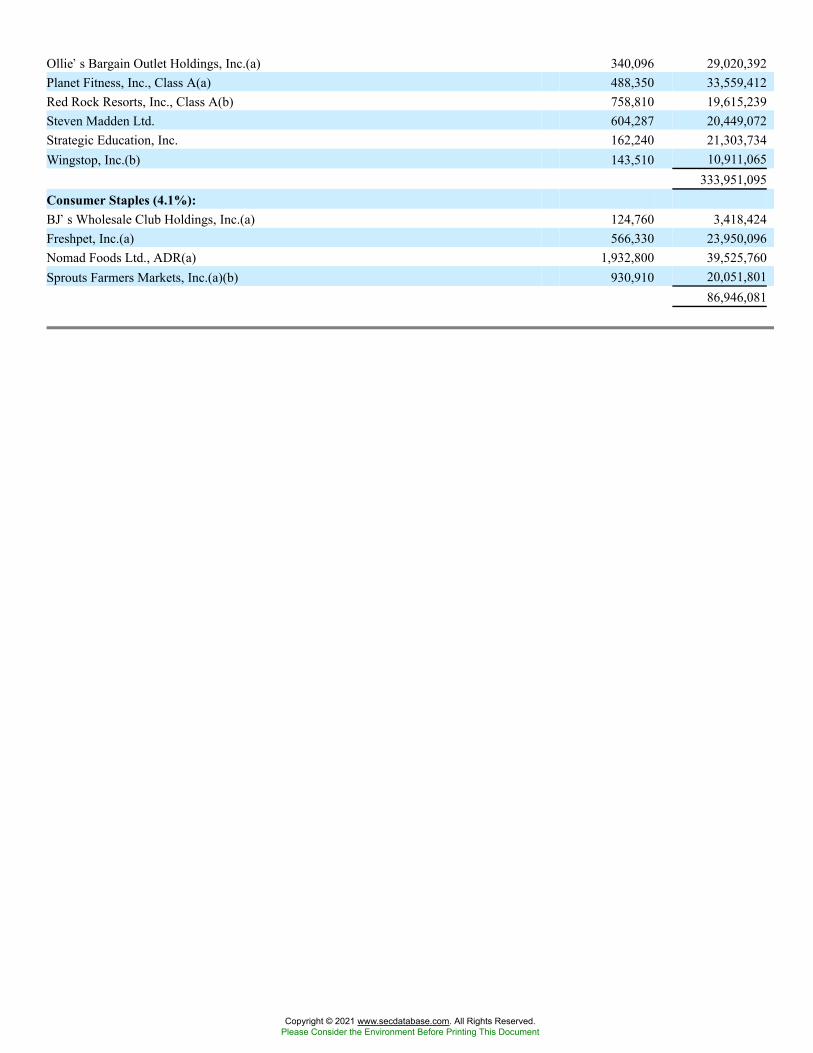
Ollie�s Bargain Outlet Holdings, Inc.(a) 340,096 29,020,392Planet Fitness, Inc., Class A(a) 488,350 33,559,412Red Rock Resorts, Inc., Class A(b) 758,810 19,615,239Steven Madden Ltd. 604,287 20,449,072Strategic Education, Inc. 162,240 21,303,734Wingstop, Inc.(b) 143,510 10,911,065
333,951,095Consumer Staples (4.1%):BJ�s Wholesale Club Holdings, Inc.(a) 124,760 3,418,424Freshpet, Inc.(a) 566,330 23,950,096Nomad Foods Ltd., ADR(a) 1,932,800 39,525,760Sprouts Farmers Markets, Inc.(a)(b) 930,910 20,051,801
86,946,081
Copyright © 2021 www.secdatabase.com. All Rights Reserved.Please Consider the Environment Before Printing This Document
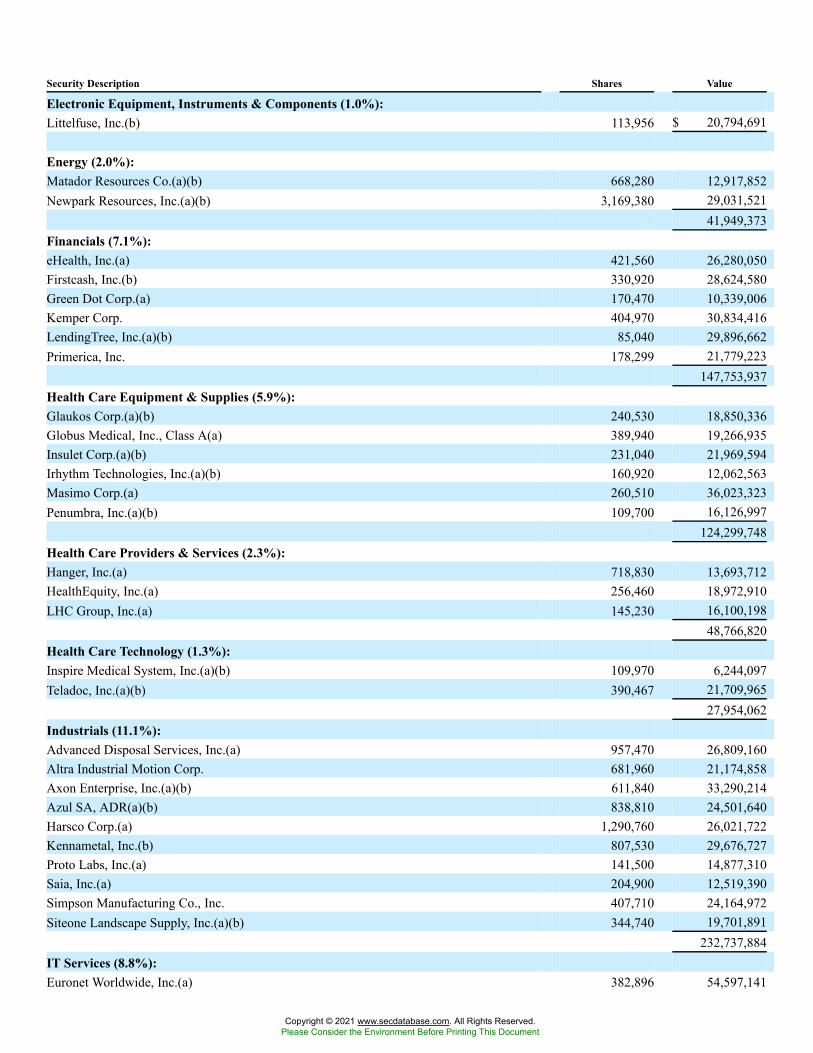
Security Description Shares Value
Electronic Equipment, Instruments & Components (1.0%):Littelfuse, Inc.(b) 113,956 $ 20,794,691
Energy (2.0%):Matador Resources Co.(a)(b) 668,280 12,917,852Newpark Resources, Inc.(a)(b) 3,169,380 29,031,521
41,949,373Financials (7.1%):eHealth, Inc.(a) 421,560 26,280,050Firstcash, Inc.(b) 330,920 28,624,580Green Dot Corp.(a) 170,470 10,339,006Kemper Corp. 404,970 30,834,416LendingTree, Inc.(a)(b) 85,040 29,896,662Primerica, Inc. 178,299 21,779,223
147,753,937Health Care Equipment & Supplies (5.9%):Glaukos Corp.(a)(b) 240,530 18,850,336Globus Medical, Inc., Class A(a) 389,940 19,266,935Insulet Corp.(a)(b) 231,040 21,969,594Irhythm Technologies, Inc.(a)(b) 160,920 12,062,563Masimo Corp.(a) 260,510 36,023,323Penumbra, Inc.(a)(b) 109,700 16,126,997
124,299,748Health Care Providers & Services (2.3%):Hanger, Inc.(a) 718,830 13,693,712HealthEquity, Inc.(a) 256,460 18,972,910LHC Group, Inc.(a) 145,230 16,100,198
48,766,820Health Care Technology (1.3%):Inspire Medical System, Inc.(a)(b) 109,970 6,244,097Teladoc, Inc.(a)(b) 390,467 21,709,965
27,954,062Industrials (11.1%):Advanced Disposal Services, Inc.(a) 957,470 26,809,160Altra Industrial Motion Corp. 681,960 21,174,858Axon Enterprise, Inc.(a)(b) 611,840 33,290,214Azul SA, ADR(a)(b) 838,810 24,501,640Harsco Corp.(a) 1,290,760 26,021,722Kennametal, Inc.(b) 807,530 29,676,727Proto Labs, Inc.(a) 141,500 14,877,310Saia, Inc.(a) 204,900 12,519,390Simpson Manufacturing Co., Inc. 407,710 24,164,972Siteone Landscape Supply, Inc.(a)(b) 344,740 19,701,891
232,737,884IT Services (8.8%):Euronet Worldwide, Inc.(a) 382,896 54,597,141
Copyright © 2021 www.secdatabase.com. All Rights Reserved.Please Consider the Environment Before Printing This Document

Evo Payments, Inc.(a) 681,140 19,787,117InterXion Holding NV, ADR(a)(b) 543,953 36,297,984Liveramp Holdings, Inc.(a) 139,320 7,602,692Wix.com Ltd., ADR(a) 384,880 46,505,050WNS Holdings Ltd., ADR(a) 397,587 21,179,459
185,969,443Materials (4.8%):Allegheny Technologies, Inc.(a)(b) 1,058,520 27,066,356
Copyright © 2021 www.secdatabase.com. All Rights Reserved.Please Consider the Environment Before Printing This Document
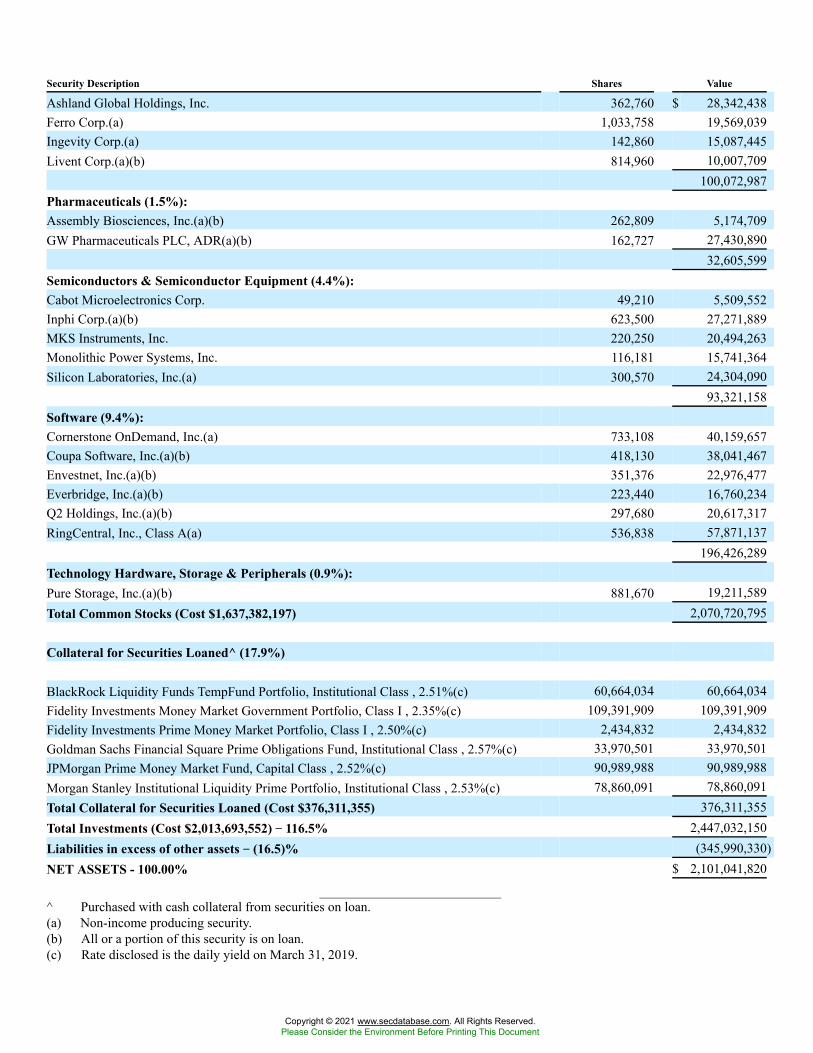
Security Description Shares Value
Ashland Global Holdings, Inc. 362,760 $ 28,342,438Ferro Corp.(a) 1,033,758 19,569,039Ingevity Corp.(a) 142,860 15,087,445Livent Corp.(a)(b) 814,960 10,007,709
100,072,987Pharmaceuticals (1.5%):Assembly Biosciences, Inc.(a)(b) 262,809 5,174,709GW Pharmaceuticals PLC, ADR(a)(b) 162,727 27,430,890
32,605,599Semiconductors & Semiconductor Equipment (4.4%):Cabot Microelectronics Corp. 49,210 5,509,552Inphi Corp.(a)(b) 623,500 27,271,889MKS Instruments, Inc. 220,250 20,494,263Monolithic Power Systems, Inc. 116,181 15,741,364Silicon Laboratories, Inc.(a) 300,570 24,304,090
93,321,158Software (9.4%):Cornerstone OnDemand, Inc.(a) 733,108 40,159,657Coupa Software, Inc.(a)(b) 418,130 38,041,467Envestnet, Inc.(a)(b) 351,376 22,976,477Everbridge, Inc.(a)(b) 223,440 16,760,234Q2 Holdings, Inc.(a)(b) 297,680 20,617,317RingCentral, Inc., Class A(a) 536,838 57,871,137
196,426,289Technology Hardware, Storage & Peripherals (0.9%):Pure Storage, Inc.(a)(b) 881,670 19,211,589Total Common Stocks (Cost $1,637,382,197) 2,070,720,795
Collateral for Securities Loaned^ (17.9%)
BlackRock Liquidity Funds TempFund Portfolio, Institutional Class , 2.51%(c) 60,664,034 60,664,034Fidelity Investments Money Market Government Portfolio, Class I , 2.35%(c) 109,391,909 109,391,909Fidelity Investments Prime Money Market Portfolio, Class I , 2.50%(c) 2,434,832 2,434,832Goldman Sachs Financial Square Prime Obligations Fund, Institutional Class , 2.57%(c) 33,970,501 33,970,501JPMorgan Prime Money Market Fund, Capital Class , 2.52%(c) 90,989,988 90,989,988Morgan Stanley Institutional Liquidity Prime Portfolio, Institutional Class , 2.53%(c) 78,860,091 78,860,091Total Collateral for Securities Loaned (Cost $376,311,355) 376,311,355Total Investments (Cost $2,013,693,552) �� 116.5% 2,447,032,150Liabilities in excess of other assets �� (16.5)% (345,990,330)NET ASSETS - 100.00% $ 2,101,041,820
^ Purchased with cash collateral from securities on loan.(a) Non-income producing security.(b) All or a portion of this security is on loan.(c) Rate disclosed is the daily yield on March 31, 2019.
Copyright © 2021 www.secdatabase.com. All Rights Reserved.Please Consider the Environment Before Printing This Document

ADR�American Depositary ReceiptPLC�Public Limited Company
Copyright © 2021 www.secdatabase.com. All Rights Reserved.Please Consider the Environment Before Printing This Document
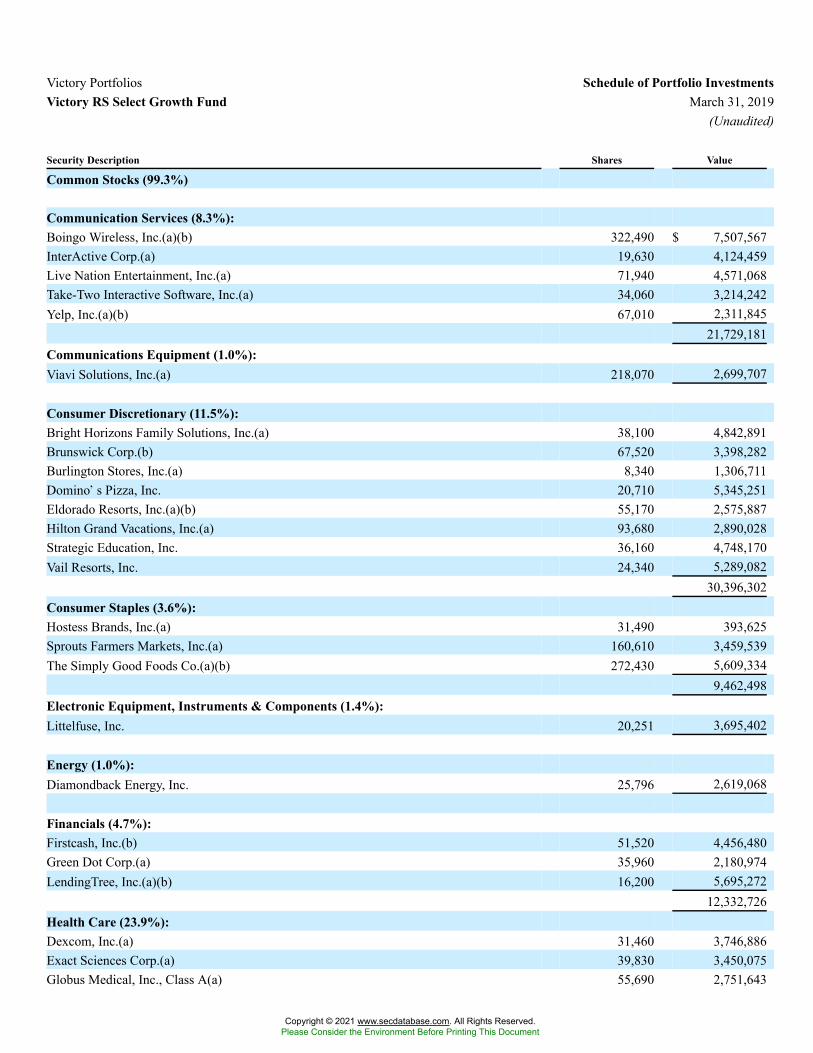
Victory Portfolios Schedule of Portfolio InvestmentsVictory RS Select Growth Fund March 31, 2019
(Unaudited)
Security Description Shares Value
Common Stocks (99.3%)
Communication Services (8.3%):Boingo Wireless, Inc.(a)(b) 322,490 $ 7,507,567InterActive Corp.(a) 19,630 4,124,459Live Nation Entertainment, Inc.(a) 71,940 4,571,068Take-Two Interactive Software, Inc.(a) 34,060 3,214,242Yelp, Inc.(a)(b) 67,010 2,311,845
21,729,181Communications Equipment (1.0%):Viavi Solutions, Inc.(a) 218,070 2,699,707
Consumer Discretionary (11.5%):Bright Horizons Family Solutions, Inc.(a) 38,100 4,842,891Brunswick Corp.(b) 67,520 3,398,282Burlington Stores, Inc.(a) 8,340 1,306,711Domino�s Pizza, Inc. 20,710 5,345,251Eldorado Resorts, Inc.(a)(b) 55,170 2,575,887Hilton Grand Vacations, Inc.(a) 93,680 2,890,028Strategic Education, Inc. 36,160 4,748,170Vail Resorts, Inc. 24,340 5,289,082
30,396,302Consumer Staples (3.6%):Hostess Brands, Inc.(a) 31,490 393,625Sprouts Farmers Markets, Inc.(a) 160,610 3,459,539The Simply Good Foods Co.(a)(b) 272,430 5,609,334
9,462,498Electronic Equipment, Instruments & Components (1.4%):Littelfuse, Inc. 20,251 3,695,402
Energy (1.0%):Diamondback Energy, Inc. 25,796 2,619,068
Financials (4.7%):Firstcash, Inc.(b) 51,520 4,456,480Green Dot Corp.(a) 35,960 2,180,974LendingTree, Inc.(a)(b) 16,200 5,695,272
12,332,726Health Care (23.9%):Dexcom, Inc.(a) 31,460 3,746,886Exact Sciences Corp.(a) 39,830 3,450,075Globus Medical, Inc., Class A(a) 55,690 2,751,643
Copyright © 2021 www.secdatabase.com. All Rights Reserved.Please Consider the Environment Before Printing This Document
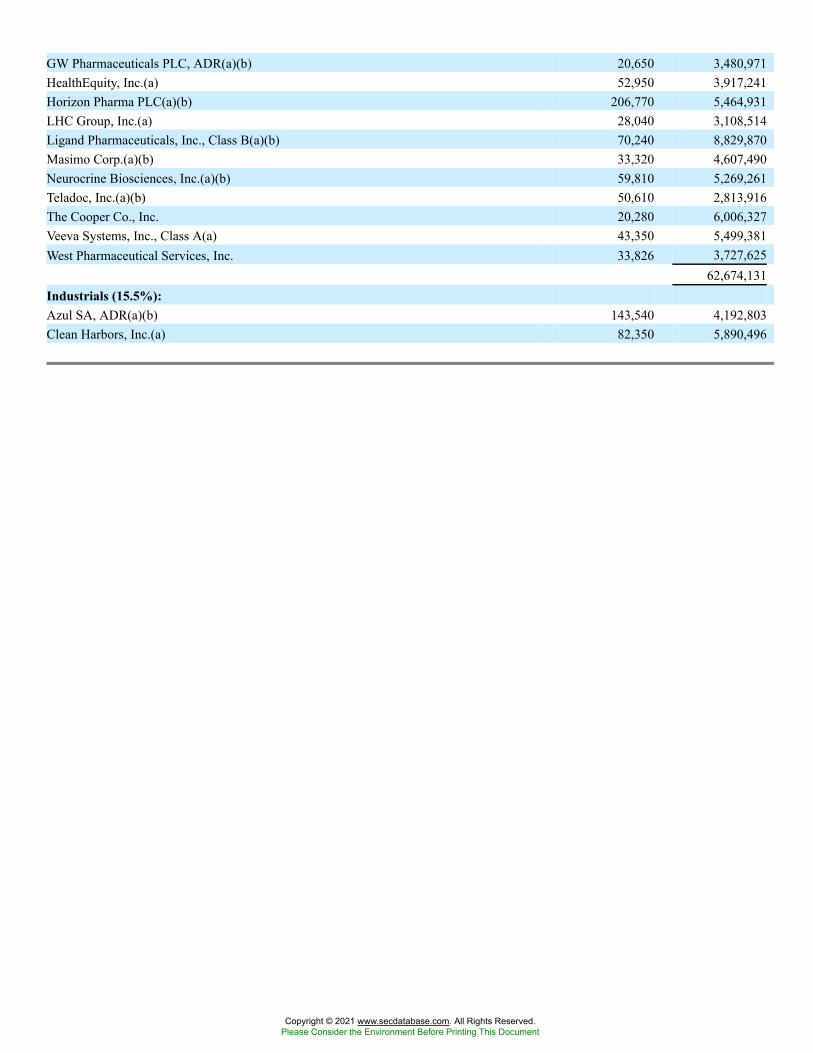
GW Pharmaceuticals PLC, ADR(a)(b) 20,650 3,480,971HealthEquity, Inc.(a) 52,950 3,917,241Horizon Pharma PLC(a)(b) 206,770 5,464,931LHC Group, Inc.(a) 28,040 3,108,514Ligand Pharmaceuticals, Inc., Class B(a)(b) 70,240 8,829,870Masimo Corp.(a)(b) 33,320 4,607,490Neurocrine Biosciences, Inc.(a)(b) 59,810 5,269,261Teladoc, Inc.(a)(b) 50,610 2,813,916The Cooper Co., Inc. 20,280 6,006,327Veeva Systems, Inc., Class A(a) 43,350 5,499,381West Pharmaceutical Services, Inc. 33,826 3,727,625
62,674,131Industrials (15.5%):Azul SA, ADR(a)(b) 143,540 4,192,803Clean Harbors, Inc.(a) 82,350 5,890,496
Copyright © 2021 www.secdatabase.com. All Rights Reserved.Please Consider the Environment Before Printing This Document
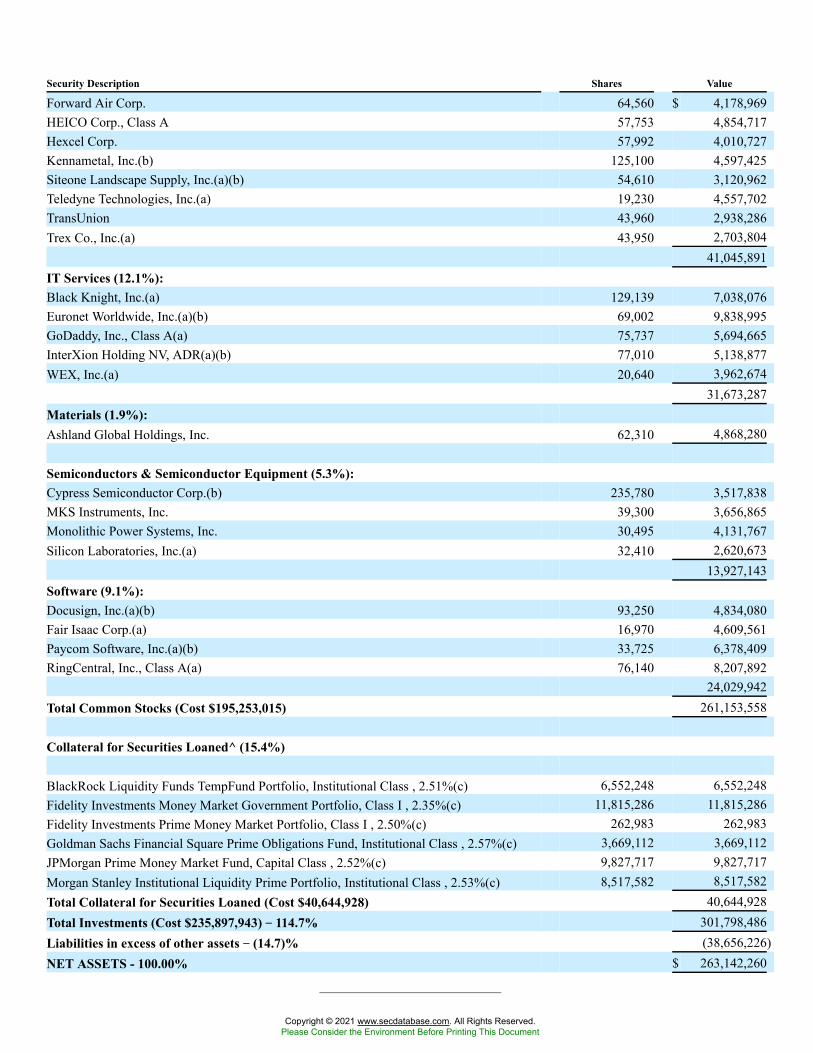
Security Description Shares Value
Forward Air Corp. 64,560 $ 4,178,969HEICO Corp., Class A 57,753 4,854,717Hexcel Corp. 57,992 4,010,727Kennametal, Inc.(b) 125,100 4,597,425Siteone Landscape Supply, Inc.(a)(b) 54,610 3,120,962Teledyne Technologies, Inc.(a) 19,230 4,557,702TransUnion 43,960 2,938,286Trex Co., Inc.(a) 43,950 2,703,804
41,045,891IT Services (12.1%):Black Knight, Inc.(a) 129,139 7,038,076Euronet Worldwide, Inc.(a)(b) 69,002 9,838,995GoDaddy, Inc., Class A(a) 75,737 5,694,665InterXion Holding NV, ADR(a)(b) 77,010 5,138,877WEX, Inc.(a) 20,640 3,962,674
31,673,287Materials (1.9%):Ashland Global Holdings, Inc. 62,310 4,868,280
Semiconductors & Semiconductor Equipment (5.3%):Cypress Semiconductor Corp.(b) 235,780 3,517,838MKS Instruments, Inc. 39,300 3,656,865Monolithic Power Systems, Inc. 30,495 4,131,767Silicon Laboratories, Inc.(a) 32,410 2,620,673
13,927,143Software (9.1%):Docusign, Inc.(a)(b) 93,250 4,834,080Fair Isaac Corp.(a) 16,970 4,609,561Paycom Software, Inc.(a)(b) 33,725 6,378,409RingCentral, Inc., Class A(a) 76,140 8,207,892
24,029,942Total Common Stocks (Cost $195,253,015) 261,153,558
Collateral for Securities Loaned^ (15.4%)
BlackRock Liquidity Funds TempFund Portfolio, Institutional Class , 2.51%(c) 6,552,248 6,552,248Fidelity Investments Money Market Government Portfolio, Class I , 2.35%(c) 11,815,286 11,815,286Fidelity Investments Prime Money Market Portfolio, Class I , 2.50%(c) 262,983 262,983Goldman Sachs Financial Square Prime Obligations Fund, Institutional Class , 2.57%(c) 3,669,112 3,669,112JPMorgan Prime Money Market Fund, Capital Class , 2.52%(c) 9,827,717 9,827,717Morgan Stanley Institutional Liquidity Prime Portfolio, Institutional Class , 2.53%(c) 8,517,582 8,517,582Total Collateral for Securities Loaned (Cost $40,644,928) 40,644,928Total Investments (Cost $235,897,943) �� 114.7% 301,798,486Liabilities in excess of other assets �� (14.7)% (38,656,226)NET ASSETS - 100.00% $ 263,142,260
Copyright © 2021 www.secdatabase.com. All Rights Reserved.Please Consider the Environment Before Printing This Document
^ Purchased with cash collateral from securities on loan.(a) Non-income producing security.(b) All or a portion of this security is on loan.(c) Rate disclosed is the daily yield on March 31, 2019.
ADR�American Depositary ReceiptPLC�Public Limited Company
Copyright © 2021 www.secdatabase.com. All Rights Reserved.Please Consider the Environment Before Printing This Document
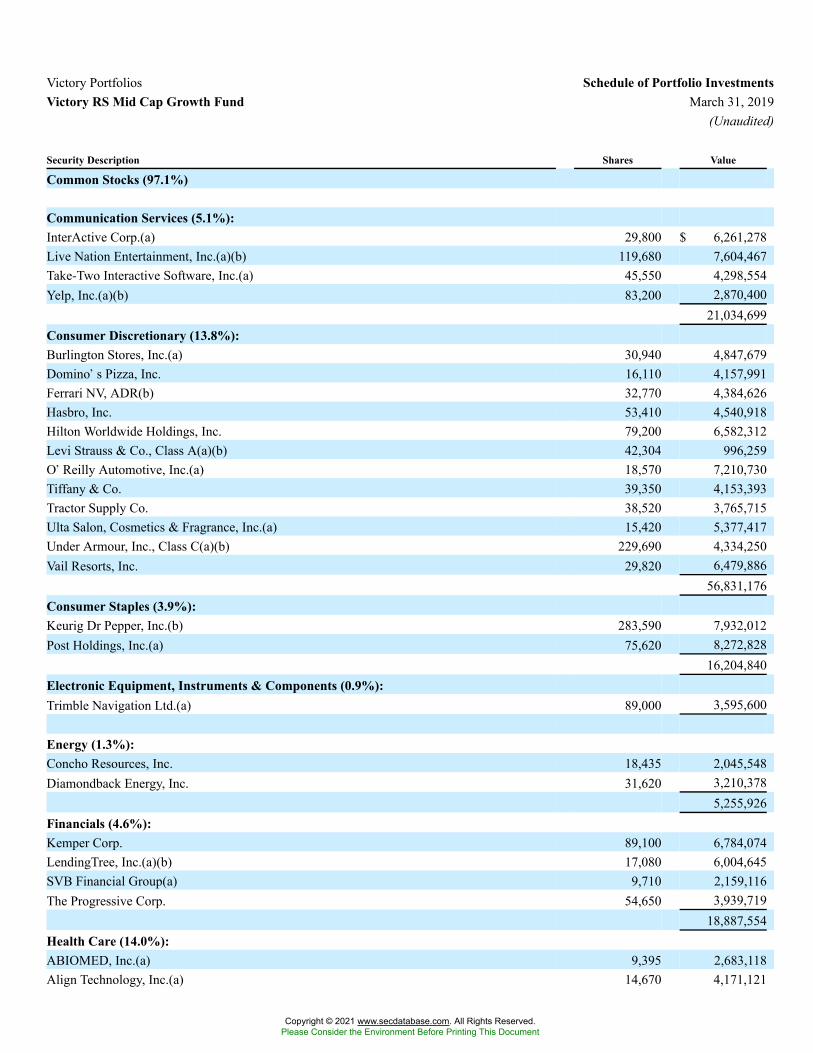
Victory Portfolios Schedule of Portfolio InvestmentsVictory RS Mid Cap Growth Fund March 31, 2019
(Unaudited)
Security Description Shares Value
Common Stocks (97.1%)
Communication Services (5.1%):InterActive Corp.(a) 29,800 $ 6,261,278Live Nation Entertainment, Inc.(a)(b) 119,680 7,604,467Take-Two Interactive Software, Inc.(a) 45,550 4,298,554Yelp, Inc.(a)(b) 83,200 2,870,400
21,034,699Consumer Discretionary (13.8%):Burlington Stores, Inc.(a) 30,940 4,847,679Domino�s Pizza, Inc. 16,110 4,157,991Ferrari NV, ADR(b) 32,770 4,384,626Hasbro, Inc. 53,410 4,540,918Hilton Worldwide Holdings, Inc. 79,200 6,582,312Levi Strauss & Co., Class A(a)(b) 42,304 996,259O�Reilly Automotive, Inc.(a) 18,570 7,210,730Tiffany & Co. 39,350 4,153,393Tractor Supply Co. 38,520 3,765,715Ulta Salon, Cosmetics & Fragrance, Inc.(a) 15,420 5,377,417Under Armour, Inc., Class C(a)(b) 229,690 4,334,250Vail Resorts, Inc. 29,820 6,479,886
56,831,176Consumer Staples (3.9%):Keurig Dr Pepper, Inc.(b) 283,590 7,932,012Post Holdings, Inc.(a) 75,620 8,272,828
16,204,840Electronic Equipment, Instruments & Components (0.9%):Trimble Navigation Ltd.(a) 89,000 3,595,600
Energy (1.3%):Concho Resources, Inc. 18,435 2,045,548Diamondback Energy, Inc. 31,620 3,210,378
5,255,926Financials (4.6%):Kemper Corp. 89,100 6,784,074LendingTree, Inc.(a)(b) 17,080 6,004,645SVB Financial Group(a) 9,710 2,159,116The Progressive Corp. 54,650 3,939,719
18,887,554Health Care (14.0%):ABIOMED, Inc.(a) 9,395 2,683,118Align Technology, Inc.(a) 14,670 4,171,121
Copyright © 2021 www.secdatabase.com. All Rights Reserved.Please Consider the Environment Before Printing This Document
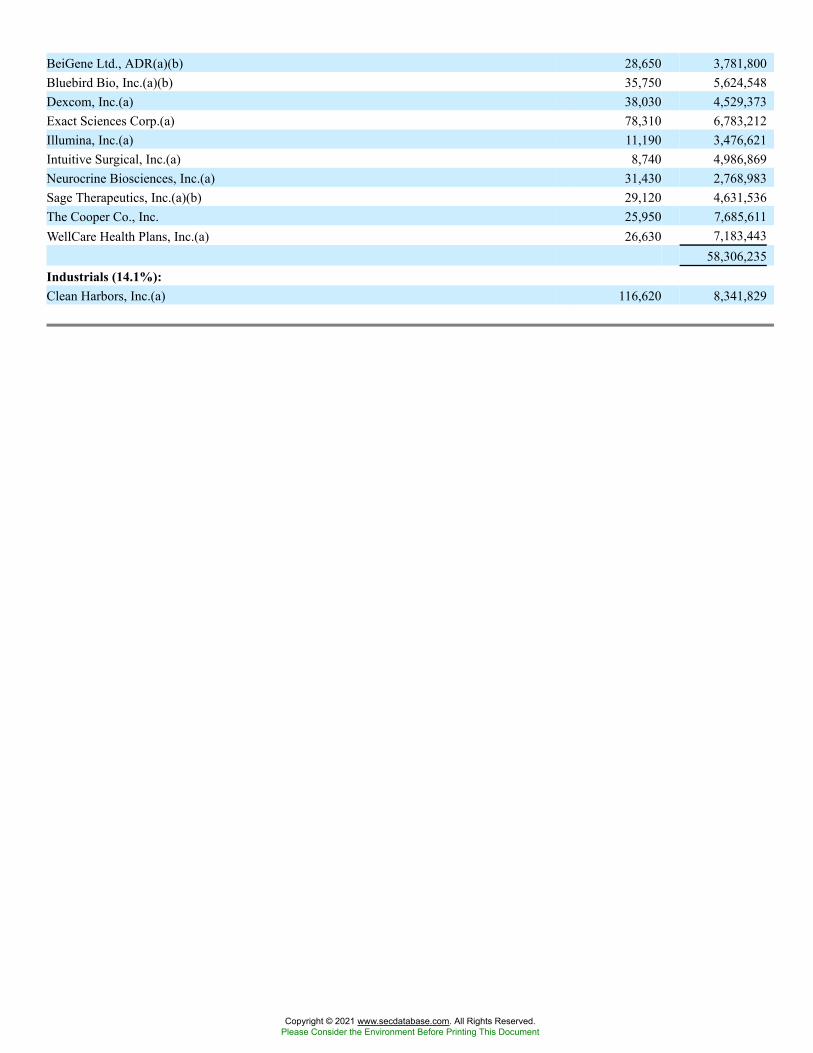
BeiGene Ltd., ADR(a)(b) 28,650 3,781,800Bluebird Bio, Inc.(a)(b) 35,750 5,624,548Dexcom, Inc.(a) 38,030 4,529,373Exact Sciences Corp.(a) 78,310 6,783,212Illumina, Inc.(a) 11,190 3,476,621Intuitive Surgical, Inc.(a) 8,740 4,986,869Neurocrine Biosciences, Inc.(a) 31,430 2,768,983Sage Therapeutics, Inc.(a)(b) 29,120 4,631,536The Cooper Co., Inc. 25,950 7,685,611WellCare Health Plans, Inc.(a) 26,630 7,183,443
58,306,235Industrials (14.1%):Clean Harbors, Inc.(a) 116,620 8,341,829
Copyright © 2021 www.secdatabase.com. All Rights Reserved.Please Consider the Environment Before Printing This Document
Security Description Shares Value
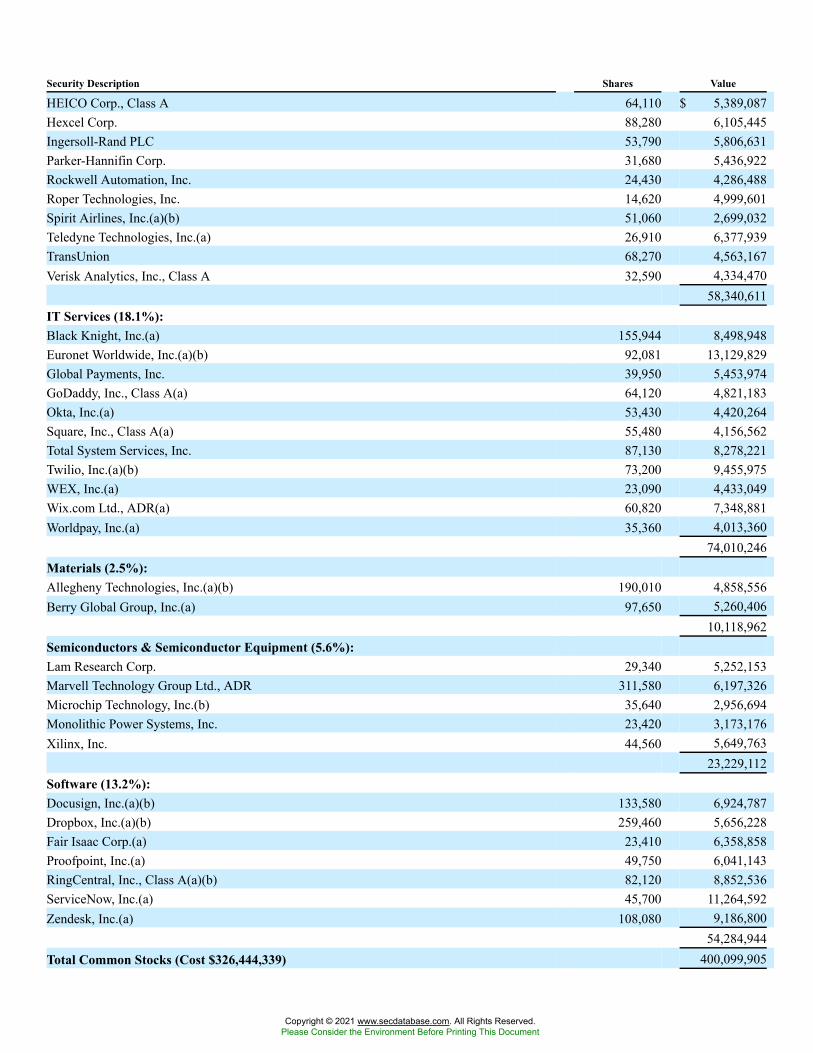
HEICO Corp., Class A 64,110 $ 5,389,087Hexcel Corp. 88,280 6,105,445Ingersoll-Rand PLC 53,790 5,806,631Parker-Hannifin Corp. 31,680 5,436,922Rockwell Automation, Inc. 24,430 4,286,488Roper Technologies, Inc. 14,620 4,999,601Spirit Airlines, Inc.(a)(b) 51,060 2,699,032Teledyne Technologies, Inc.(a) 26,910 6,377,939TransUnion 68,270 4,563,167Verisk Analytics, Inc., Class A 32,590 4,334,470
58,340,611IT Services (18.1%):Black Knight, Inc.(a) 155,944 8,498,948Euronet Worldwide, Inc.(a)(b) 92,081 13,129,829Global Payments, Inc. 39,950 5,453,974GoDaddy, Inc., Class A(a) 64,120 4,821,183Okta, Inc.(a) 53,430 4,420,264Square, Inc., Class A(a) 55,480 4,156,562Total System Services, Inc. 87,130 8,278,221Twilio, Inc.(a)(b) 73,200 9,455,975WEX, Inc.(a) 23,090 4,433,049Wix.com Ltd., ADR(a) 60,820 7,348,881Worldpay, Inc.(a) 35,360 4,013,360
74,010,246Materials (2.5%):Allegheny Technologies, Inc.(a)(b) 190,010 4,858,556Berry Global Group, Inc.(a) 97,650 5,260,406
10,118,962Semiconductors & Semiconductor Equipment (5.6%):Lam Research Corp. 29,340 5,252,153Marvell Technology Group Ltd., ADR 311,580 6,197,326Microchip Technology, Inc.(b) 35,640 2,956,694Monolithic Power Systems, Inc. 23,420 3,173,176Xilinx, Inc. 44,560 5,649,763
23,229,112Software (13.2%):Docusign, Inc.(a)(b) 133,580 6,924,787Dropbox, Inc.(a)(b) 259,460 5,656,228Fair Isaac Corp.(a) 23,410 6,358,858Proofpoint, Inc.(a) 49,750 6,041,143RingCentral, Inc., Class A(a)(b) 82,120 8,852,536ServiceNow, Inc.(a) 45,700 11,264,592Zendesk, Inc.(a) 108,080 9,186,800
54,284,944Total Common Stocks (Cost $326,444,339) 400,099,905
Copyright © 2021 www.secdatabase.com. All Rights Reserved.Please Consider the Environment Before Printing This Document
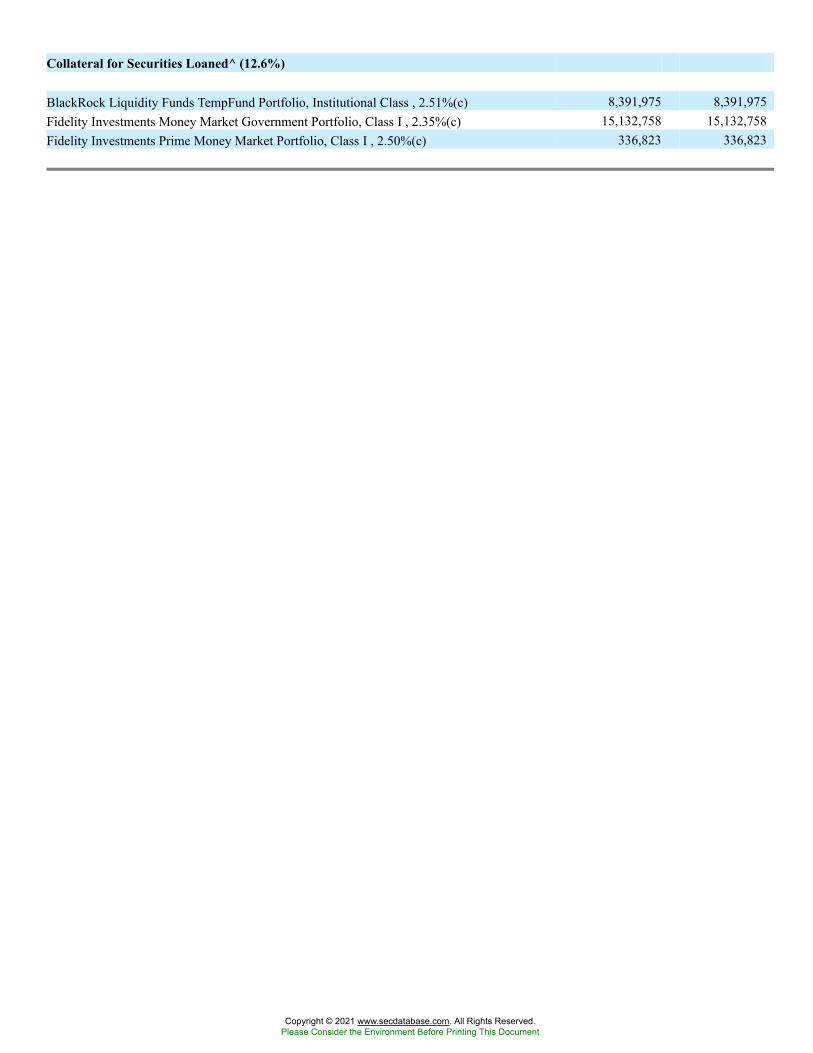
Collateral for Securities Loaned^ (12.6%)
BlackRock Liquidity Funds TempFund Portfolio, Institutional Class , 2.51%(c) 8,391,975 8,391,975Fidelity Investments Money Market Government Portfolio, Class I , 2.35%(c) 15,132,758 15,132,758Fidelity Investments Prime Money Market Portfolio, Class I , 2.50%(c) 336,823 336,823
Copyright © 2021 www.secdatabase.com. All Rights Reserved.Please Consider the Environment Before Printing This Document
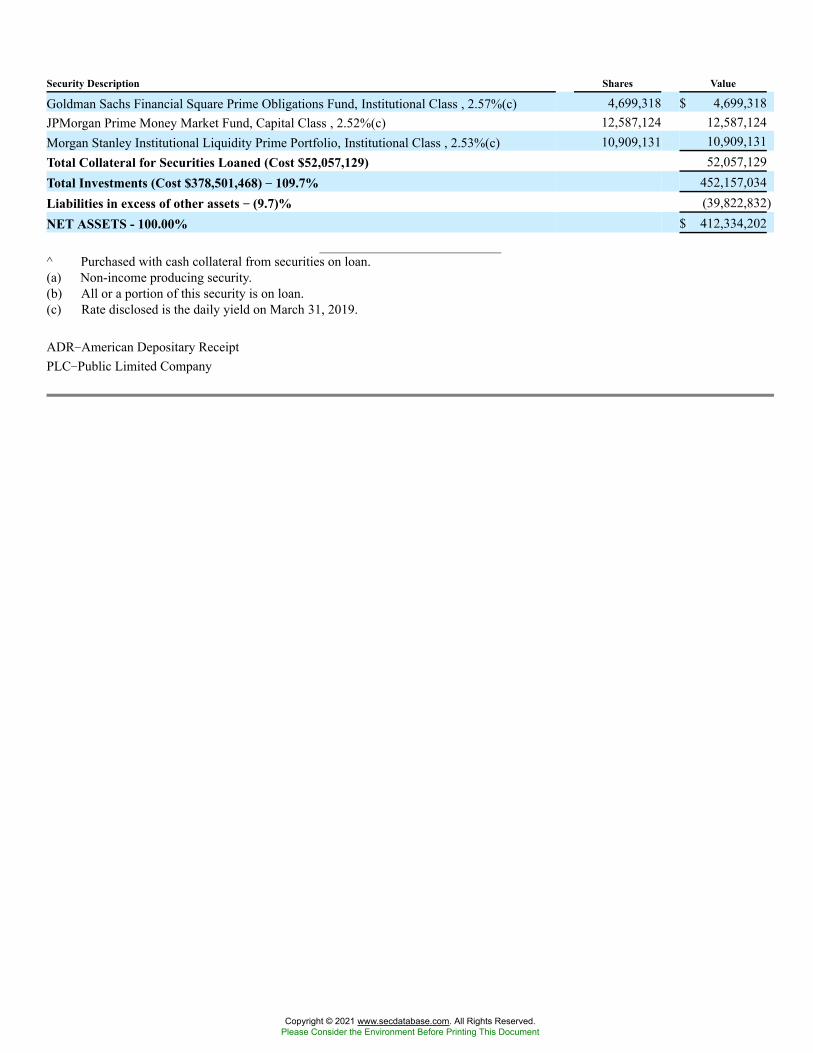
Security Description Shares Value
Goldman Sachs Financial Square Prime Obligations Fund, Institutional Class , 2.57%(c) 4,699,318 $ 4,699,318JPMorgan Prime Money Market Fund, Capital Class , 2.52%(c) 12,587,124 12,587,124Morgan Stanley Institutional Liquidity Prime Portfolio, Institutional Class , 2.53%(c) 10,909,131 10,909,131Total Collateral for Securities Loaned (Cost $52,057,129) 52,057,129Total Investments (Cost $378,501,468) �� 109.7% 452,157,034Liabilities in excess of other assets �� (9.7)% (39,822,832)NET ASSETS - 100.00% $ 412,334,202
^ Purchased with cash collateral from securities on loan.(a) Non-income producing security.(b) All or a portion of this security is on loan.(c) Rate disclosed is the daily yield on March 31, 2019.
ADR�American Depositary ReceiptPLC�Public Limited Company
Copyright © 2021 www.secdatabase.com. All Rights Reserved.Please Consider the Environment Before Printing This Document
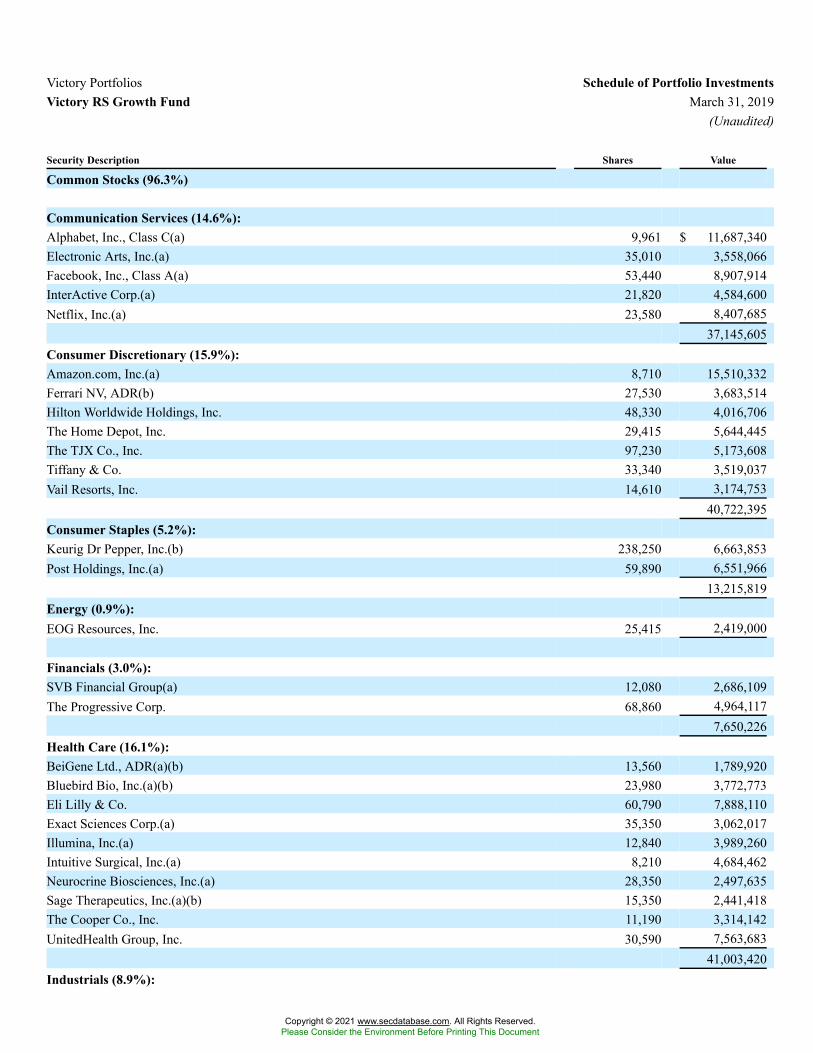
Victory Portfolios Schedule of Portfolio InvestmentsVictory RS Growth Fund March 31, 2019
(Unaudited)
Security Description Shares Value
Common Stocks (96.3%)
Communication Services (14.6%):Alphabet, Inc., Class C(a) 9,961 $ 11,687,340Electronic Arts, Inc.(a) 35,010 3,558,066Facebook, Inc., Class A(a) 53,440 8,907,914InterActive Corp.(a) 21,820 4,584,600Netflix, Inc.(a) 23,580 8,407,685
37,145,605Consumer Discretionary (15.9%):Amazon.com, Inc.(a) 8,710 15,510,332Ferrari NV, ADR(b) 27,530 3,683,514Hilton Worldwide Holdings, Inc. 48,330 4,016,706The Home Depot, Inc. 29,415 5,644,445The TJX Co., Inc. 97,230 5,173,608Tiffany & Co. 33,340 3,519,037Vail Resorts, Inc. 14,610 3,174,753
40,722,395Consumer Staples (5.2%):Keurig Dr Pepper, Inc.(b) 238,250 6,663,853Post Holdings, Inc.(a) 59,890 6,551,966
13,215,819Energy (0.9%):EOG Resources, Inc. 25,415 2,419,000
Financials (3.0%):SVB Financial Group(a) 12,080 2,686,109The Progressive Corp. 68,860 4,964,117
7,650,226Health Care (16.1%):BeiGene Ltd., ADR(a)(b) 13,560 1,789,920Bluebird Bio, Inc.(a)(b) 23,980 3,772,773Eli Lilly & Co. 60,790 7,888,110Exact Sciences Corp.(a) 35,350 3,062,017Illumina, Inc.(a) 12,840 3,989,260Intuitive Surgical, Inc.(a) 8,210 4,684,462Neurocrine Biosciences, Inc.(a) 28,350 2,497,635Sage Therapeutics, Inc.(a)(b) 15,350 2,441,418The Cooper Co., Inc. 11,190 3,314,142UnitedHealth Group, Inc. 30,590 7,563,683
41,003,420Industrials (8.9%):
Copyright © 2021 www.secdatabase.com. All Rights Reserved.Please Consider the Environment Before Printing This Document
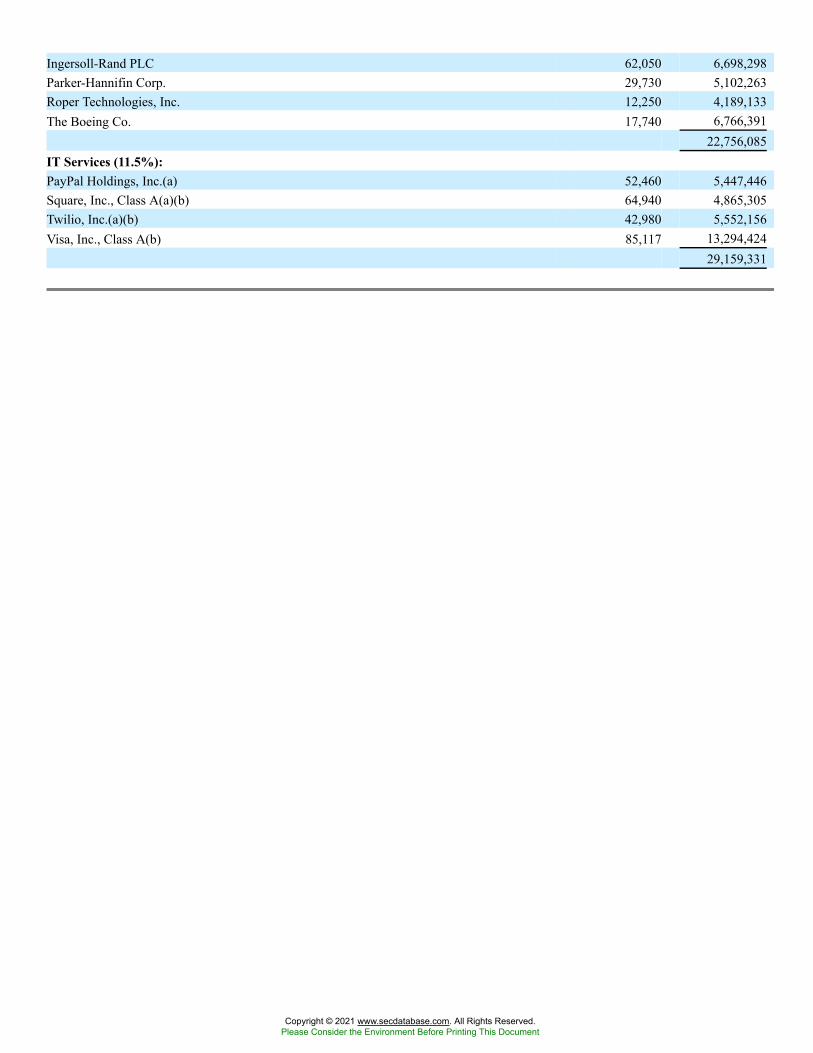
Ingersoll-Rand PLC 62,050 6,698,298Parker-Hannifin Corp. 29,730 5,102,263Roper Technologies, Inc. 12,250 4,189,133The Boeing Co. 17,740 6,766,391
22,756,085IT Services (11.5%):PayPal Holdings, Inc.(a) 52,460 5,447,446Square, Inc., Class A(a)(b) 64,940 4,865,305Twilio, Inc.(a)(b) 42,980 5,552,156Visa, Inc., Class A(b) 85,117 13,294,424
29,159,331
Copyright © 2021 www.secdatabase.com. All Rights Reserved.Please Consider the Environment Before Printing This Document
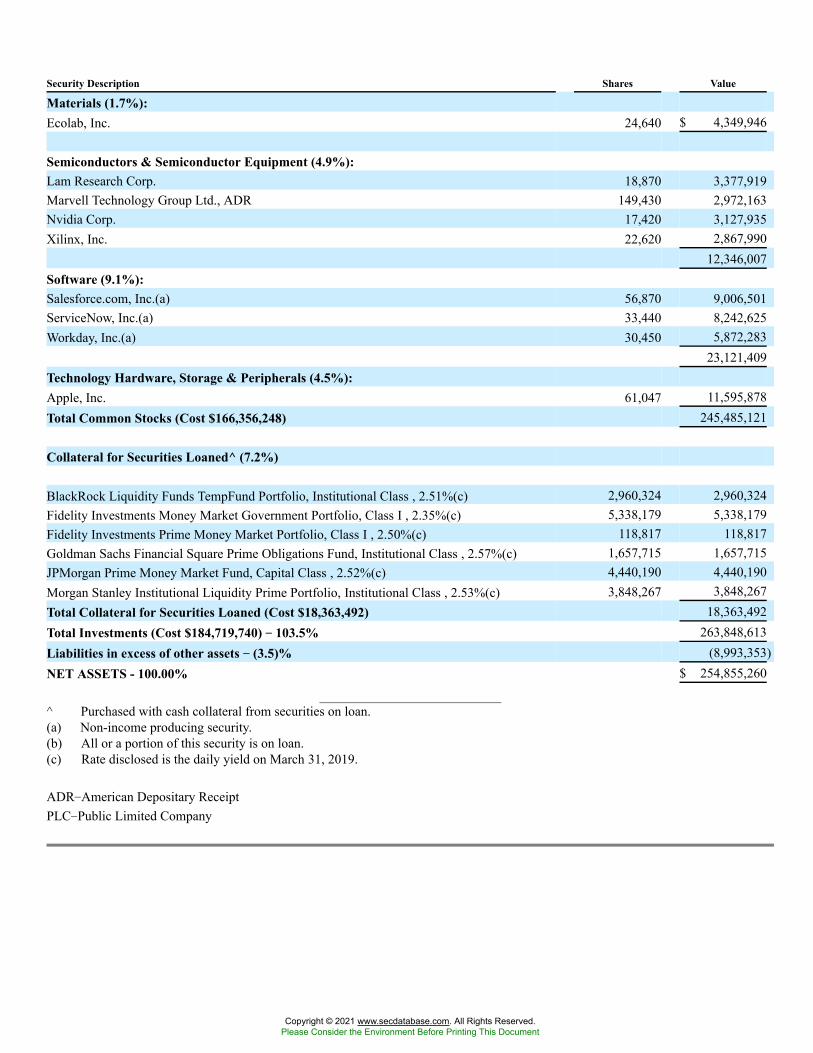
Security Description Shares Value
Materials (1.7%):Ecolab, Inc. 24,640 $ 4,349,946
Semiconductors & Semiconductor Equipment (4.9%):Lam Research Corp. 18,870 3,377,919Marvell Technology Group Ltd., ADR 149,430 2,972,163Nvidia Corp. 17,420 3,127,935Xilinx, Inc. 22,620 2,867,990
12,346,007Software (9.1%):Salesforce.com, Inc.(a) 56,870 9,006,501ServiceNow, Inc.(a) 33,440 8,242,625Workday, Inc.(a) 30,450 5,872,283
23,121,409Technology Hardware, Storage & Peripherals (4.5%):Apple, Inc. 61,047 11,595,878Total Common Stocks (Cost $166,356,248) 245,485,121
Collateral for Securities Loaned^ (7.2%)
BlackRock Liquidity Funds TempFund Portfolio, Institutional Class , 2.51%(c) 2,960,324 2,960,324Fidelity Investments Money Market Government Portfolio, Class I , 2.35%(c) 5,338,179 5,338,179Fidelity Investments Prime Money Market Portfolio, Class I , 2.50%(c) 118,817 118,817Goldman Sachs Financial Square Prime Obligations Fund, Institutional Class , 2.57%(c) 1,657,715 1,657,715JPMorgan Prime Money Market Fund, Capital Class , 2.52%(c) 4,440,190 4,440,190Morgan Stanley Institutional Liquidity Prime Portfolio, Institutional Class , 2.53%(c) 3,848,267 3,848,267Total Collateral for Securities Loaned (Cost $18,363,492) 18,363,492Total Investments (Cost $184,719,740) �� 103.5% 263,848,613Liabilities in excess of other assets �� (3.5)% (8,993,353)NET ASSETS - 100.00% $ 254,855,260
^ Purchased with cash collateral from securities on loan.(a) Non-income producing security.(b) All or a portion of this security is on loan.(c) Rate disclosed is the daily yield on March 31, 2019.
ADR�American Depositary ReceiptPLC�Public Limited Company
Copyright © 2021 www.secdatabase.com. All Rights Reserved.Please Consider the Environment Before Printing This Document
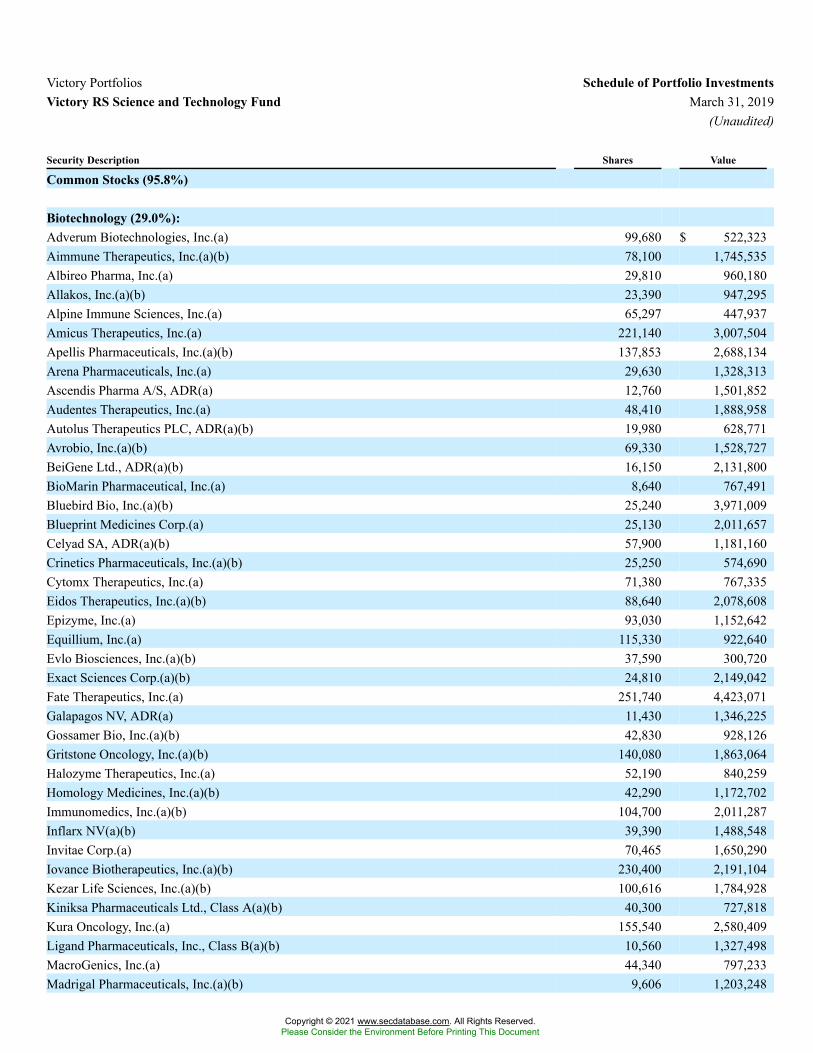
Victory Portfolios Schedule of Portfolio InvestmentsVictory RS Science and Technology Fund March 31, 2019
(Unaudited)
Security Description Shares Value
Common Stocks (95.8%)
Biotechnology (29.0%):Adverum Biotechnologies, Inc.(a) 99,680 $ 522,323Aimmune Therapeutics, Inc.(a)(b) 78,100 1,745,535Albireo Pharma, Inc.(a) 29,810 960,180Allakos, Inc.(a)(b) 23,390 947,295Alpine Immune Sciences, Inc.(a) 65,297 447,937Amicus Therapeutics, Inc.(a) 221,140 3,007,504Apellis Pharmaceuticals, Inc.(a)(b) 137,853 2,688,134Arena Pharmaceuticals, Inc.(a) 29,630 1,328,313Ascendis Pharma A/S, ADR(a) 12,760 1,501,852Audentes Therapeutics, Inc.(a) 48,410 1,888,958Autolus Therapeutics PLC, ADR(a)(b) 19,980 628,771Avrobio, Inc.(a)(b) 69,330 1,528,727BeiGene Ltd., ADR(a)(b) 16,150 2,131,800BioMarin Pharmaceutical, Inc.(a) 8,640 767,491Bluebird Bio, Inc.(a)(b) 25,240 3,971,009Blueprint Medicines Corp.(a) 25,130 2,011,657Celyad SA, ADR(a)(b) 57,900 1,181,160Crinetics Pharmaceuticals, Inc.(a)(b) 25,250 574,690Cytomx Therapeutics, Inc.(a) 71,380 767,335Eidos Therapeutics, Inc.(a)(b) 88,640 2,078,608Epizyme, Inc.(a) 93,030 1,152,642Equillium, Inc.(a) 115,330 922,640Evlo Biosciences, Inc.(a)(b) 37,590 300,720Exact Sciences Corp.(a)(b) 24,810 2,149,042Fate Therapeutics, Inc.(a) 251,740 4,423,071Galapagos NV, ADR(a) 11,430 1,346,225Gossamer Bio, Inc.(a)(b) 42,830 928,126Gritstone Oncology, Inc.(a)(b) 140,080 1,863,064Halozyme Therapeutics, Inc.(a) 52,190 840,259Homology Medicines, Inc.(a)(b) 42,290 1,172,702Immunomedics, Inc.(a)(b) 104,700 2,011,287Inflarx NV(a)(b) 39,390 1,488,548Invitae Corp.(a) 70,465 1,650,290Iovance Biotherapeutics, Inc.(a)(b) 230,400 2,191,104Kezar Life Sciences, Inc.(a)(b) 100,616 1,784,928Kiniksa Pharmaceuticals Ltd., Class A(a)(b) 40,300 727,818Kura Oncology, Inc.(a) 155,540 2,580,409Ligand Pharmaceuticals, Inc., Class B(a)(b) 10,560 1,327,498MacroGenics, Inc.(a) 44,340 797,233Madrigal Pharmaceuticals, Inc.(a)(b) 9,606 1,203,248
Copyright © 2021 www.secdatabase.com. All Rights Reserved.Please Consider the Environment Before Printing This Document
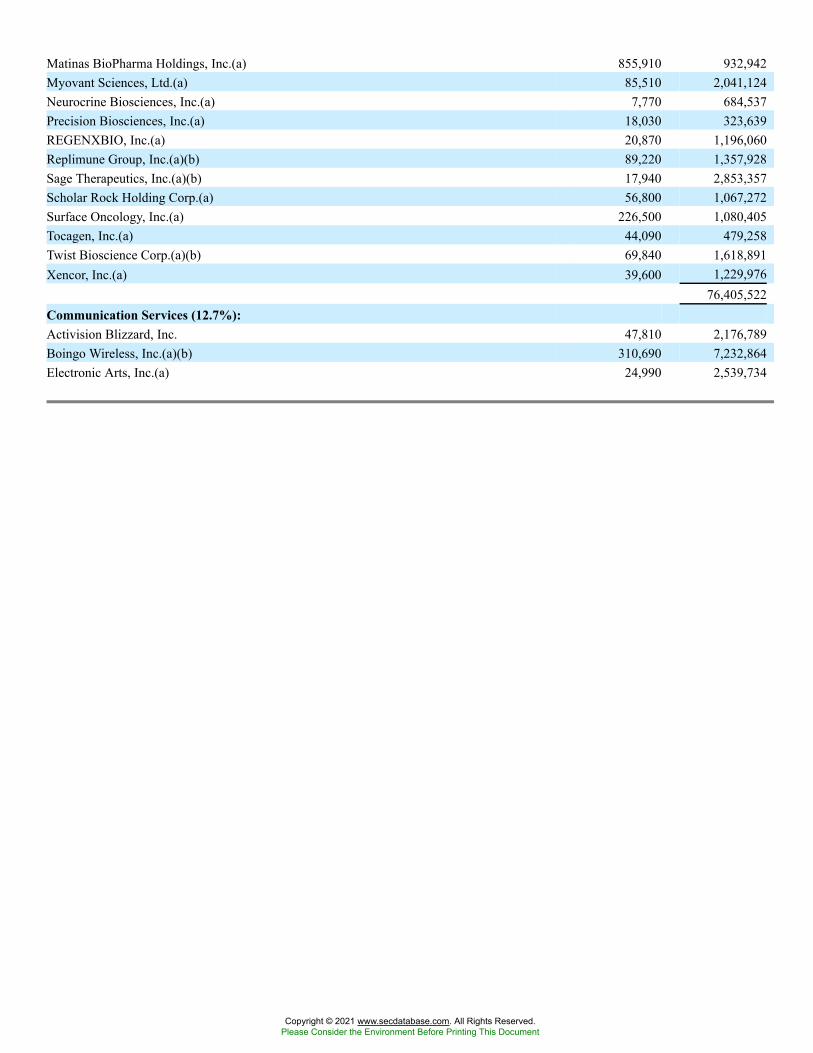
Matinas BioPharma Holdings, Inc.(a) 855,910 932,942Myovant Sciences, Ltd.(a) 85,510 2,041,124Neurocrine Biosciences, Inc.(a) 7,770 684,537Precision Biosciences, Inc.(a) 18,030 323,639REGENXBIO, Inc.(a) 20,870 1,196,060Replimune Group, Inc.(a)(b) 89,220 1,357,928Sage Therapeutics, Inc.(a)(b) 17,940 2,853,357Scholar Rock Holding Corp.(a) 56,800 1,067,272Surface Oncology, Inc.(a) 226,500 1,080,405Tocagen, Inc.(a) 44,090 479,258Twist Bioscience Corp.(a)(b) 69,840 1,618,891Xencor, Inc.(a) 39,600 1,229,976
76,405,522Communication Services (12.7%):Activision Blizzard, Inc. 47,810 2,176,789Boingo Wireless, Inc.(a)(b) 310,690 7,232,864Electronic Arts, Inc.(a) 24,990 2,539,734
Copyright © 2021 www.secdatabase.com. All Rights Reserved.Please Consider the Environment Before Printing This Document
Security Description Shares Value
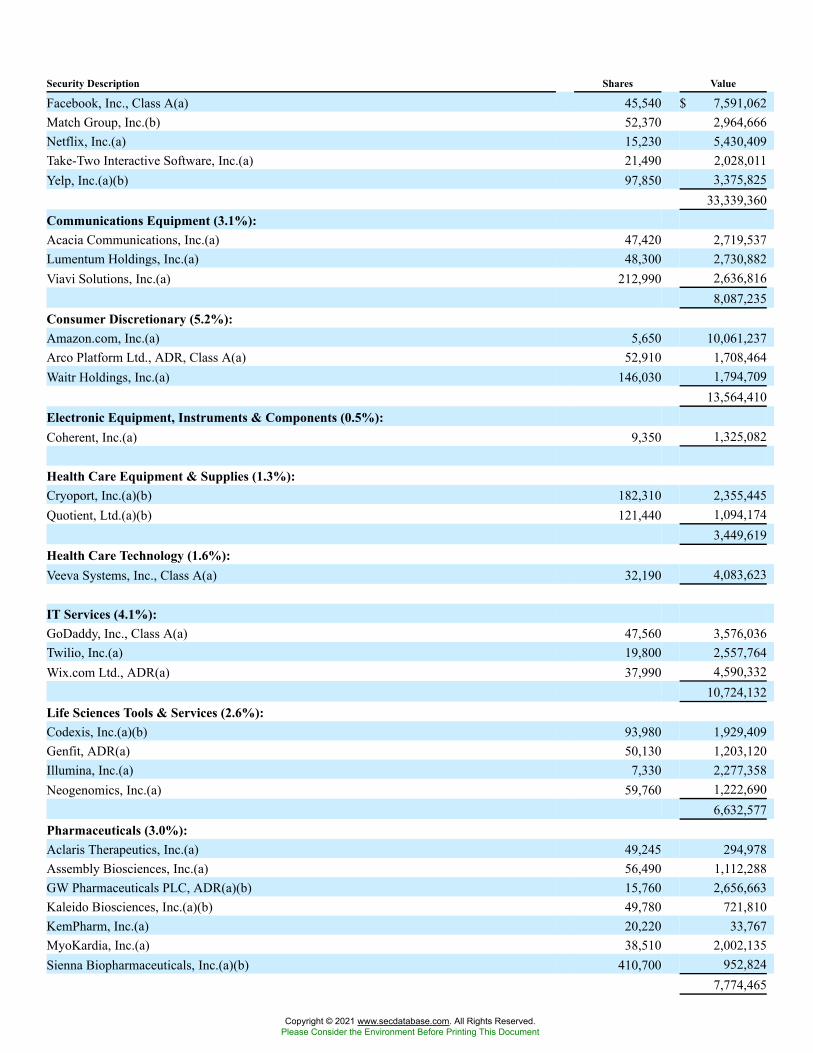
Facebook, Inc., Class A(a) 45,540 $ 7,591,062Match Group, Inc.(b) 52,370 2,964,666Netflix, Inc.(a) 15,230 5,430,409Take-Two Interactive Software, Inc.(a) 21,490 2,028,011Yelp, Inc.(a)(b) 97,850 3,375,825
33,339,360Communications Equipment (3.1%):Acacia Communications, Inc.(a) 47,420 2,719,537Lumentum Holdings, Inc.(a) 48,300 2,730,882Viavi Solutions, Inc.(a) 212,990 2,636,816
8,087,235Consumer Discretionary (5.2%):Amazon.com, Inc.(a) 5,650 10,061,237Arco Platform Ltd., ADR, Class A(a) 52,910 1,708,464Waitr Holdings, Inc.(a) 146,030 1,794,709
13,564,410Electronic Equipment, Instruments & Components (0.5%):Coherent, Inc.(a) 9,350 1,325,082
Health Care Equipment & Supplies (1.3%):Cryoport, Inc.(a)(b) 182,310 2,355,445Quotient, Ltd.(a)(b) 121,440 1,094,174
3,449,619Health Care Technology (1.6%):Veeva Systems, Inc., Class A(a) 32,190 4,083,623
IT Services (4.1%):GoDaddy, Inc., Class A(a) 47,560 3,576,036Twilio, Inc.(a) 19,800 2,557,764Wix.com Ltd., ADR(a) 37,990 4,590,332
10,724,132Life Sciences Tools & Services (2.6%):Codexis, Inc.(a)(b) 93,980 1,929,409Genfit, ADR(a) 50,130 1,203,120Illumina, Inc.(a) 7,330 2,277,358Neogenomics, Inc.(a) 59,760 1,222,690
6,632,577Pharmaceuticals (3.0%):Aclaris Therapeutics, Inc.(a) 49,245 294,978Assembly Biosciences, Inc.(a) 56,490 1,112,288GW Pharmaceuticals PLC, ADR(a)(b) 15,760 2,656,663Kaleido Biosciences, Inc.(a)(b) 49,780 721,810KemPharm, Inc.(a) 20,220 33,767MyoKardia, Inc.(a) 38,510 2,002,135Sienna Biopharmaceuticals, Inc.(a)(b) 410,700 952,824
7,774,465
Copyright © 2021 www.secdatabase.com. All Rights Reserved.Please Consider the Environment Before Printing This Document
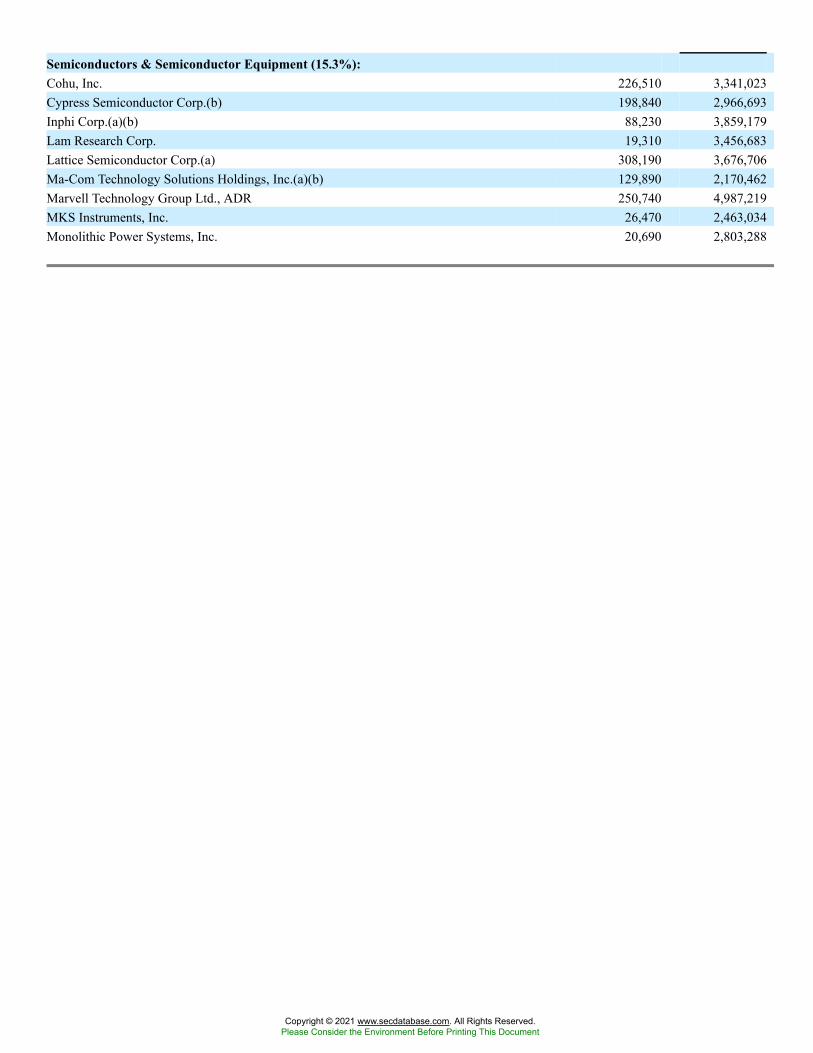
Semiconductors & Semiconductor Equipment (15.3%):Cohu, Inc. 226,510 3,341,023Cypress Semiconductor Corp.(b) 198,840 2,966,693Inphi Corp.(a)(b) 88,230 3,859,179Lam Research Corp. 19,310 3,456,683Lattice Semiconductor Corp.(a) 308,190 3,676,706Ma-Com Technology Solutions Holdings, Inc.(a)(b) 129,890 2,170,462Marvell Technology Group Ltd., ADR 250,740 4,987,219MKS Instruments, Inc. 26,470 2,463,034Monolithic Power Systems, Inc. 20,690 2,803,288
Copyright © 2021 www.secdatabase.com. All Rights Reserved.Please Consider the Environment Before Printing This Document
Security Description Shares Value
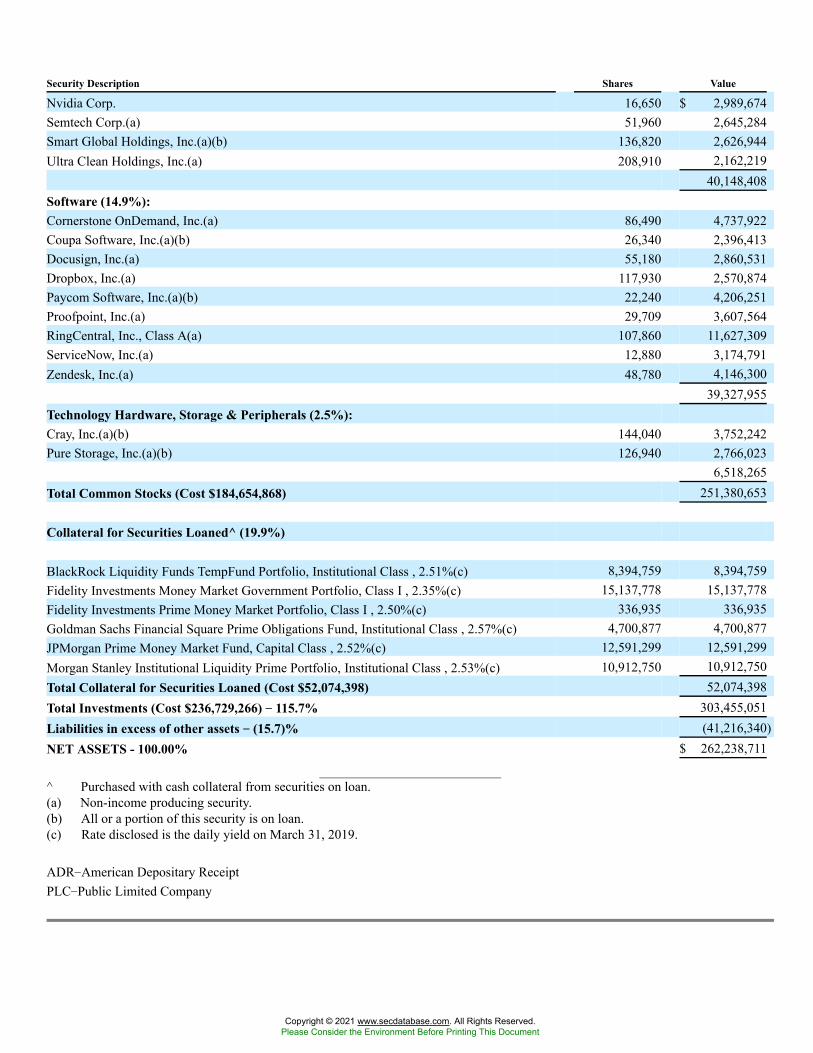
Nvidia Corp. 16,650 $ 2,989,674Semtech Corp.(a) 51,960 2,645,284Smart Global Holdings, Inc.(a)(b) 136,820 2,626,944Ultra Clean Holdings, Inc.(a) 208,910 2,162,219
40,148,408Software (14.9%):Cornerstone OnDemand, Inc.(a) 86,490 4,737,922Coupa Software, Inc.(a)(b) 26,340 2,396,413Docusign, Inc.(a) 55,180 2,860,531Dropbox, Inc.(a) 117,930 2,570,874Paycom Software, Inc.(a)(b) 22,240 4,206,251Proofpoint, Inc.(a) 29,709 3,607,564RingCentral, Inc., Class A(a) 107,860 11,627,309ServiceNow, Inc.(a) 12,880 3,174,791Zendesk, Inc.(a) 48,780 4,146,300
39,327,955Technology Hardware, Storage & Peripherals (2.5%):Cray, Inc.(a)(b) 144,040 3,752,242Pure Storage, Inc.(a)(b) 126,940 2,766,023
6,518,265Total Common Stocks (Cost $184,654,868) 251,380,653
Collateral for Securities Loaned^ (19.9%)
BlackRock Liquidity Funds TempFund Portfolio, Institutional Class , 2.51%(c) 8,394,759 8,394,759Fidelity Investments Money Market Government Portfolio, Class I , 2.35%(c) 15,137,778 15,137,778Fidelity Investments Prime Money Market Portfolio, Class I , 2.50%(c) 336,935 336,935Goldman Sachs Financial Square Prime Obligations Fund, Institutional Class , 2.57%(c) 4,700,877 4,700,877JPMorgan Prime Money Market Fund, Capital Class , 2.52%(c) 12,591,299 12,591,299Morgan Stanley Institutional Liquidity Prime Portfolio, Institutional Class , 2.53%(c) 10,912,750 10,912,750Total Collateral for Securities Loaned (Cost $52,074,398) 52,074,398Total Investments (Cost $236,729,266) �� 115.7% 303,455,051Liabilities in excess of other assets �� (15.7)% (41,216,340)NET ASSETS - 100.00% $ 262,238,711
^ Purchased with cash collateral from securities on loan.(a) Non-income producing security.(b) All or a portion of this security is on loan.(c) Rate disclosed is the daily yield on March 31, 2019.
ADR�American Depositary ReceiptPLC�Public Limited Company
Copyright © 2021 www.secdatabase.com. All Rights Reserved.Please Consider the Environment Before Printing This Document
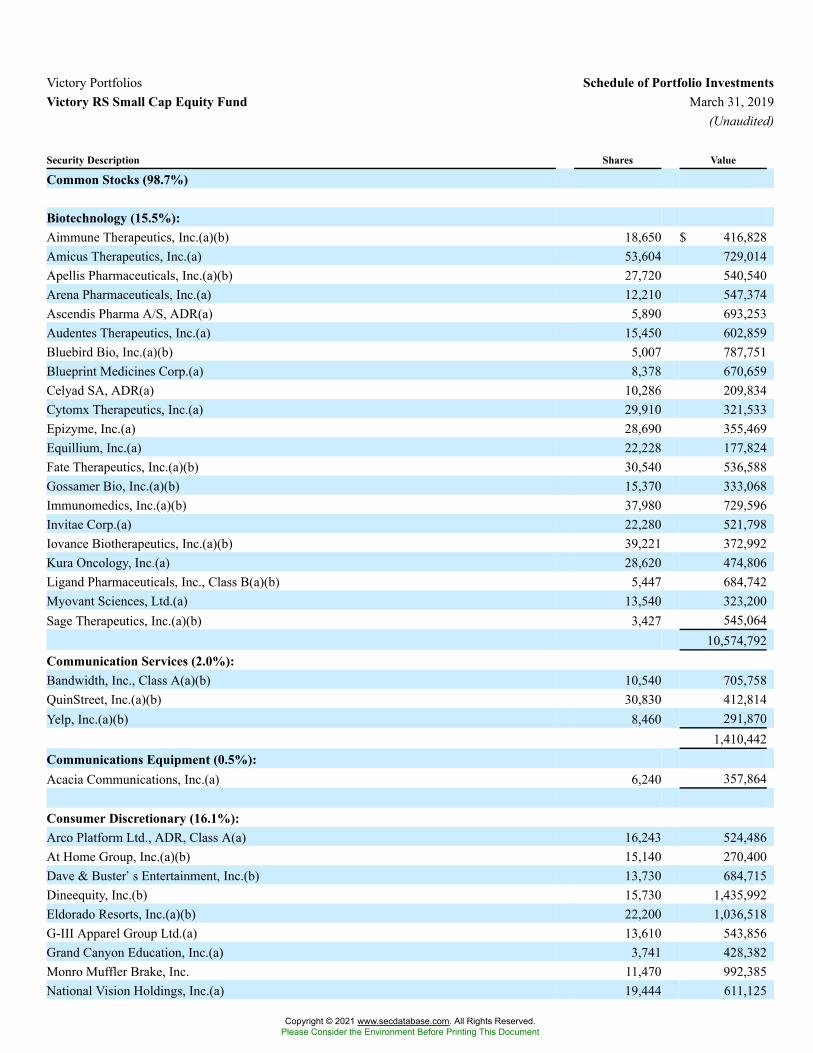
Victory Portfolios Schedule of Portfolio InvestmentsVictory RS Small Cap Equity Fund March 31, 2019
(Unaudited)
Security Description Shares Value
Common Stocks (98.7%)
Biotechnology (15.5%):Aimmune Therapeutics, Inc.(a)(b) 18,650 $ 416,828Amicus Therapeutics, Inc.(a) 53,604 729,014Apellis Pharmaceuticals, Inc.(a)(b) 27,720 540,540Arena Pharmaceuticals, Inc.(a) 12,210 547,374Ascendis Pharma A/S, ADR(a) 5,890 693,253Audentes Therapeutics, Inc.(a) 15,450 602,859Bluebird Bio, Inc.(a)(b) 5,007 787,751Blueprint Medicines Corp.(a) 8,378 670,659Celyad SA, ADR(a) 10,286 209,834Cytomx Therapeutics, Inc.(a) 29,910 321,533Epizyme, Inc.(a) 28,690 355,469Equillium, Inc.(a) 22,228 177,824Fate Therapeutics, Inc.(a)(b) 30,540 536,588Gossamer Bio, Inc.(a)(b) 15,370 333,068Immunomedics, Inc.(a)(b) 37,980 729,596Invitae Corp.(a) 22,280 521,798Iovance Biotherapeutics, Inc.(a)(b) 39,221 372,992Kura Oncology, Inc.(a) 28,620 474,806Ligand Pharmaceuticals, Inc., Class B(a)(b) 5,447 684,742Myovant Sciences, Ltd.(a) 13,540 323,200Sage Therapeutics, Inc.(a)(b) 3,427 545,064
10,574,792Communication Services (2.0%):Bandwidth, Inc., Class A(a)(b) 10,540 705,758QuinStreet, Inc.(a)(b) 30,830 412,814Yelp, Inc.(a)(b) 8,460 291,870
1,410,442Communications Equipment (0.5%):Acacia Communications, Inc.(a) 6,240 357,864
Consumer Discretionary (16.1%):Arco Platform Ltd., ADR, Class A(a) 16,243 524,486At Home Group, Inc.(a)(b) 15,140 270,400Dave & Buster�s Entertainment, Inc.(b) 13,730 684,715Dineequity, Inc.(b) 15,730 1,435,992Eldorado Resorts, Inc.(a)(b) 22,200 1,036,518G-III Apparel Group Ltd.(a) 13,610 543,856Grand Canyon Education, Inc.(a) 3,741 428,382Monro Muffler Brake, Inc. 11,470 992,385National Vision Holdings, Inc.(a) 19,444 611,125
Copyright © 2021 www.secdatabase.com. All Rights Reserved.Please Consider the Environment Before Printing This Document
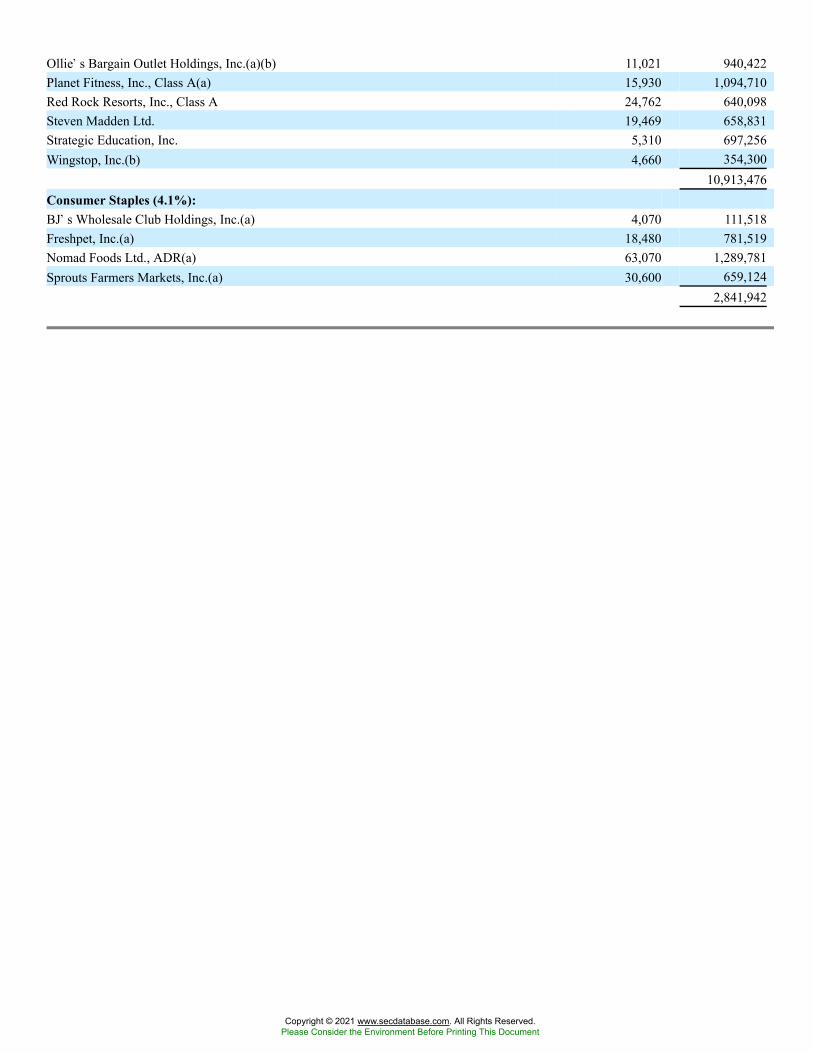
Ollie�s Bargain Outlet Holdings, Inc.(a)(b) 11,021 940,422Planet Fitness, Inc., Class A(a) 15,930 1,094,710Red Rock Resorts, Inc., Class A 24,762 640,098Steven Madden Ltd. 19,469 658,831Strategic Education, Inc. 5,310 697,256Wingstop, Inc.(b) 4,660 354,300
10,913,476Consumer Staples (4.1%):BJ�s Wholesale Club Holdings, Inc.(a) 4,070 111,518Freshpet, Inc.(a) 18,480 781,519Nomad Foods Ltd., ADR(a) 63,070 1,289,781Sprouts Farmers Markets, Inc.(a) 30,600 659,124
2,841,942
Copyright © 2021 www.secdatabase.com. All Rights Reserved.Please Consider the Environment Before Printing This Document
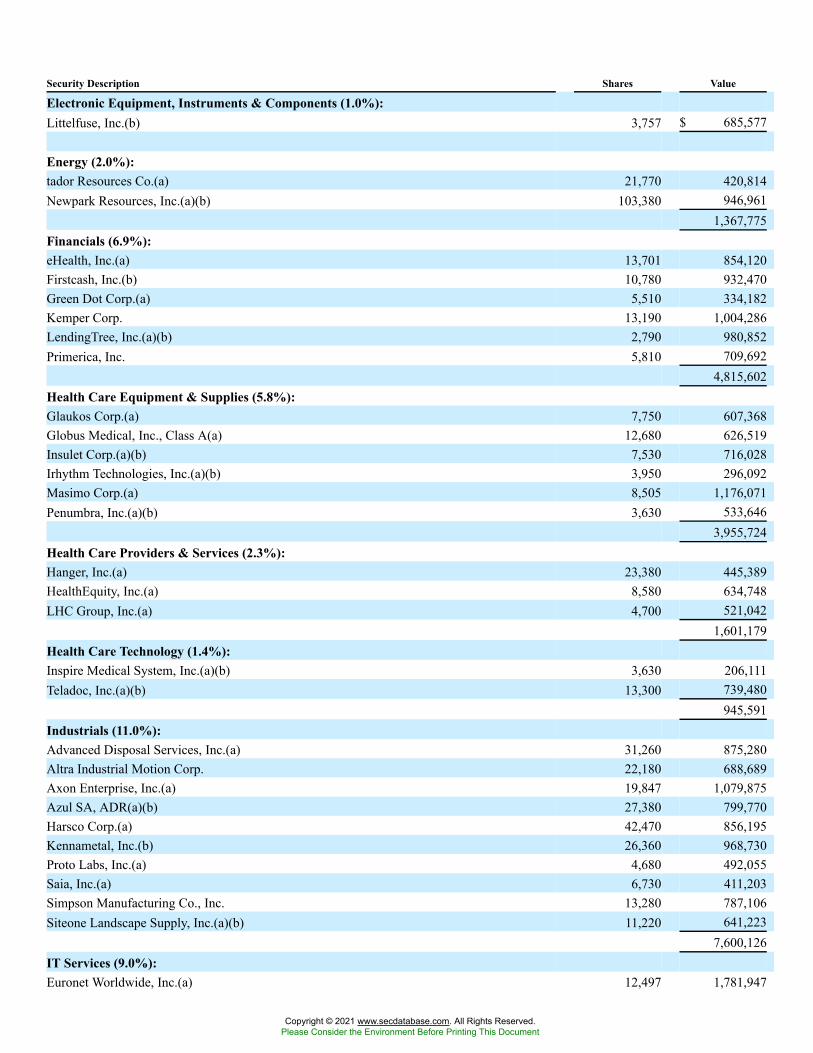
Security Description Shares Value
Electronic Equipment, Instruments & Components (1.0%):Littelfuse, Inc.(b) 3,757 $ 685,577
Energy (2.0%):tador Resources Co.(a) 21,770 420,814Newpark Resources, Inc.(a)(b) 103,380 946,961
1,367,775Financials (6.9%):eHealth, Inc.(a) 13,701 854,120Firstcash, Inc.(b) 10,780 932,470Green Dot Corp.(a) 5,510 334,182Kemper Corp. 13,190 1,004,286LendingTree, Inc.(a)(b) 2,790 980,852Primerica, Inc. 5,810 709,692
4,815,602Health Care Equipment & Supplies (5.8%):Glaukos Corp.(a) 7,750 607,368Globus Medical, Inc., Class A(a) 12,680 626,519Insulet Corp.(a)(b) 7,530 716,028Irhythm Technologies, Inc.(a)(b) 3,950 296,092Masimo Corp.(a) 8,505 1,176,071Penumbra, Inc.(a)(b) 3,630 533,646
3,955,724Health Care Providers & Services (2.3%):Hanger, Inc.(a) 23,380 445,389HealthEquity, Inc.(a) 8,580 634,748LHC Group, Inc.(a) 4,700 521,042
1,601,179Health Care Technology (1.4%):Inspire Medical System, Inc.(a)(b) 3,630 206,111Teladoc, Inc.(a)(b) 13,300 739,480
945,591Industrials (11.0%):Advanced Disposal Services, Inc.(a) 31,260 875,280Altra Industrial Motion Corp. 22,180 688,689Axon Enterprise, Inc.(a) 19,847 1,079,875Azul SA, ADR(a)(b) 27,380 799,770Harsco Corp.(a) 42,470 856,195Kennametal, Inc.(b) 26,360 968,730Proto Labs, Inc.(a) 4,680 492,055Saia, Inc.(a) 6,730 411,203Simpson Manufacturing Co., Inc. 13,280 787,106Siteone Landscape Supply, Inc.(a)(b) 11,220 641,223
7,600,126IT Services (9.0%):Euronet Worldwide, Inc.(a) 12,497 1,781,947
Copyright © 2021 www.secdatabase.com. All Rights Reserved.Please Consider the Environment Before Printing This Document

Evo Payments, Inc.(a) 22,160 643,748InterXion Holding NV, ADR(a)(b) 18,244 1,217,422Liveramp Holdings, Inc.(a) 4,540 247,748Wix.com Ltd., ADR(a) 12,970 1,567,165WNS Holdings Ltd., ADR(a) 13,078 696,665
6,154,695Materials (4.8%):Allegheny Technologies, Inc.(a)(b) 34,840 890,859
Copyright © 2021 www.secdatabase.com. All Rights Reserved.Please Consider the Environment Before Printing This Document
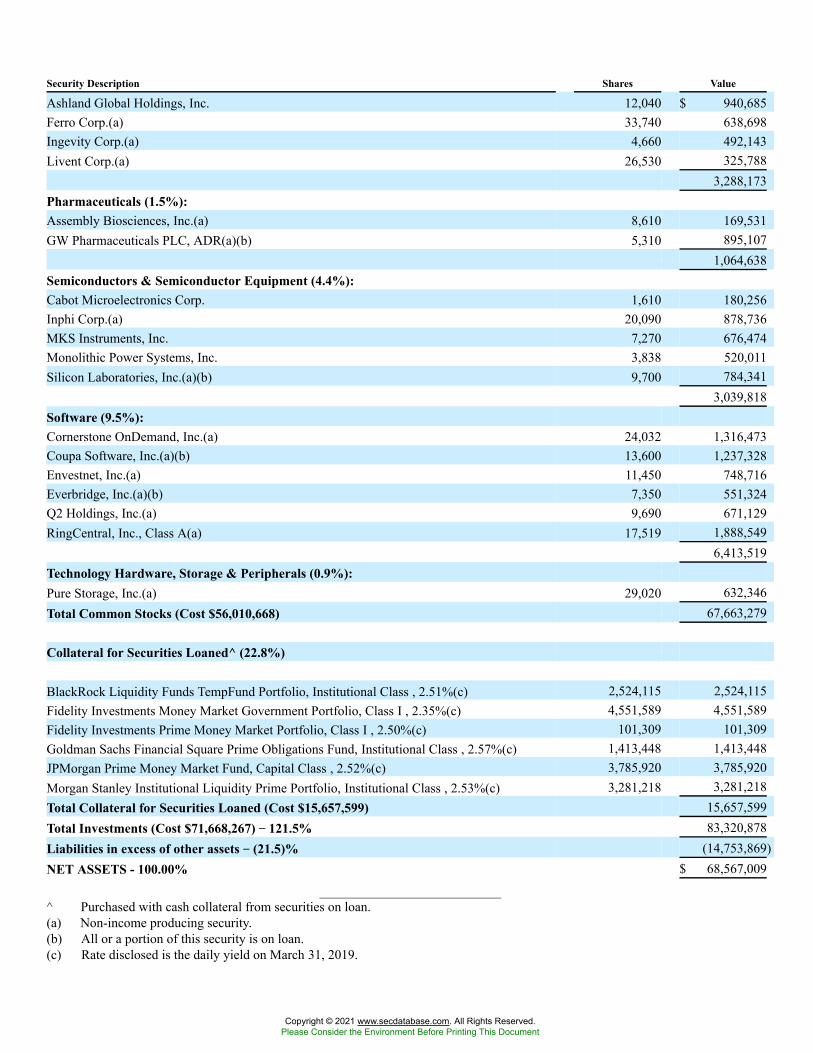
Security Description Shares Value
Ashland Global Holdings, Inc. 12,040 $ 940,685Ferro Corp.(a) 33,740 638,698Ingevity Corp.(a) 4,660 492,143Livent Corp.(a) 26,530 325,788
3,288,173Pharmaceuticals (1.5%):Assembly Biosciences, Inc.(a) 8,610 169,531GW Pharmaceuticals PLC, ADR(a)(b) 5,310 895,107
1,064,638Semiconductors & Semiconductor Equipment (4.4%):Cabot Microelectronics Corp. 1,610 180,256Inphi Corp.(a) 20,090 878,736MKS Instruments, Inc. 7,270 676,474Monolithic Power Systems, Inc. 3,838 520,011Silicon Laboratories, Inc.(a)(b) 9,700 784,341
3,039,818Software (9.5%):Cornerstone OnDemand, Inc.(a) 24,032 1,316,473Coupa Software, Inc.(a)(b) 13,600 1,237,328Envestnet, Inc.(a) 11,450 748,716Everbridge, Inc.(a)(b) 7,350 551,324Q2 Holdings, Inc.(a) 9,690 671,129RingCentral, Inc., Class A(a) 17,519 1,888,549
6,413,519Technology Hardware, Storage & Peripherals (0.9%):Pure Storage, Inc.(a) 29,020 632,346Total Common Stocks (Cost $56,010,668) 67,663,279
Collateral for Securities Loaned^ (22.8%)
BlackRock Liquidity Funds TempFund Portfolio, Institutional Class , 2.51%(c) 2,524,115 2,524,115Fidelity Investments Money Market Government Portfolio, Class I , 2.35%(c) 4,551,589 4,551,589Fidelity Investments Prime Money Market Portfolio, Class I , 2.50%(c) 101,309 101,309Goldman Sachs Financial Square Prime Obligations Fund, Institutional Class , 2.57%(c) 1,413,448 1,413,448JPMorgan Prime Money Market Fund, Capital Class , 2.52%(c) 3,785,920 3,785,920Morgan Stanley Institutional Liquidity Prime Portfolio, Institutional Class , 2.53%(c) 3,281,218 3,281,218Total Collateral for Securities Loaned (Cost $15,657,599) 15,657,599Total Investments (Cost $71,668,267) �� 121.5% 83,320,878Liabilities in excess of other assets �� (21.5)% (14,753,869)NET ASSETS - 100.00% $ 68,567,009
^ Purchased with cash collateral from securities on loan.(a) Non-income producing security.(b) All or a portion of this security is on loan.(c) Rate disclosed is the daily yield on March 31, 2019.
Copyright © 2021 www.secdatabase.com. All Rights Reserved.Please Consider the Environment Before Printing This Document
ADR�American Depositary ReceiptPLC�Public Limited Company
Copyright © 2021 www.secdatabase.com. All Rights Reserved.Please Consider the Environment Before Printing This Document
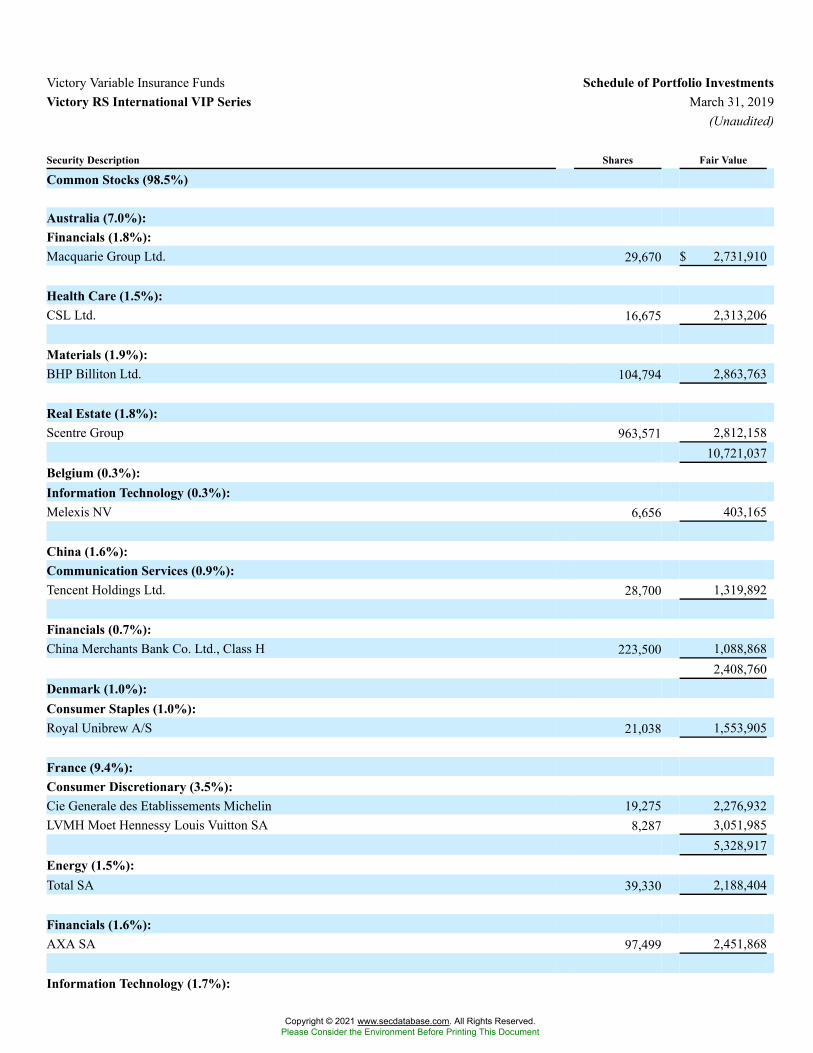
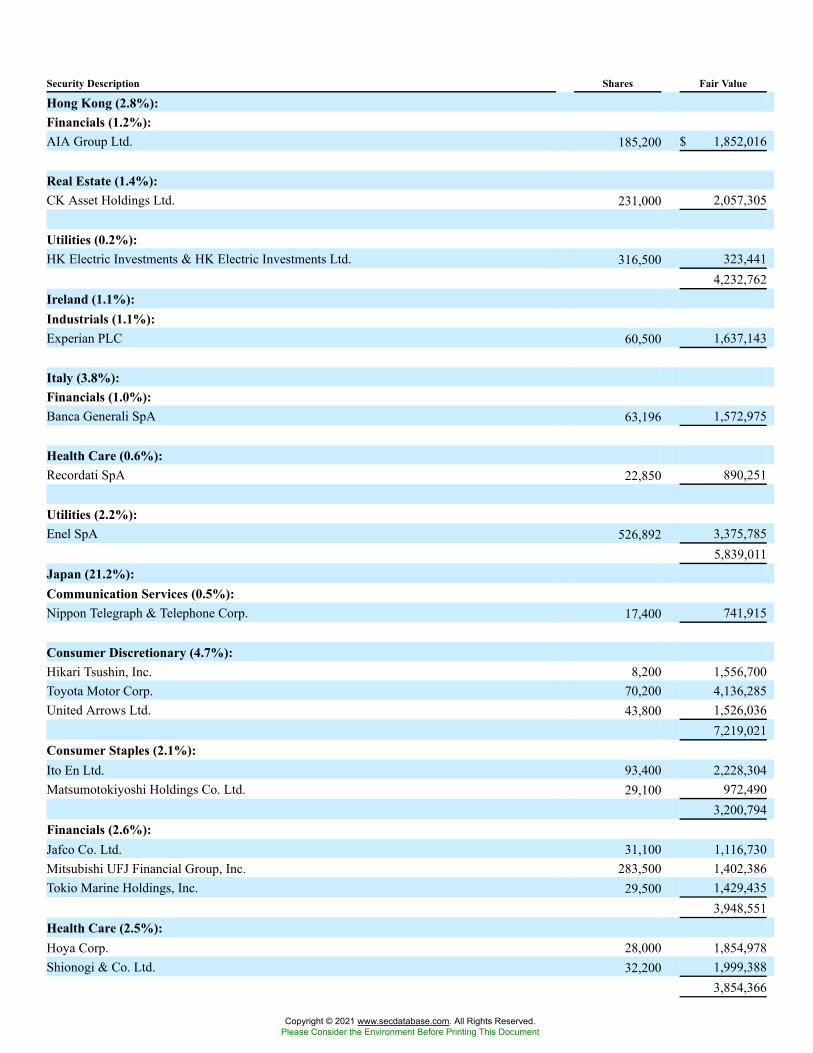
Victory Variable Insurance Funds Schedule of Portfolio InvestmentsVictory RS International VIP Series March 31, 2019
(Unaudited)
Security Description Shares Fair Value
Common Stocks (98.5%)
Australia (7.0%):Financials (1.8%):Macquarie Group Ltd. 29,670 $ 2,731,910
Health Care (1.5%):CSL Ltd. 16,675 2,313,206
Materials (1.9%):BHP Billiton Ltd. 104,794 2,863,763
Real Estate (1.8%):Scentre Group 963,571 2,812,158
10,721,037Belgium (0.3%):Information Technology (0.3%):Melexis NV 6,656 403,165
China (1.6%):Communication Services (0.9%):Tencent Holdings Ltd. 28,700 1,319,892
Financials (0.7%):China Merchants Bank Co. Ltd., Class H 223,500 1,088,868
2,408,760Denmark (1.0%):Consumer Staples (1.0%):Royal Unibrew A/S 21,038 1,553,905
France (9.4%):Consumer Discretionary (3.5%):Cie Generale des Etablissements Michelin 19,275 2,276,932LVMH Moet Hennessy Louis Vuitton SA 8,287 3,051,985
5,328,917Energy (1.5%):Total SA 39,330 2,188,404
Financials (1.6%):AXA SA 97,499 2,451,868
Information Technology (1.7%):
Copyright © 2021 www.secdatabase.com. All Rights Reserved.Please Consider the Environment Before Printing This Document
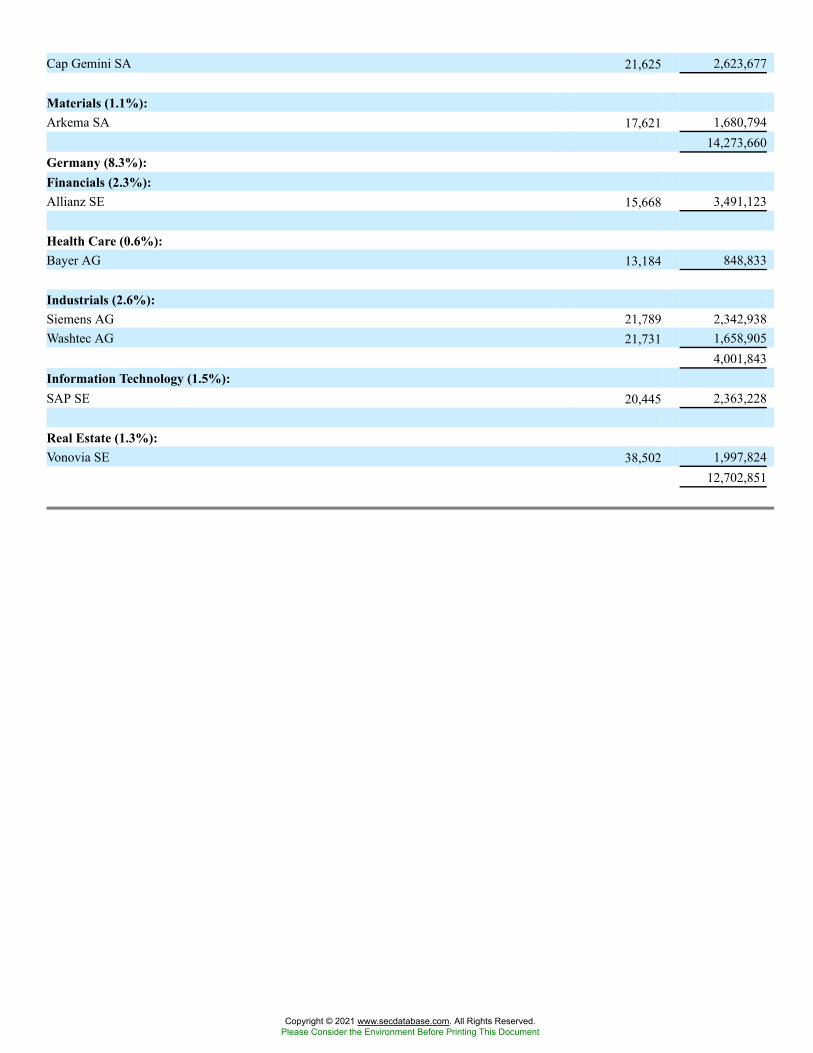
Cap Gemini SA 21,625 2,623,677
Materials (1.1%):Arkema SA 17,621 1,680,794
14,273,660Germany (8.3%):Financials (2.3%):Allianz SE 15,668 3,491,123
Health Care (0.6%):Bayer AG 13,184 848,833
Industrials (2.6%):Siemens AG 21,789 2,342,938Washtec AG 21,731 1,658,905
4,001,843Information Technology (1.5%):SAP SE 20,445 2,363,228
Real Estate (1.3%):Vonovia SE 38,502 1,997,824
12,702,851
Copyright © 2021 www.secdatabase.com. All Rights Reserved.Please Consider the Environment Before Printing This Document
Security Description Shares Fair Value
Hong Kong (2.8%):Financials (1.2%):AIA Group Ltd. 185,200 $ 1,852,016
Real Estate (1.4%):CK Asset Holdings Ltd. 231,000 2,057,305
Utilities (0.2%):HK Electric Investments & HK Electric Investments Ltd. 316,500 323,441
4,232,762Ireland (1.1%):Industrials (1.1%):Experian PLC 60,500 1,637,143
Italy (3.8%):Financials (1.0%):Banca Generali SpA 63,196 1,572,975
Health Care (0.6%):Recordati SpA 22,850 890,251
Utilities (2.2%):Enel SpA 526,892 3,375,785
5,839,011Japan (21.2%):Communication Services (0.5%):Nippon Telegraph & Telephone Corp. 17,400 741,915
Consumer Discretionary (4.7%):Hikari Tsushin, Inc. 8,200 1,556,700Toyota Motor Corp. 70,200 4,136,285United Arrows Ltd. 43,800 1,526,036
7,219,021Consumer Staples (2.1%):Ito En Ltd. 93,400 2,228,304Matsumotokiyoshi Holdings Co. Ltd. 29,100 972,490
3,200,794Financials (2.6%):Jafco Co. Ltd. 31,100 1,116,730Mitsubishi UFJ Financial Group, Inc. 283,500 1,402,386Tokio Marine Holdings, Inc. 29,500 1,429,435
3,948,551Health Care (2.5%):Hoya Corp. 28,000 1,854,978Shionogi & Co. Ltd. 32,200 1,999,388
3,854,366
Copyright © 2021 www.secdatabase.com. All Rights Reserved.Please Consider the Environment Before Printing This Document
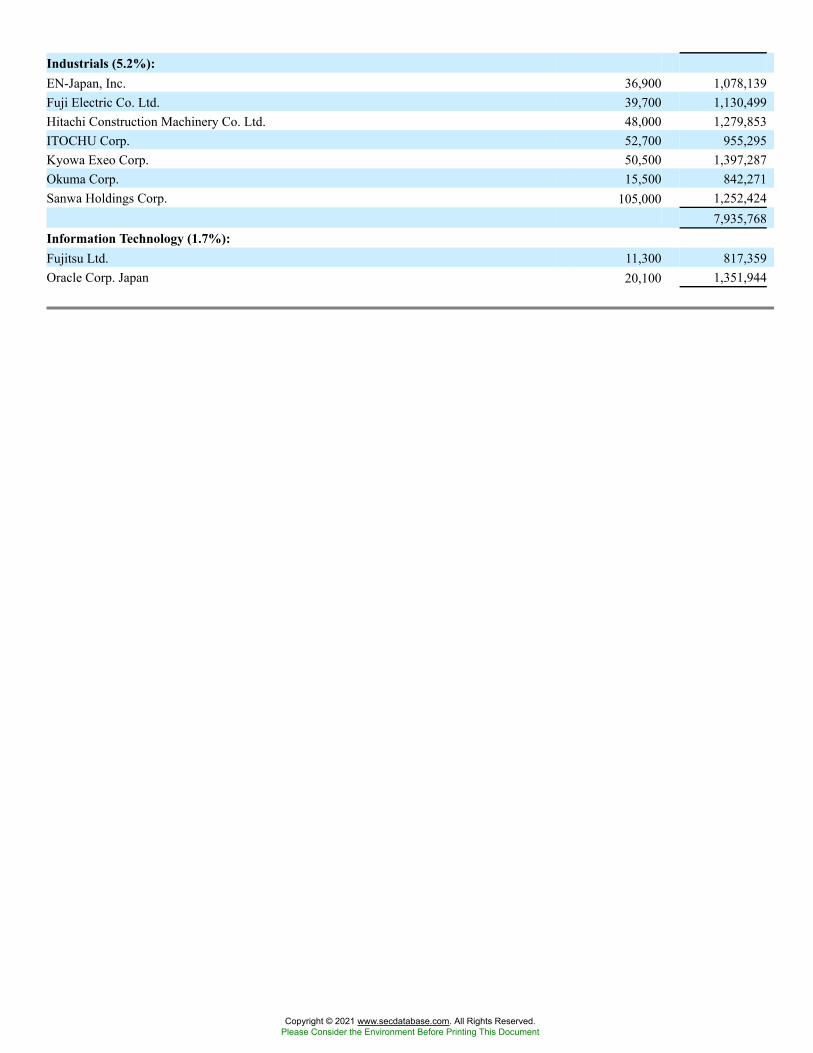
Industrials (5.2%):EN-Japan, Inc. 36,900 1,078,139Fuji Electric Co. Ltd. 39,700 1,130,499Hitachi Construction Machinery Co. Ltd. 48,000 1,279,853ITOCHU Corp. 52,700 955,295Kyowa Exeo Corp. 50,500 1,397,287Okuma Corp. 15,500 842,271Sanwa Holdings Corp. 105,000 1,252,424
7,935,768Information Technology (1.7%):Fujitsu Ltd. 11,300 817,359Oracle Corp. Japan 20,100 1,351,944
Copyright © 2021 www.secdatabase.com. All Rights Reserved.Please Consider the Environment Before Printing This Document
Security Description Shares Fair Value
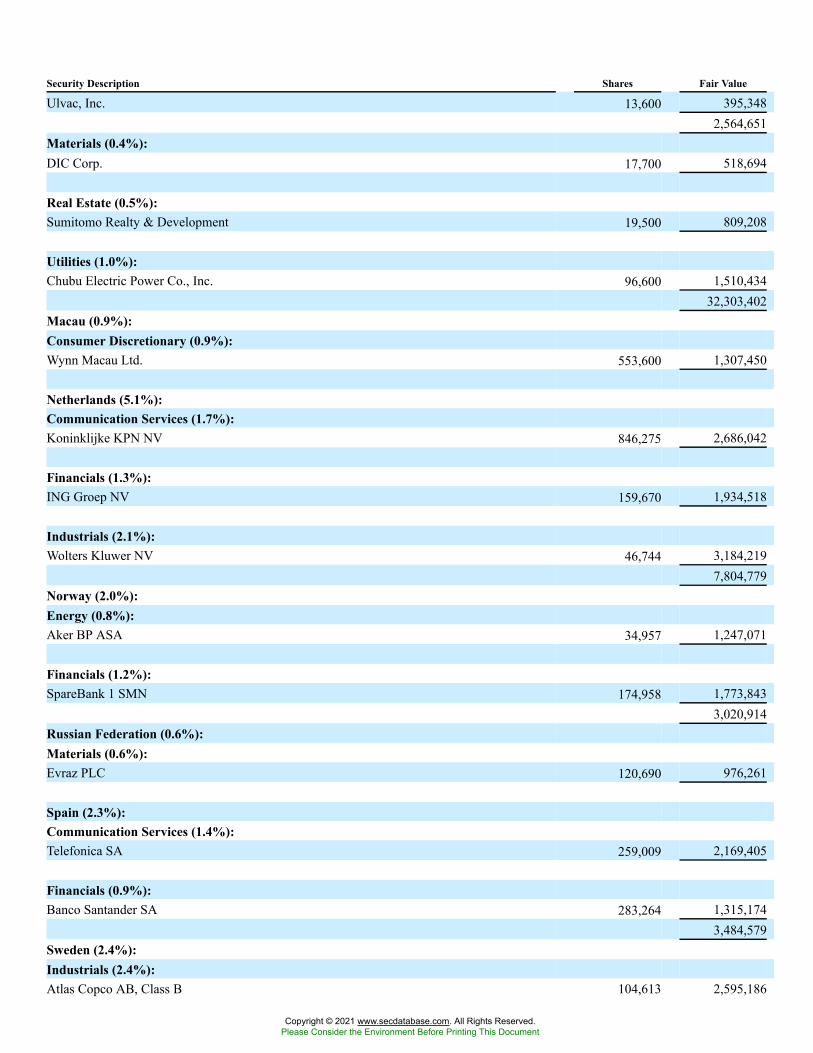
Ulvac, Inc. 13,600 395,3482,564,651
Materials (0.4%):DIC Corp. 17,700 518,694
Real Estate (0.5%):Sumitomo Realty & Development 19,500 809,208
Utilities (1.0%):Chubu Electric Power Co., Inc. 96,600 1,510,434
32,303,402Macau (0.9%):Consumer Discretionary (0.9%):Wynn Macau Ltd. 553,600 1,307,450
Netherlands (5.1%):Communication Services (1.7%):Koninklijke KPN NV 846,275 2,686,042
Financials (1.3%):ING Groep NV 159,670 1,934,518
Industrials (2.1%):Wolters Kluwer NV 46,744 3,184,219
7,804,779Norway (2.0%):Energy (0.8%):Aker BP ASA 34,957 1,247,071
Financials (1.2%):SpareBank 1 SMN 174,958 1,773,843
3,020,914Russian Federation (0.6%):Materials (0.6%):Evraz PLC 120,690 976,261
Spain (2.3%):Communication Services (1.4%):Telefonica SA 259,009 2,169,405
Financials (0.9%):Banco Santander SA 283,264 1,315,174
3,484,579Sweden (2.4%):Industrials (2.4%):Atlas Copco AB, Class B 104,613 2,595,186
Copyright © 2021 www.secdatabase.com. All Rights Reserved.Please Consider the Environment Before Printing This Document
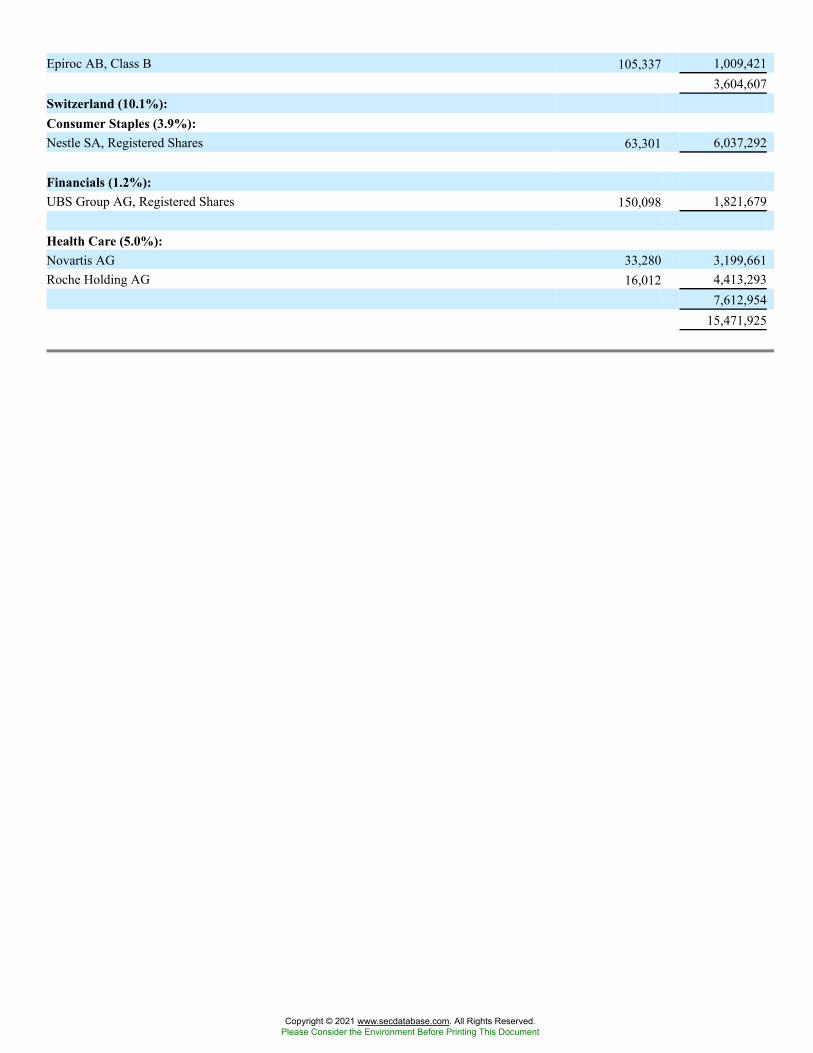
Epiroc AB, Class B 105,337 1,009,4213,604,607
Switzerland (10.1%):Consumer Staples (3.9%):Nestle SA, Registered Shares 63,301 6,037,292
Financials (1.2%):UBS Group AG, Registered Shares 150,098 1,821,679
Health Care (5.0%):Novartis AG 33,280 3,199,661Roche Holding AG 16,012 4,413,293
7,612,95415,471,925
Copyright © 2021 www.secdatabase.com. All Rights Reserved.Please Consider the Environment Before Printing This Document
Security Description Shares Fair Value
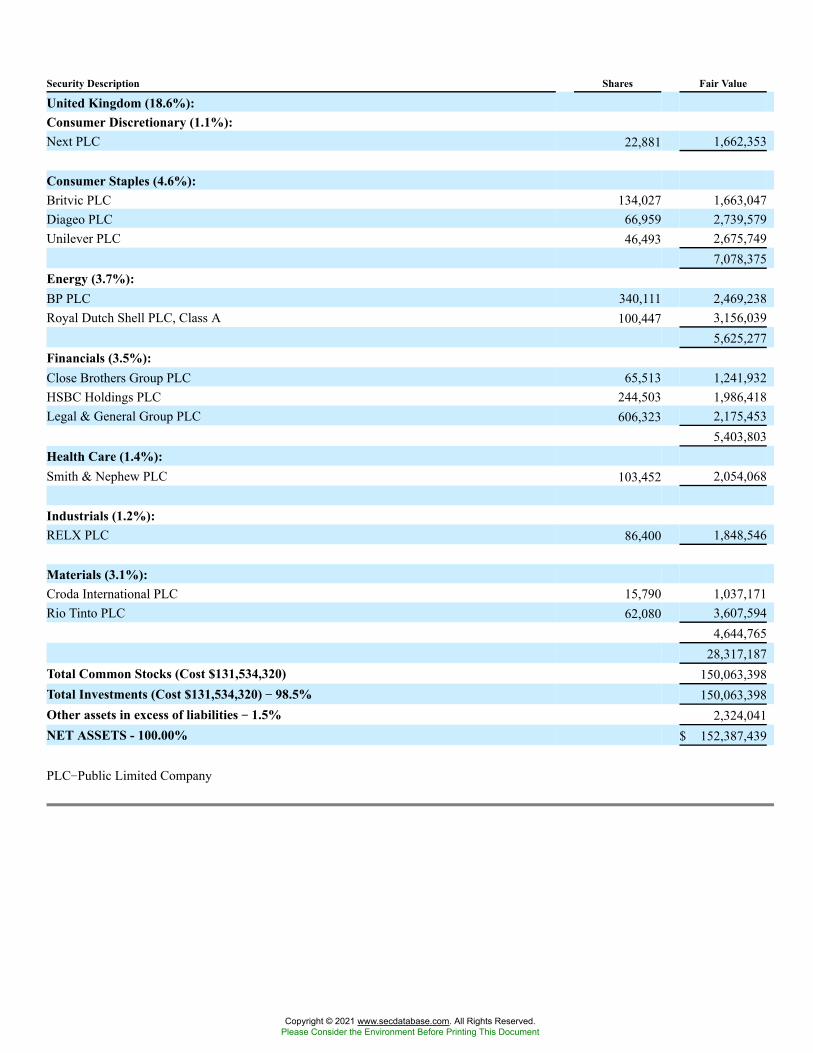
United Kingdom (18.6%):Consumer Discretionary (1.1%):Next PLC 22,881 1,662,353
Consumer Staples (4.6%):Britvic PLC 134,027 1,663,047Diageo PLC 66,959 2,739,579Unilever PLC 46,493 2,675,749
7,078,375Energy (3.7%):BP PLC 340,111 2,469,238Royal Dutch Shell PLC, Class A 100,447 3,156,039
5,625,277Financials (3.5%):Close Brothers Group PLC 65,513 1,241,932HSBC Holdings PLC 244,503 1,986,418Legal & General Group PLC 606,323 2,175,453
5,403,803Health Care (1.4%):Smith & Nephew PLC 103,452 2,054,068
Industrials (1.2%):RELX PLC 86,400 1,848,546
Materials (3.1%):Croda International PLC 15,790 1,037,171Rio Tinto PLC 62,080 3,607,594
4,644,76528,317,187
Total Common Stocks (Cost $131,534,320) 150,063,398Total Investments (Cost $131,534,320) �� 98.5% 150,063,398Other assets in excess of liabilities �� 1.5% 2,324,041NET ASSETS - 100.00% $ 152,387,439
PLC�Public Limited Company
Copyright © 2021 www.secdatabase.com. All Rights Reserved.Please Consider the Environment Before Printing This Document
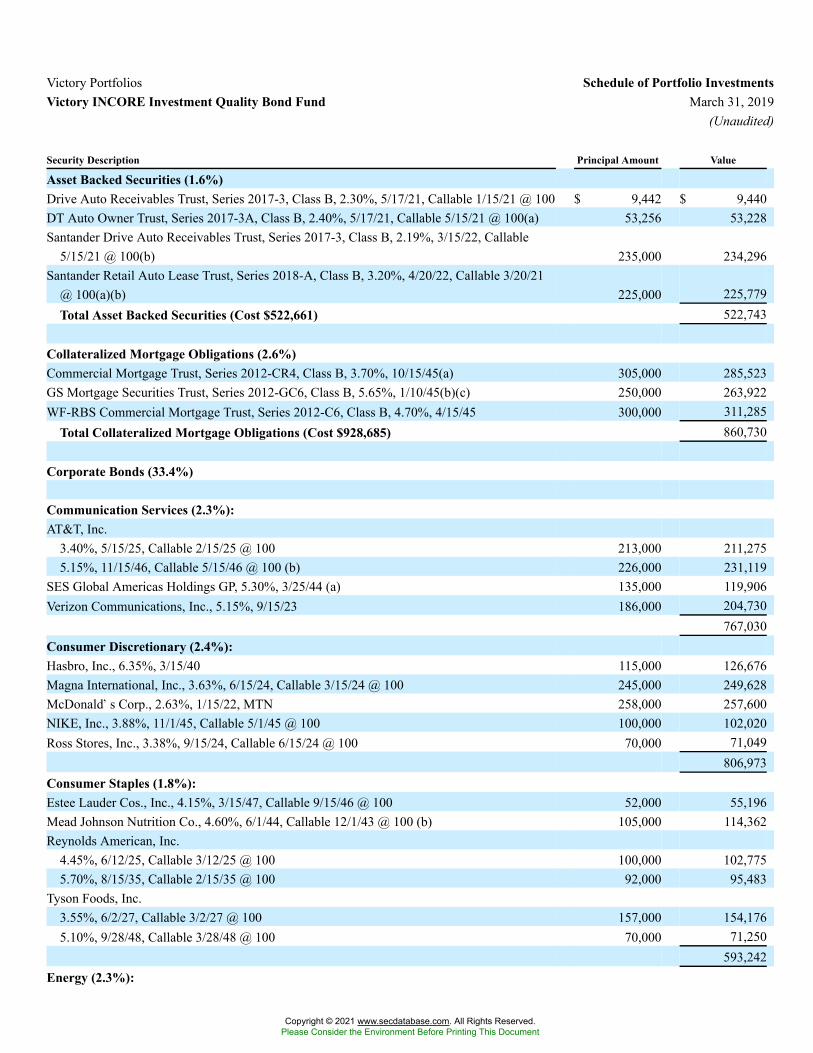
Victory Portfolios Schedule of Portfolio InvestmentsVictory INCORE Investment Quality Bond Fund March 31, 2019
(Unaudited)
Security Description Principal Amount Value
Asset Backed Securities (1.6%)Drive Auto Receivables Trust, Series 2017-3, Class B, 2.30%, 5/17/21, Callable 1/15/21 @ 100 $ 9,442 $ 9,440DT Auto Owner Trust, Series 2017-3A, Class B, 2.40%, 5/17/21, Callable 5/15/21 @ 100(a) 53,256 53,228Santander Drive Auto Receivables Trust, Series 2017-3, Class B, 2.19%, 3/15/22, Callable
5/15/21 @ 100(b) 235,000 234,296Santander Retail Auto Lease Trust, Series 2018-A, Class B, 3.20%, 4/20/22, Callable 3/20/21
@ 100(a)(b) 225,000 225,779Total Asset Backed Securities (Cost $522,661) 522,743
Collateralized Mortgage Obligations (2.6%)Commercial Mortgage Trust, Series 2012-CR4, Class B, 3.70%, 10/15/45(a) 305,000 285,523GS Mortgage Securities Trust, Series 2012-GC6, Class B, 5.65%, 1/10/45(b)(c) 250,000 263,922WF-RBS Commercial Mortgage Trust, Series 2012-C6, Class B, 4.70%, 4/15/45 300,000 311,285
Total Collateralized Mortgage Obligations (Cost $928,685) 860,730
Corporate Bonds (33.4%)
Communication Services (2.3%):AT&T, Inc.
3.40%, 5/15/25, Callable 2/15/25 @ 100 213,000 211,2755.15%, 11/15/46, Callable 5/15/46 @ 100 (b) 226,000 231,119
SES Global Americas Holdings GP, 5.30%, 3/25/44 (a) 135,000 119,906Verizon Communications, Inc., 5.15%, 9/15/23 186,000 204,730
767,030Consumer Discretionary (2.4%):Hasbro, Inc., 6.35%, 3/15/40 115,000 126,676Magna International, Inc., 3.63%, 6/15/24, Callable 3/15/24 @ 100 245,000 249,628McDonald�s Corp., 2.63%, 1/15/22, MTN 258,000 257,600NIKE, Inc., 3.88%, 11/1/45, Callable 5/1/45 @ 100 100,000 102,020Ross Stores, Inc., 3.38%, 9/15/24, Callable 6/15/24 @ 100 70,000 71,049
806,973Consumer Staples (1.8%):Estee Lauder Cos., Inc., 4.15%, 3/15/47, Callable 9/15/46 @ 100 52,000 55,196Mead Johnson Nutrition Co., 4.60%, 6/1/44, Callable 12/1/43 @ 100 (b) 105,000 114,362Reynolds American, Inc.
4.45%, 6/12/25, Callable 3/12/25 @ 100 100,000 102,7755.70%, 8/15/35, Callable 2/15/35 @ 100 92,000 95,483
Tyson Foods, Inc.3.55%, 6/2/27, Callable 3/2/27 @ 100 157,000 154,1765.10%, 9/28/48, Callable 3/28/48 @ 100 70,000 71,250
593,242Energy (2.3%):
Copyright © 2021 www.secdatabase.com. All Rights Reserved.Please Consider the Environment Before Printing This Document
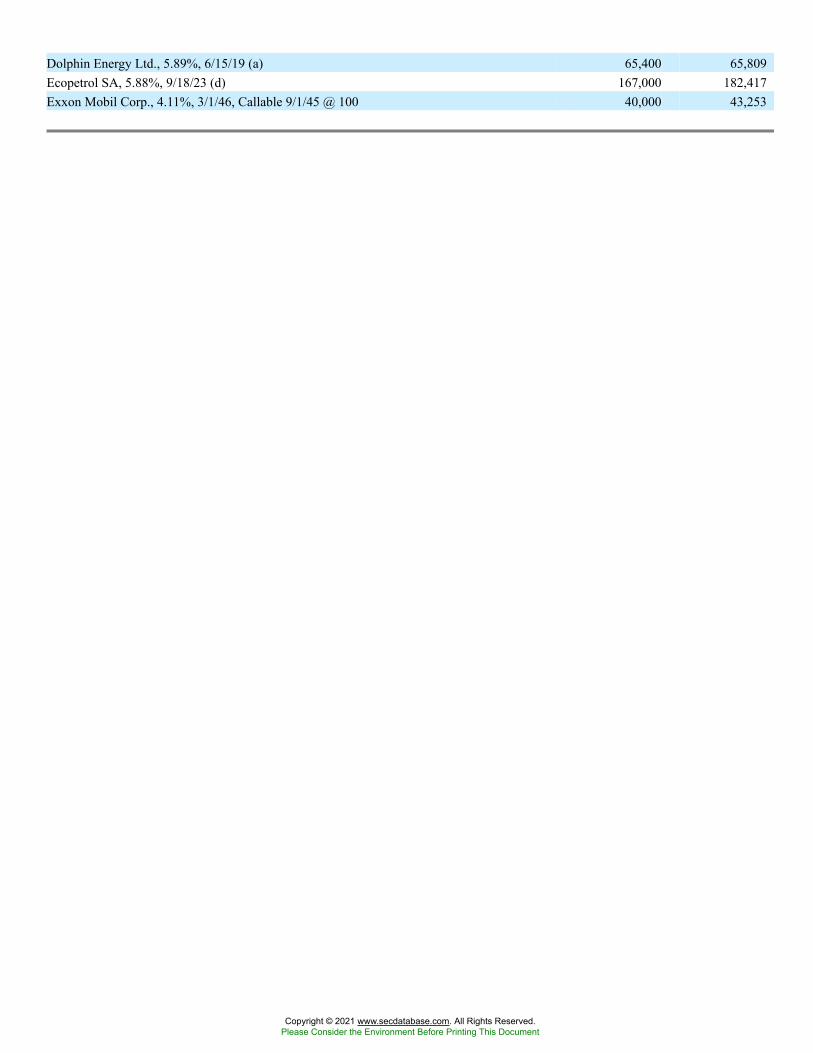
Dolphin Energy Ltd., 5.89%, 6/15/19 (a) 65,400 65,809Ecopetrol SA, 5.88%, 9/18/23 (d) 167,000 182,417Exxon Mobil Corp., 4.11%, 3/1/46, Callable 9/1/45 @ 100 40,000 43,253
Copyright © 2021 www.secdatabase.com. All Rights Reserved.Please Consider the Environment Before Printing This Document
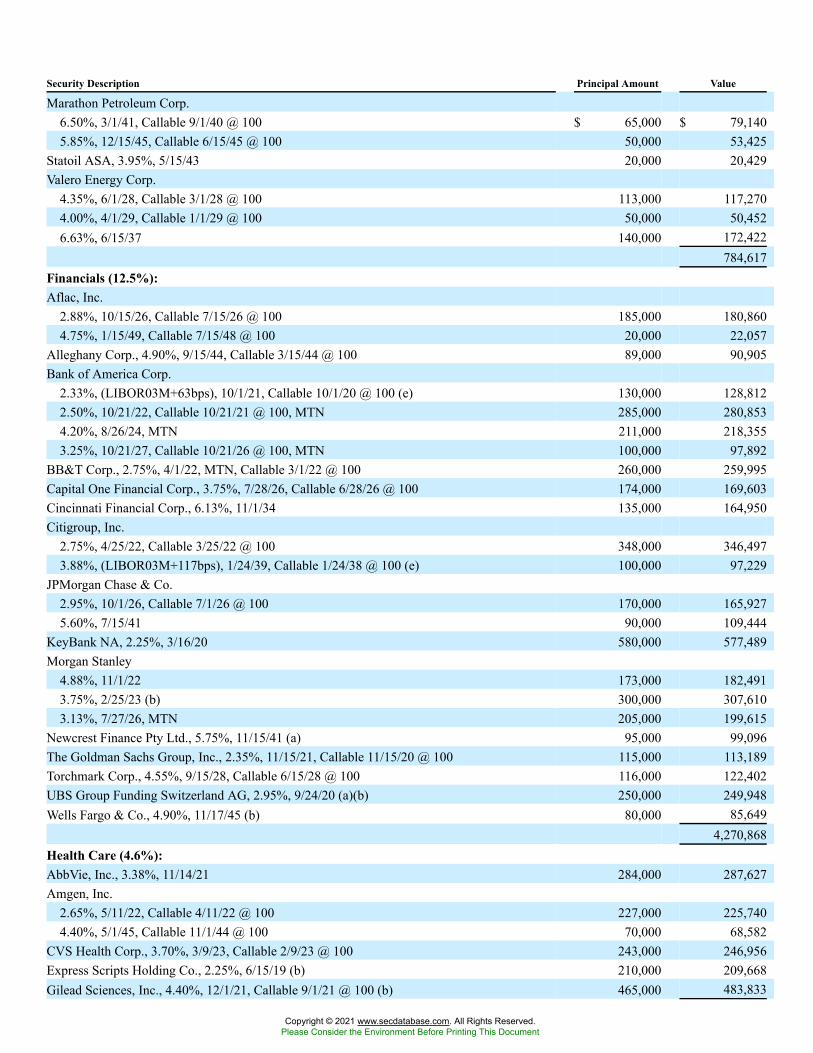
Security Description Principal Amount Value
Marathon Petroleum Corp.6.50%, 3/1/41, Callable 9/1/40 @ 100 $ 65,000 $ 79,1405.85%, 12/15/45, Callable 6/15/45 @ 100 50,000 53,425
Statoil ASA, 3.95%, 5/15/43 20,000 20,429Valero Energy Corp.
4.35%, 6/1/28, Callable 3/1/28 @ 100 113,000 117,2704.00%, 4/1/29, Callable 1/1/29 @ 100 50,000 50,4526.63%, 6/15/37 140,000 172,422
784,617Financials (12.5%):Aflac, Inc.
2.88%, 10/15/26, Callable 7/15/26 @ 100 185,000 180,8604.75%, 1/15/49, Callable 7/15/48 @ 100 20,000 22,057
Alleghany Corp., 4.90%, 9/15/44, Callable 3/15/44 @ 100 89,000 90,905Bank of America Corp.
2.33%, (LIBOR03M+63bps), 10/1/21, Callable 10/1/20 @ 100 (e) 130,000 128,8122.50%, 10/21/22, Callable 10/21/21 @ 100, MTN 285,000 280,8534.20%, 8/26/24, MTN 211,000 218,3553.25%, 10/21/27, Callable 10/21/26 @ 100, MTN 100,000 97,892
BB&T Corp., 2.75%, 4/1/22, MTN, Callable 3/1/22 @ 100 260,000 259,995Capital One Financial Corp., 3.75%, 7/28/26, Callable 6/28/26 @ 100 174,000 169,603Cincinnati Financial Corp., 6.13%, 11/1/34 135,000 164,950Citigroup, Inc.
2.75%, 4/25/22, Callable 3/25/22 @ 100 348,000 346,4973.88%, (LIBOR03M+117bps), 1/24/39, Callable 1/24/38 @ 100 (e) 100,000 97,229
JPMorgan Chase & Co.2.95%, 10/1/26, Callable 7/1/26 @ 100 170,000 165,9275.60%, 7/15/41 90,000 109,444
KeyBank NA, 2.25%, 3/16/20 580,000 577,489Morgan Stanley
4.88%, 11/1/22 173,000 182,4913.75%, 2/25/23 (b) 300,000 307,6103.13%, 7/27/26, MTN 205,000 199,615
Newcrest Finance Pty Ltd., 5.75%, 11/15/41 (a) 95,000 99,096The Goldman Sachs Group, Inc., 2.35%, 11/15/21, Callable 11/15/20 @ 100 115,000 113,189Torchmark Corp., 4.55%, 9/15/28, Callable 6/15/28 @ 100 116,000 122,402UBS Group Funding Switzerland AG, 2.95%, 9/24/20 (a)(b) 250,000 249,948Wells Fargo & Co., 4.90%, 11/17/45 (b) 80,000 85,649
4,270,868Health Care (4.6%):AbbVie, Inc., 3.38%, 11/14/21 284,000 287,627Amgen, Inc.
2.65%, 5/11/22, Callable 4/11/22 @ 100 227,000 225,7404.40%, 5/1/45, Callable 11/1/44 @ 100 70,000 68,582
CVS Health Corp., 3.70%, 3/9/23, Callable 2/9/23 @ 100 243,000 246,956Express Scripts Holding Co., 2.25%, 6/15/19 (b) 210,000 209,668Gilead Sciences, Inc., 4.40%, 12/1/21, Callable 9/1/21 @ 100 (b) 465,000 483,833
Copyright © 2021 www.secdatabase.com. All Rights Reserved.Please Consider the Environment Before Printing This Document
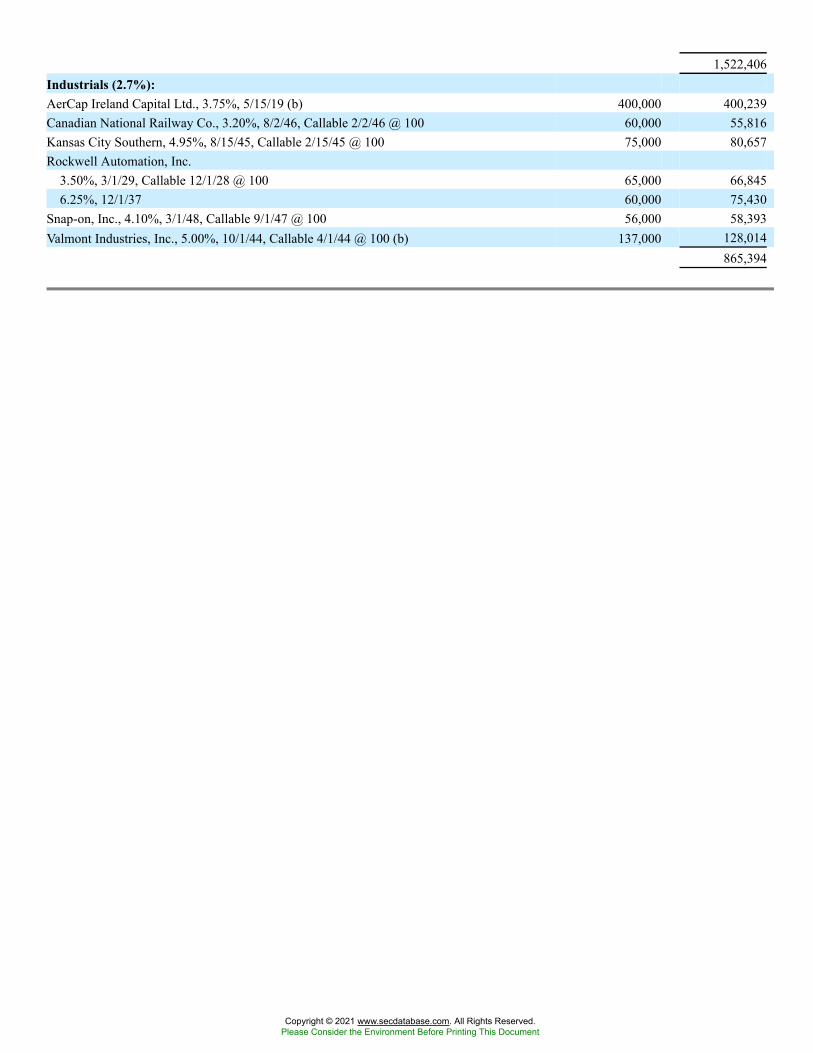
1,522,406Industrials (2.7%):AerCap Ireland Capital Ltd., 3.75%, 5/15/19 (b) 400,000 400,239Canadian National Railway Co., 3.20%, 8/2/46, Callable 2/2/46 @ 100 60,000 55,816Kansas City Southern, 4.95%, 8/15/45, Callable 2/15/45 @ 100 75,000 80,657Rockwell Automation, Inc.
3.50%, 3/1/29, Callable 12/1/28 @ 100 65,000 66,8456.25%, 12/1/37 60,000 75,430
Snap-on, Inc., 4.10%, 3/1/48, Callable 9/1/47 @ 100 56,000 58,393Valmont Industries, Inc., 5.00%, 10/1/44, Callable 4/1/44 @ 100 (b) 137,000 128,014
865,394
Copyright © 2021 www.secdatabase.com. All Rights Reserved.Please Consider the Environment Before Printing This Document
Security Description Principal Amount Value
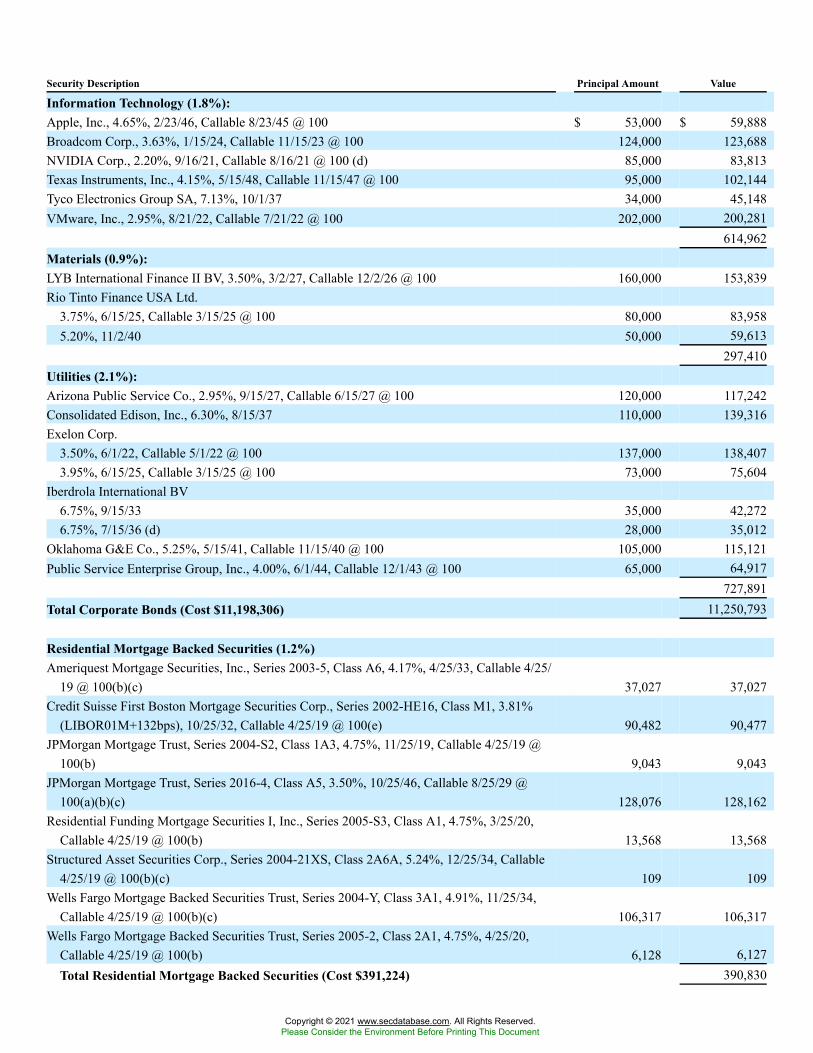
Information Technology (1.8%):Apple, Inc., 4.65%, 2/23/46, Callable 8/23/45 @ 100 $ 53,000 $ 59,888Broadcom Corp., 3.63%, 1/15/24, Callable 11/15/23 @ 100 124,000 123,688NVIDIA Corp., 2.20%, 9/16/21, Callable 8/16/21 @ 100 (d) 85,000 83,813Texas Instruments, Inc., 4.15%, 5/15/48, Callable 11/15/47 @ 100 95,000 102,144Tyco Electronics Group SA, 7.13%, 10/1/37 34,000 45,148VMware, Inc., 2.95%, 8/21/22, Callable 7/21/22 @ 100 202,000 200,281
614,962Materials (0.9%):LYB International Finance II BV, 3.50%, 3/2/27, Callable 12/2/26 @ 100 160,000 153,839Rio Tinto Finance USA Ltd.
3.75%, 6/15/25, Callable 3/15/25 @ 100 80,000 83,9585.20%, 11/2/40 50,000 59,613
297,410Utilities (2.1%):Arizona Public Service Co., 2.95%, 9/15/27, Callable 6/15/27 @ 100 120,000 117,242Consolidated Edison, Inc., 6.30%, 8/15/37 110,000 139,316Exelon Corp.
3.50%, 6/1/22, Callable 5/1/22 @ 100 137,000 138,4073.95%, 6/15/25, Callable 3/15/25 @ 100 73,000 75,604
Iberdrola International BV6.75%, 9/15/33 35,000 42,2726.75%, 7/15/36 (d) 28,000 35,012
Oklahoma G&E Co., 5.25%, 5/15/41, Callable 11/15/40 @ 100 105,000 115,121Public Service Enterprise Group, Inc., 4.00%, 6/1/44, Callable 12/1/43 @ 100 65,000 64,917
727,891Total Corporate Bonds (Cost $11,198,306) 11,250,793
Residential Mortgage Backed Securities (1.2%)Ameriquest Mortgage Securities, Inc., Series 2003-5, Class A6, 4.17%, 4/25/33, Callable 4/25/
19 @ 100(b)(c) 37,027 37,027Credit Suisse First Boston Mortgage Securities Corp., Series 2002-HE16, Class M1, 3.81%
(LIBOR01M+132bps), 10/25/32, Callable 4/25/19 @ 100(e) 90,482 90,477JPMorgan Mortgage Trust, Series 2004-S2, Class 1A3, 4.75%, 11/25/19, Callable 4/25/19 @
100(b) 9,043 9,043JPMorgan Mortgage Trust, Series 2016-4, Class A5, 3.50%, 10/25/46, Callable 8/25/29 @
100(a)(b)(c) 128,076 128,162Residential Funding Mortgage Securities I, Inc., Series 2005-S3, Class A1, 4.75%, 3/25/20,
Callable 4/25/19 @ 100(b) 13,568 13,568Structured Asset Securities Corp., Series 2004-21XS, Class 2A6A, 5.24%, 12/25/34, Callable
4/25/19 @ 100(b)(c) 109 109Wells Fargo Mortgage Backed Securities Trust, Series 2004-Y, Class 3A1, 4.91%, 11/25/34,
Callable 4/25/19 @ 100(b)(c) 106,317 106,317Wells Fargo Mortgage Backed Securities Trust, Series 2005-2, Class 2A1, 4.75%, 4/25/20,
Callable 4/25/19 @ 100(b) 6,128 6,127Total Residential Mortgage Backed Securities (Cost $391,224) 390,830
Copyright © 2021 www.secdatabase.com. All Rights Reserved.Please Consider the Environment Before Printing This Document

Copyright © 2021 www.secdatabase.com. All Rights Reserved.Please Consider the Environment Before Printing This Document
Security Description Principal Amount Value
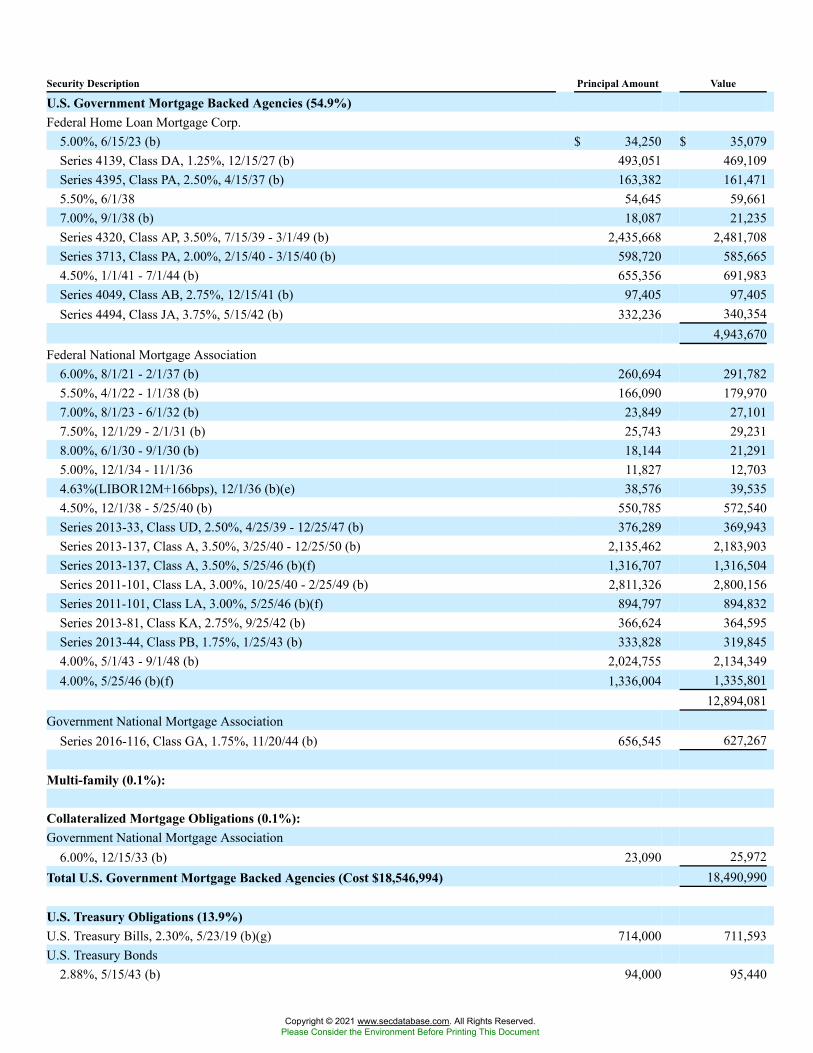
U.S. Government Mortgage Backed Agencies (54.9%)Federal Home Loan Mortgage Corp.
5.00%, 6/15/23 (b) $ 34,250 $ 35,079Series 4139, Class DA, 1.25%, 12/15/27 (b) 493,051 469,109Series 4395, Class PA, 2.50%, 4/15/37 (b) 163,382 161,4715.50%, 6/1/38 54,645 59,6617.00%, 9/1/38 (b) 18,087 21,235Series 4320, Class AP, 3.50%, 7/15/39 - 3/1/49 (b) 2,435,668 2,481,708Series 3713, Class PA, 2.00%, 2/15/40 - 3/15/40 (b) 598,720 585,6654.50%, 1/1/41 - 7/1/44 (b) 655,356 691,983Series 4049, Class AB, 2.75%, 12/15/41 (b) 97,405 97,405Series 4494, Class JA, 3.75%, 5/15/42 (b) 332,236 340,354
4,943,670Federal National Mortgage Association
6.00%, 8/1/21 - 2/1/37 (b) 260,694 291,7825.50%, 4/1/22 - 1/1/38 (b) 166,090 179,9707.00%, 8/1/23 - 6/1/32 (b) 23,849 27,1017.50%, 12/1/29 - 2/1/31 (b) 25,743 29,2318.00%, 6/1/30 - 9/1/30 (b) 18,144 21,2915.00%, 12/1/34 - 11/1/36 11,827 12,7034.63%(LIBOR12M+166bps), 12/1/36 (b)(e) 38,576 39,5354.50%, 12/1/38 - 5/25/40 (b) 550,785 572,540Series 2013-33, Class UD, 2.50%, 4/25/39 - 12/25/47 (b) 376,289 369,943Series 2013-137, Class A, 3.50%, 3/25/40 - 12/25/50 (b) 2,135,462 2,183,903Series 2013-137, Class A, 3.50%, 5/25/46 (b)(f) 1,316,707 1,316,504Series 2011-101, Class LA, 3.00%, 10/25/40 - 2/25/49 (b) 2,811,326 2,800,156Series 2011-101, Class LA, 3.00%, 5/25/46 (b)(f) 894,797 894,832Series 2013-81, Class KA, 2.75%, 9/25/42 (b) 366,624 364,595Series 2013-44, Class PB, 1.75%, 1/25/43 (b) 333,828 319,8454.00%, 5/1/43 - 9/1/48 (b) 2,024,755 2,134,3494.00%, 5/25/46 (b)(f) 1,336,004 1,335,801
12,894,081Government National Mortgage Association
Series 2016-116, Class GA, 1.75%, 11/20/44 (b) 656,545 627,267
Multi-family (0.1%):
Collateralized Mortgage Obligations (0.1%):Government National Mortgage Association
6.00%, 12/15/33 (b) 23,090 25,972Total U.S. Government Mortgage Backed Agencies (Cost $18,546,994) 18,490,990
U.S. Treasury Obligations (13.9%)U.S. Treasury Bills, 2.30%, 5/23/19 (b)(g) 714,000 711,593U.S. Treasury Bonds
2.88%, 5/15/43 (b) 94,000 95,440
Copyright © 2021 www.secdatabase.com. All Rights Reserved.Please Consider the Environment Before Printing This Document
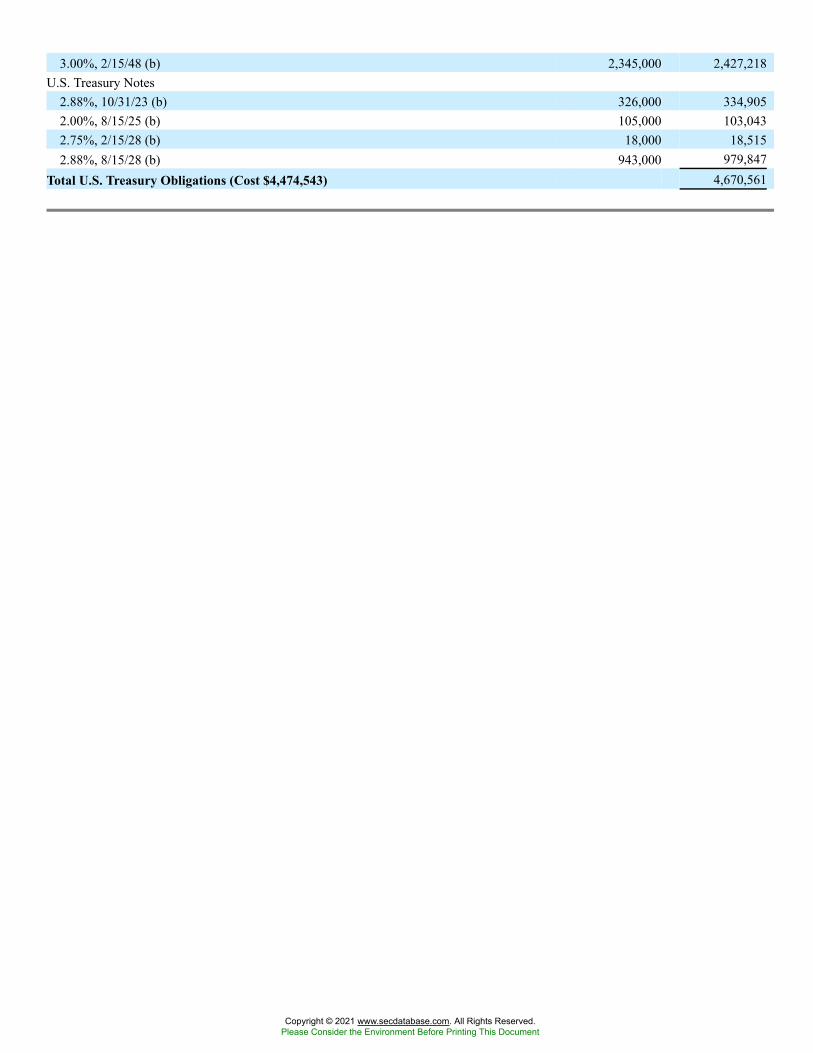
3.00%, 2/15/48 (b) 2,345,000 2,427,218U.S. Treasury Notes
2.88%, 10/31/23 (b) 326,000 334,9052.00%, 8/15/25 (b) 105,000 103,0432.75%, 2/15/28 (b) 18,000 18,5152.88%, 8/15/28 (b) 943,000 979,847
Total U.S. Treasury Obligations (Cost $4,474,543) 4,670,561
Copyright © 2021 www.secdatabase.com. All Rights Reserved.Please Consider the Environment Before Printing This Document
Security Description Shares Value
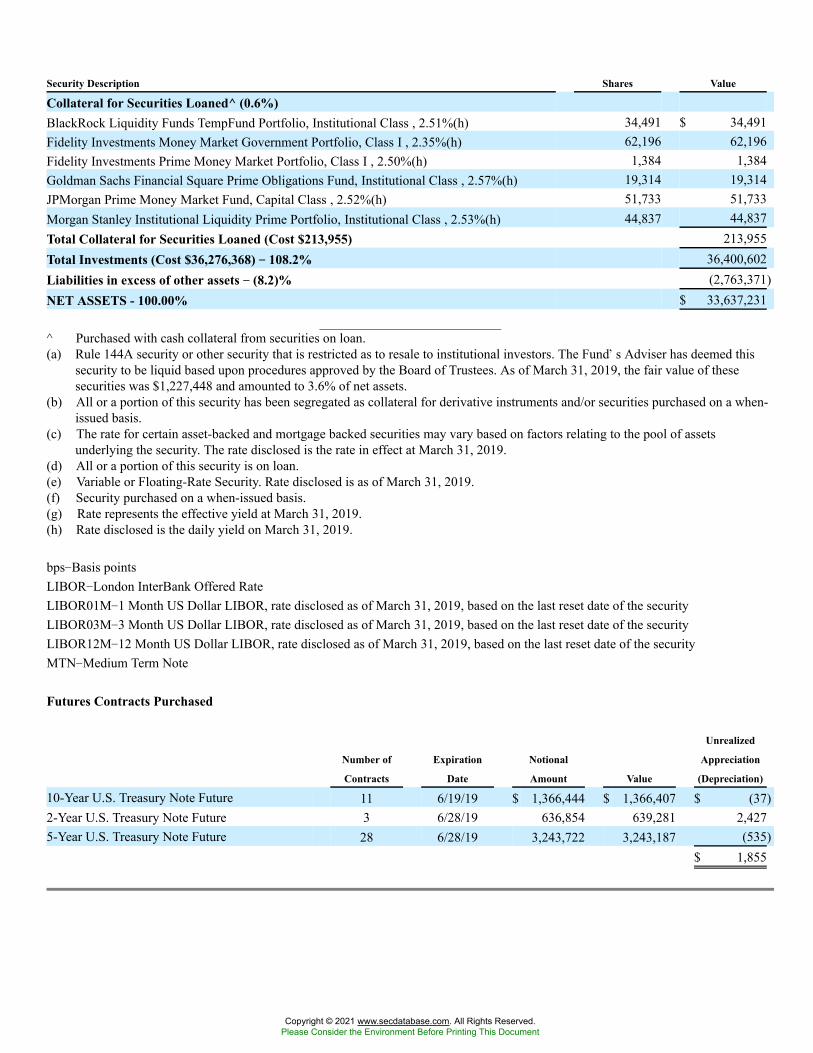
Collateral for Securities Loaned^ (0.6%)BlackRock Liquidity Funds TempFund Portfolio, Institutional Class , 2.51%(h) 34,491 $ 34,491Fidelity Investments Money Market Government Portfolio, Class I , 2.35%(h) 62,196 62,196Fidelity Investments Prime Money Market Portfolio, Class I , 2.50%(h) 1,384 1,384Goldman Sachs Financial Square Prime Obligations Fund, Institutional Class , 2.57%(h) 19,314 19,314JPMorgan Prime Money Market Fund, Capital Class , 2.52%(h) 51,733 51,733Morgan Stanley Institutional Liquidity Prime Portfolio, Institutional Class , 2.53%(h) 44,837 44,837Total Collateral for Securities Loaned (Cost $213,955) 213,955Total Investments (Cost $36,276,368) �� 108.2% 36,400,602Liabilities in excess of other assets �� (8.2)% (2,763,371)NET ASSETS - 100.00% $ 33,637,231
^ Purchased with cash collateral from securities on loan.(a) Rule 144A security or other security that is restricted as to resale to institutional investors. The Fund�s Adviser has deemed this
security to be liquid based upon procedures approved by the Board of Trustees. As of March 31, 2019, the fair value of thesesecurities was $1,227,448 and amounted to 3.6% of net assets.
(b) All or a portion of this security has been segregated as collateral for derivative instruments and/or securities purchased on a when-issued basis.
(c) The rate for certain asset-backed and mortgage backed securities may vary based on factors relating to the pool of assetsunderlying the security. The rate disclosed is the rate in effect at March 31, 2019.
(d) All or a portion of this security is on loan.(e) Variable or Floating-Rate Security. Rate disclosed is as of March 31, 2019.(f) Security purchased on a when-issued basis.(g) Rate represents the effective yield at March 31, 2019.(h) Rate disclosed is the daily yield on March 31, 2019.
bps�Basis pointsLIBOR�London InterBank Offered RateLIBOR01M�1 Month US Dollar LIBOR, rate disclosed as of March 31, 2019, based on the last reset date of the securityLIBOR03M�3 Month US Dollar LIBOR, rate disclosed as of March 31, 2019, based on the last reset date of the securityLIBOR12M�12 Month US Dollar LIBOR, rate disclosed as of March 31, 2019, based on the last reset date of the securityMTN�Medium Term Note
Futures Contracts Purchased
Number of
Contracts
Expiration
Date
Notional
Amount Value
Unrealized
Appreciation
(Depreciation)
10-Year U.S. Treasury Note Future 11 6/19/19 $ 1,366,444 $ 1,366,407 $ (37)2-Year U.S. Treasury Note Future 3 6/28/19 636,854 639,281 2,4275-Year U.S. Treasury Note Future 28 6/28/19 3,243,722 3,243,187 (535)
$ 1,855
Copyright © 2021 www.secdatabase.com. All Rights Reserved.Please Consider the Environment Before Printing This Document
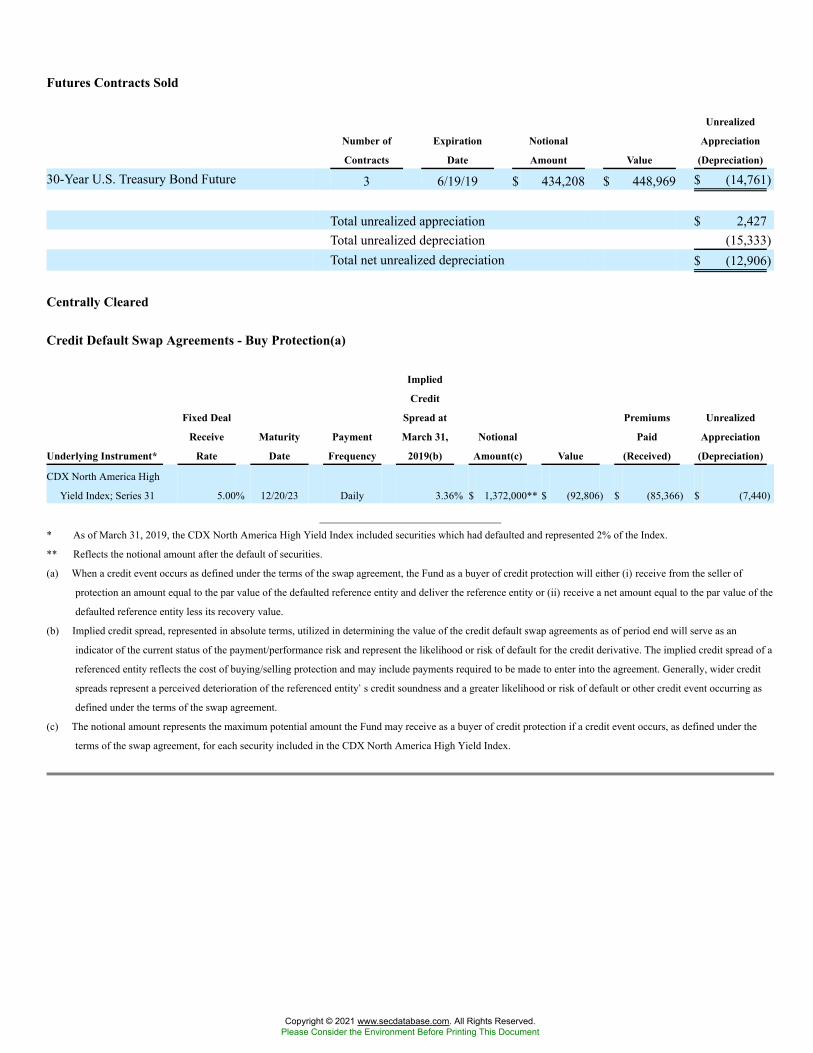
Futures Contracts Sold
Number of
Contracts
Expiration
Date
Notional
Amount Value
Unrealized
Appreciation
(Depreciation)
30-Year U.S. Treasury Bond Future 3 6/19/19 $ 434,208 $ 448,969 $ (14,761)
Total unrealized appreciation $ 2,427Total unrealized depreciation (15,333)Total net unrealized depreciation $ (12,906)
Centrally Cleared
Credit Default Swap Agreements - Buy Protection(a)
Underlying Instrument*
Fixed Deal
Receive
Rate
Maturity
Date
Payment
Frequency
Implied
Credit
Spread at
March 31,
2019(b)
Notional
Amount(c) Value
Premiums
Paid
(Received)
Unrealized
Appreciation
(Depreciation)
CDX North America High
Yield Index; Series 31 5.00% 12/20/23 Daily 3.36% $ 1,372,000** $ (92,806) $ (85,366) $ (7,440)
* As of March 31, 2019, the CDX North America High Yield Index included securities which had defaulted and represented 2% of the Index.
** Reflects the notional amount after the default of securities.
(a) When a credit event occurs as defined under the terms of the swap agreement, the Fund as a buyer of credit protection will either (i) receive from the seller of
protection an amount equal to the par value of the defaulted reference entity and deliver the reference entity or (ii) receive a net amount equal to the par value of the
defaulted reference entity less its recovery value.
(b) Implied credit spread, represented in absolute terms, utilized in determining the value of the credit default swap agreements as of period end will serve as an
indicator of the current status of the payment/performance risk and represent the likelihood or risk of default for the credit derivative. The implied credit spread of a
referenced entity reflects the cost of buying/selling protection and may include payments required to be made to enter into the agreement. Generally, wider credit
spreads represent a perceived deterioration of the referenced entity�s credit soundness and a greater likelihood or risk of default or other credit event occurring as
defined under the terms of the swap agreement.
(c) The notional amount represents the maximum potential amount the Fund may receive as a buyer of credit protection if a credit event occurs, as defined under the
terms of the swap agreement, for each security included in the CDX North America High Yield Index.
Copyright © 2021 www.secdatabase.com. All Rights Reserved.Please Consider the Environment Before Printing This Document
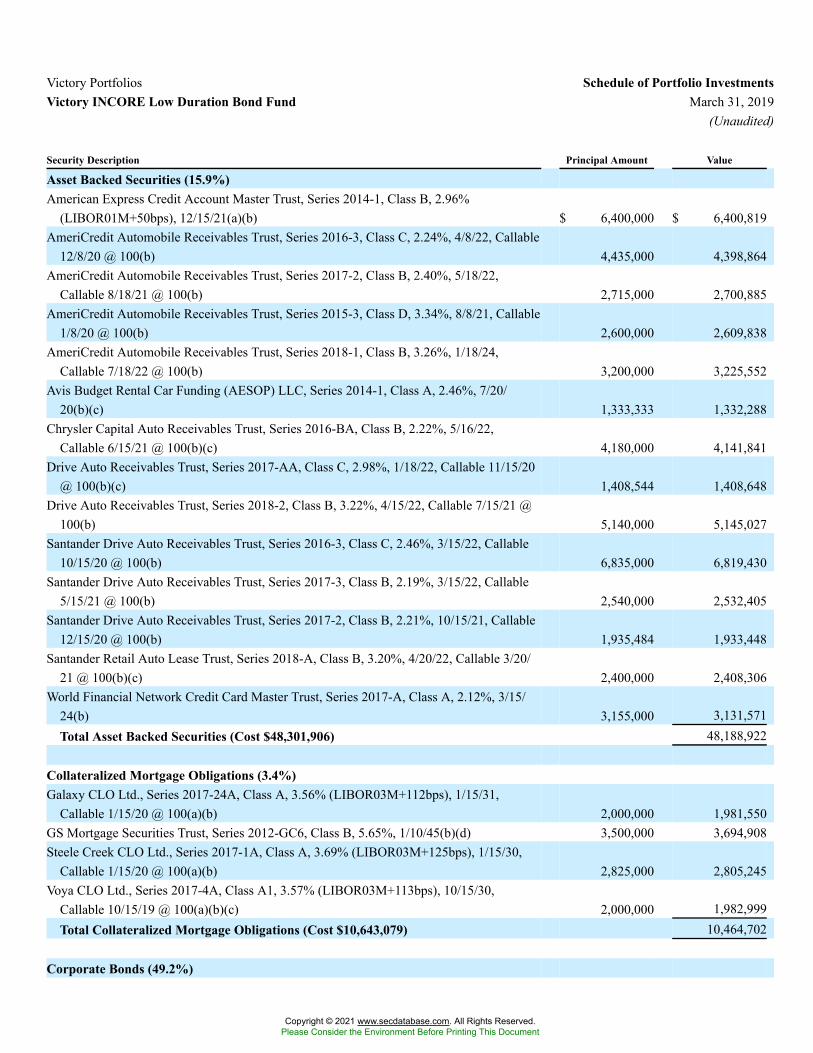
Victory Portfolios Schedule of Portfolio InvestmentsVictory INCORE Low Duration Bond Fund March 31, 2019
(Unaudited)
Security Description Principal Amount Value
Asset Backed Securities (15.9%)American Express Credit Account Master Trust, Series 2014-1, Class B, 2.96%
(LIBOR01M+50bps), 12/15/21(a)(b) $ 6,400,000 $ 6,400,819AmeriCredit Automobile Receivables Trust, Series 2016-3, Class C, 2.24%, 4/8/22, Callable
12/8/20 @ 100(b) 4,435,000 4,398,864AmeriCredit Automobile Receivables Trust, Series 2017-2, Class B, 2.40%, 5/18/22,
Callable 8/18/21 @ 100(b) 2,715,000 2,700,885AmeriCredit Automobile Receivables Trust, Series 2015-3, Class D, 3.34%, 8/8/21, Callable
1/8/20 @ 100(b) 2,600,000 2,609,838AmeriCredit Automobile Receivables Trust, Series 2018-1, Class B, 3.26%, 1/18/24,
Callable 7/18/22 @ 100(b) 3,200,000 3,225,552Avis Budget Rental Car Funding (AESOP) LLC, Series 2014-1, Class A, 2.46%, 7/20/
20(b)(c) 1,333,333 1,332,288Chrysler Capital Auto Receivables Trust, Series 2016-BA, Class B, 2.22%, 5/16/22,
Callable 6/15/21 @ 100(b)(c) 4,180,000 4,141,841Drive Auto Receivables Trust, Series 2017-AA, Class C, 2.98%, 1/18/22, Callable 11/15/20
@ 100(b)(c) 1,408,544 1,408,648Drive Auto Receivables Trust, Series 2018-2, Class B, 3.22%, 4/15/22, Callable 7/15/21 @
100(b) 5,140,000 5,145,027Santander Drive Auto Receivables Trust, Series 2016-3, Class C, 2.46%, 3/15/22, Callable
10/15/20 @ 100(b) 6,835,000 6,819,430Santander Drive Auto Receivables Trust, Series 2017-3, Class B, 2.19%, 3/15/22, Callable
5/15/21 @ 100(b) 2,540,000 2,532,405Santander Drive Auto Receivables Trust, Series 2017-2, Class B, 2.21%, 10/15/21, Callable
12/15/20 @ 100(b) 1,935,484 1,933,448Santander Retail Auto Lease Trust, Series 2018-A, Class B, 3.20%, 4/20/22, Callable 3/20/
21 @ 100(b)(c) 2,400,000 2,408,306World Financial Network Credit Card Master Trust, Series 2017-A, Class A, 2.12%, 3/15/
24(b) 3,155,000 3,131,571Total Asset Backed Securities (Cost $48,301,906) 48,188,922
Collateralized Mortgage Obligations (3.4%)Galaxy CLO Ltd., Series 2017-24A, Class A, 3.56% (LIBOR03M+112bps), 1/15/31,
Callable 1/15/20 @ 100(a)(b) 2,000,000 1,981,550GS Mortgage Securities Trust, Series 2012-GC6, Class B, 5.65%, 1/10/45(b)(d) 3,500,000 3,694,908Steele Creek CLO Ltd., Series 2017-1A, Class A, 3.69% (LIBOR03M+125bps), 1/15/30,
Callable 1/15/20 @ 100(a)(b) 2,825,000 2,805,245Voya CLO Ltd., Series 2017-4A, Class A1, 3.57% (LIBOR03M+113bps), 10/15/30,
Callable 10/15/19 @ 100(a)(b)(c) 2,000,000 1,982,999Total Collateralized Mortgage Obligations (Cost $10,643,079) 10,464,702
Corporate Bonds (49.2%)
Copyright © 2021 www.secdatabase.com. All Rights Reserved.Please Consider the Environment Before Printing This Document
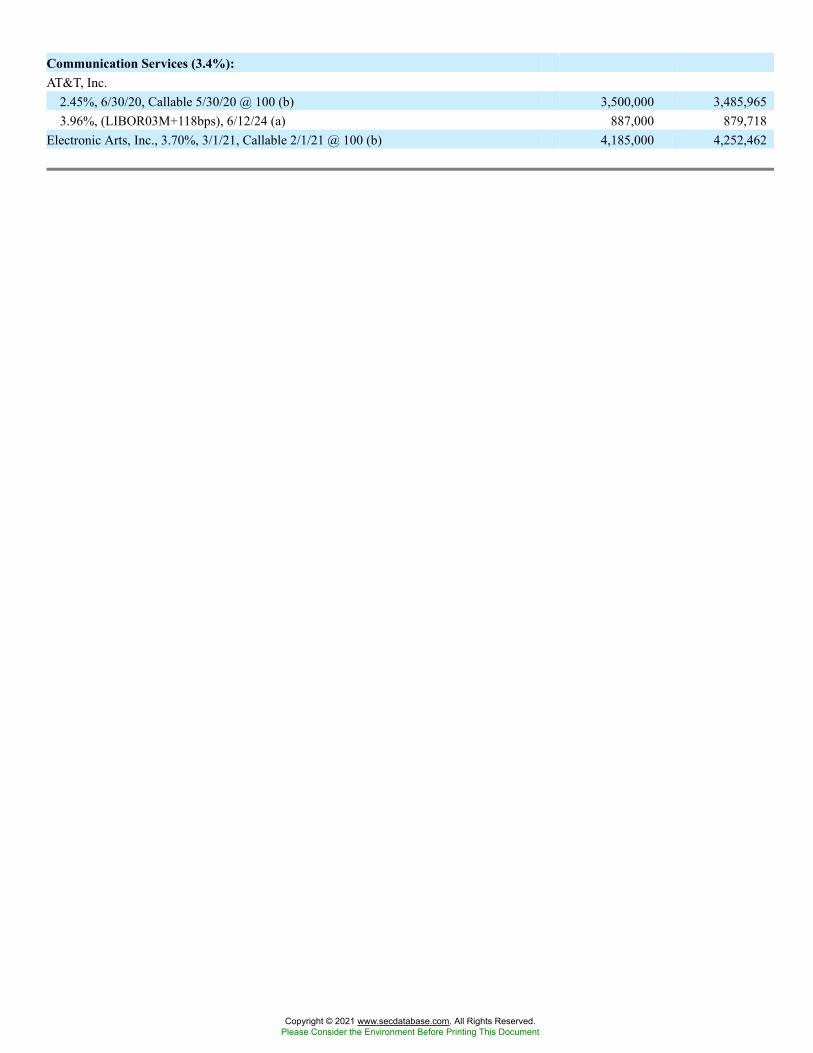
Communication Services (3.4%):AT&T, Inc.
2.45%, 6/30/20, Callable 5/30/20 @ 100 (b) 3,500,000 3,485,9653.96%, (LIBOR03M+118bps), 6/12/24 (a) 887,000 879,718
Electronic Arts, Inc., 3.70%, 3/1/21, Callable 2/1/21 @ 100 (b) 4,185,000 4,252,462
Copyright © 2021 www.secdatabase.com. All Rights Reserved.Please Consider the Environment Before Printing This Document
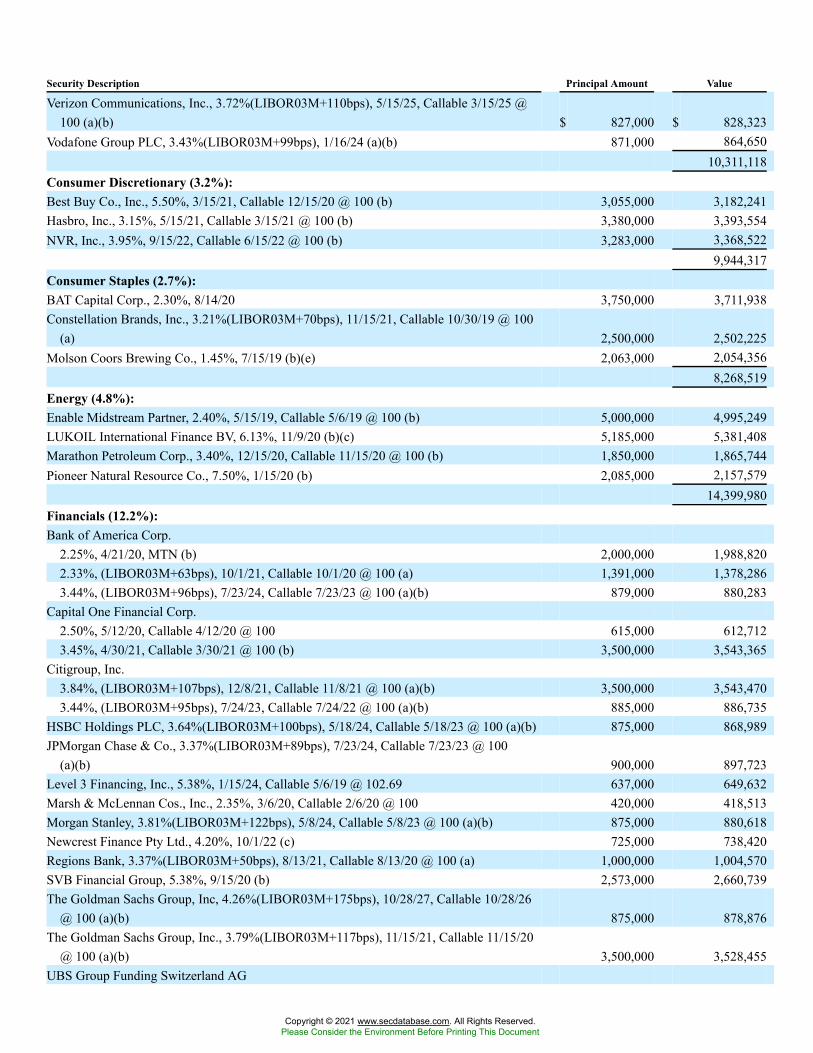
Security Description Principal Amount Value
Verizon Communications, Inc., 3.72%(LIBOR03M+110bps), 5/15/25, Callable 3/15/25 @100 (a)(b) $ 827,000 $ 828,323
Vodafone Group PLC, 3.43%(LIBOR03M+99bps), 1/16/24 (a)(b) 871,000 864,65010,311,118
Consumer Discretionary (3.2%):Best Buy Co., Inc., 5.50%, 3/15/21, Callable 12/15/20 @ 100 (b) 3,055,000 3,182,241Hasbro, Inc., 3.15%, 5/15/21, Callable 3/15/21 @ 100 (b) 3,380,000 3,393,554NVR, Inc., 3.95%, 9/15/22, Callable 6/15/22 @ 100 (b) 3,283,000 3,368,522
9,944,317Consumer Staples (2.7%):BAT Capital Corp., 2.30%, 8/14/20 3,750,000 3,711,938Constellation Brands, Inc., 3.21%(LIBOR03M+70bps), 11/15/21, Callable 10/30/19 @ 100
(a) 2,500,000 2,502,225Molson Coors Brewing Co., 1.45%, 7/15/19 (b)(e) 2,063,000 2,054,356
8,268,519Energy (4.8%):Enable Midstream Partner, 2.40%, 5/15/19, Callable 5/6/19 @ 100 (b) 5,000,000 4,995,249LUKOIL International Finance BV, 6.13%, 11/9/20 (b)(c) 5,185,000 5,381,408Marathon Petroleum Corp., 3.40%, 12/15/20, Callable 11/15/20 @ 100 (b) 1,850,000 1,865,744Pioneer Natural Resource Co., 7.50%, 1/15/20 (b) 2,085,000 2,157,579
14,399,980Financials (12.2%):Bank of America Corp.
2.25%, 4/21/20, MTN (b) 2,000,000 1,988,8202.33%, (LIBOR03M+63bps), 10/1/21, Callable 10/1/20 @ 100 (a) 1,391,000 1,378,2863.44%, (LIBOR03M+96bps), 7/23/24, Callable 7/23/23 @ 100 (a)(b) 879,000 880,283
Capital One Financial Corp.2.50%, 5/12/20, Callable 4/12/20 @ 100 615,000 612,7123.45%, 4/30/21, Callable 3/30/21 @ 100 (b) 3,500,000 3,543,365
Citigroup, Inc.3.84%, (LIBOR03M+107bps), 12/8/21, Callable 11/8/21 @ 100 (a)(b) 3,500,000 3,543,4703.44%, (LIBOR03M+95bps), 7/24/23, Callable 7/24/22 @ 100 (a)(b) 885,000 886,735
HSBC Holdings PLC, 3.64%(LIBOR03M+100bps), 5/18/24, Callable 5/18/23 @ 100 (a)(b) 875,000 868,989JPMorgan Chase & Co., 3.37%(LIBOR03M+89bps), 7/23/24, Callable 7/23/23 @ 100
(a)(b) 900,000 897,723Level 3 Financing, Inc., 5.38%, 1/15/24, Callable 5/6/19 @ 102.69 637,000 649,632Marsh & McLennan Cos., Inc., 2.35%, 3/6/20, Callable 2/6/20 @ 100 420,000 418,513Morgan Stanley, 3.81%(LIBOR03M+122bps), 5/8/24, Callable 5/8/23 @ 100 (a)(b) 875,000 880,618Newcrest Finance Pty Ltd., 4.20%, 10/1/22 (c) 725,000 738,420Regions Bank, 3.37%(LIBOR03M+50bps), 8/13/21, Callable 8/13/20 @ 100 (a) 1,000,000 1,004,570SVB Financial Group, 5.38%, 9/15/20 (b) 2,573,000 2,660,739The Goldman Sachs Group, Inc, 4.26%(LIBOR03M+175bps), 10/28/27, Callable 10/28/26
@ 100 (a)(b) 875,000 878,876The Goldman Sachs Group, Inc., 3.79%(LIBOR03M+117bps), 11/15/21, Callable 11/15/20
@ 100 (a)(b) 3,500,000 3,528,455UBS Group Funding Switzerland AG
Copyright © 2021 www.secdatabase.com. All Rights Reserved.Please Consider the Environment Before Printing This Document
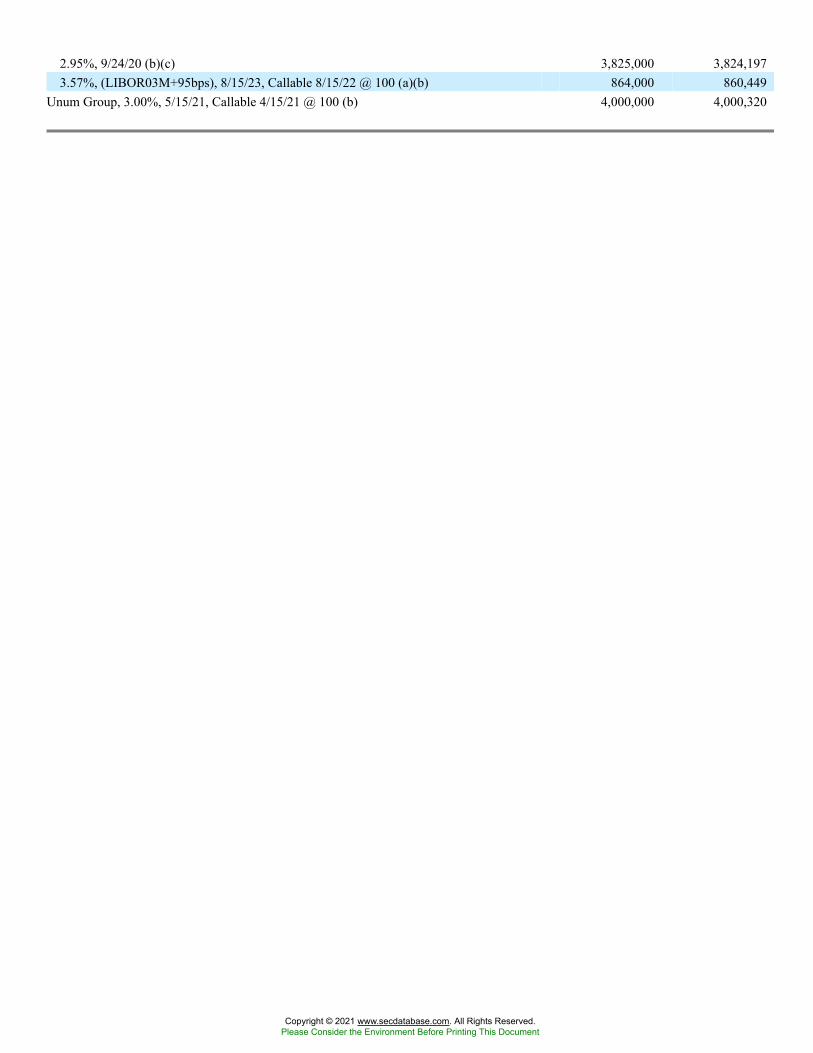
2.95%, 9/24/20 (b)(c) 3,825,000 3,824,1973.57%, (LIBOR03M+95bps), 8/15/23, Callable 8/15/22 @ 100 (a)(b) 864,000 860,449
Unum Group, 3.00%, 5/15/21, Callable 4/15/21 @ 100 (b) 4,000,000 4,000,320
Copyright © 2021 www.secdatabase.com. All Rights Reserved.Please Consider the Environment Before Printing This Document
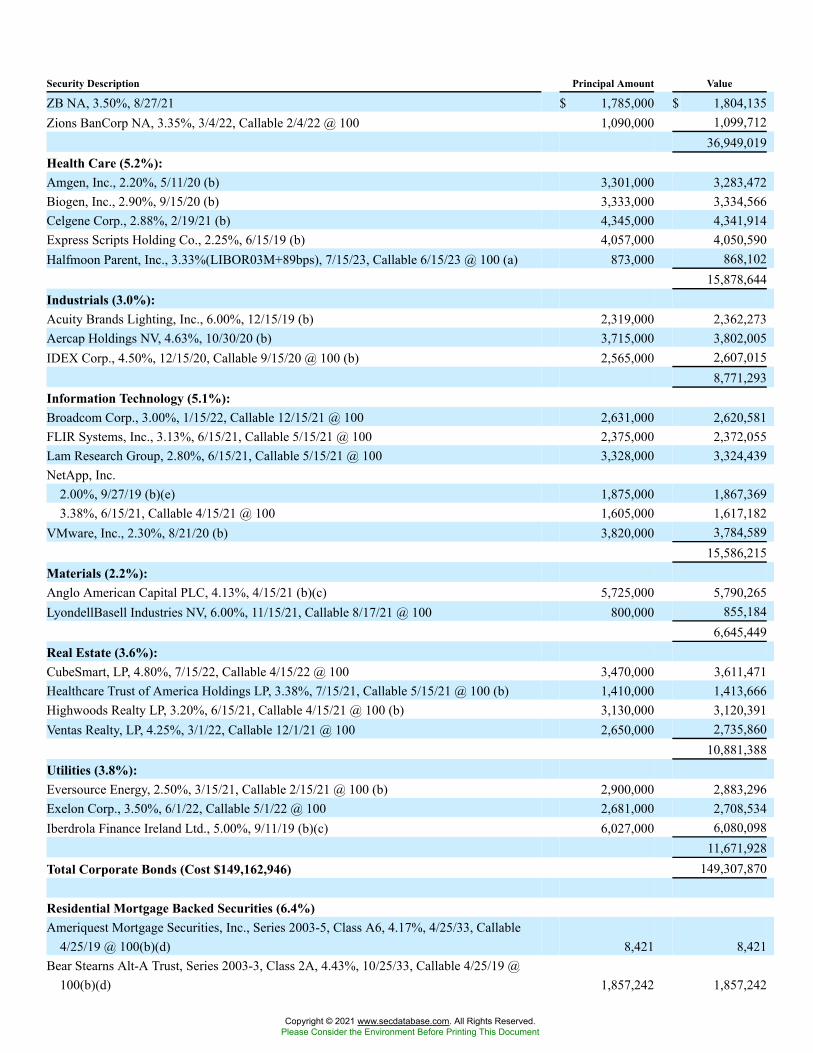
Security Description Principal Amount Value
ZB NA, 3.50%, 8/27/21 $ 1,785,000 $ 1,804,135Zions BanCorp NA, 3.35%, 3/4/22, Callable 2/4/22 @ 100 1,090,000 1,099,712
36,949,019Health Care (5.2%):Amgen, Inc., 2.20%, 5/11/20 (b) 3,301,000 3,283,472Biogen, Inc., 2.90%, 9/15/20 (b) 3,333,000 3,334,566Celgene Corp., 2.88%, 2/19/21 (b) 4,345,000 4,341,914Express Scripts Holding Co., 2.25%, 6/15/19 (b) 4,057,000 4,050,590Halfmoon Parent, Inc., 3.33%(LIBOR03M+89bps), 7/15/23, Callable 6/15/23 @ 100 (a) 873,000 868,102
15,878,644Industrials (3.0%):Acuity Brands Lighting, Inc., 6.00%, 12/15/19 (b) 2,319,000 2,362,273Aercap Holdings NV, 4.63%, 10/30/20 (b) 3,715,000 3,802,005IDEX Corp., 4.50%, 12/15/20, Callable 9/15/20 @ 100 (b) 2,565,000 2,607,015
8,771,293Information Technology (5.1%):Broadcom Corp., 3.00%, 1/15/22, Callable 12/15/21 @ 100 2,631,000 2,620,581FLIR Systems, Inc., 3.13%, 6/15/21, Callable 5/15/21 @ 100 2,375,000 2,372,055Lam Research Group, 2.80%, 6/15/21, Callable 5/15/21 @ 100 3,328,000 3,324,439NetApp, Inc.
2.00%, 9/27/19 (b)(e) 1,875,000 1,867,3693.38%, 6/15/21, Callable 4/15/21 @ 100 1,605,000 1,617,182
VMware, Inc., 2.30%, 8/21/20 (b) 3,820,000 3,784,58915,586,215
Materials (2.2%):Anglo American Capital PLC, 4.13%, 4/15/21 (b)(c) 5,725,000 5,790,265LyondellBasell Industries NV, 6.00%, 11/15/21, Callable 8/17/21 @ 100 800,000 855,184
6,645,449Real Estate (3.6%):CubeSmart, LP, 4.80%, 7/15/22, Callable 4/15/22 @ 100 3,470,000 3,611,471Healthcare Trust of America Holdings LP, 3.38%, 7/15/21, Callable 5/15/21 @ 100 (b) 1,410,000 1,413,666Highwoods Realty LP, 3.20%, 6/15/21, Callable 4/15/21 @ 100 (b) 3,130,000 3,120,391Ventas Realty, LP, 4.25%, 3/1/22, Callable 12/1/21 @ 100 2,650,000 2,735,860
10,881,388Utilities (3.8%):Eversource Energy, 2.50%, 3/15/21, Callable 2/15/21 @ 100 (b) 2,900,000 2,883,296Exelon Corp., 3.50%, 6/1/22, Callable 5/1/22 @ 100 2,681,000 2,708,534Iberdrola Finance Ireland Ltd., 5.00%, 9/11/19 (b)(c) 6,027,000 6,080,098
11,671,928Total Corporate Bonds (Cost $149,162,946) 149,307,870
Residential Mortgage Backed Securities (6.4%)Ameriquest Mortgage Securities, Inc., Series 2003-5, Class A6, 4.17%, 4/25/33, Callable
4/25/19 @ 100(b)(d) 8,421 8,421Bear Stearns Alt-A Trust, Series 2003-3, Class 2A, 4.43%, 10/25/33, Callable 4/25/19 @
100(b)(d) 1,857,242 1,857,242
Copyright © 2021 www.secdatabase.com. All Rights Reserved.Please Consider the Environment Before Printing This Document
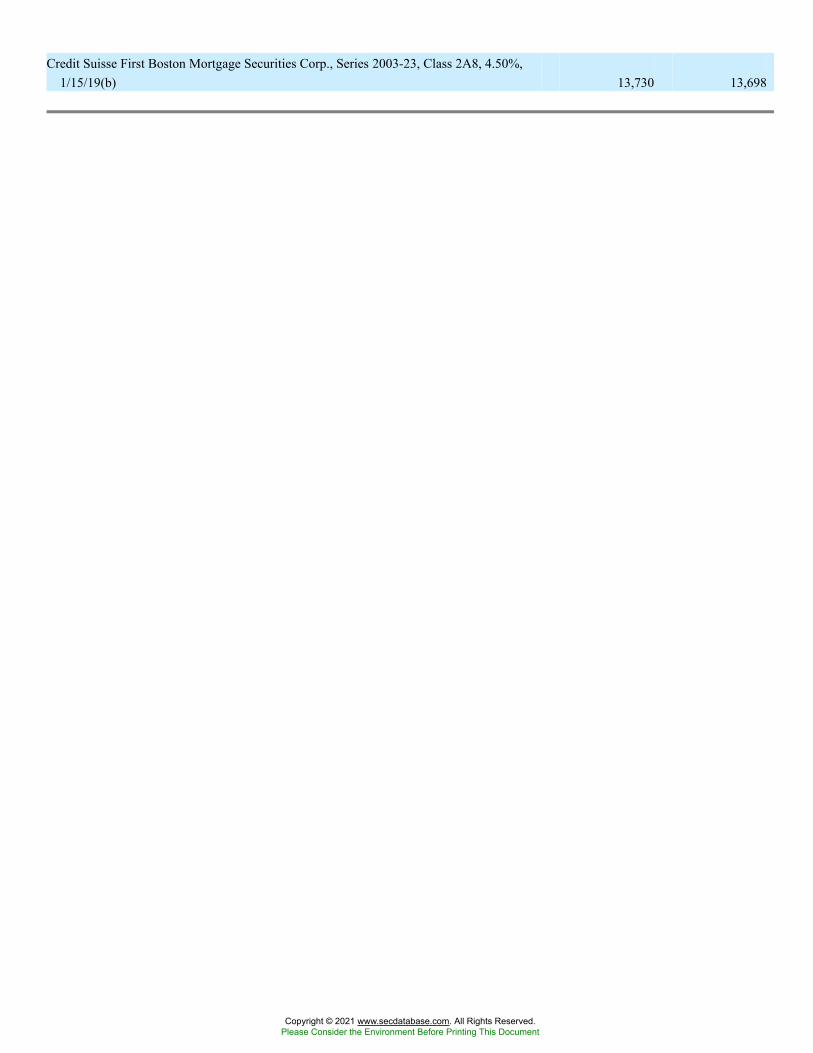
Credit Suisse First Boston Mortgage Securities Corp., Series 2003-23, Class 2A8, 4.50%,1/15/19(b) 13,730 13,698
Copyright © 2021 www.secdatabase.com. All Rights Reserved.Please Consider the Environment Before Printing This Document
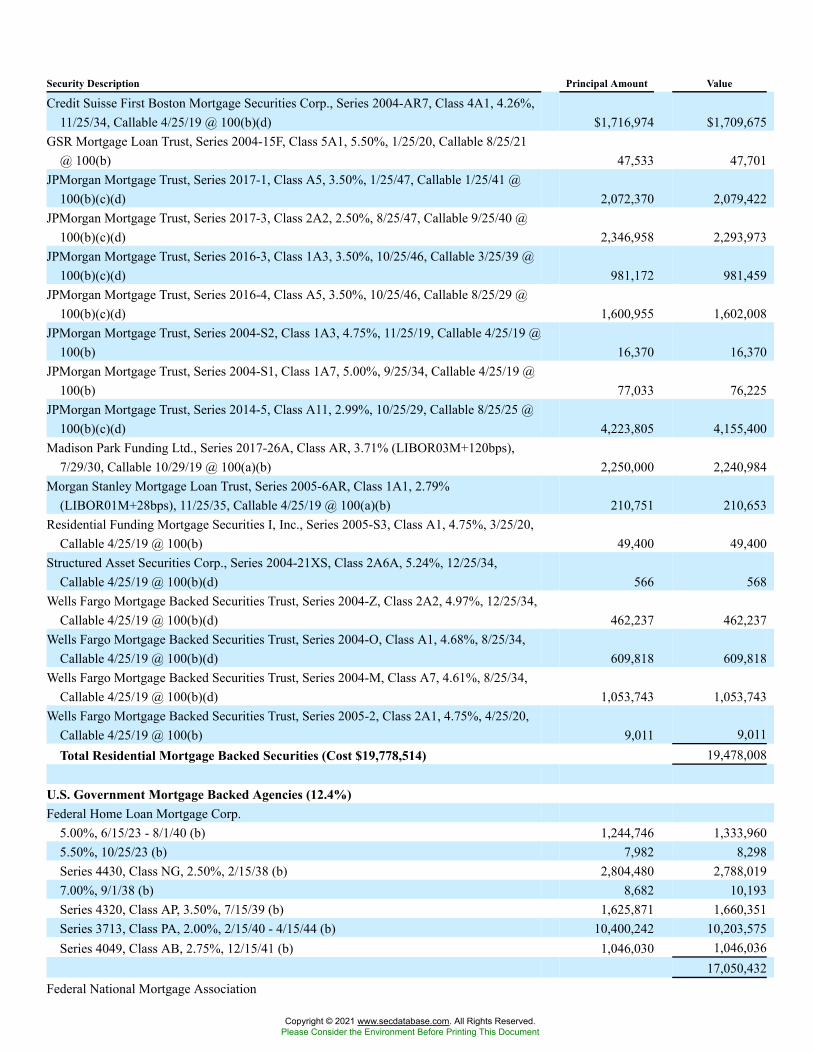
Security Description Principal Amount Value
Credit Suisse First Boston Mortgage Securities Corp., Series 2004-AR7, Class 4A1, 4.26%,11/25/34, Callable 4/25/19 @ 100(b)(d) $1,716,974 $1,709,675
GSR Mortgage Loan Trust, Series 2004-15F, Class 5A1, 5.50%, 1/25/20, Callable 8/25/21@ 100(b) 47,533 47,701
JPMorgan Mortgage Trust, Series 2017-1, Class A5, 3.50%, 1/25/47, Callable 1/25/41 @100(b)(c)(d) 2,072,370 2,079,422
JPMorgan Mortgage Trust, Series 2017-3, Class 2A2, 2.50%, 8/25/47, Callable 9/25/40 @100(b)(c)(d) 2,346,958 2,293,973
JPMorgan Mortgage Trust, Series 2016-3, Class 1A3, 3.50%, 10/25/46, Callable 3/25/39 @100(b)(c)(d) 981,172 981,459
JPMorgan Mortgage Trust, Series 2016-4, Class A5, 3.50%, 10/25/46, Callable 8/25/29 @100(b)(c)(d) 1,600,955 1,602,008
JPMorgan Mortgage Trust, Series 2004-S2, Class 1A3, 4.75%, 11/25/19, Callable 4/25/19 @100(b) 16,370 16,370
JPMorgan Mortgage Trust, Series 2004-S1, Class 1A7, 5.00%, 9/25/34, Callable 4/25/19 @100(b) 77,033 76,225
JPMorgan Mortgage Trust, Series 2014-5, Class A11, 2.99%, 10/25/29, Callable 8/25/25 @100(b)(c)(d) 4,223,805 4,155,400
Madison Park Funding Ltd., Series 2017-26A, Class AR, 3.71% (LIBOR03M+120bps),7/29/30, Callable 10/29/19 @ 100(a)(b) 2,250,000 2,240,984
Morgan Stanley Mortgage Loan Trust, Series 2005-6AR, Class 1A1, 2.79%(LIBOR01M+28bps), 11/25/35, Callable 4/25/19 @ 100(a)(b) 210,751 210,653
Residential Funding Mortgage Securities I, Inc., Series 2005-S3, Class A1, 4.75%, 3/25/20,Callable 4/25/19 @ 100(b) 49,400 49,400
Structured Asset Securities Corp., Series 2004-21XS, Class 2A6A, 5.24%, 12/25/34,Callable 4/25/19 @ 100(b)(d) 566 568
Wells Fargo Mortgage Backed Securities Trust, Series 2004-Z, Class 2A2, 4.97%, 12/25/34,Callable 4/25/19 @ 100(b)(d) 462,237 462,237
Wells Fargo Mortgage Backed Securities Trust, Series 2004-O, Class A1, 4.68%, 8/25/34,Callable 4/25/19 @ 100(b)(d) 609,818 609,818
Wells Fargo Mortgage Backed Securities Trust, Series 2004-M, Class A7, 4.61%, 8/25/34,Callable 4/25/19 @ 100(b)(d) 1,053,743 1,053,743
Wells Fargo Mortgage Backed Securities Trust, Series 2005-2, Class 2A1, 4.75%, 4/25/20,Callable 4/25/19 @ 100(b) 9,011 9,011Total Residential Mortgage Backed Securities (Cost $19,778,514) 19,478,008
U.S. Government Mortgage Backed Agencies (12.4%)Federal Home Loan Mortgage Corp.
5.00%, 6/15/23 - 8/1/40 (b) 1,244,746 1,333,9605.50%, 10/25/23 (b) 7,982 8,298Series 4430, Class NG, 2.50%, 2/15/38 (b) 2,804,480 2,788,0197.00%, 9/1/38 (b) 8,682 10,193Series 4320, Class AP, 3.50%, 7/15/39 (b) 1,625,871 1,660,351Series 3713, Class PA, 2.00%, 2/15/40 - 4/15/44 (b) 10,400,242 10,203,575Series 4049, Class AB, 2.75%, 12/15/41 (b) 1,046,030 1,046,036
17,050,432Federal National Mortgage Association
Copyright © 2021 www.secdatabase.com. All Rights Reserved.Please Consider the Environment Before Printing This Document
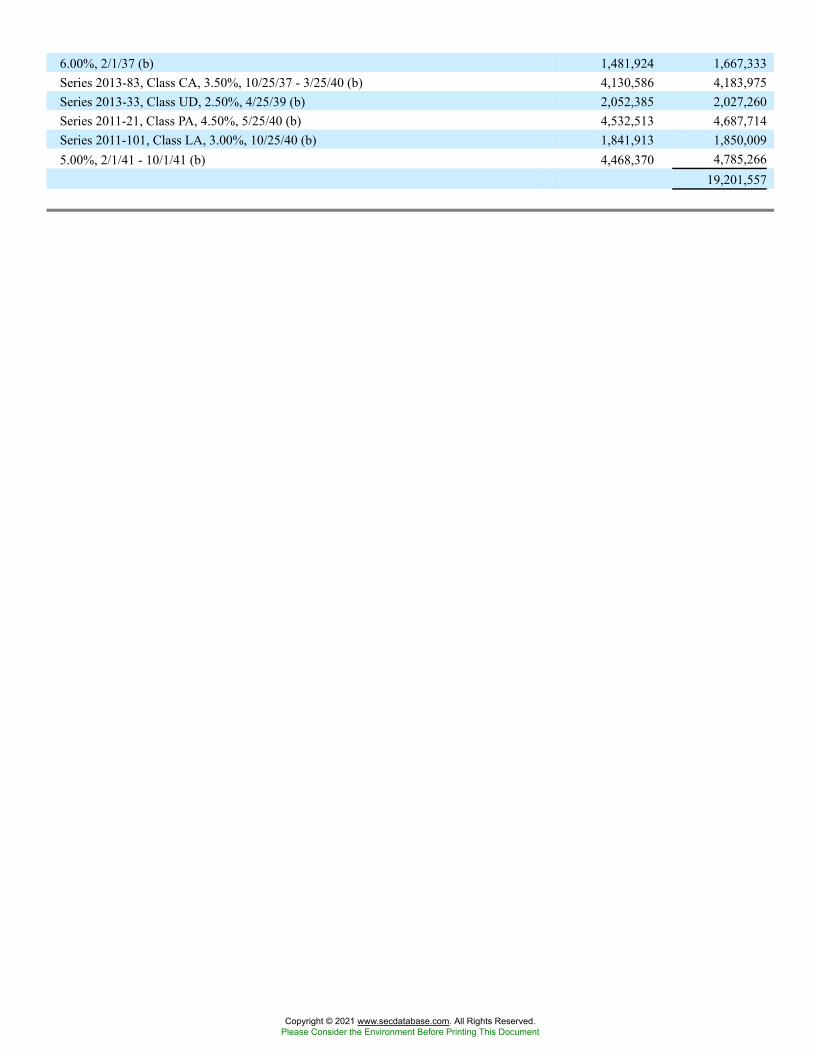
6.00%, 2/1/37 (b) 1,481,924 1,667,333Series 2013-83, Class CA, 3.50%, 10/25/37 - 3/25/40 (b) 4,130,586 4,183,975Series 2013-33, Class UD, 2.50%, 4/25/39 (b) 2,052,385 2,027,260Series 2011-21, Class PA, 4.50%, 5/25/40 (b) 4,532,513 4,687,714Series 2011-101, Class LA, 3.00%, 10/25/40 (b) 1,841,913 1,850,0095.00%, 2/1/41 - 10/1/41 (b) 4,468,370 4,785,266
19,201,557
Copyright © 2021 www.secdatabase.com. All Rights Reserved.Please Consider the Environment Before Printing This Document
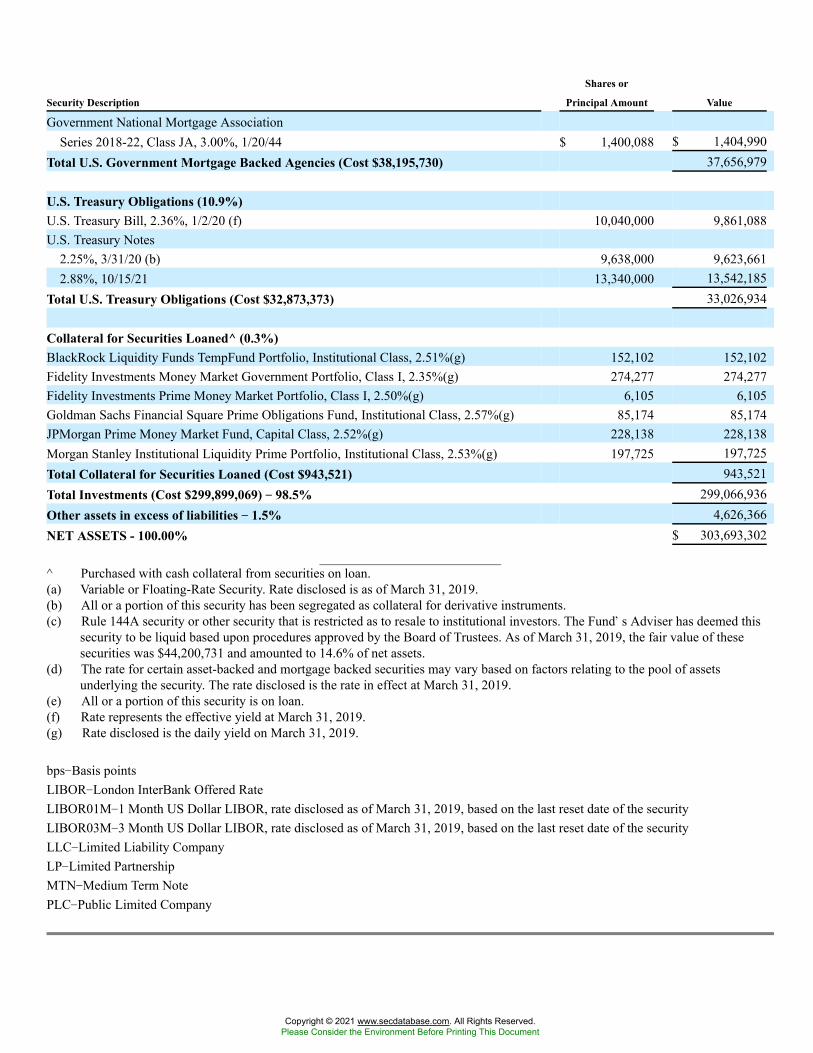
Security Description
Shares or
Principal Amount Value
Government National Mortgage AssociationSeries 2018-22, Class JA, 3.00%, 1/20/44 $ 1,400,088 $ 1,404,990
Total U.S. Government Mortgage Backed Agencies (Cost $38,195,730) 37,656,979
U.S. Treasury Obligations (10.9%)U.S. Treasury Bill, 2.36%, 1/2/20 (f) 10,040,000 9,861,088U.S. Treasury Notes
2.25%, 3/31/20 (b) 9,638,000 9,623,6612.88%, 10/15/21 13,340,000 13,542,185
Total U.S. Treasury Obligations (Cost $32,873,373) 33,026,934
Collateral for Securities Loaned^ (0.3%)BlackRock Liquidity Funds TempFund Portfolio, Institutional Class, 2.51%(g) 152,102 152,102Fidelity Investments Money Market Government Portfolio, Class I, 2.35%(g) 274,277 274,277Fidelity Investments Prime Money Market Portfolio, Class I, 2.50%(g) 6,105 6,105Goldman Sachs Financial Square Prime Obligations Fund, Institutional Class, 2.57%(g) 85,174 85,174JPMorgan Prime Money Market Fund, Capital Class, 2.52%(g) 228,138 228,138Morgan Stanley Institutional Liquidity Prime Portfolio, Institutional Class, 2.53%(g) 197,725 197,725Total Collateral for Securities Loaned (Cost $943,521) 943,521Total Investments (Cost $299,899,069) �� 98.5% 299,066,936Other assets in excess of liabilities �� 1.5% 4,626,366NET ASSETS - 100.00% $ 303,693,302
^ Purchased with cash collateral from securities on loan.(a) Variable or Floating-Rate Security. Rate disclosed is as of March 31, 2019.(b) All or a portion of this security has been segregated as collateral for derivative instruments.(c) Rule 144A security or other security that is restricted as to resale to institutional investors. The Fund�s Adviser has deemed this
security to be liquid based upon procedures approved by the Board of Trustees. As of March 31, 2019, the fair value of thesesecurities was $44,200,731 and amounted to 14.6% of net assets.
(d) The rate for certain asset-backed and mortgage backed securities may vary based on factors relating to the pool of assetsunderlying the security. The rate disclosed is the rate in effect at March 31, 2019.
(e) All or a portion of this security is on loan.(f) Rate represents the effective yield at March 31, 2019.(g) Rate disclosed is the daily yield on March 31, 2019.
bps�Basis pointsLIBOR�London InterBank Offered RateLIBOR01M�1 Month US Dollar LIBOR, rate disclosed as of March 31, 2019, based on the last reset date of the securityLIBOR03M�3 Month US Dollar LIBOR, rate disclosed as of March 31, 2019, based on the last reset date of the securityLLC�Limited Liability CompanyLP�Limited PartnershipMTN�Medium Term NotePLC�Public Limited Company
Copyright © 2021 www.secdatabase.com. All Rights Reserved.Please Consider the Environment Before Printing This Document
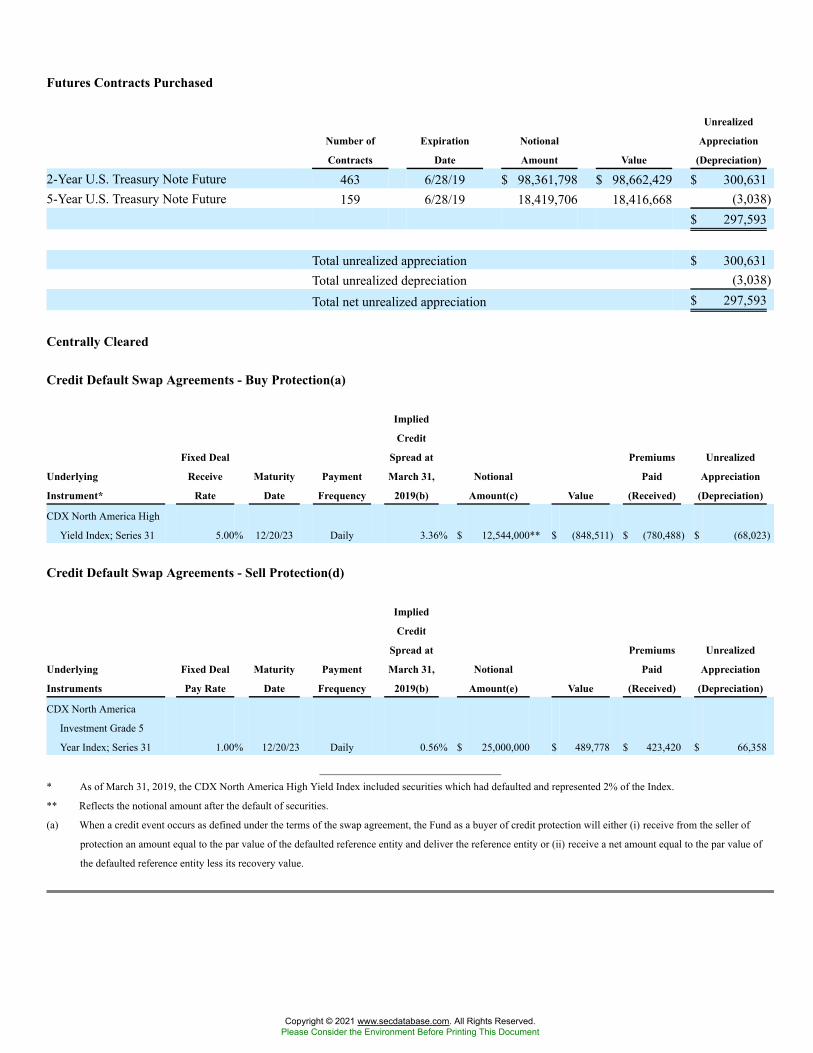
Futures Contracts Purchased
Number of
Contracts
Expiration
Date
Notional
Amount Value
Unrealized
Appreciation
(Depreciation)
2-Year U.S. Treasury Note Future 463 6/28/19 $ 98,361,798 $ 98,662,429 $ 300,6315-Year U.S. Treasury Note Future 159 6/28/19 18,419,706 18,416,668 (3,038)
$ 297,593
Total unrealized appreciation $ 300,631Total unrealized depreciation (3,038)Total net unrealized appreciation $ 297,593
Centrally Cleared
Credit Default Swap Agreements - Buy Protection(a)
Underlying
Instrument*
Fixed Deal
Receive
Rate
Maturity
Date
Payment
Frequency
Implied
Credit
Spread at
March 31,
2019(b)
Notional
Amount(c) Value
Premiums
Paid
(Received)
Unrealized
Appreciation
(Depreciation)
CDX North America High
Yield Index; Series 31 5.00% 12/20/23 Daily 3.36% $ 12,544,000** $ (848,511) $ (780,488) $ (68,023)
Credit Default Swap Agreements - Sell Protection(d)
Underlying
Instruments
Fixed Deal
Pay Rate
Maturity
Date
Payment
Frequency
Implied
Credit
Spread at
March 31,
2019(b)
Notional
Amount(e) Value
Premiums
Paid
(Received)
Unrealized
Appreciation
(Depreciation)
CDX North America
Investment Grade 5
Year Index; Series 31 1.00% 12/20/23 Daily 0.56% $ 25,000,000 $ 489,778 $ 423,420 $ 66,358
* As of March 31, 2019, the CDX North America High Yield Index included securities which had defaulted and represented 2% of the Index.
** Reflects the notional amount after the default of securities.
(a) When a credit event occurs as defined under the terms of the swap agreement, the Fund as a buyer of credit protection will either (i) receive from the seller of
protection an amount equal to the par value of the defaulted reference entity and deliver the reference entity or (ii) receive a net amount equal to the par value of
the defaulted reference entity less its recovery value.
Copyright © 2021 www.secdatabase.com. All Rights Reserved.Please Consider the Environment Before Printing This Document
(b) Implied credit spread, represented in absolute terms, utilized in determining the value of the credit default swap agreements as ofperiod end will serve as an indicator of the current status of the payment/performance risk and represent the likelihood or risk ofdefault for the credit derivative. The implied credit spread of a referenced entity reflects the cost of buying/selling protection andmay include payments required to be made to enter into the agreement. Generally, wider credit spreads represent a perceiveddeterioration of the referenced entity�s credit soundness and a greater likelihood or risk of default or other credit event occurringas defined under the terms of the swap agreement.
(c) The notional amount represents the maximum potential amount the Fund may receive as a buyer of credit protection if a creditevent occurs, as defined under the terms of the swap agreement, for each security included in the CDX North America High YieldIndex.
(d) When a credit event occurs as defined under the terms of the swap agreement, the Fund as a seller of credit protection will either(i) pay to the buyer of protection an amount equal to the par value of the defaulted reference entity and take delivery of thereference entity or (ii) pay a net amount equal to the par value of the defaulted reference entity less its recovery value.
(e) The notional amount represents the maximum potential amount the Fund could be required to pay as a seller of credit protectionif a credit event occurs, as defined under the terms of the swap agreement, for each security included in the CDX North AmericaInvestment Grade 5 Year Index.
Copyright © 2021 www.secdatabase.com. All Rights Reserved.Please Consider the Environment Before Printing This Document
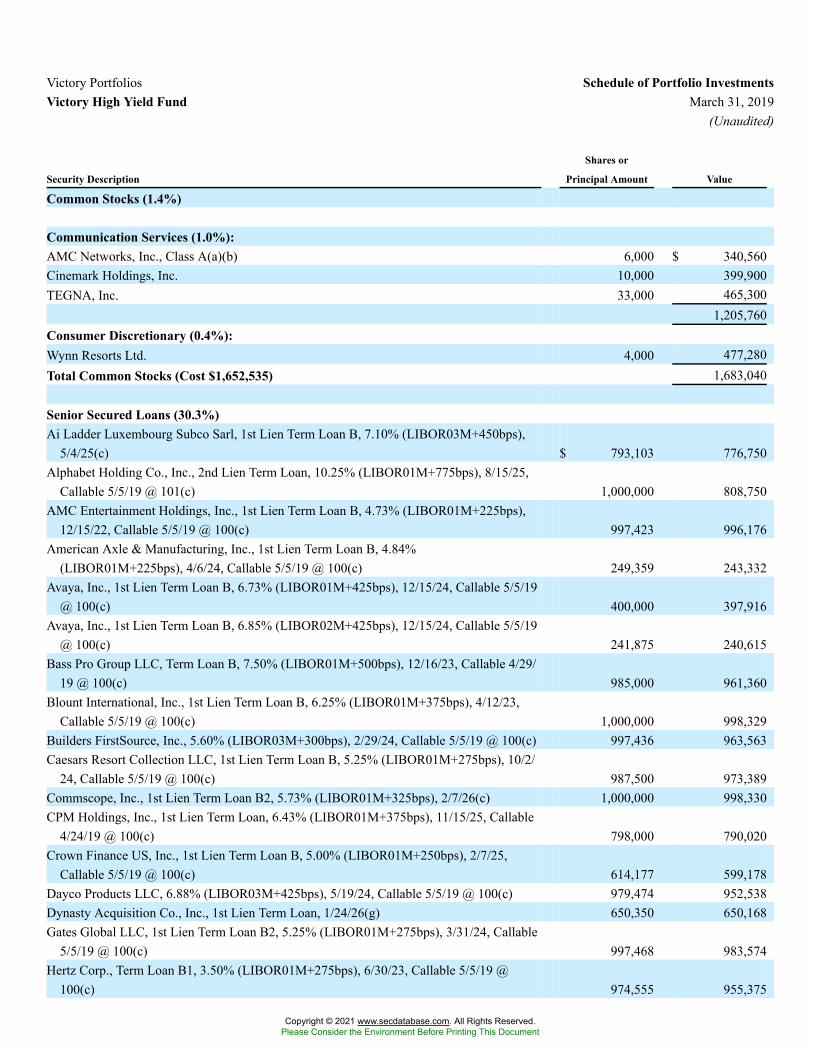
Victory Portfolios Schedule of Portfolio InvestmentsVictory High Yield Fund March 31, 2019
(Unaudited)
Security Description
Shares or
Principal Amount Value
Common Stocks (1.4%)
Communication Services (1.0%):AMC Networks, Inc., Class A(a)(b) 6,000 $ 340,560Cinemark Holdings, Inc. 10,000 399,900TEGNA, Inc. 33,000 465,300
1,205,760Consumer Discretionary (0.4%):Wynn Resorts Ltd. 4,000 477,280Total Common Stocks (Cost $1,652,535) 1,683,040
Senior Secured Loans (30.3%)Ai Ladder Luxembourg Subco Sarl, 1st Lien Term Loan B, 7.10% (LIBOR03M+450bps),
5/4/25(c) $ 793,103 776,750Alphabet Holding Co., Inc., 2nd Lien Term Loan, 10.25% (LIBOR01M+775bps), 8/15/25,
Callable 5/5/19 @ 101(c) 1,000,000 808,750AMC Entertainment Holdings, Inc., 1st Lien Term Loan B, 4.73% (LIBOR01M+225bps),
12/15/22, Callable 5/5/19 @ 100(c) 997,423 996,176American Axle & Manufacturing, Inc., 1st Lien Term Loan B, 4.84%
(LIBOR01M+225bps), 4/6/24, Callable 5/5/19 @ 100(c) 249,359 243,332Avaya, Inc., 1st Lien Term Loan B, 6.73% (LIBOR01M+425bps), 12/15/24, Callable 5/5/19
@ 100(c) 400,000 397,916Avaya, Inc., 1st Lien Term Loan B, 6.85% (LIBOR02M+425bps), 12/15/24, Callable 5/5/19
@ 100(c) 241,875 240,615Bass Pro Group LLC, Term Loan B, 7.50% (LIBOR01M+500bps), 12/16/23, Callable 4/29/
19 @ 100(c) 985,000 961,360Blount International, Inc., 1st Lien Term Loan B, 6.25% (LIBOR01M+375bps), 4/12/23,
Callable 5/5/19 @ 100(c) 1,000,000 998,329Builders FirstSource, Inc., 5.60% (LIBOR03M+300bps), 2/29/24, Callable 5/5/19 @ 100(c) 997,436 963,563Caesars Resort Collection LLC, 1st Lien Term Loan B, 5.25% (LIBOR01M+275bps), 10/2/
24, Callable 5/5/19 @ 100(c) 987,500 973,389Commscope, Inc., 1st Lien Term Loan B2, 5.73% (LIBOR01M+325bps), 2/7/26(c) 1,000,000 998,330CPM Holdings, Inc., 1st Lien Term Loan, 6.43% (LIBOR01M+375bps), 11/15/25, Callable
4/24/19 @ 100(c) 798,000 790,020Crown Finance US, Inc., 1st Lien Term Loan B, 5.00% (LIBOR01M+250bps), 2/7/25,
Callable 5/5/19 @ 100(c) 614,177 599,178Dayco Products LLC, 6.88% (LIBOR03M+425bps), 5/19/24, Callable 5/5/19 @ 100(c) 979,474 952,538Dynasty Acquisition Co., Inc., 1st Lien Term Loan, 1/24/26(g) 650,350 650,168Gates Global LLC, 1st Lien Term Loan B2, 5.25% (LIBOR01M+275bps), 3/31/24, Callable
5/5/19 @ 100(c) 997,468 983,574Hertz Corp., Term Loan B1, 3.50% (LIBOR01M+275bps), 6/30/23, Callable 5/5/19 @
100(c) 974,555 955,375
Copyright © 2021 www.secdatabase.com. All Rights Reserved.Please Consider the Environment Before Printing This Document
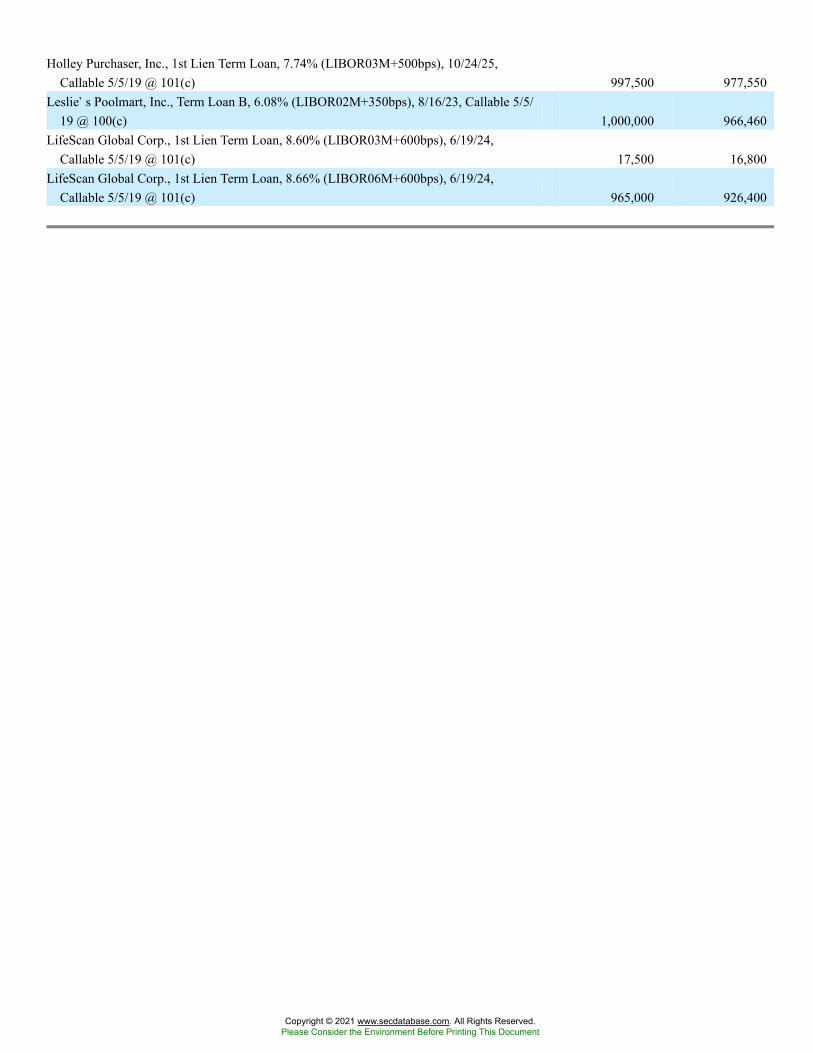
Holley Purchaser, Inc., 1st Lien Term Loan, 7.74% (LIBOR03M+500bps), 10/24/25,Callable 5/5/19 @ 101(c) 997,500 977,550
Leslie�s Poolmart, Inc., Term Loan B, 6.08% (LIBOR02M+350bps), 8/16/23, Callable 5/5/19 @ 100(c) 1,000,000 966,460
LifeScan Global Corp., 1st Lien Term Loan, 8.60% (LIBOR03M+600bps), 6/19/24,Callable 5/5/19 @ 101(c) 17,500 16,800
LifeScan Global Corp., 1st Lien Term Loan, 8.66% (LIBOR06M+600bps), 6/19/24,Callable 5/5/19 @ 101(c) 965,000 926,400
Copyright © 2021 www.secdatabase.com. All Rights Reserved.Please Consider the Environment Before Printing This Document
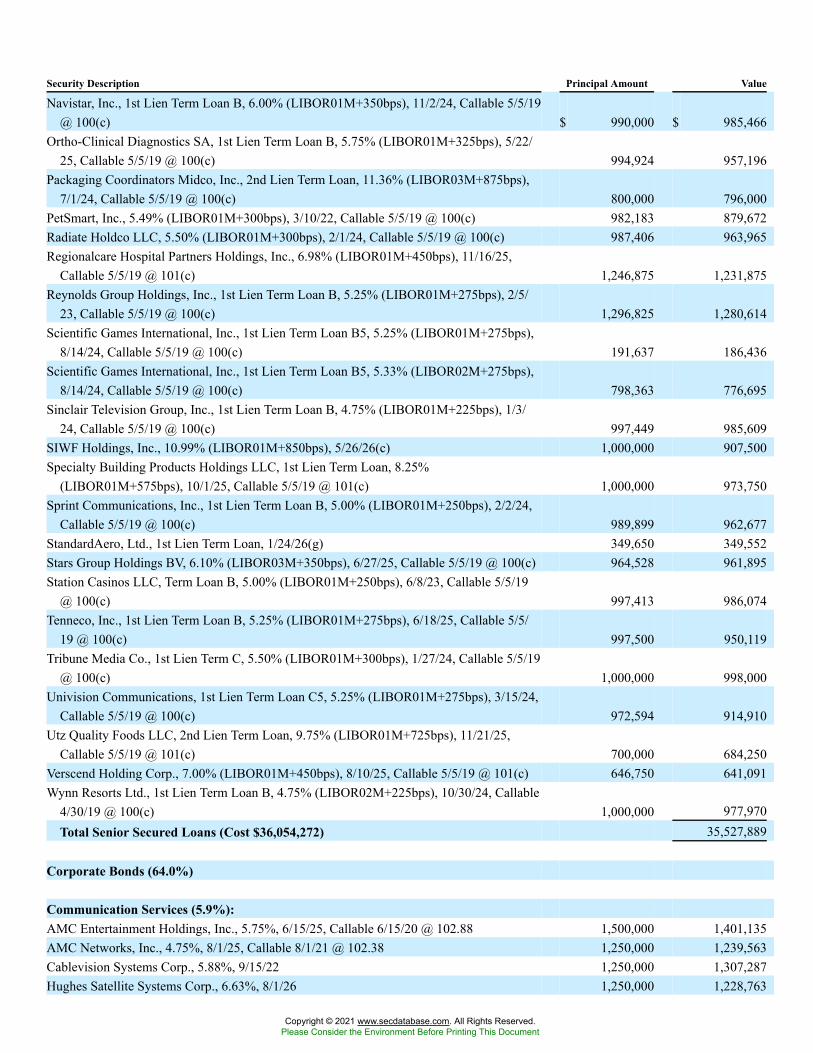
Security Description Principal Amount Value
Navistar, Inc., 1st Lien Term Loan B, 6.00% (LIBOR01M+350bps), 11/2/24, Callable 5/5/19@ 100(c) $ 990,000 $ 985,466
Ortho-Clinical Diagnostics SA, 1st Lien Term Loan B, 5.75% (LIBOR01M+325bps), 5/22/25, Callable 5/5/19 @ 100(c) 994,924 957,196
Packaging Coordinators Midco, Inc., 2nd Lien Term Loan, 11.36% (LIBOR03M+875bps),7/1/24, Callable 5/5/19 @ 100(c) 800,000 796,000
PetSmart, Inc., 5.49% (LIBOR01M+300bps), 3/10/22, Callable 5/5/19 @ 100(c) 982,183 879,672Radiate Holdco LLC, 5.50% (LIBOR01M+300bps), 2/1/24, Callable 5/5/19 @ 100(c) 987,406 963,965Regionalcare Hospital Partners Holdings, Inc., 6.98% (LIBOR01M+450bps), 11/16/25,
Callable 5/5/19 @ 101(c) 1,246,875 1,231,875Reynolds Group Holdings, Inc., 1st Lien Term Loan B, 5.25% (LIBOR01M+275bps), 2/5/
23, Callable 5/5/19 @ 100(c) 1,296,825 1,280,614Scientific Games International, Inc., 1st Lien Term Loan B5, 5.25% (LIBOR01M+275bps),
8/14/24, Callable 5/5/19 @ 100(c) 191,637 186,436Scientific Games International, Inc., 1st Lien Term Loan B5, 5.33% (LIBOR02M+275bps),
8/14/24, Callable 5/5/19 @ 100(c) 798,363 776,695Sinclair Television Group, Inc., 1st Lien Term Loan B, 4.75% (LIBOR01M+225bps), 1/3/
24, Callable 5/5/19 @ 100(c) 997,449 985,609SIWF Holdings, Inc., 10.99% (LIBOR01M+850bps), 5/26/26(c) 1,000,000 907,500Specialty Building Products Holdings LLC, 1st Lien Term Loan, 8.25%
(LIBOR01M+575bps), 10/1/25, Callable 5/5/19 @ 101(c) 1,000,000 973,750Sprint Communications, Inc., 1st Lien Term Loan B, 5.00% (LIBOR01M+250bps), 2/2/24,
Callable 5/5/19 @ 100(c) 989,899 962,677StandardAero, Ltd., 1st Lien Term Loan, 1/24/26(g) 349,650 349,552Stars Group Holdings BV, 6.10% (LIBOR03M+350bps), 6/27/25, Callable 5/5/19 @ 100(c) 964,528 961,895Station Casinos LLC, Term Loan B, 5.00% (LIBOR01M+250bps), 6/8/23, Callable 5/5/19
@ 100(c) 997,413 986,074Tenneco, Inc., 1st Lien Term Loan B, 5.25% (LIBOR01M+275bps), 6/18/25, Callable 5/5/
19 @ 100(c) 997,500 950,119Tribune Media Co., 1st Lien Term C, 5.50% (LIBOR01M+300bps), 1/27/24, Callable 5/5/19
@ 100(c) 1,000,000 998,000Univision Communications, 1st Lien Term Loan C5, 5.25% (LIBOR01M+275bps), 3/15/24,
Callable 5/5/19 @ 100(c) 972,594 914,910Utz Quality Foods LLC, 2nd Lien Term Loan, 9.75% (LIBOR01M+725bps), 11/21/25,
Callable 5/5/19 @ 101(c) 700,000 684,250Verscend Holding Corp., 7.00% (LIBOR01M+450bps), 8/10/25, Callable 5/5/19 @ 101(c) 646,750 641,091Wynn Resorts Ltd., 1st Lien Term Loan B, 4.75% (LIBOR02M+225bps), 10/30/24, Callable
4/30/19 @ 100(c) 1,000,000 977,970Total Senior Secured Loans (Cost $36,054,272) 35,527,889
Corporate Bonds (64.0%)
Communication Services (5.9%):AMC Entertainment Holdings, Inc., 5.75%, 6/15/25, Callable 6/15/20 @ 102.88 1,500,000 1,401,135AMC Networks, Inc., 4.75%, 8/1/25, Callable 8/1/21 @ 102.38 1,250,000 1,239,563Cablevision Systems Corp., 5.88%, 9/15/22 1,250,000 1,307,287Hughes Satellite Systems Corp., 6.63%, 8/1/26 1,250,000 1,228,763
Copyright © 2021 www.secdatabase.com. All Rights Reserved.Please Consider the Environment Before Printing This Document

Copyright © 2021 www.secdatabase.com. All Rights Reserved.Please Consider the Environment Before Printing This Document
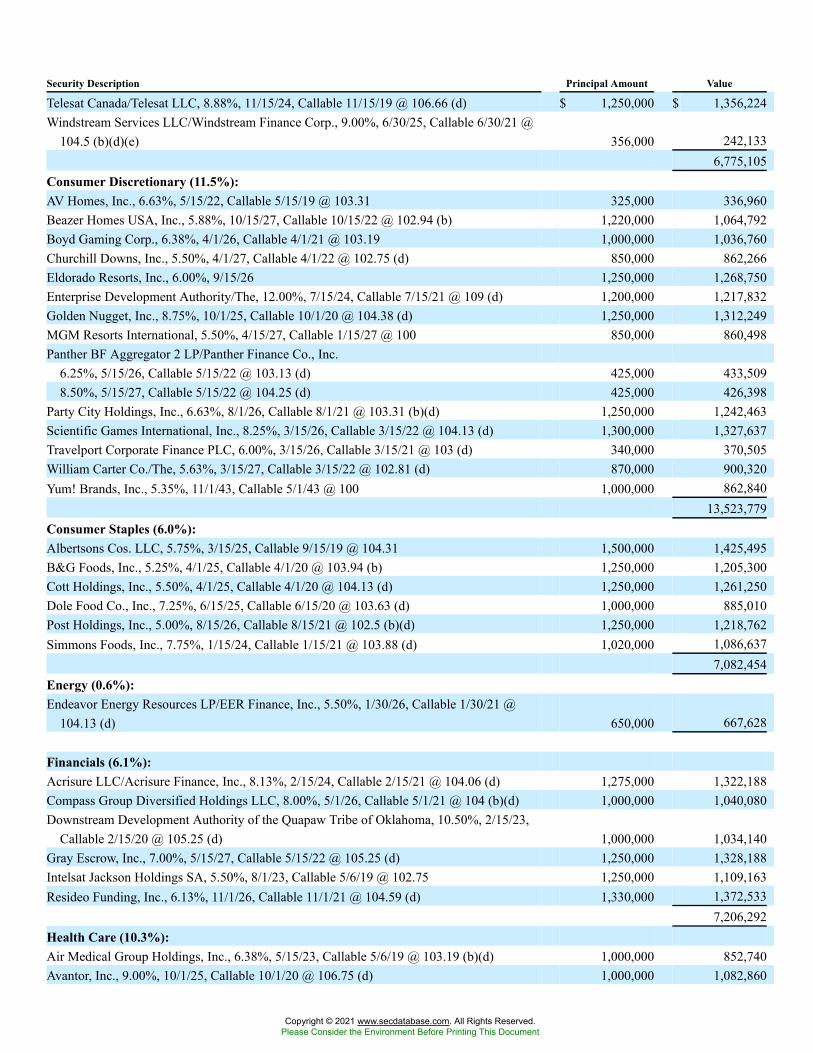
Security Description Principal Amount Value
Telesat Canada/Telesat LLC, 8.88%, 11/15/24, Callable 11/15/19 @ 106.66 (d) $ 1,250,000 $ 1,356,224Windstream Services LLC/Windstream Finance Corp., 9.00%, 6/30/25, Callable 6/30/21 @
104.5 (b)(d)(e) 356,000 242,1336,775,105
Consumer Discretionary (11.5%):AV Homes, Inc., 6.63%, 5/15/22, Callable 5/15/19 @ 103.31 325,000 336,960Beazer Homes USA, Inc., 5.88%, 10/15/27, Callable 10/15/22 @ 102.94 (b) 1,220,000 1,064,792Boyd Gaming Corp., 6.38%, 4/1/26, Callable 4/1/21 @ 103.19 1,000,000 1,036,760Churchill Downs, Inc., 5.50%, 4/1/27, Callable 4/1/22 @ 102.75 (d) 850,000 862,266Eldorado Resorts, Inc., 6.00%, 9/15/26 1,250,000 1,268,750Enterprise Development Authority/The, 12.00%, 7/15/24, Callable 7/15/21 @ 109 (d) 1,200,000 1,217,832Golden Nugget, Inc., 8.75%, 10/1/25, Callable 10/1/20 @ 104.38 (d) 1,250,000 1,312,249MGM Resorts International, 5.50%, 4/15/27, Callable 1/15/27 @ 100 850,000 860,498Panther BF Aggregator 2 LP/Panther Finance Co., Inc.
6.25%, 5/15/26, Callable 5/15/22 @ 103.13 (d) 425,000 433,5098.50%, 5/15/27, Callable 5/15/22 @ 104.25 (d) 425,000 426,398
Party City Holdings, Inc., 6.63%, 8/1/26, Callable 8/1/21 @ 103.31 (b)(d) 1,250,000 1,242,463Scientific Games International, Inc., 8.25%, 3/15/26, Callable 3/15/22 @ 104.13 (d) 1,300,000 1,327,637Travelport Corporate Finance PLC, 6.00%, 3/15/26, Callable 3/15/21 @ 103 (d) 340,000 370,505William Carter Co./The, 5.63%, 3/15/27, Callable 3/15/22 @ 102.81 (d) 870,000 900,320Yum! Brands, Inc., 5.35%, 11/1/43, Callable 5/1/43 @ 100 1,000,000 862,840
13,523,779Consumer Staples (6.0%):Albertsons Cos. LLC, 5.75%, 3/15/25, Callable 9/15/19 @ 104.31 1,500,000 1,425,495B&G Foods, Inc., 5.25%, 4/1/25, Callable 4/1/20 @ 103.94 (b) 1,250,000 1,205,300Cott Holdings, Inc., 5.50%, 4/1/25, Callable 4/1/20 @ 104.13 (d) 1,250,000 1,261,250Dole Food Co., Inc., 7.25%, 6/15/25, Callable 6/15/20 @ 103.63 (d) 1,000,000 885,010Post Holdings, Inc., 5.00%, 8/15/26, Callable 8/15/21 @ 102.5 (b)(d) 1,250,000 1,218,762Simmons Foods, Inc., 7.75%, 1/15/24, Callable 1/15/21 @ 103.88 (d) 1,020,000 1,086,637
7,082,454Energy (0.6%):Endeavor Energy Resources LP/EER Finance, Inc., 5.50%, 1/30/26, Callable 1/30/21 @
104.13 (d) 650,000 667,628
Financials (6.1%):Acrisure LLC/Acrisure Finance, Inc., 8.13%, 2/15/24, Callable 2/15/21 @ 104.06 (d) 1,275,000 1,322,188Compass Group Diversified Holdings LLC, 8.00%, 5/1/26, Callable 5/1/21 @ 104 (b)(d) 1,000,000 1,040,080Downstream Development Authority of the Quapaw Tribe of Oklahoma, 10.50%, 2/15/23,
Callable 2/15/20 @ 105.25 (d) 1,000,000 1,034,140Gray Escrow, Inc., 7.00%, 5/15/27, Callable 5/15/22 @ 105.25 (d) 1,250,000 1,328,188Intelsat Jackson Holdings SA, 5.50%, 8/1/23, Callable 5/6/19 @ 102.75 1,250,000 1,109,163Resideo Funding, Inc., 6.13%, 11/1/26, Callable 11/1/21 @ 104.59 (d) 1,330,000 1,372,533
7,206,292Health Care (10.3%):Air Medical Group Holdings, Inc., 6.38%, 5/15/23, Callable 5/6/19 @ 103.19 (b)(d) 1,000,000 852,740Avantor, Inc., 9.00%, 10/1/25, Callable 10/1/20 @ 106.75 (d) 1,000,000 1,082,860
Copyright © 2021 www.secdatabase.com. All Rights Reserved.Please Consider the Environment Before Printing This Document

Copyright © 2021 www.secdatabase.com. All Rights Reserved.Please Consider the Environment Before Printing This Document
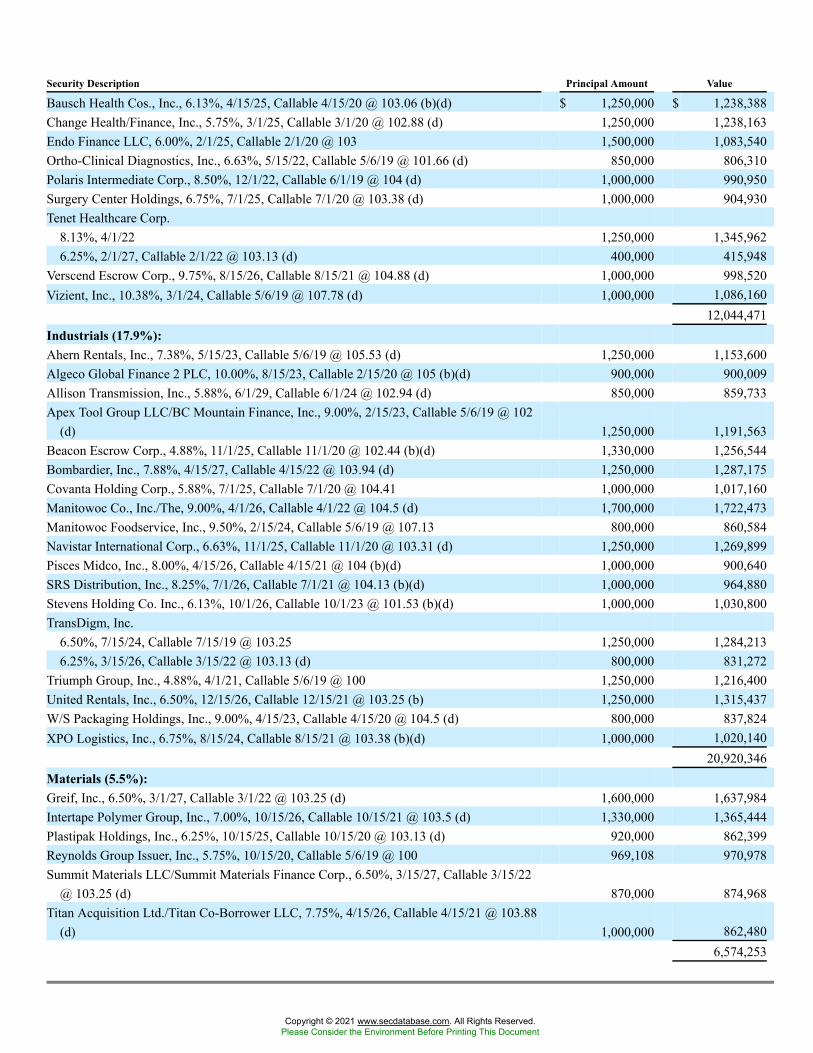
Security Description Principal Amount Value
Bausch Health Cos., Inc., 6.13%, 4/15/25, Callable 4/15/20 @ 103.06 (b)(d) $ 1,250,000 $ 1,238,388Change Health/Finance, Inc., 5.75%, 3/1/25, Callable 3/1/20 @ 102.88 (d) 1,250,000 1,238,163Endo Finance LLC, 6.00%, 2/1/25, Callable 2/1/20 @ 103 1,500,000 1,083,540Ortho-Clinical Diagnostics, Inc., 6.63%, 5/15/22, Callable 5/6/19 @ 101.66 (d) 850,000 806,310Polaris Intermediate Corp., 8.50%, 12/1/22, Callable 6/1/19 @ 104 (d) 1,000,000 990,950Surgery Center Holdings, 6.75%, 7/1/25, Callable 7/1/20 @ 103.38 (d) 1,000,000 904,930Tenet Healthcare Corp.
8.13%, 4/1/22 1,250,000 1,345,9626.25%, 2/1/27, Callable 2/1/22 @ 103.13 (d) 400,000 415,948
Verscend Escrow Corp., 9.75%, 8/15/26, Callable 8/15/21 @ 104.88 (d) 1,000,000 998,520Vizient, Inc., 10.38%, 3/1/24, Callable 5/6/19 @ 107.78 (d) 1,000,000 1,086,160
12,044,471Industrials (17.9%):Ahern Rentals, Inc., 7.38%, 5/15/23, Callable 5/6/19 @ 105.53 (d) 1,250,000 1,153,600Algeco Global Finance 2 PLC, 10.00%, 8/15/23, Callable 2/15/20 @ 105 (b)(d) 900,000 900,009Allison Transmission, Inc., 5.88%, 6/1/29, Callable 6/1/24 @ 102.94 (d) 850,000 859,733Apex Tool Group LLC/BC Mountain Finance, Inc., 9.00%, 2/15/23, Callable 5/6/19 @ 102
(d) 1,250,000 1,191,563Beacon Escrow Corp., 4.88%, 11/1/25, Callable 11/1/20 @ 102.44 (b)(d) 1,330,000 1,256,544Bombardier, Inc., 7.88%, 4/15/27, Callable 4/15/22 @ 103.94 (d) 1,250,000 1,287,175Covanta Holding Corp., 5.88%, 7/1/25, Callable 7/1/20 @ 104.41 1,000,000 1,017,160Manitowoc Co., Inc./The, 9.00%, 4/1/26, Callable 4/1/22 @ 104.5 (d) 1,700,000 1,722,473Manitowoc Foodservice, Inc., 9.50%, 2/15/24, Callable 5/6/19 @ 107.13 800,000 860,584Navistar International Corp., 6.63%, 11/1/25, Callable 11/1/20 @ 103.31 (d) 1,250,000 1,269,899Pisces Midco, Inc., 8.00%, 4/15/26, Callable 4/15/21 @ 104 (b)(d) 1,000,000 900,640SRS Distribution, Inc., 8.25%, 7/1/26, Callable 7/1/21 @ 104.13 (b)(d) 1,000,000 964,880Stevens Holding Co. Inc., 6.13%, 10/1/26, Callable 10/1/23 @ 101.53 (b)(d) 1,000,000 1,030,800TransDigm, Inc.
6.50%, 7/15/24, Callable 7/15/19 @ 103.25 1,250,000 1,284,2136.25%, 3/15/26, Callable 3/15/22 @ 103.13 (d) 800,000 831,272
Triumph Group, Inc., 4.88%, 4/1/21, Callable 5/6/19 @ 100 1,250,000 1,216,400United Rentals, Inc., 6.50%, 12/15/26, Callable 12/15/21 @ 103.25 (b) 1,250,000 1,315,437W/S Packaging Holdings, Inc., 9.00%, 4/15/23, Callable 4/15/20 @ 104.5 (d) 800,000 837,824XPO Logistics, Inc., 6.75%, 8/15/24, Callable 8/15/21 @ 103.38 (b)(d) 1,000,000 1,020,140
20,920,346Materials (5.5%):Greif, Inc., 6.50%, 3/1/27, Callable 3/1/22 @ 103.25 (d) 1,600,000 1,637,984Intertape Polymer Group, Inc., 7.00%, 10/15/26, Callable 10/15/21 @ 103.5 (d) 1,330,000 1,365,444Plastipak Holdings, Inc., 6.25%, 10/15/25, Callable 10/15/20 @ 103.13 (d) 920,000 862,399Reynolds Group Issuer, Inc., 5.75%, 10/15/20, Callable 5/6/19 @ 100 969,108 970,978Summit Materials LLC/Summit Materials Finance Corp., 6.50%, 3/15/27, Callable 3/15/22
@ 103.25 (d) 870,000 874,968Titan Acquisition Ltd./Titan Co-Borrower LLC, 7.75%, 4/15/26, Callable 4/15/21 @ 103.88
(d) 1,000,000 862,4806,574,253
Copyright © 2021 www.secdatabase.com. All Rights Reserved.Please Consider the Environment Before Printing This Document
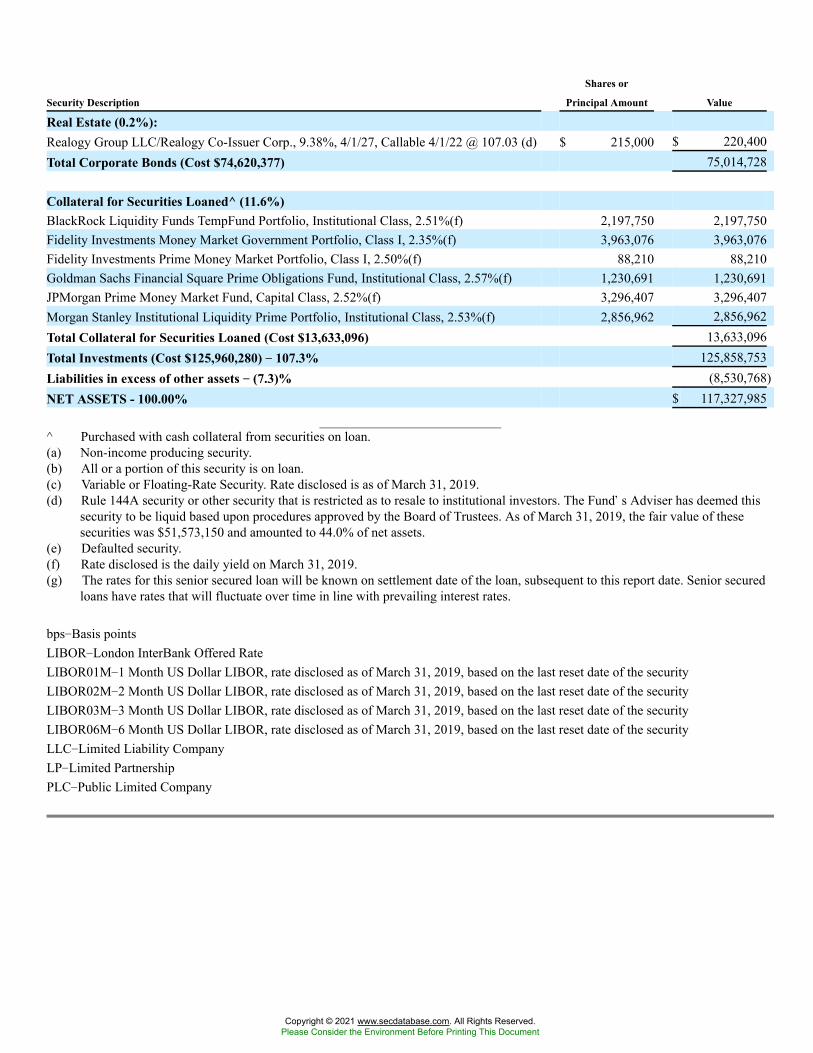
Security Description
Shares or
Principal Amount Value
Real Estate (0.2%):Realogy Group LLC/Realogy Co-Issuer Corp., 9.38%, 4/1/27, Callable 4/1/22 @ 107.03 (d) $ 215,000 $ 220,400Total Corporate Bonds (Cost $74,620,377) 75,014,728
Collateral for Securities Loaned^ (11.6%)BlackRock Liquidity Funds TempFund Portfolio, Institutional Class, 2.51%(f) 2,197,750 2,197,750Fidelity Investments Money Market Government Portfolio, Class I, 2.35%(f) 3,963,076 3,963,076Fidelity Investments Prime Money Market Portfolio, Class I, 2.50%(f) 88,210 88,210Goldman Sachs Financial Square Prime Obligations Fund, Institutional Class, 2.57%(f) 1,230,691 1,230,691JPMorgan Prime Money Market Fund, Capital Class, 2.52%(f) 3,296,407 3,296,407Morgan Stanley Institutional Liquidity Prime Portfolio, Institutional Class, 2.53%(f) 2,856,962 2,856,962Total Collateral for Securities Loaned (Cost $13,633,096) 13,633,096Total Investments (Cost $125,960,280) �� 107.3% 125,858,753Liabilities in excess of other assets �� (7.3)% (8,530,768)NET ASSETS - 100.00% $ 117,327,985
^ Purchased with cash collateral from securities on loan.(a) Non-income producing security.(b) All or a portion of this security is on loan.(c) Variable or Floating-Rate Security. Rate disclosed is as of March 31, 2019.(d) Rule 144A security or other security that is restricted as to resale to institutional investors. The Fund�s Adviser has deemed this
security to be liquid based upon procedures approved by the Board of Trustees. As of March 31, 2019, the fair value of thesesecurities was $51,573,150 and amounted to 44.0% of net assets.
(e) Defaulted security.(f) Rate disclosed is the daily yield on March 31, 2019.(g) The rates for this senior secured loan will be known on settlement date of the loan, subsequent to this report date. Senior secured
loans have rates that will fluctuate over time in line with prevailing interest rates.
bps�Basis pointsLIBOR�London InterBank Offered RateLIBOR01M�1 Month US Dollar LIBOR, rate disclosed as of March 31, 2019, based on the last reset date of the securityLIBOR02M�2 Month US Dollar LIBOR, rate disclosed as of March 31, 2019, based on the last reset date of the securityLIBOR03M�3 Month US Dollar LIBOR, rate disclosed as of March 31, 2019, based on the last reset date of the securityLIBOR06M�6 Month US Dollar LIBOR, rate disclosed as of March 31, 2019, based on the last reset date of the securityLLC�Limited Liability CompanyLP�Limited PartnershipPLC�Public Limited Company
Copyright © 2021 www.secdatabase.com. All Rights Reserved.Please Consider the Environment Before Printing This Document
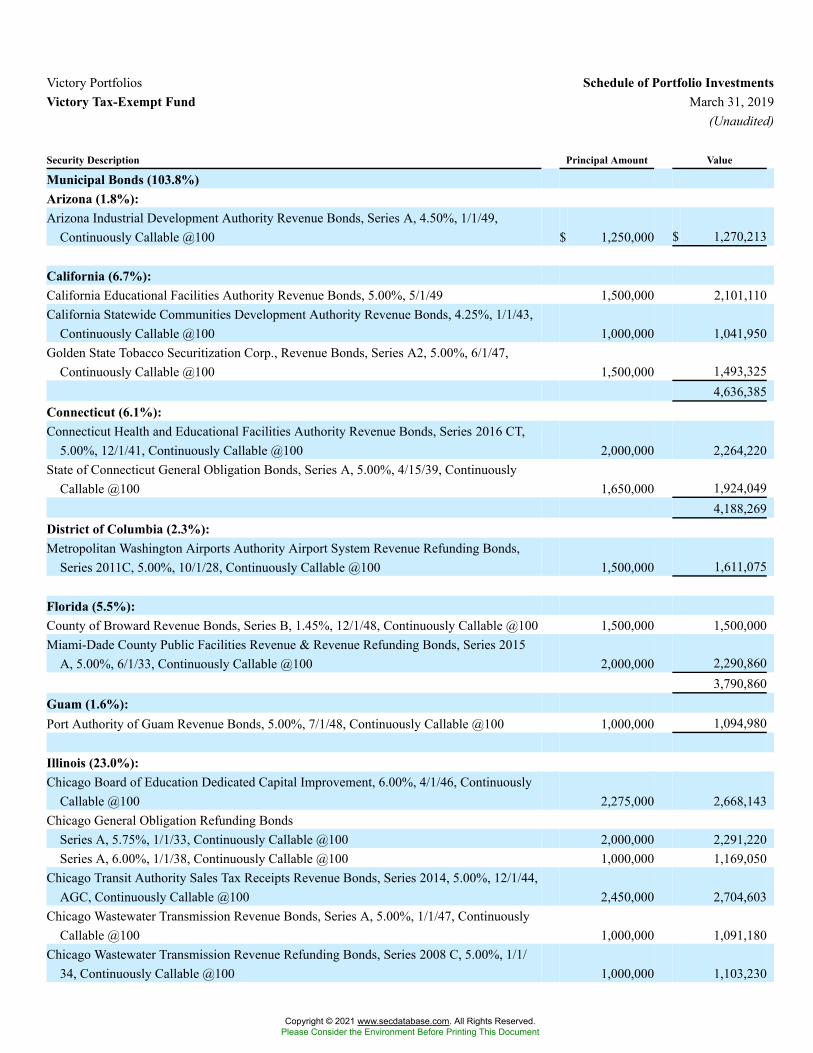
Victory Portfolios Schedule of Portfolio InvestmentsVictory Tax-Exempt Fund March 31, 2019
(Unaudited)
Security Description Principal Amount Value
Municipal Bonds (103.8%)Arizona (1.8%):Arizona Industrial Development Authority Revenue Bonds, Series A, 4.50%, 1/1/49,
Continuously Callable @100 $ 1,250,000 $ 1,270,213
California (6.7%):California Educational Facilities Authority Revenue Bonds, 5.00%, 5/1/49 1,500,000 2,101,110California Statewide Communities Development Authority Revenue Bonds, 4.25%, 1/1/43,
Continuously Callable @100 1,000,000 1,041,950Golden State Tobacco Securitization Corp., Revenue Bonds, Series A2, 5.00%, 6/1/47,
Continuously Callable @100 1,500,000 1,493,3254,636,385
Connecticut (6.1%):Connecticut Health and Educational Facilities Authority Revenue Bonds, Series 2016 CT,
5.00%, 12/1/41, Continuously Callable @100 2,000,000 2,264,220State of Connecticut General Obligation Bonds, Series A, 5.00%, 4/15/39, Continuously
Callable @100 1,650,000 1,924,0494,188,269
District of Columbia (2.3%):Metropolitan Washington Airports Authority Airport System Revenue Refunding Bonds,
Series 2011C, 5.00%, 10/1/28, Continuously Callable @100 1,500,000 1,611,075
Florida (5.5%):County of Broward Revenue Bonds, Series B, 1.45%, 12/1/48, Continuously Callable @100 1,500,000 1,500,000Miami-Dade County Public Facilities Revenue & Revenue Refunding Bonds, Series 2015
A, 5.00%, 6/1/33, Continuously Callable @100 2,000,000 2,290,8603,790,860
Guam (1.6%):Port Authority of Guam Revenue Bonds, 5.00%, 7/1/48, Continuously Callable @100 1,000,000 1,094,980
Illinois (23.0%):Chicago Board of Education Dedicated Capital Improvement, 6.00%, 4/1/46, Continuously
Callable @100 2,275,000 2,668,143Chicago General Obligation Refunding Bonds
Series A, 5.75%, 1/1/33, Continuously Callable @100 2,000,000 2,291,220Series A, 6.00%, 1/1/38, Continuously Callable @100 1,000,000 1,169,050
Chicago Transit Authority Sales Tax Receipts Revenue Bonds, Series 2014, 5.00%, 12/1/44,AGC, Continuously Callable @100 2,450,000 2,704,603
Chicago Wastewater Transmission Revenue Bonds, Series A, 5.00%, 1/1/47, ContinuouslyCallable @100 1,000,000 1,091,180
Chicago Wastewater Transmission Revenue Refunding Bonds, Series 2008 C, 5.00%, 1/1/34, Continuously Callable @100 1,000,000 1,103,230
Copyright © 2021 www.secdatabase.com. All Rights Reserved.Please Consider the Environment Before Printing This Document
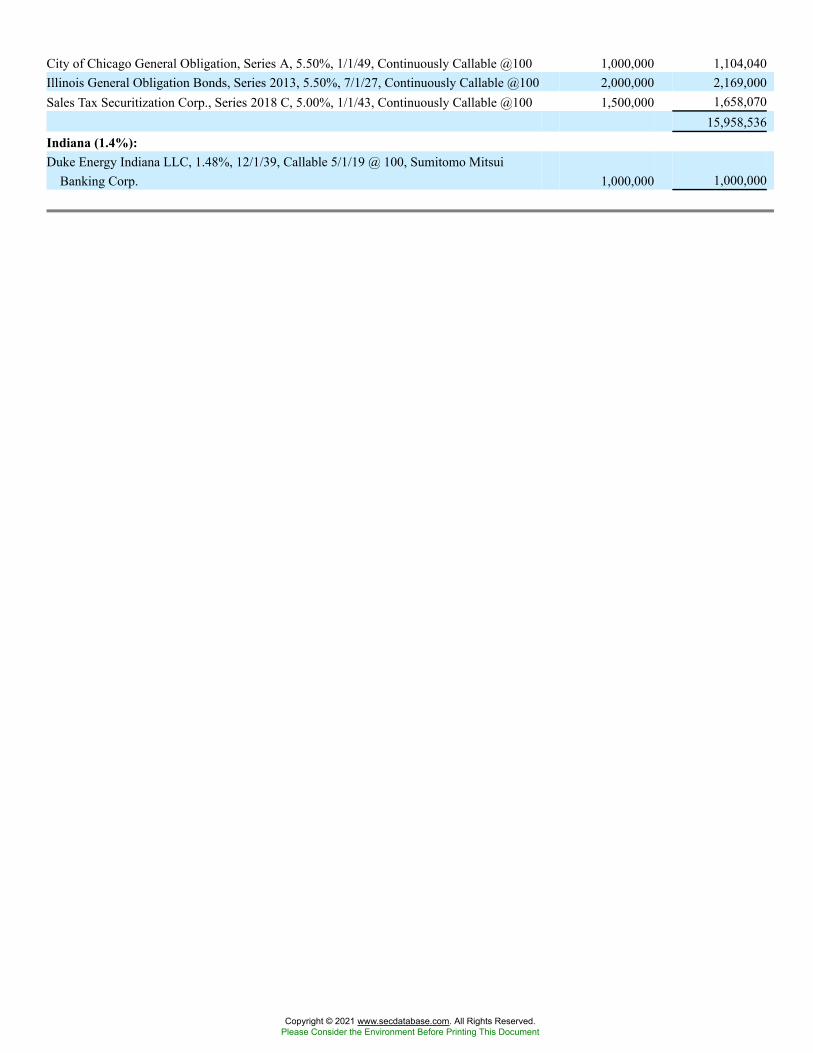
City of Chicago General Obligation, Series A, 5.50%, 1/1/49, Continuously Callable @100 1,000,000 1,104,040Illinois General Obligation Bonds, Series 2013, 5.50%, 7/1/27, Continuously Callable @100 2,000,000 2,169,000Sales Tax Securitization Corp., Series 2018 C, 5.00%, 1/1/43, Continuously Callable @100 1,500,000 1,658,070
15,958,536Indiana (1.4%):Duke Energy Indiana LLC, 1.48%, 12/1/39, Callable 5/1/19 @ 100, Sumitomo Mitsui
Banking Corp. 1,000,000 1,000,000
Copyright © 2021 www.secdatabase.com. All Rights Reserved.Please Consider the Environment Before Printing This Document
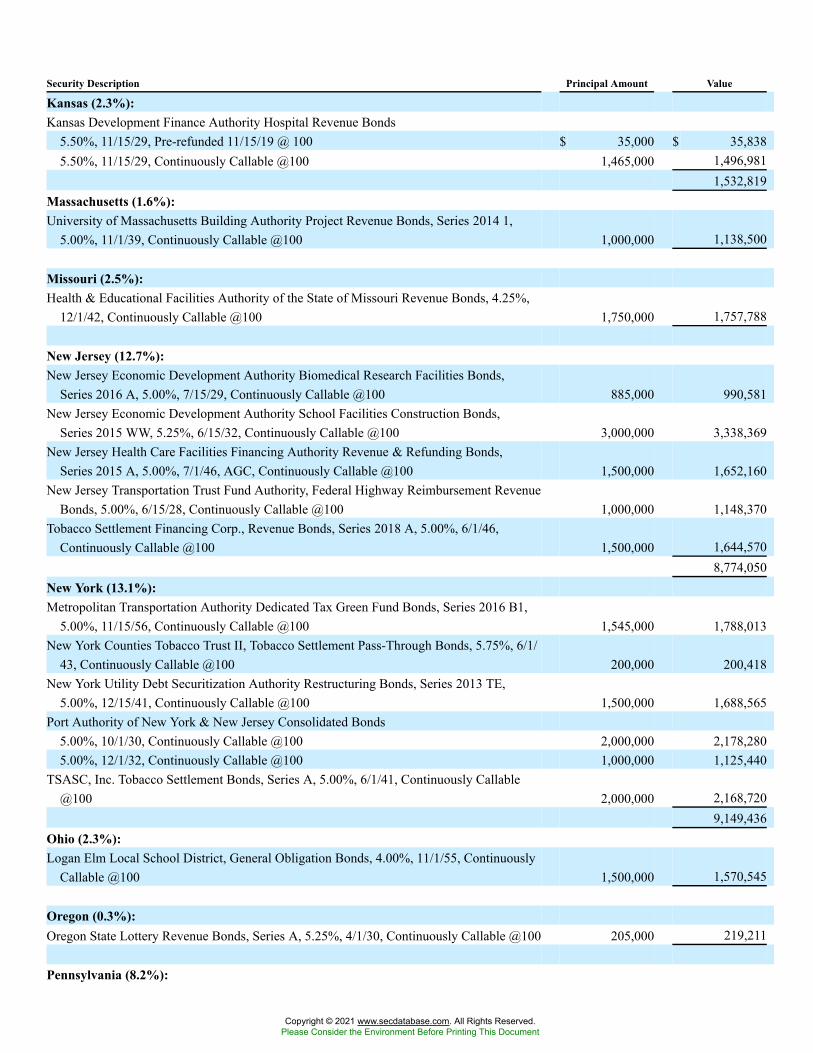
Security Description Principal Amount Value
Kansas (2.3%):Kansas Development Finance Authority Hospital Revenue Bonds
5.50%, 11/15/29, Pre-refunded 11/15/19 @ 100 $ 35,000 $ 35,8385.50%, 11/15/29, Continuously Callable @100 1,465,000 1,496,981
1,532,819Massachusetts (1.6%):University of Massachusetts Building Authority Project Revenue Bonds, Series 2014 1,
5.00%, 11/1/39, Continuously Callable @100 1,000,000 1,138,500
Missouri (2.5%):Health & Educational Facilities Authority of the State of Missouri Revenue Bonds, 4.25%,
12/1/42, Continuously Callable @100 1,750,000 1,757,788
New Jersey (12.7%):New Jersey Economic Development Authority Biomedical Research Facilities Bonds,
Series 2016 A, 5.00%, 7/15/29, Continuously Callable @100 885,000 990,581New Jersey Economic Development Authority School Facilities Construction Bonds,
Series 2015 WW, 5.25%, 6/15/32, Continuously Callable @100 3,000,000 3,338,369New Jersey Health Care Facilities Financing Authority Revenue & Refunding Bonds,
Series 2015 A, 5.00%, 7/1/46, AGC, Continuously Callable @100 1,500,000 1,652,160New Jersey Transportation Trust Fund Authority, Federal Highway Reimbursement Revenue
Bonds, 5.00%, 6/15/28, Continuously Callable @100 1,000,000 1,148,370Tobacco Settlement Financing Corp., Revenue Bonds, Series 2018 A, 5.00%, 6/1/46,
Continuously Callable @100 1,500,000 1,644,5708,774,050
New York (13.1%):Metropolitan Transportation Authority Dedicated Tax Green Fund Bonds, Series 2016 B1,
5.00%, 11/15/56, Continuously Callable @100 1,545,000 1,788,013New York Counties Tobacco Trust II, Tobacco Settlement Pass-Through Bonds, 5.75%, 6/1/
43, Continuously Callable @100 200,000 200,418New York Utility Debt Securitization Authority Restructuring Bonds, Series 2013 TE,
5.00%, 12/15/41, Continuously Callable @100 1,500,000 1,688,565Port Authority of New York & New Jersey Consolidated Bonds
5.00%, 10/1/30, Continuously Callable @100 2,000,000 2,178,2805.00%, 12/1/32, Continuously Callable @100 1,000,000 1,125,440
TSASC, Inc. Tobacco Settlement Bonds, Series A, 5.00%, 6/1/41, Continuously Callable@100 2,000,000 2,168,720
9,149,436Ohio (2.3%):Logan Elm Local School District, General Obligation Bonds, 4.00%, 11/1/55, Continuously
Callable @100 1,500,000 1,570,545
Oregon (0.3%):Oregon State Lottery Revenue Bonds, Series A, 5.25%, 4/1/30, Continuously Callable @100 205,000 219,211
Pennsylvania (8.2%):
Copyright © 2021 www.secdatabase.com. All Rights Reserved.Please Consider the Environment Before Printing This Document
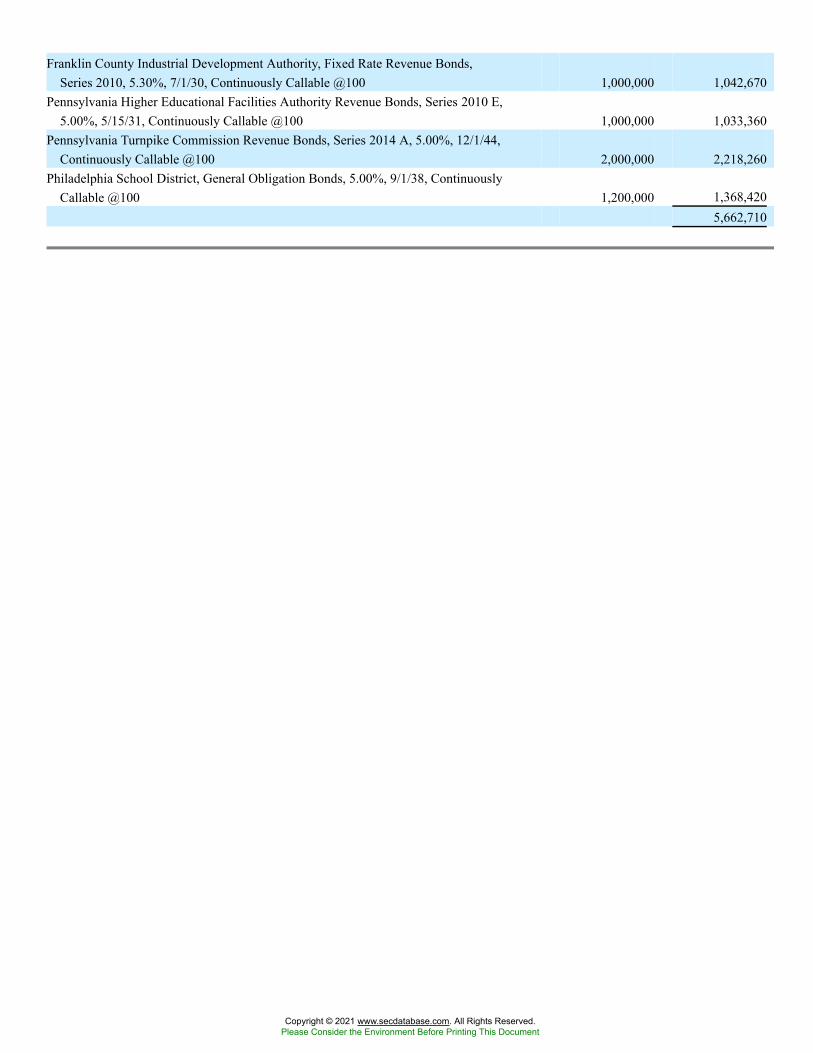
Franklin County Industrial Development Authority, Fixed Rate Revenue Bonds,Series 2010, 5.30%, 7/1/30, Continuously Callable @100 1,000,000 1,042,670
Pennsylvania Higher Educational Facilities Authority Revenue Bonds, Series 2010 E,5.00%, 5/15/31, Continuously Callable @100 1,000,000 1,033,360
Pennsylvania Turnpike Commission Revenue Bonds, Series 2014 A, 5.00%, 12/1/44,Continuously Callable @100 2,000,000 2,218,260
Philadelphia School District, General Obligation Bonds, 5.00%, 9/1/38, ContinuouslyCallable @100 1,200,000 1,368,420
5,662,710
Copyright © 2021 www.secdatabase.com. All Rights Reserved.Please Consider the Environment Before Printing This Document
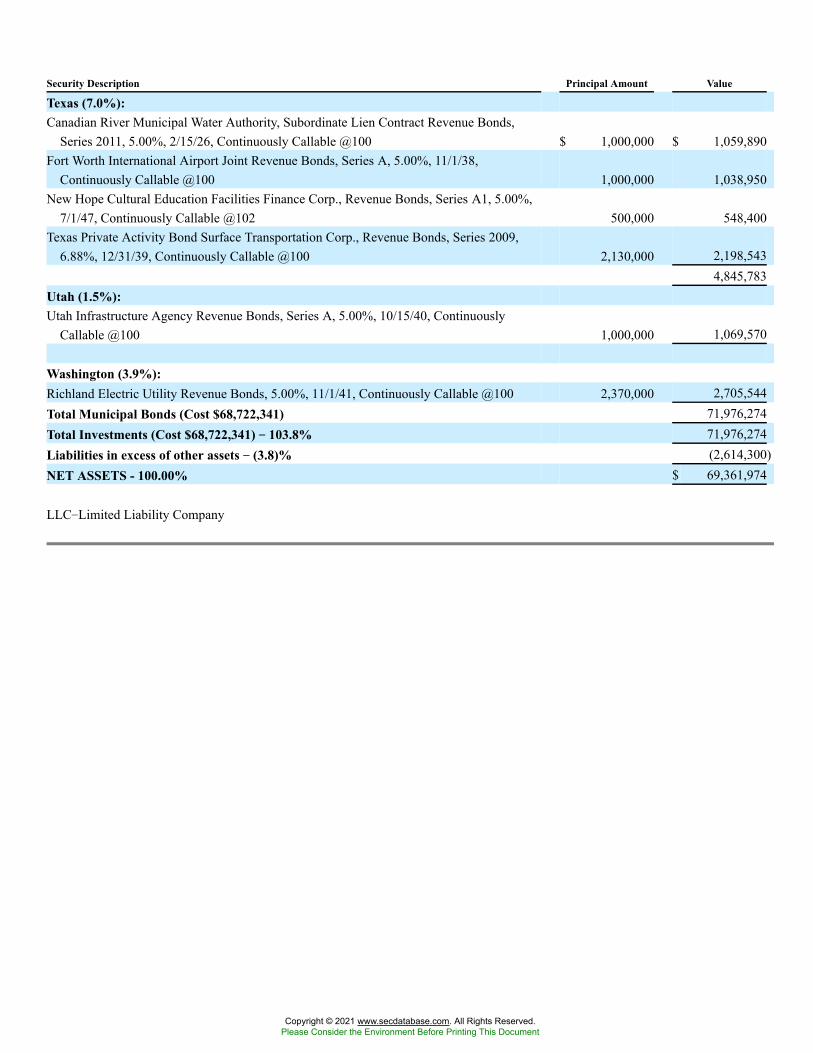
Security Description Principal Amount Value
Texas (7.0%):Canadian River Municipal Water Authority, Subordinate Lien Contract Revenue Bonds,
Series 2011, 5.00%, 2/15/26, Continuously Callable @100 $ 1,000,000 $ 1,059,890Fort Worth International Airport Joint Revenue Bonds, Series A, 5.00%, 11/1/38,
Continuously Callable @100 1,000,000 1,038,950New Hope Cultural Education Facilities Finance Corp., Revenue Bonds, Series A1, 5.00%,
7/1/47, Continuously Callable @102 500,000 548,400Texas Private Activity Bond Surface Transportation Corp., Revenue Bonds, Series 2009,
6.88%, 12/31/39, Continuously Callable @100 2,130,000 2,198,5434,845,783
Utah (1.5%):Utah Infrastructure Agency Revenue Bonds, Series A, 5.00%, 10/15/40, Continuously
Callable @100 1,000,000 1,069,570
Washington (3.9%):Richland Electric Utility Revenue Bonds, 5.00%, 11/1/41, Continuously Callable @100 2,370,000 2,705,544Total Municipal Bonds (Cost $68,722,341) 71,976,274Total Investments (Cost $68,722,341) �� 103.8% 71,976,274Liabilities in excess of other assets �� (3.8)% (2,614,300)NET ASSETS - 100.00% $ 69,361,974
LLC�Limited Liability Company
Copyright © 2021 www.secdatabase.com. All Rights Reserved.Please Consider the Environment Before Printing This Document
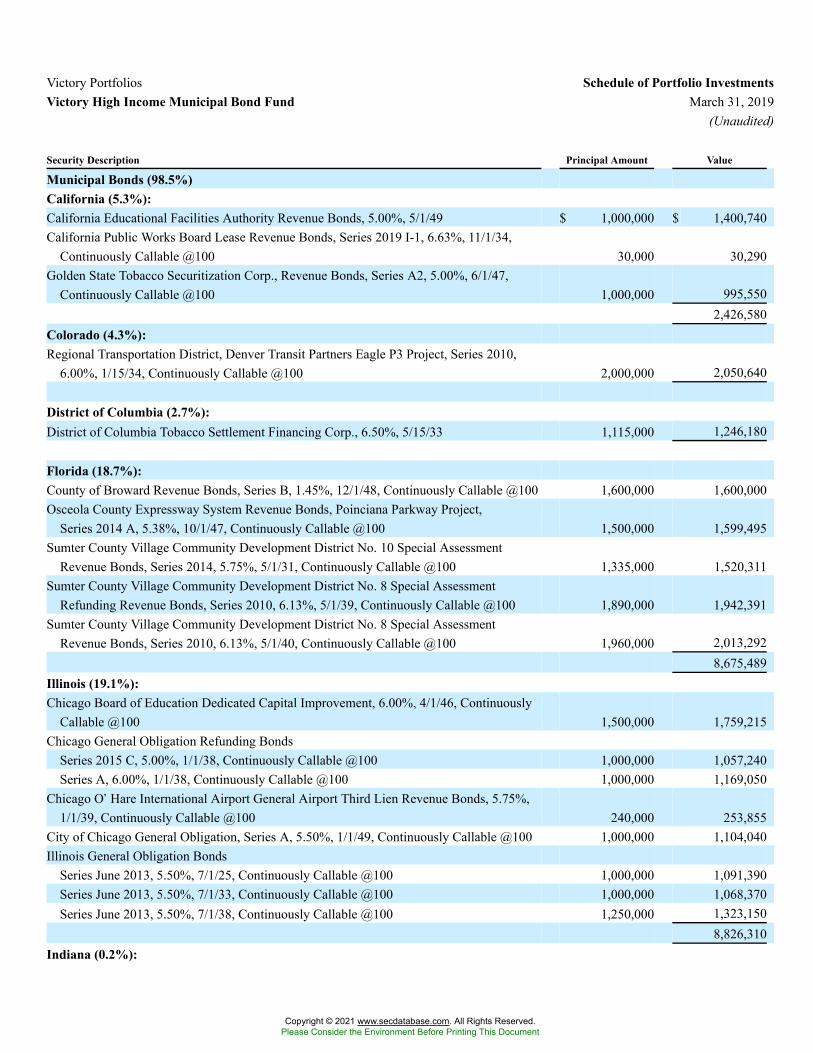
Victory Portfolios Schedule of Portfolio InvestmentsVictory High Income Municipal Bond Fund March 31, 2019
(Unaudited)
Security Description Principal Amount Value
Municipal Bonds (98.5%)California (5.3%):California Educational Facilities Authority Revenue Bonds, 5.00%, 5/1/49 $ 1,000,000 $ 1,400,740California Public Works Board Lease Revenue Bonds, Series 2019 I-1, 6.63%, 11/1/34,
Continuously Callable @100 30,000 30,290Golden State Tobacco Securitization Corp., Revenue Bonds, Series A2, 5.00%, 6/1/47,
Continuously Callable @100 1,000,000 995,5502,426,580
Colorado (4.3%):Regional Transportation District, Denver Transit Partners Eagle P3 Project, Series 2010,
6.00%, 1/15/34, Continuously Callable @100 2,000,000 2,050,640
District of Columbia (2.7%):District of Columbia Tobacco Settlement Financing Corp., 6.50%, 5/15/33 1,115,000 1,246,180
Florida (18.7%):County of Broward Revenue Bonds, Series B, 1.45%, 12/1/48, Continuously Callable @100 1,600,000 1,600,000Osceola County Expressway System Revenue Bonds, Poinciana Parkway Project,
Series 2014 A, 5.38%, 10/1/47, Continuously Callable @100 1,500,000 1,599,495Sumter County Village Community Development District No. 10 Special Assessment
Revenue Bonds, Series 2014, 5.75%, 5/1/31, Continuously Callable @100 1,335,000 1,520,311Sumter County Village Community Development District No. 8 Special Assessment
Refunding Revenue Bonds, Series 2010, 6.13%, 5/1/39, Continuously Callable @100 1,890,000 1,942,391Sumter County Village Community Development District No. 8 Special Assessment
Revenue Bonds, Series 2010, 6.13%, 5/1/40, Continuously Callable @100 1,960,000 2,013,2928,675,489
Illinois (19.1%):Chicago Board of Education Dedicated Capital Improvement, 6.00%, 4/1/46, Continuously
Callable @100 1,500,000 1,759,215Chicago General Obligation Refunding Bonds
Series 2015 C, 5.00%, 1/1/38, Continuously Callable @100 1,000,000 1,057,240Series A, 6.00%, 1/1/38, Continuously Callable @100 1,000,000 1,169,050
Chicago O�Hare International Airport General Airport Third Lien Revenue Bonds, 5.75%,1/1/39, Continuously Callable @100 240,000 253,855
City of Chicago General Obligation, Series A, 5.50%, 1/1/49, Continuously Callable @100 1,000,000 1,104,040Illinois General Obligation Bonds
Series June 2013, 5.50%, 7/1/25, Continuously Callable @100 1,000,000 1,091,390Series June 2013, 5.50%, 7/1/33, Continuously Callable @100 1,000,000 1,068,370Series June 2013, 5.50%, 7/1/38, Continuously Callable @100 1,250,000 1,323,150
8,826,310Indiana (0.2%):
Copyright © 2021 www.secdatabase.com. All Rights Reserved.Please Consider the Environment Before Printing This Document
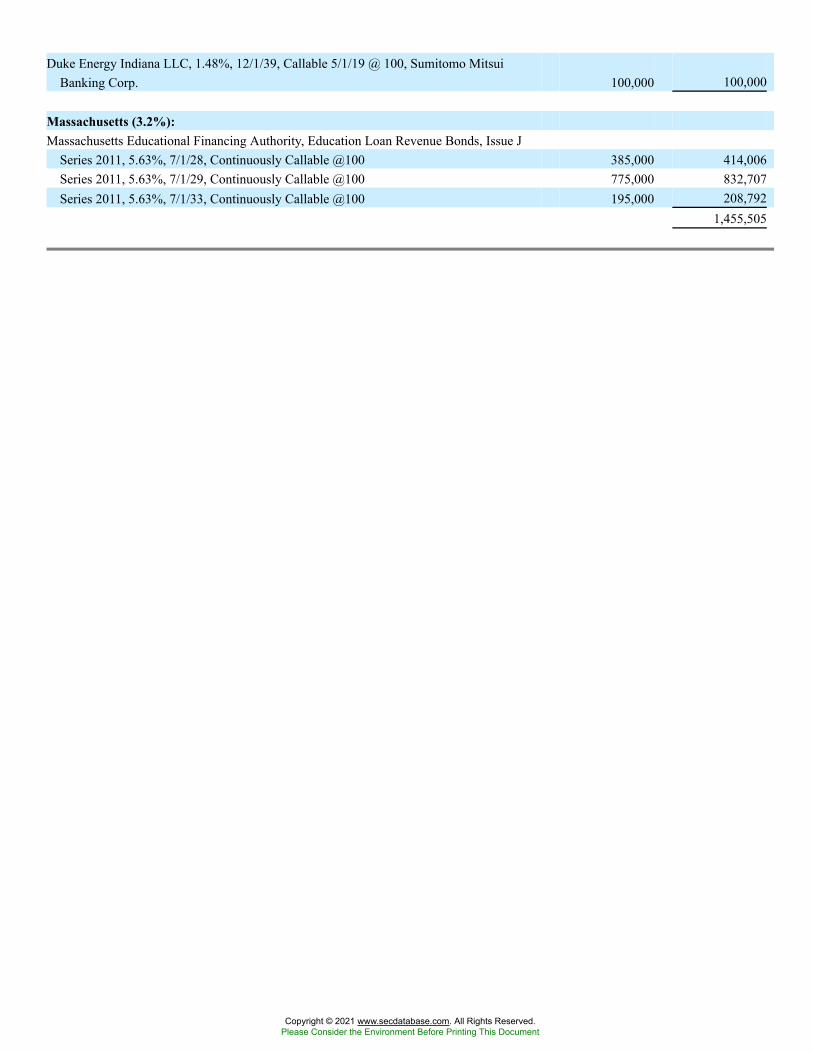
Duke Energy Indiana LLC, 1.48%, 12/1/39, Callable 5/1/19 @ 100, Sumitomo MitsuiBanking Corp. 100,000 100,000
Massachusetts (3.2%):Massachusetts Educational Financing Authority, Education Loan Revenue Bonds, Issue J
Series 2011, 5.63%, 7/1/28, Continuously Callable @100 385,000 414,006Series 2011, 5.63%, 7/1/29, Continuously Callable @100 775,000 832,707Series 2011, 5.63%, 7/1/33, Continuously Callable @100 195,000 208,792
1,455,505
Copyright © 2021 www.secdatabase.com. All Rights Reserved.Please Consider the Environment Before Printing This Document
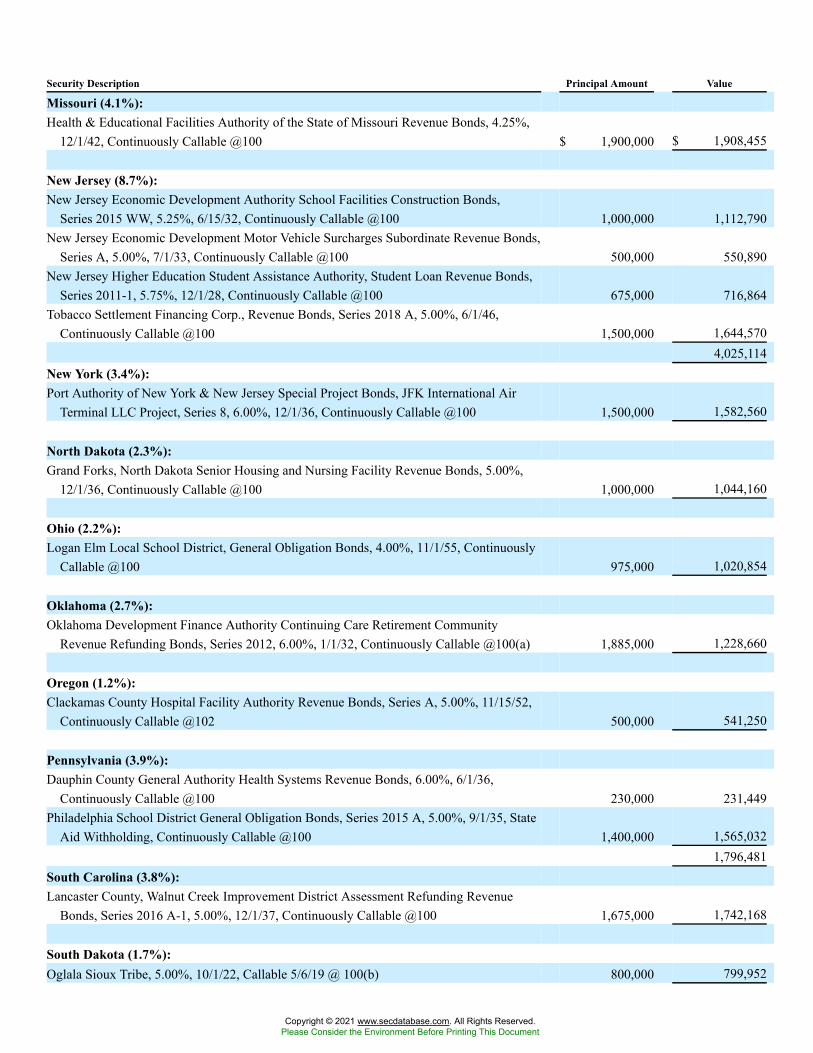
Security Description Principal Amount Value
Missouri (4.1%):Health & Educational Facilities Authority of the State of Missouri Revenue Bonds, 4.25%,
12/1/42, Continuously Callable @100 $ 1,900,000 $ 1,908,455
New Jersey (8.7%):New Jersey Economic Development Authority School Facilities Construction Bonds,
Series 2015 WW, 5.25%, 6/15/32, Continuously Callable @100 1,000,000 1,112,790New Jersey Economic Development Motor Vehicle Surcharges Subordinate Revenue Bonds,
Series A, 5.00%, 7/1/33, Continuously Callable @100 500,000 550,890New Jersey Higher Education Student Assistance Authority, Student Loan Revenue Bonds,
Series 2011-1, 5.75%, 12/1/28, Continuously Callable @100 675,000 716,864Tobacco Settlement Financing Corp., Revenue Bonds, Series 2018 A, 5.00%, 6/1/46,
Continuously Callable @100 1,500,000 1,644,5704,025,114
New York (3.4%):Port Authority of New York & New Jersey Special Project Bonds, JFK International Air
Terminal LLC Project, Series 8, 6.00%, 12/1/36, Continuously Callable @100 1,500,000 1,582,560
North Dakota (2.3%):Grand Forks, North Dakota Senior Housing and Nursing Facility Revenue Bonds, 5.00%,
12/1/36, Continuously Callable @100 1,000,000 1,044,160
Ohio (2.2%):Logan Elm Local School District, General Obligation Bonds, 4.00%, 11/1/55, Continuously
Callable @100 975,000 1,020,854
Oklahoma (2.7%):Oklahoma Development Finance Authority Continuing Care Retirement Community
Revenue Refunding Bonds, Series 2012, 6.00%, 1/1/32, Continuously Callable @100(a) 1,885,000 1,228,660
Oregon (1.2%):Clackamas County Hospital Facility Authority Revenue Bonds, Series A, 5.00%, 11/15/52,
Continuously Callable @102 500,000 541,250
Pennsylvania (3.9%):Dauphin County General Authority Health Systems Revenue Bonds, 6.00%, 6/1/36,
Continuously Callable @100 230,000 231,449Philadelphia School District General Obligation Bonds, Series 2015 A, 5.00%, 9/1/35, State
Aid Withholding, Continuously Callable @100 1,400,000 1,565,0321,796,481
South Carolina (3.8%):Lancaster County, Walnut Creek Improvement District Assessment Refunding Revenue
Bonds, Series 2016 A-1, 5.00%, 12/1/37, Continuously Callable @100 1,675,000 1,742,168
South Dakota (1.7%):Oglala Sioux Tribe, 5.00%, 10/1/22, Callable 5/6/19 @ 100(b) 800,000 799,952
Copyright © 2021 www.secdatabase.com. All Rights Reserved.Please Consider the Environment Before Printing This Document
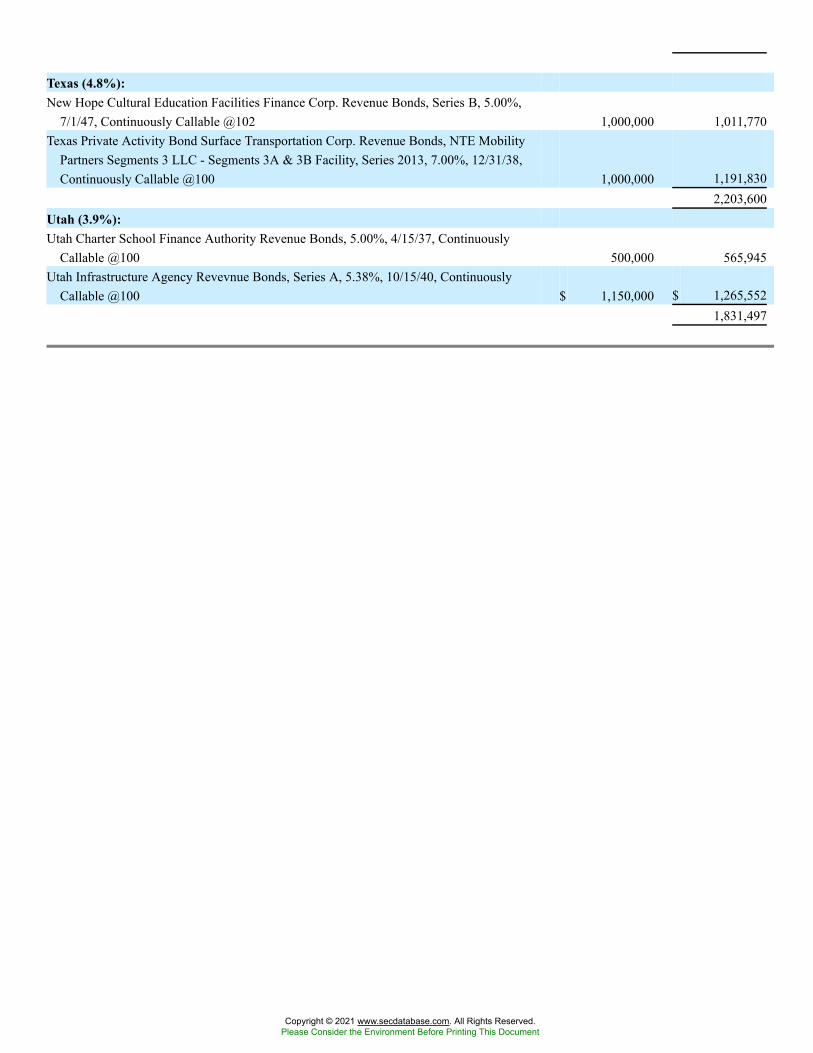
Texas (4.8%):New Hope Cultural Education Facilities Finance Corp. Revenue Bonds, Series B, 5.00%,
7/1/47, Continuously Callable @102 1,000,000 1,011,770Texas Private Activity Bond Surface Transportation Corp. Revenue Bonds, NTE Mobility
Partners Segments 3 LLC - Segments 3A & 3B Facility, Series 2013, 7.00%, 12/31/38,Continuously Callable @100 1,000,000 1,191,830
2,203,600Utah (3.9%):Utah Charter School Finance Authority Revenue Bonds, 5.00%, 4/15/37, Continuously
Callable @100 500,000 565,945Utah Infrastructure Agency Revevnue Bonds, Series A, 5.38%, 10/15/40, Continuously
Callable @100 $ 1,150,000 $ 1,265,5521,831,497
Copyright © 2021 www.secdatabase.com. All Rights Reserved.Please Consider the Environment Before Printing This Document
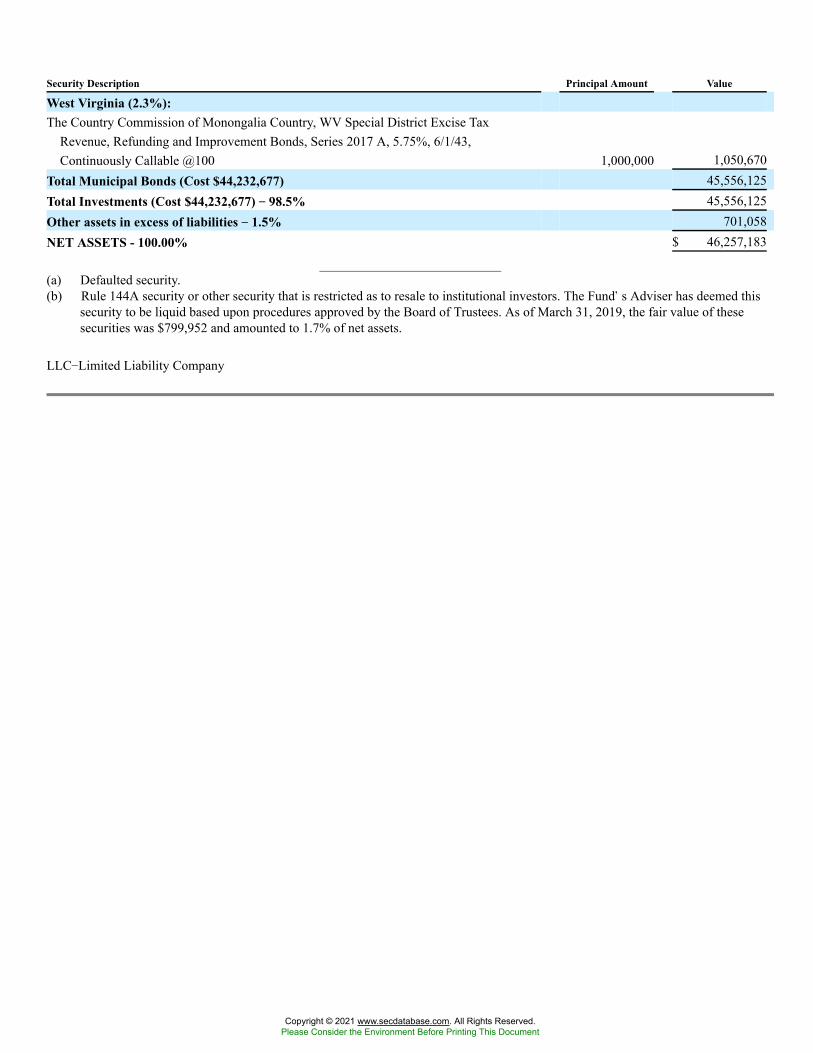
Security Description Principal Amount Value
West Virginia (2.3%):The Country Commission of Monongalia Country, WV Special District Excise Tax
Revenue, Refunding and Improvement Bonds, Series 2017 A, 5.75%, 6/1/43,Continuously Callable @100 1,000,000 1,050,670
Total Municipal Bonds (Cost $44,232,677) 45,556,125Total Investments (Cost $44,232,677) �� 98.5% 45,556,125Other assets in excess of liabilities �� 1.5% 701,058NET ASSETS - 100.00% $ 46,257,183
(a) Defaulted security.(b) Rule 144A security or other security that is restricted as to resale to institutional investors. The Fund�s Adviser has deemed this
security to be liquid based upon procedures approved by the Board of Trustees. As of March 31, 2019, the fair value of thesesecurities was $799,952 and amounted to 1.7% of net assets.
LLC�Limited Liability Company
Copyright © 2021 www.secdatabase.com. All Rights Reserved.Please Consider the Environment Before Printing This Document
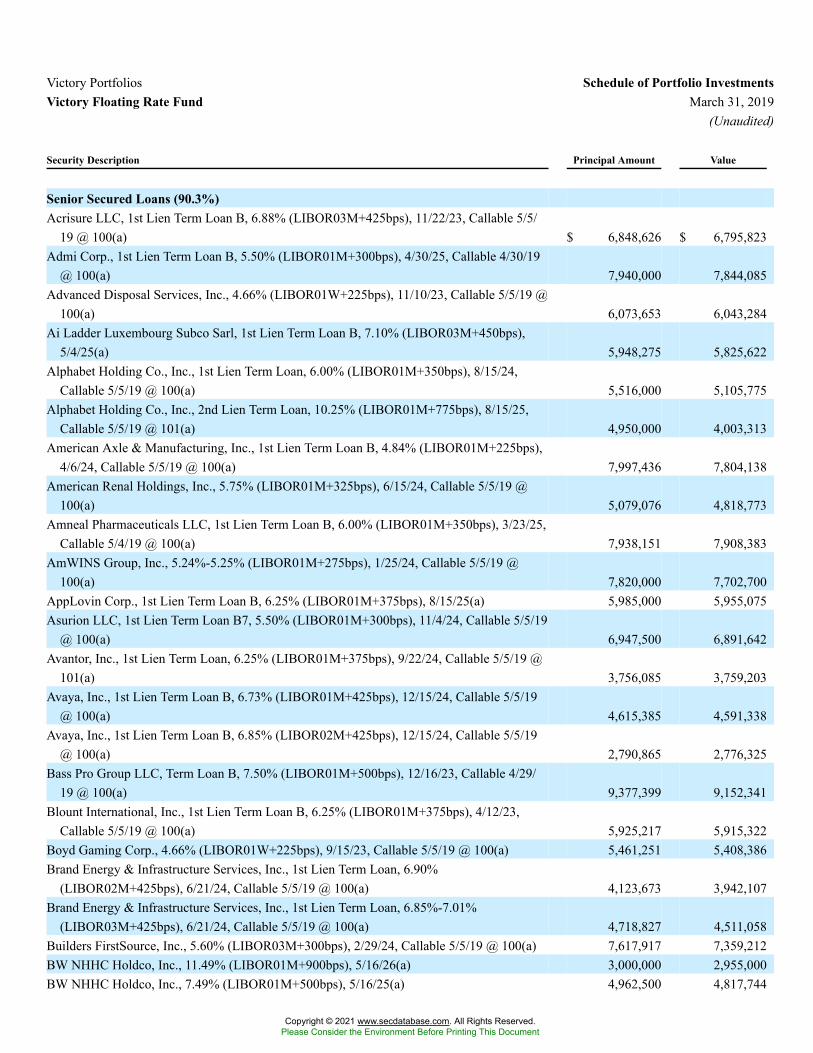
Victory Portfolios Schedule of Portfolio InvestmentsVictory Floating Rate Fund March 31, 2019
(Unaudited)
Security Description Principal Amount Value
Senior Secured Loans (90.3%)Acrisure LLC, 1st Lien Term Loan B, 6.88% (LIBOR03M+425bps), 11/22/23, Callable 5/5/
19 @ 100(a) $ 6,848,626 $ 6,795,823Admi Corp., 1st Lien Term Loan B, 5.50% (LIBOR01M+300bps), 4/30/25, Callable 4/30/19
@ 100(a) 7,940,000 7,844,085Advanced Disposal Services, Inc., 4.66% (LIBOR01W+225bps), 11/10/23, Callable 5/5/19 @
100(a) 6,073,653 6,043,284Ai Ladder Luxembourg Subco Sarl, 1st Lien Term Loan B, 7.10% (LIBOR03M+450bps),
5/4/25(a) 5,948,275 5,825,622Alphabet Holding Co., Inc., 1st Lien Term Loan, 6.00% (LIBOR01M+350bps), 8/15/24,
Callable 5/5/19 @ 100(a) 5,516,000 5,105,775Alphabet Holding Co., Inc., 2nd Lien Term Loan, 10.25% (LIBOR01M+775bps), 8/15/25,
Callable 5/5/19 @ 101(a) 4,950,000 4,003,313American Axle & Manufacturing, Inc., 1st Lien Term Loan B, 4.84% (LIBOR01M+225bps),
4/6/24, Callable 5/5/19 @ 100(a) 7,997,436 7,804,138American Renal Holdings, Inc., 5.75% (LIBOR01M+325bps), 6/15/24, Callable 5/5/19 @
100(a) 5,079,076 4,818,773Amneal Pharmaceuticals LLC, 1st Lien Term Loan B, 6.00% (LIBOR01M+350bps), 3/23/25,
Callable 5/4/19 @ 100(a) 7,938,151 7,908,383AmWINS Group, Inc., 5.24%-5.25% (LIBOR01M+275bps), 1/25/24, Callable 5/5/19 @
100(a) 7,820,000 7,702,700AppLovin Corp., 1st Lien Term Loan B, 6.25% (LIBOR01M+375bps), 8/15/25(a) 5,985,000 5,955,075Asurion LLC, 1st Lien Term Loan B7, 5.50% (LIBOR01M+300bps), 11/4/24, Callable 5/5/19
@ 100(a) 6,947,500 6,891,642Avantor, Inc., 1st Lien Term Loan, 6.25% (LIBOR01M+375bps), 9/22/24, Callable 5/5/19 @
101(a) 3,756,085 3,759,203Avaya, Inc., 1st Lien Term Loan B, 6.73% (LIBOR01M+425bps), 12/15/24, Callable 5/5/19
@ 100(a) 4,615,385 4,591,338Avaya, Inc., 1st Lien Term Loan B, 6.85% (LIBOR02M+425bps), 12/15/24, Callable 5/5/19
@ 100(a) 2,790,865 2,776,325Bass Pro Group LLC, Term Loan B, 7.50% (LIBOR01M+500bps), 12/16/23, Callable 4/29/
19 @ 100(a) 9,377,399 9,152,341Blount International, Inc., 1st Lien Term Loan B, 6.25% (LIBOR01M+375bps), 4/12/23,
Callable 5/5/19 @ 100(a) 5,925,217 5,915,322Boyd Gaming Corp., 4.66% (LIBOR01W+225bps), 9/15/23, Callable 5/5/19 @ 100(a) 5,461,251 5,408,386Brand Energy & Infrastructure Services, Inc., 1st Lien Term Loan, 6.90%
(LIBOR02M+425bps), 6/21/24, Callable 5/5/19 @ 100(a) 4,123,673 3,942,107Brand Energy & Infrastructure Services, Inc., 1st Lien Term Loan, 6.85%-7.01%
(LIBOR03M+425bps), 6/21/24, Callable 5/5/19 @ 100(a) 4,718,827 4,511,058Builders FirstSource, Inc., 5.60% (LIBOR03M+300bps), 2/29/24, Callable 5/5/19 @ 100(a) 7,617,917 7,359,212BW NHHC Holdco, Inc., 11.49% (LIBOR01M+900bps), 5/16/26(a) 3,000,000 2,955,000BW NHHC Holdco, Inc., 7.49% (LIBOR01M+500bps), 5/16/25(a) 4,962,500 4,817,744
Copyright © 2021 www.secdatabase.com. All Rights Reserved.Please Consider the Environment Before Printing This Document
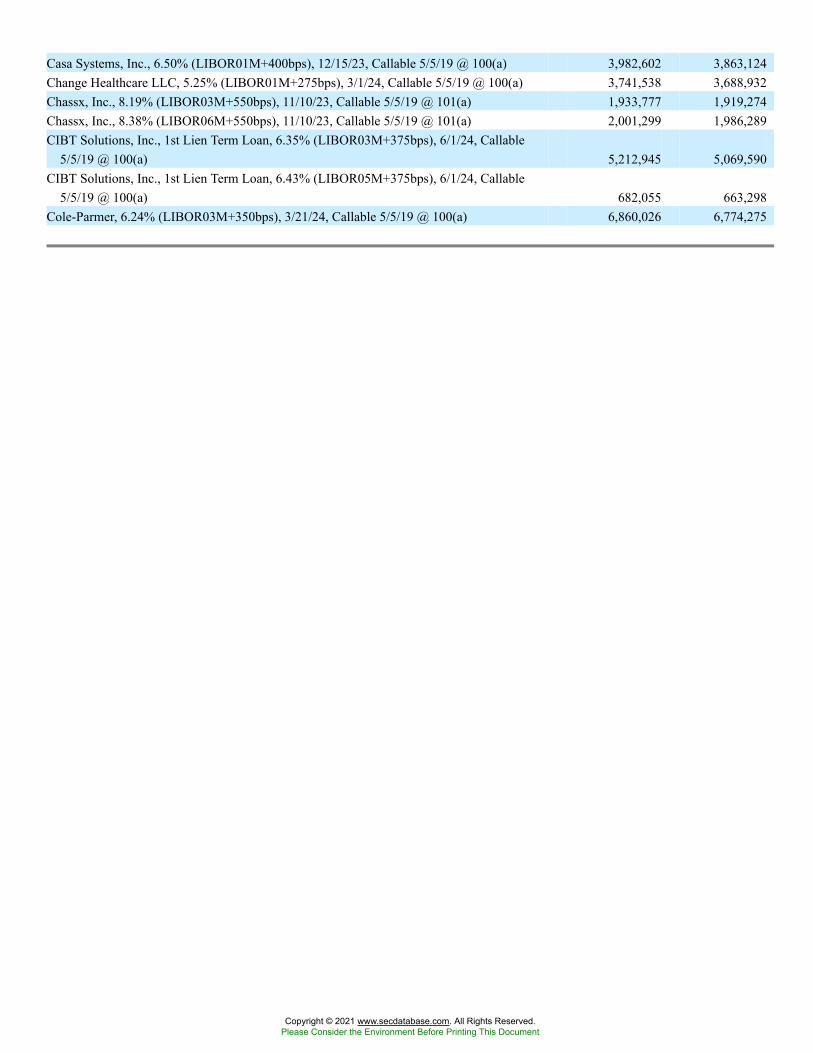
Casa Systems, Inc., 6.50% (LIBOR01M+400bps), 12/15/23, Callable 5/5/19 @ 100(a) 3,982,602 3,863,124Change Healthcare LLC, 5.25% (LIBOR01M+275bps), 3/1/24, Callable 5/5/19 @ 100(a) 3,741,538 3,688,932Chassx, Inc., 8.19% (LIBOR03M+550bps), 11/10/23, Callable 5/5/19 @ 101(a) 1,933,777 1,919,274Chassx, Inc., 8.38% (LIBOR06M+550bps), 11/10/23, Callable 5/5/19 @ 101(a) 2,001,299 1,986,289CIBT Solutions, Inc., 1st Lien Term Loan, 6.35% (LIBOR03M+375bps), 6/1/24, Callable
5/5/19 @ 100(a) 5,212,945 5,069,590CIBT Solutions, Inc., 1st Lien Term Loan, 6.43% (LIBOR05M+375bps), 6/1/24, Callable
5/5/19 @ 100(a) 682,055 663,298Cole-Parmer, 6.24% (LIBOR03M+350bps), 3/21/24, Callable 5/5/19 @ 100(a) 6,860,026 6,774,275
Copyright © 2021 www.secdatabase.com. All Rights Reserved.Please Consider the Environment Before Printing This Document
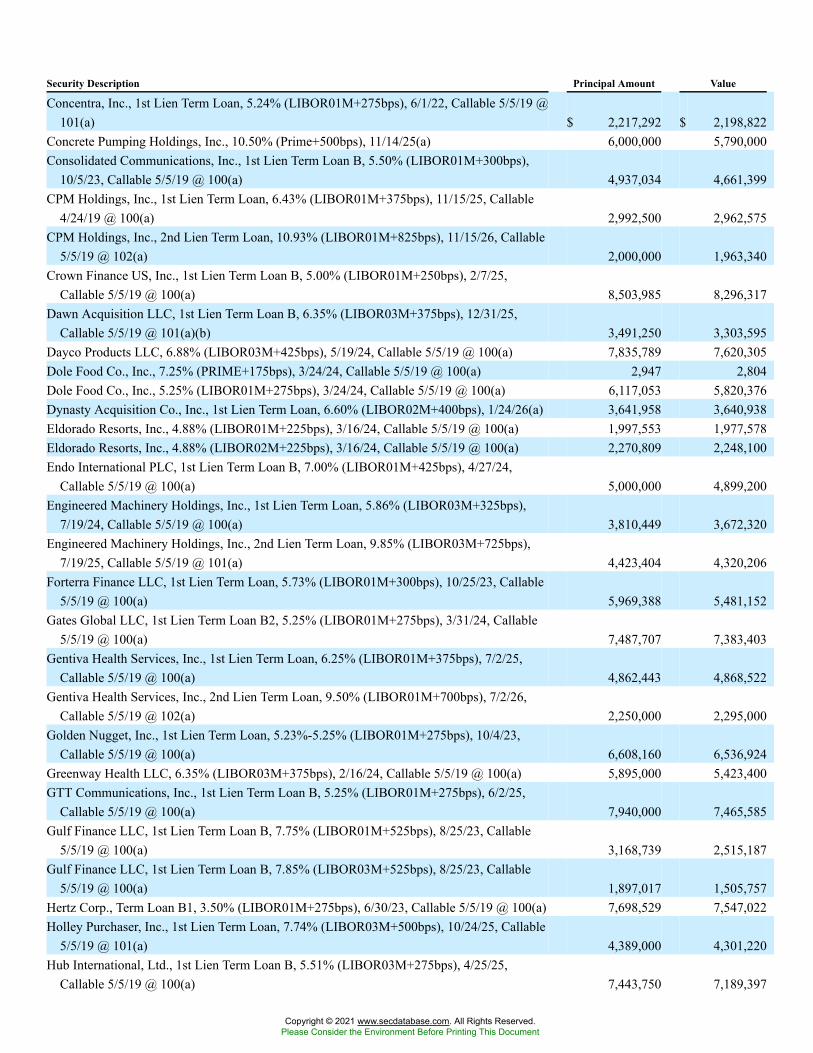
Security Description Principal Amount Value
Concentra, Inc., 1st Lien Term Loan, 5.24% (LIBOR01M+275bps), 6/1/22, Callable 5/5/19 @101(a) $ 2,217,292 $ 2,198,822
Concrete Pumping Holdings, Inc., 10.50% (Prime+500bps), 11/14/25(a) 6,000,000 5,790,000Consolidated Communications, Inc., 1st Lien Term Loan B, 5.50% (LIBOR01M+300bps),
10/5/23, Callable 5/5/19 @ 100(a) 4,937,034 4,661,399CPM Holdings, Inc., 1st Lien Term Loan, 6.43% (LIBOR01M+375bps), 11/15/25, Callable
4/24/19 @ 100(a) 2,992,500 2,962,575CPM Holdings, Inc., 2nd Lien Term Loan, 10.93% (LIBOR01M+825bps), 11/15/26, Callable
5/5/19 @ 102(a) 2,000,000 1,963,340Crown Finance US, Inc., 1st Lien Term Loan B, 5.00% (LIBOR01M+250bps), 2/7/25,
Callable 5/5/19 @ 100(a) 8,503,985 8,296,317Dawn Acquisition LLC, 1st Lien Term Loan B, 6.35% (LIBOR03M+375bps), 12/31/25,
Callable 5/5/19 @ 101(a)(b) 3,491,250 3,303,595Dayco Products LLC, 6.88% (LIBOR03M+425bps), 5/19/24, Callable 5/5/19 @ 100(a) 7,835,789 7,620,305Dole Food Co., Inc., 7.25% (PRIME+175bps), 3/24/24, Callable 5/5/19 @ 100(a) 2,947 2,804Dole Food Co., Inc., 5.25% (LIBOR01M+275bps), 3/24/24, Callable 5/5/19 @ 100(a) 6,117,053 5,820,376Dynasty Acquisition Co., Inc., 1st Lien Term Loan, 6.60% (LIBOR02M+400bps), 1/24/26(a) 3,641,958 3,640,938Eldorado Resorts, Inc., 4.88% (LIBOR01M+225bps), 3/16/24, Callable 5/5/19 @ 100(a) 1,997,553 1,977,578Eldorado Resorts, Inc., 4.88% (LIBOR02M+225bps), 3/16/24, Callable 5/5/19 @ 100(a) 2,270,809 2,248,100Endo International PLC, 1st Lien Term Loan B, 7.00% (LIBOR01M+425bps), 4/27/24,
Callable 5/5/19 @ 100(a) 5,000,000 4,899,200Engineered Machinery Holdings, Inc., 1st Lien Term Loan, 5.86% (LIBOR03M+325bps),
7/19/24, Callable 5/5/19 @ 100(a) 3,810,449 3,672,320Engineered Machinery Holdings, Inc., 2nd Lien Term Loan, 9.85% (LIBOR03M+725bps),
7/19/25, Callable 5/5/19 @ 101(a) 4,423,404 4,320,206Forterra Finance LLC, 1st Lien Term Loan, 5.73% (LIBOR01M+300bps), 10/25/23, Callable
5/5/19 @ 100(a) 5,969,388 5,481,152Gates Global LLC, 1st Lien Term Loan B2, 5.25% (LIBOR01M+275bps), 3/31/24, Callable
5/5/19 @ 100(a) 7,487,707 7,383,403Gentiva Health Services, Inc., 1st Lien Term Loan, 6.25% (LIBOR01M+375bps), 7/2/25,
Callable 5/5/19 @ 100(a) 4,862,443 4,868,522Gentiva Health Services, Inc., 2nd Lien Term Loan, 9.50% (LIBOR01M+700bps), 7/2/26,
Callable 5/5/19 @ 102(a) 2,250,000 2,295,000Golden Nugget, Inc., 1st Lien Term Loan, 5.23%-5.25% (LIBOR01M+275bps), 10/4/23,
Callable 5/5/19 @ 100(a) 6,608,160 6,536,924Greenway Health LLC, 6.35% (LIBOR03M+375bps), 2/16/24, Callable 5/5/19 @ 100(a) 5,895,000 5,423,400GTT Communications, Inc., 1st Lien Term Loan B, 5.25% (LIBOR01M+275bps), 6/2/25,
Callable 5/5/19 @ 100(a) 7,940,000 7,465,585Gulf Finance LLC, 1st Lien Term Loan B, 7.75% (LIBOR01M+525bps), 8/25/23, Callable
5/5/19 @ 100(a) 3,168,739 2,515,187Gulf Finance LLC, 1st Lien Term Loan B, 7.85% (LIBOR03M+525bps), 8/25/23, Callable
5/5/19 @ 100(a) 1,897,017 1,505,757Hertz Corp., Term Loan B1, 3.50% (LIBOR01M+275bps), 6/30/23, Callable 5/5/19 @ 100(a) 7,698,529 7,547,022Holley Purchaser, Inc., 1st Lien Term Loan, 7.74% (LIBOR03M+500bps), 10/24/25, Callable
5/5/19 @ 101(a) 4,389,000 4,301,220Hub International, Ltd., 1st Lien Term Loan B, 5.51% (LIBOR03M+275bps), 4/25/25,
Callable 5/5/19 @ 100(a) 7,443,750 7,189,397
Copyright © 2021 www.secdatabase.com. All Rights Reserved.Please Consider the Environment Before Printing This Document
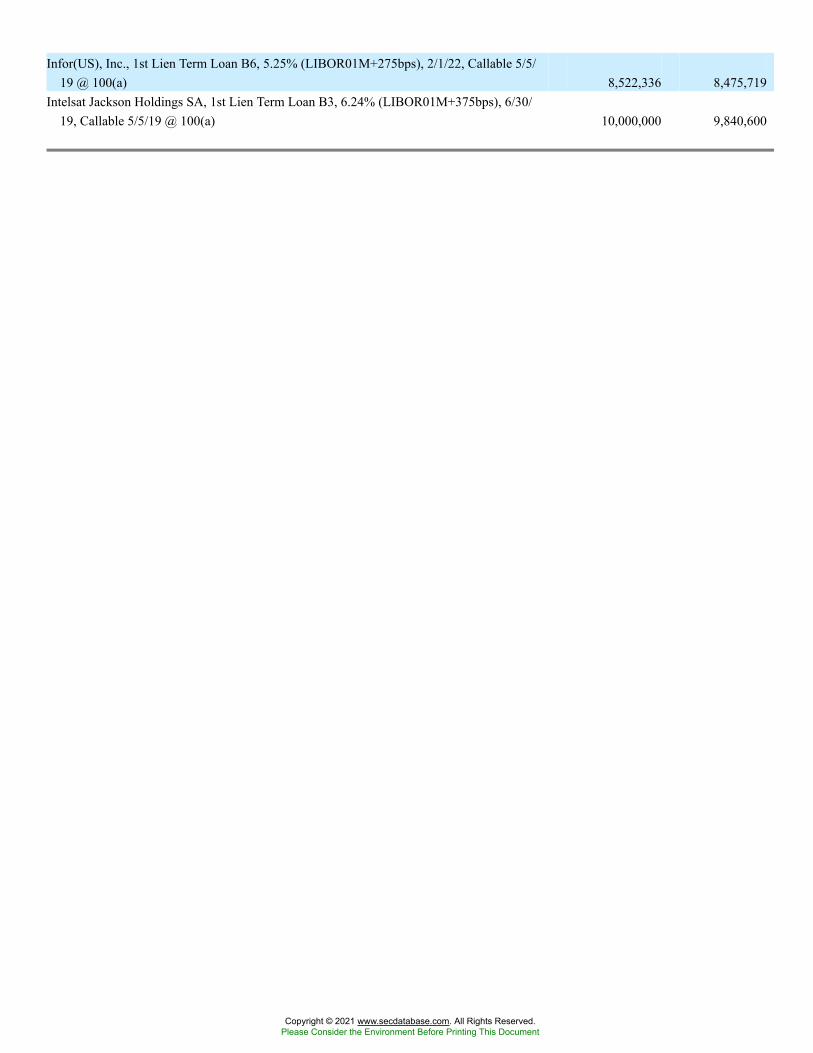
Infor(US), Inc., 1st Lien Term Loan B6, 5.25% (LIBOR01M+275bps), 2/1/22, Callable 5/5/19 @ 100(a) 8,522,336 8,475,719
Intelsat Jackson Holdings SA, 1st Lien Term Loan B3, 6.24% (LIBOR01M+375bps), 6/30/19, Callable 5/5/19 @ 100(a) 10,000,000 9,840,600
Copyright © 2021 www.secdatabase.com. All Rights Reserved.Please Consider the Environment Before Printing This Document
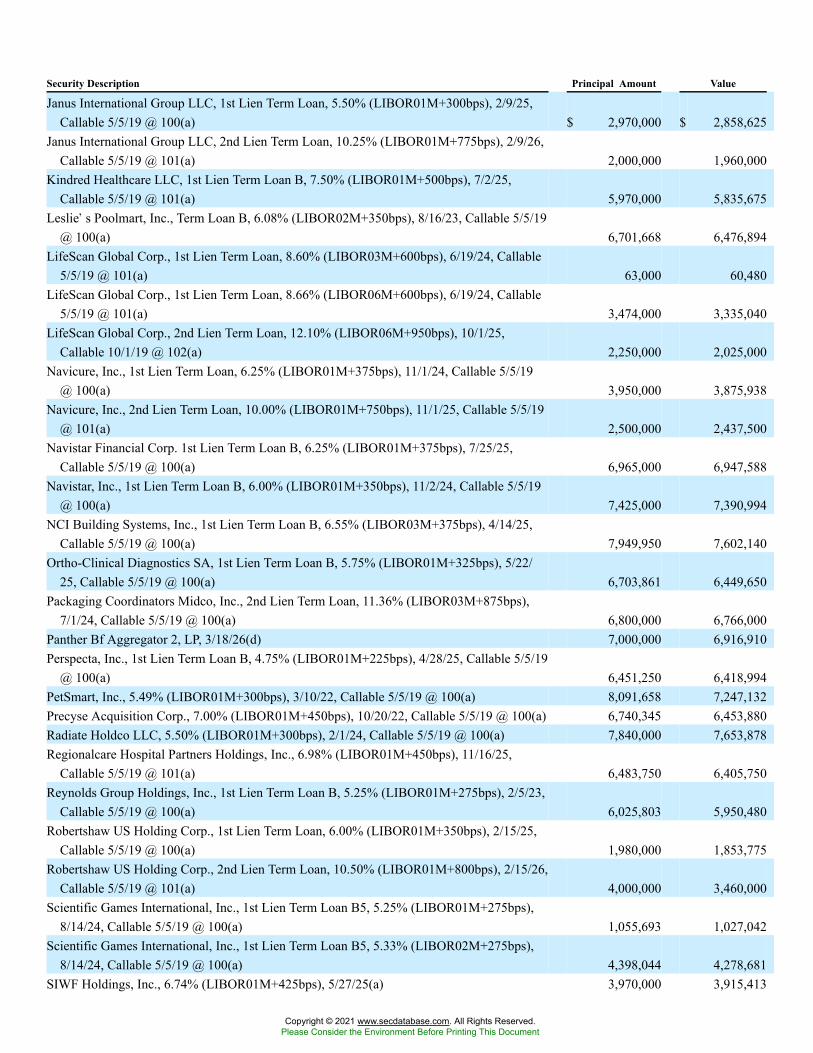
Security Description Principal Amount Value
Janus International Group LLC, 1st Lien Term Loan, 5.50% (LIBOR01M+300bps), 2/9/25,Callable 5/5/19 @ 100(a) $ 2,970,000 $ 2,858,625
Janus International Group LLC, 2nd Lien Term Loan, 10.25% (LIBOR01M+775bps), 2/9/26,Callable 5/5/19 @ 101(a) 2,000,000 1,960,000
Kindred Healthcare LLC, 1st Lien Term Loan B, 7.50% (LIBOR01M+500bps), 7/2/25,Callable 5/5/19 @ 101(a) 5,970,000 5,835,675
Leslie�s Poolmart, Inc., Term Loan B, 6.08% (LIBOR02M+350bps), 8/16/23, Callable 5/5/19@ 100(a) 6,701,668 6,476,894
LifeScan Global Corp., 1st Lien Term Loan, 8.60% (LIBOR03M+600bps), 6/19/24, Callable5/5/19 @ 101(a) 63,000 60,480
LifeScan Global Corp., 1st Lien Term Loan, 8.66% (LIBOR06M+600bps), 6/19/24, Callable5/5/19 @ 101(a) 3,474,000 3,335,040
LifeScan Global Corp., 2nd Lien Term Loan, 12.10% (LIBOR06M+950bps), 10/1/25,Callable 10/1/19 @ 102(a) 2,250,000 2,025,000
Navicure, Inc., 1st Lien Term Loan, 6.25% (LIBOR01M+375bps), 11/1/24, Callable 5/5/19@ 100(a) 3,950,000 3,875,938
Navicure, Inc., 2nd Lien Term Loan, 10.00% (LIBOR01M+750bps), 11/1/25, Callable 5/5/19@ 101(a) 2,500,000 2,437,500
Navistar Financial Corp. 1st Lien Term Loan B, 6.25% (LIBOR01M+375bps), 7/25/25,Callable 5/5/19 @ 100(a) 6,965,000 6,947,588
Navistar, Inc., 1st Lien Term Loan B, 6.00% (LIBOR01M+350bps), 11/2/24, Callable 5/5/19@ 100(a) 7,425,000 7,390,994
NCI Building Systems, Inc., 1st Lien Term Loan B, 6.55% (LIBOR03M+375bps), 4/14/25,Callable 5/5/19 @ 100(a) 7,949,950 7,602,140
Ortho-Clinical Diagnostics SA, 1st Lien Term Loan B, 5.75% (LIBOR01M+325bps), 5/22/25, Callable 5/5/19 @ 100(a) 6,703,861 6,449,650
Packaging Coordinators Midco, Inc., 2nd Lien Term Loan, 11.36% (LIBOR03M+875bps),7/1/24, Callable 5/5/19 @ 100(a) 6,800,000 6,766,000
Panther Bf Aggregator 2, LP, 3/18/26(d) 7,000,000 6,916,910Perspecta, Inc., 1st Lien Term Loan B, 4.75% (LIBOR01M+225bps), 4/28/25, Callable 5/5/19
@ 100(a) 6,451,250 6,418,994PetSmart, Inc., 5.49% (LIBOR01M+300bps), 3/10/22, Callable 5/5/19 @ 100(a) 8,091,658 7,247,132Precyse Acquisition Corp., 7.00% (LIBOR01M+450bps), 10/20/22, Callable 5/5/19 @ 100(a) 6,740,345 6,453,880Radiate Holdco LLC, 5.50% (LIBOR01M+300bps), 2/1/24, Callable 5/5/19 @ 100(a) 7,840,000 7,653,878Regionalcare Hospital Partners Holdings, Inc., 6.98% (LIBOR01M+450bps), 11/16/25,
Callable 5/5/19 @ 101(a) 6,483,750 6,405,750Reynolds Group Holdings, Inc., 1st Lien Term Loan B, 5.25% (LIBOR01M+275bps), 2/5/23,
Callable 5/5/19 @ 100(a) 6,025,803 5,950,480Robertshaw US Holding Corp., 1st Lien Term Loan, 6.00% (LIBOR01M+350bps), 2/15/25,
Callable 5/5/19 @ 100(a) 1,980,000 1,853,775Robertshaw US Holding Corp., 2nd Lien Term Loan, 10.50% (LIBOR01M+800bps), 2/15/26,
Callable 5/5/19 @ 101(a) 4,000,000 3,460,000Scientific Games International, Inc., 1st Lien Term Loan B5, 5.25% (LIBOR01M+275bps),
8/14/24, Callable 5/5/19 @ 100(a) 1,055,693 1,027,042Scientific Games International, Inc., 1st Lien Term Loan B5, 5.33% (LIBOR02M+275bps),
8/14/24, Callable 5/5/19 @ 100(a) 4,398,044 4,278,681SIWF Holdings, Inc., 6.74% (LIBOR01M+425bps), 5/27/25(a) 3,970,000 3,915,413
Copyright © 2021 www.secdatabase.com. All Rights Reserved.Please Consider the Environment Before Printing This Document
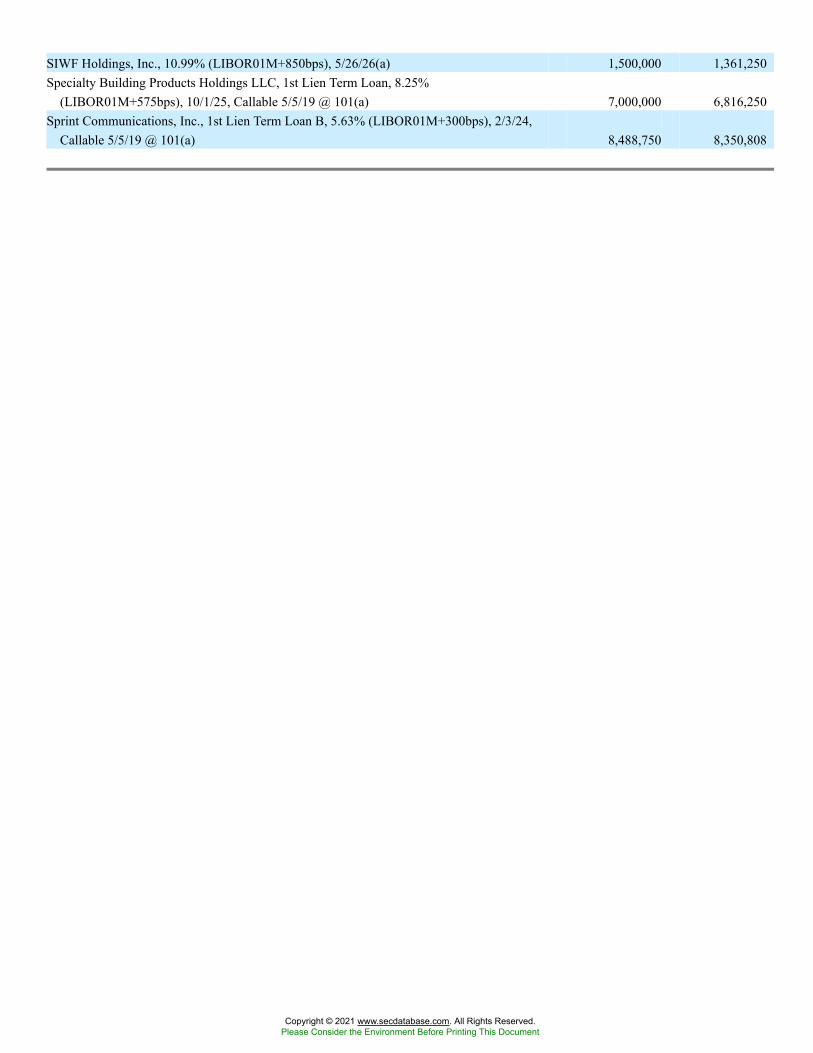
SIWF Holdings, Inc., 10.99% (LIBOR01M+850bps), 5/26/26(a) 1,500,000 1,361,250Specialty Building Products Holdings LLC, 1st Lien Term Loan, 8.25%
(LIBOR01M+575bps), 10/1/25, Callable 5/5/19 @ 101(a) 7,000,000 6,816,250Sprint Communications, Inc., 1st Lien Term Loan B, 5.63% (LIBOR01M+300bps), 2/3/24,
Callable 5/5/19 @ 101(a) 8,488,750 8,350,808
Copyright © 2021 www.secdatabase.com. All Rights Reserved.Please Consider the Environment Before Printing This Document
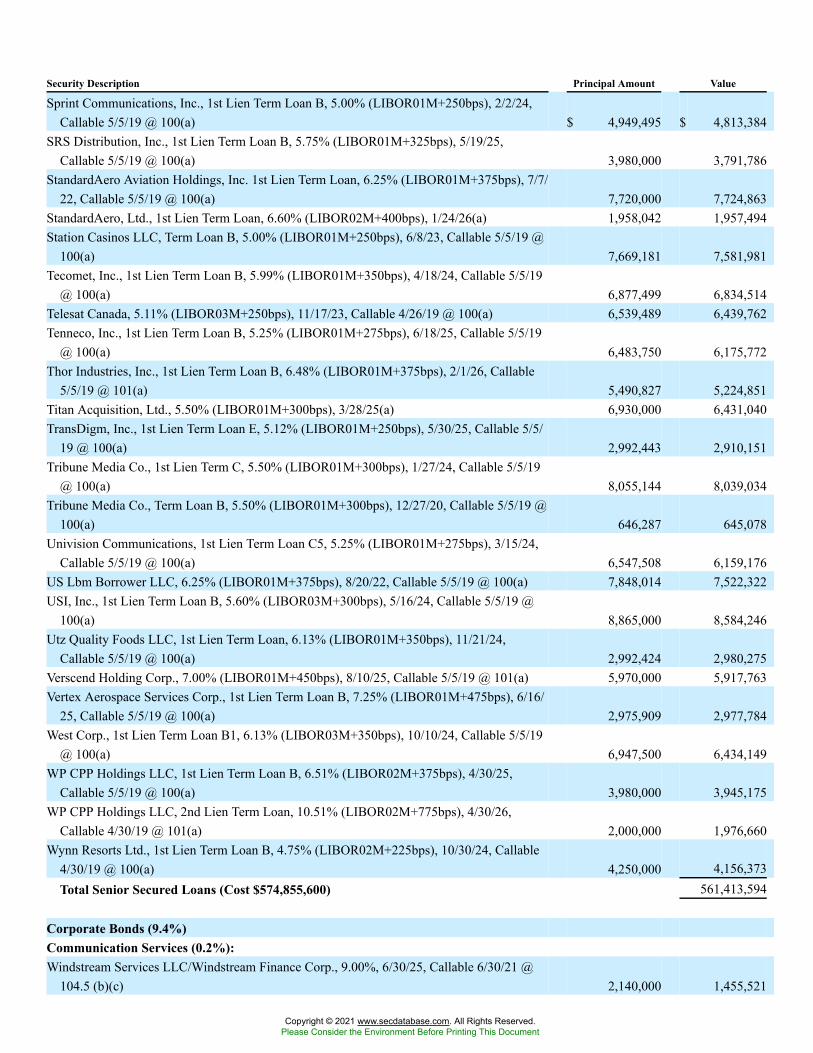
Security Description Principal Amount Value
Sprint Communications, Inc., 1st Lien Term Loan B, 5.00% (LIBOR01M+250bps), 2/2/24,Callable 5/5/19 @ 100(a) $ 4,949,495 $ 4,813,384
SRS Distribution, Inc., 1st Lien Term Loan B, 5.75% (LIBOR01M+325bps), 5/19/25,Callable 5/5/19 @ 100(a) 3,980,000 3,791,786
StandardAero Aviation Holdings, Inc. 1st Lien Term Loan, 6.25% (LIBOR01M+375bps), 7/7/22, Callable 5/5/19 @ 100(a) 7,720,000 7,724,863
StandardAero, Ltd., 1st Lien Term Loan, 6.60% (LIBOR02M+400bps), 1/24/26(a) 1,958,042 1,957,494Station Casinos LLC, Term Loan B, 5.00% (LIBOR01M+250bps), 6/8/23, Callable 5/5/19 @
100(a) 7,669,181 7,581,981Tecomet, Inc., 1st Lien Term Loan B, 5.99% (LIBOR01M+350bps), 4/18/24, Callable 5/5/19
@ 100(a) 6,877,499 6,834,514Telesat Canada, 5.11% (LIBOR03M+250bps), 11/17/23, Callable 4/26/19 @ 100(a) 6,539,489 6,439,762Tenneco, Inc., 1st Lien Term Loan B, 5.25% (LIBOR01M+275bps), 6/18/25, Callable 5/5/19
@ 100(a) 6,483,750 6,175,772Thor Industries, Inc., 1st Lien Term Loan B, 6.48% (LIBOR01M+375bps), 2/1/26, Callable
5/5/19 @ 101(a) 5,490,827 5,224,851Titan Acquisition, Ltd., 5.50% (LIBOR01M+300bps), 3/28/25(a) 6,930,000 6,431,040TransDigm, Inc., 1st Lien Term Loan E, 5.12% (LIBOR01M+250bps), 5/30/25, Callable 5/5/
19 @ 100(a) 2,992,443 2,910,151Tribune Media Co., 1st Lien Term C, 5.50% (LIBOR01M+300bps), 1/27/24, Callable 5/5/19
@ 100(a) 8,055,144 8,039,034Tribune Media Co., Term Loan B, 5.50% (LIBOR01M+300bps), 12/27/20, Callable 5/5/19 @
100(a) 646,287 645,078Univision Communications, 1st Lien Term Loan C5, 5.25% (LIBOR01M+275bps), 3/15/24,
Callable 5/5/19 @ 100(a) 6,547,508 6,159,176US Lbm Borrower LLC, 6.25% (LIBOR01M+375bps), 8/20/22, Callable 5/5/19 @ 100(a) 7,848,014 7,522,322USI, Inc., 1st Lien Term Loan B, 5.60% (LIBOR03M+300bps), 5/16/24, Callable 5/5/19 @
100(a) 8,865,000 8,584,246Utz Quality Foods LLC, 1st Lien Term Loan, 6.13% (LIBOR01M+350bps), 11/21/24,
Callable 5/5/19 @ 100(a) 2,992,424 2,980,275Verscend Holding Corp., 7.00% (LIBOR01M+450bps), 8/10/25, Callable 5/5/19 @ 101(a) 5,970,000 5,917,763Vertex Aerospace Services Corp., 1st Lien Term Loan B, 7.25% (LIBOR01M+475bps), 6/16/
25, Callable 5/5/19 @ 100(a) 2,975,909 2,977,784West Corp., 1st Lien Term Loan B1, 6.13% (LIBOR03M+350bps), 10/10/24, Callable 5/5/19
@ 100(a) 6,947,500 6,434,149WP CPP Holdings LLC, 1st Lien Term Loan B, 6.51% (LIBOR02M+375bps), 4/30/25,
Callable 5/5/19 @ 100(a) 3,980,000 3,945,175WP CPP Holdings LLC, 2nd Lien Term Loan, 10.51% (LIBOR02M+775bps), 4/30/26,
Callable 4/30/19 @ 101(a) 2,000,000 1,976,660Wynn Resorts Ltd., 1st Lien Term Loan B, 4.75% (LIBOR02M+225bps), 10/30/24, Callable
4/30/19 @ 100(a) 4,250,000 4,156,373Total Senior Secured Loans (Cost $574,855,600) 561,413,594
Corporate Bonds (9.4%)Communication Services (0.2%):Windstream Services LLC/Windstream Finance Corp., 9.00%, 6/30/25, Callable 6/30/21 @
104.5 (b)(c) 2,140,000 1,455,521
Copyright © 2021 www.secdatabase.com. All Rights Reserved.Please Consider the Environment Before Printing This Document

Copyright © 2021 www.secdatabase.com. All Rights Reserved.Please Consider the Environment Before Printing This Document
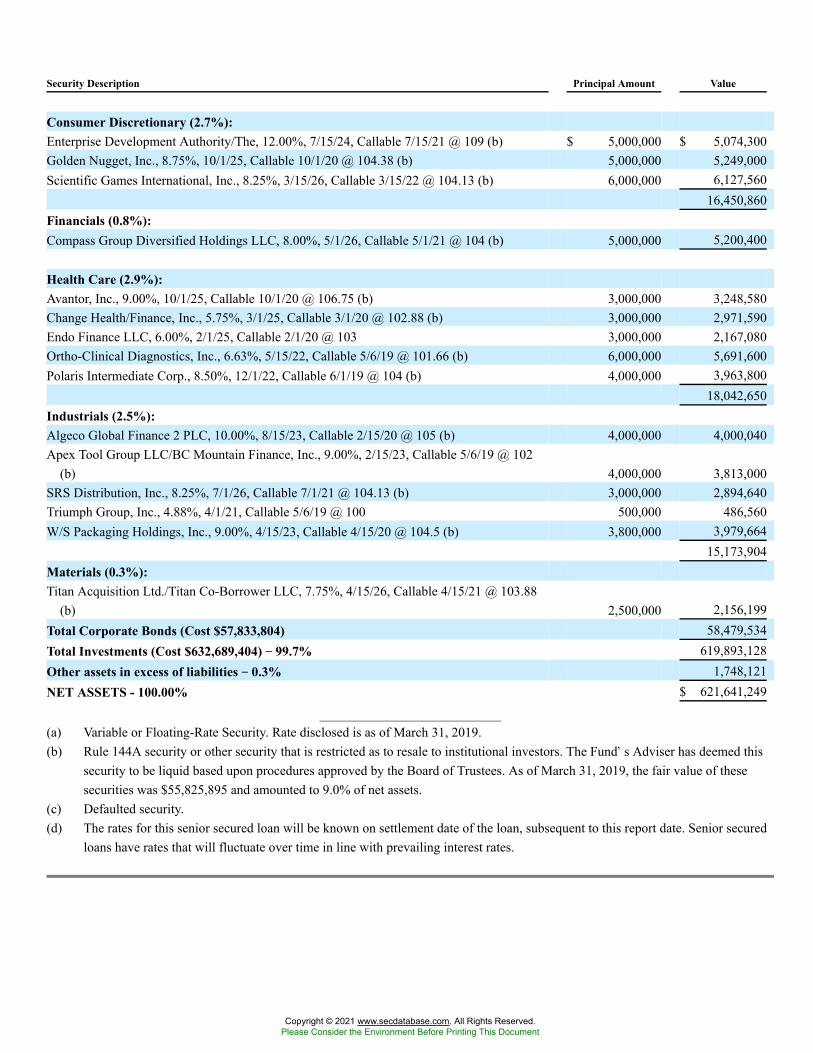
Security Description Principal Amount Value
Consumer Discretionary (2.7%):Enterprise Development Authority/The, 12.00%, 7/15/24, Callable 7/15/21 @ 109 (b) $ 5,000,000 $ 5,074,300Golden Nugget, Inc., 8.75%, 10/1/25, Callable 10/1/20 @ 104.38 (b) 5,000,000 5,249,000Scientific Games International, Inc., 8.25%, 3/15/26, Callable 3/15/22 @ 104.13 (b) 6,000,000 6,127,560
16,450,860Financials (0.8%):Compass Group Diversified Holdings LLC, 8.00%, 5/1/26, Callable 5/1/21 @ 104 (b) 5,000,000 5,200,400
Health Care (2.9%):Avantor, Inc., 9.00%, 10/1/25, Callable 10/1/20 @ 106.75 (b) 3,000,000 3,248,580Change Health/Finance, Inc., 5.75%, 3/1/25, Callable 3/1/20 @ 102.88 (b) 3,000,000 2,971,590Endo Finance LLC, 6.00%, 2/1/25, Callable 2/1/20 @ 103 3,000,000 2,167,080Ortho-Clinical Diagnostics, Inc., 6.63%, 5/15/22, Callable 5/6/19 @ 101.66 (b) 6,000,000 5,691,600Polaris Intermediate Corp., 8.50%, 12/1/22, Callable 6/1/19 @ 104 (b) 4,000,000 3,963,800
18,042,650Industrials (2.5%):Algeco Global Finance 2 PLC, 10.00%, 8/15/23, Callable 2/15/20 @ 105 (b) 4,000,000 4,000,040Apex Tool Group LLC/BC Mountain Finance, Inc., 9.00%, 2/15/23, Callable 5/6/19 @ 102
(b) 4,000,000 3,813,000SRS Distribution, Inc., 8.25%, 7/1/26, Callable 7/1/21 @ 104.13 (b) 3,000,000 2,894,640Triumph Group, Inc., 4.88%, 4/1/21, Callable 5/6/19 @ 100 500,000 486,560W/S Packaging Holdings, Inc., 9.00%, 4/15/23, Callable 4/15/20 @ 104.5 (b) 3,800,000 3,979,664
15,173,904Materials (0.3%):Titan Acquisition Ltd./Titan Co-Borrower LLC, 7.75%, 4/15/26, Callable 4/15/21 @ 103.88
(b) 2,500,000 2,156,199Total Corporate Bonds (Cost $57,833,804) 58,479,534Total Investments (Cost $632,689,404) �� 99.7% 619,893,128Other assets in excess of liabilities �� 0.3% 1,748,121NET ASSETS - 100.00% $ 621,641,249
(a) Variable or Floating-Rate Security. Rate disclosed is as of March 31, 2019.(b) Rule 144A security or other security that is restricted as to resale to institutional investors. The Fund�s Adviser has deemed this
security to be liquid based upon procedures approved by the Board of Trustees. As of March 31, 2019, the fair value of thesesecurities was $55,825,895 and amounted to 9.0% of net assets.
(c) Defaulted security.(d) The rates for this senior secured loan will be known on settlement date of the loan, subsequent to this report date. Senior secured
loans have rates that will fluctuate over time in line with prevailing interest rates.
Copyright © 2021 www.secdatabase.com. All Rights Reserved.Please Consider the Environment Before Printing This Document
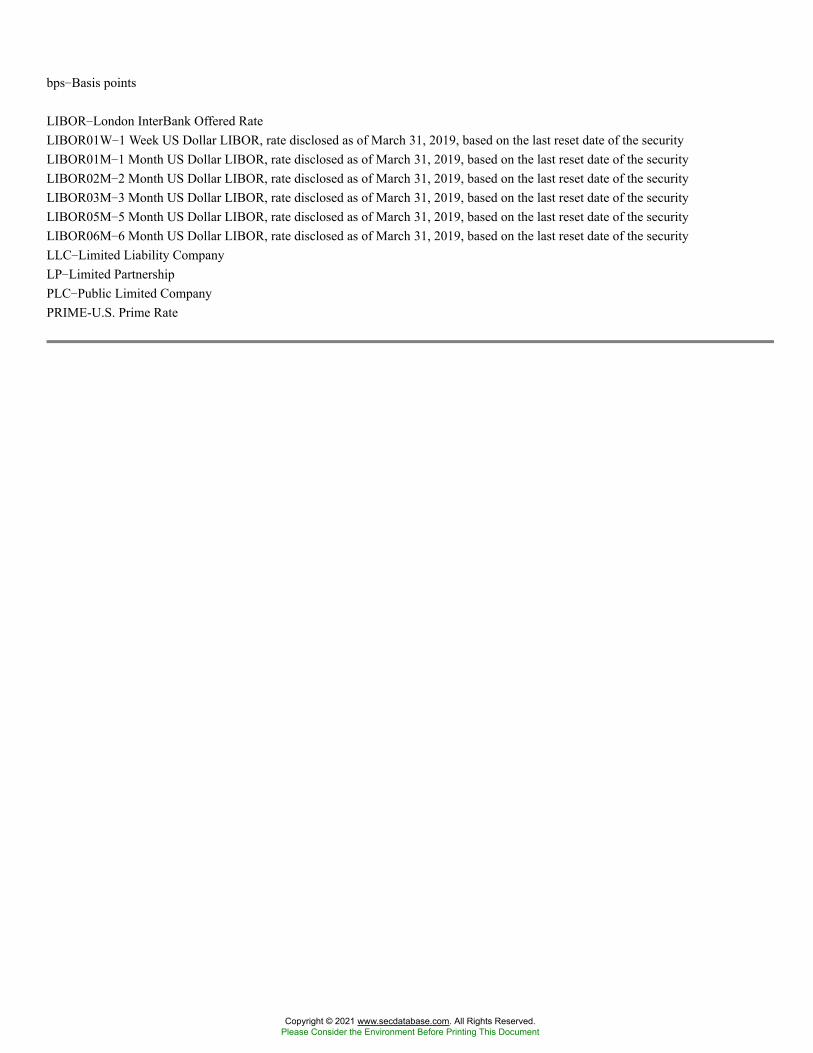
bps�Basis points
LIBOR�London InterBank Offered RateLIBOR01W�1 Week US Dollar LIBOR, rate disclosed as of March 31, 2019, based on the last reset date of the securityLIBOR01M�1 Month US Dollar LIBOR, rate disclosed as of March 31, 2019, based on the last reset date of the securityLIBOR02M�2 Month US Dollar LIBOR, rate disclosed as of March 31, 2019, based on the last reset date of the securityLIBOR03M�3 Month US Dollar LIBOR, rate disclosed as of March 31, 2019, based on the last reset date of the securityLIBOR05M�5 Month US Dollar LIBOR, rate disclosed as of March 31, 2019, based on the last reset date of the securityLIBOR06M�6 Month US Dollar LIBOR, rate disclosed as of March 31, 2019, based on the last reset date of the securityLLC�Limited Liability CompanyLP�Limited PartnershipPLC�Public Limited CompanyPRIME-U.S. Prime Rate
Copyright © 2021 www.secdatabase.com. All Rights Reserved.Please Consider the Environment Before Printing This Document
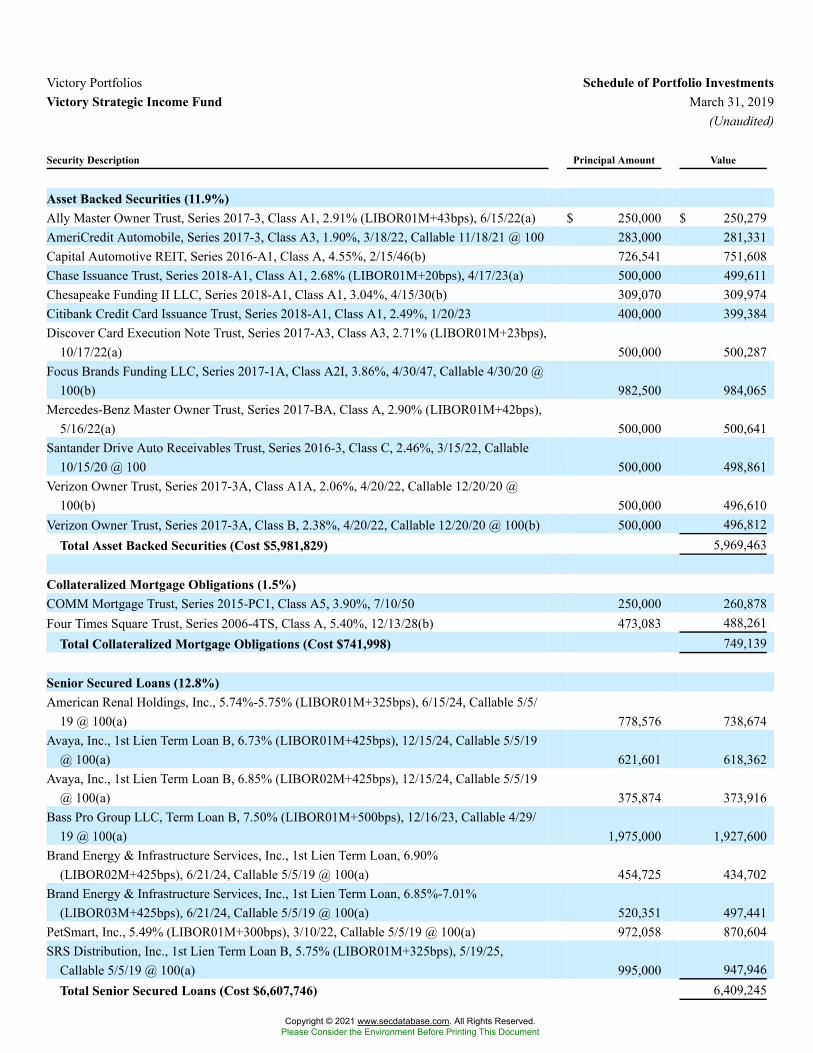
Victory Portfolios Schedule of Portfolio InvestmentsVictory Strategic Income Fund March 31, 2019
(Unaudited)
Security Description Principal Amount Value
Asset Backed Securities (11.9%)Ally Master Owner Trust, Series 2017-3, Class A1, 2.91% (LIBOR01M+43bps), 6/15/22(a) $ 250,000 $ 250,279AmeriCredit Automobile, Series 2017-3, Class A3, 1.90%, 3/18/22, Callable 11/18/21 @ 100 283,000 281,331Capital Automotive REIT, Series 2016-A1, Class A, 4.55%, 2/15/46(b) 726,541 751,608Chase Issuance Trust, Series 2018-A1, Class A1, 2.68% (LIBOR01M+20bps), 4/17/23(a) 500,000 499,611Chesapeake Funding II LLC, Series 2018-A1, Class A1, 3.04%, 4/15/30(b) 309,070 309,974Citibank Credit Card Issuance Trust, Series 2018-A1, Class A1, 2.49%, 1/20/23 400,000 399,384Discover Card Execution Note Trust, Series 2017-A3, Class A3, 2.71% (LIBOR01M+23bps),
10/17/22(a) 500,000 500,287Focus Brands Funding LLC, Series 2017-1A, Class A2I, 3.86%, 4/30/47, Callable 4/30/20 @
100(b) 982,500 984,065Mercedes-Benz Master Owner Trust, Series 2017-BA, Class A, 2.90% (LIBOR01M+42bps),
5/16/22(a) 500,000 500,641Santander Drive Auto Receivables Trust, Series 2016-3, Class C, 2.46%, 3/15/22, Callable
10/15/20 @ 100 500,000 498,861Verizon Owner Trust, Series 2017-3A, Class A1A, 2.06%, 4/20/22, Callable 12/20/20 @
100(b) 500,000 496,610Verizon Owner Trust, Series 2017-3A, Class B, 2.38%, 4/20/22, Callable 12/20/20 @ 100(b) 500,000 496,812
Total Asset Backed Securities (Cost $5,981,829) 5,969,463
Collateralized Mortgage Obligations (1.5%)COMM Mortgage Trust, Series 2015-PC1, Class A5, 3.90%, 7/10/50 250,000 260,878Four Times Square Trust, Series 2006-4TS, Class A, 5.40%, 12/13/28(b) 473,083 488,261
Total Collateralized Mortgage Obligations (Cost $741,998) 749,139
Senior Secured Loans (12.8%)American Renal Holdings, Inc., 5.74%-5.75% (LIBOR01M+325bps), 6/15/24, Callable 5/5/
19 @ 100(a) 778,576 738,674Avaya, Inc., 1st Lien Term Loan B, 6.73% (LIBOR01M+425bps), 12/15/24, Callable 5/5/19
@ 100(a) 621,601 618,362Avaya, Inc., 1st Lien Term Loan B, 6.85% (LIBOR02M+425bps), 12/15/24, Callable 5/5/19
@ 100(a) 375,874 373,916Bass Pro Group LLC, Term Loan B, 7.50% (LIBOR01M+500bps), 12/16/23, Callable 4/29/
19 @ 100(a) 1,975,000 1,927,600Brand Energy & Infrastructure Services, Inc., 1st Lien Term Loan, 6.90%
(LIBOR02M+425bps), 6/21/24, Callable 5/5/19 @ 100(a) 454,725 434,702Brand Energy & Infrastructure Services, Inc., 1st Lien Term Loan, 6.85%-7.01%
(LIBOR03M+425bps), 6/21/24, Callable 5/5/19 @ 100(a) 520,351 497,441PetSmart, Inc., 5.49% (LIBOR01M+300bps), 3/10/22, Callable 5/5/19 @ 100(a) 972,058 870,604SRS Distribution, Inc., 1st Lien Term Loan B, 5.75% (LIBOR01M+325bps), 5/19/25,
Callable 5/5/19 @ 100(a) 995,000 947,946Total Senior Secured Loans (Cost $6,607,746) 6,409,245
Copyright © 2021 www.secdatabase.com. All Rights Reserved.Please Consider the Environment Before Printing This Document

Copyright © 2021 www.secdatabase.com. All Rights Reserved.Please Consider the Environment Before Printing This Document
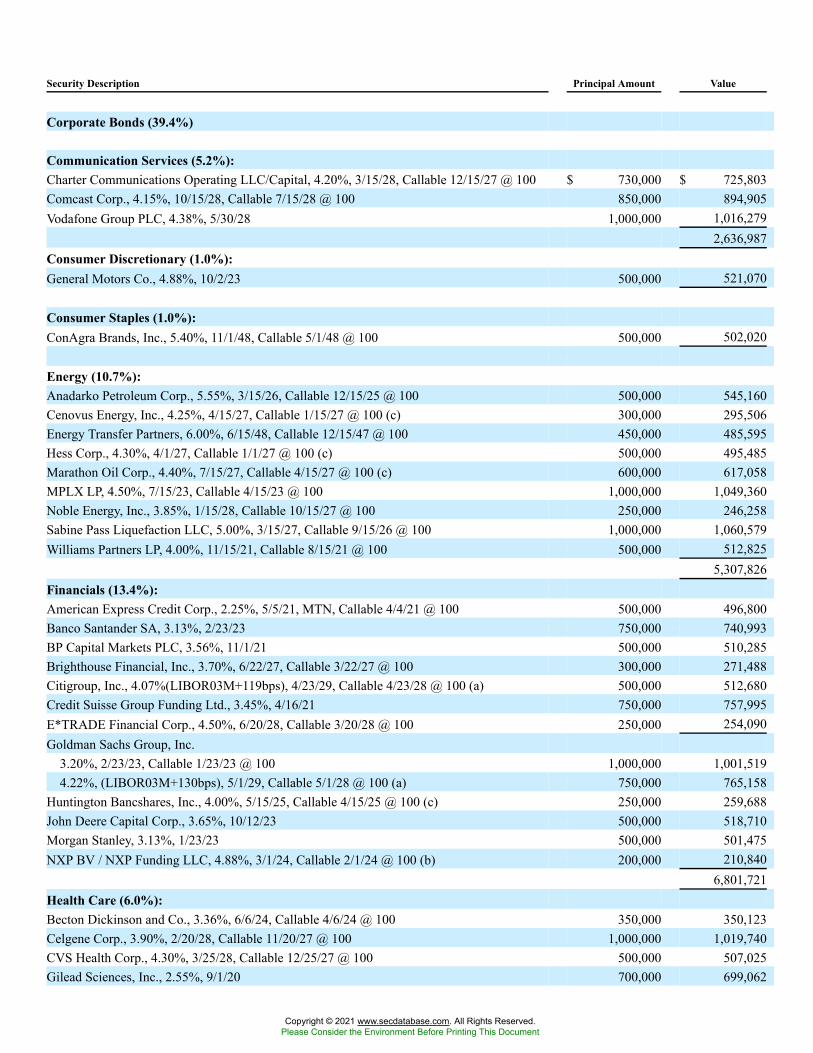
Security Description Principal Amount Value
Corporate Bonds (39.4%)
Communication Services (5.2%):Charter Communications Operating LLC/Capital, 4.20%, 3/15/28, Callable 12/15/27 @ 100 $ 730,000 $ 725,803Comcast Corp., 4.15%, 10/15/28, Callable 7/15/28 @ 100 850,000 894,905Vodafone Group PLC, 4.38%, 5/30/28 1,000,000 1,016,279
2,636,987Consumer Discretionary (1.0%):General Motors Co., 4.88%, 10/2/23 500,000 521,070
Consumer Staples (1.0%):ConAgra Brands, Inc., 5.40%, 11/1/48, Callable 5/1/48 @ 100 500,000 502,020
Energy (10.7%):Anadarko Petroleum Corp., 5.55%, 3/15/26, Callable 12/15/25 @ 100 500,000 545,160Cenovus Energy, Inc., 4.25%, 4/15/27, Callable 1/15/27 @ 100 (c) 300,000 295,506Energy Transfer Partners, 6.00%, 6/15/48, Callable 12/15/47 @ 100 450,000 485,595Hess Corp., 4.30%, 4/1/27, Callable 1/1/27 @ 100 (c) 500,000 495,485Marathon Oil Corp., 4.40%, 7/15/27, Callable 4/15/27 @ 100 (c) 600,000 617,058MPLX LP, 4.50%, 7/15/23, Callable 4/15/23 @ 100 1,000,000 1,049,360Noble Energy, Inc., 3.85%, 1/15/28, Callable 10/15/27 @ 100 250,000 246,258Sabine Pass Liquefaction LLC, 5.00%, 3/15/27, Callable 9/15/26 @ 100 1,000,000 1,060,579Williams Partners LP, 4.00%, 11/15/21, Callable 8/15/21 @ 100 500,000 512,825
5,307,826Financials (13.4%):American Express Credit Corp., 2.25%, 5/5/21, MTN, Callable 4/4/21 @ 100 500,000 496,800Banco Santander SA, 3.13%, 2/23/23 750,000 740,993BP Capital Markets PLC, 3.56%, 11/1/21 500,000 510,285Brighthouse Financial, Inc., 3.70%, 6/22/27, Callable 3/22/27 @ 100 300,000 271,488Citigroup, Inc., 4.07%(LIBOR03M+119bps), 4/23/29, Callable 4/23/28 @ 100 (a) 500,000 512,680Credit Suisse Group Funding Ltd., 3.45%, 4/16/21 750,000 757,995E*TRADE Financial Corp., 4.50%, 6/20/28, Callable 3/20/28 @ 100 250,000 254,090Goldman Sachs Group, Inc.
3.20%, 2/23/23, Callable 1/23/23 @ 100 1,000,000 1,001,5194.22%, (LIBOR03M+130bps), 5/1/29, Callable 5/1/28 @ 100 (a) 750,000 765,158
Huntington Bancshares, Inc., 4.00%, 5/15/25, Callable 4/15/25 @ 100 (c) 250,000 259,688John Deere Capital Corp., 3.65%, 10/12/23 500,000 518,710Morgan Stanley, 3.13%, 1/23/23 500,000 501,475NXP BV / NXP Funding LLC, 4.88%, 3/1/24, Callable 2/1/24 @ 100 (b) 200,000 210,840
6,801,721Health Care (6.0%):Becton Dickinson and Co., 3.36%, 6/6/24, Callable 4/6/24 @ 100 350,000 350,123Celgene Corp., 3.90%, 2/20/28, Callable 11/20/27 @ 100 1,000,000 1,019,740CVS Health Corp., 4.30%, 3/25/28, Callable 12/25/27 @ 100 500,000 507,025Gilead Sciences, Inc., 2.55%, 9/1/20 700,000 699,062
Copyright © 2021 www.secdatabase.com. All Rights Reserved.Please Consider the Environment Before Printing This Document
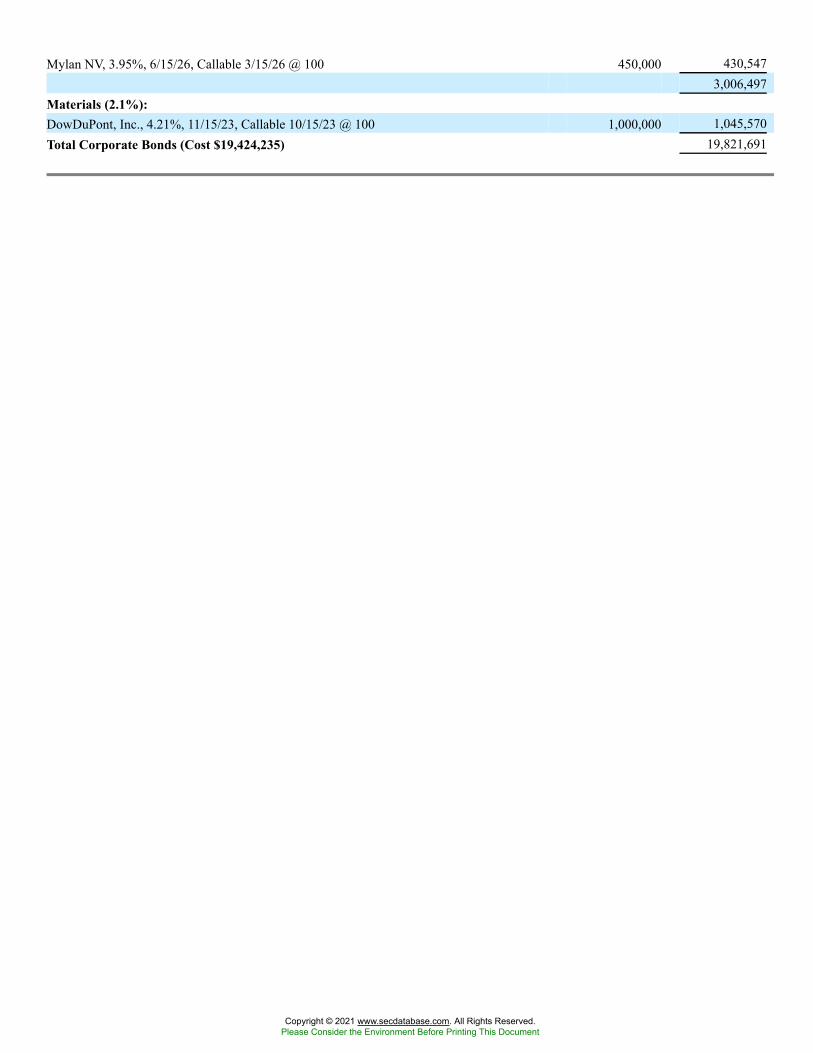
Mylan NV, 3.95%, 6/15/26, Callable 3/15/26 @ 100 450,000 430,5473,006,497
Materials (2.1%):DowDuPont, Inc., 4.21%, 11/15/23, Callable 10/15/23 @ 100 1,000,000 1,045,570Total Corporate Bonds (Cost $19,424,235) 19,821,691
Copyright © 2021 www.secdatabase.com. All Rights Reserved.Please Consider the Environment Before Printing This Document
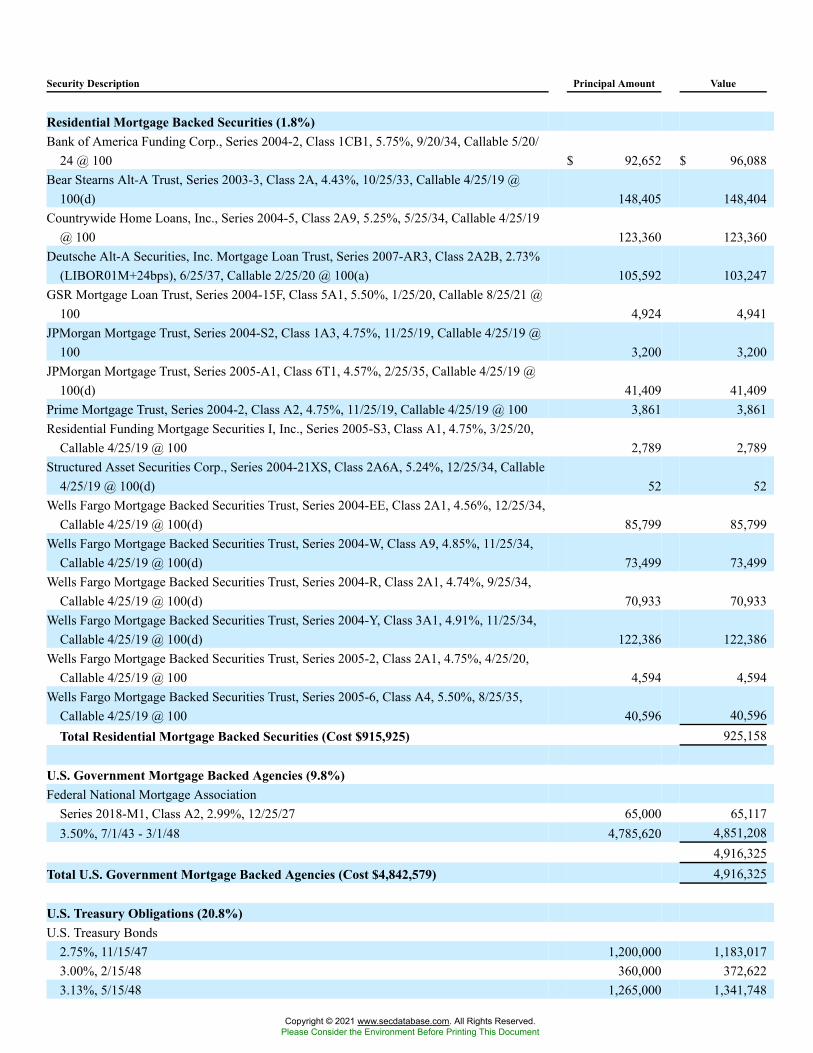
Security Description Principal Amount Value
Residential Mortgage Backed Securities (1.8%)Bank of America Funding Corp., Series 2004-2, Class 1CB1, 5.75%, 9/20/34, Callable 5/20/
24 @ 100 $ 92,652 $ 96,088Bear Stearns Alt-A Trust, Series 2003-3, Class 2A, 4.43%, 10/25/33, Callable 4/25/19 @
100(d) 148,405 148,404Countrywide Home Loans, Inc., Series 2004-5, Class 2A9, 5.25%, 5/25/34, Callable 4/25/19
@ 100 123,360 123,360Deutsche Alt-A Securities, Inc. Mortgage Loan Trust, Series 2007-AR3, Class 2A2B, 2.73%
(LIBOR01M+24bps), 6/25/37, Callable 2/25/20 @ 100(a) 105,592 103,247GSR Mortgage Loan Trust, Series 2004-15F, Class 5A1, 5.50%, 1/25/20, Callable 8/25/21 @
100 4,924 4,941JPMorgan Mortgage Trust, Series 2004-S2, Class 1A3, 4.75%, 11/25/19, Callable 4/25/19 @
100 3,200 3,200JPMorgan Mortgage Trust, Series 2005-A1, Class 6T1, 4.57%, 2/25/35, Callable 4/25/19 @
100(d) 41,409 41,409Prime Mortgage Trust, Series 2004-2, Class A2, 4.75%, 11/25/19, Callable 4/25/19 @ 100 3,861 3,861Residential Funding Mortgage Securities I, Inc., Series 2005-S3, Class A1, 4.75%, 3/25/20,
Callable 4/25/19 @ 100 2,789 2,789Structured Asset Securities Corp., Series 2004-21XS, Class 2A6A, 5.24%, 12/25/34, Callable
4/25/19 @ 100(d) 52 52Wells Fargo Mortgage Backed Securities Trust, Series 2004-EE, Class 2A1, 4.56%, 12/25/34,
Callable 4/25/19 @ 100(d) 85,799 85,799Wells Fargo Mortgage Backed Securities Trust, Series 2004-W, Class A9, 4.85%, 11/25/34,
Callable 4/25/19 @ 100(d) 73,499 73,499Wells Fargo Mortgage Backed Securities Trust, Series 2004-R, Class 2A1, 4.74%, 9/25/34,
Callable 4/25/19 @ 100(d) 70,933 70,933Wells Fargo Mortgage Backed Securities Trust, Series 2004-Y, Class 3A1, 4.91%, 11/25/34,
Callable 4/25/19 @ 100(d) 122,386 122,386Wells Fargo Mortgage Backed Securities Trust, Series 2005-2, Class 2A1, 4.75%, 4/25/20,
Callable 4/25/19 @ 100 4,594 4,594Wells Fargo Mortgage Backed Securities Trust, Series 2005-6, Class A4, 5.50%, 8/25/35,
Callable 4/25/19 @ 100 40,596 40,596Total Residential Mortgage Backed Securities (Cost $915,925) 925,158
U.S. Government Mortgage Backed Agencies (9.8%)Federal National Mortgage Association
Series 2018-M1, Class A2, 2.99%, 12/25/27 65,000 65,1173.50%, 7/1/43 - 3/1/48 4,785,620 4,851,208
4,916,325Total U.S. Government Mortgage Backed Agencies (Cost $4,842,579) 4,916,325
U.S. Treasury Obligations (20.8%)U.S. Treasury Bonds
2.75%, 11/15/47 1,200,000 1,183,0173.00%, 2/15/48 360,000 372,6223.13%, 5/15/48 1,265,000 1,341,748
Copyright © 2021 www.secdatabase.com. All Rights Reserved.Please Consider the Environment Before Printing This Document

Copyright © 2021 www.secdatabase.com. All Rights Reserved.Please Consider the Environment Before Printing This Document
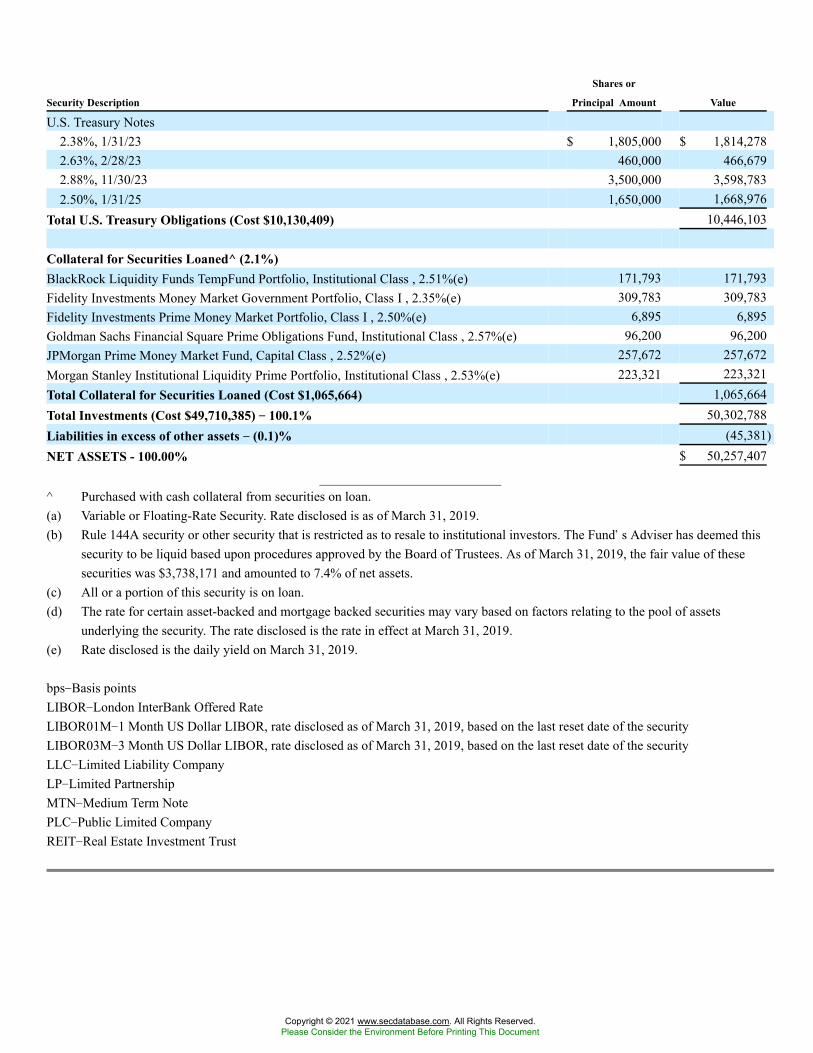
Security Description
Shares or
Principal Amount Value
U.S. Treasury Notes2.38%, 1/31/23 $ 1,805,000 $ 1,814,2782.63%, 2/28/23 460,000 466,6792.88%, 11/30/23 3,500,000 3,598,7832.50%, 1/31/25 1,650,000 1,668,976
Total U.S. Treasury Obligations (Cost $10,130,409) 10,446,103
Collateral for Securities Loaned^ (2.1%)BlackRock Liquidity Funds TempFund Portfolio, Institutional Class , 2.51%(e) 171,793 171,793Fidelity Investments Money Market Government Portfolio, Class I , 2.35%(e) 309,783 309,783Fidelity Investments Prime Money Market Portfolio, Class I , 2.50%(e) 6,895 6,895Goldman Sachs Financial Square Prime Obligations Fund, Institutional Class , 2.57%(e) 96,200 96,200JPMorgan Prime Money Market Fund, Capital Class , 2.52%(e) 257,672 257,672Morgan Stanley Institutional Liquidity Prime Portfolio, Institutional Class , 2.53%(e) 223,321 223,321Total Collateral for Securities Loaned (Cost $1,065,664) 1,065,664Total Investments (Cost $49,710,385) �� 100.1% 50,302,788Liabilities in excess of other assets �� (0.1)% (45,381)NET ASSETS - 100.00% $ 50,257,407
^ Purchased with cash collateral from securities on loan.(a) Variable or Floating-Rate Security. Rate disclosed is as of March 31, 2019.(b) Rule 144A security or other security that is restricted as to resale to institutional investors. The Fund�s Adviser has deemed this
security to be liquid based upon procedures approved by the Board of Trustees. As of March 31, 2019, the fair value of thesesecurities was $3,738,171 and amounted to 7.4% of net assets.
(c) All or a portion of this security is on loan.(d) The rate for certain asset-backed and mortgage backed securities may vary based on factors relating to the pool of assets
underlying the security. The rate disclosed is the rate in effect at March 31, 2019.(e) Rate disclosed is the daily yield on March 31, 2019.
bps�Basis pointsLIBOR�London InterBank Offered RateLIBOR01M�1 Month US Dollar LIBOR, rate disclosed as of March 31, 2019, based on the last reset date of the securityLIBOR03M�3 Month US Dollar LIBOR, rate disclosed as of March 31, 2019, based on the last reset date of the securityLLC�Limited Liability CompanyLP�Limited PartnershipMTN�Medium Term NotePLC�Public Limited CompanyREIT�Real Estate Investment Trust
Copyright © 2021 www.secdatabase.com. All Rights Reserved.Please Consider the Environment Before Printing This Document
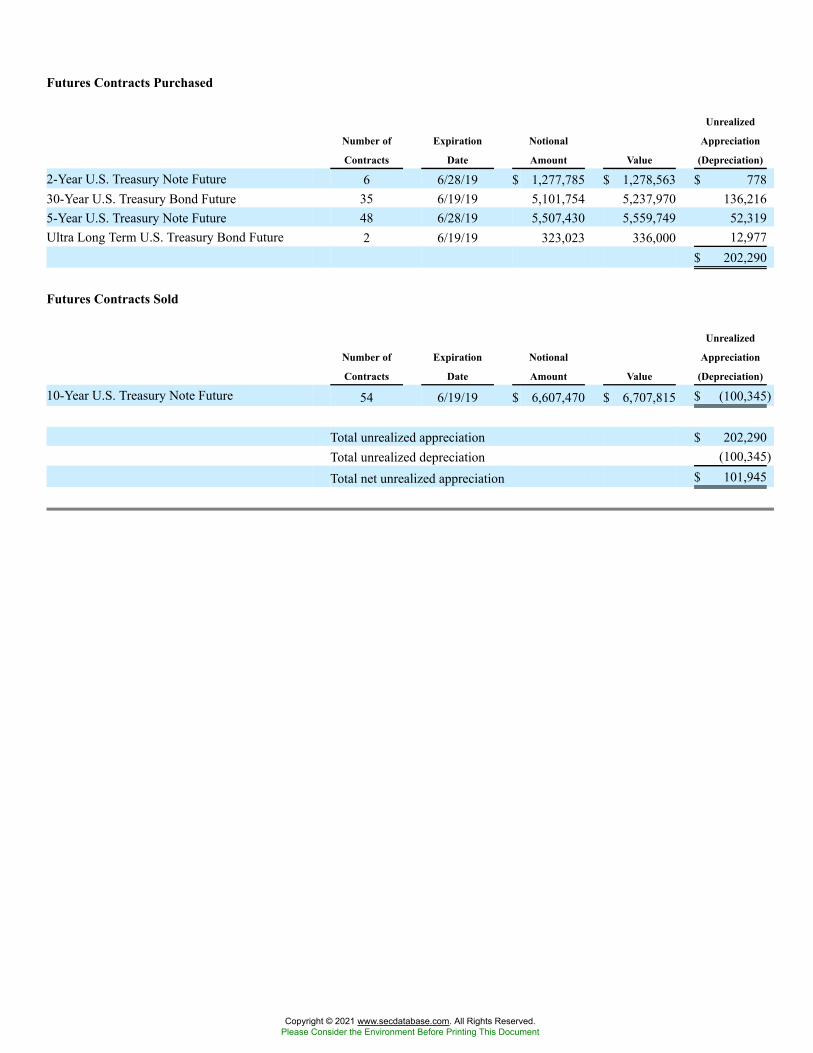
Futures Contracts Purchased
Number of
Contracts
Expiration
Date
Notional
Amount Value
Unrealized
Appreciation
(Depreciation)
2-Year U.S. Treasury Note Future 6 6/28/19 $ 1,277,785 $ 1,278,563 $ 77830-Year U.S. Treasury Bond Future 35 6/19/19 5,101,754 5,237,970 136,2165-Year U.S. Treasury Note Future 48 6/28/19 5,507,430 5,559,749 52,319Ultra Long Term U.S. Treasury Bond Future 2 6/19/19 323,023 336,000 12,977
$ 202,290
Futures Contracts Sold
Number of
Contracts
Expiration
Date
Notional
Amount Value
Unrealized
Appreciation
(Depreciation)
10-Year U.S. Treasury Note Future 54 6/19/19 $ 6,607,470 $ 6,707,815 $ (100,345)
Total unrealized appreciation $ 202,290Total unrealized depreciation (100,345)Total net unrealized appreciation $ 101,945
Copyright © 2021 www.secdatabase.com. All Rights Reserved.Please Consider the Environment Before Printing This Document
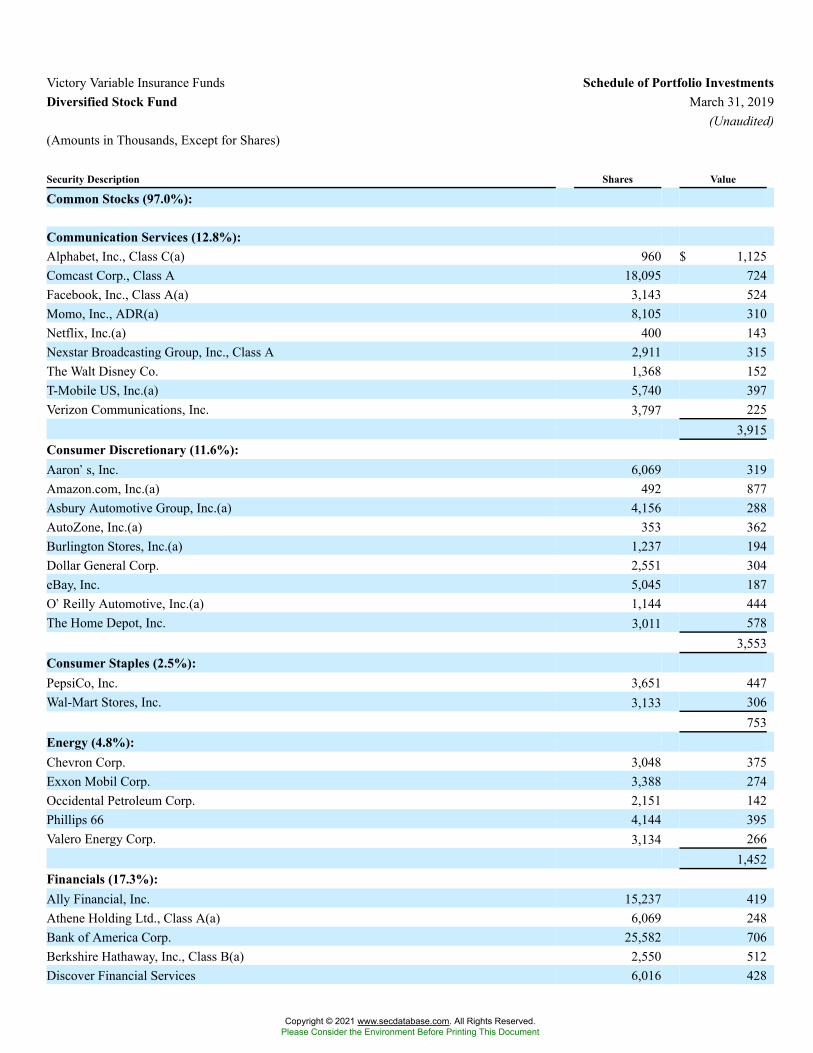
Victory Variable Insurance Funds Schedule of Portfolio InvestmentsDiversified Stock Fund March 31, 2019
(Unaudited)(Amounts in Thousands, Except for Shares)
Security Description Shares Value
Common Stocks (97.0%):
Communication Services (12.8%):Alphabet, Inc., Class C(a) 960 $ 1,125Comcast Corp., Class A 18,095 724Facebook, Inc., Class A(a) 3,143 524Momo, Inc., ADR(a) 8,105 310Netflix, Inc.(a) 400 143Nexstar Broadcasting Group, Inc., Class A 2,911 315The Walt Disney Co. 1,368 152T-Mobile US, Inc.(a) 5,740 397Verizon Communications, Inc. 3,797 225
3,915Consumer Discretionary (11.6%):Aaron�s, Inc. 6,069 319Amazon.com, Inc.(a) 492 877Asbury Automotive Group, Inc.(a) 4,156 288AutoZone, Inc.(a) 353 362Burlington Stores, Inc.(a) 1,237 194Dollar General Corp. 2,551 304eBay, Inc. 5,045 187O�Reilly Automotive, Inc.(a) 1,144 444The Home Depot, Inc. 3,011 578
3,553Consumer Staples (2.5%):PepsiCo, Inc. 3,651 447Wal-Mart Stores, Inc. 3,133 306
753Energy (4.8%):Chevron Corp. 3,048 375Exxon Mobil Corp. 3,388 274Occidental Petroleum Corp. 2,151 142Phillips 66 4,144 395Valero Energy Corp. 3,134 266
1,452Financials (17.3%):Ally Financial, Inc. 15,237 419Athene Holding Ltd., Class A(a) 6,069 248Bank of America Corp. 25,582 706Berkshire Hathaway, Inc., Class B(a) 2,550 512Discover Financial Services 6,016 428
Copyright © 2021 www.secdatabase.com. All Rights Reserved.Please Consider the Environment Before Printing This Document
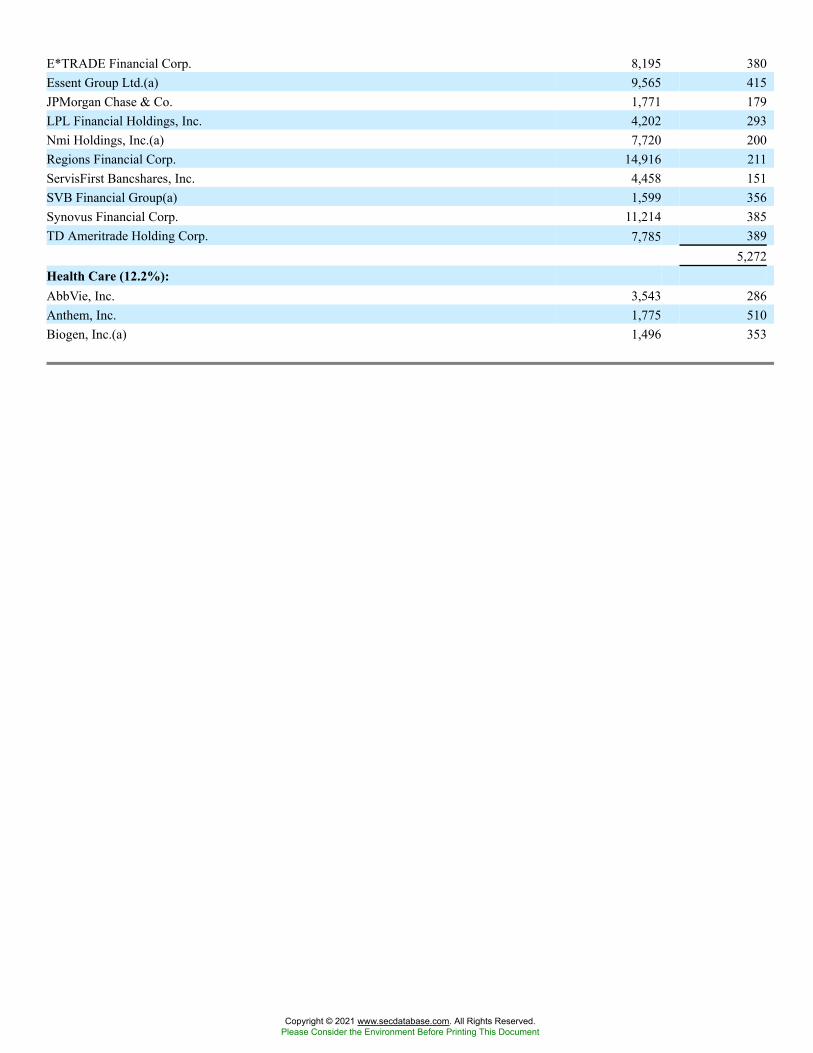
E*TRADE Financial Corp. 8,195 380Essent Group Ltd.(a) 9,565 415JPMorgan Chase & Co. 1,771 179LPL Financial Holdings, Inc. 4,202 293Nmi Holdings, Inc.(a) 7,720 200Regions Financial Corp. 14,916 211ServisFirst Bancshares, Inc. 4,458 151SVB Financial Group(a) 1,599 356Synovus Financial Corp. 11,214 385TD Ameritrade Holding Corp. 7,785 389
5,272Health Care (12.2%):AbbVie, Inc. 3,543 286Anthem, Inc. 1,775 510Biogen, Inc.(a) 1,496 353
Copyright © 2021 www.secdatabase.com. All Rights Reserved.Please Consider the Environment Before Printing This Document
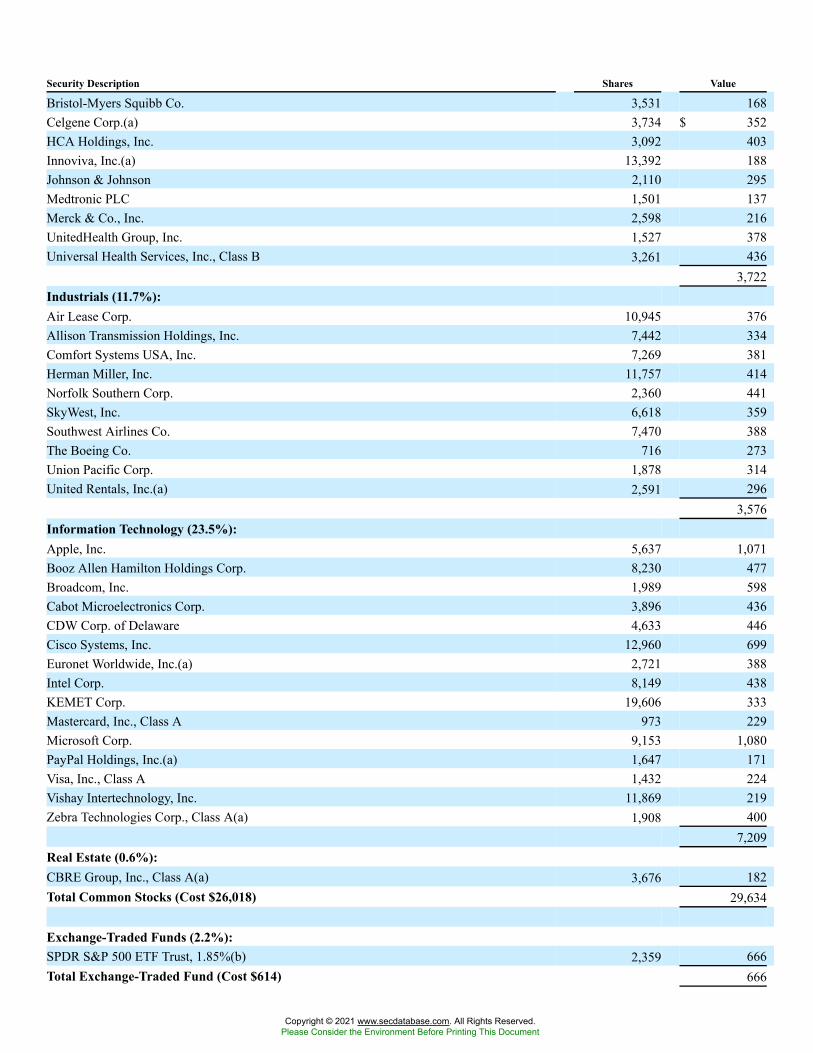
Security Description Shares Value
Bristol-Myers Squibb Co. 3,531 168Celgene Corp.(a) 3,734 $ 352HCA Holdings, Inc. 3,092 403Innoviva, Inc.(a) 13,392 188Johnson & Johnson 2,110 295Medtronic PLC 1,501 137Merck & Co., Inc. 2,598 216UnitedHealth Group, Inc. 1,527 378Universal Health Services, Inc., Class B 3,261 436
3,722Industrials (11.7%):Air Lease Corp. 10,945 376Allison Transmission Holdings, Inc. 7,442 334Comfort Systems USA, Inc. 7,269 381Herman Miller, Inc. 11,757 414Norfolk Southern Corp. 2,360 441SkyWest, Inc. 6,618 359Southwest Airlines Co. 7,470 388The Boeing Co. 716 273Union Pacific Corp. 1,878 314United Rentals, Inc.(a) 2,591 296
3,576Information Technology (23.5%):Apple, Inc. 5,637 1,071Booz Allen Hamilton Holdings Corp. 8,230 477Broadcom, Inc. 1,989 598Cabot Microelectronics Corp. 3,896 436CDW Corp. of Delaware 4,633 446Cisco Systems, Inc. 12,960 699Euronet Worldwide, Inc.(a) 2,721 388Intel Corp. 8,149 438KEMET Corp. 19,606 333Mastercard, Inc., Class A 973 229Microsoft Corp. 9,153 1,080PayPal Holdings, Inc.(a) 1,647 171Visa, Inc., Class A 1,432 224Vishay Intertechnology, Inc. 11,869 219Zebra Technologies Corp., Class A(a) 1,908 400
7,209Real Estate (0.6%):CBRE Group, Inc., Class A(a) 3,676 182Total Common Stocks (Cost $26,018) 29,634
Exchange-Traded Funds (2.2%):SPDR S&P 500 ETF Trust, 1.85%(b) 2,359 666Total Exchange-Traded Fund (Cost $614) 666
Copyright © 2021 www.secdatabase.com. All Rights Reserved.Please Consider the Environment Before Printing This Document
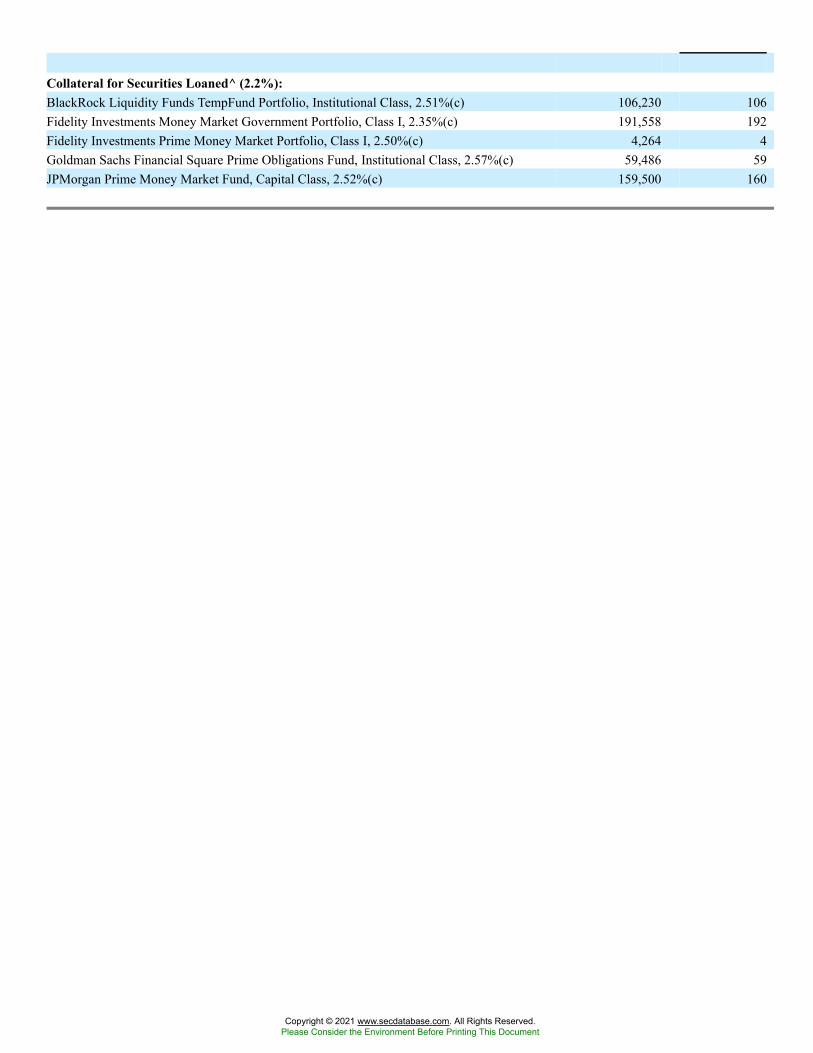
Collateral for Securities Loaned^ (2.2%):BlackRock Liquidity Funds TempFund Portfolio, Institutional Class, 2.51%(c) 106,230 106Fidelity Investments Money Market Government Portfolio, Class I, 2.35%(c) 191,558 192Fidelity Investments Prime Money Market Portfolio, Class I, 2.50%(c) 4,264 4Goldman Sachs Financial Square Prime Obligations Fund, Institutional Class, 2.57%(c) 59,486 59JPMorgan Prime Money Market Fund, Capital Class, 2.52%(c) 159,500 160
Copyright © 2021 www.secdatabase.com. All Rights Reserved.Please Consider the Environment Before Printing This Document
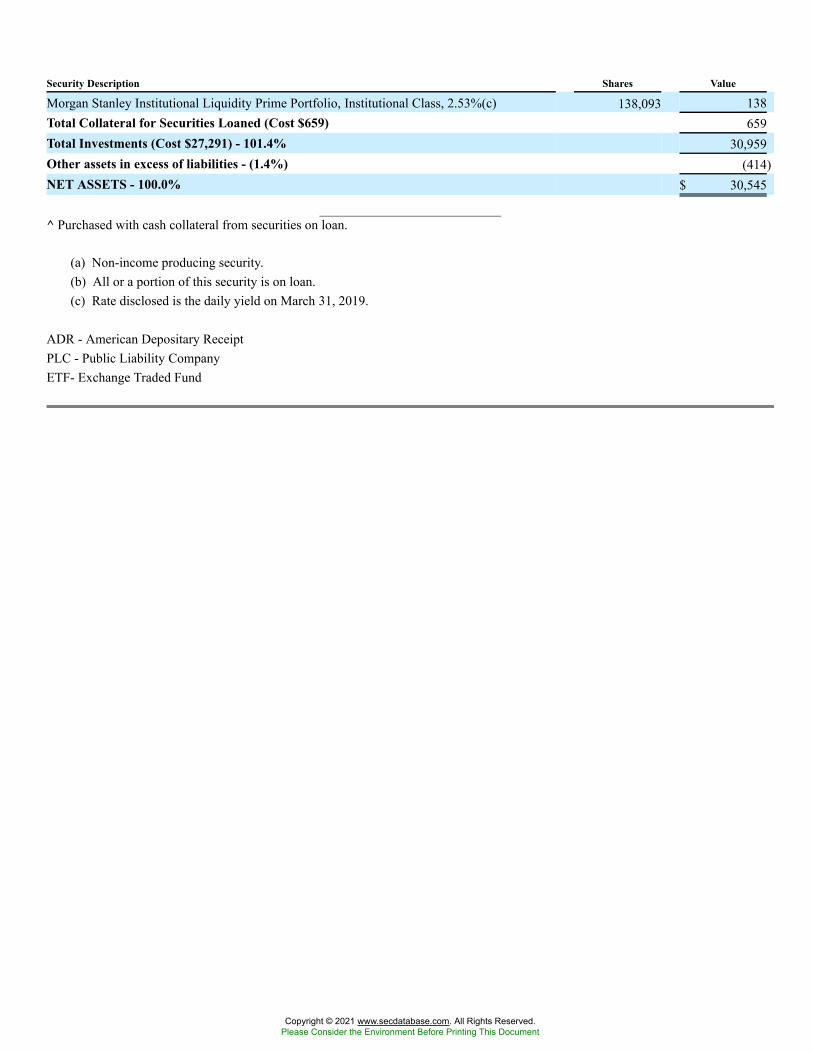
Security Description Shares Value
Morgan Stanley Institutional Liquidity Prime Portfolio, Institutional Class, 2.53%(c) 138,093 138Total Collateral for Securities Loaned (Cost $659) 659Total Investments (Cost $27,291) - 101.4% 30,959Other assets in excess of liabilities - (1.4%) (414)NET ASSETS - 100.0% $ 30,545
^ Purchased with cash collateral from securities on loan.
(a) Non-income producing security.(b) All or a portion of this security is on loan.(c) Rate disclosed is the daily yield on March 31, 2019.
ADR - American Depositary ReceiptPLC - Public Liability CompanyETF- Exchange Traded Fund
Copyright © 2021 www.secdatabase.com. All Rights Reserved.Please Consider the Environment Before Printing This Document
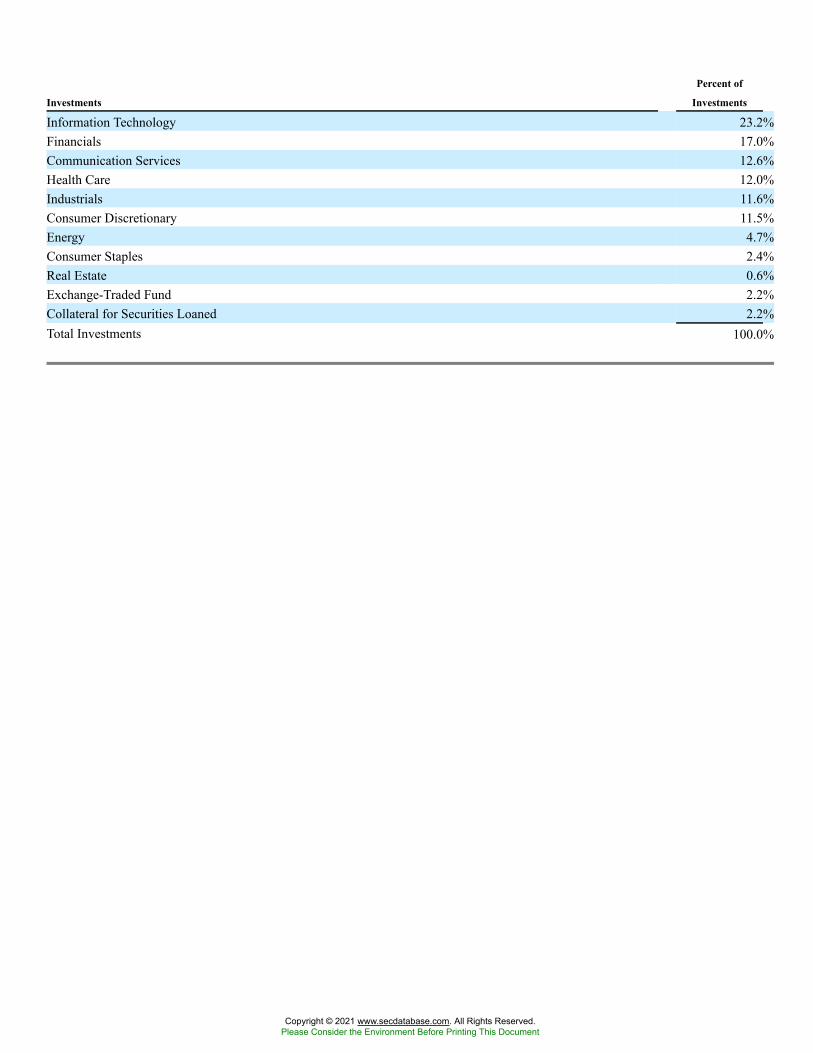
Investments
Percent of
Investments
Information Technology 23.2%Financials 17.0%Communication Services 12.6%Health Care 12.0%Industrials 11.6%Consumer Discretionary 11.5%Energy 4.7%Consumer Staples 2.4%Real Estate 0.6%Exchange-Traded Fund 2.2%Collateral for Securities Loaned 2.2%Total Investments 100.0%
Copyright © 2021 www.secdatabase.com. All Rights Reserved.Please Consider the Environment Before Printing This Document
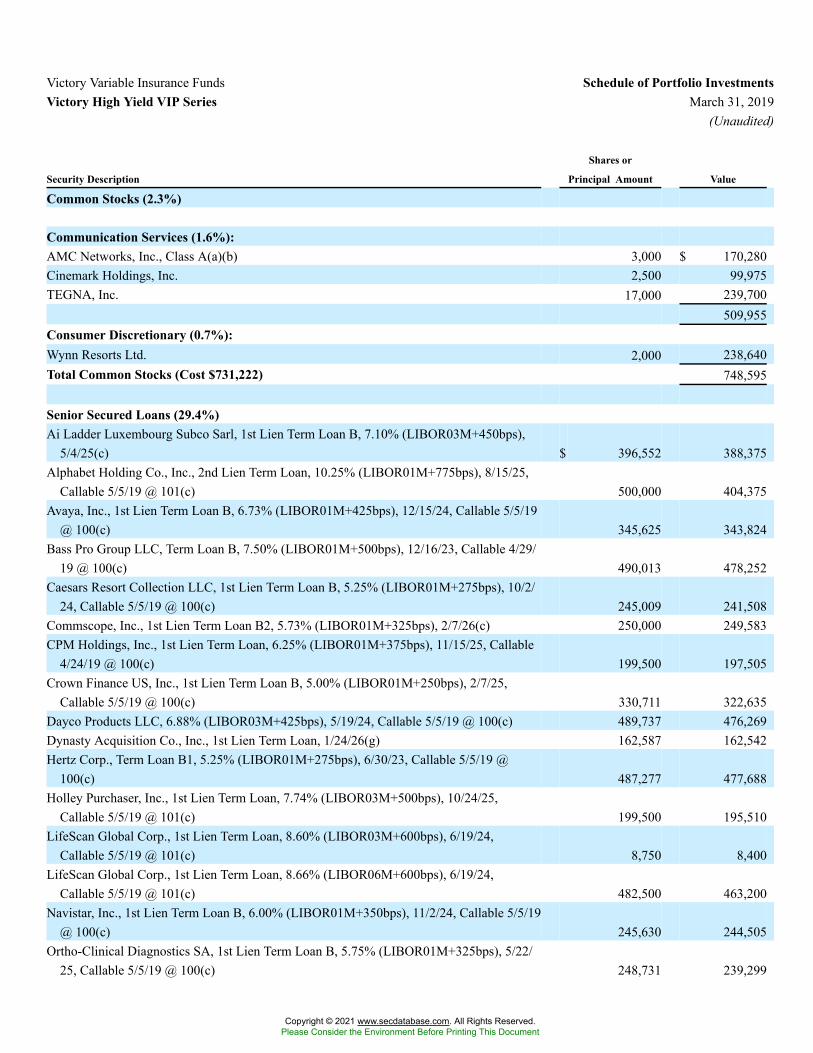
Victory Variable Insurance Funds Schedule of Portfolio InvestmentsVictory High Yield VIP Series March 31, 2019
(Unaudited)
Security Description
Shares or
Principal Amount Value
Common Stocks (2.3%)
Communication Services (1.6%):AMC Networks, Inc., Class A(a)(b) 3,000 $ 170,280Cinemark Holdings, Inc. 2,500 99,975TEGNA, Inc. 17,000 239,700
509,955Consumer Discretionary (0.7%):Wynn Resorts Ltd. 2,000 238,640Total Common Stocks (Cost $731,222) 748,595
Senior Secured Loans (29.4%)Ai Ladder Luxembourg Subco Sarl, 1st Lien Term Loan B, 7.10% (LIBOR03M+450bps),
5/4/25(c) $ 396,552 388,375Alphabet Holding Co., Inc., 2nd Lien Term Loan, 10.25% (LIBOR01M+775bps), 8/15/25,
Callable 5/5/19 @ 101(c) 500,000 404,375Avaya, Inc., 1st Lien Term Loan B, 6.73% (LIBOR01M+425bps), 12/15/24, Callable 5/5/19
@ 100(c) 345,625 343,824Bass Pro Group LLC, Term Loan B, 7.50% (LIBOR01M+500bps), 12/16/23, Callable 4/29/
19 @ 100(c) 490,013 478,252Caesars Resort Collection LLC, 1st Lien Term Loan B, 5.25% (LIBOR01M+275bps), 10/2/
24, Callable 5/5/19 @ 100(c) 245,009 241,508Commscope, Inc., 1st Lien Term Loan B2, 5.73% (LIBOR01M+325bps), 2/7/26(c) 250,000 249,583CPM Holdings, Inc., 1st Lien Term Loan, 6.25% (LIBOR01M+375bps), 11/15/25, Callable
4/24/19 @ 100(c) 199,500 197,505Crown Finance US, Inc., 1st Lien Term Loan B, 5.00% (LIBOR01M+250bps), 2/7/25,
Callable 5/5/19 @ 100(c) 330,711 322,635Dayco Products LLC, 6.88% (LIBOR03M+425bps), 5/19/24, Callable 5/5/19 @ 100(c) 489,737 476,269Dynasty Acquisition Co., Inc., 1st Lien Term Loan, 1/24/26(g) 162,587 162,542Hertz Corp., Term Loan B1, 5.25% (LIBOR01M+275bps), 6/30/23, Callable 5/5/19 @
100(c) 487,277 477,688Holley Purchaser, Inc., 1st Lien Term Loan, 7.74% (LIBOR03M+500bps), 10/24/25,
Callable 5/5/19 @ 101(c) 199,500 195,510LifeScan Global Corp., 1st Lien Term Loan, 8.60% (LIBOR03M+600bps), 6/19/24,
Callable 5/5/19 @ 101(c) 8,750 8,400LifeScan Global Corp., 1st Lien Term Loan, 8.66% (LIBOR06M+600bps), 6/19/24,
Callable 5/5/19 @ 101(c) 482,500 463,200Navistar, Inc., 1st Lien Term Loan B, 6.00% (LIBOR01M+350bps), 11/2/24, Callable 5/5/19
@ 100(c) 245,630 244,505Ortho-Clinical Diagnostics SA, 1st Lien Term Loan B, 5.75% (LIBOR01M+325bps), 5/22/
25, Callable 5/5/19 @ 100(c) 248,731 239,299
Copyright © 2021 www.secdatabase.com. All Rights Reserved.Please Consider the Environment Before Printing This Document
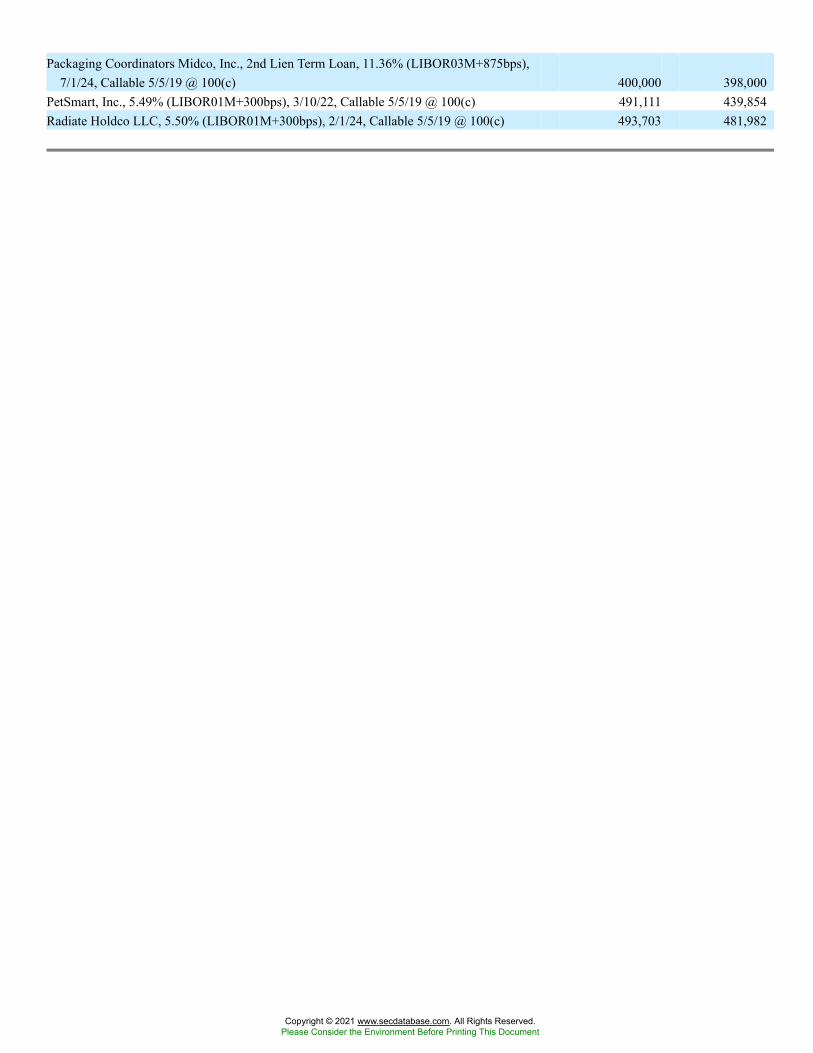
Packaging Coordinators Midco, Inc., 2nd Lien Term Loan, 11.36% (LIBOR03M+875bps),7/1/24, Callable 5/5/19 @ 100(c) 400,000 398,000
PetSmart, Inc., 5.49% (LIBOR01M+300bps), 3/10/22, Callable 5/5/19 @ 100(c) 491,111 439,854Radiate Holdco LLC, 5.50% (LIBOR01M+300bps), 2/1/24, Callable 5/5/19 @ 100(c) 493,703 481,982
Copyright © 2021 www.secdatabase.com. All Rights Reserved.Please Consider the Environment Before Printing This Document
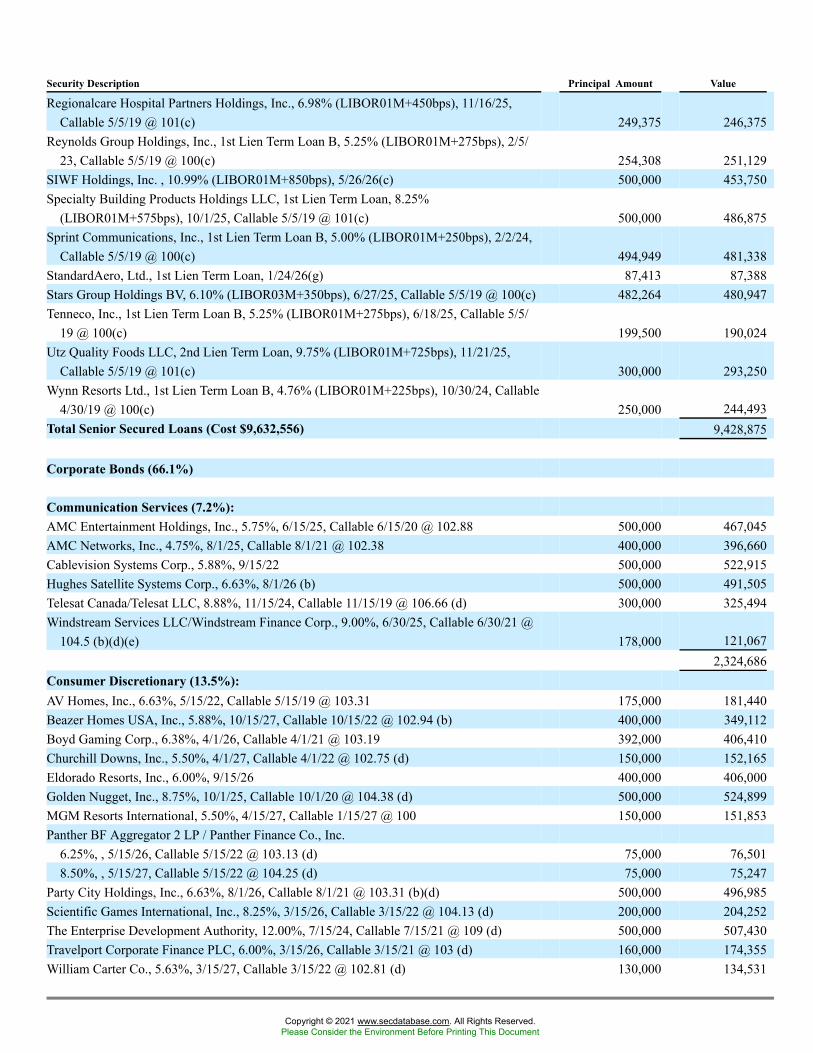
Security Description Principal Amount Value
Regionalcare Hospital Partners Holdings, Inc., 6.98% (LIBOR01M+450bps), 11/16/25,Callable 5/5/19 @ 101(c) 249,375 246,375
Reynolds Group Holdings, Inc., 1st Lien Term Loan B, 5.25% (LIBOR01M+275bps), 2/5/23, Callable 5/5/19 @ 100(c) 254,308 251,129
SIWF Holdings, Inc. , 10.99% (LIBOR01M+850bps), 5/26/26(c) 500,000 453,750Specialty Building Products Holdings LLC, 1st Lien Term Loan, 8.25%
(LIBOR01M+575bps), 10/1/25, Callable 5/5/19 @ 101(c) 500,000 486,875Sprint Communications, Inc., 1st Lien Term Loan B, 5.00% (LIBOR01M+250bps), 2/2/24,
Callable 5/5/19 @ 100(c) 494,949 481,338StandardAero, Ltd., 1st Lien Term Loan, 1/24/26(g) 87,413 87,388Stars Group Holdings BV, 6.10% (LIBOR03M+350bps), 6/27/25, Callable 5/5/19 @ 100(c) 482,264 480,947Tenneco, Inc., 1st Lien Term Loan B, 5.25% (LIBOR01M+275bps), 6/18/25, Callable 5/5/
19 @ 100(c) 199,500 190,024Utz Quality Foods LLC, 2nd Lien Term Loan, 9.75% (LIBOR01M+725bps), 11/21/25,
Callable 5/5/19 @ 101(c) 300,000 293,250Wynn Resorts Ltd., 1st Lien Term Loan B, 4.76% (LIBOR01M+225bps), 10/30/24, Callable
4/30/19 @ 100(c) 250,000 244,493Total Senior Secured Loans (Cost $9,632,556) 9,428,875
Corporate Bonds (66.1%)
Communication Services (7.2%):AMC Entertainment Holdings, Inc., 5.75%, 6/15/25, Callable 6/15/20 @ 102.88 500,000 467,045AMC Networks, Inc., 4.75%, 8/1/25, Callable 8/1/21 @ 102.38 400,000 396,660Cablevision Systems Corp., 5.88%, 9/15/22 500,000 522,915Hughes Satellite Systems Corp., 6.63%, 8/1/26 (b) 500,000 491,505Telesat Canada/Telesat LLC, 8.88%, 11/15/24, Callable 11/15/19 @ 106.66 (d) 300,000 325,494Windstream Services LLC/Windstream Finance Corp., 9.00%, 6/30/25, Callable 6/30/21 @
104.5 (b)(d)(e) 178,000 121,0672,324,686
Consumer Discretionary (13.5%):AV Homes, Inc., 6.63%, 5/15/22, Callable 5/15/19 @ 103.31 175,000 181,440Beazer Homes USA, Inc., 5.88%, 10/15/27, Callable 10/15/22 @ 102.94 (b) 400,000 349,112Boyd Gaming Corp., 6.38%, 4/1/26, Callable 4/1/21 @ 103.19 392,000 406,410Churchill Downs, Inc., 5.50%, 4/1/27, Callable 4/1/22 @ 102.75 (d) 150,000 152,165Eldorado Resorts, Inc., 6.00%, 9/15/26 400,000 406,000Golden Nugget, Inc., 8.75%, 10/1/25, Callable 10/1/20 @ 104.38 (d) 500,000 524,899MGM Resorts International, 5.50%, 4/15/27, Callable 1/15/27 @ 100 150,000 151,853Panther BF Aggregator 2 LP / Panther Finance Co., Inc.
6.25%, , 5/15/26, Callable 5/15/22 @ 103.13 (d) 75,000 76,5018.50%, , 5/15/27, Callable 5/15/22 @ 104.25 (d) 75,000 75,247
Party City Holdings, Inc., 6.63%, 8/1/26, Callable 8/1/21 @ 103.31 (b)(d) 500,000 496,985Scientific Games International, Inc., 8.25%, 3/15/26, Callable 3/15/22 @ 104.13 (d) 200,000 204,252The Enterprise Development Authority, 12.00%, 7/15/24, Callable 7/15/21 @ 109 (d) 500,000 507,430Travelport Corporate Finance PLC, 6.00%, 3/15/26, Callable 3/15/21 @ 103 (d) 160,000 174,355William Carter Co., 5.63%, 3/15/27, Callable 3/15/22 @ 102.81 (d) 130,000 134,531
Copyright © 2021 www.secdatabase.com. All Rights Reserved.Please Consider the Environment Before Printing This Document
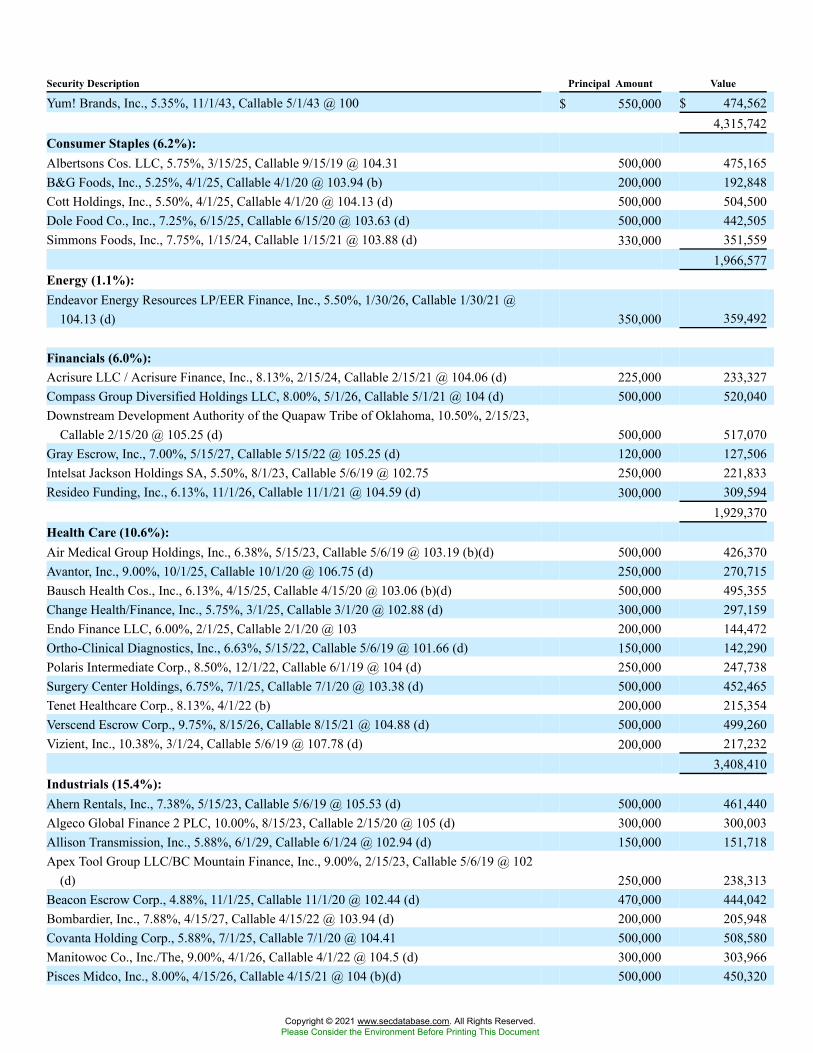
Security Description Principal Amount Value
Yum! Brands, Inc., 5.35%, 11/1/43, Callable 5/1/43 @ 100 $ 550,000 $ 474,5624,315,742
Consumer Staples (6.2%):Albertsons Cos. LLC, 5.75%, 3/15/25, Callable 9/15/19 @ 104.31 500,000 475,165B&G Foods, Inc., 5.25%, 4/1/25, Callable 4/1/20 @ 103.94 (b) 200,000 192,848Cott Holdings, Inc., 5.50%, 4/1/25, Callable 4/1/20 @ 104.13 (d) 500,000 504,500Dole Food Co., Inc., 7.25%, 6/15/25, Callable 6/15/20 @ 103.63 (d) 500,000 442,505Simmons Foods, Inc., 7.75%, 1/15/24, Callable 1/15/21 @ 103.88 (d) 330,000 351,559
1,966,577Energy (1.1%):Endeavor Energy Resources LP/EER Finance, Inc., 5.50%, 1/30/26, Callable 1/30/21 @
104.13 (d) 350,000 359,492
Financials (6.0%):Acrisure LLC / Acrisure Finance, Inc., 8.13%, 2/15/24, Callable 2/15/21 @ 104.06 (d) 225,000 233,327Compass Group Diversified Holdings LLC, 8.00%, 5/1/26, Callable 5/1/21 @ 104 (d) 500,000 520,040Downstream Development Authority of the Quapaw Tribe of Oklahoma, 10.50%, 2/15/23,
Callable 2/15/20 @ 105.25 (d) 500,000 517,070Gray Escrow, Inc., 7.00%, 5/15/27, Callable 5/15/22 @ 105.25 (d) 120,000 127,506Intelsat Jackson Holdings SA, 5.50%, 8/1/23, Callable 5/6/19 @ 102.75 250,000 221,833Resideo Funding, Inc., 6.13%, 11/1/26, Callable 11/1/21 @ 104.59 (d) 300,000 309,594
1,929,370Health Care (10.6%):Air Medical Group Holdings, Inc., 6.38%, 5/15/23, Callable 5/6/19 @ 103.19 (b)(d) 500,000 426,370Avantor, Inc., 9.00%, 10/1/25, Callable 10/1/20 @ 106.75 (d) 250,000 270,715Bausch Health Cos., Inc., 6.13%, 4/15/25, Callable 4/15/20 @ 103.06 (b)(d) 500,000 495,355Change Health/Finance, Inc., 5.75%, 3/1/25, Callable 3/1/20 @ 102.88 (d) 300,000 297,159Endo Finance LLC, 6.00%, 2/1/25, Callable 2/1/20 @ 103 200,000 144,472Ortho-Clinical Diagnostics, Inc., 6.63%, 5/15/22, Callable 5/6/19 @ 101.66 (d) 150,000 142,290Polaris Intermediate Corp., 8.50%, 12/1/22, Callable 6/1/19 @ 104 (d) 250,000 247,738Surgery Center Holdings, 6.75%, 7/1/25, Callable 7/1/20 @ 103.38 (d) 500,000 452,465Tenet Healthcare Corp., 8.13%, 4/1/22 (b) 200,000 215,354Verscend Escrow Corp., 9.75%, 8/15/26, Callable 8/15/21 @ 104.88 (d) 500,000 499,260Vizient, Inc., 10.38%, 3/1/24, Callable 5/6/19 @ 107.78 (d) 200,000 217,232
3,408,410Industrials (15.4%):Ahern Rentals, Inc., 7.38%, 5/15/23, Callable 5/6/19 @ 105.53 (d) 500,000 461,440Algeco Global Finance 2 PLC, 10.00%, 8/15/23, Callable 2/15/20 @ 105 (d) 300,000 300,003Allison Transmission, Inc., 5.88%, 6/1/29, Callable 6/1/24 @ 102.94 (d) 150,000 151,718Apex Tool Group LLC/BC Mountain Finance, Inc., 9.00%, 2/15/23, Callable 5/6/19 @ 102
(d) 250,000 238,313Beacon Escrow Corp., 4.88%, 11/1/25, Callable 11/1/20 @ 102.44 (d) 470,000 444,042Bombardier, Inc., 7.88%, 4/15/27, Callable 4/15/22 @ 103.94 (d) 200,000 205,948Covanta Holding Corp., 5.88%, 7/1/25, Callable 7/1/20 @ 104.41 500,000 508,580Manitowoc Co., Inc./The, 9.00%, 4/1/26, Callable 4/1/22 @ 104.5 (d) 300,000 303,966Pisces Midco, Inc., 8.00%, 4/15/26, Callable 4/15/21 @ 104 (b)(d) 500,000 450,320
Copyright © 2021 www.secdatabase.com. All Rights Reserved.Please Consider the Environment Before Printing This Document

Copyright © 2021 www.secdatabase.com. All Rights Reserved.Please Consider the Environment Before Printing This Document
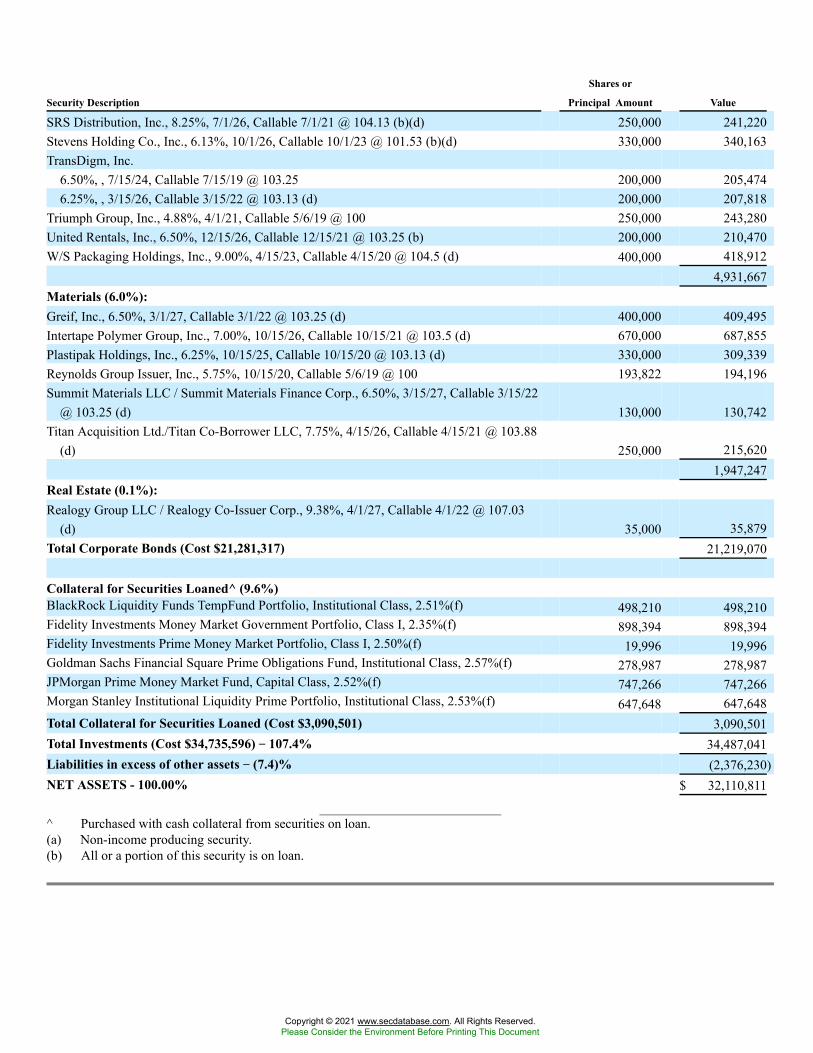
Security Description
Shares or
Principal Amount Value
SRS Distribution, Inc., 8.25%, 7/1/26, Callable 7/1/21 @ 104.13 (b)(d) 250,000 241,220Stevens Holding Co., Inc., 6.13%, 10/1/26, Callable 10/1/23 @ 101.53 (b)(d) 330,000 340,163TransDigm, Inc.
6.50%, , 7/15/24, Callable 7/15/19 @ 103.25 200,000 205,4746.25%, , 3/15/26, Callable 3/15/22 @ 103.13 (d) 200,000 207,818
Triumph Group, Inc., 4.88%, 4/1/21, Callable 5/6/19 @ 100 250,000 243,280United Rentals, Inc., 6.50%, 12/15/26, Callable 12/15/21 @ 103.25 (b) 200,000 210,470W/S Packaging Holdings, Inc., 9.00%, 4/15/23, Callable 4/15/20 @ 104.5 (d) 400,000 418,912
4,931,667Materials (6.0%):Greif, Inc., 6.50%, 3/1/27, Callable 3/1/22 @ 103.25 (d) 400,000 409,495Intertape Polymer Group, Inc., 7.00%, 10/15/26, Callable 10/15/21 @ 103.5 (d) 670,000 687,855Plastipak Holdings, Inc., 6.25%, 10/15/25, Callable 10/15/20 @ 103.13 (d) 330,000 309,339Reynolds Group Issuer, Inc., 5.75%, 10/15/20, Callable 5/6/19 @ 100 193,822 194,196Summit Materials LLC / Summit Materials Finance Corp., 6.50%, 3/15/27, Callable 3/15/22
@ 103.25 (d) 130,000 130,742Titan Acquisition Ltd./Titan Co-Borrower LLC, 7.75%, 4/15/26, Callable 4/15/21 @ 103.88
(d) 250,000 215,6201,947,247
Real Estate (0.1%):Realogy Group LLC / Realogy Co-Issuer Corp., 9.38%, 4/1/27, Callable 4/1/22 @ 107.03
(d) 35,000 35,879Total Corporate Bonds (Cost $21,281,317) 21,219,070
Collateral for Securities Loaned^ (9.6%)BlackRock Liquidity Funds TempFund Portfolio, Institutional Class, 2.51%(f) 498,210 498,210Fidelity Investments Money Market Government Portfolio, Class I, 2.35%(f) 898,394 898,394Fidelity Investments Prime Money Market Portfolio, Class I, 2.50%(f) 19,996 19,996Goldman Sachs Financial Square Prime Obligations Fund, Institutional Class, 2.57%(f) 278,987 278,987JPMorgan Prime Money Market Fund, Capital Class, 2.52%(f) 747,266 747,266Morgan Stanley Institutional Liquidity Prime Portfolio, Institutional Class, 2.53%(f) 647,648 647,648Total Collateral for Securities Loaned (Cost $3,090,501) 3,090,501Total Investments (Cost $34,735,596) �� 107.4% 34,487,041Liabilities in excess of other assets �� (7.4)% (2,376,230)NET ASSETS - 100.00% $ 32,110,811
^ Purchased with cash collateral from securities on loan.(a) Non-income producing security.(b) All or a portion of this security is on loan.
Copyright © 2021 www.secdatabase.com. All Rights Reserved.Please Consider the Environment Before Printing This Document
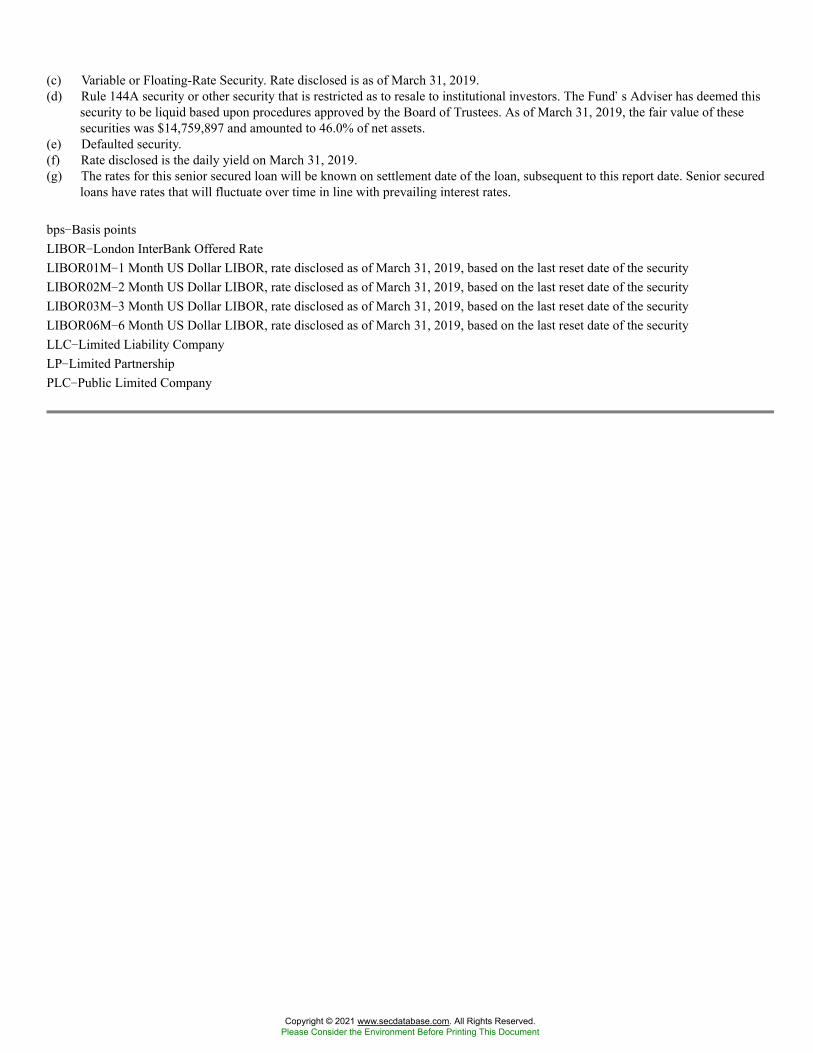
(c) Variable or Floating-Rate Security. Rate disclosed is as of March 31, 2019.(d) Rule 144A security or other security that is restricted as to resale to institutional investors. The Fund�s Adviser has deemed this
security to be liquid based upon procedures approved by the Board of Trustees. As of March 31, 2019, the fair value of thesesecurities was $14,759,897 and amounted to 46.0% of net assets.
(e) Defaulted security.(f) Rate disclosed is the daily yield on March 31, 2019.(g) The rates for this senior secured loan will be known on settlement date of the loan, subsequent to this report date. Senior secured
loans have rates that will fluctuate over time in line with prevailing interest rates.
bps�Basis pointsLIBOR�London InterBank Offered RateLIBOR01M�1 Month US Dollar LIBOR, rate disclosed as of March 31, 2019, based on the last reset date of the securityLIBOR02M�2 Month US Dollar LIBOR, rate disclosed as of March 31, 2019, based on the last reset date of the securityLIBOR03M�3 Month US Dollar LIBOR, rate disclosed as of March 31, 2019, based on the last reset date of the securityLIBOR06M�6 Month US Dollar LIBOR, rate disclosed as of March 31, 2019, based on the last reset date of the securityLLC�Limited Liability CompanyLP�Limited PartnershipPLC�Public Limited Company
Copyright © 2021 www.secdatabase.com. All Rights Reserved.Please Consider the Environment Before Printing This Document
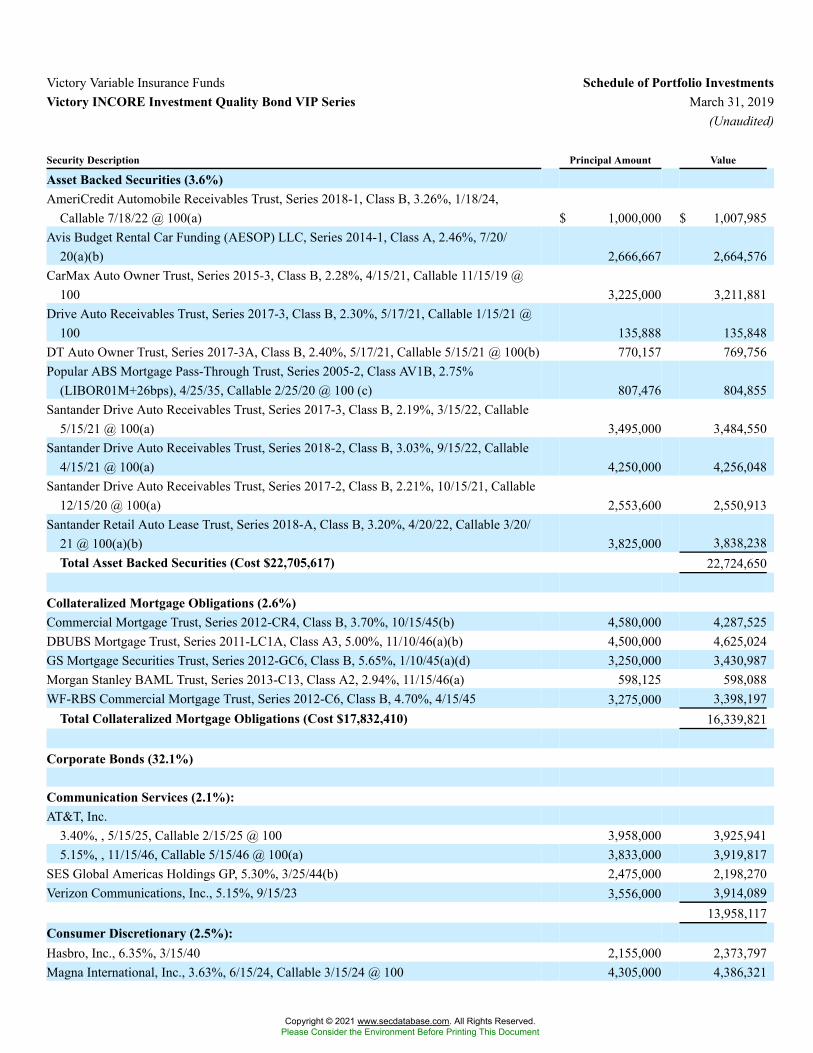
Victory Variable Insurance Funds Schedule of Portfolio InvestmentsVictory INCORE Investment Quality Bond VIP Series March 31, 2019
(Unaudited)
Security Description Principal Amount Value
Asset Backed Securities (3.6%)AmeriCredit Automobile Receivables Trust, Series 2018-1, Class B, 3.26%, 1/18/24,
Callable 7/18/22 @ 100(a) $ 1,000,000 $ 1,007,985Avis Budget Rental Car Funding (AESOP) LLC, Series 2014-1, Class A, 2.46%, 7/20/
20(a)(b) 2,666,667 2,664,576CarMax Auto Owner Trust, Series 2015-3, Class B, 2.28%, 4/15/21, Callable 11/15/19 @
100 3,225,000 3,211,881Drive Auto Receivables Trust, Series 2017-3, Class B, 2.30%, 5/17/21, Callable 1/15/21 @
100 135,888 135,848DT Auto Owner Trust, Series 2017-3A, Class B, 2.40%, 5/17/21, Callable 5/15/21 @ 100(b) 770,157 769,756Popular ABS Mortgage Pass-Through Trust, Series 2005-2, Class AV1B, 2.75%
(LIBOR01M+26bps), 4/25/35, Callable 2/25/20 @ 100 (c) 807,476 804,855Santander Drive Auto Receivables Trust, Series 2017-3, Class B, 2.19%, 3/15/22, Callable
5/15/21 @ 100(a) 3,495,000 3,484,550Santander Drive Auto Receivables Trust, Series 2018-2, Class B, 3.03%, 9/15/22, Callable
4/15/21 @ 100(a) 4,250,000 4,256,048Santander Drive Auto Receivables Trust, Series 2017-2, Class B, 2.21%, 10/15/21, Callable
12/15/20 @ 100(a) 2,553,600 2,550,913Santander Retail Auto Lease Trust, Series 2018-A, Class B, 3.20%, 4/20/22, Callable 3/20/
21 @ 100(a)(b) 3,825,000 3,838,238Total Asset Backed Securities (Cost $22,705,617) 22,724,650
Collateralized Mortgage Obligations (2.6%)Commercial Mortgage Trust, Series 2012-CR4, Class B, 3.70%, 10/15/45(b) 4,580,000 4,287,525DBUBS Mortgage Trust, Series 2011-LC1A, Class A3, 5.00%, 11/10/46(a)(b) 4,500,000 4,625,024GS Mortgage Securities Trust, Series 2012-GC6, Class B, 5.65%, 1/10/45(a)(d) 3,250,000 3,430,987Morgan Stanley BAML Trust, Series 2013-C13, Class A2, 2.94%, 11/15/46(a) 598,125 598,088WF-RBS Commercial Mortgage Trust, Series 2012-C6, Class B, 4.70%, 4/15/45 3,275,000 3,398,197
Total Collateralized Mortgage Obligations (Cost $17,832,410) 16,339,821
Corporate Bonds (32.1%)
Communication Services (2.1%):AT&T, Inc.
3.40%, , 5/15/25, Callable 2/15/25 @ 100 3,958,000 3,925,9415.15%, , 11/15/46, Callable 5/15/46 @ 100(a) 3,833,000 3,919,817
SES Global Americas Holdings GP, 5.30%, 3/25/44(b) 2,475,000 2,198,270Verizon Communications, Inc., 5.15%, 9/15/23 3,556,000 3,914,089
13,958,117Consumer Discretionary (2.5%):Hasbro, Inc., 6.35%, 3/15/40 2,155,000 2,373,797Magna International, Inc., 3.63%, 6/15/24, Callable 3/15/24 @ 100 4,305,000 4,386,321
Copyright © 2021 www.secdatabase.com. All Rights Reserved.Please Consider the Environment Before Printing This Document
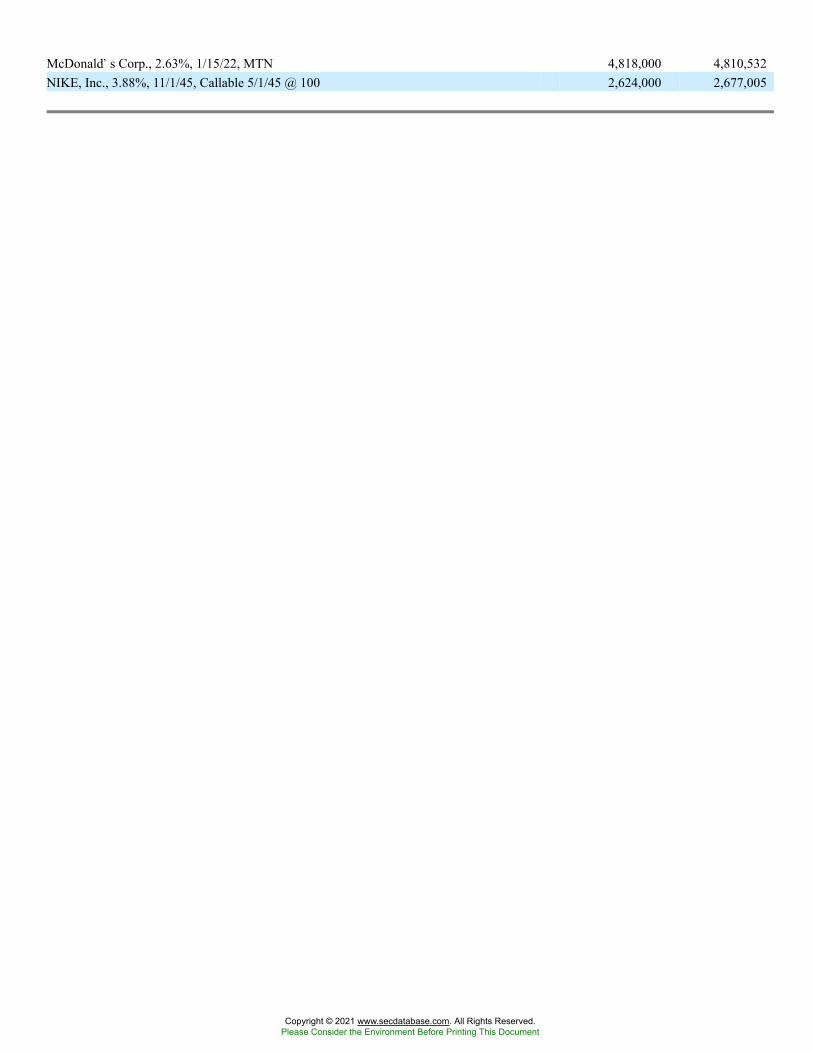
McDonald�s Corp., 2.63%, 1/15/22, MTN 4,818,000 4,810,532NIKE, Inc., 3.88%, 11/1/45, Callable 5/1/45 @ 100 2,624,000 2,677,005
Copyright © 2021 www.secdatabase.com. All Rights Reserved.Please Consider the Environment Before Printing This Document
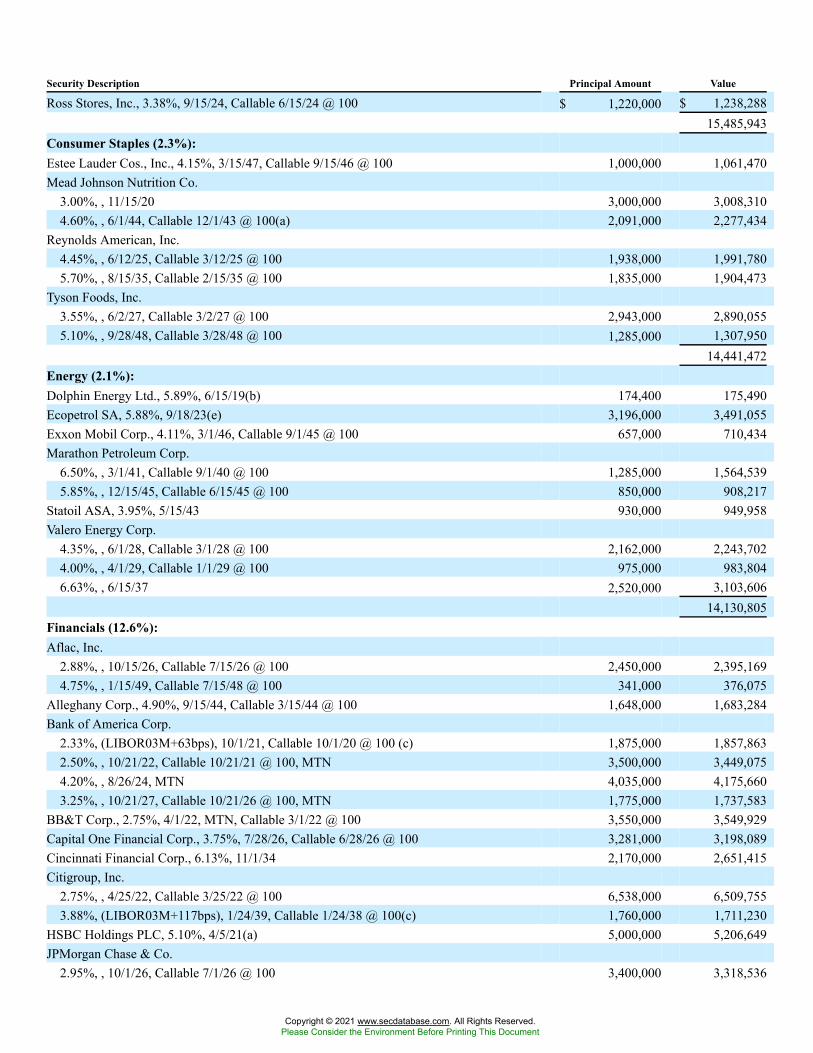
Security Description Principal Amount Value
Ross Stores, Inc., 3.38%, 9/15/24, Callable 6/15/24 @ 100 $ 1,220,000 $ 1,238,28815,485,943
Consumer Staples (2.3%):Estee Lauder Cos., Inc., 4.15%, 3/15/47, Callable 9/15/46 @ 100 1,000,000 1,061,470Mead Johnson Nutrition Co.
3.00%, , 11/15/20 3,000,000 3,008,3104.60%, , 6/1/44, Callable 12/1/43 @ 100(a) 2,091,000 2,277,434
Reynolds American, Inc.4.45%, , 6/12/25, Callable 3/12/25 @ 100 1,938,000 1,991,7805.70%, , 8/15/35, Callable 2/15/35 @ 100 1,835,000 1,904,473
Tyson Foods, Inc.3.55%, , 6/2/27, Callable 3/2/27 @ 100 2,943,000 2,890,0555.10%, , 9/28/48, Callable 3/28/48 @ 100 1,285,000 1,307,950
14,441,472Energy (2.1%):Dolphin Energy Ltd., 5.89%, 6/15/19(b) 174,400 175,490Ecopetrol SA, 5.88%, 9/18/23(e) 3,196,000 3,491,055Exxon Mobil Corp., 4.11%, 3/1/46, Callable 9/1/45 @ 100 657,000 710,434Marathon Petroleum Corp.
6.50%, , 3/1/41, Callable 9/1/40 @ 100 1,285,000 1,564,5395.85%, , 12/15/45, Callable 6/15/45 @ 100 850,000 908,217
Statoil ASA, 3.95%, 5/15/43 930,000 949,958Valero Energy Corp.
4.35%, , 6/1/28, Callable 3/1/28 @ 100 2,162,000 2,243,7024.00%, , 4/1/29, Callable 1/1/29 @ 100 975,000 983,8046.63%, , 6/15/37 2,520,000 3,103,606
14,130,805Financials (12.6%):Aflac, Inc.
2.88%, , 10/15/26, Callable 7/15/26 @ 100 2,450,000 2,395,1694.75%, , 1/15/49, Callable 7/15/48 @ 100 341,000 376,075
Alleghany Corp., 4.90%, 9/15/44, Callable 3/15/44 @ 100 1,648,000 1,683,284Bank of America Corp.
2.33%, (LIBOR03M+63bps), 10/1/21, Callable 10/1/20 @ 100 (c) 1,875,000 1,857,8632.50%, , 10/21/22, Callable 10/21/21 @ 100, MTN 3,500,000 3,449,0754.20%, , 8/26/24, MTN 4,035,000 4,175,6603.25%, , 10/21/27, Callable 10/21/26 @ 100, MTN 1,775,000 1,737,583
BB&T Corp., 2.75%, 4/1/22, MTN, Callable 3/1/22 @ 100 3,550,000 3,549,929Capital One Financial Corp., 3.75%, 7/28/26, Callable 6/28/26 @ 100 3,281,000 3,198,089Cincinnati Financial Corp., 6.13%, 11/1/34 2,170,000 2,651,415Citigroup, Inc.
2.75%, , 4/25/22, Callable 3/25/22 @ 100 6,538,000 6,509,7553.88%, (LIBOR03M+117bps), 1/24/39, Callable 1/24/38 @ 100(c) 1,760,000 1,711,230
HSBC Holdings PLC, 5.10%, 4/5/21(a) 5,000,000 5,206,649JPMorgan Chase & Co.
2.95%, , 10/1/26, Callable 7/1/26 @ 100 3,400,000 3,318,536
Copyright © 2021 www.secdatabase.com. All Rights Reserved.Please Consider the Environment Before Printing This Document
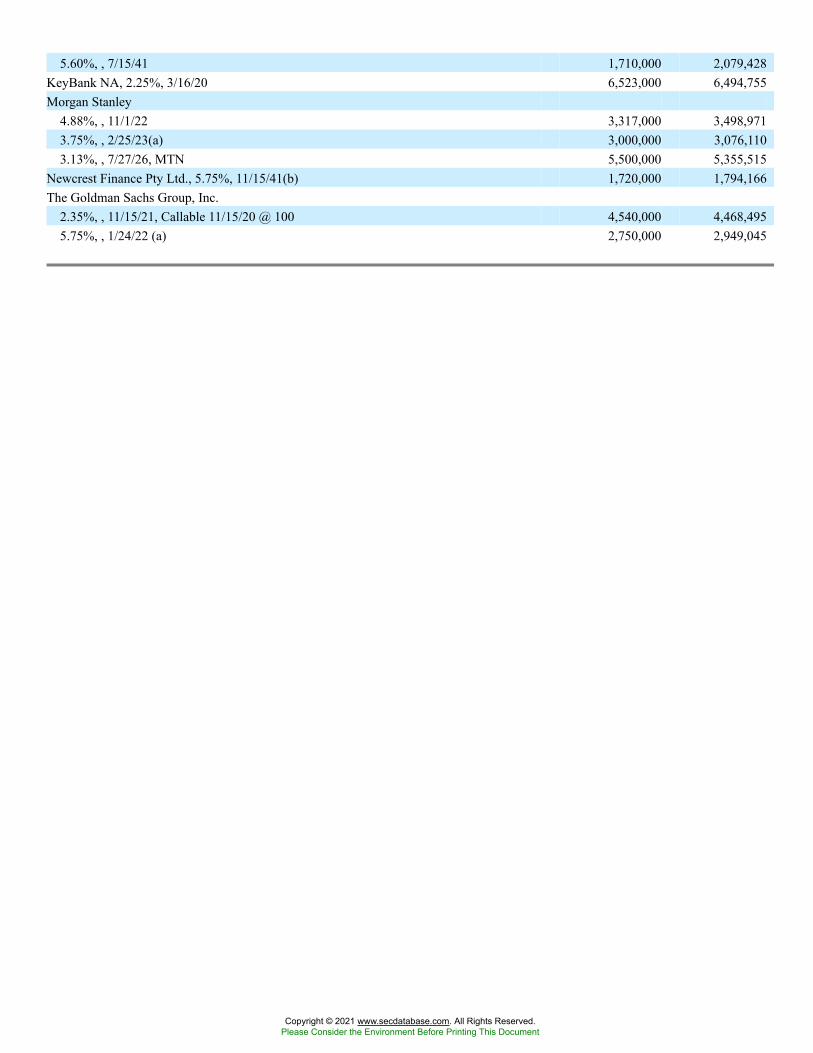
5.60%, , 7/15/41 1,710,000 2,079,428KeyBank NA, 2.25%, 3/16/20 6,523,000 6,494,755Morgan Stanley
4.88%, , 11/1/22 3,317,000 3,498,9713.75%, , 2/25/23(a) 3,000,000 3,076,1103.13%, , 7/27/26, MTN 5,500,000 5,355,515
Newcrest Finance Pty Ltd., 5.75%, 11/15/41(b) 1,720,000 1,794,166The Goldman Sachs Group, Inc.
2.35%, , 11/15/21, Callable 11/15/20 @ 100 4,540,000 4,468,4955.75%, , 1/24/22 (a) 2,750,000 2,949,045
Copyright © 2021 www.secdatabase.com. All Rights Reserved.Please Consider the Environment Before Printing This Document
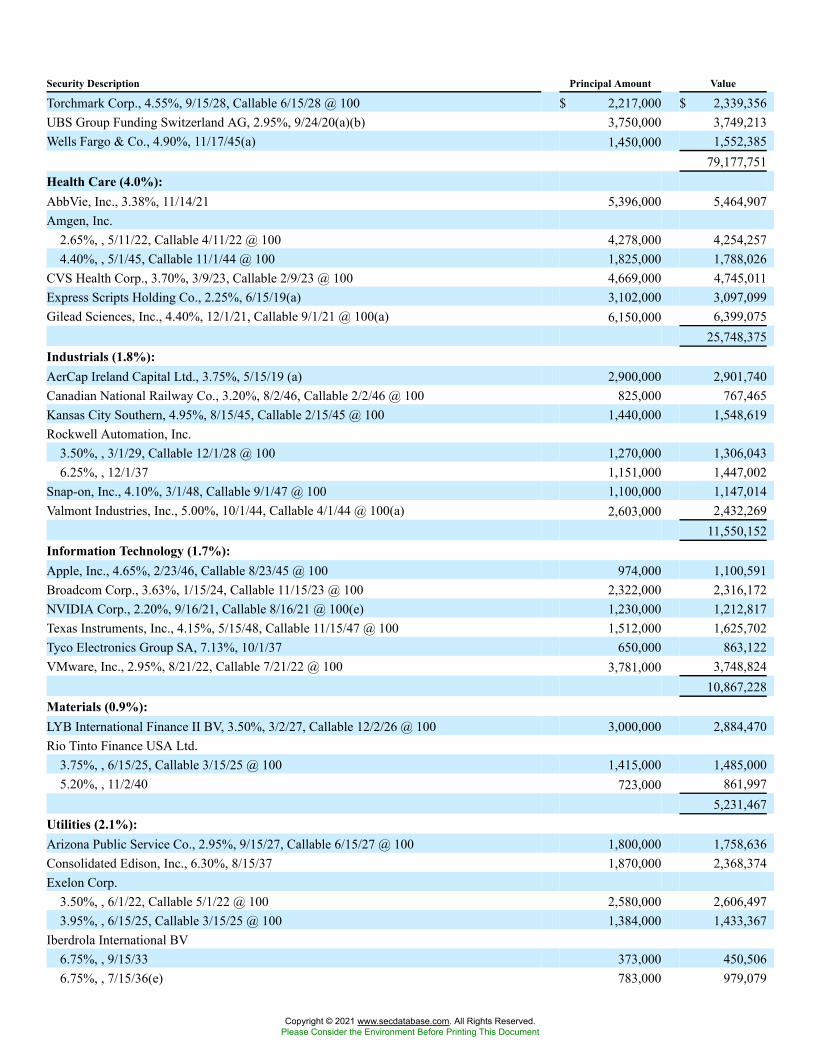
Security Description Principal Amount Value
Torchmark Corp., 4.55%, 9/15/28, Callable 6/15/28 @ 100 $ 2,217,000 $ 2,339,356UBS Group Funding Switzerland AG, 2.95%, 9/24/20(a)(b) 3,750,000 3,749,213Wells Fargo & Co., 4.90%, 11/17/45(a) 1,450,000 1,552,385
79,177,751Health Care (4.0%):AbbVie, Inc., 3.38%, 11/14/21 5,396,000 5,464,907Amgen, Inc.
2.65%, , 5/11/22, Callable 4/11/22 @ 100 4,278,000 4,254,2574.40%, , 5/1/45, Callable 11/1/44 @ 100 1,825,000 1,788,026
CVS Health Corp., 3.70%, 3/9/23, Callable 2/9/23 @ 100 4,669,000 4,745,011Express Scripts Holding Co., 2.25%, 6/15/19(a) 3,102,000 3,097,099Gilead Sciences, Inc., 4.40%, 12/1/21, Callable 9/1/21 @ 100(a) 6,150,000 6,399,075
25,748,375Industrials (1.8%):AerCap Ireland Capital Ltd., 3.75%, 5/15/19 (a) 2,900,000 2,901,740Canadian National Railway Co., 3.20%, 8/2/46, Callable 2/2/46 @ 100 825,000 767,465Kansas City Southern, 4.95%, 8/15/45, Callable 2/15/45 @ 100 1,440,000 1,548,619Rockwell Automation, Inc.
3.50%, , 3/1/29, Callable 12/1/28 @ 100 1,270,000 1,306,0436.25%, , 12/1/37 1,151,000 1,447,002
Snap-on, Inc., 4.10%, 3/1/48, Callable 9/1/47 @ 100 1,100,000 1,147,014Valmont Industries, Inc., 5.00%, 10/1/44, Callable 4/1/44 @ 100(a) 2,603,000 2,432,269
11,550,152Information Technology (1.7%):Apple, Inc., 4.65%, 2/23/46, Callable 8/23/45 @ 100 974,000 1,100,591Broadcom Corp., 3.63%, 1/15/24, Callable 11/15/23 @ 100 2,322,000 2,316,172NVIDIA Corp., 2.20%, 9/16/21, Callable 8/16/21 @ 100(e) 1,230,000 1,212,817Texas Instruments, Inc., 4.15%, 5/15/48, Callable 11/15/47 @ 100 1,512,000 1,625,702Tyco Electronics Group SA, 7.13%, 10/1/37 650,000 863,122VMware, Inc., 2.95%, 8/21/22, Callable 7/21/22 @ 100 3,781,000 3,748,824
10,867,228Materials (0.9%):LYB International Finance II BV, 3.50%, 3/2/27, Callable 12/2/26 @ 100 3,000,000 2,884,470Rio Tinto Finance USA Ltd.
3.75%, , 6/15/25, Callable 3/15/25 @ 100 1,415,000 1,485,0005.20%, , 11/2/40 723,000 861,997
5,231,467Utilities (2.1%):Arizona Public Service Co., 2.95%, 9/15/27, Callable 6/15/27 @ 100 1,800,000 1,758,636Consolidated Edison, Inc., 6.30%, 8/15/37 1,870,000 2,368,374Exelon Corp.
3.50%, , 6/1/22, Callable 5/1/22 @ 100 2,580,000 2,606,4973.95%, , 6/15/25, Callable 3/15/25 @ 100 1,384,000 1,433,367
Iberdrola International BV6.75%, , 9/15/33 373,000 450,5066.75%, , 7/15/36(e) 783,000 979,079
Copyright © 2021 www.secdatabase.com. All Rights Reserved.Please Consider the Environment Before Printing This Document
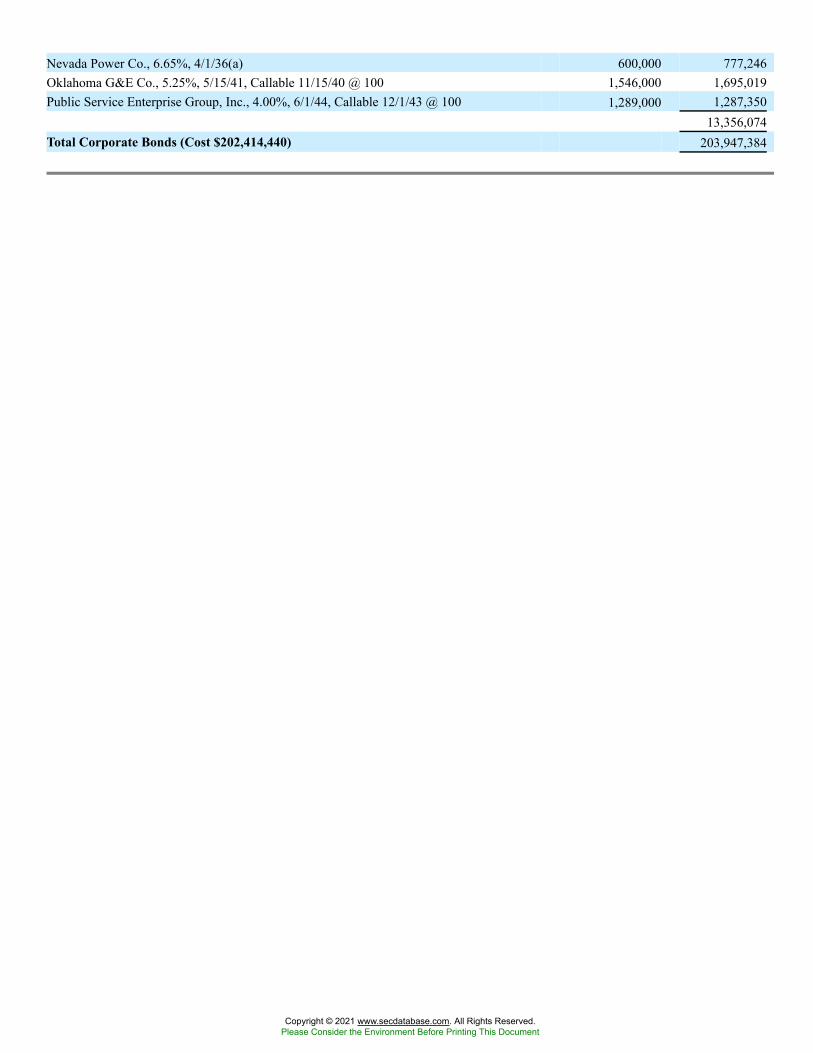
Nevada Power Co., 6.65%, 4/1/36(a) 600,000 777,246Oklahoma G&E Co., 5.25%, 5/15/41, Callable 11/15/40 @ 100 1,546,000 1,695,019Public Service Enterprise Group, Inc., 4.00%, 6/1/44, Callable 12/1/43 @ 100 1,289,000 1,287,350
13,356,074Total Corporate Bonds (Cost $202,414,440) 203,947,384
Copyright © 2021 www.secdatabase.com. All Rights Reserved.Please Consider the Environment Before Printing This Document
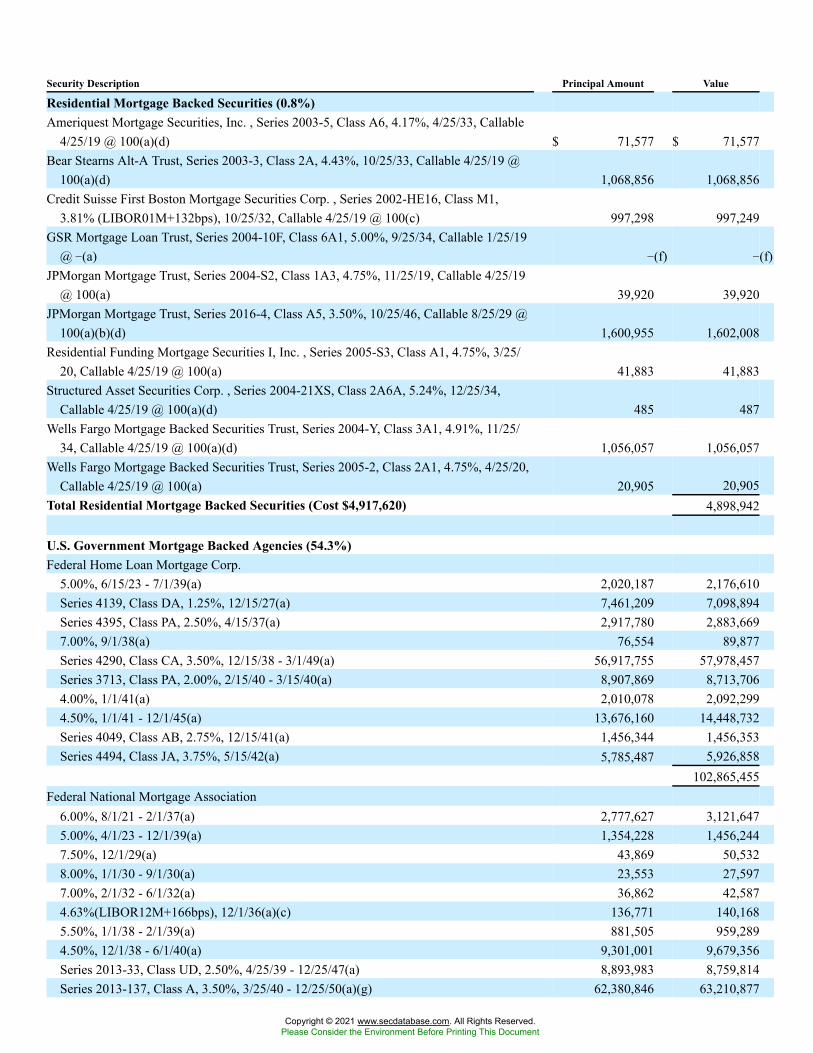
Security Description Principal Amount Value
Residential Mortgage Backed Securities (0.8%)Ameriquest Mortgage Securities, Inc. , Series 2003-5, Class A6, 4.17%, 4/25/33, Callable
4/25/19 @ 100(a)(d) $ 71,577 $ 71,577Bear Stearns Alt-A Trust, Series 2003-3, Class 2A, 4.43%, 10/25/33, Callable 4/25/19 @
100(a)(d) 1,068,856 1,068,856Credit Suisse First Boston Mortgage Securities Corp. , Series 2002-HE16, Class M1,
3.81% (LIBOR01M+132bps), 10/25/32, Callable 4/25/19 @ 100(c) 997,298 997,249GSR Mortgage Loan Trust, Series 2004-10F, Class 6A1, 5.00%, 9/25/34, Callable 1/25/19
@ �(a) �(f) �(f)JPMorgan Mortgage Trust, Series 2004-S2, Class 1A3, 4.75%, 11/25/19, Callable 4/25/19
@ 100(a) 39,920 39,920JPMorgan Mortgage Trust, Series 2016-4, Class A5, 3.50%, 10/25/46, Callable 8/25/29 @
100(a)(b)(d) 1,600,955 1,602,008Residential Funding Mortgage Securities I, Inc. , Series 2005-S3, Class A1, 4.75%, 3/25/
20, Callable 4/25/19 @ 100(a) 41,883 41,883Structured Asset Securities Corp. , Series 2004-21XS, Class 2A6A, 5.24%, 12/25/34,
Callable 4/25/19 @ 100(a)(d) 485 487Wells Fargo Mortgage Backed Securities Trust, Series 2004-Y, Class 3A1, 4.91%, 11/25/
34, Callable 4/25/19 @ 100(a)(d) 1,056,057 1,056,057Wells Fargo Mortgage Backed Securities Trust, Series 2005-2, Class 2A1, 4.75%, 4/25/20,
Callable 4/25/19 @ 100(a) 20,905 20,905Total Residential Mortgage Backed Securities (Cost $4,917,620) 4,898,942
U.S. Government Mortgage Backed Agencies (54.3%)Federal Home Loan Mortgage Corp.
5.00%, 6/15/23 - 7/1/39(a) 2,020,187 2,176,610Series 4139, Class DA, 1.25%, 12/15/27(a) 7,461,209 7,098,894Series 4395, Class PA, 2.50%, 4/15/37(a) 2,917,780 2,883,6697.00%, 9/1/38(a) 76,554 89,877Series 4290, Class CA, 3.50%, 12/15/38 - 3/1/49(a) 56,917,755 57,978,457Series 3713, Class PA, 2.00%, 2/15/40 - 3/15/40(a) 8,907,869 8,713,7064.00%, 1/1/41(a) 2,010,078 2,092,2994.50%, 1/1/41 - 12/1/45(a) 13,676,160 14,448,732Series 4049, Class AB, 2.75%, 12/15/41(a) 1,456,344 1,456,353Series 4494, Class JA, 3.75%, 5/15/42(a) 5,785,487 5,926,858
102,865,455Federal National Mortgage Association
6.00%, 8/1/21 - 2/1/37(a) 2,777,627 3,121,6475.00%, 4/1/23 - 12/1/39(a) 1,354,228 1,456,2447.50%, 12/1/29(a) 43,869 50,5328.00%, 1/1/30 - 9/1/30(a) 23,553 27,5977.00%, 2/1/32 - 6/1/32(a) 36,862 42,5874.63%(LIBOR12M+166bps), 12/1/36(a)(c) 136,771 140,1685.50%, 1/1/38 - 2/1/39(a) 881,505 959,2894.50%, 12/1/38 - 6/1/40(a) 9,301,001 9,679,356Series 2013-33, Class UD, 2.50%, 4/25/39 - 12/25/47(a) 8,893,983 8,759,814Series 2013-137, Class A, 3.50%, 3/25/40 - 12/25/50(a)(g) 62,380,846 63,210,877
Copyright © 2021 www.secdatabase.com. All Rights Reserved.Please Consider the Environment Before Printing This Document
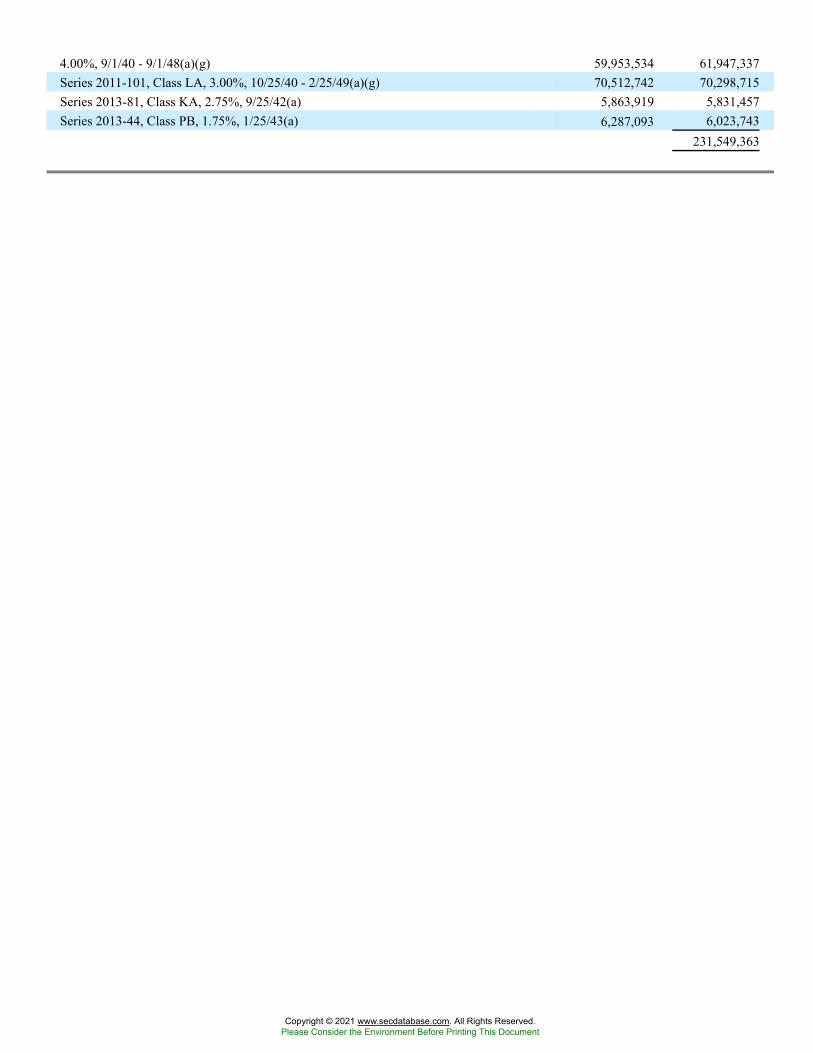
4.00%, 9/1/40 - 9/1/48(a)(g) 59,953,534 61,947,337Series 2011-101, Class LA, 3.00%, 10/25/40 - 2/25/49(a)(g) 70,512,742 70,298,715Series 2013-81, Class KA, 2.75%, 9/25/42(a) 5,863,919 5,831,457Series 2013-44, Class PB, 1.75%, 1/25/43(a) 6,287,093 6,023,743
231,549,363
Copyright © 2021 www.secdatabase.com. All Rights Reserved.Please Consider the Environment Before Printing This Document
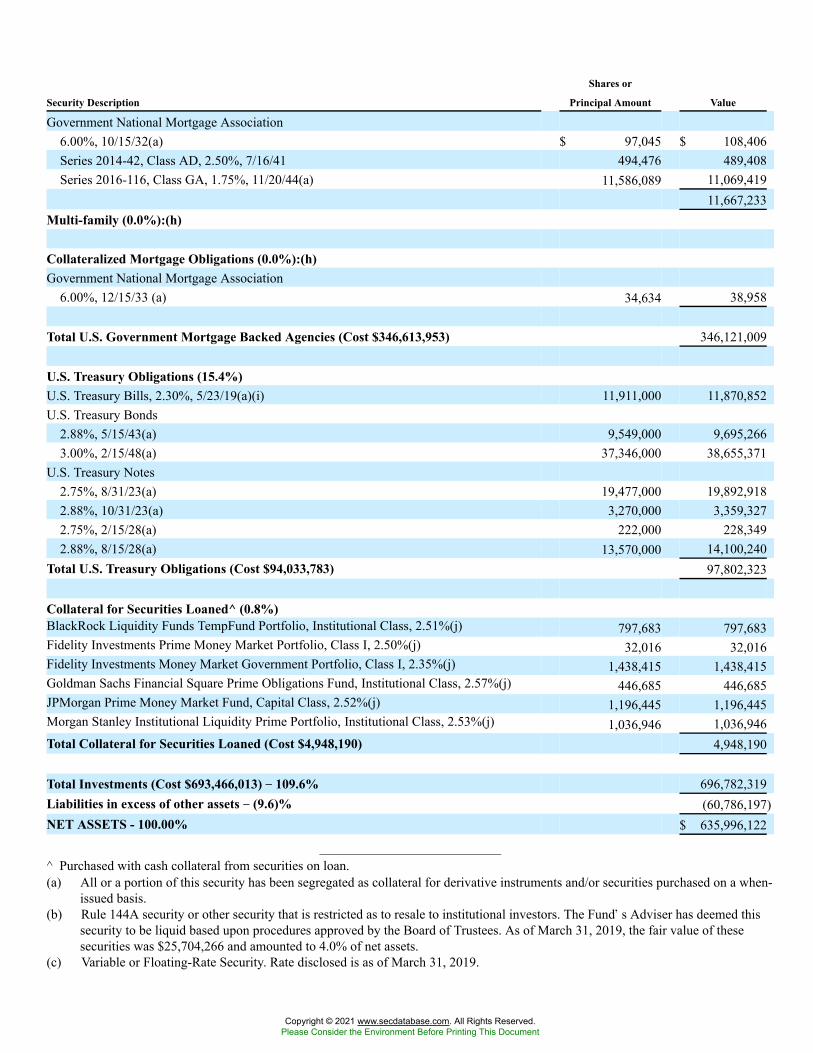
Security Description
Shares or
Principal Amount Value
Government National Mortgage Association6.00%, 10/15/32(a) $ 97,045 $ 108,406Series 2014-42, Class AD, 2.50%, 7/16/41 494,476 489,408Series 2016-116, Class GA, 1.75%, 11/20/44(a) 11,586,089 11,069,419
11,667,233Multi-family (0.0%):(h)
Collateralized Mortgage Obligations (0.0%):(h)Government National Mortgage Association
6.00%, 12/15/33 (a) 34,634 38,958
Total U.S. Government Mortgage Backed Agencies (Cost $346,613,953) 346,121,009
U.S. Treasury Obligations (15.4%)U.S. Treasury Bills, 2.30%, 5/23/19(a)(i) 11,911,000 11,870,852U.S. Treasury Bonds
2.88%, 5/15/43(a) 9,549,000 9,695,2663.00%, 2/15/48(a) 37,346,000 38,655,371
U.S. Treasury Notes2.75%, 8/31/23(a) 19,477,000 19,892,9182.88%, 10/31/23(a) 3,270,000 3,359,3272.75%, 2/15/28(a) 222,000 228,3492.88%, 8/15/28(a) 13,570,000 14,100,240
Total U.S. Treasury Obligations (Cost $94,033,783) 97,802,323
Collateral for Securities Loaned^ (0.8%)BlackRock Liquidity Funds TempFund Portfolio, Institutional Class, 2.51%(j) 797,683 797,683Fidelity Investments Prime Money Market Portfolio, Class I, 2.50%(j) 32,016 32,016Fidelity Investments Money Market Government Portfolio, Class I, 2.35%(j) 1,438,415 1,438,415Goldman Sachs Financial Square Prime Obligations Fund, Institutional Class, 2.57%(j) 446,685 446,685JPMorgan Prime Money Market Fund, Capital Class, 2.52%(j) 1,196,445 1,196,445Morgan Stanley Institutional Liquidity Prime Portfolio, Institutional Class, 2.53%(j) 1,036,946 1,036,946Total Collateral for Securities Loaned (Cost $4,948,190) 4,948,190
Total Investments (Cost $693,466,013) �� 109.6% 696,782,319Liabilities in excess of other assets �� (9.6)% (60,786,197)NET ASSETS - 100.00% $ 635,996,122
^ Purchased with cash collateral from securities on loan.(a) All or a portion of this security has been segregated as collateral for derivative instruments and/or securities purchased on a when-
issued basis.(b) Rule 144A security or other security that is restricted as to resale to institutional investors. The Fund�s Adviser has deemed this
security to be liquid based upon procedures approved by the Board of Trustees. As of March 31, 2019, the fair value of thesesecurities was $25,704,266 and amounted to 4.0% of net assets.
(c) Variable or Floating-Rate Security. Rate disclosed is as of March 31, 2019.
Copyright © 2021 www.secdatabase.com. All Rights Reserved.Please Consider the Environment Before Printing This Document
(d) The rate for certain asset-backed and mortgage backed securities may vary based on factors relating to the pool of assetsunderlying the security. The rate disclosed is the rate in effect at March 31, 2019.
Copyright © 2021 www.secdatabase.com. All Rights Reserved.Please Consider the Environment Before Printing This Document
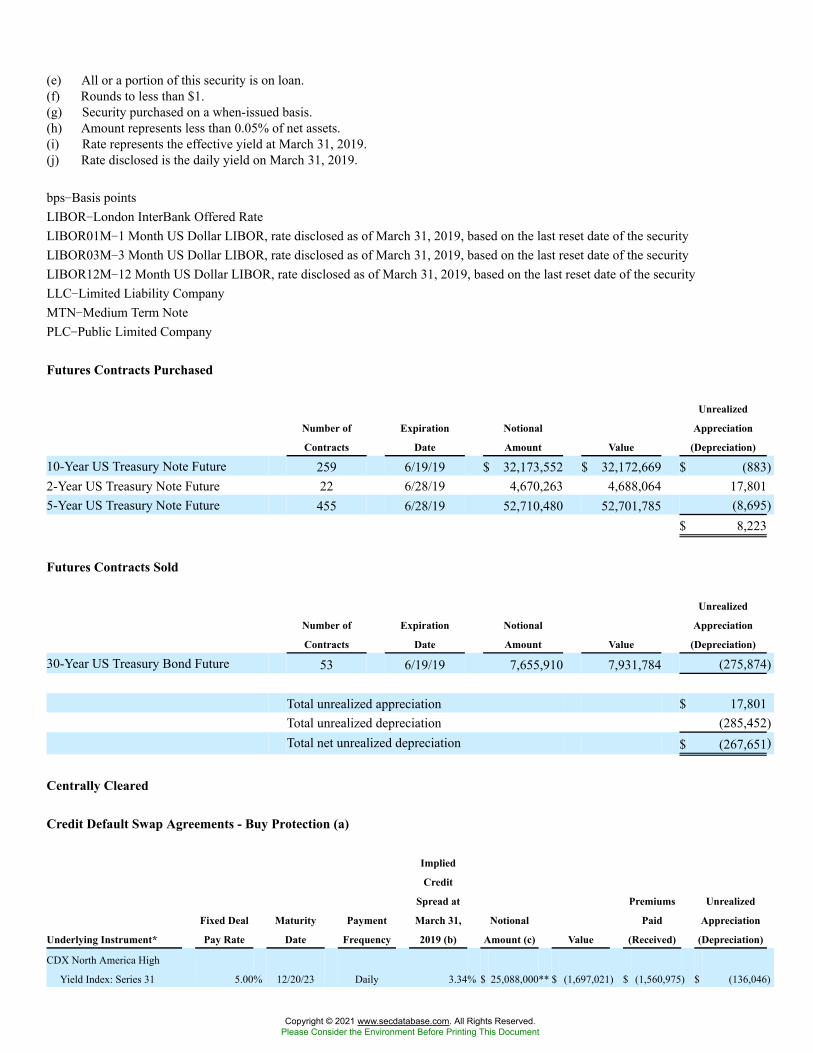
(e) All or a portion of this security is on loan.(f) Rounds to less than $1.(g) Security purchased on a when-issued basis.(h) Amount represents less than 0.05% of net assets.(i) Rate represents the effective yield at March 31, 2019.(j) Rate disclosed is the daily yield on March 31, 2019.
bps�Basis pointsLIBOR�London InterBank Offered RateLIBOR01M�1 Month US Dollar LIBOR, rate disclosed as of March 31, 2019, based on the last reset date of the securityLIBOR03M�3 Month US Dollar LIBOR, rate disclosed as of March 31, 2019, based on the last reset date of the securityLIBOR12M�12 Month US Dollar LIBOR, rate disclosed as of March 31, 2019, based on the last reset date of the securityLLC�Limited Liability CompanyMTN�Medium Term NotePLC�Public Limited Company
Futures Contracts Purchased
Number of
Contracts
Expiration
Date
Notional
Amount Value
Unrealized
Appreciation
(Depreciation)
10-Year US Treasury Note Future 259 6/19/19 $ 32,173,552 $ 32,172,669 $ (883)2-Year US Treasury Note Future 22 6/28/19 4,670,263 4,688,064 17,8015-Year US Treasury Note Future 455 6/28/19 52,710,480 52,701,785 (8,695)
$ 8,223
Futures Contracts Sold
Number of
Contracts
Expiration
Date
Notional
Amount Value
Unrealized
Appreciation
(Depreciation)
30-Year US Treasury Bond Future 53 6/19/19 7,655,910 7,931,784 (275,874)
Total unrealized appreciation $ 17,801Total unrealized depreciation (285,452)Total net unrealized depreciation $ (267,651)
Centrally Cleared
Credit Default Swap Agreements - Buy Protection (a)
Underlying Instrument*
Fixed Deal
Pay Rate
Maturity
Date
Payment
Frequency
Implied
Credit
Spread at
March 31,
2019 (b)
Notional
Amount (c) Value
Premiums
Paid
(Received)
Unrealized
Appreciation
(Depreciation)
CDX North America High
Yield Index: Series 31 5.00% 12/20/23 Daily 3.34% $ 25,088,000** $ (1,697,021) $ (1,560,975) $ (136,046)
Copyright © 2021 www.secdatabase.com. All Rights Reserved.Please Consider the Environment Before Printing This Document
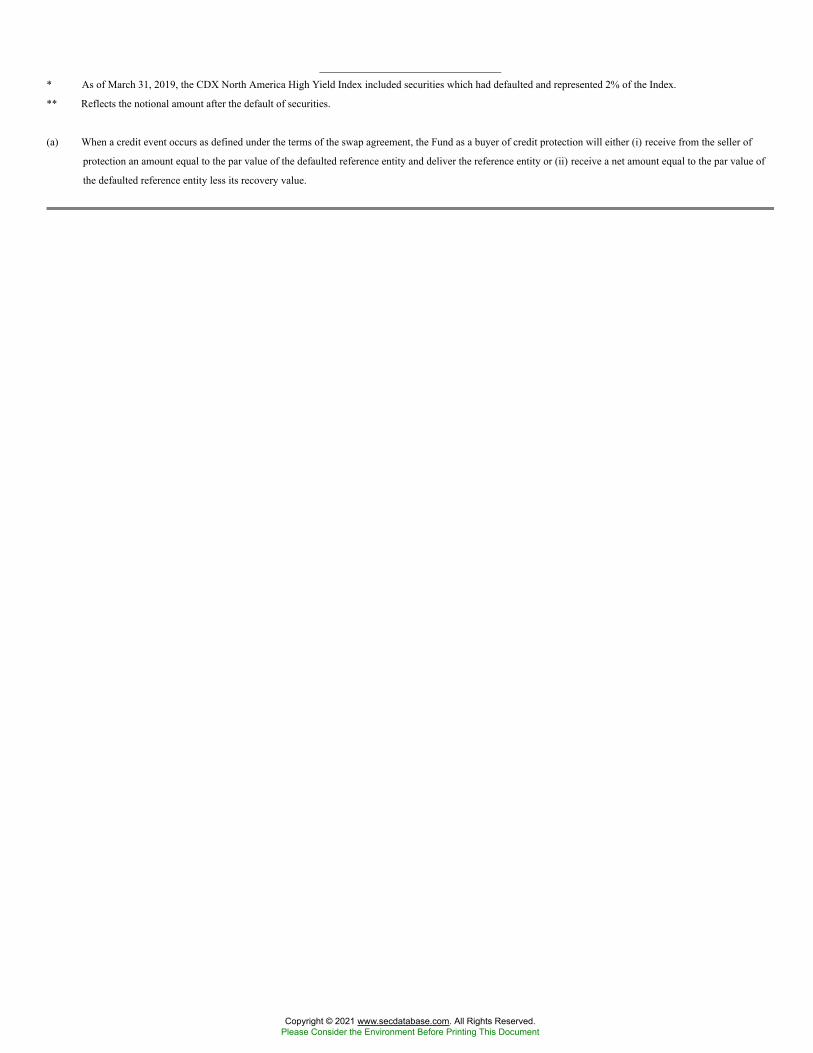
* As of March 31, 2019, the CDX North America High Yield Index included securities which had defaulted and represented 2% of the Index.
** Reflects the notional amount after the default of securities.
(a) When a credit event occurs as defined under the terms of the swap agreement, the Fund as a buyer of credit protection will either (i) receive from the seller of
protection an amount equal to the par value of the defaulted reference entity and deliver the reference entity or (ii) receive a net amount equal to the par value of
the defaulted reference entity less its recovery value.
Copyright © 2021 www.secdatabase.com. All Rights Reserved.Please Consider the Environment Before Printing This Document
(b) Implied credit spread, represented in absolute terms, utilized in determining the value of the credit default swap agreements as of period end will serve as an
indicator of the current status of the payment/performance risk and represent the likelihood or risk of default for the credit derivative. The implied credit spread of
a referenced entity reflects the cost of buying/selling protection and may include payments required to be made to enter into the agreement. Generally, wider
credit spreads represent a perceived deterioration of the referenced entity�s credit soundness and a greater likelihood or risk of default or other credit event
occurring as defined under the terms of the swap agreement.
(c) The notional amount represents the maximum potential amount the Fund may receive as a buyer of credit protection if a credit event occurs, as defined under the
terms of the swap agreement, for each security included in the CDX North America High Yield Index.
Copyright © 2021 www.secdatabase.com. All Rights Reserved.Please Consider the Environment Before Printing This Document
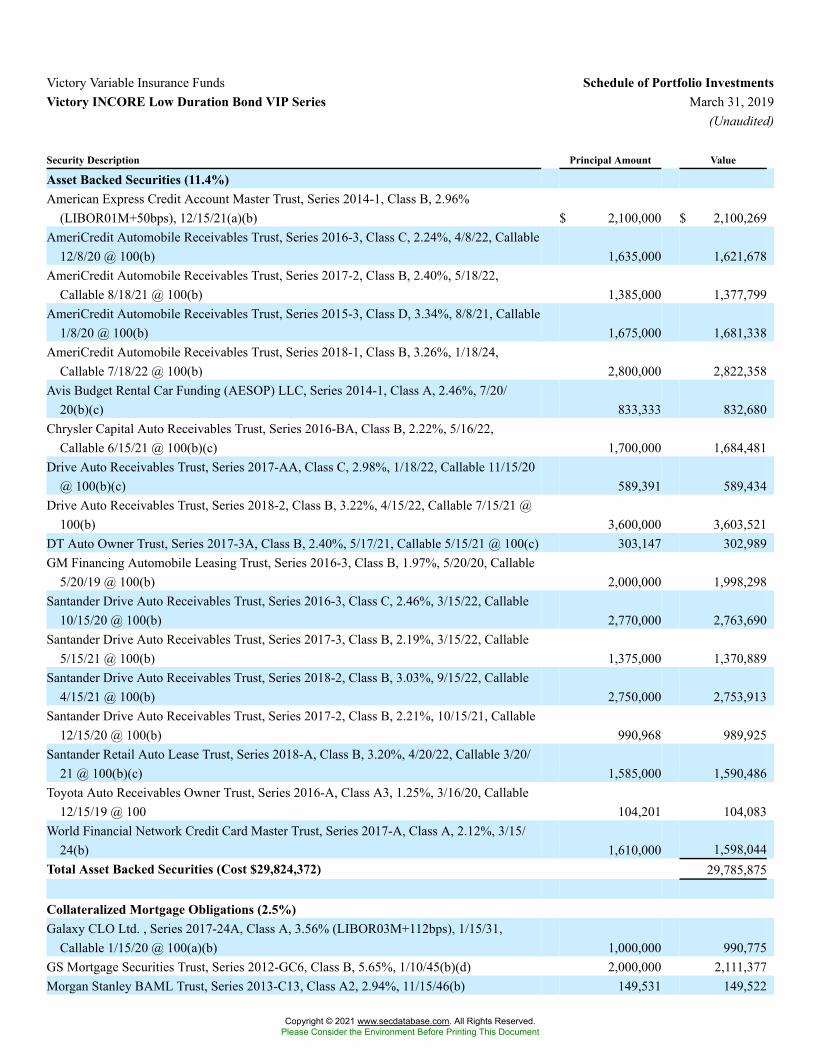
Victory Variable Insurance Funds Schedule of Portfolio InvestmentsVictory INCORE Low Duration Bond VIP Series March 31, 2019
(Unaudited)
Security Description Principal Amount Value
Asset Backed Securities (11.4%)American Express Credit Account Master Trust, Series 2014-1, Class B, 2.96%
(LIBOR01M+50bps), 12/15/21(a)(b) $ 2,100,000 $ 2,100,269AmeriCredit Automobile Receivables Trust, Series 2016-3, Class C, 2.24%, 4/8/22, Callable
12/8/20 @ 100(b) 1,635,000 1,621,678AmeriCredit Automobile Receivables Trust, Series 2017-2, Class B, 2.40%, 5/18/22,
Callable 8/18/21 @ 100(b) 1,385,000 1,377,799AmeriCredit Automobile Receivables Trust, Series 2015-3, Class D, 3.34%, 8/8/21, Callable
1/8/20 @ 100(b) 1,675,000 1,681,338AmeriCredit Automobile Receivables Trust, Series 2018-1, Class B, 3.26%, 1/18/24,
Callable 7/18/22 @ 100(b) 2,800,000 2,822,358Avis Budget Rental Car Funding (AESOP) LLC, Series 2014-1, Class A, 2.46%, 7/20/
20(b)(c) 833,333 832,680Chrysler Capital Auto Receivables Trust, Series 2016-BA, Class B, 2.22%, 5/16/22,
Callable 6/15/21 @ 100(b)(c) 1,700,000 1,684,481Drive Auto Receivables Trust, Series 2017-AA, Class C, 2.98%, 1/18/22, Callable 11/15/20
@ 100(b)(c) 589,391 589,434Drive Auto Receivables Trust, Series 2018-2, Class B, 3.22%, 4/15/22, Callable 7/15/21 @
100(b) 3,600,000 3,603,521DT Auto Owner Trust, Series 2017-3A, Class B, 2.40%, 5/17/21, Callable 5/15/21 @ 100(c) 303,147 302,989GM Financing Automobile Leasing Trust, Series 2016-3, Class B, 1.97%, 5/20/20, Callable
5/20/19 @ 100(b) 2,000,000 1,998,298Santander Drive Auto Receivables Trust, Series 2016-3, Class C, 2.46%, 3/15/22, Callable
10/15/20 @ 100(b) 2,770,000 2,763,690Santander Drive Auto Receivables Trust, Series 2017-3, Class B, 2.19%, 3/15/22, Callable
5/15/21 @ 100(b) 1,375,000 1,370,889Santander Drive Auto Receivables Trust, Series 2018-2, Class B, 3.03%, 9/15/22, Callable
4/15/21 @ 100(b) 2,750,000 2,753,913Santander Drive Auto Receivables Trust, Series 2017-2, Class B, 2.21%, 10/15/21, Callable
12/15/20 @ 100(b) 990,968 989,925Santander Retail Auto Lease Trust, Series 2018-A, Class B, 3.20%, 4/20/22, Callable 3/20/
21 @ 100(b)(c) 1,585,000 1,590,486Toyota Auto Receivables Owner Trust, Series 2016-A, Class A3, 1.25%, 3/16/20, Callable
12/15/19 @ 100 104,201 104,083World Financial Network Credit Card Master Trust, Series 2017-A, Class A, 2.12%, 3/15/
24(b) 1,610,000 1,598,044Total Asset Backed Securities (Cost $29,824,372) 29,785,875
Collateralized Mortgage Obligations (2.5%)Galaxy CLO Ltd. , Series 2017-24A, Class A, 3.56% (LIBOR03M+112bps), 1/15/31,
Callable 1/15/20 @ 100(a)(b) 1,000,000 990,775GS Mortgage Securities Trust, Series 2012-GC6, Class B, 5.65%, 1/10/45(b)(d) 2,000,000 2,111,377Morgan Stanley BAML Trust, Series 2013-C13, Class A2, 2.94%, 11/15/46(b) 149,531 149,522
Copyright © 2021 www.secdatabase.com. All Rights Reserved.Please Consider the Environment Before Printing This Document
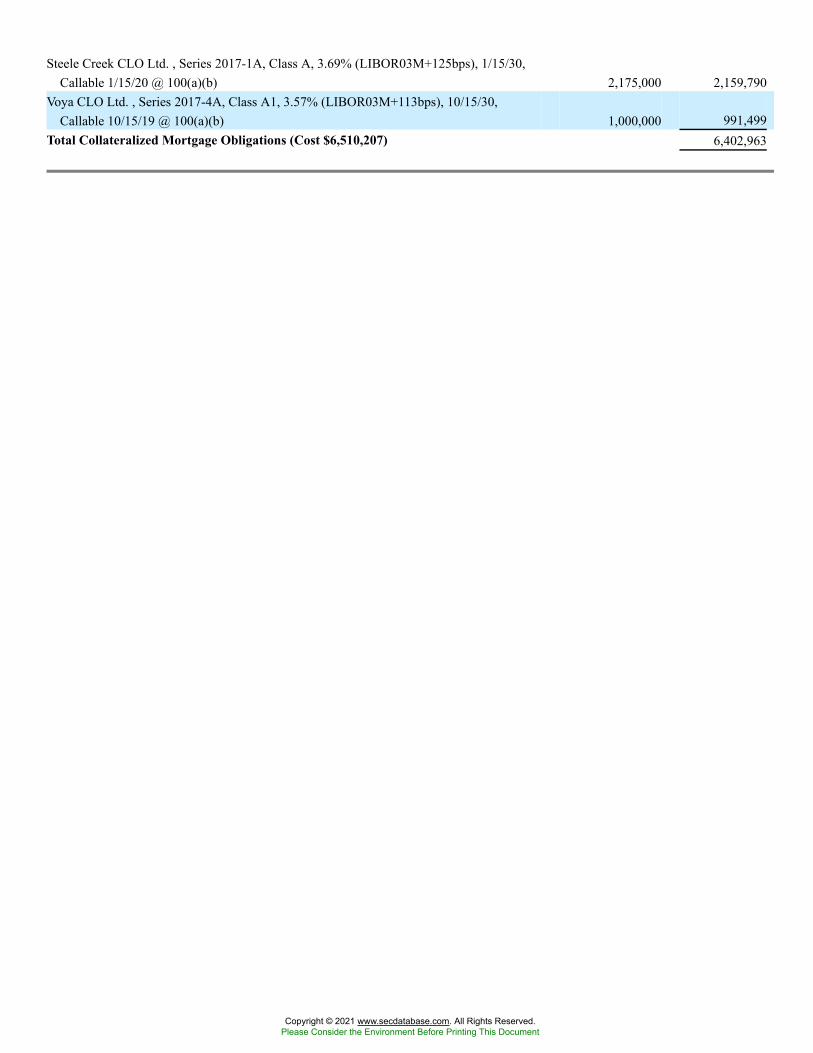
Steele Creek CLO Ltd. , Series 2017-1A, Class A, 3.69% (LIBOR03M+125bps), 1/15/30,Callable 1/15/20 @ 100(a)(b) 2,175,000 2,159,790
Voya CLO Ltd. , Series 2017-4A, Class A1, 3.57% (LIBOR03M+113bps), 10/15/30,Callable 10/15/19 @ 100(a)(b) 1,000,000 991,499
Total Collateralized Mortgage Obligations (Cost $6,510,207) 6,402,963
Copyright © 2021 www.secdatabase.com. All Rights Reserved.Please Consider the Environment Before Printing This Document
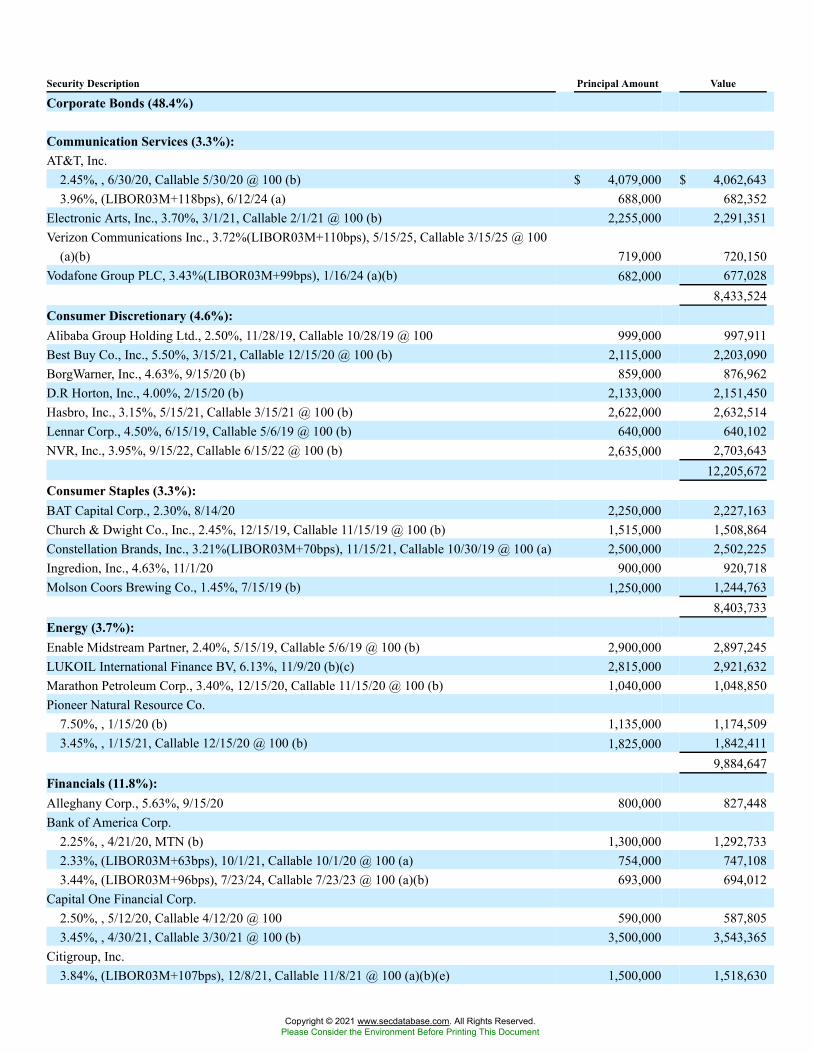
Security Description Principal Amount Value
Corporate Bonds (48.4%)
Communication Services (3.3%):AT&T, Inc.
2.45%, , 6/30/20, Callable 5/30/20 @ 100 (b) $ 4,079,000 $ 4,062,6433.96%, (LIBOR03M+118bps), 6/12/24 (a) 688,000 682,352
Electronic Arts, Inc., 3.70%, 3/1/21, Callable 2/1/21 @ 100 (b) 2,255,000 2,291,351Verizon Communications Inc., 3.72%(LIBOR03M+110bps), 5/15/25, Callable 3/15/25 @ 100
(a)(b) 719,000 720,150Vodafone Group PLC, 3.43%(LIBOR03M+99bps), 1/16/24 (a)(b) 682,000 677,028
8,433,524Consumer Discretionary (4.6%):Alibaba Group Holding Ltd., 2.50%, 11/28/19, Callable 10/28/19 @ 100 999,000 997,911Best Buy Co., Inc., 5.50%, 3/15/21, Callable 12/15/20 @ 100 (b) 2,115,000 2,203,090BorgWarner, Inc., 4.63%, 9/15/20 (b) 859,000 876,962D.R Horton, Inc., 4.00%, 2/15/20 (b) 2,133,000 2,151,450Hasbro, Inc., 3.15%, 5/15/21, Callable 3/15/21 @ 100 (b) 2,622,000 2,632,514Lennar Corp., 4.50%, 6/15/19, Callable 5/6/19 @ 100 (b) 640,000 640,102NVR, Inc., 3.95%, 9/15/22, Callable 6/15/22 @ 100 (b) 2,635,000 2,703,643
12,205,672Consumer Staples (3.3%):BAT Capital Corp., 2.30%, 8/14/20 2,250,000 2,227,163Church & Dwight Co., Inc., 2.45%, 12/15/19, Callable 11/15/19 @ 100 (b) 1,515,000 1,508,864Constellation Brands, Inc., 3.21%(LIBOR03M+70bps), 11/15/21, Callable 10/30/19 @ 100 (a) 2,500,000 2,502,225Ingredion, Inc., 4.63%, 11/1/20 900,000 920,718Molson Coors Brewing Co., 1.45%, 7/15/19 (b) 1,250,000 1,244,763
8,403,733Energy (3.7%):Enable Midstream Partner, 2.40%, 5/15/19, Callable 5/6/19 @ 100 (b) 2,900,000 2,897,245LUKOIL International Finance BV, 6.13%, 11/9/20 (b)(c) 2,815,000 2,921,632Marathon Petroleum Corp., 3.40%, 12/15/20, Callable 11/15/20 @ 100 (b) 1,040,000 1,048,850Pioneer Natural Resource Co.
7.50%, , 1/15/20 (b) 1,135,000 1,174,5093.45%, , 1/15/21, Callable 12/15/20 @ 100 (b) 1,825,000 1,842,411
9,884,647Financials (11.8%):Alleghany Corp., 5.63%, 9/15/20 800,000 827,448Bank of America Corp.
2.25%, , 4/21/20, MTN (b) 1,300,000 1,292,7332.33%, (LIBOR03M+63bps), 10/1/21, Callable 10/1/20 @ 100 (a) 754,000 747,1083.44%, (LIBOR03M+96bps), 7/23/24, Callable 7/23/23 @ 100 (a)(b) 693,000 694,012
Capital One Financial Corp.2.50%, , 5/12/20, Callable 4/12/20 @ 100 590,000 587,8053.45%, , 4/30/21, Callable 3/30/21 @ 100 (b) 3,500,000 3,543,365
Citigroup, Inc.3.84%, (LIBOR03M+107bps), 12/8/21, Callable 11/8/21 @ 100 (a)(b)(e) 1,500,000 1,518,630
Copyright © 2021 www.secdatabase.com. All Rights Reserved.Please Consider the Environment Before Printing This Document
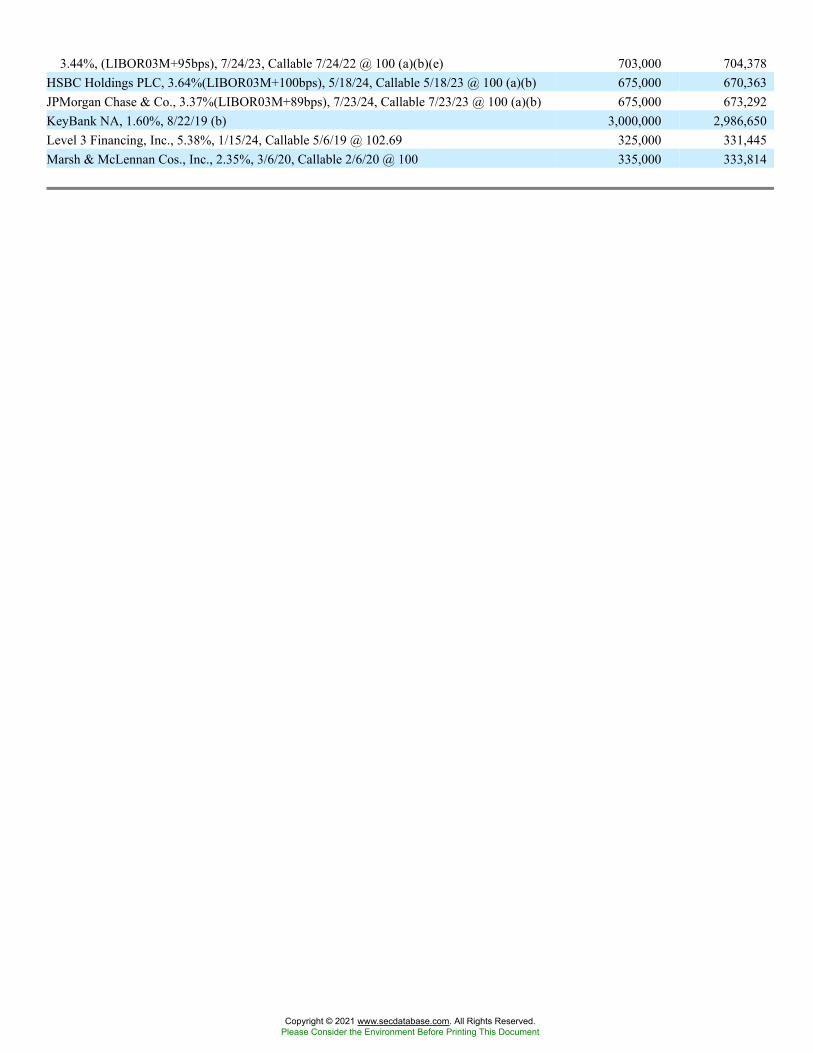
3.44%, (LIBOR03M+95bps), 7/24/23, Callable 7/24/22 @ 100 (a)(b)(e) 703,000 704,378HSBC Holdings PLC, 3.64%(LIBOR03M+100bps), 5/18/24, Callable 5/18/23 @ 100 (a)(b) 675,000 670,363JPMorgan Chase & Co., 3.37%(LIBOR03M+89bps), 7/23/24, Callable 7/23/23 @ 100 (a)(b) 675,000 673,292KeyBank NA, 1.60%, 8/22/19 (b) 3,000,000 2,986,650Level 3 Financing, Inc., 5.38%, 1/15/24, Callable 5/6/19 @ 102.69 325,000 331,445Marsh & McLennan Cos., Inc., 2.35%, 3/6/20, Callable 2/6/20 @ 100 335,000 333,814
Copyright © 2021 www.secdatabase.com. All Rights Reserved.Please Consider the Environment Before Printing This Document
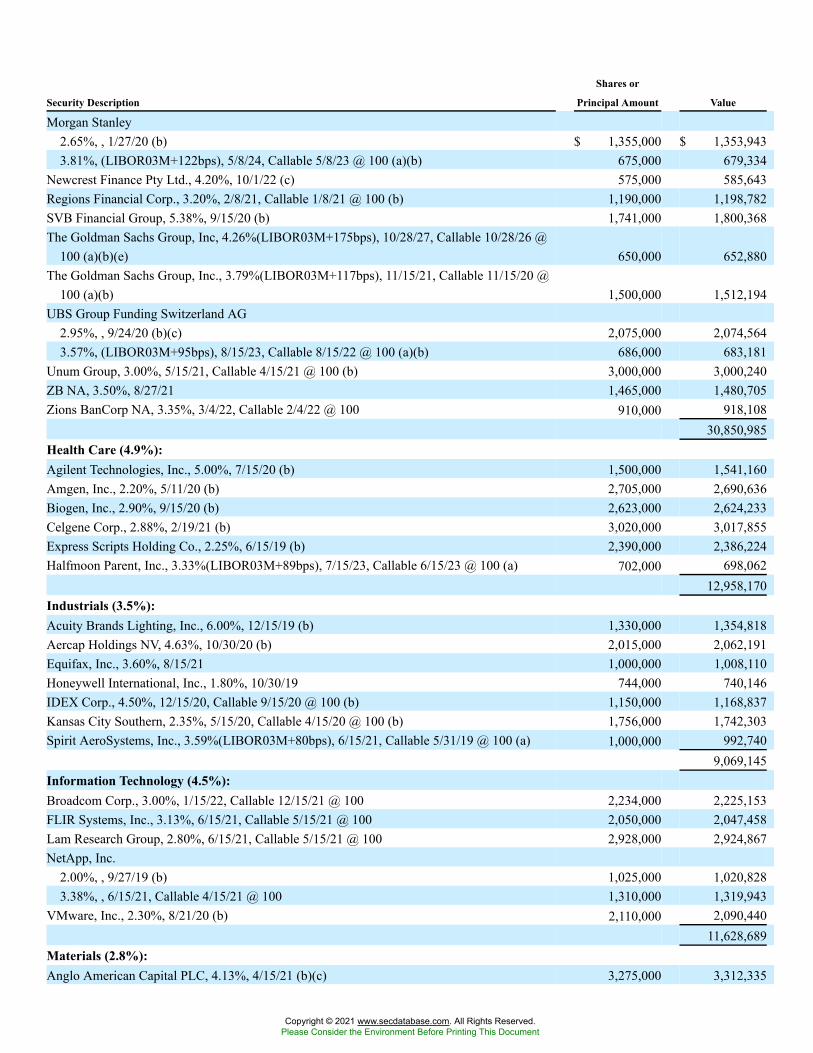
Security Description
Shares or
Principal Amount Value
Morgan Stanley2.65%, , 1/27/20 (b) $ 1,355,000 $ 1,353,9433.81%, (LIBOR03M+122bps), 5/8/24, Callable 5/8/23 @ 100 (a)(b) 675,000 679,334
Newcrest Finance Pty Ltd., 4.20%, 10/1/22 (c) 575,000 585,643Regions Financial Corp., 3.20%, 2/8/21, Callable 1/8/21 @ 100 (b) 1,190,000 1,198,782SVB Financial Group, 5.38%, 9/15/20 (b) 1,741,000 1,800,368The Goldman Sachs Group, Inc, 4.26%(LIBOR03M+175bps), 10/28/27, Callable 10/28/26 @
100 (a)(b)(e) 650,000 652,880The Goldman Sachs Group, Inc., 3.79%(LIBOR03M+117bps), 11/15/21, Callable 11/15/20 @
100 (a)(b) 1,500,000 1,512,194UBS Group Funding Switzerland AG
2.95%, , 9/24/20 (b)(c) 2,075,000 2,074,5643.57%, (LIBOR03M+95bps), 8/15/23, Callable 8/15/22 @ 100 (a)(b) 686,000 683,181
Unum Group, 3.00%, 5/15/21, Callable 4/15/21 @ 100 (b) 3,000,000 3,000,240ZB NA, 3.50%, 8/27/21 1,465,000 1,480,705Zions BanCorp NA, 3.35%, 3/4/22, Callable 2/4/22 @ 100 910,000 918,108
30,850,985Health Care (4.9%):Agilent Technologies, Inc., 5.00%, 7/15/20 (b) 1,500,000 1,541,160Amgen, Inc., 2.20%, 5/11/20 (b) 2,705,000 2,690,636Biogen, Inc., 2.90%, 9/15/20 (b) 2,623,000 2,624,233Celgene Corp., 2.88%, 2/19/21 (b) 3,020,000 3,017,855Express Scripts Holding Co., 2.25%, 6/15/19 (b) 2,390,000 2,386,224Halfmoon Parent, Inc., 3.33%(LIBOR03M+89bps), 7/15/23, Callable 6/15/23 @ 100 (a) 702,000 698,062
12,958,170Industrials (3.5%):Acuity Brands Lighting, Inc., 6.00%, 12/15/19 (b) 1,330,000 1,354,818Aercap Holdings NV, 4.63%, 10/30/20 (b) 2,015,000 2,062,191Equifax, Inc., 3.60%, 8/15/21 1,000,000 1,008,110Honeywell International, Inc., 1.80%, 10/30/19 744,000 740,146IDEX Corp., 4.50%, 12/15/20, Callable 9/15/20 @ 100 (b) 1,150,000 1,168,837Kansas City Southern, 2.35%, 5/15/20, Callable 4/15/20 @ 100 (b) 1,756,000 1,742,303Spirit AeroSystems, Inc., 3.59%(LIBOR03M+80bps), 6/15/21, Callable 5/31/19 @ 100 (a) 1,000,000 992,740
9,069,145Information Technology (4.5%):Broadcom Corp., 3.00%, 1/15/22, Callable 12/15/21 @ 100 2,234,000 2,225,153FLIR Systems, Inc., 3.13%, 6/15/21, Callable 5/15/21 @ 100 2,050,000 2,047,458Lam Research Group, 2.80%, 6/15/21, Callable 5/15/21 @ 100 2,928,000 2,924,867NetApp, Inc.
2.00%, , 9/27/19 (b) 1,025,000 1,020,8283.38%, , 6/15/21, Callable 4/15/21 @ 100 1,310,000 1,319,943
VMware, Inc., 2.30%, 8/21/20 (b) 2,110,000 2,090,44011,628,689
Materials (2.8%):Anglo American Capital PLC, 4.13%, 4/15/21 (b)(c) 3,275,000 3,312,335
Copyright © 2021 www.secdatabase.com. All Rights Reserved.Please Consider the Environment Before Printing This Document
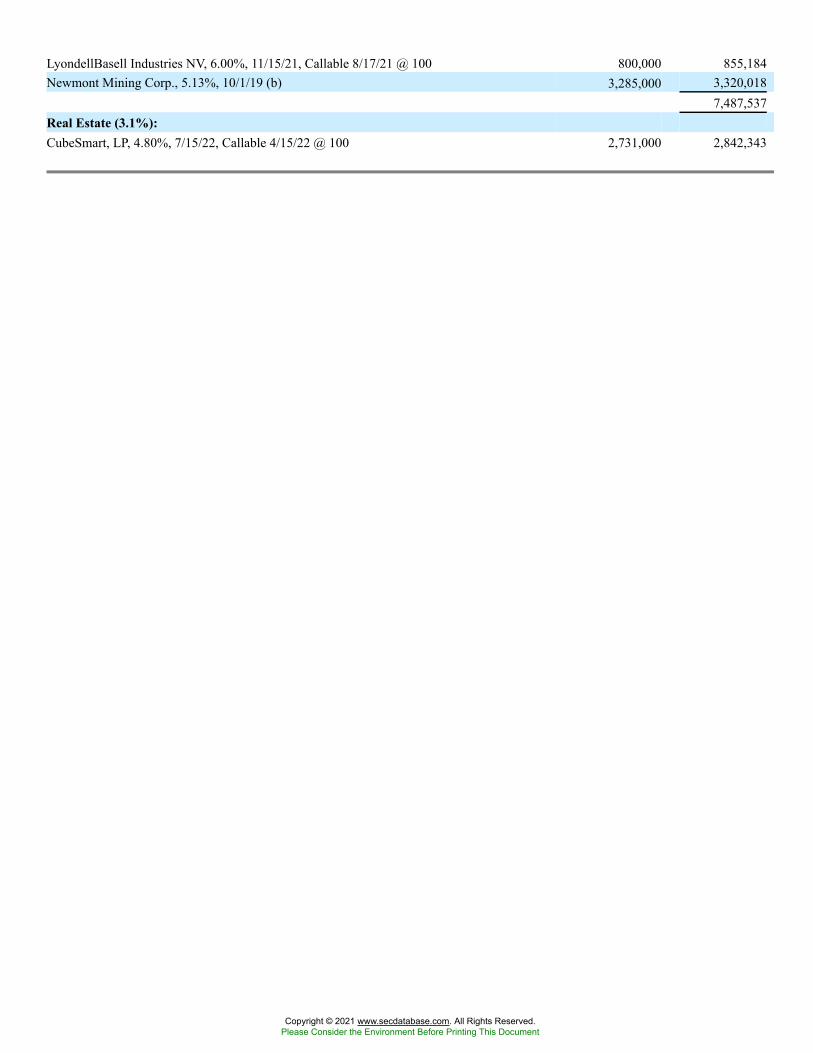
LyondellBasell Industries NV, 6.00%, 11/15/21, Callable 8/17/21 @ 100 800,000 855,184Newmont Mining Corp., 5.13%, 10/1/19 (b) 3,285,000 3,320,018
7,487,537Real Estate (3.1%):CubeSmart, LP, 4.80%, 7/15/22, Callable 4/15/22 @ 100 2,731,000 2,842,343
Copyright © 2021 www.secdatabase.com. All Rights Reserved.Please Consider the Environment Before Printing This Document
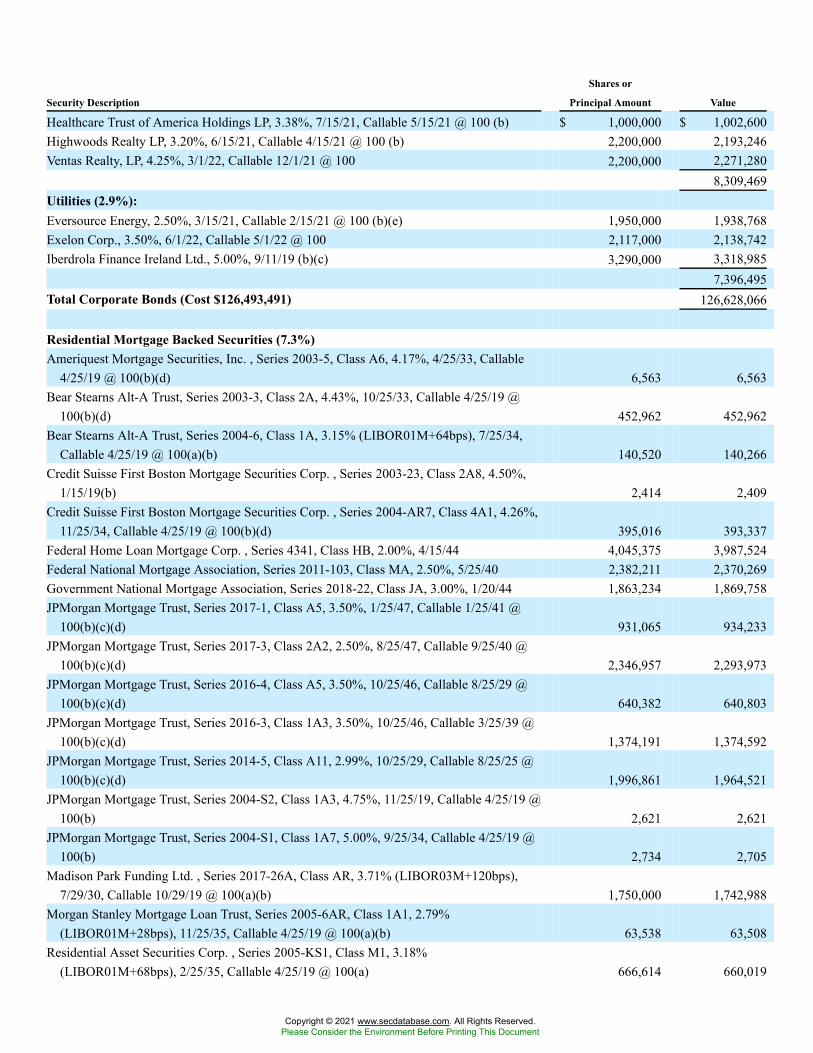
Security Description
Shares or
Principal Amount Value
Healthcare Trust of America Holdings LP, 3.38%, 7/15/21, Callable 5/15/21 @ 100 (b) $ 1,000,000 $ 1,002,600Highwoods Realty LP, 3.20%, 6/15/21, Callable 4/15/21 @ 100 (b) 2,200,000 2,193,246Ventas Realty, LP, 4.25%, 3/1/22, Callable 12/1/21 @ 100 2,200,000 2,271,280
8,309,469Utilities (2.9%):Eversource Energy, 2.50%, 3/15/21, Callable 2/15/21 @ 100 (b)(e) 1,950,000 1,938,768Exelon Corp., 3.50%, 6/1/22, Callable 5/1/22 @ 100 2,117,000 2,138,742Iberdrola Finance Ireland Ltd., 5.00%, 9/11/19 (b)(c) 3,290,000 3,318,985
7,396,495Total Corporate Bonds (Cost $126,493,491) 126,628,066
Residential Mortgage Backed Securities (7.3%)Ameriquest Mortgage Securities, Inc. , Series 2003-5, Class A6, 4.17%, 4/25/33, Callable
4/25/19 @ 100(b)(d) 6,563 6,563Bear Stearns Alt-A Trust, Series 2003-3, Class 2A, 4.43%, 10/25/33, Callable 4/25/19 @
100(b)(d) 452,962 452,962Bear Stearns Alt-A Trust, Series 2004-6, Class 1A, 3.15% (LIBOR01M+64bps), 7/25/34,
Callable 4/25/19 @ 100(a)(b) 140,520 140,266Credit Suisse First Boston Mortgage Securities Corp. , Series 2003-23, Class 2A8, 4.50%,
1/15/19(b) 2,414 2,409Credit Suisse First Boston Mortgage Securities Corp. , Series 2004-AR7, Class 4A1, 4.26%,
11/25/34, Callable 4/25/19 @ 100(b)(d) 395,016 393,337Federal Home Loan Mortgage Corp. , Series 4341, Class HB, 2.00%, 4/15/44 4,045,375 3,987,524Federal National Mortgage Association, Series 2011-103, Class MA, 2.50%, 5/25/40 2,382,211 2,370,269Government National Mortgage Association, Series 2018-22, Class JA, 3.00%, 1/20/44 1,863,234 1,869,758JPMorgan Mortgage Trust, Series 2017-1, Class A5, 3.50%, 1/25/47, Callable 1/25/41 @
100(b)(c)(d) 931,065 934,233JPMorgan Mortgage Trust, Series 2017-3, Class 2A2, 2.50%, 8/25/47, Callable 9/25/40 @
100(b)(c)(d) 2,346,957 2,293,973JPMorgan Mortgage Trust, Series 2016-4, Class A5, 3.50%, 10/25/46, Callable 8/25/29 @
100(b)(c)(d) 640,382 640,803JPMorgan Mortgage Trust, Series 2016-3, Class 1A3, 3.50%, 10/25/46, Callable 3/25/39 @
100(b)(c)(d) 1,374,191 1,374,592JPMorgan Mortgage Trust, Series 2014-5, Class A11, 2.99%, 10/25/29, Callable 8/25/25 @
100(b)(c)(d) 1,996,861 1,964,521JPMorgan Mortgage Trust, Series 2004-S2, Class 1A3, 4.75%, 11/25/19, Callable 4/25/19 @
100(b) 2,621 2,621JPMorgan Mortgage Trust, Series 2004-S1, Class 1A7, 5.00%, 9/25/34, Callable 4/25/19 @
100(b) 2,734 2,705Madison Park Funding Ltd. , Series 2017-26A, Class AR, 3.71% (LIBOR03M+120bps),
7/29/30, Callable 10/29/19 @ 100(a)(b) 1,750,000 1,742,988Morgan Stanley Mortgage Loan Trust, Series 2005-6AR, Class 1A1, 2.79%
(LIBOR01M+28bps), 11/25/35, Callable 4/25/19 @ 100(a)(b) 63,538 63,508Residential Asset Securities Corp. , Series 2005-KS1, Class M1, 3.18%
(LIBOR01M+68bps), 2/25/35, Callable 4/25/19 @ 100(a) 666,614 660,019
Copyright © 2021 www.secdatabase.com. All Rights Reserved.Please Consider the Environment Before Printing This Document
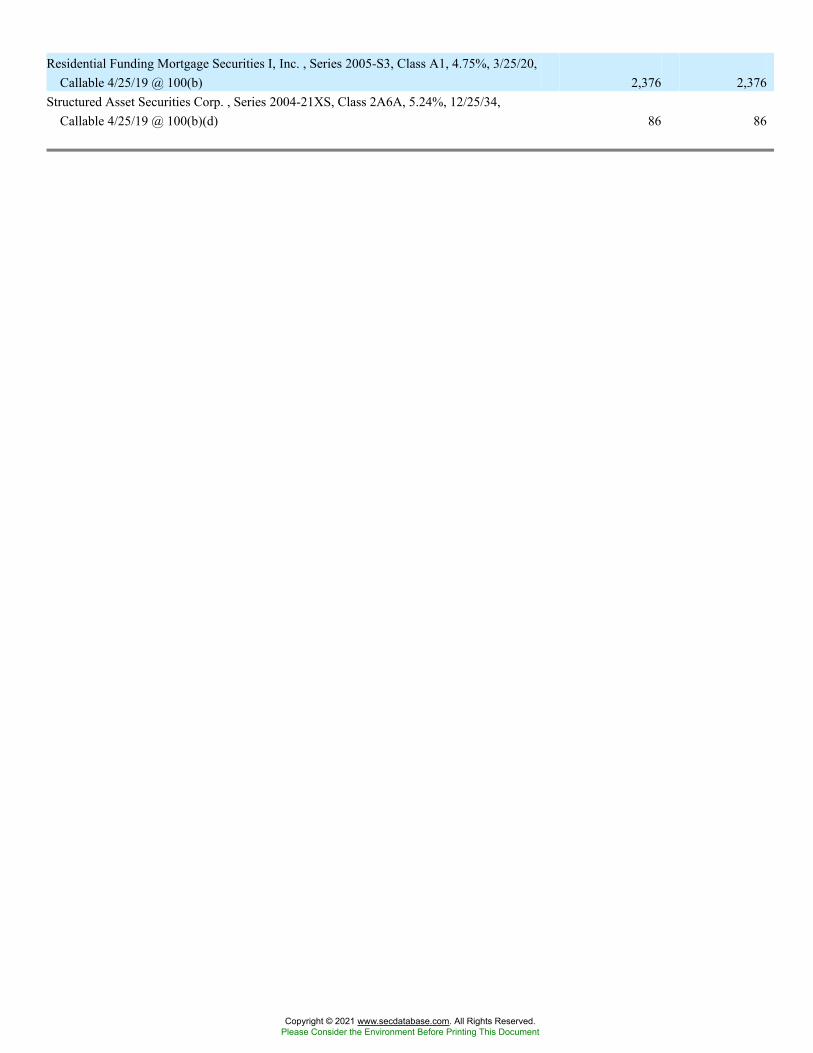
Residential Funding Mortgage Securities I, Inc. , Series 2005-S3, Class A1, 4.75%, 3/25/20,Callable 4/25/19 @ 100(b) 2,376 2,376
Structured Asset Securities Corp. , Series 2004-21XS, Class 2A6A, 5.24%, 12/25/34,Callable 4/25/19 @ 100(b)(d) 86 86
Copyright © 2021 www.secdatabase.com. All Rights Reserved.Please Consider the Environment Before Printing This Document
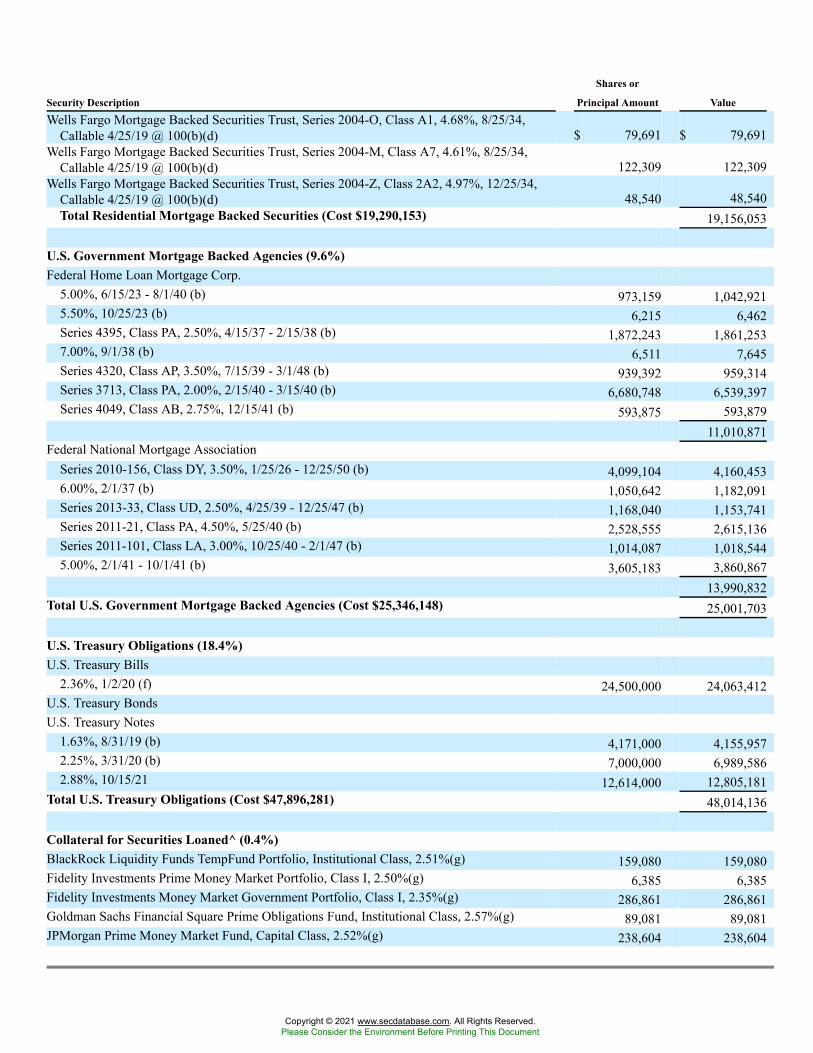
Security Description
Shares or
Principal Amount ValueWells Fargo Mortgage Backed Securities Trust, Series 2004-O, Class A1, 4.68%, 8/25/34,
Callable 4/25/19 @ 100(b)(d) $ 79,691 $ 79,691Wells Fargo Mortgage Backed Securities Trust, Series 2004-M, Class A7, 4.61%, 8/25/34,
Callable 4/25/19 @ 100(b)(d) 122,309 122,309Wells Fargo Mortgage Backed Securities Trust, Series 2004-Z, Class 2A2, 4.97%, 12/25/34,
Callable 4/25/19 @ 100(b)(d) 48,540 48,540Total Residential Mortgage Backed Securities (Cost $19,290,153) 19,156,053
U.S. Government Mortgage Backed Agencies (9.6%)Federal Home Loan Mortgage Corp.
5.00%, 6/15/23 - 8/1/40 (b) 973,159 1,042,9215.50%, 10/25/23 (b) 6,215 6,462Series 4395, Class PA, 2.50%, 4/15/37 - 2/15/38 (b) 1,872,243 1,861,2537.00%, 9/1/38 (b) 6,511 7,645Series 4320, Class AP, 3.50%, 7/15/39 - 3/1/48 (b) 939,392 959,314Series 3713, Class PA, 2.00%, 2/15/40 - 3/15/40 (b) 6,680,748 6,539,397Series 4049, Class AB, 2.75%, 12/15/41 (b) 593,875 593,879
11,010,871Federal National Mortgage Association
Series 2010-156, Class DY, 3.50%, 1/25/26 - 12/25/50 (b) 4,099,104 4,160,4536.00%, 2/1/37 (b) 1,050,642 1,182,091Series 2013-33, Class UD, 2.50%, 4/25/39 - 12/25/47 (b) 1,168,040 1,153,741Series 2011-21, Class PA, 4.50%, 5/25/40 (b) 2,528,555 2,615,136Series 2011-101, Class LA, 3.00%, 10/25/40 - 2/1/47 (b) 1,014,087 1,018,5445.00%, 2/1/41 - 10/1/41 (b) 3,605,183 3,860,867
13,990,832Total U.S. Government Mortgage Backed Agencies (Cost $25,346,148) 25,001,703
U.S. Treasury Obligations (18.4%)U.S. Treasury Bills
2.36%, 1/2/20 (f) 24,500,000 24,063,412U.S. Treasury BondsU.S. Treasury Notes
1.63%, 8/31/19 (b) 4,171,000 4,155,9572.25%, 3/31/20 (b) 7,000,000 6,989,5862.88%, 10/15/21 12,614,000 12,805,181
Total U.S. Treasury Obligations (Cost $47,896,281) 48,014,136
Collateral for Securities Loaned^ (0.4%)BlackRock Liquidity Funds TempFund Portfolio, Institutional Class, 2.51%(g) 159,080 159,080Fidelity Investments Prime Money Market Portfolio, Class I, 2.50%(g) 6,385 6,385Fidelity Investments Money Market Government Portfolio, Class I, 2.35%(g) 286,861 286,861Goldman Sachs Financial Square Prime Obligations Fund, Institutional Class, 2.57%(g) 89,081 89,081JPMorgan Prime Money Market Fund, Capital Class, 2.52%(g) 238,604 238,604
Copyright © 2021 www.secdatabase.com. All Rights Reserved.Please Consider the Environment Before Printing This Document
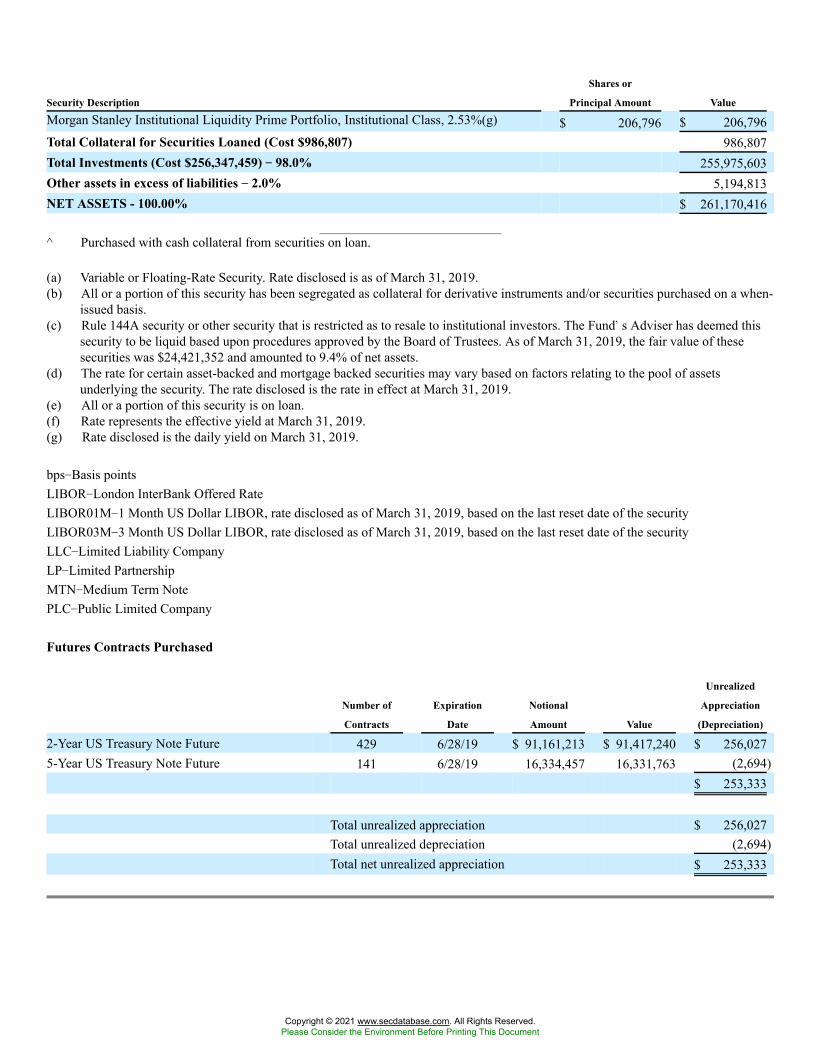
Security Description
Shares or
Principal Amount ValueMorgan Stanley Institutional Liquidity Prime Portfolio, Institutional Class, 2.53%(g) $ 206,796 $ 206,796Total Collateral for Securities Loaned (Cost $986,807) 986,807Total Investments (Cost $256,347,459) �� 98.0% 255,975,603Other assets in excess of liabilities �� 2.0% 5,194,813NET ASSETS - 100.00% $ 261,170,416
^ Purchased with cash collateral from securities on loan.
(a) Variable or Floating-Rate Security. Rate disclosed is as of March 31, 2019.(b) All or a portion of this security has been segregated as collateral for derivative instruments and/or securities purchased on a when-
issued basis.(c) Rule 144A security or other security that is restricted as to resale to institutional investors. The Fund�s Adviser has deemed this
security to be liquid based upon procedures approved by the Board of Trustees. As of March 31, 2019, the fair value of thesesecurities was $24,421,352 and amounted to 9.4% of net assets.
(d) The rate for certain asset-backed and mortgage backed securities may vary based on factors relating to the pool of assetsunderlying the security. The rate disclosed is the rate in effect at March 31, 2019.
(e) All or a portion of this security is on loan.(f) Rate represents the effective yield at March 31, 2019.(g) Rate disclosed is the daily yield on March 31, 2019.
bps�Basis pointsLIBOR�London InterBank Offered RateLIBOR01M�1 Month US Dollar LIBOR, rate disclosed as of March 31, 2019, based on the last reset date of the securityLIBOR03M�3 Month US Dollar LIBOR, rate disclosed as of March 31, 2019, based on the last reset date of the securityLLC�Limited Liability CompanyLP�Limited PartnershipMTN�Medium Term NotePLC�Public Limited Company
Futures Contracts Purchased
Number of
Contracts
Expiration
Date
Notional
Amount Value
Unrealized
Appreciation
(Depreciation)
2-Year US Treasury Note Future 429 6/28/19 $ 91,161,213 $ 91,417,240 $ 256,0275-Year US Treasury Note Future 141 6/28/19 16,334,457 16,331,763 (2,694)
$ 253,333
Total unrealized appreciation $ 256,027Total unrealized depreciation (2,694)Total net unrealized appreciation $ 253,333
Copyright © 2021 www.secdatabase.com. All Rights Reserved.Please Consider the Environment Before Printing This Document
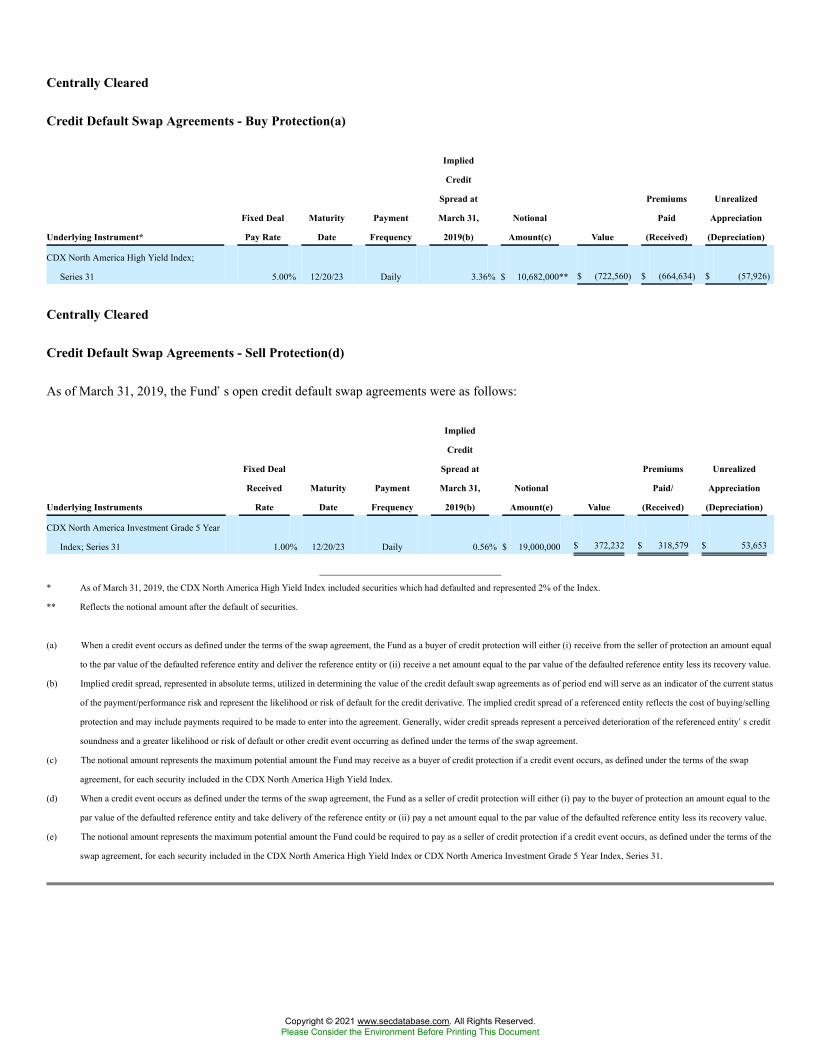
Centrally Cleared
Credit Default Swap Agreements - Buy Protection(a)
Underlying Instrument*
Fixed Deal
Pay Rate
Maturity
Date
Payment
Frequency
Implied
Credit
Spread at
March 31,
2019(b)
Notional
Amount(c) Value
Premiums
Paid
(Received)
Unrealized
Appreciation
(Depreciation)
CDX North America High Yield Index;
Series 31 5.00% 12/20/23 Daily 3.36% $ 10,682,000** $ (722,560) $ (664,634) $ (57,926)
Centrally Cleared
Credit Default Swap Agreements - Sell Protection(d)
As of March 31, 2019, the Fund�s open credit default swap agreements were as follows:
Underlying Instruments
Fixed Deal
Received
Rate
Maturity
Date
Payment
Frequency
Implied
Credit
Spread at
March 31,
2019(b)
Notional
Amount(e) Value
Premiums
Paid/
(Received)
Unrealized
Appreciation
(Depreciation)
CDX North America Investment Grade 5 Year
Index; Series 31 1.00% 12/20/23 Daily 0.56% $ 19,000,000 $ 372,232 $ 318,579 $ 53,653
* As of March 31, 2019, the CDX North America High Yield Index included securities which had defaulted and represented 2% of the Index.
** Reflects the notional amount after the default of securities.
(a) When a credit event occurs as defined under the terms of the swap agreement, the Fund as a buyer of credit protection will either (i) receive from the seller of protection an amount equal
to the par value of the defaulted reference entity and deliver the reference entity or (ii) receive a net amount equal to the par value of the defaulted reference entity less its recovery value.
(b) Implied credit spread, represented in absolute terms, utilized in determining the value of the credit default swap agreements as of period end will serve as an indicator of the current status
of the payment/performance risk and represent the likelihood or risk of default for the credit derivative. The implied credit spread of a referenced entity reflects the cost of buying/selling
protection and may include payments required to be made to enter into the agreement. Generally, wider credit spreads represent a perceived deterioration of the referenced entity�s credit
soundness and a greater likelihood or risk of default or other credit event occurring as defined under the terms of the swap agreement.
(c) The notional amount represents the maximum potential amount the Fund may receive as a buyer of credit protection if a credit event occurs, as defined under the terms of the swap
agreement, for each security included in the CDX North America High Yield Index.
(d) When a credit event occurs as defined under the terms of the swap agreement, the Fund as a seller of credit protection will either (i) pay to the buyer of protection an amount equal to the
par value of the defaulted reference entity and take delivery of the reference entity or (ii) pay a net amount equal to the par value of the defaulted reference entity less its recovery value.
(e) The notional amount represents the maximum potential amount the Fund could be required to pay as a seller of credit protection if a credit event occurs, as defined under the terms of the
swap agreement, for each security included in the CDX North America High Yield Index or CDX North America Investment Grade 5 Year Index, Series 31.
Copyright © 2021 www.secdatabase.com. All Rights Reserved.Please Consider the Environment Before Printing This Document
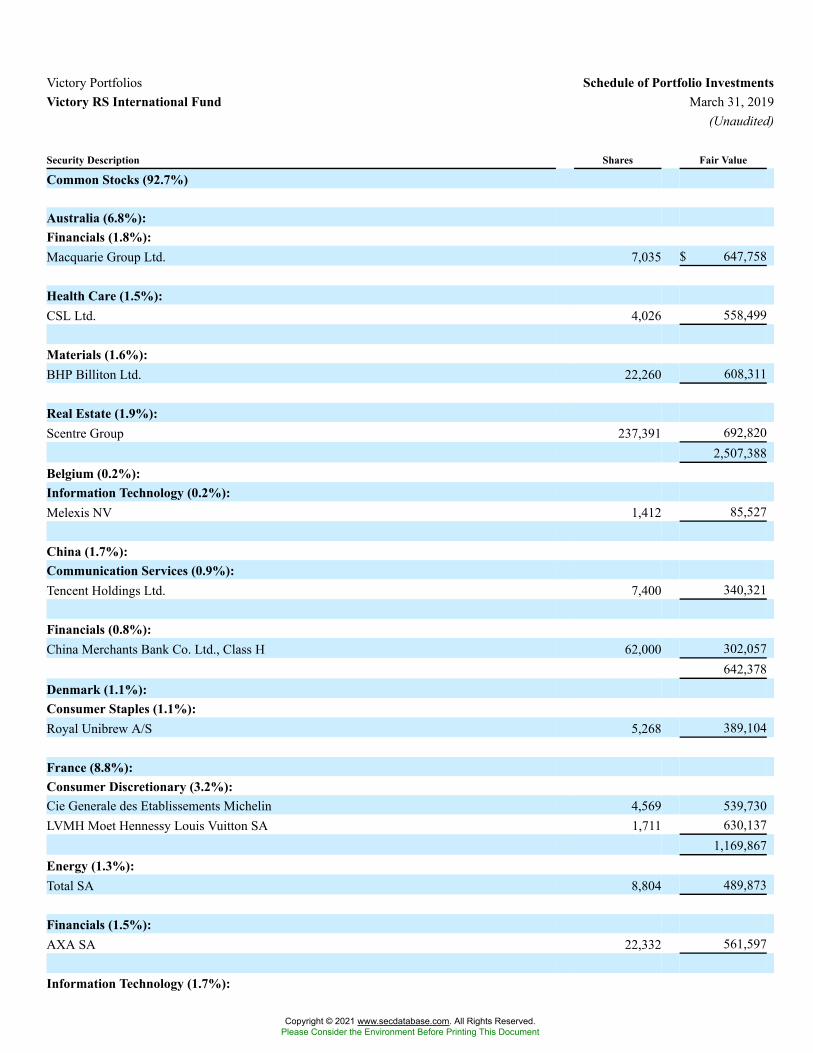
Victory Portfolios Schedule of Portfolio InvestmentsVictory RS International Fund March 31, 2019
(Unaudited)
Security Description Shares Fair Value
Common Stocks (92.7%)
Australia (6.8%):Financials (1.8%):Macquarie Group Ltd. 7,035 $ 647,758
Health Care (1.5%):CSL Ltd. 4,026 558,499
Materials (1.6%):BHP Billiton Ltd. 22,260 608,311
Real Estate (1.9%):Scentre Group 237,391 692,820
2,507,388Belgium (0.2%):Information Technology (0.2%):Melexis NV 1,412 85,527
China (1.7%):Communication Services (0.9%):Tencent Holdings Ltd. 7,400 340,321
Financials (0.8%):China Merchants Bank Co. Ltd., Class H 62,000 302,057
642,378Denmark (1.1%):Consumer Staples (1.1%):Royal Unibrew A/S 5,268 389,104
France (8.8%):Consumer Discretionary (3.2%):Cie Generale des Etablissements Michelin 4,569 539,730LVMH Moet Hennessy Louis Vuitton SA 1,711 630,137
1,169,867Energy (1.3%):Total SA 8,804 489,873
Financials (1.5%):AXA SA 22,332 561,597
Information Technology (1.7%):
Copyright © 2021 www.secdatabase.com. All Rights Reserved.Please Consider the Environment Before Printing This Document

Cap Gemini SA 5,148 624,587
Materials (1.1%):Arkema SA 4,054 386,694
3,232,618Germany (8.1%):Financials (2.1%):Allianz SE 3,519 784,099
Health Care (0.5%):Bayer AG 2,957 190,382
Industrials (2.6%):Siemens AG 5,173 556,245Washtec AG 5,090 388,561
944,806Information Technology (1.5%):SAP SE 4,847 560,263
Real Estate (1.4%):Vonovia SE 9,695 503,062
2,982,612
Copyright © 2021 www.secdatabase.com. All Rights Reserved.Please Consider the Environment Before Printing This Document
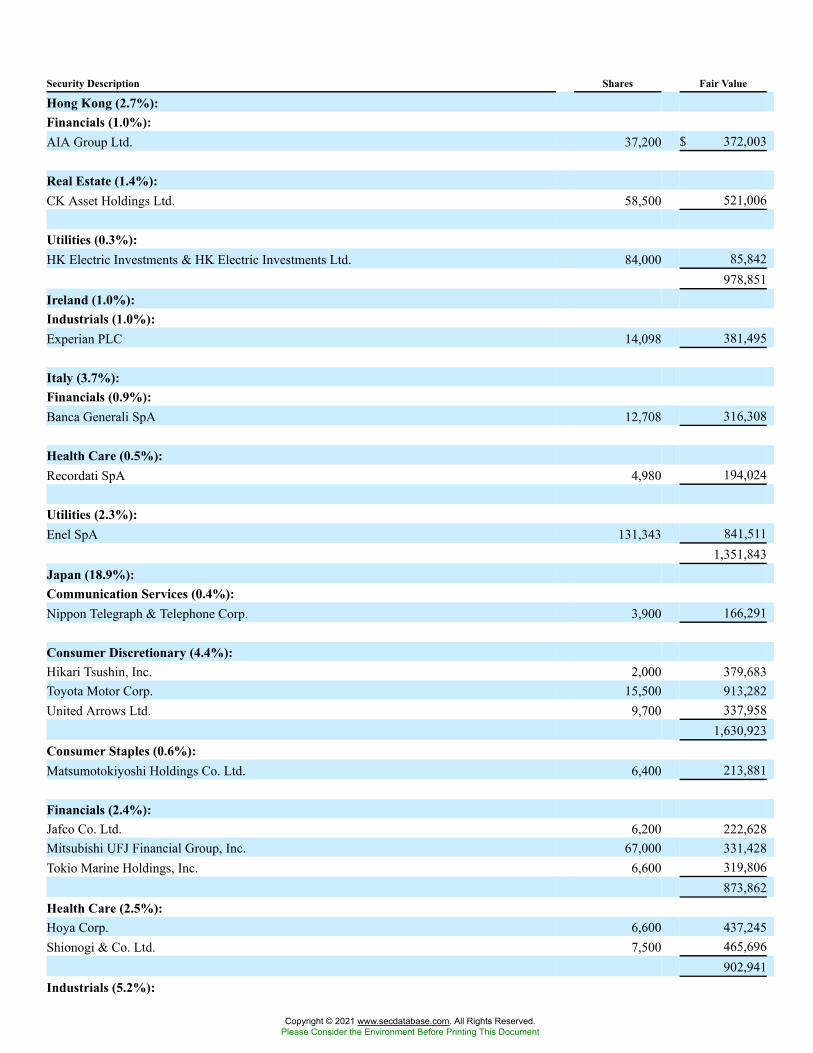
Security Description Shares Fair Value
Hong Kong (2.7%):Financials (1.0%):AIA Group Ltd. 37,200 $ 372,003
Real Estate (1.4%):CK Asset Holdings Ltd. 58,500 521,006
Utilities (0.3%):HK Electric Investments & HK Electric Investments Ltd. 84,000 85,842
978,851Ireland (1.0%):Industrials (1.0%):Experian PLC 14,098 381,495
Italy (3.7%):Financials (0.9%):Banca Generali SpA 12,708 316,308
Health Care (0.5%):Recordati SpA 4,980 194,024
Utilities (2.3%):Enel SpA 131,343 841,511
1,351,843Japan (18.9%):Communication Services (0.4%):Nippon Telegraph & Telephone Corp. 3,900 166,291
Consumer Discretionary (4.4%):Hikari Tsushin, Inc. 2,000 379,683Toyota Motor Corp. 15,500 913,282United Arrows Ltd. 9,700 337,958
1,630,923Consumer Staples (0.6%):Matsumotokiyoshi Holdings Co. Ltd. 6,400 213,881
Financials (2.4%):Jafco Co. Ltd. 6,200 222,628Mitsubishi UFJ Financial Group, Inc. 67,000 331,428Tokio Marine Holdings, Inc. 6,600 319,806
873,862Health Care (2.5%):Hoya Corp. 6,600 437,245Shionogi & Co. Ltd. 7,500 465,696
902,941Industrials (5.2%):
Copyright © 2021 www.secdatabase.com. All Rights Reserved.Please Consider the Environment Before Printing This Document
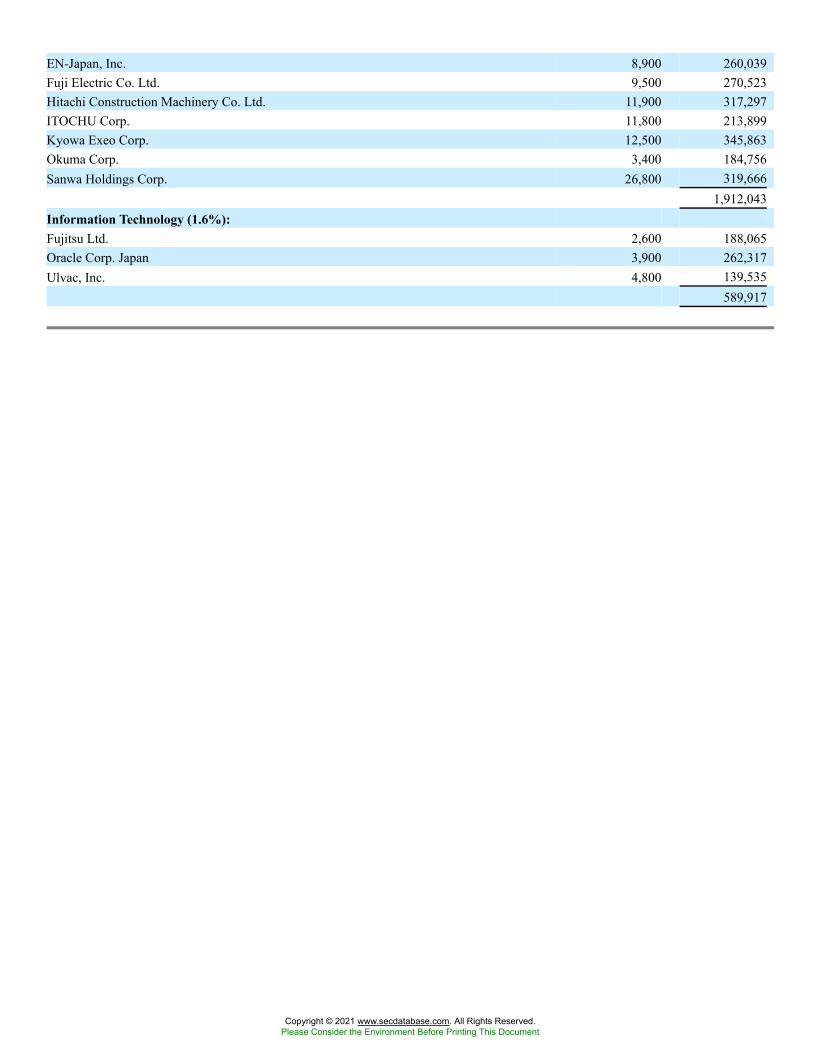
EN-Japan, Inc. 8,900 260,039Fuji Electric Co. Ltd. 9,500 270,523Hitachi Construction Machinery Co. Ltd. 11,900 317,297ITOCHU Corp. 11,800 213,899Kyowa Exeo Corp. 12,500 345,863Okuma Corp. 3,400 184,756Sanwa Holdings Corp. 26,800 319,666
1,912,043Information Technology (1.6%):Fujitsu Ltd. 2,600 188,065Oracle Corp. Japan 3,900 262,317Ulvac, Inc. 4,800 139,535
589,917
Copyright © 2021 www.secdatabase.com. All Rights Reserved.Please Consider the Environment Before Printing This Document

Security Description Shares Fair Value
Materials (0.3%):DIC Corp. 3,900 $ 114,289
Real Estate (0.5%):Sumitomo Realty & Development 4,700 195,040
Utilities (1.0%):Chubu Electric Power Co., Inc. 23,700 370,572
6,969,759Macau (0.7%):Consumer Discretionary (0.7%):Wynn Macau Ltd. 114,000 269,236
Netherlands (4.9%):Communication Services (1.7%):Koninklijke KPN NV 193,836 615,227
Financials (1.2%):ING Groep NV 38,030 460,761
Industrials (2.0%):Wolters Kluwer NV 10,704 729,161
1,805,149Norway (1.9%):Energy (0.9%):Aker BP ASA 9,118 325,279
Financials (1.0%):SpareBank 1 SMN 37,445 379,643
704,922Russian Federation (0.6%):Materials (0.6%):Evraz PLC 26,007 210,371
Spain (2.1%):Communication Services (1.3%):Telefonica SA 57,437 481,080
Financials (0.8%):Banco Santander SA 64,885 301,257
782,337Sweden (2.2%):Industrials (2.2%):Atlas Copco AB, Class B 23,054 571,912Epiroc AB, Class B 23,671 226,834
798,746
Copyright © 2021 www.secdatabase.com. All Rights Reserved.Please Consider the Environment Before Printing This Document
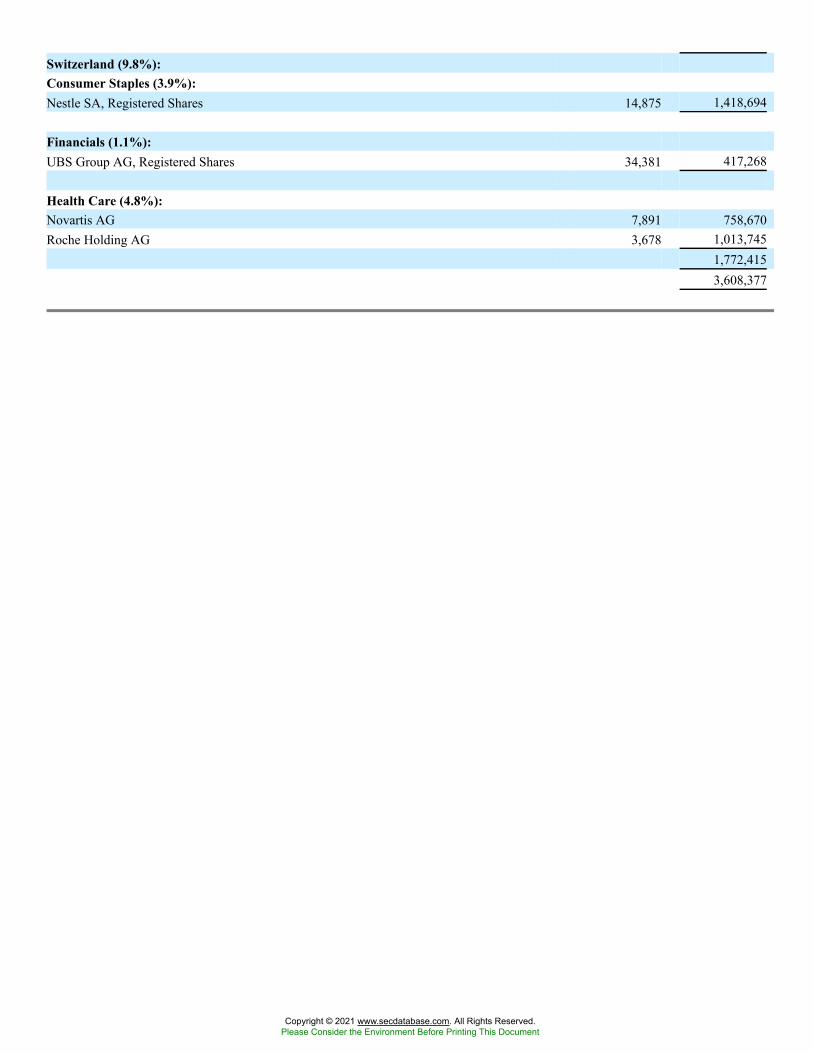
Switzerland (9.8%):Consumer Staples (3.9%):Nestle SA, Registered Shares 14,875 1,418,694
Financials (1.1%):UBS Group AG, Registered Shares 34,381 417,268
Health Care (4.8%):Novartis AG 7,891 758,670Roche Holding AG 3,678 1,013,745
1,772,4153,608,377
Copyright © 2021 www.secdatabase.com. All Rights Reserved.Please Consider the Environment Before Printing This Document
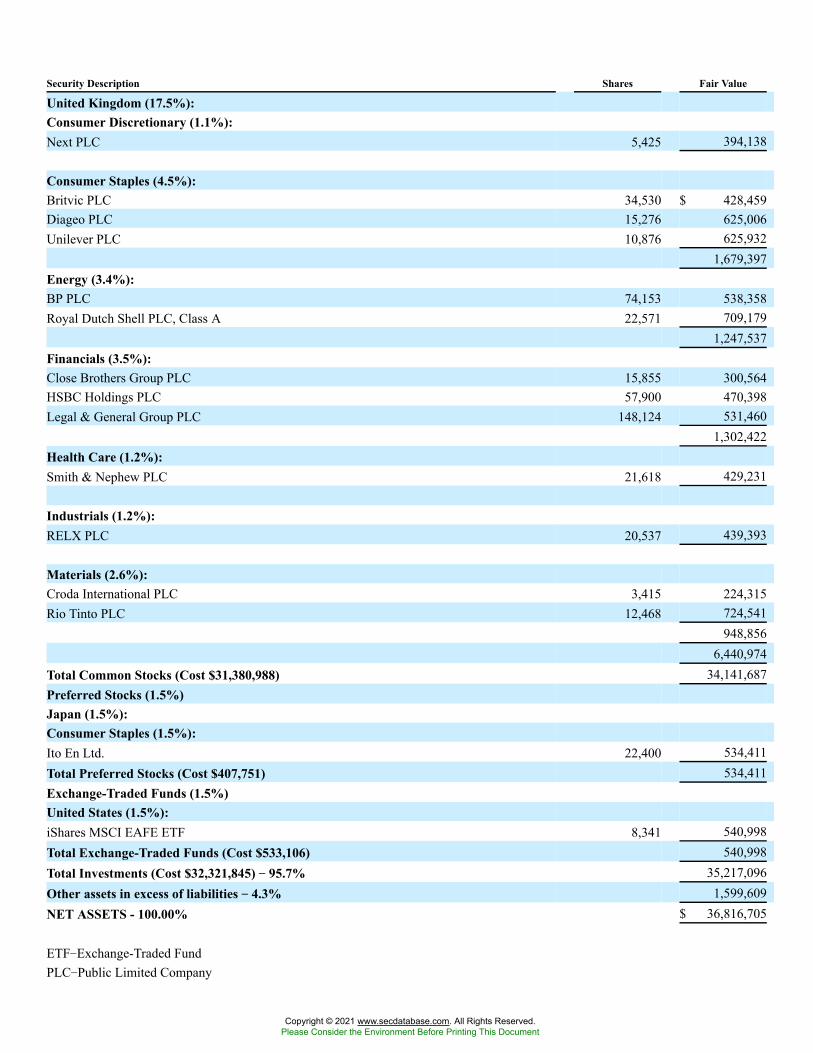
Security Description Shares Fair Value
United Kingdom (17.5%):Consumer Discretionary (1.1%):Next PLC 5,425 394,138
Consumer Staples (4.5%):Britvic PLC 34,530 $ 428,459Diageo PLC 15,276 625,006Unilever PLC 10,876 625,932
1,679,397Energy (3.4%):BP PLC 74,153 538,358Royal Dutch Shell PLC, Class A 22,571 709,179
1,247,537Financials (3.5%):Close Brothers Group PLC 15,855 300,564HSBC Holdings PLC 57,900 470,398Legal & General Group PLC 148,124 531,460
1,302,422Health Care (1.2%):Smith & Nephew PLC 21,618 429,231
Industrials (1.2%):RELX PLC 20,537 439,393
Materials (2.6%):Croda International PLC 3,415 224,315Rio Tinto PLC 12,468 724,541
948,8566,440,974
Total Common Stocks (Cost $31,380,988) 34,141,687Preferred Stocks (1.5%)Japan (1.5%):Consumer Staples (1.5%):Ito En Ltd. 22,400 534,411Total Preferred Stocks (Cost $407,751) 534,411Exchange-Traded Funds (1.5%)United States (1.5%):iShares MSCI EAFE ETF 8,341 540,998Total Exchange-Traded Funds (Cost $533,106) 540,998Total Investments (Cost $32,321,845) �� 95.7% 35,217,096Other assets in excess of liabilities �� 4.3% 1,599,609NET ASSETS - 100.00% $ 36,816,705
ETF�Exchange-Traded FundPLC�Public Limited Company
Copyright © 2021 www.secdatabase.com. All Rights Reserved.Please Consider the Environment Before Printing This Document

Copyright © 2021 www.secdatabase.com. All Rights Reserved.Please Consider the Environment Before Printing This Document
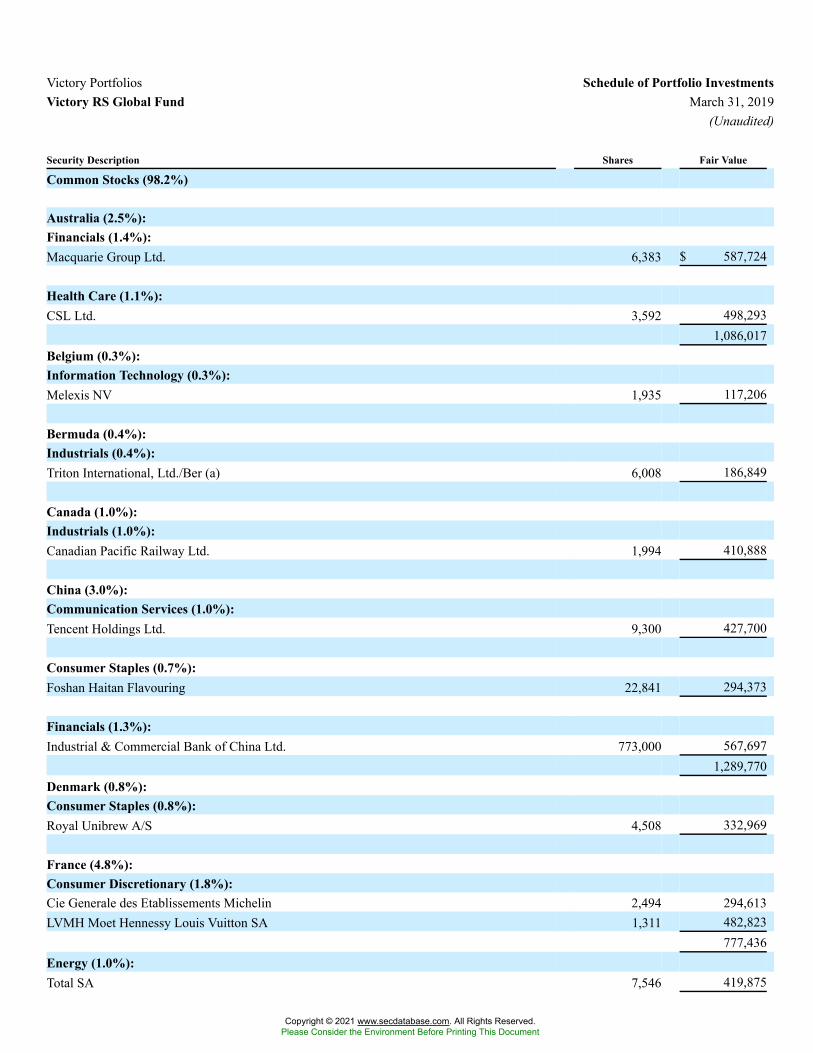
Victory Portfolios Schedule of Portfolio InvestmentsVictory RS Global Fund March 31, 2019
(Unaudited)
Security Description Shares Fair Value
Common Stocks (98.2%)
Australia (2.5%):Financials (1.4%):Macquarie Group Ltd. 6,383 $ 587,724
Health Care (1.1%):CSL Ltd. 3,592 498,293
1,086,017Belgium (0.3%):Information Technology (0.3%):Melexis NV 1,935 117,206
Bermuda (0.4%):Industrials (0.4%):Triton International, Ltd./Ber (a) 6,008 186,849
Canada (1.0%):Industrials (1.0%):Canadian Pacific Railway Ltd. 1,994 410,888
China (3.0%):Communication Services (1.0%):Tencent Holdings Ltd. 9,300 427,700
Consumer Staples (0.7%):Foshan Haitan Flavouring 22,841 294,373
Financials (1.3%):Industrial & Commercial Bank of China Ltd. 773,000 567,697
1,289,770Denmark (0.8%):Consumer Staples (0.8%):Royal Unibrew A/S 4,508 332,969
France (4.8%):Consumer Discretionary (1.8%):Cie Generale des Etablissements Michelin 2,494 294,613LVMH Moet Hennessy Louis Vuitton SA 1,311 482,823
777,436Energy (1.0%):Total SA 7,546 419,875
Copyright © 2021 www.secdatabase.com. All Rights Reserved.Please Consider the Environment Before Printing This Document
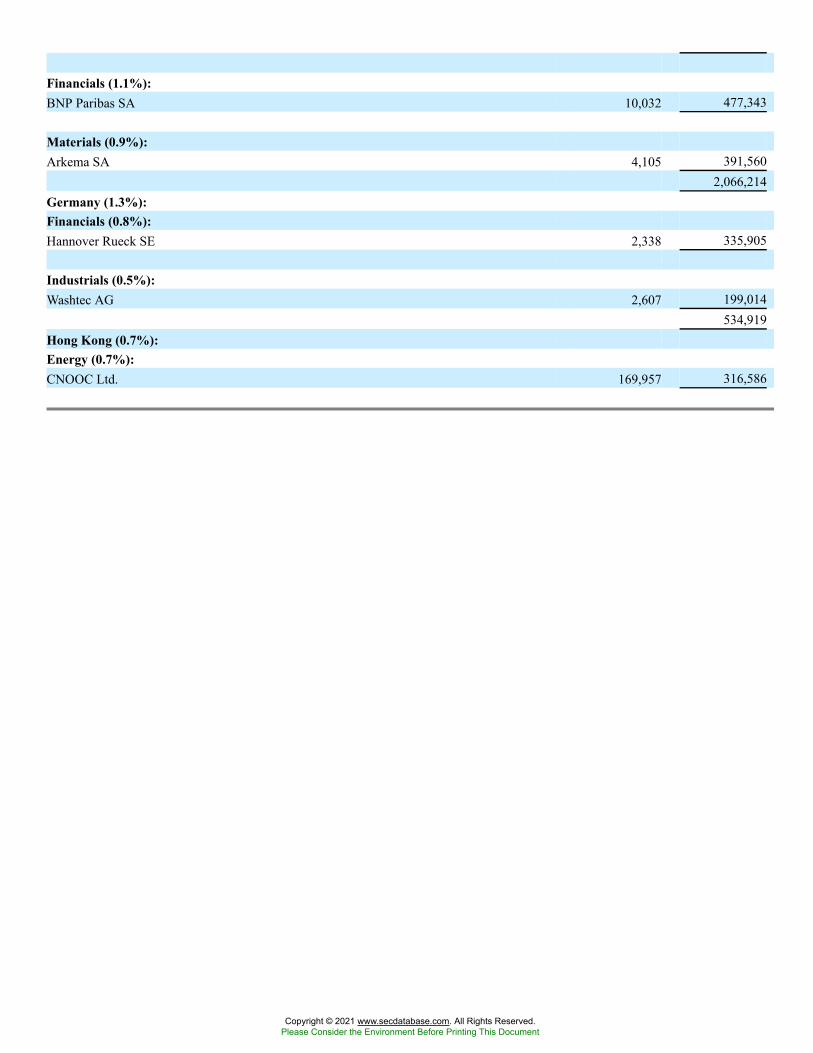
Financials (1.1%):BNP Paribas SA 10,032 477,343
Materials (0.9%):Arkema SA 4,105 391,560
2,066,214Germany (1.3%):Financials (0.8%):Hannover Rueck SE 2,338 335,905
Industrials (0.5%):Washtec AG 2,607 199,014
534,919Hong Kong (0.7%):Energy (0.7%):CNOOC Ltd. 169,957 316,586
Copyright © 2021 www.secdatabase.com. All Rights Reserved.Please Consider the Environment Before Printing This Document
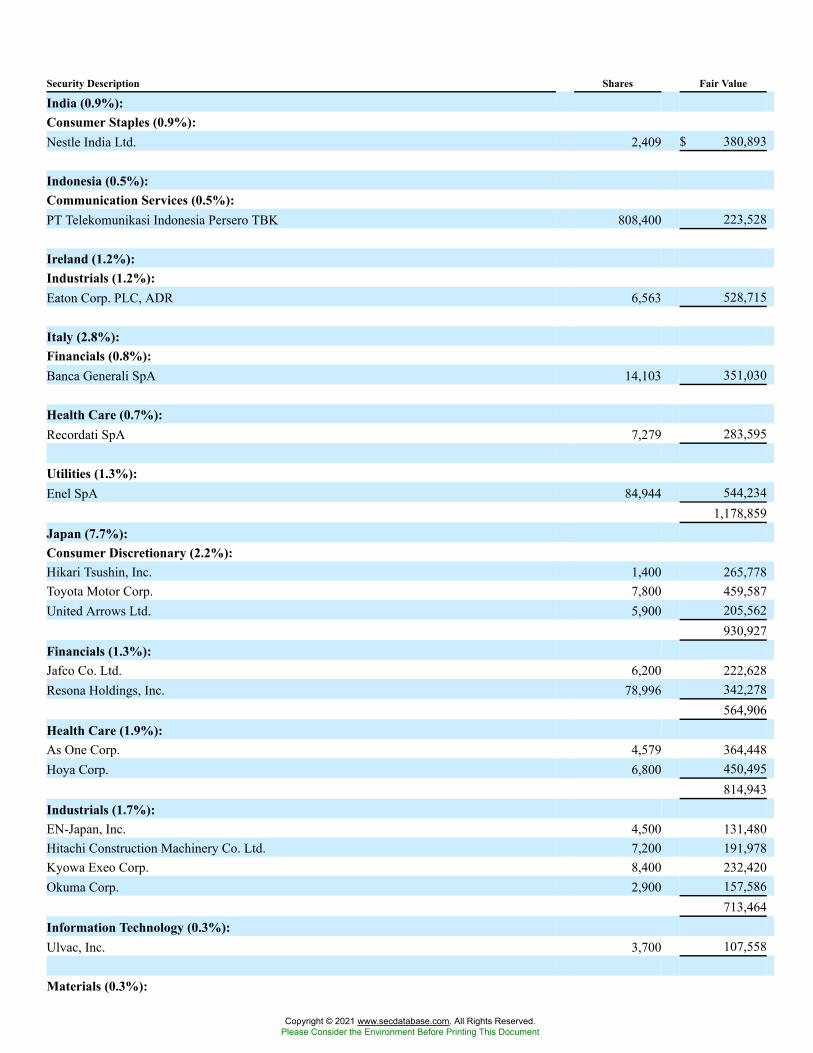
Security Description Shares Fair Value
India (0.9%):Consumer Staples (0.9%):Nestle India Ltd. 2,409 $ 380,893
Indonesia (0.5%):Communication Services (0.5%):PT Telekomunikasi Indonesia Persero TBK 808,400 223,528
Ireland (1.2%):Industrials (1.2%):Eaton Corp. PLC, ADR 6,563 528,715
Italy (2.8%):Financials (0.8%):Banca Generali SpA 14,103 351,030
Health Care (0.7%):Recordati SpA 7,279 283,595
Utilities (1.3%):Enel SpA 84,944 544,234
1,178,859Japan (7.7%):Consumer Discretionary (2.2%):Hikari Tsushin, Inc. 1,400 265,778Toyota Motor Corp. 7,800 459,587United Arrows Ltd. 5,900 205,562
930,927Financials (1.3%):Jafco Co. Ltd. 6,200 222,628Resona Holdings, Inc. 78,996 342,278
564,906Health Care (1.9%):As One Corp. 4,579 364,448Hoya Corp. 6,800 450,495
814,943Industrials (1.7%):EN-Japan, Inc. 4,500 131,480Hitachi Construction Machinery Co. Ltd. 7,200 191,978Kyowa Exeo Corp. 8,400 232,420Okuma Corp. 2,900 157,586
713,464Information Technology (0.3%):Ulvac, Inc. 3,700 107,558
Materials (0.3%):
Copyright © 2021 www.secdatabase.com. All Rights Reserved.Please Consider the Environment Before Printing This Document
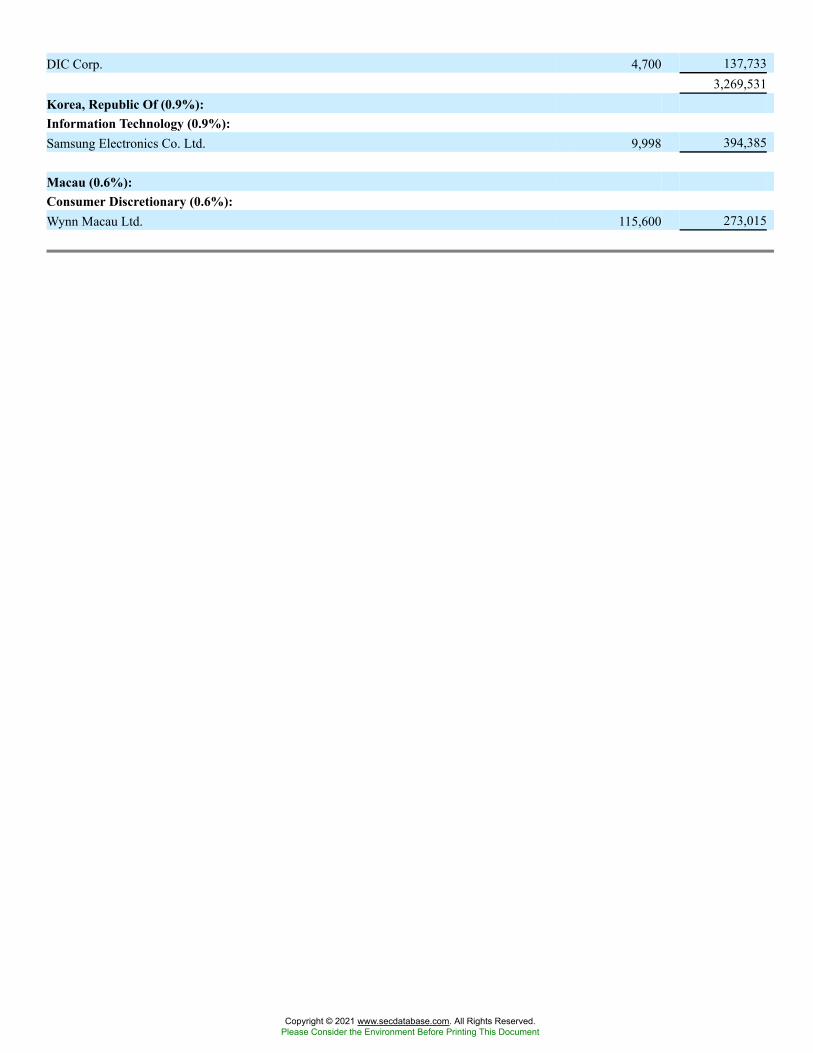
DIC Corp. 4,700 137,7333,269,531
Korea, Republic Of (0.9%):Information Technology (0.9%):Samsung Electronics Co. Ltd. 9,998 394,385
Macau (0.6%):Consumer Discretionary (0.6%):Wynn Macau Ltd. 115,600 273,015
Copyright © 2021 www.secdatabase.com. All Rights Reserved.Please Consider the Environment Before Printing This Document
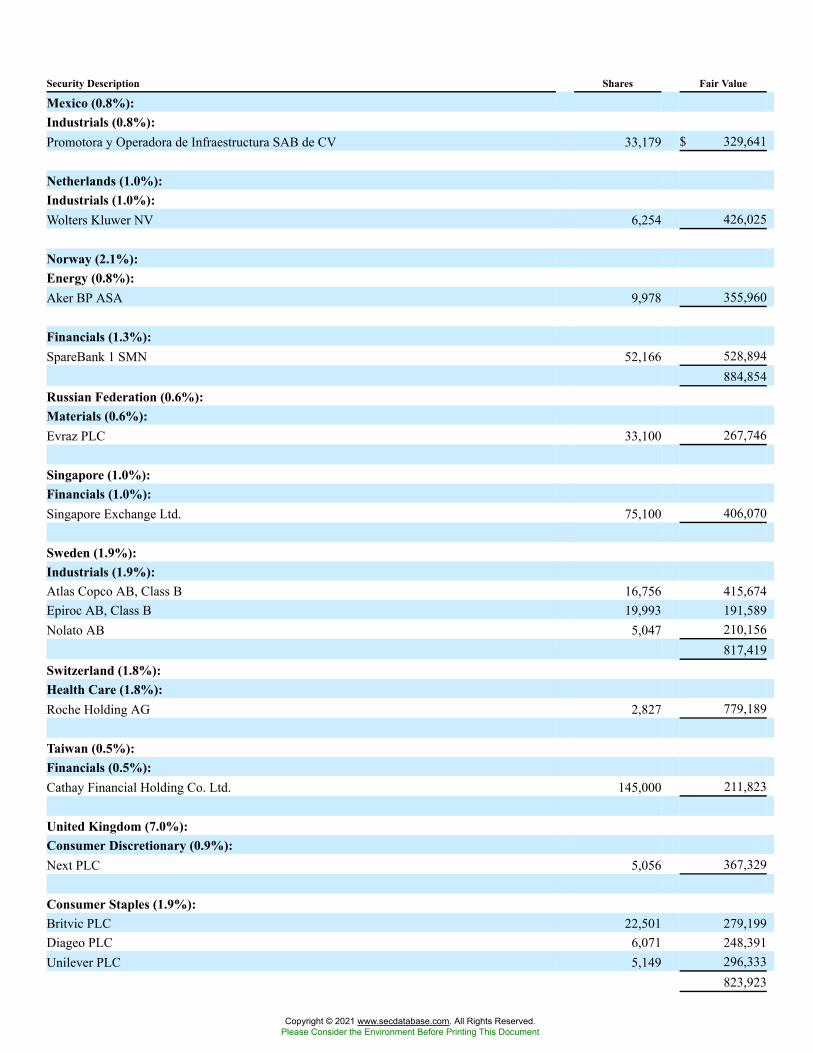
Security Description Shares Fair Value
Mexico (0.8%):Industrials (0.8%):Promotora y Operadora de Infraestructura SAB de CV 33,179 $ 329,641
Netherlands (1.0%):Industrials (1.0%):Wolters Kluwer NV 6,254 426,025
Norway (2.1%):Energy (0.8%):Aker BP ASA 9,978 355,960
Financials (1.3%):SpareBank 1 SMN 52,166 528,894
884,854Russian Federation (0.6%):Materials (0.6%):Evraz PLC 33,100 267,746
Singapore (1.0%):Financials (1.0%):Singapore Exchange Ltd. 75,100 406,070
Sweden (1.9%):Industrials (1.9%):Atlas Copco AB, Class B 16,756 415,674Epiroc AB, Class B 19,993 191,589Nolato AB 5,047 210,156
817,419Switzerland (1.8%):Health Care (1.8%):Roche Holding AG 2,827 779,189
Taiwan (0.5%):Financials (0.5%):Cathay Financial Holding Co. Ltd. 145,000 211,823
United Kingdom (7.0%):Consumer Discretionary (0.9%):Next PLC 5,056 367,329
Consumer Staples (1.9%):Britvic PLC 22,501 279,199Diageo PLC 6,071 248,391Unilever PLC 5,149 296,333
823,923
Copyright © 2021 www.secdatabase.com. All Rights Reserved.Please Consider the Environment Before Printing This Document
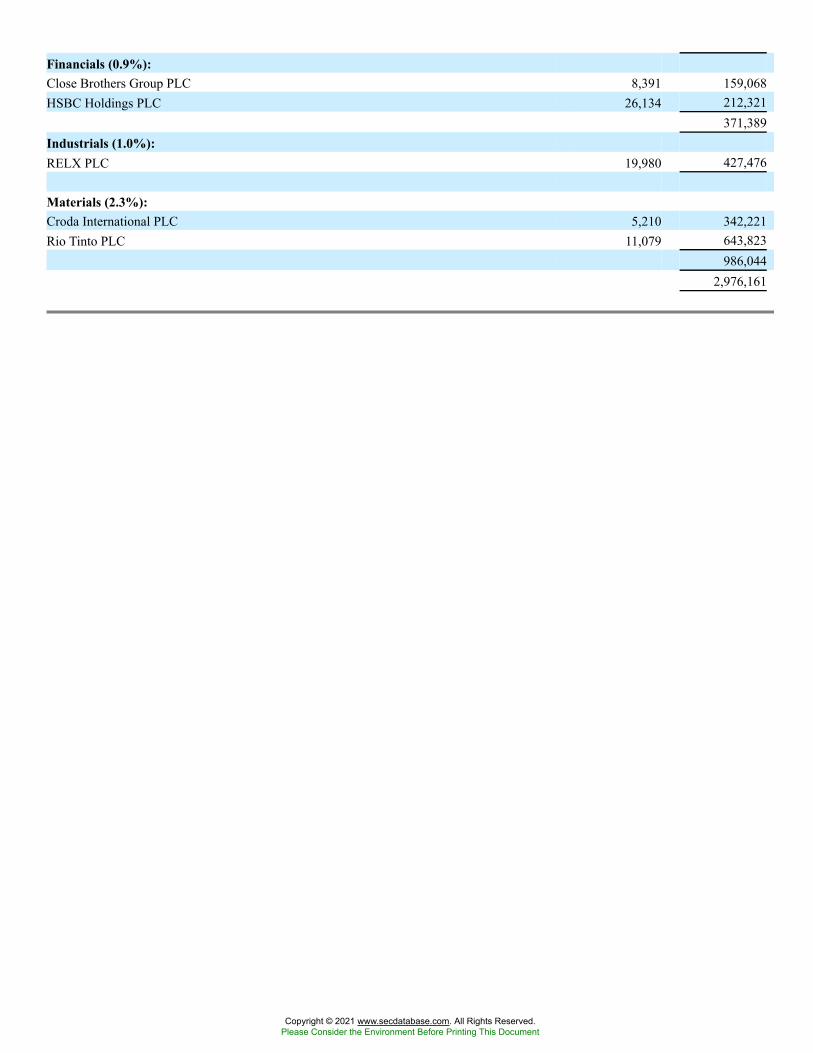
Financials (0.9%):Close Brothers Group PLC 8,391 159,068HSBC Holdings PLC 26,134 212,321
371,389Industrials (1.0%):RELX PLC 19,980 427,476
Materials (2.3%):Croda International PLC 5,210 342,221Rio Tinto PLC 11,079 643,823
986,0442,976,161
Copyright © 2021 www.secdatabase.com. All Rights Reserved.Please Consider the Environment Before Printing This Document
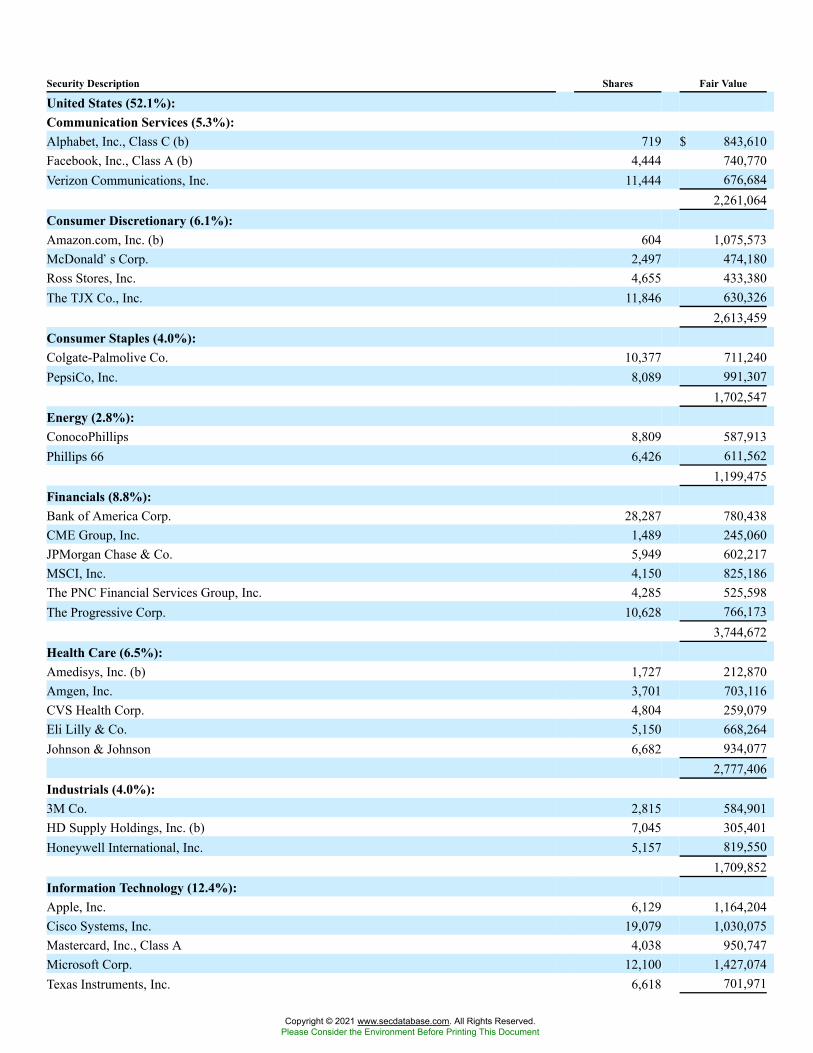
Security Description Shares Fair Value
United States (52.1%):Communication Services (5.3%):Alphabet, Inc., Class C (b) 719 $ 843,610Facebook, Inc., Class A (b) 4,444 740,770Verizon Communications, Inc. 11,444 676,684
2,261,064Consumer Discretionary (6.1%):Amazon.com, Inc. (b) 604 1,075,573McDonald�s Corp. 2,497 474,180Ross Stores, Inc. 4,655 433,380The TJX Co., Inc. 11,846 630,326
2,613,459Consumer Staples (4.0%):Colgate-Palmolive Co. 10,377 711,240PepsiCo, Inc. 8,089 991,307
1,702,547Energy (2.8%):ConocoPhillips 8,809 587,913Phillips 66 6,426 611,562
1,199,475Financials (8.8%):Bank of America Corp. 28,287 780,438CME Group, Inc. 1,489 245,060JPMorgan Chase & Co. 5,949 602,217MSCI, Inc. 4,150 825,186The PNC Financial Services Group, Inc. 4,285 525,598The Progressive Corp. 10,628 766,173
3,744,672Health Care (6.5%):Amedisys, Inc. (b) 1,727 212,870Amgen, Inc. 3,701 703,116CVS Health Corp. 4,804 259,079Eli Lilly & Co. 5,150 668,264Johnson & Johnson 6,682 934,077
2,777,406Industrials (4.0%):3M Co. 2,815 584,901HD Supply Holdings, Inc. (b) 7,045 305,401Honeywell International, Inc. 5,157 819,550
1,709,852Information Technology (12.4%):Apple, Inc. 6,129 1,164,204Cisco Systems, Inc. 19,079 1,030,075Mastercard, Inc., Class A 4,038 950,747Microsoft Corp. 12,100 1,427,074Texas Instruments, Inc. 6,618 701,971
Copyright © 2021 www.secdatabase.com. All Rights Reserved.Please Consider the Environment Before Printing This Document
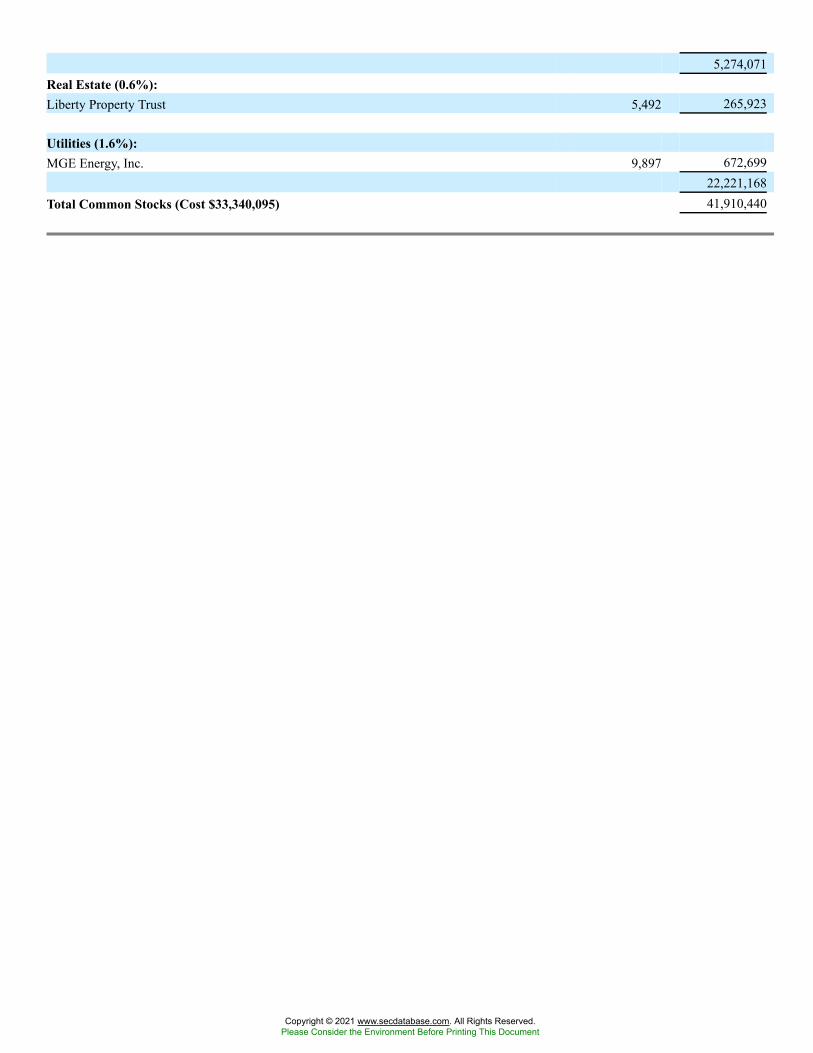
5,274,071Real Estate (0.6%):Liberty Property Trust 5,492 265,923
Utilities (1.6%):MGE Energy, Inc. 9,897 672,699
22,221,168Total Common Stocks (Cost $33,340,095) 41,910,440
Copyright © 2021 www.secdatabase.com. All Rights Reserved.Please Consider the Environment Before Printing This Document
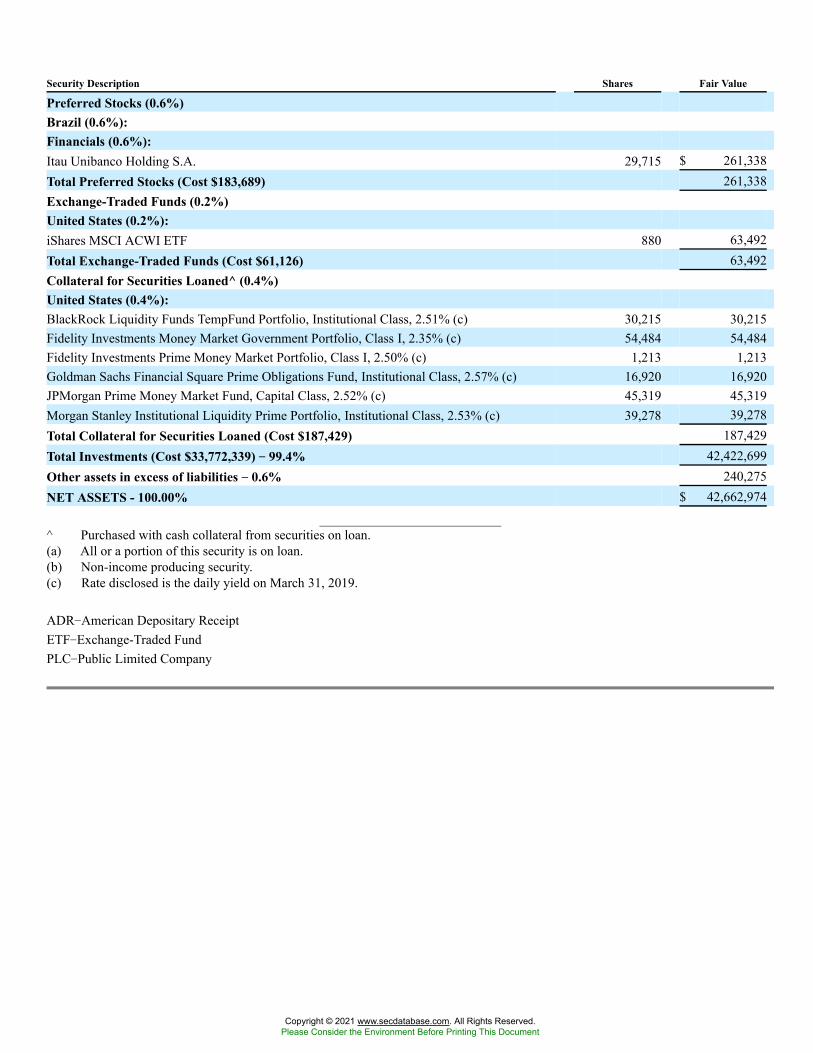
Security Description Shares Fair Value
Preferred Stocks (0.6%)Brazil (0.6%):Financials (0.6%):Itau Unibanco Holding S.A. 29,715 $ 261,338Total Preferred Stocks (Cost $183,689) 261,338Exchange-Traded Funds (0.2%)United States (0.2%):iShares MSCI ACWI ETF 880 63,492Total Exchange-Traded Funds (Cost $61,126) 63,492Collateral for Securities Loaned^ (0.4%)United States (0.4%):BlackRock Liquidity Funds TempFund Portfolio, Institutional Class, 2.51% (c) 30,215 30,215Fidelity Investments Money Market Government Portfolio, Class I, 2.35% (c) 54,484 54,484Fidelity Investments Prime Money Market Portfolio, Class I, 2.50% (c) 1,213 1,213Goldman Sachs Financial Square Prime Obligations Fund, Institutional Class, 2.57% (c) 16,920 16,920JPMorgan Prime Money Market Fund, Capital Class, 2.52% (c) 45,319 45,319Morgan Stanley Institutional Liquidity Prime Portfolio, Institutional Class, 2.53% (c) 39,278 39,278Total Collateral for Securities Loaned (Cost $187,429) 187,429Total Investments (Cost $33,772,339) �� 99.4% 42,422,699Other assets in excess of liabilities �� 0.6% 240,275NET ASSETS - 100.00% $ 42,662,974
^ Purchased with cash collateral from securities on loan.(a) All or a portion of this security is on loan.(b) Non-income producing security.(c) Rate disclosed is the daily yield on March 31, 2019.
ADR�American Depositary ReceiptETF�Exchange-Traded FundPLC�Public Limited Company
Copyright © 2021 www.secdatabase.com. All Rights Reserved.Please Consider the Environment Before Printing This Document

Victory Portfolios Schedule of Portfolio InvestmentsVictory Sophus Emerging Markets Fund March 31, 2019
(Unaudited)
Security Description Shares Fair Value
Common Stocks (96.2%)
Australia (0.7%):Materials (0.7%):BHP Billiton Ltd., ADR (a) 45,184 $ 2,470,209
Brazil (7.3%):Consumer Discretionary (1.4%):BK Brasil Operacao e Assessoria a Restaurantes SA 366,800 2,071,612Lojas Renner SA 254,800 2,850,782
4,922,394Consumer Staples (0.6%):Atacadao Distribuicao Comercio E Industria Ltd. 423,700 2,174,347
Energy (1.8%):Cosan Ltd. 151,022 1,750,345Petroleo Brasileiro SA, ADR 295,646 4,706,684
6,457,029Financials (0.8%):Banco Bradesco SA, ADR 272,961 2,978,005
Health Care (0.7%):Odontoprev SA 550,900 2,307,847
Industrials (0.5%):Companhia de Locacao das Americas 181,500 1,807,675
Materials (0.4%):Vale SA, ADR 120,883 1,578,732
Real Estate (0.6%):Multiplan Empreendimentos Imobiliarios SA 386,200 2,307,453
Utilities (0.5%):Cia de Saneamento Basico do Estado de Sao Paulo 165,000 1,770,205
26,303,687Chile (0.6%):Real Estate (0.6%):Parque Arauco SA 849,272 2,272,475
China (28.5%):Communication Services (7.8%):
Copyright © 2021 www.secdatabase.com. All Rights Reserved.Please Consider the Environment Before Printing This Document

Momo, Inc., ADR (b) 61,866 2,365,756NetEase, Inc., ADR 10,001 2,414,742Tencent Holdings Ltd. 452,215 20,797,034YY, Inc., ADR (a)(b) 27,298 2,293,305
27,870,837Consumer Discretionary (5.9%):Alibaba Group Holding Ltd., ADR (b) 98,624 17,993,949Baozun, Inc., ADR (a)(b) 48,952 2,033,466Xtep International Holdings Ltd. 1,695,500 1,212,945
21,240,360Consumer Staples (2.1%):Ausnutria Dairy Corp. Ltd. 1,318,000 1,759,934Want Want China Holdings Ltd. 3,279,000 2,727,803Wuliangye Yibin Co., Ltd. 215,050 3,035,976
7,523,713Energy (0.6%):PetroChina Co. Ltd. 3,328,000 2,178,623
Financials (6.3%):China Construction Bank Corp. 10,457,857 8,976,983China Merchants Bank Co. Ltd., Class H 1,185,000 5,773,192
Copyright © 2021 www.secdatabase.com. All Rights Reserved.Please Consider the Environment Before Printing This Document
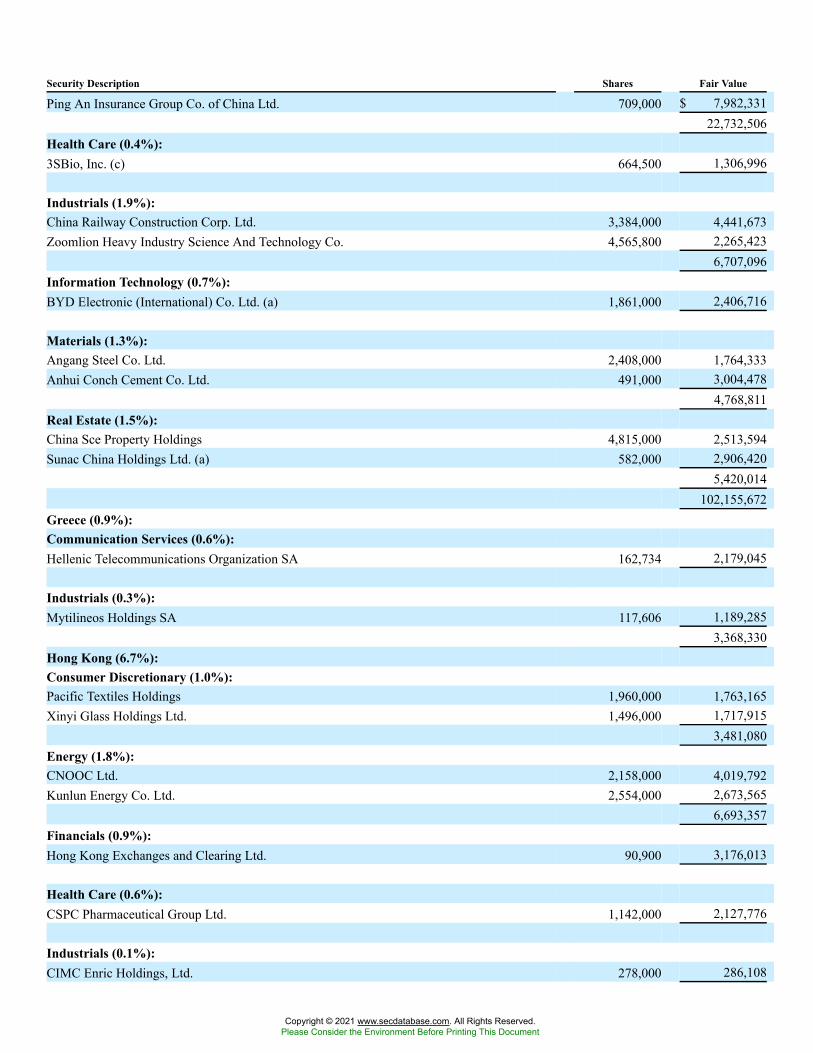
Security Description Shares Fair Value
Ping An Insurance Group Co. of China Ltd. 709,000 $ 7,982,33122,732,506
Health Care (0.4%):3SBio, Inc. (c) 664,500 1,306,996
Industrials (1.9%):China Railway Construction Corp. Ltd. 3,384,000 4,441,673Zoomlion Heavy Industry Science And Technology Co. 4,565,800 2,265,423
6,707,096Information Technology (0.7%):BYD Electronic (International) Co. Ltd. (a) 1,861,000 2,406,716
Materials (1.3%):Angang Steel Co. Ltd. 2,408,000 1,764,333Anhui Conch Cement Co. Ltd. 491,000 3,004,478
4,768,811Real Estate (1.5%):China Sce Property Holdings 4,815,000 2,513,594Sunac China Holdings Ltd. (a) 582,000 2,906,420
5,420,014102,155,672
Greece (0.9%):Communication Services (0.6%):Hellenic Telecommunications Organization SA 162,734 2,179,045
Industrials (0.3%):Mytilineos Holdings SA 117,606 1,189,285
3,368,330Hong Kong (6.7%):Consumer Discretionary (1.0%):Pacific Textiles Holdings 1,960,000 1,763,165Xinyi Glass Holdings Ltd. 1,496,000 1,717,915
3,481,080Energy (1.8%):CNOOC Ltd. 2,158,000 4,019,792Kunlun Energy Co. Ltd. 2,554,000 2,673,565
6,693,357Financials (0.9%):Hong Kong Exchanges and Clearing Ltd. 90,900 3,176,013
Health Care (0.6%):CSPC Pharmaceutical Group Ltd. 1,142,000 2,127,776
Industrials (0.1%):CIMC Enric Holdings, Ltd. 278,000 286,108
Copyright © 2021 www.secdatabase.com. All Rights Reserved.Please Consider the Environment Before Printing This Document
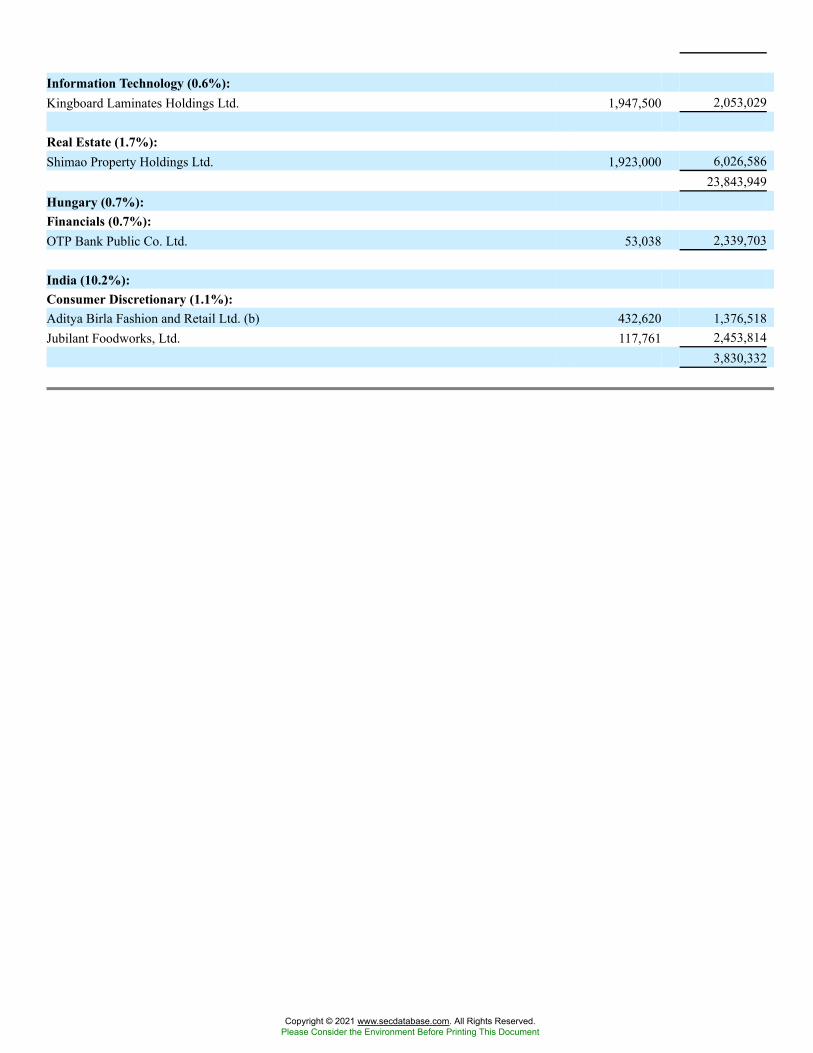
Information Technology (0.6%):Kingboard Laminates Holdings Ltd. 1,947,500 2,053,029
Real Estate (1.7%):Shimao Property Holdings Ltd. 1,923,000 6,026,586
23,843,949Hungary (0.7%):Financials (0.7%):OTP Bank Public Co. Ltd. 53,038 2,339,703
India (10.2%):Consumer Discretionary (1.1%):Aditya Birla Fashion and Retail Ltd. (b) 432,620 1,376,518Jubilant Foodworks, Ltd. 117,761 2,453,814
3,830,332
Copyright © 2021 www.secdatabase.com. All Rights Reserved.Please Consider the Environment Before Printing This Document
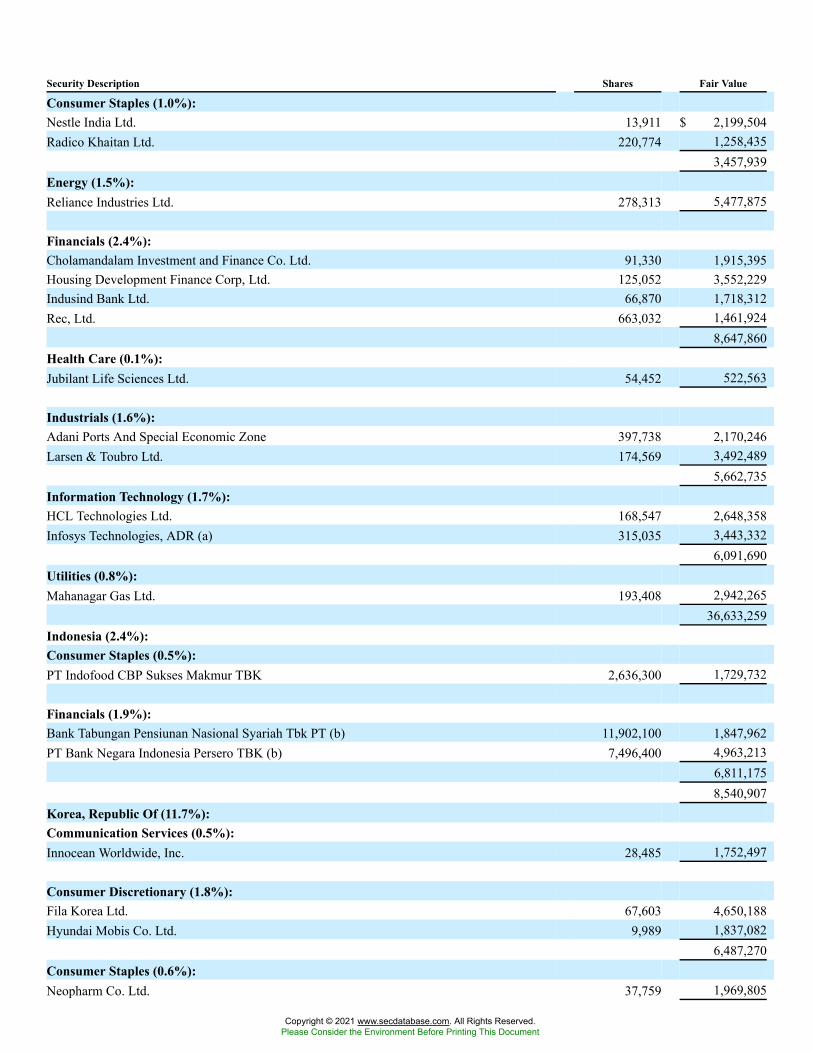
Security Description Shares Fair Value
Consumer Staples (1.0%):Nestle India Ltd. 13,911 $ 2,199,504Radico Khaitan Ltd. 220,774 1,258,435
3,457,939Energy (1.5%):Reliance Industries Ltd. 278,313 5,477,875
Financials (2.4%):Cholamandalam Investment and Finance Co. Ltd. 91,330 1,915,395Housing Development Finance Corp, Ltd. 125,052 3,552,229Indusind Bank Ltd. 66,870 1,718,312Rec, Ltd. 663,032 1,461,924
8,647,860Health Care (0.1%):Jubilant Life Sciences Ltd. 54,452 522,563
Industrials (1.6%):Adani Ports And Special Economic Zone 397,738 2,170,246Larsen & Toubro Ltd. 174,569 3,492,489
5,662,735Information Technology (1.7%):HCL Technologies Ltd. 168,547 2,648,358Infosys Technologies, ADR (a) 315,035 3,443,332
6,091,690Utilities (0.8%):Mahanagar Gas Ltd. 193,408 2,942,265
36,633,259Indonesia (2.4%):Consumer Staples (0.5%):PT Indofood CBP Sukses Makmur TBK 2,636,300 1,729,732
Financials (1.9%):Bank Tabungan Pensiunan Nasional Syariah Tbk PT (b) 11,902,100 1,847,962PT Bank Negara Indonesia Persero TBK (b) 7,496,400 4,963,213
6,811,1758,540,907
Korea, Republic Of (11.7%):Communication Services (0.5%):Innocean Worldwide, Inc. 28,485 1,752,497
Consumer Discretionary (1.8%):Fila Korea Ltd. 67,603 4,650,188Hyundai Mobis Co. Ltd. 9,989 1,837,082
6,487,270Consumer Staples (0.6%):Neopharm Co. Ltd. 37,759 1,969,805
Copyright © 2021 www.secdatabase.com. All Rights Reserved.Please Consider the Environment Before Printing This Document
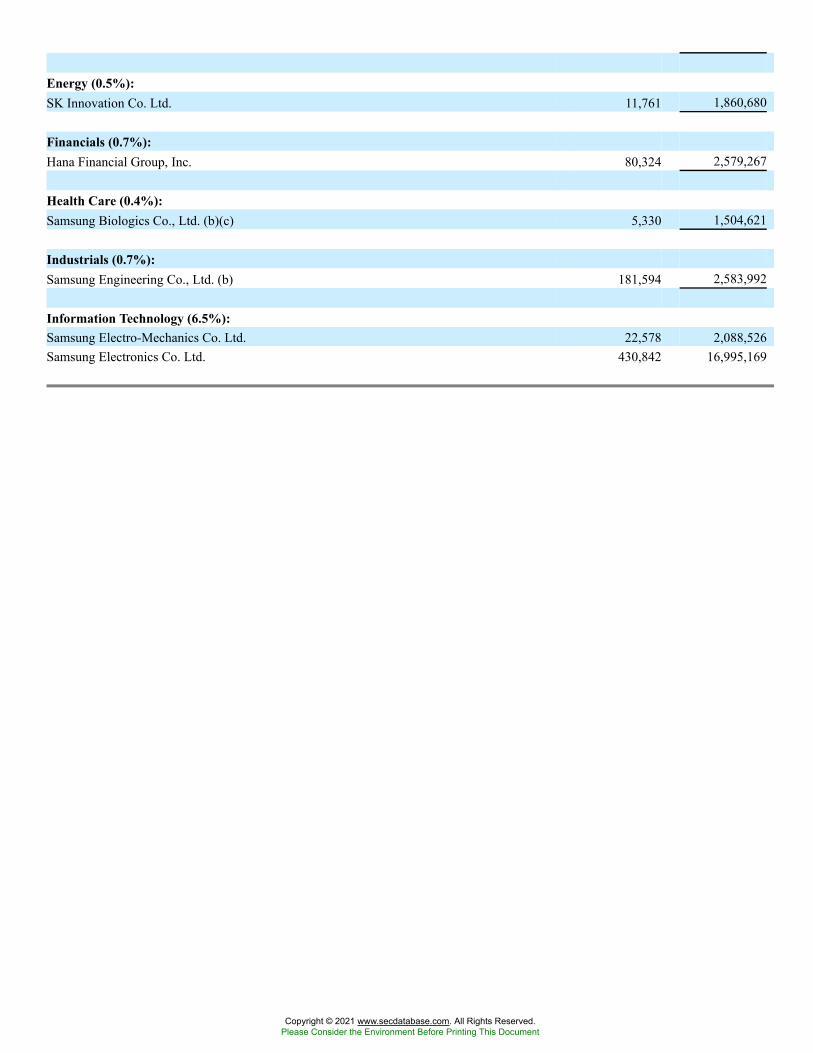
Energy (0.5%):SK Innovation Co. Ltd. 11,761 1,860,680
Financials (0.7%):Hana Financial Group, Inc. 80,324 2,579,267
Health Care (0.4%):Samsung Biologics Co., Ltd. (b)(c) 5,330 1,504,621
Industrials (0.7%):Samsung Engineering Co., Ltd. (b) 181,594 2,583,992
Information Technology (6.5%):Samsung Electro-Mechanics Co. Ltd. 22,578 2,088,526Samsung Electronics Co. Ltd. 430,842 16,995,169
Copyright © 2021 www.secdatabase.com. All Rights Reserved.Please Consider the Environment Before Printing This Document
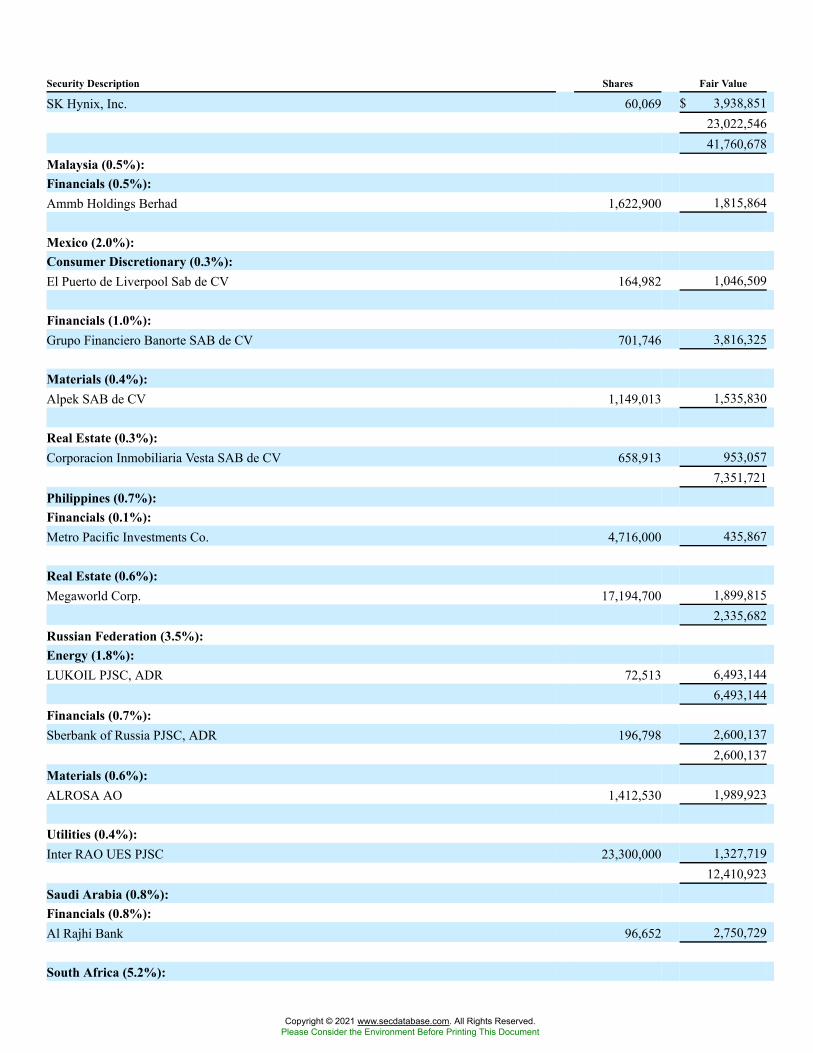
Security Description Shares Fair Value
SK Hynix, Inc. 60,069 $ 3,938,85123,022,54641,760,678
Malaysia (0.5%):Financials (0.5%):Ammb Holdings Berhad 1,622,900 1,815,864
Mexico (2.0%):Consumer Discretionary (0.3%):El Puerto de Liverpool Sab de CV 164,982 1,046,509
Financials (1.0%):Grupo Financiero Banorte SAB de CV 701,746 3,816,325
Materials (0.4%):Alpek SAB de CV 1,149,013 1,535,830
Real Estate (0.3%):Corporacion Inmobiliaria Vesta SAB de CV 658,913 953,057
7,351,721Philippines (0.7%):Financials (0.1%):Metro Pacific Investments Co. 4,716,000 435,867
Real Estate (0.6%):Megaworld Corp. 17,194,700 1,899,815
2,335,682Russian Federation (3.5%):Energy (1.8%):LUKOIL PJSC, ADR 72,513 6,493,144
6,493,144Financials (0.7%):Sberbank of Russia PJSC, ADR 196,798 2,600,137
2,600,137Materials (0.6%):ALROSA AO 1,412,530 1,989,923
Utilities (0.4%):Inter RAO UES PJSC 23,300,000 1,327,719
12,410,923Saudi Arabia (0.8%):Financials (0.8%):Al Rajhi Bank 96,652 2,750,729
South Africa (5.2%):
Copyright © 2021 www.secdatabase.com. All Rights Reserved.Please Consider the Environment Before Printing This Document
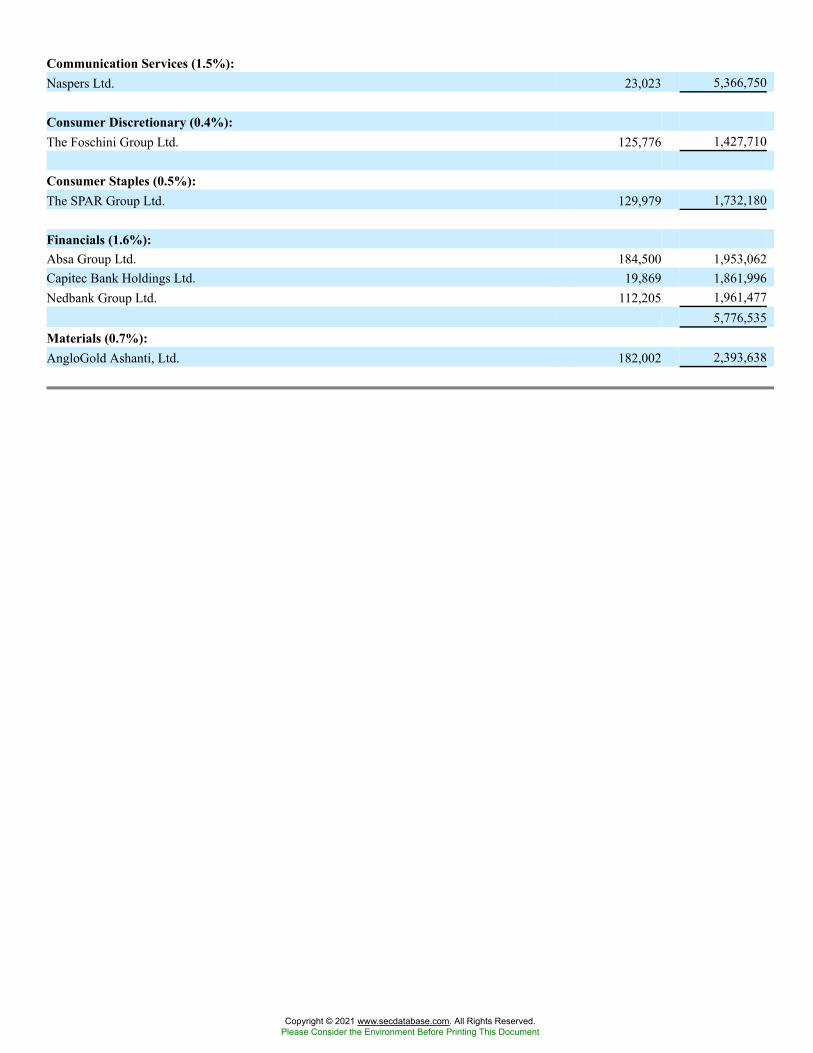
Communication Services (1.5%):Naspers Ltd. 23,023 5,366,750
Consumer Discretionary (0.4%):The Foschini Group Ltd. 125,776 1,427,710
Consumer Staples (0.5%):The SPAR Group Ltd. 129,979 1,732,180
Financials (1.6%):Absa Group Ltd. 184,500 1,953,062Capitec Bank Holdings Ltd. 19,869 1,861,996Nedbank Group Ltd. 112,205 1,961,477
5,776,535Materials (0.7%):AngloGold Ashanti, Ltd. 182,002 2,393,638
Copyright © 2021 www.secdatabase.com. All Rights Reserved.Please Consider the Environment Before Printing This Document
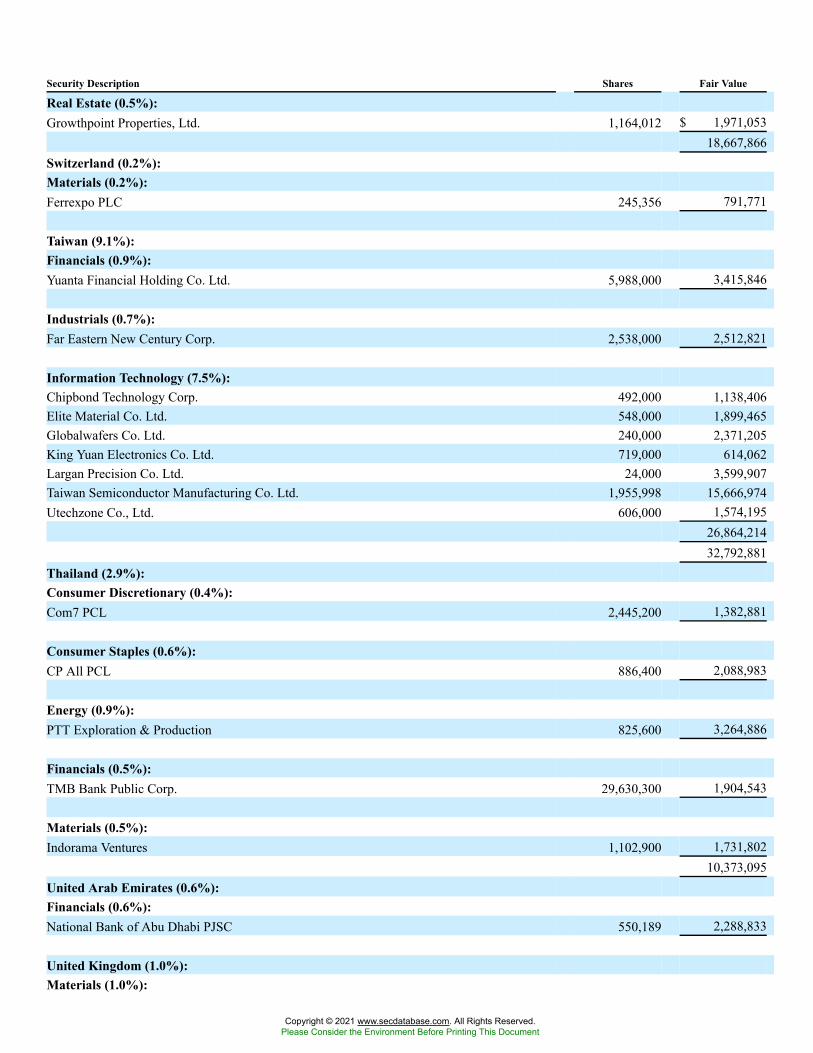
Security Description Shares Fair Value
Real Estate (0.5%):Growthpoint Properties, Ltd. 1,164,012 $ 1,971,053
18,667,866Switzerland (0.2%):Materials (0.2%):Ferrexpo PLC 245,356 791,771
Taiwan (9.1%):Financials (0.9%):Yuanta Financial Holding Co. Ltd. 5,988,000 3,415,846
Industrials (0.7%):Far Eastern New Century Corp. 2,538,000 2,512,821
Information Technology (7.5%):Chipbond Technology Corp. 492,000 1,138,406Elite Material Co. Ltd. 548,000 1,899,465Globalwafers Co. Ltd. 240,000 2,371,205King Yuan Electronics Co. Ltd. 719,000 614,062Largan Precision Co. Ltd. 24,000 3,599,907Taiwan Semiconductor Manufacturing Co. Ltd. 1,955,998 15,666,974Utechzone Co., Ltd. 606,000 1,574,195
26,864,21432,792,881
Thailand (2.9%):Consumer Discretionary (0.4%):Com7 PCL 2,445,200 1,382,881
Consumer Staples (0.6%):CP All PCL 886,400 2,088,983
Energy (0.9%):PTT Exploration & Production 825,600 3,264,886
Financials (0.5%):TMB Bank Public Corp. 29,630,300 1,904,543
Materials (0.5%):Indorama Ventures 1,102,900 1,731,802
10,373,095United Arab Emirates (0.6%):Financials (0.6%):National Bank of Abu Dhabi PJSC 550,189 2,288,833
United Kingdom (1.0%):Materials (1.0%):
Copyright © 2021 www.secdatabase.com. All Rights Reserved.Please Consider the Environment Before Printing This Document
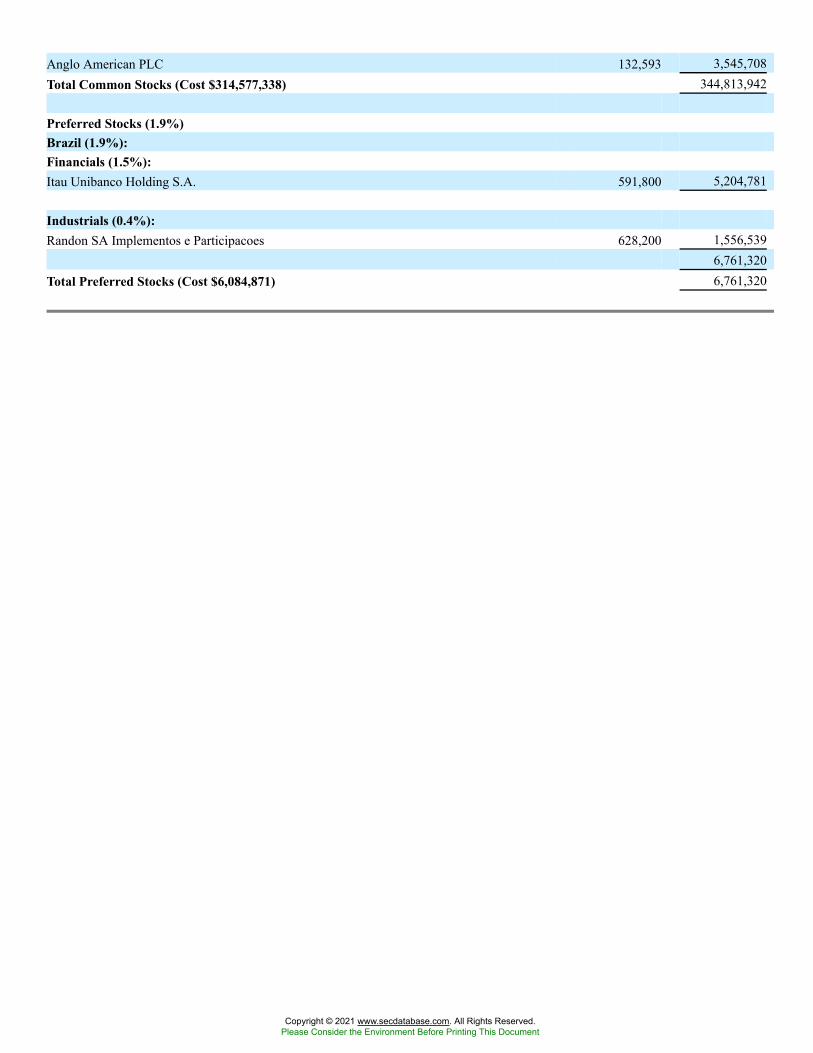
Anglo American PLC 132,593 3,545,708Total Common Stocks (Cost $314,577,338) 344,813,942
Preferred Stocks (1.9%)Brazil (1.9%):Financials (1.5%):Itau Unibanco Holding S.A. 591,800 5,204,781
Industrials (0.4%):Randon SA Implementos e Participacoes 628,200 1,556,539
6,761,320Total Preferred Stocks (Cost $6,084,871) 6,761,320
Copyright © 2021 www.secdatabase.com. All Rights Reserved.Please Consider the Environment Before Printing This Document
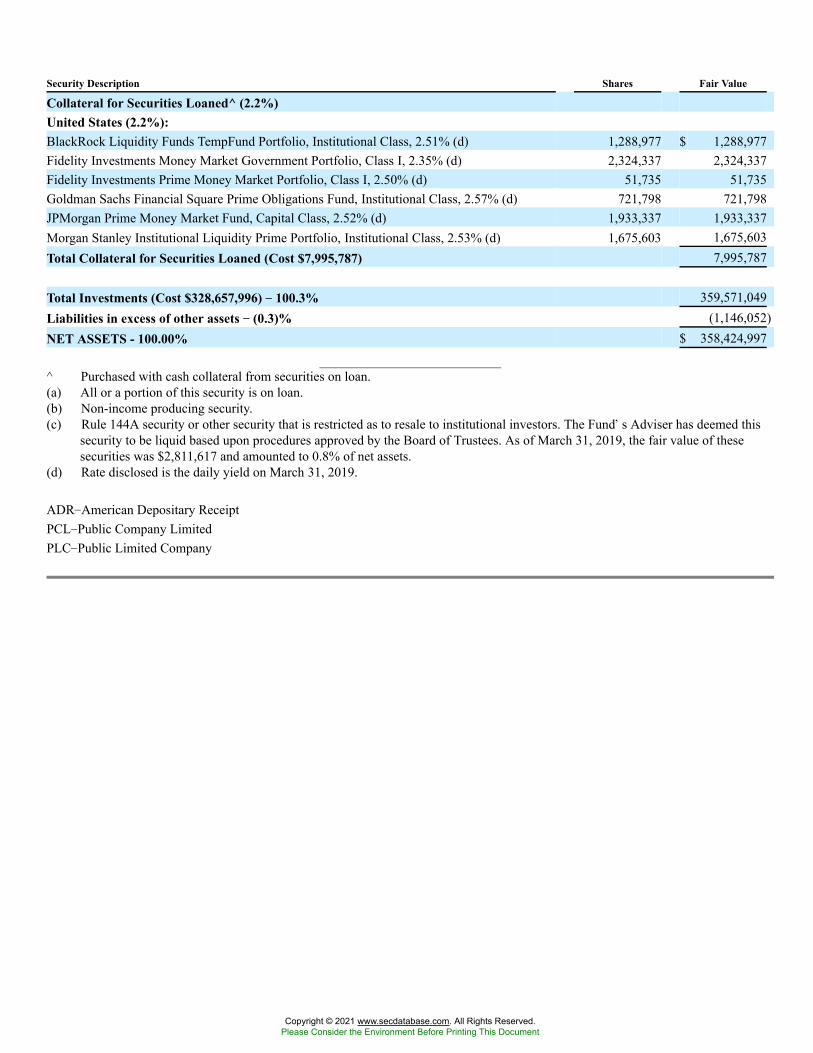
Security Description Shares Fair Value
Collateral for Securities Loaned^ (2.2%)United States (2.2%):BlackRock Liquidity Funds TempFund Portfolio, Institutional Class, 2.51% (d) 1,288,977 $ 1,288,977Fidelity Investments Money Market Government Portfolio, Class I, 2.35% (d) 2,324,337 2,324,337Fidelity Investments Prime Money Market Portfolio, Class I, 2.50% (d) 51,735 51,735Goldman Sachs Financial Square Prime Obligations Fund, Institutional Class, 2.57% (d) 721,798 721,798JPMorgan Prime Money Market Fund, Capital Class, 2.52% (d) 1,933,337 1,933,337Morgan Stanley Institutional Liquidity Prime Portfolio, Institutional Class, 2.53% (d) 1,675,603 1,675,603Total Collateral for Securities Loaned (Cost $7,995,787) 7,995,787
Total Investments (Cost $328,657,996) �� 100.3% 359,571,049Liabilities in excess of other assets �� (0.3)% (1,146,052)NET ASSETS - 100.00% $ 358,424,997
^ Purchased with cash collateral from securities on loan.(a) All or a portion of this security is on loan.(b) Non-income producing security.(c) Rule 144A security or other security that is restricted as to resale to institutional investors. The Fund�s Adviser has deemed this
security to be liquid based upon procedures approved by the Board of Trustees. As of March 31, 2019, the fair value of thesesecurities was $2,811,617 and amounted to 0.8% of net assets.
(d) Rate disclosed is the daily yield on March 31, 2019.
ADR�American Depositary ReceiptPCL�Public Company LimitedPLC�Public Limited Company
Copyright © 2021 www.secdatabase.com. All Rights Reserved.Please Consider the Environment Before Printing This Document
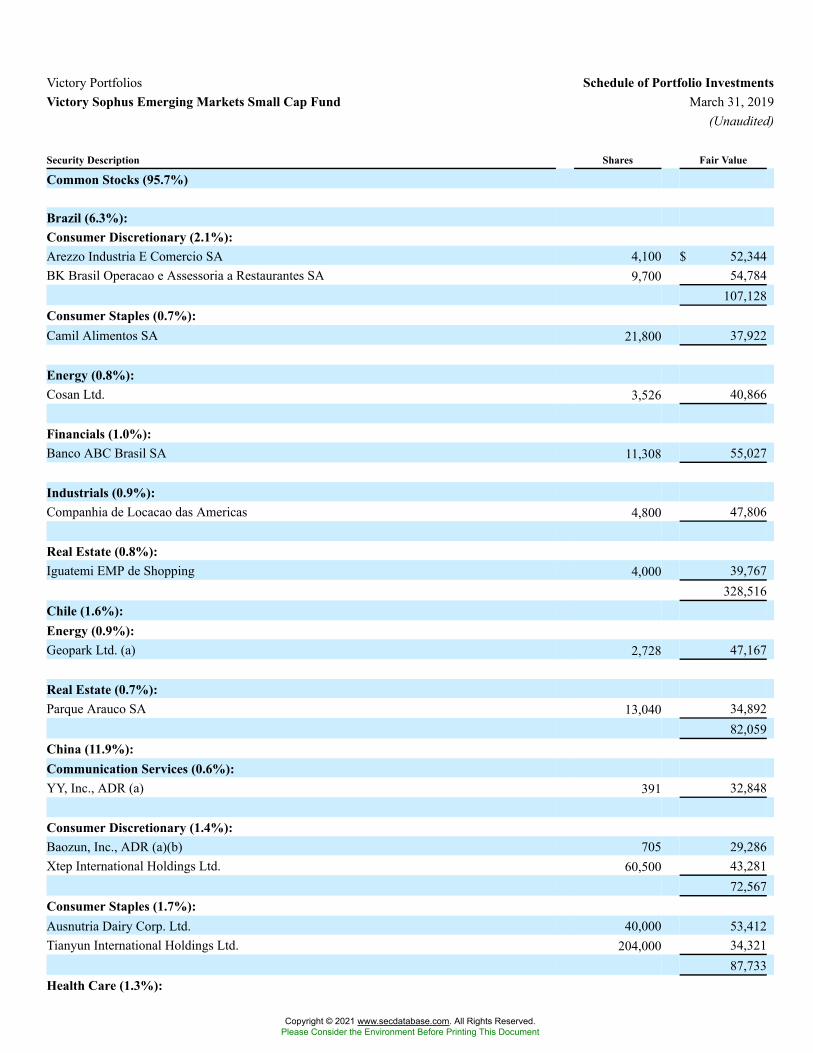
Victory Portfolios Schedule of Portfolio InvestmentsVictory Sophus Emerging Markets Small Cap Fund March 31, 2019
(Unaudited)
Security Description Shares Fair Value
Common Stocks (95.7%)
Brazil (6.3%):Consumer Discretionary (2.1%):Arezzo Industria E Comercio SA 4,100 $ 52,344BK Brasil Operacao e Assessoria a Restaurantes SA 9,700 54,784
107,128Consumer Staples (0.7%):Camil Alimentos SA 21,800 37,922
Energy (0.8%):Cosan Ltd. 3,526 40,866
Financials (1.0%):Banco ABC Brasil SA 11,308 55,027
Industrials (0.9%):Companhia de Locacao das Americas 4,800 47,806
Real Estate (0.8%):Iguatemi EMP de Shopping 4,000 39,767
328,516Chile (1.6%):Energy (0.9%):Geopark Ltd. (a) 2,728 47,167
Real Estate (0.7%):Parque Arauco SA 13,040 34,892
82,059China (11.9%):Communication Services (0.6%):YY, Inc., ADR (a) 391 32,848
Consumer Discretionary (1.4%):Baozun, Inc., ADR (a)(b) 705 29,286Xtep International Holdings Ltd. 60,500 43,281
72,567Consumer Staples (1.7%):Ausnutria Dairy Corp. Ltd. 40,000 53,412Tianyun International Holdings Ltd. 204,000 34,321
87,733Health Care (1.3%):
Copyright © 2021 www.secdatabase.com. All Rights Reserved.Please Consider the Environment Before Printing This Document
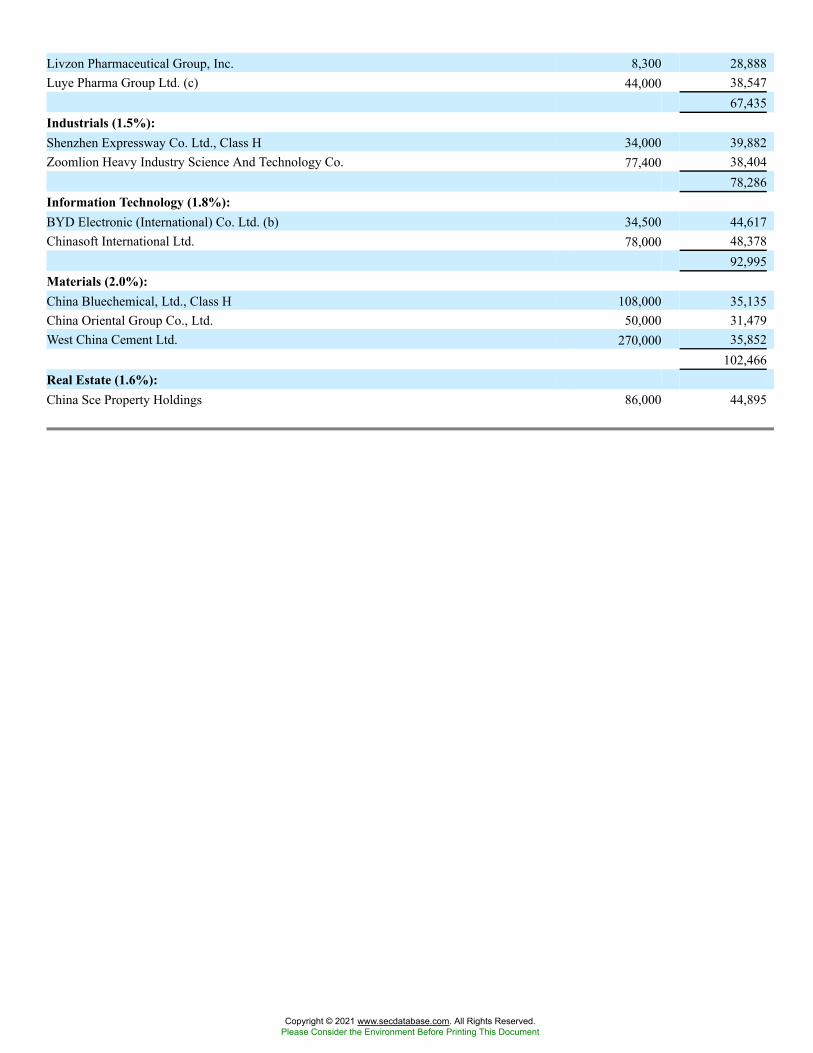
Livzon Pharmaceutical Group, Inc. 8,300 28,888Luye Pharma Group Ltd. (c) 44,000 38,547
67,435Industrials (1.5%):Shenzhen Expressway Co. Ltd., Class H 34,000 39,882Zoomlion Heavy Industry Science And Technology Co. 77,400 38,404
78,286Information Technology (1.8%):BYD Electronic (International) Co. Ltd. (b) 34,500 44,617Chinasoft International Ltd. 78,000 48,378
92,995Materials (2.0%):China Bluechemical, Ltd., Class H 108,000 35,135China Oriental Group Co., Ltd. 50,000 31,479West China Cement Ltd. 270,000 35,852
102,466Real Estate (1.6%):China Sce Property Holdings 86,000 44,895
Copyright © 2021 www.secdatabase.com. All Rights Reserved.Please Consider the Environment Before Printing This Document
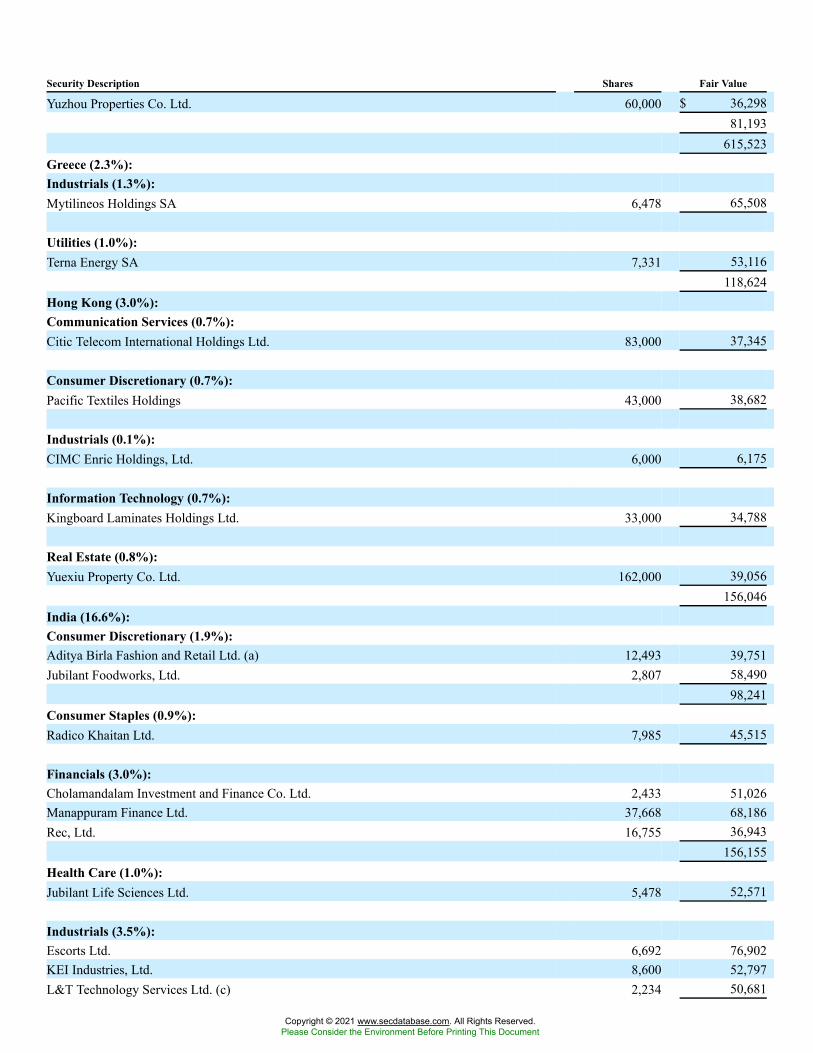
Security Description Shares Fair Value
Yuzhou Properties Co. Ltd. 60,000 $ 36,29881,193
615,523Greece (2.3%):Industrials (1.3%):Mytilineos Holdings SA 6,478 65,508
Utilities (1.0%):Terna Energy SA 7,331 53,116
118,624Hong Kong (3.0%):Communication Services (0.7%):Citic Telecom International Holdings Ltd. 83,000 37,345
Consumer Discretionary (0.7%):Pacific Textiles Holdings 43,000 38,682
Industrials (0.1%):CIMC Enric Holdings, Ltd. 6,000 6,175
Information Technology (0.7%):Kingboard Laminates Holdings Ltd. 33,000 34,788
Real Estate (0.8%):Yuexiu Property Co. Ltd. 162,000 39,056
156,046India (16.6%):Consumer Discretionary (1.9%):Aditya Birla Fashion and Retail Ltd. (a) 12,493 39,751Jubilant Foodworks, Ltd. 2,807 58,490
98,241Consumer Staples (0.9%):Radico Khaitan Ltd. 7,985 45,515
Financials (3.0%):Cholamandalam Investment and Finance Co. Ltd. 2,433 51,026Manappuram Finance Ltd. 37,668 68,186Rec, Ltd. 16,755 36,943
156,155Health Care (1.0%):Jubilant Life Sciences Ltd. 5,478 52,571
Industrials (3.5%):Escorts Ltd. 6,692 76,902KEI Industries, Ltd. 8,600 52,797L&T Technology Services Ltd. (c) 2,234 50,681
Copyright © 2021 www.secdatabase.com. All Rights Reserved.Please Consider the Environment Before Printing This Document
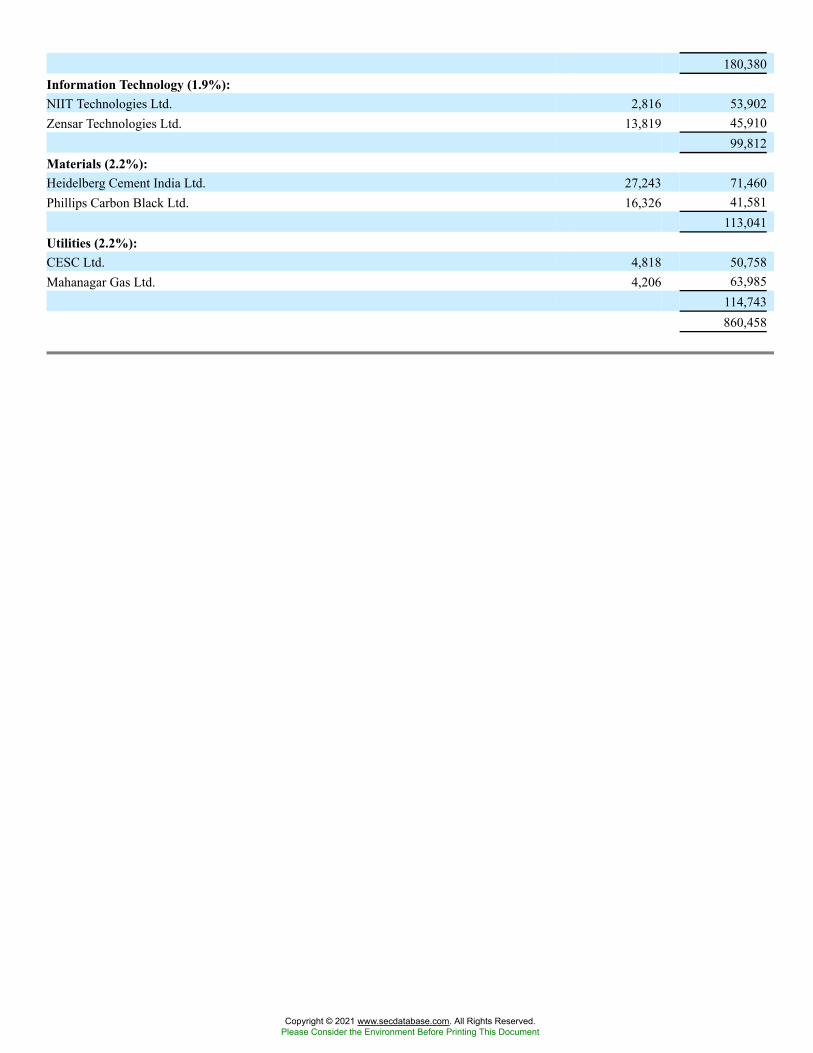
180,380Information Technology (1.9%):NIIT Technologies Ltd. 2,816 53,902Zensar Technologies Ltd. 13,819 45,910
99,812Materials (2.2%):Heidelberg Cement India Ltd. 27,243 71,460Phillips Carbon Black Ltd. 16,326 41,581
113,041Utilities (2.2%):CESC Ltd. 4,818 50,758Mahanagar Gas Ltd. 4,206 63,985
114,743860,458
Copyright © 2021 www.secdatabase.com. All Rights Reserved.Please Consider the Environment Before Printing This Document
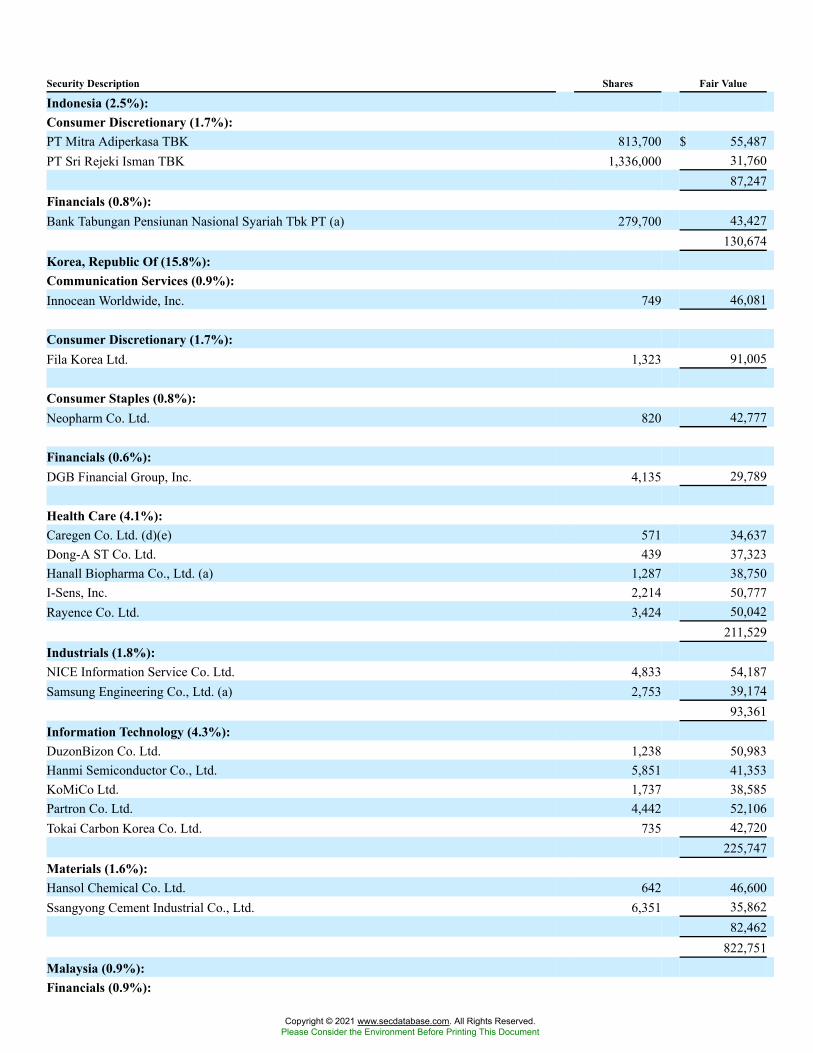
Security Description Shares Fair Value
Indonesia (2.5%):Consumer Discretionary (1.7%):PT Mitra Adiperkasa TBK 813,700 $ 55,487PT Sri Rejeki Isman TBK 1,336,000 31,760
87,247Financials (0.8%):Bank Tabungan Pensiunan Nasional Syariah Tbk PT (a) 279,700 43,427
130,674Korea, Republic Of (15.8%):Communication Services (0.9%):Innocean Worldwide, Inc. 749 46,081
Consumer Discretionary (1.7%):Fila Korea Ltd. 1,323 91,005
Consumer Staples (0.8%):Neopharm Co. Ltd. 820 42,777
Financials (0.6%):DGB Financial Group, Inc. 4,135 29,789
Health Care (4.1%):Caregen Co. Ltd. (d)(e) 571 34,637Dong-A ST Co. Ltd. 439 37,323Hanall Biopharma Co., Ltd. (a) 1,287 38,750I-Sens, Inc. 2,214 50,777Rayence Co. Ltd. 3,424 50,042
211,529Industrials (1.8%):NICE Information Service Co. Ltd. 4,833 54,187Samsung Engineering Co., Ltd. (a) 2,753 39,174
93,361Information Technology (4.3%):DuzonBizon Co. Ltd. 1,238 50,983Hanmi Semiconductor Co., Ltd. 5,851 41,353KoMiCo Ltd. 1,737 38,585Partron Co. Ltd. 4,442 52,106Tokai Carbon Korea Co. Ltd. 735 42,720
225,747Materials (1.6%):Hansol Chemical Co. Ltd. 642 46,600Ssangyong Cement Industrial Co., Ltd. 6,351 35,862
82,462822,751
Malaysia (0.9%):Financials (0.9%):
Copyright © 2021 www.secdatabase.com. All Rights Reserved.Please Consider the Environment Before Printing This Document
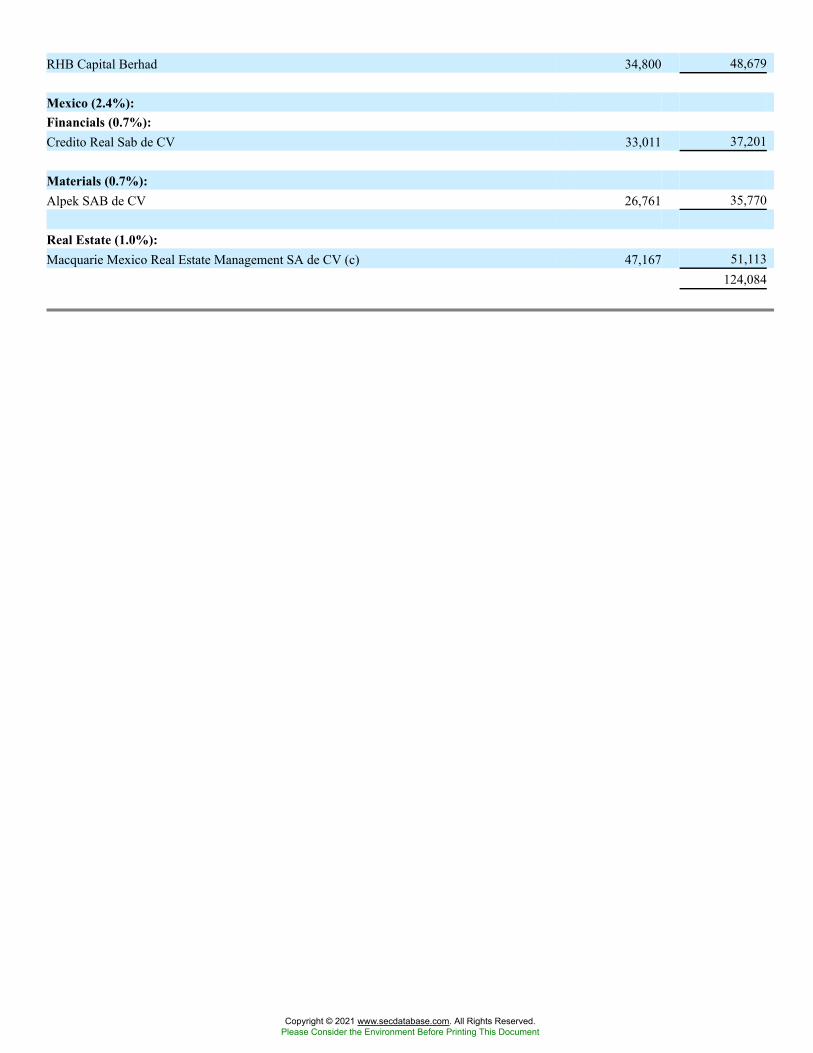
RHB Capital Berhad 34,800 48,679
Mexico (2.4%):Financials (0.7%):Credito Real Sab de CV 33,011 37,201
Materials (0.7%):Alpek SAB de CV 26,761 35,770
Real Estate (1.0%):Macquarie Mexico Real Estate Management SA de CV (c) 47,167 51,113
124,084
Copyright © 2021 www.secdatabase.com. All Rights Reserved.Please Consider the Environment Before Printing This Document
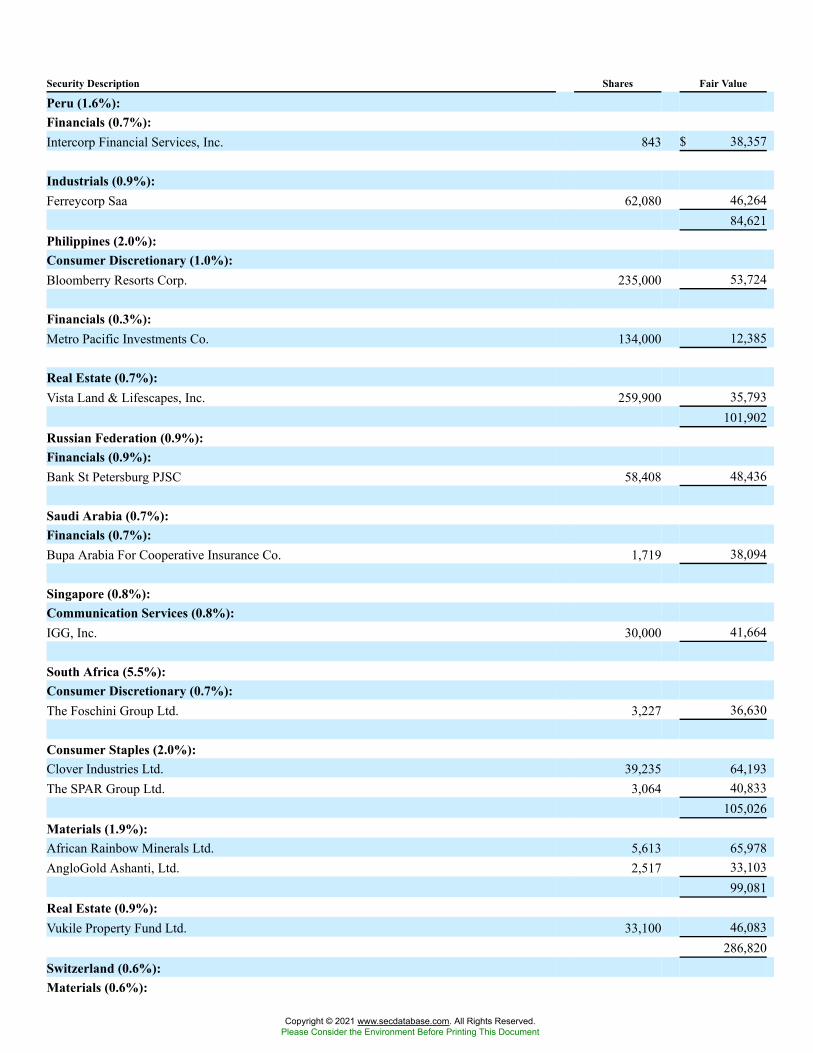
Security Description Shares Fair Value
Peru (1.6%):Financials (0.7%):Intercorp Financial Services, Inc. 843 $ 38,357
Industrials (0.9%):Ferreycorp Saa 62,080 46,264
84,621Philippines (2.0%):Consumer Discretionary (1.0%):Bloomberry Resorts Corp. 235,000 53,724
Financials (0.3%):Metro Pacific Investments Co. 134,000 12,385
Real Estate (0.7%):Vista Land & Lifescapes, Inc. 259,900 35,793
101,902Russian Federation (0.9%):Financials (0.9%):Bank St Petersburg PJSC 58,408 48,436
Saudi Arabia (0.7%):Financials (0.7%):Bupa Arabia For Cooperative Insurance Co. 1,719 38,094
Singapore (0.8%):Communication Services (0.8%):IGG, Inc. 30,000 41,664
South Africa (5.5%):Consumer Discretionary (0.7%):The Foschini Group Ltd. 3,227 36,630
Consumer Staples (2.0%):Clover Industries Ltd. 39,235 64,193The SPAR Group Ltd. 3,064 40,833
105,026Materials (1.9%):African Rainbow Minerals Ltd. 5,613 65,978AngloGold Ashanti, Ltd. 2,517 33,103
99,081Real Estate (0.9%):Vukile Property Fund Ltd. 33,100 46,083
286,820Switzerland (0.6%):Materials (0.6%):
Copyright © 2021 www.secdatabase.com. All Rights Reserved.Please Consider the Environment Before Printing This Document
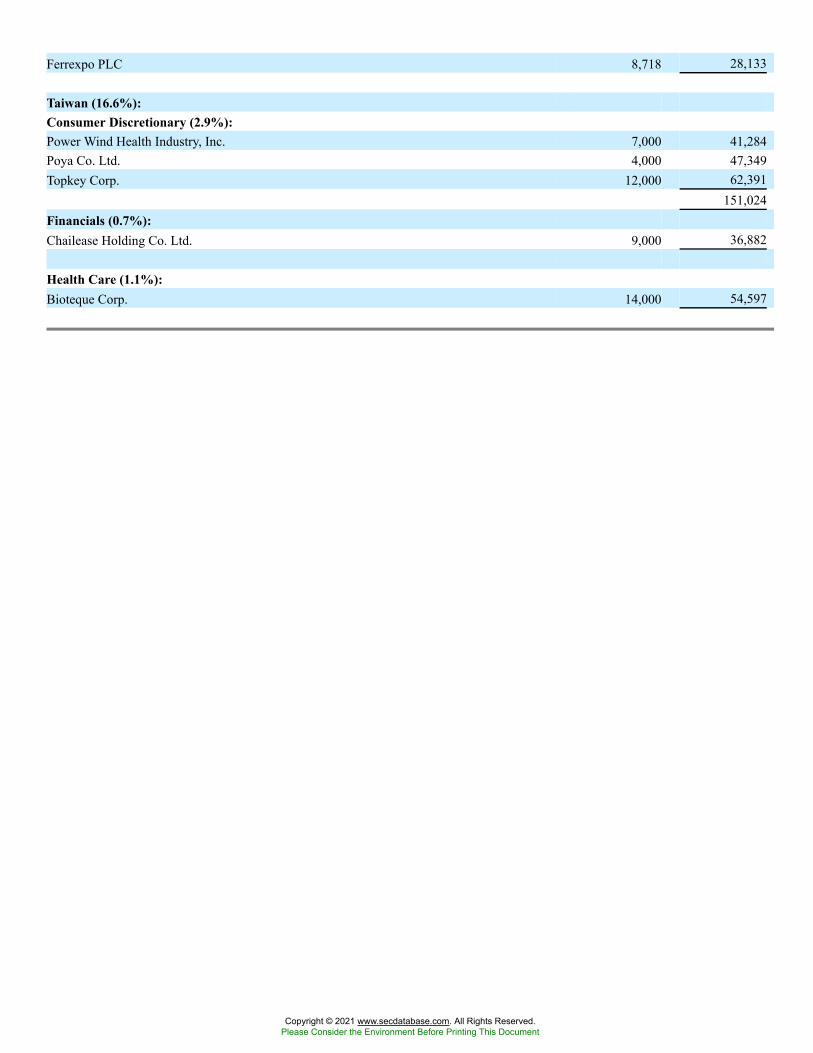
Ferrexpo PLC 8,718 28,133
Taiwan (16.6%):Consumer Discretionary (2.9%):Power Wind Health Industry, Inc. 7,000 41,284Poya Co. Ltd. 4,000 47,349Topkey Corp. 12,000 62,391
151,024Financials (0.7%):Chailease Holding Co. Ltd. 9,000 36,882
Health Care (1.1%):Bioteque Corp. 14,000 54,597
Copyright © 2021 www.secdatabase.com. All Rights Reserved.Please Consider the Environment Before Printing This Document
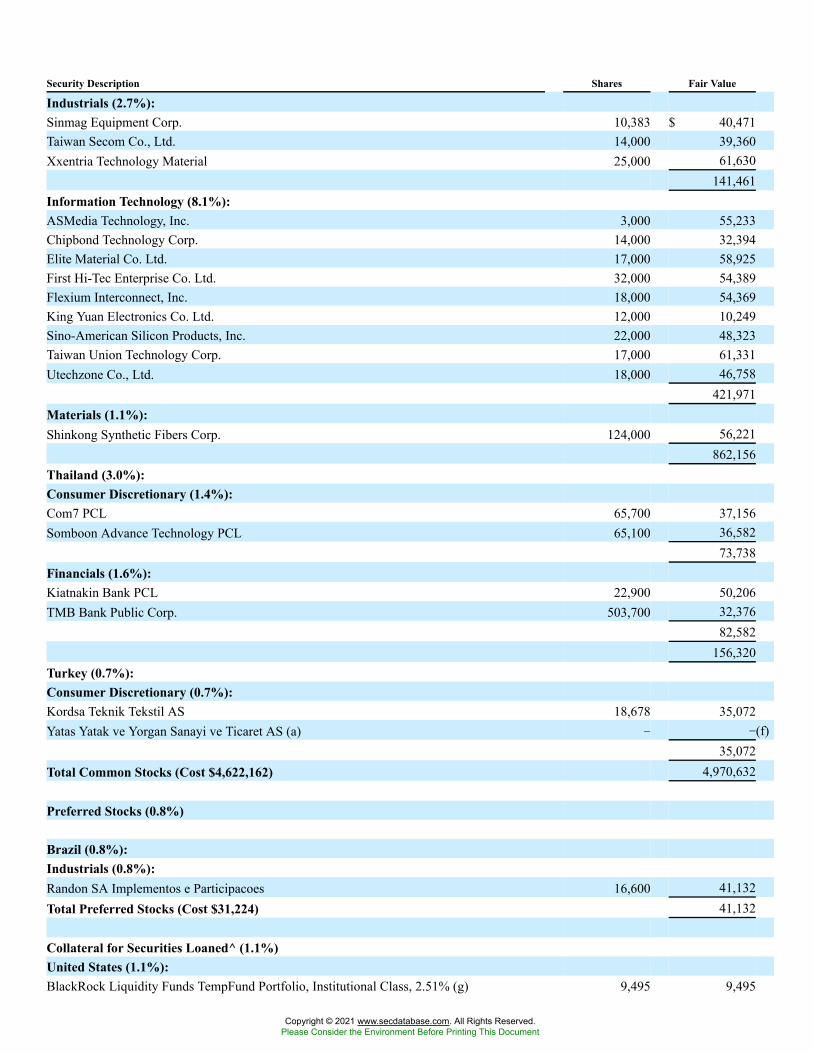
Security Description Shares Fair Value
Industrials (2.7%):Sinmag Equipment Corp. 10,383 $ 40,471Taiwan Secom Co., Ltd. 14,000 39,360Xxentria Technology Material 25,000 61,630
141,461Information Technology (8.1%):ASMedia Technology, Inc. 3,000 55,233Chipbond Technology Corp. 14,000 32,394Elite Material Co. Ltd. 17,000 58,925First Hi-Tec Enterprise Co. Ltd. 32,000 54,389Flexium Interconnect, Inc. 18,000 54,369King Yuan Electronics Co. Ltd. 12,000 10,249Sino-American Silicon Products, Inc. 22,000 48,323Taiwan Union Technology Corp. 17,000 61,331Utechzone Co., Ltd. 18,000 46,758
421,971Materials (1.1%):Shinkong Synthetic Fibers Corp. 124,000 56,221
862,156Thailand (3.0%):Consumer Discretionary (1.4%):Com7 PCL 65,700 37,156Somboon Advance Technology PCL 65,100 36,582
73,738Financials (1.6%):Kiatnakin Bank PCL 22,900 50,206TMB Bank Public Corp. 503,700 32,376
82,582156,320
Turkey (0.7%):Consumer Discretionary (0.7%):Kordsa Teknik Tekstil AS 18,678 35,072Yatas Yatak ve Yorgan Sanayi ve Ticaret AS (a) � �(f)
35,072Total Common Stocks (Cost $4,622,162) 4,970,632
Preferred Stocks (0.8%)
Brazil (0.8%):Industrials (0.8%):Randon SA Implementos e Participacoes 16,600 41,132Total Preferred Stocks (Cost $31,224) 41,132
Collateral for Securities Loaned^ (1.1%)United States (1.1%):BlackRock Liquidity Funds TempFund Portfolio, Institutional Class, 2.51% (g) 9,495 9,495
Copyright © 2021 www.secdatabase.com. All Rights Reserved.Please Consider the Environment Before Printing This Document
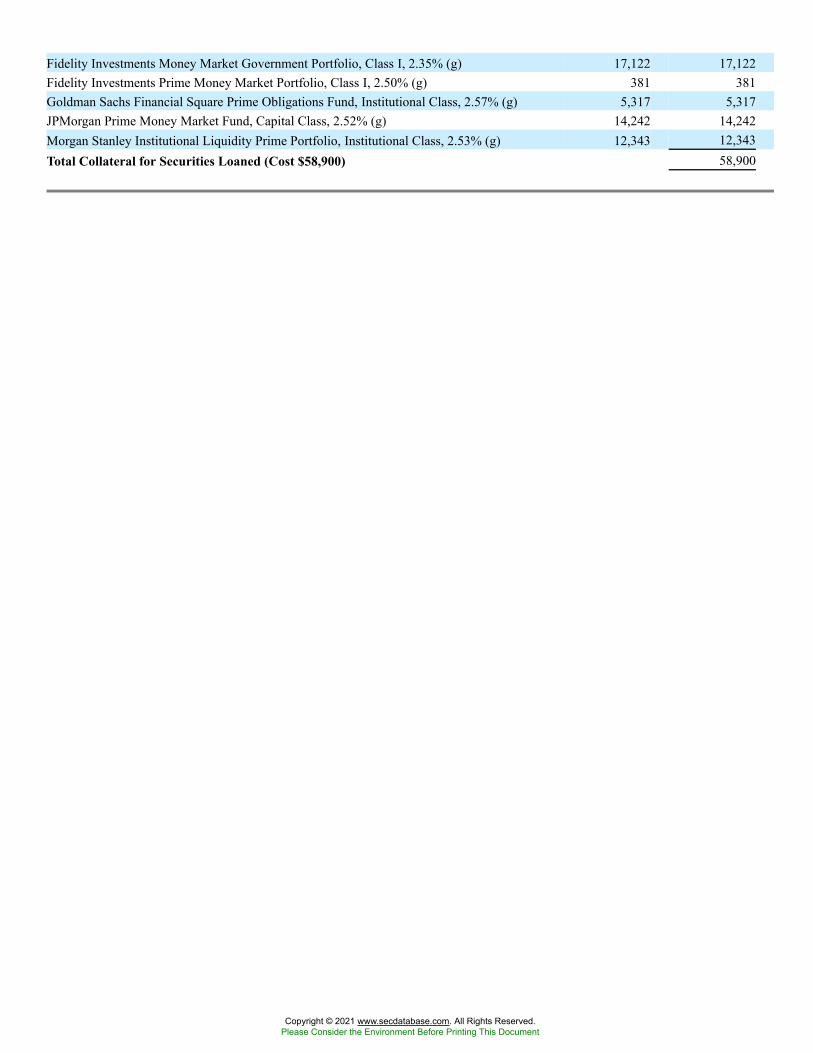
Fidelity Investments Money Market Government Portfolio, Class I, 2.35% (g) 17,122 17,122Fidelity Investments Prime Money Market Portfolio, Class I, 2.50% (g) 381 381Goldman Sachs Financial Square Prime Obligations Fund, Institutional Class, 2.57% (g) 5,317 5,317JPMorgan Prime Money Market Fund, Capital Class, 2.52% (g) 14,242 14,242Morgan Stanley Institutional Liquidity Prime Portfolio, Institutional Class, 2.53% (g) 12,343 12,343Total Collateral for Securities Loaned (Cost $58,900) 58,900
Copyright © 2021 www.secdatabase.com. All Rights Reserved.Please Consider the Environment Before Printing This Document
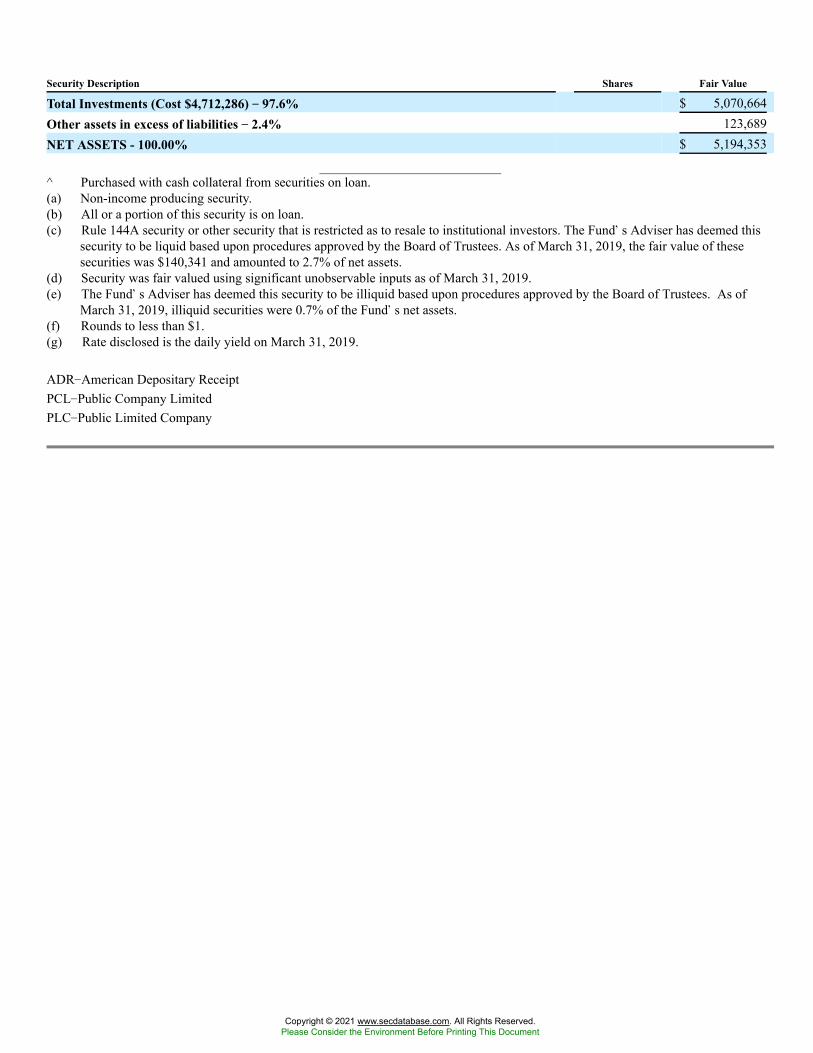
Security Description Shares Fair Value
Total Investments (Cost $4,712,286) �� 97.6% $ 5,070,664Other assets in excess of liabilities �� 2.4% 123,689NET ASSETS - 100.00% $ 5,194,353
^ Purchased with cash collateral from securities on loan.(a) Non-income producing security.(b) All or a portion of this security is on loan.(c) Rule 144A security or other security that is restricted as to resale to institutional investors. The Fund�s Adviser has deemed this
security to be liquid based upon procedures approved by the Board of Trustees. As of March 31, 2019, the fair value of thesesecurities was $140,341 and amounted to 2.7% of net assets.
(d) Security was fair valued using significant unobservable inputs as of March 31, 2019.(e) The Fund�s Adviser has deemed this security to be illiquid based upon procedures approved by the Board of Trustees. As of
March 31, 2019, illiquid securities were 0.7% of the Fund�s net assets.(f) Rounds to less than $1.(g) Rate disclosed is the daily yield on March 31, 2019.
ADR�American Depositary ReceiptPCL�Public Company LimitedPLC�Public Limited Company
Copyright © 2021 www.secdatabase.com. All Rights Reserved.Please Consider the Environment Before Printing This Document
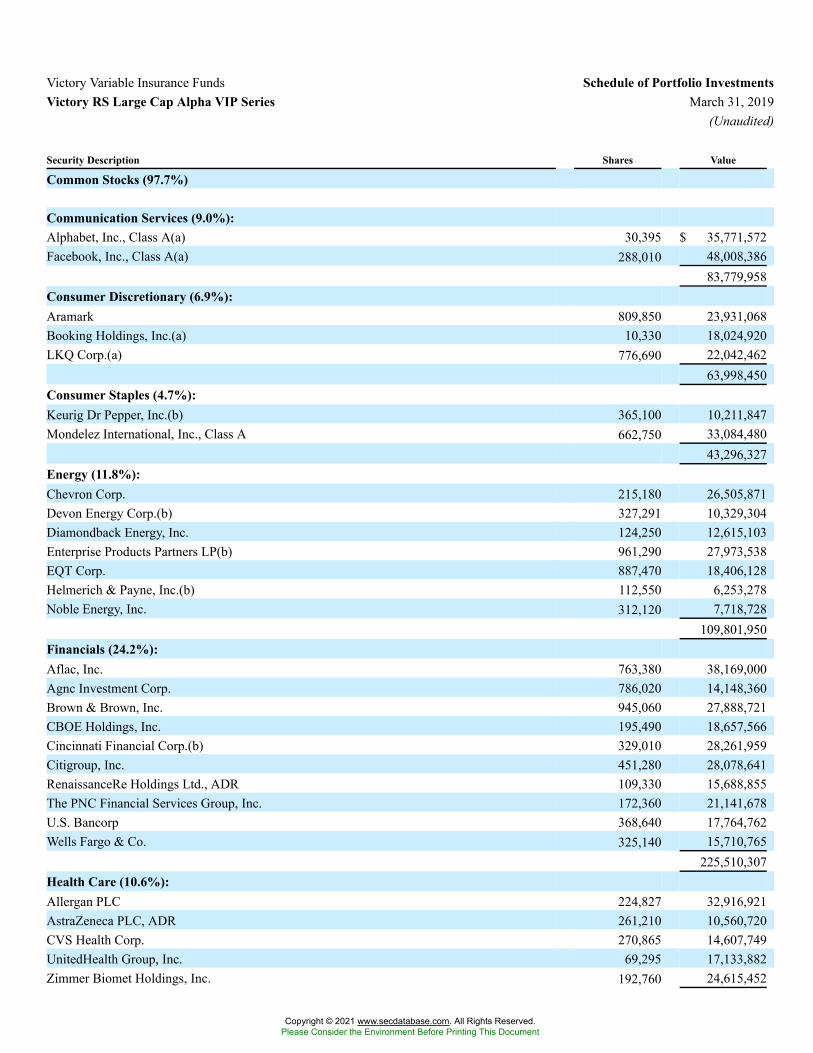
Victory Variable Insurance Funds Schedule of Portfolio InvestmentsVictory RS Large Cap Alpha VIP Series March 31, 2019
(Unaudited)
Security Description Shares Value
Common Stocks (97.7%)
Communication Services (9.0%):Alphabet, Inc., Class A(a) 30,395 $ 35,771,572Facebook, Inc., Class A(a) 288,010 48,008,386
83,779,958Consumer Discretionary (6.9%):Aramark 809,850 23,931,068Booking Holdings, Inc.(a) 10,330 18,024,920LKQ Corp.(a) 776,690 22,042,462
63,998,450Consumer Staples (4.7%):Keurig Dr Pepper, Inc.(b) 365,100 10,211,847Mondelez International, Inc., Class A 662,750 33,084,480
43,296,327Energy (11.8%):Chevron Corp. 215,180 26,505,871Devon Energy Corp.(b) 327,291 10,329,304Diamondback Energy, Inc. 124,250 12,615,103Enterprise Products Partners LP(b) 961,290 27,973,538EQT Corp. 887,470 18,406,128Helmerich & Payne, Inc.(b) 112,550 6,253,278Noble Energy, Inc. 312,120 7,718,728
109,801,950Financials (24.2%):Aflac, Inc. 763,380 38,169,000Agnc Investment Corp. 786,020 14,148,360Brown & Brown, Inc. 945,060 27,888,721CBOE Holdings, Inc. 195,490 18,657,566Cincinnati Financial Corp.(b) 329,010 28,261,959Citigroup, Inc. 451,280 28,078,641RenaissanceRe Holdings Ltd., ADR 109,330 15,688,855The PNC Financial Services Group, Inc. 172,360 21,141,678U.S. Bancorp 368,640 17,764,762Wells Fargo & Co. 325,140 15,710,765
225,510,307Health Care (10.6%):Allergan PLC 224,827 32,916,921AstraZeneca PLC, ADR 261,210 10,560,720CVS Health Corp. 270,865 14,607,749UnitedHealth Group, Inc. 69,295 17,133,882Zimmer Biomet Holdings, Inc. 192,760 24,615,452
Copyright © 2021 www.secdatabase.com. All Rights Reserved.Please Consider the Environment Before Printing This Document
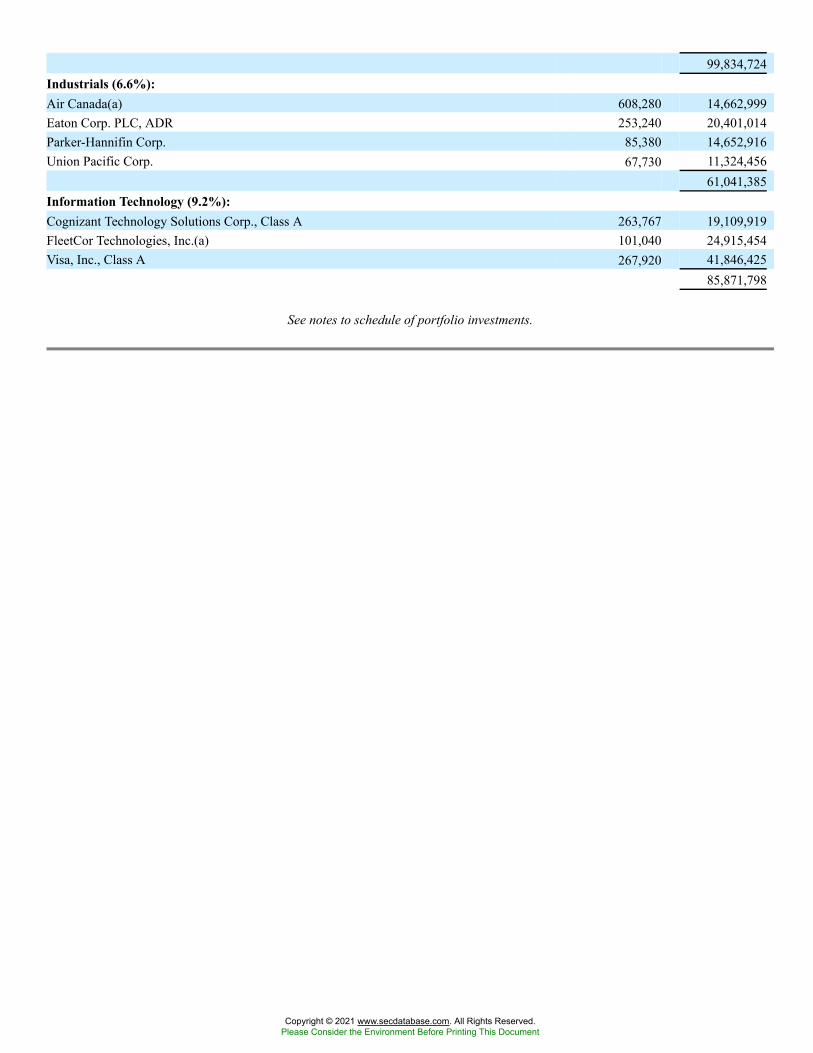
99,834,724Industrials (6.6%):Air Canada(a) 608,280 14,662,999Eaton Corp. PLC, ADR 253,240 20,401,014Parker-Hannifin Corp. 85,380 14,652,916Union Pacific Corp. 67,730 11,324,456
61,041,385Information Technology (9.2%):Cognizant Technology Solutions Corp., Class A 263,767 19,109,919FleetCor Technologies, Inc.(a) 101,040 24,915,454Visa, Inc., Class A 267,920 41,846,425
85,871,798
See notes to schedule of portfolio investments.
Copyright © 2021 www.secdatabase.com. All Rights Reserved.Please Consider the Environment Before Printing This Document
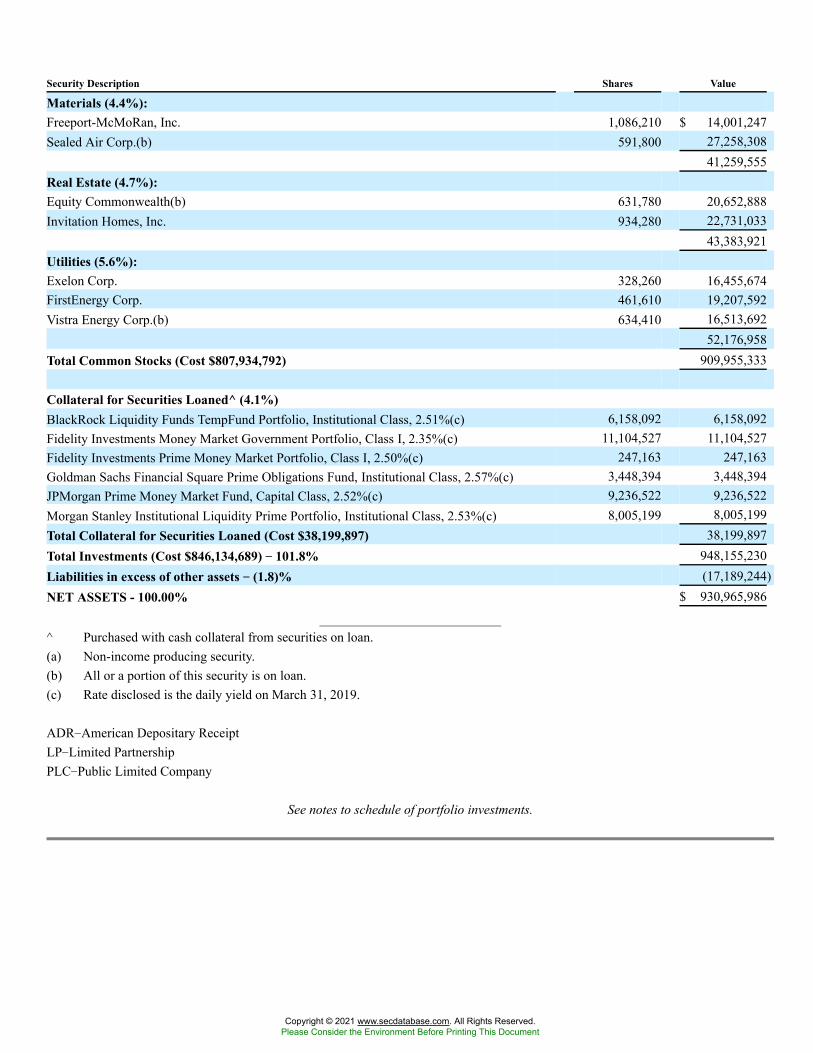
Security Description Shares Value
Materials (4.4%):Freeport-McMoRan, Inc. 1,086,210 $ 14,001,247Sealed Air Corp.(b) 591,800 27,258,308
41,259,555Real Estate (4.7%):Equity Commonwealth(b) 631,780 20,652,888Invitation Homes, Inc. 934,280 22,731,033
43,383,921Utilities (5.6%):Exelon Corp. 328,260 16,455,674FirstEnergy Corp. 461,610 19,207,592Vistra Energy Corp.(b) 634,410 16,513,692
52,176,958Total Common Stocks (Cost $807,934,792) 909,955,333
Collateral for Securities Loaned^ (4.1%)BlackRock Liquidity Funds TempFund Portfolio, Institutional Class, 2.51%(c) 6,158,092 6,158,092Fidelity Investments Money Market Government Portfolio, Class I, 2.35%(c) 11,104,527 11,104,527Fidelity Investments Prime Money Market Portfolio, Class I, 2.50%(c) 247,163 247,163Goldman Sachs Financial Square Prime Obligations Fund, Institutional Class, 2.57%(c) 3,448,394 3,448,394JPMorgan Prime Money Market Fund, Capital Class, 2.52%(c) 9,236,522 9,236,522Morgan Stanley Institutional Liquidity Prime Portfolio, Institutional Class, 2.53%(c) 8,005,199 8,005,199Total Collateral for Securities Loaned (Cost $38,199,897) 38,199,897Total Investments (Cost $846,134,689) �� 101.8% 948,155,230Liabilities in excess of other assets �� (1.8)% (17,189,244)NET ASSETS - 100.00% $ 930,965,986
^ Purchased with cash collateral from securities on loan.(a) Non-income producing security.(b) All or a portion of this security is on loan.(c) Rate disclosed is the daily yield on March 31, 2019.
ADR�American Depositary ReceiptLP�Limited PartnershipPLC�Public Limited Company
See notes to schedule of portfolio investments.
Copyright © 2021 www.secdatabase.com. All Rights Reserved.Please Consider the Environment Before Printing This Document
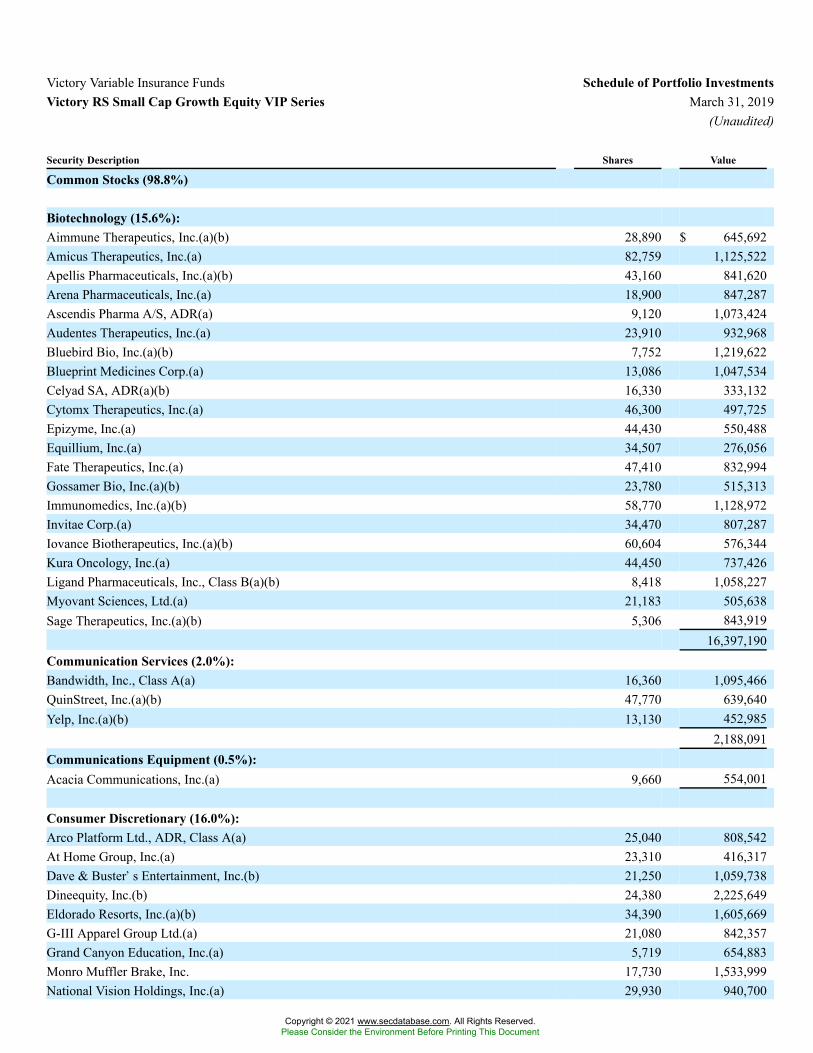
Victory Variable Insurance Funds Schedule of Portfolio InvestmentsVictory RS Small Cap Growth Equity VIP Series March 31, 2019
(Unaudited)
Security Description Shares Value
Common Stocks (98.8%)
Biotechnology (15.6%):Aimmune Therapeutics, Inc.(a)(b) 28,890 $ 645,692Amicus Therapeutics, Inc.(a) 82,759 1,125,522Apellis Pharmaceuticals, Inc.(a)(b) 43,160 841,620Arena Pharmaceuticals, Inc.(a) 18,900 847,287Ascendis Pharma A/S, ADR(a) 9,120 1,073,424Audentes Therapeutics, Inc.(a) 23,910 932,968Bluebird Bio, Inc.(a)(b) 7,752 1,219,622Blueprint Medicines Corp.(a) 13,086 1,047,534Celyad SA, ADR(a)(b) 16,330 333,132Cytomx Therapeutics, Inc.(a) 46,300 497,725Epizyme, Inc.(a) 44,430 550,488Equillium, Inc.(a) 34,507 276,056Fate Therapeutics, Inc.(a) 47,410 832,994Gossamer Bio, Inc.(a)(b) 23,780 515,313Immunomedics, Inc.(a)(b) 58,770 1,128,972Invitae Corp.(a) 34,470 807,287Iovance Biotherapeutics, Inc.(a)(b) 60,604 576,344Kura Oncology, Inc.(a) 44,450 737,426Ligand Pharmaceuticals, Inc., Class B(a)(b) 8,418 1,058,227Myovant Sciences, Ltd.(a) 21,183 505,638Sage Therapeutics, Inc.(a)(b) 5,306 843,919
16,397,190Communication Services (2.0%):Bandwidth, Inc., Class A(a) 16,360 1,095,466QuinStreet, Inc.(a)(b) 47,770 639,640Yelp, Inc.(a)(b) 13,130 452,985
2,188,091Communications Equipment (0.5%):Acacia Communications, Inc.(a) 9,660 554,001
Consumer Discretionary (16.0%):Arco Platform Ltd., ADR, Class A(a) 25,040 808,542At Home Group, Inc.(a) 23,310 416,317Dave & Buster�s Entertainment, Inc.(b) 21,250 1,059,738Dineequity, Inc.(b) 24,380 2,225,649Eldorado Resorts, Inc.(a)(b) 34,390 1,605,669G-III Apparel Group Ltd.(a) 21,080 842,357Grand Canyon Education, Inc.(a) 5,719 654,883Monro Muffler Brake, Inc. 17,730 1,533,999National Vision Holdings, Inc.(a) 29,930 940,700
Copyright © 2021 www.secdatabase.com. All Rights Reserved.Please Consider the Environment Before Printing This Document

Ollie�s Bargain Outlet Holdings, Inc.(a) 17,168 1,464,945Planet Fitness, Inc., Class A(a) 24,650 1,693,948Red Rock Resorts, Inc., Class A 38,310 990,314Steven Madden Ltd. 30,283 1,024,777Strategic Education, Inc. 8,200 1,076,742Wingstop, Inc. 7,250 551,218
16,889,798Consumer Staples (4.1%):BJ�s Wholesale Club Holdings, Inc.(a) 6,300 172,620Freshpet, Inc.(a)(b) 28,266 1,195,369Nomad Foods Ltd., ADR(a) 97,670 1,997,352Sprouts Farmers Markets, Inc.(a) 46,980 1,011,949
4,377,290
Copyright © 2021 www.secdatabase.com. All Rights Reserved.Please Consider the Environment Before Printing This Document
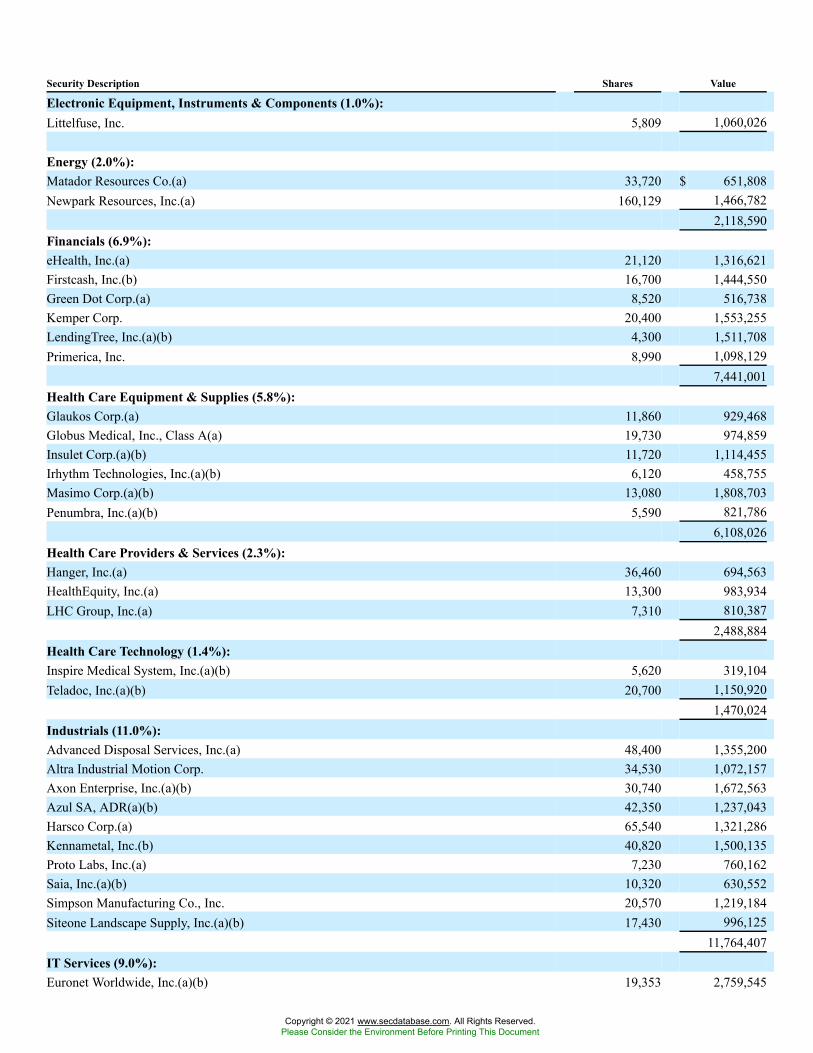
Security Description Shares Value
Electronic Equipment, Instruments & Components (1.0%):Littelfuse, Inc. 5,809 1,060,026
Energy (2.0%):Matador Resources Co.(a) 33,720 $ 651,808Newpark Resources, Inc.(a) 160,129 1,466,782
2,118,590Financials (6.9%):eHealth, Inc.(a) 21,120 1,316,621Firstcash, Inc.(b) 16,700 1,444,550Green Dot Corp.(a) 8,520 516,738Kemper Corp. 20,400 1,553,255LendingTree, Inc.(a)(b) 4,300 1,511,708Primerica, Inc. 8,990 1,098,129
7,441,001Health Care Equipment & Supplies (5.8%):Glaukos Corp.(a) 11,860 929,468Globus Medical, Inc., Class A(a) 19,730 974,859Insulet Corp.(a)(b) 11,720 1,114,455Irhythm Technologies, Inc.(a)(b) 6,120 458,755Masimo Corp.(a)(b) 13,080 1,808,703Penumbra, Inc.(a)(b) 5,590 821,786
6,108,026Health Care Providers & Services (2.3%):Hanger, Inc.(a) 36,460 694,563HealthEquity, Inc.(a) 13,300 983,934LHC Group, Inc.(a) 7,310 810,387
2,488,884Health Care Technology (1.4%):Inspire Medical System, Inc.(a)(b) 5,620 319,104Teladoc, Inc.(a)(b) 20,700 1,150,920
1,470,024Industrials (11.0%):Advanced Disposal Services, Inc.(a) 48,400 1,355,200Altra Industrial Motion Corp. 34,530 1,072,157Axon Enterprise, Inc.(a)(b) 30,740 1,672,563Azul SA, ADR(a)(b) 42,350 1,237,043Harsco Corp.(a) 65,540 1,321,286Kennametal, Inc.(b) 40,820 1,500,135Proto Labs, Inc.(a) 7,230 760,162Saia, Inc.(a)(b) 10,320 630,552Simpson Manufacturing Co., Inc. 20,570 1,219,184Siteone Landscape Supply, Inc.(a)(b) 17,430 996,125
11,764,407IT Services (9.0%):Euronet Worldwide, Inc.(a)(b) 19,353 2,759,545
Copyright © 2021 www.secdatabase.com. All Rights Reserved.Please Consider the Environment Before Printing This Document
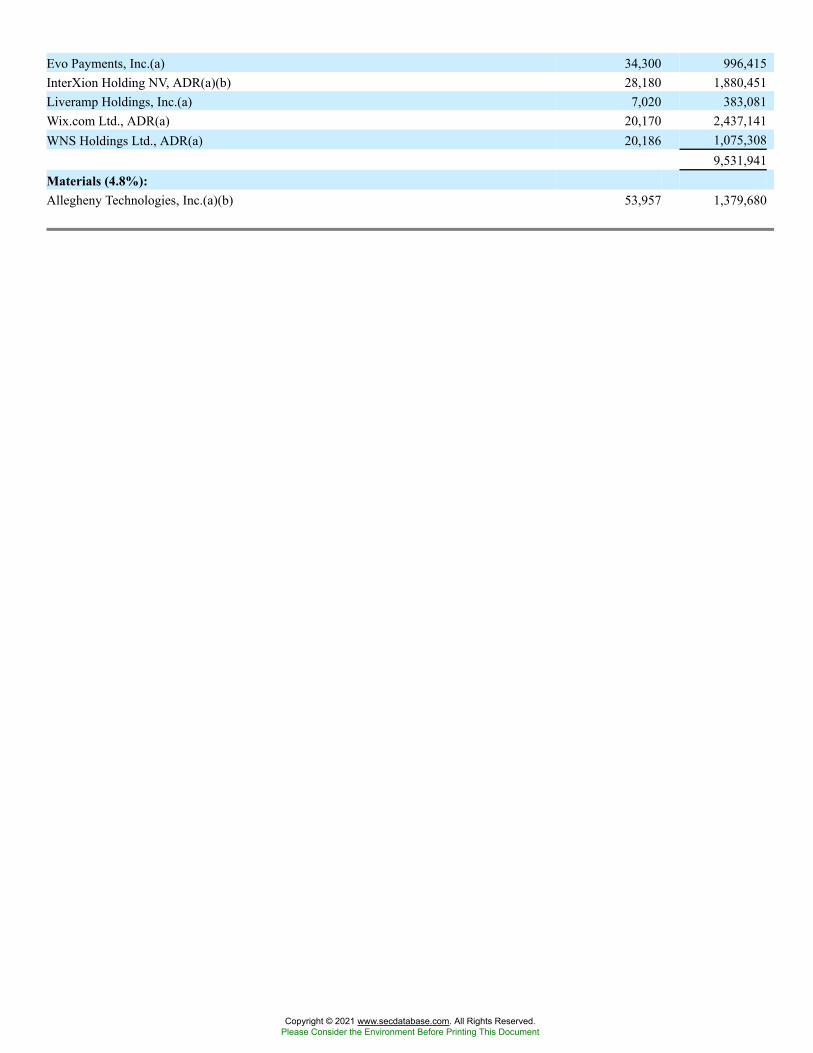
Evo Payments, Inc.(a) 34,300 996,415InterXion Holding NV, ADR(a)(b) 28,180 1,880,451Liveramp Holdings, Inc.(a) 7,020 383,081Wix.com Ltd., ADR(a) 20,170 2,437,141WNS Holdings Ltd., ADR(a) 20,186 1,075,308
9,531,941Materials (4.8%):Allegheny Technologies, Inc.(a)(b) 53,957 1,379,680
Copyright © 2021 www.secdatabase.com. All Rights Reserved.Please Consider the Environment Before Printing This Document
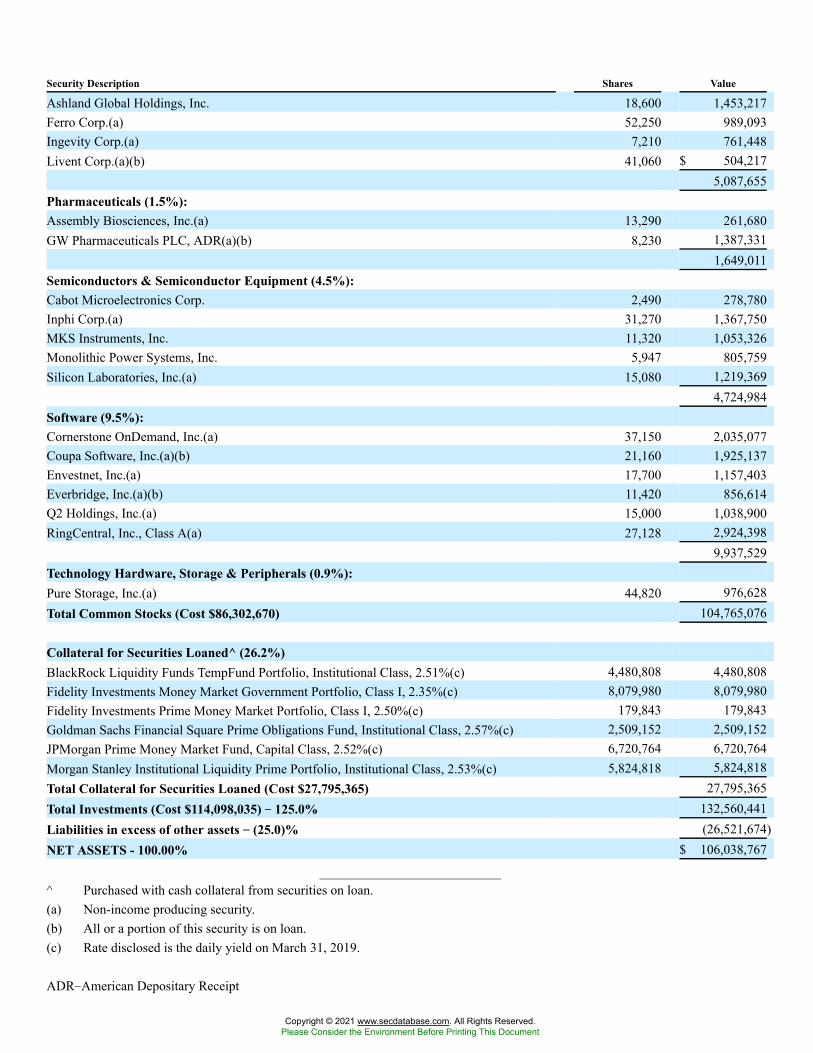
Security Description Shares Value
Ashland Global Holdings, Inc. 18,600 1,453,217Ferro Corp.(a) 52,250 989,093Ingevity Corp.(a) 7,210 761,448Livent Corp.(a)(b) 41,060 $ 504,217
5,087,655Pharmaceuticals (1.5%):Assembly Biosciences, Inc.(a) 13,290 261,680GW Pharmaceuticals PLC, ADR(a)(b) 8,230 1,387,331
1,649,011Semiconductors & Semiconductor Equipment (4.5%):Cabot Microelectronics Corp. 2,490 278,780Inphi Corp.(a) 31,270 1,367,750MKS Instruments, Inc. 11,320 1,053,326Monolithic Power Systems, Inc. 5,947 805,759Silicon Laboratories, Inc.(a) 15,080 1,219,369
4,724,984Software (9.5%):Cornerstone OnDemand, Inc.(a) 37,150 2,035,077Coupa Software, Inc.(a)(b) 21,160 1,925,137Envestnet, Inc.(a) 17,700 1,157,403Everbridge, Inc.(a)(b) 11,420 856,614Q2 Holdings, Inc.(a) 15,000 1,038,900RingCentral, Inc., Class A(a) 27,128 2,924,398
9,937,529Technology Hardware, Storage & Peripherals (0.9%):Pure Storage, Inc.(a) 44,820 976,628Total Common Stocks (Cost $86,302,670) 104,765,076
Collateral for Securities Loaned^ (26.2%)BlackRock Liquidity Funds TempFund Portfolio, Institutional Class, 2.51%(c) 4,480,808 4,480,808Fidelity Investments Money Market Government Portfolio, Class I, 2.35%(c) 8,079,980 8,079,980Fidelity Investments Prime Money Market Portfolio, Class I, 2.50%(c) 179,843 179,843Goldman Sachs Financial Square Prime Obligations Fund, Institutional Class, 2.57%(c) 2,509,152 2,509,152JPMorgan Prime Money Market Fund, Capital Class, 2.52%(c) 6,720,764 6,720,764Morgan Stanley Institutional Liquidity Prime Portfolio, Institutional Class, 2.53%(c) 5,824,818 5,824,818Total Collateral for Securities Loaned (Cost $27,795,365) 27,795,365Total Investments (Cost $114,098,035) �� 125.0% 132,560,441Liabilities in excess of other assets �� (25.0)% (26,521,674)NET ASSETS - 100.00% $ 106,038,767
^ Purchased with cash collateral from securities on loan.(a) Non-income producing security.(b) All or a portion of this security is on loan.(c) Rate disclosed is the daily yield on March 31, 2019.
ADR�American Depositary Receipt
Copyright © 2021 www.secdatabase.com. All Rights Reserved.Please Consider the Environment Before Printing This Document
PLC�Public Limited Company
Copyright © 2021 www.secdatabase.com. All Rights Reserved.Please Consider the Environment Before Printing This Document
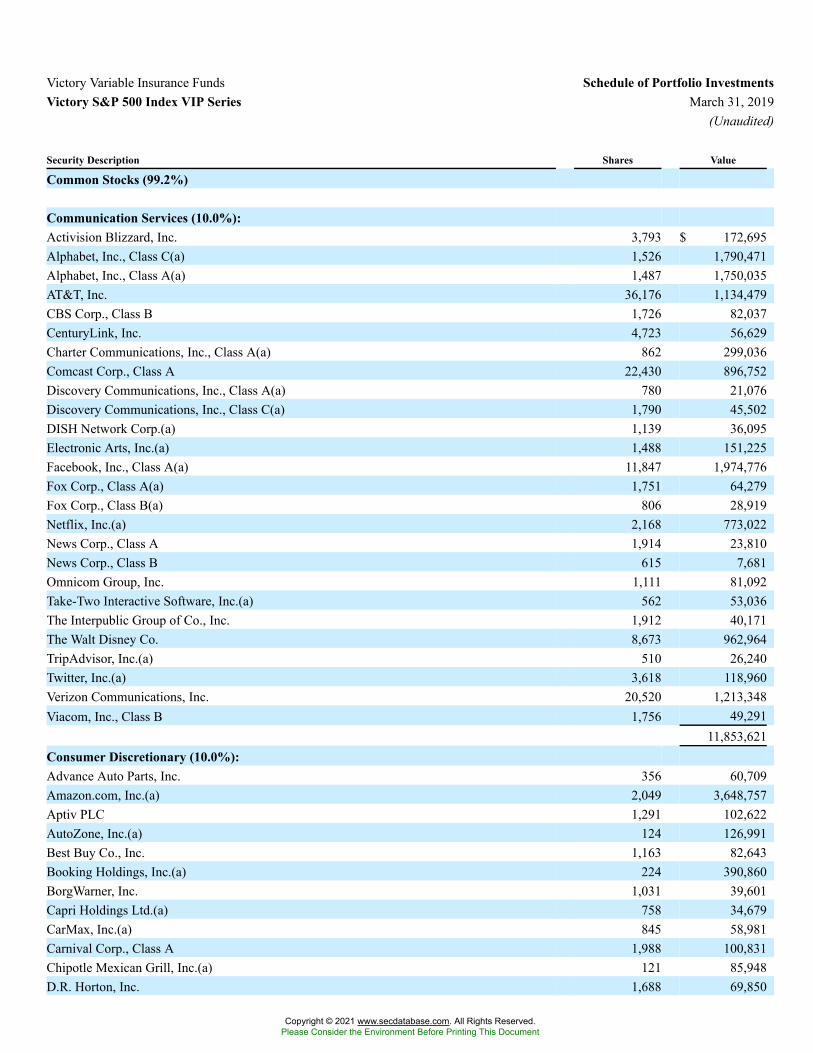
Victory Variable Insurance Funds Schedule of Portfolio InvestmentsVictory S&P 500 Index VIP Series March 31, 2019
(Unaudited)
Security Description Shares Value
Common Stocks (99.2%)
Communication Services (10.0%):Activision Blizzard, Inc. 3,793 $ 172,695Alphabet, Inc., Class C(a) 1,526 1,790,471Alphabet, Inc., Class A(a) 1,487 1,750,035AT&T, Inc. 36,176 1,134,479CBS Corp., Class B 1,726 82,037CenturyLink, Inc. 4,723 56,629Charter Communications, Inc., Class A(a) 862 299,036Comcast Corp., Class A 22,430 896,752Discovery Communications, Inc., Class A(a) 780 21,076Discovery Communications, Inc., Class C(a) 1,790 45,502DISH Network Corp.(a) 1,139 36,095Electronic Arts, Inc.(a) 1,488 151,225Facebook, Inc., Class A(a) 11,847 1,974,776Fox Corp., Class A(a) 1,751 64,279Fox Corp., Class B(a) 806 28,919Netflix, Inc.(a) 2,168 773,022News Corp., Class A 1,914 23,810News Corp., Class B 615 7,681Omnicom Group, Inc. 1,111 81,092Take-Two Interactive Software, Inc.(a) 562 53,036The Interpublic Group of Co., Inc. 1,912 40,171The Walt Disney Co. 8,673 962,964TripAdvisor, Inc.(a) 510 26,240Twitter, Inc.(a) 3,618 118,960Verizon Communications, Inc. 20,520 1,213,348Viacom, Inc., Class B 1,756 49,291
11,853,621Consumer Discretionary (10.0%):Advance Auto Parts, Inc. 356 60,709Amazon.com, Inc.(a) 2,049 3,648,757Aptiv PLC 1,291 102,622AutoZone, Inc.(a) 124 126,991Best Buy Co., Inc. 1,163 82,643Booking Holdings, Inc.(a) 224 390,860BorgWarner, Inc. 1,031 39,601Capri Holdings Ltd.(a) 758 34,679CarMax, Inc.(a) 845 58,981Carnival Corp., Class A 1,988 100,831Chipotle Mexican Grill, Inc.(a) 121 85,948D.R. Horton, Inc. 1,688 69,850
Copyright © 2021 www.secdatabase.com. All Rights Reserved.Please Consider the Environment Before Printing This Document
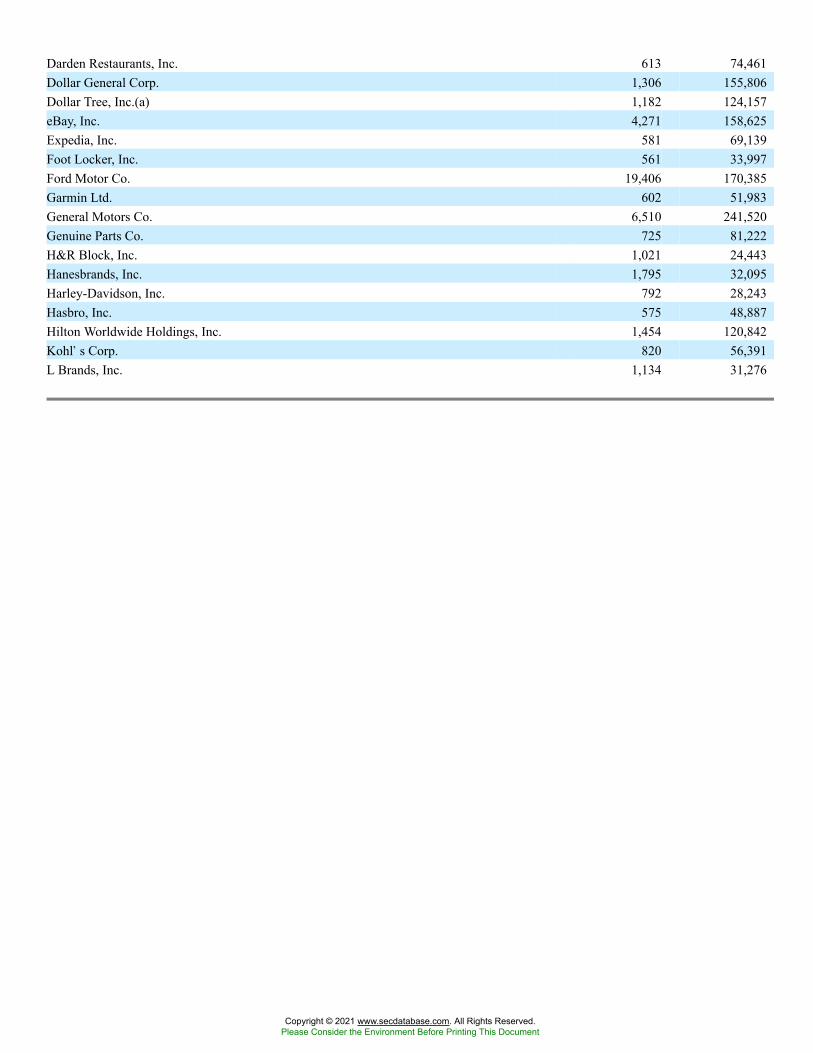
Darden Restaurants, Inc. 613 74,461Dollar General Corp. 1,306 155,806Dollar Tree, Inc.(a) 1,182 124,157eBay, Inc. 4,271 158,625Expedia, Inc. 581 69,139Foot Locker, Inc. 561 33,997Ford Motor Co. 19,406 170,385Garmin Ltd. 602 51,983General Motors Co. 6,510 241,520Genuine Parts Co. 725 81,222H&R Block, Inc. 1,021 24,443Hanesbrands, Inc. 1,795 32,095Harley-Davidson, Inc. 792 28,243Hasbro, Inc. 575 48,887Hilton Worldwide Holdings, Inc. 1,454 120,842Kohl�s Corp. 820 56,391L Brands, Inc. 1,134 31,276
Copyright © 2021 www.secdatabase.com. All Rights Reserved.Please Consider the Environment Before Printing This Document
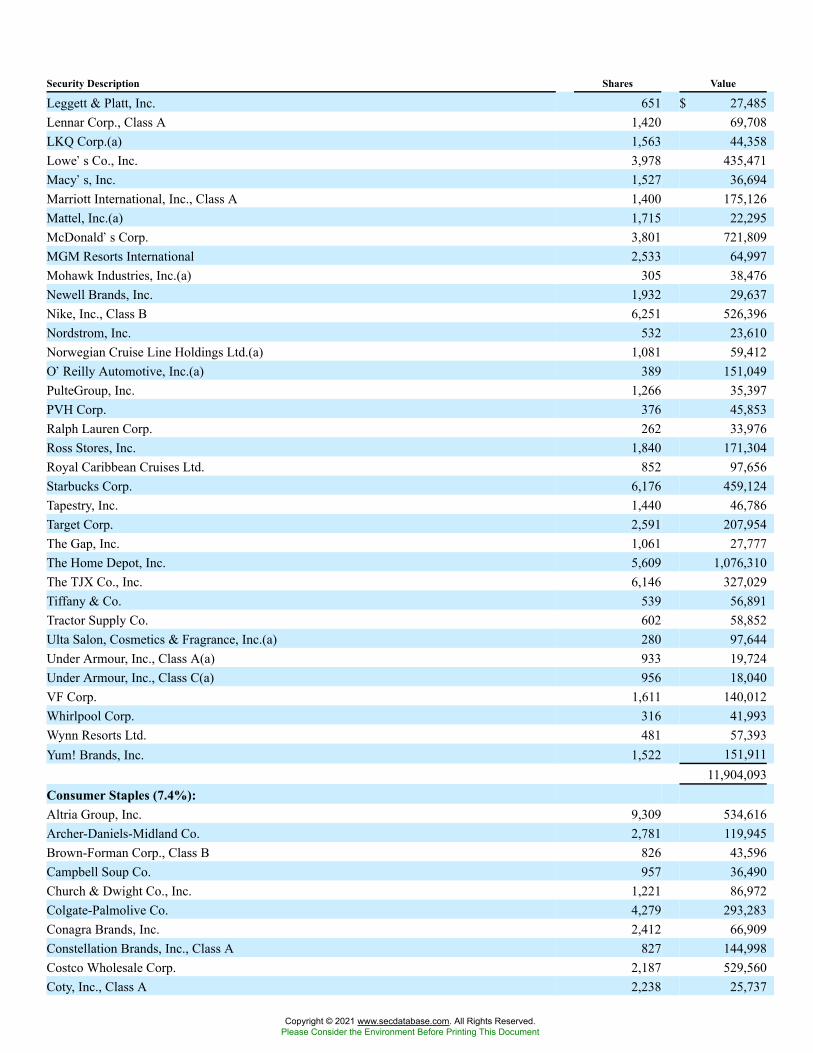
Security Description Shares Value
Leggett & Platt, Inc. 651 $ 27,485Lennar Corp., Class A 1,420 69,708LKQ Corp.(a) 1,563 44,358Lowe�s Co., Inc. 3,978 435,471Macy�s, Inc. 1,527 36,694Marriott International, Inc., Class A 1,400 175,126Mattel, Inc.(a) 1,715 22,295McDonald�s Corp. 3,801 721,809MGM Resorts International 2,533 64,997Mohawk Industries, Inc.(a) 305 38,476Newell Brands, Inc. 1,932 29,637Nike, Inc., Class B 6,251 526,396Nordstrom, Inc. 532 23,610Norwegian Cruise Line Holdings Ltd.(a) 1,081 59,412O�Reilly Automotive, Inc.(a) 389 151,049PulteGroup, Inc. 1,266 35,397PVH Corp. 376 45,853Ralph Lauren Corp. 262 33,976Ross Stores, Inc. 1,840 171,304Royal Caribbean Cruises Ltd. 852 97,656Starbucks Corp. 6,176 459,124Tapestry, Inc. 1,440 46,786Target Corp. 2,591 207,954The Gap, Inc. 1,061 27,777The Home Depot, Inc. 5,609 1,076,310The TJX Co., Inc. 6,146 327,029Tiffany & Co. 539 56,891Tractor Supply Co. 602 58,852Ulta Salon, Cosmetics & Fragrance, Inc.(a) 280 97,644Under Armour, Inc., Class A(a) 933 19,724Under Armour, Inc., Class C(a) 956 18,040VF Corp. 1,611 140,012Whirlpool Corp. 316 41,993Wynn Resorts Ltd. 481 57,393Yum! Brands, Inc. 1,522 151,911
11,904,093Consumer Staples (7.4%):Altria Group, Inc. 9,309 534,616Archer-Daniels-Midland Co. 2,781 119,945Brown-Forman Corp., Class B 826 43,596Campbell Soup Co. 957 36,490Church & Dwight Co., Inc. 1,221 86,972Colgate-Palmolive Co. 4,279 293,283Conagra Brands, Inc. 2,412 66,909Constellation Brands, Inc., Class A 827 144,998Costco Wholesale Corp. 2,187 529,560Coty, Inc., Class A 2,238 25,737
Copyright © 2021 www.secdatabase.com. All Rights Reserved.Please Consider the Environment Before Printing This Document
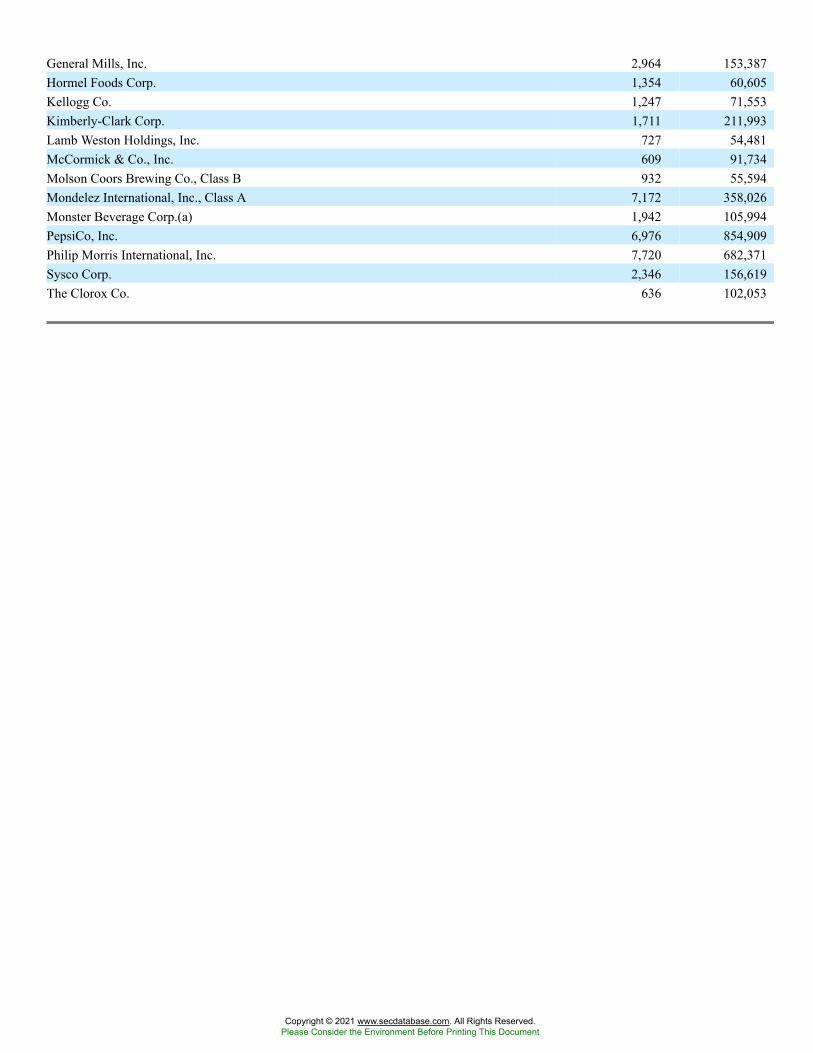
General Mills, Inc. 2,964 153,387Hormel Foods Corp. 1,354 60,605Kellogg Co. 1,247 71,553Kimberly-Clark Corp. 1,711 211,993Lamb Weston Holdings, Inc. 727 54,481McCormick & Co., Inc. 609 91,734Molson Coors Brewing Co., Class B 932 55,594Mondelez International, Inc., Class A 7,172 358,026Monster Beverage Corp.(a) 1,942 105,994PepsiCo, Inc. 6,976 854,909Philip Morris International, Inc. 7,720 682,371Sysco Corp. 2,346 156,619The Clorox Co. 636 102,053
Copyright © 2021 www.secdatabase.com. All Rights Reserved.Please Consider the Environment Before Printing This Document
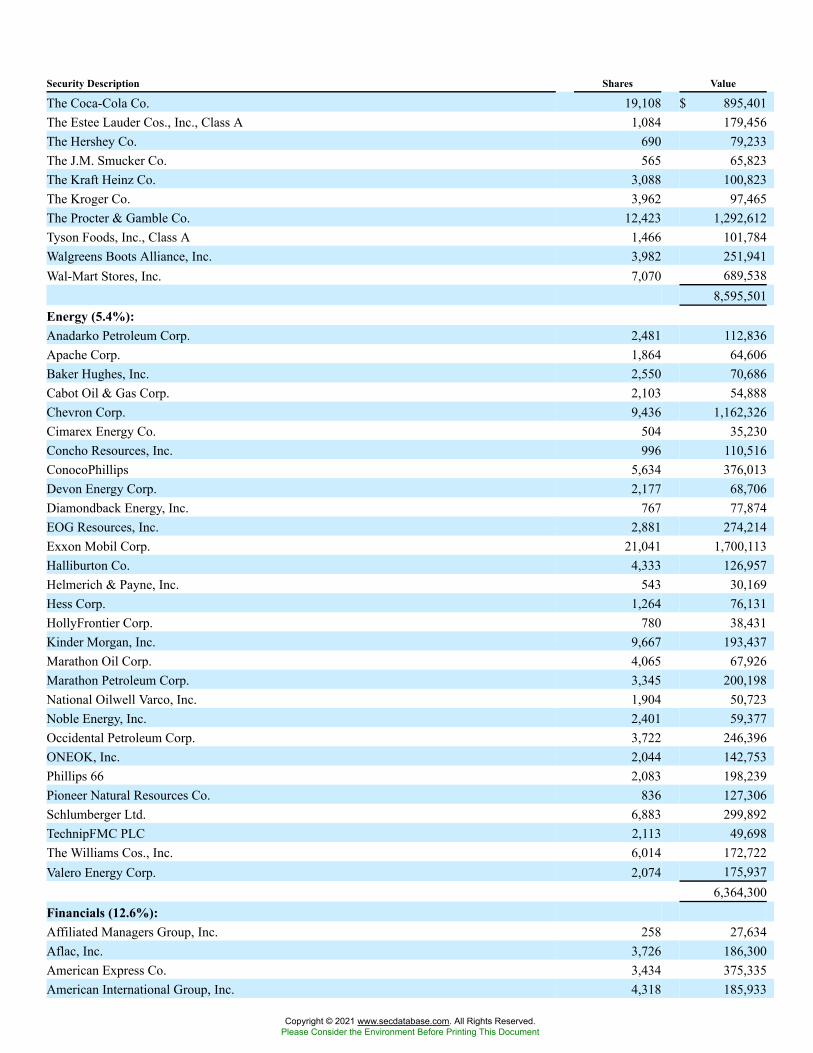
Security Description Shares Value
The Coca-Cola Co. 19,108 $ 895,401The Estee Lauder Cos., Inc., Class A 1,084 179,456The Hershey Co. 690 79,233The J.M. Smucker Co. 565 65,823The Kraft Heinz Co. 3,088 100,823The Kroger Co. 3,962 97,465The Procter & Gamble Co. 12,423 1,292,612Tyson Foods, Inc., Class A 1,466 101,784Walgreens Boots Alliance, Inc. 3,982 251,941Wal-Mart Stores, Inc. 7,070 689,538
8,595,501Energy (5.4%):Anadarko Petroleum Corp. 2,481 112,836Apache Corp. 1,864 64,606Baker Hughes, Inc. 2,550 70,686Cabot Oil & Gas Corp. 2,103 54,888Chevron Corp. 9,436 1,162,326Cimarex Energy Co. 504 35,230Concho Resources, Inc. 996 110,516ConocoPhillips 5,634 376,013Devon Energy Corp. 2,177 68,706Diamondback Energy, Inc. 767 77,874EOG Resources, Inc. 2,881 274,214Exxon Mobil Corp. 21,041 1,700,113Halliburton Co. 4,333 126,957Helmerich & Payne, Inc. 543 30,169Hess Corp. 1,264 76,131HollyFrontier Corp. 780 38,431Kinder Morgan, Inc. 9,667 193,437Marathon Oil Corp. 4,065 67,926Marathon Petroleum Corp. 3,345 200,198National Oilwell Varco, Inc. 1,904 50,723Noble Energy, Inc. 2,401 59,377Occidental Petroleum Corp. 3,722 246,396ONEOK, Inc. 2,044 142,753Phillips 66 2,083 198,239Pioneer Natural Resources Co. 836 127,306Schlumberger Ltd. 6,883 299,892TechnipFMC PLC 2,113 49,698The Williams Cos., Inc. 6,014 172,722Valero Energy Corp. 2,074 175,937
6,364,300Financials (12.6%):Affiliated Managers Group, Inc. 258 27,634Aflac, Inc. 3,726 186,300American Express Co. 3,434 375,335American International Group, Inc. 4,318 185,933
Copyright © 2021 www.secdatabase.com. All Rights Reserved.Please Consider the Environment Before Printing This Document
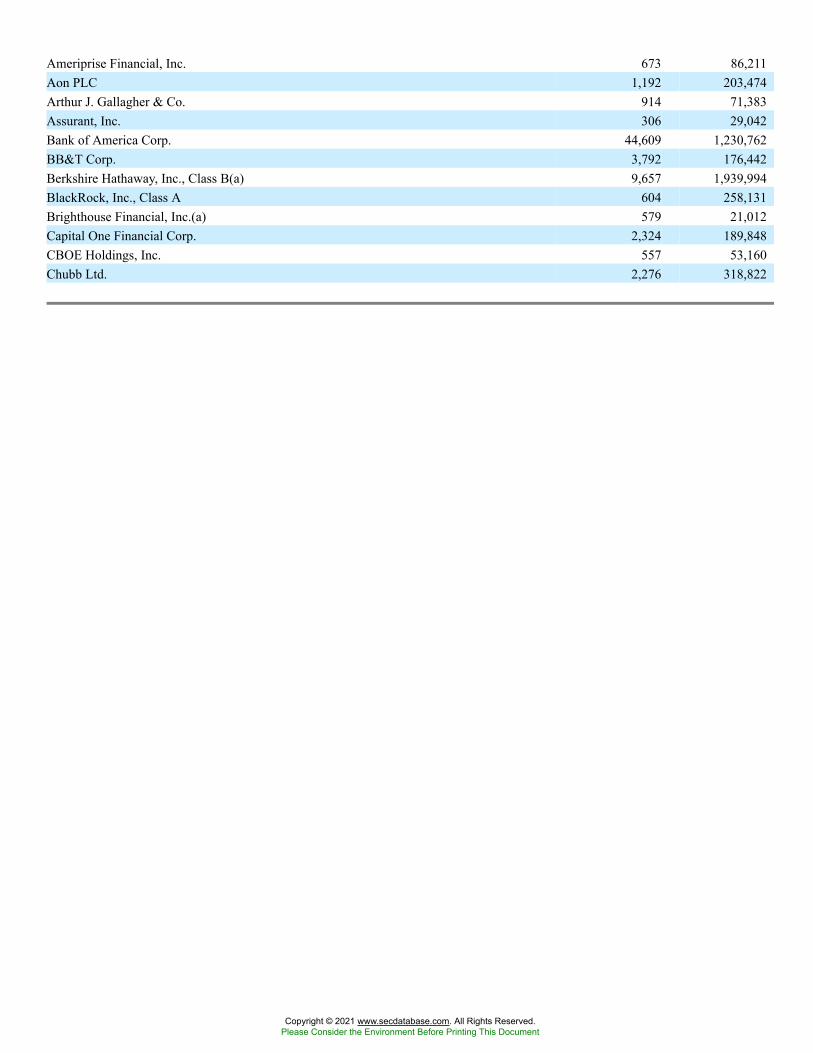
Ameriprise Financial, Inc. 673 86,211Aon PLC 1,192 203,474Arthur J. Gallagher & Co. 914 71,383Assurant, Inc. 306 29,042Bank of America Corp. 44,609 1,230,762BB&T Corp. 3,792 176,442Berkshire Hathaway, Inc., Class B(a) 9,657 1,939,994BlackRock, Inc., Class A 604 258,131Brighthouse Financial, Inc.(a) 579 21,012Capital One Financial Corp. 2,324 189,848CBOE Holdings, Inc. 557 53,160Chubb Ltd. 2,276 318,822
Copyright © 2021 www.secdatabase.com. All Rights Reserved.Please Consider the Environment Before Printing This Document
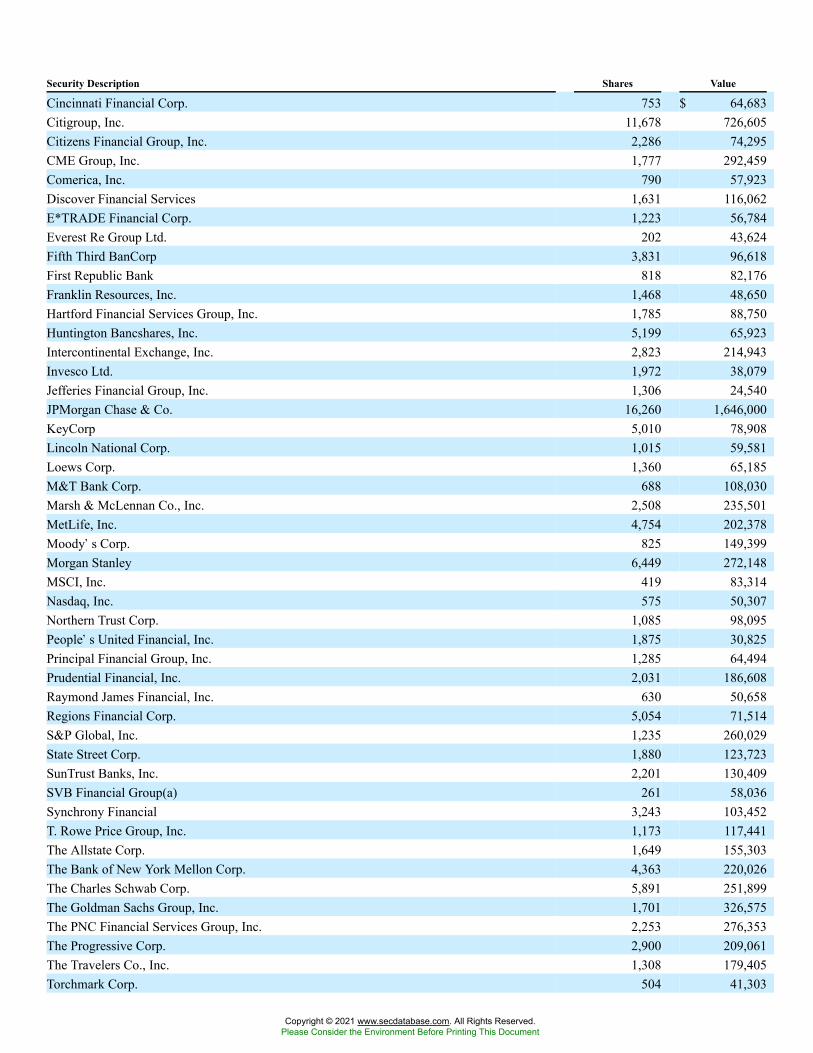
Security Description Shares Value
Cincinnati Financial Corp. 753 $ 64,683Citigroup, Inc. 11,678 726,605Citizens Financial Group, Inc. 2,286 74,295CME Group, Inc. 1,777 292,459Comerica, Inc. 790 57,923Discover Financial Services 1,631 116,062E*TRADE Financial Corp. 1,223 56,784Everest Re Group Ltd. 202 43,624Fifth Third BanCorp 3,831 96,618First Republic Bank 818 82,176Franklin Resources, Inc. 1,468 48,650Hartford Financial Services Group, Inc. 1,785 88,750Huntington Bancshares, Inc. 5,199 65,923Intercontinental Exchange, Inc. 2,823 214,943Invesco Ltd. 1,972 38,079Jefferies Financial Group, Inc. 1,306 24,540JPMorgan Chase & Co. 16,260 1,646,000KeyCorp 5,010 78,908Lincoln National Corp. 1,015 59,581Loews Corp. 1,360 65,185M&T Bank Corp. 688 108,030Marsh & McLennan Co., Inc. 2,508 235,501MetLife, Inc. 4,754 202,378Moody�s Corp. 825 149,399Morgan Stanley 6,449 272,148MSCI, Inc. 419 83,314Nasdaq, Inc. 575 50,307Northern Trust Corp. 1,085 98,095People�s United Financial, Inc. 1,875 30,825Principal Financial Group, Inc. 1,285 64,494Prudential Financial, Inc. 2,031 186,608Raymond James Financial, Inc. 630 50,658Regions Financial Corp. 5,054 71,514S&P Global, Inc. 1,235 260,029State Street Corp. 1,880 123,723SunTrust Banks, Inc. 2,201 130,409SVB Financial Group(a) 261 58,036Synchrony Financial 3,243 103,452T. Rowe Price Group, Inc. 1,173 117,441The Allstate Corp. 1,649 155,303The Bank of New York Mellon Corp. 4,363 220,026The Charles Schwab Corp. 5,891 251,899The Goldman Sachs Group, Inc. 1,701 326,575The PNC Financial Services Group, Inc. 2,253 276,353The Progressive Corp. 2,900 209,061The Travelers Co., Inc. 1,308 179,405Torchmark Corp. 504 41,303
Copyright © 2021 www.secdatabase.com. All Rights Reserved.Please Consider the Environment Before Printing This Document
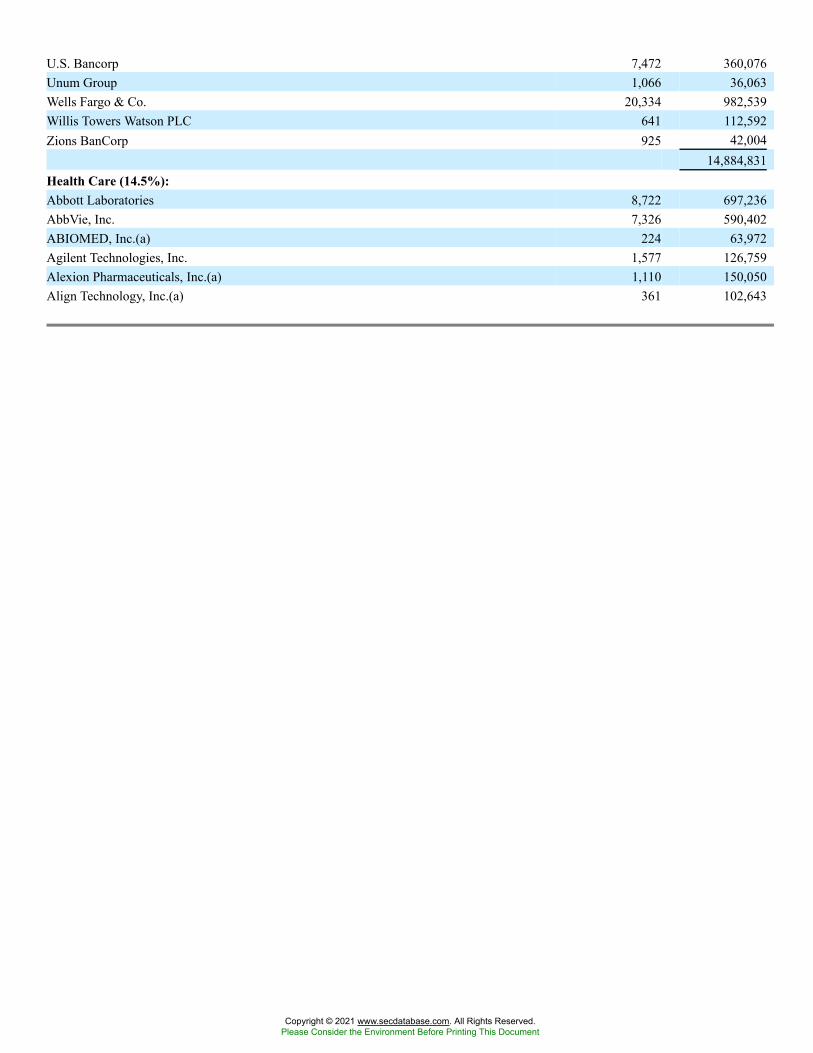
U.S. Bancorp 7,472 360,076Unum Group 1,066 36,063Wells Fargo & Co. 20,334 982,539Willis Towers Watson PLC 641 112,592Zions BanCorp 925 42,004
14,884,831Health Care (14.5%):Abbott Laboratories 8,722 697,236AbbVie, Inc. 7,326 590,402ABIOMED, Inc.(a) 224 63,972Agilent Technologies, Inc. 1,577 126,759Alexion Pharmaceuticals, Inc.(a) 1,110 150,050Align Technology, Inc.(a) 361 102,643
Copyright © 2021 www.secdatabase.com. All Rights Reserved.Please Consider the Environment Before Printing This Document
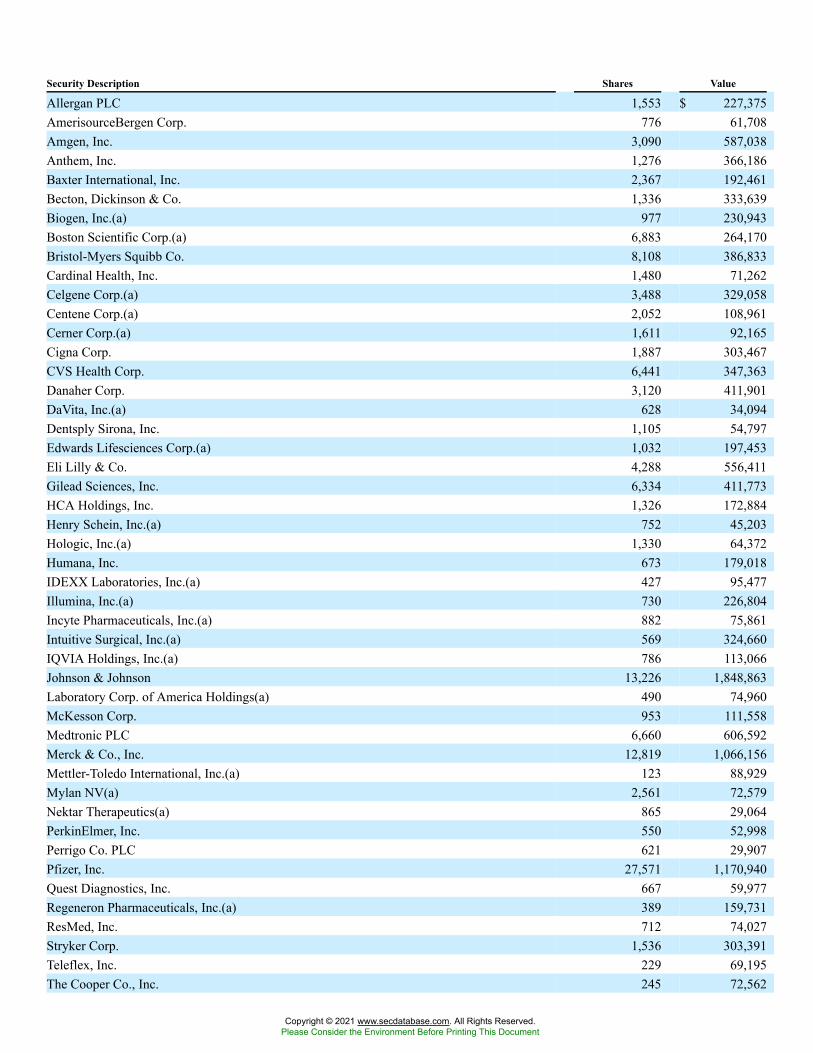
Security Description Shares Value
Allergan PLC 1,553 $ 227,375AmerisourceBergen Corp. 776 61,708Amgen, Inc. 3,090 587,038Anthem, Inc. 1,276 366,186Baxter International, Inc. 2,367 192,461Becton, Dickinson & Co. 1,336 333,639Biogen, Inc.(a) 977 230,943Boston Scientific Corp.(a) 6,883 264,170Bristol-Myers Squibb Co. 8,108 386,833Cardinal Health, Inc. 1,480 71,262Celgene Corp.(a) 3,488 329,058Centene Corp.(a) 2,052 108,961Cerner Corp.(a) 1,611 92,165Cigna Corp. 1,887 303,467CVS Health Corp. 6,441 347,363Danaher Corp. 3,120 411,901DaVita, Inc.(a) 628 34,094Dentsply Sirona, Inc. 1,105 54,797Edwards Lifesciences Corp.(a) 1,032 197,453Eli Lilly & Co. 4,288 556,411Gilead Sciences, Inc. 6,334 411,773HCA Holdings, Inc. 1,326 172,884Henry Schein, Inc.(a) 752 45,203Hologic, Inc.(a) 1,330 64,372Humana, Inc. 673 179,018IDEXX Laboratories, Inc.(a) 427 95,477Illumina, Inc.(a) 730 226,804Incyte Pharmaceuticals, Inc.(a) 882 75,861Intuitive Surgical, Inc.(a) 569 324,660IQVIA Holdings, Inc.(a) 786 113,066Johnson & Johnson 13,226 1,848,863Laboratory Corp. of America Holdings(a) 490 74,960McKesson Corp. 953 111,558Medtronic PLC 6,660 606,592Merck & Co., Inc. 12,819 1,066,156Mettler-Toledo International, Inc.(a) 123 88,929Mylan NV(a) 2,561 72,579Nektar Therapeutics(a) 865 29,064PerkinElmer, Inc. 550 52,998Perrigo Co. PLC 621 29,907Pfizer, Inc. 27,571 1,170,940Quest Diagnostics, Inc. 667 59,977Regeneron Pharmaceuticals, Inc.(a) 389 159,731ResMed, Inc. 712 74,027Stryker Corp. 1,536 303,391Teleflex, Inc. 229 69,195The Cooper Co., Inc. 245 72,562
Copyright © 2021 www.secdatabase.com. All Rights Reserved.Please Consider the Environment Before Printing This Document
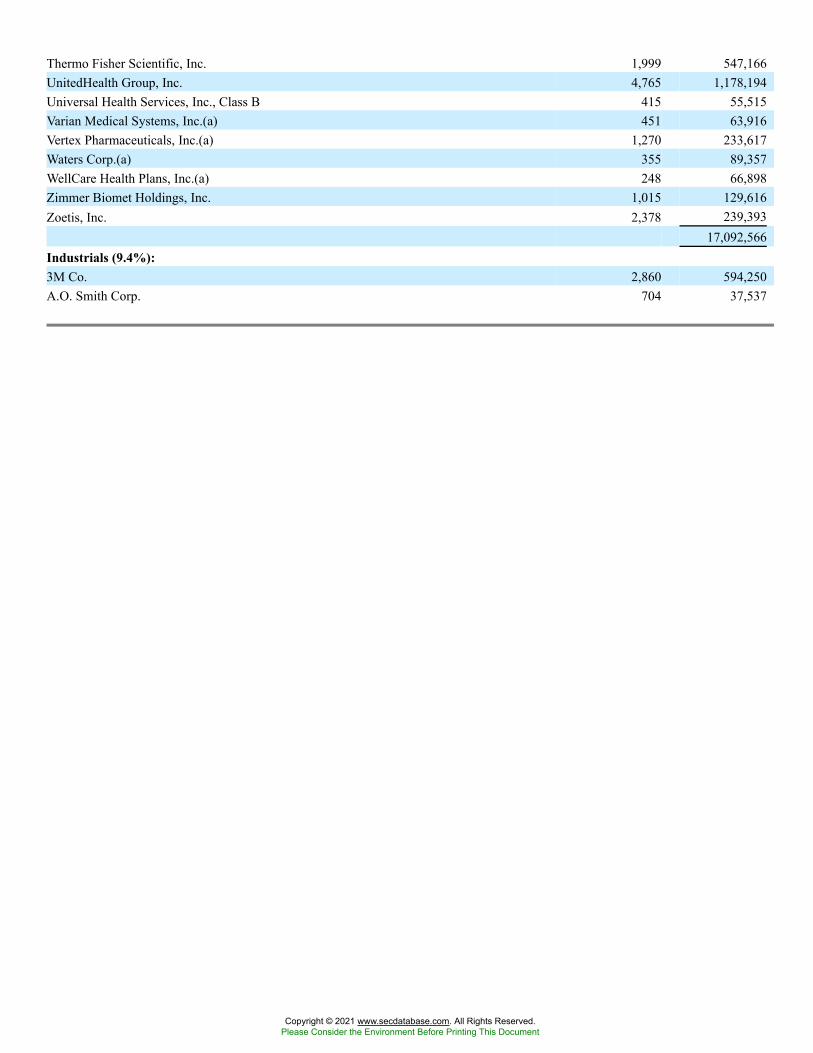
Thermo Fisher Scientific, Inc. 1,999 547,166UnitedHealth Group, Inc. 4,765 1,178,194Universal Health Services, Inc., Class B 415 55,515Varian Medical Systems, Inc.(a) 451 63,916Vertex Pharmaceuticals, Inc.(a) 1,270 233,617Waters Corp.(a) 355 89,357WellCare Health Plans, Inc.(a) 248 66,898Zimmer Biomet Holdings, Inc. 1,015 129,616Zoetis, Inc. 2,378 239,393
17,092,566Industrials (9.4%):3M Co. 2,860 594,250A.O. Smith Corp. 704 37,537
Copyright © 2021 www.secdatabase.com. All Rights Reserved.Please Consider the Environment Before Printing This Document
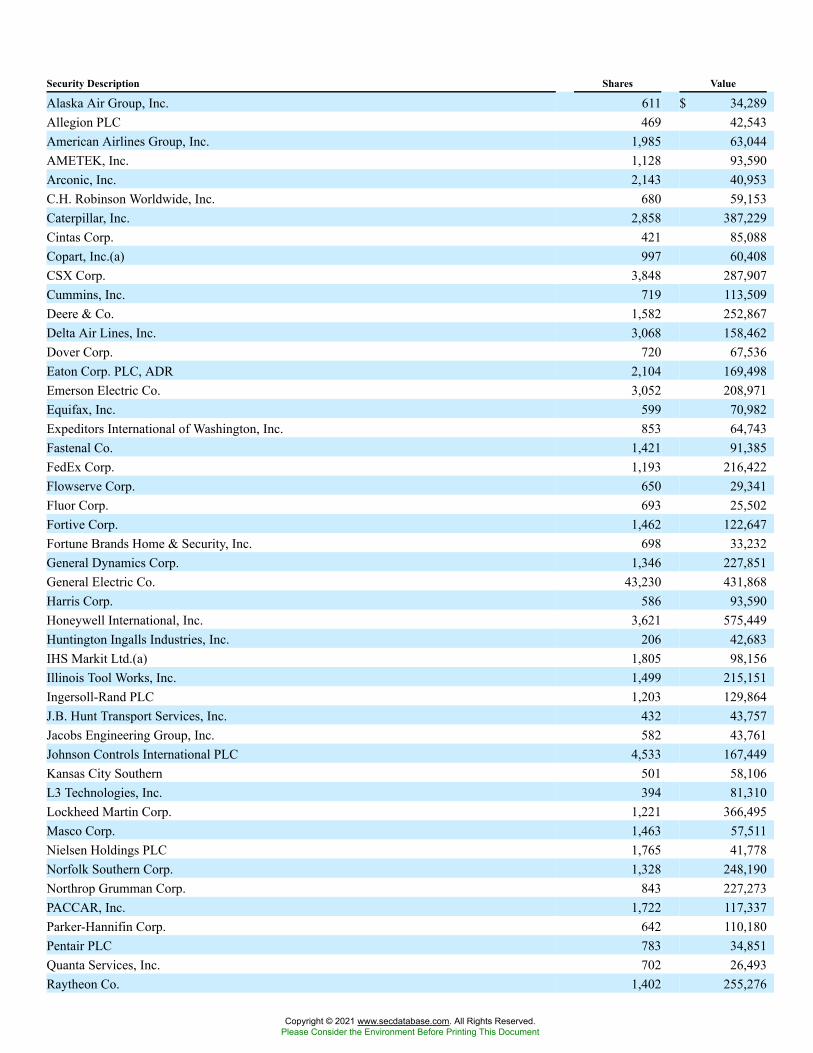
Security Description Shares Value
Alaska Air Group, Inc. 611 $ 34,289Allegion PLC 469 42,543American Airlines Group, Inc. 1,985 63,044AMETEK, Inc. 1,128 93,590Arconic, Inc. 2,143 40,953C.H. Robinson Worldwide, Inc. 680 59,153Caterpillar, Inc. 2,858 387,229Cintas Corp. 421 85,088Copart, Inc.(a) 997 60,408CSX Corp. 3,848 287,907Cummins, Inc. 719 113,509Deere & Co. 1,582 252,867Delta Air Lines, Inc. 3,068 158,462Dover Corp. 720 67,536Eaton Corp. PLC, ADR 2,104 169,498Emerson Electric Co. 3,052 208,971Equifax, Inc. 599 70,982Expeditors International of Washington, Inc. 853 64,743Fastenal Co. 1,421 91,385FedEx Corp. 1,193 216,422Flowserve Corp. 650 29,341Fluor Corp. 693 25,502Fortive Corp. 1,462 122,647Fortune Brands Home & Security, Inc. 698 33,232General Dynamics Corp. 1,346 227,851General Electric Co. 43,230 431,868Harris Corp. 586 93,590Honeywell International, Inc. 3,621 575,449Huntington Ingalls Industries, Inc. 206 42,683IHS Markit Ltd.(a) 1,805 98,156Illinois Tool Works, Inc. 1,499 215,151Ingersoll-Rand PLC 1,203 129,864J.B. Hunt Transport Services, Inc. 432 43,757Jacobs Engineering Group, Inc. 582 43,761Johnson Controls International PLC 4,533 167,449Kansas City Southern 501 58,106L3 Technologies, Inc. 394 81,310Lockheed Martin Corp. 1,221 366,495Masco Corp. 1,463 57,511Nielsen Holdings PLC 1,765 41,778Norfolk Southern Corp. 1,328 248,190Northrop Grumman Corp. 843 227,273PACCAR, Inc. 1,722 117,337Parker-Hannifin Corp. 642 110,180Pentair PLC 783 34,851Quanta Services, Inc. 702 26,493Raytheon Co. 1,402 255,276
Copyright © 2021 www.secdatabase.com. All Rights Reserved.Please Consider the Environment Before Printing This Document
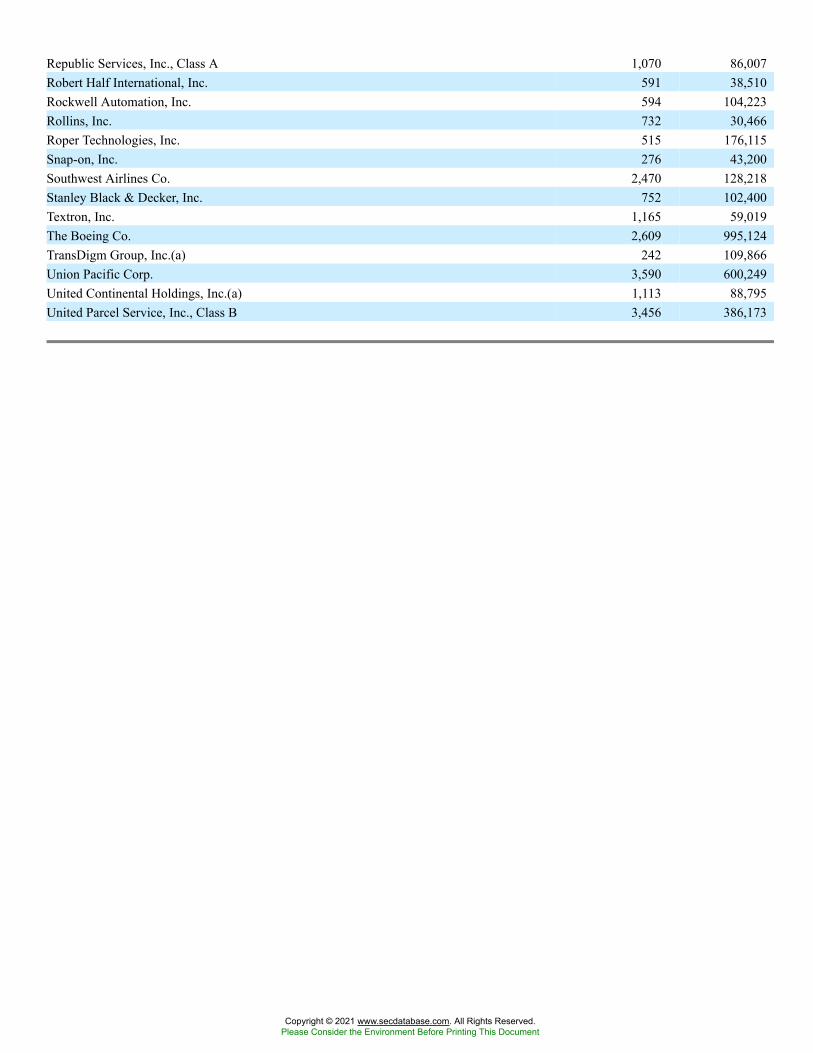
Republic Services, Inc., Class A 1,070 86,007Robert Half International, Inc. 591 38,510Rockwell Automation, Inc. 594 104,223Rollins, Inc. 732 30,466Roper Technologies, Inc. 515 176,115Snap-on, Inc. 276 43,200Southwest Airlines Co. 2,470 128,218Stanley Black & Decker, Inc. 752 102,400Textron, Inc. 1,165 59,019The Boeing Co. 2,609 995,124TransDigm Group, Inc.(a) 242 109,866Union Pacific Corp. 3,590 600,249United Continental Holdings, Inc.(a) 1,113 88,795United Parcel Service, Inc., Class B 3,456 386,173
Copyright © 2021 www.secdatabase.com. All Rights Reserved.Please Consider the Environment Before Printing This Document
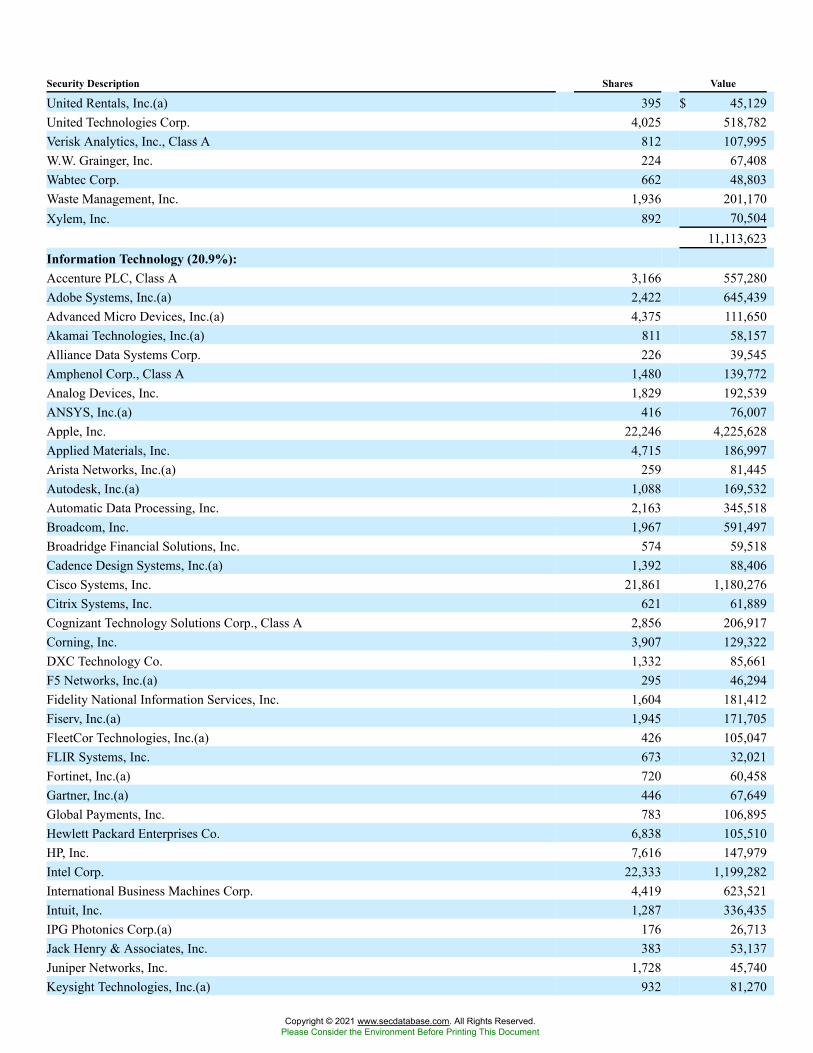
Security Description Shares Value
United Rentals, Inc.(a) 395 $ 45,129United Technologies Corp. 4,025 518,782Verisk Analytics, Inc., Class A 812 107,995W.W. Grainger, Inc. 224 67,408Wabtec Corp. 662 48,803Waste Management, Inc. 1,936 201,170Xylem, Inc. 892 70,504
11,113,623Information Technology (20.9%):Accenture PLC, Class A 3,166 557,280Adobe Systems, Inc.(a) 2,422 645,439Advanced Micro Devices, Inc.(a) 4,375 111,650Akamai Technologies, Inc.(a) 811 58,157Alliance Data Systems Corp. 226 39,545Amphenol Corp., Class A 1,480 139,772Analog Devices, Inc. 1,829 192,539ANSYS, Inc.(a) 416 76,007Apple, Inc. 22,246 4,225,628Applied Materials, Inc. 4,715 186,997Arista Networks, Inc.(a) 259 81,445Autodesk, Inc.(a) 1,088 169,532Automatic Data Processing, Inc. 2,163 345,518Broadcom, Inc. 1,967 591,497Broadridge Financial Solutions, Inc. 574 59,518Cadence Design Systems, Inc.(a) 1,392 88,406Cisco Systems, Inc. 21,861 1,180,276Citrix Systems, Inc. 621 61,889Cognizant Technology Solutions Corp., Class A 2,856 206,917Corning, Inc. 3,907 129,322DXC Technology Co. 1,332 85,661F5 Networks, Inc.(a) 295 46,294Fidelity National Information Services, Inc. 1,604 181,412Fiserv, Inc.(a) 1,945 171,705FleetCor Technologies, Inc.(a) 426 105,047FLIR Systems, Inc. 673 32,021Fortinet, Inc.(a) 720 60,458Gartner, Inc.(a) 446 67,649Global Payments, Inc. 783 106,895Hewlett Packard Enterprises Co. 6,838 105,510HP, Inc. 7,616 147,979Intel Corp. 22,333 1,199,282International Business Machines Corp. 4,419 623,521Intuit, Inc. 1,287 336,435IPG Photonics Corp.(a) 176 26,713Jack Henry & Associates, Inc. 383 53,137Juniper Networks, Inc. 1,728 45,740Keysight Technologies, Inc.(a) 932 81,270
Copyright © 2021 www.secdatabase.com. All Rights Reserved.Please Consider the Environment Before Printing This Document
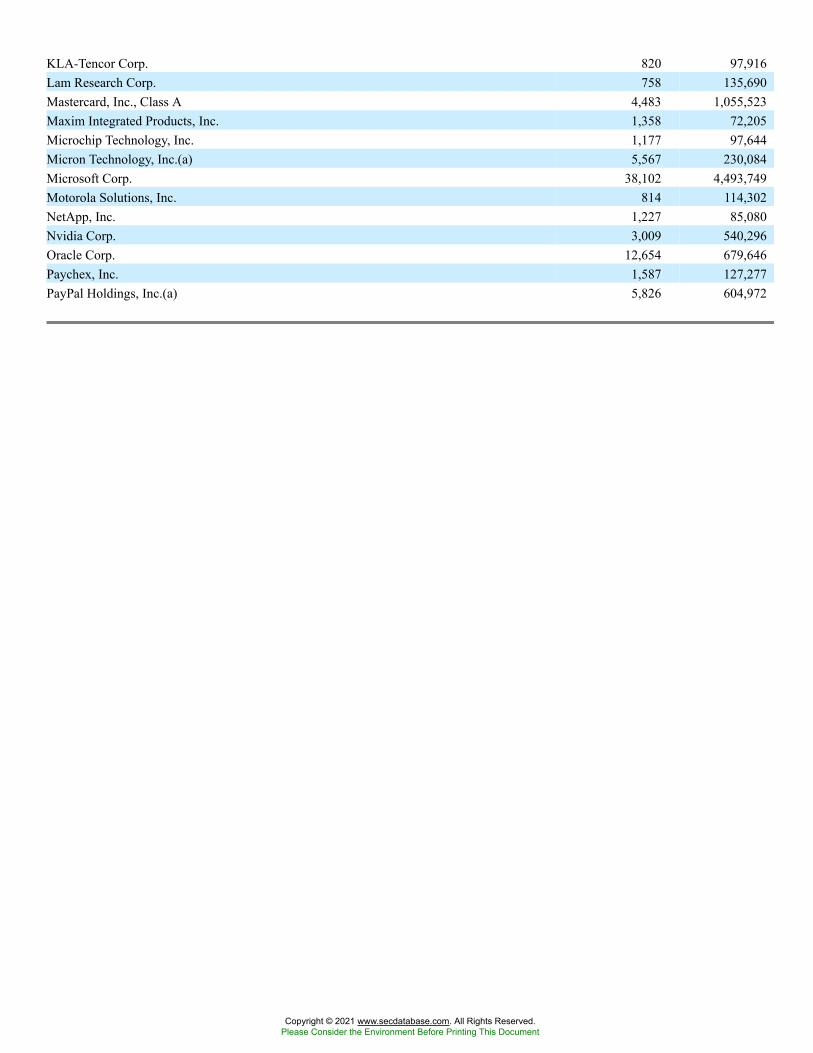
KLA-Tencor Corp. 820 97,916Lam Research Corp. 758 135,690Mastercard, Inc., Class A 4,483 1,055,523Maxim Integrated Products, Inc. 1,358 72,205Microchip Technology, Inc. 1,177 97,644Micron Technology, Inc.(a) 5,567 230,084Microsoft Corp. 38,102 4,493,749Motorola Solutions, Inc. 814 114,302NetApp, Inc. 1,227 85,080Nvidia Corp. 3,009 540,296Oracle Corp. 12,654 679,646Paychex, Inc. 1,587 127,277PayPal Holdings, Inc.(a) 5,826 604,972
Copyright © 2021 www.secdatabase.com. All Rights Reserved.Please Consider the Environment Before Printing This Document
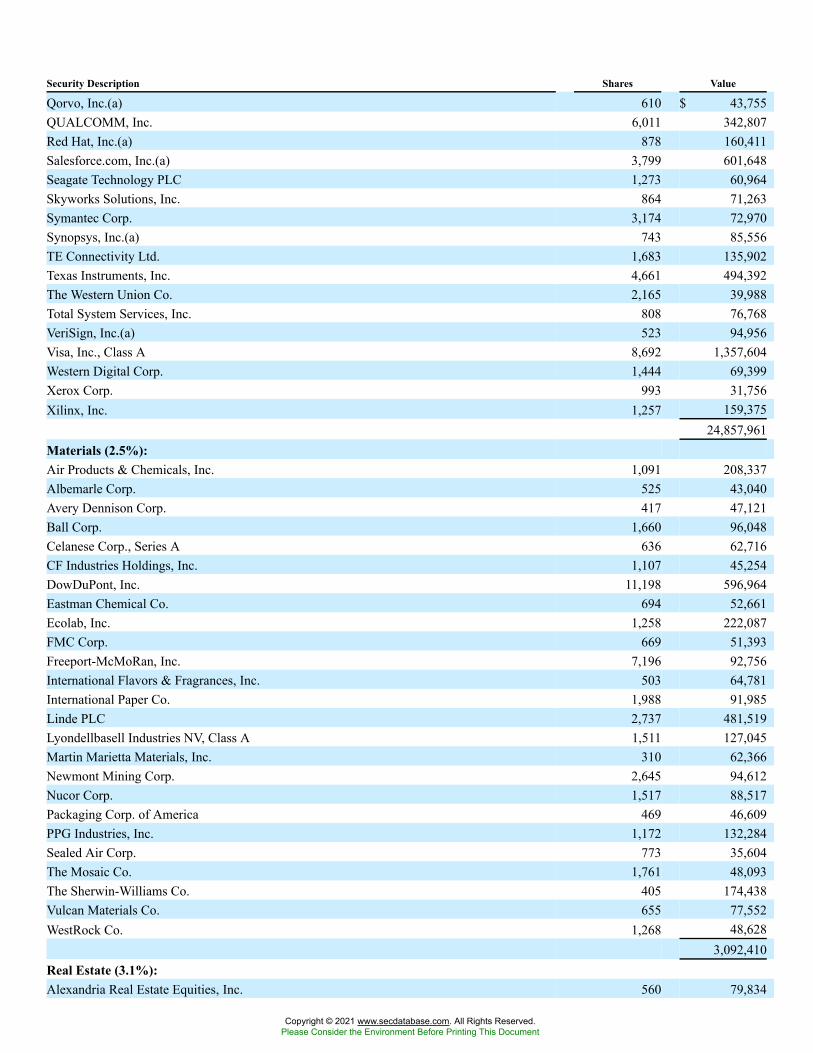
Security Description Shares Value
Qorvo, Inc.(a) 610 $ 43,755QUALCOMM, Inc. 6,011 342,807Red Hat, Inc.(a) 878 160,411Salesforce.com, Inc.(a) 3,799 601,648Seagate Technology PLC 1,273 60,964Skyworks Solutions, Inc. 864 71,263Symantec Corp. 3,174 72,970Synopsys, Inc.(a) 743 85,556TE Connectivity Ltd. 1,683 135,902Texas Instruments, Inc. 4,661 494,392The Western Union Co. 2,165 39,988Total System Services, Inc. 808 76,768VeriSign, Inc.(a) 523 94,956Visa, Inc., Class A 8,692 1,357,604Western Digital Corp. 1,444 69,399Xerox Corp. 993 31,756Xilinx, Inc. 1,257 159,375
24,857,961Materials (2.5%):Air Products & Chemicals, Inc. 1,091 208,337Albemarle Corp. 525 43,040Avery Dennison Corp. 417 47,121Ball Corp. 1,660 96,048Celanese Corp., Series A 636 62,716CF Industries Holdings, Inc. 1,107 45,254DowDuPont, Inc. 11,198 596,964Eastman Chemical Co. 694 52,661Ecolab, Inc. 1,258 222,087FMC Corp. 669 51,393Freeport-McMoRan, Inc. 7,196 92,756International Flavors & Fragrances, Inc. 503 64,781International Paper Co. 1,988 91,985Linde PLC 2,737 481,519Lyondellbasell Industries NV, Class A 1,511 127,045Martin Marietta Materials, Inc. 310 62,366Newmont Mining Corp. 2,645 94,612Nucor Corp. 1,517 88,517Packaging Corp. of America 469 46,609PPG Industries, Inc. 1,172 132,284Sealed Air Corp. 773 35,604The Mosaic Co. 1,761 48,093The Sherwin-Williams Co. 405 174,438Vulcan Materials Co. 655 77,552WestRock Co. 1,268 48,628
3,092,410Real Estate (3.1%):Alexandria Real Estate Equities, Inc. 560 79,834
Copyright © 2021 www.secdatabase.com. All Rights Reserved.Please Consider the Environment Before Printing This Document
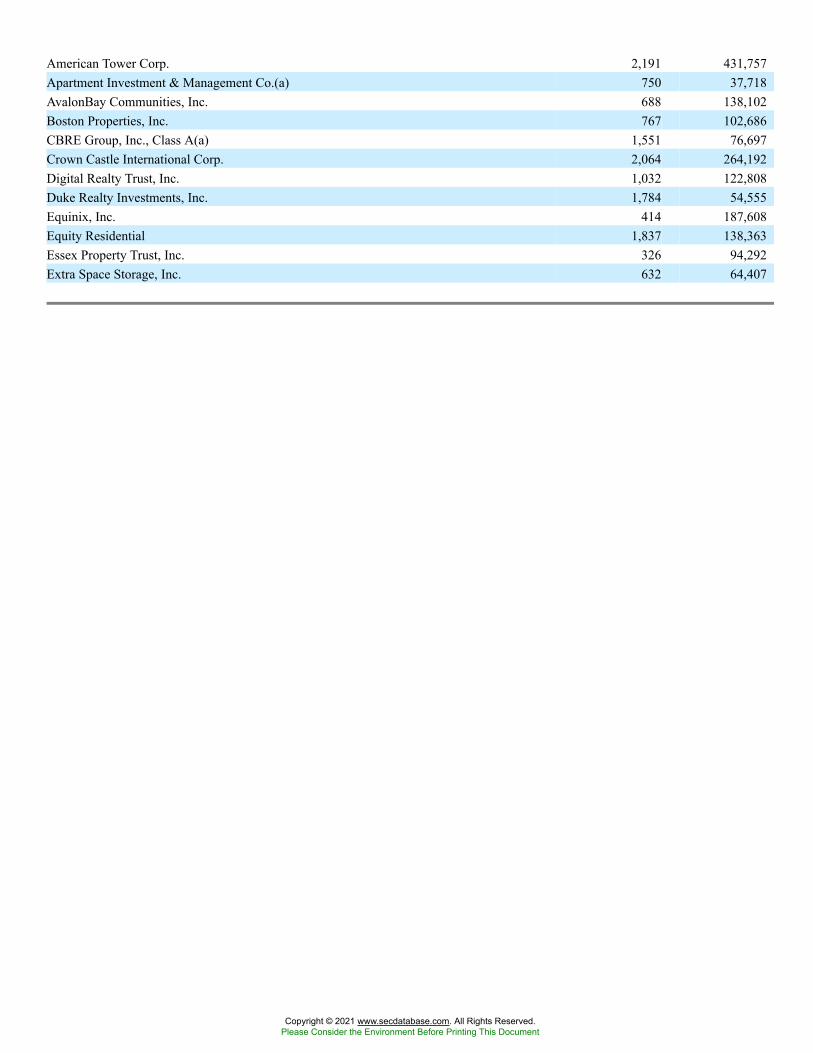
American Tower Corp. 2,191 431,757Apartment Investment & Management Co.(a) 750 37,718AvalonBay Communities, Inc. 688 138,102Boston Properties, Inc. 767 102,686CBRE Group, Inc., Class A(a) 1,551 76,697Crown Castle International Corp. 2,064 264,192Digital Realty Trust, Inc. 1,032 122,808Duke Realty Investments, Inc. 1,784 54,555Equinix, Inc. 414 187,608Equity Residential 1,837 138,363Essex Property Trust, Inc. 326 94,292Extra Space Storage, Inc. 632 64,407
Copyright © 2021 www.secdatabase.com. All Rights Reserved.Please Consider the Environment Before Printing This Document
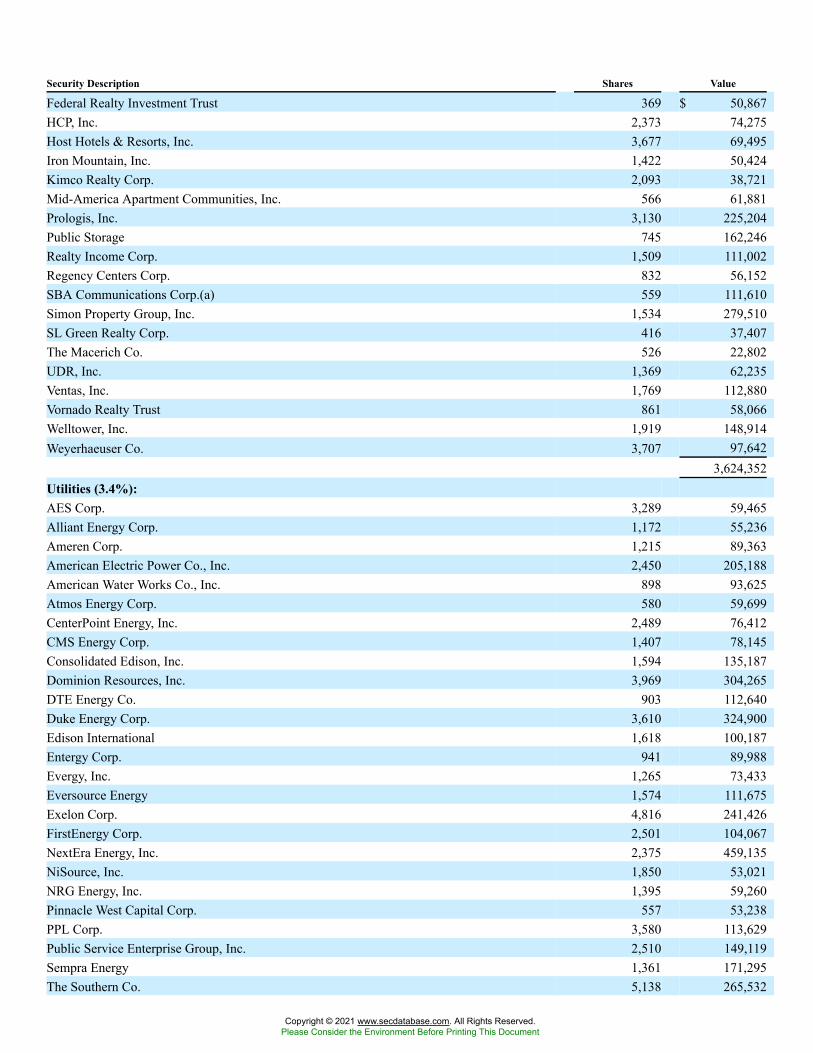
Security Description Shares Value
Federal Realty Investment Trust 369 $ 50,867HCP, Inc. 2,373 74,275Host Hotels & Resorts, Inc. 3,677 69,495Iron Mountain, Inc. 1,422 50,424Kimco Realty Corp. 2,093 38,721Mid-America Apartment Communities, Inc. 566 61,881Prologis, Inc. 3,130 225,204Public Storage 745 162,246Realty Income Corp. 1,509 111,002Regency Centers Corp. 832 56,152SBA Communications Corp.(a) 559 111,610Simon Property Group, Inc. 1,534 279,510SL Green Realty Corp. 416 37,407The Macerich Co. 526 22,802UDR, Inc. 1,369 62,235Ventas, Inc. 1,769 112,880Vornado Realty Trust 861 58,066Welltower, Inc. 1,919 148,914Weyerhaeuser Co. 3,707 97,642
3,624,352Utilities (3.4%):AES Corp. 3,289 59,465Alliant Energy Corp. 1,172 55,236Ameren Corp. 1,215 89,363American Electric Power Co., Inc. 2,450 205,188American Water Works Co., Inc. 898 93,625Atmos Energy Corp. 580 59,699CenterPoint Energy, Inc. 2,489 76,412CMS Energy Corp. 1,407 78,145Consolidated Edison, Inc. 1,594 135,187Dominion Resources, Inc. 3,969 304,265DTE Energy Co. 903 112,640Duke Energy Corp. 3,610 324,900Edison International 1,618 100,187Entergy Corp. 941 89,988Evergy, Inc. 1,265 73,433Eversource Energy 1,574 111,675Exelon Corp. 4,816 241,426FirstEnergy Corp. 2,501 104,067NextEra Energy, Inc. 2,375 459,135NiSource, Inc. 1,850 53,021NRG Energy, Inc. 1,395 59,260Pinnacle West Capital Corp. 557 53,238PPL Corp. 3,580 113,629Public Service Enterprise Group, Inc. 2,510 149,119Sempra Energy 1,361 171,295The Southern Co. 5,138 265,532
Copyright © 2021 www.secdatabase.com. All Rights Reserved.Please Consider the Environment Before Printing This Document
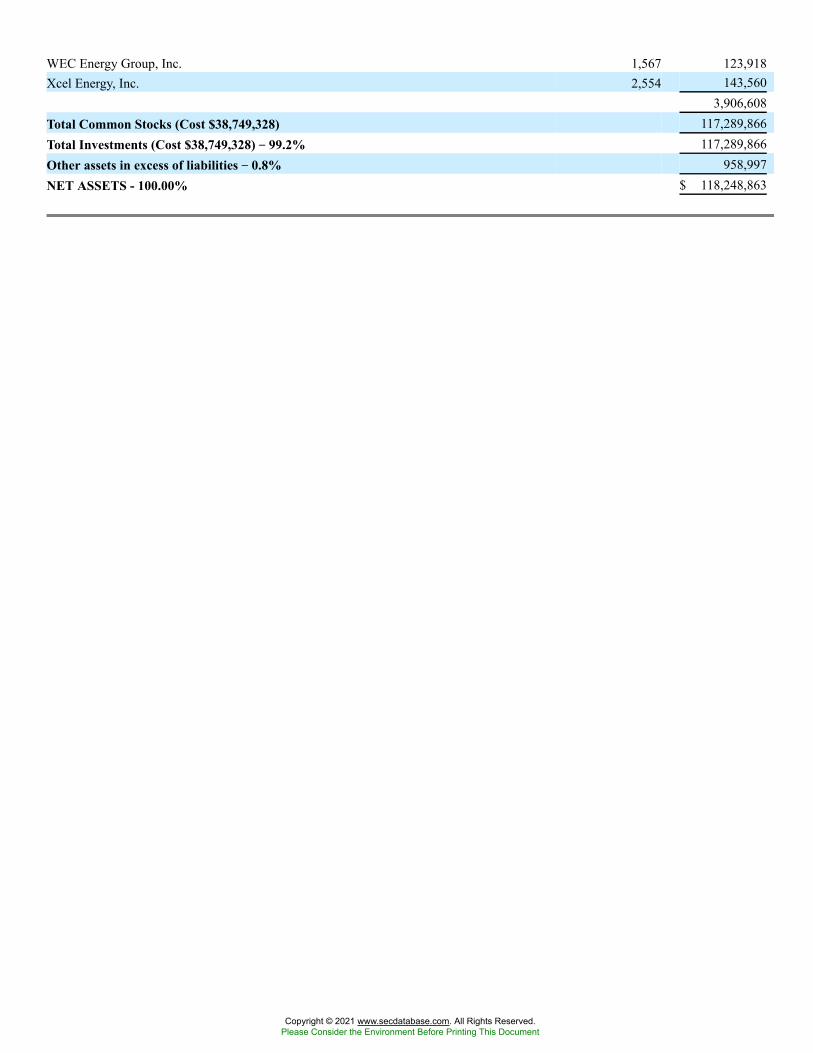
WEC Energy Group, Inc. 1,567 123,918Xcel Energy, Inc. 2,554 143,560
3,906,608Total Common Stocks (Cost $38,749,328) 117,289,866Total Investments (Cost $38,749,328) �� 99.2% 117,289,866Other assets in excess of liabilities �� 0.8% 958,997NET ASSETS - 100.00% $ 118,248,863
Copyright © 2021 www.secdatabase.com. All Rights Reserved.Please Consider the Environment Before Printing This Document
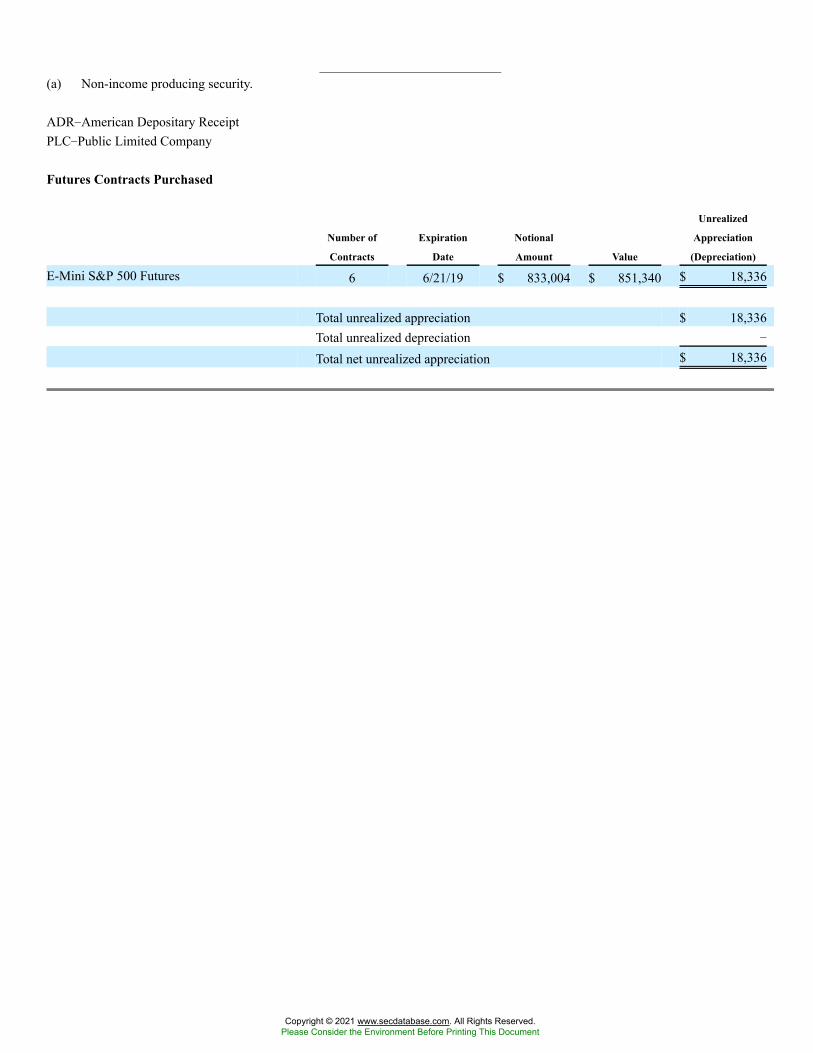
(a) Non-income producing security.
ADR�American Depositary ReceiptPLC�Public Limited Company
Futures Contracts Purchased
Number of
Contracts
Expiration
Date
Notional
Amount Value
Unrealized
Appreciation
(Depreciation)
E-Mini S&P 500 Futures 6 6/21/19 $ 833,004 $ 851,340 $ 18,336
Total unrealized appreciation $ 18,336Total unrealized depreciation �
Total net unrealized appreciation $ 18,336
Copyright © 2021 www.secdatabase.com. All Rights Reserved.Please Consider the Environment Before Printing This Document
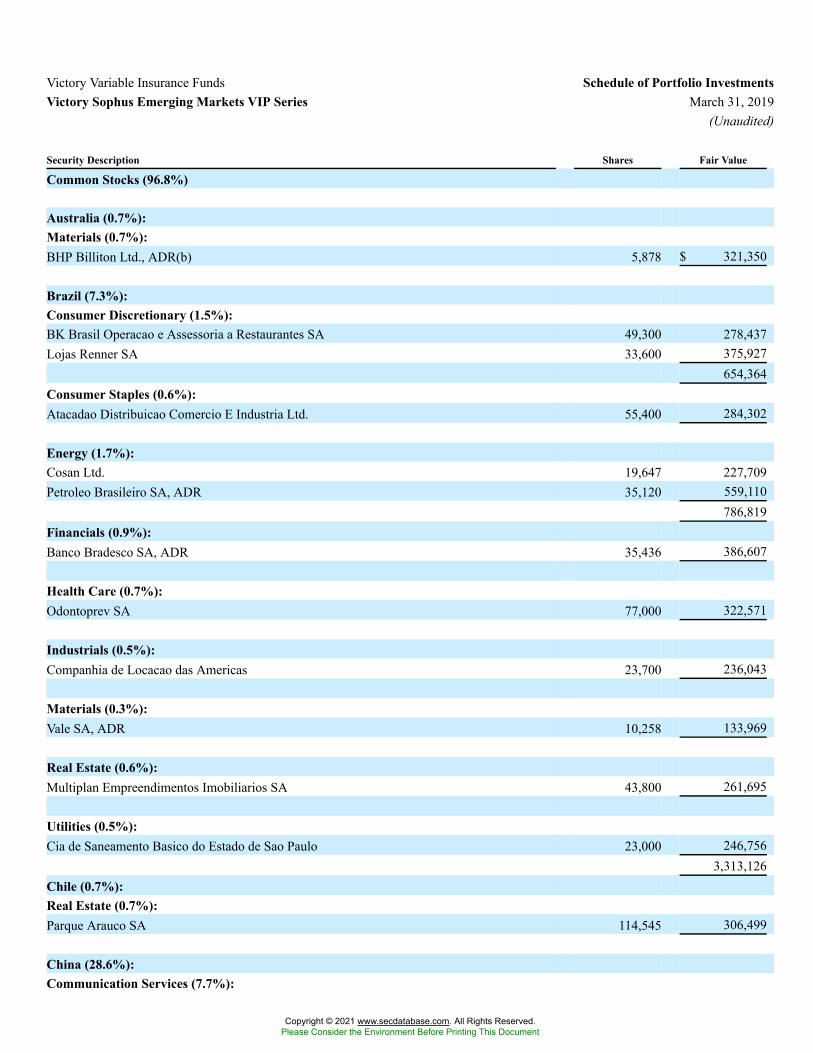
Victory Variable Insurance Funds Schedule of Portfolio InvestmentsVictory Sophus Emerging Markets VIP Series March 31, 2019
(Unaudited)
Security Description Shares Fair Value
Common Stocks (96.8%)
Australia (0.7%):Materials (0.7%):BHP Billiton Ltd., ADR(b) 5,878 $ 321,350
Brazil (7.3%):Consumer Discretionary (1.5%):BK Brasil Operacao e Assessoria a Restaurantes SA 49,300 278,437Lojas Renner SA 33,600 375,927
654,364Consumer Staples (0.6%):Atacadao Distribuicao Comercio E Industria Ltd. 55,400 284,302
Energy (1.7%):Cosan Ltd. 19,647 227,709Petroleo Brasileiro SA, ADR 35,120 559,110
786,819Financials (0.9%):Banco Bradesco SA, ADR 35,436 386,607
Health Care (0.7%):Odontoprev SA 77,000 322,571
Industrials (0.5%):Companhia de Locacao das Americas 23,700 236,043
Materials (0.3%):Vale SA, ADR 10,258 133,969
Real Estate (0.6%):Multiplan Empreendimentos Imobiliarios SA 43,800 261,695
Utilities (0.5%):Cia de Saneamento Basico do Estado de Sao Paulo 23,000 246,756
3,313,126Chile (0.7%):Real Estate (0.7%):Parque Arauco SA 114,545 306,499
China (28.6%):Communication Services (7.7%):
Copyright © 2021 www.secdatabase.com. All Rights Reserved.Please Consider the Environment Before Printing This Document
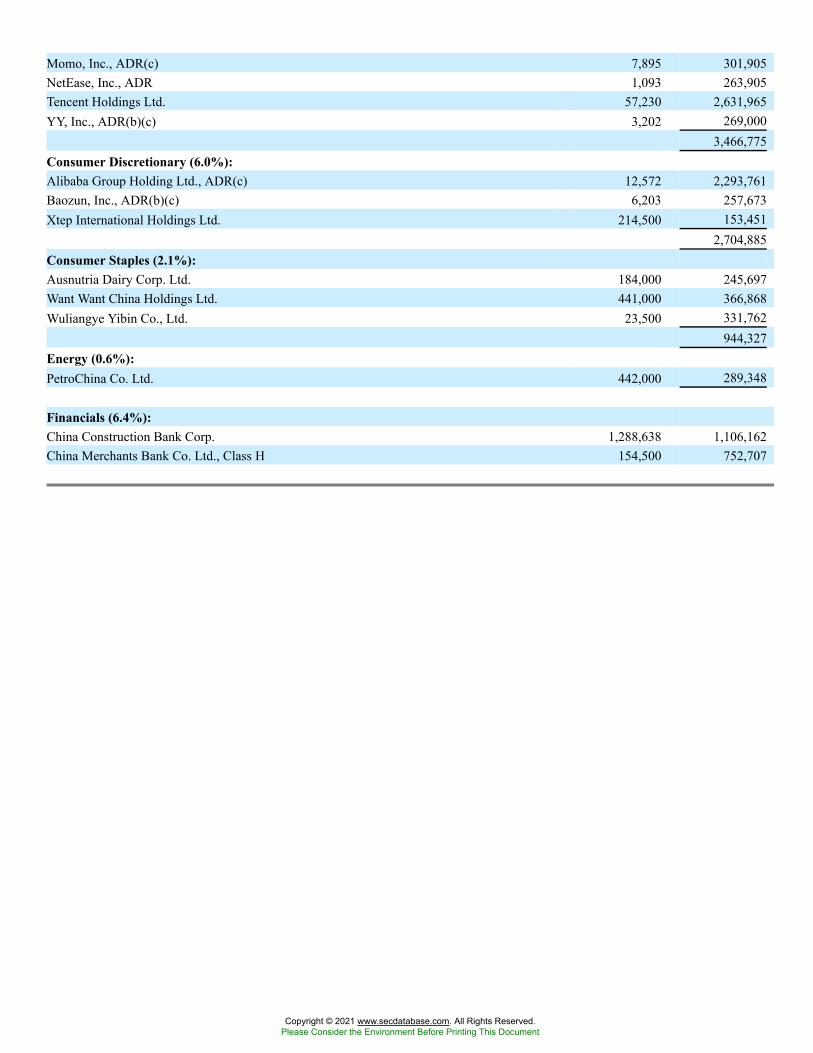
Momo, Inc., ADR(c) 7,895 301,905NetEase, Inc., ADR 1,093 263,905Tencent Holdings Ltd. 57,230 2,631,965YY, Inc., ADR(b)(c) 3,202 269,000
3,466,775Consumer Discretionary (6.0%):Alibaba Group Holding Ltd., ADR(c) 12,572 2,293,761Baozun, Inc., ADR(b)(c) 6,203 257,673Xtep International Holdings Ltd. 214,500 153,451
2,704,885Consumer Staples (2.1%):Ausnutria Dairy Corp. Ltd. 184,000 245,697Want Want China Holdings Ltd. 441,000 366,868Wuliangye Yibin Co., Ltd. 23,500 331,762
944,327Energy (0.6%):PetroChina Co. Ltd. 442,000 289,348
Financials (6.4%):China Construction Bank Corp. 1,288,638 1,106,162China Merchants Bank Co. Ltd., Class H 154,500 752,707
Copyright © 2021 www.secdatabase.com. All Rights Reserved.Please Consider the Environment Before Printing This Document
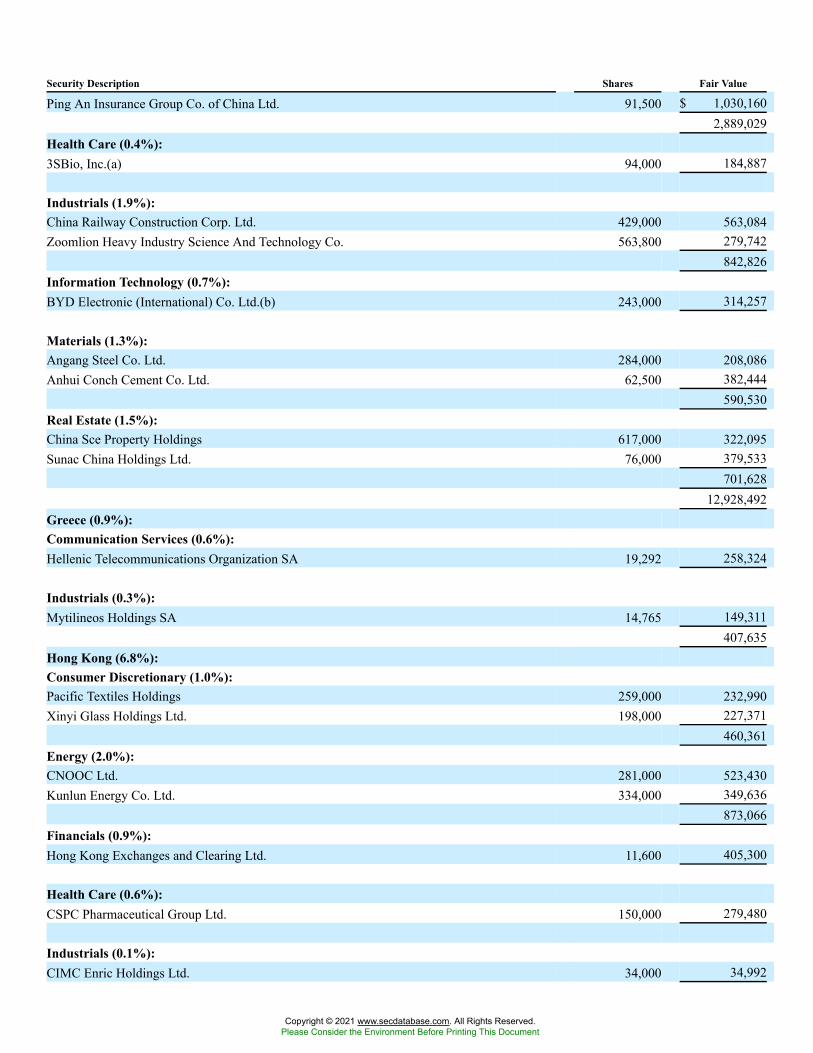
Security Description Shares Fair Value
Ping An Insurance Group Co. of China Ltd. 91,500 $ 1,030,1602,889,029
Health Care (0.4%):3SBio, Inc.(a) 94,000 184,887
Industrials (1.9%):China Railway Construction Corp. Ltd. 429,000 563,084Zoomlion Heavy Industry Science And Technology Co. 563,800 279,742
842,826Information Technology (0.7%):BYD Electronic (International) Co. Ltd.(b) 243,000 314,257
Materials (1.3%):Angang Steel Co. Ltd. 284,000 208,086Anhui Conch Cement Co. Ltd. 62,500 382,444
590,530Real Estate (1.5%):China Sce Property Holdings 617,000 322,095Sunac China Holdings Ltd. 76,000 379,533
701,62812,928,492
Greece (0.9%):Communication Services (0.6%):Hellenic Telecommunications Organization SA 19,292 258,324
Industrials (0.3%):Mytilineos Holdings SA 14,765 149,311
407,635Hong Kong (6.8%):Consumer Discretionary (1.0%):Pacific Textiles Holdings 259,000 232,990Xinyi Glass Holdings Ltd. 198,000 227,371
460,361Energy (2.0%):CNOOC Ltd. 281,000 523,430Kunlun Energy Co. Ltd. 334,000 349,636
873,066Financials (0.9%):Hong Kong Exchanges and Clearing Ltd. 11,600 405,300
Health Care (0.6%):CSPC Pharmaceutical Group Ltd. 150,000 279,480
Industrials (0.1%):CIMC Enric Holdings Ltd. 34,000 34,992
Copyright © 2021 www.secdatabase.com. All Rights Reserved.Please Consider the Environment Before Printing This Document
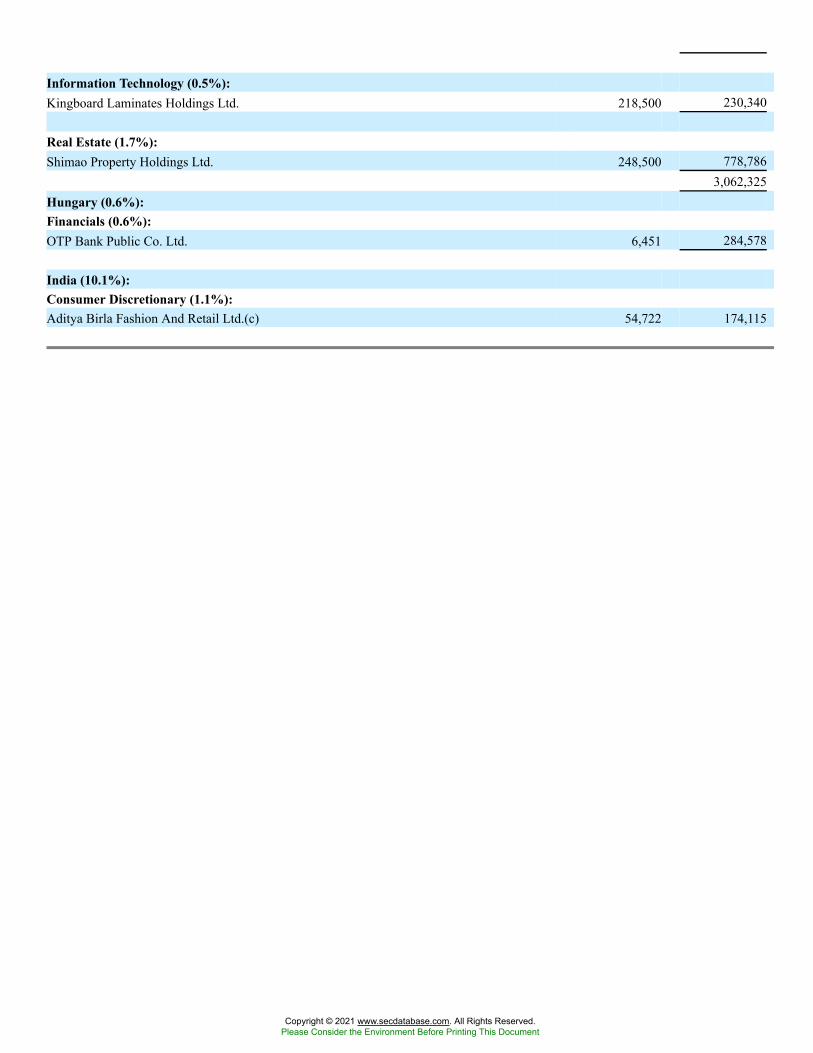
Information Technology (0.5%):Kingboard Laminates Holdings Ltd. 218,500 230,340
Real Estate (1.7%):Shimao Property Holdings Ltd. 248,500 778,786
3,062,325Hungary (0.6%):Financials (0.6%):OTP Bank Public Co. Ltd. 6,451 284,578
India (10.1%):Consumer Discretionary (1.1%):Aditya Birla Fashion And Retail Ltd.(c) 54,722 174,115
Copyright © 2021 www.secdatabase.com. All Rights Reserved.Please Consider the Environment Before Printing This Document
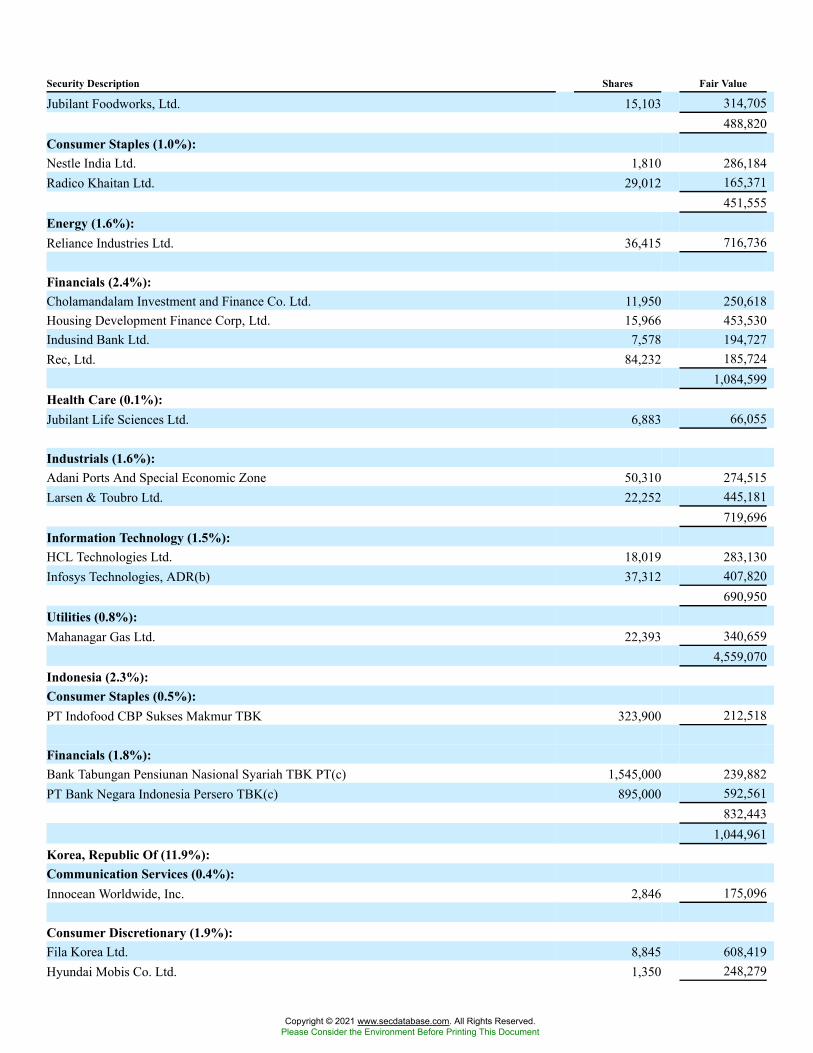
Security Description Shares Fair Value
Jubilant Foodworks, Ltd. 15,103 314,705488,820
Consumer Staples (1.0%):Nestle India Ltd. 1,810 286,184Radico Khaitan Ltd. 29,012 165,371
451,555Energy (1.6%):Reliance Industries Ltd. 36,415 716,736
Financials (2.4%):Cholamandalam Investment and Finance Co. Ltd. 11,950 250,618Housing Development Finance Corp, Ltd. 15,966 453,530Indusind Bank Ltd. 7,578 194,727Rec, Ltd. 84,232 185,724
1,084,599Health Care (0.1%):Jubilant Life Sciences Ltd. 6,883 66,055
Industrials (1.6%):Adani Ports And Special Economic Zone 50,310 274,515Larsen & Toubro Ltd. 22,252 445,181
719,696Information Technology (1.5%):HCL Technologies Ltd. 18,019 283,130Infosys Technologies, ADR(b) 37,312 407,820
690,950Utilities (0.8%):Mahanagar Gas Ltd. 22,393 340,659
4,559,070Indonesia (2.3%):Consumer Staples (0.5%):PT Indofood CBP Sukses Makmur TBK 323,900 212,518
Financials (1.8%):Bank Tabungan Pensiunan Nasional Syariah TBK PT(c) 1,545,000 239,882PT Bank Negara Indonesia Persero TBK(c) 895,000 592,561
832,4431,044,961
Korea, Republic Of (11.9%):Communication Services (0.4%):Innocean Worldwide, Inc. 2,846 175,096
Consumer Discretionary (1.9%):Fila Korea Ltd. 8,845 608,419Hyundai Mobis Co. Ltd. 1,350 248,279
Copyright © 2021 www.secdatabase.com. All Rights Reserved.Please Consider the Environment Before Printing This Document
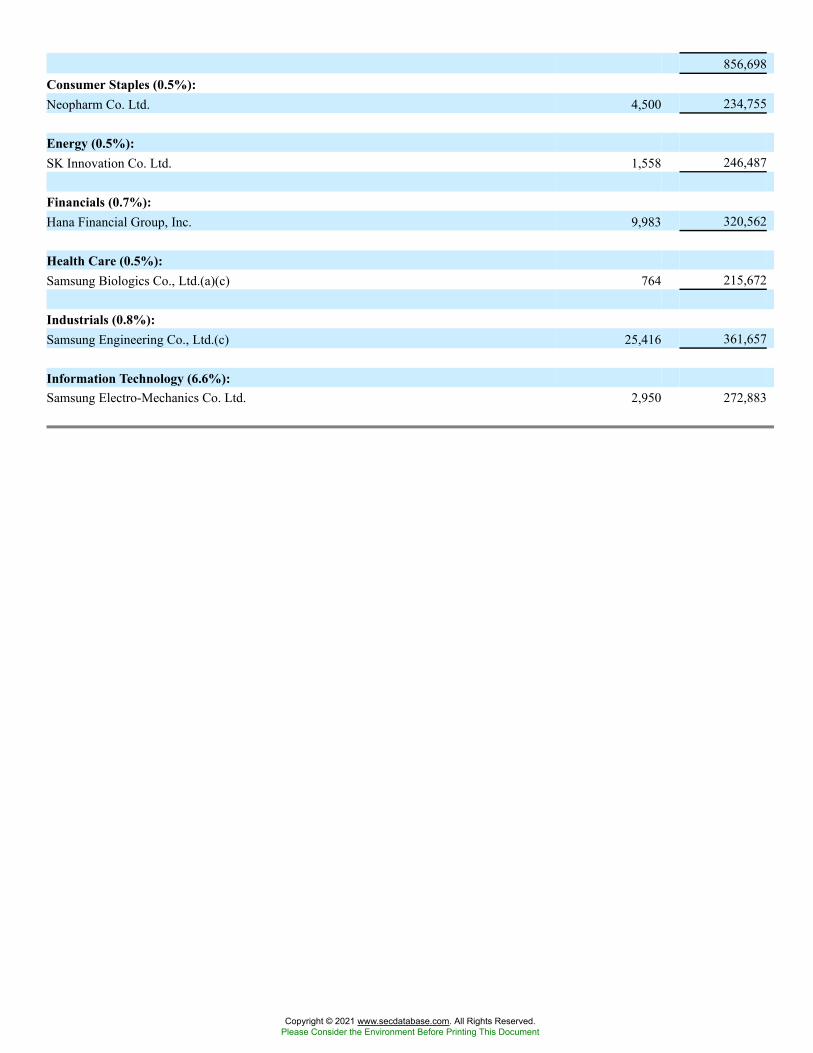
856,698Consumer Staples (0.5%):Neopharm Co. Ltd. 4,500 234,755
Energy (0.5%):SK Innovation Co. Ltd. 1,558 246,487
Financials (0.7%):Hana Financial Group, Inc. 9,983 320,562
Health Care (0.5%):Samsung Biologics Co., Ltd.(a)(c) 764 215,672
Industrials (0.8%):Samsung Engineering Co., Ltd.(c) 25,416 361,657
Information Technology (6.6%):Samsung Electro-Mechanics Co. Ltd. 2,950 272,883
Copyright © 2021 www.secdatabase.com. All Rights Reserved.Please Consider the Environment Before Printing This Document
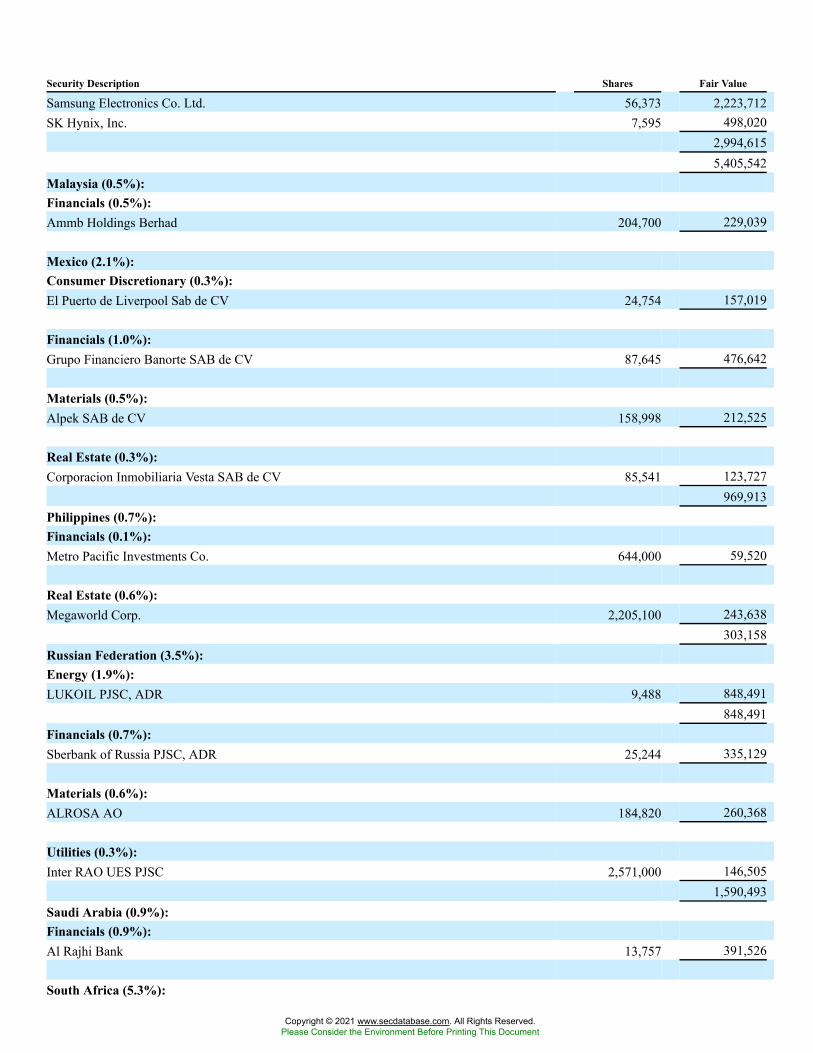
Security Description Shares Fair Value
Samsung Electronics Co. Ltd. 56,373 2,223,712SK Hynix, Inc. 7,595 498,020
2,994,6155,405,542
Malaysia (0.5%):Financials (0.5%):Ammb Holdings Berhad 204,700 229,039
Mexico (2.1%):Consumer Discretionary (0.3%):El Puerto de Liverpool Sab de CV 24,754 157,019
Financials (1.0%):Grupo Financiero Banorte SAB de CV 87,645 476,642
Materials (0.5%):Alpek SAB de CV 158,998 212,525
Real Estate (0.3%):Corporacion Inmobiliaria Vesta SAB de CV 85,541 123,727
969,913Philippines (0.7%):Financials (0.1%):Metro Pacific Investments Co. 644,000 59,520
Real Estate (0.6%):Megaworld Corp. 2,205,100 243,638
303,158Russian Federation (3.5%):Energy (1.9%):LUKOIL PJSC, ADR 9,488 848,491
848,491Financials (0.7%):Sberbank of Russia PJSC, ADR 25,244 335,129
Materials (0.6%):ALROSA AO 184,820 260,368
Utilities (0.3%):Inter RAO UES PJSC 2,571,000 146,505
1,590,493Saudi Arabia (0.9%):Financials (0.9%):Al Rajhi Bank 13,757 391,526
South Africa (5.3%):
Copyright © 2021 www.secdatabase.com. All Rights Reserved.Please Consider the Environment Before Printing This Document
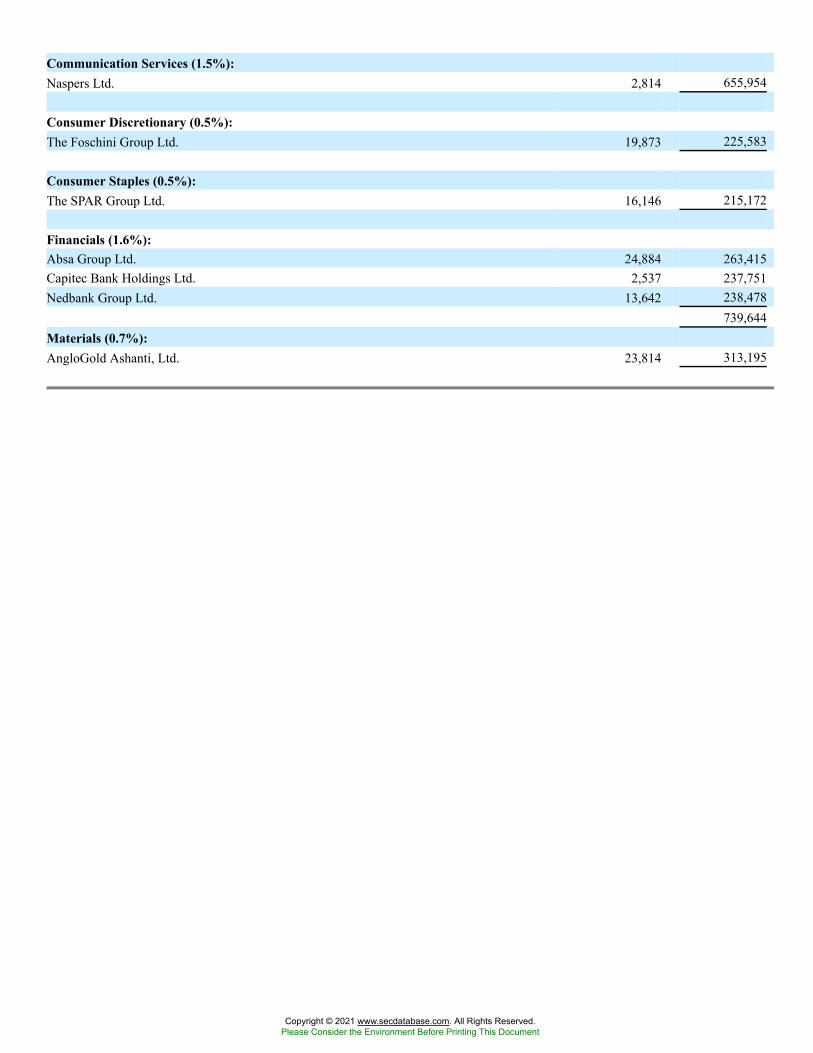
Communication Services (1.5%):Naspers Ltd. 2,814 655,954
Consumer Discretionary (0.5%):The Foschini Group Ltd. 19,873 225,583
Consumer Staples (0.5%):The SPAR Group Ltd. 16,146 215,172
Financials (1.6%):Absa Group Ltd. 24,884 263,415Capitec Bank Holdings Ltd. 2,537 237,751Nedbank Group Ltd. 13,642 238,478
739,644Materials (0.7%):AngloGold Ashanti, Ltd. 23,814 313,195
Copyright © 2021 www.secdatabase.com. All Rights Reserved.Please Consider the Environment Before Printing This Document
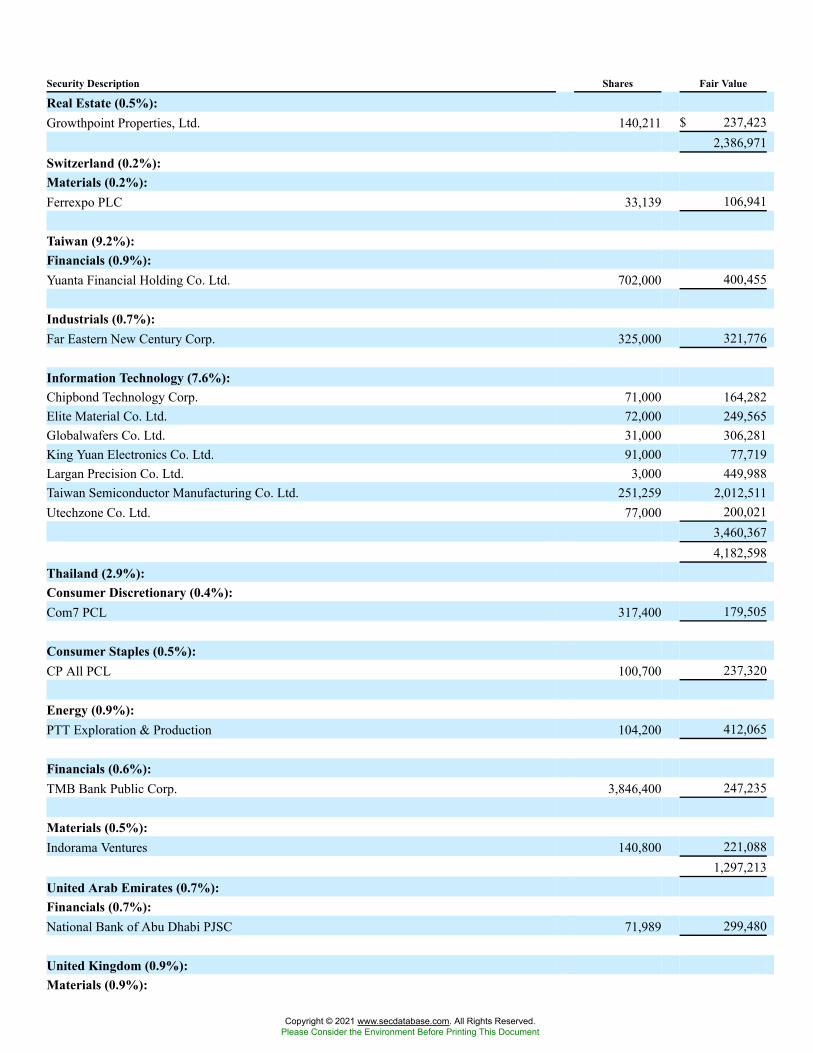
Security Description Shares Fair Value
Real Estate (0.5%):Growthpoint Properties, Ltd. 140,211 $ 237,423
2,386,971Switzerland (0.2%):Materials (0.2%):Ferrexpo PLC 33,139 106,941
Taiwan (9.2%):Financials (0.9%):Yuanta Financial Holding Co. Ltd. 702,000 400,455
Industrials (0.7%):Far Eastern New Century Corp. 325,000 321,776
Information Technology (7.6%):Chipbond Technology Corp. 71,000 164,282Elite Material Co. Ltd. 72,000 249,565Globalwafers Co. Ltd. 31,000 306,281King Yuan Electronics Co. Ltd. 91,000 77,719Largan Precision Co. Ltd. 3,000 449,988Taiwan Semiconductor Manufacturing Co. Ltd. 251,259 2,012,511Utechzone Co. Ltd. 77,000 200,021
3,460,3674,182,598
Thailand (2.9%):Consumer Discretionary (0.4%):Com7 PCL 317,400 179,505
Consumer Staples (0.5%):CP All PCL 100,700 237,320
Energy (0.9%):PTT Exploration & Production 104,200 412,065
Financials (0.6%):TMB Bank Public Corp. 3,846,400 247,235
Materials (0.5%):Indorama Ventures 140,800 221,088
1,297,213United Arab Emirates (0.7%):Financials (0.7%):National Bank of Abu Dhabi PJSC 71,989 299,480
United Kingdom (0.9%):Materials (0.9%):
Copyright © 2021 www.secdatabase.com. All Rights Reserved.Please Consider the Environment Before Printing This Document
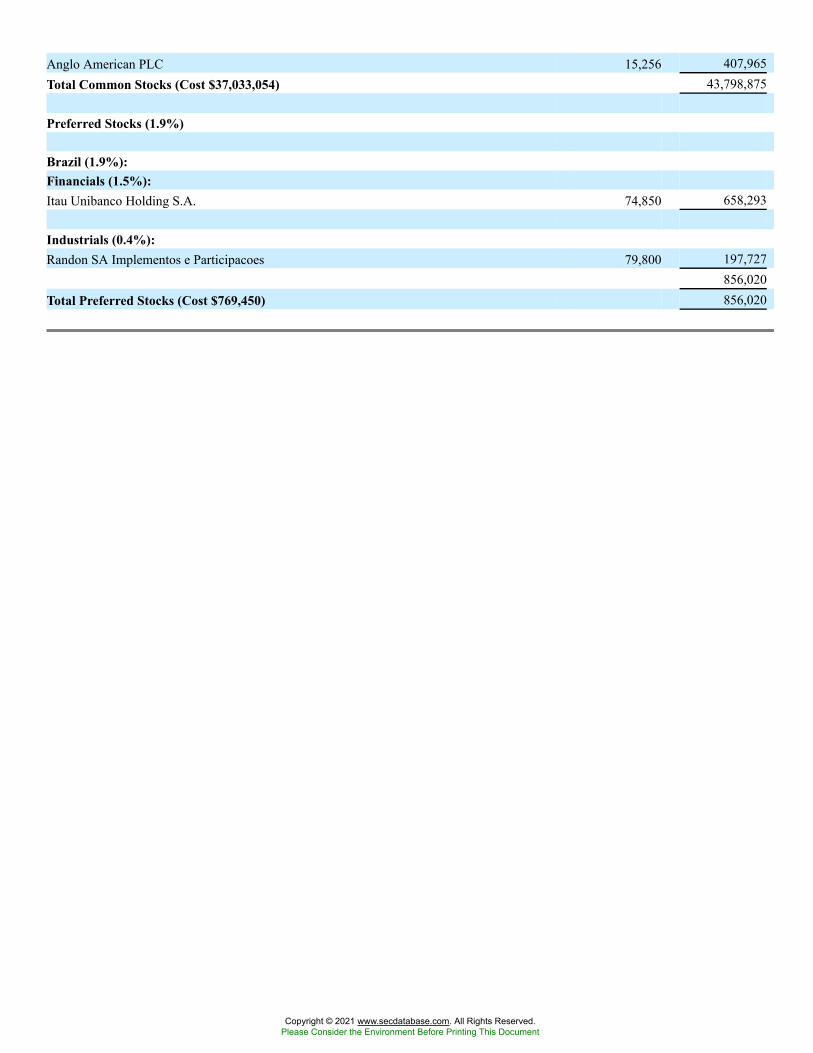
Anglo American PLC 15,256 407,965Total Common Stocks (Cost $37,033,054) 43,798,875
Preferred Stocks (1.9%)
Brazil (1.9%):Financials (1.5%):Itau Unibanco Holding S.A. 74,850 658,293
Industrials (0.4%):Randon SA Implementos e Participacoes 79,800 197,727
856,020Total Preferred Stocks (Cost $769,450) 856,020
Copyright © 2021 www.secdatabase.com. All Rights Reserved.Please Consider the Environment Before Printing This Document
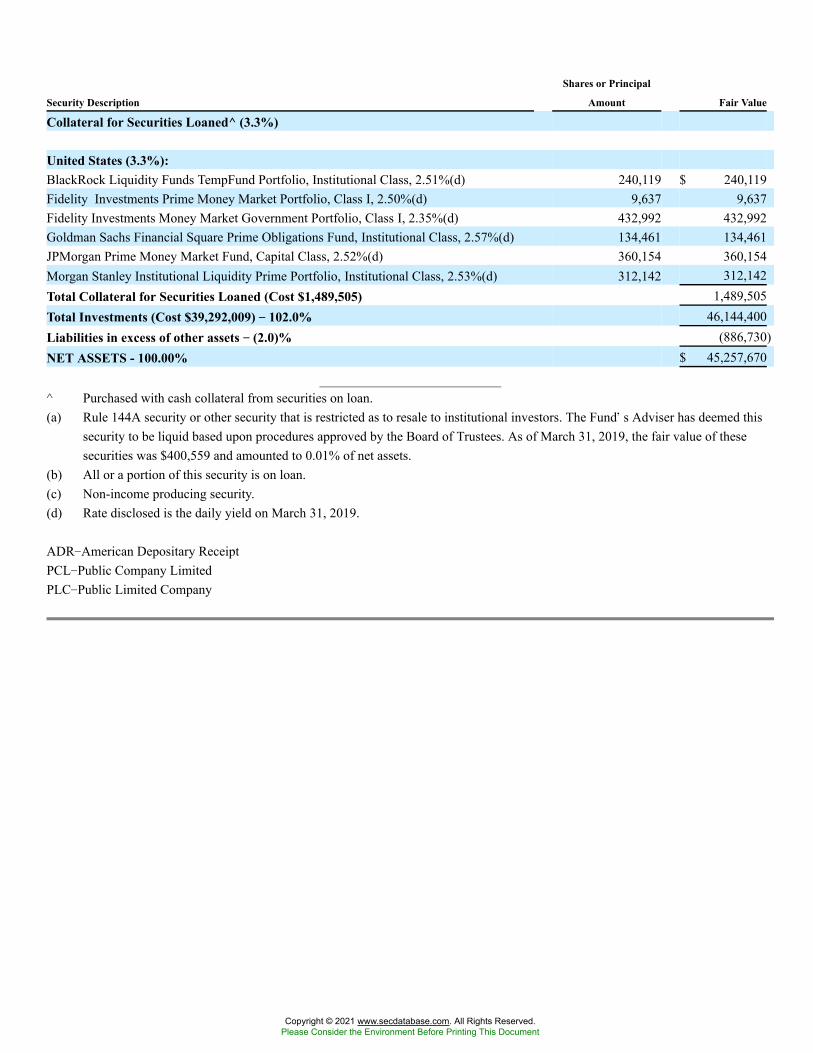
Security Description
Shares or Principal
Amount Fair Value
Collateral for Securities Loaned^ (3.3%)
United States (3.3%):BlackRock Liquidity Funds TempFund Portfolio, Institutional Class, 2.51%(d) 240,119 $ 240,119Fidelity Investments Prime Money Market Portfolio, Class I, 2.50%(d) 9,637 9,637Fidelity Investments Money Market Government Portfolio, Class I, 2.35%(d) 432,992 432,992Goldman Sachs Financial Square Prime Obligations Fund, Institutional Class, 2.57%(d) 134,461 134,461JPMorgan Prime Money Market Fund, Capital Class, 2.52%(d) 360,154 360,154Morgan Stanley Institutional Liquidity Prime Portfolio, Institutional Class, 2.53%(d) 312,142 312,142Total Collateral for Securities Loaned (Cost $1,489,505) 1,489,505Total Investments (Cost $39,292,009) �� 102.0% 46,144,400Liabilities in excess of other assets �� (2.0)% (886,730)NET ASSETS - 100.00% $ 45,257,670
^ Purchased with cash collateral from securities on loan.(a) Rule 144A security or other security that is restricted as to resale to institutional investors. The Fund�s Adviser has deemed this
security to be liquid based upon procedures approved by the Board of Trustees. As of March 31, 2019, the fair value of thesesecurities was $400,559 and amounted to 0.01% of net assets.
(b) All or a portion of this security is on loan.(c) Non-income producing security.(d) Rate disclosed is the daily yield on March 31, 2019.
ADR�American Depositary ReceiptPCL�Public Company LimitedPLC�Public Limited Company
Copyright © 2021 www.secdatabase.com. All Rights Reserved.Please Consider the Environment Before Printing This Document
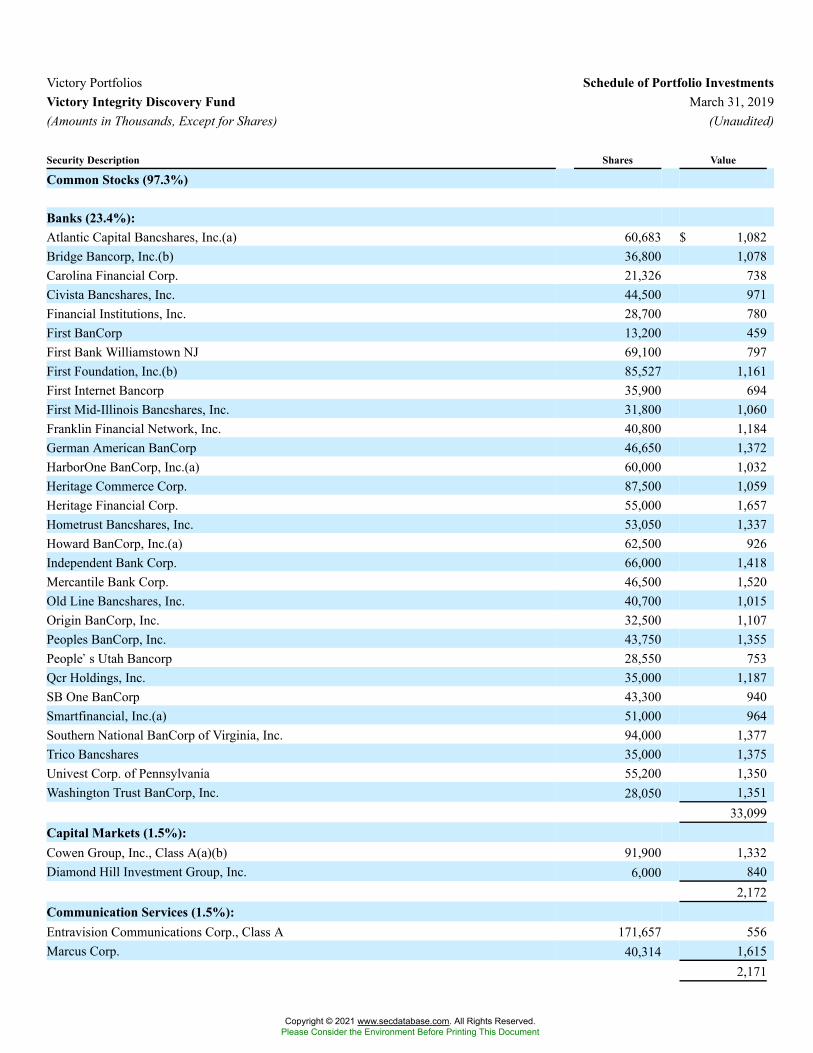
Victory Portfolios Schedule of Portfolio InvestmentsVictory Integrity Discovery Fund March 31, 2019(Amounts in Thousands, Except for Shares) (Unaudited)
Security Description Shares Value
Common Stocks (97.3%)
Banks (23.4%):Atlantic Capital Bancshares, Inc.(a) 60,683 $ 1,082Bridge Bancorp, Inc.(b) 36,800 1,078Carolina Financial Corp. 21,326 738Civista Bancshares, Inc. 44,500 971Financial Institutions, Inc. 28,700 780First BanCorp 13,200 459First Bank Williamstown NJ 69,100 797First Foundation, Inc.(b) 85,527 1,161First Internet Bancorp 35,900 694First Mid-Illinois Bancshares, Inc. 31,800 1,060Franklin Financial Network, Inc. 40,800 1,184German American BanCorp 46,650 1,372HarborOne BanCorp, Inc.(a) 60,000 1,032Heritage Commerce Corp. 87,500 1,059Heritage Financial Corp. 55,000 1,657Hometrust Bancshares, Inc. 53,050 1,337Howard BanCorp, Inc.(a) 62,500 926Independent Bank Corp. 66,000 1,418Mercantile Bank Corp. 46,500 1,520Old Line Bancshares, Inc. 40,700 1,015Origin BanCorp, Inc. 32,500 1,107Peoples BanCorp, Inc. 43,750 1,355People�s Utah Bancorp 28,550 753Qcr Holdings, Inc. 35,000 1,187SB One BanCorp 43,300 940Smartfinancial, Inc.(a) 51,000 964Southern National BanCorp of Virginia, Inc. 94,000 1,377Trico Bancshares 35,000 1,375Univest Corp. of Pennsylvania 55,200 1,350Washington Trust BanCorp, Inc. 28,050 1,351
33,099Capital Markets (1.5%):Cowen Group, Inc., Class A(a)(b) 91,900 1,332Diamond Hill Investment Group, Inc. 6,000 840
2,172Communication Services (1.5%):Entravision Communications Corp., Class A 171,657 556Marcus Corp. 40,314 1,615
2,171
Copyright © 2021 www.secdatabase.com. All Rights Reserved.Please Consider the Environment Before Printing This Document
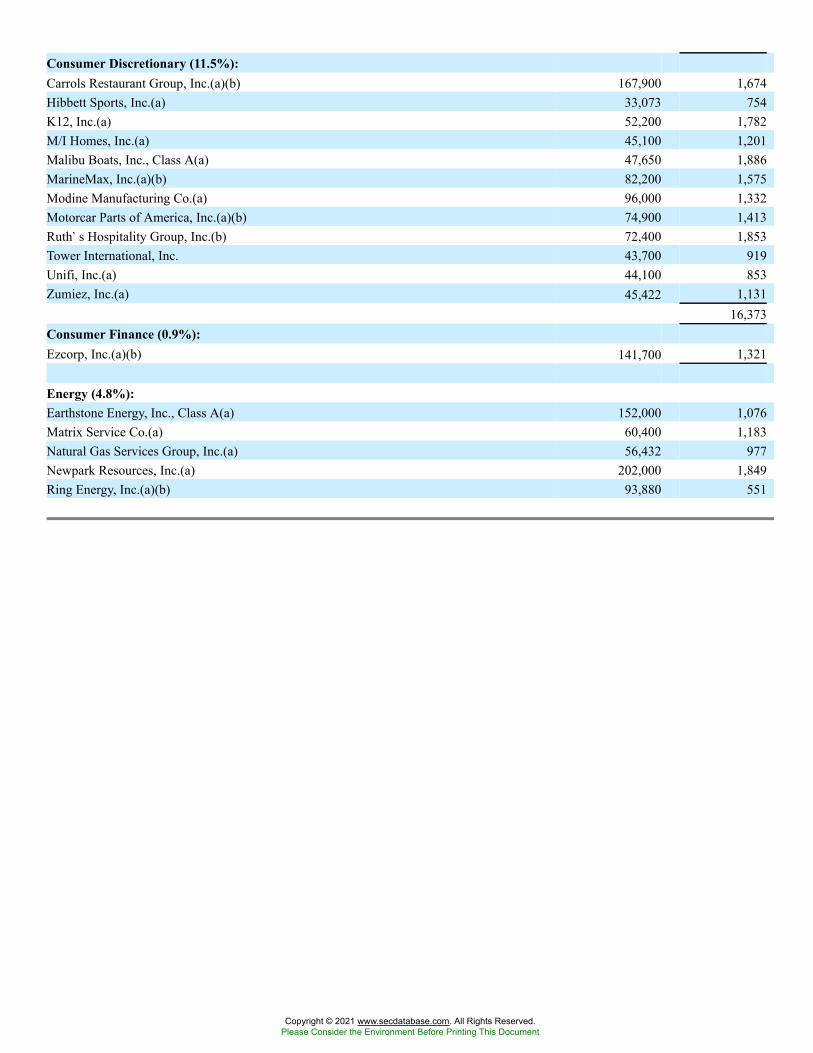
Consumer Discretionary (11.5%):Carrols Restaurant Group, Inc.(a)(b) 167,900 1,674Hibbett Sports, Inc.(a) 33,073 754K12, Inc.(a) 52,200 1,782M/I Homes, Inc.(a) 45,100 1,201Malibu Boats, Inc., Class A(a) 47,650 1,886MarineMax, Inc.(a)(b) 82,200 1,575Modine Manufacturing Co.(a) 96,000 1,332Motorcar Parts of America, Inc.(a)(b) 74,900 1,413Ruth�s Hospitality Group, Inc.(b) 72,400 1,853Tower International, Inc. 43,700 919Unifi, Inc.(a) 44,100 853Zumiez, Inc.(a) 45,422 1,131
16,373Consumer Finance (0.9%):Ezcorp, Inc.(a)(b) 141,700 1,321
Energy (4.8%):Earthstone Energy, Inc., Class A(a) 152,000 1,076Matrix Service Co.(a) 60,400 1,183Natural Gas Services Group, Inc.(a) 56,432 977Newpark Resources, Inc.(a) 202,000 1,849Ring Energy, Inc.(a)(b) 93,880 551
Copyright © 2021 www.secdatabase.com. All Rights Reserved.Please Consider the Environment Before Printing This Document
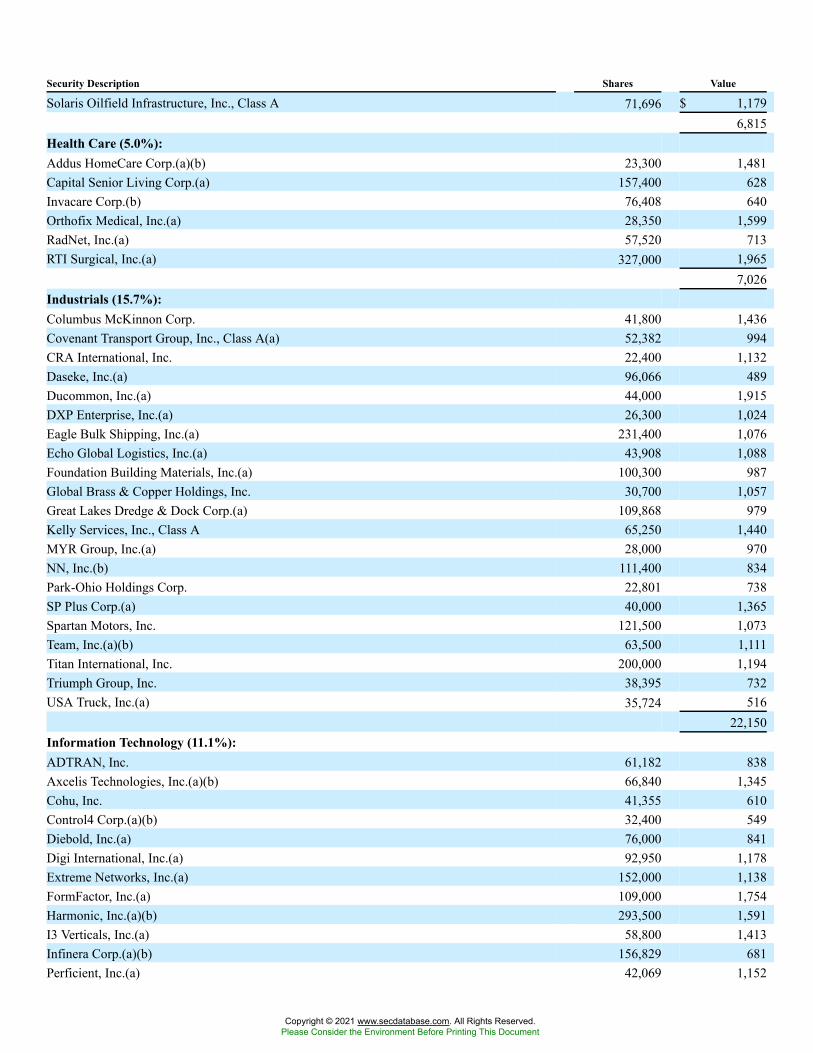
Security Description Shares Value
Solaris Oilfield Infrastructure, Inc., Class A 71,696 $ 1,1796,815
Health Care (5.0%):Addus HomeCare Corp.(a)(b) 23,300 1,481Capital Senior Living Corp.(a) 157,400 628Invacare Corp.(b) 76,408 640Orthofix Medical, Inc.(a) 28,350 1,599RadNet, Inc.(a) 57,520 713RTI Surgical, Inc.(a) 327,000 1,965
7,026Industrials (15.7%):Columbus McKinnon Corp. 41,800 1,436Covenant Transport Group, Inc., Class A(a) 52,382 994CRA International, Inc. 22,400 1,132Daseke, Inc.(a) 96,066 489Ducommon, Inc.(a) 44,000 1,915DXP Enterprise, Inc.(a) 26,300 1,024Eagle Bulk Shipping, Inc.(a) 231,400 1,076Echo Global Logistics, Inc.(a) 43,908 1,088Foundation Building Materials, Inc.(a) 100,300 987Global Brass & Copper Holdings, Inc. 30,700 1,057Great Lakes Dredge & Dock Corp.(a) 109,868 979Kelly Services, Inc., Class A 65,250 1,440MYR Group, Inc.(a) 28,000 970NN, Inc.(b) 111,400 834Park-Ohio Holdings Corp. 22,801 738SP Plus Corp.(a) 40,000 1,365Spartan Motors, Inc. 121,500 1,073Team, Inc.(a)(b) 63,500 1,111Titan International, Inc. 200,000 1,194Triumph Group, Inc. 38,395 732USA Truck, Inc.(a) 35,724 516
22,150Information Technology (11.1%):ADTRAN, Inc. 61,182 838Axcelis Technologies, Inc.(a)(b) 66,840 1,345Cohu, Inc. 41,355 610Control4 Corp.(a)(b) 32,400 549Diebold, Inc.(a) 76,000 841Digi International, Inc.(a) 92,950 1,178Extreme Networks, Inc.(a) 152,000 1,138FormFactor, Inc.(a) 109,000 1,754Harmonic, Inc.(a)(b) 293,500 1,591I3 Verticals, Inc.(a) 58,800 1,413Infinera Corp.(a)(b) 156,829 681Perficient, Inc.(a) 42,069 1,152
Copyright © 2021 www.secdatabase.com. All Rights Reserved.Please Consider the Environment Before Printing This Document
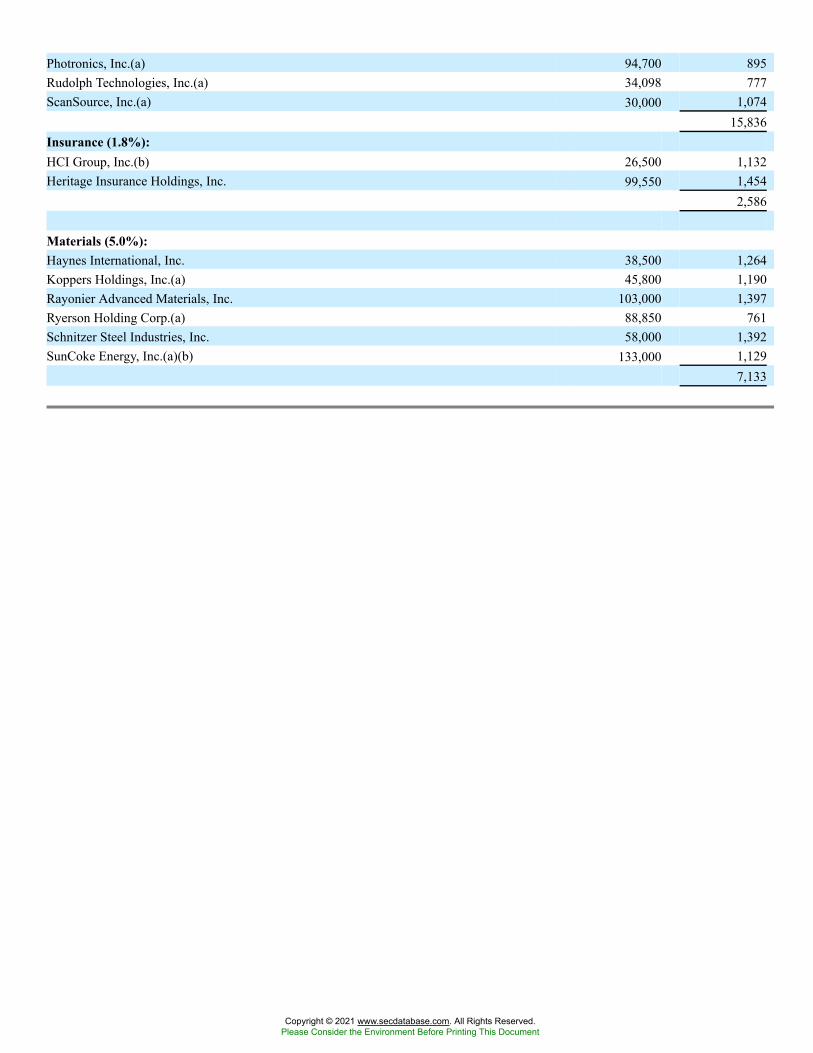
Photronics, Inc.(a) 94,700 895Rudolph Technologies, Inc.(a) 34,098 777ScanSource, Inc.(a) 30,000 1,074
15,836Insurance (1.8%):HCI Group, Inc.(b) 26,500 1,132Heritage Insurance Holdings, Inc. 99,550 1,454
2,586
Materials (5.0%):Haynes International, Inc. 38,500 1,264Koppers Holdings, Inc.(a) 45,800 1,190Rayonier Advanced Materials, Inc. 103,000 1,397Ryerson Holding Corp.(a) 88,850 761Schnitzer Steel Industries, Inc. 58,000 1,392SunCoke Energy, Inc.(a)(b) 133,000 1,129
7,133
Copyright © 2021 www.secdatabase.com. All Rights Reserved.Please Consider the Environment Before Printing This Document
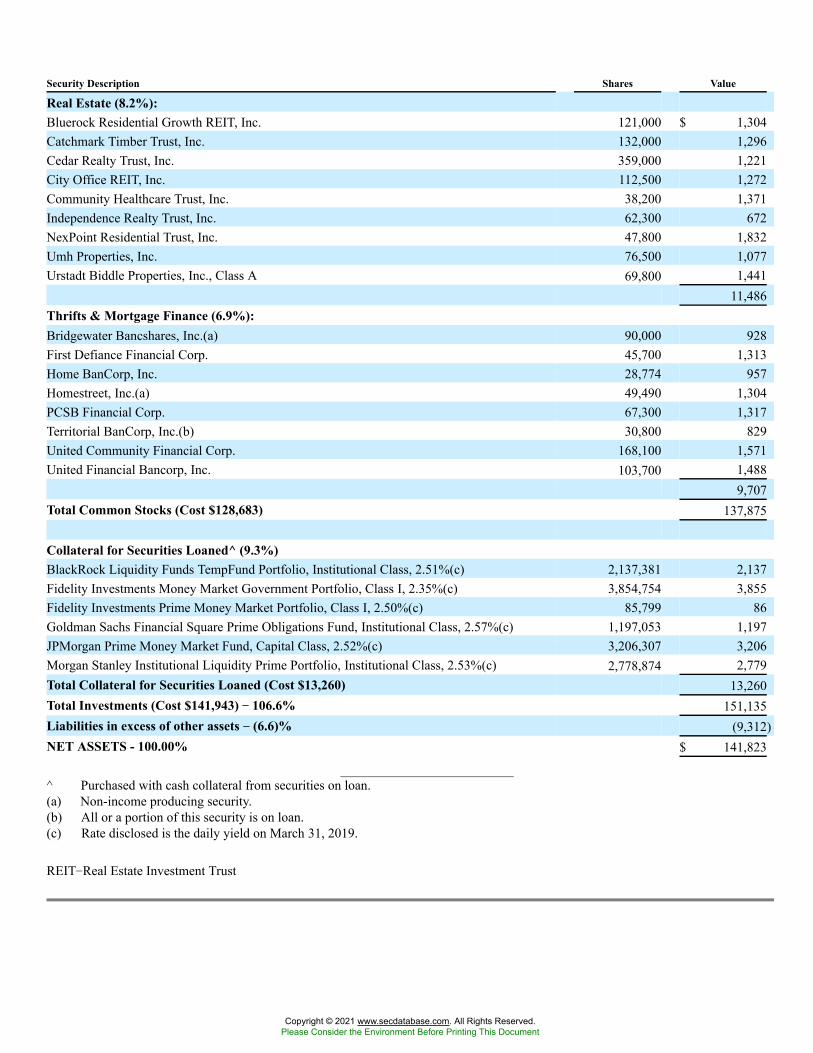
Security Description Shares Value
Real Estate (8.2%):Bluerock Residential Growth REIT, Inc. 121,000 $ 1,304Catchmark Timber Trust, Inc. 132,000 1,296Cedar Realty Trust, Inc. 359,000 1,221City Office REIT, Inc. 112,500 1,272Community Healthcare Trust, Inc. 38,200 1,371Independence Realty Trust, Inc. 62,300 672NexPoint Residential Trust, Inc. 47,800 1,832Umh Properties, Inc. 76,500 1,077Urstadt Biddle Properties, Inc., Class A 69,800 1,441
11,486Thrifts & Mortgage Finance (6.9%):Bridgewater Bancshares, Inc.(a) 90,000 928First Defiance Financial Corp. 45,700 1,313Home BanCorp, Inc. 28,774 957Homestreet, Inc.(a) 49,490 1,304PCSB Financial Corp. 67,300 1,317Territorial BanCorp, Inc.(b) 30,800 829United Community Financial Corp. 168,100 1,571United Financial Bancorp, Inc. 103,700 1,488
9,707Total Common Stocks (Cost $128,683) 137,875
Collateral for Securities Loaned^ (9.3%)BlackRock Liquidity Funds TempFund Portfolio, Institutional Class, 2.51%(c) 2,137,381 2,137Fidelity Investments Money Market Government Portfolio, Class I, 2.35%(c) 3,854,754 3,855Fidelity Investments Prime Money Market Portfolio, Class I, 2.50%(c) 85,799 86Goldman Sachs Financial Square Prime Obligations Fund, Institutional Class, 2.57%(c) 1,197,053 1,197JPMorgan Prime Money Market Fund, Capital Class, 2.52%(c) 3,206,307 3,206Morgan Stanley Institutional Liquidity Prime Portfolio, Institutional Class, 2.53%(c) 2,778,874 2,779Total Collateral for Securities Loaned (Cost $13,260) 13,260Total Investments (Cost $141,943) �� 106.6% 151,135Liabilities in excess of other assets �� (6.6)% (9,312)NET ASSETS - 100.00% $ 141,823
^ Purchased with cash collateral from securities on loan.(a) Non-income producing security.(b) All or a portion of this security is on loan.(c) Rate disclosed is the daily yield on March 31, 2019.
REIT�Real Estate Investment Trust
Copyright © 2021 www.secdatabase.com. All Rights Reserved.Please Consider the Environment Before Printing This Document
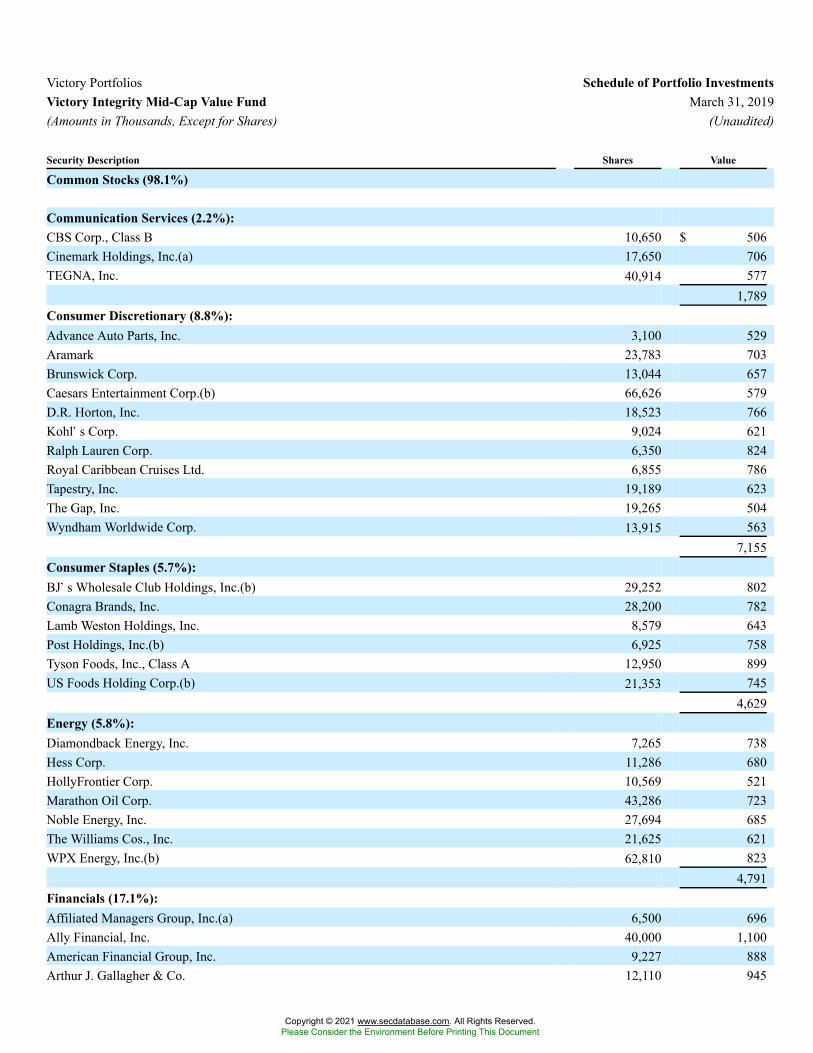
Victory Portfolios Schedule of Portfolio InvestmentsVictory Integrity Mid-Cap Value Fund March 31, 2019(Amounts in Thousands, Except for Shares) (Unaudited)
Security Description Shares Value
Common Stocks (98.1%)
Communication Services (2.2%):CBS Corp., Class B 10,650 $ 506Cinemark Holdings, Inc.(a) 17,650 706TEGNA, Inc. 40,914 577
1,789Consumer Discretionary (8.8%):Advance Auto Parts, Inc. 3,100 529Aramark 23,783 703Brunswick Corp. 13,044 657Caesars Entertainment Corp.(b) 66,626 579D.R. Horton, Inc. 18,523 766Kohl�s Corp. 9,024 621Ralph Lauren Corp. 6,350 824Royal Caribbean Cruises Ltd. 6,855 786Tapestry, Inc. 19,189 623The Gap, Inc. 19,265 504Wyndham Worldwide Corp. 13,915 563
7,155Consumer Staples (5.7%):BJ�s Wholesale Club Holdings, Inc.(b) 29,252 802Conagra Brands, Inc. 28,200 782Lamb Weston Holdings, Inc. 8,579 643Post Holdings, Inc.(b) 6,925 758Tyson Foods, Inc., Class A 12,950 899US Foods Holding Corp.(b) 21,353 745
4,629Energy (5.8%):Diamondback Energy, Inc. 7,265 738Hess Corp. 11,286 680HollyFrontier Corp. 10,569 521Marathon Oil Corp. 43,286 723Noble Energy, Inc. 27,694 685The Williams Cos., Inc. 21,625 621WPX Energy, Inc.(b) 62,810 823
4,791Financials (17.1%):Affiliated Managers Group, Inc.(a) 6,500 696Ally Financial, Inc. 40,000 1,100American Financial Group, Inc. 9,227 888Arthur J. Gallagher & Co. 12,110 945
Copyright © 2021 www.secdatabase.com. All Rights Reserved.Please Consider the Environment Before Printing This Document
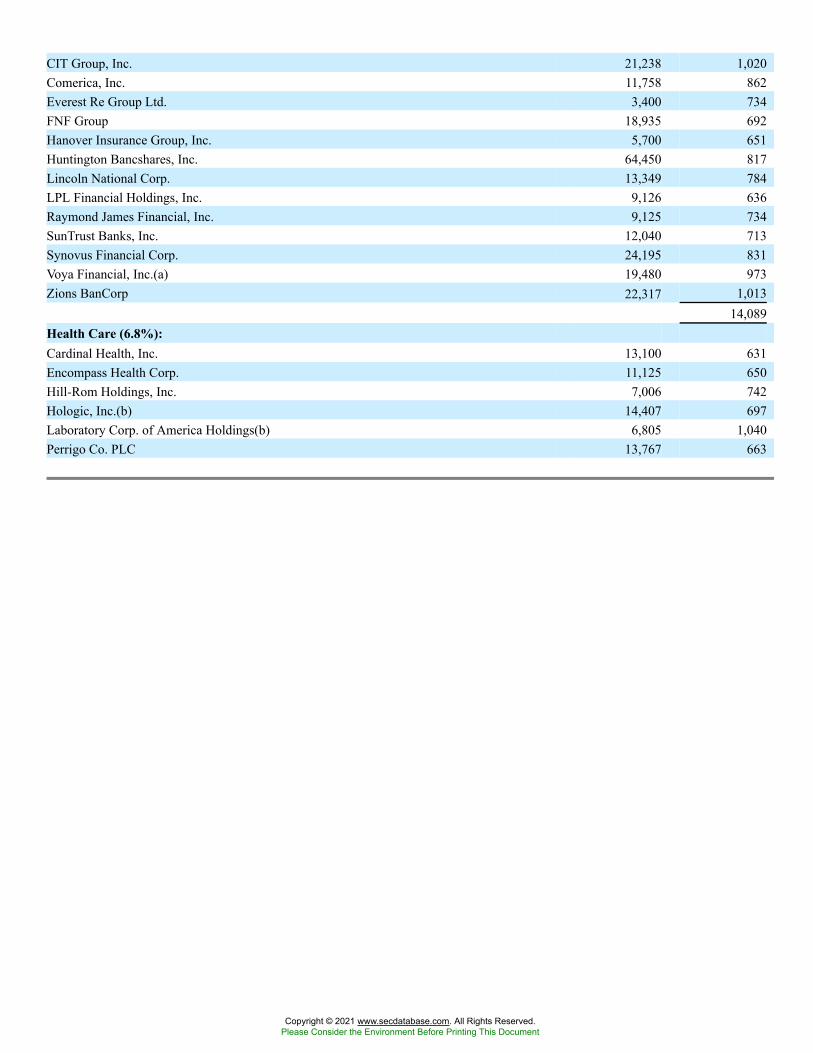
CIT Group, Inc. 21,238 1,020Comerica, Inc. 11,758 862Everest Re Group Ltd. 3,400 734FNF Group 18,935 692Hanover Insurance Group, Inc. 5,700 651Huntington Bancshares, Inc. 64,450 817Lincoln National Corp. 13,349 784LPL Financial Holdings, Inc. 9,126 636Raymond James Financial, Inc. 9,125 734SunTrust Banks, Inc. 12,040 713Synovus Financial Corp. 24,195 831Voya Financial, Inc.(a) 19,480 973Zions BanCorp 22,317 1,013
14,089Health Care (6.8%):Cardinal Health, Inc. 13,100 631Encompass Health Corp. 11,125 650Hill-Rom Holdings, Inc. 7,006 742Hologic, Inc.(b) 14,407 697Laboratory Corp. of America Holdings(b) 6,805 1,040Perrigo Co. PLC 13,767 663
Copyright © 2021 www.secdatabase.com. All Rights Reserved.Please Consider the Environment Before Printing This Document
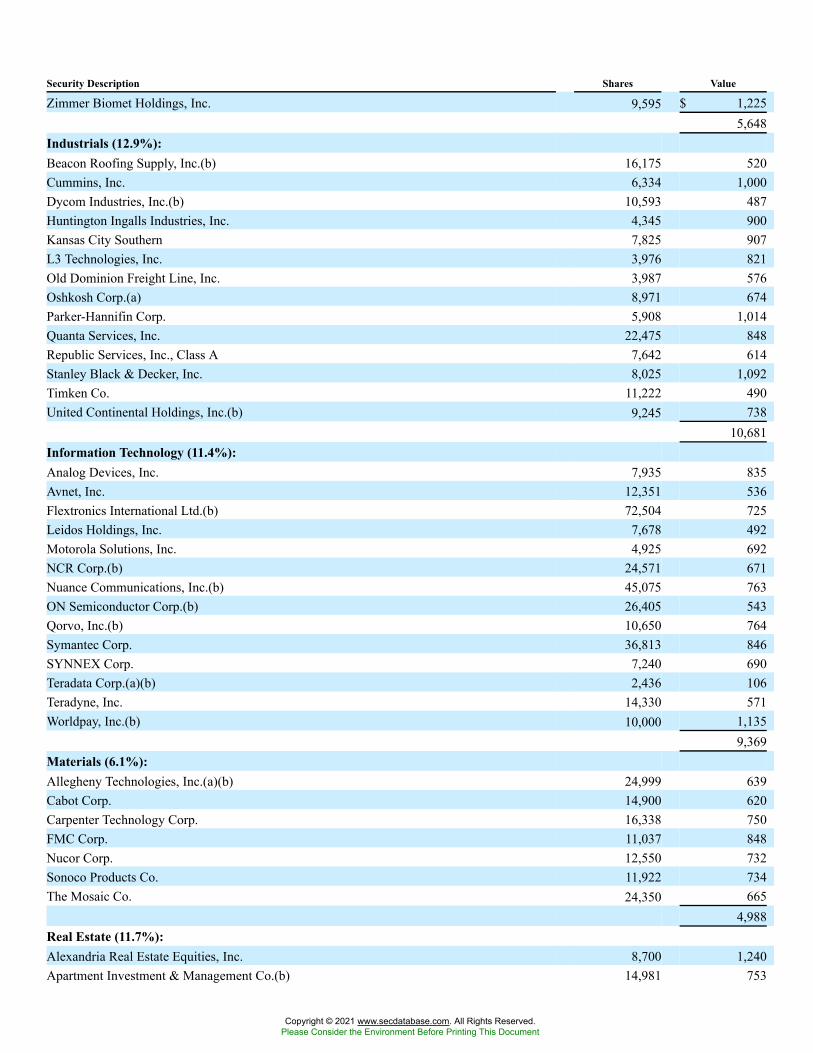
Security Description Shares Value
Zimmer Biomet Holdings, Inc. 9,595 $ 1,2255,648
Industrials (12.9%):Beacon Roofing Supply, Inc.(b) 16,175 520Cummins, Inc. 6,334 1,000Dycom Industries, Inc.(b) 10,593 487Huntington Ingalls Industries, Inc. 4,345 900Kansas City Southern 7,825 907L3 Technologies, Inc. 3,976 821Old Dominion Freight Line, Inc. 3,987 576Oshkosh Corp.(a) 8,971 674Parker-Hannifin Corp. 5,908 1,014Quanta Services, Inc. 22,475 848Republic Services, Inc., Class A 7,642 614Stanley Black & Decker, Inc. 8,025 1,092Timken Co. 11,222 490United Continental Holdings, Inc.(b) 9,245 738
10,681Information Technology (11.4%):Analog Devices, Inc. 7,935 835Avnet, Inc. 12,351 536Flextronics International Ltd.(b) 72,504 725Leidos Holdings, Inc. 7,678 492Motorola Solutions, Inc. 4,925 692NCR Corp.(b) 24,571 671Nuance Communications, Inc.(b) 45,075 763ON Semiconductor Corp.(b) 26,405 543Qorvo, Inc.(b) 10,650 764Symantec Corp. 36,813 846SYNNEX Corp. 7,240 690Teradata Corp.(a)(b) 2,436 106Teradyne, Inc. 14,330 571Worldpay, Inc.(b) 10,000 1,135
9,369Materials (6.1%):Allegheny Technologies, Inc.(a)(b) 24,999 639Cabot Corp. 14,900 620Carpenter Technology Corp. 16,338 750FMC Corp. 11,037 848Nucor Corp. 12,550 732Sonoco Products Co. 11,922 734The Mosaic Co. 24,350 665
4,988Real Estate (11.7%):Alexandria Real Estate Equities, Inc. 8,700 1,240Apartment Investment & Management Co.(b) 14,981 753
Copyright © 2021 www.secdatabase.com. All Rights Reserved.Please Consider the Environment Before Printing This Document
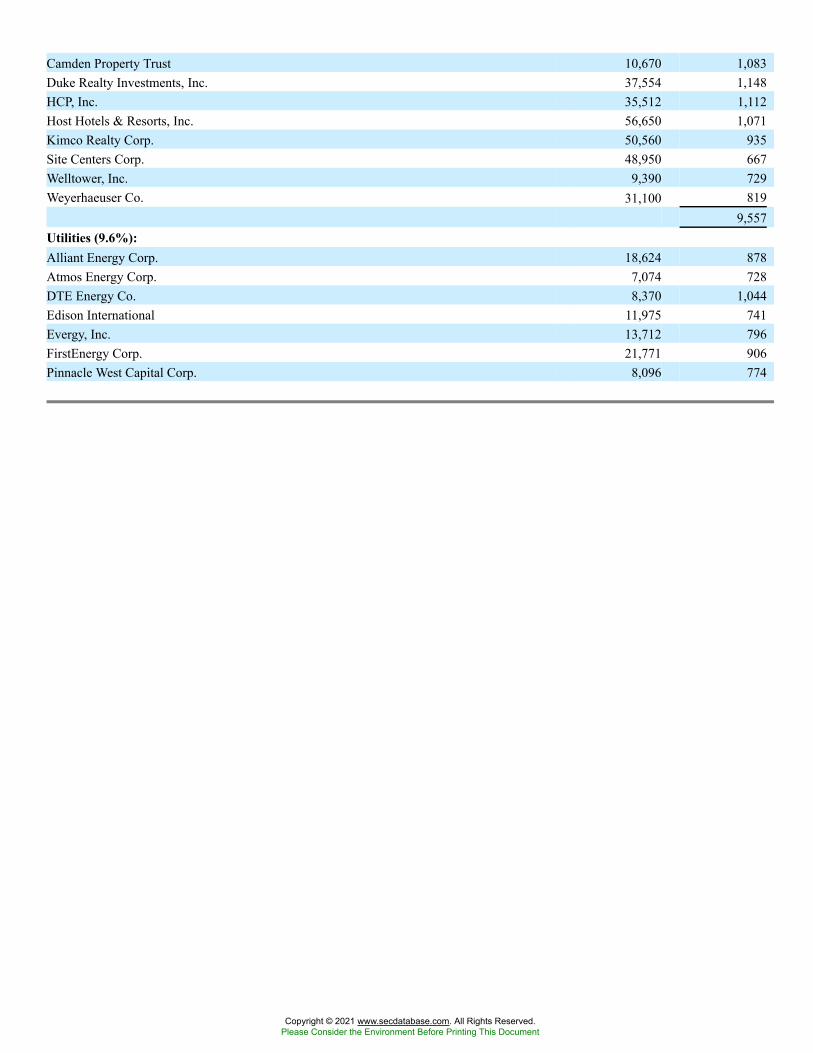
Camden Property Trust 10,670 1,083Duke Realty Investments, Inc. 37,554 1,148HCP, Inc. 35,512 1,112Host Hotels & Resorts, Inc. 56,650 1,071Kimco Realty Corp. 50,560 935Site Centers Corp. 48,950 667Welltower, Inc. 9,390 729Weyerhaeuser Co. 31,100 819
9,557Utilities (9.6%):Alliant Energy Corp. 18,624 878Atmos Energy Corp. 7,074 728DTE Energy Co. 8,370 1,044Edison International 11,975 741Evergy, Inc. 13,712 796FirstEnergy Corp. 21,771 906Pinnacle West Capital Corp. 8,096 774
Copyright © 2021 www.secdatabase.com. All Rights Reserved.Please Consider the Environment Before Printing This Document
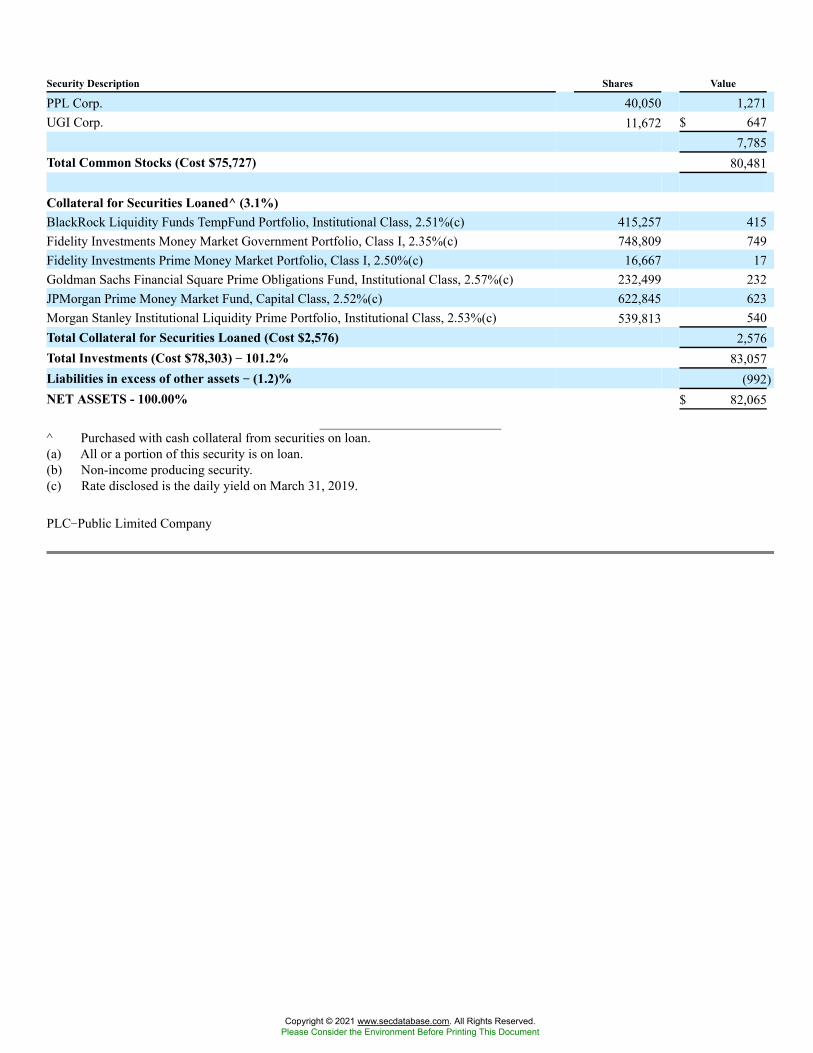
Security Description Shares Value
PPL Corp. 40,050 1,271UGI Corp. 11,672 $ 647
7,785Total Common Stocks (Cost $75,727) 80,481
Collateral for Securities Loaned^ (3.1%)BlackRock Liquidity Funds TempFund Portfolio, Institutional Class, 2.51%(c) 415,257 415Fidelity Investments Money Market Government Portfolio, Class I, 2.35%(c) 748,809 749Fidelity Investments Prime Money Market Portfolio, Class I, 2.50%(c) 16,667 17Goldman Sachs Financial Square Prime Obligations Fund, Institutional Class, 2.57%(c) 232,499 232JPMorgan Prime Money Market Fund, Capital Class, 2.52%(c) 622,845 623Morgan Stanley Institutional Liquidity Prime Portfolio, Institutional Class, 2.53%(c) 539,813 540Total Collateral for Securities Loaned (Cost $2,576) 2,576Total Investments (Cost $78,303) �� 101.2% 83,057Liabilities in excess of other assets �� (1.2)% (992)NET ASSETS - 100.00% $ 82,065
^ Purchased with cash collateral from securities on loan.(a) All or a portion of this security is on loan.(b) Non-income producing security.(c) Rate disclosed is the daily yield on March 31, 2019.
PLC�Public Limited Company
Copyright © 2021 www.secdatabase.com. All Rights Reserved.Please Consider the Environment Before Printing This Document
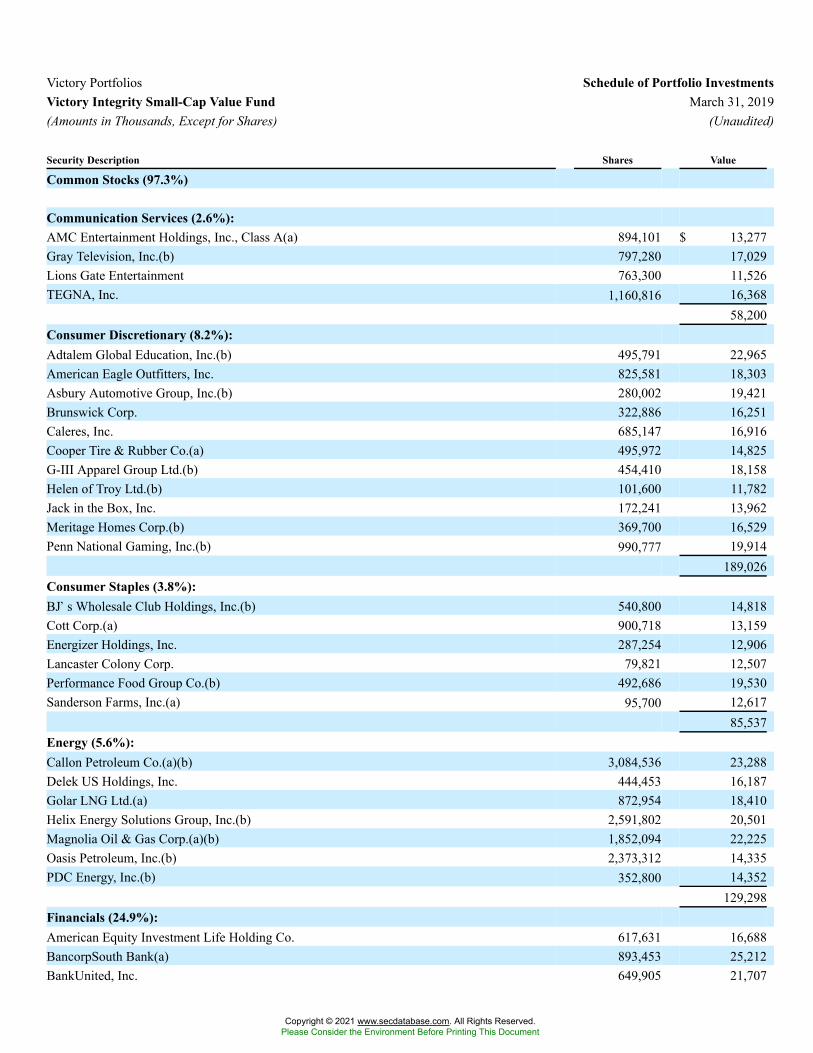
Victory Portfolios Schedule of Portfolio InvestmentsVictory Integrity Small-Cap Value Fund March 31, 2019(Amounts in Thousands, Except for Shares) (Unaudited)
Security Description Shares Value
Common Stocks (97.3%)
Communication Services (2.6%):AMC Entertainment Holdings, Inc., Class A(a) 894,101 $ 13,277Gray Television, Inc.(b) 797,280 17,029Lions Gate Entertainment 763,300 11,526TEGNA, Inc. 1,160,816 16,368
58,200Consumer Discretionary (8.2%):Adtalem Global Education, Inc.(b) 495,791 22,965American Eagle Outfitters, Inc. 825,581 18,303Asbury Automotive Group, Inc.(b) 280,002 19,421Brunswick Corp. 322,886 16,251Caleres, Inc. 685,147 16,916Cooper Tire & Rubber Co.(a) 495,972 14,825G-III Apparel Group Ltd.(b) 454,410 18,158Helen of Troy Ltd.(b) 101,600 11,782Jack in the Box, Inc. 172,241 13,962Meritage Homes Corp.(b) 369,700 16,529Penn National Gaming, Inc.(b) 990,777 19,914
189,026Consumer Staples (3.8%):BJ�s Wholesale Club Holdings, Inc.(b) 540,800 14,818Cott Corp.(a) 900,718 13,159Energizer Holdings, Inc. 287,254 12,906Lancaster Colony Corp. 79,821 12,507Performance Food Group Co.(b) 492,686 19,530Sanderson Farms, Inc.(a) 95,700 12,617
85,537Energy (5.6%):Callon Petroleum Co.(a)(b) 3,084,536 23,288Delek US Holdings, Inc. 444,453 16,187Golar LNG Ltd.(a) 872,954 18,410Helix Energy Solutions Group, Inc.(b) 2,591,802 20,501Magnolia Oil & Gas Corp.(a)(b) 1,852,094 22,225Oasis Petroleum, Inc.(b) 2,373,312 14,335PDC Energy, Inc.(b) 352,800 14,352
129,298Financials (24.9%):American Equity Investment Life Holding Co. 617,631 16,688BancorpSouth Bank(a) 893,453 25,212BankUnited, Inc. 649,905 21,707
Copyright © 2021 www.secdatabase.com. All Rights Reserved.Please Consider the Environment Before Printing This Document
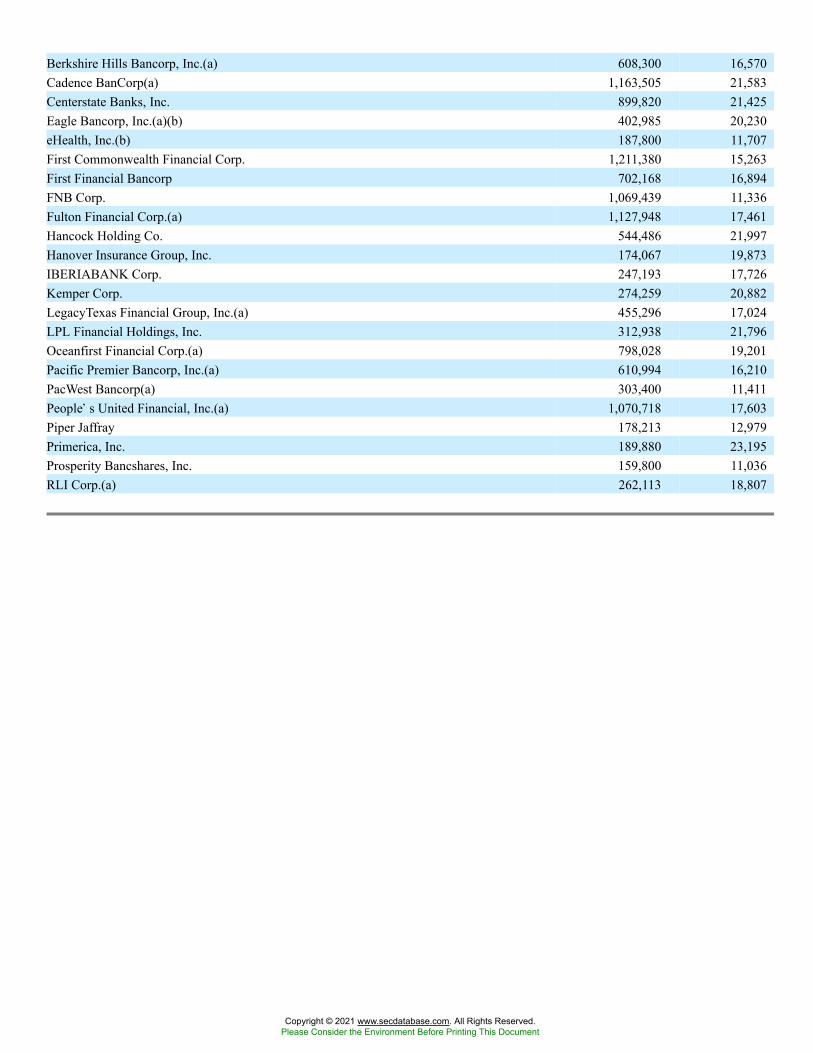
Berkshire Hills Bancorp, Inc.(a) 608,300 16,570Cadence BanCorp(a) 1,163,505 21,583Centerstate Banks, Inc. 899,820 21,425Eagle Bancorp, Inc.(a)(b) 402,985 20,230eHealth, Inc.(b) 187,800 11,707First Commonwealth Financial Corp. 1,211,380 15,263First Financial Bancorp 702,168 16,894FNB Corp. 1,069,439 11,336Fulton Financial Corp.(a) 1,127,948 17,461Hancock Holding Co. 544,486 21,997Hanover Insurance Group, Inc. 174,067 19,873IBERIABANK Corp. 247,193 17,726Kemper Corp. 274,259 20,882LegacyTexas Financial Group, Inc.(a) 455,296 17,024LPL Financial Holdings, Inc. 312,938 21,796Oceanfirst Financial Corp.(a) 798,028 19,201Pacific Premier Bancorp, Inc.(a) 610,994 16,210PacWest Bancorp(a) 303,400 11,411People�s United Financial, Inc.(a) 1,070,718 17,603Piper Jaffray 178,213 12,979Primerica, Inc. 189,880 23,195Prosperity Bancshares, Inc. 159,800 11,036RLI Corp.(a) 262,113 18,807
Copyright © 2021 www.secdatabase.com. All Rights Reserved.Please Consider the Environment Before Printing This Document
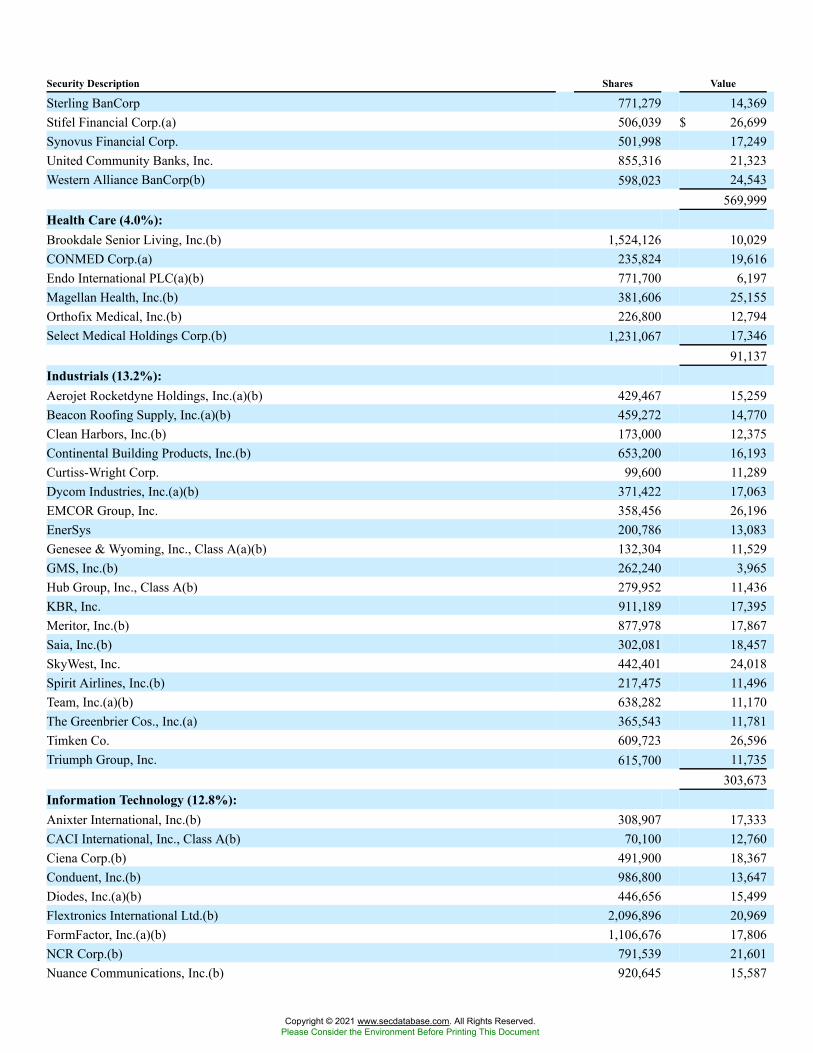
Security Description Shares Value
Sterling BanCorp 771,279 14,369Stifel Financial Corp.(a) 506,039 $ 26,699Synovus Financial Corp. 501,998 17,249United Community Banks, Inc. 855,316 21,323Western Alliance BanCorp(b) 598,023 24,543
569,999Health Care (4.0%):Brookdale Senior Living, Inc.(b) 1,524,126 10,029CONMED Corp.(a) 235,824 19,616Endo International PLC(a)(b) 771,700 6,197Magellan Health, Inc.(b) 381,606 25,155Orthofix Medical, Inc.(b) 226,800 12,794Select Medical Holdings Corp.(b) 1,231,067 17,346
91,137Industrials (13.2%):Aerojet Rocketdyne Holdings, Inc.(a)(b) 429,467 15,259Beacon Roofing Supply, Inc.(a)(b) 459,272 14,770Clean Harbors, Inc.(b) 173,000 12,375Continental Building Products, Inc.(b) 653,200 16,193Curtiss-Wright Corp. 99,600 11,289Dycom Industries, Inc.(a)(b) 371,422 17,063EMCOR Group, Inc. 358,456 26,196EnerSys 200,786 13,083Genesee & Wyoming, Inc., Class A(a)(b) 132,304 11,529GMS, Inc.(b) 262,240 3,965Hub Group, Inc., Class A(b) 279,952 11,436KBR, Inc. 911,189 17,395Meritor, Inc.(b) 877,978 17,867Saia, Inc.(b) 302,081 18,457SkyWest, Inc. 442,401 24,018Spirit Airlines, Inc.(b) 217,475 11,496Team, Inc.(a)(b) 638,282 11,170The Greenbrier Cos., Inc.(a) 365,543 11,781Timken Co. 609,723 26,596Triumph Group, Inc. 615,700 11,735
303,673Information Technology (12.8%):Anixter International, Inc.(b) 308,907 17,333CACI International, Inc., Class A(b) 70,100 12,760Ciena Corp.(b) 491,900 18,367Conduent, Inc.(b) 986,800 13,647Diodes, Inc.(a)(b) 446,656 15,499Flextronics International Ltd.(b) 2,096,896 20,969FormFactor, Inc.(a)(b) 1,106,676 17,806NCR Corp.(b) 791,539 21,601Nuance Communications, Inc.(b) 920,645 15,587
Copyright © 2021 www.secdatabase.com. All Rights Reserved.Please Consider the Environment Before Printing This Document
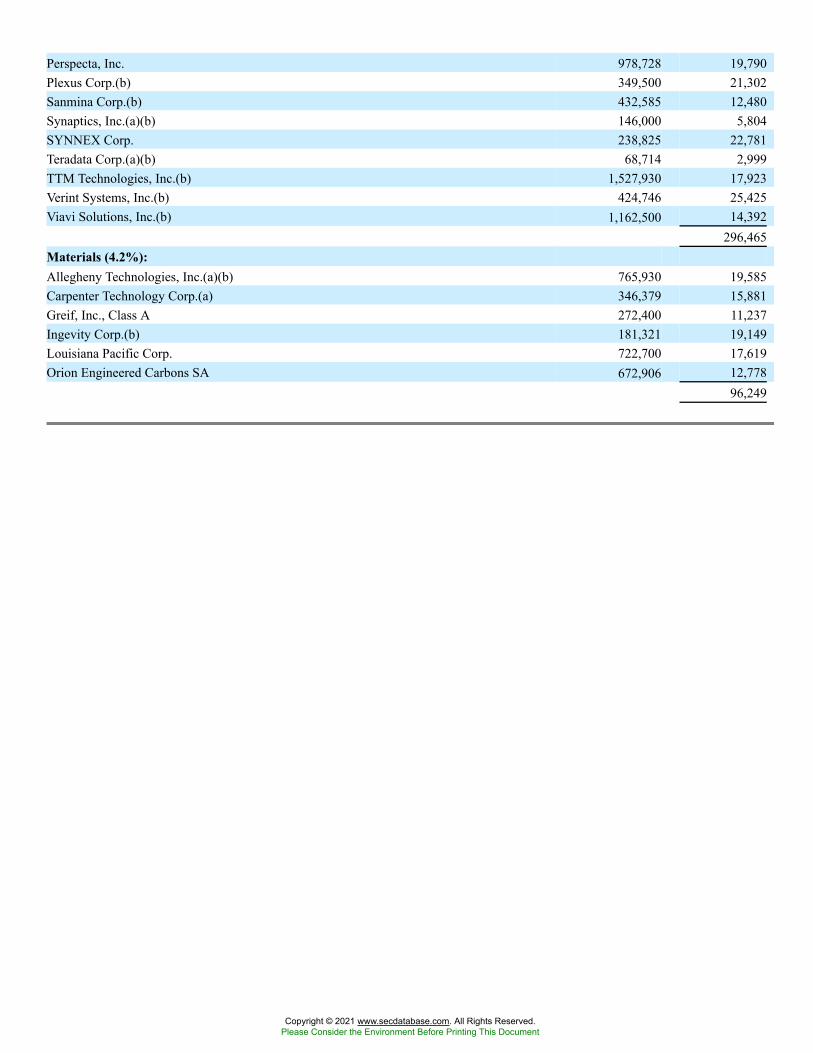
Perspecta, Inc. 978,728 19,790Plexus Corp.(b) 349,500 21,302Sanmina Corp.(b) 432,585 12,480Synaptics, Inc.(a)(b) 146,000 5,804SYNNEX Corp. 238,825 22,781Teradata Corp.(a)(b) 68,714 2,999TTM Technologies, Inc.(b) 1,527,930 17,923Verint Systems, Inc.(b) 424,746 25,425Viavi Solutions, Inc.(b) 1,162,500 14,392
296,465Materials (4.2%):Allegheny Technologies, Inc.(a)(b) 765,930 19,585Carpenter Technology Corp.(a) 346,379 15,881Greif, Inc., Class A 272,400 11,237Ingevity Corp.(b) 181,321 19,149Louisiana Pacific Corp. 722,700 17,619Orion Engineered Carbons SA 672,906 12,778
96,249
Copyright © 2021 www.secdatabase.com. All Rights Reserved.Please Consider the Environment Before Printing This Document
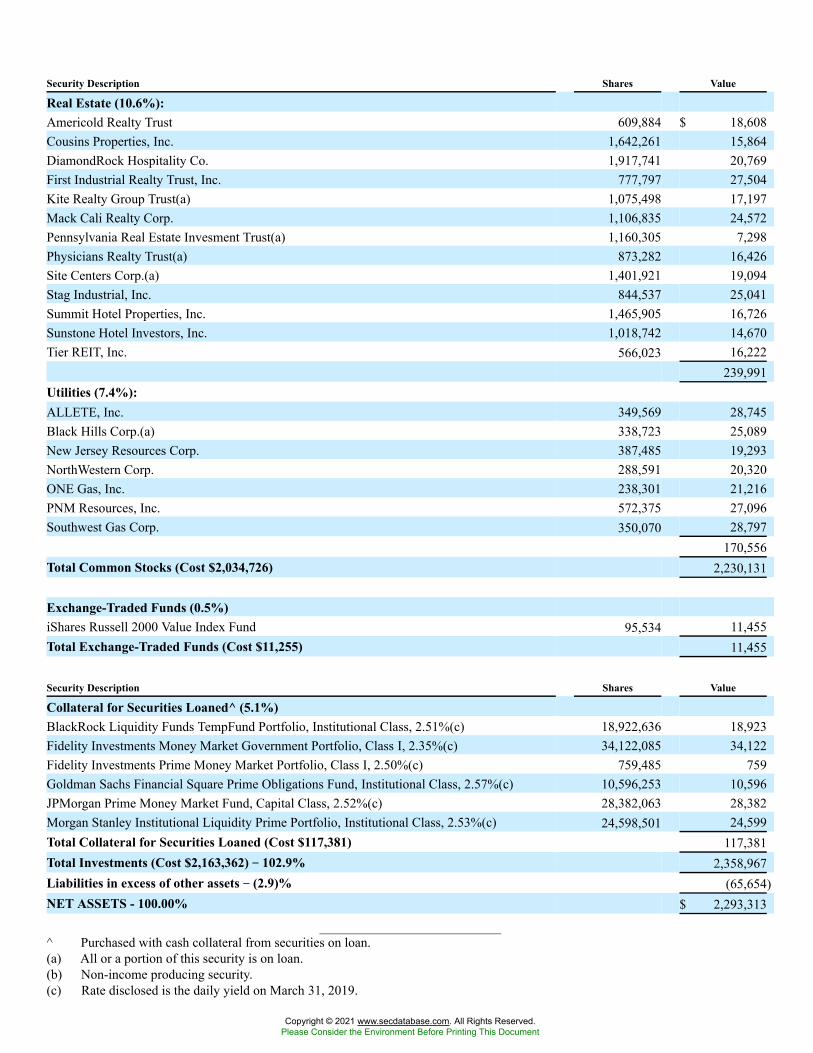
Security Description Shares Value
Real Estate (10.6%):Americold Realty Trust 609,884 $ 18,608Cousins Properties, Inc. 1,642,261 15,864DiamondRock Hospitality Co. 1,917,741 20,769First Industrial Realty Trust, Inc. 777,797 27,504Kite Realty Group Trust(a) 1,075,498 17,197Mack Cali Realty Corp. 1,106,835 24,572Pennsylvania Real Estate Invesment Trust(a) 1,160,305 7,298Physicians Realty Trust(a) 873,282 16,426Site Centers Corp.(a) 1,401,921 19,094Stag Industrial, Inc. 844,537 25,041Summit Hotel Properties, Inc. 1,465,905 16,726Sunstone Hotel Investors, Inc. 1,018,742 14,670Tier REIT, Inc. 566,023 16,222
239,991Utilities (7.4%):ALLETE, Inc. 349,569 28,745Black Hills Corp.(a) 338,723 25,089New Jersey Resources Corp. 387,485 19,293NorthWestern Corp. 288,591 20,320ONE Gas, Inc. 238,301 21,216PNM Resources, Inc. 572,375 27,096Southwest Gas Corp. 350,070 28,797
170,556Total Common Stocks (Cost $2,034,726) 2,230,131
Exchange-Traded Funds (0.5%)iShares Russell 2000 Value Index Fund 95,534 11,455Total Exchange-Traded Funds (Cost $11,255) 11,455
Security Description Shares Value
Collateral for Securities Loaned^ (5.1%)BlackRock Liquidity Funds TempFund Portfolio, Institutional Class, 2.51%(c) 18,922,636 18,923Fidelity Investments Money Market Government Portfolio, Class I, 2.35%(c) 34,122,085 34,122Fidelity Investments Prime Money Market Portfolio, Class I, 2.50%(c) 759,485 759Goldman Sachs Financial Square Prime Obligations Fund, Institutional Class, 2.57%(c) 10,596,253 10,596JPMorgan Prime Money Market Fund, Capital Class, 2.52%(c) 28,382,063 28,382Morgan Stanley Institutional Liquidity Prime Portfolio, Institutional Class, 2.53%(c) 24,598,501 24,599Total Collateral for Securities Loaned (Cost $117,381) 117,381Total Investments (Cost $2,163,362) �� 102.9% 2,358,967Liabilities in excess of other assets �� (2.9)% (65,654)NET ASSETS - 100.00% $ 2,293,313
^ Purchased with cash collateral from securities on loan.(a) All or a portion of this security is on loan.(b) Non-income producing security.(c) Rate disclosed is the daily yield on March 31, 2019.
Copyright © 2021 www.secdatabase.com. All Rights Reserved.Please Consider the Environment Before Printing This Document
PLC�Public Limited CompanyREIT�Real Estate Investment Trust
Copyright © 2021 www.secdatabase.com. All Rights Reserved.Please Consider the Environment Before Printing This Document
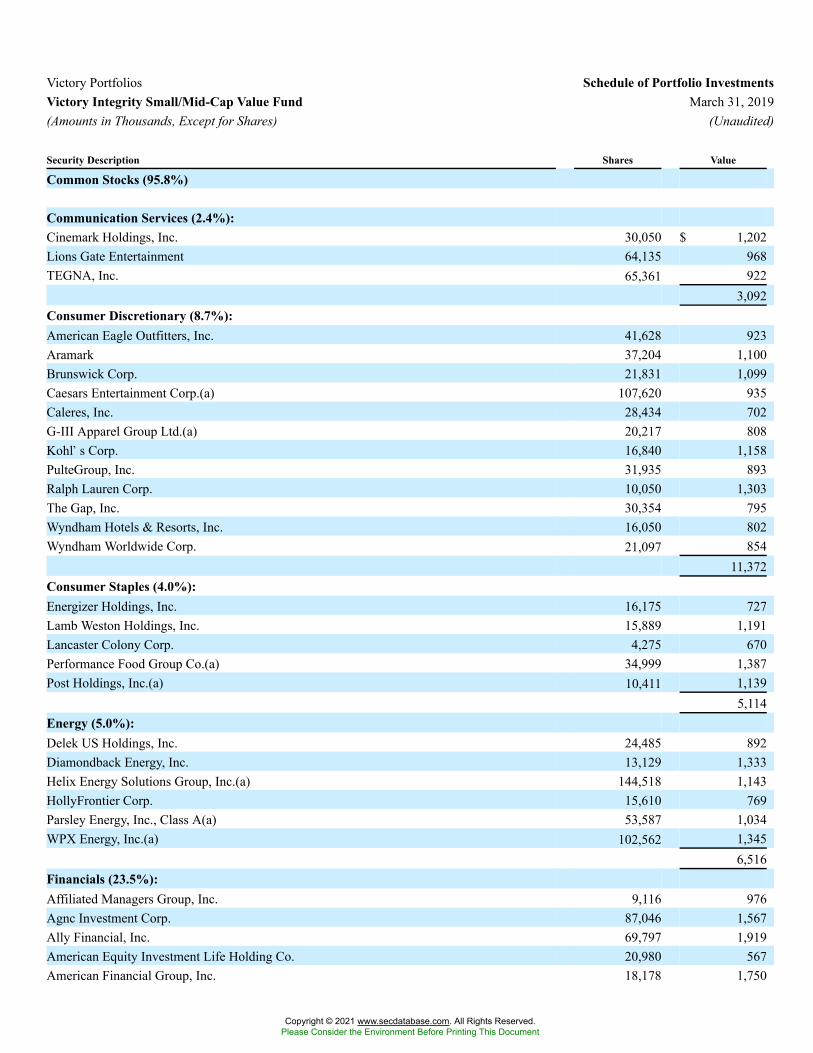
Victory Portfolios Schedule of Portfolio InvestmentsVictory Integrity Small/Mid-Cap Value Fund March 31, 2019(Amounts in Thousands, Except for Shares) (Unaudited)
Security Description Shares Value
Common Stocks (95.8%)
Communication Services (2.4%):Cinemark Holdings, Inc. 30,050 $ 1,202Lions Gate Entertainment 64,135 968TEGNA, Inc. 65,361 922
3,092Consumer Discretionary (8.7%):American Eagle Outfitters, Inc. 41,628 923Aramark 37,204 1,100Brunswick Corp. 21,831 1,099Caesars Entertainment Corp.(a) 107,620 935Caleres, Inc. 28,434 702G-III Apparel Group Ltd.(a) 20,217 808Kohl�s Corp. 16,840 1,158PulteGroup, Inc. 31,935 893Ralph Lauren Corp. 10,050 1,303The Gap, Inc. 30,354 795Wyndham Hotels & Resorts, Inc. 16,050 802Wyndham Worldwide Corp. 21,097 854
11,372Consumer Staples (4.0%):Energizer Holdings, Inc. 16,175 727Lamb Weston Holdings, Inc. 15,889 1,191Lancaster Colony Corp. 4,275 670Performance Food Group Co.(a) 34,999 1,387Post Holdings, Inc.(a) 10,411 1,139
5,114Energy (5.0%):Delek US Holdings, Inc. 24,485 892Diamondback Energy, Inc. 13,129 1,333Helix Energy Solutions Group, Inc.(a) 144,518 1,143HollyFrontier Corp. 15,610 769Parsley Energy, Inc., Class A(a) 53,587 1,034WPX Energy, Inc.(a) 102,562 1,345
6,516Financials (23.5%):Affiliated Managers Group, Inc. 9,116 976Agnc Investment Corp. 87,046 1,567Ally Financial, Inc. 69,797 1,919American Equity Investment Life Holding Co. 20,980 567American Financial Group, Inc. 18,178 1,750
Copyright © 2021 www.secdatabase.com. All Rights Reserved.Please Consider the Environment Before Printing This Document
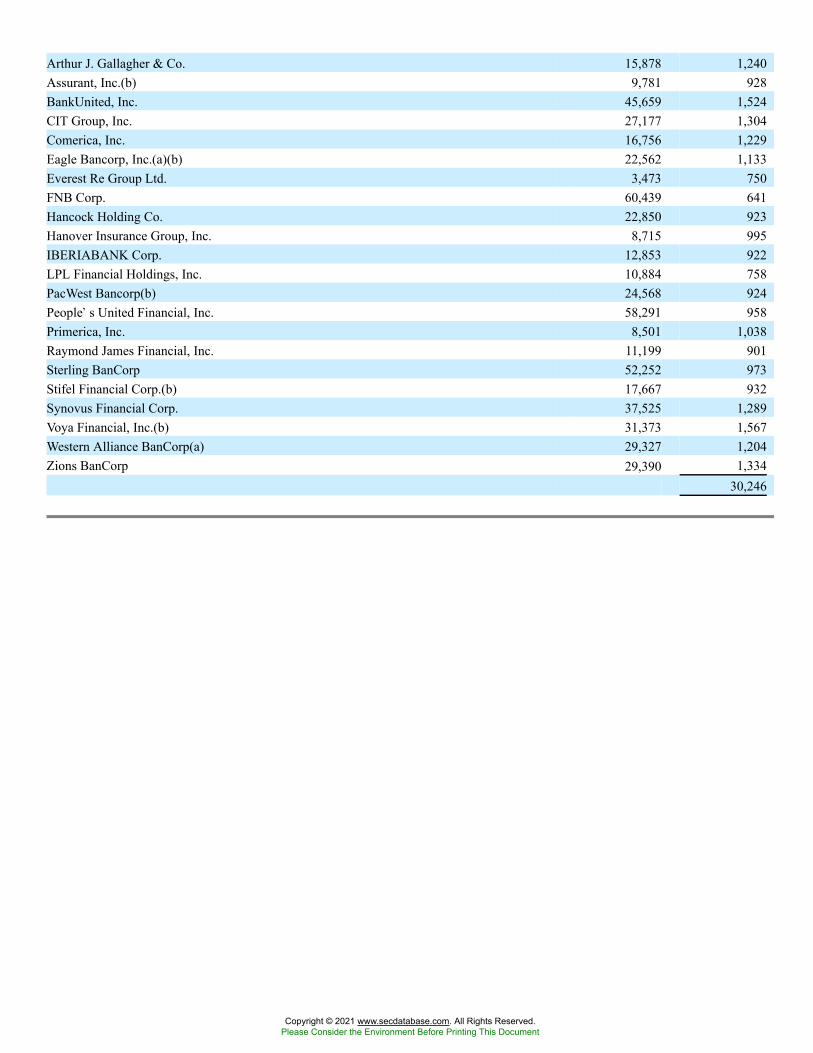
Arthur J. Gallagher & Co. 15,878 1,240Assurant, Inc.(b) 9,781 928BankUnited, Inc. 45,659 1,524CIT Group, Inc. 27,177 1,304Comerica, Inc. 16,756 1,229Eagle Bancorp, Inc.(a)(b) 22,562 1,133Everest Re Group Ltd. 3,473 750FNB Corp. 60,439 641Hancock Holding Co. 22,850 923Hanover Insurance Group, Inc. 8,715 995IBERIABANK Corp. 12,853 922LPL Financial Holdings, Inc. 10,884 758PacWest Bancorp(b) 24,568 924People�s United Financial, Inc. 58,291 958Primerica, Inc. 8,501 1,038Raymond James Financial, Inc. 11,199 901Sterling BanCorp 52,252 973Stifel Financial Corp.(b) 17,667 932Synovus Financial Corp. 37,525 1,289Voya Financial, Inc.(b) 31,373 1,567Western Alliance BanCorp(a) 29,327 1,204Zions BanCorp 29,390 1,334
30,246
Copyright © 2021 www.secdatabase.com. All Rights Reserved.Please Consider the Environment Before Printing This Document
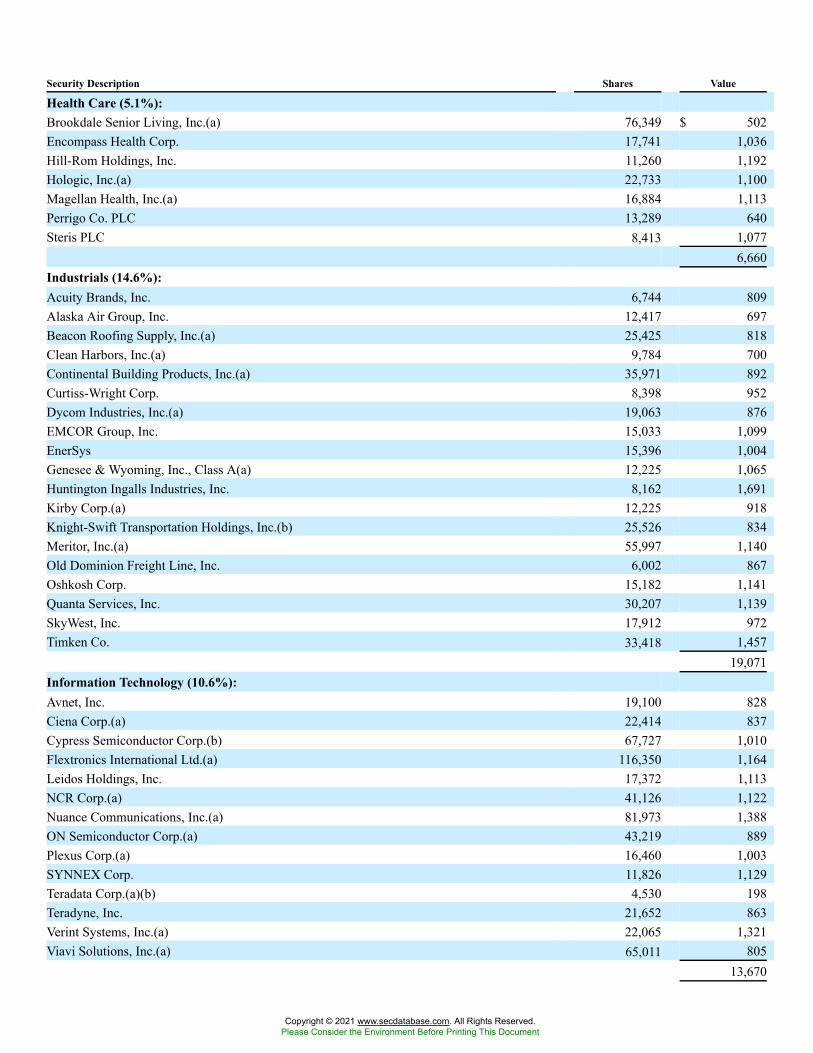
Security Description Shares Value
Health Care (5.1%):Brookdale Senior Living, Inc.(a) 76,349 $ 502Encompass Health Corp. 17,741 1,036Hill-Rom Holdings, Inc. 11,260 1,192Hologic, Inc.(a) 22,733 1,100Magellan Health, Inc.(a) 16,884 1,113Perrigo Co. PLC 13,289 640Steris PLC 8,413 1,077
6,660Industrials (14.6%):Acuity Brands, Inc. 6,744 809Alaska Air Group, Inc. 12,417 697Beacon Roofing Supply, Inc.(a) 25,425 818Clean Harbors, Inc.(a) 9,784 700Continental Building Products, Inc.(a) 35,971 892Curtiss-Wright Corp. 8,398 952Dycom Industries, Inc.(a) 19,063 876EMCOR Group, Inc. 15,033 1,099EnerSys 15,396 1,004Genesee & Wyoming, Inc., Class A(a) 12,225 1,065Huntington Ingalls Industries, Inc. 8,162 1,691Kirby Corp.(a) 12,225 918Knight-Swift Transportation Holdings, Inc.(b) 25,526 834Meritor, Inc.(a) 55,997 1,140Old Dominion Freight Line, Inc. 6,002 867Oshkosh Corp. 15,182 1,141Quanta Services, Inc. 30,207 1,139SkyWest, Inc. 17,912 972Timken Co. 33,418 1,457
19,071Information Technology (10.6%):Avnet, Inc. 19,100 828Ciena Corp.(a) 22,414 837Cypress Semiconductor Corp.(b) 67,727 1,010Flextronics International Ltd.(a) 116,350 1,164Leidos Holdings, Inc. 17,372 1,113NCR Corp.(a) 41,126 1,122Nuance Communications, Inc.(a) 81,973 1,388ON Semiconductor Corp.(a) 43,219 889Plexus Corp.(a) 16,460 1,003SYNNEX Corp. 11,826 1,129Teradata Corp.(a)(b) 4,530 198Teradyne, Inc. 21,652 863Verint Systems, Inc.(a) 22,065 1,321Viavi Solutions, Inc.(a) 65,011 805
13,670
Copyright © 2021 www.secdatabase.com. All Rights Reserved.Please Consider the Environment Before Printing This Document
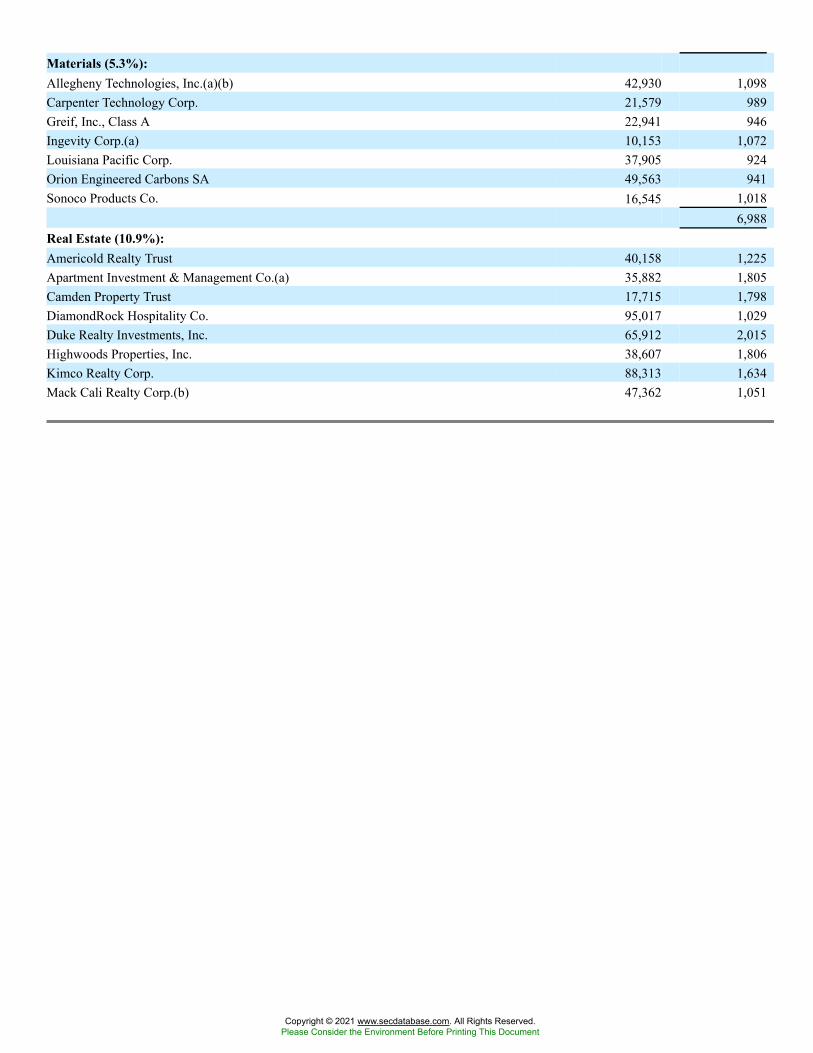
Materials (5.3%):Allegheny Technologies, Inc.(a)(b) 42,930 1,098Carpenter Technology Corp. 21,579 989Greif, Inc., Class A 22,941 946Ingevity Corp.(a) 10,153 1,072Louisiana Pacific Corp. 37,905 924Orion Engineered Carbons SA 49,563 941Sonoco Products Co. 16,545 1,018
6,988Real Estate (10.9%):Americold Realty Trust 40,158 1,225Apartment Investment & Management Co.(a) 35,882 1,805Camden Property Trust 17,715 1,798DiamondRock Hospitality Co. 95,017 1,029Duke Realty Investments, Inc. 65,912 2,015Highwoods Properties, Inc. 38,607 1,806Kimco Realty Corp. 88,313 1,634Mack Cali Realty Corp.(b) 47,362 1,051
Copyright © 2021 www.secdatabase.com. All Rights Reserved.Please Consider the Environment Before Printing This Document
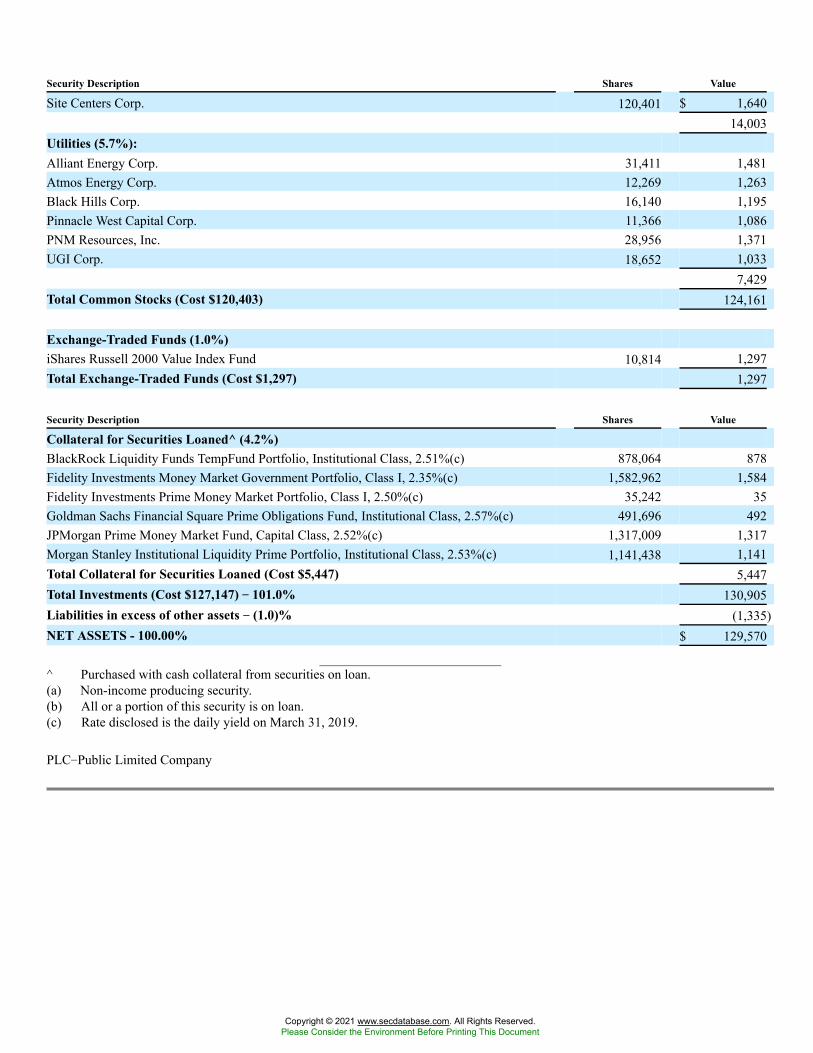
Security Description Shares Value
Site Centers Corp. 120,401 $ 1,64014,003
Utilities (5.7%):Alliant Energy Corp. 31,411 1,481Atmos Energy Corp. 12,269 1,263Black Hills Corp. 16,140 1,195Pinnacle West Capital Corp. 11,366 1,086PNM Resources, Inc. 28,956 1,371UGI Corp. 18,652 1,033
7,429Total Common Stocks (Cost $120,403) 124,161
Exchange-Traded Funds (1.0%)iShares Russell 2000 Value Index Fund 10,814 1,297Total Exchange-Traded Funds (Cost $1,297) 1,297
Security Description Shares Value
Collateral for Securities Loaned^ (4.2%)BlackRock Liquidity Funds TempFund Portfolio, Institutional Class, 2.51%(c) 878,064 878Fidelity Investments Money Market Government Portfolio, Class I, 2.35%(c) 1,582,962 1,584Fidelity Investments Prime Money Market Portfolio, Class I, 2.50%(c) 35,242 35Goldman Sachs Financial Square Prime Obligations Fund, Institutional Class, 2.57%(c) 491,696 492JPMorgan Prime Money Market Fund, Capital Class, 2.52%(c) 1,317,009 1,317Morgan Stanley Institutional Liquidity Prime Portfolio, Institutional Class, 2.53%(c) 1,141,438 1,141Total Collateral for Securities Loaned (Cost $5,447) 5,447Total Investments (Cost $127,147) �� 101.0% 130,905Liabilities in excess of other assets �� (1.0)% (1,335)NET ASSETS - 100.00% $ 129,570
^ Purchased with cash collateral from securities on loan.(a) Non-income producing security.(b) All or a portion of this security is on loan.(c) Rate disclosed is the daily yield on March 31, 2019.
PLC�Public Limited Company
Copyright © 2021 www.secdatabase.com. All Rights Reserved.Please Consider the Environment Before Printing This Document
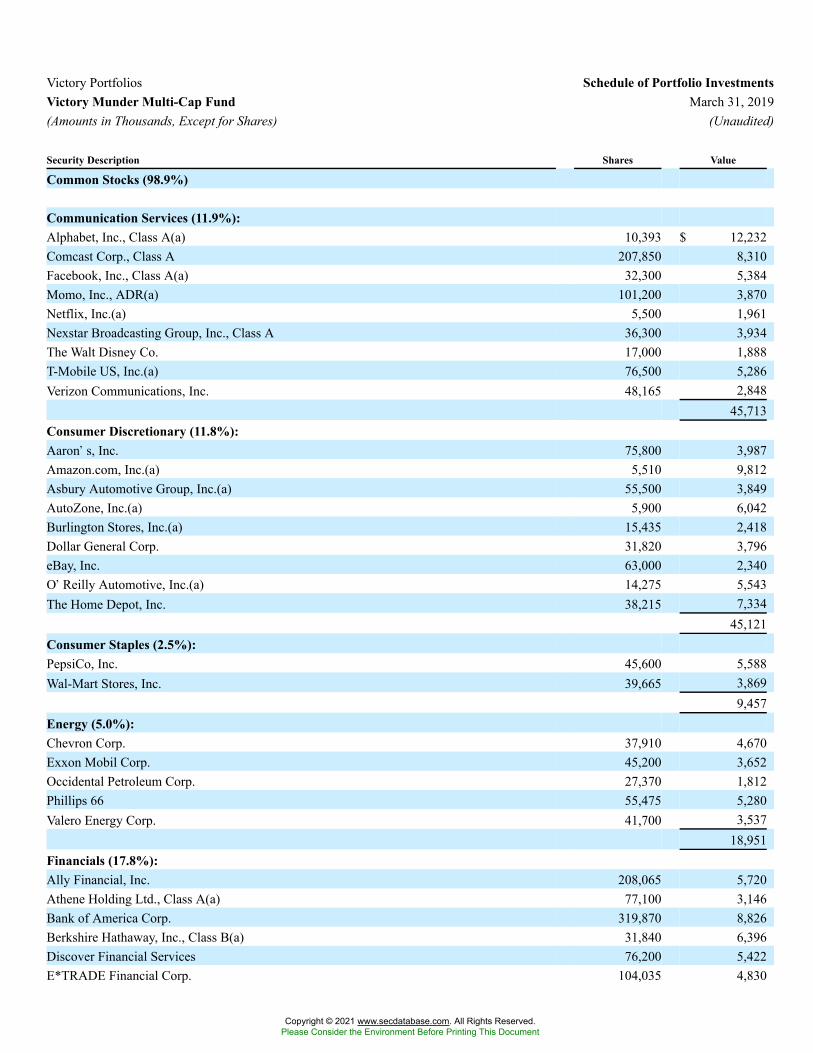
Victory Portfolios Schedule of Portfolio InvestmentsVictory Munder Multi-Cap Fund March 31, 2019(Amounts in Thousands, Except for Shares) (Unaudited)
Security Description Shares Value
Common Stocks (98.9%)
Communication Services (11.9%):Alphabet, Inc., Class A(a) 10,393 $ 12,232Comcast Corp., Class A 207,850 8,310Facebook, Inc., Class A(a) 32,300 5,384Momo, Inc., ADR(a) 101,200 3,870Netflix, Inc.(a) 5,500 1,961Nexstar Broadcasting Group, Inc., Class A 36,300 3,934The Walt Disney Co. 17,000 1,888T-Mobile US, Inc.(a) 76,500 5,286Verizon Communications, Inc. 48,165 2,848
45,713Consumer Discretionary (11.8%):Aaron�s, Inc. 75,800 3,987Amazon.com, Inc.(a) 5,510 9,812Asbury Automotive Group, Inc.(a) 55,500 3,849AutoZone, Inc.(a) 5,900 6,042Burlington Stores, Inc.(a) 15,435 2,418Dollar General Corp. 31,820 3,796eBay, Inc. 63,000 2,340O�Reilly Automotive, Inc.(a) 14,275 5,543The Home Depot, Inc. 38,215 7,334
45,121Consumer Staples (2.5%):PepsiCo, Inc. 45,600 5,588Wal-Mart Stores, Inc. 39,665 3,869
9,457Energy (5.0%):Chevron Corp. 37,910 4,670Exxon Mobil Corp. 45,200 3,652Occidental Petroleum Corp. 27,370 1,812Phillips 66 55,475 5,280Valero Energy Corp. 41,700 3,537
18,951Financials (17.8%):Ally Financial, Inc. 208,065 5,720Athene Holding Ltd., Class A(a) 77,100 3,146Bank of America Corp. 319,870 8,826Berkshire Hathaway, Inc., Class B(a) 31,840 6,396Discover Financial Services 76,200 5,422E*TRADE Financial Corp. 104,035 4,830
Copyright © 2021 www.secdatabase.com. All Rights Reserved.Please Consider the Environment Before Printing This Document
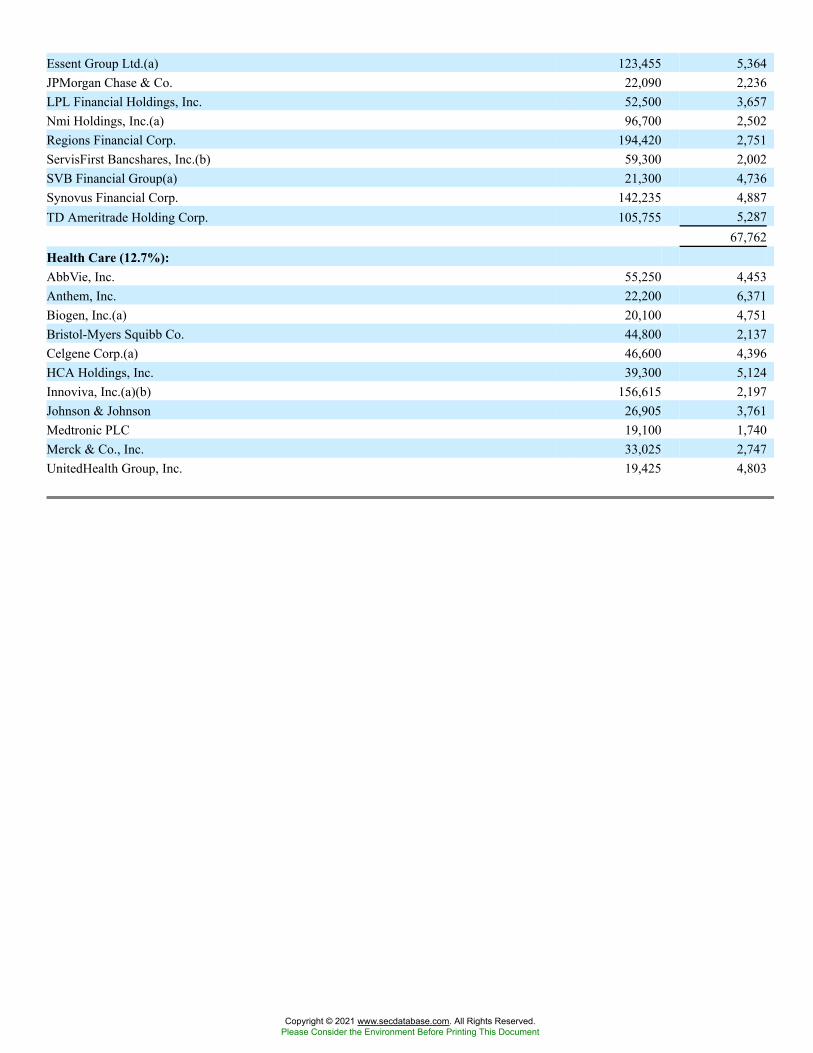
Essent Group Ltd.(a) 123,455 5,364JPMorgan Chase & Co. 22,090 2,236LPL Financial Holdings, Inc. 52,500 3,657Nmi Holdings, Inc.(a) 96,700 2,502Regions Financial Corp. 194,420 2,751ServisFirst Bancshares, Inc.(b) 59,300 2,002SVB Financial Group(a) 21,300 4,736Synovus Financial Corp. 142,235 4,887TD Ameritrade Holding Corp. 105,755 5,287
67,762Health Care (12.7%):AbbVie, Inc. 55,250 4,453Anthem, Inc. 22,200 6,371Biogen, Inc.(a) 20,100 4,751Bristol-Myers Squibb Co. 44,800 2,137Celgene Corp.(a) 46,600 4,396HCA Holdings, Inc. 39,300 5,124Innoviva, Inc.(a)(b) 156,615 2,197Johnson & Johnson 26,905 3,761Medtronic PLC 19,100 1,740Merck & Co., Inc. 33,025 2,747UnitedHealth Group, Inc. 19,425 4,803
Copyright © 2021 www.secdatabase.com. All Rights Reserved.Please Consider the Environment Before Printing This Document
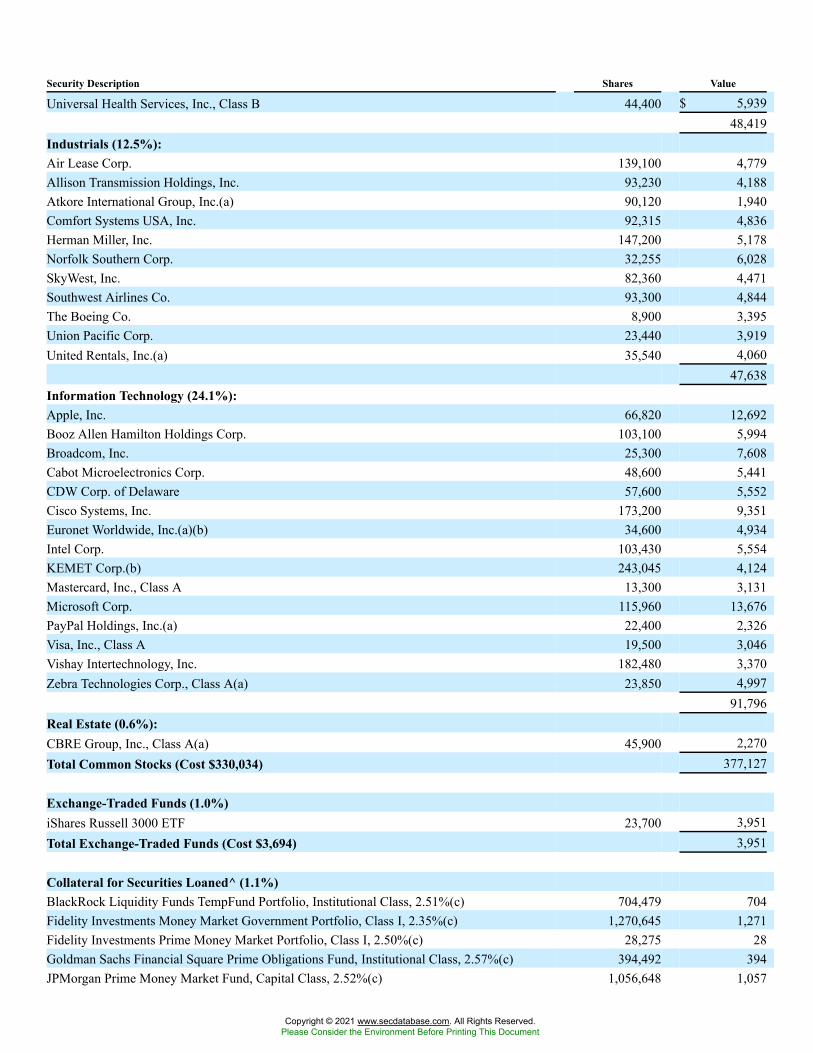
Security Description Shares Value
Universal Health Services, Inc., Class B 44,400 $ 5,93948,419
Industrials (12.5%):Air Lease Corp. 139,100 4,779Allison Transmission Holdings, Inc. 93,230 4,188Atkore International Group, Inc.(a) 90,120 1,940Comfort Systems USA, Inc. 92,315 4,836Herman Miller, Inc. 147,200 5,178Norfolk Southern Corp. 32,255 6,028SkyWest, Inc. 82,360 4,471Southwest Airlines Co. 93,300 4,844The Boeing Co. 8,900 3,395Union Pacific Corp. 23,440 3,919United Rentals, Inc.(a) 35,540 4,060
47,638Information Technology (24.1%):Apple, Inc. 66,820 12,692Booz Allen Hamilton Holdings Corp. 103,100 5,994Broadcom, Inc. 25,300 7,608Cabot Microelectronics Corp. 48,600 5,441CDW Corp. of Delaware 57,600 5,552Cisco Systems, Inc. 173,200 9,351Euronet Worldwide, Inc.(a)(b) 34,600 4,934Intel Corp. 103,430 5,554KEMET Corp.(b) 243,045 4,124Mastercard, Inc., Class A 13,300 3,131Microsoft Corp. 115,960 13,676PayPal Holdings, Inc.(a) 22,400 2,326Visa, Inc., Class A 19,500 3,046Vishay Intertechnology, Inc. 182,480 3,370Zebra Technologies Corp., Class A(a) 23,850 4,997
91,796Real Estate (0.6%):CBRE Group, Inc., Class A(a) 45,900 2,270Total Common Stocks (Cost $330,034) 377,127
Exchange-Traded Funds (1.0%)iShares Russell 3000 ETF 23,700 3,951Total Exchange-Traded Funds (Cost $3,694) 3,951
Collateral for Securities Loaned^ (1.1%)BlackRock Liquidity Funds TempFund Portfolio, Institutional Class, 2.51%(c) 704,479 704Fidelity Investments Money Market Government Portfolio, Class I, 2.35%(c) 1,270,645 1,271Fidelity Investments Prime Money Market Portfolio, Class I, 2.50%(c) 28,275 28Goldman Sachs Financial Square Prime Obligations Fund, Institutional Class, 2.57%(c) 394,492 394JPMorgan Prime Money Market Fund, Capital Class, 2.52%(c) 1,056,648 1,057
Copyright © 2021 www.secdatabase.com. All Rights Reserved.Please Consider the Environment Before Printing This Document
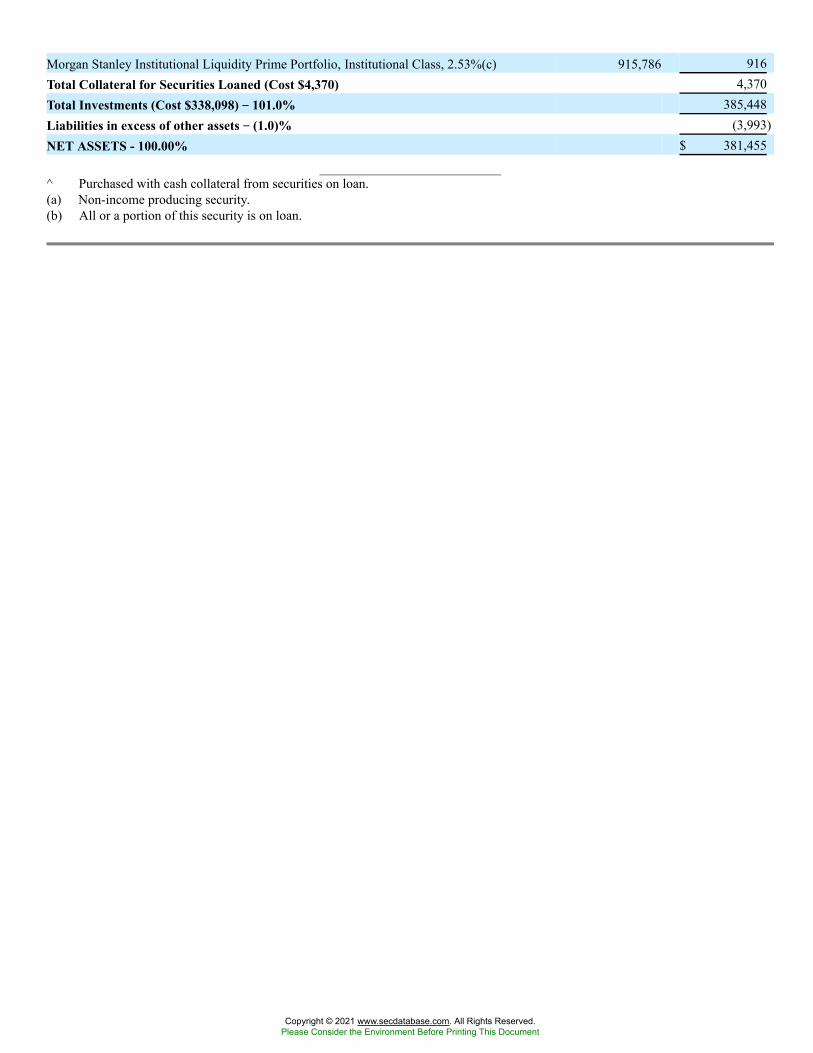
Morgan Stanley Institutional Liquidity Prime Portfolio, Institutional Class, 2.53%(c) 915,786 916Total Collateral for Securities Loaned (Cost $4,370) 4,370Total Investments (Cost $338,098) �� 101.0% 385,448Liabilities in excess of other assets �� (1.0)% (3,993)NET ASSETS - 100.00% $ 381,455
^ Purchased with cash collateral from securities on loan.(a) Non-income producing security.(b) All or a portion of this security is on loan.
Copyright © 2021 www.secdatabase.com. All Rights Reserved.Please Consider the Environment Before Printing This Document
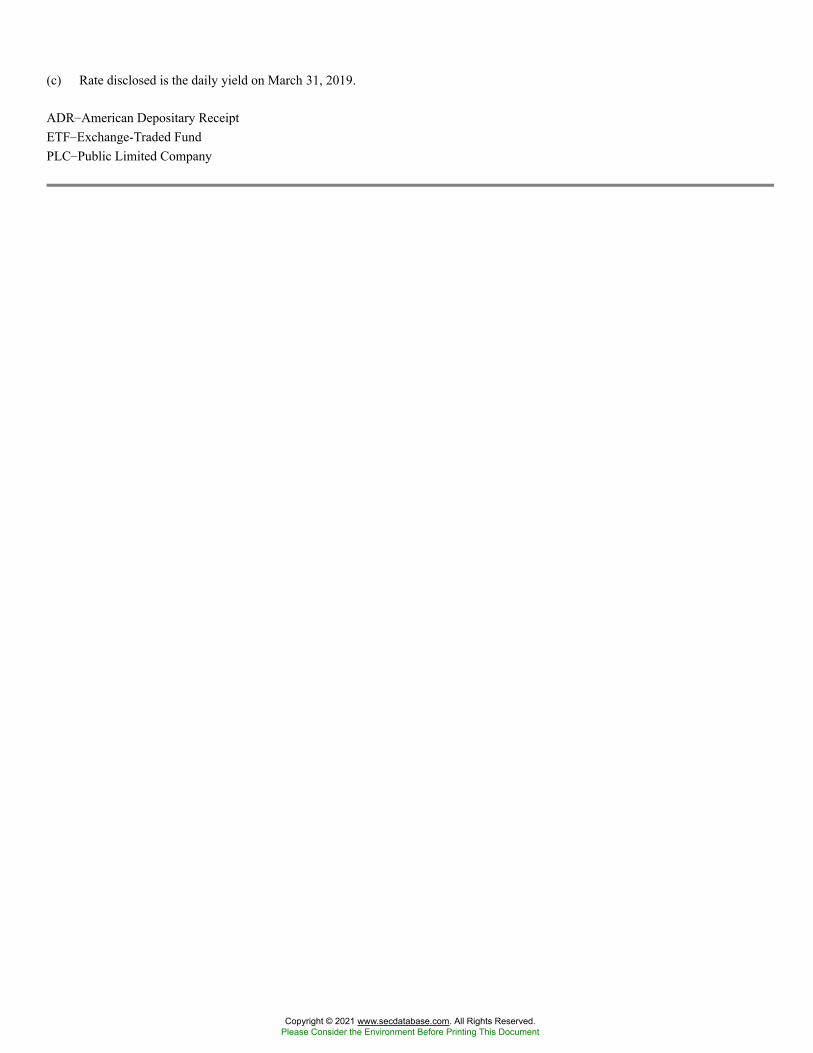
(c) Rate disclosed is the daily yield on March 31, 2019.
ADR�American Depositary ReceiptETF�Exchange-Traded FundPLC�Public Limited Company
Copyright © 2021 www.secdatabase.com. All Rights Reserved.Please Consider the Environment Before Printing This Document
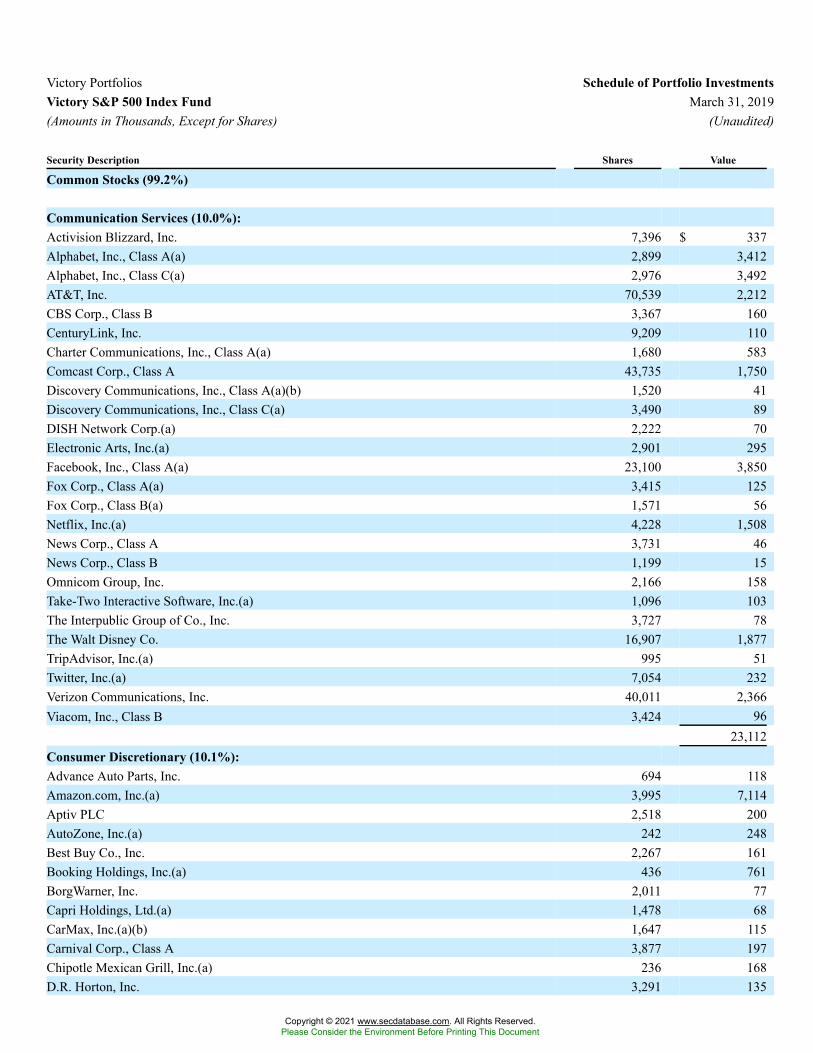
Victory Portfolios Schedule of Portfolio InvestmentsVictory S&P 500 Index Fund March 31, 2019(Amounts in Thousands, Except for Shares) (Unaudited)
Security Description Shares Value
Common Stocks (99.2%)
Communication Services (10.0%):Activision Blizzard, Inc. 7,396 $ 337Alphabet, Inc., Class A(a) 2,899 3,412Alphabet, Inc., Class C(a) 2,976 3,492AT&T, Inc. 70,539 2,212CBS Corp., Class B 3,367 160CenturyLink, Inc. 9,209 110Charter Communications, Inc., Class A(a) 1,680 583Comcast Corp., Class A 43,735 1,750Discovery Communications, Inc., Class A(a)(b) 1,520 41Discovery Communications, Inc., Class C(a) 3,490 89DISH Network Corp.(a) 2,222 70Electronic Arts, Inc.(a) 2,901 295Facebook, Inc., Class A(a) 23,100 3,850Fox Corp., Class A(a) 3,415 125Fox Corp., Class B(a) 1,571 56Netflix, Inc.(a) 4,228 1,508News Corp., Class A 3,731 46News Corp., Class B 1,199 15Omnicom Group, Inc. 2,166 158Take-Two Interactive Software, Inc.(a) 1,096 103The Interpublic Group of Co., Inc. 3,727 78The Walt Disney Co. 16,907 1,877TripAdvisor, Inc.(a) 995 51Twitter, Inc.(a) 7,054 232Verizon Communications, Inc. 40,011 2,366Viacom, Inc., Class B 3,424 96
23,112Consumer Discretionary (10.1%):Advance Auto Parts, Inc. 694 118Amazon.com, Inc.(a) 3,995 7,114Aptiv PLC 2,518 200AutoZone, Inc.(a) 242 248Best Buy Co., Inc. 2,267 161Booking Holdings, Inc.(a) 436 761BorgWarner, Inc. 2,011 77Capri Holdings, Ltd.(a) 1,478 68CarMax, Inc.(a)(b) 1,647 115Carnival Corp., Class A 3,877 197Chipotle Mexican Grill, Inc.(a) 236 168D.R. Horton, Inc. 3,291 135
Copyright © 2021 www.secdatabase.com. All Rights Reserved.Please Consider the Environment Before Printing This Document
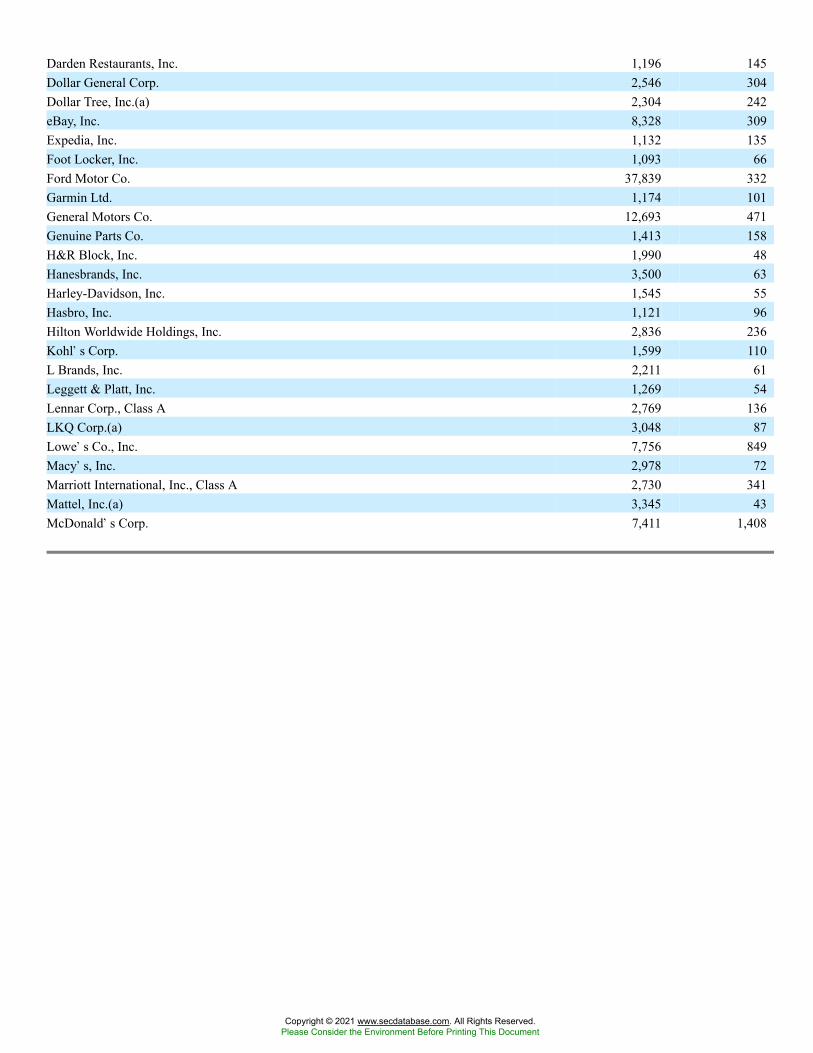
Darden Restaurants, Inc. 1,196 145Dollar General Corp. 2,546 304Dollar Tree, Inc.(a) 2,304 242eBay, Inc. 8,328 309Expedia, Inc. 1,132 135Foot Locker, Inc. 1,093 66Ford Motor Co. 37,839 332Garmin Ltd. 1,174 101General Motors Co. 12,693 471Genuine Parts Co. 1,413 158H&R Block, Inc. 1,990 48Hanesbrands, Inc. 3,500 63Harley-Davidson, Inc. 1,545 55Hasbro, Inc. 1,121 96Hilton Worldwide Holdings, Inc. 2,836 236Kohl�s Corp. 1,599 110L Brands, Inc. 2,211 61Leggett & Platt, Inc. 1,269 54Lennar Corp., Class A 2,769 136LKQ Corp.(a) 3,048 87Lowe�s Co., Inc. 7,756 849Macy�s, Inc. 2,978 72Marriott International, Inc., Class A 2,730 341Mattel, Inc.(a) 3,345 43McDonald�s Corp. 7,411 1,408
Copyright © 2021 www.secdatabase.com. All Rights Reserved.Please Consider the Environment Before Printing This Document
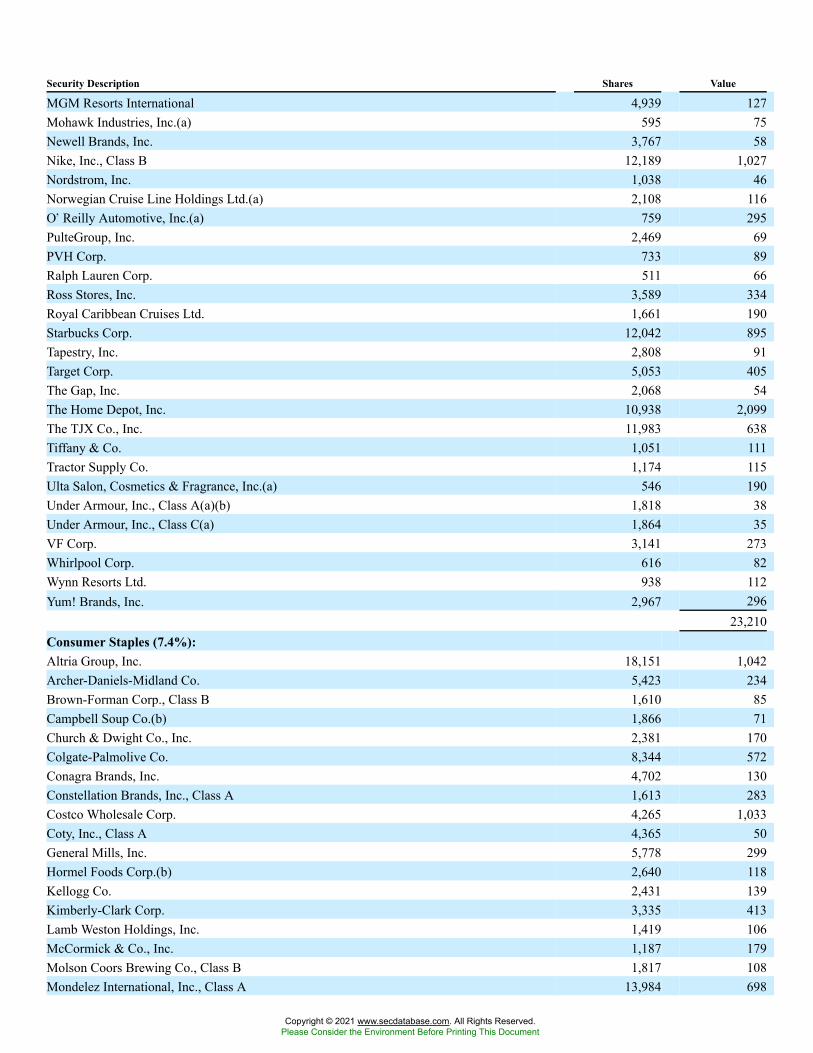
Security Description Shares Value
MGM Resorts International 4,939 127Mohawk Industries, Inc.(a) 595 75Newell Brands, Inc. 3,767 58Nike, Inc., Class B 12,189 1,027Nordstrom, Inc. 1,038 46Norwegian Cruise Line Holdings Ltd.(a) 2,108 116O�Reilly Automotive, Inc.(a) 759 295PulteGroup, Inc. 2,469 69PVH Corp. 733 89Ralph Lauren Corp. 511 66Ross Stores, Inc. 3,589 334Royal Caribbean Cruises Ltd. 1,661 190Starbucks Corp. 12,042 895Tapestry, Inc. 2,808 91Target Corp. 5,053 405The Gap, Inc. 2,068 54The Home Depot, Inc. 10,938 2,099The TJX Co., Inc. 11,983 638Tiffany & Co. 1,051 111Tractor Supply Co. 1,174 115Ulta Salon, Cosmetics & Fragrance, Inc.(a) 546 190Under Armour, Inc., Class A(a)(b) 1,818 38Under Armour, Inc., Class C(a) 1,864 35VF Corp. 3,141 273Whirlpool Corp. 616 82Wynn Resorts Ltd. 938 112Yum! Brands, Inc. 2,967 296
23,210Consumer Staples (7.4%):Altria Group, Inc. 18,151 1,042Archer-Daniels-Midland Co. 5,423 234Brown-Forman Corp., Class B 1,610 85Campbell Soup Co.(b) 1,866 71Church & Dwight Co., Inc. 2,381 170Colgate-Palmolive Co. 8,344 572Conagra Brands, Inc. 4,702 130Constellation Brands, Inc., Class A 1,613 283Costco Wholesale Corp. 4,265 1,033Coty, Inc., Class A 4,365 50General Mills, Inc. 5,778 299Hormel Foods Corp.(b) 2,640 118Kellogg Co. 2,431 139Kimberly-Clark Corp. 3,335 413Lamb Weston Holdings, Inc. 1,419 106McCormick & Co., Inc. 1,187 179Molson Coors Brewing Co., Class B 1,817 108Mondelez International, Inc., Class A 13,984 698
Copyright © 2021 www.secdatabase.com. All Rights Reserved.Please Consider the Environment Before Printing This Document
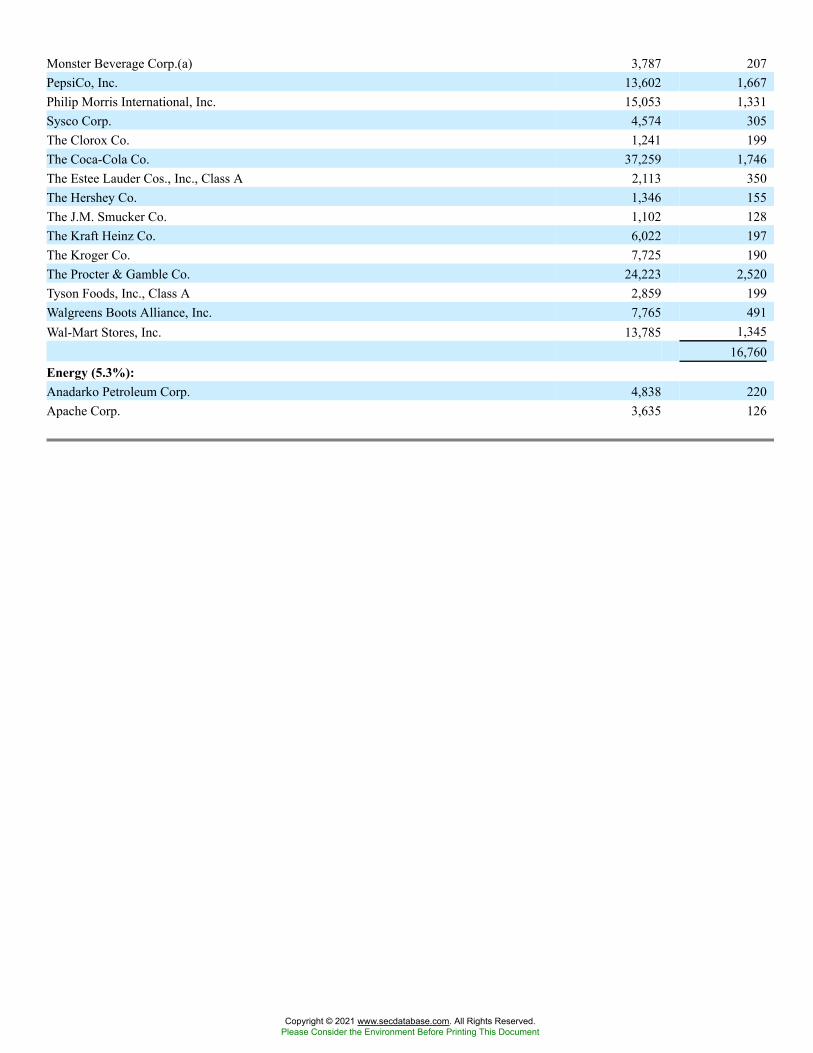
Monster Beverage Corp.(a) 3,787 207PepsiCo, Inc. 13,602 1,667Philip Morris International, Inc. 15,053 1,331Sysco Corp. 4,574 305The Clorox Co. 1,241 199The Coca-Cola Co. 37,259 1,746The Estee Lauder Cos., Inc., Class A 2,113 350The Hershey Co. 1,346 155The J.M. Smucker Co. 1,102 128The Kraft Heinz Co. 6,022 197The Kroger Co. 7,725 190The Procter & Gamble Co. 24,223 2,520Tyson Foods, Inc., Class A 2,859 199Walgreens Boots Alliance, Inc. 7,765 491Wal-Mart Stores, Inc. 13,785 1,345
16,760Energy (5.3%):Anadarko Petroleum Corp. 4,838 220Apache Corp. 3,635 126
Copyright © 2021 www.secdatabase.com. All Rights Reserved.Please Consider the Environment Before Printing This Document
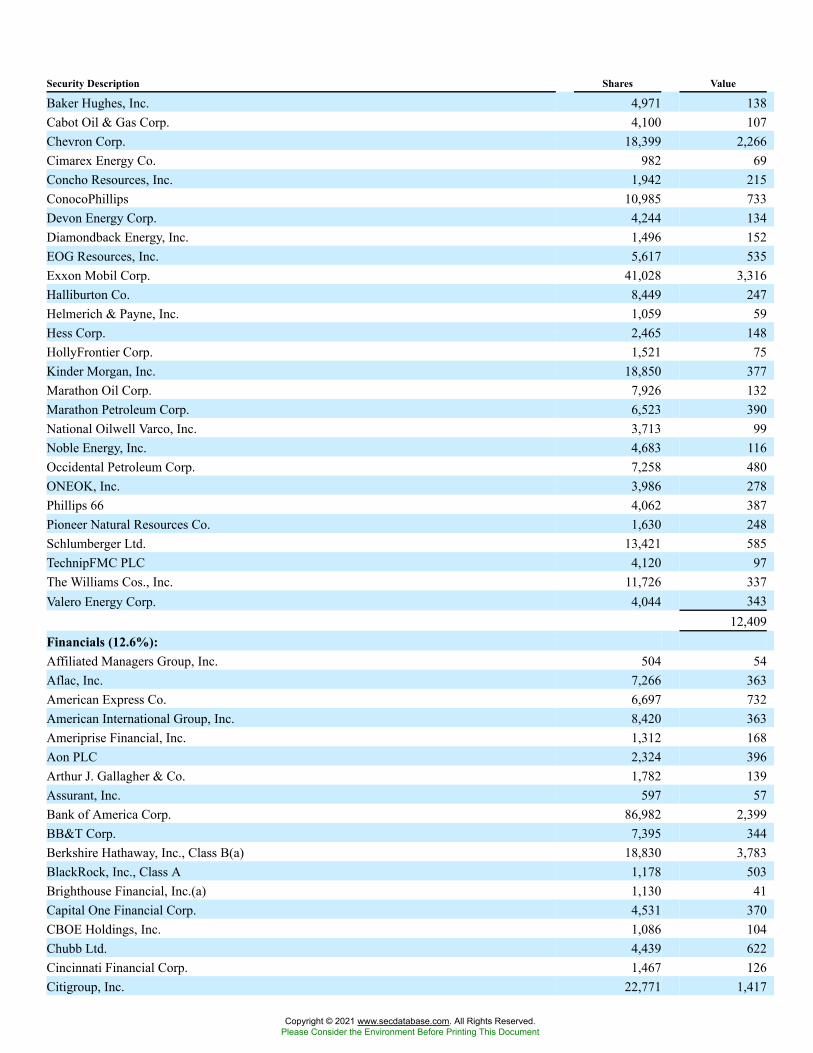
Security Description Shares Value
Baker Hughes, Inc. 4,971 138Cabot Oil & Gas Corp. 4,100 107Chevron Corp. 18,399 2,266Cimarex Energy Co. 982 69Concho Resources, Inc. 1,942 215ConocoPhillips 10,985 733Devon Energy Corp. 4,244 134Diamondback Energy, Inc. 1,496 152EOG Resources, Inc. 5,617 535Exxon Mobil Corp. 41,028 3,316Halliburton Co. 8,449 247Helmerich & Payne, Inc. 1,059 59Hess Corp. 2,465 148HollyFrontier Corp. 1,521 75Kinder Morgan, Inc. 18,850 377Marathon Oil Corp. 7,926 132Marathon Petroleum Corp. 6,523 390National Oilwell Varco, Inc. 3,713 99Noble Energy, Inc. 4,683 116Occidental Petroleum Corp. 7,258 480ONEOK, Inc. 3,986 278Phillips 66 4,062 387Pioneer Natural Resources Co. 1,630 248Schlumberger Ltd. 13,421 585TechnipFMC PLC 4,120 97The Williams Cos., Inc. 11,726 337Valero Energy Corp. 4,044 343
12,409Financials (12.6%):Affiliated Managers Group, Inc. 504 54Aflac, Inc. 7,266 363American Express Co. 6,697 732American International Group, Inc. 8,420 363Ameriprise Financial, Inc. 1,312 168Aon PLC 2,324 396Arthur J. Gallagher & Co. 1,782 139Assurant, Inc. 597 57Bank of America Corp. 86,982 2,399BB&T Corp. 7,395 344Berkshire Hathaway, Inc., Class B(a) 18,830 3,783BlackRock, Inc., Class A 1,178 503Brighthouse Financial, Inc.(a) 1,130 41Capital One Financial Corp. 4,531 370CBOE Holdings, Inc. 1,086 104Chubb Ltd. 4,439 622Cincinnati Financial Corp. 1,467 126Citigroup, Inc. 22,771 1,417
Copyright © 2021 www.secdatabase.com. All Rights Reserved.Please Consider the Environment Before Printing This Document
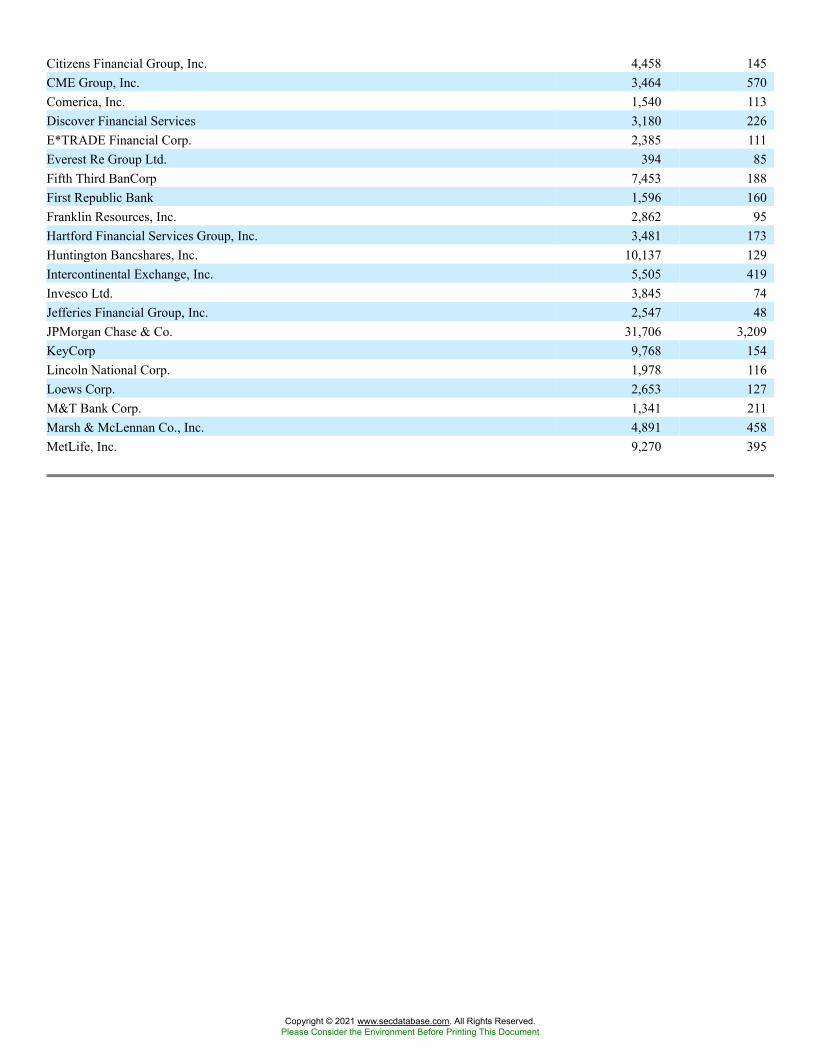
Citizens Financial Group, Inc. 4,458 145CME Group, Inc. 3,464 570Comerica, Inc. 1,540 113Discover Financial Services 3,180 226E*TRADE Financial Corp. 2,385 111Everest Re Group Ltd. 394 85Fifth Third BanCorp 7,453 188First Republic Bank 1,596 160Franklin Resources, Inc. 2,862 95Hartford Financial Services Group, Inc. 3,481 173Huntington Bancshares, Inc. 10,137 129Intercontinental Exchange, Inc. 5,505 419Invesco Ltd. 3,845 74Jefferies Financial Group, Inc. 2,547 48JPMorgan Chase & Co. 31,706 3,209KeyCorp 9,768 154Lincoln National Corp. 1,978 116Loews Corp. 2,653 127M&T Bank Corp. 1,341 211Marsh & McLennan Co., Inc. 4,891 458MetLife, Inc. 9,270 395
Copyright © 2021 www.secdatabase.com. All Rights Reserved.Please Consider the Environment Before Printing This Document
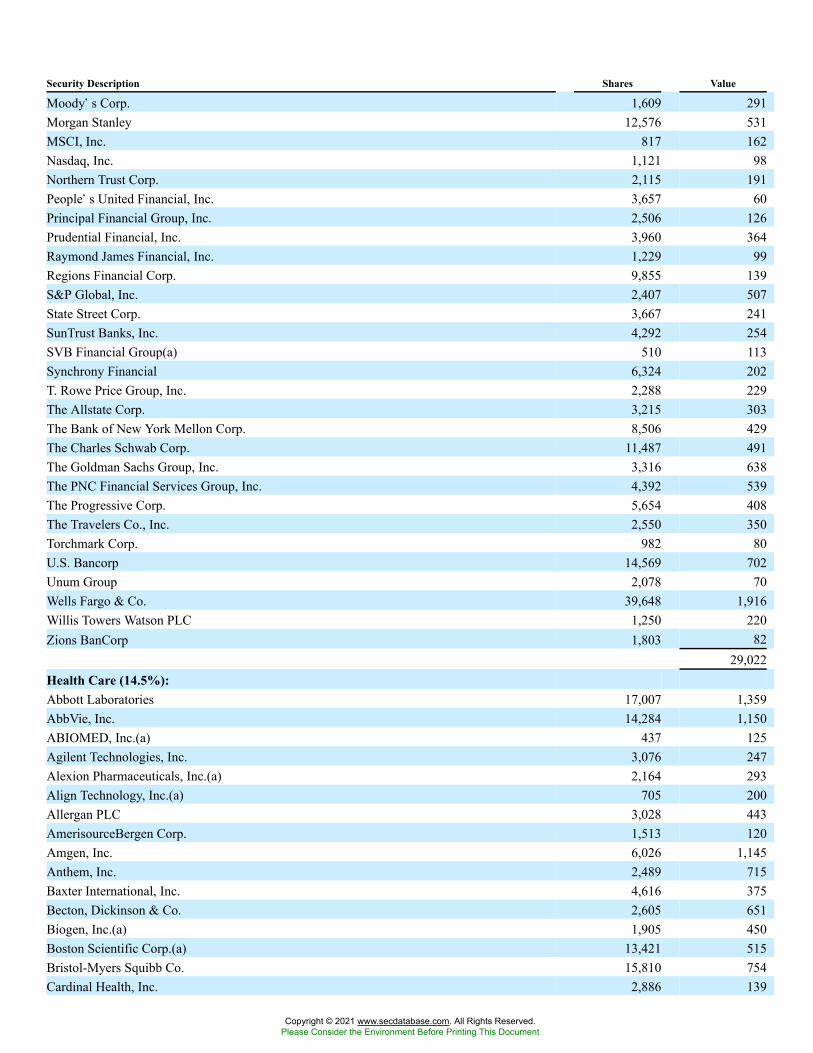
Security Description Shares Value
Moody�s Corp. 1,609 291Morgan Stanley 12,576 531MSCI, Inc. 817 162Nasdaq, Inc. 1,121 98Northern Trust Corp. 2,115 191People�s United Financial, Inc. 3,657 60Principal Financial Group, Inc. 2,506 126Prudential Financial, Inc. 3,960 364Raymond James Financial, Inc. 1,229 99Regions Financial Corp. 9,855 139S&P Global, Inc. 2,407 507State Street Corp. 3,667 241SunTrust Banks, Inc. 4,292 254SVB Financial Group(a) 510 113Synchrony Financial 6,324 202T. Rowe Price Group, Inc. 2,288 229The Allstate Corp. 3,215 303The Bank of New York Mellon Corp. 8,506 429The Charles Schwab Corp. 11,487 491The Goldman Sachs Group, Inc. 3,316 638The PNC Financial Services Group, Inc. 4,392 539The Progressive Corp. 5,654 408The Travelers Co., Inc. 2,550 350Torchmark Corp. 982 80U.S. Bancorp 14,569 702Unum Group 2,078 70Wells Fargo & Co. 39,648 1,916Willis Towers Watson PLC 1,250 220Zions BanCorp 1,803 82
29,022Health Care (14.5%):Abbott Laboratories 17,007 1,359AbbVie, Inc. 14,284 1,150ABIOMED, Inc.(a) 437 125Agilent Technologies, Inc. 3,076 247Alexion Pharmaceuticals, Inc.(a) 2,164 293Align Technology, Inc.(a) 705 200Allergan PLC 3,028 443AmerisourceBergen Corp. 1,513 120Amgen, Inc. 6,026 1,145Anthem, Inc. 2,489 715Baxter International, Inc. 4,616 375Becton, Dickinson & Co. 2,605 651Biogen, Inc.(a) 1,905 450Boston Scientific Corp.(a) 13,421 515Bristol-Myers Squibb Co. 15,810 754Cardinal Health, Inc. 2,886 139
Copyright © 2021 www.secdatabase.com. All Rights Reserved.Please Consider the Environment Before Printing This Document
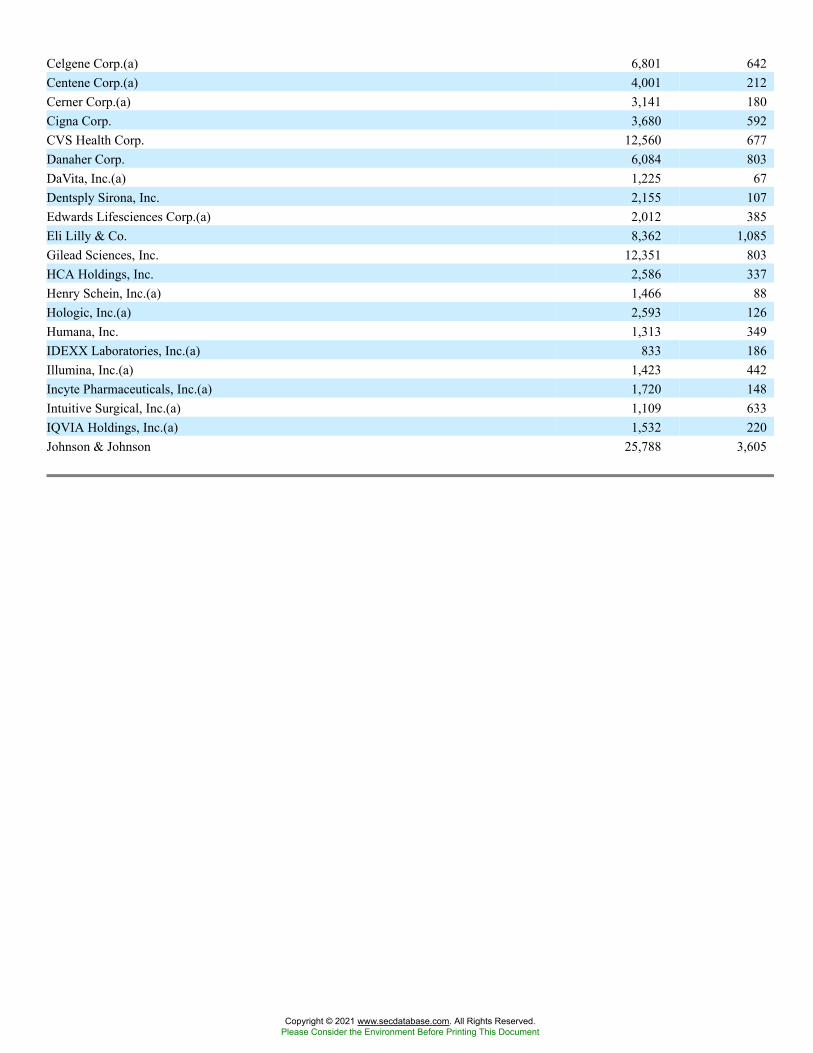
Celgene Corp.(a) 6,801 642Centene Corp.(a) 4,001 212Cerner Corp.(a) 3,141 180Cigna Corp. 3,680 592CVS Health Corp. 12,560 677Danaher Corp. 6,084 803DaVita, Inc.(a) 1,225 67Dentsply Sirona, Inc. 2,155 107Edwards Lifesciences Corp.(a) 2,012 385Eli Lilly & Co. 8,362 1,085Gilead Sciences, Inc. 12,351 803HCA Holdings, Inc. 2,586 337Henry Schein, Inc.(a) 1,466 88Hologic, Inc.(a) 2,593 126Humana, Inc. 1,313 349IDEXX Laboratories, Inc.(a) 833 186Illumina, Inc.(a) 1,423 442Incyte Pharmaceuticals, Inc.(a) 1,720 148Intuitive Surgical, Inc.(a) 1,109 633IQVIA Holdings, Inc.(a) 1,532 220Johnson & Johnson 25,788 3,605
Copyright © 2021 www.secdatabase.com. All Rights Reserved.Please Consider the Environment Before Printing This Document
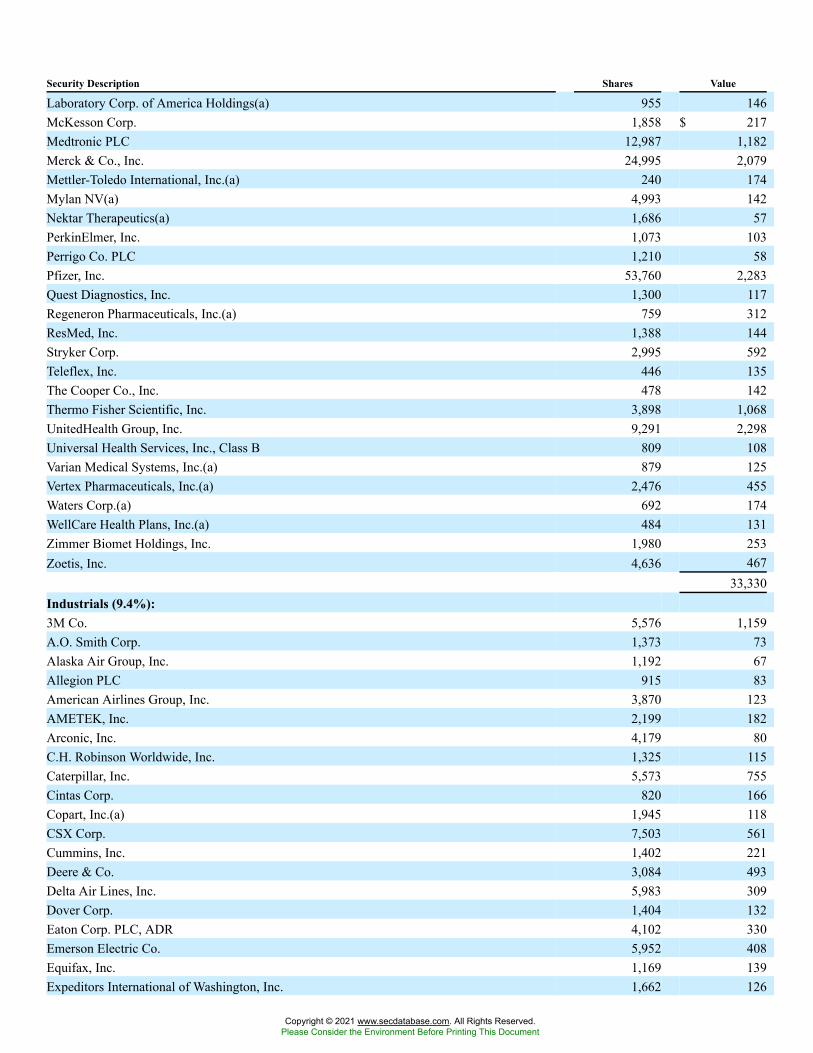
Security Description Shares Value
Laboratory Corp. of America Holdings(a) 955 146McKesson Corp. 1,858 $ 217Medtronic PLC 12,987 1,182Merck & Co., Inc. 24,995 2,079Mettler-Toledo International, Inc.(a) 240 174Mylan NV(a) 4,993 142Nektar Therapeutics(a) 1,686 57PerkinElmer, Inc. 1,073 103Perrigo Co. PLC 1,210 58Pfizer, Inc. 53,760 2,283Quest Diagnostics, Inc. 1,300 117Regeneron Pharmaceuticals, Inc.(a) 759 312ResMed, Inc. 1,388 144Stryker Corp. 2,995 592Teleflex, Inc. 446 135The Cooper Co., Inc. 478 142Thermo Fisher Scientific, Inc. 3,898 1,068UnitedHealth Group, Inc. 9,291 2,298Universal Health Services, Inc., Class B 809 108Varian Medical Systems, Inc.(a) 879 125Vertex Pharmaceuticals, Inc.(a) 2,476 455Waters Corp.(a) 692 174WellCare Health Plans, Inc.(a) 484 131Zimmer Biomet Holdings, Inc. 1,980 253Zoetis, Inc. 4,636 467
33,330Industrials (9.4%):3M Co. 5,576 1,159A.O. Smith Corp. 1,373 73Alaska Air Group, Inc. 1,192 67Allegion PLC 915 83American Airlines Group, Inc. 3,870 123AMETEK, Inc. 2,199 182Arconic, Inc. 4,179 80C.H. Robinson Worldwide, Inc. 1,325 115Caterpillar, Inc. 5,573 755Cintas Corp. 820 166Copart, Inc.(a) 1,945 118CSX Corp. 7,503 561Cummins, Inc. 1,402 221Deere & Co. 3,084 493Delta Air Lines, Inc. 5,983 309Dover Corp. 1,404 132Eaton Corp. PLC, ADR 4,102 330Emerson Electric Co. 5,952 408Equifax, Inc. 1,169 139Expeditors International of Washington, Inc. 1,662 126
Copyright © 2021 www.secdatabase.com. All Rights Reserved.Please Consider the Environment Before Printing This Document
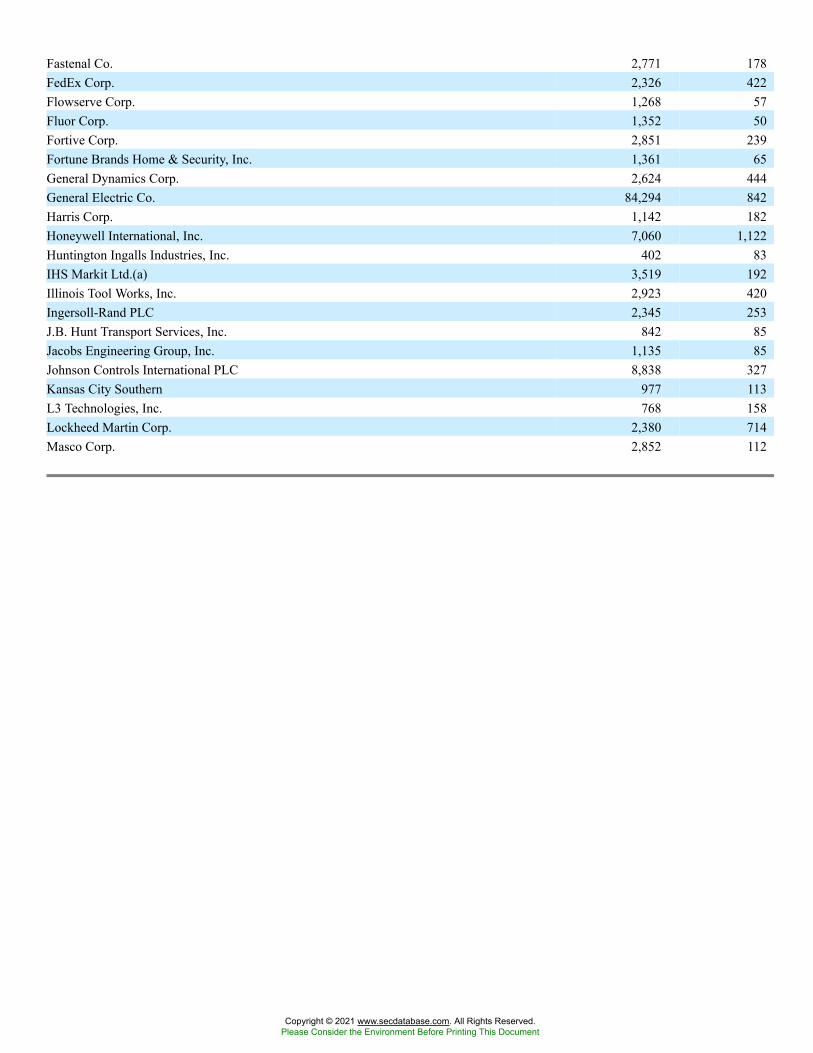
Fastenal Co. 2,771 178FedEx Corp. 2,326 422Flowserve Corp. 1,268 57Fluor Corp. 1,352 50Fortive Corp. 2,851 239Fortune Brands Home & Security, Inc. 1,361 65General Dynamics Corp. 2,624 444General Electric Co. 84,294 842Harris Corp. 1,142 182Honeywell International, Inc. 7,060 1,122Huntington Ingalls Industries, Inc. 402 83IHS Markit Ltd.(a) 3,519 192Illinois Tool Works, Inc. 2,923 420Ingersoll-Rand PLC 2,345 253J.B. Hunt Transport Services, Inc. 842 85Jacobs Engineering Group, Inc. 1,135 85Johnson Controls International PLC 8,838 327Kansas City Southern 977 113L3 Technologies, Inc. 768 158Lockheed Martin Corp. 2,380 714Masco Corp. 2,852 112
Copyright © 2021 www.secdatabase.com. All Rights Reserved.Please Consider the Environment Before Printing This Document
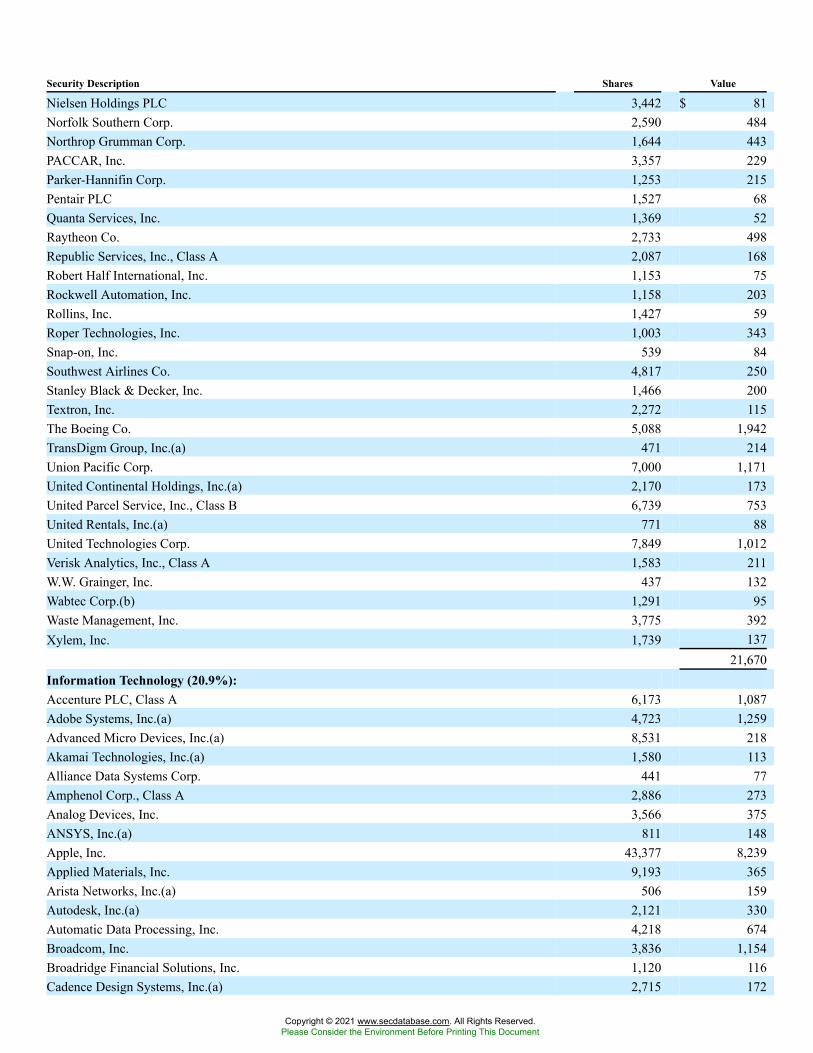
Security Description Shares Value
Nielsen Holdings PLC 3,442 $ 81Norfolk Southern Corp. 2,590 484Northrop Grumman Corp. 1,644 443PACCAR, Inc. 3,357 229Parker-Hannifin Corp. 1,253 215Pentair PLC 1,527 68Quanta Services, Inc. 1,369 52Raytheon Co. 2,733 498Republic Services, Inc., Class A 2,087 168Robert Half International, Inc. 1,153 75Rockwell Automation, Inc. 1,158 203Rollins, Inc. 1,427 59Roper Technologies, Inc. 1,003 343Snap-on, Inc. 539 84Southwest Airlines Co. 4,817 250Stanley Black & Decker, Inc. 1,466 200Textron, Inc. 2,272 115The Boeing Co. 5,088 1,942TransDigm Group, Inc.(a) 471 214Union Pacific Corp. 7,000 1,171United Continental Holdings, Inc.(a) 2,170 173United Parcel Service, Inc., Class B 6,739 753United Rentals, Inc.(a) 771 88United Technologies Corp. 7,849 1,012Verisk Analytics, Inc., Class A 1,583 211W.W. Grainger, Inc. 437 132Wabtec Corp.(b) 1,291 95Waste Management, Inc. 3,775 392Xylem, Inc. 1,739 137
21,670Information Technology (20.9%):Accenture PLC, Class A 6,173 1,087Adobe Systems, Inc.(a) 4,723 1,259Advanced Micro Devices, Inc.(a) 8,531 218Akamai Technologies, Inc.(a) 1,580 113Alliance Data Systems Corp. 441 77Amphenol Corp., Class A 2,886 273Analog Devices, Inc. 3,566 375ANSYS, Inc.(a) 811 148Apple, Inc. 43,377 8,239Applied Materials, Inc. 9,193 365Arista Networks, Inc.(a) 506 159Autodesk, Inc.(a) 2,121 330Automatic Data Processing, Inc. 4,218 674Broadcom, Inc. 3,836 1,154Broadridge Financial Solutions, Inc. 1,120 116Cadence Design Systems, Inc.(a) 2,715 172
Copyright © 2021 www.secdatabase.com. All Rights Reserved.Please Consider the Environment Before Printing This Document
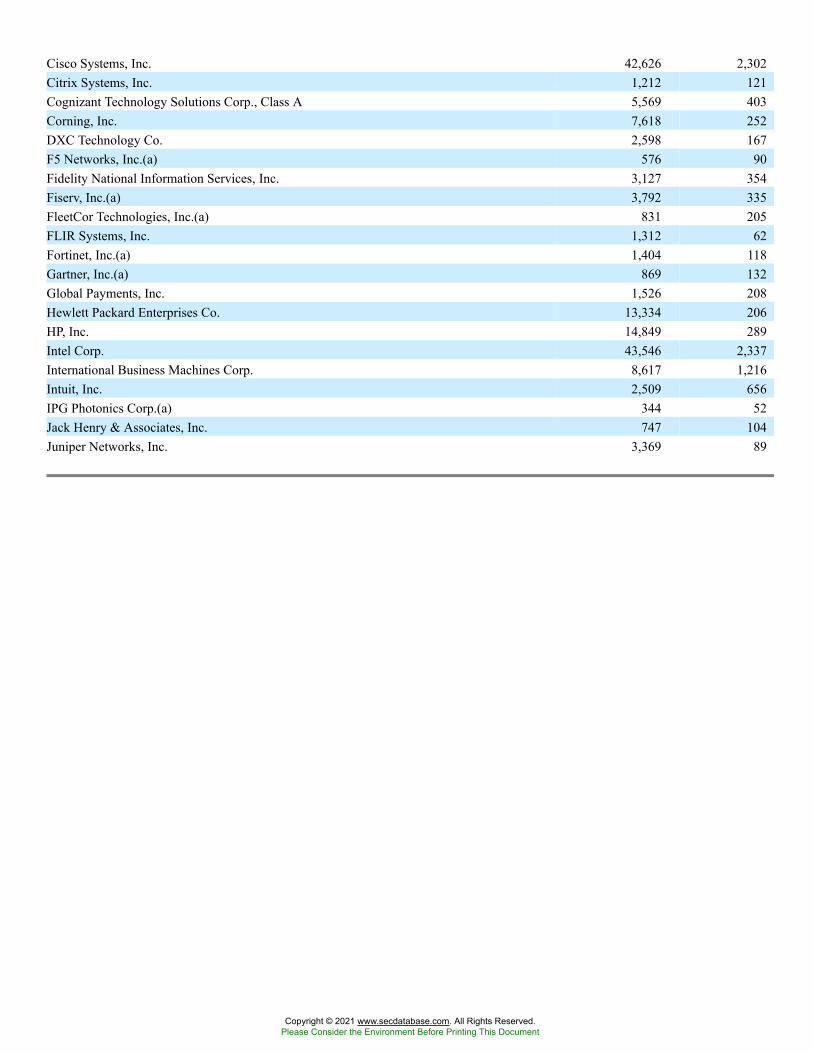
Cisco Systems, Inc. 42,626 2,302Citrix Systems, Inc. 1,212 121Cognizant Technology Solutions Corp., Class A 5,569 403Corning, Inc. 7,618 252DXC Technology Co. 2,598 167F5 Networks, Inc.(a) 576 90Fidelity National Information Services, Inc. 3,127 354Fiserv, Inc.(a) 3,792 335FleetCor Technologies, Inc.(a) 831 205FLIR Systems, Inc. 1,312 62Fortinet, Inc.(a) 1,404 118Gartner, Inc.(a) 869 132Global Payments, Inc. 1,526 208Hewlett Packard Enterprises Co. 13,334 206HP, Inc. 14,849 289Intel Corp. 43,546 2,337International Business Machines Corp. 8,617 1,216Intuit, Inc. 2,509 656IPG Photonics Corp.(a) 344 52Jack Henry & Associates, Inc. 747 104Juniper Networks, Inc. 3,369 89
Copyright © 2021 www.secdatabase.com. All Rights Reserved.Please Consider the Environment Before Printing This Document
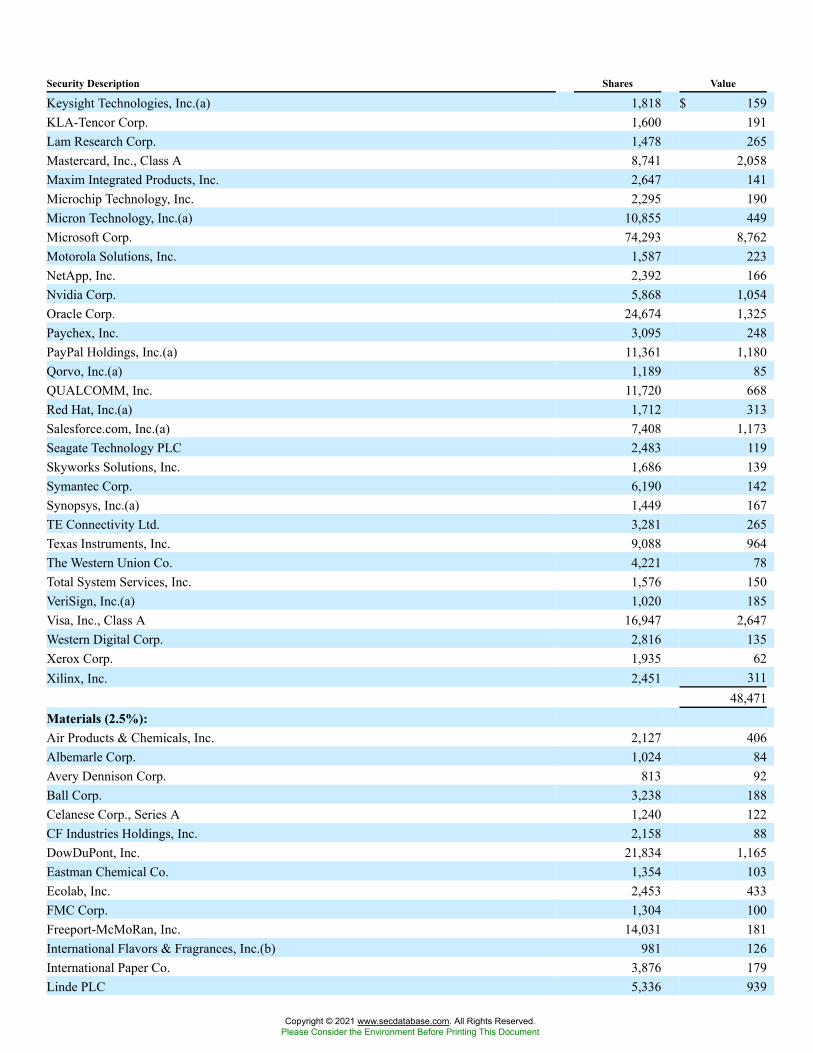
Security Description Shares Value
Keysight Technologies, Inc.(a) 1,818 $ 159KLA-Tencor Corp. 1,600 191Lam Research Corp. 1,478 265Mastercard, Inc., Class A 8,741 2,058Maxim Integrated Products, Inc. 2,647 141Microchip Technology, Inc. 2,295 190Micron Technology, Inc.(a) 10,855 449Microsoft Corp. 74,293 8,762Motorola Solutions, Inc. 1,587 223NetApp, Inc. 2,392 166Nvidia Corp. 5,868 1,054Oracle Corp. 24,674 1,325Paychex, Inc. 3,095 248PayPal Holdings, Inc.(a) 11,361 1,180Qorvo, Inc.(a) 1,189 85QUALCOMM, Inc. 11,720 668Red Hat, Inc.(a) 1,712 313Salesforce.com, Inc.(a) 7,408 1,173Seagate Technology PLC 2,483 119Skyworks Solutions, Inc. 1,686 139Symantec Corp. 6,190 142Synopsys, Inc.(a) 1,449 167TE Connectivity Ltd. 3,281 265Texas Instruments, Inc. 9,088 964The Western Union Co. 4,221 78Total System Services, Inc. 1,576 150VeriSign, Inc.(a) 1,020 185Visa, Inc., Class A 16,947 2,647Western Digital Corp. 2,816 135Xerox Corp. 1,935 62Xilinx, Inc. 2,451 311
48,471Materials (2.5%):Air Products & Chemicals, Inc. 2,127 406Albemarle Corp. 1,024 84Avery Dennison Corp. 813 92Ball Corp. 3,238 188Celanese Corp., Series A 1,240 122CF Industries Holdings, Inc. 2,158 88DowDuPont, Inc. 21,834 1,165Eastman Chemical Co. 1,354 103Ecolab, Inc. 2,453 433FMC Corp. 1,304 100Freeport-McMoRan, Inc. 14,031 181International Flavors & Fragrances, Inc.(b) 981 126International Paper Co. 3,876 179Linde PLC 5,336 939
Copyright © 2021 www.secdatabase.com. All Rights Reserved.Please Consider the Environment Before Printing This Document
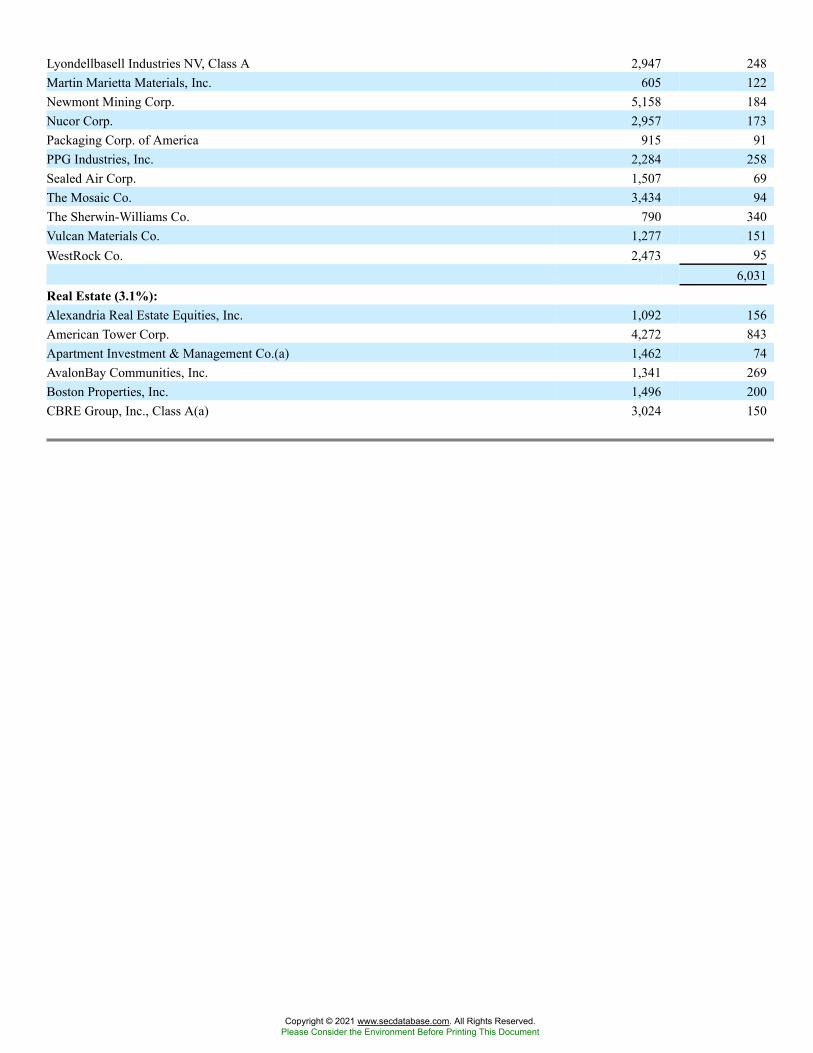
Lyondellbasell Industries NV, Class A 2,947 248Martin Marietta Materials, Inc. 605 122Newmont Mining Corp. 5,158 184Nucor Corp. 2,957 173Packaging Corp. of America 915 91PPG Industries, Inc. 2,284 258Sealed Air Corp. 1,507 69The Mosaic Co. 3,434 94The Sherwin-Williams Co. 790 340Vulcan Materials Co. 1,277 151WestRock Co. 2,473 95
6,031Real Estate (3.1%):Alexandria Real Estate Equities, Inc. 1,092 156American Tower Corp. 4,272 843Apartment Investment & Management Co.(a) 1,462 74AvalonBay Communities, Inc. 1,341 269Boston Properties, Inc. 1,496 200CBRE Group, Inc., Class A(a) 3,024 150
Copyright © 2021 www.secdatabase.com. All Rights Reserved.Please Consider the Environment Before Printing This Document
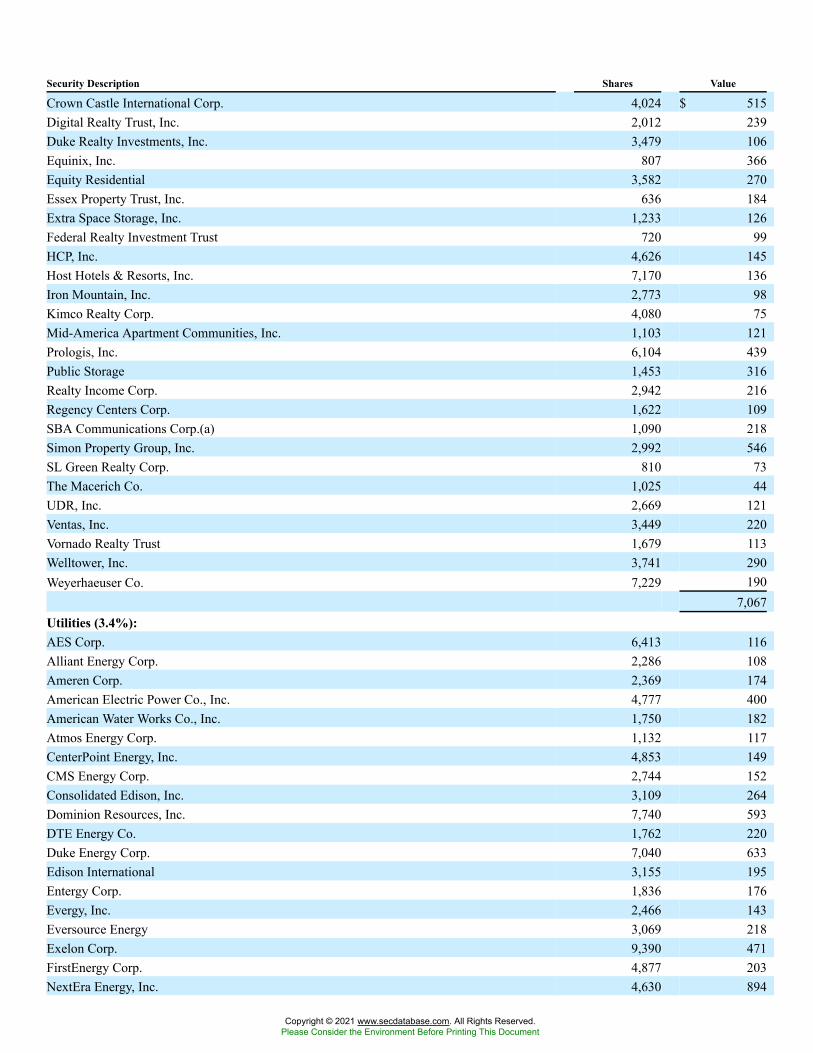
Security Description Shares Value
Crown Castle International Corp. 4,024 $ 515Digital Realty Trust, Inc. 2,012 239Duke Realty Investments, Inc. 3,479 106Equinix, Inc. 807 366Equity Residential 3,582 270Essex Property Trust, Inc. 636 184Extra Space Storage, Inc. 1,233 126Federal Realty Investment Trust 720 99HCP, Inc. 4,626 145Host Hotels & Resorts, Inc. 7,170 136Iron Mountain, Inc. 2,773 98Kimco Realty Corp. 4,080 75Mid-America Apartment Communities, Inc. 1,103 121Prologis, Inc. 6,104 439Public Storage 1,453 316Realty Income Corp. 2,942 216Regency Centers Corp. 1,622 109SBA Communications Corp.(a) 1,090 218Simon Property Group, Inc. 2,992 546SL Green Realty Corp. 810 73The Macerich Co. 1,025 44UDR, Inc. 2,669 121Ventas, Inc. 3,449 220Vornado Realty Trust 1,679 113Welltower, Inc. 3,741 290Weyerhaeuser Co. 7,229 190
7,067Utilities (3.4%):AES Corp. 6,413 116Alliant Energy Corp. 2,286 108Ameren Corp. 2,369 174American Electric Power Co., Inc. 4,777 400American Water Works Co., Inc. 1,750 182Atmos Energy Corp. 1,132 117CenterPoint Energy, Inc. 4,853 149CMS Energy Corp. 2,744 152Consolidated Edison, Inc. 3,109 264Dominion Resources, Inc. 7,740 593DTE Energy Co. 1,762 220Duke Energy Corp. 7,040 633Edison International 3,155 195Entergy Corp. 1,836 176Evergy, Inc. 2,466 143Eversource Energy 3,069 218Exelon Corp. 9,390 471FirstEnergy Corp. 4,877 203NextEra Energy, Inc. 4,630 894
Copyright © 2021 www.secdatabase.com. All Rights Reserved.Please Consider the Environment Before Printing This Document
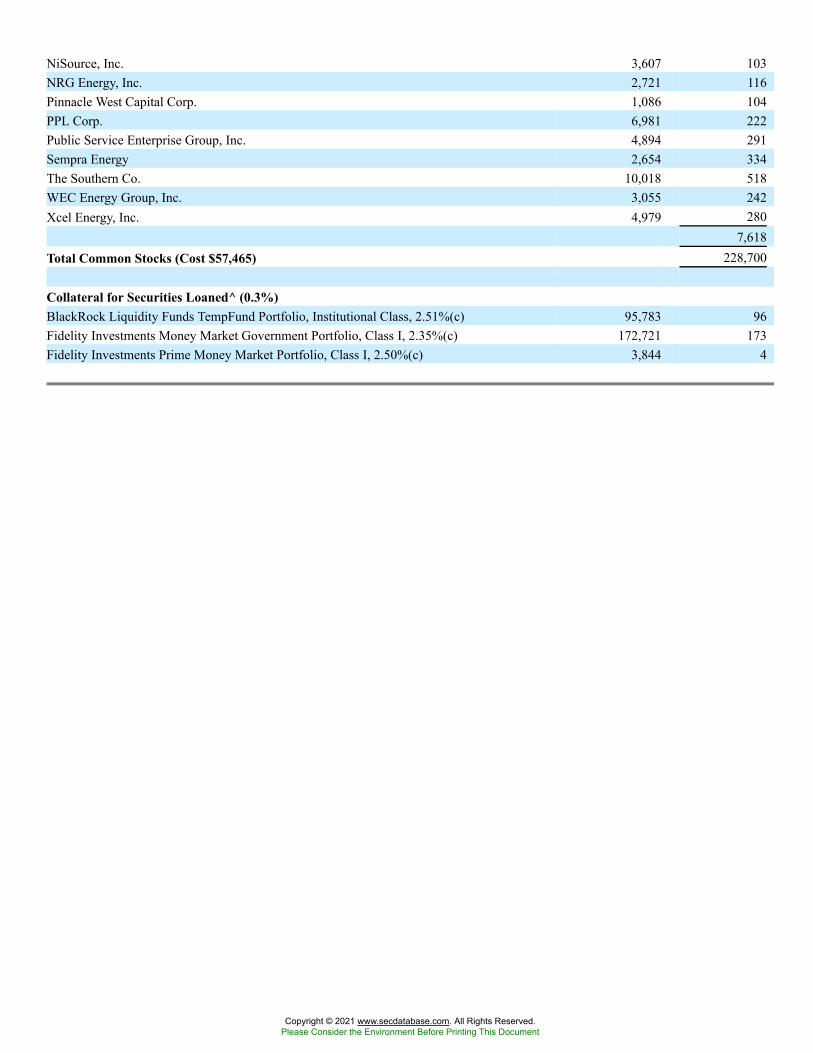
NiSource, Inc. 3,607 103NRG Energy, Inc. 2,721 116Pinnacle West Capital Corp. 1,086 104PPL Corp. 6,981 222Public Service Enterprise Group, Inc. 4,894 291Sempra Energy 2,654 334The Southern Co. 10,018 518WEC Energy Group, Inc. 3,055 242Xcel Energy, Inc. 4,979 280
7,618Total Common Stocks (Cost $57,465) 228,700
Collateral for Securities Loaned^ (0.3%)BlackRock Liquidity Funds TempFund Portfolio, Institutional Class, 2.51%(c) 95,783 96Fidelity Investments Money Market Government Portfolio, Class I, 2.35%(c) 172,721 173Fidelity Investments Prime Money Market Portfolio, Class I, 2.50%(c) 3,844 4
Copyright © 2021 www.secdatabase.com. All Rights Reserved.Please Consider the Environment Before Printing This Document
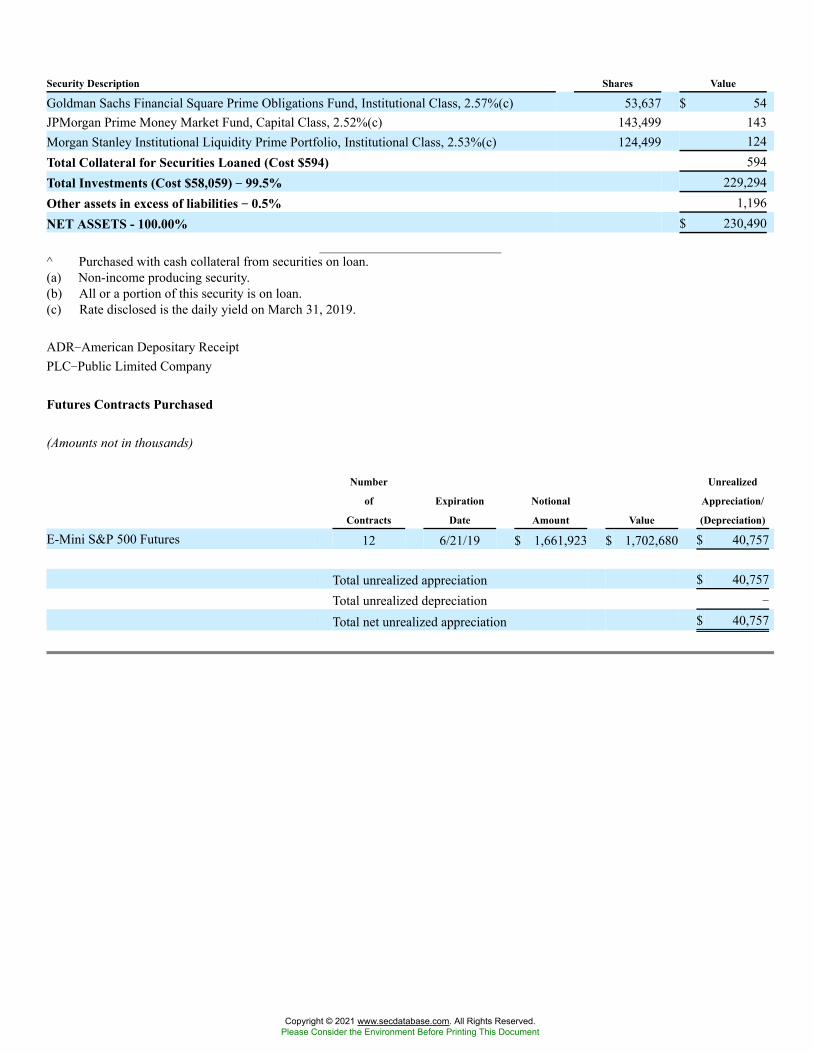
Security Description Shares Value
Goldman Sachs Financial Square Prime Obligations Fund, Institutional Class, 2.57%(c) 53,637 $ 54JPMorgan Prime Money Market Fund, Capital Class, 2.52%(c) 143,499 143Morgan Stanley Institutional Liquidity Prime Portfolio, Institutional Class, 2.53%(c) 124,499 124Total Collateral for Securities Loaned (Cost $594) 594Total Investments (Cost $58,059) �� 99.5% 229,294Other assets in excess of liabilities �� 0.5% 1,196NET ASSETS - 100.00% $ 230,490
^ Purchased with cash collateral from securities on loan.(a) Non-income producing security.(b) All or a portion of this security is on loan.(c) Rate disclosed is the daily yield on March 31, 2019.
ADR�American Depositary ReceiptPLC�Public Limited Company
Futures Contracts Purchased
(Amounts not in thousands)
Number
of
Contracts
Expiration
Date
Notional
Amount Value
Unrealized
Appreciation/
(Depreciation)
E-Mini S&P 500 Futures 12 6/21/19 $ 1,661,923 $ 1,702,680 $ 40,757
Total unrealized appreciation $ 40,757Total unrealized depreciation �
Total net unrealized appreciation $ 40,757
Copyright © 2021 www.secdatabase.com. All Rights Reserved.Please Consider the Environment Before Printing This Document
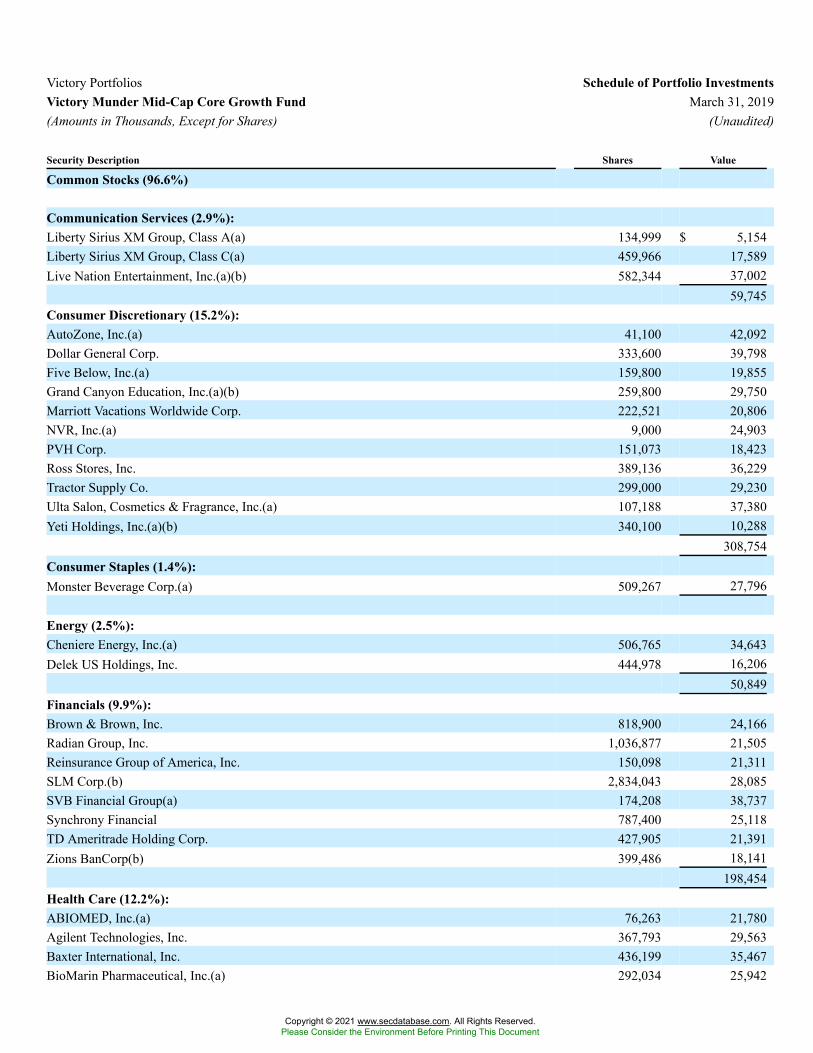
Victory Portfolios Schedule of Portfolio InvestmentsVictory Munder Mid-Cap Core Growth Fund March 31, 2019(Amounts in Thousands, Except for Shares) (Unaudited)
Security Description Shares Value
Common Stocks (96.6%)
Communication Services (2.9%):Liberty Sirius XM Group, Class A(a) 134,999 $ 5,154Liberty Sirius XM Group, Class C(a) 459,966 17,589Live Nation Entertainment, Inc.(a)(b) 582,344 37,002
59,745Consumer Discretionary (15.2%):AutoZone, Inc.(a) 41,100 42,092Dollar General Corp. 333,600 39,798Five Below, Inc.(a) 159,800 19,855Grand Canyon Education, Inc.(a)(b) 259,800 29,750Marriott Vacations Worldwide Corp. 222,521 20,806NVR, Inc.(a) 9,000 24,903PVH Corp. 151,073 18,423Ross Stores, Inc. 389,136 36,229Tractor Supply Co. 299,000 29,230Ulta Salon, Cosmetics & Fragrance, Inc.(a) 107,188 37,380Yeti Holdings, Inc.(a)(b) 340,100 10,288
308,754Consumer Staples (1.4%):Monster Beverage Corp.(a) 509,267 27,796
Energy (2.5%):Cheniere Energy, Inc.(a) 506,765 34,643Delek US Holdings, Inc. 444,978 16,206
50,849Financials (9.9%):Brown & Brown, Inc. 818,900 24,166Radian Group, Inc. 1,036,877 21,505Reinsurance Group of America, Inc. 150,098 21,311SLM Corp.(b) 2,834,043 28,085SVB Financial Group(a) 174,208 38,737Synchrony Financial 787,400 25,118TD Ameritrade Holding Corp. 427,905 21,391Zions BanCorp(b) 399,486 18,141
198,454Health Care (12.2%):ABIOMED, Inc.(a) 76,263 21,780Agilent Technologies, Inc. 367,793 29,563Baxter International, Inc. 436,199 35,467BioMarin Pharmaceutical, Inc.(a) 292,034 25,942
Copyright © 2021 www.secdatabase.com. All Rights Reserved.Please Consider the Environment Before Printing This Document
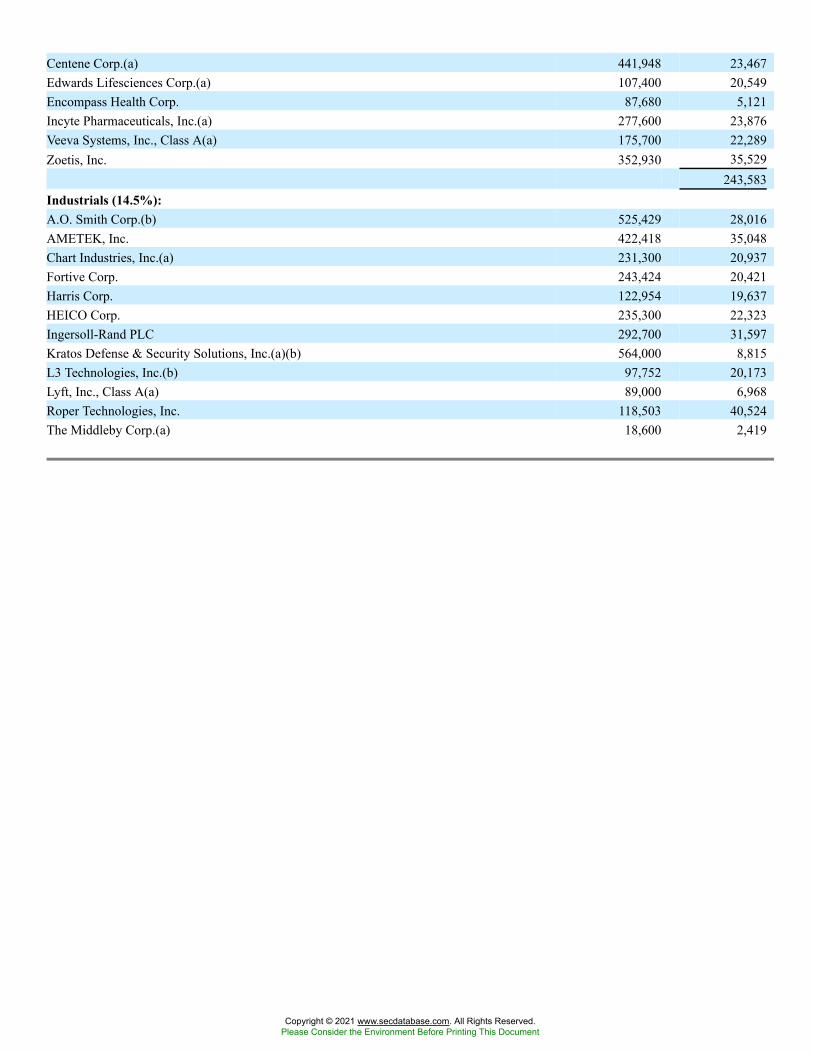
Centene Corp.(a) 441,948 23,467Edwards Lifesciences Corp.(a) 107,400 20,549Encompass Health Corp. 87,680 5,121Incyte Pharmaceuticals, Inc.(a) 277,600 23,876Veeva Systems, Inc., Class A(a) 175,700 22,289Zoetis, Inc. 352,930 35,529
243,583Industrials (14.5%):A.O. Smith Corp.(b) 525,429 28,016AMETEK, Inc. 422,418 35,048Chart Industries, Inc.(a) 231,300 20,937Fortive Corp. 243,424 20,421Harris Corp. 122,954 19,637HEICO Corp. 235,300 22,323Ingersoll-Rand PLC 292,700 31,597Kratos Defense & Security Solutions, Inc.(a)(b) 564,000 8,815L3 Technologies, Inc.(b) 97,752 20,173Lyft, Inc., Class A(a) 89,000 6,968Roper Technologies, Inc. 118,503 40,524The Middleby Corp.(a) 18,600 2,419
Copyright © 2021 www.secdatabase.com. All Rights Reserved.Please Consider the Environment Before Printing This Document
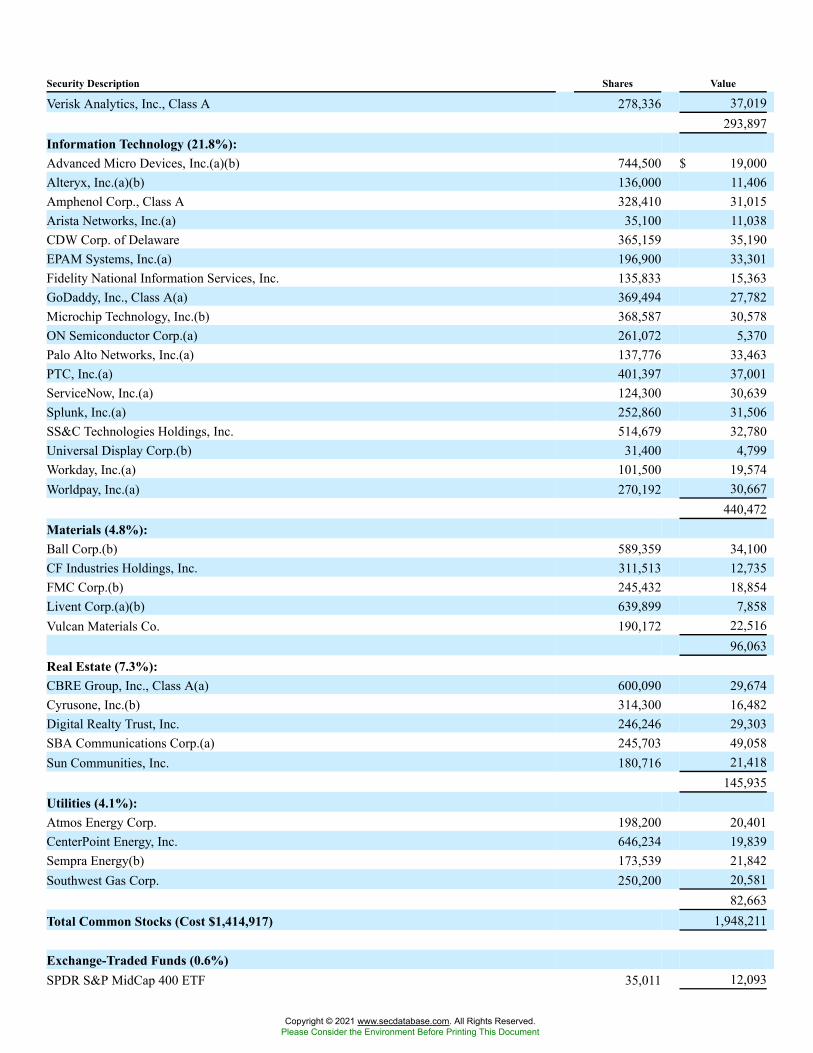
Security Description Shares Value
Verisk Analytics, Inc., Class A 278,336 37,019293,897
Information Technology (21.8%):Advanced Micro Devices, Inc.(a)(b) 744,500 $ 19,000Alteryx, Inc.(a)(b) 136,000 11,406Amphenol Corp., Class A 328,410 31,015Arista Networks, Inc.(a) 35,100 11,038CDW Corp. of Delaware 365,159 35,190EPAM Systems, Inc.(a) 196,900 33,301Fidelity National Information Services, Inc. 135,833 15,363GoDaddy, Inc., Class A(a) 369,494 27,782Microchip Technology, Inc.(b) 368,587 30,578ON Semiconductor Corp.(a) 261,072 5,370Palo Alto Networks, Inc.(a) 137,776 33,463PTC, Inc.(a) 401,397 37,001ServiceNow, Inc.(a) 124,300 30,639Splunk, Inc.(a) 252,860 31,506SS&C Technologies Holdings, Inc. 514,679 32,780Universal Display Corp.(b) 31,400 4,799Workday, Inc.(a) 101,500 19,574Worldpay, Inc.(a) 270,192 30,667
440,472Materials (4.8%):Ball Corp.(b) 589,359 34,100CF Industries Holdings, Inc. 311,513 12,735FMC Corp.(b) 245,432 18,854Livent Corp.(a)(b) 639,899 7,858Vulcan Materials Co. 190,172 22,516
96,063Real Estate (7.3%):CBRE Group, Inc., Class A(a) 600,090 29,674Cyrusone, Inc.(b) 314,300 16,482Digital Realty Trust, Inc. 246,246 29,303SBA Communications Corp.(a) 245,703 49,058Sun Communities, Inc. 180,716 21,418
145,935Utilities (4.1%):Atmos Energy Corp. 198,200 20,401CenterPoint Energy, Inc. 646,234 19,839Sempra Energy(b) 173,539 21,842Southwest Gas Corp. 250,200 20,581
82,663Total Common Stocks (Cost $1,414,917) 1,948,211
Exchange-Traded Funds (0.6%)SPDR S&P MidCap 400 ETF 35,011 12,093
Copyright © 2021 www.secdatabase.com. All Rights Reserved.Please Consider the Environment Before Printing This Document
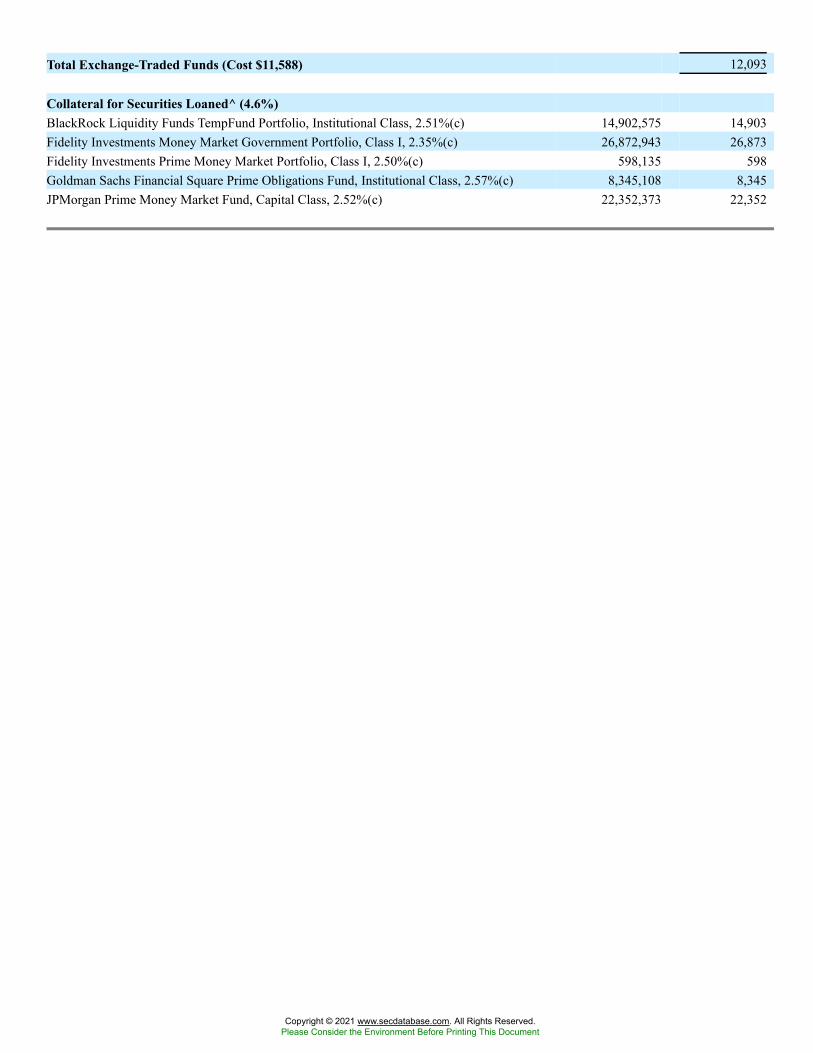
Total Exchange-Traded Funds (Cost $11,588) 12,093
Collateral for Securities Loaned^ (4.6%)BlackRock Liquidity Funds TempFund Portfolio, Institutional Class, 2.51%(c) 14,902,575 14,903Fidelity Investments Money Market Government Portfolio, Class I, 2.35%(c) 26,872,943 26,873Fidelity Investments Prime Money Market Portfolio, Class I, 2.50%(c) 598,135 598Goldman Sachs Financial Square Prime Obligations Fund, Institutional Class, 2.57%(c) 8,345,108 8,345JPMorgan Prime Money Market Fund, Capital Class, 2.52%(c) 22,352,373 22,352
Copyright © 2021 www.secdatabase.com. All Rights Reserved.Please Consider the Environment Before Printing This Document
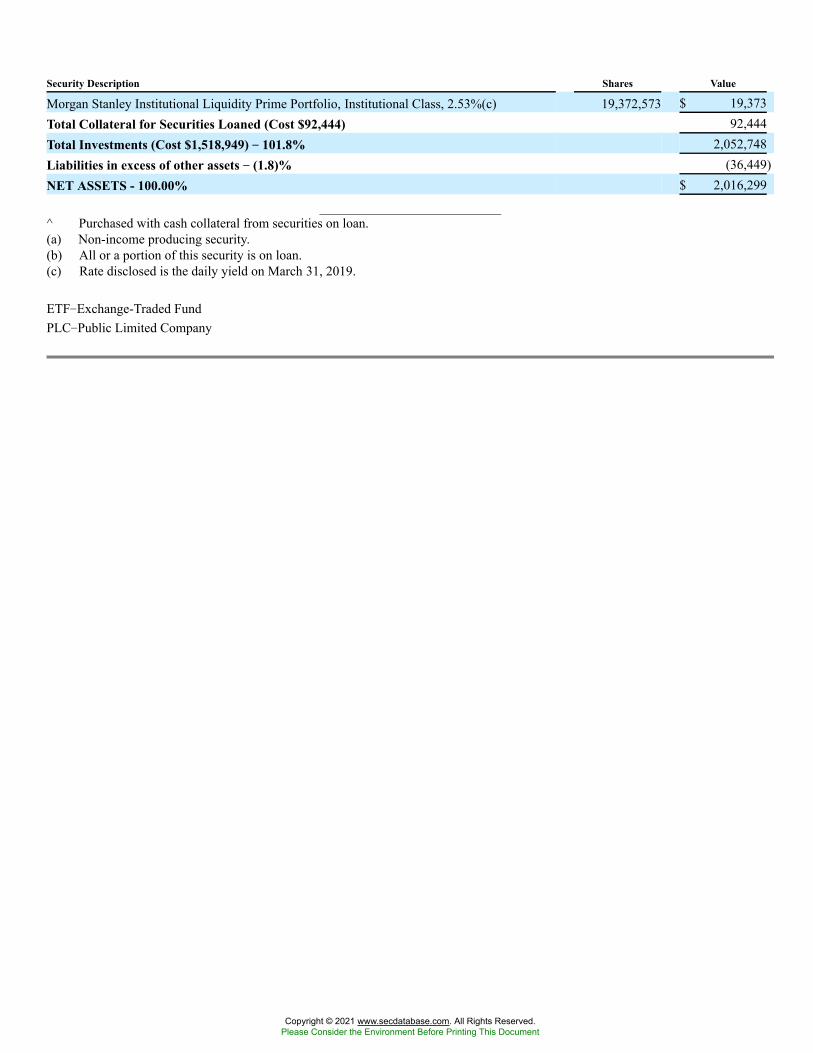
Security Description Shares Value
Morgan Stanley Institutional Liquidity Prime Portfolio, Institutional Class, 2.53%(c) 19,372,573 $ 19,373Total Collateral for Securities Loaned (Cost $92,444) 92,444Total Investments (Cost $1,518,949) �� 101.8% 2,052,748Liabilities in excess of other assets �� (1.8)% (36,449)NET ASSETS - 100.00% $ 2,016,299
^ Purchased with cash collateral from securities on loan.(a) Non-income producing security.(b) All or a portion of this security is on loan.(c) Rate disclosed is the daily yield on March 31, 2019.
ETF�Exchange-Traded FundPLC�Public Limited Company
Copyright © 2021 www.secdatabase.com. All Rights Reserved.Please Consider the Environment Before Printing This Document
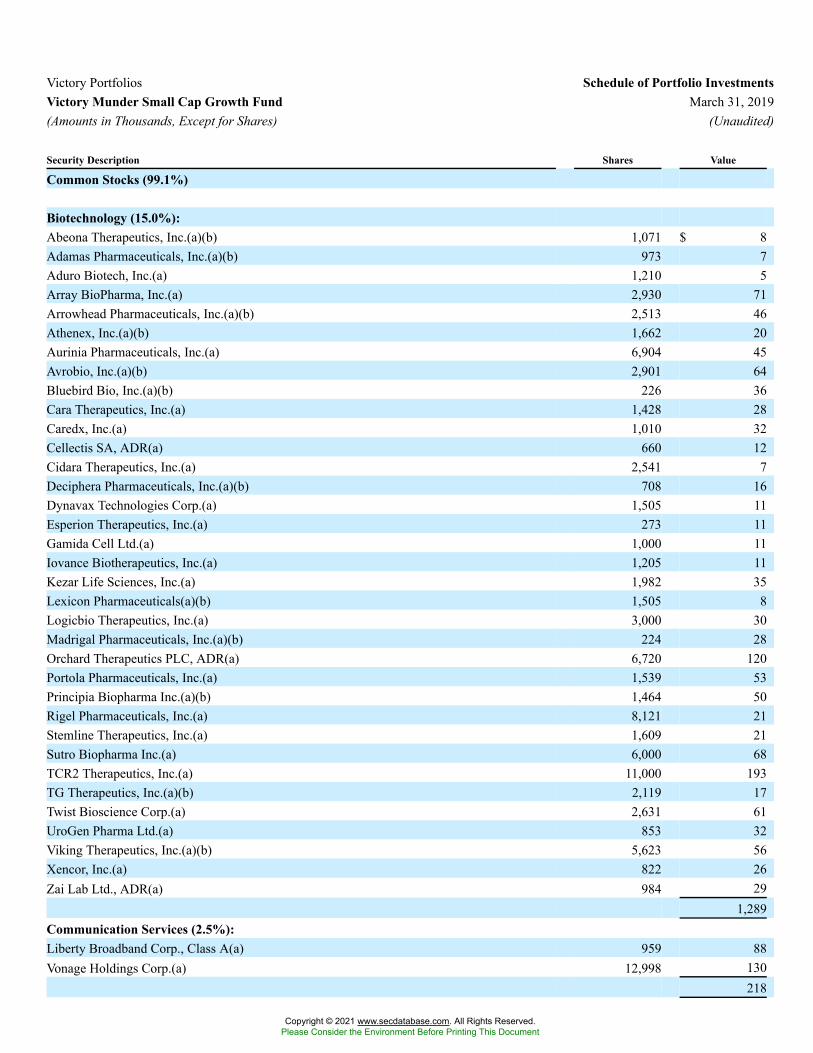
Victory Portfolios Schedule of Portfolio InvestmentsVictory Munder Small Cap Growth Fund March 31, 2019(Amounts in Thousands, Except for Shares) (Unaudited)
Security Description Shares Value
Common Stocks (99.1%)
Biotechnology (15.0%):Abeona Therapeutics, Inc.(a)(b) 1,071 $ 8Adamas Pharmaceuticals, Inc.(a)(b) 973 7Aduro Biotech, Inc.(a) 1,210 5Array BioPharma, Inc.(a) 2,930 71Arrowhead Pharmaceuticals, Inc.(a)(b) 2,513 46Athenex, Inc.(a)(b) 1,662 20Aurinia Pharmaceuticals, Inc.(a) 6,904 45Avrobio, Inc.(a)(b) 2,901 64Bluebird Bio, Inc.(a)(b) 226 36Cara Therapeutics, Inc.(a) 1,428 28Caredx, Inc.(a) 1,010 32Cellectis SA, ADR(a) 660 12Cidara Therapeutics, Inc.(a) 2,541 7Deciphera Pharmaceuticals, Inc.(a)(b) 708 16Dynavax Technologies Corp.(a) 1,505 11Esperion Therapeutics, Inc.(a) 273 11Gamida Cell Ltd.(a) 1,000 11Iovance Biotherapeutics, Inc.(a) 1,205 11Kezar Life Sciences, Inc.(a) 1,982 35Lexicon Pharmaceuticals(a)(b) 1,505 8Logicbio Therapeutics, Inc.(a) 3,000 30Madrigal Pharmaceuticals, Inc.(a)(b) 224 28Orchard Therapeutics PLC, ADR(a) 6,720 120Portola Pharmaceuticals, Inc.(a) 1,539 53Principia Biopharma Inc.(a)(b) 1,464 50Rigel Pharmaceuticals, Inc.(a) 8,121 21Stemline Therapeutics, Inc.(a) 1,609 21Sutro Biopharma Inc.(a) 6,000 68TCR2 Therapeutics, Inc.(a) 11,000 193TG Therapeutics, Inc.(a)(b) 2,119 17Twist Bioscience Corp.(a) 2,631 61UroGen Pharma Ltd.(a) 853 32Viking Therapeutics, Inc.(a)(b) 5,623 56Xencor, Inc.(a) 822 26Zai Lab Ltd., ADR(a) 984 29
1,289Communication Services (2.5%):Liberty Broadband Corp., Class A(a) 959 88Vonage Holdings Corp.(a) 12,998 130
218
Copyright © 2021 www.secdatabase.com. All Rights Reserved.Please Consider the Environment Before Printing This Document
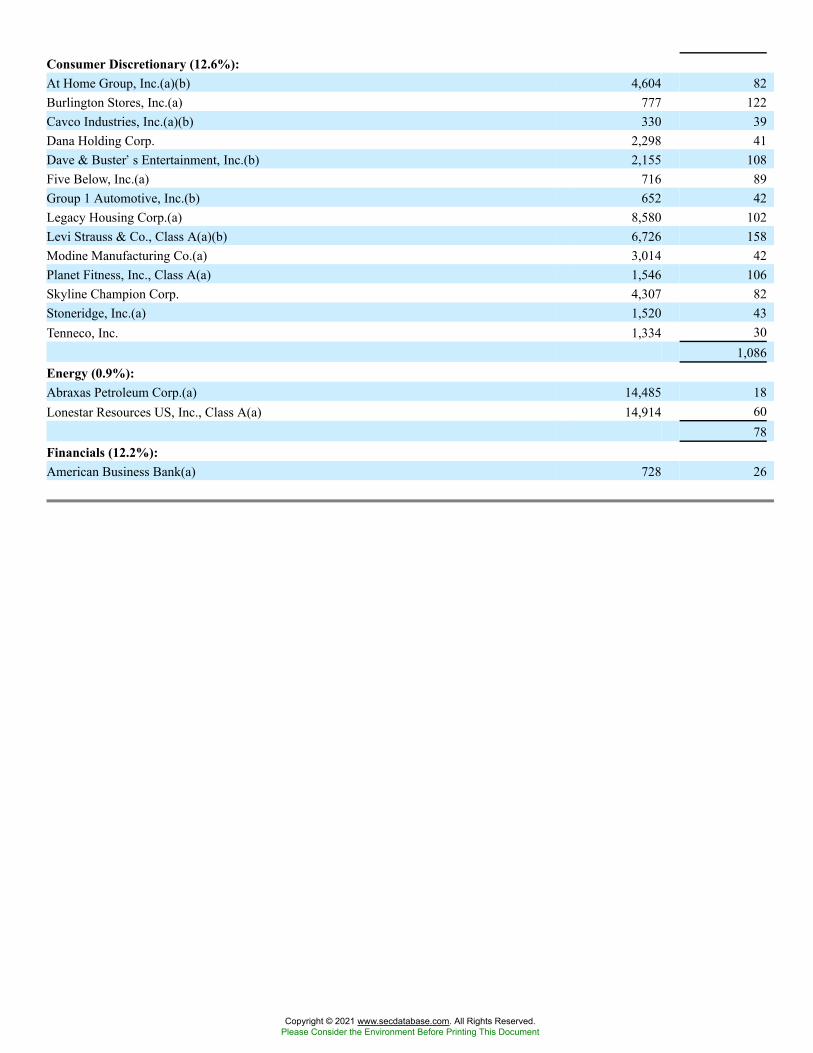
Consumer Discretionary (12.6%):At Home Group, Inc.(a)(b) 4,604 82Burlington Stores, Inc.(a) 777 122Cavco Industries, Inc.(a)(b) 330 39Dana Holding Corp. 2,298 41Dave & Buster�s Entertainment, Inc.(b) 2,155 108Five Below, Inc.(a) 716 89Group 1 Automotive, Inc.(b) 652 42Legacy Housing Corp.(a) 8,580 102Levi Strauss & Co., Class A(a)(b) 6,726 158Modine Manufacturing Co.(a) 3,014 42Planet Fitness, Inc., Class A(a) 1,546 106Skyline Champion Corp. 4,307 82Stoneridge, Inc.(a) 1,520 43Tenneco, Inc. 1,334 30
1,086Energy (0.9%):Abraxas Petroleum Corp.(a) 14,485 18Lonestar Resources US, Inc., Class A(a) 14,914 60
78Financials (12.2%):American Business Bank(a) 728 26
Copyright © 2021 www.secdatabase.com. All Rights Reserved.Please Consider the Environment Before Printing This Document
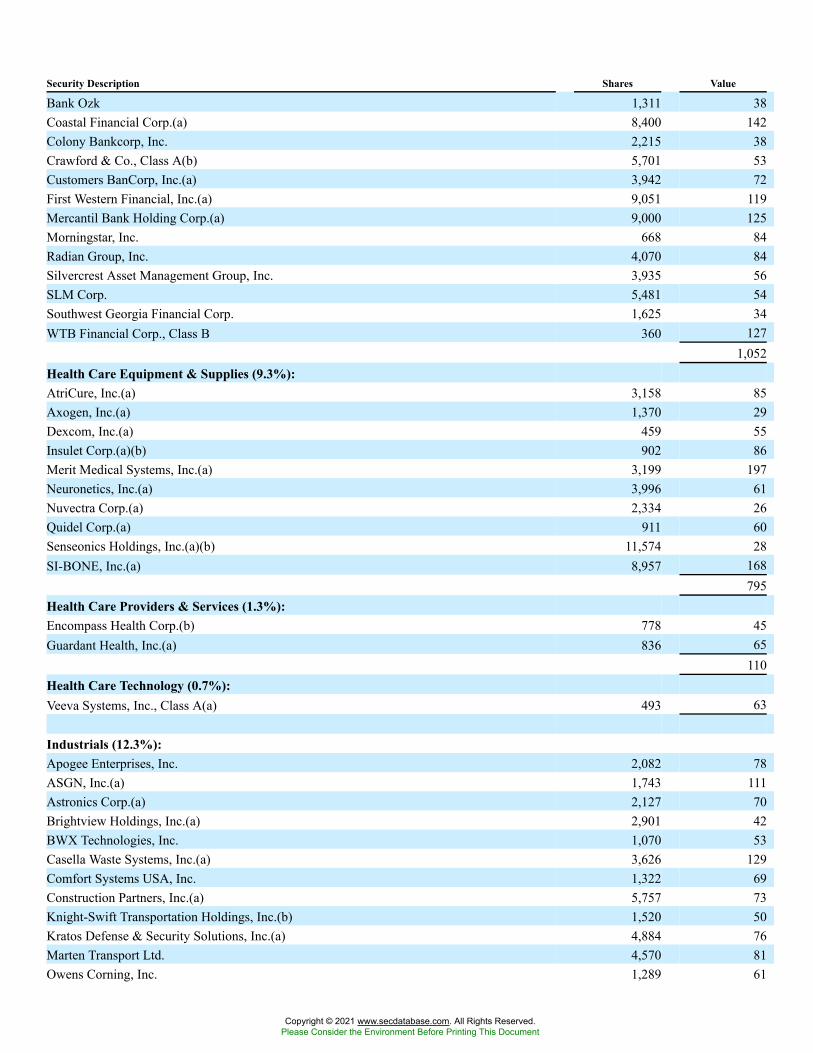
Security Description Shares Value
Bank Ozk 1,311 38Coastal Financial Corp.(a) 8,400 142Colony Bankcorp, Inc. 2,215 38Crawford & Co., Class A(b) 5,701 53Customers BanCorp, Inc.(a) 3,942 72First Western Financial, Inc.(a) 9,051 119Mercantil Bank Holding Corp.(a) 9,000 125Morningstar, Inc. 668 84Radian Group, Inc. 4,070 84Silvercrest Asset Management Group, Inc. 3,935 56SLM Corp. 5,481 54Southwest Georgia Financial Corp. 1,625 34WTB Financial Corp., Class B 360 127
1,052Health Care Equipment & Supplies (9.3%):AtriCure, Inc.(a) 3,158 85Axogen, Inc.(a) 1,370 29Dexcom, Inc.(a) 459 55Insulet Corp.(a)(b) 902 86Merit Medical Systems, Inc.(a) 3,199 197Neuronetics, Inc.(a) 3,996 61Nuvectra Corp.(a) 2,334 26Quidel Corp.(a) 911 60Senseonics Holdings, Inc.(a)(b) 11,574 28SI-BONE, Inc.(a) 8,957 168
795Health Care Providers & Services (1.3%):Encompass Health Corp.(b) 778 45Guardant Health, Inc.(a) 836 65
110Health Care Technology (0.7%):Veeva Systems, Inc., Class A(a) 493 63
Industrials (12.3%):Apogee Enterprises, Inc. 2,082 78ASGN, Inc.(a) 1,743 111Astronics Corp.(a) 2,127 70Brightview Holdings, Inc.(a) 2,901 42BWX Technologies, Inc. 1,070 53Casella Waste Systems, Inc.(a) 3,626 129Comfort Systems USA, Inc. 1,322 69Construction Partners, Inc.(a) 5,757 73Knight-Swift Transportation Holdings, Inc.(b) 1,520 50Kratos Defense & Security Solutions, Inc.(a) 4,884 76Marten Transport Ltd. 4,570 81Owens Corning, Inc. 1,289 61
Copyright © 2021 www.secdatabase.com. All Rights Reserved.Please Consider the Environment Before Printing This Document
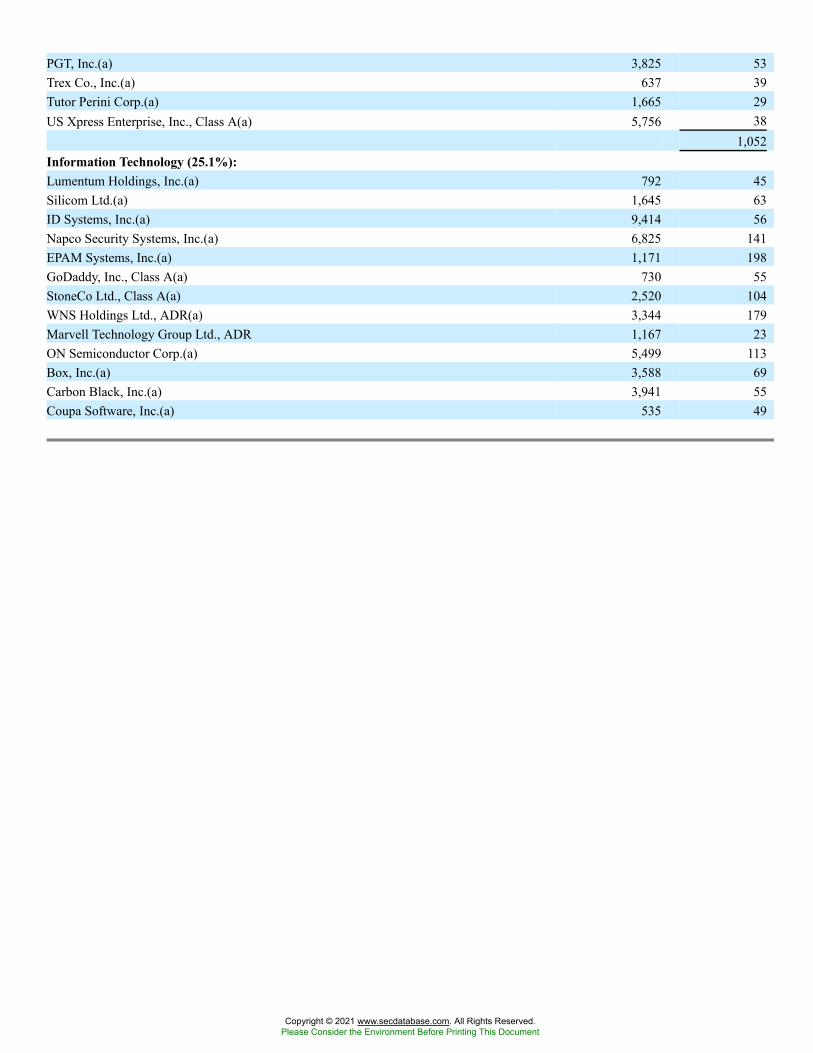
PGT, Inc.(a) 3,825 53Trex Co., Inc.(a) 637 39Tutor Perini Corp.(a) 1,665 29US Xpress Enterprise, Inc., Class A(a) 5,756 38
1,052Information Technology (25.1%):Lumentum Holdings, Inc.(a) 792 45Silicom Ltd.(a) 1,645 63ID Systems, Inc.(a) 9,414 56Napco Security Systems, Inc.(a) 6,825 141EPAM Systems, Inc.(a) 1,171 198GoDaddy, Inc., Class A(a) 730 55StoneCo Ltd., Class A(a) 2,520 104WNS Holdings Ltd., ADR(a) 3,344 179Marvell Technology Group Ltd., ADR 1,167 23ON Semiconductor Corp.(a) 5,499 113Box, Inc.(a) 3,588 69Carbon Black, Inc.(a) 3,941 55Coupa Software, Inc.(a) 535 49
Copyright © 2021 www.secdatabase.com. All Rights Reserved.Please Consider the Environment Before Printing This Document
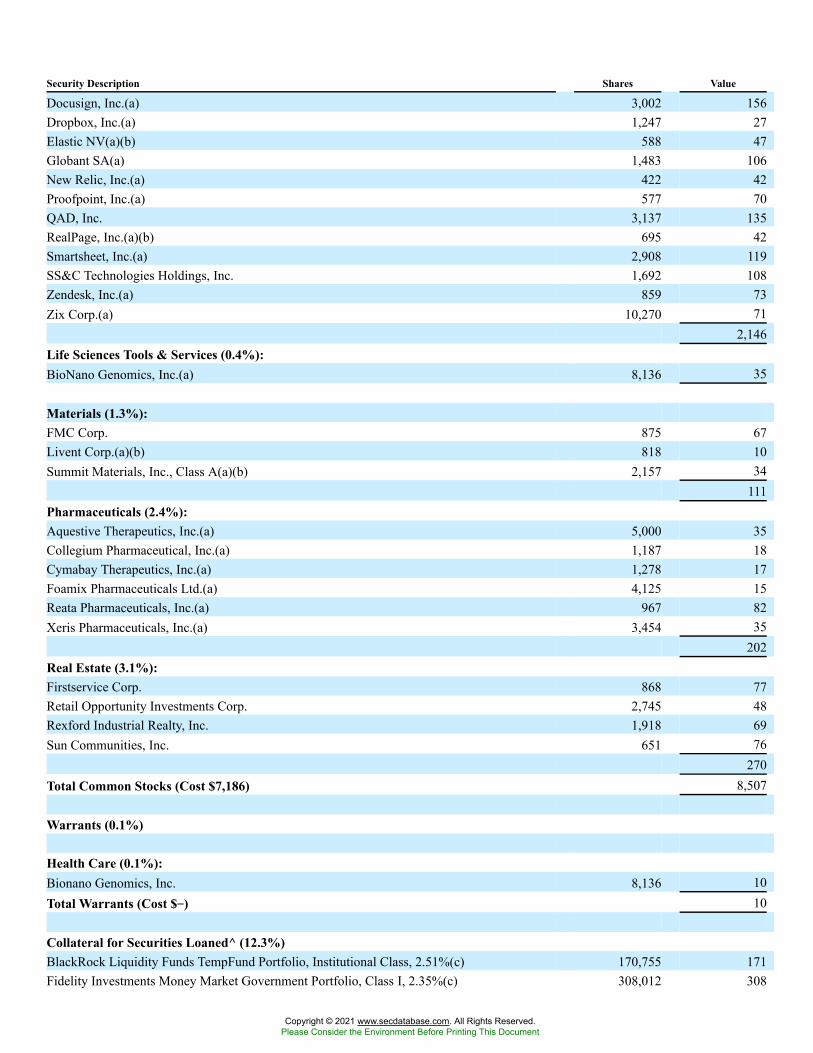
Security Description Shares Value
Docusign, Inc.(a) 3,002 156Dropbox, Inc.(a) 1,247 27Elastic NV(a)(b) 588 47Globant SA(a) 1,483 106New Relic, Inc.(a) 422 42Proofpoint, Inc.(a) 577 70QAD, Inc. 3,137 135RealPage, Inc.(a)(b) 695 42Smartsheet, Inc.(a) 2,908 119SS&C Technologies Holdings, Inc. 1,692 108Zendesk, Inc.(a) 859 73Zix Corp.(a) 10,270 71
2,146Life Sciences Tools & Services (0.4%):BioNano Genomics, Inc.(a) 8,136 35
Materials (1.3%):FMC Corp. 875 67Livent Corp.(a)(b) 818 10Summit Materials, Inc., Class A(a)(b) 2,157 34
111Pharmaceuticals (2.4%):Aquestive Therapeutics, Inc.(a) 5,000 35Collegium Pharmaceutical, Inc.(a) 1,187 18Cymabay Therapeutics, Inc.(a) 1,278 17Foamix Pharmaceuticals Ltd.(a) 4,125 15Reata Pharmaceuticals, Inc.(a) 967 82Xeris Pharmaceuticals, Inc.(a) 3,454 35
202Real Estate (3.1%):Firstservice Corp. 868 77Retail Opportunity Investments Corp. 2,745 48Rexford Industrial Realty, Inc. 1,918 69Sun Communities, Inc. 651 76
270Total Common Stocks (Cost $7,186) 8,507
Warrants (0.1%)
Health Care (0.1%):Bionano Genomics, Inc. 8,136 10Total Warrants (Cost $��) 10
Collateral for Securities Loaned^ (12.3%)BlackRock Liquidity Funds TempFund Portfolio, Institutional Class, 2.51%(c) 170,755 171Fidelity Investments Money Market Government Portfolio, Class I, 2.35%(c) 308,012 308
Copyright © 2021 www.secdatabase.com. All Rights Reserved.Please Consider the Environment Before Printing This Document
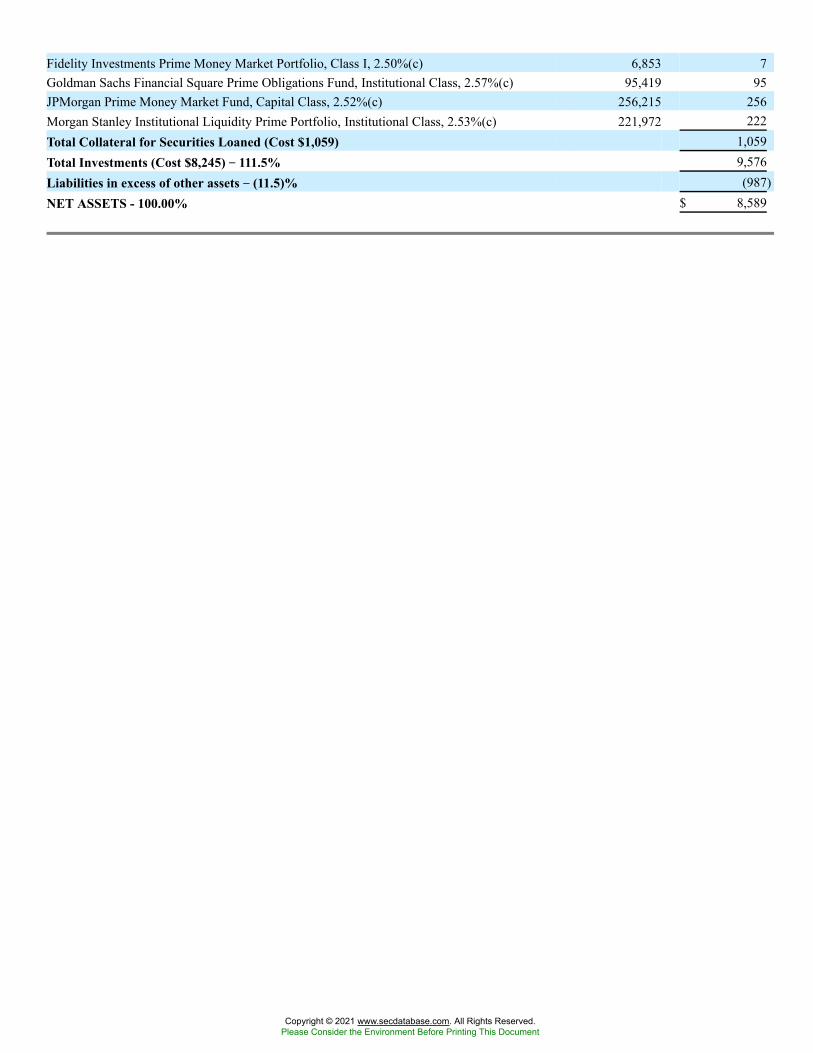
Fidelity Investments Prime Money Market Portfolio, Class I, 2.50%(c) 6,853 7Goldman Sachs Financial Square Prime Obligations Fund, Institutional Class, 2.57%(c) 95,419 95JPMorgan Prime Money Market Fund, Capital Class, 2.52%(c) 256,215 256Morgan Stanley Institutional Liquidity Prime Portfolio, Institutional Class, 2.53%(c) 221,972 222Total Collateral for Securities Loaned (Cost $1,059) 1,059Total Investments (Cost $8,245) �� 111.5% 9,576Liabilities in excess of other assets �� (11.5)% (987)NET ASSETS - 100.00% $ 8,589
Copyright © 2021 www.secdatabase.com. All Rights Reserved.Please Consider the Environment Before Printing This Document
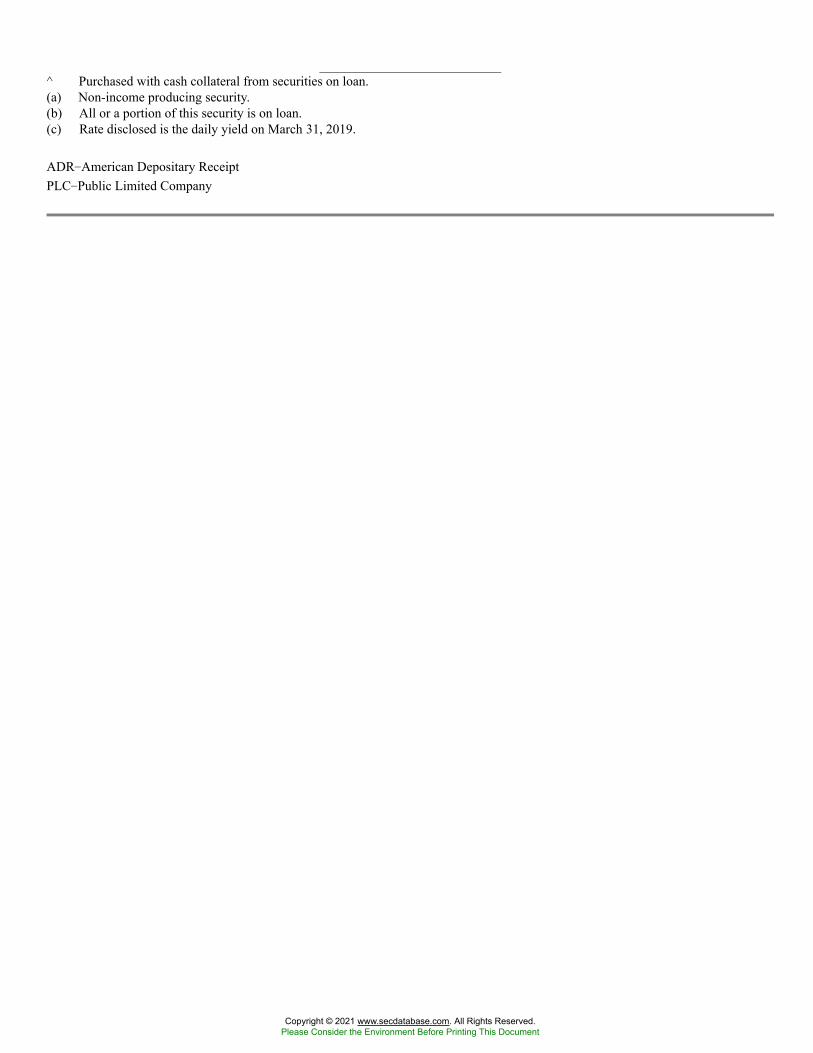
^ Purchased with cash collateral from securities on loan.(a) Non-income producing security.(b) All or a portion of this security is on loan.(c) Rate disclosed is the daily yield on March 31, 2019.
ADR�American Depositary ReceiptPLC�Public Limited Company
Copyright © 2021 www.secdatabase.com. All Rights Reserved.Please Consider the Environment Before Printing This Document
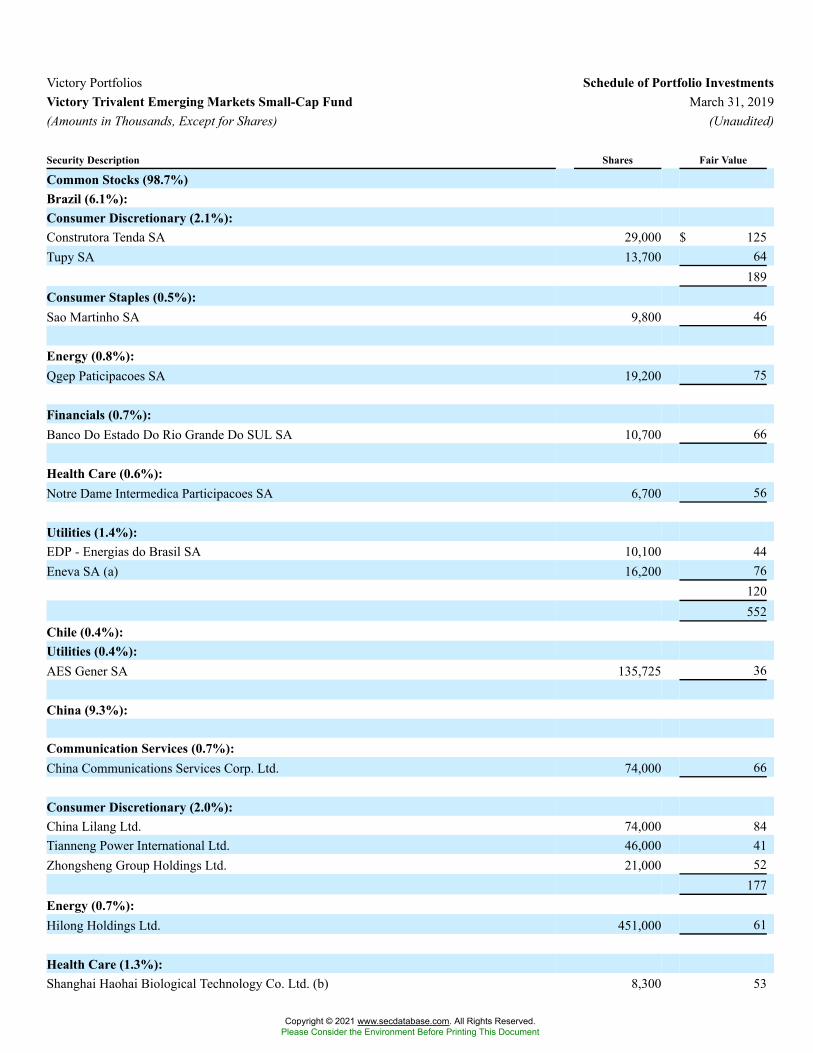
Victory Portfolios Schedule of Portfolio InvestmentsVictory Trivalent Emerging Markets Small-Cap Fund March 31, 2019(Amounts in Thousands, Except for Shares) (Unaudited)
Security Description Shares Fair Value
Common Stocks (98.7%)Brazil (6.1%):Consumer Discretionary (2.1%):Construtora Tenda SA 29,000 $ 125Tupy SA 13,700 64
189Consumer Staples (0.5%):Sao Martinho SA 9,800 46
Energy (0.8%):Qgep Paticipacoes SA 19,200 75
Financials (0.7%):Banco Do Estado Do Rio Grande Do SUL SA 10,700 66
Health Care (0.6%):Notre Dame Intermedica Participacoes SA 6,700 56
Utilities (1.4%):EDP - Energias do Brasil SA 10,100 44Eneva SA (a) 16,200 76
120552
Chile (0.4%):Utilities (0.4%):AES Gener SA 135,725 36
China (9.3%):
Communication Services (0.7%):China Communications Services Corp. Ltd. 74,000 66
Consumer Discretionary (2.0%):China Lilang Ltd. 74,000 84Tianneng Power International Ltd. 46,000 41Zhongsheng Group Holdings Ltd. 21,000 52
177Energy (0.7%):Hilong Holdings Ltd. 451,000 61
Health Care (1.3%):Shanghai Haohai Biological Technology Co. Ltd. (b) 8,300 53
Copyright © 2021 www.secdatabase.com. All Rights Reserved.Please Consider the Environment Before Printing This Document
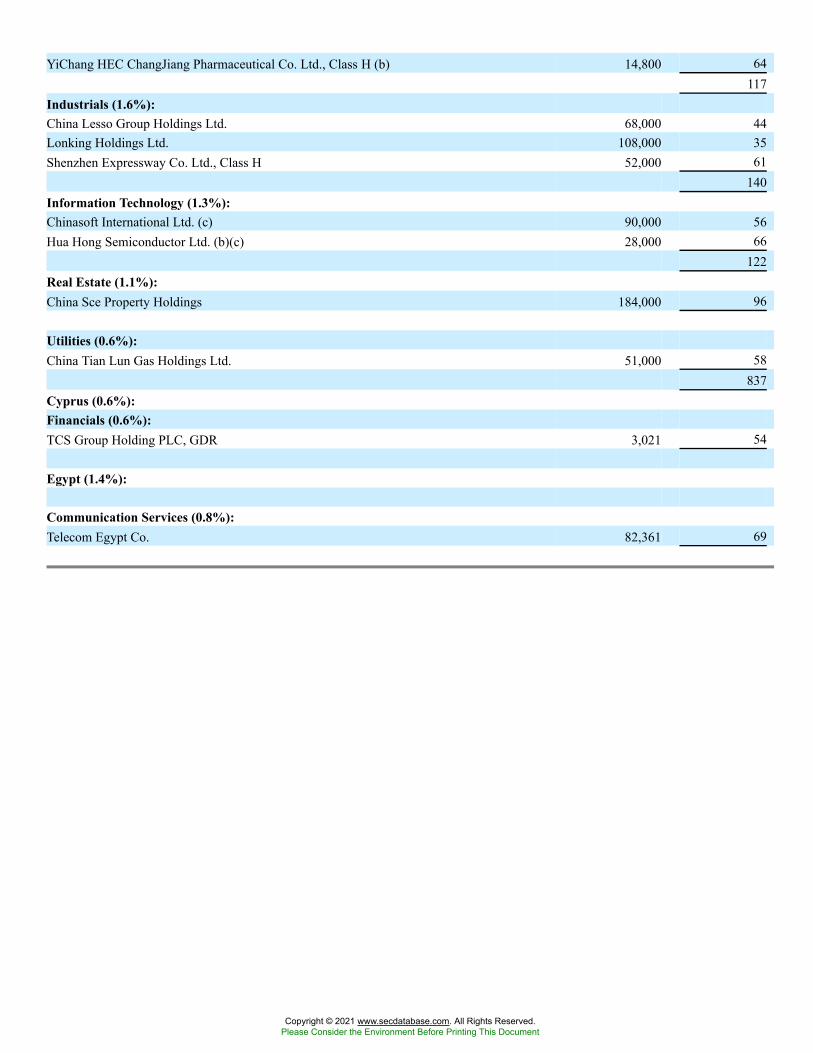
YiChang HEC ChangJiang Pharmaceutical Co. Ltd., Class H (b) 14,800 64117
Industrials (1.6%):China Lesso Group Holdings Ltd. 68,000 44Lonking Holdings Ltd. 108,000 35Shenzhen Expressway Co. Ltd., Class H 52,000 61
140Information Technology (1.3%):Chinasoft International Ltd. (c) 90,000 56Hua Hong Semiconductor Ltd. (b)(c) 28,000 66
122Real Estate (1.1%):China Sce Property Holdings 184,000 96
Utilities (0.6%):China Tian Lun Gas Holdings Ltd. 51,000 58
837Cyprus (0.6%):Financials (0.6%):TCS Group Holding PLC, GDR 3,021 54
Egypt (1.4%):
Communication Services (0.8%):Telecom Egypt Co. 82,361 69
Copyright © 2021 www.secdatabase.com. All Rights Reserved.Please Consider the Environment Before Printing This Document
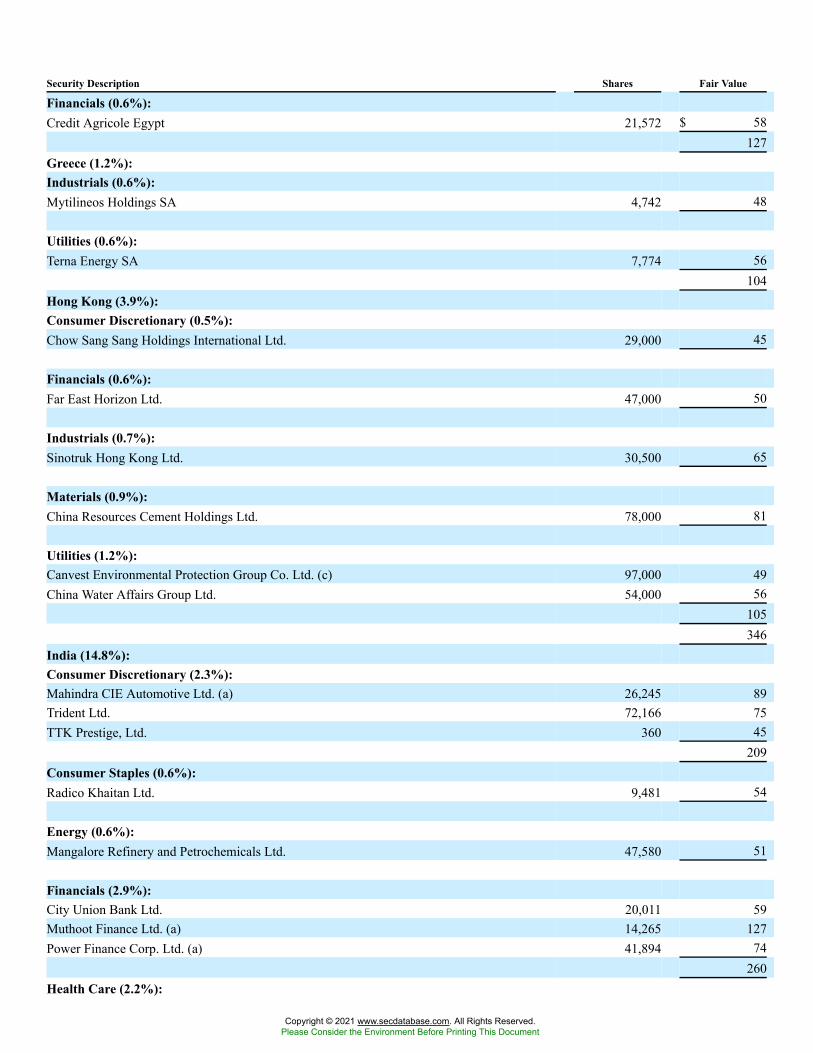
Security Description Shares Fair Value
Financials (0.6%):Credit Agricole Egypt 21,572 $ 58
127Greece (1.2%):Industrials (0.6%):Mytilineos Holdings SA 4,742 48
Utilities (0.6%):Terna Energy SA 7,774 56
104Hong Kong (3.9%):Consumer Discretionary (0.5%):Chow Sang Sang Holdings International Ltd. 29,000 45
Financials (0.6%):Far East Horizon Ltd. 47,000 50
Industrials (0.7%):Sinotruk Hong Kong Ltd. 30,500 65
Materials (0.9%):China Resources Cement Holdings Ltd. 78,000 81
Utilities (1.2%):Canvest Environmental Protection Group Co. Ltd. (c) 97,000 49China Water Affairs Group Ltd. 54,000 56
105346
India (14.8%):Consumer Discretionary (2.3%):Mahindra CIE Automotive Ltd. (a) 26,245 89Trident Ltd. 72,166 75TTK Prestige, Ltd. 360 45
209Consumer Staples (0.6%):Radico Khaitan Ltd. 9,481 54
Energy (0.6%):Mangalore Refinery and Petrochemicals Ltd. 47,580 51
Financials (2.9%):City Union Bank Ltd. 20,011 59Muthoot Finance Ltd. (a) 14,265 127Power Finance Corp. Ltd. (a) 41,894 74
260Health Care (2.2%):
Copyright © 2021 www.secdatabase.com. All Rights Reserved.Please Consider the Environment Before Printing This Document
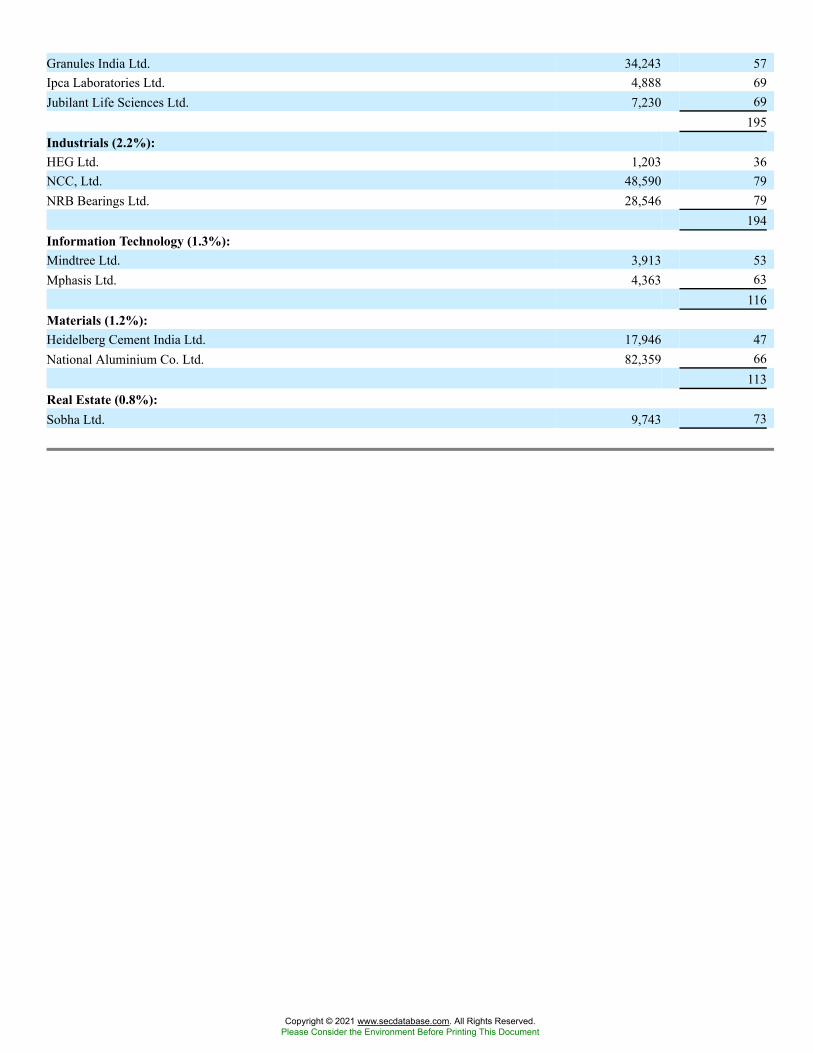
Granules India Ltd. 34,243 57Ipca Laboratories Ltd. 4,888 69Jubilant Life Sciences Ltd. 7,230 69
195Industrials (2.2%):HEG Ltd. 1,203 36NCC, Ltd. 48,590 79NRB Bearings Ltd. 28,546 79
194Information Technology (1.3%):Mindtree Ltd. 3,913 53Mphasis Ltd. 4,363 63
116Materials (1.2%):Heidelberg Cement India Ltd. 17,946 47National Aluminium Co. Ltd. 82,359 66
113Real Estate (0.8%):Sobha Ltd. 9,743 73
Copyright © 2021 www.secdatabase.com. All Rights Reserved.Please Consider the Environment Before Printing This Document
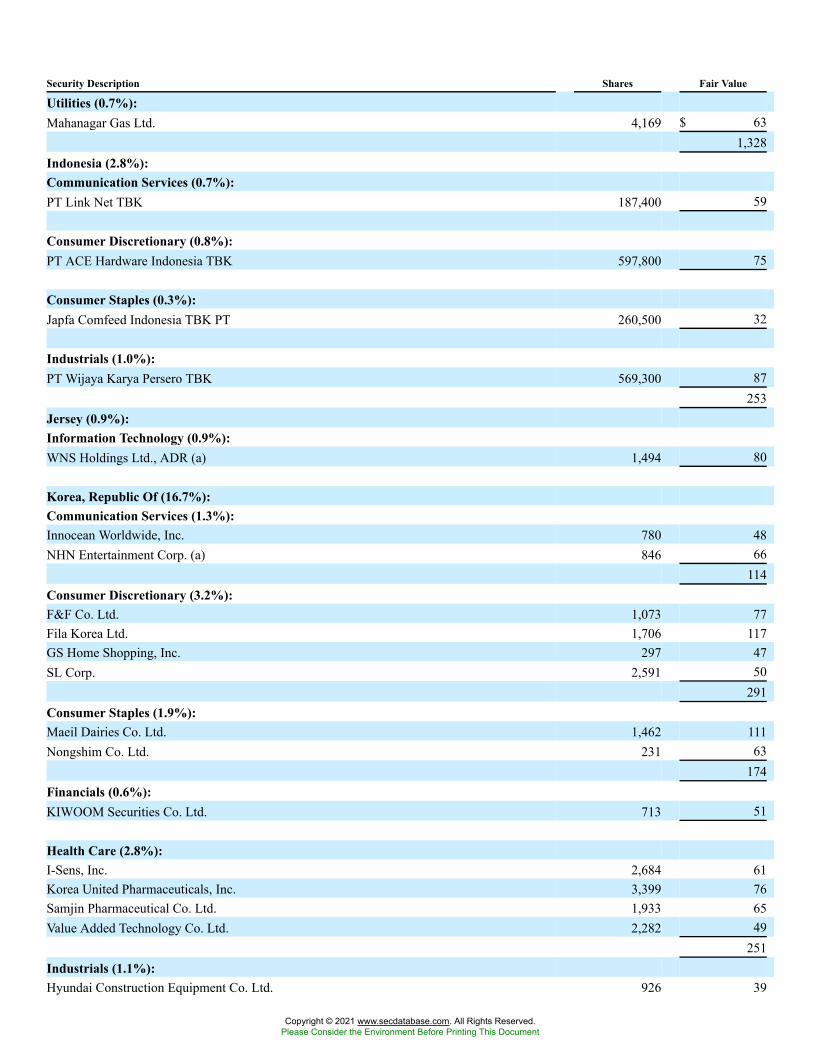
Security Description Shares Fair Value
Utilities (0.7%):Mahanagar Gas Ltd. 4,169 $ 63
1,328Indonesia (2.8%):Communication Services (0.7%):PT Link Net TBK 187,400 59
Consumer Discretionary (0.8%):PT ACE Hardware Indonesia TBK 597,800 75
Consumer Staples (0.3%):Japfa Comfeed Indonesia TBK PT 260,500 32
Industrials (1.0%):PT Wijaya Karya Persero TBK 569,300 87
253Jersey (0.9%):Information Technology (0.9%):WNS Holdings Ltd., ADR (a) 1,494 80
Korea, Republic Of (16.7%):Communication Services (1.3%):Innocean Worldwide, Inc. 780 48NHN Entertainment Corp. (a) 846 66
114Consumer Discretionary (3.2%):F&F Co. Ltd. 1,073 77Fila Korea Ltd. 1,706 117GS Home Shopping, Inc. 297 47SL Corp. 2,591 50
291Consumer Staples (1.9%):Maeil Dairies Co. Ltd. 1,462 111Nongshim Co. Ltd. 231 63
174Financials (0.6%):KIWOOM Securities Co. Ltd. 713 51
Health Care (2.8%):I-Sens, Inc. 2,684 61Korea United Pharmaceuticals, Inc. 3,399 76Samjin Pharmaceutical Co. Ltd. 1,933 65Value Added Technology Co. Ltd. 2,282 49
251Industrials (1.1%):Hyundai Construction Equipment Co. Ltd. 926 39
Copyright © 2021 www.secdatabase.com. All Rights Reserved.Please Consider the Environment Before Printing This Document
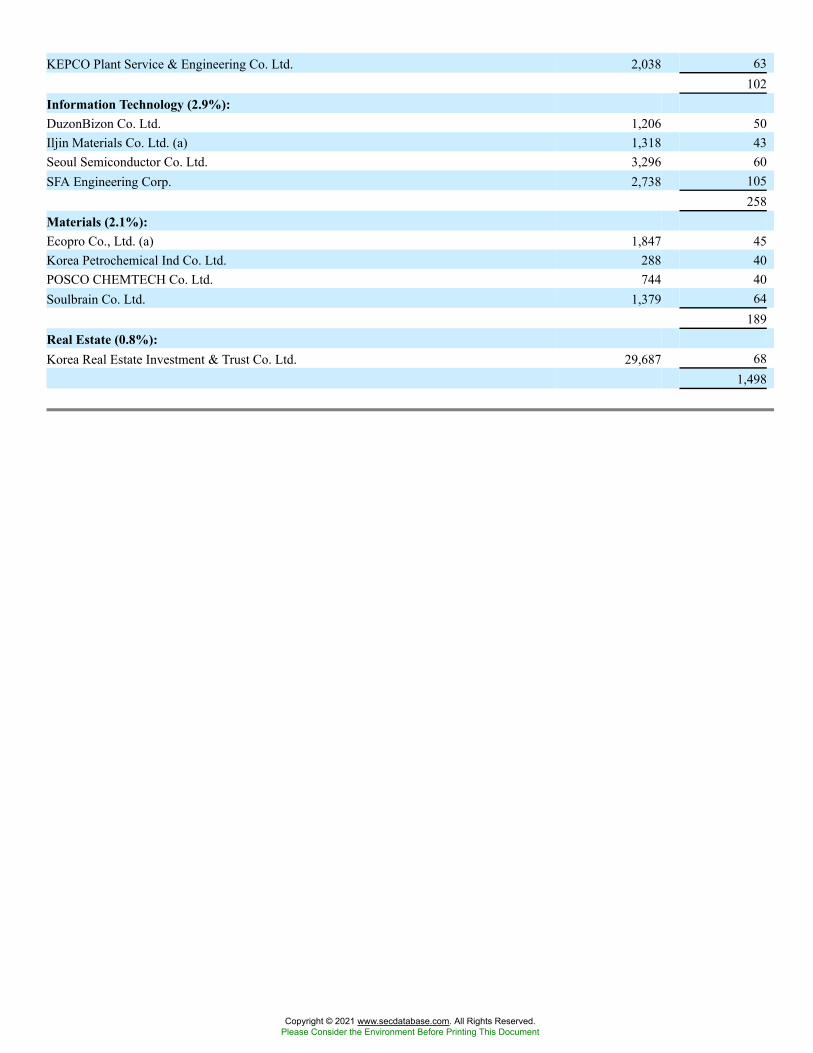
KEPCO Plant Service & Engineering Co. Ltd. 2,038 63102
Information Technology (2.9%):DuzonBizon Co. Ltd. 1,206 50Iljin Materials Co. Ltd. (a) 1,318 43Seoul Semiconductor Co. Ltd. 3,296 60SFA Engineering Corp. 2,738 105
258Materials (2.1%):Ecopro Co., Ltd. (a) 1,847 45Korea Petrochemical Ind Co. Ltd. 288 40POSCO CHEMTECH Co. Ltd. 744 40Soulbrain Co. Ltd. 1,379 64
189Real Estate (0.8%):Korea Real Estate Investment & Trust Co. Ltd. 29,687 68
1,498
Copyright © 2021 www.secdatabase.com. All Rights Reserved.Please Consider the Environment Before Printing This Document
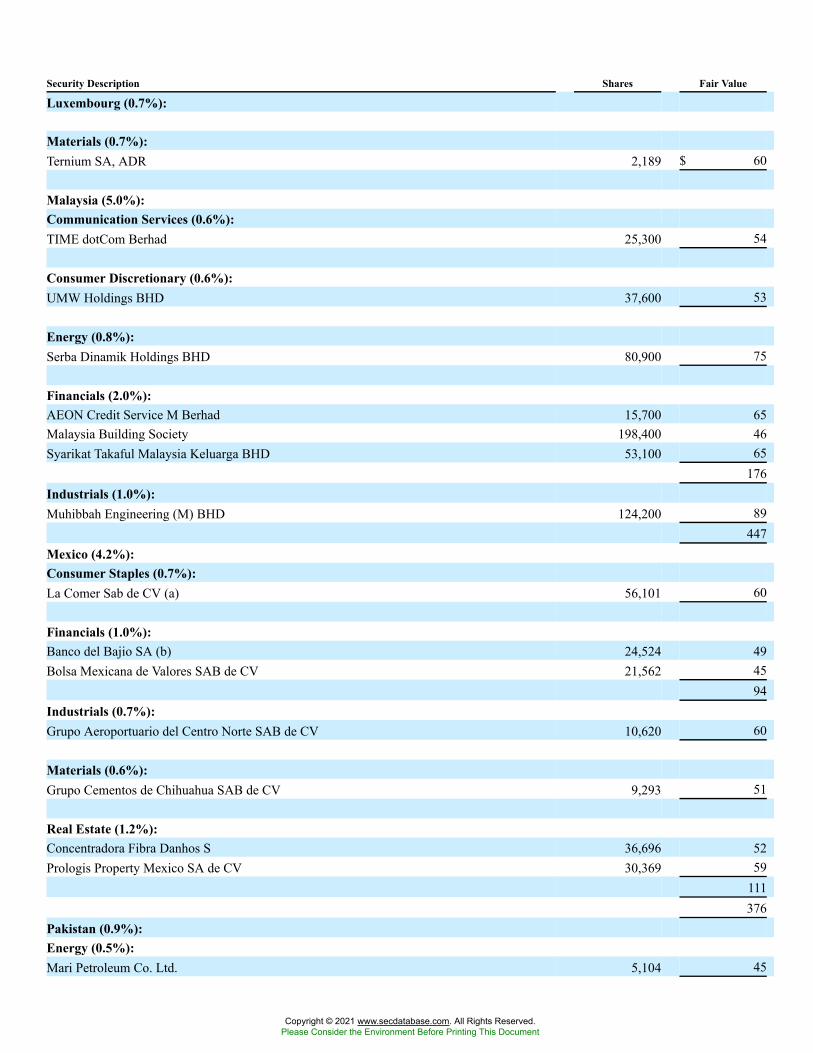
Security Description Shares Fair Value
Luxembourg (0.7%):
Materials (0.7%):Ternium SA, ADR 2,189 $ 60
Malaysia (5.0%):Communication Services (0.6%):TIME dotCom Berhad 25,300 54
Consumer Discretionary (0.6%):UMW Holdings BHD 37,600 53
Energy (0.8%):Serba Dinamik Holdings BHD 80,900 75
Financials (2.0%):AEON Credit Service M Berhad 15,700 65Malaysia Building Society 198,400 46Syarikat Takaful Malaysia Keluarga BHD 53,100 65
176Industrials (1.0%):Muhibbah Engineering (M) BHD 124,200 89
447Mexico (4.2%):Consumer Staples (0.7%):La Comer Sab de CV (a) 56,101 60
Financials (1.0%):Banco del Bajio SA (b) 24,524 49Bolsa Mexicana de Valores SAB de CV 21,562 45
94Industrials (0.7%):Grupo Aeroportuario del Centro Norte SAB de CV 10,620 60
Materials (0.6%):Grupo Cementos de Chihuahua SAB de CV 9,293 51
Real Estate (1.2%):Concentradora Fibra Danhos S 36,696 52Prologis Property Mexico SA de CV 30,369 59
111376
Pakistan (0.9%):Energy (0.5%):Mari Petroleum Co. Ltd. 5,104 45
Copyright © 2021 www.secdatabase.com. All Rights Reserved.Please Consider the Environment Before Printing This Document
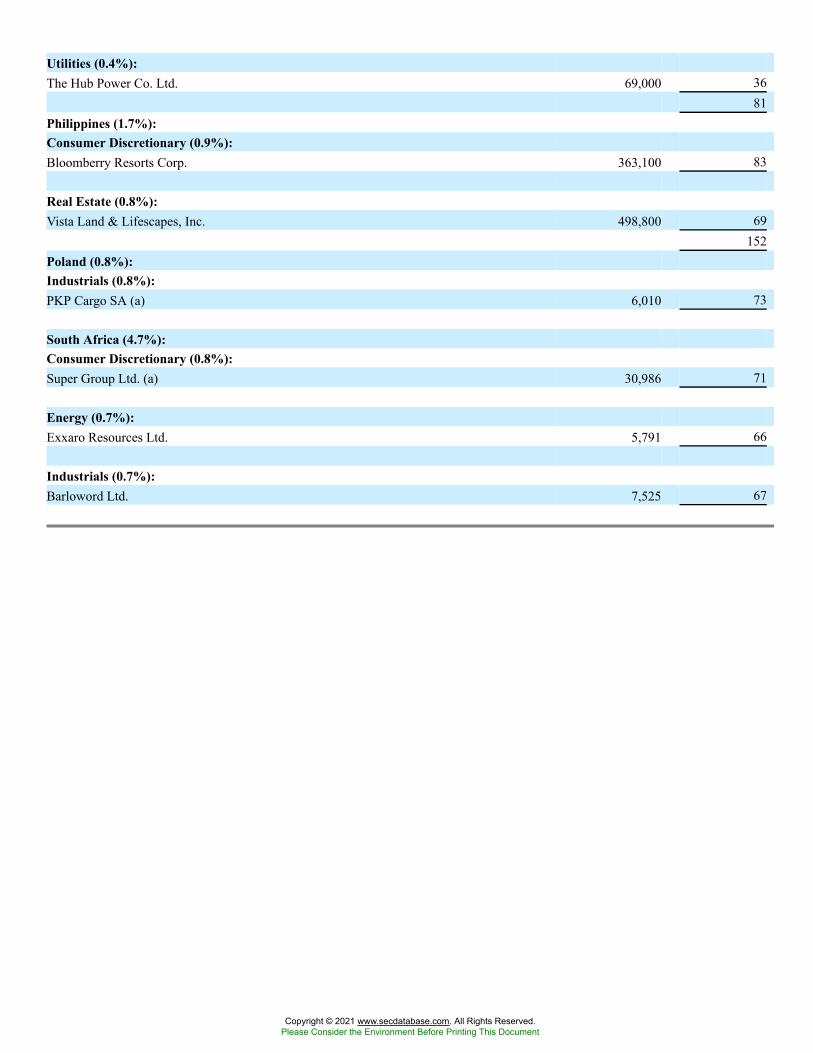
Utilities (0.4%):The Hub Power Co. Ltd. 69,000 36
81Philippines (1.7%):Consumer Discretionary (0.9%):Bloomberry Resorts Corp. 363,100 83
Real Estate (0.8%):Vista Land & Lifescapes, Inc. 498,800 69
152Poland (0.8%):Industrials (0.8%):PKP Cargo SA (a) 6,010 73
South Africa (4.7%):Consumer Discretionary (0.8%):Super Group Ltd. (a) 30,986 71
Energy (0.7%):Exxaro Resources Ltd. 5,791 66
Industrials (0.7%):Barloword Ltd. 7,525 67
Copyright © 2021 www.secdatabase.com. All Rights Reserved.Please Consider the Environment Before Printing This Document
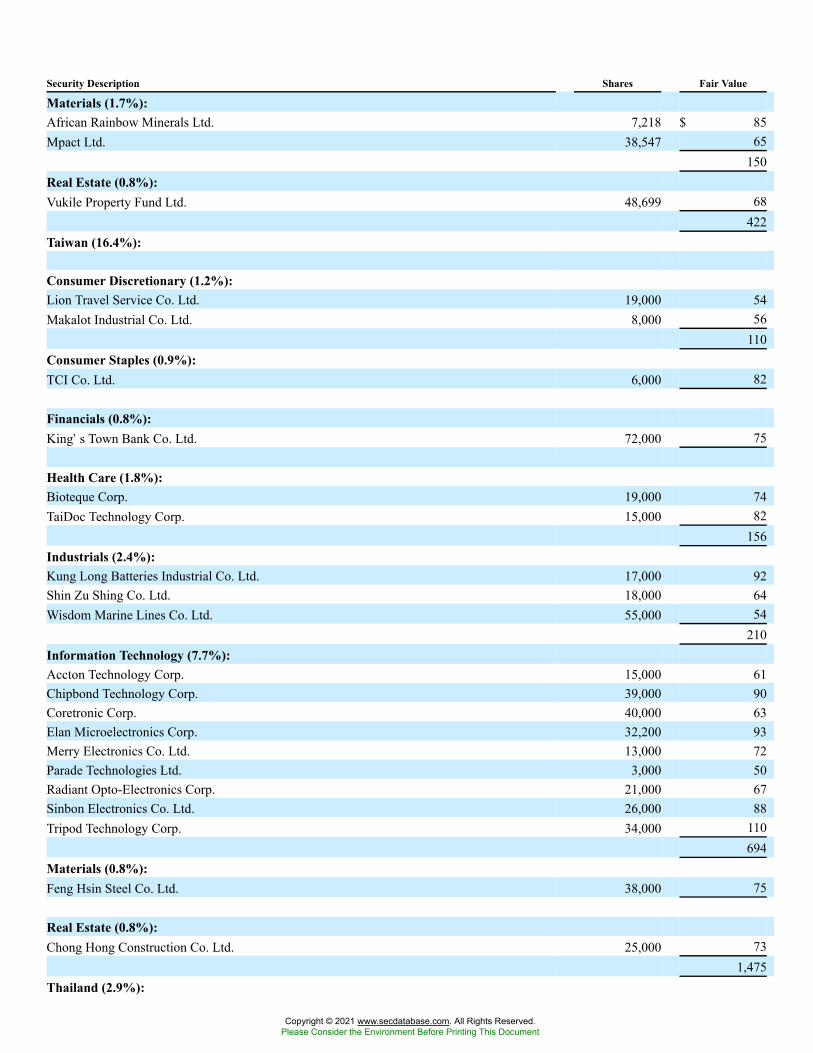
Security Description Shares Fair Value
Materials (1.7%):African Rainbow Minerals Ltd. 7,218 $ 85Mpact Ltd. 38,547 65
150Real Estate (0.8%):Vukile Property Fund Ltd. 48,699 68
422Taiwan (16.4%):
Consumer Discretionary (1.2%):Lion Travel Service Co. Ltd. 19,000 54Makalot Industrial Co. Ltd. 8,000 56
110Consumer Staples (0.9%):TCI Co. Ltd. 6,000 82
Financials (0.8%):King�s Town Bank Co. Ltd. 72,000 75
Health Care (1.8%):Bioteque Corp. 19,000 74TaiDoc Technology Corp. 15,000 82
156Industrials (2.4%):Kung Long Batteries Industrial Co. Ltd. 17,000 92Shin Zu Shing Co. Ltd. 18,000 64Wisdom Marine Lines Co. Ltd. 55,000 54
210Information Technology (7.7%):Accton Technology Corp. 15,000 61Chipbond Technology Corp. 39,000 90Coretronic Corp. 40,000 63Elan Microelectronics Corp. 32,200 93Merry Electronics Co. Ltd. 13,000 72Parade Technologies Ltd. 3,000 50Radiant Opto-Electronics Corp. 21,000 67Sinbon Electronics Co. Ltd. 26,000 88Tripod Technology Corp. 34,000 110
694Materials (0.8%):Feng Hsin Steel Co. Ltd. 38,000 75
Real Estate (0.8%):Chong Hong Construction Co. Ltd. 25,000 73
1,475Thailand (2.9%):
Copyright © 2021 www.secdatabase.com. All Rights Reserved.Please Consider the Environment Before Printing This Document
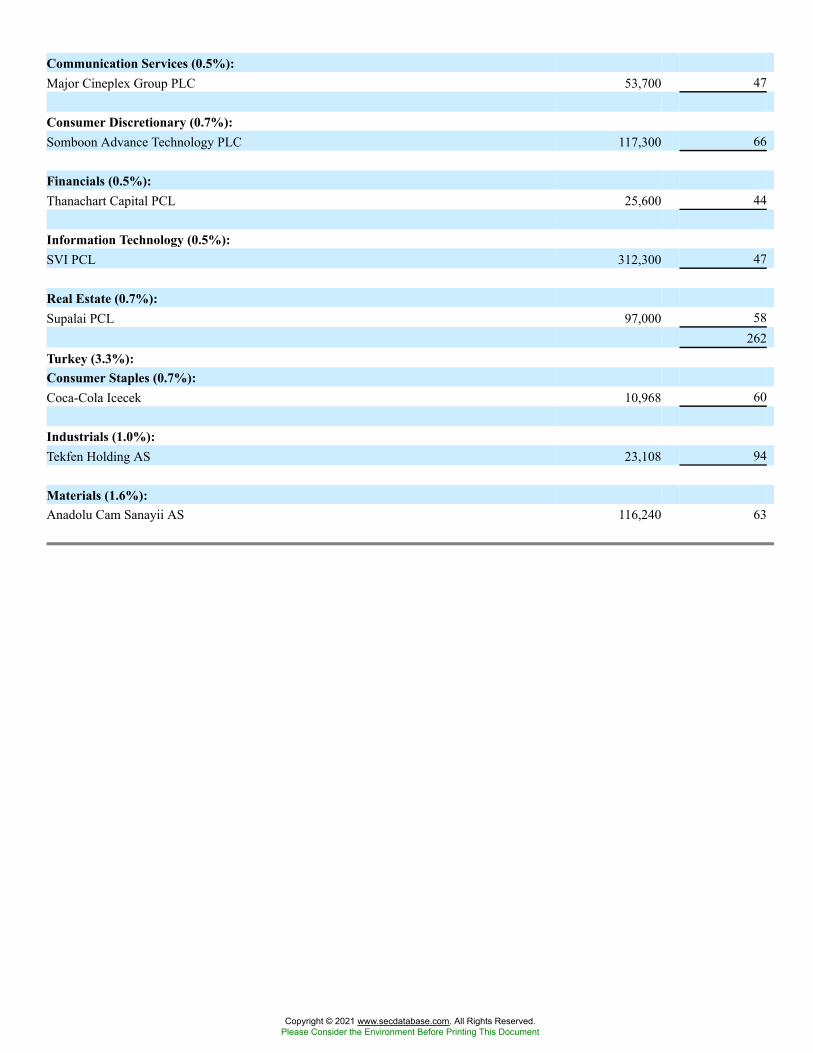
Communication Services (0.5%):Major Cineplex Group PLC 53,700 47
Consumer Discretionary (0.7%):Somboon Advance Technology PLC 117,300 66
Financials (0.5%):Thanachart Capital PCL 25,600 44
Information Technology (0.5%):SVI PCL 312,300 47
Real Estate (0.7%):Supalai PCL 97,000 58
262Turkey (3.3%):Consumer Staples (0.7%):Coca-Cola Icecek 10,968 60
Industrials (1.0%):Tekfen Holding AS 23,108 94
Materials (1.6%):Anadolu Cam Sanayii AS 116,240 63
Copyright © 2021 www.secdatabase.com. All Rights Reserved.Please Consider the Environment Before Printing This Document
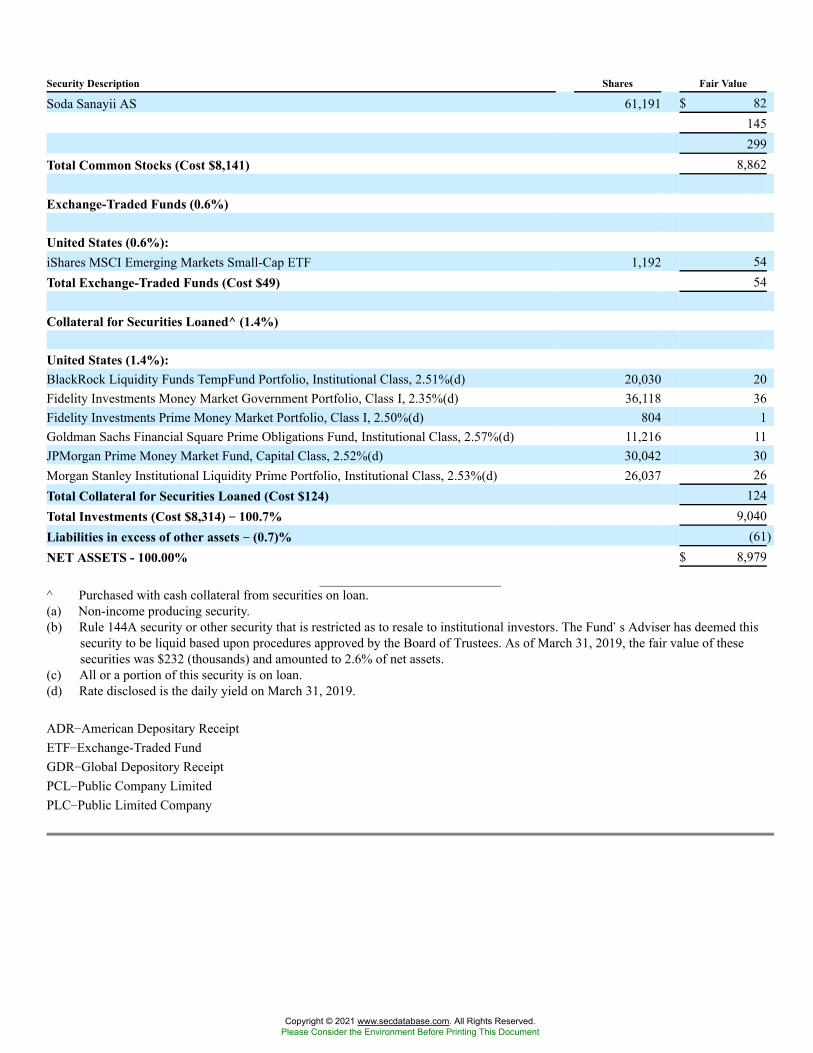
Security Description Shares Fair Value
Soda Sanayii AS 61,191 $ 82145299
Total Common Stocks (Cost $8,141) 8,862
Exchange-Traded Funds (0.6%)
United States (0.6%):iShares MSCI Emerging Markets Small-Cap ETF 1,192 54Total Exchange-Traded Funds (Cost $49) 54
Collateral for Securities Loaned^ (1.4%)
United States (1.4%):BlackRock Liquidity Funds TempFund Portfolio, Institutional Class, 2.51%(d) 20,030 20Fidelity Investments Money Market Government Portfolio, Class I, 2.35%(d) 36,118 36Fidelity Investments Prime Money Market Portfolio, Class I, 2.50%(d) 804 1Goldman Sachs Financial Square Prime Obligations Fund, Institutional Class, 2.57%(d) 11,216 11JPMorgan Prime Money Market Fund, Capital Class, 2.52%(d) 30,042 30Morgan Stanley Institutional Liquidity Prime Portfolio, Institutional Class, 2.53%(d) 26,037 26Total Collateral for Securities Loaned (Cost $124) 124Total Investments (Cost $8,314) �� 100.7% 9,040Liabilities in excess of other assets �� (0.7)% (61)NET ASSETS - 100.00% $ 8,979
^ Purchased with cash collateral from securities on loan.(a) Non-income producing security.(b) Rule 144A security or other security that is restricted as to resale to institutional investors. The Fund�s Adviser has deemed this
security to be liquid based upon procedures approved by the Board of Trustees. As of March 31, 2019, the fair value of thesesecurities was $232 (thousands) and amounted to 2.6% of net assets.
(c) All or a portion of this security is on loan.(d) Rate disclosed is the daily yield on March 31, 2019.
ADR�American Depositary ReceiptETF�Exchange-Traded FundGDR�Global Depository ReceiptPCL�Public Company LimitedPLC�Public Limited Company
Copyright © 2021 www.secdatabase.com. All Rights Reserved.Please Consider the Environment Before Printing This Document
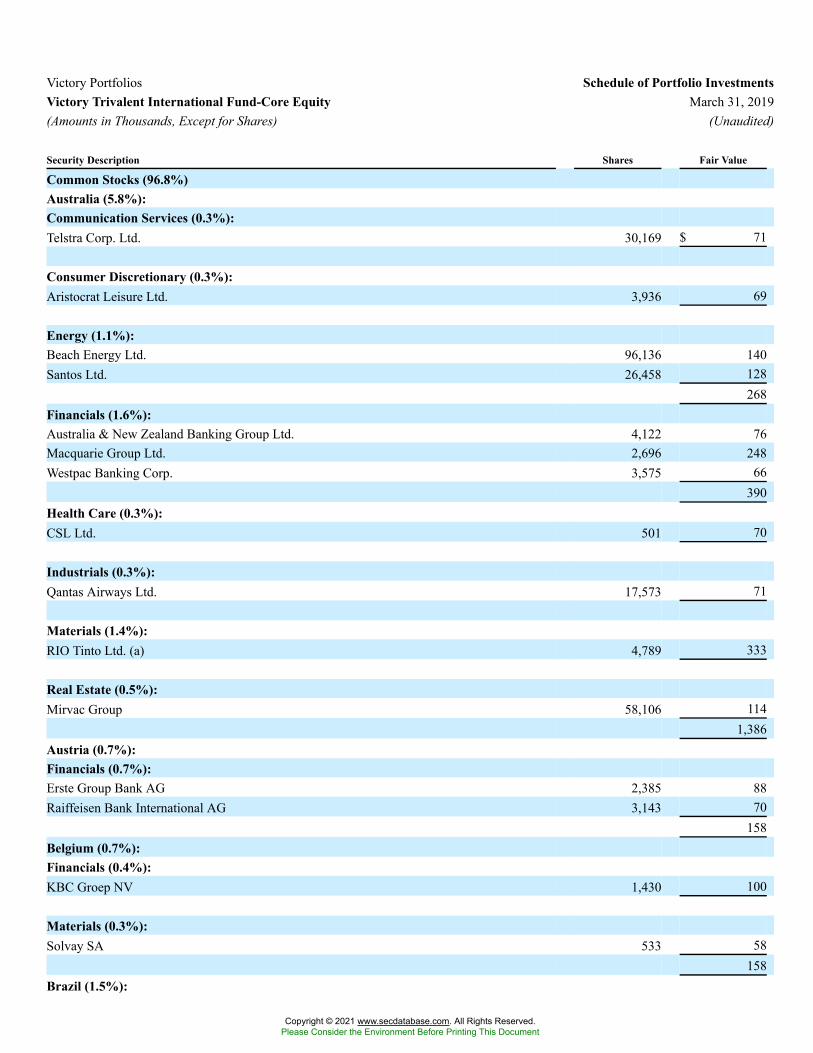
Victory Portfolios Schedule of Portfolio InvestmentsVictory Trivalent International Fund-Core Equity March 31, 2019(Amounts in Thousands, Except for Shares) (Unaudited)
Security Description Shares Fair Value
Common Stocks (96.8%)Australia (5.8%):Communication Services (0.3%):Telstra Corp. Ltd. 30,169 $ 71
Consumer Discretionary (0.3%):Aristocrat Leisure Ltd. 3,936 69
Energy (1.1%):Beach Energy Ltd. 96,136 140Santos Ltd. 26,458 128
268Financials (1.6%):Australia & New Zealand Banking Group Ltd. 4,122 76Macquarie Group Ltd. 2,696 248Westpac Banking Corp. 3,575 66
390Health Care (0.3%):CSL Ltd. 501 70
Industrials (0.3%):Qantas Airways Ltd. 17,573 71
Materials (1.4%):RIO Tinto Ltd. (a) 4,789 333
Real Estate (0.5%):Mirvac Group 58,106 114
1,386Austria (0.7%):Financials (0.7%):Erste Group Bank AG 2,385 88Raiffeisen Bank International AG 3,143 70
158Belgium (0.7%):Financials (0.4%):KBC Groep NV 1,430 100
Materials (0.3%):Solvay SA 533 58
158Brazil (1.5%):
Copyright © 2021 www.secdatabase.com. All Rights Reserved.Please Consider the Environment Before Printing This Document
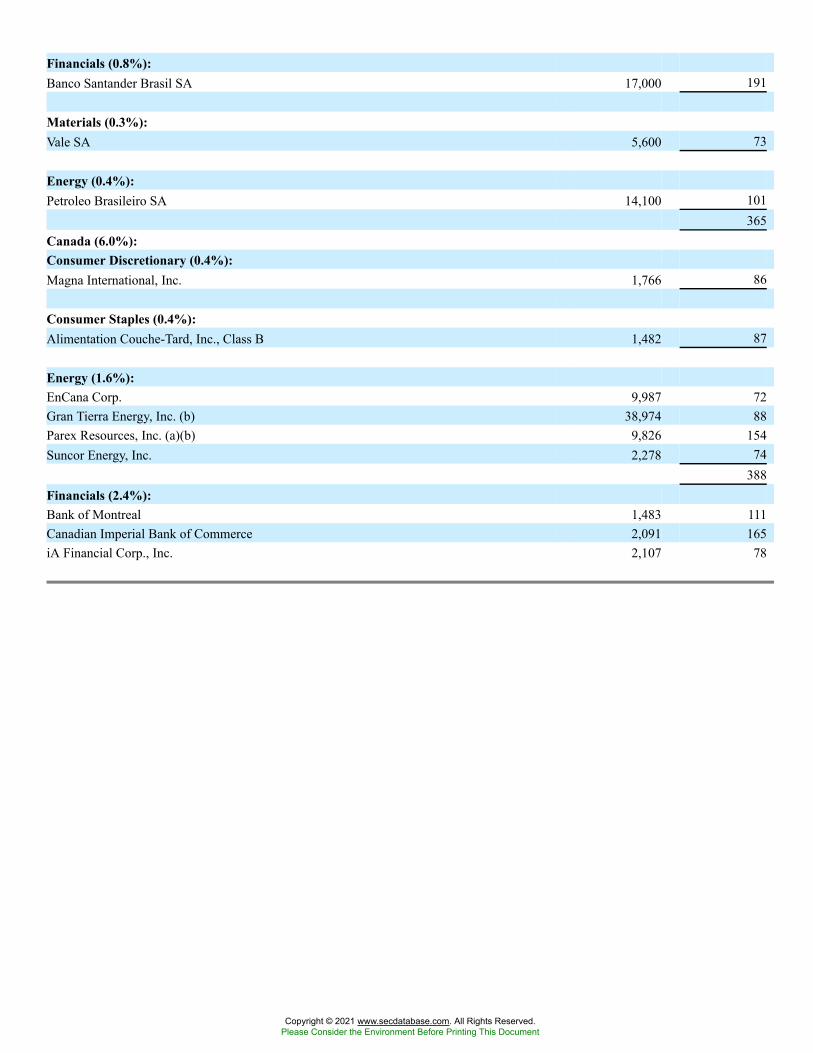
Financials (0.8%):Banco Santander Brasil SA 17,000 191
Materials (0.3%):Vale SA 5,600 73
Energy (0.4%):Petroleo Brasileiro SA 14,100 101
365Canada (6.0%):Consumer Discretionary (0.4%):Magna International, Inc. 1,766 86
Consumer Staples (0.4%):Alimentation Couche-Tard, Inc., Class B 1,482 87
Energy (1.6%):EnCana Corp. 9,987 72Gran Tierra Energy, Inc. (b) 38,974 88Parex Resources, Inc. (a)(b) 9,826 154Suncor Energy, Inc. 2,278 74
388Financials (2.4%):Bank of Montreal 1,483 111Canadian Imperial Bank of Commerce 2,091 165iA Financial Corp., Inc. 2,107 78
Copyright © 2021 www.secdatabase.com. All Rights Reserved.Please Consider the Environment Before Printing This Document
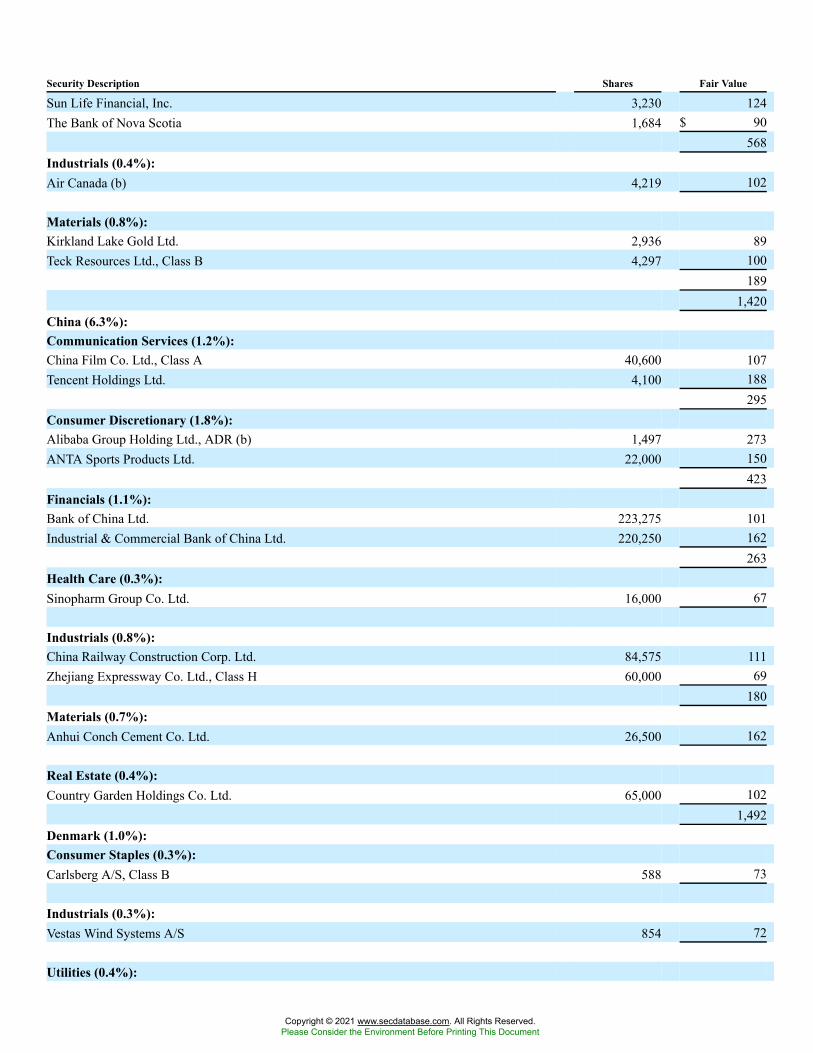
Security Description Shares Fair Value
Sun Life Financial, Inc. 3,230 124The Bank of Nova Scotia 1,684 $ 90
568Industrials (0.4%):Air Canada (b) 4,219 102
Materials (0.8%):Kirkland Lake Gold Ltd. 2,936 89Teck Resources Ltd., Class B 4,297 100
1891,420
China (6.3%):Communication Services (1.2%):China Film Co. Ltd., Class A 40,600 107Tencent Holdings Ltd. 4,100 188
295Consumer Discretionary (1.8%):Alibaba Group Holding Ltd., ADR (b) 1,497 273ANTA Sports Products Ltd. 22,000 150
423Financials (1.1%):Bank of China Ltd. 223,275 101Industrial & Commercial Bank of China Ltd. 220,250 162
263Health Care (0.3%):Sinopharm Group Co. Ltd. 16,000 67
Industrials (0.8%):China Railway Construction Corp. Ltd. 84,575 111Zhejiang Expressway Co. Ltd., Class H 60,000 69
180Materials (0.7%):Anhui Conch Cement Co. Ltd. 26,500 162
Real Estate (0.4%):Country Garden Holdings Co. Ltd. 65,000 102
1,492Denmark (1.0%):Consumer Staples (0.3%):Carlsberg A/S, Class B 588 73
Industrials (0.3%):Vestas Wind Systems A/S 854 72
Utilities (0.4%):
Copyright © 2021 www.secdatabase.com. All Rights Reserved.Please Consider the Environment Before Printing This Document
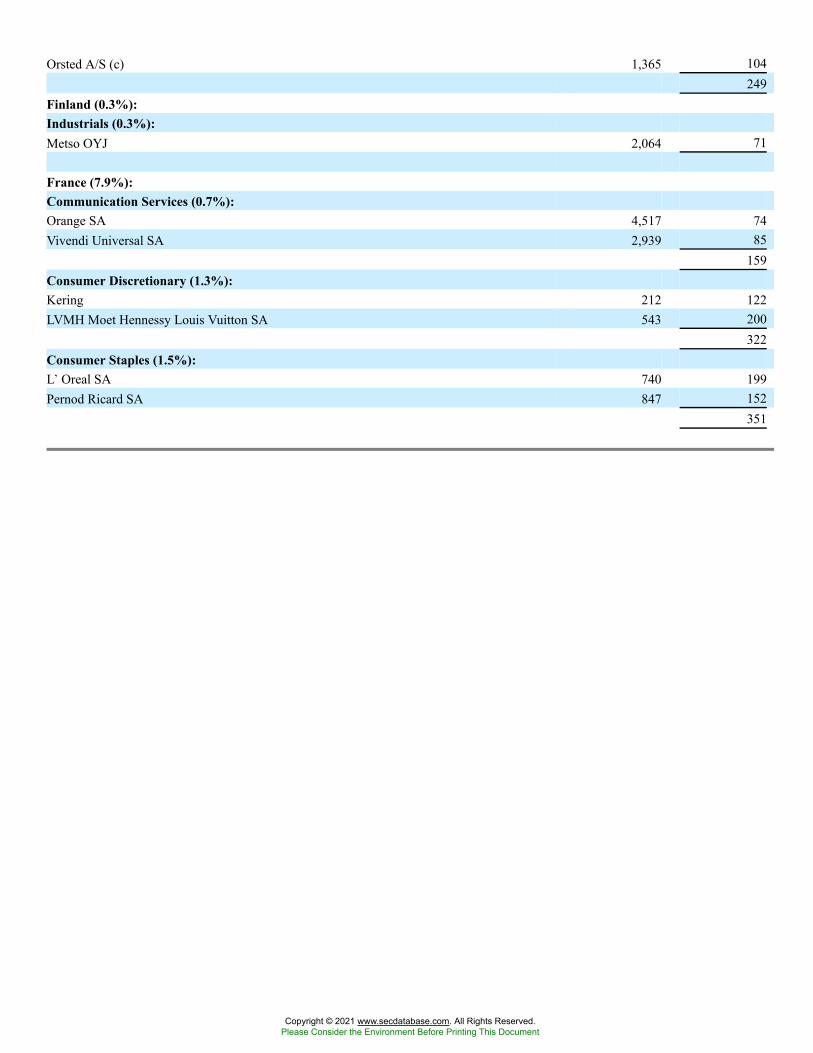
Orsted A/S (c) 1,365 104249
Finland (0.3%):Industrials (0.3%):Metso OYJ 2,064 71
France (7.9%):Communication Services (0.7%):Orange SA 4,517 74Vivendi Universal SA 2,939 85
159Consumer Discretionary (1.3%):Kering 212 122LVMH Moet Hennessy Louis Vuitton SA 543 200
322Consumer Staples (1.5%):L�Oreal SA 740 199Pernod Ricard SA 847 152
351
Copyright © 2021 www.secdatabase.com. All Rights Reserved.Please Consider the Environment Before Printing This Document
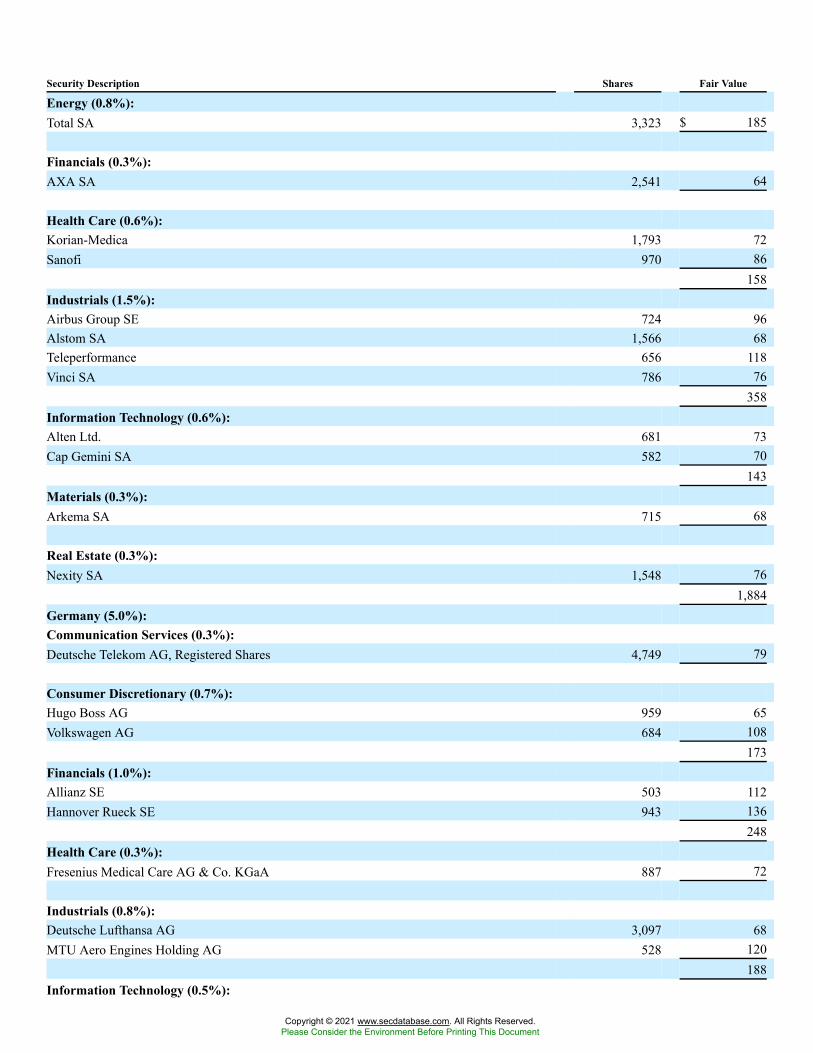
Security Description Shares Fair Value
Energy (0.8%):Total SA 3,323 $ 185
Financials (0.3%):AXA SA 2,541 64
Health Care (0.6%):Korian-Medica 1,793 72Sanofi 970 86
158Industrials (1.5%):Airbus Group SE 724 96Alstom SA 1,566 68Teleperformance 656 118Vinci SA 786 76
358Information Technology (0.6%):Alten Ltd. 681 73Cap Gemini SA 582 70
143Materials (0.3%):Arkema SA 715 68
Real Estate (0.3%):Nexity SA 1,548 76
1,884Germany (5.0%):Communication Services (0.3%):Deutsche Telekom AG, Registered Shares 4,749 79
Consumer Discretionary (0.7%):Hugo Boss AG 959 65Volkswagen AG 684 108
173Financials (1.0%):Allianz SE 503 112Hannover Rueck SE 943 136
248Health Care (0.3%):Fresenius Medical Care AG & Co. KGaA 887 72
Industrials (0.8%):Deutsche Lufthansa AG 3,097 68MTU Aero Engines Holding AG 528 120
188Information Technology (0.5%):
Copyright © 2021 www.secdatabase.com. All Rights Reserved.Please Consider the Environment Before Printing This Document
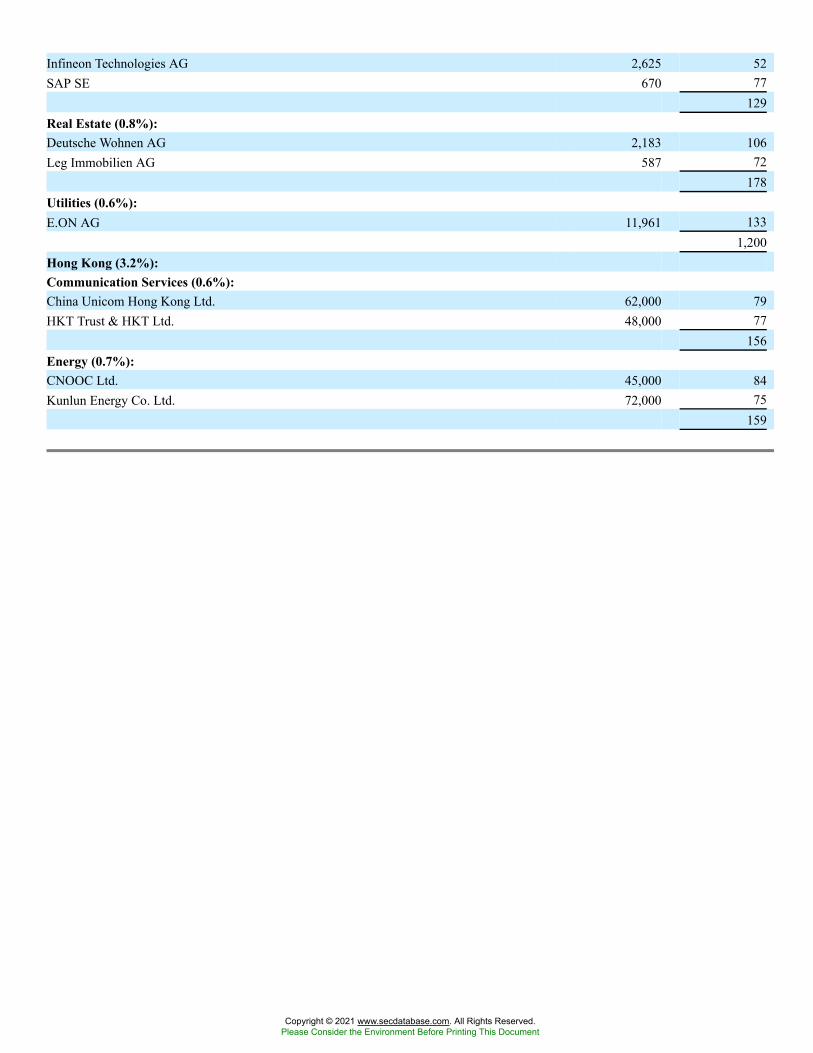
Infineon Technologies AG 2,625 52SAP SE 670 77
129Real Estate (0.8%):Deutsche Wohnen AG 2,183 106Leg Immobilien AG 587 72
178Utilities (0.6%):E.ON AG 11,961 133
1,200Hong Kong (3.2%):Communication Services (0.6%):China Unicom Hong Kong Ltd. 62,000 79HKT Trust & HKT Ltd. 48,000 77
156Energy (0.7%):CNOOC Ltd. 45,000 84Kunlun Energy Co. Ltd. 72,000 75
159
Copyright © 2021 www.secdatabase.com. All Rights Reserved.Please Consider the Environment Before Printing This Document
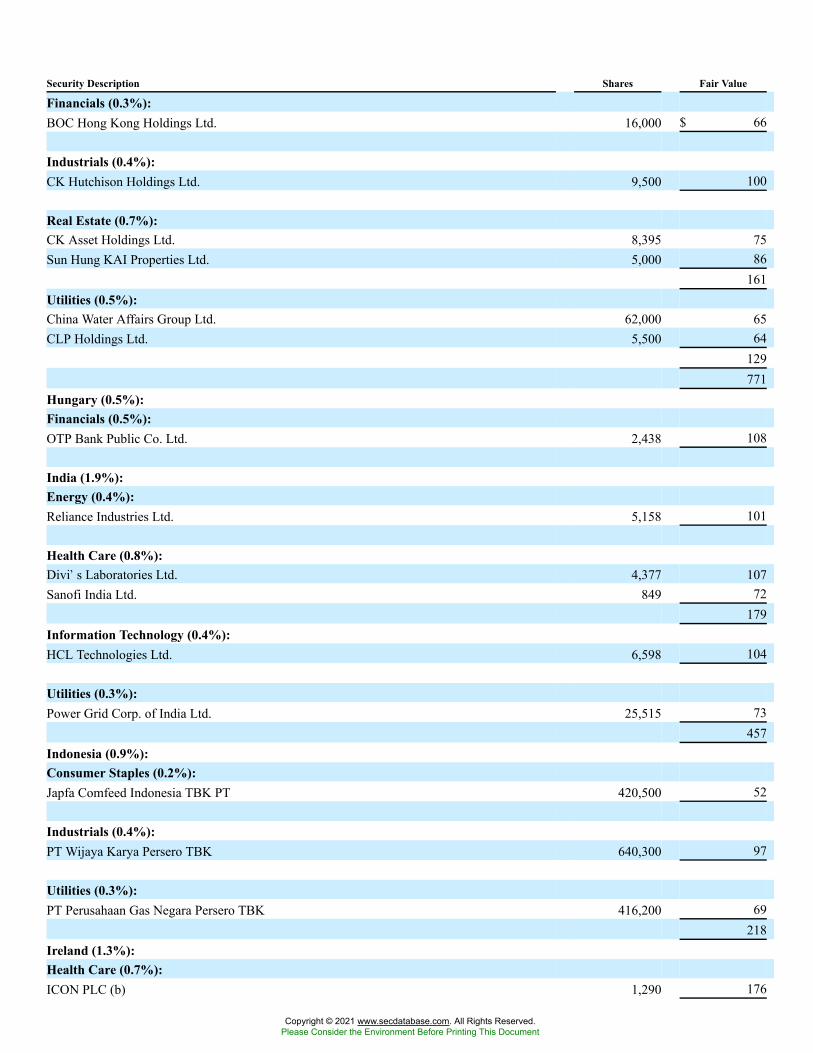
Security Description Shares Fair Value
Financials (0.3%):BOC Hong Kong Holdings Ltd. 16,000 $ 66
Industrials (0.4%):CK Hutchison Holdings Ltd. 9,500 100
Real Estate (0.7%):CK Asset Holdings Ltd. 8,395 75Sun Hung KAI Properties Ltd. 5,000 86
161Utilities (0.5%):China Water Affairs Group Ltd. 62,000 65CLP Holdings Ltd. 5,500 64
129771
Hungary (0.5%):Financials (0.5%):OTP Bank Public Co. Ltd. 2,438 108
India (1.9%):Energy (0.4%):Reliance Industries Ltd. 5,158 101
Health Care (0.8%):Divi�s Laboratories Ltd. 4,377 107Sanofi India Ltd. 849 72
179Information Technology (0.4%):HCL Technologies Ltd. 6,598 104
Utilities (0.3%):Power Grid Corp. of India Ltd. 25,515 73
457Indonesia (0.9%):Consumer Staples (0.2%):Japfa Comfeed Indonesia TBK PT 420,500 52
Industrials (0.4%):PT Wijaya Karya Persero TBK 640,300 97
Utilities (0.3%):PT Perusahaan Gas Negara Persero TBK 416,200 69
218Ireland (1.3%):Health Care (0.7%):ICON PLC (b) 1,290 176
Copyright © 2021 www.secdatabase.com. All Rights Reserved.Please Consider the Environment Before Printing This Document
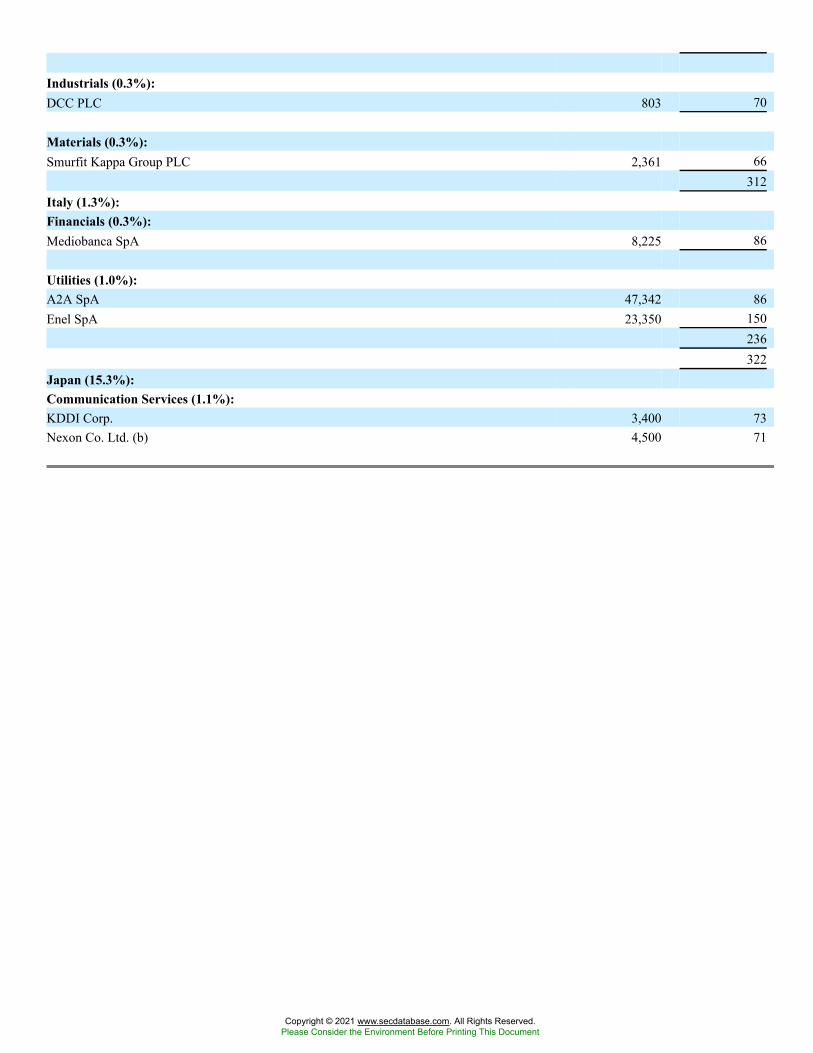
Industrials (0.3%):DCC PLC 803 70
Materials (0.3%):Smurfit Kappa Group PLC 2,361 66
312Italy (1.3%):Financials (0.3%):Mediobanca SpA 8,225 86
Utilities (1.0%):A2A SpA 47,342 86Enel SpA 23,350 150
236322
Japan (15.3%):Communication Services (1.1%):KDDI Corp. 3,400 73Nexon Co. Ltd. (b) 4,500 71
Copyright © 2021 www.secdatabase.com. All Rights Reserved.Please Consider the Environment Before Printing This Document
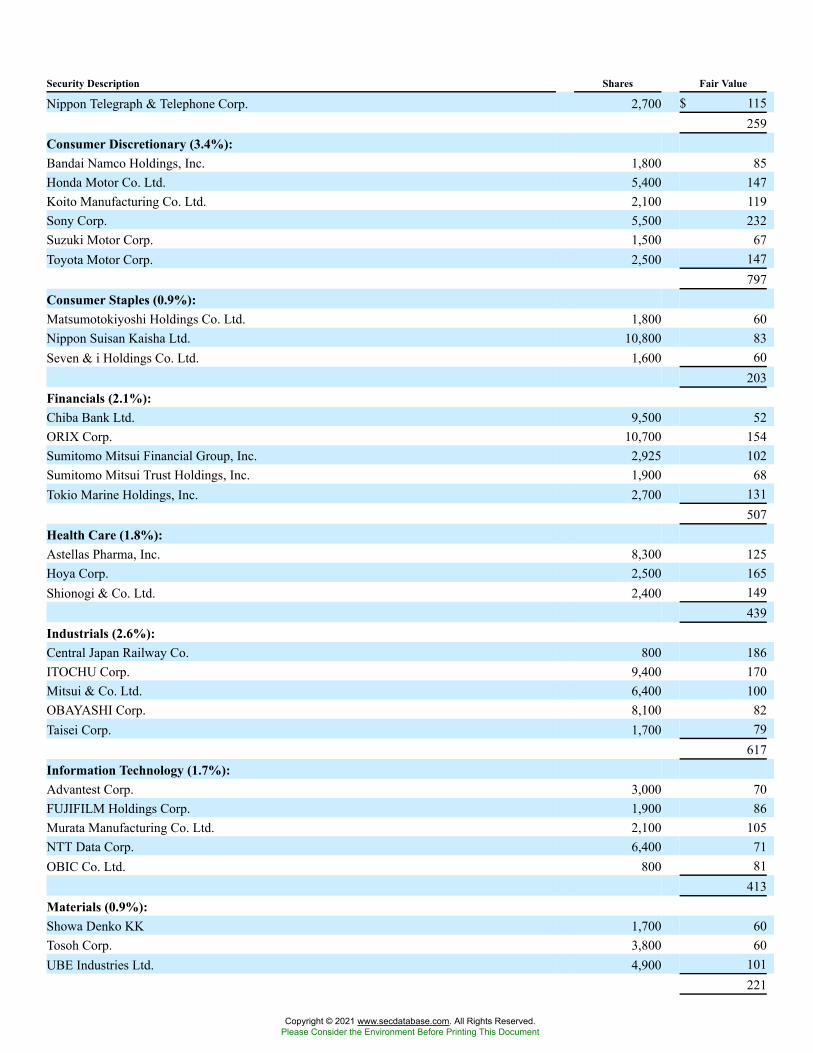
Security Description Shares Fair Value
Nippon Telegraph & Telephone Corp. 2,700 $ 115259
Consumer Discretionary (3.4%):Bandai Namco Holdings, Inc. 1,800 85Honda Motor Co. Ltd. 5,400 147Koito Manufacturing Co. Ltd. 2,100 119Sony Corp. 5,500 232Suzuki Motor Corp. 1,500 67Toyota Motor Corp. 2,500 147
797Consumer Staples (0.9%):Matsumotokiyoshi Holdings Co. Ltd. 1,800 60Nippon Suisan Kaisha Ltd. 10,800 83Seven & i Holdings Co. Ltd. 1,600 60
203Financials (2.1%):Chiba Bank Ltd. 9,500 52ORIX Corp. 10,700 154Sumitomo Mitsui Financial Group, Inc. 2,925 102Sumitomo Mitsui Trust Holdings, Inc. 1,900 68Tokio Marine Holdings, Inc. 2,700 131
507Health Care (1.8%):Astellas Pharma, Inc. 8,300 125Hoya Corp. 2,500 165Shionogi & Co. Ltd. 2,400 149
439Industrials (2.6%):Central Japan Railway Co. 800 186ITOCHU Corp. 9,400 170Mitsui & Co. Ltd. 6,400 100OBAYASHI Corp. 8,100 82Taisei Corp. 1,700 79
617Information Technology (1.7%):Advantest Corp. 3,000 70FUJIFILM Holdings Corp. 1,900 86Murata Manufacturing Co. Ltd. 2,100 105NTT Data Corp. 6,400 71OBIC Co. Ltd. 800 81
413Materials (0.9%):Showa Denko KK 1,700 60Tosoh Corp. 3,800 60UBE Industries Ltd. 4,900 101
221
Copyright © 2021 www.secdatabase.com. All Rights Reserved.Please Consider the Environment Before Printing This Document
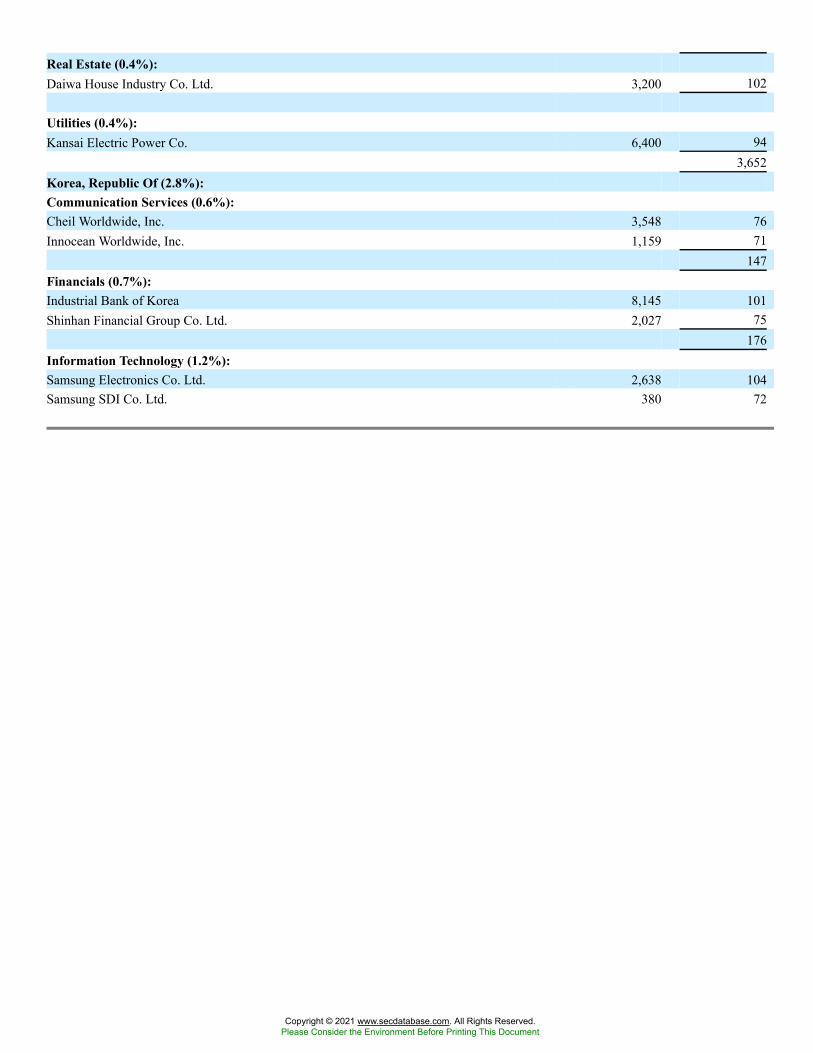
Real Estate (0.4%):Daiwa House Industry Co. Ltd. 3,200 102
Utilities (0.4%):Kansai Electric Power Co. 6,400 94
3,652Korea, Republic Of (2.8%):Communication Services (0.6%):Cheil Worldwide, Inc. 3,548 76Innocean Worldwide, Inc. 1,159 71
147Financials (0.7%):Industrial Bank of Korea 8,145 101Shinhan Financial Group Co. Ltd. 2,027 75
176Information Technology (1.2%):Samsung Electronics Co. Ltd. 2,638 104Samsung SDI Co. Ltd. 380 72
Copyright © 2021 www.secdatabase.com. All Rights Reserved.Please Consider the Environment Before Printing This Document
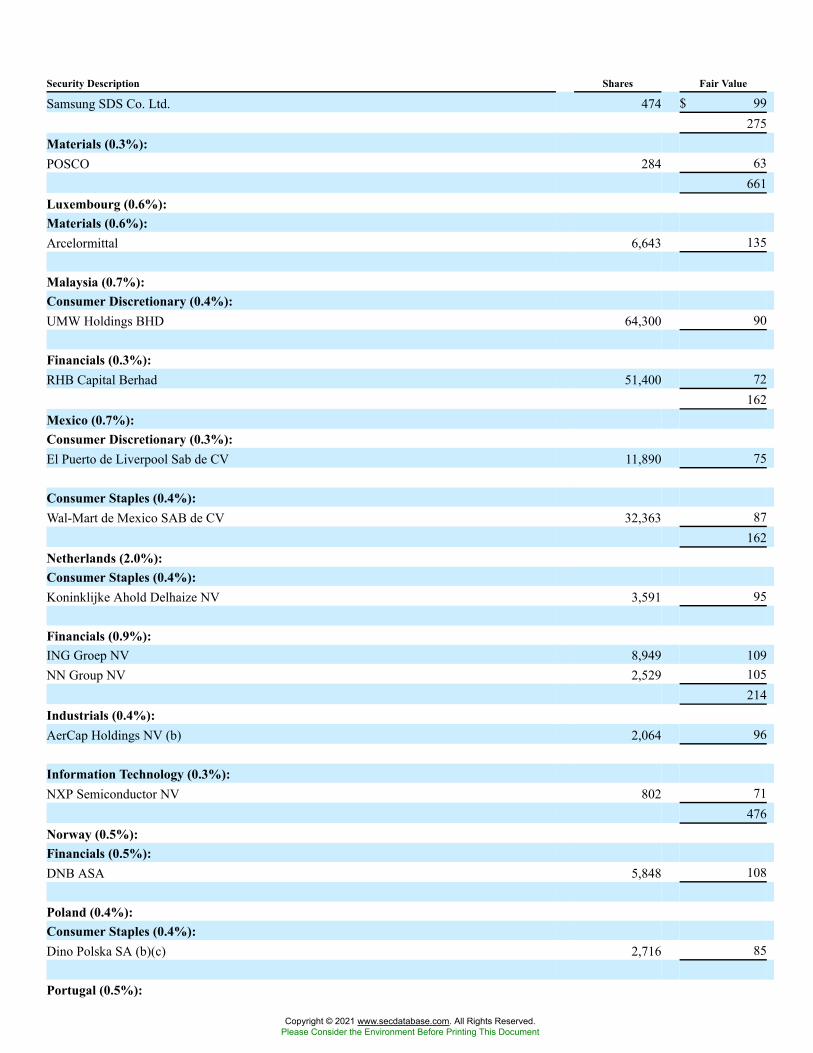
Security Description Shares Fair Value
Samsung SDS Co. Ltd. 474 $ 99275
Materials (0.3%):POSCO 284 63
661Luxembourg (0.6%):Materials (0.6%):Arcelormittal 6,643 135
Malaysia (0.7%):Consumer Discretionary (0.4%):UMW Holdings BHD 64,300 90
Financials (0.3%):RHB Capital Berhad 51,400 72
162Mexico (0.7%):Consumer Discretionary (0.3%):El Puerto de Liverpool Sab de CV 11,890 75
Consumer Staples (0.4%):Wal-Mart de Mexico SAB de CV 32,363 87
162Netherlands (2.0%):Consumer Staples (0.4%):Koninklijke Ahold Delhaize NV 3,591 95
Financials (0.9%):ING Groep NV 8,949 109NN Group NV 2,529 105
214Industrials (0.4%):AerCap Holdings NV (b) 2,064 96
Information Technology (0.3%):NXP Semiconductor NV 802 71
476Norway (0.5%):Financials (0.5%):DNB ASA 5,848 108
Poland (0.4%):Consumer Staples (0.4%):Dino Polska SA (b)(c) 2,716 85
Portugal (0.5%):
Copyright © 2021 www.secdatabase.com. All Rights Reserved.Please Consider the Environment Before Printing This Document
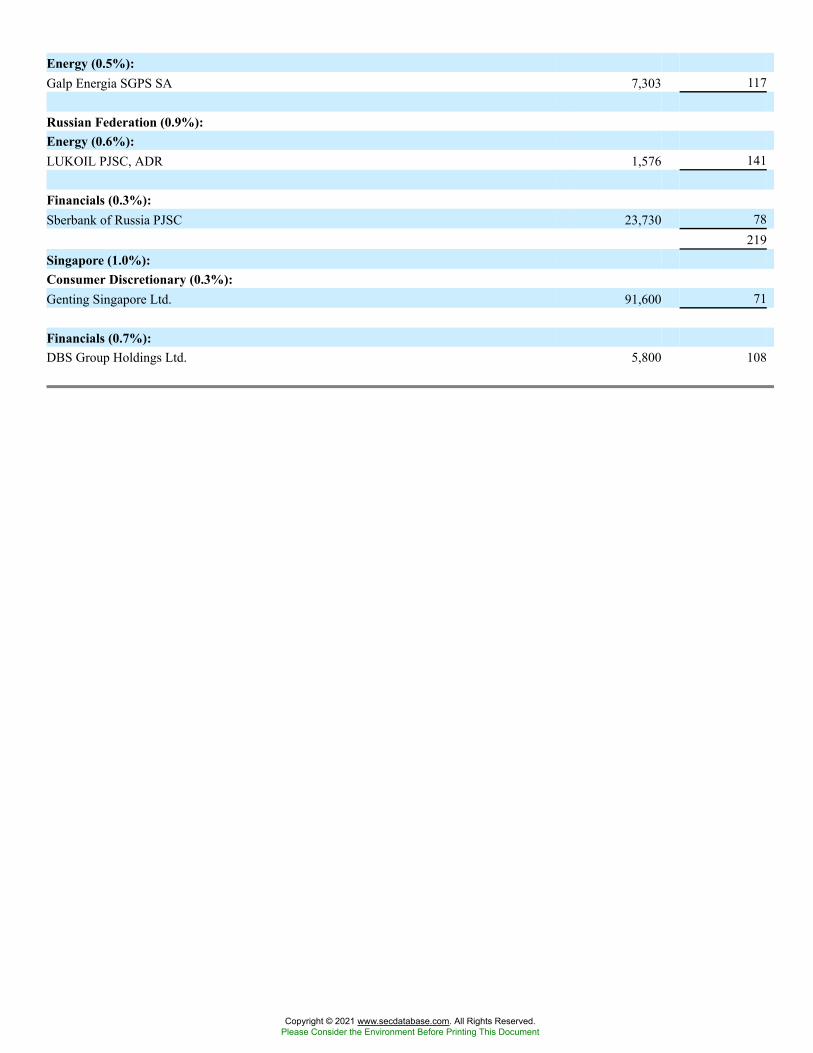
Energy (0.5%):Galp Energia SGPS SA 7,303 117
Russian Federation (0.9%):Energy (0.6%):LUKOIL PJSC, ADR 1,576 141
Financials (0.3%):Sberbank of Russia PJSC 23,730 78
219Singapore (1.0%):Consumer Discretionary (0.3%):Genting Singapore Ltd. 91,600 71
Financials (0.7%):DBS Group Holdings Ltd. 5,800 108
Copyright © 2021 www.secdatabase.com. All Rights Reserved.Please Consider the Environment Before Printing This Document
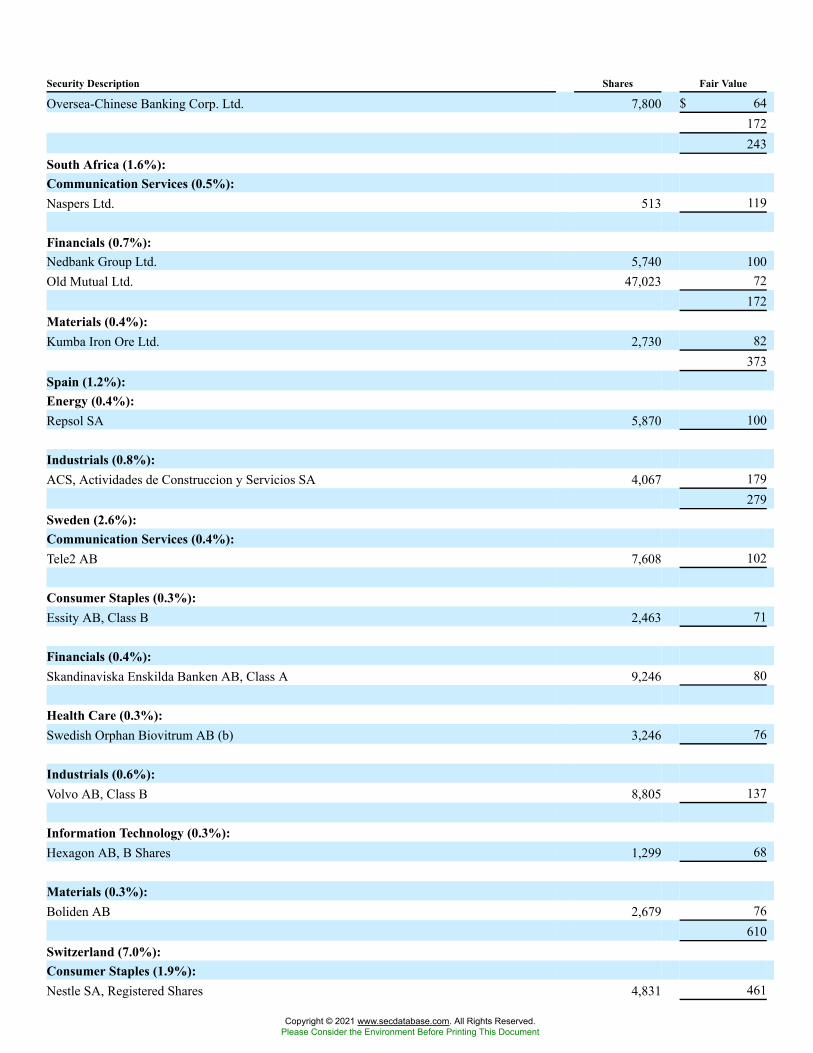
Security Description Shares Fair Value
Oversea-Chinese Banking Corp. Ltd. 7,800 $ 64172243
South Africa (1.6%):Communication Services (0.5%):Naspers Ltd. 513 119
Financials (0.7%):Nedbank Group Ltd. 5,740 100Old Mutual Ltd. 47,023 72
172Materials (0.4%):Kumba Iron Ore Ltd. 2,730 82
373Spain (1.2%):Energy (0.4%):Repsol SA 5,870 100
Industrials (0.8%):ACS, Actividades de Construccion y Servicios SA 4,067 179
279Sweden (2.6%):Communication Services (0.4%):Tele2 AB 7,608 102
Consumer Staples (0.3%):Essity AB, Class B 2,463 71
Financials (0.4%):Skandinaviska Enskilda Banken AB, Class A 9,246 80
Health Care (0.3%):Swedish Orphan Biovitrum AB (b) 3,246 76
Industrials (0.6%):Volvo AB, Class B 8,805 137
Information Technology (0.3%):Hexagon AB, B Shares 1,299 68
Materials (0.3%):Boliden AB 2,679 76
610Switzerland (7.0%):Consumer Staples (1.9%):Nestle SA, Registered Shares 4,831 461
Copyright © 2021 www.secdatabase.com. All Rights Reserved.Please Consider the Environment Before Printing This Document
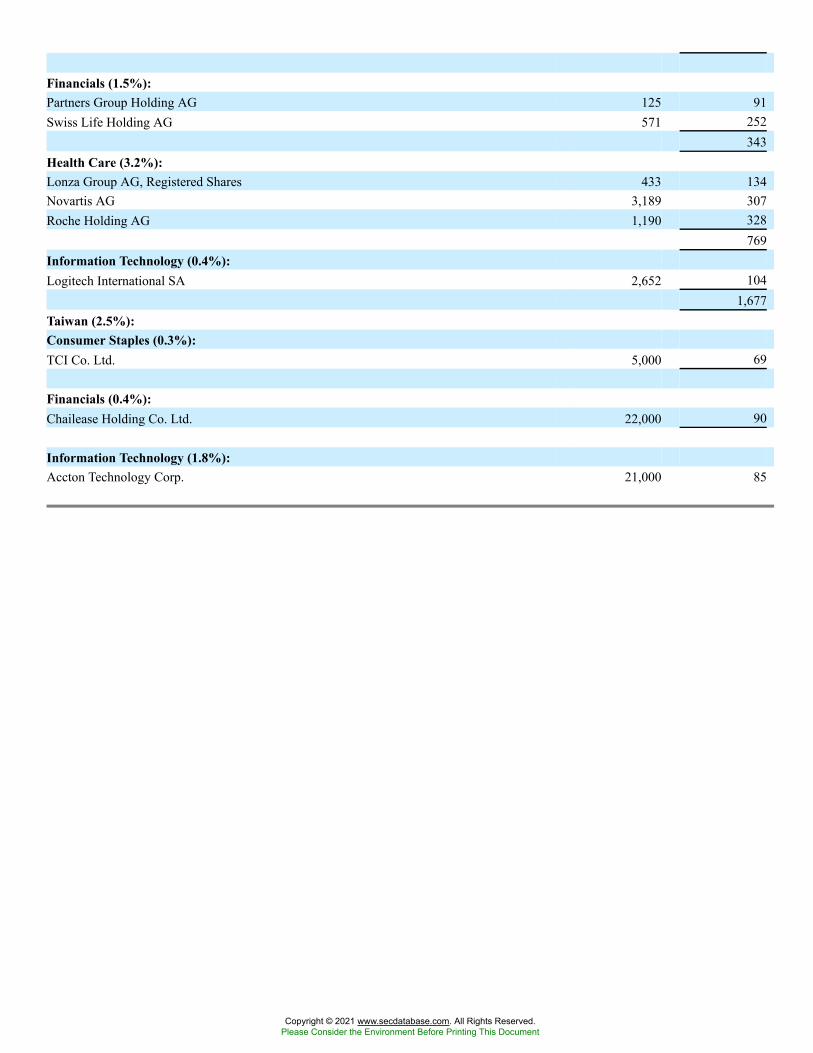
Financials (1.5%):Partners Group Holding AG 125 91Swiss Life Holding AG 571 252
343Health Care (3.2%):Lonza Group AG, Registered Shares 433 134Novartis AG 3,189 307Roche Holding AG 1,190 328
769Information Technology (0.4%):Logitech International SA 2,652 104
1,677Taiwan (2.5%):Consumer Staples (0.3%):TCI Co. Ltd. 5,000 69
Financials (0.4%):Chailease Holding Co. Ltd. 22,000 90
Information Technology (1.8%):Accton Technology Corp. 21,000 85
Copyright © 2021 www.secdatabase.com. All Rights Reserved.Please Consider the Environment Before Printing This Document
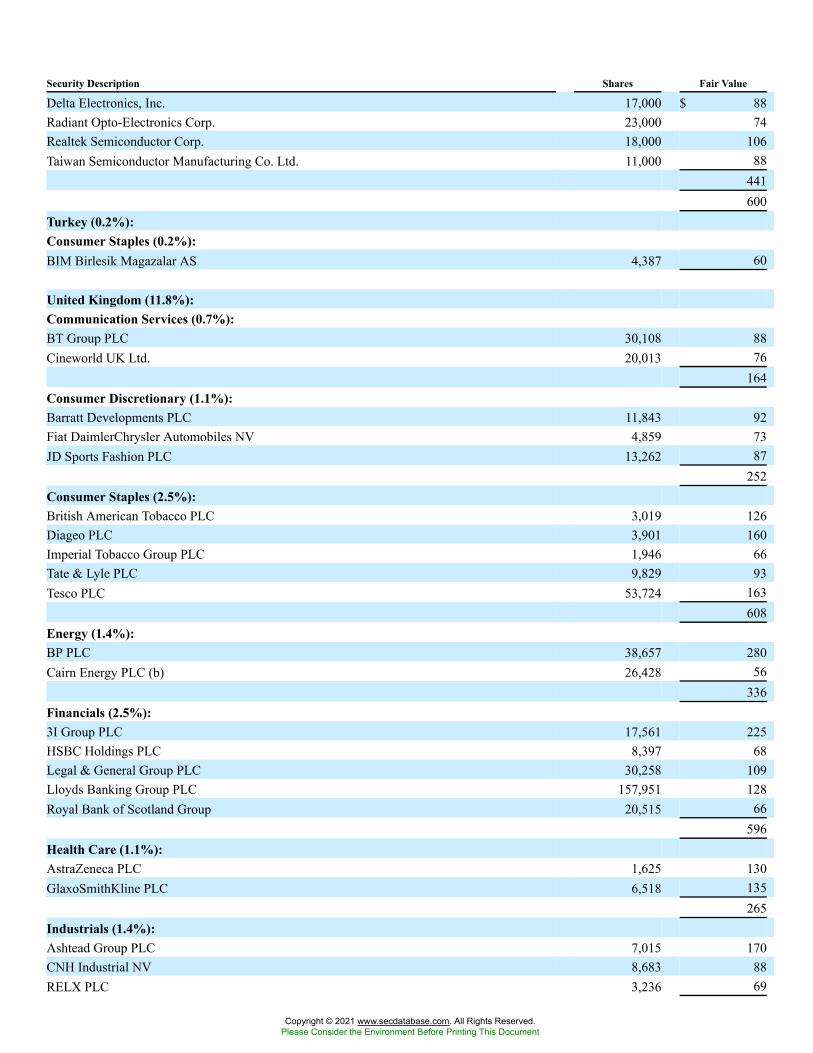
Security Description Shares Fair Value
Delta Electronics, Inc. 17,000 $ 88Radiant Opto-Electronics Corp. 23,000 74Realtek Semiconductor Corp. 18,000 106Taiwan Semiconductor Manufacturing Co. Ltd. 11,000 88
441600
Turkey (0.2%):Consumer Staples (0.2%):BIM Birlesik Magazalar AS 4,387 60
United Kingdom (11.8%):Communication Services (0.7%):BT Group PLC 30,108 88Cineworld UK Ltd. 20,013 76
164Consumer Discretionary (1.1%):Barratt Developments PLC 11,843 92Fiat DaimlerChrysler Automobiles NV 4,859 73JD Sports Fashion PLC 13,262 87
252Consumer Staples (2.5%):British American Tobacco PLC 3,019 126Diageo PLC 3,901 160Imperial Tobacco Group PLC 1,946 66Tate & Lyle PLC 9,829 93Tesco PLC 53,724 163
608Energy (1.4%):BP PLC 38,657 280Cairn Energy PLC (b) 26,428 56
336Financials (2.5%):3I Group PLC 17,561 225HSBC Holdings PLC 8,397 68Legal & General Group PLC 30,258 109Lloyds Banking Group PLC 157,951 128Royal Bank of Scotland Group 20,515 66
596Health Care (1.1%):AstraZeneca PLC 1,625 130GlaxoSmithKline PLC 6,518 135
265Industrials (1.4%):Ashtead Group PLC 7,015 170CNH Industrial NV 8,683 88RELX PLC 3,236 69
Copyright © 2021 www.secdatabase.com. All Rights Reserved.Please Consider the Environment Before Printing This Document
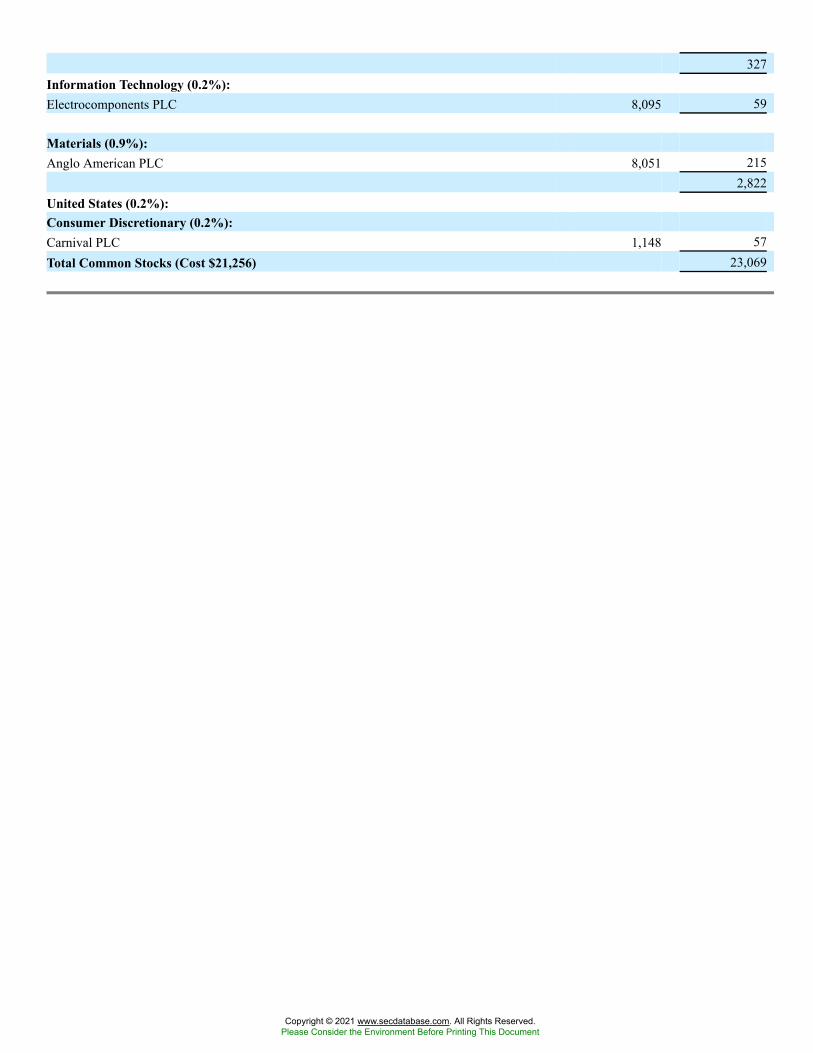
327Information Technology (0.2%):Electrocomponents PLC 8,095 59
Materials (0.9%):Anglo American PLC 8,051 215
2,822United States (0.2%):Consumer Discretionary (0.2%):Carnival PLC 1,148 57Total Common Stocks (Cost $21,256) 23,069
Copyright © 2021 www.secdatabase.com. All Rights Reserved.Please Consider the Environment Before Printing This Document
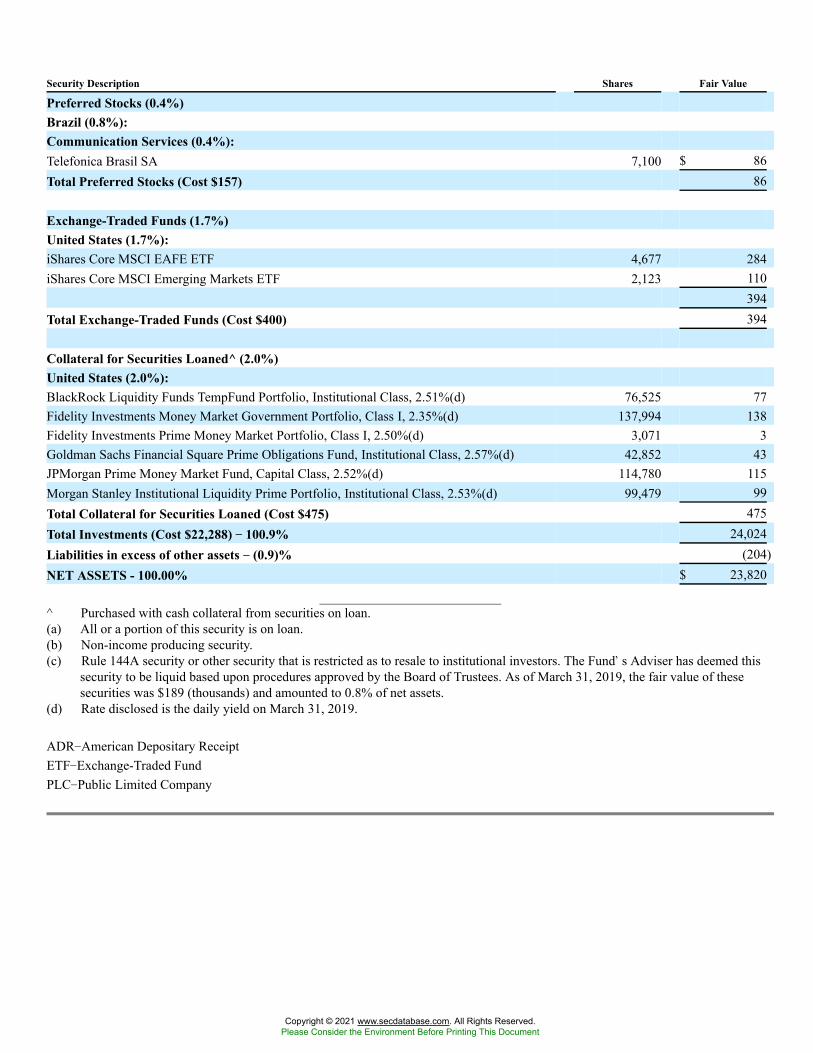
Security Description Shares Fair Value
Preferred Stocks (0.4%)Brazil (0.8%):Communication Services (0.4%):Telefonica Brasil SA 7,100 $ 86Total Preferred Stocks (Cost $157) 86
Exchange-Traded Funds (1.7%)United States (1.7%):iShares Core MSCI EAFE ETF 4,677 284iShares Core MSCI Emerging Markets ETF 2,123 110
394Total Exchange-Traded Funds (Cost $400) 394
Collateral for Securities Loaned^ (2.0%)United States (2.0%):BlackRock Liquidity Funds TempFund Portfolio, Institutional Class, 2.51%(d) 76,525 77Fidelity Investments Money Market Government Portfolio, Class I, 2.35%(d) 137,994 138Fidelity Investments Prime Money Market Portfolio, Class I, 2.50%(d) 3,071 3Goldman Sachs Financial Square Prime Obligations Fund, Institutional Class, 2.57%(d) 42,852 43JPMorgan Prime Money Market Fund, Capital Class, 2.52%(d) 114,780 115Morgan Stanley Institutional Liquidity Prime Portfolio, Institutional Class, 2.53%(d) 99,479 99Total Collateral for Securities Loaned (Cost $475) 475Total Investments (Cost $22,288) �� 100.9% 24,024Liabilities in excess of other assets �� (0.9)% (204)NET ASSETS - 100.00% $ 23,820
^ Purchased with cash collateral from securities on loan.(a) All or a portion of this security is on loan.(b) Non-income producing security.(c) Rule 144A security or other security that is restricted as to resale to institutional investors. The Fund�s Adviser has deemed this
security to be liquid based upon procedures approved by the Board of Trustees. As of March 31, 2019, the fair value of thesesecurities was $189 (thousands) and amounted to 0.8% of net assets.
(d) Rate disclosed is the daily yield on March 31, 2019.
ADR�American Depositary ReceiptETF�Exchange-Traded FundPLC�Public Limited Company
Copyright © 2021 www.secdatabase.com. All Rights Reserved.Please Consider the Environment Before Printing This Document
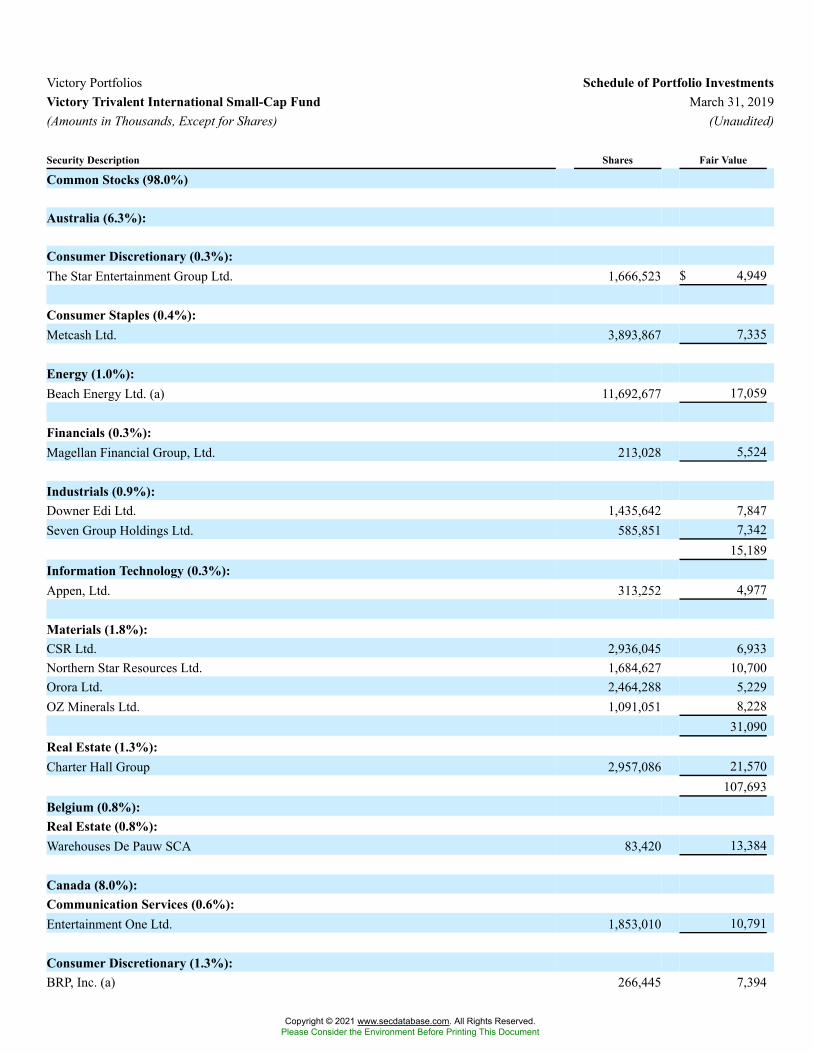
Victory Portfolios Schedule of Portfolio InvestmentsVictory Trivalent International Small-Cap Fund March 31, 2019(Amounts in Thousands, Except for Shares) (Unaudited)
Security Description Shares Fair Value
Common Stocks (98.0%)
Australia (6.3%):
Consumer Discretionary (0.3%):The Star Entertainment Group Ltd. 1,666,523 $ 4,949
Consumer Staples (0.4%):Metcash Ltd. 3,893,867 7,335
Energy (1.0%):Beach Energy Ltd. (a) 11,692,677 17,059
Financials (0.3%):Magellan Financial Group, Ltd. 213,028 5,524
Industrials (0.9%):Downer Edi Ltd. 1,435,642 7,847Seven Group Holdings Ltd. 585,851 7,342
15,189Information Technology (0.3%):Appen, Ltd. 313,252 4,977
Materials (1.8%):CSR Ltd. 2,936,045 6,933Northern Star Resources Ltd. 1,684,627 10,700Orora Ltd. 2,464,288 5,229OZ Minerals Ltd. 1,091,051 8,228
31,090Real Estate (1.3%):Charter Hall Group 2,957,086 21,570
107,693Belgium (0.8%):Real Estate (0.8%):Warehouses De Pauw SCA 83,420 13,384
Canada (8.0%):Communication Services (0.6%):Entertainment One Ltd. 1,853,010 10,791
Consumer Discretionary (1.3%):BRP, Inc. (a) 266,445 7,394
Copyright © 2021 www.secdatabase.com. All Rights Reserved.Please Consider the Environment Before Printing This Document
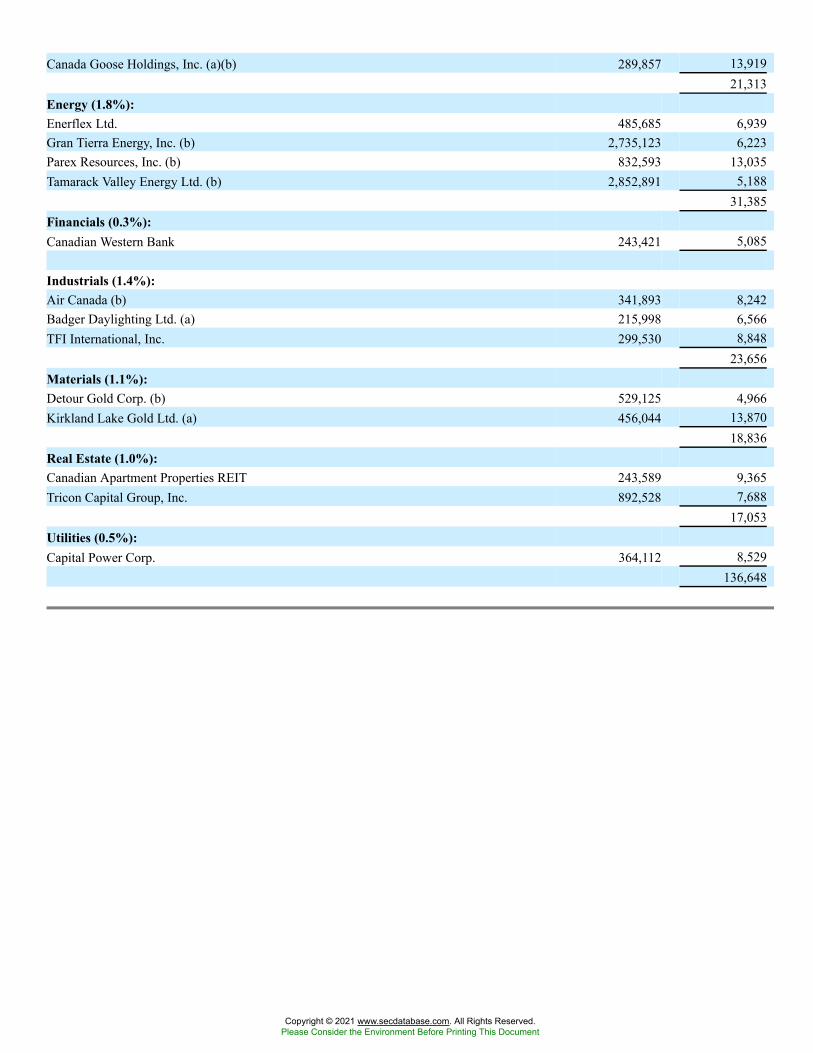
Canada Goose Holdings, Inc. (a)(b) 289,857 13,91921,313
Energy (1.8%):Enerflex Ltd. 485,685 6,939Gran Tierra Energy, Inc. (b) 2,735,123 6,223Parex Resources, Inc. (b) 832,593 13,035Tamarack Valley Energy Ltd. (b) 2,852,891 5,188
31,385Financials (0.3%):Canadian Western Bank 243,421 5,085
Industrials (1.4%):Air Canada (b) 341,893 8,242Badger Daylighting Ltd. (a) 215,998 6,566TFI International, Inc. 299,530 8,848
23,656Materials (1.1%):Detour Gold Corp. (b) 529,125 4,966Kirkland Lake Gold Ltd. (a) 456,044 13,870
18,836Real Estate (1.0%):Canadian Apartment Properties REIT 243,589 9,365Tricon Capital Group, Inc. 892,528 7,688
17,053Utilities (0.5%):Capital Power Corp. 364,112 8,529
136,648
Copyright © 2021 www.secdatabase.com. All Rights Reserved.Please Consider the Environment Before Printing This Document
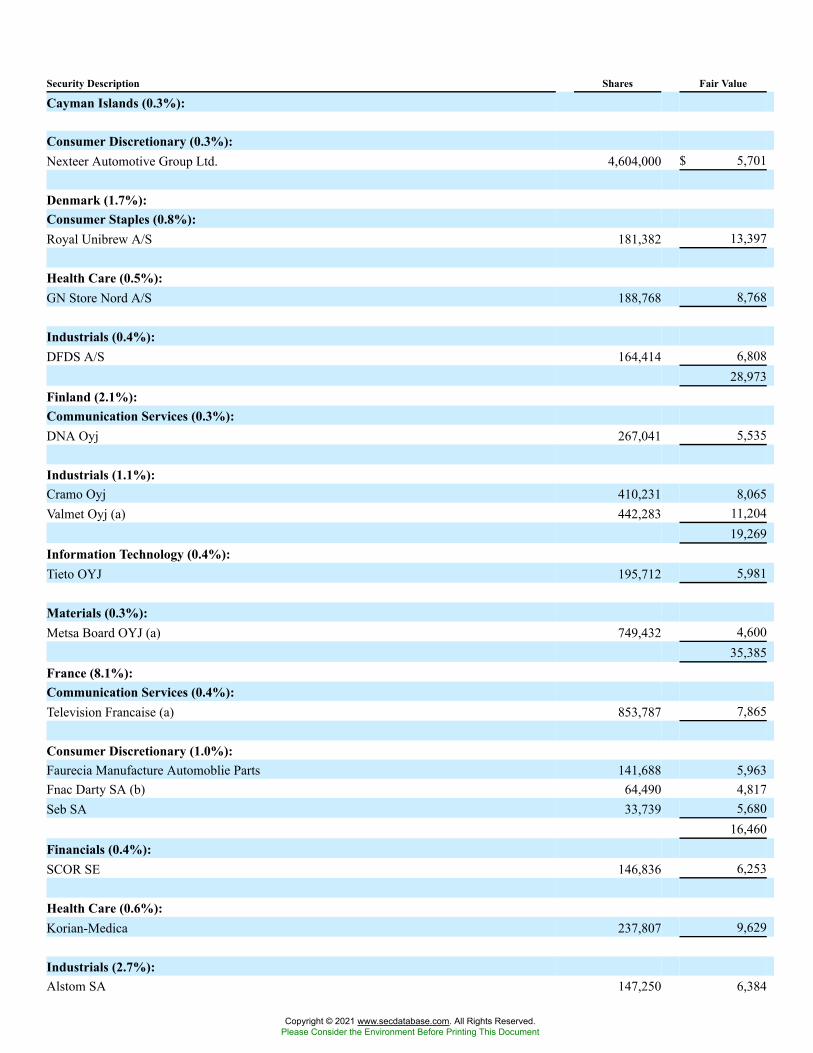
Security Description Shares Fair Value
Cayman Islands (0.3%):
Consumer Discretionary (0.3%):Nexteer Automotive Group Ltd. 4,604,000 $ 5,701
Denmark (1.7%):Consumer Staples (0.8%):Royal Unibrew A/S 181,382 13,397
Health Care (0.5%):GN Store Nord A/S 188,768 8,768
Industrials (0.4%):DFDS A/S 164,414 6,808
28,973Finland (2.1%):Communication Services (0.3%):DNA Oyj 267,041 5,535
Industrials (1.1%):Cramo Oyj 410,231 8,065Valmet Oyj (a) 442,283 11,204
19,269Information Technology (0.4%):Tieto OYJ 195,712 5,981
Materials (0.3%):Metsa Board OYJ (a) 749,432 4,600
35,385France (8.1%):Communication Services (0.4%):Television Francaise (a) 853,787 7,865
Consumer Discretionary (1.0%):Faurecia Manufacture Automoblie Parts 141,688 5,963Fnac Darty SA (b) 64,490 4,817Seb SA 33,739 5,680
16,460Financials (0.4%):SCOR SE 146,836 6,253
Health Care (0.6%):Korian-Medica 237,807 9,629
Industrials (2.7%):Alstom SA 147,250 6,384
Copyright © 2021 www.secdatabase.com. All Rights Reserved.Please Consider the Environment Before Printing This Document
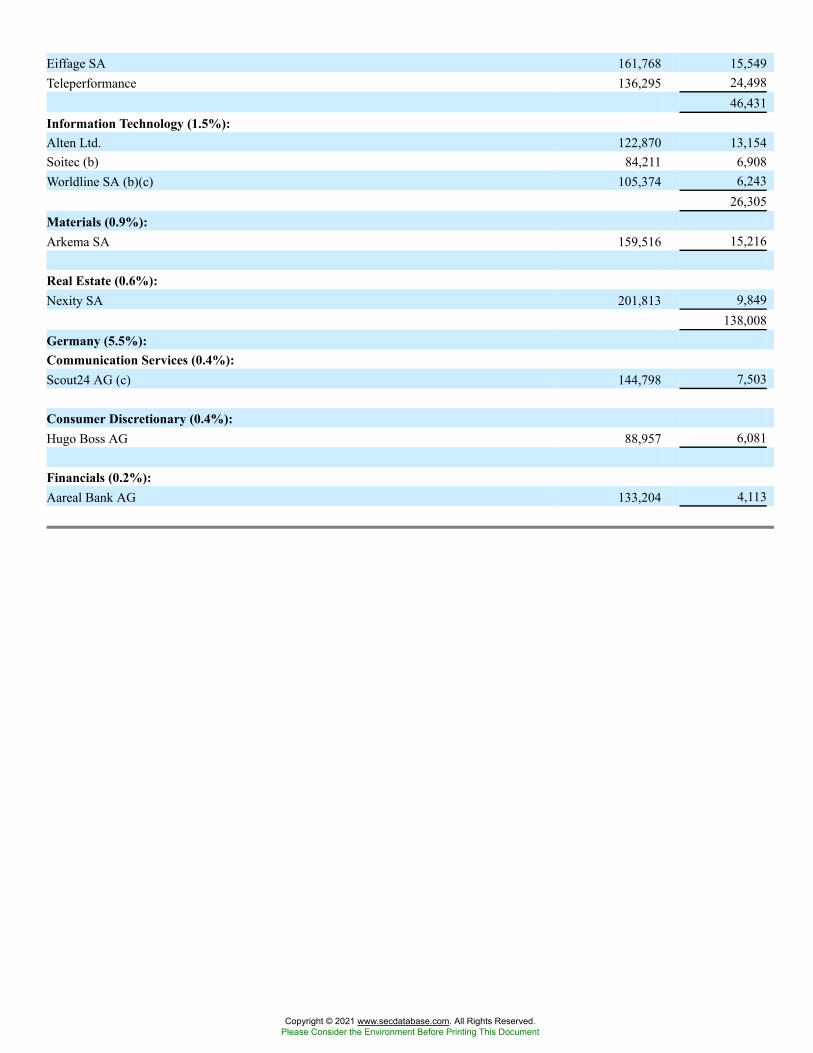
Eiffage SA 161,768 15,549Teleperformance 136,295 24,498
46,431Information Technology (1.5%):Alten Ltd. 122,870 13,154Soitec (b) 84,211 6,908Worldline SA (b)(c) 105,374 6,243
26,305Materials (0.9%):Arkema SA 159,516 15,216
Real Estate (0.6%):Nexity SA 201,813 9,849
138,008Germany (5.5%):Communication Services (0.4%):Scout24 AG (c) 144,798 7,503
Consumer Discretionary (0.4%):Hugo Boss AG 88,957 6,081
Financials (0.2%):Aareal Bank AG 133,204 4,113
Copyright © 2021 www.secdatabase.com. All Rights Reserved.Please Consider the Environment Before Printing This Document
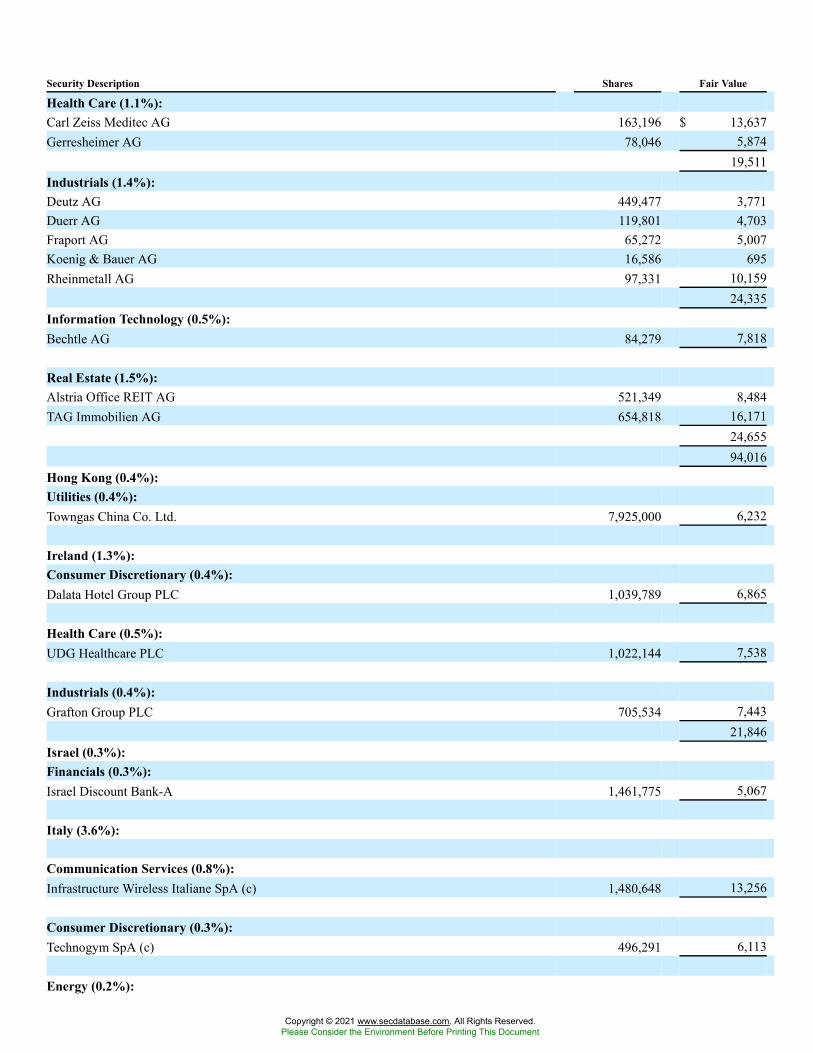
Security Description Shares Fair Value
Health Care (1.1%):Carl Zeiss Meditec AG 163,196 $ 13,637Gerresheimer AG 78,046 5,874
19,511Industrials (1.4%):Deutz AG 449,477 3,771Duerr AG 119,801 4,703Fraport AG 65,272 5,007Koenig & Bauer AG 16,586 695Rheinmetall AG 97,331 10,159
24,335Information Technology (0.5%):Bechtle AG 84,279 7,818
Real Estate (1.5%):Alstria Office REIT AG 521,349 8,484TAG Immobilien AG 654,818 16,171
24,65594,016
Hong Kong (0.4%):Utilities (0.4%):Towngas China Co. Ltd. 7,925,000 6,232
Ireland (1.3%):Consumer Discretionary (0.4%):Dalata Hotel Group PLC 1,039,789 6,865
Health Care (0.5%):UDG Healthcare PLC 1,022,144 7,538
Industrials (0.4%):Grafton Group PLC 705,534 7,443
21,846Israel (0.3%):Financials (0.3%):Israel Discount Bank-A 1,461,775 5,067
Italy (3.6%):
Communication Services (0.8%):Infrastructure Wireless Italiane SpA (c) 1,480,648 13,256
Consumer Discretionary (0.3%):Technogym SpA (c) 496,291 6,113
Energy (0.2%):
Copyright © 2021 www.secdatabase.com. All Rights Reserved.Please Consider the Environment Before Printing This Document
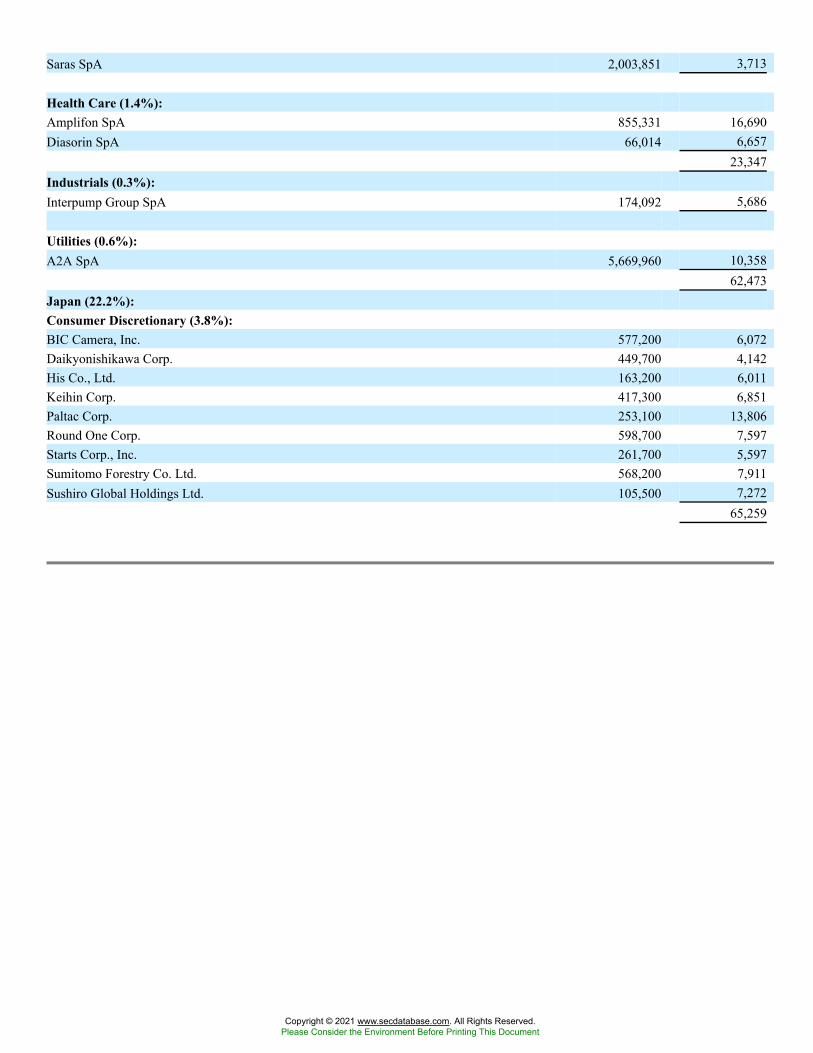
Saras SpA 2,003,851 3,713
Health Care (1.4%):Amplifon SpA 855,331 16,690Diasorin SpA 66,014 6,657
23,347Industrials (0.3%):Interpump Group SpA 174,092 5,686
Utilities (0.6%):A2A SpA 5,669,960 10,358
62,473Japan (22.2%):Consumer Discretionary (3.8%):BIC Camera, Inc. 577,200 6,072Daikyonishikawa Corp. 449,700 4,142His Co., Ltd. 163,200 6,011Keihin Corp. 417,300 6,851Paltac Corp. 253,100 13,806Round One Corp. 598,700 7,597Starts Corp., Inc. 261,700 5,597Sumitomo Forestry Co. Ltd. 568,200 7,911Sushiro Global Holdings Ltd. 105,500 7,272
65,259
Copyright © 2021 www.secdatabase.com. All Rights Reserved.Please Consider the Environment Before Printing This Document
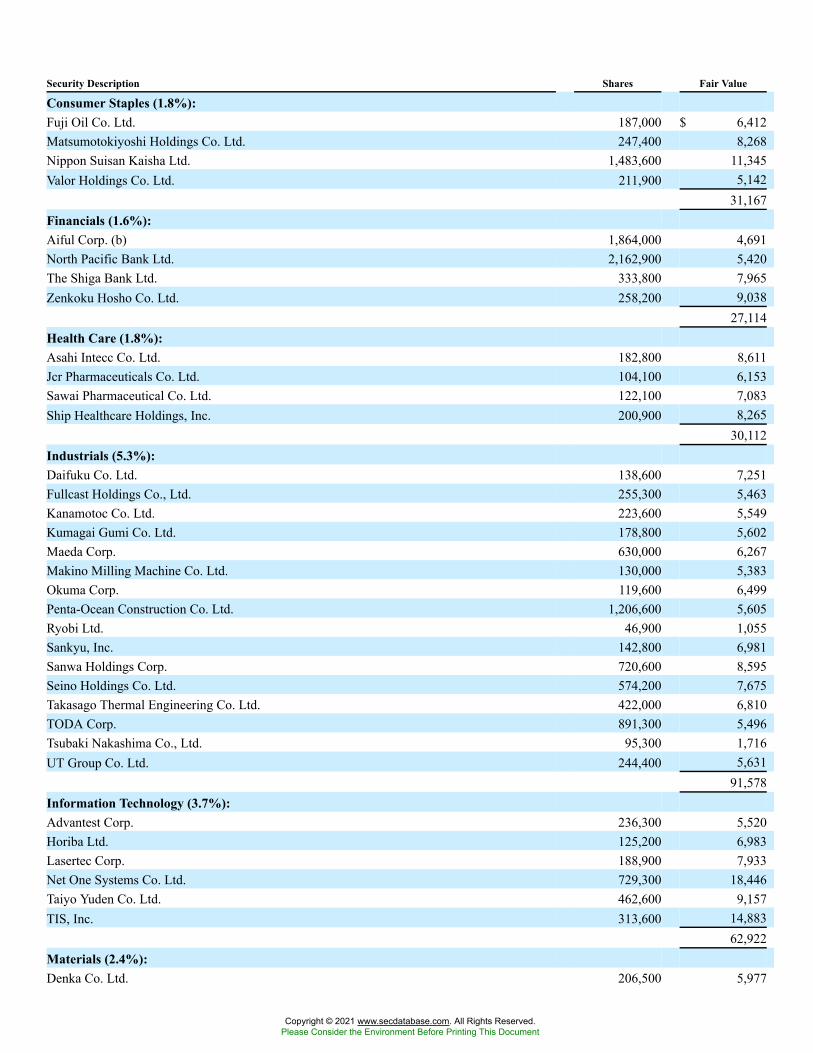
Security Description Shares Fair Value
Consumer Staples (1.8%):Fuji Oil Co. Ltd. 187,000 $ 6,412Matsumotokiyoshi Holdings Co. Ltd. 247,400 8,268Nippon Suisan Kaisha Ltd. 1,483,600 11,345Valor Holdings Co. Ltd. 211,900 5,142
31,167Financials (1.6%):Aiful Corp. (b) 1,864,000 4,691North Pacific Bank Ltd. 2,162,900 5,420The Shiga Bank Ltd. 333,800 7,965Zenkoku Hosho Co. Ltd. 258,200 9,038
27,114Health Care (1.8%):Asahi Intecc Co. Ltd. 182,800 8,611Jcr Pharmaceuticals Co. Ltd. 104,100 6,153Sawai Pharmaceutical Co. Ltd. 122,100 7,083Ship Healthcare Holdings, Inc. 200,900 8,265
30,112Industrials (5.3%):Daifuku Co. Ltd. 138,600 7,251Fullcast Holdings Co., Ltd. 255,300 5,463Kanamotoc Co. Ltd. 223,600 5,549Kumagai Gumi Co. Ltd. 178,800 5,602Maeda Corp. 630,000 6,267Makino Milling Machine Co. Ltd. 130,000 5,383Okuma Corp. 119,600 6,499Penta-Ocean Construction Co. Ltd. 1,206,600 5,605Ryobi Ltd. 46,900 1,055Sankyu, Inc. 142,800 6,981Sanwa Holdings Corp. 720,600 8,595Seino Holdings Co. Ltd. 574,200 7,675Takasago Thermal Engineering Co. Ltd. 422,000 6,810TODA Corp. 891,300 5,496Tsubaki Nakashima Co., Ltd. 95,300 1,716UT Group Co. Ltd. 244,400 5,631
91,578Information Technology (3.7%):Advantest Corp. 236,300 5,520Horiba Ltd. 125,200 6,983Lasertec Corp. 188,900 7,933Net One Systems Co. Ltd. 729,300 18,446Taiyo Yuden Co. Ltd. 462,600 9,157TIS, Inc. 313,600 14,883
62,922Materials (2.4%):Denka Co. Ltd. 206,500 5,977
Copyright © 2021 www.secdatabase.com. All Rights Reserved.Please Consider the Environment Before Printing This Document
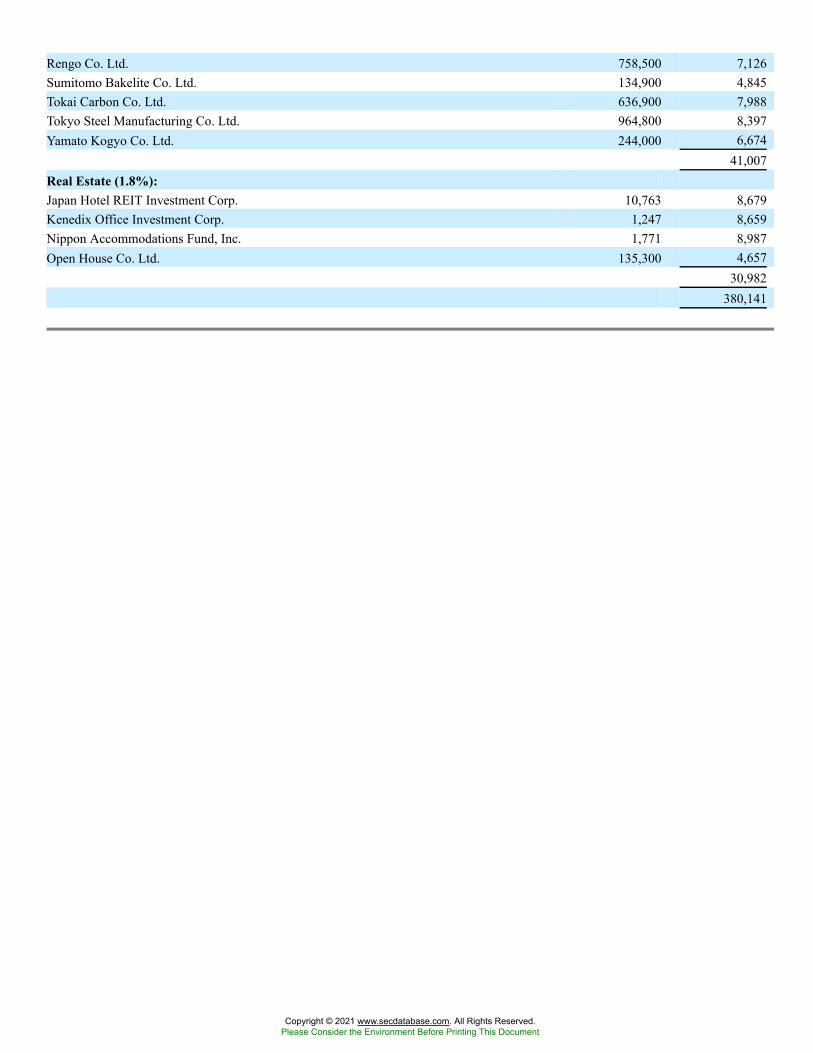
Rengo Co. Ltd. 758,500 7,126Sumitomo Bakelite Co. Ltd. 134,900 4,845Tokai Carbon Co. Ltd. 636,900 7,988Tokyo Steel Manufacturing Co. Ltd. 964,800 8,397Yamato Kogyo Co. Ltd. 244,000 6,674
41,007Real Estate (1.8%):Japan Hotel REIT Investment Corp. 10,763 8,679Kenedix Office Investment Corp. 1,247 8,659Nippon Accommodations Fund, Inc. 1,771 8,987Open House Co. Ltd. 135,300 4,657
30,982380,141
Copyright © 2021 www.secdatabase.com. All Rights Reserved.Please Consider the Environment Before Printing This Document
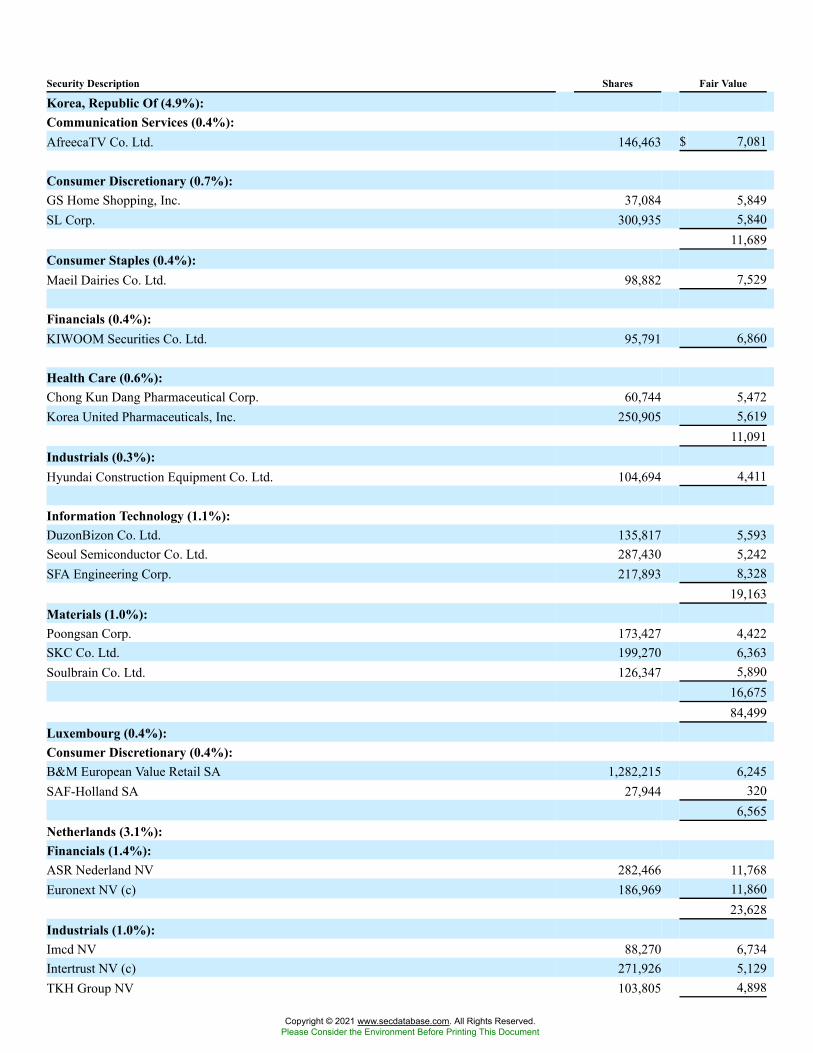
Security Description Shares Fair Value
Korea, Republic Of (4.9%):Communication Services (0.4%):AfreecaTV Co. Ltd. 146,463 $ 7,081
Consumer Discretionary (0.7%):GS Home Shopping, Inc. 37,084 5,849SL Corp. 300,935 5,840
11,689Consumer Staples (0.4%):Maeil Dairies Co. Ltd. 98,882 7,529
Financials (0.4%):KIWOOM Securities Co. Ltd. 95,791 6,860
Health Care (0.6%):Chong Kun Dang Pharmaceutical Corp. 60,744 5,472Korea United Pharmaceuticals, Inc. 250,905 5,619
11,091Industrials (0.3%):Hyundai Construction Equipment Co. Ltd. 104,694 4,411
Information Technology (1.1%):DuzonBizon Co. Ltd. 135,817 5,593Seoul Semiconductor Co. Ltd. 287,430 5,242SFA Engineering Corp. 217,893 8,328
19,163Materials (1.0%):Poongsan Corp. 173,427 4,422SKC Co. Ltd. 199,270 6,363Soulbrain Co. Ltd. 126,347 5,890
16,67584,499
Luxembourg (0.4%):Consumer Discretionary (0.4%):B&M European Value Retail SA 1,282,215 6,245SAF-Holland SA 27,944 320
6,565Netherlands (3.1%):Financials (1.4%):ASR Nederland NV 282,466 11,768Euronext NV (c) 186,969 11,860
23,628Industrials (1.0%):Imcd NV 88,270 6,734Intertrust NV (c) 271,926 5,129TKH Group NV 103,805 4,898
Copyright © 2021 www.secdatabase.com. All Rights Reserved.Please Consider the Environment Before Printing This Document
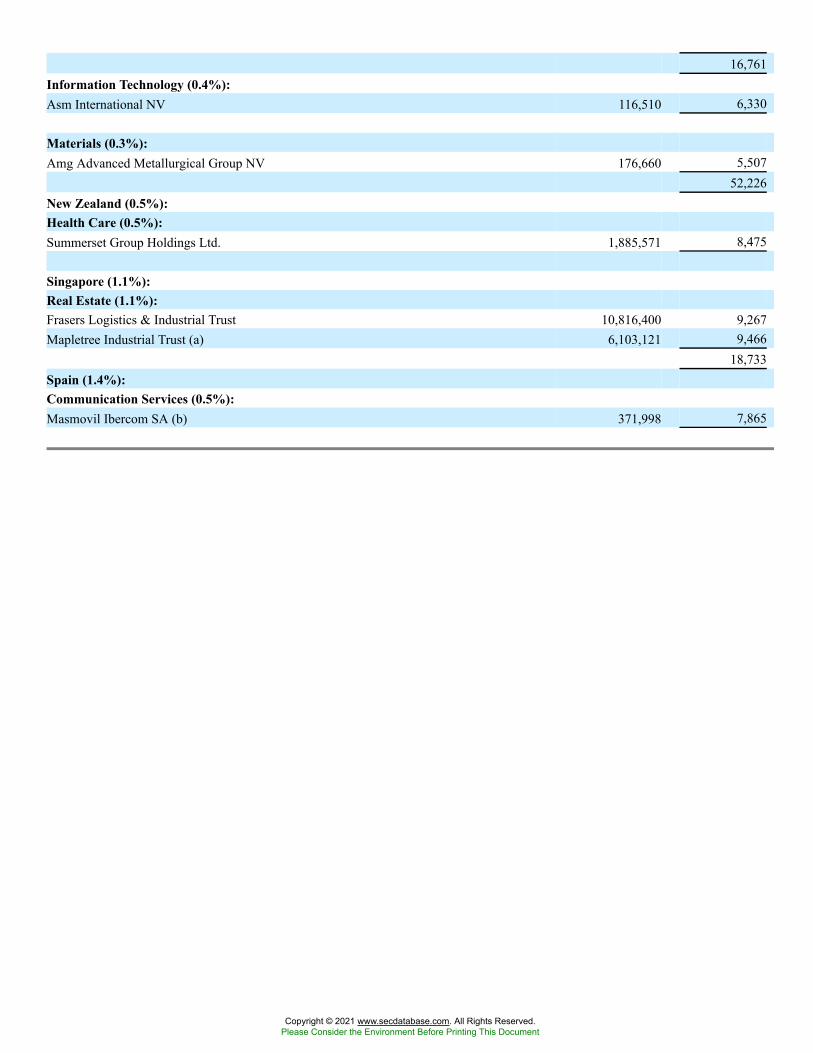
16,761Information Technology (0.4%):Asm International NV 116,510 6,330
Materials (0.3%):Amg Advanced Metallurgical Group NV 176,660 5,507
52,226New Zealand (0.5%):Health Care (0.5%):Summerset Group Holdings Ltd. 1,885,571 8,475
Singapore (1.1%):Real Estate (1.1%):Frasers Logistics & Industrial Trust 10,816,400 9,267Mapletree Industrial Trust (a) 6,103,121 9,466
18,733Spain (1.4%):Communication Services (0.5%):Masmovil Ibercom SA (b) 371,998 7,865
Copyright © 2021 www.secdatabase.com. All Rights Reserved.Please Consider the Environment Before Printing This Document
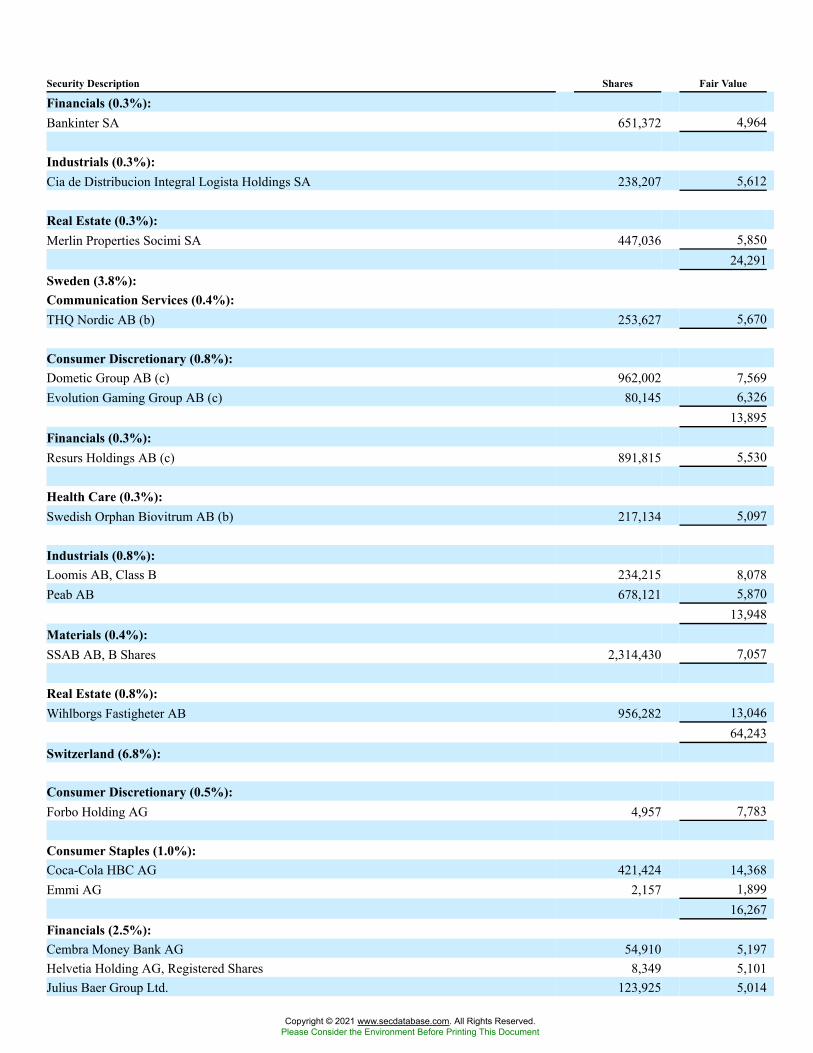
Security Description Shares Fair Value
Financials (0.3%):Bankinter SA 651,372 4,964
Industrials (0.3%):Cia de Distribucion Integral Logista Holdings SA 238,207 5,612
Real Estate (0.3%):Merlin Properties Socimi SA 447,036 5,850
24,291Sweden (3.8%):Communication Services (0.4%):THQ Nordic AB (b) 253,627 5,670
Consumer Discretionary (0.8%):Dometic Group AB (c) 962,002 7,569Evolution Gaming Group AB (c) 80,145 6,326
13,895Financials (0.3%):Resurs Holdings AB (c) 891,815 5,530
Health Care (0.3%):Swedish Orphan Biovitrum AB (b) 217,134 5,097
Industrials (0.8%):Loomis AB, Class B 234,215 8,078Peab AB 678,121 5,870
13,948Materials (0.4%):SSAB AB, B Shares 2,314,430 7,057
Real Estate (0.8%):Wihlborgs Fastigheter AB 956,282 13,046
64,243Switzerland (6.8%):
Consumer Discretionary (0.5%):Forbo Holding AG 4,957 7,783
Consumer Staples (1.0%):Coca-Cola HBC AG 421,424 14,368Emmi AG 2,157 1,899
16,267Financials (2.5%):Cembra Money Bank AG 54,910 5,197Helvetia Holding AG, Registered Shares 8,349 5,101Julius Baer Group Ltd. 123,925 5,014
Copyright © 2021 www.secdatabase.com. All Rights Reserved.Please Consider the Environment Before Printing This Document
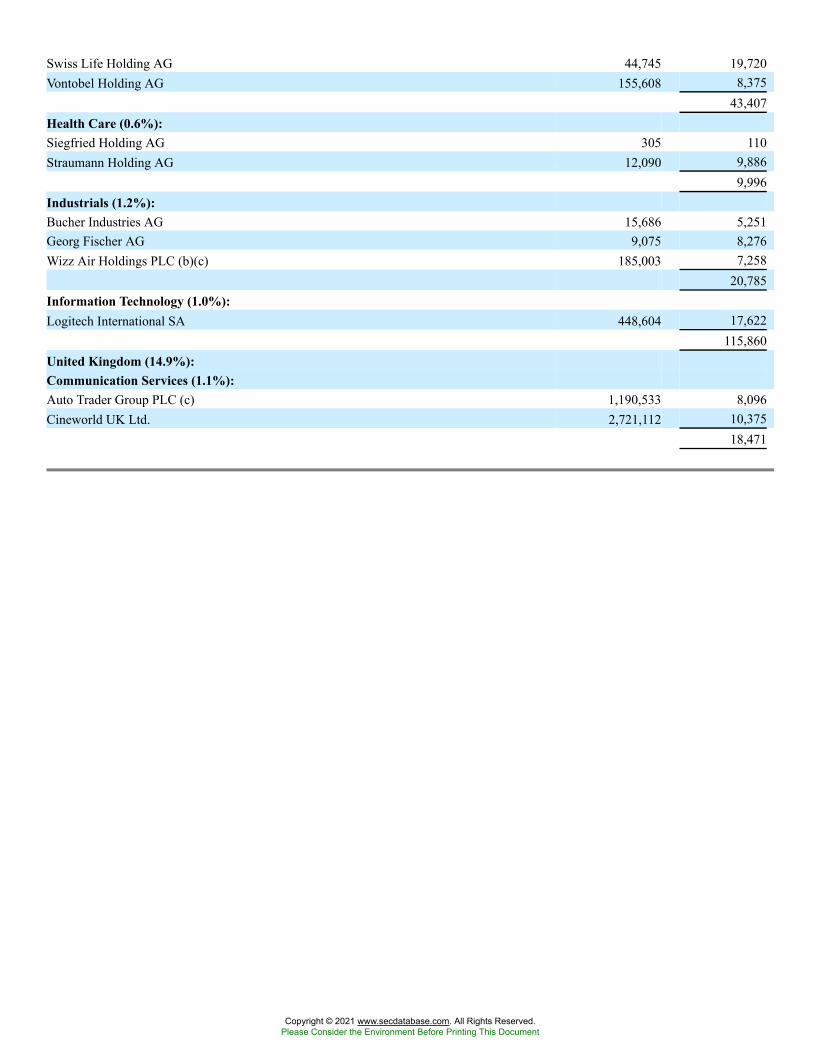
Swiss Life Holding AG 44,745 19,720Vontobel Holding AG 155,608 8,375
43,407Health Care (0.6%):Siegfried Holding AG 305 110Straumann Holding AG 12,090 9,886
9,996Industrials (1.2%):Bucher Industries AG 15,686 5,251Georg Fischer AG 9,075 8,276Wizz Air Holdings PLC (b)(c) 185,003 7,258
20,785Information Technology (1.0%):Logitech International SA 448,604 17,622
115,860United Kingdom (14.9%):Communication Services (1.1%):Auto Trader Group PLC (c) 1,190,533 8,096Cineworld UK Ltd. 2,721,112 10,375
18,471
Copyright © 2021 www.secdatabase.com. All Rights Reserved.Please Consider the Environment Before Printing This Document
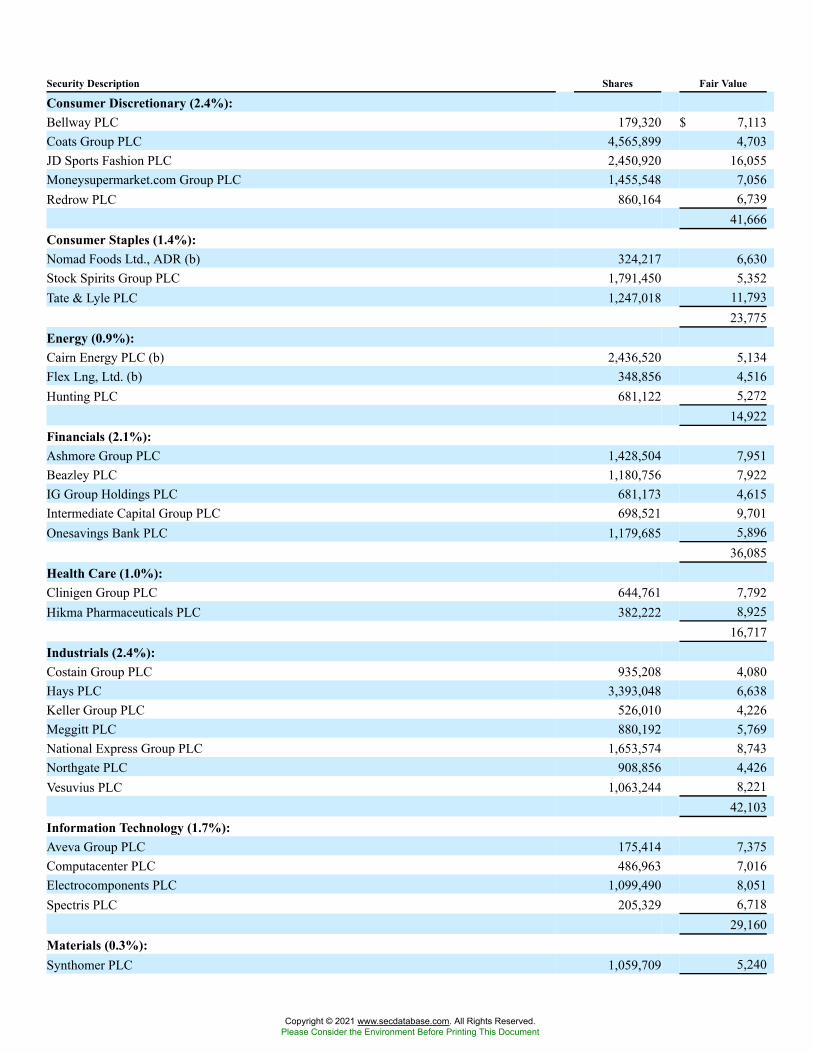
Security Description Shares Fair Value
Consumer Discretionary (2.4%):Bellway PLC 179,320 $ 7,113Coats Group PLC 4,565,899 4,703JD Sports Fashion PLC 2,450,920 16,055Moneysupermarket.com Group PLC 1,455,548 7,056Redrow PLC 860,164 6,739
41,666Consumer Staples (1.4%):Nomad Foods Ltd., ADR (b) 324,217 6,630Stock Spirits Group PLC 1,791,450 5,352Tate & Lyle PLC 1,247,018 11,793
23,775Energy (0.9%):Cairn Energy PLC (b) 2,436,520 5,134Flex Lng, Ltd. (b) 348,856 4,516Hunting PLC 681,122 5,272
14,922Financials (2.1%):Ashmore Group PLC 1,428,504 7,951Beazley PLC 1,180,756 7,922IG Group Holdings PLC 681,173 4,615Intermediate Capital Group PLC 698,521 9,701Onesavings Bank PLC 1,179,685 5,896
36,085Health Care (1.0%):Clinigen Group PLC 644,761 7,792Hikma Pharmaceuticals PLC 382,222 8,925
16,717Industrials (2.4%):Costain Group PLC 935,208 4,080Hays PLC 3,393,048 6,638Keller Group PLC 526,010 4,226Meggitt PLC 880,192 5,769National Express Group PLC 1,653,574 8,743Northgate PLC 908,856 4,426Vesuvius PLC 1,063,244 8,221
42,103Information Technology (1.7%):Aveva Group PLC 175,414 7,375Computacenter PLC 486,963 7,016Electrocomponents PLC 1,099,490 8,051Spectris PLC 205,329 6,718
29,160Materials (0.3%):Synthomer PLC 1,059,709 5,240
Copyright © 2021 www.secdatabase.com. All Rights Reserved.Please Consider the Environment Before Printing This Document
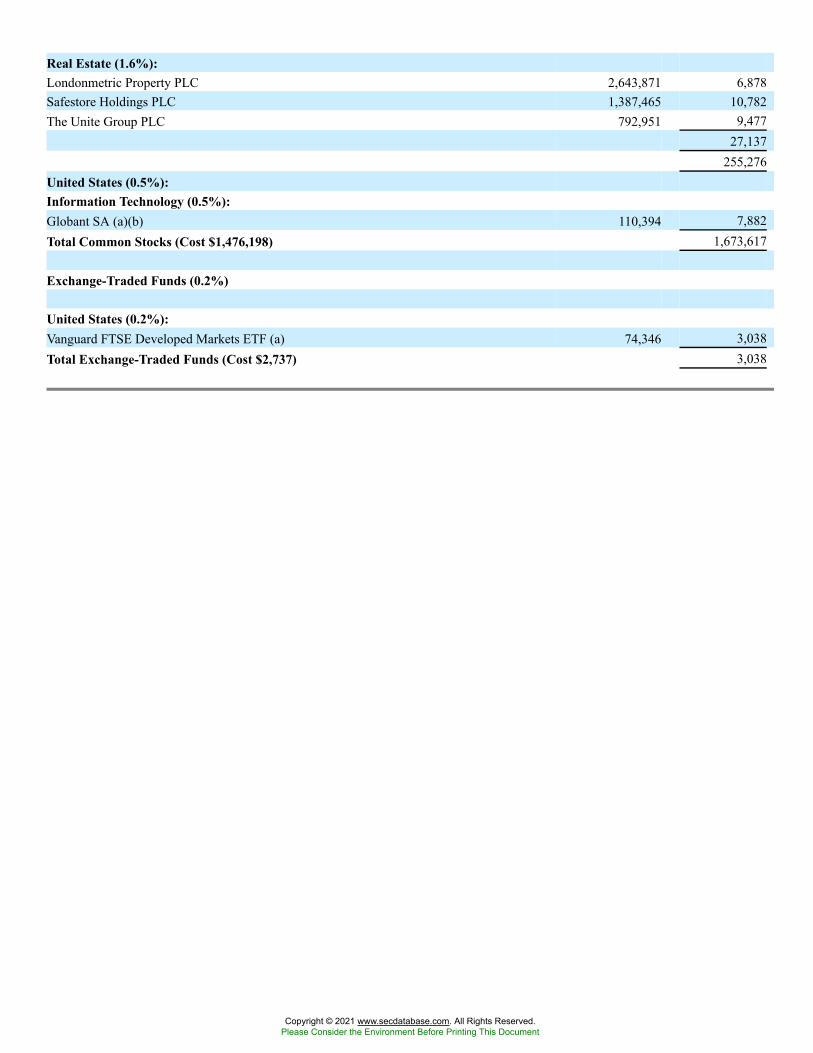
Real Estate (1.6%):Londonmetric Property PLC 2,643,871 6,878Safestore Holdings PLC 1,387,465 10,782The Unite Group PLC 792,951 9,477
27,137255,276
United States (0.5%):Information Technology (0.5%):Globant SA (a)(b) 110,394 7,882Total Common Stocks (Cost $1,476,198) 1,673,617
Exchange-Traded Funds (0.2%)
United States (0.2%):Vanguard FTSE Developed Markets ETF (a) 74,346 3,038Total Exchange-Traded Funds (Cost $2,737) 3,038
Copyright © 2021 www.secdatabase.com. All Rights Reserved.Please Consider the Environment Before Printing This Document
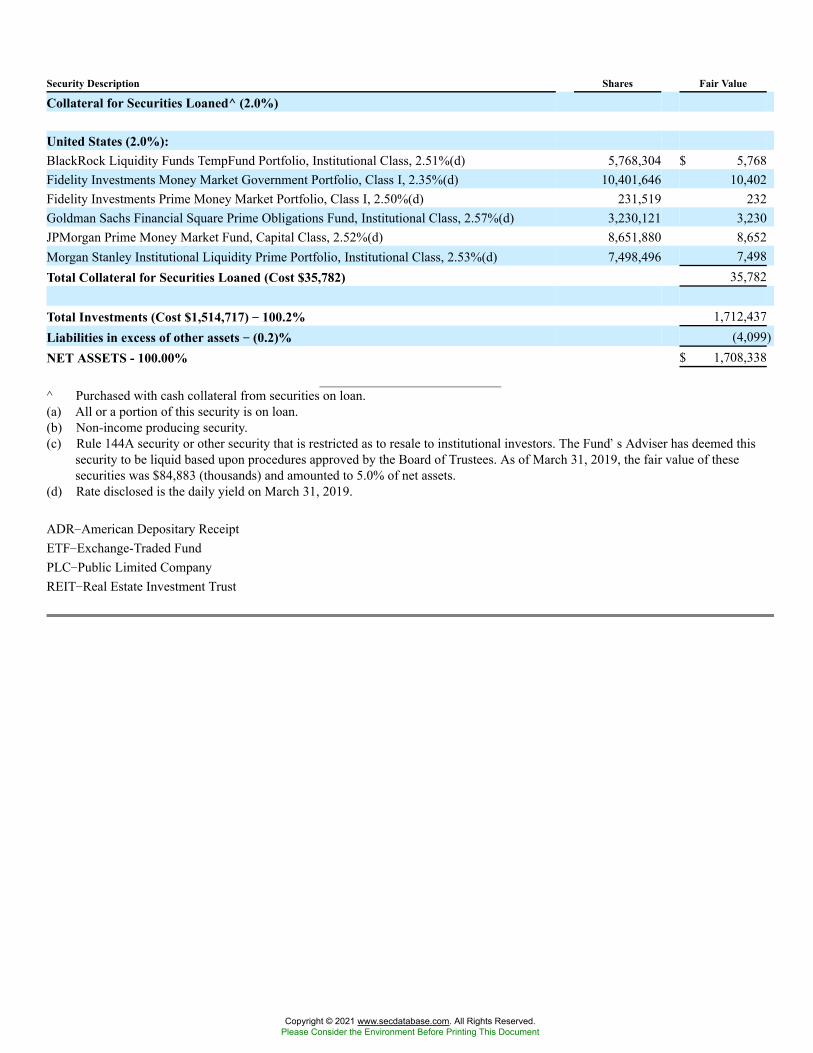
Security Description Shares Fair Value
Collateral for Securities Loaned^ (2.0%)
United States (2.0%):BlackRock Liquidity Funds TempFund Portfolio, Institutional Class, 2.51%(d) 5,768,304 $ 5,768Fidelity Investments Money Market Government Portfolio, Class I, 2.35%(d) 10,401,646 10,402Fidelity Investments Prime Money Market Portfolio, Class I, 2.50%(d) 231,519 232Goldman Sachs Financial Square Prime Obligations Fund, Institutional Class, 2.57%(d) 3,230,121 3,230JPMorgan Prime Money Market Fund, Capital Class, 2.52%(d) 8,651,880 8,652Morgan Stanley Institutional Liquidity Prime Portfolio, Institutional Class, 2.53%(d) 7,498,496 7,498Total Collateral for Securities Loaned (Cost $35,782) 35,782
Total Investments (Cost $1,514,717) �� 100.2% 1,712,437Liabilities in excess of other assets �� (0.2)% (4,099)NET ASSETS - 100.00% $ 1,708,338
^ Purchased with cash collateral from securities on loan.(a) All or a portion of this security is on loan.(b) Non-income producing security.(c) Rule 144A security or other security that is restricted as to resale to institutional investors. The Fund�s Adviser has deemed this
security to be liquid based upon procedures approved by the Board of Trustees. As of March 31, 2019, the fair value of thesesecurities was $84,883 (thousands) and amounted to 5.0% of net assets.
(d) Rate disclosed is the daily yield on March 31, 2019.
ADR�American Depositary ReceiptETF�Exchange-Traded FundPLC�Public Limited CompanyREIT�Real Estate Investment Trust
Copyright © 2021 www.secdatabase.com. All Rights Reserved.Please Consider the Environment Before Printing This Document
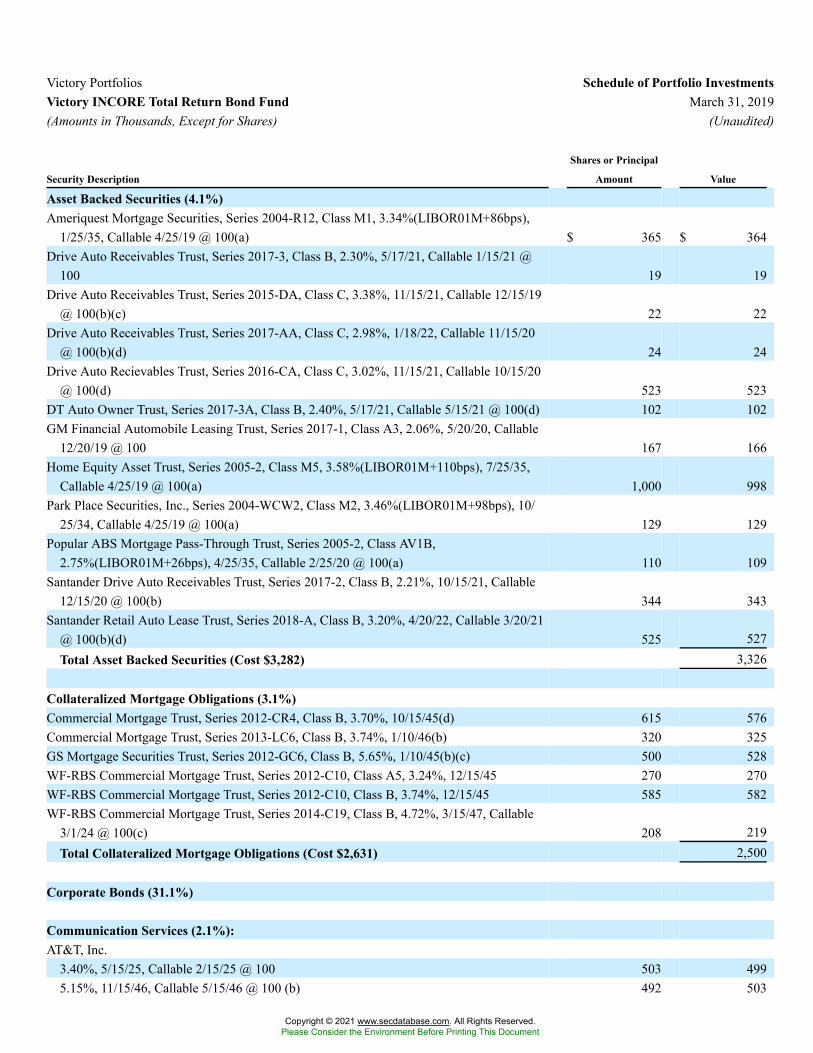
Victory Portfolios Schedule of Portfolio InvestmentsVictory INCORE Total Return Bond Fund March 31, 2019(Amounts in Thousands, Except for Shares) (Unaudited)
Security Description
Shares or Principal
Amount Value
Asset Backed Securities (4.1%)Ameriquest Mortgage Securities, Series 2004-R12, Class M1, 3.34%(LIBOR01M+86bps),
1/25/35, Callable 4/25/19 @ 100(a) $ 365 $ 364Drive Auto Receivables Trust, Series 2017-3, Class B, 2.30%, 5/17/21, Callable 1/15/21 @
100 19 19Drive Auto Receivables Trust, Series 2015-DA, Class C, 3.38%, 11/15/21, Callable 12/15/19
@ 100(b)(c) 22 22Drive Auto Receivables Trust, Series 2017-AA, Class C, 2.98%, 1/18/22, Callable 11/15/20
@ 100(b)(d) 24 24Drive Auto Recievables Trust, Series 2016-CA, Class C, 3.02%, 11/15/21, Callable 10/15/20
@ 100(d) 523 523DT Auto Owner Trust, Series 2017-3A, Class B, 2.40%, 5/17/21, Callable 5/15/21 @ 100(d) 102 102GM Financial Automobile Leasing Trust, Series 2017-1, Class A3, 2.06%, 5/20/20, Callable
12/20/19 @ 100 167 166Home Equity Asset Trust, Series 2005-2, Class M5, 3.58%(LIBOR01M+110bps), 7/25/35,
Callable 4/25/19 @ 100(a) 1,000 998Park Place Securities, Inc., Series 2004-WCW2, Class M2, 3.46%(LIBOR01M+98bps), 10/
25/34, Callable 4/25/19 @ 100(a) 129 129Popular ABS Mortgage Pass-Through Trust, Series 2005-2, Class AV1B,
2.75%(LIBOR01M+26bps), 4/25/35, Callable 2/25/20 @ 100(a) 110 109Santander Drive Auto Receivables Trust, Series 2017-2, Class B, 2.21%, 10/15/21, Callable
12/15/20 @ 100(b) 344 343Santander Retail Auto Lease Trust, Series 2018-A, Class B, 3.20%, 4/20/22, Callable 3/20/21
@ 100(b)(d) 525 527Total Asset Backed Securities (Cost $3,282) 3,326
Collateralized Mortgage Obligations (3.1%)Commercial Mortgage Trust, Series 2012-CR4, Class B, 3.70%, 10/15/45(d) 615 576Commercial Mortgage Trust, Series 2013-LC6, Class B, 3.74%, 1/10/46(b) 320 325GS Mortgage Securities Trust, Series 2012-GC6, Class B, 5.65%, 1/10/45(b)(c) 500 528WF-RBS Commercial Mortgage Trust, Series 2012-C10, Class A5, 3.24%, 12/15/45 270 270WF-RBS Commercial Mortgage Trust, Series 2012-C10, Class B, 3.74%, 12/15/45 585 582WF-RBS Commercial Mortgage Trust, Series 2014-C19, Class B, 4.72%, 3/15/47, Callable
3/1/24 @ 100(c) 208 219Total Collateralized Mortgage Obligations (Cost $2,631) 2,500
Corporate Bonds (31.1%)
Communication Services (2.1%):AT&T, Inc.
3.40%, 5/15/25, Callable 2/15/25 @ 100 503 4995.15%, 11/15/46, Callable 5/15/46 @ 100 (b) 492 503
Copyright © 2021 www.secdatabase.com. All Rights Reserved.Please Consider the Environment Before Printing This Document
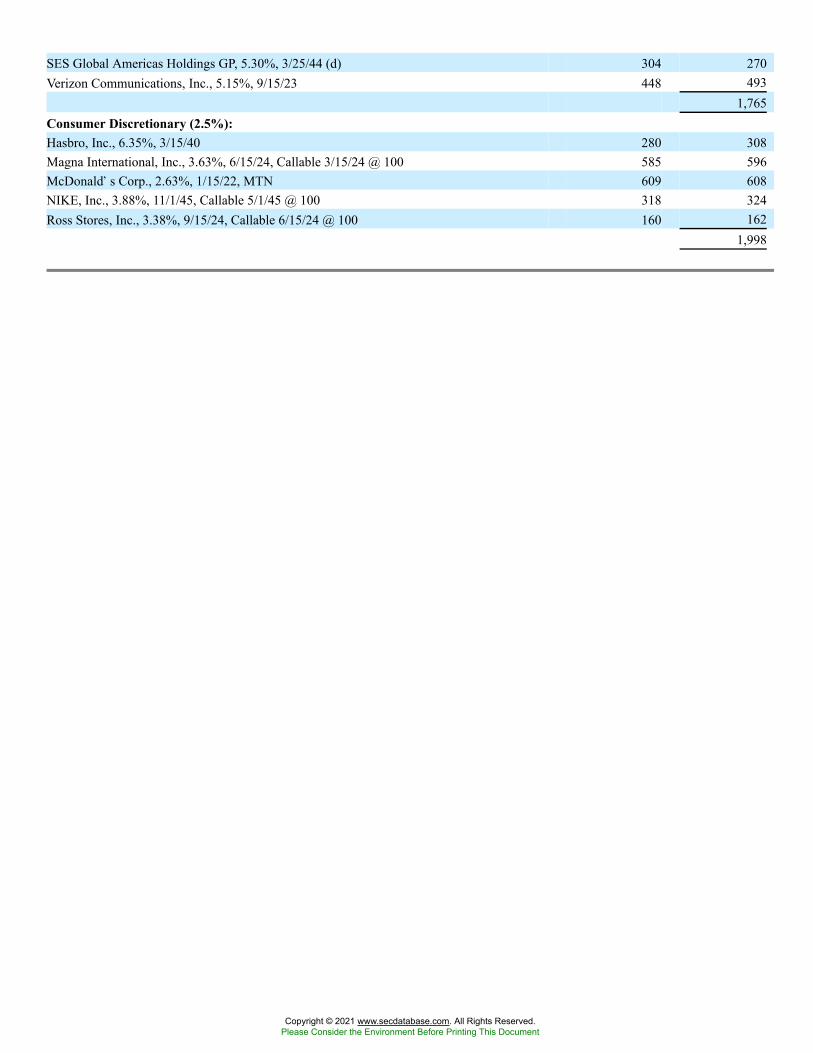
SES Global Americas Holdings GP, 5.30%, 3/25/44 (d) 304 270Verizon Communications, Inc., 5.15%, 9/15/23 448 493
1,765Consumer Discretionary (2.5%):Hasbro, Inc., 6.35%, 3/15/40 280 308Magna International, Inc., 3.63%, 6/15/24, Callable 3/15/24 @ 100 585 596McDonald�s Corp., 2.63%, 1/15/22, MTN 609 608NIKE, Inc., 3.88%, 11/1/45, Callable 5/1/45 @ 100 318 324Ross Stores, Inc., 3.38%, 9/15/24, Callable 6/15/24 @ 100 160 162
1,998
Copyright © 2021 www.secdatabase.com. All Rights Reserved.Please Consider the Environment Before Printing This Document
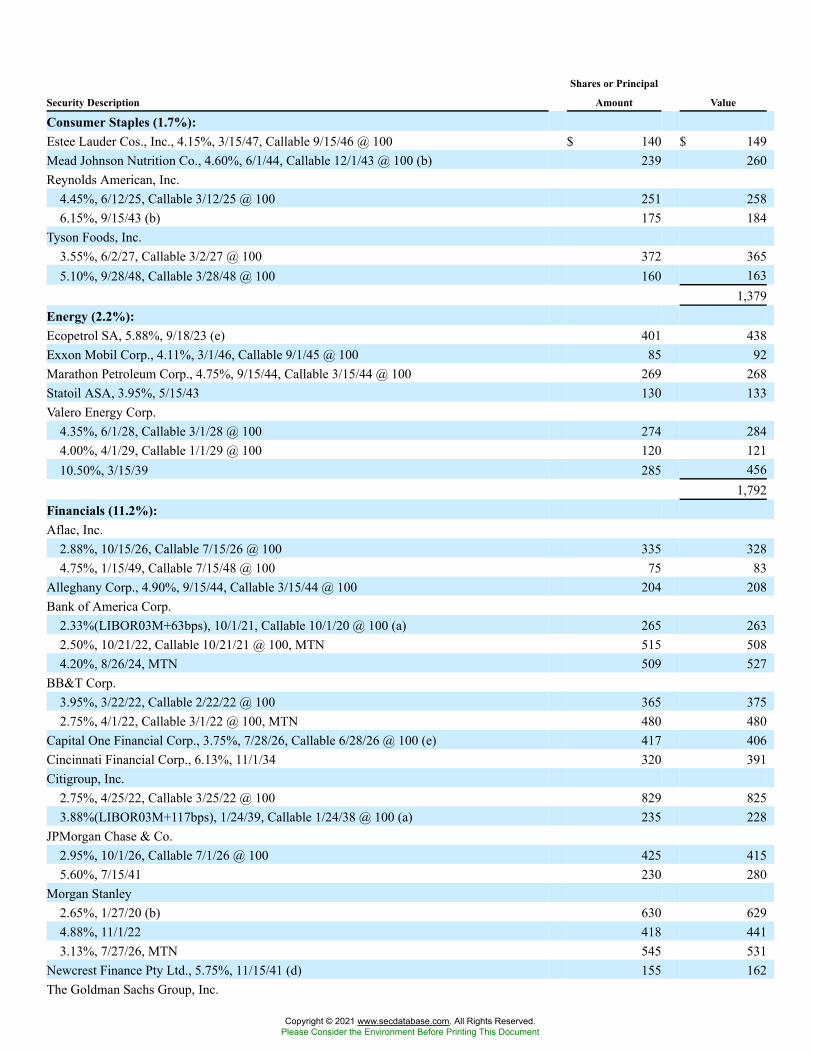
Security Description
Shares or Principal
Amount Value
Consumer Staples (1.7%):Estee Lauder Cos., Inc., 4.15%, 3/15/47, Callable 9/15/46 @ 100 $ 140 $ 149Mead Johnson Nutrition Co., 4.60%, 6/1/44, Callable 12/1/43 @ 100 (b) 239 260Reynolds American, Inc.
4.45%, 6/12/25, Callable 3/12/25 @ 100 251 2586.15%, 9/15/43 (b) 175 184
Tyson Foods, Inc.3.55%, 6/2/27, Callable 3/2/27 @ 100 372 3655.10%, 9/28/48, Callable 3/28/48 @ 100 160 163
1,379Energy (2.2%):Ecopetrol SA, 5.88%, 9/18/23 (e) 401 438Exxon Mobil Corp., 4.11%, 3/1/46, Callable 9/1/45 @ 100 85 92Marathon Petroleum Corp., 4.75%, 9/15/44, Callable 3/15/44 @ 100 269 268Statoil ASA, 3.95%, 5/15/43 130 133Valero Energy Corp.
4.35%, 6/1/28, Callable 3/1/28 @ 100 274 2844.00%, 4/1/29, Callable 1/1/29 @ 100 120 12110.50%, 3/15/39 285 456
1,792Financials (11.2%):Aflac, Inc.
2.88%, 10/15/26, Callable 7/15/26 @ 100 335 3284.75%, 1/15/49, Callable 7/15/48 @ 100 75 83
Alleghany Corp., 4.90%, 9/15/44, Callable 3/15/44 @ 100 204 208Bank of America Corp.
2.33%(LIBOR03M+63bps), 10/1/21, Callable 10/1/20 @ 100 (a) 265 2632.50%, 10/21/22, Callable 10/21/21 @ 100, MTN 515 5084.20%, 8/26/24, MTN 509 527
BB&T Corp.3.95%, 3/22/22, Callable 2/22/22 @ 100 365 3752.75%, 4/1/22, Callable 3/1/22 @ 100, MTN 480 480
Capital One Financial Corp., 3.75%, 7/28/26, Callable 6/28/26 @ 100 (e) 417 406Cincinnati Financial Corp., 6.13%, 11/1/34 320 391Citigroup, Inc.
2.75%, 4/25/22, Callable 3/25/22 @ 100 829 8253.88%(LIBOR03M+117bps), 1/24/39, Callable 1/24/38 @ 100 (a) 235 228
JPMorgan Chase & Co.2.95%, 10/1/26, Callable 7/1/26 @ 100 425 4155.60%, 7/15/41 230 280
Morgan Stanley2.65%, 1/27/20 (b) 630 6294.88%, 11/1/22 418 4413.13%, 7/27/26, MTN 545 531
Newcrest Finance Pty Ltd., 5.75%, 11/15/41 (d) 155 162The Goldman Sachs Group, Inc.
Copyright © 2021 www.secdatabase.com. All Rights Reserved.Please Consider the Environment Before Printing This Document
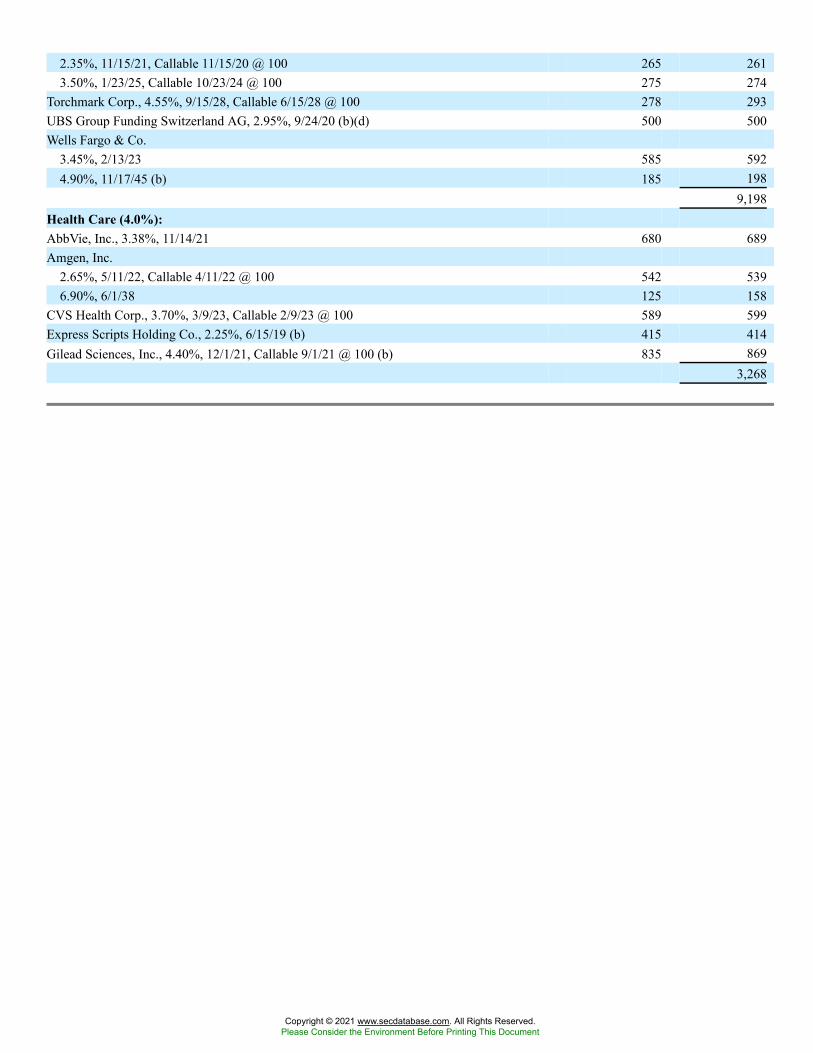
2.35%, 11/15/21, Callable 11/15/20 @ 100 265 2613.50%, 1/23/25, Callable 10/23/24 @ 100 275 274
Torchmark Corp., 4.55%, 9/15/28, Callable 6/15/28 @ 100 278 293UBS Group Funding Switzerland AG, 2.95%, 9/24/20 (b)(d) 500 500Wells Fargo & Co.
3.45%, 2/13/23 585 5924.90%, 11/17/45 (b) 185 198
9,198Health Care (4.0%):AbbVie, Inc., 3.38%, 11/14/21 680 689Amgen, Inc.
2.65%, 5/11/22, Callable 4/11/22 @ 100 542 5396.90%, 6/1/38 125 158
CVS Health Corp., 3.70%, 3/9/23, Callable 2/9/23 @ 100 589 599Express Scripts Holding Co., 2.25%, 6/15/19 (b) 415 414Gilead Sciences, Inc., 4.40%, 12/1/21, Callable 9/1/21 @ 100 (b) 835 869
3,268
Copyright © 2021 www.secdatabase.com. All Rights Reserved.Please Consider the Environment Before Printing This Document
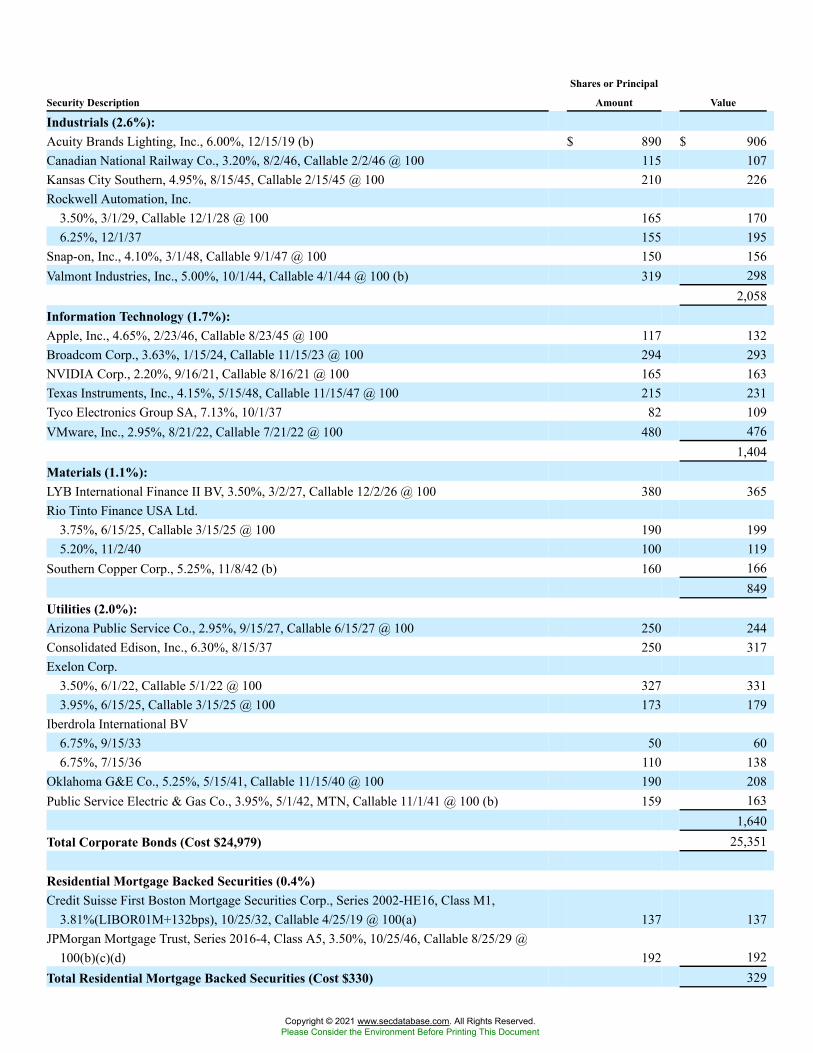
Security Description
Shares or Principal
Amount Value
Industrials (2.6%):Acuity Brands Lighting, Inc., 6.00%, 12/15/19 (b) $ 890 $ 906Canadian National Railway Co., 3.20%, 8/2/46, Callable 2/2/46 @ 100 115 107Kansas City Southern, 4.95%, 8/15/45, Callable 2/15/45 @ 100 210 226Rockwell Automation, Inc.
3.50%, 3/1/29, Callable 12/1/28 @ 100 165 1706.25%, 12/1/37 155 195
Snap-on, Inc., 4.10%, 3/1/48, Callable 9/1/47 @ 100 150 156Valmont Industries, Inc., 5.00%, 10/1/44, Callable 4/1/44 @ 100 (b) 319 298
2,058Information Technology (1.7%):Apple, Inc., 4.65%, 2/23/46, Callable 8/23/45 @ 100 117 132Broadcom Corp., 3.63%, 1/15/24, Callable 11/15/23 @ 100 294 293NVIDIA Corp., 2.20%, 9/16/21, Callable 8/16/21 @ 100 165 163Texas Instruments, Inc., 4.15%, 5/15/48, Callable 11/15/47 @ 100 215 231Tyco Electronics Group SA, 7.13%, 10/1/37 82 109VMware, Inc., 2.95%, 8/21/22, Callable 7/21/22 @ 100 480 476
1,404Materials (1.1%):LYB International Finance II BV, 3.50%, 3/2/27, Callable 12/2/26 @ 100 380 365Rio Tinto Finance USA Ltd.
3.75%, 6/15/25, Callable 3/15/25 @ 100 190 1995.20%, 11/2/40 100 119
Southern Copper Corp., 5.25%, 11/8/42 (b) 160 166849
Utilities (2.0%):Arizona Public Service Co., 2.95%, 9/15/27, Callable 6/15/27 @ 100 250 244Consolidated Edison, Inc., 6.30%, 8/15/37 250 317Exelon Corp.
3.50%, 6/1/22, Callable 5/1/22 @ 100 327 3313.95%, 6/15/25, Callable 3/15/25 @ 100 173 179
Iberdrola International BV6.75%, 9/15/33 50 606.75%, 7/15/36 110 138
Oklahoma G&E Co., 5.25%, 5/15/41, Callable 11/15/40 @ 100 190 208Public Service Electric & Gas Co., 3.95%, 5/1/42, MTN, Callable 11/1/41 @ 100 (b) 159 163
1,640Total Corporate Bonds (Cost $24,979) 25,351
Residential Mortgage Backed Securities (0.4%)Credit Suisse First Boston Mortgage Securities Corp., Series 2002-HE16, Class M1,
3.81%(LIBOR01M+132bps), 10/25/32, Callable 4/25/19 @ 100(a) 137 137JPMorgan Mortgage Trust, Series 2016-4, Class A5, 3.50%, 10/25/46, Callable 8/25/29 @
100(b)(c)(d) 192 192Total Residential Mortgage Backed Securities (Cost $330) 329
Copyright © 2021 www.secdatabase.com. All Rights Reserved.Please Consider the Environment Before Printing This Document
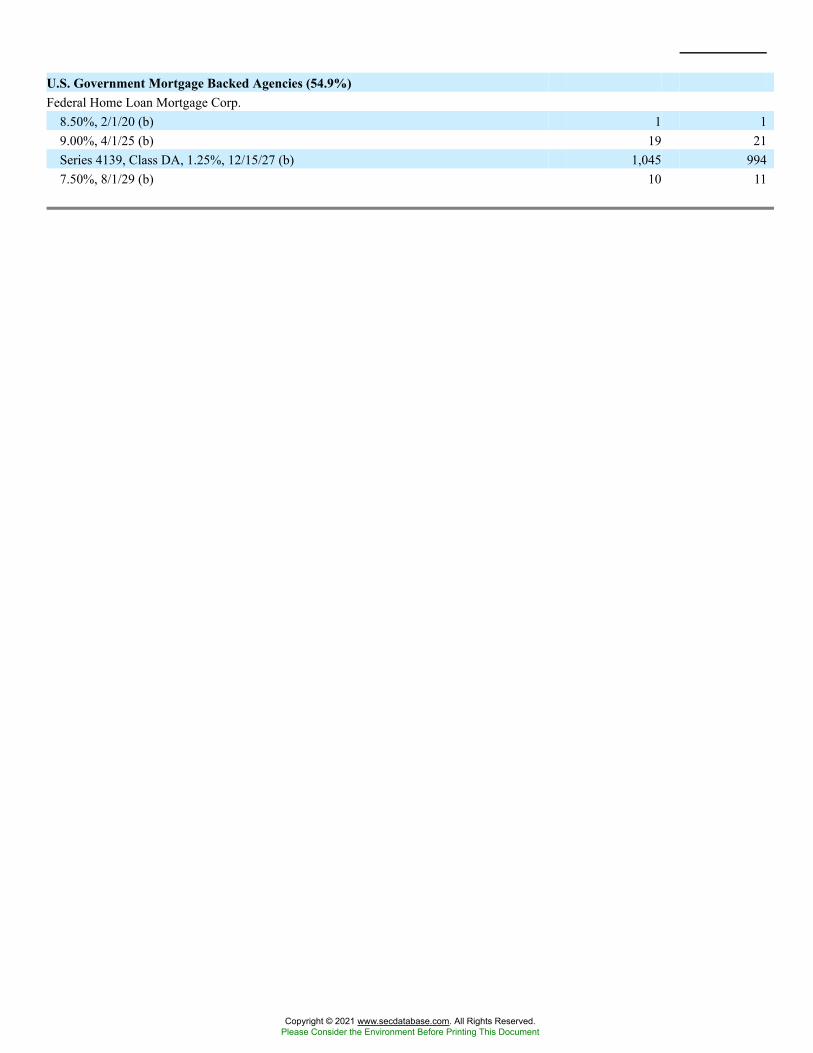
U.S. Government Mortgage Backed Agencies (54.9%)Federal Home Loan Mortgage Corp.
8.50%, 2/1/20 (b) 1 19.00%, 4/1/25 (b) 19 21Series 4139, Class DA, 1.25%, 12/15/27 (b) 1,045 9947.50%, 8/1/29 (b) 10 11
Copyright © 2021 www.secdatabase.com. All Rights Reserved.Please Consider the Environment Before Printing This Document
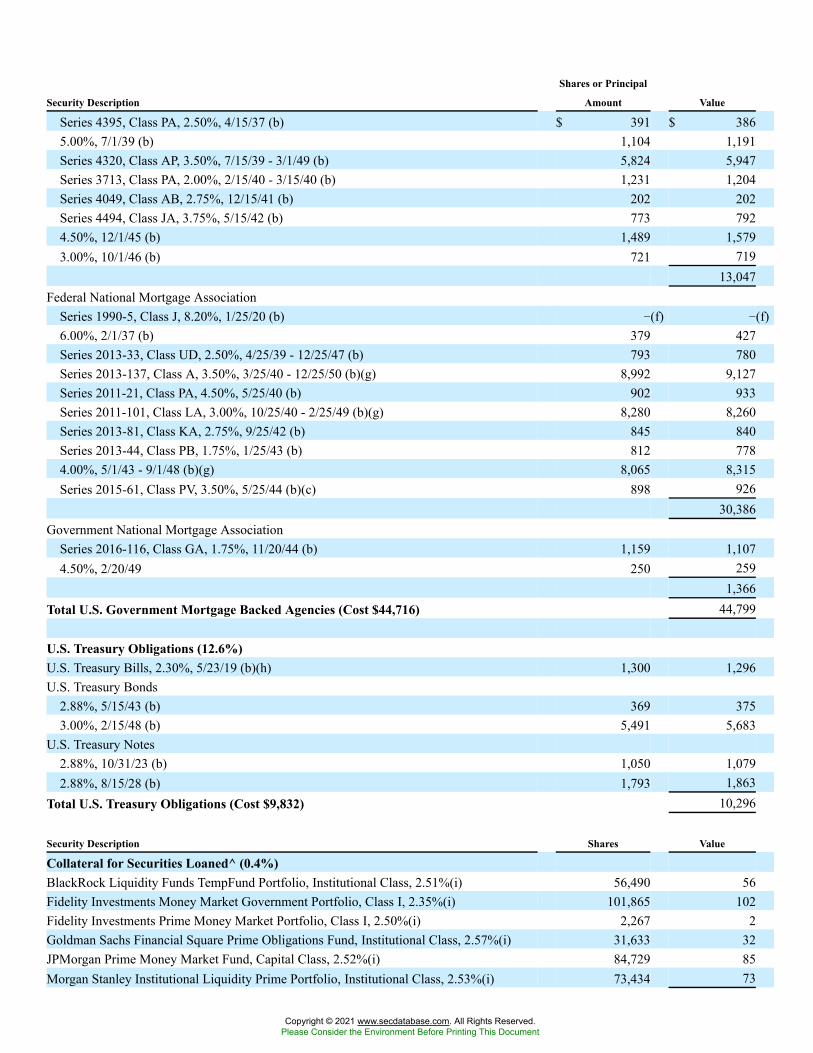
Security Description
Shares or Principal
Amount Value
Series 4395, Class PA, 2.50%, 4/15/37 (b) $ 391 $ 3865.00%, 7/1/39 (b) 1,104 1,191Series 4320, Class AP, 3.50%, 7/15/39 - 3/1/49 (b) 5,824 5,947Series 3713, Class PA, 2.00%, 2/15/40 - 3/15/40 (b) 1,231 1,204Series 4049, Class AB, 2.75%, 12/15/41 (b) 202 202Series 4494, Class JA, 3.75%, 5/15/42 (b) 773 7924.50%, 12/1/45 (b) 1,489 1,5793.00%, 10/1/46 (b) 721 719
13,047Federal National Mortgage Association
Series 1990-5, Class J, 8.20%, 1/25/20 (b) �(f) �(f)6.00%, 2/1/37 (b) 379 427Series 2013-33, Class UD, 2.50%, 4/25/39 - 12/25/47 (b) 793 780Series 2013-137, Class A, 3.50%, 3/25/40 - 12/25/50 (b)(g) 8,992 9,127Series 2011-21, Class PA, 4.50%, 5/25/40 (b) 902 933Series 2011-101, Class LA, 3.00%, 10/25/40 - 2/25/49 (b)(g) 8,280 8,260Series 2013-81, Class KA, 2.75%, 9/25/42 (b) 845 840Series 2013-44, Class PB, 1.75%, 1/25/43 (b) 812 7784.00%, 5/1/43 - 9/1/48 (b)(g) 8,065 8,315Series 2015-61, Class PV, 3.50%, 5/25/44 (b)(c) 898 926
30,386Government National Mortgage Association
Series 2016-116, Class GA, 1.75%, 11/20/44 (b) 1,159 1,1074.50%, 2/20/49 250 259
1,366Total U.S. Government Mortgage Backed Agencies (Cost $44,716) 44,799
U.S. Treasury Obligations (12.6%)U.S. Treasury Bills, 2.30%, 5/23/19 (b)(h) 1,300 1,296U.S. Treasury Bonds
2.88%, 5/15/43 (b) 369 3753.00%, 2/15/48 (b) 5,491 5,683
U.S. Treasury Notes2.88%, 10/31/23 (b) 1,050 1,0792.88%, 8/15/28 (b) 1,793 1,863
Total U.S. Treasury Obligations (Cost $9,832) 10,296
Security Description Shares Value
Collateral for Securities Loaned^ (0.4%)BlackRock Liquidity Funds TempFund Portfolio, Institutional Class, 2.51%(i) 56,490 56Fidelity Investments Money Market Government Portfolio, Class I, 2.35%(i) 101,865 102Fidelity Investments Prime Money Market Portfolio, Class I, 2.50%(i) 2,267 2Goldman Sachs Financial Square Prime Obligations Fund, Institutional Class, 2.57%(i) 31,633 32JPMorgan Prime Money Market Fund, Capital Class, 2.52%(i) 84,729 85Morgan Stanley Institutional Liquidity Prime Portfolio, Institutional Class, 2.53%(i) 73,434 73
Copyright © 2021 www.secdatabase.com. All Rights Reserved.Please Consider the Environment Before Printing This Document
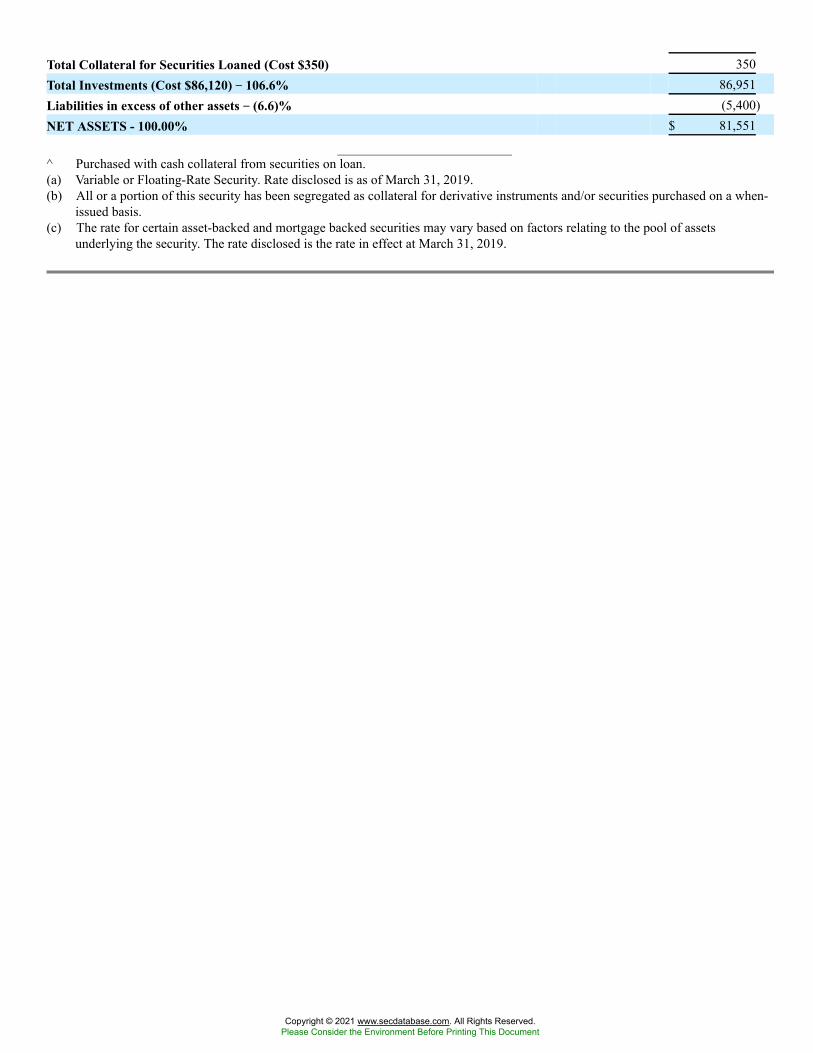
Total Collateral for Securities Loaned (Cost $350) 350Total Investments (Cost $86,120) �� 106.6% 86,951Liabilities in excess of other assets �� (6.6)% (5,400)NET ASSETS - 100.00% $ 81,551
^ Purchased with cash collateral from securities on loan.(a) Variable or Floating-Rate Security. Rate disclosed is as of March 31, 2019.(b) All or a portion of this security has been segregated as collateral for derivative instruments and/or securities purchased on a when-
issued basis.(c) The rate for certain asset-backed and mortgage backed securities may vary based on factors relating to the pool of assets
underlying the security. The rate disclosed is the rate in effect at March 31, 2019.
Copyright © 2021 www.secdatabase.com. All Rights Reserved.Please Consider the Environment Before Printing This Document
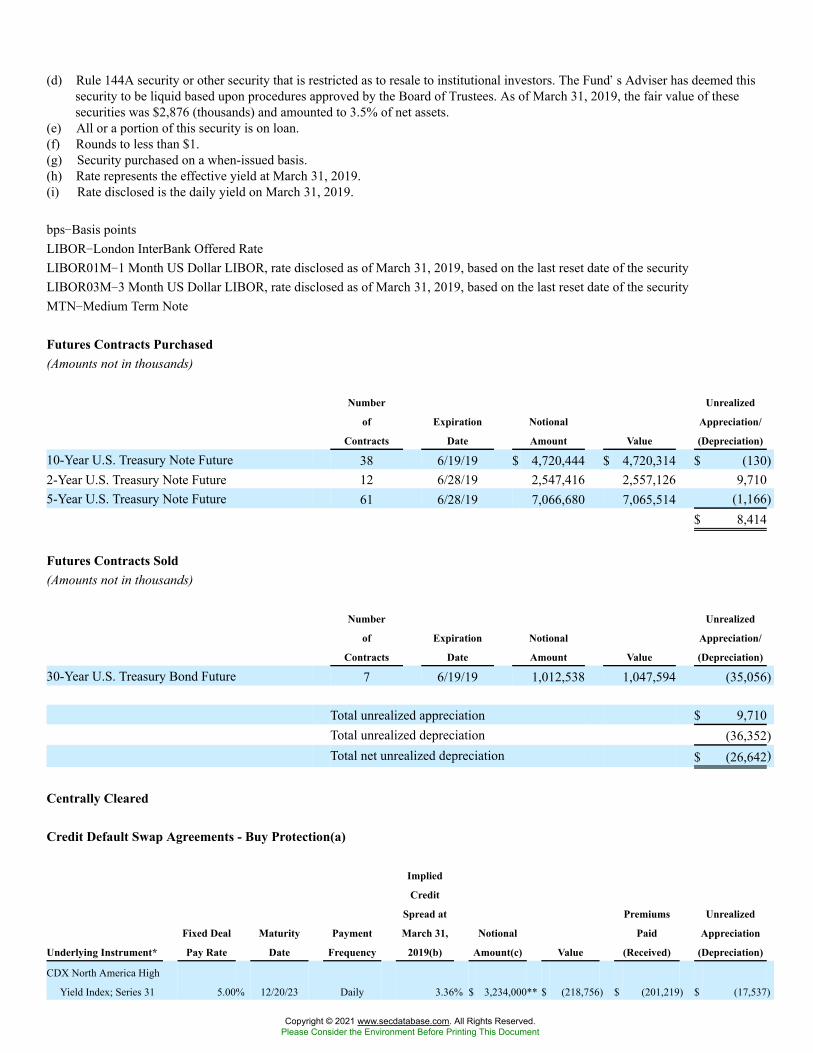
(d) Rule 144A security or other security that is restricted as to resale to institutional investors. The Fund�s Adviser has deemed thissecurity to be liquid based upon procedures approved by the Board of Trustees. As of March 31, 2019, the fair value of thesesecurities was $2,876 (thousands) and amounted to 3.5% of net assets.
(e) All or a portion of this security is on loan.(f) Rounds to less than $1.(g) Security purchased on a when-issued basis.(h) Rate represents the effective yield at March 31, 2019.(i) Rate disclosed is the daily yield on March 31, 2019.
bps�Basis pointsLIBOR�London InterBank Offered RateLIBOR01M�1 Month US Dollar LIBOR, rate disclosed as of March 31, 2019, based on the last reset date of the securityLIBOR03M�3 Month US Dollar LIBOR, rate disclosed as of March 31, 2019, based on the last reset date of the securityMTN�Medium Term Note
Futures Contracts Purchased(Amounts not in thousands)
Number
of
Contracts
Expiration
Date
Notional
Amount Value
Unrealized
Appreciation/
(Depreciation)
10-Year U.S. Treasury Note Future 38 6/19/19 $ 4,720,444 $ 4,720,314 $ (130)2-Year U.S. Treasury Note Future 12 6/28/19 2,547,416 2,557,126 9,7105-Year U.S. Treasury Note Future 61 6/28/19 7,066,680 7,065,514 (1,166)
$ 8,414
Futures Contracts Sold(Amounts not in thousands)
Number
of
Contracts
Expiration
Date
Notional
Amount Value
Unrealized
Appreciation/
(Depreciation)
30-Year U.S. Treasury Bond Future 7 6/19/19 1,012,538 1,047,594 (35,056)
Total unrealized appreciation $ 9,710Total unrealized depreciation (36,352)Total net unrealized depreciation $ (26,642)
Centrally Cleared
Credit Default Swap Agreements - Buy Protection(a)
Underlying Instrument*
Fixed Deal
Pay Rate
Maturity
Date
Payment
Frequency
Implied
Credit
Spread at
March 31,
2019(b)
Notional
Amount(c) Value
Premiums
Paid
(Received)
Unrealized
Appreciation
(Depreciation)
CDX North America High
Yield Index; Series 31 5.00% 12/20/23 Daily 3.36% $ 3,234,000** $ (218,756) $ (201,219) $ (17,537)
Copyright © 2021 www.secdatabase.com. All Rights Reserved.Please Consider the Environment Before Printing This Document
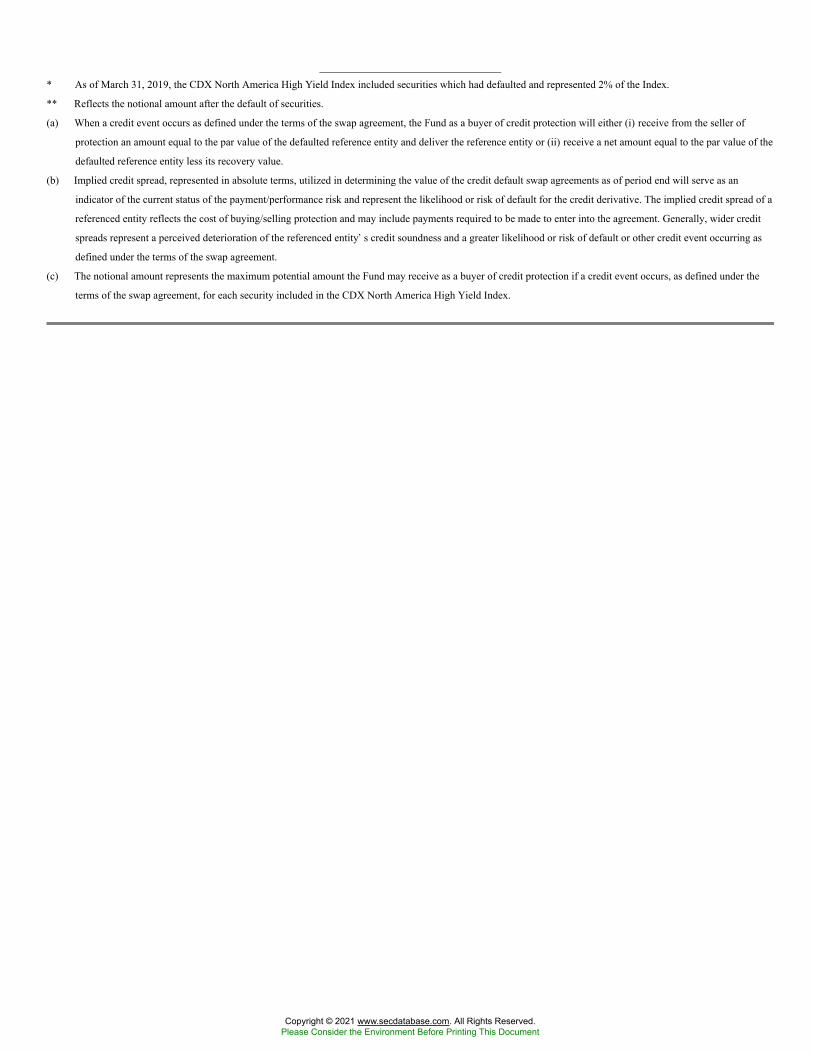
* As of March 31, 2019, the CDX North America High Yield Index included securities which had defaulted and represented 2% of the Index.
** Reflects the notional amount after the default of securities.
(a) When a credit event occurs as defined under the terms of the swap agreement, the Fund as a buyer of credit protection will either (i) receive from the seller of
protection an amount equal to the par value of the defaulted reference entity and deliver the reference entity or (ii) receive a net amount equal to the par value of the
defaulted reference entity less its recovery value.
(b) Implied credit spread, represented in absolute terms, utilized in determining the value of the credit default swap agreements as of period end will serve as an
indicator of the current status of the payment/performance risk and represent the likelihood or risk of default for the credit derivative. The implied credit spread of a
referenced entity reflects the cost of buying/selling protection and may include payments required to be made to enter into the agreement. Generally, wider credit
spreads represent a perceived deterioration of the referenced entity�s credit soundness and a greater likelihood or risk of default or other credit event occurring as
defined under the terms of the swap agreement.
(c) The notional amount represents the maximum potential amount the Fund may receive as a buyer of credit protection if a credit event occurs, as defined under the
terms of the swap agreement, for each security included in the CDX North America High Yield Index.
Copyright © 2021 www.secdatabase.com. All Rights Reserved.Please Consider the Environment Before Printing This Document
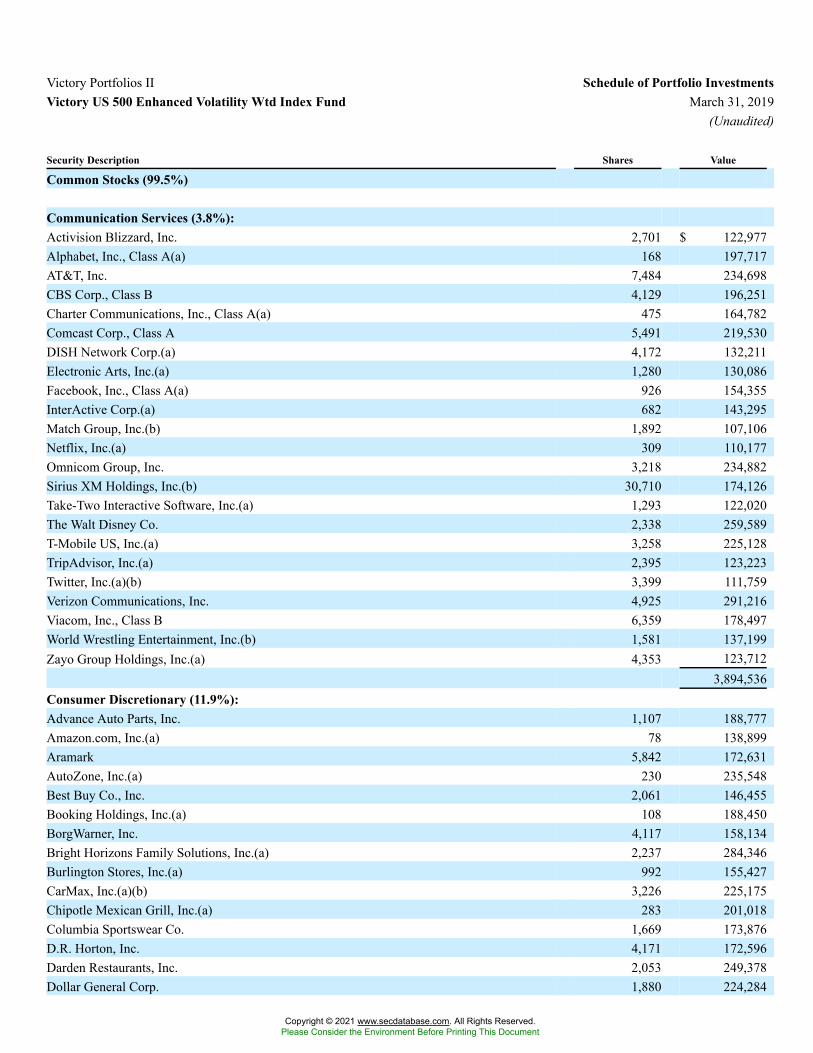
Victory Portfolios II Schedule of Portfolio InvestmentsVictory US 500 Enhanced Volatility Wtd Index Fund March 31, 2019
(Unaudited)
Security Description Shares Value
Common Stocks (99.5%)
Communication Services (3.8%):Activision Blizzard, Inc. 2,701 $ 122,977Alphabet, Inc., Class A(a) 168 197,717AT&T, Inc. 7,484 234,698CBS Corp., Class B 4,129 196,251Charter Communications, Inc., Class A(a) 475 164,782Comcast Corp., Class A 5,491 219,530DISH Network Corp.(a) 4,172 132,211Electronic Arts, Inc.(a) 1,280 130,086Facebook, Inc., Class A(a) 926 154,355InterActive Corp.(a) 682 143,295Match Group, Inc.(b) 1,892 107,106Netflix, Inc.(a) 309 110,177Omnicom Group, Inc. 3,218 234,882Sirius XM Holdings, Inc.(b) 30,710 174,126Take-Two Interactive Software, Inc.(a) 1,293 122,020The Walt Disney Co. 2,338 259,589T-Mobile US, Inc.(a) 3,258 225,128TripAdvisor, Inc.(a) 2,395 123,223Twitter, Inc.(a)(b) 3,399 111,759Verizon Communications, Inc. 4,925 291,216Viacom, Inc., Class B 6,359 178,497World Wrestling Entertainment, Inc.(b) 1,581 137,199Zayo Group Holdings, Inc.(a) 4,353 123,712
3,894,536Consumer Discretionary (11.9%):Advance Auto Parts, Inc. 1,107 188,777Amazon.com, Inc.(a) 78 138,899Aramark 5,842 172,631AutoZone, Inc.(a) 230 235,548Best Buy Co., Inc. 2,061 146,455Booking Holdings, Inc.(a) 108 188,450BorgWarner, Inc. 4,117 158,134Bright Horizons Family Solutions, Inc.(a) 2,237 284,346Burlington Stores, Inc.(a) 992 155,427CarMax, Inc.(a)(b) 3,226 225,175Chipotle Mexican Grill, Inc.(a) 283 201,018Columbia Sportswear Co. 1,669 173,876D.R. Horton, Inc. 4,171 172,596Darden Restaurants, Inc. 2,053 249,378Dollar General Corp. 1,880 224,284
Copyright © 2021 www.secdatabase.com. All Rights Reserved.Please Consider the Environment Before Printing This Document
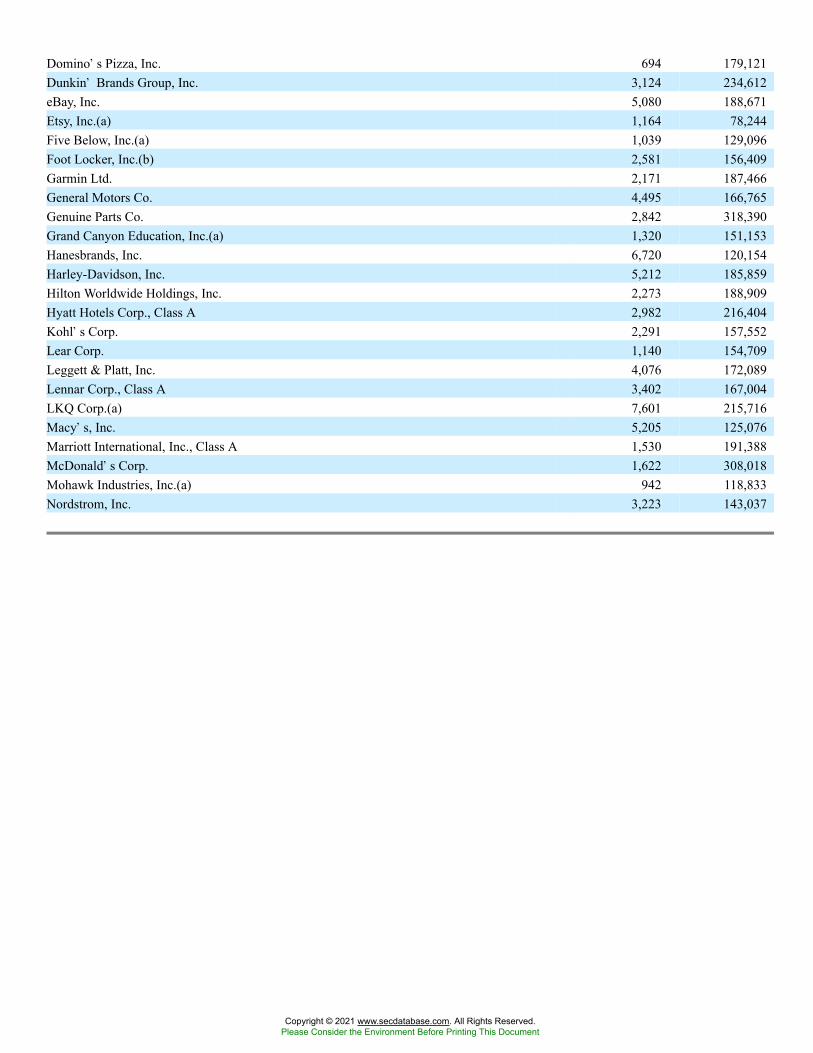
Domino�s Pizza, Inc. 694 179,121Dunkin� Brands Group, Inc. 3,124 234,612eBay, Inc. 5,080 188,671Etsy, Inc.(a) 1,164 78,244Five Below, Inc.(a) 1,039 129,096Foot Locker, Inc.(b) 2,581 156,409Garmin Ltd. 2,171 187,466General Motors Co. 4,495 166,765Genuine Parts Co. 2,842 318,390Grand Canyon Education, Inc.(a) 1,320 151,153Hanesbrands, Inc. 6,720 120,154Harley-Davidson, Inc. 5,212 185,859Hilton Worldwide Holdings, Inc. 2,273 188,909Hyatt Hotels Corp., Class A 2,982 216,404Kohl�s Corp. 2,291 157,552Lear Corp. 1,140 154,709Leggett & Platt, Inc. 4,076 172,089Lennar Corp., Class A 3,402 167,004LKQ Corp.(a) 7,601 215,716Macy�s, Inc. 5,205 125,076Marriott International, Inc., Class A 1,530 191,388McDonald�s Corp. 1,622 308,018Mohawk Industries, Inc.(a) 942 118,833Nordstrom, Inc. 3,223 143,037
Copyright © 2021 www.secdatabase.com. All Rights Reserved.Please Consider the Environment Before Printing This Document
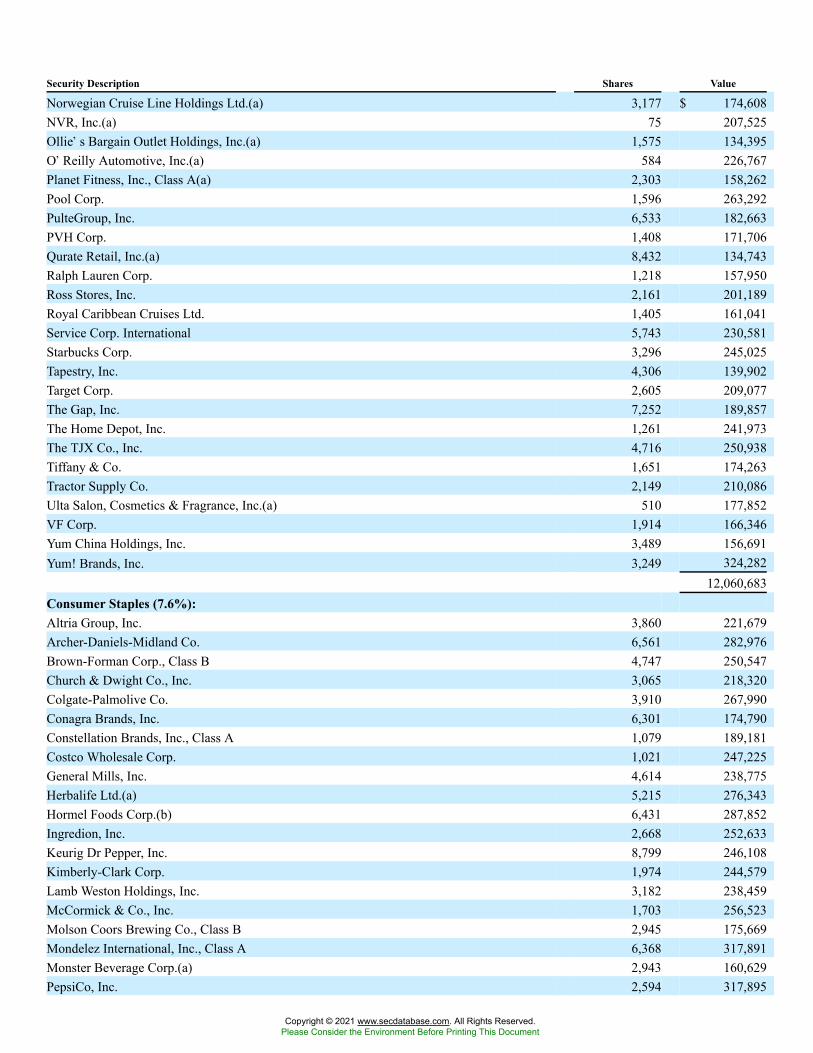
Security Description Shares Value
Norwegian Cruise Line Holdings Ltd.(a) 3,177 $ 174,608NVR, Inc.(a) 75 207,525Ollie�s Bargain Outlet Holdings, Inc.(a) 1,575 134,395O�Reilly Automotive, Inc.(a) 584 226,767Planet Fitness, Inc., Class A(a) 2,303 158,262Pool Corp. 1,596 263,292PulteGroup, Inc. 6,533 182,663PVH Corp. 1,408 171,706Qurate Retail, Inc.(a) 8,432 134,743Ralph Lauren Corp. 1,218 157,950Ross Stores, Inc. 2,161 201,189Royal Caribbean Cruises Ltd. 1,405 161,041Service Corp. International 5,743 230,581Starbucks Corp. 3,296 245,025Tapestry, Inc. 4,306 139,902Target Corp. 2,605 209,077The Gap, Inc. 7,252 189,857The Home Depot, Inc. 1,261 241,973The TJX Co., Inc. 4,716 250,938Tiffany & Co. 1,651 174,263Tractor Supply Co. 2,149 210,086Ulta Salon, Cosmetics & Fragrance, Inc.(a) 510 177,852VF Corp. 1,914 166,346Yum China Holdings, Inc. 3,489 156,691Yum! Brands, Inc. 3,249 324,282
12,060,683Consumer Staples (7.6%):Altria Group, Inc. 3,860 221,679Archer-Daniels-Midland Co. 6,561 282,976Brown-Forman Corp., Class B 4,747 250,547Church & Dwight Co., Inc. 3,065 218,320Colgate-Palmolive Co. 3,910 267,990Conagra Brands, Inc. 6,301 174,790Constellation Brands, Inc., Class A 1,079 189,181Costco Wholesale Corp. 1,021 247,225General Mills, Inc. 4,614 238,775Herbalife Ltd.(a) 5,215 276,343Hormel Foods Corp.(b) 6,431 287,852Ingredion, Inc. 2,668 252,633Keurig Dr Pepper, Inc. 8,799 246,108Kimberly-Clark Corp. 1,974 244,579Lamb Weston Holdings, Inc. 3,182 238,459McCormick & Co., Inc. 1,703 256,523Molson Coors Brewing Co., Class B 2,945 175,669Mondelez International, Inc., Class A 6,368 317,891Monster Beverage Corp.(a) 2,943 160,629PepsiCo, Inc. 2,594 317,895
Copyright © 2021 www.secdatabase.com. All Rights Reserved.Please Consider the Environment Before Printing This Document
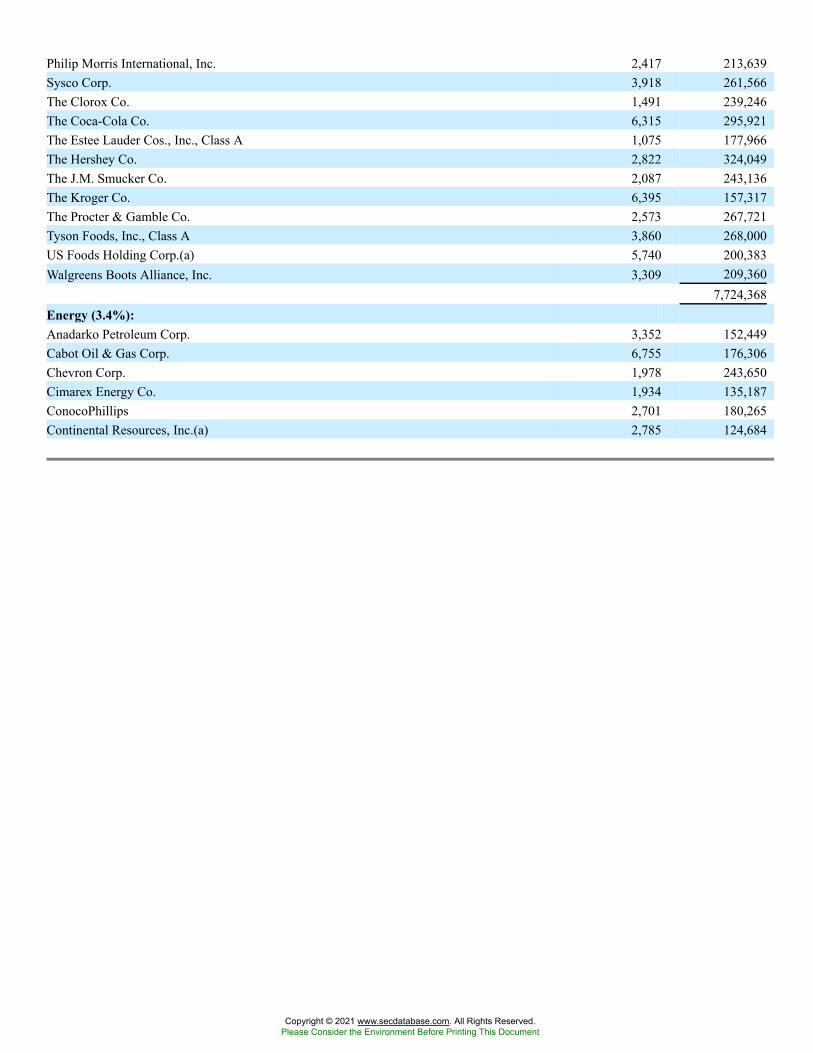
Philip Morris International, Inc. 2,417 213,639Sysco Corp. 3,918 261,566The Clorox Co. 1,491 239,246The Coca-Cola Co. 6,315 295,921The Estee Lauder Cos., Inc., Class A 1,075 177,966The Hershey Co. 2,822 324,049The J.M. Smucker Co. 2,087 243,136The Kroger Co. 6,395 157,317The Procter & Gamble Co. 2,573 267,721Tyson Foods, Inc., Class A 3,860 268,000US Foods Holding Corp.(a) 5,740 200,383Walgreens Boots Alliance, Inc. 3,309 209,360
7,724,368Energy (3.4%):Anadarko Petroleum Corp. 3,352 152,449Cabot Oil & Gas Corp. 6,755 176,306Chevron Corp. 1,978 243,650Cimarex Energy Co. 1,934 135,187ConocoPhillips 2,701 180,265Continental Resources, Inc.(a) 2,785 124,684
Copyright © 2021 www.secdatabase.com. All Rights Reserved.Please Consider the Environment Before Printing This Document
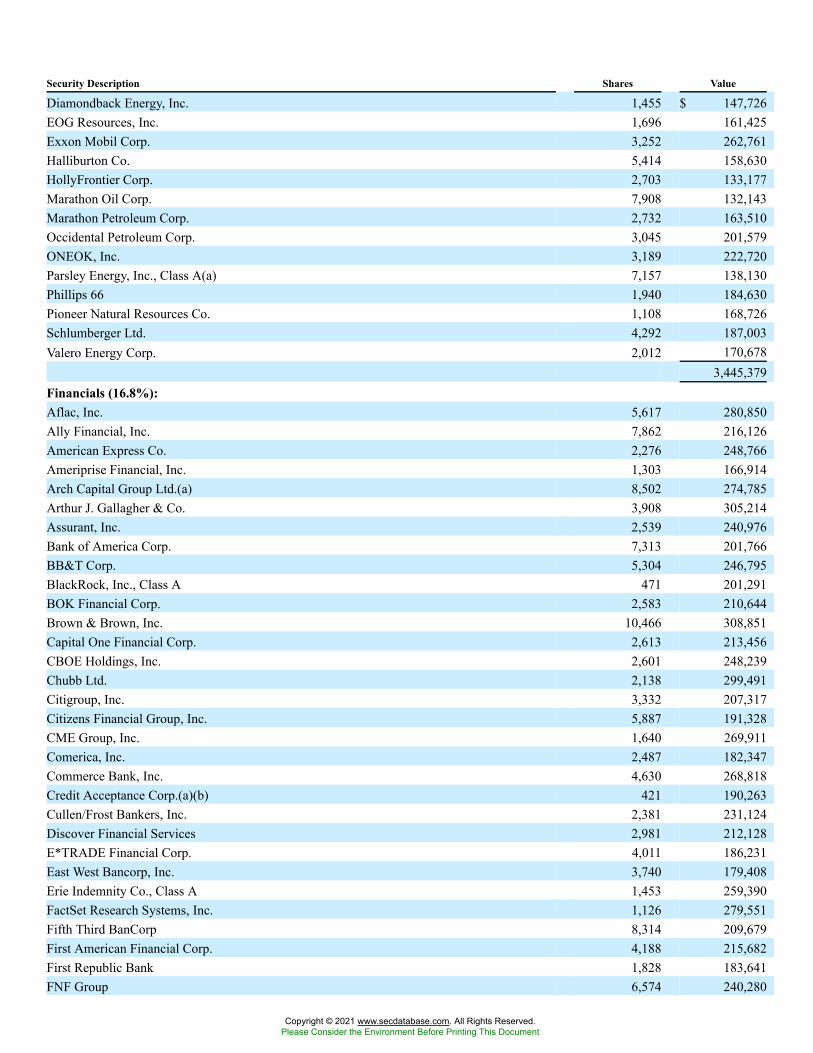
Security Description Shares Value
Diamondback Energy, Inc. 1,455 $ 147,726EOG Resources, Inc. 1,696 161,425Exxon Mobil Corp. 3,252 262,761Halliburton Co. 5,414 158,630HollyFrontier Corp. 2,703 133,177Marathon Oil Corp. 7,908 132,143Marathon Petroleum Corp. 2,732 163,510Occidental Petroleum Corp. 3,045 201,579ONEOK, Inc. 3,189 222,720Parsley Energy, Inc., Class A(a) 7,157 138,130Phillips 66 1,940 184,630Pioneer Natural Resources Co. 1,108 168,726Schlumberger Ltd. 4,292 187,003Valero Energy Corp. 2,012 170,678
3,445,379Financials (16.8%):Aflac, Inc. 5,617 280,850Ally Financial, Inc. 7,862 216,126American Express Co. 2,276 248,766Ameriprise Financial, Inc. 1,303 166,914Arch Capital Group Ltd.(a) 8,502 274,785Arthur J. Gallagher & Co. 3,908 305,214Assurant, Inc. 2,539 240,976Bank of America Corp. 7,313 201,766BB&T Corp. 5,304 246,795BlackRock, Inc., Class A 471 201,291BOK Financial Corp. 2,583 210,644Brown & Brown, Inc. 10,466 308,851Capital One Financial Corp. 2,613 213,456CBOE Holdings, Inc. 2,601 248,239Chubb Ltd. 2,138 299,491Citigroup, Inc. 3,332 207,317Citizens Financial Group, Inc. 5,887 191,328CME Group, Inc. 1,640 269,911Comerica, Inc. 2,487 182,347Commerce Bank, Inc. 4,630 268,818Credit Acceptance Corp.(a)(b) 421 190,263Cullen/Frost Bankers, Inc. 2,381 231,124Discover Financial Services 2,981 212,128E*TRADE Financial Corp. 4,011 186,231East West Bancorp, Inc. 3,740 179,408Erie Indemnity Co., Class A 1,453 259,390FactSet Research Systems, Inc. 1,126 279,551Fifth Third BanCorp 8,314 209,679First American Financial Corp. 4,188 215,682First Republic Bank 1,828 183,641FNF Group 6,574 240,280
Copyright © 2021 www.secdatabase.com. All Rights Reserved.Please Consider the Environment Before Printing This Document
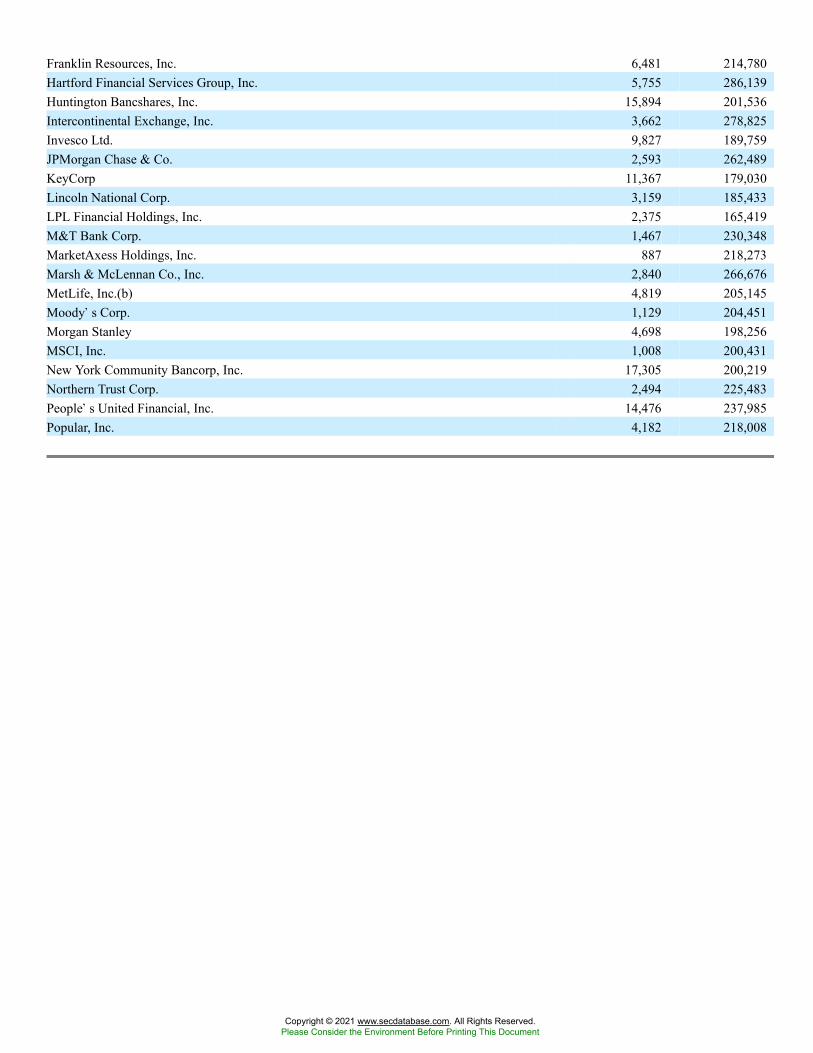
Franklin Resources, Inc. 6,481 214,780Hartford Financial Services Group, Inc. 5,755 286,139Huntington Bancshares, Inc. 15,894 201,536Intercontinental Exchange, Inc. 3,662 278,825Invesco Ltd. 9,827 189,759JPMorgan Chase & Co. 2,593 262,489KeyCorp 11,367 179,030Lincoln National Corp. 3,159 185,433LPL Financial Holdings, Inc. 2,375 165,419M&T Bank Corp. 1,467 230,348MarketAxess Holdings, Inc. 887 218,273Marsh & McLennan Co., Inc. 2,840 266,676MetLife, Inc.(b) 4,819 205,145Moody�s Corp. 1,129 204,451Morgan Stanley 4,698 198,256MSCI, Inc. 1,008 200,431New York Community Bancorp, Inc. 17,305 200,219Northern Trust Corp. 2,494 225,483People�s United Financial, Inc. 14,476 237,985Popular, Inc. 4,182 218,008
Copyright © 2021 www.secdatabase.com. All Rights Reserved.Please Consider the Environment Before Printing This Document
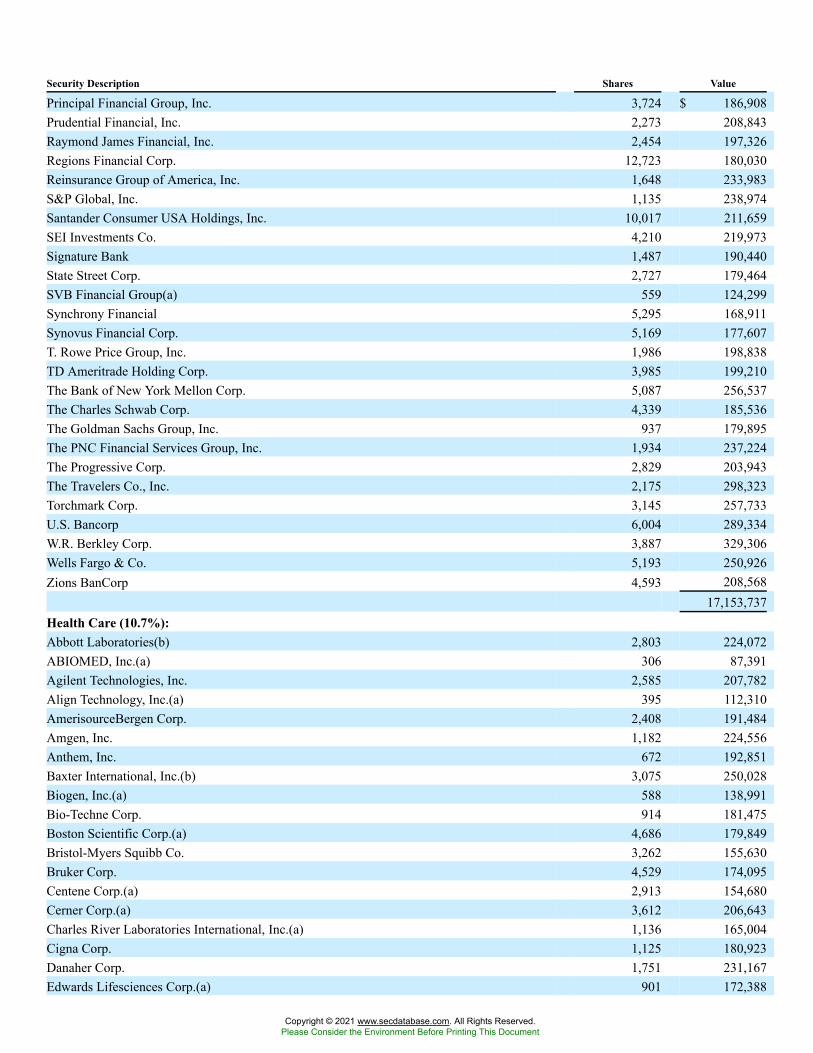
Security Description Shares Value
Principal Financial Group, Inc. 3,724 $ 186,908Prudential Financial, Inc. 2,273 208,843Raymond James Financial, Inc. 2,454 197,326Regions Financial Corp. 12,723 180,030Reinsurance Group of America, Inc. 1,648 233,983S&P Global, Inc. 1,135 238,974Santander Consumer USA Holdings, Inc. 10,017 211,659SEI Investments Co. 4,210 219,973Signature Bank 1,487 190,440State Street Corp. 2,727 179,464SVB Financial Group(a) 559 124,299Synchrony Financial 5,295 168,911Synovus Financial Corp. 5,169 177,607T. Rowe Price Group, Inc. 1,986 198,838TD Ameritrade Holding Corp. 3,985 199,210The Bank of New York Mellon Corp. 5,087 256,537The Charles Schwab Corp. 4,339 185,536The Goldman Sachs Group, Inc. 937 179,895The PNC Financial Services Group, Inc. 1,934 237,224The Progressive Corp. 2,829 203,943The Travelers Co., Inc. 2,175 298,323Torchmark Corp. 3,145 257,733U.S. Bancorp 6,004 289,334W.R. Berkley Corp. 3,887 329,306Wells Fargo & Co. 5,193 250,926Zions BanCorp 4,593 208,568
17,153,737Health Care (10.7%):Abbott Laboratories(b) 2,803 224,072ABIOMED, Inc.(a) 306 87,391Agilent Technologies, Inc. 2,585 207,782Align Technology, Inc.(a) 395 112,310AmerisourceBergen Corp. 2,408 191,484Amgen, Inc. 1,182 224,556Anthem, Inc. 672 192,851Baxter International, Inc.(b) 3,075 250,028Biogen, Inc.(a) 588 138,991Bio-Techne Corp. 914 181,475Boston Scientific Corp.(a) 4,686 179,849Bristol-Myers Squibb Co. 3,262 155,630Bruker Corp. 4,529 174,095Centene Corp.(a) 2,913 154,680Cerner Corp.(a) 3,612 206,643Charles River Laboratories International, Inc.(a) 1,136 165,004Cigna Corp. 1,125 180,923Danaher Corp. 1,751 231,167Edwards Lifesciences Corp.(a) 901 172,388
Copyright © 2021 www.secdatabase.com. All Rights Reserved.Please Consider the Environment Before Printing This Document
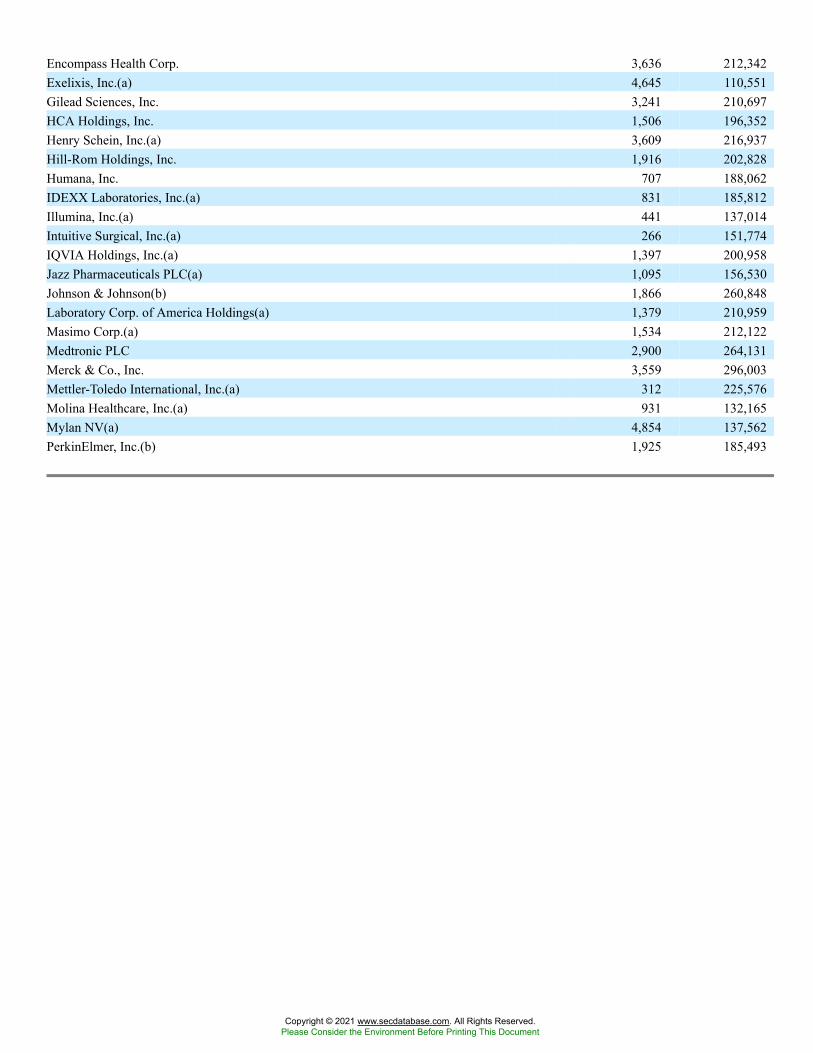
Encompass Health Corp. 3,636 212,342Exelixis, Inc.(a) 4,645 110,551Gilead Sciences, Inc. 3,241 210,697HCA Holdings, Inc. 1,506 196,352Henry Schein, Inc.(a) 3,609 216,937Hill-Rom Holdings, Inc. 1,916 202,828Humana, Inc. 707 188,062IDEXX Laboratories, Inc.(a) 831 185,812Illumina, Inc.(a) 441 137,014Intuitive Surgical, Inc.(a) 266 151,774IQVIA Holdings, Inc.(a) 1,397 200,958Jazz Pharmaceuticals PLC(a) 1,095 156,530Johnson & Johnson(b) 1,866 260,848Laboratory Corp. of America Holdings(a) 1,379 210,959Masimo Corp.(a) 1,534 212,122Medtronic PLC 2,900 264,131Merck & Co., Inc. 3,559 296,003Mettler-Toledo International, Inc.(a) 312 225,576Molina Healthcare, Inc.(a) 931 132,165Mylan NV(a) 4,854 137,562PerkinElmer, Inc.(b) 1,925 185,493
Copyright © 2021 www.secdatabase.com. All Rights Reserved.Please Consider the Environment Before Printing This Document
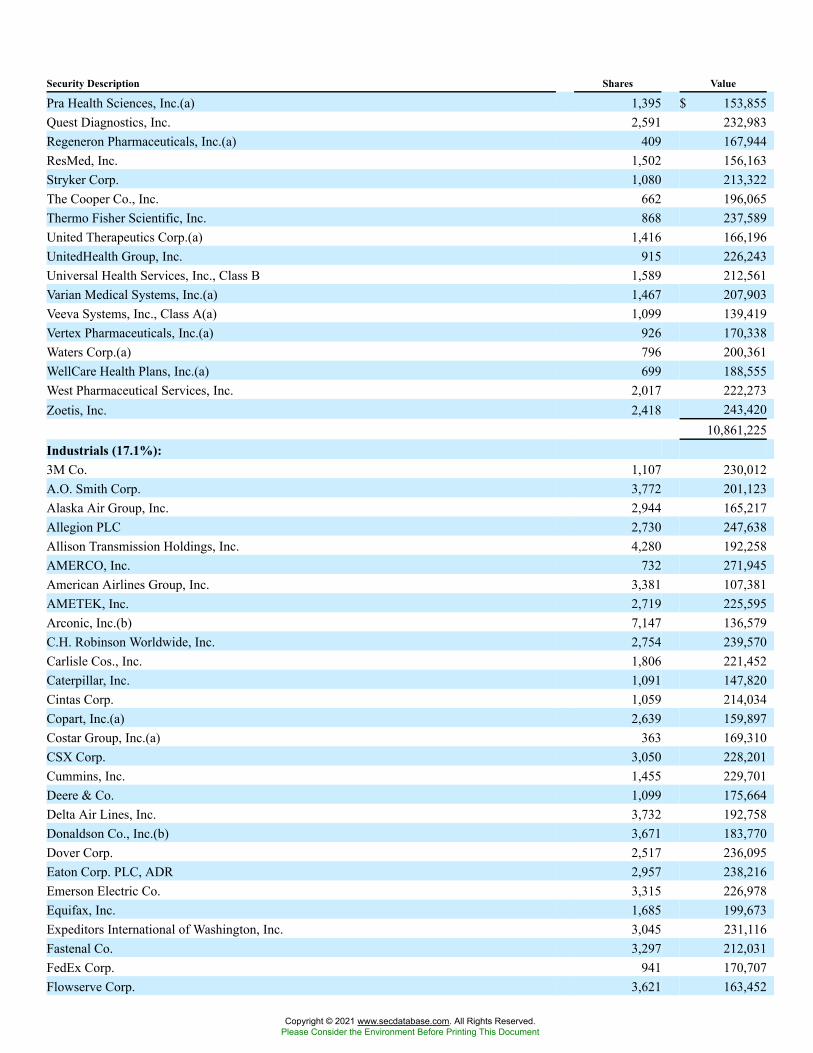
Security Description Shares Value
Pra Health Sciences, Inc.(a) 1,395 $ 153,855Quest Diagnostics, Inc. 2,591 232,983Regeneron Pharmaceuticals, Inc.(a) 409 167,944ResMed, Inc. 1,502 156,163Stryker Corp. 1,080 213,322The Cooper Co., Inc. 662 196,065Thermo Fisher Scientific, Inc. 868 237,589United Therapeutics Corp.(a) 1,416 166,196UnitedHealth Group, Inc. 915 226,243Universal Health Services, Inc., Class B 1,589 212,561Varian Medical Systems, Inc.(a) 1,467 207,903Veeva Systems, Inc., Class A(a) 1,099 139,419Vertex Pharmaceuticals, Inc.(a) 926 170,338Waters Corp.(a) 796 200,361WellCare Health Plans, Inc.(a) 699 188,555West Pharmaceutical Services, Inc. 2,017 222,273Zoetis, Inc. 2,418 243,420
10,861,225Industrials (17.1%):3M Co. 1,107 230,012A.O. Smith Corp. 3,772 201,123Alaska Air Group, Inc. 2,944 165,217Allegion PLC 2,730 247,638Allison Transmission Holdings, Inc. 4,280 192,258AMERCO, Inc. 732 271,945American Airlines Group, Inc. 3,381 107,381AMETEK, Inc. 2,719 225,595Arconic, Inc.(b) 7,147 136,579C.H. Robinson Worldwide, Inc. 2,754 239,570Carlisle Cos., Inc. 1,806 221,452Caterpillar, Inc. 1,091 147,820Cintas Corp. 1,059 214,034Copart, Inc.(a) 2,639 159,897Costar Group, Inc.(a) 363 169,310CSX Corp. 3,050 228,201Cummins, Inc. 1,455 229,701Deere & Co. 1,099 175,664Delta Air Lines, Inc. 3,732 192,758Donaldson Co., Inc.(b) 3,671 183,770Dover Corp. 2,517 236,095Eaton Corp. PLC, ADR 2,957 238,216Emerson Electric Co. 3,315 226,978Equifax, Inc. 1,685 199,673Expeditors International of Washington, Inc. 3,045 231,116Fastenal Co. 3,297 212,031FedEx Corp. 941 170,707Flowserve Corp. 3,621 163,452
Copyright © 2021 www.secdatabase.com. All Rights Reserved.Please Consider the Environment Before Printing This Document
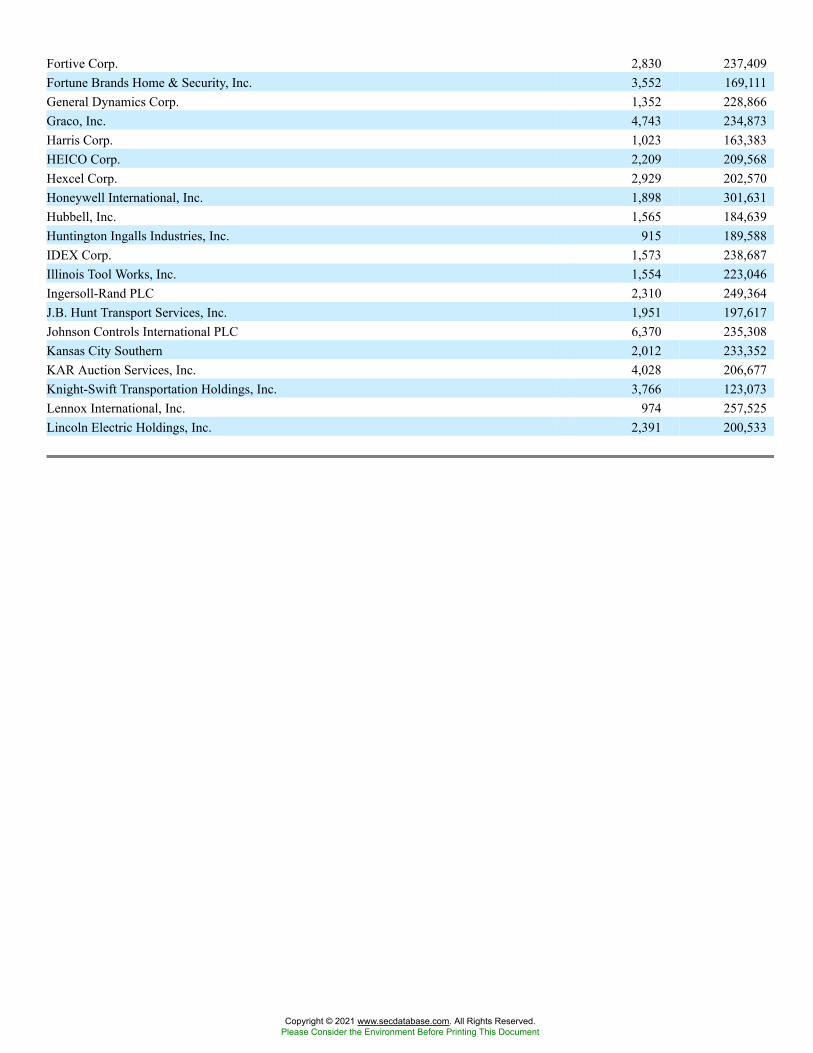
Fortive Corp. 2,830 237,409Fortune Brands Home & Security, Inc. 3,552 169,111General Dynamics Corp. 1,352 228,866Graco, Inc. 4,743 234,873Harris Corp. 1,023 163,383HEICO Corp. 2,209 209,568Hexcel Corp. 2,929 202,570Honeywell International, Inc. 1,898 301,631Hubbell, Inc. 1,565 184,639Huntington Ingalls Industries, Inc. 915 189,588IDEX Corp. 1,573 238,687Illinois Tool Works, Inc. 1,554 223,046Ingersoll-Rand PLC 2,310 249,364J.B. Hunt Transport Services, Inc. 1,951 197,617Johnson Controls International PLC 6,370 235,308Kansas City Southern 2,012 233,352KAR Auction Services, Inc. 4,028 206,677Knight-Swift Transportation Holdings, Inc. 3,766 123,073Lennox International, Inc. 974 257,525Lincoln Electric Holdings, Inc. 2,391 200,533
Copyright © 2021 www.secdatabase.com. All Rights Reserved.Please Consider the Environment Before Printing This Document
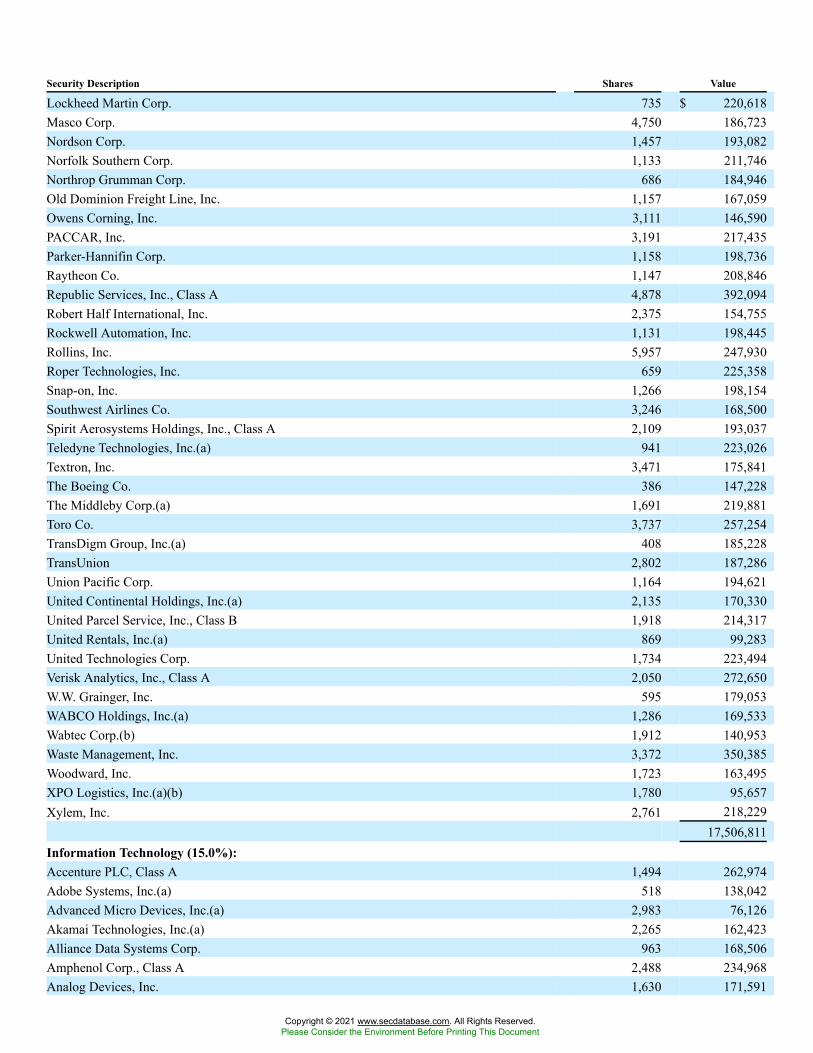
Security Description Shares Value
Lockheed Martin Corp. 735 $ 220,618Masco Corp. 4,750 186,723Nordson Corp. 1,457 193,082Norfolk Southern Corp. 1,133 211,746Northrop Grumman Corp. 686 184,946Old Dominion Freight Line, Inc. 1,157 167,059Owens Corning, Inc. 3,111 146,590PACCAR, Inc. 3,191 217,435Parker-Hannifin Corp. 1,158 198,736Raytheon Co. 1,147 208,846Republic Services, Inc., Class A 4,878 392,094Robert Half International, Inc. 2,375 154,755Rockwell Automation, Inc. 1,131 198,445Rollins, Inc. 5,957 247,930Roper Technologies, Inc. 659 225,358Snap-on, Inc. 1,266 198,154Southwest Airlines Co. 3,246 168,500Spirit Aerosystems Holdings, Inc., Class A 2,109 193,037Teledyne Technologies, Inc.(a) 941 223,026Textron, Inc. 3,471 175,841The Boeing Co. 386 147,228The Middleby Corp.(a) 1,691 219,881Toro Co. 3,737 257,254TransDigm Group, Inc.(a) 408 185,228TransUnion 2,802 187,286Union Pacific Corp. 1,164 194,621United Continental Holdings, Inc.(a) 2,135 170,330United Parcel Service, Inc., Class B 1,918 214,317United Rentals, Inc.(a) 869 99,283United Technologies Corp. 1,734 223,494Verisk Analytics, Inc., Class A 2,050 272,650W.W. Grainger, Inc. 595 179,053WABCO Holdings, Inc.(a) 1,286 169,533Wabtec Corp.(b) 1,912 140,953Waste Management, Inc. 3,372 350,385Woodward, Inc. 1,723 163,495XPO Logistics, Inc.(a)(b) 1,780 95,657Xylem, Inc. 2,761 218,229
17,506,811Information Technology (15.0%):Accenture PLC, Class A 1,494 262,974Adobe Systems, Inc.(a) 518 138,042Advanced Micro Devices, Inc.(a) 2,983 76,126Akamai Technologies, Inc.(a) 2,265 162,423Alliance Data Systems Corp. 963 168,506Amphenol Corp., Class A 2,488 234,968Analog Devices, Inc. 1,630 171,591
Copyright © 2021 www.secdatabase.com. All Rights Reserved.Please Consider the Environment Before Printing This Document
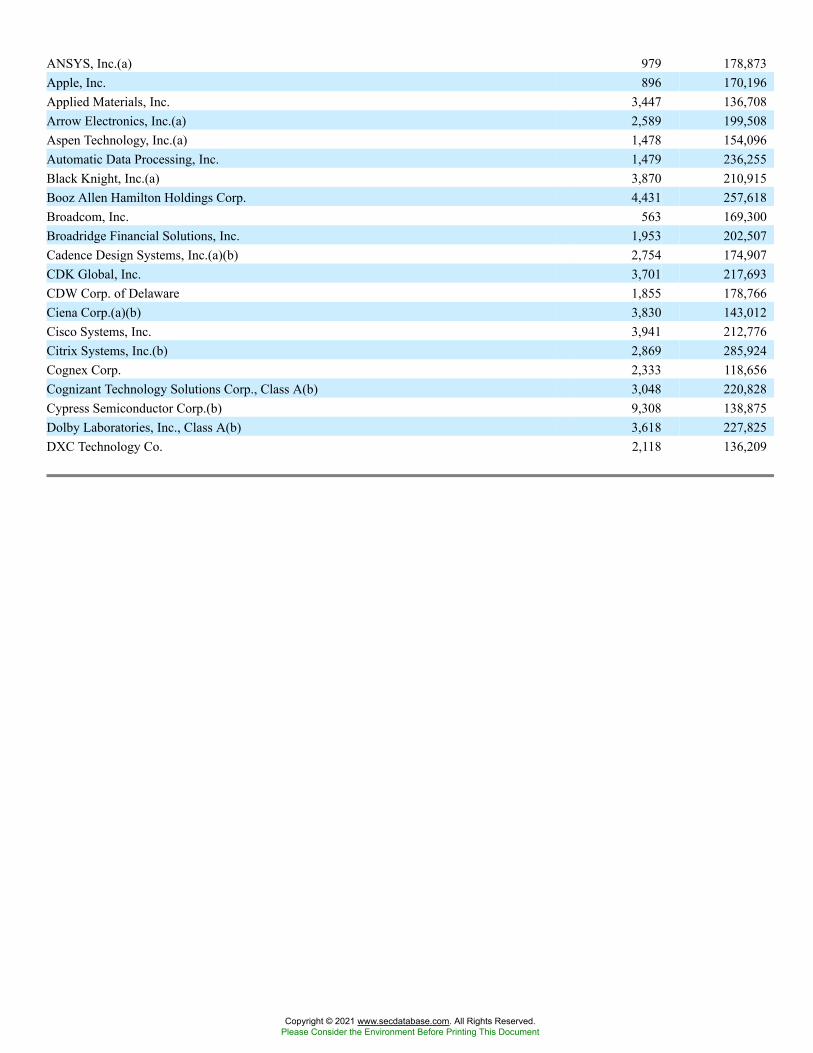
ANSYS, Inc.(a) 979 178,873Apple, Inc. 896 170,196Applied Materials, Inc. 3,447 136,708Arrow Electronics, Inc.(a) 2,589 199,508Aspen Technology, Inc.(a) 1,478 154,096Automatic Data Processing, Inc. 1,479 236,255Black Knight, Inc.(a) 3,870 210,915Booz Allen Hamilton Holdings Corp. 4,431 257,618Broadcom, Inc. 563 169,300Broadridge Financial Solutions, Inc. 1,953 202,507Cadence Design Systems, Inc.(a)(b) 2,754 174,907CDK Global, Inc. 3,701 217,693CDW Corp. of Delaware 1,855 178,766Ciena Corp.(a)(b) 3,830 143,012Cisco Systems, Inc. 3,941 212,776Citrix Systems, Inc.(b) 2,869 285,924Cognex Corp. 2,333 118,656Cognizant Technology Solutions Corp., Class A(b) 3,048 220,828Cypress Semiconductor Corp.(b) 9,308 138,875Dolby Laboratories, Inc., Class A(b) 3,618 227,825DXC Technology Co. 2,118 136,209
Copyright © 2021 www.secdatabase.com. All Rights Reserved.Please Consider the Environment Before Printing This Document
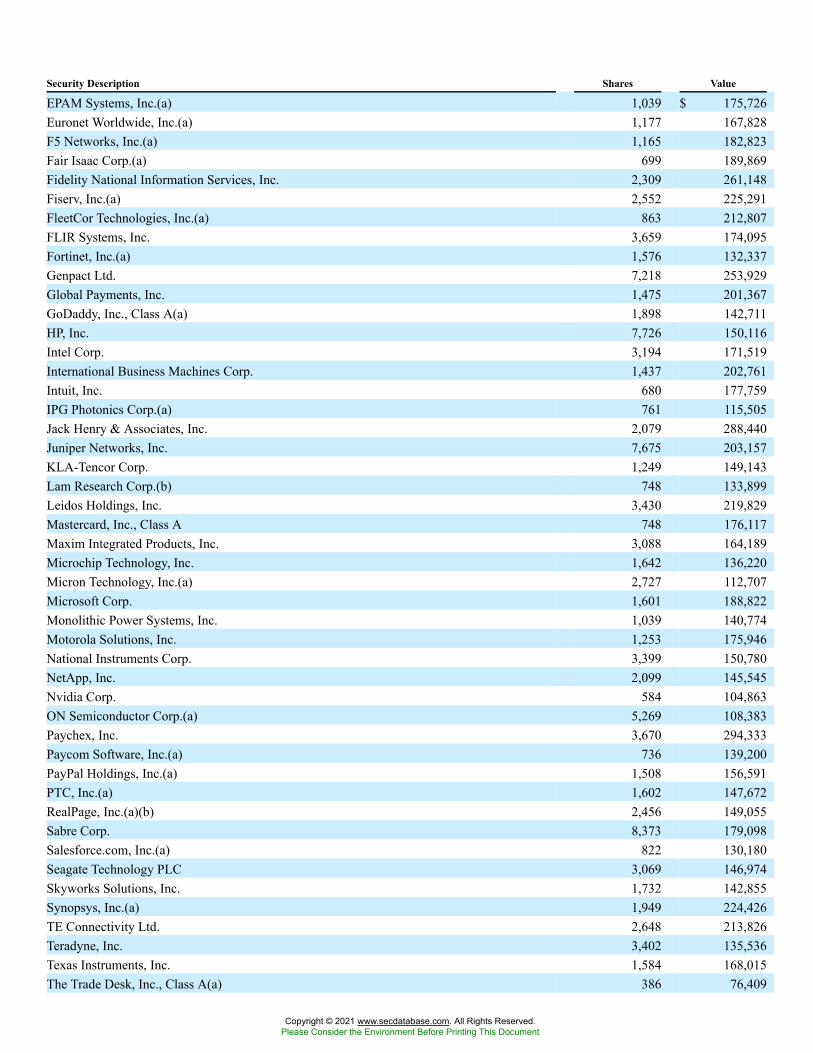
Security Description Shares Value
EPAM Systems, Inc.(a) 1,039 $ 175,726Euronet Worldwide, Inc.(a) 1,177 167,828F5 Networks, Inc.(a) 1,165 182,823Fair Isaac Corp.(a) 699 189,869Fidelity National Information Services, Inc. 2,309 261,148Fiserv, Inc.(a) 2,552 225,291FleetCor Technologies, Inc.(a) 863 212,807FLIR Systems, Inc. 3,659 174,095Fortinet, Inc.(a) 1,576 132,337Genpact Ltd. 7,218 253,929Global Payments, Inc. 1,475 201,367GoDaddy, Inc., Class A(a) 1,898 142,711HP, Inc. 7,726 150,116Intel Corp. 3,194 171,519International Business Machines Corp. 1,437 202,761Intuit, Inc. 680 177,759IPG Photonics Corp.(a) 761 115,505Jack Henry & Associates, Inc. 2,079 288,440Juniper Networks, Inc. 7,675 203,157KLA-Tencor Corp. 1,249 149,143Lam Research Corp.(b) 748 133,899Leidos Holdings, Inc. 3,430 219,829Mastercard, Inc., Class A 748 176,117Maxim Integrated Products, Inc. 3,088 164,189Microchip Technology, Inc. 1,642 136,220Micron Technology, Inc.(a) 2,727 112,707Microsoft Corp. 1,601 188,822Monolithic Power Systems, Inc. 1,039 140,774Motorola Solutions, Inc. 1,253 175,946National Instruments Corp. 3,399 150,780NetApp, Inc. 2,099 145,545Nvidia Corp. 584 104,863ON Semiconductor Corp.(a) 5,269 108,383Paychex, Inc. 3,670 294,333Paycom Software, Inc.(a) 736 139,200PayPal Holdings, Inc.(a) 1,508 156,591PTC, Inc.(a) 1,602 147,672RealPage, Inc.(a)(b) 2,456 149,055Sabre Corp. 8,373 179,098Salesforce.com, Inc.(a) 822 130,180Seagate Technology PLC 3,069 146,974Skyworks Solutions, Inc. 1,732 142,855Synopsys, Inc.(a) 1,949 224,426TE Connectivity Ltd. 2,648 213,826Teradyne, Inc. 3,402 135,536Texas Instruments, Inc. 1,584 168,015The Trade Desk, Inc., Class A(a) 386 76,409
Copyright © 2021 www.secdatabase.com. All Rights Reserved.Please Consider the Environment Before Printing This Document
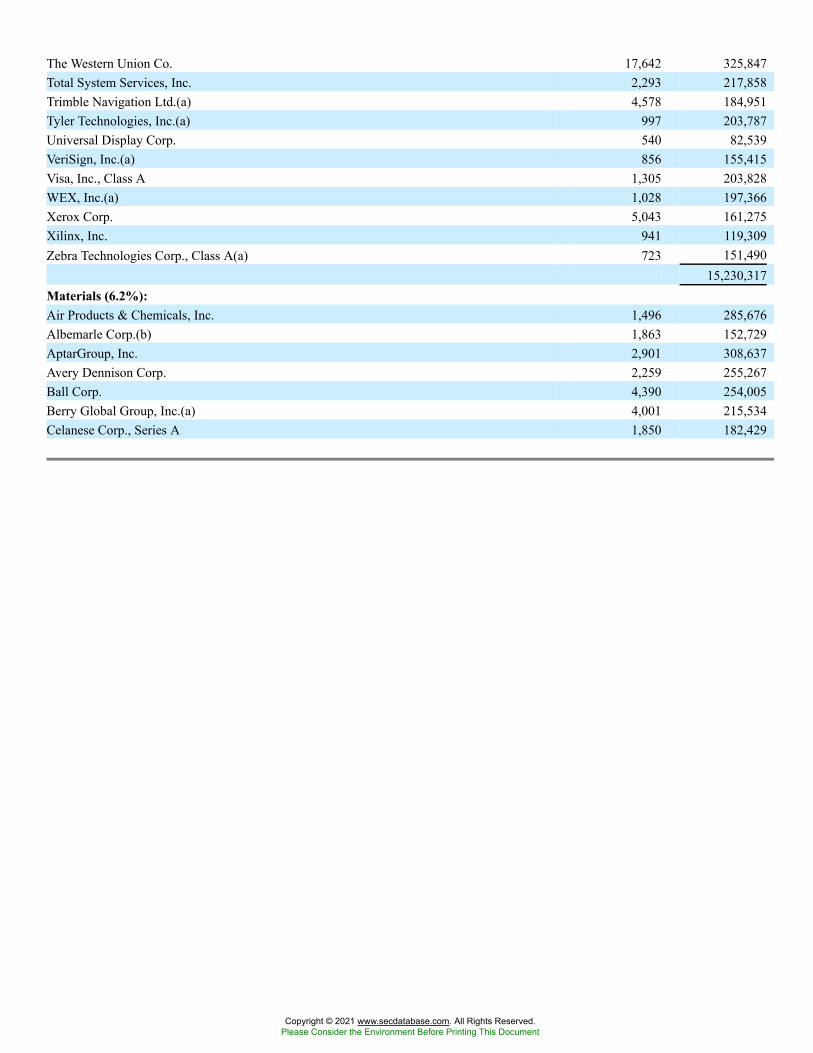
The Western Union Co. 17,642 325,847Total System Services, Inc. 2,293 217,858Trimble Navigation Ltd.(a) 4,578 184,951Tyler Technologies, Inc.(a) 997 203,787Universal Display Corp. 540 82,539VeriSign, Inc.(a) 856 155,415Visa, Inc., Class A 1,305 203,828WEX, Inc.(a) 1,028 197,366Xerox Corp. 5,043 161,275Xilinx, Inc. 941 119,309Zebra Technologies Corp., Class A(a) 723 151,490
15,230,317Materials (6.2%):Air Products & Chemicals, Inc. 1,496 285,676Albemarle Corp.(b) 1,863 152,729AptarGroup, Inc. 2,901 308,637Avery Dennison Corp. 2,259 255,267Ball Corp. 4,390 254,005Berry Global Group, Inc.(a) 4,001 215,534Celanese Corp., Series A 1,850 182,429
Copyright © 2021 www.secdatabase.com. All Rights Reserved.Please Consider the Environment Before Printing This Document
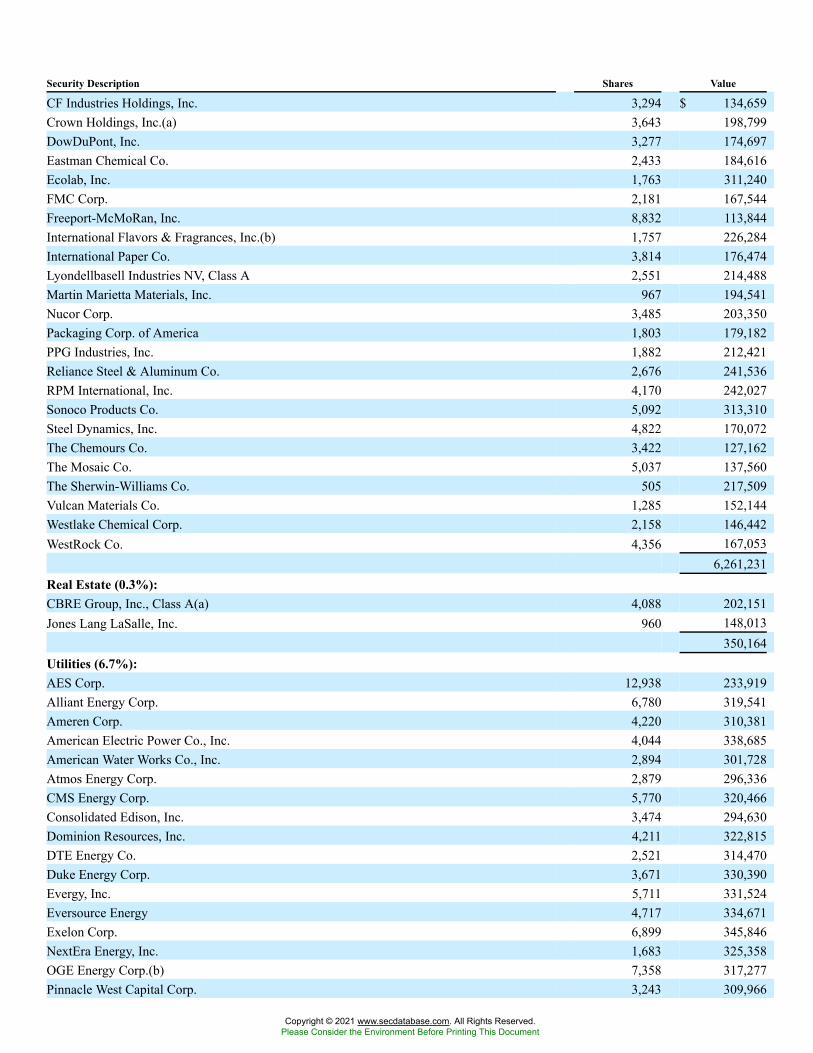
Security Description Shares Value
CF Industries Holdings, Inc. 3,294 $ 134,659Crown Holdings, Inc.(a) 3,643 198,799DowDuPont, Inc. 3,277 174,697Eastman Chemical Co. 2,433 184,616Ecolab, Inc. 1,763 311,240FMC Corp. 2,181 167,544Freeport-McMoRan, Inc. 8,832 113,844International Flavors & Fragrances, Inc.(b) 1,757 226,284International Paper Co. 3,814 176,474Lyondellbasell Industries NV, Class A 2,551 214,488Martin Marietta Materials, Inc. 967 194,541Nucor Corp. 3,485 203,350Packaging Corp. of America 1,803 179,182PPG Industries, Inc. 1,882 212,421Reliance Steel & Aluminum Co. 2,676 241,536RPM International, Inc. 4,170 242,027Sonoco Products Co. 5,092 313,310Steel Dynamics, Inc. 4,822 170,072The Chemours Co. 3,422 127,162The Mosaic Co. 5,037 137,560The Sherwin-Williams Co. 505 217,509Vulcan Materials Co. 1,285 152,144Westlake Chemical Corp. 2,158 146,442WestRock Co. 4,356 167,053
6,261,231Real Estate (0.3%):CBRE Group, Inc., Class A(a) 4,088 202,151Jones Lang LaSalle, Inc. 960 148,013
350,164Utilities (6.7%):AES Corp. 12,938 233,919Alliant Energy Corp. 6,780 319,541Ameren Corp. 4,220 310,381American Electric Power Co., Inc. 4,044 338,685American Water Works Co., Inc. 2,894 301,728Atmos Energy Corp. 2,879 296,336CMS Energy Corp. 5,770 320,466Consolidated Edison, Inc. 3,474 294,630Dominion Resources, Inc. 4,211 322,815DTE Energy Co. 2,521 314,470Duke Energy Corp. 3,671 330,390Evergy, Inc. 5,711 331,524Eversource Energy 4,717 334,671Exelon Corp. 6,899 345,846NextEra Energy, Inc. 1,683 325,358OGE Energy Corp.(b) 7,358 317,277Pinnacle West Capital Corp. 3,243 309,966
Copyright © 2021 www.secdatabase.com. All Rights Reserved.Please Consider the Environment Before Printing This Document
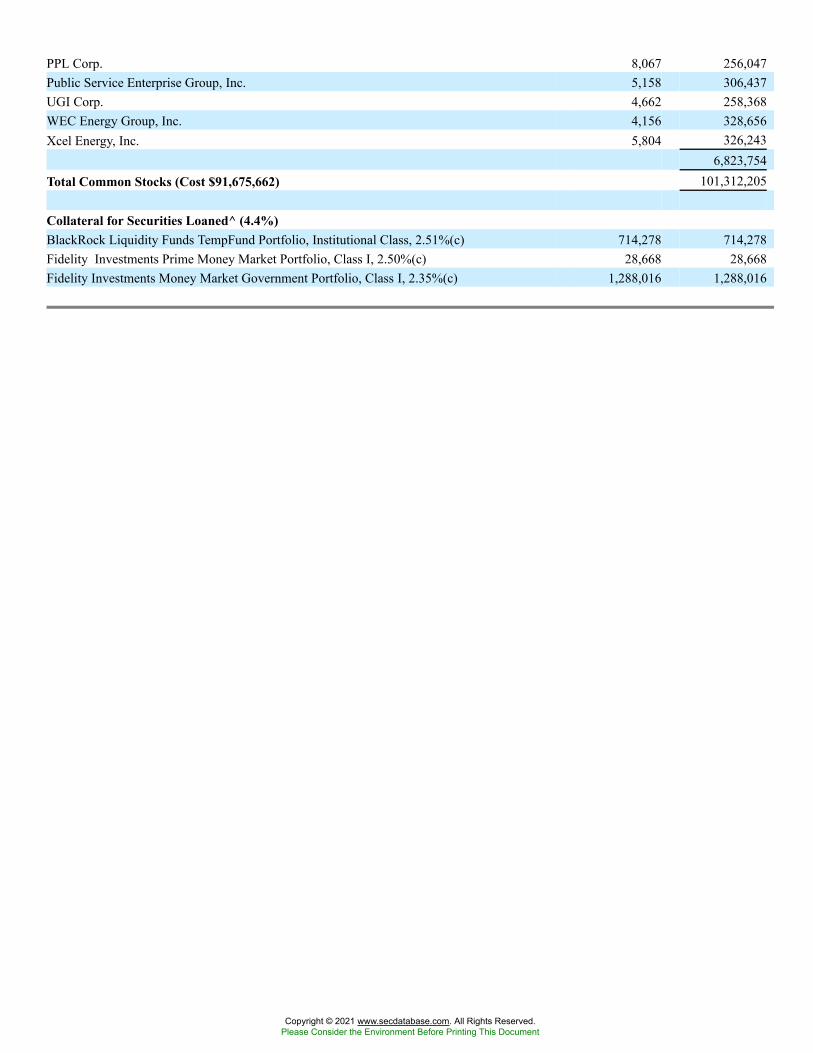
PPL Corp. 8,067 256,047Public Service Enterprise Group, Inc. 5,158 306,437UGI Corp. 4,662 258,368WEC Energy Group, Inc. 4,156 328,656Xcel Energy, Inc. 5,804 326,243
6,823,754Total Common Stocks (Cost $91,675,662) 101,312,205
Collateral for Securities Loaned^ (4.4%)BlackRock Liquidity Funds TempFund Portfolio, Institutional Class, 2.51%(c) 714,278 714,278Fidelity Investments Prime Money Market Portfolio, Class I, 2.50%(c) 28,668 28,668Fidelity Investments Money Market Government Portfolio, Class I, 2.35%(c) 1,288,016 1,288,016
Copyright © 2021 www.secdatabase.com. All Rights Reserved.Please Consider the Environment Before Printing This Document
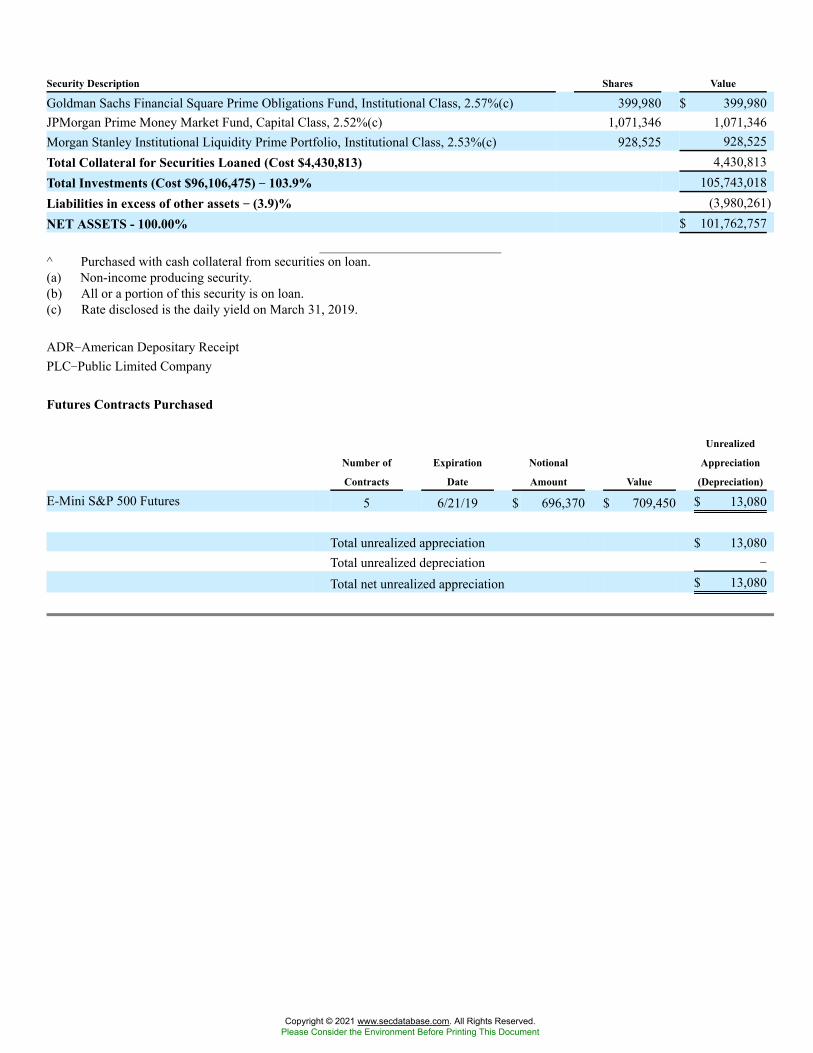
Security Description Shares Value
Goldman Sachs Financial Square Prime Obligations Fund, Institutional Class, 2.57%(c) 399,980 $ 399,980JPMorgan Prime Money Market Fund, Capital Class, 2.52%(c) 1,071,346 1,071,346Morgan Stanley Institutional Liquidity Prime Portfolio, Institutional Class, 2.53%(c) 928,525 928,525Total Collateral for Securities Loaned (Cost $4,430,813) 4,430,813Total Investments (Cost $96,106,475) �� 103.9% 105,743,018Liabilities in excess of other assets �� (3.9)% (3,980,261)NET ASSETS - 100.00% $ 101,762,757
^ Purchased with cash collateral from securities on loan.(a) Non-income producing security.(b) All or a portion of this security is on loan.(c) Rate disclosed is the daily yield on March 31, 2019.
ADR�American Depositary ReceiptPLC�Public Limited Company
Futures Contracts Purchased
Number of
Contracts
Expiration
Date
Notional
Amount Value
Unrealized
Appreciation
(Depreciation)
E-Mini S&P 500 Futures 5 6/21/19 $ 696,370 $ 709,450 $ 13,080
Total unrealized appreciation $ 13,080Total unrealized depreciation �
Total net unrealized appreciation $ 13,080
Copyright © 2021 www.secdatabase.com. All Rights Reserved.Please Consider the Environment Before Printing This Document
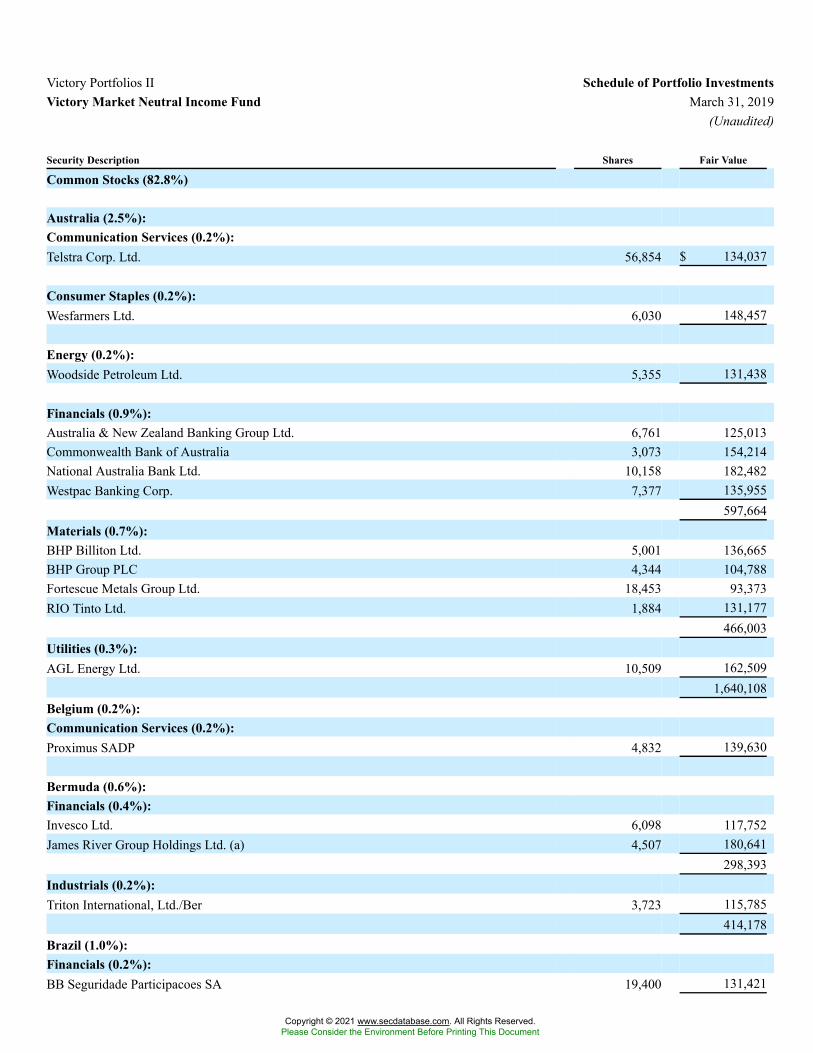
Victory Portfolios II Schedule of Portfolio InvestmentsVictory Market Neutral Income Fund March 31, 2019
(Unaudited)
Security Description Shares Fair Value
Common Stocks (82.8%)
Australia (2.5%):Communication Services (0.2%):Telstra Corp. Ltd. 56,854 $ 134,037
Consumer Staples (0.2%):Wesfarmers Ltd. 6,030 148,457
Energy (0.2%):Woodside Petroleum Ltd. 5,355 131,438
Financials (0.9%):Australia & New Zealand Banking Group Ltd. 6,761 125,013Commonwealth Bank of Australia 3,073 154,214National Australia Bank Ltd. 10,158 182,482Westpac Banking Corp. 7,377 135,955
597,664Materials (0.7%):BHP Billiton Ltd. 5,001 136,665BHP Group PLC 4,344 104,788Fortescue Metals Group Ltd. 18,453 93,373RIO Tinto Ltd. 1,884 131,177
466,003Utilities (0.3%):AGL Energy Ltd. 10,509 162,509
1,640,108Belgium (0.2%):Communication Services (0.2%):Proximus SADP 4,832 139,630
Bermuda (0.6%):Financials (0.4%):Invesco Ltd. 6,098 117,752James River Group Holdings Ltd. (a) 4,507 180,641
298,393Industrials (0.2%):Triton International, Ltd./Ber 3,723 115,785
414,178Brazil (1.0%):Financials (0.2%):BB Seguridade Participacoes SA 19,400 131,421
Copyright © 2021 www.secdatabase.com. All Rights Reserved.Please Consider the Environment Before Printing This Document
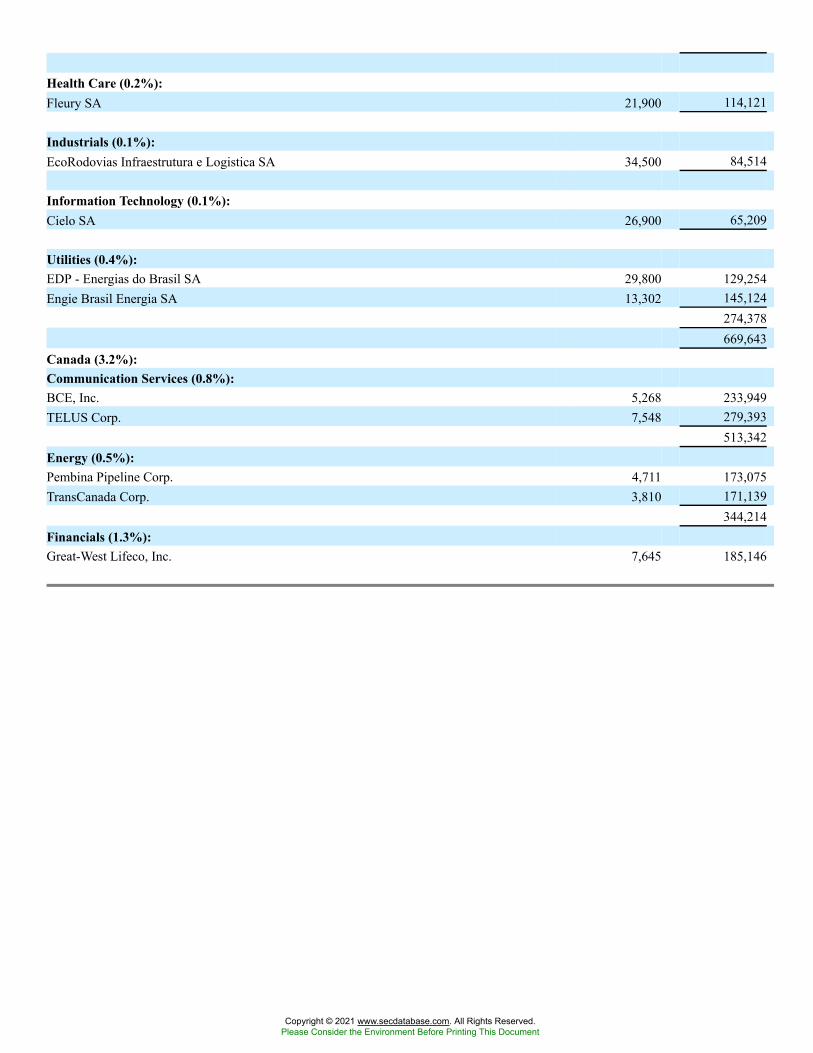
Health Care (0.2%):Fleury SA 21,900 114,121
Industrials (0.1%):EcoRodovias Infraestrutura e Logistica SA 34,500 84,514
Information Technology (0.1%):Cielo SA 26,900 65,209
Utilities (0.4%):EDP - Energias do Brasil SA 29,800 129,254Engie Brasil Energia SA 13,302 145,124
274,378669,643
Canada (3.2%):Communication Services (0.8%):BCE, Inc. 5,268 233,949TELUS Corp. 7,548 279,393
513,342Energy (0.5%):Pembina Pipeline Corp. 4,711 173,075TransCanada Corp. 3,810 171,139
344,214Financials (1.3%):Great-West Lifeco, Inc. 7,645 185,146
Copyright © 2021 www.secdatabase.com. All Rights Reserved.Please Consider the Environment Before Printing This Document
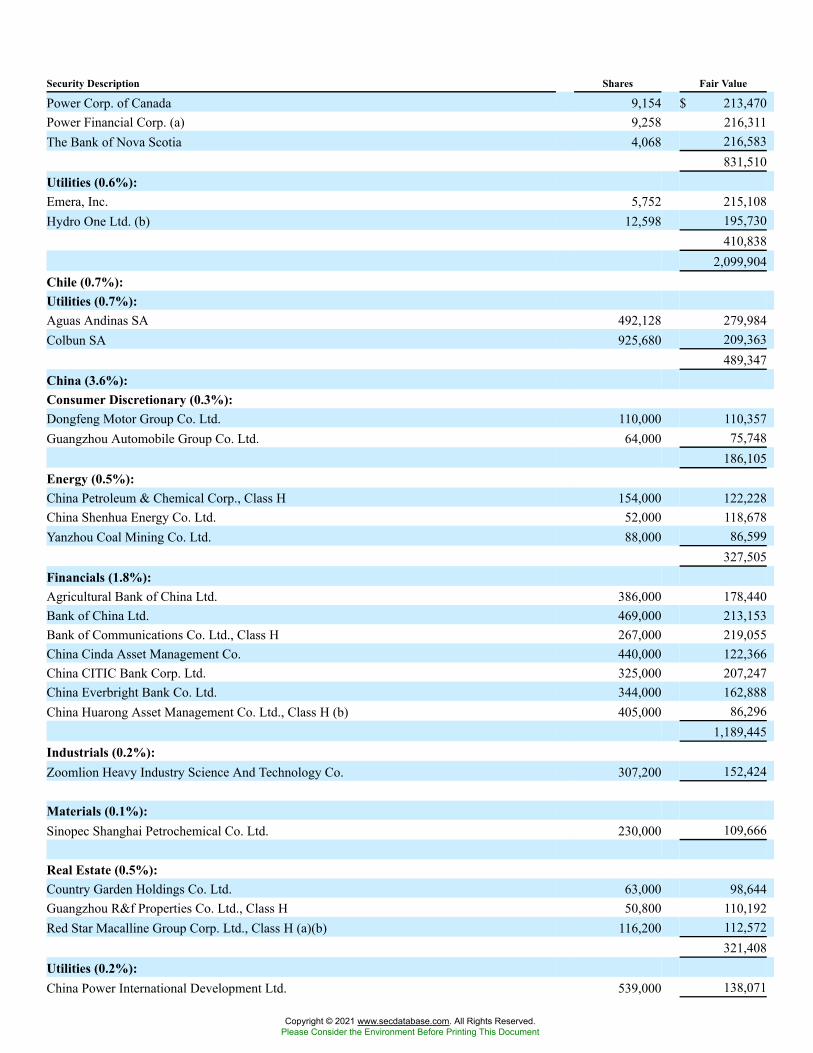
Security Description Shares Fair Value
Power Corp. of Canada 9,154 $ 213,470Power Financial Corp. (a) 9,258 216,311The Bank of Nova Scotia 4,068 216,583
831,510Utilities (0.6%):Emera, Inc. 5,752 215,108Hydro One Ltd. (b) 12,598 195,730
410,8382,099,904
Chile (0.7%):Utilities (0.7%):Aguas Andinas SA 492,128 279,984Colbun SA 925,680 209,363
489,347China (3.6%):Consumer Discretionary (0.3%):Dongfeng Motor Group Co. Ltd. 110,000 110,357Guangzhou Automobile Group Co. Ltd. 64,000 75,748
186,105Energy (0.5%):China Petroleum & Chemical Corp., Class H 154,000 122,228China Shenhua Energy Co. Ltd. 52,000 118,678Yanzhou Coal Mining Co. Ltd. 88,000 86,599
327,505Financials (1.8%):Agricultural Bank of China Ltd. 386,000 178,440Bank of China Ltd. 469,000 213,153Bank of Communications Co. Ltd., Class H 267,000 219,055China Cinda Asset Management Co. 440,000 122,366China CITIC Bank Corp. Ltd. 325,000 207,247China Everbright Bank Co. Ltd. 344,000 162,888China Huarong Asset Management Co. Ltd., Class H (b) 405,000 86,296
1,189,445Industrials (0.2%):Zoomlion Heavy Industry Science And Technology Co. 307,200 152,424
Materials (0.1%):Sinopec Shanghai Petrochemical Co. Ltd. 230,000 109,666
Real Estate (0.5%):Country Garden Holdings Co. Ltd. 63,000 98,644Guangzhou R&f Properties Co. Ltd., Class H 50,800 110,192Red Star Macalline Group Corp. Ltd., Class H (a)(b) 116,200 112,572
321,408Utilities (0.2%):China Power International Development Ltd. 539,000 138,071
Copyright © 2021 www.secdatabase.com. All Rights Reserved.Please Consider the Environment Before Printing This Document
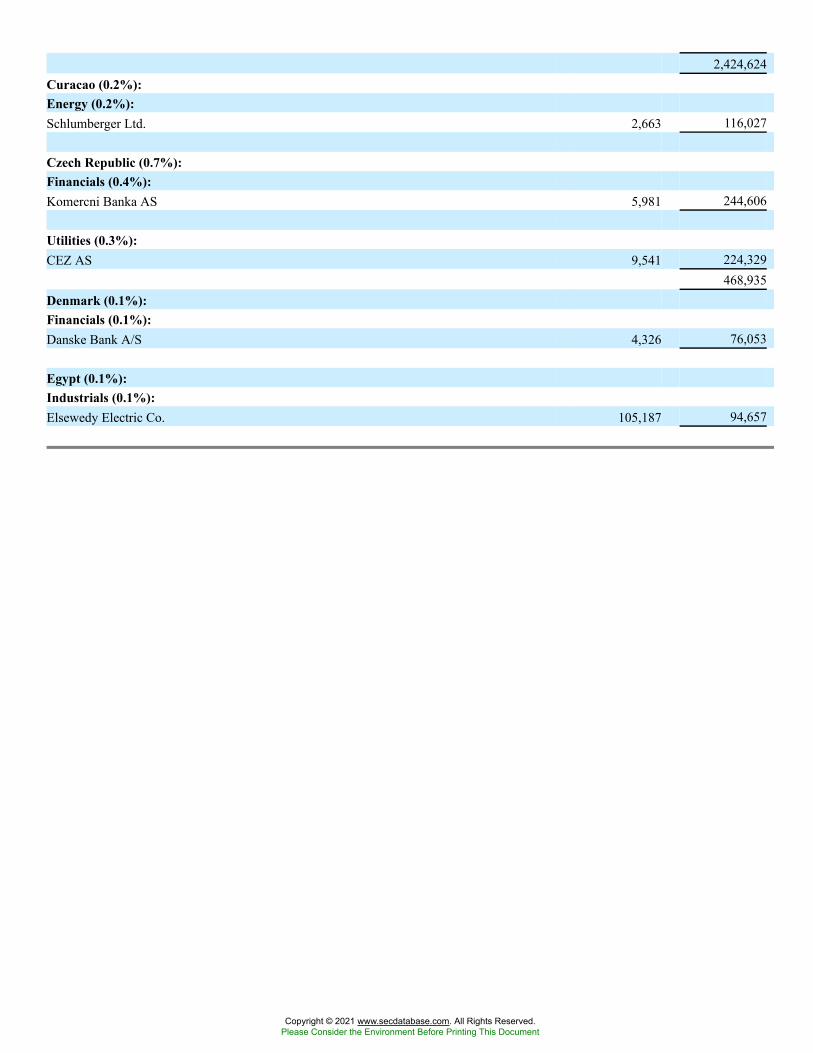
2,424,624Curacao (0.2%):Energy (0.2%):Schlumberger Ltd. 2,663 116,027
Czech Republic (0.7%):Financials (0.4%):Komercni Banka AS 5,981 244,606
Utilities (0.3%):CEZ AS 9,541 224,329
468,935Denmark (0.1%):Financials (0.1%):Danske Bank A/S 4,326 76,053
Egypt (0.1%):Industrials (0.1%):Elsewedy Electric Co. 105,187 94,657
Copyright © 2021 www.secdatabase.com. All Rights Reserved.Please Consider the Environment Before Printing This Document
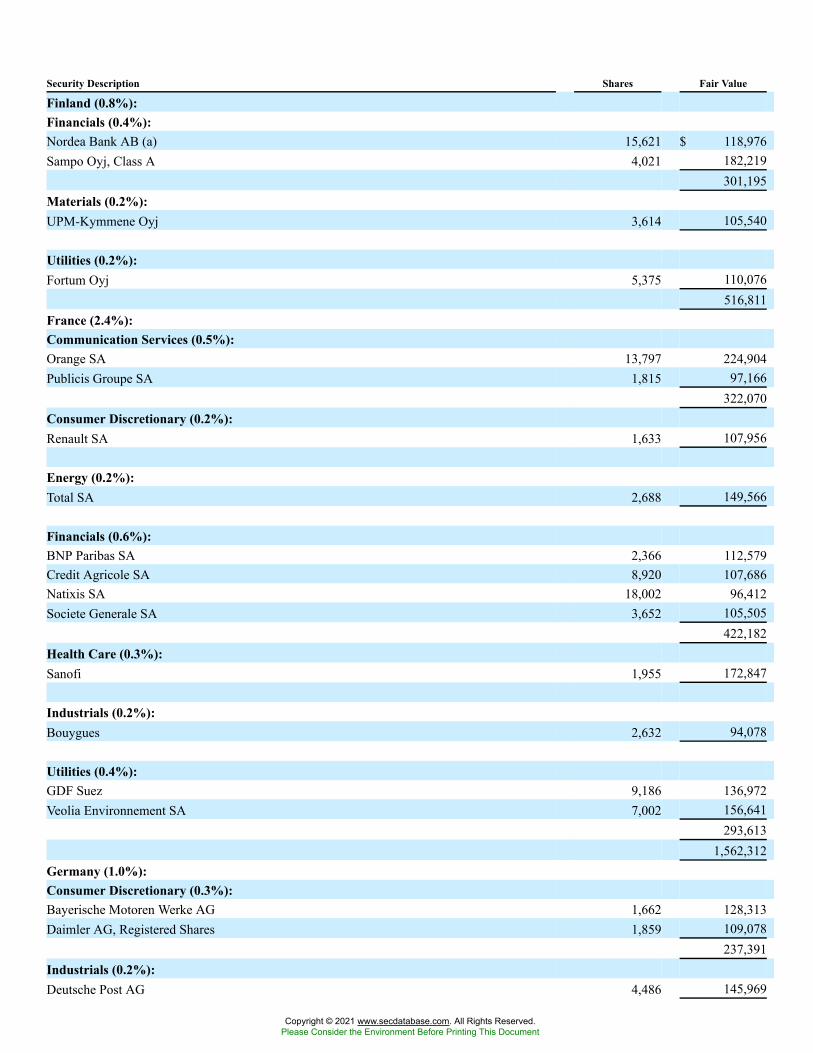
Security Description Shares Fair Value
Finland (0.8%):Financials (0.4%):Nordea Bank AB (a) 15,621 $ 118,976Sampo Oyj, Class A 4,021 182,219
301,195Materials (0.2%):UPM-Kymmene Oyj 3,614 105,540
Utilities (0.2%):Fortum Oyj 5,375 110,076
516,811France (2.4%):Communication Services (0.5%):Orange SA 13,797 224,904Publicis Groupe SA 1,815 97,166
322,070Consumer Discretionary (0.2%):Renault SA 1,633 107,956
Energy (0.2%):Total SA 2,688 149,566
Financials (0.6%):BNP Paribas SA 2,366 112,579Credit Agricole SA 8,920 107,686Natixis SA 18,002 96,412Societe Generale SA 3,652 105,505
422,182Health Care (0.3%):Sanofi 1,955 172,847
Industrials (0.2%):Bouygues 2,632 94,078
Utilities (0.4%):GDF Suez 9,186 136,972Veolia Environnement SA 7,002 156,641
293,6131,562,312
Germany (1.0%):Consumer Discretionary (0.3%):Bayerische Motoren Werke AG 1,662 128,313Daimler AG, Registered Shares 1,859 109,078
237,391Industrials (0.2%):Deutsche Post AG 4,486 145,969
Copyright © 2021 www.secdatabase.com. All Rights Reserved.Please Consider the Environment Before Printing This Document
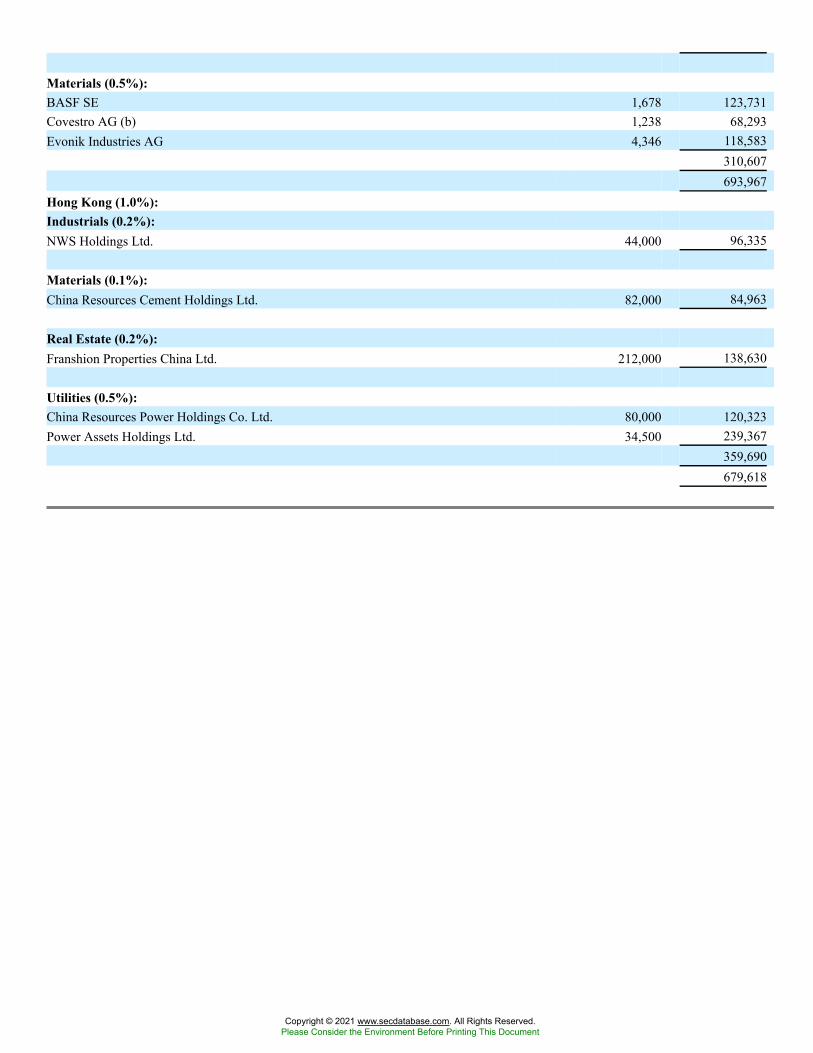
Materials (0.5%):BASF SE 1,678 123,731Covestro AG (b) 1,238 68,293Evonik Industries AG 4,346 118,583
310,607693,967
Hong Kong (1.0%):Industrials (0.2%):NWS Holdings Ltd. 44,000 96,335
Materials (0.1%):China Resources Cement Holdings Ltd. 82,000 84,963
Real Estate (0.2%):Franshion Properties China Ltd. 212,000 138,630
Utilities (0.5%):China Resources Power Holdings Co. Ltd. 80,000 120,323Power Assets Holdings Ltd. 34,500 239,367
359,690679,618
Copyright © 2021 www.secdatabase.com. All Rights Reserved.Please Consider the Environment Before Printing This Document
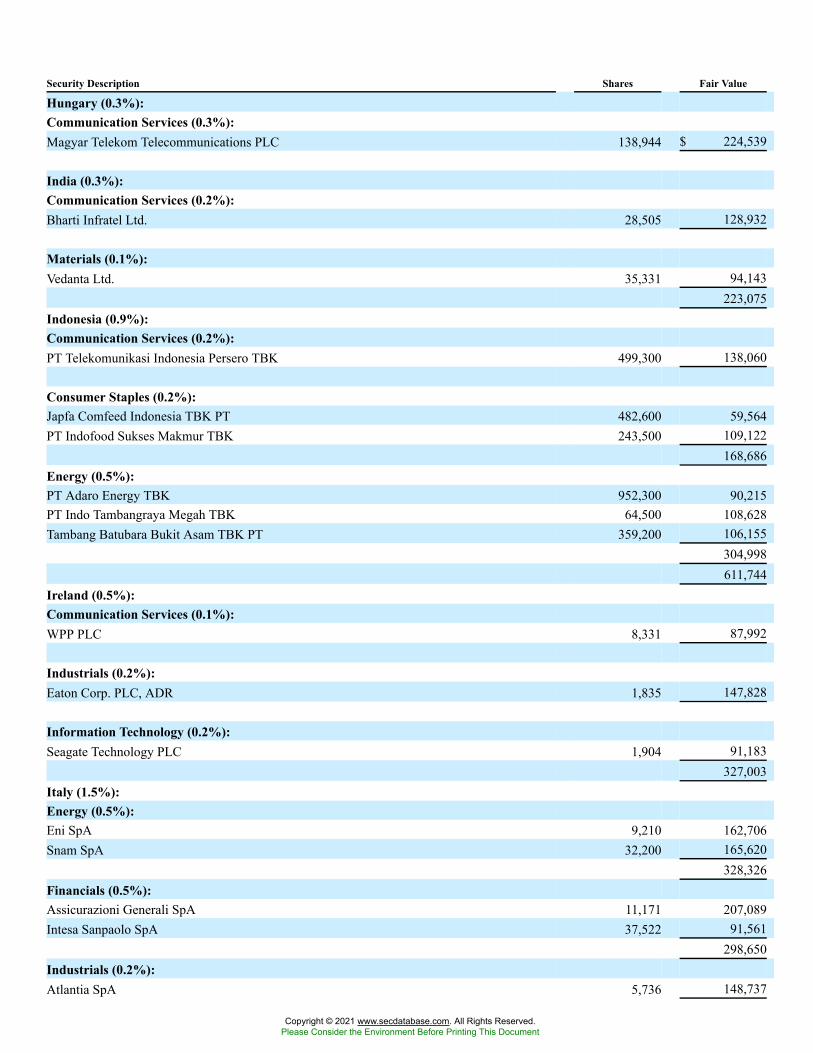
Security Description Shares Fair Value
Hungary (0.3%):Communication Services (0.3%):Magyar Telekom Telecommunications PLC 138,944 $ 224,539
India (0.3%):Communication Services (0.2%):Bharti Infratel Ltd. 28,505 128,932
Materials (0.1%):Vedanta Ltd. 35,331 94,143
223,075Indonesia (0.9%):Communication Services (0.2%):PT Telekomunikasi Indonesia Persero TBK 499,300 138,060
Consumer Staples (0.2%):Japfa Comfeed Indonesia TBK PT 482,600 59,564PT Indofood Sukses Makmur TBK 243,500 109,122
168,686Energy (0.5%):PT Adaro Energy TBK 952,300 90,215PT Indo Tambangraya Megah TBK 64,500 108,628Tambang Batubara Bukit Asam TBK PT 359,200 106,155
304,998611,744
Ireland (0.5%):Communication Services (0.1%):WPP PLC 8,331 87,992
Industrials (0.2%):Eaton Corp. PLC, ADR 1,835 147,828
Information Technology (0.2%):Seagate Technology PLC 1,904 91,183
327,003Italy (1.5%):Energy (0.5%):Eni SpA 9,210 162,706Snam SpA 32,200 165,620
328,326Financials (0.5%):Assicurazioni Generali SpA 11,171 207,089Intesa Sanpaolo SpA 37,522 91,561
298,650Industrials (0.2%):Atlantia SpA 5,736 148,737
Copyright © 2021 www.secdatabase.com. All Rights Reserved.Please Consider the Environment Before Printing This Document
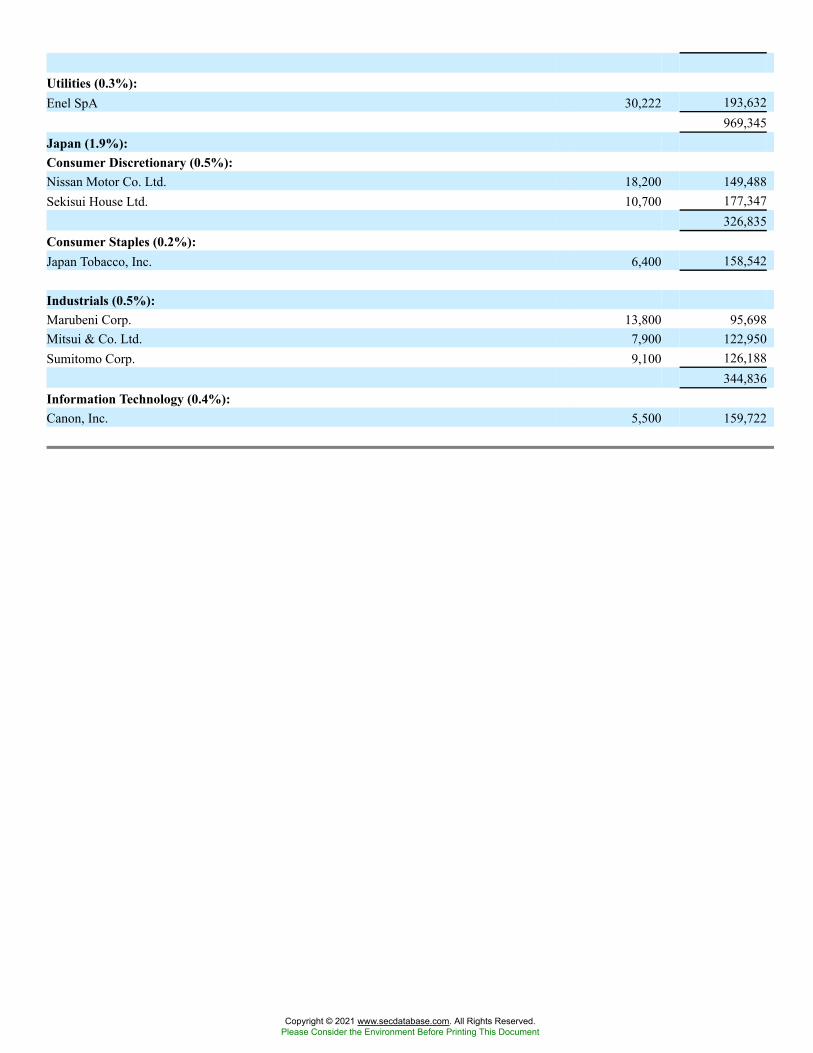
Utilities (0.3%):Enel SpA 30,222 193,632
969,345Japan (1.9%):Consumer Discretionary (0.5%):Nissan Motor Co. Ltd. 18,200 149,488Sekisui House Ltd. 10,700 177,347
326,835Consumer Staples (0.2%):Japan Tobacco, Inc. 6,400 158,542
Industrials (0.5%):Marubeni Corp. 13,800 95,698Mitsui & Co. Ltd. 7,900 122,950Sumitomo Corp. 9,100 126,188
344,836Information Technology (0.4%):Canon, Inc. 5,500 159,722
Copyright © 2021 www.secdatabase.com. All Rights Reserved.Please Consider the Environment Before Printing This Document
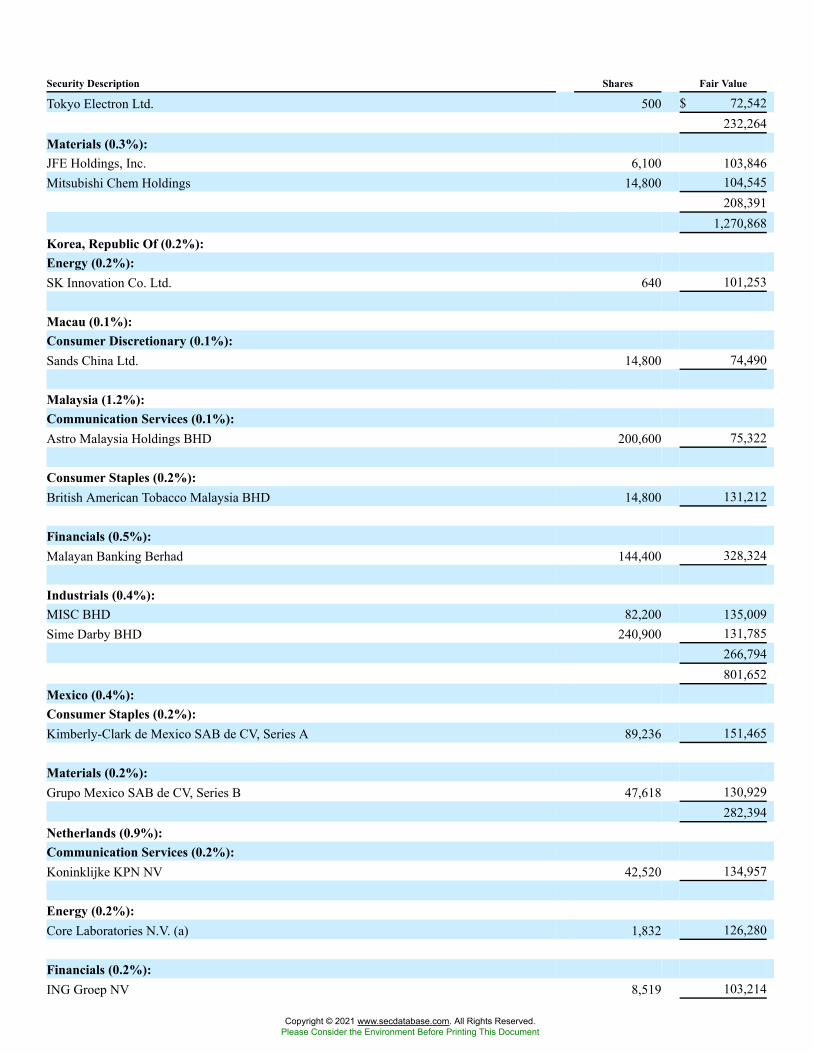
Security Description Shares Fair Value
Tokyo Electron Ltd. 500 $ 72,542232,264
Materials (0.3%):JFE Holdings, Inc. 6,100 103,846Mitsubishi Chem Holdings 14,800 104,545
208,3911,270,868
Korea, Republic Of (0.2%):Energy (0.2%):SK Innovation Co. Ltd. 640 101,253
Macau (0.1%):Consumer Discretionary (0.1%):Sands China Ltd. 14,800 74,490
Malaysia (1.2%):Communication Services (0.1%):Astro Malaysia Holdings BHD 200,600 75,322
Consumer Staples (0.2%):British American Tobacco Malaysia BHD 14,800 131,212
Financials (0.5%):Malayan Banking Berhad 144,400 328,324
Industrials (0.4%):MISC BHD 82,200 135,009Sime Darby BHD 240,900 131,785
266,794801,652
Mexico (0.4%):Consumer Staples (0.2%):Kimberly-Clark de Mexico SAB de CV, Series A 89,236 151,465
Materials (0.2%):Grupo Mexico SAB de CV, Series B 47,618 130,929
282,394Netherlands (0.9%):Communication Services (0.2%):Koninklijke KPN NV 42,520 134,957
Energy (0.2%):Core Laboratories N.V. (a) 1,832 126,280
Financials (0.2%):ING Groep NV 8,519 103,214
Copyright © 2021 www.secdatabase.com. All Rights Reserved.Please Consider the Environment Before Printing This Document
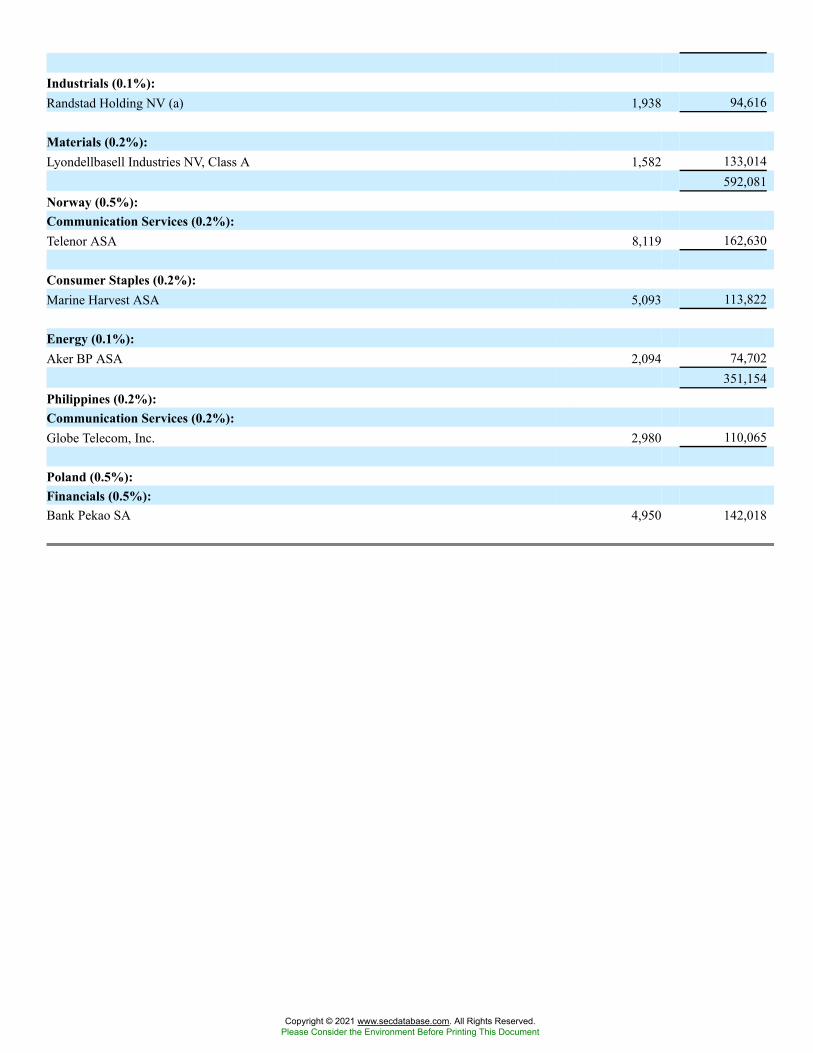
Industrials (0.1%):Randstad Holding NV (a) 1,938 94,616
Materials (0.2%):Lyondellbasell Industries NV, Class A 1,582 133,014
592,081Norway (0.5%):Communication Services (0.2%):Telenor ASA 8,119 162,630
Consumer Staples (0.2%):Marine Harvest ASA 5,093 113,822
Energy (0.1%):Aker BP ASA 2,094 74,702
351,154Philippines (0.2%):Communication Services (0.2%):Globe Telecom, Inc. 2,980 110,065
Poland (0.5%):Financials (0.5%):Bank Pekao SA 4,950 142,018
Copyright © 2021 www.secdatabase.com. All Rights Reserved.Please Consider the Environment Before Printing This Document
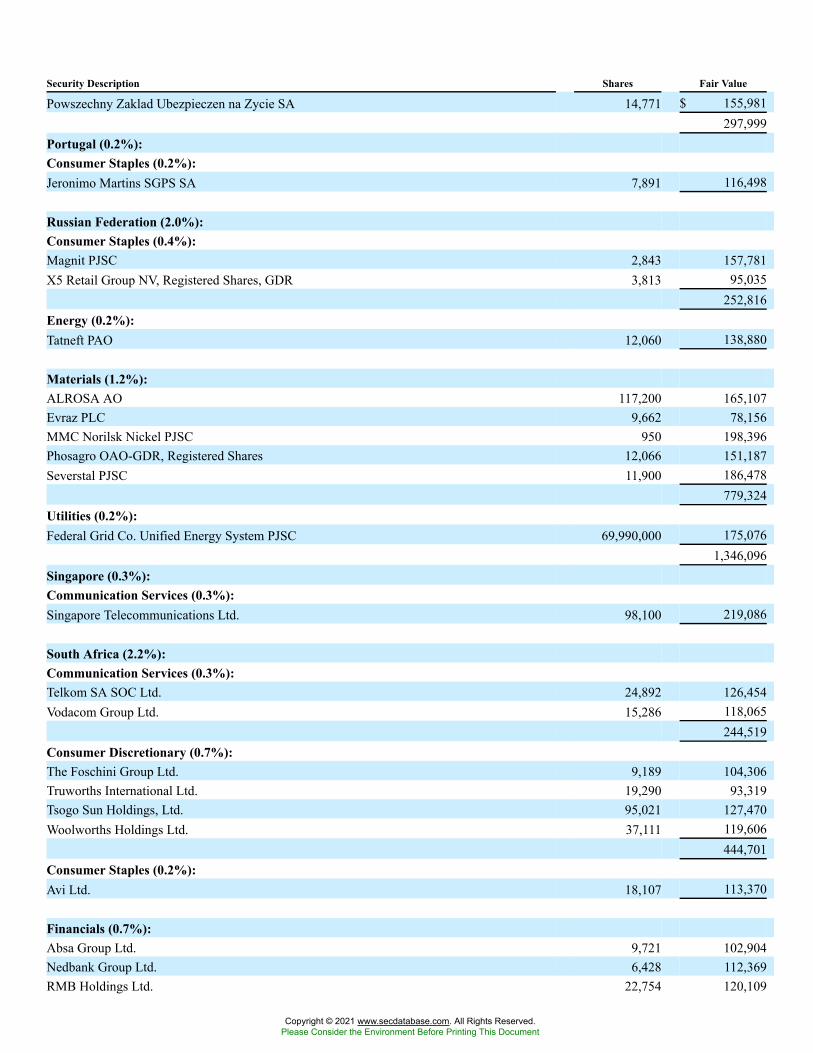
Security Description Shares Fair Value
Powszechny Zaklad Ubezpieczen na Zycie SA 14,771 $ 155,981297,999
Portugal (0.2%):Consumer Staples (0.2%):Jeronimo Martins SGPS SA 7,891 116,498
Russian Federation (2.0%):Consumer Staples (0.4%):Magnit PJSC 2,843 157,781X5 Retail Group NV, Registered Shares, GDR 3,813 95,035
252,816Energy (0.2%):Tatneft PAO 12,060 138,880
Materials (1.2%):ALROSA AO 117,200 165,107Evraz PLC 9,662 78,156MMC Norilsk Nickel PJSC 950 198,396Phosagro OAO-GDR, Registered Shares 12,066 151,187Severstal PJSC 11,900 186,478
779,324Utilities (0.2%):Federal Grid Co. Unified Energy System PJSC 69,990,000 175,076
1,346,096Singapore (0.3%):Communication Services (0.3%):Singapore Telecommunications Ltd. 98,100 219,086
South Africa (2.2%):Communication Services (0.3%):Telkom SA SOC Ltd. 24,892 126,454Vodacom Group Ltd. 15,286 118,065
244,519Consumer Discretionary (0.7%):The Foschini Group Ltd. 9,189 104,306Truworths International Ltd. 19,290 93,319Tsogo Sun Holdings, Ltd. 95,021 127,470Woolworths Holdings Ltd. 37,111 119,606
444,701Consumer Staples (0.2%):Avi Ltd. 18,107 113,370
Financials (0.7%):Absa Group Ltd. 9,721 102,904Nedbank Group Ltd. 6,428 112,369RMB Holdings Ltd. 22,754 120,109
Copyright © 2021 www.secdatabase.com. All Rights Reserved.Please Consider the Environment Before Printing This Document
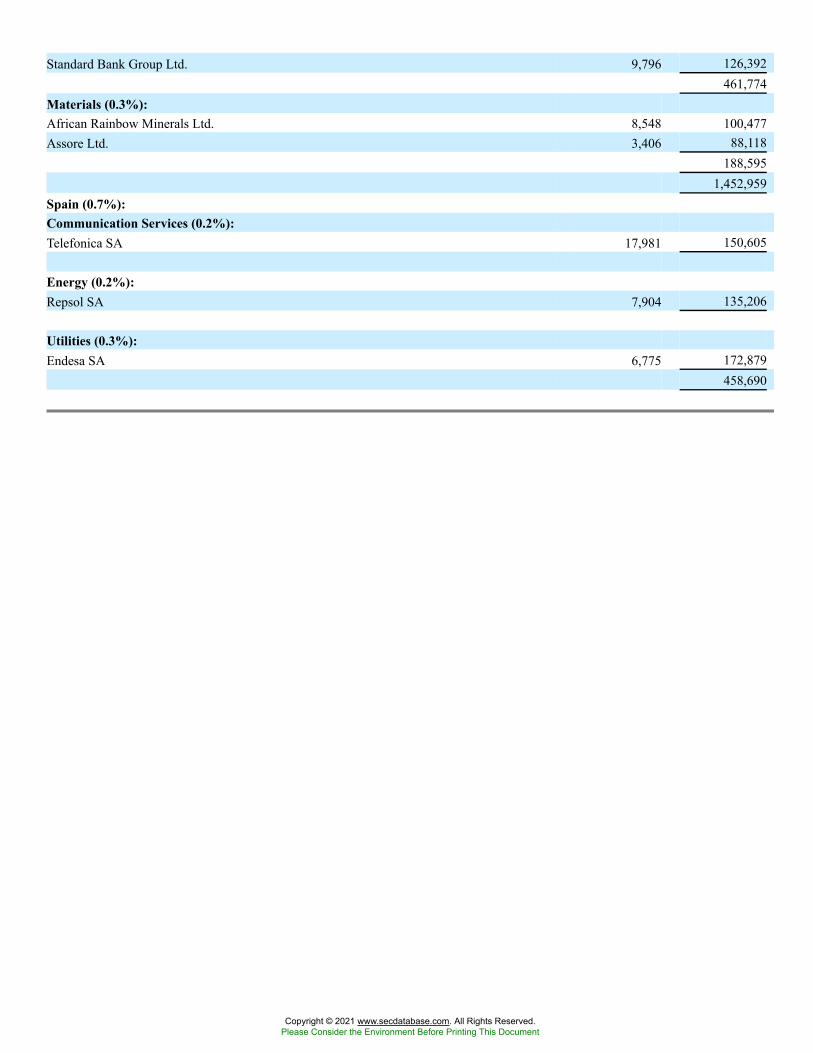
Standard Bank Group Ltd. 9,796 126,392461,774
Materials (0.3%):African Rainbow Minerals Ltd. 8,548 100,477Assore Ltd. 3,406 88,118
188,5951,452,959
Spain (0.7%):Communication Services (0.2%):Telefonica SA 17,981 150,605
Energy (0.2%):Repsol SA 7,904 135,206
Utilities (0.3%):Endesa SA 6,775 172,879
458,690
Copyright © 2021 www.secdatabase.com. All Rights Reserved.Please Consider the Environment Before Printing This Document
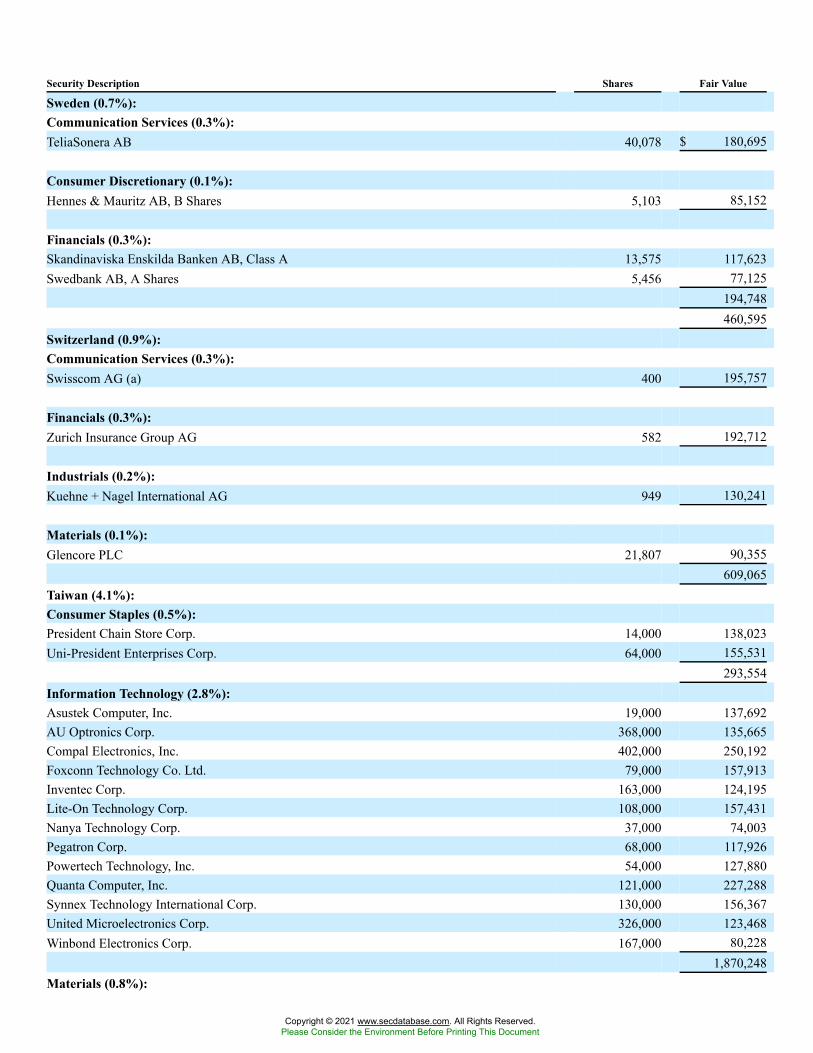
Security Description Shares Fair Value
Sweden (0.7%):Communication Services (0.3%):TeliaSonera AB 40,078 $ 180,695
Consumer Discretionary (0.1%):Hennes & Mauritz AB, B Shares 5,103 85,152
Financials (0.3%):Skandinaviska Enskilda Banken AB, Class A 13,575 117,623Swedbank AB, A Shares 5,456 77,125
194,748460,595
Switzerland (0.9%):Communication Services (0.3%):Swisscom AG (a) 400 195,757
Financials (0.3%):Zurich Insurance Group AG 582 192,712
Industrials (0.2%):Kuehne + Nagel International AG 949 130,241
Materials (0.1%):Glencore PLC 21,807 90,355
609,065Taiwan (4.1%):Consumer Staples (0.5%):President Chain Store Corp. 14,000 138,023Uni-President Enterprises Corp. 64,000 155,531
293,554Information Technology (2.8%):Asustek Computer, Inc. 19,000 137,692AU Optronics Corp. 368,000 135,665Compal Electronics, Inc. 402,000 250,192Foxconn Technology Co. Ltd. 79,000 157,913Inventec Corp. 163,000 124,195Lite-On Technology Corp. 108,000 157,431Nanya Technology Corp. 37,000 74,003Pegatron Corp. 68,000 117,926Powertech Technology, Inc. 54,000 127,880Quanta Computer, Inc. 121,000 227,288Synnex Technology International Corp. 130,000 156,367United Microelectronics Corp. 326,000 123,468Winbond Electronics Corp. 167,000 80,228
1,870,248Materials (0.8%):
Copyright © 2021 www.secdatabase.com. All Rights Reserved.Please Consider the Environment Before Printing This Document
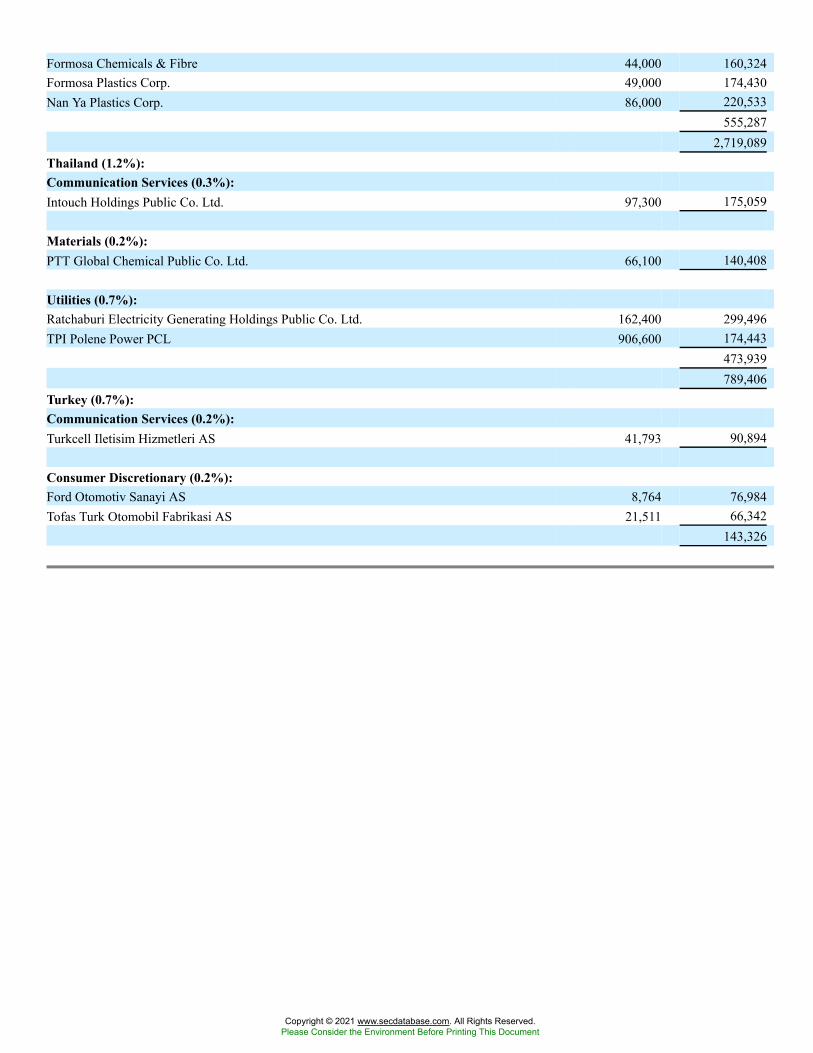
Formosa Chemicals & Fibre 44,000 160,324Formosa Plastics Corp. 49,000 174,430Nan Ya Plastics Corp. 86,000 220,533
555,2872,719,089
Thailand (1.2%):Communication Services (0.3%):Intouch Holdings Public Co. Ltd. 97,300 175,059
Materials (0.2%):PTT Global Chemical Public Co. Ltd. 66,100 140,408
Utilities (0.7%):Ratchaburi Electricity Generating Holdings Public Co. Ltd. 162,400 299,496TPI Polene Power PCL 906,600 174,443
473,939789,406
Turkey (0.7%):Communication Services (0.2%):Turkcell Iletisim Hizmetleri AS 41,793 90,894
Consumer Discretionary (0.2%):Ford Otomotiv Sanayi AS 8,764 76,984Tofas Turk Otomobil Fabrikasi AS 21,511 66,342
143,326
Copyright © 2021 www.secdatabase.com. All Rights Reserved.Please Consider the Environment Before Printing This Document
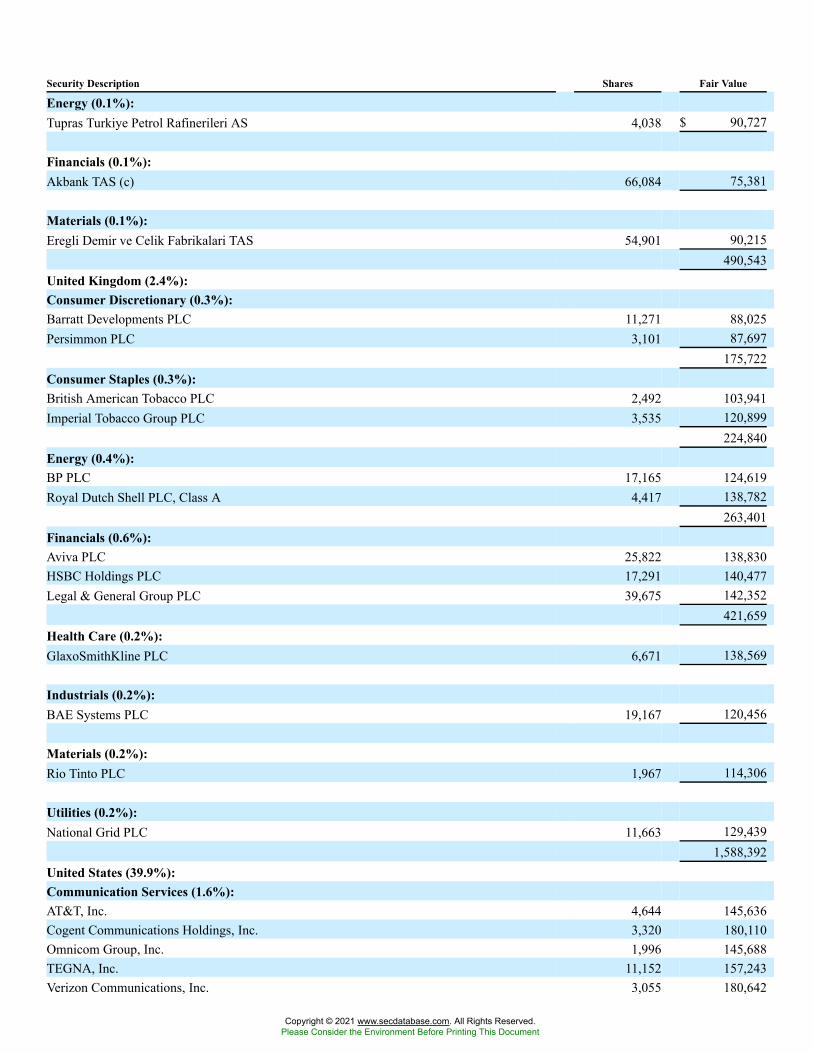
Security Description Shares Fair Value
Energy (0.1%):Tupras Turkiye Petrol Rafinerileri AS 4,038 $ 90,727
Financials (0.1%):Akbank TAS (c) 66,084 75,381
Materials (0.1%):Eregli Demir ve Celik Fabrikalari TAS 54,901 90,215
490,543United Kingdom (2.4%):Consumer Discretionary (0.3%):Barratt Developments PLC 11,271 88,025Persimmon PLC 3,101 87,697
175,722Consumer Staples (0.3%):British American Tobacco PLC 2,492 103,941Imperial Tobacco Group PLC 3,535 120,899
224,840Energy (0.4%):BP PLC 17,165 124,619Royal Dutch Shell PLC, Class A 4,417 138,782
263,401Financials (0.6%):Aviva PLC 25,822 138,830HSBC Holdings PLC 17,291 140,477Legal & General Group PLC 39,675 142,352
421,659Health Care (0.2%):GlaxoSmithKline PLC 6,671 138,569
Industrials (0.2%):BAE Systems PLC 19,167 120,456
Materials (0.2%):Rio Tinto PLC 1,967 114,306
Utilities (0.2%):National Grid PLC 11,663 129,439
1,588,392United States (39.9%):Communication Services (1.6%):AT&T, Inc. 4,644 145,636Cogent Communications Holdings, Inc. 3,320 180,110Omnicom Group, Inc. 1,996 145,688TEGNA, Inc. 11,152 157,243Verizon Communications, Inc. 3,055 180,642
Copyright © 2021 www.secdatabase.com. All Rights Reserved.Please Consider the Environment Before Printing This Document
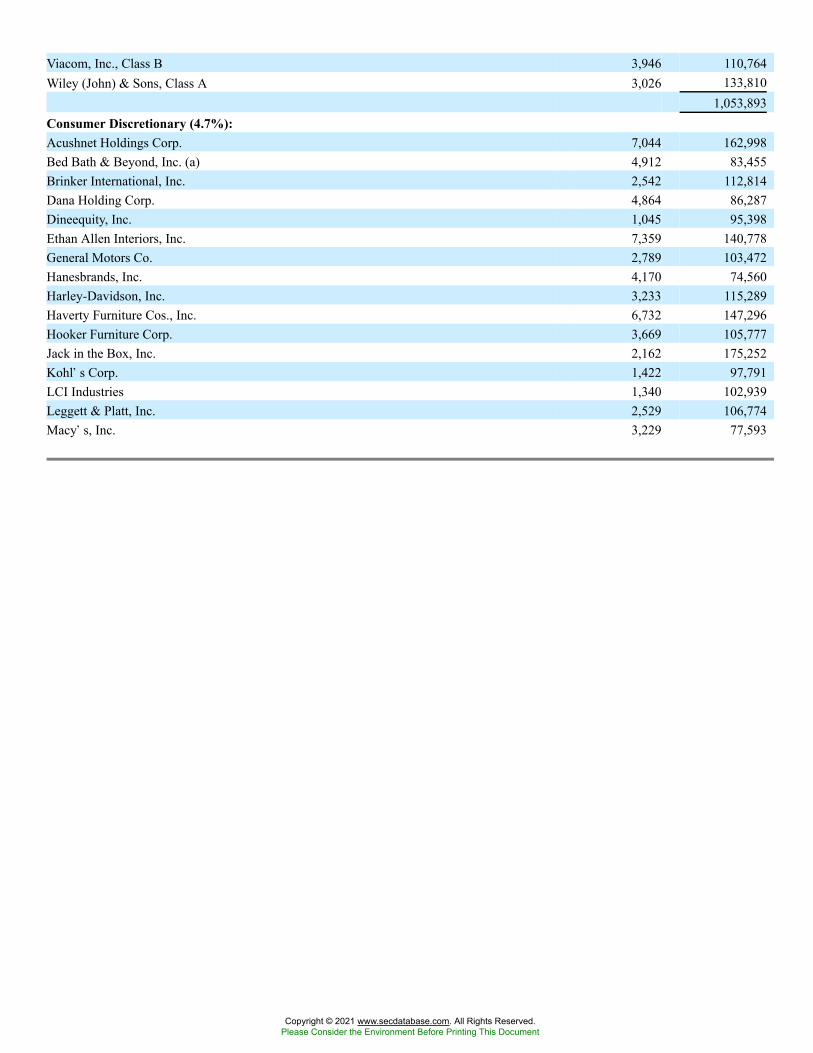
Viacom, Inc., Class B 3,946 110,764Wiley (John) & Sons, Class A 3,026 133,810
1,053,893Consumer Discretionary (4.7%):Acushnet Holdings Corp. 7,044 162,998Bed Bath & Beyond, Inc. (a) 4,912 83,455Brinker International, Inc. 2,542 112,814Dana Holding Corp. 4,864 86,287Dineequity, Inc. 1,045 95,398Ethan Allen Interiors, Inc. 7,359 140,778General Motors Co. 2,789 103,472Hanesbrands, Inc. 4,170 74,560Harley-Davidson, Inc. 3,233 115,289Haverty Furniture Cos., Inc. 6,732 147,296Hooker Furniture Corp. 3,669 105,777Jack in the Box, Inc. 2,162 175,252Kohl�s Corp. 1,422 97,791LCI Industries 1,340 102,939Leggett & Platt, Inc. 2,529 106,774Macy�s, Inc. 3,229 77,593
Copyright © 2021 www.secdatabase.com. All Rights Reserved.Please Consider the Environment Before Printing This Document
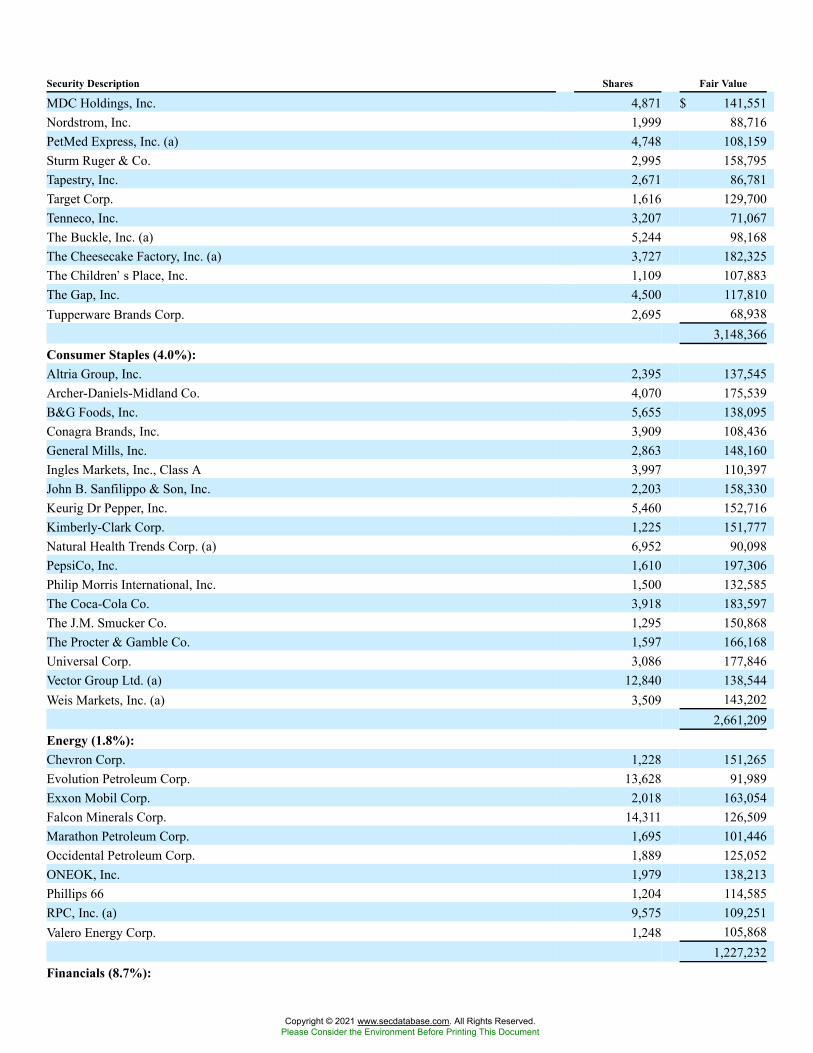
Security Description Shares Fair Value
MDC Holdings, Inc. 4,871 $ 141,551Nordstrom, Inc. 1,999 88,716PetMed Express, Inc. (a) 4,748 108,159Sturm Ruger & Co. 2,995 158,795Tapestry, Inc. 2,671 86,781Target Corp. 1,616 129,700Tenneco, Inc. 3,207 71,067The Buckle, Inc. (a) 5,244 98,168The Cheesecake Factory, Inc. (a) 3,727 182,325The Children�s Place, Inc. 1,109 107,883The Gap, Inc. 4,500 117,810Tupperware Brands Corp. 2,695 68,938
3,148,366Consumer Staples (4.0%):Altria Group, Inc. 2,395 137,545Archer-Daniels-Midland Co. 4,070 175,539B&G Foods, Inc. 5,655 138,095Conagra Brands, Inc. 3,909 108,436General Mills, Inc. 2,863 148,160Ingles Markets, Inc., Class A 3,997 110,397John B. Sanfilippo & Son, Inc. 2,203 158,330Keurig Dr Pepper, Inc. 5,460 152,716Kimberly-Clark Corp. 1,225 151,777Natural Health Trends Corp. (a) 6,952 90,098PepsiCo, Inc. 1,610 197,306Philip Morris International, Inc. 1,500 132,585The Coca-Cola Co. 3,918 183,597The J.M. Smucker Co. 1,295 150,868The Procter & Gamble Co. 1,597 166,168Universal Corp. 3,086 177,846Vector Group Ltd. (a) 12,840 138,544Weis Markets, Inc. (a) 3,509 143,202
2,661,209Energy (1.8%):Chevron Corp. 1,228 151,265Evolution Petroleum Corp. 13,628 91,989Exxon Mobil Corp. 2,018 163,054Falcon Minerals Corp. 14,311 126,509Marathon Petroleum Corp. 1,695 101,446Occidental Petroleum Corp. 1,889 125,052ONEOK, Inc. 1,979 138,213Phillips 66 1,204 114,585RPC, Inc. (a) 9,575 109,251Valero Energy Corp. 1,248 105,868
1,227,232Financials (8.7%):
Copyright © 2021 www.secdatabase.com. All Rights Reserved.Please Consider the Environment Before Printing This Document
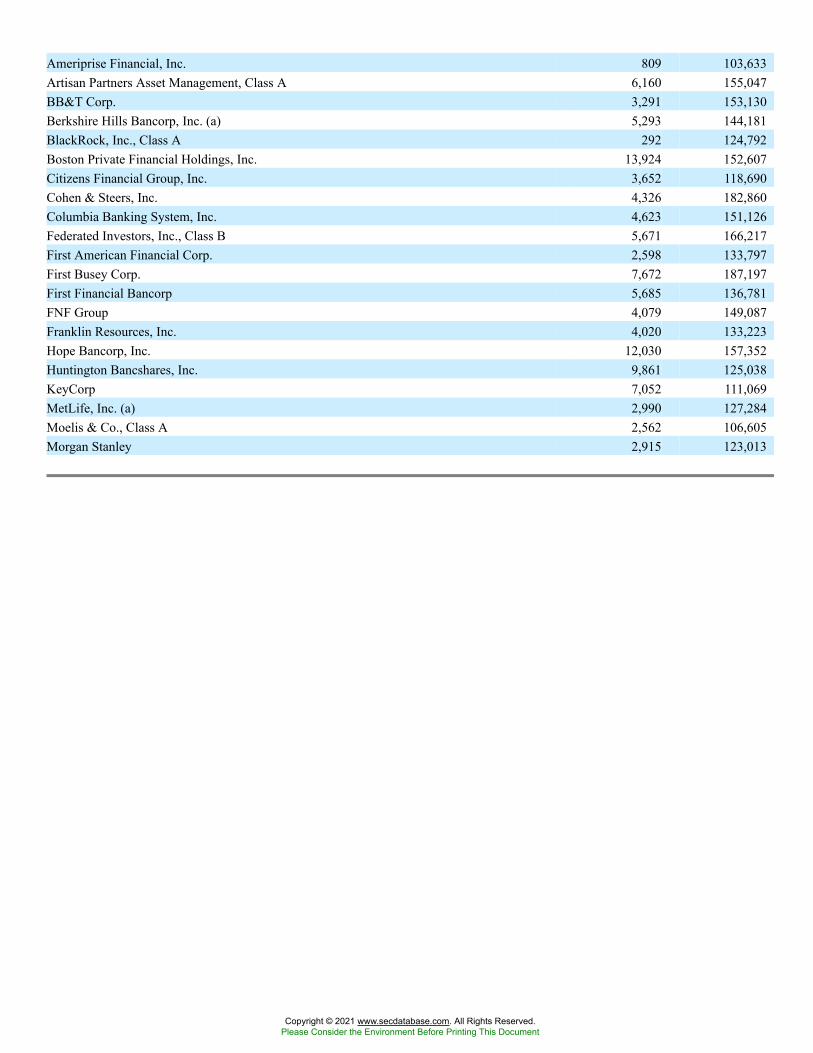
Ameriprise Financial, Inc. 809 103,633Artisan Partners Asset Management, Class A 6,160 155,047BB&T Corp. 3,291 153,130Berkshire Hills Bancorp, Inc. (a) 5,293 144,181BlackRock, Inc., Class A 292 124,792Boston Private Financial Holdings, Inc. 13,924 152,607Citizens Financial Group, Inc. 3,652 118,690Cohen & Steers, Inc. 4,326 182,860Columbia Banking System, Inc. 4,623 151,126Federated Investors, Inc., Class B 5,671 166,217First American Financial Corp. 2,598 133,797First Busey Corp. 7,672 187,197First Financial Bancorp 5,685 136,781FNF Group 4,079 149,087Franklin Resources, Inc. 4,020 133,223Hope Bancorp, Inc. 12,030 157,352Huntington Bancshares, Inc. 9,861 125,038KeyCorp 7,052 111,069MetLife, Inc. (a) 2,990 127,284Moelis & Co., Class A 2,562 106,605Morgan Stanley 2,915 123,013
Copyright © 2021 www.secdatabase.com. All Rights Reserved.Please Consider the Environment Before Printing This Document
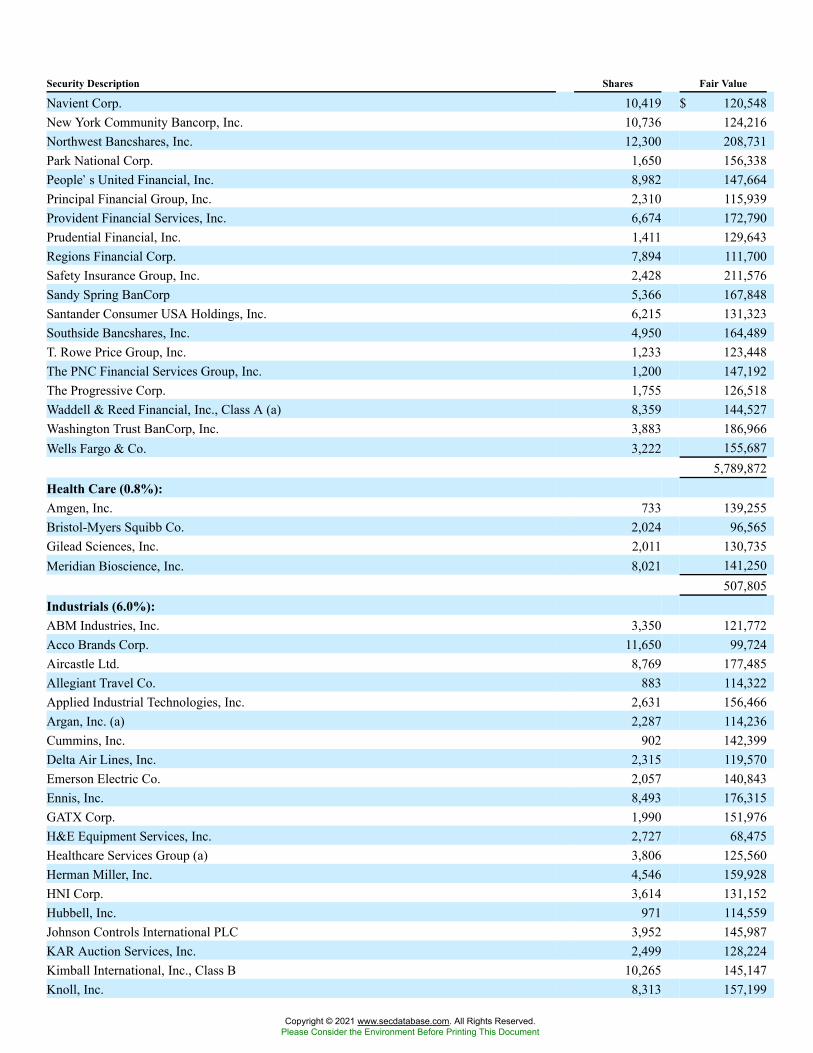
Security Description Shares Fair Value
Navient Corp. 10,419 $ 120,548New York Community Bancorp, Inc. 10,736 124,216Northwest Bancshares, Inc. 12,300 208,731Park National Corp. 1,650 156,338People�s United Financial, Inc. 8,982 147,664Principal Financial Group, Inc. 2,310 115,939Provident Financial Services, Inc. 6,674 172,790Prudential Financial, Inc. 1,411 129,643Regions Financial Corp. 7,894 111,700Safety Insurance Group, Inc. 2,428 211,576Sandy Spring BanCorp 5,366 167,848Santander Consumer USA Holdings, Inc. 6,215 131,323Southside Bancshares, Inc. 4,950 164,489T. Rowe Price Group, Inc. 1,233 123,448The PNC Financial Services Group, Inc. 1,200 147,192The Progressive Corp. 1,755 126,518Waddell & Reed Financial, Inc., Class A (a) 8,359 144,527Washington Trust BanCorp, Inc. 3,883 186,966Wells Fargo & Co. 3,222 155,687
5,789,872Health Care (0.8%):Amgen, Inc. 733 139,255Bristol-Myers Squibb Co. 2,024 96,565Gilead Sciences, Inc. 2,011 130,735Meridian Bioscience, Inc. 8,021 141,250
507,805Industrials (6.0%):ABM Industries, Inc. 3,350 121,772Acco Brands Corp. 11,650 99,724Aircastle Ltd. 8,769 177,485Allegiant Travel Co. 883 114,322Applied Industrial Technologies, Inc. 2,631 156,466Argan, Inc. (a) 2,287 114,236Cummins, Inc. 902 142,399Delta Air Lines, Inc. 2,315 119,570Emerson Electric Co. 2,057 140,843Ennis, Inc. 8,493 176,315GATX Corp. 1,990 151,976H&E Equipment Services, Inc. 2,727 68,475Healthcare Services Group (a) 3,806 125,560Herman Miller, Inc. 4,546 159,928HNI Corp. 3,614 131,152Hubbell, Inc. 971 114,559Johnson Controls International PLC 3,952 145,987KAR Auction Services, Inc. 2,499 128,224Kimball International, Inc., Class B 10,265 145,147Knoll, Inc. 8,313 157,199
Copyright © 2021 www.secdatabase.com. All Rights Reserved.Please Consider the Environment Before Printing This Document
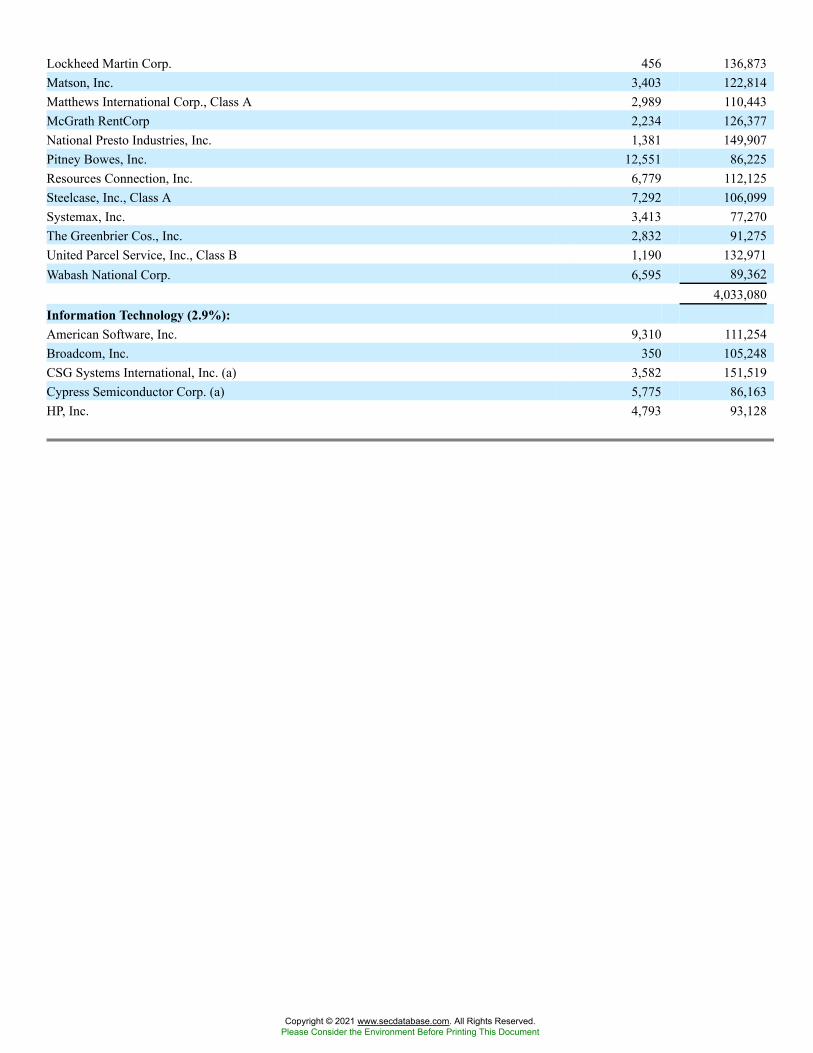
Lockheed Martin Corp. 456 136,873Matson, Inc. 3,403 122,814Matthews International Corp., Class A 2,989 110,443McGrath RentCorp 2,234 126,377National Presto Industries, Inc. 1,381 149,907Pitney Bowes, Inc. 12,551 86,225Resources Connection, Inc. 6,779 112,125Steelcase, Inc., Class A 7,292 106,099Systemax, Inc. 3,413 77,270The Greenbrier Cos., Inc. 2,832 91,275United Parcel Service, Inc., Class B 1,190 132,971Wabash National Corp. 6,595 89,362
4,033,080Information Technology (2.9%):American Software, Inc. 9,310 111,254Broadcom, Inc. 350 105,248CSG Systems International, Inc. (a) 3,582 151,519Cypress Semiconductor Corp. (a) 5,775 86,163HP, Inc. 4,793 93,128
Copyright © 2021 www.secdatabase.com. All Rights Reserved.Please Consider the Environment Before Printing This Document
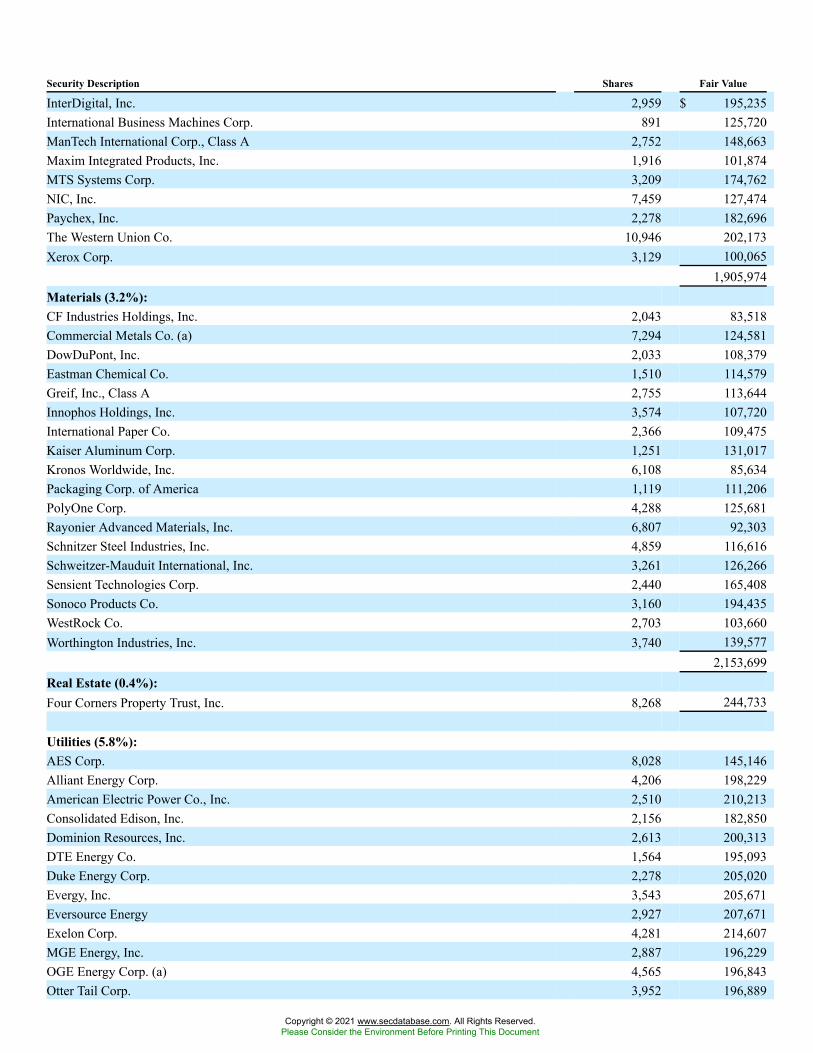
Security Description Shares Fair Value
InterDigital, Inc. 2,959 $ 195,235International Business Machines Corp. 891 125,720ManTech International Corp., Class A 2,752 148,663Maxim Integrated Products, Inc. 1,916 101,874MTS Systems Corp. 3,209 174,762NIC, Inc. 7,459 127,474Paychex, Inc. 2,278 182,696The Western Union Co. 10,946 202,173Xerox Corp. 3,129 100,065
1,905,974Materials (3.2%):CF Industries Holdings, Inc. 2,043 83,518Commercial Metals Co. (a) 7,294 124,581DowDuPont, Inc. 2,033 108,379Eastman Chemical Co. 1,510 114,579Greif, Inc., Class A 2,755 113,644Innophos Holdings, Inc. 3,574 107,720International Paper Co. 2,366 109,475Kaiser Aluminum Corp. 1,251 131,017Kronos Worldwide, Inc. 6,108 85,634Packaging Corp. of America 1,119 111,206PolyOne Corp. 4,288 125,681Rayonier Advanced Materials, Inc. 6,807 92,303Schnitzer Steel Industries, Inc. 4,859 116,616Schweitzer-Mauduit International, Inc. 3,261 126,266Sensient Technologies Corp. 2,440 165,408Sonoco Products Co. 3,160 194,435WestRock Co. 2,703 103,660Worthington Industries, Inc. 3,740 139,577
2,153,699Real Estate (0.4%):Four Corners Property Trust, Inc. 8,268 244,733
Utilities (5.8%):AES Corp. 8,028 145,146Alliant Energy Corp. 4,206 198,229American Electric Power Co., Inc. 2,510 210,213Consolidated Edison, Inc. 2,156 182,850Dominion Resources, Inc. 2,613 200,313DTE Energy Co. 1,564 195,093Duke Energy Corp. 2,278 205,020Evergy, Inc. 3,543 205,671Eversource Energy 2,927 207,671Exelon Corp. 4,281 214,607MGE Energy, Inc. 2,887 196,229OGE Energy Corp. (a) 4,565 196,843Otter Tail Corp. 3,952 196,889
Copyright © 2021 www.secdatabase.com. All Rights Reserved.Please Consider the Environment Before Printing This Document
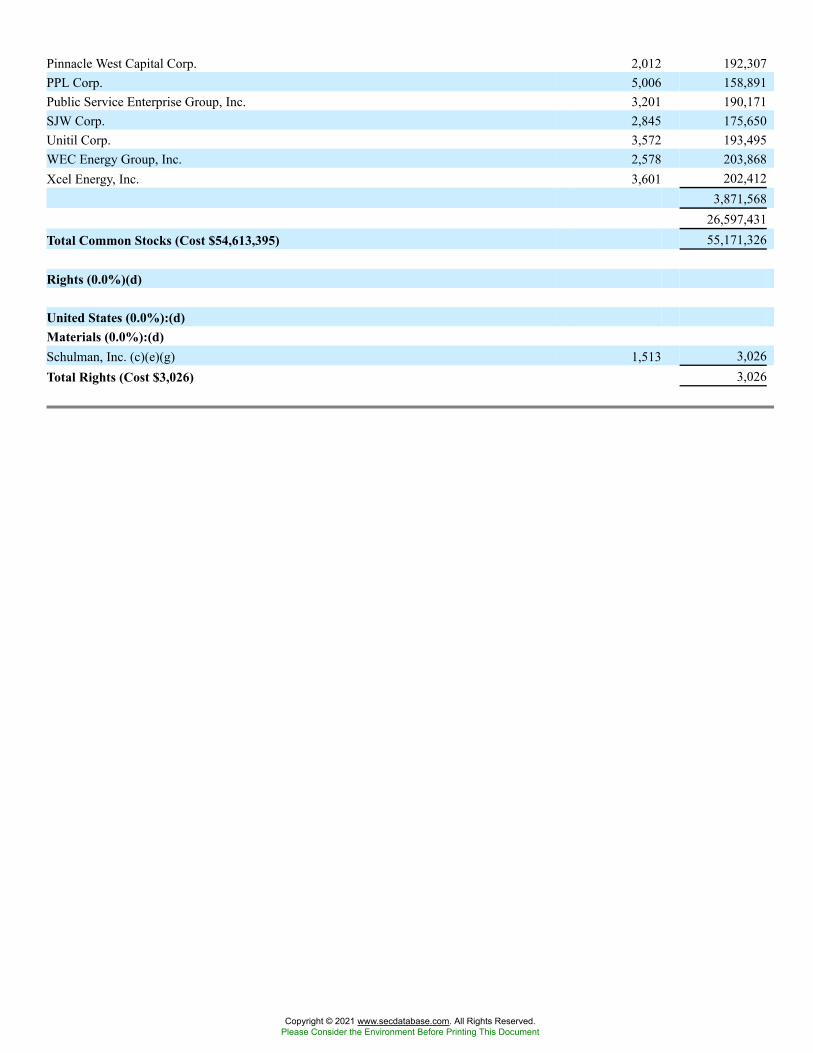
Pinnacle West Capital Corp. 2,012 192,307PPL Corp. 5,006 158,891Public Service Enterprise Group, Inc. 3,201 190,171SJW Corp. 2,845 175,650Unitil Corp. 3,572 193,495WEC Energy Group, Inc. 2,578 203,868Xcel Energy, Inc. 3,601 202,412
3,871,56826,597,431
Total Common Stocks (Cost $54,613,395) 55,171,326
Rights (0.0%)(d)
United States (0.0%):(d)Materials (0.0%):(d)Schulman, Inc. (c)(e)(g) 1,513 3,026Total Rights (Cost $3,026) 3,026
Copyright © 2021 www.secdatabase.com. All Rights Reserved.Please Consider the Environment Before Printing This Document
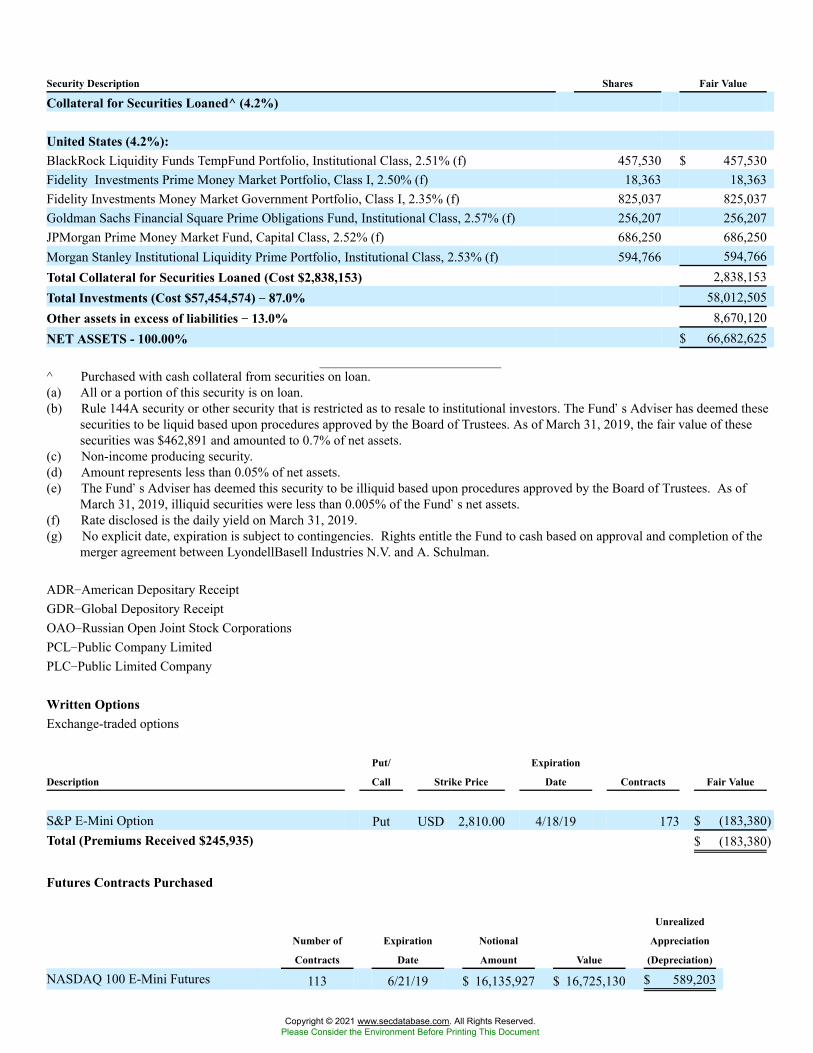
Security Description Shares Fair Value
Collateral for Securities Loaned^ (4.2%)
United States (4.2%):BlackRock Liquidity Funds TempFund Portfolio, Institutional Class, 2.51% (f) 457,530 $ 457,530Fidelity Investments Prime Money Market Portfolio, Class I, 2.50% (f) 18,363 18,363Fidelity Investments Money Market Government Portfolio, Class I, 2.35% (f) 825,037 825,037Goldman Sachs Financial Square Prime Obligations Fund, Institutional Class, 2.57% (f) 256,207 256,207JPMorgan Prime Money Market Fund, Capital Class, 2.52% (f) 686,250 686,250Morgan Stanley Institutional Liquidity Prime Portfolio, Institutional Class, 2.53% (f) 594,766 594,766Total Collateral for Securities Loaned (Cost $2,838,153) 2,838,153Total Investments (Cost $57,454,574) �� 87.0% 58,012,505Other assets in excess of liabilities �� 13.0% 8,670,120NET ASSETS - 100.00% $ 66,682,625
^ Purchased with cash collateral from securities on loan.(a) All or a portion of this security is on loan.(b) Rule 144A security or other security that is restricted as to resale to institutional investors. The Fund�s Adviser has deemed these
securities to be liquid based upon procedures approved by the Board of Trustees. As of March 31, 2019, the fair value of thesesecurities was $462,891 and amounted to 0.7% of net assets.
(c) Non-income producing security.(d) Amount represents less than 0.05% of net assets.(e) The Fund�s Adviser has deemed this security to be illiquid based upon procedures approved by the Board of Trustees. As of
March 31, 2019, illiquid securities were less than 0.005% of the Fund�s net assets.(f) Rate disclosed is the daily yield on March 31, 2019.(g) No explicit date, expiration is subject to contingencies. Rights entitle the Fund to cash based on approval and completion of the
merger agreement between LyondellBasell Industries N.V. and A. Schulman.
ADR�American Depositary ReceiptGDR�Global Depository ReceiptOAO�Russian Open Joint Stock CorporationsPCL�Public Company LimitedPLC�Public Limited Company
Written OptionsExchange-traded options
Description
Put/
Call Strike Price
Expiration
Date Contracts Fair Value
S&P E-Mini Option Put USD 2,810.00 4/18/19 173 $ (183,380)Total (Premiums Received $245,935) $ (183,380)
Futures Contracts Purchased
Number of
Contracts
Expiration
Date
Notional
Amount Value
Unrealized
Appreciation
(Depreciation)
NASDAQ 100 E-Mini Futures 113 6/21/19 $ 16,135,927 $ 16,725,130 $ 589,203
Copyright © 2021 www.secdatabase.com. All Rights Reserved.Please Consider the Environment Before Printing This Document
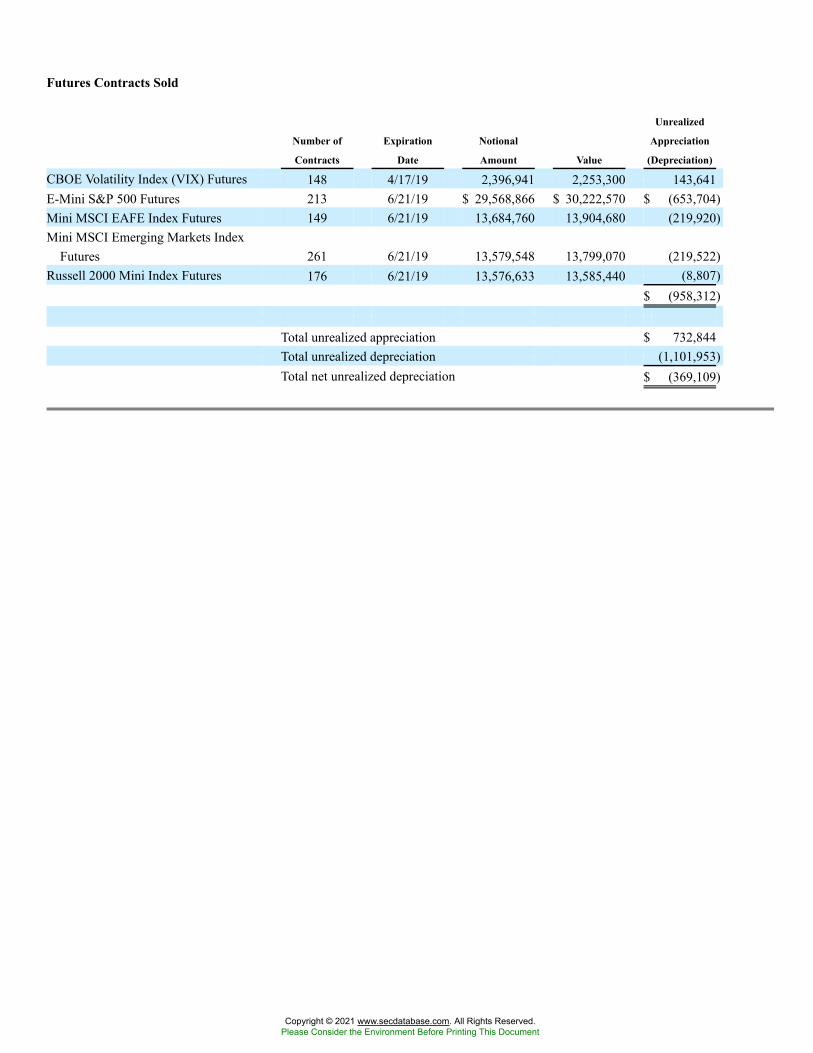
Futures Contracts Sold
Number of
Contracts
Expiration
Date
Notional
Amount Value
Unrealized
Appreciation
(Depreciation)
CBOE Volatility Index (VIX) Futures 148 4/17/19 2,396,941 2,253,300 143,641E-Mini S&P 500 Futures 213 6/21/19 $ 29,568,866 $ 30,222,570 $ (653,704)Mini MSCI EAFE Index Futures 149 6/21/19 13,684,760 13,904,680 (219,920)Mini MSCI Emerging Markets Index
Futures 261 6/21/19 13,579,548 13,799,070 (219,522)Russell 2000 Mini Index Futures 176 6/21/19 13,576,633 13,585,440 (8,807)
$ (958,312)
Total unrealized appreciation $ 732,844Total unrealized depreciation (1,101,953)Total net unrealized depreciation $ (369,109)
Copyright © 2021 www.secdatabase.com. All Rights Reserved.Please Consider the Environment Before Printing This Document
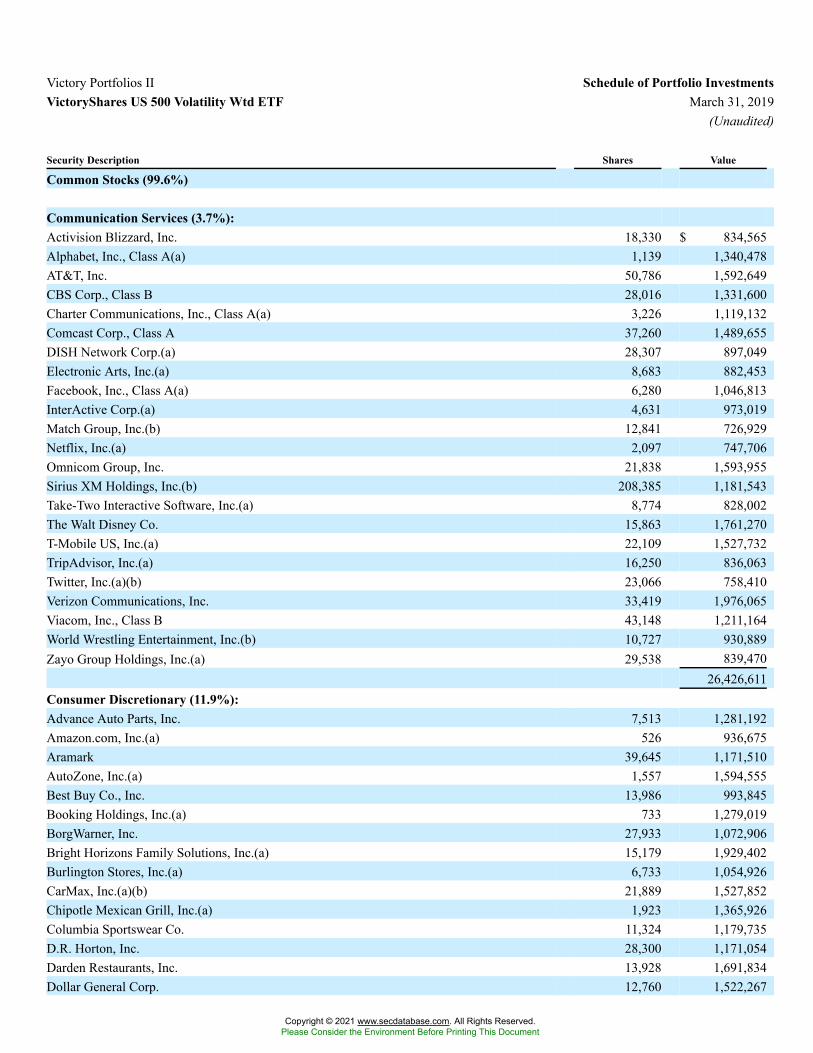
Victory Portfolios II Schedule of Portfolio InvestmentsVictoryShares US 500 Volatility Wtd ETF March 31, 2019
(Unaudited)
Security Description Shares Value
Common Stocks (99.6%)
Communication Services (3.7%):Activision Blizzard, Inc. 18,330 $ 834,565Alphabet, Inc., Class A(a) 1,139 1,340,478AT&T, Inc. 50,786 1,592,649CBS Corp., Class B 28,016 1,331,600Charter Communications, Inc., Class A(a) 3,226 1,119,132Comcast Corp., Class A 37,260 1,489,655DISH Network Corp.(a) 28,307 897,049Electronic Arts, Inc.(a) 8,683 882,453Facebook, Inc., Class A(a) 6,280 1,046,813InterActive Corp.(a) 4,631 973,019Match Group, Inc.(b) 12,841 726,929Netflix, Inc.(a) 2,097 747,706Omnicom Group, Inc. 21,838 1,593,955Sirius XM Holdings, Inc.(b) 208,385 1,181,543Take-Two Interactive Software, Inc.(a) 8,774 828,002The Walt Disney Co. 15,863 1,761,270T-Mobile US, Inc.(a) 22,109 1,527,732TripAdvisor, Inc.(a) 16,250 836,063Twitter, Inc.(a)(b) 23,066 758,410Verizon Communications, Inc. 33,419 1,976,065Viacom, Inc., Class B 43,148 1,211,164World Wrestling Entertainment, Inc.(b) 10,727 930,889Zayo Group Holdings, Inc.(a) 29,538 839,470
26,426,611Consumer Discretionary (11.9%):Advance Auto Parts, Inc. 7,513 1,281,192Amazon.com, Inc.(a) 526 936,675Aramark 39,645 1,171,510AutoZone, Inc.(a) 1,557 1,594,555Best Buy Co., Inc. 13,986 993,845Booking Holdings, Inc.(a) 733 1,279,019BorgWarner, Inc. 27,933 1,072,906Bright Horizons Family Solutions, Inc.(a) 15,179 1,929,402Burlington Stores, Inc.(a) 6,733 1,054,926CarMax, Inc.(a)(b) 21,889 1,527,852Chipotle Mexican Grill, Inc.(a) 1,923 1,365,926Columbia Sportswear Co. 11,324 1,179,735D.R. Horton, Inc. 28,300 1,171,054Darden Restaurants, Inc. 13,928 1,691,834Dollar General Corp. 12,760 1,522,267
Copyright © 2021 www.secdatabase.com. All Rights Reserved.Please Consider the Environment Before Printing This Document
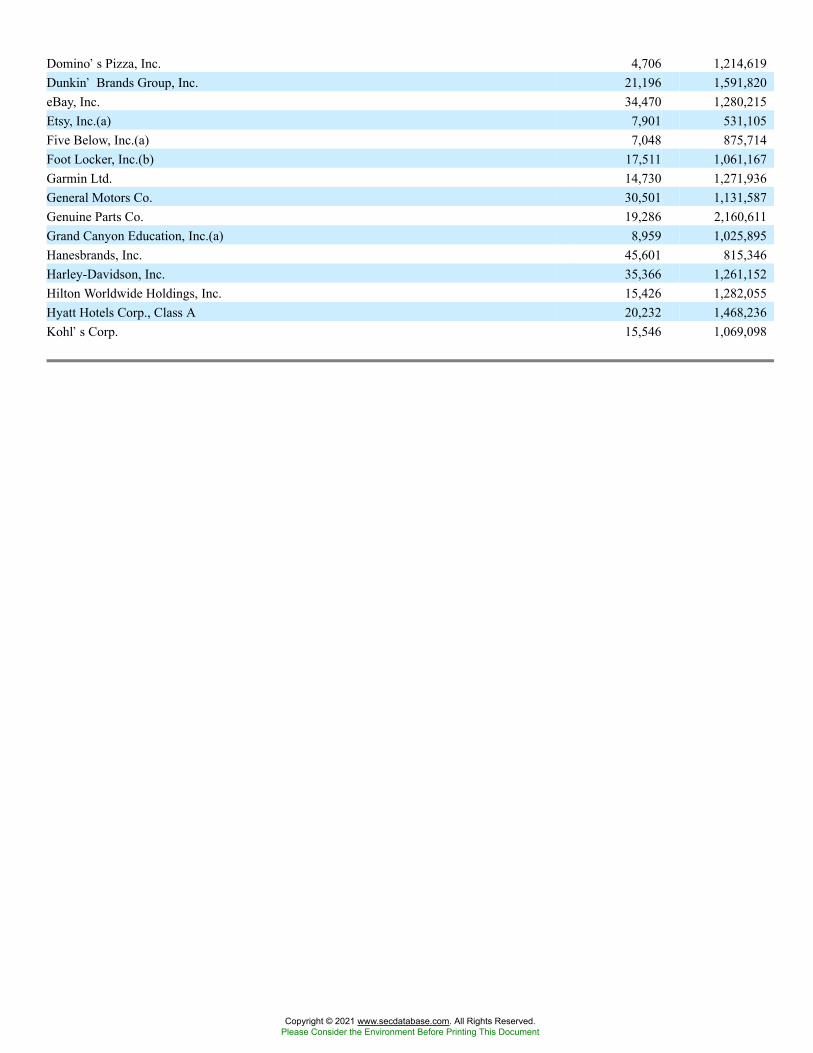
Domino�s Pizza, Inc. 4,706 1,214,619Dunkin� Brands Group, Inc. 21,196 1,591,820eBay, Inc. 34,470 1,280,215Etsy, Inc.(a) 7,901 531,105Five Below, Inc.(a) 7,048 875,714Foot Locker, Inc.(b) 17,511 1,061,167Garmin Ltd. 14,730 1,271,936General Motors Co. 30,501 1,131,587Genuine Parts Co. 19,286 2,160,611Grand Canyon Education, Inc.(a) 8,959 1,025,895Hanesbrands, Inc. 45,601 815,346Harley-Davidson, Inc. 35,366 1,261,152Hilton Worldwide Holdings, Inc. 15,426 1,282,055Hyatt Hotels Corp., Class A 20,232 1,468,236Kohl�s Corp. 15,546 1,069,098
Copyright © 2021 www.secdatabase.com. All Rights Reserved.Please Consider the Environment Before Printing This Document
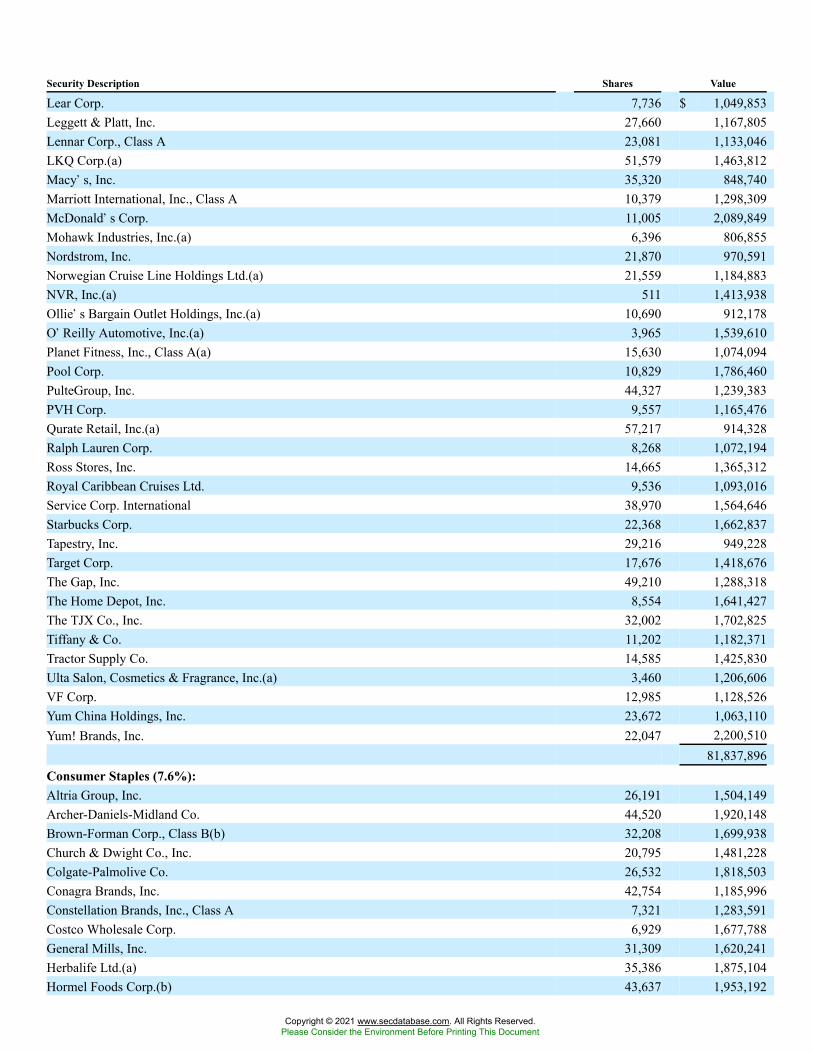
Security Description Shares Value
Lear Corp. 7,736 $ 1,049,853Leggett & Platt, Inc. 27,660 1,167,805Lennar Corp., Class A 23,081 1,133,046LKQ Corp.(a) 51,579 1,463,812Macy�s, Inc. 35,320 848,740Marriott International, Inc., Class A 10,379 1,298,309McDonald�s Corp. 11,005 2,089,849Mohawk Industries, Inc.(a) 6,396 806,855Nordstrom, Inc. 21,870 970,591Norwegian Cruise Line Holdings Ltd.(a) 21,559 1,184,883NVR, Inc.(a) 511 1,413,938Ollie�s Bargain Outlet Holdings, Inc.(a) 10,690 912,178O�Reilly Automotive, Inc.(a) 3,965 1,539,610Planet Fitness, Inc., Class A(a) 15,630 1,074,094Pool Corp. 10,829 1,786,460PulteGroup, Inc. 44,327 1,239,383PVH Corp. 9,557 1,165,476Qurate Retail, Inc.(a) 57,217 914,328Ralph Lauren Corp. 8,268 1,072,194Ross Stores, Inc. 14,665 1,365,312Royal Caribbean Cruises Ltd. 9,536 1,093,016Service Corp. International 38,970 1,564,646Starbucks Corp. 22,368 1,662,837Tapestry, Inc. 29,216 949,228Target Corp. 17,676 1,418,676The Gap, Inc. 49,210 1,288,318The Home Depot, Inc. 8,554 1,641,427The TJX Co., Inc. 32,002 1,702,825Tiffany & Co. 11,202 1,182,371Tractor Supply Co. 14,585 1,425,830Ulta Salon, Cosmetics & Fragrance, Inc.(a) 3,460 1,206,606VF Corp. 12,985 1,128,526Yum China Holdings, Inc. 23,672 1,063,110Yum! Brands, Inc. 22,047 2,200,510
81,837,896Consumer Staples (7.6%):Altria Group, Inc. 26,191 1,504,149Archer-Daniels-Midland Co. 44,520 1,920,148Brown-Forman Corp., Class B(b) 32,208 1,699,938Church & Dwight Co., Inc. 20,795 1,481,228Colgate-Palmolive Co. 26,532 1,818,503Conagra Brands, Inc. 42,754 1,185,996Constellation Brands, Inc., Class A 7,321 1,283,591Costco Wholesale Corp. 6,929 1,677,788General Mills, Inc. 31,309 1,620,241Herbalife Ltd.(a) 35,386 1,875,104Hormel Foods Corp.(b) 43,637 1,953,192
Copyright © 2021 www.secdatabase.com. All Rights Reserved.Please Consider the Environment Before Printing This Document
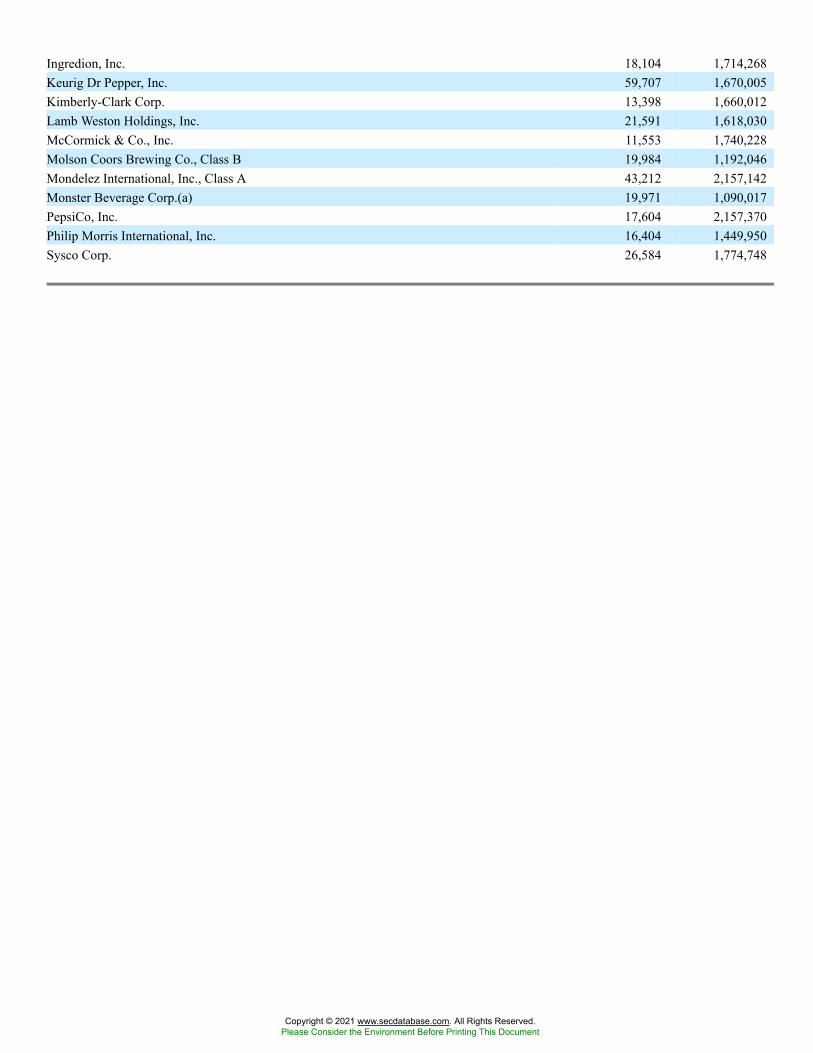
Ingredion, Inc. 18,104 1,714,268Keurig Dr Pepper, Inc. 59,707 1,670,005Kimberly-Clark Corp. 13,398 1,660,012Lamb Weston Holdings, Inc. 21,591 1,618,030McCormick & Co., Inc. 11,553 1,740,228Molson Coors Brewing Co., Class B 19,984 1,192,046Mondelez International, Inc., Class A 43,212 2,157,142Monster Beverage Corp.(a) 19,971 1,090,017PepsiCo, Inc. 17,604 2,157,370Philip Morris International, Inc. 16,404 1,449,950Sysco Corp. 26,584 1,774,748
Copyright © 2021 www.secdatabase.com. All Rights Reserved.Please Consider the Environment Before Printing This Document
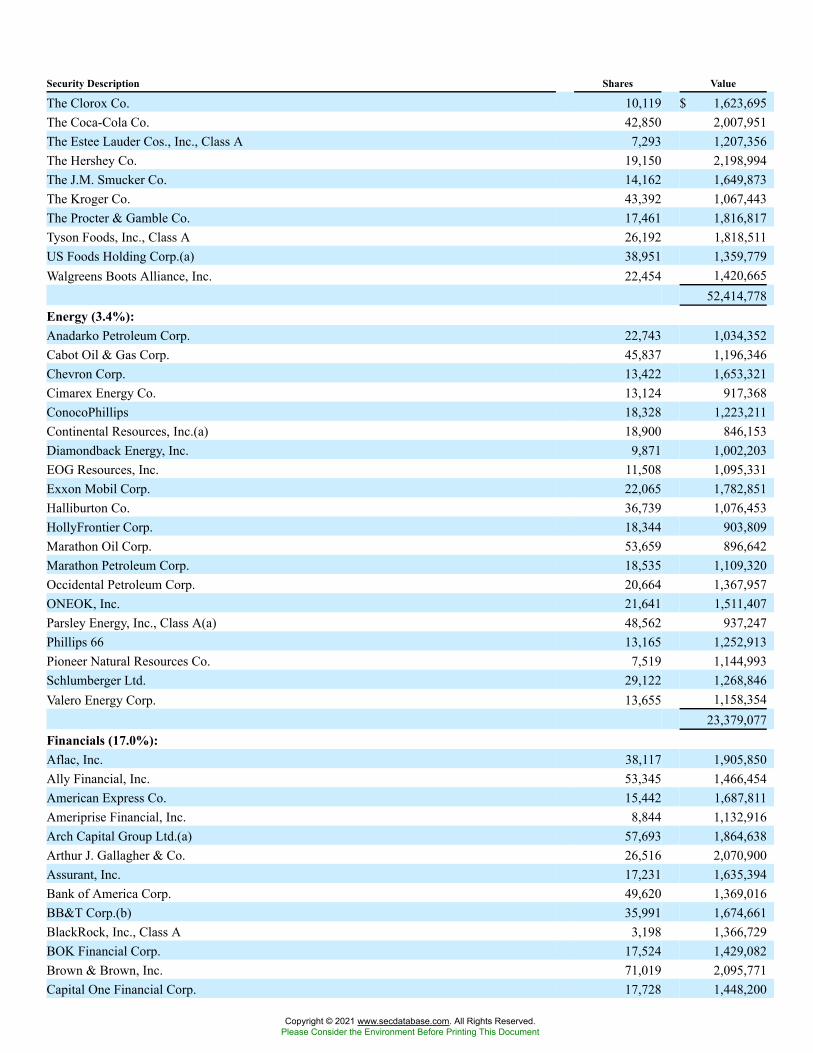
Security Description Shares Value
The Clorox Co. 10,119 $ 1,623,695The Coca-Cola Co. 42,850 2,007,951The Estee Lauder Cos., Inc., Class A 7,293 1,207,356The Hershey Co. 19,150 2,198,994The J.M. Smucker Co. 14,162 1,649,873The Kroger Co. 43,392 1,067,443The Procter & Gamble Co. 17,461 1,816,817Tyson Foods, Inc., Class A 26,192 1,818,511US Foods Holding Corp.(a) 38,951 1,359,779Walgreens Boots Alliance, Inc. 22,454 1,420,665
52,414,778Energy (3.4%):Anadarko Petroleum Corp. 22,743 1,034,352Cabot Oil & Gas Corp. 45,837 1,196,346Chevron Corp. 13,422 1,653,321Cimarex Energy Co. 13,124 917,368ConocoPhillips 18,328 1,223,211Continental Resources, Inc.(a) 18,900 846,153Diamondback Energy, Inc. 9,871 1,002,203EOG Resources, Inc. 11,508 1,095,331Exxon Mobil Corp. 22,065 1,782,851Halliburton Co. 36,739 1,076,453HollyFrontier Corp. 18,344 903,809Marathon Oil Corp. 53,659 896,642Marathon Petroleum Corp. 18,535 1,109,320Occidental Petroleum Corp. 20,664 1,367,957ONEOK, Inc. 21,641 1,511,407Parsley Energy, Inc., Class A(a) 48,562 937,247Phillips 66 13,165 1,252,913Pioneer Natural Resources Co. 7,519 1,144,993Schlumberger Ltd. 29,122 1,268,846Valero Energy Corp. 13,655 1,158,354
23,379,077Financials (17.0%):Aflac, Inc. 38,117 1,905,850Ally Financial, Inc. 53,345 1,466,454American Express Co. 15,442 1,687,811Ameriprise Financial, Inc. 8,844 1,132,916Arch Capital Group Ltd.(a) 57,693 1,864,638Arthur J. Gallagher & Co. 26,516 2,070,900Assurant, Inc. 17,231 1,635,394Bank of America Corp. 49,620 1,369,016BB&T Corp.(b) 35,991 1,674,661BlackRock, Inc., Class A 3,198 1,366,729BOK Financial Corp. 17,524 1,429,082Brown & Brown, Inc. 71,019 2,095,771Capital One Financial Corp. 17,728 1,448,200
Copyright © 2021 www.secdatabase.com. All Rights Reserved.Please Consider the Environment Before Printing This Document
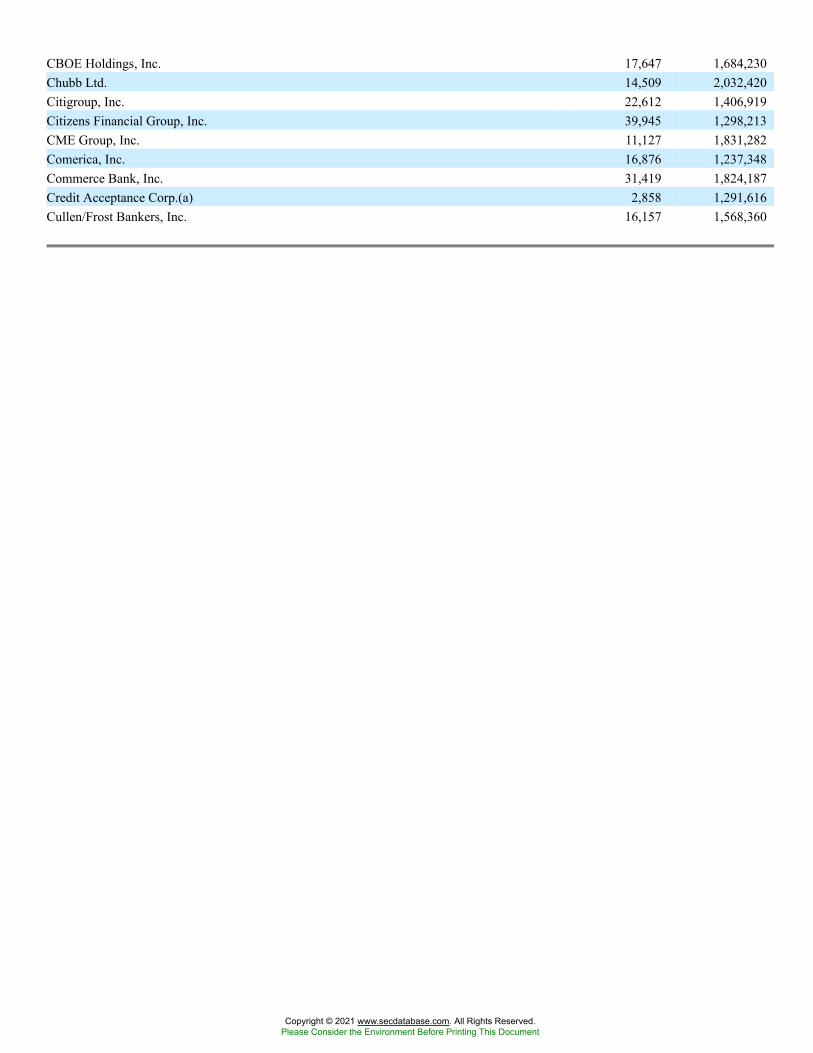
CBOE Holdings, Inc. 17,647 1,684,230Chubb Ltd. 14,509 2,032,420Citigroup, Inc. 22,612 1,406,919Citizens Financial Group, Inc. 39,945 1,298,213CME Group, Inc. 11,127 1,831,282Comerica, Inc. 16,876 1,237,348Commerce Bank, Inc. 31,419 1,824,187Credit Acceptance Corp.(a) 2,858 1,291,616Cullen/Frost Bankers, Inc. 16,157 1,568,360
Copyright © 2021 www.secdatabase.com. All Rights Reserved.Please Consider the Environment Before Printing This Document
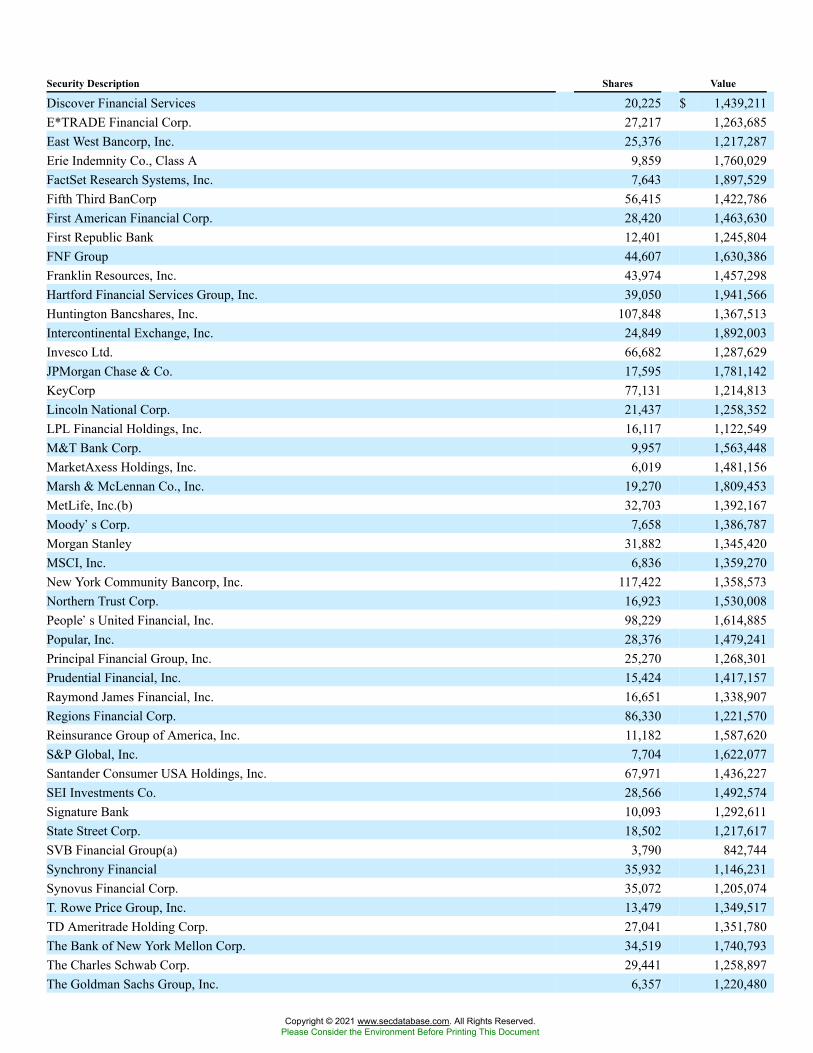
Security Description Shares Value
Discover Financial Services 20,225 $ 1,439,211E*TRADE Financial Corp. 27,217 1,263,685East West Bancorp, Inc. 25,376 1,217,287Erie Indemnity Co., Class A 9,859 1,760,029FactSet Research Systems, Inc. 7,643 1,897,529Fifth Third BanCorp 56,415 1,422,786First American Financial Corp. 28,420 1,463,630First Republic Bank 12,401 1,245,804FNF Group 44,607 1,630,386Franklin Resources, Inc. 43,974 1,457,298Hartford Financial Services Group, Inc. 39,050 1,941,566Huntington Bancshares, Inc. 107,848 1,367,513Intercontinental Exchange, Inc. 24,849 1,892,003Invesco Ltd. 66,682 1,287,629JPMorgan Chase & Co. 17,595 1,781,142KeyCorp 77,131 1,214,813Lincoln National Corp. 21,437 1,258,352LPL Financial Holdings, Inc. 16,117 1,122,549M&T Bank Corp. 9,957 1,563,448MarketAxess Holdings, Inc. 6,019 1,481,156Marsh & McLennan Co., Inc. 19,270 1,809,453MetLife, Inc.(b) 32,703 1,392,167Moody�s Corp. 7,658 1,386,787Morgan Stanley 31,882 1,345,420MSCI, Inc. 6,836 1,359,270New York Community Bancorp, Inc. 117,422 1,358,573Northern Trust Corp. 16,923 1,530,008People�s United Financial, Inc. 98,229 1,614,885Popular, Inc. 28,376 1,479,241Principal Financial Group, Inc. 25,270 1,268,301Prudential Financial, Inc. 15,424 1,417,157Raymond James Financial, Inc. 16,651 1,338,907Regions Financial Corp. 86,330 1,221,570Reinsurance Group of America, Inc. 11,182 1,587,620S&P Global, Inc. 7,704 1,622,077Santander Consumer USA Holdings, Inc. 67,971 1,436,227SEI Investments Co. 28,566 1,492,574Signature Bank 10,093 1,292,611State Street Corp. 18,502 1,217,617SVB Financial Group(a) 3,790 842,744Synchrony Financial 35,932 1,146,231Synovus Financial Corp. 35,072 1,205,074T. Rowe Price Group, Inc. 13,479 1,349,517TD Ameritrade Holding Corp. 27,041 1,351,780The Bank of New York Mellon Corp. 34,519 1,740,793The Charles Schwab Corp. 29,441 1,258,897The Goldman Sachs Group, Inc. 6,357 1,220,480
Copyright © 2021 www.secdatabase.com. All Rights Reserved.Please Consider the Environment Before Printing This Document
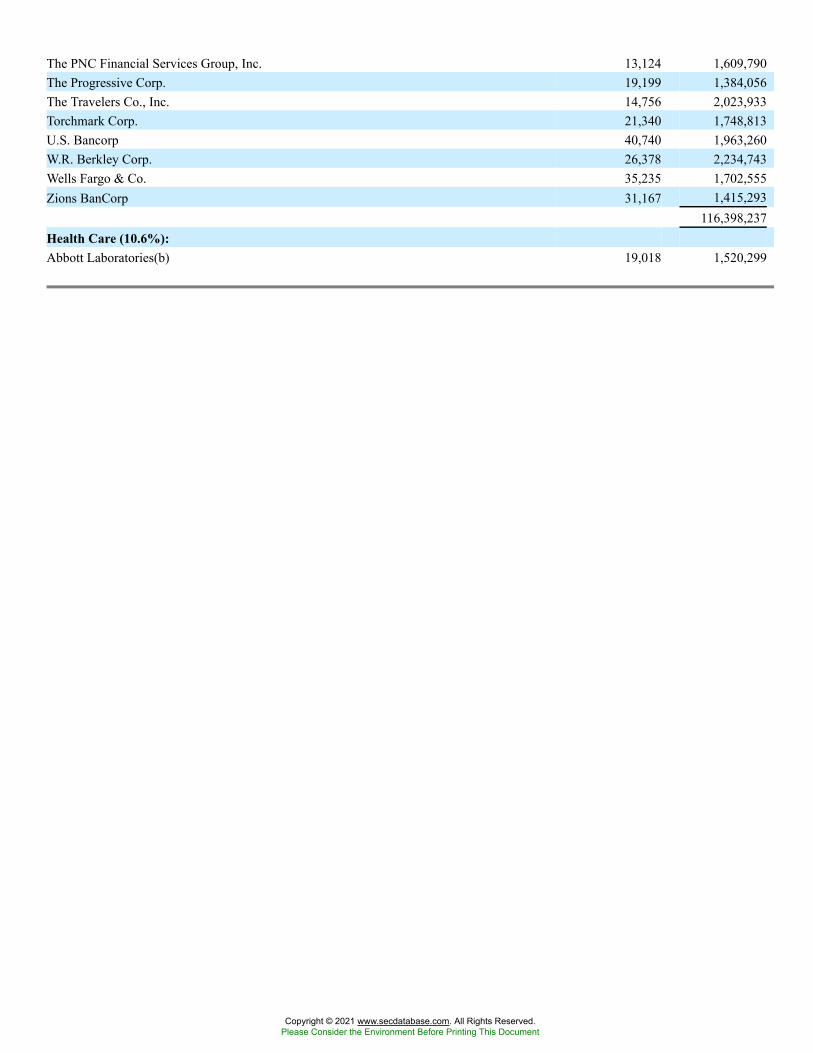
The PNC Financial Services Group, Inc. 13,124 1,609,790The Progressive Corp. 19,199 1,384,056The Travelers Co., Inc. 14,756 2,023,933Torchmark Corp. 21,340 1,748,813U.S. Bancorp 40,740 1,963,260W.R. Berkley Corp. 26,378 2,234,743Wells Fargo & Co. 35,235 1,702,555Zions BanCorp 31,167 1,415,293
116,398,237Health Care (10.6%):Abbott Laboratories(b) 19,018 1,520,299
Copyright © 2021 www.secdatabase.com. All Rights Reserved.Please Consider the Environment Before Printing This Document
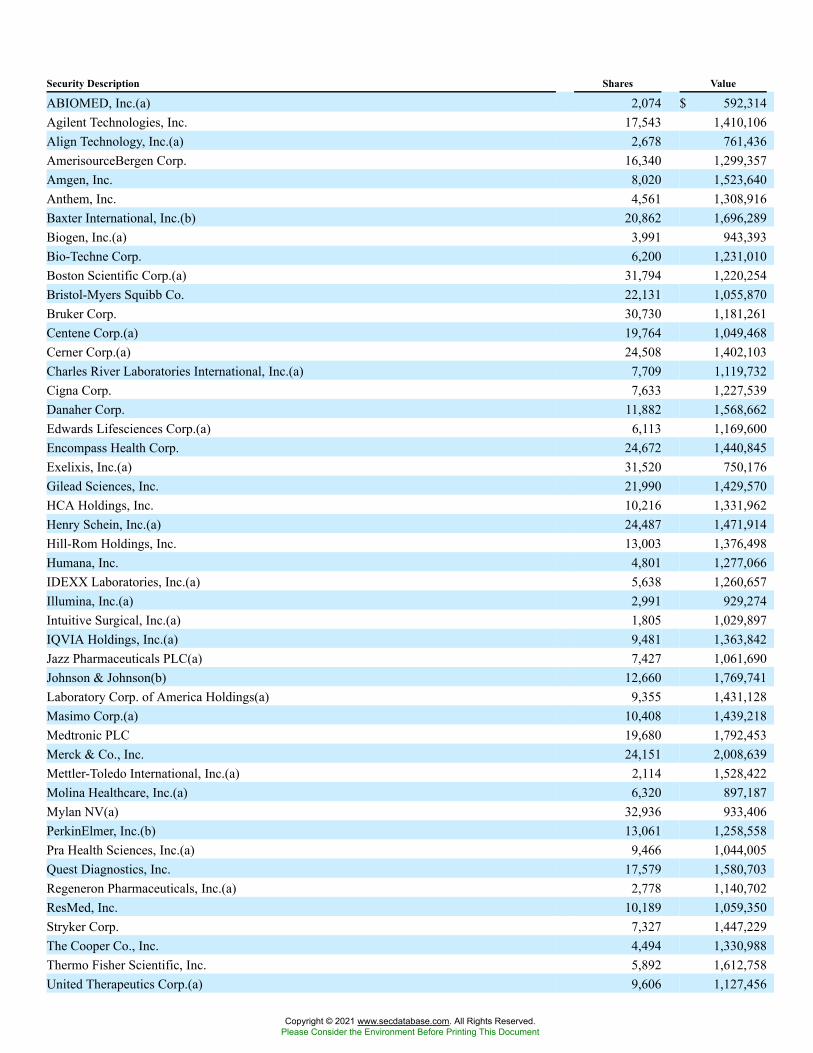
Security Description Shares Value
ABIOMED, Inc.(a) 2,074 $ 592,314Agilent Technologies, Inc. 17,543 1,410,106Align Technology, Inc.(a) 2,678 761,436AmerisourceBergen Corp. 16,340 1,299,357Amgen, Inc. 8,020 1,523,640Anthem, Inc. 4,561 1,308,916Baxter International, Inc.(b) 20,862 1,696,289Biogen, Inc.(a) 3,991 943,393Bio-Techne Corp. 6,200 1,231,010Boston Scientific Corp.(a) 31,794 1,220,254Bristol-Myers Squibb Co. 22,131 1,055,870Bruker Corp. 30,730 1,181,261Centene Corp.(a) 19,764 1,049,468Cerner Corp.(a) 24,508 1,402,103Charles River Laboratories International, Inc.(a) 7,709 1,119,732Cigna Corp. 7,633 1,227,539Danaher Corp. 11,882 1,568,662Edwards Lifesciences Corp.(a) 6,113 1,169,600Encompass Health Corp. 24,672 1,440,845Exelixis, Inc.(a) 31,520 750,176Gilead Sciences, Inc. 21,990 1,429,570HCA Holdings, Inc. 10,216 1,331,962Henry Schein, Inc.(a) 24,487 1,471,914Hill-Rom Holdings, Inc. 13,003 1,376,498Humana, Inc. 4,801 1,277,066IDEXX Laboratories, Inc.(a) 5,638 1,260,657Illumina, Inc.(a) 2,991 929,274Intuitive Surgical, Inc.(a) 1,805 1,029,897IQVIA Holdings, Inc.(a) 9,481 1,363,842Jazz Pharmaceuticals PLC(a) 7,427 1,061,690Johnson & Johnson(b) 12,660 1,769,741Laboratory Corp. of America Holdings(a) 9,355 1,431,128Masimo Corp.(a) 10,408 1,439,218Medtronic PLC 19,680 1,792,453Merck & Co., Inc. 24,151 2,008,639Mettler-Toledo International, Inc.(a) 2,114 1,528,422Molina Healthcare, Inc.(a) 6,320 897,187Mylan NV(a) 32,936 933,406PerkinElmer, Inc.(b) 13,061 1,258,558Pra Health Sciences, Inc.(a) 9,466 1,044,005Quest Diagnostics, Inc. 17,579 1,580,703Regeneron Pharmaceuticals, Inc.(a) 2,778 1,140,702ResMed, Inc. 10,189 1,059,350Stryker Corp. 7,327 1,447,229The Cooper Co., Inc. 4,494 1,330,988Thermo Fisher Scientific, Inc. 5,892 1,612,758United Therapeutics Corp.(a) 9,606 1,127,456
Copyright © 2021 www.secdatabase.com. All Rights Reserved.Please Consider the Environment Before Printing This Document
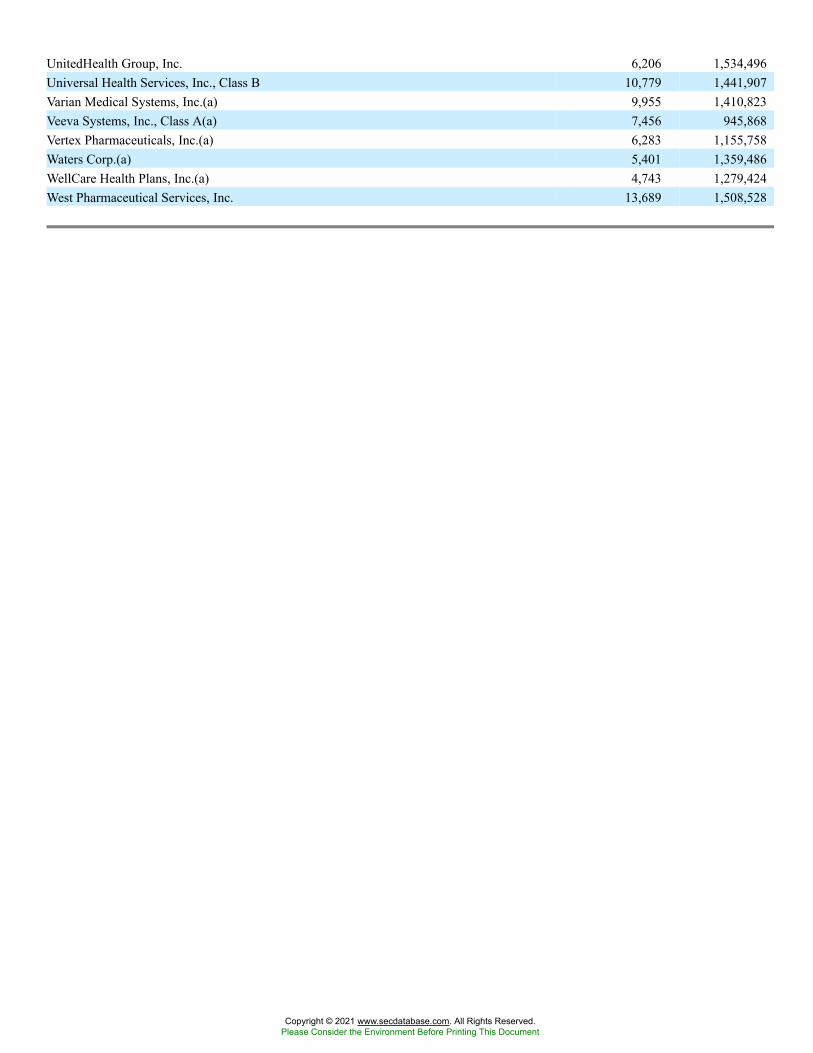
UnitedHealth Group, Inc. 6,206 1,534,496Universal Health Services, Inc., Class B 10,779 1,441,907Varian Medical Systems, Inc.(a) 9,955 1,410,823Veeva Systems, Inc., Class A(a) 7,456 945,868Vertex Pharmaceuticals, Inc.(a) 6,283 1,155,758Waters Corp.(a) 5,401 1,359,486WellCare Health Plans, Inc.(a) 4,743 1,279,424West Pharmaceutical Services, Inc. 13,689 1,508,528
Copyright © 2021 www.secdatabase.com. All Rights Reserved.Please Consider the Environment Before Printing This Document
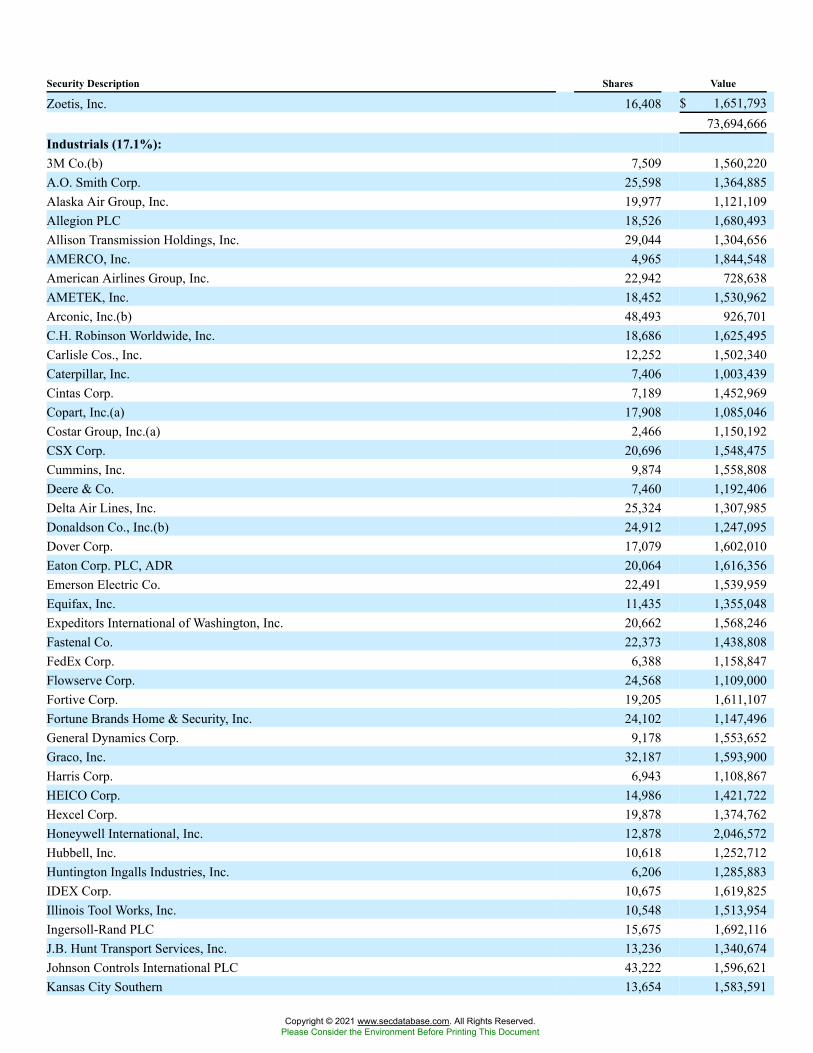
Security Description Shares Value
Zoetis, Inc. 16,408 $ 1,651,79373,694,666
Industrials (17.1%):3M Co.(b) 7,509 1,560,220A.O. Smith Corp. 25,598 1,364,885Alaska Air Group, Inc. 19,977 1,121,109Allegion PLC 18,526 1,680,493Allison Transmission Holdings, Inc. 29,044 1,304,656AMERCO, Inc. 4,965 1,844,548American Airlines Group, Inc. 22,942 728,638AMETEK, Inc. 18,452 1,530,962Arconic, Inc.(b) 48,493 926,701C.H. Robinson Worldwide, Inc. 18,686 1,625,495Carlisle Cos., Inc. 12,252 1,502,340Caterpillar, Inc. 7,406 1,003,439Cintas Corp. 7,189 1,452,969Copart, Inc.(a) 17,908 1,085,046Costar Group, Inc.(a) 2,466 1,150,192CSX Corp. 20,696 1,548,475Cummins, Inc. 9,874 1,558,808Deere & Co. 7,460 1,192,406Delta Air Lines, Inc. 25,324 1,307,985Donaldson Co., Inc.(b) 24,912 1,247,095Dover Corp. 17,079 1,602,010Eaton Corp. PLC, ADR 20,064 1,616,356Emerson Electric Co. 22,491 1,539,959Equifax, Inc. 11,435 1,355,048Expeditors International of Washington, Inc. 20,662 1,568,246Fastenal Co. 22,373 1,438,808FedEx Corp. 6,388 1,158,847Flowserve Corp. 24,568 1,109,000Fortive Corp. 19,205 1,611,107Fortune Brands Home & Security, Inc. 24,102 1,147,496General Dynamics Corp. 9,178 1,553,652Graco, Inc. 32,187 1,593,900Harris Corp. 6,943 1,108,867HEICO Corp. 14,986 1,421,722Hexcel Corp. 19,878 1,374,762Honeywell International, Inc. 12,878 2,046,572Hubbell, Inc. 10,618 1,252,712Huntington Ingalls Industries, Inc. 6,206 1,285,883IDEX Corp. 10,675 1,619,825Illinois Tool Works, Inc. 10,548 1,513,954Ingersoll-Rand PLC 15,675 1,692,116J.B. Hunt Transport Services, Inc. 13,236 1,340,674Johnson Controls International PLC 43,222 1,596,621Kansas City Southern 13,654 1,583,591
Copyright © 2021 www.secdatabase.com. All Rights Reserved.Please Consider the Environment Before Printing This Document
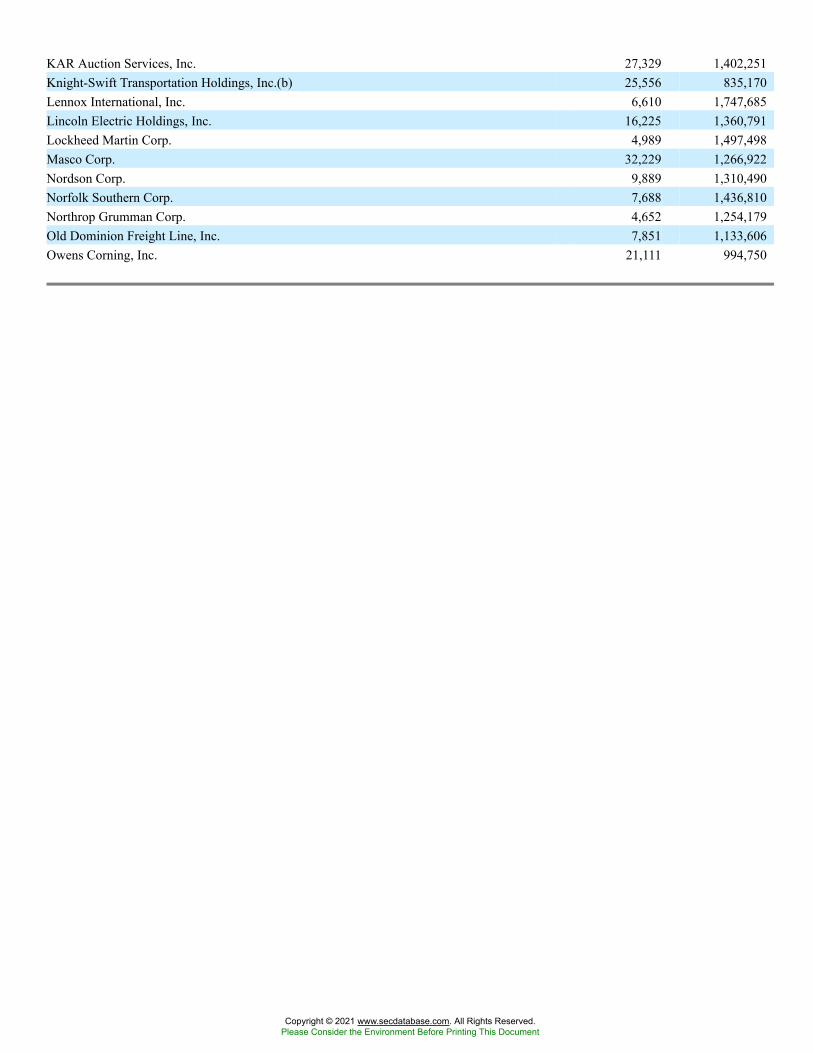
KAR Auction Services, Inc. 27,329 1,402,251Knight-Swift Transportation Holdings, Inc.(b) 25,556 835,170Lennox International, Inc. 6,610 1,747,685Lincoln Electric Holdings, Inc. 16,225 1,360,791Lockheed Martin Corp. 4,989 1,497,498Masco Corp. 32,229 1,266,922Nordson Corp. 9,889 1,310,490Norfolk Southern Corp. 7,688 1,436,810Northrop Grumman Corp. 4,652 1,254,179Old Dominion Freight Line, Inc. 7,851 1,133,606Owens Corning, Inc. 21,111 994,750
Copyright © 2021 www.secdatabase.com. All Rights Reserved.Please Consider the Environment Before Printing This Document
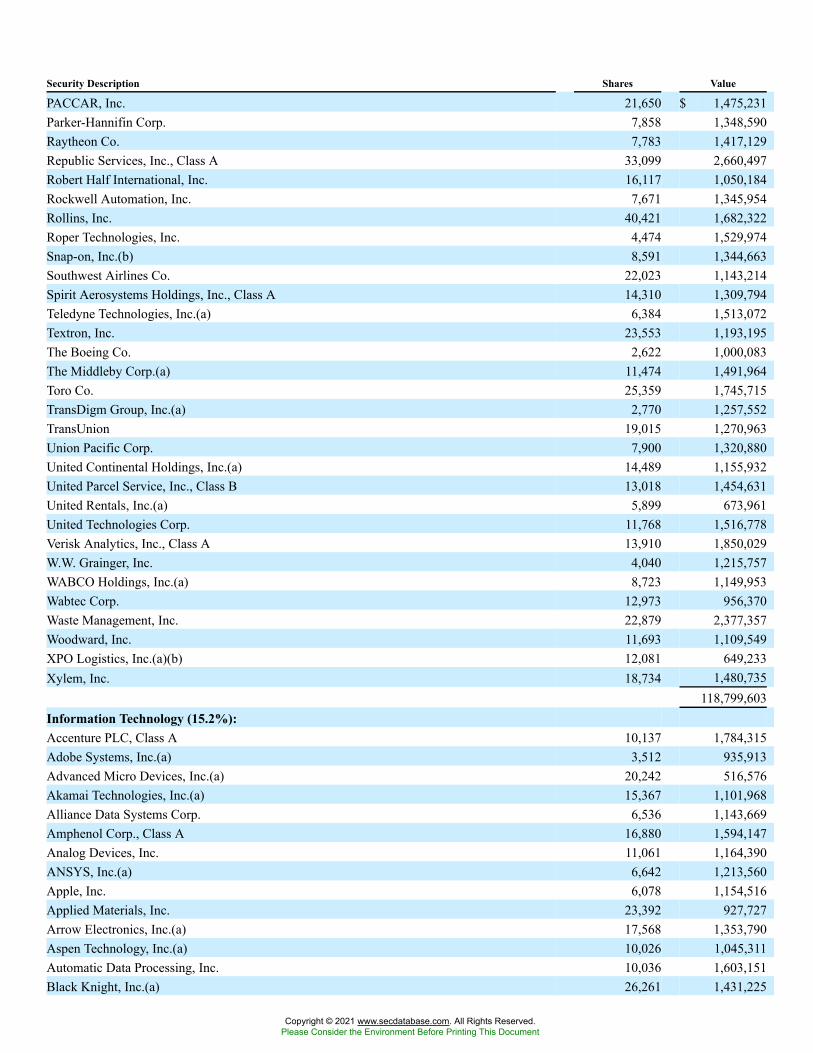
Security Description Shares Value
PACCAR, Inc. 21,650 $ 1,475,231Parker-Hannifin Corp. 7,858 1,348,590Raytheon Co. 7,783 1,417,129Republic Services, Inc., Class A 33,099 2,660,497Robert Half International, Inc. 16,117 1,050,184Rockwell Automation, Inc. 7,671 1,345,954Rollins, Inc. 40,421 1,682,322Roper Technologies, Inc. 4,474 1,529,974Snap-on, Inc.(b) 8,591 1,344,663Southwest Airlines Co. 22,023 1,143,214Spirit Aerosystems Holdings, Inc., Class A 14,310 1,309,794Teledyne Technologies, Inc.(a) 6,384 1,513,072Textron, Inc. 23,553 1,193,195The Boeing Co. 2,622 1,000,083The Middleby Corp.(a) 11,474 1,491,964Toro Co. 25,359 1,745,715TransDigm Group, Inc.(a) 2,770 1,257,552TransUnion 19,015 1,270,963Union Pacific Corp. 7,900 1,320,880United Continental Holdings, Inc.(a) 14,489 1,155,932United Parcel Service, Inc., Class B 13,018 1,454,631United Rentals, Inc.(a) 5,899 673,961United Technologies Corp. 11,768 1,516,778Verisk Analytics, Inc., Class A 13,910 1,850,029W.W. Grainger, Inc. 4,040 1,215,757WABCO Holdings, Inc.(a) 8,723 1,149,953Wabtec Corp. 12,973 956,370Waste Management, Inc. 22,879 2,377,357Woodward, Inc. 11,693 1,109,549XPO Logistics, Inc.(a)(b) 12,081 649,233Xylem, Inc. 18,734 1,480,735
118,799,603Information Technology (15.2%):Accenture PLC, Class A 10,137 1,784,315Adobe Systems, Inc.(a) 3,512 935,913Advanced Micro Devices, Inc.(a) 20,242 516,576Akamai Technologies, Inc.(a) 15,367 1,101,968Alliance Data Systems Corp. 6,536 1,143,669Amphenol Corp., Class A 16,880 1,594,147Analog Devices, Inc. 11,061 1,164,390ANSYS, Inc.(a) 6,642 1,213,560Apple, Inc. 6,078 1,154,516Applied Materials, Inc. 23,392 927,727Arrow Electronics, Inc.(a) 17,568 1,353,790Aspen Technology, Inc.(a) 10,026 1,045,311Automatic Data Processing, Inc. 10,036 1,603,151Black Knight, Inc.(a) 26,261 1,431,225
Copyright © 2021 www.secdatabase.com. All Rights Reserved.Please Consider the Environment Before Printing This Document
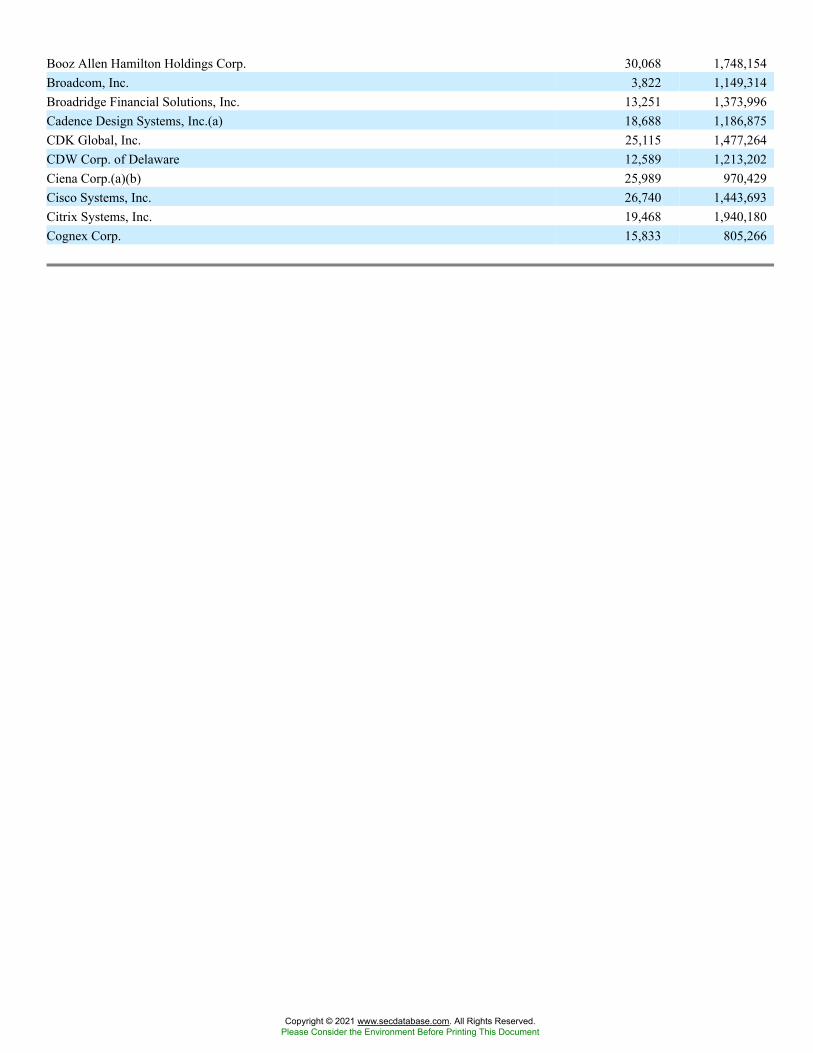
Booz Allen Hamilton Holdings Corp. 30,068 1,748,154Broadcom, Inc. 3,822 1,149,314Broadridge Financial Solutions, Inc. 13,251 1,373,996Cadence Design Systems, Inc.(a) 18,688 1,186,875CDK Global, Inc. 25,115 1,477,264CDW Corp. of Delaware 12,589 1,213,202Ciena Corp.(a)(b) 25,989 970,429Cisco Systems, Inc. 26,740 1,443,693Citrix Systems, Inc. 19,468 1,940,180Cognex Corp. 15,833 805,266
Copyright © 2021 www.secdatabase.com. All Rights Reserved.Please Consider the Environment Before Printing This Document
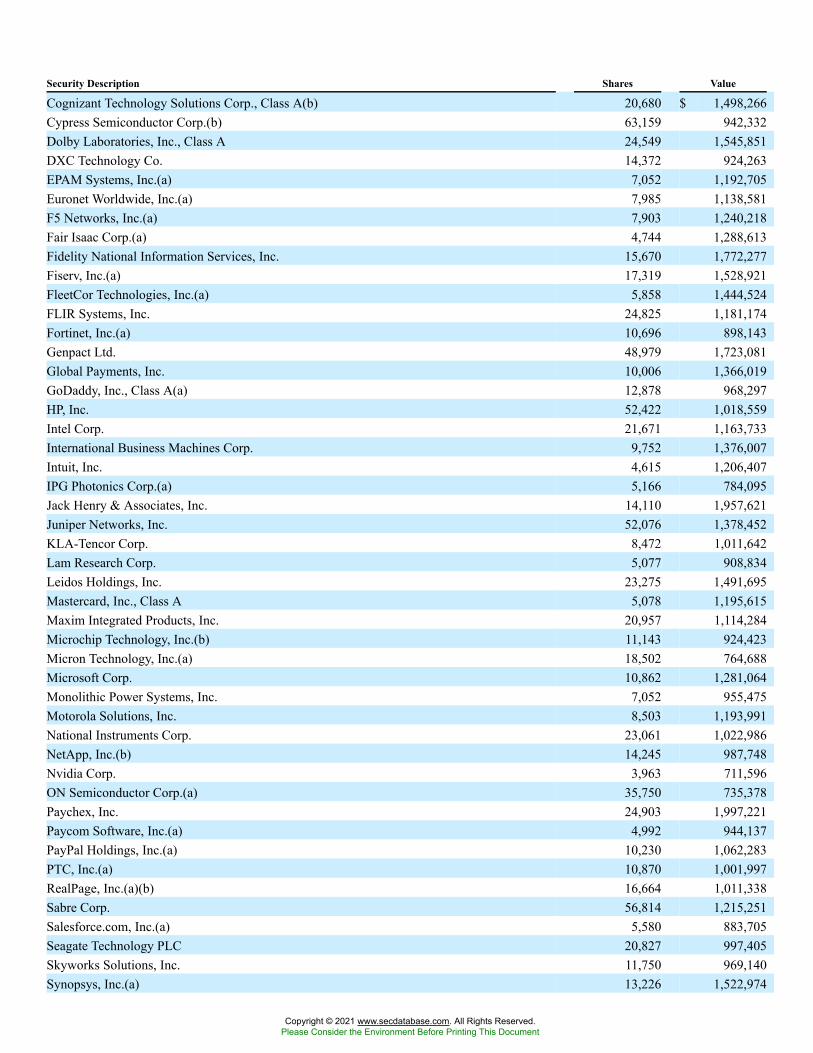
Security Description Shares Value
Cognizant Technology Solutions Corp., Class A(b) 20,680 $ 1,498,266Cypress Semiconductor Corp.(b) 63,159 942,332Dolby Laboratories, Inc., Class A 24,549 1,545,851DXC Technology Co. 14,372 924,263EPAM Systems, Inc.(a) 7,052 1,192,705Euronet Worldwide, Inc.(a) 7,985 1,138,581F5 Networks, Inc.(a) 7,903 1,240,218Fair Isaac Corp.(a) 4,744 1,288,613Fidelity National Information Services, Inc. 15,670 1,772,277Fiserv, Inc.(a) 17,319 1,528,921FleetCor Technologies, Inc.(a) 5,858 1,444,524FLIR Systems, Inc. 24,825 1,181,174Fortinet, Inc.(a) 10,696 898,143Genpact Ltd. 48,979 1,723,081Global Payments, Inc. 10,006 1,366,019GoDaddy, Inc., Class A(a) 12,878 968,297HP, Inc. 52,422 1,018,559Intel Corp. 21,671 1,163,733International Business Machines Corp. 9,752 1,376,007Intuit, Inc. 4,615 1,206,407IPG Photonics Corp.(a) 5,166 784,095Jack Henry & Associates, Inc. 14,110 1,957,621Juniper Networks, Inc. 52,076 1,378,452KLA-Tencor Corp. 8,472 1,011,642Lam Research Corp. 5,077 908,834Leidos Holdings, Inc. 23,275 1,491,695Mastercard, Inc., Class A 5,078 1,195,615Maxim Integrated Products, Inc. 20,957 1,114,284Microchip Technology, Inc.(b) 11,143 924,423Micron Technology, Inc.(a) 18,502 764,688Microsoft Corp. 10,862 1,281,064Monolithic Power Systems, Inc. 7,052 955,475Motorola Solutions, Inc. 8,503 1,193,991National Instruments Corp. 23,061 1,022,986NetApp, Inc.(b) 14,245 987,748Nvidia Corp. 3,963 711,596ON Semiconductor Corp.(a) 35,750 735,378Paychex, Inc. 24,903 1,997,221Paycom Software, Inc.(a) 4,992 944,137PayPal Holdings, Inc.(a) 10,230 1,062,283PTC, Inc.(a) 10,870 1,001,997RealPage, Inc.(a)(b) 16,664 1,011,338Sabre Corp. 56,814 1,215,251Salesforce.com, Inc.(a) 5,580 883,705Seagate Technology PLC 20,827 997,405Skyworks Solutions, Inc. 11,750 969,140Synopsys, Inc.(a) 13,226 1,522,974
Copyright © 2021 www.secdatabase.com. All Rights Reserved.Please Consider the Environment Before Printing This Document
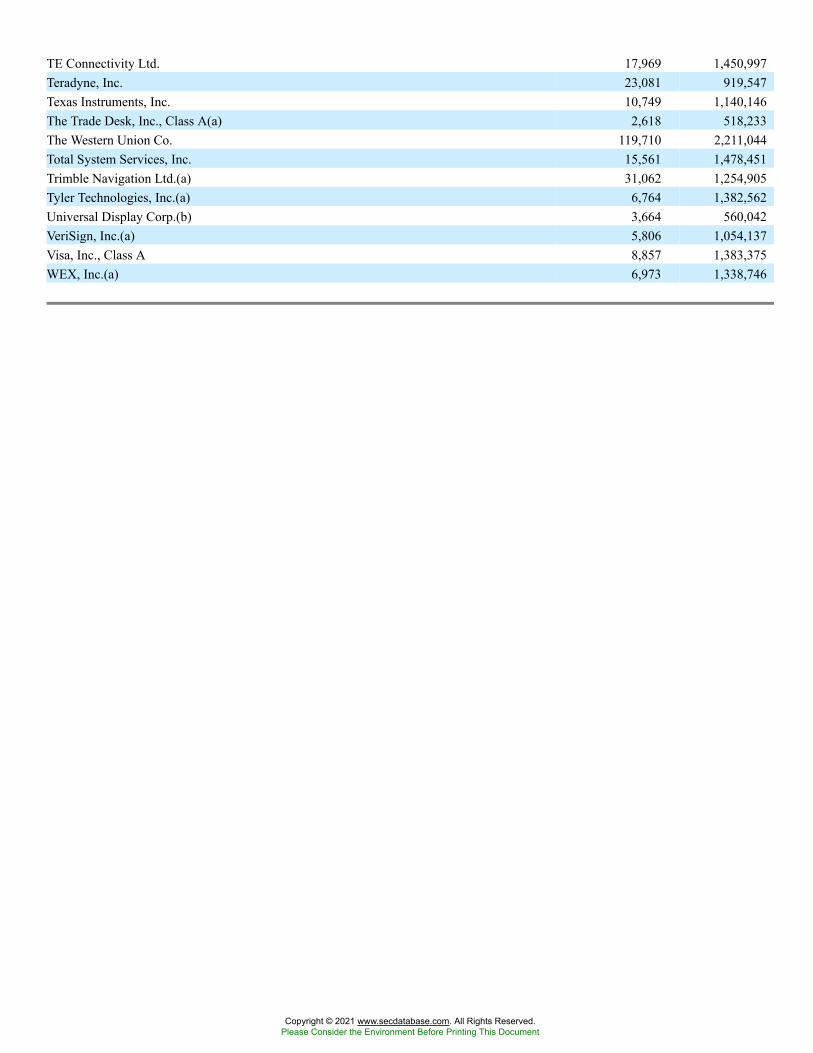
TE Connectivity Ltd. 17,969 1,450,997Teradyne, Inc. 23,081 919,547Texas Instruments, Inc. 10,749 1,140,146The Trade Desk, Inc., Class A(a) 2,618 518,233The Western Union Co. 119,710 2,211,044Total System Services, Inc. 15,561 1,478,451Trimble Navigation Ltd.(a) 31,062 1,254,905Tyler Technologies, Inc.(a) 6,764 1,382,562Universal Display Corp.(b) 3,664 560,042VeriSign, Inc.(a) 5,806 1,054,137Visa, Inc., Class A 8,857 1,383,375WEX, Inc.(a) 6,973 1,338,746
Copyright © 2021 www.secdatabase.com. All Rights Reserved.Please Consider the Environment Before Printing This Document
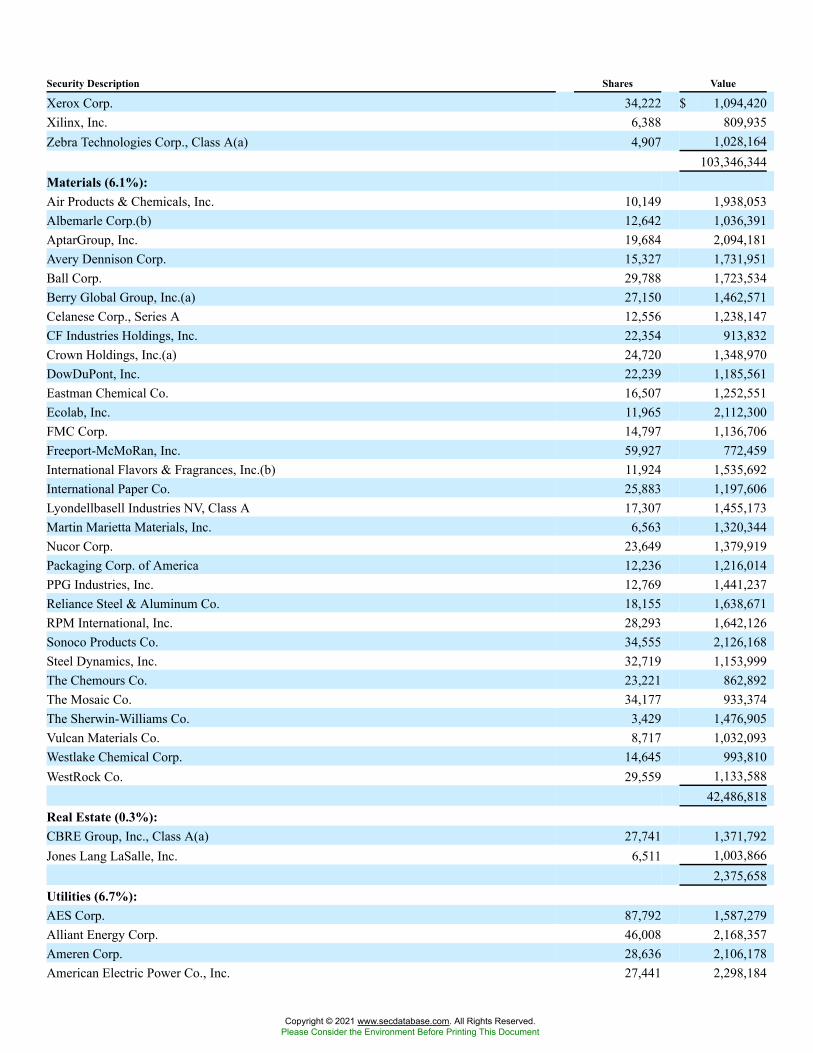
Security Description Shares Value
Xerox Corp. 34,222 $ 1,094,420Xilinx, Inc. 6,388 809,935Zebra Technologies Corp., Class A(a) 4,907 1,028,164
103,346,344Materials (6.1%):Air Products & Chemicals, Inc. 10,149 1,938,053Albemarle Corp.(b) 12,642 1,036,391AptarGroup, Inc. 19,684 2,094,181Avery Dennison Corp. 15,327 1,731,951Ball Corp. 29,788 1,723,534Berry Global Group, Inc.(a) 27,150 1,462,571Celanese Corp., Series A 12,556 1,238,147CF Industries Holdings, Inc. 22,354 913,832Crown Holdings, Inc.(a) 24,720 1,348,970DowDuPont, Inc. 22,239 1,185,561Eastman Chemical Co. 16,507 1,252,551Ecolab, Inc. 11,965 2,112,300FMC Corp. 14,797 1,136,706Freeport-McMoRan, Inc. 59,927 772,459International Flavors & Fragrances, Inc.(b) 11,924 1,535,692International Paper Co. 25,883 1,197,606Lyondellbasell Industries NV, Class A 17,307 1,455,173Martin Marietta Materials, Inc. 6,563 1,320,344Nucor Corp. 23,649 1,379,919Packaging Corp. of America 12,236 1,216,014PPG Industries, Inc. 12,769 1,441,237Reliance Steel & Aluminum Co. 18,155 1,638,671RPM International, Inc. 28,293 1,642,126Sonoco Products Co. 34,555 2,126,168Steel Dynamics, Inc. 32,719 1,153,999The Chemours Co. 23,221 862,892The Mosaic Co. 34,177 933,374The Sherwin-Williams Co. 3,429 1,476,905Vulcan Materials Co. 8,717 1,032,093Westlake Chemical Corp. 14,645 993,810WestRock Co. 29,559 1,133,588
42,486,818Real Estate (0.3%):CBRE Group, Inc., Class A(a) 27,741 1,371,792Jones Lang LaSalle, Inc. 6,511 1,003,866
2,375,658Utilities (6.7%):AES Corp. 87,792 1,587,279Alliant Energy Corp. 46,008 2,168,357Ameren Corp. 28,636 2,106,178American Electric Power Co., Inc. 27,441 2,298,184
Copyright © 2021 www.secdatabase.com. All Rights Reserved.Please Consider the Environment Before Printing This Document
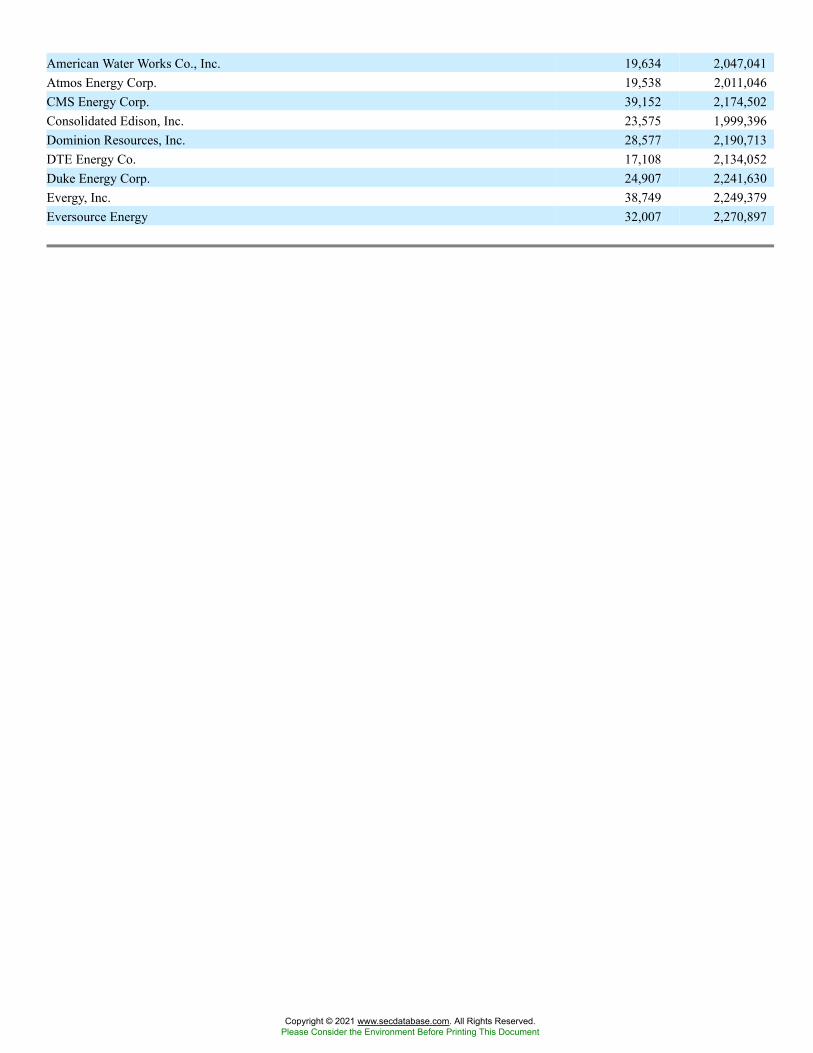
American Water Works Co., Inc. 19,634 2,047,041Atmos Energy Corp. 19,538 2,011,046CMS Energy Corp. 39,152 2,174,502Consolidated Edison, Inc. 23,575 1,999,396Dominion Resources, Inc. 28,577 2,190,713DTE Energy Co. 17,108 2,134,052Duke Energy Corp. 24,907 2,241,630Evergy, Inc. 38,749 2,249,379Eversource Energy 32,007 2,270,897
Copyright © 2021 www.secdatabase.com. All Rights Reserved.Please Consider the Environment Before Printing This Document
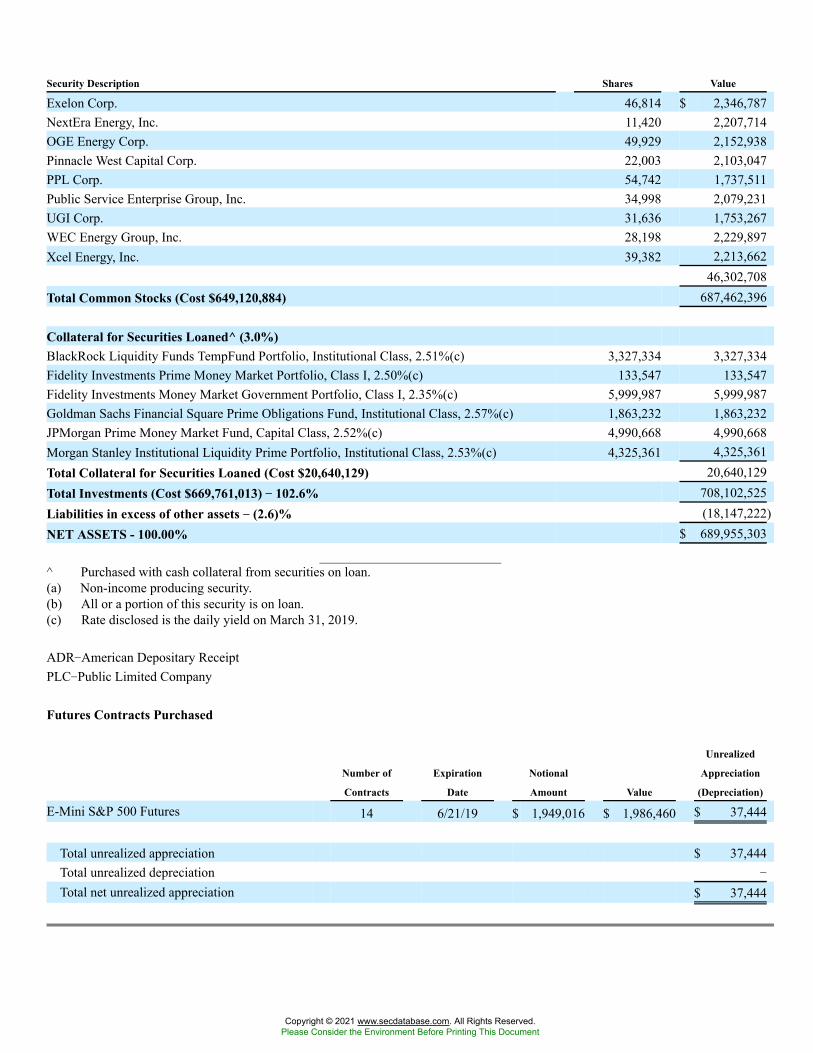
Security Description Shares Value
Exelon Corp. 46,814 $ 2,346,787NextEra Energy, Inc. 11,420 2,207,714OGE Energy Corp. 49,929 2,152,938Pinnacle West Capital Corp. 22,003 2,103,047PPL Corp. 54,742 1,737,511Public Service Enterprise Group, Inc. 34,998 2,079,231UGI Corp. 31,636 1,753,267WEC Energy Group, Inc. 28,198 2,229,897Xcel Energy, Inc. 39,382 2,213,662
46,302,708Total Common Stocks (Cost $649,120,884) 687,462,396
Collateral for Securities Loaned^ (3.0%)BlackRock Liquidity Funds TempFund Portfolio, Institutional Class, 2.51%(c) 3,327,334 3,327,334Fidelity Investments Prime Money Market Portfolio, Class I, 2.50%(c) 133,547 133,547Fidelity Investments Money Market Government Portfolio, Class I, 2.35%(c) 5,999,987 5,999,987Goldman Sachs Financial Square Prime Obligations Fund, Institutional Class, 2.57%(c) 1,863,232 1,863,232JPMorgan Prime Money Market Fund, Capital Class, 2.52%(c) 4,990,668 4,990,668Morgan Stanley Institutional Liquidity Prime Portfolio, Institutional Class, 2.53%(c) 4,325,361 4,325,361Total Collateral for Securities Loaned (Cost $20,640,129) 20,640,129Total Investments (Cost $669,761,013) �� 102.6% 708,102,525Liabilities in excess of other assets �� (2.6)% (18,147,222)NET ASSETS - 100.00% $ 689,955,303
^ Purchased with cash collateral from securities on loan.(a) Non-income producing security.(b) All or a portion of this security is on loan.(c) Rate disclosed is the daily yield on March 31, 2019.
ADR�American Depositary ReceiptPLC�Public Limited Company
Futures Contracts Purchased
Number of
Contracts
Expiration
Date
Notional
Amount Value
Unrealized
Appreciation
(Depreciation)
E-Mini S&P 500 Futures 14 6/21/19 $ 1,949,016 $ 1,986,460 $ 37,444
Total unrealized appreciation $ 37,444Total unrealized depreciation �
Total net unrealized appreciation $ 37,444
Copyright © 2021 www.secdatabase.com. All Rights Reserved.Please Consider the Environment Before Printing This Document
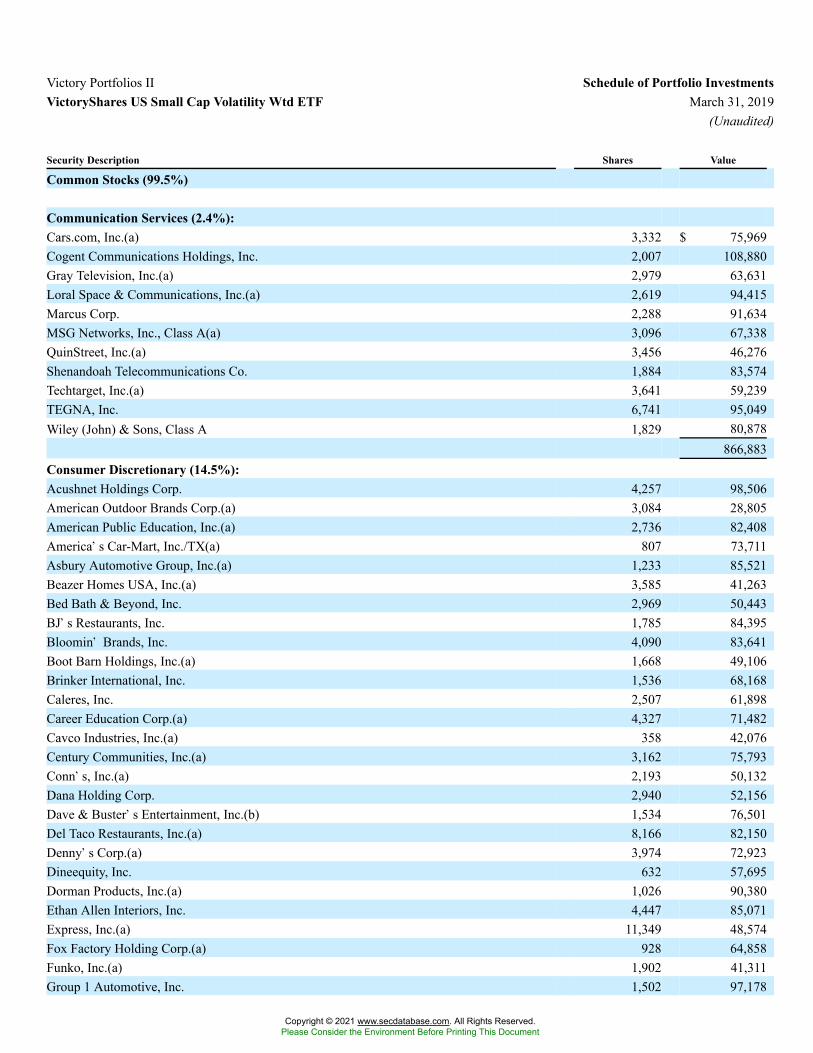
Victory Portfolios II Schedule of Portfolio InvestmentsVictoryShares US Small Cap Volatility Wtd ETF March 31, 2019
(Unaudited)
Security Description Shares Value
Common Stocks (99.5%)
Communication Services (2.4%):Cars.com, Inc.(a) 3,332 $ 75,969Cogent Communications Holdings, Inc. 2,007 108,880Gray Television, Inc.(a) 2,979 63,631Loral Space & Communications, Inc.(a) 2,619 94,415Marcus Corp. 2,288 91,634MSG Networks, Inc., Class A(a) 3,096 67,338QuinStreet, Inc.(a) 3,456 46,276Shenandoah Telecommunications Co. 1,884 83,574Techtarget, Inc.(a) 3,641 59,239TEGNA, Inc. 6,741 95,049Wiley (John) & Sons, Class A 1,829 80,878
866,883Consumer Discretionary (14.5%):Acushnet Holdings Corp. 4,257 98,506American Outdoor Brands Corp.(a) 3,084 28,805American Public Education, Inc.(a) 2,736 82,408America�s Car-Mart, Inc./TX(a) 807 73,711Asbury Automotive Group, Inc.(a) 1,233 85,521Beazer Homes USA, Inc.(a) 3,585 41,263Bed Bath & Beyond, Inc. 2,969 50,443BJ�s Restaurants, Inc. 1,785 84,395Bloomin� Brands, Inc. 4,090 83,641Boot Barn Holdings, Inc.(a) 1,668 49,106Brinker International, Inc. 1,536 68,168Caleres, Inc. 2,507 61,898Career Education Corp.(a) 4,327 71,482Cavco Industries, Inc.(a) 358 42,076Century Communities, Inc.(a) 3,162 75,793Conn�s, Inc.(a) 2,193 50,132Dana Holding Corp. 2,940 52,156Dave & Buster�s Entertainment, Inc.(b) 1,534 76,501Del Taco Restaurants, Inc.(a) 8,166 82,150Denny�s Corp.(a) 3,974 72,923Dineequity, Inc. 632 57,695Dorman Products, Inc.(a) 1,026 90,380Ethan Allen Interiors, Inc. 4,447 85,071Express, Inc.(a) 11,349 48,574Fox Factory Holding Corp.(a) 928 64,858Funko, Inc.(a) 1,902 41,311Group 1 Automotive, Inc. 1,502 97,178
Copyright © 2021 www.secdatabase.com. All Rights Reserved.Please Consider the Environment Before Printing This Document
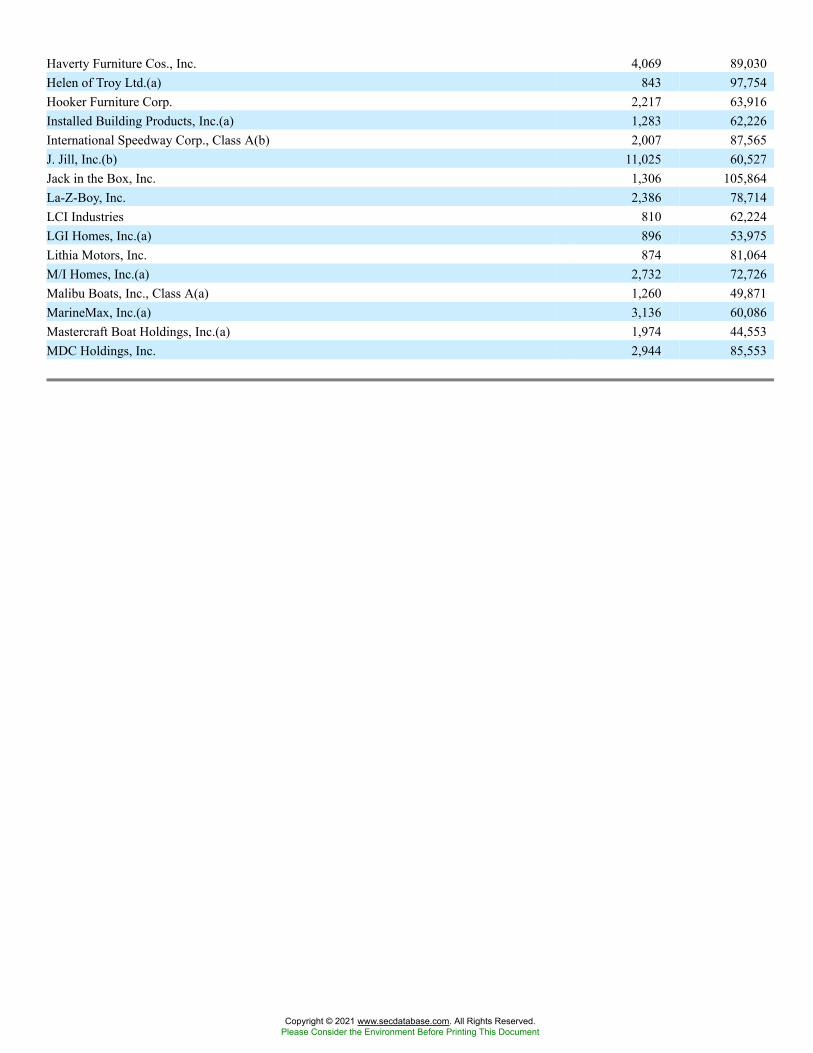
Haverty Furniture Cos., Inc. 4,069 89,030Helen of Troy Ltd.(a) 843 97,754Hooker Furniture Corp. 2,217 63,916Installed Building Products, Inc.(a) 1,283 62,226International Speedway Corp., Class A(b) 2,007 87,565J. Jill, Inc.(b) 11,025 60,527Jack in the Box, Inc. 1,306 105,864La-Z-Boy, Inc. 2,386 78,714LCI Industries 810 62,224LGI Homes, Inc.(a) 896 53,975Lithia Motors, Inc. 874 81,064M/I Homes, Inc.(a) 2,732 72,726Malibu Boats, Inc., Class A(a) 1,260 49,871MarineMax, Inc.(a) 3,136 60,086Mastercraft Boat Holdings, Inc.(a) 1,974 44,553MDC Holdings, Inc. 2,944 85,553
Copyright © 2021 www.secdatabase.com. All Rights Reserved.Please Consider the Environment Before Printing This Document
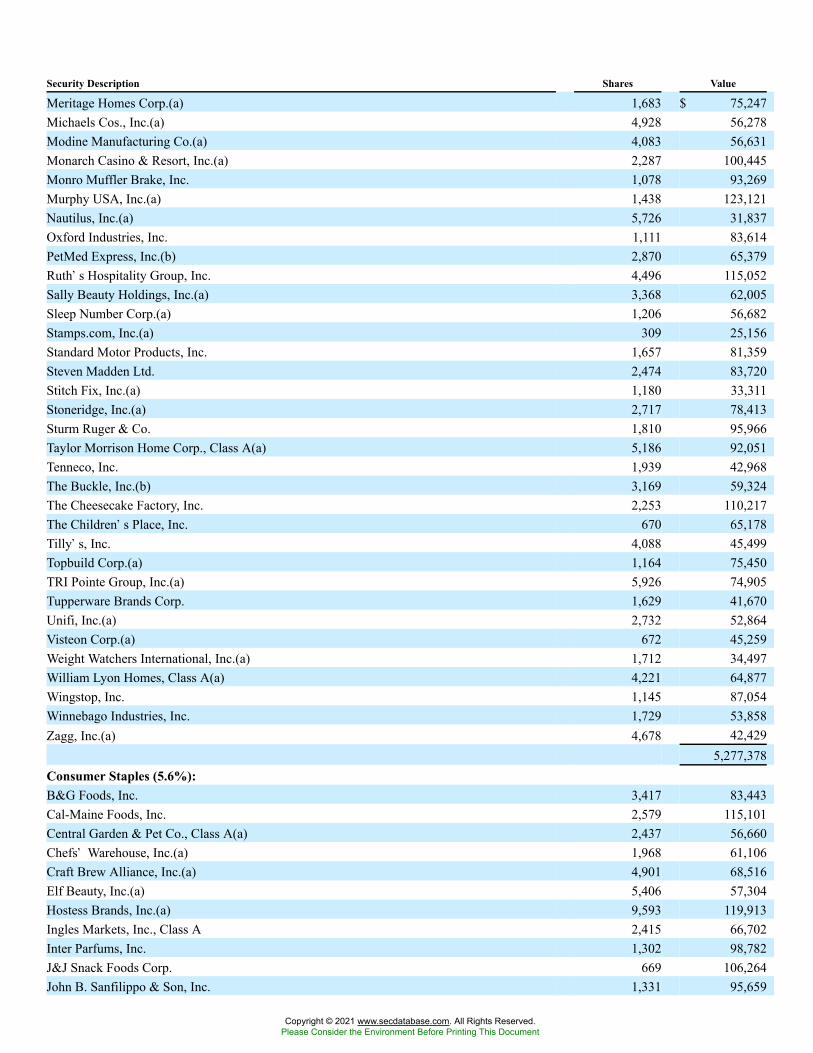
Security Description Shares Value
Meritage Homes Corp.(a) 1,683 $ 75,247Michaels Cos., Inc.(a) 4,928 56,278Modine Manufacturing Co.(a) 4,083 56,631Monarch Casino & Resort, Inc.(a) 2,287 100,445Monro Muffler Brake, Inc. 1,078 93,269Murphy USA, Inc.(a) 1,438 123,121Nautilus, Inc.(a) 5,726 31,837Oxford Industries, Inc. 1,111 83,614PetMed Express, Inc.(b) 2,870 65,379Ruth�s Hospitality Group, Inc. 4,496 115,052Sally Beauty Holdings, Inc.(a) 3,368 62,005Sleep Number Corp.(a) 1,206 56,682Stamps.com, Inc.(a) 309 25,156Standard Motor Products, Inc. 1,657 81,359Steven Madden Ltd. 2,474 83,720Stitch Fix, Inc.(a) 1,180 33,311Stoneridge, Inc.(a) 2,717 78,413Sturm Ruger & Co. 1,810 95,966Taylor Morrison Home Corp., Class A(a) 5,186 92,051Tenneco, Inc. 1,939 42,968The Buckle, Inc.(b) 3,169 59,324The Cheesecake Factory, Inc. 2,253 110,217The Children�s Place, Inc. 670 65,178Tilly�s, Inc. 4,088 45,499Topbuild Corp.(a) 1,164 75,450TRI Pointe Group, Inc.(a) 5,926 74,905Tupperware Brands Corp. 1,629 41,670Unifi, Inc.(a) 2,732 52,864Visteon Corp.(a) 672 45,259Weight Watchers International, Inc.(a) 1,712 34,497William Lyon Homes, Class A(a) 4,221 64,877Wingstop, Inc. 1,145 87,054Winnebago Industries, Inc. 1,729 53,858Zagg, Inc.(a) 4,678 42,429
5,277,378Consumer Staples (5.6%):B&G Foods, Inc. 3,417 83,443Cal-Maine Foods, Inc. 2,579 115,101Central Garden & Pet Co., Class A(a) 2,437 56,660Chefs� Warehouse, Inc.(a) 1,968 61,106Craft Brew Alliance, Inc.(a) 4,901 68,516Elf Beauty, Inc.(a) 5,406 57,304Hostess Brands, Inc.(a) 9,593 119,913Ingles Markets, Inc., Class A 2,415 66,702Inter Parfums, Inc. 1,302 98,782J&J Snack Foods Corp. 669 106,264John B. Sanfilippo & Son, Inc. 1,331 95,659
Copyright © 2021 www.secdatabase.com. All Rights Reserved.Please Consider the Environment Before Printing This Document
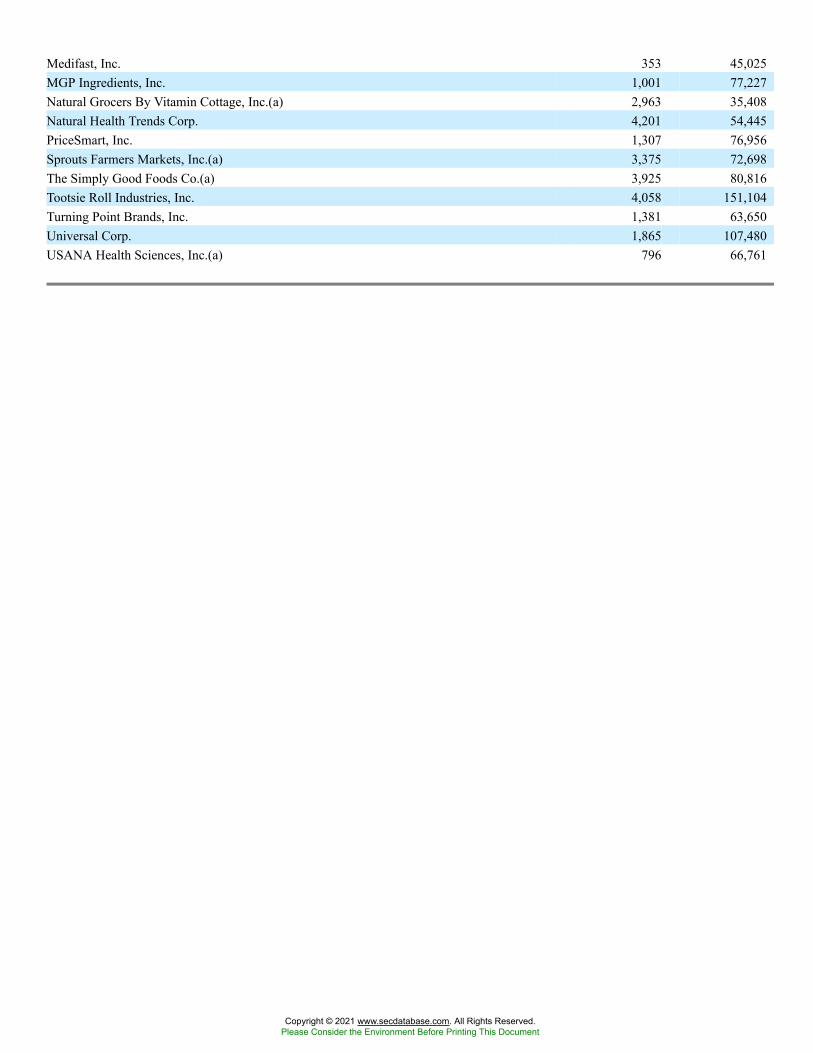
Medifast, Inc. 353 45,025MGP Ingredients, Inc. 1,001 77,227Natural Grocers By Vitamin Cottage, Inc.(a) 2,963 35,408Natural Health Trends Corp. 4,201 54,445PriceSmart, Inc. 1,307 76,956Sprouts Farmers Markets, Inc.(a) 3,375 72,698The Simply Good Foods Co.(a) 3,925 80,816Tootsie Roll Industries, Inc. 4,058 151,104Turning Point Brands, Inc. 1,381 63,650Universal Corp. 1,865 107,480USANA Health Sciences, Inc.(a) 796 66,761
Copyright © 2021 www.secdatabase.com. All Rights Reserved.Please Consider the Environment Before Printing This Document
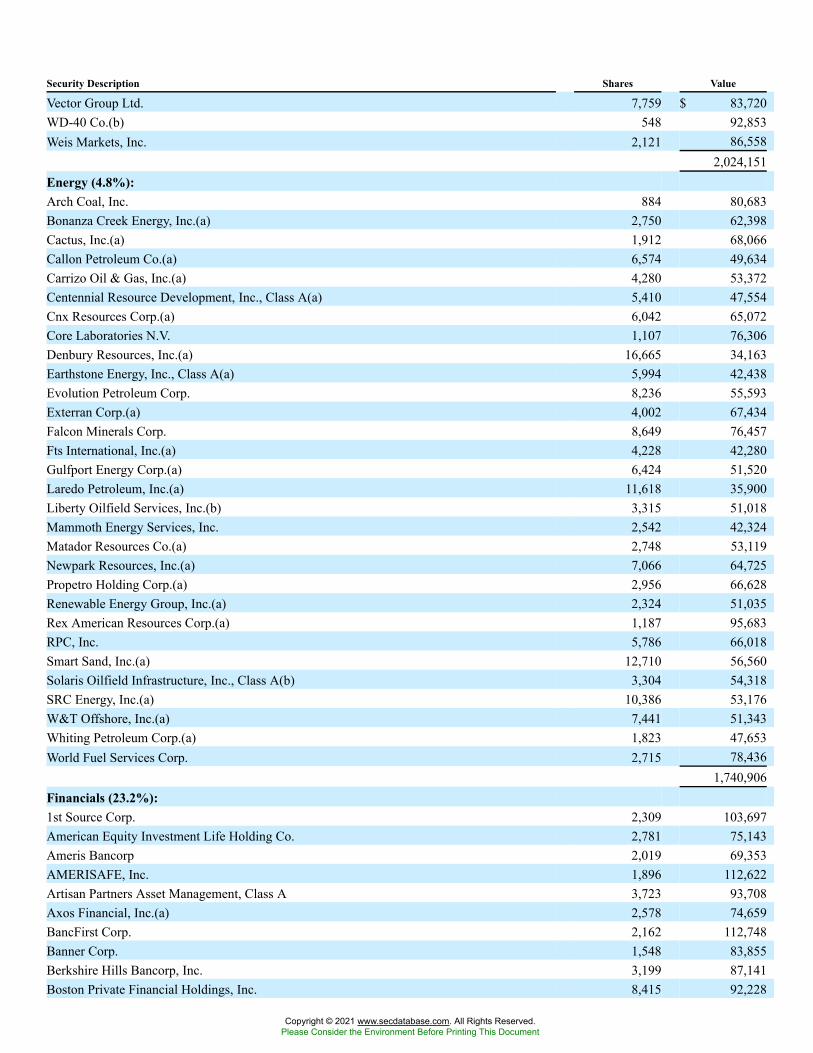
Security Description Shares Value
Vector Group Ltd. 7,759 $ 83,720WD-40 Co.(b) 548 92,853Weis Markets, Inc. 2,121 86,558
2,024,151Energy (4.8%):Arch Coal, Inc. 884 80,683Bonanza Creek Energy, Inc.(a) 2,750 62,398Cactus, Inc.(a) 1,912 68,066Callon Petroleum Co.(a) 6,574 49,634Carrizo Oil & Gas, Inc.(a) 4,280 53,372Centennial Resource Development, Inc., Class A(a) 5,410 47,554Cnx Resources Corp.(a) 6,042 65,072Core Laboratories N.V. 1,107 76,306Denbury Resources, Inc.(a) 16,665 34,163Earthstone Energy, Inc., Class A(a) 5,994 42,438Evolution Petroleum Corp. 8,236 55,593Exterran Corp.(a) 4,002 67,434Falcon Minerals Corp. 8,649 76,457Fts International, Inc.(a) 4,228 42,280Gulfport Energy Corp.(a) 6,424 51,520Laredo Petroleum, Inc.(a) 11,618 35,900Liberty Oilfield Services, Inc.(b) 3,315 51,018Mammoth Energy Services, Inc. 2,542 42,324Matador Resources Co.(a) 2,748 53,119Newpark Resources, Inc.(a) 7,066 64,725Propetro Holding Corp.(a) 2,956 66,628Renewable Energy Group, Inc.(a) 2,324 51,035Rex American Resources Corp.(a) 1,187 95,683RPC, Inc. 5,786 66,018Smart Sand, Inc.(a) 12,710 56,560Solaris Oilfield Infrastructure, Inc., Class A(b) 3,304 54,318SRC Energy, Inc.(a) 10,386 53,176W&T Offshore, Inc.(a) 7,441 51,343Whiting Petroleum Corp.(a) 1,823 47,653World Fuel Services Corp. 2,715 78,436
1,740,906Financials (23.2%):1st Source Corp. 2,309 103,697American Equity Investment Life Holding Co. 2,781 75,143Ameris Bancorp 2,019 69,353AMERISAFE, Inc. 1,896 112,622Artisan Partners Asset Management, Class A 3,723 93,708Axos Financial, Inc.(a) 2,578 74,659BancFirst Corp. 2,162 112,748Banner Corp. 1,548 83,855Berkshire Hills Bancorp, Inc. 3,199 87,141Boston Private Financial Holdings, Inc. 8,415 92,228
Copyright © 2021 www.secdatabase.com. All Rights Reserved.Please Consider the Environment Before Printing This Document
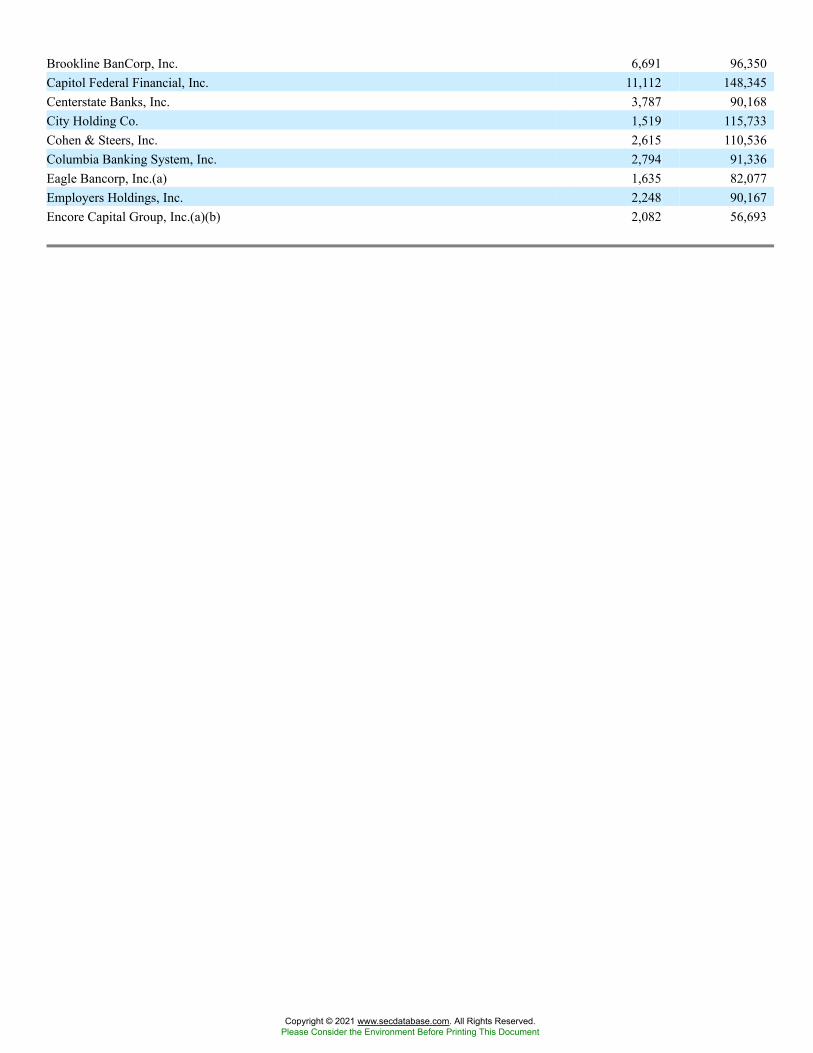
Brookline BanCorp, Inc. 6,691 96,350Capitol Federal Financial, Inc. 11,112 148,345Centerstate Banks, Inc. 3,787 90,168City Holding Co. 1,519 115,733Cohen & Steers, Inc. 2,615 110,536Columbia Banking System, Inc. 2,794 91,336Eagle Bancorp, Inc.(a) 1,635 82,077Employers Holdings, Inc. 2,248 90,167Encore Capital Group, Inc.(a)(b) 2,082 56,693
Copyright © 2021 www.secdatabase.com. All Rights Reserved.Please Consider the Environment Before Printing This Document
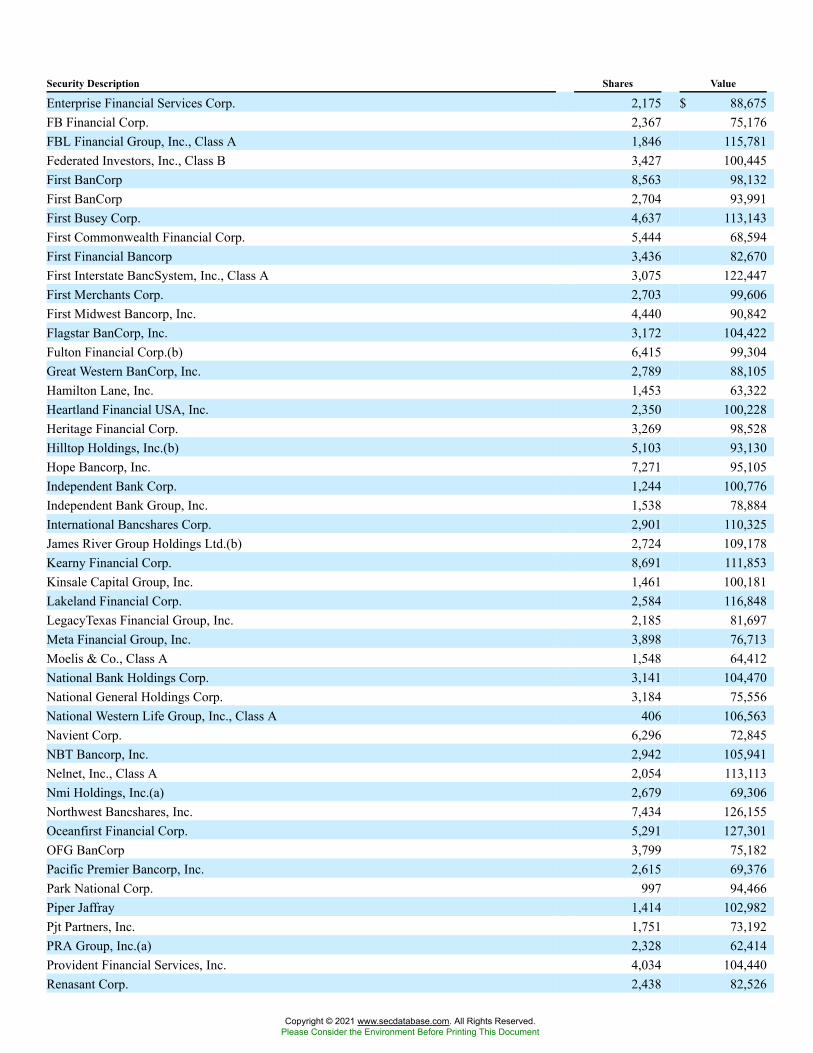
Security Description Shares Value
Enterprise Financial Services Corp. 2,175 $ 88,675FB Financial Corp. 2,367 75,176FBL Financial Group, Inc., Class A 1,846 115,781Federated Investors, Inc., Class B 3,427 100,445First BanCorp 8,563 98,132First BanCorp 2,704 93,991First Busey Corp. 4,637 113,143First Commonwealth Financial Corp. 5,444 68,594First Financial Bancorp 3,436 82,670First Interstate BancSystem, Inc., Class A 3,075 122,447First Merchants Corp. 2,703 99,606First Midwest Bancorp, Inc. 4,440 90,842Flagstar BanCorp, Inc. 3,172 104,422Fulton Financial Corp.(b) 6,415 99,304Great Western BanCorp, Inc. 2,789 88,105Hamilton Lane, Inc. 1,453 63,322Heartland Financial USA, Inc. 2,350 100,228Heritage Financial Corp. 3,269 98,528Hilltop Holdings, Inc.(b) 5,103 93,130Hope Bancorp, Inc. 7,271 95,105Independent Bank Corp. 1,244 100,776Independent Bank Group, Inc. 1,538 78,884International Bancshares Corp. 2,901 110,325James River Group Holdings Ltd.(b) 2,724 109,178Kearny Financial Corp. 8,691 111,853Kinsale Capital Group, Inc. 1,461 100,181Lakeland Financial Corp. 2,584 116,848LegacyTexas Financial Group, Inc. 2,185 81,697Meta Financial Group, Inc. 3,898 76,713Moelis & Co., Class A 1,548 64,412National Bank Holdings Corp. 3,141 104,470National General Holdings Corp. 3,184 75,556National Western Life Group, Inc., Class A 406 106,563Navient Corp. 6,296 72,845NBT Bancorp, Inc. 2,942 105,941Nelnet, Inc., Class A 2,054 113,113Nmi Holdings, Inc.(a) 2,679 69,306Northwest Bancshares, Inc. 7,434 126,155Oceanfirst Financial Corp. 5,291 127,301OFG BanCorp 3,799 75,182Pacific Premier Bancorp, Inc. 2,615 69,376Park National Corp. 997 94,466Piper Jaffray 1,414 102,982Pjt Partners, Inc. 1,751 73,192PRA Group, Inc.(a) 2,328 62,414Provident Financial Services, Inc. 4,034 104,440Renasant Corp. 2,438 82,526
Copyright © 2021 www.secdatabase.com. All Rights Reserved.Please Consider the Environment Before Printing This Document
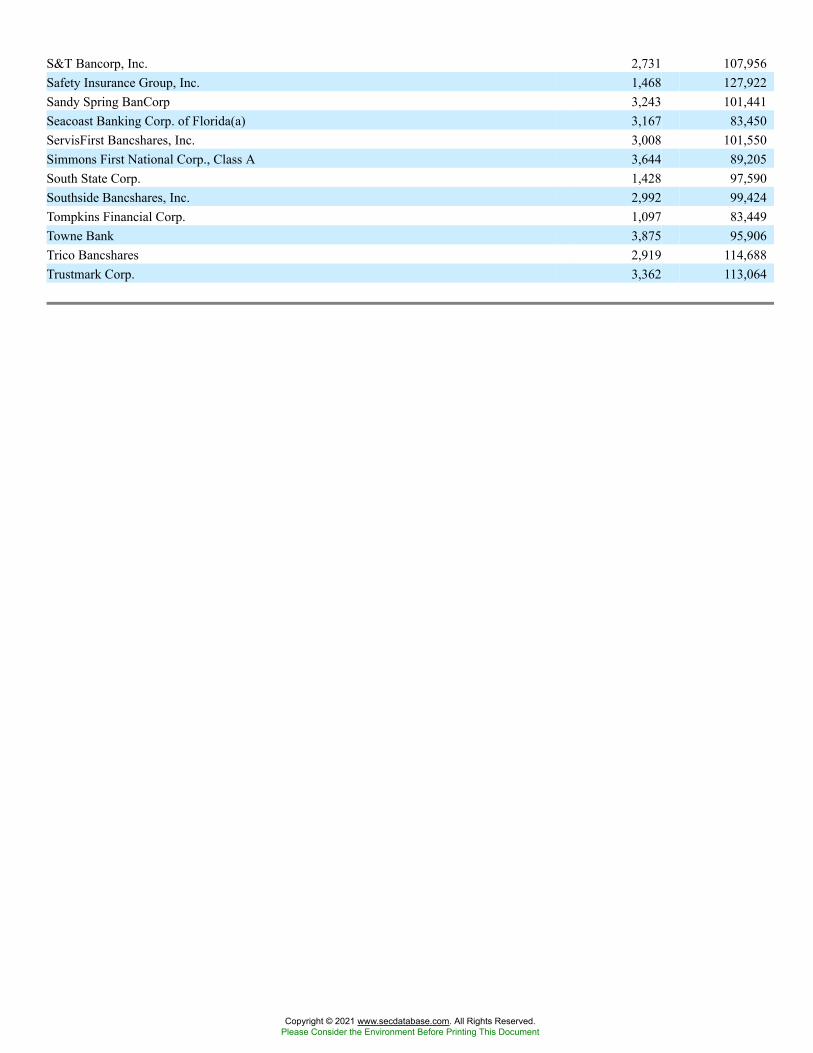
S&T Bancorp, Inc. 2,731 107,956Safety Insurance Group, Inc. 1,468 127,922Sandy Spring BanCorp 3,243 101,441Seacoast Banking Corp. of Florida(a) 3,167 83,450ServisFirst Bancshares, Inc. 3,008 101,550Simmons First National Corp., Class A 3,644 89,205South State Corp. 1,428 97,590Southside Bancshares, Inc. 2,992 99,424Tompkins Financial Corp. 1,097 83,449Towne Bank 3,875 95,906Trico Bancshares 2,919 114,688Trustmark Corp. 3,362 113,064
Copyright © 2021 www.secdatabase.com. All Rights Reserved.Please Consider the Environment Before Printing This Document
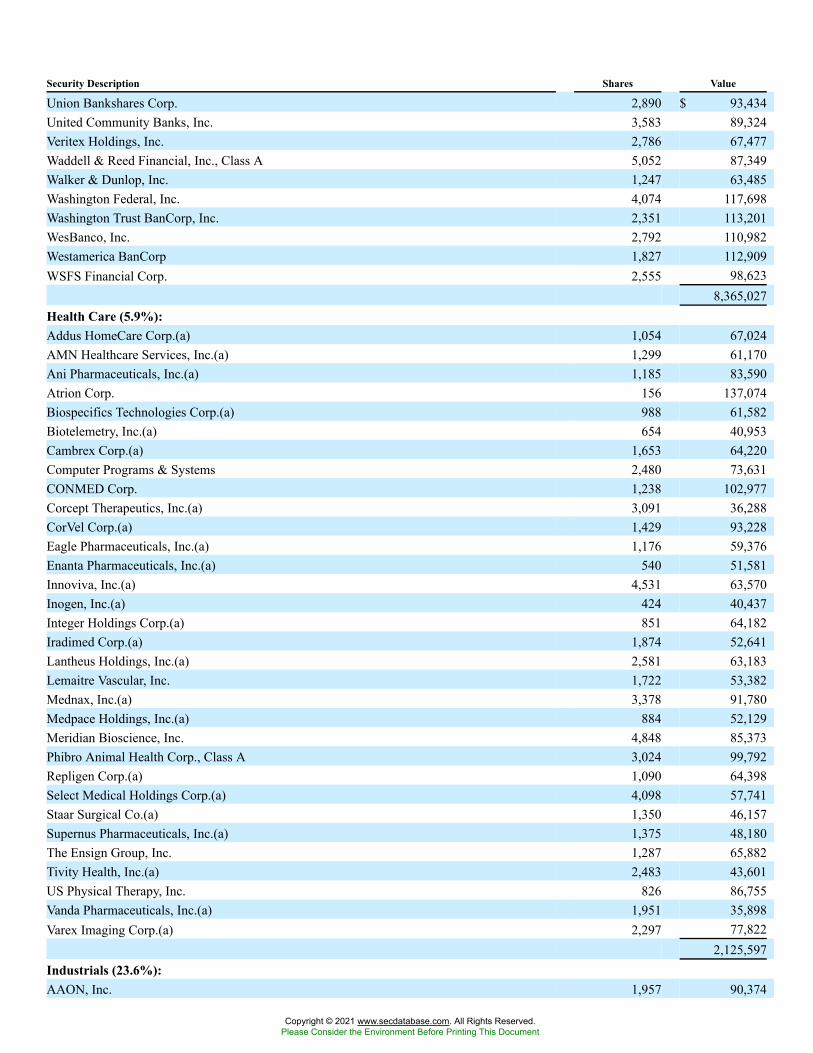
Security Description Shares Value
Union Bankshares Corp. 2,890 $ 93,434United Community Banks, Inc. 3,583 89,324Veritex Holdings, Inc. 2,786 67,477Waddell & Reed Financial, Inc., Class A 5,052 87,349Walker & Dunlop, Inc. 1,247 63,485Washington Federal, Inc. 4,074 117,698Washington Trust BanCorp, Inc. 2,351 113,201WesBanco, Inc. 2,792 110,982Westamerica BanCorp 1,827 112,909WSFS Financial Corp. 2,555 98,623
8,365,027Health Care (5.9%):Addus HomeCare Corp.(a) 1,054 67,024AMN Healthcare Services, Inc.(a) 1,299 61,170Ani Pharmaceuticals, Inc.(a) 1,185 83,590Atrion Corp. 156 137,074Biospecifics Technologies Corp.(a) 988 61,582Biotelemetry, Inc.(a) 654 40,953Cambrex Corp.(a) 1,653 64,220Computer Programs & Systems 2,480 73,631CONMED Corp. 1,238 102,977Corcept Therapeutics, Inc.(a) 3,091 36,288CorVel Corp.(a) 1,429 93,228Eagle Pharmaceuticals, Inc.(a) 1,176 59,376Enanta Pharmaceuticals, Inc.(a) 540 51,581Innoviva, Inc.(a) 4,531 63,570Inogen, Inc.(a) 424 40,437Integer Holdings Corp.(a) 851 64,182Iradimed Corp.(a) 1,874 52,641Lantheus Holdings, Inc.(a) 2,581 63,183Lemaitre Vascular, Inc. 1,722 53,382Mednax, Inc.(a) 3,378 91,780Medpace Holdings, Inc.(a) 884 52,129Meridian Bioscience, Inc. 4,848 85,373Phibro Animal Health Corp., Class A 3,024 99,792Repligen Corp.(a) 1,090 64,398Select Medical Holdings Corp.(a) 4,098 57,741Staar Surgical Co.(a) 1,350 46,157Supernus Pharmaceuticals, Inc.(a) 1,375 48,180The Ensign Group, Inc. 1,287 65,882Tivity Health, Inc.(a) 2,483 43,601US Physical Therapy, Inc. 826 86,755Vanda Pharmaceuticals, Inc.(a) 1,951 35,898Varex Imaging Corp.(a) 2,297 77,822
2,125,597Industrials (23.6%):AAON, Inc. 1,957 90,374
Copyright © 2021 www.secdatabase.com. All Rights Reserved.Please Consider the Environment Before Printing This Document
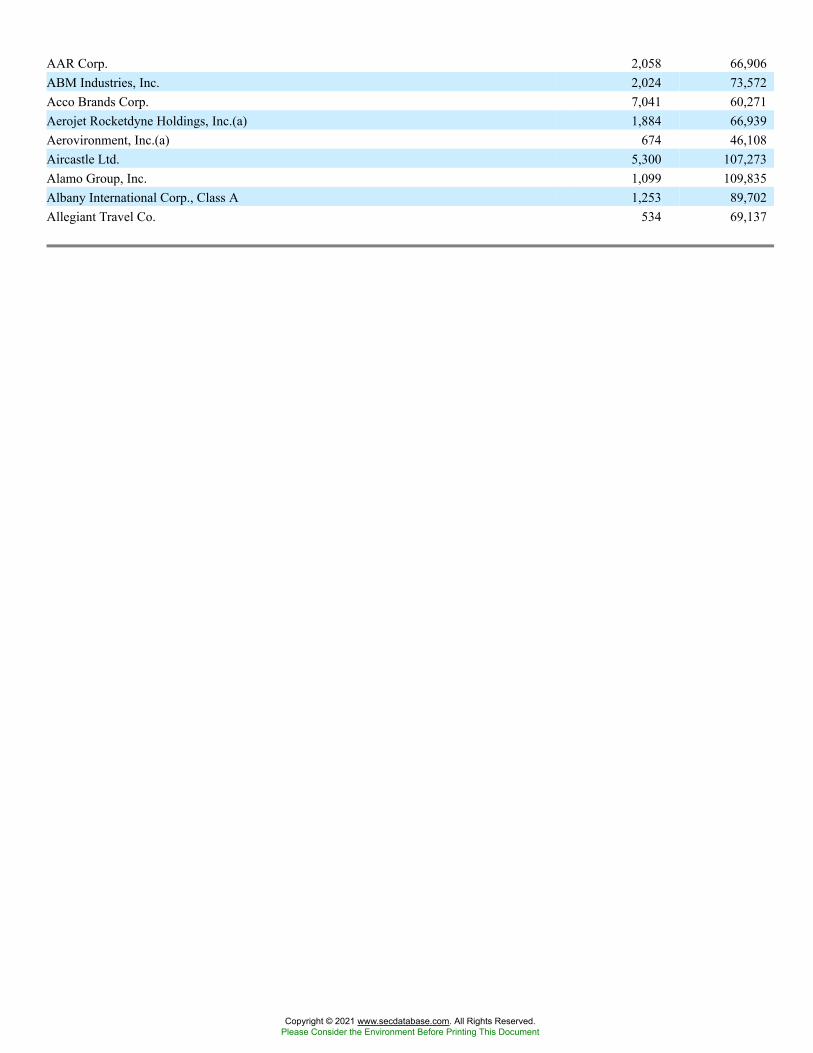
AAR Corp. 2,058 66,906ABM Industries, Inc. 2,024 73,572Acco Brands Corp. 7,041 60,271Aerojet Rocketdyne Holdings, Inc.(a) 1,884 66,939Aerovironment, Inc.(a) 674 46,108Aircastle Ltd. 5,300 107,273Alamo Group, Inc. 1,099 109,835Albany International Corp., Class A 1,253 89,702Allegiant Travel Co. 534 69,137
Copyright © 2021 www.secdatabase.com. All Rights Reserved.Please Consider the Environment Before Printing This Document
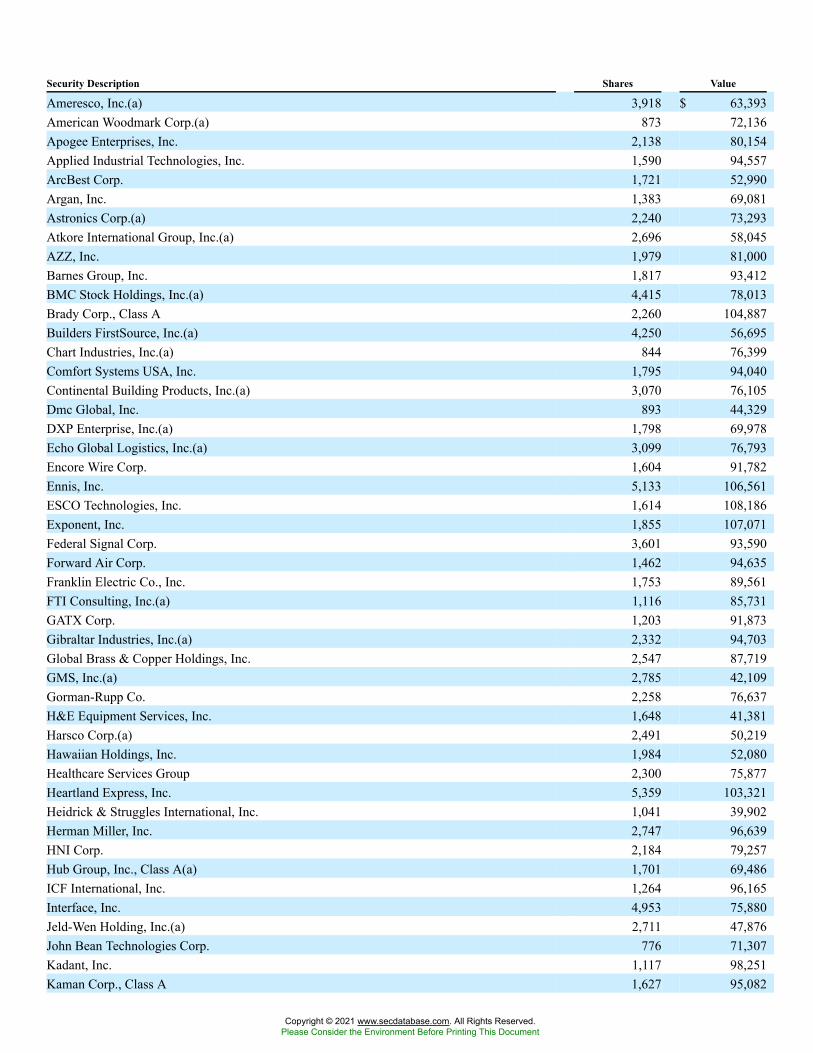
Security Description Shares Value
Ameresco, Inc.(a) 3,918 $ 63,393American Woodmark Corp.(a) 873 72,136Apogee Enterprises, Inc. 2,138 80,154Applied Industrial Technologies, Inc. 1,590 94,557ArcBest Corp. 1,721 52,990Argan, Inc. 1,383 69,081Astronics Corp.(a) 2,240 73,293Atkore International Group, Inc.(a) 2,696 58,045AZZ, Inc. 1,979 81,000Barnes Group, Inc. 1,817 93,412BMC Stock Holdings, Inc.(a) 4,415 78,013Brady Corp., Class A 2,260 104,887Builders FirstSource, Inc.(a) 4,250 56,695Chart Industries, Inc.(a) 844 76,399Comfort Systems USA, Inc. 1,795 94,040Continental Building Products, Inc.(a) 3,070 76,105Dmc Global, Inc. 893 44,329DXP Enterprise, Inc.(a) 1,798 69,978Echo Global Logistics, Inc.(a) 3,099 76,793Encore Wire Corp. 1,604 91,782Ennis, Inc. 5,133 106,561ESCO Technologies, Inc. 1,614 108,186Exponent, Inc. 1,855 107,071Federal Signal Corp. 3,601 93,590Forward Air Corp. 1,462 94,635Franklin Electric Co., Inc. 1,753 89,561FTI Consulting, Inc.(a) 1,116 85,731GATX Corp. 1,203 91,873Gibraltar Industries, Inc.(a) 2,332 94,703Global Brass & Copper Holdings, Inc. 2,547 87,719GMS, Inc.(a) 2,785 42,109Gorman-Rupp Co. 2,258 76,637H&E Equipment Services, Inc. 1,648 41,381Harsco Corp.(a) 2,491 50,219Hawaiian Holdings, Inc. 1,984 52,080Healthcare Services Group 2,300 75,877Heartland Express, Inc. 5,359 103,321Heidrick & Struggles International, Inc. 1,041 39,902Herman Miller, Inc. 2,747 96,639HNI Corp. 2,184 79,257Hub Group, Inc., Class A(a) 1,701 69,486ICF International, Inc. 1,264 96,165Interface, Inc. 4,953 75,880Jeld-Wen Holding, Inc.(a) 2,711 47,876John Bean Technologies Corp. 776 71,307Kadant, Inc. 1,117 98,251Kaman Corp., Class A 1,627 95,082
Copyright © 2021 www.secdatabase.com. All Rights Reserved.Please Consider the Environment Before Printing This Document
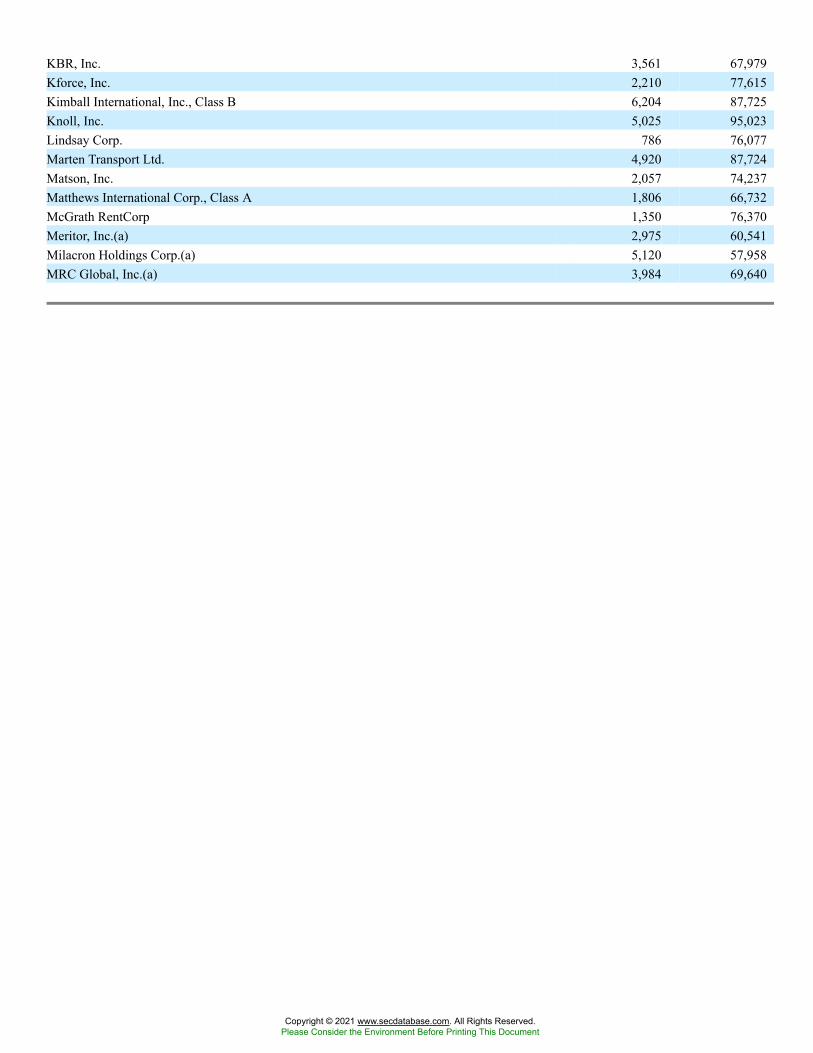
KBR, Inc. 3,561 67,979Kforce, Inc. 2,210 77,615Kimball International, Inc., Class B 6,204 87,725Knoll, Inc. 5,025 95,023Lindsay Corp. 786 76,077Marten Transport Ltd. 4,920 87,724Matson, Inc. 2,057 74,237Matthews International Corp., Class A 1,806 66,732McGrath RentCorp 1,350 76,370Meritor, Inc.(a) 2,975 60,541Milacron Holdings Corp.(a) 5,120 57,958MRC Global, Inc.(a) 3,984 69,640
Copyright © 2021 www.secdatabase.com. All Rights Reserved.Please Consider the Environment Before Printing This Document
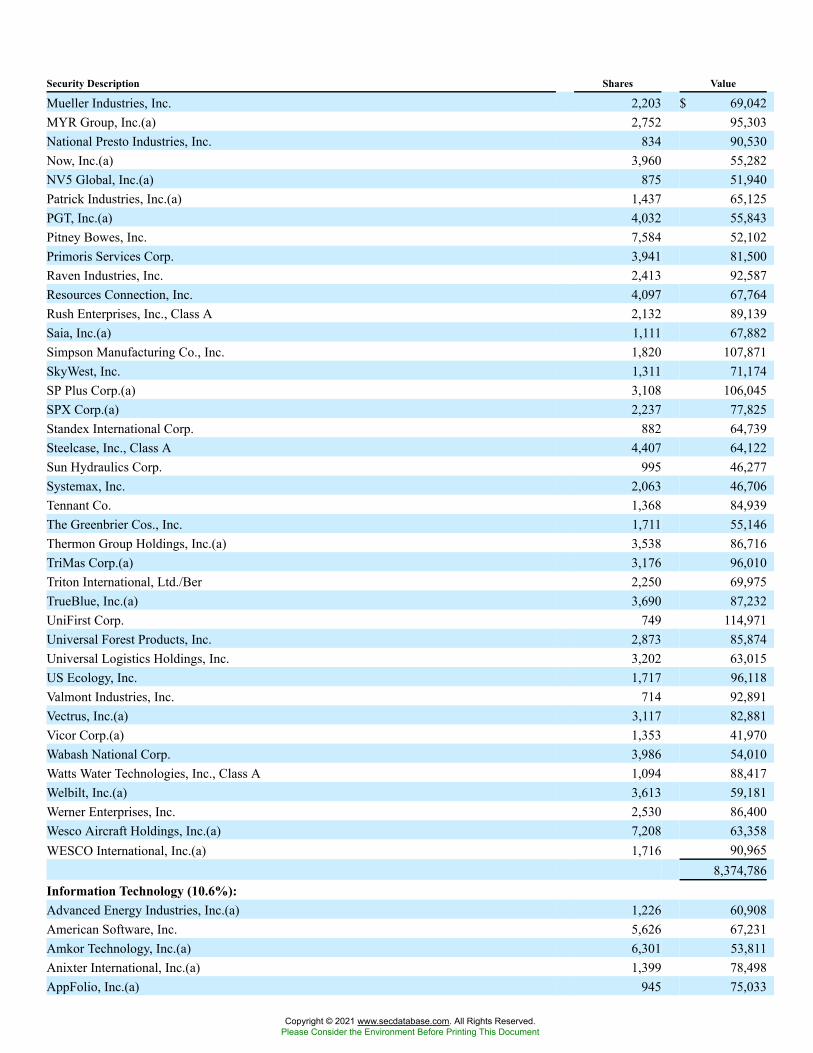
Security Description Shares Value
Mueller Industries, Inc. 2,203 $ 69,042MYR Group, Inc.(a) 2,752 95,303National Presto Industries, Inc. 834 90,530Now, Inc.(a) 3,960 55,282NV5 Global, Inc.(a) 875 51,940Patrick Industries, Inc.(a) 1,437 65,125PGT, Inc.(a) 4,032 55,843Pitney Bowes, Inc. 7,584 52,102Primoris Services Corp. 3,941 81,500Raven Industries, Inc. 2,413 92,587Resources Connection, Inc. 4,097 67,764Rush Enterprises, Inc., Class A 2,132 89,139Saia, Inc.(a) 1,111 67,882Simpson Manufacturing Co., Inc. 1,820 107,871SkyWest, Inc. 1,311 71,174SP Plus Corp.(a) 3,108 106,045SPX Corp.(a) 2,237 77,825Standex International Corp. 882 64,739Steelcase, Inc., Class A 4,407 64,122Sun Hydraulics Corp. 995 46,277Systemax, Inc. 2,063 46,706Tennant Co. 1,368 84,939The Greenbrier Cos., Inc. 1,711 55,146Thermon Group Holdings, Inc.(a) 3,538 86,716TriMas Corp.(a) 3,176 96,010Triton International, Ltd./Ber 2,250 69,975TrueBlue, Inc.(a) 3,690 87,232UniFirst Corp. 749 114,971Universal Forest Products, Inc. 2,873 85,874Universal Logistics Holdings, Inc. 3,202 63,015US Ecology, Inc. 1,717 96,118Valmont Industries, Inc. 714 92,891Vectrus, Inc.(a) 3,117 82,881Vicor Corp.(a) 1,353 41,970Wabash National Corp. 3,986 54,010Watts Water Technologies, Inc., Class A 1,094 88,417Welbilt, Inc.(a) 3,613 59,181Werner Enterprises, Inc. 2,530 86,400Wesco Aircraft Holdings, Inc.(a) 7,208 63,358WESCO International, Inc.(a) 1,716 90,965
8,374,786Information Technology (10.6%):Advanced Energy Industries, Inc.(a) 1,226 60,908American Software, Inc. 5,626 67,231Amkor Technology, Inc.(a) 6,301 53,811Anixter International, Inc.(a) 1,399 78,498AppFolio, Inc.(a) 945 75,033
Copyright © 2021 www.secdatabase.com. All Rights Reserved.Please Consider the Environment Before Printing This Document

Axcelis Technologies, Inc.(a) 2,873 57,805Badger Meter, Inc. 1,825 101,543Brooks Automation, Inc. 1,817 53,293Casa Systems, Inc.(a) 5,145 42,704Cass Information Systems, Inc. 2,262 106,992Cohu, Inc. 3,255 48,011Comtech Telecommunications Corp. 2,520 58,514CoreLogic, Inc.(a) 2,767 103,098CSG Systems International, Inc. 2,165 91,580CTS Corp. 2,984 87,640
Copyright © 2021 www.secdatabase.com. All Rights Reserved.Please Consider the Environment Before Printing This Document
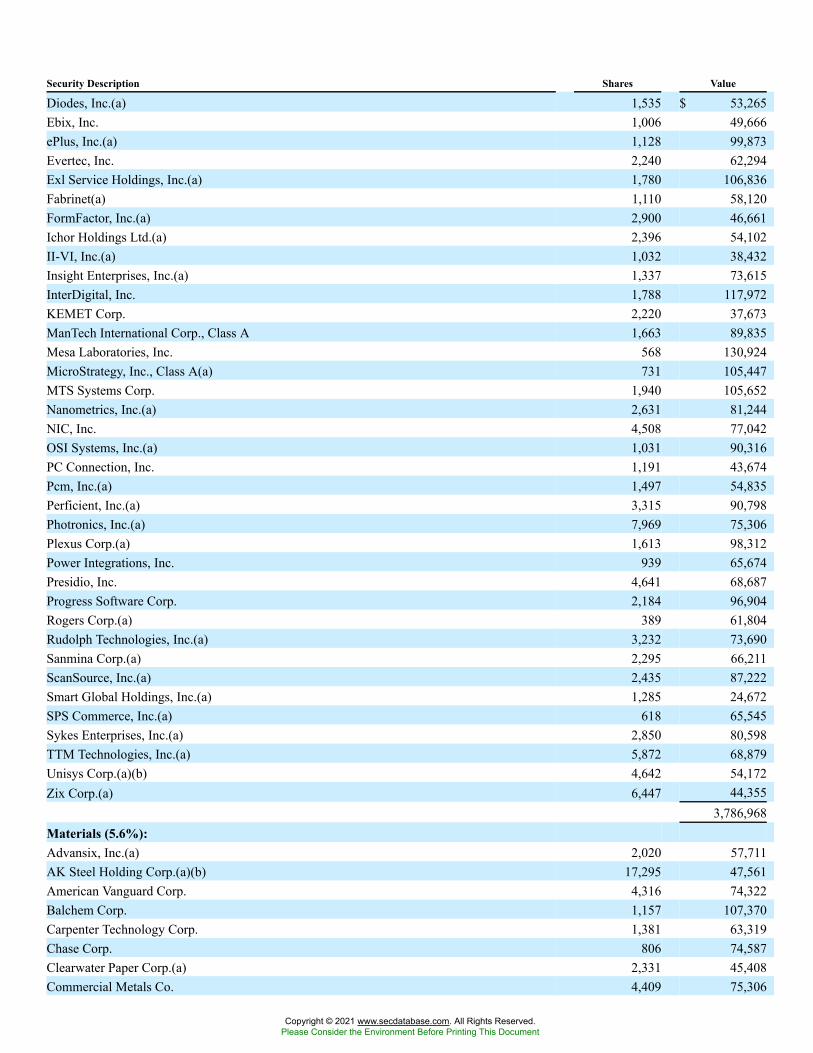
Security Description Shares Value
Diodes, Inc.(a) 1,535 $ 53,265Ebix, Inc. 1,006 49,666ePlus, Inc.(a) 1,128 99,873Evertec, Inc. 2,240 62,294Exl Service Holdings, Inc.(a) 1,780 106,836Fabrinet(a) 1,110 58,120FormFactor, Inc.(a) 2,900 46,661Ichor Holdings Ltd.(a) 2,396 54,102II-VI, Inc.(a) 1,032 38,432Insight Enterprises, Inc.(a) 1,337 73,615InterDigital, Inc. 1,788 117,972KEMET Corp. 2,220 37,673ManTech International Corp., Class A 1,663 89,835Mesa Laboratories, Inc. 568 130,924MicroStrategy, Inc., Class A(a) 731 105,447MTS Systems Corp. 1,940 105,652Nanometrics, Inc.(a) 2,631 81,244NIC, Inc. 4,508 77,042OSI Systems, Inc.(a) 1,031 90,316PC Connection, Inc. 1,191 43,674Pcm, Inc.(a) 1,497 54,835Perficient, Inc.(a) 3,315 90,798Photronics, Inc.(a) 7,969 75,306Plexus Corp.(a) 1,613 98,312Power Integrations, Inc. 939 65,674Presidio, Inc. 4,641 68,687Progress Software Corp. 2,184 96,904Rogers Corp.(a) 389 61,804Rudolph Technologies, Inc.(a) 3,232 73,690Sanmina Corp.(a) 2,295 66,211ScanSource, Inc.(a) 2,435 87,222Smart Global Holdings, Inc.(a) 1,285 24,672SPS Commerce, Inc.(a) 618 65,545Sykes Enterprises, Inc.(a) 2,850 80,598TTM Technologies, Inc.(a) 5,872 68,879Unisys Corp.(a)(b) 4,642 54,172Zix Corp.(a) 6,447 44,355
3,786,968Materials (5.6%):Advansix, Inc.(a) 2,020 57,711AK Steel Holding Corp.(a)(b) 17,295 47,561American Vanguard Corp. 4,316 74,322Balchem Corp. 1,157 107,370Carpenter Technology Corp. 1,381 63,319Chase Corp. 806 74,587Clearwater Paper Corp.(a) 2,331 45,408Commercial Metals Co. 4,409 75,306
Copyright © 2021 www.secdatabase.com. All Rights Reserved.Please Consider the Environment Before Printing This Document
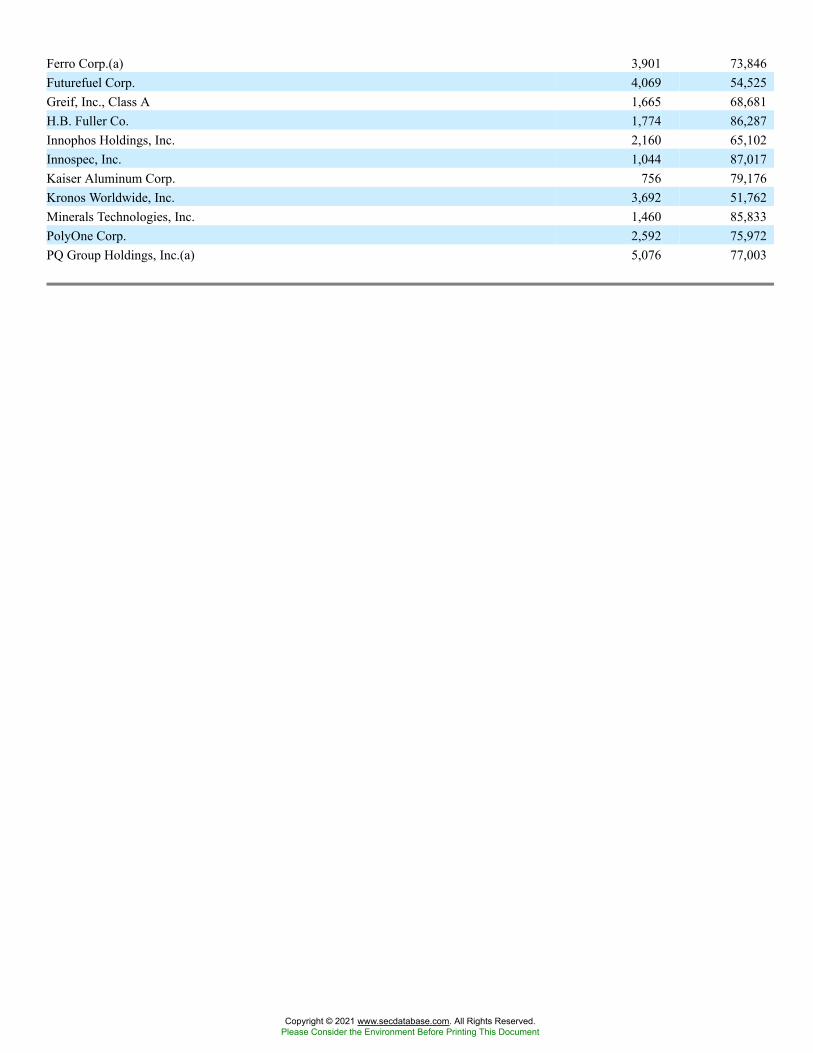
Ferro Corp.(a) 3,901 73,846Futurefuel Corp. 4,069 54,525Greif, Inc., Class A 1,665 68,681H.B. Fuller Co. 1,774 86,287Innophos Holdings, Inc. 2,160 65,102Innospec, Inc. 1,044 87,017Kaiser Aluminum Corp. 756 79,176Kronos Worldwide, Inc. 3,692 51,762Minerals Technologies, Inc. 1,460 85,833PolyOne Corp. 2,592 75,972PQ Group Holdings, Inc.(a) 5,076 77,003
Copyright © 2021 www.secdatabase.com. All Rights Reserved.Please Consider the Environment Before Printing This Document
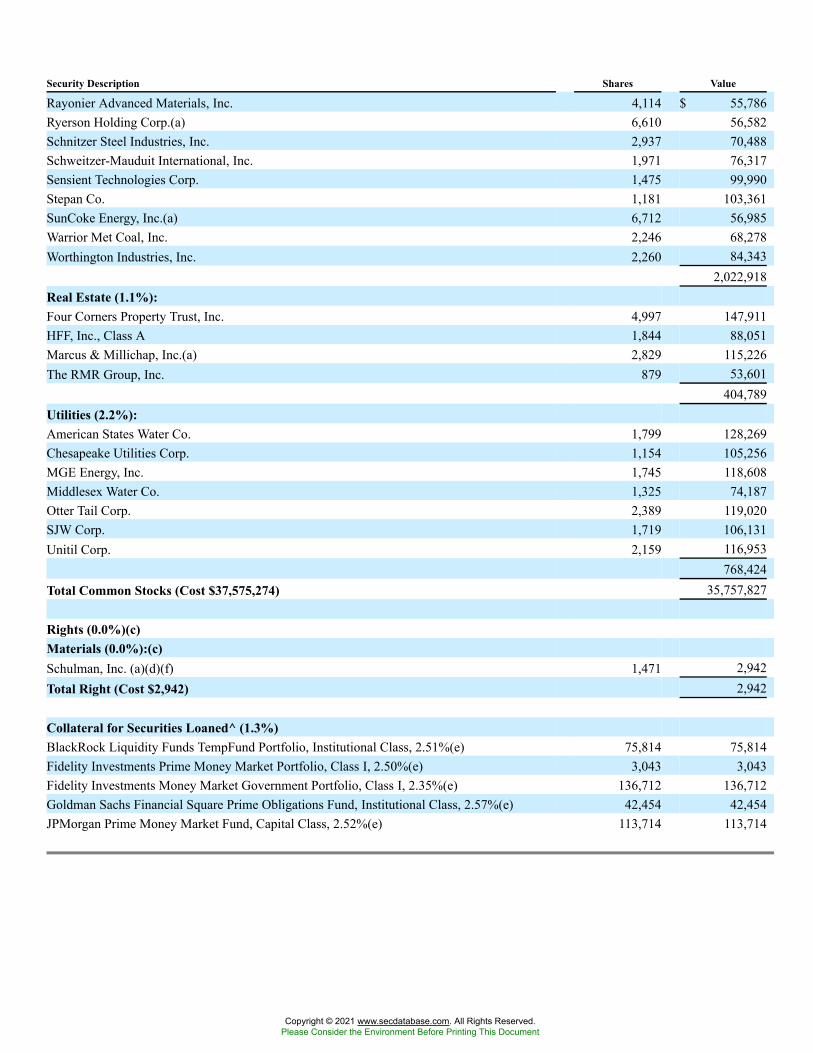
Security Description Shares Value
Rayonier Advanced Materials, Inc. 4,114 $ 55,786Ryerson Holding Corp.(a) 6,610 56,582Schnitzer Steel Industries, Inc. 2,937 70,488Schweitzer-Mauduit International, Inc. 1,971 76,317Sensient Technologies Corp. 1,475 99,990Stepan Co. 1,181 103,361SunCoke Energy, Inc.(a) 6,712 56,985Warrior Met Coal, Inc. 2,246 68,278Worthington Industries, Inc. 2,260 84,343
2,022,918Real Estate (1.1%):Four Corners Property Trust, Inc. 4,997 147,911HFF, Inc., Class A 1,844 88,051Marcus & Millichap, Inc.(a) 2,829 115,226The RMR Group, Inc. 879 53,601
404,789Utilities (2.2%):American States Water Co. 1,799 128,269Chesapeake Utilities Corp. 1,154 105,256MGE Energy, Inc. 1,745 118,608Middlesex Water Co. 1,325 74,187Otter Tail Corp. 2,389 119,020SJW Corp. 1,719 106,131Unitil Corp. 2,159 116,953
768,424Total Common Stocks (Cost $37,575,274) 35,757,827
Rights (0.0%)(c)Materials (0.0%):(c)Schulman, Inc. (a)(d)(f) 1,471 2,942Total Right (Cost $2,942) 2,942
Collateral for Securities Loaned^ (1.3%)BlackRock Liquidity Funds TempFund Portfolio, Institutional Class, 2.51%(e) 75,814 75,814Fidelity Investments Prime Money Market Portfolio, Class I, 2.50%(e) 3,043 3,043Fidelity Investments Money Market Government Portfolio, Class I, 2.35%(e) 136,712 136,712Goldman Sachs Financial Square Prime Obligations Fund, Institutional Class, 2.57%(e) 42,454 42,454JPMorgan Prime Money Market Fund, Capital Class, 2.52%(e) 113,714 113,714
Copyright © 2021 www.secdatabase.com. All Rights Reserved.Please Consider the Environment Before Printing This Document
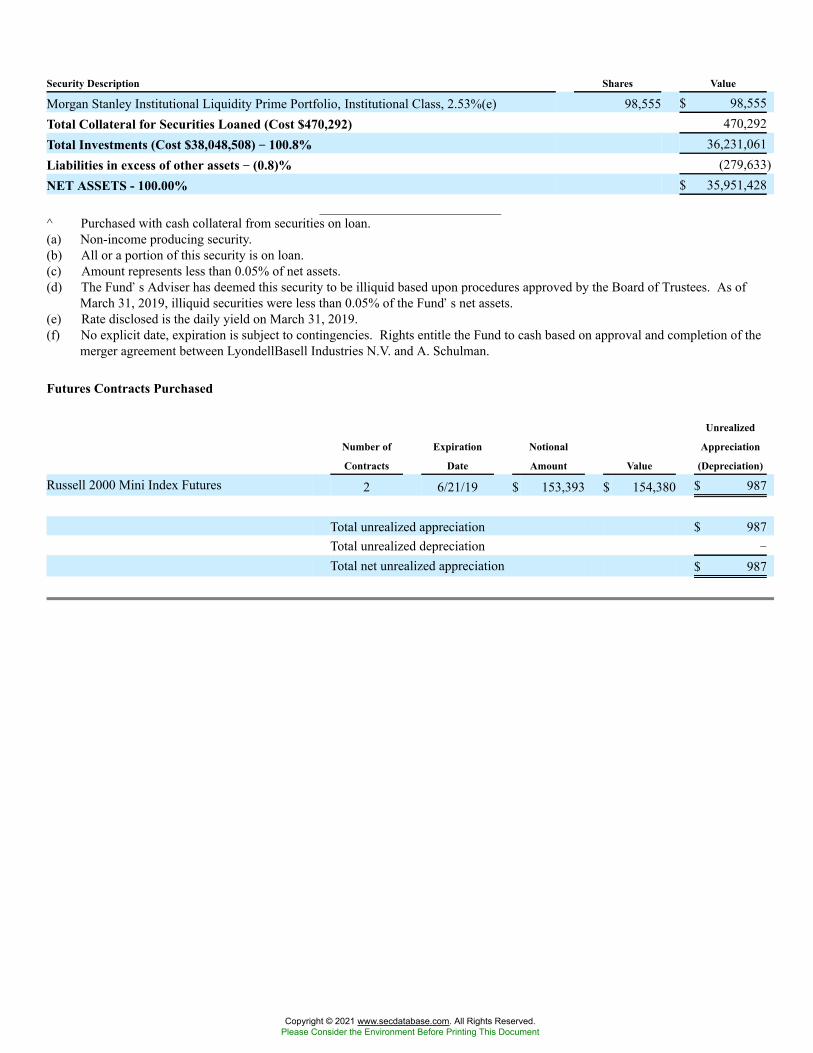
Security Description Shares Value
Morgan Stanley Institutional Liquidity Prime Portfolio, Institutional Class, 2.53%(e) 98,555 $ 98,555Total Collateral for Securities Loaned (Cost $470,292) 470,292Total Investments (Cost $38,048,508) �� 100.8% 36,231,061Liabilities in excess of other assets �� (0.8)% (279,633)NET ASSETS - 100.00% $ 35,951,428
^ Purchased with cash collateral from securities on loan.(a) Non-income producing security.(b) All or a portion of this security is on loan.(c) Amount represents less than 0.05% of net assets.(d) The Fund�s Adviser has deemed this security to be illiquid based upon procedures approved by the Board of Trustees. As of
March 31, 2019, illiquid securities were less than 0.05% of the Fund�s net assets.(e) Rate disclosed is the daily yield on March 31, 2019.(f) No explicit date, expiration is subject to contingencies. Rights entitle the Fund to cash based on approval and completion of the
merger agreement between LyondellBasell Industries N.V. and A. Schulman.
Futures Contracts Purchased
Number of
Contracts
Expiration
Date
Notional
Amount Value
Unrealized
Appreciation
(Depreciation)
Russell 2000 Mini Index Futures 2 6/21/19 $ 153,393 $ 154,380 $ 987
Total unrealized appreciation $ 987Total unrealized depreciation �
Total net unrealized appreciation $ 987
Copyright © 2021 www.secdatabase.com. All Rights Reserved.Please Consider the Environment Before Printing This Document
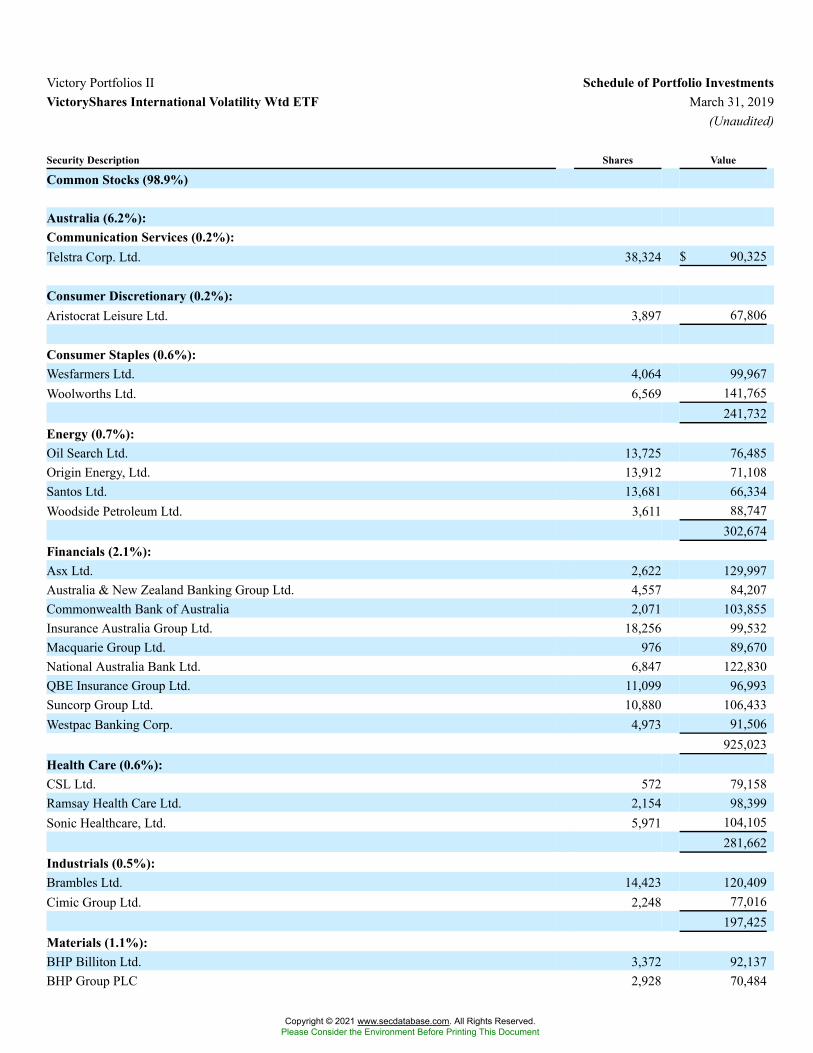
Victory Portfolios II Schedule of Portfolio InvestmentsVictoryShares International Volatility Wtd ETF March 31, 2019
(Unaudited)
Security Description Shares Value
Common Stocks (98.9%)
Australia (6.2%):Communication Services (0.2%):Telstra Corp. Ltd. 38,324 $ 90,325
Consumer Discretionary (0.2%):Aristocrat Leisure Ltd. 3,897 67,806
Consumer Staples (0.6%):Wesfarmers Ltd. 4,064 99,967Woolworths Ltd. 6,569 141,765
241,732Energy (0.7%):Oil Search Ltd. 13,725 76,485Origin Energy, Ltd. 13,912 71,108Santos Ltd. 13,681 66,334Woodside Petroleum Ltd. 3,611 88,747
302,674Financials (2.1%):Asx Ltd. 2,622 129,997Australia & New Zealand Banking Group Ltd. 4,557 84,207Commonwealth Bank of Australia 2,071 103,855Insurance Australia Group Ltd. 18,256 99,532Macquarie Group Ltd. 976 89,670National Australia Bank Ltd. 6,847 122,830QBE Insurance Group Ltd. 11,099 96,993Suncorp Group Ltd. 10,880 106,433Westpac Banking Corp. 4,973 91,506
925,023Health Care (0.6%):CSL Ltd. 572 79,158Ramsay Health Care Ltd. 2,154 98,399Sonic Healthcare, Ltd. 5,971 104,105
281,662Industrials (0.5%):Brambles Ltd. 14,423 120,409Cimic Group Ltd. 2,248 77,016
197,425Materials (1.1%):BHP Billiton Ltd. 3,372 92,137BHP Group PLC 2,928 70,484
Copyright © 2021 www.secdatabase.com. All Rights Reserved.Please Consider the Environment Before Printing This Document
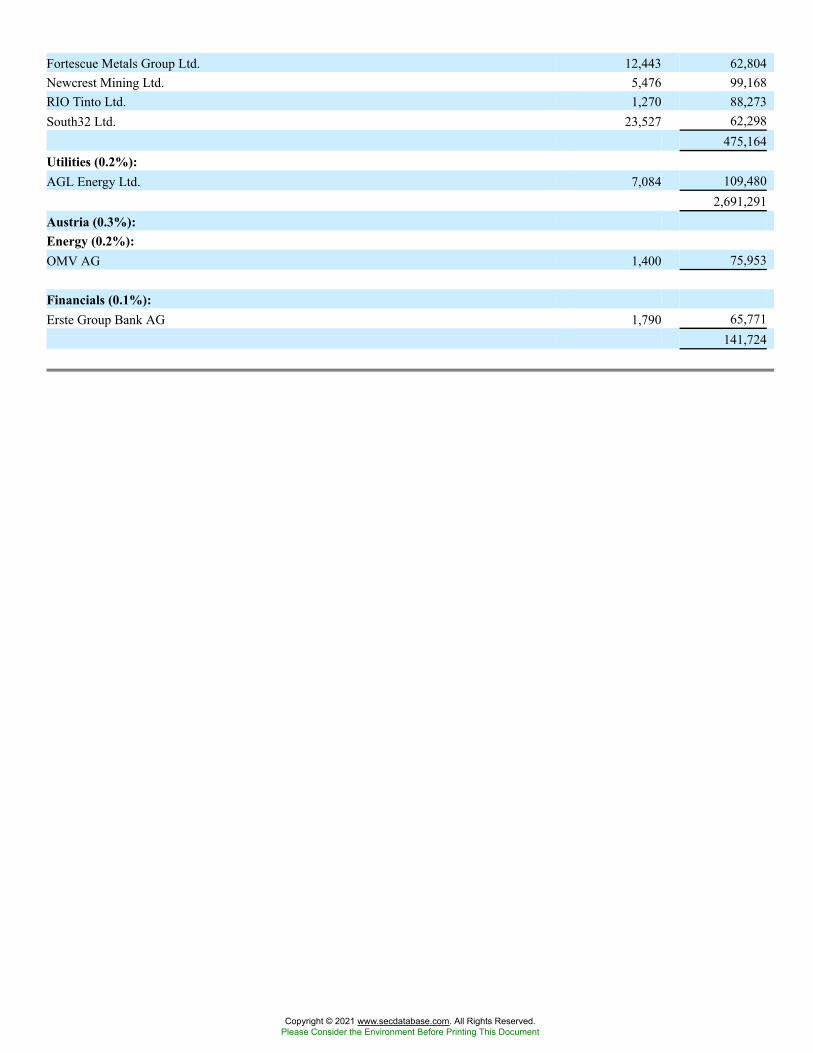
Fortescue Metals Group Ltd. 12,443 62,804Newcrest Mining Ltd. 5,476 99,168RIO Tinto Ltd. 1,270 88,273South32 Ltd. 23,527 62,298
475,164Utilities (0.2%):AGL Energy Ltd. 7,084 109,480
2,691,291Austria (0.3%):Energy (0.2%):OMV AG 1,400 75,953
Financials (0.1%):Erste Group Bank AG 1,790 65,771
141,724
Copyright © 2021 www.secdatabase.com. All Rights Reserved.Please Consider the Environment Before Printing This Document

Security Description Shares Value
Belgium (2.0%):Communication Services (0.2%):Proximus SADP 3,258 $ 93,949
Consumer Staples (0.5%):Anheuser-Busch InBev SA/NV 943 79,072Colruyt SA 1,938 143,245
222,317Financials (0.7%):Ageas 2,323 112,036Groupe Bruxelles Lambert SA 1,181 114,738KBC Groep NV 1,128 78,795
305,569Health Care (0.3%):UCB SA 1,107 95,058
Materials (0.3%):Solvay SA 624 67,454Umicore SA 1,456 64,653
132,107849,000
Bermuda (0.4%):Industrials (0.2%):Jardine Matheson Holdings Ltd. 1,300 81,068
Real Estate (0.2%):Hongkong Land Holdings Ltd. 15,500 110,205
191,273Canada (10.4%):Communication Services (1.1%):BCE, Inc. 3,550 157,654Rogers Communications, Inc. 2,635 141,728TELUS Corp. 5,087 188,298
487,680Consumer Discretionary (0.5%):Dollarama, Inc. 1,994 53,200Magna International, Inc. 1,313 63,940Restaurant Brands International, Inc. 1,203 78,274
195,414Consumer Staples (1.4%):Alimentation Couche-Tard, Inc., Class B 1,897 111,759George Weston Ltd. 1,789 128,652Loblaw Cos. Ltd. 2,391 117,957Metro, Inc. 3,380 124,454Saputo, Inc. 3,224 109,904
592,726
Copyright © 2021 www.secdatabase.com. All Rights Reserved.Please Consider the Environment Before Printing This Document
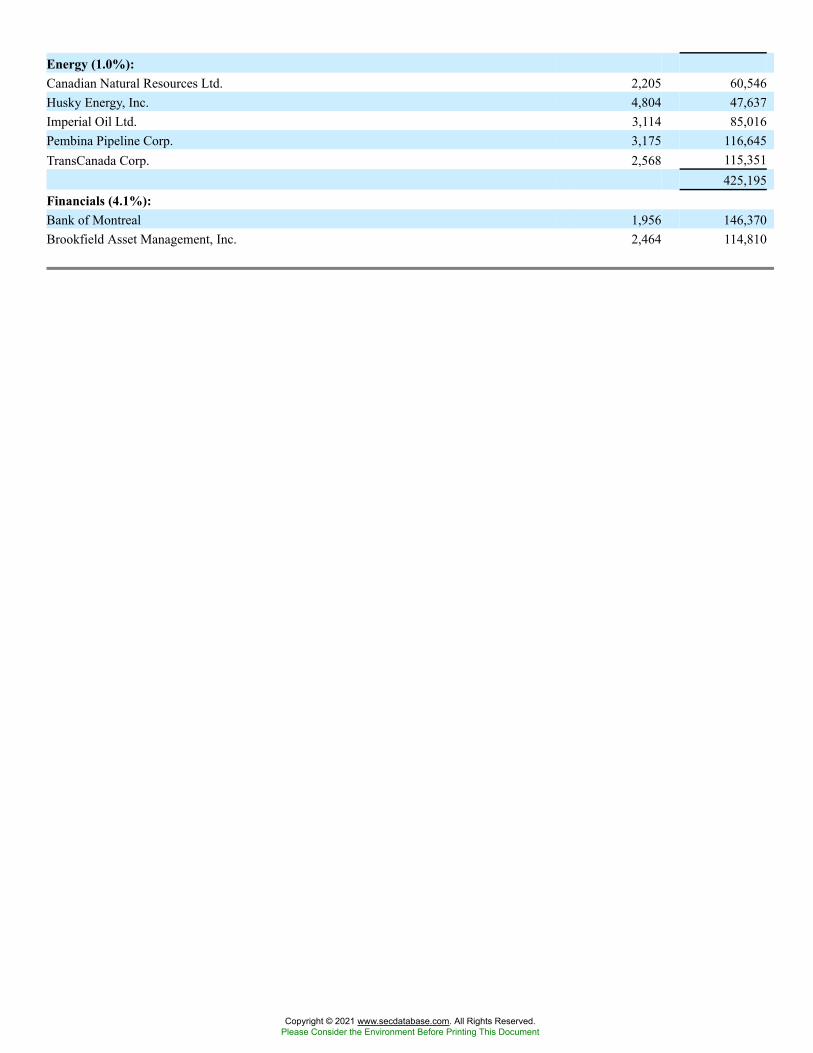
Energy (1.0%):Canadian Natural Resources Ltd. 2,205 60,546Husky Energy, Inc. 4,804 47,637Imperial Oil Ltd. 3,114 85,016Pembina Pipeline Corp. 3,175 116,645TransCanada Corp. 2,568 115,351
425,195Financials (4.1%):Bank of Montreal 1,956 146,370Brookfield Asset Management, Inc. 2,464 114,810
Copyright © 2021 www.secdatabase.com. All Rights Reserved.Please Consider the Environment Before Printing This Document
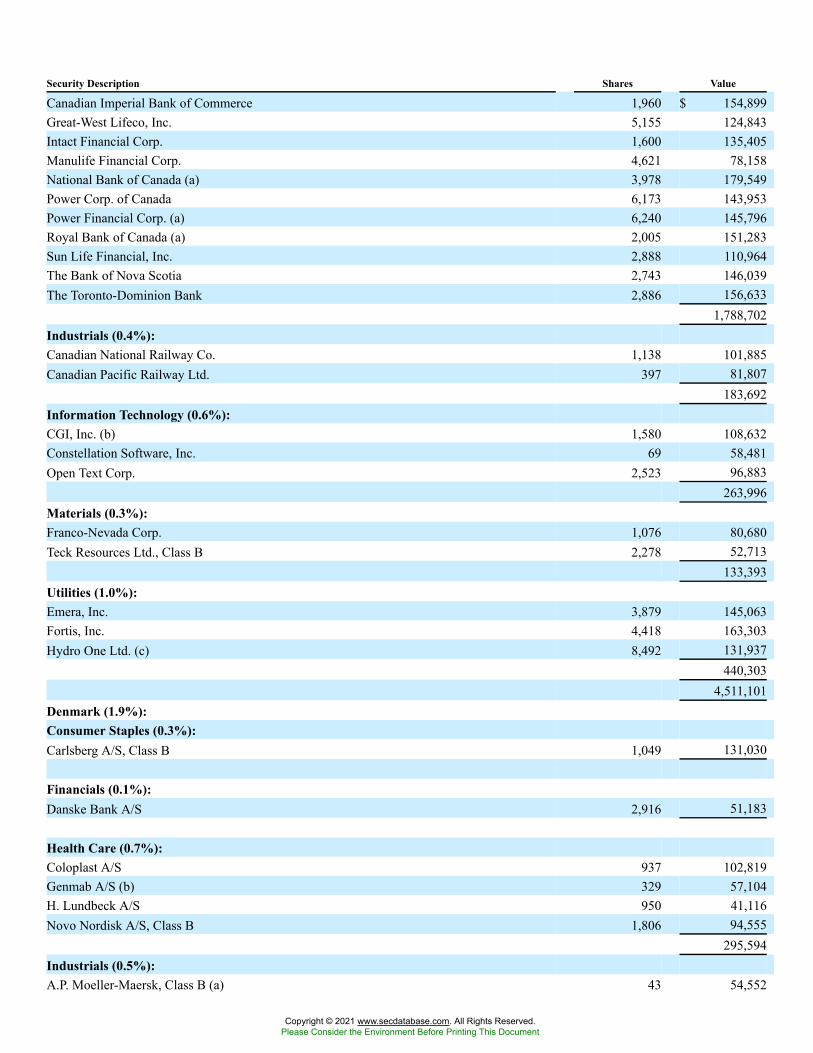
Security Description Shares Value
Canadian Imperial Bank of Commerce 1,960 $ 154,899Great-West Lifeco, Inc. 5,155 124,843Intact Financial Corp. 1,600 135,405Manulife Financial Corp. 4,621 78,158National Bank of Canada (a) 3,978 179,549Power Corp. of Canada 6,173 143,953Power Financial Corp. (a) 6,240 145,796Royal Bank of Canada (a) 2,005 151,283Sun Life Financial, Inc. 2,888 110,964The Bank of Nova Scotia 2,743 146,039The Toronto-Dominion Bank 2,886 156,633
1,788,702Industrials (0.4%):Canadian National Railway Co. 1,138 101,885Canadian Pacific Railway Ltd. 397 81,807
183,692Information Technology (0.6%):CGI, Inc. (b) 1,580 108,632Constellation Software, Inc. 69 58,481Open Text Corp. 2,523 96,883
263,996Materials (0.3%):Franco-Nevada Corp. 1,076 80,680Teck Resources Ltd., Class B 2,278 52,713
133,393Utilities (1.0%):Emera, Inc. 3,879 145,063Fortis, Inc. 4,418 163,303Hydro One Ltd. (c) 8,492 131,937
440,3034,511,101
Denmark (1.9%):Consumer Staples (0.3%):Carlsberg A/S, Class B 1,049 131,030
Financials (0.1%):Danske Bank A/S 2,916 51,183
Health Care (0.7%):Coloplast A/S 937 102,819Genmab A/S (b) 329 57,104H. Lundbeck A/S 950 41,116Novo Nordisk A/S, Class B 1,806 94,555
295,594Industrials (0.5%):A.P. Moeller-Maersk, Class B (a) 43 54,552
Copyright © 2021 www.secdatabase.com. All Rights Reserved.Please Consider the Environment Before Printing This Document
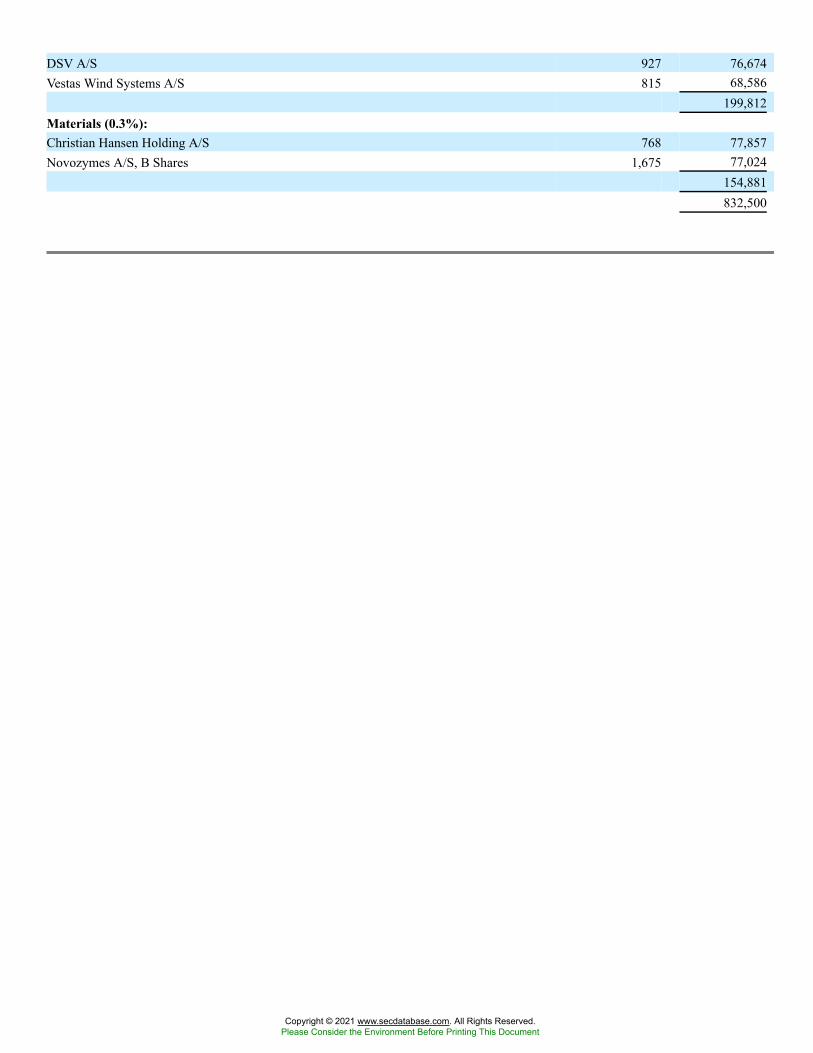
DSV A/S 927 76,674Vestas Wind Systems A/S 815 68,586
199,812Materials (0.3%):Christian Hansen Holding A/S 768 77,857Novozymes A/S, B Shares 1,675 77,024
154,881832,500
Copyright © 2021 www.secdatabase.com. All Rights Reserved.Please Consider the Environment Before Printing This Document
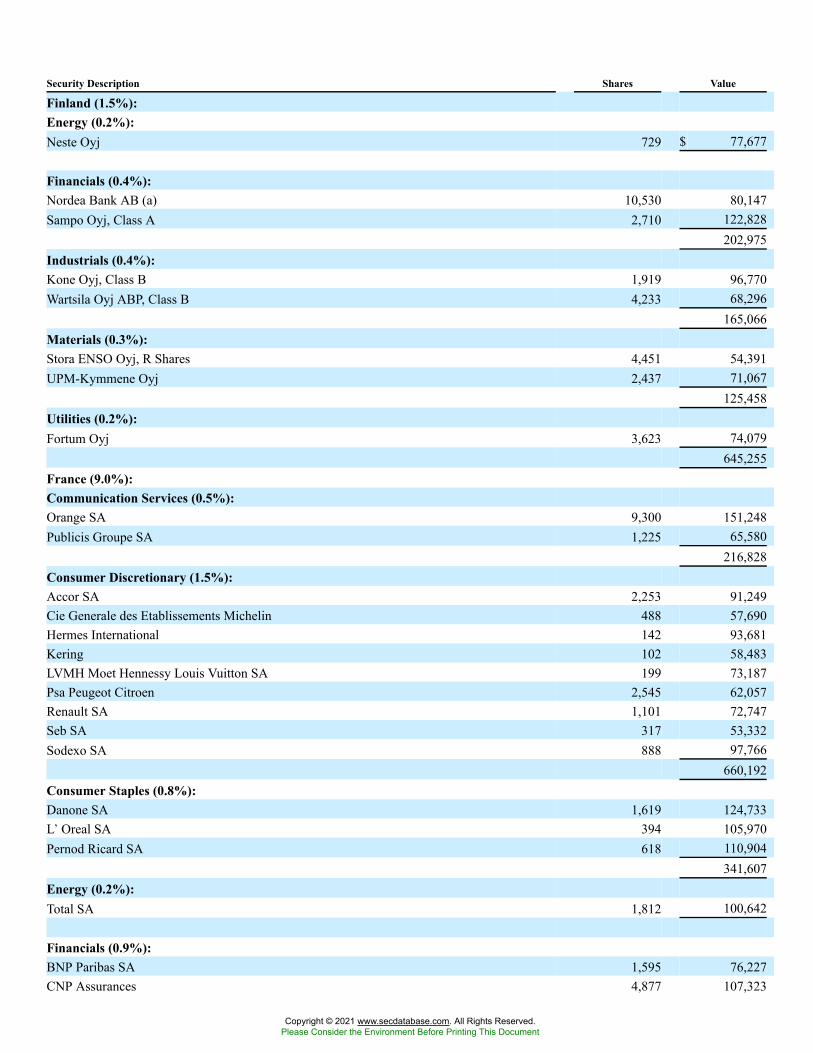
Security Description Shares Value
Finland (1.5%):Energy (0.2%):Neste Oyj 729 $ 77,677
Financials (0.4%):Nordea Bank AB (a) 10,530 80,147Sampo Oyj, Class A 2,710 122,828
202,975Industrials (0.4%):Kone Oyj, Class B 1,919 96,770Wartsila Oyj ABP, Class B 4,233 68,296
165,066Materials (0.3%):Stora ENSO Oyj, R Shares 4,451 54,391UPM-Kymmene Oyj 2,437 71,067
125,458Utilities (0.2%):Fortum Oyj 3,623 74,079
645,255France (9.0%):Communication Services (0.5%):Orange SA 9,300 151,248Publicis Groupe SA 1,225 65,580
216,828Consumer Discretionary (1.5%):Accor SA 2,253 91,249Cie Generale des Etablissements Michelin 488 57,690Hermes International 142 93,681Kering 102 58,483LVMH Moet Hennessy Louis Vuitton SA 199 73,187Psa Peugeot Citroen 2,545 62,057Renault SA 1,101 72,747Seb SA 317 53,332Sodexo SA 888 97,766
660,192Consumer Staples (0.8%):Danone SA 1,619 124,733L�Oreal SA 394 105,970Pernod Ricard SA 618 110,904
341,607Energy (0.2%):Total SA 1,812 100,642
Financials (0.9%):BNP Paribas SA 1,595 76,227CNP Assurances 4,877 107,323
Copyright © 2021 www.secdatabase.com. All Rights Reserved.Please Consider the Environment Before Printing This Document
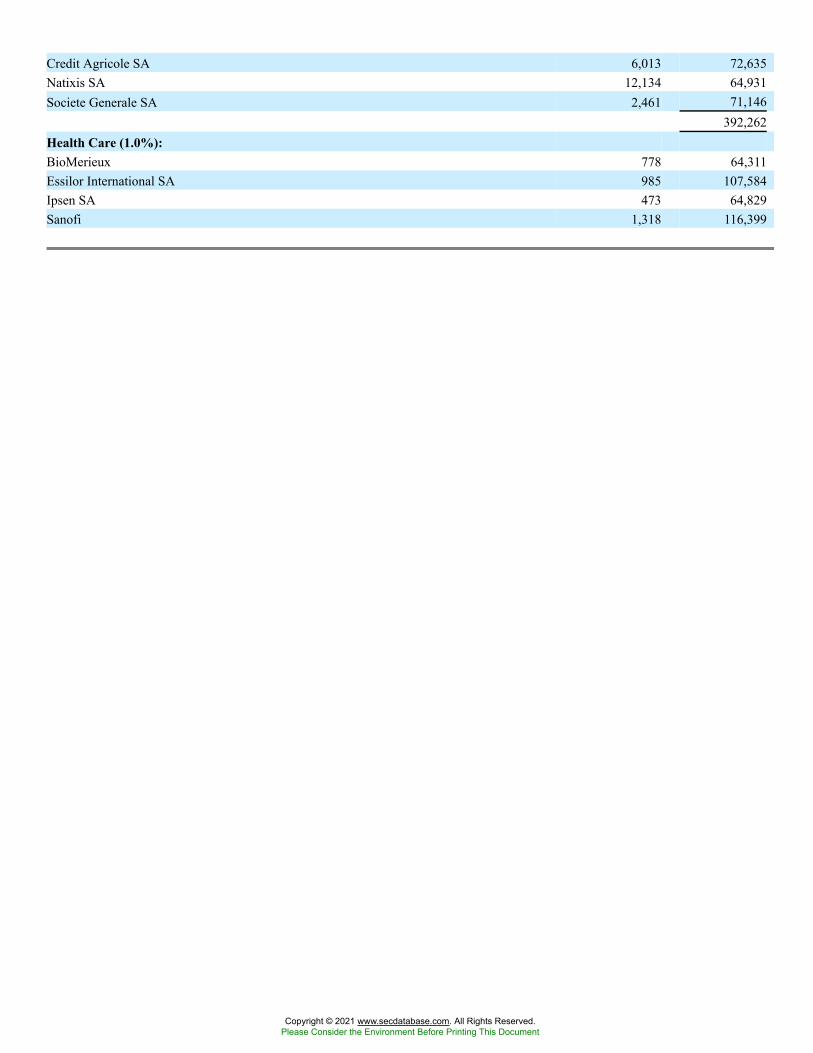
Credit Agricole SA 6,013 72,635Natixis SA 12,134 64,931Societe Generale SA 2,461 71,146
392,262Health Care (1.0%):BioMerieux 778 64,311Essilor International SA 985 107,584Ipsen SA 473 64,829Sanofi 1,318 116,399
Copyright © 2021 www.secdatabase.com. All Rights Reserved.Please Consider the Environment Before Printing This Document

Security Description Shares Value
Sartorius Stedim Biotech 462 $ 58,503411,626
Industrials (2.9%):Aeroports de Paris 481 93,008Airbus Group SE 577 76,301Alstom SA 1,982 85,853Bollore SA 17,885 80,801Bouygues 1,774 63,373Bureau Veritas SA 3,444 80,733Edenred 1,581 71,941Eiffage SA 1,024 98,383Groupe Eurotunnel SE 6,973 105,700Legrand SA 1,417 94,818Safran SA 560 76,785Schneider Electric SA 1,012 79,386Teleperformance 396 71,154Thales SA 704 84,291Vinci SA 1,074 104,463
1,266,990Information Technology (0.4%):Atos SE 444 42,827Cap Gemini SA 517 62,684Dassault Systemes SA 406 60,451
165,962Materials (0.3%):Air Liquide SA 969 123,193
Utilities (0.5%):Gdf Suez 6,191 92,214Veolia Environnement SA 4,719 105,487
197,7013,877,003
Germany (5.4%):Consumer Discretionary (0.5%):Bayerische Motoren Werke AG 1,121 86,441Continental AG 385 57,950Daimler AG, Registered Shares 1,254 73,489
217,880Consumer Staples (0.3%):Beiersdorf AG 1,096 114,003
Financials (1.4%):Allianz SE 509 113,198Commerzbank AG 6,090 47,131Deutsche Boerse AG 844 108,200Hannover Rueck SE 809 116,144
Copyright © 2021 www.secdatabase.com. All Rights Reserved.Please Consider the Environment Before Printing This Document
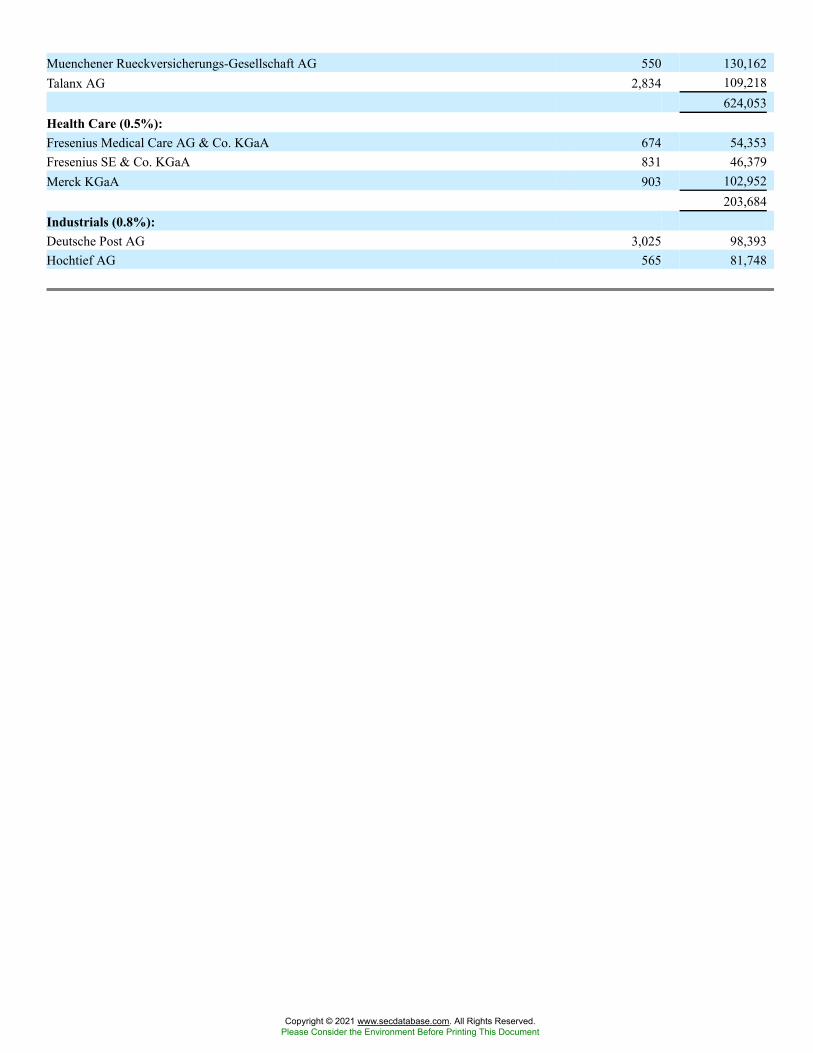
Muenchener Rueckversicherungs-Gesellschaft AG 550 130,162Talanx AG 2,834 109,218
624,053Health Care (0.5%):Fresenius Medical Care AG & Co. KGaA 674 54,353Fresenius SE & Co. KGaA 831 46,379Merck KGaA 903 102,952
203,684Industrials (0.8%):Deutsche Post AG 3,025 98,393Hochtief AG 565 81,748
Copyright © 2021 www.secdatabase.com. All Rights Reserved.Please Consider the Environment Before Printing This Document
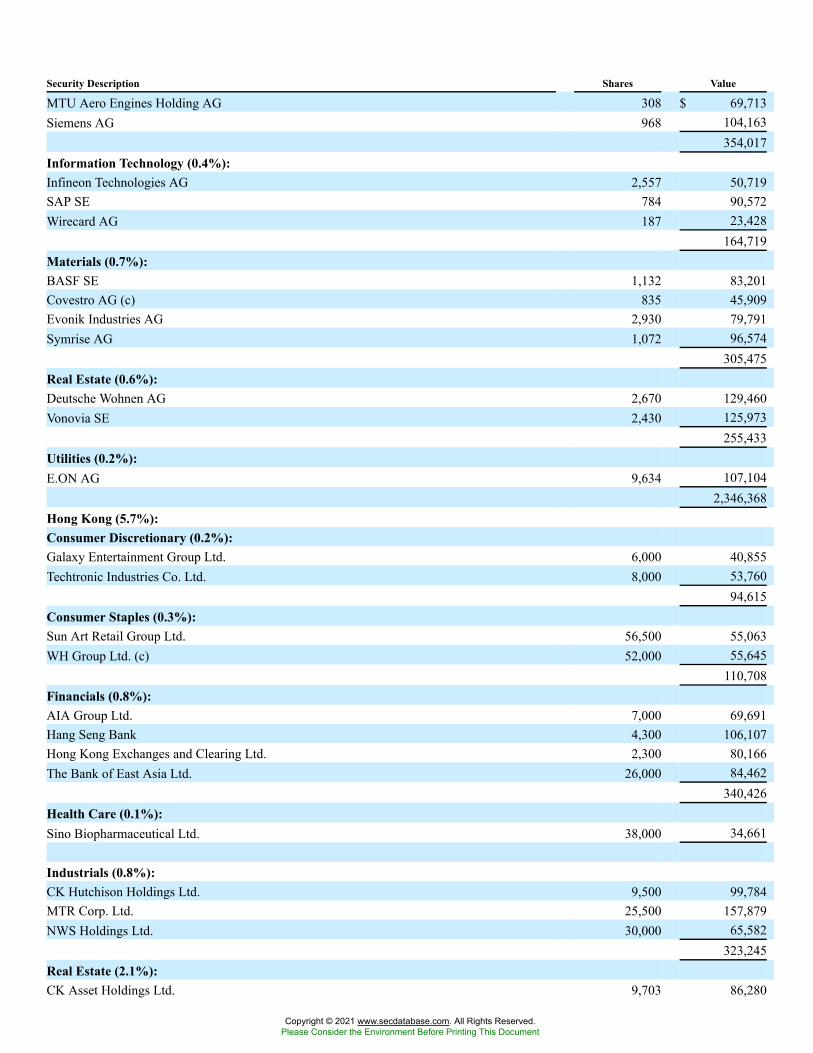
Security Description Shares Value
MTU Aero Engines Holding AG 308 $ 69,713Siemens AG 968 104,163
354,017Information Technology (0.4%):Infineon Technologies AG 2,557 50,719SAP SE 784 90,572Wirecard AG 187 23,428
164,719Materials (0.7%):BASF SE 1,132 83,201Covestro AG (c) 835 45,909Evonik Industries AG 2,930 79,791Symrise AG 1,072 96,574
305,475Real Estate (0.6%):Deutsche Wohnen AG 2,670 129,460Vonovia SE 2,430 125,973
255,433Utilities (0.2%):E.ON AG 9,634 107,104
2,346,368Hong Kong (5.7%):Consumer Discretionary (0.2%):Galaxy Entertainment Group Ltd. 6,000 40,855Techtronic Industries Co. Ltd. 8,000 53,760
94,615Consumer Staples (0.3%):Sun Art Retail Group Ltd. 56,500 55,063WH Group Ltd. (c) 52,000 55,645
110,708Financials (0.8%):AIA Group Ltd. 7,000 69,691Hang Seng Bank 4,300 106,107Hong Kong Exchanges and Clearing Ltd. 2,300 80,166The Bank of East Asia Ltd. 26,000 84,462
340,426Health Care (0.1%):Sino Biopharmaceutical Ltd. 38,000 34,661
Industrials (0.8%):CK Hutchison Holdings Ltd. 9,500 99,784MTR Corp. Ltd. 25,500 157,879NWS Holdings Ltd. 30,000 65,582
323,245Real Estate (2.1%):CK Asset Holdings Ltd. 9,703 86,280
Copyright © 2021 www.secdatabase.com. All Rights Reserved.Please Consider the Environment Before Printing This Document
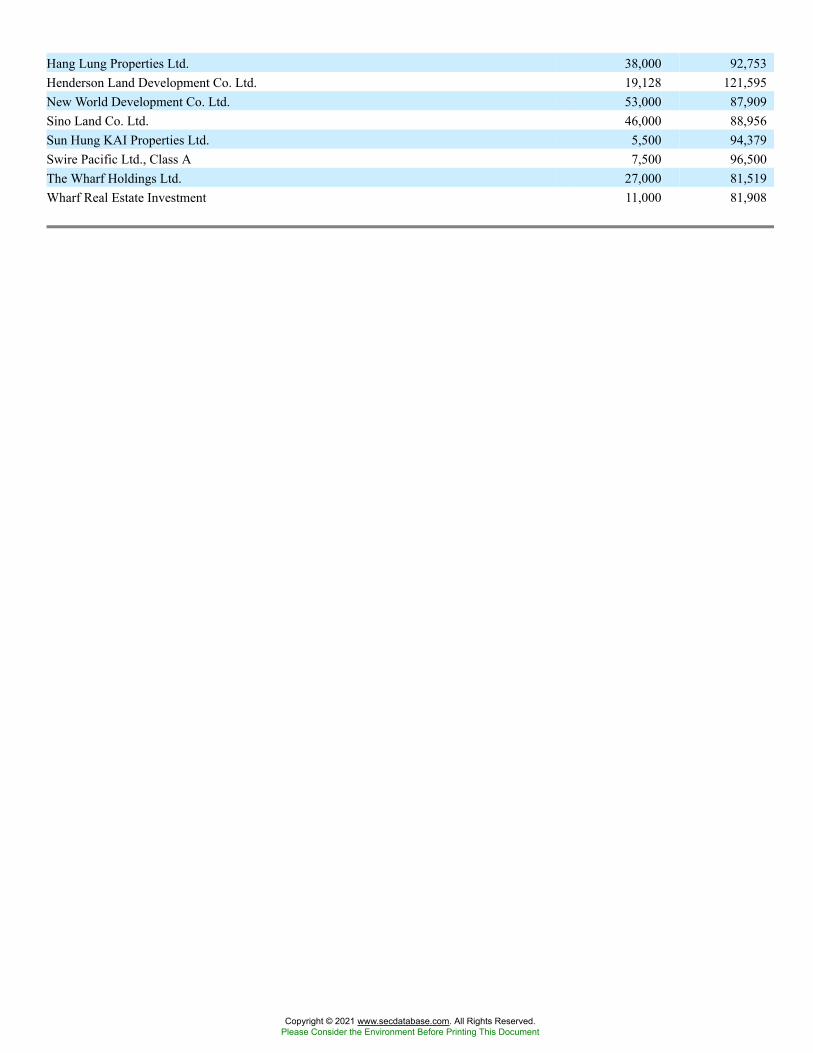
Hang Lung Properties Ltd. 38,000 92,753Henderson Land Development Co. Ltd. 19,128 121,595New World Development Co. Ltd. 53,000 87,909Sino Land Co. Ltd. 46,000 88,956Sun Hung KAI Properties Ltd. 5,500 94,379Swire Pacific Ltd., Class A 7,500 96,500The Wharf Holdings Ltd. 27,000 81,519Wharf Real Estate Investment 11,000 81,908
Copyright © 2021 www.secdatabase.com. All Rights Reserved.Please Consider the Environment Before Printing This Document
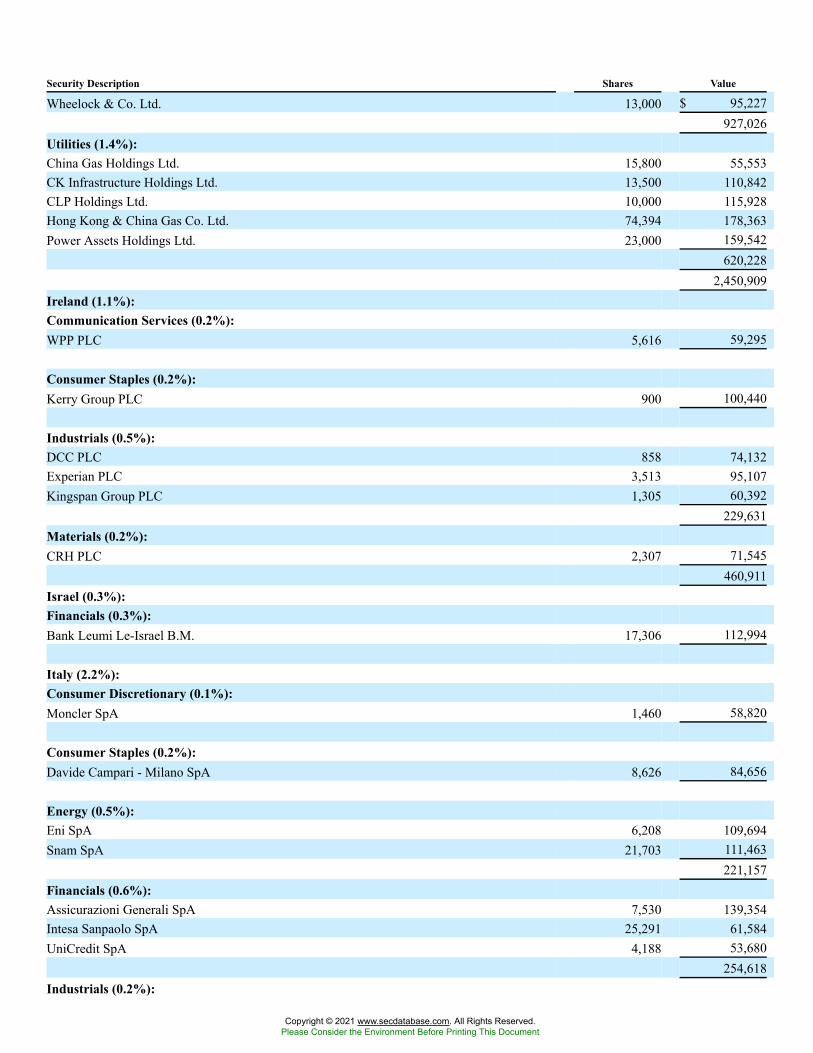
Security Description Shares Value
Wheelock & Co. Ltd. 13,000 $ 95,227927,026
Utilities (1.4%):China Gas Holdings Ltd. 15,800 55,553CK Infrastructure Holdings Ltd. 13,500 110,842CLP Holdings Ltd. 10,000 115,928Hong Kong & China Gas Co. Ltd. 74,394 178,363Power Assets Holdings Ltd. 23,000 159,542
620,2282,450,909
Ireland (1.1%):Communication Services (0.2%):WPP PLC 5,616 59,295
Consumer Staples (0.2%):Kerry Group PLC 900 100,440
Industrials (0.5%):DCC PLC 858 74,132Experian PLC 3,513 95,107Kingspan Group PLC 1,305 60,392
229,631Materials (0.2%):CRH PLC 2,307 71,545
460,911Israel (0.3%):Financials (0.3%):Bank Leumi Le-Israel B.M. 17,306 112,994
Italy (2.2%):Consumer Discretionary (0.1%):Moncler SpA 1,460 58,820
Consumer Staples (0.2%):Davide Campari - Milano SpA 8,626 84,656
Energy (0.5%):Eni SpA 6,208 109,694Snam SpA 21,703 111,463
221,157Financials (0.6%):Assicurazioni Generali SpA 7,530 139,354Intesa Sanpaolo SpA 25,291 61,584UniCredit SpA 4,188 53,680
254,618Industrials (0.2%):
Copyright © 2021 www.secdatabase.com. All Rights Reserved.Please Consider the Environment Before Printing This Document
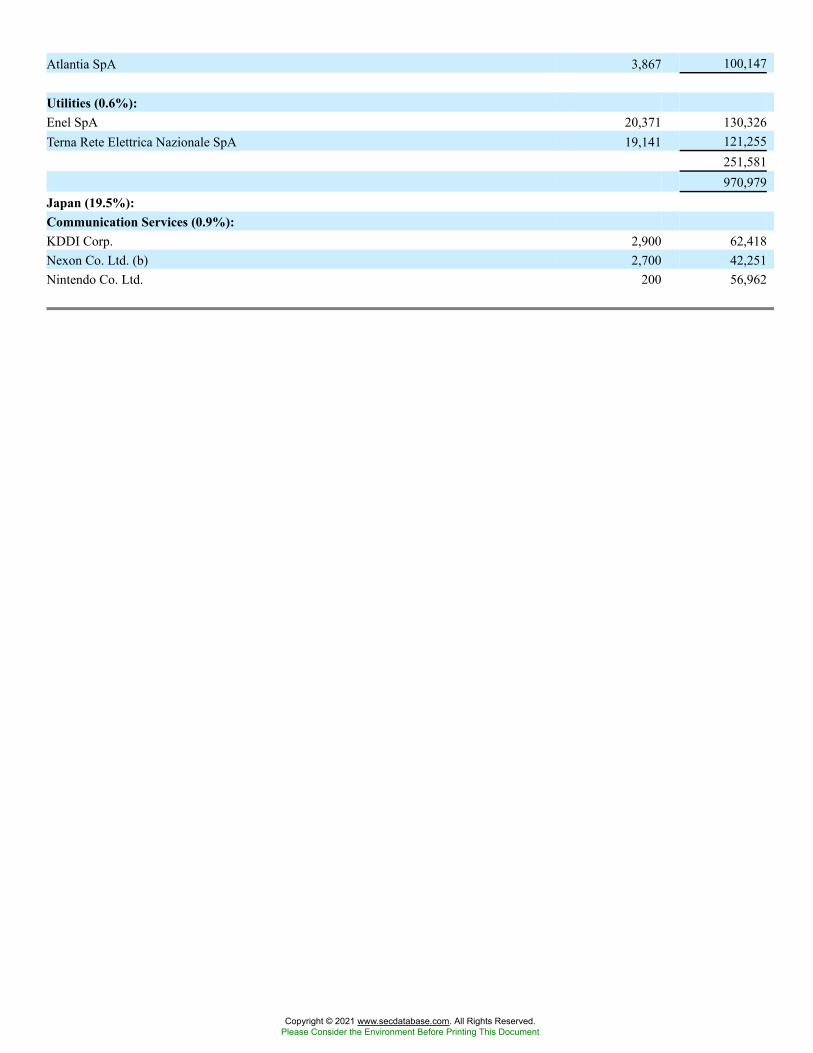
Atlantia SpA 3,867 100,147
Utilities (0.6%):Enel SpA 20,371 130,326Terna Rete Elettrica Nazionale SpA 19,141 121,255
251,581970,979
Japan (19.5%):Communication Services (0.9%):KDDI Corp. 2,900 62,418Nexon Co. Ltd. (b) 2,700 42,251Nintendo Co. Ltd. 200 56,962
Copyright © 2021 www.secdatabase.com. All Rights Reserved.Please Consider the Environment Before Printing This Document
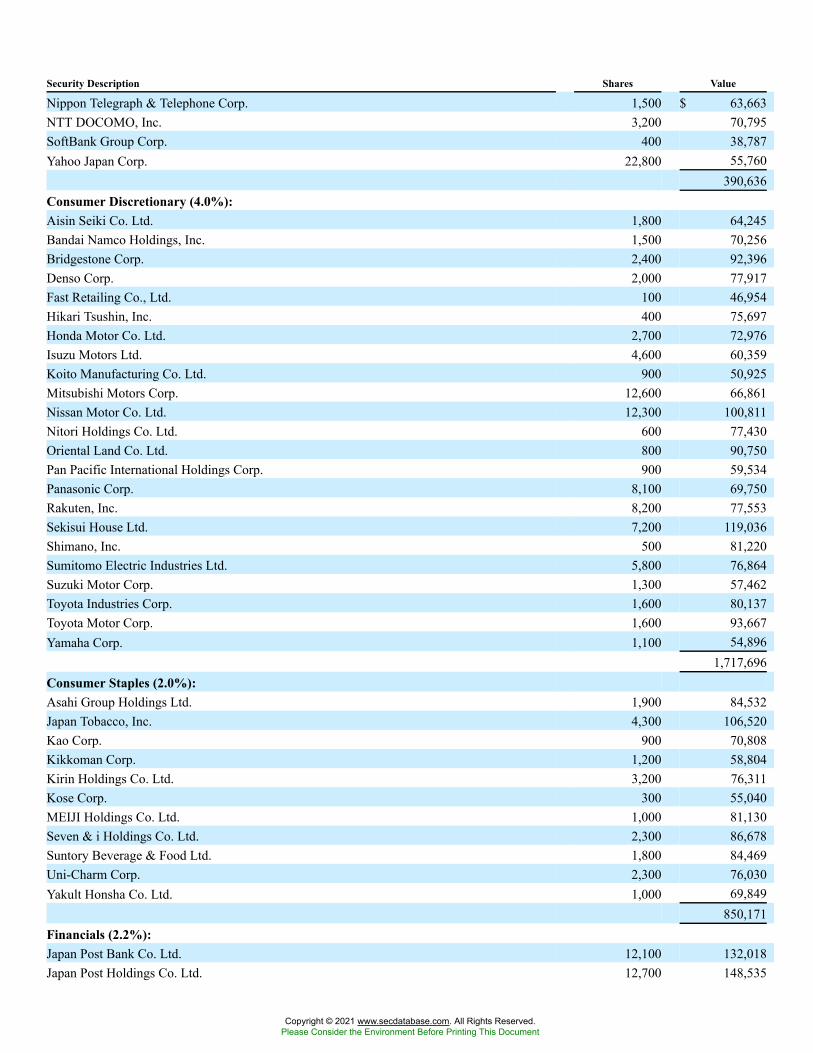
Security Description Shares Value
Nippon Telegraph & Telephone Corp. 1,500 $ 63,663NTT DOCOMO, Inc. 3,200 70,795SoftBank Group Corp. 400 38,787Yahoo Japan Corp. 22,800 55,760
390,636Consumer Discretionary (4.0%):Aisin Seiki Co. Ltd. 1,800 64,245Bandai Namco Holdings, Inc. 1,500 70,256Bridgestone Corp. 2,400 92,396Denso Corp. 2,000 77,917Fast Retailing Co., Ltd. 100 46,954Hikari Tsushin, Inc. 400 75,697Honda Motor Co. Ltd. 2,700 72,976Isuzu Motors Ltd. 4,600 60,359Koito Manufacturing Co. Ltd. 900 50,925Mitsubishi Motors Corp. 12,600 66,861Nissan Motor Co. Ltd. 12,300 100,811Nitori Holdings Co. Ltd. 600 77,430Oriental Land Co. Ltd. 800 90,750Pan Pacific International Holdings Corp. 900 59,534Panasonic Corp. 8,100 69,750Rakuten, Inc. 8,200 77,553Sekisui House Ltd. 7,200 119,036Shimano, Inc. 500 81,220Sumitomo Electric Industries Ltd. 5,800 76,864Suzuki Motor Corp. 1,300 57,462Toyota Industries Corp. 1,600 80,137Toyota Motor Corp. 1,600 93,667Yamaha Corp. 1,100 54,896
1,717,696Consumer Staples (2.0%):Asahi Group Holdings Ltd. 1,900 84,532Japan Tobacco, Inc. 4,300 106,520Kao Corp. 900 70,808Kikkoman Corp. 1,200 58,804Kirin Holdings Co. Ltd. 3,200 76,311Kose Corp. 300 55,040MEIJI Holdings Co. Ltd. 1,000 81,130Seven & i Holdings Co. Ltd. 2,300 86,678Suntory Beverage & Food Ltd. 1,800 84,469Uni-Charm Corp. 2,300 76,030Yakult Honsha Co. Ltd. 1,000 69,849
850,171Financials (2.2%):Japan Post Bank Co. Ltd. 12,100 132,018Japan Post Holdings Co. Ltd. 12,700 148,535
Copyright © 2021 www.secdatabase.com. All Rights Reserved.Please Consider the Environment Before Printing This Document
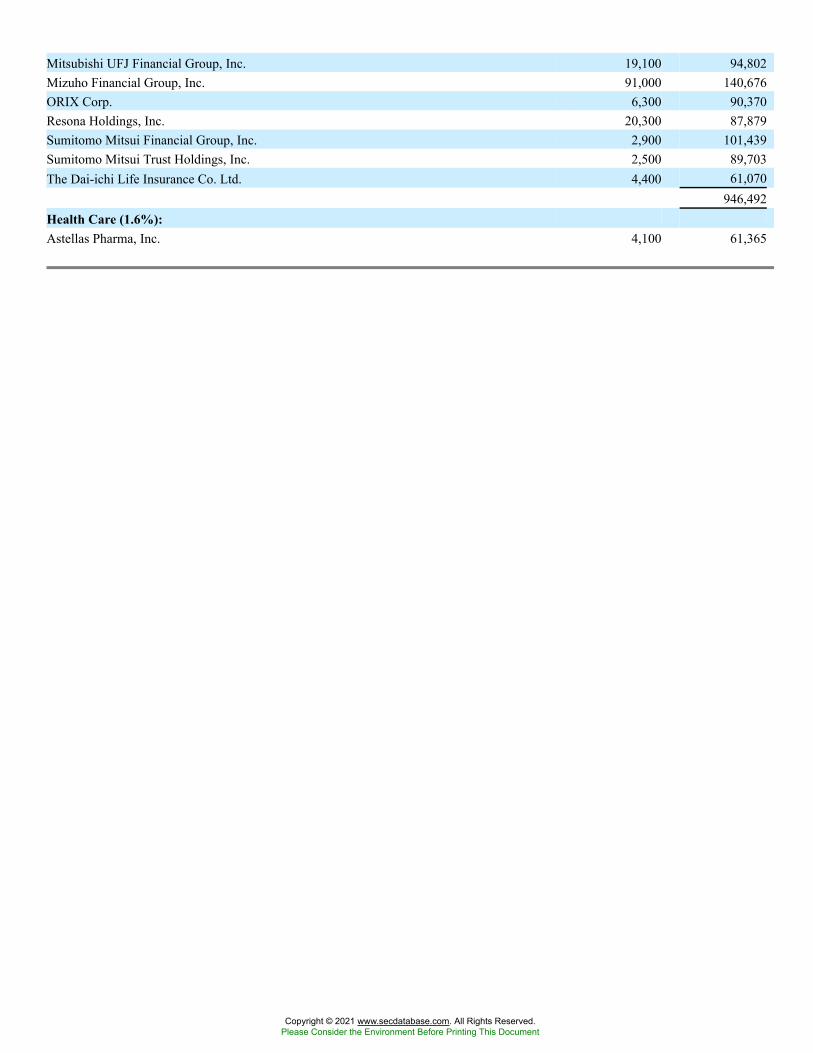
Mitsubishi UFJ Financial Group, Inc. 19,100 94,802Mizuho Financial Group, Inc. 91,000 140,676ORIX Corp. 6,300 90,370Resona Holdings, Inc. 20,300 87,879Sumitomo Mitsui Financial Group, Inc. 2,900 101,439Sumitomo Mitsui Trust Holdings, Inc. 2,500 89,703The Dai-ichi Life Insurance Co. Ltd. 4,400 61,070
946,492Health Care (1.6%):Astellas Pharma, Inc. 4,100 61,365
Copyright © 2021 www.secdatabase.com. All Rights Reserved.Please Consider the Environment Before Printing This Document
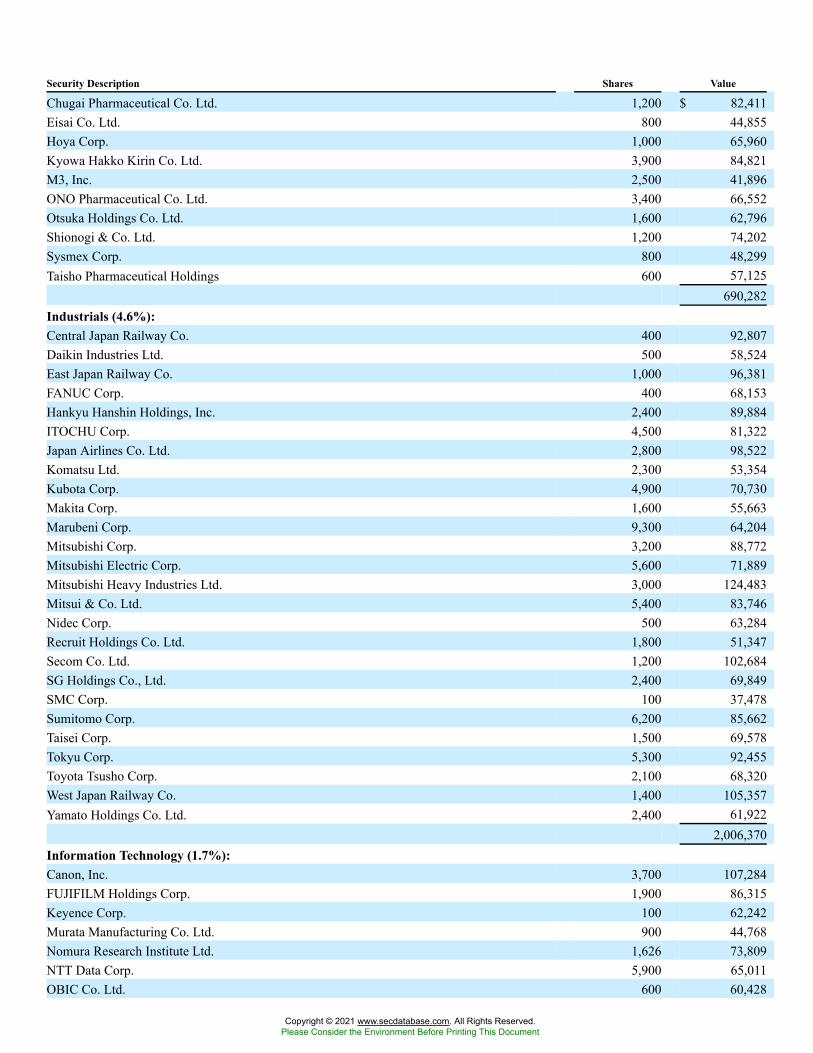
Security Description Shares Value
Chugai Pharmaceutical Co. Ltd. 1,200 $ 82,411Eisai Co. Ltd. 800 44,855Hoya Corp. 1,000 65,960Kyowa Hakko Kirin Co. Ltd. 3,900 84,821M3, Inc. 2,500 41,896ONO Pharmaceutical Co. Ltd. 3,400 66,552Otsuka Holdings Co. Ltd. 1,600 62,796Shionogi & Co. Ltd. 1,200 74,202Sysmex Corp. 800 48,299Taisho Pharmaceutical Holdings 600 57,125
690,282Industrials (4.6%):Central Japan Railway Co. 400 92,807Daikin Industries Ltd. 500 58,524East Japan Railway Co. 1,000 96,381FANUC Corp. 400 68,153Hankyu Hanshin Holdings, Inc. 2,400 89,884ITOCHU Corp. 4,500 81,322Japan Airlines Co. Ltd. 2,800 98,522Komatsu Ltd. 2,300 53,354Kubota Corp. 4,900 70,730Makita Corp. 1,600 55,663Marubeni Corp. 9,300 64,204Mitsubishi Corp. 3,200 88,772Mitsubishi Electric Corp. 5,600 71,889Mitsubishi Heavy Industries Ltd. 3,000 124,483Mitsui & Co. Ltd. 5,400 83,746Nidec Corp. 500 63,284Recruit Holdings Co. Ltd. 1,800 51,347Secom Co. Ltd. 1,200 102,684SG Holdings Co., Ltd. 2,400 69,849SMC Corp. 100 37,478Sumitomo Corp. 6,200 85,662Taisei Corp. 1,500 69,578Tokyu Corp. 5,300 92,455Toyota Tsusho Corp. 2,100 68,320West Japan Railway Co. 1,400 105,357Yamato Holdings Co. Ltd. 2,400 61,922
2,006,370Information Technology (1.7%):Canon, Inc. 3,700 107,284FUJIFILM Holdings Corp. 1,900 86,315Keyence Corp. 100 62,242Murata Manufacturing Co. Ltd. 900 44,768Nomura Research Institute Ltd. 1,626 73,809NTT Data Corp. 5,900 65,011OBIC Co. Ltd. 600 60,428
Copyright © 2021 www.secdatabase.com. All Rights Reserved.Please Consider the Environment Before Printing This Document
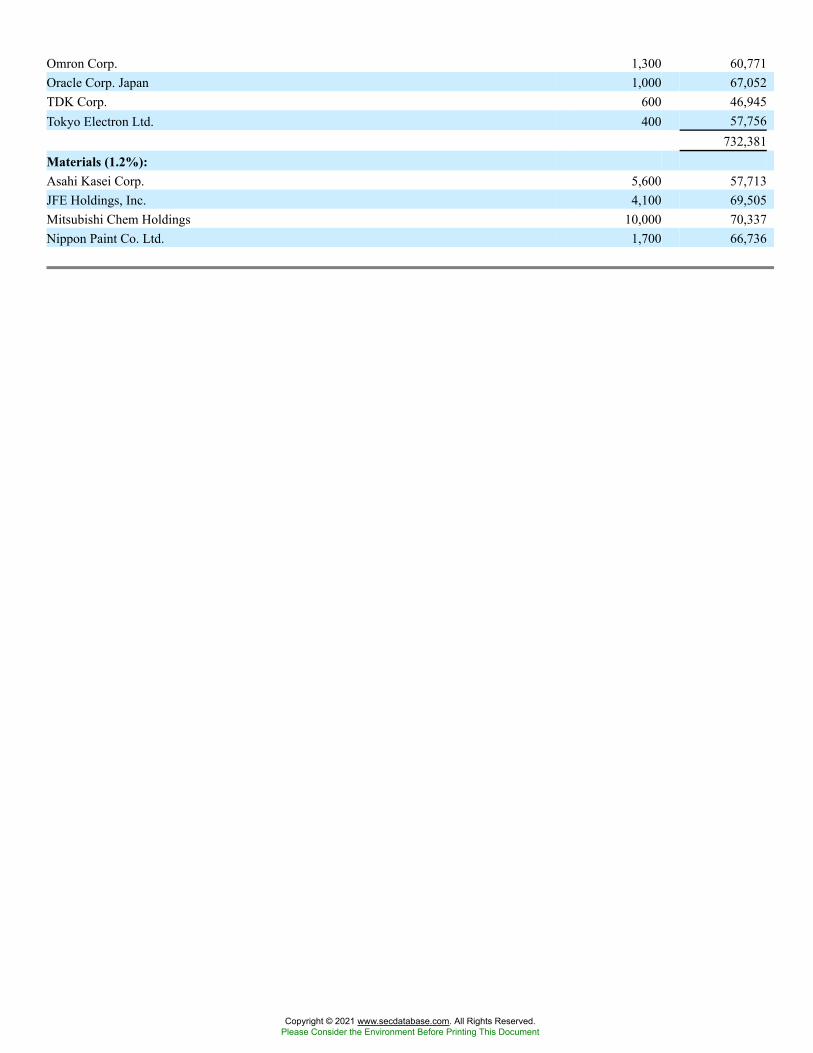
Omron Corp. 1,300 60,771Oracle Corp. Japan 1,000 67,052TDK Corp. 600 46,945Tokyo Electron Ltd. 400 57,756
732,381Materials (1.2%):Asahi Kasei Corp. 5,600 57,713JFE Holdings, Inc. 4,100 69,505Mitsubishi Chem Holdings 10,000 70,337Nippon Paint Co. Ltd. 1,700 66,736
Copyright © 2021 www.secdatabase.com. All Rights Reserved.Please Consider the Environment Before Printing This Document
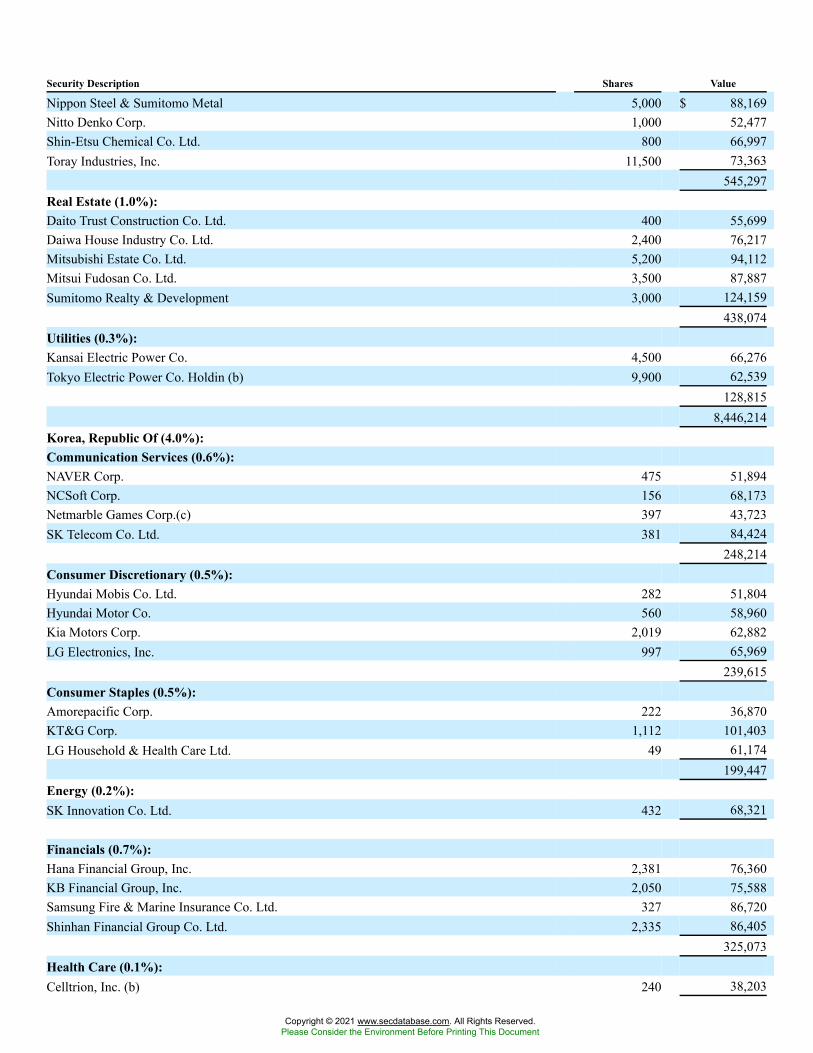
Security Description Shares Value
Nippon Steel & Sumitomo Metal 5,000 $ 88,169Nitto Denko Corp. 1,000 52,477Shin-Etsu Chemical Co. Ltd. 800 66,997Toray Industries, Inc. 11,500 73,363
545,297Real Estate (1.0%):Daito Trust Construction Co. Ltd. 400 55,699Daiwa House Industry Co. Ltd. 2,400 76,217Mitsubishi Estate Co. Ltd. 5,200 94,112Mitsui Fudosan Co. Ltd. 3,500 87,887Sumitomo Realty & Development 3,000 124,159
438,074Utilities (0.3%):Kansai Electric Power Co. 4,500 66,276Tokyo Electric Power Co. Holdin (b) 9,900 62,539
128,8158,446,214
Korea, Republic Of (4.0%):Communication Services (0.6%):NAVER Corp. 475 51,894NCSoft Corp. 156 68,173Netmarble Games Corp.(c) 397 43,723SK Telecom Co. Ltd. 381 84,424
248,214Consumer Discretionary (0.5%):Hyundai Mobis Co. Ltd. 282 51,804Hyundai Motor Co. 560 58,960Kia Motors Corp. 2,019 62,882LG Electronics, Inc. 997 65,969
239,615Consumer Staples (0.5%):Amorepacific Corp. 222 36,870KT&G Corp. 1,112 101,403LG Household & Health Care Ltd. 49 61,174
199,447Energy (0.2%):SK Innovation Co. Ltd. 432 68,321
Financials (0.7%):Hana Financial Group, Inc. 2,381 76,360KB Financial Group, Inc. 2,050 75,588Samsung Fire & Marine Insurance Co. Ltd. 327 86,720Shinhan Financial Group Co. Ltd. 2,335 86,405
325,073Health Care (0.1%):Celltrion, Inc. (b) 240 38,203
Copyright © 2021 www.secdatabase.com. All Rights Reserved.Please Consider the Environment Before Printing This Document
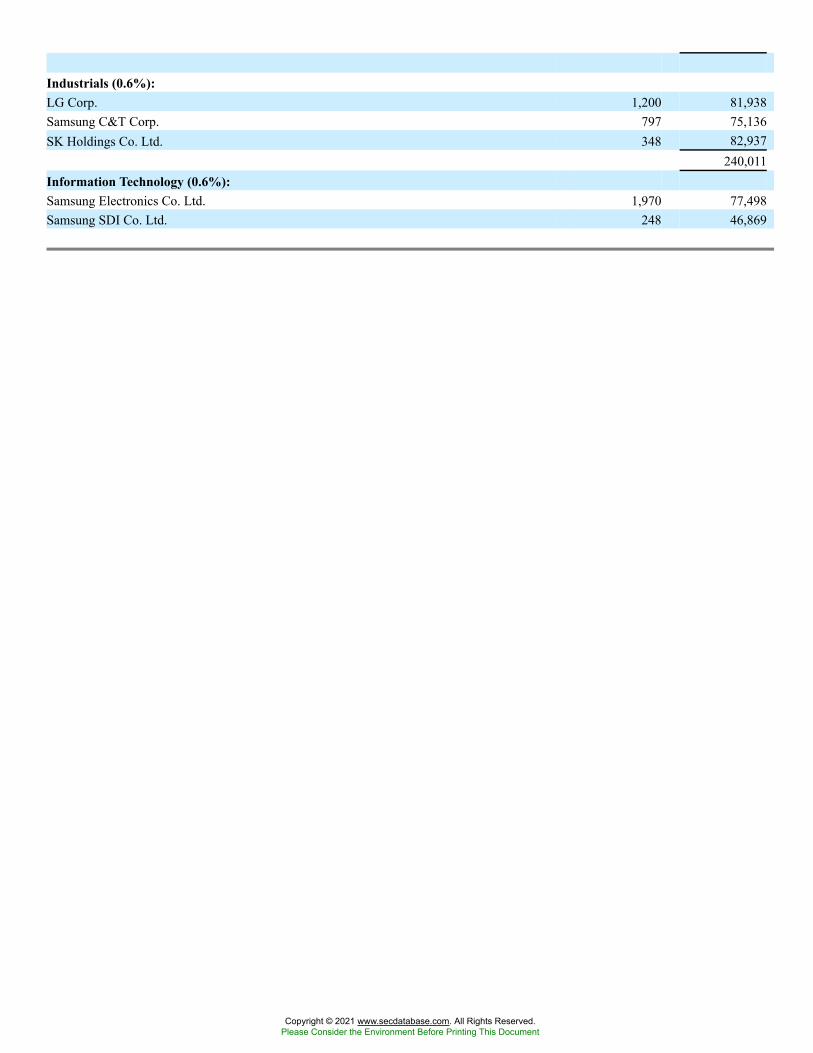
Industrials (0.6%):LG Corp. 1,200 81,938Samsung C&T Corp. 797 75,136SK Holdings Co. Ltd. 348 82,937
240,011Information Technology (0.6%):Samsung Electronics Co. Ltd. 1,970 77,498Samsung SDI Co. Ltd. 248 46,869
Copyright © 2021 www.secdatabase.com. All Rights Reserved.Please Consider the Environment Before Printing This Document
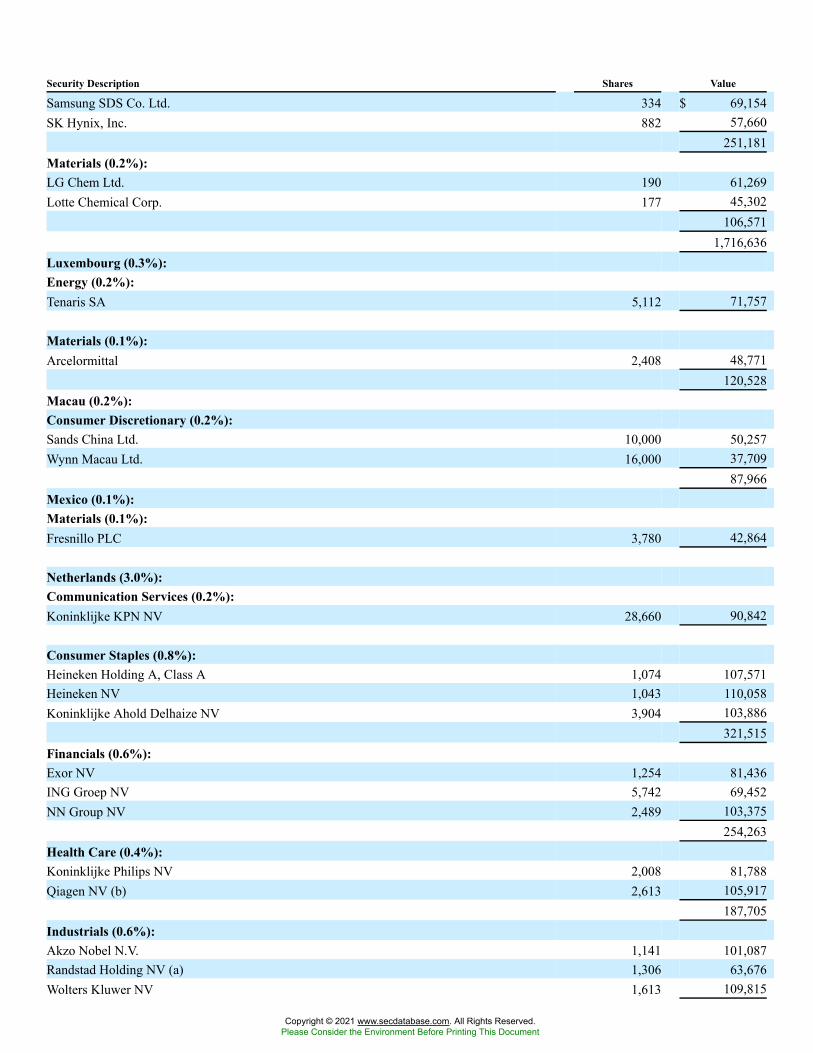
Security Description Shares Value
Samsung SDS Co. Ltd. 334 $ 69,154SK Hynix, Inc. 882 57,660
251,181Materials (0.2%):LG Chem Ltd. 190 61,269Lotte Chemical Corp. 177 45,302
106,5711,716,636
Luxembourg (0.3%):Energy (0.2%):Tenaris SA 5,112 71,757
Materials (0.1%):Arcelormittal 2,408 48,771
120,528Macau (0.2%):Consumer Discretionary (0.2%):Sands China Ltd. 10,000 50,257Wynn Macau Ltd. 16,000 37,709
87,966Mexico (0.1%):Materials (0.1%):Fresnillo PLC 3,780 42,864
Netherlands (3.0%):Communication Services (0.2%):Koninklijke KPN NV 28,660 90,842
Consumer Staples (0.8%):Heineken Holding A, Class A 1,074 107,571Heineken NV 1,043 110,058Koninklijke Ahold Delhaize NV 3,904 103,886
321,515Financials (0.6%):Exor NV 1,254 81,436ING Groep NV 5,742 69,452NN Group NV 2,489 103,375
254,263Health Care (0.4%):Koninklijke Philips NV 2,008 81,788Qiagen NV (b) 2,613 105,917
187,705Industrials (0.6%):Akzo Nobel N.V. 1,141 101,087Randstad Holding NV (a) 1,306 63,676Wolters Kluwer NV 1,613 109,815
Copyright © 2021 www.secdatabase.com. All Rights Reserved.Please Consider the Environment Before Printing This Document
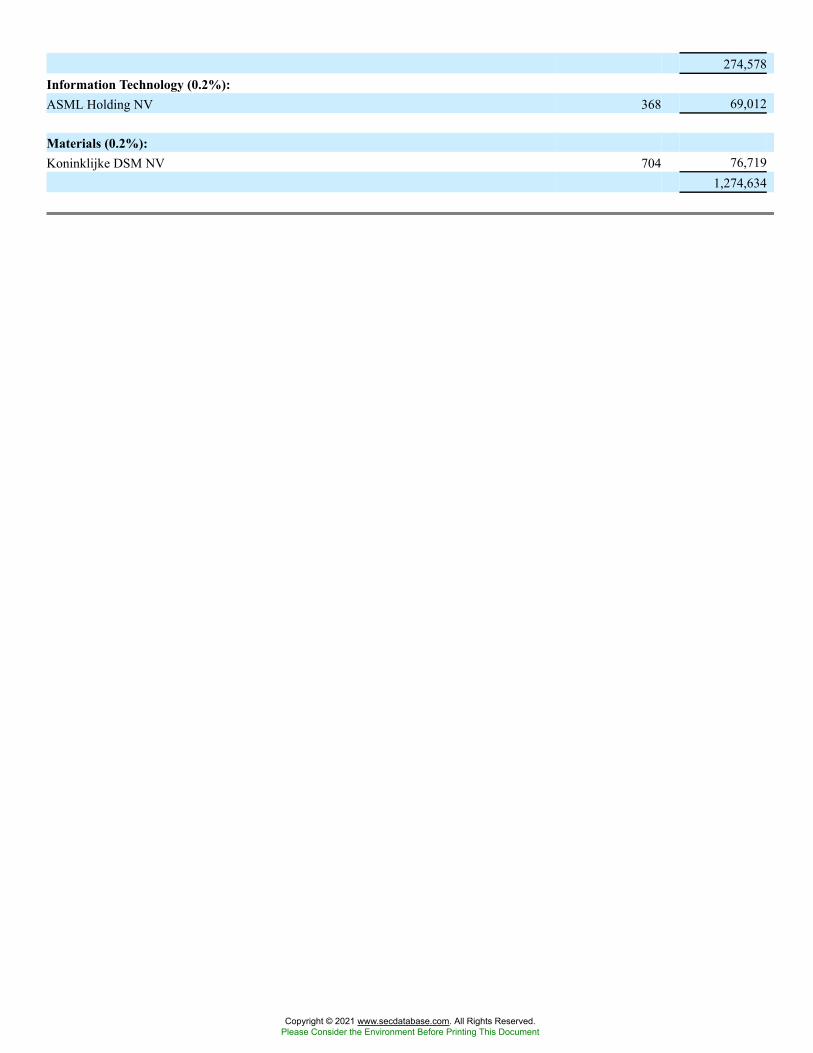
274,578Information Technology (0.2%):ASML Holding NV 368 69,012
Materials (0.2%):Koninklijke DSM NV 704 76,719
1,274,634
Copyright © 2021 www.secdatabase.com. All Rights Reserved.Please Consider the Environment Before Printing This Document
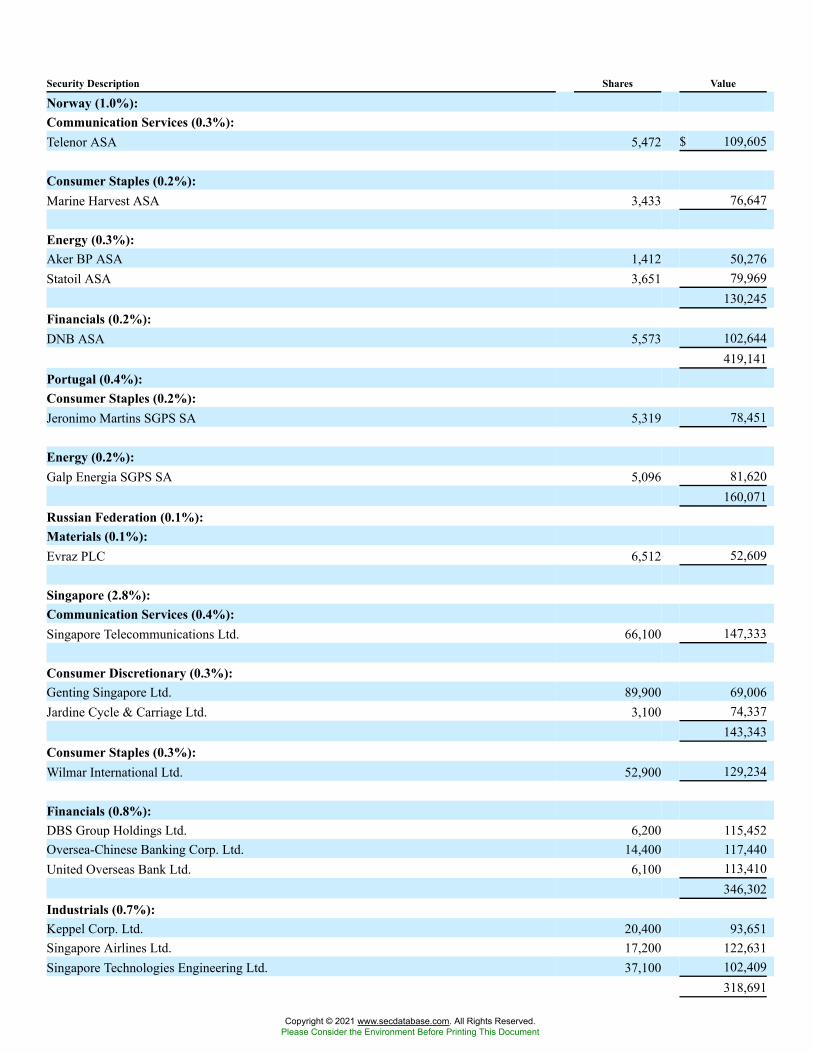
Security Description Shares Value
Norway (1.0%):Communication Services (0.3%):Telenor ASA 5,472 $ 109,605
Consumer Staples (0.2%):Marine Harvest ASA 3,433 76,647
Energy (0.3%):Aker BP ASA 1,412 50,276Statoil ASA 3,651 79,969
130,245Financials (0.2%):DNB ASA 5,573 102,644
419,141Portugal (0.4%):Consumer Staples (0.2%):Jeronimo Martins SGPS SA 5,319 78,451
Energy (0.2%):Galp Energia SGPS SA 5,096 81,620
160,071Russian Federation (0.1%):Materials (0.1%):Evraz PLC 6,512 52,609
Singapore (2.8%):Communication Services (0.4%):Singapore Telecommunications Ltd. 66,100 147,333
Consumer Discretionary (0.3%):Genting Singapore Ltd. 89,900 69,006Jardine Cycle & Carriage Ltd. 3,100 74,337
143,343Consumer Staples (0.3%):Wilmar International Ltd. 52,900 129,234
Financials (0.8%):DBS Group Holdings Ltd. 6,200 115,452Oversea-Chinese Banking Corp. Ltd. 14,400 117,440United Overseas Bank Ltd. 6,100 113,410
346,302Industrials (0.7%):Keppel Corp. Ltd. 20,400 93,651Singapore Airlines Ltd. 17,200 122,631Singapore Technologies Engineering Ltd. 37,100 102,409
318,691
Copyright © 2021 www.secdatabase.com. All Rights Reserved.Please Consider the Environment Before Printing This Document
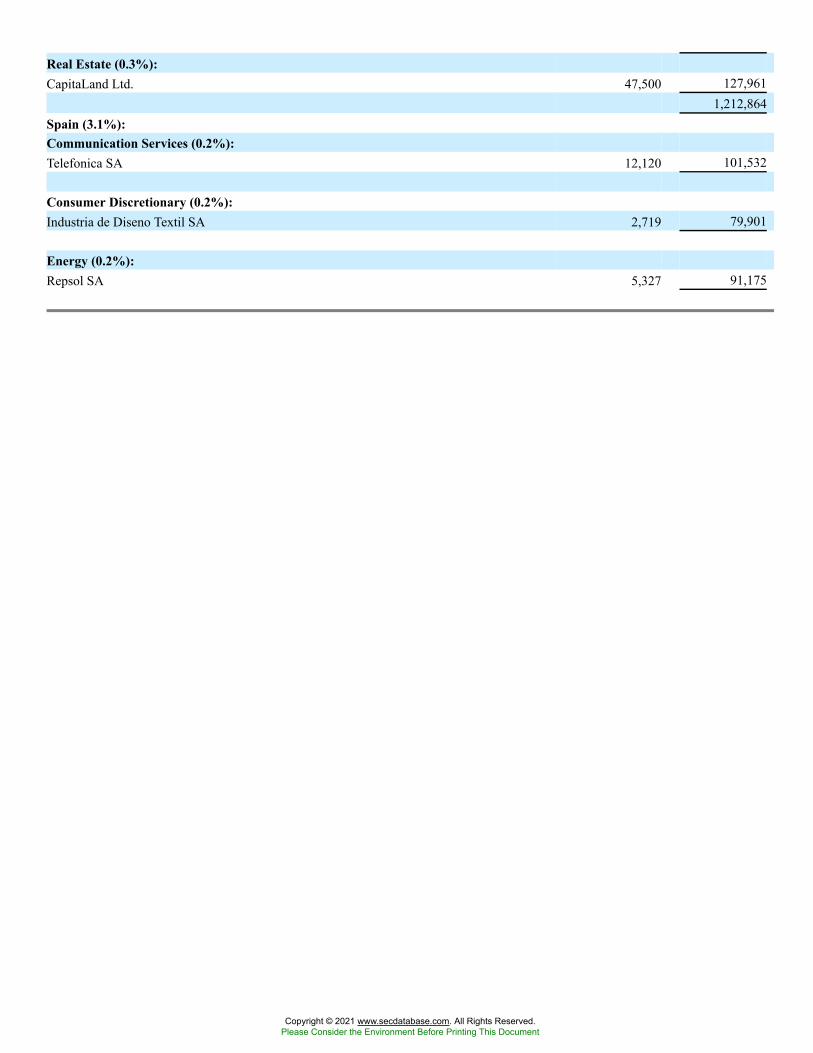
Real Estate (0.3%):CapitaLand Ltd. 47,500 127,961
1,212,864Spain (3.1%):Communication Services (0.2%):Telefonica SA 12,120 101,532
Consumer Discretionary (0.2%):Industria de Diseno Textil SA 2,719 79,901
Energy (0.2%):Repsol SA 5,327 91,175
Copyright © 2021 www.secdatabase.com. All Rights Reserved.Please Consider the Environment Before Printing This Document
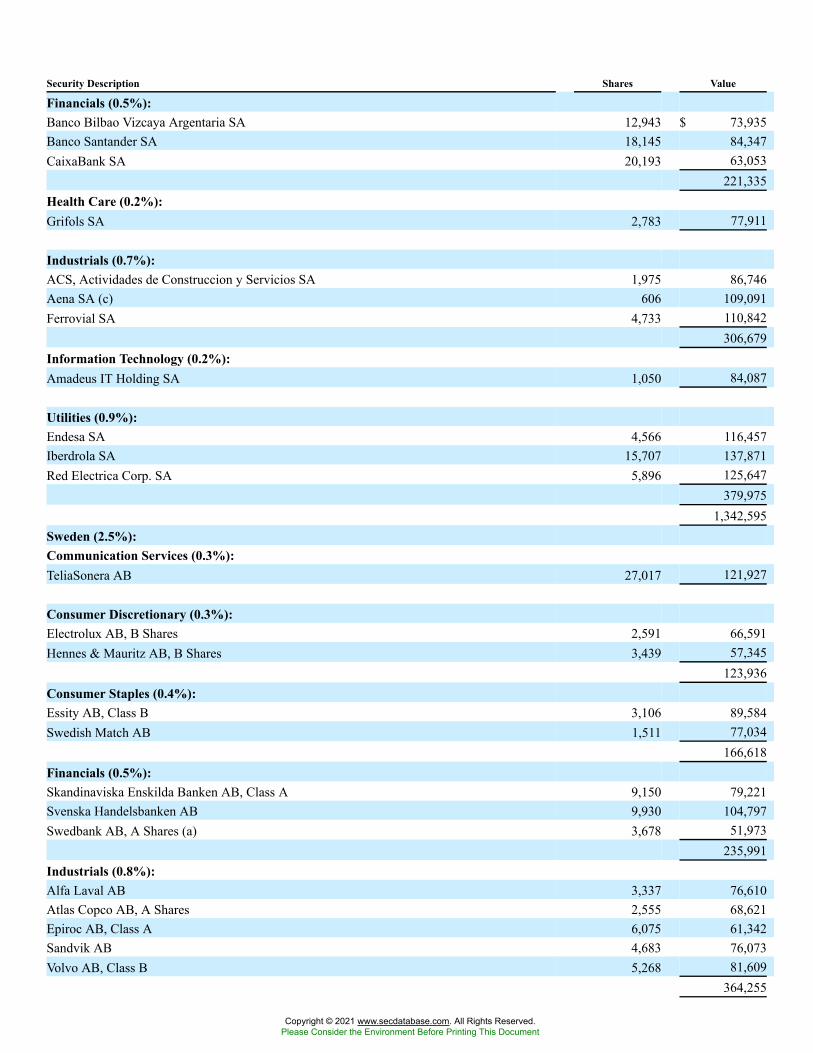
Security Description Shares Value
Financials (0.5%):Banco Bilbao Vizcaya Argentaria SA 12,943 $ 73,935Banco Santander SA 18,145 84,347CaixaBank SA 20,193 63,053
221,335Health Care (0.2%):Grifols SA 2,783 77,911
Industrials (0.7%):ACS, Actividades de Construccion y Servicios SA 1,975 86,746Aena SA (c) 606 109,091Ferrovial SA 4,733 110,842
306,679Information Technology (0.2%):Amadeus IT Holding SA 1,050 84,087
Utilities (0.9%):Endesa SA 4,566 116,457Iberdrola SA 15,707 137,871Red Electrica Corp. SA 5,896 125,647
379,9751,342,595
Sweden (2.5%):Communication Services (0.3%):TeliaSonera AB 27,017 121,927
Consumer Discretionary (0.3%):Electrolux AB, B Shares 2,591 66,591Hennes & Mauritz AB, B Shares 3,439 57,345
123,936Consumer Staples (0.4%):Essity AB, Class B 3,106 89,584Swedish Match AB 1,511 77,034
166,618Financials (0.5%):Skandinaviska Enskilda Banken AB, Class A 9,150 79,221Svenska Handelsbanken AB 9,930 104,797Swedbank AB, A Shares (a) 3,678 51,973
235,991Industrials (0.8%):Alfa Laval AB 3,337 76,610Atlas Copco AB, A Shares 2,555 68,621Epiroc AB, Class A 6,075 61,342Sandvik AB 4,683 76,073Volvo AB, Class B 5,268 81,609
364,255
Copyright © 2021 www.secdatabase.com. All Rights Reserved.Please Consider the Environment Before Printing This Document
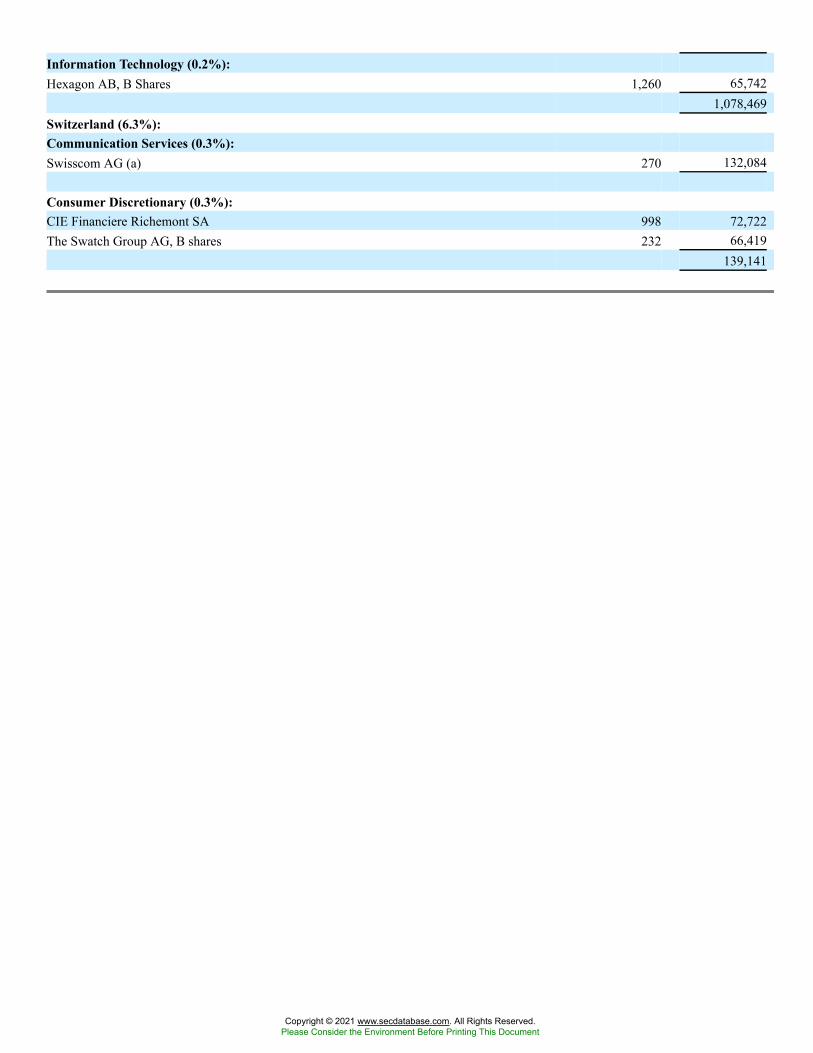
Information Technology (0.2%):Hexagon AB, B Shares 1,260 65,742
1,078,469Switzerland (6.3%):Communication Services (0.3%):Swisscom AG (a) 270 132,084
Consumer Discretionary (0.3%):CIE Financiere Richemont SA 998 72,722The Swatch Group AG, B shares 232 66,419
139,141
Copyright © 2021 www.secdatabase.com. All Rights Reserved.Please Consider the Environment Before Printing This Document
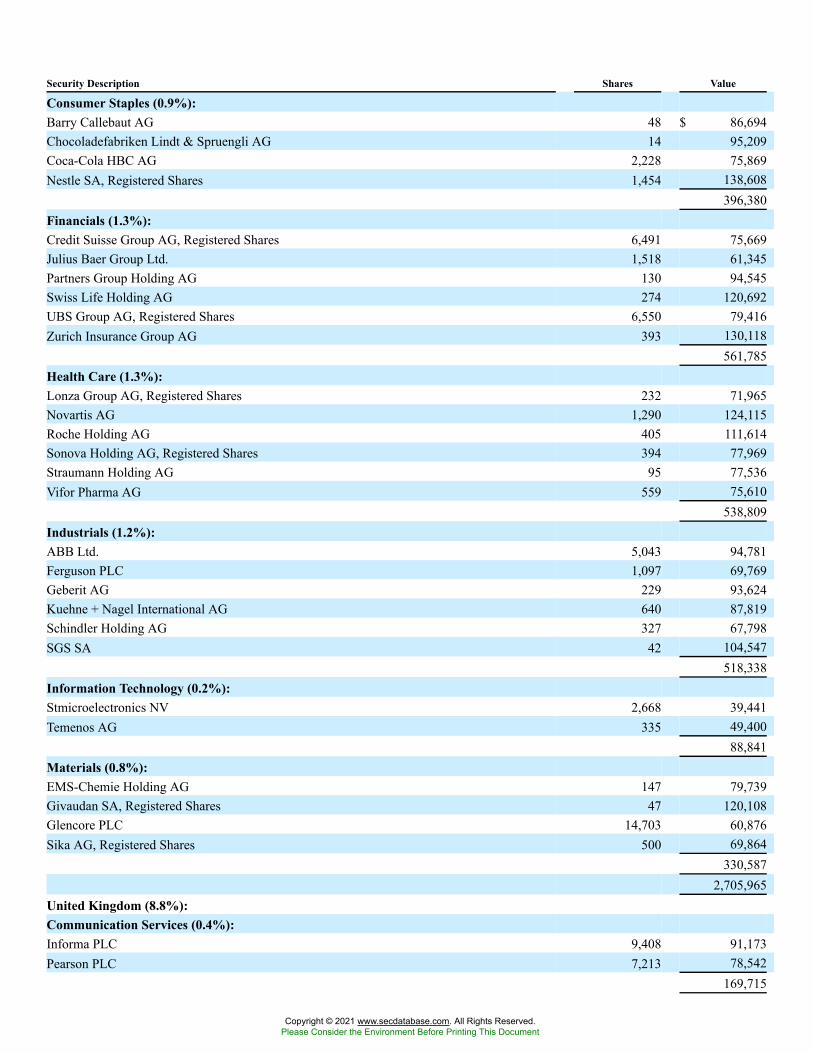
Security Description Shares Value
Consumer Staples (0.9%):Barry Callebaut AG 48 $ 86,694Chocoladefabriken Lindt & Spruengli AG 14 95,209Coca-Cola HBC AG 2,228 75,869Nestle SA, Registered Shares 1,454 138,608
396,380Financials (1.3%):Credit Suisse Group AG, Registered Shares 6,491 75,669Julius Baer Group Ltd. 1,518 61,345Partners Group Holding AG 130 94,545Swiss Life Holding AG 274 120,692UBS Group AG, Registered Shares 6,550 79,416Zurich Insurance Group AG 393 130,118
561,785Health Care (1.3%):Lonza Group AG, Registered Shares 232 71,965Novartis AG 1,290 124,115Roche Holding AG 405 111,614Sonova Holding AG, Registered Shares 394 77,969Straumann Holding AG 95 77,536Vifor Pharma AG 559 75,610
538,809Industrials (1.2%):ABB Ltd. 5,043 94,781Ferguson PLC 1,097 69,769Geberit AG 229 93,624Kuehne + Nagel International AG 640 87,819Schindler Holding AG 327 67,798SGS SA 42 104,547
518,338Information Technology (0.2%):Stmicroelectronics NV 2,668 39,441Temenos AG 335 49,400
88,841Materials (0.8%):EMS-Chemie Holding AG 147 79,739Givaudan SA, Registered Shares 47 120,108Glencore PLC 14,703 60,876Sika AG, Registered Shares 500 69,864
330,5872,705,965
United Kingdom (8.8%):Communication Services (0.4%):Informa PLC 9,408 91,173Pearson PLC 7,213 78,542
169,715
Copyright © 2021 www.secdatabase.com. All Rights Reserved.Please Consider the Environment Before Printing This Document

Consumer Discretionary (1.2%):Barratt Developments PLC 7,599 59,293Burberry Group PLC 2,384 60,677Compass Group PLC 4,729 111,123Intercontinental Hotels Group PLC 1,525 91,647Next PLC 1,030 74,843Persimmon PLC 2,090 59,059Whitbread PLC 1,203 79,549
536,191
Copyright © 2021 www.secdatabase.com. All Rights Reserved.Please Consider the Environment Before Printing This Document
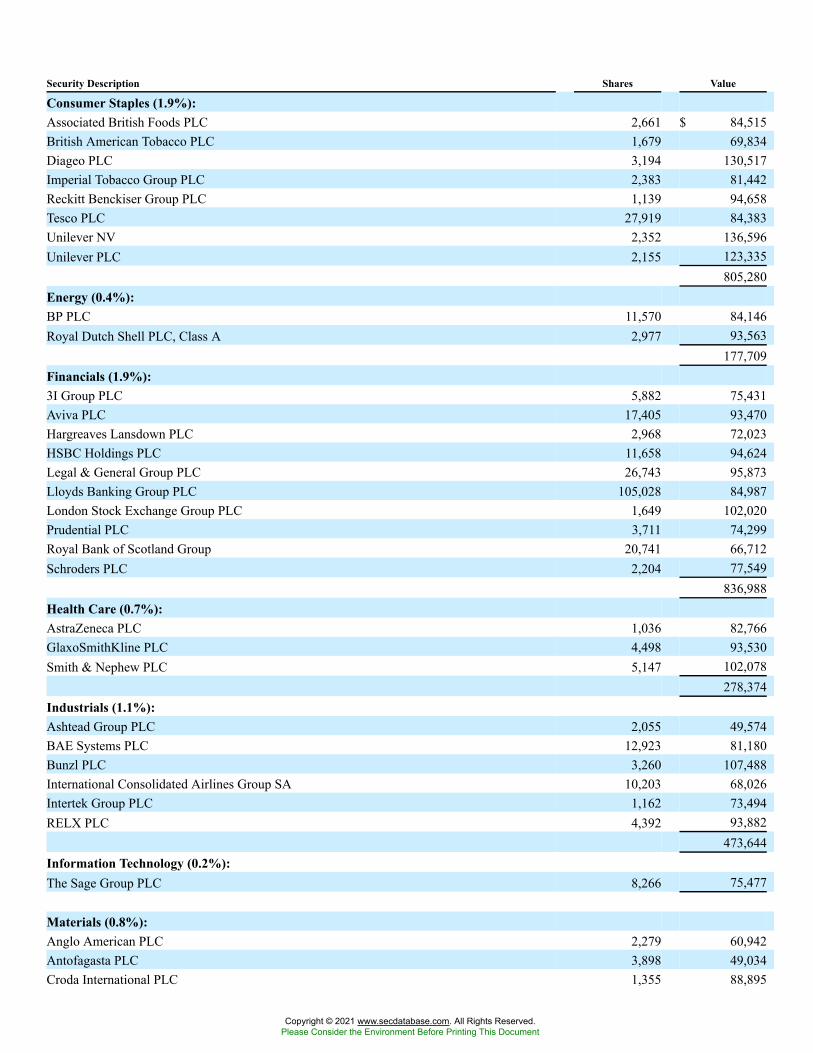
Security Description Shares Value
Consumer Staples (1.9%):Associated British Foods PLC 2,661 $ 84,515British American Tobacco PLC 1,679 69,834Diageo PLC 3,194 130,517Imperial Tobacco Group PLC 2,383 81,442Reckitt Benckiser Group PLC 1,139 94,658Tesco PLC 27,919 84,383Unilever NV 2,352 136,596Unilever PLC 2,155 123,335
805,280Energy (0.4%):BP PLC 11,570 84,146Royal Dutch Shell PLC, Class A 2,977 93,563
177,709Financials (1.9%):3I Group PLC 5,882 75,431Aviva PLC 17,405 93,470Hargreaves Lansdown PLC 2,968 72,023HSBC Holdings PLC 11,658 94,624Legal & General Group PLC 26,743 95,873Lloyds Banking Group PLC 105,028 84,987London Stock Exchange Group PLC 1,649 102,020Prudential PLC 3,711 74,299Royal Bank of Scotland Group 20,741 66,712Schroders PLC 2,204 77,549
836,988Health Care (0.7%):AstraZeneca PLC 1,036 82,766GlaxoSmithKline PLC 4,498 93,530Smith & Nephew PLC 5,147 102,078
278,374Industrials (1.1%):Ashtead Group PLC 2,055 49,574BAE Systems PLC 12,923 81,180Bunzl PLC 3,260 107,488International Consolidated Airlines Group SA 10,203 68,026Intertek Group PLC 1,162 73,494RELX PLC 4,392 93,882
473,644Information Technology (0.2%):The Sage Group PLC 8,266 75,477
Materials (0.8%):Anglo American PLC 2,279 60,942Antofagasta PLC 3,898 49,034Croda International PLC 1,355 88,895
Copyright © 2021 www.secdatabase.com. All Rights Reserved.Please Consider the Environment Before Printing This Document
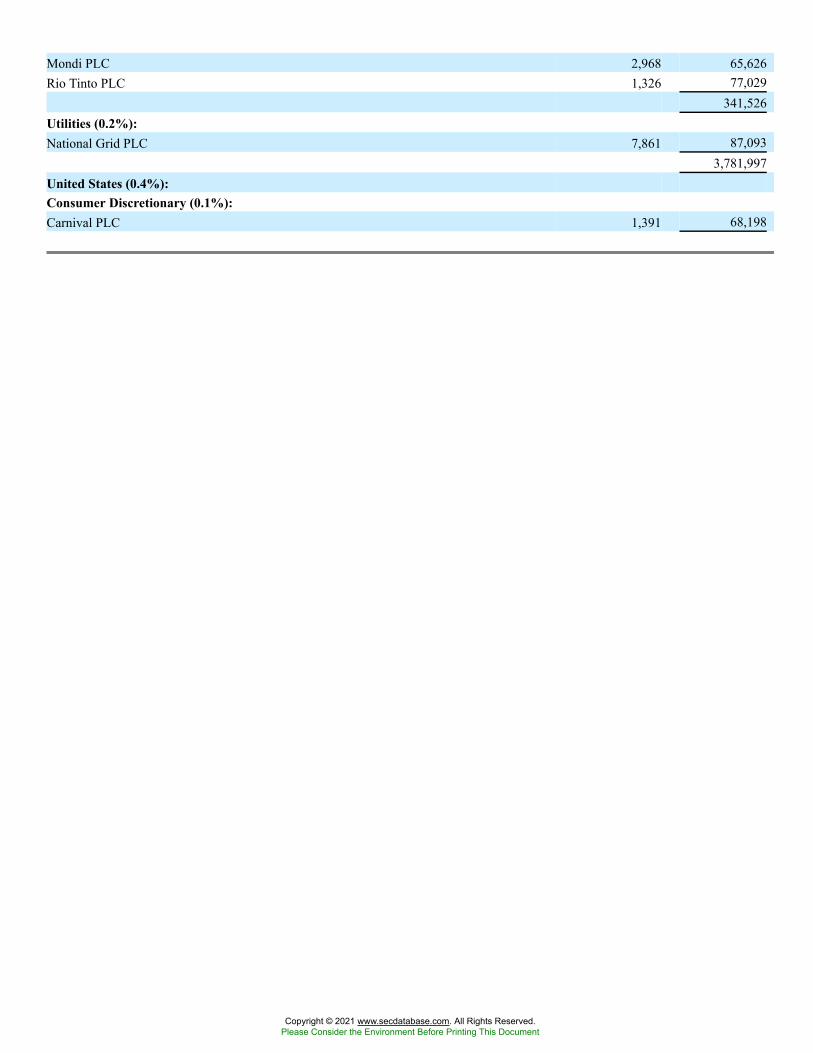
Mondi PLC 2,968 65,626Rio Tinto PLC 1,326 77,029
341,526Utilities (0.2%):National Grid PLC 7,861 87,093
3,781,997United States (0.4%):Consumer Discretionary (0.1%):Carnival PLC 1,391 68,198
Copyright © 2021 www.secdatabase.com. All Rights Reserved.Please Consider the Environment Before Printing This Document
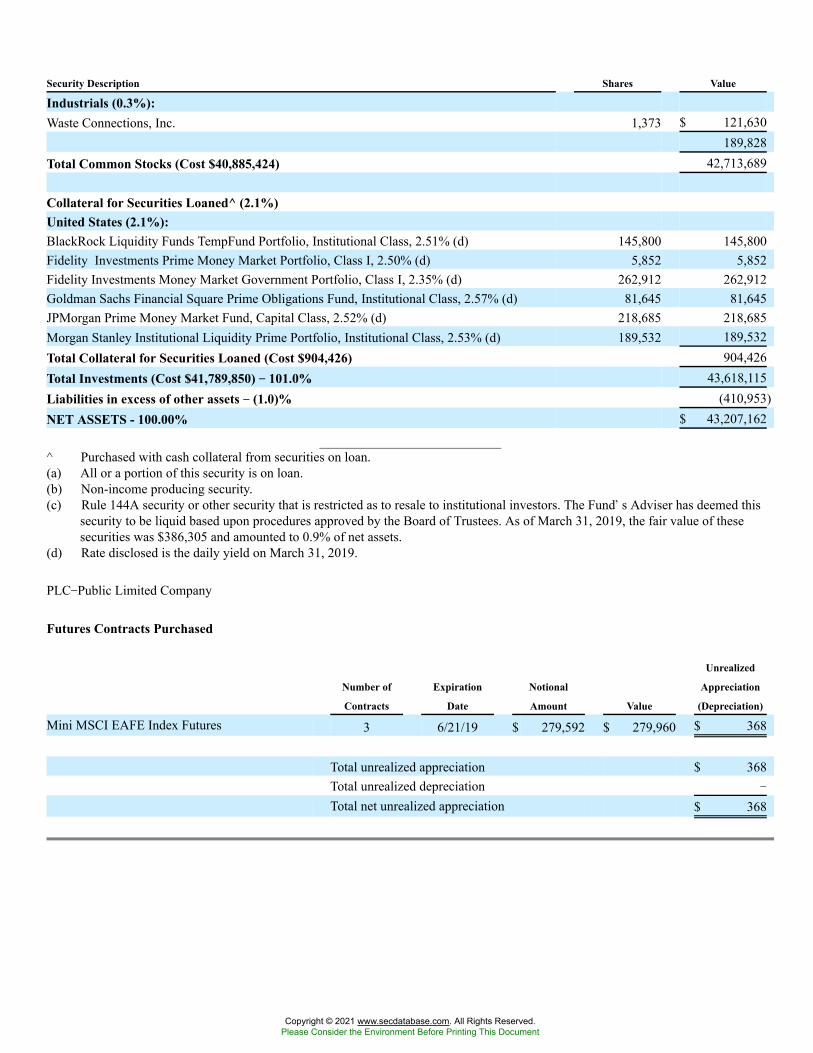
Security Description Shares Value
Industrials (0.3%):Waste Connections, Inc. 1,373 $ 121,630
189,828Total Common Stocks (Cost $40,885,424) 42,713,689
Collateral for Securities Loaned^ (2.1%)United States (2.1%):BlackRock Liquidity Funds TempFund Portfolio, Institutional Class, 2.51% (d) 145,800 145,800Fidelity Investments Prime Money Market Portfolio, Class I, 2.50% (d) 5,852 5,852Fidelity Investments Money Market Government Portfolio, Class I, 2.35% (d) 262,912 262,912Goldman Sachs Financial Square Prime Obligations Fund, Institutional Class, 2.57% (d) 81,645 81,645JPMorgan Prime Money Market Fund, Capital Class, 2.52% (d) 218,685 218,685Morgan Stanley Institutional Liquidity Prime Portfolio, Institutional Class, 2.53% (d) 189,532 189,532Total Collateral for Securities Loaned (Cost $904,426) 904,426Total Investments (Cost $41,789,850) �� 101.0% 43,618,115Liabilities in excess of other assets �� (1.0)% (410,953)NET ASSETS - 100.00% $ 43,207,162
^ Purchased with cash collateral from securities on loan.(a) All or a portion of this security is on loan.(b) Non-income producing security.(c) Rule 144A security or other security that is restricted as to resale to institutional investors. The Fund�s Adviser has deemed this
security to be liquid based upon procedures approved by the Board of Trustees. As of March 31, 2019, the fair value of thesesecurities was $386,305 and amounted to 0.9% of net assets.
(d) Rate disclosed is the daily yield on March 31, 2019.
PLC�Public Limited Company
Futures Contracts Purchased
Number of
Contracts
Expiration
Date
Notional
Amount Value
Unrealized
Appreciation
(Depreciation)
Mini MSCI EAFE Index Futures 3 6/21/19 $ 279,592 $ 279,960 $ 368
Total unrealized appreciation $ 368Total unrealized depreciation �
Total net unrealized appreciation $ 368
Copyright © 2021 www.secdatabase.com. All Rights Reserved.Please Consider the Environment Before Printing This Document
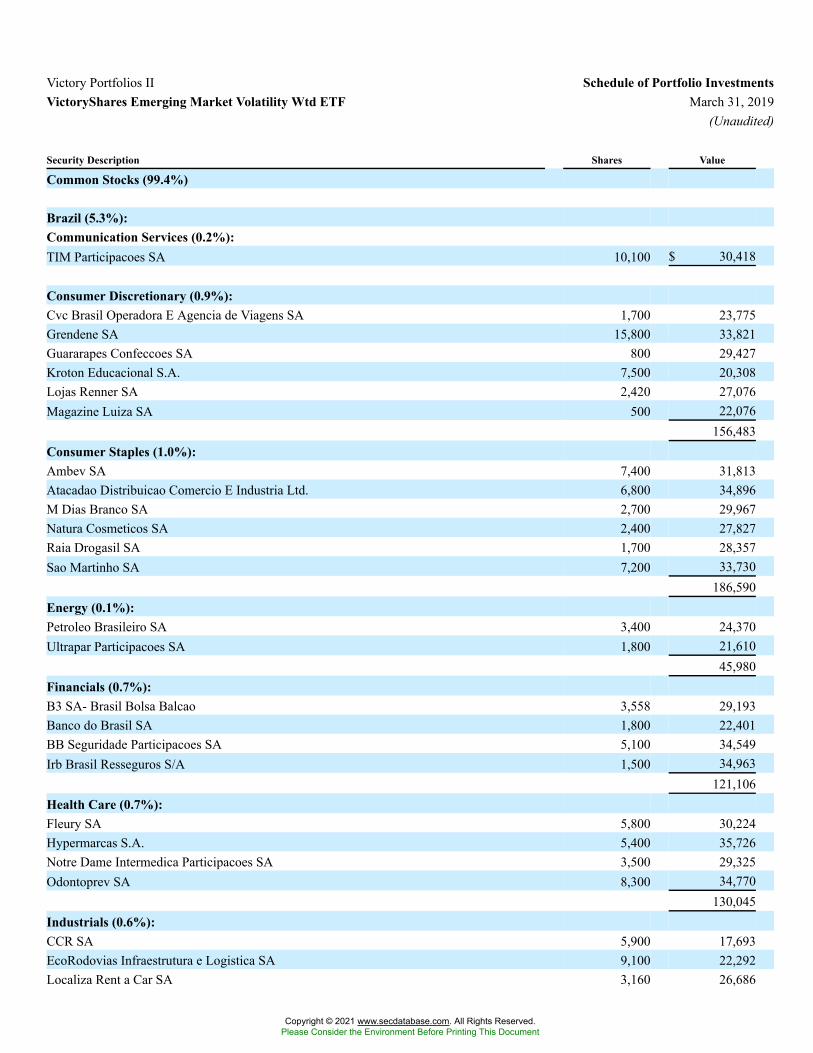
Victory Portfolios II Schedule of Portfolio InvestmentsVictoryShares Emerging Market Volatility Wtd ETF March 31, 2019
(Unaudited)
Security Description Shares Value
Common Stocks (99.4%)
Brazil (5.3%):Communication Services (0.2%):TIM Participacoes SA 10,100 $ 30,418
Consumer Discretionary (0.9%):Cvc Brasil Operadora E Agencia de Viagens SA 1,700 23,775Grendene SA 15,800 33,821Guararapes Confeccoes SA 800 29,427Kroton Educacional S.A. 7,500 20,308Lojas Renner SA 2,420 27,076Magazine Luiza SA 500 22,076
156,483Consumer Staples (1.0%):Ambev SA 7,400 31,813Atacadao Distribuicao Comercio E Industria Ltd. 6,800 34,896M Dias Branco SA 2,700 29,967Natura Cosmeticos SA 2,400 27,827Raia Drogasil SA 1,700 28,357Sao Martinho SA 7,200 33,730
186,590Energy (0.1%):Petroleo Brasileiro SA 3,400 24,370Ultrapar Participacoes SA 1,800 21,610
45,980Financials (0.7%):B3 SA- Brasil Bolsa Balcao 3,558 29,193Banco do Brasil SA 1,800 22,401BB Seguridade Participacoes SA 5,100 34,549Irb Brasil Resseguros S/A 1,500 34,963
121,106Health Care (0.7%):Fleury SA 5,800 30,224Hypermarcas S.A. 5,400 35,726Notre Dame Intermedica Participacoes SA 3,500 29,325Odontoprev SA 8,300 34,770
130,045Industrials (0.6%):CCR SA 5,900 17,693EcoRodovias Infraestrutura e Logistica SA 9,100 22,292Localiza Rent a Car SA 3,160 26,686
Copyright © 2021 www.secdatabase.com. All Rights Reserved.Please Consider the Environment Before Printing This Document
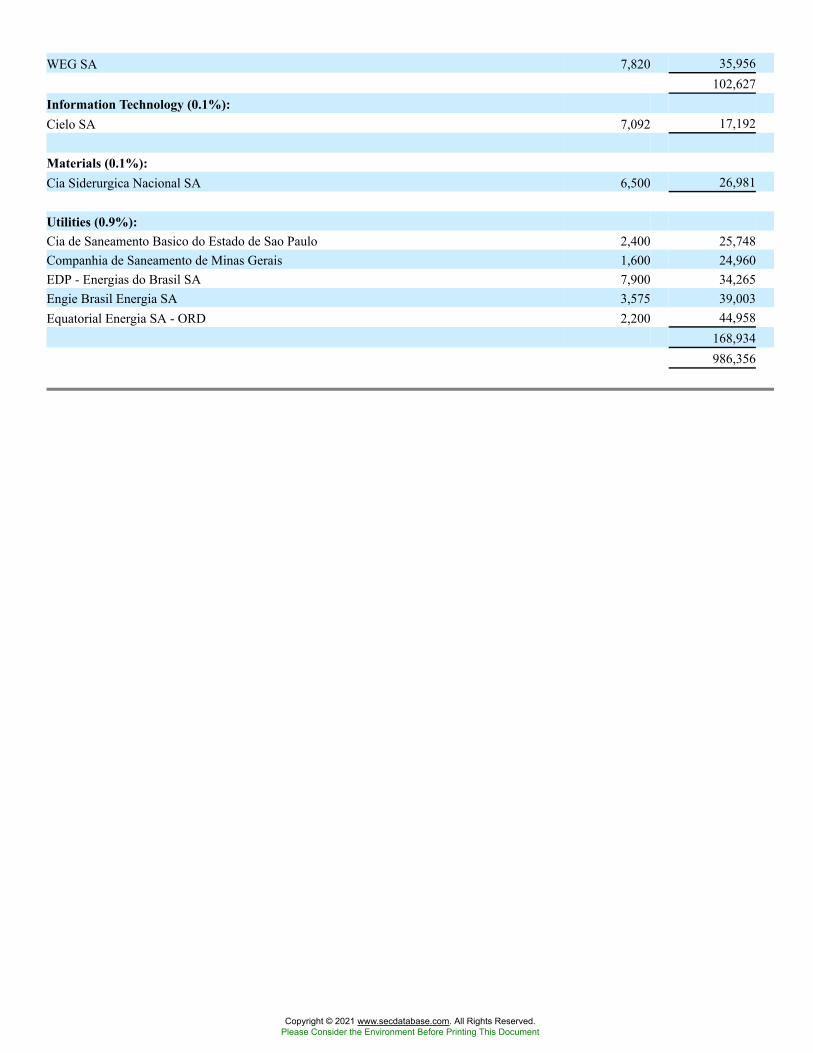
WEG SA 7,820 35,956102,627
Information Technology (0.1%):Cielo SA 7,092 17,192
Materials (0.1%):Cia Siderurgica Nacional SA 6,500 26,981
Utilities (0.9%):Cia de Saneamento Basico do Estado de Sao Paulo 2,400 25,748Companhia de Saneamento de Minas Gerais 1,600 24,960EDP - Energias do Brasil SA 7,900 34,265Engie Brasil Energia SA 3,575 39,003Equatorial Energia SA - ORD 2,200 44,958
168,934986,356
Copyright © 2021 www.secdatabase.com. All Rights Reserved.Please Consider the Environment Before Printing This Document
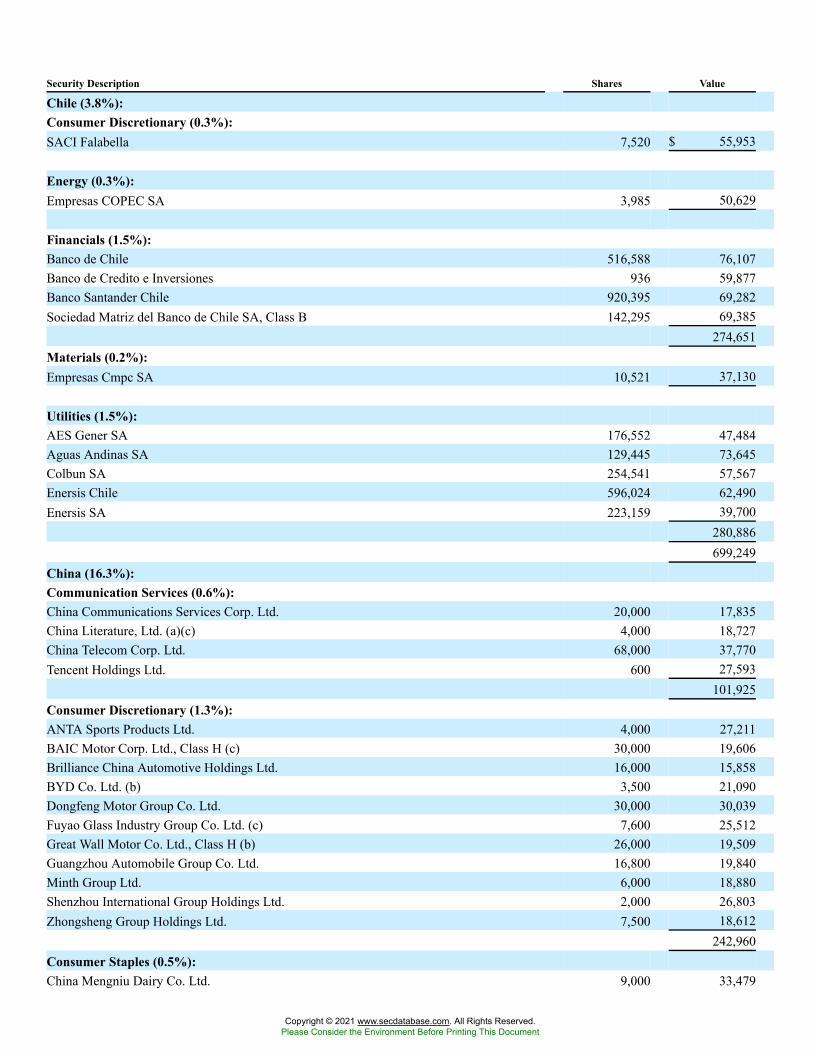
Security Description Shares Value
Chile (3.8%):Consumer Discretionary (0.3%):SACI Falabella 7,520 $ 55,953
Energy (0.3%):Empresas COPEC SA 3,985 50,629
Financials (1.5%):Banco de Chile 516,588 76,107Banco de Credito e Inversiones 936 59,877Banco Santander Chile 920,395 69,282Sociedad Matriz del Banco de Chile SA, Class B 142,295 69,385
274,651Materials (0.2%):Empresas Cmpc SA 10,521 37,130
Utilities (1.5%):AES Gener SA 176,552 47,484Aguas Andinas SA 129,445 73,645Colbun SA 254,541 57,567Enersis Chile 596,024 62,490Enersis SA 223,159 39,700
280,886699,249
China (16.3%):Communication Services (0.6%):China Communications Services Corp. Ltd. 20,000 17,835China Literature, Ltd. (a)(c) 4,000 18,727China Telecom Corp. Ltd. 68,000 37,770Tencent Holdings Ltd. 600 27,593
101,925Consumer Discretionary (1.3%):ANTA Sports Products Ltd. 4,000 27,211BAIC Motor Corp. Ltd., Class H (c) 30,000 19,606Brilliance China Automotive Holdings Ltd. 16,000 15,858BYD Co. Ltd. (b) 3,500 21,090Dongfeng Motor Group Co. Ltd. 30,000 30,039Fuyao Glass Industry Group Co. Ltd. (c) 7,600 25,512Great Wall Motor Co. Ltd., Class H (b) 26,000 19,509Guangzhou Automobile Group Co. Ltd. 16,800 19,840Minth Group Ltd. 6,000 18,880Shenzhou International Group Holdings Ltd. 2,000 26,803Zhongsheng Group Holdings Ltd. 7,500 18,612
242,960Consumer Staples (0.5%):China Mengniu Dairy Co. Ltd. 9,000 33,479
Copyright © 2021 www.secdatabase.com. All Rights Reserved.Please Consider the Environment Before Printing This Document
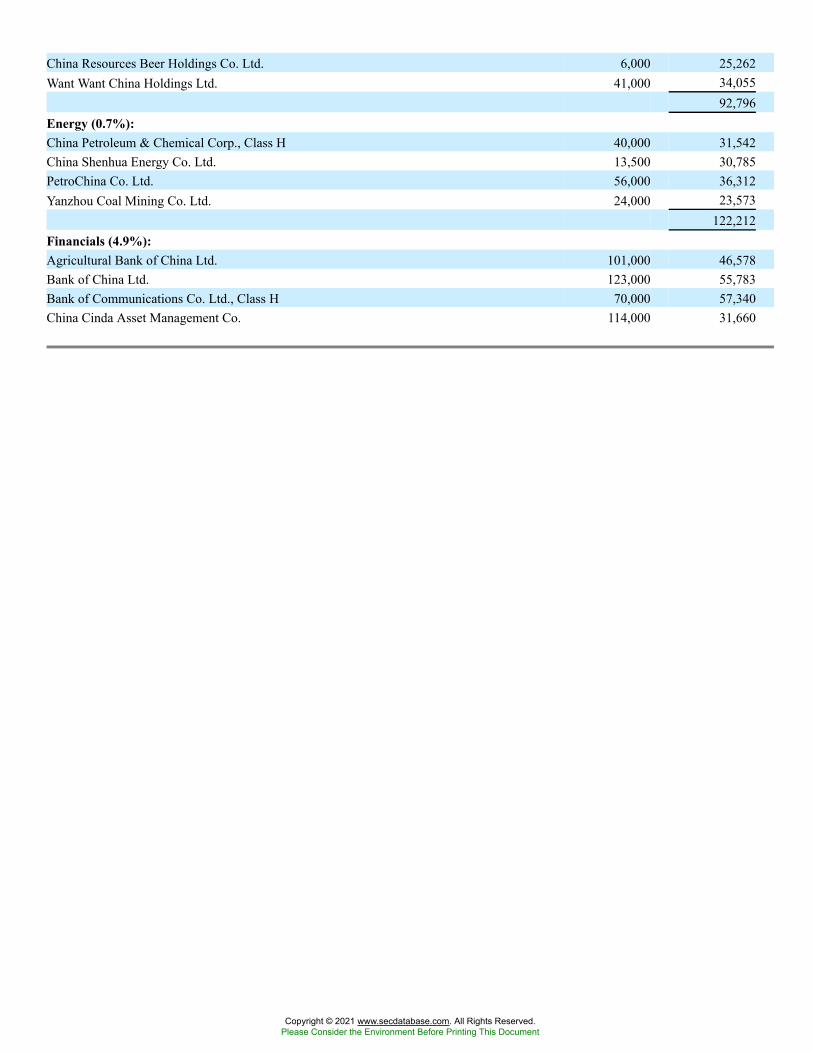
China Resources Beer Holdings Co. Ltd. 6,000 25,262Want Want China Holdings Ltd. 41,000 34,055
92,796Energy (0.7%):China Petroleum & Chemical Corp., Class H 40,000 31,542China Shenhua Energy Co. Ltd. 13,500 30,785PetroChina Co. Ltd. 56,000 36,312Yanzhou Coal Mining Co. Ltd. 24,000 23,573
122,212Financials (4.9%):Agricultural Bank of China Ltd. 101,000 46,578Bank of China Ltd. 123,000 55,783Bank of Communications Co. Ltd., Class H 70,000 57,340China Cinda Asset Management Co. 114,000 31,660
Copyright © 2021 www.secdatabase.com. All Rights Reserved.Please Consider the Environment Before Printing This Document
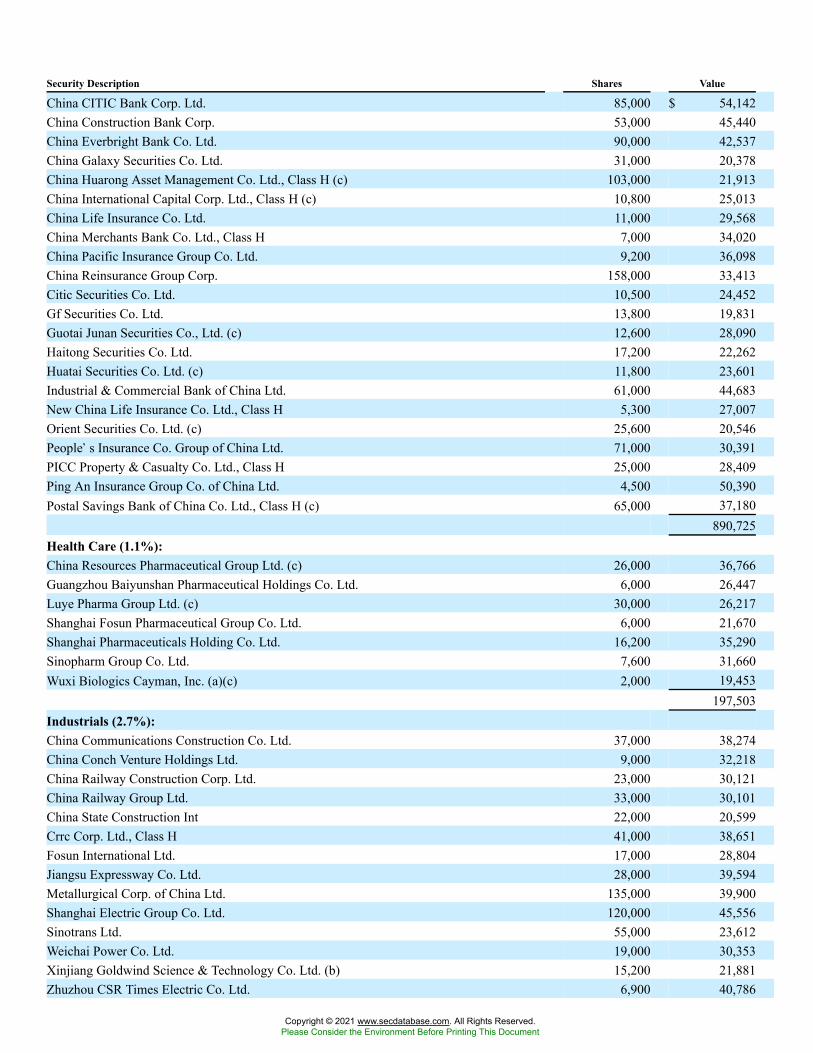
Security Description Shares Value
China CITIC Bank Corp. Ltd. 85,000 $ 54,142China Construction Bank Corp. 53,000 45,440China Everbright Bank Co. Ltd. 90,000 42,537China Galaxy Securities Co. Ltd. 31,000 20,378China Huarong Asset Management Co. Ltd., Class H (c) 103,000 21,913China International Capital Corp. Ltd., Class H (c) 10,800 25,013China Life Insurance Co. Ltd. 11,000 29,568China Merchants Bank Co. Ltd., Class H 7,000 34,020China Pacific Insurance Group Co. Ltd. 9,200 36,098China Reinsurance Group Corp. 158,000 33,413Citic Securities Co. Ltd. 10,500 24,452Gf Securities Co. Ltd. 13,800 19,831Guotai Junan Securities Co., Ltd. (c) 12,600 28,090Haitong Securities Co. Ltd. 17,200 22,262Huatai Securities Co. Ltd. (c) 11,800 23,601Industrial & Commercial Bank of China Ltd. 61,000 44,683New China Life Insurance Co. Ltd., Class H 5,300 27,007Orient Securities Co. Ltd. (c) 25,600 20,546People�s Insurance Co. Group of China Ltd. 71,000 30,391PICC Property & Casualty Co. Ltd., Class H 25,000 28,409Ping An Insurance Group Co. of China Ltd. 4,500 50,390Postal Savings Bank of China Co. Ltd., Class H (c) 65,000 37,180
890,725Health Care (1.1%):China Resources Pharmaceutical Group Ltd. (c) 26,000 36,766Guangzhou Baiyunshan Pharmaceutical Holdings Co. Ltd. 6,000 26,447Luye Pharma Group Ltd. (c) 30,000 26,217Shanghai Fosun Pharmaceutical Group Co. Ltd. 6,000 21,670Shanghai Pharmaceuticals Holding Co. Ltd. 16,200 35,290Sinopharm Group Co. Ltd. 7,600 31,660Wuxi Biologics Cayman, Inc. (a)(c) 2,000 19,453
197,503Industrials (2.7%):China Communications Construction Co. Ltd. 37,000 38,274China Conch Venture Holdings Ltd. 9,000 32,218China Railway Construction Corp. Ltd. 23,000 30,121China Railway Group Ltd. 33,000 30,101China State Construction Int 22,000 20,599Crrc Corp. Ltd., Class H 41,000 38,651Fosun International Ltd. 17,000 28,804Jiangsu Expressway Co. Ltd. 28,000 39,594Metallurgical Corp. of China Ltd. 135,000 39,900Shanghai Electric Group Co. Ltd. 120,000 45,556Sinotrans Ltd. 55,000 23,612Weichai Power Co. Ltd. 19,000 30,353Xinjiang Goldwind Science & Technology Co. Ltd. (b) 15,200 21,881Zhuzhou CSR Times Electric Co. Ltd. 6,900 40,786
Copyright © 2021 www.secdatabase.com. All Rights Reserved.Please Consider the Environment Before Printing This Document
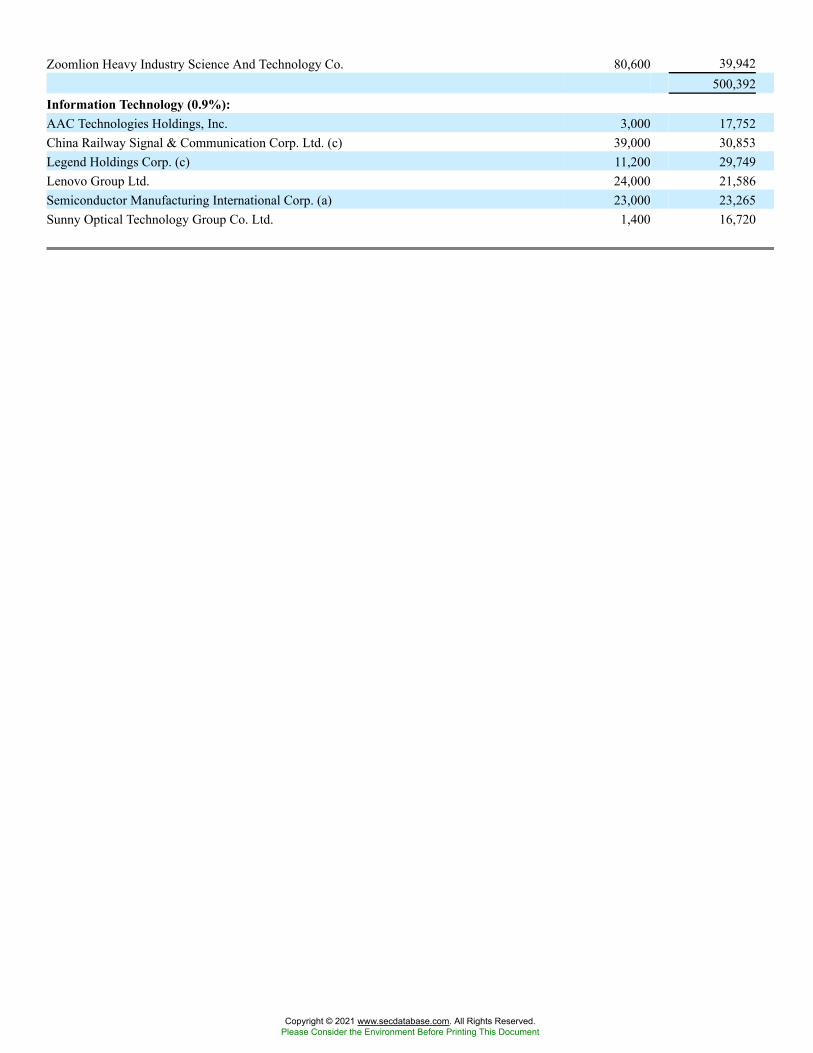
Zoomlion Heavy Industry Science And Technology Co. 80,600 39,942500,392
Information Technology (0.9%):AAC Technologies Holdings, Inc. 3,000 17,752China Railway Signal & Communication Corp. Ltd. (c) 39,000 30,853Legend Holdings Corp. (c) 11,200 29,749Lenovo Group Ltd. 24,000 21,586Semiconductor Manufacturing International Corp. (a) 23,000 23,265Sunny Optical Technology Group Co. Ltd. 1,400 16,720
Copyright © 2021 www.secdatabase.com. All Rights Reserved.Please Consider the Environment Before Printing This Document
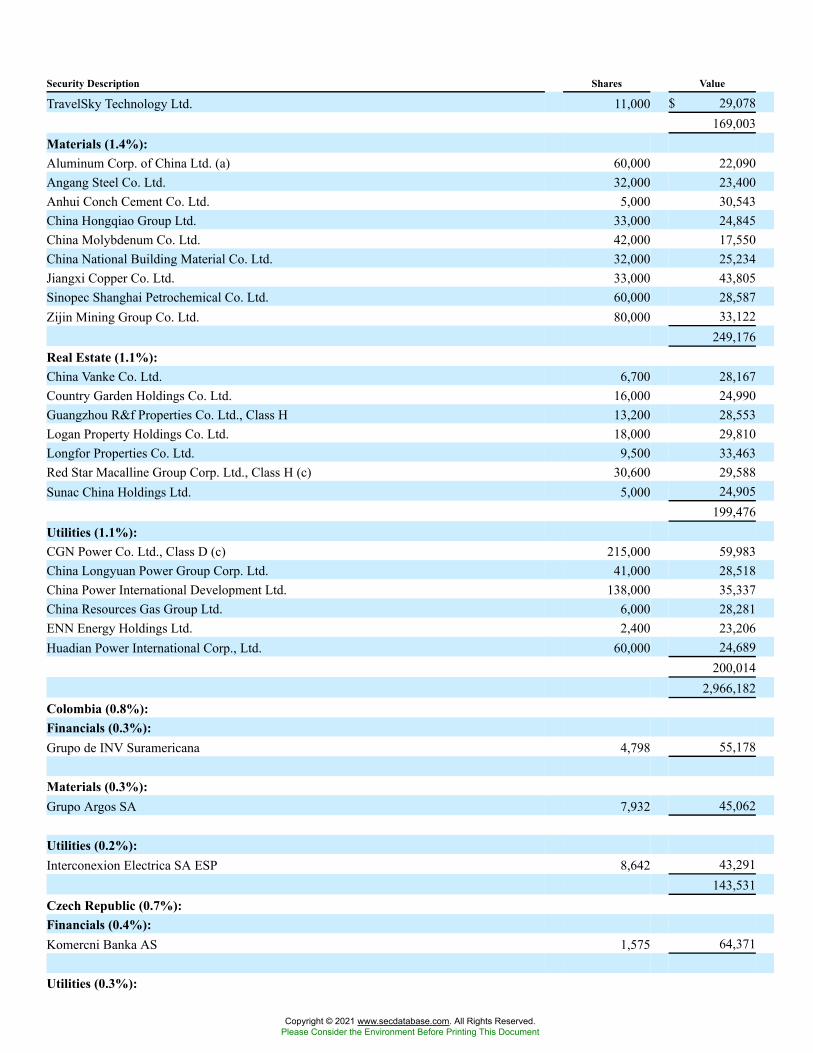
Security Description Shares Value
TravelSky Technology Ltd. 11,000 $ 29,078169,003
Materials (1.4%):Aluminum Corp. of China Ltd. (a) 60,000 22,090Angang Steel Co. Ltd. 32,000 23,400Anhui Conch Cement Co. Ltd. 5,000 30,543China Hongqiao Group Ltd. 33,000 24,845China Molybdenum Co. Ltd. 42,000 17,550China National Building Material Co. Ltd. 32,000 25,234Jiangxi Copper Co. Ltd. 33,000 43,805Sinopec Shanghai Petrochemical Co. Ltd. 60,000 28,587Zijin Mining Group Co. Ltd. 80,000 33,122
249,176Real Estate (1.1%):China Vanke Co. Ltd. 6,700 28,167Country Garden Holdings Co. Ltd. 16,000 24,990Guangzhou R&f Properties Co. Ltd., Class H 13,200 28,553Logan Property Holdings Co. Ltd. 18,000 29,810Longfor Properties Co. Ltd. 9,500 33,463Red Star Macalline Group Corp. Ltd., Class H (c) 30,600 29,588Sunac China Holdings Ltd. 5,000 24,905
199,476Utilities (1.1%):CGN Power Co. Ltd., Class D (c) 215,000 59,983China Longyuan Power Group Corp. Ltd. 41,000 28,518China Power International Development Ltd. 138,000 35,337China Resources Gas Group Ltd. 6,000 28,281ENN Energy Holdings Ltd. 2,400 23,206Huadian Power International Corp., Ltd. 60,000 24,689
200,0142,966,182
Colombia (0.8%):Financials (0.3%):Grupo de INV Suramericana 4,798 55,178
Materials (0.3%):Grupo Argos SA 7,932 45,062
Utilities (0.2%):Interconexion Electrica SA ESP 8,642 43,291
143,531Czech Republic (0.7%):Financials (0.4%):Komercni Banka AS 1,575 64,371
Utilities (0.3%):
Copyright © 2021 www.secdatabase.com. All Rights Reserved.Please Consider the Environment Before Printing This Document
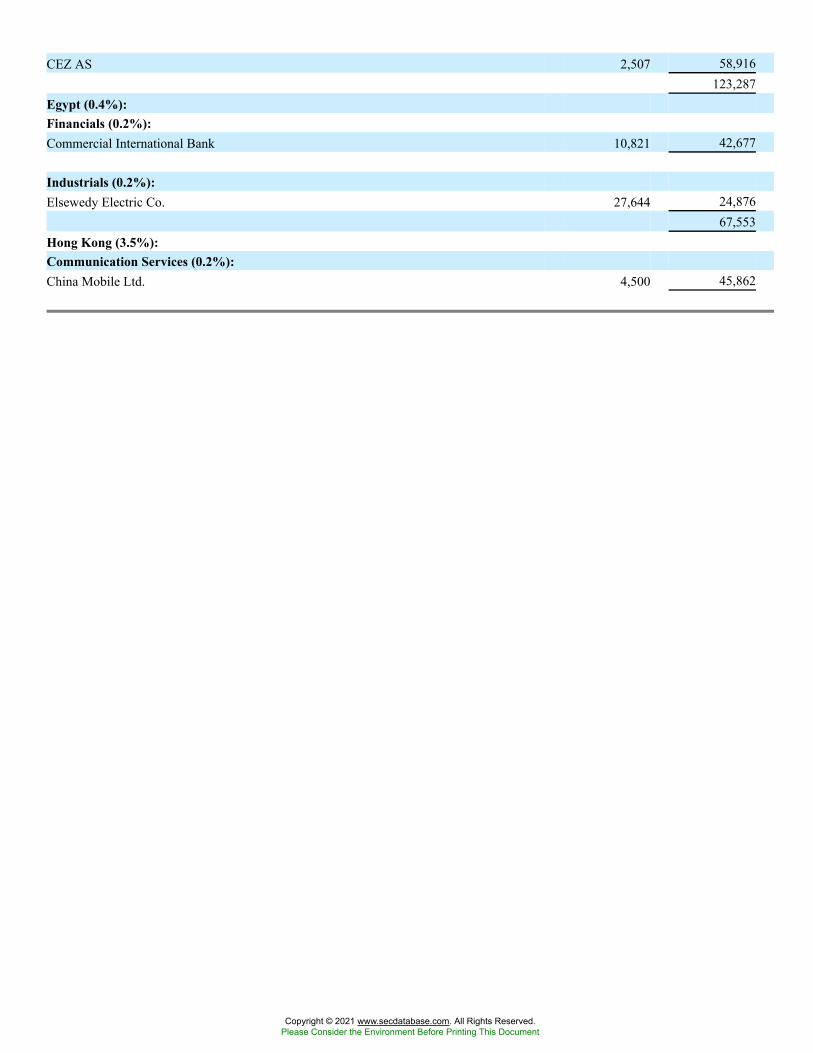
CEZ AS 2,507 58,916123,287
Egypt (0.4%):Financials (0.2%):Commercial International Bank 10,821 42,677
Industrials (0.2%):Elsewedy Electric Co. 27,644 24,876
67,553Hong Kong (3.5%):Communication Services (0.2%):China Mobile Ltd. 4,500 45,862
Copyright © 2021 www.secdatabase.com. All Rights Reserved.Please Consider the Environment Before Printing This Document
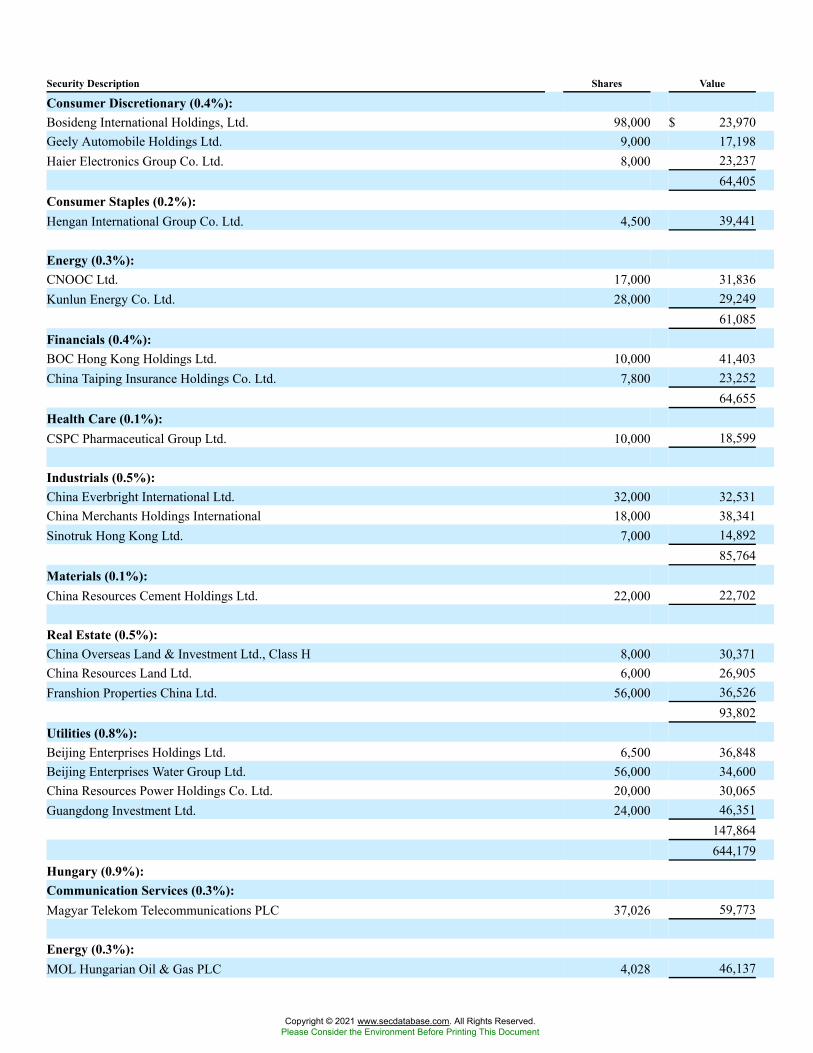
Security Description Shares Value
Consumer Discretionary (0.4%):Bosideng International Holdings, Ltd. 98,000 $ 23,970Geely Automobile Holdings Ltd. 9,000 17,198Haier Electronics Group Co. Ltd. 8,000 23,237
64,405Consumer Staples (0.2%):Hengan International Group Co. Ltd. 4,500 39,441
Energy (0.3%):CNOOC Ltd. 17,000 31,836Kunlun Energy Co. Ltd. 28,000 29,249
61,085Financials (0.4%):BOC Hong Kong Holdings Ltd. 10,000 41,403China Taiping Insurance Holdings Co. Ltd. 7,800 23,252
64,655Health Care (0.1%):CSPC Pharmaceutical Group Ltd. 10,000 18,599
Industrials (0.5%):China Everbright International Ltd. 32,000 32,531China Merchants Holdings International 18,000 38,341Sinotruk Hong Kong Ltd. 7,000 14,892
85,764Materials (0.1%):China Resources Cement Holdings Ltd. 22,000 22,702
Real Estate (0.5%):China Overseas Land & Investment Ltd., Class H 8,000 30,371China Resources Land Ltd. 6,000 26,905Franshion Properties China Ltd. 56,000 36,526
93,802Utilities (0.8%):Beijing Enterprises Holdings Ltd. 6,500 36,848Beijing Enterprises Water Group Ltd. 56,000 34,600China Resources Power Holdings Co. Ltd. 20,000 30,065Guangdong Investment Ltd. 24,000 46,351
147,864644,179
Hungary (0.9%):Communication Services (0.3%):Magyar Telekom Telecommunications PLC 37,026 59,773
Energy (0.3%):MOL Hungarian Oil & Gas PLC 4,028 46,137
Copyright © 2021 www.secdatabase.com. All Rights Reserved.Please Consider the Environment Before Printing This Document
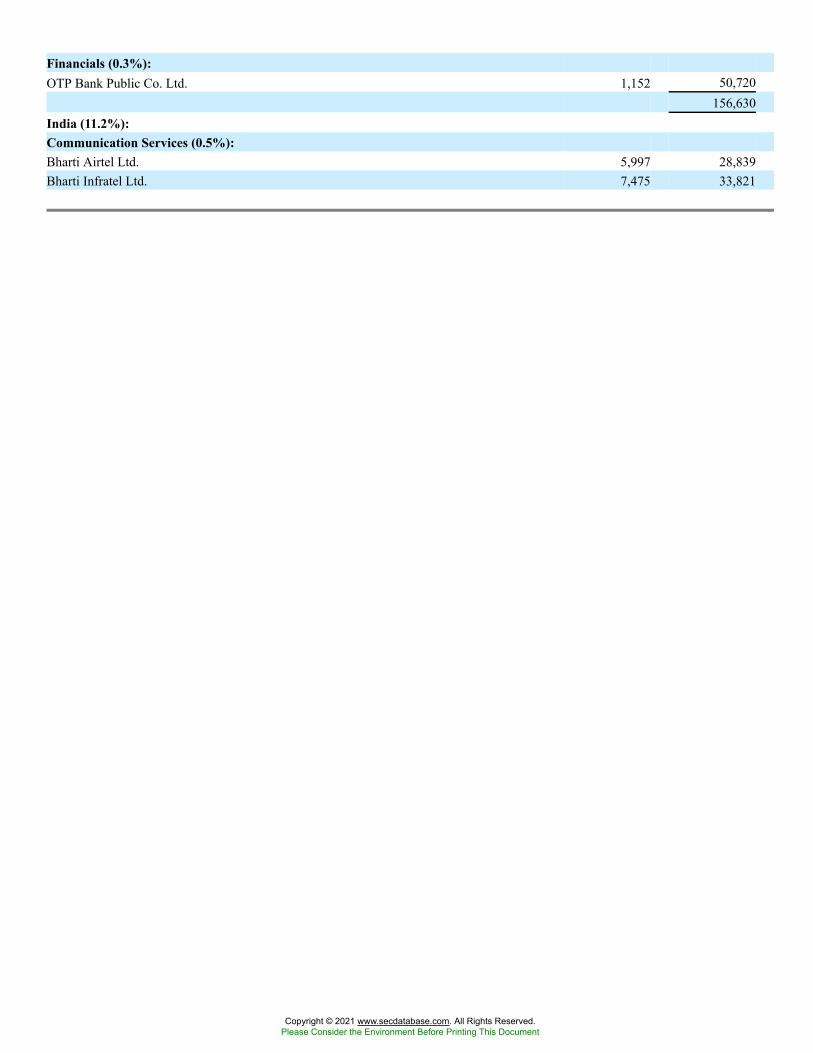
Financials (0.3%):OTP Bank Public Co. Ltd. 1,152 50,720
156,630India (11.2%):Communication Services (0.5%):Bharti Airtel Ltd. 5,997 28,839Bharti Infratel Ltd. 7,475 33,821
Copyright © 2021 www.secdatabase.com. All Rights Reserved.Please Consider the Environment Before Printing This Document
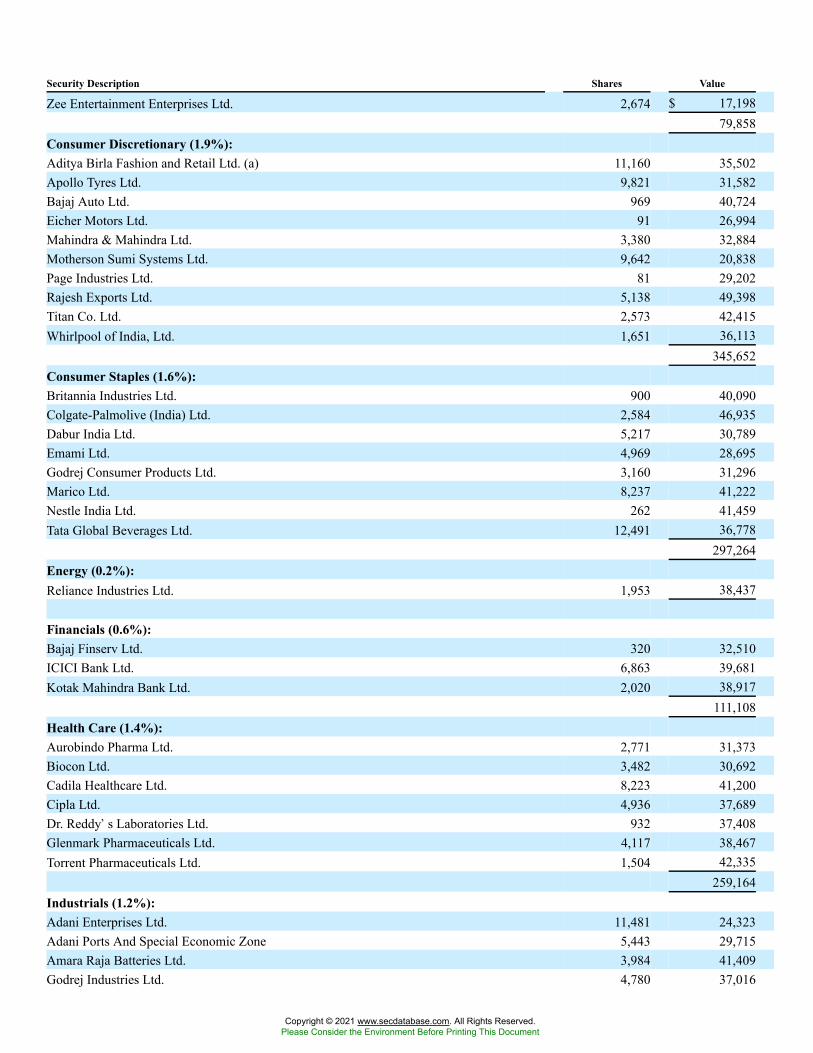
Security Description Shares Value
Zee Entertainment Enterprises Ltd. 2,674 $ 17,19879,858
Consumer Discretionary (1.9%):Aditya Birla Fashion and Retail Ltd. (a) 11,160 35,502Apollo Tyres Ltd. 9,821 31,582Bajaj Auto Ltd. 969 40,724Eicher Motors Ltd. 91 26,994Mahindra & Mahindra Ltd. 3,380 32,884Motherson Sumi Systems Ltd. 9,642 20,838Page Industries Ltd. 81 29,202Rajesh Exports Ltd. 5,138 49,398Titan Co. Ltd. 2,573 42,415Whirlpool of India, Ltd. 1,651 36,113
345,652Consumer Staples (1.6%):Britannia Industries Ltd. 900 40,090Colgate-Palmolive (India) Ltd. 2,584 46,935Dabur India Ltd. 5,217 30,789Emami Ltd. 4,969 28,695Godrej Consumer Products Ltd. 3,160 31,296Marico Ltd. 8,237 41,222Nestle India Ltd. 262 41,459Tata Global Beverages Ltd. 12,491 36,778
297,264Energy (0.2%):Reliance Industries Ltd. 1,953 38,437
Financials (0.6%):Bajaj Finserv Ltd. 320 32,510ICICI Bank Ltd. 6,863 39,681Kotak Mahindra Bank Ltd. 2,020 38,917
111,108Health Care (1.4%):Aurobindo Pharma Ltd. 2,771 31,373Biocon Ltd. 3,482 30,692Cadila Healthcare Ltd. 8,223 41,200Cipla Ltd. 4,936 37,689Dr. Reddy�s Laboratories Ltd. 932 37,408Glenmark Pharmaceuticals Ltd. 4,117 38,467Torrent Pharmaceuticals Ltd. 1,504 42,335
259,164Industrials (1.2%):Adani Enterprises Ltd. 11,481 24,323Adani Ports And Special Economic Zone 5,443 29,715Amara Raja Batteries Ltd. 3,984 41,409Godrej Industries Ltd. 4,780 37,016
Copyright © 2021 www.secdatabase.com. All Rights Reserved.Please Consider the Environment Before Printing This Document
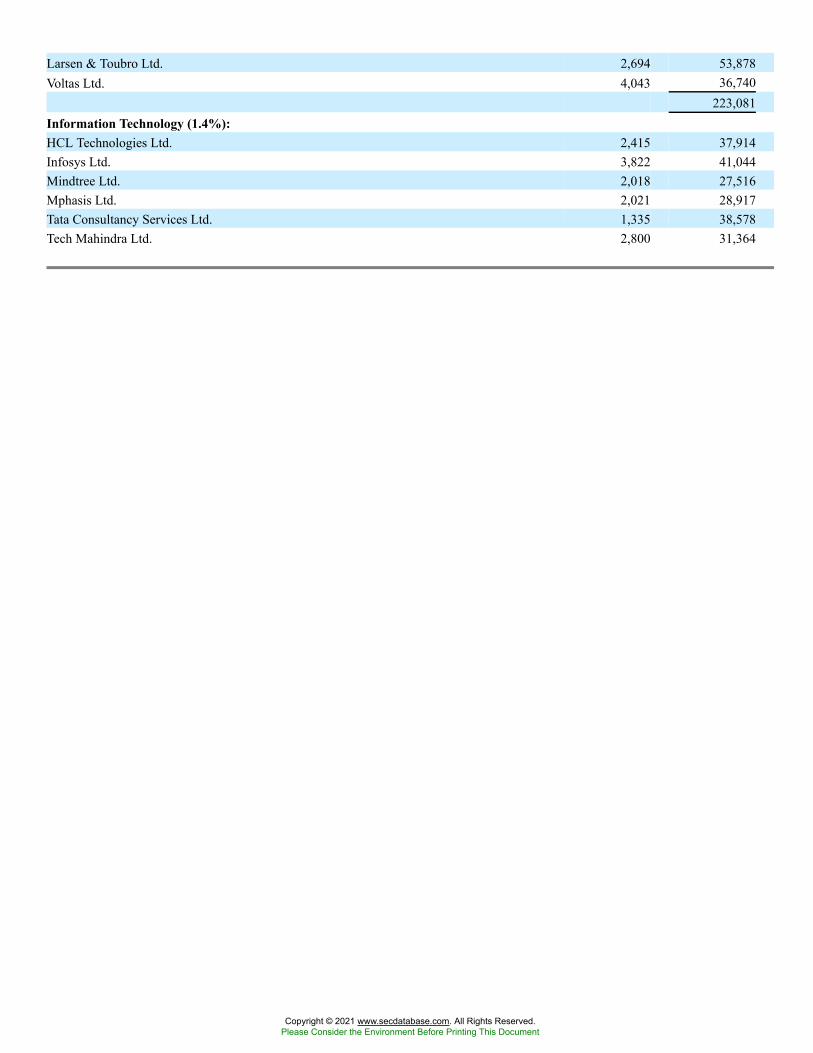
Larsen & Toubro Ltd. 2,694 53,878Voltas Ltd. 4,043 36,740
223,081Information Technology (1.4%):HCL Technologies Ltd. 2,415 37,914Infosys Ltd. 3,822 41,044Mindtree Ltd. 2,018 27,516Mphasis Ltd. 2,021 28,917Tata Consultancy Services Ltd. 1,335 38,578Tech Mahindra Ltd. 2,800 31,364
Copyright © 2021 www.secdatabase.com. All Rights Reserved.Please Consider the Environment Before Printing This Document
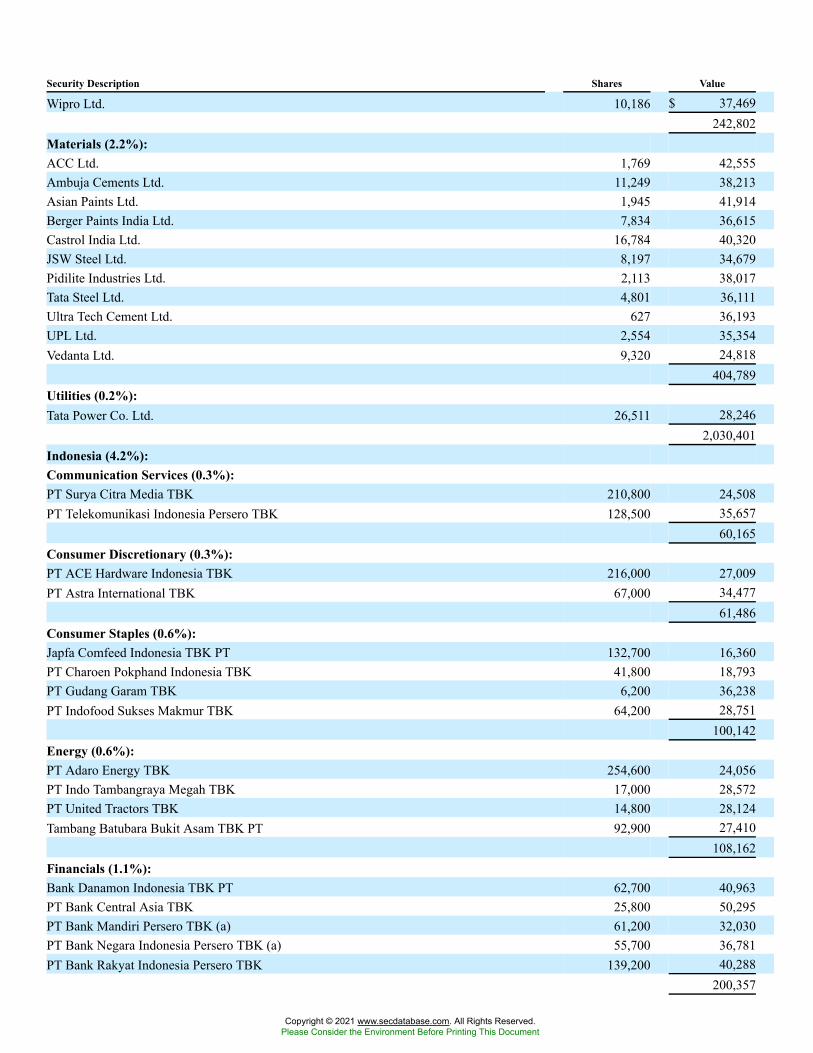
Security Description Shares Value
Wipro Ltd. 10,186 $ 37,469242,802
Materials (2.2%):ACC Ltd. 1,769 42,555Ambuja Cements Ltd. 11,249 38,213Asian Paints Ltd. 1,945 41,914Berger Paints India Ltd. 7,834 36,615Castrol India Ltd. 16,784 40,320JSW Steel Ltd. 8,197 34,679Pidilite Industries Ltd. 2,113 38,017Tata Steel Ltd. 4,801 36,111Ultra Tech Cement Ltd. 627 36,193UPL Ltd. 2,554 35,354Vedanta Ltd. 9,320 24,818
404,789Utilities (0.2%):Tata Power Co. Ltd. 26,511 28,246
2,030,401Indonesia (4.2%):Communication Services (0.3%):PT Surya Citra Media TBK 210,800 24,508PT Telekomunikasi Indonesia Persero TBK 128,500 35,657
60,165Consumer Discretionary (0.3%):PT ACE Hardware Indonesia TBK 216,000 27,009PT Astra International TBK 67,000 34,477
61,486Consumer Staples (0.6%):Japfa Comfeed Indonesia TBK PT 132,700 16,360PT Charoen Pokphand Indonesia TBK 41,800 18,793PT Gudang Garam TBK 6,200 36,238PT Indofood Sukses Makmur TBK 64,200 28,751
100,142Energy (0.6%):PT Adaro Energy TBK 254,600 24,056PT Indo Tambangraya Megah TBK 17,000 28,572PT United Tractors TBK 14,800 28,124Tambang Batubara Bukit Asam TBK PT 92,900 27,410
108,162Financials (1.1%):Bank Danamon Indonesia TBK PT 62,700 40,963PT Bank Central Asia TBK 25,800 50,295PT Bank Mandiri Persero TBK (a) 61,200 32,030PT Bank Negara Indonesia Persero TBK (a) 55,700 36,781PT Bank Rakyat Indonesia Persero TBK 139,200 40,288
200,357
Copyright © 2021 www.secdatabase.com. All Rights Reserved.Please Consider the Environment Before Printing This Document
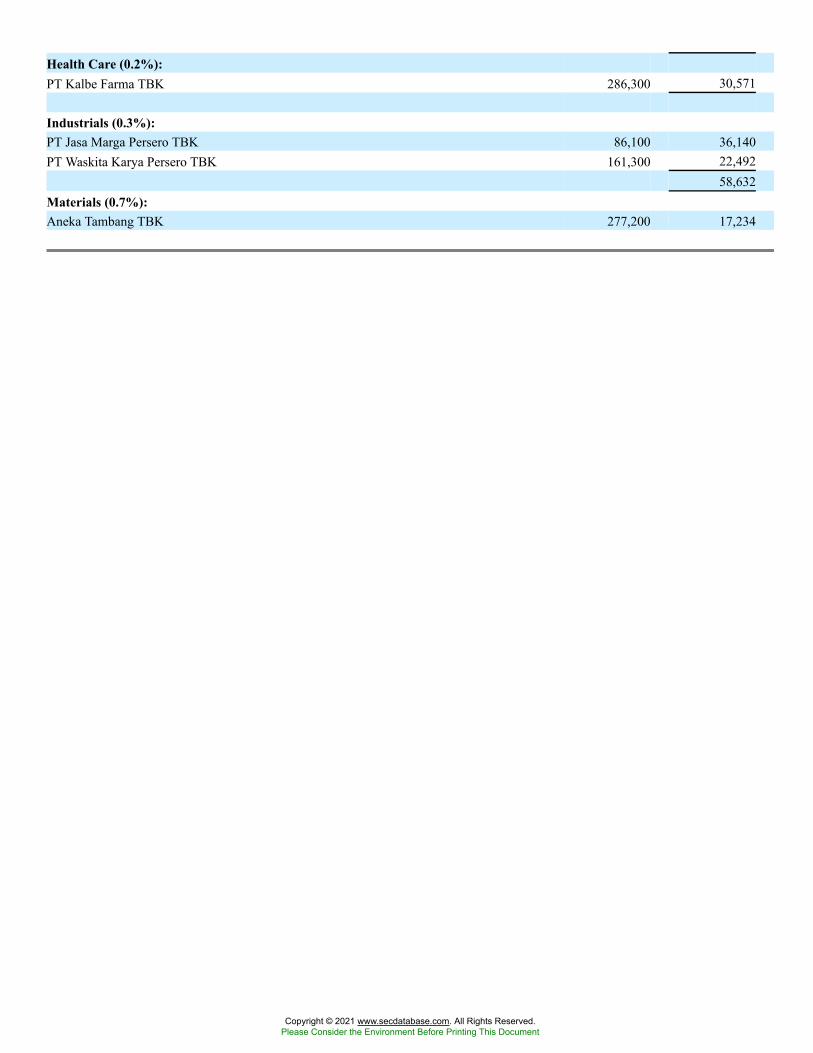
Health Care (0.2%):PT Kalbe Farma TBK 286,300 30,571
Industrials (0.3%):PT Jasa Marga Persero TBK 86,100 36,140PT Waskita Karya Persero TBK 161,300 22,492
58,632Materials (0.7%):Aneka Tambang TBK 277,200 17,234
Copyright © 2021 www.secdatabase.com. All Rights Reserved.Please Consider the Environment Before Printing This Document
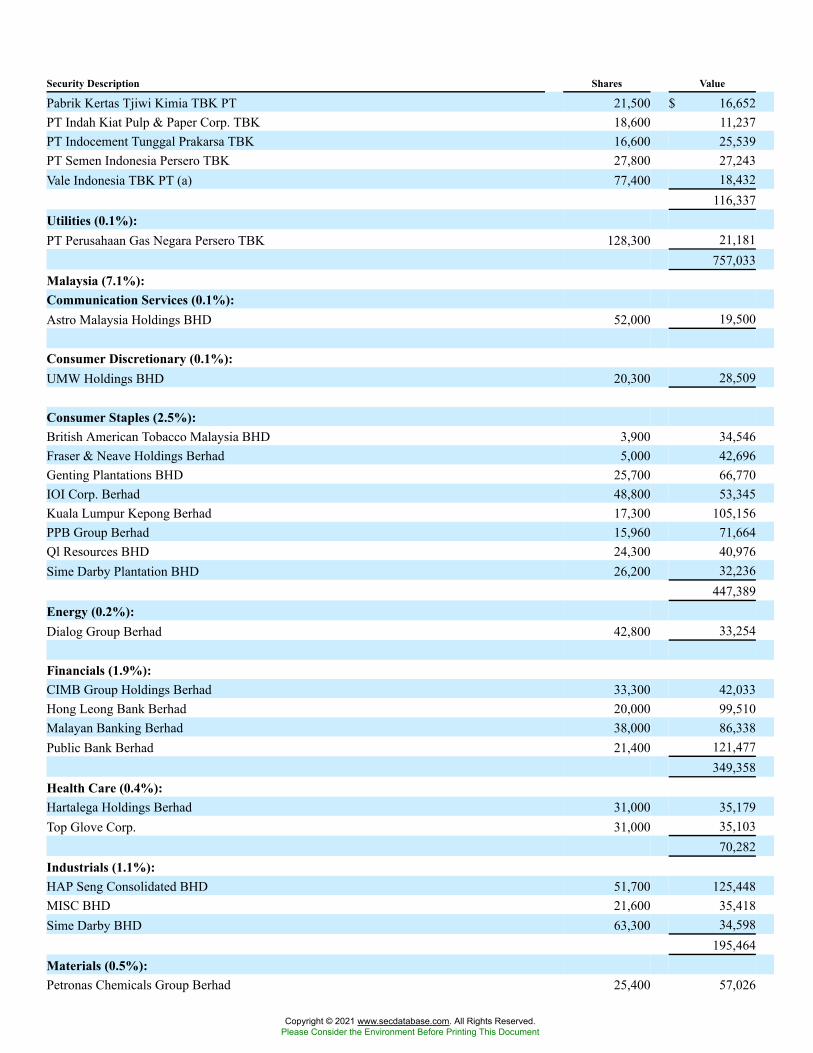
Security Description Shares Value
Pabrik Kertas Tjiwi Kimia TBK PT 21,500 $ 16,652PT Indah Kiat Pulp & Paper Corp. TBK 18,600 11,237PT Indocement Tunggal Prakarsa TBK 16,600 25,539PT Semen Indonesia Persero TBK 27,800 27,243Vale Indonesia TBK PT (a) 77,400 18,432
116,337Utilities (0.1%):PT Perusahaan Gas Negara Persero TBK 128,300 21,181
757,033Malaysia (7.1%):Communication Services (0.1%):Astro Malaysia Holdings BHD 52,000 19,500
Consumer Discretionary (0.1%):UMW Holdings BHD 20,300 28,509
Consumer Staples (2.5%):British American Tobacco Malaysia BHD 3,900 34,546Fraser & Neave Holdings Berhad 5,000 42,696Genting Plantations BHD 25,700 66,770IOI Corp. Berhad 48,800 53,345Kuala Lumpur Kepong Berhad 17,300 105,156PPB Group Berhad 15,960 71,664Ql Resources BHD 24,300 40,976Sime Darby Plantation BHD 26,200 32,236
447,389Energy (0.2%):Dialog Group Berhad 42,800 33,254
Financials (1.9%):CIMB Group Holdings Berhad 33,300 42,033Hong Leong Bank Berhad 20,000 99,510Malayan Banking Berhad 38,000 86,338Public Bank Berhad 21,400 121,477
349,358Health Care (0.4%):Hartalega Holdings Berhad 31,000 35,179Top Glove Corp. 31,000 35,103
70,282Industrials (1.1%):HAP Seng Consolidated BHD 51,700 125,448MISC BHD 21,600 35,418Sime Darby BHD 63,300 34,598
195,464Materials (0.5%):Petronas Chemicals Group Berhad 25,400 57,026
Copyright © 2021 www.secdatabase.com. All Rights Reserved.Please Consider the Environment Before Printing This Document
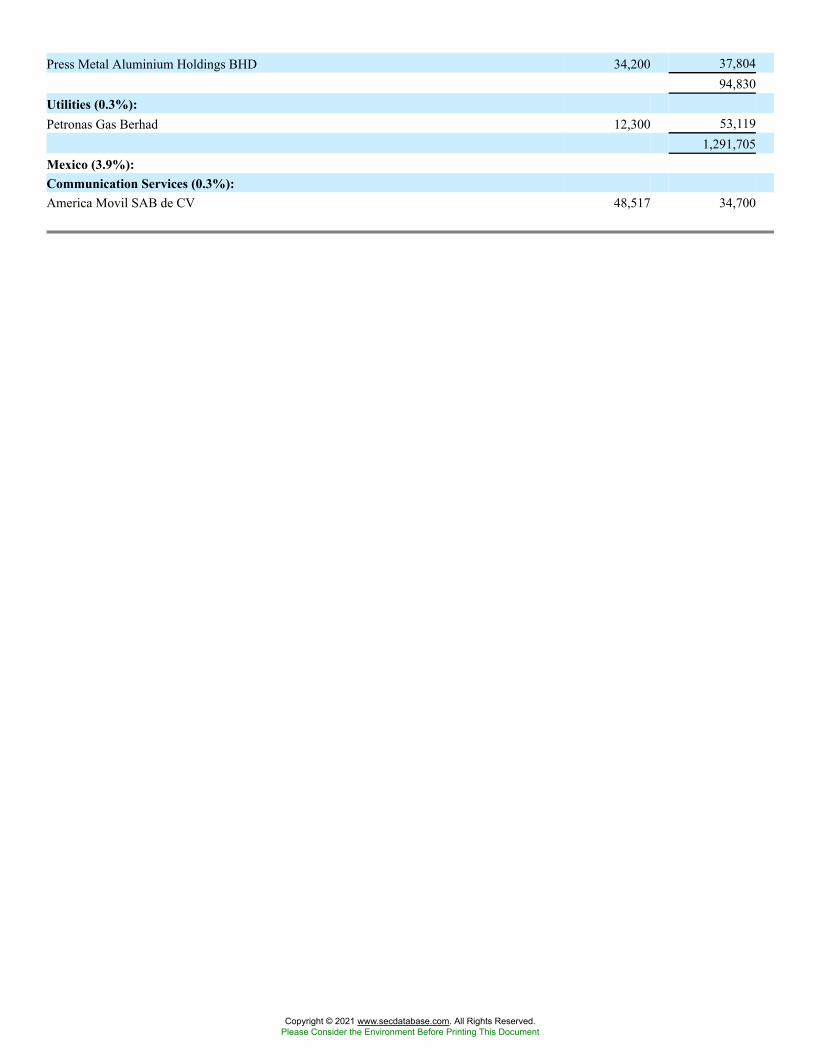
Press Metal Aluminium Holdings BHD 34,200 37,80494,830
Utilities (0.3%):Petronas Gas Berhad 12,300 53,119
1,291,705Mexico (3.9%):Communication Services (0.3%):America Movil SAB de CV 48,517 34,700
Copyright © 2021 www.secdatabase.com. All Rights Reserved.Please Consider the Environment Before Printing This Document
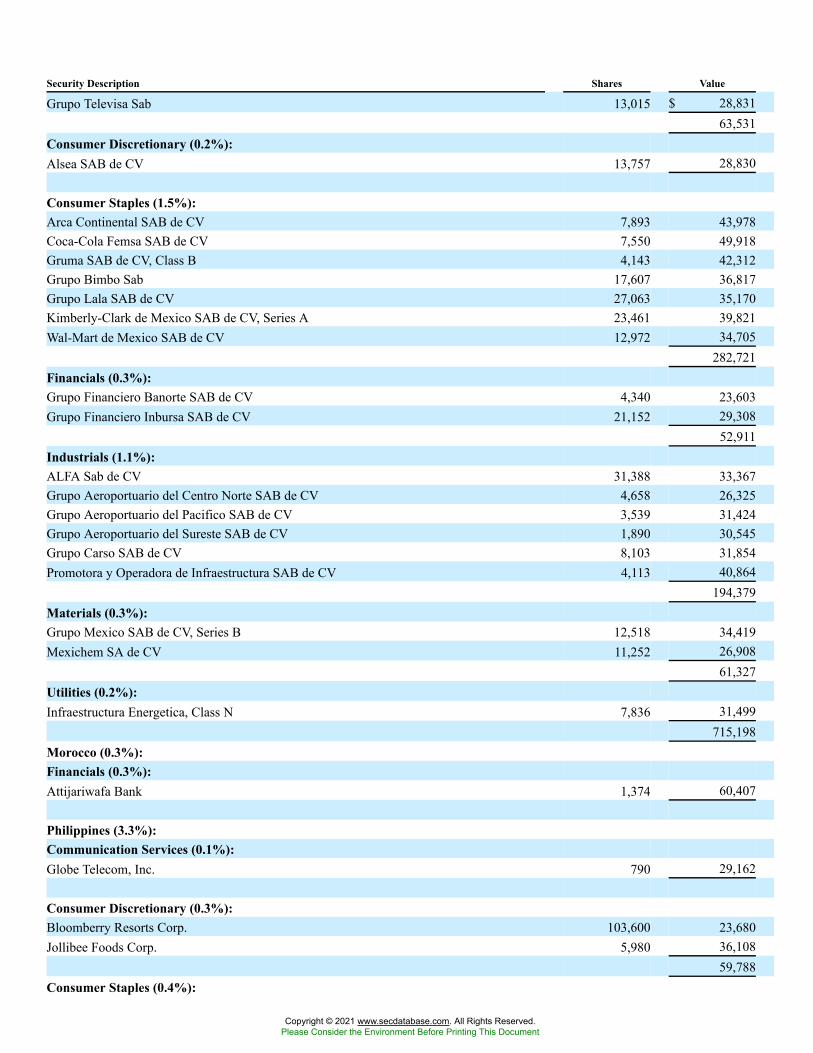
Security Description Shares Value
Grupo Televisa Sab 13,015 $ 28,83163,531
Consumer Discretionary (0.2%):Alsea SAB de CV 13,757 28,830
Consumer Staples (1.5%):Arca Continental SAB de CV 7,893 43,978Coca-Cola Femsa SAB de CV 7,550 49,918Gruma SAB de CV, Class B 4,143 42,312Grupo Bimbo Sab 17,607 36,817Grupo Lala SAB de CV 27,063 35,170Kimberly-Clark de Mexico SAB de CV, Series A 23,461 39,821Wal-Mart de Mexico SAB de CV 12,972 34,705
282,721Financials (0.3%):Grupo Financiero Banorte SAB de CV 4,340 23,603Grupo Financiero Inbursa SAB de CV 21,152 29,308
52,911Industrials (1.1%):ALFA Sab de CV 31,388 33,367Grupo Aeroportuario del Centro Norte SAB de CV 4,658 26,325Grupo Aeroportuario del Pacifico SAB de CV 3,539 31,424Grupo Aeroportuario del Sureste SAB de CV 1,890 30,545Grupo Carso SAB de CV 8,103 31,854Promotora y Operadora de Infraestructura SAB de CV 4,113 40,864
194,379Materials (0.3%):Grupo Mexico SAB de CV, Series B 12,518 34,419Mexichem SA de CV 11,252 26,908
61,327Utilities (0.2%):Infraestructura Energetica, Class N 7,836 31,499
715,198Morocco (0.3%):Financials (0.3%):Attijariwafa Bank 1,374 60,407
Philippines (3.3%):Communication Services (0.1%):Globe Telecom, Inc. 790 29,162
Consumer Discretionary (0.3%):Bloomberry Resorts Corp. 103,600 23,680Jollibee Foods Corp. 5,980 36,108
59,788Consumer Staples (0.4%):
Copyright © 2021 www.secdatabase.com. All Rights Reserved.Please Consider the Environment Before Printing This Document
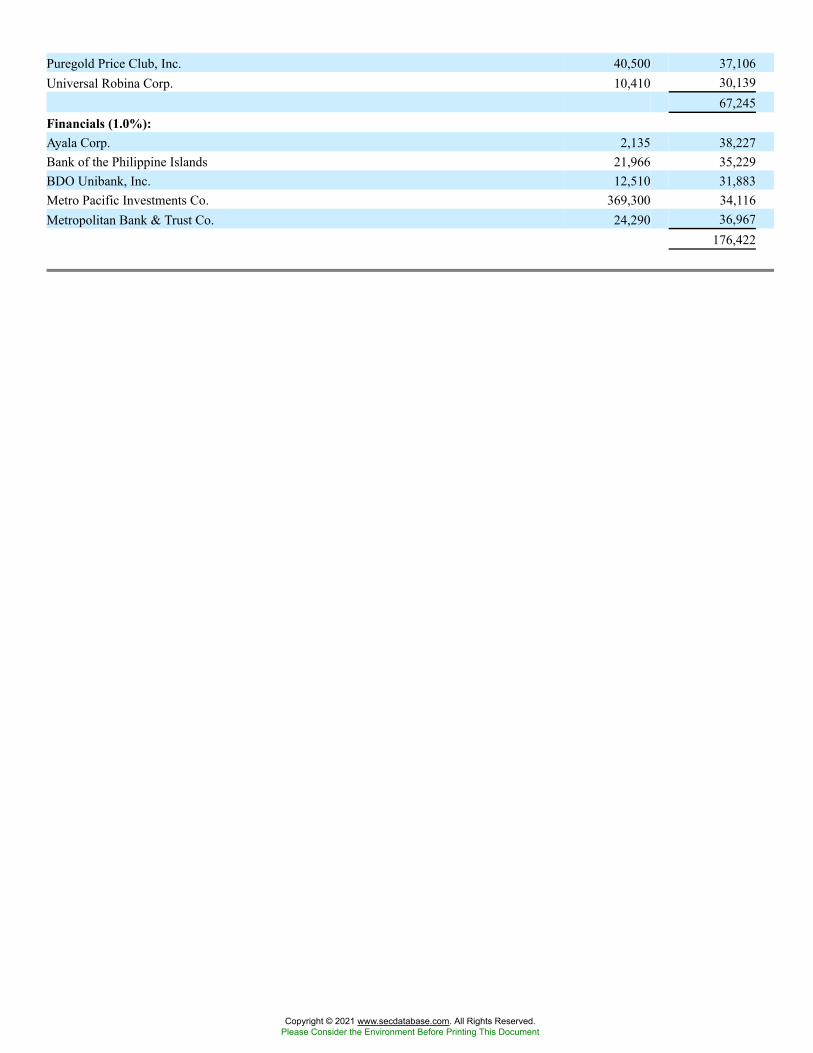
Puregold Price Club, Inc. 40,500 37,106Universal Robina Corp. 10,410 30,139
67,245Financials (1.0%):Ayala Corp. 2,135 38,227Bank of the Philippine Islands 21,966 35,229BDO Unibank, Inc. 12,510 31,883Metro Pacific Investments Co. 369,300 34,116Metropolitan Bank & Trust Co. 24,290 36,967
176,422
Copyright © 2021 www.secdatabase.com. All Rights Reserved.Please Consider the Environment Before Printing This Document
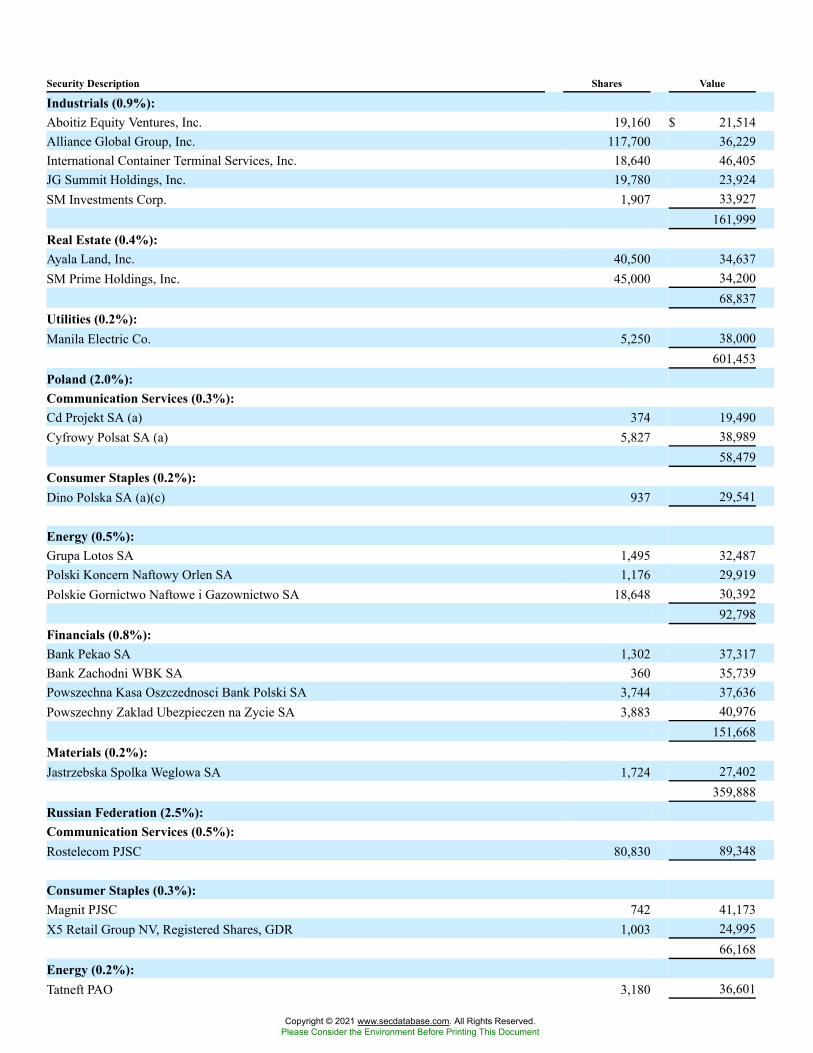
Security Description Shares Value
Industrials (0.9%):Aboitiz Equity Ventures, Inc. 19,160 $ 21,514Alliance Global Group, Inc. 117,700 36,229International Container Terminal Services, Inc. 18,640 46,405JG Summit Holdings, Inc. 19,780 23,924SM Investments Corp. 1,907 33,927
161,999Real Estate (0.4%):Ayala Land, Inc. 40,500 34,637SM Prime Holdings, Inc. 45,000 34,200
68,837Utilities (0.2%):Manila Electric Co. 5,250 38,000
601,453Poland (2.0%):Communication Services (0.3%):Cd Projekt SA (a) 374 19,490Cyfrowy Polsat SA (a) 5,827 38,989
58,479Consumer Staples (0.2%):Dino Polska SA (a)(c) 937 29,541
Energy (0.5%):Grupa Lotos SA 1,495 32,487Polski Koncern Naftowy Orlen SA 1,176 29,919Polskie Gornictwo Naftowe i Gazownictwo SA 18,648 30,392
92,798Financials (0.8%):Bank Pekao SA 1,302 37,317Bank Zachodni WBK SA 360 35,739Powszechna Kasa Oszczednosci Bank Polski SA 3,744 37,636Powszechny Zaklad Ubezpieczen na Zycie SA 3,883 40,976
151,668Materials (0.2%):Jastrzebska Spolka Weglowa SA 1,724 27,402
359,888Russian Federation (2.5%):Communication Services (0.5%):Rostelecom PJSC 80,830 89,348
Consumer Staples (0.3%):Magnit PJSC 742 41,173X5 Retail Group NV, Registered Shares, GDR 1,003 24,995
66,168Energy (0.2%):Tatneft PAO 3,180 36,601
Copyright © 2021 www.secdatabase.com. All Rights Reserved.Please Consider the Environment Before Printing This Document
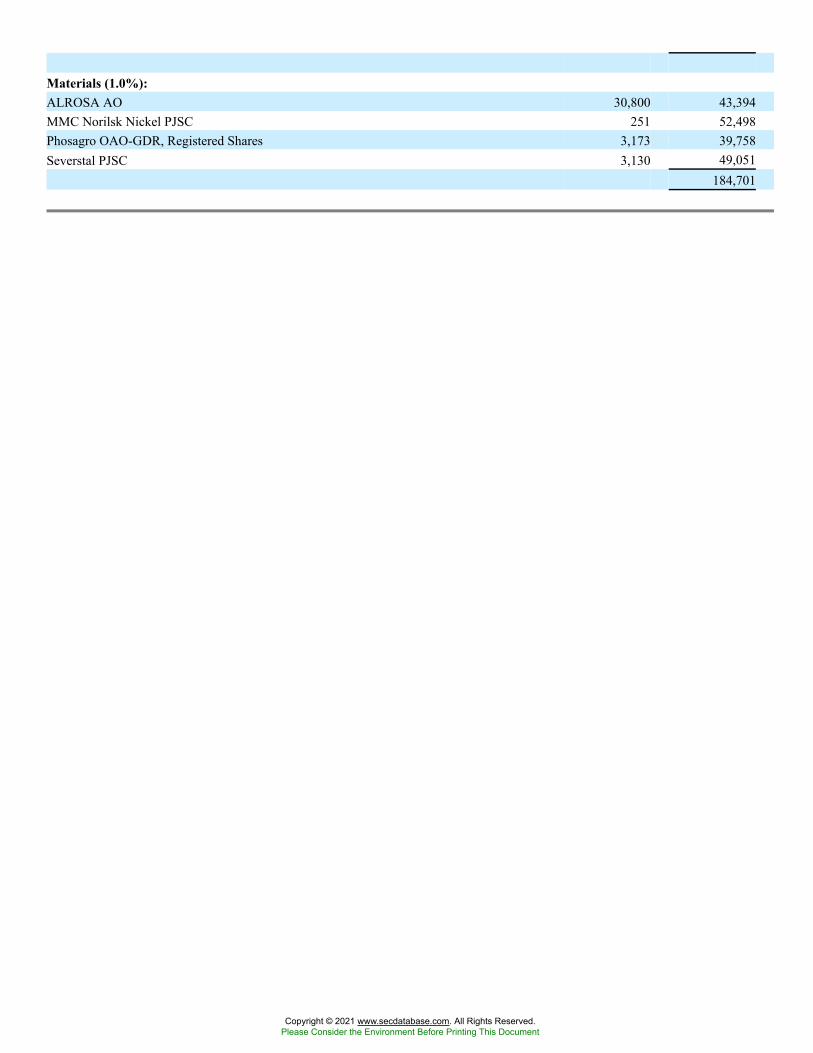
Materials (1.0%):ALROSA AO 30,800 43,394MMC Norilsk Nickel PJSC 251 52,498Phosagro OAO-GDR, Registered Shares 3,173 39,758Severstal PJSC 3,130 49,051
184,701
Copyright © 2021 www.secdatabase.com. All Rights Reserved.Please Consider the Environment Before Printing This Document
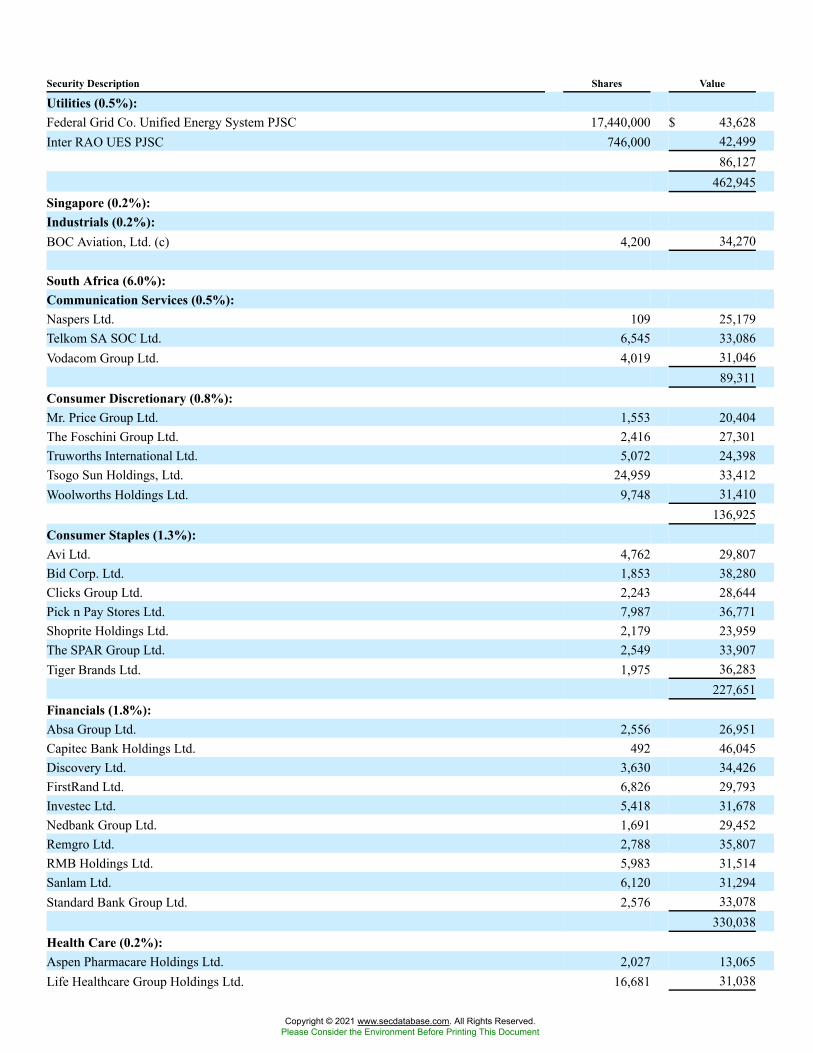
Security Description Shares Value
Utilities (0.5%):Federal Grid Co. Unified Energy System PJSC 17,440,000 $ 43,628Inter RAO UES PJSC 746,000 42,499
86,127462,945
Singapore (0.2%):Industrials (0.2%):BOC Aviation, Ltd. (c) 4,200 34,270
South Africa (6.0%):Communication Services (0.5%):Naspers Ltd. 109 25,179Telkom SA SOC Ltd. 6,545 33,086Vodacom Group Ltd. 4,019 31,046
89,311Consumer Discretionary (0.8%):Mr. Price Group Ltd. 1,553 20,404The Foschini Group Ltd. 2,416 27,301Truworths International Ltd. 5,072 24,398Tsogo Sun Holdings, Ltd. 24,959 33,412Woolworths Holdings Ltd. 9,748 31,410
136,925Consumer Staples (1.3%):Avi Ltd. 4,762 29,807Bid Corp. Ltd. 1,853 38,280Clicks Group Ltd. 2,243 28,644Pick n Pay Stores Ltd. 7,987 36,771Shoprite Holdings Ltd. 2,179 23,959The SPAR Group Ltd. 2,549 33,907Tiger Brands Ltd. 1,975 36,283
227,651Financials (1.8%):Absa Group Ltd. 2,556 26,951Capitec Bank Holdings Ltd. 492 46,045Discovery Ltd. 3,630 34,426FirstRand Ltd. 6,826 29,793Investec Ltd. 5,418 31,678Nedbank Group Ltd. 1,691 29,452Remgro Ltd. 2,788 35,807RMB Holdings Ltd. 5,983 31,514Sanlam Ltd. 6,120 31,294Standard Bank Group Ltd. 2,576 33,078
330,038Health Care (0.2%):Aspen Pharmacare Holdings Ltd. 2,027 13,065Life Healthcare Group Holdings Ltd. 16,681 31,038
Copyright © 2021 www.secdatabase.com. All Rights Reserved.Please Consider the Environment Before Printing This Document
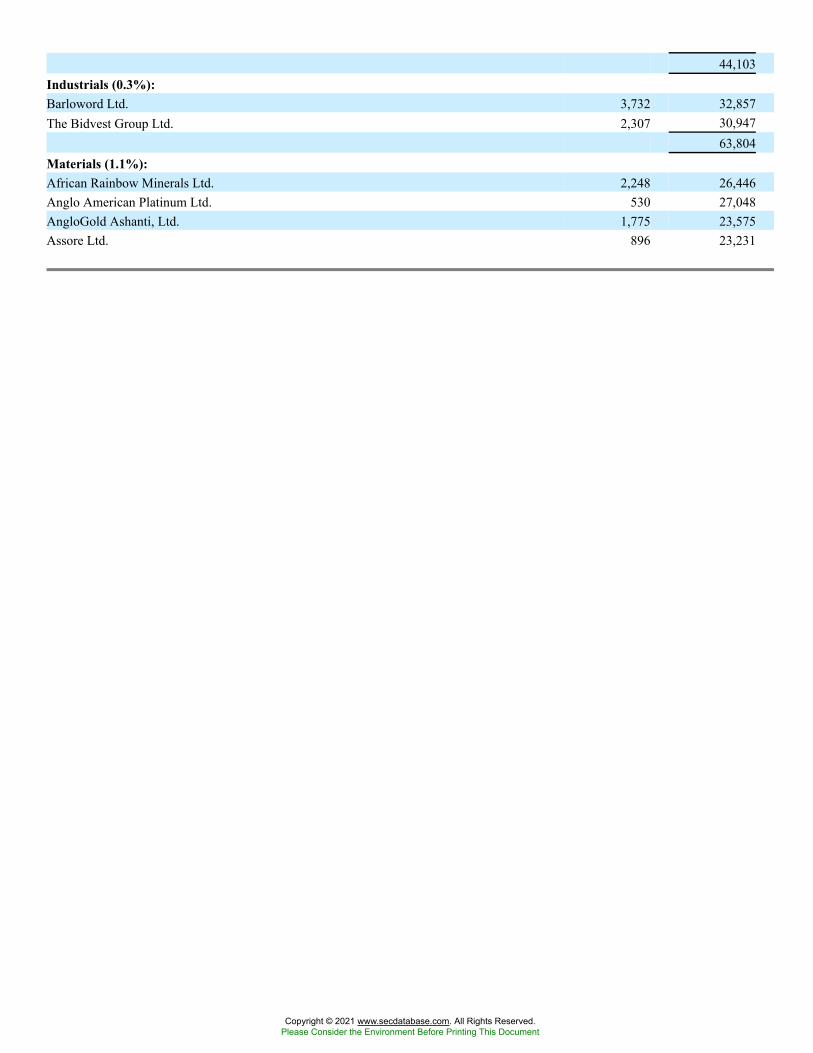
44,103Industrials (0.3%):Barloword Ltd. 3,732 32,857The Bidvest Group Ltd. 2,307 30,947
63,804Materials (1.1%):African Rainbow Minerals Ltd. 2,248 26,446Anglo American Platinum Ltd. 530 27,048AngloGold Ashanti, Ltd. 1,775 23,575Assore Ltd. 896 23,231
Copyright © 2021 www.secdatabase.com. All Rights Reserved.Please Consider the Environment Before Printing This Document
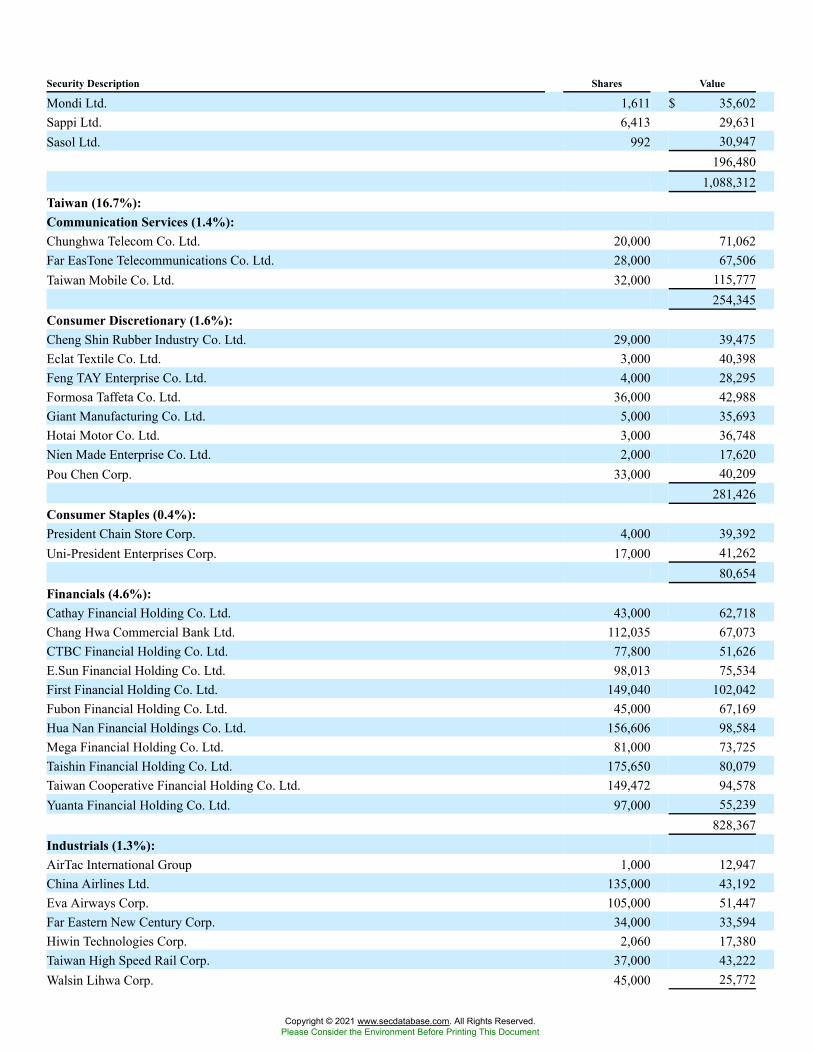
Security Description Shares Value
Mondi Ltd. 1,611 $ 35,602Sappi Ltd. 6,413 29,631Sasol Ltd. 992 30,947
196,4801,088,312
Taiwan (16.7%):Communication Services (1.4%):Chunghwa Telecom Co. Ltd. 20,000 71,062Far EasTone Telecommunications Co. Ltd. 28,000 67,506Taiwan Mobile Co. Ltd. 32,000 115,777
254,345Consumer Discretionary (1.6%):Cheng Shin Rubber Industry Co. Ltd. 29,000 39,475Eclat Textile Co. Ltd. 3,000 40,398Feng TAY Enterprise Co. Ltd. 4,000 28,295Formosa Taffeta Co. Ltd. 36,000 42,988Giant Manufacturing Co. Ltd. 5,000 35,693Hotai Motor Co. Ltd. 3,000 36,748Nien Made Enterprise Co. Ltd. 2,000 17,620Pou Chen Corp. 33,000 40,209
281,426Consumer Staples (0.4%):President Chain Store Corp. 4,000 39,392Uni-President Enterprises Corp. 17,000 41,262
80,654Financials (4.6%):Cathay Financial Holding Co. Ltd. 43,000 62,718Chang Hwa Commercial Bank Ltd. 112,035 67,073CTBC Financial Holding Co. Ltd. 77,800 51,626E.Sun Financial Holding Co. Ltd. 98,013 75,534First Financial Holding Co. Ltd. 149,040 102,042Fubon Financial Holding Co. Ltd. 45,000 67,169Hua Nan Financial Holdings Co. Ltd. 156,606 98,584Mega Financial Holding Co. Ltd. 81,000 73,725Taishin Financial Holding Co. Ltd. 175,650 80,079Taiwan Cooperative Financial Holding Co. Ltd. 149,472 94,578Yuanta Financial Holding Co. Ltd. 97,000 55,239
828,367Industrials (1.3%):AirTac International Group 1,000 12,947China Airlines Ltd. 135,000 43,192Eva Airways Corp. 105,000 51,447Far Eastern New Century Corp. 34,000 33,594Hiwin Technologies Corp. 2,060 17,380Taiwan High Speed Rail Corp. 37,000 43,222Walsin Lihwa Corp. 45,000 25,772
Copyright © 2021 www.secdatabase.com. All Rights Reserved.Please Consider the Environment Before Printing This Document
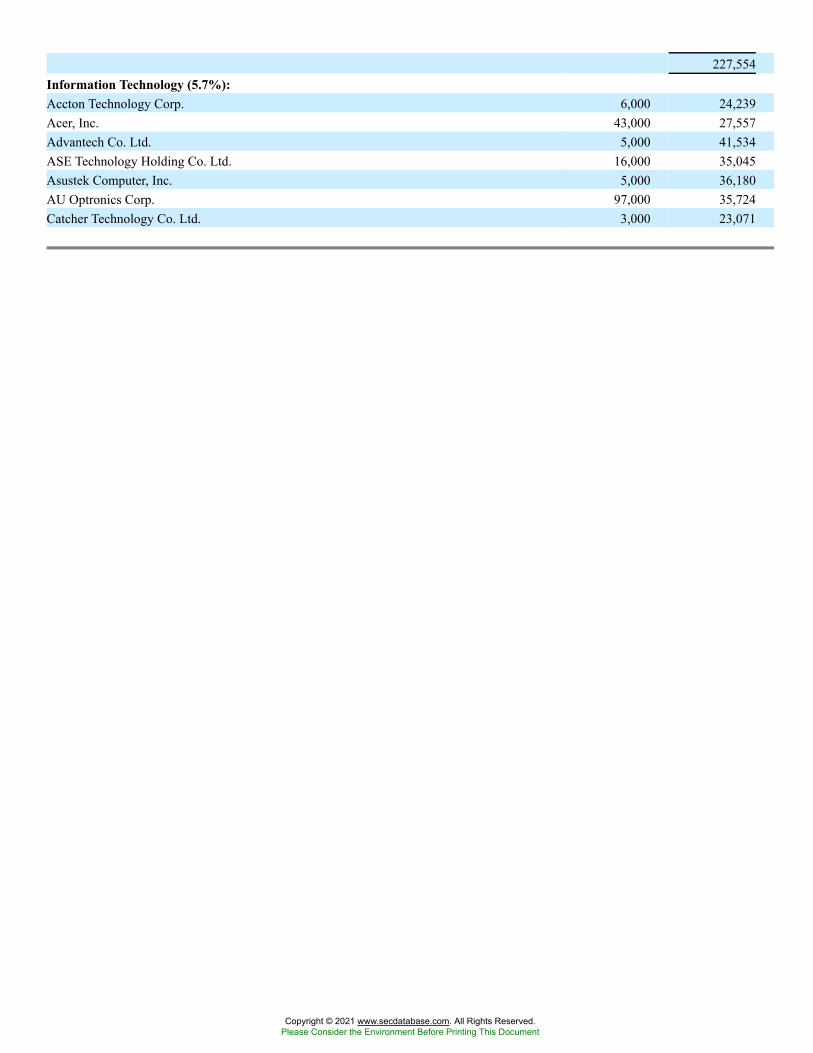
227,554Information Technology (5.7%):Accton Technology Corp. 6,000 24,239Acer, Inc. 43,000 27,557Advantech Co. Ltd. 5,000 41,534ASE Technology Holding Co. Ltd. 16,000 35,045Asustek Computer, Inc. 5,000 36,180AU Optronics Corp. 97,000 35,724Catcher Technology Co. Ltd. 3,000 23,071
Copyright © 2021 www.secdatabase.com. All Rights Reserved.Please Consider the Environment Before Printing This Document
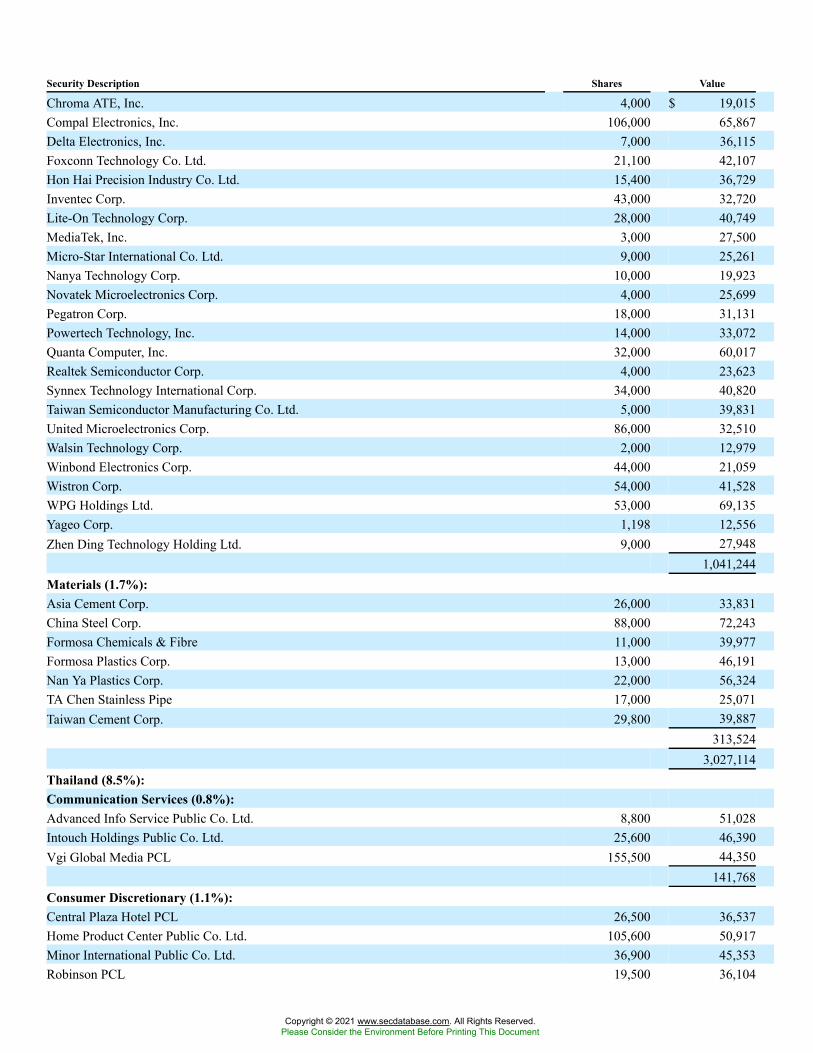
Security Description Shares Value
Chroma ATE, Inc. 4,000 $ 19,015Compal Electronics, Inc. 106,000 65,867Delta Electronics, Inc. 7,000 36,115Foxconn Technology Co. Ltd. 21,100 42,107Hon Hai Precision Industry Co. Ltd. 15,400 36,729Inventec Corp. 43,000 32,720Lite-On Technology Corp. 28,000 40,749MediaTek, Inc. 3,000 27,500Micro-Star International Co. Ltd. 9,000 25,261Nanya Technology Corp. 10,000 19,923Novatek Microelectronics Corp. 4,000 25,699Pegatron Corp. 18,000 31,131Powertech Technology, Inc. 14,000 33,072Quanta Computer, Inc. 32,000 60,017Realtek Semiconductor Corp. 4,000 23,623Synnex Technology International Corp. 34,000 40,820Taiwan Semiconductor Manufacturing Co. Ltd. 5,000 39,831United Microelectronics Corp. 86,000 32,510Walsin Technology Corp. 2,000 12,979Winbond Electronics Corp. 44,000 21,059Wistron Corp. 54,000 41,528WPG Holdings Ltd. 53,000 69,135Yageo Corp. 1,198 12,556Zhen Ding Technology Holding Ltd. 9,000 27,948
1,041,244Materials (1.7%):Asia Cement Corp. 26,000 33,831China Steel Corp. 88,000 72,243Formosa Chemicals & Fibre 11,000 39,977Formosa Plastics Corp. 13,000 46,191Nan Ya Plastics Corp. 22,000 56,324TA Chen Stainless Pipe 17,000 25,071Taiwan Cement Corp. 29,800 39,887
313,5243,027,114
Thailand (8.5%):Communication Services (0.8%):Advanced Info Service Public Co. Ltd. 8,800 51,028Intouch Holdings Public Co. Ltd. 25,600 46,390Vgi Global Media PCL 155,500 44,350
141,768Consumer Discretionary (1.1%):Central Plaza Hotel PCL 26,500 36,537Home Product Center Public Co. Ltd. 105,600 50,917Minor International Public Co. Ltd. 36,900 45,353Robinson PCL 19,500 36,104
Copyright © 2021 www.secdatabase.com. All Rights Reserved.Please Consider the Environment Before Printing This Document
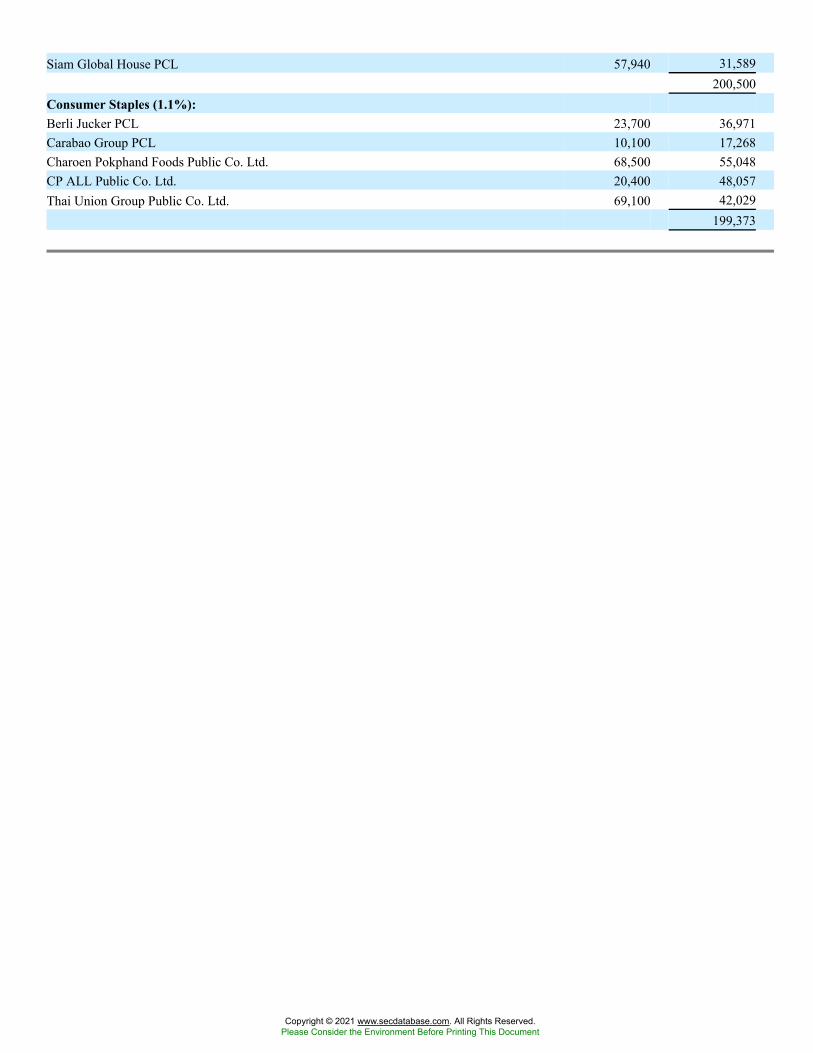
Siam Global House PCL 57,940 31,589200,500
Consumer Staples (1.1%):Berli Jucker PCL 23,700 36,971Carabao Group PCL 10,100 17,268Charoen Pokphand Foods Public Co. Ltd. 68,500 55,048CP ALL Public Co. Ltd. 20,400 48,057Thai Union Group Public Co. Ltd. 69,100 42,029
199,373
Copyright © 2021 www.secdatabase.com. All Rights Reserved.Please Consider the Environment Before Printing This Document
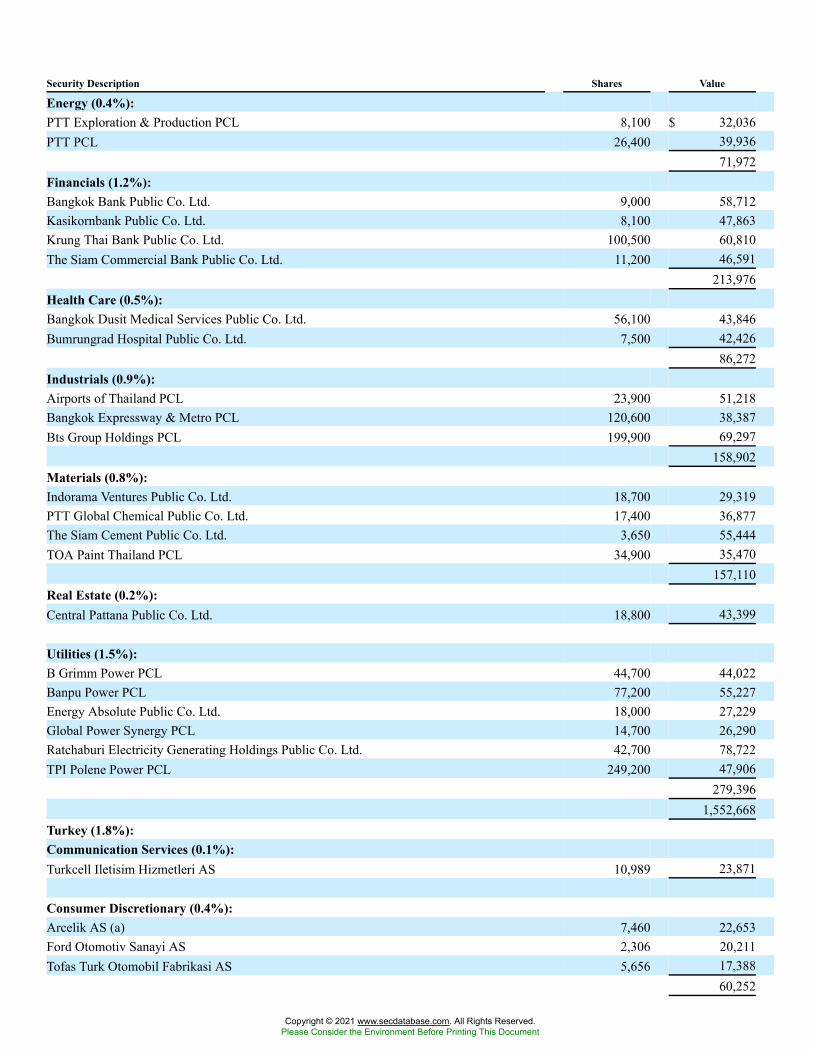
Security Description Shares Value
Energy (0.4%):PTT Exploration & Production PCL 8,100 $ 32,036PTT PCL 26,400 39,936
71,972Financials (1.2%):Bangkok Bank Public Co. Ltd. 9,000 58,712Kasikornbank Public Co. Ltd. 8,100 47,863Krung Thai Bank Public Co. Ltd. 100,500 60,810The Siam Commercial Bank Public Co. Ltd. 11,200 46,591
213,976Health Care (0.5%):Bangkok Dusit Medical Services Public Co. Ltd. 56,100 43,846Bumrungrad Hospital Public Co. Ltd. 7,500 42,426
86,272Industrials (0.9%):Airports of Thailand PCL 23,900 51,218Bangkok Expressway & Metro PCL 120,600 38,387Bts Group Holdings PCL 199,900 69,297
158,902Materials (0.8%):Indorama Ventures Public Co. Ltd. 18,700 29,319PTT Global Chemical Public Co. Ltd. 17,400 36,877The Siam Cement Public Co. Ltd. 3,650 55,444TOA Paint Thailand PCL 34,900 35,470
157,110Real Estate (0.2%):Central Pattana Public Co. Ltd. 18,800 43,399
Utilities (1.5%):B Grimm Power PCL 44,700 44,022Banpu Power PCL 77,200 55,227Energy Absolute Public Co. Ltd. 18,000 27,229Global Power Synergy PCL 14,700 26,290Ratchaburi Electricity Generating Holdings Public Co. Ltd. 42,700 78,722TPI Polene Power PCL 249,200 47,906
279,3961,552,668
Turkey (1.8%):Communication Services (0.1%):Turkcell Iletisim Hizmetleri AS 10,989 23,871
Consumer Discretionary (0.4%):Arcelik AS (a) 7,460 22,653Ford Otomotiv Sanayi AS 2,306 20,211Tofas Turk Otomobil Fabrikasi AS 5,656 17,388
60,252
Copyright © 2021 www.secdatabase.com. All Rights Reserved.Please Consider the Environment Before Printing This Document
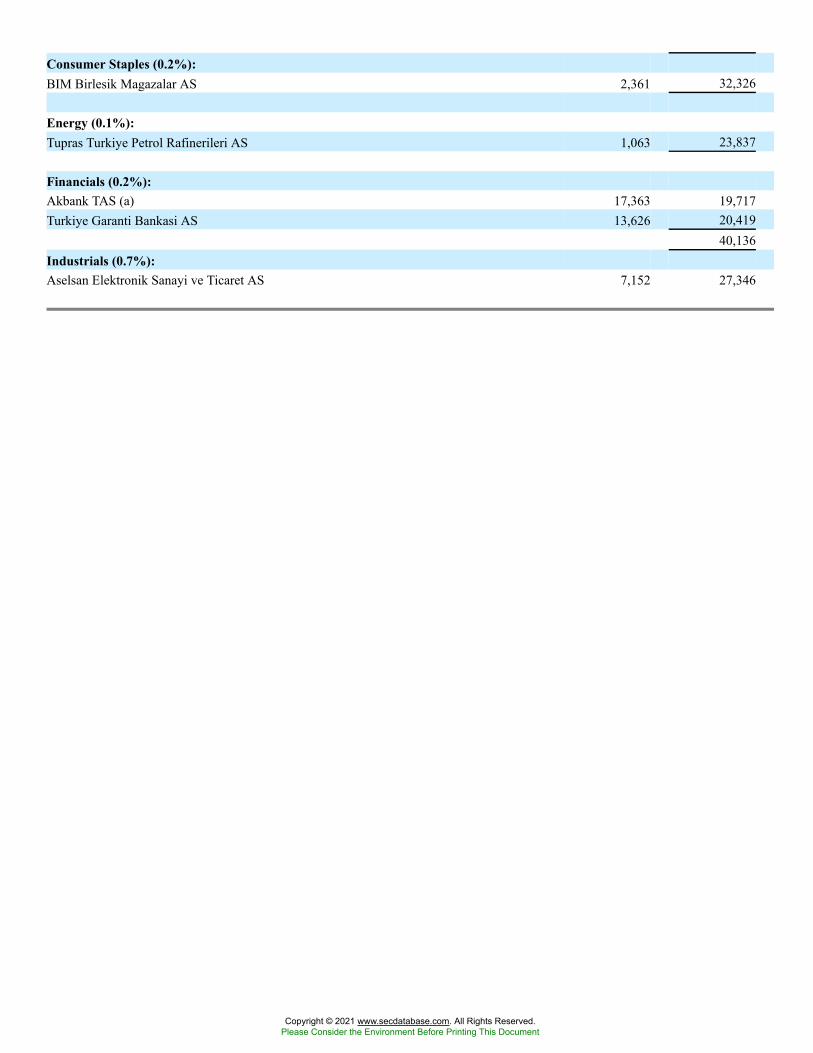
Consumer Staples (0.2%):BIM Birlesik Magazalar AS 2,361 32,326
Energy (0.1%):Tupras Turkiye Petrol Rafinerileri AS 1,063 23,837
Financials (0.2%):Akbank TAS (a) 17,363 19,717Turkiye Garanti Bankasi AS 13,626 20,419
40,136Industrials (0.7%):Aselsan Elektronik Sanayi ve Ticaret AS 7,152 27,346
Copyright © 2021 www.secdatabase.com. All Rights Reserved.Please Consider the Environment Before Printing This Document
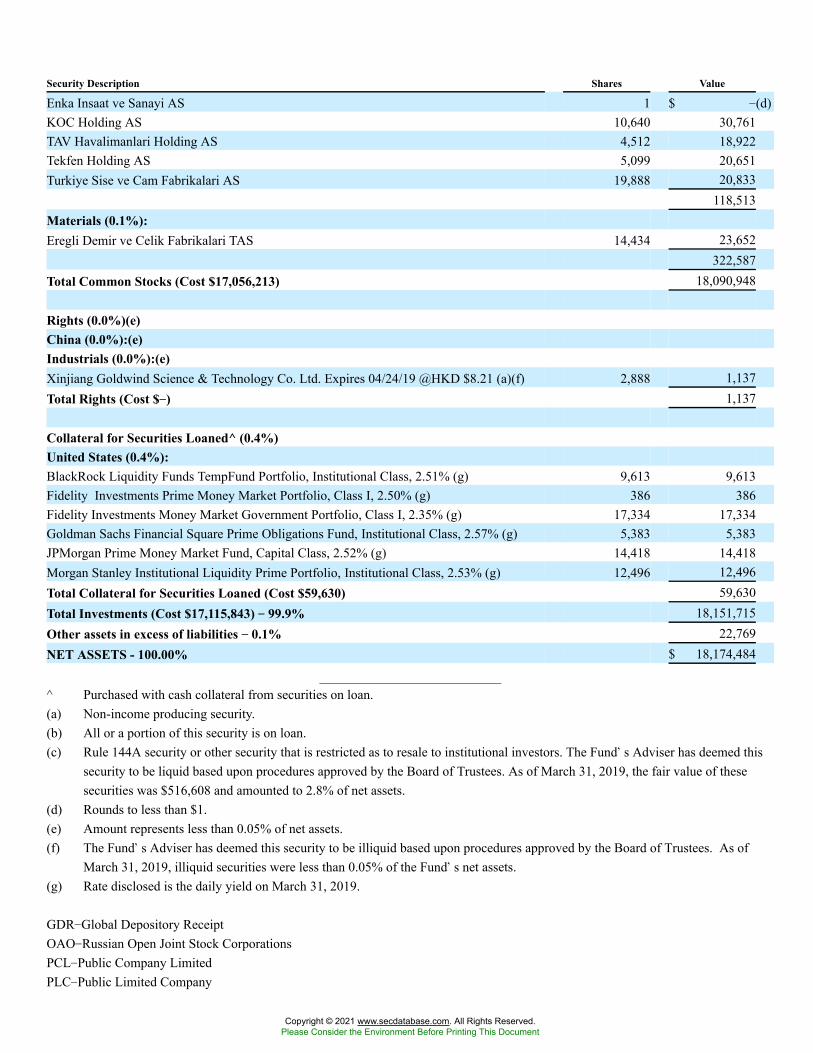
Security Description Shares Value
Enka Insaat ve Sanayi AS 1 $ �(d)KOC Holding AS 10,640 30,761TAV Havalimanlari Holding AS 4,512 18,922Tekfen Holding AS 5,099 20,651Turkiye Sise ve Cam Fabrikalari AS 19,888 20,833
118,513Materials (0.1%):Eregli Demir ve Celik Fabrikalari TAS 14,434 23,652
322,587Total Common Stocks (Cost $17,056,213) 18,090,948
Rights (0.0%)(e)China (0.0%):(e)Industrials (0.0%):(e)Xinjiang Goldwind Science & Technology Co. Ltd. Expires 04/24/19 @HKD $8.21 (a)(f) 2,888 1,137Total Rights (Cost $��) 1,137
Collateral for Securities Loaned^ (0.4%)United States (0.4%):BlackRock Liquidity Funds TempFund Portfolio, Institutional Class, 2.51% (g) 9,613 9,613Fidelity Investments Prime Money Market Portfolio, Class I, 2.50% (g) 386 386Fidelity Investments Money Market Government Portfolio, Class I, 2.35% (g) 17,334 17,334Goldman Sachs Financial Square Prime Obligations Fund, Institutional Class, 2.57% (g) 5,383 5,383JPMorgan Prime Money Market Fund, Capital Class, 2.52% (g) 14,418 14,418Morgan Stanley Institutional Liquidity Prime Portfolio, Institutional Class, 2.53% (g) 12,496 12,496Total Collateral for Securities Loaned (Cost $59,630) 59,630Total Investments (Cost $17,115,843) �� 99.9% 18,151,715Other assets in excess of liabilities �� 0.1% 22,769NET ASSETS - 100.00% $ 18,174,484
^ Purchased with cash collateral from securities on loan.(a) Non-income producing security.(b) All or a portion of this security is on loan.(c) Rule 144A security or other security that is restricted as to resale to institutional investors. The Fund�s Adviser has deemed this
security to be liquid based upon procedures approved by the Board of Trustees. As of March 31, 2019, the fair value of thesesecurities was $516,608 and amounted to 2.8% of net assets.
(d) Rounds to less than $1.(e) Amount represents less than 0.05% of net assets.(f) The Fund�s Adviser has deemed this security to be illiquid based upon procedures approved by the Board of Trustees. As of
March 31, 2019, illiquid securities were less than 0.05% of the Fund�s net assets.(g) Rate disclosed is the daily yield on March 31, 2019.
GDR�Global Depository ReceiptOAO�Russian Open Joint Stock CorporationsPCL�Public Company LimitedPLC�Public Limited Company
Copyright © 2021 www.secdatabase.com. All Rights Reserved.Please Consider the Environment Before Printing This Document
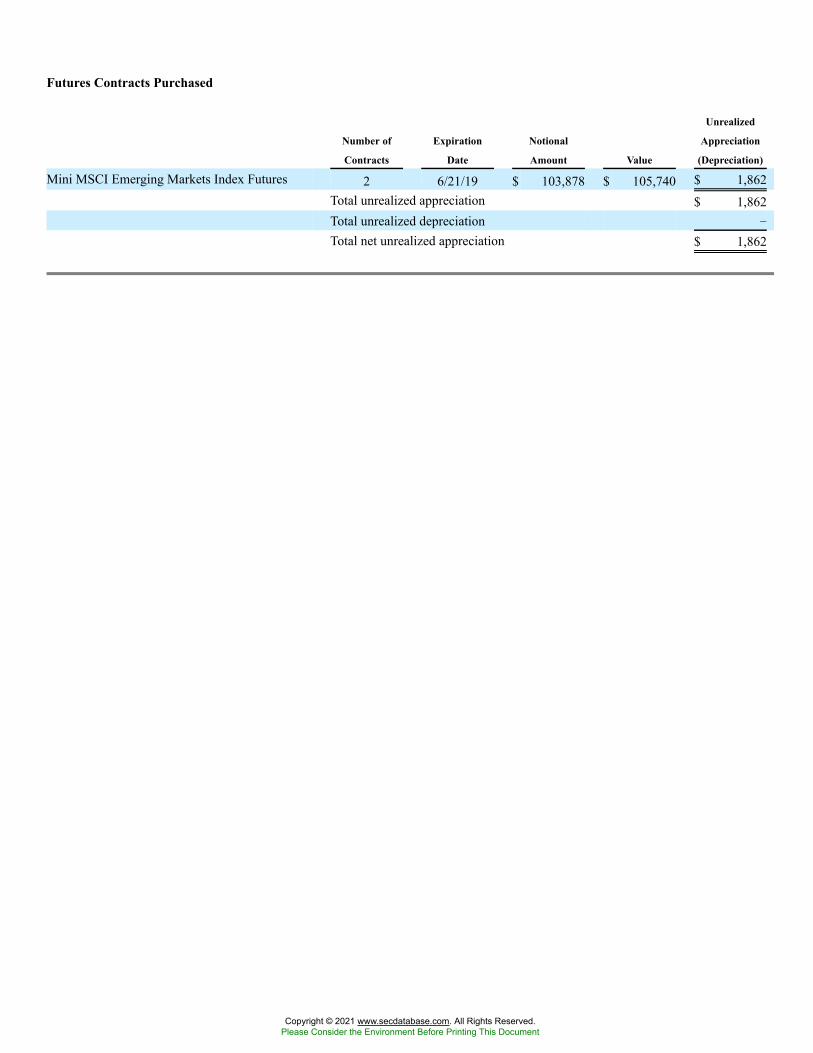
Futures Contracts Purchased
Number of
Contracts
Expiration
Date
Notional
Amount Value
Unrealized
Appreciation
(Depreciation)
Mini MSCI Emerging Markets Index Futures 2 6/21/19 $ 103,878 $ 105,740 $ 1,862Total unrealized appreciation $ 1,862Total unrealized depreciation �
Total net unrealized appreciation $ 1,862
Copyright © 2021 www.secdatabase.com. All Rights Reserved.Please Consider the Environment Before Printing This Document
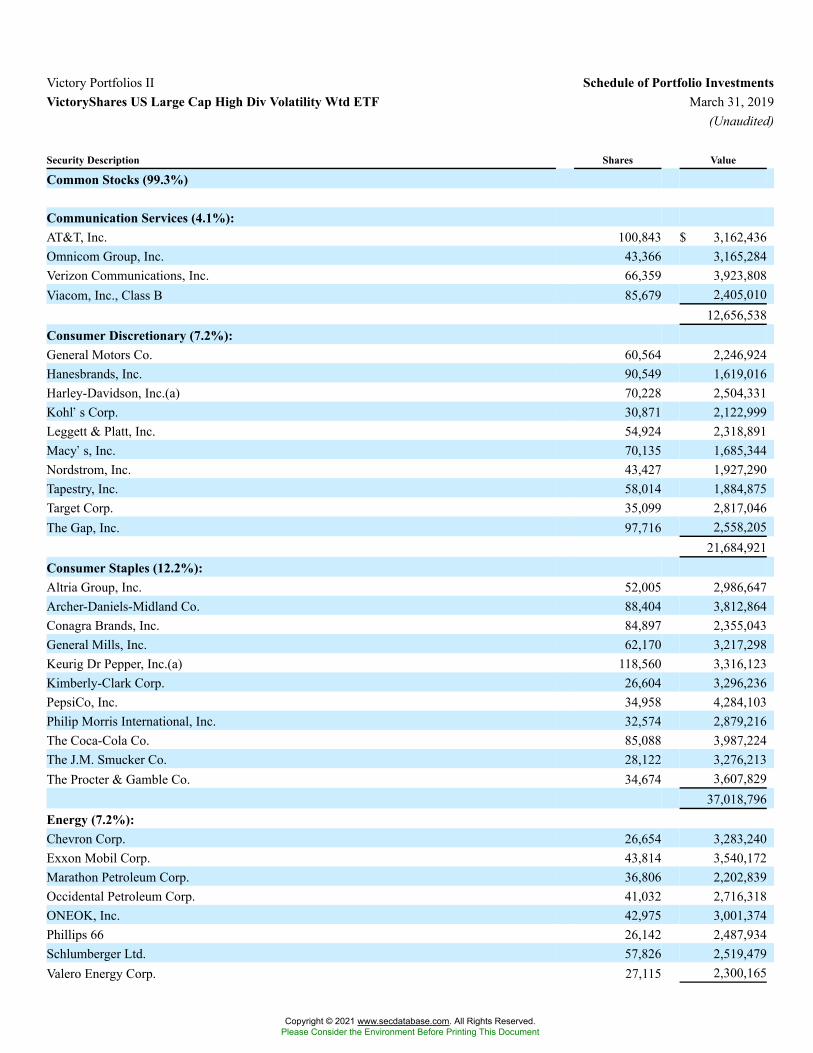
Victory Portfolios II Schedule of Portfolio InvestmentsVictoryShares US Large Cap High Div Volatility Wtd ETF March 31, 2019
(Unaudited)
Security Description Shares Value
Common Stocks (99.3%)
Communication Services (4.1%):AT&T, Inc. 100,843 $ 3,162,436Omnicom Group, Inc. 43,366 3,165,284Verizon Communications, Inc. 66,359 3,923,808Viacom, Inc., Class B 85,679 2,405,010
12,656,538Consumer Discretionary (7.2%):General Motors Co. 60,564 2,246,924Hanesbrands, Inc. 90,549 1,619,016Harley-Davidson, Inc.(a) 70,228 2,504,331Kohl�s Corp. 30,871 2,122,999Leggett & Platt, Inc. 54,924 2,318,891Macy�s, Inc. 70,135 1,685,344Nordstrom, Inc. 43,427 1,927,290Tapestry, Inc. 58,014 1,884,875Target Corp. 35,099 2,817,046The Gap, Inc. 97,716 2,558,205
21,684,921Consumer Staples (12.2%):Altria Group, Inc. 52,005 2,986,647Archer-Daniels-Midland Co. 88,404 3,812,864Conagra Brands, Inc. 84,897 2,355,043General Mills, Inc. 62,170 3,217,298Keurig Dr Pepper, Inc.(a) 118,560 3,316,123Kimberly-Clark Corp. 26,604 3,296,236PepsiCo, Inc. 34,958 4,284,103Philip Morris International, Inc. 32,574 2,879,216The Coca-Cola Co. 85,088 3,987,224The J.M. Smucker Co. 28,122 3,276,213The Procter & Gamble Co. 34,674 3,607,829
37,018,796Energy (7.2%):Chevron Corp. 26,654 3,283,240Exxon Mobil Corp. 43,814 3,540,172Marathon Petroleum Corp. 36,806 2,202,839Occidental Petroleum Corp. 41,032 2,716,318ONEOK, Inc. 42,975 3,001,374Phillips 66 26,142 2,487,934Schlumberger Ltd. 57,826 2,519,479Valero Energy Corp. 27,115 2,300,165
Copyright © 2021 www.secdatabase.com. All Rights Reserved.Please Consider the Environment Before Printing This Document
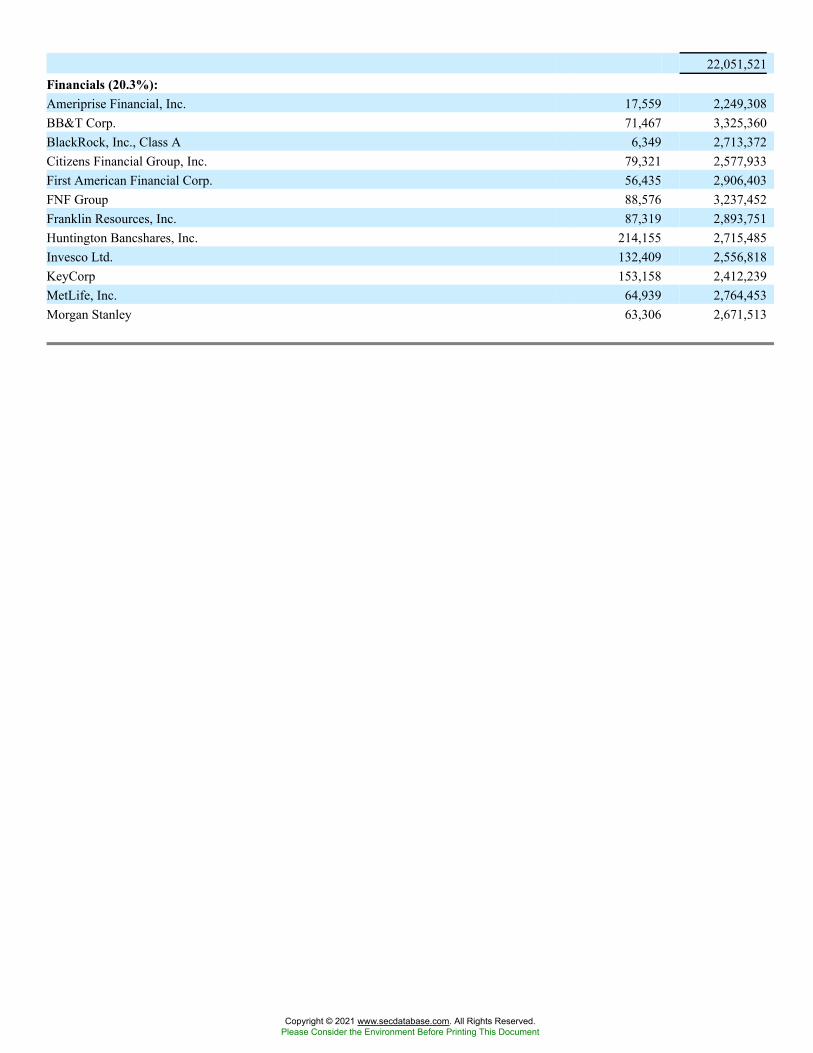
22,051,521Financials (20.3%):Ameriprise Financial, Inc. 17,559 2,249,308BB&T Corp. 71,467 3,325,360BlackRock, Inc., Class A 6,349 2,713,372Citizens Financial Group, Inc. 79,321 2,577,933First American Financial Corp. 56,435 2,906,403FNF Group 88,576 3,237,452Franklin Resources, Inc. 87,319 2,893,751Huntington Bancshares, Inc. 214,155 2,715,485Invesco Ltd. 132,409 2,556,818KeyCorp 153,158 2,412,239MetLife, Inc. 64,939 2,764,453Morgan Stanley 63,306 2,671,513
Copyright © 2021 www.secdatabase.com. All Rights Reserved.Please Consider the Environment Before Printing This Document
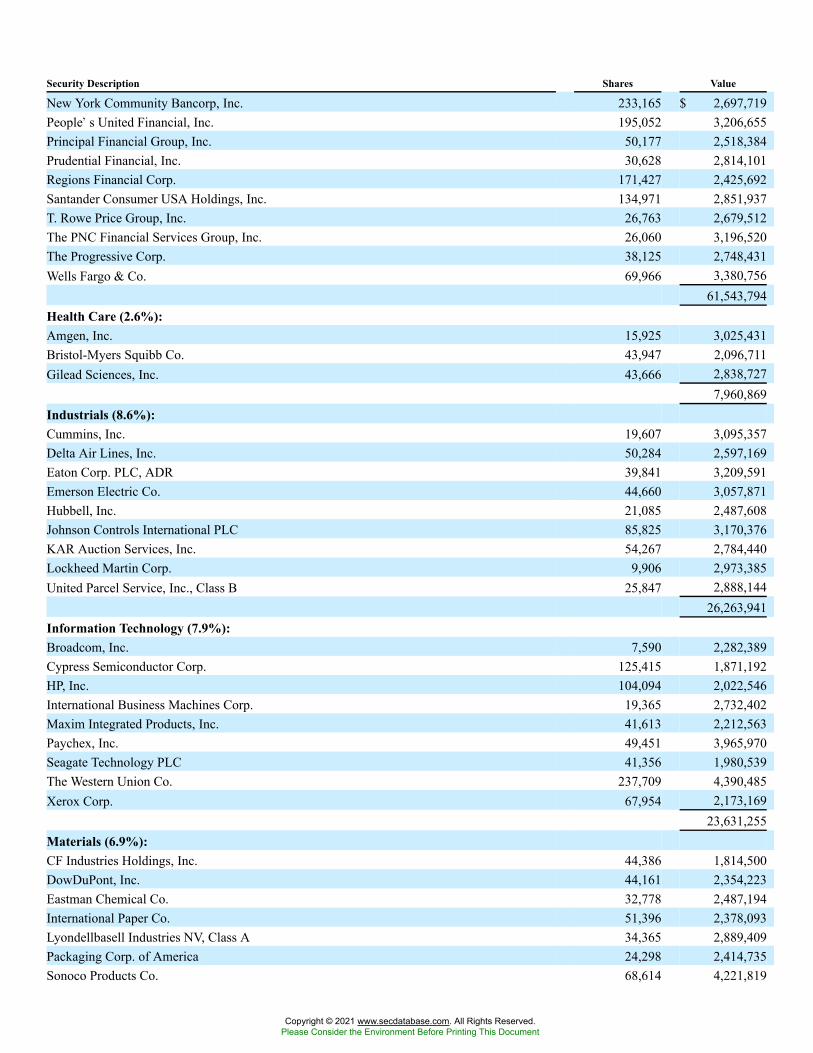
Security Description Shares Value
New York Community Bancorp, Inc. 233,165 $ 2,697,719People�s United Financial, Inc. 195,052 3,206,655Principal Financial Group, Inc. 50,177 2,518,384Prudential Financial, Inc. 30,628 2,814,101Regions Financial Corp. 171,427 2,425,692Santander Consumer USA Holdings, Inc. 134,971 2,851,937T. Rowe Price Group, Inc. 26,763 2,679,512The PNC Financial Services Group, Inc. 26,060 3,196,520The Progressive Corp. 38,125 2,748,431Wells Fargo & Co. 69,966 3,380,756
61,543,794Health Care (2.6%):Amgen, Inc. 15,925 3,025,431Bristol-Myers Squibb Co. 43,947 2,096,711Gilead Sciences, Inc. 43,666 2,838,727
7,960,869Industrials (8.6%):Cummins, Inc. 19,607 3,095,357Delta Air Lines, Inc. 50,284 2,597,169Eaton Corp. PLC, ADR 39,841 3,209,591Emerson Electric Co. 44,660 3,057,871Hubbell, Inc. 21,085 2,487,608Johnson Controls International PLC 85,825 3,170,376KAR Auction Services, Inc. 54,267 2,784,440Lockheed Martin Corp. 9,906 2,973,385United Parcel Service, Inc., Class B 25,847 2,888,144
26,263,941Information Technology (7.9%):Broadcom, Inc. 7,590 2,282,389Cypress Semiconductor Corp. 125,415 1,871,192HP, Inc. 104,094 2,022,546International Business Machines Corp. 19,365 2,732,402Maxim Integrated Products, Inc. 41,613 2,212,563Paychex, Inc. 49,451 3,965,970Seagate Technology PLC 41,356 1,980,539The Western Union Co. 237,709 4,390,485Xerox Corp. 67,954 2,173,169
23,631,255Materials (6.9%):CF Industries Holdings, Inc. 44,386 1,814,500DowDuPont, Inc. 44,161 2,354,223Eastman Chemical Co. 32,778 2,487,194International Paper Co. 51,396 2,378,093Lyondellbasell Industries NV, Class A 34,365 2,889,409Packaging Corp. of America 24,298 2,414,735Sonoco Products Co. 68,614 4,221,819
Copyright © 2021 www.secdatabase.com. All Rights Reserved.Please Consider the Environment Before Printing This Document
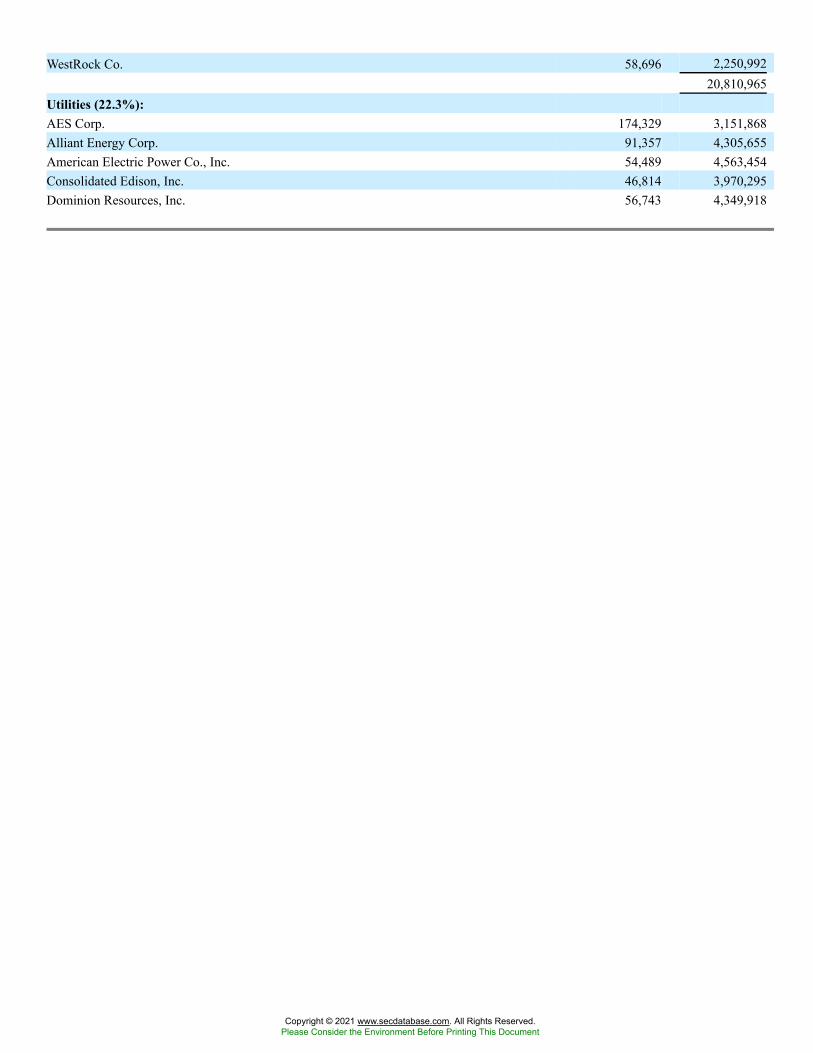
WestRock Co. 58,696 2,250,99220,810,965
Utilities (22.3%):AES Corp. 174,329 3,151,868Alliant Energy Corp. 91,357 4,305,655American Electric Power Co., Inc. 54,489 4,563,454Consolidated Edison, Inc. 46,814 3,970,295Dominion Resources, Inc. 56,743 4,349,918
Copyright © 2021 www.secdatabase.com. All Rights Reserved.Please Consider the Environment Before Printing This Document
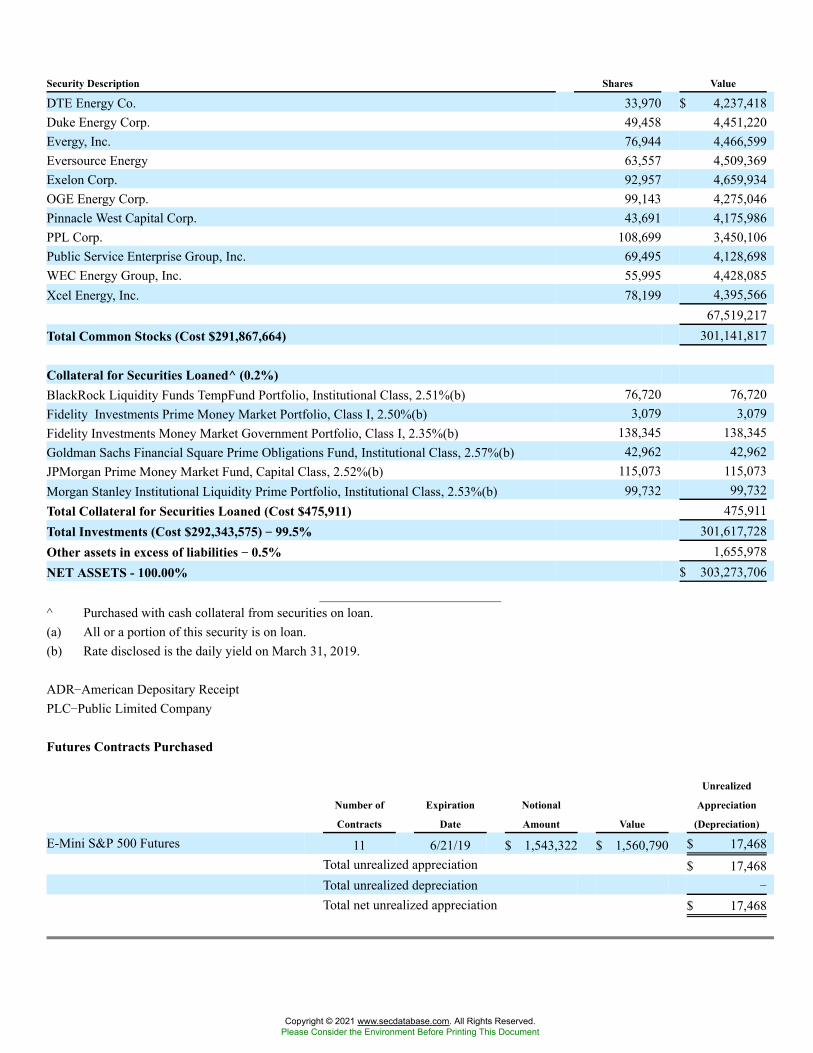
Security Description Shares Value
DTE Energy Co. 33,970 $ 4,237,418Duke Energy Corp. 49,458 4,451,220Evergy, Inc. 76,944 4,466,599Eversource Energy 63,557 4,509,369Exelon Corp. 92,957 4,659,934OGE Energy Corp. 99,143 4,275,046Pinnacle West Capital Corp. 43,691 4,175,986PPL Corp. 108,699 3,450,106Public Service Enterprise Group, Inc. 69,495 4,128,698WEC Energy Group, Inc. 55,995 4,428,085Xcel Energy, Inc. 78,199 4,395,566
67,519,217Total Common Stocks (Cost $291,867,664) 301,141,817
Collateral for Securities Loaned^ (0.2%)BlackRock Liquidity Funds TempFund Portfolio, Institutional Class, 2.51%(b) 76,720 76,720Fidelity Investments Prime Money Market Portfolio, Class I, 2.50%(b) 3,079 3,079Fidelity Investments Money Market Government Portfolio, Class I, 2.35%(b) 138,345 138,345Goldman Sachs Financial Square Prime Obligations Fund, Institutional Class, 2.57%(b) 42,962 42,962JPMorgan Prime Money Market Fund, Capital Class, 2.52%(b) 115,073 115,073Morgan Stanley Institutional Liquidity Prime Portfolio, Institutional Class, 2.53%(b) 99,732 99,732Total Collateral for Securities Loaned (Cost $475,911) 475,911Total Investments (Cost $292,343,575) �� 99.5% 301,617,728Other assets in excess of liabilities �� 0.5% 1,655,978NET ASSETS - 100.00% $ 303,273,706
^ Purchased with cash collateral from securities on loan.(a) All or a portion of this security is on loan.(b) Rate disclosed is the daily yield on March 31, 2019.
ADR�American Depositary ReceiptPLC�Public Limited Company
Futures Contracts Purchased
Number of
Contracts
Expiration
Date
Notional
Amount Value
Unrealized
Appreciation
(Depreciation)
E-Mini S&P 500 Futures 11 6/21/19 $ 1,543,322 $ 1,560,790 $ 17,468Total unrealized appreciation $ 17,468Total unrealized depreciation �
Total net unrealized appreciation $ 17,468
Copyright © 2021 www.secdatabase.com. All Rights Reserved.Please Consider the Environment Before Printing This Document
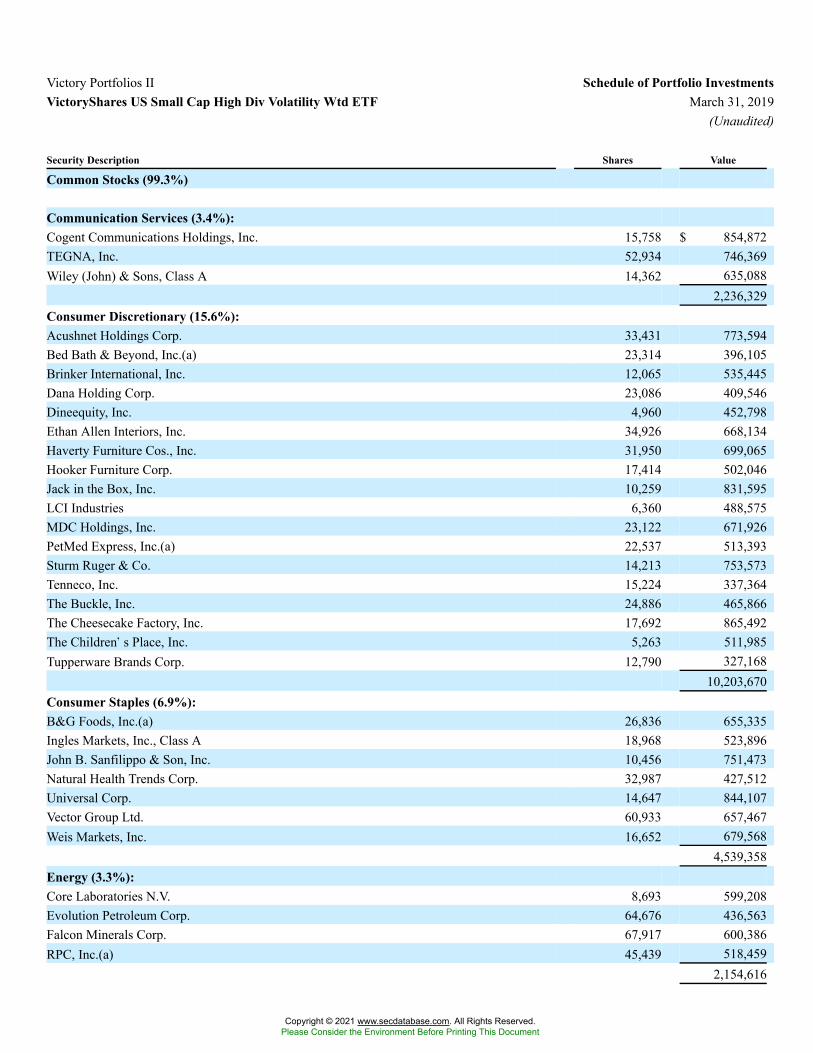
Victory Portfolios II Schedule of Portfolio InvestmentsVictoryShares US Small Cap High Div Volatility Wtd ETF March 31, 2019
(Unaudited)
Security Description Shares Value
Common Stocks (99.3%)
Communication Services (3.4%):Cogent Communications Holdings, Inc. 15,758 $ 854,872TEGNA, Inc. 52,934 746,369Wiley (John) & Sons, Class A 14,362 635,088
2,236,329Consumer Discretionary (15.6%):Acushnet Holdings Corp. 33,431 773,594Bed Bath & Beyond, Inc.(a) 23,314 396,105Brinker International, Inc. 12,065 535,445Dana Holding Corp. 23,086 409,546Dineequity, Inc. 4,960 452,798Ethan Allen Interiors, Inc. 34,926 668,134Haverty Furniture Cos., Inc. 31,950 699,065Hooker Furniture Corp. 17,414 502,046Jack in the Box, Inc. 10,259 831,595LCI Industries 6,360 488,575MDC Holdings, Inc. 23,122 671,926PetMed Express, Inc.(a) 22,537 513,393Sturm Ruger & Co. 14,213 753,573Tenneco, Inc. 15,224 337,364The Buckle, Inc. 24,886 465,866The Cheesecake Factory, Inc. 17,692 865,492The Children�s Place, Inc. 5,263 511,985Tupperware Brands Corp. 12,790 327,168
10,203,670Consumer Staples (6.9%):B&G Foods, Inc.(a) 26,836 655,335Ingles Markets, Inc., Class A 18,968 523,896John B. Sanfilippo & Son, Inc. 10,456 751,473Natural Health Trends Corp. 32,987 427,512Universal Corp. 14,647 844,107Vector Group Ltd. 60,933 657,467Weis Markets, Inc. 16,652 679,568
4,539,358Energy (3.3%):Core Laboratories N.V. 8,693 599,208Evolution Petroleum Corp. 64,676 436,563Falcon Minerals Corp. 67,917 600,386RPC, Inc.(a) 45,439 518,459
2,154,616
Copyright © 2021 www.secdatabase.com. All Rights Reserved.Please Consider the Environment Before Printing This Document
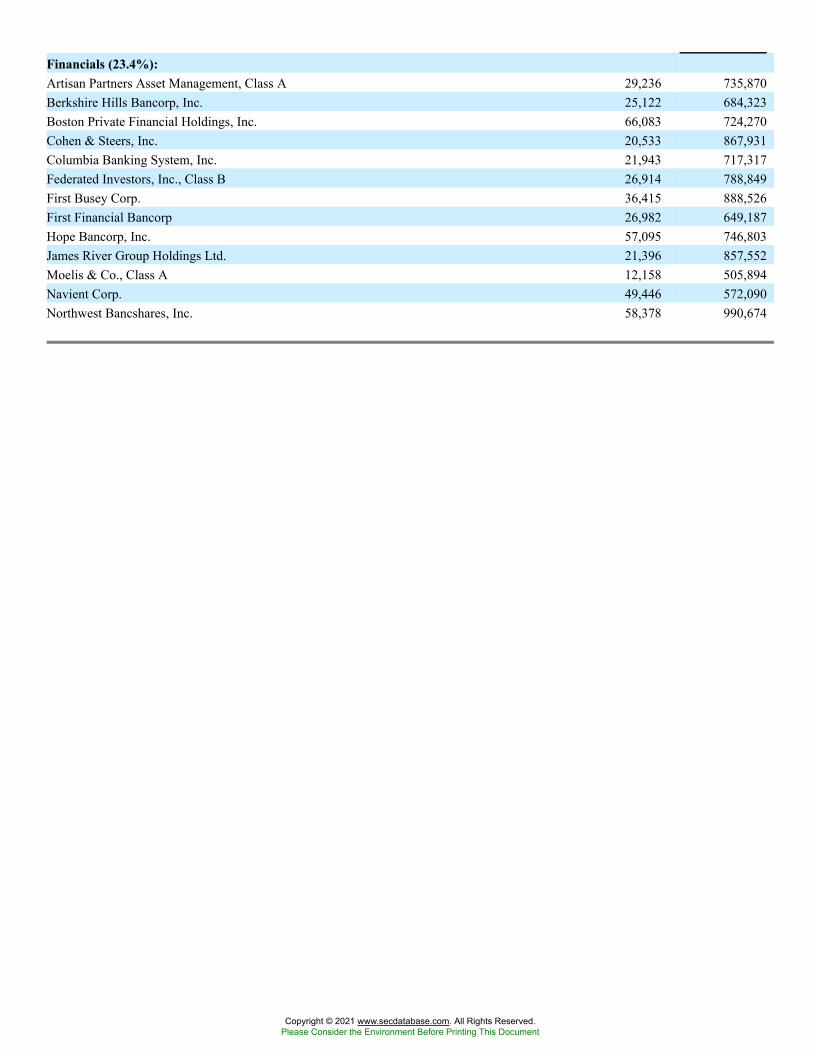
Financials (23.4%):Artisan Partners Asset Management, Class A 29,236 735,870Berkshire Hills Bancorp, Inc. 25,122 684,323Boston Private Financial Holdings, Inc. 66,083 724,270Cohen & Steers, Inc. 20,533 867,931Columbia Banking System, Inc. 21,943 717,317Federated Investors, Inc., Class B 26,914 788,849First Busey Corp. 36,415 888,526First Financial Bancorp 26,982 649,187Hope Bancorp, Inc. 57,095 746,803James River Group Holdings Ltd. 21,396 857,552Moelis & Co., Class A 12,158 505,894Navient Corp. 49,446 572,090Northwest Bancshares, Inc. 58,378 990,674
Copyright © 2021 www.secdatabase.com. All Rights Reserved.Please Consider the Environment Before Printing This Document
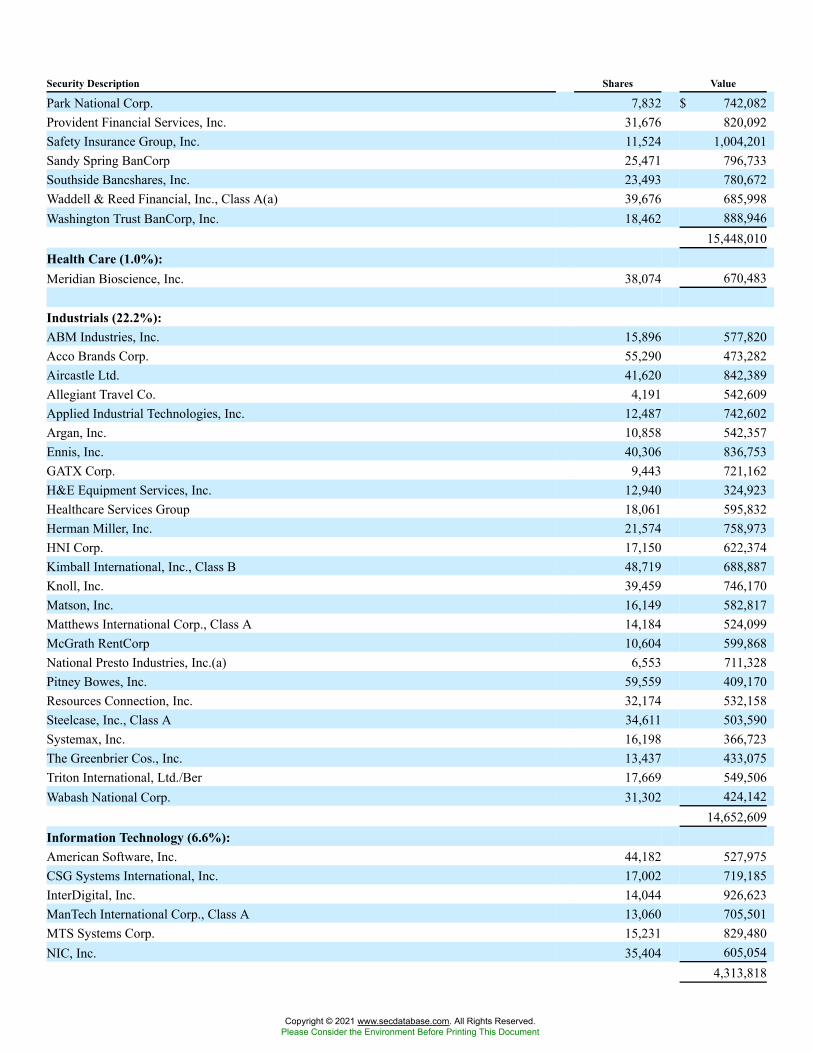
Security Description Shares Value
Park National Corp. 7,832 $ 742,082Provident Financial Services, Inc. 31,676 820,092Safety Insurance Group, Inc. 11,524 1,004,201Sandy Spring BanCorp 25,471 796,733Southside Bancshares, Inc. 23,493 780,672Waddell & Reed Financial, Inc., Class A(a) 39,676 685,998Washington Trust BanCorp, Inc. 18,462 888,946
15,448,010Health Care (1.0%):Meridian Bioscience, Inc. 38,074 670,483
Industrials (22.2%):ABM Industries, Inc. 15,896 577,820Acco Brands Corp. 55,290 473,282Aircastle Ltd. 41,620 842,389Allegiant Travel Co. 4,191 542,609Applied Industrial Technologies, Inc. 12,487 742,602Argan, Inc. 10,858 542,357Ennis, Inc. 40,306 836,753GATX Corp. 9,443 721,162H&E Equipment Services, Inc. 12,940 324,923Healthcare Services Group 18,061 595,832Herman Miller, Inc. 21,574 758,973HNI Corp. 17,150 622,374Kimball International, Inc., Class B 48,719 688,887Knoll, Inc. 39,459 746,170Matson, Inc. 16,149 582,817Matthews International Corp., Class A 14,184 524,099McGrath RentCorp 10,604 599,868National Presto Industries, Inc.(a) 6,553 711,328Pitney Bowes, Inc. 59,559 409,170Resources Connection, Inc. 32,174 532,158Steelcase, Inc., Class A 34,611 503,590Systemax, Inc. 16,198 366,723The Greenbrier Cos., Inc. 13,437 433,075Triton International, Ltd./Ber 17,669 549,506Wabash National Corp. 31,302 424,142
14,652,609Information Technology (6.6%):American Software, Inc. 44,182 527,975CSG Systems International, Inc. 17,002 719,185InterDigital, Inc. 14,044 926,623ManTech International Corp., Class A 13,060 705,501MTS Systems Corp. 15,231 829,480NIC, Inc. 35,404 605,054
4,313,818
Copyright © 2021 www.secdatabase.com. All Rights Reserved.Please Consider the Environment Before Printing This Document
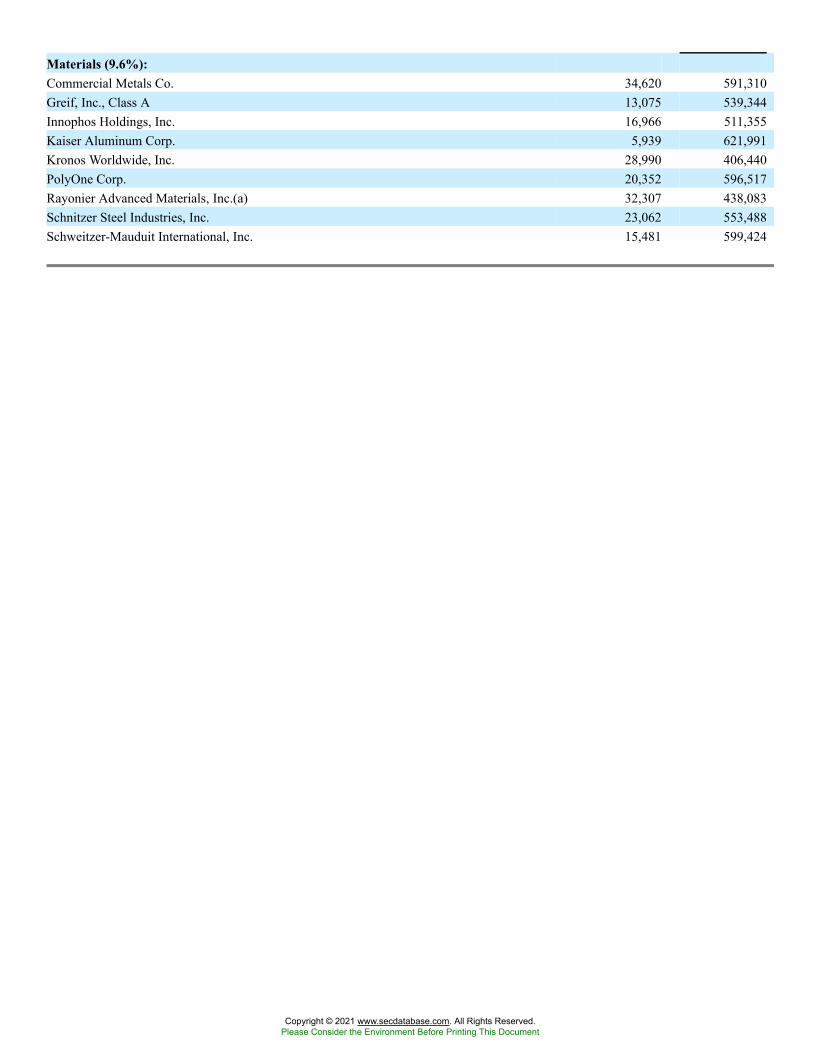
Materials (9.6%):Commercial Metals Co. 34,620 591,310Greif, Inc., Class A 13,075 539,344Innophos Holdings, Inc. 16,966 511,355Kaiser Aluminum Corp. 5,939 621,991Kronos Worldwide, Inc. 28,990 406,440PolyOne Corp. 20,352 596,517Rayonier Advanced Materials, Inc.(a) 32,307 438,083Schnitzer Steel Industries, Inc. 23,062 553,488Schweitzer-Mauduit International, Inc. 15,481 599,424
Copyright © 2021 www.secdatabase.com. All Rights Reserved.Please Consider the Environment Before Printing This Document
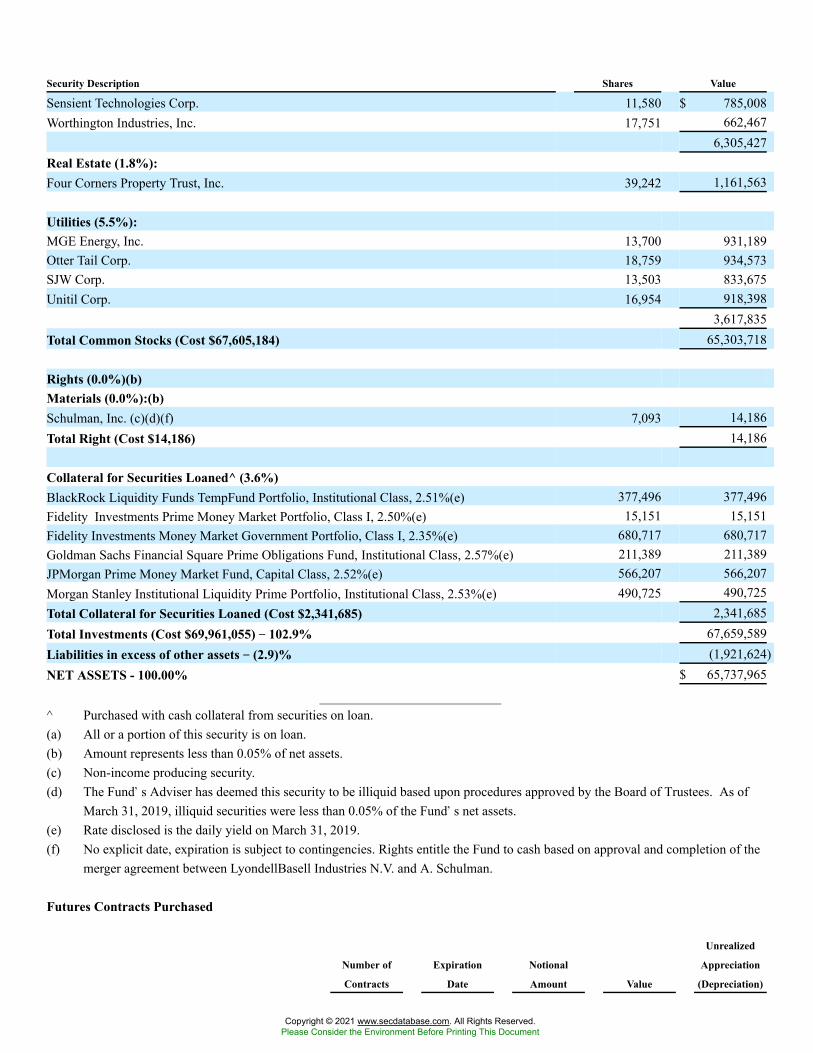
Security Description Shares Value
Sensient Technologies Corp. 11,580 $ 785,008Worthington Industries, Inc. 17,751 662,467
6,305,427Real Estate (1.8%):Four Corners Property Trust, Inc. 39,242 1,161,563
Utilities (5.5%):MGE Energy, Inc. 13,700 931,189Otter Tail Corp. 18,759 934,573SJW Corp. 13,503 833,675Unitil Corp. 16,954 918,398
3,617,835Total Common Stocks (Cost $67,605,184) 65,303,718
Rights (0.0%)(b)Materials (0.0%):(b)Schulman, Inc. (c)(d)(f) 7,093 14,186Total Right (Cost $14,186) 14,186
Collateral for Securities Loaned^ (3.6%)BlackRock Liquidity Funds TempFund Portfolio, Institutional Class, 2.51%(e) 377,496 377,496Fidelity Investments Prime Money Market Portfolio, Class I, 2.50%(e) 15,151 15,151Fidelity Investments Money Market Government Portfolio, Class I, 2.35%(e) 680,717 680,717Goldman Sachs Financial Square Prime Obligations Fund, Institutional Class, 2.57%(e) 211,389 211,389JPMorgan Prime Money Market Fund, Capital Class, 2.52%(e) 566,207 566,207Morgan Stanley Institutional Liquidity Prime Portfolio, Institutional Class, 2.53%(e) 490,725 490,725Total Collateral for Securities Loaned (Cost $2,341,685) 2,341,685Total Investments (Cost $69,961,055) �� 102.9% 67,659,589Liabilities in excess of other assets �� (2.9)% (1,921,624)NET ASSETS - 100.00% $ 65,737,965
^ Purchased with cash collateral from securities on loan.(a) All or a portion of this security is on loan.(b) Amount represents less than 0.05% of net assets.(c) Non-income producing security.(d) The Fund�s Adviser has deemed this security to be illiquid based upon procedures approved by the Board of Trustees. As of
March 31, 2019, illiquid securities were less than 0.05% of the Fund�s net assets.(e) Rate disclosed is the daily yield on March 31, 2019.(f) No explicit date, expiration is subject to contingencies. Rights entitle the Fund to cash based on approval and completion of the
merger agreement between LyondellBasell Industries N.V. and A. Schulman.
Futures Contracts Purchased
Number of
Contracts
Expiration
Date
Notional
Amount Value
Unrealized
Appreciation
(Depreciation)
Copyright © 2021 www.secdatabase.com. All Rights Reserved.Please Consider the Environment Before Printing This Document
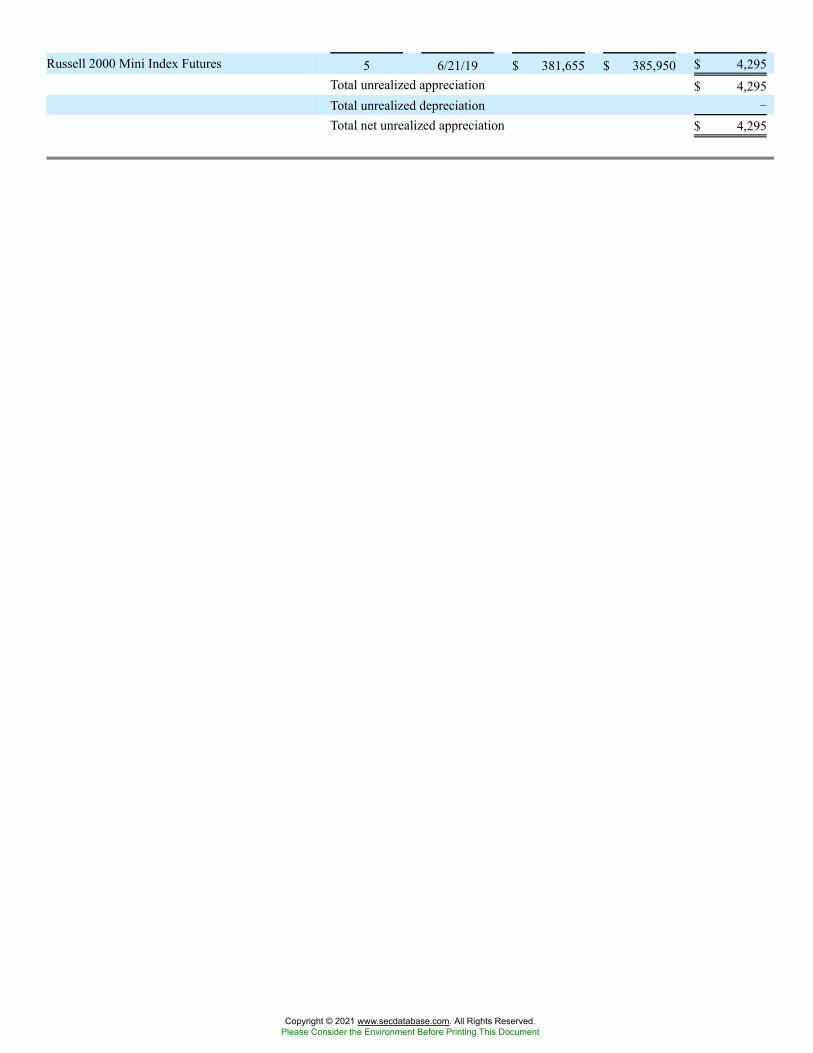
Russell 2000 Mini Index Futures 5 6/21/19 $ 381,655 $ 385,950 $ 4,295Total unrealized appreciation $ 4,295Total unrealized depreciation �
Total net unrealized appreciation $ 4,295
Copyright © 2021 www.secdatabase.com. All Rights Reserved.Please Consider the Environment Before Printing This Document
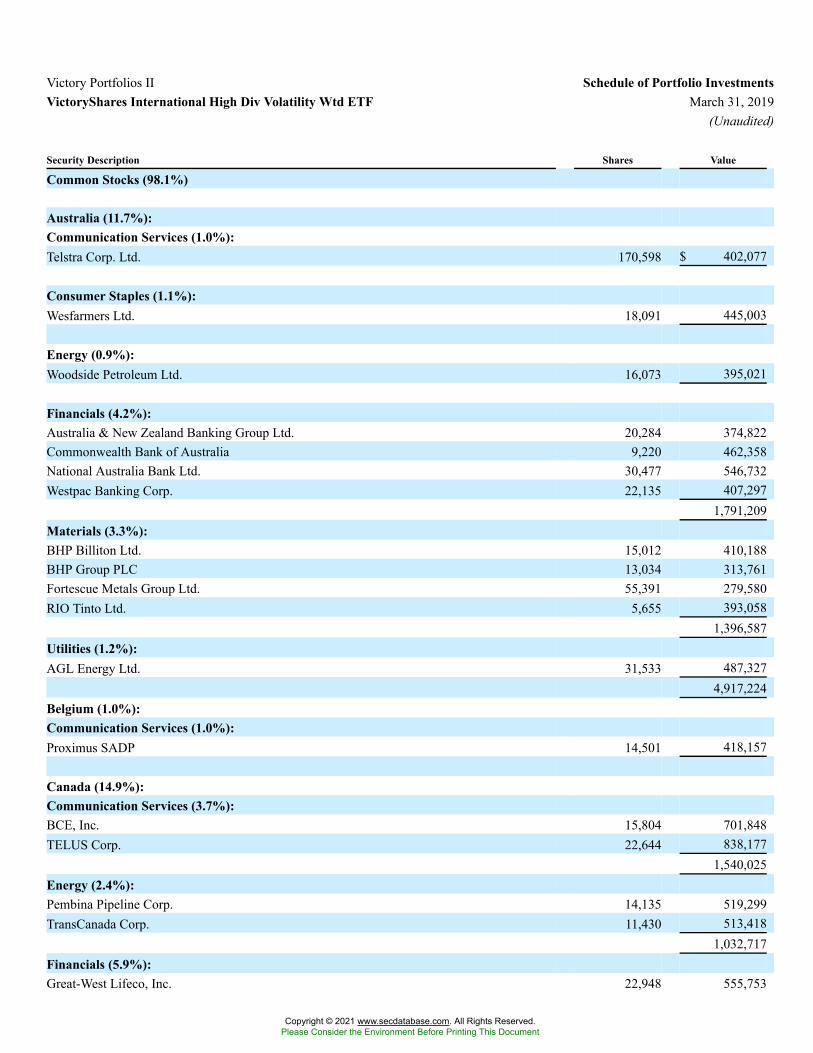
Victory Portfolios II Schedule of Portfolio InvestmentsVictoryShares International High Div Volatility Wtd ETF March 31, 2019
(Unaudited)
Security Description Shares Value
Common Stocks (98.1%)
Australia (11.7%):Communication Services (1.0%):Telstra Corp. Ltd. 170,598 $ 402,077
Consumer Staples (1.1%):Wesfarmers Ltd. 18,091 445,003
Energy (0.9%):Woodside Petroleum Ltd. 16,073 395,021
Financials (4.2%):Australia & New Zealand Banking Group Ltd. 20,284 374,822Commonwealth Bank of Australia 9,220 462,358National Australia Bank Ltd. 30,477 546,732Westpac Banking Corp. 22,135 407,297
1,791,209Materials (3.3%):BHP Billiton Ltd. 15,012 410,188BHP Group PLC 13,034 313,761Fortescue Metals Group Ltd. 55,391 279,580RIO Tinto Ltd. 5,655 393,058
1,396,587Utilities (1.2%):AGL Energy Ltd. 31,533 487,327
4,917,224Belgium (1.0%):Communication Services (1.0%):Proximus SADP 14,501 418,157
Canada (14.9%):Communication Services (3.7%):BCE, Inc. 15,804 701,848TELUS Corp. 22,644 838,177
1,540,025Energy (2.4%):Pembina Pipeline Corp. 14,135 519,299TransCanada Corp. 11,430 513,418
1,032,717Financials (5.9%):Great-West Lifeco, Inc. 22,948 555,753
Copyright © 2021 www.secdatabase.com. All Rights Reserved.Please Consider the Environment Before Printing This Document
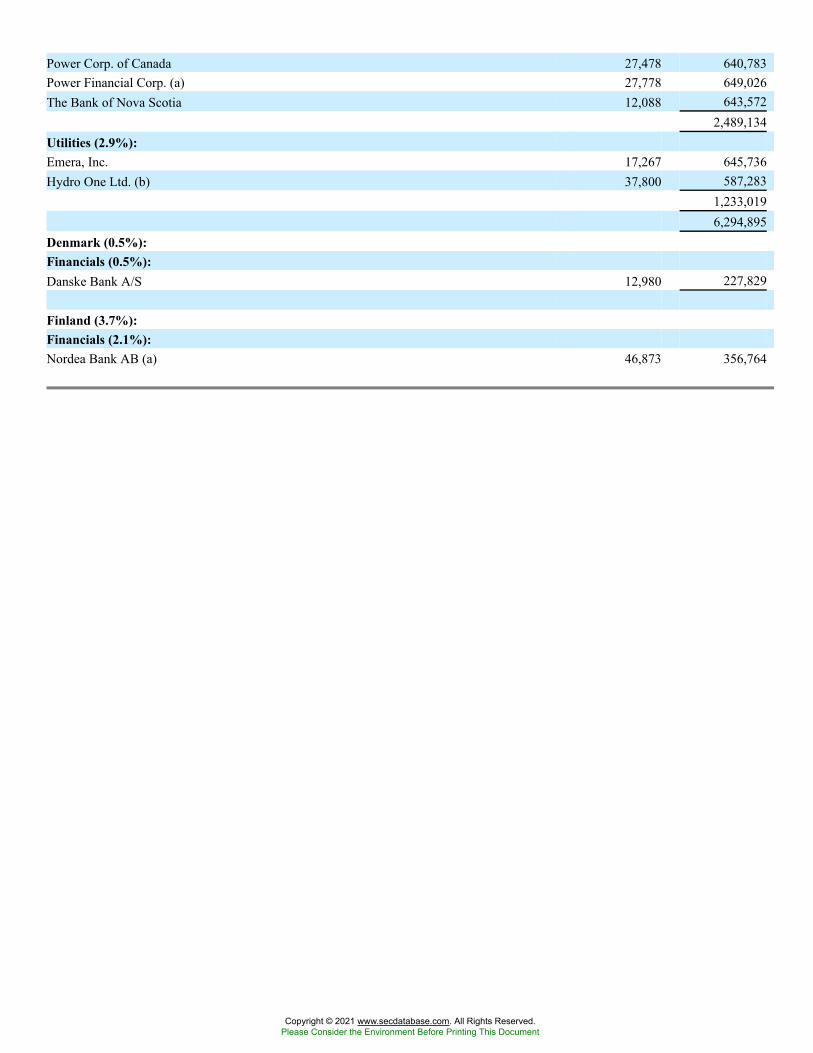
Power Corp. of Canada 27,478 640,783Power Financial Corp. (a) 27,778 649,026The Bank of Nova Scotia 12,088 643,572
2,489,134Utilities (2.9%):Emera, Inc. 17,267 645,736Hydro One Ltd. (b) 37,800 587,283
1,233,0196,294,895
Denmark (0.5%):Financials (0.5%):Danske Bank A/S 12,980 227,829
Finland (3.7%):Financials (2.1%):Nordea Bank AB (a) 46,873 356,764
Copyright © 2021 www.secdatabase.com. All Rights Reserved.Please Consider the Environment Before Printing This Document
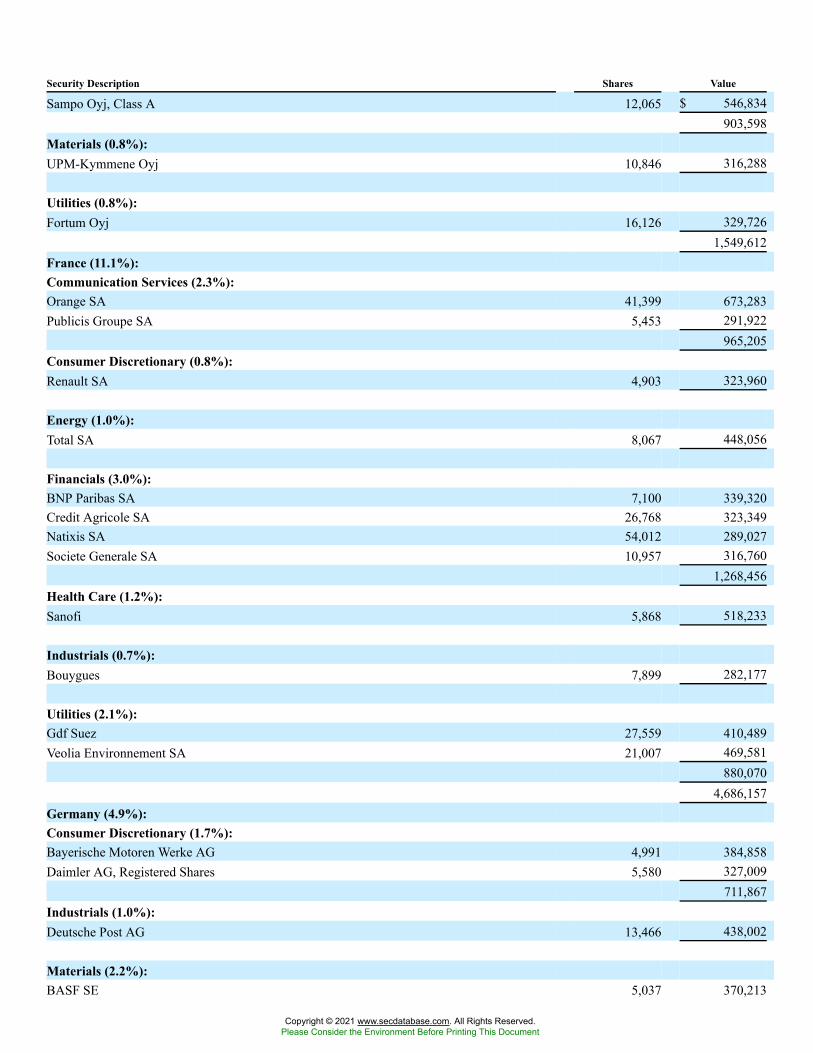
Security Description Shares Value
Sampo Oyj, Class A 12,065 $ 546,834903,598
Materials (0.8%):UPM-Kymmene Oyj 10,846 316,288
Utilities (0.8%):Fortum Oyj 16,126 329,726
1,549,612France (11.1%):Communication Services (2.3%):Orange SA 41,399 673,283Publicis Groupe SA 5,453 291,922
965,205Consumer Discretionary (0.8%):Renault SA 4,903 323,960
Energy (1.0%):Total SA 8,067 448,056
Financials (3.0%):BNP Paribas SA 7,100 339,320Credit Agricole SA 26,768 323,349Natixis SA 54,012 289,027Societe Generale SA 10,957 316,760
1,268,456Health Care (1.2%):Sanofi 5,868 518,233
Industrials (0.7%):Bouygues 7,899 282,177
Utilities (2.1%):Gdf Suez 27,559 410,489Veolia Environnement SA 21,007 469,581
880,0704,686,157
Germany (4.9%):Consumer Discretionary (1.7%):Bayerische Motoren Werke AG 4,991 384,858Daimler AG, Registered Shares 5,580 327,009
711,867Industrials (1.0%):Deutsche Post AG 13,466 438,002
Materials (2.2%):BASF SE 5,037 370,213
Copyright © 2021 www.secdatabase.com. All Rights Reserved.Please Consider the Environment Before Printing This Document
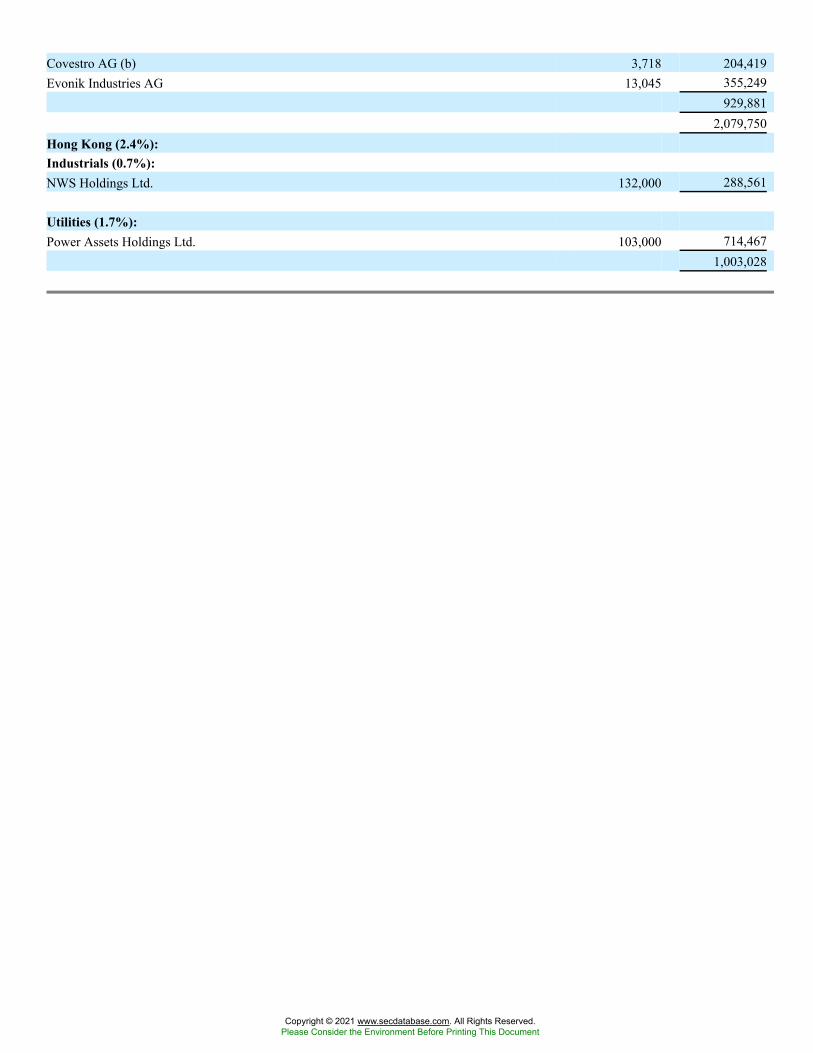
Covestro AG (b) 3,718 204,419Evonik Industries AG 13,045 355,249
929,8812,079,750
Hong Kong (2.4%):Industrials (0.7%):NWS Holdings Ltd. 132,000 288,561
Utilities (1.7%):Power Assets Holdings Ltd. 103,000 714,467
1,003,028
Copyright © 2021 www.secdatabase.com. All Rights Reserved.Please Consider the Environment Before Printing This Document
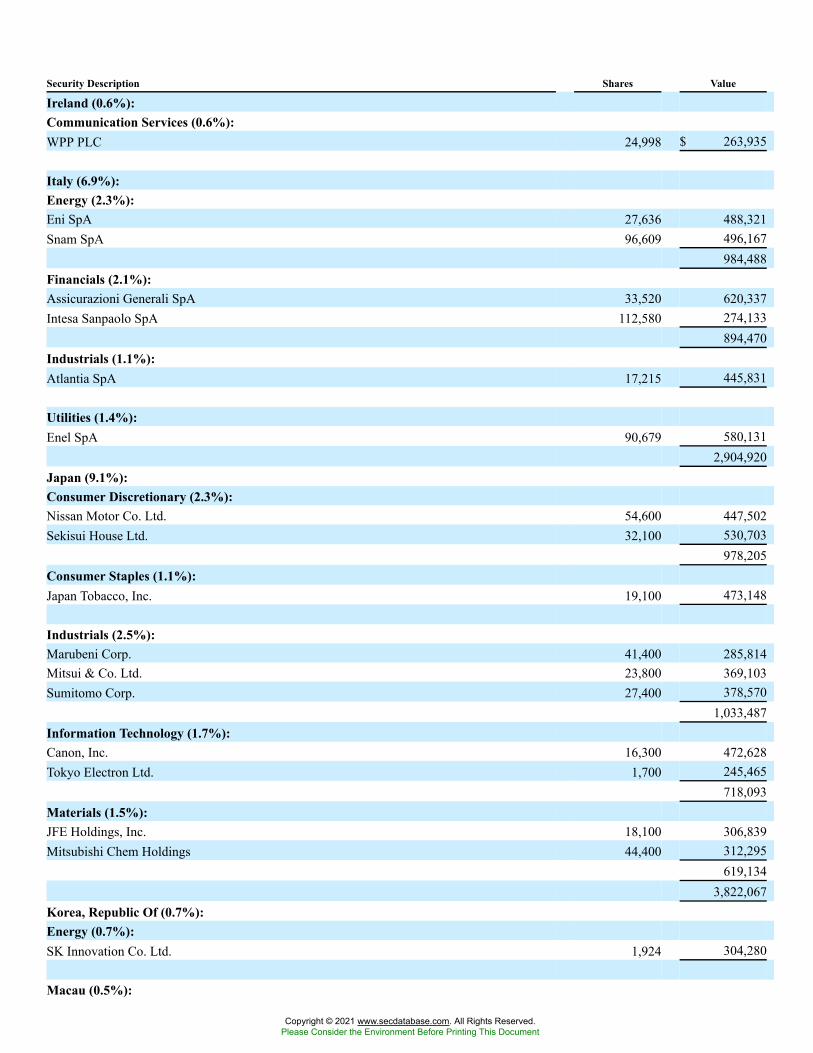
Security Description Shares Value
Ireland (0.6%):Communication Services (0.6%):WPP PLC 24,998 $ 263,935
Italy (6.9%):Energy (2.3%):Eni SpA 27,636 488,321Snam SpA 96,609 496,167
984,488Financials (2.1%):Assicurazioni Generali SpA 33,520 620,337Intesa Sanpaolo SpA 112,580 274,133
894,470Industrials (1.1%):Atlantia SpA 17,215 445,831
Utilities (1.4%):Enel SpA 90,679 580,131
2,904,920Japan (9.1%):Consumer Discretionary (2.3%):Nissan Motor Co. Ltd. 54,600 447,502Sekisui House Ltd. 32,100 530,703
978,205Consumer Staples (1.1%):Japan Tobacco, Inc. 19,100 473,148
Industrials (2.5%):Marubeni Corp. 41,400 285,814Mitsui & Co. Ltd. 23,800 369,103Sumitomo Corp. 27,400 378,570
1,033,487Information Technology (1.7%):Canon, Inc. 16,300 472,628Tokyo Electron Ltd. 1,700 245,465
718,093Materials (1.5%):JFE Holdings, Inc. 18,100 306,839Mitsubishi Chem Holdings 44,400 312,295
619,1343,822,067
Korea, Republic Of (0.7%):Energy (0.7%):SK Innovation Co. Ltd. 1,924 304,280
Macau (0.5%):
Copyright © 2021 www.secdatabase.com. All Rights Reserved.Please Consider the Environment Before Printing This Document
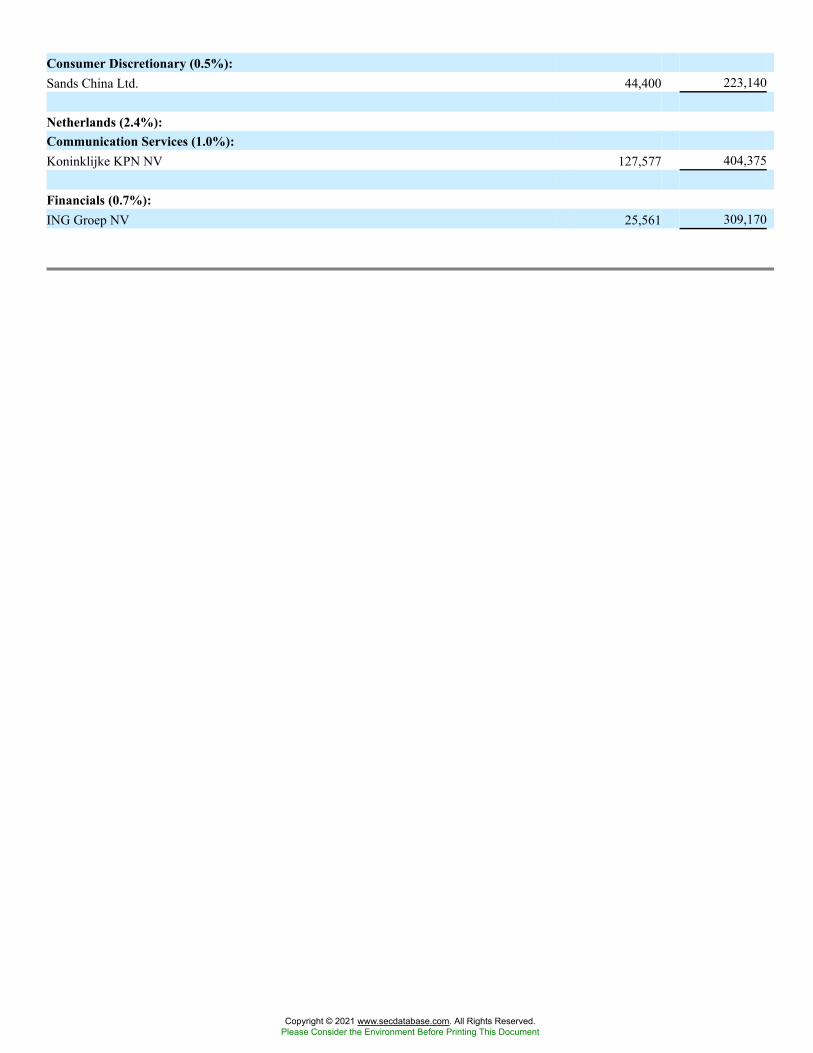
Consumer Discretionary (0.5%):Sands China Ltd. 44,400 223,140
Netherlands (2.4%):Communication Services (1.0%):Koninklijke KPN NV 127,577 404,375
Financials (0.7%):ING Groep NV 25,561 309,170
Copyright © 2021 www.secdatabase.com. All Rights Reserved.Please Consider the Environment Before Printing This Document
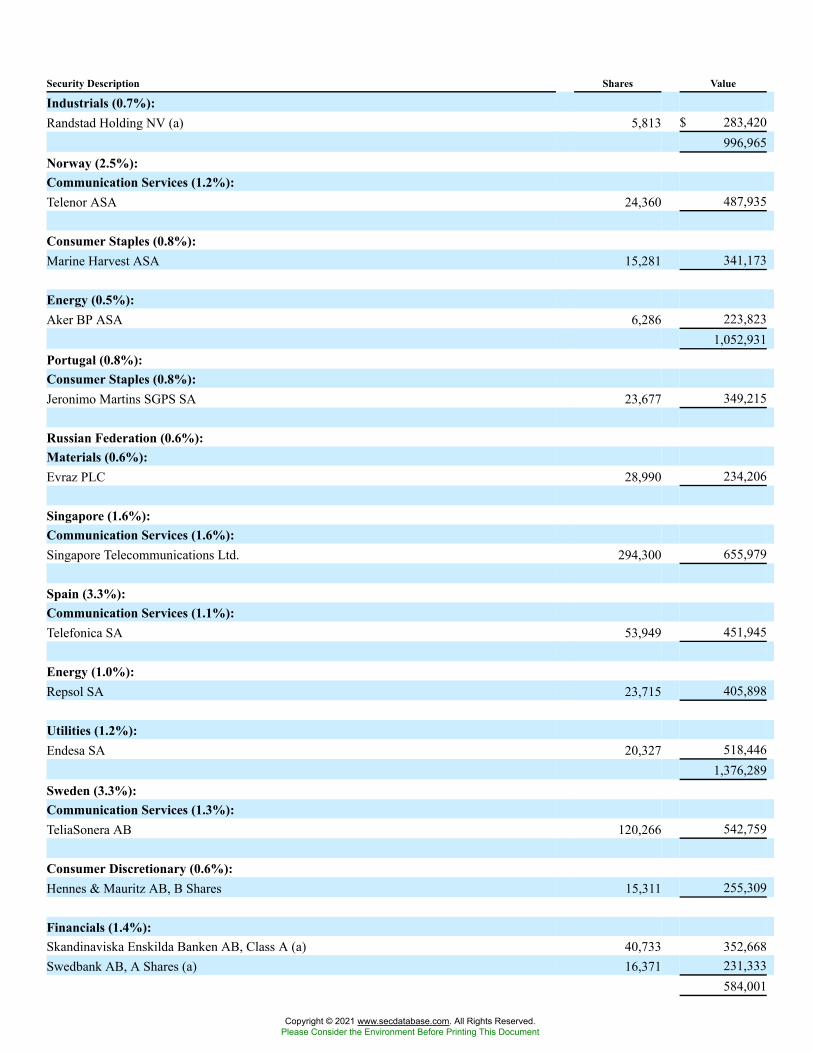
Security Description Shares Value
Industrials (0.7%):Randstad Holding NV (a) 5,813 $ 283,420
996,965Norway (2.5%):Communication Services (1.2%):Telenor ASA 24,360 487,935
Consumer Staples (0.8%):Marine Harvest ASA 15,281 341,173
Energy (0.5%):Aker BP ASA 6,286 223,823
1,052,931Portugal (0.8%):Consumer Staples (0.8%):Jeronimo Martins SGPS SA 23,677 349,215
Russian Federation (0.6%):Materials (0.6%):Evraz PLC 28,990 234,206
Singapore (1.6%):Communication Services (1.6%):Singapore Telecommunications Ltd. 294,300 655,979
Spain (3.3%):Communication Services (1.1%):Telefonica SA 53,949 451,945
Energy (1.0%):Repsol SA 23,715 405,898
Utilities (1.2%):Endesa SA 20,327 518,446
1,376,289Sweden (3.3%):Communication Services (1.3%):TeliaSonera AB 120,266 542,759
Consumer Discretionary (0.6%):Hennes & Mauritz AB, B Shares 15,311 255,309
Financials (1.4%):Skandinaviska Enskilda Banken AB, Class A (a) 40,733 352,668Swedbank AB, A Shares (a) 16,371 231,333
584,001
Copyright © 2021 www.secdatabase.com. All Rights Reserved.Please Consider the Environment Before Printing This Document
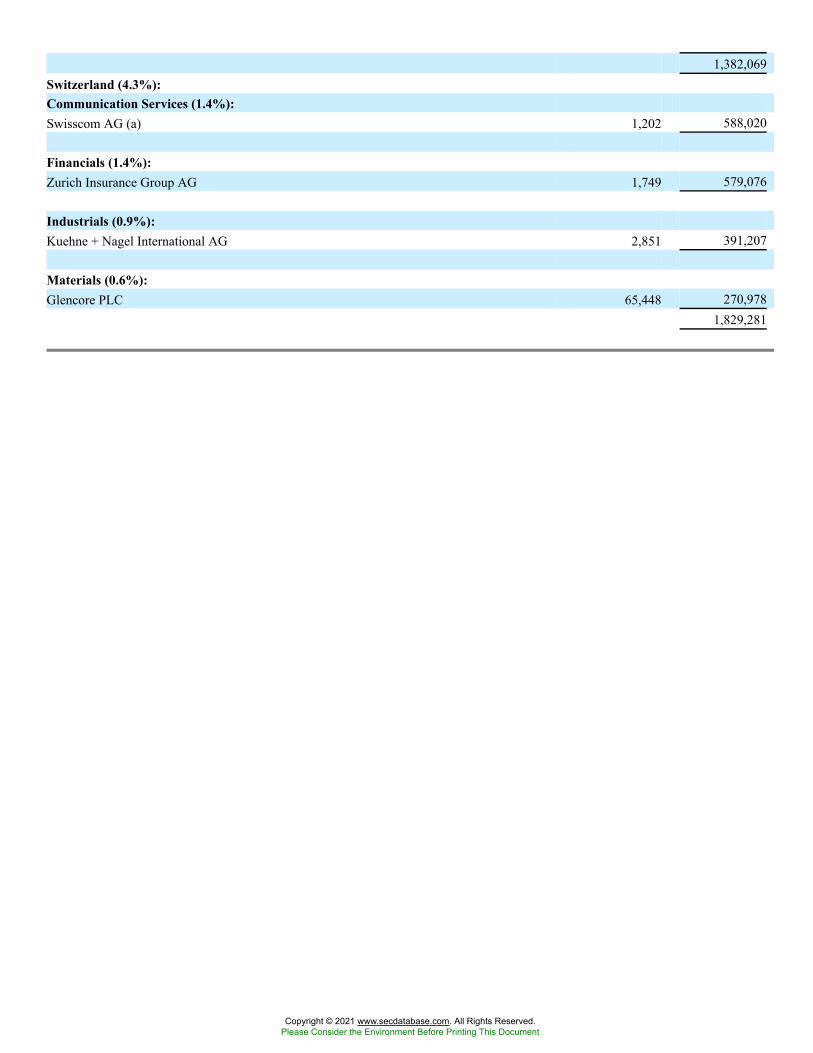
1,382,069Switzerland (4.3%):Communication Services (1.4%):Swisscom AG (a) 1,202 588,020
Financials (1.4%):Zurich Insurance Group AG 1,749 579,076
Industrials (0.9%):Kuehne + Nagel International AG 2,851 391,207
Materials (0.6%):Glencore PLC 65,448 270,978
1,829,281
Copyright © 2021 www.secdatabase.com. All Rights Reserved.Please Consider the Environment Before Printing This Document
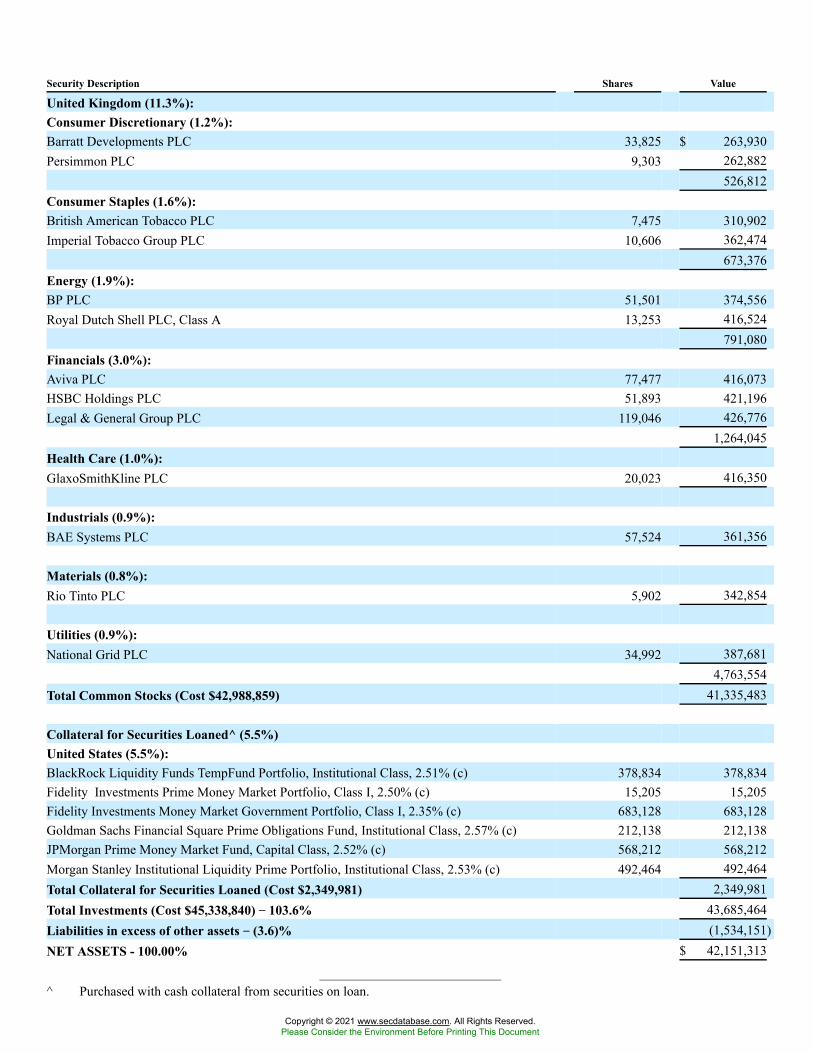
Security Description Shares Value
United Kingdom (11.3%):Consumer Discretionary (1.2%):Barratt Developments PLC 33,825 $ 263,930Persimmon PLC 9,303 262,882
526,812Consumer Staples (1.6%):British American Tobacco PLC 7,475 310,902Imperial Tobacco Group PLC 10,606 362,474
673,376Energy (1.9%):BP PLC 51,501 374,556Royal Dutch Shell PLC, Class A 13,253 416,524
791,080Financials (3.0%):Aviva PLC 77,477 416,073HSBC Holdings PLC 51,893 421,196Legal & General Group PLC 119,046 426,776
1,264,045Health Care (1.0%):GlaxoSmithKline PLC 20,023 416,350
Industrials (0.9%):BAE Systems PLC 57,524 361,356
Materials (0.8%):Rio Tinto PLC 5,902 342,854
Utilities (0.9%):National Grid PLC 34,992 387,681
4,763,554Total Common Stocks (Cost $42,988,859) 41,335,483
Collateral for Securities Loaned^ (5.5%)United States (5.5%):BlackRock Liquidity Funds TempFund Portfolio, Institutional Class, 2.51% (c) 378,834 378,834Fidelity Investments Prime Money Market Portfolio, Class I, 2.50% (c) 15,205 15,205Fidelity Investments Money Market Government Portfolio, Class I, 2.35% (c) 683,128 683,128Goldman Sachs Financial Square Prime Obligations Fund, Institutional Class, 2.57% (c) 212,138 212,138JPMorgan Prime Money Market Fund, Capital Class, 2.52% (c) 568,212 568,212Morgan Stanley Institutional Liquidity Prime Portfolio, Institutional Class, 2.53% (c) 492,464 492,464Total Collateral for Securities Loaned (Cost $2,349,981) 2,349,981Total Investments (Cost $45,338,840) �� 103.6% 43,685,464Liabilities in excess of other assets �� (3.6)% (1,534,151)NET ASSETS - 100.00% $ 42,151,313
^ Purchased with cash collateral from securities on loan.
Copyright © 2021 www.secdatabase.com. All Rights Reserved.Please Consider the Environment Before Printing This Document
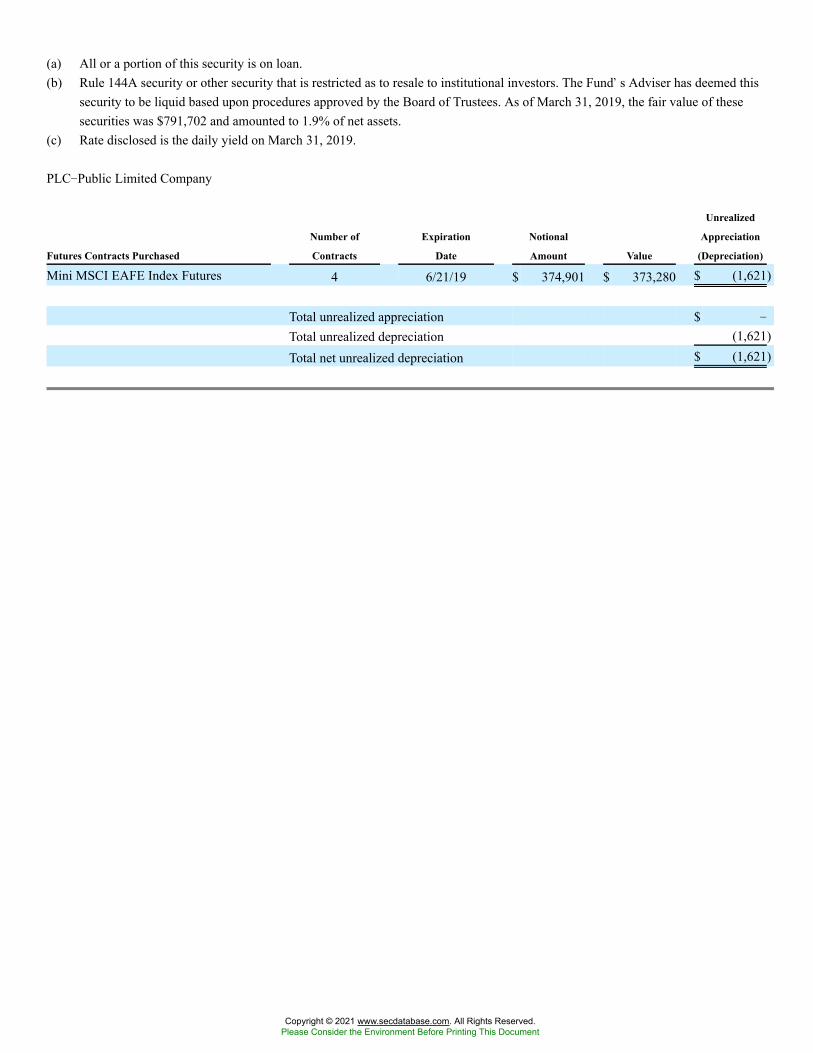
(a) All or a portion of this security is on loan.(b) Rule 144A security or other security that is restricted as to resale to institutional investors. The Fund�s Adviser has deemed this
security to be liquid based upon procedures approved by the Board of Trustees. As of March 31, 2019, the fair value of thesesecurities was $791,702 and amounted to 1.9% of net assets.
(c) Rate disclosed is the daily yield on March 31, 2019.
PLC�Public Limited Company
Futures Contracts Purchased
Number of
Contracts
Expiration
Date
Notional
Amount Value
Unrealized
Appreciation
(Depreciation)
Mini MSCI EAFE Index Futures 4 6/21/19 $ 374,901 $ 373,280 $ (1,621)
Total unrealized appreciation $ �
Total unrealized depreciation (1,621)Total net unrealized depreciation $ (1,621)
Copyright © 2021 www.secdatabase.com. All Rights Reserved.Please Consider the Environment Before Printing This Document
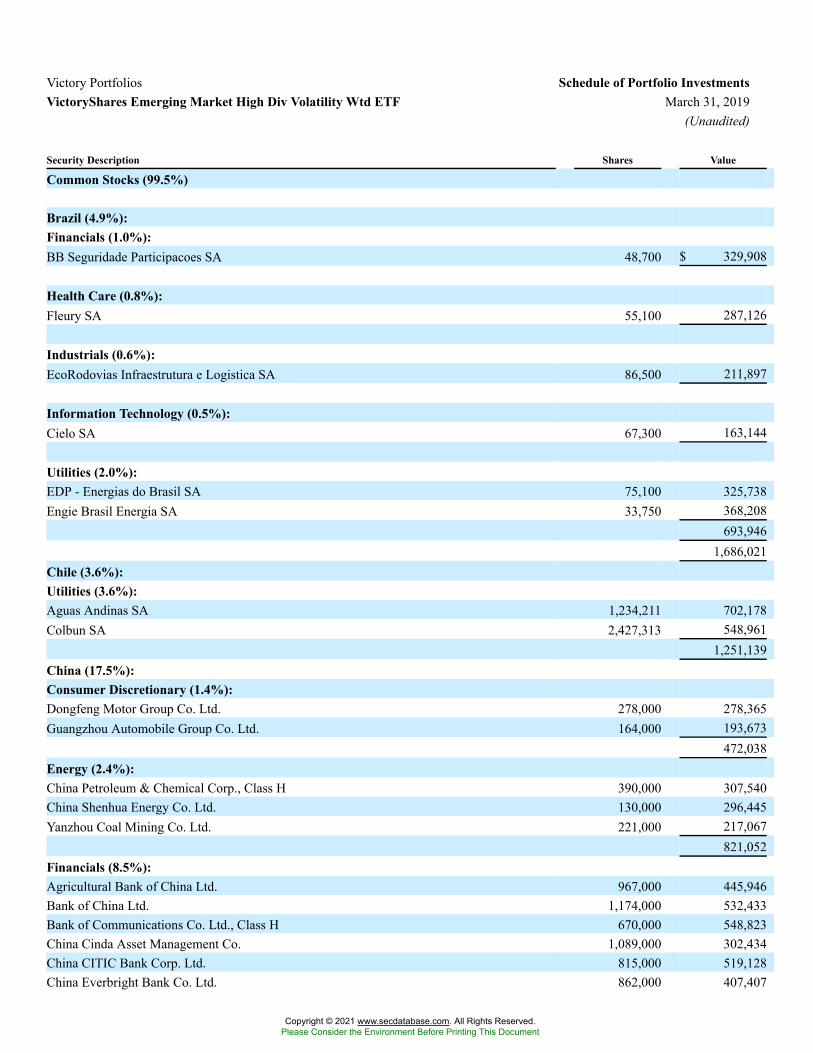
Victory Portfolios Schedule of Portfolio InvestmentsVictoryShares Emerging Market High Div Volatility Wtd ETF March 31, 2019
(Unaudited)
Security Description Shares Value
Common Stocks (99.5%)
Brazil (4.9%):Financials (1.0%):BB Seguridade Participacoes SA 48,700 $ 329,908
Health Care (0.8%):Fleury SA 55,100 287,126
Industrials (0.6%):EcoRodovias Infraestrutura e Logistica SA 86,500 211,897
Information Technology (0.5%):Cielo SA 67,300 163,144
Utilities (2.0%):EDP - Energias do Brasil SA 75,100 325,738Engie Brasil Energia SA 33,750 368,208
693,9461,686,021
Chile (3.6%):Utilities (3.6%):Aguas Andinas SA 1,234,211 702,178Colbun SA 2,427,313 548,961
1,251,139China (17.5%):Consumer Discretionary (1.4%):Dongfeng Motor Group Co. Ltd. 278,000 278,365Guangzhou Automobile Group Co. Ltd. 164,000 193,673
472,038Energy (2.4%):China Petroleum & Chemical Corp., Class H 390,000 307,540China Shenhua Energy Co. Ltd. 130,000 296,445Yanzhou Coal Mining Co. Ltd. 221,000 217,067
821,052Financials (8.5%):Agricultural Bank of China Ltd. 967,000 445,946Bank of China Ltd. 1,174,000 532,433Bank of Communications Co. Ltd., Class H 670,000 548,823China Cinda Asset Management Co. 1,089,000 302,434China CITIC Bank Corp. Ltd. 815,000 519,128China Everbright Bank Co. Ltd. 862,000 407,407
Copyright © 2021 www.secdatabase.com. All Rights Reserved.Please Consider the Environment Before Printing This Document
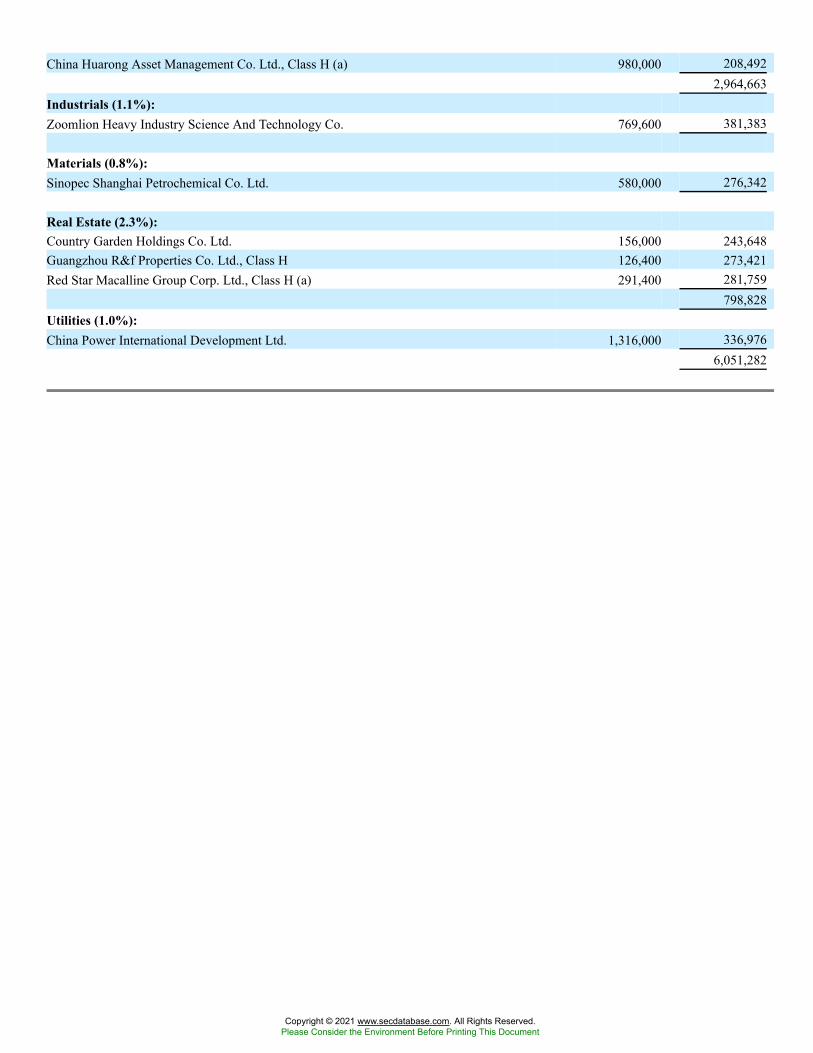
China Huarong Asset Management Co. Ltd., Class H (a) 980,000 208,4922,964,663
Industrials (1.1%):Zoomlion Heavy Industry Science And Technology Co. 769,600 381,383
Materials (0.8%):Sinopec Shanghai Petrochemical Co. Ltd. 580,000 276,342
Real Estate (2.3%):Country Garden Holdings Co. Ltd. 156,000 243,648Guangzhou R&f Properties Co. Ltd., Class H 126,400 273,421Red Star Macalline Group Corp. Ltd., Class H (a) 291,400 281,759
798,828Utilities (1.0%):China Power International Development Ltd. 1,316,000 336,976
6,051,282
Copyright © 2021 www.secdatabase.com. All Rights Reserved.Please Consider the Environment Before Printing This Document
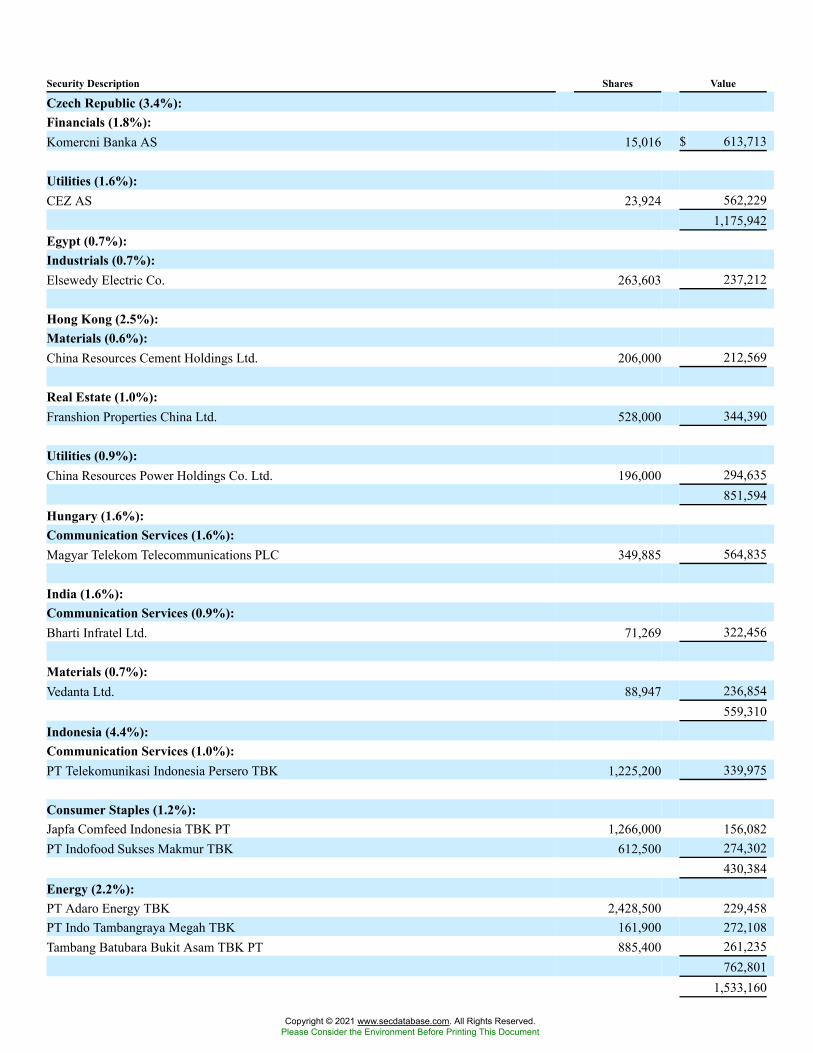
Security Description Shares Value
Czech Republic (3.4%):Financials (1.8%):Komercni Banka AS 15,016 $ 613,713
Utilities (1.6%):CEZ AS 23,924 562,229
1,175,942Egypt (0.7%):Industrials (0.7%):Elsewedy Electric Co. 263,603 237,212
Hong Kong (2.5%):Materials (0.6%):China Resources Cement Holdings Ltd. 206,000 212,569
Real Estate (1.0%):Franshion Properties China Ltd. 528,000 344,390
Utilities (0.9%):China Resources Power Holdings Co. Ltd. 196,000 294,635
851,594Hungary (1.6%):Communication Services (1.6%):Magyar Telekom Telecommunications PLC 349,885 564,835
India (1.6%):Communication Services (0.9%):Bharti Infratel Ltd. 71,269 322,456
Materials (0.7%):Vedanta Ltd. 88,947 236,854
559,310Indonesia (4.4%):Communication Services (1.0%):PT Telekomunikasi Indonesia Persero TBK 1,225,200 339,975
Consumer Staples (1.2%):Japfa Comfeed Indonesia TBK PT 1,266,000 156,082PT Indofood Sukses Makmur TBK 612,500 274,302
430,384Energy (2.2%):PT Adaro Energy TBK 2,428,500 229,458PT Indo Tambangraya Megah TBK 161,900 272,108Tambang Batubara Bukit Asam TBK PT 885,400 261,235
762,8011,533,160
Copyright © 2021 www.secdatabase.com. All Rights Reserved.Please Consider the Environment Before Printing This Document
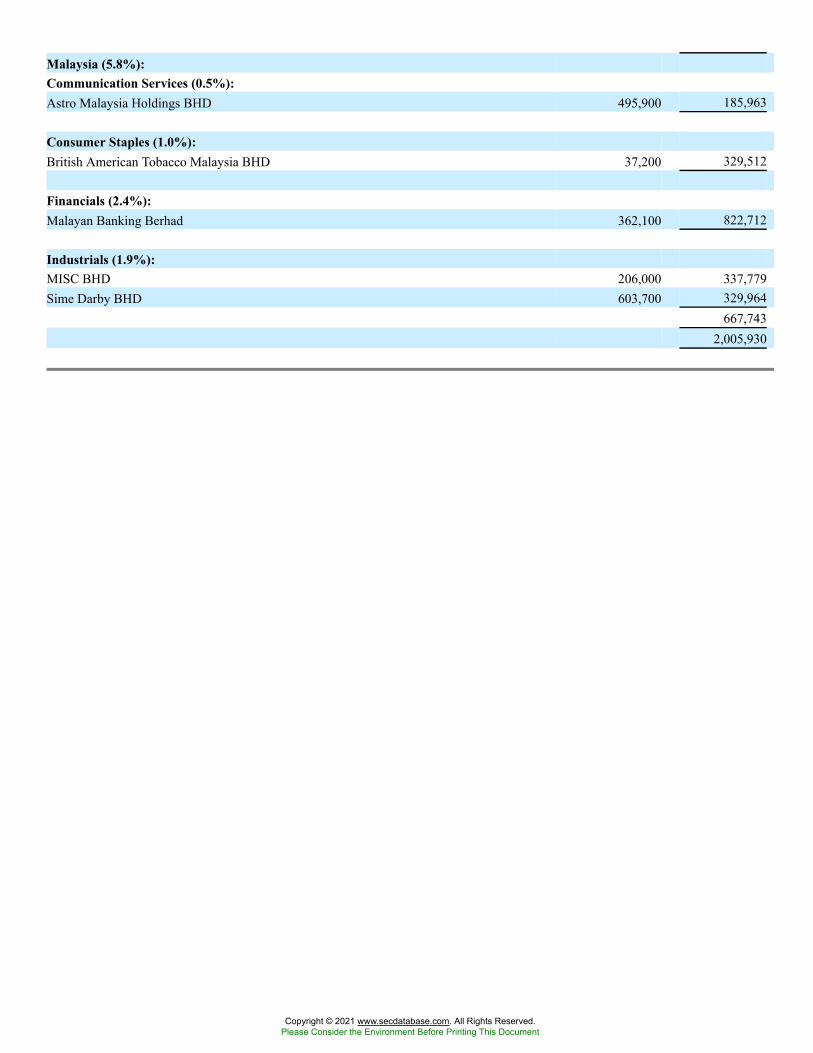
Malaysia (5.8%):Communication Services (0.5%):Astro Malaysia Holdings BHD 495,900 185,963
Consumer Staples (1.0%):British American Tobacco Malaysia BHD 37,200 329,512
Financials (2.4%):Malayan Banking Berhad 362,100 822,712
Industrials (1.9%):MISC BHD 206,000 337,779Sime Darby BHD 603,700 329,964
667,7432,005,930
Copyright © 2021 www.secdatabase.com. All Rights Reserved.Please Consider the Environment Before Printing This Document
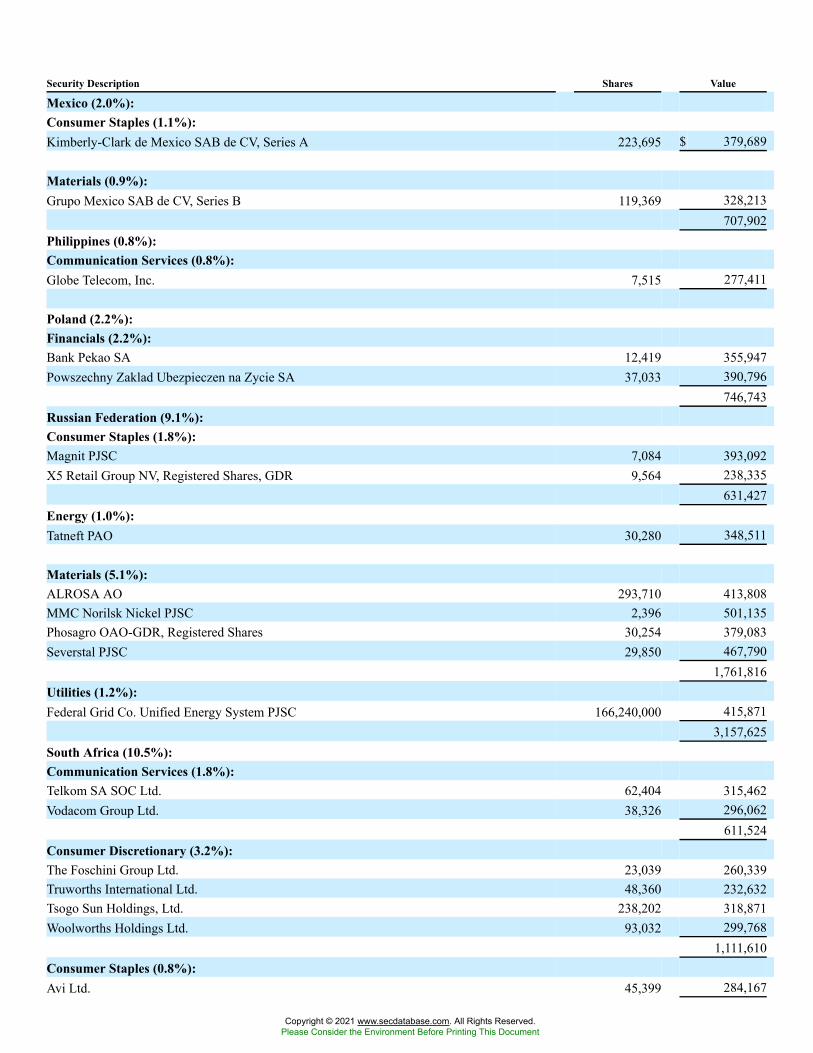
Security Description Shares Value
Mexico (2.0%):Consumer Staples (1.1%):Kimberly-Clark de Mexico SAB de CV, Series A 223,695 $ 379,689
Materials (0.9%):Grupo Mexico SAB de CV, Series B 119,369 328,213
707,902Philippines (0.8%):Communication Services (0.8%):Globe Telecom, Inc. 7,515 277,411
Poland (2.2%):Financials (2.2%):Bank Pekao SA 12,419 355,947Powszechny Zaklad Ubezpieczen na Zycie SA 37,033 390,796
746,743Russian Federation (9.1%):Consumer Staples (1.8%):Magnit PJSC 7,084 393,092X5 Retail Group NV, Registered Shares, GDR 9,564 238,335
631,427Energy (1.0%):Tatneft PAO 30,280 348,511
Materials (5.1%):ALROSA AO 293,710 413,808MMC Norilsk Nickel PJSC 2,396 501,135Phosagro OAO-GDR, Registered Shares 30,254 379,083Severstal PJSC 29,850 467,790
1,761,816Utilities (1.2%):Federal Grid Co. Unified Energy System PJSC 166,240,000 415,871
3,157,625South Africa (10.5%):Communication Services (1.8%):Telkom SA SOC Ltd. 62,404 315,462Vodacom Group Ltd. 38,326 296,062
611,524Consumer Discretionary (3.2%):The Foschini Group Ltd. 23,039 260,339Truworths International Ltd. 48,360 232,632Tsogo Sun Holdings, Ltd. 238,202 318,871Woolworths Holdings Ltd. 93,032 299,768
1,111,610Consumer Staples (0.8%):Avi Ltd. 45,399 284,167
Copyright © 2021 www.secdatabase.com. All Rights Reserved.Please Consider the Environment Before Printing This Document
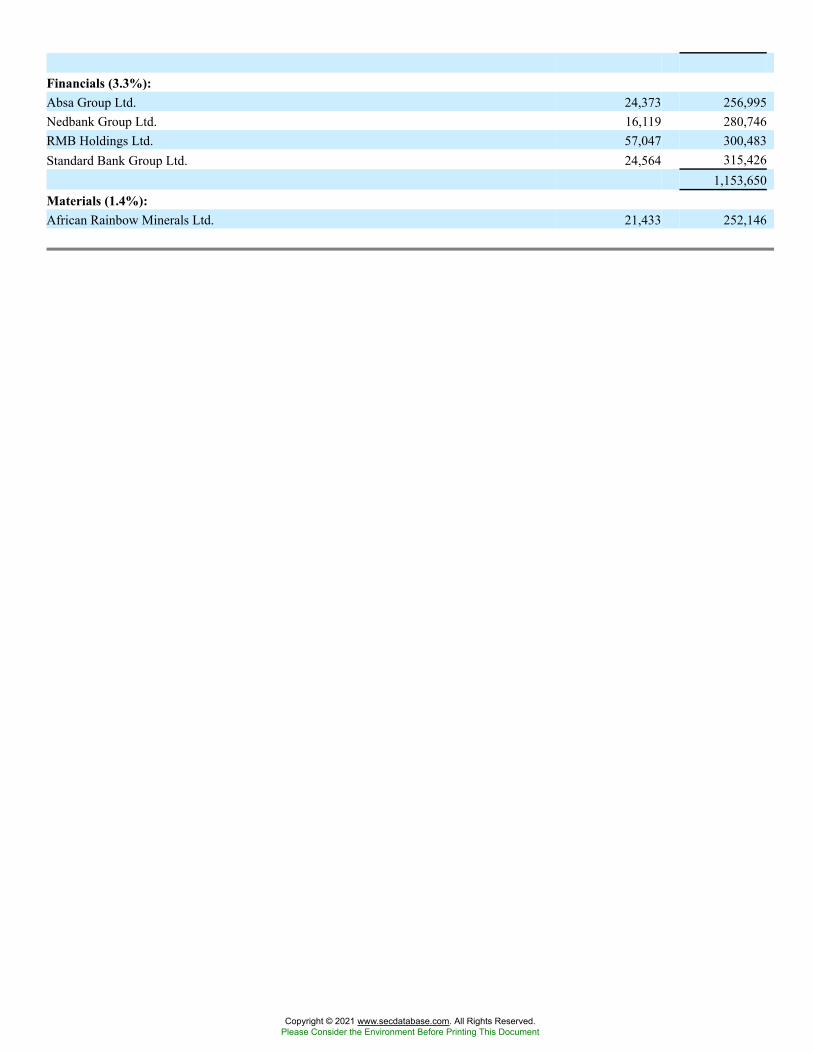
Financials (3.3%):Absa Group Ltd. 24,373 256,995Nedbank Group Ltd. 16,119 280,746RMB Holdings Ltd. 57,047 300,483Standard Bank Group Ltd. 24,564 315,426
1,153,650Materials (1.4%):African Rainbow Minerals Ltd. 21,433 252,146
Copyright © 2021 www.secdatabase.com. All Rights Reserved.Please Consider the Environment Before Printing This Document
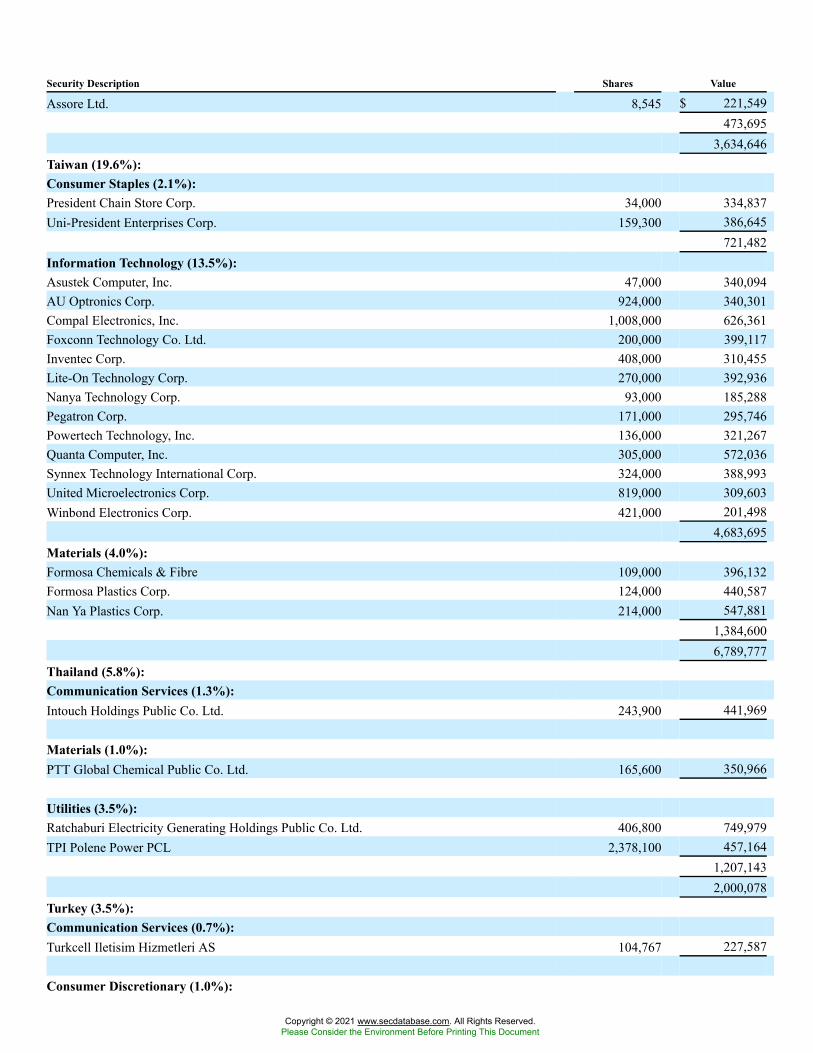
Security Description Shares Value
Assore Ltd. 8,545 $ 221,549473,695
3,634,646Taiwan (19.6%):Consumer Staples (2.1%):President Chain Store Corp. 34,000 334,837Uni-President Enterprises Corp. 159,300 386,645
721,482Information Technology (13.5%):Asustek Computer, Inc. 47,000 340,094AU Optronics Corp. 924,000 340,301Compal Electronics, Inc. 1,008,000 626,361Foxconn Technology Co. Ltd. 200,000 399,117Inventec Corp. 408,000 310,455Lite-On Technology Corp. 270,000 392,936Nanya Technology Corp. 93,000 185,288Pegatron Corp. 171,000 295,746Powertech Technology, Inc. 136,000 321,267Quanta Computer, Inc. 305,000 572,036Synnex Technology International Corp. 324,000 388,993United Microelectronics Corp. 819,000 309,603Winbond Electronics Corp. 421,000 201,498
4,683,695Materials (4.0%):Formosa Chemicals & Fibre 109,000 396,132Formosa Plastics Corp. 124,000 440,587Nan Ya Plastics Corp. 214,000 547,881
1,384,6006,789,777
Thailand (5.8%):Communication Services (1.3%):Intouch Holdings Public Co. Ltd. 243,900 441,969
Materials (1.0%):PTT Global Chemical Public Co. Ltd. 165,600 350,966
Utilities (3.5%):Ratchaburi Electricity Generating Holdings Public Co. Ltd. 406,800 749,979TPI Polene Power PCL 2,378,100 457,164
1,207,1432,000,078
Turkey (3.5%):Communication Services (0.7%):Turkcell Iletisim Hizmetleri AS 104,767 227,587
Consumer Discretionary (1.0%):
Copyright © 2021 www.secdatabase.com. All Rights Reserved.Please Consider the Environment Before Printing This Document
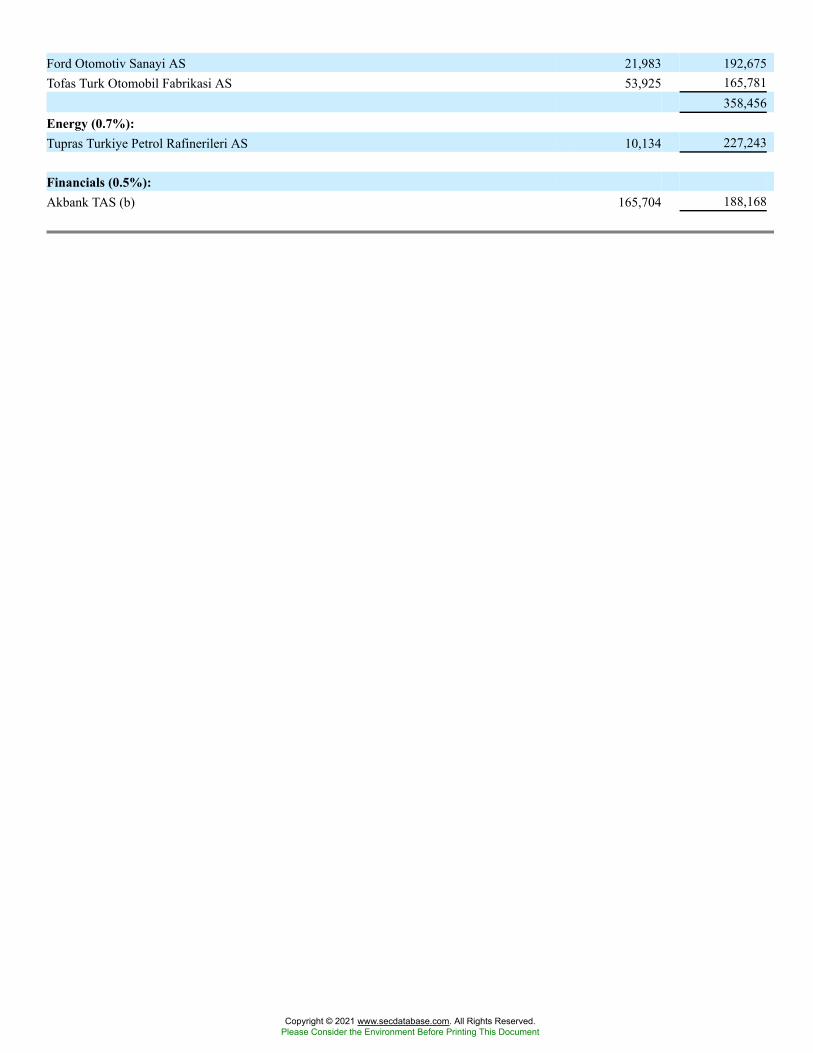
Ford Otomotiv Sanayi AS 21,983 192,675Tofas Turk Otomobil Fabrikasi AS 53,925 165,781
358,456Energy (0.7%):Tupras Turkiye Petrol Rafinerileri AS 10,134 227,243
Financials (0.5%):Akbank TAS (b) 165,704 188,168
Copyright © 2021 www.secdatabase.com. All Rights Reserved.Please Consider the Environment Before Printing This Document
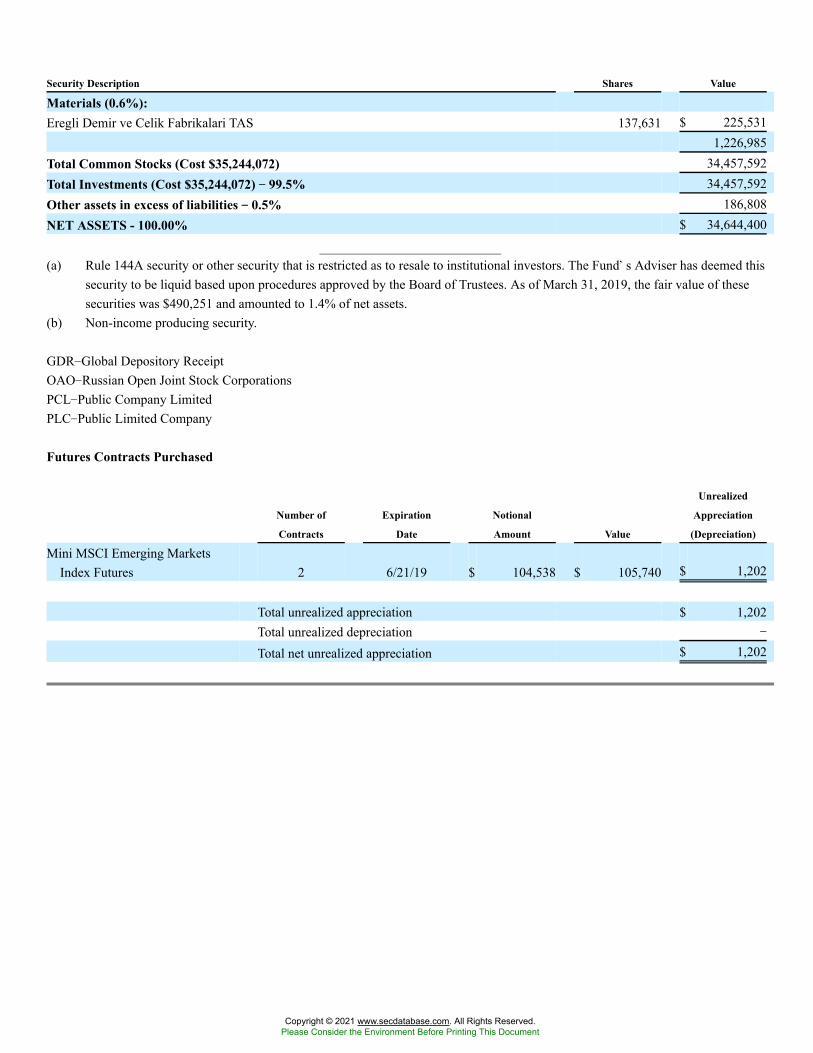
Security Description Shares Value
Materials (0.6%):Eregli Demir ve Celik Fabrikalari TAS 137,631 $ 225,531
1,226,985Total Common Stocks (Cost $35,244,072) 34,457,592Total Investments (Cost $35,244,072) �� 99.5% 34,457,592Other assets in excess of liabilities �� 0.5% 186,808NET ASSETS - 100.00% $ 34,644,400
(a) Rule 144A security or other security that is restricted as to resale to institutional investors. The Fund�s Adviser has deemed thissecurity to be liquid based upon procedures approved by the Board of Trustees. As of March 31, 2019, the fair value of thesesecurities was $490,251 and amounted to 1.4% of net assets.
(b) Non-income producing security.
GDR�Global Depository ReceiptOAO�Russian Open Joint Stock CorporationsPCL�Public Company LimitedPLC�Public Limited Company
Futures Contracts Purchased
Number of
Contracts
Expiration
Date
Notional
Amount Value
Unrealized
Appreciation
(Depreciation)
Mini MSCI Emerging MarketsIndex Futures 2 6/21/19 $ 104,538 $ 105,740 $ 1,202
Total unrealized appreciation $ 1,202Total unrealized depreciation �
Total net unrealized appreciation $ 1,202
Copyright © 2021 www.secdatabase.com. All Rights Reserved.Please Consider the Environment Before Printing This Document
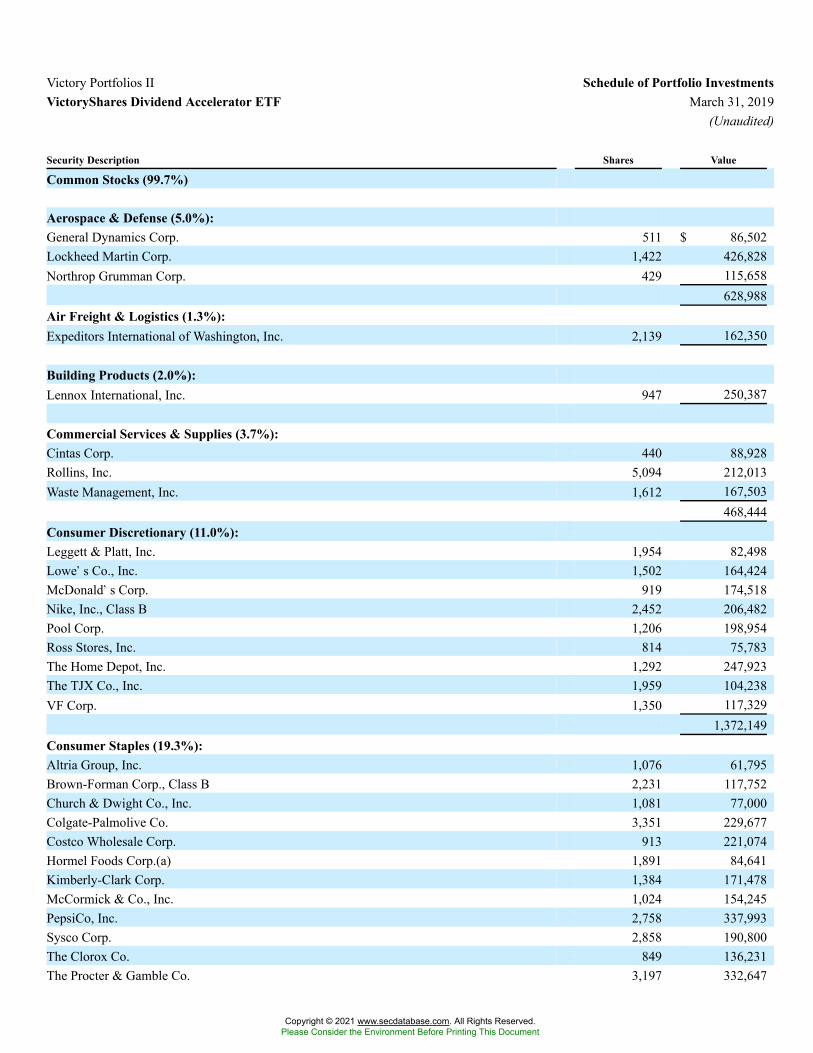
Victory Portfolios II Schedule of Portfolio InvestmentsVictoryShares Dividend Accelerator ETF March 31, 2019
(Unaudited)
Security Description Shares Value
Common Stocks (99.7%)
Aerospace & Defense (5.0%):General Dynamics Corp. 511 $ 86,502Lockheed Martin Corp. 1,422 426,828Northrop Grumman Corp. 429 115,658
628,988Air Freight & Logistics (1.3%):Expeditors International of Washington, Inc. 2,139 162,350
Building Products (2.0%):Lennox International, Inc. 947 250,387
Commercial Services & Supplies (3.7%):Cintas Corp. 440 88,928Rollins, Inc. 5,094 212,013Waste Management, Inc. 1,612 167,503
468,444Consumer Discretionary (11.0%):Leggett & Platt, Inc. 1,954 82,498Lowe�s Co., Inc. 1,502 164,424McDonald�s Corp. 919 174,518Nike, Inc., Class B 2,452 206,482Pool Corp. 1,206 198,954Ross Stores, Inc. 814 75,783The Home Depot, Inc. 1,292 247,923The TJX Co., Inc. 1,959 104,238VF Corp. 1,350 117,329
1,372,149Consumer Staples (19.3%):Altria Group, Inc. 1,076 61,795Brown-Forman Corp., Class B 2,231 117,752Church & Dwight Co., Inc. 1,081 77,000Colgate-Palmolive Co. 3,351 229,677Costco Wholesale Corp. 913 221,074Hormel Foods Corp.(a) 1,891 84,641Kimberly-Clark Corp. 1,384 171,478McCormick & Co., Inc. 1,024 154,245PepsiCo, Inc. 2,758 337,993Sysco Corp. 2,858 190,800The Clorox Co. 849 136,231The Procter & Gamble Co. 3,197 332,647
Copyright © 2021 www.secdatabase.com. All Rights Reserved.Please Consider the Environment Before Printing This Document
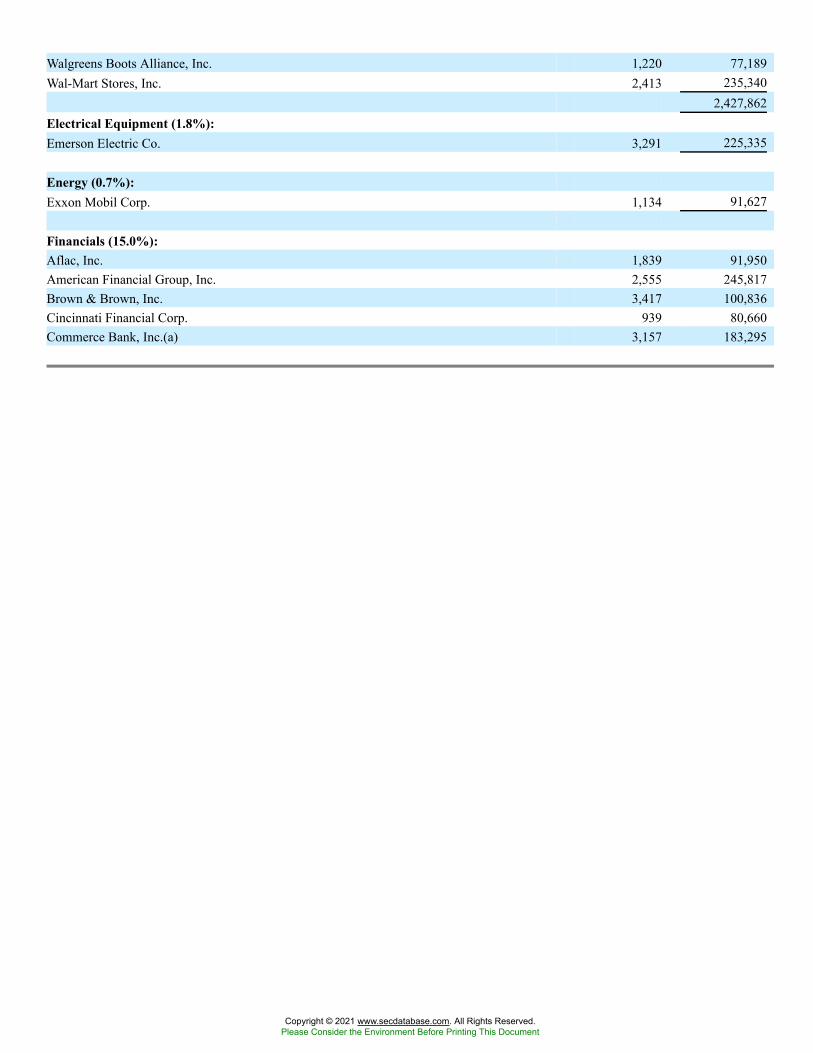
Walgreens Boots Alliance, Inc. 1,220 77,189Wal-Mart Stores, Inc. 2,413 235,340
2,427,862Electrical Equipment (1.8%):Emerson Electric Co. 3,291 225,335
Energy (0.7%):Exxon Mobil Corp. 1,134 91,627
Financials (15.0%):Aflac, Inc. 1,839 91,950American Financial Group, Inc. 2,555 245,817Brown & Brown, Inc. 3,417 100,836Cincinnati Financial Corp. 939 80,660Commerce Bank, Inc.(a) 3,157 183,295
Copyright © 2021 www.secdatabase.com. All Rights Reserved.Please Consider the Environment Before Printing This Document
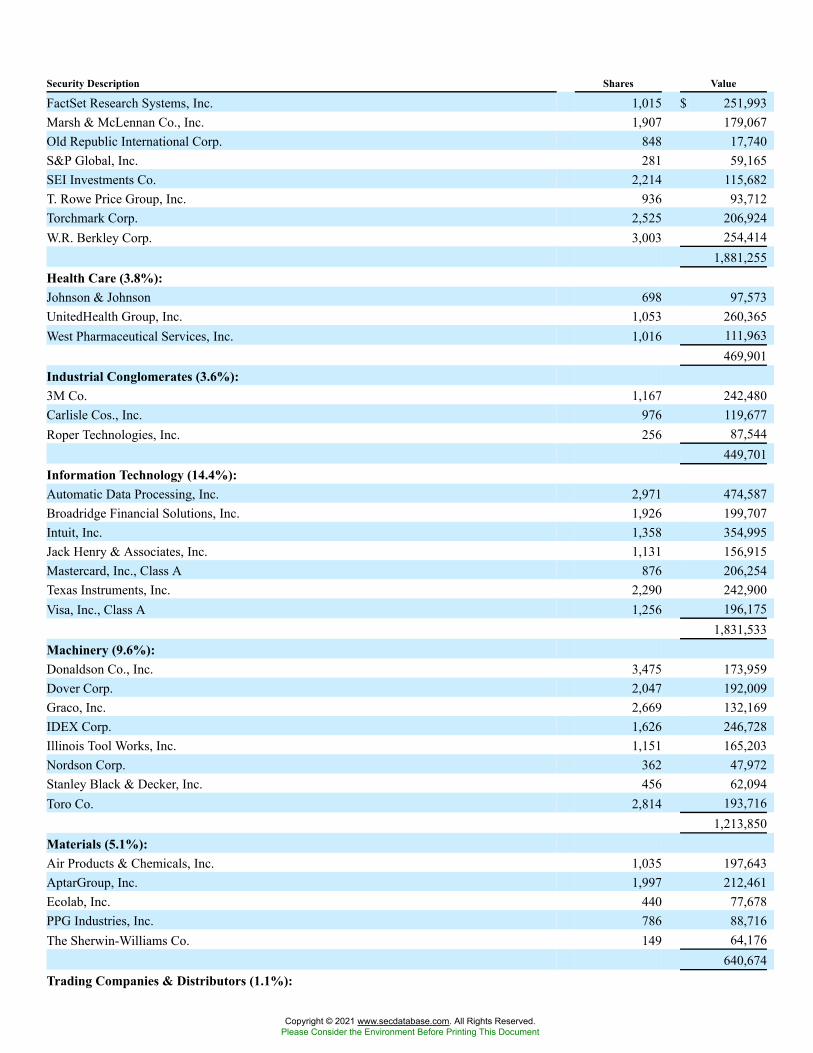
Security Description Shares Value
FactSet Research Systems, Inc. 1,015 $ 251,993Marsh & McLennan Co., Inc. 1,907 179,067Old Republic International Corp. 848 17,740S&P Global, Inc. 281 59,165SEI Investments Co. 2,214 115,682T. Rowe Price Group, Inc. 936 93,712Torchmark Corp. 2,525 206,924W.R. Berkley Corp. 3,003 254,414
1,881,255Health Care (3.8%):Johnson & Johnson 698 97,573UnitedHealth Group, Inc. 1,053 260,365West Pharmaceutical Services, Inc. 1,016 111,963
469,901Industrial Conglomerates (3.6%):3M Co. 1,167 242,480Carlisle Cos., Inc. 976 119,677Roper Technologies, Inc. 256 87,544
449,701Information Technology (14.4%):Automatic Data Processing, Inc. 2,971 474,587Broadridge Financial Solutions, Inc. 1,926 199,707Intuit, Inc. 1,358 354,995Jack Henry & Associates, Inc. 1,131 156,915Mastercard, Inc., Class A 876 206,254Texas Instruments, Inc. 2,290 242,900Visa, Inc., Class A 1,256 196,175
1,831,533Machinery (9.6%):Donaldson Co., Inc. 3,475 173,959Dover Corp. 2,047 192,009Graco, Inc. 2,669 132,169IDEX Corp. 1,626 246,728Illinois Tool Works, Inc. 1,151 165,203Nordson Corp. 362 47,972Stanley Black & Decker, Inc. 456 62,094Toro Co. 2,814 193,716
1,213,850Materials (5.1%):Air Products & Chemicals, Inc. 1,035 197,643AptarGroup, Inc. 1,997 212,461Ecolab, Inc. 440 77,678PPG Industries, Inc. 786 88,716The Sherwin-Williams Co. 149 64,176
640,674Trading Companies & Distributors (1.1%):
Copyright © 2021 www.secdatabase.com. All Rights Reserved.Please Consider the Environment Before Printing This Document
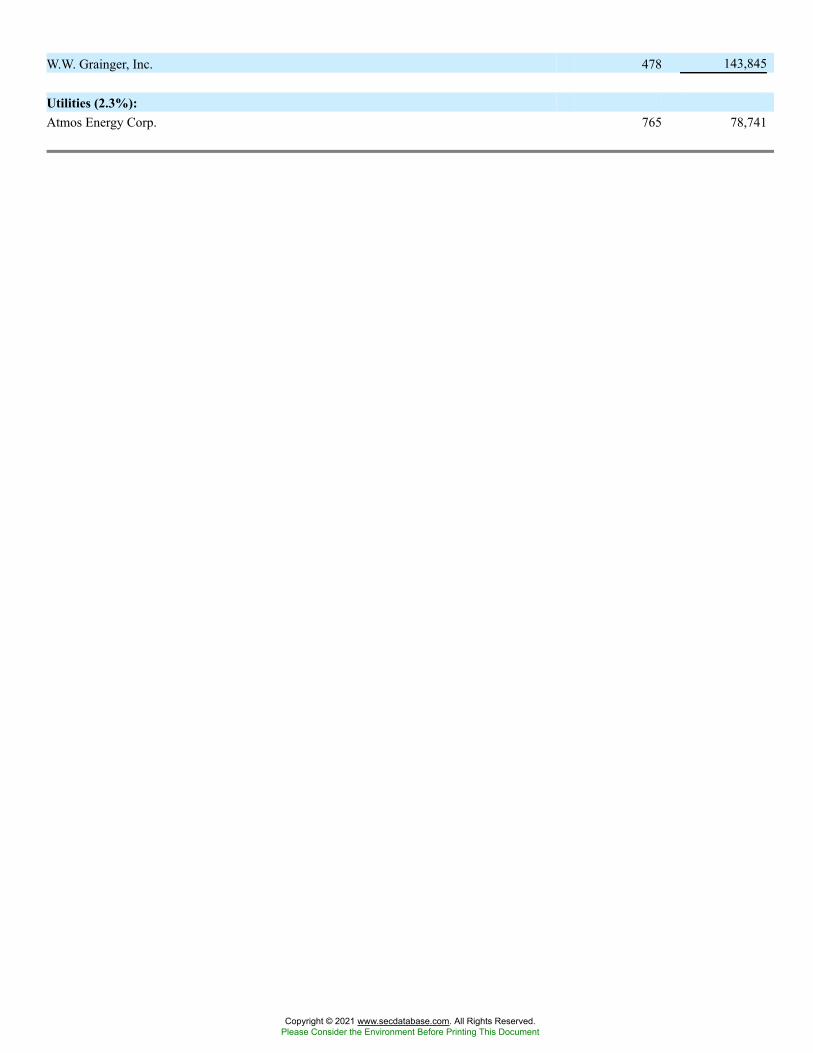
W.W. Grainger, Inc. 478 143,845
Utilities (2.3%):Atmos Energy Corp. 765 78,741
Copyright © 2021 www.secdatabase.com. All Rights Reserved.Please Consider the Environment Before Printing This Document
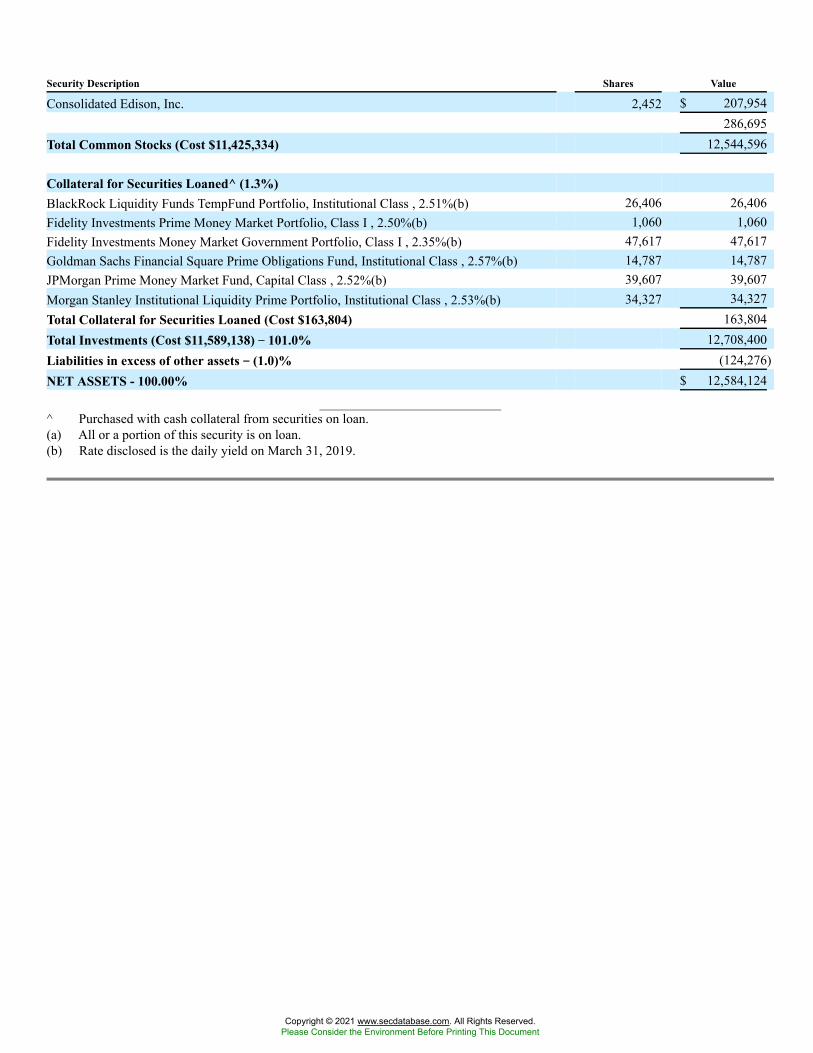
Security Description Shares Value
Consolidated Edison, Inc. 2,452 $ 207,954286,695
Total Common Stocks (Cost $11,425,334) 12,544,596
Collateral for Securities Loaned^ (1.3%)BlackRock Liquidity Funds TempFund Portfolio, Institutional Class , 2.51%(b) 26,406 26,406Fidelity Investments Prime Money Market Portfolio, Class I , 2.50%(b) 1,060 1,060Fidelity Investments Money Market Government Portfolio, Class I , 2.35%(b) 47,617 47,617Goldman Sachs Financial Square Prime Obligations Fund, Institutional Class , 2.57%(b) 14,787 14,787JPMorgan Prime Money Market Fund, Capital Class , 2.52%(b) 39,607 39,607Morgan Stanley Institutional Liquidity Prime Portfolio, Institutional Class , 2.53%(b) 34,327 34,327Total Collateral for Securities Loaned (Cost $163,804) 163,804Total Investments (Cost $11,589,138) �� 101.0% 12,708,400Liabilities in excess of other assets �� (1.0)% (124,276)NET ASSETS - 100.00% $ 12,584,124
^ Purchased with cash collateral from securities on loan.(a) All or a portion of this security is on loan.(b) Rate disclosed is the daily yield on March 31, 2019.
Copyright © 2021 www.secdatabase.com. All Rights Reserved.Please Consider the Environment Before Printing This Document
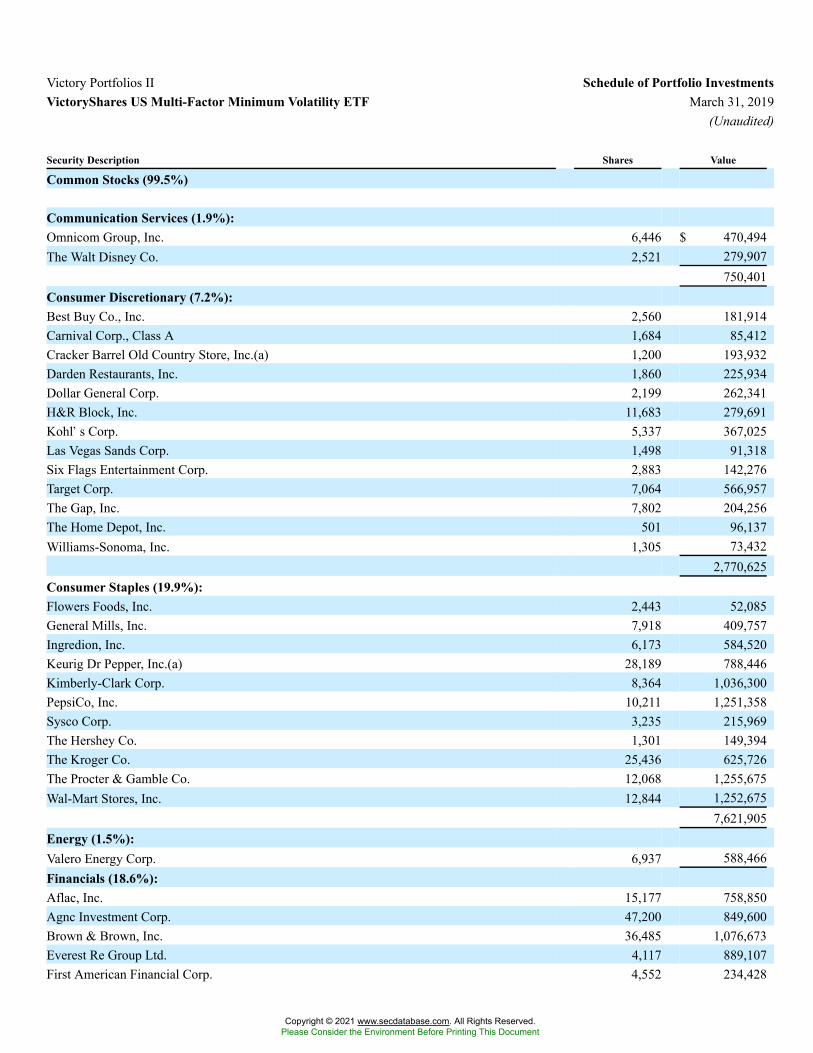
Victory Portfolios II Schedule of Portfolio InvestmentsVictoryShares US Multi-Factor Minimum Volatility ETF March 31, 2019
(Unaudited)
Security Description Shares Value
Common Stocks (99.5%)
Communication Services (1.9%):Omnicom Group, Inc. 6,446 $ 470,494The Walt Disney Co. 2,521 279,907
750,401Consumer Discretionary (7.2%):Best Buy Co., Inc. 2,560 181,914Carnival Corp., Class A 1,684 85,412Cracker Barrel Old Country Store, Inc.(a) 1,200 193,932Darden Restaurants, Inc. 1,860 225,934Dollar General Corp. 2,199 262,341H&R Block, Inc. 11,683 279,691Kohl�s Corp. 5,337 367,025Las Vegas Sands Corp. 1,498 91,318Six Flags Entertainment Corp. 2,883 142,276Target Corp. 7,064 566,957The Gap, Inc. 7,802 204,256The Home Depot, Inc. 501 96,137Williams-Sonoma, Inc. 1,305 73,432
2,770,625Consumer Staples (19.9%):Flowers Foods, Inc. 2,443 52,085General Mills, Inc. 7,918 409,757Ingredion, Inc. 6,173 584,520Keurig Dr Pepper, Inc.(a) 28,189 788,446Kimberly-Clark Corp. 8,364 1,036,300PepsiCo, Inc. 10,211 1,251,358Sysco Corp. 3,235 215,969The Hershey Co. 1,301 149,394The Kroger Co. 25,436 625,726The Procter & Gamble Co. 12,068 1,255,675Wal-Mart Stores, Inc. 12,844 1,252,675
7,621,905Energy (1.5%):Valero Energy Corp. 6,937 588,466Financials (18.6%):Aflac, Inc. 15,177 758,850Agnc Investment Corp. 47,200 849,600Brown & Brown, Inc. 36,485 1,076,673Everest Re Group Ltd. 4,117 889,107First American Financial Corp. 4,552 234,428
Copyright © 2021 www.secdatabase.com. All Rights Reserved.Please Consider the Environment Before Printing This Document
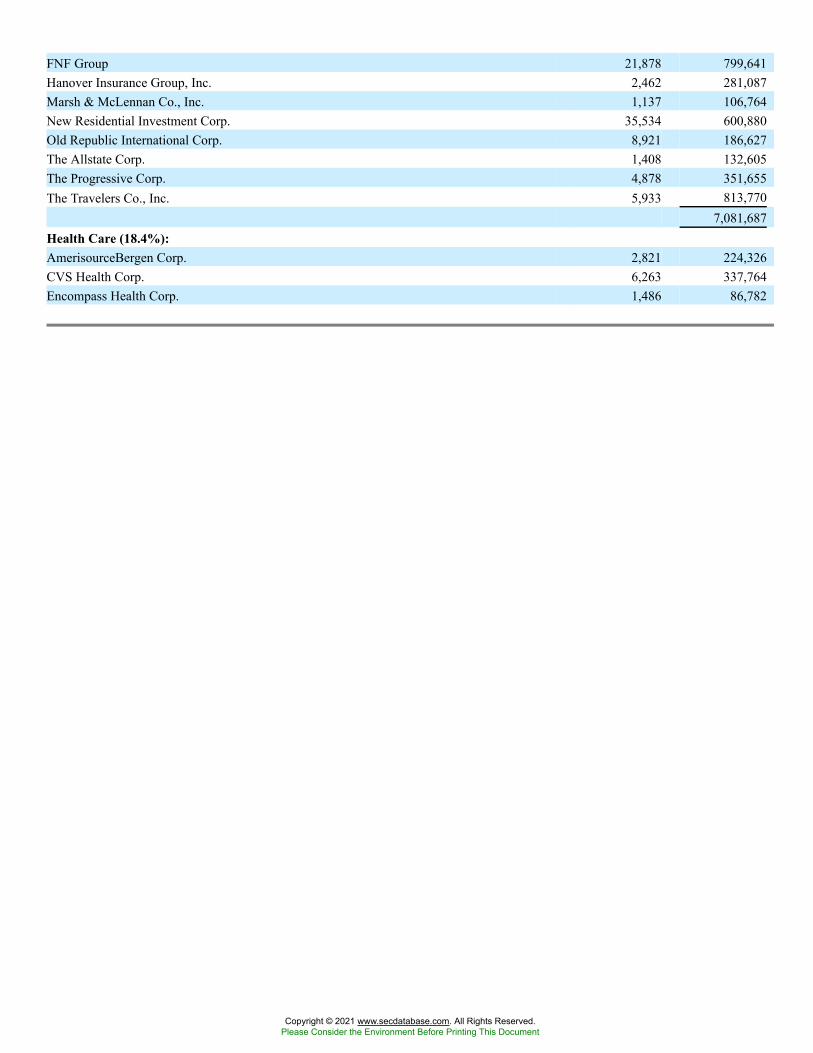
FNF Group 21,878 799,641Hanover Insurance Group, Inc. 2,462 281,087Marsh & McLennan Co., Inc. 1,137 106,764New Residential Investment Corp. 35,534 600,880Old Republic International Corp. 8,921 186,627The Allstate Corp. 1,408 132,605The Progressive Corp. 4,878 351,655The Travelers Co., Inc. 5,933 813,770
7,081,687Health Care (18.4%):AmerisourceBergen Corp. 2,821 224,326CVS Health Corp. 6,263 337,764Encompass Health Corp. 1,486 86,782
Copyright © 2021 www.secdatabase.com. All Rights Reserved.Please Consider the Environment Before Printing This Document
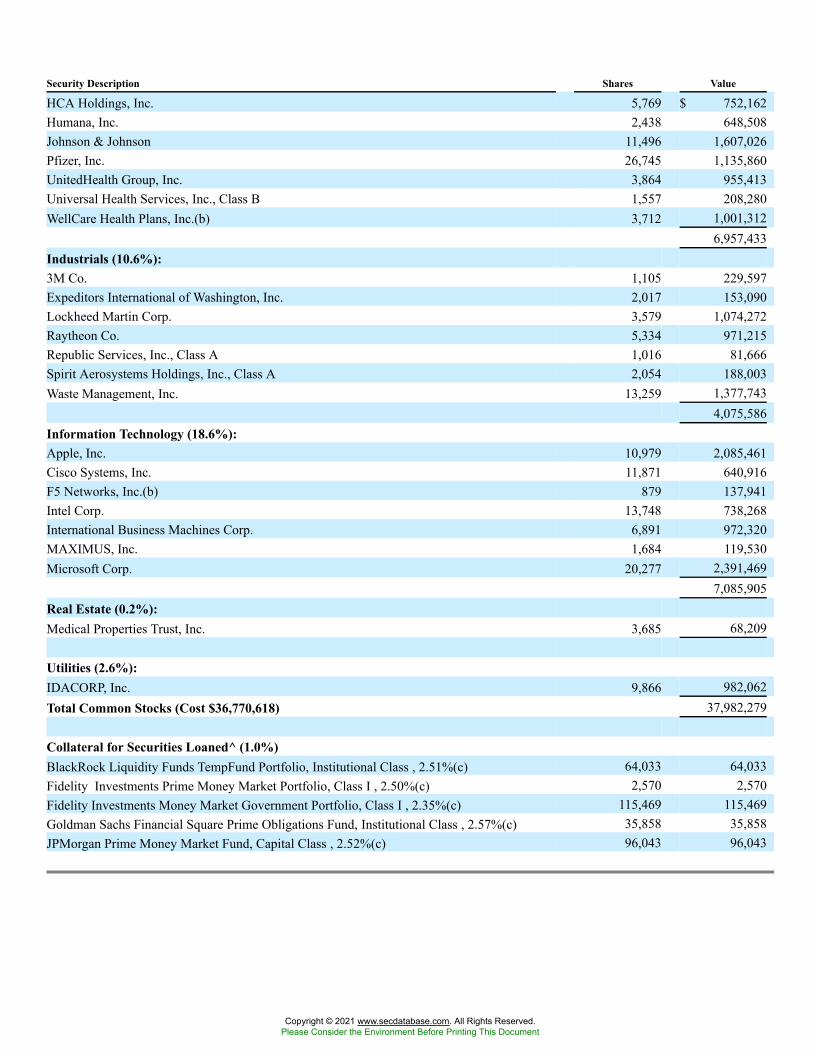
Security Description Shares Value
HCA Holdings, Inc. 5,769 $ 752,162Humana, Inc. 2,438 648,508Johnson & Johnson 11,496 1,607,026Pfizer, Inc. 26,745 1,135,860UnitedHealth Group, Inc. 3,864 955,413Universal Health Services, Inc., Class B 1,557 208,280WellCare Health Plans, Inc.(b) 3,712 1,001,312
6,957,433Industrials (10.6%):3M Co. 1,105 229,597Expeditors International of Washington, Inc. 2,017 153,090Lockheed Martin Corp. 3,579 1,074,272Raytheon Co. 5,334 971,215Republic Services, Inc., Class A 1,016 81,666Spirit Aerosystems Holdings, Inc., Class A 2,054 188,003Waste Management, Inc. 13,259 1,377,743
4,075,586Information Technology (18.6%):Apple, Inc. 10,979 2,085,461Cisco Systems, Inc. 11,871 640,916F5 Networks, Inc.(b) 879 137,941Intel Corp. 13,748 738,268International Business Machines Corp. 6,891 972,320MAXIMUS, Inc. 1,684 119,530Microsoft Corp. 20,277 2,391,469
7,085,905Real Estate (0.2%):Medical Properties Trust, Inc. 3,685 68,209
Utilities (2.6%):IDACORP, Inc. 9,866 982,062Total Common Stocks (Cost $36,770,618) 37,982,279
Collateral for Securities Loaned^ (1.0%)BlackRock Liquidity Funds TempFund Portfolio, Institutional Class , 2.51%(c) 64,033 64,033Fidelity Investments Prime Money Market Portfolio, Class I , 2.50%(c) 2,570 2,570Fidelity Investments Money Market Government Portfolio, Class I , 2.35%(c) 115,469 115,469Goldman Sachs Financial Square Prime Obligations Fund, Institutional Class , 2.57%(c) 35,858 35,858JPMorgan Prime Money Market Fund, Capital Class , 2.52%(c) 96,043 96,043
Copyright © 2021 www.secdatabase.com. All Rights Reserved.Please Consider the Environment Before Printing This Document
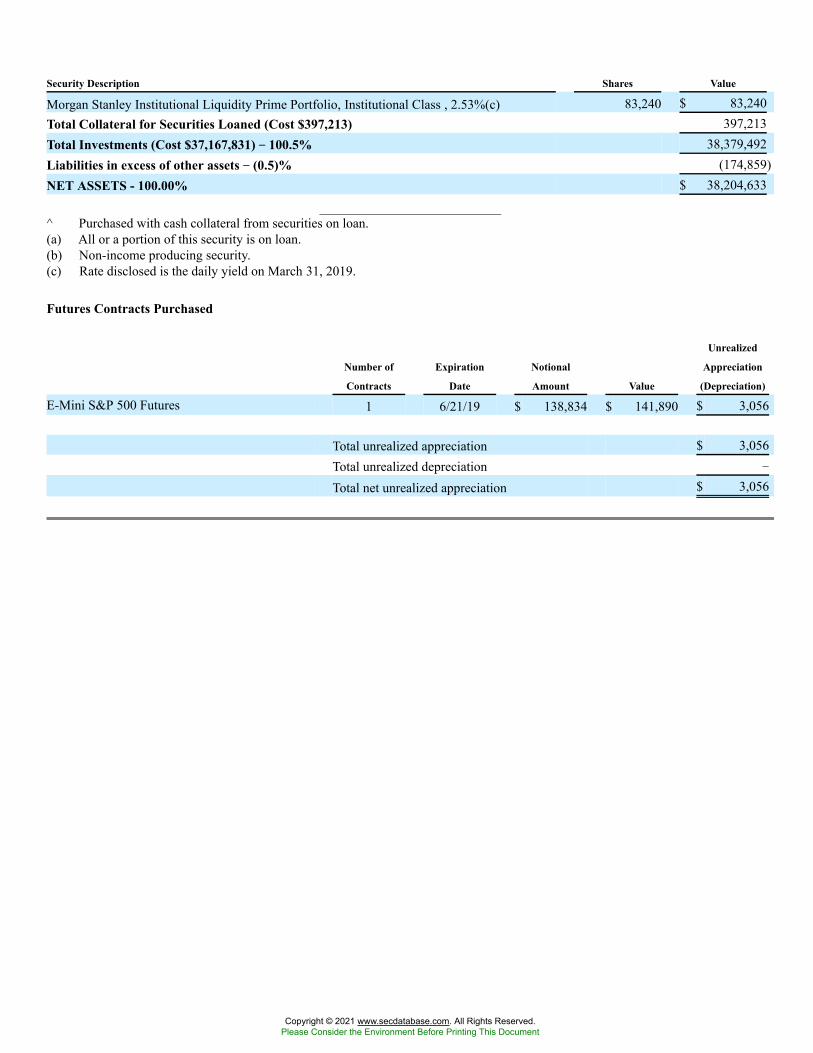
Security Description Shares Value
Morgan Stanley Institutional Liquidity Prime Portfolio, Institutional Class , 2.53%(c) 83,240 $ 83,240Total Collateral for Securities Loaned (Cost $397,213) 397,213Total Investments (Cost $37,167,831) �� 100.5% 38,379,492Liabilities in excess of other assets �� (0.5)% (174,859)NET ASSETS - 100.00% $ 38,204,633
^ Purchased with cash collateral from securities on loan.(a) All or a portion of this security is on loan.(b) Non-income producing security.(c) Rate disclosed is the daily yield on March 31, 2019.
Futures Contracts Purchased
Number of
Contracts
Expiration
Date
Notional
Amount Value
Unrealized
Appreciation
(Depreciation)
E-Mini S&P 500 Futures 1 6/21/19 $ 138,834 $ 141,890 $ 3,056
Total unrealized appreciation $ 3,056Total unrealized depreciation �
Total net unrealized appreciation $ 3,056
Copyright © 2021 www.secdatabase.com. All Rights Reserved.Please Consider the Environment Before Printing This Document
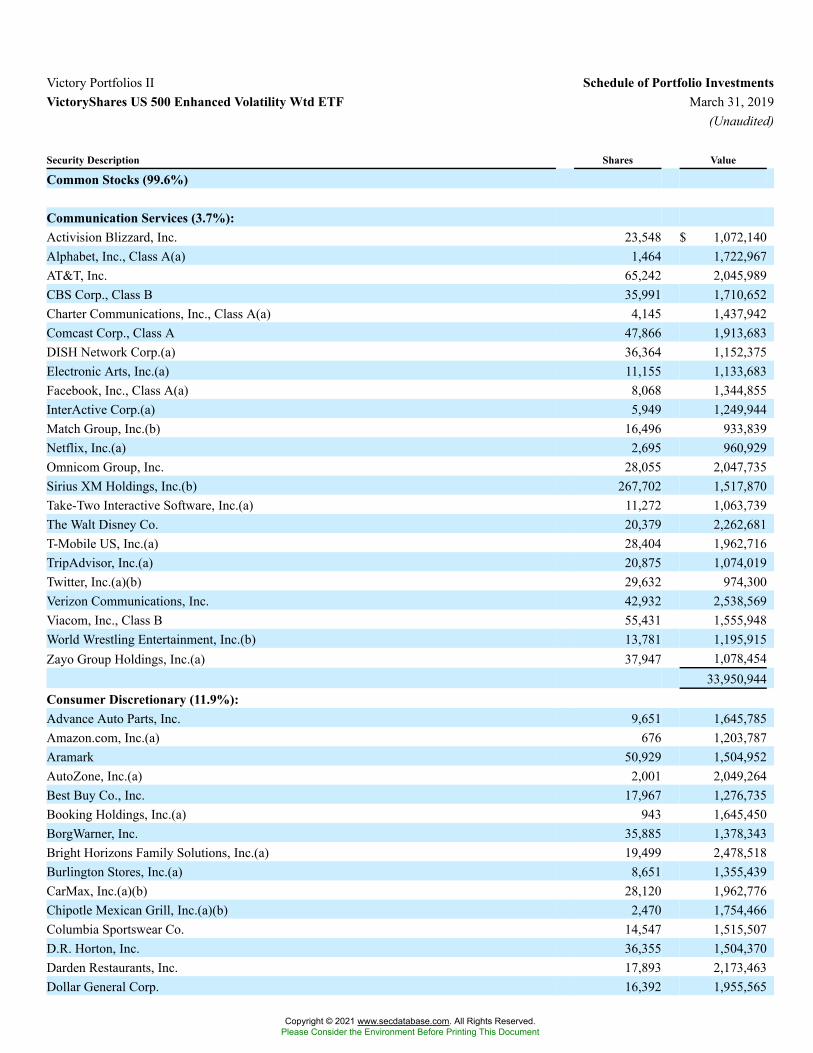
Victory Portfolios II Schedule of Portfolio InvestmentsVictoryShares US 500 Enhanced Volatility Wtd ETF March 31, 2019
(Unaudited)
Security Description Shares Value
Common Stocks (99.6%)
Communication Services (3.7%):Activision Blizzard, Inc. 23,548 $ 1,072,140Alphabet, Inc., Class A(a) 1,464 1,722,967AT&T, Inc. 65,242 2,045,989CBS Corp., Class B 35,991 1,710,652Charter Communications, Inc., Class A(a) 4,145 1,437,942Comcast Corp., Class A 47,866 1,913,683DISH Network Corp.(a) 36,364 1,152,375Electronic Arts, Inc.(a) 11,155 1,133,683Facebook, Inc., Class A(a) 8,068 1,344,855InterActive Corp.(a) 5,949 1,249,944Match Group, Inc.(b) 16,496 933,839Netflix, Inc.(a) 2,695 960,929Omnicom Group, Inc. 28,055 2,047,735Sirius XM Holdings, Inc.(b) 267,702 1,517,870Take-Two Interactive Software, Inc.(a) 11,272 1,063,739The Walt Disney Co. 20,379 2,262,681T-Mobile US, Inc.(a) 28,404 1,962,716TripAdvisor, Inc.(a) 20,875 1,074,019Twitter, Inc.(a)(b) 29,632 974,300Verizon Communications, Inc. 42,932 2,538,569Viacom, Inc., Class B 55,431 1,555,948World Wrestling Entertainment, Inc.(b) 13,781 1,195,915Zayo Group Holdings, Inc.(a) 37,947 1,078,454
33,950,944Consumer Discretionary (11.9%):Advance Auto Parts, Inc. 9,651 1,645,785Amazon.com, Inc.(a) 676 1,203,787Aramark 50,929 1,504,952AutoZone, Inc.(a) 2,001 2,049,264Best Buy Co., Inc. 17,967 1,276,735Booking Holdings, Inc.(a) 943 1,645,450BorgWarner, Inc. 35,885 1,378,343Bright Horizons Family Solutions, Inc.(a) 19,499 2,478,518Burlington Stores, Inc.(a) 8,651 1,355,439CarMax, Inc.(a)(b) 28,120 1,962,776Chipotle Mexican Grill, Inc.(a)(b) 2,470 1,754,466Columbia Sportswear Co. 14,547 1,515,507D.R. Horton, Inc. 36,355 1,504,370Darden Restaurants, Inc. 17,893 2,173,463Dollar General Corp. 16,392 1,955,565
Copyright © 2021 www.secdatabase.com. All Rights Reserved.Please Consider the Environment Before Printing This Document
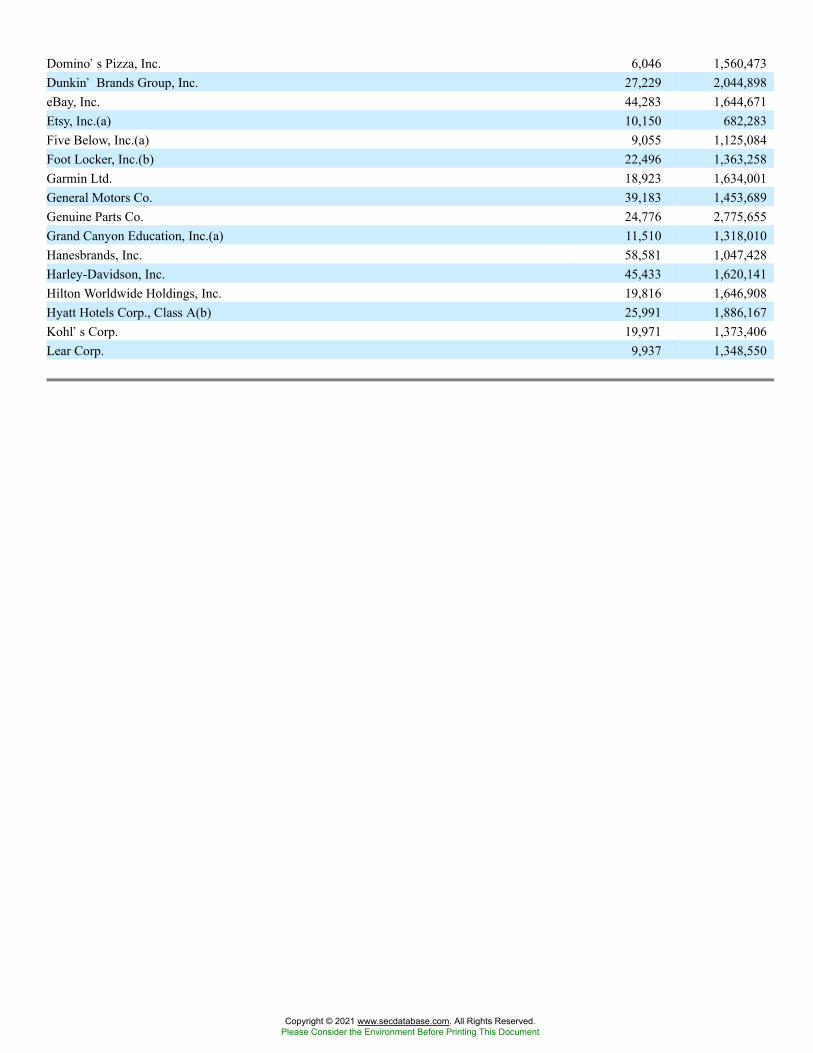
Domino�s Pizza, Inc. 6,046 1,560,473Dunkin� Brands Group, Inc. 27,229 2,044,898eBay, Inc. 44,283 1,644,671Etsy, Inc.(a) 10,150 682,283Five Below, Inc.(a) 9,055 1,125,084Foot Locker, Inc.(b) 22,496 1,363,258Garmin Ltd. 18,923 1,634,001General Motors Co. 39,183 1,453,689Genuine Parts Co. 24,776 2,775,655Grand Canyon Education, Inc.(a) 11,510 1,318,010Hanesbrands, Inc. 58,581 1,047,428Harley-Davidson, Inc. 45,433 1,620,141Hilton Worldwide Holdings, Inc. 19,816 1,646,908Hyatt Hotels Corp., Class A(b) 25,991 1,886,167Kohl�s Corp. 19,971 1,373,406Lear Corp. 9,937 1,348,550
Copyright © 2021 www.secdatabase.com. All Rights Reserved.Please Consider the Environment Before Printing This Document
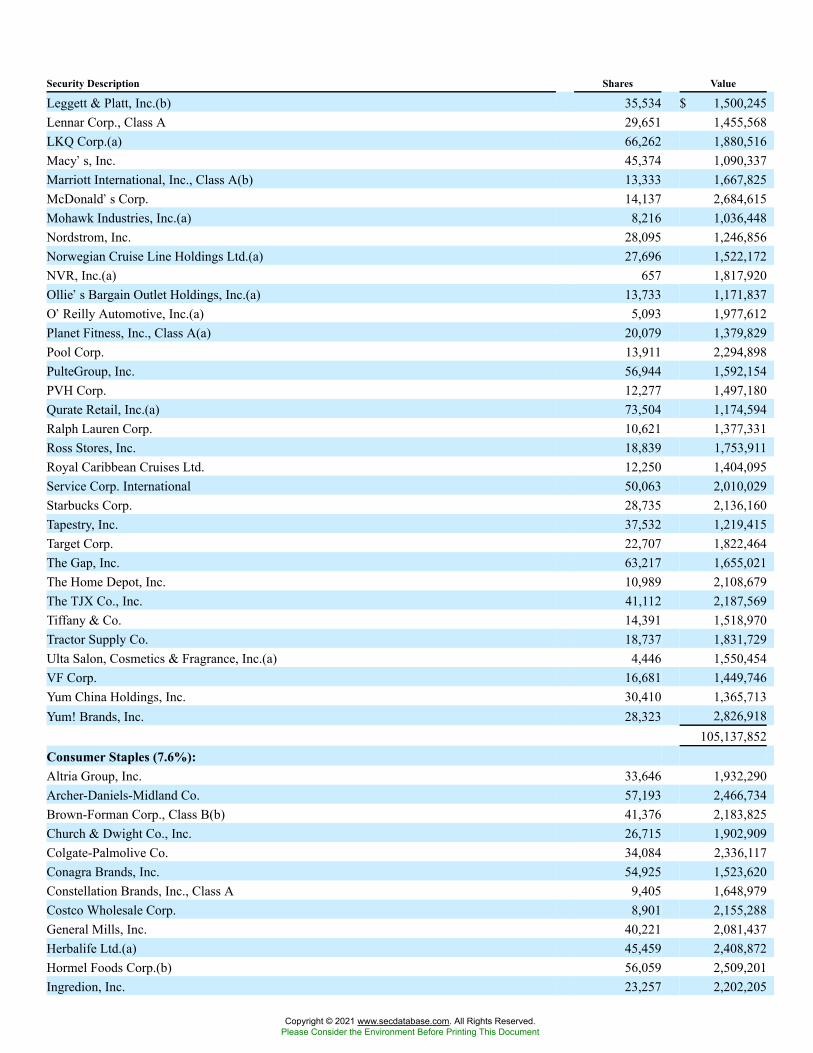
Security Description Shares Value
Leggett & Platt, Inc.(b) 35,534 $ 1,500,245Lennar Corp., Class A 29,651 1,455,568LKQ Corp.(a) 66,262 1,880,516Macy�s, Inc. 45,374 1,090,337Marriott International, Inc., Class A(b) 13,333 1,667,825McDonald�s Corp. 14,137 2,684,615Mohawk Industries, Inc.(a) 8,216 1,036,448Nordstrom, Inc. 28,095 1,246,856Norwegian Cruise Line Holdings Ltd.(a) 27,696 1,522,172NVR, Inc.(a) 657 1,817,920Ollie�s Bargain Outlet Holdings, Inc.(a) 13,733 1,171,837O�Reilly Automotive, Inc.(a) 5,093 1,977,612Planet Fitness, Inc., Class A(a) 20,079 1,379,829Pool Corp. 13,911 2,294,898PulteGroup, Inc. 56,944 1,592,154PVH Corp. 12,277 1,497,180Qurate Retail, Inc.(a) 73,504 1,174,594Ralph Lauren Corp. 10,621 1,377,331Ross Stores, Inc. 18,839 1,753,911Royal Caribbean Cruises Ltd. 12,250 1,404,095Service Corp. International 50,063 2,010,029Starbucks Corp. 28,735 2,136,160Tapestry, Inc. 37,532 1,219,415Target Corp. 22,707 1,822,464The Gap, Inc. 63,217 1,655,021The Home Depot, Inc. 10,989 2,108,679The TJX Co., Inc. 41,112 2,187,569Tiffany & Co. 14,391 1,518,970Tractor Supply Co. 18,737 1,831,729Ulta Salon, Cosmetics & Fragrance, Inc.(a) 4,446 1,550,454VF Corp. 16,681 1,449,746Yum China Holdings, Inc. 30,410 1,365,713Yum! Brands, Inc. 28,323 2,826,918
105,137,852Consumer Staples (7.6%):Altria Group, Inc. 33,646 1,932,290Archer-Daniels-Midland Co. 57,193 2,466,734Brown-Forman Corp., Class B(b) 41,376 2,183,825Church & Dwight Co., Inc. 26,715 1,902,909Colgate-Palmolive Co. 34,084 2,336,117Conagra Brands, Inc. 54,925 1,523,620Constellation Brands, Inc., Class A 9,405 1,648,979Costco Wholesale Corp. 8,901 2,155,288General Mills, Inc. 40,221 2,081,437Herbalife Ltd.(a) 45,459 2,408,872Hormel Foods Corp.(b) 56,059 2,509,201Ingredion, Inc. 23,257 2,202,205
Copyright © 2021 www.secdatabase.com. All Rights Reserved.Please Consider the Environment Before Printing This Document
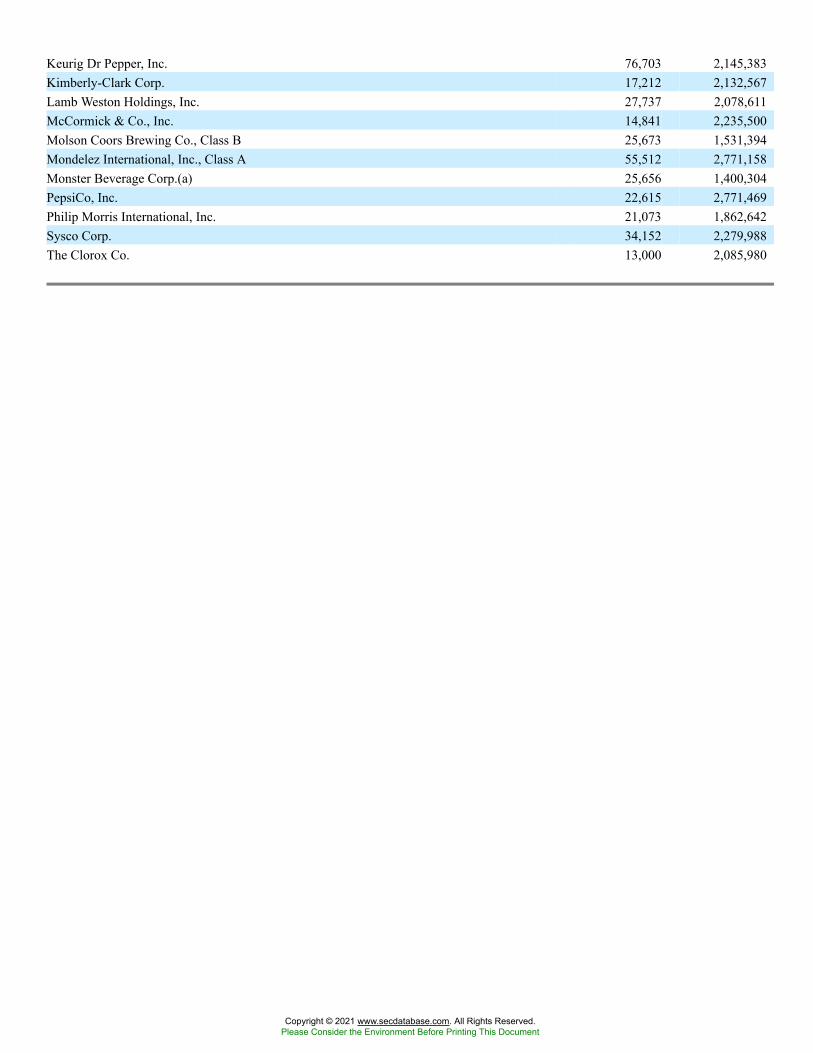
Keurig Dr Pepper, Inc. 76,703 2,145,383Kimberly-Clark Corp. 17,212 2,132,567Lamb Weston Holdings, Inc. 27,737 2,078,611McCormick & Co., Inc. 14,841 2,235,500Molson Coors Brewing Co., Class B 25,673 1,531,394Mondelez International, Inc., Class A 55,512 2,771,158Monster Beverage Corp.(a) 25,656 1,400,304PepsiCo, Inc. 22,615 2,771,469Philip Morris International, Inc. 21,073 1,862,642Sysco Corp. 34,152 2,279,988The Clorox Co. 13,000 2,085,980
Copyright © 2021 www.secdatabase.com. All Rights Reserved.Please Consider the Environment Before Printing This Document
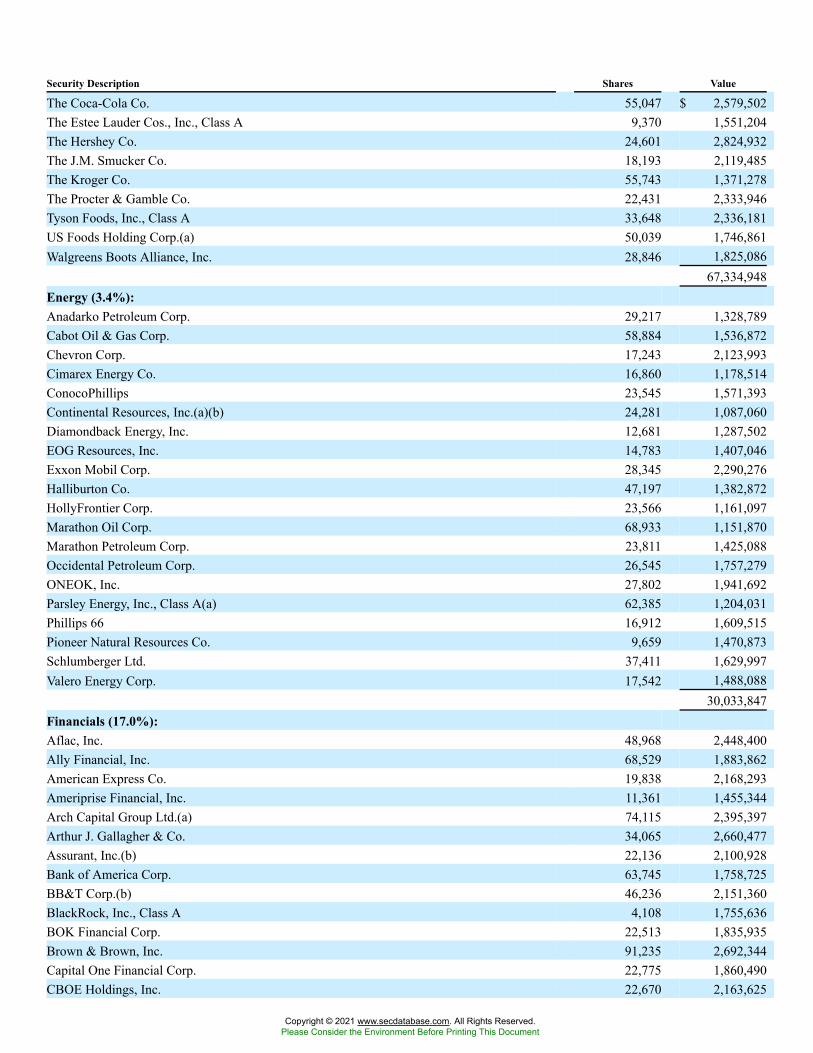
Security Description Shares Value
The Coca-Cola Co. 55,047 $ 2,579,502The Estee Lauder Cos., Inc., Class A 9,370 1,551,204The Hershey Co. 24,601 2,824,932The J.M. Smucker Co. 18,193 2,119,485The Kroger Co. 55,743 1,371,278The Procter & Gamble Co. 22,431 2,333,946Tyson Foods, Inc., Class A 33,648 2,336,181US Foods Holding Corp.(a) 50,039 1,746,861Walgreens Boots Alliance, Inc. 28,846 1,825,086
67,334,948Energy (3.4%):Anadarko Petroleum Corp. 29,217 1,328,789Cabot Oil & Gas Corp. 58,884 1,536,872Chevron Corp. 17,243 2,123,993Cimarex Energy Co. 16,860 1,178,514ConocoPhillips 23,545 1,571,393Continental Resources, Inc.(a)(b) 24,281 1,087,060Diamondback Energy, Inc. 12,681 1,287,502EOG Resources, Inc. 14,783 1,407,046Exxon Mobil Corp. 28,345 2,290,276Halliburton Co. 47,197 1,382,872HollyFrontier Corp. 23,566 1,161,097Marathon Oil Corp. 68,933 1,151,870Marathon Petroleum Corp. 23,811 1,425,088Occidental Petroleum Corp. 26,545 1,757,279ONEOK, Inc. 27,802 1,941,692Parsley Energy, Inc., Class A(a) 62,385 1,204,031Phillips 66 16,912 1,609,515Pioneer Natural Resources Co. 9,659 1,470,873Schlumberger Ltd. 37,411 1,629,997Valero Energy Corp. 17,542 1,488,088
30,033,847Financials (17.0%):Aflac, Inc. 48,968 2,448,400Ally Financial, Inc. 68,529 1,883,862American Express Co. 19,838 2,168,293Ameriprise Financial, Inc. 11,361 1,455,344Arch Capital Group Ltd.(a) 74,115 2,395,397Arthur J. Gallagher & Co. 34,065 2,660,477Assurant, Inc.(b) 22,136 2,100,928Bank of America Corp. 63,745 1,758,725BB&T Corp.(b) 46,236 2,151,360BlackRock, Inc., Class A 4,108 1,755,636BOK Financial Corp. 22,513 1,835,935Brown & Brown, Inc. 91,235 2,692,344Capital One Financial Corp. 22,775 1,860,490CBOE Holdings, Inc. 22,670 2,163,625
Copyright © 2021 www.secdatabase.com. All Rights Reserved.Please Consider the Environment Before Printing This Document
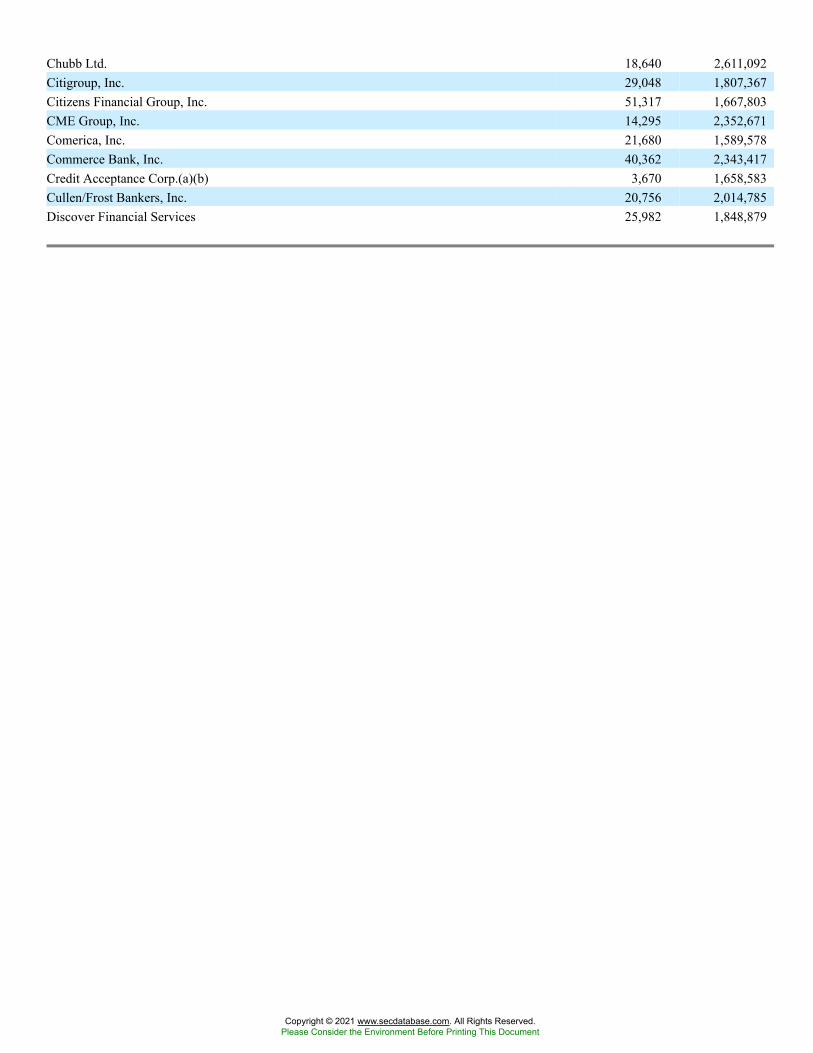
Chubb Ltd. 18,640 2,611,092Citigroup, Inc. 29,048 1,807,367Citizens Financial Group, Inc. 51,317 1,667,803CME Group, Inc. 14,295 2,352,671Comerica, Inc. 21,680 1,589,578Commerce Bank, Inc. 40,362 2,343,417Credit Acceptance Corp.(a)(b) 3,670 1,658,583Cullen/Frost Bankers, Inc. 20,756 2,014,785Discover Financial Services 25,982 1,848,879
Copyright © 2021 www.secdatabase.com. All Rights Reserved.Please Consider the Environment Before Printing This Document
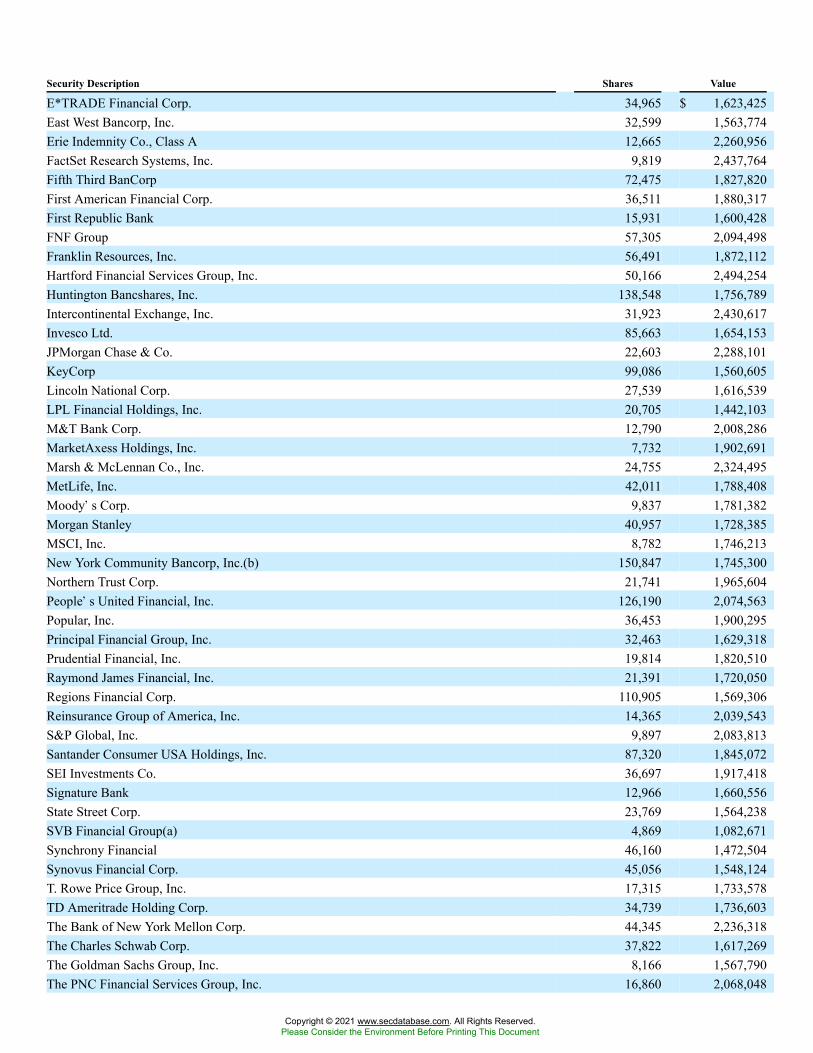
Security Description Shares Value
E*TRADE Financial Corp. 34,965 $ 1,623,425East West Bancorp, Inc. 32,599 1,563,774Erie Indemnity Co., Class A 12,665 2,260,956FactSet Research Systems, Inc. 9,819 2,437,764Fifth Third BanCorp 72,475 1,827,820First American Financial Corp. 36,511 1,880,317First Republic Bank 15,931 1,600,428FNF Group 57,305 2,094,498Franklin Resources, Inc. 56,491 1,872,112Hartford Financial Services Group, Inc. 50,166 2,494,254Huntington Bancshares, Inc. 138,548 1,756,789Intercontinental Exchange, Inc. 31,923 2,430,617Invesco Ltd. 85,663 1,654,153JPMorgan Chase & Co. 22,603 2,288,101KeyCorp 99,086 1,560,605Lincoln National Corp. 27,539 1,616,539LPL Financial Holdings, Inc. 20,705 1,442,103M&T Bank Corp. 12,790 2,008,286MarketAxess Holdings, Inc. 7,732 1,902,691Marsh & McLennan Co., Inc. 24,755 2,324,495MetLife, Inc. 42,011 1,788,408Moody�s Corp. 9,837 1,781,382Morgan Stanley 40,957 1,728,385MSCI, Inc. 8,782 1,746,213New York Community Bancorp, Inc.(b) 150,847 1,745,300Northern Trust Corp. 21,741 1,965,604People�s United Financial, Inc. 126,190 2,074,563Popular, Inc. 36,453 1,900,295Principal Financial Group, Inc. 32,463 1,629,318Prudential Financial, Inc. 19,814 1,820,510Raymond James Financial, Inc. 21,391 1,720,050Regions Financial Corp. 110,905 1,569,306Reinsurance Group of America, Inc. 14,365 2,039,543S&P Global, Inc. 9,897 2,083,813Santander Consumer USA Holdings, Inc. 87,320 1,845,072SEI Investments Co. 36,697 1,917,418Signature Bank 12,966 1,660,556State Street Corp. 23,769 1,564,238SVB Financial Group(a) 4,869 1,082,671Synchrony Financial 46,160 1,472,504Synovus Financial Corp. 45,056 1,548,124T. Rowe Price Group, Inc. 17,315 1,733,578TD Ameritrade Holding Corp. 34,739 1,736,603The Bank of New York Mellon Corp. 44,345 2,236,318The Charles Schwab Corp. 37,822 1,617,269The Goldman Sachs Group, Inc. 8,166 1,567,790The PNC Financial Services Group, Inc. 16,860 2,068,048
Copyright © 2021 www.secdatabase.com. All Rights Reserved.Please Consider the Environment Before Printing This Document
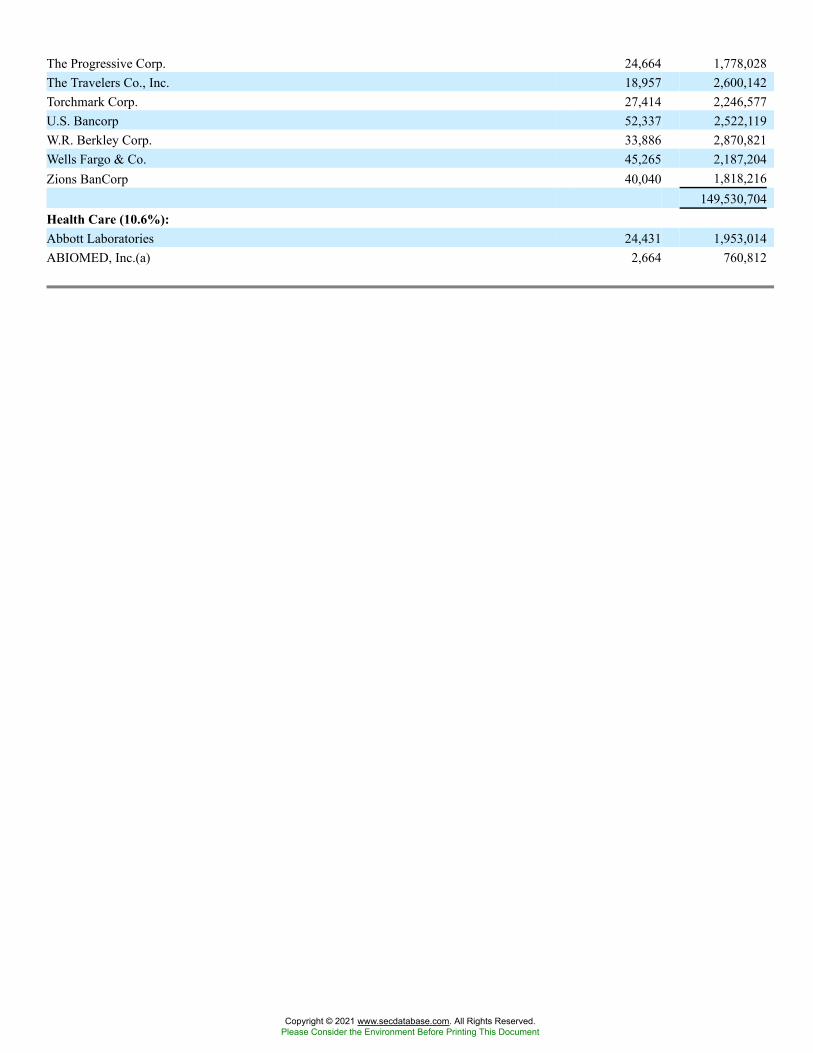
The Progressive Corp. 24,664 1,778,028The Travelers Co., Inc. 18,957 2,600,142Torchmark Corp. 27,414 2,246,577U.S. Bancorp 52,337 2,522,119W.R. Berkley Corp. 33,886 2,870,821Wells Fargo & Co. 45,265 2,187,204Zions BanCorp 40,040 1,818,216
149,530,704Health Care (10.6%):Abbott Laboratories 24,431 1,953,014ABIOMED, Inc.(a) 2,664 760,812
Copyright © 2021 www.secdatabase.com. All Rights Reserved.Please Consider the Environment Before Printing This Document
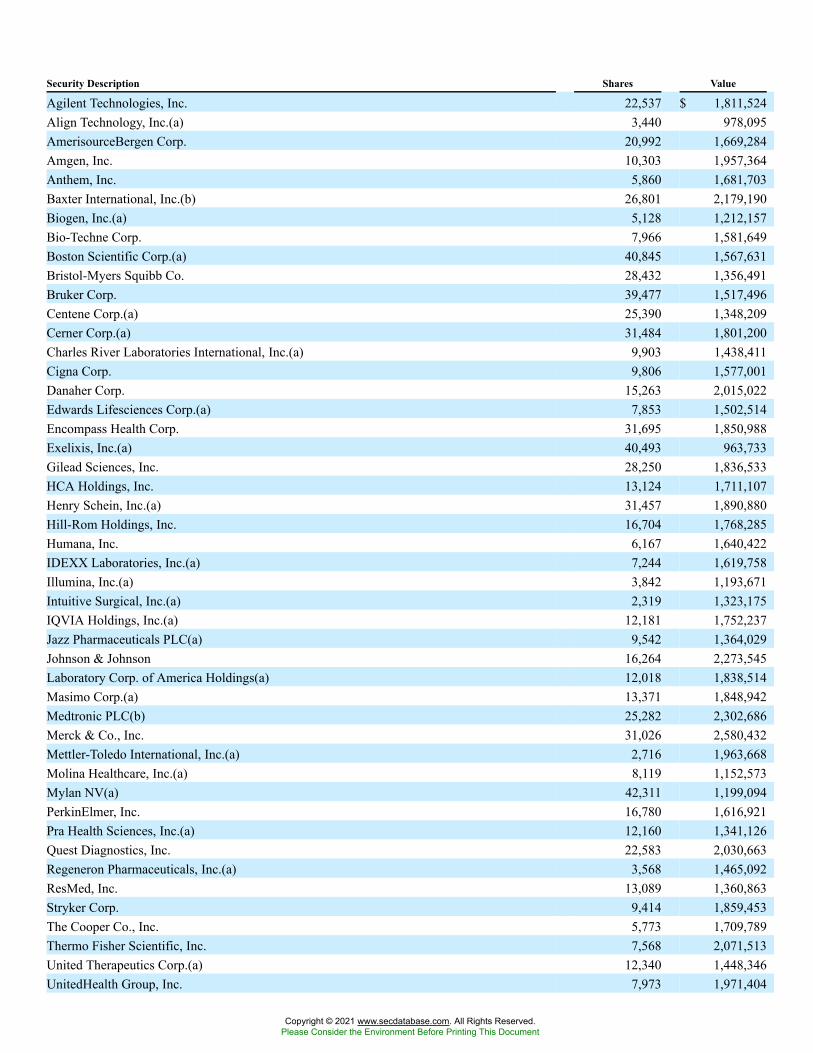
Security Description Shares Value
Agilent Technologies, Inc. 22,537 $ 1,811,524Align Technology, Inc.(a) 3,440 978,095AmerisourceBergen Corp. 20,992 1,669,284Amgen, Inc. 10,303 1,957,364Anthem, Inc. 5,860 1,681,703Baxter International, Inc.(b) 26,801 2,179,190Biogen, Inc.(a) 5,128 1,212,157Bio-Techne Corp. 7,966 1,581,649Boston Scientific Corp.(a) 40,845 1,567,631Bristol-Myers Squibb Co. 28,432 1,356,491Bruker Corp. 39,477 1,517,496Centene Corp.(a) 25,390 1,348,209Cerner Corp.(a) 31,484 1,801,200Charles River Laboratories International, Inc.(a) 9,903 1,438,411Cigna Corp. 9,806 1,577,001Danaher Corp. 15,263 2,015,022Edwards Lifesciences Corp.(a) 7,853 1,502,514Encompass Health Corp. 31,695 1,850,988Exelixis, Inc.(a) 40,493 963,733Gilead Sciences, Inc. 28,250 1,836,533HCA Holdings, Inc. 13,124 1,711,107Henry Schein, Inc.(a) 31,457 1,890,880Hill-Rom Holdings, Inc. 16,704 1,768,285Humana, Inc. 6,167 1,640,422IDEXX Laboratories, Inc.(a) 7,244 1,619,758Illumina, Inc.(a) 3,842 1,193,671Intuitive Surgical, Inc.(a) 2,319 1,323,175IQVIA Holdings, Inc.(a) 12,181 1,752,237Jazz Pharmaceuticals PLC(a) 9,542 1,364,029Johnson & Johnson 16,264 2,273,545Laboratory Corp. of America Holdings(a) 12,018 1,838,514Masimo Corp.(a) 13,371 1,848,942Medtronic PLC(b) 25,282 2,302,686Merck & Co., Inc. 31,026 2,580,432Mettler-Toledo International, Inc.(a) 2,716 1,963,668Molina Healthcare, Inc.(a) 8,119 1,152,573Mylan NV(a) 42,311 1,199,094PerkinElmer, Inc. 16,780 1,616,921Pra Health Sciences, Inc.(a) 12,160 1,341,126Quest Diagnostics, Inc. 22,583 2,030,663Regeneron Pharmaceuticals, Inc.(a) 3,568 1,465,092ResMed, Inc. 13,089 1,360,863Stryker Corp. 9,414 1,859,453The Cooper Co., Inc. 5,773 1,709,789Thermo Fisher Scientific, Inc. 7,568 2,071,513United Therapeutics Corp.(a) 12,340 1,448,346UnitedHealth Group, Inc. 7,973 1,971,404
Copyright © 2021 www.secdatabase.com. All Rights Reserved.Please Consider the Environment Before Printing This Document
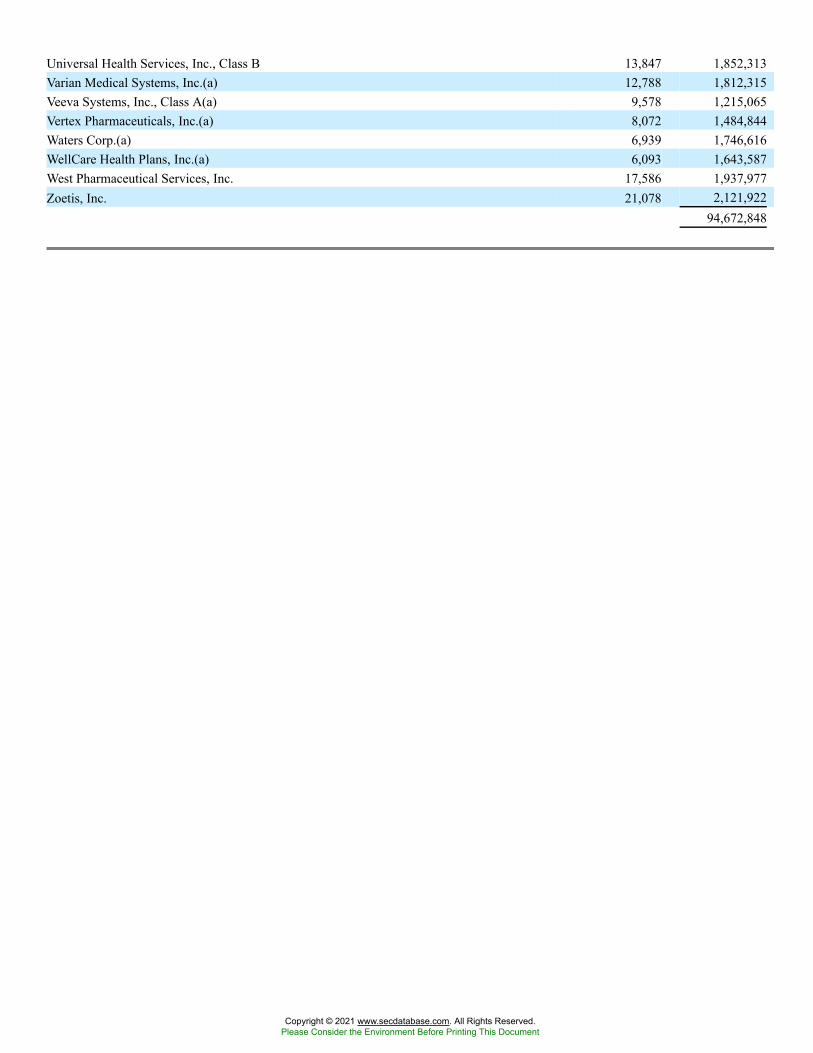
Universal Health Services, Inc., Class B 13,847 1,852,313Varian Medical Systems, Inc.(a) 12,788 1,812,315Veeva Systems, Inc., Class A(a) 9,578 1,215,065Vertex Pharmaceuticals, Inc.(a) 8,072 1,484,844Waters Corp.(a) 6,939 1,746,616WellCare Health Plans, Inc.(a) 6,093 1,643,587West Pharmaceutical Services, Inc. 17,586 1,937,977Zoetis, Inc. 21,078 2,121,922
94,672,848
Copyright © 2021 www.secdatabase.com. All Rights Reserved.Please Consider the Environment Before Printing This Document
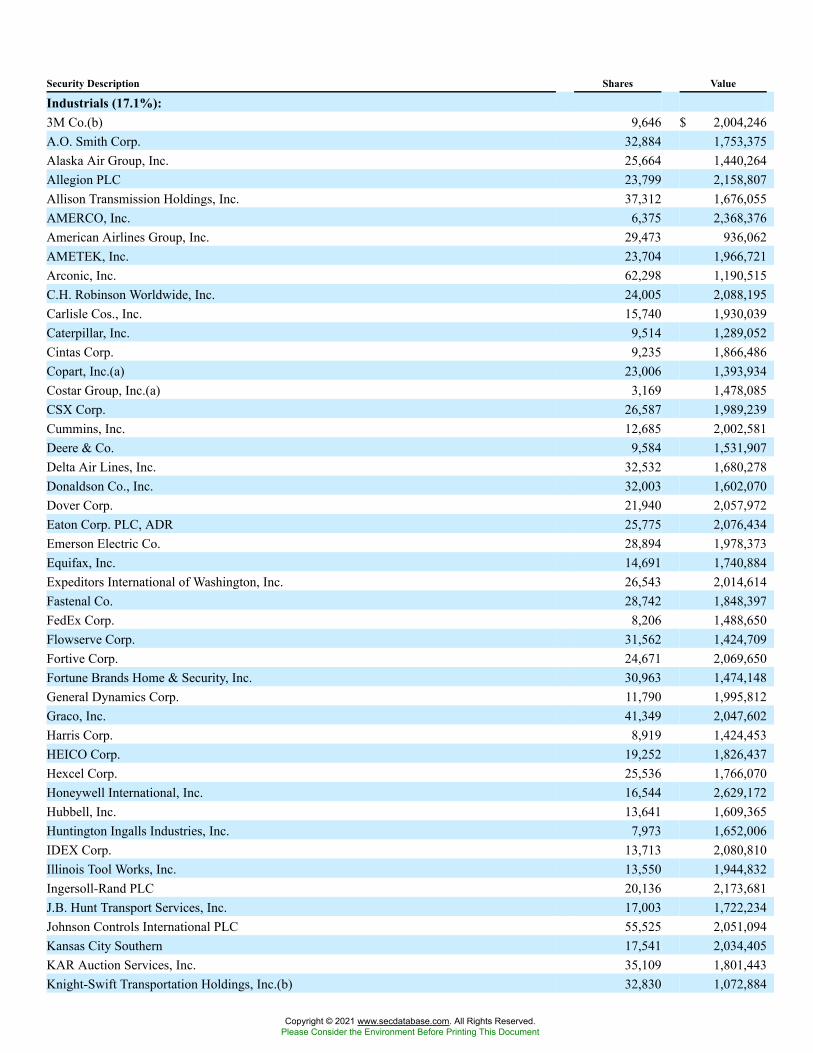
Security Description Shares Value
Industrials (17.1%):3M Co.(b) 9,646 $ 2,004,246A.O. Smith Corp. 32,884 1,753,375Alaska Air Group, Inc. 25,664 1,440,264Allegion PLC 23,799 2,158,807Allison Transmission Holdings, Inc. 37,312 1,676,055AMERCO, Inc. 6,375 2,368,376American Airlines Group, Inc. 29,473 936,062AMETEK, Inc. 23,704 1,966,721Arconic, Inc. 62,298 1,190,515C.H. Robinson Worldwide, Inc. 24,005 2,088,195Carlisle Cos., Inc. 15,740 1,930,039Caterpillar, Inc. 9,514 1,289,052Cintas Corp. 9,235 1,866,486Copart, Inc.(a) 23,006 1,393,934Costar Group, Inc.(a) 3,169 1,478,085CSX Corp. 26,587 1,989,239Cummins, Inc. 12,685 2,002,581Deere & Co. 9,584 1,531,907Delta Air Lines, Inc. 32,532 1,680,278Donaldson Co., Inc. 32,003 1,602,070Dover Corp. 21,940 2,057,972Eaton Corp. PLC, ADR 25,775 2,076,434Emerson Electric Co. 28,894 1,978,373Equifax, Inc. 14,691 1,740,884Expeditors International of Washington, Inc. 26,543 2,014,614Fastenal Co. 28,742 1,848,397FedEx Corp. 8,206 1,488,650Flowserve Corp. 31,562 1,424,709Fortive Corp. 24,671 2,069,650Fortune Brands Home & Security, Inc. 30,963 1,474,148General Dynamics Corp. 11,790 1,995,812Graco, Inc. 41,349 2,047,602Harris Corp. 8,919 1,424,453HEICO Corp. 19,252 1,826,437Hexcel Corp. 25,536 1,766,070Honeywell International, Inc. 16,544 2,629,172Hubbell, Inc. 13,641 1,609,365Huntington Ingalls Industries, Inc. 7,973 1,652,006IDEX Corp. 13,713 2,080,810Illinois Tool Works, Inc. 13,550 1,944,832Ingersoll-Rand PLC 20,136 2,173,681J.B. Hunt Transport Services, Inc. 17,003 1,722,234Johnson Controls International PLC 55,525 2,051,094Kansas City Southern 17,541 2,034,405KAR Auction Services, Inc. 35,109 1,801,443Knight-Swift Transportation Holdings, Inc.(b) 32,830 1,072,884
Copyright © 2021 www.secdatabase.com. All Rights Reserved.Please Consider the Environment Before Printing This Document
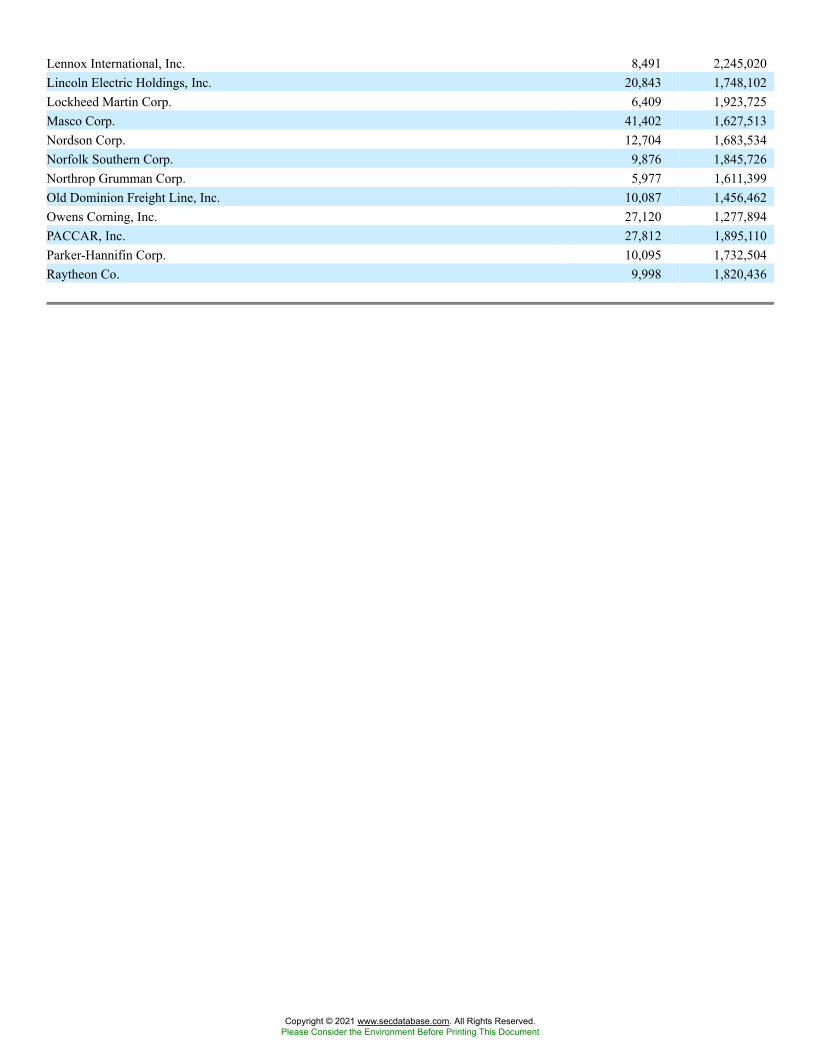
Lennox International, Inc. 8,491 2,245,020Lincoln Electric Holdings, Inc. 20,843 1,748,102Lockheed Martin Corp. 6,409 1,923,725Masco Corp. 41,402 1,627,513Nordson Corp. 12,704 1,683,534Norfolk Southern Corp. 9,876 1,845,726Northrop Grumman Corp. 5,977 1,611,399Old Dominion Freight Line, Inc. 10,087 1,456,462Owens Corning, Inc. 27,120 1,277,894PACCAR, Inc. 27,812 1,895,110Parker-Hannifin Corp. 10,095 1,732,504Raytheon Co. 9,998 1,820,436
Copyright © 2021 www.secdatabase.com. All Rights Reserved.Please Consider the Environment Before Printing This Document
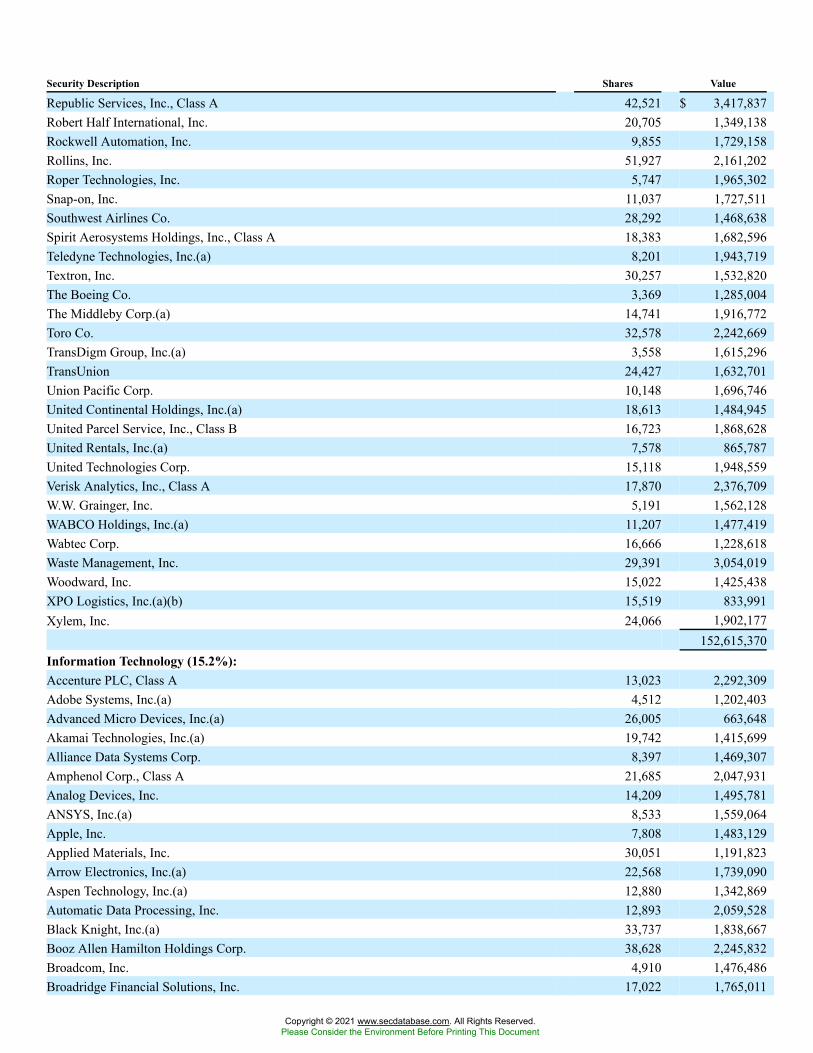
Security Description Shares Value
Republic Services, Inc., Class A 42,521 $ 3,417,837Robert Half International, Inc. 20,705 1,349,138Rockwell Automation, Inc. 9,855 1,729,158Rollins, Inc. 51,927 2,161,202Roper Technologies, Inc. 5,747 1,965,302Snap-on, Inc. 11,037 1,727,511Southwest Airlines Co. 28,292 1,468,638Spirit Aerosystems Holdings, Inc., Class A 18,383 1,682,596Teledyne Technologies, Inc.(a) 8,201 1,943,719Textron, Inc. 30,257 1,532,820The Boeing Co. 3,369 1,285,004The Middleby Corp.(a) 14,741 1,916,772Toro Co. 32,578 2,242,669TransDigm Group, Inc.(a) 3,558 1,615,296TransUnion 24,427 1,632,701Union Pacific Corp. 10,148 1,696,746United Continental Holdings, Inc.(a) 18,613 1,484,945United Parcel Service, Inc., Class B 16,723 1,868,628United Rentals, Inc.(a) 7,578 865,787United Technologies Corp. 15,118 1,948,559Verisk Analytics, Inc., Class A 17,870 2,376,709W.W. Grainger, Inc. 5,191 1,562,128WABCO Holdings, Inc.(a) 11,207 1,477,419Wabtec Corp. 16,666 1,228,618Waste Management, Inc. 29,391 3,054,019Woodward, Inc. 15,022 1,425,438XPO Logistics, Inc.(a)(b) 15,519 833,991Xylem, Inc. 24,066 1,902,177
152,615,370Information Technology (15.2%):Accenture PLC, Class A 13,023 2,292,309Adobe Systems, Inc.(a) 4,512 1,202,403Advanced Micro Devices, Inc.(a) 26,005 663,648Akamai Technologies, Inc.(a) 19,742 1,415,699Alliance Data Systems Corp. 8,397 1,469,307Amphenol Corp., Class A 21,685 2,047,931Analog Devices, Inc. 14,209 1,495,781ANSYS, Inc.(a) 8,533 1,559,064Apple, Inc. 7,808 1,483,129Applied Materials, Inc. 30,051 1,191,823Arrow Electronics, Inc.(a) 22,568 1,739,090Aspen Technology, Inc.(a) 12,880 1,342,869Automatic Data Processing, Inc. 12,893 2,059,528Black Knight, Inc.(a) 33,737 1,838,667Booz Allen Hamilton Holdings Corp. 38,628 2,245,832Broadcom, Inc. 4,910 1,476,486Broadridge Financial Solutions, Inc. 17,022 1,765,011
Copyright © 2021 www.secdatabase.com. All Rights Reserved.Please Consider the Environment Before Printing This Document
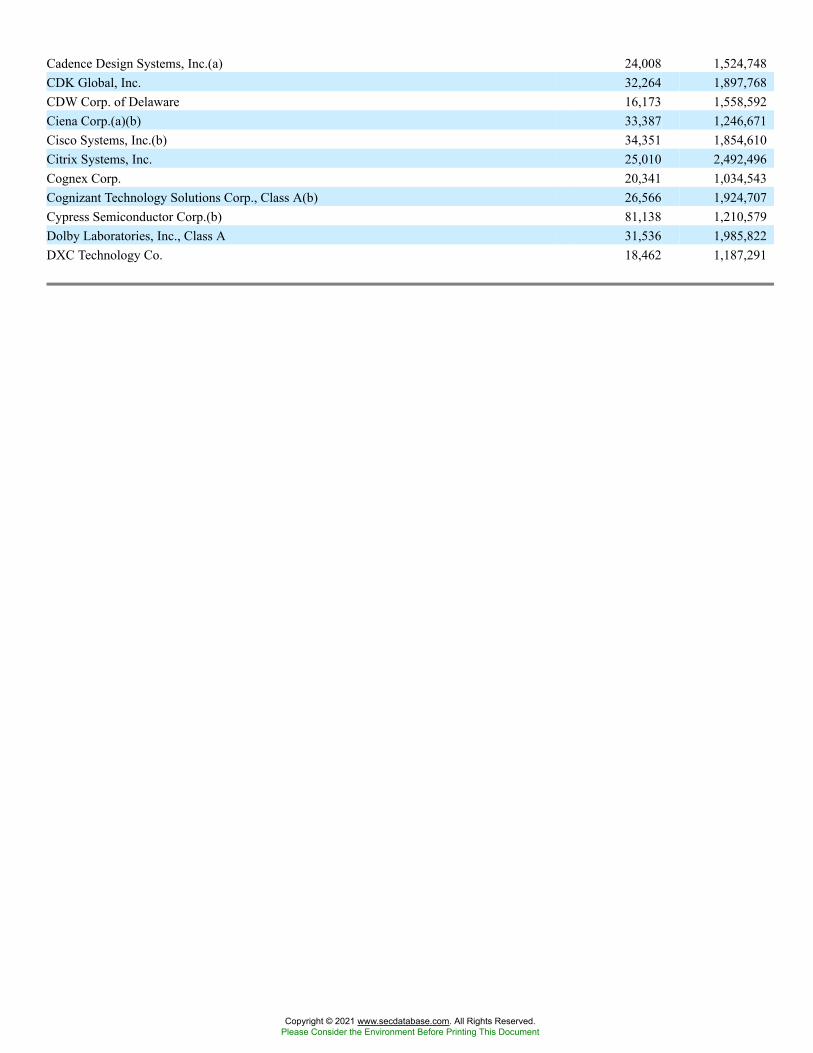
Cadence Design Systems, Inc.(a) 24,008 1,524,748CDK Global, Inc. 32,264 1,897,768CDW Corp. of Delaware 16,173 1,558,592Ciena Corp.(a)(b) 33,387 1,246,671Cisco Systems, Inc.(b) 34,351 1,854,610Citrix Systems, Inc. 25,010 2,492,496Cognex Corp. 20,341 1,034,543Cognizant Technology Solutions Corp., Class A(b) 26,566 1,924,707Cypress Semiconductor Corp.(b) 81,138 1,210,579Dolby Laboratories, Inc., Class A 31,536 1,985,822DXC Technology Co. 18,462 1,187,291
Copyright © 2021 www.secdatabase.com. All Rights Reserved.Please Consider the Environment Before Printing This Document
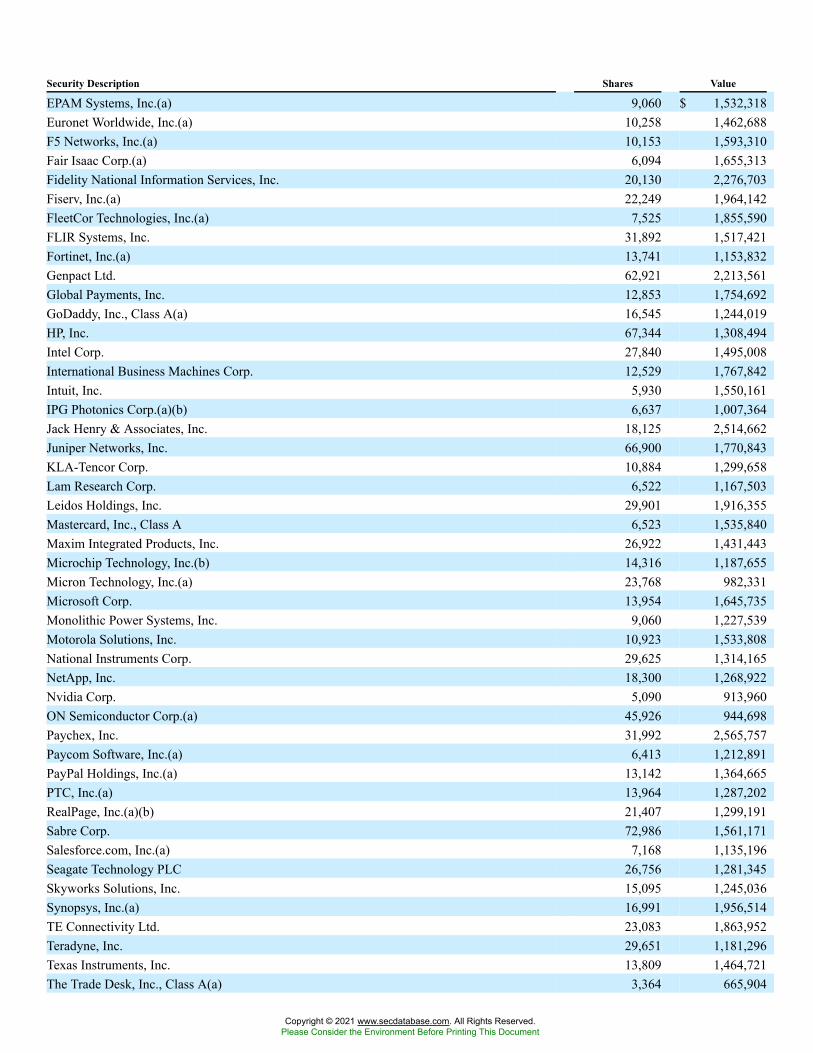
Security Description Shares Value
EPAM Systems, Inc.(a) 9,060 $ 1,532,318Euronet Worldwide, Inc.(a) 10,258 1,462,688F5 Networks, Inc.(a) 10,153 1,593,310Fair Isaac Corp.(a) 6,094 1,655,313Fidelity National Information Services, Inc. 20,130 2,276,703Fiserv, Inc.(a) 22,249 1,964,142FleetCor Technologies, Inc.(a) 7,525 1,855,590FLIR Systems, Inc. 31,892 1,517,421Fortinet, Inc.(a) 13,741 1,153,832Genpact Ltd. 62,921 2,213,561Global Payments, Inc. 12,853 1,754,692GoDaddy, Inc., Class A(a) 16,545 1,244,019HP, Inc. 67,344 1,308,494Intel Corp. 27,840 1,495,008International Business Machines Corp. 12,529 1,767,842Intuit, Inc. 5,930 1,550,161IPG Photonics Corp.(a)(b) 6,637 1,007,364Jack Henry & Associates, Inc. 18,125 2,514,662Juniper Networks, Inc. 66,900 1,770,843KLA-Tencor Corp. 10,884 1,299,658Lam Research Corp. 6,522 1,167,503Leidos Holdings, Inc. 29,901 1,916,355Mastercard, Inc., Class A 6,523 1,535,840Maxim Integrated Products, Inc. 26,922 1,431,443Microchip Technology, Inc.(b) 14,316 1,187,655Micron Technology, Inc.(a) 23,768 982,331Microsoft Corp. 13,954 1,645,735Monolithic Power Systems, Inc. 9,060 1,227,539Motorola Solutions, Inc. 10,923 1,533,808National Instruments Corp. 29,625 1,314,165NetApp, Inc. 18,300 1,268,922Nvidia Corp. 5,090 913,960ON Semiconductor Corp.(a) 45,926 944,698Paychex, Inc. 31,992 2,565,757Paycom Software, Inc.(a) 6,413 1,212,891PayPal Holdings, Inc.(a) 13,142 1,364,665PTC, Inc.(a) 13,964 1,287,202RealPage, Inc.(a)(b) 21,407 1,299,191Sabre Corp. 72,986 1,561,171Salesforce.com, Inc.(a) 7,168 1,135,196Seagate Technology PLC 26,756 1,281,345Skyworks Solutions, Inc. 15,095 1,245,036Synopsys, Inc.(a) 16,991 1,956,514TE Connectivity Ltd. 23,083 1,863,952Teradyne, Inc. 29,651 1,181,296Texas Instruments, Inc. 13,809 1,464,721The Trade Desk, Inc., Class A(a) 3,364 665,904
Copyright © 2021 www.secdatabase.com. All Rights Reserved.Please Consider the Environment Before Printing This Document
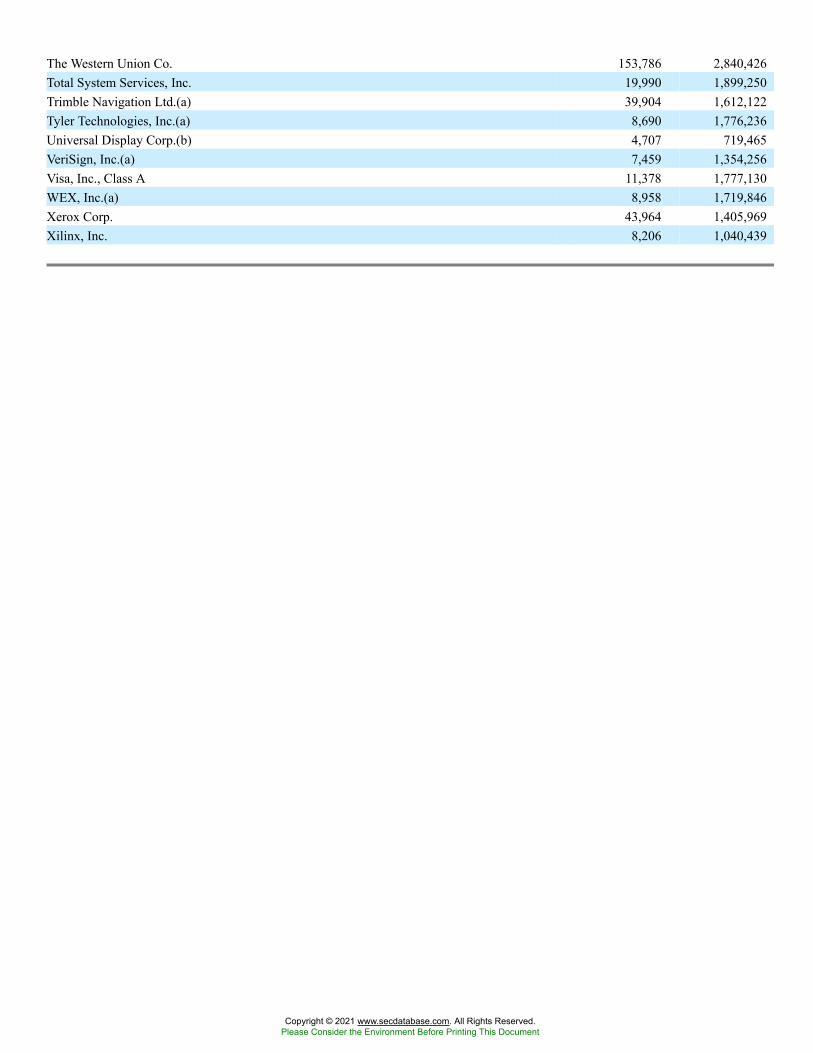
The Western Union Co. 153,786 2,840,426Total System Services, Inc. 19,990 1,899,250Trimble Navigation Ltd.(a) 39,904 1,612,122Tyler Technologies, Inc.(a) 8,690 1,776,236Universal Display Corp.(b) 4,707 719,465VeriSign, Inc.(a) 7,459 1,354,256Visa, Inc., Class A 11,378 1,777,130WEX, Inc.(a) 8,958 1,719,846Xerox Corp. 43,964 1,405,969Xilinx, Inc. 8,206 1,040,439
Copyright © 2021 www.secdatabase.com. All Rights Reserved.Please Consider the Environment Before Printing This Document
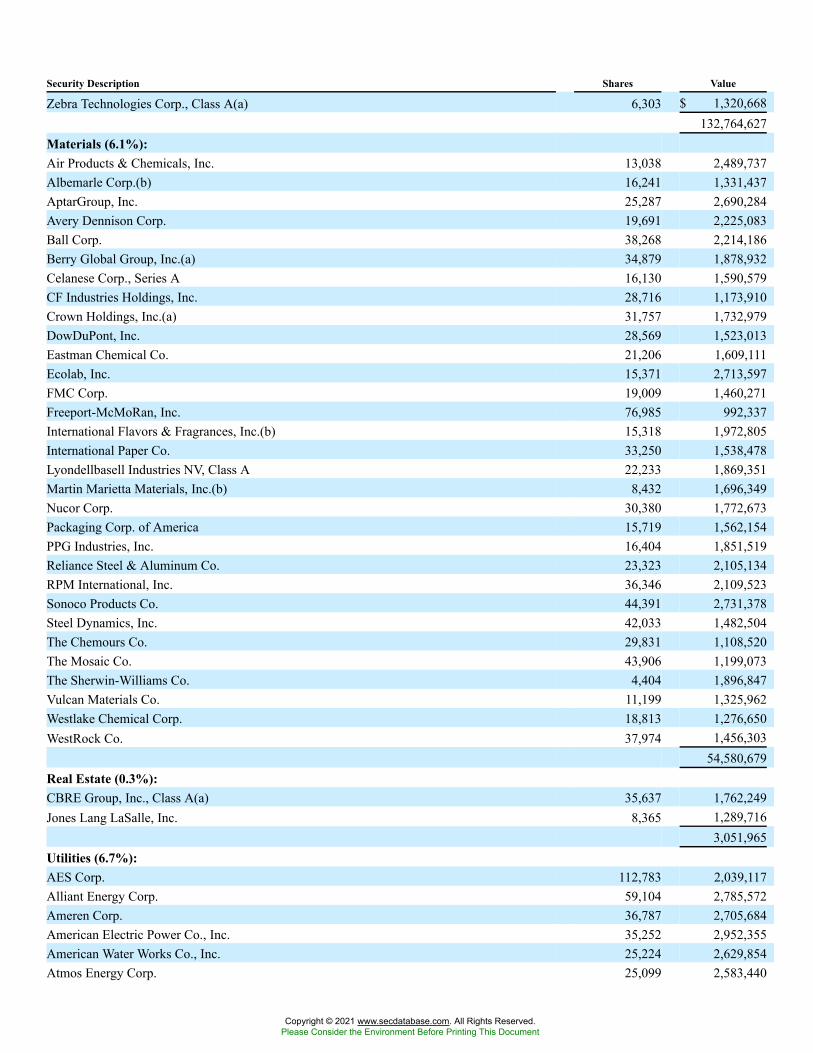
Security Description Shares Value
Zebra Technologies Corp., Class A(a) 6,303 $ 1,320,668132,764,627
Materials (6.1%):Air Products & Chemicals, Inc. 13,038 2,489,737Albemarle Corp.(b) 16,241 1,331,437AptarGroup, Inc. 25,287 2,690,284Avery Dennison Corp. 19,691 2,225,083Ball Corp. 38,268 2,214,186Berry Global Group, Inc.(a) 34,879 1,878,932Celanese Corp., Series A 16,130 1,590,579CF Industries Holdings, Inc. 28,716 1,173,910Crown Holdings, Inc.(a) 31,757 1,732,979DowDuPont, Inc. 28,569 1,523,013Eastman Chemical Co. 21,206 1,609,111Ecolab, Inc. 15,371 2,713,597FMC Corp. 19,009 1,460,271Freeport-McMoRan, Inc. 76,985 992,337International Flavors & Fragrances, Inc.(b) 15,318 1,972,805International Paper Co. 33,250 1,538,478Lyondellbasell Industries NV, Class A 22,233 1,869,351Martin Marietta Materials, Inc.(b) 8,432 1,696,349Nucor Corp. 30,380 1,772,673Packaging Corp. of America 15,719 1,562,154PPG Industries, Inc. 16,404 1,851,519Reliance Steel & Aluminum Co. 23,323 2,105,134RPM International, Inc. 36,346 2,109,523Sonoco Products Co. 44,391 2,731,378Steel Dynamics, Inc. 42,033 1,482,504The Chemours Co. 29,831 1,108,520The Mosaic Co. 43,906 1,199,073The Sherwin-Williams Co. 4,404 1,896,847Vulcan Materials Co. 11,199 1,325,962Westlake Chemical Corp. 18,813 1,276,650WestRock Co. 37,974 1,456,303
54,580,679Real Estate (0.3%):CBRE Group, Inc., Class A(a) 35,637 1,762,249Jones Lang LaSalle, Inc. 8,365 1,289,716
3,051,965Utilities (6.7%):AES Corp. 112,783 2,039,117Alliant Energy Corp. 59,104 2,785,572Ameren Corp. 36,787 2,705,684American Electric Power Co., Inc. 35,252 2,952,355American Water Works Co., Inc. 25,224 2,629,854Atmos Energy Corp. 25,099 2,583,440
Copyright © 2021 www.secdatabase.com. All Rights Reserved.Please Consider the Environment Before Printing This Document
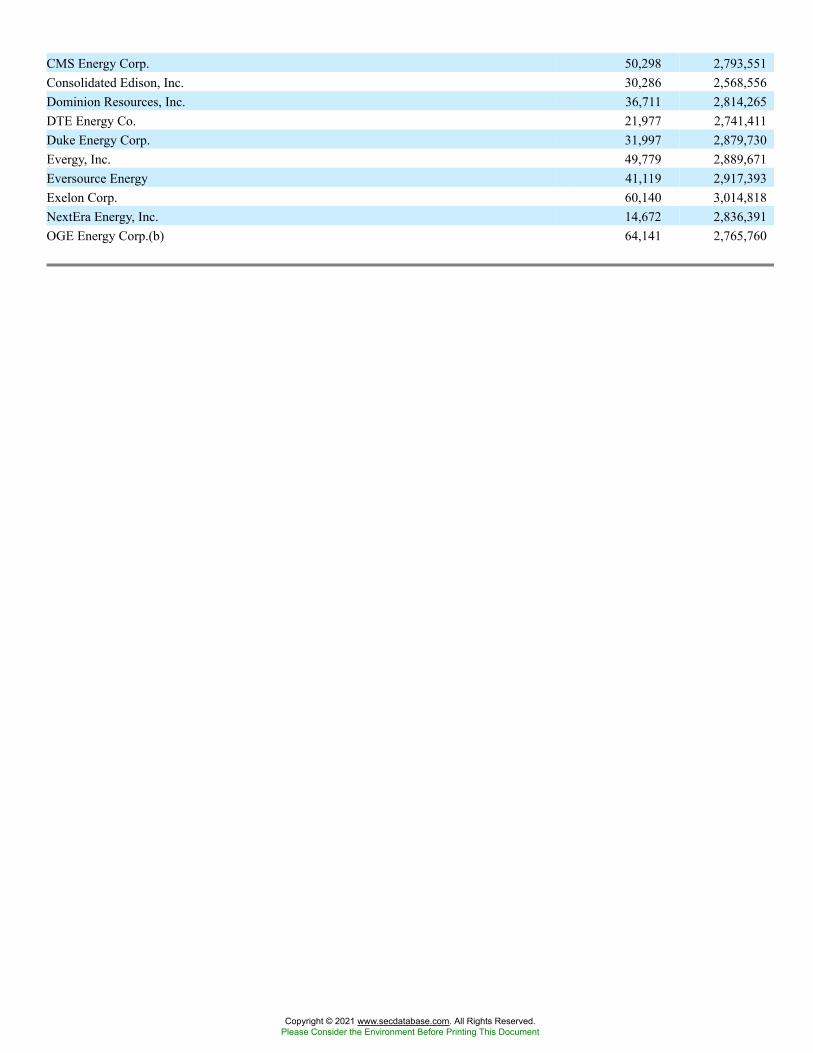
CMS Energy Corp. 50,298 2,793,551Consolidated Edison, Inc. 30,286 2,568,556Dominion Resources, Inc. 36,711 2,814,265DTE Energy Co. 21,977 2,741,411Duke Energy Corp. 31,997 2,879,730Evergy, Inc. 49,779 2,889,671Eversource Energy 41,119 2,917,393Exelon Corp. 60,140 3,014,818NextEra Energy, Inc. 14,672 2,836,391OGE Energy Corp.(b) 64,141 2,765,760
Copyright © 2021 www.secdatabase.com. All Rights Reserved.Please Consider the Environment Before Printing This Document
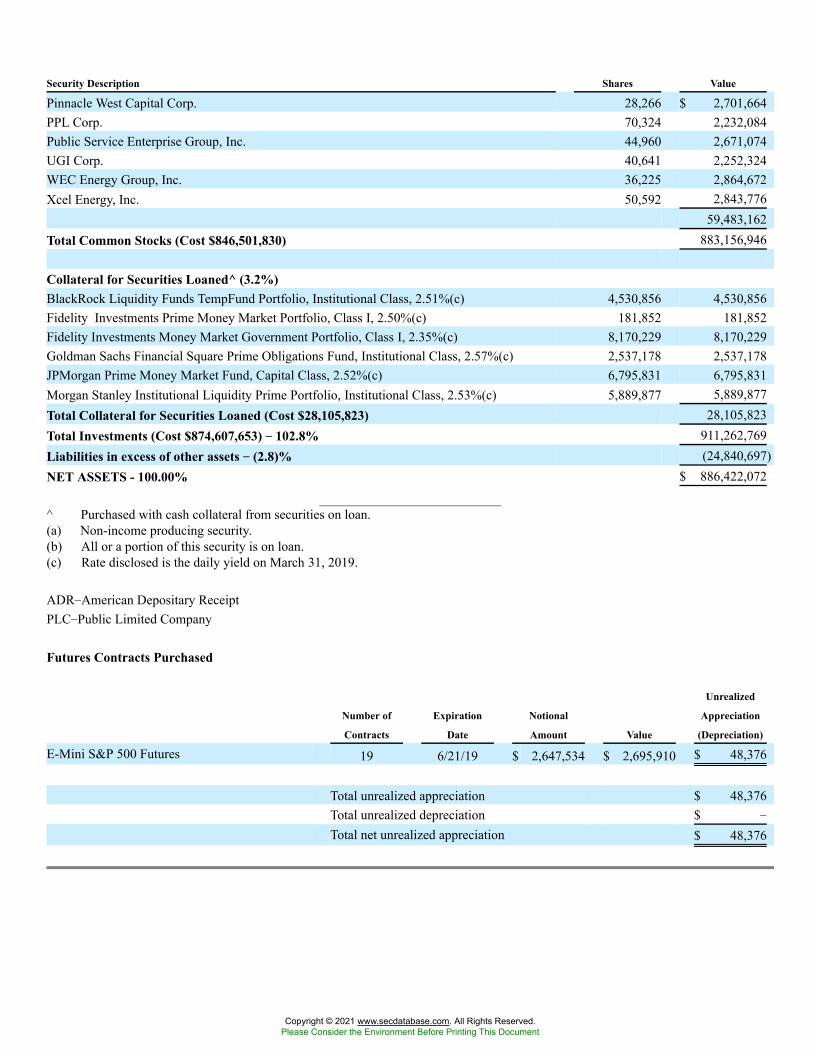
Security Description Shares Value
Pinnacle West Capital Corp. 28,266 $ 2,701,664PPL Corp. 70,324 2,232,084Public Service Enterprise Group, Inc. 44,960 2,671,074UGI Corp. 40,641 2,252,324WEC Energy Group, Inc. 36,225 2,864,672Xcel Energy, Inc. 50,592 2,843,776
59,483,162Total Common Stocks (Cost $846,501,830) 883,156,946
Collateral for Securities Loaned^ (3.2%)BlackRock Liquidity Funds TempFund Portfolio, Institutional Class, 2.51%(c) 4,530,856 4,530,856Fidelity Investments Prime Money Market Portfolio, Class I, 2.50%(c) 181,852 181,852Fidelity Investments Money Market Government Portfolio, Class I, 2.35%(c) 8,170,229 8,170,229Goldman Sachs Financial Square Prime Obligations Fund, Institutional Class, 2.57%(c) 2,537,178 2,537,178JPMorgan Prime Money Market Fund, Capital Class, 2.52%(c) 6,795,831 6,795,831Morgan Stanley Institutional Liquidity Prime Portfolio, Institutional Class, 2.53%(c) 5,889,877 5,889,877Total Collateral for Securities Loaned (Cost $28,105,823) 28,105,823Total Investments (Cost $874,607,653) �� 102.8% 911,262,769Liabilities in excess of other assets �� (2.8)% (24,840,697)NET ASSETS - 100.00% $ 886,422,072
^ Purchased with cash collateral from securities on loan.(a) Non-income producing security.(b) All or a portion of this security is on loan.(c) Rate disclosed is the daily yield on March 31, 2019.
ADR�American Depositary ReceiptPLC�Public Limited Company
Futures Contracts Purchased
Number of
Contracts
Expiration
Date
Notional
Amount Value
Unrealized
Appreciation
(Depreciation)
E-Mini S&P 500 Futures 19 6/21/19 $ 2,647,534 $ 2,695,910 $ 48,376
Total unrealized appreciation $ 48,376Total unrealized depreciation $ �
Total net unrealized appreciation $ 48,376
Copyright © 2021 www.secdatabase.com. All Rights Reserved.Please Consider the Environment Before Printing This Document
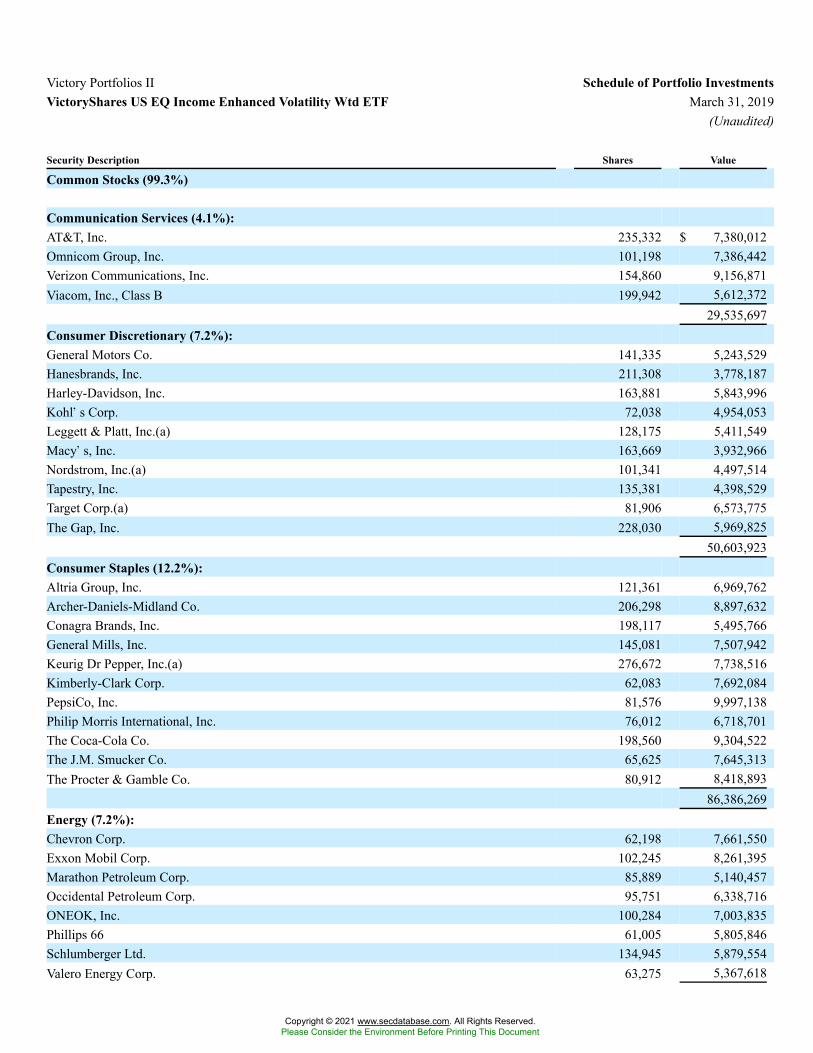
Victory Portfolios II Schedule of Portfolio InvestmentsVictoryShares US EQ Income Enhanced Volatility Wtd ETF March 31, 2019
(Unaudited)
Security Description Shares Value
Common Stocks (99.3%)
Communication Services (4.1%):AT&T, Inc. 235,332 $ 7,380,012Omnicom Group, Inc. 101,198 7,386,442Verizon Communications, Inc. 154,860 9,156,871Viacom, Inc., Class B 199,942 5,612,372
29,535,697Consumer Discretionary (7.2%):General Motors Co. 141,335 5,243,529Hanesbrands, Inc. 211,308 3,778,187Harley-Davidson, Inc. 163,881 5,843,996Kohl�s Corp. 72,038 4,954,053Leggett & Platt, Inc.(a) 128,175 5,411,549Macy�s, Inc. 163,669 3,932,966Nordstrom, Inc.(a) 101,341 4,497,514Tapestry, Inc. 135,381 4,398,529Target Corp.(a) 81,906 6,573,775The Gap, Inc. 228,030 5,969,825
50,603,923Consumer Staples (12.2%):Altria Group, Inc. 121,361 6,969,762Archer-Daniels-Midland Co. 206,298 8,897,632Conagra Brands, Inc. 198,117 5,495,766General Mills, Inc. 145,081 7,507,942Keurig Dr Pepper, Inc.(a) 276,672 7,738,516Kimberly-Clark Corp. 62,083 7,692,084PepsiCo, Inc. 81,576 9,997,138Philip Morris International, Inc. 76,012 6,718,701The Coca-Cola Co. 198,560 9,304,522The J.M. Smucker Co. 65,625 7,645,313The Procter & Gamble Co. 80,912 8,418,893
86,386,269Energy (7.2%):Chevron Corp. 62,198 7,661,550Exxon Mobil Corp. 102,245 8,261,395Marathon Petroleum Corp. 85,889 5,140,457Occidental Petroleum Corp. 95,751 6,338,716ONEOK, Inc. 100,284 7,003,835Phillips 66 61,005 5,805,846Schlumberger Ltd. 134,945 5,879,554Valero Energy Corp. 63,275 5,367,618
Copyright © 2021 www.secdatabase.com. All Rights Reserved.Please Consider the Environment Before Printing This Document

51,458,971Financials (20.3%):Ameriprise Financial, Inc. 40,980 5,249,538BB&T Corp. 166,777 7,760,134BlackRock, Inc., Class A 14,818 6,332,769Citizens Financial Group, Inc. 185,102 6,015,815First American Financial Corp. 131,699 6,782,499FNF Group 206,704 7,555,031Franklin Resources, Inc.(a) 203,765 6,752,771Huntington Bancshares, Inc. 499,752 6,336,855Invesco Ltd. 308,995 5,966,693KeyCorp 357,412 5,629,239MetLife, Inc. 151,538 6,450,973Morgan Stanley 147,733 6,234,333
Copyright © 2021 www.secdatabase.com. All Rights Reserved.Please Consider the Environment Before Printing This Document
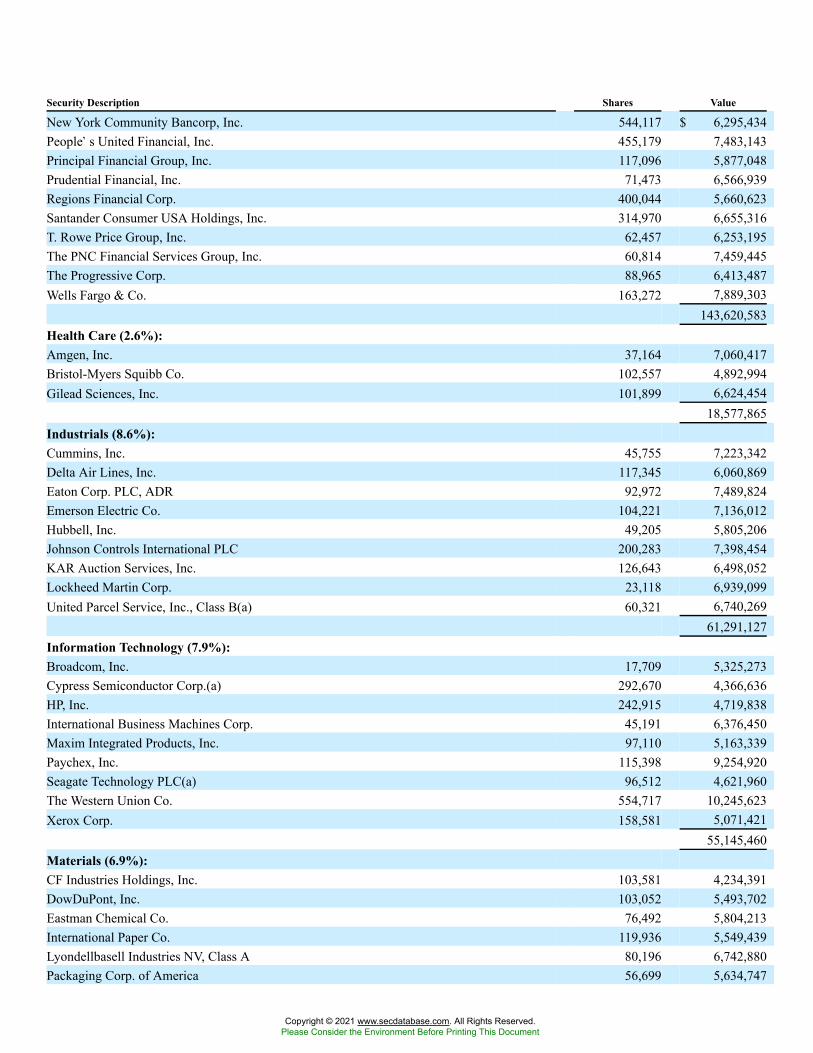
Security Description Shares Value
New York Community Bancorp, Inc. 544,117 $ 6,295,434People�s United Financial, Inc. 455,179 7,483,143Principal Financial Group, Inc. 117,096 5,877,048Prudential Financial, Inc. 71,473 6,566,939Regions Financial Corp. 400,044 5,660,623Santander Consumer USA Holdings, Inc. 314,970 6,655,316T. Rowe Price Group, Inc. 62,457 6,253,195The PNC Financial Services Group, Inc. 60,814 7,459,445The Progressive Corp. 88,965 6,413,487Wells Fargo & Co. 163,272 7,889,303
143,620,583Health Care (2.6%):Amgen, Inc. 37,164 7,060,417Bristol-Myers Squibb Co. 102,557 4,892,994Gilead Sciences, Inc. 101,899 6,624,454
18,577,865Industrials (8.6%):Cummins, Inc. 45,755 7,223,342Delta Air Lines, Inc. 117,345 6,060,869Eaton Corp. PLC, ADR 92,972 7,489,824Emerson Electric Co. 104,221 7,136,012Hubbell, Inc. 49,205 5,805,206Johnson Controls International PLC 200,283 7,398,454KAR Auction Services, Inc. 126,643 6,498,052Lockheed Martin Corp. 23,118 6,939,099United Parcel Service, Inc., Class B(a) 60,321 6,740,269
61,291,127Information Technology (7.9%):Broadcom, Inc. 17,709 5,325,273Cypress Semiconductor Corp.(a) 292,670 4,366,636HP, Inc. 242,915 4,719,838International Business Machines Corp. 45,191 6,376,450Maxim Integrated Products, Inc. 97,110 5,163,339Paychex, Inc. 115,398 9,254,920Seagate Technology PLC(a) 96,512 4,621,960The Western Union Co. 554,717 10,245,623Xerox Corp. 158,581 5,071,421
55,145,460Materials (6.9%):CF Industries Holdings, Inc. 103,581 4,234,391DowDuPont, Inc. 103,052 5,493,702Eastman Chemical Co. 76,492 5,804,213International Paper Co. 119,936 5,549,439Lyondellbasell Industries NV, Class A 80,196 6,742,880Packaging Corp. of America 56,699 5,634,747
Copyright © 2021 www.secdatabase.com. All Rights Reserved.Please Consider the Environment Before Printing This Document
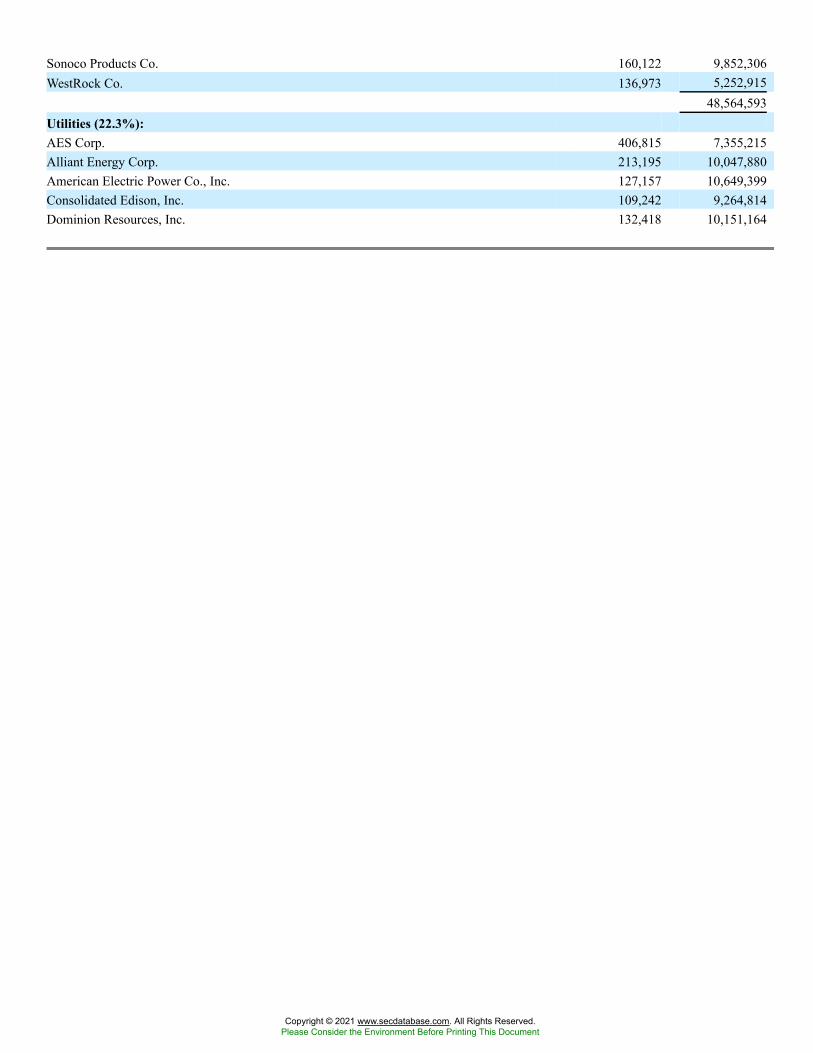
Sonoco Products Co. 160,122 9,852,306WestRock Co. 136,973 5,252,915
48,564,593Utilities (22.3%):AES Corp. 406,815 7,355,215Alliant Energy Corp. 213,195 10,047,880American Electric Power Co., Inc. 127,157 10,649,399Consolidated Edison, Inc. 109,242 9,264,814Dominion Resources, Inc. 132,418 10,151,164
Copyright © 2021 www.secdatabase.com. All Rights Reserved.Please Consider the Environment Before Printing This Document
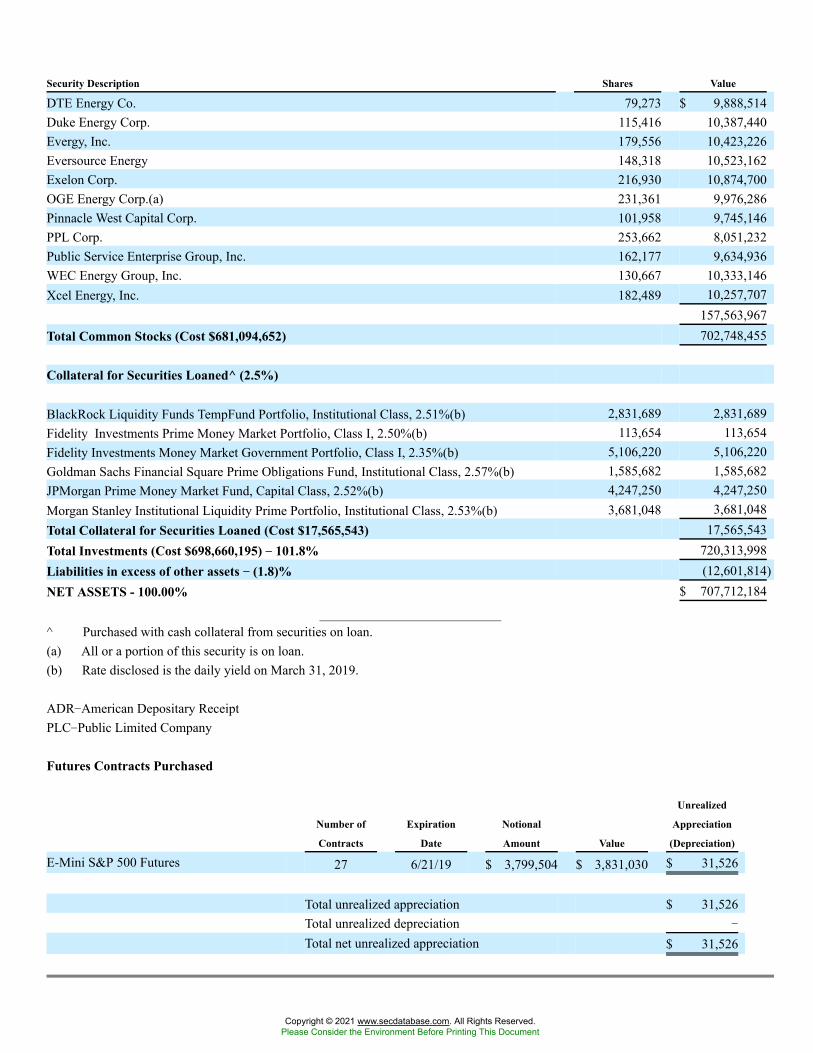
Security Description Shares Value
DTE Energy Co. 79,273 $ 9,888,514Duke Energy Corp. 115,416 10,387,440Evergy, Inc. 179,556 10,423,226Eversource Energy 148,318 10,523,162Exelon Corp. 216,930 10,874,700OGE Energy Corp.(a) 231,361 9,976,286Pinnacle West Capital Corp. 101,958 9,745,146PPL Corp. 253,662 8,051,232Public Service Enterprise Group, Inc. 162,177 9,634,936WEC Energy Group, Inc. 130,667 10,333,146Xcel Energy, Inc. 182,489 10,257,707
157,563,967Total Common Stocks (Cost $681,094,652) 702,748,455
Collateral for Securities Loaned^ (2.5%)
BlackRock Liquidity Funds TempFund Portfolio, Institutional Class, 2.51%(b) 2,831,689 2,831,689Fidelity Investments Prime Money Market Portfolio, Class I, 2.50%(b) 113,654 113,654Fidelity Investments Money Market Government Portfolio, Class I, 2.35%(b) 5,106,220 5,106,220Goldman Sachs Financial Square Prime Obligations Fund, Institutional Class, 2.57%(b) 1,585,682 1,585,682JPMorgan Prime Money Market Fund, Capital Class, 2.52%(b) 4,247,250 4,247,250Morgan Stanley Institutional Liquidity Prime Portfolio, Institutional Class, 2.53%(b) 3,681,048 3,681,048Total Collateral for Securities Loaned (Cost $17,565,543) 17,565,543Total Investments (Cost $698,660,195) �� 101.8% 720,313,998Liabilities in excess of other assets �� (1.8)% (12,601,814)NET ASSETS - 100.00% $ 707,712,184
^ Purchased with cash collateral from securities on loan.(a) All or a portion of this security is on loan.(b) Rate disclosed is the daily yield on March 31, 2019.
ADR�American Depositary ReceiptPLC�Public Limited Company
Futures Contracts Purchased
Number of
Contracts
Expiration
Date
Notional
Amount Value
Unrealized
Appreciation
(Depreciation)
E-Mini S&P 500 Futures 27 6/21/19 $ 3,799,504 $ 3,831,030 $ 31,526
Total unrealized appreciation $ 31,526Total unrealized depreciation �
Total net unrealized appreciation $ 31,526
Copyright © 2021 www.secdatabase.com. All Rights Reserved.Please Consider the Environment Before Printing This Document
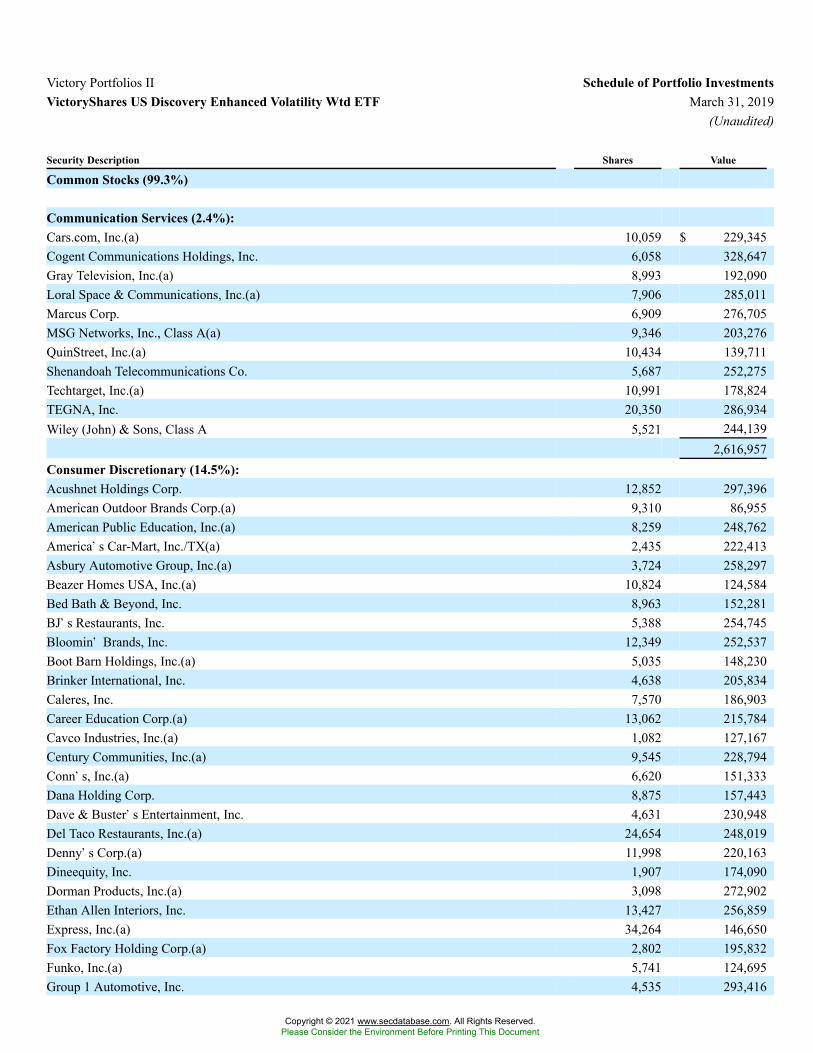
Victory Portfolios II Schedule of Portfolio InvestmentsVictoryShares US Discovery Enhanced Volatility Wtd ETF March 31, 2019
(Unaudited)
Security Description Shares Value
Common Stocks (99.3%)
Communication Services (2.4%):Cars.com, Inc.(a) 10,059 $ 229,345Cogent Communications Holdings, Inc. 6,058 328,647Gray Television, Inc.(a) 8,993 192,090Loral Space & Communications, Inc.(a) 7,906 285,011Marcus Corp. 6,909 276,705MSG Networks, Inc., Class A(a) 9,346 203,276QuinStreet, Inc.(a) 10,434 139,711Shenandoah Telecommunications Co. 5,687 252,275Techtarget, Inc.(a) 10,991 178,824TEGNA, Inc. 20,350 286,934Wiley (John) & Sons, Class A 5,521 244,139
2,616,957Consumer Discretionary (14.5%):Acushnet Holdings Corp. 12,852 297,396American Outdoor Brands Corp.(a) 9,310 86,955American Public Education, Inc.(a) 8,259 248,762America�s Car-Mart, Inc./TX(a) 2,435 222,413Asbury Automotive Group, Inc.(a) 3,724 258,297Beazer Homes USA, Inc.(a) 10,824 124,584Bed Bath & Beyond, Inc. 8,963 152,281BJ�s Restaurants, Inc. 5,388 254,745Bloomin� Brands, Inc. 12,349 252,537Boot Barn Holdings, Inc.(a) 5,035 148,230Brinker International, Inc. 4,638 205,834Caleres, Inc. 7,570 186,903Career Education Corp.(a) 13,062 215,784Cavco Industries, Inc.(a) 1,082 127,167Century Communities, Inc.(a) 9,545 228,794Conn�s, Inc.(a) 6,620 151,333Dana Holding Corp. 8,875 157,443Dave & Buster�s Entertainment, Inc. 4,631 230,948Del Taco Restaurants, Inc.(a) 24,654 248,019Denny�s Corp.(a) 11,998 220,163Dineequity, Inc. 1,907 174,090Dorman Products, Inc.(a) 3,098 272,902Ethan Allen Interiors, Inc. 13,427 256,859Express, Inc.(a) 34,264 146,650Fox Factory Holding Corp.(a) 2,802 195,832Funko, Inc.(a) 5,741 124,695Group 1 Automotive, Inc. 4,535 293,416
Copyright © 2021 www.secdatabase.com. All Rights Reserved.Please Consider the Environment Before Printing This Document
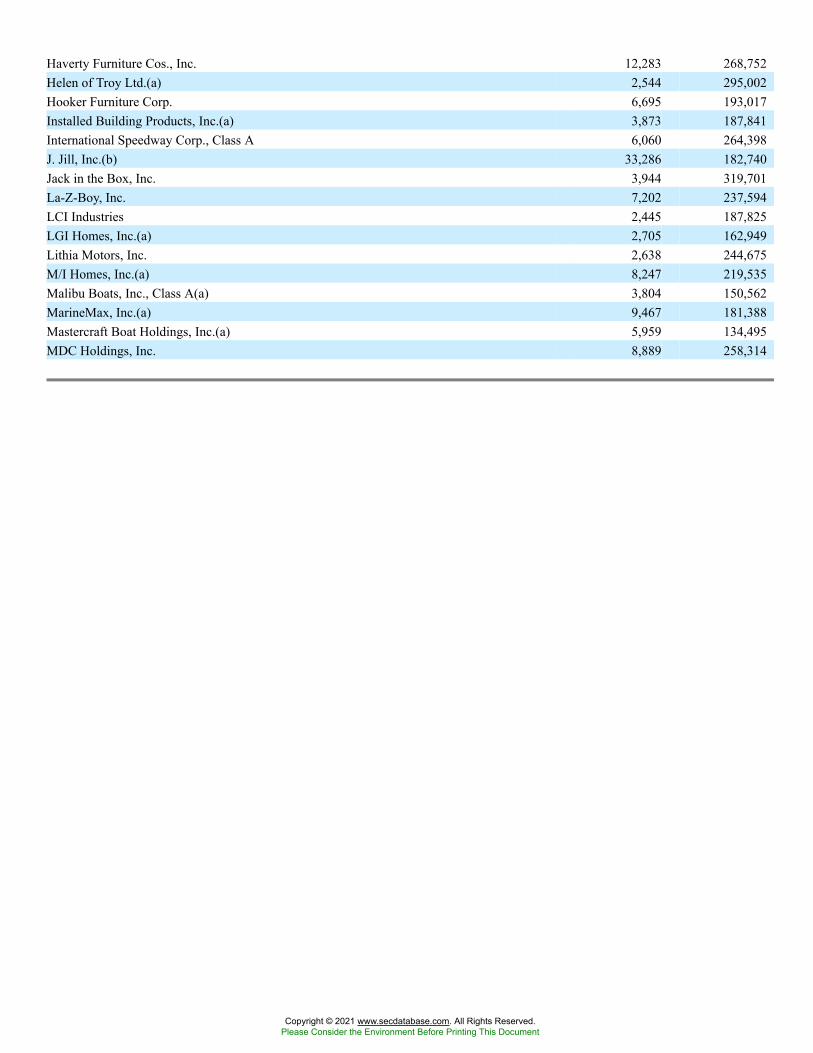
Haverty Furniture Cos., Inc. 12,283 268,752Helen of Troy Ltd.(a) 2,544 295,002Hooker Furniture Corp. 6,695 193,017Installed Building Products, Inc.(a) 3,873 187,841International Speedway Corp., Class A 6,060 264,398J. Jill, Inc.(b) 33,286 182,740Jack in the Box, Inc. 3,944 319,701La-Z-Boy, Inc. 7,202 237,594LCI Industries 2,445 187,825LGI Homes, Inc.(a) 2,705 162,949Lithia Motors, Inc. 2,638 244,675M/I Homes, Inc.(a) 8,247 219,535Malibu Boats, Inc., Class A(a) 3,804 150,562MarineMax, Inc.(a) 9,467 181,388Mastercraft Boat Holdings, Inc.(a) 5,959 134,495MDC Holdings, Inc. 8,889 258,314
Copyright © 2021 www.secdatabase.com. All Rights Reserved.Please Consider the Environment Before Printing This Document
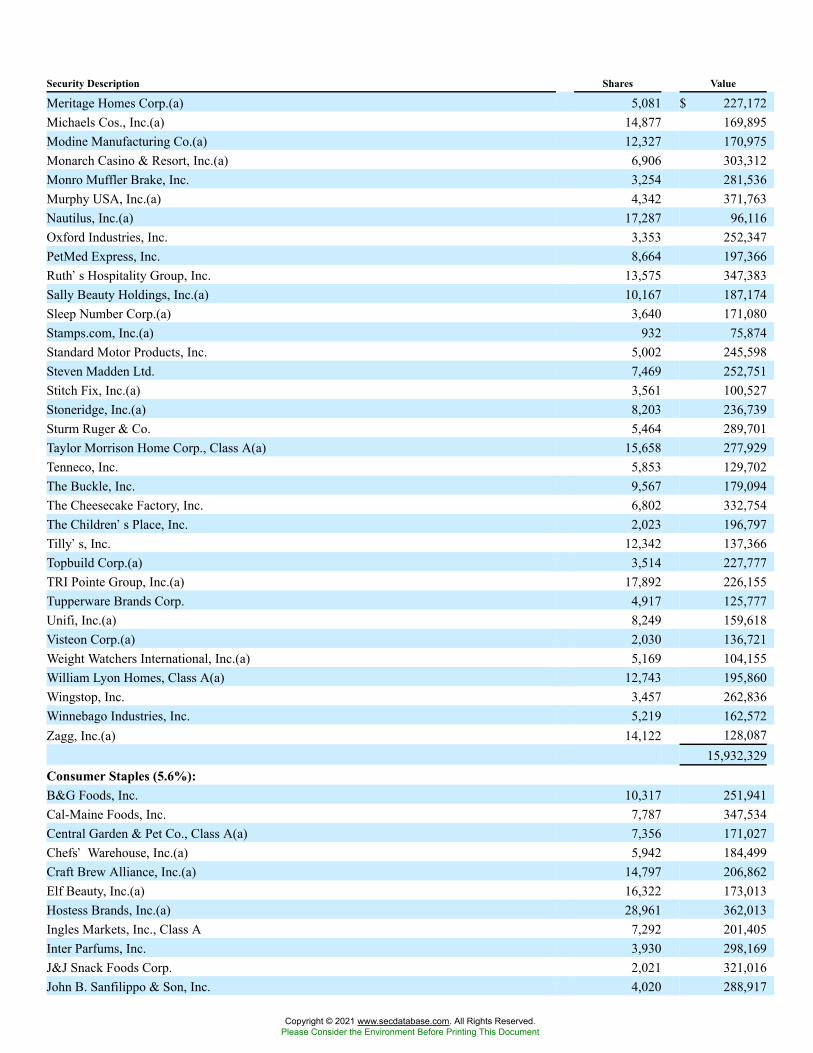
Security Description Shares Value
Meritage Homes Corp.(a) 5,081 $ 227,172Michaels Cos., Inc.(a) 14,877 169,895Modine Manufacturing Co.(a) 12,327 170,975Monarch Casino & Resort, Inc.(a) 6,906 303,312Monro Muffler Brake, Inc. 3,254 281,536Murphy USA, Inc.(a) 4,342 371,763Nautilus, Inc.(a) 17,287 96,116Oxford Industries, Inc. 3,353 252,347PetMed Express, Inc. 8,664 197,366Ruth�s Hospitality Group, Inc. 13,575 347,383Sally Beauty Holdings, Inc.(a) 10,167 187,174Sleep Number Corp.(a) 3,640 171,080Stamps.com, Inc.(a) 932 75,874Standard Motor Products, Inc. 5,002 245,598Steven Madden Ltd. 7,469 252,751Stitch Fix, Inc.(a) 3,561 100,527Stoneridge, Inc.(a) 8,203 236,739Sturm Ruger & Co. 5,464 289,701Taylor Morrison Home Corp., Class A(a) 15,658 277,929Tenneco, Inc. 5,853 129,702The Buckle, Inc. 9,567 179,094The Cheesecake Factory, Inc. 6,802 332,754The Children�s Place, Inc. 2,023 196,797Tilly�s, Inc. 12,342 137,366Topbuild Corp.(a) 3,514 227,777TRI Pointe Group, Inc.(a) 17,892 226,155Tupperware Brands Corp. 4,917 125,777Unifi, Inc.(a) 8,249 159,618Visteon Corp.(a) 2,030 136,721Weight Watchers International, Inc.(a) 5,169 104,155William Lyon Homes, Class A(a) 12,743 195,860Wingstop, Inc. 3,457 262,836Winnebago Industries, Inc. 5,219 162,572Zagg, Inc.(a) 14,122 128,087
15,932,329Consumer Staples (5.6%):B&G Foods, Inc. 10,317 251,941Cal-Maine Foods, Inc. 7,787 347,534Central Garden & Pet Co., Class A(a) 7,356 171,027Chefs� Warehouse, Inc.(a) 5,942 184,499Craft Brew Alliance, Inc.(a) 14,797 206,862Elf Beauty, Inc.(a) 16,322 173,013Hostess Brands, Inc.(a) 28,961 362,013Ingles Markets, Inc., Class A 7,292 201,405Inter Parfums, Inc. 3,930 298,169J&J Snack Foods Corp. 2,021 321,016John B. Sanfilippo & Son, Inc. 4,020 288,917
Copyright © 2021 www.secdatabase.com. All Rights Reserved.Please Consider the Environment Before Printing This Document

Medifast, Inc. 1,067 136,096MGP Ingredients, Inc. 3,023 233,225Natural Grocers By Vitamin Cottage, Inc.(a) 8,945 106,893Natural Health Trends Corp. 12,682 164,359PriceSmart, Inc. 3,946 232,340Sprouts Farmers Markets, Inc.(a) 10,191 219,514The Simply Good Foods Co.(a) 11,849 243,971Tootsie Roll Industries, Inc. 12,248 456,117Turning Point Brands, Inc. 4,168 192,103Universal Corp. 5,631 324,514USANA Health Sciences, Inc.(a) 2,402 201,456
Copyright © 2021 www.secdatabase.com. All Rights Reserved.Please Consider the Environment Before Printing This Document
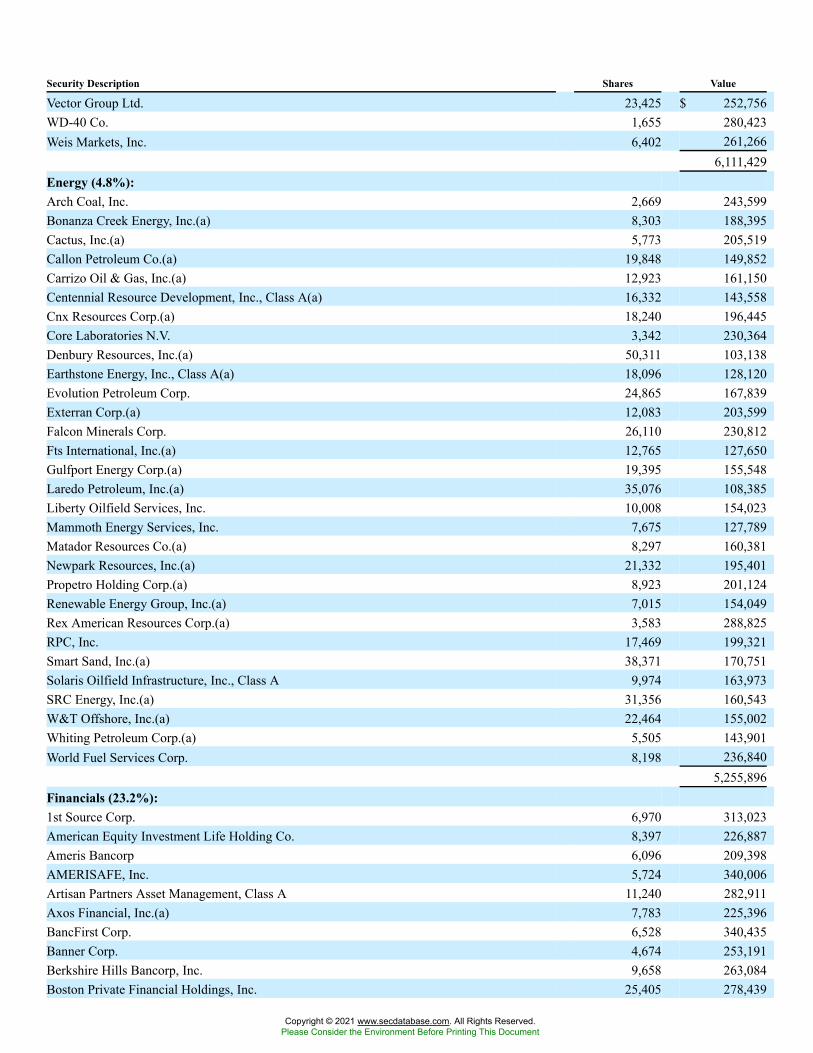
Security Description Shares Value
Vector Group Ltd. 23,425 $ 252,756WD-40 Co. 1,655 280,423Weis Markets, Inc. 6,402 261,266
6,111,429Energy (4.8%):Arch Coal, Inc. 2,669 243,599Bonanza Creek Energy, Inc.(a) 8,303 188,395Cactus, Inc.(a) 5,773 205,519Callon Petroleum Co.(a) 19,848 149,852Carrizo Oil & Gas, Inc.(a) 12,923 161,150Centennial Resource Development, Inc., Class A(a) 16,332 143,558Cnx Resources Corp.(a) 18,240 196,445Core Laboratories N.V. 3,342 230,364Denbury Resources, Inc.(a) 50,311 103,138Earthstone Energy, Inc., Class A(a) 18,096 128,120Evolution Petroleum Corp. 24,865 167,839Exterran Corp.(a) 12,083 203,599Falcon Minerals Corp. 26,110 230,812Fts International, Inc.(a) 12,765 127,650Gulfport Energy Corp.(a) 19,395 155,548Laredo Petroleum, Inc.(a) 35,076 108,385Liberty Oilfield Services, Inc. 10,008 154,023Mammoth Energy Services, Inc. 7,675 127,789Matador Resources Co.(a) 8,297 160,381Newpark Resources, Inc.(a) 21,332 195,401Propetro Holding Corp.(a) 8,923 201,124Renewable Energy Group, Inc.(a) 7,015 154,049Rex American Resources Corp.(a) 3,583 288,825RPC, Inc. 17,469 199,321Smart Sand, Inc.(a) 38,371 170,751Solaris Oilfield Infrastructure, Inc., Class A 9,974 163,973SRC Energy, Inc.(a) 31,356 160,543W&T Offshore, Inc.(a) 22,464 155,002Whiting Petroleum Corp.(a) 5,505 143,901World Fuel Services Corp. 8,198 236,840
5,255,896Financials (23.2%):1st Source Corp. 6,970 313,023American Equity Investment Life Holding Co. 8,397 226,887Ameris Bancorp 6,096 209,398AMERISAFE, Inc. 5,724 340,006Artisan Partners Asset Management, Class A 11,240 282,911Axos Financial, Inc.(a) 7,783 225,396BancFirst Corp. 6,528 340,435Banner Corp. 4,674 253,191Berkshire Hills Bancorp, Inc. 9,658 263,084Boston Private Financial Holdings, Inc. 25,405 278,439
Copyright © 2021 www.secdatabase.com. All Rights Reserved.Please Consider the Environment Before Printing This Document
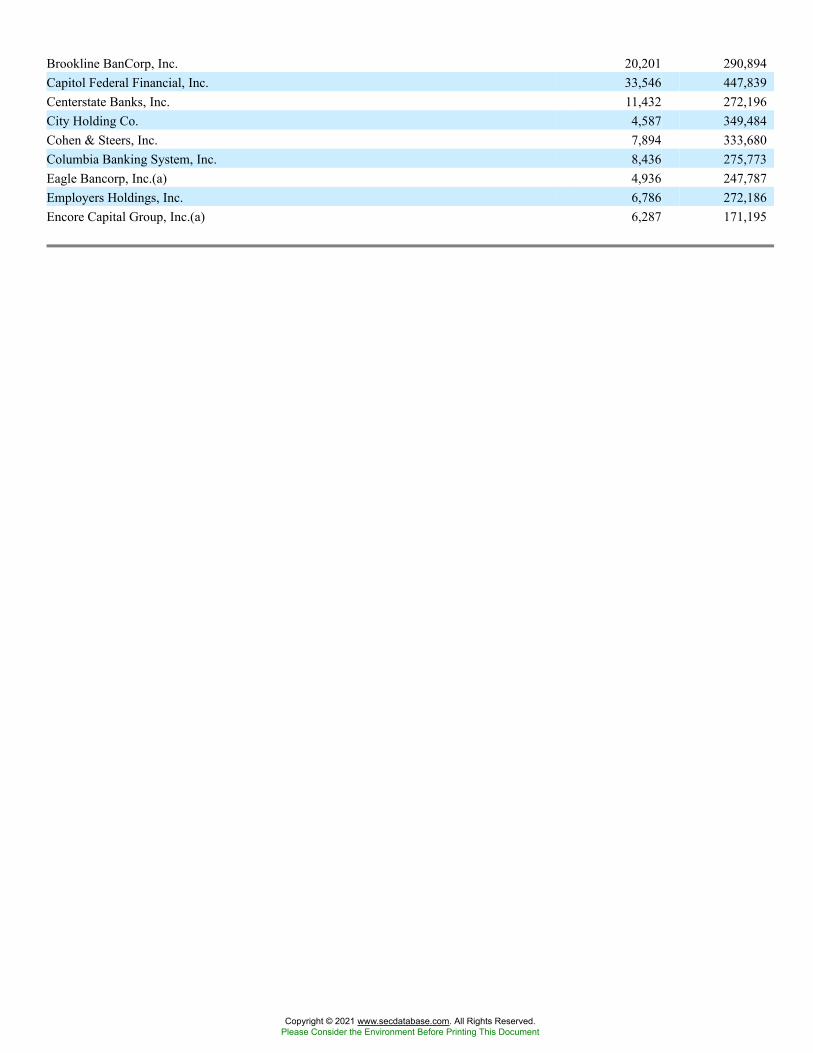
Brookline BanCorp, Inc. 20,201 290,894Capitol Federal Financial, Inc. 33,546 447,839Centerstate Banks, Inc. 11,432 272,196City Holding Co. 4,587 349,484Cohen & Steers, Inc. 7,894 333,680Columbia Banking System, Inc. 8,436 275,773Eagle Bancorp, Inc.(a) 4,936 247,787Employers Holdings, Inc. 6,786 272,186Encore Capital Group, Inc.(a) 6,287 171,195
Copyright © 2021 www.secdatabase.com. All Rights Reserved.Please Consider the Environment Before Printing This Document
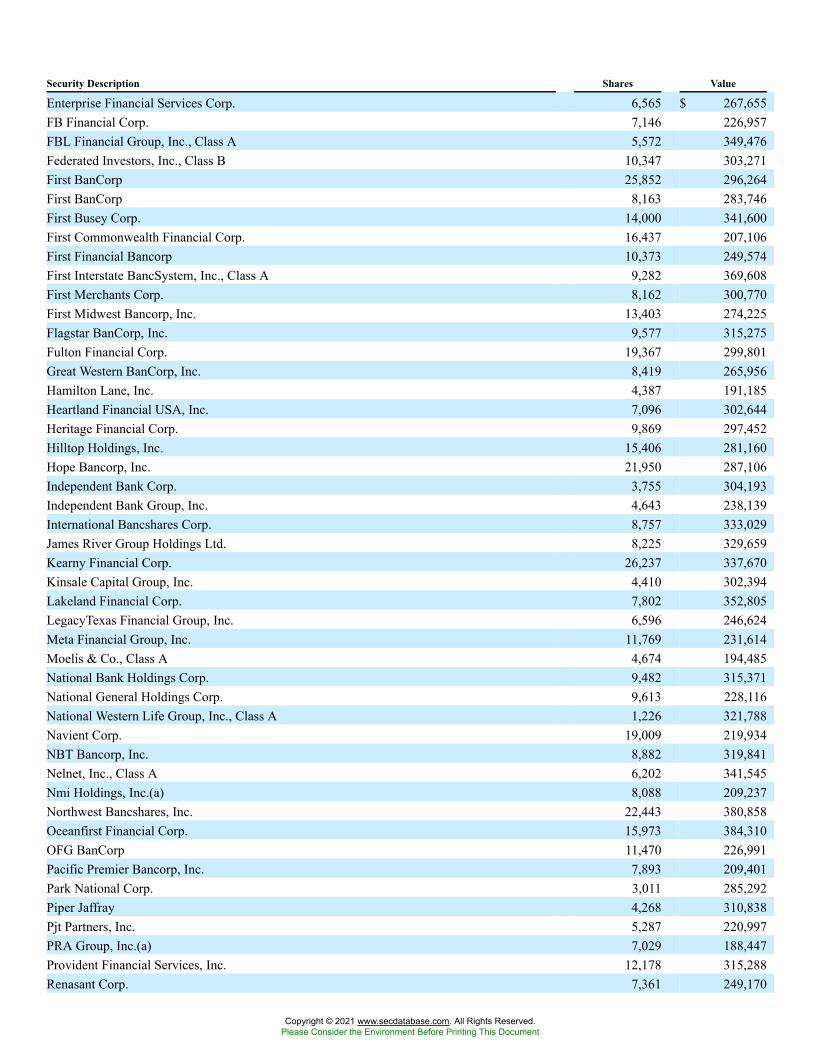
Security Description Shares Value
Enterprise Financial Services Corp. 6,565 $ 267,655FB Financial Corp. 7,146 226,957FBL Financial Group, Inc., Class A 5,572 349,476Federated Investors, Inc., Class B 10,347 303,271First BanCorp 25,852 296,264First BanCorp 8,163 283,746First Busey Corp. 14,000 341,600First Commonwealth Financial Corp. 16,437 207,106First Financial Bancorp 10,373 249,574First Interstate BancSystem, Inc., Class A 9,282 369,608First Merchants Corp. 8,162 300,770First Midwest Bancorp, Inc. 13,403 274,225Flagstar BanCorp, Inc. 9,577 315,275Fulton Financial Corp. 19,367 299,801Great Western BanCorp, Inc. 8,419 265,956Hamilton Lane, Inc. 4,387 191,185Heartland Financial USA, Inc. 7,096 302,644Heritage Financial Corp. 9,869 297,452Hilltop Holdings, Inc. 15,406 281,160Hope Bancorp, Inc. 21,950 287,106Independent Bank Corp. 3,755 304,193Independent Bank Group, Inc. 4,643 238,139International Bancshares Corp. 8,757 333,029James River Group Holdings Ltd. 8,225 329,659Kearny Financial Corp. 26,237 337,670Kinsale Capital Group, Inc. 4,410 302,394Lakeland Financial Corp. 7,802 352,805LegacyTexas Financial Group, Inc. 6,596 246,624Meta Financial Group, Inc. 11,769 231,614Moelis & Co., Class A 4,674 194,485National Bank Holdings Corp. 9,482 315,371National General Holdings Corp. 9,613 228,116National Western Life Group, Inc., Class A 1,226 321,788Navient Corp. 19,009 219,934NBT Bancorp, Inc. 8,882 319,841Nelnet, Inc., Class A 6,202 341,545Nmi Holdings, Inc.(a) 8,088 209,237Northwest Bancshares, Inc. 22,443 380,858Oceanfirst Financial Corp. 15,973 384,310OFG BanCorp 11,470 226,991Pacific Premier Bancorp, Inc. 7,893 209,401Park National Corp. 3,011 285,292Piper Jaffray 4,268 310,838Pjt Partners, Inc. 5,287 220,997PRA Group, Inc.(a) 7,029 188,447Provident Financial Services, Inc. 12,178 315,288Renasant Corp. 7,361 249,170
Copyright © 2021 www.secdatabase.com. All Rights Reserved.Please Consider the Environment Before Printing This Document
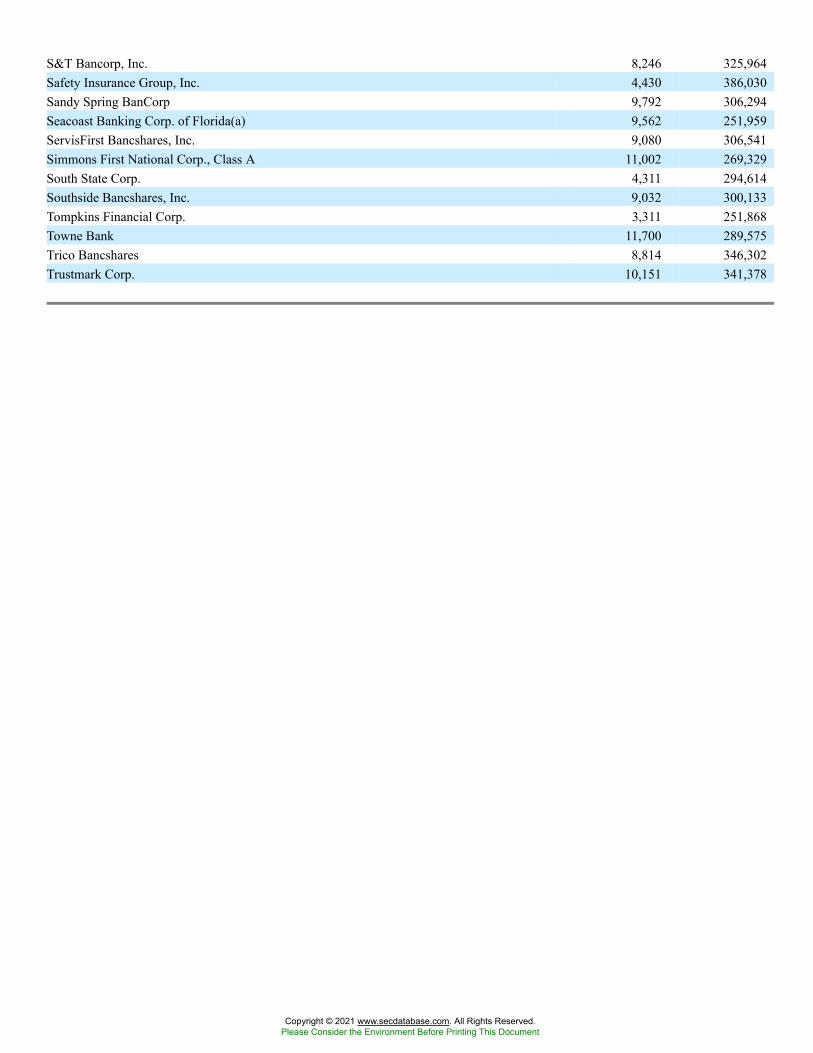
S&T Bancorp, Inc. 8,246 325,964Safety Insurance Group, Inc. 4,430 386,030Sandy Spring BanCorp 9,792 306,294Seacoast Banking Corp. of Florida(a) 9,562 251,959ServisFirst Bancshares, Inc. 9,080 306,541Simmons First National Corp., Class A 11,002 269,329South State Corp. 4,311 294,614Southside Bancshares, Inc. 9,032 300,133Tompkins Financial Corp. 3,311 251,868Towne Bank 11,700 289,575Trico Bancshares 8,814 346,302Trustmark Corp. 10,151 341,378
Copyright © 2021 www.secdatabase.com. All Rights Reserved.Please Consider the Environment Before Printing This Document
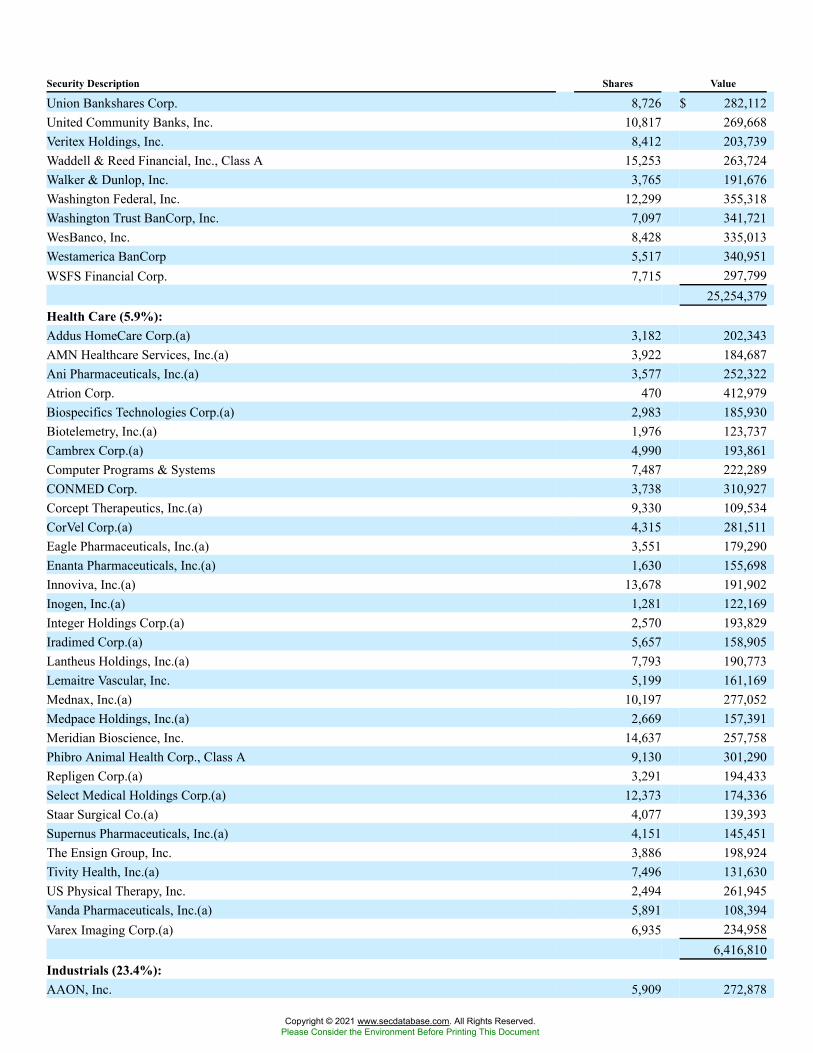
Security Description Shares Value
Union Bankshares Corp. 8,726 $ 282,112United Community Banks, Inc. 10,817 269,668Veritex Holdings, Inc. 8,412 203,739Waddell & Reed Financial, Inc., Class A 15,253 263,724Walker & Dunlop, Inc. 3,765 191,676Washington Federal, Inc. 12,299 355,318Washington Trust BanCorp, Inc. 7,097 341,721WesBanco, Inc. 8,428 335,013Westamerica BanCorp 5,517 340,951WSFS Financial Corp. 7,715 297,799
25,254,379Health Care (5.9%):Addus HomeCare Corp.(a) 3,182 202,343AMN Healthcare Services, Inc.(a) 3,922 184,687Ani Pharmaceuticals, Inc.(a) 3,577 252,322Atrion Corp. 470 412,979Biospecifics Technologies Corp.(a) 2,983 185,930Biotelemetry, Inc.(a) 1,976 123,737Cambrex Corp.(a) 4,990 193,861Computer Programs & Systems 7,487 222,289CONMED Corp. 3,738 310,927Corcept Therapeutics, Inc.(a) 9,330 109,534CorVel Corp.(a) 4,315 281,511Eagle Pharmaceuticals, Inc.(a) 3,551 179,290Enanta Pharmaceuticals, Inc.(a) 1,630 155,698Innoviva, Inc.(a) 13,678 191,902Inogen, Inc.(a) 1,281 122,169Integer Holdings Corp.(a) 2,570 193,829Iradimed Corp.(a) 5,657 158,905Lantheus Holdings, Inc.(a) 7,793 190,773Lemaitre Vascular, Inc. 5,199 161,169Mednax, Inc.(a) 10,197 277,052Medpace Holdings, Inc.(a) 2,669 157,391Meridian Bioscience, Inc. 14,637 257,758Phibro Animal Health Corp., Class A 9,130 301,290Repligen Corp.(a) 3,291 194,433Select Medical Holdings Corp.(a) 12,373 174,336Staar Surgical Co.(a) 4,077 139,393Supernus Pharmaceuticals, Inc.(a) 4,151 145,451The Ensign Group, Inc. 3,886 198,924Tivity Health, Inc.(a) 7,496 131,630US Physical Therapy, Inc. 2,494 261,945Vanda Pharmaceuticals, Inc.(a) 5,891 108,394Varex Imaging Corp.(a) 6,935 234,958
6,416,810Industrials (23.4%):AAON, Inc. 5,909 272,878
Copyright © 2021 www.secdatabase.com. All Rights Reserved.Please Consider the Environment Before Printing This Document
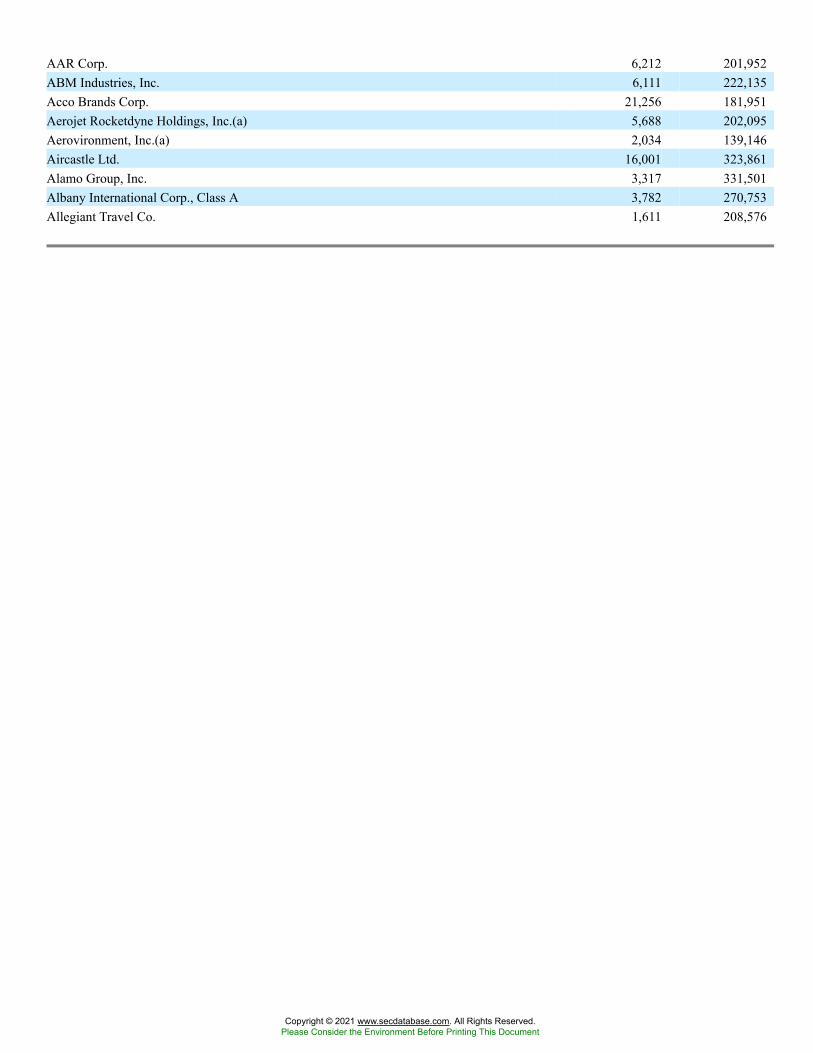
AAR Corp. 6,212 201,952ABM Industries, Inc. 6,111 222,135Acco Brands Corp. 21,256 181,951Aerojet Rocketdyne Holdings, Inc.(a) 5,688 202,095Aerovironment, Inc.(a) 2,034 139,146Aircastle Ltd. 16,001 323,861Alamo Group, Inc. 3,317 331,501Albany International Corp., Class A 3,782 270,753Allegiant Travel Co. 1,611 208,576
Copyright © 2021 www.secdatabase.com. All Rights Reserved.Please Consider the Environment Before Printing This Document
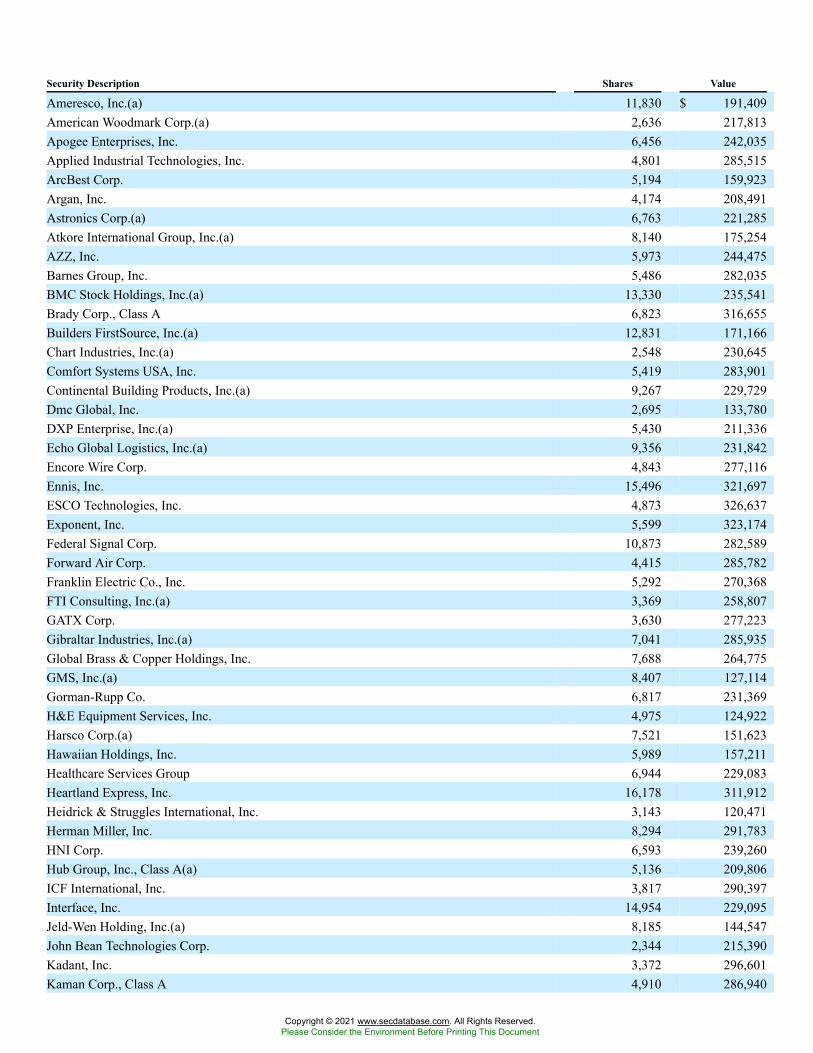
Security Description Shares Value
Ameresco, Inc.(a) 11,830 $ 191,409American Woodmark Corp.(a) 2,636 217,813Apogee Enterprises, Inc. 6,456 242,035Applied Industrial Technologies, Inc. 4,801 285,515ArcBest Corp. 5,194 159,923Argan, Inc. 4,174 208,491Astronics Corp.(a) 6,763 221,285Atkore International Group, Inc.(a) 8,140 175,254AZZ, Inc. 5,973 244,475Barnes Group, Inc. 5,486 282,035BMC Stock Holdings, Inc.(a) 13,330 235,541Brady Corp., Class A 6,823 316,655Builders FirstSource, Inc.(a) 12,831 171,166Chart Industries, Inc.(a) 2,548 230,645Comfort Systems USA, Inc. 5,419 283,901Continental Building Products, Inc.(a) 9,267 229,729Dmc Global, Inc. 2,695 133,780DXP Enterprise, Inc.(a) 5,430 211,336Echo Global Logistics, Inc.(a) 9,356 231,842Encore Wire Corp. 4,843 277,116Ennis, Inc. 15,496 321,697ESCO Technologies, Inc. 4,873 326,637Exponent, Inc. 5,599 323,174Federal Signal Corp. 10,873 282,589Forward Air Corp. 4,415 285,782Franklin Electric Co., Inc. 5,292 270,368FTI Consulting, Inc.(a) 3,369 258,807GATX Corp. 3,630 277,223Gibraltar Industries, Inc.(a) 7,041 285,935Global Brass & Copper Holdings, Inc. 7,688 264,775GMS, Inc.(a) 8,407 127,114Gorman-Rupp Co. 6,817 231,369H&E Equipment Services, Inc. 4,975 124,922Harsco Corp.(a) 7,521 151,623Hawaiian Holdings, Inc. 5,989 157,211Healthcare Services Group 6,944 229,083Heartland Express, Inc. 16,178 311,912Heidrick & Struggles International, Inc. 3,143 120,471Herman Miller, Inc. 8,294 291,783HNI Corp. 6,593 239,260Hub Group, Inc., Class A(a) 5,136 209,806ICF International, Inc. 3,817 290,397Interface, Inc. 14,954 229,095Jeld-Wen Holding, Inc.(a) 8,185 144,547John Bean Technologies Corp. 2,344 215,390Kadant, Inc. 3,372 296,601Kaman Corp., Class A 4,910 286,940
Copyright © 2021 www.secdatabase.com. All Rights Reserved.Please Consider the Environment Before Printing This Document
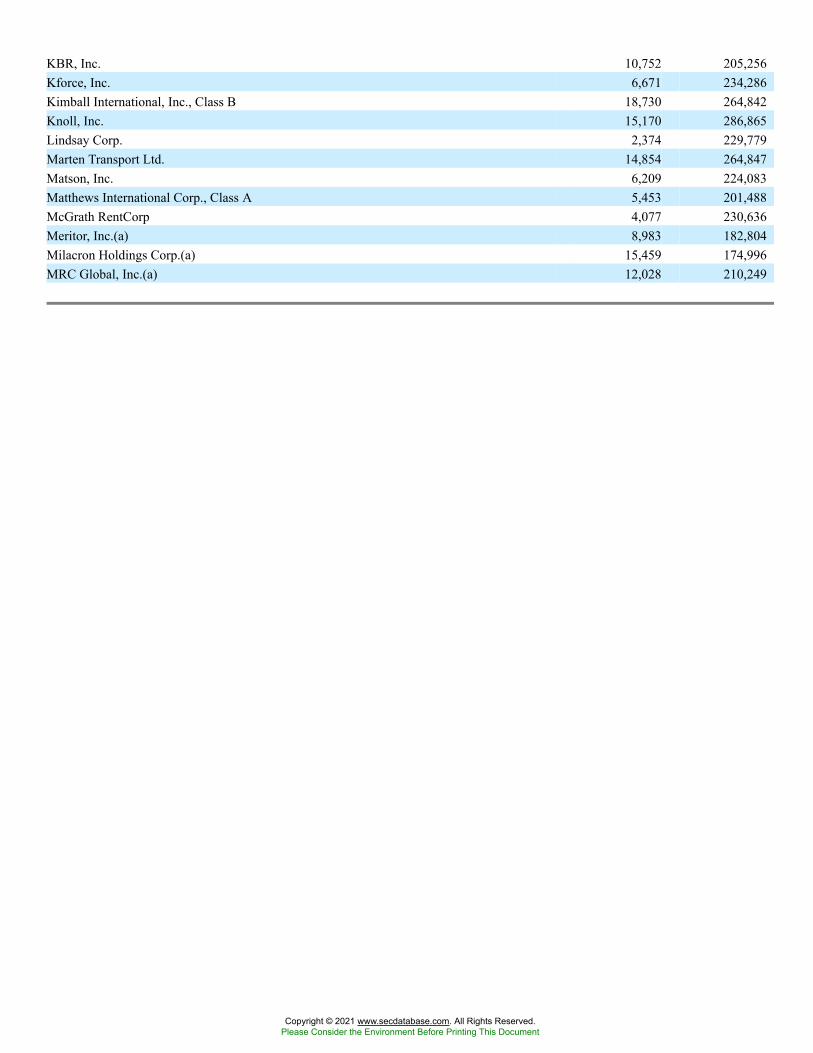
KBR, Inc. 10,752 205,256Kforce, Inc. 6,671 234,286Kimball International, Inc., Class B 18,730 264,842Knoll, Inc. 15,170 286,865Lindsay Corp. 2,374 229,779Marten Transport Ltd. 14,854 264,847Matson, Inc. 6,209 224,083Matthews International Corp., Class A 5,453 201,488McGrath RentCorp 4,077 230,636Meritor, Inc.(a) 8,983 182,804Milacron Holdings Corp.(a) 15,459 174,996MRC Global, Inc.(a) 12,028 210,249
Copyright © 2021 www.secdatabase.com. All Rights Reserved.Please Consider the Environment Before Printing This Document
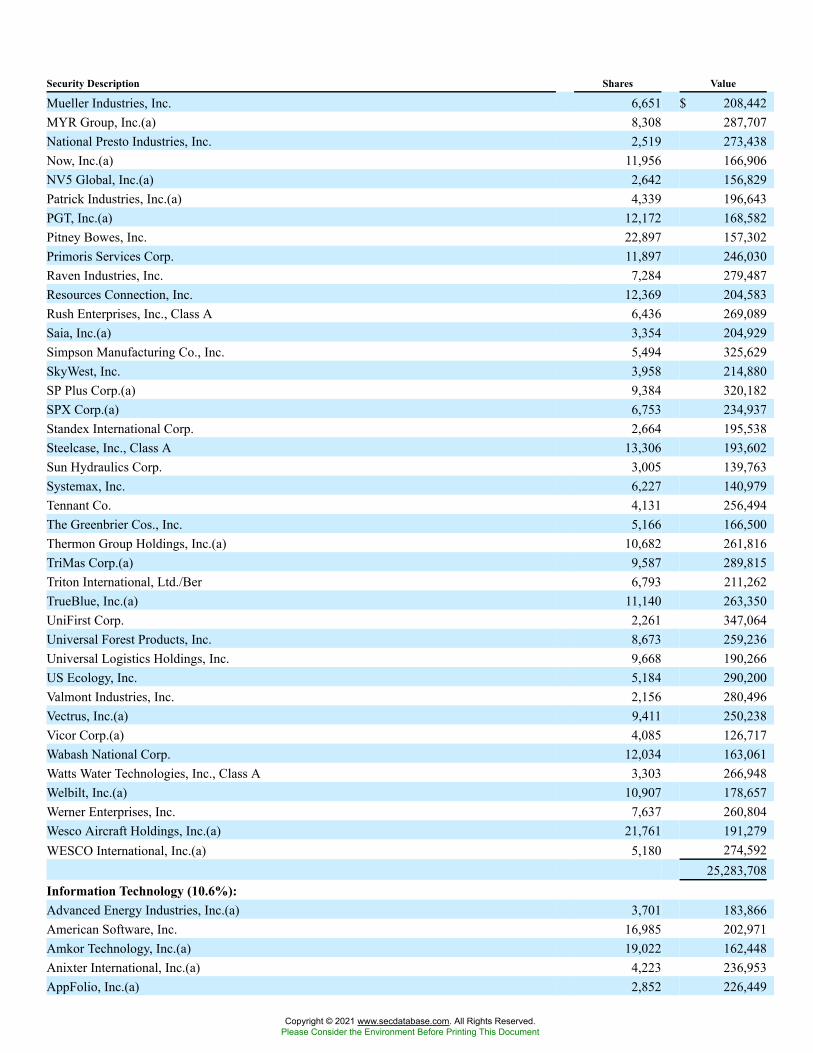
Security Description Shares Value
Mueller Industries, Inc. 6,651 $ 208,442MYR Group, Inc.(a) 8,308 287,707National Presto Industries, Inc. 2,519 273,438Now, Inc.(a) 11,956 166,906NV5 Global, Inc.(a) 2,642 156,829Patrick Industries, Inc.(a) 4,339 196,643PGT, Inc.(a) 12,172 168,582Pitney Bowes, Inc. 22,897 157,302Primoris Services Corp. 11,897 246,030Raven Industries, Inc. 7,284 279,487Resources Connection, Inc. 12,369 204,583Rush Enterprises, Inc., Class A 6,436 269,089Saia, Inc.(a) 3,354 204,929Simpson Manufacturing Co., Inc. 5,494 325,629SkyWest, Inc. 3,958 214,880SP Plus Corp.(a) 9,384 320,182SPX Corp.(a) 6,753 234,937Standex International Corp. 2,664 195,538Steelcase, Inc., Class A 13,306 193,602Sun Hydraulics Corp. 3,005 139,763Systemax, Inc. 6,227 140,979Tennant Co. 4,131 256,494The Greenbrier Cos., Inc. 5,166 166,500Thermon Group Holdings, Inc.(a) 10,682 261,816TriMas Corp.(a) 9,587 289,815Triton International, Ltd./Ber 6,793 211,262TrueBlue, Inc.(a) 11,140 263,350UniFirst Corp. 2,261 347,064Universal Forest Products, Inc. 8,673 259,236Universal Logistics Holdings, Inc. 9,668 190,266US Ecology, Inc. 5,184 290,200Valmont Industries, Inc. 2,156 280,496Vectrus, Inc.(a) 9,411 250,238Vicor Corp.(a) 4,085 126,717Wabash National Corp. 12,034 163,061Watts Water Technologies, Inc., Class A 3,303 266,948Welbilt, Inc.(a) 10,907 178,657Werner Enterprises, Inc. 7,637 260,804Wesco Aircraft Holdings, Inc.(a) 21,761 191,279WESCO International, Inc.(a) 5,180 274,592
25,283,708Information Technology (10.6%):Advanced Energy Industries, Inc.(a) 3,701 183,866American Software, Inc. 16,985 202,971Amkor Technology, Inc.(a) 19,022 162,448Anixter International, Inc.(a) 4,223 236,953AppFolio, Inc.(a) 2,852 226,449
Copyright © 2021 www.secdatabase.com. All Rights Reserved.Please Consider the Environment Before Printing This Document
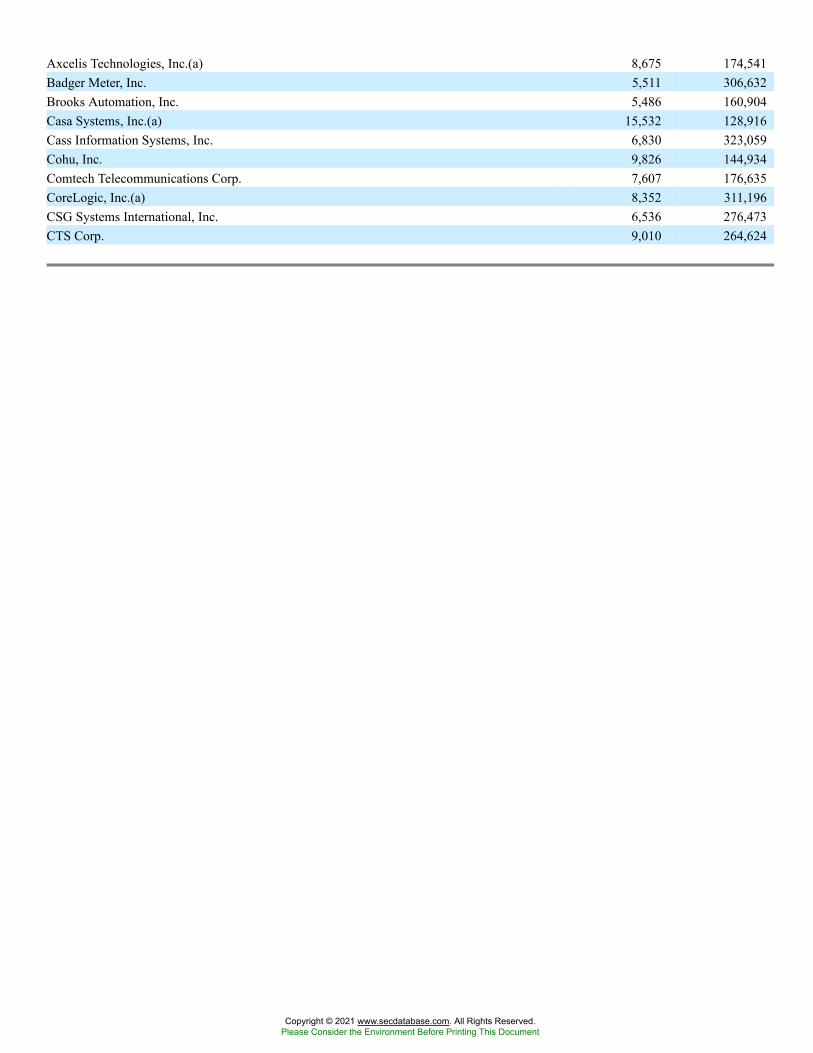
Axcelis Technologies, Inc.(a) 8,675 174,541Badger Meter, Inc. 5,511 306,632Brooks Automation, Inc. 5,486 160,904Casa Systems, Inc.(a) 15,532 128,916Cass Information Systems, Inc. 6,830 323,059Cohu, Inc. 9,826 144,934Comtech Telecommunications Corp. 7,607 176,635CoreLogic, Inc.(a) 8,352 311,196CSG Systems International, Inc. 6,536 276,473CTS Corp. 9,010 264,624
Copyright © 2021 www.secdatabase.com. All Rights Reserved.Please Consider the Environment Before Printing This Document

Security Description Shares Value
Diodes, Inc.(a) 4,634 $ 160,800Ebix, Inc. 3,038 149,986ePlus, Inc.(a) 3,405 301,479Evertec, Inc. 6,763 188,079Exl Service Holdings, Inc.(a) 5,375 322,608Fabrinet(a) 3,352 175,511FormFactor, Inc.(a) 8,755 140,868Ichor Holdings Ltd.(a) 7,233 163,321II-VI, Inc.(a) 3,117 116,077Insight Enterprises, Inc.(a) 4,037 222,277InterDigital, Inc. 5,399 356,225KEMET Corp. 6,702 113,733ManTech International Corp., Class A 5,021 271,234Mesa Laboratories, Inc. 1,714 395,076MicroStrategy, Inc., Class A(a) 2,206 318,216MTS Systems Corp. 5,855 318,862Nanometrics, Inc.(a) 7,942 245,249NIC, Inc. 13,611 232,612OSI Systems, Inc.(a) 3,112 272,611PC Connection, Inc. 3,596 131,865Pcm, Inc.(a) 4,520 165,568Perficient, Inc.(a) 10,007 274,092Photronics, Inc.(a) 24,058 227,348Plexus Corp.(a) 4,869 296,766Power Integrations, Inc. 2,834 198,210Presidio, Inc. 14,010 207,348Progress Software Corp. 6,595 292,620Rogers Corp.(a) 1,174 186,525Rudolph Technologies, Inc.(a) 9,758 222,482Sanmina Corp.(a) 6,929 199,902ScanSource, Inc.(a) 7,352 263,349Smart Global Holdings, Inc.(a) 3,879 74,477SPS Commerce, Inc.(a) 1,867 198,014Sykes Enterprises, Inc.(a) 8,605 243,349TTM Technologies, Inc.(a) 17,727 207,938Unisys Corp.(a)(b) 14,014 163,543Zix Corp.(a) 19,464 133,912
11,432,733Materials (5.6%):Advansix, Inc.(a) 6,098 174,220AK Steel Holding Corp.(a) 52,214 143,589American Vanguard Corp. 13,030 224,377Balchem Corp. 3,494 324,243Carpenter Technology Corp. 4,169 191,149Chase Corp. 2,432 225,057Clearwater Paper Corp.(a) 7,039 137,120Commercial Metals Co. 13,310 227,335
Copyright © 2021 www.secdatabase.com. All Rights Reserved.Please Consider the Environment Before Printing This Document
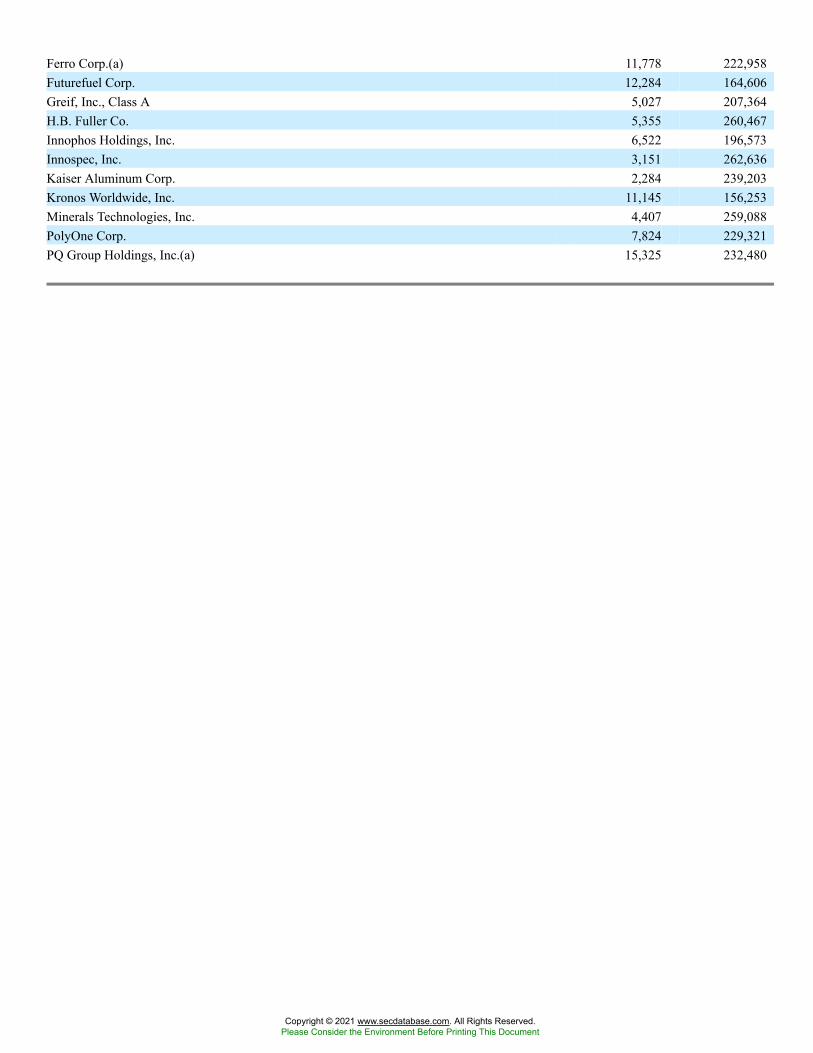
Ferro Corp.(a) 11,778 222,958Futurefuel Corp. 12,284 164,606Greif, Inc., Class A 5,027 207,364H.B. Fuller Co. 5,355 260,467Innophos Holdings, Inc. 6,522 196,573Innospec, Inc. 3,151 262,636Kaiser Aluminum Corp. 2,284 239,203Kronos Worldwide, Inc. 11,145 156,253Minerals Technologies, Inc. 4,407 259,088PolyOne Corp. 7,824 229,321PQ Group Holdings, Inc.(a) 15,325 232,480
Copyright © 2021 www.secdatabase.com. All Rights Reserved.Please Consider the Environment Before Printing This Document
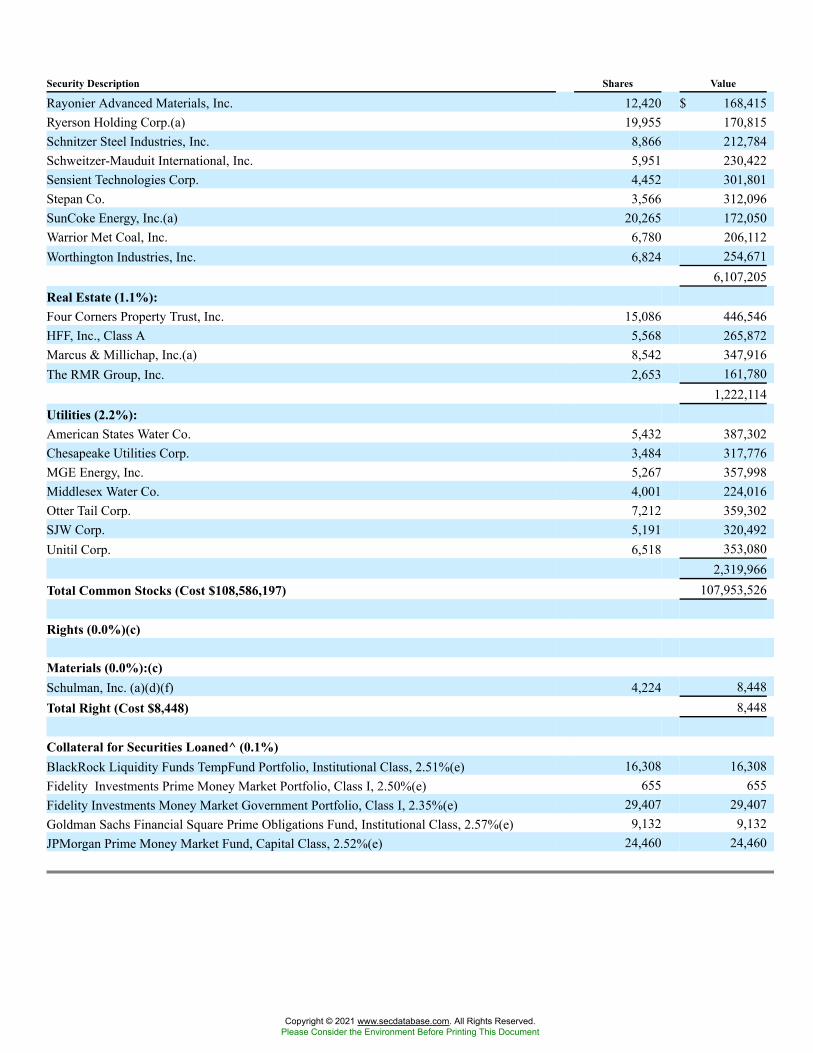
Security Description Shares Value
Rayonier Advanced Materials, Inc. 12,420 $ 168,415Ryerson Holding Corp.(a) 19,955 170,815Schnitzer Steel Industries, Inc. 8,866 212,784Schweitzer-Mauduit International, Inc. 5,951 230,422Sensient Technologies Corp. 4,452 301,801Stepan Co. 3,566 312,096SunCoke Energy, Inc.(a) 20,265 172,050Warrior Met Coal, Inc. 6,780 206,112Worthington Industries, Inc. 6,824 254,671
6,107,205Real Estate (1.1%):Four Corners Property Trust, Inc. 15,086 446,546HFF, Inc., Class A 5,568 265,872Marcus & Millichap, Inc.(a) 8,542 347,916The RMR Group, Inc. 2,653 161,780
1,222,114Utilities (2.2%):American States Water Co. 5,432 387,302Chesapeake Utilities Corp. 3,484 317,776MGE Energy, Inc. 5,267 357,998Middlesex Water Co. 4,001 224,016Otter Tail Corp. 7,212 359,302SJW Corp. 5,191 320,492Unitil Corp. 6,518 353,080
2,319,966Total Common Stocks (Cost $108,586,197) 107,953,526
Rights (0.0%)(c)
Materials (0.0%):(c)Schulman, Inc. (a)(d)(f) 4,224 8,448Total Right (Cost $8,448) 8,448
Collateral for Securities Loaned^ (0.1%)BlackRock Liquidity Funds TempFund Portfolio, Institutional Class, 2.51%(e) 16,308 16,308Fidelity Investments Prime Money Market Portfolio, Class I, 2.50%(e) 655 655Fidelity Investments Money Market Government Portfolio, Class I, 2.35%(e) 29,407 29,407Goldman Sachs Financial Square Prime Obligations Fund, Institutional Class, 2.57%(e) 9,132 9,132JPMorgan Prime Money Market Fund, Capital Class, 2.52%(e) 24,460 24,460
Copyright © 2021 www.secdatabase.com. All Rights Reserved.Please Consider the Environment Before Printing This Document
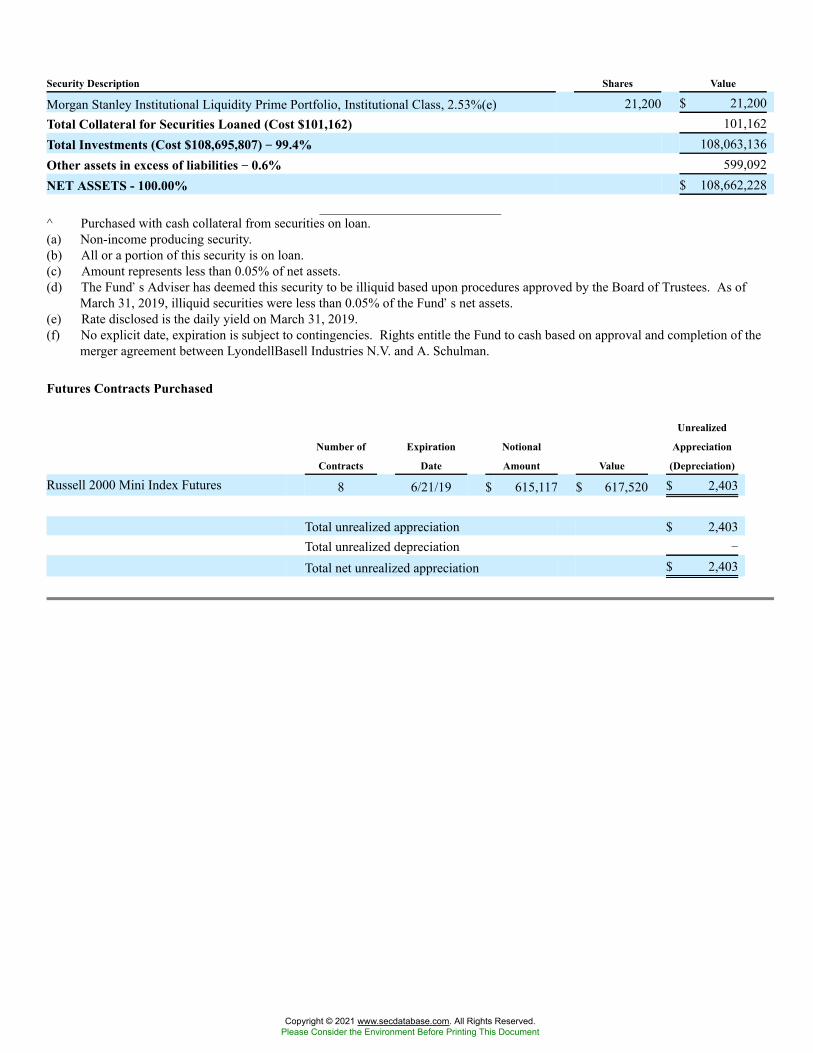
Security Description Shares Value
Morgan Stanley Institutional Liquidity Prime Portfolio, Institutional Class, 2.53%(e) 21,200 $ 21,200Total Collateral for Securities Loaned (Cost $101,162) 101,162Total Investments (Cost $108,695,807) �� 99.4% 108,063,136Other assets in excess of liabilities �� 0.6% 599,092NET ASSETS - 100.00% $ 108,662,228
^ Purchased with cash collateral from securities on loan.(a) Non-income producing security.(b) All or a portion of this security is on loan.(c) Amount represents less than 0.05% of net assets.(d) The Fund�s Adviser has deemed this security to be illiquid based upon procedures approved by the Board of Trustees. As of
March 31, 2019, illiquid securities were less than 0.05% of the Fund�s net assets.(e) Rate disclosed is the daily yield on March 31, 2019.(f) No explicit date, expiration is subject to contingencies. Rights entitle the Fund to cash based on approval and completion of the
merger agreement between LyondellBasell Industries N.V. and A. Schulman.
Futures Contracts Purchased
Number of
Contracts
Expiration
Date
Notional
Amount Value
Unrealized
Appreciation
(Depreciation)
Russell 2000 Mini Index Futures 8 6/21/19 $ 615,117 $ 617,520 $ 2,403
Total unrealized appreciation $ 2,403Total unrealized depreciation �
Total net unrealized appreciation $ 2,403
Copyright © 2021 www.secdatabase.com. All Rights Reserved.Please Consider the Environment Before Printing This Document
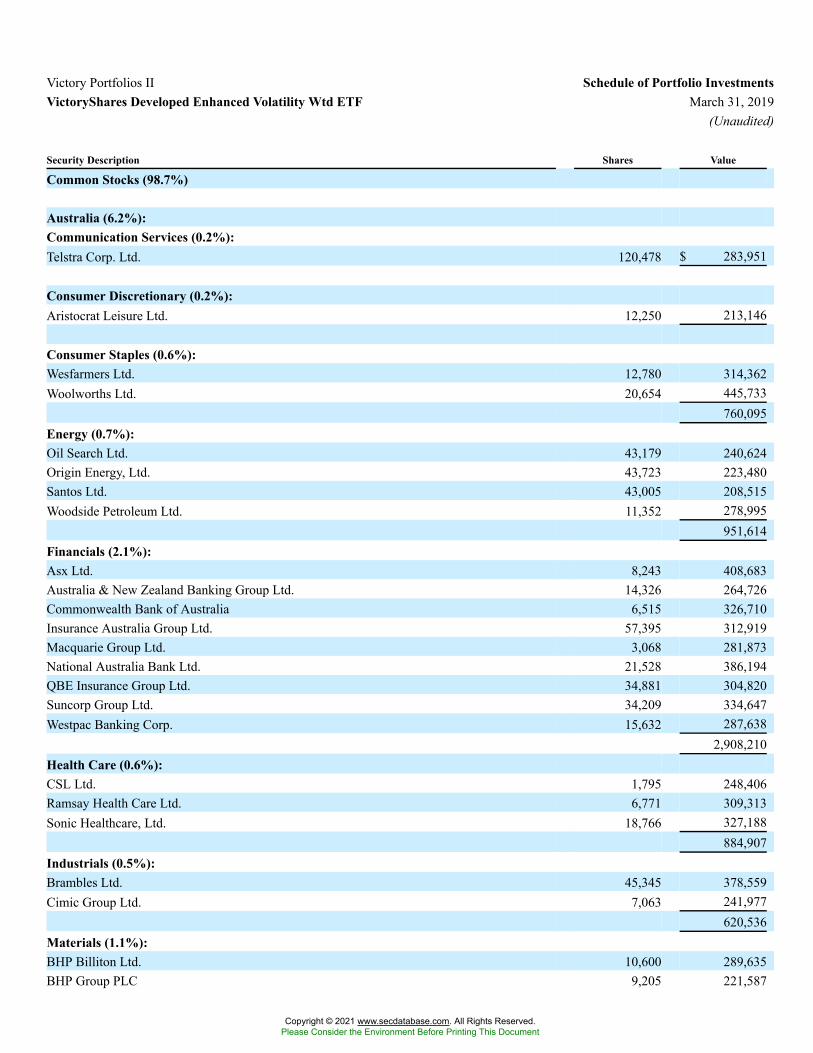
Victory Portfolios II Schedule of Portfolio InvestmentsVictoryShares Developed Enhanced Volatility Wtd ETF March 31, 2019
(Unaudited)
Security Description Shares Value
Common Stocks (98.7%)
Australia (6.2%):Communication Services (0.2%):Telstra Corp. Ltd. 120,478 $ 283,951
Consumer Discretionary (0.2%):Aristocrat Leisure Ltd. 12,250 213,146
Consumer Staples (0.6%):Wesfarmers Ltd. 12,780 314,362Woolworths Ltd. 20,654 445,733
760,095Energy (0.7%):Oil Search Ltd. 43,179 240,624Origin Energy, Ltd. 43,723 223,480Santos Ltd. 43,005 208,515Woodside Petroleum Ltd. 11,352 278,995
951,614Financials (2.1%):Asx Ltd. 8,243 408,683Australia & New Zealand Banking Group Ltd. 14,326 264,726Commonwealth Bank of Australia 6,515 326,710Insurance Australia Group Ltd. 57,395 312,919Macquarie Group Ltd. 3,068 281,873National Australia Bank Ltd. 21,528 386,194QBE Insurance Group Ltd. 34,881 304,820Suncorp Group Ltd. 34,209 334,647Westpac Banking Corp. 15,632 287,638
2,908,210Health Care (0.6%):CSL Ltd. 1,795 248,406Ramsay Health Care Ltd. 6,771 309,313Sonic Healthcare, Ltd. 18,766 327,188
884,907Industrials (0.5%):Brambles Ltd. 45,345 378,559Cimic Group Ltd. 7,063 241,977
620,536Materials (1.1%):BHP Billiton Ltd. 10,600 289,635BHP Group PLC 9,205 221,587
Copyright © 2021 www.secdatabase.com. All Rights Reserved.Please Consider the Environment Before Printing This Document
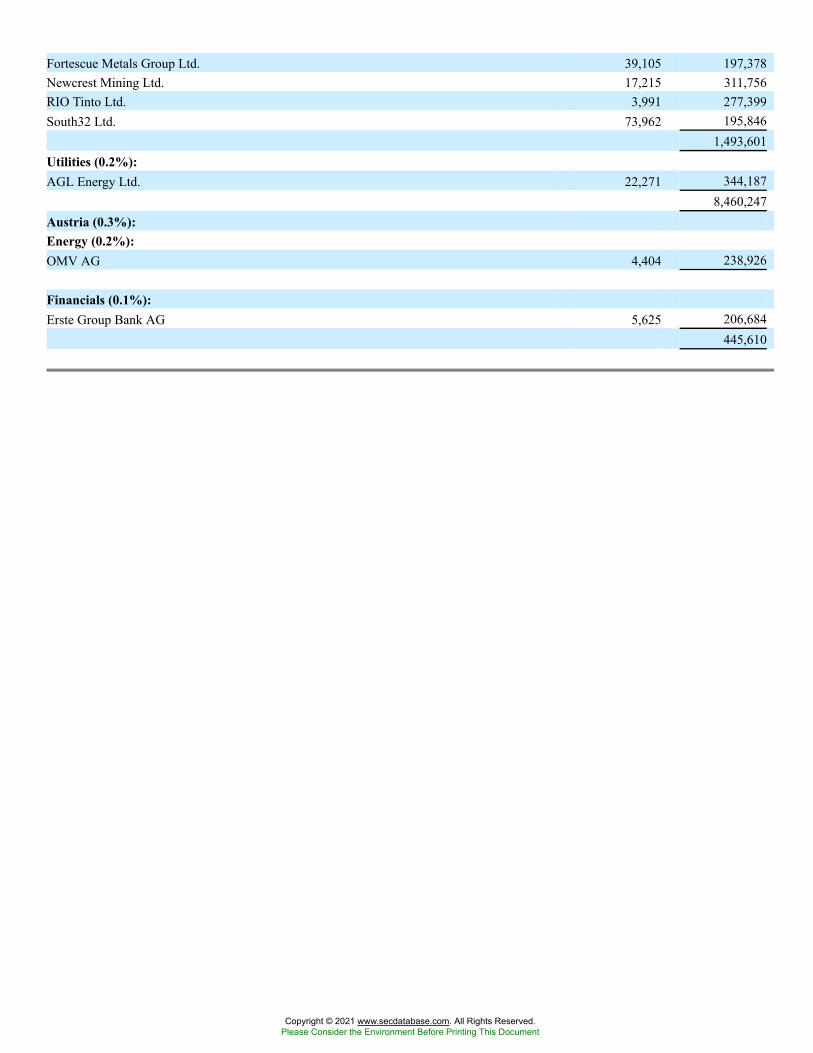
Fortescue Metals Group Ltd. 39,105 197,378Newcrest Mining Ltd. 17,215 311,756RIO Tinto Ltd. 3,991 277,399South32 Ltd. 73,962 195,846
1,493,601Utilities (0.2%):AGL Energy Ltd. 22,271 344,187
8,460,247Austria (0.3%):Energy (0.2%):OMV AG 4,404 238,926
Financials (0.1%):Erste Group Bank AG 5,625 206,684
445,610
Copyright © 2021 www.secdatabase.com. All Rights Reserved.Please Consider the Environment Before Printing This Document
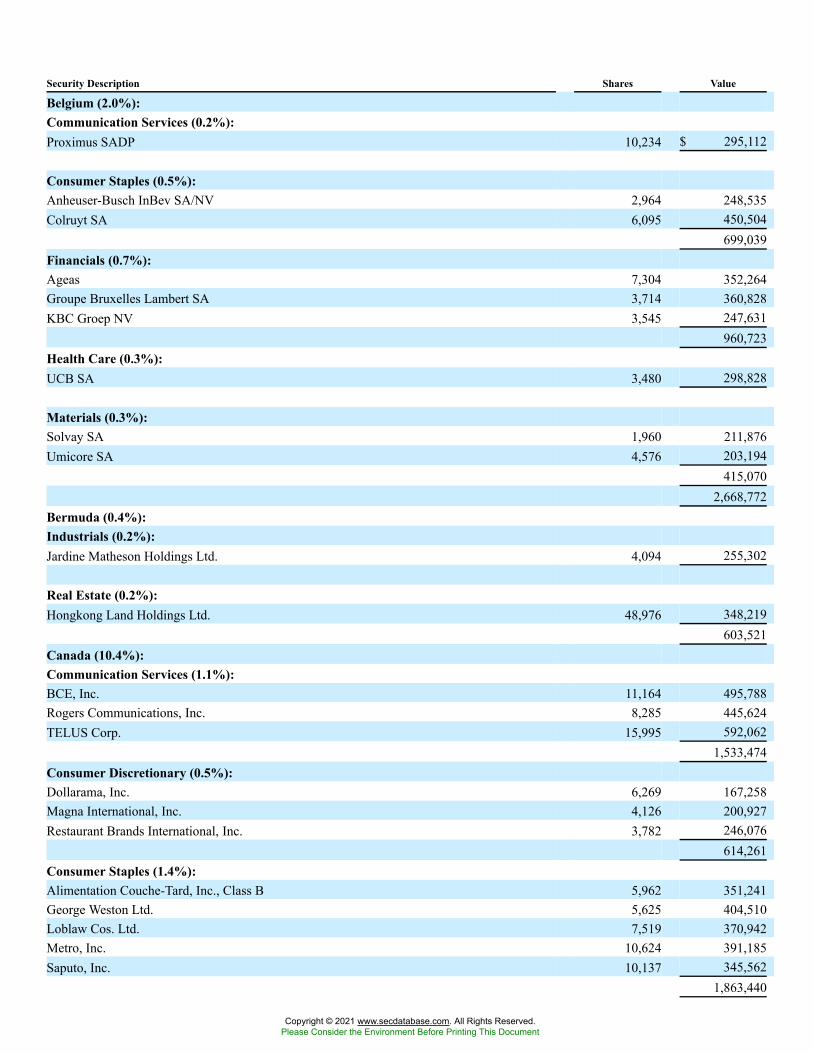
Security Description Shares Value
Belgium (2.0%):Communication Services (0.2%):Proximus SADP 10,234 $ 295,112
Consumer Staples (0.5%):Anheuser-Busch InBev SA/NV 2,964 248,535Colruyt SA 6,095 450,504
699,039Financials (0.7%):Ageas 7,304 352,264Groupe Bruxelles Lambert SA 3,714 360,828KBC Groep NV 3,545 247,631
960,723Health Care (0.3%):UCB SA 3,480 298,828
Materials (0.3%):Solvay SA 1,960 211,876Umicore SA 4,576 203,194
415,0702,668,772
Bermuda (0.4%):Industrials (0.2%):Jardine Matheson Holdings Ltd. 4,094 255,302
Real Estate (0.2%):Hongkong Land Holdings Ltd. 48,976 348,219
603,521Canada (10.4%):Communication Services (1.1%):BCE, Inc. 11,164 495,788Rogers Communications, Inc. 8,285 445,624TELUS Corp. 15,995 592,062
1,533,474Consumer Discretionary (0.5%):Dollarama, Inc. 6,269 167,258Magna International, Inc. 4,126 200,927Restaurant Brands International, Inc. 3,782 246,076
614,261Consumer Staples (1.4%):Alimentation Couche-Tard, Inc., Class B 5,962 351,241George Weston Ltd. 5,625 404,510Loblaw Cos. Ltd. 7,519 370,942Metro, Inc. 10,624 391,185Saputo, Inc. 10,137 345,562
1,863,440
Copyright © 2021 www.secdatabase.com. All Rights Reserved.Please Consider the Environment Before Printing This Document
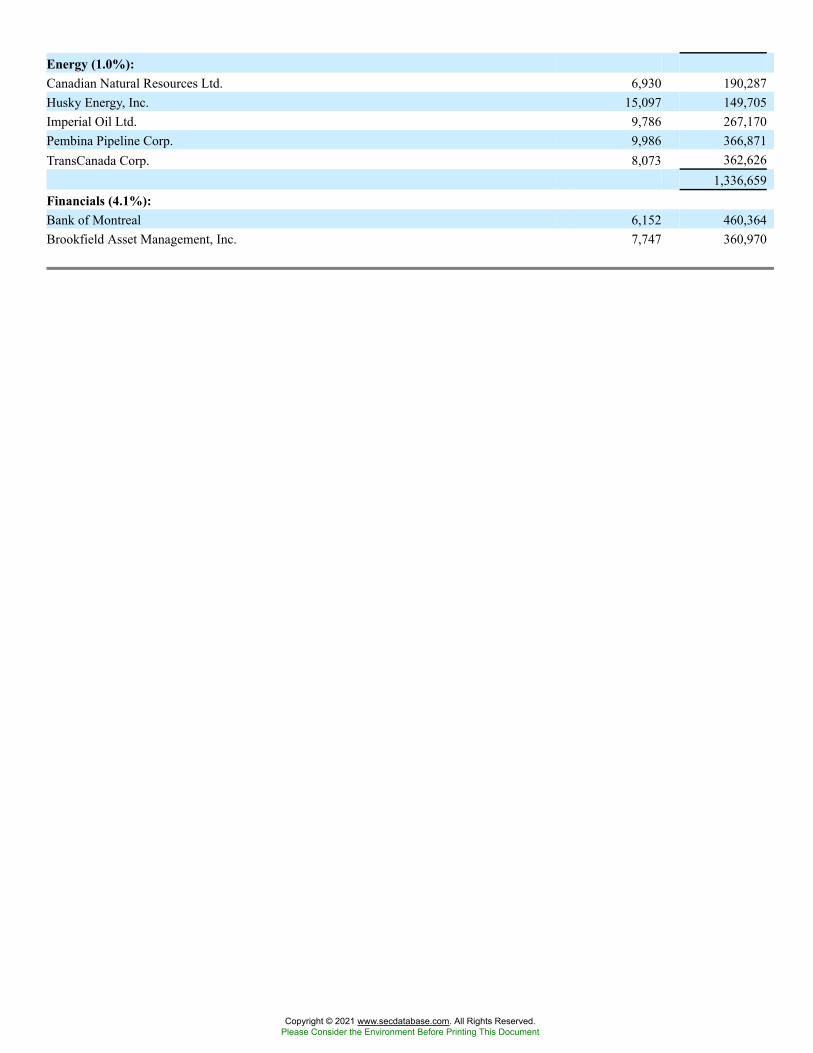
Energy (1.0%):Canadian Natural Resources Ltd. 6,930 190,287Husky Energy, Inc. 15,097 149,705Imperial Oil Ltd. 9,786 267,170Pembina Pipeline Corp. 9,986 366,871TransCanada Corp. 8,073 362,626
1,336,659Financials (4.1%):Bank of Montreal 6,152 460,364Brookfield Asset Management, Inc. 7,747 360,970
Copyright © 2021 www.secdatabase.com. All Rights Reserved.Please Consider the Environment Before Printing This Document
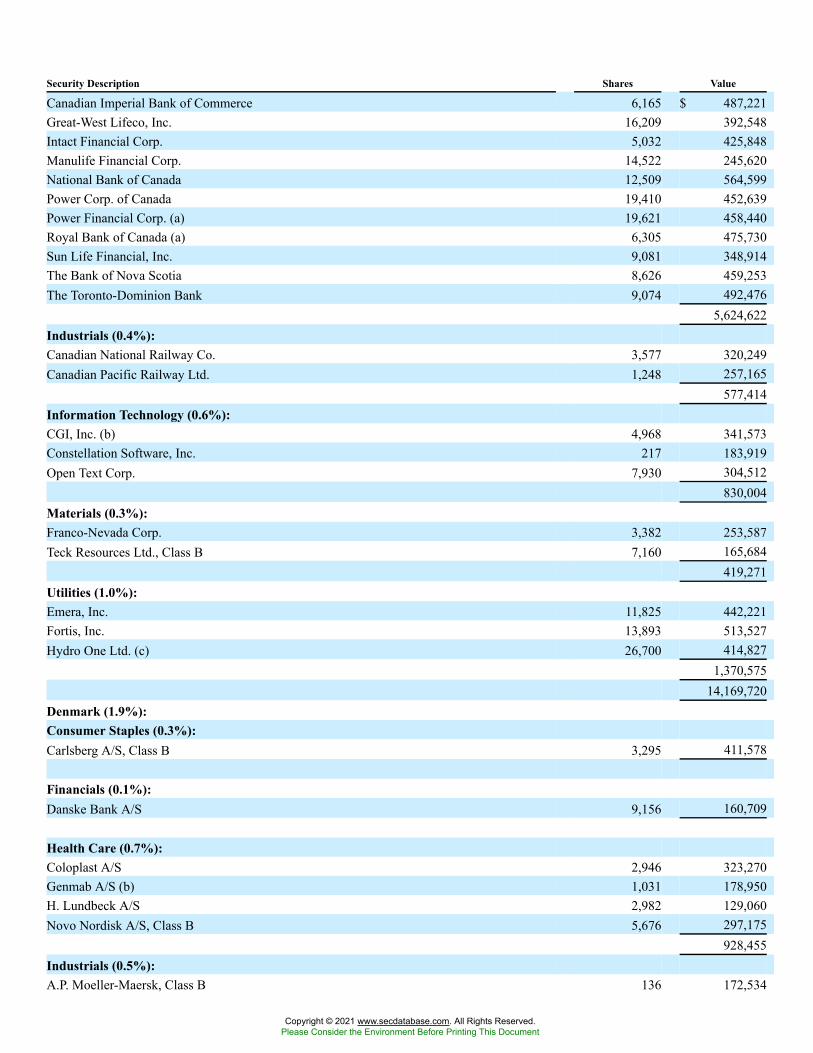
Security Description Shares Value
Canadian Imperial Bank of Commerce 6,165 $ 487,221Great-West Lifeco, Inc. 16,209 392,548Intact Financial Corp. 5,032 425,848Manulife Financial Corp. 14,522 245,620National Bank of Canada 12,509 564,599Power Corp. of Canada 19,410 452,639Power Financial Corp. (a) 19,621 458,440Royal Bank of Canada (a) 6,305 475,730Sun Life Financial, Inc. 9,081 348,914The Bank of Nova Scotia 8,626 459,253The Toronto-Dominion Bank 9,074 492,476
5,624,622Industrials (0.4%):Canadian National Railway Co. 3,577 320,249Canadian Pacific Railway Ltd. 1,248 257,165
577,414Information Technology (0.6%):CGI, Inc. (b) 4,968 341,573Constellation Software, Inc. 217 183,919Open Text Corp. 7,930 304,512
830,004Materials (0.3%):Franco-Nevada Corp. 3,382 253,587Teck Resources Ltd., Class B 7,160 165,684
419,271Utilities (1.0%):Emera, Inc. 11,825 442,221Fortis, Inc. 13,893 513,527Hydro One Ltd. (c) 26,700 414,827
1,370,57514,169,720
Denmark (1.9%):Consumer Staples (0.3%):Carlsberg A/S, Class B 3,295 411,578
Financials (0.1%):Danske Bank A/S 9,156 160,709
Health Care (0.7%):Coloplast A/S 2,946 323,270Genmab A/S (b) 1,031 178,950H. Lundbeck A/S 2,982 129,060Novo Nordisk A/S, Class B 5,676 297,175
928,455Industrials (0.5%):A.P. Moeller-Maersk, Class B 136 172,534
Copyright © 2021 www.secdatabase.com. All Rights Reserved.Please Consider the Environment Before Printing This Document
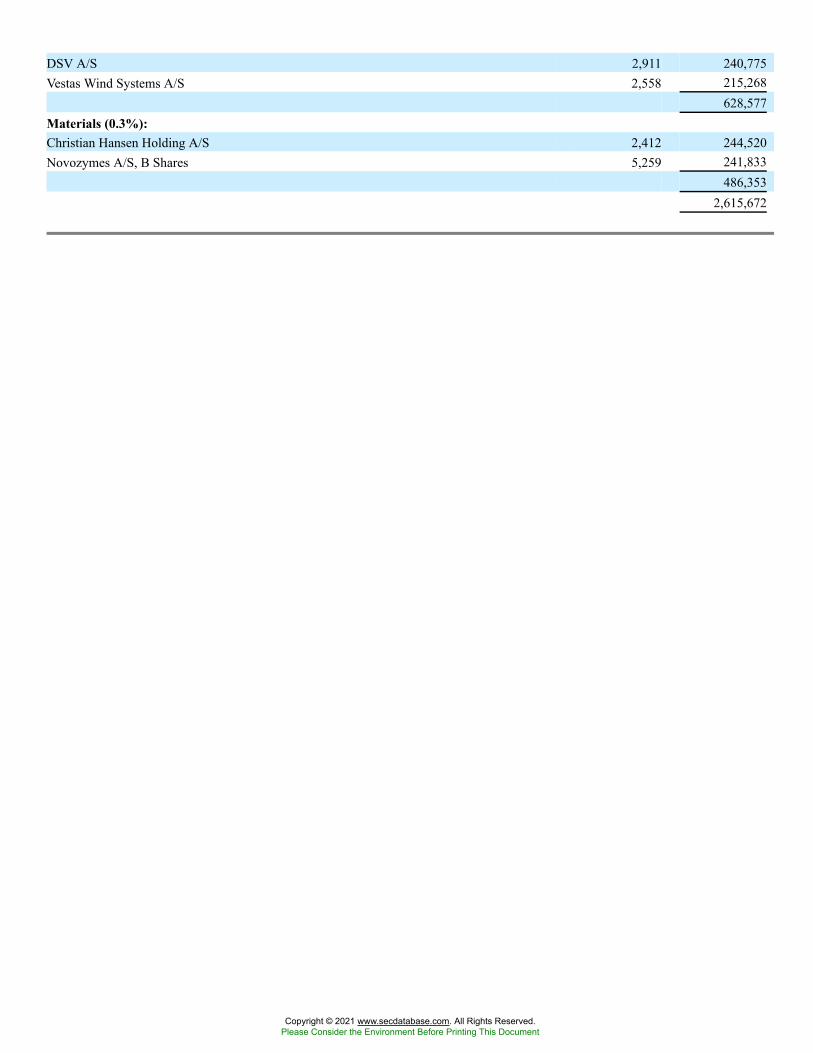
DSV A/S 2,911 240,775Vestas Wind Systems A/S 2,558 215,268
628,577Materials (0.3%):Christian Hansen Holding A/S 2,412 244,520Novozymes A/S, B Shares 5,259 241,833
486,3532,615,672
Copyright © 2021 www.secdatabase.com. All Rights Reserved.Please Consider the Environment Before Printing This Document

Security Description Shares Value
Finland (1.5%):Energy (0.2%):Neste Oyj 2,292 $ 244,218
Financials (0.4%):Nordea Bank AB 33,104 251,964Sampo Oyj, Class A 8,522 386,252
638,216Industrials (0.4%):Kone Oyj, Class B 6,034 304,279Wartsila Oyj ABP, Class B 13,309 214,731
519,010Materials (0.3%):Stora ENSO Oyj, R Shares 13,985 170,895UPM-Kymmene Oyj 7,658 223,320
394,215Utilities (0.2%):Fortum Oyj 11,391 232,910
2,028,569France (9.0%):Communication Services (0.5%):Orange SA 29,240 475,538Publicis Groupe SA 3,850 206,106
681,644Consumer Discretionary (1.5%):Accor SA 7,086 286,991Cie Generale des Etablissements Michelin 1,532 181,109Hermes International 448 295,558Kering 320 183,476LVMH Moet Hennessy Louis Vuitton SA 625 229,859Psa Peugeot Citroen 8,000 195,069Renault SA 3,462 228,747Seb SA 996 167,568Sodexo SA 2,793 307,500
2,075,877Consumer Staples (0.8%):Danone SA 5,089 392,072L�Oreal SA 1,239 333,242Pernod Ricard SA 1,947 349,402
1,074,716Energy (0.2%):Total SA 5,698 316,477
Financials (0.9%):BNP Paribas SA 5,015 239,675CNP Assurances 15,337 337,504
Copyright © 2021 www.secdatabase.com. All Rights Reserved.Please Consider the Environment Before Printing This Document
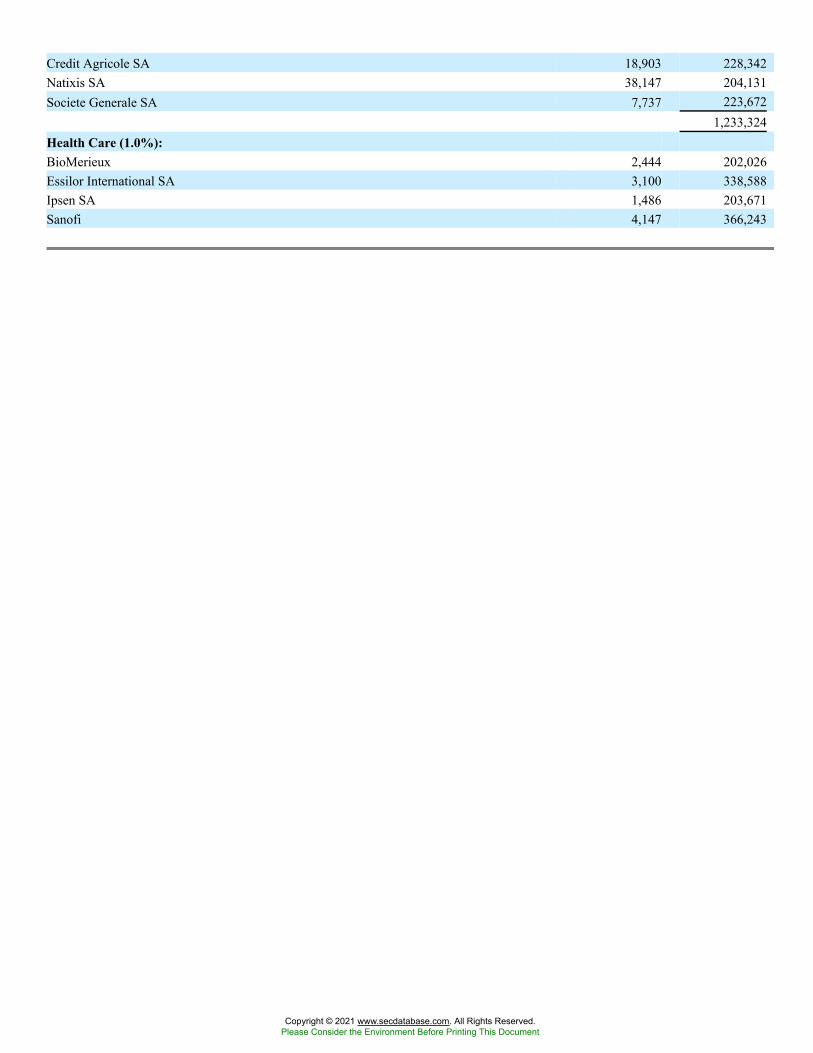
Credit Agricole SA 18,903 228,342Natixis SA 38,147 204,131Societe Generale SA 7,737 223,672
1,233,324Health Care (1.0%):BioMerieux 2,444 202,026Essilor International SA 3,100 338,588Ipsen SA 1,486 203,671Sanofi 4,147 366,243
Copyright © 2021 www.secdatabase.com. All Rights Reserved.Please Consider the Environment Before Printing This Document
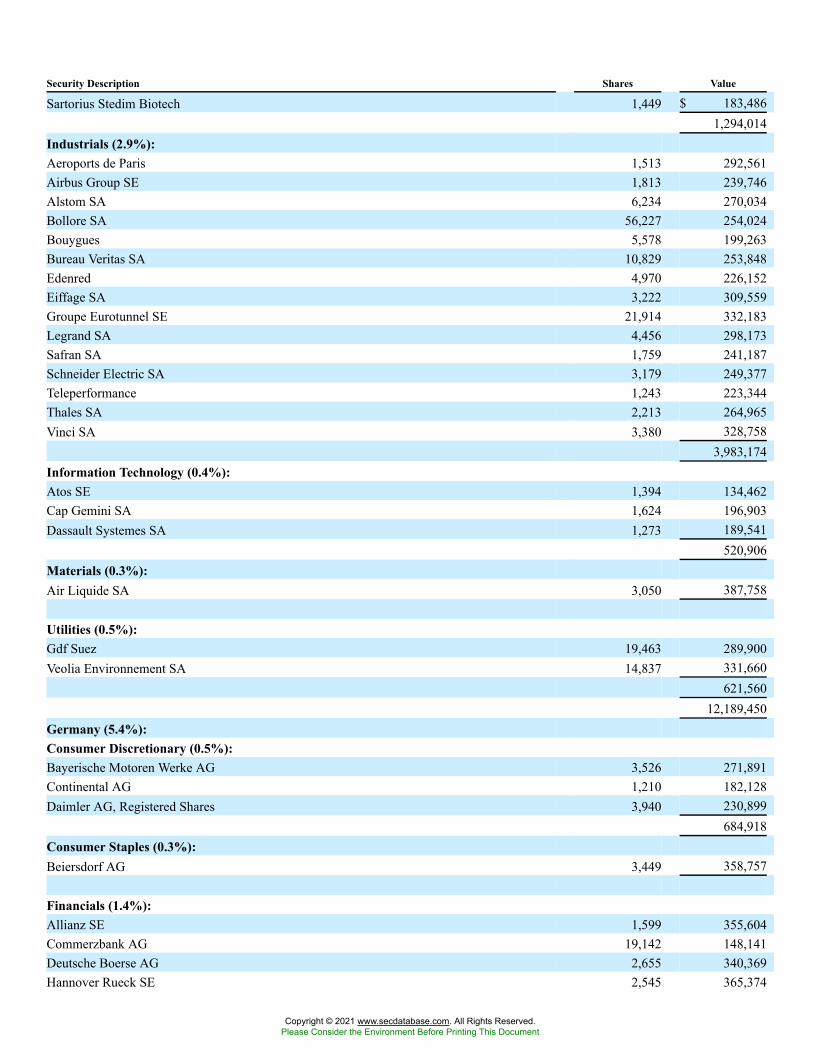
Security Description Shares Value
Sartorius Stedim Biotech 1,449 $ 183,4861,294,014
Industrials (2.9%):Aeroports de Paris 1,513 292,561Airbus Group SE 1,813 239,746Alstom SA 6,234 270,034Bollore SA 56,227 254,024Bouygues 5,578 199,263Bureau Veritas SA 10,829 253,848Edenred 4,970 226,152Eiffage SA 3,222 309,559Groupe Eurotunnel SE 21,914 332,183Legrand SA 4,456 298,173Safran SA 1,759 241,187Schneider Electric SA 3,179 249,377Teleperformance 1,243 223,344Thales SA 2,213 264,965Vinci SA 3,380 328,758
3,983,174Information Technology (0.4%):Atos SE 1,394 134,462Cap Gemini SA 1,624 196,903Dassault Systemes SA 1,273 189,541
520,906Materials (0.3%):Air Liquide SA 3,050 387,758
Utilities (0.5%):Gdf Suez 19,463 289,900Veolia Environnement SA 14,837 331,660
621,56012,189,450
Germany (5.4%):Consumer Discretionary (0.5%):Bayerische Motoren Werke AG 3,526 271,891Continental AG 1,210 182,128Daimler AG, Registered Shares 3,940 230,899
684,918Consumer Staples (0.3%):Beiersdorf AG 3,449 358,757
Financials (1.4%):Allianz SE 1,599 355,604Commerzbank AG 19,142 148,141Deutsche Boerse AG 2,655 340,369Hannover Rueck SE 2,545 365,374
Copyright © 2021 www.secdatabase.com. All Rights Reserved.Please Consider the Environment Before Printing This Document
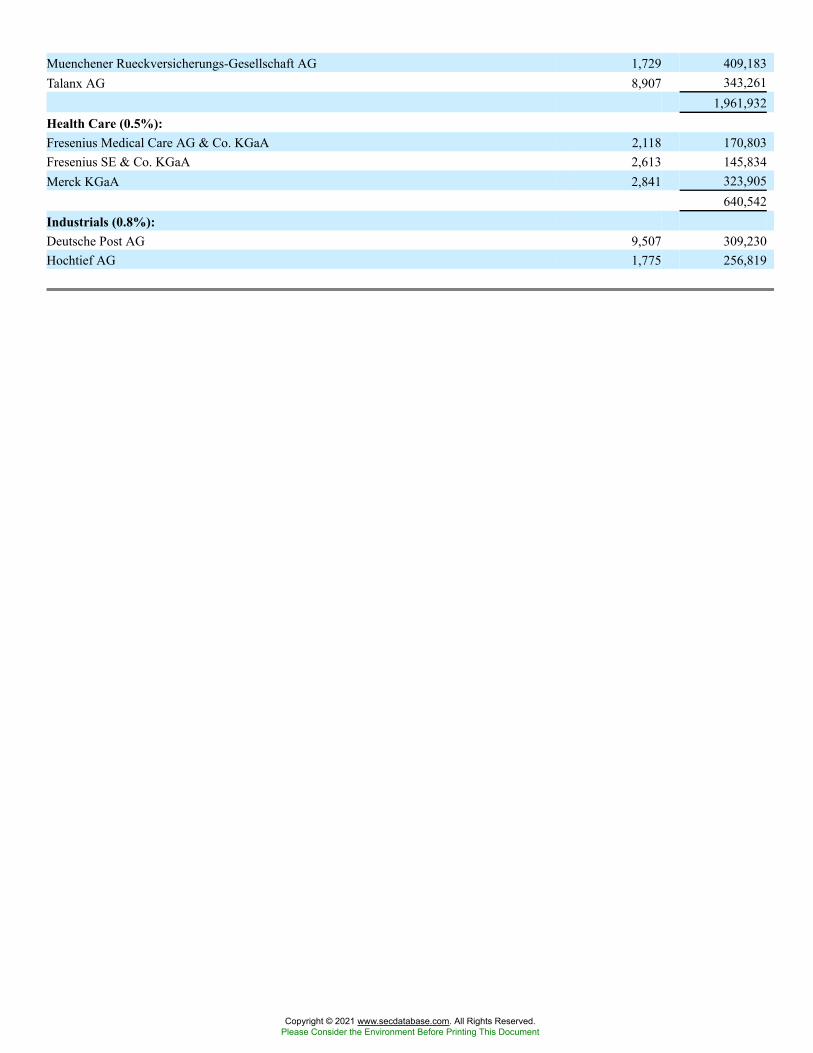
Muenchener Rueckversicherungs-Gesellschaft AG 1,729 409,183Talanx AG 8,907 343,261
1,961,932Health Care (0.5%):Fresenius Medical Care AG & Co. KGaA 2,118 170,803Fresenius SE & Co. KGaA 2,613 145,834Merck KGaA 2,841 323,905
640,542Industrials (0.8%):Deutsche Post AG 9,507 309,230Hochtief AG 1,775 256,819
Copyright © 2021 www.secdatabase.com. All Rights Reserved.Please Consider the Environment Before Printing This Document
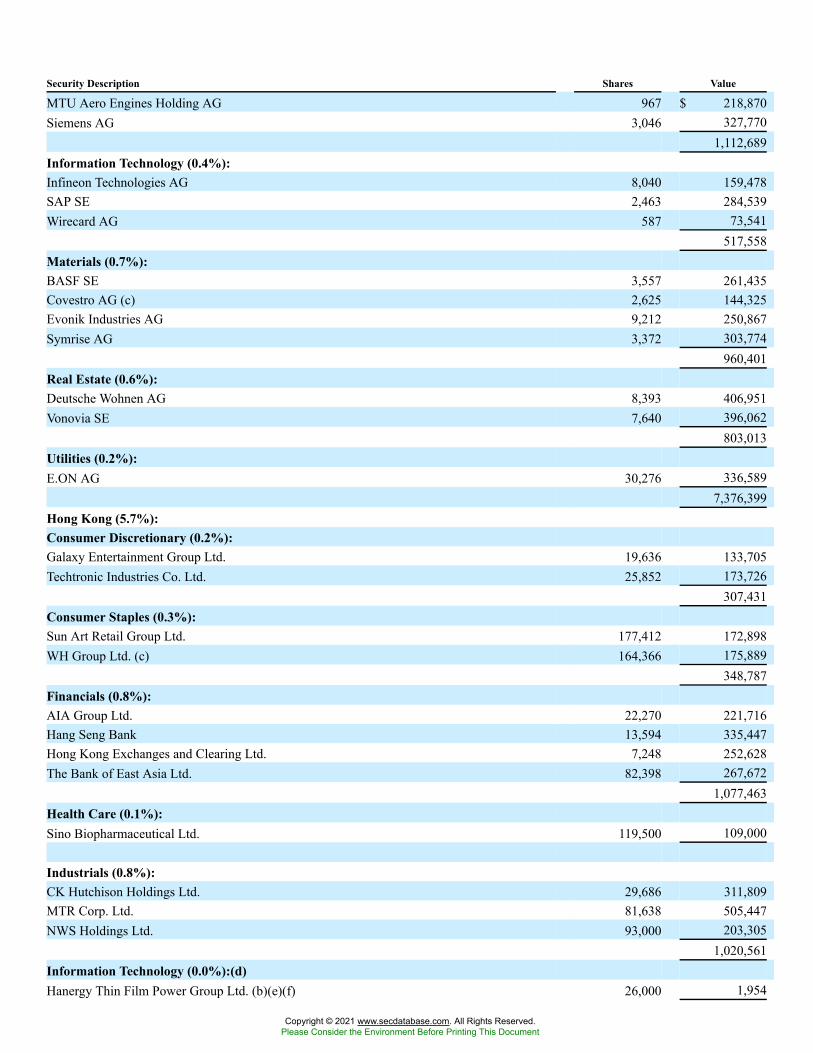
Security Description Shares Value
MTU Aero Engines Holding AG 967 $ 218,870Siemens AG 3,046 327,770
1,112,689Information Technology (0.4%):Infineon Technologies AG 8,040 159,478SAP SE 2,463 284,539Wirecard AG 587 73,541
517,558Materials (0.7%):BASF SE 3,557 261,435Covestro AG (c) 2,625 144,325Evonik Industries AG 9,212 250,867Symrise AG 3,372 303,774
960,401Real Estate (0.6%):Deutsche Wohnen AG 8,393 406,951Vonovia SE 7,640 396,062
803,013Utilities (0.2%):E.ON AG 30,276 336,589
7,376,399Hong Kong (5.7%):Consumer Discretionary (0.2%):Galaxy Entertainment Group Ltd. 19,636 133,705Techtronic Industries Co. Ltd. 25,852 173,726
307,431Consumer Staples (0.3%):Sun Art Retail Group Ltd. 177,412 172,898WH Group Ltd. (c) 164,366 175,889
348,787Financials (0.8%):AIA Group Ltd. 22,270 221,716Hang Seng Bank 13,594 335,447Hong Kong Exchanges and Clearing Ltd. 7,248 252,628The Bank of East Asia Ltd. 82,398 267,672
1,077,463Health Care (0.1%):Sino Biopharmaceutical Ltd. 119,500 109,000
Industrials (0.8%):CK Hutchison Holdings Ltd. 29,686 311,809MTR Corp. Ltd. 81,638 505,447NWS Holdings Ltd. 93,000 203,305
1,020,561Information Technology (0.0%):(d)Hanergy Thin Film Power Group Ltd. (b)(e)(f) 26,000 1,954
Copyright © 2021 www.secdatabase.com. All Rights Reserved.Please Consider the Environment Before Printing This Document
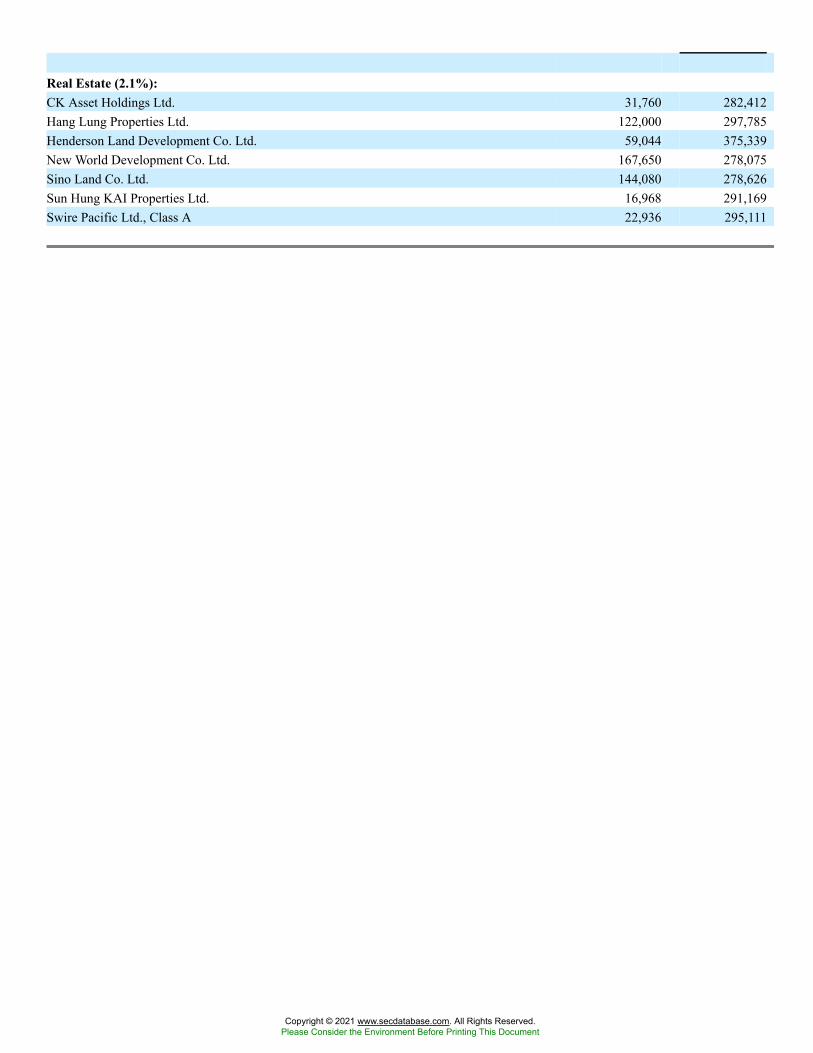
Real Estate (2.1%):CK Asset Holdings Ltd. 31,760 282,412Hang Lung Properties Ltd. 122,000 297,785Henderson Land Development Co. Ltd. 59,044 375,339New World Development Co. Ltd. 167,650 278,075Sino Land Co. Ltd. 144,080 278,626Sun Hung KAI Properties Ltd. 16,968 291,169Swire Pacific Ltd., Class A 22,936 295,111
Copyright © 2021 www.secdatabase.com. All Rights Reserved.Please Consider the Environment Before Printing This Document
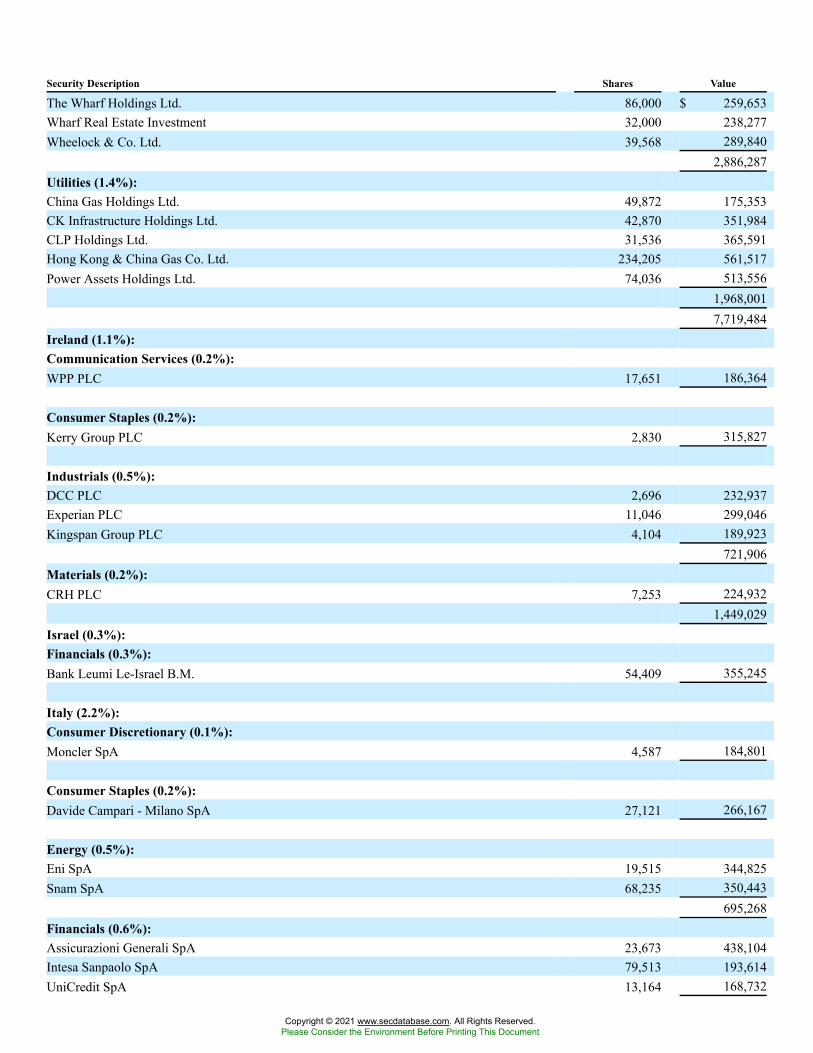
Security Description Shares Value
The Wharf Holdings Ltd. 86,000 $ 259,653Wharf Real Estate Investment 32,000 238,277Wheelock & Co. Ltd. 39,568 289,840
2,886,287Utilities (1.4%):China Gas Holdings Ltd. 49,872 175,353CK Infrastructure Holdings Ltd. 42,870 351,984CLP Holdings Ltd. 31,536 365,591Hong Kong & China Gas Co. Ltd. 234,205 561,517Power Assets Holdings Ltd. 74,036 513,556
1,968,0017,719,484
Ireland (1.1%):Communication Services (0.2%):WPP PLC 17,651 186,364
Consumer Staples (0.2%):Kerry Group PLC 2,830 315,827
Industrials (0.5%):DCC PLC 2,696 232,937Experian PLC 11,046 299,046Kingspan Group PLC 4,104 189,923
721,906Materials (0.2%):CRH PLC 7,253 224,932
1,449,029Israel (0.3%):Financials (0.3%):Bank Leumi Le-Israel B.M. 54,409 355,245
Italy (2.2%):Consumer Discretionary (0.1%):Moncler SpA 4,587 184,801
Consumer Staples (0.2%):Davide Campari - Milano SpA 27,121 266,167
Energy (0.5%):Eni SpA 19,515 344,825Snam SpA 68,235 350,443
695,268Financials (0.6%):Assicurazioni Generali SpA 23,673 438,104Intesa Sanpaolo SpA 79,513 193,614UniCredit SpA 13,164 168,732
Copyright © 2021 www.secdatabase.com. All Rights Reserved.Please Consider the Environment Before Printing This Document
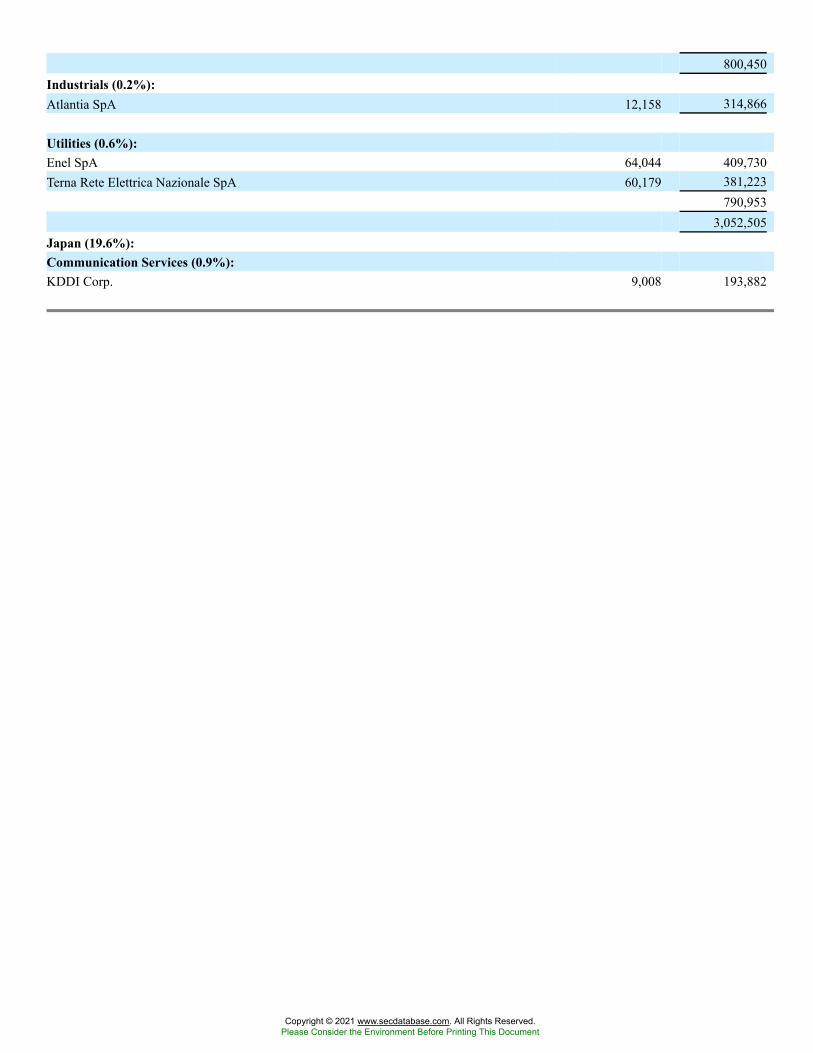
800,450Industrials (0.2%):Atlantia SpA 12,158 314,866
Utilities (0.6%):Enel SpA 64,044 409,730Terna Rete Elettrica Nazionale SpA 60,179 381,223
790,9533,052,505
Japan (19.6%):Communication Services (0.9%):KDDI Corp. 9,008 193,882
Copyright © 2021 www.secdatabase.com. All Rights Reserved.Please Consider the Environment Before Printing This Document
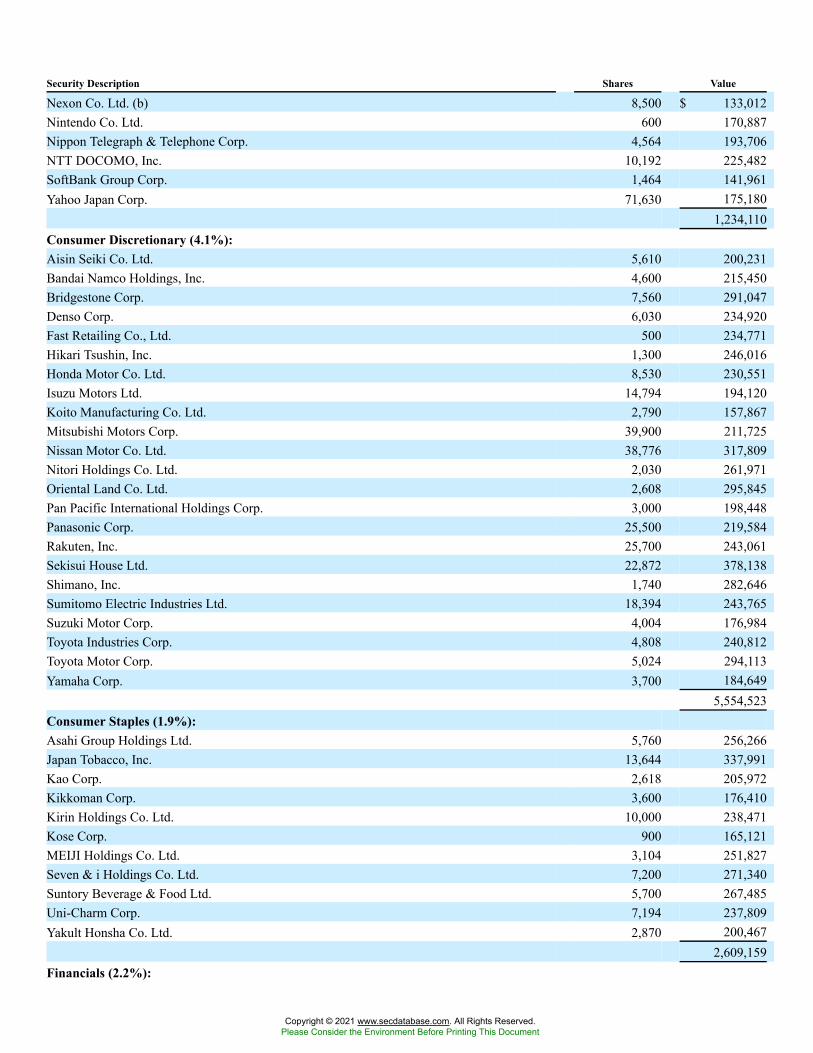
Security Description Shares Value
Nexon Co. Ltd. (b) 8,500 $ 133,012Nintendo Co. Ltd. 600 170,887Nippon Telegraph & Telephone Corp. 4,564 193,706NTT DOCOMO, Inc. 10,192 225,482SoftBank Group Corp. 1,464 141,961Yahoo Japan Corp. 71,630 175,180
1,234,110Consumer Discretionary (4.1%):Aisin Seiki Co. Ltd. 5,610 200,231Bandai Namco Holdings, Inc. 4,600 215,450Bridgestone Corp. 7,560 291,047Denso Corp. 6,030 234,920Fast Retailing Co., Ltd. 500 234,771Hikari Tsushin, Inc. 1,300 246,016Honda Motor Co. Ltd. 8,530 230,551Isuzu Motors Ltd. 14,794 194,120Koito Manufacturing Co. Ltd. 2,790 157,867Mitsubishi Motors Corp. 39,900 211,725Nissan Motor Co. Ltd. 38,776 317,809Nitori Holdings Co. Ltd. 2,030 261,971Oriental Land Co. Ltd. 2,608 295,845Pan Pacific International Holdings Corp. 3,000 198,448Panasonic Corp. 25,500 219,584Rakuten, Inc. 25,700 243,061Sekisui House Ltd. 22,872 378,138Shimano, Inc. 1,740 282,646Sumitomo Electric Industries Ltd. 18,394 243,765Suzuki Motor Corp. 4,004 176,984Toyota Industries Corp. 4,808 240,812Toyota Motor Corp. 5,024 294,113Yamaha Corp. 3,700 184,649
5,554,523Consumer Staples (1.9%):Asahi Group Holdings Ltd. 5,760 256,266Japan Tobacco, Inc. 13,644 337,991Kao Corp. 2,618 205,972Kikkoman Corp. 3,600 176,410Kirin Holdings Co. Ltd. 10,000 238,471Kose Corp. 900 165,121MEIJI Holdings Co. Ltd. 3,104 251,827Seven & i Holdings Co. Ltd. 7,200 271,340Suntory Beverage & Food Ltd. 5,700 267,485Uni-Charm Corp. 7,194 237,809Yakult Honsha Co. Ltd. 2,870 200,467
2,609,159Financials (2.2%):
Copyright © 2021 www.secdatabase.com. All Rights Reserved.Please Consider the Environment Before Printing This Document
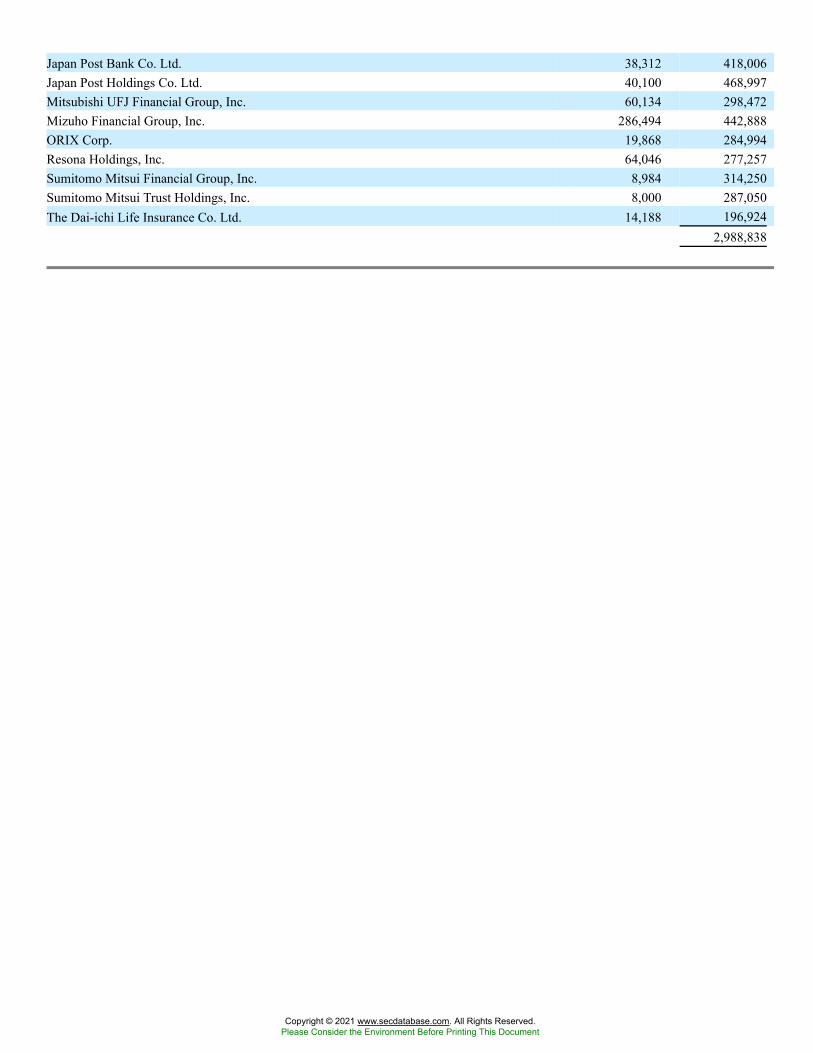
Japan Post Bank Co. Ltd. 38,312 418,006Japan Post Holdings Co. Ltd. 40,100 468,997Mitsubishi UFJ Financial Group, Inc. 60,134 298,472Mizuho Financial Group, Inc. 286,494 442,888ORIX Corp. 19,868 284,994Resona Holdings, Inc. 64,046 277,257Sumitomo Mitsui Financial Group, Inc. 8,984 314,250Sumitomo Mitsui Trust Holdings, Inc. 8,000 287,050The Dai-ichi Life Insurance Co. Ltd. 14,188 196,924
2,988,838
Copyright © 2021 www.secdatabase.com. All Rights Reserved.Please Consider the Environment Before Printing This Document
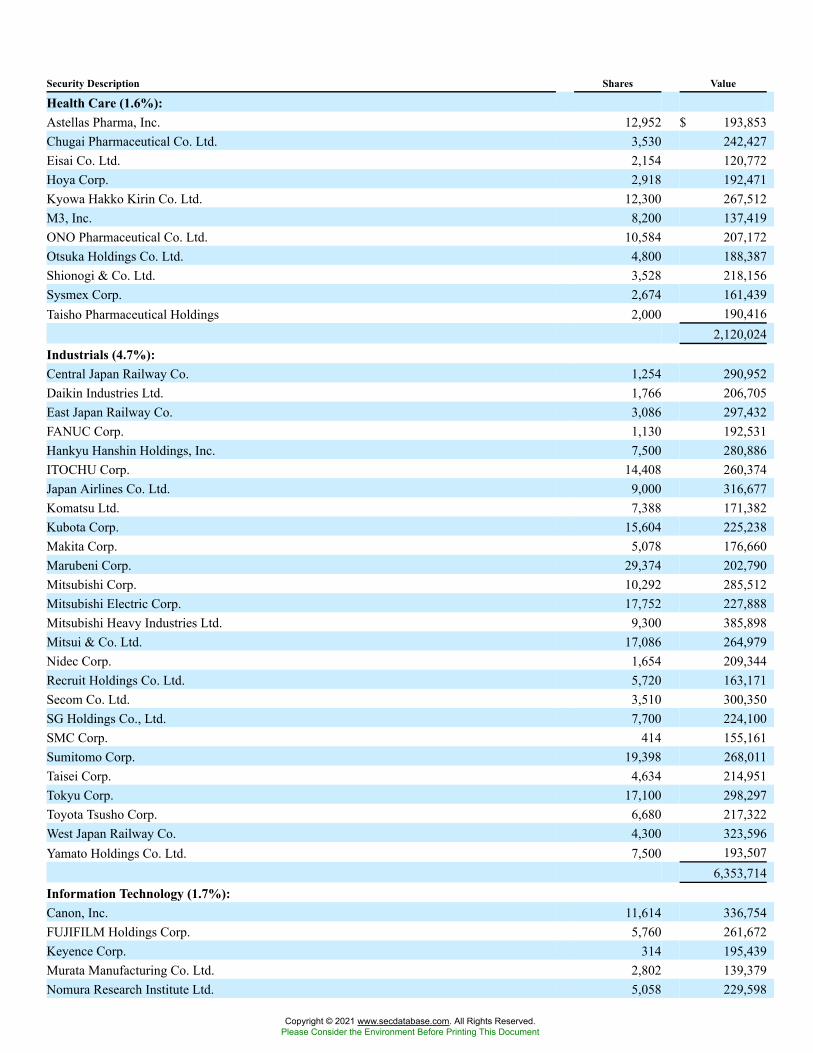
Security Description Shares Value
Health Care (1.6%):Astellas Pharma, Inc. 12,952 $ 193,853Chugai Pharmaceutical Co. Ltd. 3,530 242,427Eisai Co. Ltd. 2,154 120,772Hoya Corp. 2,918 192,471Kyowa Hakko Kirin Co. Ltd. 12,300 267,512M3, Inc. 8,200 137,419ONO Pharmaceutical Co. Ltd. 10,584 207,172Otsuka Holdings Co. Ltd. 4,800 188,387Shionogi & Co. Ltd. 3,528 218,156Sysmex Corp. 2,674 161,439Taisho Pharmaceutical Holdings 2,000 190,416
2,120,024Industrials (4.7%):Central Japan Railway Co. 1,254 290,952Daikin Industries Ltd. 1,766 206,705East Japan Railway Co. 3,086 297,432FANUC Corp. 1,130 192,531Hankyu Hanshin Holdings, Inc. 7,500 280,886ITOCHU Corp. 14,408 260,374Japan Airlines Co. Ltd. 9,000 316,677Komatsu Ltd. 7,388 171,382Kubota Corp. 15,604 225,238Makita Corp. 5,078 176,660Marubeni Corp. 29,374 202,790Mitsubishi Corp. 10,292 285,512Mitsubishi Electric Corp. 17,752 227,888Mitsubishi Heavy Industries Ltd. 9,300 385,898Mitsui & Co. Ltd. 17,086 264,979Nidec Corp. 1,654 209,344Recruit Holdings Co. Ltd. 5,720 163,171Secom Co. Ltd. 3,510 300,350SG Holdings Co., Ltd. 7,700 224,100SMC Corp. 414 155,161Sumitomo Corp. 19,398 268,011Taisei Corp. 4,634 214,951Tokyu Corp. 17,100 298,297Toyota Tsusho Corp. 6,680 217,322West Japan Railway Co. 4,300 323,596Yamato Holdings Co. Ltd. 7,500 193,507
6,353,714Information Technology (1.7%):Canon, Inc. 11,614 336,754FUJIFILM Holdings Corp. 5,760 261,672Keyence Corp. 314 195,439Murata Manufacturing Co. Ltd. 2,802 139,379Nomura Research Institute Ltd. 5,058 229,598
Copyright © 2021 www.secdatabase.com. All Rights Reserved.Please Consider the Environment Before Printing This Document
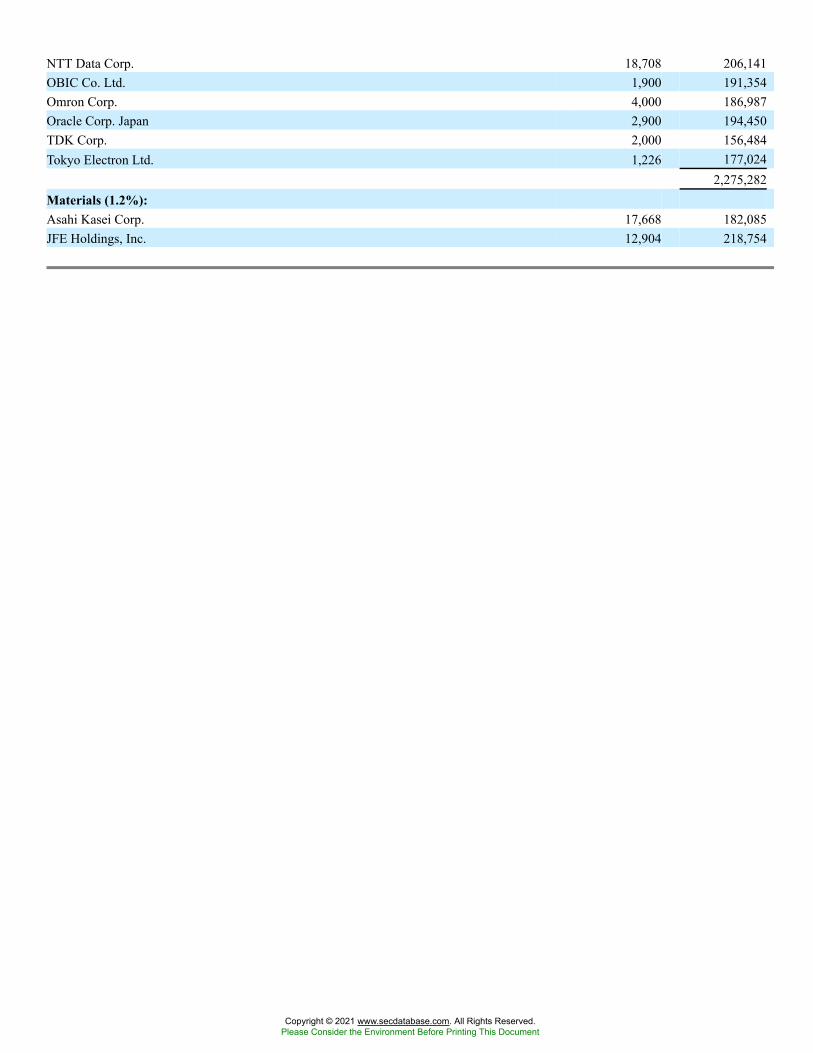
NTT Data Corp. 18,708 206,141OBIC Co. Ltd. 1,900 191,354Omron Corp. 4,000 186,987Oracle Corp. Japan 2,900 194,450TDK Corp. 2,000 156,484Tokyo Electron Ltd. 1,226 177,024
2,275,282Materials (1.2%):Asahi Kasei Corp. 17,668 182,085JFE Holdings, Inc. 12,904 218,754
Copyright © 2021 www.secdatabase.com. All Rights Reserved.Please Consider the Environment Before Printing This Document
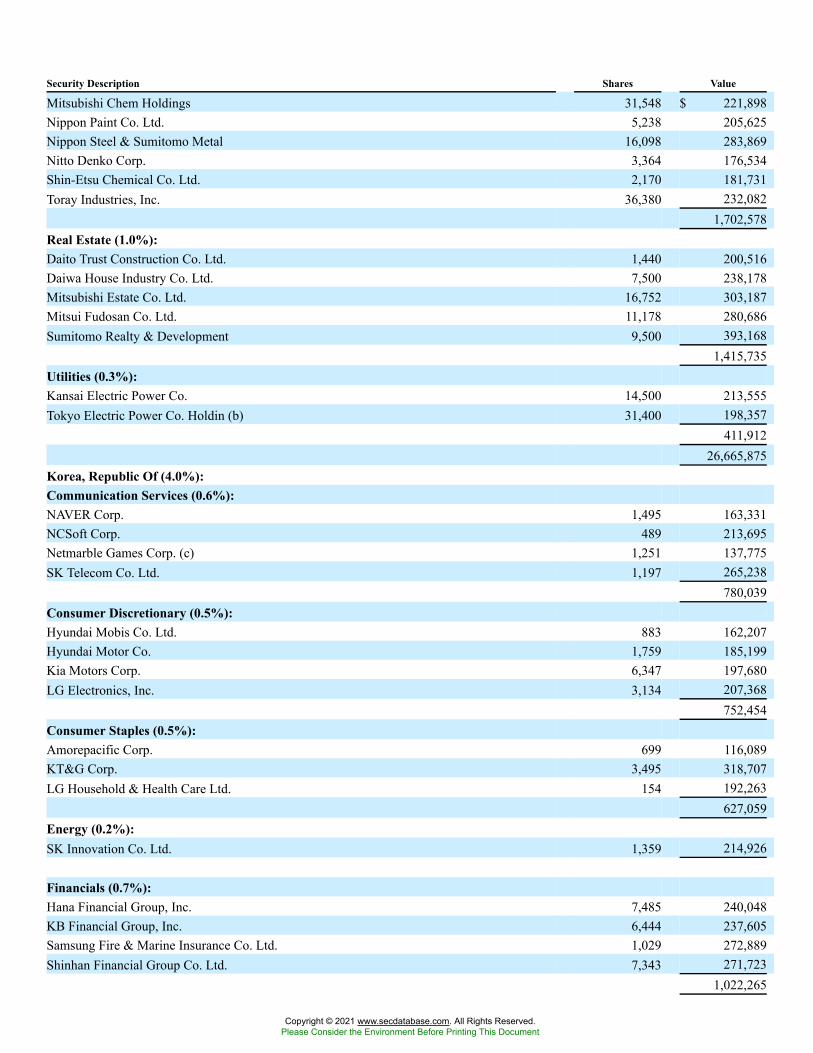
Security Description Shares Value
Mitsubishi Chem Holdings 31,548 $ 221,898Nippon Paint Co. Ltd. 5,238 205,625Nippon Steel & Sumitomo Metal 16,098 283,869Nitto Denko Corp. 3,364 176,534Shin-Etsu Chemical Co. Ltd. 2,170 181,731Toray Industries, Inc. 36,380 232,082
1,702,578Real Estate (1.0%):Daito Trust Construction Co. Ltd. 1,440 200,516Daiwa House Industry Co. Ltd. 7,500 238,178Mitsubishi Estate Co. Ltd. 16,752 303,187Mitsui Fudosan Co. Ltd. 11,178 280,686Sumitomo Realty & Development 9,500 393,168
1,415,735Utilities (0.3%):Kansai Electric Power Co. 14,500 213,555Tokyo Electric Power Co. Holdin (b) 31,400 198,357
411,91226,665,875
Korea, Republic Of (4.0%):Communication Services (0.6%):NAVER Corp. 1,495 163,331NCSoft Corp. 489 213,695Netmarble Games Corp. (c) 1,251 137,775SK Telecom Co. Ltd. 1,197 265,238
780,039Consumer Discretionary (0.5%):Hyundai Mobis Co. Ltd. 883 162,207Hyundai Motor Co. 1,759 185,199Kia Motors Corp. 6,347 197,680LG Electronics, Inc. 3,134 207,368
752,454Consumer Staples (0.5%):Amorepacific Corp. 699 116,089KT&G Corp. 3,495 318,707LG Household & Health Care Ltd. 154 192,263
627,059Energy (0.2%):SK Innovation Co. Ltd. 1,359 214,926
Financials (0.7%):Hana Financial Group, Inc. 7,485 240,048KB Financial Group, Inc. 6,444 237,605Samsung Fire & Marine Insurance Co. Ltd. 1,029 272,889Shinhan Financial Group Co. Ltd. 7,343 271,723
1,022,265
Copyright © 2021 www.secdatabase.com. All Rights Reserved.Please Consider the Environment Before Printing This Document
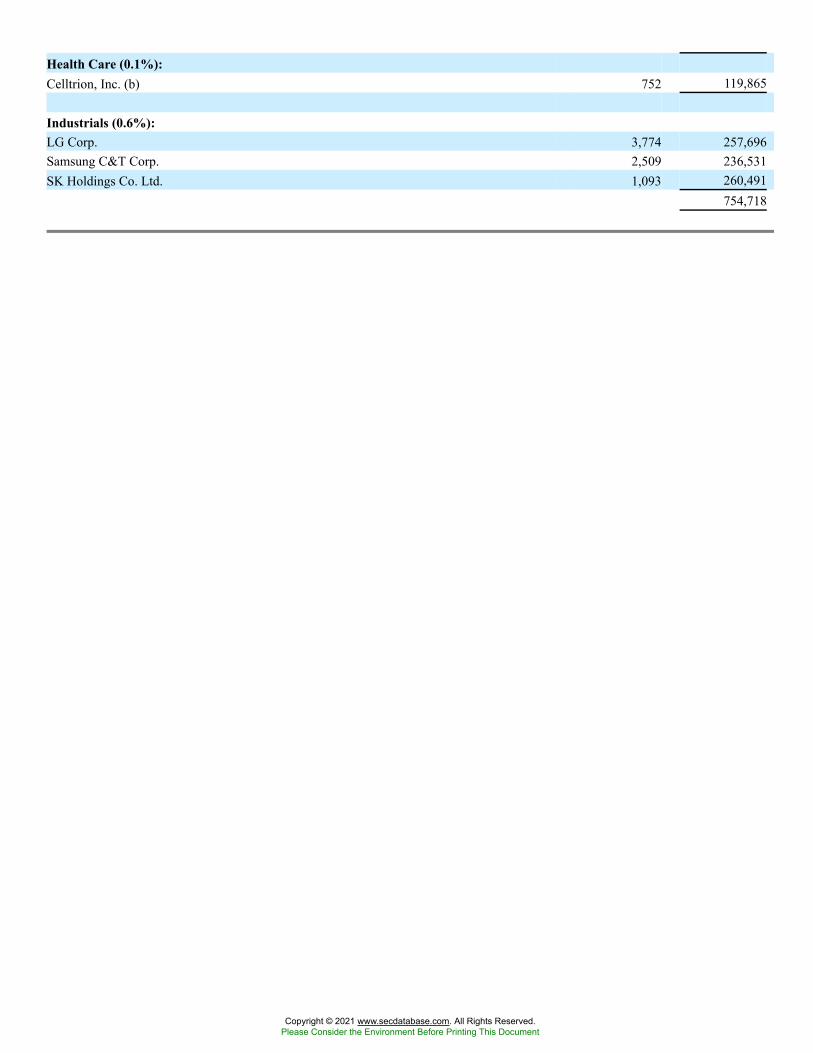
Health Care (0.1%):Celltrion, Inc. (b) 752 119,865
Industrials (0.6%):LG Corp. 3,774 257,696Samsung C&T Corp. 2,509 236,531SK Holdings Co. Ltd. 1,093 260,491
754,718
Copyright © 2021 www.secdatabase.com. All Rights Reserved.Please Consider the Environment Before Printing This Document
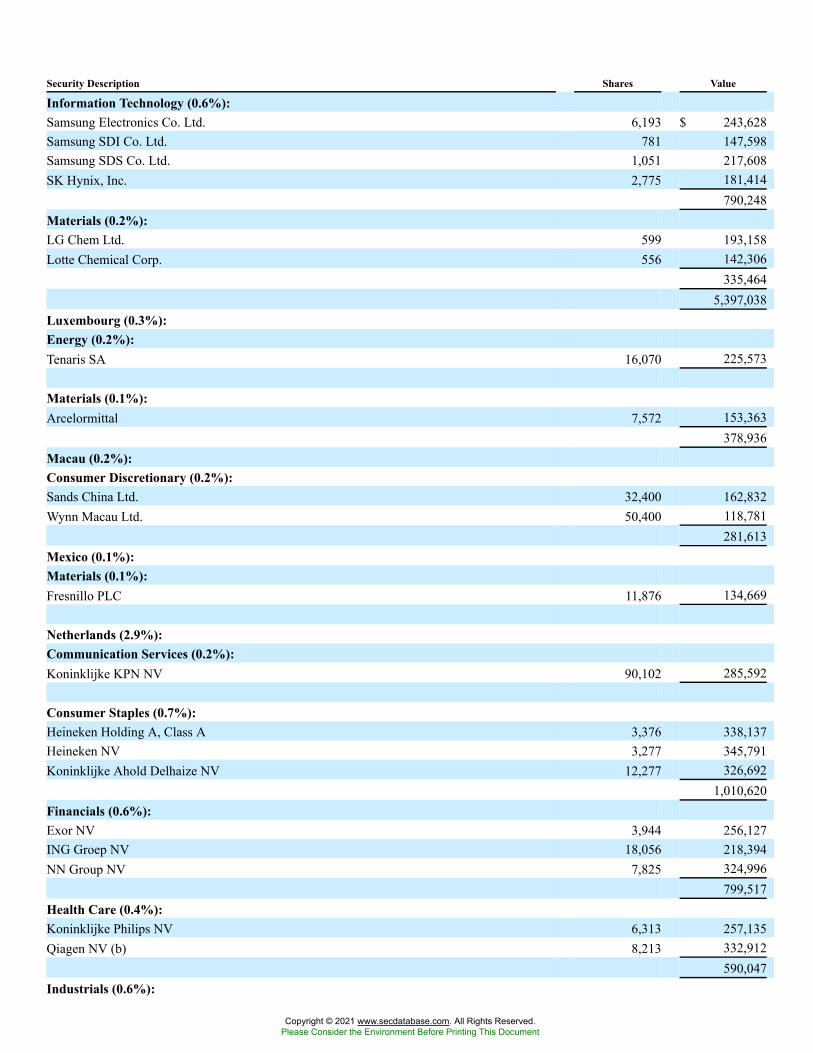
Security Description Shares Value
Information Technology (0.6%):Samsung Electronics Co. Ltd. 6,193 $ 243,628Samsung SDI Co. Ltd. 781 147,598Samsung SDS Co. Ltd. 1,051 217,608SK Hynix, Inc. 2,775 181,414
790,248Materials (0.2%):LG Chem Ltd. 599 193,158Lotte Chemical Corp. 556 142,306
335,4645,397,038
Luxembourg (0.3%):Energy (0.2%):Tenaris SA 16,070 225,573
Materials (0.1%):Arcelormittal 7,572 153,363
378,936Macau (0.2%):Consumer Discretionary (0.2%):Sands China Ltd. 32,400 162,832Wynn Macau Ltd. 50,400 118,781
281,613Mexico (0.1%):Materials (0.1%):Fresnillo PLC 11,876 134,669
Netherlands (2.9%):Communication Services (0.2%):Koninklijke KPN NV 90,102 285,592
Consumer Staples (0.7%):Heineken Holding A, Class A 3,376 338,137Heineken NV 3,277 345,791Koninklijke Ahold Delhaize NV 12,277 326,692
1,010,620Financials (0.6%):Exor NV 3,944 256,127ING Groep NV 18,056 218,394NN Group NV 7,825 324,996
799,517Health Care (0.4%):Koninklijke Philips NV 6,313 257,135Qiagen NV (b) 8,213 332,912
590,047Industrials (0.6%):
Copyright © 2021 www.secdatabase.com. All Rights Reserved.Please Consider the Environment Before Printing This Document
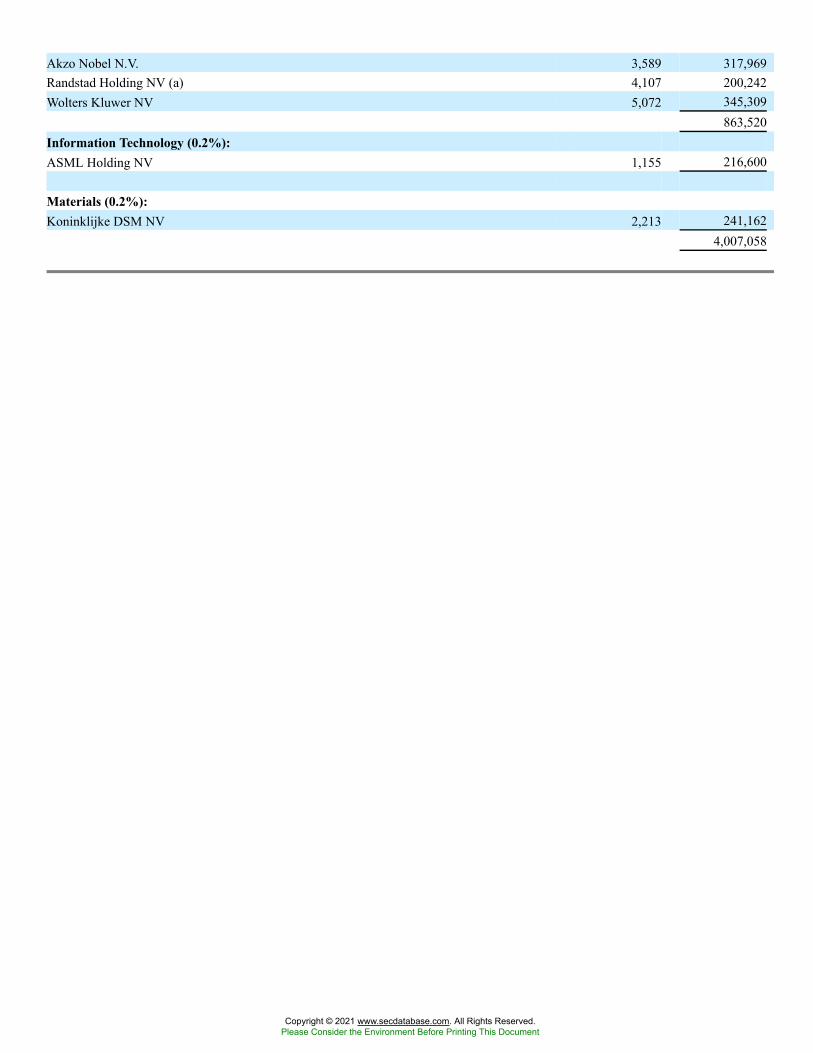
Akzo Nobel N.V. 3,589 317,969Randstad Holding NV (a) 4,107 200,242Wolters Kluwer NV 5,072 345,309
863,520Information Technology (0.2%):ASML Holding NV 1,155 216,600
Materials (0.2%):Koninklijke DSM NV 2,213 241,162
4,007,058
Copyright © 2021 www.secdatabase.com. All Rights Reserved.Please Consider the Environment Before Printing This Document
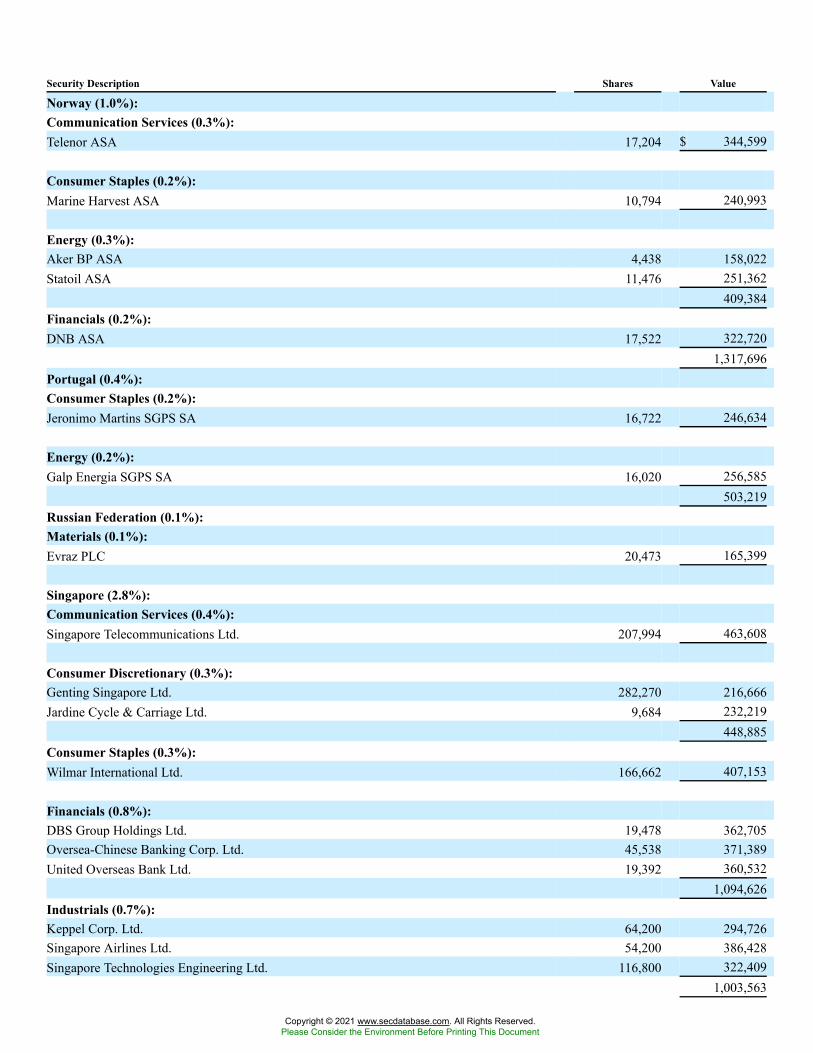
Security Description Shares Value
Norway (1.0%):Communication Services (0.3%):Telenor ASA 17,204 $ 344,599
Consumer Staples (0.2%):Marine Harvest ASA 10,794 240,993
Energy (0.3%):Aker BP ASA 4,438 158,022Statoil ASA 11,476 251,362
409,384Financials (0.2%):DNB ASA 17,522 322,720
1,317,696Portugal (0.4%):Consumer Staples (0.2%):Jeronimo Martins SGPS SA 16,722 246,634
Energy (0.2%):Galp Energia SGPS SA 16,020 256,585
503,219Russian Federation (0.1%):Materials (0.1%):Evraz PLC 20,473 165,399
Singapore (2.8%):Communication Services (0.4%):Singapore Telecommunications Ltd. 207,994 463,608
Consumer Discretionary (0.3%):Genting Singapore Ltd. 282,270 216,666Jardine Cycle & Carriage Ltd. 9,684 232,219
448,885Consumer Staples (0.3%):Wilmar International Ltd. 166,662 407,153
Financials (0.8%):DBS Group Holdings Ltd. 19,478 362,705Oversea-Chinese Banking Corp. Ltd. 45,538 371,389United Overseas Bank Ltd. 19,392 360,532
1,094,626Industrials (0.7%):Keppel Corp. Ltd. 64,200 294,726Singapore Airlines Ltd. 54,200 386,428Singapore Technologies Engineering Ltd. 116,800 322,409
1,003,563
Copyright © 2021 www.secdatabase.com. All Rights Reserved.Please Consider the Environment Before Printing This Document
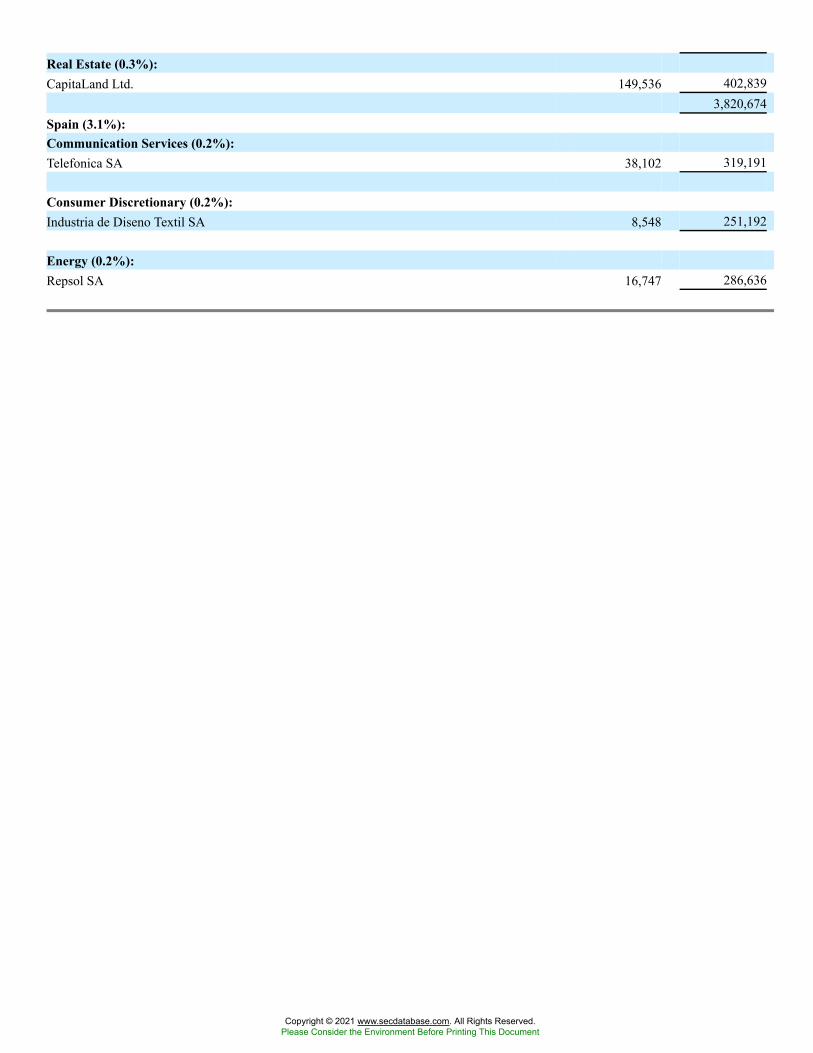
Real Estate (0.3%):CapitaLand Ltd. 149,536 402,839
3,820,674Spain (3.1%):Communication Services (0.2%):Telefonica SA 38,102 319,191
Consumer Discretionary (0.2%):Industria de Diseno Textil SA 8,548 251,192
Energy (0.2%):Repsol SA 16,747 286,636
Copyright © 2021 www.secdatabase.com. All Rights Reserved.Please Consider the Environment Before Printing This Document
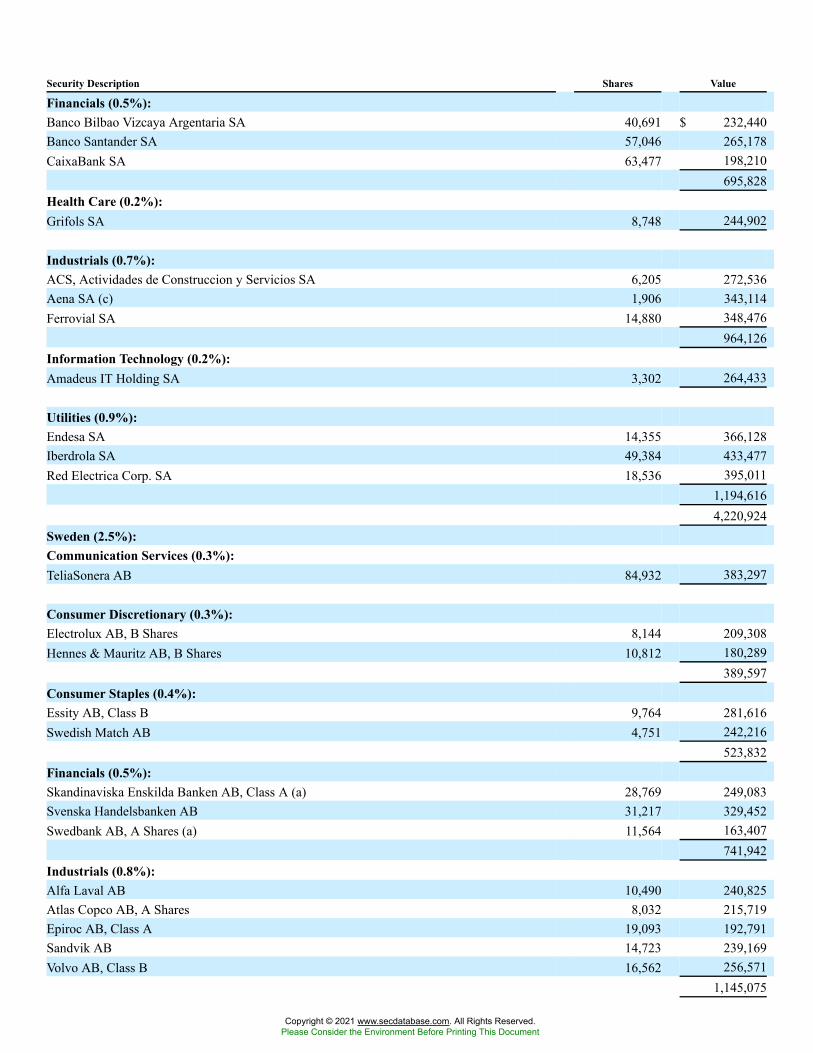
Security Description Shares Value
Financials (0.5%):Banco Bilbao Vizcaya Argentaria SA 40,691 $ 232,440Banco Santander SA 57,046 265,178CaixaBank SA 63,477 198,210
695,828Health Care (0.2%):Grifols SA 8,748 244,902
Industrials (0.7%):ACS, Actividades de Construccion y Servicios SA 6,205 272,536Aena SA (c) 1,906 343,114Ferrovial SA 14,880 348,476
964,126Information Technology (0.2%):Amadeus IT Holding SA 3,302 264,433
Utilities (0.9%):Endesa SA 14,355 366,128Iberdrola SA 49,384 433,477Red Electrica Corp. SA 18,536 395,011
1,194,6164,220,924
Sweden (2.5%):Communication Services (0.3%):TeliaSonera AB 84,932 383,297
Consumer Discretionary (0.3%):Electrolux AB, B Shares 8,144 209,308Hennes & Mauritz AB, B Shares 10,812 180,289
389,597Consumer Staples (0.4%):Essity AB, Class B 9,764 281,616Swedish Match AB 4,751 242,216
523,832Financials (0.5%):Skandinaviska Enskilda Banken AB, Class A (a) 28,769 249,083Svenska Handelsbanken AB 31,217 329,452Swedbank AB, A Shares (a) 11,564 163,407
741,942Industrials (0.8%):Alfa Laval AB 10,490 240,825Atlas Copco AB, A Shares 8,032 215,719Epiroc AB, Class A 19,093 192,791Sandvik AB 14,723 239,169Volvo AB, Class B 16,562 256,571
1,145,075
Copyright © 2021 www.secdatabase.com. All Rights Reserved.Please Consider the Environment Before Printing This Document

Information Technology (0.2%):Hexagon AB, B Shares 3,960 206,618
3,390,361Switzerland (6.2%):Communication Services (0.3%):Swisscom AG (a) 849 415,332
Consumer Discretionary (0.3%):CIE Financiere Richemont SA 3,139 228,732The Swatch Group AG, B shares 732 209,563
438,295
Copyright © 2021 www.secdatabase.com. All Rights Reserved.Please Consider the Environment Before Printing This Document
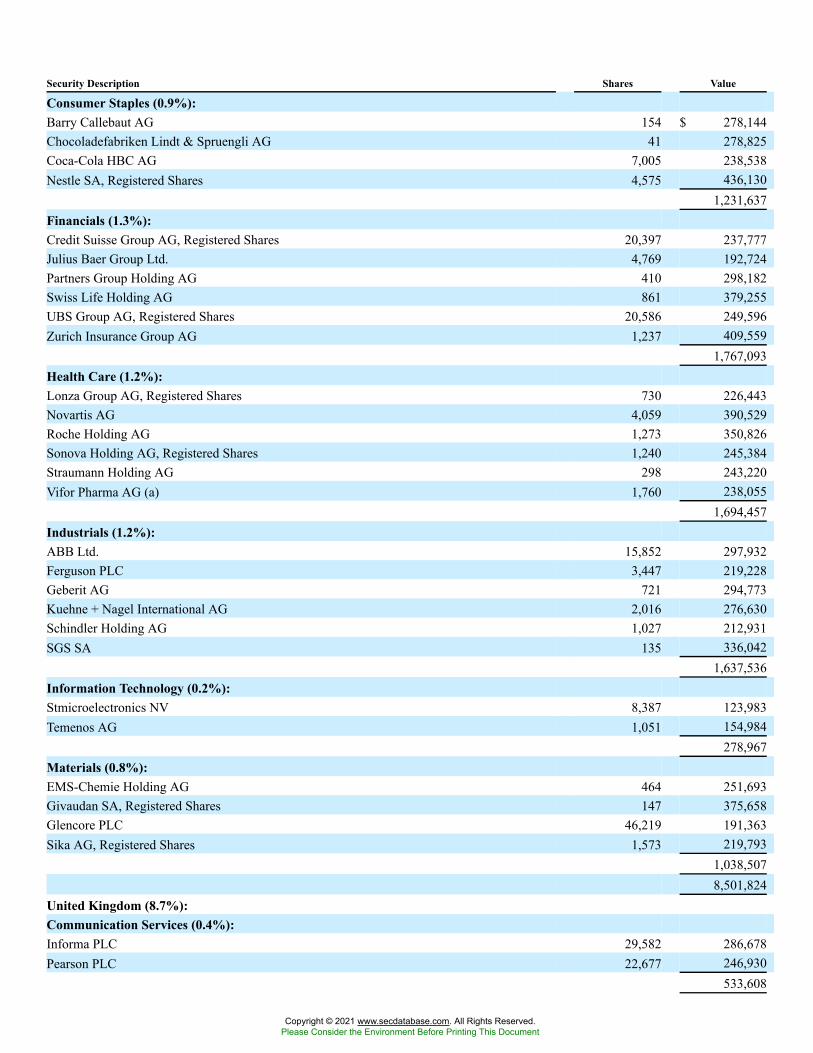
Security Description Shares Value
Consumer Staples (0.9%):Barry Callebaut AG 154 $ 278,144Chocoladefabriken Lindt & Spruengli AG 41 278,825Coca-Cola HBC AG 7,005 238,538Nestle SA, Registered Shares 4,575 436,130
1,231,637Financials (1.3%):Credit Suisse Group AG, Registered Shares 20,397 237,777Julius Baer Group Ltd. 4,769 192,724Partners Group Holding AG 410 298,182Swiss Life Holding AG 861 379,255UBS Group AG, Registered Shares 20,586 249,596Zurich Insurance Group AG 1,237 409,559
1,767,093Health Care (1.2%):Lonza Group AG, Registered Shares 730 226,443Novartis AG 4,059 390,529Roche Holding AG 1,273 350,826Sonova Holding AG, Registered Shares 1,240 245,384Straumann Holding AG 298 243,220Vifor Pharma AG (a) 1,760 238,055
1,694,457Industrials (1.2%):ABB Ltd. 15,852 297,932Ferguson PLC 3,447 219,228Geberit AG 721 294,773Kuehne + Nagel International AG 2,016 276,630Schindler Holding AG 1,027 212,931SGS SA 135 336,042
1,637,536Information Technology (0.2%):Stmicroelectronics NV 8,387 123,983Temenos AG 1,051 154,984
278,967Materials (0.8%):EMS-Chemie Holding AG 464 251,693Givaudan SA, Registered Shares 147 375,658Glencore PLC 46,219 191,363Sika AG, Registered Shares 1,573 219,793
1,038,5078,501,824
United Kingdom (8.7%):Communication Services (0.4%):Informa PLC 29,582 286,678Pearson PLC 22,677 246,930
533,608
Copyright © 2021 www.secdatabase.com. All Rights Reserved.Please Consider the Environment Before Printing This Document
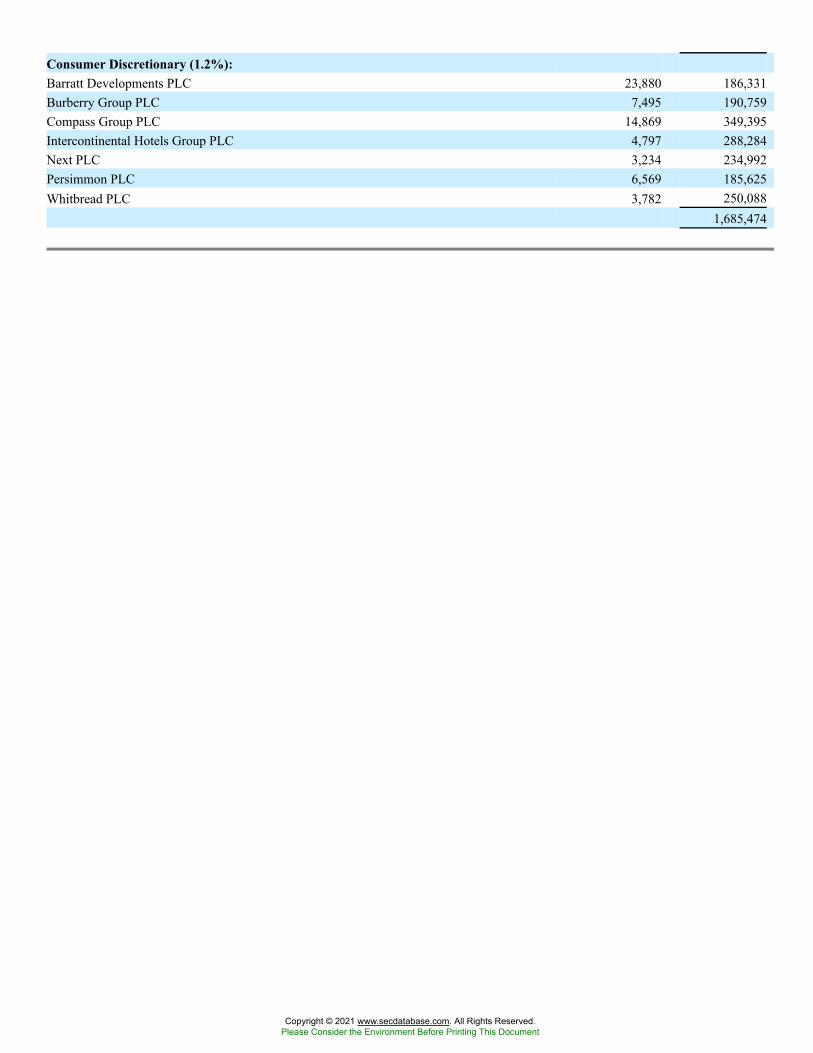
Consumer Discretionary (1.2%):Barratt Developments PLC 23,880 186,331Burberry Group PLC 7,495 190,759Compass Group PLC 14,869 349,395Intercontinental Hotels Group PLC 4,797 288,284Next PLC 3,234 234,992Persimmon PLC 6,569 185,625Whitbread PLC 3,782 250,088
1,685,474
Copyright © 2021 www.secdatabase.com. All Rights Reserved.Please Consider the Environment Before Printing This Document
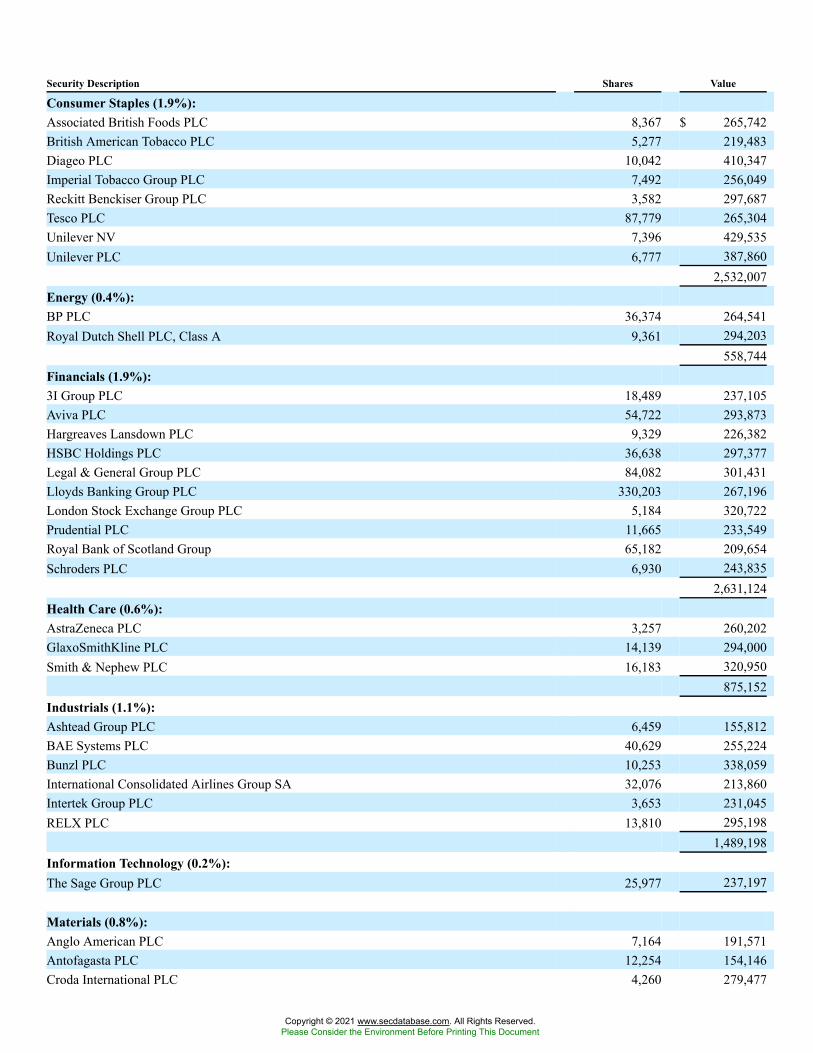
Security Description Shares Value
Consumer Staples (1.9%):Associated British Foods PLC 8,367 $ 265,742British American Tobacco PLC 5,277 219,483Diageo PLC 10,042 410,347Imperial Tobacco Group PLC 7,492 256,049Reckitt Benckiser Group PLC 3,582 297,687Tesco PLC 87,779 265,304Unilever NV 7,396 429,535Unilever PLC 6,777 387,860
2,532,007Energy (0.4%):BP PLC 36,374 264,541Royal Dutch Shell PLC, Class A 9,361 294,203
558,744Financials (1.9%):3I Group PLC 18,489 237,105Aviva PLC 54,722 293,873Hargreaves Lansdown PLC 9,329 226,382HSBC Holdings PLC 36,638 297,377Legal & General Group PLC 84,082 301,431Lloyds Banking Group PLC 330,203 267,196London Stock Exchange Group PLC 5,184 320,722Prudential PLC 11,665 233,549Royal Bank of Scotland Group 65,182 209,654Schroders PLC 6,930 243,835
2,631,124Health Care (0.6%):AstraZeneca PLC 3,257 260,202GlaxoSmithKline PLC 14,139 294,000Smith & Nephew PLC 16,183 320,950
875,152Industrials (1.1%):Ashtead Group PLC 6,459 155,812BAE Systems PLC 40,629 255,224Bunzl PLC 10,253 338,059International Consolidated Airlines Group SA 32,076 213,860Intertek Group PLC 3,653 231,045RELX PLC 13,810 295,198
1,489,198Information Technology (0.2%):The Sage Group PLC 25,977 237,197
Materials (0.8%):Anglo American PLC 7,164 191,571Antofagasta PLC 12,254 154,146Croda International PLC 4,260 279,477
Copyright © 2021 www.secdatabase.com. All Rights Reserved.Please Consider the Environment Before Printing This Document
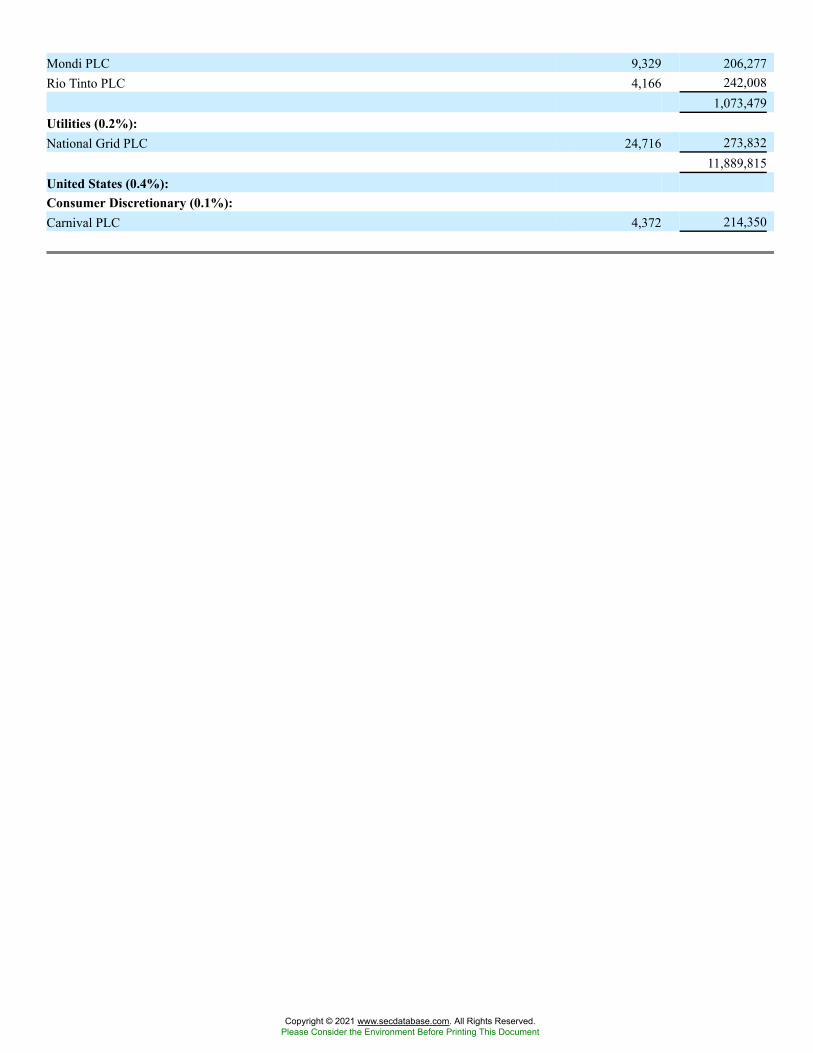
Mondi PLC 9,329 206,277Rio Tinto PLC 4,166 242,008
1,073,479Utilities (0.2%):National Grid PLC 24,716 273,832
11,889,815United States (0.4%):Consumer Discretionary (0.1%):Carnival PLC 4,372 214,350
Copyright © 2021 www.secdatabase.com. All Rights Reserved.Please Consider the Environment Before Printing This Document
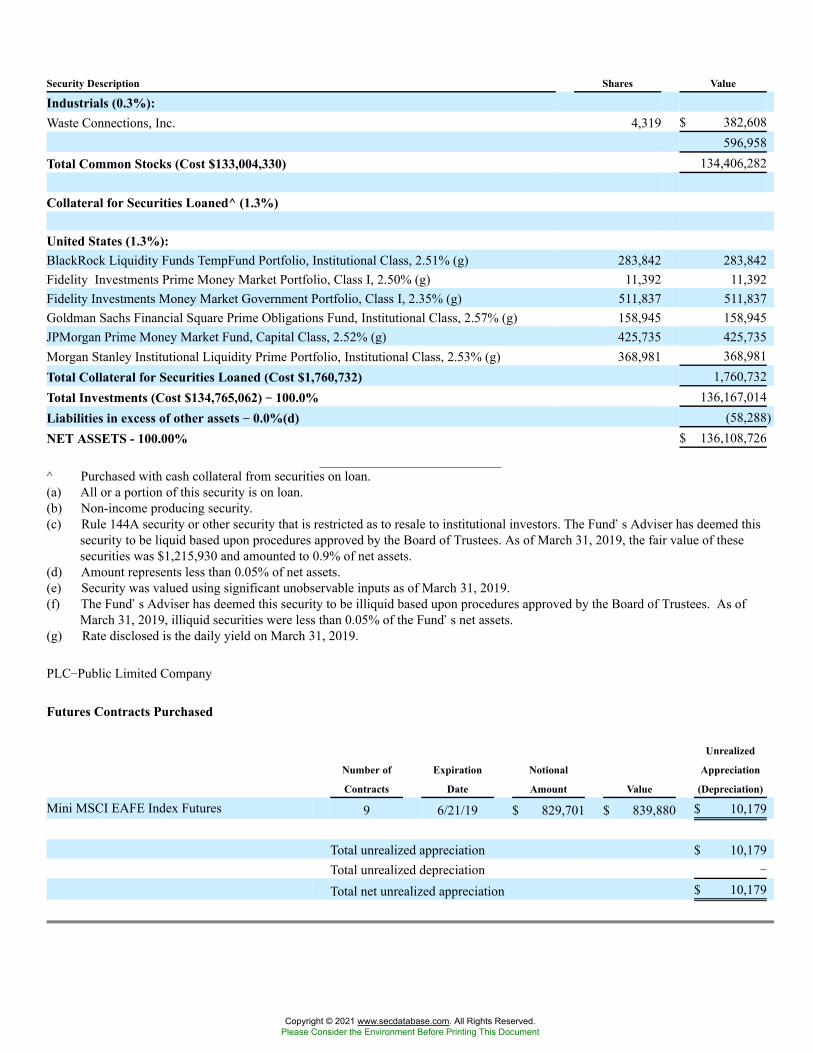
Security Description Shares Value
Industrials (0.3%):Waste Connections, Inc. 4,319 $ 382,608
596,958Total Common Stocks (Cost $133,004,330) 134,406,282
Collateral for Securities Loaned^ (1.3%)
United States (1.3%):BlackRock Liquidity Funds TempFund Portfolio, Institutional Class, 2.51% (g) 283,842 283,842Fidelity Investments Prime Money Market Portfolio, Class I, 2.50% (g) 11,392 11,392Fidelity Investments Money Market Government Portfolio, Class I, 2.35% (g) 511,837 511,837Goldman Sachs Financial Square Prime Obligations Fund, Institutional Class, 2.57% (g) 158,945 158,945JPMorgan Prime Money Market Fund, Capital Class, 2.52% (g) 425,735 425,735Morgan Stanley Institutional Liquidity Prime Portfolio, Institutional Class, 2.53% (g) 368,981 368,981Total Collateral for Securities Loaned (Cost $1,760,732) 1,760,732Total Investments (Cost $134,765,062) �� 100.0% 136,167,014Liabilities in excess of other assets �� 0.0%(d) (58,288)NET ASSETS - 100.00% $ 136,108,726
^ Purchased with cash collateral from securities on loan.(a) All or a portion of this security is on loan.(b) Non-income producing security.(c) Rule 144A security or other security that is restricted as to resale to institutional investors. The Fund�s Adviser has deemed this
security to be liquid based upon procedures approved by the Board of Trustees. As of March 31, 2019, the fair value of thesesecurities was $1,215,930 and amounted to 0.9% of net assets.
(d) Amount represents less than 0.05% of net assets.(e) Security was valued using significant unobservable inputs as of March 31, 2019.(f) The Fund�s Adviser has deemed this security to be illiquid based upon procedures approved by the Board of Trustees. As of
March 31, 2019, illiquid securities were less than 0.05% of the Fund�s net assets.(g) Rate disclosed is the daily yield on March 31, 2019.
PLC�Public Limited Company
Futures Contracts Purchased
Number of
Contracts
Expiration
Date
Notional
Amount Value
Unrealized
Appreciation
(Depreciation)
Mini MSCI EAFE Index Futures 9 6/21/19 $ 829,701 $ 839,880 $ 10,179
Total unrealized appreciation $ 10,179Total unrealized depreciation �
Total net unrealized appreciation $ 10,179
Copyright © 2021 www.secdatabase.com. All Rights Reserved.Please Consider the Environment Before Printing This Document


