Embed Size (px)
Citation preview
Visual Tools for Accessible Computer SupportedCollaboration
Antti Raike, Joanna Saad-Sulonen, Jurgen Scheible,Roman Suzi, and Tarmo Toikkanen
University of Art and Design Helsinki TaiK,Hameentie 135 C, 00560 Helsinki, Finland
http://www.taik.fi/
Abstract. This paper discusses device-agnostic technologies and the useof visual mashups in augmenting accessibility in computer supportedcollaboration. The principles of Design for All (DfA) could be easilytaken into software development if participants are allowed to contributewith whatever devices they have at their disposal or are able to use.However, device-agnostic services should rely on open standards, agiledevelopment and accessibility guidelines to allow participation of diverseuser communities. We present three cases for further considerations ofDfA in software development. We aim to promote the learning dimensionof the visual tools; the ability of peers to learn and let colleagues learn,collaborate and innovate.
Key words: Accessibility, Agile Development, Co-Design, Collabora-tion, Design for All, Map mashup
1 Introduction: Designing Tools for Visualisation
The term ’mashup’ stands for a web application that combines data from morethan one source into a single integrated tool. Map mashups offer a possibilityto create visual tools, using various existing data brought together in a mean-ingful visualisation. Map mashups have become popular with the online mapsand because some online systems and platforms offer open application program-ming interface (API), making it possible to combine location data and otherinformation and visualise it on the map. A map mashup can for example usecartographic data from Google Maps, combined with other information, makingit possible to add location information to a film scheduling and budgeting data,and thereby creating a new web service for a film crew that was not originallyprovided by either source. Other examples include future mobile services thatcombine the virtual and physical space, offering mobile and web users a seam-less collaborative experience in real-time. More software examples to the needsof special-purpose designs are available at Programmableweb.com [1] and Web-mashup.com [2]: Both WWW sites contain information of a large diversity of webmashups. Mashups are also a good example of tools for rapid prototyping. Thefact that relevant prototypes of a system being developed can quickly be mashed
2 Visual Tools for Accessible Computer Supported Collaboration
up using existing applications, data sets and tools, makes them valid tools forcollaborative design. Mashups are also moving to the sphere of the mainstream,with ”do it yourself” (DIY) mashup sites offering users with no programmingknowledge the possibility to quickly create their own map mashups [3]. The ef-fective use of mashups nevertheless requires knowledge about open technologiesfor sharing information, the existing and developing practices related to the useof these technologies, the providers of these technologies and their goals, andfinally, IPR issues related to the use of these technologies. Attention should alsobe paid to technological issues such as data-capture, encoding, data loss, whitenoise, visual clutter [4], and especially standards for accessibility [5].
However, the diversity of user groups provides even more challenges for thedevelopers. Joanna Saad-Sulonen and Roman Suzi [6] point out that benefit ofa collaborative design process is not always clear for the users. Hence we havebecome aware that it is essential to understand human issues such as perceptionand cognition, language and culture along the development of new devices andservices. The multiple pathways used to derive meaning from culturally loadedvisualisations have yet to be fully understood [7–9]. Thus agile development [10]methodologies challenge designers and programmers to understand users diversethinking, collaborate more effectively with them and consult peers during itera-tive development process if needed. All in all the odds are against an individualdesigner or developer if he or she is unable to collaborate with users or consultpeers during the design process or production. A solution could be based ondevice-agnostic services which rely on open standards and accessibility guide-lines thus reinforcing the principles of Design for All (DfA) by allowing users toutilize whatever tools they have at their disposal.
2 Design Research Methodology and Agile Development
Collaborative design (Co-design) refers both to hardware and software designas well as collaborative design focusing on human and social factors in design.Design research, such as co-design and agile development, integrates the devel-opment of digital technologies with theory and practice focusing on the variationof users [11, 12]. Graham [13, 14] describes software design as a process wherethe aim is to find simple solutions to overlooked problems that need to be solved,and deliver them as informally as possible, starting with a crude first version,then iterating rapidly. Software co-design methodology bears many similaritieswith agile methodologies, as reported in the online document Manifesto for Ag-ile Software Development [15]. Agile methodologies value customer collaborationand responding to change over following a plan, which are quite similar to theideas of collaborative design and continuous design through use.
According to Saad-Sulonen and Suzi [6] a co-design work seems to help de-signers and programmers in development if a dialog happens between all theengaged stakeholders. Appropriate software prototypes can facilitate the pro-cess, because potential users can express their ideas with the common languageof such prototypes. Saad-Sulonen and Suzi [6] observed that software designers
Visual Tools for Accessible Computer Supported Collaboration 3
are specialists in building information models of any problem domains and thatability may lead to more streamlined designs. Likewise, HCI specialists possesspractical knowledge on improving interfaces, and thus the feature requests bythe user are not handled one by one but as representatives of underlying inte-gral model. While certain qualities of agile methodologies are welcome in thedesign research, co-design can not be purely adaptive to the reality. The ef-forts described by Saad-Sulonen and Suzi [6] were combination of predictive andadaptive approaches. The design of the concepts defines the predictive backbone,while concrete implementation is adaptive and attentive to the stakeholder’s owndesign efforts. However, the area needs more exploration and future research. Thefollowing chapters will present three examples of projects developed at the Uni-versity of Art and Design Helsinki, where co-design and agile development havebeen used as a part of the design research.
2.1 Case 1: ImaNote
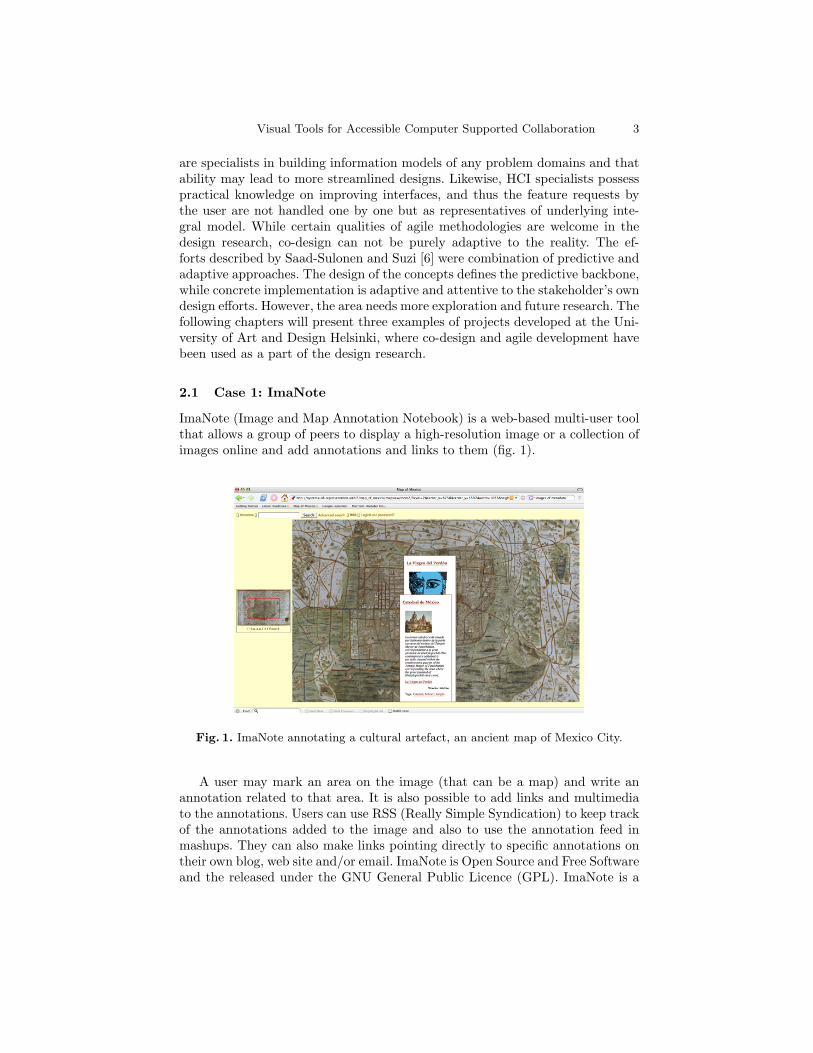
ImaNote (Image and Map Annotation Notebook) is a web-based multi-user toolthat allows a group of peers to display a high-resolution image or a collection ofimages online and add annotations and links to them (fig. 1).
Fig. 1. ImaNote annotating a cultural artefact, an ancient map of Mexico City.
A user may mark an area on the image (that can be a map) and write anannotation related to that area. It is also possible to add links and multimediato the annotations. Users can use RSS (Really Simple Syndication) to keep trackof the annotations added to the image and also to use the annotation feed inmashups. They can also make links pointing directly to specific annotations ontheir own blog, web site and/or email. ImaNote is Open Source and Free Softwareand the released under the GNU General Public Licence (GPL). ImaNote is a
4 Visual Tools for Accessible Computer Supported Collaboration
Zope product, written in Python. Zope and ImaNote run on almost all operatingsystems (GNU/Linux, MacOS X, *BSD, Microsoft Windows, etc.). Imanote wasdeveloped as a collaboration between the Systems of Representation and Learn-ing Environments research groups at the University of Art and Design Helsinki[16].
2.2 Case 2: Development of the Urban Mediator
Urban Mediator (UM) is a platform that provides a way for communities tomediate local, location-based discussions, activities, and information. UM uses amap-portrayal service as means for representing location-based information andcomplements it with a set of tools for users to process, share and organise thisinformation. The software and related web-based services enable users (citizensand city administration) to obtain and share information about a city neigh-bourhood. Urban Mediator is available in a desktop and mobile version [17].TheUM software and related services are being developed within the context ofthe EU-funded Innovative Cities for the Next Generation (ICING) project [18].
UM has been developed following an iterative co-design approach, whichmeans that designers and programmers would not first gather all the require-ments and then build software for the rest of the time (purely predictive method).The approach rather emphasised the involvement of a variety of stakeholdersin the area of Arabianranta in Helsinki (active residents, local actors, workersin city administration, local pupils and teachers), throughout the developmentand design process. Co-design workshops and exercises involved paper and penprototyping sessions as well as the use of lightweight software prototypes [6].The choice of using light-weight prototypes meant that making quick changesin response to participants experience of the prototype and their comments waspossible. The software development tools chosen to build UM were web.py (webframework written in Python) and MySQL database.
Saad-Sulonen and Suzi [6] followed guidelines of Floyd [3] and made constantattention not to overlook existing online components that could complement andenrich UM functionality, or provide it with spare parts. Some of the prototypesused through the development of UM included mashups. One prototype mashupexample consisted of using web feeds containing geodata, from the photo sharingplatform Flickr [19], as an example of data that can be harvested by Urban Me-diator and that enriches the collections of location-based information gatheredin a particular UM instance.
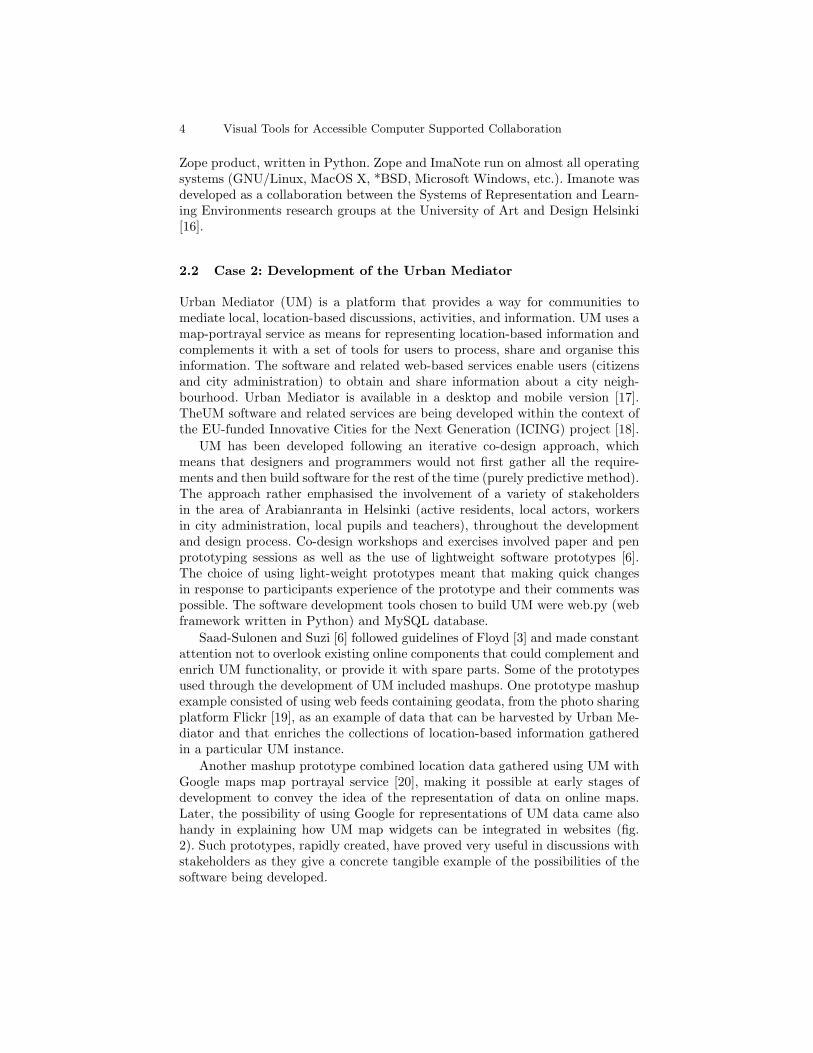
Another mashup prototype combined location data gathered using UM withGoogle maps map portrayal service [20], making it possible at early stages ofdevelopment to convey the idea of the representation of data on online maps.Later, the possibility of using Google for representations of UM data came alsohandy in explaining how UM map widgets can be integrated in websites (fig.2). Such prototypes, rapidly created, have proved very useful in discussions withstakeholders as they give a concrete tangible example of the possibilities of thesoftware being developed.
Visual Tools for Accessible Computer Supported Collaboration 5
Fig. 2. A Google map showing UM data is embedded along with UM web widgets ona website (in this case the UM development blog).
Using mashups can lead to flexible designs benefiting from rigid, simple build-ing blocks. This enormously facilitates overall design efforts as building blocksbecome more comprehensible by stakeholders than traditional building blocksfound in software design. These extra components also served as means to illus-trate possiblecourses of development and showcase for encouraging more collab-orative, user-designable, ecosystemic software [21].
2.3 Case 3: Mobile Python
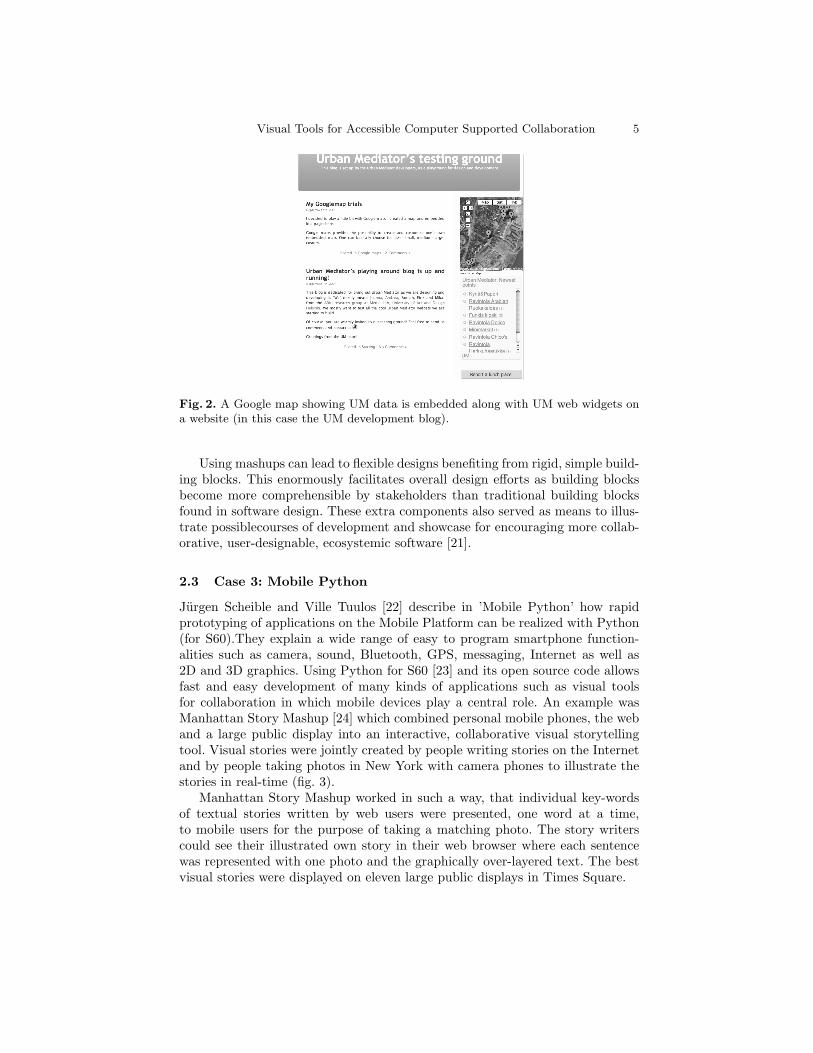
Jurgen Scheible and Ville Tuulos [22] describe in ’Mobile Python’ how rapidprototyping of applications on the Mobile Platform can be realized with Python(for S60).They explain a wide range of easy to program smartphone function-alities such as camera, sound, Bluetooth, GPS, messaging, Internet as well as2D and 3D graphics. Using Python for S60 [23] and its open source code allowsfast and easy development of many kinds of applications such as visual toolsfor collaboration in which mobile devices play a central role. An example wasManhattan Story Mashup [24] which combined personal mobile phones, the weband a large public display into an interactive, collaborative visual storytellingtool. Visual stories were jointly created by people writing stories on the Internetand by people taking photos in New York with camera phones to illustrate thestories in real-time (fig. 3).
Manhattan Story Mashup worked in such a way, that individual key-wordsof textual stories written by web users were presented, one word at a time,to mobile users for the purpose of taking a matching photo. The story writerscould see their illustrated own story in their web browser where each sentencewas represented with one photo and the graphically over-layered text. The bestvisual stories were displayed on eleven large public displays in Times Square.
6 Visual Tools for Accessible Computer Supported Collaboration
Fig. 3. Storytelling tool in the web.
Scheible and Tuulos [24] conclude that the system like Manhattan StoryMashup could well suit for educational purposes, even across city and countryboarders. The use of video or other multimedia pieces would increase the presen-tation power over still images and would open many new opportunities on howthe Story Mashup system could be utilized. In addition, Tuulos, Scheible andNyholm [25] suggest that developers have to pay more attention to matching thephysical and the virtual timescales, to the natural friction between the web andthe physical world. Hence further experiments are needed to find best practicesand design frameworks for successful interaction between the two worlds.
3 Discussion: Potential of Visual Tools in DfA
How to optimise learning and knowledge sharing by visual tools? In principle,modern ICT could be used to solve varied challenges caused by the potentialusers. The three presented examples have led us to considerations of accessibil-ity and DfA in software development. What kind of practice should be takeninto consideration and embedded in the co-design and agile development? Howto make the interactive maps accessible to the widest possible range of users?What kinds of representations are effective for collaborative situations? Expertslike Tufte [27] and Zeki [28] highlight e.g. the importance of colours in envision-ing information, but do the designers and programmers understand the basicelements for visualisations, like the cultural symbolism of colour [8]? Indeed itis rather easy both for people with normal vision and with vision impairmentor dyslexia to adjust text sizes and colours of an interface. However, there areseveral types of cognitive disabilities more difficult to diagnose than e.g. hearingor vision impairment or colour blindness. These include e.g. dyslexia or autism,motor or dexterity disability such as paralysis, cerebral palsy, carpal tunnel syn-
Visual Tools for Accessible Computer Supported Collaboration 7
drome, and all impairments due to ageing. Another challenge of effective DfAin ICT is to improve accessibility of people with cognitive disabilities; includingthose with reduced communication or reading skills.
Brown [26] makes a relevant question for developers: Would it be possible tosee over the impairments differentiating people and focus on the common univer-sal mind of humans and cultural universals? The general principles of vision holdalso when it comes to complex visualisations of any kind.Hence we should alsoincorporate the lessons from the research on emotional and motivational systems,but the interpretation of the role and significance of the brain processes requiresthat the whole situational context of interaction is taken into account. Humanbrain is not a fixed system but rather has the ability to adjust its functions andstructure according to the demands set and challenges given by the surroundingenvironment. Thus pervasive (ubiquitous) computing is a way to improve vi-sual accessibility of collaboration. Small devices like mobile camera-phones offeran access to cheap, low-powered and constant networking with peers. Similarly,laptop computers and PDAs have become a common accessory almost for ev-eryone. Such ubiquitous interaction devices extend communication and enhancenovel ways to collaborate with visual tools.
4 Conclusion
We have seen it worthwhile to study cognitive, cartographic and social principlesaffecting mashups and other complicated layering used in computer displays andvisualisations. Interactive visualisations would be beneficial to users of minoritieswho should have device-agnostic ICT augmenting accessible collaboration withpeers.Finding common language is crucial to the success of co-design and agiledevelopment as it allows all engaged stakeholders to see technical and social pos-sibilities in the solution domain. It is quite safe to claim, that almost any datacould be organised and analysed to display large amounts of information in waysthat are easy to understand and help reveal relationships and patterns.Visualtools help users in clarifying thoughts and assist seeing how ideas are connectedand how information can be organised to construct knowledge. In addition, mo-bile tools can offer collaborative tools for people with various backgrounds, aswas seen in the case of Manhattan Story Mashup: Strangers formed teams toachieve an ad hoc goal in a game. In further projects we will continue to seek thepotential of different disciplines to understand better how knowledge buildinghappens in and between diverse communities.
References
1. ProgrammableWeb, http://www.programmableweb.com/ (2006)2. Webmashup.com, http://www.webmashup.com/ (2007)3. Floyd, I. Using Mashups for End-user rapid and responsive prototyping in col-
laborative environments. Presented at the 20th ACM Conference on ComputerSupported Cooperative Work. Banff, Alberta, Canada. 04-08 November, 2006. Pro-ceedings available at http://mashworks.net/wiki/CSCW_workshop_papers (2006)
8 Visual Tools for Accessible Computer Supported Collaboration
4. Rosenholtz, R., Li, Y., & Nakano, L. Measuring visual clutter. Journal of Vision,7(2):17, pp. 1–22, http://journalofvision.org/7/2/17/ (2007)
5. Web Accessibility Initiative (WAI), http://www.w3.org/WAI/6. Saad-Sulonen, J. & Suzi, R. 2007: Designing Urban Mediator. Proceedings of THE
GOOD, THE BAD AND THE UNEXPECTED Conference. Brussels: COST Ac-tion 298 – Participation in the Broadband Society (2007)
7. Poizner, H.; Klima, E. S. & Bellugi, U. What the Hands Reveal About the Brain.MIT, Massachusetts (1987)
8. Nisbett, R.E. The Geography of Thought. How Asians and Westerners Think Dif-ferently – and Why. Nicholas Brealey, London (2003)
9. Tufte, E.R. Ask E.T. Forum: Project Management Graphics (or Gantt Charts),https://www.edwardtufte.com/tufte/index (2002)
10. Cockburn, A. Agile Software Development. Addison-Wesley (2002)11. Raike, A.; Laitinen, K. & Viikari, T. Elokuvantaju–Cinemasense,
http://elokuvantaju.uiah.fi/ (2001)12. Raike, A. Searching knowledge: CinemaSense as a Case Study in Collaborative
Production of a WWW Service in Two Universities. In: Miesenberger & al. (eds.)ICCHP 2006. LNCS, vol. 4061, pp. 568–574. Springer, Heidelberg (2006)
13. Graham, P. Hackers & Painters. Big Ideas from the Computer Age. OReilly, Cam-bridge (2004)
14. Graham, P. Six Principles in Making New Things. In paulgraham.com,http://www.paulgraham.com/index.html (2008)
15. Beck, K. & al. Manifesto for Agile Software Development,http://agilemanifesto.org/ (2001)
16. Pietarila, J.;Timonen, A;Dıaz, L.;Toikkanen, T. & Leinonen, T. ImaNote – Imageand Map Annotation Notebook, http://www.taik.fi/imanote/ (2005)
17. Urban Mediator information website, http://um.uiah.fi/ (2007)18. Innovative Cities for the Next Generation (ICING) project 2007,
http://www.fp6-project-icing.eu/ (2007)19. Flickr, http://www.flickr.com/20. Google Maps http://maps.google.com21. Myller, M. On the System of Systems Approach to the Development of Everyday
Life Applications. Master’s Thesis. University of Helsinki, Faculty of Science, De-partment of Computer Science and University of Art and Design Helsinki, MediaLab, ARKI Research Group. University of Helsinki, Helsinki,http://ethesis.helsinki.fi/julkaisut/mat/tieto/pg/myller/ (2005)
22. Scheible, J. & Tuulos, V. Mobile Python: Rapid Prototyping of Applications onthe Mobile Platform. Indianapolis: Wiley (2007)
23. Scheible, J. Mobilephone programming for Multimedia. Proceedings of the 15thinternational conference on Multimedia. ACM Press, New York (2007)
24. Scheible, J. & Tuulos, V. Manhattan Story Mashup – Interactive, CollaborativeStreet Art. In: Space Time Play. Birkhuser, Basel (2007)
25. Tuulos, V.; Scheible, J. & Nyholm, H. Combining Web, Mobile Phones and PublicDisplays in Large-Scale: Manhattan Story Mashup. Proceedings of the 5th Inter-national Conference on Pervasive Computing, Toronto, Canada, May (2007)
26. Brown, D.E. Human universals and their implications. In: N. Roughley (Ed.) Beinghumans: Anthropological universality and particularity in transdisplinary perspec-tives. Walter de Gruyter, New York (2000)
27. Tufte, E. R. Envisioning Information. Graphics, Cheshire, Connecticut (1990)28. Zeki, S. Inner Vision: An Exploration of Art and the Brain. Oxford University,
Oxford (2000)