Embed Size (px)
Citation preview
Voice Source Differences Between Registers in FemaleMusical Theater Singers
*†Eva Bjorkner, *Johan Sundberg, ‡Tom Cleveland, and ‡Ed Stone
*Stockholm, Sweden, †Helsinki, Finland, and ‡Nashville, Tennessee
Summary: Musical theater singing typically requires women to use two vocalregisters. Our investigation considered voice source and subglottal pressurePs characteristics of the speech pressure signal recorded for a sequence of/pae/ syllables sung at constant pitch and decreasing vocal loudness in eachregister by seven female musical theater singers. Ten equally spaced Ps valueswere selected, and the relationships between Ps and several parameters wereexamined; closed-quotient (Qclosed), peak-to-peak pulse amplitude (Up-t-p), am-plitude of the negative peak of the differentiated flow glottogram, ie, themaximum flow declination rate (MFDR), and the normalized amplitude quo-tient (NAQ) [Up-t-p/(T0*MFDR)], where T0 is the fundamental period. Ps
was typically slightly higher in chest than in head register. As Ps influencesthe measured glottogram parameters, these were also compared at an approxi-mately identical Ps of 11 cm H2O. Results showed that for typical tokens,MFDR and Qclosed were significantly greater, whereas Up-t-p and thereforeNAQ were significantly lower in chest than in head.
Key Words: Voice source—Subglottal pressure—Flow glottogram—Normalizedamplitude quotient—Female singers—Musical theater singing.
Accepted for publication January 25, 2005.Presented at the 18th International Congress on Acoustics:
ICA 2004, Kyoto, Japan, April 5, 2004.From the *Department of Speech Music Hearing, KTH,
Stockholm, Sweden; †Laboratory of Acoustics and AudioSignal Processing, Helsinki University of Technology, Helsinki,Finland; and ‡Vanderbilt Voice Center, Dept. of Otolaryngology,Vanderbilt University Medical Center, Nashville, Tennessee.
The work of E. B. is supported by the European Community’sHuman Potential Programme under Contract HPRN-CT-2002-00276 [HOARSE-network].
Address correspondence and reprint requests to Eva Bjorkner,Laboratory of Acoustics and Audio Signal Processing, HelsinkiUniversity of Technology, PO Box 3000, FIN-02015 HUTFinland. E-mail: [email protected]
Journal of Voice, Vol. 20, No. 2, pp. 187–1970892-1997/$32.00� 2006 The Voice Foundationdoi:10.1016/j.jvoice.2005.01.008
187
INTRODUCTION
Vocal register is a phenomenon of great relevancein vocal art, particularly in female singing. The aimof this study was to explore and deepen the knowl-edge about the voice source characteristics in thefemale singing voice. Results from seven singersare presented, and the recently introduced normal-ized amplitude quotient (NAQ) parameter serves asa complementary measurement.
According to Titze,1 “the term register has beenused to describe perceptually distinct regions ofvocal quality that can be maintained over someranges of pitch and loudness.” The register used byfemale singers in the lower part of their pitch range isgenerally referred to as chest or modal and theregister in the adjacent higher part as head, middle, orfalsetto, henceforth chest and head register,respectively. An important task in singing training,
EVA BJORKNER ET AL188
regardless of style, is to teach the student how tomaster the transition from one register to the otherwith minimal timbral changes. A register transitiontypically occurs somewhere in the pitch range D4–C5 (294–523 Hz), and most voices can produceseveral pitches in both registers near this transition.1
This result implies that the singer, depending ongenre, vocal conditions, and musical expressioncan choose to sing the same tones in different regis-ters. Large2 compared vocal registers with isopara-metric tones, ie, “tones of the same fundamentalfrequency, sound level and phonemic category.”However, as subglottal pressure (Ps) is the mainphysiological control parameter for vocal loudness,and as the relationship between Ps and sound levelis complex, it seems more interesting to analyze thevoice source as a function of Ps.
It is generally agreed that vocal registers reflectvoice source characteristics, such as the relative du-ration of the closed phase (Qclosed), the peak-to-peakpulse amplitude (Up-t-p), and the amplitude of thenegative peak of the differentiated flow glottogram,ie, the maximum flow declination rate (MFDR).These parameters are heavily influenced by twophysiological voice control parameters: Ps and glot-tal adduction. For example, with increased glottaladduction, Qclosed tends to increase and Up-t-p tendsto decrease.3 Hence, it seems important to take theseparameters into account in a study of vocal registers.
The so-called NAQ reflects glottal adduction.4
It is defined as the ratio Up-t-p/ (T0*MFDR). In aone-singer subject investigation, NAQ was found tocorrelate with the degree of perceived phonatorypressedness.5 The same study also showed that theNAQ parameter differed between styles of singing.
Within the genre of musical theater singing, thestyles of singing can differ considerably, dependingon what epoch of time a musical theater piece iswritten. The singing styles a singer is expected tomaster may differ from jazz and opera, to soul, rock,and pop. There are also specified musical theatersinging techniques within the genre. Consideringthis wide range of styles and techniques, NAQseemed to be an interesting parameter for this studywith musical theater singers.
In classical singing, the head register is mainlyused by the singer, whereas in nonclassical styles,like pop, jazz, and blues, chest register is more
Journal of Voice, Vol. 20, No. 2, 2006
common. The repertoire in musical theater, on theother hand, demands an excellent control of bothregisters. Also, singing in musical theater styleseems to require frequent use of high Ps by the singer.This is commonly assumed to jeopardize vocalhealth. Knowledge and better descriptions of Ps andthe register function in the female singing voiceshould therefore be valuable in vocal training andtherapy. This investigation studies the register func-tion in female musical theater singers by analyz-ing their voice source characteristics and by payingspecial attention to the influence of Ps on thesecharacteristics.
MATERIAL AND METHODS
Subjects and recordingSeven female musical theater singers between the
ages of 17 and 43 years, all classically trained, volun-teered as subjects. Six of them had been professionalsingers for 8 years or more (Table 1), and all subjectsreported being in good vocal condition at the timeof the recordings. Their task was to sing a sequence ofthe syllable /pae/ on a pitch where they could useboth chest and head register. This pitch variedbetween C4 (262 Hz) and G4 (392 Hz) for differentsubjects. They initiated the sequence at high lungvolume and at maximum degree of vocal loudness,and they continued while gradually decreasing vocalloudness until softest possible. They were asked toperform this sequence three times in chest and thenthree times in head register. The syllable /pae/ waschosen because the high first and second formants ofthe vowel add to the reliability of inverse filtering
TABLE 1. Data for the Singer Subjects, Includingthe Pitches Chosen
Pitch chosenAge Years of professional
Singer (yrs) experience Chest Head
MAR 43 14 Eb4 Eb4PAT 37 17 C4 C4SUB 39 11 G4 G4COX 29 10 E4 F4CIE 25 12 E4 Eb4JUL 39 25 F4 F4AL 17 None F4 F4
VOICE SOURCE DIFFERENCES 189
and the oral pressure during the p-occlusion allowsestimation of Ps.
The recordings were made with the Rothenbergmask, a specially designed pneumotachograph forcapturing oral flow. The subject held a plastic tube,inner diameter 4 mm, in the corner of her mouthfor recording oral pressure. The audio signal outsidethe mask was recorded from a microphone at adistance of 30 cm from the lips. These signals wererecorded on a multichannel digital recorder (TEACRD 180 PCM, Japan). Calibration signals for soundlevel, flow, and pressure were all recorded on thesame tape; the sound level by recording two vowelsounds, about 10 dB apart, with SPL values deter-mined from a sound level meter (Ono-Sokki LA-210, Ono-Sokki Co., Ltd., Japan) that was held nextto the recording microphone; airflow was obtainedfrom a pressure tank attached to the flow mask viaa flow meter; pressure was measured by meansof a water manometer. All calibration values wereannounced on the tape. The recorded material wastransferred into sound files with the Soundswellsignal analysis workstation (Hitech DevelopmentAB, Stockholm, Sweden).
Ps measurementThe effect of Ps variation on the voice source can
ideally be analyzed by examining glottal parametersas a function of several equally spaced Ps values.Therefore, for each subject and register, ten Ps-values were selected. These values were gained inthe following manner. The total Ps variation rangeof the singer in the three takes was divided bynine, thus yielding ten equally spaced Ps values. ThePs values closest to these ideal values were thenidentified from the three takes, and the subsequentvowel was selected for analysis. Because the sub-jects continuously decreased vocal loudness whilerepeating the syllable /pae/, Ps decreased somewhatduring each vowel, which caused an overestimationof Ps. However, the Ps decrease during the vowelwas no more than about 7% on average. The entirematerial thus consisted of a total of 140 samples,ten for each register and singer, respectively.
Subject MAR produced emphatic /p/-explosionsin her head register recordings as demonstrated bysharply peaked oral pressure peaks. Following therecommendation of Hertegard et al,6 the estimates
of Ps in these cases were taken from the discontinuityappearing in the initial part of the pressure peak.
Perceptual evaluationInformal listening to the samples of the subjects
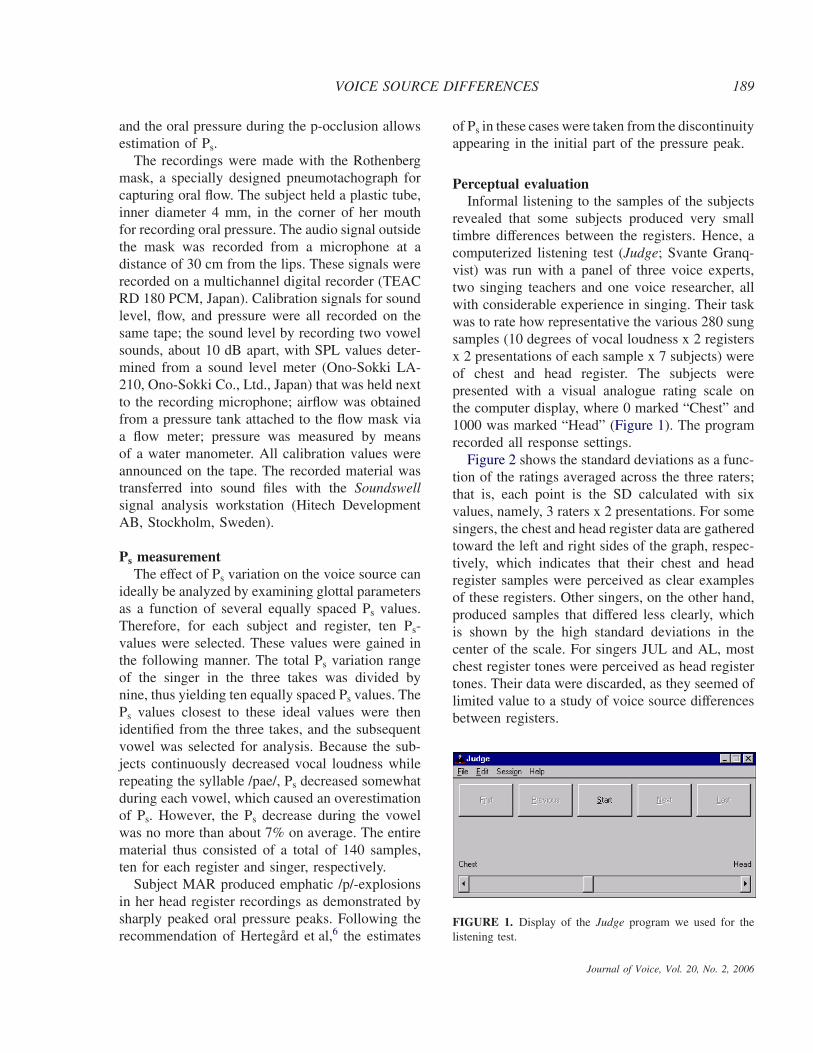
revealed that some subjects produced very smalltimbre differences between the registers. Hence, acomputerized listening test (Judge; Svante Granq-vist) was run with a panel of three voice experts,two singing teachers and one voice researcher, allwith considerable experience in singing. Their taskwas to rate how representative the various 280 sungsamples (10 degrees of vocal loudness x 2 registersx 2 presentations of each sample x 7 subjects) wereof chest and head register. The subjects werepresented with a visual analogue rating scale onthe computer display, where 0 marked “Chest” and1000 was marked “Head” (Figure 1). The programrecorded all response settings.
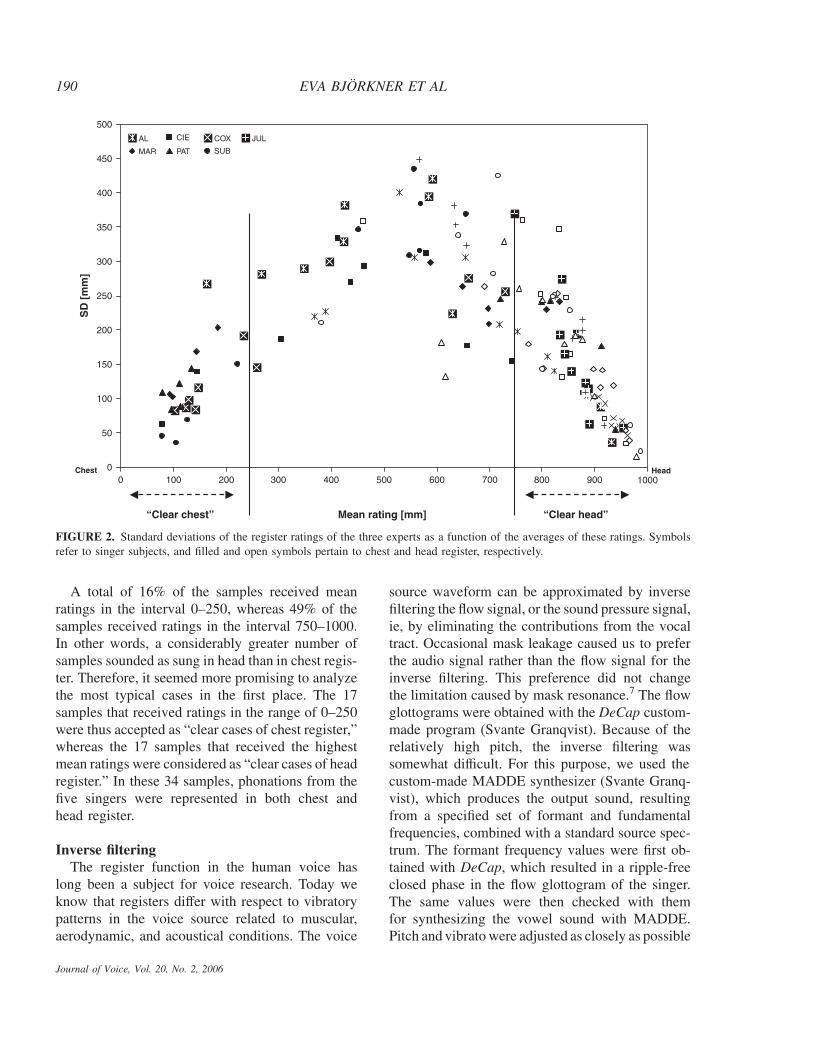
Figure 2 shows the standard deviations as a func-tion of the ratings averaged across the three raters;that is, each point is the SD calculated with sixvalues, namely, 3 raters x 2 presentations. For somesingers, the chest and head register data are gatheredtoward the left and right sides of the graph, respec-tively, which indicates that their chest and headregister samples were perceived as clear examplesof these registers. Other singers, on the other hand,produced samples that differed less clearly, whichis shown by the high standard deviations in thecenter of the scale. For singers JUL and AL, mostchest register tones were perceived as head registertones. Their data were discarded, as they seemed oflimited value to a study of voice source differencesbetween registers.
FIGURE 1. Display of the Judge program we used for thelistening test.
Journal of Voice, Vol. 20, No. 2, 2006
EVA BJORKNER ET AL190
0
50
100
150
200
250
300
350
400
450
500
0 100 200 300 400 500 600 700 800 900 1000
Mean rating [mm]
SD
[m
m]
AL CIE COX JUL
MAR PAT SUB
Chest Head
“Clear chest” “Clear head”
FIGURE 2. Standard deviations of the register ratings of the three experts as a function of the averages of these ratings. Symbolsrefer to singer subjects, and filled and open symbols pertain to chest and head register, respectively.
A total of 16% of the samples received meanratings in the interval 0–250, whereas 49% of thesamples received ratings in the interval 750–1000.In other words, a considerably greater number ofsamples sounded as sung in head than in chest regis-ter. Therefore, it seemed more promising to analyzethe most typical cases in the first place. The 17samples that received ratings in the range of 0–250were thus accepted as “clear cases of chest register,”whereas the 17 samples that received the highestmean ratings were considered as “clear cases of headregister.” In these 34 samples, phonations from thefive singers were represented in both chest andhead register.
Inverse filteringThe register function in the human voice has
long been a subject for voice research. Today weknow that registers differ with respect to vibratorypatterns in the voice source related to muscular,aerodynamic, and acoustical conditions. The voice
Journal of Voice, Vol. 20, No. 2, 2006
source waveform can be approximated by inversefiltering the flow signal, or the sound pressure signal,ie, by eliminating the contributions from the vocaltract. Occasional mask leakage caused us to preferthe audio signal rather than the flow signal for theinverse filtering. This preference did not changethe limitation caused by mask resonance.7 The flowglottograms were obtained with the DeCap custom-made program (Svante Granqvist). Because of therelatively high pitch, the inverse filtering wassomewhat difficult. For this purpose, we used thecustom-made MADDE synthesizer (Svante Granq-vist), which produces the output sound, resultingfrom a specified set of formant and fundamentalfrequencies, combined with a standard source spec-trum. The formant frequency values were first ob-tained with DeCap, which resulted in a ripple-freeclosed phase in the flow glottogram of the singer.The same values were then checked with themfor synthesizing the vowel sound with MADDE.Pitch and vibrato were adjusted as closely as possible
VOICE SOURCE DIFFERENCES 191
to the voices. If the synthesized voice timbre wasnot similar to that of the original of the singer, theDecap analysis was revised. We used this methodfor approximately 60% of the samples.
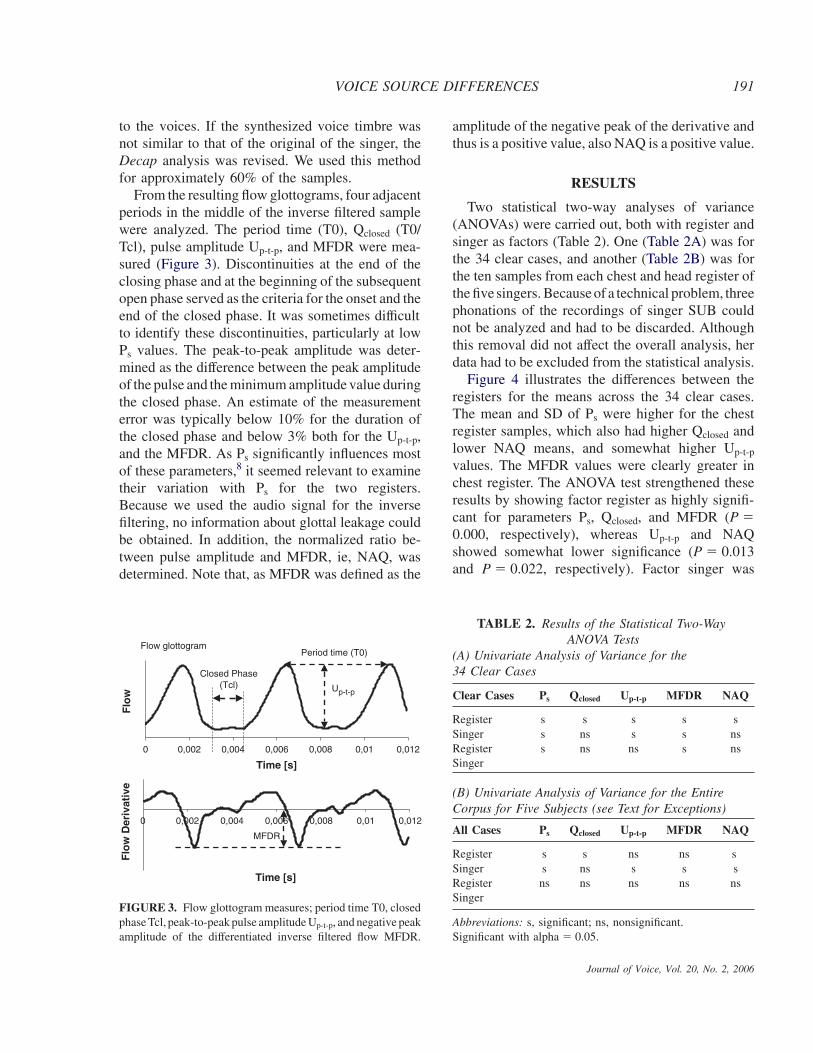
From the resulting flow glottograms, four adjacentperiods in the middle of the inverse filtered samplewere analyzed. The period time (T0), Qclosed (T0/Tcl), pulse amplitude Up-t-p, and MFDR were mea-sured (Figure 3). Discontinuities at the end of theclosing phase and at the beginning of the subsequentopen phase served as the criteria for the onset and theend of the closed phase. It was sometimes difficultto identify these discontinuities, particularly at lowPs values. The peak-to-peak amplitude was deter-mined as the difference between the peak amplitudeof the pulse and the minimum amplitude value duringthe closed phase. An estimate of the measurementerror was typically below 10% for the duration ofthe closed phase and below 3% both for the Up-t-p,and the MFDR. As Ps significantly influences mostof these parameters,8 it seemed relevant to examinetheir variation with Ps for the two registers.Because we used the audio signal for the inversefiltering, no information about glottal leakage couldbe obtained. In addition, the normalized ratio be-tween pulse amplitude and MFDR, ie, NAQ, wasdetermined. Note that, as MFDR was defined as the
0 0,002 0,004 0,006 0,008 0,01 0,012
Time [s]
Flo
w D
eriv
ativ
e
MFDR
0 0,002 0,004 0,006 0,008 0,01 0,012
Time [s]
Flo
w Up-t-p
Period time (T0)
Closed Phase(Tcl)
Flow glottogram
FIGURE 3. Flow glottogram measures; period time T0, closedphase Tcl, peak-to-peak pulse amplitude Up-t-p, and negative peakamplitude of the differentiated inverse filtered flow MFDR.
amplitude of the negative peak of the derivative andthus is a positive value, also NAQ is a positive value.
RESULTS
Two statistical two-way analyses of variance(ANOVAs) were carried out, both with register andsinger as factors (Table 2). One (Table 2A) was forthe 34 clear cases, and another (Table 2B) was forthe ten samples from each chest and head register ofthe five singers. Because of a technical problem, threephonations of the recordings of singer SUB couldnot be analyzed and had to be discarded. Althoughthis removal did not affect the overall analysis, herdata had to be excluded from the statistical analysis.
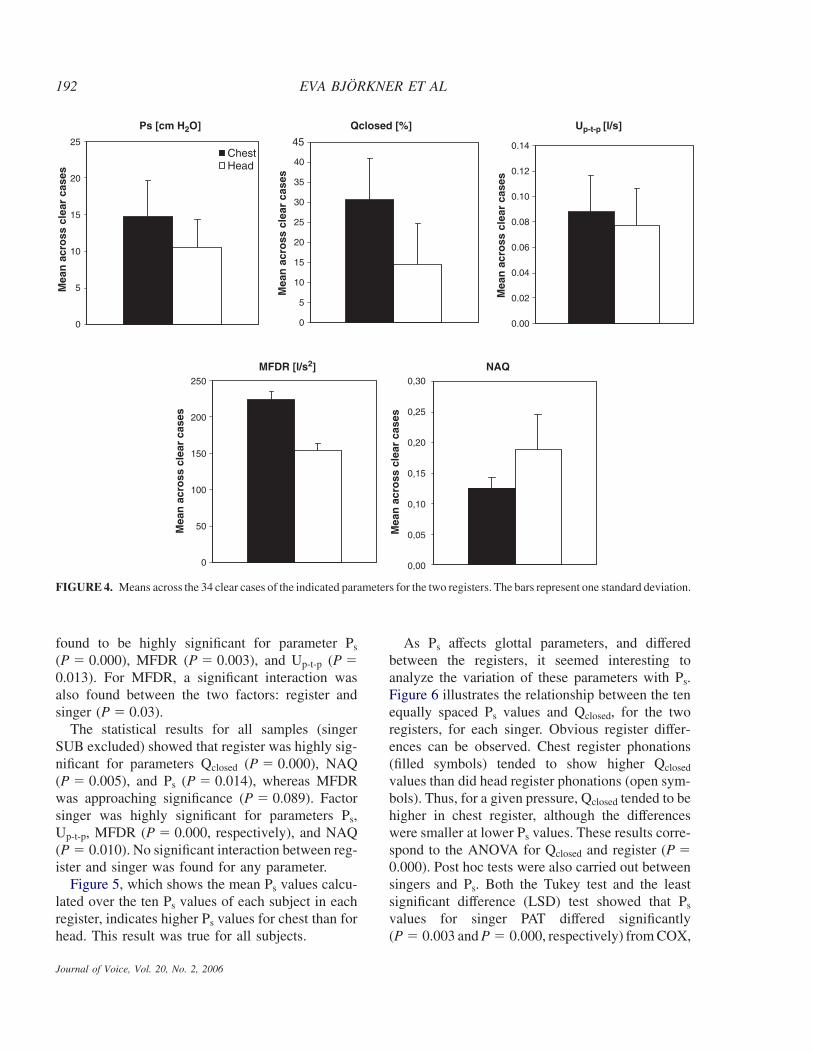
Figure 4 illustrates the differences between theregisters for the means across the 34 clear cases.The mean and SD of Ps were higher for the chestregister samples, which also had higher Qclosed andlower NAQ means, and somewhat higher Up-t-p
values. The MFDR values were clearly greater inchest register. The ANOVA test strengthened theseresults by showing factor register as highly signifi-cant for parameters Ps, Qclosed, and MFDR (P �0.000, respectively), whereas Up-t-p and NAQshowed somewhat lower significance (P � 0.013and P � 0.022, respectively). Factor singer was
TABLE 2. Results of the Statistical Two-WayANOVA Tests
(A) Univariate Analysis of Variance for the34 Clear Cases
Clear Cases Ps Qclosed Up-t-p MFDR NAQ
Register s s s s sSinger s ns s s nsRegister s ns ns s nsSinger
(B) Univariate Analysis of Variance for the EntireCorpus for Five Subjects (see Text for Exceptions)
All Cases Ps Qclosed Up-t-p MFDR NAQ
Register s s ns ns sSinger s ns s s sRegister ns ns ns ns nsSinger
Abbreviations: s, significant; ns, nonsignificant.Significant with alpha � 0.05.
Journal of Voice, Vol. 20, No. 2, 2006
EVA BJORKNER ET AL192
Ps [cm H2O]
0
5
10
15
20
25
Mea
n a
cro
ss c
lear
cas
es
ChestHead
Qclosed [%]
0
5
10
15
20
25
30
35
40
45
Mea
n a
cro
ss c
lear
cas
es
Up-t-p [l/s]
0.00
0.02
0.04
0.06
0.08
0.10
0.12
0.14
Mea
n a
cro
ss c
lear
cas
es
NAQ
0,00
0,05
0,10
0,15
0,20
0,25
0,30
Mea
n a
cro
ss c
lear
cas
es
MFDR [l/s2]
0
50
100
150
200
250
Mea
n a
cro
ss c
lear
cas
es
FIGURE 4. Means across the 34 clear cases of the indicated parameters for the two registers. The bars represent one standard deviation.
found to be highly significant for parameter Ps
(P � 0.000), MFDR (P � 0.003), and Up-t-p (P �0.013). For MFDR, a significant interaction wasalso found between the two factors: register andsinger (P � 0.03).
The statistical results for all samples (singerSUB excluded) showed that register was highly sig-nificant for parameters Qclosed (P � 0.000), NAQ(P � 0.005), and Ps (P � 0.014), whereas MFDRwas approaching significance (P � 0.089). Factorsinger was highly significant for parameters Ps,Up-t-p, MFDR (P � 0.000, respectively), and NAQ(P � 0.010). No significant interaction between reg-ister and singer was found for any parameter.
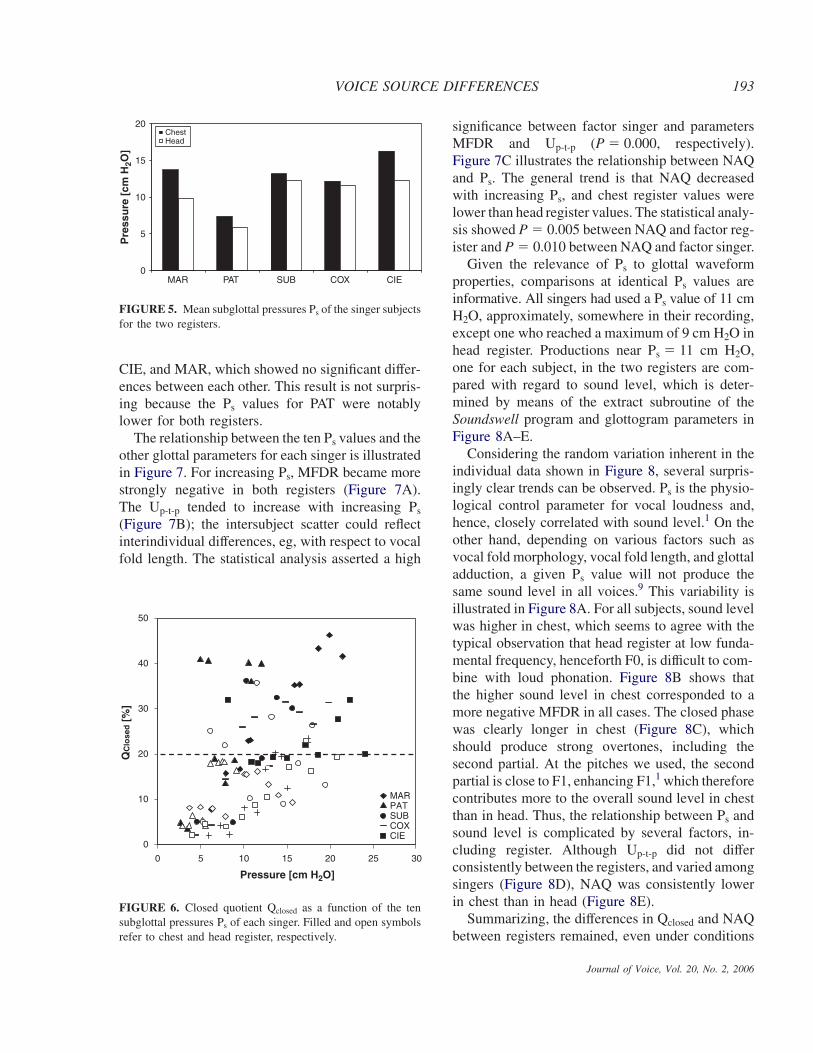
Figure 5, which shows the mean Ps values calcu-lated over the ten Ps values of each subject in eachregister, indicates higher Ps values for chest than forhead. This result was true for all subjects.
Journal of Voice, Vol. 20, No. 2, 2006
As Ps affects glottal parameters, and differedbetween the registers, it seemed interesting toanalyze the variation of these parameters with Ps.Figure 6 illustrates the relationship between the tenequally spaced Ps values and Qclosed, for the tworegisters, for each singer. Obvious register differ-ences can be observed. Chest register phonations(filled symbols) tended to show higher Qclosed
values than did head register phonations (open sym-bols). Thus, for a given pressure, Qclosed tended to behigher in chest register, although the differenceswere smaller at lower Ps values. These results corre-spond to the ANOVA for Qclosed and register (P �0.000). Post hoc tests were also carried out betweensingers and Ps. Both the Tukey test and the leastsignificant difference (LSD) test showed that Ps
values for singer PAT differed significantly(P � 0.003 and P � 0.000, respectively) from COX,
VOICE SOURCE DIFFERENCES 193
0
5
10
15
20
MAR PAT SUB COX CIE
Pre
ssu
re [
cm H
2O]
ChestHead
FIGURE 5. Mean subglottal pressures Ps of the singer subjectsfor the two registers.
CIE, and MAR, which showed no significant differ-ences between each other. This result is not surpris-ing because the Ps values for PAT were notablylower for both registers.
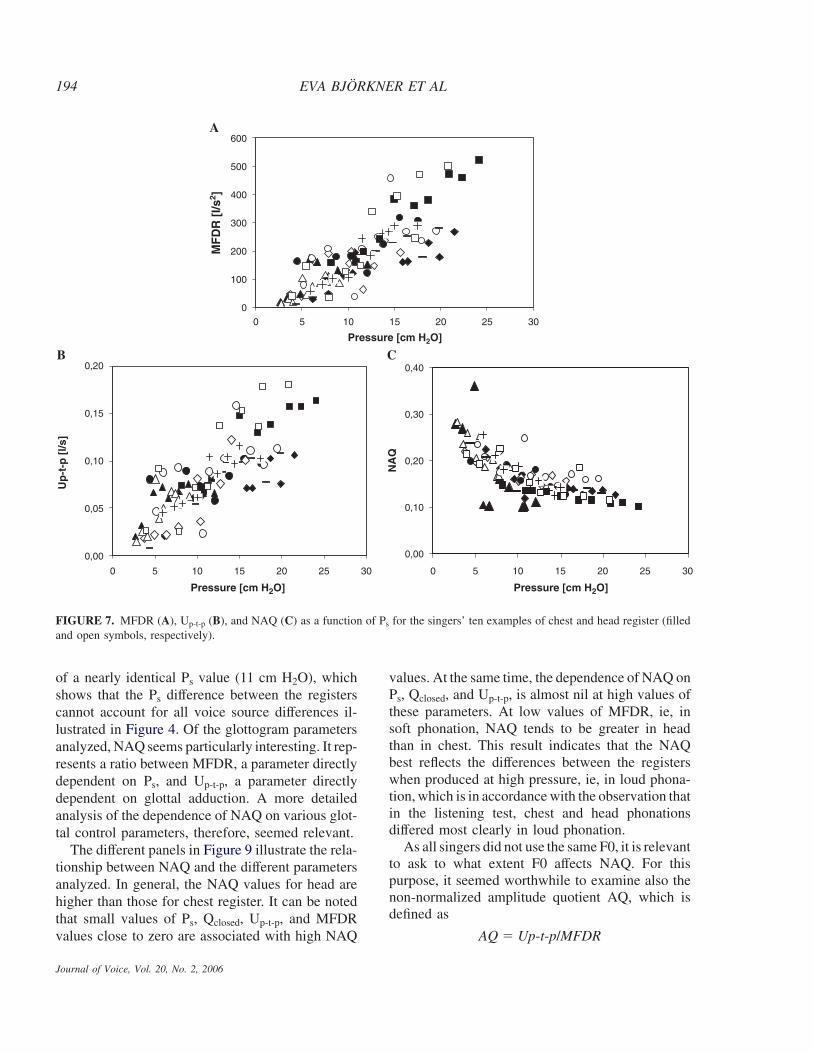
The relationship between the ten Ps values and theother glottal parameters for each singer is illustratedin Figure 7. For increasing Ps, MFDR became morestrongly negative in both registers (Figure 7A).The Up-t-p tended to increase with increasing Ps
(Figure 7B); the intersubject scatter could reflectinterindividual differences, eg, with respect to vocalfold length. The statistical analysis asserted a high
0
10
20
30
40
50
0 5 10 15 20 25 30
Pressure [cm H2O]
QC
lose
d [
%]
MARPATSUBCOXCIE
FIGURE 6. Closed quotient Qclosed as a function of the tensubglottal pressures Ps of each singer. Filled and open symbolsrefer to chest and head register, respectively.
significance between factor singer and parametersMFDR and Up-t-p (P � 0.000, respectively).Figure 7C illustrates the relationship between NAQand Ps. The general trend is that NAQ decreasedwith increasing Ps, and chest register values werelower than head register values. The statistical analy-sis showed P � 0.005 between NAQ and factor reg-ister and P � 0.010 between NAQ and factor singer.
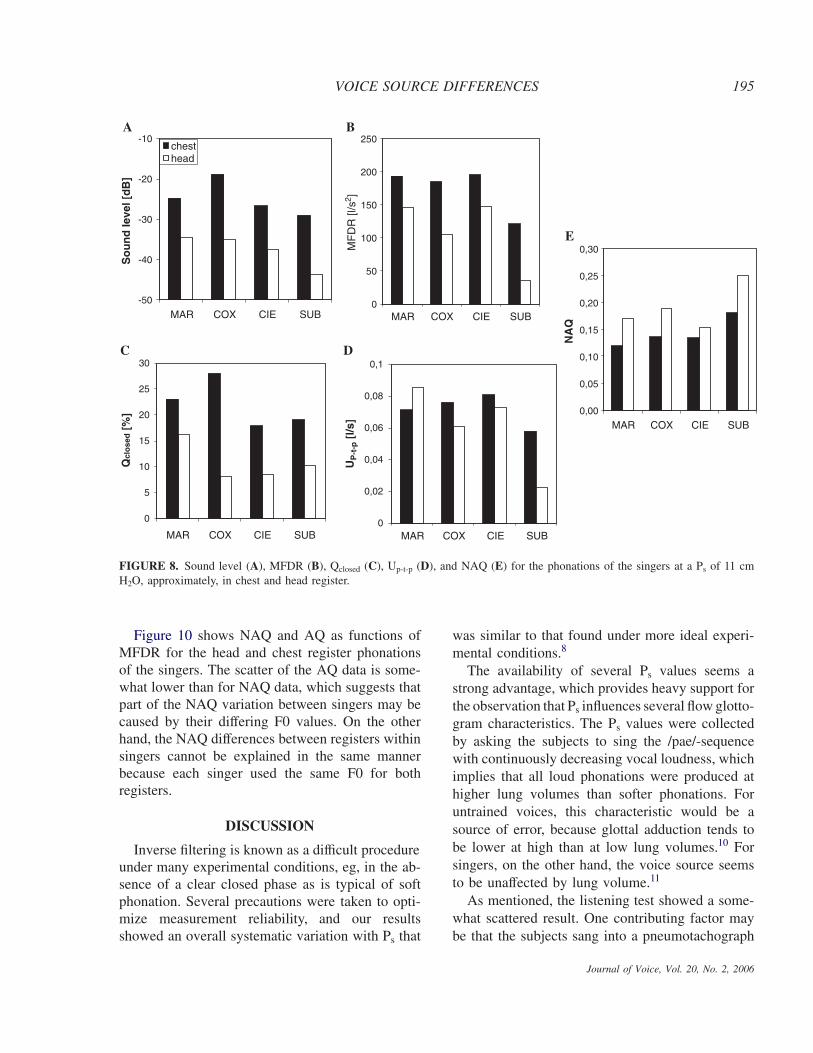
Given the relevance of Ps to glottal waveformproperties, comparisons at identical Ps values areinformative. All singers had used a Ps value of 11 cmH2O, approximately, somewhere in their recording,except one who reached a maximum of 9 cm H2O inhead register. Productions near Ps � 11 cm H2O,one for each subject, in the two registers are com-pared with regard to sound level, which is deter-mined by means of the extract subroutine of theSoundswell program and glottogram parameters inFigure 8A–E.
Considering the random variation inherent in theindividual data shown in Figure 8, several surpris-ingly clear trends can be observed. Ps is the physio-logical control parameter for vocal loudness and,hence, closely correlated with sound level.1 On theother hand, depending on various factors such asvocal fold morphology, vocal fold length, and glottaladduction, a given Ps value will not produce thesame sound level in all voices.9 This variability isillustrated in Figure 8A. For all subjects, sound levelwas higher in chest, which seems to agree with thetypical observation that head register at low funda-mental frequency, henceforth F0, is difficult to com-bine with loud phonation. Figure 8B shows thatthe higher sound level in chest corresponded to amore negative MFDR in all cases. The closed phasewas clearly longer in chest (Figure 8C), whichshould produce strong overtones, including thesecond partial. At the pitches we used, the secondpartial is close to F1, enhancing F1,1 which thereforecontributes more to the overall sound level in chestthan in head. Thus, the relationship between Ps andsound level is complicated by several factors, in-cluding register. Although Up-t-p did not differconsistently between the registers, and varied amongsingers (Figure 8D), NAQ was consistently lowerin chest than in head (Figure 8E).
Summarizing, the differences in Qclosed and NAQbetween registers remained, even under conditions
Journal of Voice, Vol. 20, No. 2, 2006
EVA BJORKNER ET AL194
0,00
0,10
0,20
0,30
0,40
0 5 10 15 20 25 30
Pressure [cm H2O]
NA
Q
0,00
0,05
0,10
0,15
0,20
0 5 10 15 20 25 30
Pressure [cm H2O]
Up
-t-p
[l/s
]
0
100
200
300
400
500
600
0 5 10 15 20 25 30
Pressure [cm H2O]
MF
DR
[l/s
2 ]
B
A
C
FIGURE 7. MFDR (A), Up-t-p (B), and NAQ (C) as a function of Ps for the singers’ ten examples of chest and head register (filledand open symbols, respectively).
of a nearly identical Ps value (11 cm H2O), whichshows that the Ps difference between the registerscannot account for all voice source differences il-lustrated in Figure 4. Of the glottogram parametersanalyzed, NAQ seems particularly interesting. It rep-resents a ratio between MFDR, a parameter directlydependent on Ps, and Up-t-p, a parameter directlydependent on glottal adduction. A more detailedanalysis of the dependence of NAQ on various glot-tal control parameters, therefore, seemed relevant.
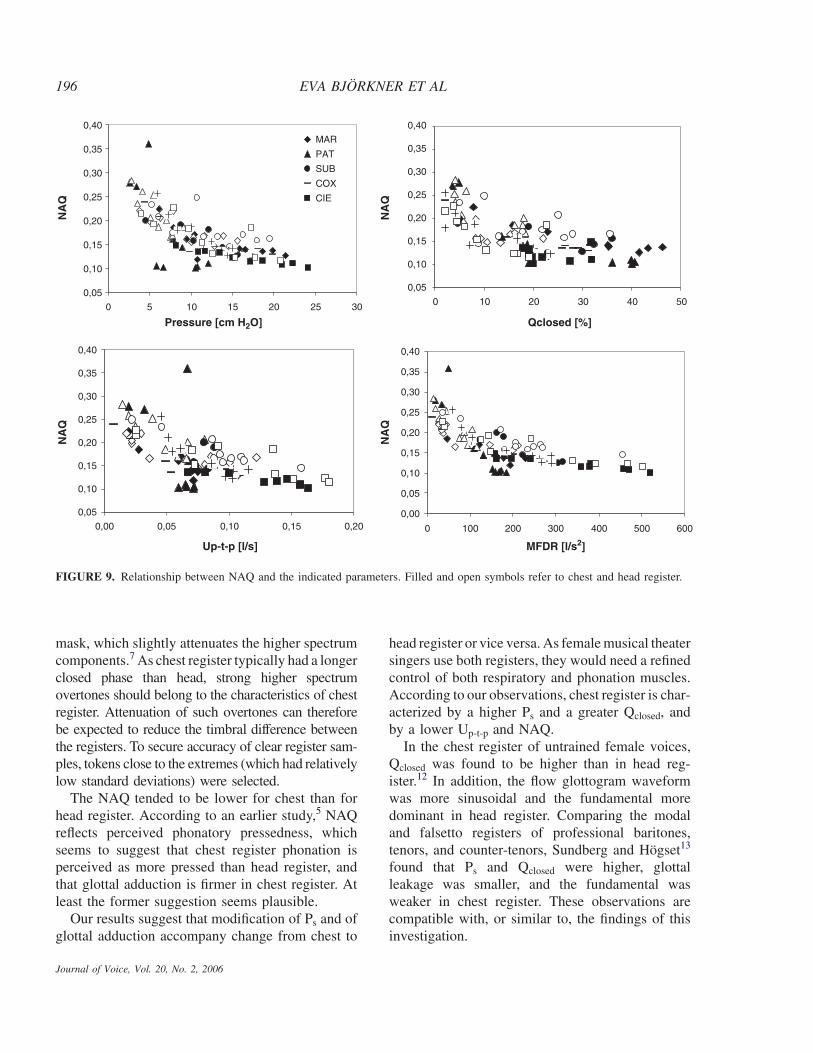
The different panels in Figure 9 illustrate the rela-tionship between NAQ and the different parametersanalyzed. In general, the NAQ values for head arehigher than those for chest register. It can be notedthat small values of Ps, Qclosed, Up-t-p, and MFDRvalues close to zero are associated with high NAQ
Journal of Voice, Vol. 20, No. 2, 2006
values. At the same time, the dependence of NAQ onPs, Qclosed, and Up-t-p, is almost nil at high values ofthese parameters. At low values of MFDR, ie, insoft phonation, NAQ tends to be greater in headthan in chest. This result indicates that the NAQbest reflects the differences between the registerswhen produced at high pressure, ie, in loud phona-tion, which is in accordance with the observation thatin the listening test, chest and head phonationsdiffered most clearly in loud phonation.
As all singers did not use the same F0, it is relevantto ask to what extent F0 affects NAQ. For thispurpose, it seemed worthwhile to examine also thenon-normalized amplitude quotient AQ, which isdefined as
AQ � Up-t-p/MFDR
VOICE SOURCE DIFFERENCES 195
0
5
10
15
20
25
30
Qcl
ose
d [
%]
-50
-40
-30
-20
-10
MAR COX CIE SUB
MAR COX CIE SUB
MAR COX CIE SUB
MAR COX CIE SUB
MAR COX CIE SUB
So
un
d le
vel [
dB
]
chesthead
0
0,02
0,04
0,06
0,08
0,1
UP
-t-p
[l/s
]
0,00
0,05
0,10
0,15
0,20
0,25
0,30
NA
Q
0
50
100
150
200
250
MF
DR
[l/s
2 ] C D
E
BA
FIGURE 8. Sound level (A), MFDR (B), Qclosed (C), Up-t-p (D), and NAQ (E) for the phonations of the singers at a Ps of 11 cmH2O, approximately, in chest and head register.
Journal of Voice, Vol. 20, No. 2, 2006
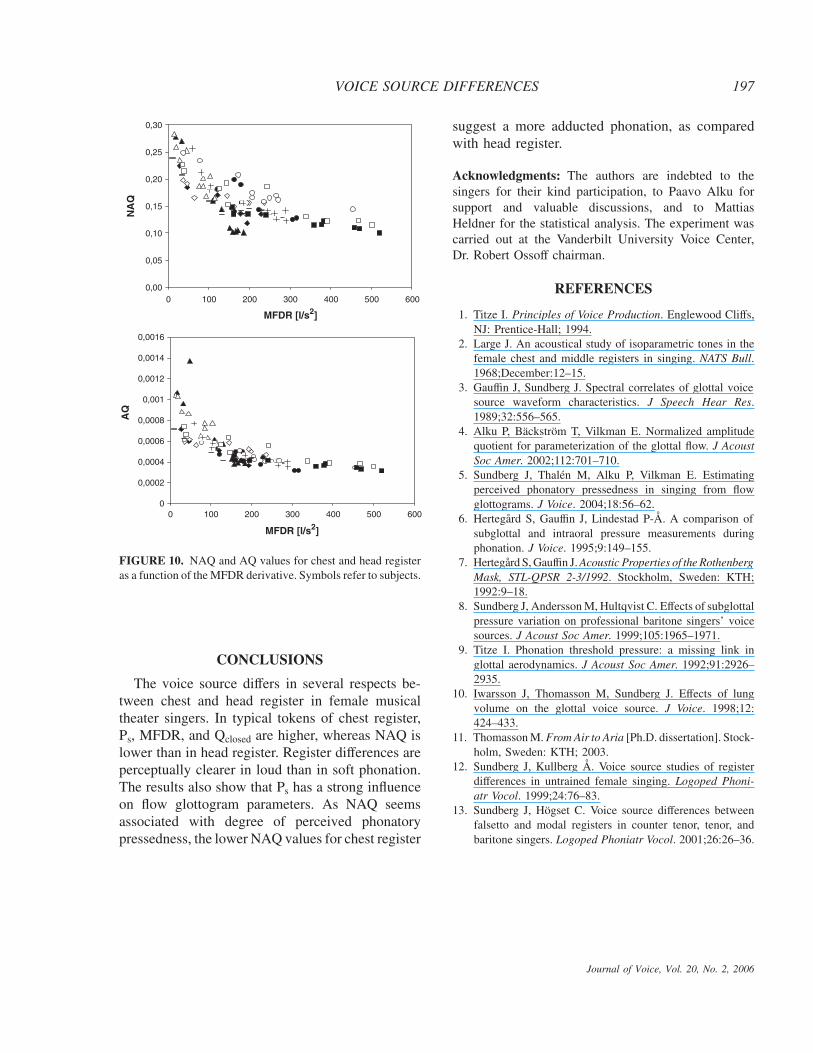
Figure 10 shows NAQ and AQ as functions ofMFDR for the head and chest register phonationsof the singers. The scatter of the AQ data is some-what lower than for NAQ data, which suggests thatpart of the NAQ variation between singers may becaused by their differing F0 values. On the otherhand, the NAQ differences between registers withinsingers cannot be explained in the same mannerbecause each singer used the same F0 for bothregisters.
DISCUSSION
Inverse filtering is known as a difficult procedureunder many experimental conditions, eg, in the ab-sence of a clear closed phase as is typical of softphonation. Several precautions were taken to opti-mize measurement reliability, and our resultsshowed an overall systematic variation with Ps that
was similar to that found under more ideal experi-mental conditions.8
The availability of several Ps values seems astrong advantage, which provides heavy support forthe observation that Ps influences several flow glotto-gram characteristics. The Ps values were collectedby asking the subjects to sing the /pae/-sequencewith continuously decreasing vocal loudness, whichimplies that all loud phonations were produced athigher lung volumes than softer phonations. Foruntrained voices, this characteristic would be asource of error, because glottal adduction tends tobe lower at high than at low lung volumes.10 Forsingers, on the other hand, the voice source seemsto be unaffected by lung volume.11
As mentioned, the listening test showed a some-what scattered result. One contributing factor maybe that the subjects sang into a pneumotachograph
EVA BJORKNER ET AL196
0,05
0,10
0,15
0,20
0,25
0,30
0,35
0,40
0,05
0,10
0,15
0,20
0,25
0,30
0,35
0,40
0,05
0,10
0,15
0,20
0,25
0,30
0,35
0,40
0,05
0,00
0,10
0,15
0,20
0,25
0,30
0,35
0,40
0 5 10 15 20 25 30
Pressure [cm H2O]
NA
Q
MAR
PAT
SUB
COX
CIE
0 10 20 30 40 50
Qclosed [%]
NA
Q
0,00 0,05 0,10 0,15 0,20
Up-t-p [l/s]
NA
Q
0 100 200 300 400 500 600
MFDR [l/s2]
NA
Q
FIGURE 9. Relationship between NAQ and the indicated parameters. Filled and open symbols refer to chest and head register.
mask, which slightly attenuates the higher spectrumcomponents.7 As chest register typically had a longerclosed phase than head, strong higher spectrumovertones should belong to the characteristics of chestregister. Attenuation of such overtones can thereforebe expected to reduce the timbral difference betweenthe registers. To secure accuracy of clear register sam-ples, tokens close to the extremes (which had relativelylow standard deviations) were selected.
The NAQ tended to be lower for chest than forhead register. According to an earlier study,5 NAQreflects perceived phonatory pressedness, whichseems to suggest that chest register phonation isperceived as more pressed than head register, andthat glottal adduction is firmer in chest register. Atleast the former suggestion seems plausible.
Our results suggest that modification of Ps and ofglottal adduction accompany change from chest to
Journal of Voice, Vol. 20, No. 2, 2006
head register or vice versa. As female musical theatersingers use both registers, they would need a refinedcontrol of both respiratory and phonation muscles.According to our observations, chest register is char-acterized by a higher Ps and a greater Qclosed, andby a lower Up-t-p and NAQ.
In the chest register of untrained female voices,Qclosed was found to be higher than in head reg-ister.12 In addition, the flow glottogram waveformwas more sinusoidal and the fundamental moredominant in head register. Comparing the modaland falsetto registers of professional baritones,tenors, and counter-tenors, Sundberg and Hogset13
found that Ps and Qclosed were higher, glottalleakage was smaller, and the fundamental wasweaker in chest register. These observations arecompatible with, or similar to, the findings of thisinvestigation.
VOICE SOURCE DIFFERENCES 197
0,00
0,05
0,10
0,15
0,20
0,25
0,30
0 100 200 300 400 500 600
MFDR [l/s2]
NA
Q
0
0,0002
0,0004
0,0006
0,0008
0,001
0,0012
0,0014
0,0016
0 100 200 300 400 500 600
MFDR [l/s2]
AQ
FIGURE 10. NAQ and AQ values for chest and head registeras a function of the MFDR derivative. Symbols refer to subjects.
CONCLUSIONS
The voice source differs in several respects be-tween chest and head register in female musicaltheater singers. In typical tokens of chest register,Ps, MFDR, and Qclosed are higher, whereas NAQ islower than in head register. Register differences areperceptually clearer in loud than in soft phonation.The results also show that Ps has a strong influenceon flow glottogram parameters. As NAQ seemsassociated with degree of perceived phonatorypressedness, the lower NAQ values for chest register
suggest a more adducted phonation, as comparedwith head register.
Acknowledgments: The authors are indebted to thesingers for their kind participation, to Paavo Alku forsupport and valuable discussions, and to MattiasHeldner for the statistical analysis. The experiment wascarried out at the Vanderbilt University Voice Center,Dr. Robert Ossoff chairman.
REFERENCES
1. Titze I. Principles of Voice Production. Englewood Cliffs,NJ: Prentice-Hall; 1994.
2. Large J. An acoustical study of isoparametric tones in thefemale chest and middle registers in singing. NATS Bull.1968;December:12–15.
3. Gauffin J, Sundberg J. Spectral correlates of glottal voicesource waveform characteristics. J Speech Hear Res.1989;32:556–565.
4. Alku P, Backstrom T, Vilkman E. Normalized amplitudequotient for parameterization of the glottal flow. J AcoustSoc Amer. 2002;112:701–710.
5. Sundberg J, Thalen M, Alku P, Vilkman E. Estimatingperceived phonatory pressedness in singing from flowglottograms. J Voice. 2004;18:56–62.
6. Hertegard S, Gauffin J, Lindestad P-A. A comparison ofsubglottal and intraoral pressure measurements duringphonation. J Voice. 1995;9:149–155.
7. Hertegard S, Gauffin J. Acoustic Properties of the RothenbergMask, STL-QPSR 2-3/1992. Stockholm, Sweden: KTH;1992:9–18.
8. Sundberg J, Andersson M, Hultqvist C. Effects of subglottalpressure variation on professional baritone singers’ voicesources. J Acoust Soc Amer. 1999;105:1965–1971.
9. Titze I. Phonation threshold pressure: a missing link inglottal aerodynamics. J Acoust Soc Amer. 1992;91:2926–2935.
10. Iwarsson J, Thomasson M, Sundberg J. Effects of lungvolume on the glottal voice source. J Voice. 1998;12:424–433.
11. Thomasson M. From Air to Aria [Ph.D. dissertation]. Stock-holm, Sweden: KTH; 2003.
12. Sundberg J, Kullberg A. Voice source studies of registerdifferences in untrained female singing. Logoped Phoni-atr Vocol. 1999;24:76–83.
13. Sundberg J, Hogset C. Voice source differences betweenfalsetto and modal registers in counter tenor, tenor, andbaritone singers. Logoped Phoniatr Vocol. 2001;26:26–36.
Journal of Voice, Vol. 20, No. 2, 2006


