Embed Size (px)
Citation preview
Volatile Emissions from Alnus glutionosa Inducedby Herbivory are Quantitatively Relatedto the Extent of Damage
Lucian Copolovici & Astrid Kännaste & Triinu Remmel &Vivian Vislap & Ülo Niinemets
Received: 28 June 2010 /Revised: 25 November 2010 /Accepted: 3 December 2010 /Published online: 23 December 2010# Springer Science+Business Media, LLC 2010
Abstract Plant volatile organic compounds (VOCs) eli-cited in response to herbivory serve as cues for parasiticand predatory insects. Knowledge about quantitative rela-tionships between the extent of herbivore-induced damageand the quantities of VOCs released is scarce. We studiedthe kinetics of VOC-emissions from foliage of thedeciduous tree Alnus glutinosa induced by feeding activityof larvae of the geometrid moth Cabera pusaria. Quanti-tative relationships between the intensity of stress andstrength of plant response were determined. Intensity ofbiotic stress was characterized by herbivore numbers (0–8 larvae) and by the amount of leaf area eaten. The strengthof plant response was characterized by monitoring (i)changes in photosynthesis, (ii) leaf ultrastructure, and (iii)plant volatiles. Net assimilation rate displayed compensa-tory responses in herbivore-damaged leaves compared withcontrol leaves. This compensatory response was associatedwith an overall increase in chloroplast size. Feeding-induced emissions of products of the lipoxygenase pathway(LOX products; (E)-2-hexenal, (Z)-3-hexenol, 1-hexanol,and (Z)-3-hexenyl acetate) peaked at day 1 after larvalfeeding started, followed by an increase of emissions ofubiquitous monoterpenes peaking on days 2 and 3. Theemission of the monoterpene (E)-β-ocimene and of the
nerolidol-derived homoterpene 4,8-dimethyl-nona-1,3,7-tri-ene (DMNT) peaked on day 3. Furthermore, the emissionkinetics of the sesquiterpene (E,E)-α-farnesene tended to bebiphasic with peaks on days 2 and 4 after start of larvalfeeding. Emission rates of the induced LOX products, of(E)-β-ocimene and (E,E)-α-farnesene were positively cor-related with the number of larvae feeding. In contrast, theemission of DMNT was independent of the number offeeders. These data show quantitative relationships betweenthe strength of herbivory and the emissions of LOXproducts and most of the terpenoids elicited in response tofeeding. Thus, herbivory-elicited LOX products and terpe-noid emissions may convey both quantitative and qualita-tive signals to antagonists of the herbivores. In contrast, ourdata suggest that the feeding-induced homoterpene DMNTconveys the information “presence of herbivores” ratherthan information about the quantities of herbivores topredators and parasitoids.
Key Words Biotic stress . Green leaf volatiles . Leafultrastructure . Photosynthesis rate . Volatile organiccompounds
Introduction
Plants have developed a variety of defense strategies thatcope with insect attacks. Direct defenses act directly againstthe herbivores, whereas indirect plant defenses may act byrelease of plant volatile organic compounds (VOCs) thatattract natural enemies of the herbivores (see for reviewsGershenzon and Dudareva, 2007; Poelman et al., 2008;Dicke, 2009). Quantitative and qualitative herbivore-induced changes in VOC emissions have attracted specialattention (Holopainen, 2004; Arimura et al., 2005; Brilli et
L. Copolovici (*) :A. Kännaste :V. Vislap :Ü. NiinemetsInstitute of Agricultural and Environmental Sciences,Estonian University of Life Sciences,Kreutzwaldi 1,Tartu 51014, Estoniae-mail: [email protected]
T. RemmelDepartment of Zoology, Institute of Ecology and Earth Sciences,University of Tartu,Vanemuise 46,Tartu 51014, Estonia
J Chem Ecol (2011) 37:18–28DOI 10.1007/s10886-010-9897-9
al., 2009; Dicke, 2009; Kännaste et al., 2009; Wu andBaldwin, 2009; Schaub et al., 2010).
The first, almost instantaneous response of plants towounding is the emission of volatile products of thelipoxygenase pathway, i.e., LOX products (various C6-aldehydes, -alcohols, and -esters, also called green leafvolatiles; Pinto et al., 2007; Gosset et al., 2009). Lip-oxygenase (LOX) pathway products are induced in avariety of plant species during different stress conditions(e.g., Heiden et al., 2003; Copolovici and Niinemets, 2010)in a process where free octadecanoid fatty acids are releasedfrom plant membranes by phospholipases. As furtherresponses to continued herbivory, emissions of LOXvolatiles are enhanced and a wide range of otherherbivore-induced VOCs is released: e.g., terpenes pro-duced via the mevalonic acid (MVA) pathway and/or the 2-C-methyl-D-erythritol 4-phosphate (MEP) pathway ormethyl salicylate biosynthesized via the shikimic acidpathway (Holopainen, 2004; Dudareva et al., 2006).
Although extensive evidence for the induction of plantvolatiles by herbivory is available, studies of herbivore-induced plant VOCs often provide only information of thespectrum of compounds emitted, but no quantitative data(De Boer et al., 2004; Kännaste et al., 2008, 2009). Even inquantitative analyses that have determined the amount ofcompounds emitted by damaged plants (Dicke et al., 1999;Mumm et al., 2003; Schuman et al., 2009), quantitativerelationships between the amounts of compounds emittedand degree of damage or the number of insects feedingrarely have been reported (Gouinguene et al., 2003).However, the strength of the signal may significantly alterthe degree of attraction of the parasitoids and predators ofherbivores (De Boer and Dicke, 2004; Chen and Fadamiro,2007; Bruinsma et al., 2009). Thus, quantitative relation-ships between plant VOC emissions and degree ofherbivory damage are of key importance for understandingmultitrophic plant—insect interactions. Stress strength vs.emission response relationships have been studied for a fewabiotic stresses (Beauchamp et al., 2005; Niinemets, 2010).These studies provide evidence that plant VOC emissionsare quantitatively associated with stress strength. Suchquantitative relationships are needed to develop large-scale models of VOC release in response to biotic stresses(Arneth and Niinemets, 2010).
In the current study, we tested the hypothesis that plantVOC emissions are quantitatively associated with thedegree of damage by herbivores. We used Alnus glutinosa,an early successional alder species, and larvae of thegeometrid moth Cabera pusaria for our analysis. The plantspecies we studied is a temperate deciduous tree speciesthat is wide-spread in Europe and is colonizing habitatsalong streambanks and wet forests. Due to the capacity ofnitrogen-fixation, protein-rich foliage of Alnus spp. is under
strong herbivory pressure in natural environments. So far,only a few studies have investigated VOCs induced byherbivore attack in Alnus spp. (e.g., Dolch and Tscharntke,2000; Tscharntke et al., 2001; Giertych et al., 2006; Blandeet al., 2010). Larvae of C. pusaria are common defoliatorsof deciduous trees throughout the Palearctic region; theoligophagous larvae feed solitarily and externally in thefoliage of deciduous trees late in the season. Herbivorouslarvae, such as geometrids, cause considerable damage todeciduous trees, ranging from the consumption of a notablepercentage of total leaf area (Marquis and Whelan, 1994;Martel and Mauffette, 1997) to complete defoliation inextreme cases (Wesolowski and Rowinski, 2006; van Aschand Visser, 2007).
We analyzed the kinetics of VOC emission in A.glutinosa leaves during and after grazing by C. pusarialarvae, and we determined quantitative relationshipsbetween the intensity of stress (leaf damage and herbivorenumbers) and strength of plant response (photosynthesisand emissions of the lipoxygenase pathway products andterpenes).
Methods and Materials
Plant Material Alnus glutinosa plants were grown fromseeds (seed source: Oudewater, The Netherlands, 52° 01′N,4° 52′E). After germination, seedlings were grown in 3 Lclay pots filled with a 1:1 mixture of quartz sand andcommercial potting soil (Biolan Oy, Finland) under lightintensity of 200 μmol m−2 s−1 (HPI-T Plus 400 W metalhalide lamps, Philips) for a 12 h light period and day/nighttemperatures of 24/18°C. Plants were watered daily andfertilized once per month with slow release NPK (3-1-2ratio) fertilizer containing microelements. In all experi-ments, we used similar-sized 1-yr-old seedlings with 15–20leaves.
Insects Larvae of Cabera pusaria were collected from adeciduous-conifer mixed forest (58°23′N, 26°40′E) in thevicinity of Tartu, Estonia, and reared in the laboratory for15 d in 200 ml containers at varying temperatures tosynchronize the larval stages. Before the experiment, larvaewere supplied with fresh alder leaves that were changed onalternate days. We used larvae in the beginning of theirfinal instar for the experiments; at this age they have gainedabout 350 to 400 mg in body mass.
Experimental Setup Whole plants were placed in a dynamicheadspace sampling cuvette system consisting of four 3 Lglass chambers described in detail by Toome et al. (2010).In this system, above-ground plant parts were hermeticallysealed in individual cuvettes, while the root system with
J Chem Ecol (2011) 37:18–28 19
potting medium stayed outside. The air flow through eachchamber was 0.3 Lmin−1, and a fan (Sunon Group, Bejing,China) was installed in the chamber resulting in highturbulence. Assuming fully turbulent conditions and first-order exponential decay kinetics, the half-time of thechamber air corresponding to this chamber size and theflow rate was 6.9 min. (Li-Cor Inc., 2001; Niinemets,2011). During the experiment, light was provided by theHPI-T Plus 400 W metal halide lamps for a 12 hphotoperiod. Light intensity at the leaf surface was200 μmol m−2 s−1. After hermetic installation of the plants(day -1), they were left untreated for 24 h for stabilization.By the end of the stabilization period (day 0), treatment wasstarted by placing 2, 4, or 8 larvae of C. pusaria onindividual plants, while one plant was left untreated ascontrol. After introduction of the larvae, plants were kept inthe system in the dynamic air flow for one more hourbefore VOC sampling. Larvae were allowed to feed fromthe leaves for 4 d. After 4 d, they were removed, and theplants were maintained in the chambers for a further day forthe collection of VOCs.
Morphological and Chemical Measurements On the 5thday, all leaves were harvested and scanned at 300 dpi.Projected leaf area was determined from the scannedimages by custom made software. Leaf fresh mass wasthen determined immediately, and leaf dry mass wasestimated after drying the leaves for 48 h at 70°C. Nitrogencontent was determined by Vario Max CNS (ElementarAnalyse System GmbH, Hanau, Germany).
The experiment was conducted on plants with fullymature leaves, and no leaf area expansion was observedthroughout the experiment in either the control or insect-treated plants. Leaf area eaten by larvae was calculated asthe difference between leaf area before the start of theexperiment and the leaf area after all measurements.
Anatomical Measurements Samples for anatomicalmeasurements were collected at the end of the experiment.From the middle part of a fully developed leaf, 1×1 mmpieces were cut between the main veins. In the damagedplants, all leaves were partly damaged, and leaves with ca.10% damage were sampled, while intact leaves weresampled in the control plants. Leaf material was fixed byinfiltrating with 2% glutaric aldehyde in 0.2 M phosphatebuffer (pH 7.2) in a syringe under negative pressure. Afterfixation, leaf material was dehydrated in ethanol and finallyembedded into Epoxy Embedding Medium (Sigma-AldrichChemie, Steinheim, Germany) as described by Bozzola andRussell (1992). After embedding and curing in a ventilatedoven at 60°C for 48 h, semi-thin (0.5–0.2 μm) and ultra-thin (70–90 nm) cross sections were cut with an OM U2Ultra Microtome (American Optical Corporation, Reichert
Products, Buffalo, NY, USA) using a 45° diamond knife(Diatome, Hatfield, PA, USA). Semi-thin sections for lightmicroscopy were stained with Toluidine Blue as describedin Burns (1978) and Mercer (1963) for 30 sec, and photoswere taken with a Zeiss Axioplan 2 (Carl Zeiss Microscopy,Jena, Germany) at 40× magnification with 0.63×lens and adigital camera AxioCam HRc (Carl Zeiss Microscopy, Jena,Germany). Images were analyzed with UTHSCSA ImageTool for Windows Version 3.00 (UTHSCSA, Texas, USA1995–2002). Thickness of the leaf, palisade and spongymesophyll, and upper and lower epidermis were measuredfrom 10 sections per treatment.
Samples for transmission electron microscopy (TEM)were contrasted with 2% uranyl acetate in 50% ethanolsolution for 2 min and in 0.2% lead citrate in 0.1 M sodiumhydroxide solution for 2 min (Bozzola and Russell, 1992).Samples were viewed with a Philips Tecnai 10 TEM (FEI,Eindhoven, Netherlands) with an accelerating voltage of80 kV. 1100–2900x magnification was used to measuremesophyll cells size, and chloroplast and mesophyll surfacearea exposed to intercellular air space (Sc and Sm). Sc andSm were calculated according to Evans et al. (1994) byusing 2100–4200x magnification for length, thicknessand area of chloroplasts, mitochondria and starch grainsin the chloroplasts. Finally, 7000–14000x magnificationwas used for measurements of cell wall thickness andchloroplast distance from the cell wall. All parameterswere assessed separately for palisade and spongymesophyll cells. Based on the measurements we calcu-lated the chloroplast surface area exposed to intercellularair spaces per unit leaf area, mesophyll surface areaexposed to intercellular air spaces per unit leaf area,chloroplast area/mesophyll area, and starch grain arearelative to chloroplast area.
Photosynthesis Measurements The photosynthetic parame-ters of the plants during larval feeding were monitoredusing a set up described in detail earlier (Rasulov et al.,2009; Copolovici and Niinemets, 2010). Light intensity waskept at 200 nmol m−2 s−1, temperature at 28°C, and ambientCO2 concentration was 380–400 μmol mol−1. CO2 andH2O concentrations at the chamber in- and outlets weremeasured with an infra-red dual-channel gas analyzeroperated in differential mode (CIRAS II, PP-systems,Amesbury, MA, USA). The rates of net assimilation (A),transpiration (E), and stomatal conductance to water vapour(gs) were calculated from these measurements according tovon Caemmerer and Farquhar (1981).
VOC Sampling and GC-MS Analysis VOC sampling wasperformed via the outlets of each cuvette every morningwith a flow rate of 200 ml min−1 for 20 min by using aconstant flow air sample pump (1003-SKC, SKC Inc.,
20 J Chem Ecol (2011) 37:18–28
Houston, TX, USA). Air was drawn through a multibedstainless steel cartridge (10.5 cm length, 0.3 cm innerdiam., Supelco, Bellefonte, PA, USA) filled with CarbotrapC 20/40 mesh (0.2 g), Carbopack C 40/60 mesh (0.1 g), andCarbotrap X 20/40 mesh (0.1 g) adsorbents (Supelco,Bellefonte, PA, USA). In addition, a sample was takenfrom the air inlet prior to the cuvettes to estimatebackground VOC concentrations. Adsorbent cartridgeswere analyzed for lipoxygenase (LOX) pathway products,mono-, homo-, and sesquiterpene emissions with a com-bined Shimadzu TD20 automated cartridge desorber andShimadzu 2010 plus GC MS instrument (ShimadzuCorporation, Kyoto, Japan) using a method as detailed inCopolovici et al. (2009) and Toome et al. (2010). Thebackground (blank) VOC concentrations were subtractedfrom emission samples of the seedlings.
Separate samples were collected from larvae withoutplants. Emissions of volatile compounds from insects werebelow the detection limits of our system (range from 1.4 to5.2 nmol mol−1 for all compounds (Copolovici et al., 2009).
Statistical Analysis and Data Handling Experiments werereplicated three times with independent samples of plantsand larvae. Means were statistically compared by Tukey’stest and Student ANOVA post-hoc test using ORIGIN8 (OriginLab corporation, MA, USA) and STATISTICA 6.0(StatSoft, Inc., Tulsa, OK, USA).
Results
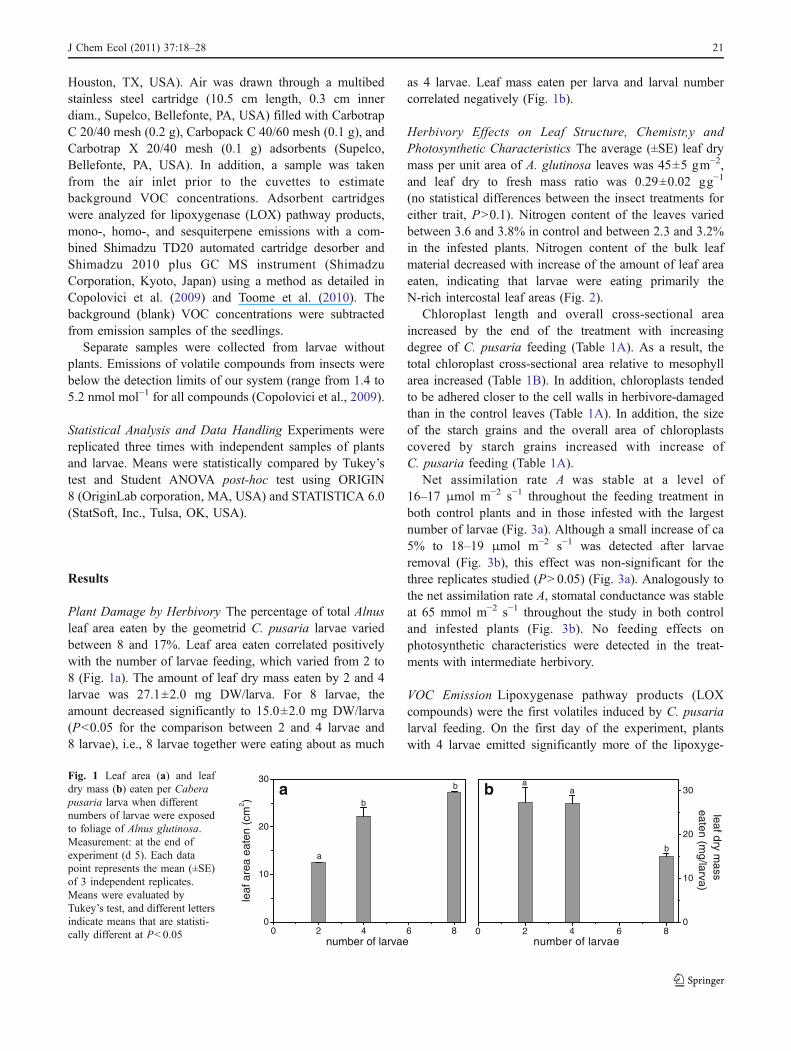
Plant Damage by Herbivory The percentage of total Alnusleaf area eaten by the geometrid C. pusaria larvae variedbetween 8 and 17%. Leaf area eaten correlated positivelywith the number of larvae feeding, which varied from 2 to8 (Fig. 1a). The amount of leaf dry mass eaten by 2 and 4larvae was 27.1±2.0 mg DW/larva. For 8 larvae, theamount decreased significantly to 15.0±2.0 mg DW/larva(P<0.05 for the comparison between 2 and 4 larvae and8 larvae), i.e., 8 larvae together were eating about as much
as 4 larvae. Leaf mass eaten per larva and larval numbercorrelated negatively (Fig. 1b).
Herbivory Effects on Leaf Structure, Chemistr,y andPhotosynthetic Characteristics The average (±SE) leaf drymass per unit area of A. glutinosa leaves was 45±5 gm−2,and leaf dry to fresh mass ratio was 0.29±0.02 gg−1
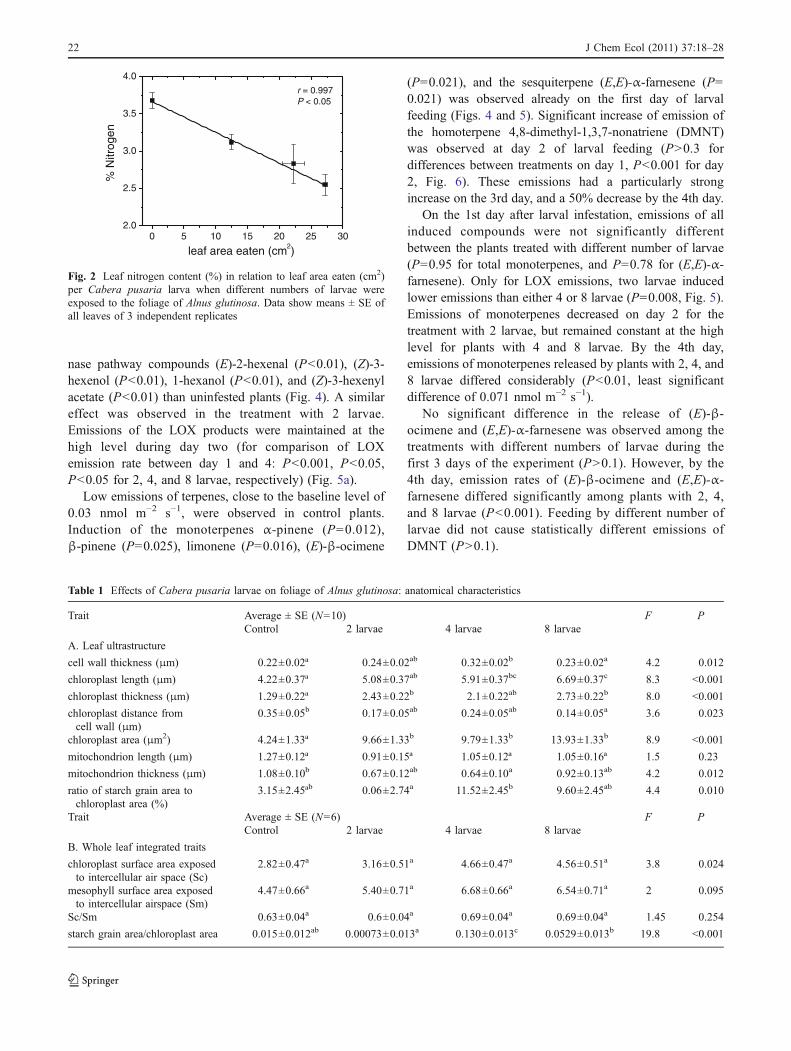
(no statistical differences between the insect treatments foreither trait, P>0.1). Nitrogen content of the leaves variedbetween 3.6 and 3.8% in control and between 2.3 and 3.2%in the infested plants. Nitrogen content of the bulk leafmaterial decreased with increase of the amount of leaf areaeaten, indicating that larvae were eating primarily theN-rich intercostal leaf areas (Fig. 2).
Chloroplast length and overall cross-sectional areaincreased by the end of the treatment with increasingdegree of C. pusaria feeding (Table 1A). As a result, thetotal chloroplast cross-sectional area relative to mesophyllarea increased (Table 1B). In addition, chloroplasts tendedto be adhered closer to the cell walls in herbivore-damagedthan in the control leaves (Table 1A). In addition, the sizeof the starch grains and the overall area of chloroplastscovered by starch grains increased with increase ofC. pusaria feeding (Table 1A).
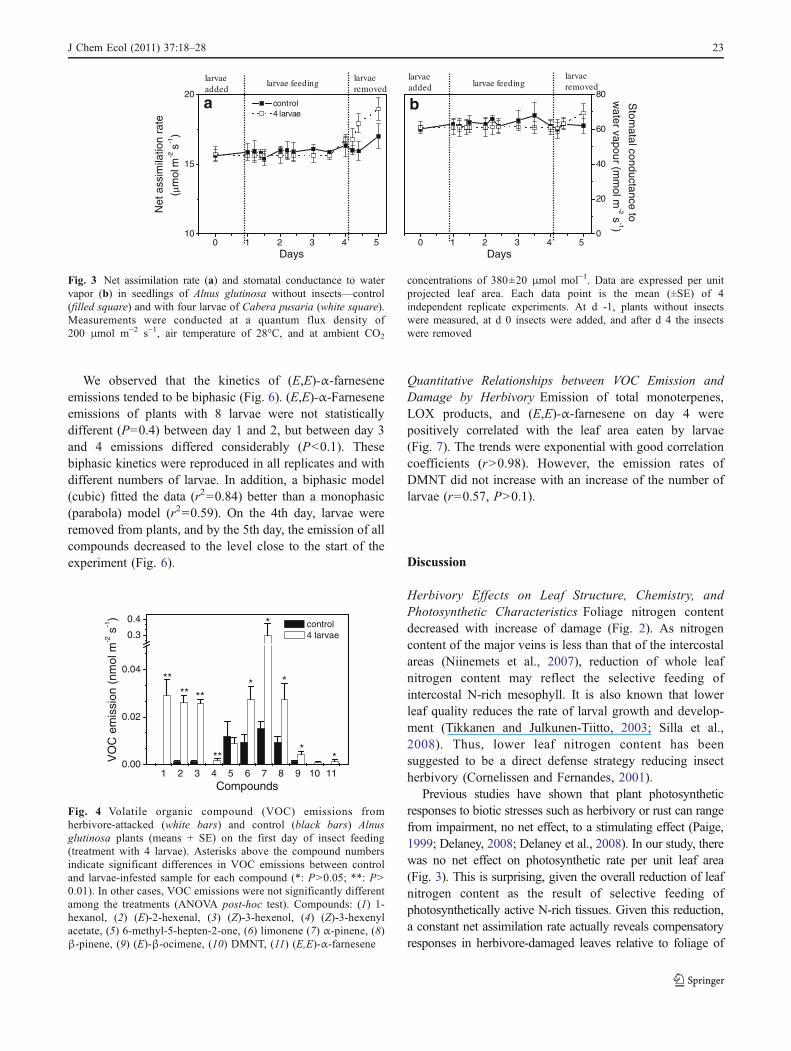
Net assimilation rate A was stable at a level of16–17 μmol m−2 s−1 throughout the feeding treatment inboth control plants and in those infested with the largestnumber of larvae (Fig. 3a). Although a small increase of ca5% to 18–19 μmol m−2 s−1 was detected after larvaeremoval (Fig. 3b), this effect was non-significant for thethree replicates studied (P>0.05) (Fig. 3a). Analogously tothe net assimilation rate A, stomatal conductance was stableat 65 mmol m−2 s−1 throughout the study in both controland infested plants (Fig. 3b). No feeding effects onphotosynthetic characteristics were detected in the treat-ments with intermediate herbivory.
VOC Emission Lipoxygenase pathway products (LOXcompounds) were the first volatiles induced by C. pusarialarval feeding. On the first day of the experiment, plantswith 4 larvae emitted significantly more of the lipoxyge-
0 2 4 6 80
10
20
30b
b
a
leaf
are
a ea
ten
(cm
2 )
number of larvae
a
0 2 4 6 80
10
20
30
b
a
leaf dry mass
eaten (mg/larva)
number of larvae
abFig. 1 Leaf area (a) and leafdry mass (b) eaten per Caberapusaria larva when differentnumbers of larvae were exposedto foliage of Alnus glutinosa.Measurement: at the end ofexperiment (d 5). Each datapoint represents the mean (±SE)of 3 independent replicates.Means were evaluated byTukey’s test, and different lettersindicate means that are statisti-cally different at P<0.05
J Chem Ecol (2011) 37:18–28 21
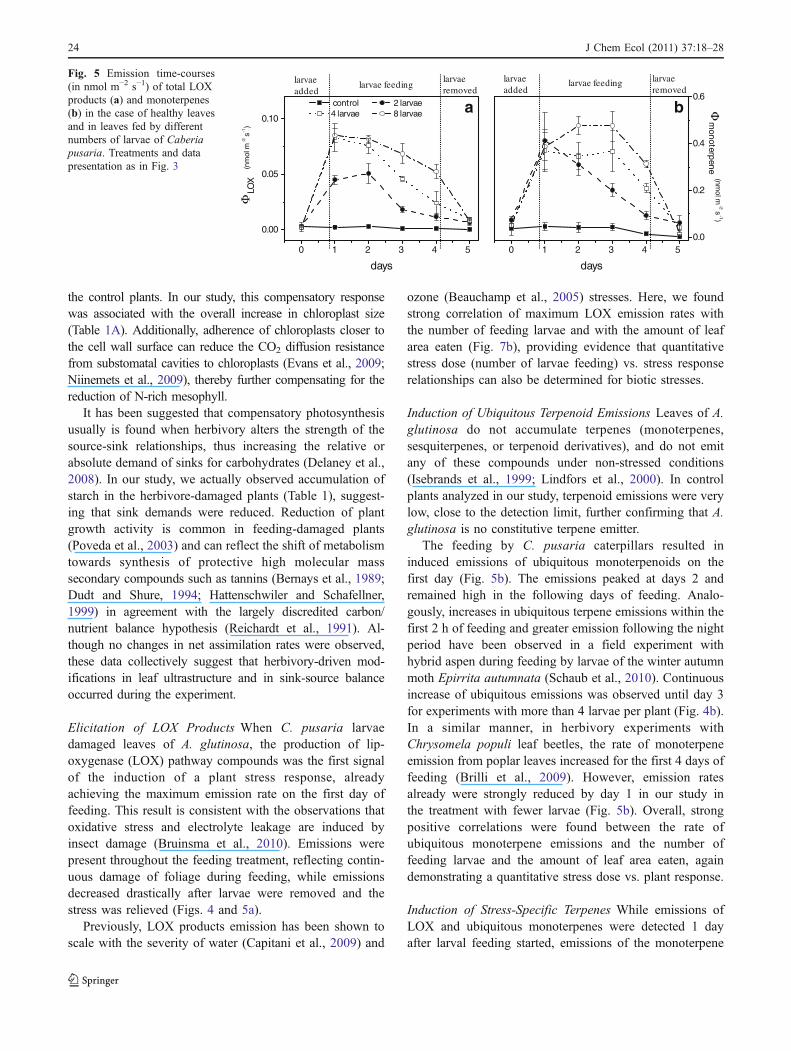
nase pathway compounds (E)-2-hexenal (P<0.01), (Z)-3-hexenol (P<0.01), 1-hexanol (P<0.01), and (Z)-3-hexenylacetate (P<0.01) than uninfested plants (Fig. 4). A similareffect was observed in the treatment with 2 larvae.Emissions of the LOX products were maintained at thehigh level during day two (for comparison of LOXemission rate between day 1 and 4: P<0.001, P<0.05,P<0.05 for 2, 4, and 8 larvae, respectively) (Fig. 5a).
Low emissions of terpenes, close to the baseline level of0.03 nmol m−2 s−1, were observed in control plants.Induction of the monoterpenes α-pinene (P=0.012),β-pinene (P=0.025), limonene (P=0.016), (E)-β-ocimene
(P=0.021), and the sesquiterpene (E,E)-α-farnesene (P=0.021) was observed already on the first day of larvalfeeding (Figs. 4 and 5). Significant increase of emission ofthe homoterpene 4,8-dimethyl-1,3,7-nonatriene (DMNT)was observed at day 2 of larval feeding (P>0.3 fordifferences between treatments on day 1, P<0.001 for day2, Fig. 6). These emissions had a particularly strongincrease on the 3rd day, and a 50% decrease by the 4th day.
On the 1st day after larval infestation, emissions of allinduced compounds were not significantly differentbetween the plants treated with different number of larvae(P=0.95 for total monoterpenes, and P=0.78 for (E,E)-α-farnesene). Only for LOX emissions, two larvae inducedlower emissions than either 4 or 8 larvae (P=0.008, Fig. 5).Emissions of monoterpenes decreased on day 2 for thetreatment with 2 larvae, but remained constant at the highlevel for plants with 4 and 8 larvae. By the 4th day,emissions of monoterpenes released by plants with 2, 4, and8 larvae differed considerably (P<0.01, least significantdifference of 0.071 nmol m−2 s−1).
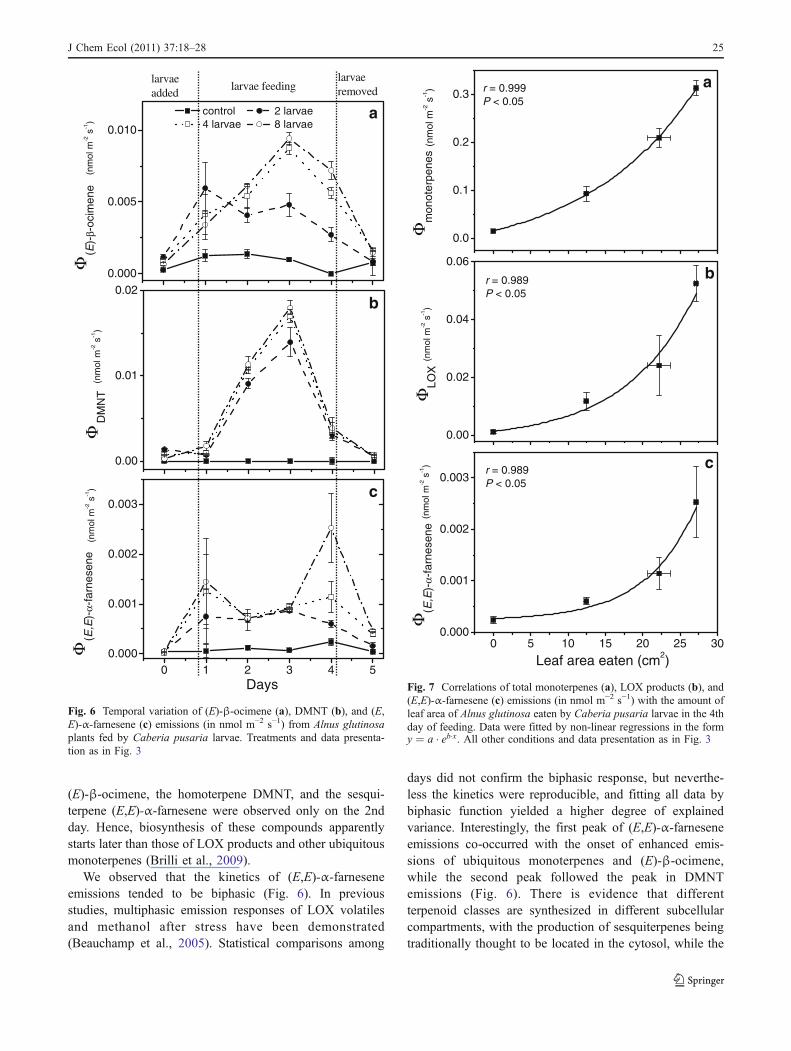
No significant difference in the release of (E)-β-ocimene and (E,E)-α-farnesene was observed among thetreatments with different numbers of larvae during thefirst 3 days of the experiment (P>0.1). However, by the4th day, emission rates of (E)-β-ocimene and (E,E)-α-farnesene differed significantly among plants with 2, 4,and 8 larvae (P<0.001). Feeding by different number oflarvae did not cause statistically different emissions ofDMNT (P>0.1).
0 5 10 15 20 25 302.0
2.5
3.0
3.5
4.0
% N
itrog
en
leaf area eaten (cm2)
r = 0.997P < 0.05
Fig. 2 Leaf nitrogen content (%) in relation to leaf area eaten (cm2)per Cabera pusaria larva when different numbers of larvae wereexposed to the foliage of Alnus glutinosa. Data show means ± SE ofall leaves of 3 independent replicates
Table 1 Effects of Cabera pusaria larvae on foliage of Alnus glutinosa: anatomical characteristics
Trait Average ± SE (N=10) F PControl 2 larvae 4 larvae 8 larvae
A. Leaf ultrastructure
cell wall thickness (μm) 0.22±0.02ª 0.24±0.02ab 0.32±0.02b 0.23±0.02a 4.2 0.012
chloroplast length (μm) 4.22±0.37ª 5.08±0.37ab 5.91±0.37bc 6.69±0.37c 8.3 <0.001
chloroplast thickness (μm) 1.29±0.22ª 2.43±0.22b 2.1±0.22ab 2.73±0.22b 8.0 <0.001
chloroplast distance fromcell wall (μm)
0.35±0.05b 0.17±0.05ab 0.24±0.05ab 0.14±0.05a 3.6 0.023
chloroplast area (μm2) 4.24±1.33ª 9.66±1.33b 9.79±1.33b 13.93±1.33b 8.9 <0.001
mitochondrion length (μm) 1.27±0.12ª 0.91±0.15ª 1.05±0.12ª 1.05±0.16ª 1.5 0.23
mitochondrion thickness (μm) 1.08±0.10b 0.67±0.12ab 0.64±0.10a 0.92±0.13ab 4.2 0.012
ratio of starch grain area tochloroplast area (%)
3.15±2.45ªb 0.06±2.74a 11.52±2.45b 9.60±2.45ab 4.4 0.010
Trait Average ± SE (N=6) F PControl 2 larvae 4 larvae 8 larvae
B. Whole leaf integrated traits
chloroplast surface area exposedto intercellular air space (Sc)
2.82±0.47a 3.16±0.51a 4.66±0.47a 4.56±0.51a 3.8 0.024
mesophyll surface area exposedto intercellular airspace (Sm)
4.47±0.66a 5.40±0.71a 6.68±0.66a 6.54±0.71a 2 0.095
Sc/Sm 0.63±0.04a 0.6±0.04a 0.69±0.04a 0.69±0.04a 1.45 0.254
starch grain area/chloroplast area 0.015±0.012ab 0.00073±0.013a 0.130±0.013c 0.0529±0.013b 19.8 <0.001
22 J Chem Ecol (2011) 37:18–28
We observed that the kinetics of (E,E)-α-farneseneemissions tended to be biphasic (Fig. 6). (E,E)-α-Farneseneemissions of plants with 8 larvae were not statisticallydifferent (P=0.4) between day 1 and 2, but between day 3and 4 emissions differed considerably (P<0.1). Thesebiphasic kinetics were reproduced in all replicates and withdifferent numbers of larvae. In addition, a biphasic model(cubic) fitted the data (r2=0.84) better than a monophasic(parabola) model (r2=0.59). On the 4th day, larvae wereremoved from plants, and by the 5th day, the emission of allcompounds decreased to the level close to the start of theexperiment (Fig. 6).
Quantitative Relationships between VOC Emission andDamage by Herbivory Emission of total monoterpenes,LOX products, and (E,E)-α-farnesene on day 4 werepositively correlated with the leaf area eaten by larvae(Fig. 7). The trends were exponential with good correlationcoefficients (r>0.98). However, the emission rates ofDMNT did not increase with an increase of the number oflarvae (r=0.57, P>0.1).
Discussion
Herbivory Effects on Leaf Structure, Chemistry, andPhotosynthetic Characteristics Foliage nitrogen contentdecreased with increase of damage (Fig. 2). As nitrogencontent of the major veins is less than that of the intercostalareas (Niinemets et al., 2007), reduction of whole leafnitrogen content may reflect the selective feeding ofintercostal N-rich mesophyll. It is also known that lowerleaf quality reduces the rate of larval growth and develop-ment (Tikkanen and Julkunen-Tiitto, 2003; Silla et al.,2008). Thus, lower leaf nitrogen content has beensuggested to be a direct defense strategy reducing insectherbivory (Cornelissen and Fernandes, 2001).
Previous studies have shown that plant photosyntheticresponses to biotic stresses such as herbivory or rust can rangefrom impairment, no net effect, to a stimulating effect (Paige,1999; Delaney, 2008; Delaney et al., 2008). In our study, therewas no net effect on photosynthetic rate per unit leaf area(Fig. 3). This is surprising, given the overall reduction of leafnitrogen content as the result of selective feeding ofphotosynthetically active N-rich tissues. Given this reduction,a constant net assimilation rate actually reveals compensatoryresponses in herbivore-damaged leaves relative to foliage of
0 1 2 3 4 510
15
20larvae feeding
larvae removed
control 4 larvae
Net
ass
imila
tion
rate
(μm
ol m
-2 s
-1)
Days
larvaeadded
a
0 1 2 3 4 50
20
40
60
80
larvae removedlarvae feeding
larvaeadded
Stom
atal conductance to
water vapour (m
mol m
-2 s-1)
Days
b
Fig. 3 Net assimilation rate (a) and stomatal conductance to watervapor (b) in seedlings of Alnus glutinosa without insects—control(filled square) and with four larvae of Cabera pusaria (white square).Measurements were conducted at a quantum flux density of200 μmol m−2 s−1, air temperature of 28°C, and at ambient CO2
concentrations of 380±20 μmol mol−1. Data are expressed per unitprojected leaf area. Each data point is the mean (±SE) of 4independent replicate experiments. At d -1, plants without insectswere measured, at d 0 insects were added, and after d 4 the insectswere removed
1 2 3 4 5 6 7 8 9 10 110.00
0.02
0.04
0.3
0.4
*
**
*
*
**
****
Compounds
VO
C e
mis
sion
(nm
ol m
-2 s
-1)
control 4 larvae
**
Fig. 4 Volatile organic compound (VOC) emissions fromherbivore-attacked (white bars) and control (black bars) Alnusglutinosa plants (means + SE) on the first day of insect feeding(treatment with 4 larvae). Asterisks above the compound numbersindicate significant differences in VOC emissions between controland larvae-infested sample for each compound (*: P>0.05; **: P>0.01). In other cases, VOC emissions were not significantly differentamong the treatments (ANOVA post-hoc test). Compounds: (1) 1-hexanol, (2) (E)-2-hexenal, (3) (Z)-3-hexenol, (4) (Z)-3-hexenylacetate, (5) 6-methyl-5-hepten-2-one, (6) limonene (7) α-pinene, (8)β-pinene, (9) (E)-β-ocimene, (10) DMNT, (11) (E,E)-α-farnesene
J Chem Ecol (2011) 37:18–28 23
the control plants. In our study, this compensatory responsewas associated with the overall increase in chloroplast size(Table 1A). Additionally, adherence of chloroplasts closer tothe cell wall surface can reduce the CO2 diffusion resistancefrom substomatal cavities to chloroplasts (Evans et al., 2009;Niinemets et al., 2009), thereby further compensating for thereduction of N-rich mesophyll.
It has been suggested that compensatory photosynthesisusually is found when herbivory alters the strength of thesource-sink relationships, thus increasing the relative orabsolute demand of sinks for carbohydrates (Delaney et al.,2008). In our study, we actually observed accumulation ofstarch in the herbivore-damaged plants (Table 1), suggest-ing that sink demands were reduced. Reduction of plantgrowth activity is common in feeding-damaged plants(Poveda et al., 2003) and can reflect the shift of metabolismtowards synthesis of protective high molecular masssecondary compounds such as tannins (Bernays et al., 1989;Dudt and Shure, 1994; Hattenschwiler and Schafellner,1999) in agreement with the largely discredited carbon/nutrient balance hypothesis (Reichardt et al., 1991). Al-though no changes in net assimilation rates were observed,these data collectively suggest that herbivory-driven mod-ifications in leaf ultrastructure and in sink-source balanceoccurred during the experiment.
Elicitation of LOX Products When C. pusaria larvaedamaged leaves of A. glutinosa, the production of lip-oxygenase (LOX) pathway compounds was the first signalof the induction of a plant stress response, alreadyachieving the maximum emission rate on the first day offeeding. This result is consistent with the observations thatoxidative stress and electrolyte leakage are induced byinsect damage (Bruinsma et al., 2010). Emissions werepresent throughout the feeding treatment, reflecting contin-uous damage of foliage during feeding, while emissionsdecreased drastically after larvae were removed and thestress was relieved (Figs. 4 and 5a).
Previously, LOX products emission has been shown toscale with the severity of water (Capitani et al., 2009) and
ozone (Beauchamp et al., 2005) stresses. Here, we foundstrong correlation of maximum LOX emission rates withthe number of feeding larvae and with the amount of leafarea eaten (Fig. 7b), providing evidence that quantitativestress dose (number of larvae feeding) vs. stress responserelationships can also be determined for biotic stresses.
Induction of Ubiquitous Terpenoid Emissions Leaves of A.glutinosa do not accumulate terpenes (monoterpenes,sesquiterpenes, or terpenoid derivatives), and do not emitany of these compounds under non-stressed conditions(Isebrands et al., 1999; Lindfors et al., 2000). In controlplants analyzed in our study, terpenoid emissions were verylow, close to the detection limit, further confirming that A.glutinosa is no constitutive terpene emitter.
The feeding by C. pusaria caterpillars resulted ininduced emissions of ubiquitous monoterpenoids on thefirst day (Fig. 5b). The emissions peaked at days 2 andremained high in the following days of feeding. Analo-gously, increases in ubiquitous terpene emissions within thefirst 2 h of feeding and greater emission following the nightperiod have been observed in a field experiment withhybrid aspen during feeding by larvae of the winter autumnmoth Epirrita autumnata (Schaub et al., 2010). Continuousincrease of ubiquitous emissions was observed until day 3for experiments with more than 4 larvae per plant (Fig. 4b).In a similar manner, in herbivory experiments withChrysomela populi leaf beetles, the rate of monoterpeneemission from poplar leaves increased for the first 4 days offeeding (Brilli et al., 2009). However, emission ratesalready were strongly reduced by day 1 in our study inthe treatment with fewer larvae (Fig. 5b). Overall, strongpositive correlations were found between the rate ofubiquitous monoterpene emissions and the number offeeding larvae and the amount of leaf area eaten, againdemonstrating a quantitative stress dose vs. plant response.
Induction of Stress-Specific Terpenes While emissions ofLOX and ubiquitous monoterpenes were detected 1 dayafter larval feeding started, emissions of the monoterpene
0 1 2 3 4 5
0.00
0.05
0.10
(nm
ol m
-2 s
-1)
control 2 larvae 4 larvae 8 larvae
larvaeadded
days
larvaeremoved
larvae feeding
LΦ
OX
a
0 1 2 3 4 50.0
0.2
0.4
0.6
(nmol m
-2 s-1)
larvaeadded
days
larvaeremoved
larvae feedingm
onoterpene
b ΦFig. 5 Emission time-courses(in nmol m−2 s−1) of total LOXproducts (a) and monoterpenes(b) in the case of healthy leavesand in leaves fed by differentnumbers of larvae of Caberiapusaria. Treatments and datapresentation as in Fig. 3
24 J Chem Ecol (2011) 37:18–28
(E)-β-ocimene, the homoterpene DMNT, and the sesqui-terpene (E,E)-α-farnesene were observed only on the 2ndday. Hence, biosynthesis of these compounds apparentlystarts later than those of LOX products and other ubiquitousmonoterpenes (Brilli et al., 2009).
We observed that the kinetics of (E,E)-α-farneseneemissions tended to be biphasic (Fig. 6). In previousstudies, multiphasic emission responses of LOX volatilesand methanol after stress have been demonstrated(Beauchamp et al., 2005). Statistical comparisons among
days did not confirm the biphasic response, but neverthe-less the kinetics were reproducible, and fitting all data bybiphasic function yielded a higher degree of explainedvariance. Interestingly, the first peak of (E,E)-α-farneseneemissions co-occurred with the onset of enhanced emis-sions of ubiquitous monoterpenes and (E)-β-ocimene,while the second peak followed the peak in DMNTemissions (Fig. 6). There is evidence that differentterpenoid classes are synthesized in different subcellularcompartments, with the production of sesquiterpenes beingtraditionally thought to be located in the cytosol, while the
0.0
0.1
0.2
0.3
(nm
ol m
-2 s
-1)
Φm
onot
erpe
nes
r = 0.999P < 0.05
a
0.00
0.02
0.04
0.06
(nm
ol m
-2 s
-1)
ΦLO
X
r = 0.989P < 0.05
b
0 5 10 15 20 25 300.000
0.001
0.002
0.003
(nm
ol m
-2 s
-1)
Φ(E
,E)-
α-fa
rnes
ene
Leaf area eaten (cm2)
r = 0.989P < 0.05
c
Fig. 7 Correlations of total monoterpenes (a), LOX products (b), and(E,E)-α-farnesene (c) emissions (in nmol m−2 s−1) with the amount ofleaf area of Alnus glutinosa eaten by Caberia pusaria larvae in the 4thday of feeding. Data were fitted by non-linear regressions in the formy ¼ a � eb�x. All other conditions and data presentation as in Fig. 3
0.000
0.005
0.010
(nm
ol m
-2 s
-1)
control 2 larvae 4 larvae 8 larvae
larvaeadded
larvaeremovedlarvae feeding
Φ(E
)-β-
ocim
ene
a
0.00
0.01
0.02
(nm
ol m
-2 s
-1)
ΦD
MN
T
b
0 1 2 3 4 50.000
0.001
0.002
0.003
(nm
ol m
-2 s
-1)
Φ(E
,E)-
α-fa
rnes
ene
Days
c
Fig. 6 Temporal variation of (E)-β-ocimene (a), DMNT (b), and (E,E)-α-farnesene (c) emissions (in nmol m−2 s−1) from Alnus glutinosaplants fed by Caberia pusaria larvae. Treatments and data presenta-tion as in Fig. 3
J Chem Ecol (2011) 37:18–28 25
production of monoterpenoids is confined to the plastids(Nagegowda, 2010). Furthermore, enzymes of the mevalo-nate (MVA) pathway are present in the cytosol, whiletypically the genes coding for enzymes of the mevalonatepathway are presented in the chloroplast and in themitochondrial compartments (Lee and Chappell, 2008).This suggests different pathways for synthesis of (E,E)-α-farnesene and (E)-β-ocimene. Nevertheless, there arenumerous examples of coordination of expression ofnuclear and chloroplastic genes during biotic stress (e.g., DeConinck et al., 2010). Furthermore, there is now conclusiveevidence of plastidial synthesis of sesquiterpenes as well(Sallaud et al., 2009). Thus, it is tempting to speculate thatthe first peak of (E,E)-α-farnesene emission coinciding with(E)-β-ocimene emission reflects activation of chloroplasticsesquiterpene synthesis, while the second peak coincidingwith DMNT reflects activation of the cytosolic pathway.
Previous studies demonstrate that (E)-β-ocimenesynthase is induced by insect herbivory in Medicagotruncatula leaves (Navia-Gine et al., 2009), and thatinduction of expression of terpene and sesquiterpenesynthases genes are involved in the overall defenseresponse in Oryza sativa plants (Yuan et al., 2008).Elicitation of defense isoprenoid emissions can furtherelicit defense genes in undamaged lima bean leaves(Arimura et al., 2000), and biosynthesis of differentβ-ocimene isomers are almost exclusively fuelled by therecently assimilated photosynthetic carbon according tothe plastidial 2-C-methyl-D-erythritol 4-P (MEP) pathway(Arimura et al., 2008). On the other hand, in bean plants,the emission of induced (E)-β-ocimene was reduced whenthe whiteflies Bemisia tabaci attacked spider mite-infestedplants (Zhang et al., 2009). Although our data cannot beused to resolve the cause/effect relationships in thesequence of various terpenoids emitted, we suggest thatthe secondary peak in (E,E)-α-farnesene emissions isassociated with systemic induction of DMNT in undamagedleaves of an herbivore-infested plant.
After larvae were removed, emission of (E,E)-α-farne-sene and (E)-β-ocimene rapidly decreased until reachingthe level of non-stressed plants (Fig. 6). Previous studieshave demonstrated that specific elicitors in the regurgitantof the caterpillar enhance the amount of several releasedvolatiles (Halitschke et al., 2000; Rose and Tumlinson,2005), Thus, reductions in volatile emissions after feedingand removal of larvae can reflect the lack of these elicitors.However, the emissions of DMNT started to decreasealready during insect feeding, suggesting a differentmechanism of induction. Different mechanisms of actionare consistent with previous experiments employing variouselicitors. Bartram et al. (2006) demonstrated that insectfeeding resulted in induction of volatile release predomi-nantly via activation of the MVA pathway, while exposure
to fungal elicitor alamethicin stimulated the production ofDMNT mainly via the MEP pathway.
As with ubiquitous terpenes, the emission rates of (E)-β-ocimene and (E,E)-α-farnesene were quantitatively relatedto the strength of biotic stress (Fig. 7). However, no suchpattern was visible in the case of DMNT. We suggest thatthe quantitaties of (E)-β-ocimene and (E,E)-α-farnesenecan be important for attraction of natural enemies of theherbivores, as the attraction effect of certain compoundsmay depend on their relative amounts compared to othervolatiles (Beyaert et al., 2010).
In summary, these data provide evidence that biotic stresseffects on plant VOC emissions are quantitative forubiquitous monoterpenes, (E)-β-ocimene, and (E,E)-α-farnesene. To our knowledge, this quantitative relationshipbetween plant VOC emission and extent of plant damageby herbivory has not been shown in deciduous trees. Incontrast to the other compounds, DMNT emissions werenot quantitatively related to the extent of herbivory stress.Thus, we hypothesize that DMNT can serve as a qualitativesignal for predators and parasitoids that conveys theinformation “presence of herbivores”, while the emissionof mono- and sesquiterpenes or their amounts relative toother volatiles provides information about the abundance ofthe herbivores. Parasitoid and predator attraction experi-ments are needed to test this hypothesis.
Acknowledgements We thank Prof. Jarmo Holopainen, Universityof Eastern Finland, Kuopio, Finland, for the 4,8-dimethyl-nona-1,3,7-triene (DMNT) standard. The Estonian Ministry of Science andEducation (grants SF1090065s07 and SF0180122S08), the EstonianScience Foundation (post-doctoral grants JD101, MJD14 and grant7645) and the European Commission through the European RegionalDevelopment Fund (Center of Excellence FIBIR) provided financialsupport for this research.
References
ARIMURA, G., OZAWA, R., SHIMODA, T., NISHIOKA, T., BOLAND, W.,and TAKABAYASHI, J. 2000. Herbivory-induced volatiles elicitdefence genes in lima bean leaves. Nature 406:512–515.
ARIMURA, G., KOST, C., and BOLAND, W. 2005. Herbivore-induced,indirect plant defences. BBA-Mol. Cell Biol. L. 1734:91–111.
ARIMURA, G., KOPKE, S., KUNERT, M., VOLPE, V., DAVID, A., BRAND,
P., DABROWSKA, P., MAFFEI, M. E., and BOLAND, W. 2008.Effects of feeding Spodoptera littoralis on lima bean leaves: IV.Diurnal and nocturnal damage differentially initiate plant volatileemission. Plant Physiol. 146:965–973.
ARNETH, A. and NIINEMETS, Ü. 2010. Induced BVOCs: how to bugour models? Trends Plant Sci. 15:118–125.
BARTRAM, S., JUX, A., GLEIXNER, G., and BOLAND, W. 2006.Dynamic pathway allocation in early terpenoid biosynthesis ofstress-induced lima bean leaves. Phytochemistry 67:1661–1672.
BEAUCHAMP, J., WISTHALER, A., HANSEL, A., KLEIST, E., MIEBACH,
M., NIINEMETS, Ü., SCHURR, U., and WILDT, J. 2005. Ozoneinduced emissions of biogenic VOC from tobacco: relations
26 J Chem Ecol (2011) 37:18–28
between ozone uptake and emission of LOX products. Plant CellEnviron. 28:1334–1343.
BERNAYS, E. A., DRIVER, G. C., and BILGENER, M. 1989. Herbivoresand plant tannins. Adv. Ecol. Res. 19:263–302.
BEYAERT, I., WÄSCHKE, N, SCHOLZ, A., VARAMA, M., REINECKE, A.,and HILKER, M. 2010. Relevance of resource-indicating keyvolatiles and habitat odour for insect orientation. Anim. Behav.79:1077–1086.
BLANDE, J. D., KORJUS, M., and HOLOPAINEN, J. K. 2010. Foliarmethyl salicylate emissions indicate prolonged aphid infestationon silver birch and black alder. Tree Physiol. 30:404–416.
BOZZOLA, J. J. and RUSSELL, L. D. 1992. Electron Microscopy.Principles and Techniques for Biologists: Jones and Bartlett Eds.
BRILLI, F., CICCIOLI, P., FRATTONI, M., PRESTININZI, M., SPANEDDA,A. F., and LORETO, F. 2009. Constitutive and herbivore-inducedmonoterpenes emitted by Populus x euroamericana leaves arekey volatiles that orient Chrysomela populi beetles. Plant CellEnviron. 32:542–552.
BRUINSMA, M., PANG, B. P., MUMM, R., VAN LOON, J. J. A., andDICKE M. 2009. Comparing induction at an early and late step insignal transduction mediating indirect defence in Brassicaoleracea. J. Exp. Bot. 60:2589–2599.
BRUINSMA, M., VAN BROEKHOVEN, S., POELMAN, E. H., POSTHUMUS,
M. A., MULLER, M. J., VAN LOON, J. J. A., and DICKE, M. 2010.Inhibition of lipoxygenase affects induction of both direct andindirect plant defences against herbivorous insects. Oecologia162:393–404.
BURNS, W. A. 1978. Thick sections: Technique and applications, in B.F. Trump and R. J. Jones (eds.). Diagnostic Electron Microscopy.Wiley, New York.
CAPITANI, D., BRILLI, F., MANNINA, L., PROIETTI, N., and LORETO, F.2009. In situ investigation of leaf water status by portableunilateral Nuclear Magnetic Resonance. Plant Physiol. 149(4):1638–1647.
CHEN, L., and FADAMIRO, H. Y. 2007. Differential electroantennogramresponse of females and males of two parasitoid species to host-related green leaf volatiles and inducible compounds. Bull.Entomol. Res. 97:515–522.
COPOLOVICI, L., and NIINEMETS, Ü. 2010. Flooding induced emis-sions of volatile signalling compounds in three tree species withdiffering waterlogging tolerance. Plant Cell Environ. 33:1582–1594.
COPOLOVICI, L., KÄNNASTE, A., and NIINEMETS, Ü. 2009. Gaschromatography-mass spectrometry method for determination ofmonoterpene and sesquiterpene emissions from stressed plants.Stud. Univ. Babes-Bol. Chem. 54:329–334.
CORNELISSEN, T. G., and FERNANDES, G. W. 2001. Induced defencesin the neotropical tree Bauhinia brevipes (Vog.) to herbivory:effects of damage-induced changes on leaf quality and insectattack. Trees-Struct. Funct. 15:236–241.
DE BOER, J. G., and DICKE, M. 2004. The role of methyl salicylate inprey searching behavior of the predatory mite Phytoseiuluspersimilis. J. Chem. Ecol. 30:255–271.
DE BOER, J. G., POSTHUMUS, M. A., and DICKE, M. 2004.Identification of volatiles that are used in discrimination betweenplants infested with prey or nonprey herbivores by a predatorymite. J. Chem. Ecol. 30:2215–2230.
DE CONINCK, B. M. A., SELS, J., VENMANS, E., THYS, W., GODERIS, I.,CARRON, D., DELAURE, S. L., CAMMUE, B. P. A., DE BOLLE, M.F. C., and MATHYS, J. 2010. Arabidopsis thaliana plant defensinAtPDF1.1 is involved in the plant response to biotic stress. NewPhytol. 187:1075–1088.
DELANEY, K. J. 2008. Injured and uninjured leaf photosyntheticresponses after mechanical injury on Nerium oleander leaves,and Danaus plexippus herbivory on Asclepias curassavicaleaves. Plant Ecol. 199:187–200.
DELANEY, K. J., HAILE, F. J., PETERSON, R. K. D., and HIGLEY, L. G.2008. Impairment of leaf photosynthesis after insect herbivory ormechanical injury on common milkweed, Asclepias syriaca.Environ. Entomol. 37:1332–1343.
DICKE, M. 2009. Behavioural and community ecology of plants thatcry for help. Plant Cell Environ. 32:654–665.
DICKE, M., GOLS, R., LUDEKING, D., and POSTHUMUS, M. A. 1999.Jasmonic acid and herbivory differentially induce carnivore-attracting plant volatiles in lima bean plants. J. Chem. Ecol.25:1907–1922.
DOLCH, R. and TSCHARNTKE, T. 2000. Defoliation of alders (Alnusglutinosa) affects herbivory by leaf beetles on undamagedneighbours. Oecologia 125:504–511.
DUDAREVA, N., NEGRE, F., NAGEGOWDA, D. A., and ORLOVA, I. 2006.Plant volatiles: Recent advances and future perspectives. Crit.Rev. Plant Sci. 25:417–440.
DUDT, J. F., and SHURE, D. J. 1994. The influence of light andnutrients on foliar phenolics and insect herbivory. Ecology75:86–98.
EVANS, J. R., VONCAEMMERER, S., SETCHELL, B. A., and HUDSON, G.S. 1994. The relationship between CO2 transfer conductance andleaf anatomy in transgenic tobacco with a reduced content ofRubisco. Aust. J. Plant Physiol. 21:475–495.
EVANS, J. R., KALDENHOFF, R., and TERASHIMA, I. 2009. Resistancesalong the CO2 diffusion pathway inside leaves. J. Exp. Bot.60:2235–2248.
GERSHENZON, J., and DUDAREVA, N. 2007. The function of terpenenatural products in the natural world. Nat. Chem. Biol. 3:408–414.
GIERTYCH, M. J., KAROLEWSKI, P., ZYTKOWIAK, R., and OLEKSYN, J.2006. Differences in defence strategies against herbivoresbetween two pioneer tree species: Alnus glutinosa (L.) Gaertn.and Betula pendula Roth. Pol. J. Ecol. 54:181–187.
GOSSET, V., HARMEL, N., GOBEL, C., FRANCIS, F., HAUBRUGE, E.,WATHELET, J. P., DU JARDIN, P., FEUSSNER, I., and FAUCONNIER,M. L. 2009. Attacks by a piercing-sucking insect (Myzuspersicae Sultzer) or a chewing insect (Leptinotarsa decemlineataSay) on potato plants (Solanum tuberosum L.) induce differentialchanges in volatile compound release and oxylipin synthesis. J.Exp. Bot. 60:1231–1240.
GOUINGUENE, S., ALBORN, H., and TURLINGS, T. C. J. 2003. Inductionof volatile emissions in maize by different larval instars ofSpodoptera littoralis. J. Chem. Ecol. 29:145–162.
HALITSCHKE, R., KESSLER, A., KAHL, J., LORENZ, A., and BALDWIN,
I. T. 2000. Ecophysiological comparison of direct and indirectdefenses in Nicotiana attenuata. Oecologia 124:408–417.
HATTENSCHWILER, S., and SCHAFELLNER, C. 1999. Opposing effectsof elevated CO2 and N deposition on Lymantria monacha larvaefeeding on spruce trees. Oecologia 118:210–217.
HEIDEN, A. C., KOBEL, K., LANGEBARTELS, C., SCHUH-THOMAS, G.,and WILDT, J. 2003. Emissions of oxygenated volatile organiccompounds from plants. Part I: Emissions from lipoxygenaseactivity. J. Atmos. Chem. 45:143–172.
HOLOPAINEN, J. K. 2004. Multiple functions of inducible plantvolatiles. Trends Plant Sci. 9:529–533.
ISEBRANDS, J. G., GUENTHER, A. B., HARLEY, P., HELMIG, D.,KLINGER, L., VIERLING, L., ZIMMERMAN, P., and GERON, C.1999. Volatile organic compound emission rates from mixeddeciduous and coniferous forests in Northern Wisconsin, USA.Atmos. Environ. 33:2527–2536.
KÄNNASTE, A., VONGVANICH, N., and BORG-KARLSON, A. K. 2008.Infestation by a Nalepella species induces emissions of α- and β-farnesenes, (-)-linalool and aromatic compounds in Norwayspruce clones of different susceptibility to the large pine weevil.Arthropod-Plant Interactions 2:31–41.
KÄNNASTE, A., NORDENHEM, H., NORDLANDER, G., and BORG-KARLSON, A. K. 2009. Volatiles from a mite-infested spruce
J Chem Ecol (2011) 37:18–28 27
clone and their effects on pine weevil behavior. J. Chem. Ecol.35:1262–1271.
LEE, S., and CHAPPELL, J. 2008. Biochemical and genomic character-ization of terpene synthases in Magnolia grandiflora. PlantPhysiol. 147:1017–1033.
Li-Cor Inc. 2001. Interfacing Custom Chambers to the LI-6400 SensorHead. LI-6400 Portable Photosynthesis System: ApplicationNote 3. Li-Cor Inc., Lincoln, 7 p.
LINDFORS, V., LAURILA, T., HAKOLA, H., STEINBRECHER, R., andRINNE, J. 2000. Modeling speciated terpenoid emissions from theEuropean boreal forest. Atmos. Environ. 34:4983–4996.
MARQUIS, R. J., and WHELAN, C. J. 1994. Insectivorous birds increasegrowth of white oak through consumption of leaf-chewinginsects. Ecology 75:2007–2014.
MARTEL, J., and MAUFFETTE, Y. 1997. Lepidopteran Communities inTemperate Deciduous Forests Affected by Forest Decline. Den-mark Blackwell, Oxford.
MERCER, E. H. 1963. A scheme for section staining in electronmicroscopy. J. Royal Micro. Soc. 81:179.
MUMM, R., SCHRANK, K., WEGENER, R., SCHULZ, S., and HILKER, M.2003. Chemical analysis of volatiles emitted by Pinus sylvestrisafter induction by insect oviposition. J. Chem. Ecol. 29:1235–1252.
NAGEGOWDA, D. A. 2010. Plant volatile terpenoid metabolism:biosynthetic genes, transcriptional regulation and subcellularcompartmentation. FEBS Lett. 584:2965–2973.
NAVIA-GINE, W. G., YUAN, J. S., MAUROMOUSTAKOS, A., MURPHY, J.B., CHEN, F., and KORTH, K. L. 2009. Medicago truncatula(E)-β-ocimene synthase is induced by insect herbivory withcorresponding increases in emission of volatile ocimene. PlantPhysiol. Bioch. 47:416–425.
NIINEMETS, Ü. 2010. Mild versus severe stress and BVOCs: thresh-olds, priming and consequences. Trends Plant Sci. 15:145–153.
NIINEMETS, Ü. 2011. Whole plant photosynthesis. in J. Flexas, F.Loreto and H. Medrano (eds.). Terrestrial Photosynthesis in aChanging Environment. The Molecular, Physiological andEcological Bases of Photosynthesis Driving its Response to theEnvironmental Changes. Cambridge University Press, CambridgeIn press.
NIINEMETS, Ü., PORTSMUTH, A., TENA, D., TOBIAS, M., andVALLADARES, F. 2007. Do we underestimate the importance ofleaf size in plant economics? Disproportionate scaling of supportcosts within the spectrum of leaf physiognomy. Ann. Bot.100:283–303.
NIINEMETS, Ü., DÍAZ-ESPEJO, A., FLEXAS, J., GALMÉS, J., andWARREN, C. R. 2009. Role of mesophyll diffusion conductancein constraining potential photosynthetic productivity in the field.J. Exp. Bot. 60:2249–2270.
PAIGE, K. N. 1999. Regrowth following ungulate herbivory inIpomopsis aggregata: geographic evidence for overcompensa-tion. Oecologia 118(3):316–323.
PINTO, D. M., BLANDE, J. D., NYKÄNEN, R., DONG, W. X., NERG, A.M., and HOLOPAINEN, J. K. 2007. Ozone degrades commonherbivore-induced plant volatiles: does this affect herbivore preylocation by predators and parasitoids? J. Chem. Ecol. 33:683–694
POELMAN, E. H., VAN LOON, J. J. A., and DICKE, M. 2008.Consequences of variation in plant defense for biodiversity athigher trophic levels. Trends Plant Sci.13: 534–541.
POVEDA, K., STEFFAN-DEWENTER, I., SCHEU, S., and TSCHARNTKE, T.2003. Effects of below- and above-ground herbivores on plantgrowth, flower visitation and seed set. Oecologia 135:601–605.
RASULOV, B., COPOLOVICI, L., LAISK, A., and NIINEMETS, Ü. 2009.Postillumination isoprene emission: in vivo measurements ofdimethylallyldiphosphate pool size and isoprene synthase kinet-ics in aspen leaves. Plant Physiol. 149:1609–1618.
REICHARDT, F. B., CHAPIN, F. S., III, BRYANT, J. P., MATTES, B. R.,and CLAUSEN, T. P. 1991. Carbon/nutrient balance as a predictorof plant defense in Alaskan balsam poplar: potential importanceof metabolite turnover. Oecologia 88:401–406.
ROSE, U. S. R., and TUMLINSON, J. H. 2005. Systemic induction ofvolatile release in cotton: How specific is the signal to herbivory?Planta 222:327–335.
SALLAUD, C., RONTEIN, D., ONILLON, S., JABES, F., DUFFE, P.,GIACALONE, C., THORAVAL, S., ESCOFFIER, C., HERBETTE, G.,LEONHARDT, N., CAUSSE, M., and TISSIER, A. 2009. A novelpathway for sesquiterpene biosynthesis from Z,Z-farnesyl pyro-phosphate in the wild tomato Solanum habrochaites. Plant Cell21:301–317.
SCHAUB, A., BLANDE, J. D., GRAUS, M., OKSANEN, E., HOLOPAINEN,
J. K., and HANSEL, A. 2010. Real-time monitoring of herbivoreinduced volatile emissions in the field. Physiol. Plantarum138:123–133.
SCHUMAN, M. C., HEINZEL, N., GAQUEREL, E., SVATOS, A., andBALDWIN, I. T. 2009. Polymorphism in jasmonate signalingpartially accounts for the variety of volatiles produced byNicotiana attenuata plants in a native population. New Phytol.183:1134–1148.
SILLA, F., FLEURY, M., MEDIAVILLA, S., and ESCUDERO, A. 2008.Effects of simulated herbivory on photosynthesis and Nresorption efficiency in Quercus pyrenaica Willd. saplings.Trees-Struct. Funct. 22:785–793.
TIKKANEN, O. P., and JULKUNEN-TIITTO, R. 2003. Phenologicalvariation as protection against defoliating insects: the case ofQuercus robur and Operophtera brumata. Oecologia 136:244–251.
TOOME, M., RANDJÄRV, P., COPOLOVICI, L., NIINEMETS, Ü., HEINSOO,
K., LUIK, A., and NOE, SM. 2010. Leaf rust induced volatileorganic compounds signalling in willow during the infection.Planta 232:235–243.
TSCHARNTKE, T., THIESSEN, S., DOLCH, R., and BOLAND, W. 2001.Herbivory, induced resistance, and interplant signal transfer inAlnus glutinosa. Biochem. Syst. Ecol. 29:1025–1047.
VAN ASCH, M., and VISSER, M. E. 2007. Phenology of forestcaterpillars and their host trees: the importance of synchrony.Annu. Rev. Entomol. 52:37–55.
VON CAEMMERER, S., and FARQUHAR, G. D. 1981. Some relationshipsbetween the biochemistry of photosynthesis and the gasexchange of leaves. Planta 153:376–387.
WESOLOWSKI, T., and ROWINSKI, P. 2006. Tree defoliation by wintermoth Operophtera brumata L. during an outbreak affected bystructure of forest landscape. Forest Ecol. Manag. 221:299–305.
WU, J. Q., and BALDWIN, I. T. 2009. Herbivory-induced signalling inplants: perception and action. Plant Cell Environ. 32:1161–1174.
YUAN, J. S., KOLLNER, T. G., WIGGINS, G., GRANT, J., DEGENHARDT,
J., and CHEN, F. 2008. Molecular and genomic basis of volatile-mediated indirect defense against insects in rice. Plant J. 55:491–503.
ZHANG, P. J., ZHENG, S. J., VAN LOON, J. J. A., BOLAND, W., DAVID,
A., MUMM, R., and DICKE, M. 2009. Whiteflies interfere withindirect plant defense against spider mites in Lima bean. Proc.Natl. Acad. Sci. U. S. A. 106:21202–21207.
28 J Chem Ecol (2011) 37:18–28


