Embed Size (px)
Citation preview
1
Volatile Organic Compounds over Eastern Himalaya, India: 1
Temporal Variation and Source Characterization using Positive 2
Matrix Factorization 3
4 5
C. Sarkar1, A. Chatterjee1,2,4, D. Majumdar3, S. K. Ghosh4, A. Srivastava3 and S. 6 Raha2,4 7
8 1Environmental Science Section, Bose Institute, P 1/12 CIT Scheme VII-M, Kolkata-700054, 9 India 10 2National Facility on Astroparticle Physics and Space Science, Bose institute, 16, A.J.C. Bose 11 Road, Darjeeling-734101, India 12 3National Environmental Engineering Research Institute, I-8 Sector-C, EKDP, Kolkata-13 700107, India 14 4Center for Astroparticle Physics and Space Science, Block-EN, Sector-V, Salt Lake, 15 Kolkata-700091, India 16 5National Environmental Engineering Research Institute, Delhi, India 17 18 Correspondence to: A. Chatterjee ([email protected]) 19 20 21 22 23 24 25 26 27 28 29 30 31 32 33 34 35 36 37 38 39 40 41 42 43 44 45 46 47 48
2
Abstract 49
A first ever study on the characterization of Volatile Organic Compounds (VOCs) has 50
been made over a Himalayan high altitude station in India. A total of 18 VOCs consisting of 51
mono aromatics-BTEX (Benzene, Toluene, Ethylbenzene, Xylene), non-BTEX substituted 52
aromatics and halocarbon have been measured over Darjeeling (27.01 ºN, 88.15 ºE, 2200 m 53
asl) in the eastern Himalaya in India during the period of July, 2011 – June, 2012. The annual 54
average concentration of the sum of 18 target VOCs (TVOC) was 376.3 ± 857.2 µg m-3. 55
Monoaromatics had the highest contribution (72 %) followed by other substituted aromatics 56
(22 %) and halocarbon (6 %) compounds. Toluene was the most abundant VOC in the 57
atmosphere of Darjeeling with the contribution of ~ 37 % to TVOC followed by benzene (~ 58
21 %), ethylbenzene (~ 9 %) and xylenes (~ 6 %). TVOC concentrations were highest during 59
the postmonsoon season with minimum solar radiation and lowest during the premonsoon 60
season with maximum solar radiation. Anthropogenic activities related mainly to tourists like 61
diesel and gasoline emissions, biomass and coal burning and solid waste emissions were 62
almost equal in both the seasons. Seasonal variation in TVOCs over Darjeeling was mainly 63
governed by the incoming solar radiation rather than the emission sources. Source 64
apportionment study using Positive Matrix Factorization (PMF) model indicated that major 65
fraction of (~60 %) TVOC were contributed by diesel and gasoline exhausts followed by 66
solvent evaporation (18 %) and other sources. Of the measured compounds, diesel exhaust 67
was also found to have the maximum potential in tropospheric ozone formation. The 68
atmospheric loading of BTEX over Darjeeling was found to be comparable with several 69
Indian metro cities and much higher than other cities around the world. 70
71 72 73 74 75 76 77 78 79 80 81 82 83 84 85 86
3
1 Introduction 87
The studies on Volatile Organic Compounds (VOCs) have gained much attention because of 88
their ability in modifying oxidizing capacity of the atmosphere as well as health implications 89
to humans. VOCs play an important role in the formation of photochemical smog and 90
tropospheric ozone by reacting with hydroxyl radicals (OH) in the presence of NOx 91
(Atkinson, 2000). Some of the VOCs also have the potential towards stratospheric ozone 92
depletion and enhancement of the global greenhouse effect (Prather and Watson, 1990). 93
VOCs comprise a wide range of compounds including aliphatic and aromatic hydrocarbons, 94
alcohols, aldehydes, ketones, esters, and halogenated compounds. Many VOCs react with 95
hydroxyl radicals (OH) and/or nitrate (NO3) radicals to form secondary organic aerosol 96
(SOA) by nucleation and condensation with a significant aerosol yield and thus they 97
influence gas phase pollutants directly and particle-phase pollutants indirectly (Brocco et al., 98
1997; Odum et al., 1997). 99
There is as such no general source for VOCs as there are numerous compounds in this group, 100
which can be emitted from very different sources (Yurdakul et al., 2013). In addition to the 101
biogenic sources of VOCs (Williams and Koppmann., 2007), some well documented 102
anthropogenic sources are gasoline powered and diesel powered motor vehicles (Demir et al., 103
2011), fuel storage (Lanz et al., 2008), biomass burning (Yokelson et al., 2008), natural gas 104
(Latella et al., 2005), LPG (Lai et al., 2005), industrial processes and solvents (Lanz et al., 105
2008) etc. 106
High levels of VOCs have been observed in Asian countries where significant fractions of 107
VOCs have been considered to be originating from vehicular emissions (Srivastava et al., 108
2005). Among the Asian countries, India is the second largest contributor to the emission of 109
non-methane VOCs (Kurokawa et al., 2013). In spite of growing population and associated 110
increase in vehicular and industrial activities, the studies on VOCs in India are limited. Some 111
of those important studies have been conducted in the recent past mostly in metro cities such 112
as in Delhi, the capital city of India (Hoque et al., 2008; Khillare et al., 2008; Srivastava., 113
2005; Srivastava et al., 2005a, 2005b, 2005c; Gurjar et al., 2004; Padhay and Varshney, 114
2000), in Mumbai, a metro city and financial capital of India situated in western India 115
(Srivastava and Som, 2007; Srivastava et al., 2006a and 2006b; Srivastava., 2004; Srivastava 116
et al., 2004), in Kolkata, a metro city in eastern India (Dutta et al., 2009; Mujumdar et al., 117
2008; Som et al., 2007; Mukherjee et al., 2003), in Hyderabad, a metro city in southern India 118
4
(Rekhadevi et al., 2010), in Agra in northern India, (Singla et al., 2012), in Firozabad in 119
northern India (Chaudhury and Kumar, 2012), in Mohali, a suburban site in north-western 120
India (Sinha et al., 2014; Sarkar et al., 2013) etc. In India there is no legislation of VOC as a 121
whole except national ambient air quality standard for Benzene by Central Pollution Control 122
Board of India. Globally US Occupational Safety and Health Administration (OSHA) and 123
World Health Organization (WHO) have proposed some guidelines and recommendations for 124
VOCs and not compulsory for governments to follow (Han and Naeher, 2006). 125
Where almost all the studies were conducted over several cities in India, no such study on 126
VOCs have been ever made over high altitude stations over Indian Himalaya with both 127
ecological and climatic importance. Mayewski et al., (1979) studied the fluctuations of 128
Himalayan and Trans-Himalayan glaciers including Kanchenjunga at eastern Himalaya and 129
reported that the volume and extent of these glaciers have been decreasing since 1850 which 130
could be due to the increase in the loading of atmospheric carbonaceous pollutants. Air 131
quality over Himalaya is deteriorating due to increased man-made activities to meet the 132
demands related to urbanization and economic development (Momin et al., 1999; Meena et 133
al., 2012). High altitude Himalayan hill stations especially over eastern part in India which 134
earlier were considered as the pollution-free regions have now become the source of huge 135
amount of hazardous air pollutants due to the increase in various tourism-related 136
anthropogenic activities like fossil fuel and biomass burning etc (Adak et al., 2014). 137
The present study on the characterization of VOCs has been made over a high altitude (2200 138
m asl) hill station, Darjeeling (27.010N, 88.150E) at eastern Himalaya and the first ever study 139
conducted over Indian Himalaya to the best of our knowledge. Our earlier studies (Chatterjee 140
et al, 2010, 2012; Adak et al, 2014; Sarkar et al 2014) over the same region showed high 141
aerosol loading during premonsoon (March-May) due to vehicular emissions related to tourist 142
activities and during winter (December-February) due to massive biomass burning. In 143
addition to the local sources, pollutants were also found to be accumulated over this region 144
transported from long distant regions like Indo-Gangetic Plain (IGP) and other Asian sub 145
continents. Sarkar et al., (2014) found enhancement of Black Carbon aerosols over Darjeeling 146
during postmonsoon (October-November) due to transported plumes of biomass burning 147
from northern India. The seasonal variation of aerosols associated to the variation in emission 148
sources (local and transported) as observed from earlier studies have prompted us to make a 149
yearlong study on VOCs over Darjeeling as major aerosol sources over this region are 150
generally the major sources of VOCs too. 151
5
The present study is thus mainly focused on 1) the identification of the major factors 152
governing seasonal variation of VOCs, 2) contribution of long distant source regions, 3) 153
source apportionment of VOCs using Positive Matrix Factorization (PMF) and their potential 154
in tropospheric ozone formation 155
156
2 Study site and synoptic meteorology 157
The study has been carried out at a high altitude hill station Darjeeling at eastern Himalaya in 158
India. A map showing the geographical position of Darjeeling and its adjacent regions is 159
given in Figure 1. The sampling site (27º 01’N, 88º15’E) in Darjeeling is situated at the 160
elevation of 2200 from mean sea level at eastern Himalaya. The site is located at an elevation 161
of 200 m from the main town centre which is populated mainly by several hotels and resorts, 162
offices, shopping malls, bus and car stands, schools and colleges. The National Highway 163
(NH55) with high vehicular density connects Darjeeling with the city called Siliguri at the 164
foothill of Himalaya. Darjeeling Himalayan Railway (also known as “Toy Train”), is a 165
narrow gauge railway which runs by coal and diesel for the tourists and a world heritage site, 166
too. The site in Darjeeling represents a typical urban atmosphere with major anthropogenic 167
sources like vehicular emissions, biomass burning, agricultural activities etc. The description 168
of the study site has been given in detail in our earlier studies (Chatterjee et al., 2010, 2012, 169
Adak et al., 2014). 170
The seasonal average along with minimum and maximum of surface meteorological 171
parameters; temperature (T) in ºC, wind speed (WS) in ms-1, relative humidity (RH) in % and 172
rainfall (mm) are given in Figure 2. The entire study period is divided into four seasons; 173
winter (December – February), premonsoon (March – May), monsoon (June – September) 174
and postmonsoon (October – November). Figure 2 shows that the temperature was highest 175
during monsoon and lowest in winter whereas relative humidity shows monsoon maximum 176
and premonsoon minimum. Wind speed was found to be maximum in premonsoon which 177
was ~2 times than that in other seasons. We did not observe much variation between daytime 178
and nighttime wind speed except in premonsoon when daytime wind speed was much higher 179
(~1.8 times) than night-time wind speed. The surface reaching solar radiation was maximum 180
during premonsoon and was much higher than postmonsoon, monsoon and winter. The total 181
amount of rainfall over the entire sampling days was 421 mm where ~ 95 % rain occurred 182
during monsoon (397 mm) only. 183
6
3 Methodology 184
3.1 Sampling and analysis of VOCs 185
The study was carried out in the campus of National Facility on Astroparticle Physics and 186
Space Science, Bose Institute, Darjeeling. Samples were collected on a roof top of the 187
building of Bose Institute at a height of about 20 meters from the ground level at day (7 a.m. 188
to 7 p.m.) and night (7 p.m. to 7 a.m.) basis with the sample integration time of 11 hours for a 189
year long period from 7th July 2011 to 25th June 2012. The samples were collected once a 190
week. A total of 90 samples were collected during the study period, using a custom made 191
glass sampling tube containing charcoal and chromosorb. The tubes were pre-conditioned by 192
heating over night at 200 °C temperature. The tubes were connected with a low flow air 193
suction pump (SKC, USA). The flow rate was maintained at ~100 ml/min. The flow was 194
measured before and after each sampling event using a flow meter. After sampling the ends 195
of the tubes were sealed well with the Teflon tape and cap and kept at 4°C for analysis. 196
The analysis was done by thermal desorption followed by detection on GC-MS in accordance 197
with USEPA TO-17 compendium method for the determination of target VOCs and 198
described in details in the authors’ previous publications (CPCB 2007, CPCB 2010, 199
Srivastava & Som, 2007, Majumdar et al., 2014). In short the thermal desorption of sorbent 200
tube was done by heating at 180°C for 25 min. 100 μl of desorbed gas was injected into 201
Varian Make GC-MS [Now Agilent; GC–MS model: (Model 450GC-240MS)] operated 202
under SCAN mode. Target VOCs were separated using DB 624 capillary column of 30 m 203
length and 0.32mm internal diameter. Helium gas with flow rate of 1ml min-1 was used as 204
carrier gas with split ratio 1:20, GC oven was programmed for 35oC hold for 4 min and 205
ramped to 210oC. For estimation of the target compounds external five point calibration 206
curve was prepared in triplicate using VOC mix 20 by Dr. Ehrenstorfer GmbH, Germany. 207
208 3.2 Quality assurance and quality control 209 210 Breakthrough for air sampling procedure value was estimated by connecting two tubes in 211
series and it was considered that breakthrough occurred when the backup tube had 212
concentration more than 10% of the total concentration. Breakthrough has been observed 213
after passing 70 Lit of air sample in ambient condition. As soon as the air pump was turned 214
off, the sorbent tubes were removed, capped tightly and sealed in plastic bags and stored at 4 215
°C. Blank cartridges were also stored under identical conditions. 216
7
Percentage accuracy for observation has been determined as a relative difference of measured 217
concentration and spiked concentration for each component. Also mean response factor and 218
percent relative standard deviation for all target compounds has been calculated. For 219
determination of Relative Standard Deviation (RSD) we performed five runs of the same 220
concentration of mixed standard. For the lowest concentration of 0.005 µg of each target 221
compound the RSD varied between 3-10%. Method detection limit (MDL) has been 222
established by making seven replicated measurements of 0.005 µg of each target compound. 223
The standard deviation for these replicated concentrations multiplied by student’s t value for 224
99% confidence for seven values gives the MDL. The MDL varied from 0.01 µg m-3 for 225
1,2,4-Trimethylbenzene to 0.08 µg m-3 for 1,1-Dichloroethane considering 70 Lit of air 226
sample. The MDL for individual component has been given in Table 1. 227
4 Results and discussion 228
4.1 General characteristics of VOCs over Darjeeling 229
All the 18 VOCs measured in this study denoted as TVOC (Total VOCs) have been classified 230
in to three groups; mono-aromatics BTEX, non-BTEX substituted aromatics (iso-231
propylbenzene, n-propylbenzene, 1,3,5 trimethylbenzene, 1,2,4 trimethylbenzene, sec-232
butylbenzene, 4-isopropyltoluene, 2-chlorotoluene, 1,4 dichlorobenzene, n-butylbenzene, 233
naphthalene), and halocarbons (1,1 dichloroethane, 1,2 dichloroethane, chloroform and 234
carbon tetra chloride). The annual average concentrations of each VOC for each group along 235
with their minimum and maximum concentrations over the entire period of study have been 236
given in Table 1. The concentration of TVOC over Darjeeling was found to vary widely from 237
as low as 6.6 µg m-3 to as high as 4707.5 µg m-3 over the entire period of study (July, 2011 – 238
June, 2012). The annual average concentration of TVOC was 376.3 ± 857.2 µg m-3. BTEX 239
was found to have the highest contribution (72 %) followed by non-BTEX substituted 240
aromatics (22 %) and halocarbon (6 %) compounds. BTEX varied over a wide range between 241
1.5 µg m-3 and 3975.6 µg m-3 with an average of 275.1 ± 685.7 µg m-3. Toluene was found to 242
be the most abundant VOC in the atmosphere of Darjeeling with the contribution of ~ 37 % 243
to TVOC followed by benzene (~ 21 %), ethylbenzene (~ 9 %) and xylenes (~ 6 %). The 244
concentration of non-BTEX aromatics, too, varied widely from a very low (0.3 µg m-3) to a 245
very high (912.1 µg m-3) value with an average of 88.6 ± 220.1 µg m-3. On the other hand, 246
halocarbon compounds, unlike other VOCs, did not show such large variability during the 247
study period. The concentration of halocarbons varied from 1.5 µg m-3 to 73.3 µg m-3 with an 248
8
average of 21.5 ± 15.4 µg m-3. An important observation is that the concentration of carbon 249
tetrachloride (CTC) over Darjeeling was found to be much lower (0.18 µg m-3 which is 250
equivalent to 30 pptv) than the global mean concentration (~ 85 pptv during 2011-2012; 251
http://cdiac.ornl.gov/oceans/new_atmCFC.html). Studies on global distribution of CTC were 252
made using model-based simulation studies (Liang et al., 2014), occultation measurement 253
studies (Allen et al., 2009) etc. But, very few ground-based observations on CTC were made 254
in India where no such studies exist over eastern part of this country. However, the 255
concentration of CTC was found to have wide spatial variation. Srivastava et al., (2006) 256
observed CTC concentration of 55 pptv over an industrial region of Mumbai whereas very 257
high CTC concentration of 560-800 pptv was observed over an industrial region of Delhi 258
(Srivastava et al., 2005). Glavas and Moschonas (2002) observed very low CTC 259
concentration of 40 pptv over Athens, Greece during summer in 2000. There is no industries 260
exist in and around Darjeeling which could result to such low CTC concentration. TVOC and 261
most of its components showed their minimum concentrations during premonsoon (May 15, 262
2012) and maximum concentrations during postmonsoon (November 21, 2012). 263
4.2 Factors affecting seasonal variations of VOCs 264
Figure 3 shows the seasonal variations of VOCs over Darjeeling. The concentration of TVOC 265
was maximum in postmonsoon (1649.9 ± 875.4 µg m-3) followed by monsoon (117.1 ± 88.3 266
µg m-3), winter (60.4 ± 28.2 µg m-3) and minimum during premonsoon (35.9 ± 9.7 µg m-3). 267
BTEX and non-BTEX substituted aromatics showed similar seasonal patterns. The high 268
postmonsoon concentrations were found to be 1228.2 ± 534.1 µg m-3 and 404.0 ± 336.1 µg m-269
3 and the low premonsoon concentrations were found to be 12.9 ± 3.3 µg m-3 and 3.5 ± 1.5 µg 270
m-3 for BTEX and non-BTEX substituted aromatics respectively. Unlike BTEX and non-271
BTEX, halocarbons showed highest abundance in winter (33.5 ± 10.4 µg m-3) with small 272
variabilities between premonsoon (19.1 ± 4.2 µg m-3), postmonsoon (17.6 ± 4.5 µg m-3) and 273
monsoon (14.5 ± 5.2 µg m-3). 274
Postmonsoon and premonsoon are the tourist seasons over Darjeeling. Darjeeling experiences 275
huge emissions of fossil fuel burning from large numbers of tourist vehicles during these two 276
seasons compared to other seasons. We had made rough measurements on vehicle counts and 277
consumption of fossil fuel over Darjeeling earlier in the year of 2005 (Adak et al., 2010). We 278
observed that the number of light and medium duty vehicles was 6000-6700 per day during 279
premonsoon and postmonsoon whereas 3000-3600 per day during winter and monsoon. The 280
9
total consumption of fossil fuel (petrol and diesel) was 6500-7500 lit per day during 281
premonsoon and postmonsoon whereas it was 3500-4500 lit per day during winter and 282
monsoon. In addition to the vehicular emissions, various other anthropogenic activities are 283
also increased in premonsoon and postmonsoon seasons. The tourist activities remained the 284
same in these two seasons but VOCs showed significant variations with high level in 285
postmonsoon and low level in premonsoon. The other factors related to the sinks of VOCs 286
played major roles dominating the emission sources of VOCs, leading to the significant 287
variation between postmonsoon and premonsoon. Observed seasonal trends can thus be 288
addressed by the characteristics of the prevailing meteorology, and most importantly, the 289
availability of solar insolation in these two seasons. Darjeeling recorded maximum solar 290
insolation in premonsoon (360 ± 140 watt m-2; Fig 2) which could help in the photolysis of 291
ozone, carbonyls, water vapour etc leading to the formation of OH radicals in the atmosphere 292
(Ho et al, 2004). Another important meteorological factor is wind speed which was observed 293
to be maximum during premonsoon months (1.4 ± 0.5 m s-1; Fig 2). This could favour the 294
ventilation and dispersion of VOCs from the study site. On the other hand, the solar 295
insolation (220 ± 100 watt m-2) and wind speed (0.65 ± 0.2 m s-1) during postmonsoon were 296
much lower than premonsoon. Thus, although the VOC emissions remained comparable, 297
VOC degradation was maximum in premonsoon than postmonsoon leading to premonsoon 298
low and postmonsoon high VOC concentrations. In addition to the local emissions, 299
transported carbonaceous compounds could also contribute significantly in enhancing 300
carbonaceous compounds over eastern part of Himalaya during postmonsoon. Bonasoni et al., 301
(2010), Marinoni et al., (2010), Dumka et al., (2010) and Kaskaoutis et al., (2014) have 302
shown the influence of carbonaceous compounds (mainly Black Carbon) over Himalayas due 303
to transported plumes associated to crop residue burning over Punjab and adjacent Indo 304
Gangetic Plain regions during postmonsoon seasons. Sinha et al., (2014) and Sarkar et al., 305
(2013) showed significant increase in VOC concentrations due to agricultural residue burning 306
over Mohali, a suburban site in north-western India. Our recent study (Sarkar et al., 2014) 307
showed the impact of this transported biomass burning plumes on Black Carbon aerosols 308
over Darjeeling in the same study period. These biomass burning plumes could also bring 309
significant amount of VOCs over Darjeeling enhancing their concentrations during 310
postmonsoon. 311
The tourist activities remained low both during monsoon and winter months over Darjeeling. 312
The solar insolation during monsoon and winter was comparable in magnitude (180 ± 80 watt 313
10
m-2). Darjeeling recorded maximum temperature during monsoon (15.8 ± 0.9 0C) which may 314
lead to increased evaporative emissions for certain VOC species with higher vapour pressure 315
from vehicular service stations, and also from waste decomposition in the hotter months 316
(Talapatra and Srivastava, 2011). VOC emission from solvent evaporation is less significant 317
at very low temperature (5.3 ± 2.1 0C) during winter. 318
In order to better establish the fact of the dependence of TVOC with meteorological 319
parameters, we have investigated the day-to-day variations of TVOC with temperature and 320
solar radiation during the entire study period and shown in Figure 4. It shows well correlation 321
between TVOC and solar radiation during premonsoon. TVOC was found to decrease with 322
the increase in radiation. Thus, we can say that solar radiation played key role in atmospheric 323
clean-up and degradation of VOCs during premonsoon. On the other hand, correlation was 324
also observed between TVOC and temperature during monsoon. We observed increase in 325
TVOC with the increase in temperature favouring evaporative emissions during monsoon. 326
In general, variation in VOC concentrations between hotter and colder months over plain land 327
cities is addressed with the help of vertical advection through boundary layer dynamics in 328
addition to other meteorological factors. The low VOC concentration during summer is 329
generally associated to favourable vertical mixing due to high boundary layer/mixing height 330
whereas comparatively higher VOC concentration during winter is associated to calm and 331
stable atmospheric condition with low boundary layer/mixing height restricting vertical 332
dissipation. The boundary layer dynamics has been used for addressing seasonal variation of 333
VOCs for most of the studies conducted over several Indian cities (Talapatra and Srivastava, 334
2011 and several references therein). But the case of Darjeeling is unique, unlike plain land 335
cities, the seasonal variation in VOC concentration could not be addressed through boundary 336
layer dynamics as the station itself is situated at a height of 2.2 km, well above the boundary 337
layer. But there is a probability that boundary layer could reach the altitude of Darjeeling 338
during premonsoon under high convective activities. Thus, VOCs emitted from plain land 339
regions could reach Darjeeling after their vertical advection and could contribute and enhance 340
VOC concentrations over Darjeeling. But, photochemical degradation under high solar 341
insolation over Darjeeling could have hindered the development in VOC concentrations 342
during premonsoon. 343
4.3 Day and night time VOCs: Role of anthropogenic and meteorological factors 344
11
VOC concentrations over Darjeeling were compared between day and night time for different 345
seasons in order to investigate the potential impact of the variability in emission sources 346
and/or meteorological factors between day and night time. The night to day ratio was greater 347
than 1.0 in each season. We infer that although the emissions were high, the photochemical 348
degradation could decrease the day-time VOC concentrations. Thus, night-time VOCs could 349
be attributed to the VOCs generated during night (which could not degrade by photolysis) 350
plus residual VOCs generated during day-time. Another important factor is higher wind 351
speed during daytime which could favour the dispersion of VOCs more than night. The ratio 352
for TVOC was highest during premonsoon (1.9) followed by postmonsoon (1.4), monsoon 353
(1.2) and minimum during winter (1.1). The highest ratio in premonsoon could be due to the 354
removal of VOCs by efficient and faster photo-degradation by very high solar insolation and 355
higher wind speed favouring dispersion of pollutants during day time leading to lower day-356
time VOC concentrations compared to the other seasons. However, the minimum value of the 357
ratio in winter could be due to minimum night-time VOC emissions due to subdued 358
anthropogenic activities (except biomass burning) in colder nights. Another possibility is that 359
the boundary layer could remain well below the observational site (2200 m asl) during winter 360
nights and hence pollutants could be accumulated below Darjeeling leading to lower night-361
time VOC concentration. 362
4.4 Contribution of long distant source regions to VOCs over Darjeeling 363
The transport of air masses from distant sources could affect the pollutant concentrations at 364
the study site in conjunction with the local sources. In order to investigate the transport of 365
VOCs from long distances, we have computed 36 h air-mass back trajectories, arriving at an 366
altitude of 500 m above ground level over Darjeeling for all the days on which VOCs were 367
measured, using Hybrid Single Particle Lagrangian Integrated Trajectory (HYSPLIT) model 368
(http://www.arl.noaa.gov/ready/hysplit4.html). Over the entire period of study, we have 369
identified three major source regions for long range transport as shown in Figure 5. The 370
frequency of transport from each of the source regions has also been shown in the figure. 371
Region 1 corresponds to the transport from SE directions and the air masses originated from 372
southern part of West Bengal, India and Bangladesh with the frequency of 32 %. The average 373
TVOC concentration associated to Region 1 was found to be 117.2 ± 86.1 µg m-3. Region 2 374
corresponds to the transport from W/NW directions and the air masses originated from 375
eastern and central part of Nepal with the frequency of 42 %. The associated TVOC 376
12
concentration was found to be 831.5 ± 955.2 µg m-3. Region 3 corresponds to local/regional 377
sources and the air masses originated mainly from the E/SE directions with the frequency of 378
26 %. The major regions were northern part of West Bengal and the average TVOC 379
concentration was found to be 620.1 ± 535.4 µg m-3. Thus, the contribution from Nepal 380
(Region 2) was found to be 5.5-8 and 1.3-1.8 times higher than West Bengal/Bangladesh 381
(Region 1) and local/regional sources (Region 3) respectively. The contributions from each 382
source regions were also investigated for different seasons. The average TVOC 383
concentrations associated to respective source regions along with their frequencies have been 384
given in Table 2 season-wise. It was observed that during monsoon, all the air masses 385
originated from Region 1 with 100 % frequency with the average TVOC concentration of 386
117.2 ± 86.1 µg m-3. Similarly, during winter, 100 % air masses originated from Nepal with 387
the TVOC concentration of 60.9 ± 28.0 µg m-3. During postmonsoon, 60 % air masses 388
originated from local/regional sources (Region 3) and 40 % originated from Nepal (Region 2) 389
with the average TVOC concentrations of 1206.8 ± 628.3 µg m-3 and 2978.1 ± 1538.1 µg m-3 390
respectively. It was observed that 50 % air masses originated from local/regional and 50 % 391
originated from Nepal during premonsoon and the TVOC concentration associated to Nepal 392
was found to be slightly higher (46.2 ± 12.5 µg m-3) than local/regional sources (34.2 ± 11.3 393
µg m-3). This result indicates that the air masses coming from Nepal carried more VOCs and 394
thus more polluted compared to other source regions. It is important to mention over here that 395
the altitudes of the air masses were below 1000 m asl throughout their trajectories/pathways 396
originating from their source regions. Thus the air masses could pick up the boundary layer 397
pollutants of the regions they passed over before reaching our observational site. 398
As Nepal was found to be most polluted source regions, an attempt was made to roughly 399
estimate the contribution of TVOC from Nepal in postmonsoon and premonsoon seasons. 400
During these two seasons, air masses originated both from Nepal and local/regional source 401
regions and thus contribution from Nepal was estimated in terms of the relative 402
concentrations associated to these two regions. The estimation has been made by the 403
following equation: 404
% contribution from Nepal = (ECNepal/ MCTotal)*100 = ((MCTotal – MCLocal)/ MCTotal)*100, 405
where ECNepal is the estimated concentrations of TVOC coming only from Nepal i.e. 406
additional amount of TVOC coming from Nepal. MCTotal is the measured concentration of 407
TVOC on respective days when air masses generated from Nepal i.e. with the total 408
13
contribution of both Nepal and local air masses. MCLocal is the average measured 409
concentration of TVOC on all the days when air masses originated from local sources i.e. 410
contribution from local sources only. It was observed that VOCs from Nepal contributed to 411
the TVOC concentration over Darjeeling by 38-54 % with the average of ~53 % during 412
postmonsoon and 32-65 % with the average of ~50 % during premonsoon. 413
4.5 Effect of local and long distant sources on the variability-lifetime relationship for 414
VOCs 415
The relationship between the variability in concentrations and the life time of VOCs can be 416
used to estimate the distance of their source regions regardless the influence of the regional 417
transport. The following empirical equation was first proposed by Jobson et al.(1998). 418
Slnx = Aτ-b 419
Where Slnx is the standard deviation of the natural logarithm of the concentration X of VOC, τ 420
is the atmospheric lifetime of VOC, A and b are the fit parameters. 421
The value of exponent b lies between 0 and 1 and describes the influence of the source 422
contribution. The value of b will approach zero when sampling site is closed to a source and 423
the variability-lifetime relation will be ‘weaker’. In the extreme case, when b = 0, the 424
variability will not depend on the atmospheric lifetime but will depend on the variability of 425
the emission sources. In remote areas b will approach 1 (Jobson et al., 1998, Ehhalt et al., 426
1998, Wang et al., 2005) where the distance of sampling site is longer from the potential 427
sources. The variability concept is based on the assumption that the chosen compounds have 428
more or less the same source distribution. The compounds reported in this paper, are mostly 429
of anthropogenic origin (aromatic hydrocarbons and halocarbons). We have used their 430
concentrations for premonsoon and postmonsoon as the sources of VOCs are same in both 431
the seasons. We have calculated the back trajectory analysis for each sampling day and based 432
on the trajectories we have separated the transported air masses from the local emissions (as 433
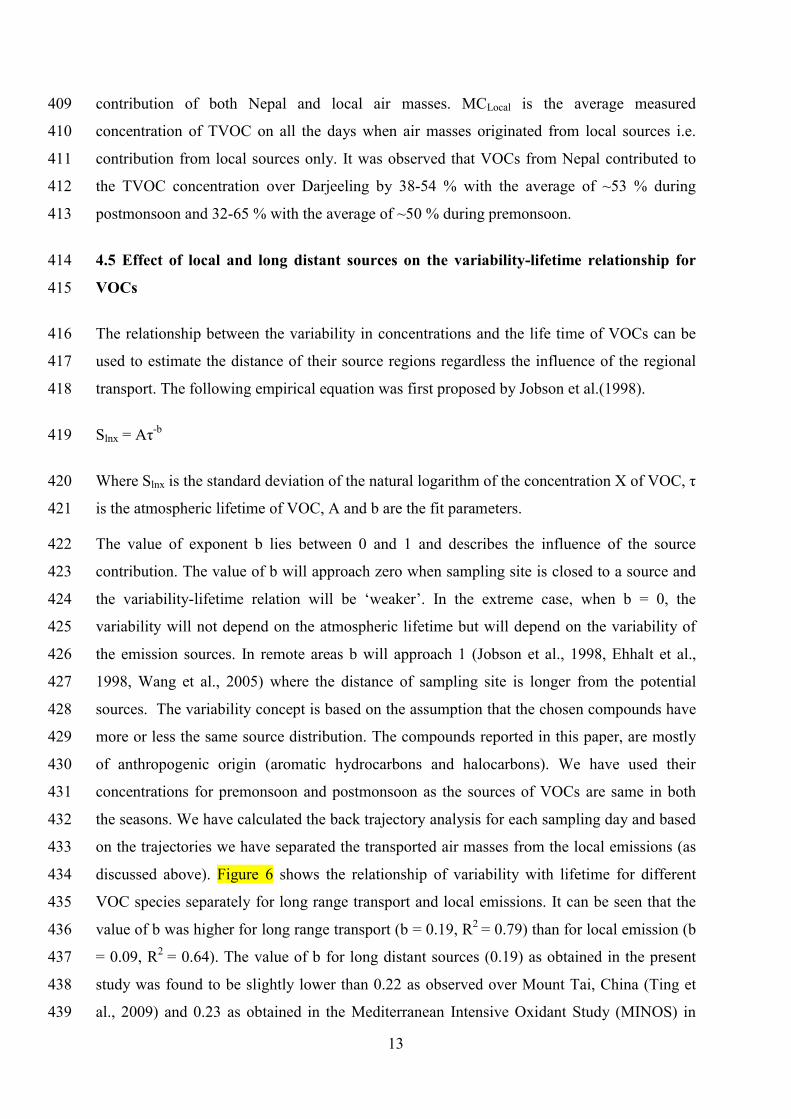
discussed above). Figure 6 shows the relationship of variability with lifetime for different 434
VOC species separately for long range transport and local emissions. It can be seen that the 435
value of b was higher for long range transport (b = 0.19, R2 = 0.79) than for local emission (b 436
= 0.09, R2 = 0.64). The value of b for long distant sources (0.19) as obtained in the present 437
study was found to be slightly lower than 0.22 as observed over Mount Tai, China (Ting et 438
al., 2009) and 0.23 as obtained in the Mediterranean Intensive Oxidant Study (MINOS) in 439
14
August 2001 on Crete (Gros et al., 2003). But, it was much lower than 0.44 as observed over 440
the remote NARE locations (Jobson et al., 1999) and 0.41 on a cruise through the western 441
Indian Ocean during the INDOEX field study (Karl et al., 2001). Thus, Darjeeling does not 442
represent a remote site where the variability is strongly dependent on the lifetime of VOC but 443
represent a typical urban site in the vicinity of sources where the sources dictate the 444
variability and not the chemistry. The longest source regions (Central part of Nepal or 445
southern part of West Bengal/Bangladesh) for VOCs over Darjeeling as estimated from 446
HYSPLIT trajectory models were within 200 km from Darjeeling. 447
4.6 Characterization of sources of VOCs by Positive Matrix Factorization receptor 448
model 449
In recent years, an advanced receptor model, Positive Matrix Factorization (PMF), has been 450
applied extensively in identifying VOC contributing sources at different locations in the 451
world (e.g., Jorquera and Rappengluck, 2004; Latella et al., 2005; Xie and Berkowitz, 2006; 452
Brown et al., 2007; Song et al., 2007; Yuan et al., 2009). PMF does not require any priori 453
knowledge on the exact VOC emission profiles, and it can be used to apportion source 454
contributions solely based on observations at the receptor site, thus avoiding VOC decay 455
adjustment problem i.e. quick loss of some reactive VOC species in the path between source 456
and receptor. However, very high reactive species could be excluded from the model run 457
provided they are not marker or tracer of any VOC source. In this study, we have measured 458
18 VOC species which are major and abundant in the atmosphere and can not be considered 459
as highly reactive and have been included in PMF model run by earlier studies, too. More 460
details about the PMF method were described by several studies (Paatero and Tapper, 1994; 461
Paatero, 1997; Reff et al., 2007). Q is a typical parameter in PMF which is the measure of 462
goodness of fit parameters. Q (true) is calculated including all data points where Q (robust) is 463
calculated excluding data points not fit by the model. The difference between Q (true) and Q 464
(robust) is the measure of the impact of data points with high scaled residuals whereas high 465
uncertainties result in similar Q values. Q (robust) is used to choose the optimal run from the 466
multiple runs. If the number of sources is estimated properly, Q (robust) will have little 467
variability between the runs and thus we get stable Q. The variability of Q (robust) is the 468
indication of the variability of initial base run results. 469
In this study, the PMF method has been applied to identify the possible sources of VOCs over 470
Darjeeling. Table 3 shows the source profiles derived by the PMF model. Eight factors were 471
15
selected according to the resulted stable Q values. Figure 7 shows the percentage contribution 472
of each VOC associated to each of eight sources. 473
Table 3 shows that Factor 1 is dominated by high values of BTEX with much higher 474
concentrations of benzene and toluene followed by ethylbenzene and xylene. Toluene to 475
benzene ratio was found to be 0.9 in this factor. Thus factor 1 could be associated to the 476
gasoline-related emissions. Several earlier studies showed the ratio values near 1.0 (1.0 over 477
Kolkata, India by Som et al., 2007; ~ 1.0 over Mumbai, India by Srivastava et al., 2004; ~ 1.0 478
over Ganga Mountain, China by Zhang et al., 2013; 0.8 over Hongkong, China by Lau et al., 479
2007; 0.7 over Sanghai, China by Cai et al., 2010) attributing to gasoline related emissions. 480
VOC emissions from gasoline may occur along many pathways like, evaporative emission 481
from gas stations and bulk terminals and exhaust released from the gasoline-powered vehicles 482
during gasoline combustion (Watson et al., 2001; Choi and Ehrman, 2004). BTEX are the 483
major components of vehicular exhaust, as shown by many studies (Watson et al., 2001; Guo 484
et al., 2006, 2007, Som et al., 2007). High VOC emissions from tourist vehicles during 485
premonsoon and postmonsoon seasons and the gasoline vapours from the frequent use of the 486
gas stations are the most important contributors to this source over Darjeeling. 487
Factor 2 is also dominated by BTEX. Toluene was found to have the maximum contribution 488
followed by benzene, ethylbenzene and xylene. The toluene to benzene ratio is 2.5 in this 489
factor. Previous study of the authors (Som et al., 2007) reported the same ratio in a study 490
made over Kolkata, India for the VOCs emitted from diesel-driven vehicles. This factor is 491
associated to diesel exhaust. It is interesting to observe that the number of petrol and diesel 492
driven vehicles are nearly same over Darjeeling and PMF result indicates the percentage 493
contribution of TVOCs from Diesel and gasoline sources are also comparable (discussed later 494
in details). 495
Factor 3 is characterized by the high values of TEX. TEX being the primary constituents of 496
solvents (Guo et al., 2004a; Choi et al., 2011), often used as a solvent in paints, coatings, 497
synthetic fragrances, adhesives, inks and cleaning agents, in addition to its use in fossil fuel 498
(Borbon et al., 2002; Chan et al., 2006). This factor can therefore be assigned to the solvent 499
usage and related emission. The rapid growth in tourism related infrastructure like hotels, 500
resorts, restaurants etc over Darjeeling could be the reason for high VOC emission from 501
solvent usage. 502
16
Factor 4 is characterized by the high values of n-propyl benzene, 2-chloro toluene and BTEX 503
and could be assigned to solid waste disposal. Majumdar et al., (2014) reported the high 504
values of these compounds in municipal waste dumping stations in Kolkata, India. With the 505
dramatic increase in tourists and changing consumption patterns, Darjeeling is facing 506
immense problems of waste management. The existing systems of waste management are 507
technically unscientific and the infrastructure is insufficient to manage the waste. 508
Factor 5 is dominated mainly by chloroform and carbon tetrachloride and thus the factor 509
could be associated to chlorine bleach containing house hold products. Odabasi et al., (2008) 510
showed that house hold cleaning agents and fresheners produce these two VOCs 511
significantly. Chloroform and carbon tetrachloride are the major compounds along with 512
several halogenated compounds in chlorinated bleach products. 513
Factor 6 is dominated by m,p-xylene and ethylbenzene followed by n-butylbenzene and 514
toluene and could be assigned to industrial sources (Yuan et al., 2010). Although there is no 515
industry in Darjeeling, but the VOCs could be transported from low land townships and 516
cities. The m,p-xylene to ethylbenzene ratio in this factor was found to be 1.8. The ratio of 517
m,p-xylene to ethylbenzene (X/E ratio) is used as indicator for the age of the VOCs in the 518
atmosphere (Elbir et al., 2007; Guo et al., 2004a, 2004b). The ratio becomes smaller as the 519
VOCs get older in the atmosphere, because m,p-xylene is more reactive than ethylbenzene. 520
Kuntasal (2005) found X/E ratio to be varied between 3.8- 4.4 in fresh emissions at gasoline 521
station, underground garage and a tunnel. The low ratio in this study (1.8) suggests that the 522
species were not emitted in situ but aged/transported. 523
Factor 7 is dominated by chloroalkanes, benzene and toluene and could be associated to coal 524
and biomass burning (Fernandez-Martinez et al., 2001, Barletta et al., 2009). Coal burning is 525
a significant anthropogenic source in Darjeeling as it is used for the domestic cooking 526
purpose and it is also used in a large scale for coal engines in the toy trains. In addition to 527
that, massive biomass burning during winter to get warmth against cold and probable 528
transportation of biomass burning species from northern Indian states (as discussed earlier) 529
during postmonsoon could enhance those VOCs in the atmosphere of Darjeeling. 530
Factor 8 is characterized by high values of aromatics with high molecular weight like 1,2,3-tri 531
methyl benzene, 1,2,4-trimethyl benzene, o-xylene. Liu et al., (2005) reported high emissions 532
of these VOCs from asphalt related road construction works. Road construction works were 533
17
in progress in and around Darjeeling during few sampling events. Thus the factor 8 could be 534
assigned to the asphalt related emission. 535
Figure 8 shows the percentage contributions of each source to the total VOC loading over 536
Darjeeling during the entire study period. It can be seen that the major sources are diesel 537
exhaust (32 %) and gasoline exhaust (29 %) followed by solvent evaporation (18 %). 538
Chlorine bleach containing house hold products and solid wastes contributed equally (6 %) 539
whereas industrial sources situated at the regions far from Darjeeling, coal/biomass burning 540
and asphalt related constructional works contributed nominally by 4 %, 3 % and 2 % 541
respectively. Thus it can be concluded that the major source of 18 VOCs (BTEX, non-BTEX 542
aromatics and halocarbons) measured over Darjeeling is gasoline and diesel driven vehicular 543
activities which contributed by more than 60 %. 544
4.7 Ozone formation potential of VOC sources 545
Although it is well known that tropospheric NOx plays important role in tropospheric ozone 546
formation, the measurement of NOx was beyond our scope during the study period. Hence, in 547
this study, the investigation of ozone formation potential (OFP) was limited to VOCs only. 548
To find out the potential of various VOC sources (as derived from PMF model) to the 549
tropospheric ozone formation over Darjeeling, we have computed OFP of each source using 550
the Maximum Incremental Reactivity (MIR) values derived by Carter (2008). To do this, we 551
have used the equation derived by Na and Kim, (2007). 552
n
jjjiii MIRSOFP
1
)( 553
Where, OFPi is the estimated contribution of ith source to OFP, Si is the total mass 554
contribution of the source i, αji is the mass fraction of species j in source i and MIRj is MIR 555
value of species j. Figure 9 shows the relative contribution of each source to OFP. It can be 556
seen from the figure that diesel exhaust has the maximum potential (45%) followed by 557
solvent (24 %) and gasoline exhaust (18 %). Although, Gasoline exhaust contributes more 558
(29%) towards TVOC concentration than solvent usage (18%), the later source is 559
contributing more towards tropospheric ozone generation. The MIR values of the individual 560
species are also responsible for the total OFP of a source along with the corresponding source 561
strength. Thus, it can be said that amongst the 18 VOCs measured over Darjeeling, those 562
emitted from vehicular emissions and solvents played the key role in the formation of 563
tropospheric ozone and modifying tropospheric ozone budget. 564
18
4.8 Comparison with other studies 565
The concentration of BTEX over Darjeeling (present study) has been compared with that 566
over several metro cities in India and also with other cities in Asian, European, African, 567
Arabian and American countries (Table 4). We have taken the sum of BTEX (not TVOC) for 568
comparison as the data of BTEX is more available in the literature. 569
Table 4 shows that BTEX over Darjeeling is lower than the commercial, industrial and the 570
areas with high traffic density (traffic intersection) over Delhi, the capital city of India; traffic 571
intersection and petrol pumps over Mumbai, a metro city in western India and Hyderabad, a 572
metro city in south-eastern India. This is quite expected as the vehicular and industrial 573
activities over those metro cities are much higher than Darjeeling. But the most interesting 574
fact is that BTEX over Darjeeling shows ~3, ~2 and ~5 times higher concentrations than 575
residential areas over Kolkata (a mega city in eastern India), Delhi and Mumbai respectively. 576
Even, Darjeeling shows higher BTEX concentrations than commercial areas of Mumbai and 577
much higher than roadside (~10 times) and petrol pump (~7 times) areas in Agra, a city in 578
northern India with much less vehicular activities compared to other Indian metro cities. 579
BTEX over Darjeeling was found to be much higher (10-25 times) than the 580
residential/industrial/commercial areas of Turkey, Houston, Rome and Paris; 2-6 times higher 581
than residential/commercial areas of Bangkok, Yokohama, Kuwait and Hongkong; 1.5-2 582
times higher than roadside/industrial/commercial areas of Kaohsiung, Sanghai and Beijing. 583
Darjeeling shows much higher (~8 times) BTEX concentration than Gongga Mountain, a 584
high altitude (1640 m asl) remote station in southwestern China. However, BTEX over a 585
commercial area with heavy traffic density in Cairo, Egypt shows 1.7 times higher 586
concentration than that over Darjeeling. 587
In our earlier study (Sarkar et al., 2014), we also reported much higher concentration of black 588
carbon aerosols over Darjeeling compared to other high altitude Himalayan stations in India 589
and Nepal and some of the metro cities in India like Ahmedabad, Bangalore, Trivandrum and 590
Chandigarh. The present study corroborate with that findings. The major source for black 591
carbon aerosol and VOCs over Darjeeling is same, vehicular emissions. Thus, Darjeeling 592
represents a typical urban atmosphere at eastern Himalaya with high loading of carbonaceous 593
pollutants. This could be due to high anthropogenic emissions related to tourist activities, 594
high population density and moreover it’s unique orography and land use pattern with narrow 595
19
roads, unplanned township, poor administrative control on solid waste disposal and burning 596
of these wastes, unplanned constructions of buildings/hotels/resorts which reducing open 597
space/area which in turn prevents ventilation and dispersion of pollutants. 598
5 Conclusion 599
The major findings of the study on VOCs conducted over Darjeeling, a high altitude hill 600
station over eastern Himalaya in India are as follows: 601
1. The annual average concentrations of TVOC, BTEX, non-BTEX aromatics and 602
halocarbons were 376.3 ± 857.2, 275.1 ± 685.7, 88.6 ± 220.1 and 21.5 ± 15.4 µg m-3 603
respectively with the maximum contribution from BTEX (72 %), non-BTEX 604
aromatics (22 %) and halocarbons (6 %). Toluene was found to be the most abundant 605
VOC over Darjeeling which contributed 37 % to the TVOC. 606
2. Concentration of TVOC showed well defined seasonal variations with maximum in 607
postmonsoon (1650 ± 875.4 µg m-3) followed by monsoon (117.1 ± 88.3 µg m-3), 608
winter (60.4 ± 28.2 µg m-3) and minimum during premonsoon (36 ± 9.7 µg m-3). The 609
seasonal variation in VOC concentration was mainly governed by the photochemical 610
degradation process rather than the emission source strength. Although, the 611
anthropogenic activities related to massive tourist influxes during premonsoon and 612
postmonsoon were comparable, the solar radiation made the difference between 613
premonsoon and postmonsoon VOC concentrations. 614
3. Other than local sources, two major regions were identified for VOCs over 615
Darjeeling; Nepal and southern part of West Bengal, India/Bangladesh. It was 616
observed that VOC concentration over Darjeeling was higher when air masses arrived 617
from Nepal than West Bengal, India/Bangladesh and local/regional source regions. 618
The relationship between variability and lifetime of VOC was discussed and it was 619
observed that Darjeeling represents the site in the vicinity of sources as compared 620
with other studies. 621
4. Positive matrix facorization receptor model was used to characterize the sources of 622
VOCs over Darjeeling. It was observed that the major source of VOC over Darjeeling 623
was emission from petrol and diesel driven vehicles which contributed by more than 624
60 % followed by solvent evaporation (18 %) and other sources. 625
20
5. Diesel exhaust was found to have the maximum potential (45 %) in the formation of 626
tropospheric ozone followed by solvent evaporation (24 %) and gasoline exhaust (18 627
%). 628
6. The atmospheric loading of BTEX over Darjeeling was comparable with Indian metro 629
cities and much higher than other Asian, American, African, Arabian and European 630
countries. 631
Thus we found that Darjeeling represents a typical urban atmosphere over eastern Himalaya 632
in India from the point of view of VOC pollution. The high VOC pollution over Darjeeling 633
draws a serious attention as it could significantly affect human health as well as the sensitive 634
ecosystem over this part of Indian Himalaya. Study result emphasis the need for better 635
pollution control system for the vehicles plying on the road of Darjeeling. Imposing 636
regulations on uncontrolled solvent usage is also necessary. Better Solid waste management 637
system is also called for. This year long data set of VOC can be used to make further studies 638
on the modification of the budget of tropospheric ozone, NOx and other gaseous and 639
particulate pollutants. This would, in turn, help us to make studies on the implications of 640
VOCs for regional atmospheric chemistry over eastern Himalaya. 641
642 Authors’contribution 643 644 C.S., A.C., D.M., S.K.G., A.S. and S.R. conceived and designed the experiment. C.S. and 645
A.C. performed the experiment. C.S. and D.M. analyzed the samples. D.M. and A.S. supplied 646
the materials/chemicals and instruments for chemical analysis. C.S., A.C. and D.M. analyzed 647
the data. A.C., C.S. and D.M prepared the manuscript with the contribution of rest of authors. 648
Acknowledgement 649
Authors would like to thank Science and Engineering Council, Department of Science and 650
Technology, Government of India for supporting the study under IRHPA (Intensification of 651
Research in High Priority Areas) scheme. Authors also like to thank University Grant 652
Commision, Govt of India for providing fellowship to Mr C. Sarkar (first author). The study 653
was undertaken by Bose Institute in collaboration with CSIR-NEERI. Field study conducted 654
by Bose Institute and sample analysis performed by CSIR-NEERI, Kolkata Zonal 655
Laboratory. Thanks are due to Mr. Sabyasachi Majee, Bose Institute for his consistent 656
support in sampling and Mr. Debasish Sengupta and Ms Pamela Chowdhury, NEERI for their 657

21
assistance during sample analysis. Authors would also like to thank Mr D. K. Roy, Bose 658
Institute for his overall logistic support. 659
660
661
662
663
664
665
666
667
668
669
670
671
672
673
674
675
676
677
678
679
680
681
682
683
22
References 684
Adak, A., Sen, G., Chatterjee, A., Yadav, Y., Singh, A.K., Srivastava, M.K., Ghosh, S. and 685 Raha,S.: Mathematical modelling of atmospheric pollutant dispersion: a case study of the 686 behaviour of respirable suspended particles at Darjeeling (Eastern Himalaya), India. 687 Proceedings of the national seminar on mathematical modelling of natural phenomena, 2010. 688
Adak, A., Chatterjee, A., Singh, A. K., Sarkar, C., Ghosh, S. and Raha, S.: Atmospheric Fine 689 Mode Particulates at Eastern Himalaya, India: Role of Meteorology, Long-Range Transport 690 and Local Anthropogenic Sources, Aerosol. Air. Qual. Res., 14, 440–450, doi: 691 10.4209/aaqr.2013.03.0090, 2014 692
Ait-Helal, W., Borbon, A., Sauvage, S., Gouw, J. A. D, Colomb, A., Gros, V., Freutel, F., 693 Crippa, M., Afif, C., Baltensperger, U., Beekmann, M., Doussin, J. F., Jolibois, R. D., 694 Fronval, I., Grand, N., Leonardis, T., Lopez, M., Michoud, V., Miet, K., Perrier, S., Prévôt, 695 A. S. H., Schneider, J., Siour, G., Zapf, P., Locoge, N.: Volatile and intermediate-volatility 696 organic compounds in sub-urban Paris: variability, origin and importance for SOA formation, 697 Atmos. Chem. Phys. Discuss, 14, 4841–4904, doi:10.5194/acpd-14-4841-2014, 2014 698
Al-Khulaifi, N. M., Al-Mudhaf, H. F., Alenezi, R., Abu-Shady, A. S. I., Selim, M. I.: 699 Seasonal and Temporal Variations in Volatile Organic Compounds in Indoor and Outdoor 700 Air in Al-Jahra City, Kuwait, Journal of Environmental Protection, 5, 310-326, 2014 701
Anderson, M. J.: Source Apportionment of Toxic Volatile Organic Compounds, M.S. thesis, 702 Department of Civil, Environmental, and Architectural Engineering, University of Colorado, 703 Boulder, CO, 2001 704
Anderson, M. J., Daly, E.P., Miller, S.L., Milford, J.B.: Source apportionment of exposure to 705 volatile organic compounds: II. Application of receptor models to TEAM study data, Atmos. 706 Environ., 39, 3642-3658, 2002 707
Atkinson, R.: Atmospheric chemistry of VOCs and NO(x), Atmos. Environ., 34, 12–14, 708 2063–2101, 2000. 709
Barletta, B., Meinardi, S., Simpson, I. J., Atlas, E. L., Beyersdorf, A. J., Baker, N. J., Yang, 710 M., Midyett, J. R., Novak, B. J., McKeachie, R. J., Fuelberg, H. E., Sachse, G. W., Avery, M. 711 A., Campos, T., Weinheimer, A. J., Rowland, F. S., Blake, D. R.: Characterization of volatile 712 organic compounds (VOCs) in Asian and north. Atmos. Chem. Phys., 9, 5371-5388, 713 doi:10.5194/acp-9-5371-2009, 2009 714
Bonasoni, P.: Atmospheric brown clouds in the Himalayas: First two years of continuous 715 observations at the Nepal Climate Observatory-Pyramid (5079 m). Atmos. Chem. Phys., 716 10,7515–7531, doi:10.5194/acp-10-7515-2010, 2010 717
Borbon, A., Locoge, N., Veillerot, M., Gallooa, J.C., Guillermoa, R.: Characterisation of 718 NMHCs in a French urban atmosphere: overview of the main sources. Sci. Total. Environ., 719 292, 177-191, 2002 720
23
Brown, S. G., Frankel, A., Hafner, H. R.: Source apportionment of VOCs in the Los Angeles 721 area using Positive Matrix Factorization, Atmos. Environ., 41, 227–37, 2007 722
Brocco D, Fratarcangelli R, Lepore L, Petricca M, Ventrone I (1997). Determination of 723 aromatic hydrocarbons in urban air of Rome. Atmos Environ., 31, 557–566, 1997 724
Cai, C., Geng, F., Tie, X., Yu, Q., An, J.: Characteristics and source apportionment of VOCs 725 measured in Shanghai, China, Atmos. Environ., 44, 5005-5014, 2010 726
Carter, W. P. L.: Updated maximum incremental reactivity scale and Hydrocarbon bin 727 reactivities for regulatory applications, Prepared for California Air Resources Board Contract 728 07-339, College of Engineering Center for Environmental Research and Technology, 729 University of California, Riverside, CA 92521, 2008 730
Chan, L. Y., Chu, K. W., Zou, S. C., Chan, C.Y., Wang, X. M., Barletta, B., Blake, D. R., 731 Guo, H., Tsai,W. Y. Characteristics of nonmethane hydrocarbons (NMHCs) in industrial, 732 industrialeurban, and industrialesuburban atmospheres of the Pearl River Delta (PRD) region 733 of south China.: J. Geophys. Res., 111, D11304, doi:11310.11029/12005JD006481, 2006 734
Chatterjee, A., Adak, A., Singh, A. K., Srivastava, M.K., Ghosh, S.K., Tiwari, S., Devara, 735 P.C.S. and Raha, S.: Aerosol Chemistry over a High Altitude Station at Northeastern 736 Himalayas, India, PLoS One, 5, e11122, doi: 10.1371/journal.pone.0011122, 2010 737
Chatterjee, A., Ghosh, S.K., Adak, A., Singh, A.K., Devara, P.C.S. and Raha, S.: Effect of 738 Dust and Anthropogenic Aerosols on Columnar Aerosol Optical Properties over Darjeeling 739 (2200 m asl), Eastern Himalayas, India, PLoS One., 7, e40286, doi: 740 10.1371/journal.pone.0011122, 2012 741
Chaudhary, S., Kumar, A.: Monitoring of Benzene, Toluene, Ethylbenzene and Xylene 742 (BTEX) Concentrations in Ambient Air in Firozabad, India. Inter. Arch. App. Sci. Technol., 743 3, 92 – 96, 2012. 744
Choi, Y. J. and Ehrman, S. H.: Investigation of sources of volatile organic carbon in the 745 Baltimore area using highly time-resolved measurements, Atmos. Environ., 38, 775-791. 746 2004 747
Choi, E., Choi, K., Yi, S. M. : Non-methane hydrocarbons in the atmosphere of a 748 Metropolitan City and a background site in South Korea: sources and health risk potentials. 749 Atmos. Environ., 45, 7563-7573, 2011 750
CPCB 2007. Estimation of levels of benzene in ambient air and its impact on health in 751 Mumbai. National Ambient Air Quality Monitoring Series: NAAQMS/31/2007. Central 752 Pollution Control Board, Ministry of Environment & Forests, Government of India, 2007. 753
CPCB 2010. Study of Urban Air Quality in Kolkata for Source Identification and Estimation 754 of Ozone, Carbonyls, NOx and VOC Emissions. Control of Urban Pollution Series: 755 CUPS/72/ 20010-11. Central Pollution Control Board, India, 2010. 756
24
Demir, S., Saral, A., Ertürk, F., Kuzu, S. L., Goncaloğlu, B. İ., Demir, G.: Effect of diurnal 757 changes in VOC source strengths on performances of receptor models, Environ. Sci. Pollut. 758 Res., 19, 5, 1503-1514, 2012 759
Dumka, U. C., Moorthy,K. K., Kumar, R., Hegde, P., Sagar, R., Pant, P., Singh, N. and Babu, 760 S. S.: Characteristics of aerosol black carbon mass concentration over a high altitude location 761 in the Central Himalayas from multi-year measurements, Atmos. Res., 96, 510–521, 762 doi:10.1016/j. atmosres.2009.12.010, 2010 763
Dutta, C, Som, D., Chatterjee, A., Mukherjee, A. K., Jana, T. K., Sen, S.: Mixing Ratios of 764 Carbonyls and BTEX in Ambient Air of Kolkata, India and Their Associated Health Risk. 765 Environ. Monit. Assess., 148, 97-107, 2009 766
Ehhalt, D. H., Rohrer, F., Wahner, A., Prather, M. J., and Blake, D.R.: On the use of 767 hydrocarbons for the determination of tropospheric OH concentrations, J. Geophys. Res., 768 103, 18981–18997, 1998 769
Elbir, T., Cetin, B., Çetin, E., Bayram, A., Odabası, M.: Characterization of volatile organic 770 compounds (VOCs) and their sources in the air of İzmir, Turkey, Environ. Monit. Assess., 771 133: 149–160. 2007 772
Fanizza, C., Incoronato, F., Baiguera, S., Schiro, R., Brocco, D.: Volatile organic compound 773 levels at one site in Rome urban air. Atmospheric Pollution Research, 5, 303–314, 2014 774
Fernandez, M. G., Mahia, P. L., Lorenzo, S. M., Rodriguez, D. P., Fernandez, E. F.: 775 Distribution of volatile organic compounds during the combustion process in coal-fired 776 power station, Atmos. Environ., 35: 5823-5831, 2001 777
Glavas, S., Moschonas, N. First measurements of carbon tetrachloride and tetrachloroethene 778 in the atmosphere of Athens, Greece. Sci. Total. Environ, 290, 231-237, 2002 779
Gros, V., Williams, J., Aardenne, J.A., Salisbury, G., Hofmann, R., Lawrence, M.G., 780 Kuhlmann, R. V., Lelieveld, J., Krol, M., Berresheim, H., Lobert, J. M., Atlas, E.: Origin of 781 anthropogenic hydrocarbons and halocarbons measured in the summertime european outflow 782 (on Crete in 2001), Atmos. Chem. Phys., 3, 1223–1235, 2003 783
Guo, H., Lee, S. C., Chan, L. Y., Li, W. M.: Risk assessment of exposure to volatiles organic 784 compounds in different indoor environments, Environ. Res., 94, 57–66. 2004 785
Guo, H., Lee, S. C., Loure, P. K. K., Ho, K. F.: Characterization of hydrocarbons, 786 halocarbons and carbonyls in the atmosphere of Hong Kong, Chemosphere, 57, 1363–1372, 787 2004a 788
Guo, H., Wang, T., Louie, P. K. K.: Source apportionment of ambient non-methane 789 hydrocarbons in Hong Kong: application of a principal component analysis/absolute principal 790 component scores (PCA/APCS) receptor model, Environ. Pollut., 129 (3), 489–496, 2004b 791
Guo, H., Wang, T., Blake, D. R., Simpson, I. J., Kwok, Y. H., Li, Y. S.: Regional and local 792 contributions to ambient non-methane volatile organic compounds at a polluted rural/coastal 793 site in Pearl River Delta, China, Atmos. Environ., 40, 2345-2359, 2006 794
25
Guo, H., So, K. L., Simpson, I. J., Barletta, B., Meinardi, S., Blake, D. R.: C1-C8 volatile 795 organic compounds in the atmosphere of Hong Kong: overview of atmospheric processing 796 and source apportionment, Atmos. Environ., 41, 1456-1472, 2007 797
Gurjar, B., Aardenne, J. A. V., Lelieveld, J. Mohan, M.: Emission Estimates and Trends 798 (1990-2000) for Megacity Delhi and Implications, Atmos. Environ., 38, 5663-5681. 799 doi:10.1016/j.atmosenv.2004.05.057, 2004 800
Han, X. and Naeher, L. P.: A review of traffic-related air pollution exposure assessment 801 studies in the developing world, Environ. Int., 32, 106 – 120, 2006 802
Ho, K. F., Lee, S. C., Guo, H., Tsai, W. Y.: Seasonal and diurnal variations of volatile 803 organic compounds (VOCs) in the atmosphere of Hong Kong, Sci. Total. Environ., 322, 155–804 166, 2004 805
Hoque, R. R., Khillare, P. S., Agarwal, T., Shridhar, V., Balachandran, S.: Spatial and 806 temporal variation of BTEX in the urban atmosphere of Delhi, India, Sci. Total. Environ., 807 392, 30 – 40, 2008 808
Jobson, B. T., Parrish, D. D., Goldan, P., Kuster, W., Fehsenfeld, F. C., Blake, D. R., Blake, 809 N. J., Niki, H.: Spatial and temporal variability of nonmethane hydrocarbon mixing ratios and 810 their relation to photochemical lifetime, J. Geophys. Res., 103, 13557–13567, 1998 811
Jobson, B. T., Mckeen, S. A., Parrish, D. D., Fehsenfld, F. C., Blake, D. R., Goldstein, A. H., 812 Schauffler, S. M., Elkins, J. W.: Trace gas mixing ratio variability versus lifetime in the 813 troposphere and stratosphere: observations, J. Geophys. Res., 104, 16091–16113, 1999 814
Jorquera, H., Rappengluck, B.: Receptor modeling of ambient VOC at Santiago, Chile, 815 Atmos. Environ., 38, 4243–63, 2004 816
Karl, T., Crutzen, P.J., Mandl, M., Staudinger, M., Guenther, A., Jordan, A., Fall, R., 817 Lindinger, W.: Variability-lifetime relationship of VOCs observed at the Sonnblick 818 Observatory 1999-estimation of HO-densities, Atmos. Environ., 35, 5287–5300, 2001 819
Kaskaoutis, D. G., Kumar, S., Sharma, D., Singh, R. P., Kharol, S. K., Sharma, M., Singh, A. 820 K., Singh, S., Singh, A. and Singh, D.: Effects of crop residue burning on aerosol properties, 821 plume characteristics, and long-range transport over northern India, J. Geophys. Res. 822 Atmos.,119, 5424–5444, doi:10.1002/2013JD021357, 2014 823
Khillare, P. S., Hoque, R. R., Shridhar, V., Agarwal, T., Balachandran, S. Temporal 824 Variability of Benzene Concentration in the ambient Air of Delhi: A Comparative 825 Assessment of Pre- and Post-CNG Periods, J. Hazard. Mater., 154, 1013- 1018. 826 doi:10.1016/j.jhazmat.2007.11.006, 2008 827
Khoder, M.I.: Ambient levels of volatile organic compounds in the atmosphere of Greater 828 Cairo, Atmos. Environ., 41, 554–566. 2007 829
Kuntasal Ö. O.: Organic composition of particles and gases in the Ankara atmosphere. 830 Unpublished Ph.D. Thesis, METU, Ankara, 2005 831
26
Kurokawa, J., Ohara, T., Morikawa, T., Hanayama, S., Janssens-Maenhout, G., Fukui, T., 832 Kawashima, K., Akimoto, H.: Emissions of air pollutants and greenhouse gases over Asian 833 regions during 2000–2008: Regional emission inventory in Asia (REAS) version 2, Atmos. 834 Chem. Phys., 13, 11019–11058, doi:10.5194/acp-13-11019-2013, 2013 835
Lai, C. H., Chen, K. S., Ho, Y. T., Peng, Y. P., Chou, Y. M.: Receptor modelling of source 836 contributions to atmospheric hydrocarbons in urban Kaohsiung, Taiwan, Atmos. Environ., 837 39, 4543–4559, 2005 838
Lam. S. H. M., Saunders, S. M., Guo, H., Ling, Z. H., Jiang, F., Wang, X. M., Wang, T. J.: 839 Modelling VOC source impacts on high ozone episode days observed at a mountain summit 840 in Hong Kong under the influence of mountain-valley breezes, Atmos. Environ., 81, 166-176, 841 2013 842
Lanz, V. A., Buchmann, B., Hueglin, C., Locher, R., Reimann, S., Staehelin, J. Factor 843 analytical modeling of C2–C7 hydrocarbon sources at an urban background site in Zurich 844 (Switzerland): changes between 1993–1994 and 2005–2006, Atmos. Chem. Phys. Discuss., 8, 845 907–955, 2008 846
Latella, A., Stani, G., Cobelli, L., Duane, M., Junninen, H., Astorga, C., Larsen, B. R.: 847 Semicontinuous GC analysis and receptor modelling for source apportionment of ozone 848 precursor hydrocarbons in Bresso, Milan, 2003, J. Chromatogr. A., 1071, 29–39, 2005 849
Lee, L. K., Yoon, C. S., Kim, J. H., Kim, B., Kim, J.: A Study of Volatile Organic Compound 850 Concentrations in a New School Building over One Year Period, Toxicol. Environ. Health. 851 Sci., 4(4):248-255, DOI 10.1007/s13530-012-0143-4, 2012 852
Leuchner, M., Rappenglu, B.: VOC source–receptor relationships in Houston during 853 TexAQS-II. Atmos. Environ., 4, 4056–4067, 2010 854
Liang, Q., Newman, P. A., Daniel, J. S., Reimann, S., Hall, B. D., Dutton, G., & Kuijpers, L. 855 J. Constraining the carbon tetrachloride (CCl4) budget using its global trend and 856
inter‐hemispheric gradient. Geophys Res Lett, 41, 5307-5315, 2014 857
Liu, Y., Shao, M., Zhang, J. İ., Fu, L., Lu, S. Distributions and Source apportionment of 858 ambient volatile organic compounds in Beijing City, China, J. Environ. Sci. Health, Part A: 859 Tox. Hazard. Subst. Environ. Eng., 40, 1843–1860, 2005 860
Liu, Y., Shao, M., Fu, L., Lu, S., Zeng, L., Tang, D.: Source profiles of volatile organic 861 compounds (VOCs) measured in China: Part I, Atmos. Environ., 42, 6247–6260, 2008 862
Majumdar, D. (neé Som), Dutta, C., Mukherjee, A. K., Sen. S.: Source Apportionment of 863 VOCs at the Petrol Pumps in Kolkata, India; Exposure of Workers and Assessment of 864 Associated Health Risk, Transport. Res. D. Tr. E., 13, 524-530. 865 doi:10.1016/j.trd.2008.09.011, 2008 866
27
Majumdar, D., Ray, S., Chakraborty, S., Rao, P. S., Akolkar, A.B., Chowdhury, M. & 867 Srivastava, A.: Emission, speciation, and evaluation of impacts of nonmethane volatile 868 organic compounds from open dump site, J. Air Waste Manag. Assoc., 869 DOI:10.1080/10962247.2013.873747, 2014 870
Marinoni, A.: Aerosol mass and black carbon concentrations, a two year record at NCO-P 871 (5079 m, Southern Himalayas), Atmos. Chem. Phys., 10, 8551–8562, doi:10.5194/acp-10-872 8551-2010, 2010 873
Mayewski, P. A., Jeschke, P. A. (1979). Himalayan and Trans-Himalayan Glacier 874 Fluctuations Since AD 1812. Arct. Alp. Res., 11, 267–287. 875
Meena, J., Pathak, A., Soni, A., Soni, D., Kumar, A.: Study on ambient air quality monitoring 876 on Himalayan regions Garhwal and Kumaon, Uttarakhand, India, International Journal of 877 Applied Engineering and Technology, 2, 18-22, 2012 878
Momin, G. A., Rao, P. S. P., Safai, P. D., Ali, K., Naik, M. S. and Pillai, A. G.: Atmospheric 879 Aerosol Characteristic Studies at Pune and Thiruvananthapuram during INDOEX 880 Programme-1998, Curr. Sci., 76, 985–989, 1999 881
Mukherjee, A. K., Bhattacharya, S. K., Ahmed, S., Roy, S. K., Roychowdhury, A., Sen, S.: 882 Exposure of Drivers and Conductors to Noise, Heat, Dust and Volatile Or-ganic Compounds 883 in the State Transport Special Buses of Kolkata City, Transport. Res. D. Tr. E., 8, 11-19, 884 doi:10.1016/S1361-9209(02)00015-9, 2003 885
Na, K. S., Kim, Y. P., Chemical mass balance receptor model applied to ambient C2-C9 886 VOC concentration in Seoul, Korea: effect of chemical reaction losses, Atmos. Environ., 41, 887 6715-6728, 2007 888
Odabasi, M.: Halogenated Volatile OrganicCompounds from the Use of Chlorine-Bleach-889 Containing Household Products, Environ. Sci. Technol., 42, 1445–1451, 2008 890
Odum JR, Jungkamp TPW, Griffin RJ, Forstner HJL, Flagan RC, Seinfeld JH. Aromatics, 891 reformulated gasoline, and atmospheric organic aerosol formation. Environ. Sci. Technol., 892 31, 1890-1897, 1997 893
Ongwandee, M., Moonrinta, R., Panyametheekul, S., Tangbanluekal, C. and Morrison, G.: 894 Investigation of Volatile Organic Compounds in Office Buildings in Bangkok, Thailand: 895 Concentrations, Sources, and Occupant Symptoms, Build. Environ., 46, 1512-1522, 2011 896
Paatero, P., Tapper, U.: Positive matrix factorization: a non-negative factor model with 897 optimal utilization of error estimates of data values, Environmentrics, 5, 111-126, 1994 898
Paatero, P.: Least squares formulation of robust non-negative factor analysis, Chemometr. 899 Intell. Lab. Syst, 37, 23-35, 1997 900
Padhy, P. K., Varshney, C. K.: Total Non-Methane Volatile Organic Compounds 901 (TNMVOC) in the Atmos-phere of Delhi, Atmos. Environ., 34, 577-584, doi:10.1016/S1352-902 2310(99)00204-6, 2000 903
28
Prather, M. J., & Watson, R. T. (1990). Stratospheric ozone depletion and future levels of 904 atmospheric chlorine and bromine. Nature, 344, 729-734. 905
Rekhadevi, P., Rahman, M. F., Mahboob, M., Grover, P.: Genotoxicity in Filling Station 906 Attendants Exposed to Petroleum Hydrocarbons, Ann. Occup. Hyg., 54, 944–954. 907 doi:10.1093/annhyg/meq065, 2010 908
Reff, A., Eberly, S. I., Bhave, P. V.: Receptor modeling of ambient particulate matter data 909 using positive matrix factorization: review of existing methods, J. Air Waste Manag. Assoc., 910 57: 146-154, 2007 911
Sarkar C., Kumar, V., Sinha, V: Massive Emissions of Carcinogenic Benzenoids from Paddy 912 residue burning in North India, Curr Sci, 104, 1703-1709, 2013 913
Sarkar, C., Chatterjee, A., Singh, A. K., Ghosh, S. and Raha, S.: Characterization of Black 914 Carbon Aerosols over Darjeeling - A High Altitude Himalayan Station in Eastern India. 915 Aerosol. Air Qual. Res., doi: 10.4209/aaqr.2014.02.0028, 2014 916
Singla, V., Pachauri, T., Satsangi. A., Kumari. K. M., and Lakhani. A.: Comparison of BTX 917 Profiles and Their Mutagenicity Assessment at Two Sites of Agra, India, The ScientificWorld 918 Journal, Article ID 272853, 2012 919
Sinha, V., Kumar, V., and Sarkar, C.: Chemical composition of pre-monsoon air in the Indo-920 Gangetic Plain measured using a new air quality facility and PTR-MS: high surface ozone 921 and strong influence of biomass burning, Atmos. Chem. Phys., 14, 5921-5941, 922 doi:10.5194/acp-14-5921-2014, 2014 923
Som, D, Dutta, C., Chatterjee, A., Mallick, D., Jana, T. K., Sen, S.: Studies on Commuters’ 924 Exposure to BTEX in Passenger Cars in Kolkata, India, Sci. Total. Environ., 372, 426-432, 925 doi:10.1016/j.scitotenv.2006.09.025, 2007 926
Song, Y., Shao, M., Liu, Y., Lu, S. H., Kuster, W., Goldan, P., Xie, S.D.: Source 927 apportionment of ambient volatile organic compounds in Beijing, Environ. Sci. Technol., 41, 928 4348-4353, 2007 929
Srivastava, A.: Source Apportionment of Ambient VOCS in Mumbai City, Atmos. Environ., 930 38, 6829-6843, doi:10.1016/j.atmosenv.2004.09.009, 2004 931
Srivastava, A., Joseph, A. E., Nair, S.: Ambient Levels of Benzene in Mumbai City, Int. J. 932 Environ. Heal. R., 14, 215-222. doi:10.1080/0960312042000218624, 2004 933
Srivastava, A., Joseph, E., Wachasunnder, S. D.: Qualitative Detection of Volatile Organic 934 Compounds in Out-door and Indoor Air, Environ. Monit. Assess., 96, 263-271, 935 doi:10.1023/B:EMAS.0000031732.68465.af, 2004 936
Srivastava, A., Joseph, A. E., More, A., Patil, S.: Emis-sions of VOCs at Urban Petrol Retail 937 Distribution Centres in India (Delhi and Mumbai), Environ. Monit. Assess., 109, 227-242, 938 doi:10.1007/s10661-005-6292-z, 2005 939
29
Srivastava, A., Singh. R. N.: Use of Multimedia Mass Balance Model to Predict 940 Concentrations of Benzene in Microenvironment in Air. Environ. Modell. Softw., 20:1-5, 941 doi:10.1016/j.envsoft.2004.04.003, 2005a 942
Srivastava, A., Joseph, A. E., Patila, S., More, A., Dixit, R. C., Prakash, M.: Air Toxics in 943 Ambient Air of Delhi, Atmos. Environ., 39, 59-71. doi:10.1016/j.atmosenv.2004.09.053, 944 2005b 945
Srivastava, A., Sengupta, B., Dutta, S.A.: Source apportionment of ambient VOCs in Delhi 946 City. Sci. Total. Environ., 343, 207– 220, 2005c 947
Srivastava, A., Joseph, A. E., Devotta, S.: Volatile Organic Compounds in Ambient Air of 948 Mumbai – India, Atmos. Environ., 40, 892- 903. doi:10.1016/J.atmosenv.2005.10.045 , 2006 949
Srivastava, A., Nair, S. N., Joseph, A. E.: Ambient Concentration of Benzene in Air Due to 950 Vehicular Movement in Mumbai, Current Science. 91, 1-5. 2006 951
Srivastava, A., Som, D.: Hazardous Air Pollutants in Industrial Area of Mumbai–India. 952 Chemosphere, 69, 458-468, doi:10.1016/j.chemosphere.2007.04.050. 2007 953
Talapatra, A., Srivastava, A.: Ambient Air Non-Methane Volatile Organic Compound 954 (NMVOC) Study Initiatives in India - a Review Journal of Environmental Protection, 2, 21-955 36, doi:10.4236/jep.2011.21003, 2011 956
Ting, M., Yue-si, W., Hong-hui, X., Jie, J., Fang-kun, W., Xiao-bin, X.: A study of the 957 atmospheric VOCs of Mount Tai in June 2006. Atmos. Environ., 43, 2503–2508, 2009 958
Tiwari, V., Hanai, Y., Masunaga, S.: Ambient levels of volatile organic compounds in the 959 vicinity of petrochemical industrial area of Yokohama, Japan, Air. Qual. Atmos. Health, 3, 960 65–75, DOI 10.1007/s11869-009-0052-0, 2010 961
Wang, T., Guo, H., Blake, D. R., Kwok, Y. H., Simpson, I. J., and Li, Y. S. Measurements of 962 trace gases in the inflow of South China Sea background air and outflow of regional pollution 963 at Tai O, Southern China, J. Atmos. Chem., 52, 295–317, 2005 964
Watson, J. G., Chow, J. C., Fujita, E. M.: Review of volatile organic compound source 965 apportionment by chemical mass balance, Atmos. Environ., 35, 1567-1584. 2001 966
Williams, J., Koppmann, R.: Volatile Organic Compounds in the Atmosphere: An Overview, 967 in: Volatile Organic Compounds in the Atmosphere, Blackwell Publishing Ltd., Oxford, UK. 968 2007 969
Xie, Y. L., Berkowitz, C. M.: The use of positive matrix factorization with conditional 970 probability functions in air quality studies: an application to hydrocarbon emissions in 971 Houston, Texas, Atmos. Environ., 40, 3070–91, 2006 972
Yokelson, R. J., Christian, T. J., Karl, T. G., Guenther, A.: The tropical forest and fire 973 emissions experiment: laboratory fire measurements and synthesis of campaign data. Atmos. 974 Chem. Phys., 8, 3509–3527, 2008 975
30
Yuan, Z. B., Lau, A. K. H., Zhang, H. Y., Yu, J. Z., Louie, P. K. K., Fung, J. C. H.: 976 Identification and spatial distribution of dominant sources of PM10 in Hong Kong, Atmos. 977 Environ., 40, 1803–15, 2006 978
Yuan, B., Shao, M., Lu, S., Wang, B.: Source profiles of volatile organic compounds 979
associated with solvent use in Beijing, China, Atmos. Environ., 44, 1919–1926, 2010 980
Yurdakul, S., Civan, M., Tunce, G.: Volatile organic compounds in suburban Ankara 981 atmosphere, Turkey: Sources and variability. Atmos. Res., 120–121, 298–311, 2013 982
Zhang, J., Sun, Y., Wu, F., Sun, J., Wang, Y.: The characteristics, seasonal variation and 983 source apportionment of VOCs at Gongga Mountain, China, Atmos. Environ., 88, 297-305, 984 2014 985
986
987
988
989
990
991
992
993
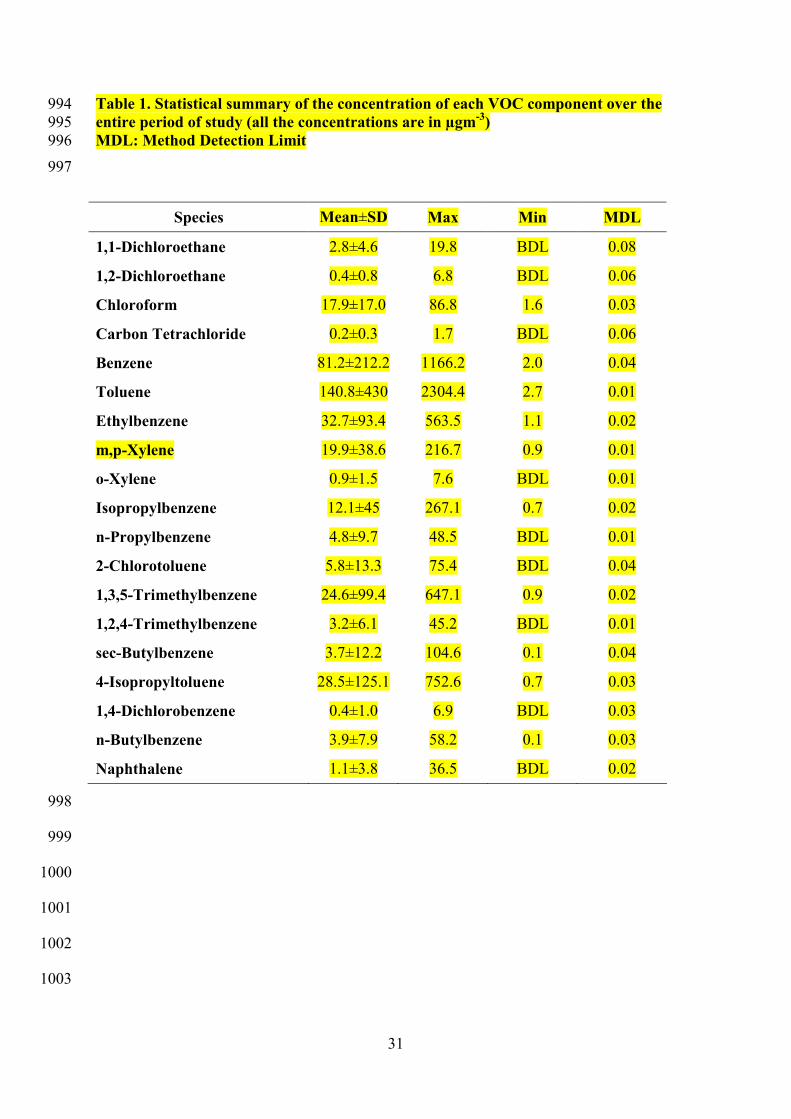
31
Table 1. Statistical summary of the concentration of each VOC component over the 994 entire period of study (all the concentrations are in µgm-3) 995 MDL: Method Detection Limit 996
997
998
999
1000
1001
1002
1003
Species Mean±SD Max Min MDL
1,1-Dichloroethane 2.8±4.6 19.8 BDL 0.08
1,2-Dichloroethane 0.4±0.8 6.8 BDL 0.06
Chloroform 17.9±17.0 86.8 1.6 0.03
Carbon Tetrachloride 0.2±0.3 1.7 BDL 0.06
Benzene 81.2±212.2 1166.2 2.0 0.04
Toluene 140.8±430 2304.4 2.7 0.01
Ethylbenzene 32.7±93.4 563.5 1.1 0.02
m,p-Xylene 19.9±38.6 216.7 0.9 0.01
o-Xylene 0.9±1.5 7.6 BDL 0.01
Isopropylbenzene 12.1±45 267.1 0.7 0.02
n-Propylbenzene 4.8±9.7 48.5 BDL 0.01
2-Chlorotoluene 5.8±13.3 75.4 BDL 0.04
1,3,5-Trimethylbenzene 24.6±99.4 647.1 0.9 0.02
1,2,4-Trimethylbenzene 3.2±6.1 45.2 BDL 0.01
sec-Butylbenzene 3.7±12.2 104.6 0.1 0.04
4-Isopropyltoluene 28.5±125.1 752.6 0.7 0.03
1,4-Dichlorobenzene 0.4±1.0 6.9 BDL 0.03
n-Butylbenzene 3.9±7.9 58.2 0.1 0.03
Naphthalene 1.1±3.8 36.5 BDL 0.02
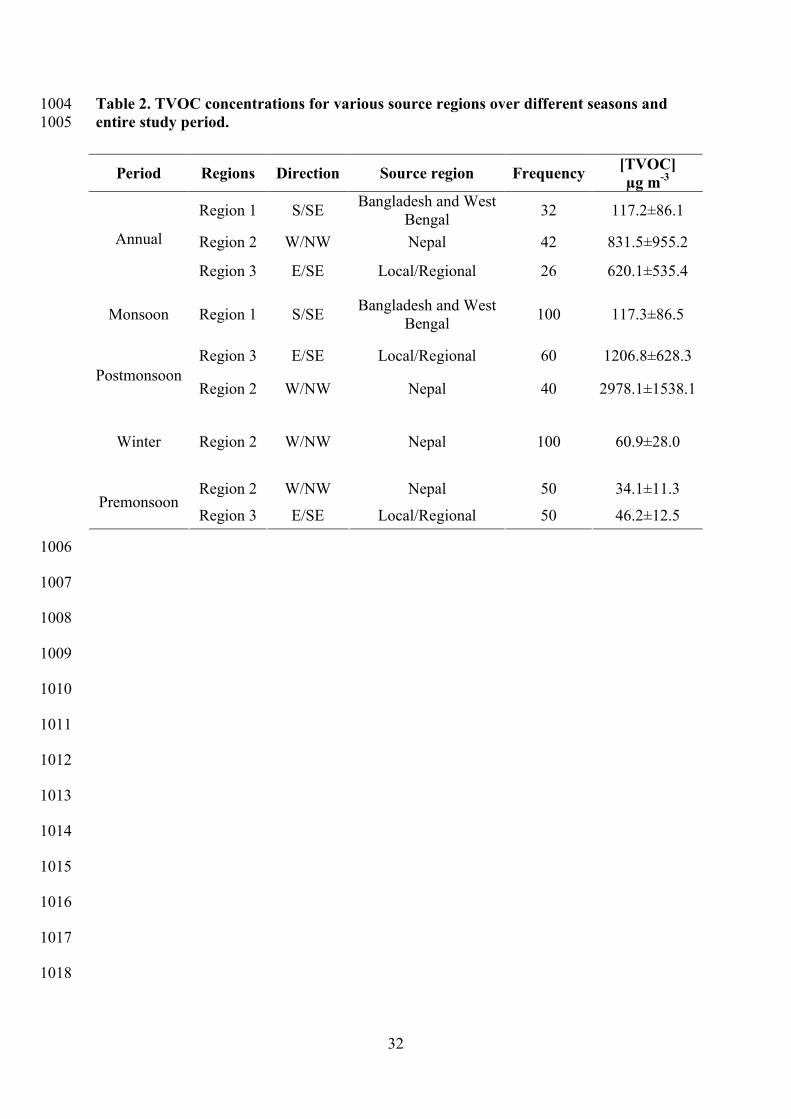
32
Table 2. TVOC concentrations for various source regions over different seasons and 1004 entire study period. 1005
1006
1007
1008
1009
1010
1011
1012
1013
1014
1015
1016
1017
1018
Period Regions Direction Source region Frequency [TVOC] µg m-3
Region 1 S/SE Bangladesh and West
Bengal 32 117.2±86.1
Region 2 W/NW Nepal 42 831.5±955.2 Annual
Region 3 E/SE Local/Regional 26 620.1±535.4
Monsoon Region 1 S/SE Bangladesh and West
Bengal 100 117.3±86.5
Region 3 E/SE Local/Regional 60 1206.8±628.3 Postmonsoon
Region 2 W/NW Nepal 40 2978.1±1538.1
Winter Region 2 W/NW Nepal 100 60.9±28.0
Region 2 W/NW Nepal 50 34.1±11.3 Premonsoon
Region 3 E/SE Local/Regional 50 46.2±12.5
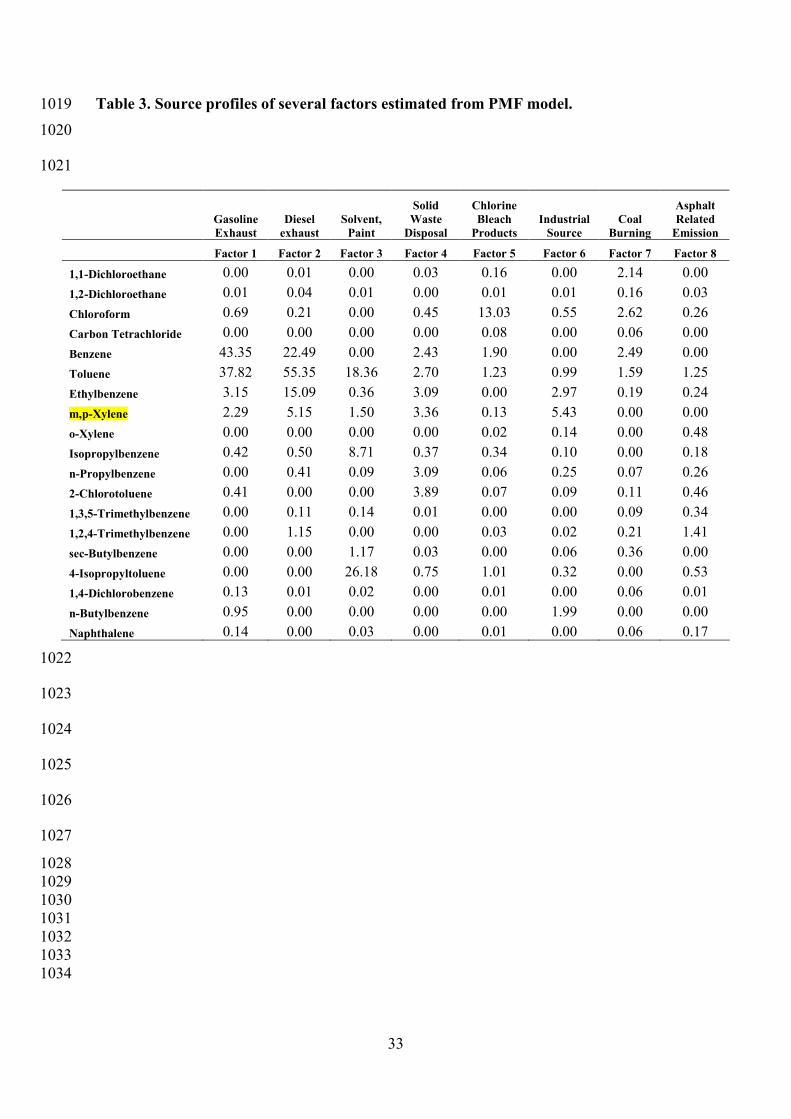
33
Table 3. Source profiles of several factors estimated from PMF model. 1019
1020
1021
1022
1023
1024
1025
1026
1027
1028 1029 1030 1031 1032 1033 1034
Gasoline Exhaust
Diesel exhaust
Solvent, Paint
Solid Waste
Disposal
Chlorine Bleach
Products Industrial
Source Coal
Burning
Asphalt Related
Emission
Factor 1 Factor 2 Factor 3 Factor 4 Factor 5 Factor 6 Factor 7 Factor 8
1,1-Dichloroethane 0.00 0.01 0.00 0.03 0.16 0.00 2.14 0.00
1,2-Dichloroethane 0.01 0.04 0.01 0.00 0.01 0.01 0.16 0.03
Chloroform 0.69 0.21 0.00 0.45 13.03 0.55 2.62 0.26
Carbon Tetrachloride 0.00 0.00 0.00 0.00 0.08 0.00 0.06 0.00
Benzene 43.35 22.49 0.00 2.43 1.90 0.00 2.49 0.00
Toluene 37.82 55.35 18.36 2.70 1.23 0.99 1.59 1.25
Ethylbenzene 3.15 15.09 0.36 3.09 0.00 2.97 0.19 0.24
m,p-Xylene 2.29 5.15 1.50 3.36 0.13 5.43 0.00 0.00
o-Xylene 0.00 0.00 0.00 0.00 0.02 0.14 0.00 0.48
Isopropylbenzene 0.42 0.50 8.71 0.37 0.34 0.10 0.00 0.18
n-Propylbenzene 0.00 0.41 0.09 3.09 0.06 0.25 0.07 0.26
2-Chlorotoluene 0.41 0.00 0.00 3.89 0.07 0.09 0.11 0.46
1,3,5-Trimethylbenzene 0.00 0.11 0.14 0.01 0.00 0.00 0.09 0.34
1,2,4-Trimethylbenzene 0.00 1.15 0.00 0.00 0.03 0.02 0.21 1.41
sec-Butylbenzene 0.00 0.00 1.17 0.03 0.00 0.06 0.36 0.00
4-Isopropyltoluene 0.00 0.00 26.18 0.75 1.01 0.32 0.00 0.53
1,4-Dichlorobenzene 0.13 0.01 0.02 0.00 0.01 0.00 0.06 0.01
n-Butylbenzene 0.95 0.00 0.00 0.00 0.00 1.99 0.00 0.00
Naphthalene 0.14 0.00 0.03 0.00 0.01 0.00 0.06 0.17
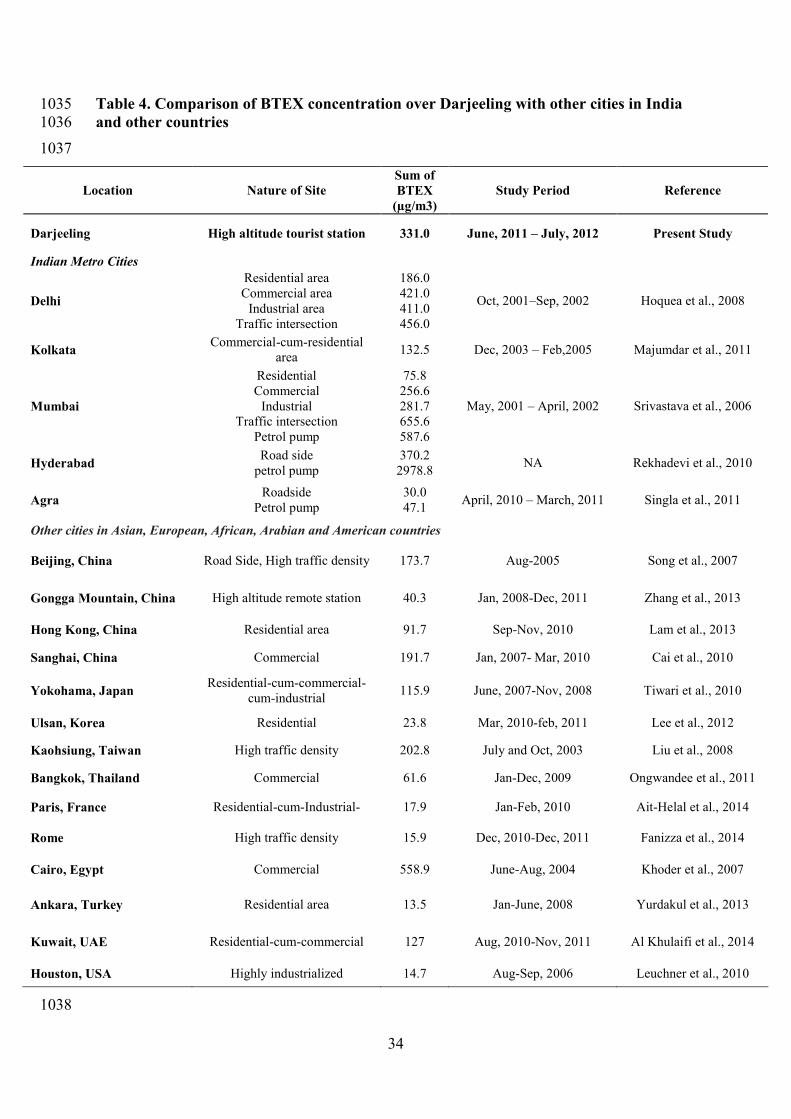
34
Table 4. Comparison of BTEX concentration over Darjeeling with other cities in India 1035 and other countries 1036
1037
Location Nature of Site Sum of BTEX
(µg/m3) Study Period Reference
Darjeeling High altitude tourist station 331.0 June, 2011 – July, 2012 Present Study
Indian Metro Cities
Delhi
Residential area Commercial area
Industrial area Traffic intersection
186.0 421.0 411.0 456.0
Oct, 2001–Sep, 2002 Hoquea et al., 2008
Kolkata Commercial-cum-residential
area 132.5 Dec, 2003 – Feb,2005 Majumdar et al., 2011
Mumbai
Residential Commercial
Industrial Traffic intersection
Petrol pump
75.8 256.6 281.7 655.6 587.6
May, 2001 – April, 2002 Srivastava et al., 2006
Hyderabad Road side
petrol pump 370.2
2978.8 NA Rekhadevi et al., 2010
Agra Roadside
Petrol pump 30.0 47.1
April, 2010 – March, 2011 Singla et al., 2011
Other cities in Asian, European, African, Arabian and American countries
Beijing, China Road Side, High traffic density 173.7 Aug-2005 Song et al., 2007
Gongga Mountain, China High altitude remote station 40.3 Jan, 2008-Dec, 2011 Zhang et al., 2013
Hong Kong, China Residential area 91.7 Sep-Nov, 2010 Lam et al., 2013
Sanghai, China Commercial 191.7 Jan, 2007- Mar, 2010 Cai et al., 2010
Yokohama, Japan Residential-cum-commercial-
cum-industrial 115.9 June, 2007-Nov, 2008 Tiwari et al., 2010
Ulsan, Korea Residential 23.8 Mar, 2010-feb, 2011 Lee et al., 2012
Kaohsiung, Taiwan High traffic density 202.8 July and Oct, 2003 Liu et al., 2008
Bangkok, Thailand Commercial 61.6 Jan-Dec, 2009 Ongwandee et al., 2011
Paris, France Residential-cum-Industrial- 17.9 Jan-Feb, 2010 Ait-Helal et al., 2014
Rome High traffic density 15.9 Dec, 2010-Dec, 2011 Fanizza et al., 2014
Cairo, Egypt Commercial 558.9 June-Aug, 2004 Khoder et al., 2007
Ankara, Turkey Residential area 13.5 Jan-June, 2008 Yurdakul et al., 2013
Kuwait, UAE Residential-cum-commercial 127 Aug, 2010-Nov, 2011 Al Khulaifi et al., 2014
Houston, USA Highly industrialized 14.7 Aug-Sep, 2006 Leuchner et al., 2010
1038
35
Figure Caption 1039 1040 Figure 1. The geographical location and aerial view of the sampling area and the hill station 1041 Darjeeling 1042 Figure 2. Seasonal variation of micro-meteorological parameters over Darjeeling during the 1043 study period. 1044 Figure 3. Seasonal variation of a)TVOC, b) mono aromatics-BTEX, c) non-BTEX substituted 1045 aromatics and d) halocarbons shown in box-whisker plot. The lower boundary of the box, the 1046 horizontal line inside the box and upper boundary of the box represent 25th percentile, median 1047 and 75th percentile respectively. The whiskers below and above represent minimum and 1048 maximum respectively. 1049 Figure 4. Day to day variation of TVOC with temperature and solar radiation. 1050 Figure 5. Source regions of VOCs obtained from air mass trajectories from HYSPLIT model. 1051 Figure 6. Variability-Lifetime relationship of different VOC’s for local/regional and long 1052 distant source regions. 1053 Figure 7. VOC Source profiles estimated from PMF model. 1054 Figure 8. Percentage contribution of various sources for VOC’s over Darjeeling. 1055 Figure 9. Ozone formation potential of each source of VOC’s. 1056 1057 1058
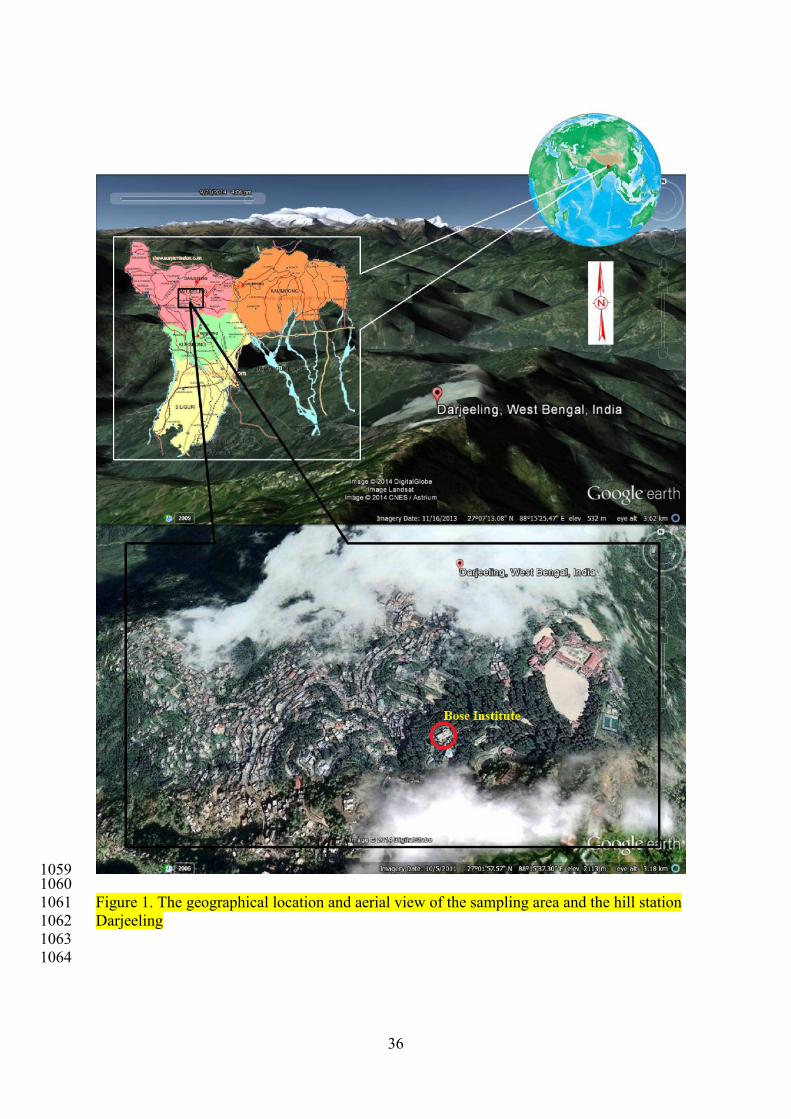
36
1059 1060 Figure 1. The geographical location and aerial view of the sampling area and the hill station 1061 Darjeeling 1062 1063 1064
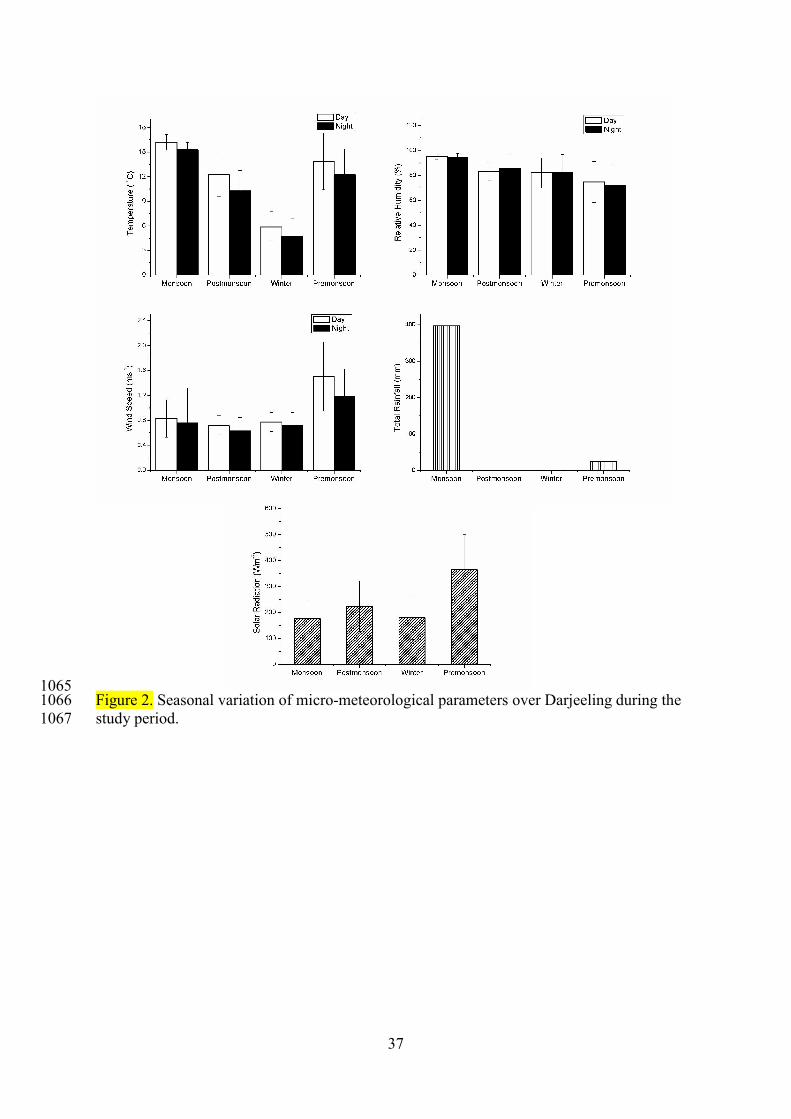
37
1065 Figure 2. Seasonal variation of micro-meteorological parameters over Darjeeling during the 1066 study period. 1067
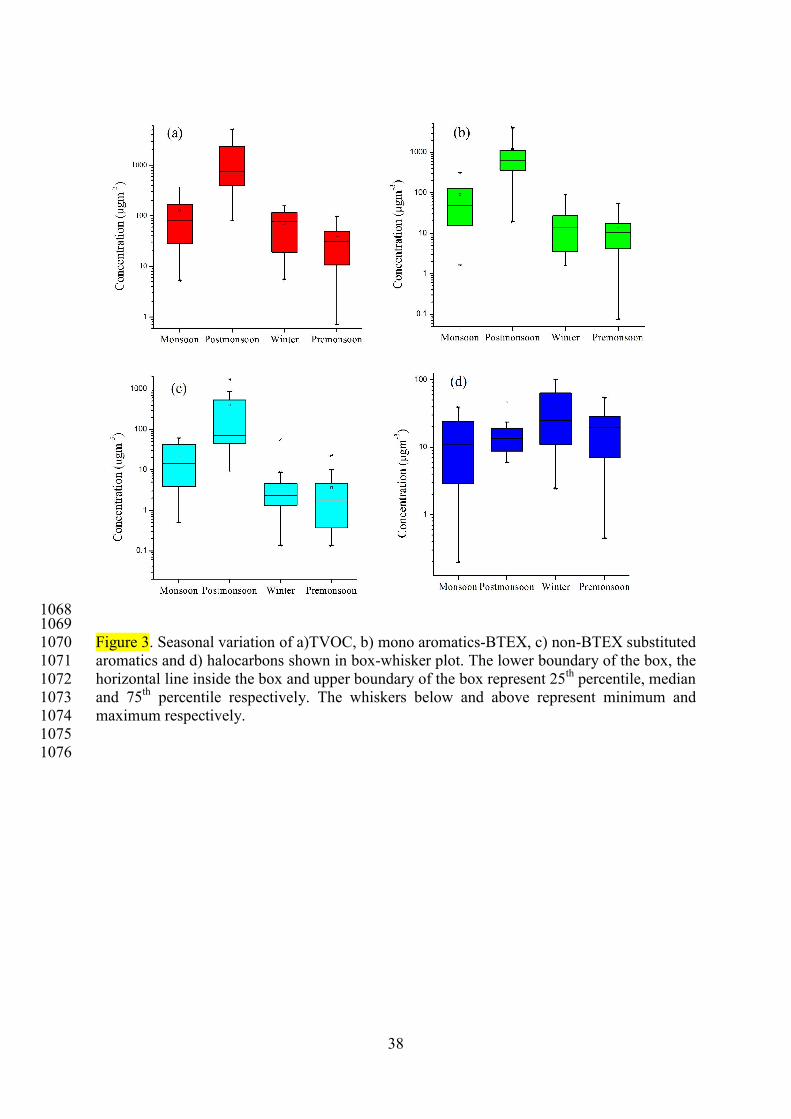
38
1068 1069 Figure 3. Seasonal variation of a)TVOC, b) mono aromatics-BTEX, c) non-BTEX substituted 1070 aromatics and d) halocarbons shown in box-whisker plot. The lower boundary of the box, the 1071 horizontal line inside the box and upper boundary of the box represent 25th percentile, median 1072 and 75th percentile respectively. The whiskers below and above represent minimum and 1073 maximum respectively. 1074 1075 1076
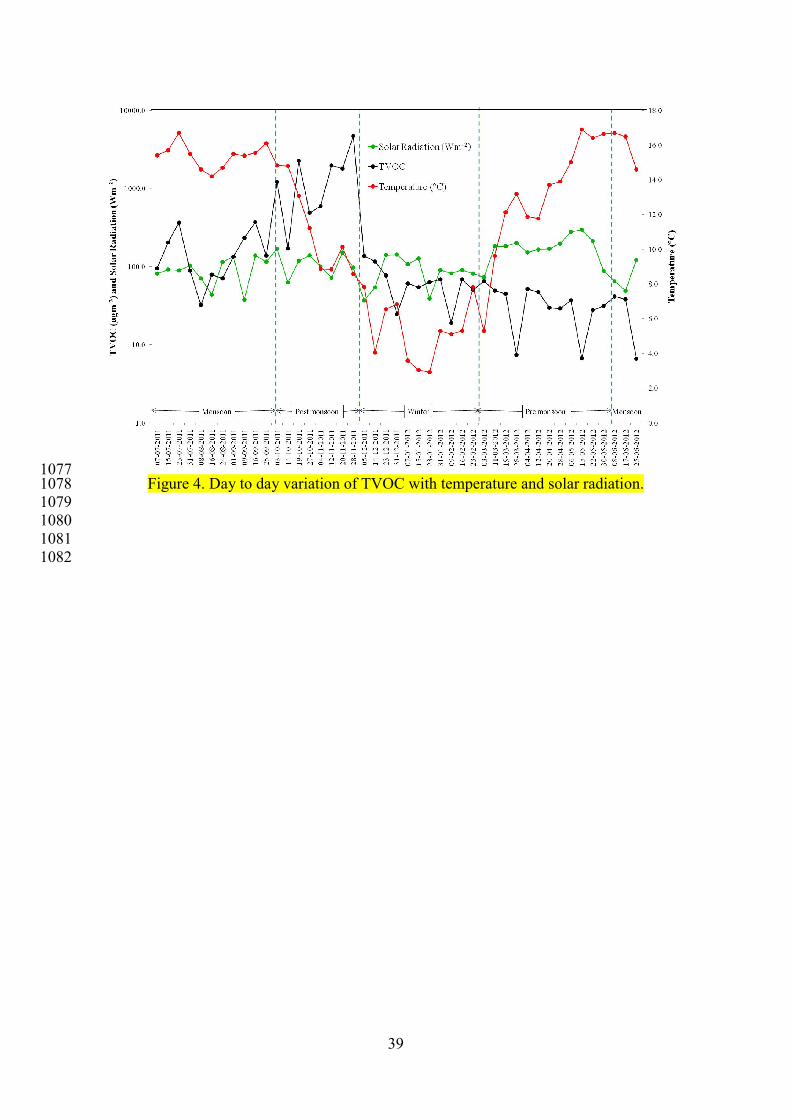
39
1077 Figure 4. Day to day variation of TVOC with temperature and solar radiation. 1078
1079 1080 1081 1082
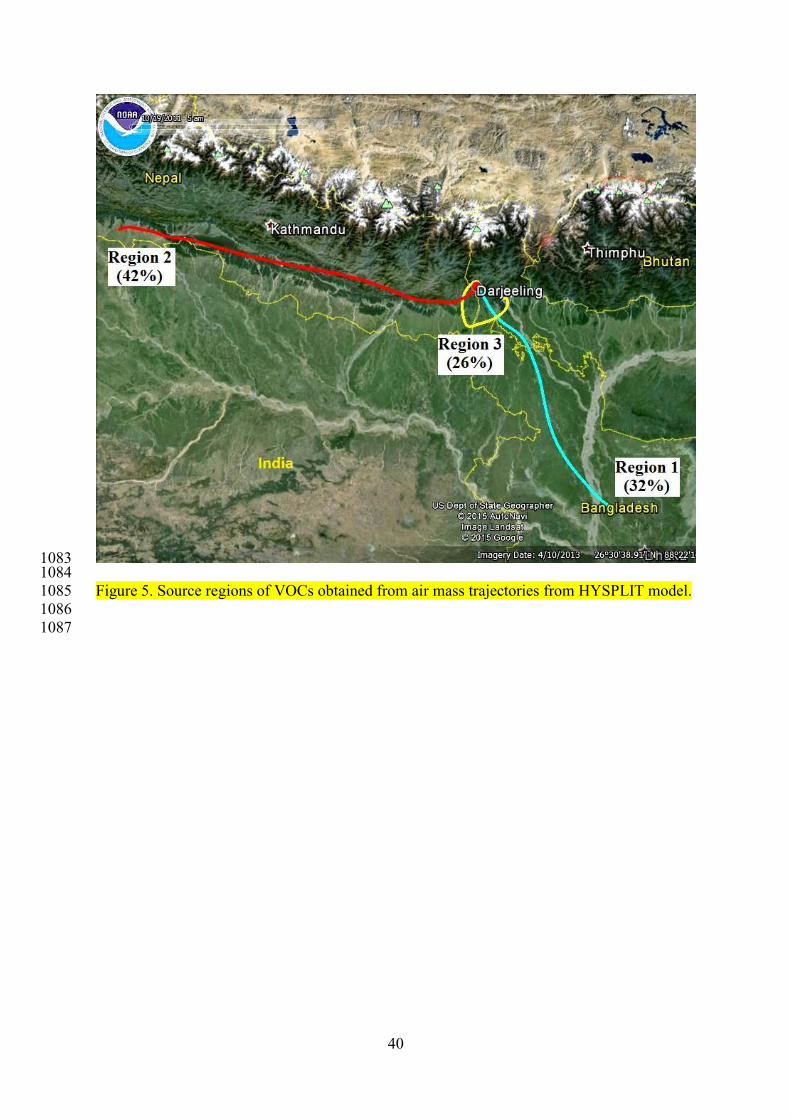
40
1083 1084 Figure 5. Source regions of VOCs obtained from air mass trajectories from HYSPLIT model. 1085 1086 1087
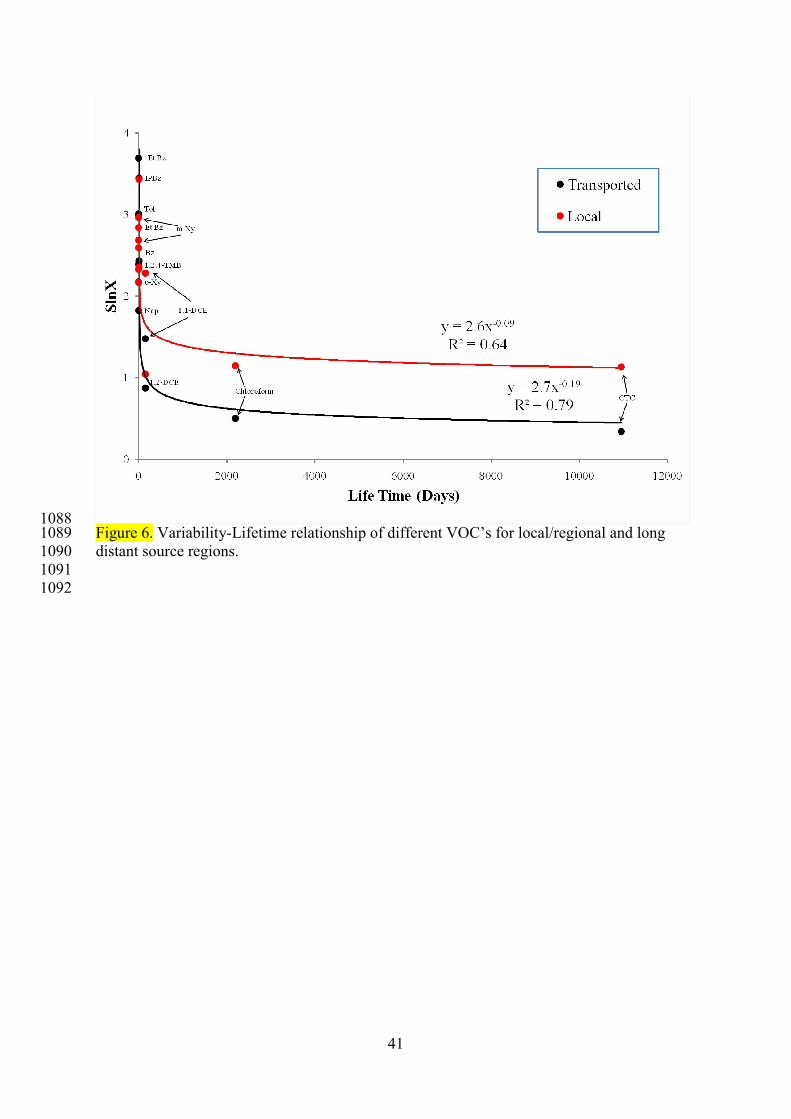
41
1088 Figure 6. Variability-Lifetime relationship of different VOC’s for local/regional and long 1089 distant source regions. 1090 1091 1092
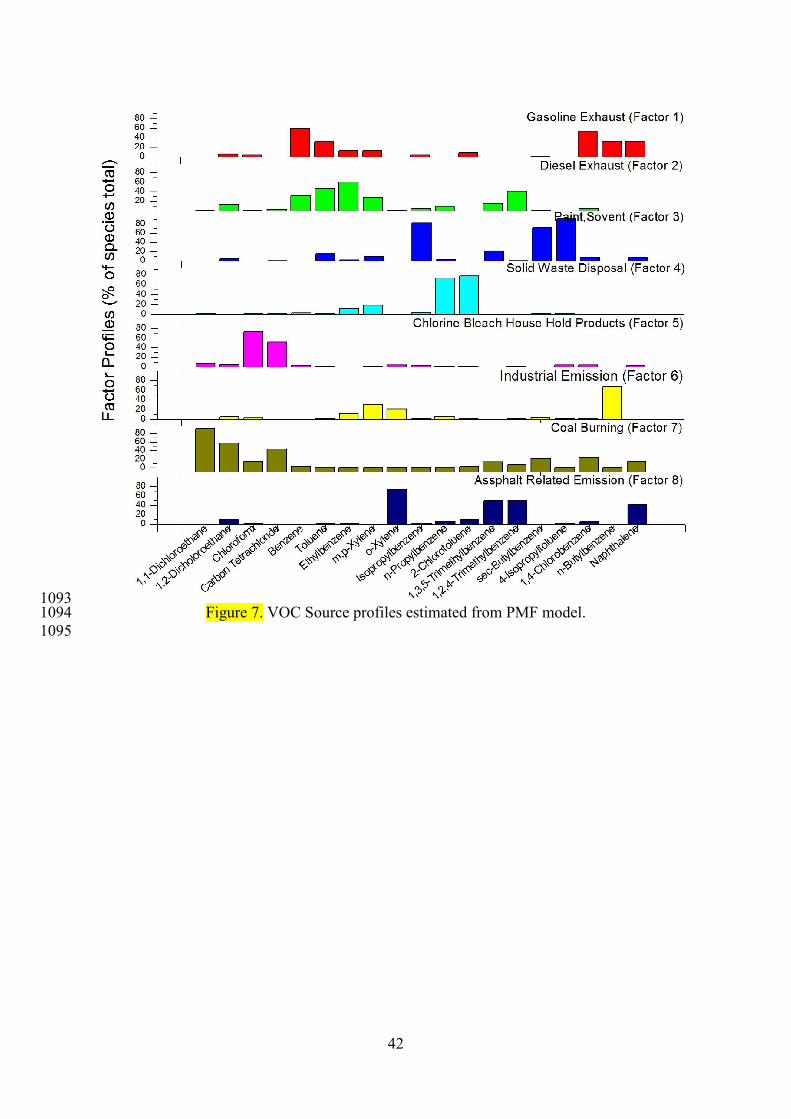
42
1093 Figure 7. VOC Source profiles estimated from PMF model. 1094
1095
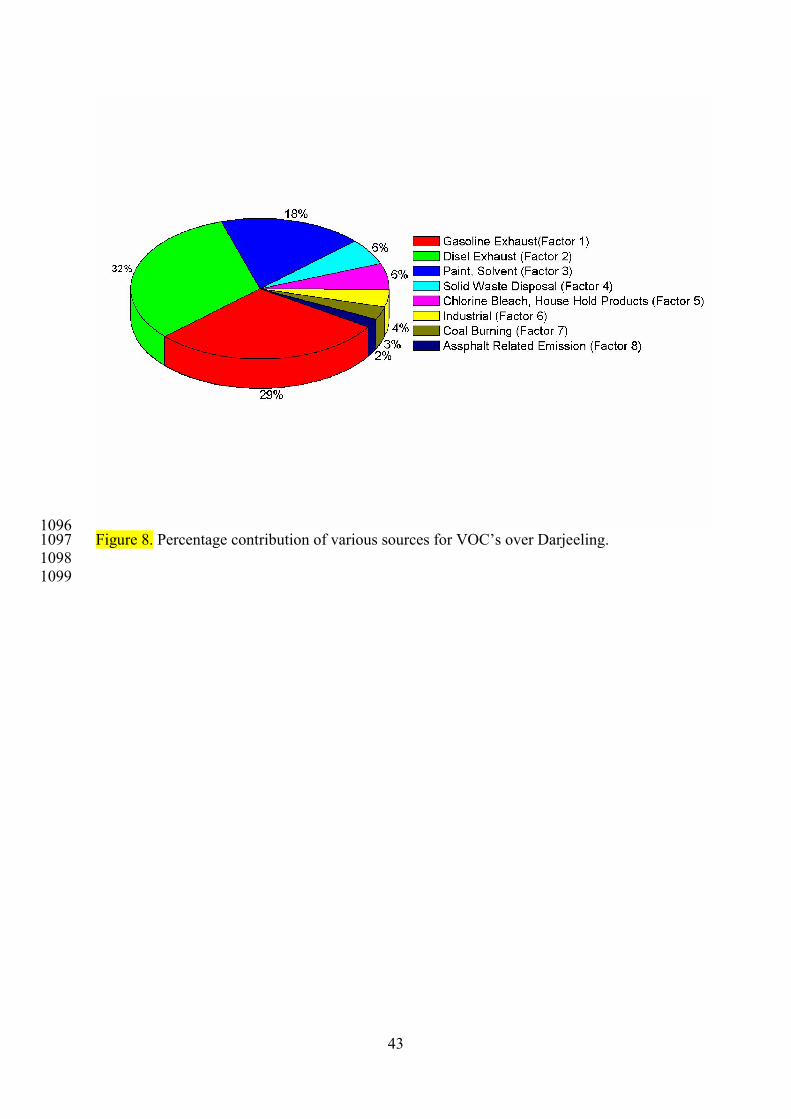
43
1096 Figure 8. Percentage contribution of various sources for VOC’s over Darjeeling. 1097 1098 1099
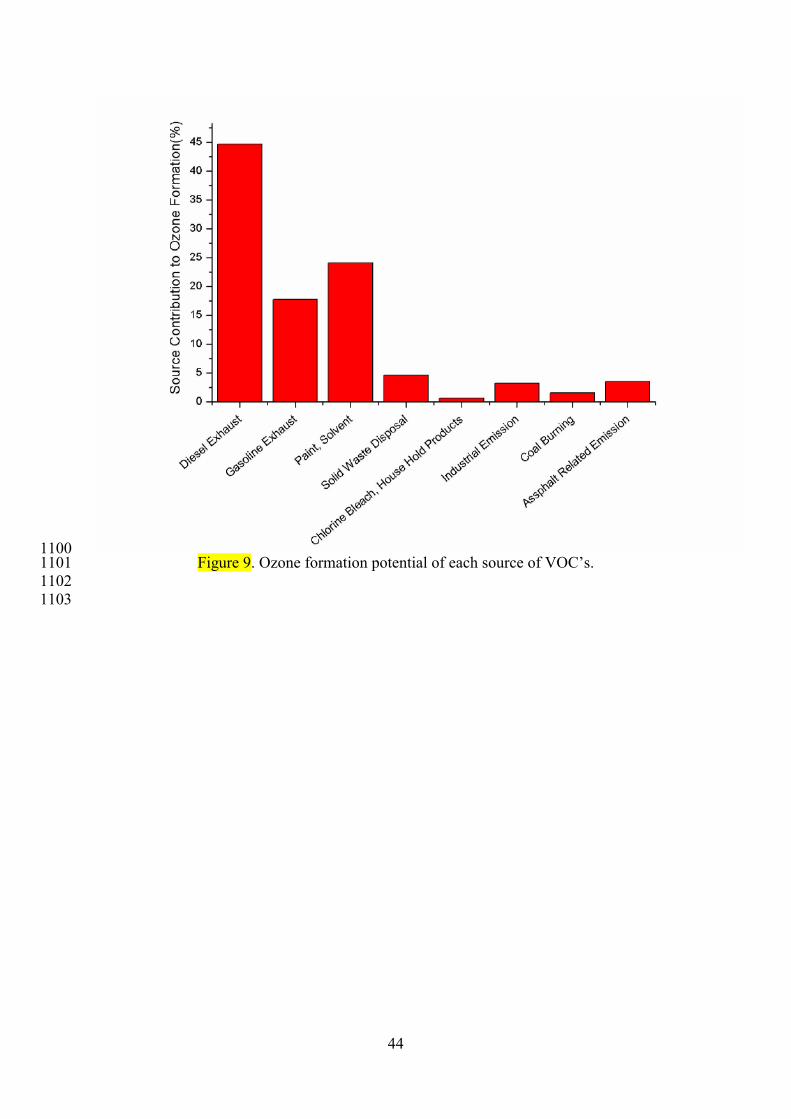
44
1100 Figure 9. Ozone formation potential of each source of VOC’s. 1101
1102 1103


