Embed Size (px)
Citation preview

May 2000 • EBRI Issue Brief 1
EBRIEMPLOYEEBENEFITRESEARCHINSTITUTE
EBRI Issue Brief Number 221 • May 2000 • © 2000. EBRI
Voluntary Long-Term Care Insurance:Best Practices for Increasing EmployeeParticipationby Jeremy Pincus, EBRI Fellow
Jan.
Feb.
Mar.
Apr.
May
Jun.
Jul.
Aug.
Sep.
Oct.
Nov.
Dec.
2000
May 2000
Issu
e Br
ief
®
• This is the second of two Issue Briefs (April and May 2000) on long-term care (LTC)insurance. The previous Issue Brief addressed the problem of increasing sponsorship,while this report addresses the issue of increasing employee participation.
• Participation rates in group LTC insurance plans tend to be low. A potential watershedevent for the development of the employment-based group LTC market is the proposedLTC program for federal employees and retirees (a program that would have to beenacted by Congress). The perception of a successful offering to federal employees couldprovide an enormous boost to the group LTC insurance market.
• Employee communication and education are seen as critical to the success of LTCenrollments. The importance of support shown by an employer for a new LTC planoffering cannot be overstated. Unlike 401(k) plan participation trends, LTC participa-tion rates are highest among large companies.
• Insurers tend to view the 40–60 age range as the primary target for group LTCinsurance, and employee salary as the best predictor of LTC insurance enrollment.Higher educational levels also are associated with higher levels of LTC participation.Perceived need for LTC insurance is perhaps the biggest barrier to the purchase of LTCinsurance by employees due to competing financial priorities and the fact that LTCissues are generally off the “radar screens” of younger employees.
• Plans with skilled nursing home and home care benefits experience higher participa-tion rates than plans lacking these benefits. The availability of lower-cost and longduration benefit options can be an important factor in determining participation.
• Most sponsors have chosen to offer noncontributory (i.e., fully employee-paid) LTCplans. Employer reluctance to make contributions may be caused by HIPAA’s prohibi-tion on the inclusion of LTC insurance in cafeteria plans.
• One of the major advantages of group LTC plans is the availability of guaranteed issue(i.e., issuing coverage without requiring evidence of insurability) for employees, whichis not available in the individual LTC market.
• It is easy for enrollment to be derailed by the presence of any of a number of harmfulconditions, such as employer-sponsors who distance themselves from the offer, ineffec-tive communications, or difficult enrollment processes. Achieving consistently stronglevels of participation in LTC plans will require employer-sponsors and their insurancecarriers to form strong partnerships, with worker participation as their primary statedgoal.

May 2000 • EBRI Issue Brief2
Jeremy Pincus, an EBRI Fellow, is director of quantitative research at Forbes Consulting Group in Newton,MA, and has held a number of senior marketing research positions, including director of marketing research forthe Business Insurance Group of John Hancock Mutual Life Insurance Co. This is the second of two Issue Briefsby Pincus on long-term care insurance (the first, EBRI Issue Brief no. 220, was published in April 2000, andfocused on employer sponsorship).
The author wishes to thank Ryan Foreman and Greg Crawford for their assistance with the multivari-ate analysis, and Donna Hetzel for her assistance with data collection. Technical issues surrounding themultivariate results are available from the author.
This Issue Brief was written with the assistance of the Employee Benefit Research Institute’s researchand editorial staffs. The EBRI Fellows Program provided a grant to support the author’s research in this area.Any views expressed in this report are the author’s and should not be ascribed to the officers, trustees, mem-bers, or other sponsors of EBRI, EBRI-ERF, or their staffs. Neither EBRI nor EBRI-ERF lobbies or takespositions on specific policy proposals. EBRI invites comments on this research.
TextIntroduction ..................................................................... 3Employee Participation ................................................... 4
Definitions ................................................................... 4Average Participation ................................................. 5Determinants of Participation.................................... 5Communication and Awareness ................................. 6Motivation and Ability to Process Messages ........... 11Acceptability of Plan Design and Pricing ................ 15Simplified Enrollment Process ................................. 20
Multivariate Results ...................................................... 21Demographic Effects ................................................. 22Plan Design and Offering ......................................... 23The Full Model .......................................................... 24Extensions of the Model and Directions for Future
Research ................................................................. 25Application of the Model to the Federal
Employee LTC Plan ............................................... 25Best Practices for Maximizing Participation ........... 27
Conclusion ...................................................................... 27References ...................................................................... 29
TablesTable 1, Employment-Based LTC Insurance
Participation Rates ..................................................... 5Table 2, Correlation of Employer Motivations for Spon-
sorship and LTC Insurance Participation Rates ..... 10Table 3, Supportive Actions of Employer Sponsors for
LTC Plan Enrollment ............................................... 11
Table 4, Source of Benefits and LTC InsuranceParticipation Rates ................................................... 12
Table 5, Most and Least Preferred Industries forEmployment-Based LTC Insurance ......................... 14
Table 6, Typical Employment-Based LTC InsurancePlan Design ............................................................... 17
Table 7, Average Employee Participation Rate by PlanFeatures ..................................................................... 19
Table 8, Average LTC Insurance Participation RatesAssociated With Enrollment Processes.................... 21
Table 9, Effects of Explanatory Demographic Variableson the Natural Log of Employee Participation........ 23
Table 10, Effects of Explanatory Plan Design andEmployer-Specific Variables on the Natural Log ofEmployee Participation ............................................ 24
Table 11, Effects of Various Explanatory Variables onthe Natural Log of Employee Participation............. 25
Table 12, State-Sponsored LTC InsuranceParticipation Rates ................................................... 26
Table 13, Values Associated With the Federal EmployeesUsed in Predicting Participation Rates .................. 26
Table 14, Predictions of Federal Employee LTC PlanParticipation Rates Under Different Scenarios,Using the Full Model ................................................ 27
Table 15, Best Practices for Maximizing EmployeeParticipation in Employment-Based LTCPlans .......................................................................... 28
ChartsChart 1, A Theoretical Model of the Determinants of
Employment-Based LTC Plan Participation ............. 6Chart 2, Group LTC Marketing Process: Best
Practice ........................................................................ 9Chart 3, Scatterplot of LTC Participation and
Proportion of Employees Over Age 40 ..................... 13Chart 4, Scatterplot of LTC Participation and Indexed
Average Employee Salary ......................................... 13
Table ofContents

May 2000 • EBRI Issue Brief 3
Introduction
Different proposals before Congress, however,would result in vastly different numbers of eligibleindividuals, ranging from approximately 8 million to20 million, significantly affecting the ultimate number oflives to be insured under this program. Advocates hopethat sponsorship of an LTC plan for federal employeeswill increase employer and consumer interest in LTCinsurance.
This report reviews several studies of theemployment-based group LTC market and analyzes thefactors associated with employee participation rates.Participation rates associated with group LTC are highlyvariable across employer groups, averaging less than10 percent, but reaching 40 percent and higher in somecases. The existing literature on group LTC enrollment isreviewed with an emphasis on insurer, employer,benefits consultant, and employee perspectives onfacilitating and inhibiting factors. Key concepts arereviewed and definitions recommended for assessingparticipation in group LTC plans.
Analysis of the existing data focuses on answer-ing the following questions:
• How should LTC participation rate be defined?• What levels of LTC participation are achieved, on
average?• What employer and employee characteristics are
associated with participation?• What plan designs are associated with participation
and which policy offerings are most popular amongemployee purchasers?
• What communications and enrollment campaigncharacteristics are associated with participation?
• What participation levels are most likely for theproposed LTC program for federal employees?
Results form the basis for a set of recommended“best practices” for maximizing employee participation.1 Jeremy Pincus, “Employer-Sponsored Long-Term Care Insurance: Best
Practices for Increasing Sponsorship,” EBRI Issue Brief no. 220 (Washington,DC: Employee Benefit Research Institute, April 2000).
As summarizedin a previousIssue Brief, 1
employment-based long-termcare (LTC)
insurance is increasingly viewed as a viable means ofreducing the growth in government obligations forfinancing long-term care. However, for private long-termcare insurance to soften the projected blow to the Medi-caid and Medicare programs, there would need to be adramatic increase in the prevalence of employer sponsor-ship from the current level of less than 1 percent, and anequally dramatic increase in the participation levels ofeligible workers. The previous Issue Brief addressed theproblem of increasing sponsorship, while this Issue Briefaddresses the issue of increasing the level of employeeparticipation.
A potential watershed event for the developmentof the employment-based group LTC market is theproposed LTC program for federal employees andretirees (a program that would have to be enacted byCongress). The perception of a successful offering tofederal employees could provide an enormous boost tothe group LTC insurance market; conversely, a federaloffering that is perceived as a failure has the potential tocurtail future market growth. The federal Office ofPersonnel Management (OPM) has clearly stated that itwould measure the success of this offering—if it isextended to federal employees—according to the partici-pation level. Participation in the proposed federaloffering has been estimated by OPM at 300,000 insuredlives, which would represent an increase in the size ofthe total U.S. group LTC market of approximately50 percent.

May 2000 • EBRI Issue Brief4
EmployeeParticipation
Althoughemployersponsorship ofLTC plans is anessentialprerequisite to
employee ownership of LTC insurance, the ultimatedeterminant of the extent of coverage is the rate ofparticipation (or “take-up rate”) by workers in employ-ment-based plans. The following section reviews theresults of several studies of the determinants of partici-pation in employment-based LTC plans and presentsrecommendations for maximizing participation involuntary plans.
DefinitionsDefinitions of participation rates vary dramatically bothwithin and outside of the LTC insurance industry.Participation rates may be calculated using a variety ofmethods including:
• Employee participation rate:employees insured
employees eligible
• Retiree participation rate:retirees insured
retirees eligible
• Aggregate participation rate:(employeesinsured + retireesinsured + spousesinsured+ parents/in-lawsinsured + ...)
employeeseligible + retireeseligible
• Book of business participation rate:(employeesever-insured + retireesever-insured +spousesever-insured + parents/in-lawsever-insured + ...
employeesever-eligible + retireesever-eligible
=
2 The target participation rates of five top group LTC insurance companiesrange from 5 percent to 12 percent (The Advisory Board Company, 1996).
3 Younger work forces are more likely to have living parents, but are lesslikely to be married, than older work forces. At the group level, employeespouses are more likely to enroll in LTC plans than parents/in-laws ofemployees.
Employee, retiree, and aggregate participationrates tend to be reported when participation is sought ona company-by-company basis, especially following theinitial enrollment. Cumulative participation rates (i.e.,participation rates for a specific company or an entirebook of business that are aggregated over time) tend tobe used to measure an insurer’s (or company’s) overallparticipation rate over time. Actuaries tend to viewparticipation in terms of ultimately achieving a targetparticipation rate after a specified number of years,which allows estimation of the base size for spreadingfixed and variable costs of enrollment and administra-tion.2
For purposes of comparison, when cumulativeparticipation rates are reported, it is important to knowwhether lapses and deaths are included in the numera-tor (i.e., is the numerator a measure of individuals everor currently insured?). Clear definition of the denomina-tor is also important because company employment isdynamic, with higher worker displacement rates seen inthe mid-1990s than during the 1980s (Aaronson andSullivan, 1998). Many employer sponsors of LTC insur-ance have experienced higher participation rates overtime, primarily due to downsizing of the number ofeligible employees during the 1990s.
Because the promise of significant savings topublic programs depends upon widespread ownershipamong working-age adults, for the purposes of thispaper, the participation rate will be defined as employeeparticipation rate. Employee participation rate alsoaffords researchers greater specificity, as the size of theeligible group is a known quantity; aggregate participa-tion is less specific, as numbers of eligible spouses andparents are generally unknown and can vary signifi-cantly by industry.3 Employee participation rate will be
=
=
∑
∑
∑=
∑

May 2000 • EBRI Issue Brief 5
4 To evaluate the success of LTC insurance campaigns, ideally, participationrates within defined employee target markets (e.g., employees age 40 and olderearning $40,000 or more) should be measured and compared for addedspecificity.
used in this report to evaluate the relative influences ofsponsoring company environments, demographics,enrollment campaigns, and plan designs.4
Average ParticipationDue to a variety of factors, employee participation ratescurrently average less than 10 percent and vary widelyamong sponsoring companies within the range of lessthan 1 percent to 46 percent (Brenerman, 1999; seetable 1). Participation rates tend to run lower still amongretiree and parent-eligible groups (parents and parents-in-law of eligible employees) due to employer-negotiatedpricing, which favors active employee ages, and generallylower income levels among retirees and parents.
The average participation rate associated withemployment-based LTC plans is relatively low whencompared with other types of employment-based volun-tary plans, and extremely low when compared with“core” benefits such as health insurance and 401(k)salary deferral retirement plans. According to LIMRA’s1994 survey of insurance carriers, participation rates formost types of voluntary employment-based groupinsurance plans range between 32 percent and 48 per-cent, as follows: accidental death and dismemberment,32 percent; supplemental life, 36 percent; dental, 43 per-cent; and long-term disability, 48 percent. The samesurvey found group LTC average participation to be the“outlier” at just 5 percent; LIMRA suggests that thereason for relatively low LTC participation may be lowlevels of interest among younger employees and the highcost of premiums for older workers.
By comparison, the Employee Benefit ResearchInstitute estimates that 83 percent of workers offeredhealth insurance participate in their employer’s healthplan (Fronstin, 1999). A recent survey by Buck Consult-ants (1999) found average employee participation in
Table 1Employment-Based Long-Term Care
Insurance Participation Rates
Sample Distribution
Ranges of International FoundationParticipation Ratesa Mercer of Employee Benefit Plans
15% or Higher 12% 3%10%–14% 16 175%–9% 23 19Less than 5% 49 52Executive Only NA 5No Response NA 5
Total 100 101b
Average Participation
LIMRA International, 1994 5%LIMRA International, 1999c 8William M. Mercer, 1998 6.2Health Insurance Association of America, 1998 6Bureau of Labor Statistics, Part-Time Employees, 1997 3Bureau of Labor Statistics, Full-Time Employees,
Medium and Large Establishments, 1995 6Bureau of Labor Statistics, Full-Time Employees,
Small Establishments, 1996 1Datamonitor, 1997 2Lutzky et al., 1999 8.8
Sources: William M. Mercer (1998), International Foundation of EmployeeBenefit Plans (1999), The Advisory Board (1995), LIMRA International (1999),U.S. Department of Labor, Bureau of Labor Statistics, Employee Benefits inMedium and Large Private Establishments, 1997, Datamonitor (1997), Lutzky etal. (1999).aBecause no definition of participation rate was provided to respondents andresponses tended to be rounded, the percentages should be interpreted withcaution.bDoes not equal 100 percent because of rounding.cLIMRA International, Worksite Marketing of Voluntary Products: A GroupInsurance Perspective (Windsor, CT: LIMRA International, 1999).
401(k) plans to be 77 percent, ranging from 67 percent ofworkers whose plans have no employer match to 70 per-cent to 99 percent for those with an employer match,depending on the type of match provided.
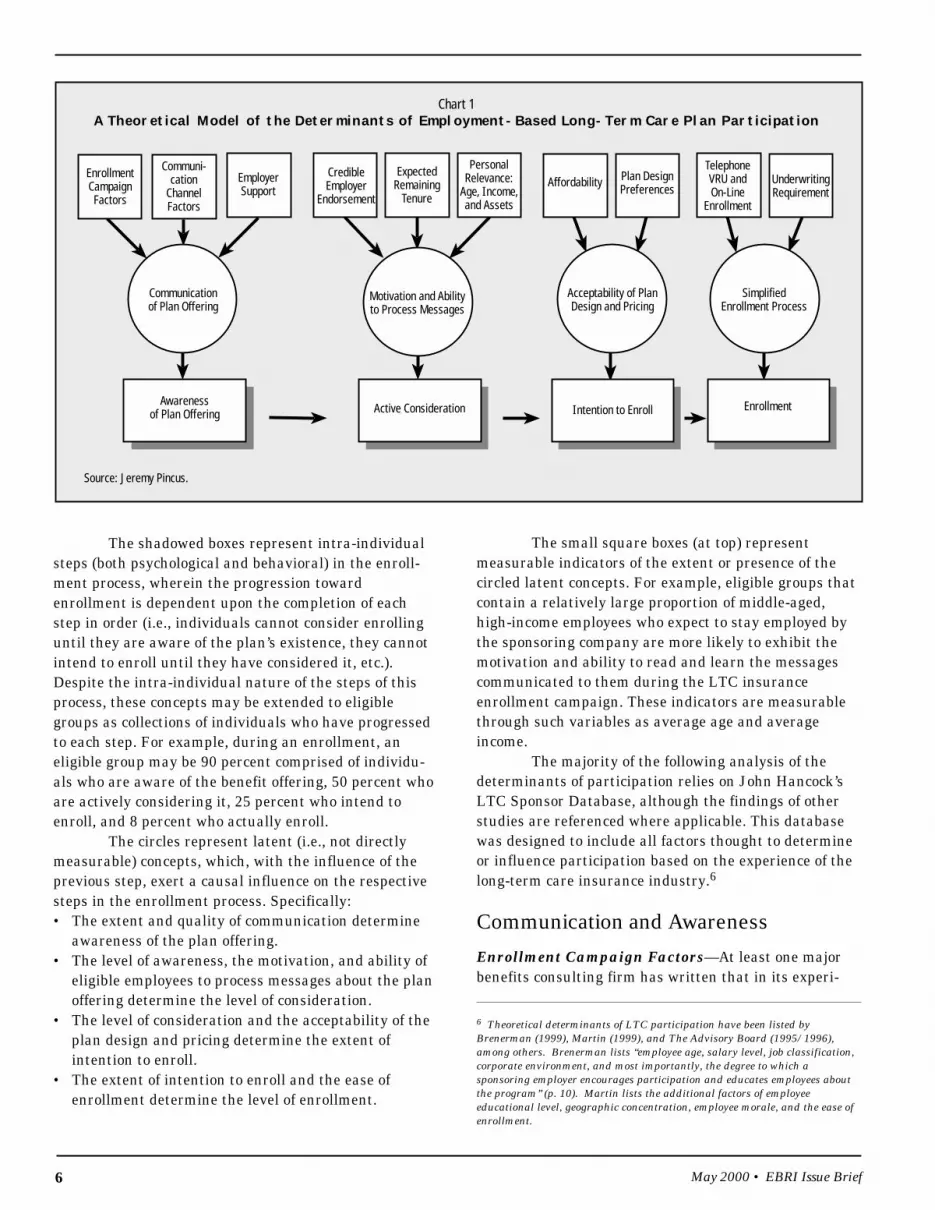
Determinants of ParticipationA theoretical model is proposed to summarize some ofthe more important antecedents of LTC plan participa-tion (see chart 1). Although this model is intended todescribe enrollment in employment-based LTC plans, itis conceptually similar to many general communicationprocess models5 and could be applied to any new volun-tary benefit offering.
5 Examples include Strong’s AIDA model (1925), Lavidge and Steiner’s“Hierarchy of Effects” model (1961), McGuire’s “Information Processing”model (1978), and Colley’s DAGMAR method (1961) of setting advertisingcampaign objectives, summarized in Belch and Belch (1990).
May 2000 • EBRI Issue Brief6
Chart 1A Theoretical Model of the Determinants of Employment-Based Long-Term Care Plan Participation
Source: Jeremy Pincus.
The shadowed boxes represent intra-individualsteps (both psychological and behavioral) in the enroll-ment process, wherein the progression towardenrollment is dependent upon the completion of eachstep in order (i.e., individuals cannot consider enrollinguntil they are aware of the plan’s existence, they cannotintend to enroll until they have considered it, etc.).Despite the intra-individual nature of the steps of thisprocess, these concepts may be extended to eligiblegroups as collections of individuals who have progressedto each step. For example, during an enrollment, aneligible group may be 90 percent comprised of individu-als who are aware of the benefit offering, 50 percent whoare actively considering it, 25 percent who intend toenroll, and 8 percent who actually enroll.
The circles represent latent (i.e., not directlymeasurable) concepts, which, with the influence of theprevious step, exert a causal influence on the respectivesteps in the enrollment process. Specifically:• The extent and quality of communication determine
awareness of the plan offering.• The level of awareness, the motivation, and ability of
eligible employees to process messages about the planoffering determine the level of consideration.
• The level of consideration and the acceptability of theplan design and pricing determine the extent ofintention to enroll.
• The extent of intention to enroll and the ease ofenrollment determine the level of enrollment.
The small square boxes (at top) representmeasurable indicators of the extent or presence of thecircled latent concepts. For example, eligible groups thatcontain a relatively large proportion of middle-aged,high-income employees who expect to stay employed bythe sponsoring company are more likely to exhibit themotivation and ability to read and learn the messagescommunicated to them during the LTC insuranceenrollment campaign. These indicators are measurablethrough such variables as average age and averageincome.
The majority of the following analysis of thedeterminants of participation relies on John Hancock’sLTC Sponsor Database, although the findings of otherstudies are referenced where applicable. This databasewas designed to include all factors thought to determineor influence participation based on the experience of thelong-term care insurance industry.6
Communication and AwarenessEnrollment Campaign Factors—At least one majorbenefits consulting firm has written that in its experi-
6 Theoretical determinants of LTC participation have been listed byBrenerman (1999), Martin (1999), and The Advisory Board (1995/1996),among others. Brenerman lists “employee age, salary level, job classification,corporate environment, and most importantly, the degree to which asponsoring employer encourages participation and educates employees aboutthe program” (p. 10). Martin lists the additional factors of employeeeducational level, geographic concentration, employee morale, and the ease ofenrollment.
EnrollmentCampaignFactors
Communi-cation
ChannelFactors
EmployerSupport
CredibleEmployer
Endorsement
ExpectedRemaining
Tenure
PersonalRelevance:
Age, Income,and Assets
Affordability Plan DesignPreferences
TelephoneVRU andOn-Line
Enrollment
UnderwritingRequirement
Communicationof Plan Offering
Motivation and Abilityto Process Messages
Awarenessof Plan Offering Active Consideration Intention to Enroll Enrollment
Acceptability of PlanDesign and Pricing
SimplifiedEnrollment Process
May 2000 • EBRI Issue Brief 7
ence, communication is the mostcritical factor determining LTC partici-pation (William M. Mercer, 1998c).7
Similarly, respondents to both theMercer and LIMRA surveys mentionedcommunication and education ascritical to the success of LTC enroll-ments; the Mercer survey found that fully 38 percent ofplan sponsors wished to have communicated moreeffectively. This suggests that communication plays acrucial role in generating plan participation.
Reach, Frequency, and Effectiveness—Reach is ameasure of the size of the audience actually exposed to atleast one communication during a specific period of time.Frequency refers to the number of exposures that theaudience receives to a communication (Belch and Belch,1990). Message effectiveness refers to the ability to drawattention, convey cogent messages understandably andpersuasively, and motivate readers toward enrollment.8
Employment-based LTC campaigns are gener-ally communicated to all benefit-eligible employees, nottargeted to a specific class of employees. Thus, employersusually intend to reach all employees with communica-tions about LTC plan offerings. Employers differ,however, in the type of communications that are sent toall employees: Some merely intend to inform theiremployees that a new benefit is available, whereasothers prefer to distribute enrollment kits with applica-
tions to each employee. Employersalso differ with regard to the effec-tiveness and amount/frequency ofplan communication.9
Communications expenditureper eligible employee provides animperfect proxy for reach, as new
forms of communication such as e-mail, voice mail, andthe Internet offer the potential to reach many employeesinexpensively. Traditional benefits communicationvehicles, such as employee meetings, benefits fairs, andhome mailings, are usually more costly. Nevertheless, tothe extent that employers are using new communicationstechnologies equally, expenditure per eligible employeeshould reflect variation in reach. The correlation betweencommunications expenditure per employee and employeeparticipation rate is positive and significant (r = 0.35,p = 0.03), indicating that reach may be a significantfactor.10 (r is a measure of linear association between twovariables, p is the observed significance level.)
As further evidence of the influence of reach andfrequency on participation rate, the success11 of the self-funded California Public Employees’ Retirement System(CalPERS) LTC insurance program has been largelyattributed by observers to intensive education andmarketing by CalPERS and its administrator, UnitedHealth Care. The enrollment campaign featuredmultiple mailings to eligible individuals, more than300 statewide enrollment meetings, and the support of
7 This sentiment is echoed by Brenerman (1999): “Communication is the keyto success in employer-sponsored LTC plans. The higher the input of theemployer, the more likely that better participation rates will occur” (p. 10).
8 The effectiveness of messages in producing desired attitudinal andbehavioral outcomes has been thought to be the result of the interplay of thecogency of message arguments, the quality of the presentation, the presence ofcues to accept the message (e.g., a credible source), and receiver factors, suchas their level of involvement in the issue being presented (Petty and Cacioppo,1986).
9 Brenerman (1999) confirms the importance of reach and frequency ofcommunications: “Experience has shown that a mere announcement of theavailability of a plan and distribution of plan materials are not sufficient to
With regard to effectivepositioning of LTCinsurance, data
strongly suggest thatLTC should be closely
tied to employee retire-ment planning; nearly
30 percent of plansponsors wished they
had done so.
experience good participation rates. Follow-up communication is essentialand has proven to be extremely effective in increasing participation rates”(p. 11).
10 The large enrollment of CalPERS may be due in large part to theinvestment by United Health Care of more than $3 million in the CalPERScampaign and retainer of the marketing firm of Saatchi and Saatchi to guidethe campaign (Mahoney, 1995).
11 CalPERS provides benefits for more than 776,000 active and inactivemembers and approximately 332,000 retirees (Business Wire, April 9, 1999).With more than 115,000 LTC participants, CalPERS’ aggregate participationrate = 115,000/1,108,000 = 10.4 percent. The current administrator’s (i.e.,The Long Term Care Group) Web site estimates the number of eligible personsat nearly 5 million, which would drop the participation rate to 2.3 percent.
May 2000 • EBRI Issue Brief8
multiple public agency employers and associations.12
An effective proxy for frequency is the number ofseparate employee exposures to LTC communicationsduring a given enrollment campaign. The correlationbetween number of exposures and employee participa-tion rate is positive but nonsignificant (r = 0.19,p = 0.18), indicating that frequency is positively relatedto participation but with less strength of associationthan reach.
A great deal of research has been devoted toincreasing the effectiveness of employment-based LTCcommunications, specifically addressing the problem ofdirecting the attention of young employees to the distantissue of long-term care financing. The use of communica-tions that accomplish this feat should be associated withhigher participation enrollments, and there is anecdotalevidence that this is the case.
With regard to effective positioning of LTCinsurance, analysis of the Mercer data strongly suggeststhat LTC should be closely tied to employee retirementplanning; nearly 30 percent of plan sponsors wished theyhad done so. This finding suggests that integration ofLTC with retirement planning vehicles or themes shouldbe a goal of the communications campaign.13 A frame-work for the integration of the LTC insurance offerwithin the scope of company retirement planning is
presented by Granza, Madamba, and Warshawsky(1998).
Communications media also vary in theireffectiveness. It is a truism among work site marketersand insurance agents that LTC sales require one-on-onecontact (Metropolitan Life Insurance Co., 1995), whichcan be impractical in dispersed employer-group enroll-ments. Group seminars provide the opportunity forface-to-face contact, and industry research has foundevidence that such meetings can be very effective inincreasing participation.14
Timing of Enrollment—Enrollment of LTC insuranceat a time other than during the main benefits enrollmentperiod (i.e., off-cycle) has a nonsignificant positivecorrelation with participation (r = 0.14, p = 0.33), butwhen statistically controlling for other factors, therelationship turns negative (and also nonsignificant).15
This tactic may seem reasonable for initial enrollments,when the plans are new and unknown and require extraemphasis. However, the practice of off-cycle enrollmentintroduces the risk of positioning the new LTC plan as a“direct mail”-type solicitation that is not really part ofthe company benefits package. Furthermore, removingplans from the general enrollment period could depressparticipation, as “benefits dollars” are allocated by
12 Mahoney and Connolly (1995): “CalPERS learned a valuable lesson fromthe lackluster outcomes of several other states’ long-term care offerings: thatsignificant resources must be dedicated to member education and marketingefforts. As this new voluntary benefit is rolled out, all members will receive atleast one direct mailing and a paycheck enclosure. In addition, employer,state association, and union newsletters will highlight this new benefit. Whilethe benefit is being marketed by mail, interested members can call a toll-free800 number for additional information and/or attend local seminars on theprogram. Members will, therefore, hear about the offering through multiplecommunications. CalPERS recognized that direct and repeated employeeeducation was essential for a successful voluntary offering” (p. 10).
13 The highly successful State of Alaska LTC plan is totally integrated withretirement planning. Employees become eligible for the plan at retirement,and communications about the plan are packaged with retirement planningmaterials.
14 The City National Bank of Florida’s enrollment featured both groupseminars for employees to explain plan features and the opportunity to meetindividually with a CNA representative in the company’s human resources
office. The resulting employee participation rate was 28 percent (Workforce,July 1997). John Hancock’s One-on-One Consultation Study found thatapproximately 40 percent of Harvard University employees participating inone-on-one consultations eventually applied for coverage under the plan. TheJohn Hancock/SBC Communications Enrollment Meeting Survey used a self-assessment of purchase intention prior to exposure to enrollment meetingpresentations, followed by a post-exposure self-assessment, followed bytracking of application behavior. Results showed that approximately half ofmeeting audiences applied for coverage. Approximately one-third of audiences(30 percent) would likely have applied even if they hadn’t attended, andapproximately one-fifth (20 percent) were converted from unlikely-to-enroll orundecided status to actual enrollment.
15 The partial correlation of off-cycle enrollment and participation, control-ling for number of plan choices, employer support, simplified enrollmentprocess, facilities-only plan option, underwriting requirements, andmanagement-only eligibility is equal to –0.01 (p = 0.97). This suggests that,holding other elements of plan design constant (as in the multivariateprocedures in the next section), the true relationship might be negative ornegligible.
May 2000 • EBRI Issue Brief 9
Chart 2Group Long-Term Care Marketing Process: Best Practice
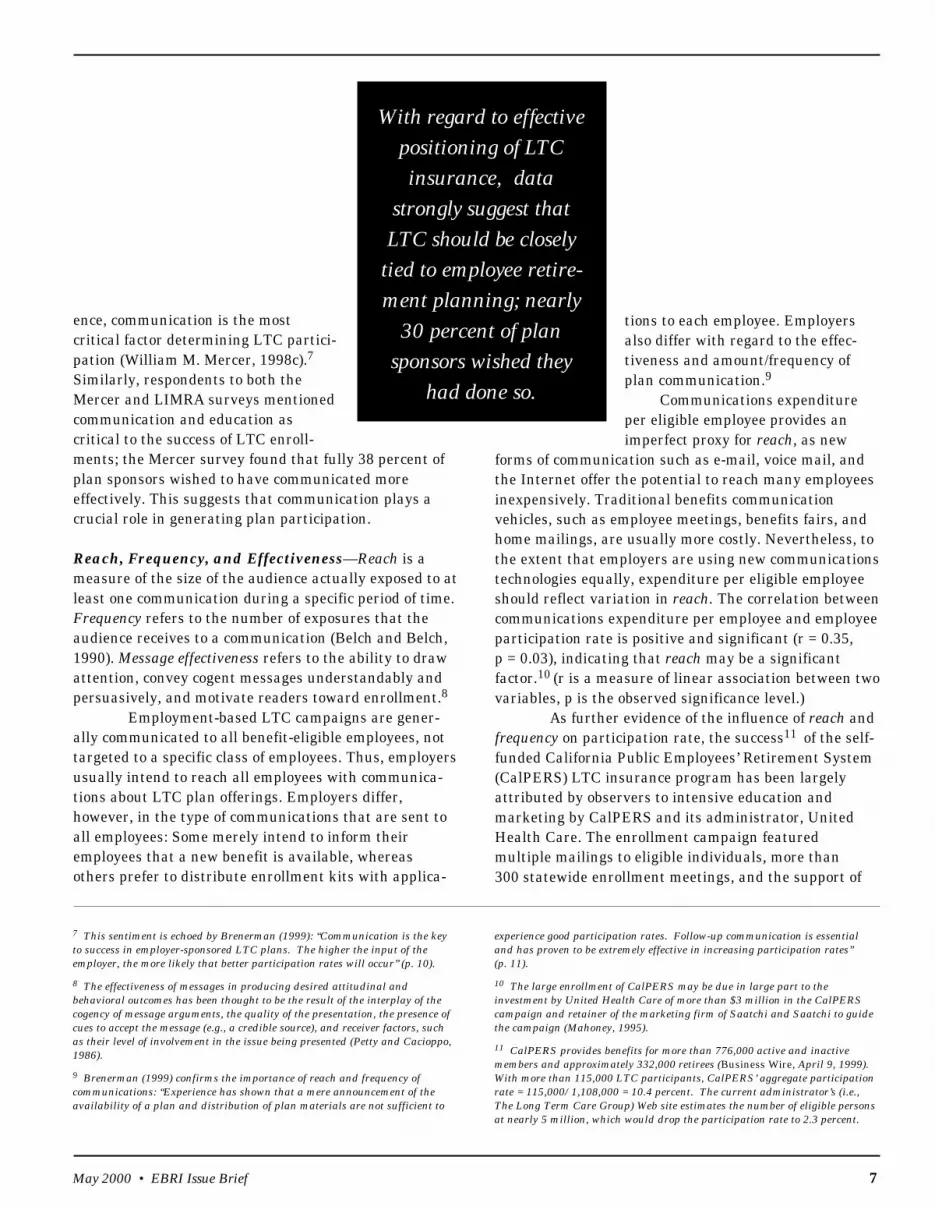
Source: Adapted from: The Advisory Board Company, Issue Brief: Group Long Term Care Insurance (Washington, DC: The Advisory Board Company, April 1996).
participants in the absence of LTC plans. The bestpractice appears to be to hold enrollments on-cycle (i.e.,during the main benefits period), because employeesexpect to receive benefits information and make benefitschoices during this time period.
Allowing sufficient time for the communicationscampaign (as opposed to rushing the process) should beassociated with higher participation, as the eligiblepopulation has time to process materials. Insurersgenerally prefer a six-month period in which to promoteand enroll new LTC plans. Insurers need this timebecause LTC coverage is a new benefit, with limitedconsumer comprehension of product features, and atleast one company’s research indicated that employeesare more likely to enroll if they have been supplied withsmall amounts of information over a period of time (chart2). Providing all information at once is perceived byemployees as overwhelming and confusing (The AdvisoryBoard, 1996).
Another important consideration is the use of anenrollment deadline as a call to action (Mahoney, 1995).The pattern of group LTC application invariably includesa peak of activity at the deadline date, which may bediminished by long or rolling enrollment periods.
Communication Channel Factors—Regardless of anenrollment campaign’s potential reach, frequency, andeffectiveness, some portion of the initiative must beconveyed using the company’s regular communicationchannels, and these channels may vary in their effective-ness and “signal strength.” It is expected that companiesthat already communicate effectively with their employ-ees about benefits and policies are more likely toeffectively communicate the LTC plan offering as well.Potential indicators of channel effectiveness include thepresence of voluntary benefits, employee participation in
other voluntary benefits, the size of the sponsoringcompany (i.e., number of employees), and its level ofgeographic and organizational dispersion. Anotherimportant concept is channel “noise,” or the amount ofunrelated information being conveyed within the com-munication channel, which may distract the audiencefrom LTC campaign communications.
The presence of existing voluntary insurancebenefits and the level of employee participation in themshould be positively related to participation. Companiesthat offer voluntary benefits prior to the LTC insuranceoffering should have already worked through the issuessurrounding communication and administration ofvoluntary benefits. Employees who have already beenoffered voluntary benefits should also be more accus-tomed to the idea of noncontributory benefits, and areless likely to view them as a “take away.” The LTCSponsor Database shows a small positive associationbetween the number of existing voluntary plans andparticipation (r = 0.18, p = 0.37).16 Participation inexisting voluntary benefits provides an excellent indica-tor of participation in LTC plans, as it is a measure ofenrollment behavior. The LTC Sponsor Database showsthat the strength of association varies from 0.38 (p = .06)to 0.88 (p = .00), depending upon the voluntary benefitmeasured. It is important to note that participation inother benefits is merely a correlate of participation inLTC plans, not a cause of it; participation levels in allvoluntary benefits, including LTC insurance, are prob-ably caused by the same cluster of factors.
A 1995 study by the Advisory Board Companyindicated that size of the eligible population was notpredictive of LTC enrollment success in their sample of
16 John Hancock LTC Sponsor Database (1997).
I. Announce plan to all eligibleemployees.
II. Publish introductory articlein company newsletter.
III. Provide enrollment package.
IV. Train company benefits staff.
Pre-Enrollment
I. Certificates issued to enrolledmembers.
II. Distribute LTC informationto enrolled members.
III. Mail supply of enrollmentpackages for additionalenrollees.
I. Employee meetings, featuringvideo and Q&A session.
II. Publish second article.
III. Activate toll-free line.
IV. Follow-up with postcards,mail to selected employees’homes.
Enrollment Post Enrollment

May 2000 • EBRI Issue Brief10
the 12 “best” and12 “worst” LTCenrollments. However,it would be reasonableto hypothesize thatsmaller employers will experience higher participationrates on average than larger employers, because they aremore likely to be geographically centralized, with moreeffective communication channels.17 In fact, studies haveshown consistently higher 401(k) plan participation ratesamong smaller companies, with highest participationamong companies with fewer than 100 employees(86 percent) and lowest participation among companieswith more than 10,000 employees (68 percent)(Datamonitor, 1997).
However, unlike 401(k) plan participationtrends, LTC participation rates are highest among largecompanies (the correlation of number of employees andemployee participation rate = 0.20, p = 0.05). Amongcompanies with more than 50,000 employees, averageemployee participation is 7.8 percent, whereas amongcompanies with fewer than 50,000 employees, averageemployee participation is 4 percent, with participationrates averaging between 3 percent and 5 percent indifferent employment bands below 50,000 employees.This finding is driven largely by the high participationrates associated with several very large companiesknown for their paternalistic policies and excellentcommunication and enrollment systems.
The perception among employees that thesponsoring corporation is the source of their benefits (asrated by insurer account executives in conjunction withbenefit managers) is strongly associated with employeeenrollment (r = 0.43, p = 0.03), primarily because partici-pation suffers in cases where this perception is absent.
In general, the moredispersed the com-pany, the lessconnection there maybe between plan
sponsors and eligible employees and the more difficult itmay be to communicate with them. Indicators of corpo-rate dispersion include the ratio of home officeemployment to total employment (r = –0.03, p = 0.80),the number of separate payroll locations (r = –0.08,p = 0.58), and recent merger and acquisition ordownsizing activity (r = –0.16, p = 0.18). Although theserelationships are not statistically significant, all show anegative correlation with employee participation rate,supporting the notion that dispersion complicates theoffering of new benefits.
Increased channel noise may be expected toincrease the likelihood of distraction and informationaloverload, ultimately resulting in lower LTC insuranceparticipation. A useful indicator of channel noise mightbe the simultaneous introduction of other new benefits,but this factor shows no relation to participation rate(r = 0.09, p = 0.66).
Employer Support—The importance of the level ofsupport shown by an employer for a new LTC planoffering cannot be overstated. Sponsoring employers mayor may not choose to engage in a variety of activities thatsupport LTC enrollment. Employer support may bedefined in terms of the employer’s attitude and motiva-tion toward the enrollment; the level of access permittedto employees (resulting in increased campaign reach andfrequency); and the degree of partnership that developsbetween the sponsoring employer and its insurancecarrier. How employers define the goals of the planoffering (i.e., to cover as many employees as possible orto merely educate employees about LTC) often deter-mines the character of the marketing and communi-cations campaign (Martin, 1999), and, consequently, thelevel of participation.
Employer motivation for sponsorship appears to
Table 2Correlation of Employer Motivations for Sponsorship
and Long-Term Care Insurance Participation Rates
Motivations r values
We wanted to offer leading-edge benefits. 0.28a
It was a good fit for our workforce. 0.25
It could be offered at low cost to the organization. 0.07
It was offered by competitors. 0.06
Senior management wanted it. 0.01
It helped achieve an HR objective (e.g., reducing turnover). –0.05
Employees/retirees wanted it. –0.15
Source: Author’s analysis of William M. Mercer data (1998c).aStatistically significant at p <0.05 level.
17 Buck Consultants (1999). As further evidence of this trend, a recentDatamonitor (1997) report on work-site marketing of insurance productsconcludes that “generally, the larger the company, the lower the penetrationrate achieved by the insurer. This is because as the number of employeesincreases, it becomes increasingly difficult to accurately target a certainproduct to the immediate needs of a diverse pool of workers” (p. 123).

May 2000 • EBRI Issue Brief 11
be significantly relatedto participationrate.18 Analysis of theMercer data showsthat the desire to offerleading-edge benefitsis significantly corre-lated with participa-tion, followed closely by employer assessment that LTCinsurance is a good fit for the work force (table 2). Theformer suggests employers that are active in the selec-tion of benefits, and perhaps committed to theirsuccessful enrollment, whereas the latter suggestsemployer awareness of the presence of demographicsegments most likely to participate in LTC plans.Motivations for sponsorship that do not suggest commit-ment to LTC or work force suitability for LTC (i.e., lowcost, competition offers it, management wanted it) areunrelated to participation rate.
When support is defined as the number ofactions taken by an employer in support of an LTCcampaign, the correlation with employee participation ispositive and significant (r = 0.32, p = 0.05). The specificactions taken by the employer can either signal corporateenthusiasm and commitment to the LTC offering (e.g.,sending an encouraging cover letter signed by a seniorofficer) or actions that facilitate communication (e.g.,permitting enrollment meetings on company time)(table 3).
Why should employers actively support LTCenrollment campaigns? Survey data suggest that spon-sors of LTC plans that achieve higher participation ratesare more satisfied with the benefit than those with lower
Table 3Supportive Actions of Employer Sponsors
for Long-Term Care Plan Enrollment
• Statement of achieving high participation as an employer goal.
• Working directly with insurance carrier in carefully planning the enrollment campaign.
• Allowing four to six months for communication.
• Sponsoring pre-enrollment employee research to refine communications and positioning.
• Training of benefits staff on long-term care plan.
• Sponsoring seminars during work hours at convenient locations.
• Facilitating face-to-face meetings with insurers where employee can ask questions.
• Writing supportive endorsement letter signed by a senior officer to introduce the plan.
• Using company newsletters, e-mail, voice mail, or payroll stuffers to communicate.
• Developing integrated response systems for ease and speed of enrollment.
• Permitting use of company payroll systems for payroll deduction of premiums.
• Employer contribution to communications budget.
• Employer contribution to employee premiums.
Sources: The Advisory Board (1995); Workforce (July 1997); Brenerman (1999).
participation rates,although causalitycannot be inferred.Analysis of thesurveys by Mercer(William M. Mercer,1998c) and theInternational Founda-
tion of Employee Benefit Plans (IFEBP, 1999) revealed asignificant correlation (r = 0.35, p = 0.01) and a nearlysignificant correlation (r = 0.19, p = 0.13) betweenemployer satisfaction and participation rate, respec-tively.
Motivation and Ability to ProcessMessagesCredible Employer Endorsement—It is expected thata credible employer’s endorsement of its LTC plan shouldincrease employee receptivity to subsequent communica-tions about it. In the communication and persuasionliterature, source credibility is viewed as being based oneither source expertise or trustworthiness, or both (Pettyand Cacioppo, 1981). Thus, the effectiveness of anemployer’s implied endorsement of the sponsored LTCplan rests upon employee perception of the employer’sexpertise in designing and negotiating benefits, and ofthe employer’s trustworthiness in terms of safeguardingemployee welfare.19 Employer reputations for expertiseand trustworthiness may vary. For instance, the successof the CalPERS plan has been attributed largely toCalPERS’s “special credibility” based on its “solidreputation for managing health care costs without
18 See Mahoney (1995): “At this early date, it is already obvious thatenrollment is substantially higher in counties and districts which endorsed the(CalPERS) Long-Term Care offering and encouraged their employees to attendseminars and learn more about this option” (p. 8).
19 Metropolitan Life Insurance Company (1996): “In terms of corporateculture, participation rates are higher when the sponsoring employer isperceived by the employee to be supportive and genuinely concerned about the
welfare of employees and their families” (p. 22). Also see Advisory Board(1995): “An employer that addresses the plan in the context of ‘we researchedall the available options…and our carrier is the best’ not only dispels the fearsof uncertain employee prospects but also instills a feeling in employees that‘the employer did it for them.’ Employees who feel as though their employersare caring for them are more likely to enroll than employees who simply ‘seeanother insurance product offering in front of them’” (p. 2).
May 2000 • EBRI Issue Brief12
sacrificing quality of care,”20 implying expertise inmanaging benefits for the welfare of its members, whichshould engender trust.
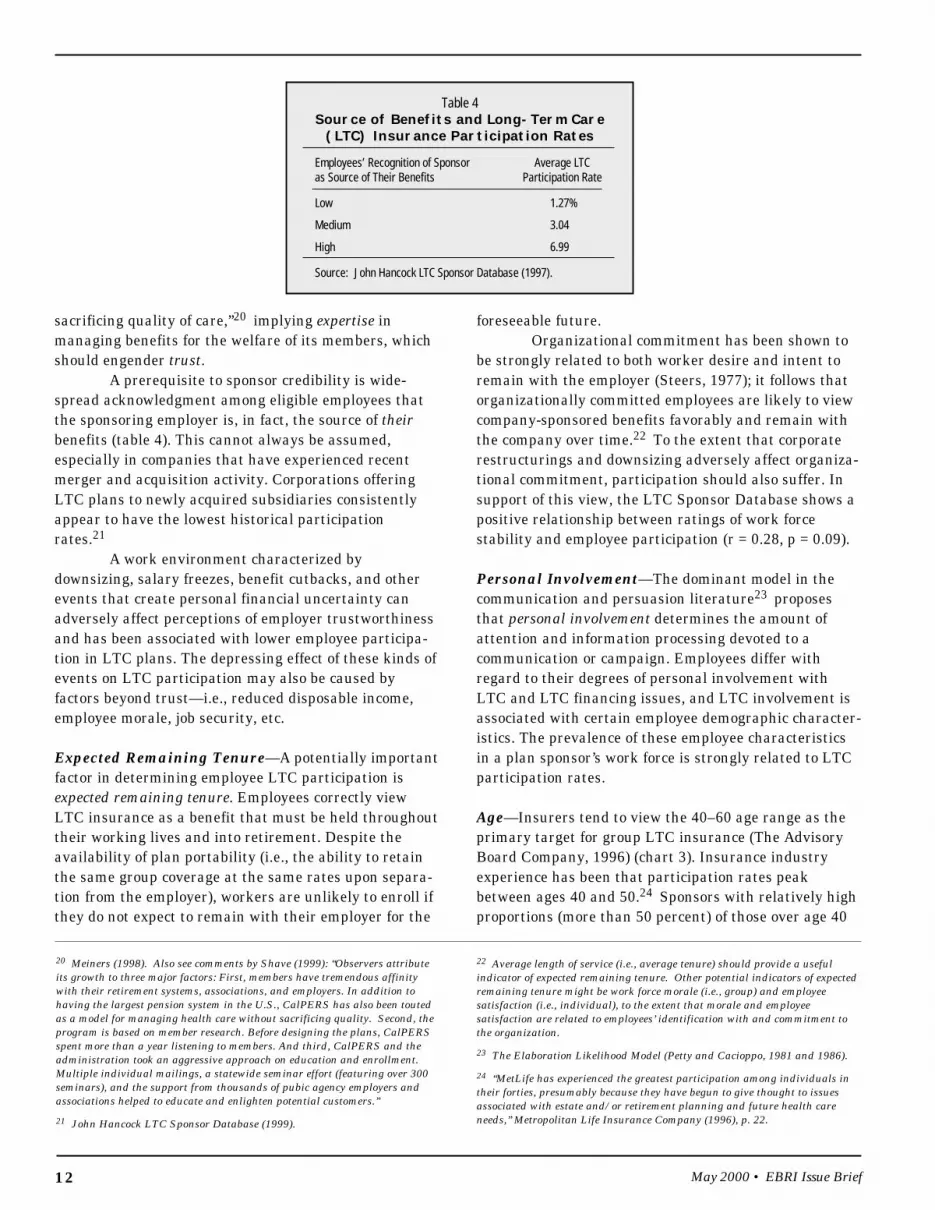
A prerequisite to sponsor credibility is wide-spread acknowledgment among eligible employees thatthe sponsoring employer is, in fact, the source of theirbenefits (table 4). This cannot always be assumed,especially in companies that have experienced recentmerger and acquisition activity. Corporations offeringLTC plans to newly acquired subsidiaries consistentlyappear to have the lowest historical participationrates.21
A work environment characterized bydownsizing, salary freezes, benefit cutbacks, and otherevents that create personal financial uncertainty canadversely affect perceptions of employer trustworthinessand has been associated with lower employee participa-tion in LTC plans. The depressing effect of these kinds ofevents on LTC participation may also be caused byfactors beyond trust—i.e., reduced disposable income,employee morale, job security, etc.
Expected Remaining Tenure—A potentially importantfactor in determining employee LTC participation isexpected remaining tenure. Employees correctly viewLTC insurance as a benefit that must be held throughouttheir working lives and into retirement. Despite theavailability of plan portability (i.e., the ability to retainthe same group coverage at the same rates upon separa-tion from the employer), workers are unlikely to enroll ifthey do not expect to remain with their employer for the
Table 4Source of Benefits and Long-Term Care
(LTC) Insurance Participation Rates
Employees’ Recognition of Sponsor Average LTCas Source of Their Benefits Participation Rate
Low 1.27%
Medium 3.04
High 6.99
Source: John Hancock LTC Sponsor Database (1997).
foreseeable future.Organizational commitment has been shown to
be strongly related to both worker desire and intent toremain with the employer (Steers, 1977); it follows thatorganizationally committed employees are likely to viewcompany-sponsored benefits favorably and remain withthe company over time.22 To the extent that corporaterestructurings and downsizing adversely affect organiza-tional commitment, participation should also suffer. Insupport of this view, the LTC Sponsor Database shows apositive relationship between ratings of work forcestability and employee participation (r = 0.28, p = 0.09).
Personal Involvement—The dominant model in thecommunication and persuasion literature23 proposesthat personal involvement determines the amount ofattention and information processing devoted to acommunication or campaign. Employees differ withregard to their degrees of personal involvement withLTC and LTC financing issues, and LTC involvement isassociated with certain employee demographic character-istics. The prevalence of these employee characteristicsin a plan sponsor’s work force is strongly related to LTCparticipation rates.
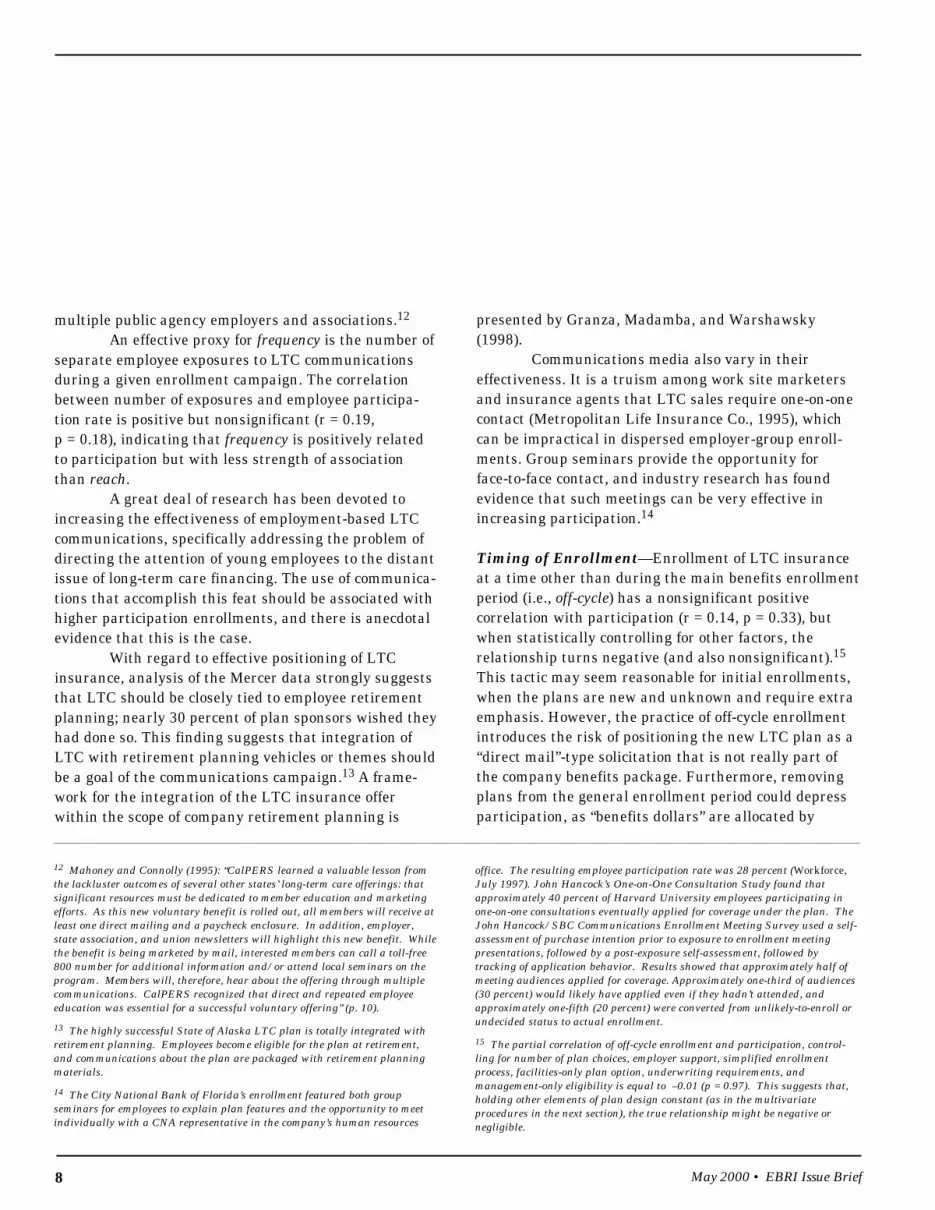
Age—Insurers tend to view the 40–60 age range as theprimary target for group LTC insurance (The AdvisoryBoard Company, 1996) (chart 3). Insurance industryexperience has been that participation rates peakbetween ages 40 and 50.24 Sponsors with relatively highproportions (more than 50 percent) of those over age 40
20 Meiners (1998). Also see comments by Shave (1999): “Observers attributeits growth to three major factors: First, members have tremendous affinitywith their retirement systems, associations, and employers. In addition tohaving the largest pension system in the U.S., CalPERS has also been toutedas a model for managing health care without sacrificing quality. Second, theprogram is based on member research. Before designing the plans, CalPERSspent more than a year listening to members. And third, CalPERS and theadministration took an aggressive approach on education and enrollment.Multiple individual mailings, a statewide seminar effort (featuring over 300seminars), and the support from thousands of pubic agency employers andassociations helped to educate and enlighten potential customers.”
21 John Hancock LTC Sponsor Database (1999).
22 Average length of service (i.e., average tenure) should provide a usefulindicator of expected remaining tenure. Other potential indicators of expectedremaining tenure might be work force morale (i.e., group) and employeesatisfaction (i.e., individual), to the extent that morale and employeesatisfaction are related to employees’ identification with and commitment tothe organization.
23 The Elaboration Likelihood Model (Petty and Cacioppo, 1981 and 1986).
24 “MetLife has experienced the greatest participation among individuals intheir forties, presumably because they have begun to give thought to issuesassociated with estate and/or retirement planning and future health careneeds,” Metropolitan Life Insurance Company (1996), p. 22.

May 2000 • EBRI Issue Brief 13
should experience higher participation than employerswith younger work forces. Indeed, analysis of the LTCSponsor Database shows a highly significant correlationbetween employee participation and the percentage ofthe eligible employee population ages 40 and older(r = 0.41, p = 0.01).
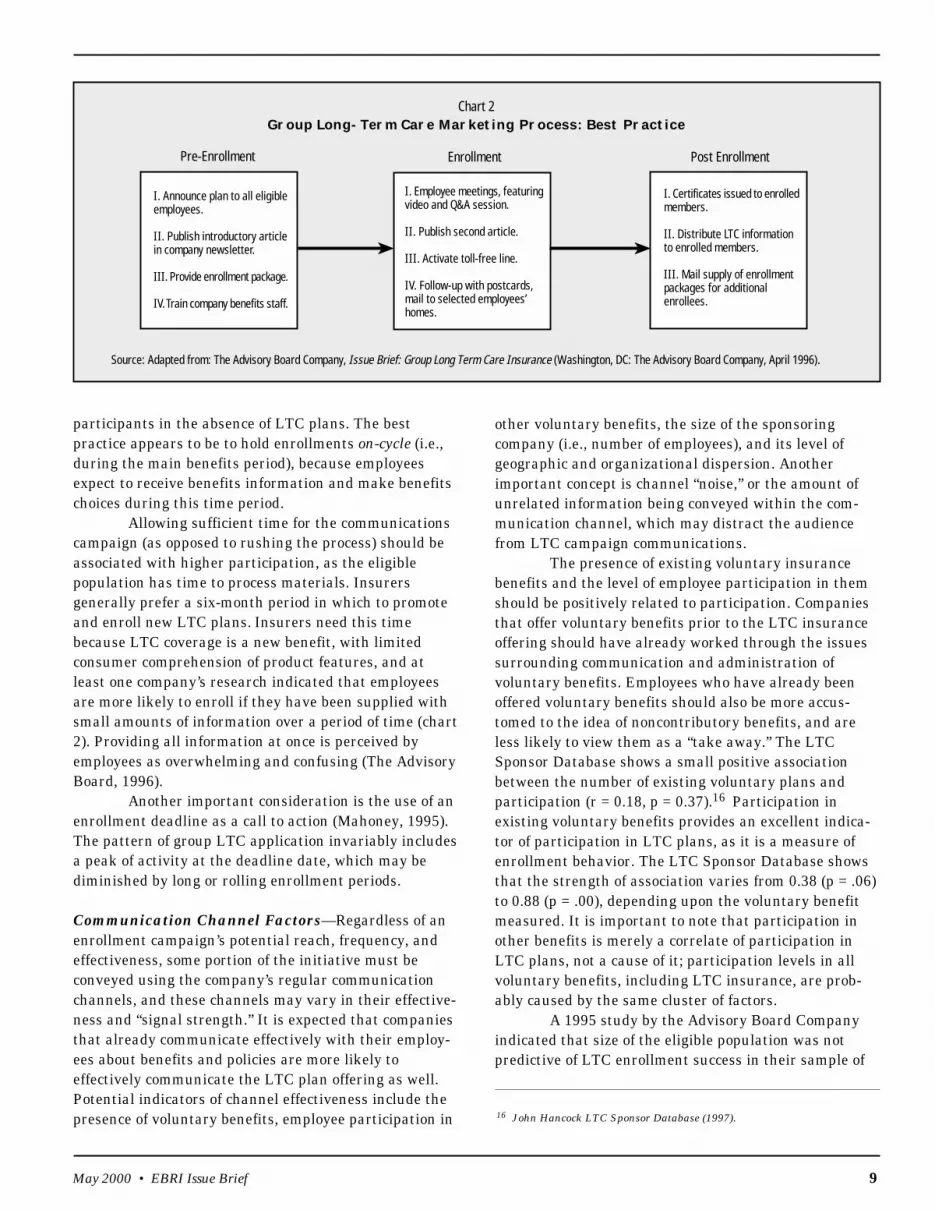
Salary—The 1995 Advisory Board study found thatgroup LTC insurers believe that employee salary is thebest predictor of enrollment success, along with activesponsor support for the plan.25 Survey data have shownthat employment-based group LTC purchasers arenearly eight times as likely as the general public to havehousehold income in excess of $50,000, and that 80 per-cent of purchasers had annual incomes over $35,000 in1990 (Health Insurance Association of America/LifePlans, 1992).
Analysis of the LTC Sponsor Database revealsthat indexed average employee salary (indexed forgeography and year of enrollment) is significantlycorrelated with employee participation (r = 0.31,p = 0.01), although the relationship appears to turn
negative at very high salary levels (i.e., salaries that arethree times higher than average state salary in the yearof enrollment) (see chart 4).
The downturn in participation at very highsalary is primarily associated with investment bank andtechnology firms and may be due to a tendency towardself-insurance among the affluent.26 To test the effect ofaffluence on participation rate, average salary and avariable reflecting the amount by which average salariesexceed $65,000 were entered into a regression equationpredicting employee participation rates, and both werefound to be statistically significant. Examination of thepartial regression coefficients of these variables revealedthat additional amounts of income beyond $65,000 havea negative effect more than twice as great as the initialpositive effect of income (i.e., –0.08 for high salary; 0.04for average salary) implying that the function for wageand participation takes a sharp (approximately90 degrees) downward turn at high average salary levels.
25 See also Metropolitan Life Insurance Company (1996): “Participation tendsto be higher among salaried employees who typically have a higher percentageof discretionary income than hourly employees. For example, one of ourcustomers experienced an 11 percent participation rate among salariedemployees and a 3 percent participation rate among hourly workers” (p. 22).
26 Self-insuring against LTC risks for the affluent has been recommended byseveral financial planning publications, including Money, “Stocks vs.Insurance: Why a Long-Term-Care Policy May Not Make Sense” (August
1999): 52–53; Fortune, “Should You Self-Insure? The Fortune Worksheet”(October 14, 1996): 300; Kiplinger’s Personal Finance Magazine, “The Catch-22 of Long-Term-Care Insurance” (May 1997): 97–102, “You don’t need thisinsurance if you have enough income from retirement plans and investmentsthat you would not have to tap assets to pay the annual tab at a nursinghome.” Consumer Reports, “Do You Need Insurance?” (October 1997) informsreaders that “(You do not) need insurance if you can set aside $160,000 atcompound interest solely to pay for nursing home care” p. 39.
Source: Author’s analysis of the John Hancock Mutual Life InsuranceCompany LTC Sponsor Database (1999).
Source: Author’s analysis of the John Hancock Mutual Life InsuranceCompany LTC Sponsor Database (1999).aAverage salary of the employee population divided by average householdincome in the state in the year of enrollment X 100.
Salary Indexed by Statea
14%
12%
10%
8%
6%
4%
2%
010% 20% 30% 40% 50% 60% 70% 80% 90%
Empl
oyee
Initi
al P
artic
ipat
ion
Rate
Percentage of Employees Over Age 40
Chart 3Scatterplot of Long-Term Care Participation
and Proportion of Employees Over Age 40
16%
0 100 200 300 400
30%
20%
10%
0
Chart 4Scatterplot of Long-Term Care Participation
and Indexed Average Employee Salary
Empl
oyee
Initi
al P
artic
ipat
ion
Rate

May 2000 • EBRI Issue Brief14
Educational Level—Thegeneral educational level ofemployees may be an impor-tant factor in determining planparticipation, because of thepotential complexity and sophistication of the long-termcare insurance product and the well-established relation-ship between education and income. A superficialanalysis of the desirable industries (table 5) reveals thatsome of the “best” industries for employment-based LTCparticipation are characterized by high percentages ofprofessionals with higher educational levels (e.g.,universities, pharmaceuticals). Higher educational levelsmay also appeal to insurers because of lower disabilityrates resulting in delayed claims.27
Gender—Companies with relatively high numbers offemale employees should have higher participation thanthose with relatively higher percentages of males,because females are both more likely to need long-termcare and to provide informal long-term care.28 Analysisof the LTC Sponsor Database reveals no correlationbetween overall employee participation and the propor-tion of female employees (r = –0.04, p = 0.80), althoughsegmentation analyses of individual buyers of employ-ment-based LTC plans find that single, high-incomefemales enroll in disproportionately high numbers.29
Salaried and Management Employees—Some of thehighest participation enrollments have occurred incompanies where only management-level employeeswere solicited. When managers and nonmanagers areboth solicited, management participation rates are close
to double those ofnonmanagers. Managers tendto be older and to have highersalaries and higher educationallevels, on average, all of which
predispose them toward participation. Analysis of theLTC Sponsor Database reveals that LTC plans that areoffered to salaried and/or management employees onlyhave a higher average employee participation rate(11 percent) than LTC plans offered to all benefit-eligibleemployees (4 percent), which is consistent with theexperience reported by others.30 The correlation betweenthis type of offer and the employee participation rate ispositive and statistically significant (r = 0.23, p = 0.03).
Pre-Enrollment Employee Research and NeedsAssessment—One of the cornerstones of the success ofthe CalPERS LTC program cited by observers wasextensive pre-enrollment research on employee prefer-ences (Mahoney, 1995). Interestingly, companies thatsurvey their employees’ wants and needs prior to offeringLTC insurance tend to experience higher participationrates than those that do not measure employee inter-est.31 Analysis of the IFEBP survey reveals a significantcorrelation between the participation rate and thetendency to measure employees’ level of knowledge andconcern about LTC issues (r = 0.26, p = 0.04). Of thoseemployer sponsors measuring employee LTC awarenessand knowledge, half experienced rates of 10 percent orhigher; of those not surveying their employees, only8 percent achieved such participation rates. Similarly,the Mercer survey found that the desire “to find out moreabout employee wants and needs beforehand” was one of
Table 5Most and Least Preferred Industries
for Employment-Based
Long-Term Care Insurance
Industries Repeatedly Industries Repeatedly NamedNamed As “Top Clients” As “Bottom Clients”
Airline AssociationFinancial Hospital
Insurance State GovernmentPharmaceutical Municipal Government
TelecommunicationsUniversity
Source: The Advisory Board Company, Issue Brief: Group LongTerm Care Enrollment and the “Ideal” Employer Prospect(Washington, DC: The Advisory Board Company, March 1995), p. 2.
27 New York Times, “New Era of Robust Elderly”: “In study after study,educational level is associated with better health...throughout life and late inlife” (February 27, 1996).
28 The National Alliance for Caregiving/The American Association of RetiredPersons (1997); Murtaugh et al. (1997).
29 Jeremy Pincus, “Increasing GLTC Participation: What Works?” Presenta-tion to the 1997 John Hancock client conference, Boston, June 5, 1997.
30 Metropolitan Life Insurance Company (1996): “Participation tends to behigher among salaried employees than union employees. For example, oneemployer group offered our plan to both salaried and union employees. Theparticipation rate among salaried employees was 15 percent, while theparticipation rate for union employees was only 3 percent” (p. 22).
31 The 28 percent LTC participation rate of City National Bank of Floridaemployees also involved pre-enrollment employee needs assessment. Accordingto a benefits manager, “We expected participation in the plan because we knewit was something our employees wanted” (Workforce, July 1997).

May 2000 • EBRI Issue Brief 15
the top three lessons learned by sponsors. This effect islikely due to employer screening of new benefits in lightof employee interest levels, resulting in companies withrelatively high levels of interest in LTC insurance beingoffered an LTC plan. Employee need assessments thatreveal high levels of interest should equate to strongdemand and plan participation. However, for employeesurveys to provide a useful indicator of demand, em-ployee response needs to be truly representative. Toooften such surveys are vulnerable to self-selection bias,wherein only the more interested employees respond tothe survey, creating the illusion of widespread interest.
It is also instructive to consider the relationshipbetween participation and employee reaction to the LTCplan following the offering. The Mercer survey foundthat the majority of sponsors (59 percent) have notmeasured employee reaction to the LTC plan and haveno plans to do so. Only 4 percent have formally surveyedemployee response (with another 17 percent planning todo so), and 20 percent claim to have informally measuredemployee reaction. Of those respondents measuringemployee response, three-quarters reported positivereactions and one-quarter report neutral reactions; nonegative responses were reported. Analysis of the Mercersurvey reveals a significant correlation between positiveemployee reaction and participation rate (r = 0.57,p = 0.02).
Acceptability of Plan Design and PricingAffordability—The affordability of LTC insurance is afunction of three factors: cost, discretionary income, andperceived need (Center for Long-Term Care Financing,1999). The average cost of premiums is affordable to theaverage American, although many consumers assume
that premiums are unaffordable, which suggests the costof LTC premiums should be a focus of plan communica-tion efforts. Discretionary income is affected by who paysfor how much of the plan—the employee or the em-ployer—and the cost associated with other benefits.Employer contributions are a guaranteed method ofincreasing plan participation. Plan participation can alsobe enhanced by avoiding enrollments accompanied bycost increases associated with other benefits.
Perceived need for LTC insurance is perhaps thebiggest barrier to the purchase of LTC insurance byemployees due to competing financial priorities and thefact that LTC issues are generally off the “radar screens”of younger employees. As a result, education of employ-ees regarding the need for LTC insurance is an essential(and measurable) goal for any communications campaignby employers and insurers. Plan participation should behigher when eligible employees know the actual cost ofplan premiums, are not presented with new competingdemands on their incomes, and are aware of the need forLTC insurance.
Cost of LTC Premiums—By most standards, employ-ment-based LTC insurance should be affordable to mostworking people. The average annual premium in theemployment-based LTC insurance market is $446,32 or$37 per month. The work-site marketing insuranceindustry uses hourly salary as the yardstick ofaffordability of the weekly cost of all voluntarybenefits33 (i.e., if an employee earns $10 per hour, he orshe can afford up to $10 per week on all voluntarybenefits); using this measure, employees earning morethan $9.25 per hour should be able to afford the averagegroup LTC policy.
When compared with median annual householdincome of $37,005,34 this average premium representsapproximately 1 percent of household income, or 2 per-cent if two LTC insurance policies are purchased (one foreach spouse). On a percentage basis and in absolutedollars, the cost of employment-based LTC insurance isfar below the cost of individual LTC policies, primarily
32 Author’s analysis of LIMRA (1999a) data.
33 See Podgurski (1995).
34 U.S. Department of Commerce, Bureau of the Census, Current PopulationReports, Consumer Income, P60-200, Money Income in the United States:1997, Washington, DC: U.S. Government Printing Office, 1998.
May 2000 • EBRI Issue Brief16
because of younger issue age; individualLTC insurance purchasers spend anaverage of 6 percent of their annualhousehold income on their policies.35
The most common objection topurchasing LTC insurance is that it isunaffordable.36 However, qualitativeand survey research has consistentlydemonstrated that nonowners of LTC insurance signifi-cantly overestimate the actual cost of LTC insurance.37
The tendency to overestimate is most pronounced atyounger ages (i.e., under age 65).38 Ironically, youngeremployee nonpurchasers are far more likely to citeconcerns about cost as the primary barrier to purchase ofgroup LTC policies (46 percent) than significantly oldernonpurchasers of costlier individual LTC policies(25 percent).
Analysis of the LTC Sponsor Database reveals anegative correlation between employee participation rateand the average premium associated with the employergroup (where both employees and retirees were eligible:r = –0.30, p = 0.03). The finding of an inverse relation-ship between average premium and employeeparticipation could mean either (a) that employees areprice sensitive (i.e., demand increases at lower prices), or(b) lower average premium is an artifact of higherparticipation among younger employees. Further analy-sis supports the latter explanation: other measures ofaffordability (e.g., the presence of low-cost plan designs[r = 0.07, facilities-only and r = 0.03, shortened benefitperiod] and the lowest available premium at age 45[r = –0.09]) show no relationship to participation rate,
while average age of insured employ-ees is inversely related to employeeparticipation rate. This indicatesthat plans with higher participationare those with greater numbers ofyounger insured employees.
Price sensitivity analysis (usingthe van Westendorp technique) has
been conducted by at least one major LTC insurer (JohnHancock/Eastern Research Associates, 1998). This studydemonstrated that demand for LTC insurance is rela-tively elastic at younger ages (i.e., one unit change inprice results in greater than one unit change in demand)and relatively inelastic at older ages (i.e., one unitchange in price results in less than one unit change indemand). Although the degree of elasticity and the mostacceptable price varied by age group (with youngeremployees more price sensitive and older employees lessprice sensitive), this study showed that average groupLTC premiums fall within the range of acceptable priceswithin each age group. The employment-based LTCinsurance buyer/nonbuyer study conducted by HealthInsurance Association of America/LifePlans (1992)similarly showed that “slightly more than one in threenonpurchasers (of employment-based LTC plans) wouldbe willing to pay an annual premium that was at least1.5 times that of the industry average” (p. 75).
Discretionary Income—Group differences in discre-tionary income are accounted for in the Salary sectionabove; this section will review other factors that affectthe availability of discretionary income for purchasing
35 Health Association of America/LifePlans, Inc., Who Buys Long-Term CareInsurance?: 1994–95 Profiles and Innovations in a Dynamic Market, HealthInsurance Association of America (1995), p. 2.
36 As found by the Health Insurance Association of America/LifePlans (1992)and the National Council on the Aging/John Hancock (1996) surveys.
37 The National Council on the Aging/John Hancock (1997): “Both a lack ofknowledge of long-term care insurance and misperceptions of its cost affectAmericans’ decisions about purchasing this type of coverage. Sixty-eightpercent of working-age Americans reported that they could not afford a policy,
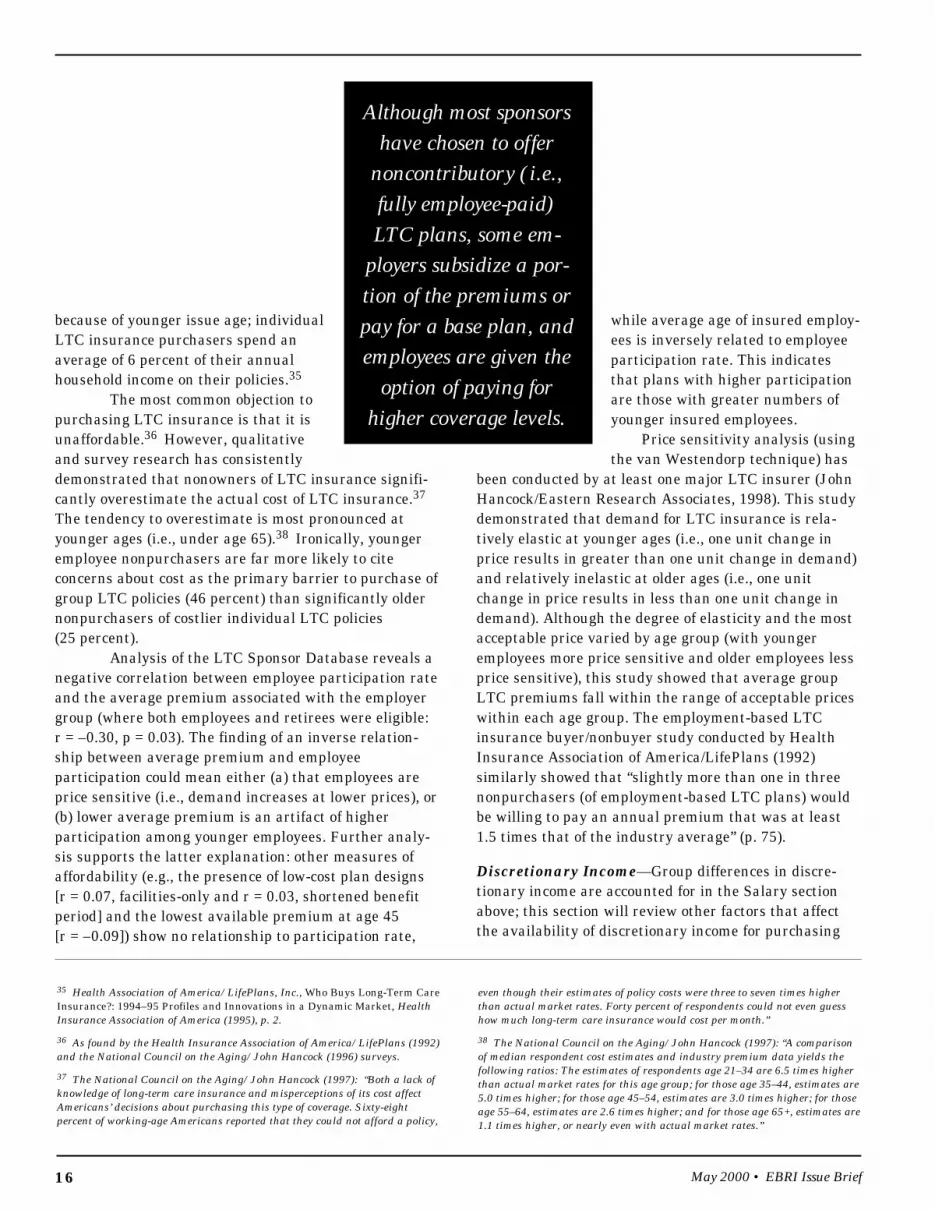
Although most sponsorshave chosen to offer
noncontributory (i.e.,fully employee-paid)LTC plans, some em-
ployers subsidize a por-tion of the premiums orpay for a base plan, andemployees are given the
option of paying forhigher coverage levels.
even though their estimates of policy costs were three to seven times higherthan actual market rates. Forty percent of respondents could not even guesshow much long-term care insurance would cost per month.”
38 The National Council on the Aging/John Hancock (1997): “A comparisonof median respondent cost estimates and industry premium data yields thefollowing ratios: The estimates of respondents age 21–34 are 6.5 times higherthan actual market rates for this age group; for those age 35–44, estimates are5.0 times higher; for those age 45–54, estimates are 3.0 times higher; for thoseage 55–64, estimates are 2.6 times higher; and for those age 65+, estimates are1.1 times higher, or nearly even with actual market rates.”

May 2000 • EBRI Issue Brief 17
employment-based LTC insurance, such as the presenceof employer contributions to premiums and the cost ofother benefits to employees.
Employer Contributions—Perhaps the most basicdecision an employer makes (after the decision to offerLTC insurance as a benefit) is whether to make the plancontributory or noncontributory. Although most sponsorshave chosen to offer noncontributory (i.e., fully employee-paid) LTC plans, some employers subsidize a portion ofthe premiums or pay for a base plan, and employees aregiven the option of paying for higher coverage levels.Employer-funded LTC plans are the surest way toincrease employee coverage levels, but this practice hasbeen generally limited to smaller employers and execu-tive “carve-outs.” Observers have speculated thatemployer reluctance to make contributions may becaused by HIPAA’s prohibition on the inclusion of LTCinsurance in cafeteria plans (Lutzky et al., 1999). TheIFEBP survey found that only 6 percent of sponsorscontribute to employee LTC plans, and half of theseemployers experienced participation rates above 15 per-cent. In contrast, no sponsors offering LTC insurance ona noncontributory basis experienced participation rateshigher than 15 percent. Typical LTC design elements areshown in table 6.
The IFEBP survey results suggest that the trendtoward noncontribution is likely to continue, althoughthere is hope for increased employer funding of LTCbenefits. The majority of nonsponsors that may sponsorLTC insurance in the future (54 percent) expect to offeremployee-pay-all plans, yet 11 percent expect to make apartial contribution, and an additional 1 percent expectto fully fund the LTC benefit.
Costs of Other Benefits—Another determinant of thelevel of discretionary “benefit dollars” available toemployees is the cost of other benefits. In general,benefits programs that require smaller contributionsfrom employees leave more discretionary income avail-able for LTC insurance and have been associated with
Table 6Typical Employment-Based Long-Term Care
Insurance Plan Design
Covered ServicesSkilled and custodial nursing facility care (most commonly $80–$120 per day)Skilled and custodial home care (most commonly $40–$80 per day)Assisted living facilitiesAdult day careRespite careHomemaker servicesHome modificationsInformal care
Benefit StructuresMost common maximum dollar benefits: $100,000–$200,000Most common elimination period: 90-day deductible periodMost common inflation protection option: future purchase optionMost common nonforfeiture (lapse protection): reduced paid-up benefit
Benefit TriggersTwo out of six activities of daily living (ADLs) or cognitive impairment (post-HIPAAa)
Eligible GroupsFull-time employeesSpouses of full-time employeesParents and in-lawsRetired employees
Source: Steven Lutzky, John Corea, Lisa Alecxih, Laura Marburger, and KathlynWee, Preliminary Data From a Survey of Employers Offering Group Long-TermCare Insurance to Their Employees: Interim Report (1999), ASPE website, http://aspe.hhs.gov/daltcp/reports/ltcinsir.htmaHealth Insurance Portability and Accountability Act of 1996.
higher participation rates.39 Although decreased benefitcosts would likely be associated with increased participa-tion, such changes are rare in today’s benefits climateand could not be tested using the LTC Sponsor Database.Instead, benefit cutbacks or increased benefit costs (e.g.,health insurance premiums) are the rule rather than theexception.
Perceived Need for LTC Insurance—Establishing theneed for LTC insurance generally falls to the communi-cations campaign, and involves identifying threeessential ingredients of perceived need: the lifetime riskof needing LTC services, the cost of LTC services, andthe positioning of LTC insurance as a desirable financingoption. Unfortunately, baseline knowledge levels are lowas LTC and LTC insurance are widely misunderstood byconsumers (The National Council on the Aging/JohnHancock, 1996–1999).
Employer sponsors of LTC plans and their
39 “If employers offer rich benefit programs with various indemnities, suchas flexible benefits programs (especially those that incur very minimal out-of-pocket expenses), employees are much more likely to enroll in LTC compo-nents of programs. Because LTC is fully paid by employees, the ‘affordabilityissue’ becomes less of a factor if employees are not already paying for otherforms of insurance,” Advisory Board (1995), p. 2.

May 2000 • EBRI Issue Brief18
40 Mahoney and Connolly (1995): “Mailed surveys and focus groups wereused to identify the key features members wanted. The product was thendesigned in light of the features members had identified as essential. Everyeffort was made to keep choices simple…Valuable lessons can be learned fromCalPERS’s approach in building a program based on the features memberswanted.”
41 MetLife/AARP (1998): “We talked with AARP members across the country,in every region of the country, so no region’s bias would influence us unduly inthe design of this program. We talked to both working and non-workingAARP members, and we learned a lot about the way the membership looks atlong-term care…AARP members understand the need for this coverage, andwhat they asked for in the way of an insurance program is based on theirpersonal experience with a friend or a parent, or other family members”(p. 13).
42 See Appendix D in Weiner et al. (1994), for a summary of survey researchon consumer preferences.
43 John Hancock/Eastern Research Associates (1998), AARP/DanielYankelovich Group (1990), and Metropolitan Life Insurance Company (1998).
insurers can measure the effectiveness of their communi-cations campaigns in terms of achieving intermediate“milestones” on the path toward enrollment. Campaignsmay vary in their ability to generate awareness of theplan offering, knowledge of plan features and benefitsand reasons for purchase, favorable attitudes towardenrollment, enrollment intention, and actual planparticipation. These “milestones” are most useful whenthey are concrete and measurable, have a specified timeperiod associated with them (e.g., by the third month ofthe campaign), have benchmarks available to assess thedegree of change, and are linked to target audiencedemographics (e.g., employees age 40 and above, andearning at least $40,000) (Belch and Belch, 1990).
Plan Design Preferences—The following sectionreviews the plan design features associated with partici-pation and those most popular among employeepurchasers.
A recent survey by the Lewin Group (Lutzky etal., 1999) of 39 employment-based LTC plans identifiedthe most commonly offered plan design features (seetable 6). Similar findings are reported by William M.Mercer (1998c) and the IFEBP (1999). These studiesprovide useful information about what employers offertheir employees, presumably an indicator of whatemployers and their benefits consultants believe to beimportant components of LTC insurance plans. One ofthe primary functions of the benefits manager andbenefits consultant is to ensure the suitability of the plandesign and pricing to the eligible population. In investi-gating the effects of plan design on employeeparticipation, it is important to consider employeepreferences in determining plan suitability.
Observers have noted that one of the keystrengths of the CalPERS LTC plan offering was that theplan design was based on extensive member research.40
The same approach has been employed by the Metropoli-tan Life Insurance Company in its design of the AARPplan.41
Employee Preferences—Although traditional surveyresearch has extensively documented consumer prefer-ences for various LTC services,42 this method lacks theability to simulate the tradeoffs that consumers makewhen they purchase goods and services. Conjoint analy-sis is the preferred method used to evaluate suchtradeoffs and provide data on the relative importancethat consumers attach to each attribute of a product andtheir degree of preference for each level of each attribute.Conjoint analysis has been applied to LTC insurance byat least two of the leading insurers in the employment-based group LTC market, and has been used previouslyby AARP.43
Results show that although preferences vary byconsumer segment, consumers tend to value LTCattributes similarly. Both the John Hancock and theAARP studies revealed that an “adequate” amount ofnursing home coverage is the most important driver ofpreferences, followed by an “adequate” amount of homecare coverage. Although home care is consistently thepreferred location of care, consumers view LTC insur-ance primarily as protection against the worst-casescenario of needing nursing home care.
Both the John Hancock and MetLife analysesdemonstrate consumer preferences for extended (e.g.,

May 2000 • EBRI Issue Brief 19
unlimited lifetime) benefit periods.44 Similarly, theAARP study’s longest benefit period option presented toconsumers (five years) was the most preferred level.Industry data confirm this preference, especially amongyounger-age consumers (whose lower age-based premi-ums enable them to purchase richer plan options).45
Both studies also found that consumers are willing totrade price for a shorter elimination (deductible) period.MetLife’s research led them to offer AARP members aplan with the option of unlimited lifetime coverage; a30-day waiting period; nursing home, home care, andinformal care coverage; and monthly (rather than daily)benefit caps (MetLife/AARP, 1998).
Plan Design Preferences and Employee Participa-tion—As shown in table 7, certain plan features areassociated with employee participation rates. Plans withskilled nursing home and home care benefits experiencehigher participation rates than plans lacking thesebenefits, as predicted by the conjoint studies. Analysis ofthe Mercer dataset reveals a significant positive correla-tion between the highest daily benefit offered andparticipation rate (r = 0.41, p = 0.00), and a nearlysignificant correlation between the lowest daily benefitamount and participation (r = 0.27, p = 0.06). The findingthat both higher and lower coverage levels are associatedwith participation supports the notion that group LTCplans should offer a range of options and flexibility tomeet diverse needs.46
The availability of lower-cost options can be animportant factor in determining participation, dependingupon demographic distribution of eligible groups. Insur-ance industry data show that a much higher percentageof retirees and parents than employees elect nursinghome-only coverage when this option is available.Participation in facilities-only coverage has accounted formore than one-quarter of total participation in severalmajor employer plans. The correlation of the availabilityof facilities-only coverage and employee participationrate is nonsignificant (r = 0.07, p = 0.53); however, thecorrelation of such coverage and aggregate participation
Table 7Average Employee Participation Rate
by Plan Features
(IFEBP and Mercer Datasets, Respectively)
Offered Not Offered
Nursing Home Care 6.7% (60)a 2.8% (5)a
6.2% (56) NA
Skilled Home Care 6.6% (61) 2.8% (4)6.2% (53) 6.9% (3)
Unskilled Home Care 4.8% (33) 8.0% (32)6.0% (42) 6.9% (14)
Adult Day Care 6.1% (44) 7.0% (21)6.1% (51) 7.2% (5)
Respite Care 4.9% (31) 7.8% (34)5.1% (40) 8.9% (16)
Hospice 9.7% (37) 2.1% (28)NA NA
Physical/Occupational Therapy 10.9% (22) 4.1% (43)NA NA
Alternate Care Benefit 8.7% (14) 5.8% (51)NA NA
Care Management 7.3% (22) 5.3% (29)NA NA
Highest Lifetime Maximum Benefit:5 years 5.3% (3)10 years 8.0% (2)Unlimited 8.8% (4)
Source: Author’s analysis of International Foundation of Employee BenefitPlans (1999) and Mercer (1998c) datasets.aEmployee participation rate (number of companies).
rate is nearly significant (r = 0.19, p = 0.09), indicatingthat its availability drives up retiree and parent partici-pation, and consequently overall participation.47
Interestingly, nontraditional LTC benefits areassociated with the highest participation rates: physical,occupational, and speech therapy; hospice; and alternatecare benefits, perhaps indicative of more sophisticatedbenefits purchasers or simply greater consumer prefer-
44 As reported in MetLife/AARP (1998), p. 13.
45 See Mahoney’s (1995) discussion of consumer preferences for CalPERS’plan options: “Younger active employees overwhelmingly favored and felt theycould afford, lifetime coverage. By comparison, older retirees were more aptto choose shorter coverage and the lifetime asset protection of the Partnership.Purchasers seemed to make economic decisions in choosing among plans”(p. 8).
46 Datamonitor (1997): “Products that are not suited for a specific pool ofemployees are not going to sell well…The products need to be complex but atthe same time flexible enough to meet different needs. Since insurers usuallyhave a limited amount of time, if at all, to meet with employees at the point-of-sale, the product needs to be simple enough to be understood in a relativelyshort amount of time” (p. 124).
47 When the availability of facilities-only coverage is included in a multipleregression equation with other plan design factors, this factor achievessignificance (t = 2.21, p = 0.03) as a predictor of employee participation.

May 2000 • EBRI Issue Brief20
ence for these benefits. Also anticipated by the conjointanalyses is the finding of higher participation ratesamong plans with long-duration lifetime maximumbenefits.
Simplicity of Offer—“Keeping it simple” has becomethe conventional wisdom of group LTC plan design. TheLewin Group’s (Lutzky et al., 1999) foremost suggestionfor increasing participation is to limit plan complexityand number of choices. Similarly, observers of CalPERS’ssuccess have commented that “every effort was made tokeep choices simple” (Mahoney and Connolly, 1995).Conversely, the number of employee options in employ-ment-based LTC plans was mildly associated withenrollment success in the Advisory Board study (six ofthe “best” and four of the “worst” had employee optionchoices).48
Analysis of the Mercer dataset similarly revealsno correlation between the number of daily benefitamount choices and participation rate (r = –0.10,p = 0.51). Although relatively few sponsors indicate thatif they “could do it all over again” they would make theplan design simpler, this response was associated withthe lowest average participation rate (average = 3.2 per-cent) of any “lesson learned,” further supporting adepressing effect of plan complexity on participation.Using the John Hancock LTC Sponsor Database, whenthe total number of plan choices is included in a multipleregression equation with other plan design factors, thisfactor has a nearly significant (t = –1.87, p = 0.07)depressing effect on employee participation.
In addition to the simplicity of the plan design interms of number of choices that need to be made, thesimplicity of the communications and enrollment processaffects participation. The Lewin Group’s report (Lutzkyet al., 1999) cites the example of using more than onecarrier as a major complicating factor that was avoidedby most sponsors due to the potential for confusion, andwas regretted by the one employer in the sample whoused two insurers. This finding has clear implications forthe structure of the federal employee LTC plan, favoringthe position of offering a single plan.49
Payroll Deduction—A potentially important but oftenoverlooked advantage of employment-based LTC insur-ance is the convenience of payroll deduction of premiumsfor employees and retirees.50 A recent Roper/MetLifesurvey found that respondents view payroll deduction(71 percent) and convenience (67 percent), along withbetter group rates (74 percent), as the primary advan-tages of employment-based voluntary benefits (RoperReports/Metropolitan Life Insurance Company, 1999).Analysis of the John Hancock LTC Sponsor Databasereveals a significant positive correlation between theavailability of payroll deduction and employee participa-tion rate (r = 0.32, p = 0.00).
Simplified Enrollment ProcessTelephone and On-line Enrollment Process—Enrollment processes vary greatly in terms of their easeof use, from paper applications (which require theapplicant to find the time to read and complete formsand mail them to the insurer) to Internet-based enroll-ments (which require little more than a click of themouse). As indicated in table 8, it is expected that theease of the enrollment process is a determinant ofemployee participation rate, but not the participationrates of other eligible groups, as nonemployees aregenerally not eligible to enroll via the simplified enroll-ment processes (see Underwriting Requirements, below).Analysis of the John Hancock LTC Sponsor Databasereveals that the use of telephone enrollment is signifi-cantly correlated with participation (r = 0.29, p = 0.04).Similarly, the Advisory Board (1995) study showed that
48 “Among the clients of companies profiled, a small correlation surfacesbetween plans that require more choices and more healthy relationships withgroup customers. Presumably, more choices allow for more customization andthus, more sophisticated plans” (p. 3).
49 See description of Democratic and Republican positions in Causey (1999).
50 Podgurski (1995): “Payroll deduction is convenient for the employee becausethe premium is automatically deducted from the paycheck, freeing theemployee from having to write checks, pay postage, or worry about missedpremium statements” (p. 17).
“Keeping it simple”has become the
conventional wisdomof group LTCplan design.

May 2000 • EBRI Issue Brief 21
all telephone and electronicenrollments included wereamong the “best” enrollments,whereas all of the “worst”enrollments involved paper-based application.51
Underwriting Requirements—One of the majoradvantages of group LTC plans is the availability ofguaranteed issue (i.e., issuing coverage without requiringevidence of insurability) for employees, which is notavailable in the individual LTC market. Some employersprefer to have the insurer underwrite all applicants as ameans of keeping premiums as low as possible. A inter-mediate point between guaranteed issue and fullunderwriting is short-form underwriting (or modifiedunderwriting), wherein the applicant answers several“yes/no” questions related to the use of long-term careservices or diagnosis with several conditions that areassociated with use of such services, but does not need toprovide any physical exams or physician’s statements.The majority of sponsors offer LTC plans on a guaran-teed-issue basis to their actively-at-work employeesduring the initial enrollment period; other eligiblegroups are generally fully underwritten.52
Guaranteed issue has a direct effect on partici-pation in terms of encouraging enrollment among thosewho have (or perceive that they have) health conditionsthat might disqualify them for coverage through anindividually purchased policy. A potentially larger effectof guaranteed issue, however, stems from its facilitationof streamlined enrollment processes: The primarydeterminant of eligibility for telephone and on-lineenrollment is eligibility for guaranteed issue, primarilybecause these enrollment media cannot collect signa-tures, which are generally required with the submissionof individual applications. Thus, in order to take advan-tage of telephone and on-line enrollment, guaranteedissue must be available.
The positive effect of guaranteed issue is sup-ported by analysis of the John Hancock LTC SponsorDatabase, which reveals a small negative relationship
between the use of underwriting(as opposed to guaranteeingissue to actively-at-work employ-ees) and employee participation
(r = –0.10, p = 0.46). Similarly, the Advisory Board study(1995) found that LTC plans that require underwritingfor all applicants “all appear in lists of ‘bottom’ clients.”
Table 8Average Long-Term Care Insurance
Participation Rates
Associated With Enrollment Processes
Average EmployeeEnrollment Process Participation Rate
Paper Applications 2.81% (29)a
Enrollment Postcards 6.36 (18)
Telephone VRUb 8.16 (13)
On-line Enrollment 3.59 (2)
Source: John Hancock LTC Sponsor Database (1999).aEmployee participation rate (number of companies).bVoice response unit.
51 “Enrollment methods show some correlation: companies that enrolled viamedia other than paper-based applications (e.g., telephone or electronicmeans) all appear in lists of ‘top’ clients” (p. 3).
52 Conning & Company (1999); Lutzky et al. (1999).
53 For example, we may observe high participation for companies with largeemployee populations and for companies that offer their employees many planchoices. However, if larger companies tend to offer more plan options, how dowe separate the effects of these two factors, i.e., how much of the highparticipation do we attribute to size and how much to the number of planoptions?
54 Initial employee participation and the size of the employee population havebeen transformed by the natural log function to correct for non-normality.
MultivariateResults
The precedingdiscussionindicates thatvarious charac-teristics ofemployers, the
plans offered, and marketing strategy affect participa-tion rates. However, it is difficult to consider the effectsof these factors in isolation, because each may be pickingup some of the effects of other correlated factors.53
To consider the effect of many variables simulta-neously, several multivariate equations were estimated.In each of these analyses, the dependent variable (thevariable we are trying to explain) is the employeeparticipation rate during the initial enrollment period.The basic form of the estimated model is that of theLinear Probability Model (LPM), but some variableshave been transformed for technical reasons.54 Thisimplies that the underlying relationship between partici-pation and the independent variables is fundamentallynonlinear, so that the coefficients reported cannot be

May 2000 • EBRI Issue Brief22
55 Marginal effects are calculated as the first derivative of the estimatedrelationship. These effects are reported at the means of all variables.
56 For example, if the smaller company’s participation rate is 10 percent, thelarger company’s participation rate would be 10.28 percent. Alternatively, ifone company is twice as large as another (100 percent larger), but otherwiseidentical, then enrollments at the large company will be 28 percent higherthan enrollments at the small company.
57 As (e0.034 ) = 1.03. Alternatively, a $1,000 increase in average salarycorresponds to a 3 percent increase in enrollment.
58 As (e–0.26 ) = 0.77 from Model B and (e–0.76) = 0.47 from Model A.
interpreted in the traditional fashion. In the tablesbelow, the marginal effects (the change in participationdue to a one-unit change in one of the independentvariables, all else being equal) are reported alongside theregression coefficients.55
Demographic EffectsThe first set of estimated equations describes the rela-tionship between demographic characteristics of a groupof employees and LTC plan participation.
As expected, the size of the employee group(EEPOP) is a highly significant predictor of the employeeparticipation rate. Other things being equal, largercompanies tend to experience higher participation rates.The coefficient estimate for population size in this model(0.28 using Model B) may be interpreted as an elasticity.For example, if one company is 10 percent more populousthan another, one would expect enrollments at the largercompany to be 2.8 percent higher than enrollments atthe smaller company.56
A similar positive effect for average salary(SAL_1999) is seen in Models A and B. Salary is mea-sured in (thousands of) constant 1999 dollars to permitcomparison of real salaries across employer groups thatenrolled in different years. The coefficient of averagesalary (0.034) can be interpreted as follows: if averagesalary is a thousand dollars higher at one company thanat another, one would expect enrollment for the higher-paid company to be 3.4 percent higher than that for thelower-paid company.57
The variable “unstable” measures whether therewas a sizable merger, acquisition, restructuring, ordownsizing involving the company around the time of theinitial enrollment. This variable was included as a proxyfor employee job stability, based on the notion thatemployees who fear losing their jobs are less likely topurchase LTC insurance through their employer. Thisdummy variable takes on the value “1” if there was amajor merger, restructuring, or layoff and the value “0” ifthis was not the case. The effect of a merger on participa-
tion rates ranges from highly significant to marginallysignificant to nonsignificant in different models. How-ever, in all cases, the effect is negative and strong; amerger or downsizing is estimated to lower enrollmentby 23 percent to 53 percent.58
As discussed above, participation in othervoluntary benefits (BEN_IDX) has a significant positiverelationship with participation in group LTC plans. Asindicated above, this relationship represents correlation,rather than causation—the same (unobserved) factorsare presumed to cause both participation in group LTCplans and participation in other voluntary benefits.However, this measure (an index of participation inseveral voluntary benefits) does exhibit strong predictivepower, so it has been included in the model. Estimates ofthe size of this effect vary, but are generally strong andpositive. An employee group with benefit participationrates at twice the national average is predicted to haveLTC participation between 2.7 and 4 times higher than agroup with only average participation. This suggests thatLTC participation is very sensitive to general levels ofparticipation in voluntary benefits (or, more precisely,their underlying, unobserved determinants).
The last two demographic variables consideredare the percentage of females (PC_FEM) and the percent-age over 40 (OVER_40) in the employee population. Thepercentage of females in the group is positively related toparticipation rates, but is only marginally significant(p = 0.11). Although the analysis indicates that the sizeof the over-40 population (i.e., the LTC insurance targetgroup) relative to the size of the total employee popula-

May 2000 • EBRI Issue Brief 23
tion is positively related to participation rates, therelationship does not achieve statistical significance.
The results for the two demographic models arereported in table 9. The marginal effects are reportedalong with the unstandardized regression coefficients.
Plan Design and OfferingEvidence reviewed above suggests that aspects of theplan design and employer actions influence employeeparticipation. These relationships are examined in thissection. Multivariate regression analysis is used with thesame dependent variable in the same manner as above.
The most important result that emerges fromthis analysis is that employer support (SUPPORT) forthe group LTC plan plays a large part in determiningparticipation. This result is robust across several differ-ent specifications of the model. As explained in precedingsections, the support variable is coded +1, 0, and –1, torepresent extraordinary, average, and substandardlevels of employer support for the LTC insurance offer-ing, respectively. An increase in support (from –1 to 0 or0 to +1) is estimated to increase participation by 76 per-cent to 98 percent, so that a very supportive employerwould see participation rates three to four times as largeas those of a very unsupportive employer. Alternatively,for the average sponsor, a one-step increase in supportwould add 2.24 percent to 2.70 percent to the company’sparticipation rate.
Whether or not employees must pass medicalunderwriting (UNDERWRT) has a relatively large,significant effect on enrollment. This dummy variable iscoded “zero” for use of guaranteed issue for employees,and “one” for any kind of underwriting for employees(nonemployee eligible classes, such as retirees, spouses,parents, etc. are almost always underwritten). Thisresult is also very robust across different specifications ofthe model, and generally predicts that underwriting foremployees lowers enrollments by 45 percent to 69 per-cent. Using the marginal effect, this corresponds to anaverage employee participation rate 2.3 to 4.7 percentage
Table 9Effects of Explanatory Demographic Variables
on the Natural Log of Employee Participation
Variable Model A Model B (n = 36) (n = 23)
Coefficient Marginal Coefficient MarginalEstimates Effects Estimates Effects
EEPOP 0.290427 1.4135 E-5 0.281446 7.0391 E-5(0.094654) (0.114843)p=0.0044 p=0.0254
SAL_1999 0.033109 0.13078055 0.033911 0.13394845(0.013273) (0.016666)p=0.0180 p=0.0578
BEN_IDX 0.992563 3.92062385 1.391388 5.4959826(0.325321) (0.549045)p=0.0046 p=0.0214
UNSTABLE –0.760542 –3.0041409 –0.259561 –1.025266(0.300597) (0.393646)p=0.0165 p=0.5185
OVER_40 0.009402 0.0371379(0.016977)p=0.5869
PC_FEM 0.018772 0.0741494(0.010975)p=0.1054
Constant –4.014299 –5.916553
R-squared 0.49078 0.52357
Standard Error 0.85897 0.85320
Source: Author’s analysis of the John Hancock Mutual Life InsuranceCompany LTC Sponsor Database (1999).
points lower than with guaranteed issue.The presence of a simplified enrollment process
(PHONE) appears significant in some model specifica-tions, but not in others. However, in all models, thecoefficient is positive and ranges from being associatedwith 32 percent increases in enrollments to beingassociated with more than doubled enrollment.
Similarly, the total number of plan choicesconfronting those seeking to enroll (TOT_CHC) isambiguous in its significance; in Model B, it is margin-ally significant and in Model A it is nonsignificant.However, the sign of the coefficient for this variable isconsistently negative, suggesting that plan designs thatforce consumers to make more choices tend to discourageparticipation. The predicted magnitudes of this changeare that a plan with one more choice than another will,all else being equal, have only 70 percent to 89 percent ofthe enrollment of the less complicated plan. Using themarginal effect, each additional choice reduces enroll-ment by 0.48 percent to 1.41 percent for the averageplan. Using economic reasoning, the cost to the consumer

May 2000 • EBRI Issue Brief24
of enrolling includes not just the monetary price of theplan, but also the “cost” of devoting time and effort tolearning about each plan option and making an informeddecision. As the number of choices increases, so does theeffective cost of enrolling, leading some consumers not topurchase at all. Some observers have suggested bundlingdifferent options together into a fixed product to limit thenumber of separate decisions required.59
Other variables that were tested, but failed toachieve even marginal significance, are whether the planwas offered to all employees, or to management only(MGT_ONLY) and whether the group LTC insuranceplan was offered on- or off-cycle with other benefits(CYCLE).60 The effect of a management-only plan(relative to a plan offered to all employees) was positive,but not statistically significant (see preceding sectionsfor discussion). The effect of offering a plan off-cycle wasnegative, but also statistically nonsignificant. However,the estimated magnitudes of this effect were fairlylarge—offering LTC insurance off- rather than on-cyclemay reduce enrollment by 9.6 percent to 31.7 percent,i.e., lower employee participation rate by 0.4 percent to1.5 percent for the average case. For example, an on-cycle enrollment experiencing a participation rate of6 percent might experience an enrollment of 4.5 percentif held off-cycle.
The presence of a facilities-only plan (NHO)option has a very strong positive effect on participation,reflecting the lower cost of these plans. This may suggestthat sponsors consider offering at least one lower-costplan to employee groups. This conclusion should betentatively held due to the relatively small number ofcases that included a facilities-only plan option (n = 4).
Summary results of the effects of plan designand offering factors on participation rates are shown intable 10.
The Full ModelFinally, an inclusive model is estimated to simulta-neously account for as many factors as possible to isolate
Table 10Effects of Explanatory Plan Design
and Employer-Specific Variables
on the Natural Log of Employee Participation
Model C Model D(n = 54) (n = 38)
Coefficient Marginal Coefficient MarginalVariable Estimates Effects Estimates Effects
SUPPORT 0.567816 2.2428732 0.682600 2.69627(0.189291) (0.245554)p=0.0042 p=0.0092
UNDERWRT –1.186879 –4.688172 –1.102860 –4.356297(0.486726) (0.514765)p=0.0184 p=0.0401
PHONE 0.725111 2.8641885 0.280992 1.1099184(0.283317) (0.381837)p=0.0136 p=0.4673
TOT_CHC –0.120951 –0.477756 –.357556 –1.412346(0.156051) (0.202378)p=0.4420 p=0.0871
MGT_ONLY 0.881460 3.481767(0.988746)p=0.3795
CYCLE –0.100586 –0.397315(0.321617)p=0.7566
NHO 1.426694 5.6354413 1.627431 6.4283525(0.691856) (0.743115)p=0.0445 p=0.0362
Constant 0.962852 1.572519
R-squared 0.39699 0.47740
Standard Error 0.90871 0.92518
Source: Author’s analysis of the John Hancock Mutual Life InsuranceCompany LTC Sponsor Database (1999).
the importance of the various demographic, plan design,and offering effects.61 Unfortunately, some variableshad to be excluded from the final analysis due tomissing data and collinearity (i.e., intercorrelation withother variables).62 Table 11 summarizes the results
59 Conning & Company (1999), p. 48.
60 The CYCLE variable is coded as off-cycle = 1 and on-cycle = 0.
61 There are costs and benefits to doing this kind of analysis, particularlywith a dataset that is limited in size. While it permits testing the resultsobtained above to determine if the same relationships hold when a widerrange of effects is controlled for, this must be accomplished using a smallernumber of cases. The smaller number of cases makes it more difficult toachieve statistical significance.
62 Several variables were omitted from the preceding analysis because theydid not achieve even marginal significance, despite being theoreticallyappealing. Examples include:• Long and short duration benefit pools in the plans offered.• Geographic dispersion.• Communications expenditure per eligible employee.• Payroll deduction.• Lowest premium at age 45.

May 2000 • EBRI Issue Brief 25
Table 11Effects of Various Explanatory Variables
on the Natural Log of Employee Participation
Full Model(n = 33) Marginal
Variable Coefficient Estimate Effect
EEPOP 0.223832 1.92358 E-5(0.123724)p=0.0830
SAL_1999 0.040324 0.1592798(0.016538)p=0.0255
HISAL –0.095884 –0.3787418(0.043081)p=0.0357
OVER_40 0.014813 0.05851135(0.013141)p=0.2708
UNSTABLE –0.614909 –2.42889055(0.349154)p=0.0910
CYCLE –0.381322 –1.5062219(0.321146)p=0.2467
UNDERWRT –0.590247 –2.33147565(0.574794)p=0.3147
PHONE 0.309669 1.2231955(0.362583)p=0.4015
SUPPORT 0.671069 2.65072255(0.220261)p=0.0056
Constant –3.458265
R-squared 0.61344
Standard Error 0.78020
Source: Author’s analysis of the John Hancock Mutual LifeInsurance Company LTC Sponsor Database (1999).
obtained from this more inclusive model of enrollmentbehavior.
The magnitudes of both the coefficients and themarginal effects in this model are roughly consistentwith estimates obtained in earlier analyses. The pres-ence or absence of guaranteed issue seems to be lessimportant when all variables are controlled for than inthe case of plan design variables only. The coefficientsassociated with employer support, corporate instability,employee population, and simplified enrollment processare generally equivalent to those estimated in Models Athrough D. The negative effects of offering a plan off-cycle are greater in this inclusive regression, but still notstatistically significant. The effects of average salary andpercentage of employees over age 40 are slightly greaterthan estimates obtained in Models A through D. Thepresence of a significant high-salary effect (HISAL) heresupports the “self-insurance” hypothesis presentedabove.
In conclusion, the evidence from the threeanalytical approaches suggests that the most importantfactors in determining initial employee participationrates are:• Average salary of employees (including the negative
effect of income at high levels).• Employer support for the offering.• The size of the eligible employee population.
Other important factors seem to be:• Participation in other voluntary benefits.• Whether the sponsoring company has experienced
corporate instability (e.g., merger, acquisition, re-structuring, or downsizing) around the time of theinitial enrollment.
• Whether employees are guaranteed issue or whetherthey must submit to an underwriting process.
Extensions of the Model and Directionsfor Future ResearchThe results reported above are a first step toward a more
complete theory of long-term care insurance purchasingbehavior. The results above estimate only initial partici-pation for employees. Future research might attempt toestimate aggregate participation rates (i.e., predict theadditional participation of spouses, retirees, parents, in-laws, etc.). Another direction would be to analyze thebehavior of participation rates over time to shed light onthe potentially important effects of legislative andregulatory actions, and company growth, merging, andrestructuring, on voluntary benefits participation.
Application of the Models to the FederalEmployee LTC PlanThe models estimated above may be applied to other

May 2000 • EBRI Issue Brief26
employer groups, but this should be attempted withcaution.63 In addition to the caveat issued below, it isalso important to note that the models are derived from alargely corporate sample, and have historically experi-enced higher participation rates than state government-sponsored LTC plans (table 12). Thus, when applying themodels to the proposed federal employee LTC plan, it isreasonable to apply a correction factor to account for thisdisparity. Using the LTC Sponsor Database, on a group-by-group basis, the average employee participation rateis 3.95 percent; the typical (assuming that Alaska andCalPERS are atypical) state-sponsored LTC plan hasexperienced less than 1 percent participation. A proposed(liberal) correction would be to multiply predicted federalemployee participation by 0.25.
The Base Case—The demographic characteristics offederal employees were obtained from the U.S. Office ofPersonnel Management’s Fact Book (1998 edition).Information about the most likely scenario for theproposed enrollment came from personal communica-tions with John Cutler of the Office of the AssistantSecretary of Planning and Evaluation, Department ofHealth and Human Services, Laura Lawrence of theOffice of Personnel Management, and others.
As shown in table 13, the federal employee workforce is very large (2.8 million people), relatively old,mostly male, with an average salary similar to the
average of the LTC Sponsor Database. This group hasrelatively high participation in at least two voluntarybenefits (i.e., optional life insurance and the ThriftSavings Plan64 ) and offers job stability. There wasconsensus that the offer of group LTC would most likelyinvolve short-form underwriting of employees as a cost-control measure, as has been the precedent in othergovernment-sponsored LTC plan offerings. Threedeviations from the base case are simulated below,varying levels of sponsor support, ease of enrollmentprocess, and timing of offer.
To the extent that the enrollment behavior offederal employees is similar to that of state employees,the corrected predictions should have greater accu-racy.65 The corrected predictions vary from 1.0 percentto 6.3 percent employee participation rates, with medianpredictions of 1.3 percent to 4.8 percent. These percent-
Table 12State-Sponsored Long-Term Care Insurance
Participation Rates
Eligible Insured AggregateLives Lives Participation Rate
State of Alaskaa 20,650 14,137 68.46%
State of California (CalPERS) 1,108,000 115,000 10.4
State of Kansas 48,000 845 0.02
State of Marylandb 214,897 NA NA
State of North Carolina 396,015 4,500 0.01
State of Oregonb 217,616 NA NA
State of Rhode Island 36,000 103 0.01
State of Washington 169,000 1,813 0.01
Source: Author’s discussion with state benefits personnel representing Alaska,Kansas, Maryland, Oregon, Rhode Island, and Washington; CalPERS data fromadministrator’s Web site (www.LTCG.com); North Carolina data from DavidDeVries, “Long-Term Care in North Carolina,” State and Local GovernmentsAssociation newsletter, Vol. 9, no. 1 (February 1999).aThe remarkably higher participation rate of this group is attributed to very lowpremium rates, the scarcity and high cost of LTC providers in Alaska, and the“self-reliant” state ethic.bParticipation rates are not available, as the plans are currently enrolling.
Table 13Values Associated With the Federal Employees
Used in Predicting Participation Rates
Base Case Values
Eligible Employees 2,787,100
Average Salary in 1999 Dollars $44,900
Percentage Age 40 or Older 60%
Percentage Female 44%
Employee Participation in Optional Term Life Insurance 66.5%
Employee Participation in Thrift Savings Plan 86.3%
Instability No
Underwriting Short-Form Underwriting for Employees
Level of Employer Support Average (High, Low)a
Simplified Enrollment Process Yes (No)a
Cycle On-Cycle (Off-Cycle)a
Source: U.S. Office of Personnel Management, Fact Book: Federal CivilianWorkforce Statistics, 1998 edition; and personal communications with JohnCutler, Office of the Assistant Secretary of Planning and Evaluation, U.S.Department of Health and Human Services, Laura Lawrence, Office of PersonnelManagement, and others.a Effects on participation of other values (in parentheses) were simulated.
63 The models should be applicable to other groups only to the extent thatthey conform to the characteristics of the LTC sponsors in the dataset used tocreate these models.
64 Participation data on the Thrift Savings Plan was provided by the FederalRetirement Thrift Investment Board, and reflects participation as of August1999. The Thrift Savings Plan is the equivalent of a 401(k) plan.
65 To the extent that the enrollment behavior of federal employees is similarto that of corporate employees, the uncorrected predictions would be moreaccurate. The uncorrected predictions would yield a range of coveredemployee lives of between 105,910 (3.8 percent) to 696,775 (25 percent).Applying the percentage of additional insured dependents and retireesincreases the estimated range to between 175,811 and 1,156,647.

May 2000 • EBRI Issue Brief 27
ages translate to a range of 27,871 to 175,587 employeescovered. Across one insurer’s book of business, all othereligible groups (i.e., spouses, retirees, retiree spouses,parents, in-laws) represent an additional 66 percent ofinsured employee lives. Applying this percentage (i.e.,1.66) to the lowest and highest corrected predictions ofemployee participation yields an estimate for total livescovered ranging from 46,266 to 291,474.
As indicated in table 14, varying assumptionsabout the federal employee plan offering produce differ-ent predicted participation rates. As indicated above,sponsor support has the strongest effect, doublingparticipation when moving from average support to highlevels of support, and halving participation when movingto low levels of support.66 Substitution of a paperapplication-based enrollment process instead of asimplified enrollment process (e.g., telephone VRU)reduces enrollment by approximately one-quarter.Substitution of an off-cycle enrollment for an on-cycleenrollment reduces enrollment by approximatelyone-third.
The stated goal of the OPM is to cover 300,000individuals under the proposed federal employee LTCplan. Based on the present analysis, this objective is notunreasonable but will require an extraordinary demon-stration of sponsor support for enrollment, use of asimplified enrollment process, and on-cycle enrollment,among other facilitating factors reviewed below.
Best Practices for MaximizingParticipationThe results reviewed above form the basis for a set ofrecommended “best practices” for maximizing participa-tion. These recommendations relate to maximizingparticipation only; clearly, other considerations may bepresent in a particular plan offering. A useful distinctionin evaluating the factors presented is the “controllable”versus “knowable” distinction—i.e., some factors areunder the control of the employer and insurer (e.g., plandesign and communications), whereas others can merely
be known and responded to accordingly (e.g., employeedemographics, cost of other benefits). Best practices aresummarized in table 15.
Table 14Predictions of Federal Employee Long-Term
Care Plan Participation Rates Under Different
Scenarios, Using the Full Modela
Low Median High
Base CaseModerate level of employer support 7.5% 9.8% 12.8%
(1.9) (2.5) (3.2)Variations
High level of employer support 14.7 19.2 25.0(3.7) (4.8) (6.3)
Low level of employer support 3.8 5.0 6.5(1.0) (1.3) (1.7)
No simplified enrollment process 5.5 7.2 9.4(1.4) (1.8) (2.4)
Off benefits cycle 5.1 6.7 8.7(1.3) (1.7) (2.2)
Source: Author’s application of the Full Model to the values associated withfederal employees.aPredictions with correction for government-sponsored long-term care plansare shown in parentheses
66 The present analysis supports Brenerman’s (1999) statement that “the keyto a successful Federal Long-Term Care Insurance Program is an effectiveeducation and marketing campaign. Successful employer plans that haveexperienced high participation rates are those that have invested in multi-faceted education and marketing campaigns. The federal government’sinvolvement, in partnership with the participating carriers, is critical to thesuccess of this program. Without substantial employer participation andcommitment in educating employees about the importance of a long-term careinsurance policy, this program will not be successful.” (p. 14).
Conclusion
At this point intime, employ-ment-basedlong-term careinsuranceappears to have
theoretical potential for achieving widespread coverageamong working-age Americans. However, the currentlow prevalence of employer sponsorship conspires withlow participation levels among eligible employees todiminish that potential. Even those cases of relativelyhigh employee participation in long-term care plansequate to coverage of a minority of eligible workers. Toachieve even this requires the alignment of multiplefacilitating factors, not the least of which is the un-changeable demographic set that characterizes anemployee population.
An optimistic perspective on the current level ofcoverage might be to view employment-based LTC

May 2000 • EBRI Issue Brief28
insurance as relatively early in the “adoption curve.”From this perspective, as rational consumers inevitablyface the prospect of an uninsured retirement, they willbecome increasingly aware of LTC financing issues andwill become motivated to purchase LTC insurance,resulting in its mass adoption.
However, it may be more realistic to viewadoption of LTC insurance from the conceptual frame-work of compliance theory (e.g., taking medications asdirected, wearing seatbelts, practicing safe sex, etc.),rather than adoption of ordinary new products. Whereasnew product concepts are generally marketed as bundlesof immediately enjoyable benefits, LTC insurance isessentially prophylactic, protecting the owner from asituation that most people dread and/or assume willnever happen to them. Compliance theories67 suggestthat adoption of new socially desirable behaviors is bestaccomplished through discovery of barriers to change(i.e., misinformation, denial of risk); education regardingnegative consequences of maintaining the status quo(i.e., lifetime risk of needing long-term care, LTC coststatistics, advantages of privately paid LTC insurancevs. disadvantages of Medicaid financing); teachingeffective new behaviors (i.e., suitability for LTC insur-ance, how to choose a policy to match individual needs);and provision of social support for the changed behavior(i.e., confirmation that the purchase of one’s LTC insur-ance policy was a good decision). Accomplishment of eachcomponent step in the compliance process could begreatly facilitated through government and employerinterventions, primarily through signs of endorsementand provision of information.
Because multiple facilitating factors are re-quired for successful enrollment (especially high levels ofemployer support, high—but not too high—employeesalary, large employment size, and job stability), it iseasy for enrollment to be derailed by the presence of anyof a number of harmful conditions; for example, em-ployer-sponsors that distance themselves from the offer,
Table 15Best Practices for Maximizing Employee
Participation in Employment-Based
Long-Term Care Plans
Suitability for LTC enrollment:The company currently offers two or more voluntary benefits with at least
average employee participation.Employee median salary is $35,000 or higher (at least half of employees
earning at least $35,000).Employee median age is 40 or older (at least half of employees are older
than age 39).Employees perceive that sponsoring entity is the source of their benefits.Employee work locations are geographically concentrated.Employees have job satisfaction and feel that their jobs are stable.
Before the plan is offered to employees:Clear statement that the primary objective is maximizing participation.Primary motivations for sponsoring LTC should be interest in innovative
benefits and concern for employee welfare.Review employee demographics to determine suitability for LTC.Conduct needs assessment to determine employee interest level in LTC.Conduct pre-testing of communications campaign.Limit offer to a single insurance carrier.
Designing the core plan:Conduct research to determine employee preferences for plan design.Offer benefit levels that are appropriate to the cost of care in region of
employment.Require employees to make no more than three choices.Offer a range of coverage, including a low-end (e.g., facilities-only) and
high-end option (e.g., unlimited lifetime maximum).Offer a long-duration benefit pool option.The actual weekly cost of the plan does not exceed the hourly wage of
target employees.The plan does not build in expensive inflation or nonforfeiture features.The plan design includes lower-cost options (i.e., facilities-only, shortened
benefit period).
Other plan benefits:Offer payroll deduction of premiums.Offer guaranteed issue to actively-at-work employees.Consider partially or fully subsidizing premiums.
Communications and enrollment process:Employer visibly and enthusiastically supports the plan offering and acts to
facilitate its communication.Enroll the LTC plan using simplified enrollment processes (e.g., telephone
VRU).Conduct enrollment meetings at work locations with many employees.Use multiple media for communication.Make an informational toll-free 800 number available.Conduct initial enrollment on-cycle with other benefits.Spread the communications campaign over at least three months.Conduct post-enrollment research to refine future campaigns.
Source: Jeremy Pincus.
ineffective communications, difficult enrollment pro-cesses, corporate downsizing, etc.
Achieving consistently strong levels of participa-tion in LTC plans will require employer-sponsors andtheir insurance carriers to form strong partnerships,with worker participation as their primary stated goal.With participation as a shared goal, key decisions aboutLTC plans (e.g., plan design and pricing, communica-tions, support) can be evaluated in terms of theirultimate impact on participation.67 See Fisher and Fisher (2000) for review.

May 2000 • EBRI Issue Brief 29
February 1999.Business Week. “How to Retire Successfully,” 21 July
1997.Business Wire. “CalPERS Long-Term Care Program
Again Accepting Applications,” 9 April 1999.Causey, Mike. “Long-Term Care Program Recedes Into
the Future.” Washington Post, Federal Diary, 24 Sept.1999, p. 37.
Center for Long-Term Care Financing. The Myth ofUnaffordability: How Most Americans Should, Could,and Would Buy Private Long-Term Care Insurance.Seattle, WA: Center for Long-Term Care Financing,1999.
________. LTC Choice: A Simple, Cost-Free Solution tothe Long-Term Care Financing Puzzle. Seattle, WA:Center for Long-Term Care Financing, 1998.
Clinton, William Jefferson. State of the Union Address,January 19, 1999.
Cohen, Marc A., and Maurice Weinrobe. Tax Deductibil-ity of Long-Term Care Insurance Premiums:Implications for Market Growth and Public LTCExpenditures. Washington, DC: Health InsuranceAssociation of America, 1999.
Conning & Company. Long-Term Care Insurance: BabyBoom or Bust? Hartford, CT: Conning & Company,1999.
Cutler, John. ASPE Research Notes. Washington, DC:U.S. Department of Health and Human Services,Office of the Assistant Secretary for Planning andEvaluation, 1999.
Datamonitor. Marketing Insurance to Affinity Groups.New York: Datamonitor, Inc., 1997.
Fisher, J.D., and W.A. Fisher. “Theoretical Approachesto Individual-Level Change” in J. Peterson and R.DiClemente (eds.), HIV Prevention Handbook. NewYork: Kluwer Academic/Plenum Press pp. 3–55.
Fortune. “A Health Care Safety Net,” 14 October 1996.Fortune Magazine and John Hancock Financial Services.
Corporate and Employee Response to Caring for theElderly. The Time Inc. Magazine Company and JohnHancock Financial Services, 1989.
Foster Higgins. Tables: National Survey of Employer-Sponsored Health Plans, 1993. New York: FosterHiggins Survey and Research Services, 1994.
Franklin, Mary Beth. Kiplinger’s Personal FinanceMagazine and Retirement Report. 13th Annual PrivateLong-Term Care Insurance Conference, AmeliaIsland, FL, February 21–24, 1999.
Fronstin, Paul. “Employment Based Health Benefits:Who is Offered Coverage vs. Who Takes It.” EBRIIssue Brief no. 213 (Employee Benefit ResearchInstitute, September 1999).
Granza, Lee, Anna Madamba, and Mark Warshawsky.
BibliographyAaronson, Daniel, and Daniel G. Sullivan. “The Decline
of Job Security in the 1990s: Displacement, Anxiety,and Their Effect on Wage Growth.” Economic Perspec-tives. Federal Reserve Bank of Chicago (First Quarter1998): 17–43.
The Advisory Board Company. Issue Brief: Group LongTerm Care Enrollment and The “Ideal” EmployerProspect. Washington, DC: The Advisory Board,March 1995.
________. Issue Brief: Group Long Term Care Insurance.Washington, DC: The Advisory Board, April 1996.
American Association of Retired Persons/DanielYankelovich Group. Long Term Care in America:Public Attitudes and Possible Solutions. Washington,DC: American Association of Retired Persons, 1990.
American Council of Life Insurance. Monitoring Atti-tudes of the Public. Washington, DC: AmericanCouncil of Life Insurance, 1998.
________. Survey of professional financial planners(conducted by Mathew Greenwald & Associates).Washington, DC: American Council of Life Insurance.Released April 21, 1999.
________. Who Will Pay for the Baby Boomers’ Long-TermCare Needs? Washington, DC: American Council ofLife Insurance, 1998.
American Health Care Association. Poll of Baby Boomersupport for President Clinton’s long-term care initia-tive. Conducted by Fabrizio, McLaughlin &Associates. Washington, DC: American Health CareAssociation, 1999.
American Health Line. Federal Employees: Group LongTerm Care Coverage on Hold. September 16, 1999.
Belch, George E., and Michael A. Belch. Introduction toAdvertising and Promotion Management. Homewood,IL: Richard D. Irwin, Inc., 1990.
Brenerman, David H., Second Vice President, Govern-ment Relations, UNUM Life Insurance Company ofAmerica. Statement of the Health Insurance Associa-tion of America before the Subcommittee on CivilService, Committee on Government Reform andOversight, U.S. House of Representatives, on OfferingLong-Term Care Insurance To All Federal Employees,Annuitants and their Families And the Role of PrivateLong-Term Care Insurance in Financing Long-TermCare. March 18, 1999.
Buck Consultants. 401(k) Plans: Survey Report onPlan Design 1998. New York: Buck Consultants,

May 2000 • EBRI Issue Brief30
“Financing Long-Term Care: Employee Needs andAttitudes, and the Employer’s Role.” Benefits Quar-terly (Fourth quarter 1998): 60–72.
John Hancock Mutual Life Insurance Company. LTCSponsor Database. 1999.
John Hancock/Eastern Research Associates. A ConjointAnalysis Study of Long-Term Care Insurance. Granby,CT: Eastern Research Associates, Sept. 1, 1998.
________. LTC Sponsor Database 1997.Health Insurance Association of America. Long-Term
Care Insurance in 1996. Washington, DC: HealthInsurance Association of America, September 1998.
Health Insurance Association of America/LifePlans. WhoBuys Long-Term Care Insurance? Washington, DC:Health Insurance Association of America, 1992.
________. Who Buys Long-Term Care Insurance?: 1994–95 Profiles and Innovations in a Dynamic Market.Washington, DC: Health Insurance Association ofAmerica, 1995.
International Foundation of Employee Benefit Plans.Employer-Sponsored Long-Term Care Insurance: DidHIPAA Matter? Brookfield, WI: International Founda-tion of Employee Benefit Plans, Inc., 1999.
International Society of Certified Employee BenefitSpecialists. Census of Certified Employee BenefitSpecialists: Results. Voluntary Benefits: Commentary,1997. Brookfield, WI: International Society of Certi-fied Employee Benefit Specialists, 1997.
Lachance, Janice R., Director, U.S. Office of PersonnelManagement. Statement before the Subcommittee onCivil Service, Committee on Government Reform andOversight, U.S. House of Representatives, on GroupLong Term Care Insurance for Federal Employees.March 18, 1999.
LIMRA International. Long-Term Care Insurance:Sharpen Your Edge, Employer Survey. Windsor, CT:LIMRA International, June 1998.
________. U.S. Employer-Sponsored Group Long-TermCare Survey: Sales and In Force (1998). Windsor, CT:LIMRA International, April 1999a.
________. Worksite Marketing of Voluntary Products:Market Potential. Windsor, CT: LIMRA International,1994.
________. Worksite Marketing of Voluntary Products: AGroup Insurance Perspective. Windsor, CT: LIMRAInternational, 1999b.
Lutzky, Steven, John Corea, Lisa Alecxih, LauraMarburger, and Kathlyn Wee. Preliminary Data Froma Survey of Employers Offering Group Long-TermCare Insurance to Their Employees: Interim Report ofthe Lewin Group (1999). ASPE Web site, http://aspe.hhs.gov/daltcp/reports/ltcinsir.htm
Magee, Nancy C. “Confusion Reigns in the Realm of
Long Term Care.” Broker World (May 1998).Maguire, William J. “An Information-Processing Model
of Advertising Effectiveness.” In H.L. David and A. J.Silk, eds., Behavioral and Management Sciences inMarketing. New York: Ronald/Wiley, 1978.
Mahoney, Kevin J. “Strategies for Making Private Long-Term Care Insurance More Accessible to the MiddleClass: Lessons from the California Experience.”Prepared for the Florida Commission on Long-TermCare’s Legislative Symposium, November 6 and 7,1995.
Mahoney, Kevin J., and Lora A. Connolly. “Long-TermCare: California’s Trend-Setting Initiatives.” Compen-sation & Benefits Management (Autumn 1995): 7–13.
Martin, David S. Chair, ACLI Accelerated Death Ben-efits/Long-Term Care Committee. Statement of theAmerican Council on Life Insurance before theSubcommittee on Civil Service, Committee on Govern-ment Reform and Oversight, U.S. House ofRepresentatives, on Offering Long-Term Care Insur-ance to Federal Employees as an Employment Benefit.March 18, 1999.
Meiners, Mark R. “Public-Private Partnerships in Long-Term Care.” In Public and Private Responsibilities inLong-Term Care: Finding the Balance. Baltimore, MD:Johns Hopkins University Press, 1998, pp. 115–133.
Metropolitan Life Insurance Company. How MarketResearch Drives Voluntary Product Sales. Presenta-tion at LIMRA Group Insurance Conference, Toronto,Canada, 1998.
________. Marketing Voluntary Benefits: What DoEmployees Want? LIMRA International ResearchPlanning Conference, June 1995.
________. Proposal to the University of North Carolina atChapel Hill. 1996.
Metropolitan Life Insurance Company/AARP. Introduc-ing the New AARP Long-Term Care InsuranceProgram from MetLife. Westport, CT: MetropolitanLife Insurance Company, 1998.
Murtaugh, Christopher M., Peter Kemper, Brenda C.Spillman, and Barbara Lepidus Carlson. “TheAmount, Distribution, and Timing of Lifetime NursingHome Use.” Medical Care. Vol. 35(3) (1997): 204–218.
National Academy on an Aging Society. Demography IsNot Destiny. Washington, DC: National Academy onan Aging Society, February 1999.
National Alliance for Caregiving/American Association ofRetired Persons. Family Caregiving in the U.S.:Findings from a National Survey. Washington, DC:NAC/AARP, 1997.
National Council on the Aging/John Hancock. Long-Term Care Surveys (1996, 1997, 1999). Washington,DC: National Council of the Aging.

May 2000 • EBRI Issue Brief 31
Petty, Richard E., and John T. Cacioppo. Attitudes andPersuasion: Classic and Contemporary Approaches.Dubuque, IA: Wm. C. Brown Company, 1981.
________. Communication and Persuasion: Central andPeripheral Routes to Attitude Change. New York:Springer-Verlag, 1986.
Pincus, Jeremy. “Employer-Sponsored Long-Term CareInsurance: Best Practices for Increasing Sponsorship.”EBRI Issue Brief no. 220 (Washington, DC: EmployeeBenefit Research Institute, April 2000).
________. “Increasing GLTC Participation: What Works?”presentation to the 1997 John Hancock client confer-ence. Boston, June 5, 1997.
Podgurski, Walter B. Payroll Deduction: The Selling ofVoluntary Benefits. Cincinnati, OH: National Under-writer Co., 1995.
Riefberg, Vivian, and Cyrus Taraporevala. “Long-TermCare Insurance: The $10+ Billion Silver Lining in theU.S. Health Insurance Cloud?” Managed Medicare &Medicaid (04/13/1998).
Riefberg, Vivian, Cyrus Taraporevala, H. Dietrich Moor,and Eric D. Streisand. “Long-Term Care Insurance:The $10+ Billion Silver Lining in the U.S. HealthInsurance Cloud?” The McKinsey Quarterly. NewYork: McKinsey & Company, 1997.
Roper Reports/Metropolitan Life Insurance Company.Survey on voluntary benefits cited in EmployeeBenefit Plan Review (September 1999).
Quinn, Jane Bryant. 13th Annual Private Long-TermCare Insurance Conference, Amelia Island, FL,February 21-24, 1999.
Shave, George F. “CalPERS Self-Funded LTC ProgramHas Enrolled 70,000+.” Long Term Care Group homepage (www.ltcg.com) 1999.
Snider, Sarah. “Long-Term Care and the Private Insur-ance Market.” EBRI Issue Brief no. 163 (EmployeeBenefit Research Institute, July 1995).
Steers, R.M. “Antecedents and Outcomes of Organiza-tional Commitment.” Administrative SciencesQuarterly. Vol. 22 (1977): 46–56.
Titus, Frank. Assistant Director for Insurance Programs,U.S. Office of Personnel Management. 13th AnnualPrivate Long-Term Care Insurance Conference,Amelia Island, FL, February 21–24, 1999.
Towers Perrin. Group Long Term Care Survey Results.Stamford, CT: Towers Perrin, October 27, 1995.
U.S. Congressional Budget Office. Projections of Expen-ditures for Long-Term Care Services for the Elderly.Washington, DC: U.S. Congressional Budget Office,1999.
U.S. Department of Commerce. Bureau of the Census.Statistical Abstract of the United States: 1997, 117th
edition. Washington, DC, U.S. Government PrintingOffice, 1997. Table No. 620, Civilian Labor Force andParticipation Rates, With Projections: 1980 to 2005.
________. Current Population Reports, Consumer Income.P60-200: Money Income in the United States: 1997.Washington, DC: U.S. Government Printing Office,1998.
U.S. Department of Labor. Bureau of Labor Statistics.Employee Benefits in Medium and Large PrivateEstablishments, 1997. Available at www.bls.gov/special.requests/ocwc/oclt/ebs/ebbl0017.pdf
U.S. Office of Personnel Management. The Fact Book,Federal Civilian Workforce Statistics, 1998 Edition.Washington, DC: U.S. Office of Personal Management,1988. Current and past editions are available atwww.opm.gov/feddata/factbook/index.htm
Washington Business Group on Health. The MetLifeStudy of Employer Costs for Working Caregivers.Washington, DC: Washington Business Group ofHealth, 1995.
Weiner, Joshua M., Laurel Hixon Illston, and RaymondJ. Hanley. Sharing the Burden: Strategies for Publicand Private Long Term Care Insurance, Washington,DC: The Brookings Institution, 1994.
William M. Mercer. Mercer/Foster Higgins. NationalSurvey of Employer-Sponsored Health Plans, 1998.New York: William M. Mercer, 1999.
________. Spotlight on Benefits for the Council on Em-ployee Benefits. New York: William M. Mercer, 1998a.
________. Survey of Employee Benefit Preferences. NewYork: William M. Mercer, 1998b.
________. Survey of Employers with Long-Term CareBenefits. New York: William M. Mercer, 1998c.
Workforce. “Offer Long-Term Care Insurance: Uncle SamNo Longer Has His Hand Out” (July 1997): pp. 84–88.
Yakoboski, Paul, Pamela Ostuw, and Bill Pierron. “The1999 Small Employer Retirement Survey: Building aBetter Mousetrap is Not Enough.” EBRI Issue Briefno. 212 (Employee Benefit Research Institute, August1999).

May 2000 • EBRI Issue Brief32
S© 2000.EmployeeBenefit
ResearchInstitute-Education
and ResearchFund.
All rightsreserved.
Issu
e Br
ief
EBRIEMPLOYEE
BENEFIT
RESEARCH
INSTITUTE ®
EBRI Issue Brief (ISSN 0887-137X) is published monthly at $300 per year or is included as part of a membership subscriptionby the Employee Benefit Research Institute, 2121 K Street, NW, Suite 600, Washington, DC 20037-1896. Periodicals postagerate paid in Washington, DC. POSTMASTER: Send address changes to: EBRI Issue Brief, 2121 K Street, NW, Suite 600,Washington, DC 20037-1896. Copyright 2000 by Employee Benefit Research Institute. All rights reserved, No. 221.
W
O
Who we are
hat we do
ur publications
ubscriptions/orders
Could we send a friend or colleague a complimentarycopy of EBRI Issue Brief?
Send an issue to
Organization
Address
City/State/ZIP
Your Name
Mail to: EBRI, 2121 K Street, NW, Suite 600, Washington, DC 20037or Fax to: (202) 775-6312
Did you read this as a pass-along? Stay ahead of employee benefitissues with your own subscription to EBRI Issue Briefs for only $49/year electronically e-mailed to you or $99/year printed and mailed.
For more information about subscriptions, visit our Web site atwww.ebri.org or complete the form below and return it to EBRI.
Name
Organization
Address
City/State/ZIP
Mail to: EBRI, 2121 K Street, NW, Suite 600, Washington, DC 20037or Fax to: (202) 775-6312
The Employee Benefit Research Institute (EBRI) was founded in 1978. Its mission isto contribute to, to encourage, and to enhance the development of sound employee benefit
programs and sound public policy through objective research and education. EBRI is the only private, nonprofit,nonpartisan, Washington, DC-based organization committed exclusively to public policy research and education oneconomic security and employee benefit issues. EBRI’s membership includes a cross-section of pension funds,businesses, trade associations, labor unions, health care providers and insurers, government organizations, andservice firms.
EBRI’s work advances knowledge and understanding of employee benefits and theirimportance to the nation’s economy among policymakers, the news media and the public.
It does this by conducting and publishing policy research, analysis, and special reports on employee benefits issues;holding educational briefings for EBRI members, congressional and federal agency staff, and the news media; andsponsoring public opinion surveys on employee benefit issues. EBRI’s Education and Research Fund (EBRI-ERF)performs the charitable, educational, and scientific functions of the Institute. EBRI-ERF is a tax-exempt organizationsupported by contributions and grants.
EBRI Issue Briefs are monthly periodicals providing expert evaluations ofemployee benefit issues and trends, as well as critical analyses of employee
benefit policies and proposals. Each issue, ranging in length from 16–28 pages, thoroughly explores one topic. EBRINotes is a monthly periodical providing current information on a variety of employee benefit topics. EBRI’s WashingtonBulletin provides sponsors with short, timely updates on major federal developments in employee benefits. EBRI’sFundamentals of Employee Benefit Programs offers a straightforward, basic explanation of employee benefit programsin the private and public sectors. The EBRI Databook on Employee Benefits is a statistical reference volume on employeebenefit programs and work force related issues.
Contact EBRI Publications, (202) 659-0670; fax publication orders to(202) 775-6312. Subscriptions to EBRI Issue Briefs are included as part of
EBRI membership, or as part of a $199 annual subscription to EBRI Notes and EBRI Issue Briefs. Individual copies areavailable with prepayment for $25 each (for printed copies) or for $7.50 (as an e-mailed electronic file) by callingEBRI or from www.ebri.org. Change of Address: EBRI, 2121 K Street, NW, Suite 600, Washington, DC 20037, (202)775-9132; fax number, (202) 775-6312; e-mail: Publications [email protected]. Membership Information: Inquir-ies regarding EBRI membership, and/or contributions to EBRI-ERF should be directed to EBRI President DallasSalisbury at the above address, (202) 659-0670; e-mail: [email protected]
Editorial Board: Dallas L. Salisbury, publisher; Steve Blakely, managing editor; Cindy O’Connor, production and distribution. Anyviews expressed in this publication and those of the authors should not be ascribed to the officers, trustees, members, or othersponsors of the Employee Benefit Research Institute, the EBRI Education and Research Fund, or their staffs. Nothing herein is tobe construed as an attempt to aid or hinder the adoption of any pending legislation, regulation, or interpretative rule, or as legal,accounting, actuarial, or other such professional advice.
EBRI Issue Brief is registered in the U.S. Patent and Trademark Office. ISSN: 0887-137X 0887-137X/90 $ .50+.50


