Embed Size (px)
Citation preview
INDIANA DEPARTMENT OF ENVIRONMENTAL MANAGEMENT
Indiana Department of
Environmental Management
Office of Water Qualitywww.idem.IN.gov
EducationMonitoring
PreservationImprovement
Volunteer Stream Monitoring Training Manual
2015
WA - 1023-ML
“Never doubt that a small group of thoughtful, committed citizens can change the world. Indeed, it’s the only thing that ever has.”
MARGARET MEADE
www.idem.IN.gov/riverwatch
Indiana Department of
Environmental Management
Office of Water Quality vog.NI.medi.www

Password: _________________________________
Volunteer ID: _________________________________
Site ID: _________________________________
_________________________________ _________________________________
_________________________________
2 www.idem.IN.gov /riverwatch
The original training manual was developed by Hoosier Riverwatch staff in 1997. This manual represents many revisions and updates, and is the ninth edition. Special thanks to Lyn (Hartman) Crighton, Lisa Ritter-McMahan, Katie Hodgdon, Jan (Hosier) Sneddon, Mandy Burk, Jeff Muse, Gwen White, and Sarah Hippensteel for their contributions through the years. The beautiful large-scale graphics were created by Sarah Beth Lauterbach, unless otherwise indicated. All parts of this publication may be copied and distributed for educational use and free distribution with proper credit provided to Hoosier Riverwatch.
www.idem.IN.gov/riverwatchwww.HoosierRiverwatch.com
Indiana Department of Environmental Management
3
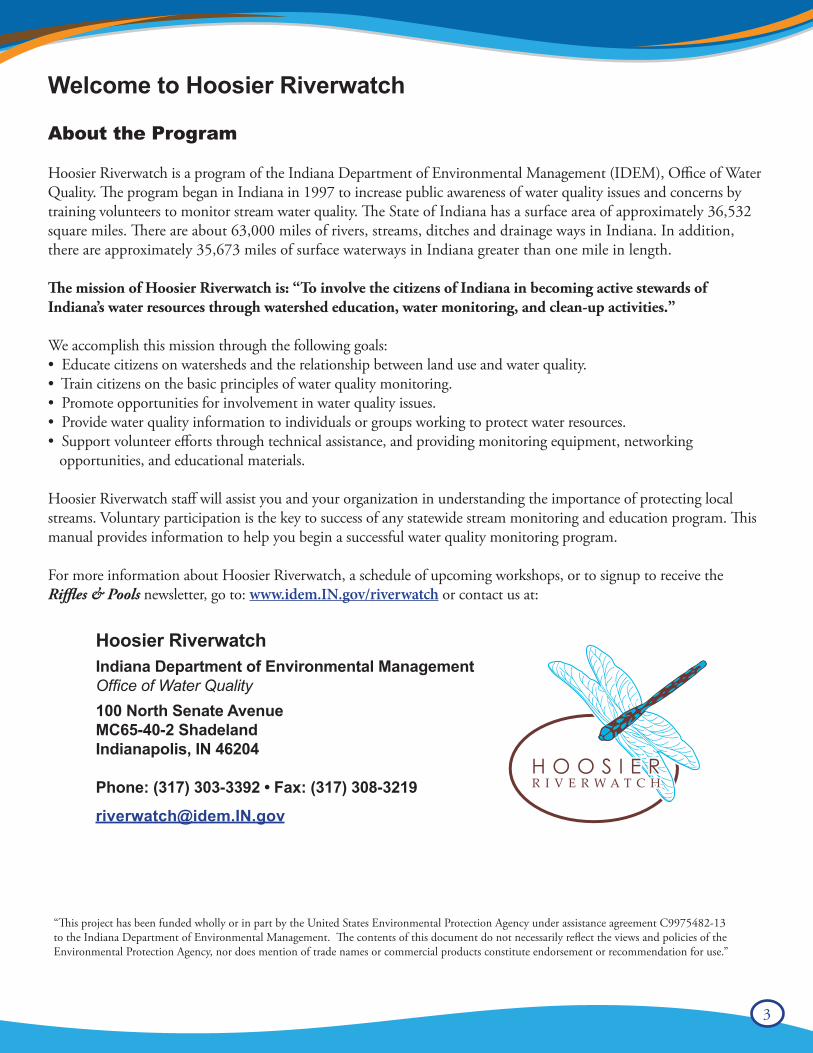
About the Program
Hoosier Riverwatch is a program of the Indiana Department of Environmental Management (IDEM), Office of Water Quality. The program began in Indiana in 1997 to increase public awareness of water quality issues and concerns by training volunteers to monitor stream water quality. The State of Indiana has a surface area of approximately 36,532 square miles. There are about 63,000 miles of rivers, streams, ditches and drainage ways in Indiana. In addition, there are approximately 35,673 miles of surface waterways in Indiana greater than one mile in length.
The mission of Hoosier Riverwatch is: “To involve the citizens of Indiana in becoming active stewards of Indiana’s water resources through watershed education, water monitoring, and clean-up activities.”
We accomplish this mission through the following goals:• Educate citizens on watersheds and the relationship between land use and water quality.• Train citizens on the basic principles of water quality monitoring.• Promote opportunities for involvement in water quality issues.• Provide water quality information to individuals or groups working to protect water resources.• Support volunteer efforts through technical assistance, and providing monitoring equipment, networking opportunities, and educational materials.
Hoosier Riverwatch staff will assist you and your organization in understanding the importance of protecting local streams. Voluntary participation is the key to success of any statewide stream monitoring and education program. This manual provides information to help you begin a successful water quality monitoring program.
For more information about Hoosier Riverwatch, a schedule of upcoming workshops, or to signup to receive the Riffles & Pools newsletter, go to: www.idem.IN.gov/riverwatch or contact us at:
Hoosier RiverwatchIndiana Department of Environmental ManagementOffice of Water Quality100 North Senate AvenueMC65-40-2 ShadelandIndianapolis, IN 46204
Phone: (317) 303-3392 • Fax: (317) 308-3219
“This project has been funded wholly or in part by the United States Environmental Protection Agency under assistance agreement C9975482-13 to the Indiana Department of Environmental Management. The contents of this document do not necessarily reflect the views and policies of the Environmental Protection Agency, nor does mention of trade names or commercial products constitute endorsement or recommendation for use.”
Welcome to Hoosier Riverwatch
4 www.idem.IN.gov /riverwatch
Acknowledgements:
Indiana Department of Environmental Management - Office of Water Quality Rhonda Dufour Jody Arthur Steve Hall Chuck Bell Carol Newhouse Dennis Clark Steve Newhouse Sam Gibson Stacey Sobat Larry McFall Joanna Wood
Indiana Department of Natural Resources Division of Entomology Division of Fish & Wildlife Division of Outdoor Recreation Division of Soil Conservation Deb Fairhurst Kim Guinnup Deborah Messenger Jim Ray Gwen White Bob Waltz Diane Day Doug Keller
Past Hoosier Riverwatch Coordinators Jason Bowling Sarah Hippensteel Jan (Hosier) Sneddon Jeff Muse Mandy Burk Lyn (Hartman) Crighton Katie Hodgdon Lisa Ritter-McMahan
Special Thanks to: Stephanie Ayres Ian Crighton Claudia Denton Sarah Engle Jim Gammon Art Henerlong William W. Jones Meg Larson Stewart Lewis Patrick McCafferty Arwin Provonsha Ed Rankin Stacy Renfro John Rouch Robert Vertrees Bob Williams
All Indiana Soil and Water Conservation DistrictsAll Hoosier Riverwatch Volunteer Water Monitoring InstructorsClinton River (Michigan) Watershed CouncilGLOBE ProgramEarth Force / Global Rivers Environmental Education Network (GREEN)Hach CompanyIllinois Department of Natural ResourcesIOWATER/Iowa Department of Natural ResourcesKentucky Water WatchLaMotte CompanyOhio Department of Natural ResourcesOhio Environmental Protection AgencyTennessee Valley AuthorityStudent Watershed Research Project/Saturday Academy of OregonUnited States Environmental Protection Agency
5
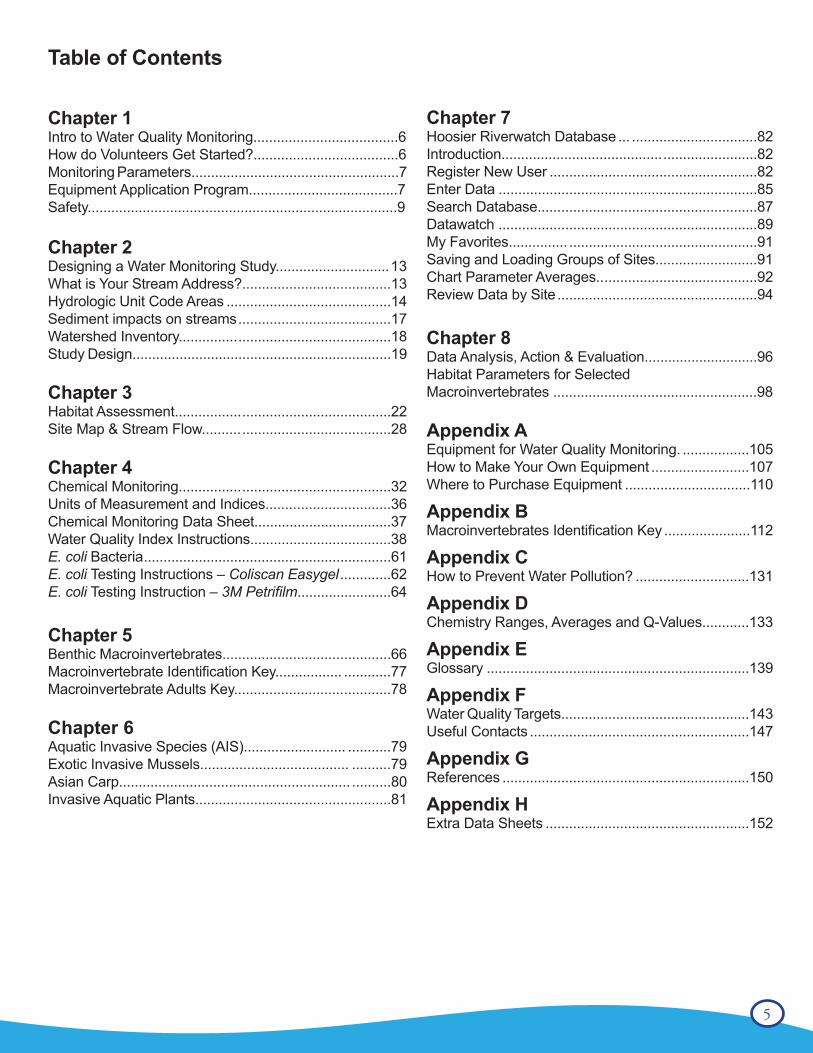
Table of Contents
Chapter 1 Intro to Water Quality Monitoring.....................................6How do Volunteers Get Started?.....................................6Monitoring Parameters.....................................................7Equipment Application Program......................................7Safety...............................................................................9
Chapter 2 Designing a Water Monitoring Study............................. 13What is Your Stream Address?......................................13Hydrologic Unit Code Areas ..........................................14Sediment impacts on streams .......................................17Watershed Inventory............... .......................................18Study Design..................................................................19
Chapter 3 Habitat Assessment................. ......................................22Site Map & Stream Flow.......... ......................................28
Chapter 4 Chemical Monitoring................ ......................................32Units of Measurement and Indices........ ........................36Chemical Monitoring Data Sheet........... ........................37Water Quality Index Instructions............ ........................38E. coli Bacteria ....................................... ........................61E. coli Testing Instructions – Coliscan Easygel .............62E. coli Testing Instruction – 3M Petrifilm........... .............64
Chapter 5 Benthic Macroinvertebrates.............................. .............66Macroinvertebrate Identification Key................. ............77Macroinvertebrate Adults Key............................ ............78
Chapter 6 Aquatic Invasive Species (AIS).......................... ...........79Exotic Invasive Mussels...................................... ..........79Asian Carp........................................................... ..........80Invasive Aquatic Plants........................................ ..........81
Chapter 7 Hoosier Riverwatch Database ... ................................82Introduction......................................... ........................82Register New User .....................................................82Enter Data ..................................................................85Search Database...... ..................................................87Datawatch ................. .................................................89My Favorites............... ................................................91Saving and Loading Groups of Sites..........................91Chart Parameter Averages.. .......................................92Review Data by Site ...................................................94
Chapter 8 Data Analysis, Action & Evaluation..... ........................96Habitat Parameters for Selected Macroinvertebrates ....................................................98
Appendix A Equipment for Water Quality Monitoring. .................105How to Make Your Own Equipment .........................107Where to Purchase Equipment ................................110
Appendix B Macroinvertebrates Identification Key ......................112
Appendix C How to Prevent Water Pollution? .............................131
Appendix D Chemistry Ranges, Averages and Q-Values............133
Appendix E Glossary ...................................................................139
Appendix F Water Quality Targets................................................143Useful Contacts ........................................................147
Appendix G References ...............................................................150
Appendix H Extra Data Sheets ....................................................152
6 www.idem.IN.gov /riverwatch
Chapter 1 - Introduction to Water Quality Monitoring
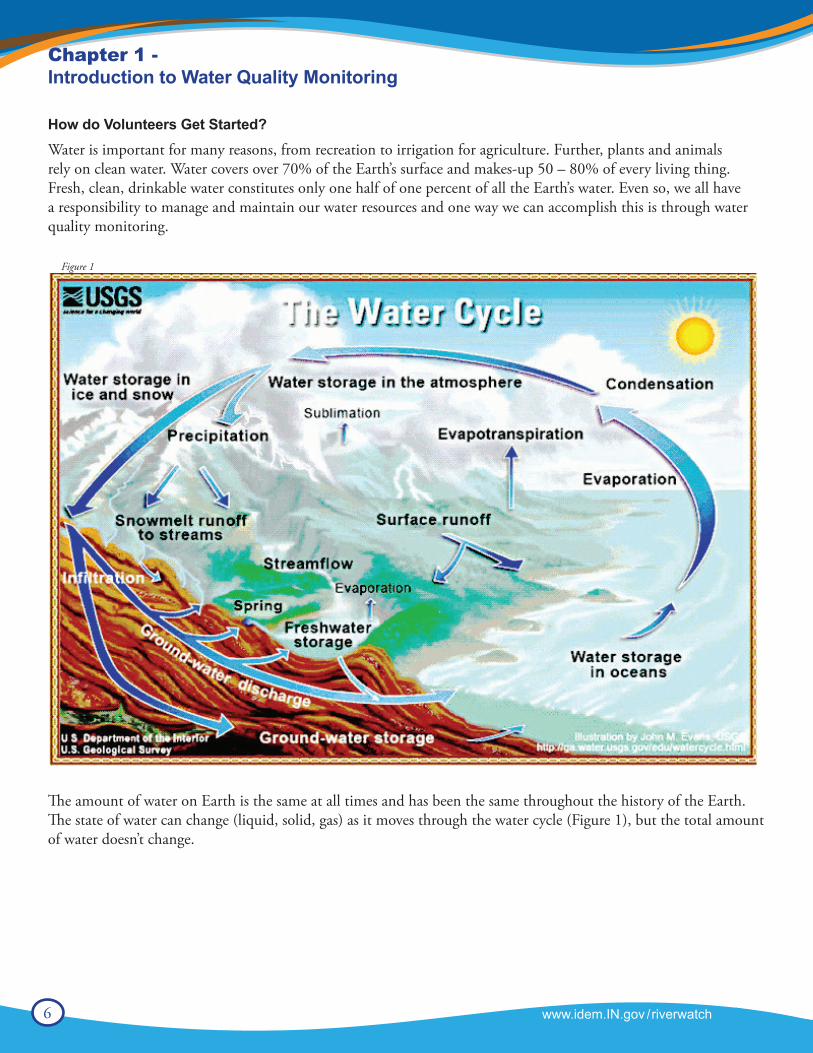
How do Volunteers Get Started?Water is important for many reasons, from recreation to irrigation for agriculture. Further, plants and animals rely on clean water. Water covers over 70% of the Earth’s surface and makes-up 50 – 80% of every living thing. Fresh, clean, drinkable water constitutes only one half of one percent of all the Earth’s water. Even so, we all have a responsibility to manage and maintain our water resources and one way we can accomplish this is through water quality monitoring.
The amount of water on Earth is the same at all times and has been the same throughout the history of the Earth. The state of water can change (liquid, solid, gas) as it moves through the water cycle (Figure 1), but the total amount of water doesn’t change.
Figure 1
7
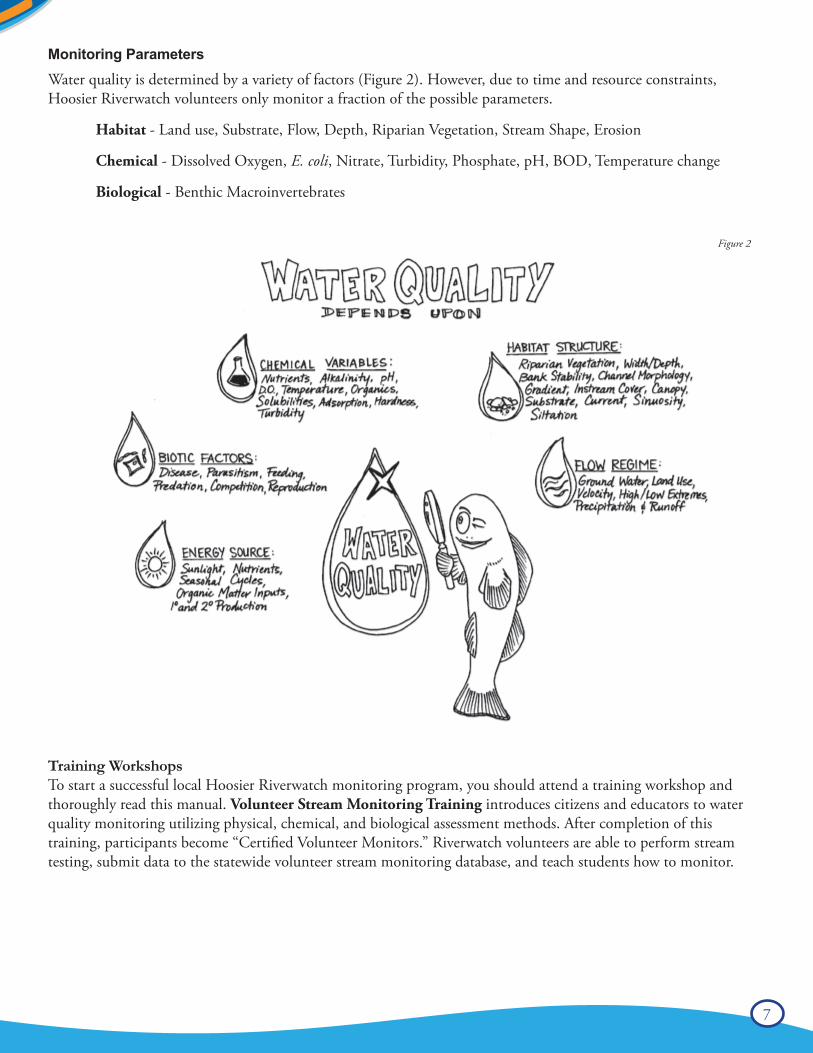
Monitoring ParametersWater quality is determined by a variety of factors (Figure 2). However, due to time and resource constraints, Hoosier Riverwatch volunteers only monitor a fraction of the possible parameters.
Habitat - Land use, Substrate, Flow, Depth, Riparian Vegetation, Stream Shape, Erosion
Chemical - Dissolved Oxygen, E. coli, Nitrate, Turbidity, Phosphate, pH, BOD, Temperature change
Biological - Benthic Macroinvertebrates
Training WorkshopsTo start a successful local Hoosier Riverwatch monitoring program, you should attend a training workshop and thoroughly read this manual. Volunteer Stream Monitoring Training introduces citizens and educators to water quality monitoring utilizing physical, chemical, and biological assessment methods. After completion of this training, participants become “Certified Volunteer Monitors.” Riverwatch volunteers are able to perform stream testing, submit data to the statewide volunteer stream monitoring database, and teach students how to monitor.
Figure 2
8 www.idem.IN.gov /riverwatch
Equipment Application ProgramHoosier Riverwatch has been awarding water monitoring equipment to volunteer groups since 1996. Equipment recipients form the foundation of the Hoosier Riverwatch volunteer stream monitoring network. These volunteers agree to monitor their selected stream or river segments at least four times per year for two years and must attend a Riverwatch training workshop. Any school, nonprofit organization, or governmental agency in Indiana is eligible to apply. Contact Hoosier Riverwatch for this year’s guidelines and application procedures. Equipment packages offered:
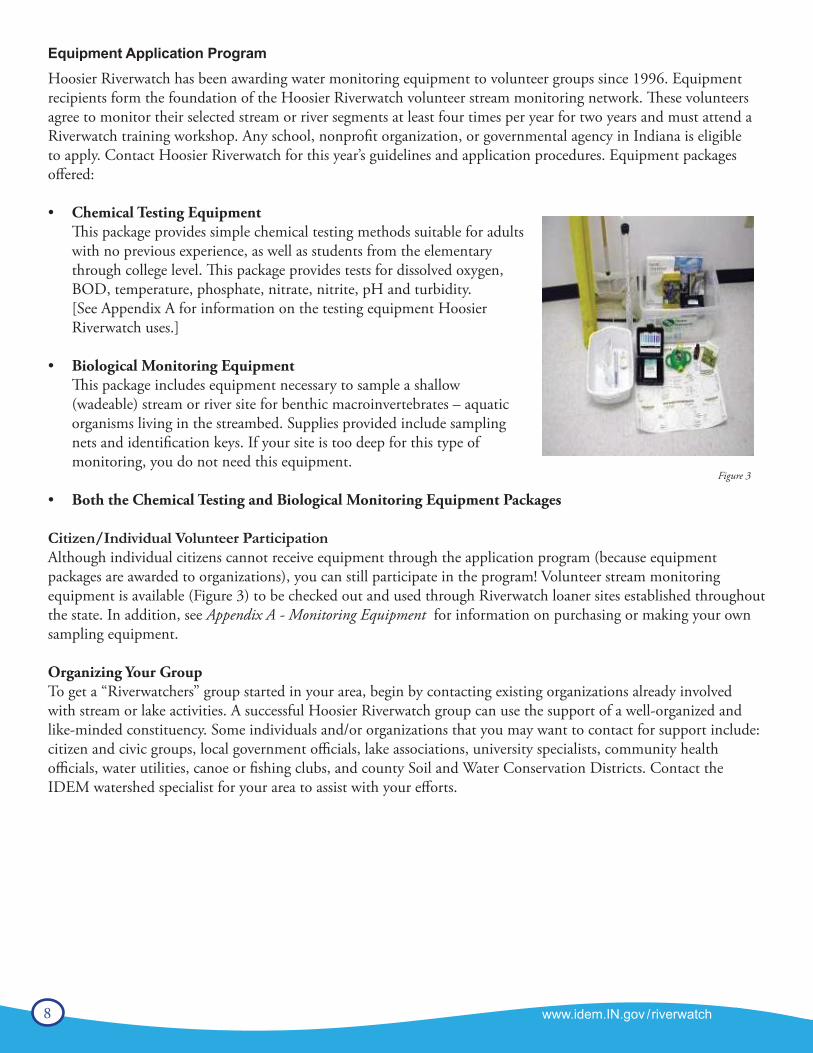
• Chemical Testing EquipmentThis package provides simple chemical testing methods suitable for adults with no previous experience, as well as students from the elementary through college level. This package provides tests for dissolved oxygen, BOD, temperature, phosphate, nitrate, nitrite, pH and turbidity. [See Appendix A for information on the testing equipment Hoosier Riverwatch uses.]
• Biological Monitoring EquipmentThis package includes equipment necessary to sample a shallow (wadeable) stream or river site for benthic macroinvertebrates – aquatic organisms living in the streambed. Supplies provided include sampling nets and identification keys. If your site is too deep for this type of monitoring, you do not need this equipment.
• Both the Chemical Testing and Biological Monitoring Equipment Packages
Citizen/Individual Volunteer ParticipationAlthough individual citizens cannot receive equipment through the application program (because equipment packages are awarded to organizations), you can still participate in the program! Volunteer stream monitoring equipment is available (Figure 3) to be checked out and used through Riverwatch loaner sites established throughout the state. In addition, see Appendix A - Monitoring Equipment for information on purchasing or making your own sampling equipment.
Organizing Your GroupTo get a “Riverwatchers” group started in your area, begin by contacting existing organizations already involved with stream or lake activities. A successful Hoosier Riverwatch group can use the support of a well-organized and like-minded constituency. Some individuals and/or organizations that you may want to contact for support include: citizen and civic groups, local government officials, lake associations, university specialists, community health officials, water utilities, canoe or fishing clubs, and county Soil and Water Conservation Districts. Contact the IDEM watershed specialist for your area to assist with your efforts.
Figure 3
9
Safety
Safety is the critical first step in any volunteer stream monitoring program. All volunteers should read the following safety precautions prior to beginning any monitoring activity.
• Take a buddy along! Always monitor with at least one partner. Always let someone else know where you are, when you intend to return, and what to do if you do not return on time.
• Honor private property rights. Never cross a landowner’s property without permission. The right of public access to Indiana streams is determined by whether the waterway is classified as “navigable.” While all flowing surface water in Indiana is owned by its citizens, the public may only enter or access without permission the streambeds and banks (up to the Ordinary High Water Mark) of navigable waterways. The streambeds and banks of non-navigable waterways are privately owned and, therefore, require permission to enter or access. To learn if a particular stream is navigable, non-navigable, or currently unclassified, please refer to. www.IN.gov/nrc/2390.htm .
• Never wade in swift or high water. Do not wade if depth is greater than knee-deep. Do not monitor if the stream is at flood stage. Any stream is dangerous in times of flooding. If you have a potential drowning situation, remember the lifeguarding tenant: Reach, Throw, Go! First, try to reach with a pole, net, branch, or yardstick. Then, throw something (life preserver) that floats or that is tied with a rope and will enable you to pull him/her into shore. Only attempt a swimming rescue as a last resort. A drowning person can panic and pull you under, too.
• Beware of polluted streams that are known to be unsafe for handling. Check with your County Health Department or the Indiana Department of Environmental Management for information on bacterial and/or toxic contamination of local waterways. As a rule, treat every stream as if it were polluted - wear waders, rubber gloves, and protective eyewear. Never drink the water in a stream. Wash with soap if your hands have been in contact with stream water.
• Have a first aid kit on hand. Preferably, at least one team member should have first aid/CPR training. Your first aid kit should contain the following items (at a minimum):
Ͱ Several bandages for minor cuts Ͱ Antibacterial soap or alcohol wipes Ͱ First aid cream or ointment Ͱ Several gauze pads 3-4” square for deep wounds with excessive bleeding Ͱ Aspirin or other pain reliever/fever reducer Ͱ A needle and tweezers for removing splinters Ͱ A first aid manual that outlines diagnosis and treatment procedures Ͱ A single-edged razor blade for minor surgery and cutting tape to size Ͱ A 2”-wide roll of gauze and a triangular bandage for large wounds Ͱ A large compress bandage to hold a dressing in place Ͱ A 3”-wide elastic band for sprains, applying pressure to bleeding wounds Ͱ If a participant is sensitive to bee stings, include their doctor-prescribed antihistamine Ͱ An eyewash to flush chemicals Ͱ Telephone numbers of emergency personnel
• Develop a safety plan. Take a cell phone with you. Locate the nearest medical center and write down directions for traveling there. Have a medical form for each volunteer monitor including emergency contacts, insurance and pertinent health information such as allergies, diabetes, epilepsy.
Phone Numbers for EMERGENCY only:Indiana Poison Control Center (800) 382-9097
Rocky Mountain Poison Center (800) 623-5716
10 www.idem.IN.gov /riverwatch
• Listen to weather reports. Never monitor if severe weather is predicted or if a storm occurs.
• Be very careful when walking in the stream. Wear shoes that are in good condition and have traction. Rocky-bottom streams can be very slippery and may contain deep pools. Muddy-bottom streams may also prove dangerous where mud, silt, and sand have accumulated in sinkholes. If you must cross the stream, use a walking stick to steady yourself. Watch for barbed wire fences or sharp, rusty objects (e.g., car bodies, appliances) that may pose a particular hazard.
• Do not walk on unstable stream banks. Disturbing these banks; including the vegetation growing upon them, can accelerate erosion and lead to a collapse.
• Beware of animals and plants. Watch for irate dogs, farm animals, wildlife (e.g., snakes), and insects such as ticks, mosquitoes, and hornets. Know what to do if you are bitten or stung. Watch for poison ivy, sumac, giant hogweed, and other skin-irritating vegetation.
The chemical reagents supplied in the testing kits are laboratory grade reagents. Some of the chemicals are concentrated, some are irritating, some are poisonous and some will just make you itch. Please read thoroughly the directions and the Materials Safety Data Sheets (MSDS) provided with each kit. The reagents provided in the CHEMetrics kits are mild skin and eye irritants.
• Wear safety goggles and rubber gloves. Avoid contact between chemical reagents and your skin, eyes, nose, and mouth. Never use your fingers to stopper a bottle when shaking a solution.
• Do not mix chemicals indiscriminately. Use only the designated chemicals in specified amounts when performing tests.
• Provide wash water at the monitoring site to wash any chemicals from the eyes or the body.
• Know chemical clean-up, disposal, and first aid procedures. Wipe up all spills when they occur. Use sealed plastic containers filled with an absorbent material (e.g., kitty litter) to store waste before disposal. If accidental consumption of chemical reagents occurs, have your MSDS on hand and contact your local poison control office or one of the following:
• A first aid kit may not be enough. In addition, carry such safety equipment as life buoys, life jackets, river rescue throw bag, a flashlight, a whistle, and insect repellant.
These guidelines were adapted from the Environmental Protection Agency’s 1997 Volunteer Stream Monitoring Manual.
11
Prevent the Spread of Aquatic Invasive Species (AIS)
As Riverwatch volunteers, you will be coming into regular contact with Indiana’s waters. As a result, we would like you to help us prevent the spread of aquatic invasive species (see chapter 6 for more information).
• Remove all mud and plants from sampling equipment before transporting.
• Drain all water from equipment before transporting.
• If multiple locations on a stream are sampled in the same day, begin upstream and work downstream. If working in this order no drying or decontamination of equipment is necessary. If an upstream area is infested with an invasive then downstream areas likely are also. An infested downstream area does not necessarily mean upstream areas are infested too. This is why you should sample from upstream to downstream.
• Equipment decontamination is necessary following each sampling location if working from downstream to upstream or working on different water bodies in the same day. The simplest decontamination is to rinse equipment well with 104º F or hotter water.
• Ideally, sampling of different water bodies should be put off for 5 days following the last sampling. Sampling gear should be allowed to completely dry during these 5 days to allow any unseen hitchhikers to die.
• Dispose of unwanted live bait and worms in trash.
• NEVER transfer plants, fish, or animals to another body of water. They should only be released if they came out of that body of water.
12 www.idem.IN.gov /riverwatch
A Few More Details Before We Get Started...
Volunteer Monitoring NetworkThere is no national volunteer water quality monitoring program, but many states have a statewide program with their own set of parameters and methods. Our neighboring states, Ohio, Illinois, Kentucky, and Wisconsin have statewide volunteer stream and river monitoring programs. Hoosier Riverwatch has many state and national partners with whom we collaborate; we are truly part of something bigger. In Indiana, many lakes are also monitored by volunteer monitors who are trained and coordinated through IU/SPEA with funding from IDEM. Could there be one in your area?
What You Can Expect From Hoosier RiverwatchWhat is Hoosier Riverwatch’s role in our partnership with you? Our primary responsibilities are to provide hands-on training, as well as supply water monitoring equipment, ongoing technical support, information and education, and maintenance of the Online Volunteer Stream Monitoring Database. Our job is to empower you, to provide you with help and support to monitor Indiana’s water quality, and to help you find solutions to problems if they arise.
Riverwatch Wouldn’t Exist Without YouAs a volunteer monitor, you have the freedom to monitor when and where (with permission from private property owners) you choose. You should make these decisions based on your monitoring goals and monitoring plan. Remember, you are the primary user of the data collected, but it is possible that it could also be of interest to others (e.g., Indiana Department of Environmental Management, consultants, universities, local governmental agencies and watershed groups). Remember, the only way to share your data and for your data to be used is to submit it to the Hoosier Riverwatch Database. Your findings, as a volunteer, may indicate that professional testing is needed to determine the extent of a potential problem.
Preparation for ParticipationYou’re going to learn a lot of new information as you attend a Riverwatch training workshop or read through this training manual on your own. You may feel a little overwhelmed with new information at times. But, we guarantee that with some advanced preparation (e.g., planning, scheduling, financing, networking, gaining permission, and possibly getting through a little red tape) and practice with the equipment and data sheets, any educator, community group, or interested citizen can make a difference by participating in this program.
Take a deep breath and relax! You will be fine!
Smile - this stuff is fun!
13
Chapter 2 - Designing a Water Monitoring Study
The first step in developing a water monitoring study design is identifying your watershed. The ability of a stream to support beneficial uses such as fishing, boating and swimming is influenced by the major land uses in the watershed, the nature of the stream channel, the diversity of instream habitats, and the character of the riparian area.
Planning is critical to a successful water monitoring program. Knowing why you are monitoring will determine where, when, and how often you monitor.
What is Your Stream Address?“Just as everyone in Indiana lives within the boundaries of county, everyone also lives within a watershed; though we may live, work or play in different watersheds or in different parts of the same watershed.” A watershed is the total area of land that drains into a particular waterbody (wetland, stream, river, lake, or sea). Land uses and runoff in a watershed determine the quality of surface water in smaller streams and waterways. They can then influence the water quality of larger streams. For example, point source discharges, urban runoff, runoff from landfills and runoff from agricultural areas may contain sediments, organic material, nutrients, toxic substances, bacteria or other contaminants. When these substances are present in significant concentrations, they may interfere with some stream uses.
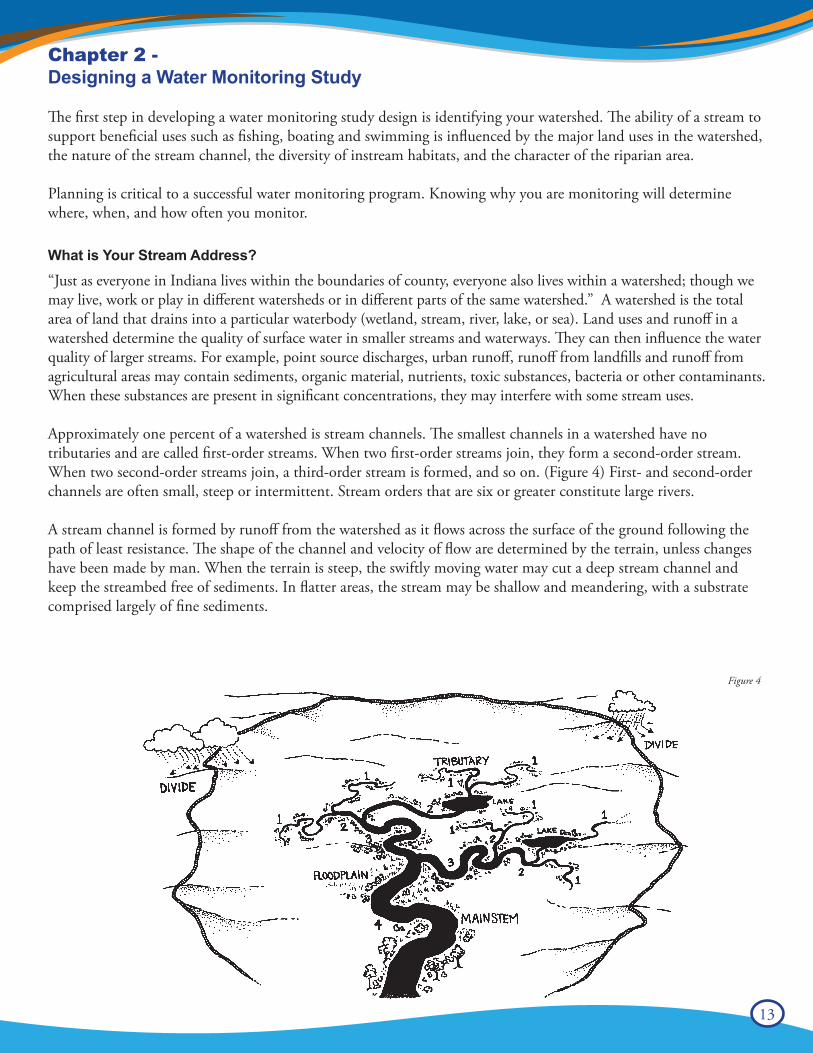
Approximately one percent of a watershed is stream channels. The smallest channels in a watershed have no tributaries and are called first-order streams. When two first-order streams join, they form a second-order stream. When two second-order streams join, a third-order stream is formed, and so on. (Figure 4) First- and second-order channels are often small, steep or intermittent. Stream orders that are six or greater constitute large rivers.
A stream channel is formed by runoff from the watershed as it flows across the surface of the ground following the path of least resistance. The shape of the channel and velocity of flow are determined by the terrain, unless changes have been made by man. When the terrain is steep, the swiftly moving water may cut a deep stream channel and keep the streambed free of sediments. In flatter areas, the stream may be shallow and meandering, with a substrate comprised largely of fine sediments.
Figure 4
14 www.idem.IN.gov /riverwatch
What is your Watershed Address?
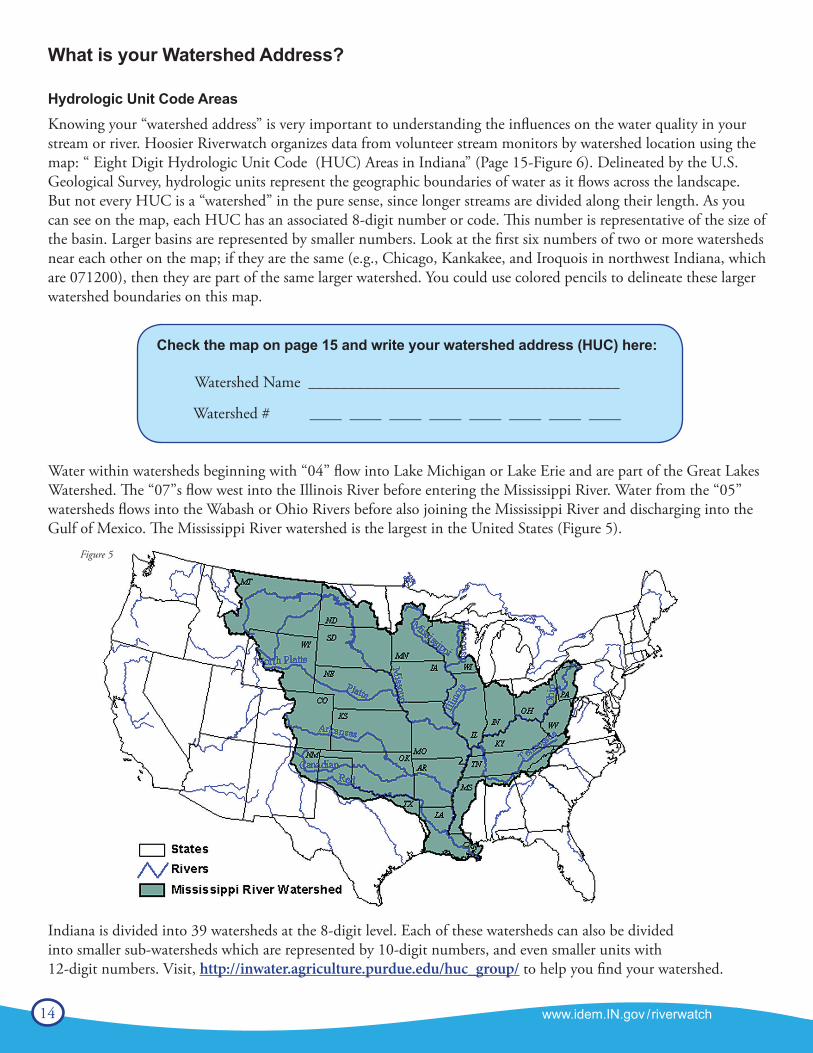
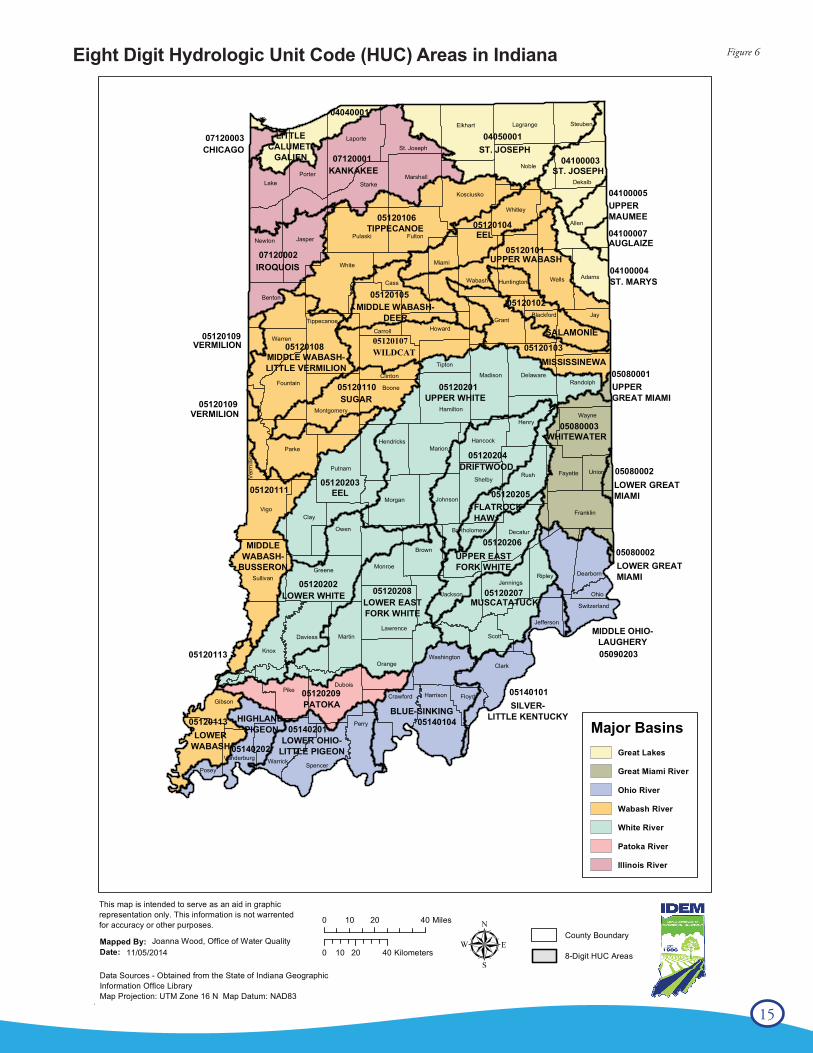
Hydrologic Unit Code AreasKnowing your “watershed address” is very important to understanding the influences on the water quality in your stream or river. Hoosier Riverwatch organizes data from volunteer stream monitors by watershed location using the map: “ Eight Digit Hydrologic Unit Code (HUC) Areas in Indiana” (Page 15-Figure 6). Delineated by the U.S. Geological Survey, hydrologic units represent the geographic boundaries of water as it flows across the landscape. But not every HUC is a “watershed” in the pure sense, since longer streams are divided along their length. As you can see on the map, each HUC has an associated 8-digit number or code. This number is representative of the size of the basin. Larger basins are represented by smaller numbers. Look at the first six numbers of two or more watersheds near each other on the map; if they are the same (e.g., Chicago, Kankakee, and Iroquois in northwest Indiana, which are 071200), then they are part of the same larger watershed. You could use colored pencils to delineate these larger watershed boundaries on this map.
Check the map on page 15 and write your watershed address (HUC) here:
Watershed Name _______________________________________
Watershed # ____ ____ ____ ____ ____ ____ ____ ____
Water within watersheds beginning with “04” flow into Lake Michigan or Lake Erie and are part of the Great Lakes Watershed. The “07”s flow west into the Illinois River before entering the Mississippi River. Water from the “05” watersheds flows into the Wabash or Ohio Rivers before also joining the Mississippi River and discharging into the Gulf of Mexico. The Mississippi River watershed is the largest in the United States (Figure 5).
Indiana is divided into 39 watersheds at the 8-digit level. Each of these watersheds can also be divided into smaller sub-watersheds which are represented by 10-digit numbers, and even smaller units with 12-digit numbers. Visit, http://inwater.agriculture.purdue.edu/huc_group/ to help you find your watershed.
Figure 5
15
Eight Digit Hydrologic Unit Code (HUC) Areas in Indiana8 - Digit Hydrologic Unit Code Areas in Indiana
This map is intended to serve as an aid in graphicrepresentation only. This information is not warrentedfor accuracy or other purposes.
Major BasinsGreat Lakes
Great Miami River
Ohio River
Wabash River
White River
Patoka River
Illinois River
SteubenLagrangeElkhart
St. JosephLaporte
PorterLake Dekalb
Noble
Marshall
Kosciusko
Starke
Whitley
Allen
JasperNewtonFultonPulaski
Wabash Huntington
Miami
AdamsWells
White
Cass
Carroll
Benton
GrantJayBlackford
HowardTippecanoe
Warren
Clinton
Tipton
DelawareMadisonFountain Randolph
HamiltonMontgomery
Boone
Ver
mill
ion
HenryWayne
HancockParke Marion
Hendricks
PutnamFayetteRush Union
Shelby
JohnsonMorganVigo
ClayFranklin
Owen DecaturBartholomew
Monroe
Brown
Ripley DearbornSullivan
Jennings
Greene
Jackson Ohio
Lawrence
Switzerland
Jefferson
Knox
MartinDaviess Scott
WashingtonOrange Clark
Pike
Gibson
Dubois
Crawford Harrison Floyd
Perry
WarrickPosey
SpencerVanderburg
04100003
04050001
07120001
04040001
07120003
05120106
04100005
05120104
07120002
04100004
05120101
04100007
0512010505120102
051201030512010805120109 05120107
051202010512011005080001
05120109
05080003
05120204
051202030512020505120111
05080002
05120206
05120202
05090203
0512020705120208
05080002
05140101
05140104
05120209
05140202
0514020105120113
UPPER WHITE
WILDCAT
MIDDLE WABASH-DEER
MISSISSINEWA
SALAMONIE
ST. MARYS
UPPER GREAT MIAMI
DRIFTWOOD
WHITEWATER
SUGAR
LITTLECALUMET-
GALIENKANKAKEE
TIPPECANOE
ST. JOSEPH
IROQUOISUPPER WABASH
EEL
CHICAGO
VERMILION
VERMILION
MIDDLE WABASH-LITTLE VERMILION
EEL
MIDDLEWABASH-
BUSSERON
LOWER WHITELOWER EASTFORK WHITE
UPPER EASTFORK WHITE
MUSCATATUCK
LOWERWABASH
PATOKA
LOWER OHIO-LITTLE PIGEON
BLUE-SINKINGHIGHLAND-
PIGEON
SILVER-LITTLE KENTUCKY
LOWER GREATMIAMI
LOWER GREATMIAMI
MIDDLE OHIO-LAUGHERY
FLATROCK-HAW
ST. JOSEPH
UPPERMAUMEE
AUGLAIZE
05120113
Mapped By:Date: µJoanna Wood, Office of Water Quality
11/05/2014
Data Sources - Obtained from the State of Indiana GeographicInformation Office LibraryMap Projection: UTM Zone 16 N Map Datum: NAD83
0 20 4010 Kilometers
0 20 4010 Miles
County Boundary
8-Digit HUC Areas
Figure 6
16 www.idem.IN.gov /riverwatch
What is Water Pollution and Where Does it Come From?
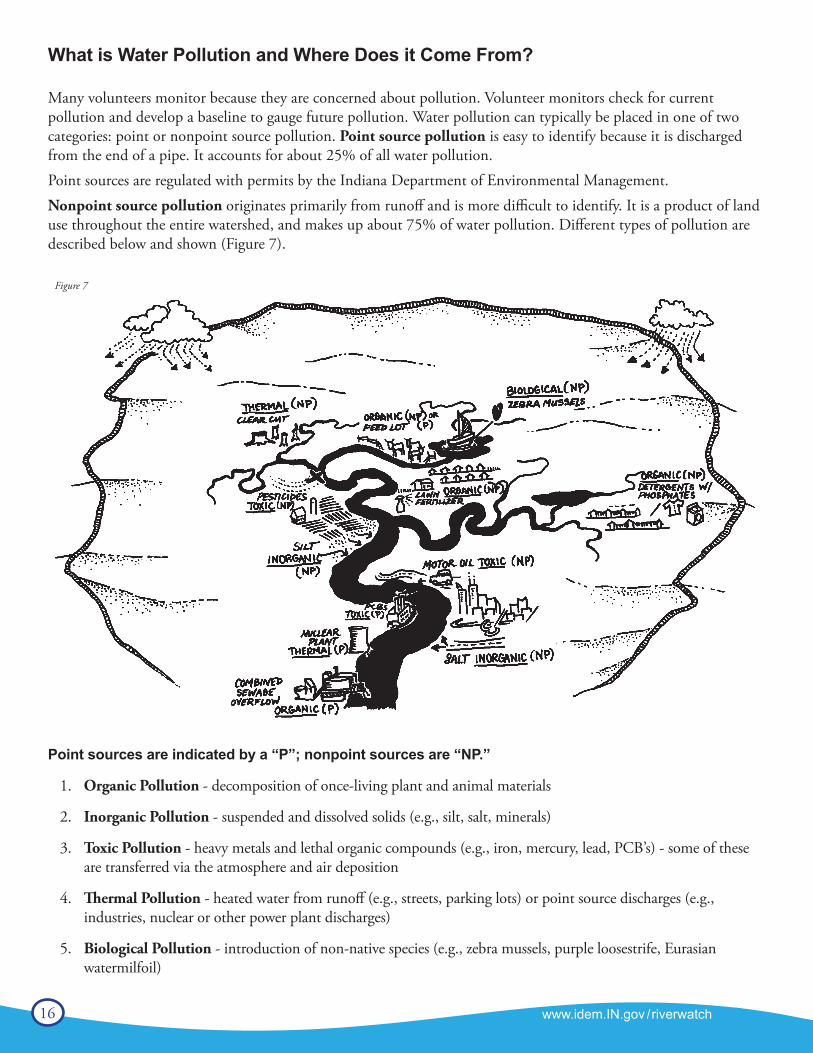
Many volunteers monitor because they are concerned about pollution. Volunteer monitors check for current pollution and develop a baseline to gauge future pollution. Water pollution can typically be placed in one of two categories: point or nonpoint source pollution. Point source pollution is easy to identify because it is discharged from the end of a pipe. It accounts for about 25% of all water pollution.Point sources are regulated with permits by the Indiana Department of Environmental Management.Nonpoint source pollution originates primarily from runoff and is more difficult to identify. It is a product of land use throughout the entire watershed, and makes up about 75% of water pollution. Different types of pollution are described below and shown (Figure 7).
Point sources are indicated by a “P”; nonpoint sources are “NP.”
1. Organic Pollution - decomposition of once-living plant and animal materials
2. Inorganic Pollution - suspended and dissolved solids (e.g., silt, salt, minerals)
3. Toxic Pollution - heavy metals and lethal organic compounds (e.g., iron, mercury, lead, PCB’s) - some of these are transferred via the atmosphere and air deposition
4. Thermal Pollution - heated water from runoff (e.g., streets, parking lots) or point source discharges (e.g., industries, nuclear or other power plant discharges)
5. Biological Pollution - introduction of non-native species (e.g., zebra mussels, purple loosestrife, Eurasian watermilfoil)
Figure 7
17
Sediment is a Leading Source of Water Pollutionby Volume to Indiana Streams and Rivers!
Soil erosion and sediment as a result of poor construction, logging, landscaping, and agricultural practices, aswell as eroding stream banks, cause many physical changes in streams that lead to decreased water quality.
Resulting Direct and Indirect Effects on Aquatic Organisms
• Metabolic rates of organisms increases, leading to wasted energy not available for growth and reproduction.
• Reduction in visual feeding and visual mating.• Clogging of gills during breathing and feeding.• Smothering of nests and eggs.• Change in habitat and filling of crevices in bottom
gravel.
• Oxygen sensitive species are detrimentally affected.• pH is reduced (water becomes more acidic) resulting in:
¤ Phosphorus becoming more available ¤ Ammonia becoming more toxic ¤ More leaching of heavy metals.
• Phosphorus acts as a “fertilizer,” so algal growth increases, leading to higher daytime dissolved oxygen and lower nighttime levels.
• Can upset normal feeding on the aquatic food chain.
• Developmental deformities.• Behavioral changes in feeding, mate attraction and
activity, and parental care.
Sediment impacts on streams
• Heat is absorbed resulting in increased water temperature.
• Water clarity is decreased, thereby increasing turbidity.
• Increased siltation and embeddedness on stream bottom (Figure 9).
• Excess organic debris is carried with soil, which may result in increased Biochemical Oxygen Demand (BOD)and decreased dissolved oxygen.
• Excess phosphorus is attached to soil particles and is carried into streams.
• Heavy metals may be leached from the soil leading to increased toxicity.
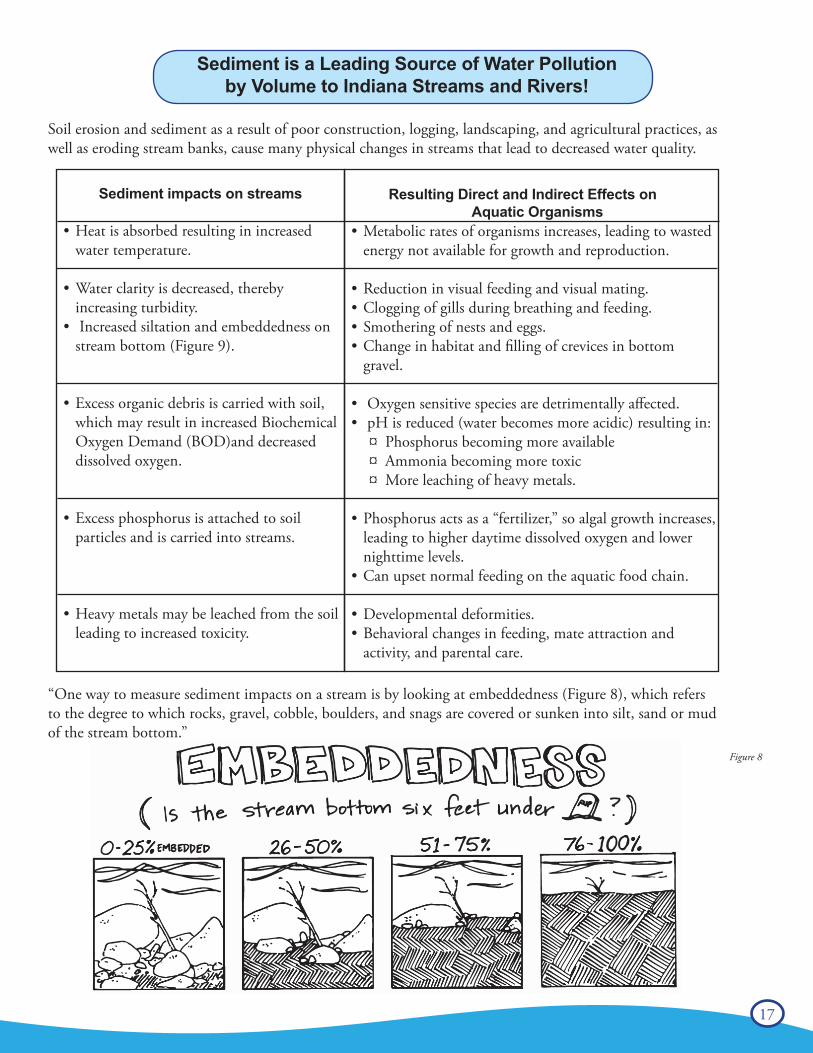
“One way to measure sediment impacts on a stream is by looking at embeddedness (Figure 8), which refers to the degree to which rocks, gravel, cobble, boulders, and snags are covered or sunken into silt, sand or mud of the stream bottom.”
Figure 8
18 www.idem.IN.gov /riverwatch
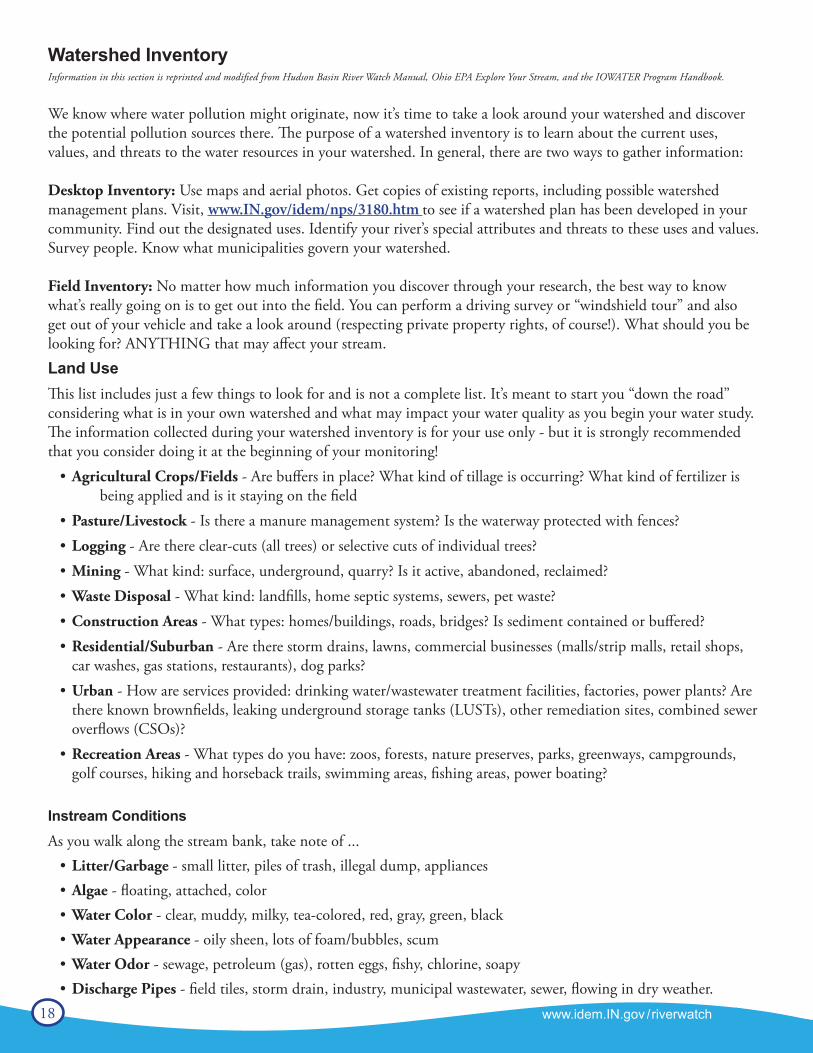
Watershed InventoryInformation in this section is reprinted and modified from Hudson Basin River Watch Manual, Ohio EPA Explore Your Stream, and the IOWATER Program Handbook.
We know where water pollution might originate, now it’s time to take a look around your watershed and discover the potential pollution sources there. The purpose of a watershed inventory is to learn about the current uses, values, and threats to the water resources in your watershed. In general, there are two ways to gather information:
Desktop Inventory: Use maps and aerial photos. Get copies of existing reports, including possible watershed management plans. Visit, www.IN.gov/idem/nps/3180.htm to see if a watershed plan has been developed in your community. Find out the designated uses. Identify your river’s special attributes and threats to these uses and values. Survey people. Know what municipalities govern your watershed.
Field Inventory: No matter how much information you discover through your research, the best way to know what’s really going on is to get out into the field. You can perform a driving survey or “windshield tour” and also get out of your vehicle and take a look around (respecting private property rights, of course!). What should you be looking for? ANYTHING that may affect your stream.Land UseThis list includes just a few things to look for and is not a complete list. It’s meant to start you “down the road” considering what is in your own watershed and what may impact your water quality as you begin your water study. The information collected during your watershed inventory is for your use only - but it is strongly recommended that you consider doing it at the beginning of your monitoring!
• Agricultural Crops/Fields - Are buffers in place? What kind of tillage is occurring? What kind of fertilizer is being applied and is it staying on the field
• Pasture/Livestock - Is there a manure management system? Is the waterway protected with fences?• Logging - Are there clear-cuts (all trees) or selective cuts of individual trees?• Mining - What kind: surface, underground, quarry? Is it active, abandoned, reclaimed?• Waste Disposal - What kind: landfills, home septic systems, sewers, pet waste?• Construction Areas - What types: homes/buildings, roads, bridges? Is sediment contained or buffered?• Residential/Suburban - Are there storm drains, lawns, commercial businesses (malls/strip malls, retail shops,
car washes, gas stations, restaurants), dog parks?• Urban - How are services provided: drinking water/wastewater treatment facilities, factories, power plants? Are
there known brownfields, leaking underground storage tanks (LUSTs), other remediation sites, combined sewer overflows (CSOs)?
• Recreation Areas - What types do you have: zoos, forests, nature preserves, parks, greenways, campgrounds, golf courses, hiking and horseback trails, swimming areas, fishing areas, power boating?
Instream ConditionsAs you walk along the stream bank, take note of ...
• Litter/Garbage - small litter, piles of trash, illegal dump, appliances• Algae - floating, attached, color• Water Color - clear, muddy, milky, tea-colored, red, gray, green, black• Water Appearance - oily sheen, lots of foam/bubbles, scum• Water Odor - sewage, petroleum (gas), rotten eggs, fishy, chlorine, soapy• Discharge Pipes - field tiles, storm drain, industry, municipal wastewater, sewer, flowing in dry weather.
Each sampling site is 200 feet
in length.
• Inform stakeholders• Assess use attainment• Provide information and data to support modeling• Characterize the watershed
19
Study Design - 5 W’s of Water Quality Monitoring
WHY - Define your purpose or goal. Initially this may be simple and straightforward, is the water safe for recre-ational activities (swimming, wading, and boating)? However, over time, the knowledge you gain may prompt you to ask bigger questions and prompt action in your watershed.
Goals will differ among groups. Some common reason folks may monitor include:
• Identify pollutants and sources • Establish baseline data• Document changes and trends• Measure effectiveness
This definition will influence decisions on what, where, when…
WHAT - What parameters you choose to monitor will depend upon your goals. There is no right or wrong answer; however, parameters should align with the question you want to answer and your budget for monitoring. For example, if you are interested in algae blooms, you may sample for nutrients and collect representative algae samples for identification.
WHERE - Where you monitor depends upon your sampling goals/objectives. Before you select one or more sites, it is important to research, visit, and learn about your watershed, land uses, and potential sources of pollution. If you are interested in the affects of agriculture on water quality, you may want to sample a stream with a primarily agricultural watershed. If you want to determine the affects of industrial discharge on stream water quality, you may choose to monitor at three points, one upstream (control site), immediately below the source, and one further downstream to gauge recovery. It is up to you to choose where you would like to monitor.
If you need help choosing a spot, your watershed specialist (Figure 1) or your county Soil and Water Conservation District (www.iaswcd.org) may have some suggestions. A watershed management plan may be in development in your community.
Each sampling site is a 200-foot stream segment. You should use local landmarks (bridges, trees) or survey tape to define the boundaries of your sampling site. You might also want to sketch your site. You must also ensure safety by considering bank accessibility, water depth, and private property rights. Review the safety section (Chapter 1) for other important safety considerations.
WHEN - Once again, when you monitor will depend upon your goals. Consider the following impacts on water quality to help determine your sampling schedule.
Trend monitoring is the primary testing method preferred by Hoosier Riverwatch. To get an accurate picture of a stream’s water quality, tests have to be performed on a regular basis (consistently), over a period of years (persistently). Without long-term continued monitoring, data obtained by Riverwatch volunteers may have limited uses. A random, one-time sample provides a limited picture of water quality and overall health of a water body at the particular site and time it was monitored. Many things can affect a one-time sample, and weather can be the largest single outside influence on many water quality parameters. Trend monitoring provides a broad view of the stream allowing the seasonal variations to be sorted out from long-term changes. In order to obtain data useful for trend analysis, volunteers should consider the long-term commitment involved in this type of monitoring.
20 www.idem.IN.gov /riverwatch
Daily Changes - Water samples taken at different times of the day may yield different results. Changes in stream flow, air temperature, and photosynthesis of aquatic plants influence chemical properties of water.
Seasonal Changes – Nutrient levels may vary by season depending on the number of aquatic plants, as they take up nutrients from the water. Spring run-off may increase water levels, thereby changing the pollutant levels one may find. In addition, macroinvertebrate populations vary seasonally. You should find the greatest diversity in spring and fall.
The best way to ensure you get out to the stream is to make a sampling schedule. Consider how many people will be monitoring, how many sites you or your group plan to sample, and whether sampling is feasible year-round (e.g., due to drought, flooding, or ice cover). Think about the types of tests you will perform, the time requirements, and the goals you have set.
Many Riverwatch groups monitor four times a year, but if sampling can only be done once or twice a year, it is preferable to do it in early spring and fall.
WHO - Groups of 2-3 students or adults can take measurements. Tasks within a group include collecting samples, processing samples, and recording data. It is very useful to have multiple groups testing for each parameter (for example, two groups measure dissolved oxygen). This allows more participants to get involved and builds in some quality control. Groups conducting the same test should compare results to determine if the data are similar. If there are different results for the same sample, group members should check the procedures and repeat the test to determine the cause of the difference. Quality control is an important part of the science and the learning experience.
Remember – no matter what your goal for monitoring, any water study must be founded on sound, scientific, and objective research.
Quality Assurance & Quality ControlMany volunteers strive to obtain the best data possible. We think this is important, as YOU are one of the primary users of the data. The following are some suggestions on how you can improve the quality of your water monitoring data.
A Quality Assurance Project Plan (QAPP), is a written document outlining the procedures a monitoring project will use to ensure the data it collects and analyzes meets project requirements. A QAPP helps the data user and monitoring project leaders ensure that the collected data meet their needs and that the quality control steps needed to verify this are built into the project from the beginning. By law, any EPA-funded monitoring project must have an approved QAPP before it can begin collecting samples.
The American Society for Quality (ASQ) states, that often “quality assurance” and “quality control” are used interchangeably to refer to ways of ensuring the quality of a service or product. However, they do have different meanings.
► Quality Assurance: The planned and systematic activities implemented in a quality system so that quality requirements for data will be fulfilled. ► Quality Control: The observation techniques and activities used to fulfill requirements for quality.
21
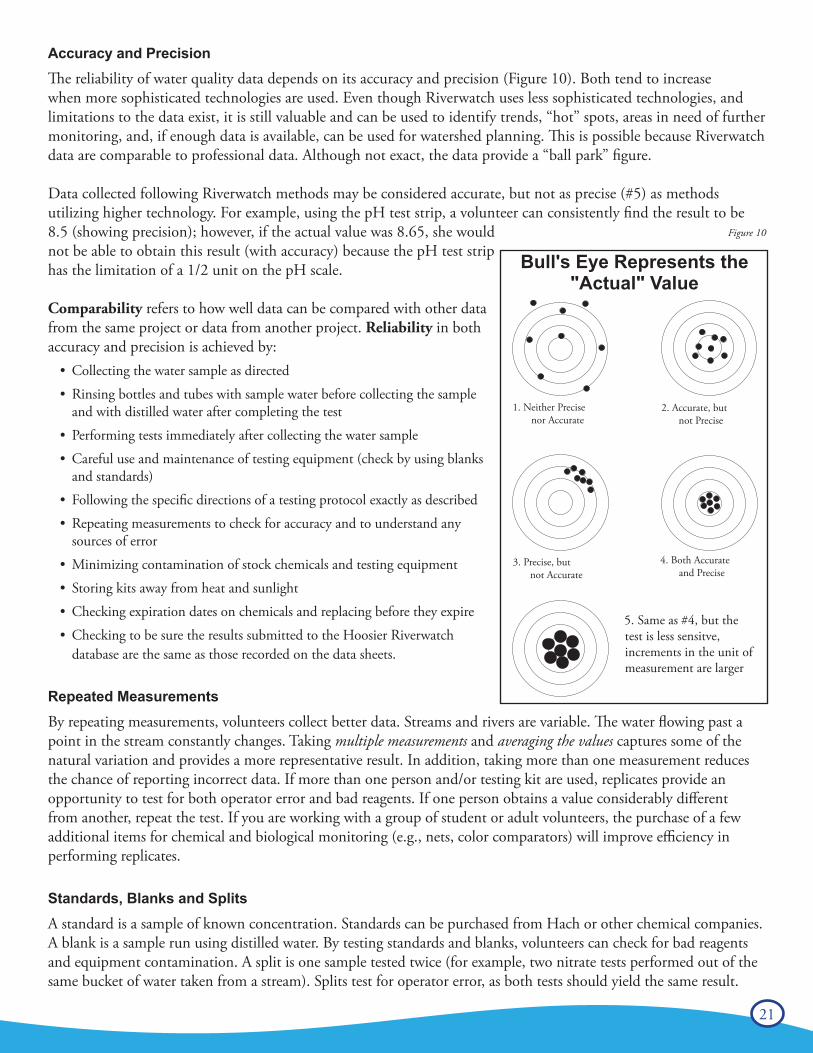
Accuracy and Precision The reliability of water quality data depends on its accuracy and precision (Figure 10). Both tend to increase when more sophisticated technologies are used. Even though Riverwatch uses less sophisticated technologies, and limitations to the data exist, it is still valuable and can be used to identify trends, “hot” spots, areas in need of further monitoring, and, if enough data is available, can be used for watershed planning. This is possible because Riverwatch data are comparable to professional data. Although not exact, the data provide a “ball park” figure.
Data collected following Riverwatch methods may be considered accurate, but not as precise (#5) as methods utilizing higher technology. For example, using the pH test strip, a volunteer can consistently find the result to be 8.5 (showing precision); however, if the actual value was 8.65, she would not be able to obtain this result (with accuracy) because the pH test strip has the limitation of a 1/2 unit on the pH scale.
Comparability refers to how well data can be compared with other data from the same project or data from another project. Reliability in both accuracy and precision is achieved by:
• Collecting the water sample as directed
• Rinsing bottles and tubes with sample water before collecting the sample and with distilled water after completing the test
• Performing tests immediately after collecting the water sample
• Careful use and maintenance of testing equipment (check by using blanks and standards)
• Following the specific directions of a testing protocol exactly as described
• Repeating measurements to check for accuracy and to understand any sources of error
• Minimizing contamination of stock chemicals and testing equipment
• Storing kits away from heat and sunlight
• Checking expiration dates on chemicals and replacing before they expire
• Checking to be sure the results submitted to the Hoosier Riverwatch database are the same as those recorded on the data sheets.
Repeated Measurements By repeating measurements, volunteers collect better data. Streams and rivers are variable. The water flowing past a point in the stream constantly changes. Taking multiple measurements and averaging the values captures some of the natural variation and provides a more representative result. In addition, taking more than one measurement reduces the chance of reporting incorrect data. If more than one person and/or testing kit are used, replicates provide an opportunity to test for both operator error and bad reagents. If one person obtains a value considerably different from another, repeat the test. If you are working with a group of student or adult volunteers, the purchase of a few additional items for chemical and biological monitoring (e.g., nets, color comparators) will improve efficiency in performing replicates.
Standards, Blanks and SplitsA standard is a sample of known concentration. Standards can be purchased from Hach or other chemical companies. A blank is a sample run using distilled water. By testing standards and blanks, volunteers can check for bad reagents and equipment contamination. A split is one sample tested twice (for example, two nitrate tests performed out of the same bucket of water taken from a stream). Splits test for operator error, as both tests should yield the same result.
5. Same as #4, but the test is less sensitve, increments in the unit of measurement are larger
1. Neither Precise nor Accurate
2. Accurate, but not Precise
3. Precise, but not Accurate
4. Both Accurate and Precise
Bull's Eye Represents the "Actual" Value
Figure 10
22 www.idem.IN.gov /riverwatch
Chapter 3 - Habitat Assessment
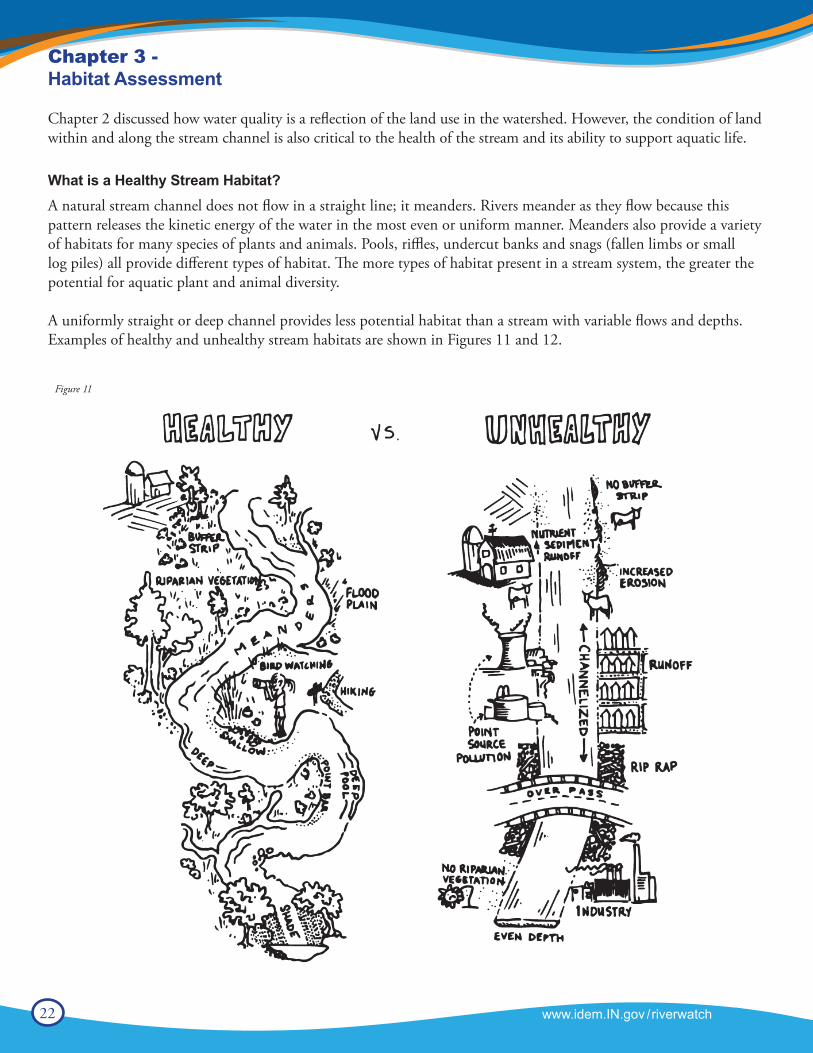
Chapter 2 discussed how water quality is a reflection of the land use in the watershed. However, the condition of land within and along the stream channel is also critical to the health of the stream and its ability to support aquatic life.
What is a Healthy Stream Habitat?A natural stream channel does not flow in a straight line; it meanders. Rivers meander as they flow because this pattern releases the kinetic energy of the water in the most even or uniform manner. Meanders also provide a variety of habitats for many species of plants and animals. Pools, riffles, undercut banks and snags (fallen limbs or small log piles) all provide different types of habitat. The more types of habitat present in a stream system, the greater the potential for aquatic plant and animal diversity.
A uniformly straight or deep channel provides less potential habitat than a stream with variable flows and depths. Examples of healthy and unhealthy stream habitats are shown in Figures 11 and 12.
Figure 11
23
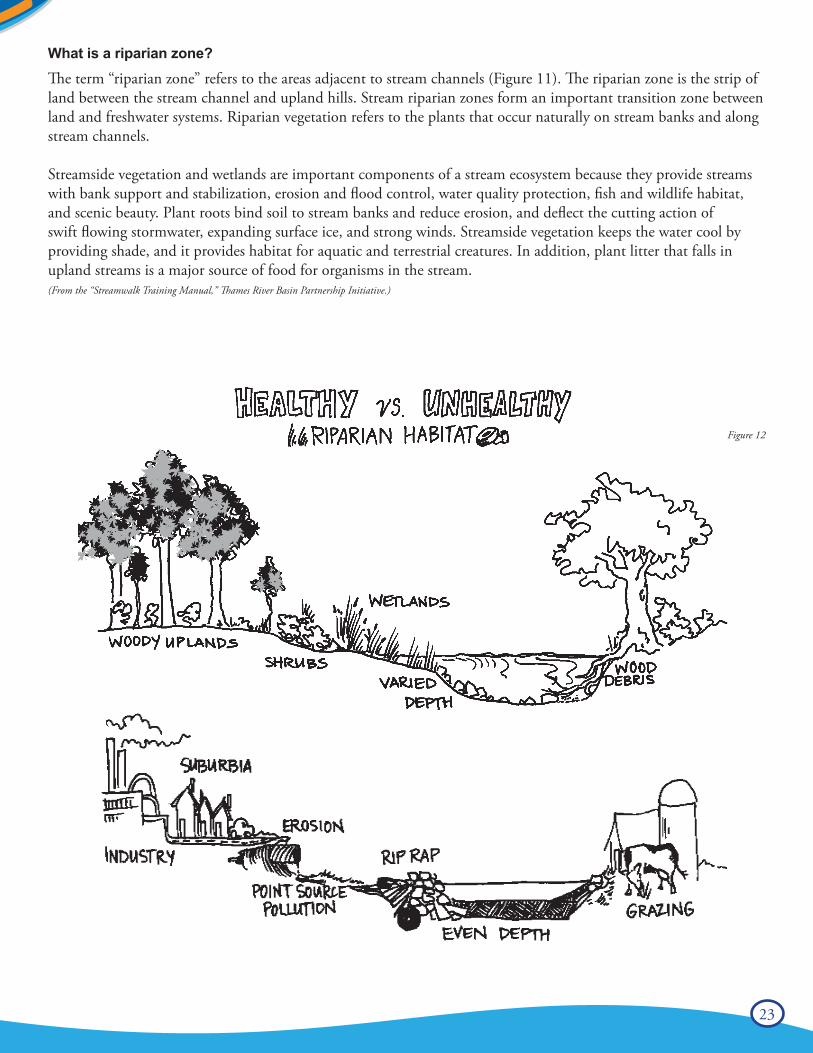
What is a riparian zone?The term “riparian zone” refers to the areas adjacent to stream channels (Figure 11). The riparian zone is the strip of land between the stream channel and upland hills. Stream riparian zones form an important transition zone between land and freshwater systems. Riparian vegetation refers to the plants that occur naturally on stream banks and along stream channels.
Streamside vegetation and wetlands are important components of a stream ecosystem because they provide streams with bank support and stabilization, erosion and flood control, water quality protection, fish and wildlife habitat, and scenic beauty. Plant roots bind soil to stream banks and reduce erosion, and deflect the cutting action of swift flowing stormwater, expanding surface ice, and strong winds. Streamside vegetation keeps the water cool by providing shade, and it provides habitat for aquatic and terrestrial creatures. In addition, plant litter that falls in upland streams is a major source of food for organisms in the stream. (From the “Streamwalk Training Manual,” Thames River Basin Partnership Initiative.)
Figure 12
24 www.idem.IN.gov /riverwatch
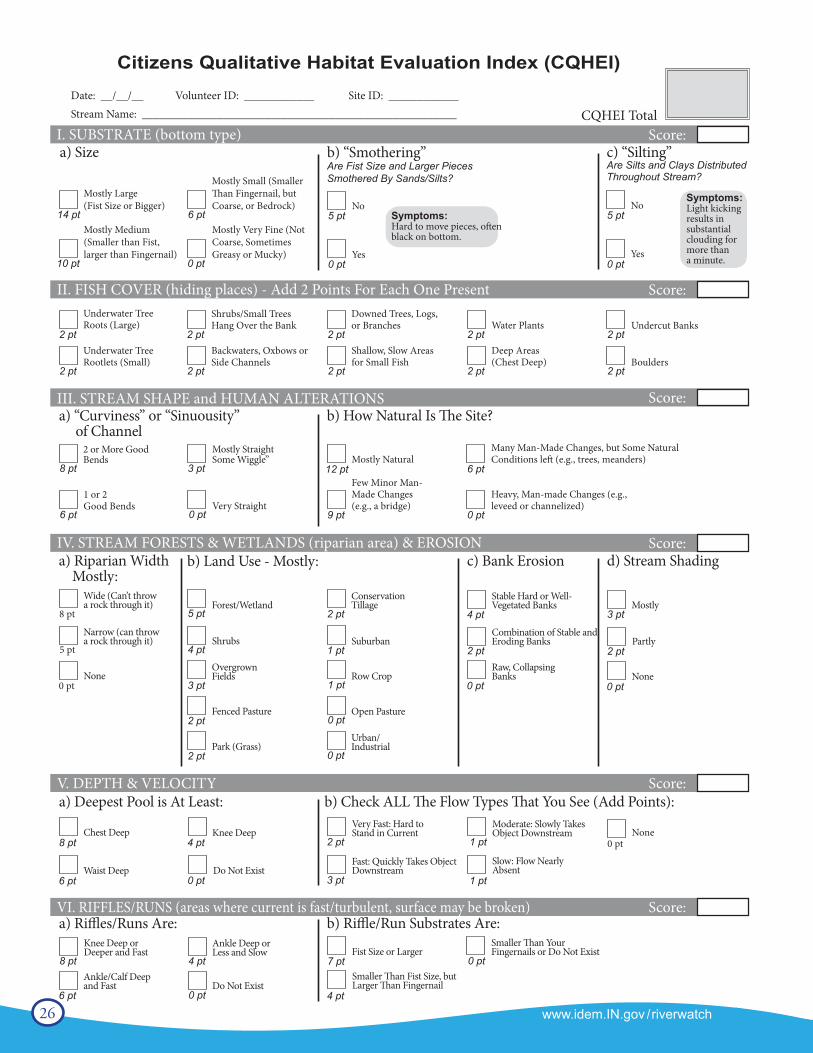
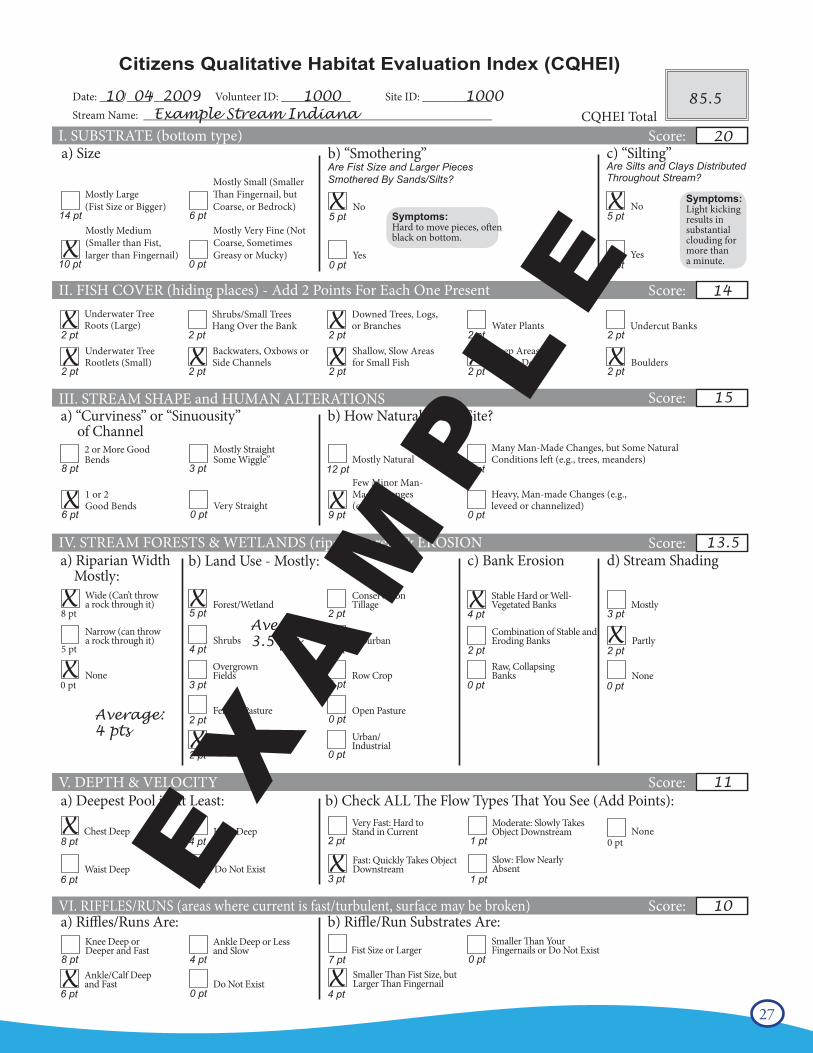
Citizens Qualitative Habitat Evaluation Index (CQHEI)
This index was developed by the Ohio Environmental Protection Agency as a “Citizens” companion to the Qualitative Habitat Evaluation Index (QHEI) used by the state’s professional staff. The diagram’s data sheet on pages 26-27 were modified from information provided by the Ohio EPA. The purpose of the index is to provide a measure of the stream habitat and riparian health that generally corresponds to physical factors affecting fish and other aquatic life (i.e., macroinvertebrates). The CQHEI produces a total score that can be used to compare changes at one site over time or compare two different sites.
NOTE: The CQHEI data sheet was designed to be used primarily in wadeable streams. The index scores do not necessarily reflect the conditions found in intermittent streams or large rivers.
When completing the CQHEI, evaluate your entire stream site (200’ section).In each category choose the most predominant answer. If sections of the stream or stream banks have completely different characteristics, you may check two boxes and average the points to obtain a score for the subsection (a), (b), or (c). An example is provided on page 27.
I. Substrate (Bottom Type) - Max 24 pts (Note: “smothering” is the same as “embeddedness.” See Figure 8 on page 17. Check “yes” for smothering, if the steam bottom is more than 50% embedded.)
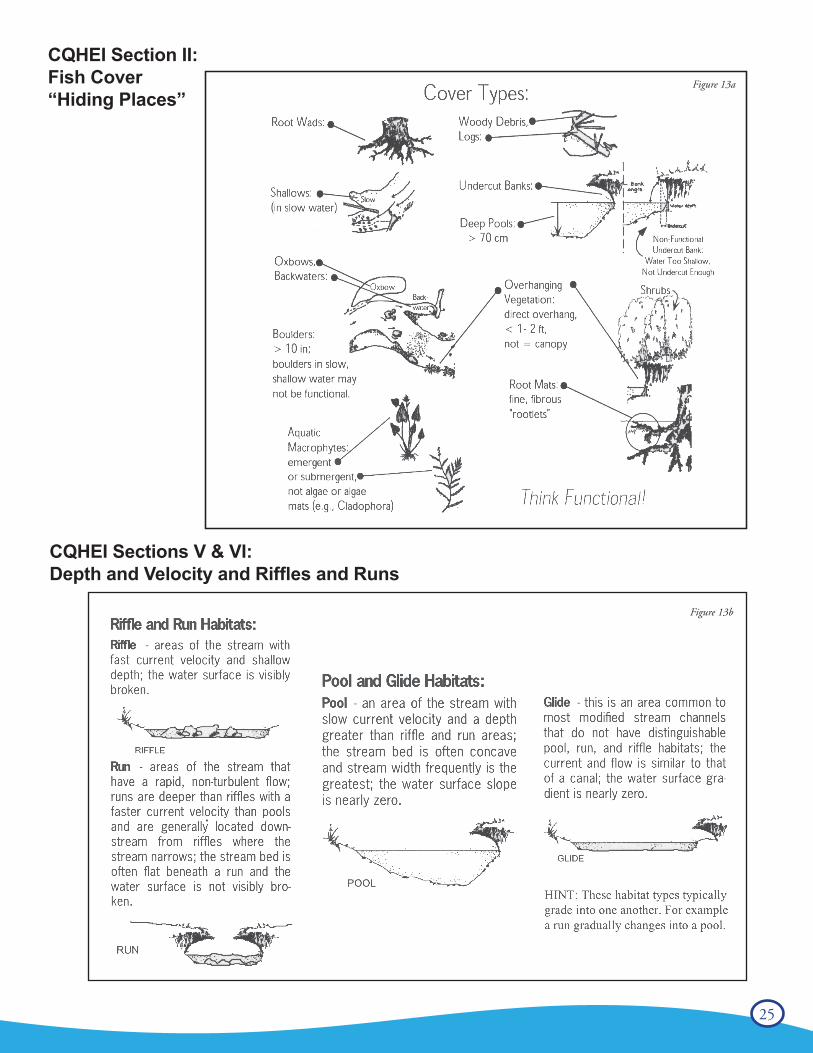
II. Fish Cover (Hiding Places) - Max 20 pts Select all the cover types that you see using Figure 13a on page 25 as a guide. Add the points.
III. Stream Shape and Human Alterations - Max 20 pts
IV. Stream Forests and Wetlands (Riparian Areas) & Erosion - Max 20 ptsa) Width of the Riparian Forest or Wetland - This is not the width of the stream! Estimate the width of the area containing trees or wetlands on each side of the stream by answering: “Can you throw a rock to the other side?”b) See Appendix C - Glossary for a description of conservation tillage.
V. Depth & Velocity - Max 15 pts a) Deepest Pool - If your stream is a consistent depth, select the maximum depth.b) Select all the flow types that you see and add the points.
VI. Riffles/Runs (where the current is turbulent) - Max 15 Using the lower diagrams (Figure 13b) on page 25 as a guide.
Maximum Total Points for the CQHEI is 114If the score is over 100, consider it “extra credit.” You have an exceptional high-quality stream.
A set of ranges for Excellent, Medium, Poor, Very Poor has not yet been developed for this index - but, QHEI scores > 60 have been found to be “generally conducive to the existence of warmwater fauna.”
25
CQHEI Section II: Fish Cover “Hiding Places”
Figure 13b
CQHEI Sections V & VI: Depth and Velocity and Riffles and Runs
Figure 13a
26 www.idem.IN.gov /riverwatchwww.idem.IN.gov/riverwatch 23
CQHEI Section II: Fish Cover “Hiding Places”
a) Size
Mostly Large(Fist Size or Bigger)
Mostly Medium(Smaller than Fist,larger than Fingernail)
Mostly Very Fine (Not Coarse, Sometimes Greasy or Mucky)
Mostly Small (Smaller Than Fingernail, but Coarse, or Bedrock)
Symptoms: Hard to move pieces, often black on bottom.
5 pt
0 pt
Citizens Qualitative Habitat Evaluation Index (CQHEI)
I. SUBSTRATE (bottom type) Score:
II. FISH COVER (hiding places) - Add 2 Points For Each One Present Score:
III. STREAM SHAPE and HUMAN ALTERATIONS Score:
IV. STREAM FORESTS & WETLANDS (riparian area) & EROSION Score:
V. DEPTH & VELOCITY Score:
VI. RIFFLES/RUNS (areas where current is fast/turbulent, surface may be broken) Score:
a) “Curviness” or “Sinuousity” of Channel
a) Riparian Width Mostly:
b) Land Use - Mostly:
Underwater Tree Roots (Large)
Underwater Tree Rootlets (Small)
Shrubs/Small Trees Hang Over the Bank
Backwaters, Oxbows or Side Channels
Downed Trees, Logs, or Branches
Shallow, Slow Areas for Small Fish
Water Plants
Deep Areas (Chest Deep)
Undercut Banks
Boulders
14 pt
10 pt 0 pt
6 pt
2 pt
2 pt
2 pt
2 pt
2 pt
2 pt
2 pt
2 pt
b) “Smothering” Are Fist Size and Larger Pieces Smothered By Sands/Silts?
c) “Silting” Are Silts and Clays Distributed Throughout Stream?
5 pt
0 pt
Symptoms: Light kicking results in substantial clouding for more than a minute.
2 pt
2 pt
CQHEI Total
b) How Natural Is The Site?
c) Bank Erosion d) Stream Shading
8 pt
6 pt 0 pt
3 pt 12 ptMostly Natural
Very Straight1 or 2Good Bends
2 or More Good Bends
Mostly Straight Some Wiggle”
Few Minor Man-Made Changes (e.g., a bridge)
Many Man-Made Changes, but Some Natural Conditions left (e.g., trees, meanders)
Heavy, Man-made Changes (e.g., leveed or channelized)
9 pt 0 pt
6 pt
8 pt
0 pt
0 pt
0 pt
1 pt
1 pt
2 pt
2 pt
2 pt
3 pt
4 pt
5 pt
5 pt
8 pt
8 pt
a) Deepest Pool is At Least:
a) Riffles/Runs Are: b) Riffle/Run Substrates Are:
b) Check ALL The Flow Types That You See (Add Points):
None
Forest/Wetland
Shrubs
Overgrown Fields
Fenced Pasture
Park (Grass)
Conservation Tillage
Suburban
Urban/Industrial
Row Crop
Open Pasture
Combination of Stable and Eroding Banks
Stable Hard or Well-Vegetated Banks
Raw, Collapsing Banks
Very Fast: Hard to Stand in Current
0 pt
2 pt
4 pt
2 pt
0 pt
3 ptMostly
Partly
None
Moderate: Slowly Takes Object Downstream
Slow: Flow Nearly Absent
0 ptNone
1 pt
1 pt
Fast: Quickly Takes Object DownstreamDo Not Exist
Knee Deep
Waist Deep
Chest Deep
6 pt
4 pt
0 pt
6 pt
4 pt
0 pt
Ankle/Calf Deep and Fast
Knee Deep or Deeper and Fast
Ankle Deep or Less and Slow
Do Not ExistSmaller Than Fist Size, but Larger Than Fingernail
Fist Size or LargerSmaller Than YourFingernails or Do Not Exist
4 pt
7 pt 0 pt
2 pt
3 pt
Wide (Can’t throw a rock through it)
Narrow (can throw a rock through it)
Date: __/__/__ Volunteer ID: ____________ Site ID: ____________Stream Name: ______________________________________________________
No
Yes
No
Yes
27www.idem.IN.gov/riverwatch24
a) Size
Mostly Large(Fist Size or Bigger)
Mostly Medium(Smaller than Fist,larger than Fingernail)
Mostly Very Fine (Not Coarse, Sometimes Greasy or Mucky)
Mostly Small (Smaller Than Fingernail, but Coarse, or Bedrock)
Symptoms: Hard to move pieces, often black on bottom.
5 pt
0 pt
Citizens Qualitative Habitat Evaluation Index (CQHEI)
I. SUBSTRATE (bottom type) Score:
II. FISH COVER (hiding places) - Add 2 Points For Each One Present Score:
III. STREAM SHAPE and HUMAN ALTERATIONS Score:
IV. STREAM FORESTS & WETLANDS (riparian area) & EROSION Score:
V. DEPTH & VELOCITY Score:
VI. RIFFLES/RUNS (areas where current is fast/turbulent, surface may be broken) Score:
a) “Curviness” or “Sinuousity” of Channel
a) Riparian Width Mostly:
b) Land Use - Mostly:
Underwater Tree Roots (Large)
Underwater Tree Rootlets (Small)
Shrubs/Small Trees Hang Over the Bank
Backwaters, Oxbows or Side Channels
Downed Trees, Logs, or Branches
Shallow, Slow Areas for Small Fish
Water Plants
Deep Areas (Chest Deep)
Undercut Banks
Boulders
14 pt
10 pt 0 pt
6 pt
2 pt
2 pt
2 pt
2 pt
2 pt
2 pt
2 pt
2 pt
b) “Smothering” Are Fist Size and Larger Pieces Smothered By Sands/Silts?
c) “Silting” Are Silts and Clays Distributed Throughout Stream?
5 pt
0 pt
Symptoms: Light kicking results in substantial clouding for more than a minute.
2 pt
2 pt
CQHEI Total
b) How Natural Is The Site?
c) Bank Erosion d) Stream Shading
8 pt
6 pt 0 pt
3 pt 12 ptMostly Natural
Very Straight1 or 2Good Bends
2 or More Good Bends
Mostly Straight Some Wiggle”
Few Minor Man-Made Changes (e.g., a bridge)
Many Man-Made Changes, but Some Natural Conditions left (e.g., trees, meanders)
Heavy, Man-made Changes (e.g., leveed or channelized)
9 pt 0 pt
6 pt
8 pt
0 pt
0 pt
0 pt
1 pt
1 pt
2 pt
2 pt
2 pt
3 pt
4 pt
5 pt
5 pt
8 pt
8 pt
a) Deepest Pool is At Least:
a) Riffles/Runs Are: b) Riffle/Run Substrates Are:
b) Check ALL The Flow Types That You See (Add Points):
None
Forest/Wetland
Shrubs
Overgrown Fields
Fenced Pasture
Park (Grass)
Conservation Tillage
Suburban
Urban/Industrial
Row Crop
Open Pasture
Combination of Stable and Eroding Banks
Stable Hard or Well-Vegetated Banks
Raw, Collapsing Banks
Very Fast: Hard to Stand in Current
0 pt
2 pt
4 pt
2 pt
0 pt
3 ptMostly
Partly
None
Moderate: Slowly Takes Object Downstream
Slow: Flow Nearly Absent
0 ptNone
1 pt
1 pt
Fast: Quickly Takes Object DownstreamDo Not Exist
Knee Deep
Waist Deep
Chest Deep
6 pt
4 pt
0 pt
6 pt
4 pt
0 pt
Ankle/Calf Deep and Fast
Knee Deep or Deeper and Fast
Ankle Deep or Less and Slow
Do Not ExistSmaller Than Fist Size, but Larger Than Fingernail
Fist Size or LargerSmaller Than YourFingernails or Do Not Exist
4 pt
7 pt 0 pt
2 pt
3 pt
Wide (Can’t throw a rock through it)
Narrow (can throw a rock through it)
Date: ____/____/______ Volunteer ID: ____________ Site ID: ____________Stream Name: ____________________________________________________________
No
Yes
No
Yes
10 04 2009 1000 1000Example Stream Indiana
85.5
20
14
15
13.5
11
10
Average:4 pts
Average:3.5 pts
X
X X
X
X XXX X X
X X
X
X
X
X
XX
X
X
X X
EX
AM
PL
E
28 www.idem.IN.gov /riverwatch
Site Map & Stream Flow
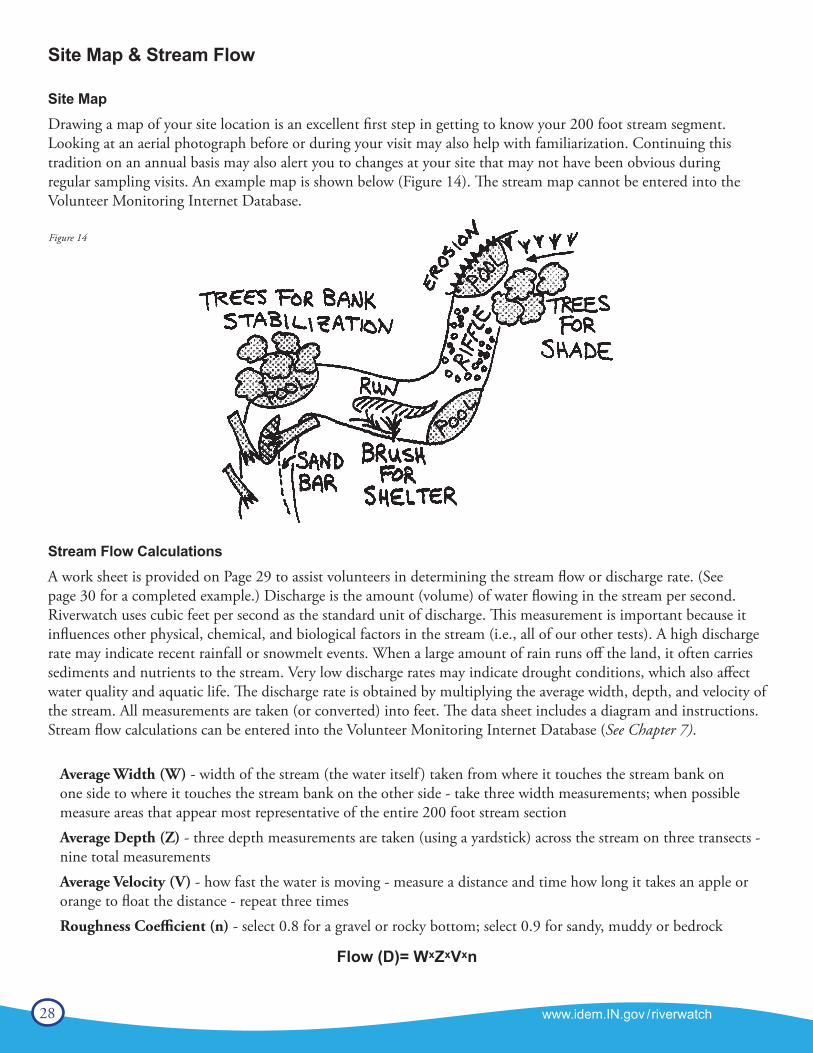
Site MapDrawing a map of your site location is an excellent first step in getting to know your 200 foot stream segment. Looking at an aerial photograph before or during your visit may also help with familiarization. Continuing this tradition on an annual basis may also alert you to changes at your site that may not have been obvious during regular sampling visits. An example map is shown below (Figure 14). The stream map cannot be entered into the Volunteer Monitoring Internet Database.
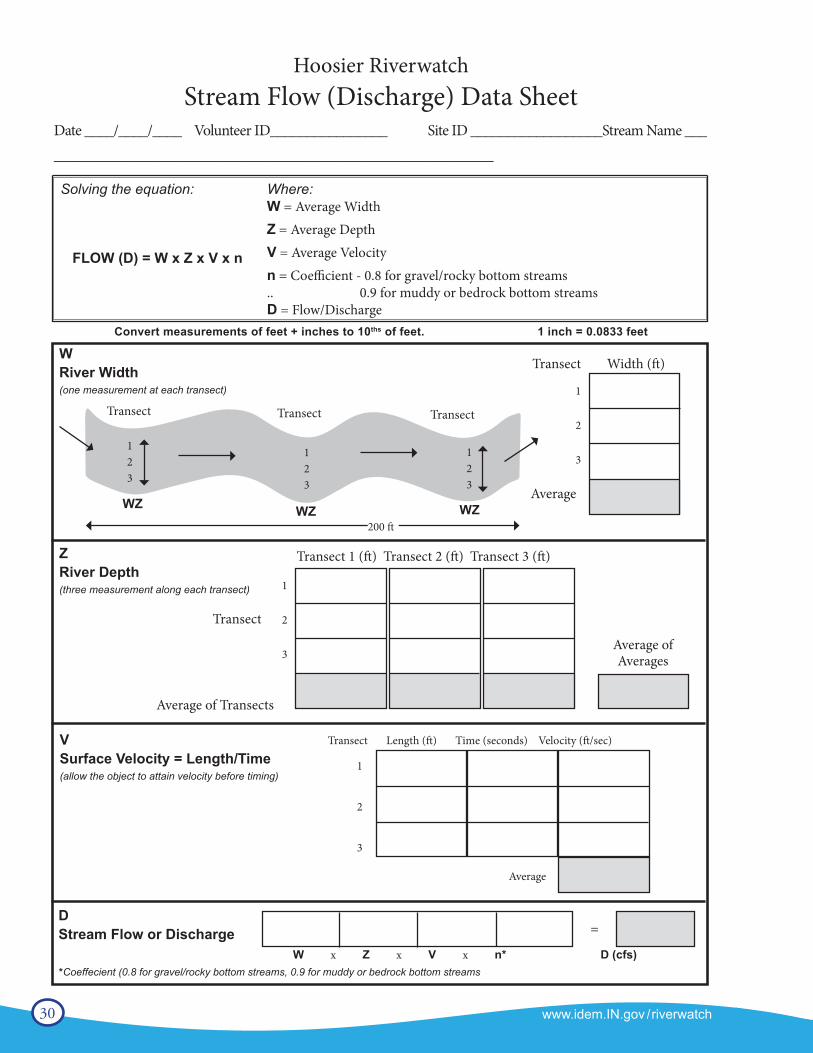
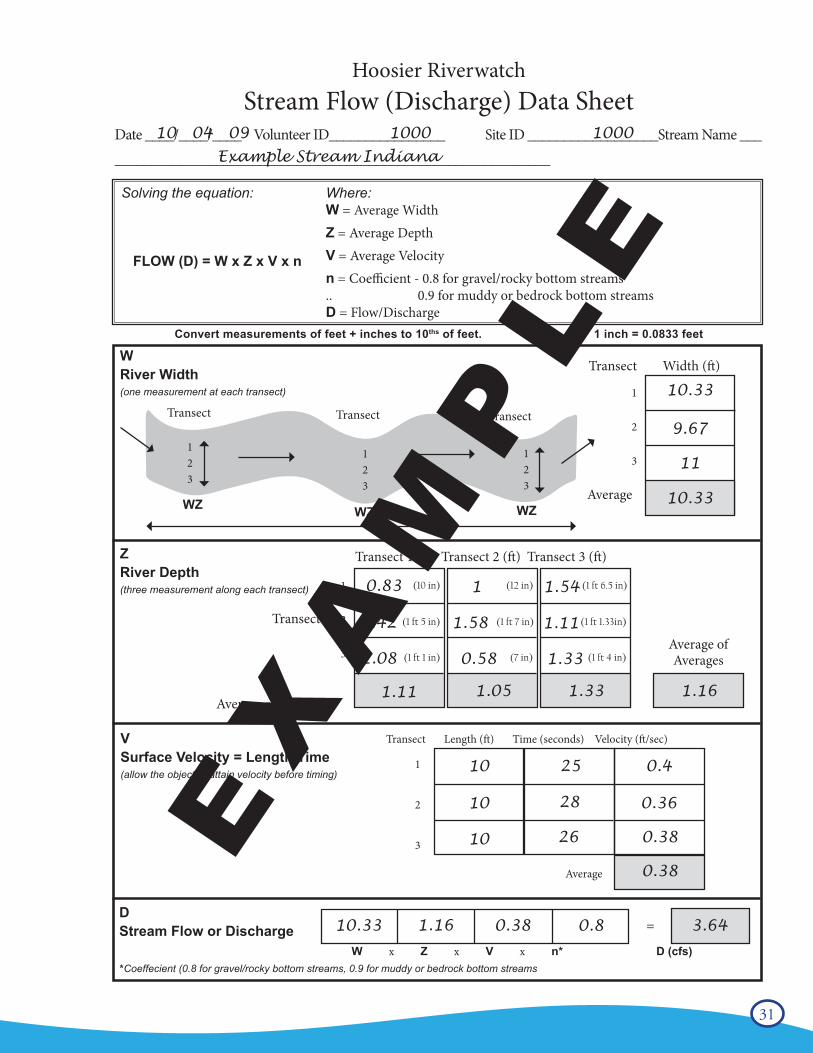
Stream Flow CalculationsA work sheet is provided on Page 29 to assist volunteers in determining the stream flow or discharge rate. (See page 30 for a completed example.) Discharge is the amount (volume) of water flowing in the stream per second. Riverwatch uses cubic feet per second as the standard unit of discharge. This measurement is important because it influences other physical, chemical, and biological factors in the stream (i.e., all of our other tests). A high discharge rate may indicate recent rainfall or snowmelt events. When a large amount of rain runs off the land, it often carries sediments and nutrients to the stream. Very low discharge rates may indicate drought conditions, which also affect water quality and aquatic life. The discharge rate is obtained by multiplying the average width, depth, and velocity of the stream. All measurements are taken (or converted) into feet. The data sheet includes a diagram and instructions. Stream flow calculations can be entered into the Volunteer Monitoring Internet Database (See Chapter 7).
Average Width (W) - width of the stream (the water itself ) taken from where it touches the stream bank on one side to where it touches the stream bank on the other side - take three width measurements; when possible measure areas that appear most representative of the entire 200 foot stream sectionAverage Depth (Z) - three depth measurements are taken (using a yardstick) across the stream on three transects - nine total measurementsAverage Velocity (V) - how fast the water is moving - measure a distance and time how long it takes an apple or orange to float the distance - repeat three timesRoughness Coefficient (n) - select 0.8 for a gravel or rocky bottom; select 0.9 for sandy, muddy or bedrock
Flow (D)= WxZxVxn
Figure 14

29
Stre
am S
ite M
ap
30 www.idem.IN.gov /riverwatchwww.idem.IN.gov/riverwatch 27
Convert measurements of feet + inches to 10ths of feet. 1 inch = 0.0833 feet
Hoosier Riverwatch Stream Flow (Discharge) Data Sheet
Date ____/____/____ Volunteer ID________________ Site ID __________________Stream Name _______________________________________________________________
Solving the equation:
FLOW (D) = W x Z x V x n
Where: W = Average WidthZ = Average DepthV = Average Velocityn = Coefficient - 0.8 for gravel/rocky bottom streams .. 0.9 for muddy or bedrock bottom streams D = Flow/Discharge
WRiver Width(one measurement at each transect)
Transect Transect Transect
200 ft
WZ WZ WZ
123
123
123
Transect Width (ft)
1
2
3
Average
ZRiver Depth(three measurement along each transect)
VSurface Velocity = Length/Time(allow the object to attain velocity before timing)
DStream Flow or Discharge
*Coeffecient (0.8 for gravel/rocky bottom streams, 0.9 for muddy or bedrock bottom streamsW x Z x V x n* D (cfs)
Transect Length (ft) Time (seconds) Velocity (ft/sec)
1
2
3
Average
Transect 1 (ft) Transect 2 (ft) Transect 3 (ft)
1
2
3
Transect
Average of Transects
Average of Averages
=
31www.idem.IN.gov/riverwatch28
Convert measurements of feet + inches to 10ths of feet. 1 inch = 0.0833 feet
Hoosier Riverwatch Stream Flow (Discharge) Data Sheet
Date ____/____/____ Volunteer ID________________ Site ID __________________Stream Name _______________________________________________________________
Solving the equation:
FLOW (D) = W x Z x V x n
Where: W = Average WidthZ = Average DepthV = Average Velocityn = Coefficient - 0.8 for gravel/rocky bottom streams .. 0.9 for muddy or bedrock bottom streams D = Flow/Discharge
WRiver Width(one measurement at each transect)
Transect Transect Transect
200 ft
WZ WZ WZ
123
123
123
Transect Width (ft)
1
2
3
Average
ZRiver Depth(three measurement along each transect)
VSurface Velocity = Length/Time(allow the object to attain velocity before timing)
DStream Flow or Discharge
*Coeffecient (0.8 for gravel/rocky bottom streams, 0.9 for muddy or bedrock bottom streamsW x Z x V x n* D (cfs)
Transect Length (ft) Time (seconds) Velocity (ft/sec)
1
2
3
Average
Transect 1 (ft) Transect 2 (ft) Transect 3 (ft)
1
2
3
Transect
Average of Transects
Average of Averages
=
10.33
9.67
11
10.33
0.83
1.42
1.08
1
1.58
0.58
1.54
1.11
1.33
1.11 1.05 1.33 1.16
(10 in)
(1 ft 5 in)
(1 ft 1 in)
(12 in)
(1 ft 7 in)
(7 in)
(1 ft 6.5 in)
(1 ft 1.33in)
(1 ft 4 in)
10
10
10
25
28
26
0.4
0.36
0.38
0.38
10.33 1.16 0.38 0.8 3.64
10 04 09 1000 1000Example Stream Indiana
EX
AM
PL
E
32 www.idem.IN.gov /riverwatch
Chapter 4 - Chemical Monitoring
Chemical ParametersMany types of chemical tests can be performed to assess varying aspects of stream water quality. However,volunteer monitoring programs are faced with both financial and technical limitations. Given these constraints,Hoosier Riverwatch trains volunteers to conduct eight of the chemical parameters considered by the National Sanitation Foundation to be most useful in determining stream water quality (as well as a few additional tests):
Dissolved Oxygen E. coli and Coliform BacteriapH Water Temperature ChangeBiochemical Oxygen Demand Nitrate and NitriteOrthophosphate Transparency/Turbidity
Riverwatch Chemical Testing Instructions
Hoosier Riverwatch does not require volunteers to use a standard set of equipment or methods for chemicaltesting. However, the majority of volunteer groups actively participating in the program have received equipmentthrough the Riverwatch Equipment Application program. The chemical testing instructions provided are forthe most common methods used by volunteer stream monitoring groups in Indiana. They are also the methodspresented during Hoosier Riverwatch training sessions.
Tips on Collecting Water SamplesHow you physically obtain the water sample depends on the size, depth, and banks of your stream. MostHoosier Riverwatch volunteers sample wadeable streams. If you are wading, make sure that you collect waterfrom a point upstream of where you are standing, being careful not to stir up any sediment. The sample mustbe collected in a clean container to avoid contamination. Collecting water directly from the stream with thecontainer used for the chemical test is preferred. Lower your container down 3 to 5 inches below the surfaceof the water (or until your wrist is completely submerged) so that your sample is representative of the wholestream. Be sure to rinse your collection container three times with sample water before collecting your finalsample.
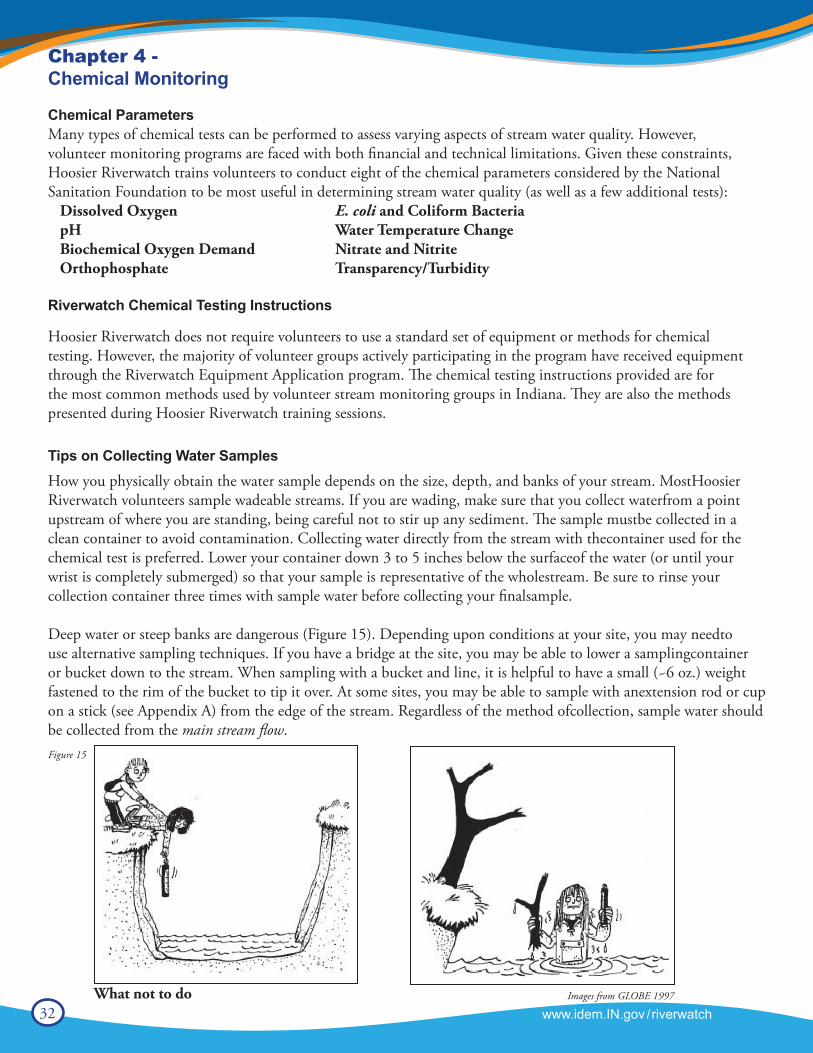
Deep water or steep banks are dangerous (Figure 15). Depending upon conditions at your site, you may needto use alternative sampling techniques. If you have a bridge at the site, you may be able to lower a samplingcontainer or bucket down to the stream. When sampling with a bucket and line, it is helpful to have a small (~6 oz.) weight fastened to the rim of the bucket to tip it over. At some sites, you may be able to sample with anextension rod or cup on a stick (see Appendix A) from the edge of the stream. Regardless of the method ofcollection, sample water should be collected from the main stream flow.
Figure 15
What not to do Images from GLOBE 1997
33
Chemical Monitoring Critical Thinking Questions(For Use During Hoosier Riverwatch Basic Training Workshops)
What is / are:
• Dissolved Oxygen?• Biochemical Oxygen Demand 5 day?• pH?• Nutrients (N and P)?• Turbidity• E. coli
What are sources of:
• Nutrients?
• Turbid Water?
• E. coli?
What problems can result from:
• High BODS?
• Excess nutrients?
• Excessive turbidity?
What other parameters are associated with or affected by:
• Dissolved oxygen?
• pH?
• High nutrients?
• High E. coli?

34 www.idem.IN.gov /riverwatch
Notes:
35
Hints For Performing Chemical Tests
• Practice! The more familiar you are with the tests, the easier they will be to perform, and the more accurate your results will be.
• Do not store chemical testing kits in your car, in direct sunlight, or in any extreme temperatures.The chemical reagents will degrade.
• Perform each test multiple times or have another volunteer read the results to assure precision.• Wear protective gloves and safety goggles. Do not wear sunglasses when reading the test results.• Rinse testing tubes or bottles with sample water before collecting the sample.• Obtain your water sample from the stream’s main stream flow (usually in the middle). Take the sample 3-5
inches under the surface.• Rinse testing tubes and bottles with distilled water after completing each test.• Wash your hands when you are finished.
How to Discard Chemical WasteLabel a plastic container with a secure lid (such as a margarine or milk container) with “Chemical Waste”. Placeliquids and solids in the plastic container along with cat litter. The chemical waste is in a solid form and can bediscarded with your regular trash.
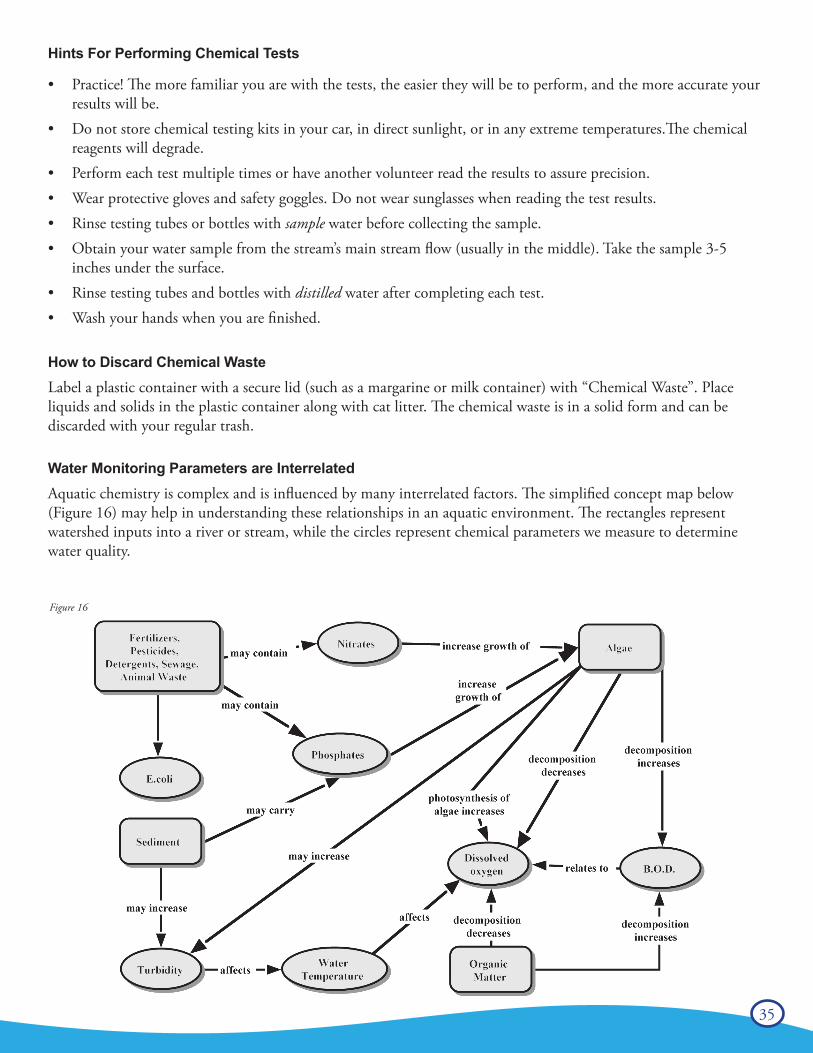
Water Monitoring Parameters are InterrelatedAquatic chemistry is complex and is influenced by many interrelated factors. The simplified concept map below (Figure 16) may help in understanding these relationships in an aquatic environment. The rectangles represent watershed inputs into a river or stream, while the circles represent chemical parameters we measure to determine water quality.
Figure 16
36 www.idem.IN.gov /riverwatch
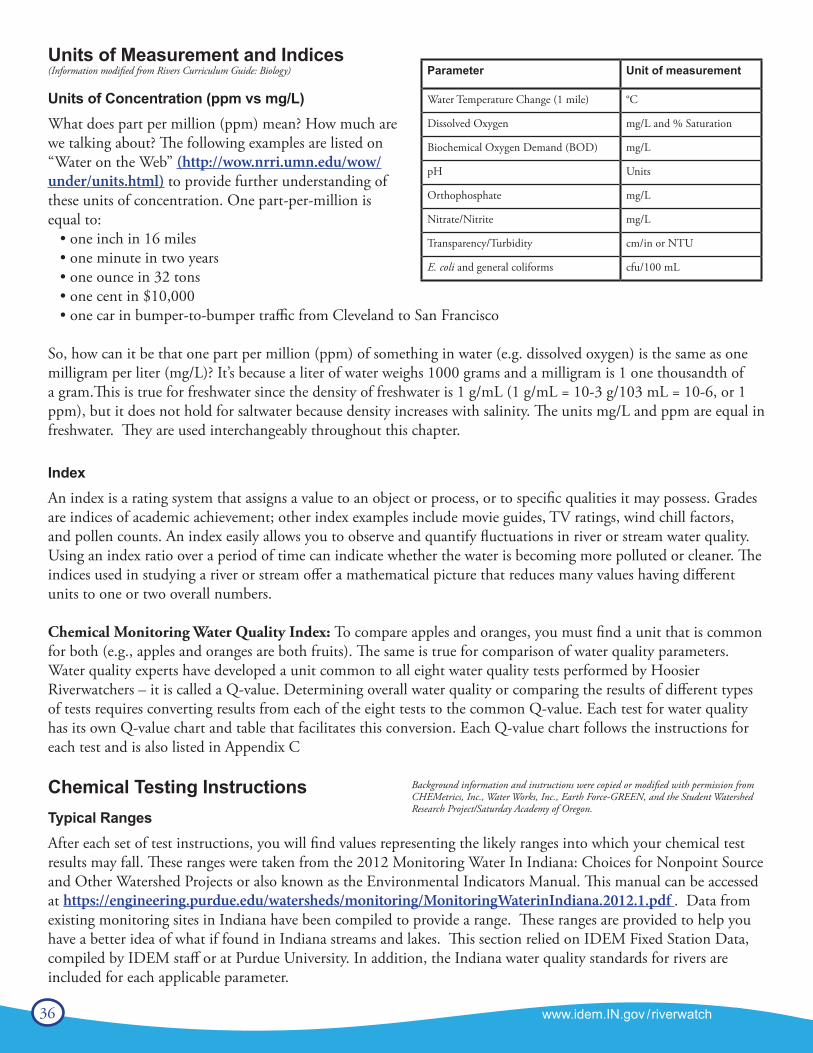
Units of Measurement and Indices (Information modified from Rivers Curriculum Guide: Biology)
Units of Concentration (ppm vs mg/L)What does part per million (ppm) mean? How much are we talking about? The following examples are listed on “Water on the Web” (http://wow.nrri.umn.edu/wow/under/units.html) to provide further understanding of these units of concentration. One part-per-million is equal to:
• one inch in 16 miles• one minute in two years• one ounce in 32 tons• one cent in $10,000• one car in bumper-to-bumper traffic from Cleveland to San Francisco
So, how can it be that one part per million (ppm) of something in water (e.g. dissolved oxygen) is the same as one milligram per liter (mg/L)? It’s because a liter of water weighs 1000 grams and a milligram is 1 one thousandth of a gram.This is true for freshwater since the density of freshwater is 1 g/mL (1 g/mL = 10-3 g/103 mL = 10-6, or 1 ppm), but it does not hold for saltwater because density increases with salinity. The units mg/L and ppm are equal in freshwater. They are used interchangeably throughout this chapter.
IndexAn index is a rating system that assigns a value to an object or process, or to specific qualities it may possess. Grades are indices of academic achievement; other index examples include movie guides, TV ratings, wind chill factors, and pollen counts. An index easily allows you to observe and quantify fluctuations in river or stream water quality. Using an index ratio over a period of time can indicate whether the water is becoming more polluted or cleaner. The indices used in studying a river or stream offer a mathematical picture that reduces many values having different units to one or two overall numbers.
Chemical Monitoring Water Quality Index: To compare apples and oranges, you must find a unit that is common for both (e.g., apples and oranges are both fruits). The same is true for comparison of water quality parameters. Water quality experts have developed a unit common to all eight water quality tests performed by Hoosier Riverwatchers – it is called a Q-value. Determining overall water quality or comparing the results of different types of tests requires converting results from each of the eight tests to the common Q-value. Each test for water quality has its own Q-value chart and table that facilitates this conversion. Each Q-value chart follows the instructions for each test and is also listed in Appendix C
Chemical Testing InstructionsTypical RangesAfter each set of test instructions, you will find values representing the likely ranges into which your chemical test results may fall. These ranges were taken from the 2012 Monitoring Water In Indiana: Choices for Nonpoint Source and Other Watershed Projects or also known as the Environmental Indicators Manual. This manual can be accessed at https://engineering.purdue.edu/watersheds/monitoring/MonitoringWaterinIndiana.2012.1.pdf . Data from existing monitoring sites in Indiana have been compiled to provide a range. These ranges are provided to help you have a better idea of what if found in Indiana streams and lakes. This section relied on IDEM Fixed Station Data, compiled by IDEM staff or at Purdue University. In addition, the Indiana water quality standards for rivers are included for each applicable parameter.
Parameter Unit of measurement
Water Temperature Change (1 mile) °C
Dissolved Oxygen mg/L and % Saturation
Biochemical Oxygen Demand (BOD) mg/L
pH Units
Orthophosphate mg/L
Nitrate/Nitrite mg/L
Transparency/Turbidity cm/in or NTU
E. coli and general coliforms cfu/100 mL
Background information and instructions were copied or modified with permission from CHEMetrics, Inc., Water Works, Inc., Earth Force-GREEN, and the Student Watershed Research Project/Saturday Academy of Oregon.
37
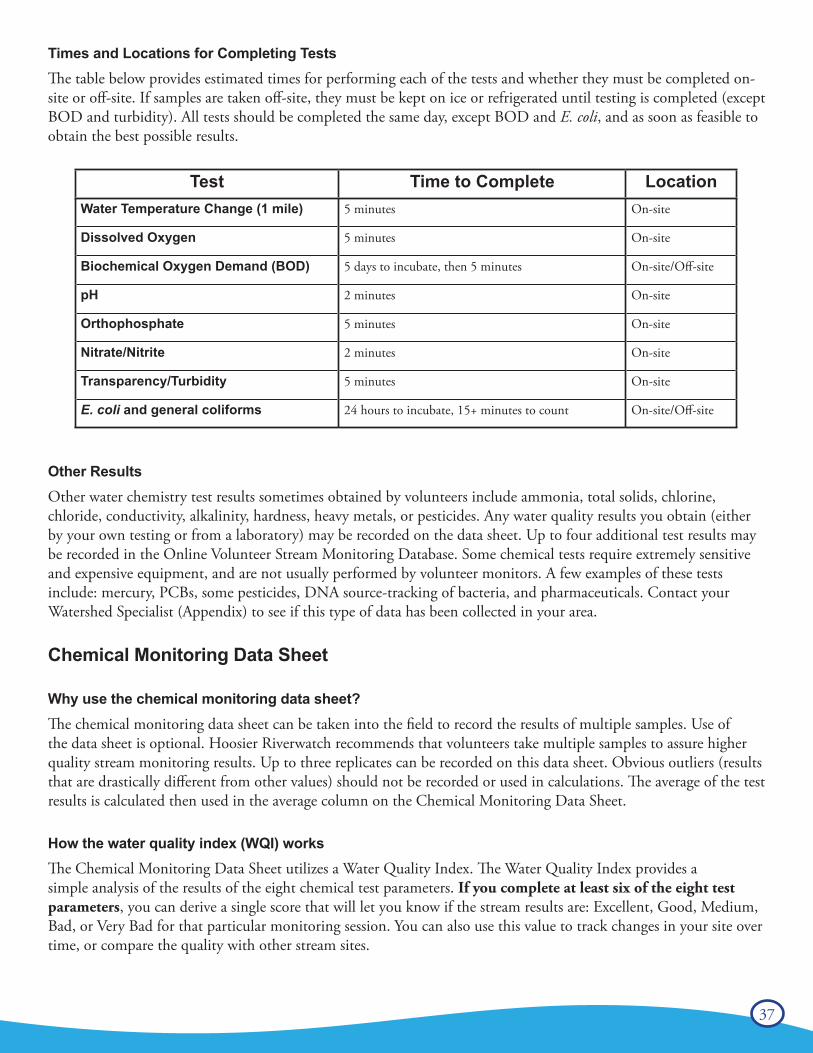
Times and Locations for Completing TestsThe table below provides estimated times for performing each of the tests and whether they must be completed on-site or off-site. If samples are taken off-site, they must be kept on ice or refrigerated until testing is completed (except BOD and turbidity). All tests should be completed the same day, except BOD and E. coli, and as soon as feasible to obtain the best possible results.
Other ResultsOther water chemistry test results sometimes obtained by volunteers include ammonia, total solids, chlorine, chloride, conductivity, alkalinity, hardness, heavy metals, or pesticides. Any water quality results you obtain (either by your own testing or from a laboratory) may be recorded on the data sheet. Up to four additional test results may be recorded in the Online Volunteer Stream Monitoring Database. Some chemical tests require extremely sensitive and expensive equipment, and are not usually performed by volunteer monitors. A few examples of these tests include: mercury, PCBs, some pesticides, DNA source-tracking of bacteria, and pharmaceuticals. Contact your Watershed Specialist (Appendix) to see if this type of data has been collected in your area.
Chemical Monitoring Data Sheet
Why use the chemical monitoring data sheet?The chemical monitoring data sheet can be taken into the field to record the results of multiple samples. Use of the data sheet is optional. Hoosier Riverwatch recommends that volunteers take multiple samples to assure higher quality stream monitoring results. Up to three replicates can be recorded on this data sheet. Obvious outliers (results that are drastically different from other values) should not be recorded or used in calculations. The average of the test results is calculated then used in the average column on the Chemical Monitoring Data Sheet.
How the water quality index (WQI) worksThe Chemical Monitoring Data Sheet utilizes a Water Quality Index. The Water Quality Index provides a simple analysis of the results of the eight chemical test parameters. If you complete at least six of the eight test parameters, you can derive a single score that will let you know if the stream results are: Excellent, Good, Medium, Bad, or Very Bad for that particular monitoring session. You can also use this value to track changes in your site over time, or compare the quality with other stream sites.
Test Time to Complete LocationWater Temperature Change (1 mile) 5 minutes On-site
Dissolved Oxygen 5 minutes On-site
Biochemical Oxygen Demand (BOD) 5 days to incubate, then 5 minutes On-site/Off-site
pH 2 minutes On-site
Orthophosphate 5 minutes On-site
Nitrate/Nitrite 2 minutes On-site
Transparency/Turbidity 5 minutes On-site
E. coli and general coliforms 24 hours to incubate, 15+ minutes to count On-site/Off-site
38 www.idem.IN.gov /riverwatch
Each of the test parameters is weighted according to its level of importance to the overall water quality (in this particular index). Dissolved oxygen has the highest weighting factor (0.18); therefore, the oxygen results are the most important value in determining the water quality rating using the index. The weighting scheme allows analysts to condense complex test results into a common water quality measurement that can be readily communicated to the public and to other volunteers. The Water Quality Index score is like a final grade - weighting the results of multiple tests and exams.
How to use the Q-value chartsIn order to obtain a WQI Rating, you must first determine the Q-value for each test. Each parameter (exceptOrthophosphate and Nitrite) has its own Q-chart immediately following the instructions. To find the Q-value: locate your test result on the bottom of the appropriate chart (x-axis). Draw a vertical line up from your test result until it intersects the curved line (Q-line). From this point of intersection draw a line across to the left hand side (y-axis). Read the number on the left side of the chart closest to intersection; this is the Q-value for that particular test result. Record the Q-value in the second column of the Chemical Monitoring Data Sheet.
You can also check the Q-value table (as an alternative to reading the graph) if your result is close to a given value. In addition, the Riverwatch database will calculate your Q-value when you submit chemical data online.
What does a Q-value mean?You can think of a Q-value as a “Quality-value.” It helps interpret your results in terms of the overall health or water quality of your stream. Think of it like a grade. The higher the Q-value, the better the test results (100 is the maximum value; 0 is the minimum).
Water Quality Index Instructions
As you complete each chemical test (or average your results for up to three test events for a parameter from the Chemical Monitoring Data Sheet), record the values on the chemical monitoring data sheet. Use the Q-charts or Q-tables in this chapter to derive the Q-values for each parameter. Record them in the Q-value column. After the Q-values have been determined and recorded in the appropriate column, multiply the Q-value for each test by the Weighting Factor provided and record the value in the Calculation column. Once the calculations are completed for each parameter, you can then sum the Weighting Factor column and the Calculation column. Divide the total of the Calculation column by the total of the Weighting Factor column to obtain the Water Quality Index (WQI). See example on page 40.
If you complete all eight parameters, the total of the Weighting Factor column is 1.00 (or 100%). If you are missing one or two test parameters (but no more than two!) you can calculate an adjusted Water Quality Index (WQI) Rating. Follow the same procedures: Divide the total of the Calculation column by the total of the Weighting Factor column for the tests you completed to obtain the adjusted WQI. In the example on page 41, if the Total Phosphate and E. coli tests were not completed, the total of the Weighting Factor column would be 0.72, and the total of the Calculation column would be 55.9.
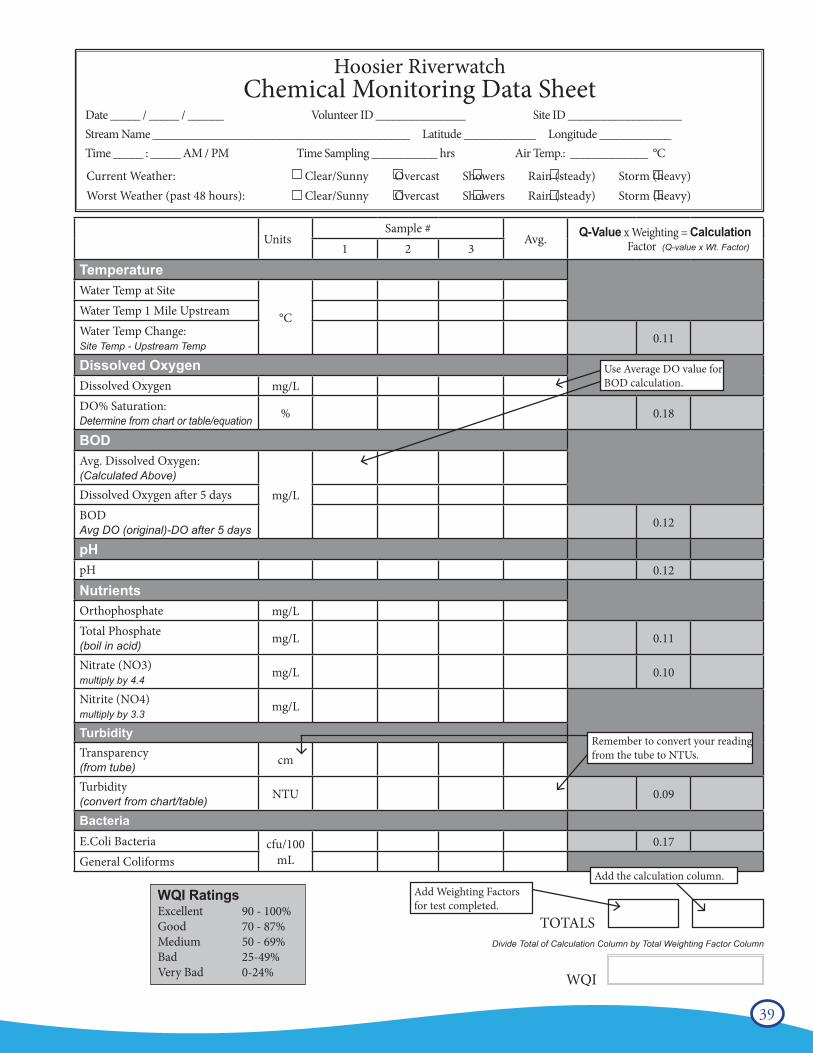
39www.idem.IN.gov/riverwatch 37
Date _____ / _____ / ______ Volunteer ID _______________ Site ID ___________________Stream Name ___________________________________________ Latitude ____________ Longitude ____________Time _____ : _____ AM / PM Time Sampling ___________ hrs Air Temp.: _____________ °C
Current Weather:Worst Weather (past 48 hours):
Clear/Sunny Overcast Showers Rain (steady) Storm (heavy)Clear/Sunny Overcast Showers Rain (steady) Storm (heavy)
Hoosier Riverwatch Chemical Monitoring Data Sheet
UnitsSample #
Avg. Q-Value x Weighting = Calculation Factor (Q-value x Wt. Factor)1 2 3
TemperatureWater Temp at Site
°CWater Temp 1 Mile UpstreamWater Temp Change:Site Temp - Upstream Temp
0.11
Dissolved OxygenDissolved Oxygen mg/LDO% Saturation:Determine from chart or table/equation % 0.18
BODAvg. Dissolved Oxygen:(Calculated Above)
mg/LDissolved Oxygen after 5 daysBODAvg DO (original)-DO after 5 days 0.12
pHpH 0.12
NutrientsOrthophosphate mg/LTotal Phosphate(boil in acid) mg/L 0.11
Nitrate (NO3)multiply by 4.4
mg/L 0.10
Nitrite (NO4)multiply by 3.3
mg/L
TurbidityTransparency(from tube) cm
Turbidity(convert from chart/table) NTU 0.09
BacteriaE.Coli Bacteria cfu/100
mL0.17
General Coliforms
WQI RatingsExcellentGoodMediumBadVery Bad
90 - 100%70 - 87%50 - 69%25-49%0-24%
Use Average DO value for BOD calculation.
Remember to convert your reading from the tube to NTUs.
TOTALSDivide Total of Calculation Column by Total Weighting Factor Column
WQI
Add Weighting Factors for test completed.
Add the calculation column.
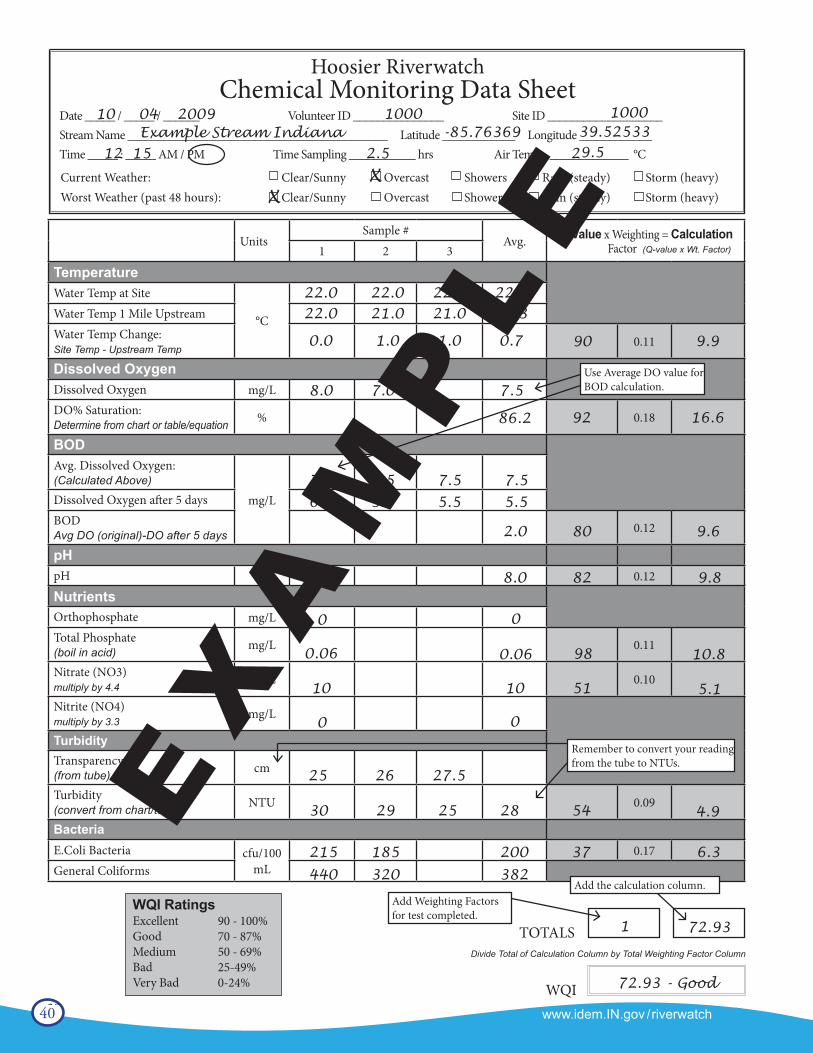
40 www.idem.IN.gov /riverwatchwww.idem.IN.gov/riverwatch38
Date _____ / _____ / ______ Volunteer ID _______________ Site ID ___________________Stream Name ___________________________________________ Latitude ____________ Longitude ____________Time _____ : _____ AM / PM Time Sampling ___________ hrs Air Temp.: _____________ °C
Current Weather:Worst Weather (past 48 hours):
Clear/Sunny Overcast Showers Rain (steady) Storm (heavy)Clear/Sunny Overcast Showers Rain (steady) Storm (heavy)
Hoosier Riverwatch Chemical Monitoring Data Sheet
UnitsSample #
Avg. Q-Value x Weighting = Calculation Factor (Q-value x Wt. Factor)1 2 3
TemperatureWater Temp at Site
°CWater Temp 1 Mile UpstreamWater Temp Change:Site Temp - Upstream Temp
0.11
Dissolved OxygenDissolved Oxygen mg/LDO% Saturation:Determine from chart or table/equation % 0.18
BODAvg. Dissolved Oxygen:(Calculated Above)
mg/LDissolved Oxygen after 5 daysBODAvg DO (original)-DO after 5 days 0.12
pHpH 0.12
NutrientsOrthophosphate mg/LTotal Phosphate(boil in acid) mg/L 0.11
Nitrate (NO3)multiply by 4.4
mg/L 0.10
Nitrite (NO4)multiply by 3.3
mg/L
TurbidityTransparency(from tube) cm
Turbidity(convert from chart/table) NTU 0.09
BacteriaE.Coli Bacteria cfu/100
mL0.17
General Coliforms
WQI RatingsExcellentGoodMediumBadVery Bad
90 - 100%70 - 87%50 - 69%25-49%0-24%
Use Average DO value for BOD calculation.
Remember to convert your reading from the tube to NTUs.
TOTALSDivide Total of Calculation Column by Total Weighting Factor Column
WQI
Add Weighting Factors for test completed.
Add the calculation column.
10 04 2009 1000 1000Example Stream Indiana -85.76369 39.52533
12 15 2.5 29.5
22.0 22.0 22.0 22.0 22.0 21.0 21.0 21.3
0.0 1.0 1.0 0.7
8.0 7.0 7.5
7.5 7.5 7.5 7.5 6.0 5.0 5.5 5.5
86.2
90 9.9
92 16.6
2.0 80 9.6
440 320 382
8.0 8.0 82 9.8
0 0
0.06 0.06 98 10.8
10 10 51 5.1
0 0
25 26 27.5
30 29 25 28 54
215 185 200 37
4.9
6.3
1 72.93
72.93 - Good
XX
EX
AM
PL
E
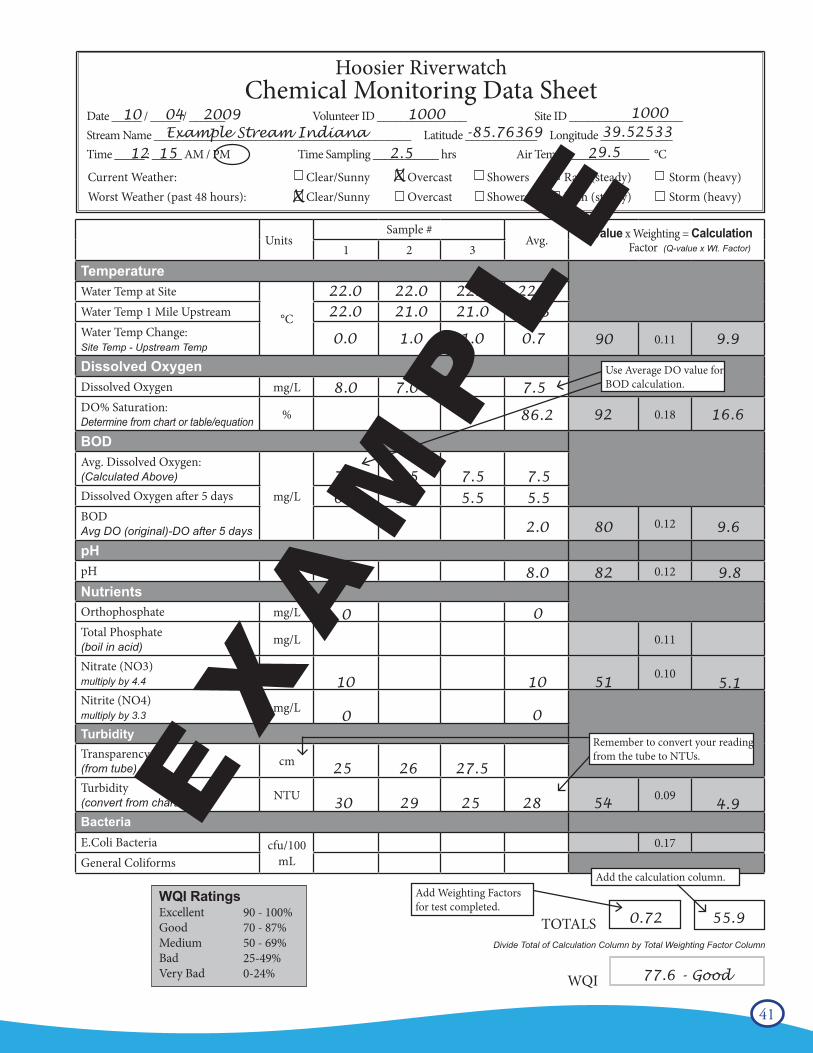
41www.idem.IN.gov/riverwatch 39
Date _____ / _____ / ______ Volunteer ID _______________ Site ID ___________________Stream Name ___________________________________________ Latitude ____________ Longitude ____________Time _____ : _____ AM / PM Time Sampling ___________ hrs Air Temp.: _____________ °C
Current Weather:Worst Weather (past 48 hours):
Clear/Sunny Overcast Showers Rain (steady) Storm (heavy)Clear/Sunny Overcast Showers Rain (steady) Storm (heavy)
Hoosier Riverwatch Chemical Monitoring Data Sheet
UnitsSample #
Avg. Q-Value x Weighting = Calculation Factor (Q-value x Wt. Factor)1 2 3
TemperatureWater Temp at Site
°CWater Temp 1 Mile UpstreamWater Temp Change:Site Temp - Upstream Temp
0.11
Dissolved OxygenDissolved Oxygen mg/LDO% Saturation:Determine from chart or table/equation % 0.18
BODAvg. Dissolved Oxygen:(Calculated Above)
mg/LDissolved Oxygen after 5 daysBODAvg DO (original)-DO after 5 days 0.12
pHpH 0.12
NutrientsOrthophosphate mg/LTotal Phosphate(boil in acid) mg/L 0.11
Nitrate (NO3)multiply by 4.4
mg/L 0.10
Nitrite (NO4)multiply by 3.3
mg/L
TurbidityTransparency(from tube) cm
Turbidity(convert from chart/table) NTU 0.09
BacteriaE.Coli Bacteria cfu/100
mL0.17
General Coliforms
WQI RatingsExcellentGoodMediumBadVery Bad
90 - 100%70 - 87%50 - 69%25-49%0-24%
Use Average DO value for BOD calculation.
Remember to convert your reading from the tube to NTUs.
TOTALSDivide Total of Calculation Column by Total Weighting Factor Column
WQI
Add Weighting Factors for test completed.
Add the calculation column.
10 04 2009 1000 1000Example Stream Indiana -85.76369 39.52533
12 15 2.5 29.5
22.0 22.0 22.0 22.0 22.0 21.0 21.0 21.3
0.0 1.0 1.0 0.7
8.0 7.0 7.5
7.5 7.5 7.5 7.5 6.0 5.0 5.5 5.5
86.2
90 9.9
92 16.6
2.0 80 9.6
8.0 8.0 82 9.8
0 0
10 10 51 5.1
0 0
25 26 27.5
30 29 25 28 54 4.9
0.72 55.9
77.6 - Good
XX
EX
AM
PL
E
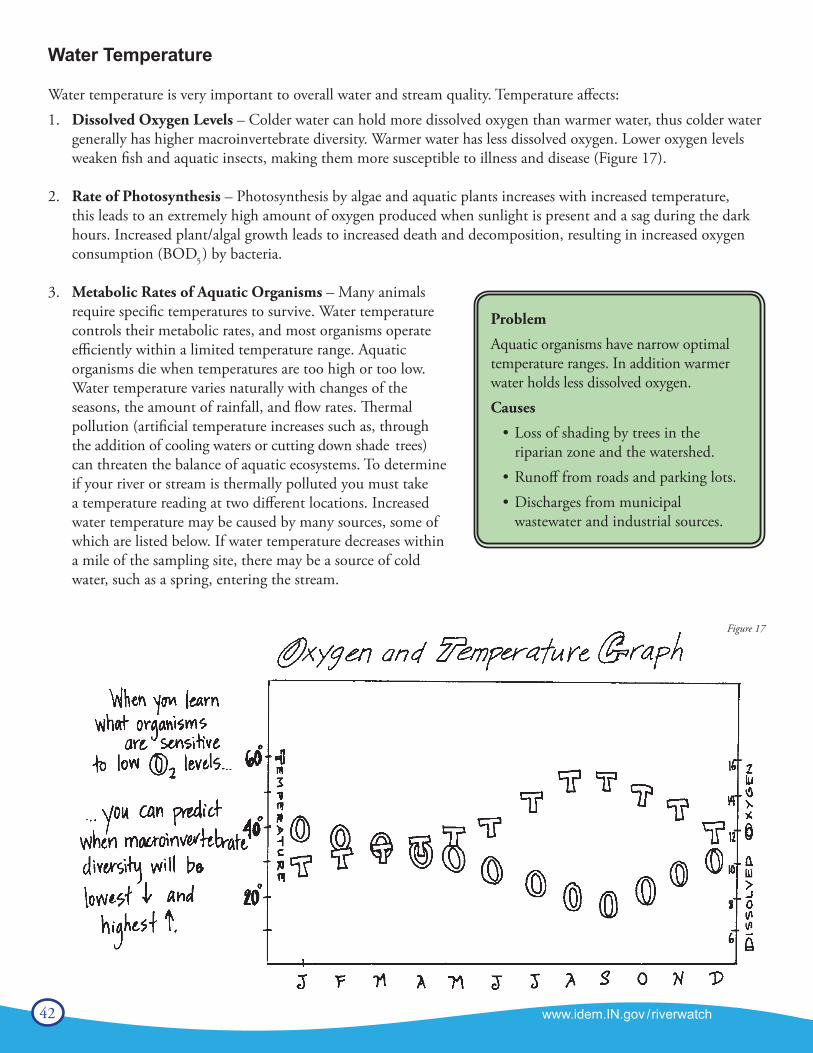
42 www.idem.IN.gov /riverwatch
Water Temperature
Water temperature is very important to overall water and stream quality. Temperature affects:1. Dissolved Oxygen Levels – Colder water can hold more dissolved oxygen than warmer water, thus colder water
generally has higher macroinvertebrate diversity. Warmer water has less dissolved oxygen. Lower oxygen levels weaken fish and aquatic insects, making them more susceptible to illness and disease (Figure 17).
2. Rate of Photosynthesis – Photosynthesis by algae and aquatic plants increases with increased temperature, this leads to an extremely high amount of oxygen produced when sunlight is present and a sag during the dark hours. Increased plant/algal growth leads to increased death and decomposition, resulting in increased oxygen consumption (BOD5) by bacteria.
3. Metabolic Rates of Aquatic Organisms – Many animals require specific temperatures to survive. Water temperature controls their metabolic rates, and most organisms operate efficiently within a limited temperature range. Aquatic organisms die when temperatures are too high or too low. Water temperature varies naturally with changes of the seasons, the amount of rainfall, and flow rates. Thermal pollution (artificial temperature increases such as, through the addition of cooling waters or cutting down shade trees) can threaten the balance of aquatic ecosystems. To determine if your river or stream is thermally polluted you must take a temperature reading at two different locations. Increased water temperature may be caused by many sources, some of which are listed below. If water temperature decreases within a mile of the sampling site, there may be a source of cold water, such as a spring, entering the stream.
Problem
Aquatic organisms have narrow optimal temperature ranges. In addition warmer water holds less dissolved oxygen.Causes
• Loss of shading by trees in the riparian zone and the watershed.
• Runoff from roads and parking lots.• Discharges from municipal
wastewater and industrial sources.
Figure 17
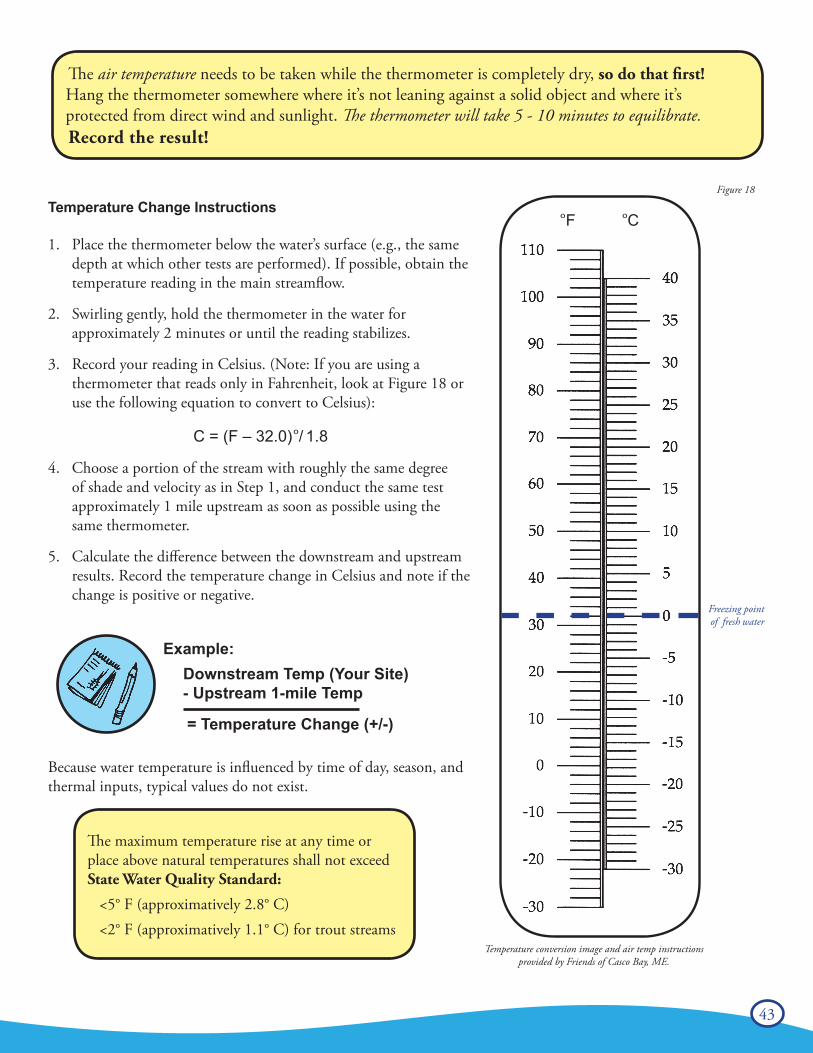
43
Temperature Change Instructions
1. Place the thermometer below the water’s surface (e.g., the same depth at which other tests are performed). If possible, obtain the temperature reading in the main streamflow.
2. Swirling gently, hold the thermometer in the water for approximately 2 minutes or until the reading stabilizes.
3. Record your reading in Celsius. (Note: If you are using a thermometer that reads only in Fahrenheit, look at Figure 18 or use the following equation to convert to Celsius):
C = (F – 32.0)°/ 1.8
4. Choose a portion of the stream with roughly the same degree of shade and velocity as in Step 1, and conduct the same test approximately 1 mile upstream as soon as possible using the same thermometer.
5. Calculate the difference between the downstream and upstream results. Record the temperature change in Celsius and note if the change is positive or negative.
Because water temperature is influenced by time of day, season, and thermal inputs, typical values do not exist.
The air temperature needs to be taken while the thermometer is completely dry, so do that first! Hang the thermometer somewhere where it’s not leaning against a solid object and where it’s protected from direct wind and sunlight. The thermometer will take 5 - 10 minutes to equilibrate. Record the result!
Example: Downstream Temp (Your Site) - Upstream 1-mile Temp
= Temperature Change (+/-)
The maximum temperature rise at any time or place above natural temperatures shall not exceed State Water Quality Standard:
<5° F (approximatively 2.8° C) <2° F (approximatively 1.1° C) for trout streams
Figure 18
Freezing point of fresh water
° F ° C
Temperature conversion image and air temp instructionsprovided by Friends of Casco Bay, ME.
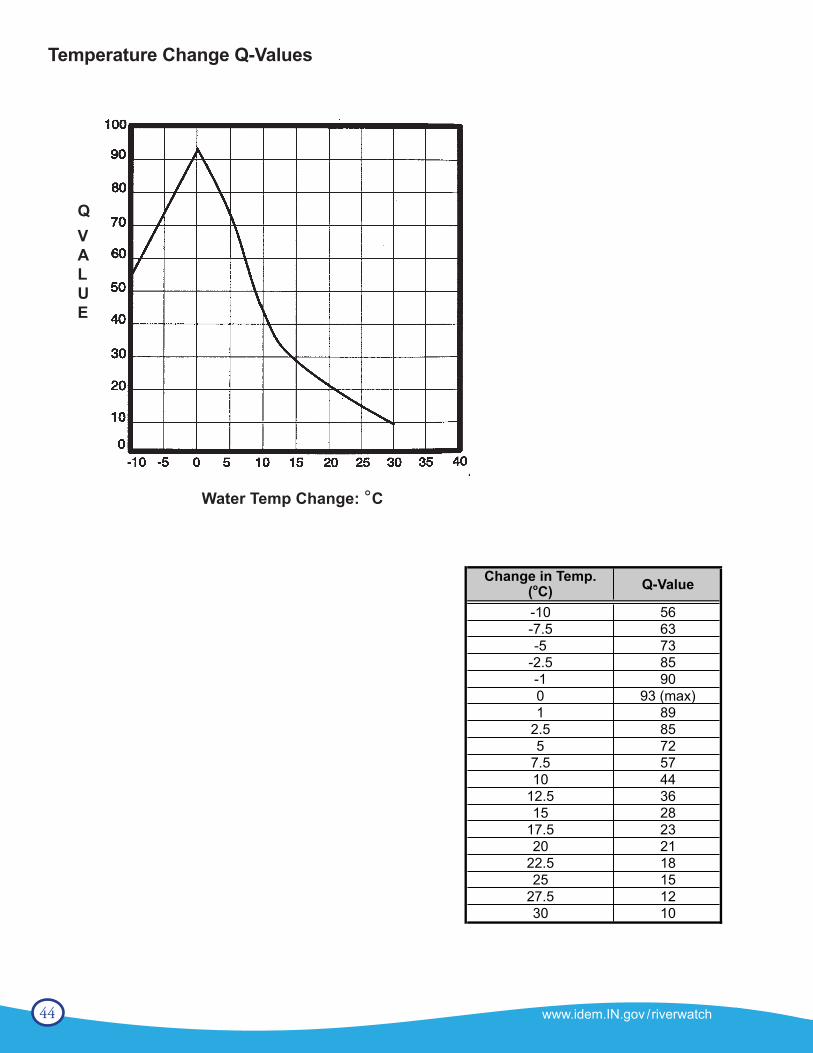
44 www.idem.IN.gov /riverwatch
Temperature Change Q-Values
Change in Temp.(oC)
-10 56
-7.5 63
-5 73
-2.5 85
-1 90
0 93 (max)
1 89
2.5 85
5 72
7.5 57
10 44
12.5 36
15 28
17.5 23
20 21
22.5 18
25 15
27.5 12
30 10
Q-Value
Water Temp Change: ° C
QVALUE
45
Dissolved Oxygen
Oxygen is as important to life in water as it is to life on land. Most aquatic plants and animals requireoxygen for survival. Although oxygen atoms are present in the water molecule (H2O), most aquaticlife require oxygen in the free elemental state (O2) as a dissolved gas. The amount of oxygen in water is called the dissolved oxygen (DO) concentration. Oxygen dissolves into the water from the atmosphere until the water is saturated. Aquatic plants, algae, and plankton also produce oxygen as a by-product of photosynthesis; which is why oxygen levels rise during the day and fall at night during respiration. DO is an important measure of stream health. Presence of oxygen in water is a positive sign, while absence of oxygen from water often indicates water pollution. Aquatic organisms require different levels of DO. Dissolved oxygen levels below 3 ppm are stressful to most aquatic life. DO levels below 2 or 1 ppm will not support fish. Levels of 5 to 6 ppm are usually required for healthy growth and activity of aquatic life. Some of the factors affecting DO are:• Temperature (water can’t hold as much dissolved oxygen at
higher temperatures)• Altitude/atmospheric pressure• Turbulence• Plant growth/photosynthesis• Amount of decaying organic material
% SaturationTwo pieces of information are needed to interpret dissolved oxygen levels – the DO concentration (in ppm or mg/L) and the water temperature. From these two values, the percent saturation canbe determined. Percent saturation expresses the current amount (in milligrams) of oxygen gas dissolved in one liter of water at a given temperature compared with the maximum milligrams of oxygen gas that can remain dissolved in one liter of water as the same temperature and pressure. The table on page 48 shows the mg/L of DO that represents 100% saturation at each given temperature. Cold water can hold more dissolved oxygen than warm water.
For example, water at 27°C is 100% saturated with 8 ppm dissolved oxygen. However, water at 8 °C can hold up to 11.8 ppm DO before it is 100% saturated. Thus, daily and seasonal temperature changes, as well as thermal pollution, greatly impact oxygen levels and aquatic life in streams and rivers.
SupersaturationHigh levels of bacteria or large amounts of rotting organic material can consume oxygen very rapidly and cause the percent saturation to decrease. Conversely, water may become supersaturated for short periods of time, holding more than 100% of the oxygen it would hold under normal conditions. Supersaturation is often caused by high levels of photosynthesis in streams overloaded with aquatic plants and algae. Supersaturation may also occur at the base of dams due to increased pressure. Supersaturation can be harmful to aquatic organisms, causing gas bubble disease, a condition similar to “the bends”, which scuba divers may get if they surface too fast. Supersaturation during daytime hours, along with evidence of high photosynthetic activity may indicate a possible oxygen sag during the evening hours, which would limit aquatic life use.
ProblemLack of sufficient dissolved oxygen required by most aquatic organisms to breathe. Lack of oxygen increases the toxicity of other chemicals (e.g., hydrogen sulfide and ammonia).Causes
• Rapid decomposition of organic materials, including dead algae, shoreline vegetation, manure or wastewater decreases oxygen.
• High ammonia concentrations in the stream use up oxygen in the process of oxidizing ammonia (NH4+) to nitrate (NO3-) through nitrification.
• Less oxygen can dissolve in water at higher temperatures
• Lack of turbulence or mixing to expose water to atmospheric oxygen results in low dissolved oxygen concentrations.
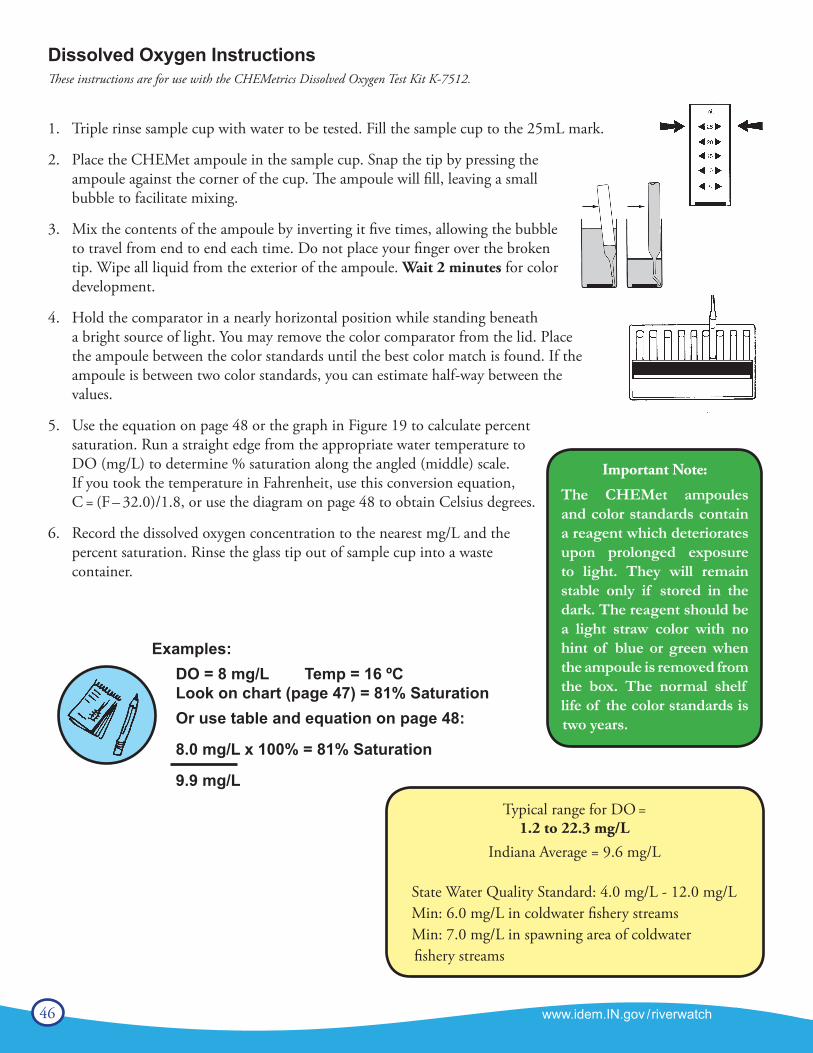
46 www.idem.IN.gov /riverwatch
Dissolved Oxygen Instructions These instructions are for use with the CHEMetrics Dissolved Oxygen Test Kit K-7512.
1. Triple rinse sample cup with water to be tested. Fill the sample cup to the 25mL mark.
2. Place the CHEMet ampoule in the sample cup. Snap the tip by pressing the ampoule against the corner of the cup. The ampoule will fill, leaving a small bubble to facilitate mixing.
3. Mix the contents of the ampoule by inverting it five times, allowing the bubble to travel from end to end each time. Do not place your finger over the broken tip. Wipe all liquid from the exterior of the ampoule. Wait 2 minutes for color development.
4. Hold the comparator in a nearly horizontal position while standing beneath a bright source of light. You may remove the color comparator from the lid. Place the ampoule between the color standards until the best color match is found. If the ampoule is between two color standards, you can estimate half-way between the values.
5. Use the equation on page 48 or the graph in Figure 19 to calculate percent saturation. Run a straight edge from the appropriate water temperature to DO (mg/L) to determine % saturation along the angled (middle) scale. If you took the temperature in Fahrenheit, use this conversion equation, C = (F – 32.0)/1.8, or use the diagram on page 48 to obtain Celsius degrees.
6. Record the dissolved oxygen concentration to the nearest mg/L and the percent saturation. Rinse the glass tip out of sample cup into a waste container.
Examples: DO = 8 mg/L Temp = 16 ºCLook on chart (page 47) = 81% SaturationOr use table and equation on page 48:
8.0 mg/L x 100% = 81% Saturation
9.9 mg/L
Typical range for DO =1.2 to 22.3 mg/L
Indiana Average = 9.6 mg/L
State Water Quality Standard: 4.0 mg/L - 12.0 mg/LMin: 6.0 mg/L in coldwater fishery streamsMin: 7.0 mg/L in spawning area of coldwater fishery streams
Important Note:
The CHEMet ampoules and color standards contain a reagent which deteriorates upon prolonged exposure to light. They will remain stable only if stored in the dark. The reagent should be a light straw color with no hint of blue or green when the ampoule is removed from the box. The normal shelf life of the color standards is two years.
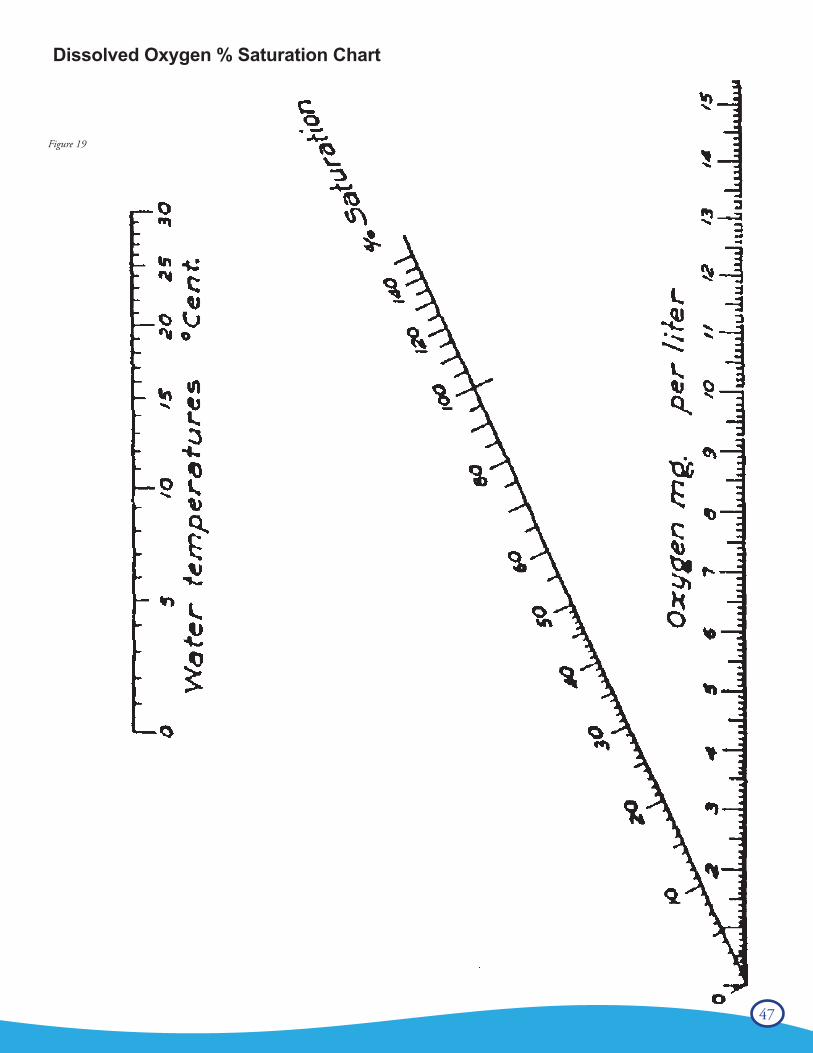
47
Dissolved Oxygen % Saturation Chart
Figure 19
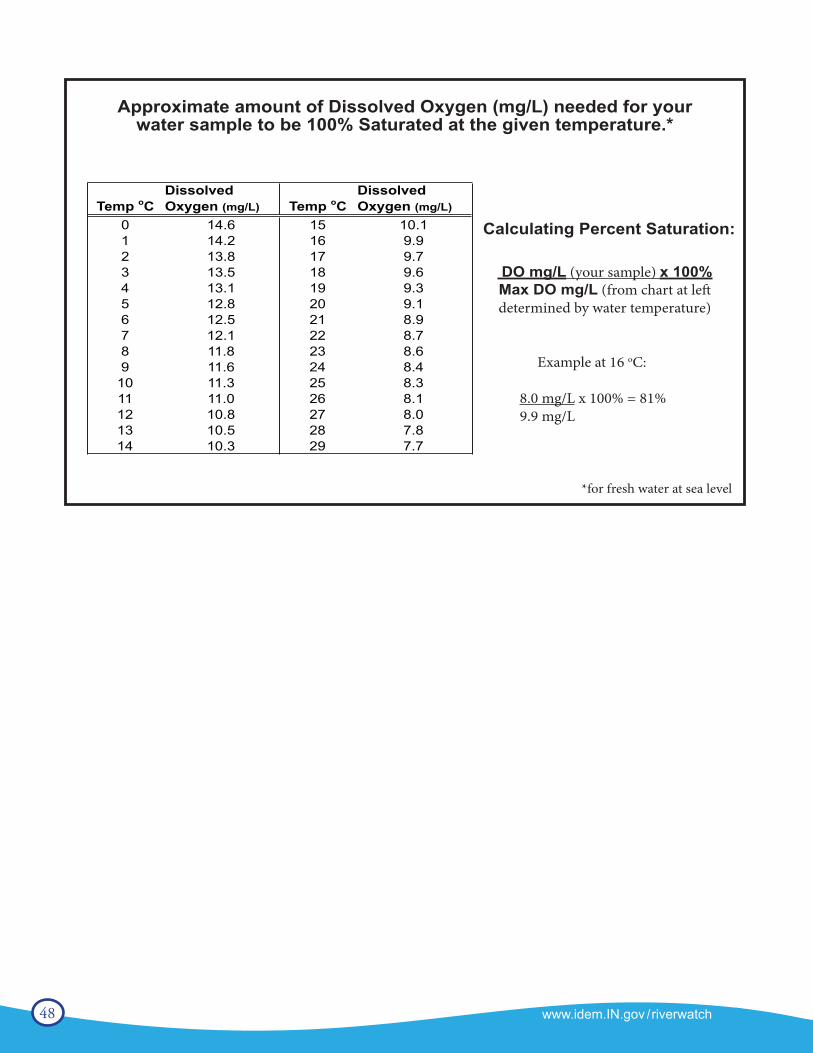
48 www.idem.IN.gov /riverwatch
www.idem.IN.gov/riverwatch46
Temp oCDissolvedOxygen (mg/L) Temp oC
DissolvedOxygen (mg/L)
0 14.6 15 10.11 14.2 16 9.92 13.8 17 9.73 13.5 18 9.64 13.1 19 9.35 12.8 20 9.16 12.5 21 8.97 12.1 22 8.78 11.8 23 8.69 11.6 24 8.4
10 11.3 25 8.311 11.0 26 8.112 10.8 27 8.013 10.5 28 7.814 10.3 29 7.7
*for fresh water at sea level
Approximate amount of Dissolved Oxygen (mg/L) needed for your water sample to be 100% Saturated at the given temperature.*
Example at 16 oC:
8.0 mg/L x 100% = 81%9.9 mg/L
DO mg/L (your sample) x 100%
Calculating Percent Saturation:
Max DO mg/L (from chart at left determined by water temperature)
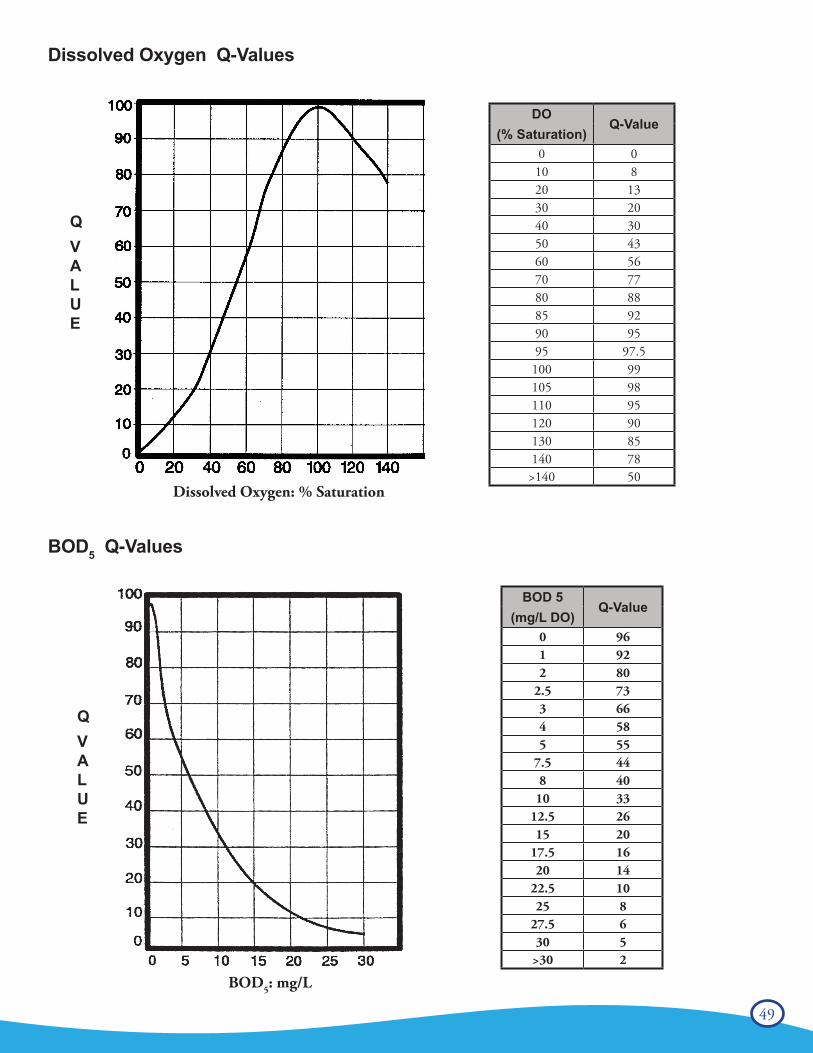
49
Dissolved Oxygen Q-Values
BOD5 Q-Values
Dissolved Oxygen: % Saturation
BOD5: mg/L
QVALUE
QVALUE
DOQ-Value
(% Saturation)0 010 820 1330 2040 3050 4360 5670 7780 8885 9290 9595 97.5100 99105 98110 95120 90130 85140 78>140 50
BOD 5Q-Value
(mg/L DO)0 961 922 80
2.5 733 664 585 55
7.5 448 40
10 3312.5 2615 20
17.5 1620 14
22.5 1025 8
27.5 630 5
>30 2
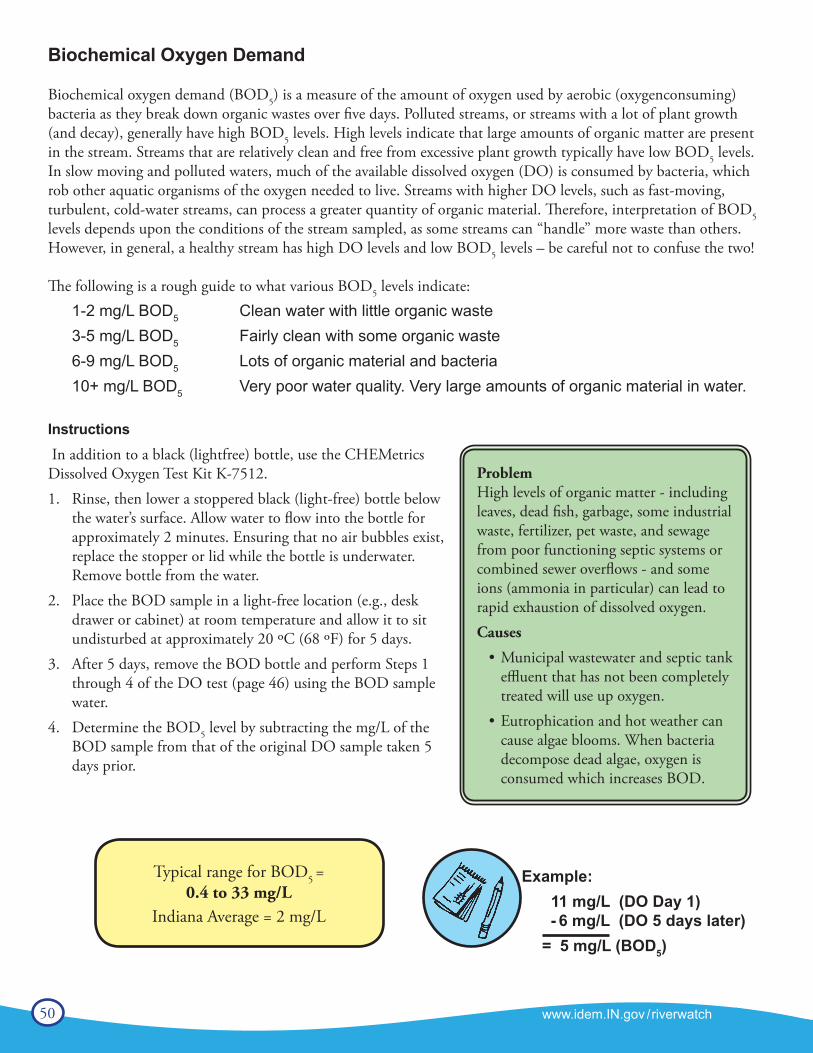
50 www.idem.IN.gov /riverwatch
Biochemical Oxygen Demand
Biochemical oxygen demand (BOD5) is a measure of the amount of oxygen used by aerobic (oxygenconsuming) bacteria as they break down organic wastes over five days. Polluted streams, or streams with a lot of plant growth (and decay), generally have high BOD5 levels. High levels indicate that large amounts of organic matter are present in the stream. Streams that are relatively clean and free from excessive plant growth typically have low BOD5 levels. In slow moving and polluted waters, much of the available dissolved oxygen (DO) is consumed by bacteria, which rob other aquatic organisms of the oxygen needed to live. Streams with higher DO levels, such as fast-moving, turbulent, cold-water streams, can process a greater quantity of organic material. Therefore, interpretation of BOD5 levels depends upon the conditions of the stream sampled, as some streams can “handle” more waste than others. However, in general, a healthy stream has high DO levels and low BOD5 levels – be careful not to confuse the two!
The following is a rough guide to what various BOD5 levels indicate:1-2 mg/L BOD5 Clean water with little organic waste3-5 mg/L BOD5 Fairly clean with some organic waste6-9 mg/L BOD5 Lots of organic material and bacteria10+ mg/L BOD5 Very poor water quality. Very large amounts of organic material in water.
Instructions In addition to a black (lightfree) bottle, use the CHEMetrics Dissolved Oxygen Test Kit K-7512. 1. Rinse, then lower a stoppered black (light-free) bottle below
the water’s surface. Allow water to flow into the bottle for approximately 2 minutes. Ensuring that no air bubbles exist, replace the stopper or lid while the bottle is underwater. Remove bottle from the water.
2. Place the BOD sample in a light-free location (e.g., desk drawer or cabinet) at room temperature and allow it to sit undisturbed at approximately 20 ºC (68 ºF) for 5 days.
3. After 5 days, remove the BOD bottle and perform Steps 1 through 4 of the DO test (page 46) using the BOD sample water.
4. Determine the BOD5 level by subtracting the mg/L of the BOD sample from that of the original DO sample taken 5 days prior.
Example: 11 mg/L (DO Day 1) - 6 mg/L (DO 5 days later) = 5 mg/L (BOD5)
Typical range for BOD5 =0.4 to 33 mg/L
Indiana Average = 2 mg/L
ProblemHigh levels of organic matter - including leaves, dead fish, garbage, some industrial waste, fertilizer, pet waste, and sewage from poor functioning septic systems or combined sewer overflows - and some ions (ammonia in particular) can lead to rapid exhaustion of dissolved oxygen.Causes
• Municipal wastewater and septic tank effluent that has not been completely treated will use up oxygen.
• Eutrophication and hot weather can cause algae blooms. When bacteria decompose dead algae, oxygen is consumed which increases BOD.
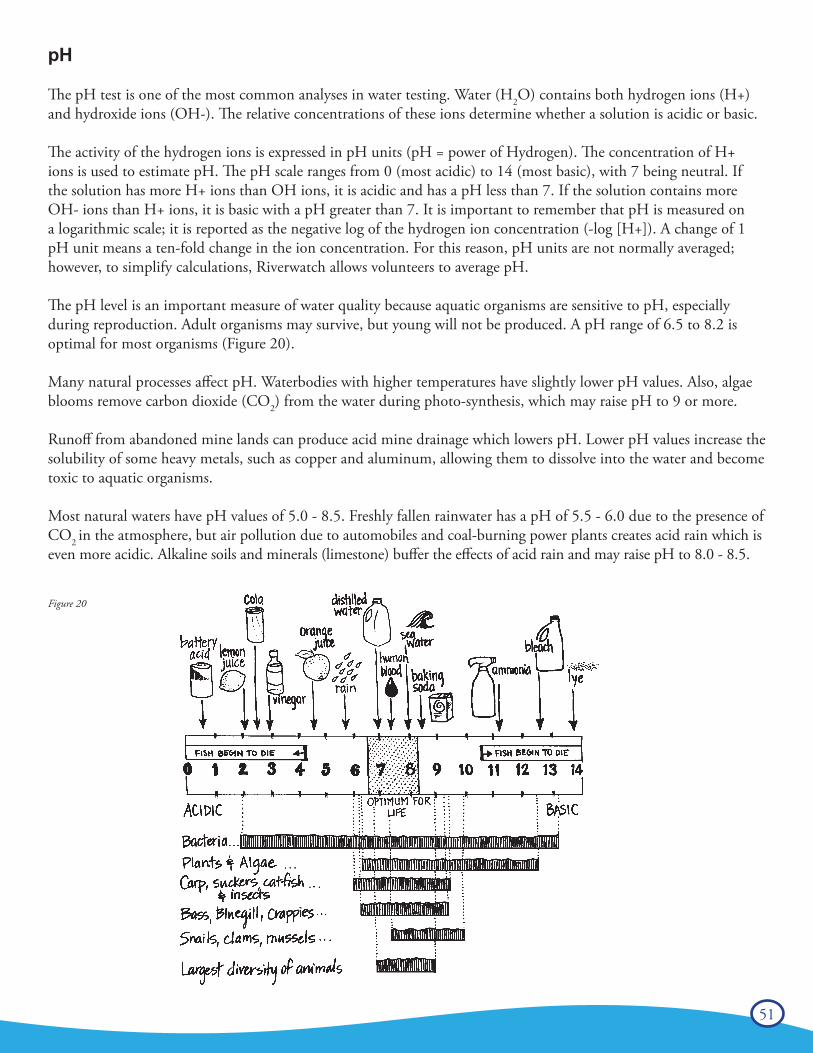
51
pH
The pH test is one of the most common analyses in water testing. Water (H2O) contains both hydrogen ions (H+) and hydroxide ions (OH-). The relative concentrations of these ions determine whether a solution is acidic or basic.
The activity of the hydrogen ions is expressed in pH units (pH = power of Hydrogen). The concentration of H+ ions is used to estimate pH. The pH scale ranges from 0 (most acidic) to 14 (most basic), with 7 being neutral. If the solution has more H+ ions than OH ions, it is acidic and has a pH less than 7. If the solution contains more OH- ions than H+ ions, it is basic with a pH greater than 7. It is important to remember that pH is measured on a logarithmic scale; it is reported as the negative log of the hydrogen ion concentration (-log [H+]). A change of 1 pH unit means a ten-fold change in the ion concentration. For this reason, pH units are not normally averaged; however, to simplify calculations, Riverwatch allows volunteers to average pH.
The pH level is an important measure of water quality because aquatic organisms are sensitive to pH, especially during reproduction. Adult organisms may survive, but young will not be produced. A pH range of 6.5 to 8.2 is optimal for most organisms (Figure 20).
Many natural processes affect pH. Waterbodies with higher temperatures have slightly lower pH values. Also, algae blooms remove carbon dioxide (CO2) from the water during photo-synthesis, which may raise pH to 9 or more. Runoff from abandoned mine lands can produce acid mine drainage which lowers pH. Lower pH values increase the solubility of some heavy metals, such as copper and aluminum, allowing them to dissolve into the water and become toxic to aquatic organisms.
Most natural waters have pH values of 5.0 - 8.5. Freshly fallen rainwater has a pH of 5.5 - 6.0 due to the presence of CO2 in the atmosphere, but air pollution due to automobiles and coal-burning power plants creates acid rain which is even more acidic. Alkaline soils and minerals (limestone) buffer the effects of acid rain and may raise pH to 8.0 - 8.5.
Figure 20
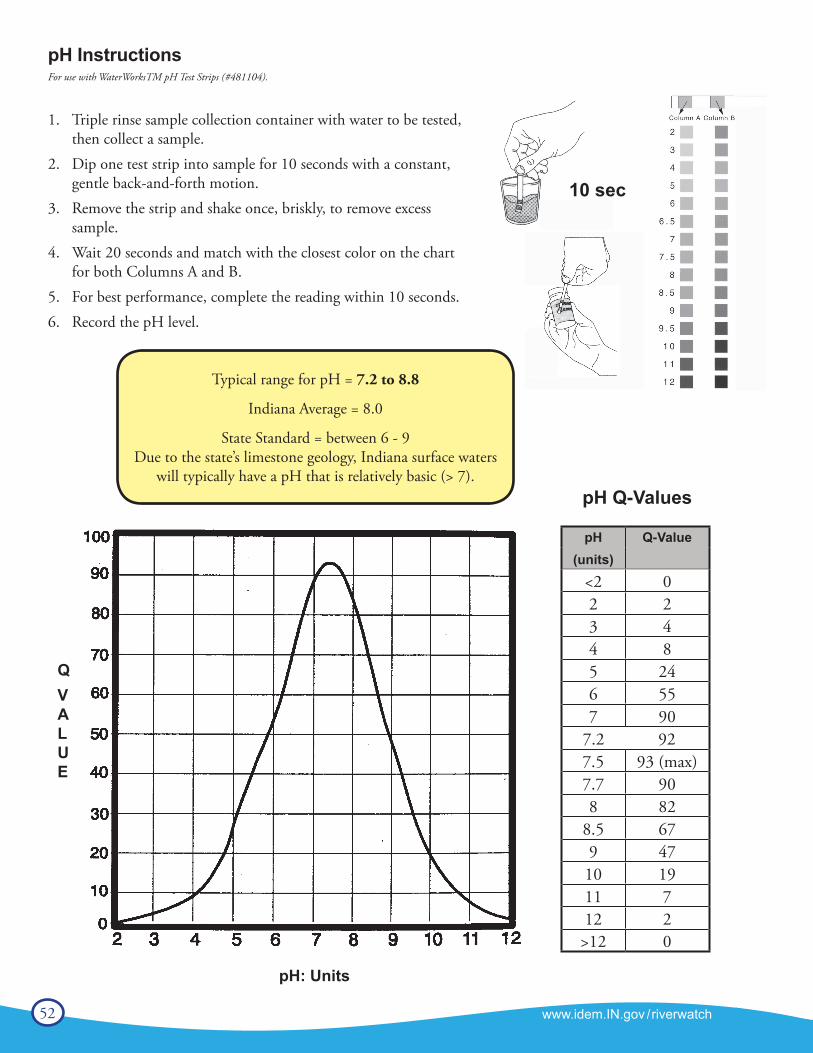
52 www.idem.IN.gov /riverwatch
pH InstructionsFor use with WaterWorksTM pH Test Strips (#481104).
1. Triple rinse sample collection container with water to be tested, then collect a sample.
2. Dip one test strip into sample for 10 seconds with a constant, gentle back-and-forth motion.
3. Remove the strip and shake once, briskly, to remove excess sample.
4. Wait 20 seconds and match with the closest color on the chart for both Columns A and B.
5. For best performance, complete the reading within 10 seconds.6. Record the pH level.
pH: Units
pH Q-Values
QVALUE
pH Q-Value(units)
<2 02 23 44 85 246 557 90
7.2 927.5 93 (max)7.7 908 82
8.5 679 4710 1911 712 2>12 0
Typical range for pH = 7.2 to 8.8
Indiana Average = 8.0
State Standard = between 6 - 9Due to the state’s limestone geology, Indiana surface waters
will typically have a pH that is relatively basic (> 7).
10 sec
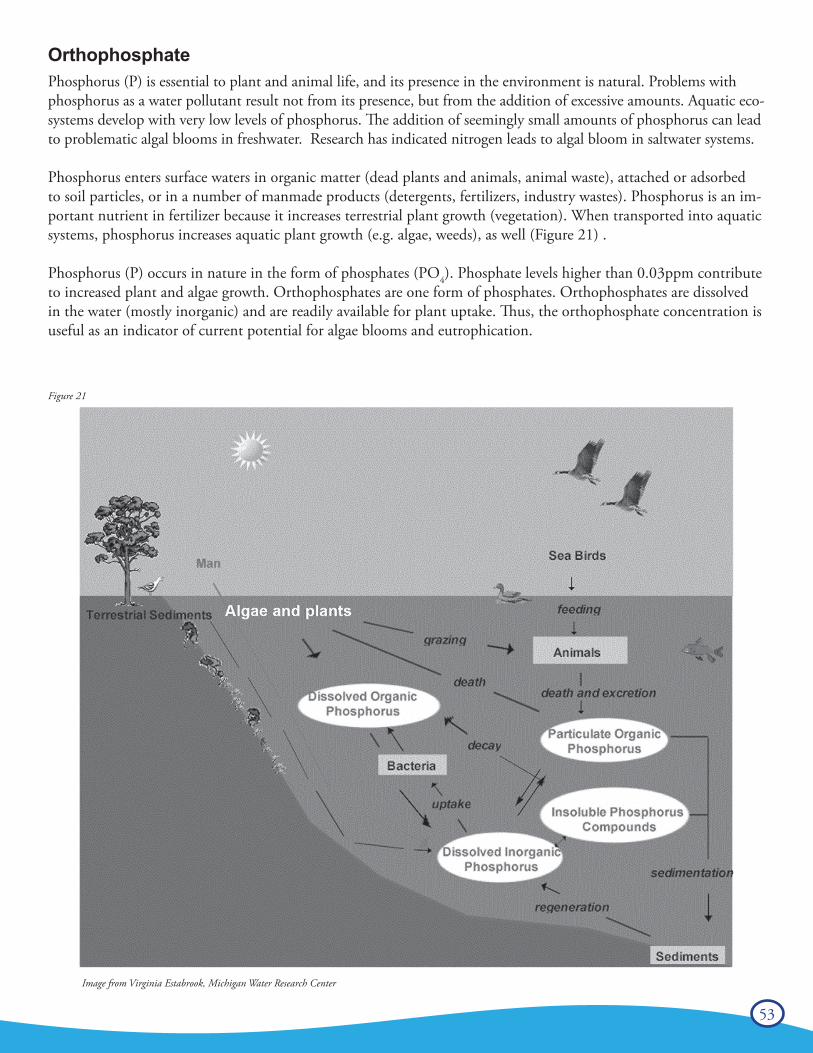
53
Orthophosphate Phosphorus (P) is essential to plant and animal life, and its presence in the environment is natural. Problems with phosphorus as a water pollutant result not from its presence, but from the addition of excessive amounts. Aquatic eco-systems develop with very low levels of phosphorus. The addition of seemingly small amounts of phosphorus can lead to problematic algal blooms in freshwater. Research has indicated nitrogen leads to algal bloom in saltwater systems.
Phosphorus enters surface waters in organic matter (dead plants and animals, animal waste), attached or adsorbed to soil particles, or in a number of manmade products (detergents, fertilizers, industry wastes). Phosphorus is an im-portant nutrient in fertilizer because it increases terrestrial plant growth (vegetation). When transported into aquatic systems, phosphorus increases aquatic plant growth (e.g. algae, weeds), as well (Figure 21) .
Phosphorus (P) occurs in nature in the form of phosphates (PO4). Phosphate levels higher than 0.03ppm contribute to increased plant and algae growth. Orthophosphates are one form of phosphates. Orthophosphates are dissolved in the water (mostly inorganic) and are readily available for plant uptake. Thus, the orthophosphate concentration is useful as an indicator of current potential for algae blooms and eutrophication.
Figure 21
Image from Virginia Estabrook, Michigan Water Research Center
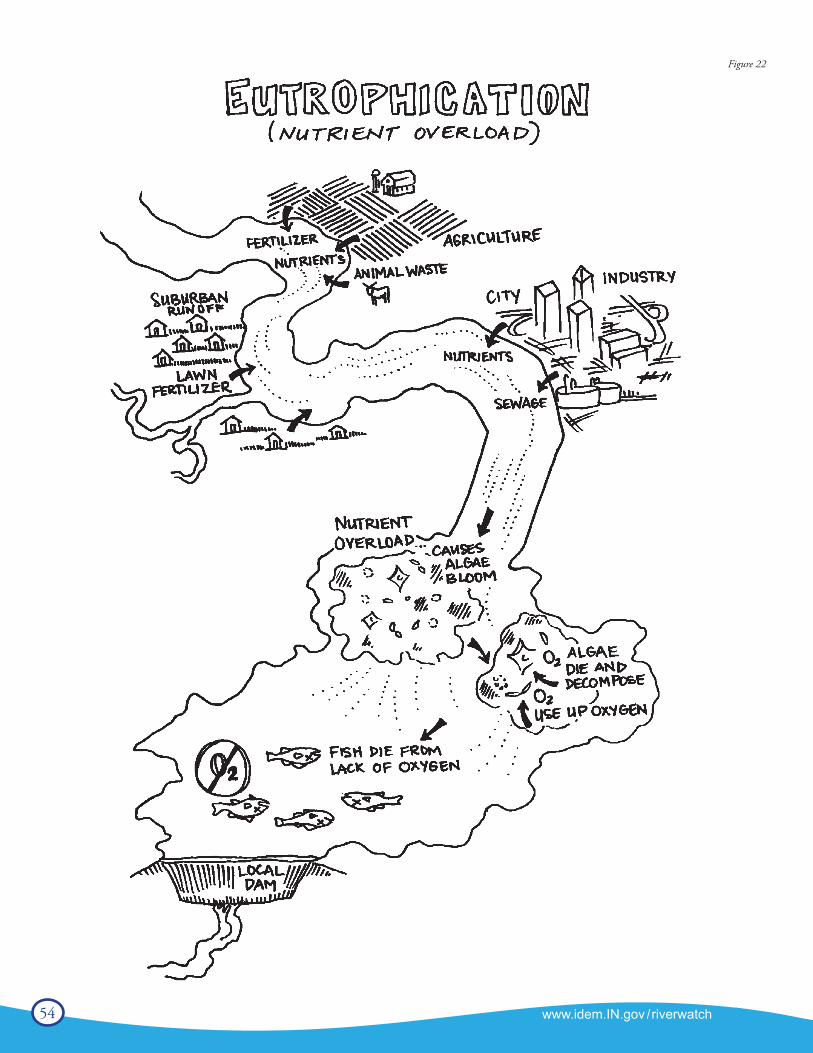
54 www.idem.IN.gov /riverwatch
Figure 22
55
When phosphorus levels are too high, excess plant and algal growth creates water quality problems. Plants begin to die and decompose, depleting the dissolved oxygen supply in the water - a condition called hypoxia, which can lead to fish kills in some cases. Phosphorus is also released from the sediments and decomposing plants back into the water, continuing the cycle. The reaction of the aquatic system to an overloading of nutrients is known as eutrophication (Figure 22). Hypoxia and eutrophication, to some extent, occur within many of our lakes and stream every year, and, on a larger scale, such as in the western basin of Lake Erie.
Unlike nitrogen and other nutrients, phosphorus does not have a gaseous phase. Once it is in an aquatic system, it remains there and cycles through different forms unless physically removed (e.g. by dredging). Over time some of the other forms of phosphates attached to particles in the water column and in the sediments (including organic forms) can be changed into orthophosphates, becoming available for plant growth. For this reason, it is useful to test for total phosphate levels.
However, the chemistry methods currently utilized by Hoosier Riverwatch do not include a means for obtaining total phosphate results.
ProblemMost fresh water has naturally low phosphate levels, and this limits algal growth. If excessive phosphates enter surface water, it can support rapid algal growth. When the algae die, their decomposition by bacteria uses up oxygen and may produce odors and algal toxins.
Causes
• Phosphorus occurs naturally in soil. Sediments from soil erosion and runoff are often a significant source of phosphorus. These may enter the stream via bank erosion or runoff from forestry, agriculture, and urban lands. Phosphorus can desorb from soil particles and enter solution.
• Phosphorus can come from manure sources, such as treatment lagoons, over-fertilized agricultural fields, or waterfowl.
• Urban sources of phosphorus may include: storm drains, parking lot and road runoff, construction sites, inadequately treated municipal wastewater and septic tank effluent, and lawn fertilizer.
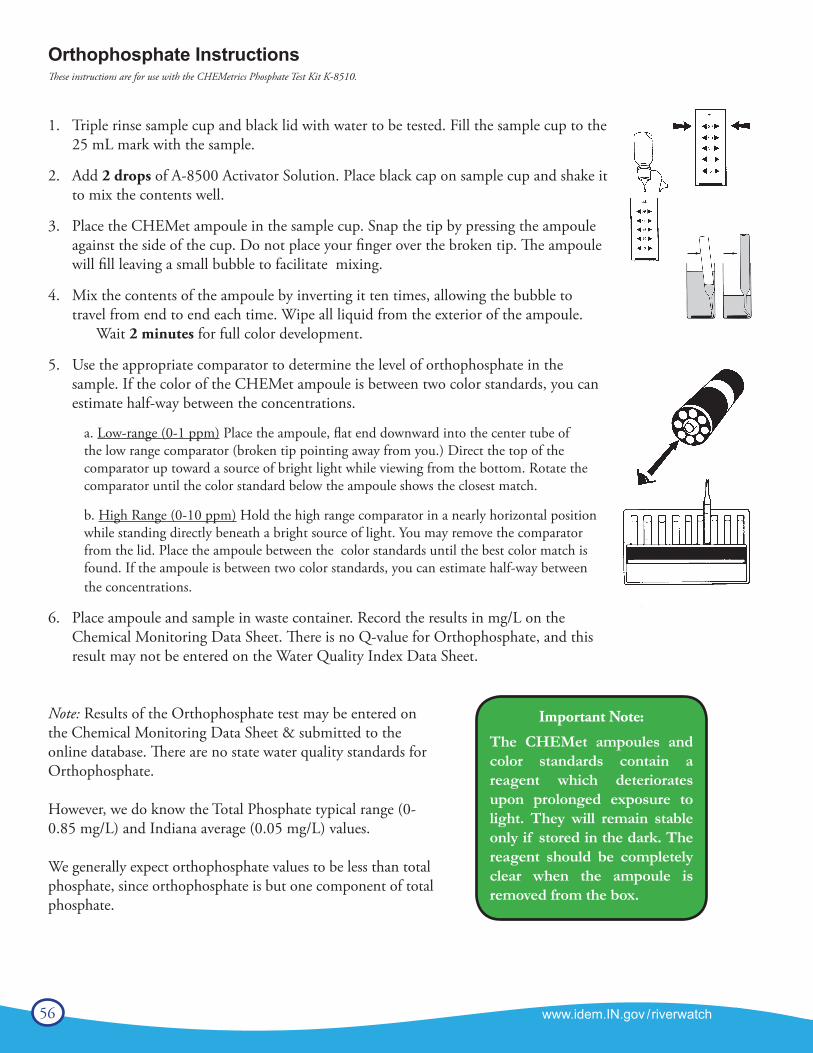
56 www.idem.IN.gov /riverwatch
Orthophosphate InstructionsThese instructions are for use with the CHEMetrics Phosphate Test Kit K-8510.
1. Triple rinse sample cup and black lid with water to be tested. Fill the sample cup to the 25 mL mark with the sample.
2. Add 2 drops of A-8500 Activator Solution. Place black cap on sample cup and shake it to mix the contents well.
3. Place the CHEMet ampoule in the sample cup. Snap the tip by pressing the ampoule against the side of the cup. Do not place your finger over the broken tip. The ampoule will fill leaving a small bubble to facilitate mixing.
4. Mix the contents of the ampoule by inverting it ten times, allowing the bubble to travel from end to end each time. Wipe all liquid from the exterior of the ampoule. Wait 2 minutes for full color development.
5. Use the appropriate comparator to determine the level of orthophosphate in the sample. If the color of the CHEMet ampoule is between two color standards, you can estimate half-way between the concentrations.
a. Low-range (0-1 ppm) Place the ampoule, flat end downward into the center tube of the low range comparator (broken tip pointing away from you.) Direct the top of the comparator up toward a source of bright light while viewing from the bottom. Rotate the comparator until the color standard below the ampoule shows the closest match.
b. High Range (0-10 ppm) Hold the high range comparator in a nearly horizontal position while standing directly beneath a bright source of light. You may remove the comparator from the lid. Place the ampoule between the color standards until the best color match is found. If the ampoule is between two color standards, you can estimate half-way between the concentrations.
6. Place ampoule and sample in waste container. Record the results in mg/L on the Chemical Monitoring Data Sheet. There is no Q-value for Orthophosphate, and this result may not be entered on the Water Quality Index Data Sheet.
Note: Results of the Orthophosphate test may be entered on the Chemical Monitoring Data Sheet & submitted to the online database. There are no state water quality standards for Orthophosphate.
However, we do know the Total Phosphate typical range (0-0.85 mg/L) and Indiana average (0.05 mg/L) values.
We generally expect orthophosphate values to be less than total phosphate, since orthophosphate is but one component of total phosphate.
Important Note:
The CHEMet ampoules and color standards contain a reagent which deteriorates upon prolonged exposure to light. They will remain stable only if stored in the dark. The reagent should be completely clear when the ampoule is removed from the box.
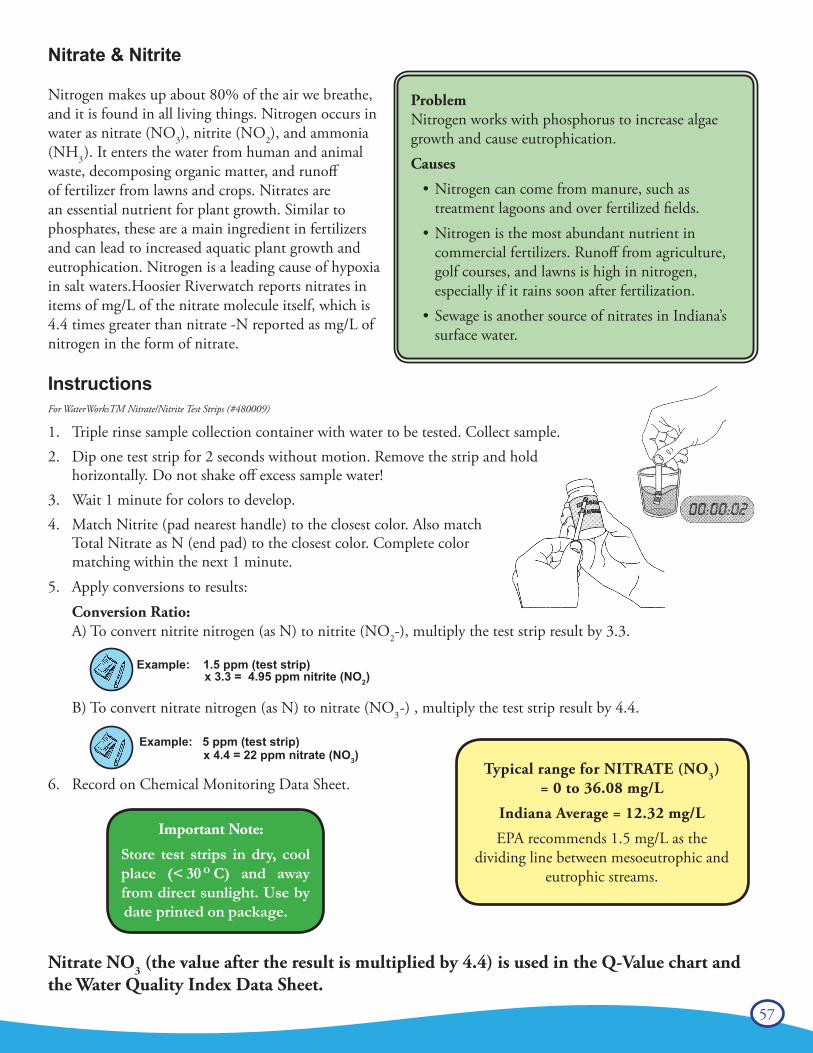
57
Nitrate & Nitrite
Nitrogen makes up about 80% of the air we breathe, and it is found in all living things. Nitrogen occurs inwater as nitrate (NO3), nitrite (NO2), and ammonia (NH3). It enters the water from human and animalwaste, decomposing organic matter, and runoff of fertilizer from lawns and crops. Nitrates are an essential nutrient for plant growth. Similar to phosphates, these are a main ingredient in fertilizers and can lead to increased aquatic plant growth and eutrophication. Nitrogen is a leading cause of hypoxia in salt waters.Hoosier Riverwatch reports nitrates in items of mg/L of the nitrate molecule itself, which is 4.4 times greater than nitrate -N reported as mg/L of nitrogen in the form of nitrate.
Instructions For WaterWorksTM Nitrate/Nitrite Test Strips (#480009)
1. Triple rinse sample collection container with water to be tested. Collect sample.2. Dip one test strip for 2 seconds without motion. Remove the strip and hold
horizontally. Do not shake off excess sample water!3. Wait 1 minute for colors to develop.4. Match Nitrite (pad nearest handle) to the closest color. Also match
Total Nitrate as N (end pad) to the closest color. Complete color matching within the next 1 minute.
5. Apply conversions to results:Conversion Ratio:A) To convert nitrite nitrogen (as N) to nitrite (NO2-), multiply the test strip result by 3.3.
B) To convert nitrate nitrogen (as N) to nitrate (NO3-) , multiply the test strip result by 4.4.
6. Record on Chemical Monitoring Data Sheet.
Nitrate NO3 (the value after the result is multiplied by 4.4) is used in the Q-Value chart and the Water Quality Index Data Sheet.
Example: 1.5 ppm (test strip) x 3.3 = 4.95 ppm nitrite (NO2)
Example: 5 ppm (test strip) x 4.4 = 22 ppm nitrate (NO3)
Typical range for NITRATE (NO3)= 0 to 36.08 mg/L
Indiana Average = 12.32 mg/L
EPA recommends 1.5 mg/L as the dividing line between mesoeutrophic and
eutrophic streams.
ProblemNitrogen works with phosphorus to increase algae growth and cause eutrophication.Causes
• Nitrogen can come from manure, such as treatment lagoons and over fertilized fields.
• Nitrogen is the most abundant nutrient in commercial fertilizers. Runoff from agriculture, golf courses, and lawns is high in nitrogen, especially if it rains soon after fertilization.
• Sewage is another source of nitrates in Indiana’s surface water.
Important Note:
Store test strips in dry, cool place (< 30 o C) and away from direct sunlight. Use by date printed on package.
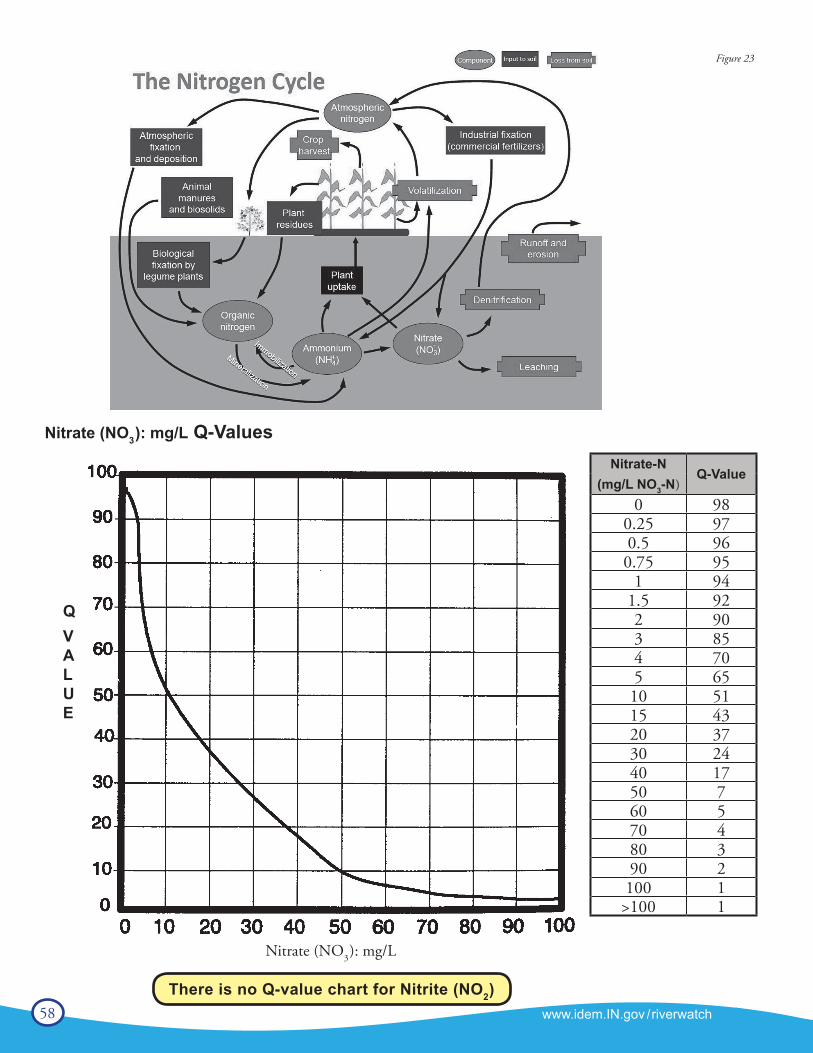
58 www.idem.IN.gov /riverwatch
There is no Q-value chart for Nitrite (NO2)
Nitrate (NO3): mg/L Q-Values
QVALUE
Nitrate-NQ-Value
(mg/L NO3-N)0 98
0.25 970.5 960.75 95
1 941.5 922 903 854 705 6510 5115 4320 3730 2440 1750 760 570 480 390 2100 1>100 1
Figure 23
Nitrate (NO3): mg/L
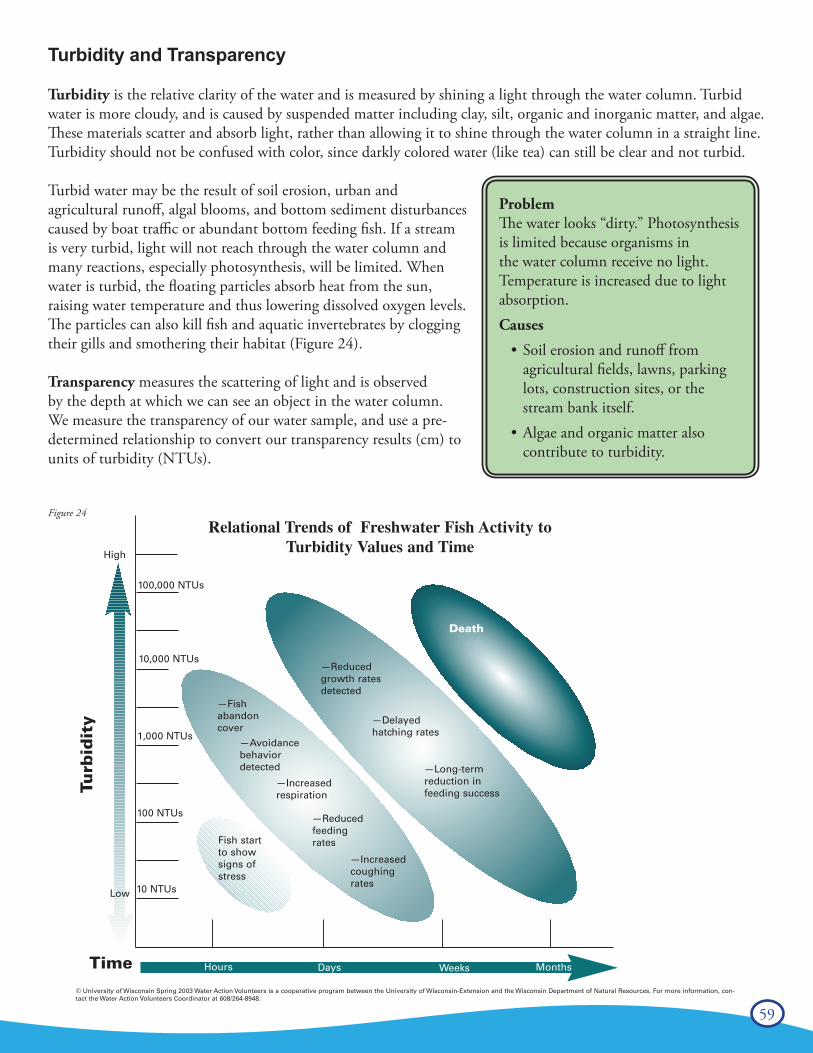
59
Turbidity and Transparency
Turbidity is the relative clarity of the water and is measured by shining a light through the water column. Turbid water is more cloudy, and is caused by suspended matter including clay, silt, organic and inorganic matter, and algae. These materials scatter and absorb light, rather than allowing it to shine through the water column in a straight line. Turbidity should not be confused with color, since darkly colored water (like tea) can still be clear and not turbid.
Turbid water may be the result of soil erosion, urban and agricultural runoff, algal blooms, and bottom sediment disturbances caused by boat traffic or abundant bottom feeding fish. If a stream is very turbid, light will not reach through the water column and many reactions, especially photosynthesis, will be limited. When water is turbid, the floating particles absorb heat from the sun, raising water temperature and thus lowering dissolved oxygen levels. The particles can also kill fish and aquatic invertebrates by clogging their gills and smothering their habitat (Figure 24).
Transparency measures the scattering of light and is observed by the depth at which we can see an object in the water column. We measure the transparency of our water sample, and use a pre-determined relationship to convert our transparency results (cm) to units of turbidity (NTUs).
ProblemThe water looks “dirty.” Photosynthesis is limited because organisms in the water column receive no light. Temperature is increased due to light absorption.Causes
• Soil erosion and runoff from agricultural fields, lawns, parking lots, construction sites, or the stream bank itself.
• Algae and organic matter also contribute to turbidity.
Tu
rbid
ity
High
Time
Fish start
to show
signs of
stress
—Fish
abandon
cover
—Avoidance
behavior
detected
—Increased
respiration
—Reduced
feeding
rates
Hours Days Weeks Months
—Reduced
growth rates
detected
—Delayed
hatching rates
—Long-term
reduction in
feeding success
Low
10,000 NTUs
1,000 NTUs
100 NTUs
10 NTUs
—Increased
coughing
rates
© University of Wisconsin Spring 2003 Water Action Volunteers is a cooperative program between the University of Wisconsin-Extension and the Wisconsin Department of Natural Resources. For more information, con-
tact the Water Action Volunteers Coordinator at 608/264-8948.
Death
100,000 NTUs
Figure 24
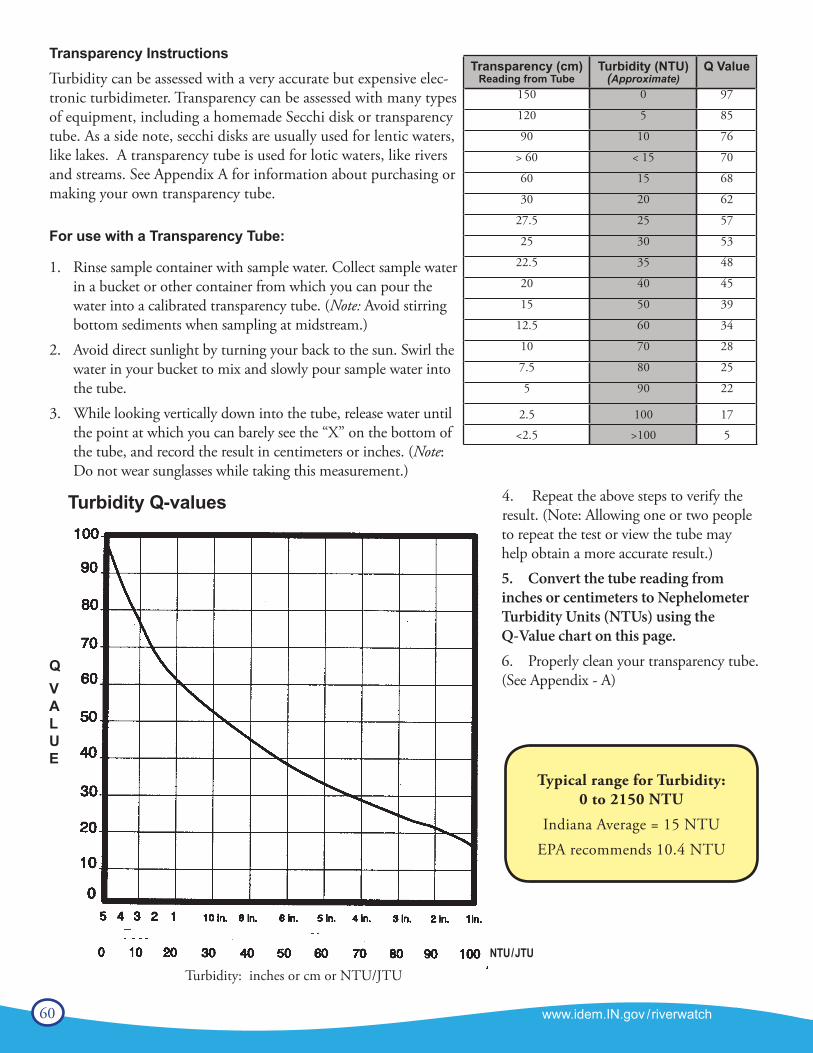
60 www.idem.IN.gov /riverwatch
Transparency Instructions Turbidity can be assessed with a very accurate but expensive elec-tronic turbidimeter. Transparency can be assessed with many types of equipment, including a homemade Secchi disk or transparency tube. As a side note, secchi disks are usually used for lentic waters, like lakes. A transparency tube is used for lotic waters, like rivers and streams. See Appendix A for information about purchasing or making your own transparency tube.
For use with a Transparency Tube:
1. Rinse sample container with sample water. Collect sample water in a bucket or other container from which you can pour the water into a calibrated transparency tube. (Note: Avoid stirring bottom sediments when sampling at midstream.)
2. Avoid direct sunlight by turning your back to the sun. Swirl the water in your bucket to mix and slowly pour sample water into the tube.
3. While looking vertically down into the tube, release water until the point at which you can barely see the “X” on the bottom of the tube, and record the result in centimeters or inches. (Note: Do not wear sunglasses while taking this measurement.)
4. Repeat the above steps to verify the result. (Note: Allowing one or two people to repeat the test or view the tube may help obtain a more accurate result.)5. Convert the tube reading from inches or centimeters to Nephelometer Turbidity Units (NTUs) using the Q-Value chart on this page.6. Properly clean your transparency tube. (See Appendix - A)
Transparency (cm)Reading from Tube
Turbidity (NTU)(Approximate)
Q Value
150 0 97
120 5 85
90 10 76
> 60 < 15 70
60 15 68
30 20 62
27.5 25 57
25 30 53
22.5 35 48
20 40 45
15 50 39
12.5 60 34
10 70 28
7.5 80 25
5 90 22
2.5 100 17
<2.5 >100 5
Turbidity Q-values
Typical range for Turbidity:0 to 2150 NTU
Indiana Average = 15 NTUEPA recommends 10.4 NTU
QVALUE
NTU/JTU
Turbidity: inches or cm or NTU/JTU
61
E. coli Bacteria
Fecal coliform bacteria are found in the feces of warm-blooded animals, including humans, livestock, andwaterfowl. These bacteria are naturally present in the digestive tracts of animals, but are rare or absent inunpolluted waters. Fecal coliform bacteria typically enter water via combined sewer overflows (CSOs), poor septicsystems, and runoff from agricultural feedlots. The bacteria can enter the body through the mouth, nose, eyes, ears,or cuts in the skin.
E. coli is a specific species of fecal coliform bacteria that is used as an indicator of fecal contamination Indiana’s state water quality standards. Thirty-eight percent (16,027 miles) of Indiana streams do not support primary contact recreation due to high E. coli bacteria levels (Source: IDEM Integrated Water Quality Monitoring and Assessment Report, 2012).
Bacteria & Human HealthSome strains of E. coli can lead to illness in humans. While not all strains of E. coli are pathogenic themselves,they occur with other intestinal tract pathogens that may be dangerous to human health. We test for the presenceof E. coli as an indicator of fecal contamination, which may include many dangerous bacteria, viruses, protozoa, and other microbes.
The U.S. EPA has determined that E. coli bacteria counts above 235 colonies per 100 mL indicate that more than 8people out of 1,000 who come into contact with the water may become sick. But it is important to remember thatas E. coli counts go up, it is the chance that someone will get sick that goes up - there are many other things thatdetermine if a person will become sick:• How long someone is in contact with the water• If water comes into contact with a person’s eyes or mouth• lf the person has skin abrasions or wounds• The age and health of the person, as that can determine a person’s susceptibility to illness.
(Source: USGS Chattahoochee BacteriALERT website - http://ga2.er.usgs.gov/bacteria)
Hoosier Riverwatch participated in a six-state research project from 2004-2006 in conjunction with PurdueExtension to determine the most accurate and usable method for detecting E. coli and coliform bacteria byvolunteers. Details of the study may be found at www.usawaterquality.org/volunteer/ecoli/.
ProblemHigh levels of E. coli indicate fecal contamination and the potential presence of pathogens that could cause human illness.Causes
• Human waste from poorly functioning septic systems, wastewater treatment systems, or combined sewer overflows.
• Pet waste, wildlife (including waterfowl).• Livestock or manure runoff from fields.
62 www.idem.IN.gov /riverwatch
E. coli Testing Instructions – Coliscan Easygel
The following instructions are adapted from those provided by Micrology Laboratories, Inc. for use with theColiscan Easygel method. For details on use and interpretation of results, please refer to the manufacturer’sinstructions. Be sure to request a copy of the color ID photo examples when ordering! Contact them (toll-free) at 1-888-EASYGEL or www.micrologylabs.com.
Coliscan media incorporates a patented combination of color-producing chemicals and nutrients that make E. colicolonies appear blue, coliform bacteria that are not E. coli as a pink magenta and non coliforms as white or tealgreen colonies.Checklist
Ͱ Pre-treated petri dish from Micrology Labs Ͱ Sterile pipettes, Whirl-pac bag or other sterile collection container Ͱ Bottle(s) of Coliscan Easygel (thawed) Ͱ Permanent marker (e.g. Sharpie) Ͱ Tape, rubber gloves, ice and cooler (if needed) Ͱ Bleach and water-tight bag for disposal Ͱ Incubator
Do not rinse these materials before or after use! They are specially pre-treated orsterilized for use. Be sure to follow the instructions provided!
1. Preparation - Thaw Coliscan®Easygel® at room temperature by removing from freezer before sampling. Labelthe bottom of Petri dishes using a permanent marker. This label should include site ID, date and time of samplecollection, volume of water collected, and sample number. Before plating, you may also secure the top andbottom of the petri dish with one piece of tape to make a “hinge.”
The amount of sample used will vary according to the suspected conditions of the water you are testing. ForEasygel methods, .25 mL is the minimum and 5.0 mL is the maximum amount of sample you can use. If yoususpect a high bacteria count after a recent rainfall event, transfer only 0.5-1.0 mL of sample. Typically, 3-5 mL isappropriate. Your goal is to have < 200 colonies in the petri dish.
2. Collection - Wearing gloves and using only sterile collection equipment, obtain a sample slightly below thewater’s surface in one of two ways:
a) Take a measured sample directly from the source using a sterile pipette and immediately place it intothe bottle of Coliscan Easygel, orb) Collect your sample in a sterile container (e.g. Whirl-pak Bag) and transport the water to anappropriate test site.
3. Plating - Transfer a measured volume of sample water into the bottle of Coliscan Easygel. Gently swirl andinvert the bottle to distribute the Easygel and then pour the mixture into the bottom half of a Micrology Labspre-treated petri dish. (If you hold the petri dish up to a light, you can see the gelling agent.) Being careful not to splash over the side or onto the lid, gently swirl the dish until the mixture is evenly distributedacross the bottom.
63
While its contents are still in liquid form, place the dish right-side-up directly onto a level location out of directsunlight. Solidification will occur in approximately 45 minutes.
4. Incubation - Turn the petri dish upside down (to reduce condensation) and incubate at 35° C(95° F) for 24-hours.
5. Counting/Analysis - After the appropriate incubation period, inspect the dish. Count all of the purple/blueviolet colonies in the dish and record the results in terms of E. coli per 100 mL of water. You may also countall of the pink and magenta colonies and record these as coliforms. Do not count pin-point colonies < 1mm insize, and disregard any light blue, teal, or white colonies, as these indicate other types of bacteria.
To report the total number of E. coli and coliform bacteria colony forming units (CFU) per 100mL, first divide 100by the number of mL you used in your sample, then multiply that figure by the # of colonies you counted in yourpetri dish.
6. Disposal - To prepare your sample bottle and petri dish for disposal in normal trash, place 5 mL (about 1teaspoon) of bleach onto the surface of the plate. Allow to sit for at least 5 minutes. Place in a watertight plasticbag and discard in trash.
Expiration - Coliscan Easygel bottles (not petri dishes) need to be stored in a freezer. Coliscan Easygel medium is
good for 1 year, and can be refrozen if thawed.
Plating offsite is recommended. Water samples and Easygel bottles containing samples kept longer than 10 minutes prior to plating should be kept on ice in a cooler or in a refrigerator until plating. Samples must be plated within 24 hours.
Example: You used 3 ml of stream water and you counted 4 purple colonies in your dish. First divide 100 by 3 = 33.3 then multiply 33.3 x 4 = 133.2 colonies / 100mL
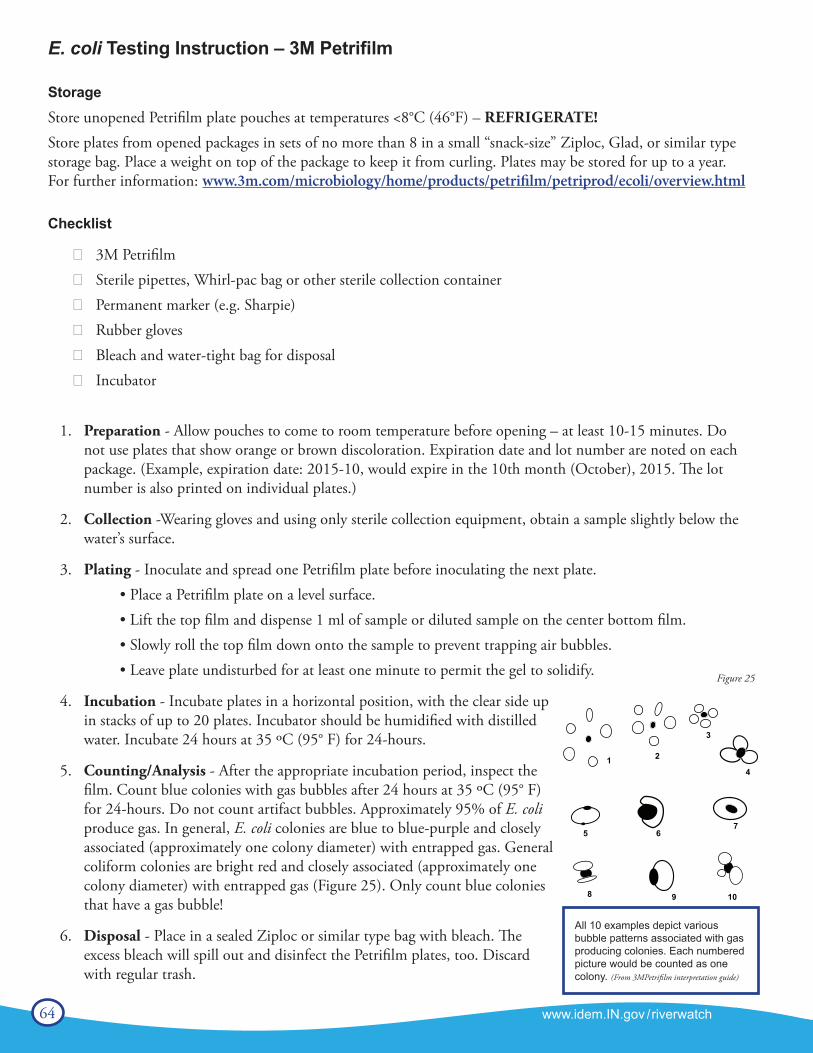
64 www.idem.IN.gov /riverwatch
E. coli Testing Instruction – 3M Petrifilm
StorageStore unopened Petrifilm plate pouches at temperatures <8°C (46°F) – REFRIGERATE!
Store plates from opened packages in sets of no more than 8 in a small “snack-size” Ziploc, Glad, or similar typestorage bag. Place a weight on top of the package to keep it from curling. Plates may be stored for up to a year.For further information: www.3m.com/microbiology/home/products/petrifilm/petriprod/ecoli/overview.html
Checklist
Ͱ 3M Petrifilm Ͱ Sterile pipettes, Whirl-pac bag or other sterile collection container Ͱ Permanent marker (e.g. Sharpie) Ͱ Rubber gloves Ͱ Bleach and water-tight bag for disposal Ͱ Incubator
1. Preparation - Allow pouches to come to room temperature before opening – at least 10-15 minutes. Do not use plates that show orange or brown discoloration. Expiration date and lot number are noted on each package. (Example, expiration date: 2015-10, would expire in the 10th month (October), 2015. The lot number is also printed on individual plates.)
2. Collection -Wearing gloves and using only sterile collection equipment, obtain a sample slightly below the water’s surface.
3. Plating - Inoculate and spread one Petrifilm plate before inoculating the next plate.• Place a Petrifilm plate on a level surface.• Lift the top film and dispense 1 ml of sample or diluted sample on the center bottom film.• Slowly roll the top film down onto the sample to prevent trapping air bubbles.• Leave plate undisturbed for at least one minute to permit the gel to solidify.
4. Incubation - Incubate plates in a horizontal position, with the clear side up in stacks of up to 20 plates. Incubator should be humidified with distilled water. Incubate 24 hours at 35 ºC (95° F) for 24-hours.
5. Counting/Analysis - After the appropriate incubation period, inspect the film. Count blue colonies with gas bubbles after 24 hours at 35 ºC (95° F) for 24-hours. Do not count artifact bubbles. Approximately 95% of E. coli produce gas. In general, E. coli colonies are blue to blue-purple and closely associated (approximately one colony diameter) with entrapped gas. General coliform colonies are bright red and closely associated (approximately one colony diameter) with entrapped gas (Figure 25). Only count blue colonies that have a gas bubble!
6. Disposal - Place in a sealed Ziploc or similar type bag with bleach. The excess bleach will spill out and disinfect the Petrifilm plates, too. Discard with regular trash.
All 10 examples depict various bubble patterns associated with gas producing colonies. Each numbered picture would be counted as one colony. (From 3MPetrifilm interpretation guide)
1 2
57
6
98 10
3
4
Figure 25
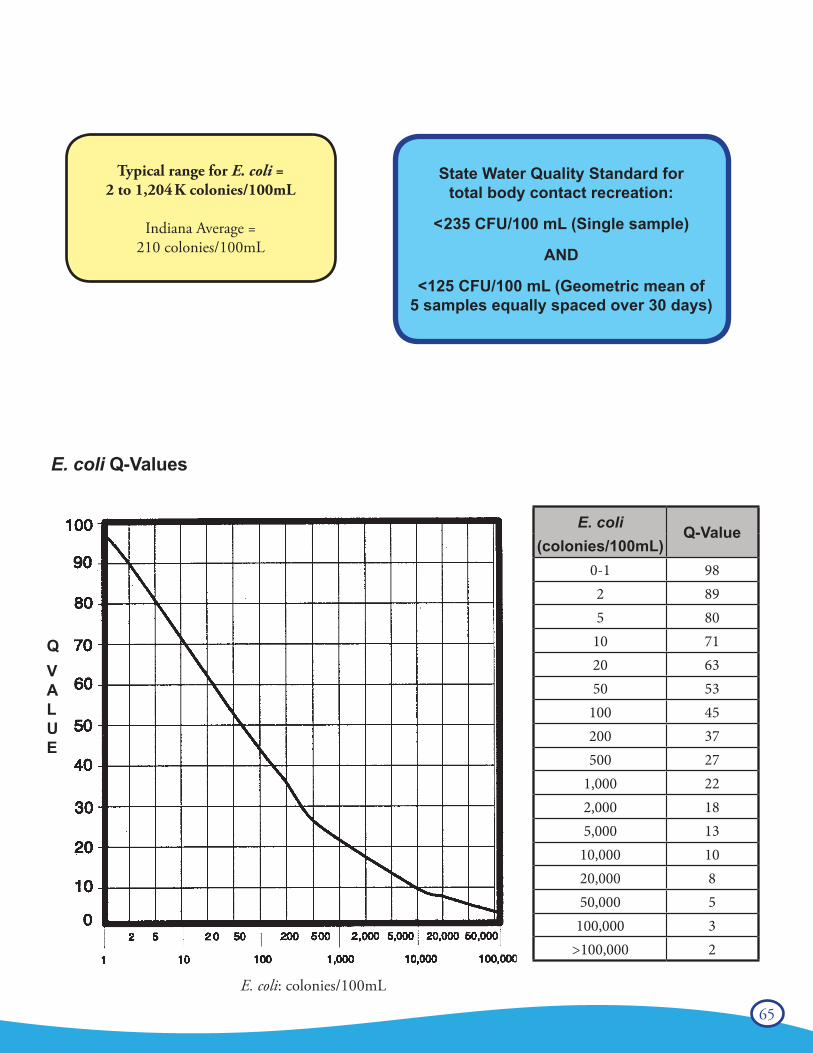
65
E. coli Q-Values
State Water Quality Standard fortotal body contact recreation:
<235 CFU/100 mL (Single sample)
AND
<125 CFU/100 mL (Geometric mean of5 samples equally spaced over 30 days)
Typical range for E. coli =2 to 1,204 K colonies/100mL
Indiana Average = 210 colonies/100mL
E. coli Q-Value(colonies/100mL)
0-1 982 895 80
10 7120 6350 53
100 45200 37500 27
1,000 222,000 185,000 13
10,000 1020,000 850,000 5
100,000 3>100,000 2
QVALUE
E. coli: colonies/100mL
66 www.idem.IN.gov /riverwatch
Chapter 5 - Benthic Macroinvertebrates
Benthic macroinvertebrates are animals that are big enough (macro) to be seen with the naked eye. They lackbackbones (invertebrate) and live at least part of their lives in or on the bottom (benthos) of a body of water.
Macroinvertebrates include aquatic insects (such as mayflies, stoneflies, caddisflies, midges, beetles), snails, worms, freshwater clams, mussels, and crayfish. Some benthic macroinvertebrates, such as midges, are small and grow no larger than 1/2 inch in length. Others, like the three ridge mussel, can be more than ten inches long.
What is the ecological importance of benthic macroinvertebrates? Benthos are an important part of the food chain, especially for fish. Many feed on algae and bacteria which are on the lower end of the food chain. Some shred and eat leaves and other organic matter that enters the water. Because of their abundance and position as “middleman” in the aquatic food chain, benthos play a critical role in the balance and natural flow of energy and nutrients. As benthos die, they decay, leaving behind nutrients that are reused by aquatic plants and other animals in the food chain. (Source: Maryland Department of Natural Resources)
Why Do We Monitor Them?Biological monitoring focuses on the aquatic organisms that live in streams and rivers. Scientists observechanges that occur in the number of types of organisms present in a stream system to determine the richnessof the biological community. They also observe the total number of organisms in an area, or the density of thecommunity. If community richness and community density change over time, it may indicate the effects ofhuman activity on the stream.
Biological stream monitoring is based on the fact that different species react to pollution in different ways.Pollution-sensitive organisms such as mayflies, stoneflies, and caddisflies are more susceptible to the effects of physical or chemical changes in a stream than other organisms. These organisms act as indicators of the absence of pollutants. Pollution-tolerant organisms such as midges and worms are less susceptible to changes in physical and chemical parameters in a stream. The presence or absence of such indicator organisms is an indirect measure of pollution. When a stream becomes polluted, pollution-sensitive organisms decrease in number or disappear; pollution-tolerant organisms increase in variety and number.
In addition to being sensitive to changes in the stream’s overall ecological integrity, benthic macroinvertebratesoffer other advantages to scientists looking for indications of stream pollution.• Benthic macroinvertebrates are relatively easy to sample. They are abundant and can be easily collected and
identified by trained volunteers.• They are relatively immobile. Fish can escape toxic spills or degraded habitats by swimming away. Migratory
animals may spend only a small portion of their life cycles in a particular stream before moving to larger rivers, wetlands, or other streams. However, most macroinvertebrates spend a large part of their life cycle in the same part of a stream, clinging to objects so they are not swept away with the water’s current.
• Benthic macroinvertebrates are continuous indicators of environmental quality. The composition of a macroinvertebrate community in a stream reflects that stream’s physical and chemical conditions over time. Monitoring for certain water quality parameters (such as the amount of dissolved oxygen ) only describes the condition of the water at the moment in time the samples were taken.
• Benthic macroinvertebrates are a critical part of the aquatic food web (Figure 26). They form a vital link in the food chain connecting aquatic plants, algae, and leaf litter to the fish species in streams. The condition of the benthic macroinvertebrate community reflects the stability and diversity of the larger aquatic food web.
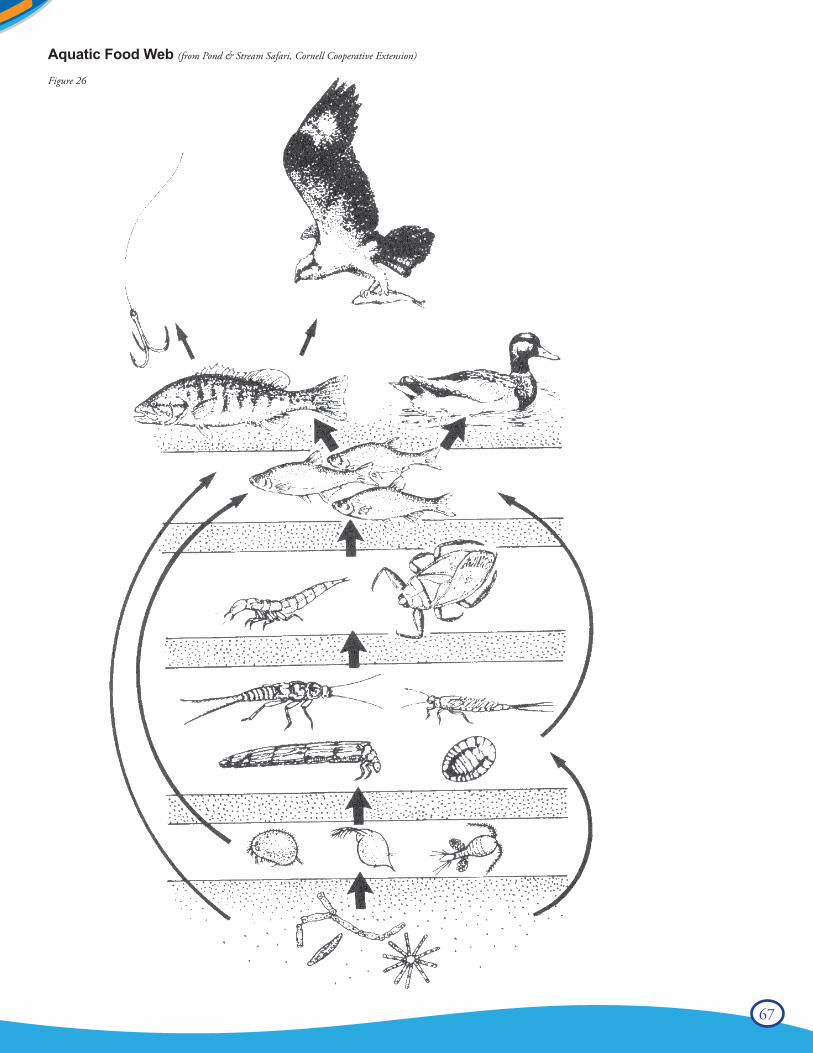
67
Aquatic Food Web (from Pond & Stream Safari, Cornell Cooperative Extension)
Figure 26
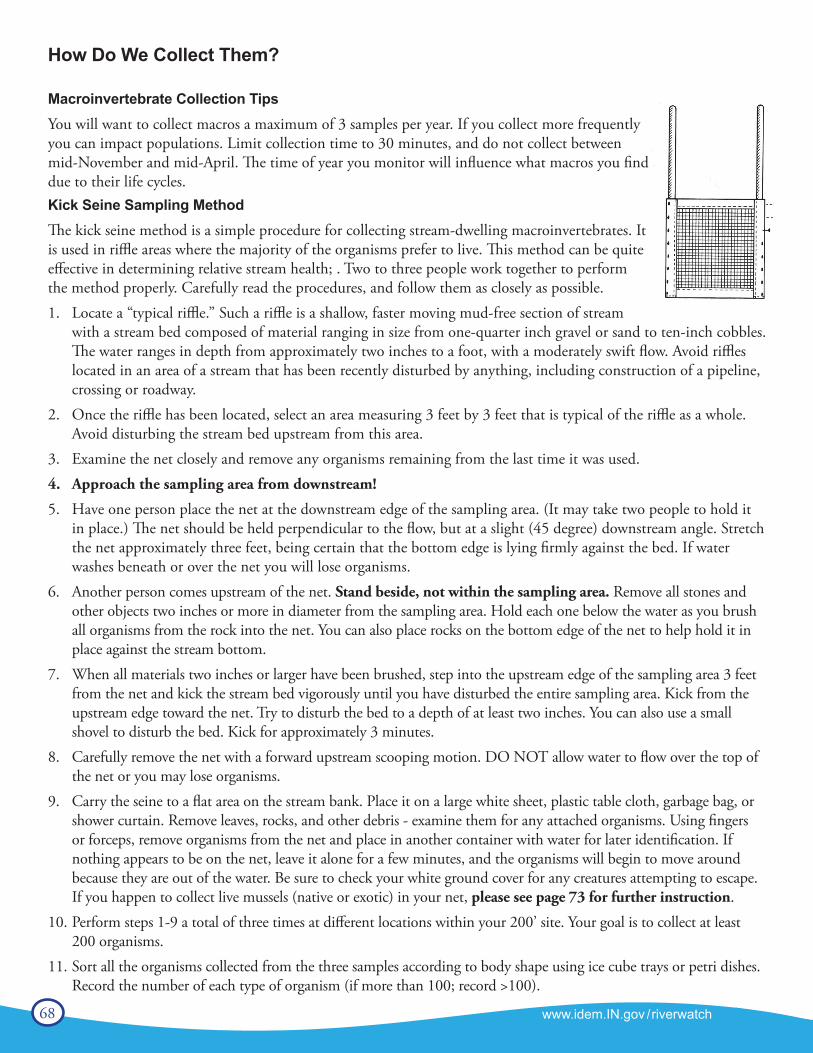
68 www.idem.IN.gov /riverwatch
How Do We Collect Them?
Macroinvertebrate Collection TipsYou will want to collect macros a maximum of 3 samples per year. If you collect more frequently you can impact populations. Limit collection time to 30 minutes, and do not collect between mid-November and mid-April. The time of year you monitor will influence what macros you find due to their life cycles.Kick Seine Sampling MethodThe kick seine method is a simple procedure for collecting stream-dwelling macroinvertebrates. It is used in riffle areas where the majority of the organisms prefer to live. This method can be quite effective in determining relative stream health; . Two to three people work together to performthe method properly. Carefully read the procedures, and follow them as closely as possible.1. Locate a “typical riffle.” Such a riffle is a shallow, faster moving mud-free section of stream
with a stream bed composed of material ranging in size from one-quarter inch gravel or sand to ten-inch cobbles. The water ranges in depth from approximately two inches to a foot, with a moderately swift flow. Avoid riffles located in an area of a stream that has been recently disturbed by anything, including construction of a pipeline, crossing or roadway.
2. Once the riffle has been located, select an area measuring 3 feet by 3 feet that is typical of the riffle as a whole. Avoid disturbing the stream bed upstream from this area.
3. Examine the net closely and remove any organisms remaining from the last time it was used.4. Approach the sampling area from downstream!
5. Have one person place the net at the downstream edge of the sampling area. (It may take two people to hold it in place.) The net should be held perpendicular to the flow, but at a slight (45 degree) downstream angle. Stretch the net approximately three feet, being certain that the bottom edge is lying firmly against the bed. If water washes beneath or over the net you will lose organisms.
6. Another person comes upstream of the net. Stand beside, not within the sampling area. Remove all stones and other objects two inches or more in diameter from the sampling area. Hold each one below the water as you brush all organisms from the rock into the net. You can also place rocks on the bottom edge of the net to help hold it in place against the stream bottom.
7. When all materials two inches or larger have been brushed, step into the upstream edge of the sampling area 3 feet from the net and kick the stream bed vigorously until you have disturbed the entire sampling area. Kick from the upstream edge toward the net. Try to disturb the bed to a depth of at least two inches. You can also use a small shovel to disturb the bed. Kick for approximately 3 minutes.
8. Carefully remove the net with a forward upstream scooping motion. DO NOT allow water to flow over the top of the net or you may lose organisms.
9. Carry the seine to a flat area on the stream bank. Place it on a large white sheet, plastic table cloth, garbage bag, or shower curtain. Remove leaves, rocks, and other debris - examine them for any attached organisms. Using fingers or forceps, remove organisms from the net and place in another container with water for later identification. If nothing appears to be on the net, leave it alone for a few minutes, and the organisms will begin to move around because they are out of the water. Be sure to check your white ground cover for any creatures attempting to escape. If you happen to collect live mussels (native or exotic) in your net, please see page 73 for further instruction.
10. Perform steps 1-9 a total of three times at different locations within your 200’ site. Your goal is to collect at least 200 organisms.
11. Sort all the organisms collected from the three samples according to body shape using ice cube trays or petri dishes. Record the number of each type of organism (if more than 100; record >100).
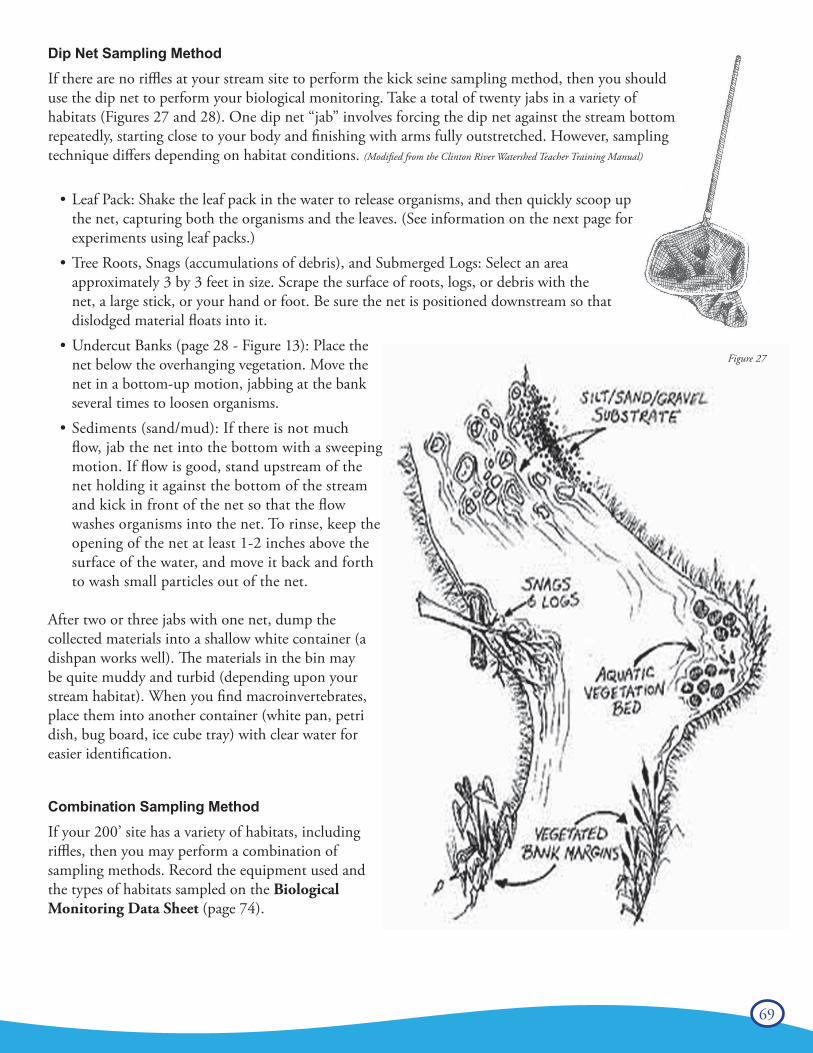
69
Dip Net Sampling MethodIf there are no riffles at your stream site to perform the kick seine sampling method, then you should use the dip net to perform your biological monitoring. Take a total of twenty jabs in a variety of habitats (Figures 27 and 28). One dip net “jab” involves forcing the dip net against the stream bottom repeatedly, starting close to your body and finishing with arms fully outstretched. However, sampling technique differs depending on habitat conditions. (Modified from the Clinton River Watershed Teacher Training Manual)
• Leaf Pack: Shake the leaf pack in the water to release organisms, and then quickly scoop up the net, capturing both the organisms and the leaves. (See information on the next page for experiments using leaf packs.)
• Tree Roots, Snags (accumulations of debris), and Submerged Logs: Select an area approximately 3 by 3 feet in size. Scrape the surface of roots, logs, or debris with the net, a large stick, or your hand or foot. Be sure the net is positioned downstream so that dislodged material floats into it.
• Undercut Banks (page 28 - Figure 13): Place the net below the overhanging vegetation. Move the net in a bottom-up motion, jabbing at the bank several times to loosen organisms.
• Sediments (sand/mud): If there is not much flow, jab the net into the bottom with a sweeping motion. If flow is good, stand upstream of the net holding it against the bottom of the stream and kick in front of the net so that the flow washes organisms into the net. To rinse, keep the opening of the net at least 1-2 inches above the surface of the water, and move it back and forth to wash small particles out of the net.
After two or three jabs with one net, dump the collected materials into a shallow white container (a dishpan works well). The materials in the bin may be quite muddy and turbid (depending upon your stream habitat). When you find macroinvertebrates, place them into another container (white pan, petri dish, bug board, ice cube tray) with clear water for easier identification.
Combination Sampling MethodIf your 200’ site has a variety of habitats, including riffles, then you may perform a combination of sampling methods. Record the equipment used and the types of habitats sampled on the Biological Monitoring Data Sheet (page 74).
Figure 27
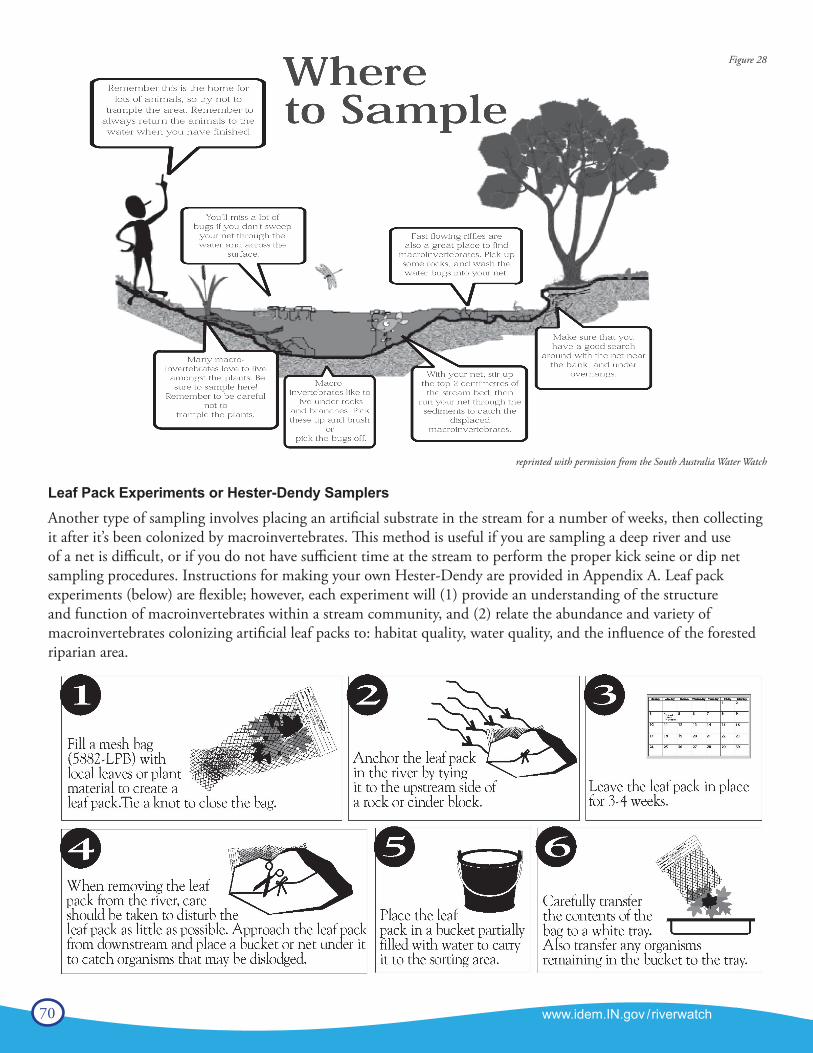
70 www.idem.IN.gov /riverwatch
Leaf Pack Experiments or Hester-Dendy SamplersAnother type of sampling involves placing an artificial substrate in the stream for a number of weeks, then collecting it after it’s been colonized by macroinvertebrates. This method is useful if you are sampling a deep river and use of a net is difficult, or if you do not have sufficient time at the stream to perform the proper kick seine or dip net sampling procedures. Instructions for making your own Hester-Dendy are provided in Appendix A. Leaf pack experiments (below) are flexible; however, each experiment will (1) provide an understanding of the structure and function of macroinvertebrates within a stream community, and (2) relate the abundance and variety of macroinvertebrates colonizing artificial leaf packs to: habitat quality, water quality, and the influence of the forested riparian area.
reprinted with permission from the South Australia Water Watch
Figure 28
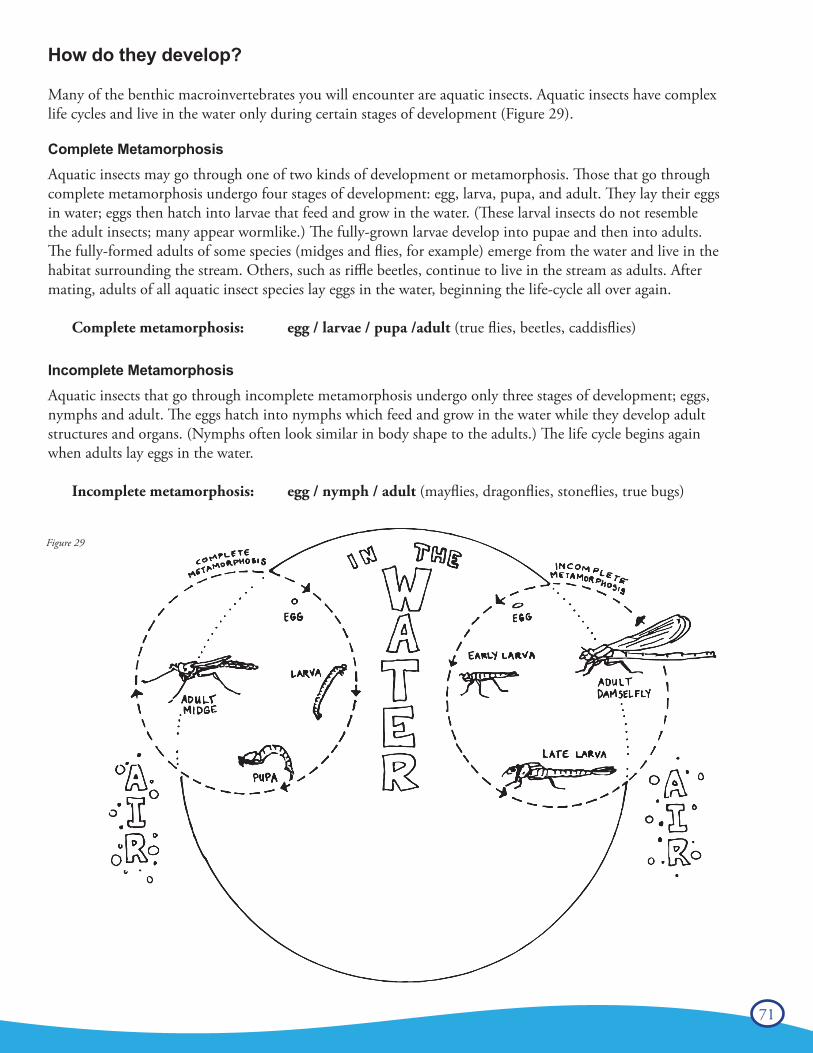
71
How do they develop?
Many of the benthic macroinvertebrates you will encounter are aquatic insects. Aquatic insects have complexlife cycles and live in the water only during certain stages of development (Figure 29).
Complete MetamorphosisAquatic insects may go through one of two kinds of development or metamorphosis. Those that go throughcomplete metamorphosis undergo four stages of development: egg, larva, pupa, and adult. They lay their eggsin water; eggs then hatch into larvae that feed and grow in the water. (These larval insects do not resemblethe adult insects; many appear wormlike.) The fully-grown larvae develop into pupae and then into adults.The fully-formed adults of some species (midges and flies, for example) emerge from the water and live in thehabitat surrounding the stream. Others, such as riffle beetles, continue to live in the stream as adults. Aftermating, adults of all aquatic insect species lay eggs in the water, beginning the life-cycle all over again.
Complete metamorphosis: egg / larvae / pupa /adult (true flies, beetles, caddisflies)
Incomplete MetamorphosisAquatic insects that go through incomplete metamorphosis undergo only three stages of development; eggs,nymphs and adult. The eggs hatch into nymphs which feed and grow in the water while they develop adultstructures and organs. (Nymphs often look similar in body shape to the adults.) The life cycle begins againwhen adults lay eggs in the water.
Incomplete metamorphosis: egg / nymph / adult (mayflies, dragonflies, stoneflies, true bugs)
Figure 29
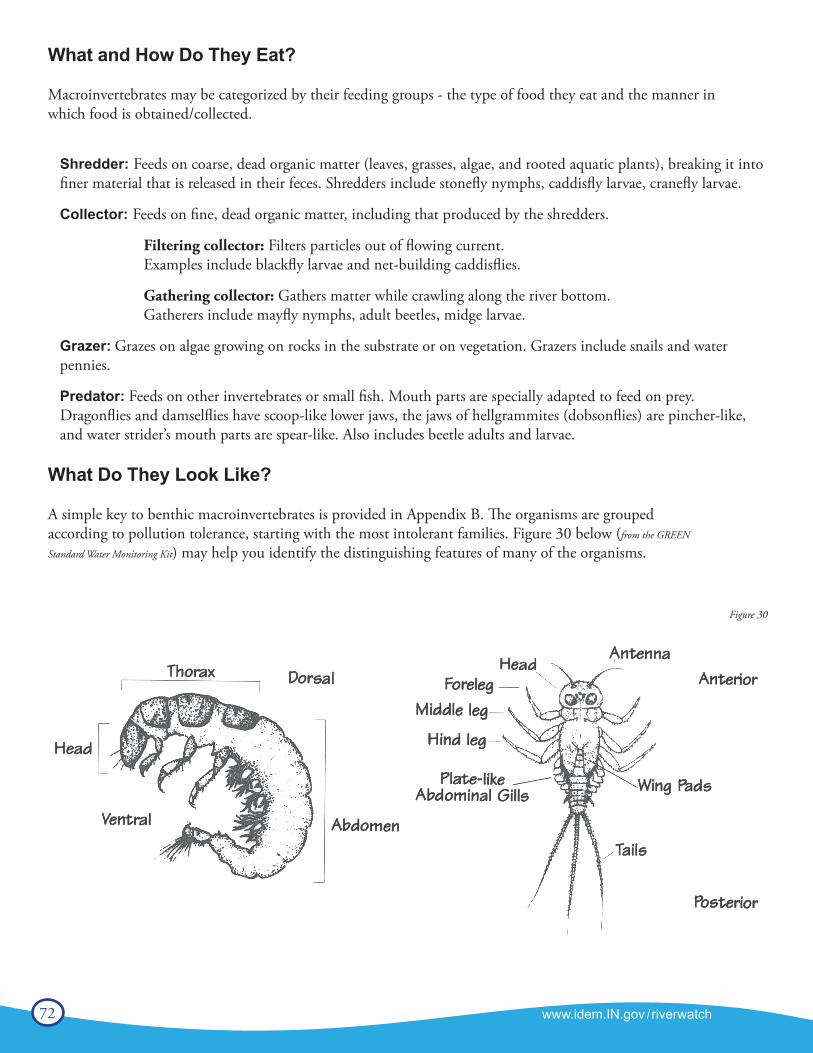
72 www.idem.IN.gov /riverwatch
What and How Do They Eat?
Macroinvertebrates may be categorized by their feeding groups - the type of food they eat and the manner inwhich food is obtained/collected.
Shredder: Feeds on coarse, dead organic matter (leaves, grasses, algae, and rooted aquatic plants), breaking it into finer material that is released in their feces. Shredders include stonefly nymphs, caddisfly larvae, cranefly larvae.
Collector: Feeds on fine, dead organic matter, including that produced by the shredders.
Filtering collector: Filters particles out of flowing current. Examples include blackfly larvae and net-building caddisflies.
Gathering collector: Gathers matter while crawling along the river bottom. Gatherers include mayfly nymphs, adult beetles, midge larvae.
Grazer: Grazes on algae growing on rocks in the substrate or on vegetation. Grazers include snails and water pennies.
Predator: Feeds on other invertebrates or small fish. Mouth parts are specially adapted to feed on prey. Dragonflies and damselflies have scoop-like lower jaws, the jaws of hellgrammites (dobsonflies) are pincher-like, and water strider’s mouth parts are spear-like. Also includes beetle adults and larvae.
What Do They Look Like?
A simple key to benthic macroinvertebrates is provided in Appendix B. The organisms are groupedaccording to pollution tolerance, starting with the most intolerant families. Figure 30 below (from the GREEN
Standard Water Monitoring Kit) may help you identify the distinguishing features of many of the organisms.
Figure 30
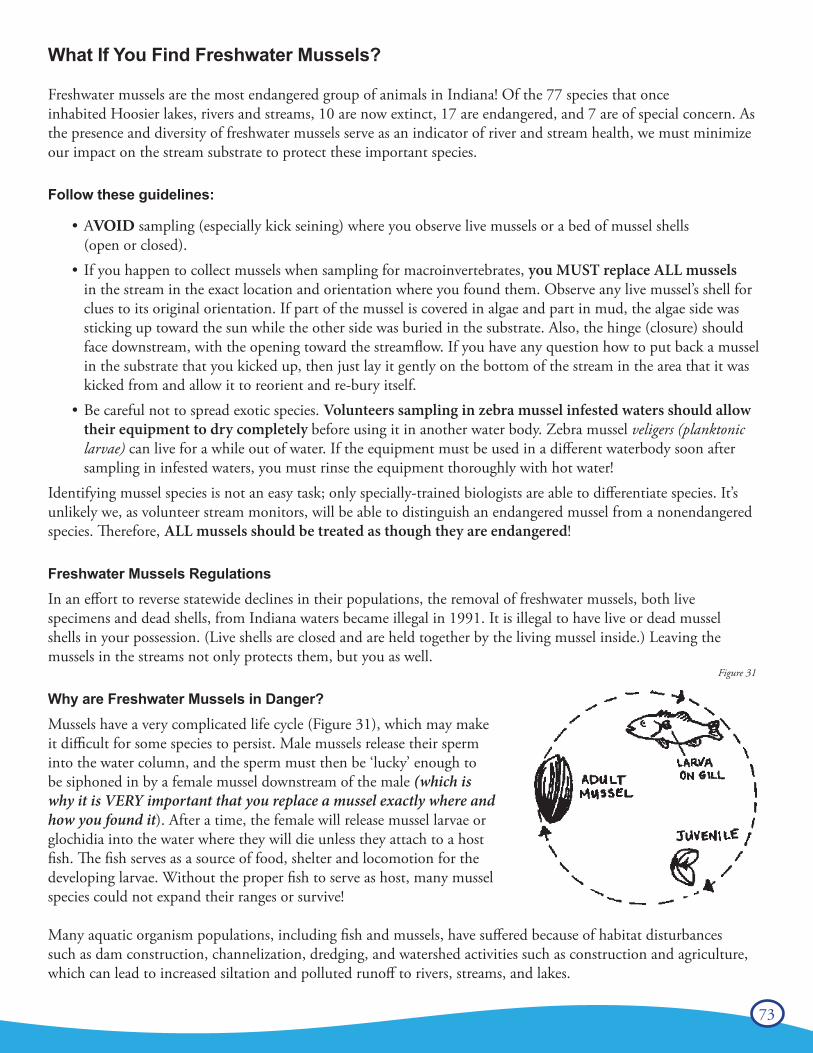
73
What If You Find Freshwater Mussels?
Freshwater mussels are the most endangered group of animals in Indiana! Of the 77 species that onceinhabited Hoosier lakes, rivers and streams, 10 are now extinct, 17 are endangered, and 7 are of special concern. Asthe presence and diversity of freshwater mussels serve as an indicator of river and stream health, we must minimizeour impact on the stream substrate to protect these important species.
Follow these guidelines:
• AVOID sampling (especially kick seining) where you observe live mussels or a bed of mussel shells (open or closed).
• If you happen to collect mussels when sampling for macroinvertebrates, you MUST replace ALL mussels in the stream in the exact location and orientation where you found them. Observe any live mussel’s shell for clues to its original orientation. If part of the mussel is covered in algae and part in mud, the algae side was sticking up toward the sun while the other side was buried in the substrate. Also, the hinge (closure) should face downstream, with the opening toward the streamflow. If you have any question how to put back a mussel in the substrate that you kicked up, then just lay it gently on the bottom of the stream in the area that it was kicked from and allow it to reorient and re-bury itself.
• Be careful not to spread exotic species. Volunteers sampling in zebra mussel infested waters should allow their equipment to dry completely before using it in another water body. Zebra mussel veligers (planktonic larvae) can live for a while out of water. If the equipment must be used in a different waterbody soon after sampling in infested waters, you must rinse the equipment thoroughly with hot water!
Identifying mussel species is not an easy task; only specially-trained biologists are able to differentiate species. It’s unlikely we, as volunteer stream monitors, will be able to distinguish an endangered mussel from a nonendangered species. Therefore, ALL mussels should be treated as though they are endangered!
Freshwater Mussels RegulationsIn an effort to reverse statewide declines in their populations, the removal of freshwater mussels, both livespecimens and dead shells, from Indiana waters became illegal in 1991. It is illegal to have live or dead musselshells in your possession. (Live shells are closed and are held together by the living mussel inside.) Leaving themussels in the streams not only protects them, but you as well.
Why are Freshwater Mussels in Danger?Mussels have a very complicated life cycle (Figure 31), which may make it difficult for some species to persist. Male mussels release their sperm into the water column, and the sperm must then be ‘lucky’ enough to be siphoned in by a female mussel downstream of the male (which is why it is VERY important that you replace a mussel exactly where and how you found it). After a time, the female will release mussel larvae or glochidia into the water where they will die unless they attach to a host fish. The fish serves as a source of food, shelter and locomotion for the developing larvae. Without the proper fish to serve as host, many mussel species could not expand their ranges or survive!
Many aquatic organism populations, including fish and mussels, have suffered because of habitat disturbancessuch as dam construction, channelization, dredging, and watershed activities such as construction and agriculture,which can lead to increased siltation and polluted runoff to rivers, streams, and lakes.
www.idem.IN.gov/riverwatch70
Freshwater mussels are the in Indiana! Of the 77 species that once inhabited Hoosier lakes, rivers and streams, 10 are now extinct, 15 are endangered, and 9 are of special concern. As the presence and diversity of freshwater mussels serve as an indicator of river and stream health, we must minimize our impact on the stream substrate to protect these important species.
sampling (especially kick seining) where you observe live mussels or a bed of mussel shells (open or closed).
mussels in the stream in the exact location and orientation where you found them. Observe any live mussel’s shell for clues to its original orientation. If part of the mussel is covered in algae and part in mud, the algae side was sticking up toward the sun while the other side was buried in the substrate. Also, the hinge (closure) should face downstream, with the opening toward the stream�ow.
infested waters should
can live for a while out of water. If the equipment must be used in a di�erent waterbody soon a�er sampling in infested waters, you must rinse the equipment thoroughly with hot water! Identifying mussel species is not an easy task; only specially-trained biologists are able to di�erentiate species. It’s unlikely we, as volunteer stream monitors, will be able to distinguish an endangered mussel from a non-endangered species. �erefore, mussels should be treated as though they are endangered!
In an e�ort to reverse statewide declines in their populations, the removal of freshwater mussels, both live specimens and dead shells, from Indiana waters became illegal in 1991. It is illegal to have live or dead mussel shells in your possession. (Live shells are closed and are held together by the living mussel inside.) Leaving the mussels in the streams not only protects them, but you as well.
Mussels have a very complicated life cycle (Figure 24), which may make it di�cult for some species to persist. Male mussels release their sperm into the water column, and the sperm must then be ‘lucky’ enough to be siphoned in by a female mussel downstream of the male (which is why it is important that you replace a mussel exactly and you found it). A�er a time, the female will release mussel larvae or glochidia into the water where they will die unless they attach to a host �sh. �e �sh serves as a source of food, shelter and locomotion for the developing larvae. Without the proper �sh to serve as host, many mussel species could not expand their ranges or survive!
Figure 24Figure 31

74 www.idem.IN.gov /riverwatch
Commercial demands for freshwater mussel shells have also contributed to their decline. Mussel shells were usedto make pearl buttons from the late 19th and early 20th centuries until the 1940s when plastic became the buttonmaterial of choice. Current commercial use involves grinding freshwater mussel shells to insert into oysters andstimulate the production of cultured pearls. Poaching remains a threat to mussel populations. If you suspectpoaching of mussels, report it to the Indiana Department of Natural Resources immediately through(800) TIP - IDNR, toll-free.
Other Biological Indicators of Stream HealthIf any of these indicators are present, please check the appropriate box on the bottom of the biological MonitoringData Sheet.• Native Mussels• Zebra Mussels – Invasive species• Rusty Crayfish – Invasive species• Aquatic Plants – Indicators of clear water and stable substrate. They provide habitat and stabilize the stream
bed during high flow conditions. They also produce oxygen and take contaminants out the sediment via root absorption (From IOWATER Program Handbook). However, exotic invasive plant can cause serious damage to an ecosystem.
• % Algae Cover - Excess algae can be caused by too many nutrients in the stream. Too much algae can lead to oxygen depletion. Estimate the amount of the stream bottom (or the rocks) within your 200’ stream section covered with algae - in increments of 25%, 50%, 75%, or 100%.
Biological Monitoring Data Sheet
The biological monitoring data sheet can be taken into the field to record the results of your biological sampling. The sheet includes information about the day, equipment used to collect samples (kick net or dip net), habitats sampled, and organisms collected. The bottom of the sheet includes other biological indicators. Although these do not factor into scoring, they can help you document what is going on in your stream.
The macroinvertebrate index is divided into Pollution Tolerance Groups 1, 2, 3, and 4. These groups represent the different levels of pollution tolerance, the higher the number, the higher the pollution tolerance level. Record the number of macroinvertebrates you find in this space.
A completed data sheet can be found on page 76. After counting and recording numbers of organisms found in the appropriate space, you count the number of taxa present and record that information in the # of Taxa box. Do not make the mistake of adding the numbers of organisms together. You will then multiply the # of Taxa by the appropriate weighting factor and total these to get a Pollution Tolerance Index (PTI) score.
Note: The volunteer stream monitoring database (www.HoosierRiverwatch.com) will perform the calculations for you when you submit data.
Once you have identified the macroinvertebrates in your river or stream samples and noted the number of each tax, the data can be easily applied to more than one index. These include Virginia Save our Streams Multimetric Index and the Macroinvertebrate Diversity Index. You can use these indices for education and further reference about your stream.
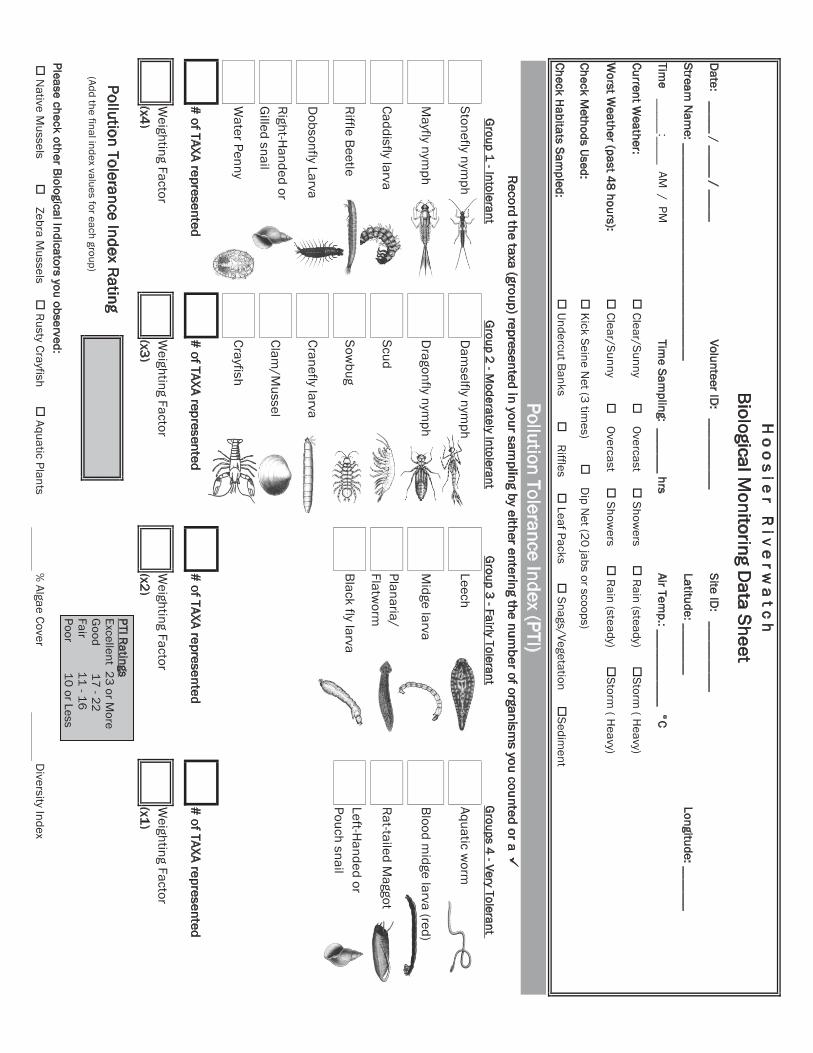
Date: _____ / _____ / _____
Volunteer ID: ___________
Site ID: ___________
S tream N
ame: __________________________________
Latitude: ________Longitude: _______
Time _____:____ AM
/ PMT im
e Sampling: _______ hrs
Air Temp.: ____________ °C
Current Weather:
o Clear/Sunny o
O
vercast o Show
ers o Rain (steady) o
Storm ( H
eavy)
Worst W
eather (past 48 hours): o
Clear/Sunny o
Overcast o
Showers o
Rain (steady) oStorm
( Heavy)
Check Methods Used:
o K
ick Seine Net (3 tim
es) o
Dip N
et (20 jabs or scoops)
Check Habitats Sam
pled:o
Undercut Banks o
Riffles o Leaf Packs o
Snags/Vegetation oSedim
ent
Stonefly nymph
Dam
selfly nymph
LeechAquatic w
orm
Mayfly nym
phD
ragonfly nymph
Midge larva
Blood midge larva (red)
Caddisfly larvaScud
Planaria/Flatw
ormRat-tailed M
aggot
Riffle BeetleSow
bugBlack fly larva
Left-Handed or
Pouch snail
Dobsonfly Larva
Cranefly larva
Right-Handed or
Gilled snail
Clam/M
ussel
Water Penny
Crayfish
# of TAXA represented# of TAXA represented
# of TAXA represented# of TAXA represented
Weighting Factor
(x4)W
eighting Factor (x3)
Weighting Factor
(x2)W
eighting Factor (x1)
(Add the final index values for each group)
Please check other Biological Indicators you observed:%
Algae CoverD
iversity Index
Pollution Tolerance Index Rating
o N
ative Mussels o
Zebra M
ussels o Rusty Crayfish o
Aquatic Plants
Group 1 - Intolerant
Group 2 - M
oderately IntolerantG
roup 3 - Fairly TolerantG
roups 4 - Very Tolerant
Record the taxa (group) represented in your sam
pling by either entering the number of organism
s you counted or a
H o o s i e r R i v e r w
a t c hBiological M
onitoring Data Sheet
Pollution Tolerance Index (PTI)
PTI Ratings
Excellent 23 or More
Good 17 - 22
Fair 11 - 16 Poor 10 or Less
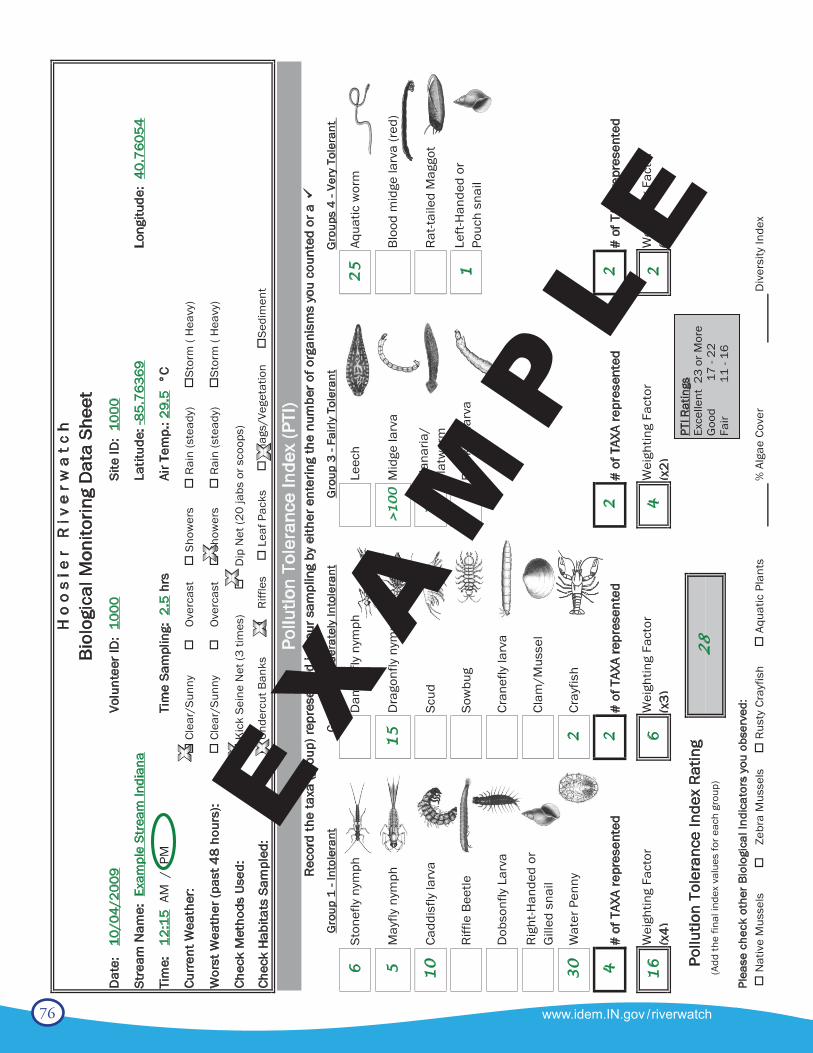
76 www.idem.IN.gov /riverwatch
Dat
e:
10/0
4/20
09Vo
lunt
eer I
D:
1000
Site
ID:
1000
Stre
am N
ame:
Exa
mpl
e St
ream
Indi
ana
Latit
ude:
-85.
7636
9Lo
ngitu
de:
40.7
6054
Tim
e:
12:1
5 A
M /
PM
Tim
e Sa
mpl
ing:
2.5
hrs
Air T
emp.
: 29.
5 °
C
Curr
ent W
eath
er:
o C
lear
/Sun
ny
o
Ove
rcas
t o
Sho
wer
s
o R
ain
(ste
ady)
o
Stor
m (
Hea
vy)
Wor
st W
eath
er (p
ast 4
8 ho
urs)
:
o
Cle
ar/S
unny
o
Ove
rcas
t o
Sho
wer
s
o R
ain
(ste
ady)
o
Stor
m (
Hea
vy)
Chec
k M
etho
ds U
sed:
o K
ick
Sein
e N
et (3
tim
es)
o
Dip
Net
(20
jabs
or s
coop
s)
Chec
k H
abita
ts S
ampl
ed:
o U
nder
cut B
anks
o
Riff
les
o
Lea
f Pac
ks
o
Sna
gs/V
eget
atio
n
oSe
dim
ent
6St
onef
ly n
ymph
Dam
selfl
y ny
mph
Leec
h25
Aqua
tic w
orm
5M
ayfly
nym
ph15
Dra
gonf
ly n
ymph
>100
Mid
ge la
rva
Bloo
d m
idge
larv
a (r
ed)
10
Cadd
isfly
larv
aSc
ud16
Plan
aria
/Fl
atw
orm
Rat
-taile
d M
aggo
t
Riff
le B
eetle
Sow
bug
Blac
k fly
larv
a1
Left
-Han
ded
or
Pouc
h sn
ail
Dob
sonf
ly L
arva
Cran
efly
larv
a
Rig
ht-H
ande
d or
G
illed
sna
ilCl
am/M
usse
l
30
Wat
er P
enny
2Cr
ayfis
h
4#
of T
AXA
repr
esen
ted
2#
of T
AXA
repr
esen
ted
2#
of T
AXA
repr
esen
ted
2#
of T
AXA
repr
esen
ted
16
Wei
ghtin
g Fa
ctor
( x
4)6
Wei
ghtin
g Fa
ctor
( x
3)4
Wei
ghtin
g Fa
ctor
( x
2)2
Wei
ghtin
g Fa
ctor
( x
1)
(
Add
the
final
inde
x va
lues
for e
ach
grou
p)
Plea
se c
heck
oth
er B
iolo
gica
l Ind
icat
ors
you
obse
rved
:%
Alg
ae C
over
Div
ersi
ty In
dex
o N
ativ
e M
usse
ls
o
Zebr
a M
usse
ls
o R
usty
Cra
yfis
h
o A
quat
ic P
lant
s
Gro
up 1
- In
tole
rant
Gro
up 2
- M
oder
atel
y In
tole
rant
Gro
up 3
- Fa
irly
Tole
rant
Gro
ups
4 - V
ery
Tole
rant
Rec
ord
the
taxa
(gro
up) r
epre
sent
ed in
you
r sam
plin
g by
eith
er e
nter
ing
the
num
ber o
f org
anis
ms
you
coun
ted
or a
H o
o s
i e
r R
i v
e r w
a t
c h
Bio
logi
cal M
onito
ring
Dat
a Sh
eet
Pollu
tion
Tole
ranc
e In
dex
(PTI
)
28
Pollu
tion
Tole
ranc
e In
dex
Rat
ing
PTI R
atin
gs
Exce
llent
23
or M
ore
Goo
d
1
7 - 2
2 Fa
ir
11
- 16
EX
AM
PL
E
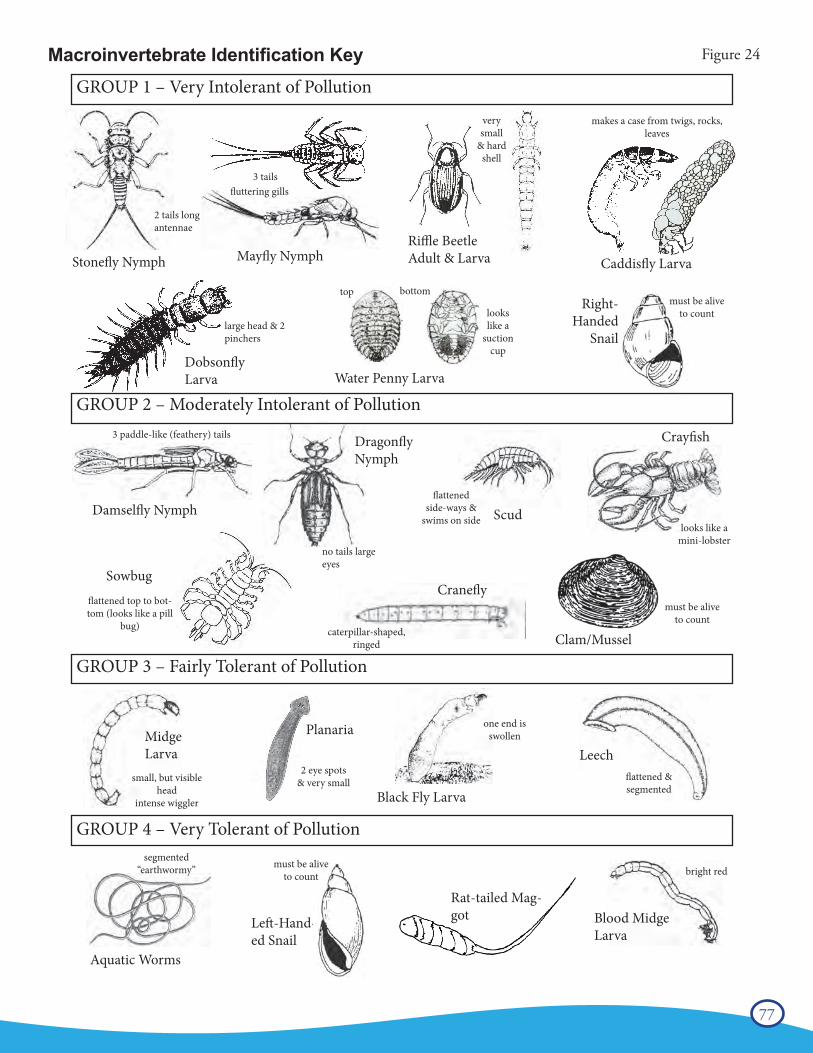
77
Macroinvertebrate Identification Key
www.idem.IN.gov/riverwatch 93
GROUP 4 – Very Tolerant of Pollution
GROUP 3 – Fairly Tolerant of Pollution
GROUP 2 – Moderately Intolerant of Pollution
GROUP 1 – Very Intolerant of Pollution
Stonefly Nymph Mayfly NymphRiffle BeetleAdult & Larva Caddisfly Larva
Dobsonfly Larva Water Penny Larva
Right-Handed
Snail
Damselfly Nymph
Dragonfly Nymph
Scud
SowbugCranefly
Clam/Mussel
Midge Larva
Planaria
Black Fly Larva
Leech
Aquatic Worms
Rat-tailed Mag-got Blood Midge
LarvaLeft-Hand-ed Snail
Macroinvertebrate Identification Key
2 tails long antennae
3 tails
3 paddle-like (feathery) tails
no tails large eyes
flattened top to bot-tom (looks like a pill
bug)
flattened side-ways &
swims on side
caterpillar-shaped, ringed
large head & 2 pinchers
looks like a
suction cup
makes a case from twigs, rocks, leaves
flattened & segmented
one end is swollen
bright red
2 eye spots& very small
top bottom
very small
& hard shell
must be alive to count
must be alive to count
must be alive to count
small, but visible head
intense wiggler
segmented“earthwormy”
Crayfish
looks like a mini-lobster
fluttering gills
Figure 24
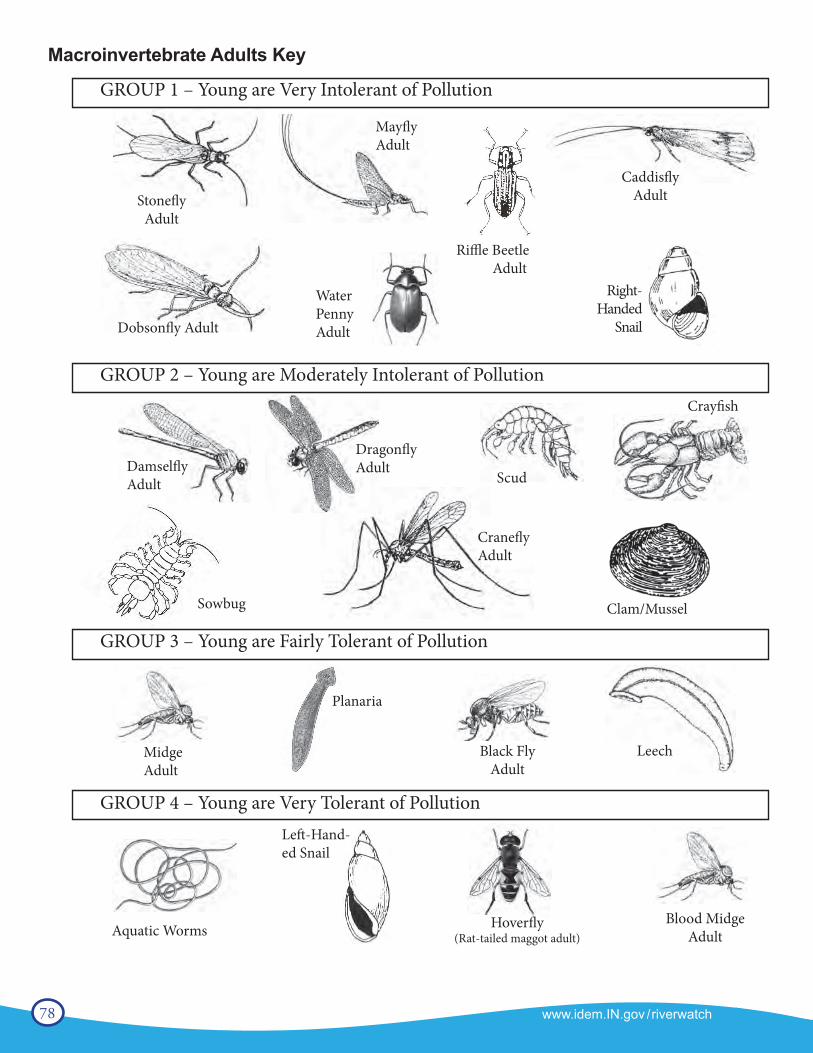
78 www.idem.IN.gov /riverwatch
Macroinvertebrate Adults Key
www.idem.IN.gov/riverwatch94
Macroinvertebrate Adults Key
Midge Adult
Planaria
Black Fly Adult
Leech
Scud
Sowbug
Cranefly Adult
Clam/Mussel
Crayfish
Dragonfly AdultDamselfly
Adult
GROUP 2 – Young are Moderately Intolerant of Pollution
GROUP 3 – Young are Fairly Tolerant of Pollution
Water Penny AdultDobsonfly Adult
Caddisfly Adult
Riffle Beetle Adult
Mayfly Adult
Stonefly Adult
Right-Handed
Snail
GROUP 1 – Young are Very Intolerant of Pollution
Aquatic WormsBlood Midge
Adult
GROUP 4 – Young are Very Tolerant of Pollution
Hoverfly (Rat-tailed maggot adult)
Left-Hand-ed Snail

79
Chapter 6 - Aquatic Invasive Species (AIS)
What are aquatic nuisance species?An “invasive species” is defined as a species that is non-native (or alien) to the ecosystem under consideration andwhose introduction causes or is likely to cause economic or environmental harm or harm to human health (Executive Order 13112; www.invasivespecies.gov/). Invasive species can be plants, animals, and other organisms, such as bacteria and viruses. This plan addresses invasive species that can live in the aquatic habitats of Indiana, such as lakes, rivers and wetlands.
Why should we be concerned?Invasive species problems are both a consequence of and an impact on the economic welfare of our nation (Evans,2003). Most introductions of invasive species can be linked to the intended or unintended consequences of conomic activities, such as trade and shipping (Perrings, et al., 2002). Six types of economic impacts can be dentified: (a) production; (b) price and market effects; (c) trade; (d) food security and nutrition; (e) human health and the environment; and (f ) financial costs impacts (Food and Agricultural Organization, 2001). During the past 200 years or so, more than 50,000 foreign plant and animal species have become established in the United States. About one in seven has become invasive, with damage and control costs estimated at more than $137 billion each year (Pimental et al., 2000).
New invasions of nuisance aquatic species could decimate fisheries and other aquatic resources, requiring funds for prevention, control and mitigation that could have been used for other purposes. Nuisance aquatic plant and animal invaders, such as zebra mussels, bighead carp, purple loosestrife, gizzard shad and sea lamprey, cost Hoosiers millions of dollars each year in control measures and lost natural resource value. For instance, University of Notre Dame researchers determined that it would be cost effective to spend $324,000 per year to prevent zebra mussel infestation of each lake associated with a power plant due to the high costs of managing their negative impacts on water withdrawals (Leung et al., 2002). A recent survey conducted by the Invasive Plant Advisory Committee of the Indiana invasive species council found that land owners and managers in Indiana spent $5.85 million in 2012 to manage invasive plants on their land.
Species of InterestThe following pages list just a few of the species of concern in Indiana. This is by no means a complete list, but these are species that you may have heard of. As Riverwatch volunteers, we ask that you keep your eyes open for anything that looks out of place. In an attempt to aid the public and water resource managers, DNR has posted 40+ aquatic invasive species fact sheets that aid in identification of plants, vertebrates, and fish at: www.IN.gov/dnr/3123.htm.If you think you’ve seen an exotic or invasive species, there are several ways that you can report it. Visit the above website for more information and pictures of invasive species in Indiana and instruction on how to report a sighting.
Exotic Invasive MusselsThe introduction of exotic invasive species such as the Asian clam (Corbicula fluminea), quagga mussel and the very prolific zebra mussel (Dreissena polymorpha) has had detrimental effects on many mussel species. Zebra mussels colonize on native mussels which can hamper their movements and even opening and closing their shells. Zebra mussels filter a large amount of water for such a small mussel (1 liter per day) and due to their large numbers they can take away a large portion of the food that the natives need. If zebra mussels are found, check the box on the Biological Monitoring Data Sheet.
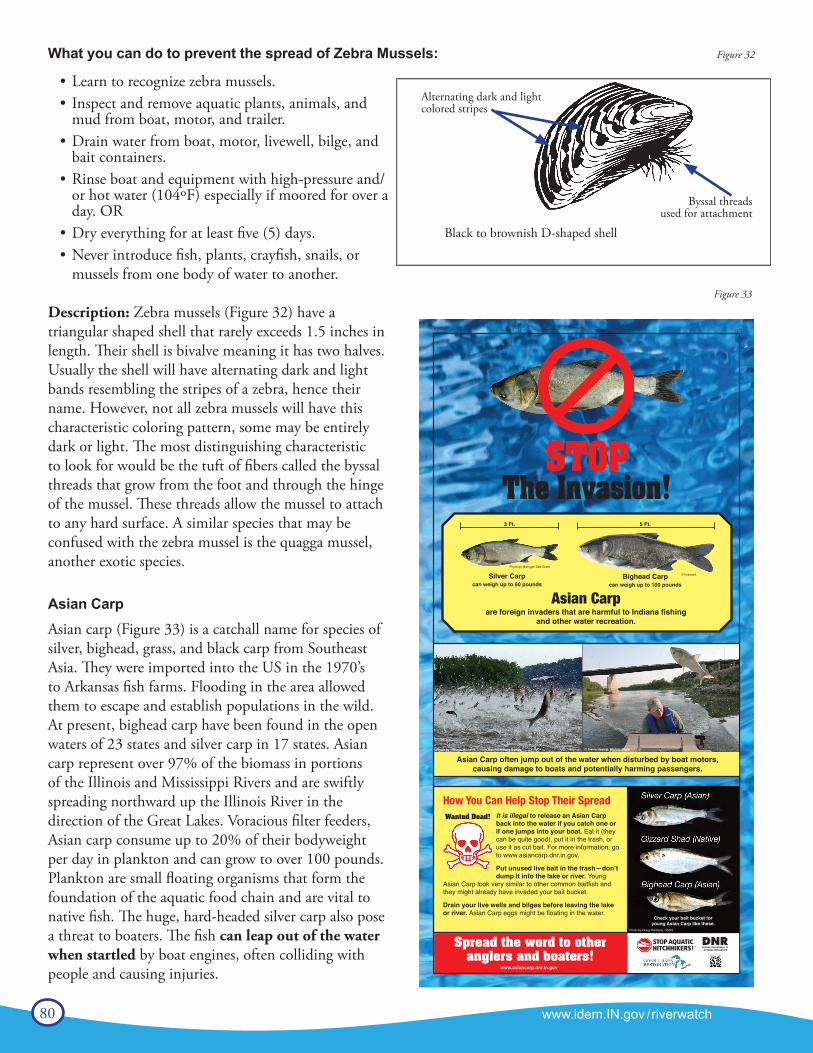
80 www.idem.IN.gov /riverwatch
What you can do to prevent the spread of Zebra Mussels:
• Learn to recognize zebra mussels.• Inspect and remove aquatic plants, animals, and
mud from boat, motor, and trailer.• Drain water from boat, motor, livewell, bilge, and
bait containers.• Rinse boat and equipment with high-pressure and/
or hot water (104ºF) especially if moored for over a day. OR
• Dry everything for at least five (5) days.• Never introduce fish, plants, crayfish, snails, or
mussels from one body of water to another.
Description: Zebra mussels (Figure 32) have a triangular shaped shell that rarely exceeds 1.5 inches in length. Their shell is bivalve meaning it has two halves. Usually the shell will have alternating dark and light bands resembling the stripes of a zebra, hence their name. However, not all zebra mussels will have this characteristic coloring pattern, some may be entirely dark or light. The most distinguishing characteristic to look for would be the tuft of fibers called the byssal threads that grow from the foot and through the hinge of the mussel. These threads allow the mussel to attach to any hard surface. A similar species that may be confused with the zebra mussel is the quagga mussel, another exotic species.
Asian CarpAsian carp (Figure 33) is a catchall name for species of silver, bighead, grass, and black carp from Southeast Asia. They were imported into the US in the 1970’s to Arkansas fish farms. Flooding in the area allowed them to escape and establish populations in the wild. At present, bighead carp have been found in the open waters of 23 states and silver carp in 17 states. Asian carp represent over 97% of the biomass in portions of the Illinois and Mississippi Rivers and are swiftly spreading northward up the Illinois River in the direction of the Great Lakes. Voracious filter feeders, Asian carp consume up to 20% of their bodyweight per day in plankton and can grow to over 100 pounds. Plankton are small floating organisms that form the foundation of the aquatic food chain and are vital to native fish. The huge, hard-headed silver carp also pose a threat to boaters. The fish can leap out of the water when startled by boat engines, often colliding with people and causing injuries.
The Invasion!STOP
How You Can Help Stop Their SpreadIt is illegal to release an Asian Carp back into the water if you catch one or if one jumps into your boat. Eat it (they can be quite good), put it in the trash, or use it as cut bait. For more information, go to www.asiancarp.dnr.in.gov.
Put unused live bait in the trash—don’t dump it into the lake or river. Young
Asian Carp look very similar to other common baitfish and they might already have invaded your bait bucket.
Drain your live wells and bilges before leaving the lake or river. Asian Carp eggs might be floating in the water.
Spread the word to other anglers and boaters!
Wanted Dead!
Asian Carpare foreign invaders that are harmful to Indiana fishing
and other water recreation.
Silver Carpcan weigh up to 60 pounds
Asian Carp often jump out of the water when disturbed by boat motors, causing damage to boats and potentially harming passengers.
Bighead Carpcan weigh up to 100 pounds
3 Ft. 5 Ft.
www.asiancarp.dnr.in.gov
Check your bait bucket foryoung Asian Carp like these.
Photo by Michigan Sea Grant
© Krasowit
Photo by Nerissa Michaels, Illinois Natural History Survey © Travis Heying, Wichita Eagle
Photo by Doug Hardesty, USGS
Figure 33
Figure 32
Alternating dark and light colored stripes
Byssal threads used for attachment
Black to brownish D-shaped shell
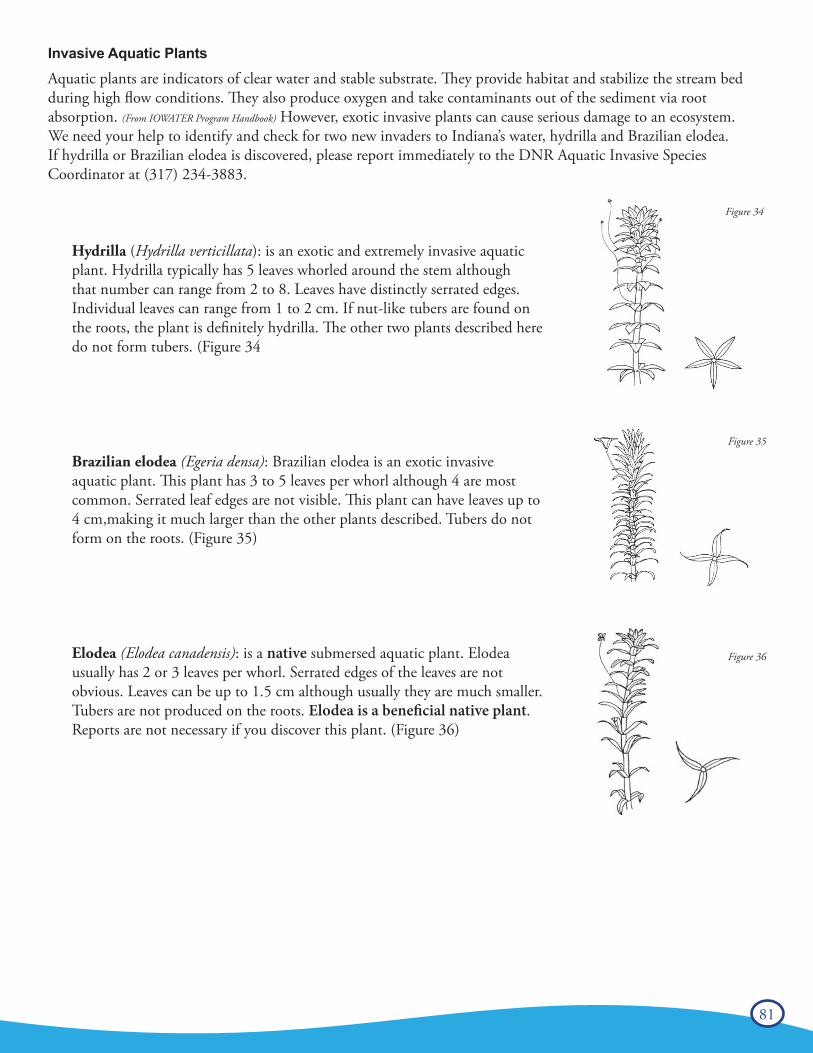
81
Invasive Aquatic PlantsAquatic plants are indicators of clear water and stable substrate. They provide habitat and stabilize the stream bedduring high flow conditions. They also produce oxygen and take contaminants out of the sediment via root absorption. (From IOWATER Program Handbook) However, exotic invasive plants can cause serious damage to an ecosystem. We need your help to identify and check for two new invaders to Indiana’s water, hydrilla and Brazilian elodea. If hydrilla or Brazilian elodea is discovered, please report immediately to the DNR Aquatic Invasive Species Coordinator at (317) 234-3883.
Hydrilla (Hydrilla verticillata): is an exotic and extremely invasive aquatic plant. Hydrilla typically has 5 leaves whorled around the stem although that number can range from 2 to 8. Leaves have distinctly serrated edges. Individual leaves can range from 1 to 2 cm. If nut-like tubers are found on the roots, the plant is definitely hydrilla. The other two plants described here do not form tubers. (Figure 34
Brazilian elodea (Egeria densa): Brazilian elodea is an exotic invasiveaquatic plant. This plant has 3 to 5 leaves per whorl although 4 are most common. Serrated leaf edges are not visible. This plant can have leaves up to 4 cm,making it much larger than the other plants described. Tubers do not form on the roots. (Figure 35)
Elodea (Elodea canadensis): is a native submersed aquatic plant. Elodea usually has 2 or 3 leaves per whorl. Serrated edges of the leaves are not obvious. Leaves can be up to 1.5 cm although usually they are much smaller. Tubers are not produced on the roots. Elodea is a beneficial native plant. Reports are not necessary if you discover this plant. (Figure 36)
Figure 34
Figure 35
Figure 36

82 www.idem.IN.gov /riverwatch
Chapter 7 - Hoosier Riverwatch DatabaseIntroduction
The Hoosier Riverwatch Volunteer Stream Monitoring database went online in fall 2001. Hoosier Riverwatch is interested in your results and we strongly encourage you to share your data by entering it online at www.HoosierRiverwatch.com. This database is yours, giving you a location to store and retrieve your data. Entry in this database also makes your data accessible to the public, other volunteers, agencies, and anyone else interested in Indiana’s water quality.
To enter your stream data, you first need to register yourself, your group, and your stream site through the data-base. Instructions for database registration are provided on the following pages. Only data collected by trained Riverwatch volunteers may be entered in the statewide online database. You will need the database password to register and submit data. The database can be reached through HoosierRiverwatch.com.Due to the limited number of Hoosier Riverwatch program staff, volunteers are encouraged to enter their own datathrough this system. If you don’t have a computer or Internet access at home, going to your local library is anoption; most libraries offer public Internet access. Another option is to partner with a school or local organization(i.e., Soil and Water Conservation District) that may have a computer and Internet access.
Keep Hard Copies of Your Datasheets!Make sure to keep your field data sheets. You may need them several months later if you or we question a result when checking the database. It is possible that a perceived problem may be nothing more than a simple data entry error.
Register New UserCreating a new user in the Hoosier Riverwatch program is simple. (Figure 37) Please be sure to fill out all of the required fields as noted by the * in front of their title. If you would like to be included in the Hoosier Riverwatch Directory, please check the box. This directory will be available online and will include your name and email address so other volunteers may contact you. This directory will only be accessible to Riverwatch volunteers.
If you are collecting data as a member of an organization, please check the button -“Yes, I am collecting for an organization.” If you are not collecting for an organization, you may check -“No, I am not collecting for an organization” (figure 37).
For those users not collecting for an organization, clicking the Continue button will register you into the system and generate a Volunteer ID number. Please record this number or print the page for your records. You will need this Volunteer ID. An email confirmation will also be sent to the email on file.
Users collecting for an organization, will be asked to select your organization from a list of current organizations in our system. Look carefully to see if your organization is already listed. If you find your organization, select from the drop-down menu and hit the Continue button. Clicking that button will register you into the system and generate a
Figure 37
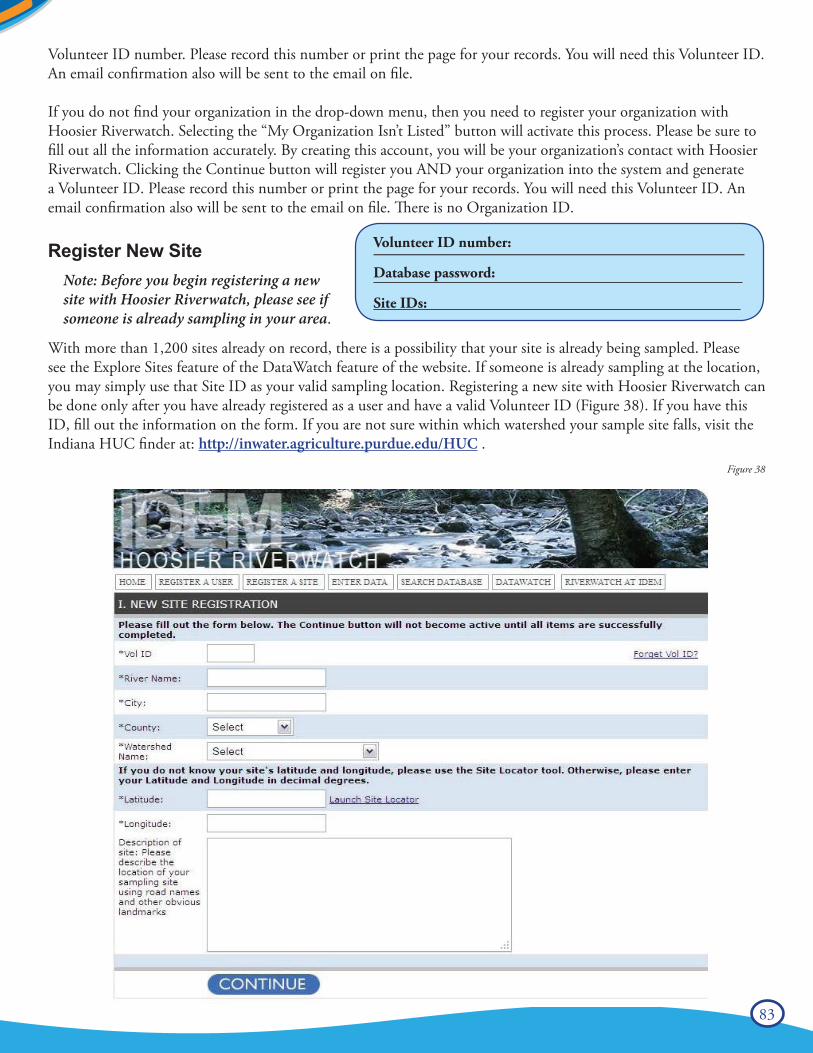
Volunteer ID number:
Database password:
Site IDs:
83
Volunteer ID number. Please record this number or print the page for your records. You will need this Volunteer ID. An email confirmation also will be sent to the email on file.
If you do not find your organization in the drop-down menu, then you need to register your organization with Hoosier Riverwatch. Selecting the “My Organization Isn’t Listed” button will activate this process. Please be sure to fill out all the information accurately. By creating this account, you will be your organization’s contact with Hoosier Riverwatch. Clicking the Continue button will register you AND your organization into the system and generate a Volunteer ID. Please record this number or print the page for your records. You will need this Volunteer ID. An email confirmation also will be sent to the email on file. There is no Organization ID.
Register New Site
With more than 1,200 sites already on record, there is a possibility that your site is already being sampled. Please see the Explore Sites feature of the DataWatch feature of the website. If someone is already sampling at the location, you may simply use that Site ID as your valid sampling location. Registering a new site with Hoosier Riverwatch can be done only after you have already registered as a user and have a valid Volunteer ID (Figure 38). If you have this ID, fill out the information on the form. If you are not sure within which watershed your sample site falls, visit the Indiana HUC finder at: http://inwater.agriculture.purdue.edu/HUC .
Note: Before you begin registering a new site with Hoosier Riverwatch, please see if someone is already sampling in your area.
Figure 38
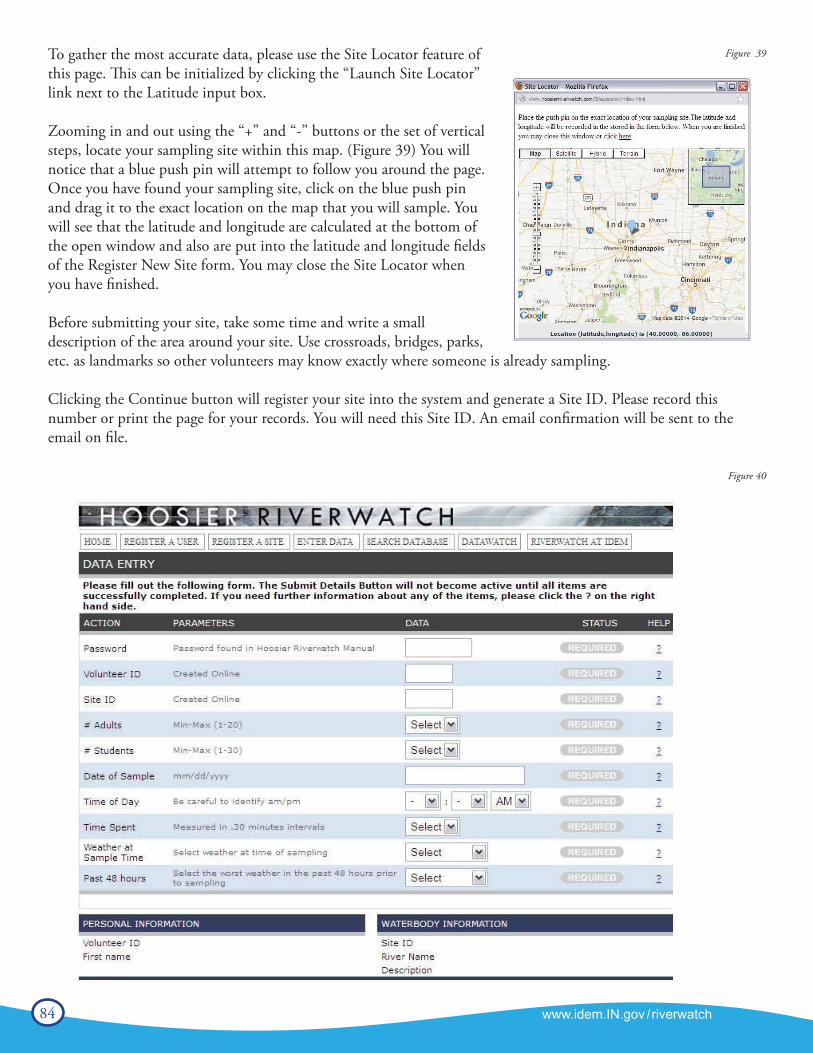
84 www.idem.IN.gov /riverwatch
To gather the most accurate data, please use the Site Locator feature of this page. This can be initialized by clicking the “Launch Site Locator” link next to the Latitude input box.
Zooming in and out using the “+” and “-” buttons or the set of vertical steps, locate your sampling site within this map. (Figure 39) You will notice that a blue push pin will attempt to follow you around the page. Once you have found your sampling site, click on the blue push pin and drag it to the exact location on the map that you will sample. You will see that the latitude and longitude are calculated at the bottom of the open window and also are put into the latitude and longitude fields of the Register New Site form. You may close the Site Locator when you have finished.
Before submitting your site, take some time and write a small description of the area around your site. Use crossroads, bridges, parks, etc. as landmarks so other volunteers may know exactly where someone is already sampling.
Clicking the Continue button will register your site into the system and generate a Site ID. Please record this number or print the page for your records. You will need this Site ID. An email confirmation will be sent to the email on file.
Figure 40
Figure 39
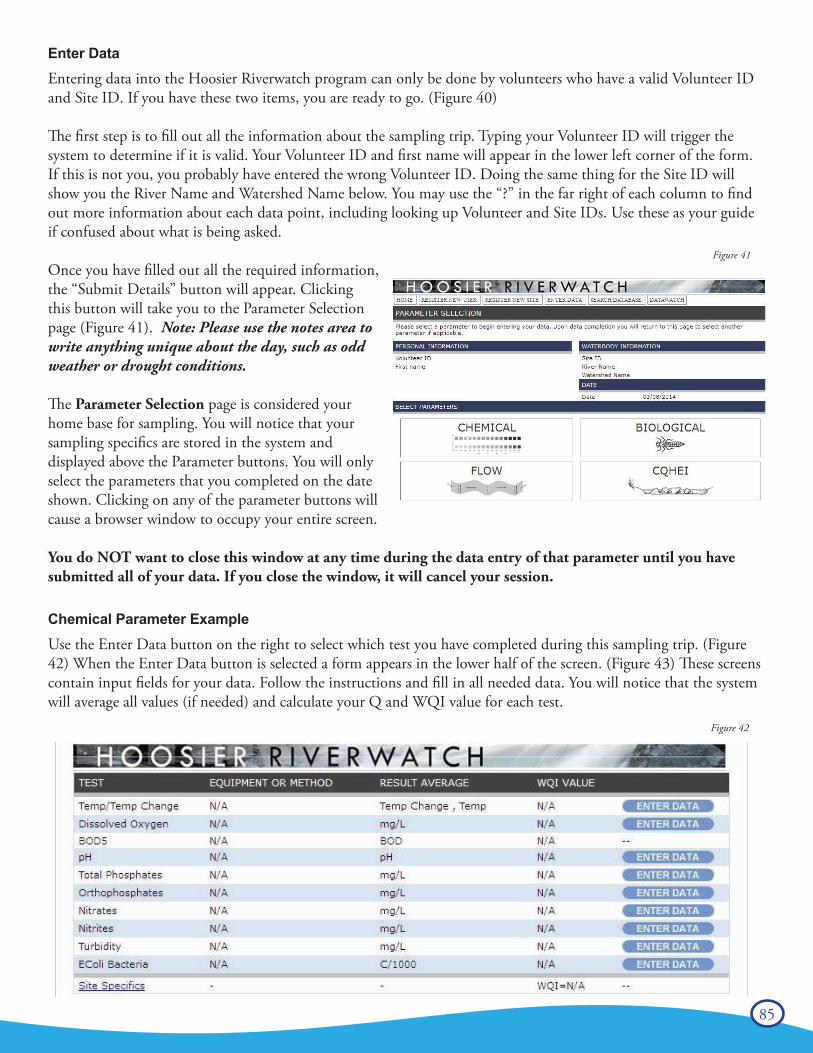
85
Enter DataEntering data into the Hoosier Riverwatch program can only be done by volunteers who have a valid Volunteer IDand Site ID. If you have these two items, you are ready to go. (Figure 40)
The first step is to fill out all the information about the sampling trip. Typing your Volunteer ID will trigger the system to determine if it is valid. Your Volunteer ID and first name will appear in the lower left corner of the form. If this is not you, you probably have entered the wrong Volunteer ID. Doing the same thing for the Site ID will show you the River Name and Watershed Name below. You may use the “?” in the far right of each column to find out more information about each data point, including looking up Volunteer and Site IDs. Use these as your guide if confused about what is being asked.
Once you have filled out all the required information, the “Submit Details” button will appear. Clicking this button will take you to the Parameter Selection page (Figure 41). Note: Please use the notes area to write anything unique about the day, such as odd weather or drought conditions.
The Parameter Selection page is considered your home base for sampling. You will notice that your sampling specifics are stored in the system and displayed above the Parameter buttons. You will only select the parameters that you completed on the date shown. Clicking on any of the parameter buttons will cause a browser window to occupy your entire screen. You do NOT want to close this window at any time during the data entry of that parameter until you have submitted all of your data. If you close the window, it will cancel your session.
Chemical Parameter ExampleUse the Enter Data button on the right to select which test you have completed during this sampling trip. (Figure 42) When the Enter Data button is selected a form appears in the lower half of the screen. (Figure 43) These screens contain input fields for your data. Follow the instructions and fill in all needed data. You will notice that the system will average all values (if needed) and calculate your Q and WQI value for each test.
Figure 41
Figure 42
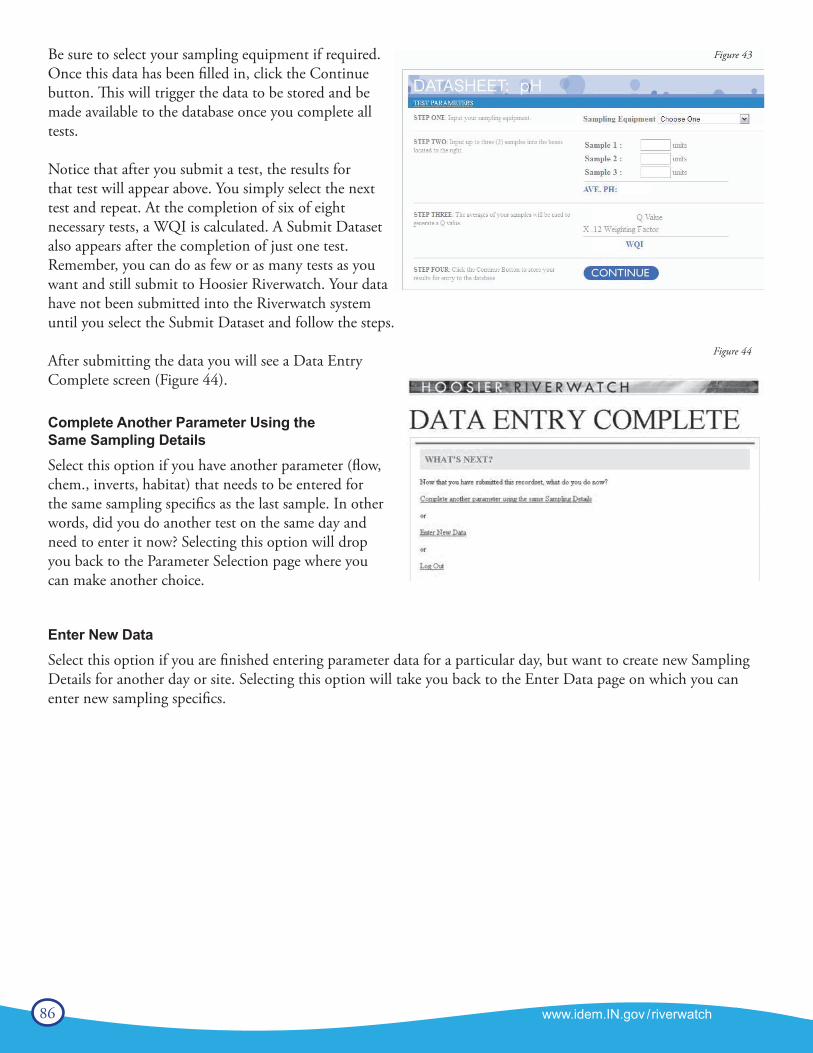
86 www.idem.IN.gov /riverwatch
Be sure to select your sampling equipment if required. Once this data has been filled in, click the Continue button. This will trigger the data to be stored and be made available to the database once you complete all tests.
Notice that after you submit a test, the results for that test will appear above. You simply select the next test and repeat. At the completion of six of eight necessary tests, a WQI is calculated. A Submit Dataset also appears after the completion of just one test. Remember, you can do as few or as many tests as you want and still submit to Hoosier Riverwatch. Your data have not been submitted into the Riverwatch system until you select the Submit Dataset and follow the steps.
After submitting the data you will see a Data Entry Complete screen (Figure 44).
Complete Another Parameter Using the Same Sampling DetailsSelect this option if you have another parameter (flow, chem., inverts, habitat) that needs to be entered for the same sampling specifics as the last sample. In other words, did you do another test on the same day and need to enter it now? Selecting this option will drop you back to the Parameter Selection page where you can make another choice.
Enter New DataSelect this option if you are finished entering parameter data for a particular day, but want to create new SamplingDetails for another day or site. Selecting this option will take you back to the Enter Data page on which you canenter new sampling specifics.
Figure 44
Figure 43
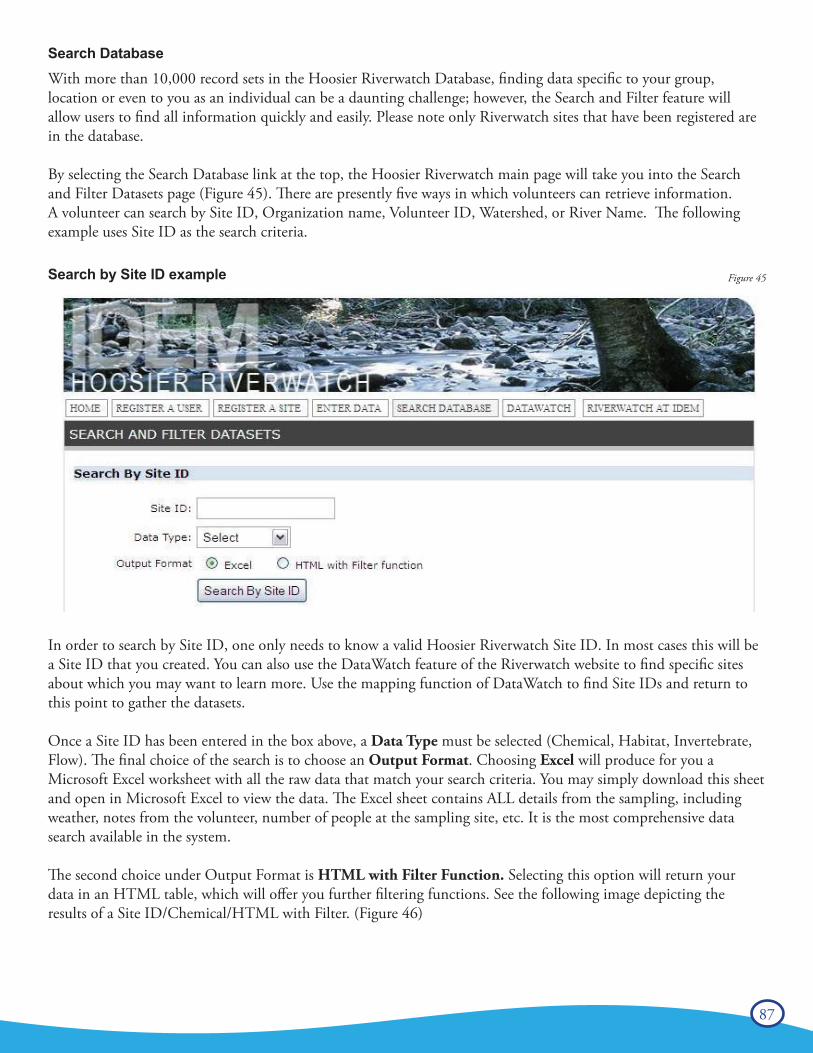
87
Search DatabaseWith more than 10,000 record sets in the Hoosier Riverwatch Database, finding data specific to your group, location or even to you as an individual can be a daunting challenge; however, the Search and Filter feature will allow users to find all information quickly and easily. Please note only Riverwatch sites that have been registered are in the database.
By selecting the Search Database link at the top, the Hoosier Riverwatch main page will take you into the Searchand Filter Datasets page (Figure 45). There are presently five ways in which volunteers can retrieve information. A volunteer can search by Site ID, Organization name, Volunteer ID, Watershed, or River Name. The following example uses Site ID as the search criteria.
Search by Site ID example
In order to search by Site ID, one only needs to know a valid Hoosier Riverwatch Site ID. In most cases this will bea Site ID that you created. You can also use the DataWatch feature of the Riverwatch website to find specific sitesabout which you may want to learn more. Use the mapping function of DataWatch to find Site IDs and return tothis point to gather the datasets.
Once a Site ID has been entered in the box above, a Data Type must be selected (Chemical, Habitat, Invertebrate,Flow). The final choice of the search is to choose an Output Format. Choosing Excel will produce for you a Microsoft Excel worksheet with all the raw data that match your search criteria. You may simply download this sheetand open in Microsoft Excel to view the data. The Excel sheet contains ALL details from the sampling, includingweather, notes from the volunteer, number of people at the sampling site, etc. It is the most comprehensive datasearch available in the system.
The second choice under Output Format is HTML with Filter Function. Selecting this option will return yourdata in an HTML table, which will offer you further filtering functions. See the following image depicting the results of a Site ID/Chemical/HTML with Filter. (Figure 46)
Figure 45
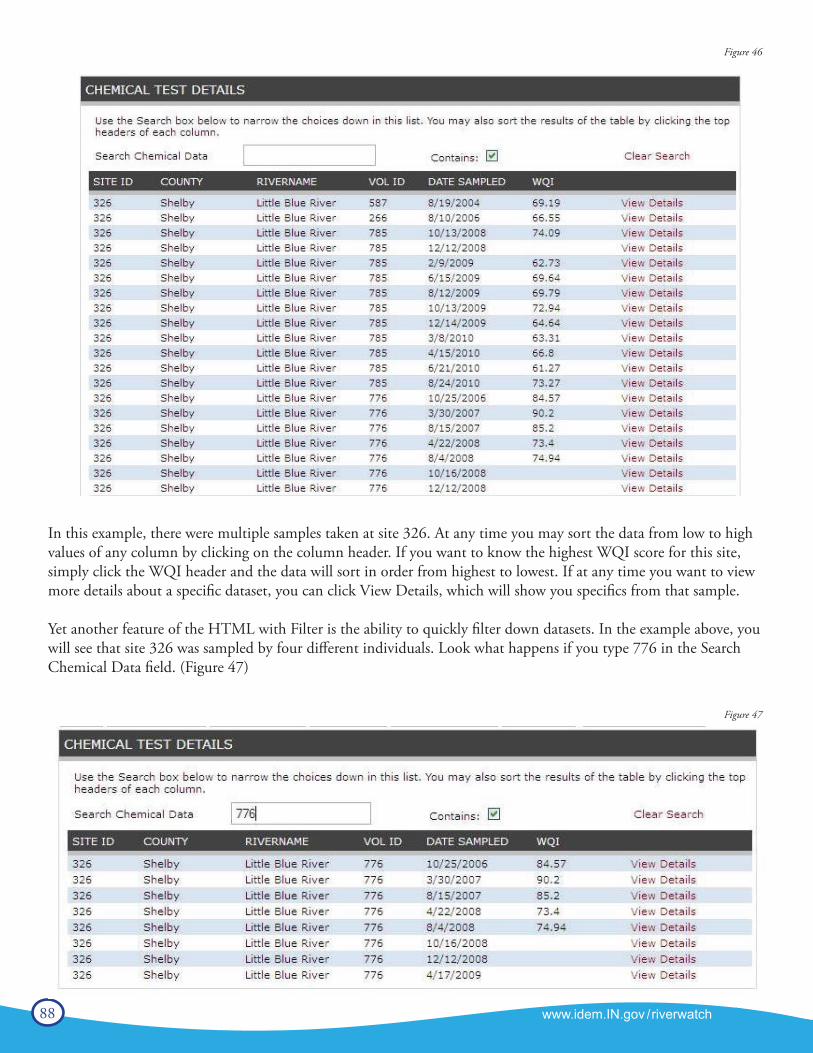
88 www.idem.IN.gov /riverwatch
In this example, there were multiple samples taken at site 326. At any time you may sort the data from low to highvalues of any column by clicking on the column header. If you want to know the highest WQI score for this site,simply click the WQI header and the data will sort in order from highest to lowest. If at any time you want to viewmore details about a specific dataset, you can click View Details, which will show you specifics from that sample.
Yet another feature of the HTML with Filter is the ability to quickly filter down datasets. In the example above, youwill see that site 326 was sampled by four different individuals. Look what happens if you type 776 in the SearchChemical Data field. (Figure 47)
Figure 46
Figure 47
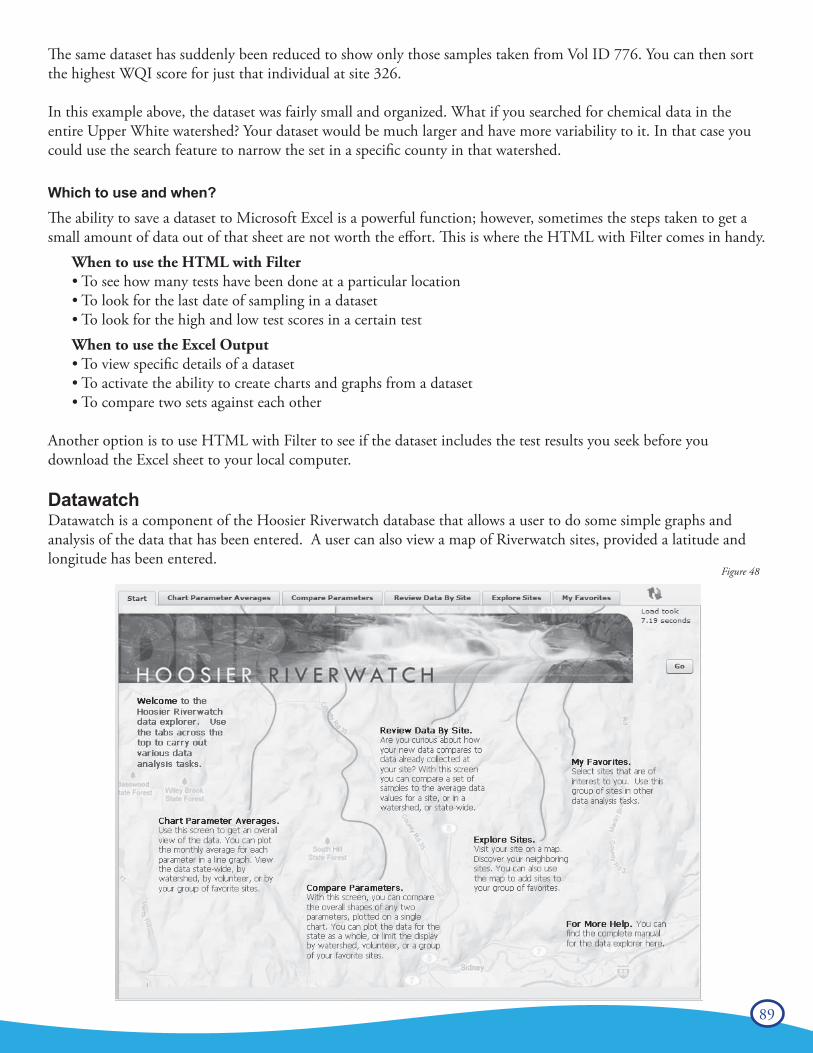
89
The same dataset has suddenly been reduced to show only those samples taken from Vol ID 776. You can then sortthe highest WQI score for just that individual at site 326.
In this example above, the dataset was fairly small and organized. What if you searched for chemical data in theentire Upper White watershed? Your dataset would be much larger and have more variability to it. In that case youcould use the search feature to narrow the set in a specific county in that watershed.
Which to use and when?The ability to save a dataset to Microsoft Excel is a powerful function; however, sometimes the steps taken to get asmall amount of data out of that sheet are not worth the effort. This is where the HTML with Filter comes in handy.
When to use the HTML with Filter• To see how many tests have been done at a particular location• To look for the last date of sampling in a dataset• To look for the high and low test scores in a certain testWhen to use the Excel Output• To view specific details of a dataset• To activate the ability to create charts and graphs from a dataset• To compare two sets against each other
Another option is to use HTML with Filter to see if the dataset includes the test results you seek before you download the Excel sheet to your local computer.
Datawatch Datawatch is a component of the Hoosier Riverwatch database that allows a user to do some simple graphs and analysis of the data that has been entered. A user can also view a map of Riverwatch sites, provided a latitude and longitude has been entered.
Figure 48
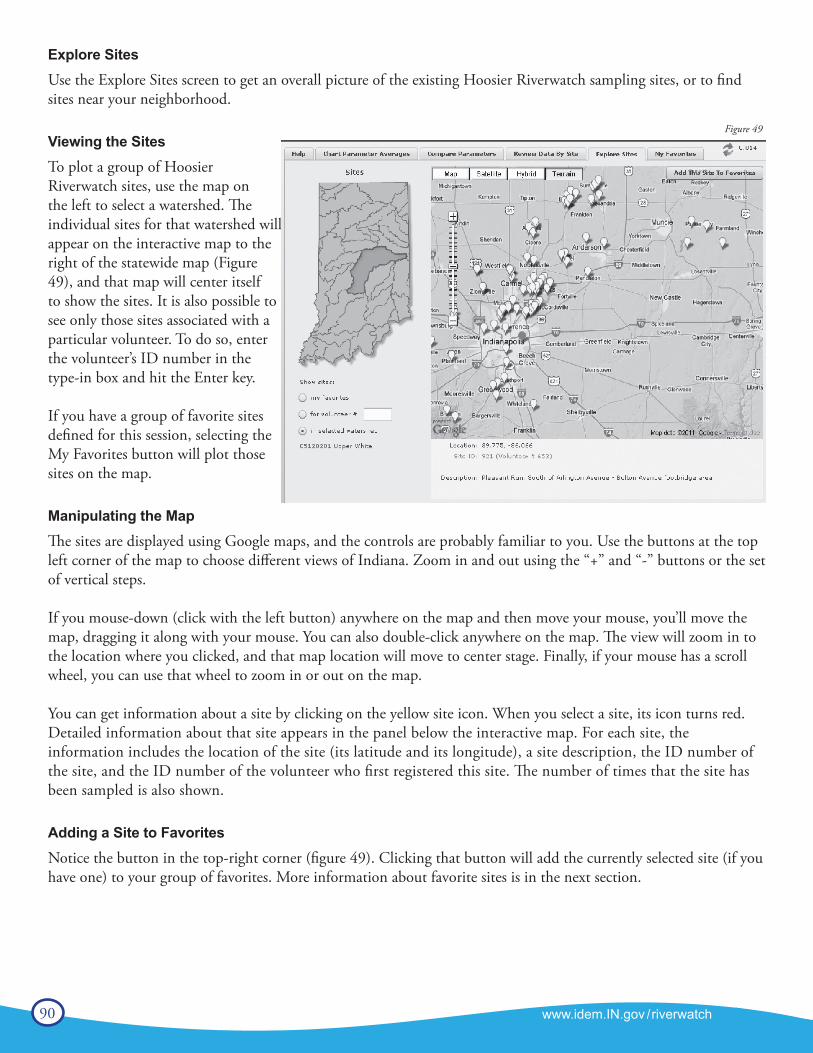
90 www.idem.IN.gov /riverwatch
Explore SitesUse the Explore Sites screen to get an overall picture of the existing Hoosier Riverwatch sampling sites, or to find sites near your neighborhood.
Viewing the SitesTo plot a group of Hoosier Riverwatch sites, use the map on the left to select a watershed. The individual sites for that watershed will appear on the interactive map to the right of the statewide map (Figure 49), and that map will center itself to show the sites. It is also possible to see only those sites associated with a particular volunteer. To do so, enter the volunteer’s ID number in the type-in box and hit the Enter key.
If you have a group of favorite sites defined for this session, selecting the My Favorites button will plot those sites on the map.
Manipulating the MapThe sites are displayed using Google maps, and the controls are probably familiar to you. Use the buttons at the topleft corner of the map to choose different views of Indiana. Zoom in and out using the “+” and “-” buttons or the setof vertical steps.
If you mouse-down (click with the left button) anywhere on the map and then move your mouse, you’ll move themap, dragging it along with your mouse. You can also double-click anywhere on the map. The view will zoom in tothe location where you clicked, and that map location will move to center stage. Finally, if your mouse has a scrollwheel, you can use that wheel to zoom in or out on the map.
You can get information about a site by clicking on the yellow site icon. When you select a site, its icon turns red.Detailed information about that site appears in the panel below the interactive map. For each site, the information includes the location of the site (its latitude and its longitude), a site description, the ID number of the site, and the ID number of the volunteer who first registered this site. The number of times that the site has been sampled is also shown.
Adding a Site to FavoritesNotice the button in the top-right corner (figure 49). Clicking that button will add the currently selected site (if you have one) to your group of favorites. More information about favorite sites is in the next section.
Figure 49
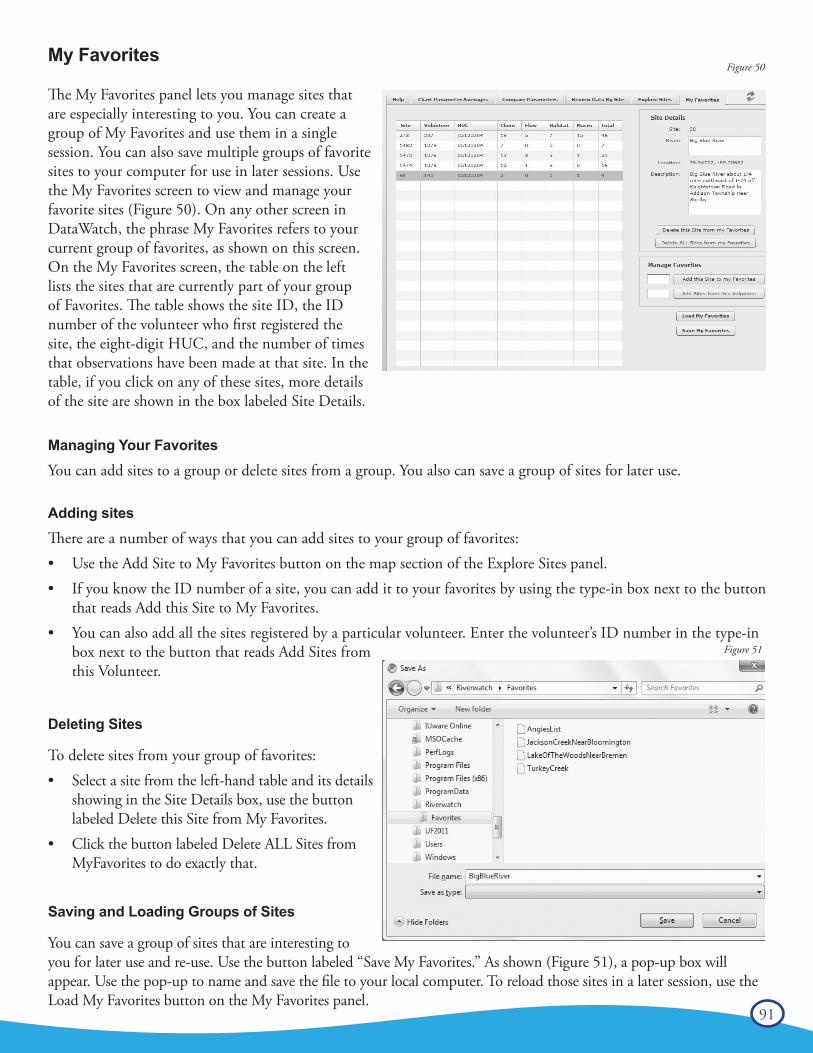
91
My Favorites
The My Favorites panel lets you manage sites that are especially interesting to you. You can create a group of My Favorites and use them in a single session. You can also save multiple groups of favorite sites to your computer for use in later sessions. Use the My Favorites screen to view and manage your favorite sites (Figure 50). On any other screen in DataWatch, the phrase My Favorites refers to your current group of favorites, as shown on this screen. On the My Favorites screen, the table on the left lists the sites that are currently part of your group of Favorites. The table shows the site ID, the ID number of the volunteer who first registered the site, the eight-digit HUC, and the number of times that observations have been made at that site. In the table, if you click on any of these sites, more details of the site are shown in the box labeled Site Details.
Managing Your FavoritesYou can add sites to a group or delete sites from a group. You also can save a group of sites for later use.
Adding sitesThere are a number of ways that you can add sites to your group of favorites:• Use the Add Site to My Favorites button on the map section of the Explore Sites panel.• If you know the ID number of a site, you can add it to your favorites by using the type-in box next to the button
that reads Add this Site to My Favorites.• You can also add all the sites registered by a particular volunteer. Enter the volunteer’s ID number in the type-in
box next to the button that reads Add Sites from this Volunteer.
Deleting Sites
To delete sites from your group of favorites:• Select a site from the left-hand table and its details
showing in the Site Details box, use the button labeled Delete this Site from My Favorites.
• Click the button labeled Delete ALL Sites from MyFavorites to do exactly that.
Saving and Loading Groups of Sites
You can save a group of sites that are interesting to you for later use and re-use. Use the button labeled “Save My Favorites.” As shown (Figure 51), a pop-up box will appear. Use the pop-up to name and save the file to your local computer. To reload those sites in a later session, use the Load My Favorites button on the My Favorites panel.
Figure 50
Figure 51
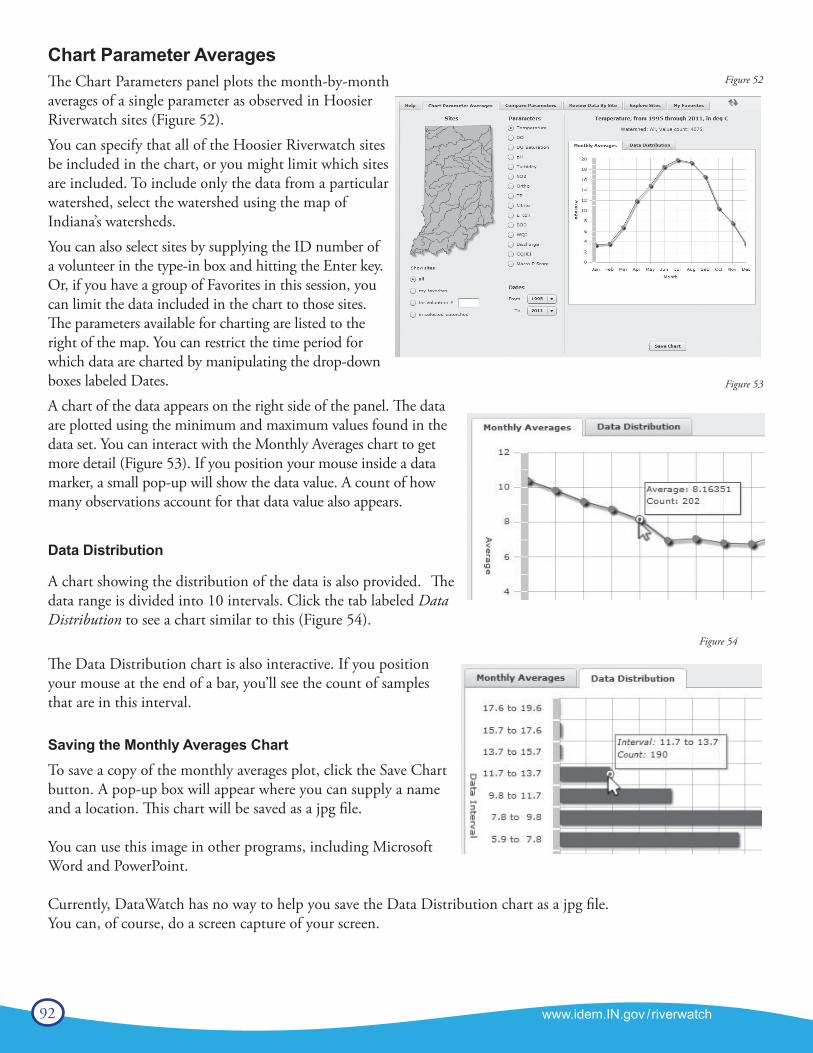
92 www.idem.IN.gov /riverwatch
Chart Parameter AveragesThe Chart Parameters panel plots the month-by-month averages of a single parameter as observed in Hoosier Riverwatch sites (Figure 52). You can specify that all of the Hoosier Riverwatch sites be included in the chart, or you might limit which sites are included. To include only the data from a particular watershed, select the watershed using the map of Indiana’s watersheds. You can also select sites by supplying the ID number of a volunteer in the type-in box and hitting the Enter key. Or, if you have a group of Favorites in this session, you can limit the data included in the chart to those sites. The parameters available for charting are listed to the right of the map. You can restrict the time period for which data are charted by manipulating the drop-down boxes labeled Dates.A chart of the data appears on the right side of the panel. The data are plotted using the minimum and maximum values found in the data set. You can interact with the Monthly Averages chart to get more detail (Figure 53). If you position your mouse inside a data marker, a small pop-up will show the data value. A count of how many observations account for that data value also appears.
Data Distribution
A chart showing the distribution of the data is also provided. The data range is divided into 10 intervals. Click the tab labeled Data Distribution to see a chart similar to this (Figure 54).
The Data Distribution chart is also interactive. If you position your mouse at the end of a bar, you’ll see the count of samples that are in this interval.
Saving the Monthly Averages ChartTo save a copy of the monthly averages plot, click the Save Chart button. A pop-up box will appear where you can supply a name and a location. This chart will be saved as a jpg file.
You can use this image in other programs, including Microsoft Word and PowerPoint.
Currently, DataWatch has no way to help you save the Data Distribution chart as a jpg file. You can, of course, do a screen capture of your screen.
Figure 52
Figure 53
Figure 54
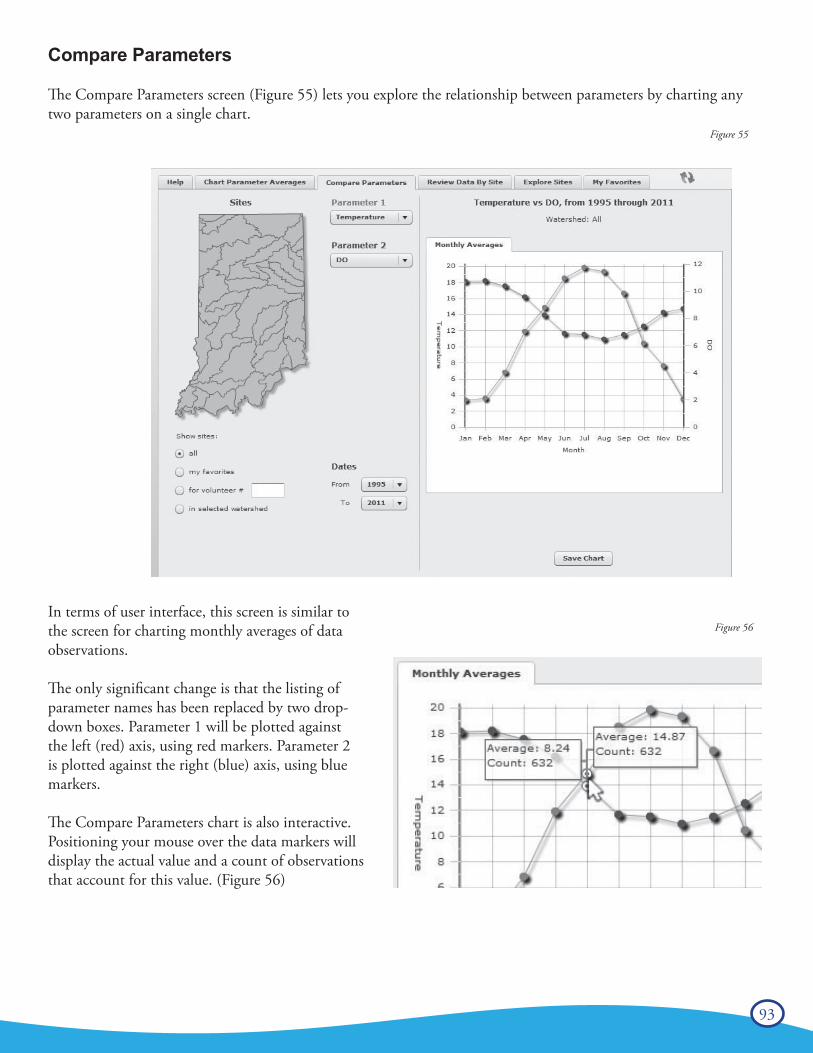
93
Compare Parameters
The Compare Parameters screen (Figure 55) lets you explore the relationship between parameters by charting any two parameters on a single chart.
In terms of user interface, this screen is similar to the screen for charting monthly averages of data observations.
The only significant change is that the listing of parameter names has been replaced by two drop-down boxes. Parameter 1 will be plotted against the left (red) axis, using red markers. Parameter 2 is plotted against the right (blue) axis, using blue markers.
The Compare Parameters chart is also interactive. Positioning your mouse over the data markers will display the actual value and a count of observations that account for this value. (Figure 56)
Figure 56
Figure 55
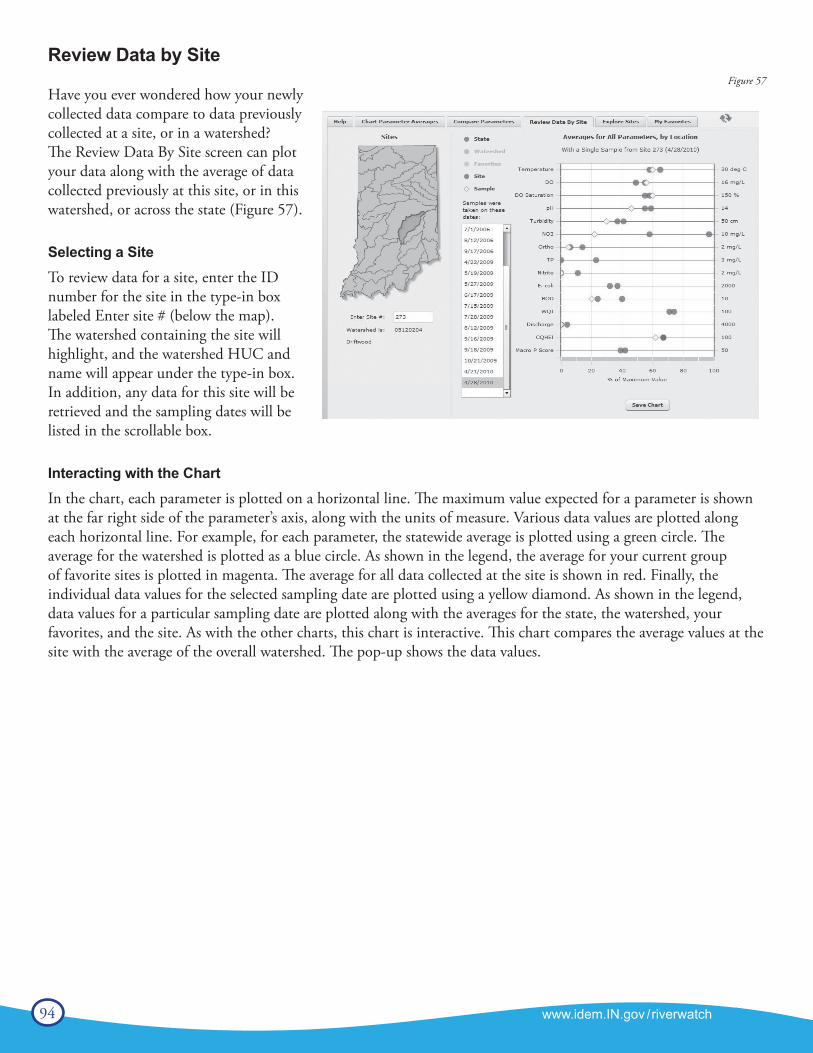
94 www.idem.IN.gov /riverwatch
Review Data by Site
Have you ever wondered how your newly collected data compare to data previously collected at a site, or in a watershed? The Review Data By Site screen can plot your data along with the average of data collected previously at this site, or in this watershed, or across the state (Figure 57).
Selecting a SiteTo review data for a site, enter the ID number for the site in the type-in box labeled Enter site # (below the map). The watershed containing the site will highlight, and the watershed HUC and name will appear under the type-in box. In addition, any data for this site will be retrieved and the sampling dates will be listed in the scrollable box.
Interacting with the ChartIn the chart, each parameter is plotted on a horizontal line. The maximum value expected for a parameter is shownat the far right side of the parameter’s axis, along with the units of measure. Various data values are plotted along each horizontal line. For example, for each parameter, the statewide average is plotted using a green circle. The average for the watershed is plotted as a blue circle. As shown in the legend, the average for your current group of favorite sites is plotted in magenta. The average for all data collected at the site is shown in red. Finally, the individual data values for the selected sampling date are plotted using a yellow diamond. As shown in the legend, data values for a particular sampling date are plotted along with the averages for the state, the watershed, yourfavorites, and the site. As with the other charts, this chart is interactive. This chart compares the average values at thesite with the average of the overall watershed. The pop-up shows the data values.
Figure 57

95
Notes:
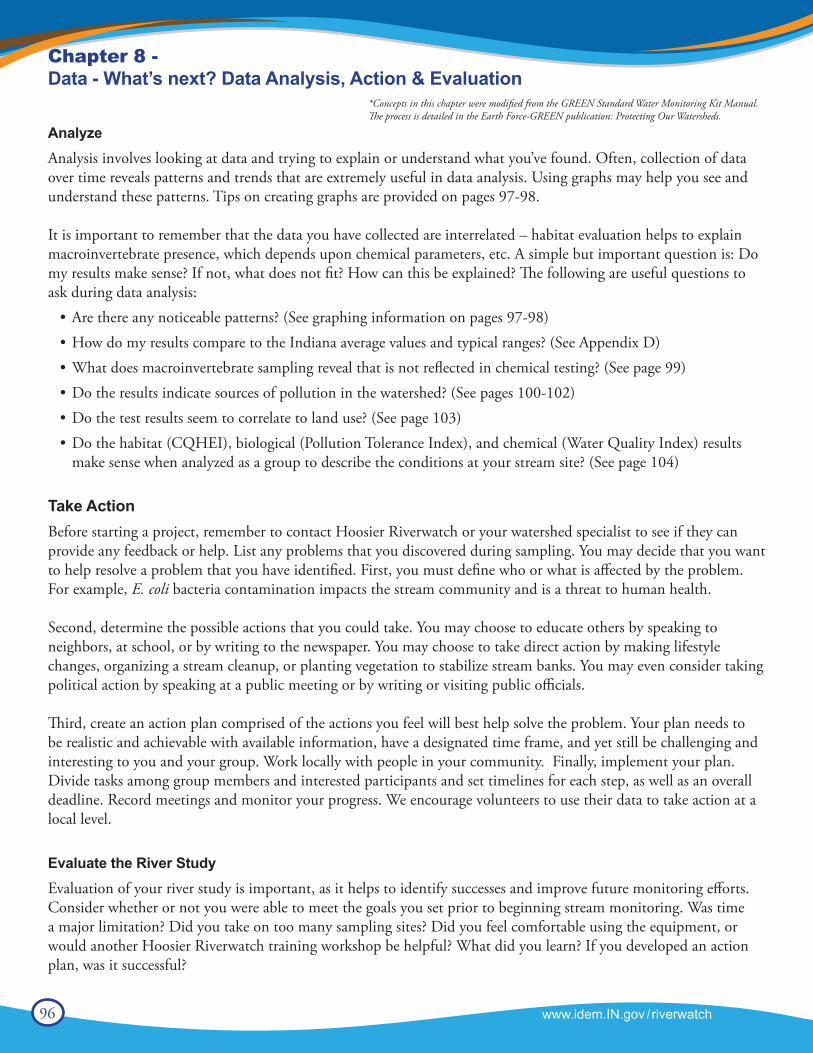
96 www.idem.IN.gov /riverwatch
Chapter 8 - Data - What’s next? Data Analysis, Action & Evaluation
AnalyzeAnalysis involves looking at data and trying to explain or understand what you’ve found. Often, collection of data over time reveals patterns and trends that are extremely useful in data analysis. Using graphs may help you see and understand these patterns. Tips on creating graphs are provided on pages 97-98.
It is important to remember that the data you have collected are interrelated – habitat evaluation helps to explainmacroinvertebrate presence, which depends upon chemical parameters, etc. A simple but important question is: Do my results make sense? If not, what does not fit? How can this be explained? The following are useful questions to ask during data analysis:
• Are there any noticeable patterns? (See graphing information on pages 97-98)• How do my results compare to the Indiana average values and typical ranges? (See Appendix D)• What does macroinvertebrate sampling reveal that is not reflected in chemical testing? (See page 99)• Do the results indicate sources of pollution in the watershed? (See pages 100-102)• Do the test results seem to correlate to land use? (See page 103)• Do the habitat (CQHEI), biological (Pollution Tolerance Index), and chemical (Water Quality Index) results
make sense when analyzed as a group to describe the conditions at your stream site? (See page 104)
Take ActionBefore starting a project, remember to contact Hoosier Riverwatch or your watershed specialist to see if they can provide any feedback or help. List any problems that you discovered during sampling. You may decide that you want to help resolve a problem that you have identified. First, you must define who or what is affected by the problem. For example, E. coli bacteria contamination impacts the stream community and is a threat to human health.
Second, determine the possible actions that you could take. You may choose to educate others by speaking to neighbors, at school, or by writing to the newspaper. You may choose to take direct action by making lifestyle changes, organizing a stream cleanup, or planting vegetation to stabilize stream banks. You may even consider taking political action by speaking at a public meeting or by writing or visiting public officials.
Third, create an action plan comprised of the actions you feel will best help solve the problem. Your plan needs to be realistic and achievable with available information, have a designated time frame, and yet still be challenging and interesting to you and your group. Work locally with people in your community. Finally, implement your plan. Divide tasks among group members and interested participants and set timelines for each step, as well as an overall deadline. Record meetings and monitor your progress. We encourage volunteers to use their data to take action at a local level.
Evaluate the River StudyEvaluation of your river study is important, as it helps to identify successes and improve future monitoring efforts. Consider whether or not you were able to meet the goals you set prior to beginning stream monitoring. Was time a major limitation? Did you take on too many sampling sites? Did you feel comfortable using the equipment, or would another Hoosier Riverwatch training workshop be helpful? What did you learn? If you developed an action plan, was it successful?
*Concepts in this chapter were modified from the GREEN Standard Water Monitoring Kit Manual. The process is detailed in the Earth Force-GREEN publication: Protecting Our Watersheds.
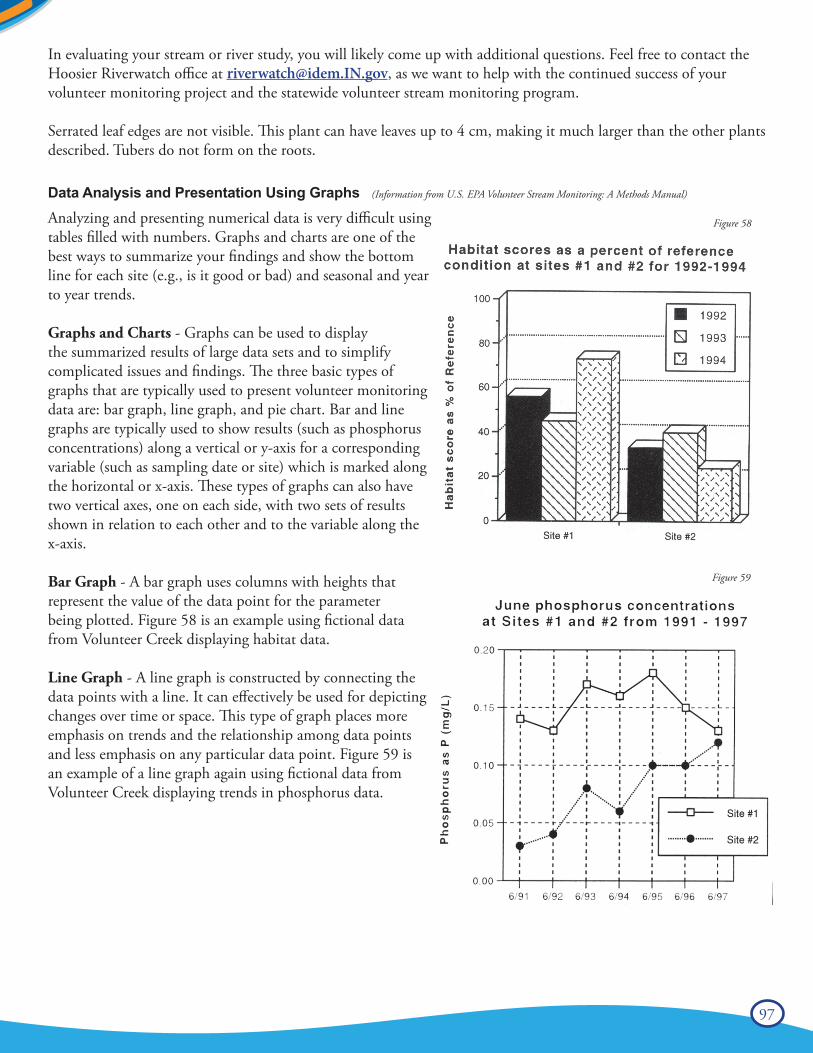
97
In evaluating your stream or river study, you will likely come up with additional questions. Feel free to contact the Hoosier Riverwatch office at [email protected], as we want to help with the continued success of your volunteer monitoring project and the statewide volunteer stream monitoring program. Serrated leaf edges are not visible. This plant can have leaves up to 4 cm, making it much larger than the other plants described. Tubers do not form on the roots.
Data Analysis and Presentation Using Graphs (Information from U.S. EPA Volunteer Stream Monitoring: A Methods Manual)
Analyzing and presenting numerical data is very difficult using tables filled with numbers. Graphs and charts are one of the best ways to summarize your findings and show the bottom line for each site (e.g., is it good or bad) and seasonal and year to year trends.
Graphs and Charts - Graphs can be used to display the summarized results of large data sets and to simplify complicated issues and findings. The three basic types of graphs that are typically used to present volunteer monitoring data are: bar graph, line graph, and pie chart. Bar and line graphs are typically used to show results (such as phosphorus concentrations) along a vertical or y-axis for a corresponding variable (such as sampling date or site) which is marked along the horizontal or x-axis. These types of graphs can also have two vertical axes, one on each side, with two sets of results shown in relation to each other and to the variable along the x-axis.
Bar Graph - A bar graph uses columns with heights that represent the value of the data point for the parameterbeing plotted. Figure 58 is an example using fictional data from Volunteer Creek displaying habitat data.
Line Graph - A line graph is constructed by connecting the data points with a line. It can effectively be used for depicting changes over time or space. This type of graph places more emphasis on trends and the relationship among data points and less emphasis on any particular data point. Figure 59 is an example of a line graph again using fictional data from Volunteer Creek displaying trends in phosphorus data.
Figure 58
Figure 59
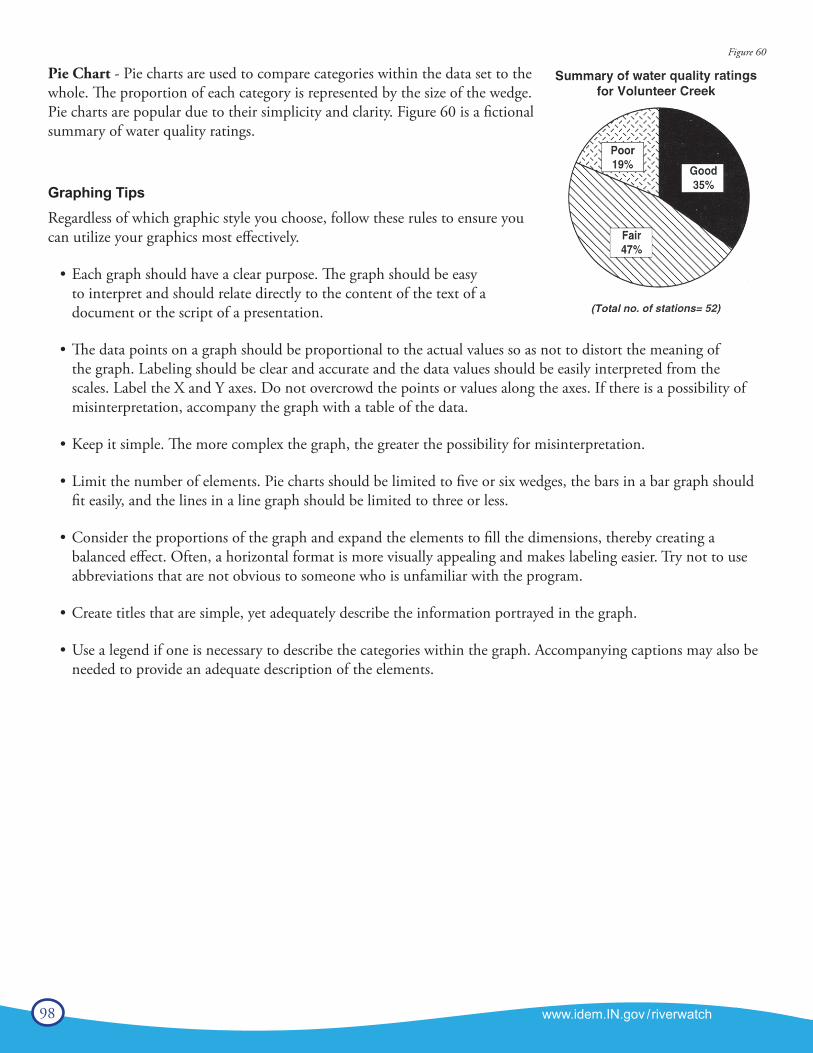
98 www.idem.IN.gov /riverwatch
Pie Chart - Pie charts are used to compare categories within the data set to the whole. The proportion of each category is represented by the size of the wedge. Pie charts are popular due to their simplicity and clarity. Figure 60 is a fictional summary of water quality ratings.
Graphing TipsRegardless of which graphic style you choose, follow these rules to ensure you can utilize your graphics most effectively.
• Each graph should have a clear purpose. The graph should be easy to interpret and should relate directly to the content of the text of a document or the script of a presentation.
• The data points on a graph should be proportional to the actual values so as not to distort the meaning of the graph. Labeling should be clear and accurate and the data values should be easily interpreted from the scales. Label the X and Y axes. Do not overcrowd the points or values along the axes. If there is a possibility of misinterpretation, accompany the graph with a table of the data.
• Keep it simple. The more complex the graph, the greater the possibility for misinterpretation.
• Limit the number of elements. Pie charts should be limited to five or six wedges, the bars in a bar graph should fit easily, and the lines in a line graph should be limited to three or less.
• Consider the proportions of the graph and expand the elements to fill the dimensions, thereby creating a balanced effect. Often, a horizontal format is more visually appealing and makes labeling easier. Try not to use abbreviations that are not obvious to someone who is unfamiliar with the program.
• Create titles that are simple, yet adequately describe the information portrayed in the graph.
• Use a legend if one is necessary to describe the categories within the graph. Accompanying captions may also be needed to provide an adequate description of the elements.
Figure 60
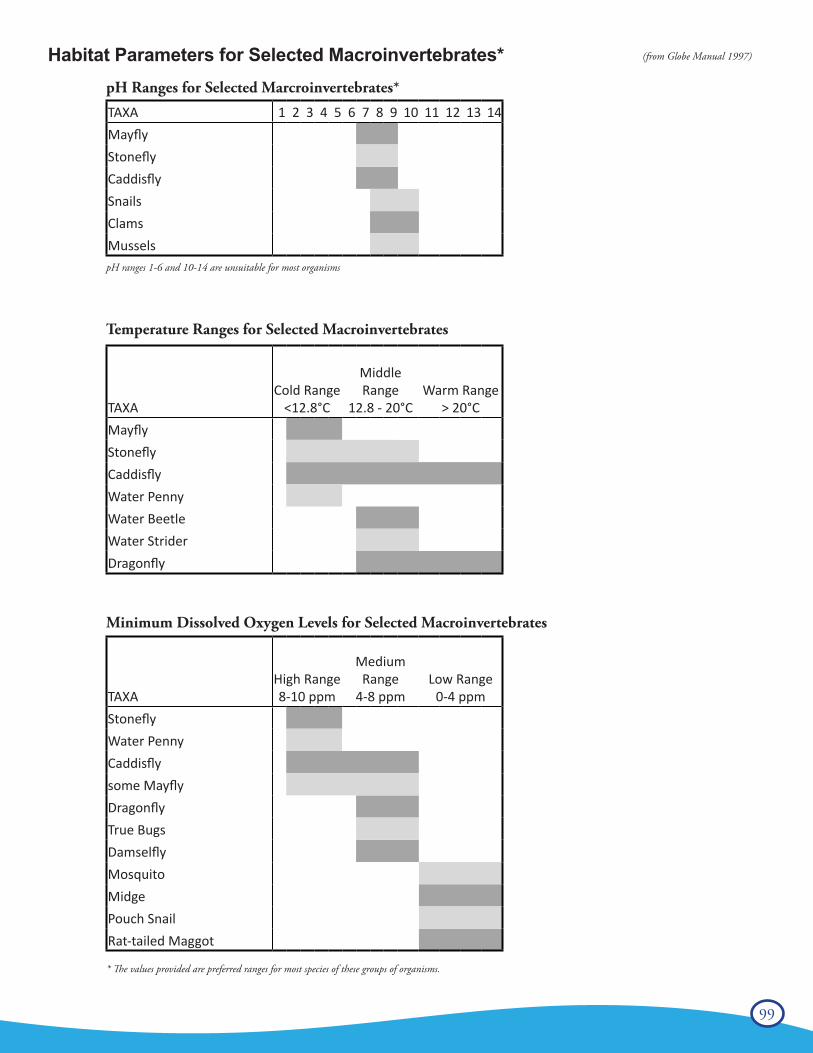
99
Habitat Parameters for Selected Macroinvertebrates* (from Globe Manual 1997)
pH Ranges for Selected Marcroinvertebrates*
pH ranges 1-6 and 10-14 are unsuitable for most organisms
Temperature Ranges for Selected Macroinvertebrates
Minimum Dissolved Oxygen Levels for Selected Macroinvertebrates
* The values provided are preferred ranges for most species of these groups of organisms.
TAXA 1 2 3 4 5 6 7 8 9 10 11 12 13 14MayflyStoneflyCaddisflySnailsClamsMussels
TAXACold Range
<12.8°C
Middle Range
12.8 - 20°CWarm Range
> 20°CMayflyStoneflyCaddisflyWater PennyWater BeetleWater StriderDragonfly
TAXAHigh Range 8-10 ppm
Medium Range
4-8 ppmLow Range
0-4 ppmStoneflyWater PennyCaddisflysome MayflyDragonflyTrue BugsDamselflyMosquitoMidgePouch SnailRat-tailed Maggot
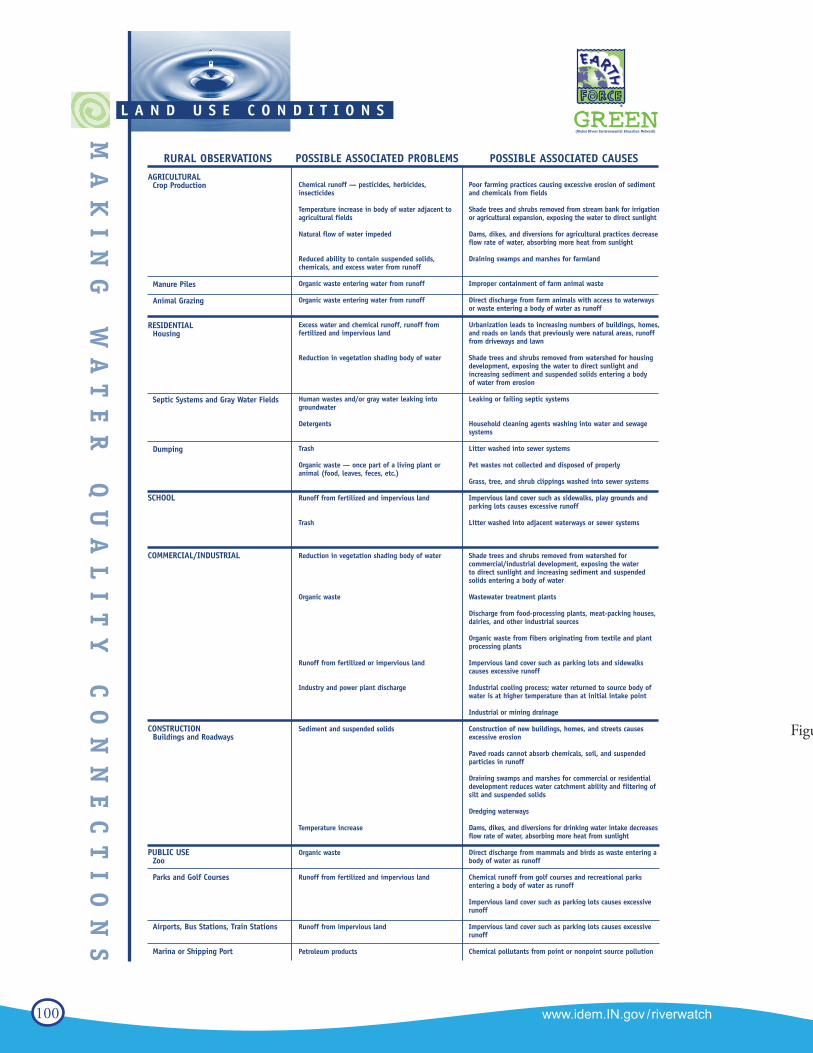
100 www.idem.IN.gov /riverwatch
GREENMA
KI
NG
W
AT
ER
Q
UA
LI
TY
C
ON
NE
CT
IO
NS
L A N D U S E C O N D I T I O N S (Global Rivers Environmental Education Network)
RURAL OBSERVATIONS POSSIBLE ASSOCIATED PROBLEMS POSSIBLE ASSOCIATED CAUSESAGRICULTURAL
Crop Production
Manure Piles
Animal Grazing
RESIDENTIAL Housing
Septic Systems and Gray Water Fields
Dumping
SCHOOL
COMMERCIAL/INDUSTRIAL
CONSTRUCTIONBuildings and Roadways
PUBLIC USEZoo
Parks and Golf Courses
Airports, Bus Stations, Train Stations
Marina or Shipping Port
Chemical runoff — pesticides, herbicides, insecticides
Temperature increase in body of water adjacent toagricultural fields
Natural flow of water impeded
Reduced ability to contain suspended solids, chemicals, and excess water from runoff
Organic waste entering water from runoff
Organic waste entering water from runoff
Excess water and chemical runoff, runoff from fertilized and impervious land
Reduction in vegetation shading body of water
Human wastes and/or gray water leaking intogroundwater
Detergents
Trash
Organic waste — once part of a living plant or animal (food, leaves, feces, etc.)
Runoff from fertilized and impervious land
Trash
Reduction in vegetation shading body of water
Organic waste
Runoff from fertilized or impervious land
Industry and power plant discharge
Sediment and suspended solids
Temperature increase
Organic waste
Runoff from fertilized and impervious land
Runoff from impervious land
Petroleum products
Poor farming practices causing excessive erosion of sedimentand chemicals from fields
Shade trees and shrubs removed from stream bank for irrigationor agricultural expansion, exposing the water to direct sunlight
Dams, dikes, and diversions for agricultural practices decreaseflow rate of water, absorbing more heat from sunlight
Draining swamps and marshes for farmland
Improper containment of farm animal waste
Direct discharge from farm animals with access to waterwaysor waste entering a body of water as runoff
Urbanization leads to increasing numbers of buildings, homes,and roads on lands that previously were natural areas, runofffrom driveways and lawn
Shade trees and shrubs removed from watershed for housingdevelopment, exposing the water to direct sunlight andincreasing sediment and suspended solids entering a body of water from erosion
Leaking or failing septic systems
Household cleaning agents washing into water and sewagesystems
Litter washed into sewer systems
Pet wastes not collected and disposed of properly
Grass, tree, and shrub clippings washed into sewer systems
Impervious land cover such as sidewalks, play grounds andparking lots causes excessive runoff
Litter washed into adjacent waterways or sewer systems
Shade trees and shrubs removed from watershed for commercial/industrial development, exposing the water to direct sunlight and increasing sediment and suspendedsolids entering a body of water
Wastewater treatment plants
Discharge from food-processing plants, meat-packing houses,dairies, and other industrial sources
Organic waste from fibers originating from textile and plantprocessing plants
Impervious land cover such as parking lots and sidewalkscauses excessive runoff
Industrial cooling process; water returned to source body ofwater is at higher temperature than at initial intake point
Industrial or mining drainage
Construction of new buildings, homes, and streets causesexcessive erosion
Paved roads cannot absorb chemicals, soil, and suspendedparticles in runoff
Draining swamps and marshes for commercial or residentialdevelopment reduces water catchment ability and filtering ofsilt and suspended solids
Dredging waterways
Dams, dikes, and diversions for drinking water intake decreasesflow rate of water, absorbing more heat from sunlight
Direct discharge from mammals and birds as waste entering abody of water as runoff
Chemical runoff from golf courses and recreational parksentering a body of water as runoff
Impervious land cover such as parking lots causes excessiverunoff
Impervious land cover such as parking lots causes excessiverunoff
Chemical pollutants from point or nonpoint source pollution
This product was created with the help of generous funding from General Motors, Inc.
Figure 24
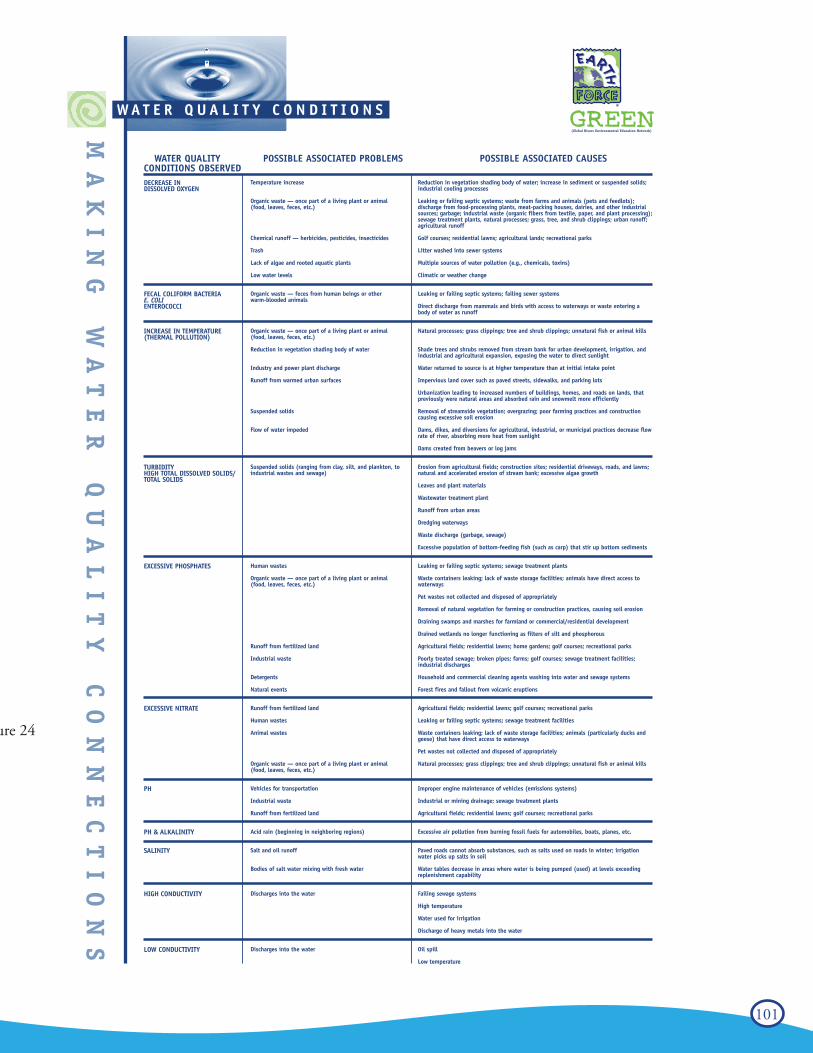
101
MA
KI
NG
W
AT
ER
Q
UA
LI
TY
C
ON
NE
CT
IO
NS
W A T E R Q U A L I T Y C O N D I T I O N S
WATER QUALITY POSSIBLE ASSOCIATED PROBLEMS POSSIBLE ASSOCIATED CAUSESCONDITIONS OBSERVEDDECREASE IN DISSOLVED OXYGEN
FECAL COLIFORM BACTERIAE. COLIENTEROCOCCI
INCREASE IN TEMPERATURE (THERMAL POLLUTION)
TURBIDITYHIGH TOTAL DISSOLVED SOLIDS/TOTAL SOLIDS
EXCESSIVE PHOSPHATES
EXCESSIVE NITRATE
PH
PH & ALKALINITY
SALINITY
HIGH CONDUCTIVITY
LOW CONDUCTIVITY
Temperature increase
Organic waste — once part of a living plant or animal (food, leaves, feces, etc.)
Chemical runoff — herbicides, pesticides, insecticides
Trash
Lack of algae and rooted aquatic plants
Low water levels
Organic waste — feces from human beings or other warm-blooded animals
Organic waste — once part of a living plant or animal (food, leaves, feces, etc.)
Reduction in vegetation shading body of water
Industry and power plant discharge
Runoff from warmed urban surfaces
Suspended solids
Flow of water impeded
Suspended solids (ranging from clay, silt, and plankton, to industrial wastes and sewage)
Human wastes
Organic waste — once part of a living plant or animal (food, leaves, feces, etc.)
Runoff from fertilized land
Industrial waste
Detergents
Natural events
Runoff from fertilized land
Human wastes
Animal wastes
Organic waste — once part of a living plant or animal (food, leaves, feces, etc.)
Vehicles for transportation
Industrial waste
Runoff from fertilized land
Acid rain (beginning in neighboring regions)
Salt and oil runoff
Bodies of salt water mixing with fresh water
Discharges into the water
Discharges into the water
Reduction in vegetation shading body of water; increase in sediment or suspended solids;industrial cooling processes
Leaking or failing septic systems; waste from farms and animals (pets and feedlots);discharge from food-processing plants, meat-packing houses, dairies, and other industrialsources; garbage; industrial waste (organic fibers from textile, paper, and plant processing);sewage treatment plants, natural processes; grass, tree, and shrub clippings; urban runoff;agricultural runoff
Golf courses; residential lawns; agricultural lands; recreational parks
Litter washed into sewer systems
Multiple sources of water pollution (e.g., chemicals, toxins)
Climatic or weather change
Leaking or failing septic systems; failing sewer systems
Direct discharge from mammals and birds with access to waterways or waste entering abody of water as runoff
Natural processes; grass clippings; tree and shrub clippings; unnatural fish or animal kills
Shade trees and shrubs removed from stream bank for urban development, irrigation, andindustrial and agricultural expansion, exposing the water to direct sunlight
Water returned to source is at higher temperature than at initial intake point
Impervious land cover such as paved streets, sidewalks, and parking lots
Urbanization leading to increased numbers of buildings, homes, and roads on lands, thatpreviously were natural areas and absorbed rain and snowmelt more efficiently
Removal of streamside vegetation; overgrazing; poor farming practices and constructioncausing excessive soil erosion
Dams, dikes, and diversions for agricultural, industrial, or municipal practices decrease flowrate of river, absorbing more heat from sunlight
Dams created from beavers or log jams
Erosion from agricultural fields; construction sites; residential driveways, roads, and lawns;natural and accelerated erosion of stream bank; excessive algae growth
Leaves and plant materials
Wastewater treatment plant
Runoff from urban areas
Dredging waterways
Waste discharge (garbage, sewage)
Excessive population of bottom-feeding fish (such as carp) that stir up bottom sediments
Leaking or failing septic systems; sewage treatment plants
Waste containers leaking; lack of waste storage facilities; animals have direct access towaterways
Pet wastes not collected and disposed of appropriately
Removal of natural vegetation for farming or construction practices, causing soil erosion
Draining swamps and marshes for farmland or commercial/residential development
Drained wetlands no longer functioning as filters of silt and phosphorous
Agricultural fields; residential lawns; home gardens; golf courses; recreational parks
Poorly treated sewage; broken pipes; farms; golf courses; sewage treatment facilities; industrial discharges
Household and commercial cleaning agents washing into water and sewage systems
Forest fires and fallout from volcanic eruptions
Agricultural fields; residential lawns; golf courses; recreational parks
Leaking or failing septic systems; sewage treatment facilities
Waste containers leaking; lack of waste storage facilities; animals (particularly ducks andgeese) that have direct access to waterways
Pet wastes not collected and disposed of appropriately
Natural processes; grass clippings; tree and shrub clippings; unnatural fish or animal kills
Improper engine maintenance of vehicles (emissions systems)
Industrial or mining drainage; sewage treatment plants
Agricultural fields; residential lawns; golf courses; recreational parks
Excessive air pollution from burning fossil fuels for automobiles, boats, planes, etc.
Paved roads cannot absorb substances, such as salts used on roads in winter; irrigationwater picks up salts in soil
Water tables decrease in areas where water is being pumped (used) at levels exceedingreplenishment capability
Failing sewage systems
High temperature
Water used for irrigation
Discharge of heavy metals into the water
Oil spill
Low temperature
GREEN(Global Rivers Environmental Education Network)
This product was created with the help of generous funding from General Motors, Inc.
Figure 24
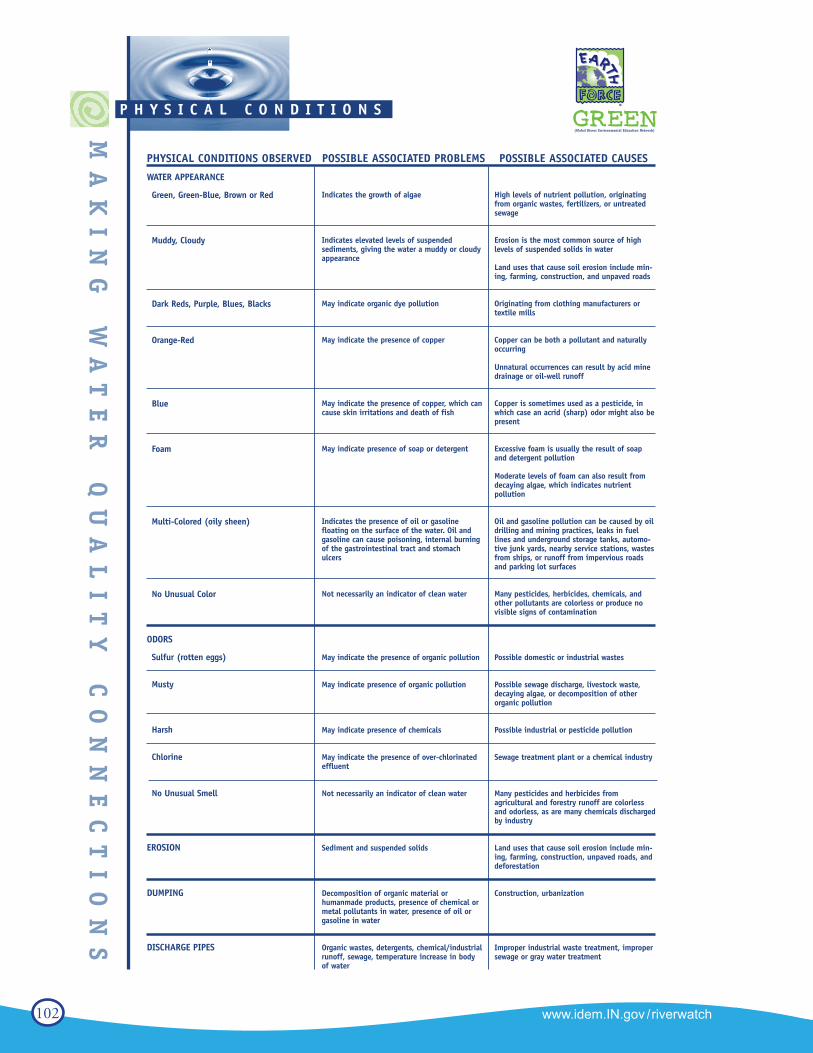
102 www.idem.IN.gov /riverwatch
MA
KI
NG
W
AT
ER
Q
UA
LI
TY
C
ON
NE
CT
IO
NS
P H Y S I C A L C O N D I T I O N S
PHYSICAL CONDITIONS OBSERVED POSSIBLE ASSOCIATED PROBLEMS POSSIBLE ASSOCIATED CAUSES
WATER APPEARANCE
Green, Green-Blue, Brown or Red
Muddy, Cloudy
Dark Reds, Purple, Blues, Blacks
Orange-Red
Blue
Foam
Multi-Colored (oily sheen)
No Unusual Color
ODORS
Sulfur (rotten eggs)
Musty
Harsh
Chlorine
No Unusual Smell
EROSION
DUMPING
DISCHARGE PIPES
Indicates the growth of algae
Indicates elevated levels of suspendedsediments, giving the water a muddy or cloudyappearance
May indicate organic dye pollution
May indicate the presence of copper
May indicate the presence of copper, which cancause skin irritations and death of fish
May indicate presence of soap or detergent
Indicates the presence of oil or gasoline floating on the surface of the water. Oil andgasoline can cause poisoning, internal burningof the gastrointestinal tract and stomachulcers
Not necessarily an indicator of clean water
May indicate the presence of organic pollution
May indicate presence of organic pollution
May indicate presence of chemicals
May indicate the presence of over-chlorinatedeffluent
Not necessarily an indicator of clean water
Sediment and suspended solids
Decomposition of organic material orhumanmade products, presence of chemical ormetal pollutants in water, presence of oil orgasoline in water
Organic wastes, detergents, chemical/industrialrunoff, sewage, temperature increase in bodyof water
High levels of nutrient pollution, originatingfrom organic wastes, fertilizers, or untreatedsewage
Erosion is the most common source of highlevels of suspended solids in water
Land uses that cause soil erosion include min-ing, farming, construction, and unpaved roads
Originating from clothing manufacturers or textile mills
Copper can be both a pollutant and naturallyoccurring
Unnatural occurrences can result by acid minedrainage or oil-well runoff
Copper is sometimes used as a pesticide, inwhich case an acrid (sharp) odor might also bepresent
Excessive foam is usually the result of soapand detergent pollution
Moderate levels of foam can also result fromdecaying algae, which indicates nutrient pollution
Oil and gasoline pollution can be caused by oildrilling and mining practices, leaks in fuellines and underground storage tanks, automo-tive junk yards, nearby service stations, wastesfrom ships, or runoff from impervious roadsand parking lot surfaces
Many pesticides, herbicides, chemicals, andother pollutants are colorless or produce novisible signs of contamination
Possible domestic or industrial wastes
Possible sewage discharge, livestock waste,decaying algae, or decomposition of otherorganic pollution
Possible industrial or pesticide pollution
Sewage treatment plant or a chemical industry
Many pesticides and herbicides fromagricultural and forestry runoff are colorlessand odorless, as are many chemicals dischargedby industry
Land uses that cause soil erosion include min-ing, farming, construction, unpaved roads, anddeforestation
Construction, urbanization
Improper industrial waste treatment, impropersewage or gray water treatment
GREEN(Global Rivers Environmental Education Network)
This product was created with the help of generous funding from General Motors, Inc.
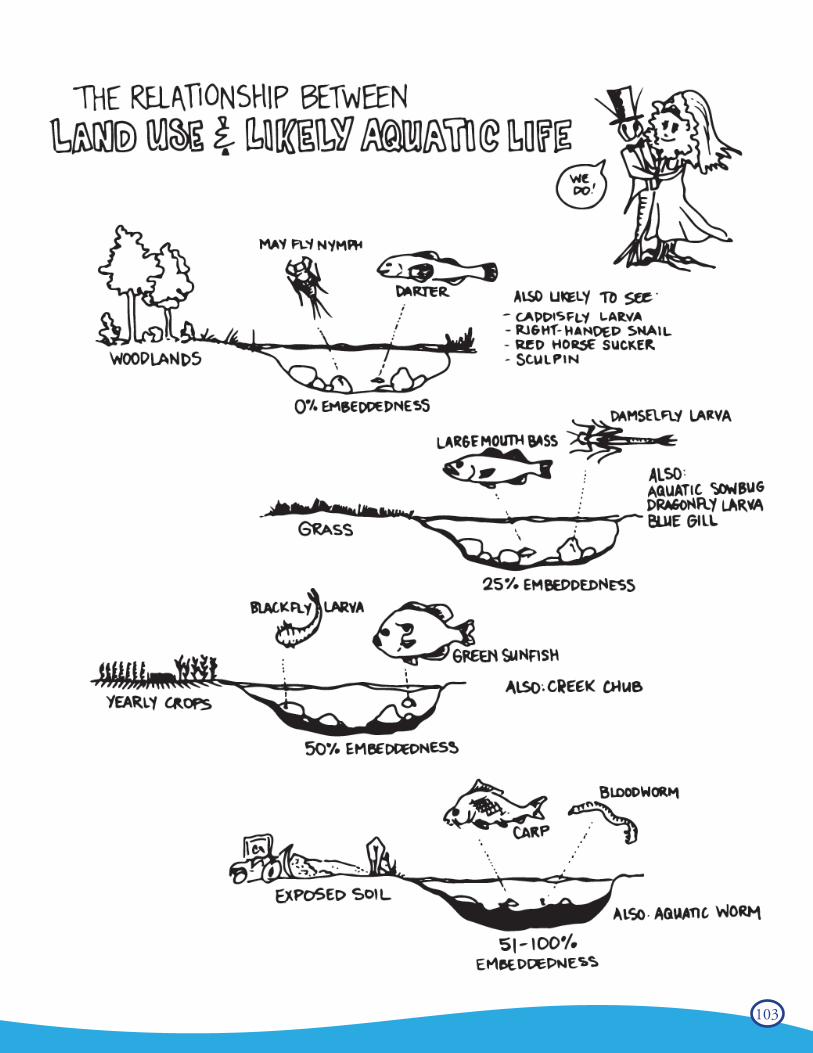
103
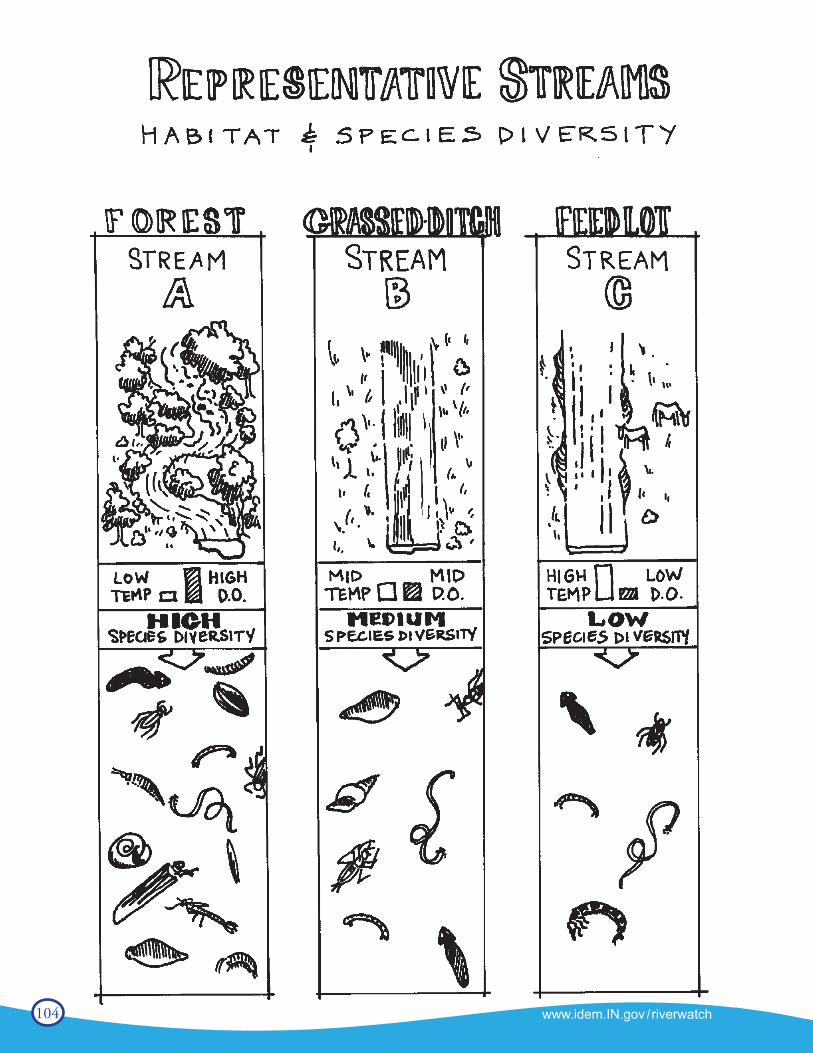
104 www.idem.IN.gov /riverwatch
105
Appendix A - Equipment
How to Clean and Care for EquipmentNetsTo ensure that no contamination occurs between sampling sites, make sure that all nets and organism collectionequipment have been cleaned of all organisms and matter. Be sure to rinse them thoroughly with hot water before transporting to another location.
Transparency Tube(From Minnesota Citizen Stream Monitoring Program, “Stream Reader” Spring 2000)
If you monitor a stream that is on the murky side, chances are the walls of your transparency tube have clouded up. Try cleaning the inside of your tube by filling it three-quarters full with tap water, add a couple drops of dish soap, and push a clean, soft rag or washcloth down the tube with the end of a broom handle, scrubbing the sides. If you take the stopper out of the bottom, be sure to fit it back into the tube securely. If your tube has a release tube and valve, it may become crimped. Try moving the position of the clamp on your release valve from time to time, and fully release the clamp between uses. By doing this, the tube won’t break down and get crimped in any one spot.
E.coli Testing SuppliesStore bottles of Coliscan Easygel in the freezer for up to one year. Thawed bottles can be refrozen. Do not freeze pretreated petri dishes.
Chemical Testing KitsDo not store kits in your car or anywhere they would experience extreme hot or cold temperatures. Bright lightdegrades the reagents in the CHEMetrics ampoules and color standards - do not leave them open in sunlight orindoors. Be sure to triple rinse bottles & tubes with distilled water immediately following tests to avoid stainingand contamination, and always triple rinse with sample water before taking a stream sample.
Be sure your chemicals, test strips, and color standards are not expired! CHEMetrics color standards are good for 2 years, Water Works pH test strips are good for 2 years, and the Nitrate/Nitrite test strips expire after 20 months.
106 www.idem.IN.gov /riverwatch
Equipment for Water Quality Monitoring
The following supplies may be useful in monitoring the water quality of your local river or stream:Site Assessment
Ͱ Maps (e.g., 7.5” topographic map, assessor’s map indicating property boundaries) and aerial photos Ͱ Compass and survey tape for marking boundaries Ͱ Clipboard, writing utensils, and laminated copies of chemical, biological, and habitat data sheets Ͱ Tape measure or twine marked in one-meter/foot lengths Ͱ Stopwatch for measuring stream flow Ͱ Apple, orange, or other biodegradable object that can be floated to measure stream flow Ͱ Yardstick or other device to measure depth
Biological Assessment
Ͱ Kick seine net, dip net, shovel, or other tools for collecting benthic macroinvertebrates Ͱ Sieve and trays for sorting biological samples (ice cube trays work well for sorting organisms) Ͱ Tweezers, hand lens, magnifying glass, and possibly a microscope Ͱ Glass vials or jars filled with isopropyl alcohol or white vinegar for storing insects (if so desired) Ͱ Handmade Hester-Dendy substrate sampler or GREEN Leaf-pack bags to use in waterways too deep to enter on foot.
Chemical Assessment
Ͱ Chemical water quality testing equipment will vary with the type of monitoring you wish to pursue. Some of the tests most commonly performed include dissolved oxygen, E.coli, pH, BOD, water temperature change, total phosphates, nitrates, turbidity, and total solids. Equipment for each test will vary in range, sensitivity, and cost depending on the use of chemical or electronic materials
Ͱ Handmade extension sampling rod (See page 109) Ͱ Distilled water for rinsing sampling bottles and tubes Ͱ Secchi disk or handmade turbidity tube Ͱ Container with kitty litter for liquid waste (if using hazardous chemicals, need separate waste container) Ͱ Material Safety Data sheets for every chemical being used
Safety
Ͱ Throw bag, life preserver or rope Ͱ Rubber boots, hip boots or waders (WARNING: Never put children in chest-high waders because they can fill with dangerous amounts of water if submerged.)
Ͱ Rubber gloves and protective eyewear Ͱ First Aid kit that includes eyewash Ͱ Washing water, antibacterial soap, and a towel Ͱ Insect repellent Ͱ Life vest
Other Supplies
Ͱ Drinking water Ͱ Camera for documenting site Ͱ Trash bags or other waste containers for a streambank clean-up Ͱ Folding card table Ͱ Calculator Ͱ Computer and Internet access for entry of water quality data

107
How to Make Your Own Equipment
Not all of your water monitoring equipment has to be purchased through a catalog or at a store.Nets and other sampling supplies can be made at home.Kick Seine Net #1Materials:
Ͱ 3 foot by 6 foot piece of nylon or fiberglass screening (white, if you can find it)
Ͱ 4 strips of heavy canvas (6 inches by 36 inches) Ͱ 2 broom handles or wooden dowels (6 feet long)
Ͱ finishing nails Ͱ sewing machine and thread Ͱ hammer Ͱ iron and ironing board
Directions:1. Fold screening in half (3 foot by 3 foot).2. Fold edges of canvas strips under 1/2 inch and
press with iron.3. Sew 2 strips at top and bottom of screening,
then use remaining 2 strips on the sides of the screening to make casings for handles. Sew bottom of casings shut.
4. Insert handles into casings and nail into place with finishing nails.
Kick Seine Net #2Materials:
Ͱ 3 foot by 4 foot piece of nylon or fiberglass screening (white, if you can find it)
Ͱ 2 strips of heavy canvas (6 inches by 36 inches) Ͱ 2 broom handles or wooden dowels (6 feet long) Ͱ Staple gun and staples Ͱ sewing machine and thread
Directions:1. Fold one strip of fabric over one of the long screen edges and sew,
reinforcing the edge.2. Repeat for the other long edge.3. Attach screen to poles with staples, making the poles even with
the bottom of the screen and extending to form handles at the top.
4. Wrap screen around poles several times and staple again to reinforce the edges.
Kick Seine Net #1
Kick Seine Net #2
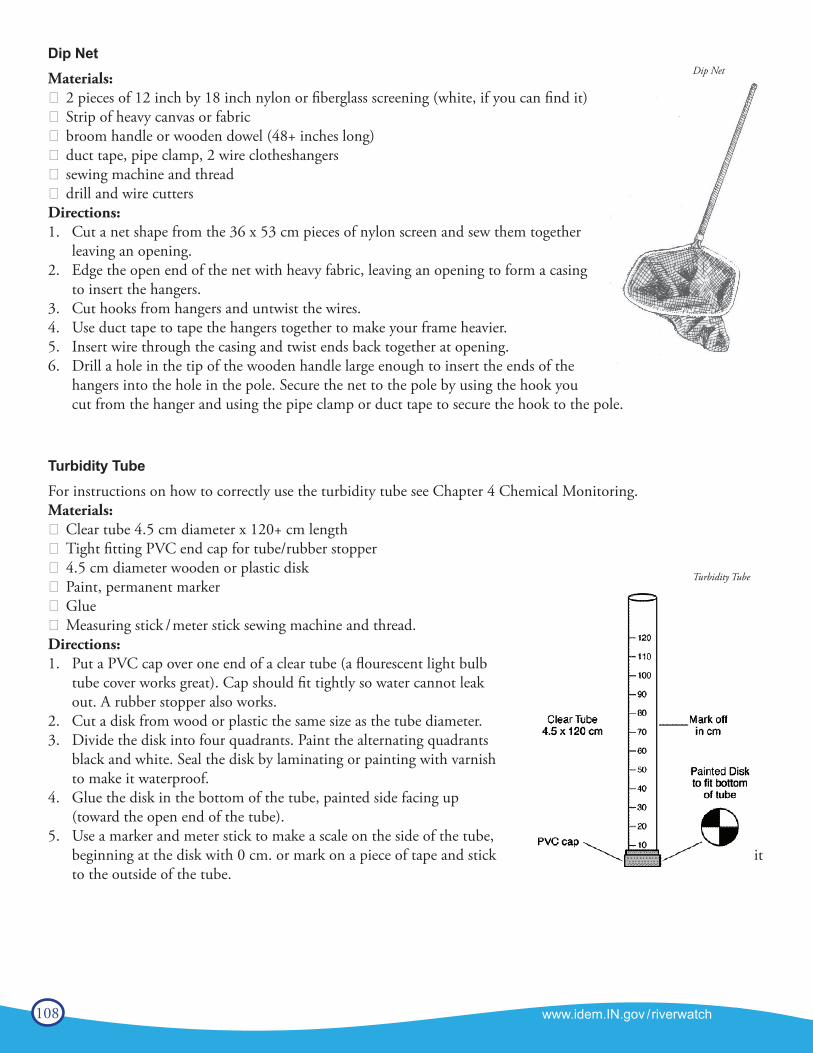
108 www.idem.IN.gov /riverwatch
Dip NetMaterials:
Ͱ 2 pieces of 12 inch by 18 inch nylon or fiberglass screening (white, if you can find it) Ͱ Strip of heavy canvas or fabric Ͱ broom handle or wooden dowel (48+ inches long) Ͱ duct tape, pipe clamp, 2 wire clotheshangers Ͱ sewing machine and thread Ͱ drill and wire cutters
Directions:1. Cut a net shape from the 36 x 53 cm pieces of nylon screen and sew them together
leaving an opening.2. Edge the open end of the net with heavy fabric, leaving an opening to form a casing
to insert the hangers.3. Cut hooks from hangers and untwist the wires.4. Use duct tape to tape the hangers together to make your frame heavier.5. Insert wire through the casing and twist ends back together at opening.6. Drill a hole in the tip of the wooden handle large enough to insert the ends of the
hangers into the hole in the pole. Secure the net to the pole by using the hook you cut from the hanger and using the pipe clamp or duct tape to secure the hook to the pole.
Turbidity TubeFor instructions on how to correctly use the turbidity tube see Chapter 4 Chemical Monitoring.Materials:
Ͱ Clear tube 4.5 cm diameter x 120+ cm length Ͱ Tight fitting PVC end cap for tube/rubber stopper Ͱ 4.5 cm diameter wooden or plastic disk Ͱ Paint, permanent marker Ͱ Glue Ͱ Measuring stick /meter stick sewing machine and thread.
Directions:1. Put a PVC cap over one end of a clear tube (a flourescent light bulb
tube cover works great). Cap should fit tightly so water cannot leak out. A rubber stopper also works.
2. Cut a disk from wood or plastic the same size as the tube diameter.3. Divide the disk into four quadrants. Paint the alternating quadrants
black and white. Seal the disk by laminating or painting with varnish to make it waterproof.
4. Glue the disk in the bottom of the tube, painted side facing up (toward the open end of the tube).
5. Use a marker and meter stick to make a scale on the side of the tube, beginning at the disk with 0 cm. or mark on a piece of tape and stick it to the outside of the tube.
Dip Net
Turbidity Tube
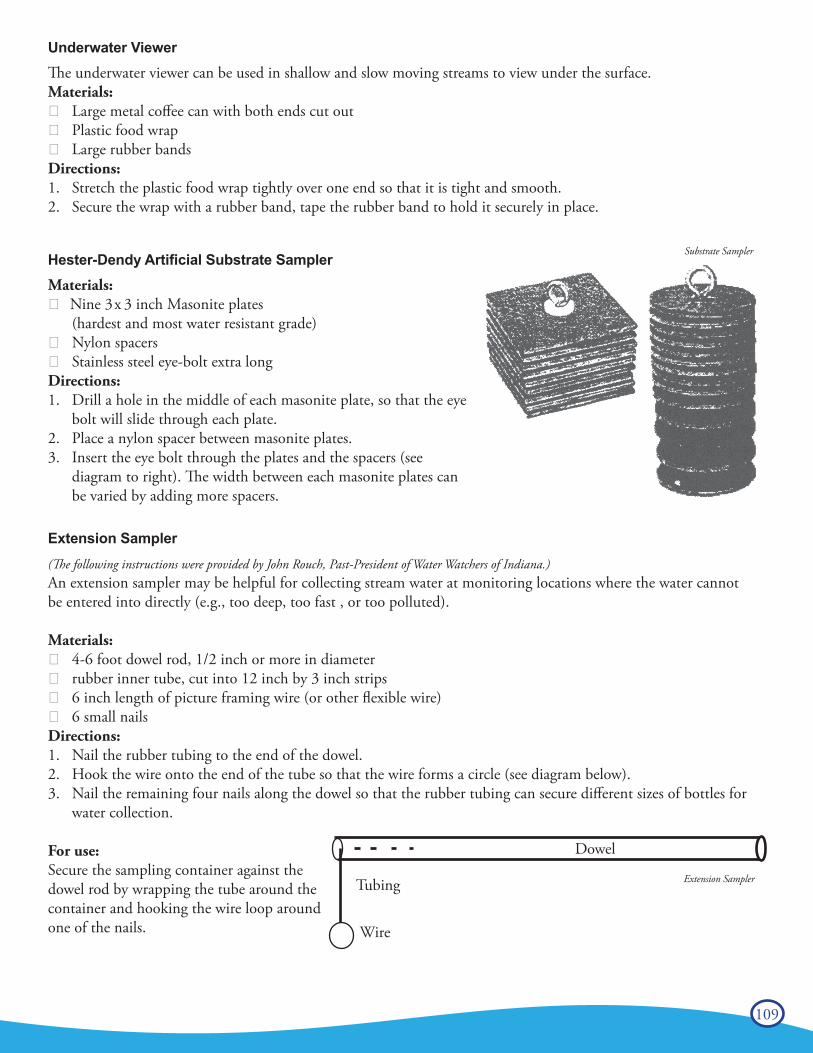
109
Underwater ViewerThe underwater viewer can be used in shallow and slow moving streams to view under the surface.Materials:
Ͱ Large metal coffee can with both ends cut out Ͱ Plastic food wrap Ͱ Large rubber bands
Directions:1. Stretch the plastic food wrap tightly over one end so that it is tight and smooth.2. Secure the wrap with a rubber band, tape the rubber band to hold it securely in place.
Hester-Dendy Artificial Substrate Sampler Materials:
Ͱ Nine 3x 3 inch Masonite plates (hardest and most water resistant grade)
Ͱ Nylon spacers Ͱ Stainless steel eye-bolt extra long
Directions:1. Drill a hole in the middle of each masonite plate, so that the eye
bolt will slide through each plate.2. Place a nylon spacer between masonite plates.3. Insert the eye bolt through the plates and the spacers (see
diagram to right). The width between each masonite plates can be varied by adding more spacers.
Extension Sampler(The following instructions were provided by John Rouch, Past-President of Water Watchers of Indiana.)An extension sampler may be helpful for collecting stream water at monitoring locations where the water cannotbe entered into directly (e.g., too deep, too fast , or too polluted).
Materials: Ͱ 4-6 foot dowel rod, 1/2 inch or more in diameter Ͱ rubber inner tube, cut into 12 inch by 3 inch strips Ͱ 6 inch length of picture framing wire (or other flexible wire) Ͱ 6 small nails
Directions:1. Nail the rubber tubing to the end of the dowel.2. Hook the wire onto the end of the tube so that the wire forms a circle (see diagram below).3. Nail the remaining four nails along the dowel so that the rubber tubing can secure different sizes of bottles for
water collection.
For use:Secure the sampling container against the dowel rod by wrapping the tube around the container and hooking the wire loop around one of the nails.
Dowel
Tubing
Wire
Substrate Sampler
Extension Sampler
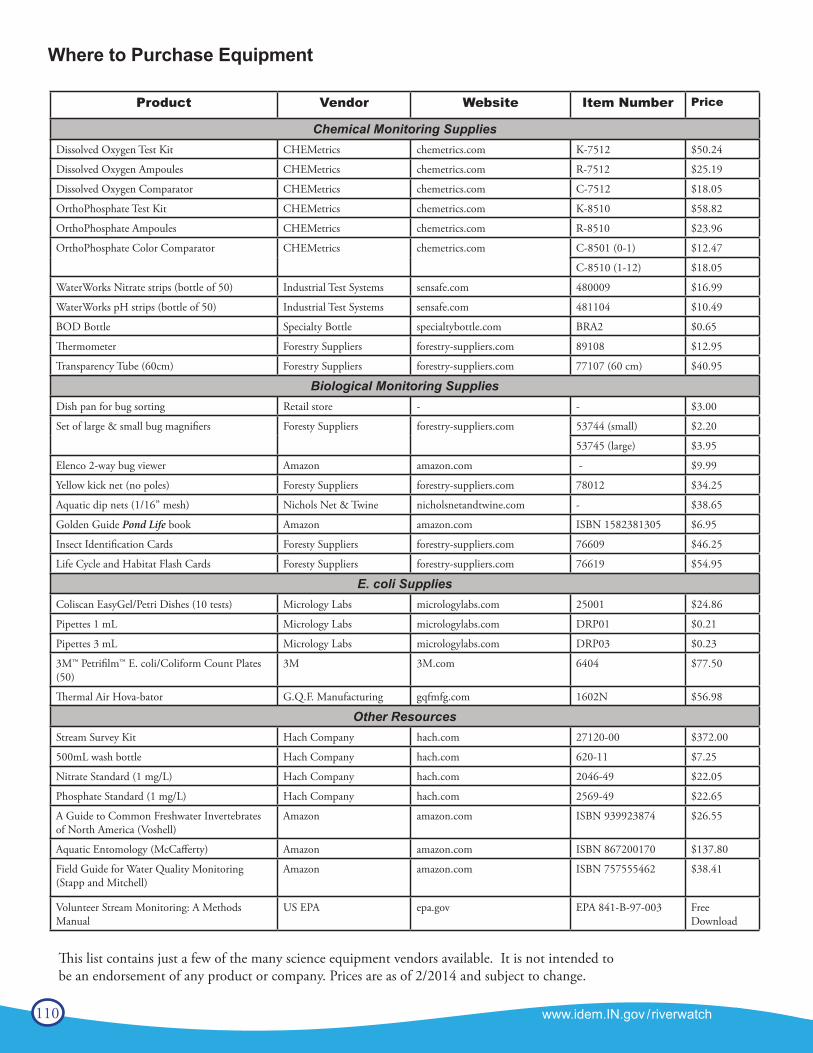
110 www.idem.IN.gov /riverwatch
Product Vendor Website Item Number Price
Chemical Monitoring SuppliesDissolved Oxygen Test Kit CHEMetrics chemetrics.com K-7512 $50.24
Dissolved Oxygen Ampoules CHEMetrics chemetrics.com R-7512 $25.19
Dissolved Oxygen Comparator CHEMetrics chemetrics.com C-7512 $18.05
OrthoPhosphate Test Kit CHEMetrics chemetrics.com K-8510 $58.82
OrthoPhosphate Ampoules CHEMetrics chemetrics.com R-8510 $23.96
OrthoPhosphate Color Comparator CHEMetrics chemetrics.com C-8501 (0-1) $12.47
C-8510 (1-12) $18.05
WaterWorks Nitrate strips (bottle of 50) Industrial Test Systems sensafe.com 480009 $16.99
WaterWorks pH strips (bottle of 50) Industrial Test Systems sensafe.com 481104 $10.49
BOD Bottle Specialty Bottle specialtybottle.com BRA2 $0.65
Thermometer Forestry Suppliers forestry-suppliers.com 89108 $12.95
Transparency Tube (60cm) Forestry Suppliers forestry-suppliers.com 77107 (60 cm) $40.95
Biological Monitoring SuppliesDish pan for bug sorting Retail store - - $3.00
Set of large & small bug magnifiers Foresty Suppliers forestry-suppliers.com 53744 (small) $2.20
53745 (large) $3.95
Elenco 2-way bug viewer Amazon amazon.com - $9.99
Yellow kick net (no poles) Foresty Suppliers forestry-suppliers.com 78012 $34.25
Aquatic dip nets (1/16” mesh) Nichols Net & Twine nicholsnetandtwine.com - $38.65
Golden Guide Pond Life book Amazon amazon.com ISBN 1582381305 $6.95
Insect Identification Cards Foresty Suppliers forestry-suppliers.com 76609 $46.25
Life Cycle and Habitat Flash Cards Foresty Suppliers forestry-suppliers.com 76619 $54.95
E. coli SuppliesColiscan EasyGel/Petri Dishes (10 tests) Micrology Labs micrologylabs.com 25001 $24.86
Pipettes 1 mL Micrology Labs micrologylabs.com DRP01 $0.21
Pipettes 3 mL Micrology Labs micrologylabs.com DRP03 $0.23
3M™ Petrifilm™ E. coli/Coliform Count Plates (50)
3M 3M.com 6404 $77.50
Thermal Air Hova-bator G.Q.F. Manufacturing gqfmfg.com 1602N $56.98
Other ResourcesStream Survey Kit Hach Company hach.com 27120-00 $372.00
500mL wash bottle Hach Company hach.com 620-11 $7.25
Nitrate Standard (1 mg/L) Hach Company hach.com 2046-49 $22.05
Phosphate Standard (1 mg/L) Hach Company hach.com 2569-49 $22.65
A Guide to Common Freshwater Invertebrates of North America (Voshell)
Amazon amazon.com ISBN 939923874 $26.55
Aquatic Entomology (McCafferty) Amazon amazon.com ISBN 867200170 $137.80
Field Guide for Water Quality Monitoring (Stapp and Mitchell)
Amazon amazon.com ISBN 757555462 $38.41
Volunteer Stream Monitoring: A Methods Manual
US EPA epa.gov EPA 841-B-97-003 Free Download
Where to Purchase Equipment
This list contains just a few of the many science equipment vendors available. It is not intended tobe an endorsement of any product or company. Prices are as of 2/2014 and subject to change.

111
Notes:
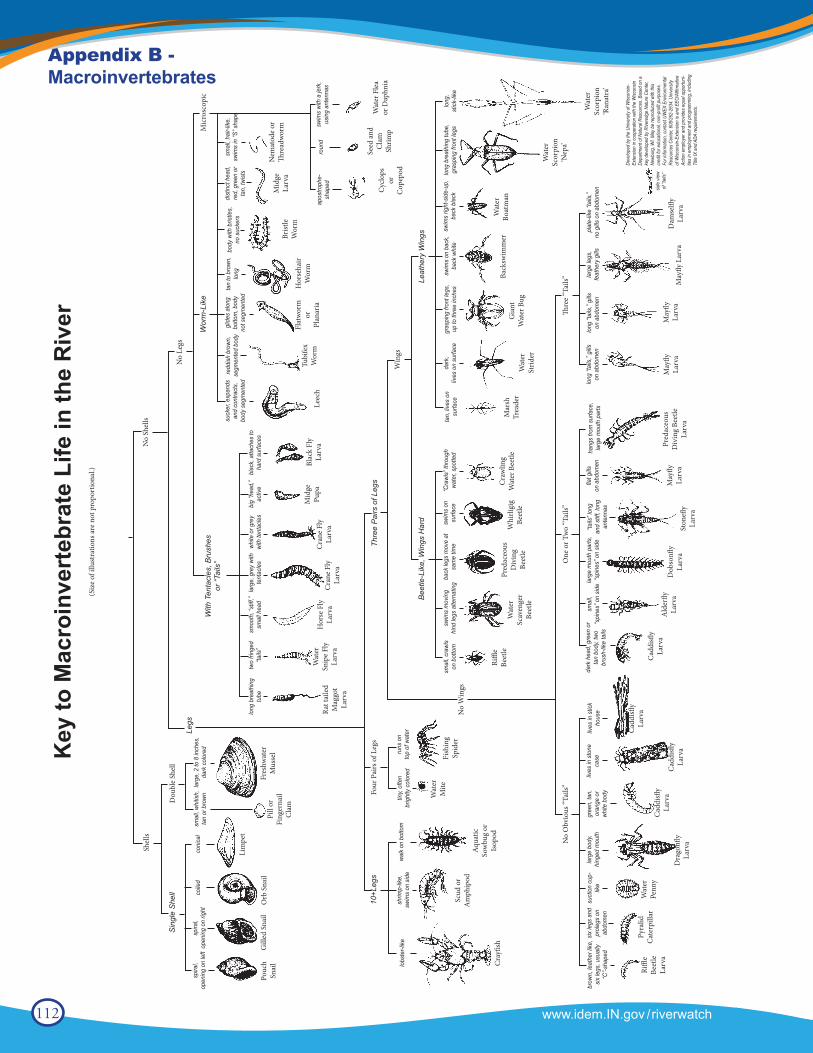
112 www.idem.IN.gov /riverwatch
Appendix B - Macroinvertebrates
www.idem.IN.gov/riverwatch72
Shel
ls
Sin
gle
She
ll
Legs
Dou
ble
Shel
l
No
Shel
ls
No
Legs
Wor
m-L
ike
Mic
rosc
opic
Leat
hery
Win
gs
Four
Pai
rs o
f Leg
s
Bee
tle-L
ike,
Win
gs H
ard
10+L
egs
No
Obv
ious
“Tai
ls”Th
ree
“Tai
ls”
Win
gs
One
or T
wo
“Tai
ls”
Thre
e P
airs
of L
egs
No
Win
gs
With
Ten
tacl
es, B
rush
es
or “T
ails
”
Key
to M
acro
inve
rteb
rate
Life
in th
e R
iver
spira
l,op
enin
g on
left
spira
l,op
enin
g on
righ
tco
iled
coni
cal
smal
l, wh
itish,
ta
n or
bro
wnla
rge,
2 to
8 in
ches
, da
rk c
olor
ed
Rat t
aile
dM
aggo
t La
rva
Wat
erSn
ipe
Fly
Larv
a
Hor
se F
lyLa
rva
Cra
ne F
lyLa
rva
Mid
gePu
paC
rane
Fly
Larv
a
Blac
k Fl
yLa
rva
Leec
hTu
bife
xW
orm
Flat
wor
mor
Plan
aria
Hor
seha
irW
orm
Brist
leW
orm
Mid
geLa
rva
Nem
atod
e or
Thre
adw
orm
long
bre
athi
ngtu
betw
o fri
nged
“tails
”sm
ooth
, “st
iff,”
smal
l hea
dla
rge,
gre
y wi
thte
ntac
les
white
or g
rey
with
tent
acle
sbi
g “h
ead,
”ac
tive
blac
k, a
ttach
es to
hard
sur
face
s
suck
er, e
xpan
dsan
d co
ntra
cts,
body
seg
men
ted
redd
ish b
rown
,se
gmen
ted
body
glid
es a
long
botto
m, b
ody
not s
egm
ente
d
tan
to b
rown
,lo
ngbo
dy w
ith b
ristle
s,no
suc
kers
dist
inct
hea
d,re
d, g
reen
or
tan,
twist
s
smal
l, ha
ir-lik
e,sw
ims
in “S
” sha
pe
swim
s wi
th a
jerk
,us
ing
ante
nnas
roun
dap
ostro
phe-
shap
ed
smal
l, cr
awls
on b
otto
msw
ims
mov
ing
hind
legs
alte
rnat
ing
back
legs
mov
e at
sam
e tim
esw
ims
onsu
rface
“Cra
wls”
thro
ugh
wate
r, sp
otte
dta
n, liv
es o
nsu
rface
dark
,liv
es o
n su
rface
gras
ping
fron
t leg
s,up
to th
ree
inch
essw
ims
on b
ack,
back
whi
tesw
ims
right
-sid
e-up
,ba
ck b
lack
long
bre
athi
ng tu
be,
gras
ping
fron
t leg
slo
ng,
stick
-like
long
“tai
ls,” g
illson
abd
omen
larg
e le
gs,
feat
hery
gills
plat
e-lik
e “ta
ils,”
no g
ills o
n ab
dom
enlo
ng “t
ails,
” gills
on a
bdom
en
Cyc
lops
orC
opep
od
Seed
and
Cla
mSh
rimp
Wat
er F
lea
or D
aphn
ia
Wat
erBo
atm
an
Wat
erSc
orpi
on‘R
anat
ra’
Wat
erSc
orpi
on‘N
epa’
Back
swim
mer
Gia
ntW
ater
Bug
Wat
erSt
rider
Mar
shTr
eade
r
Dam
selfl
yLa
rva
May
fly L
arva
May
flyLa
rva
May
flyLa
rva
Pred
aceo
usD
ivin
g Be
etle
Larv
a
May
flyLa
rva
Ston
efly
Larv
a
Dob
sonfl
yLa
rva
Ald
erfly
Larv
a
Cad
disfl
yLa
rva
Cad
disfl
yLa
rva
Wat
erPe
nny
Cad
disfl
yLa
rva
Dra
gonfl
yLa
rva
Cad
disfl
yLa
rva
Pyra
lidC
ater
pilla
rRi
ffle
Beet
leLa
rva
side
view
of “t
ails”
Riffl
eBe
etle
Wat
erSc
aven
ger
Beet
le
Pred
aceo
usD
ivin
gBe
etle
Whi
rligi
gBe
etle
Cra
wlin
gW
ater
Bee
tle
dark
hea
d, g
reen
or
tan
body
, two
brus
h-lik
e ta
ils
smal
l,“s
pine
s” o
n sid
elarg
e m
outh
par
ts,
“spi
nes”
on
side
“tails
” lon
gan
d st
iff, l
ong
ante
nnas
flat g
illson
abd
omen
hang
s fro
m s
urfa
ce,
larg
e m
outh
par
ts
Fish
ing
Spid
er
Wat
erM
ite
Aqu
atic
Sow
bug
orIs
opod
Scud
or
Am
phip
od
Cra
yfish
brow
n, le
athe
r like
,six
legs
, usu
ally
“C”-s
hape
d
gree
n, ta
n,or
ange
or
white
bod
y
lives
in s
tick
hous
esu
ctio
n cu
p-lik
ela
rge
body
,hi
nged
mou
thsix
legs
and
prol
egs
onab
dom
en
lives
in s
tone
case
runs
on
top
of w
ater
tiny,
ofte
nbr
ight
ly co
lore
dwa
lk on
bot
tom
shrim
p-lik
e,sw
ims
on s
ide
lobs
ter-l
ike
(Siz
e of
illu
stra
tions
are
not
pro
port
iona
l.)
Deve
loped
by t
he U
niver
sity o
f Wisc
onsin
-Ex
tens
ion in
coop
erat
ion w
ith th
e W
iscon
sinDe
partm
ent o
f Nat
ural
Reso
urce
s. Ba
sed
on a
key d
evelo
ped
by R
ivere
dge
Natu
re C
ente
r,Ne
wbur
g, W
I. M
ay b
e re
prod
uced
with
this
cred
it for
edu
catio
nal, n
on-p
rofit
purp
oses
.Fo
r inf
orm
ation
, con
tact
UWEX
Env
ironm
enta
lRe
sour
ces C
ente
r, 60
8/26
2-26
34. U
niver
sity
of W
iscon
sin-E
xtens
ion is
and
EEO
/Affir
mat
ive
Actio
n em
ploye
r and
pro
vides
equ
al op
portu
ni-tie
s in
emplo
ymen
t and
pro
gram
ming
, inclu
ding
Title
IX a
nd A
DA re
quire
men
ts.
Pouc
h Sn
ail
Gill
ed S
nail
Orb
Sna
il
Lim
pet
Pill
orFi
nger
nail
Cla
m
Fres
hwat
erM
usse
l
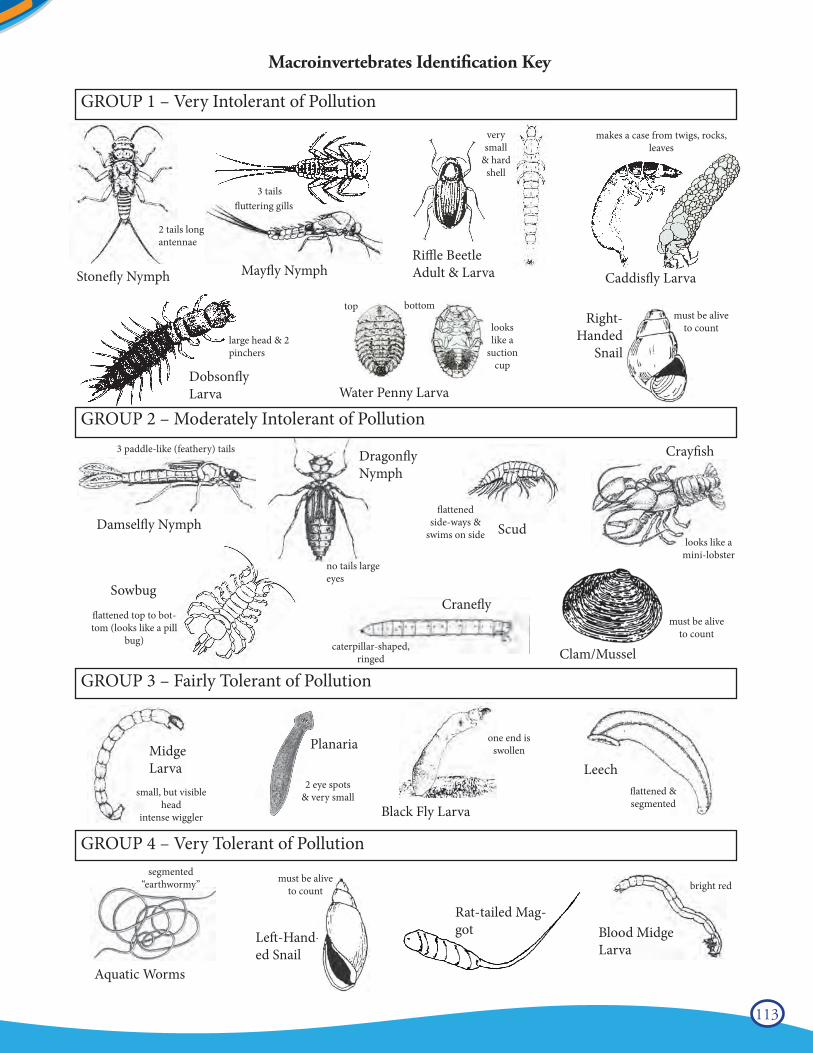
113
Macroinvertebrates Identification Key
www.idem.IN.gov/riverwatch 93
GROUP 4 – Very Tolerant of Pollution
GROUP 3 – Fairly Tolerant of Pollution
GROUP 2 – Moderately Intolerant of Pollution
GROUP 1 – Very Intolerant of Pollution
Stonefly Nymph Mayfly NymphRiffle BeetleAdult & Larva Caddisfly Larva
Dobsonfly Larva Water Penny Larva
Right-Handed
Snail
Damselfly Nymph
Dragonfly Nymph
Scud
SowbugCranefly
Clam/Mussel
Midge Larva
Planaria
Black Fly Larva
Leech
Aquatic Worms
Rat-tailed Mag-got Blood Midge
LarvaLeft-Hand-ed Snail
Macroinvertebrate Identification Key
2 tails long antennae
3 tails
3 paddle-like (feathery) tails
no tails large eyes
flattened top to bot-tom (looks like a pill
bug)
flattened side-ways &
swims on side
caterpillar-shaped, ringed
large head & 2 pinchers
looks like a
suction cup
makes a case from twigs, rocks, leaves
flattened & segmented
one end is swollen
bright red
2 eye spots& very small
top bottom
very small
& hard shell
must be alive to count
must be alive to count
must be alive to count
small, but visible head
intense wiggler
segmented“earthwormy”
Crayfish
looks like a mini-lobster
fluttering gills
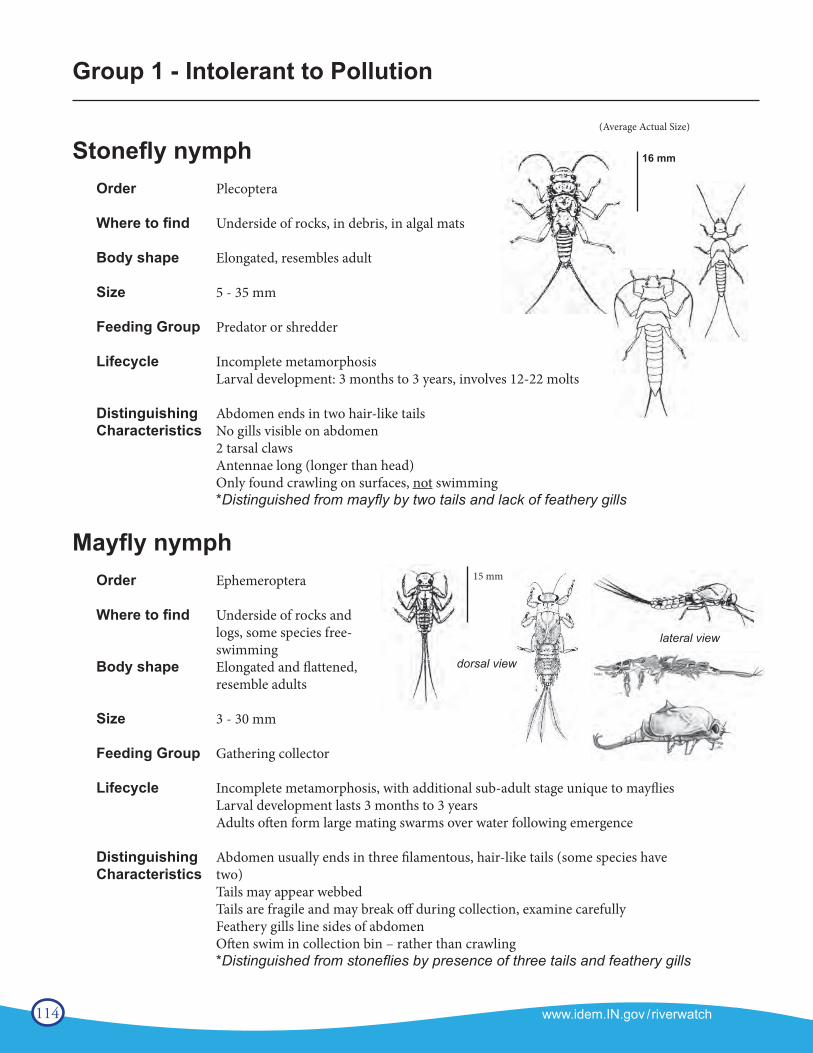
114 www.idem.IN.gov /riverwatchwww.idem.IN.gov/riverwatch 73
(Average Actual Size)
Stonefly nymphOrder Plecoptera
Where to find Underside of rocks, in debris, in algal mats
Body shape Elongated, resembles adult
Size 5 - 35 mm
Feeding Group Predator or shredder
Lifecycle Incomplete metamorphosis Larval development: 3 months to 3 years, involves 12-22 molts
Distinguishing Abdomen ends in two hair-like tailsCharacteristics No gills visible on abdomen 2 tarsal claws Antennae long (longer than head) Only found crawling on surfaces, not swimming *Distinguished from mayfly by two tails and lack of feathery gills
Mayfly nymph Order Ephemeroptera
Where to find Underside of rocks and logs, some species free- swimmingBody shape Elongated and flattened, resemble adults
Size 3 - 30 mm
Feeding Group Gathering collector
Lifecycle Incomplete metamorphosis, with additional sub-adult stage unique to mayflies Larval development lasts 3 months to 3 years Adults often form large mating swarms over water following emergence
Distinguishing Abdomen usually ends in three filamentous, hair-like tails (some species haveCharacteristics two) Tails may appear webbed Tails are fragile and may break off during collection, examine carefully Feathery gills line sides of abdomen Often swim in collection bin – rather than crawling *Distinguished from stoneflies by presence of three tails and feathery gills
Group 1 - Intolerant to Pollution
16 mm
15 mm
dorsal view
lateral view
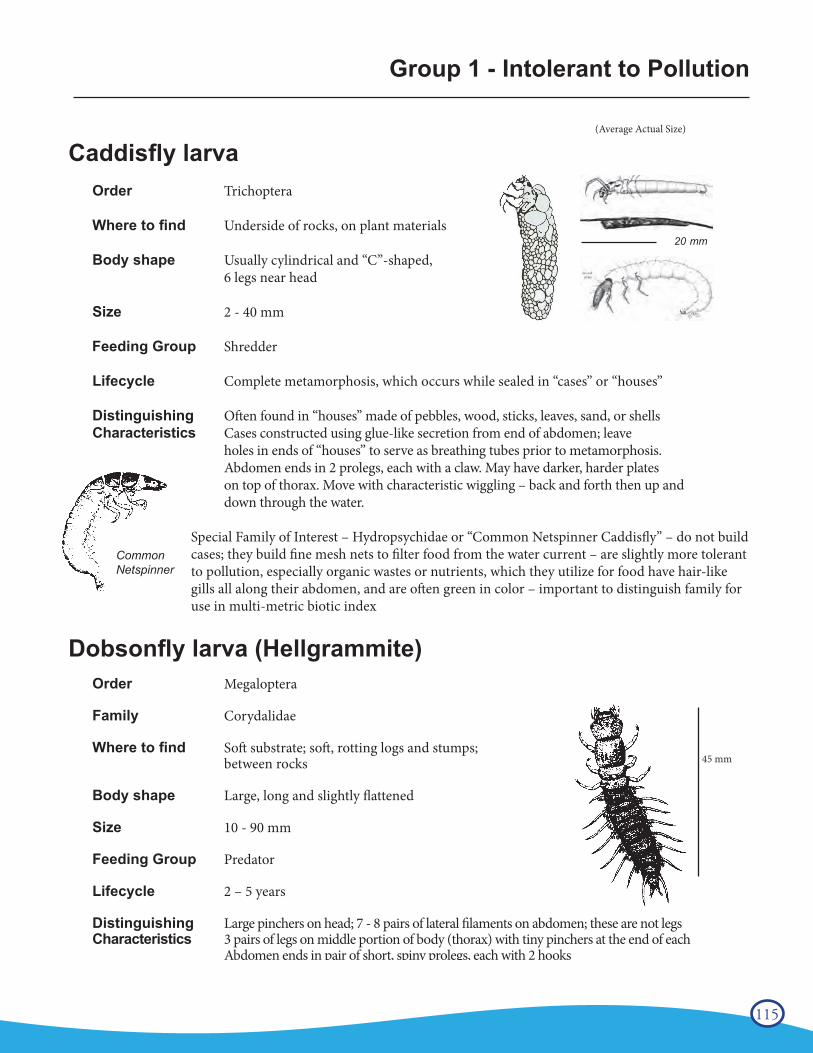
115www.idem.IN.gov/riverwatch74
(Average Actual Size)
Caddisfly larva Order Trichoptera
Where to find Underside of rocks, on plant materials
Body shape Usually cylindrical and “C”-shaped, 6 legs near head
Size 2 - 40 mm
Feeding Group Shredder
Lifecycle Complete metamorphosis, which occurs while sealed in “cases” or “houses”
Distinguishing Often found in “houses” made of pebbles, wood, sticks, leaves, sand, or shells Characteristics Cases constructed using glue-like secretion from end of abdomen; leave holes in ends of “houses” to serve as breathing tubes prior to metamorphosis.
Abdomen ends in 2 prolegs, each with a claw. May have darker, harder plates on top of thorax. Move with characteristic wiggling – back and forth then up and down through the water.
Special Family of Interest – Hydropsychidae or “Common Netspinner Caddisfly” – do not build cases; they build fine mesh nets to filter food from the water current – are slightly more tolerant to pollution, especially organic wastes or nutrients, which they utilize for food have hair-like gills all along their abdomen, and are often green in color – important to distinguish family for use in multi-metric biotic index on pages 97,98.
Dobsonfly larva (Hellgrammite)Order Megaloptera
Family Corydalidae
Where to find Soft substrate; soft, rotting logs and stumps; between rocks
Body shape Large, long and slightly flattened
Size 10 - 90 mm
Feeding Group Predator
Lifecycle 2 – 5 years
Distinguishing Large pinchers on head; 7 - 8 pairs of lateral filaments on abdomen; these are not legs Characteristics 3 pairs of legs on middle portion of body (thorax) with tiny pinchers at the end of each Abdomen ends in pair of short, spiny prolegs, each with 2 hooks
20 mm
45 mm
Common Netspinner
Group 1 - Intolerant to Pollution
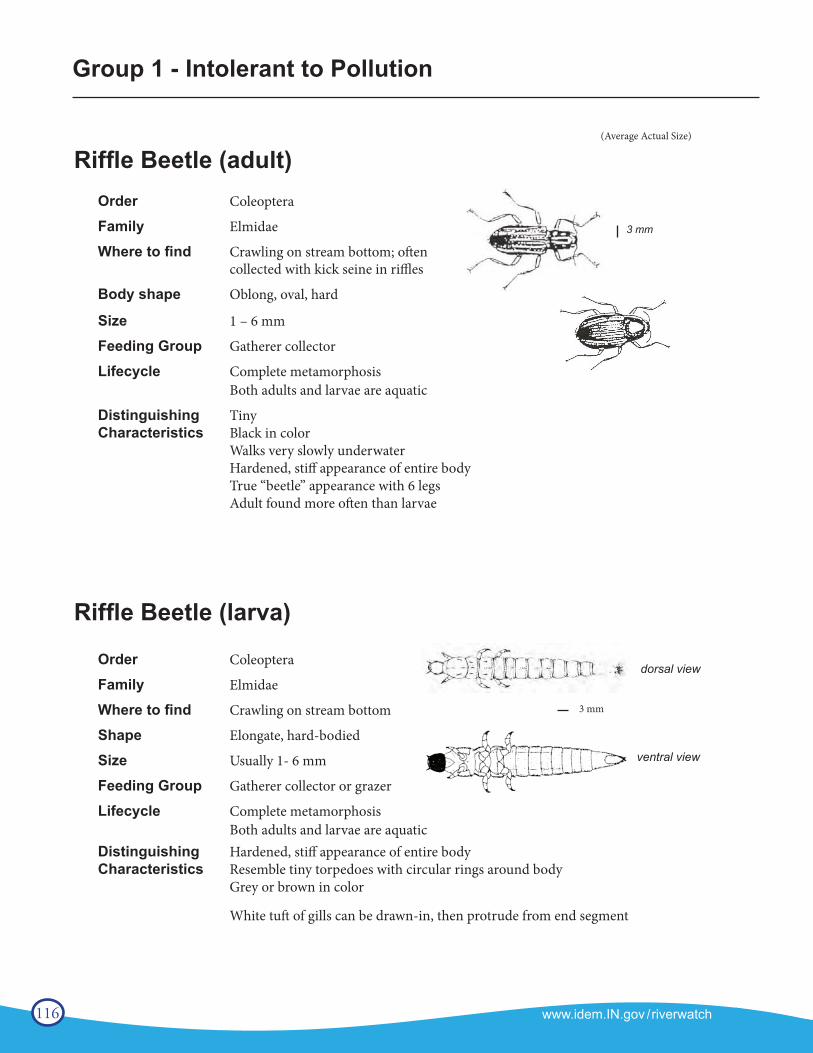
116 www.idem.IN.gov /riverwatchwww.idem.IN.gov/riverwatch 75
(Average Actual Size)
Riffle Beetle (adult) Order Coleoptera
Family Elmidae
Where to find Crawling on stream bottom; often collected with kick seine in riffles
Body shape Oblong, oval, hard
Size 1 – 6 mm
Feeding Group Gatherer collector
Lifecycle Complete metamorphosis Both adults and larvae are aquatic
Distinguishing TinyCharacteristics Black in color Walks very slowly underwater Hardened, stiff appearance of entire body True “beetle” appearance with 6 legs
Adult found more often than larvae
Riffle Beetle (larva)
Order Coleoptera
Family Elmidae
Where to find Crawling on stream bottom
Shape Elongate, hard-bodied
Size Usually 1- 6 mm
Feeding Group Gatherer collector or grazer
Lifecycle Complete metamorphosis Both adults and larvae are aquaticDistinguishing Hardened, stiff appearance of entire bodyCharacteristics Resemble tiny torpedoes with circular rings around body Grey or brown in color
White tuft of gills can be drawn-in, then protrude from end segment
3 mm
ventral view
3 mm
dorsal view
Group 1 - Intolerant to Pollution
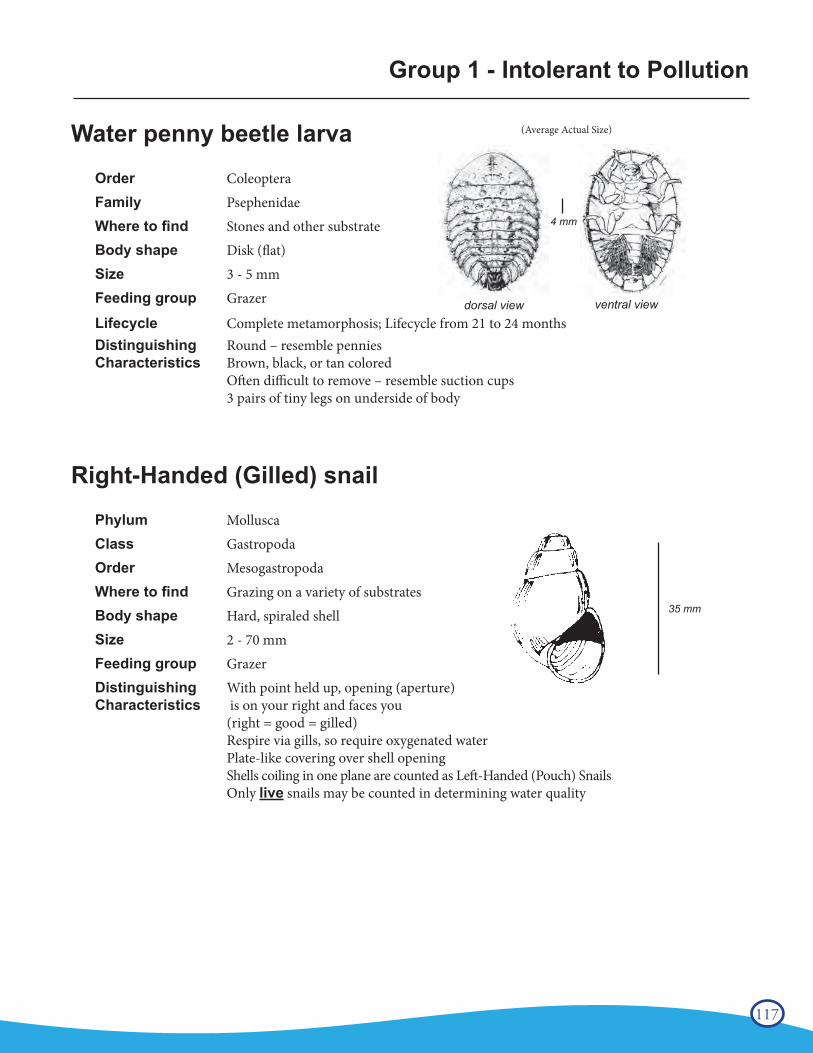
117www.idem.IN.gov/riverwatch76
Water penny beetle larva
Order Coleoptera
Family Psephenidae
Where to find Stones and other substrate
Body shape Disk (flat)
Size 3 - 5 mm
Feeding group Grazer
Lifecycle Complete metamorphosis; Lifecycle from 21 to 24 months Distinguishing Round – resemble penniesCharacteristics Brown, black, or tan colored Often difficult to remove – resemble suction cups 3 pairs of tiny legs on underside of body
Right-Handed (Gilled) snail
Phylum Mollusca
Class Gastropoda
Order Mesogastropoda
Where to find Grazing on a variety of substrates
Body shape Hard, spiraled shell
Size 2 - 70 mm
Feeding group Grazer
Distinguishing With point held up, opening (aperture)Characteristics is on your right and faces you (right = good = gilled) Respire via gills, so require oxygenated water Plate-like covering over shell opening Shells coiling in one plane are counted as Left-Handed (Pouch) Snails (page 97) Only live snails may be counted in determining water quality
(Average Actual Size)
ventral viewdorsal view
4 mm
35 mm
Group 1 - Intolerant to Pollution
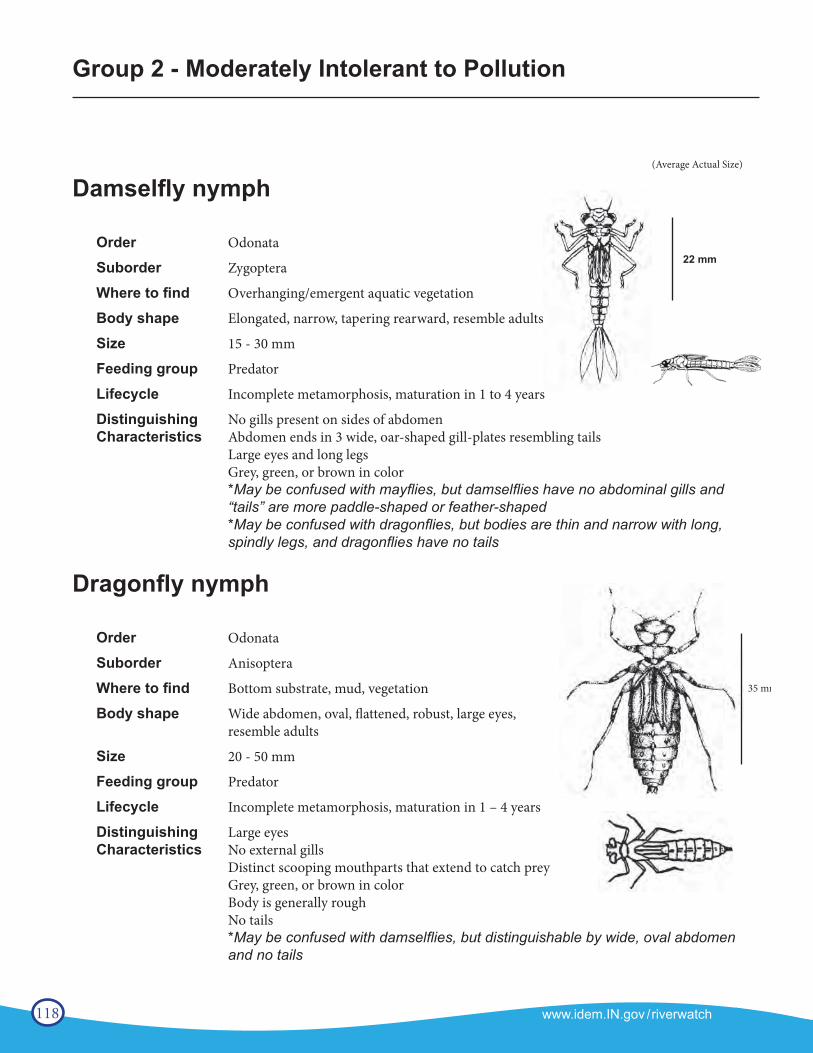
118 www.idem.IN.gov /riverwatchwww.idem.IN.gov/riverwatch 77
(Average Actual Size)
Damselfly nymph
Order Odonata
Suborder Zygoptera
Where to find Overhanging/emergent aquatic vegetation
Body shape Elongated, narrow, tapering rearward, resemble adults
Size 15 - 30 mm
Feeding group Predator
Lifecycle Incomplete metamorphosis, maturation in 1 to 4 years
Distinguishing No gills present on sides of abdomenCharacteristics Abdomen ends in 3 wide, oar-shaped gill-plates resembling tails Large eyes and long legs Grey, green, or brown in color *May be confused with mayflies, but damselflies have no abdominal gills and “tails” are more paddle-shaped or feather-shaped *May be confused with dragonflies, but bodies are thin and narrow with long, spindly legs, and dragonflies have no tails
Dragonfly nymph
Order Odonata
Suborder Anisoptera
Where to find Bottom substrate, mud, vegetation
Body shape Wide abdomen, oval, flattened, robust, large eyes, resemble adults
Size 20 - 50 mm
Feeding group Predator
Lifecycle Incomplete metamorphosis, maturation in 1 – 4 years
Distinguishing Large eyesCharacteristics No external gills Distinct scooping mouthparts that extend to catch prey Grey, green, or brown in color Body is generally rough No tails *May be confused with damselflies, but distinguishable by wide, oval abdomen and no tails
22 mm
Group 2 - Moderately Intolerant to Pollution
35 mm
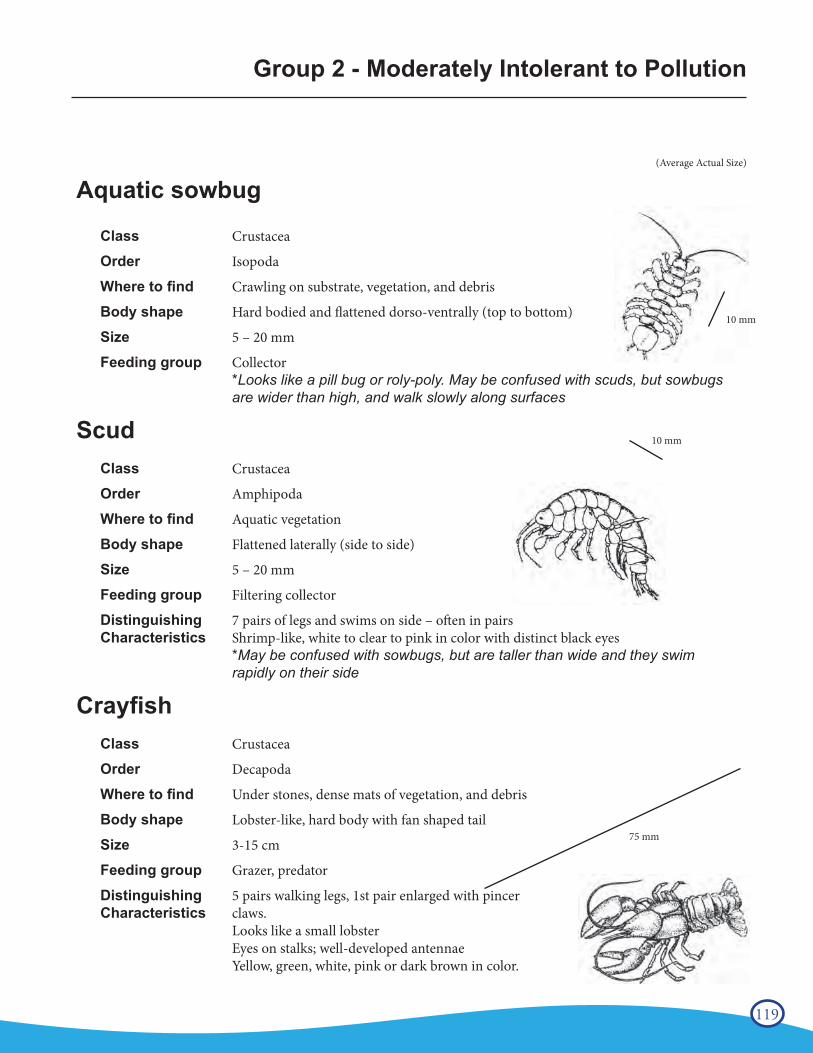
119www.idem.IN.gov/riverwatch78
(Average Actual Size)
Aquatic sowbug
Class Crustacea
Order Isopoda
Where to find Crawling on substrate, vegetation, and debris
Body shape Hard bodied and flattened dorso-ventrally (top to bottom)
Size 5 – 20 mm
Feeding group Collector *Looks like a pill bug or roly-poly. May be confused with scuds, but sowbugs are wider than high, and walk slowly along surfaces
ScudClass Crustacea
Order Amphipoda
Where to find Aquatic vegetation
Body shape Flattened laterally (side to side)
Size 5 – 20 mm
Feeding group Filtering collector
Distinguishing 7 pairs of legs and swims on side – often in pairsCharacteristics Shrimp-like, white to clear to pink in color with distinct black eyes *May be confused with sowbugs, but are taller than wide and they swim rapidly on their side
Crayfish Class Crustacea
Order Decapoda
Where to find Under stones, dense mats of vegetation, and debris
Body shape Lobster-like, hard body with fan shaped tail
Size 3-15 cm
Feeding group Grazer, predator
Distinguishing 5 pairs walking legs, 1st pair enlarged with pincer Characteristics claws. Looks like a small lobster Eyes on stalks; well-developed antennae Yellow, green, white, pink or dark brown in color.
10 mm
75 mm
10 mm
Group 2 - Moderately Intolerant to Pollution
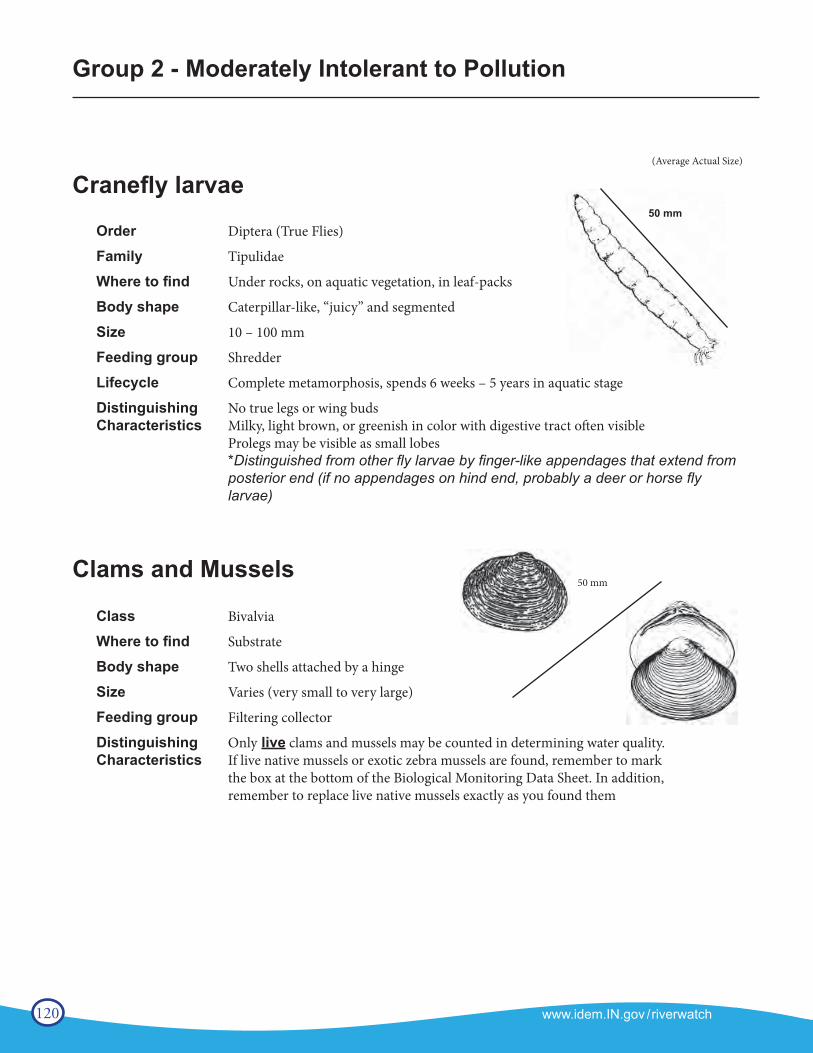
120 www.idem.IN.gov /riverwatchwww.idem.IN.gov/riverwatch 79
(Average Actual Size)
Cranefly larvae
Order Diptera (True Flies)
Family Tipulidae
Where to find Under rocks, on aquatic vegetation, in leaf-packs
Body shape Caterpillar-like, “juicy” and segmented
Size 10 – 100 mm
Feeding group Shredder
Lifecycle Complete metamorphosis, spends 6 weeks – 5 years in aquatic stage
Distinguishing No true legs or wing budsCharacteristics Milky, light brown, or greenish in color with digestive tract often visible Prolegs may be visible as small lobes *Distinguished from other fly larvae by finger-like appendages that extend from posterior end (if no appendages on hind end, probably a deer or horse fly larvae)
Clams and Mussels
Class Bivalvia
Where to find Substrate
Body shape Two shells attached by a hinge
Size Varies (very small to very large)
Feeding group Filtering collector
Distinguishing Only live clams and mussels may be counted in determining water quality.Characteristics If live native mussels or exotic zebra mussels are found, remember to mark the box at the bottom of the Biological Monitoring Data Sheet. In addition, remember to replace live native mussels exactly as you found them as described on page 70.
10 mm
50 mm
50 mm
Group 2 - Moderately Intolerant to Pollution
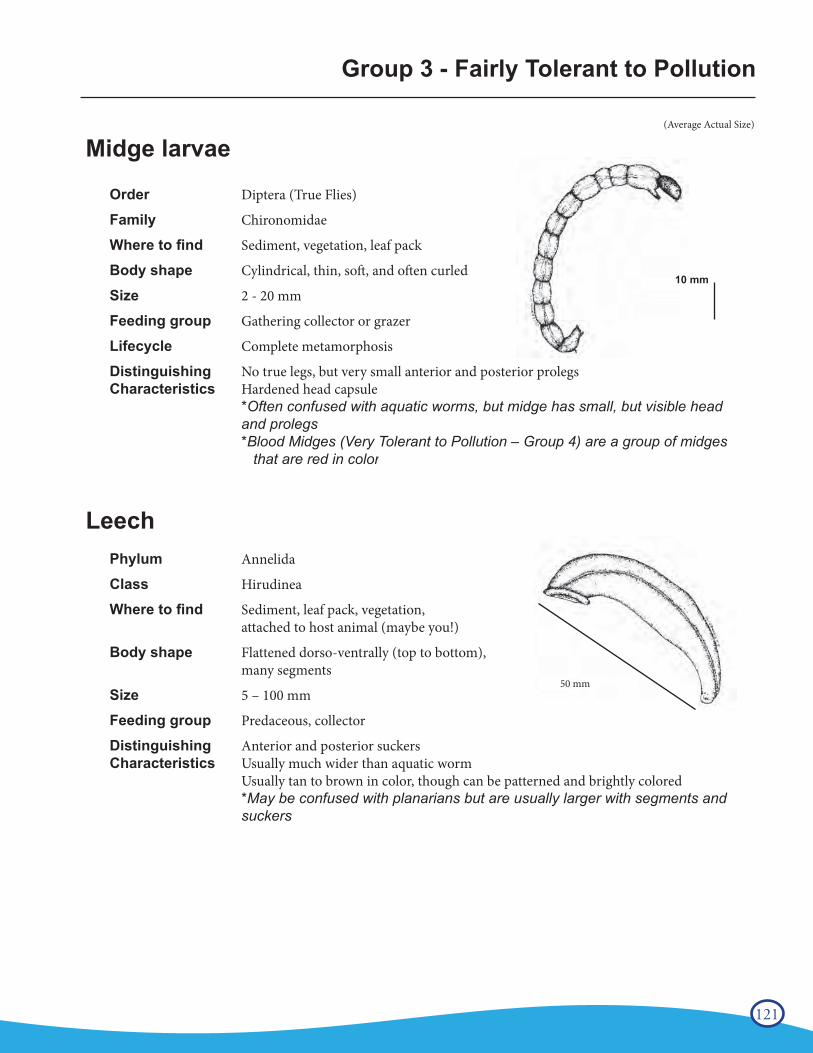
121www.idem.IN.gov/riverwatch80
(Average Actual Size)
Midge larvae
Order Diptera (True Flies)
Family Chironomidae
Where to find Sediment, vegetation, leaf pack
Body shape Cylindrical, thin, soft, and often curled
Size 2 - 20 mm
Feeding group Gathering collector or grazer
Lifecycle Complete metamorphosis
Distinguishing No true legs, but very small anterior and posterior prolegsCharacteristics Hardened head capsule *Often confused with aquatic worms, but midge has small, but visible head and prolegs *Blood Midges (Very Tolerant to Pollution – Group 4) are a group of midges
that are red in color – they are discussed separately on page 82
LeechPhylum Annelida
Class Hirudinea
Where to find Sediment, leaf pack, vegetation, attached to host animal (maybe you!)
Body shape Flattened dorso-ventrally (top to bottom), many segments
Size 5 – 100 mm
Feeding group Predaceous, collector
Distinguishing Anterior and posterior suckersCharacteristics Usually much wider than aquatic worm Usually tan to brown in color, though can be patterned and brightly colored *May be confused with planarians but are usually larger with segments and suckers
Group 3 - Fairly Tolerant to Pollution
10 mm
50 mm
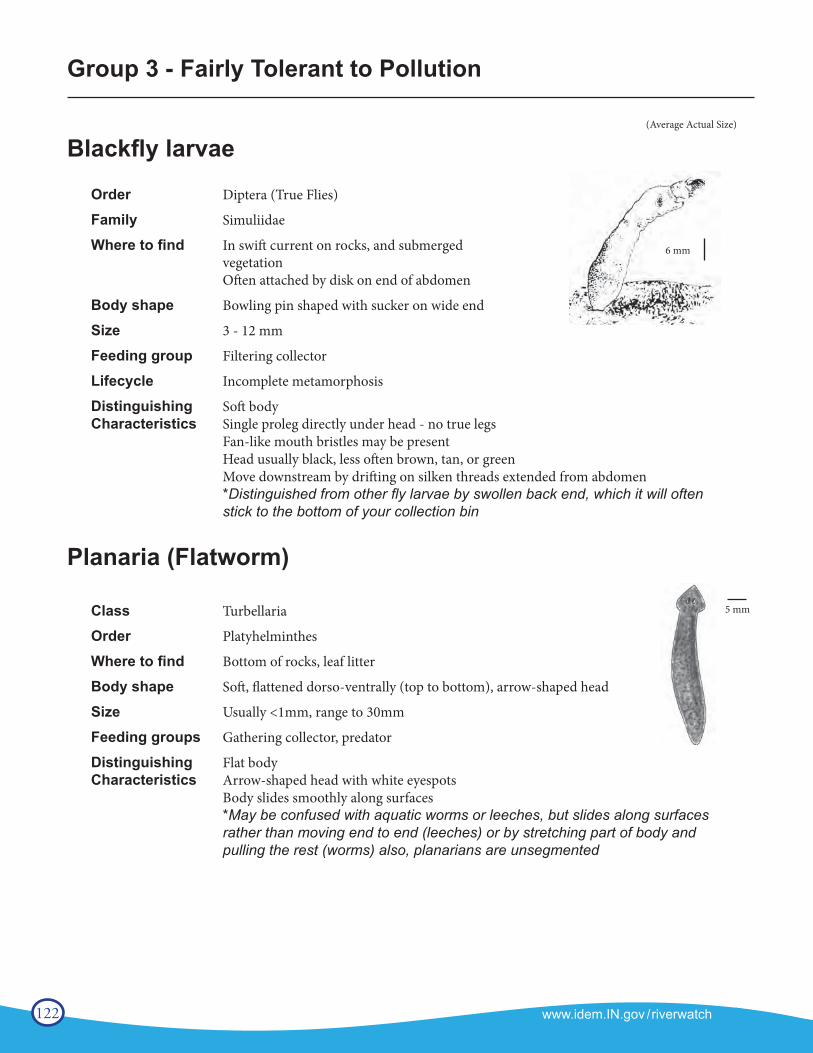
122 www.idem.IN.gov /riverwatchwww.idem.IN.gov/riverwatch 81
(Average Actual Size)
Blackfly larvae
Order Diptera (True Flies)
Family Simuliidae
Where to find In swift current on rocks, and submerged vegetation
Often attached by disk on end of abdomen
Body shape Bowling pin shaped with sucker on wide end
Size 3 - 12 mm
Feeding group Filtering collector
Lifecycle Incomplete metamorphosis
Distinguishing Soft bodyCharacteristics Single proleg directly under head - no true legs Fan-like mouth bristles may be present Head usually black, less often brown, tan, or green Move downstream by drifting on silken threads extended from abdomen *Distinguished from other fly larvae by swollen back end, which it will often stick to the bottom of your collection bin
Planaria (Flatworm)
Class Turbellaria
Order Platyhelminthes
Where to find Bottom of rocks, leaf litter
Body shape Soft, flattened dorso-ventrally (top to bottom), arrow-shaped head
Size Usually <1mm, range to 30mm
Feeding groups Gathering collector, predator
Distinguishing Flat bodyCharacteristics Arrow-shaped head with white eyespots Body slides smoothly along surfaces *May be confused with aquatic worms or leeches, but slides along surfaces rather than moving end to end (leeches) or by stretching part of body and pulling the rest (worms) also, planarians are unsegmented
6 mm
5 mm
Group 3 - Fairly Tolerant to Pollution
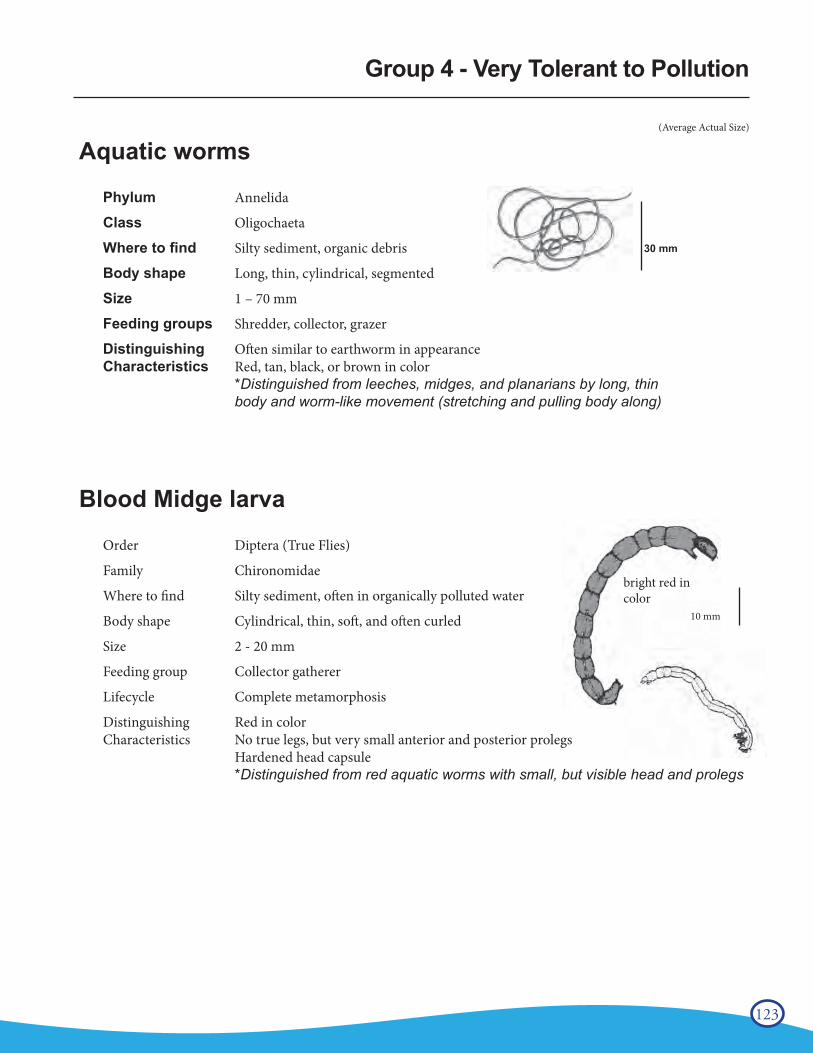
123www.idem.IN.gov/riverwatch82
(Average Actual Size)
Aquatic worms
Phylum Annelida
Class Oligochaeta
Where to find Silty sediment, organic debris
Body shape Long, thin, cylindrical, segmented
Size 1 – 70 mm
Feeding groups Shredder, collector, grazer
Distinguishing Often similar to earthworm in appearanceCharacteristics Red, tan, black, or brown in color *Distinguished from leeches, midges, and planarians by long, thin body and worm-like movement (stretching and pulling body along)
Blood Midge larva
Order Diptera (True Flies)
Family Chironomidae
Where to find Silty sediment, often in organically polluted water
Body shape Cylindrical, thin, soft, and often curled
Size 2 - 20 mm
Feeding group Collector gatherer
Lifecycle Complete metamorphosis
Distinguishing Red in colorCharacteristics No true legs, but very small anterior and posterior prolegs Hardened head capsule *Distinguished from red aquatic worms with small, but visible head and prolegs
30 mm
bright red in color
10 mm
Group 4 - Very Tolerant to Pollution
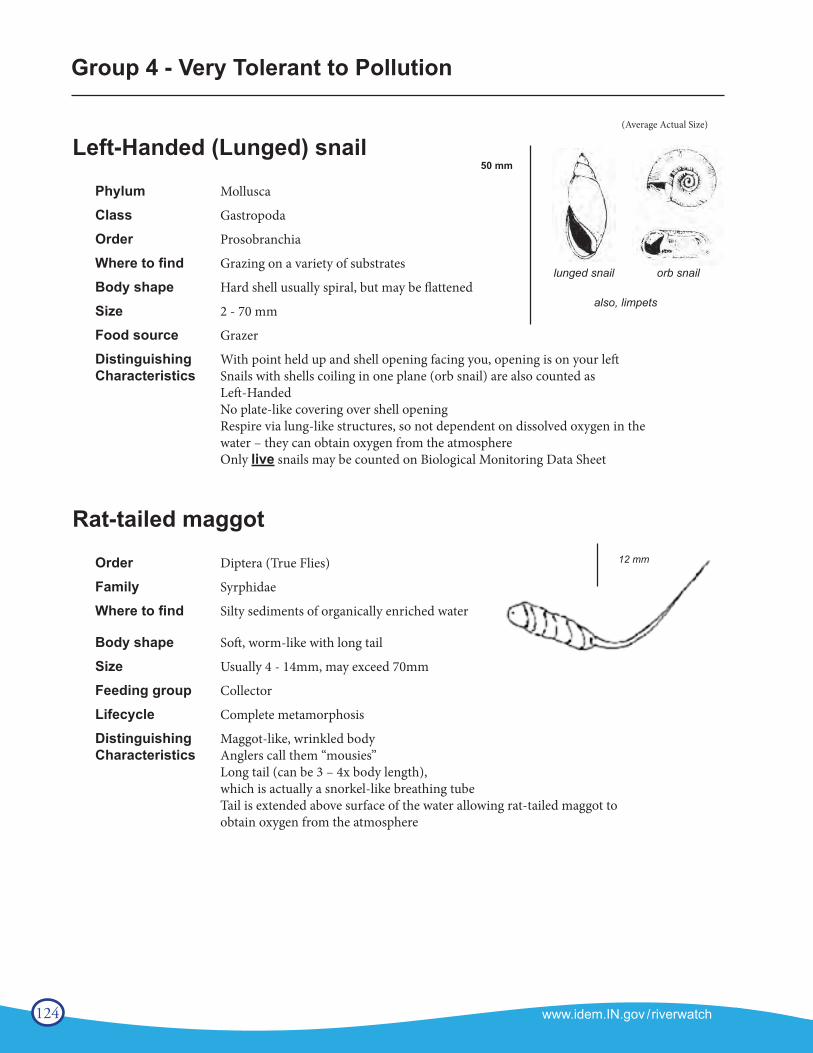
124 www.idem.IN.gov /riverwatch
www.idem.IN.gov/riverwatch 83
(Average Actual Size)
Left-Handed (Lunged) snail
Phylum Mollusca
Class Gastropoda
Order Prosobranchia
Where to find Grazing on a variety of substrates
Body shape Hard shell usually spiral, but may be flattened
Size 2 - 70 mm
Food source Grazer
Distinguishing With point held up and shell opening facing you, opening is on your left Characteristics Snails with shells coiling in one plane (orb snail) are also counted as Left-Handed No plate-like covering over shell opening Respire via lung-like structures, so not dependent on dissolved oxygen in the water – they can obtain oxygen from the atmosphere Only live snails may be counted on Biological Monitoring Data Sheet
Rat-tailed maggot
Order Diptera (True Flies)
Family Syrphidae
Where to find Silty sediments of organically enriched water
Body shape Soft, worm-like with long tail
Size Usually 4 - 14mm, may exceed 70mm
Feeding group Collector
Lifecycle Complete metamorphosis
Distinguishing Maggot-like, wrinkled bodyCharacteristics Anglers call them “mousies” Long tail (can be 3 – 4x body length), which is actually a snorkel-like breathing tube Tail is extended above surface of the water allowing rat-tailed maggot to obtain oxygen from the atmosphere
50 mm
also, limpets
lunged snail orb snail
12 mm
Group 4 - Very Tolerant to Pollution
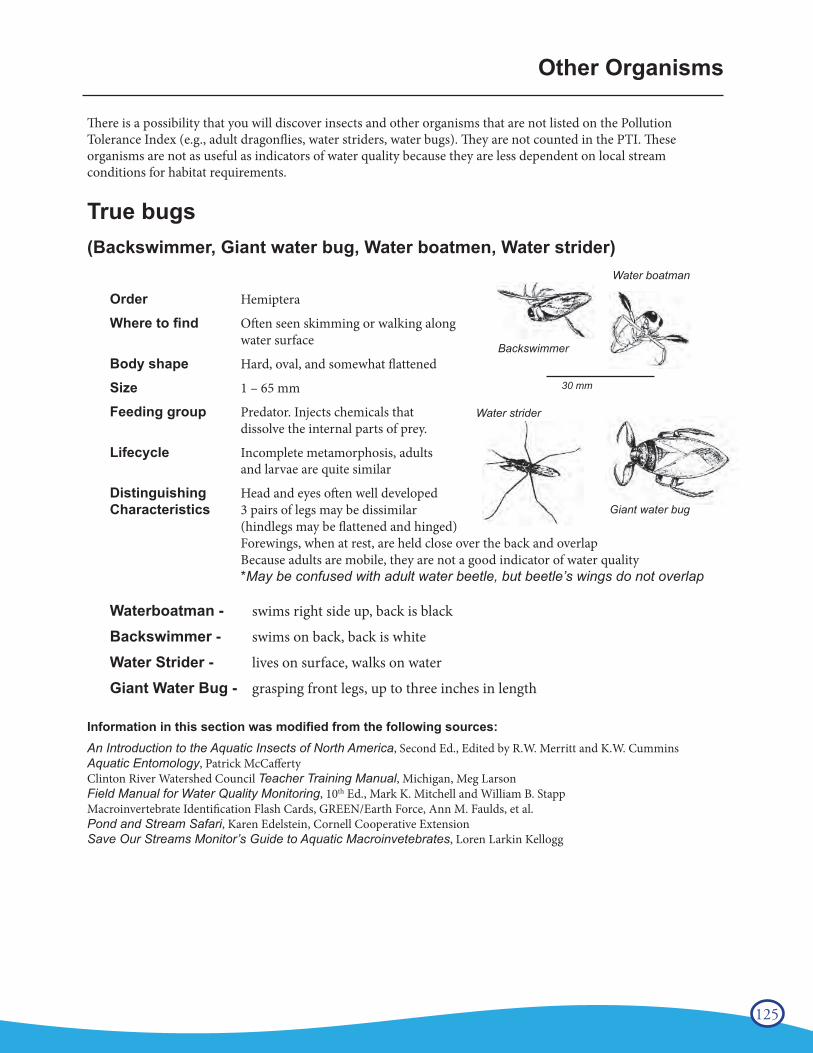
125
www.idem.IN.gov/riverwatch84
There is a possibility that you will discover insects and other organisms that are not listed on the Pollution Tolerance Index (e.g., adult dragonflies, water striders, water bugs). They are not counted in the PTI. These organisms are not as useful as indicators of water quality because they are less dependent on local stream conditions for habitat requirements.
True bugs (Backswimmer, Giant water bug, Water boatmen, Water strider)
Order Hemiptera
Where to find Often seen skimming or walking along water surface
Body shape Hard, oval, and somewhat flattened
Size 1 – 65 mm
Feeding group Predator. Injects chemicals that dissolve the internal parts of prey.
Lifecycle Incomplete metamorphosis, adults and larvae are quite similar
Distinguishing Head and eyes often well developedCharacteristics 3 pairs of legs may be dissimilar (hindlegs may be flattened and hinged) Forewings, when at rest, are held close over the back and overlap Because adults are mobile, they are not a good indicator of water quality *May be confused with adult water beetle, but beetle’s wings do not overlap
Waterboatman - swims right side up, back is black
Backswimmer - swims on back, back is white
Water Strider - lives on surface, walks on water
Giant Water Bug - grasping front legs, up to three inches in length
Information in this section was modified from the following sources:An Introduction to the Aquatic Insects of North America, Second Ed., Edited by R.W. Merritt and K.W. CumminsAquatic Entomology, Patrick McCaffertyClinton River Watershed Council Teacher Training Manual, Michigan, Meg LarsonField Manual for Water Quality Monitoring, 10th Ed., Mark K. Mitchell and William B. StappMacroinvertebrate Identification Flash Cards, GREEN/Earth Force, Ann M. Faulds, et al.Pond and Stream Safari, Karen Edelstein, Cornell Cooperative ExtensionSave Our Streams Monitor’s Guide to Aquatic Macroinvetebrates, Loren Larkin Kellogg
Other Organisms
Backswimmer
Water strider
Giant water bug
30 mm
Water boatman
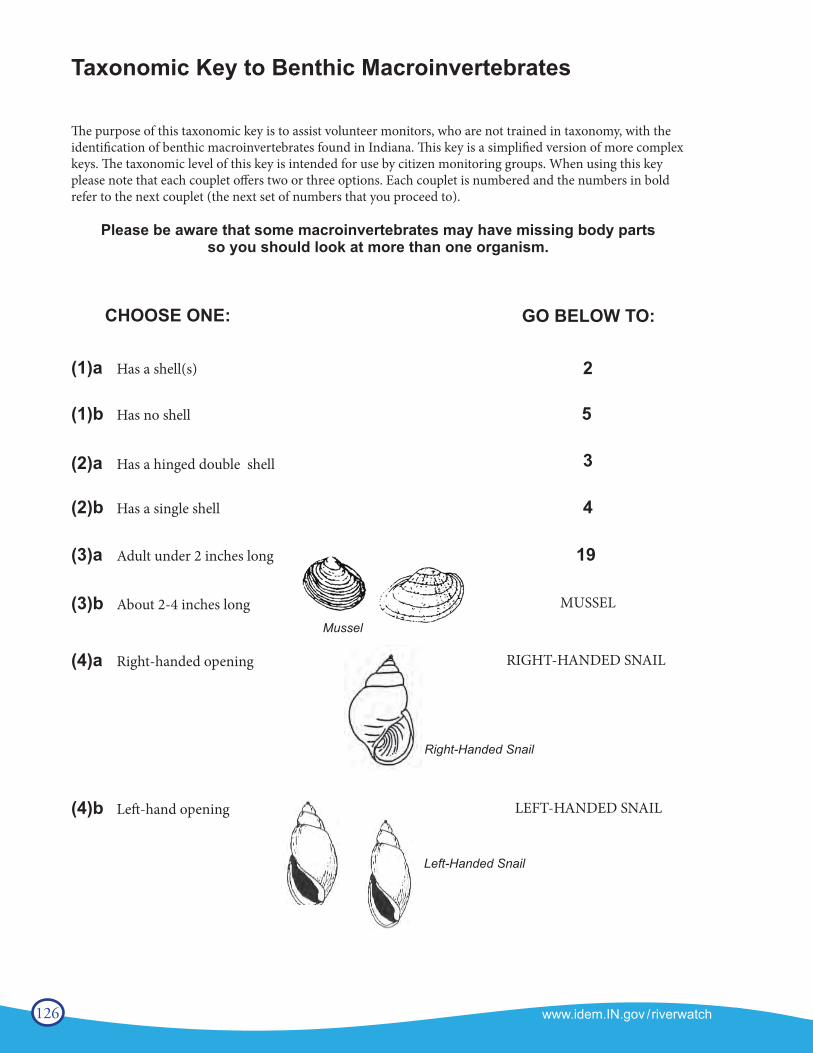
126 www.idem.IN.gov /riverwatch
www.idem.IN.gov/riverwatch 85
GO BELOW TO:
The purpose of this taxonomic key is to assist volunteer monitors, who are not trained in taxonomy, with the identification of benthic macroinvertebrates found in Indiana. This key is a simplified version of more complex keys. The taxonomic level of this key is intended for use by citizen monitoring groups. When using this key please note that each couplet offers two or three options. Each couplet is numbered and the numbers in bold refer to the next couplet (the next set of numbers that you proceed to).
Please be aware that some macroinvertebrates may have missing body parts so you should look at more than one organism.
(1)a Has a shell(s) 2
(4)a Right-handed opening RIGHT-HANDED SNAIL
Right-Handed Snail
(4)b Left-hand opening LEFT-HANDED SNAIL
Left-Handed Snail
(1)b Has no shell 5
(2)a Has a hinged double shell
(2)b Has a single shell 4
(3)a Adult under 2 inches long 19
(3)b About 2-4 inches long MUSSEL
Taxonomic Key to Benthic Macroinvertebrates
CHOOSE ONE:
3
Mussel
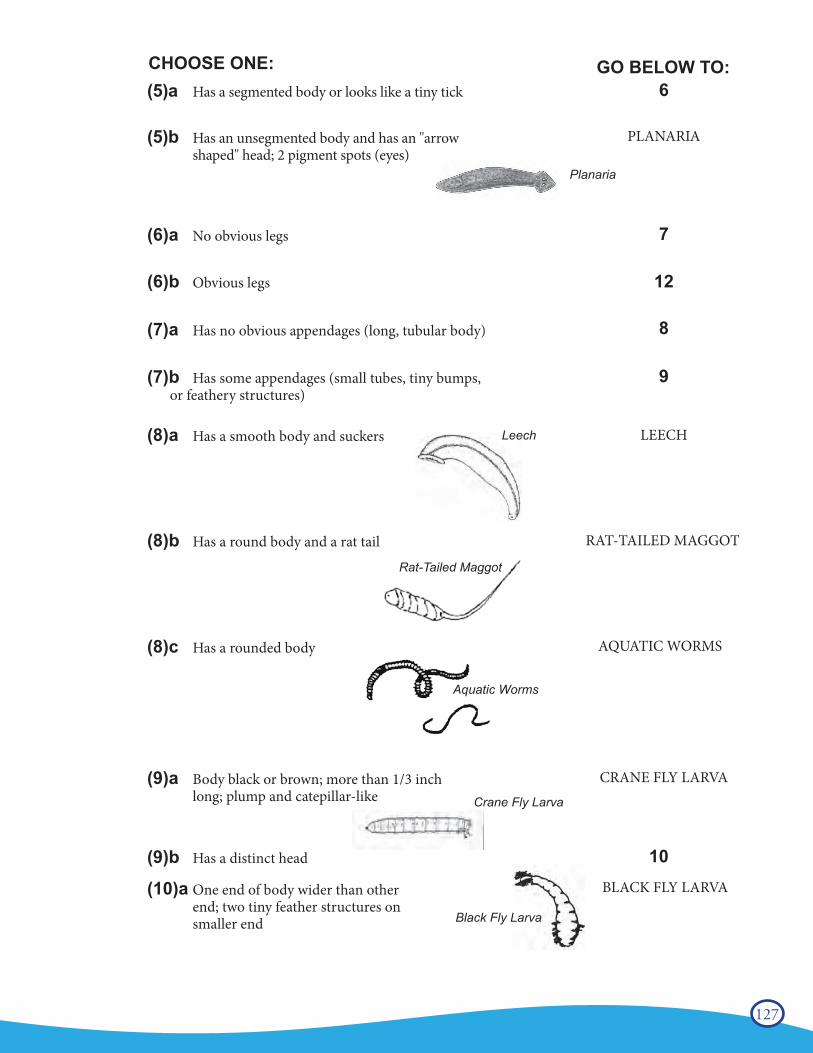
127
www.idem.IN.gov/riverwatch86
GO BELOW TO:6(5)a Has a segmented body or looks like a tiny tick
(5)b Has an unsegmented body and has an "arrow shaped" head; 2 pigment spots (eyes)
PLANARIA
Planaria
(6)a No obvious legs 7
(6)b Obvious legs
(7)a Has no obvious appendages (long, tubular body)
12
8
(7)b Has some appendages (small tubes, tiny bumps, or feathery structures)
9
LEECH(8)a Has a smooth body and suckers Leech
RAT-TAILED MAGGOT
Rat-Tailed Maggot
(8)b Has a round body and a rat tail
(8)c Has a rounded body AQUATIC WORMS
Aquatic Worms
CRANE FLY LARVA(9)a Body black or brown; more than 1/3 inch long; plump and catepillar-like
(9)b Has a distinct head 10
CHOOSE ONE:
BLACK FLY LARVA (10)a One end of body wider than other end; two tiny feather structures on smaller end Black Fly Larva
Crane Fly Larva
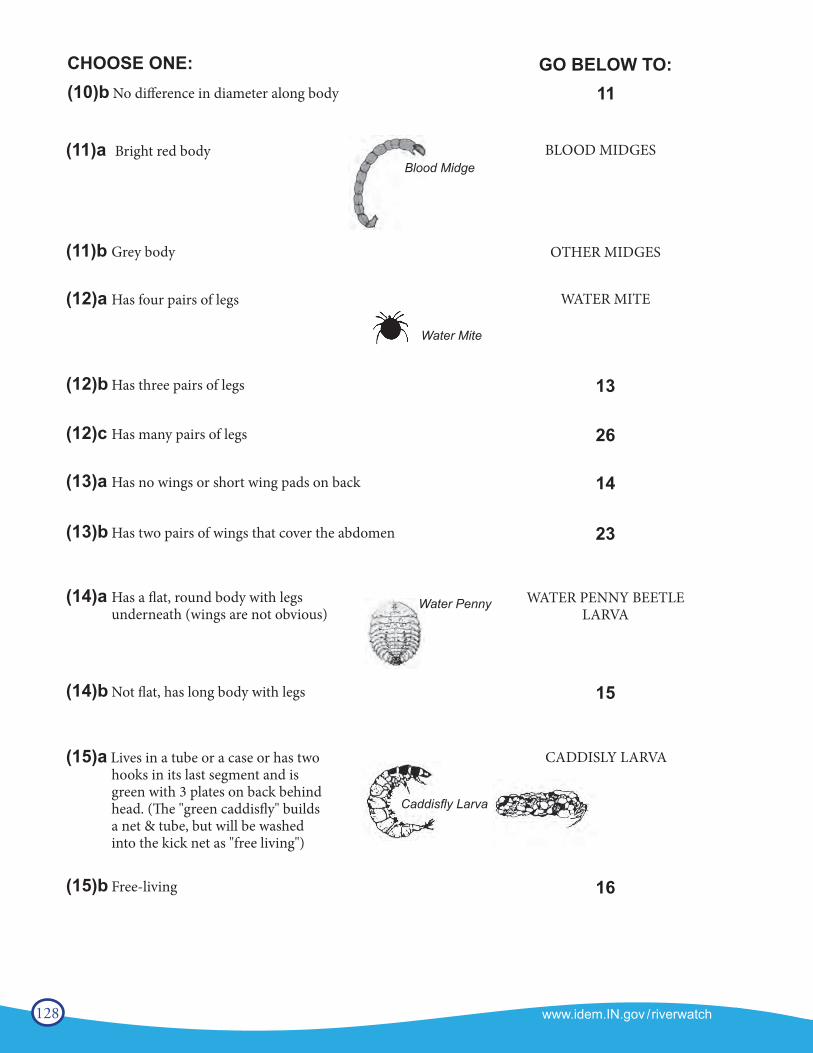
128 www.idem.IN.gov /riverwatch
www.idem.IN.gov/riverwatch 87
GO BELOW TO:CHOOSE ONE:(10)b No difference in diameter along body 11
(11)a Bright red body BLOOD MIDGESBlood Midge
(11)b Grey body OTHER MIDGES
(12)a Has four pairs of legs WATER MITE
Water Mite
(12)b Has three pairs of legs 13
(12)c Has many pairs of legs 26
(13)a Has no wings or short wing pads on back 14
(13)b Has two pairs of wings that cover the abdomen 23
WATER PENNY BEETLE LARVA
(14)a Has a flat, round body with legs underneath (wings are not obvious)
Water Penny
(14)b Not flat, has long body with legs 15
(15)a Lives in a tube or a case or has two hooks in its last segment and is green with 3 plates on back behind head. (The "green caddisfly" builds a net & tube, but will be washed into the kick net as "free living")
CADDISLY LARVA
Caddisfly Larva
(15)b Free-living 16
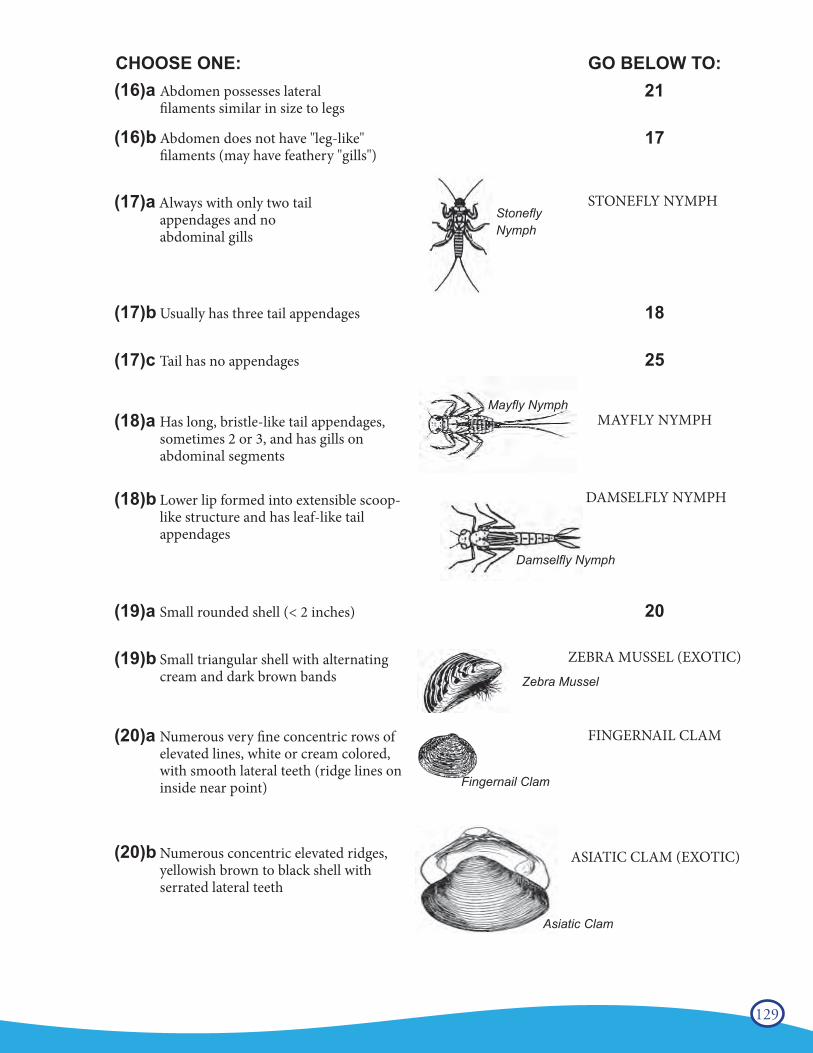
129
www.idem.IN.gov/riverwatch88
GO BELOW TO:CHOOSE ONE:(16)a Abdomen possesses lateral filaments similar in size to legs
21
(16)b Abdomen does not have "leg-like" filaments (may have feathery "gills")
17
(17)a Always with only two tail appendages and no abdominal gills
STONEFLY NYMPHStonefly Nymph
(17)b Usually has three tail appendages 18
(17)c Tail has no appendages 25
MAYFLY NYMPH (18)a Has long, bristle-like tail appendages, sometimes 2 or 3, and has gills on abdominal segments
Mayfly Nymph
(18)b Lower lip formed into extensible scoop-like structure and has leaf-like tail appendages
DAMSELFLY NYMPH
20
(19)b Small triangular shell with alternating cream and dark brown bands
ZEBRA MUSSEL (EXOTIC)
(20)a Numerous very fine concentric rows of elevated lines, white or cream colored, with smooth lateral teeth (ridge lines on inside near point)
FINGERNAIL CLAM
(19)a Small rounded shell (< 2 inches)
Fingernail Clam
Zebra Mussel
(20)b Numerous concentric elevated ridges, yellowish brown to black shell with serrated lateral teeth
ASIATIC CLAM (EXOTIC)
Asiatic Clam
Damselfly Nymph
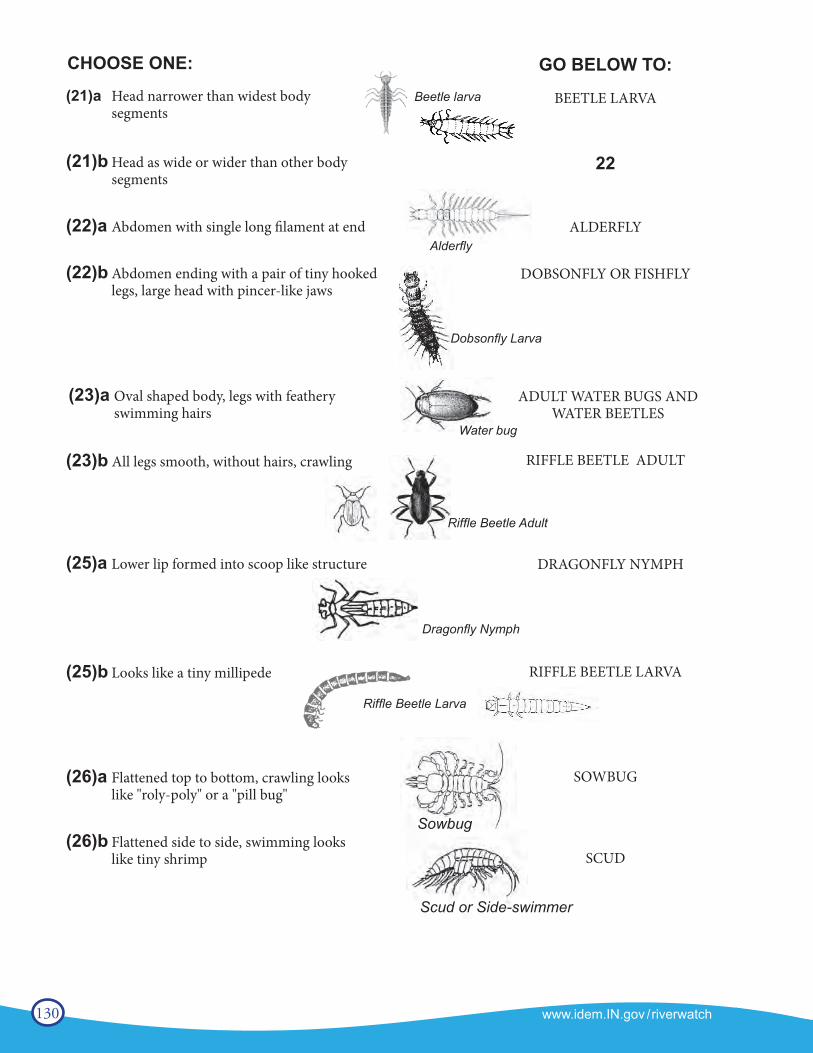
130 www.idem.IN.gov /riverwatch
www.idem.IN.gov/riverwatch 89
CHOOSE ONE:
(21)a Head narrower than widest body segments
BEETLE LARVA
(21)b Head as wide or wider than other body segments
22
(22)a Abdomen with single long filament at end ALDERFLY
(22)b Abdomen ending with a pair of tiny hooked legs, large head with pincer-like jaws
DOBSONFLY OR FISHFLY
Dobsonfly Larva
(23)a Oval shaped body, legs with feathery swimming hairs
ADULT WATER BUGS AND WATER BEETLES
(23)b All legs smooth, without hairs, crawling RIFFLE BEETLE ADULT
Riffle Beetle Adult
GO BELOW TO:
(25)a Lower lip formed into scoop like structure
Dragonfly Nymph
(25)b Looks like a tiny millipede RIFFLE BEETLE LARVA
DRAGONFLY NYMPH
Beetle larva
Alderfly
Water bug
(26)a Flattened top to bottom, crawling looks like "roly-poly" or a "pill bug"
SOWBUG
(26)b Flattened side to side, swimming looks like tiny shrimp SCUD
Sowbug
Scud or Side-swimmer
Riffle Beetle Larva
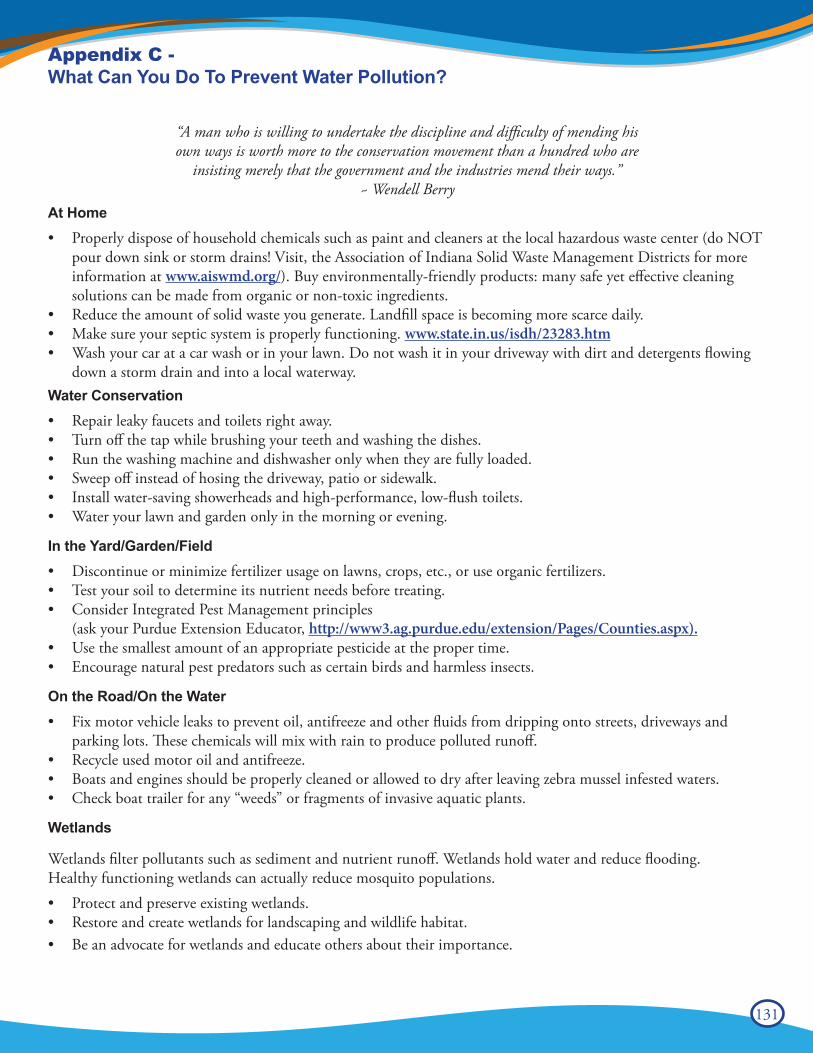
131
Appendix C - What Can You Do To Prevent Water Pollution?
“A man who is willing to undertake the discipline and difficulty of mending hisown ways is worth more to the conservation movement than a hundred who are
insisting merely that the government and the industries mend their ways.”~ Wendell Berry
At Home• Properly dispose of household chemicals such as paint and cleaners at the local hazardous waste center (do NOT
pour down sink or storm drains! Visit, the Association of Indiana Solid Waste Management Districts for more information at www.aiswmd.org/). Buy environmentally-friendly products: many safe yet effective cleaning solutions can be made from organic or non-toxic ingredients.
• Reduce the amount of solid waste you generate. Landfill space is becoming more scarce daily.• Make sure your septic system is properly functioning. www.state.in.us/isdh/23283.htm• Wash your car at a car wash or in your lawn. Do not wash it in your driveway with dirt and detergents flowing
down a storm drain and into a local waterway.Water Conservation• Repair leaky faucets and toilets right away.• Turn off the tap while brushing your teeth and washing the dishes.• Run the washing machine and dishwasher only when they are fully loaded.• Sweep off instead of hosing the driveway, patio or sidewalk.• Install water-saving showerheads and high-performance, low-flush toilets.• Water your lawn and garden only in the morning or evening.
In the Yard/Garden/Field• Discontinue or minimize fertilizer usage on lawns, crops, etc., or use organic fertilizers.• Test your soil to determine its nutrient needs before treating.• Consider Integrated Pest Management principles (ask your Purdue Extension Educator, http://www3.ag.purdue.edu/extension/Pages/Counties.aspx).• Use the smallest amount of an appropriate pesticide at the proper time.• Encourage natural pest predators such as certain birds and harmless insects.
On the Road/On the Water• Fix motor vehicle leaks to prevent oil, antifreeze and other fluids from dripping onto streets, driveways and
parking lots. These chemicals will mix with rain to produce polluted runoff.• Recycle used motor oil and antifreeze.• Boats and engines should be properly cleaned or allowed to dry after leaving zebra mussel infested waters.• Check boat trailer for any “weeds” or fragments of invasive aquatic plants.
Wetlands
Wetlands filter pollutants such as sediment and nutrient runoff. Wetlands hold water and reduce flooding. Healthy functioning wetlands can actually reduce mosquito populations.• Protect and preserve existing wetlands.• Restore and create wetlands for landscaping and wildlife habitat.• Be an advocate for wetlands and educate others about their importance.
132 www.idem.IN.gov /riverwatch
Best Management Practices (BMPs)Agricultural, urban/residential, and construction BMPs are systems or activities that are practiced to control and prevent erosion and nonpoint source pollution. They generally involve various combinations of the following approaches:• Minimize mixing of rain and pollutants (e.g., animal waste management, fertilizer and pesticide/herbicide
management, integrated pest management).• Restrict water runoff, thereby restricting transportation of pollutants through the use of:
¤ Porous pavement, ¤ Ground cover management, ¤ Conservation tillage (any tillage and planting system that covers 30% or more of the soil surface with crop
residue after planting); and, ¤ No-till (leaves the soil undisturbed from harvest to planting except for nutrient injection: Planting or drilling
is accomplished in a narrow seedbed or slot created by special equipment. Weed control is accomplished primarily with herbicides).
• Trap/collect pollutants to prevent them from entering waterbodies or groundwater through the use of: ¤ Silt fences’ ¤ Detention sedimentation basins, ¤ Riparian buffer strips (streamside plantings of trees, shrubs, and grasses); and, ¤ Grassed waterways (strips of grass seeded in areas of cropland where water concentrates and flows off a field).
AdvocacyAdvocacy is the act of pleading for, supporting or recommending a cause or course of action. Becoming anadvocate may require seeking out information about what laws exist and who is instrumental in deciding orenforcing those laws. Be sure you are well informed before pursuing a course of action. Get involved!• To influence new or existing regulations, attend public comment meetings and participate in discussion (avoid
opinionated comments, make articulate ones), write well-written letters, and/or arrange face-to-face meetings with rule makers (i.e. legislators, city/county council members, zoning board members).
• Participate in your neighborhood organization, watershed organization, land trust, local or state-wide river/stream/lake/wetland protection organization (or START one-http://inwater.agriculture.purdue.edu/huc_group/).
• Participate in storm drain stenciling programs (or START one!).• Arrange and/or sponsor public presentations by respected experts.• Serve on a decision-making board or run for office.
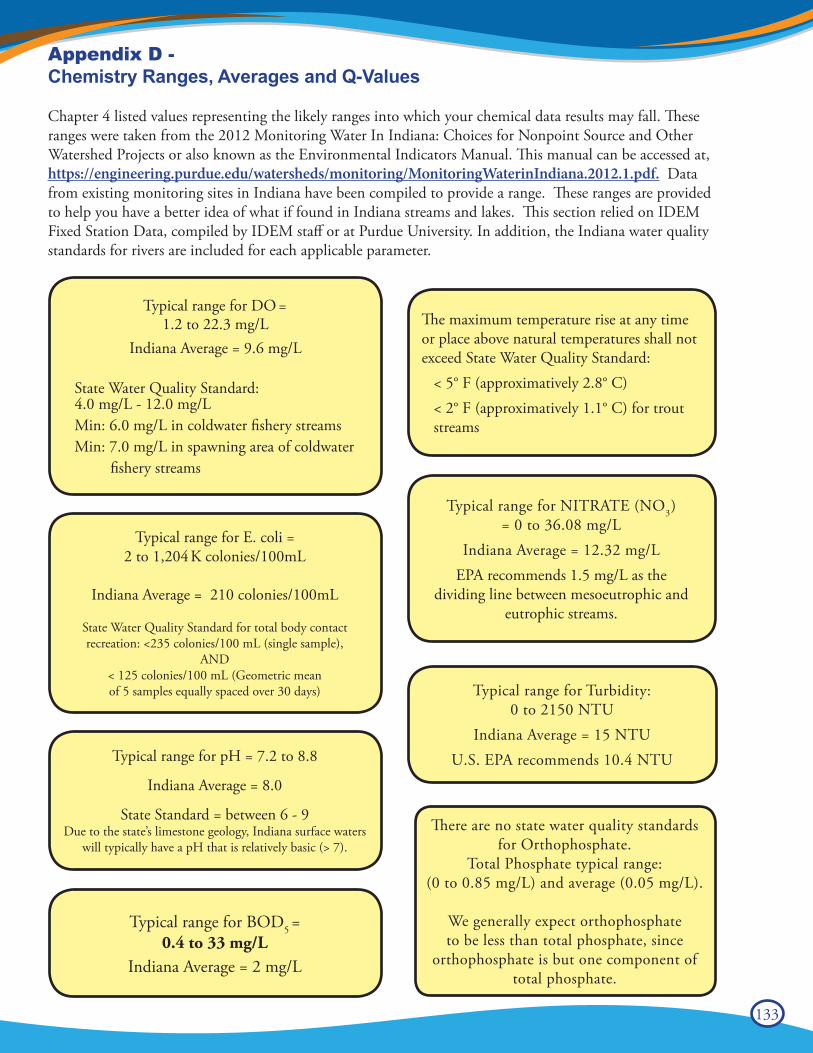
133
Appendix D - Chemistry Ranges, Averages and Q-Values
Chapter 4 listed values representing the likely ranges into which your chemical data results may fall. These ranges were taken from the 2012 Monitoring Water In Indiana: Choices for Nonpoint Source and Other Watershed Projects or also known as the Environmental Indicators Manual. This manual can be accessed at, https://engineering.purdue.edu/watersheds/monitoring/MonitoringWaterinIndiana.2012.1.pdf. Data from existing monitoring sites in Indiana have been compiled to provide a range. These ranges are provided to help you have a better idea of what if found in Indiana streams and lakes. This section relied on IDEM Fixed Station Data, compiled by IDEM staff or at Purdue University. In addition, the Indiana water quality standards for rivers are included for each applicable parameter.
Typical range for DO =1.2 to 22.3 mg/L
Indiana Average = 9.6 mg/L
State Water Quality Standard: 4.0 mg/L - 12.0 mg/LMin: 6.0 mg/L in coldwater fishery streamsMin: 7.0 mg/L in spawning area of coldwater fishery streams
Typical range for BOD5 =0.4 to 33 mg/L
Indiana Average = 2 mg/L
The maximum temperature rise at any time or place above natural temperatures shall not exceed State Water Quality Standard:
< 5° F (approximatively 2.8° C) < 2° F (approximatively 1.1° C) for trout streams
Typical range for NITRATE (NO3)= 0 to 36.08 mg/L
Indiana Average = 12.32 mg/LEPA recommends 1.5 mg/L as the
dividing line between mesoeutrophic and eutrophic streams.
Typical range for pH = 7.2 to 8.8
Indiana Average = 8.0
State Standard = between 6 - 9Due to the state’s limestone geology, Indiana surface waters
will typically have a pH that is relatively basic (> 7).
Typical range for E. coli =2 to 1,204 K colonies/100mL
Indiana Average = 210 colonies/100mL
State Water Quality Standard for total body contact recreation: <235 colonies/100 mL (single sample),
AND< 125 colonies/100 mL (Geometric meanof 5 samples equally spaced over 30 days) Typical range for Turbidity:
0 to 2150 NTUIndiana Average = 15 NTU
U.S. EPA recommends 10.4 NTU
There are no state water quality standards for Orthophosphate.
Total Phosphate typical range:(0 to 0.85 mg/L) and average (0.05 mg/L).
We generally expect orthophosphate to be less than total phosphate, since
orthophosphate is but one component of total phosphate.
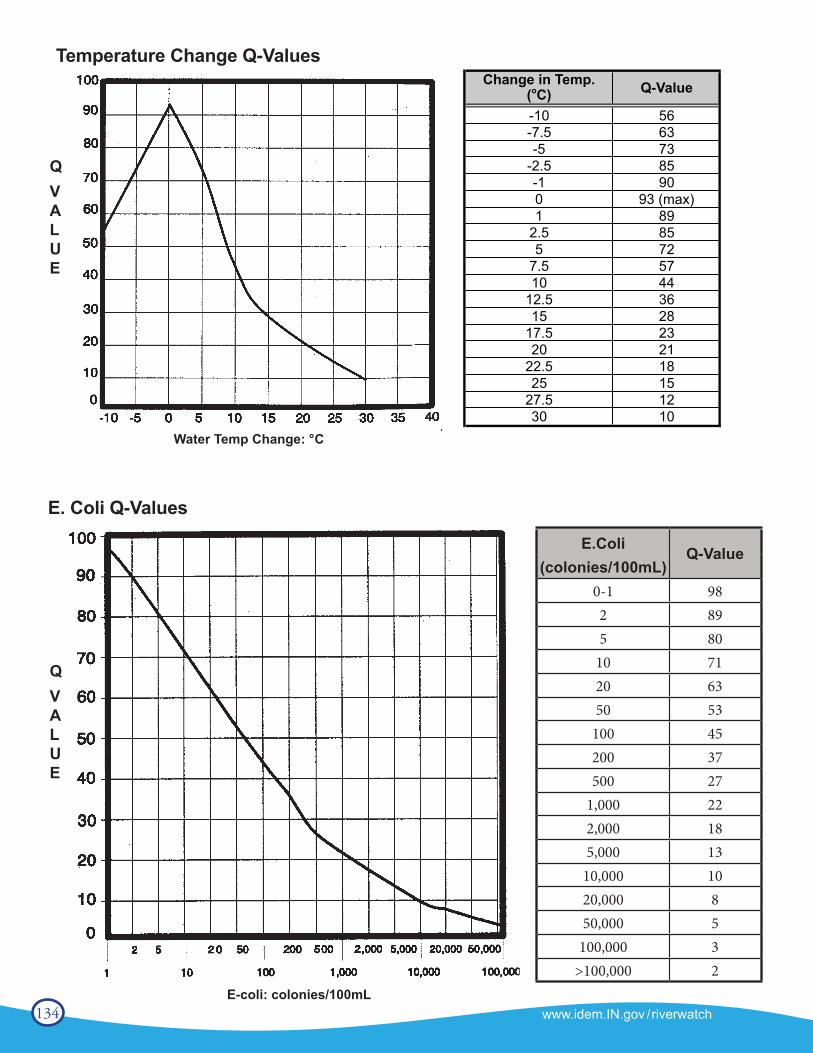
134 www.idem.IN.gov /riverwatch
Temperature Change Q-ValuesChange in Temp.
(oC)
-10 56
-7.5 63
-5 73
-2.5 85
-1 90
0 93 (max)
1 89
2.5 85
5 72
7.5 57
10 44
12.5 36
15 28
17.5 23
20 21
22.5 18
25 15
27.5 12
30 10
Q-Value
Water Temp Change: ° C
QVALUE
E. Coli Q-Values
E.Coli Q-Value(colonies/100mL)
0-1 982 895 80
10 7120 6350 53
100 45200 37500 27
1,000 222,000 185,000 13
10,000 1020,000 850,000 5
100,000 3>100,000 2
QVALUE
E-coli: colonies/100mL
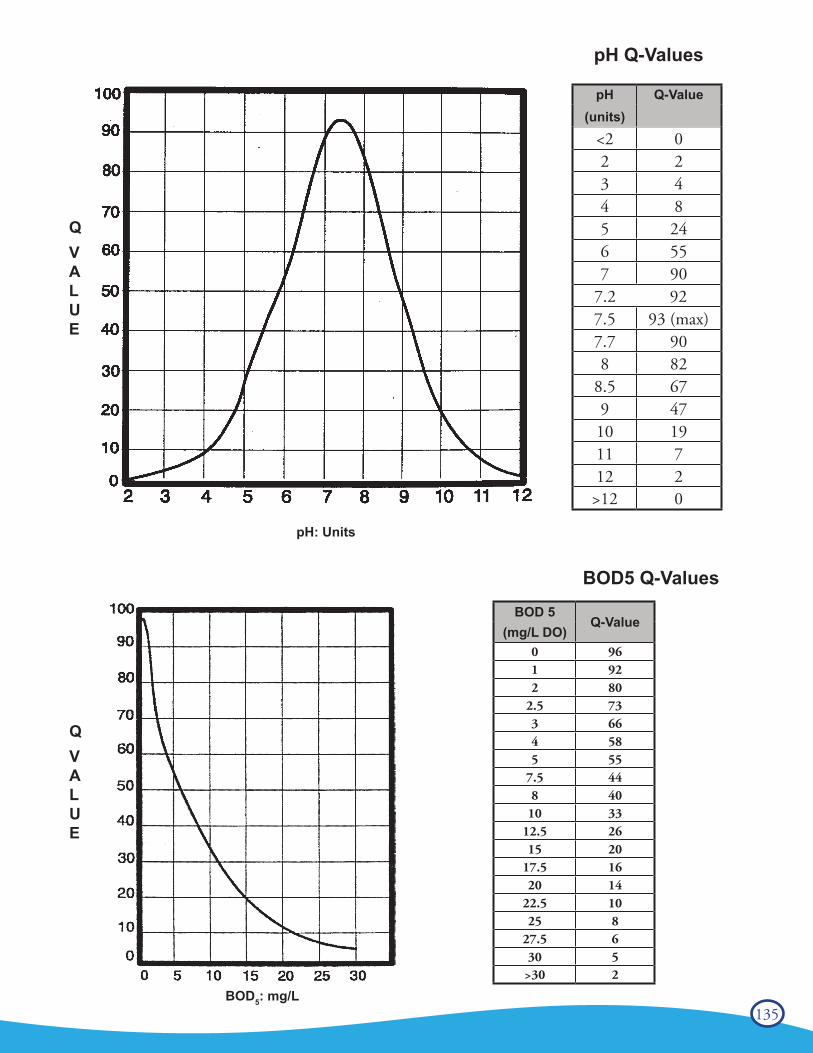
135
pH: Units
pH Q-Values
QVALUE
pH Q-Value(units)
<2 02 23 44 85 246 557 90
7.2 927.5 93 (max)7.7 908 82
8.5 679 4710 1911 712 2>12 0
BOD5: mg/L
QVALUE
BOD 5Q-Value
(mg/L DO)0 961 922 80
2.5 733 664 585 55
7.5 448 40
10 3312.5 2615 20
17.5 1620 14
22.5 1025 8
27.5 630 5
>30 2
BOD5 Q-Values
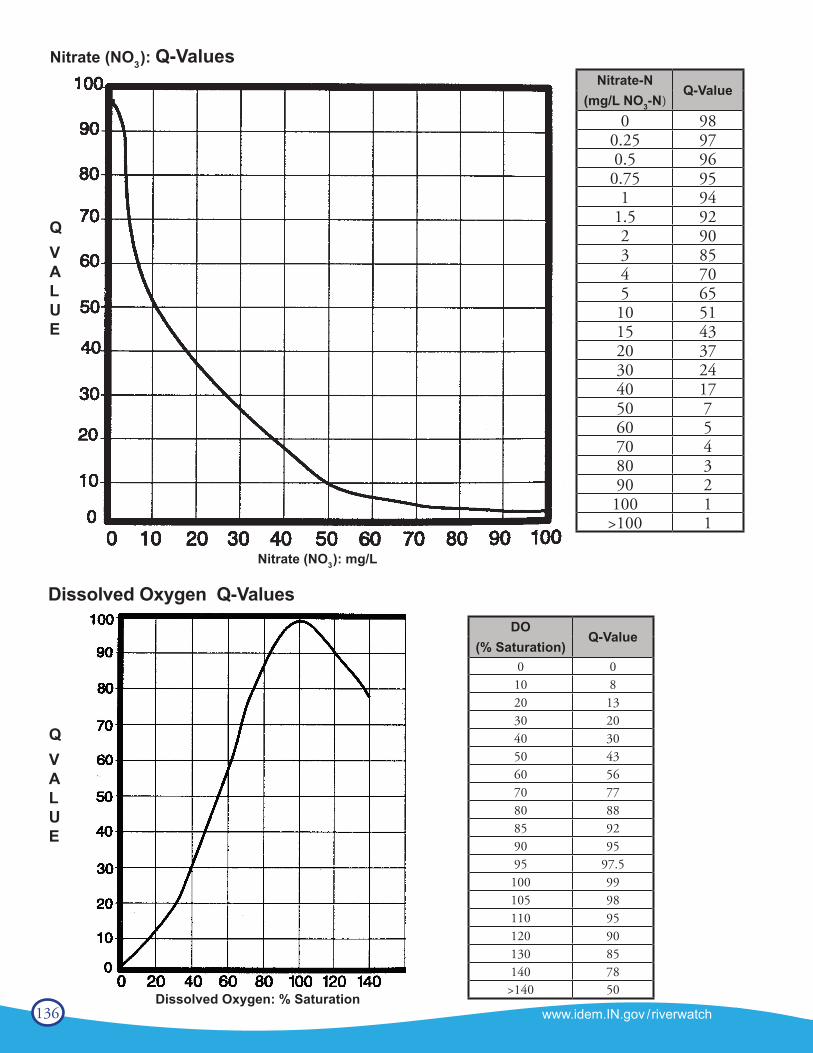
136 www.idem.IN.gov /riverwatch
Nitrate (NO3): Q-Values
QVALUE
Nitrate-NQ-Value
(mg/L NO3-N)0 98
0.25 970.5 960.75 95
1 941.5 922 903 854 705 6510 5115 4320 3730 2440 1750 760 570 480 390 2100 1>100 1
Nitrate (NO3): mg/L
Dissolved Oxygen Q-Values
Dissolved Oxygen: % Saturation
QVALUE
DOQ-Value
(% Saturation)0 010 820 1330 2040 3050 4360 5670 7780 8885 9290 9595 97.5100 99105 98110 95120 90130 85140 78>140 50
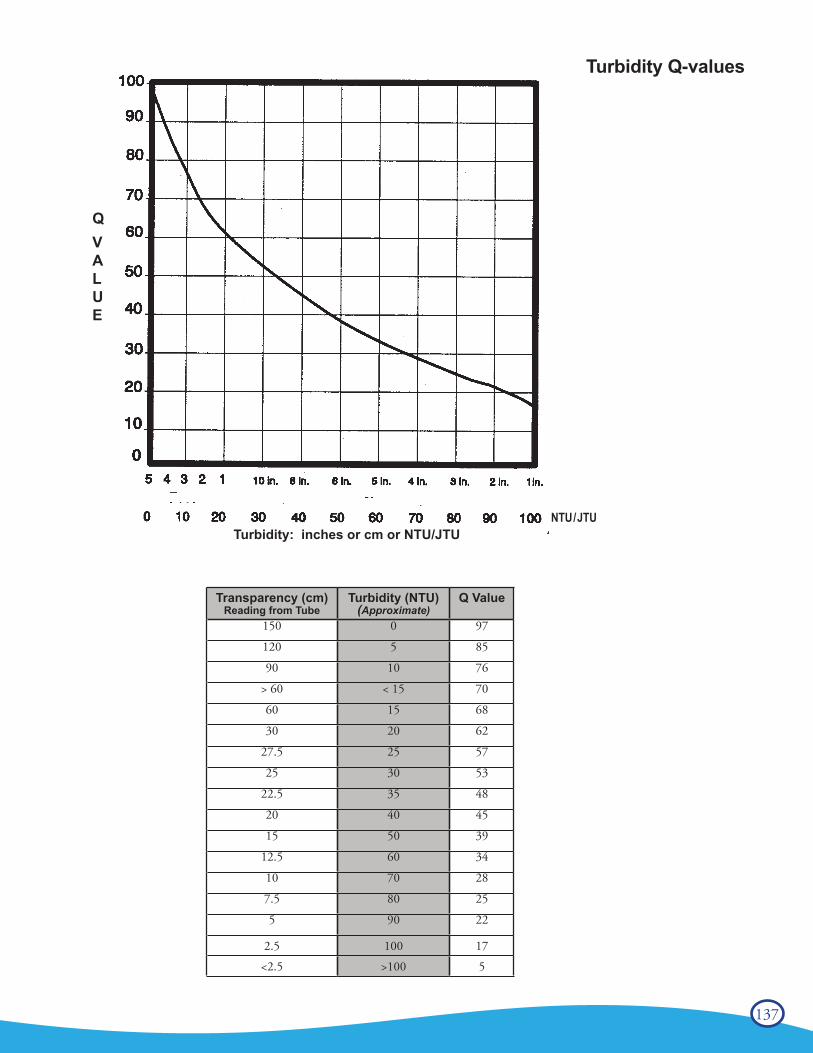
137
Turbidity Q-values
QVALUE
NTU/JTUTurbidity: inches or cm or NTU/JTU
Transparency (cm)Reading from Tube
Turbidity (NTU)(Approximate)
Q Value
150 0 97
120 5 85
90 10 76
> 60 < 15 70
60 15 68
30 20 62
27.5 25 57
25 30 53
22.5 35 48
20 40 45
15 50 39
12.5 60 34
10 70 28
7.5 80 25
5 90 22
2.5 100 17
<2.5 >100 5
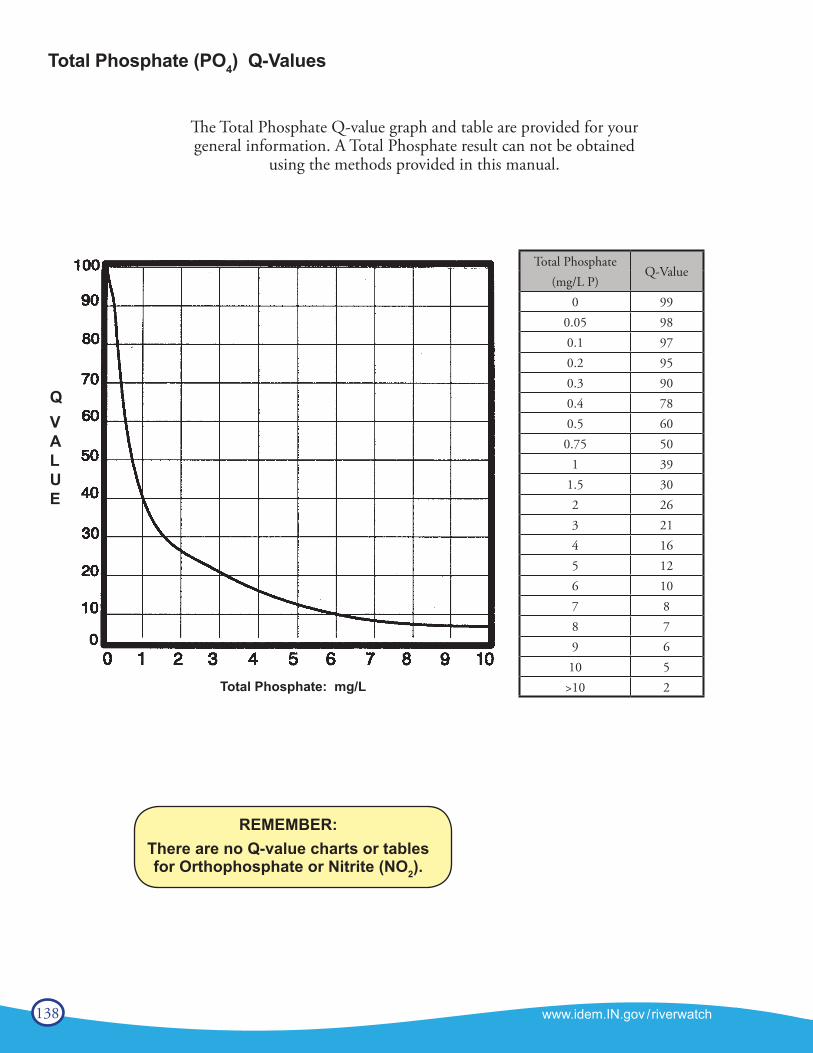
138 www.idem.IN.gov /riverwatch
Total Phosphate: mg/L
Total PhosphateQ-Value
(mg/L P)0 99
0.05 980.1 970.2 950.3 900.4 780.5 600.75 50
1 391.5 302 263 214 165 126 107 88 79 610 5>10 2
The Total Phosphate Q-value graph and table are provided for your general information. A Total Phosphate result can not be obtained
using the methods provided in this manual.
REMEMBER:There are no Q-value charts or tablesfor Orthophosphate or Nitrite (NO2).
Total Phosphate (PO4) Q-Values
QVALUE
139
Appendix E - GlossaryA
acid mine drainage: Waters of low pH (less than 6) from mining areas.algae: Small plants which lack roots, stems, flowers, and leaves; living mainly in water and using the sun as anenergy source.alkalinity: A measurement of water’s ability to neutralize acid.aquatic habitat: All of the areas in a stream, lake or wetland that are occupied by an organism, population orcommunity.aquifer: Any geological formation containing water, especially one that supplies water for wells, springs, etc.
Bbanks: The portion of the stream channel which restricts the movement of the water out of the channel duringtimes of normal water depth. This area of the stream is characterized as being the exposed terrestrial areas oneither side of the stream.benthic: An adjective which describes all things associated with the bottom, or sediments of a stream.bedrock: Unbroken solid rock, overlain in most places by soil or rock fragments.biochemical oxygen demand (BOD): An empirical test in which standardized laboratory proceduresmeasure the oxygen required for the biochemical degradation of organic material, and the oxygen used tooxidize inorganic materials, such as sulfides and ferrous iron.
Cchannelization: The straightening of a stream or the dredging of a new stream channel to which the stream isdiverted. A channelized stream is straight with little or no meanders.class: A taxonomic rank which falls under the taxonomic rank of Order.cobble streambed: A watercourse predominately lined with naturally rounded stones, rounded by the water’saction. Size varies from a hen’s egg to that used as paving stones.complete metamorphosis: The type of insect development that includes four stages; egg, larva, pupa, adult.conservation practice: An engineered structure or management activity that eliminates or reduces an adverseenvironmental effect of a pollutant and conserves soil, water, plant, or animal resources.
DDissolved Oxygen (DO): The amount of oxygen dissolved in water. Generally, proportionately higher amountsof oxygen can be dissolved in colder waters that in warmer waters.drainage basin: The total land area draining to any point in a stream. A drainage basin is composed of manysmaller watersheds.
Eecology: The relationship between living things and their environments or the study of such relationships.effluent: A discharge of partially or completely treated pollutants into the environment; generally used todescribe discharge into the water.emergent plants: Plants rooted in the bottom of the watercourse, that rise above the water surface.erosion: The wearing away of the land surface by wind or water.Escherichia coli (E. Coli): A bacterium of the intestines of warm-blooded organisms, including humans, that D-2is used as an indicator of water pollution for disease producing organisms.eutrophic: A waterbody enriched with nutrients (nitrates and phosphates) and consequently overgrown with plants or algae.eutrophication: Natural eutrophication is the process of lake aging. Cultural eutrophication occurs whennutrients are added from agricultural runoff, sewage, or other sources. lake is filled in with sediment and plants to become swamp, marsh, then dry land)
140 www.idem.IN.gov /riverwatch
Ffecal coliform bacteria: The portion of the coliform group which is present in the gut or feces of warm-bloodedanimals. The presence of fecal coliform bacteria in water is an indication of pollution and potential human healthproblems.floodplain: An area on both sides of a stream where flood waters spread out during high rains. The surface mayappear dry for most of the year, but it is generally occupied by plants that are adapted to wet soils.food chain: A transfer of energy in a sequence of organisms (algae, fish, etc.) in a community in which eachmember of the chain feeds on the member below it.
Hhabitat: The area in which an organism lives.herbaceous vegetation: Plants having a stem that remains soft and succulent during the growing, not woody.
Iincomplete metamorphosis: The type of insect development that consists of three stages; egg stage, a nymphstage and an adult stage.indicator organism: Organisms which respond predictably to various environmental changes, and whose presenceor absence, and abundance, are used as indicators of environmental conditions.inorganic: Any compound not containing carbon.intermittent stream: A watercourse that flows only at certain times of the year, receiving water from springs orsurface sources; also, a watercourse that does not flow continuously, when water losses from evaporation or seepageexceed available stream flow.invertebrate: An organism without a backbone.
JJTUs - Jackson Turbidity Units: a unit of measurement commonly used in electronic turbidity meters thatindicate how far light can penetrate into a water sample before the cloudiness of the sample cuts the light. Similar to NTUs or Nephelometric Turbidity Unit.
Llake: A body of fresh or salt water of considerable size, whose open-water and deep-bottom zones (no lightpenetration to the bottom) are large compared to the shallow-water (shoreline zone, which has light penetration toits bottom zones.
Mmacroinvertebrates: Animals lacking backbones that are large enough to be visible without the aid of a microscope.meanders: Curves. Streams with meanders display sinuosity, or snake-like curving of a natural stream channel. metamorphose: To change into a different form, such as from an insect pupa to an adult.methemoglobinemia: The presence of methemoglobin in the blood, making the blood useless as a carrier ofoxygen. Methemoglobin, a compound closely related to oxyhemoglobin, is found in the blood following poisoning by certain substances, such as nitrate. Young babies, both human and animal, are particularly susceptible to methemoglobinemia, leading to a condition known as “blue baby” which if untreated can cause death.mollusk: Soft-bodied (usually hard-shelled) animals such as clams or mussels.
141
Nnitrogen: A limiting nutrient for the aquatic environment. Nitrogen is considered to be limiting because it is needed by the plants and animals in the stream in moderate amounts. When present in higher amounts, such as large amounts of fertilizer runoff from local farm fields, large algal blooms occur which cause a depletion of dissolved oxygen.nonpoint source pollution: A type of pollution whose source is not readily identifiable as any one particularpoint, such as pollution caused by runoff from streets and agricultural land.NTU - Nephelometric Turbidity Units: a unit of measurement commonly used in electronic turbidity metersthat indicate how far light can penetrate into a water sample before the cloudiness of the sample cuts into the light.Similar to Jackson Turbidity Units. nutrient: Any substance which is necessary for growth of living things.nymph: A juvenile, wingless stage of an insect.
Oorder: Taxonomic grouping of related families of organisms.organic material: Any compound containing carbon.
Ppathogenic: Capable of causing disease.pH: The measurement of acidity or alkalinity on a scale of 0 - 14. A pH of 7 is neutral, less than 7 is acidic, andmore than 7 is alkaline (basic).phosphorus: An essential plant nutrient that, in excessive quantities, can contribute to the eutrophication ofwater bodies.photosynthesis: Process by which green plants use sunlight to produce food.perennial stream: A watercourse that flows continuously throughout the year and whose upper surface generally stands lower than the water table in the area adjacent to the watercourse.point source pollution: Pollutants originating from a “point” source, such as a pipe, vent, or culvert.pollution sensitive organisms: Those organisms which cannot withstand the stresses applied on the aquaticenvironment by pollution.pollution tolerant organisms: Those organisms which can withstand many of the stresses applied to anaquatic environment by pollution.pond: A body of fresh or salt water, smaller than a lake, and where the shallow-water zone (light penetration to itsbottom) is relatively large compared to the open water and deep bottom (no light penetration to the bottom).pools: In a watercourse, an area often following a rapids (riffle), which is relatively deep with slowly moving watercompared to the rapids.pupa: The stage of an insect in which it is enclosed in a protective case while changing from larva to an adult.
Rriffle: In a watercourse, an area often upstream of a pool, which is relatively shallow with swiftly moving watercompared to the pool.riparian zone: An area, adjacent to and along a watercourse, which is often vegetated and constitutes a bufferzone between the nearby lands and the watercourse.riprap: Any hard material (such as concrete blocks, rocks, car tires or log pilings) which are used to protect a stream bank from erosion.runoff: Water from rain, snowmelt, or irrigation that flows over the ground surface and runs into a water body.
Ssediment: Soil, sand, and minerals washed from land into waterways.sedimentation: The process by which soil particles (sediment) enter, accumulate and settle to the bottom of awaterbody.septic odor: The sulfur (rotten egg) smell produced by the decomposition of organic matter in the absence of oxygen.
142 www.idem.IN.gov /riverwatch
sewage: The organic waste and wastewater produced by residential and commercial establishments.sewage treatment plant: A facility designed to remove organic pollutants from wastewater.silt: Fine particles of soil or rock that can be picked up by air or water and deposited as sediment.siltation: The process of silt settling out of the water and being deposited as sediment.species: A unit of classification for a group of closely related individuals. The lowest common taxonomic unit.stream bed: The bottom of a stream where the substrate and sediments lay. stream depth: A measurement of the depth of a stream from the water’s surface to the stream bed.stream flow: The amount of water moving in a stream in a given amount of time.submergent rooted plant: An aquatic plant whose roots are in the watercourse’s bottom with the upper part ofthe plant submerged below the surface of the water.substrate: The surface upon which an organism lives or is attached.
Ttolerant species: An organism that can exist in the presence of a certain degree of pollution.topographic map: A map representing the surface features of a particular area.total coliform bacteria: A group of bacteria that are used as an indicator of drinking water quality. The presence of total coliform bacteria indicates the possible presence of disease-causing bacteria.total dissolved solids: Substances that are dissolved in the water which can color the water brown or yellow.Tannic acids that leach from tree roots or from decomposing leaves can color the water brown to black due todissolved chemicals. This color does not disappear by filtering the water.total suspended solids: Whole particles carried or suspended in the water, such as silt, sand or small algae or animals, that cause a green or brown color in the water. These substances can be filtered out of the water and weighed.toxicity: A measurement of how poisonous or harmful a substance is to plants and animals.trend data: Data or measurements of a stream system which will show how particular characteristics changedover time. turbidity: The presence of sediment in water, making it unclear, murky or opaque.
Uurban runoff: Water which has drained from the surface of land which is used for urban uses, such as pavedroads, subdivisions and parking lots.
Wwastewater: Water carrying unwanted material from homes, farms, businesses and industries.water quality: The condition of the water with regard to the presence or absence of pollution.watershed: The entire surface drainage area that contributes water to a stream or river. Many watersheds whichdrain into a common river make a drainage basin.woody vegetation: Plants having a stem or trunk that is fibrous and rigid.
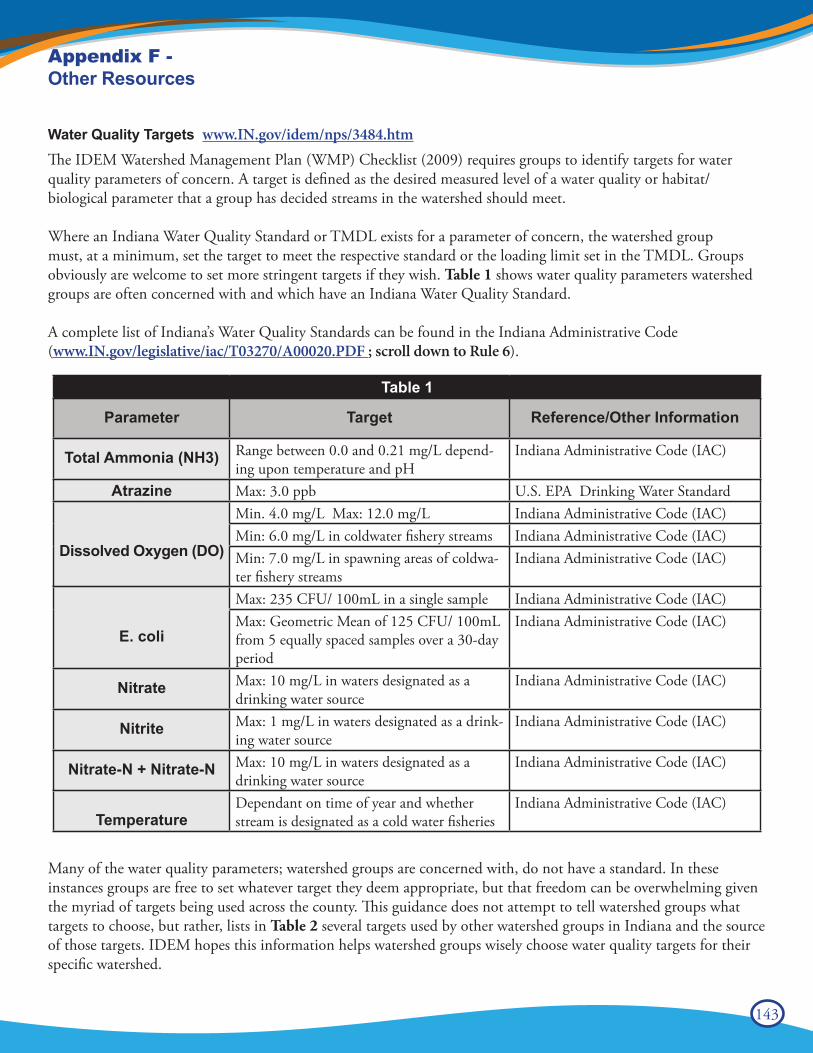
143
Appendix F - Other Resources
Water Quality Targets www.IN.gov/idem/nps/3484.htmThe IDEM Watershed Management Plan (WMP) Checklist (2009) requires groups to identify targets for water quality parameters of concern. A target is defined as the desired measured level of a water quality or habitat/biological parameter that a group has decided streams in the watershed should meet.
Where an Indiana Water Quality Standard or TMDL exists for a parameter of concern, the watershed group must, at a minimum, set the target to meet the respective standard or the loading limit set in the TMDL. Groups obviously are welcome to set more stringent targets if they wish. Table 1 shows water quality parameters watershed groups are often concerned with and which have an Indiana Water Quality Standard.
A complete list of Indiana’s Water Quality Standards can be found in the Indiana Administrative Code (www.IN.gov/legislative/iac/T03270/A00020.PDF ; scroll down to Rule 6).
Many of the water quality parameters; watershed groups are concerned with, do not have a standard. In these instances groups are free to set whatever target they deem appropriate, but that freedom can be overwhelming given the myriad of targets being used across the county. This guidance does not attempt to tell watershed groups what targets to choose, but rather, lists in Table 2 several targets used by other watershed groups in Indiana and the source of those targets. IDEM hopes this information helps watershed groups wisely choose water quality targets for their specific watershed.
Table 1
Parameter Target Reference/Other Information
Total Ammonia (NH3) Range between 0.0 and 0.21 mg/L depend-ing upon temperature and pH
Indiana Administrative Code (IAC)
Atrazine Max: 3.0 ppb U.S. EPA Drinking Water Standard
Dissolved Oxygen (DO)
Min. 4.0 mg/L Max: 12.0 mg/L Indiana Administrative Code (IAC)Min: 6.0 mg/L in coldwater fishery streams Indiana Administrative Code (IAC)Min: 7.0 mg/L in spawning areas of coldwa-ter fishery streams
Indiana Administrative Code (IAC)
E. coli
Max: 235 CFU/ 100mL in a single sample Indiana Administrative Code (IAC)Max: Geometric Mean of 125 CFU/ 100mL from 5 equally spaced samples over a 30-day period
Indiana Administrative Code (IAC)
Nitrate Max: 10 mg/L in waters designated as a drinking water source
Indiana Administrative Code (IAC)
Nitrite Max: 1 mg/L in waters designated as a drink-ing water source
Indiana Administrative Code (IAC)
Nitrate-N + Nitrate-N Max: 10 mg/L in waters designated as a drinking water source
Indiana Administrative Code (IAC)
TemperatureDependant on time of year and whether stream is designated as a cold water fisheries
Indiana Administrative Code (IAC)
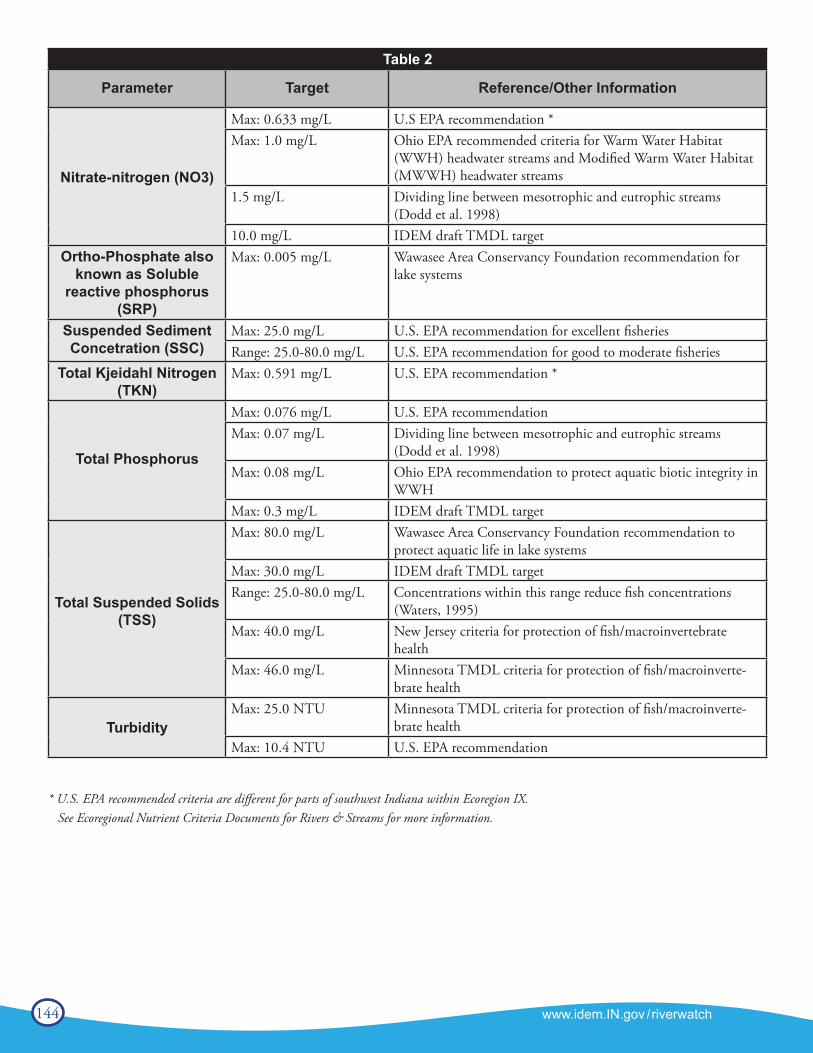
144 www.idem.IN.gov /riverwatch
* U.S. EPA recommended criteria are different for parts of southwest Indiana within Ecoregion IX. See Ecoregional Nutrient Criteria Documents for Rivers & Streams for more information.
Table 2
Parameter Target Reference/Other Information
Nitrate-nitrogen (NO3)
Max: 0.633 mg/L U.S EPA recommendation *Max: 1.0 mg/L Ohio EPA recommended criteria for Warm Water Habitat
(WWH) headwater streams and Modified Warm Water Habitat (MWWH) headwater streams
1.5 mg/L Dividing line between mesotrophic and eutrophic streams (Dodd et al. 1998)
10.0 mg/L IDEM draft TMDL targetOrtho-Phosphate also
known as Soluble reactive phosphorus
(SRP)
Max: 0.005 mg/L Wawasee Area Conservancy Foundation recommendation for lake systems
Suspended Sediment Concetration (SSC)
Max: 25.0 mg/L U.S. EPA recommendation for excellent fisheriesRange: 25.0-80.0 mg/L U.S. EPA recommendation for good to moderate fisheries
Total Kjeidahl Nitrogen (TKN)
Max: 0.591 mg/L U.S. EPA recommendation *
Total Phosphorus
Max: 0.076 mg/L U.S. EPA recommendationMax: 0.07 mg/L Dividing line between mesotrophic and eutrophic streams
(Dodd et al. 1998)Max: 0.08 mg/L Ohio EPA recommendation to protect aquatic biotic integrity in
WWHMax: 0.3 mg/L IDEM draft TMDL target
Total Suspended Solids (TSS)
Max: 80.0 mg/L Wawasee Area Conservancy Foundation recommendation to protect aquatic life in lake systems
Max: 30.0 mg/L IDEM draft TMDL targetRange: 25.0-80.0 mg/L Concentrations within this range reduce fish concentrations
(Waters, 1995)Max: 40.0 mg/L New Jersey criteria for protection of fish/macroinvertebrate
healthMax: 46.0 mg/L Minnesota TMDL criteria for protection of fish/macroinverte-
brate health
TurbidityMax: 25.0 NTU Minnesota TMDL criteria for protection of fish/macroinverte-
brate healthMax: 10.4 NTU U.S. EPA recommendation
145
Geometric Mean: In mathematics, a type of mean or average, which indicates the central tendency or typical value of a set of numbers. It is similar to the arithmetic mean, which is what most people think of with the word “average,” except that instead of adding the set of numbers and then dividing the sum by the count of numbers in the set, n, the numbers are multiplied and then the nth root of the resulting product is taken. A geometric mean, unlike an arithmetic mean, tends to dampen the effect of very high or low values, which might bias the mean if a straight average (arithmetic mean) were calculated. This is helpful when analyzing bacteria concentrations, because levels may vary anywhere from 10 to 10,000 fold over a given period.
Geometric Mean Formula:Geometric Mean = ((X1)*(X2)*(X3)*.......(XN))1/Nwhere X = Individual score N = Sample size (Number of scores)
Geometric Mean Example:Use the following set of values - 1, 2, 3, 4, and 5 to find the Geometric Mean.
Step 1: Find 1/N Step 2: Calculate the Geometric Mean a. N = 5, the total number of values a. ((1)*(2)*(3)*(4)*(5))0.2 = (120)0.2 b. Using the above value, 1/5 = 0.2 b. Geometric Mean = 2.60517
The Indiana Administrative Code uses the Geometric Mean as a calculation for five evenly spaced samples of E. coli over 30-days in order to determine compliance with the water quality standard.
In Microsoft Excel, the equation for geomean is =Geomean(Xx:Yy)

146 www.idem.IN.gov /riverwatch
Notes:
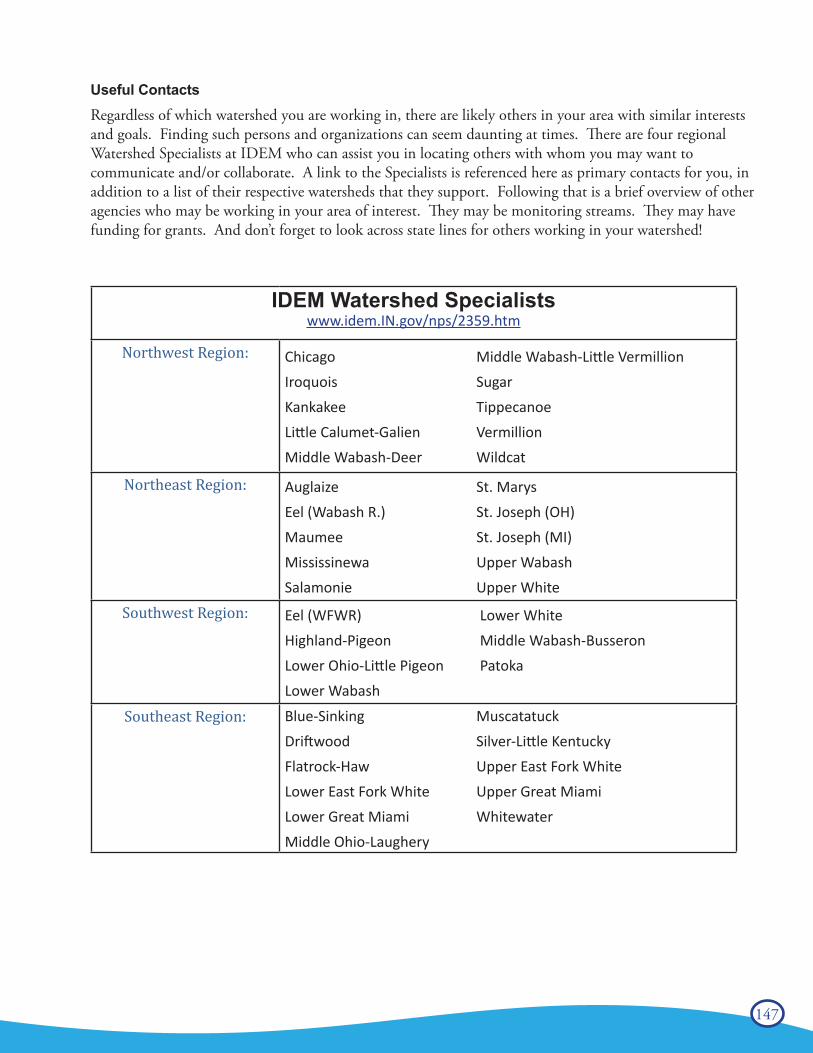
147
Useful ContactsRegardless of which watershed you are working in, there are likely others in your area with similar interests and goals. Finding such persons and organizations can seem daunting at times. There are four regional Watershed Specialists at IDEM who can assist you in locating others with whom you may want to communicate and/or collaborate. A link to the Specialists is referenced here as primary contacts for you, in addition to a list of their respective watersheds that they support. Following that is a brief overview of other agencies who may be working in your area of interest. They may be monitoring streams. They may have funding for grants. And don’t forget to look across state lines for others working in your watershed!
IDEM Watershed Specialistswww.idem.IN.gov/nps/2359.htm
Northwest Region: Chicago Middle Wabash-Little VermillionIroquois SugarKankakee TippecanoeLittle Calumet-Galien VermillionMiddle Wabash-Deer Wildcat
Northeast Region: Auglaize St. Marys Eel (Wabash R.) St. Joseph (OH)Maumee St. Joseph (MI) Mississinewa Upper WabashSalamonie Upper White
Southwest Region: Eel (WFWR) Lower WhiteHighland-Pigeon Middle Wabash-BusseronLower Ohio-Little Pigeon PatokaLower Wabash
Southeast Region: Blue-Sinking MuscatatuckDriftwood Silver-Little KentuckyFlatrock-Haw Upper East Fork WhiteLower East Fork White Upper Great MiamiLower Great Miami Whitewater Middle Ohio-Laughery
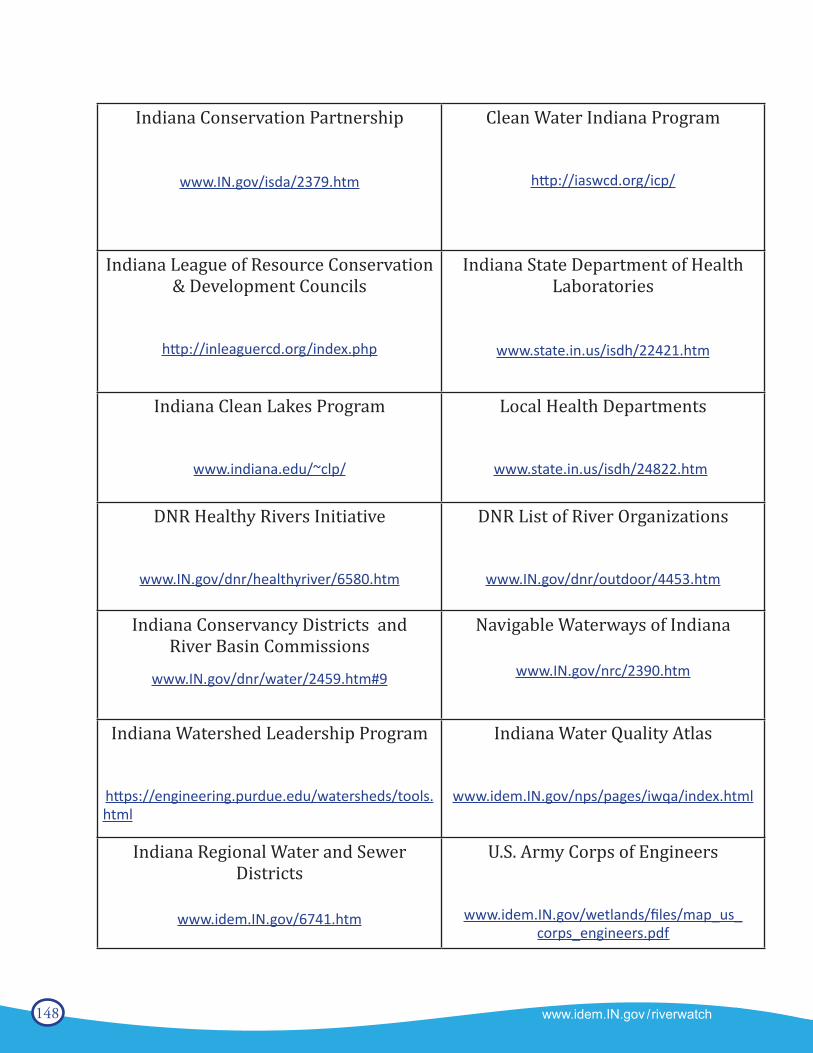
148 www.idem.IN.gov /riverwatch
Indiana Conservation Partnership
www.IN.gov/isda/2379.htm
Clean Water Indiana Program
http://iaswcd.org/icp/
Indiana League of Resource Conservation & Development Councils
http://inleaguercd.org/index.php
Indiana State Department of Health Laboratories
www.state.in.us/isdh/22421.htm
Indiana Clean Lakes Program
www.indiana.edu/~clp/
Local Health Departments
www.state.in.us/isdh/24822.htm
DNR Healthy Rivers Initiative
www.IN.gov/dnr/healthyriver/6580.htm
DNR List of River Organizations
www.IN.gov/dnr/outdoor/4453.htm
Indiana Conservancy Districts and River Basin Commissions
www.IN.gov/dnr/water/2459.htm#9
Navigable Waterways of Indiana
www.IN.gov/nrc/2390.htm
Indiana Watershed Leadership Program
https://engineering.purdue.edu/watersheds/tools.html
Indiana Water Quality Atlas
www.idem.IN.gov/nps/pages/iwqa/index.html
Indiana Regional Water and Sewer Districts
www.idem.IN.gov/6741.htm
U.S. Army Corps of Engineers
www.idem.IN.gov/wetlands/files/map_us_corps_engineers.pdf

149
Notes:
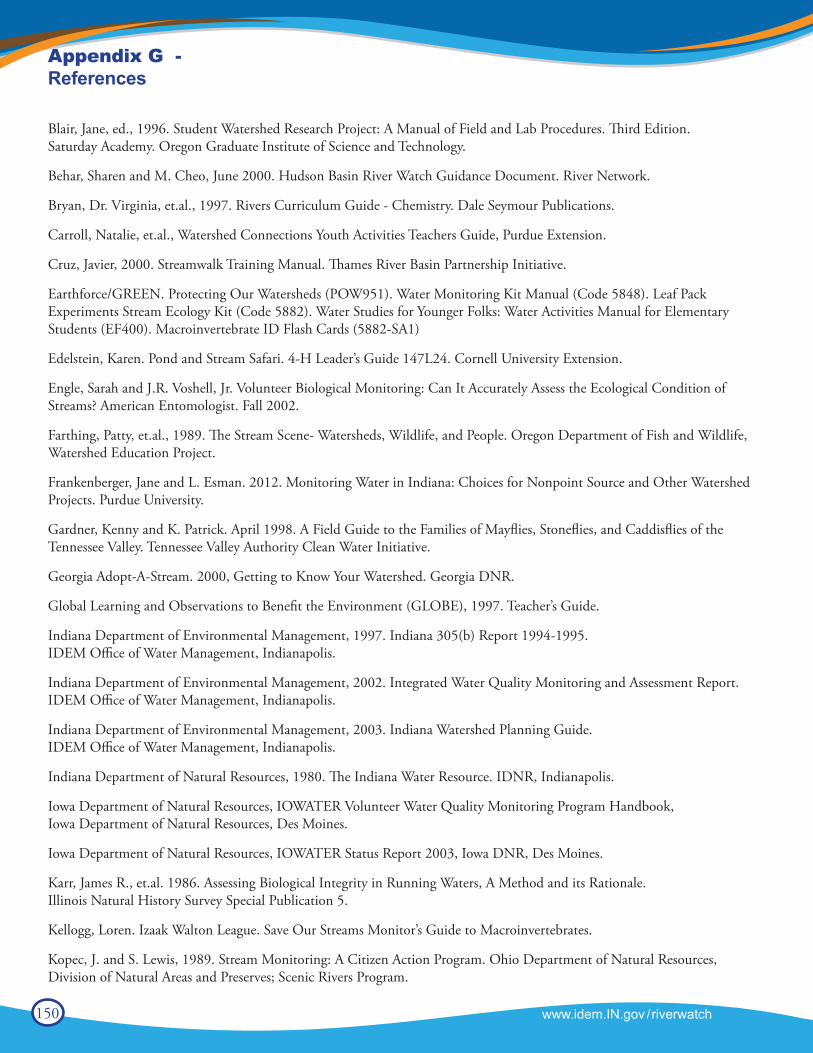
150 www.idem.IN.gov /riverwatch
Appendix G - References
Blair, Jane, ed., 1996. Student Watershed Research Project: A Manual of Field and Lab Procedures. Third Edition. Saturday Academy. Oregon Graduate Institute of Science and Technology.
Behar, Sharen and M. Cheo, June 2000. Hudson Basin River Watch Guidance Document. River Network.
Bryan, Dr. Virginia, et.al., 1997. Rivers Curriculum Guide - Chemistry. Dale Seymour Publications.
Carroll, Natalie, et.al., Watershed Connections Youth Activities Teachers Guide, Purdue Extension.
Cruz, Javier, 2000. Streamwalk Training Manual. Thames River Basin Partnership Initiative.
Earthforce/GREEN. Protecting Our Watersheds (POW951). Water Monitoring Kit Manual (Code 5848). Leaf Pack Experiments Stream Ecology Kit (Code 5882). Water Studies for Younger Folks: Water Activities Manual for Elementary Students (EF400). Macroinvertebrate ID Flash Cards (5882-SA1)
Edelstein, Karen. Pond and Stream Safari. 4-H Leader’s Guide 147L24. Cornell University Extension.
Engle, Sarah and J.R. Voshell, Jr. Volunteer Biological Monitoring: Can It Accurately Assess the Ecological Condition of Streams? American Entomologist. Fall 2002.
Farthing, Patty, et.al., 1989. The Stream Scene- Watersheds, Wildlife, and People. Oregon Department of Fish and Wildlife, Watershed Education Project.
Frankenberger, Jane and L. Esman. 2012. Monitoring Water in Indiana: Choices for Nonpoint Source and Other Watershed Projects. Purdue University.
Gardner, Kenny and K. Patrick. April 1998. A Field Guide to the Families of Mayflies, Stoneflies, and Caddisflies of the Tennessee Valley. Tennessee Valley Authority Clean Water Initiative.
Georgia Adopt-A-Stream. 2000, Getting to Know Your Watershed. Georgia DNR.
Global Learning and Observations to Benefit the Environment (GLOBE), 1997. Teacher’s Guide.
Indiana Department of Environmental Management, 1997. Indiana 305(b) Report 1994-1995. IDEM Office of Water Management, Indianapolis.
Indiana Department of Environmental Management, 2002. Integrated Water Quality Monitoring and Assessment Report. IDEM Office of Water Management, Indianapolis.
Indiana Department of Environmental Management, 2003. Indiana Watershed Planning Guide. IDEM Office of Water Management, Indianapolis.
Indiana Department of Natural Resources, 1980. The Indiana Water Resource. IDNR, Indianapolis.
Iowa Department of Natural Resources, IOWATER Volunteer Water Quality Monitoring Program Handbook, Iowa Department of Natural Resources, Des Moines.
Iowa Department of Natural Resources, IOWATER Status Report 2003, Iowa DNR, Des Moines.
Karr, James R., et.al. 1986. Assessing Biological Integrity in Running Waters, A Method and its Rationale. Illinois Natural History Survey Special Publication 5.
Kellogg, Loren. Izaak Walton League. Save Our Streams Monitor’s Guide to Macroinvertebrates.
Kopec, J. and S. Lewis, 1989. Stream Monitoring: A Citizen Action Program. Ohio Department of Natural Resources, Division of Natural Areas and Preserves; Scenic Rivers Program.
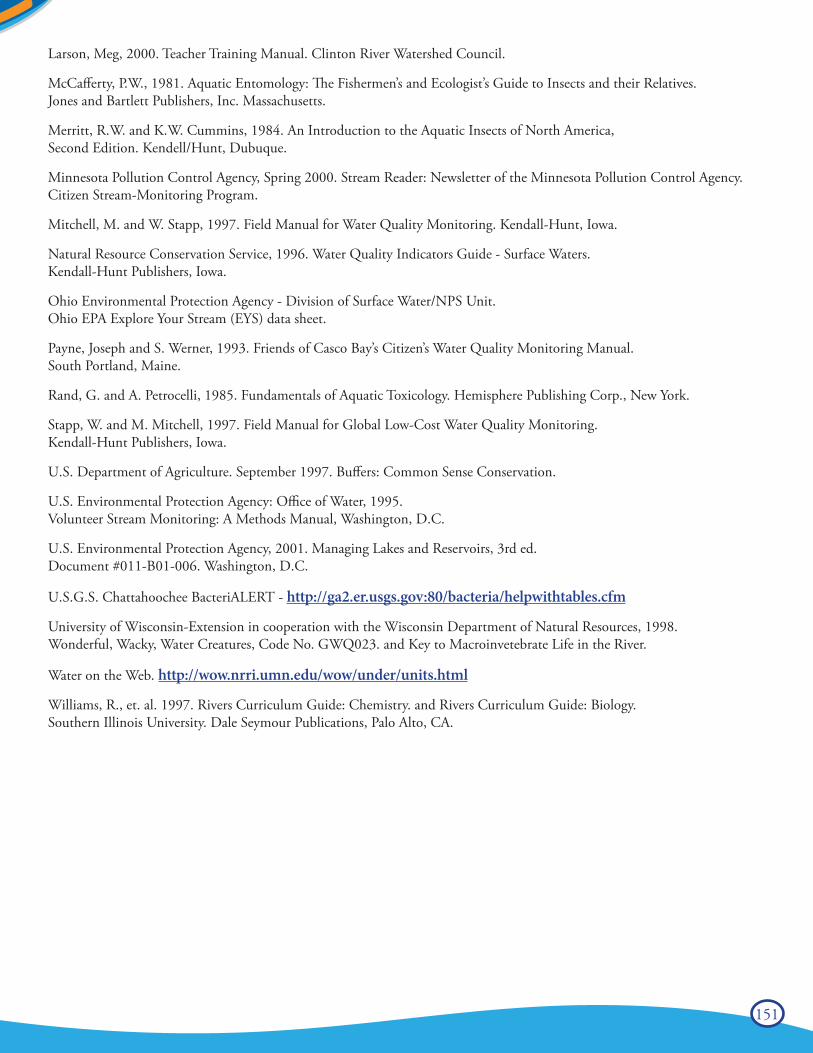
151
Larson, Meg, 2000. Teacher Training Manual. Clinton River Watershed Council.
McCafferty, P.W., 1981. Aquatic Entomology: The Fishermen’s and Ecologist’s Guide to Insects and their Relatives. Jones and Bartlett Publishers, Inc. Massachusetts.
Merritt, R.W. and K.W. Cummins, 1984. An Introduction to the Aquatic Insects of North America, Second Edition. Kendell/Hunt, Dubuque.
Minnesota Pollution Control Agency, Spring 2000. Stream Reader: Newsletter of the Minnesota Pollution Control Agency. Citizen Stream-Monitoring Program.
Mitchell, M. and W. Stapp, 1997. Field Manual for Water Quality Monitoring. Kendall-Hunt, Iowa.
Natural Resource Conservation Service, 1996. Water Quality Indicators Guide - Surface Waters. Kendall-Hunt Publishers, Iowa.
Ohio Environmental Protection Agency - Division of Surface Water/NPS Unit. Ohio EPA Explore Your Stream (EYS) data sheet.
Payne, Joseph and S. Werner, 1993. Friends of Casco Bay’s Citizen’s Water Quality Monitoring Manual. South Portland, Maine.
Rand, G. and A. Petrocelli, 1985. Fundamentals of Aquatic Toxicology. Hemisphere Publishing Corp., New York.
Stapp, W. and M. Mitchell, 1997. Field Manual for Global Low-Cost Water Quality Monitoring. Kendall-Hunt Publishers, Iowa.
U.S. Department of Agriculture. September 1997. Buffers: Common Sense Conservation.
U.S. Environmental Protection Agency: Office of Water, 1995. Volunteer Stream Monitoring: A Methods Manual, Washington, D.C.
U.S. Environmental Protection Agency, 2001. Managing Lakes and Reservoirs, 3rd ed. Document #011-B01-006. Washington, D.C.
U.S.G.S. Chattahoochee BacteriALERT - http://ga2.er.usgs.gov:80/bacteria/helpwithtables.cfm
University of Wisconsin-Extension in cooperation with the Wisconsin Department of Natural Resources, 1998. Wonderful, Wacky, Water Creatures, Code No. GWQ023. and Key to Macroinvetebrate Life in the River.
Water on the Web. http://wow.nrri.umn.edu/wow/under/units.html
Williams, R., et. al. 1997. Rivers Curriculum Guide: Chemistry. and Rivers Curriculum Guide: Biology. Southern Illinois University. Dale Seymour Publications, Palo Alto, CA.

152 www.idem.IN.gov /riverwatch
Appendix H - Extra Data Sheets
• Citizens Qualitative Habitat Evaluation Index
• Stream Flow (Discharge) Data Sheet
• Stream Site Map
• Chemical Monitoring Data Sheet
• Biological Monitoring Data Sheet
After each data sheer, a blank page follows for reproduction purposes if needed.
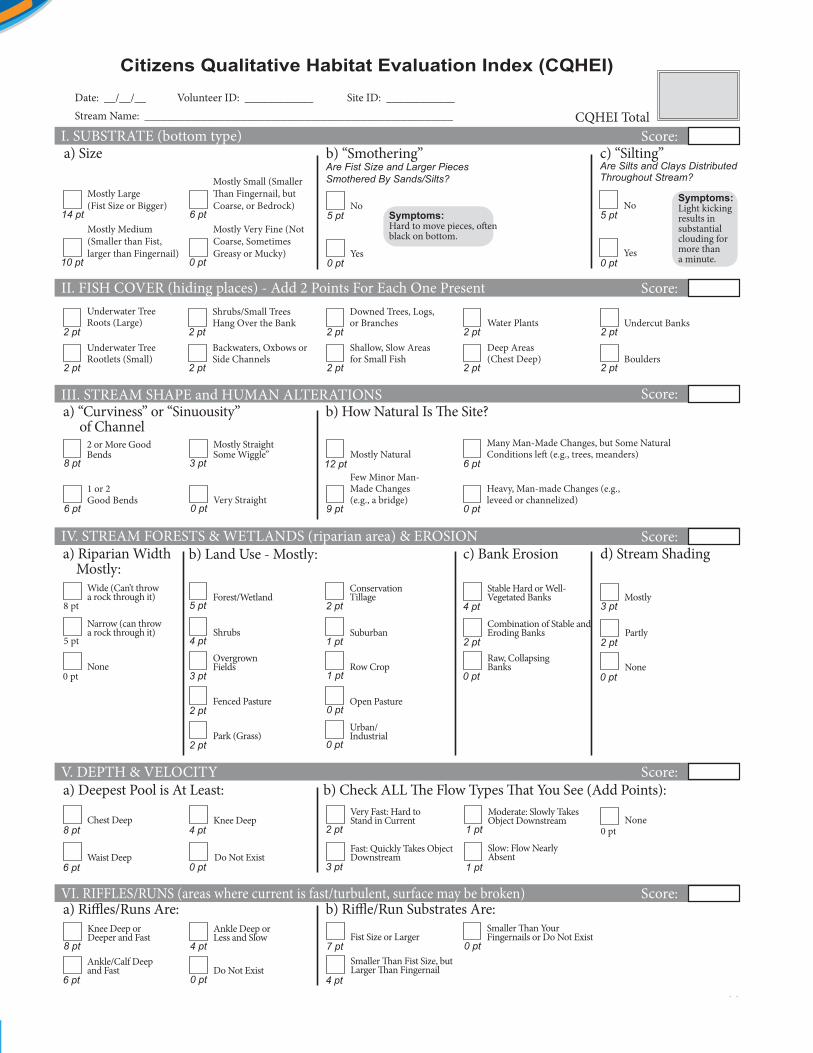
www.idem.IN.gov/riverwatch 23
CQHEI Section II: Fish Cover “Hiding Places”
a) Size
Mostly Large(Fist Size or Bigger)
Mostly Medium(Smaller than Fist,larger than Fingernail)
Mostly Very Fine (Not Coarse, Sometimes Greasy or Mucky)
Mostly Small (Smaller Than Fingernail, but Coarse, or Bedrock)
Symptoms: Hard to move pieces, often black on bottom.
5 pt
0 pt
Citizens Qualitative Habitat Evaluation Index (CQHEI)
I. SUBSTRATE (bottom type) Score:
II. FISH COVER (hiding places) - Add 2 Points For Each One Present Score:
III. STREAM SHAPE and HUMAN ALTERATIONS Score:
IV. STREAM FORESTS & WETLANDS (riparian area) & EROSION Score:
V. DEPTH & VELOCITY Score:
VI. RIFFLES/RUNS (areas where current is fast/turbulent, surface may be broken) Score:
a) “Curviness” or “Sinuousity” of Channel
a) Riparian Width Mostly:
b) Land Use - Mostly:
Underwater Tree Roots (Large)
Underwater Tree Rootlets (Small)
Shrubs/Small Trees Hang Over the Bank
Backwaters, Oxbows or Side Channels
Downed Trees, Logs, or Branches
Shallow, Slow Areas for Small Fish
Water Plants
Deep Areas (Chest Deep)
Undercut Banks
Boulders
14 pt
10 pt 0 pt
6 pt
2 pt
2 pt
2 pt
2 pt
2 pt
2 pt
2 pt
2 pt
b) “Smothering” Are Fist Size and Larger Pieces Smothered By Sands/Silts?
c) “Silting” Are Silts and Clays Distributed Throughout Stream?
5 pt
0 pt
Symptoms: Light kicking results in substantial clouding for more than a minute.
2 pt
2 pt
CQHEI Total
b) How Natural Is The Site?
c) Bank Erosion d) Stream Shading
8 pt
6 pt 0 pt
3 pt 12 ptMostly Natural
Very Straight1 or 2Good Bends
2 or More Good Bends
Mostly Straight Some Wiggle”
Few Minor Man-Made Changes (e.g., a bridge)
Many Man-Made Changes, but Some Natural Conditions left (e.g., trees, meanders)
Heavy, Man-made Changes (e.g., leveed or channelized)
9 pt 0 pt
6 pt
8 pt
0 pt
0 pt
0 pt
1 pt
1 pt
2 pt
2 pt
2 pt
3 pt
4 pt
5 pt
5 pt
8 pt
8 pt
a) Deepest Pool is At Least:
a) Riffles/Runs Are: b) Riffle/Run Substrates Are:
b) Check ALL The Flow Types That You See (Add Points):
None
Forest/Wetland
Shrubs
Overgrown Fields
Fenced Pasture
Park (Grass)
Conservation Tillage
Suburban
Urban/Industrial
Row Crop
Open Pasture
Combination of Stable and Eroding Banks
Stable Hard or Well-Vegetated Banks
Raw, Collapsing Banks
Very Fast: Hard to Stand in Current
0 pt
2 pt
4 pt
2 pt
0 pt
3 ptMostly
Partly
None
Moderate: Slowly Takes Object Downstream
Slow: Flow Nearly Absent
0 ptNone
1 pt
1 pt
Fast: Quickly Takes Object DownstreamDo Not Exist
Knee Deep
Waist Deep
Chest Deep
6 pt
4 pt
0 pt
6 pt
4 pt
0 pt
Ankle/Calf Deep and Fast
Knee Deep or Deeper and Fast
Ankle Deep or Less and Slow
Do Not ExistSmaller Than Fist Size, but Larger Than Fingernail
Fist Size or LargerSmaller Than YourFingernails or Do Not Exist
4 pt
7 pt 0 pt
2 pt
3 pt
Wide (Can’t throw a rock through it)
Narrow (can throw a rock through it)
Date: __/__/__ Volunteer ID: ____________ Site ID: ____________Stream Name: ______________________________________________________
No
Yes
No
Yes

This page intentionally blank.
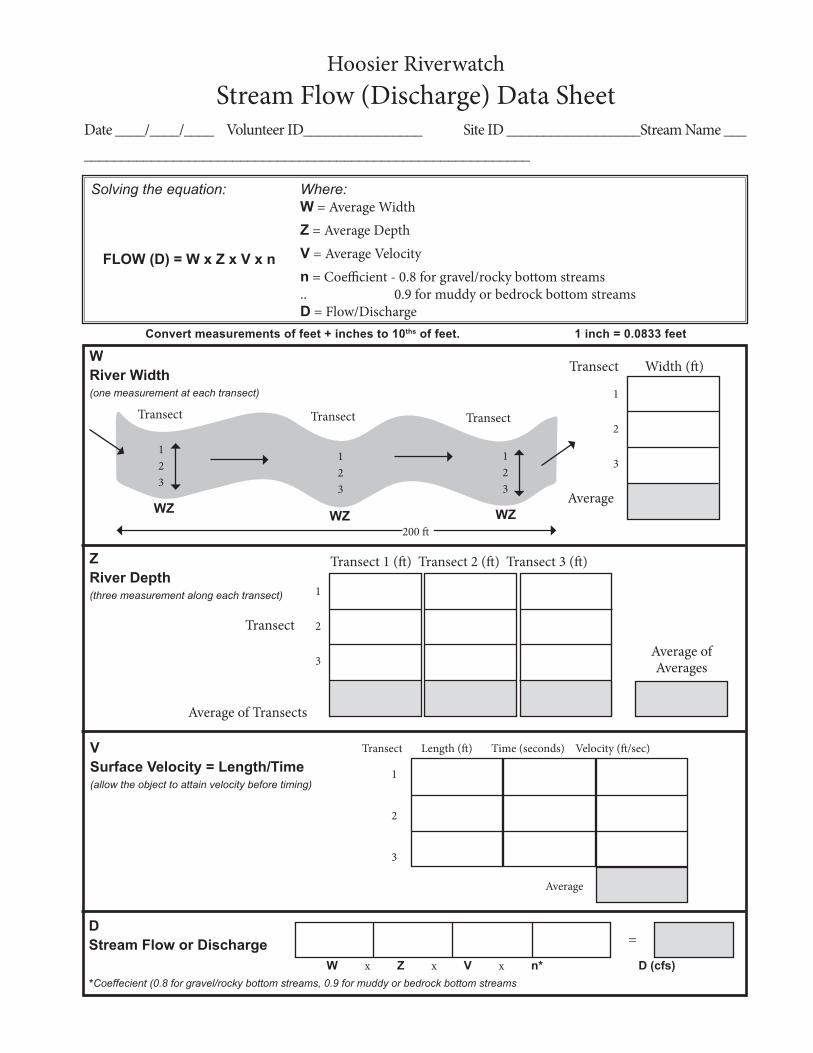
www.idem.IN.gov/riverwatch 27
Convert measurements of feet + inches to 10ths of feet. 1 inch = 0.0833 feet
Hoosier Riverwatch Stream Flow (Discharge) Data Sheet
Date ____/____/____ Volunteer ID________________ Site ID __________________Stream Name _______________________________________________________________
Solving the equation:
FLOW (D) = W x Z x V x n
Where: W = Average WidthZ = Average DepthV = Average Velocityn = Coefficient - 0.8 for gravel/rocky bottom streams .. 0.9 for muddy or bedrock bottom streams D = Flow/Discharge
WRiver Width(one measurement at each transect)
Transect Transect Transect
200 ft
WZ WZ WZ
123
123
123
Transect Width (ft)
1
2
3
Average
ZRiver Depth(three measurement along each transect)
VSurface Velocity = Length/Time(allow the object to attain velocity before timing)
DStream Flow or Discharge
*Coeffecient (0.8 for gravel/rocky bottom streams, 0.9 for muddy or bedrock bottom streamsW x Z x V x n* D (cfs)
Transect Length (ft) Time (seconds) Velocity (ft/sec)
1
2
3
Average
Transect 1 (ft) Transect 2 (ft) Transect 3 (ft)
1
2
3
Transect
Average of Transects
Average of Averages
=

This page intentionally blank.


This page intentionally blank.
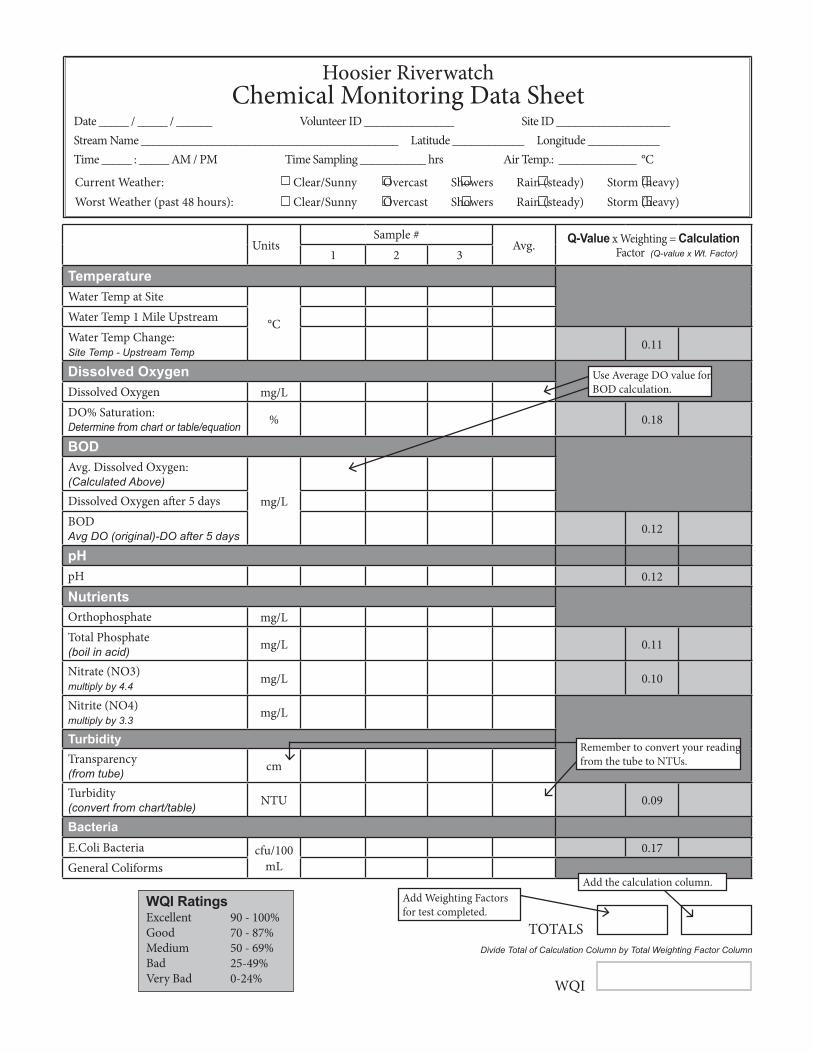
www.idem.IN.gov/riverwatch 37
Date _____ / _____ / ______ Volunteer ID _______________ Site ID ___________________Stream Name ___________________________________________ Latitude ____________ Longitude ____________Time _____ : _____ AM / PM Time Sampling ___________ hrs Air Temp.: _____________ °C
Current Weather:Worst Weather (past 48 hours):
Clear/Sunny Overcast Showers Rain (steady) Storm (heavy)Clear/Sunny Overcast Showers Rain (steady) Storm (heavy)
Hoosier Riverwatch Chemical Monitoring Data Sheet
UnitsSample #
Avg. Q-Value x Weighting = Calculation Factor (Q-value x Wt. Factor)1 2 3
TemperatureWater Temp at Site
°CWater Temp 1 Mile UpstreamWater Temp Change:Site Temp - Upstream Temp
0.11
Dissolved OxygenDissolved Oxygen mg/LDO% Saturation:Determine from chart or table/equation % 0.18
BODAvg. Dissolved Oxygen:(Calculated Above)
mg/LDissolved Oxygen after 5 daysBODAvg DO (original)-DO after 5 days 0.12
pHpH 0.12
NutrientsOrthophosphate mg/LTotal Phosphate(boil in acid) mg/L 0.11
Nitrate (NO3)multiply by 4.4
mg/L 0.10
Nitrite (NO4)multiply by 3.3
mg/L
TurbidityTransparency(from tube) cm
Turbidity(convert from chart/table) NTU 0.09
BacteriaE.Coli Bacteria cfu/100
mL0.17
General Coliforms
WQI RatingsExcellentGoodMediumBadVery Bad
90 - 100%70 - 87%50 - 69%25-49%0-24%
Use Average DO value for BOD calculation.
Remember to convert your reading from the tube to NTUs.
TOTALSDivide Total of Calculation Column by Total Weighting Factor Column
WQI
Add Weighting Factors for test completed.
Add the calculation column.

This page intentionally blank.
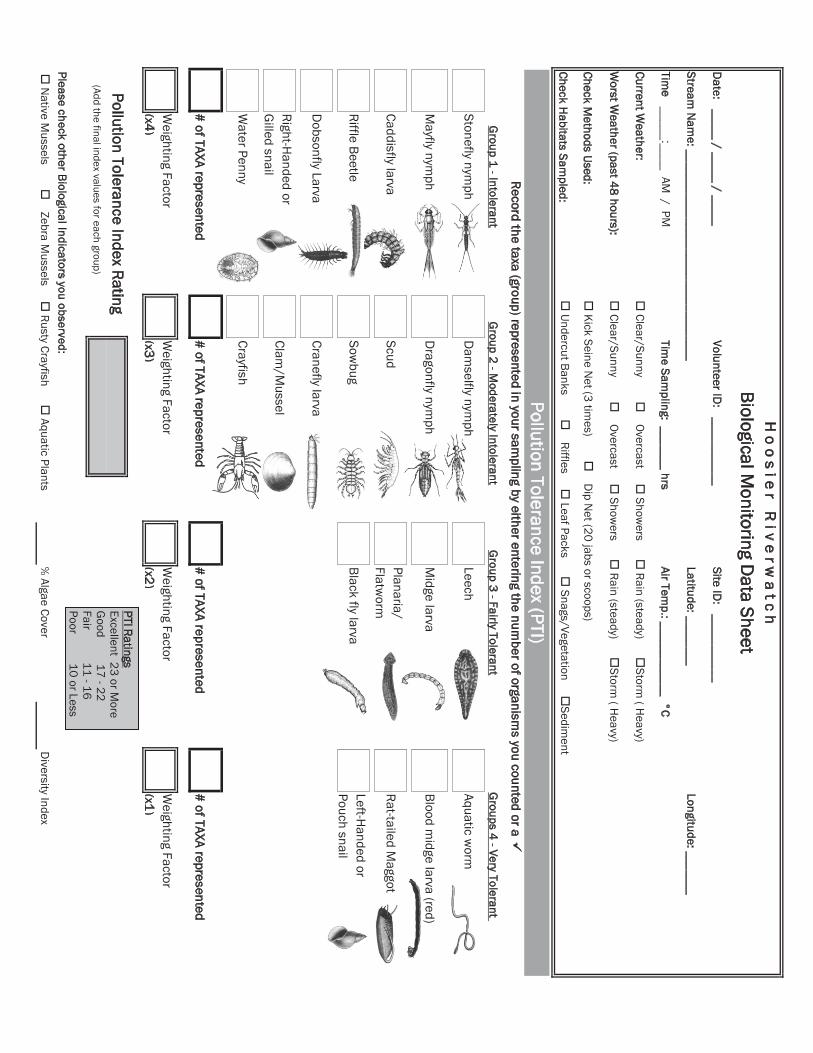
Date: _____ / _____ / _____
Volunteer ID: ___________
Site ID: ___________
Stream N
ame: __________________________________
Latitude: ________Longitude: _______
Time _____:____ AM
/ PMTim
e Sampling: _______ hrs
Air Temp.: ____________ °C
Current Weather:
o Clear/Sunny o
Overcast o
Showers o
Rain (steady) oStorm
( Heavy)
Worst W
eather (past 48 hours): o
Clear/Sunny o
Overcast o Show
ers o Rain (steady) o
Storm ( H
eavy)
Check Methods Used:
o Kick Seine N
et (3 times) o
D
ip Net (20 jabs or scoops)
Check Habitats Sam
pled:o
Undercut Banks o
Riffles o Leaf Packs o
Snags/Vegetation oSedim
ent
Stonefly nymph
Dam
selfly nymph
LeechAquatic w
orm
Mayfly nym
phD
ragonfly nymph
Midge larva
Blood midge larva (red)
Caddisfly larvaScud
Planaria/Flatw
ormRat-tailed M
aggot
Riffle BeetleSow
bugBlack fly larva
Left-Handed or Pouch snail
Dobsonfly Larva
Cranefly larva
Right-Handed or G
illed snailClam
/Mussel
Water Penny
Crayfish
# of TAXA represented# of TAXA represented
# of TAXA represented# of TAXA represented
Weighting Factor
(x4)W
eighting Factor (x3)
Weighting Factor
(x2)W
eighting Factor (x1)
(Add the final index values for each group)
Please check other Biological Indicators you observed:%
Algae CoverD
iversity Index
Pollution Tolerance Index Rating
o N
ative Mussels o
Zebra M
ussels o Rusty Crayfish o
Aquatic Plants
Group 1 - Intolerant
Group 2 - M
oderately IntolerantG
roup 3 - Fairly TolerantG
roups 4 - Very Tolerant
Record the taxa (group) represented in your sampling by either entering the num
ber of organisms you counted or a
H o o s i e r R i v e r w
a t c hBiological M
onitoring Data Sheet
Pollution Tolerance Index (PTI)
PTI Ratings Excellent 23 or M
ore G
ood 17 - 22 Fair 11 - 16 Poor 10 or Less

This page intentionally blank.
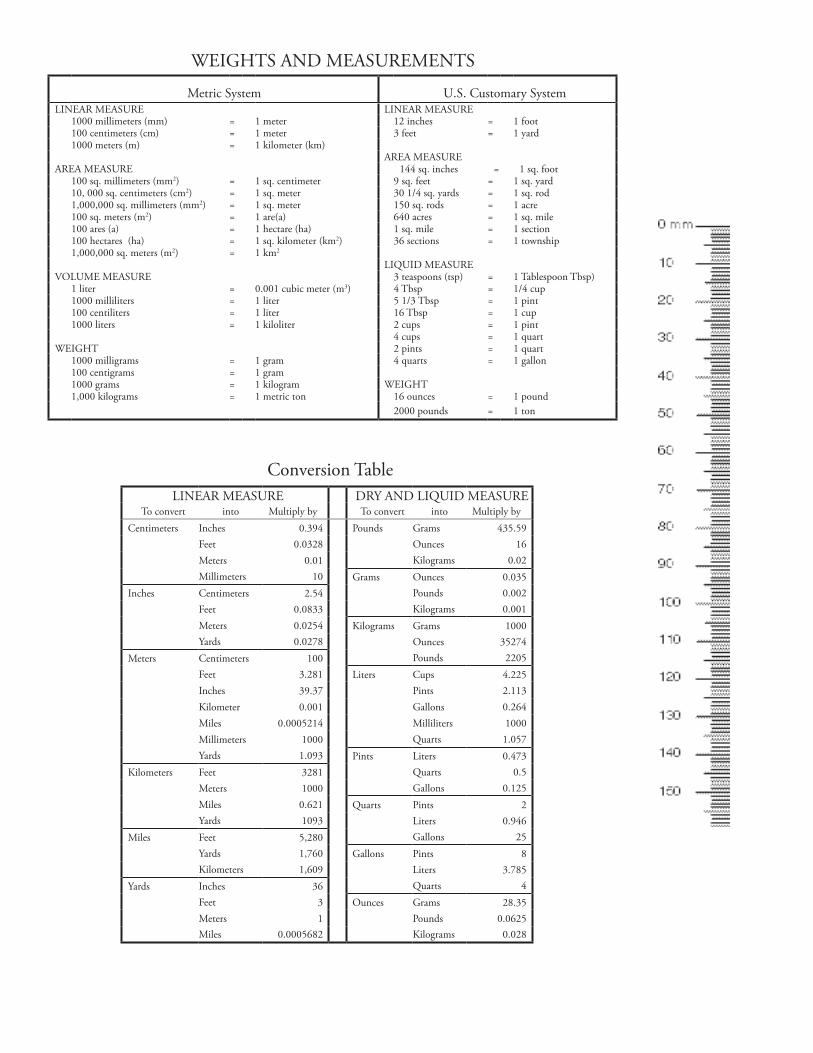
Conversion TableLINEAR MEASURE DRY AND LIQUID MEASURE
To convert into Multiply by To convert into Multiply byCentimeters Inches 0.394 Pounds Grams 435.59
Feet 0.0328 Ounces 16Meters 0.01 Kilograms 0.02Millimeters 10 Grams Ounces 0.035
Inches Centimeters 2.54 Pounds 0.002Feet 0.0833 Kilograms 0.001Meters 0.0254 Kilograms Grams 1000Yards 0.0278 Ounces 35274
Meters Centimeters 100 Pounds 2205Feet 3.281 Liters Cups 4.225Inches 39.37 Pints 2.113Kilometer 0.001 Gallons 0.264Miles 0.0005214 Milliliters 1000Millimeters 1000 Quarts 1.057Yards 1.093 Pints Liters 0.473
Kilometers Feet 3281 Quarts 0.5Meters 1000 Gallons 0.125Miles 0.621 Quarts Pints 2Yards 1093 Liters 0.946
Miles Feet 5,280 Gallons 25Yards 1,760 Gallons Pints 8Kilometers 1,609 Liters 3.785
Yards Inches 36 Quarts 4Feet 3 Ounces Grams 28.35Meters 1 Pounds 0.0625Miles 0.0005682 Kilograms 0.028
WEIGHTS AND MEASUREMENTS
Metric System U.S. Customary SystemLINEAR MEASURE LINEAR MEASURE
1000 millimeters (mm) = 1 meter 12 inches = 1 foot100 centimeters (cm) = 1 meter 3 feet = 1 yard1000 meters (m) = 1 kilometer (km)
AREA MEASUREAREA MEASURE 144 sq. inches = 1 sq. foot
100 sq. millimeters (mm2) = 1 sq. centimeter 9 sq. feet = 1 sq. yard10, 000 sq. centimeters (cm2) = 1 sq. meter 30 1/4 sq. yards = 1 sq. rod1,000,000 sq. millimeters (mm2) = 1 sq. meter 150 sq. rods = 1 acre100 sq. meters (m2) = 1 are(a) 640 acres = 1 sq. mile100 ares (a) = 1 hectare (ha) 1 sq. mile = 1 section100 hectares (ha) = 1 sq. kilometer (km2) 36 sections = 1 township1,000,000 sq. meters (m2) = 1 km2
LIQUID MEASUREVOLUME MEASURE 3 teaspoons (tsp) = 1 Tablespoon Tbsp)
1 liter = 0.001 cubic meter (m3) 4 Tbsp = 1/4 cup1000 milliliters = 1 liter 5 1/3 Tbsp = 1 pint100 centiliters = 1 liter 16 Tbsp = 1 cup1000 liters = 1 kiloliter 2 cups = 1 pint
4 cups = 1 quartWEIGHT 2 pints = 1 quart
1000 milligrams = 1 gram 4 quarts = 1 gallon100 centigrams = 1 gram1000 grams = 1 kilogram WEIGHT1,000 kilograms = 1 metric ton 16 ounces = 1 pound
2000 pounds = 1 ton
INDIANA DEPARTMENT OF ENVIRONMENTAL MANAGEMENT
Indiana Department of
Environmental Management
Office of Water Qualitywww.idem.IN.gov
EducationMonitoring
PreservationImprovement
Volunteer Stream Monitoring Training Manual
2015
WA - 1023-ML
“Never doubt that a small group of thoughtful, committed citizens can change the world. Indeed, it’s the only thing that ever has.”
MARGARET MEADE
www.idem.IN.gov/riverwatch
Indiana Department of
Environmental Management
Office of Water Quality vog.NI.medi.www


