Embed Size (px)
Citation preview
Water in Egypt
Mostafa El Gamal Matriculation no.: 6005342
HafenCity Universität Hamburg
Resource Efficiency in Architecture and Planning (REAP)
Urban Water Cycles
Prof. Wolfgang Dickhaut
Summer semester 2012
www.csmonitor.com
1
Contents 1. Introduction ........................................................................................................................................ 2
2. Background information about Egypt ................................................................................................. 3
2.1. Geography .................................................................................................................................... 3
2.2. Climatic data ................................................................................................................................ 4
3. Water in Egypt – an overview ............................................................................................................. 6
3.1. Resources ..................................................................................................................................... 6
3.2. Supply ......................................................................................................................................... 11
3.3. Demand ...................................................................................................................................... 12
3.4. Quality ........................................................................................................................................ 12
3.5. Wastewater treatment .............................................................................................................. 14
4. Ecological sanitation in Egypt............................................................................................................ 17
4.1. Humification of sewage sludge in El Minia and Nawaq ............................................................. 17
5. Final remarks ..................................................................................................................................... 21
Bibliography .......................................................................................................................................... 22
Figure 1: Areas of physical and economical water scarcity (Molden, 2007, p. 11) ................................. 2
Figure 2: Agro-ecological zones of Egypt (Hussein, 2011, p. 865) ......................................................... 3
Figure 3: Average monthly rainfall and temperature for Egypt from 1990-2009 (UEA, 2009) .............. 4
Figure 4: Map with aridity index of Egypt (Hussein, 2011, p. 864) ......................................................... 4
Figure 5: Annual rainfall (mm/year) (International Consultants Egypt, 2009, p. 16) ............................. 6
Figure 6: Water resources share in Egypt (billion m3 per year) .............................................................. 6
Figure 7: Nile river basin ........................................................................................................................ 7
Figure 8: Locations of aquifer systems in Egypt ...................................................................................... 9
Figure 9: Hydrological cross section of Nile bank filtration in Assiut, Upper Egypt .............................. 10
Figure 10: Schematic diagram showing the water balance of the Nile system .................................... 10
Figure 11: Projected annual per capita share of renewable water sources in Egypt ............................ 11
Figure 12: Wastewater treatment coverage in Egypt (EEAA, 2008, p. 133) ........................................ 14
Figure 13: Water and sludge treatment process flow diagram in the El Gabal El Asfar plant ............ 16
Figure 14: ECOSAN sludge conversion system (GIZ, 2005, p. 1) ............................................................ 17
Figure 15: Agricultural tests results (GIZ, 2005, pp. 2,3) ....................................................................... 18
Figure 16: Cross section of sludge conversion plant (GIZ, 2005, p. 4) ................................................... 19
Figure 17: Development of Ladyfinger on sand with converted sludge (GIZ, 2005, p. 4) .................... 20
Table 1: Distribution of groundwater abstraction (million m3 per year) ............................................. 11
Table 3: Water quality of the main stream of Nile River from Aswan to Cairo ................................... 13
Table 3: Water quality of the two branches of the Nile River ............................................................... 13
Table 4: Type and capacity of existing and planned wastewater treatment plants in Egypt ............... 15
2
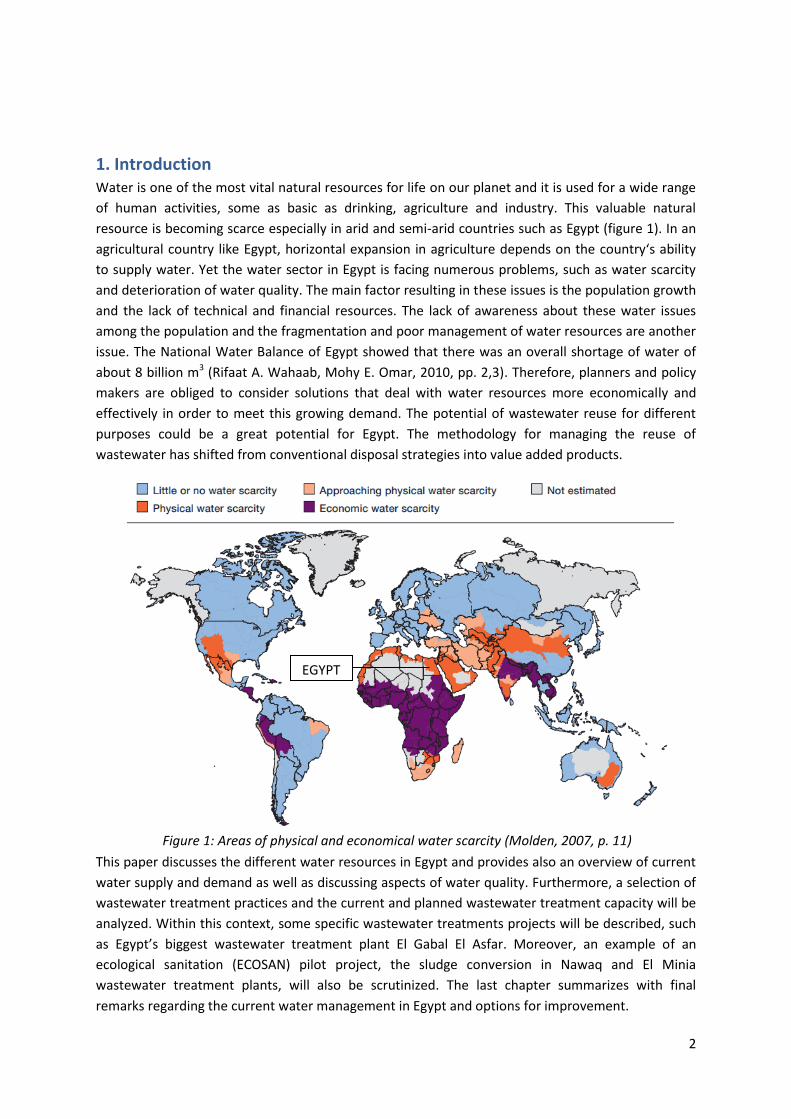
1. Introduction Water is one of the most vital natural resources for life on our planet and it is used for a wide range
of human activities, some as basic as drinking, agriculture and industry. This valuable natural
resource is becoming scarce especially in arid and semi-arid countries such as Egypt (figure 1). In an
agricultural country like Egypt, horizontal expansion in agriculture depends on the country‘s ability
to supply water. Yet the water sector in Egypt is facing numerous problems, such as water scarcity
and deterioration of water quality. The main factor resulting in these issues is the population growth
and the lack of technical and financial resources. The lack of awareness about these water issues
among the population and the fragmentation and poor management of water resources are another
issue. The National Water Balance of Egypt showed that there was an overall shortage of water of
about 8 billion m3 (Rifaat A. Wahaab, Mohy E. Omar, 2010, pp. 2,3). Therefore, planners and policy
makers are obliged to consider solutions that deal with water resources more economically and
effectively in order to meet this growing demand. The potential of wastewater reuse for different
purposes could be a great potential for Egypt. The methodology for managing the reuse of
wastewater has shifted from conventional disposal strategies into value added products.
This paper discusses the different water resources in Egypt and provides also an overview of current
water supply and demand as well as discussing aspects of water quality. Furthermore, a selection of
wastewater treatment practices and the current and planned wastewater treatment capacity will be
analyzed. Within this context, some specific wastewater treatments projects will be described, such
as Egypt’s biggest wastewater treatment plant El Gabal El Asfar. Moreover, an example of an
ecological sanitation (ECOSAN) pilot project, the sludge conversion in Nawaq and El Minia
wastewater treatment plants, will also be scrutinized. The last chapter summarizes with final
remarks regarding the current water management in Egypt and options for improvement.
Figure 1: Areas of physical and economical water scarcity (Molden, 2007, p. 11)
EGYPT
3
2. Background information about Egypt
2.1. Geography
Egypt is located in north-east Africa and spans a total area of around 1.01 million km2 Egypt has a
population of about 83 million (CAPMAS, 2012) and an average annual population growth of 1.7%
(United Nations Statistics Division, 2010). The greatest portion of the population resides along the
Delta and the Nile Valley. The urban population encompasses 43.4% of the total population (United
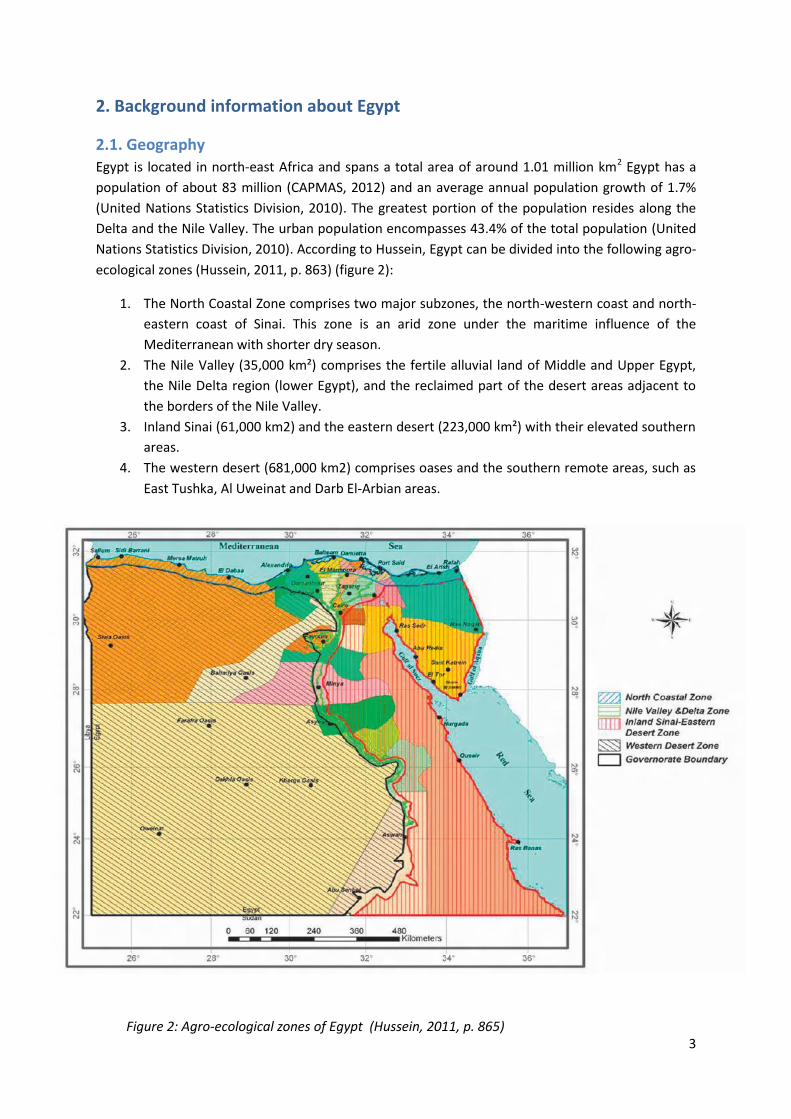
Nations Statistics Division, 2010). According to Hussein, Egypt can be divided into the following agro-
ecological zones (Hussein, 2011, p. 863) (figure 2):
1. The North Coastal Zone comprises two major subzones, the north-western coast and north-
eastern coast of Sinai. This zone is an arid zone under the maritime influence of the
Mediterranean with shorter dry season.
2. The Nile Valley (35,000 km²) comprises the fertile alluvial land of Middle and Upper Egypt,
the Nile Delta region (lower Egypt), and the reclaimed part of the desert areas adjacent to
the borders of the Nile Valley.
3. Inland Sinai (61,000 km2) and the eastern desert (223,000 km²) with their elevated southern
areas.
4. The western desert (681,000 km2) comprises oases and the southern remote areas, such as
East Tushka, Al Uweinat and Darb El-Arbian areas.
Figure 2: Agro-ecological zones of Egypt (Hussein, 2011, p. 865)
4
2.2. Climatic data
Egypt’s climatic conditions are characterized by the country’s position between Africa, Asia and the
Mediterranean, which has resulted in four climatic zones: hyper-arid, arid, semi-arid, and dry Sub-
humid. “According to the aridity index P/ETP (P = precipitation and ETP = potential
evapotranspiration, calculated by Penman’s formula), the arid regions are classified to Hyperarid
(P/ETP< 0.03) and arid (P/ETP = 0.03 – 0.20). These classes are, in turn, subdivided according to the
mean temperature of the coldest month and that of the hottest month of the year. Consideration is
also given to the time of rainy period relative to the temperature regime” (A.M.Hegazi , 2005, p. 5).
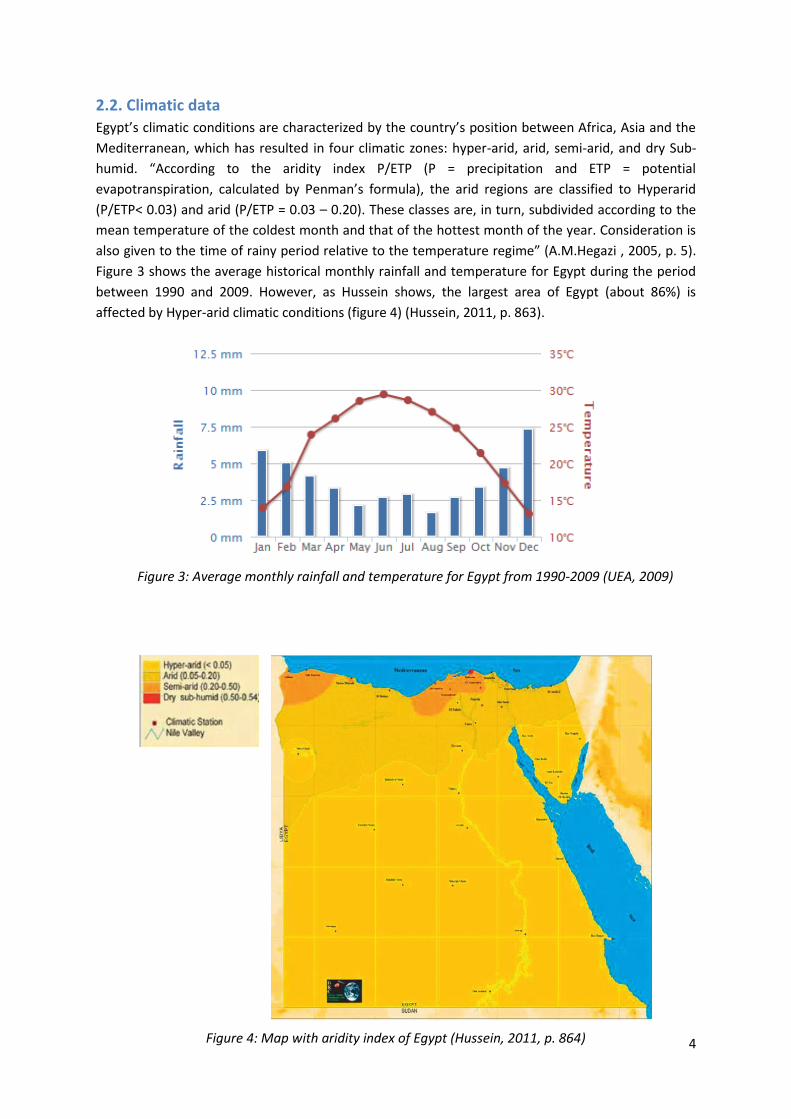
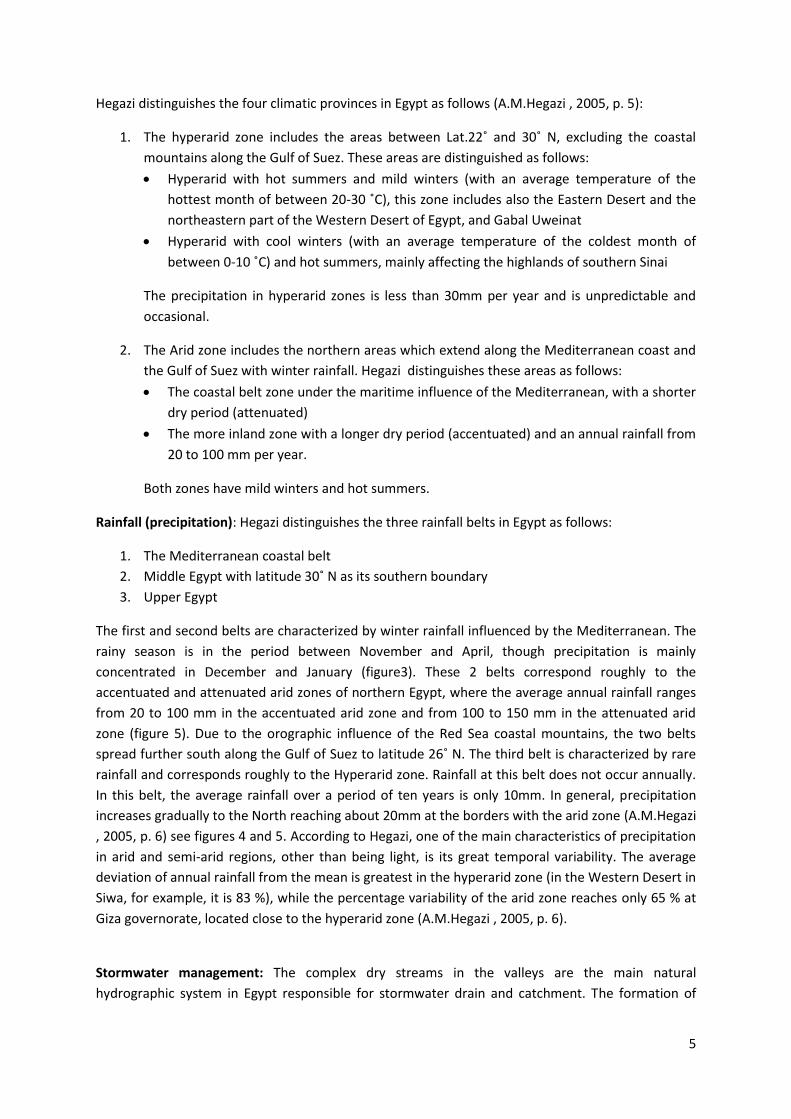
Figure 3 shows the average historical monthly rainfall and temperature for Egypt during the period
between 1990 and 2009. However, as Hussein shows, the largest area of Egypt (about 86%) is
affected by Hyper-arid climatic conditions (figure 4) (Hussein, 2011, p. 863).
Figure 3: Average monthly rainfall and temperature for Egypt from 1990-2009 (UEA, 2009)
Figure 4: Map with aridity index of Egypt (Hussein, 2011, p. 864)
5
Hegazi distinguishes the four climatic provinces in Egypt as follows (A.M.Hegazi , 2005, p. 5):
1. The hyperarid zone includes the areas between Lat.22˚ and 30˚ N, excluding the coastal
mountains along the Gulf of Suez. These areas are distinguished as follows:
Hyperarid with hot summers and mild winters (with an average temperature of the
hottest month of between 20-30 ˚C), this zone includes also the Eastern Desert and the
northeastern part of the Western Desert of Egypt, and Gabal Uweinat
Hyperarid with cool winters (with an average temperature of the coldest month of
between 0-10 ˚C) and hot summers, mainly affecting the highlands of southern Sinai
The precipitation in hyperarid zones is less than 30mm per year and is unpredictable and
occasional.
2. The Arid zone includes the northern areas which extend along the Mediterranean coast and
the Gulf of Suez with winter rainfall. Hegazi distinguishes these areas as follows:
The coastal belt zone under the maritime influence of the Mediterranean, with a shorter
dry period (attenuated)
The more inland zone with a longer dry period (accentuated) and an annual rainfall from
20 to 100 mm per year.
Both zones have mild winters and hot summers.
Rainfall (precipitation): Hegazi distinguishes the three rainfall belts in Egypt as follows:
1. The Mediterranean coastal belt
2. Middle Egypt with latitude 30˚ N as its southern boundary
3. Upper Egypt
The first and second belts are characterized by winter rainfall influenced by the Mediterranean. The
rainy season is in the period between November and April, though precipitation is mainly
concentrated in December and January (figure3). These 2 belts correspond roughly to the
accentuated and attenuated arid zones of northern Egypt, where the average annual rainfall ranges
from 20 to 100 mm in the accentuated arid zone and from 100 to 150 mm in the attenuated arid
zone (figure 5). Due to the orographic influence of the Red Sea coastal mountains, the two belts
spread further south along the Gulf of Suez to latitude 26˚ N. The third belt is characterized by rare
rainfall and corresponds roughly to the Hyperarid zone. Rainfall at this belt does not occur annually.
In this belt, the average rainfall over a period of ten years is only 10mm. In general, precipitation
increases gradually to the North reaching about 20mm at the borders with the arid zone (A.M.Hegazi
, 2005, p. 6) see figures 4 and 5. According to Hegazi, one of the main characteristics of precipitation
in arid and semi-arid regions, other than being light, is its great temporal variability. The average
deviation of annual rainfall from the mean is greatest in the hyperarid zone (in the Western Desert in
Siwa, for example, it is 83 %), while the percentage variability of the arid zone reaches only 65 % at
Giza governorate, located close to the hyperarid zone (A.M.Hegazi , 2005, p. 6).
Stormwater management: The complex dry streams in the valleys are the main natural
hydrographic system in Egypt responsible for stormwater drain and catchment. The formation of
6
those streams dates back to past wet periods
in the Quaternary and Tertiary. This system
represents about 90% of the surface area of
Egypt and is mainly located in the Western
and Eastern Deserts and on the Sinai
Peninsula. The main catchment areas drain
towards the Nile Valley and the Nile Delta,
inland depressions and the coastal zones
(Attia, 1999, p. 83). The areas where
stormwater harvesting is being practiced
represent an area of about 133,500 hectares
and are located mainly in Matruh (at the
north coast) and in North Sinai (International
Consultants Egypt, 2009, p. 19).
3. Water in Egypt – an overview
3.1. Resources
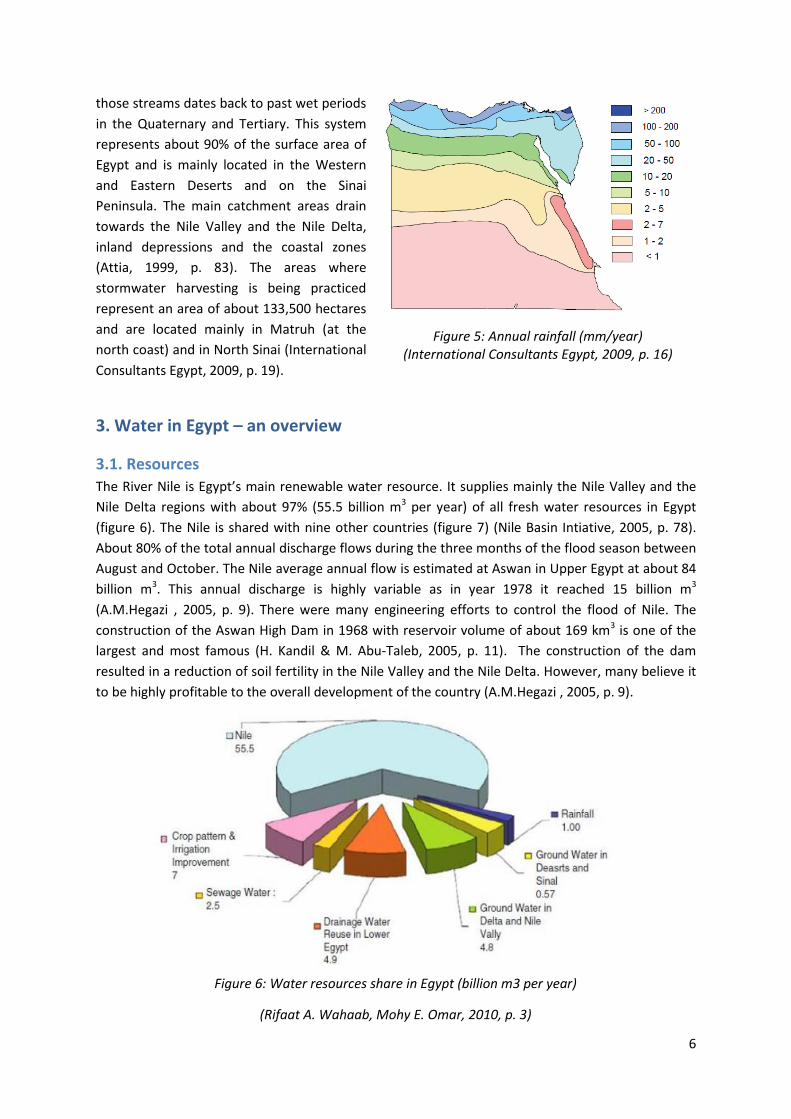
The River Nile is Egypt’s main renewable water resource. It supplies mainly the Nile Valley and the
Nile Delta regions with about 97% (55.5 billion m3 per year) of all fresh water resources in Egypt
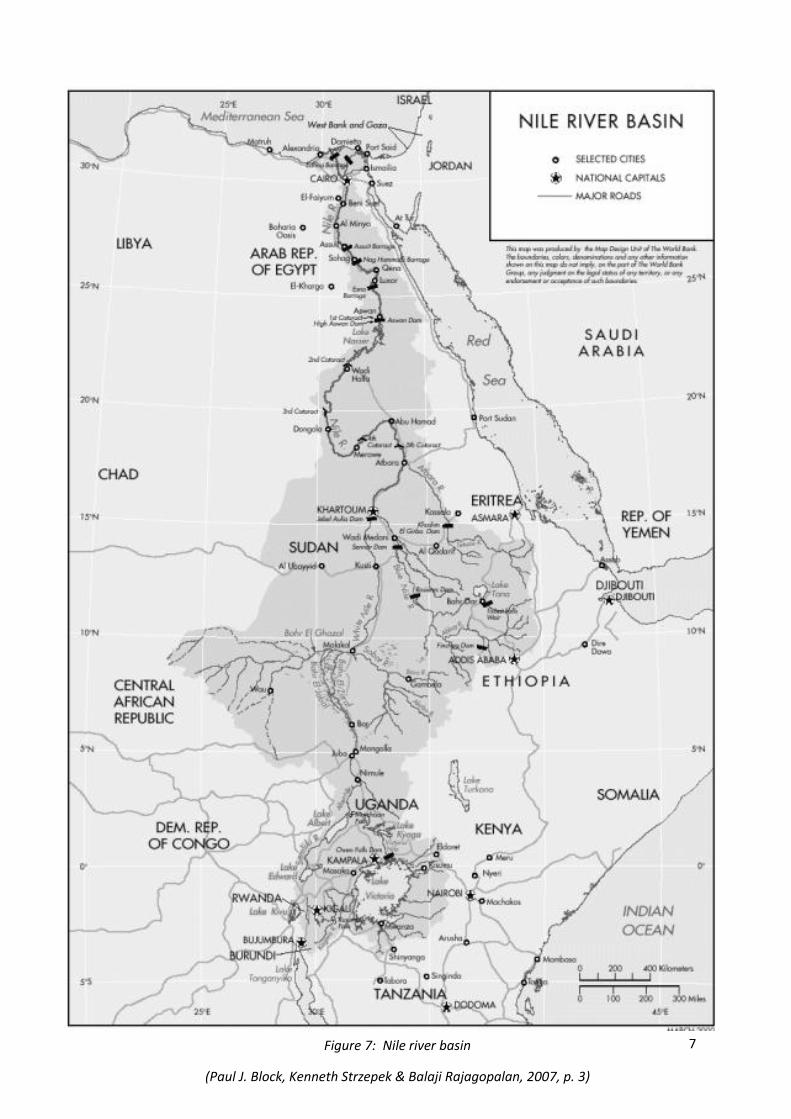
(figure 6). The Nile is shared with nine other countries (figure 7) (Nile Basin Intiative, 2005, p. 78).
About 80% of the total annual discharge flows during the three months of the flood season between
August and October. The Nile average annual flow is estimated at Aswan in Upper Egypt at about 84
billion m3. This annual discharge is highly variable as in year 1978 it reached 15 billion m3
(A.M.Hegazi , 2005, p. 9). There were many engineering efforts to control the flood of Nile. The
construction of the Aswan High Dam in 1968 with reservoir volume of about 169 km3 is one of the
largest and most famous (H. Kandil & M. Abu-Taleb, 2005, p. 11). The construction of the dam
resulted in a reduction of soil fertility in the Nile Valley and the Nile Delta. However, many believe it
to be highly profitable to the overall development of the country (A.M.Hegazi , 2005, p. 9).
Figure 5: Annual rainfall (mm/year) (International Consultants Egypt, 2009, p. 16)
Figure 6: Water resources share in Egypt (billion m3 per year)
(Rifaat A. Wahaab, Mohy E. Omar, 2010, p. 3)
7
Figure 7: Nile river basin
(Paul J. Block, Kenneth Strzepek & Balaji Rajagopalan, 2007, p. 3)
8
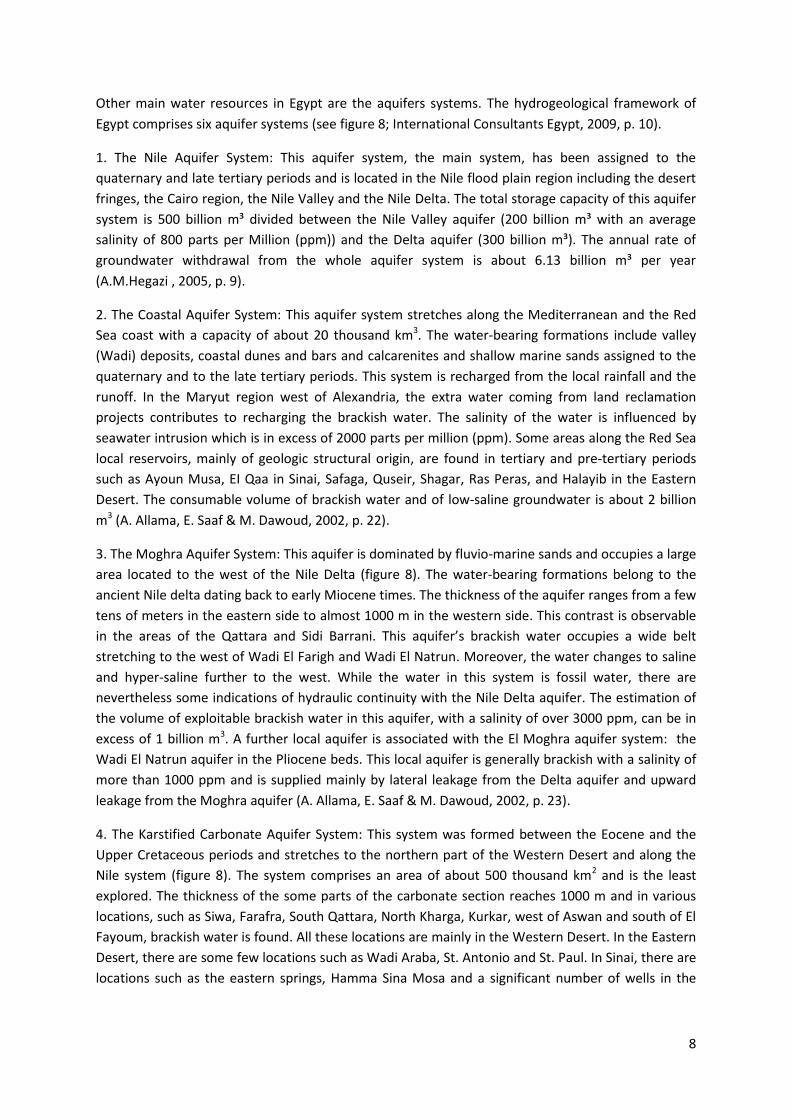
Other main water resources in Egypt are the aquifers systems. The hydrogeological framework of
Egypt comprises six aquifer systems (see figure 8; International Consultants Egypt, 2009, p. 10).
1. The Nile Aquifer System: This aquifer system, the main system, has been assigned to the
quaternary and late tertiary periods and is located in the Nile flood plain region including the desert
fringes, the Cairo region, the Nile Valley and the Nile Delta. The total storage capacity of this aquifer
system is 500 billion m³ divided between the Nile Valley aquifer (200 billion m³ with an average
salinity of 800 parts per Million (ppm)) and the Delta aquifer (300 billion m³). The annual rate of
groundwater withdrawal from the whole aquifer system is about 6.13 billion m³ per year
(A.M.Hegazi , 2005, p. 9).
2. The Coastal Aquifer System: This aquifer system stretches along the Mediterranean and the Red
Sea coast with a capacity of about 20 thousand km3. The water-bearing formations include valley
(Wadi) deposits, coastal dunes and bars and calcarenites and shallow marine sands assigned to the
quaternary and to the late tertiary periods. This system is recharged from the local rainfall and the
runoff. In the Maryut region west of Alexandria, the extra water coming from land reclamation
projects contributes to recharging the brackish water. The salinity of the water is influenced by
seawater intrusion which is in excess of 2000 parts per million (ppm). Some areas along the Red Sea
local reservoirs, mainly of geologic structural origin, are found in tertiary and pre-tertiary periods
such as Ayoun Musa, EI Qaa in Sinai, Safaga, Quseir, Shagar, Ras Peras, and Halayib in the Eastern
Desert. The consumable volume of brackish water and of low-saline groundwater is about 2 billion
m3 (A. Allama, E. Saaf & M. Dawoud, 2002, p. 22).
3. The Moghra Aquifer System: This aquifer is dominated by fluvio-marine sands and occupies a large
area located to the west of the Nile Delta (figure 8). The water-bearing formations belong to the
ancient Nile delta dating back to early Miocene times. The thickness of the aquifer ranges from a few
tens of meters in the eastern side to almost 1000 m in the western side. This contrast is observable
in the areas of the Qattara and Sidi Barrani. This aquifer’s brackish water occupies a wide belt
stretching to the west of Wadi El Farigh and Wadi El Natrun. Moreover, the water changes to saline
and hyper-saline further to the west. While the water in this system is fossil water, there are
nevertheless some indications of hydraulic continuity with the Nile Delta aquifer. The estimation of
the volume of exploitable brackish water in this aquifer, with a salinity of over 3000 ppm, can be in
excess of 1 billion m3. A further local aquifer is associated with the El Moghra aquifer system: the
Wadi El Natrun aquifer in the Pliocene beds. This local aquifer is generally brackish with a salinity of
more than 1000 ppm and is supplied mainly by lateral leakage from the Delta aquifer and upward
leakage from the Moghra aquifer (A. Allama, E. Saaf & M. Dawoud, 2002, p. 23).
4. The Karstified Carbonate Aquifer System: This system was formed between the Eocene and the
Upper Cretaceous periods and stretches to the northern part of the Western Desert and along the
Nile system (figure 8). The system comprises an area of about 500 thousand km2 and is the least
explored. The thickness of the some parts of the carbonate section reaches 1000 m and in various
locations, such as Siwa, Farafra, South Qattara, North Kharga, Kurkar, west of Aswan and south of El
Fayoum, brackish water is found. All these locations are mainly in the Western Desert. In the Eastern
Desert, there are some few locations such as Wadi Araba, St. Antonio and St. Paul. In Sinai, there are
locations such as the eastern springs, Hamma Sina Mosa and a significant number of wells in the
9
central portion. The exploitable brackish water in the fissured carbonates is estimated at about 5
billion m3 (A. Allama, E. Saaf & M. Dawoud, 2002, p. 24).
5. The Nubian Sandstone Aquifer System: This system is assigned to the Palaeozoic and Mesozoic
periods and mainly occupies the western desert where deep groundwater exists (figure 8). Recent
studies have indicated that this system is not a renewable resource (A.M.Hegazi , 2005, p. 9). The
eastern part of this aquifer occupies an area of about 100 thousand km2 and contains brackish water
with salinity between 1500 to 3500 ppm. This type of water is located the valleys of the Western
Desert such as Wadi Qena, Wadi Umm Hibal, Wadi EI laqliita as well as in the areas Dahmit and
Andendan and in the Eastern Desert in Esna, Idf, Kom Ombo, Aswan, Kalabsha and Tlishka in the Nile
Valley. Similar brackish water, passing into saline water at depths, is reported in the same aquifer as
in Qattara and Siwa areas. In the Sinai Peninsula, brackish water dominates in the Nubian formations
with an estimated reserve of about 100 billion m3. Similar brackish water and low saline water exists
in the Eastern Desert along the Red Sea in areas such as Safaga, Quseir, Marsa Alam and Halaib. In
total, the brackish water in the Nubian Sandstone Aquifer is estimated at about 500 billion m3 (A.
Allama, E. Saaf & M. Dawoud, 2002, p. 23).
6. The Fissured and Weathered Hard Rock Aquifer System: This system is assigned to the Pre‐
Cambrian period and stretches between the Eastern Desert and Sinai (figure 8). Weathered hard
rock is considered a water-bearing media through cracks and fractures. The water abstracted from
this type of formation is used on a small local scale for tourism and domestic purposes (Shahin,
2002).
Since the Nile aquifer system is the main water resource, the following section will discuss its
hydraulic conductivity, filtration efficiency and use efficiency.
Figure 8: Locations of aquifer systems in Egypt
(International Consultants Egypt, 2009, p. 10)
10
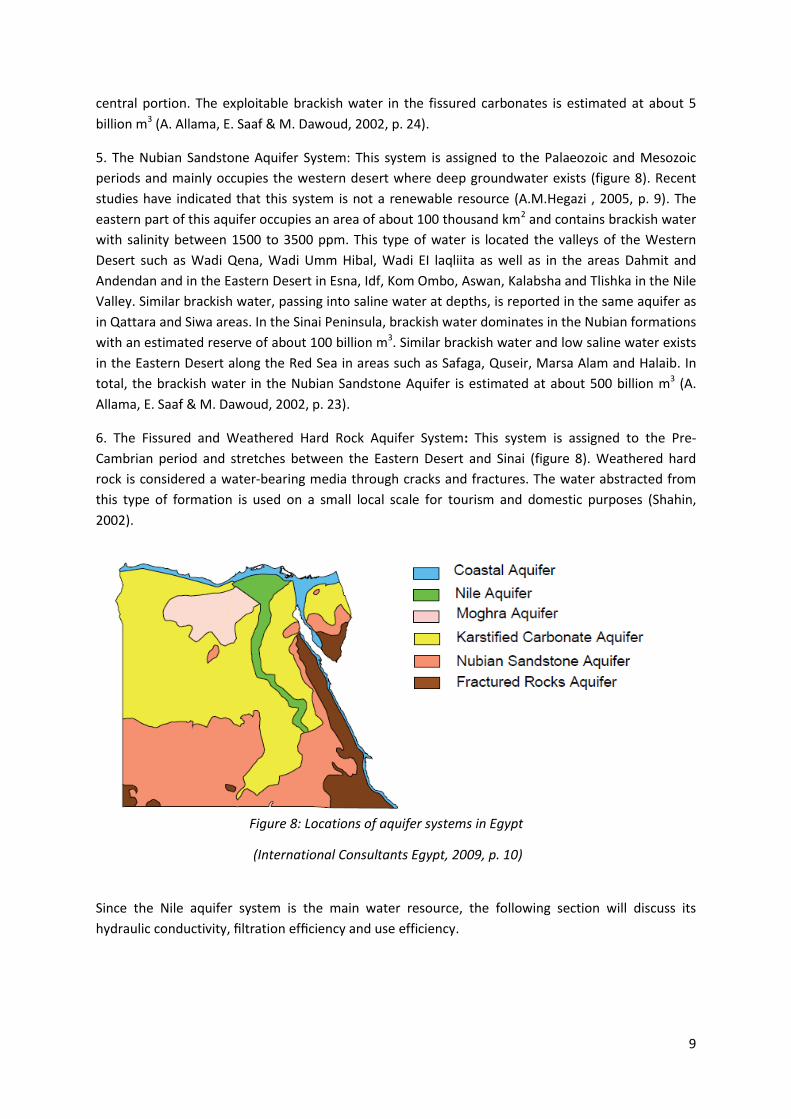
Hydraulic conductivity and filtration efficiency: In the Nile aquifer, the hydraulic horizontal
conductivities of the silt–clay cap and sand–gravel layers are 0.20 and 60 to 110 m per day
respectively. The hydraulic vertical conductivities are 0.04 and 7 to 12 m per day respectively. The
water transmisson properties of the sandy aquifer are excellent with a transmissivity rate of about
12 thousand m2 per day in the central part of the valley. In some locations, there are clay spots
mixed with the main sand gravel aquifer which reduce the overall hydraulic conductivities. The
groundwater flow is generally moving towards the River Nile acting as a major natural drain. Yet
since the construction of the Aswan High Dam, minor variations have occurred in the seasonal
fluctuations of Nile surface water. Figure 9 illustrates the bank filtrate and the generic flow lines of
natural groundwater at a study site in Assiut in Upper Egypt. The most significant layer is the
biologically active layer, whichis responsible for the effectiveness of Riverbank filtration systems. It
islocated at the Nile bed with about 800 m width (M. Shamrukh & A. Abdel-Wahab, 2008, p. 353).
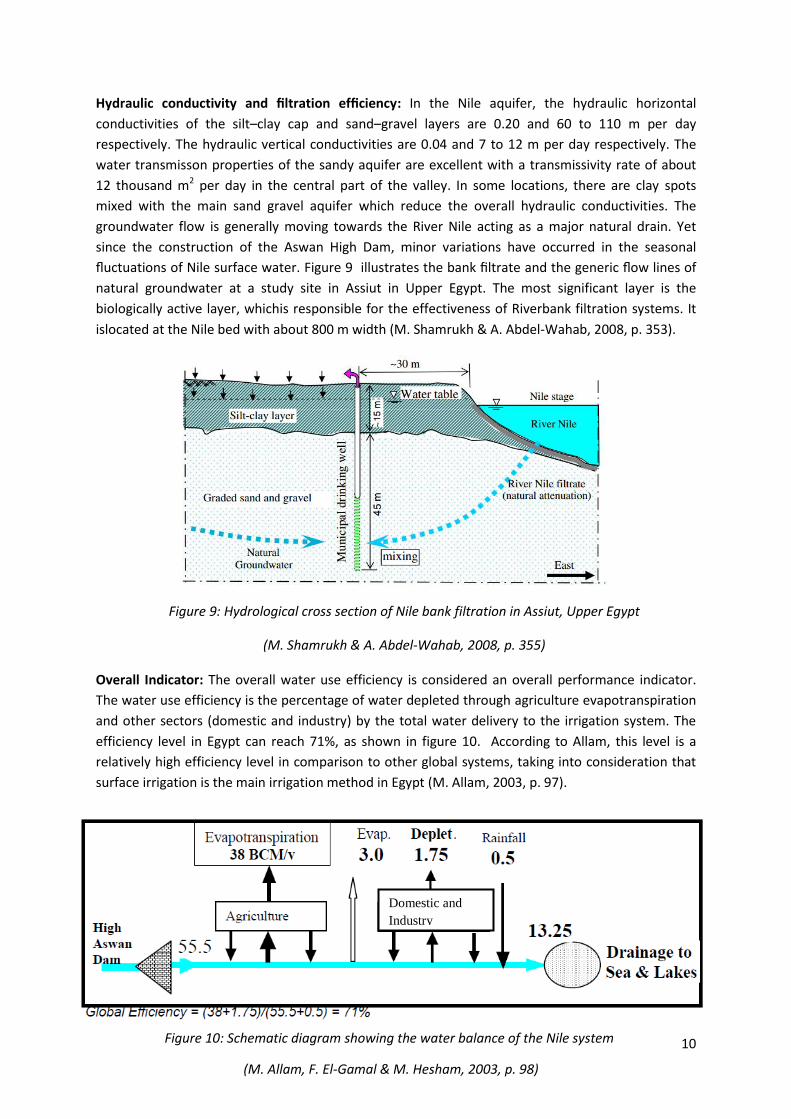
Overall Indicator: The overall water use efficiency is considered an overall performance indicator.
The water use efficiency is the percentage of water depleted through agriculture evapotranspiration
and other sectors (domestic and industry) by the total water delivery to the irrigation system. The
efficiency level in Egypt can reach 71%, as shown in figure 10. According to Allam, this level is a
relatively high efficiency level in comparison to other global systems, taking into consideration that
surface irrigation is the main irrigation method in Egypt (M. Allam, 2003, p. 97).
Figure 9: Hydrological cross section of Nile bank filtration in Assiut, Upper Egypt
(M. Shamrukh & A. Abdel-Wahab, 2008, p. 355)
Domestic and
Industry
Figure 10: Schematic diagram showing the water balance of the Nile system
(M. Allam, F. El-Gamal & M. Hesham, 2003, p. 98)
11
3.2. Supply
The total of renewable water supply in Egypt is estimated at about 56.8 billion m3 per year. The
precipitation accounts for 1.3 billion m3 per year of the internal renewable water resources. The
rainfall is mainly recharging shallow aquifers with a small portion going to surface water resources.
As mentioned earlier, the Nile River supplies about 97 % of the total annual renewable water
resources in Egypt. Out of the natural average flow of the Nile, a volume of 84 km3 per year reaches
the Upper Egyptian city of Aswan, representing a share of 55.5 billion m3 per year which is allocated
for Egypt according to the Nile Water Agreement signed in 1959. About 10 billion m3 per year is
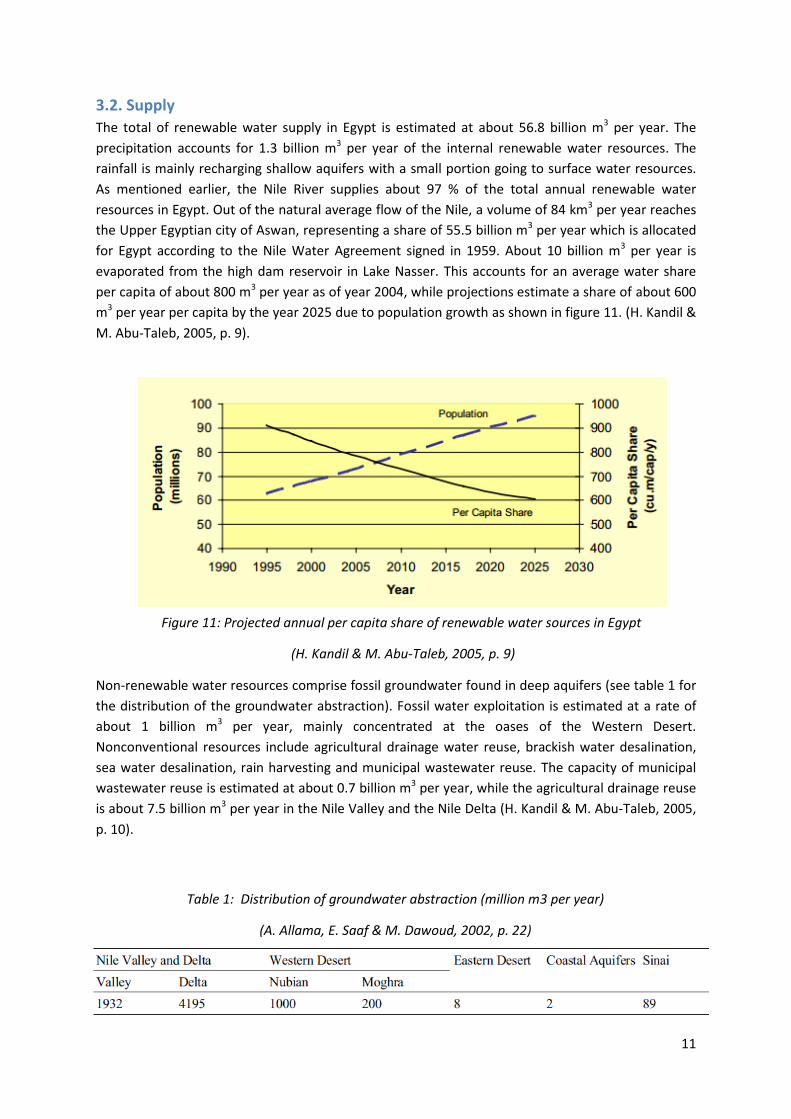
evaporated from the high dam reservoir in Lake Nasser. This accounts for an average water share
per capita of about 800 m3 per year as of year 2004, while projections estimate a share of about 600
m3 per year per capita by the year 2025 due to population growth as shown in figure 11. (H. Kandil &
M. Abu-Taleb, 2005, p. 9).
Non-renewable water resources comprise fossil groundwater found in deep aquifers (see table 1 for
the distribution of the groundwater abstraction). Fossil water exploitation is estimated at a rate of
about 1 billion m3 per year, mainly concentrated at the oases of the Western Desert.
Nonconventional resources include agricultural drainage water reuse, brackish water desalination,
sea water desalination, rain harvesting and municipal wastewater reuse. The capacity of municipal
wastewater reuse is estimated at about 0.7 billion m3 per year, while the agricultural drainage reuse
is about 7.5 billion m3 per year in the Nile Valley and the Nile Delta (H. Kandil & M. Abu-Taleb, 2005,
p. 10).
Figure 11: Projected annual per capita share of renewable water sources in Egypt
(H. Kandil & M. Abu-Taleb, 2005, p. 9)
Table 1: Distribution of groundwater abstraction (million m3 per year)
(A. Allama, E. Saaf & M. Dawoud, 2002, p. 22)
12
3.3. Demand
The biggest challenge for Egypt is to be able to meet the future water demand in correspondence to
the expected population growth. More than 95% of the currently estimated 83 million inhabitants
(CAPMAS, 2012) of Egypt are concentrated in only about 5.5% of Egypt’s total area (mainly in the
Nile Valley and the Delta). In line with the population growth, the water demand is growing rapidly,
reflecting growing needs in agricultural and industrial sectors as well as those of expanding
communities (H. Kandil & M. Abu-Taleb, 2005, p. 11). These varying demands for water are putting
strong pressure on the available water supply. The agricultural sector, including fishing, is considered
the highest freshwater consumer with about 86% consumption of the available supplies (excluding
recycling). The domestic and industrial sectors consume 6% and 8% of the total natural supplies
respectively. There are some sub-sectors such as navigation and energy (hydropower) which utilize
the irrigation distribution system of the Nile but they are not net consumers of the water resources
(H. Kandil & M. Abu-Taleb, 2005, p. 10).
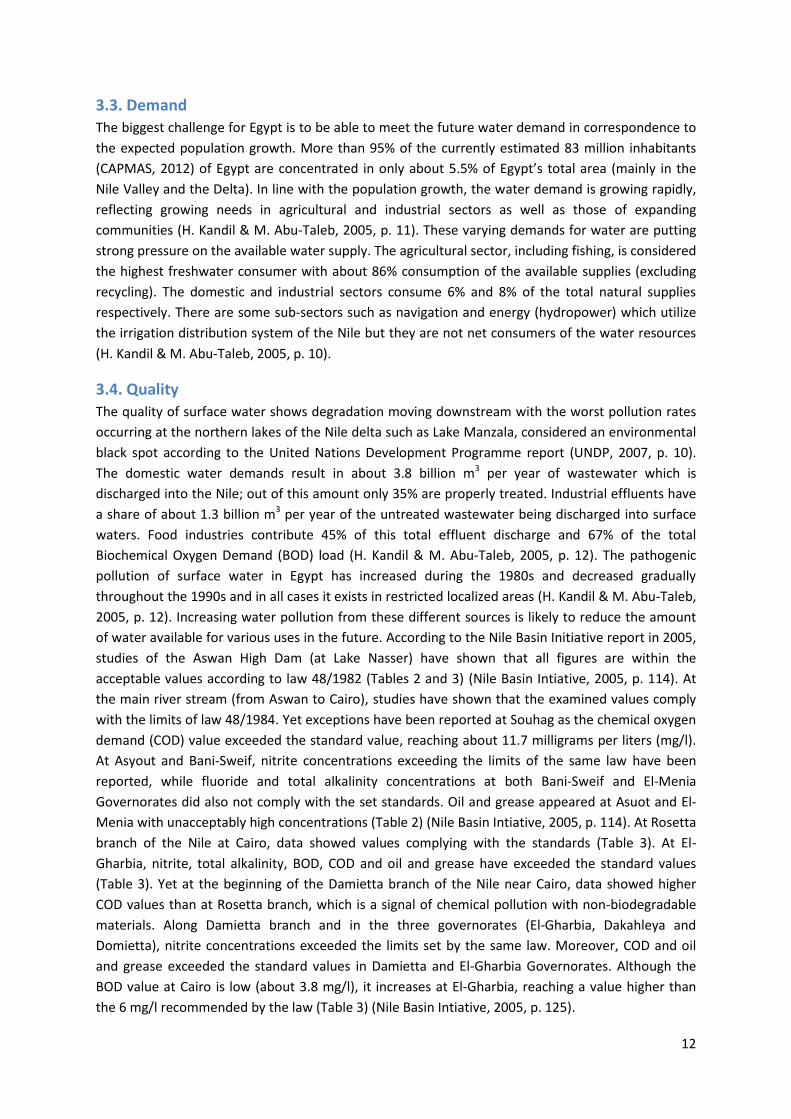
3.4. Quality The quality of surface water shows degradation moving downstream with the worst pollution rates
occurring at the northern lakes of the Nile delta such as Lake Manzala, considered an environmental
black spot according to the United Nations Development Programme report (UNDP, 2007, p. 10).
The domestic water demands result in about 3.8 billion m3 per year of wastewater which is
discharged into the Nile; out of this amount only 35% are properly treated. Industrial effluents have
a share of about 1.3 billion m3 per year of the untreated wastewater being discharged into surface
waters. Food industries contribute 45% of this total effluent discharge and 67% of the total
Biochemical Oxygen Demand (BOD) load (H. Kandil & M. Abu-Taleb, 2005, p. 12). The pathogenic
pollution of surface water in Egypt has increased during the 1980s and decreased gradually
throughout the 1990s and in all cases it exists in restricted localized areas (H. Kandil & M. Abu-Taleb,
2005, p. 12). Increasing water pollution from these different sources is likely to reduce the amount
of water available for various uses in the future. According to the Nile Basin Initiative report in 2005,
studies of the Aswan High Dam (at Lake Nasser) have shown that all figures are within the
acceptable values according to law 48/1982 (Tables 2 and 3) (Nile Basin Intiative, 2005, p. 114). At
the main river stream (from Aswan to Cairo), studies have shown that the examined values comply
with the limits of law 48/1984. Yet exceptions have been reported at Souhag as the chemical oxygen
demand (COD) value exceeded the standard value, reaching about 11.7 milligrams per liters (mg/l).
At Asyout and Bani-Sweif, nitrite concentrations exceeding the limits of the same law have been
reported, while fluoride and total alkalinity concentrations at both Bani-Sweif and El-Menia
Governorates did also not comply with the set standards. Oil and grease appeared at Asuot and El-
Menia with unacceptably high concentrations (Table 2) (Nile Basin Intiative, 2005, p. 114). At Rosetta
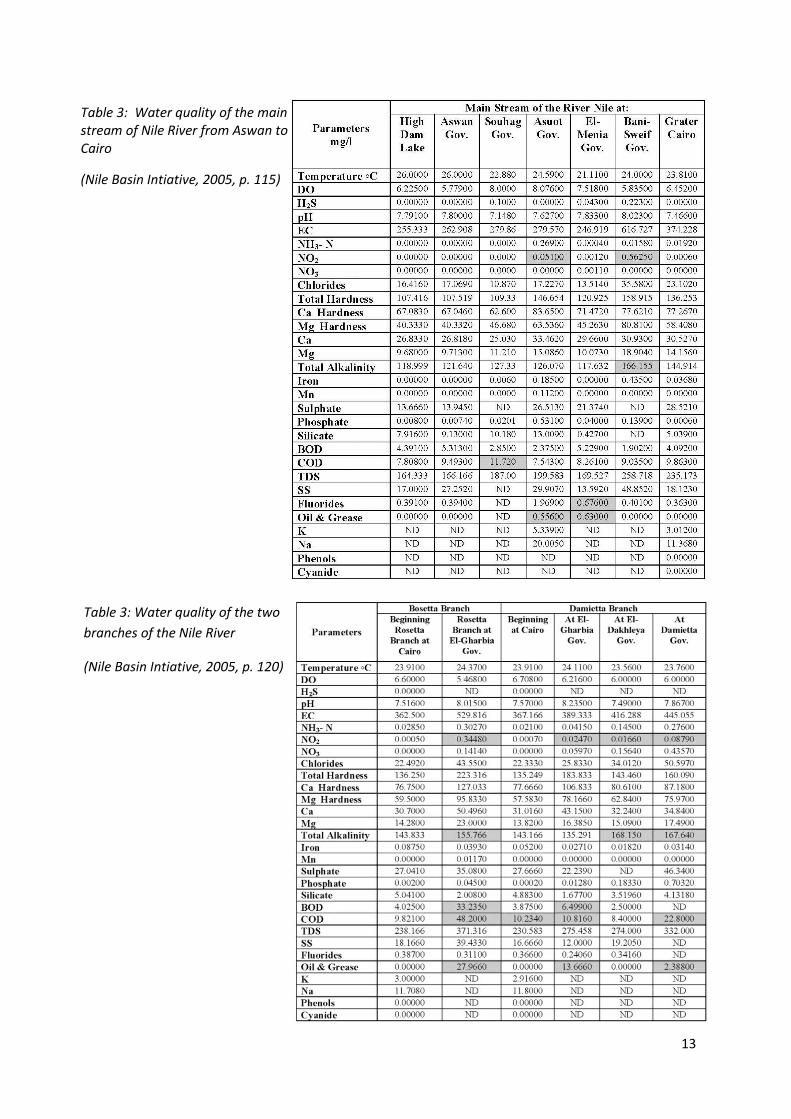
branch of the Nile at Cairo, data showed values complying with the standards (Table 3). At El-
Gharbia, nitrite, total alkalinity, BOD, COD and oil and grease have exceeded the standard values
(Table 3). Yet at the beginning of the Damietta branch of the Nile near Cairo, data showed higher
COD values than at Rosetta branch, which is a signal of chemical pollution with non-biodegradable
materials. Along Damietta branch and in the three governorates (El-Gharbia, Dakahleya and
Domietta), nitrite concentrations exceeded the limits set by the same law. Moreover, COD and oil
and grease exceeded the standard values in Damietta and El-Gharbia Governorates. Although the
BOD value at Cairo is low (about 3.8 mg/l), it increases at El-Gharbia, reaching a value higher than
the 6 mg/l recommended by the law (Table 3) (Nile Basin Intiative, 2005, p. 125).
13
Table 3: Water quality of the main stream of Nile River from Aswan to Cairo
(Nile Basin Intiative, 2005, p. 115)
Table 3: Water quality of the two
branches of the Nile River
(Nile Basin Intiative, 2005, p. 120)
14
3.5. Wastewater treatment
The capacity of the current wastewater treatment plants in Egypt has increased by 10 times in the
last two decades and has now reached 12 million m3 per day. The length of the wastewater
collection networks and sanitation pipelines has increased from 28 thousand km in 2005 to 34
thousand km in 2010 (Rifaat A. Wahaab, Mohy E. Omar, 2010, p. 5).
Agricultural wastewater: About 4.07 billion m3 of water is annually discharged into the Nile from
Upper Egypt. Amounts of agricultural wastewater discharged into the sea between 2006 and 2007
were about 15.651 billion m3 (EEAA, 2008, p. 125). Agricultural drainages are exposed to different
sources of pollution (such as the discharge of incompatible industrial wastewater, primary treated
and/or untreated domestic wastewater), which leads to a degradation of the water quality.
Moreover, the usage of untreated wastewater in irrigation has led to an increase in the salinity in
agricultural drainages with more than 2750 mg/l in some of cases (EEAA, 2008, p. 137).
Domestic wastewater: It is estimated at 12 million m3 per day. A large portion of this amount is
discharged into sanitation networks and the rest is discharged into agricultural drainages which lead
into the Nile, canals and lakes or directly into the sea. Egypt has 239 domestic wastewater treatment
plants, which produce different kinds of treated water (about 8,123 million m3 per day) through the
different treatment processes (primary, secondary, biological, activated sludge, plant and aerobic
and anaerobic oxidation ponds). Domestic wastewater collected from around five thousand basins in
rural areas are directly discharged into agricultural drains without proper treatment in addition to
the untreated or secondary treated sewage from sanitation networks of major cities (EEAA, 2008, p.
130). Wastewater quantities produced per capita vary significantly from one city to another
according to the size of the city and the standard of living. This is about 440 liters per capita per day
in Alexandria (rainfall discharge included) and an estimated 200 to 250 liters per capita per day in
Cairo, while it is only 50 to 80 liters per capita per day in rural areas. An amount of 1,150 million m3
per day of wastewater, representing 19% of the total treated wastewater, is primarily treated by two
plants in western and eastern Alexandria and one in Abu-Rawash in greater Cairo and treated as
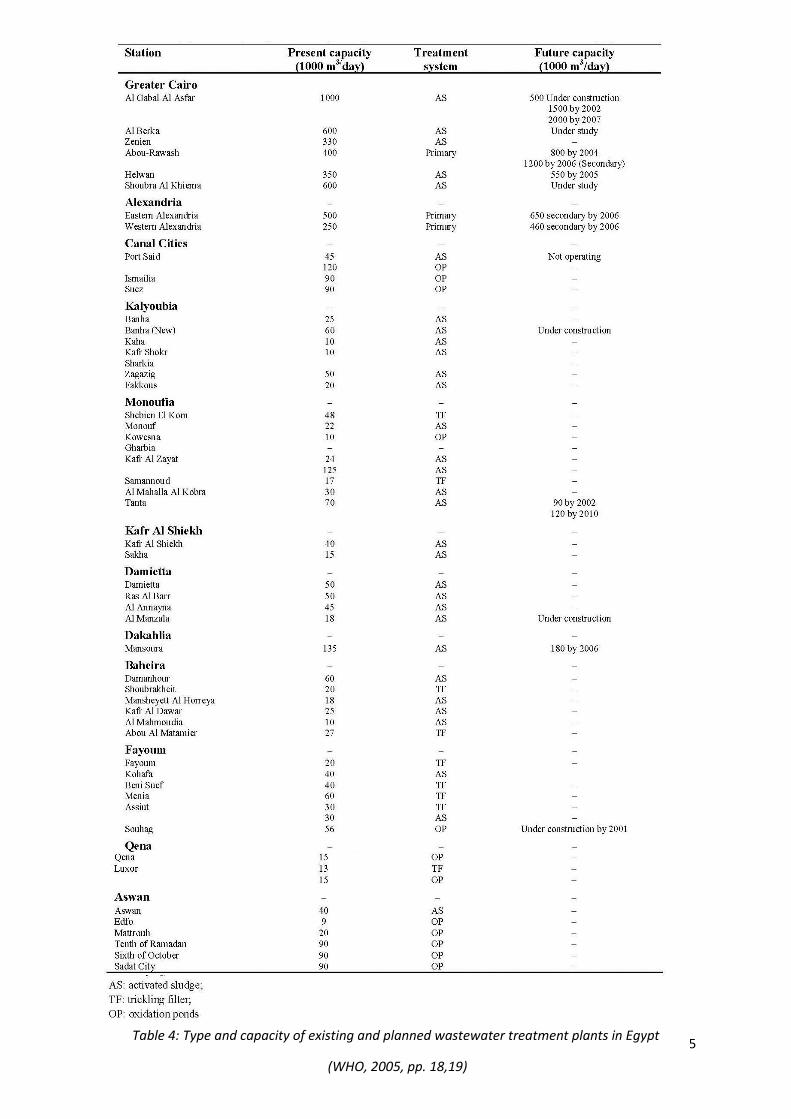
follows: 65% by activated sludge 11% by waste stabilization ponds and 4.5% by trickling filters. Table
4 below shows the capacities and types of the existing and planned wastewater treatment plants in
Egypt (WHO, 2005, p. 17).
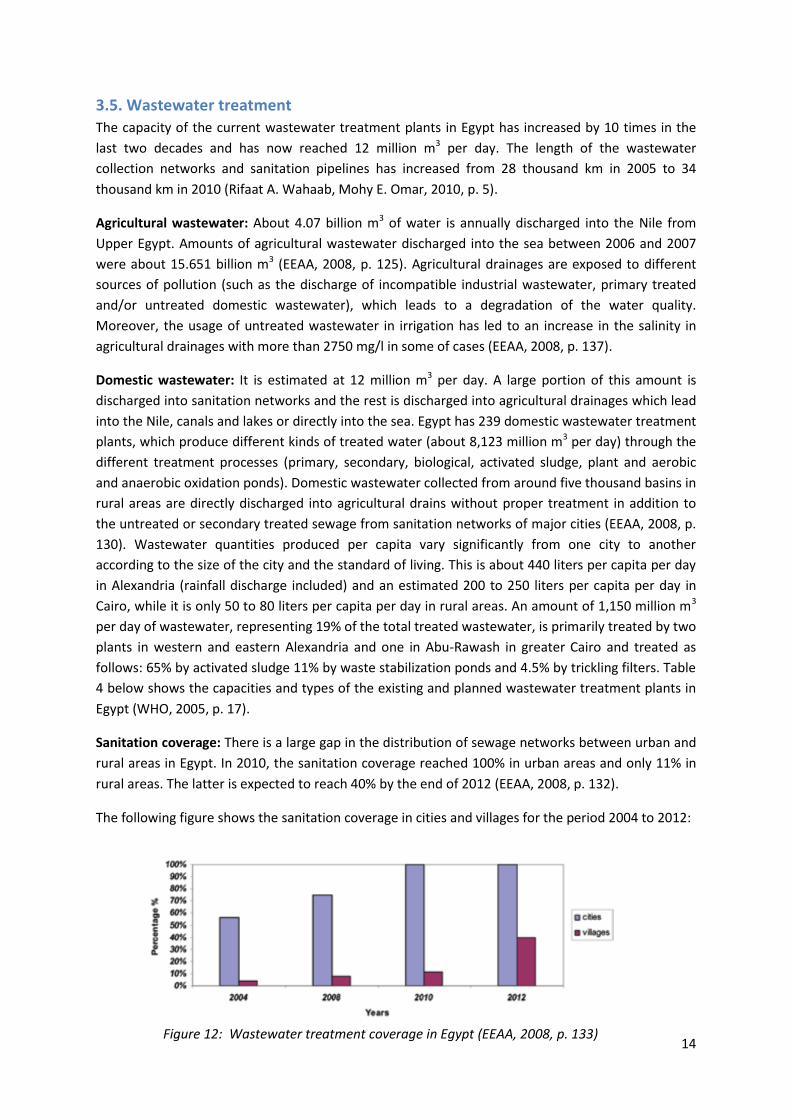
Sanitation coverage: There is a large gap in the distribution of sewage networks between urban and
rural areas in Egypt. In 2010, the sanitation coverage reached 100% in urban areas and only 11% in
rural areas. The latter is expected to reach 40% by the end of 2012 (EEAA, 2008, p. 132).
The following figure shows the sanitation coverage in cities and villages for the period 2004 to 2012:
Figure 12: Wastewater treatment coverage in Egypt (EEAA, 2008, p. 133)
15
Table 4: Type and capacity of existing and planned wastewater treatment plants in Egypt
(WHO, 2005, pp. 18,19)
16
Industrial Wastewater: This type of wastewater is one of the main sources of pollution of the Nile,
canals and drainages that may penetrate into groundwater in case of being improperly discharged or
injected into the soil. Industrial wastewater contains heavy metals and both organic and inorganic
components that are a health hazard and can prevent the optimal use of water sources. Wastewater
resulting from food industries is one of the most important factors leading to an increase in the
organic matter that consumes dissolved oxygen (DO) as a result of the decomposition of this type of
wastewater. There are about 129 industrial facilities located along the Nile. 102 of these discharge
directly or indirectly about 4 billion m3 per year into the Nile (EEAA, 2008, pp. 133, 134).
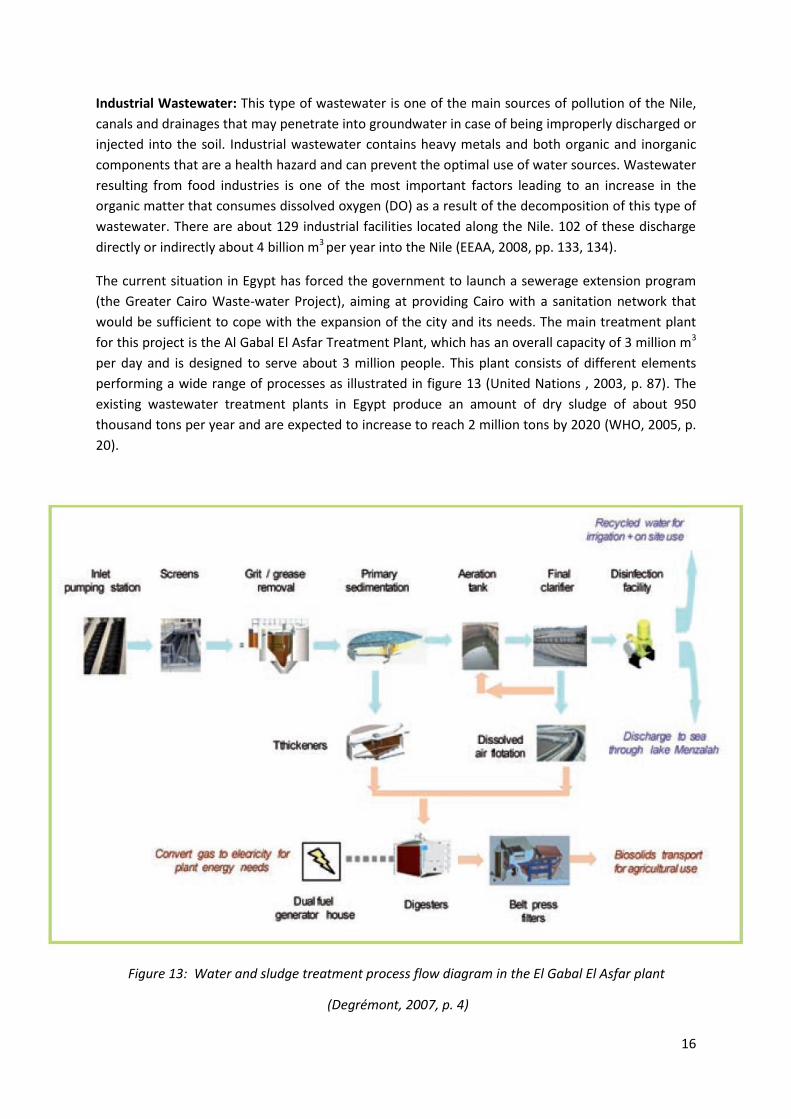
The current situation in Egypt has forced the government to launch a sewerage extension program
(the Greater Cairo Waste-water Project), aiming at providing Cairo with a sanitation network that
would be sufficient to cope with the expansion of the city and its needs. The main treatment plant
for this project is the Al Gabal El Asfar Treatment Plant, which has an overall capacity of 3 million m3
per day and is designed to serve about 3 million people. This plant consists of different elements
performing a wide range of processes as illustrated in figure 13 (United Nations , 2003, p. 87). The
existing wastewater treatment plants in Egypt produce an amount of dry sludge of about 950
thousand tons per year and are expected to increase to reach 2 million tons by 2020 (WHO, 2005, p.
20).
Figure 13: Water and sludge treatment process flow diagram in the El Gabal El Asfar plant
(Degrémont, 2007, p. 4)
17
4. Ecological sanitation in Egypt
4.1. Humification of sewage sludge in El Minia and Nawaq
Most of the Egypt’s small towns and municipalities already have or are planning to build their own
sewage treatment plant. In Egypt, the sewage sludge production per capita has an annual amount of
12 to 15 kg of solid matter, which corresponds to a daily production of 35 to 40 g. The method of
treatment adopted in all Egyptian treatment plants is a thickening of the matter, followed by drying.
There are complaints by the plant operators about the low market value of the dry sludge produced
in the plants (GIZ, 2005, p. 1). When applied in hot and dry climates, this method of fast drying of
sludge has the disadvantage that the hydrolytic and microbiological decomposition and conversion
of organic and inorganic substances is minimized and offensive odors may occur. Other drawbacks of
the fast drying are the hardness and large size of the lumps, the low hygienisation rate, the low
water storage capacity, and the low microbiological conversion of the organic substances (GIZ, 2005,
p. 2). Moreover, the final product has high concentrations of substances which have many negative
effects, such as lower germination rates and slow development and its use is frequently at a high risk
with respect to salmonella and helminths (GIZ, 2005, p. 2).
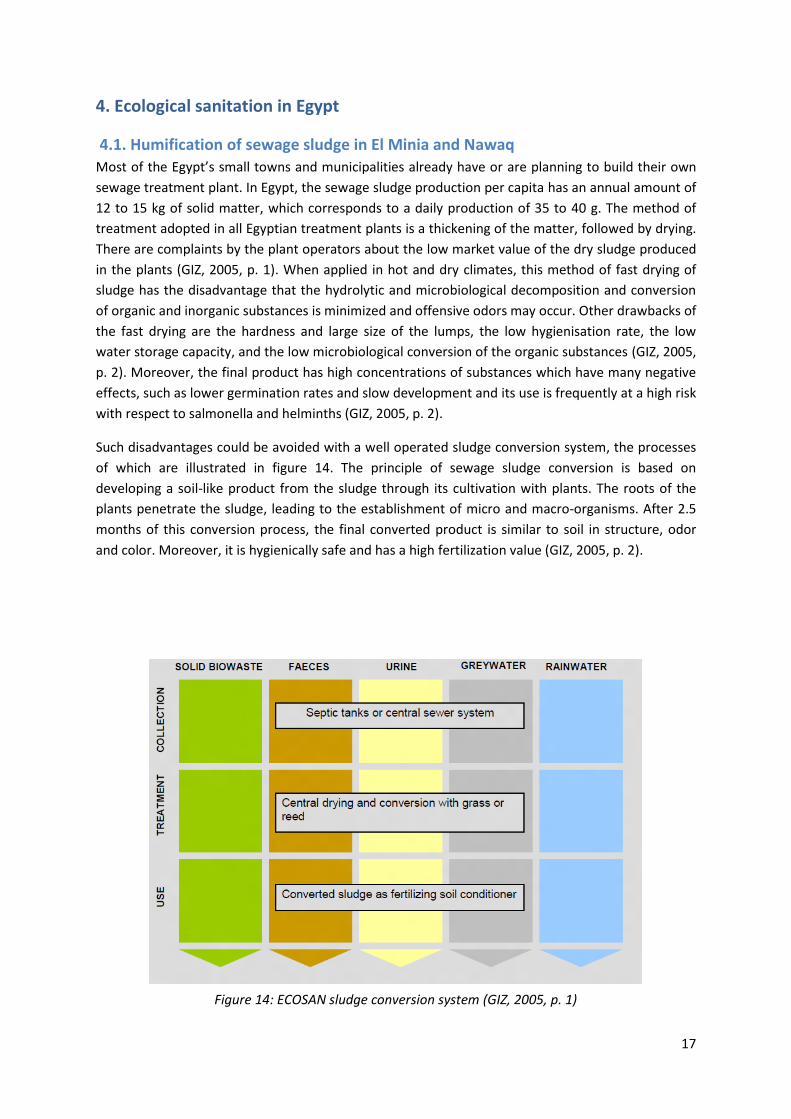
Such disadvantages could be avoided with a well operated sludge conversion system, the processes
of which are illustrated in figure 14. The principle of sewage sludge conversion is based on
developing a soil-like product from the sludge through its cultivation with plants. The roots of the
plants penetrate the sludge, leading to the establishment of micro and macro-organisms. After 2.5
months of this conversion process, the final converted product is similar to soil in structure, odor
and color. Moreover, it is hygienically safe and has a high fertilization value (GIZ, 2005, p. 2).
Figure 14: ECOSAN sludge conversion system (GIZ, 2005, p. 1)
18
The Deutsche Gesellschaft für Internationale Zusammenarbeit (GIZ) in cooperation with the
independent engineering company Ingenieurbüro Pabsch & Partner (IPP) and the University of
Mansoura in Egypt has carried out projects of sludge conversion in two plants in Egypt. The main
project activities took place in two treatment plants in Nawaq and El Minia. The aim was to test and
to compare sludge conversion with grasses and reed under Egyptian conditions and to apply the
converted sludge product in agricultural experiments to observe its qualities as natural fertilizer and
soil conditioner. The first treatment plant in Nawaq in the Nile Delta serves about 17 thousand
inhabitants and consists of an oxidation pond with rotating aeration and a post treatment facility
with additional chlorination of the effluent before leading it into the receiving ditch. The sludge is
usually dried in stabilization ponds, but since the plant does not operate at full capacity the ponds
were used for this sludge conversion project. The second plant is in El Minia in Upper Egypt which
has a desert climate with extreme temperature differences. Serving about 200 thousand inhabitants,
this treatment plant is slightly bigger than the one in Nawaq. It has a similar technical system as
Nawaq but the stabilization ponds are not properly constructed, which leads to a highly loaded
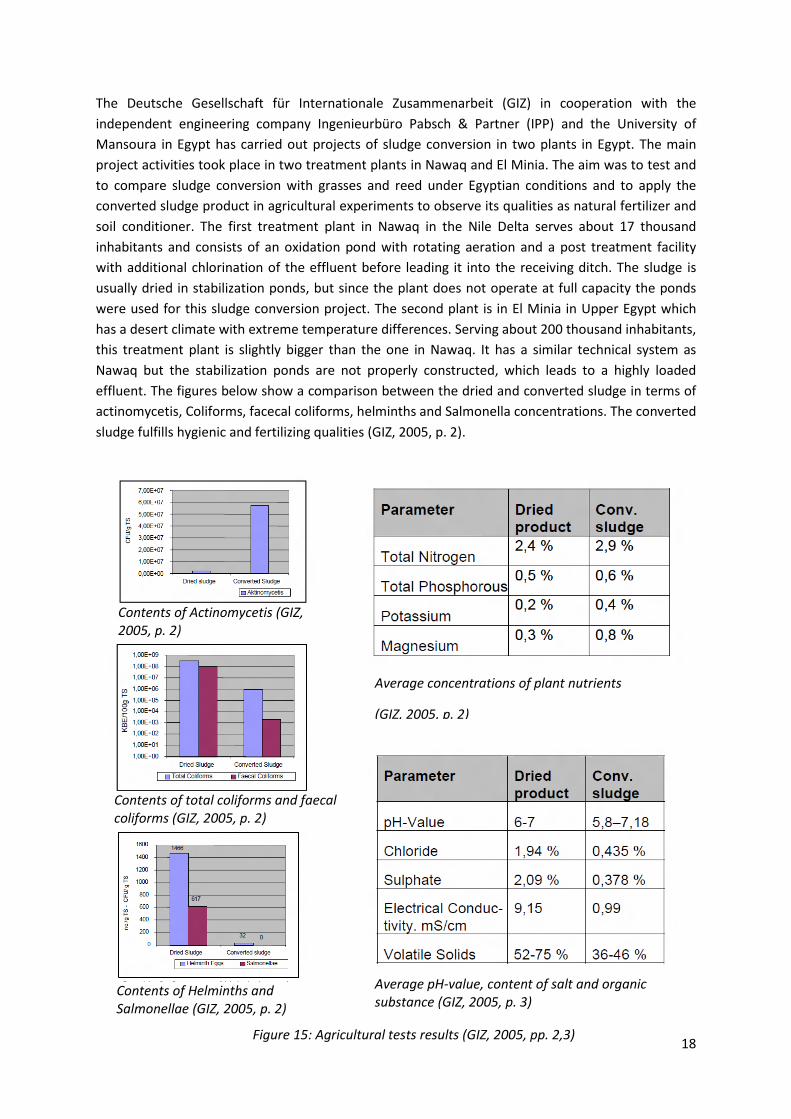
effluent. The figures below show a comparison between the dried and converted sludge in terms of
actinomycetis, Coliforms, facecal coliforms, helminths and Salmonella concentrations. The converted
sludge fulfills hygienic and fertilizing qualities (GIZ, 2005, p. 2).
Contents of Helminths and Salmonellae (GIZ, 2005, p. 2)
Average concentrations of plant nutrients
(GIZ, 2005, p. 2)
Average pH-value, content of salt and organic substance (GIZ, 2005, p. 3)
Contents of Actinomycetis (GIZ, 2005, p. 2)
Contents of total coliforms and faecal coliforms (GIZ, 2005, p. 2)
Figure 15: Agricultural tests results (GIZ, 2005, pp. 2,3)
19
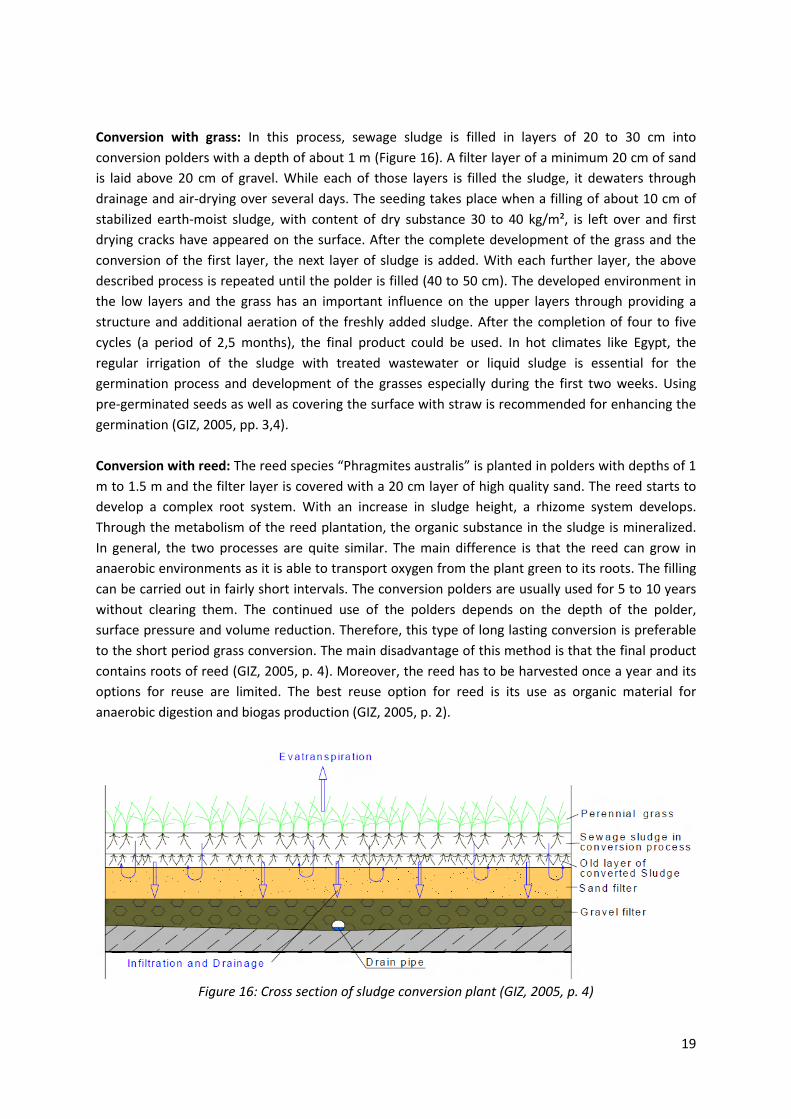
Conversion with grass: In this process, sewage sludge is filled in layers of 20 to 30 cm into
conversion polders with a depth of about 1 m (Figure 16). A filter layer of a minimum 20 cm of sand
is laid above 20 cm of gravel. While each of those layers is filled the sludge, it dewaters through
drainage and air-drying over several days. The seeding takes place when a filling of about 10 cm of
stabilized earth-moist sludge, with content of dry substance 30 to 40 kg/m², is left over and first
drying cracks have appeared on the surface. After the complete development of the grass and the
conversion of the first layer, the next layer of sludge is added. With each further layer, the above
described process is repeated until the polder is filled (40 to 50 cm). The developed environment in
the low layers and the grass has an important influence on the upper layers through providing a
structure and additional aeration of the freshly added sludge. After the completion of four to five
cycles (a period of 2,5 months), the final product could be used. In hot climates like Egypt, the
regular irrigation of the sludge with treated wastewater or liquid sludge is essential for the
germination process and development of the grasses especially during the first two weeks. Using
pre-germinated seeds as well as covering the surface with straw is recommended for enhancing the
germination (GIZ, 2005, pp. 3,4).
Conversion with reed: The reed species “Phragmites australis” is planted in polders with depths of 1
m to 1.5 m and the filter layer is covered with a 20 cm layer of high quality sand. The reed starts to
develop a complex root system. With an increase in sludge height, a rhizome system develops.
Through the metabolism of the reed plantation, the organic substance in the sludge is mineralized.
In general, the two processes are quite similar. The main difference is that the reed can grow in
anaerobic environments as it is able to transport oxygen from the plant green to its roots. The filling
can be carried out in fairly short intervals. The conversion polders are usually used for 5 to 10 years
without clearing them. The continued use of the polders depends on the depth of the polder,
surface pressure and volume reduction. Therefore, this type of long lasting conversion is preferable
to the short period grass conversion. The main disadvantage of this method is that the final product
contains roots of reed (GIZ, 2005, p. 4). Moreover, the reed has to be harvested once a year and its
options for reuse are limited. The best reuse option for reed is its use as organic material for
anaerobic digestion and biogas production (GIZ, 2005, p. 2).
Figure 16: Cross section of sludge conversion plant (GIZ, 2005, p. 4)
20
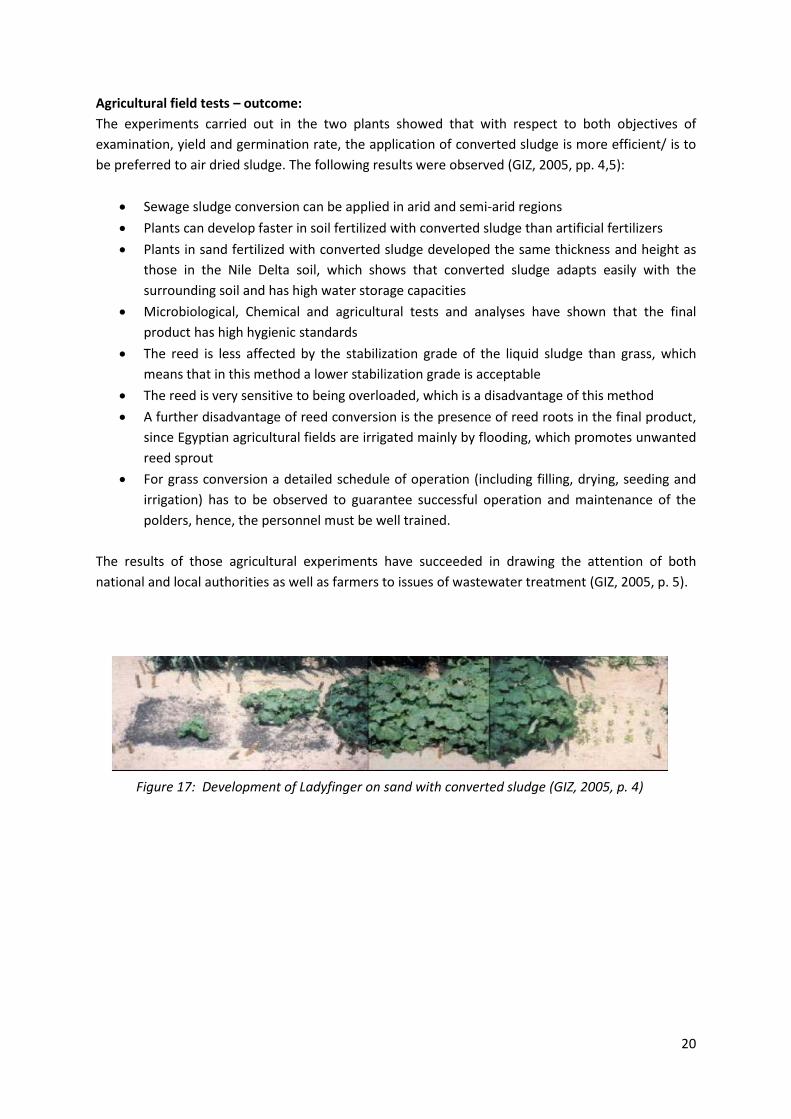
Agricultural field tests – outcome:
The experiments carried out in the two plants showed that with respect to both objectives of
examination, yield and germination rate, the application of converted sludge is more efficient/ is to
be preferred to air dried sludge. The following results were observed (GIZ, 2005, pp. 4,5):
Sewage sludge conversion can be applied in arid and semi-arid regions
Plants can develop faster in soil fertilized with converted sludge than artificial fertilizers
Plants in sand fertilized with converted sludge developed the same thickness and height as
those in the Nile Delta soil, which shows that converted sludge adapts easily with the
surrounding soil and has high water storage capacities
Microbiological, Chemical and agricultural tests and analyses have shown that the final
product has high hygienic standards
The reed is less affected by the stabilization grade of the liquid sludge than grass, which
means that in this method a lower stabilization grade is acceptable
The reed is very sensitive to being overloaded, which is a disadvantage of this method
A further disadvantage of reed conversion is the presence of reed roots in the final product,
since Egyptian agricultural fields are irrigated mainly by flooding, which promotes unwanted
reed sprout
For grass conversion a detailed schedule of operation (including filling, drying, seeding and
irrigation) has to be observed to guarantee successful operation and maintenance of the
polders, hence, the personnel must be well trained.
The results of those agricultural experiments have succeeded in drawing the attention of both
national and local authorities as well as farmers to issues of wastewater treatment (GIZ, 2005, p. 5).
Figure 17: Development of Ladyfinger on sand with converted sludge (GIZ, 2005, p. 4)
21
5. Final remarks The water sector in Egypt faces many challenges regarding water supply, demand and quality. The
mobilization of all resources and their management in an integrated manner is now required.
Integrated Water Resources Management (IWRM) is the process where water and land resources
are developed and managed within a coordinated framework. Such framework should aim to
maximize social and economic welfare and provide environmentally sound solutions. Moreover, this
integrated approach must tackle the management of demand as well as supply (H. Kandil & M. Abu-
Taleb, 2005, p. 6). The Ministry of Water Resources and Irrigation has launched a National Water
Resources Plan for Egypt (NWRP) which describes how Egypt will safeguard its water resources in
the future from an integrated approach. (H. Kandil & M. Abu-Taleb, 2005, p. 5). The NWRP
recommends the following actions (H. Kandil & M. Abu-Taleb, 2005, pp. 20, 21):
1. Securing drinking water: The challenge is to provide quality according to health standards and
to provide the necessary facilities such as distribution systems and drinking water plants.
2. Securing water for food production: Since agriculture is Egypt’s major water consumer, the
government shall increase the supply for irrigation water.
3. Securing water for industry: Egypt shall develop further other livelihood opportunities than
agriculture, in particular to water-related services sectors and the industry. The challenge here is
also not quantity but quality and to provide adequate wastewater treatment facilities in relation
to the quality of sewage and its reuse.
4. Developing a strong institutional framework: The IWRM stimulates the cooperation between
the public sector and stakeholders, privatization and decentralization. This requires institutional
reforms in relation to water management and co-ordinated policy-making, institutional and
professional boundaries and implementation. In respect to sufficient financial and legal means
within these institutions.
5. Creating public awareness and understanding: Campaigns shall raise public awareness
regarding water scarcity and the deterioration of its quality. This may help and even put
pressure in stimulating the political will to act.
6. Protection and restoration of vital ecosystems: Coastal lakes should be protected and
restored to their original states. The remaining systems are limited and in need of protection.
7. Co-operation with Nile Basin countries: Co-operation with Nile Basin countries is
indispensable in order to achieve an equitable overall development of the Nile Basin.
8. Stimulating the political will to act: Bringing water issues to the political agenda is essential in
order to achieve a sustainable management of water resources and to bring the necessary
investments to develop the water sector in Egypt.
In addition to these measures, options such as the decentralization of the current centralized water
infrastructure, wastewater separation and treatment at source should be considered in order to
22
improve water use efficiency. For Egypt’s large agricultural sector, technologies such as drip or
sprinkler irrigation must be considered in order to minimize irrigation water consumption and to
secure a sustainable water sector development in Egypt.
Bibliography A. Allama, E. Saaf & M. Dawoud. (2002, May 10). Desalination of brackish groundwater in Egypt.
Retrieved August 29, 2012, from Desalination Directory Online: http://desline.com/articoli/4852.pdf
A.M.Hegazi . (2005, June). Egyptian National Action Program To Combat Desertification . Retrieved August 06, 2012, from CEDARE: http://land.cedare.int/cedare.int/files24%5CFile1669.pdf
Attia, F. A. (1999). Water and Development in Greater Cairo (Egypt). Cairo: Ministry of Water Resources and Irrigation.
CAPMAS. (2012, January 24). Central agency for public mobilization and statistics. Retrieved January 24, 2012, from http://www.capmas.gov.eg/
Degrémont. (2007). GABAL EL ASFAR Cairo - Egypt, Wastewater Treatment Plant. Retrieved August 28, 2012, from Degrémont: http://www.degremont.co.za/files/content/docs/gabal_brochure_en.pdf
EEAA. (2008). Egypt State of Environment Report. Retrieved September 04, 2012, from Egyptian Ministry of State For Environmental Affairs (EEAA): http://www.eeaa.gov.eg/english/reports/SoE2009en/Egypt%20State%20of%20Environment%20Report.pdf
GIZ. (2005, June 16). Humification of sewage- Data sheets for ecosan projects. Retrieved July 02, 2012, from Deutsche Gesellschaft für Internationale Zusammenarbeit (GIZ) GmbH: http://www.giz.de/Themen/en/SID-86667F74-23DE29FB/dokumente/en-ecosan-pds-014-egypt-nawaq-2005.pdf
H. Kandil & M. Abu-Taleb. (2005, June). Integrated Water Resources Management Plan - Ministry of Water Resources and Irrigation, Egypt. Retrieved August 28, 2012, from The World Bank: https://openknowledge.worldbank.org/bitstream/handle/10986/8320/341800EGY0whit11public10Action0Plan.pdf?sequence=1
Hussein, I. A. (2011). Desertification Process in Egypt. Retrieved July 12, 2012, from SpringerLink: http://www.springerlink.com/content/h12p9358627p2832/fulltext.pdf
International Consultants Egypt. (2009, March). Institutional framework and decisionmaking practices for water management in Egypt. Retrieved August 27, 2012, from Environmental & Energy Management Research Unit (EEMRU): http://environ.chemeng.ntua.gr/ineco/UserFiles/File/Deliverables/Publishable%20Report%20-%20Egypt.pdf
M. Allam, F. El-Gamal & M. Hesham. (2003). IRRIGATION SYSTEMS PERFORMANCE IN EGYPT. Retrieved August 28, 2012, from Options méditerranéennes, Series B, n°52: http://ressources.ciheam.org/om/pdf/b52/05002250.pdf
M. Shamrukh & A. Abdel-Wahab. (2008, January 11). Riverbank filtration for sustainable water supply: application to a large-scale facility on the Nile River. Retrieved August 29, 2012, from SUSTAINABLE SANITATION AND WATER MANAGEMENT (SSWM):
23
http://www.sswm.info/sites/default/files/reference_attachments/SHAMRUKH%20and%20ABDEL%20WAHAB%202008%20Riverbank%20Filtration%20for%20Sustainable%20Water%20Supply.pdf
Molden, D. (2007, February 14). A Comprehensive Assessment of Water Management in Agriculture. Retrieved August 30, 2012, from FAO: http://www.iwmi.cgiar.org/assessment/files_new/synthesis/Summary_SynthesisBook.pdf
Nile Basin Intiative. (2005, August). Nile Basin National Water Quality Monitoring Baseline Study Report for Egypt. Retrieved August 28, 2012, from Nile Reiver Awareness kit: http://nile.riverawarenesskit.org/English/NRAK/Resources/Document_centre/WQ_Baseline_report_Egypt.pdf
Paul J. Block, Kenneth Strzepek & Balaji Rajagopalan. (2007, May). Integrated Management of the Blue Nile Basin in Ethiopia. Retrieved August 29, 2012, from International Food Policy Research Institute: http://www.ifpri.org/sites/default/files/pubs/pubs/dp/ifpridp00700.pdf
Rifaat A. Wahaab, Mohy E. Omar. (2010). Wastewater Reuse in Egypt: Opportunities and Challenges. Retrieved July 18, 2012, from The Arab Water Council: http://www.arabwatercouncil.org/administrator/Modules/CMS/Egypt-Country-Report.pdf
Shahin, M. (2002, Novemeber 30). Hydrology and Water Resources of Africa. Retrieved September 02, 2012, from Google Books: http://books.google.de/books?id=O6rW502ECxEC&pg=PA524&lpg=PA524&dq=Fissured+and+Weathered+Hard+Rock+Aquifer+egypt&source=bl&ots=9u-n00XUIC&sig=BncGgh9eTk6mRR-RwJFMMgcsyU0&hl=de#v=onepage&q=Fissured%20and%20Weathered%20Hard%20Rock%20Aquifer%20egypt&f=false
UEA, C. R. (2009). Climate Change Knowledge Portal For Development Practitioners and Policy Makers. Retrieved September 01, 2012, from The World Bank Group: http://sdwebx.worldbank.org/climateportal/index.cfm?page=country_historical_climate&ThisRegion=Africa&ThisCCode=EGY
UNDP. (2007, October 24). Final Evaluation of the UNDP/GEF, Lake Manzala Engineered Wetlands Project. Retrieved September 03, 2012, from United Nations Development Programme (UNDP): https://docs.google.com/viewer?a=v&q=cache:CmpeqZitz20J:erc.undp.org/evaluationadmin/downloaddocument.html%3Fdocid%3D1734+lake+manzala+egypt+black+spot+united+natio&hl=de&gl=de&pid=bl&srcid=ADGEESgJxQ4IcFUGP1UwiTJh5kQWEXh50u7TeEzepAm7txd9-mIWd5saYAi1h3EXe
United Nations . (2003, September 11). WASTE-WATER TREATMENT TECHNOLOGIES: A GENERAL REVIEW . Retrieved August 28, 2012, from IGEM Portal: http://www.igemportal.org/Resim/Wastewater%20Treatment%20Technologies_%20A%20general%20rewiev.pdf
United Nations Statistics Division. (2010). 2010 World Statistics Pocketbook Country Profile: Egypt. Retrieved March 04, 2012, from http://data.un.org/CountryProfile.aspx?crName=EGYPT
WHO. (2005). A regional overview of wastewater management and reuse in the Eastern Mediterranean Region. Retrieved August 27, 2012, from World Health Organization: http://applications.emro.who.int/dsaf/dsa759.pdf


