Embed Size (px)
Citation preview
This article appeared in a journal published by Elsevier. The attachedcopy is furnished to the author for internal non-commercial researchand education use, including for instruction at the authors institution
and sharing with colleagues.
Other uses, including reproduction and distribution, or selling orlicensing copies, or posting to personal, institutional or third party
websites are prohibited.
In most cases authors are permitted to post their version of thearticle (e.g. in Word or Tex form) to their personal website orinstitutional repository. Authors requiring further information
regarding Elsevier’s archiving and manuscript policies areencouraged to visit:
http://www.elsevier.com/copyright
Author's personal copyARTICLE IN PRESS
Water sources and nitrogen relations of grasses and shrubs inphreatophytic communities of the Great Basin Desert
D.E. Pataki a,b,�, S.A. Billings c, E. Naumburg d, C.M. Goedhart b
a Department of Earth System Science, University of California, Irvine, CA, USAb Department of Ecology and Evolutionary Biology, University of California, Irvine, CA, USAc Department of Ecology and Evolutionary Biology and Kansas Biological Survey, University of Kansas, Lawrence, KS, USAd Glorieta Geoscience Inc., Santa Fe, NM, USA
a r t i c l e i n f o
Article history:
Received 11 April 2007
Received in revised form
21 March 2008
Accepted 26 March 2008Available online 8 May 2008
Keywords:
Ecohydrology
Halophytes
Hydrologic change
Stable isotopes
Woody encroachment
a b s t r a c t
Water exports have been occurring in Owens Valley, California for almost a century,
leading to questions about possible interactions between groundwater availability and
community composition. While many studies of vegetation change in Owens Valley
focused on depth to groundwater as the primary factor influencing competition among
grasses and shrubs, nutrient relations may also play an important role. We evaluated
access to groundwater and nitrogen (N) in grasses and shrubs in Owens Valley with
measurements of water isotopes and N concentrations, isotopes, and fluxes. We found
that grasses accessed isotopically enriched soil water at shallow depths while shrubs
utilized groundwater throughout the growing season. However, N relations showed a
different pattern among functional types. Halophytic species showed consistently high
leaf N that was also more isotopically enriched than other species. Soil N was also highly
isotopically enriched in the surface soil, suggesting that halophytes accessed shallow N
pools. In general, there was a consistent relationship between leaf C:N and leaf N isotopes
across all species and sites. These results suggest that access to isotopically enriched,
surface N is a strong control on N uptake, and that N relations play an important role in
vegetation composition in this ecosystem.
& 2008 Elsevier Ltd. All rights reserved.
1. Introduction
Owens Valley, California is a closed hydrologic basin at the base of the Sierra Nevada Mountains. In 1913, the Los AngelesDepartment of Water and Power (LADWP) began diverting water from this semi-arid basin, which supports vegetationfrom both the Great Basin and the Mojave Deserts. Despite several decades of water management and monitoring in thevalley, the current and potential impacts of water redistribution on local vegetation and ecosystem processes remain highlyuncertain, in part due to a limited understanding of the interactions between vegetation dynamics and hydrology.
Research focusing on altered and reduced streamflow has provided us with a fairly good understanding of thedependence of riparian trees on groundwater (see reviews by Friedman et al., 1997; Stromberg, 1993a, b, 2001). Desertshrub and grassland communities may also use groundwater (Robinson, 1958), but the impacts of altered water tables onthese communities has been less studied than their riparian counterparts. Semi-arid, shallow groundwater ecosystems are
Contents lists available at ScienceDirect
journal homepage: www.elsevier.com/locate/jaridenv
Journal of Arid Environments
0140-1963/$ - see front matter & 2008 Elsevier Ltd. All rights reserved.
doi:10.1016/j.jaridenv.2008.03.011
� Corresponding author at: Department of Earth System Science, University of California, Irvine, CA 92697-3100, USA. Tel.: +1949 824 9411;
fax: +1949 824 3874.
E-mail address: [email protected] (D.E. Pataki).
Journal of Arid Environments 72 (2008) 1581– 1593
Author's personal copyARTICLE IN PRESS
generally dominated by species that are not obligate phreatophytes. These species can occur in areas where they do nothave access to groundwater and show great tolerance to water stress, as well as in shallow groundwater sites withabundant available water (Naumburg et al., 2005b). Several uncertainties limit our ability to predict responses of theseecosystems to hydrologic change, including a limited understanding of species differences in rooting depths anddistribution, and of linkages between nutrient availability, groundwater uptake by vegetation, and communitycomposition. A quantitative understanding of these interactions is critical for a variety of resource and land managementissues in Owens Valley and in other arid and semi-arid ecosystems experiencing hydrologic change.
Previous studies have attempted to quantify linkages between hydrologic change and shifts in the proportion of grassand shrub cover in Owens Valley. Groeneveld and Or (1994) attributed changes in the proportion of grasses and shrubs atan ‘‘ecotone’’ site to variations in groundwater depth. Elmore et al. (2003, 2006a) attributed declines in herbaceous plantcover detected with remote sensing to lowered water tables caused both by groundwater pumping and drought. Severalstudies have suggested the importance of rainfall as a driver of plant productivity in the region, despite abundantgroundwater resources that often are within reach of plant rooting zones. Sorenson et al. (1991) experimentally drew downthe water table at four sites supporting a mixture of grasses and shrubs. Pumping did not achieve the planned drawdowngoals, but leaf area index declined during the experiment relative to the pre-pumping year irrespective of the proximity tothe pumping wells (Sorenson et al., 1991). Leaf area index also declined throughout the valley, at least in part due to above-average precipitation in the pre-pumping year followed by below-average precipitation (Sorenson et al., 1991). Over thestudy period, leaf area indices were impacted by variation in precipitation and not just the degree of water table decline(Groeneveld et al., 1994, Sorenson et al., 1991). Similar results were seen by Naumburg et al. (2005b), who found that thetwo major grass species in the valley (Distichlis spicata and Sporobolus airoides) responded with declining abovegroundbiomass to a low rainfall year despite constant water tables. This was true even for locations where water tables were wellwithin the rooting zone, indicating the importance of rainfall for plant productivity in these facultatively phreatophyticcommunities.
The strong correlation between productivity and precipitation in the valley, even at sites with shallow groundwater,suggests that groundwater is not as determinant as previously considered and highlights the potential importance of otherfactors such as nutrient limitation and availability in this region. Mean annual precipitation at the valley floor is only150 mm/yr, and rainfall occurs primarily in the winter such that soil moisture becomes increasingly limited at shallowdepths during the growing season (Steinwand et al., 2006). This likely inhibits decomposition and N mineralization at theend of the summer. Increasingly, the importance of pulses of N availability following rainfall events has been demonstratedin a number of semi-arid ecosystems (Chesson et al., 2004; Huxman et al., 2004; Newman et al., 2006; Schaeffer and Evans,2005; Schwinning and Sala, 2004). In Owens Valley, the responses of common species to N addition have been evaluated inmanipulative experiments in the high salinity lake playas of Owens and Mono Lakes (Donovan and Richards, 2000;Drenovsky and Richards, 2003, 2004, 2005; James and Richards, 2005, 2006; James et al., 2005). These studies showed thatthe growth and N uptake of Sarcobatus vermiculatus and Atriplex parryi can be responsive to N additions, while Ericameria
nauseosa (formerly Chrysothamnus nauseosus) and the grass D. spicata appear to be responsive to N only in the presence ofadditional water or phosphorus (Drenovsky and Richards, 2004; James and Richards, 2005; James et al., 2005).
While many studies of vegetation change in Owens Valley have focused on depth to groundwater as the primary factorinfluencing competitive interactions among grasses and shrubs, the responsiveness of these ecosystems to N suggests thatnutrient relations may also play an important role in mediating changes in plant cover and composition. In this study, weevaluated species differences in plant water and nitrogen sources to explore potential drivers of the success of grass andshrub functional types within the central Owens Valley. Specifically, we posed the question: are differences in watersources between grasses and shrubs coupled with differences in N relations? To address this question, we sampled avariety of species and locations in the valley for the isotopic composition of plant water, leaf N, and soil N, as well as totalsoil C and N, soil N losses, and the relative abundance of soil inorganic nitrate vs. ammonium. The natural abundance ofstable isotopes of water in ecosystems with seasonally varying water sources has been shown to be a useful tracer ofshallow vs. groundwater or deep soil water uptake (Dawson and Ehleringer, 1991; Ehleringer and Dawson, 1992; Ehleringeret al., 1991). We hypothesized that if grasses are generally more shallowly rooted than shrubs, the isotopic composition ofwater in grass stems/rhizomes would be isotopically enriched relative to stem water of deeply rooted shrubs due to uptakeof enriched water in the surface soil. In addition, because varying root distributions may lead to species differences in Navailability and uptake, grasses may also take up N at a shallower depth. This may result in isotopic enrichment of N ingrasses, as shallow soil N is often isotopically enriched due to gaseous losses of N in the surface soil of semi-aridecosystems (Amundson et al., 2003; Hogberg, 1997; van Groenigen and van Kessel, 2002). By evaluating possible linkagesbetween water and N relations, we evaluated multiple features of water and N relations for dominant plant species inOwens Valley to assess how plant competition for these resources may govern species composition.
2. Materials and methods
Owens Valley lies in the rainshadow of the Sierra Nevada and receives approximately 150 mm precipitation per year, ofwhich �75% falls from November to March. Precipitation increases with proximity to the Sierra Nevada. Depth togroundwater (DTW) ranges from the ground surface to well below �6 m, which was suggested by Groeneveld (1990) as a
D.E. Pataki et al. / Journal of Arid Environments 72 (2008) 1581–15931582
Author's personal copyARTICLE IN PRESS
critical threshold for common species in Owens Valley. The majority of groundwater recharge comes from Sierra Nevadaprecipitation that infiltrates in the upper reaches of alluvial fans and through tributary stream channels (Hollett et al.,1989). Vegetation in the valley varies depending on groundwater depth and salinity, and has been classified into four majorgroups: (1) alkaline meadow on saline sites with 0–1.5 m DTW, (2) alkaline scrub on saline sites with 1–3 m DTW, (3)dryland alkaline scrub on saline sites with deeper groundwater, and (4) dryland scrub on coarse soils of low salinity anddeep water tables (Griepentrog and Groeneveld, 1981). Dominant species in the valley are the shrub species Artemisia
tridentata, S. vermiculatus, E. nauseosa, and Atriplex spp., and the grass species D. spicata, Leymus triticoides, and S. airoides.
2.1. Study sites
In August 2004, we sampled a variety of species for elemental and stable isotope analyses of leaves at nine sites locatedthroughout Owens Valley with the goal of sampling a wide variety of both community types and groundwater depths. Twosites were categorized as dryland scrub, two as dryland alkaline scrub, and five as alkaline scrub. The sites were located asfar south as the town of Manzanar and as far north as Bishop, California (Table 1). Most of the sites were located nearmonitoring wells. Depth to groundwater varied from a minimum of 2 m to greater than 10 m (LADWP, unpublished data). Inaddition, two of these sites were selected for measurements of the isotopic composition of plant stem water. One of thesesites was the ‘‘ecotone’’ site described in Groeneveld and Or (1994); sampling was conducted on the mixed grass–shrubportion of the site only; we will refer to this site as the ‘‘mixed grass–shrub site.’’ The second site was the location of agroundwater pumping experiment conducted by the USGS in the 1980s; it is referred to as site B in Sorenson et al. (1991)and Groeneveld et al. (1994), and as the ‘‘shrubland’’ site here. In order to measure the isotopic composition ofgroundwater, water samples were collected from the Owens River, nearby Taboose Creek, and from tap water in the townsof Bishop, Lone Pine, Big Pine, and Independence, which are all supplied by local groundwater.
In 2005, we selected a smaller number of sites for more intensive plant and soil sampling. We chose three sites whichvaried in the proportion of grass vs. shrub cover but had similar depth to groundwater (o3 m). These sites consisted of (1)an alkaline meadow near Chalk Bluffs north of the town of Bishop; (2) an intermediate, mixed grass–shrub communitynear the Owens River south of Bishop; and (3) the shrubland site sampled in 2004, which is a shrub dominated site withvery sparse grass cover. The meadow site was dominated by D. spicata, S. airoides, and L. triticoides; grass cover is nearlycontinuous at this site. Both the intermediate and shrub sites were dominated by the shrubs Atriplex torreyi, E. nauseosa,and S. vermiculatus, and the grasses D. spicata and S. airoides. The depth to groundwater (DTW) was o3 m at all three sitesthroughout the study. At each site, leaves were collected for elemental and stable isotope analysis in July and stems weresampled for water extraction and stable isotope analysis in June, July, and August. In June 2005, soil cores were extractedfor analysis of water and N isotopes from 0 to 200 cm depth. Soil collars for nitrous oxide (N2O) and ammonia (NH3) fluxmeasurements were installed in June 2005 and sampled in July 2005. In June of 2005 and 2006, soil samples to 15 cm depthwere extracted from the meadow site, and at the mixed grass–shrub and shrubland sites, both under shrubs and inintershrub spaces for laboratory assays of C and N fluxes and availability. A detailed description of each measurement isgiven below.
2.2. Stable isotope measurements
Sampled sun leaves at the top of the canopy were dried for at least 48 h at 70 1C and ground to a fine powder. Nitrogenisotope ratio (d15N), leaf %N, and C:N ratio were measured with an elemental analyzer coupled to an Isotope Ratio Mass
Table 1Site coordinate locations, elevation, ecosystem types, and sampling dates
Site name N W Ecosystem Sampling dates
Manzanar 36142.490 118108.580 Dryland scrub August 2004
USGS site Ha 36148.000 118109.600 Alkaline scrub August 2004
Well 447 site A 36147.050 118109.870 Dryland alkaline scrub August 2004
Well 447 site B 36146.970 118109.760 Dryland alkaline scrub August 2004
Black Rock 36156.840 118115.210 Dryland scrub August 2004
Taboose Creek 36159.990 118113.580 Alkaline scrub August 2004
Mixed grass– shrubb 37116.930 118121.810 Alkaline scrub August 2004
Mazurka Canyon Road 36149.080 118109.480 Alkaline scrub August 2004
Meadowc 37124.710 118125.590 Alkaline meadow 2005– 2006
Intermediate 37117.490 118119.030 Alkaline scrub 2005– 2006
Shrublandd,e 37119.300 118121.500 Alkaline scrub 2004– 2006
a Site H from Sorenson et al. (1991) and Groeneveld et al. (1994).b The ‘‘ecotone’’ site from Groeneveld and Or (1994).c Site AM2 from Steinwand et al. (2006).d Site B from Sorenson et al. (1991) and Groeneveld et al. (1994).e Site SBM from Steinwand et al. (2006).
D.E. Pataki et al. / Journal of Arid Environments 72 (2008) 1581–1593 1583
Author's personal copyARTICLE IN PRESS
Spectrometer (Delta Plus IRMS, Thermofinnigan, San Jose, CA). Plants were sampled for stable isotope analysis of water byremoving small sections of non-green woody stems for shrubs, and non-evaporating rhizomes extracted from the justbelow the soil surface for grasses. Samples were placed in vacutainers, sealed with parafilm, and stored in a cooler in thefield. Soil samples at 10–20 cm increments from 0 to 200 cm depth were also stored in a cooler in sealed vacutainers. In thelaboratory, stem, rhizome, and soil samples were stored at freezing temperatures until extraction by cryogenic vacuumdistillation (West et al., 2006). Water samples were analyzed for oxygen isotope ratio (d18O) by pyrolysis after Gehre et al.(2004) using a TCEA interface coupled to an IRMS (Delta Plus XP, Thermofinnigan, San Jose, CA). Following the waterextraction, roots were removed from the soil samples, and the remaining fraction was ground to a fine powder andanalyzed for d15N as described above. All isotope measurements were conducted at the University of California, Irvine IRMSfacility. Nitrogen isotopes were referenced to atmospheric N2 and oxygen isotopes were referenced to Vienna StandardMean Ocean Water (V-SMOW).
2.3. Soil flux measurements and assays
Collars for gaseous N emissions in the field (625 cm2) were inserted �5 cm into the soil profile at the meadow, mixedgrass–shrub, and shrubland sites. At each site, we installed chambers in four plots. At the intermediate and shrubland sites,replicate chambers were installed under three different cover types (intershrub, Atriplex and Ericameria) for a total of 12collars. At the meadow site, all chambers were surrounded by grass species. On July 24, 2005, airtight lids were placed onthe chambers and four sequential gas samples were taken (14 mL) over a period of approximately 45 min. Gas sampleswere injected into pre-evacuated, air-tight vials and transported to the University of Kansas, where they were analyzed forN2O on a Varian CP3800 gas chromatograph equipped with an electron capture detector. Standards were also injected intovials in the field and analyzed in a similar manner to ensure that sample transport did not affect accuracy of the data. Ratesof N2O were calculated using chamber headspace and footprint and the rate of increase of N2O concentration in thechamber over time (Billings et al., 2003). On July 25, chambers were equipped with a small dish of 2% H2SO4 and sealedwith Vaseline and aluminum foil for a 24 h period. H2SO4 samples were collected and transported to the University ofKansas, where they were analyzed for NH4
+ concentration. Rates of NH3 volatilization were calculated as the amount of NH4+
produced per unit time using the footprint of the chambers (Schlesinger and Peterjohn, 1991).Soils collected in June 2005 were transported at 4 1C to the University of Kansas, where they were maintained at this
temperature until further processing. Within 1 week, all roots 42 mm were removed, and soils were sieved andhomogenized. They subsequently were subjected to long-term soil incubations for determination of net N mineralizationduring decomposition of both labile and relatively recalcitrant soil organic matter. Fifty grams of each soil (fresh weight)were weighed into a 5 cm diameter, 7.5 cm tall PVC core contained by glass fiber filter paper. Cores were leached with aN-free nutrient solution (Nadelhoffer, 1990) to remove inorganic N and placed in 1 L incubation jars on a layer of marbles tomaintain unsaturated conditions at the base of the cores. Jars were incubated at 25 1C. On each sampling date, soil coreswere removed and leached with the N-free nutrient solution. Aerobic conditions were maintained in the incubation vesselsbetween sampling dates. Leachate was stored at 4 1C until analysis, and then analyzed colorimetrically for NH4
+ and NO3� on
an autoanalyzer at the University of Kansas (Lachat Instruments, Loveland, CO, USA). Net N mineralization was calculatedas the cumulative sum of inorganic N leached over time, using the equivalent dry weight of each soil sample (Billings,2006). Leachate samples were obtained on days 3, 7, 15, 21, 31, 42, 56, and 72.
Inorganic N availability was assessed in June 2006. Soil samples from each of the 12 locations specified above for soilcollars were extracted in 2 M KCl. Extracts were analyzed colorimetrically for NH4
+ and NO3� on a Lachat autoanalyzer. Soil
pH was assessed by generating a 5:1 water slurry of all soil samples. Soil texture was assessed via the hydrometer method,using sodium hexametaphosphate as a dispersing agent at the Kansas State University Soils Testing Laboratory.
2.4. Statistical methods
Comparisons of parameters among different species within a given site, or among the same species at multiple siteswere conducted with one-way ANOVA and the Tukey–Kramer HSD post-doc test. Comparisons of multiple species and siteswere conducted with two-way ANOVA. We conducted comparisons of nitrogenous gas fluxes across sites with one-wayANOVA. When comparisons involved repeated sampling at multiple time periods, differences were tested with repeatedmeasures ANOVA. Correlations between % inorganic N as ammonium and soil pH and between leaf d15N and leaf C:N wereevaluated with linear regression. Correlations were considered significant when po0.05. Statistical analyses wereconducted in JMP v.6 (SAS Institute Inc., Cary, NC, USA).
3. Results
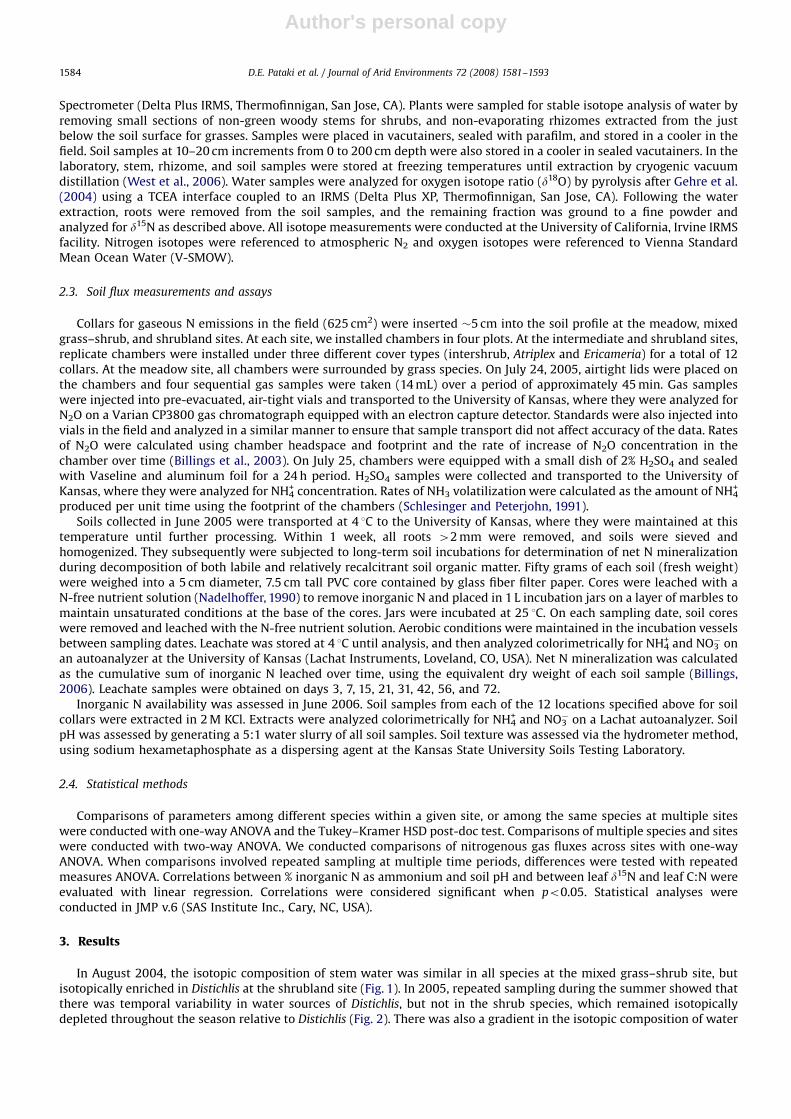
In August 2004, the isotopic composition of stem water was similar in all species at the mixed grass–shrub site, butisotopically enriched in Distichlis at the shrubland site (Fig. 1). In 2005, repeated sampling during the summer showed thatthere was temporal variability in water sources of Distichlis, but not in the shrub species, which remained isotopicallydepleted throughout the season relative to Distichlis (Fig. 2). There was also a gradient in the isotopic composition of water
D.E. Pataki et al. / Journal of Arid Environments 72 (2008) 1581–15931584
Author's personal copyARTICLE IN PRESS
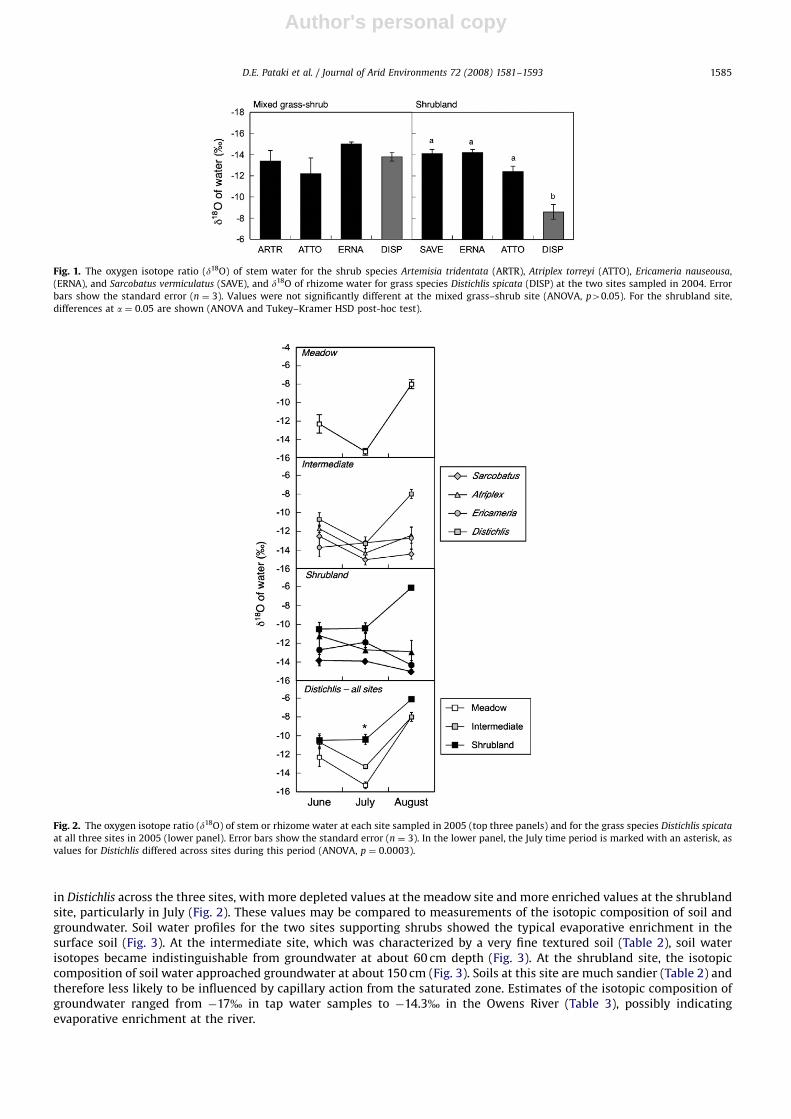
in Distichlis across the three sites, with more depleted values at the meadow site and more enriched values at the shrublandsite, particularly in July (Fig. 2). These values may be compared to measurements of the isotopic composition of soil andgroundwater. Soil water profiles for the two sites supporting shrubs showed the typical evaporative enrichment in thesurface soil (Fig. 3). At the intermediate site, which was characterized by a very fine textured soil (Table 2), soil waterisotopes became indistinguishable from groundwater at about 60 cm depth (Fig. 3). At the shrubland site, the isotopiccomposition of soil water approached groundwater at about 150 cm (Fig. 3). Soils at this site are much sandier (Table 2) andtherefore less likely to be influenced by capillary action from the saturated zone. Estimates of the isotopic composition ofgroundwater ranged from �17% in tap water samples to �14.3% in the Owens River (Table 3), possibly indicatingevaporative enrichment at the river.
Fig. 1. The oxygen isotope ratio (d18O) of stem water for the shrub species Artemisia tridentata (ARTR), Atriplex torreyi (ATTO), Ericameria nauseousa,
(ERNA), and Sarcobatus vermiculatus (SAVE), and d18O of rhizome water for grass species Distichlis spicata (DISP) at the two sites sampled in 2004. Error
bars show the standard error (n ¼ 3). Values were not significantly different at the mixed grass–shrub site (ANOVA, p40.05). For the shrubland site,
differences at a ¼ 0.05 are shown (ANOVA and Tukey–Kramer HSD post-hoc test).
Fig. 2. The oxygen isotope ratio (d18O) of stem or rhizome water at each site sampled in 2005 (top three panels) and for the grass species Distichlis spicata
at all three sites in 2005 (lower panel). Error bars show the standard error (n ¼ 3). In the lower panel, the July time period is marked with an asterisk, as
values for Distichlis differed across sites during this period (ANOVA, p ¼ 0.0003).
D.E. Pataki et al. / Journal of Arid Environments 72 (2008) 1581–1593 1585
Author's personal copyARTICLE IN PRESS
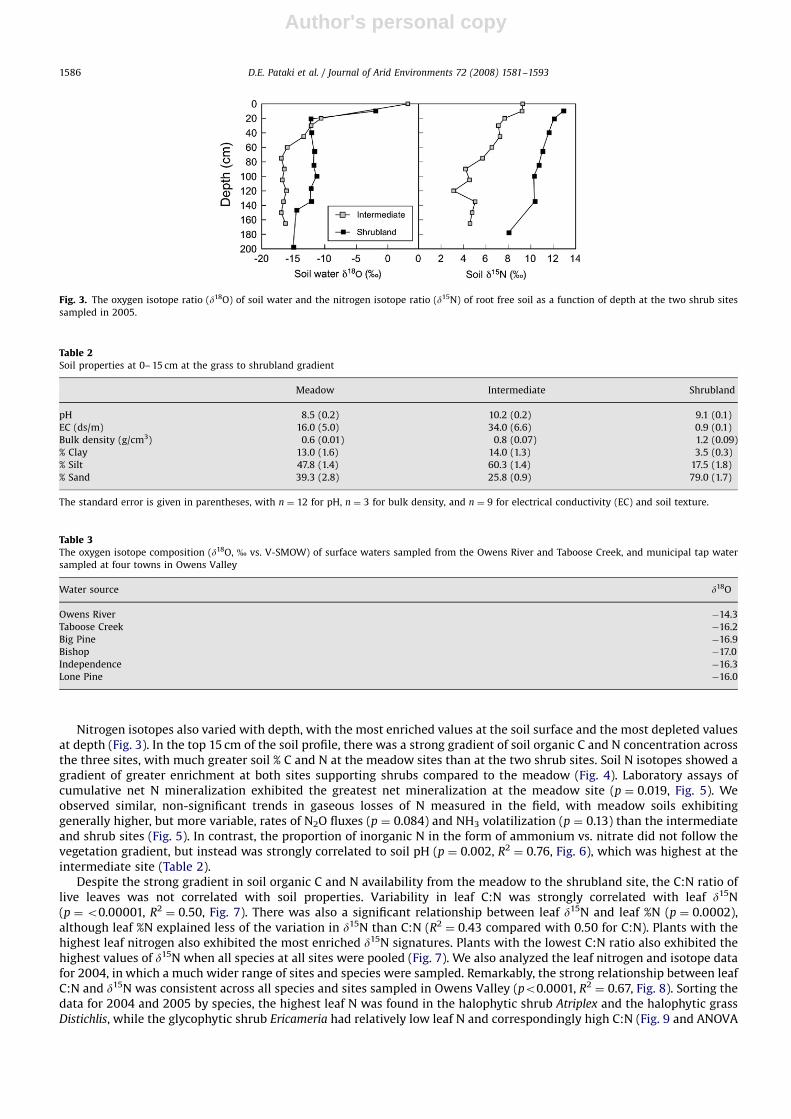
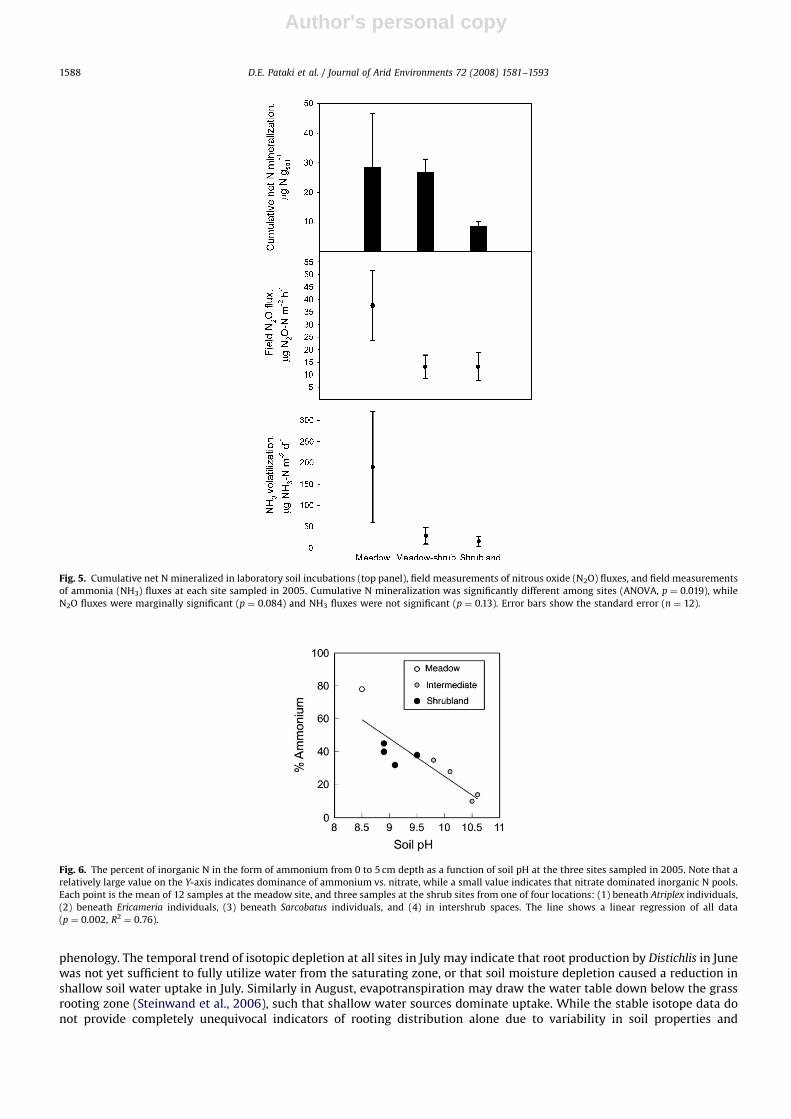
Nitrogen isotopes also varied with depth, with the most enriched values at the soil surface and the most depleted valuesat depth (Fig. 3). In the top 15 cm of the soil profile, there was a strong gradient of soil organic C and N concentration acrossthe three sites, with much greater soil % C and N at the meadow sites than at the two shrub sites. Soil N isotopes showed agradient of greater enrichment at both sites supporting shrubs compared to the meadow (Fig. 4). Laboratory assays ofcumulative net N mineralization exhibited the greatest net mineralization at the meadow site (p ¼ 0.019, Fig. 5). Weobserved similar, non-significant trends in gaseous losses of N measured in the field, with meadow soils exhibitinggenerally higher, but more variable, rates of N2O fluxes (p ¼ 0.084) and NH3 volatilization (p ¼ 0.13) than the intermediateand shrub sites (Fig. 5). In contrast, the proportion of inorganic N in the form of ammonium vs. nitrate did not follow thevegetation gradient, but instead was strongly correlated to soil pH (p ¼ 0.002, R2
¼ 0.76, Fig. 6), which was highest at theintermediate site (Table 2).
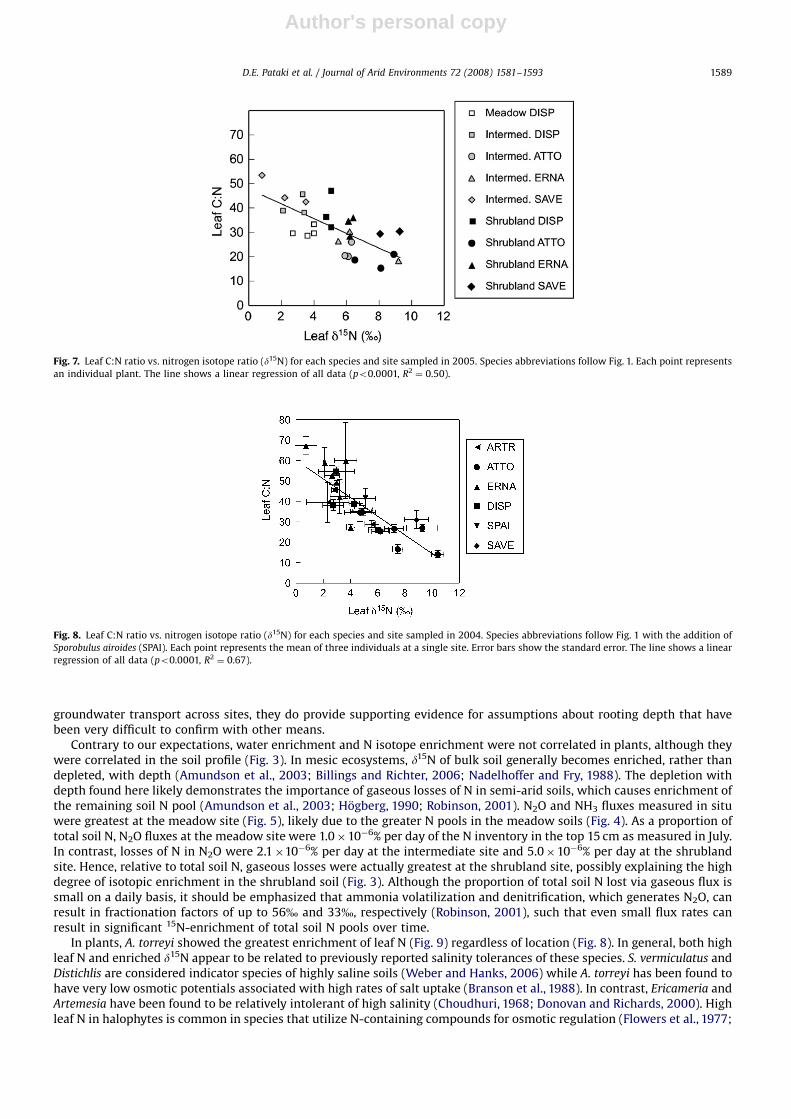
Despite the strong gradient in soil organic C and N availability from the meadow to the shrubland site, the C:N ratio oflive leaves was not correlated with soil properties. Variability in leaf C:N was strongly correlated with leaf d15N(p ¼o0.00001, R2
¼ 0.50, Fig. 7). There was also a significant relationship between leaf d15N and leaf %N (p ¼ 0.0002),although leaf %N explained less of the variation in d15N than C:N (R2
¼ 0.43 compared with 0.50 for C:N). Plants with thehighest leaf nitrogen also exhibited the most enriched d15N signatures. Plants with the lowest C:N ratio also exhibited thehighest values of d15N when all species at all sites were pooled (Fig. 7). We also analyzed the leaf nitrogen and isotope datafor 2004, in which a much wider range of sites and species were sampled. Remarkably, the strong relationship between leafC:N and d15N was consistent across all species and sites sampled in Owens Valley (po0.0001, R2
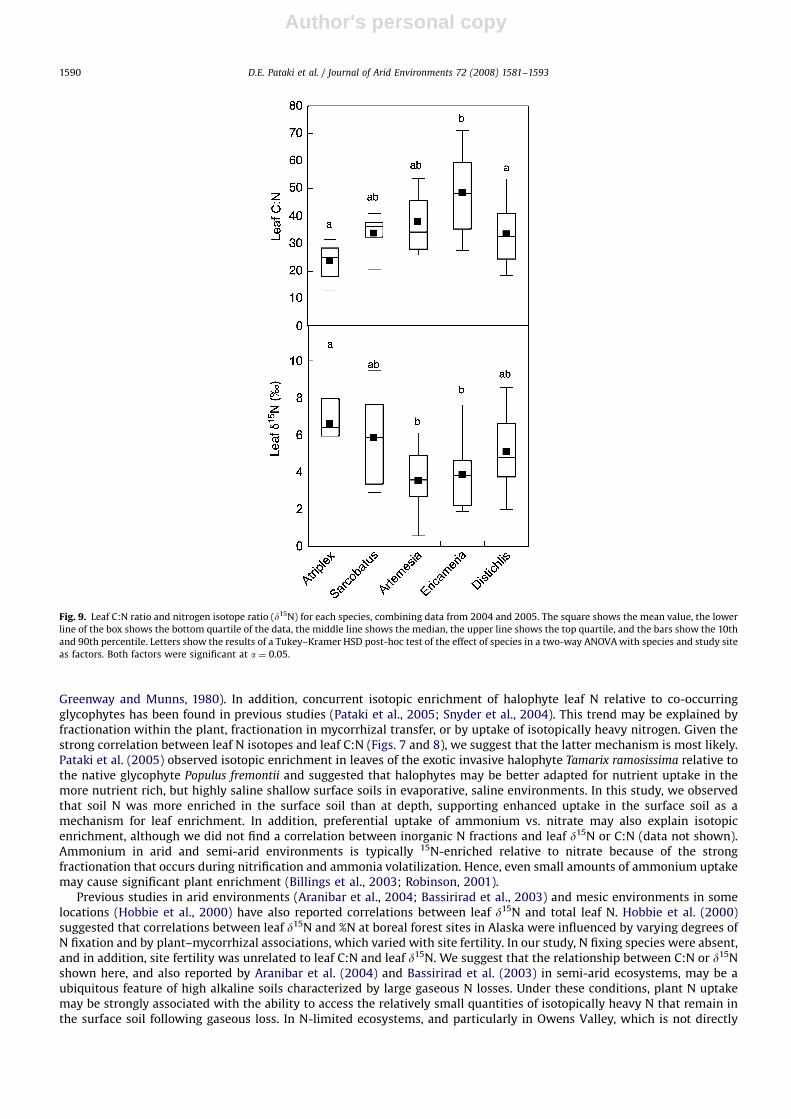
¼ 0.67, Fig. 8). Sorting thedata for 2004 and 2005 by species, the highest leaf N was found in the halophytic shrub Atriplex and the halophytic grassDistichlis, while the glycophytic shrub Ericameria had relatively low leaf N and correspondingly high C:N (Fig. 9 and ANOVA
Fig. 3. The oxygen isotope ratio (d18O) of soil water and the nitrogen isotope ratio (d15N) of root free soil as a function of depth at the two shrub sites
sampled in 2005.
Table 2Soil properties at 0– 15 cm at the grass to shrubland gradient
Meadow Intermediate Shrubland
pH 8.5 (0.2) 10.2 (0.2) 9.1 (0.1)
EC (ds/m) 16.0 (5.0) 34.0 (6.6) 0.9 (0.1)
Bulk density (g/cm3) 0.6 (0.01) 0.8 (0.07) 1.2 (0.09)
% Clay 13.0 (1.6) 14.0 (1.3) 3.5 (0.3)
% Silt 47.8 (1.4) 60.3 (1.4) 17.5 (1.8)
% Sand 39.3 (2.8) 25.8 (0.9) 79.0 (1.7)
The standard error is given in parentheses, with n ¼ 12 for pH, n ¼ 3 for bulk density, and n ¼ 9 for electrical conductivity (EC) and soil texture.
Table 3The oxygen isotope composition (d18O, % vs. V-SMOW) of surface waters sampled from the Owens River and Taboose Creek, and municipal tap water
sampled at four towns in Owens Valley
Water source d18O
Owens River �14.3
Taboose Creek �16.2
Big Pine �16.9
Bishop �17.0
Independence �16.3
Lone Pine �16.0
D.E. Pataki et al. / Journal of Arid Environments 72 (2008) 1581–15931586
Author's personal copyARTICLE IN PRESS
of species and site differences with both factors significant at po0.0001). Ericameria also showed a wide range of values,with some samples containing very low N (Fig. 9). Similarly, d15N was most enriched in Atriplex and least enriched in theglycophytic shrubs Ericameria and Artemesia (Fig. 9 and ANOVA of species and site differences with both factors significantat po0.0006).
4. Discussion
The oxygen isotope ratio of shrub stem and grass rhizome water support the assumption that grasses are moreshallowly rooted than shrubs. The oxygen isotope ratio of stem water in shrubs was similar to groundwater at all sites bothin 2004 and 2005 (Figs. 1 and 2, Table 3). There was a trend of greater isotopic enrichment in Atriplex, although the valueswere not statistically different from the other two shrub species (p40.05, one-way ANOVA). While it is generally assumedthat there is no fractionation in plant water uptake, there is some evidence for fractionation of deuterium isotopes inhalophytes (Lin and Sternberg, 1992). Fractionation may have had a small effect on the oxygen isotopes measured here, butit is unlikely that these effects would explain the temporal variability observed for Distichlis (Fig. 2). Distichlis appears tohave utilized isotopically enriched water in the shallow surface soil at the shrubland site in 2004, and at all sites in June andAugust of 2005. Previous studies in semi-arid ecosystems have shown that grasses are more likely to utilize summermonsoonal rains than shrubs due to varying root distributions (Dodd et al., 1998; Ehleringer et al., 1991; Schwinning et al.,2002; Weltzin and McPherson, 1997). Uptake of rainfall from a 22 mm event 2 days prior to sampling could account for theobserved isotopic enrichment of Distichlis at all sites in August.
Distichlis also showed variability across the grass to shrub gradient, with more enriched values at the shrubland site inJuly (po0.05, Fig. 2). This may be due to the slight gradient in groundwater depth across the sites, as the depth togroundwater was approximately 0.5 m greater at the shrubland site than at the meadow site. However, the difference insoil texture among the sites may also explain the variability. The shrubland site is characterized by a sandy soil (Table 2)and a steep gradient of soil water isotopic depletion with depth (Fig. 3). In contrast, the soil water profile at theintermediate site showed a more gradual depletion, with values approaching the isotopic composition of groundwatermuch closer to the surface (Fig. 3). Intensive measurements of root distributions coupled with analyses of the stable isotopecomposition of water are needed to determine the extent to which the trends shown in Fig. 2 may be explained bydifferences in groundwater depth, capillary transport of groundwater to the unsaturated zone, or plant allometry and
Fig. 4. The total % C and N and the nitrogen isotope ratio (d15N) of soil sampled from 0 to 15 cm depth. Error bars show the standard error (n ¼ 9). Letters
show significance at a ¼ 0.05 (ANOVA and Tukey–Kramer post-hoc test).
D.E. Pataki et al. / Journal of Arid Environments 72 (2008) 1581–1593 1587
Author's personal copyARTICLE IN PRESS
phenology. The temporal trend of isotopic depletion at all sites in July may indicate that root production by Distichlis in Junewas not yet sufficient to fully utilize water from the saturating zone, or that soil moisture depletion caused a reduction inshallow soil water uptake in July. Similarly in August, evapotranspiration may draw the water table down below the grassrooting zone (Steinwand et al., 2006), such that shallow water sources dominate uptake. While the stable isotope data donot provide completely unequivocal indicators of rooting distribution alone due to variability in soil properties and
Fig. 5. Cumulative net N mineralized in laboratory soil incubations (top panel), field measurements of nitrous oxide (N2O) fluxes, and field measurements
of ammonia (NH3) fluxes at each site sampled in 2005. Cumulative N mineralization was significantly different among sites (ANOVA, p ¼ 0.019), while
N2O fluxes were marginally significant (p ¼ 0.084) and NH3 fluxes were not significant (p ¼ 0.13). Error bars show the standard error (n ¼ 12).
Fig. 6. The percent of inorganic N in the form of ammonium from 0 to 5 cm depth as a function of soil pH at the three sites sampled in 2005. Note that a
relatively large value on the Y-axis indicates dominance of ammonium vs. nitrate, while a small value indicates that nitrate dominated inorganic N pools.
Each point is the mean of 12 samples at the meadow site, and three samples at the shrub sites from one of four locations: (1) beneath Atriplex individuals,
(2) beneath Ericameria individuals, (3) beneath Sarcobatus individuals, and (4) in intershrub spaces. The line shows a linear regression of all data
(p ¼ 0.002, R2¼ 0.76).
D.E. Pataki et al. / Journal of Arid Environments 72 (2008) 1581–15931588
Author's personal copyARTICLE IN PRESS
groundwater transport across sites, they do provide supporting evidence for assumptions about rooting depth that havebeen very difficult to confirm with other means.
Contrary to our expectations, water enrichment and N isotope enrichment were not correlated in plants, although theywere correlated in the soil profile (Fig. 3). In mesic ecosystems, d15N of bulk soil generally becomes enriched, rather thandepleted, with depth (Amundson et al., 2003; Billings and Richter, 2006; Nadelhoffer and Fry, 1988). The depletion withdepth found here likely demonstrates the importance of gaseous losses of N in semi-arid soils, which causes enrichment ofthe remaining soil N pool (Amundson et al., 2003; Hogberg, 1990; Robinson, 2001). N2O and NH3 fluxes measured in situwere greatest at the meadow site (Fig. 5), likely due to the greater N pools in the meadow soils (Fig. 4). As a proportion oftotal soil N, N2O fluxes at the meadow site were 1.0�10�6% per day of the N inventory in the top 15 cm as measured in July.In contrast, losses of N in N2O were 2.1�10�6% per day at the intermediate site and 5.0�10�6% per day at the shrublandsite. Hence, relative to total soil N, gaseous losses were actually greatest at the shrubland site, possibly explaining the highdegree of isotopic enrichment in the shrubland soil (Fig. 3). Although the proportion of total soil N lost via gaseous flux issmall on a daily basis, it should be emphasized that ammonia volatilization and denitrification, which generates N2O, canresult in fractionation factors of up to 56% and 33%, respectively (Robinson, 2001), such that even small flux rates canresult in significant 15N-enrichment of total soil N pools over time.
In plants, A. torreyi showed the greatest enrichment of leaf N (Fig. 9) regardless of location (Fig. 8). In general, both highleaf N and enriched d15N appear to be related to previously reported salinity tolerances of these species. S. vermiculatus andDistichlis are considered indicator species of highly saline soils (Weber and Hanks, 2006) while A. torreyi has been found tohave very low osmotic potentials associated with high rates of salt uptake (Branson et al., 1988). In contrast, Ericameria andArtemesia have been found to be relatively intolerant of high salinity (Choudhuri, 1968; Donovan and Richards, 2000). Highleaf N in halophytes is common in species that utilize N-containing compounds for osmotic regulation (Flowers et al., 1977;
Fig. 7. Leaf C:N ratio vs. nitrogen isotope ratio (d15N) for each species and site sampled in 2005. Species abbreviations follow Fig. 1. Each point represents
an individual plant. The line shows a linear regression of all data (po0.0001, R2¼ 0.50).
Fig. 8. Leaf C:N ratio vs. nitrogen isotope ratio (d15N) for each species and site sampled in 2004. Species abbreviations follow Fig. 1 with the addition of
Sporobulus airoides (SPAI). Each point represents the mean of three individuals at a single site. Error bars show the standard error. The line shows a linear
regression of all data (po0.0001, R2¼ 0.67).
D.E. Pataki et al. / Journal of Arid Environments 72 (2008) 1581–1593 1589
Author's personal copyARTICLE IN PRESS
Greenway and Munns, 1980). In addition, concurrent isotopic enrichment of halophyte leaf N relative to co-occurringglycophytes has been found in previous studies (Pataki et al., 2005; Snyder et al., 2004). This trend may be explained byfractionation within the plant, fractionation in mycorrhizal transfer, or by uptake of isotopically heavy nitrogen. Given thestrong correlation between leaf N isotopes and leaf C:N (Figs. 7 and 8), we suggest that the latter mechanism is most likely.Pataki et al. (2005) observed isotopic enrichment in leaves of the exotic invasive halophyte Tamarix ramosissima relative tothe native glycophyte Populus fremontii and suggested that halophytes may be better adapted for nutrient uptake in themore nutrient rich, but highly saline shallow surface soils in evaporative, saline environments. In this study, we observedthat soil N was more enriched in the surface soil than at depth, supporting enhanced uptake in the surface soil as amechanism for leaf enrichment. In addition, preferential uptake of ammonium vs. nitrate may also explain isotopicenrichment, although we did not find a correlation between inorganic N fractions and leaf d15N or C:N (data not shown).Ammonium in arid and semi-arid environments is typically 15N-enriched relative to nitrate because of the strongfractionation that occurs during nitrification and ammonia volatilization. Hence, even small amounts of ammonium uptakemay cause significant plant enrichment (Billings et al., 2003; Robinson, 2001).
Previous studies in arid environments (Aranibar et al., 2004; Bassirirad et al., 2003) and mesic environments in somelocations (Hobbie et al., 2000) have also reported correlations between leaf d15N and total leaf N. Hobbie et al. (2000)suggested that correlations between leaf d15N and %N at boreal forest sites in Alaska were influenced by varying degrees ofN fixation and by plant–mycorrhizal associations, which varied with site fertility. In our study, N fixing species were absent,and in addition, site fertility was unrelated to leaf C:N and leaf d15N. We suggest that the relationship between C:N or d15Nshown here, and also reported by Aranibar et al. (2004) and Bassirirad et al. (2003) in semi-arid ecosystems, may be aubiquitous feature of high alkaline soils characterized by large gaseous N losses. Under these conditions, plant N uptakemay be strongly associated with the ability to access the relatively small quantities of isotopically heavy N that remain inthe surface soil following gaseous loss. In N-limited ecosystems, and particularly in Owens Valley, which is not directly
Fig. 9. Leaf C:N ratio and nitrogen isotope ratio (d15N) for each species, combining data from 2004 and 2005. The square shows the mean value, the lower
line of the box shows the bottom quartile of the data, the middle line shows the median, the upper line shows the top quartile, and the bars show the 10th
and 90th percentile. Letters show the results of a Tukey–Kramer HSD post-hoc test of the effect of species in a two-way ANOVA with species and study site
as factors. Both factors were significant at a ¼ 0.05.
D.E. Pataki et al. / Journal of Arid Environments 72 (2008) 1581–15931590
Author's personal copyARTICLE IN PRESS
water limited where plants can access groundwater, the ability to extract these small pools of isotopically heavy soil N mayplay an important role in species distributions and community structure.
We did not find large differences in leaf N or isotopic composition between grasses and shrubs, but differences wereapparent among shrub species (Fig. 9). In this study, Ericameria showed the greatest variability in leaf N (Fig. 9), althoughleaf N was still closely associated with leaf d15N (Figs. 7 and 8). Ericameria nauseousa is a common early-to-mid successionalspecies that is often the first shrub species to become established following abandonment of agricultural fields (Naumburget al., 2005a). Because disturbance and agricultural abandonment may be associated with high nutrient availability,colonization of disturbed sites by Ericameria may reflect a dependence on pulses of available N, although experimentaladditions of N and P by James and Richards (2005) indicated that co-limitation by P may be important in Ericameria. Incontrast, Atriplex, which exhibited consistently lower C:N ratios, may have a competitive advantage in sites with low N andhigh salinity due to an apparent ability to extract pools of plant-available N unavailable to other species, as evidenced by its15N-enriched status. James and Richards (2006) and James et al. (2006) found that the responses of Atriplex species to Npulses were restricted to short periods of active growth, generally in mid spring.
We acknowledge that plant uptake of isotopically enriched ammonium and surface inorganic N are not the only possiblemechanisms that may explain strong correlations between leaf d15N and C:N in these semi-arid soils. Fractionation duringmycorrhizal N transfer, fractionation within the plant, temporal shifts in availability of N sources, and varied sources of N,including organic N, cannot be excluded based on the measurements in this study. We suggest that further studies of plantN preference, forms of N uptake, and mycorrhizal associations in alkaline, saline soils across ecosystems are needed todetermine general patterns in the relationship between plant N concentrations and d15N. Studies using isotopically labeledN sources as well as studies of mycorrhizal infection in these soils can help elucidate similarities and differences in themechanisms by which halophytes and glycophytes obtain and compete for N resources under conditions of high salinityand high rates of N volatilization.
We do not have sufficient information to determine with certainty whether the large variability in soil C and N poolsacross the meadow to shrubland gradient is a cause or an effect of the gradient in community composition. However, thetrend of declining soil organic C and N with increasing proportions of shrub cover is consistent with the conceptual modelof Schlesinger et al. (1990), in which shrub invasions result in a positive feedback of soil C and N losses, increasing spatialheterogeneity of soil resources and reductions in plant cover in intershrub spaces. Despite very low soil organic C and N atthe shrubland site, gaseous losses of N comprised a greater proportion of the total N pool than at the intermediate ormeadow sites. Our results are also consistent with hydrologic change and declines in water table depth as a potentialtrigger for vegetation change, as the rooting distribution of grasses appeared to be shallower than shrubs based on stemwater isotope measurements at several sites (Figs. 1 and 2). However, it should be noted that there are many other potentialcauses of vegetation change in Owens Valley. Early in the 20th century, agricultural abandonment was widespread in thevalley, potentially influencing soil C and N pools, successional patterns, and community responses to water availability(Elmore et al., 2006b). In addition, grazing is widespread and has been widely cited as a cause of woody encroachment innon-phreatophytic ecosystems (Archer et al., 1995; Scholes and Archer, 1997; Van Auken, 2000). In order to resolve thecomplex interactions between land use, groundwater depth, and community composition, plant and soil nutrient relationsas well as plant access to groundwater must be monitored at a variety of locations. Studies that examine groundwaterdepth, plant water sources, and water relations without consideration of interactions with nutrient availability will beunlikely to provide a predictive capacity for determining the response of local communities to future change.
5. Conclusions
Our measurements of water isotopes support the hypothesis that grasses and shrubs access different depths of water inOwens Valley, with greater uptake of isotopically enriched water by grasses late in the growing season. However, water andnitrogen relations were not well coupled in this study. Nitrogen isotope data indicate that there are larger differences inplant N concentrations and isotopic composition between halophytic species and non-halophytic species than betweengrass and shrub functional types. This, in conjunction with the close coupling between leaf d15N and C:N, suggests thathalophytic shrubs may employ unique mechanisms for uptake of isotopically enriched N pools when N is limiting, and thatisotopic variability is driven by differential access to N pools. These features of N uptake in N-limited systems mayultimately have a strong influence on plant community composition. In particular, A. torreyi appears well adapted foraccessing isotopically enriched N pools under conditions of low N availability. Hence, future vegetation change in OwensValley will likely be influenced not only by water redistribution, but also by the biogeochemical feedbacks between plantcover, soil N fluxes and subsequent availability, and nutrient relations of both grass and shrub species. Further studieslinking water and nutrient relations as a function of both community composition and groundwater depth will be neededto forecast the responses of local plant communities to decisions about water management.
Acknowledgments
We thank Jennifer Koh Shake and Neeta Bijoor for their assistance in the field, Guihong Zhang and Greg Cane forassistance in the laboratory, and the Los Angeles Department of Water and Power for access to their property. This research
D.E. Pataki et al. / Journal of Arid Environments 72 (2008) 1581–1593 1591
Author's personal copyARTICLE IN PRESS
was funded by the UC Center for Water Resources grant WR-986 and the University of Kansas General Research Fundallocation 2301447.
References
Amundson, R., Austin, A.T., Schuur, E.A.G., et al., 2003. Global patterns of the isotopic composition of soil and plant nitrogen. Global Biogeochemical Cycles17, 1031 doi:1010.1029/2002GB001903.
Aranibar, J.N., Otter, L., Macko, S.A., et al., 2004. Nitrogen cycling in the soil–plant system along a precipitation gradient in the Kalahari sands. GlobalChange Biology 10, 359–373.
Archer, S.R., Schimel, D.S., Holland, E.A., 1995. Mechanisms of shrubland expansion: land use, climate or CO2? Climatic Change 29, 91–99.Bassirirad, H., Constable, J.V.H., Lussenhop, H., et al., 2003. Widespread foliage of d15N depletion under elevated CO2: inferences for the nitrogen cycle.
Global Change Biology 9, 1582–1590.Billings, S.A., 2006. Soil organic matter dynamics and land use change at a grassland/forest ecotone. Soil Biology and Biochemistry 38, 2934–2943.Billings, S.A., Richter, D.D., 2006. Changes in stable isotopic signatures of soil nitrogen and carbon during 40 years of forest development. Oecologia 148,
325–333.Billings, S.A., Schaeffer, S.M., Zitzer, S.F., Evans, R.D., 2003. Trace N gas losses and N mineralization in an intact Mojave Desert ecosystem with elevated CO2.
Soil Biology and Biochemistry 34, 1777–1784.Branson, F.A., Miller, R.F., Sorenson, S.K., 1988. Tolerances of plants to drought and salinity in the western United States. USGS Water Resources
Investigations Report 88-4070, USDA, Denver, CO.Chesson, P., Gebauer, R.L.E., Schwinning, S., et al., 2004. Resource pulses, species interactions, and diversity maintenance in arid and semi-arid
environments. Oecologia 141, 236–253.Choudhuri, G.N., 1968. Effect of soil salinity on germination and survival of some steppe plants in Washington. Ecology 49, 465–471.Dawson, T.E., Ehleringer, J.R., 1991. Streamside trees that do not use stream water. Nature 350, 335–337.Dodd, M.B., Lauenroth, W.K., Welker, J.M., 1998. Differential water resource use by herbaceous and woody plant life-forms in a shortgrass steppe
community. Oecologia 117, 504–512.Donovan, L.A., Richards, J.H., 2000. Juvenile shrubs show differences in stress tolerance, but no competition or facilitation, along a stress gradient. The
Journal of Ecology 88, 1–16.Drenovsky, R.E., Richards, J.H., 2003. High nitrogen availability does not improve salinity tolerance in Sarcobatus vermiculatus. Western North American
Naturalist 63, 472–478.Drenovsky, R.E., Richards, J.H., 2004. Critical N:P values: predicting nutrient deficiencies in desert shrublands. Plant and Soil 259, 59–69.Drenovsky, R.E., Richards, J.H., 2005. Nitrogen addition increases fecundity in the desert shrub, Sarcobatus vermiculatus. Oecologia 143, 349–356.Ehleringer, J.R., Dawson, T.E., 1992. Water uptake by plants: perspectives from stable isotope composition. Plant, Cell and Environment 15, 1073–1082.Ehleringer, J.R., Phillips, S.L., Schuster, W.S.F., Sandquist, D.R., 1991. Differential utilization of summer rains by desert plants. Oecologia 88, 430–434.Elmore, A.J., Mustard, J.F., Manning, S.J., 2003. Regional patterns of plant community response to changes in water: Owens Valley, CA. Ecological
Applications 13, 443–460.Elmore, A.J., Manning, S.J., Mustard, J.F., Craine, J.M., 2006a. Decline in alkali meadow vegetation cover in California: the effects of groundwater extraction
and drought. Journal of Applied Ecology 43, 770–779.Elmore, A.J., Mustard, J.F., Hamburg, S.P., Manning, S.J., 2006b. Agricultural legacies in the Great Basin alter vegetation cover, composition, and response to
precipitation. Ecosystems 9, 1231–1241.Flowers, T.J., Troke, P.F., Yeo, A.R., 1977. The mechanism of salt tolerance in halophytes. Annual Review of Plant Physiology 28, 89–121.Friedman, J.M., Scott, M.L., Auble, G.T., 1997. Water management and cottonwood forest dynamics along prairie streams. In: Knopf, F.L., Sampson, F.B.
(Eds.), Ecology and Conservation of Great Plains Vertebrates. Springer, New York, pp. 49–71.Gehre, M., Geilmann, H., Richter, J., Werner, R.A., Brand, W.A., 2004. Continuous flow 2H/1H and 18O/16O analysis of water samples with dual inlet precision.
Rapid Communications in Mass Spectrometry 18, 2650–2660.Greenway, H., Munns, R., 1980. Mechanisms of salt tolerance in nonhalophytes. Annual Review of Plant Physiology 31, 149–190.Griepentrog, T.E., Groeneveld, D.P., 1981. The Owens Valley Management Report. Prepared for the County of Inyo, California.Groeneveld, D.P., 1990. Shrub rooting and water acquisition on threatened shallow groundwater habitats in the Owens Valley, California. USDA Forest
Service GTR-INT-276.Groeneveld, D.P., Or, D., 1994. Water-table induced shrub-herbaceous ecotone-hydrologic management implications. Water Resources Bulletin 30,
911–920.Groeneveld, D.P., Warren, D.C., Hubbard, P.J., 1994. Responses of five dominant Owens Valley scrub phreatophytes to controlled water table drawdown.
County of Inyo and Los Angeles Technical Group.Hobbie, E.A., Macko, S.A., Williams, M., 2000. Correlations between foliar d15N and nitrogen concentrations may indicate plant–mycorrhizal interactions.
Oecologia 122, 273–283.Hogberg, P., 1990. Forests losing large quantities of nitrogen have elevated 15N:14N ratios. Oecologia 84, 229–231.Hogberg, P., 1997. 15N natural abundance in soil–plant systems. New Phytologist 137, 179–203.Hollett, K.J., Danskin, W.R., McCaffrey, W.F., Walti, C.L., 1989. Geology and water resources of Owens Valley, California. Water Supply Paper 2370-B, USGS.Huxman, T.E., Snyder, K.A., Tissue, D.T., et al., 2004. Precipitation pulses and carbon fluxes in semiarid and arid ecosystems. Oecologia 141, 254–268.James, J.J., Richards, J.H., 2005. Plant N capture from pulses: effects of pulse size, growth rate, and other soil resources. Oecologia 154, 113–122.James, J.J., Richards, J.H., 2006. Plant nitrogen capture in pulse-driven systems: interactions between root responses and soil processes. Journal of Ecology
94, 765–777.James, J.J., Tiller, R.L., Richards, J.H., 2005. Multiple resources limit plant growth and function in a saline-alkaline desert community. Journal of Ecology 93,
113–126.James, J.J., Aanderud, Z.T., Richards, J.H., 2006. Seasonal timing of N pulses influences N capture in a saltbush scrub community. Journal of Arid
Environments 67, 688–700.Lin, G., Sternberg, L., 1992. Hydrogen isotopic fractionation by plant roots during water uptake in coastal wetland plants. In: Ehleringer, J.R., Hall, A.E.,
Farquhar, G.D. (Eds.), Stable Isotopes in Plant Carbon–Water Relations. Academic Press, San Diego, pp. 497–510.Nadelhoffer, K.J., 1990. Microlysimeter for measuring nitrogen mineralization and microbial respiration in aerobic soil incubations. Soil Science Society of
America Journal 54, 411–415.Nadelhoffer, K.J., Fry, B., 1988. Controls on natural nitrogen-15 and carbon-13 abundances in forest soil organic matter. Soil Science Society of America
Journal 52, 1633–1640.Naumburg, E., Hubbard, P.J., Martin, D., McLendon, T., 2005a. Successional trends following cultivation in Owens Valley, California. Paper presented at the
Ecological Society of America 90th Annual Meeting, Montreal, Canada.Naumburg, E., Mata-Gonzalez, R., Hunter, R.G., McLendon, T., Martin, D.W., 2005b. Phreatophytic vegetation and groundwater fluctuations: a review of
current research and application of ecosystem response modeling with an emphasis on Great Basin vegetation. Environmental Management 35,726–740.
Newman, B.D., Wilcox, B.P., Archer, S.R., et al., 2006. Ecohydrology of water-limited environments: a scientific vision. Water Resources Research 42,W06302 doi:06310.01029/02005WR004141.
D.E. Pataki et al. / Journal of Arid Environments 72 (2008) 1581–15931592

Author's personal copyARTICLE IN PRESS
Pataki, D.E., Bush, S.E., Gardner, P., Solomon, D.K., Ehleringer, J.R., 2005. Ecohydrology in a Colorado River riparian forest: implications for the decline ofPopulus fremontii. Ecological Applications 15, 1009–1018.
Robinson, T.W., 1958. Phreatophytes (Geological Survey Water-Supply Paper 1423). US Government Printing Office.Robinson, D., 2001. d15N as an integrator of the nitrogen cycle. Trends in Ecology and Evolution 16, 153–162.Schaeffer, S.M., Evans, R.D., 2005. Pulse additions of soil carbon and nitrogen affect soil nitrogen dynamics in an arid Colorado Plateau shrubland.
Oecologia 145, 425–433.Schlesinger, W.H., Peterjohn, W.T., 1991. Processes controlling ammonia volatilization from Chihuahuan Desert soils. Soil Biology and Biochemistry 23,
637–642.Schlesinger, W.H., Reynolds, J.F., Cunningham, G.L., Huenneke, L.F., Jarrell, W.M., Virginia, R.A., Whitford, W.G., 1990. Biological feedbacks in global
desertification. Science 247, 1043–1048.Scholes, R.J., Archer, S.R., 1997. Tree–grass interactions in savannas. Annual Review of Ecology and Systematics 28, 517–544.Schwinning, S., Sala, E.A., 2004. Hierarchy of responses to resource pulses in arid and semi-arid ecosystems. Oecologia 141, 211–220.Schwinning, S., Davis, K., Richardson, L., Ehleringer, J.R., 2002. Deuterium enriched irrigation indicates different forms of rain use in shrub/grass species of
the Colorado Plateau. Oecologia 130, 345–355.Snyder, K.A., Donovan, L.A., James, J.J., Tiller, R.L., Richards, J.H., 2004. Extensive summer water pulses do not necessarily lead to canopy growth of Great
Basin and northern Mojave Desert shrubs. Oecologia 141, 325–334.Sorenson, S.K., Dileanis, P.D., Branson, F.A., 1991. Soil water and vegetation responses to precipitation and changes in groundwater in Owens Valley,
California. Water Supply Paper 2370-C, USGS.Steinwand, A.L., Harrington, R.F., Or, D., 2006. Water balance for Great Basin phreatophytes derived from eddy covariance, soil water, and water table
measurements. Journal of Hydrology 329, 595–605.Stromberg, J.C., 1993a. Fremont cottonwood Goodding willow riparian forests: a review of their ecology, threats, and recovery potential. Journal of
Arizona–Nevada Academy of Science 26, 98–109.Stromberg, J.C., 1993b. Riparian mesquite forests: a review of their ecology threats, and recover potential. Journal of the Arizona–Nevada Academy of
Science 27, 111–124.Stromberg, J.C., 2001. Restoration of riparian vegetation in the south-western United States: importance of flow regimes and fluvial dynamism. Journal of
Arid Environments 49, 17–34.Van Auken, O.W., 2000. Shrub invasions of North Amercian semiarid grasslands. Annual Review of Ecology and Systematics 31, 197–215.van Groenigen, J.-W., van Kessel, C., 2002. Salinity-induced patterns of natural abundance Carbon-13 and Nitrogen-15 in plant and soil. Soil Science Society
of America Journal 66, 489–498.Weber, D.J., Hanks, J., 2006. Salt tolerant plants from the Great Basin region of the United States. In: Khan, M.A., Weber, D.J. (Eds.), Ecophysiology High
Salinity Tolerant Plants. Springer, Amsterdam, pp. 69–106.Weltzin, J.F., McPherson, G.R., 1997. Spatial and temporal soil moisture resource partitioning by trees and grasses in a temperate savanna, Arizona, USA.
Oecologia 112, 156–164.West, A.G., Patrickson, S.J., Ehleringer, J.R., 2006. Water extraction times for plant and soil materials used in stable isotope analysis. Rapid Communications
in Mass Spectrometry 20, 1317–1321.
D.E. Pataki et al. / Journal of Arid Environments 72 (2008) 1581–1593 1593

![Maintenance of C sinks sustains enhanced C assimilation during long-term exposure to elevated [CO 2 ] in Mojave Desert shrubs](https://img.pdfslide.net/doc/110x75/631799d3831644824d0390d1/maintenance-of-c-sinks-sustains-enhanced-c-assimilation-during-long-term-exposure.jpg)


![Suspectibility of shrubs to accumulation of airborne microdust [PL]](https://img.pdfslide.net/doc/110x75/634a11c4dedec593d70ed194/suspectibility-of-shrubs-to-accumulation-of-airborne-microdust-pl.jpg)


