Embed Size (px)
Citation preview

Journal of Applied Ecology
2002
39
, 987–1001
© 2002 British Ecological Society
Blackwell Science, Ltd
Waterbird responses to experimental drawdown: implications for the multispecies management of wetland mosaics
ORIANE W. TAFT*, MARK A. COLWELL, CRAIG R. ISOLA and REBECCA J. SAFRAN
Department of Wildlife, Humboldt State University, Arcata, CA 95521, USA
Summary
1.
The loss and human modification of wetlands world-wide underscores the import-ance of efficient management. For wetlands that provide habitats for non-breedingwaterbirds, such management often aims to support a rich and abundant waterbirdcommunity.
2.
Among the world’s many seasonal, moist-soil managed wetlands, annual winterflooding is followed by spring drawdown to encourage germination of waterfowl foodplants. Recommendations on how best to maintain flooded wetlands for multiplespecies are mostly theoretical, and drawdown management typically focuses on springfor migrating shorebirds. The benefits and drawbacks of shallow-water management inwinter have not been examined, especially where sizeable populations of winteringshorebirds and waterfowl occur together.
3.
We considered The Grasslands Ecological Area in California’s Central Valley, USA,as a model wetland complex in which to assess optimal winter flood-depth for multi-species use. We also examined the relative benefits for each waterbird group (e.g. shore-birds and waterfowl) of drawdowns conducted in winter and spring. We experimentallydewatered wetlands of measured topography in the winter and spring of 1994–95,documenting changes in waterbird species richness and abundance associated withdaily changes in habitat diversity and availability.
4.
Results indicated limited regional availability of shallow-water habitat across thelandscape in winter but not spring, as use by shorebirds and teal increased on drawn-down wetlands in winter only. Use by deeper-water dabbling ducks and diving water-birds declined during the later stages of drawdown in both seasons, but not until use byshorebirds and teal had peaked. The maximum diversity and abundance of waterbirdsoccurred at average depths of 10–20 cm on wetlands with topographic gradients of30–40 cm.
5.
This study has important implications for the winter management of seasonalwetland complexes, especially moist-soil systems where managers provide habitat fordifferent waterbird groups (from shorebirds to diving waterbirds) simultaneously. Ingeneral, where topography is variable (e.g. a difference of 30–40 cm between the deepestand shallowest zones), wetlands flooded to average depths of 15–20 cm should accom-modate the greatest richness and abundance of waterbirds.
Key-words
:
diving waterbirds, habitat use, moist-soil management, non-breedingseason, shorebirds, water depth, waterfowl.
Journal of Applied Ecology
(2002)
39
, 987–1001
*Present address and correspondence: Department of Fisheries and Wildlife, 104 Nash Hall, Oregon State University, Corvallis,OR 97331, USA (e-mail [email protected]).
JPE_763.fm Page 987 Wednesday, November 13, 2002 8:07 PM

988
O. W. Taft
et al.
© 2002 British Ecological Society,
Journal of Applied Ecology
,
39
,987–1001
Introduction
The severe world-wide loss of wetlands (Mitsch &Gosselink 2000) has significantly increased the impor-tance of those that remain to wetland-dependentorganisms such as waterbirds (e.g. Podicipediformes,Ciconiiformes, Anseriformes, Gruiformes and Chara-driiformes). For managed wetlands, this importancehas led to the goal of attracting diverse and abundantwaterbird communities by providing a diversity offoraging habitats (Fredrickson & Reid 1986; Velasquez1992; Laubhan & Fredrickson 1993; Reid 1993). Thedistribution and abundance of resources such as seeds,tubers and invertebrates are critical to this end (Krapu& Reinecke 1992; Davis & Smith 1998; Sanders 2000).However, for waterbirds, access to these resourcesis constrained by water depth (Velasquez 1992;Nagarajan & Thiyagesan 1996; Elphick & Oring 1998;Isola
et al
. 2000) and required foraging depths varywidely among species (Baker 1979; Pöysä 1983). Con-sequently, the manipulation of a wetland’s water depthcan be a valuable tool in providing habitat for multiplespecies.
For many impounded seasonal wetlands, manage-ment for waterbirds involves maintaining a stableflooded state (flooded phase) during winter, then de-watering (drawdown phase) in late winter/early springto germinate the moist-soil plants on which waterfowlfeed (Fredrickson & Taylor 1982). Strategies to accom-modate multiple waterbird species have been devel-oped for both phases of this drawdown cycle. However,optimal average depths for the flooded phase aremostly supported by either correlational studies(Colwell & Taft 2000) or from observations of overlapamong preferred foraging depths (Fredrickson & Reid1986; Fredrickson 1991; Elphick & Oring 1998). A richliterature has focused on the merits of spring draw-downs for migrant shorebirds (Rundle & Fredrickson1981; Fredrickson & Taylor 1982; Hands, Ryan &Smith 1991; Velasquez 1992; Weber & Haig 1996) butthe relative benefits of drawdown to different waterbirdgroups have not been contrasted among seasons (wintervs. spring), when resident communities and regionalavailability of shallow and deep habitats may vary.
The Grasslands Ecological Area (hereafter TheGrasslands) of the Central Valley of California, USA,is an ideal wetland complex for assessing the optimalflood depths and seasonal management of drawdowns.Water manipulation is an integral aspect of wetlandmanagement in this region. Moreover, in addition towaterfowl, the region attracts a large number ofshorebirds during winter and spring (Shuford, Page &Hickey 1998), warranting consideration of optimumdepth management in winter. Wetland topographyis variable enough to provide a diversity of foragingdepths within individual wetlands (Colwell & Taft2000). Finally, current allocation of habitat via watermanipulations may not adequately meet the needs ofthe differing waterbird communities each season.
We used The Grasslands as a model to examine andrefine strategies for multispecies water management.Our objectives were to (i) use drawdowns to identify theaverage depth at which communities are most diverseand abundant during the flooded phase of wetlands,and (ii) examine the benefits to each waterbird group(e.g. shorebirds and waterfowl) of drawdowns con-ducted in winter relative to spring, given differentseasonal patterns of habitat availability and regionalcommunity composition. We examined the effect ofdrawdown on waterbird communities by prescribingcontrolled experiments that compared replicated treat-ments of ‘drawdown’ to ‘no drawdown’ in winter andspring. For each experiment, we tested the hypothesisthat the species richness and the abundance of differentwaterbird groups increased or decreased over time inresponse to drawdown, but remained unchanged onflooded wetlands. We then compared drawdown effectsamong waterbird groups within and among seasons,addressing whether (i) different taxa temporally over-lapped in their use of draining wetlands, and (ii)responses depended on season of drawdown.
Study area
The Grasslands of Merced County, California, USA, issituated in the southern portion of California’s CentralValley (37
°
00
′
00
″
, 120
°
45
′
00
″
) and consists of about47 000 ha of private, state and federally managednative uplands and palustrine emergent wetlands.The largest continuous area of wetland habitat in theCentral Valley (Fredrickson & Laubhan 1995), thisarea is important for wintering waterbirds (Heitmeyer,Connelly & Pederson 1989; Hunter
et al
. 1991), pro-viding habitat to 800 000 ducks, geese and swans inmid-winter (California Department of Fish & Game1987–1996) and 60 000–200 000 shorebirds, dependingon the season (Shuford, Page & Hickey 1998).
Wetlands in this area are primarily managed underone of four drawdown regimes for annual grasses orwaterfowl food plants. Management for cattle pasturerequires drawdown in January/February, followed bydrawdowns to encourage growth of waterfowl foodplants such as nodding smartweed
Polygonum lapathi-folium
L. (late February drawdown), swamp timothy
Heleochloa schoenoides
L. (March/April), and water-grass
Echinochloa
spp. (April /May). In addition, eachyear a small number of seasonal wetlands undergopartial dewatering (flushing) in the winter in an effortto improve water quality. Most wetlands (
c.
80%) aredewatered in spring for swamp timothy. Descriptionsof the study area may be found in Fredrickson & Laubhan(1995) and Williams (1996).
Methods
We conducted four experiments simulating drawdownregimes practised by Grasslands managers: two duringlate winter (1–21 February 1994; 7–20 February 1995)
JPE_763.fm Page 988 Wednesday, November 13, 2002 8:07 PM

989
Waterbird communities and wetland drawdown
© 2002 British Ecological Society,
Journal of Applied Ecology
,
39
,987–1001
and two during early spring (26 March
−
8 April 1994;30 March
−
13 April 1995). The winter 1994 drawdownconsisted of partial drainage to mimic flushing to amaximum of 30% mudflat exposure. To minimizeconfounding effects due to water quality, we conductedthis experiment on swamp timothy-managed wetlandswith low salt and selenium loads. For winter 1995, weconducted a complete drawdown on impoundmentsmanaged for cattle pasture. We dewatered swamptimothy wetlands for both spring drawdowns.
To assess drawdown effects, we compared waterbirduse of experimentally drawndown wetlands with floodedwetlands held as controls. Constraints on access andwater control prevented complete randomization inwetland selection and assignment of treatments.However, we interspersed sites spatially to minimizeconfounding environmental factors. For three experi-ments we replicated treatments on four wetlands; forthe spring 1995 experiment, drainage difficulties onone wetland limited sample size to three.
Replicate wetlands were similar in size, topographyand dominant plant communities. We chose only wet-lands that had retained their natural topography. Allhad an emergent edge of cattail
Typha
spp., hardstembulrush
Scirpus acutus
Bigelow, alkali bulrush
Scirpusrobustus
Pursh and an interior moist-soil plant com-munity dominated by swamp timothy (winter 1994,spring 1994 and spring 1995 experiments) or mixedannual grasses (winter 1995). Swamp timothy unitswere irrigated throughout the summer (Heitmeyer,Connelly & Pederson 1989). We presumed invertebratecommunities were similar among units due to similar-ity in vegetation management (i.e. plant communities,drawdown dates and irrigation dates). Moist-soil vegeta-tion and grasses had senesced on all wetlands such thatmudflats were unvegetated when dewatered.
We dewatered experimental wetlands at a rate of lessthan 5 cm day
−
1
, achieved by determining the necessaryrate of water outflow (ha cm
−
1
day
−
1
) given the wetland’ssize (ha). We monitored daily the water outflow at one ormore water-control structures at each wetland. We chosethese relatively slow rates to provide a sufficient num-ber of days to observe changes in waterbird communities.
Prior to initiating experiments, we estimated theinitial depth (mean and variation) of all wetlands. Tosample depth variation, we positioned two samplingtransects at roughly 45
°
angles to the slope (shallow todeep areas) of each wetland. Using a centimetre-markedstaff, we measured water at systematically spacedpoints along these transects, beginning at a randomlocation 0–10 m from the wetland edge. Wetland edgewas defined as the area where moist substrate bord-ered standing water, hence some samples occurred inunflooded habitats. We obtained at least 25 point sam-ples from each wetland to determine initial averagewater depths with an absolute error of 3 cm. Weestimated topographic variation by calculating thedifference between the deepest and shallowest depthmeasurements.
As drawdowns progressed, we monitored changes indepth and amount of available habitat using a gaugeplaced in the deepest portion of each wetland. For eachsurvey, we estimated the depth at each sample pointusing the equation
D
n
=
D
0
−
(
G
0
−
G
n
), where
D
n
=point estimate of water depth at survey
n
,
D
0
= initialdepth measured at the sample point,
G
0
= initial depthreading at gauge, and
G
n
= gauge reading at survey
n
.We then calculated the average
D
for each survey
n
.On control wetlands in 1994, we coarsely monitoredchanges in water levels by estimating, with the aid ofaerial photographs showing prominent wetland features,changes in the percentages of unflooded habitat.
We surveyed waterbirds during daylight hours(06:00–17:50), each site at roughly the same time of dayto reduce noise from systematic patterns (e.g. regulardiurnal bird movements) obscuring trends observedwithin wetlands. Using 22
×
spotting’s copes and 8
×
binoculars, we counted and identified all waterbirdsfrom fixed locations that maximized observations. Forseveral wetlands, we conducted surveys from a hide. Allcounts required 1–2 h. We combined observations forspecies that were difficult to distinguish from a distanceor that were indistinguishable except by call (Table 1).We obtained multiple counts of species exceeding 1000individuals to improve accuracy of estimates.
We surveyed waterbirds once on each wetland beforedrawdown (survey 0). Thereafter, we conducted sur-veys coincident with a 2–5 cm decrease in water depthon experimental wetlands between successive visits.Thus we matched waterbird-use data by drainage inter-val since drawdown initiation, and referred to the timevariable as survey instead of day. Owing to differencesin drawdown extent among experiments, we conducted7–10 surveys per wetland during winter experiments,and 11–12 surveys per wetland for spring experiments.
Mean (
±
SD) areas (ha) of experimental and controlwetlands, respectively, were 47·2 (
±
15·3) and 47·7(
±
21·5) in winter 1994, 14·4 (
±
10·1) and 14·5 (
±
9·7) inwinter 1995, 31·8 (
±
5·7) and 32·1 (
±
9·4) in spring1994, and 30·2 (
±
5·9) and 35·0 (
±
19·1) in spring 1995.Although we positioned all survey locations to guar-antee observing shallow habitats exposed by draw-down, we could rarely observe an entire wetland. Wetherefore estimated the visible percentage of eachwetland to calculate the actual observed wetland area.Thus, mean (
±
SD) observed areas (ha) of experimentaland control wetlands, respectively, were 39·9 (
±
15·5) and30·7 (
±
11·6) in winter 1994, 9·7 (
±
3·2) and 8·8 (
±
3·6)in winter 1995, 24·4 (
±
3·8) and 27·4 (
±
7·7) in spring1994, and 25·2 (
±
3·3) and 27·2 (
±
10·3) in spring 1995.
To classify community structure, we quantified thetemporal variation in species richness (number ofspecies) for the entire community (all waterbirds), andof three foraging groups: waders, dabbling ducks anddiving waterbirds (Table 1). We included all waterbird
JPE_763.fm Page 989 Wednesday, November 13, 2002 8:07 PM

990
O. W. Taft
et al.
© 2002 British Ecological Society,
Journal of Applied Ecology
,
39
,987–1001
species in analyses of total waterbird richness, butomitted species of variable or uncertain depth prefer-ences (e.g. gulls, terns and pelicans) from group richnessanalyses. We examined changes in the abundance of the14 most common waterbird species, grouped into fourforaging guilds: calidridine sandpipers (dunlin
Calidrisalpina
, western sandpiper
Calidris mauri
and leastsandpiper
Calidris minutilla
) associated with water >0–5 cm deep; large shorebirds (black-necked stilt
Himantopus mexicanus
, American avocet
Recurviros-tra americana
, yellowleg
Tringa
spp. and dowitcher
Limnodromus
spp.) associated with water 5–15 cm deep;
teal (cinnamon teal
Anas cyanoptera
and Americangreen-winged teal
Anas carolinensis
) associated withwater 5–20 cm deep; and large dabbling ducks (northernpintail
Anas acuta
, mallard
Anas platyrhynchos
, gadwall
Mareca strepera
, American wigeon
Mareca americana
andnorthern shoveler
Anas clypeata
) associated with water5–25 cm deep (Baker 1979; Pöysä 1983; Baldassarre &Fischer 1984; Skagen & Knopf 1994; Elphick & Oring1998; Isola
et al
. 2000).We summarized changes in water depth resulting
from drawdown into two predictors of waterbirdresponses: depth diversity and habitat availability. We
Table 1.
Species observed on wetlands during drawdown experiments conducted in The Grasslands in the winter and spring of 1994 and 1995, includingwaterbird group and foraging habitat with which each species is affiliated. Common species included in guild abundance analyses in bold. See AmericanOrnithologists’ Union (1998) for taxonomic authorities
Diving waterbirds (> 25 cm) Dabbling ducks (5–25 cm) Waders (< 15 cm) Other waterbirds (unclear, variable)
Clark’s grebe
Aechmophorus clarkii
Mallard
Anas platyrhynchos
Greater white-fronted goose
Anser albifrons
American white pelican
Pelecanus erythrorhynchos
Western grebe
Aechmophorus occidentalis
Gadwall
Mareca strepera
Lesser snow goose
Chen c. caerulescens
Bonaparte’s gull
Larus philadelphia
Eared grebe
Podiceps nigricollis
American green-winged teal
Anas carolinensis
Black-crowned night-heron
Nycticorax nycticorax
Ring-billed gull
Larus delawarensis
Pied-billed grebe
Podilymbus podiceps
American wigeon
Mareca americana
Snowy egret
Egretta thula
Mew gull
Larus canus
Double-crested cormorant
Phalacrocorax auritus
Eurasian wigeon
Mareca penelope
Great egret
Casmerodius albus
Herring gull
Larus argentatus
Ruddy duck
Oxyura jamaicensis
Northern pintail
Anas acuta
Cattle egret
Bubulcus ibis
California gull
Larus californicus
Canvasback
Aythya valisineria
Northern shoveler
Anas clypeata
Great blue heron
Ardea herodias
Forster’s tern
Sterna forsteri
Redhead
Aythya americana
Blue-winged teal
Anas discors
White-faced ibis
Plegadis chihi
Ring-necked duck
Aythya collaris
Cinnamon teal
Anas cyanoptera
American avocet
Recurvirostra americana
Scaup spp.*
Aythya marila/affinis
Black-necked stilt
Himantopus mexicanus
Common goldeneye
Bucephala clangula
Semipalmated plover
Charadrius semipalmatus
Bufflehead
Bucephala albeola
Snowy plover
Charadrius alexandrinus
Common merganser
Mergus merganser
Killdeer
Charadrius vociferus
American coot
Fulica americana
Black-bellied plover
Pluvialis squatarola
Marbled godwit
Limosa fedoa
Whimbrel
Numenius phaeopus
Long-billed curlew
Numenius americanus
Yellowleg
spp.*
Tringa melanoleuca/flavipes
Dowitcher
spp.*
Limnodromus scolopaceus/griseus
Dunlin
Calidris alpina
Western sandpiper
Calidris mauri
Least sandpiper
Calidris minutilla
*Species pairs treated as one because they were too difficult to distinguish reliably at great distances (greater and lesser scaup, greater and lesser yellowlegs) or were indistinguishable except by call (long-billed and short-billed dowitcher).
JPE_763.fm Page 990 Wednesday, November 13, 2002 8:07 PM

991
Waterbird communities and wetland drawdown
© 2002 British Ecological Society, Journal of Applied Ecology, 39,987–1001
used depth diversity to predict changes in the speciesrichness of waterbird groups and entire communities,and used habitat availability to predict changes in guildabundances. For depth diversity, we quantified thepercentage cover of water at six 5-cm depth intervals(0–5 cm, 6–10 cm, 11–15 cm, 16–20 cm, 21–25 cm,> 25 cm) and calculated a Brillouin Index (Krebs1989) describing the diversity of depths on each wet-land at each survey. A wetland with a low index is eitherpredominantly deep or shallow, whereas a high indexindicates even availability of deep and shallow habitats.To quantify changes in habitat availability resultingfrom drawdown, we calculated the area of foraginghabitat within the different depth zones (> 25 cm, 5–25 cm, 5–20 cm, 5–15 cm and > 0–5 cm). From depthdata, we estimated the proportions of total point sam-ples in each foraging zone at the time of each survey.From the area of wetlands, we estimated the surfacearea of each foraging zone within wetlands.
For each experiment, with (SAS Institute1995) we used analysis of covariance () tocompare cumulative (total over time) square-roottransformed waterbird richness among treatmentswhile controlling for wetland size (covariate). Whenwetland size was not a significant covariate, we com-pared cumulative waterbird richness among treatmentsusing two-tailed t-tests.
We compared temporal changes in waterbird rich-ness and abundances (standardized into birds observedarea−1) among treatments using repeated measures (; Stevens 1992). To normalize countdistributions, we square-root or log10-transformed data.We conducted separate s for each responsevariable, with treatment (drawdown or control) andtime (survey) as main effects, and the interaction term(survey × drawdown/control) included in each ana-lysis. For species richness analyses, we included actualwetland area as a covariate to adjust for sampling effortdue to differences in wetland size. However, when theeffect of area was not significant, we made no covariateadjustment in order to retain error degrees of freedom.To maintain balanced s with no missing cells,we included only surveys 0–6 in analyses of winterdrawdowns, and surveys 0–10 in spring drawdowns.When F-tests were significant at P ≤ 0·05, we compliedto the Huynh–Feldt ε-adjusted P-values (to controlfor type I error when the variance–covariance matrixdeviates from sphericity; Stevens 1992). We consideredmodel terms for interactions significant only if ε-adjusted P-values were ≤ 0·05. We used (SAS Institute 1995) to run all s.
We considered a significant interaction as sufficientevidence that drawdown wetlands differed fromcontrol wetlands in waterbird response over time (i.e.differences between treatment and control increasedor decreased over time), and did not conduct the high
number of multiple comparisons required to determinepairwise differences between surveys. Instead, we plottedsurvey means (± 95% confidence interval; CI) to inter-pret the results. Because experimental wetlands couldhave differed from control wetlands prior to treatment,we considered significant treatment effects meaningfulonly if survey 0 values were similar (initial means laywithin each other’s SE). If experiments resulted in asignificant main effect of treatment in addition to asignificant interaction, we interpreted the effect of draw-down as particularly strong.
We used linear regression to assess whether temporalpatterns of waterbird responses were associatedwith drawdown habitat changes. To control for non-independence of successive surveys (Hurlbert 1984),we considered wetland replicates as experimental units.Additionally, because wetland replicates may havediffered in the timing and extent of habitat changes,analyses on individual wetlands could reveal trendsotherwise obscured in s. Consequently, weanalysed each wetland separately, using depth diversityto predict total waterbird richness, and square-root orlog10-transformed habitat availability to predict guildabundances. For each regression, we included allsurveys for each wetland, giving sample sizes of 7–10.Predicting that richness or abundance would increase/decrease with an increase/decrease in predictor vari-ables, we determined if these relationships were positiveby testing if mean correlation coefficients were signi-ficantly greater than zero (one-tailed, one-sample t-testfor mean coefficients > 0). We only conducted t-testswhen at least two of 3–4 regressions gave correlationcoefficients ≥ 0·60. We conducted correlations andt-tests using SAS (SAS Institute 1995) and consideredtests significant at P ≤ 0·05.
Results
Rates of drawdown were similar among experiments,but patterns of change in predictor variables varied byseason (Table 2). For all drawdowns, wetlands reachedmaximum depth diversity (Brillouin Index) at 10–20 cm average depth and mudflat exposure from 2% to20%. However, while winter wetlands reached thesepeaks mid-way during drawdowns, spring wetlandswere already at maximum diversity at the onset ofmanipulations. Experiments fell into the followingorder from most to least complete in extent of drain-age: spring 1994, spring 1995, winter 1995, winter 1994.
Dewatering substantially changed the amount offoraging habitat in each depth category used bywaterbirds (Table 2). Habitat available to divingwaterbirds (> 25 cm) declined precipitously in allfour experiments. The availability of habitat for largerdabbling ducks (5–25 cm) followed a curvilinearpattern (increase followed by decrease) throughout
JPE_763.fm Page 991 Wednesday, November 13, 2002 8:07 PM

992O
. W. T
aft et al.
© 2002 B
ritish E
cological Society, Journal of A
pplied E
cology, 39,987–1001
Table 2. Changes in water depth (cm), mean depth diversity (Brillouin Index) and waterbird habitats on Grasslands wetlands during drawdowns in 1994–95. Maximum depth diversity and habitat amounts ondrawdown wetlands in bold. n = 4 wetlands for winter 1994, winter 1995, spring 1994; n = 3 wetlands for spring 1995
Experiment Survey (time)
Grand mean depth (± SD) on treatments
Grand mean depth (± SD) on controls
Mean (± SD) Depth diversity (Brillouin Index) on experimental wetlands
Habitat availability (mean ± SD percentage on experimental wetlands) for
Diving waterbirds(> 25 cm)
Largedabbler(5–25 cm)
Teal(5–20 cm)
Largeshorebird(5–15 cm)
Calidridine sandpiper(> 0–5 cm) Mudflat
Winter 0* 27 ± 4 29 ± 4 1·0 ± 0·3 63 ± 17 35 ± 16 19 ± 12 12 ± 7 0 ± 0 0 ± 01994 1 25 ± 3 1·2 ± 0·2 47 ± 20 49 ± 16 23 ± 10 13 ± 6 2 ± 2 0 ± 0
2 21 ± 3 1·4 ± 0·3 33 ± 20 60 ± 20 35 ± 14 17 ± 11 5 ± 1 1 ± 03 18 ± 5 1·5 ± 0·2 21 ± 26 66 ± 21 46 ± 19 24 ± 11 6 ± 6 5 ± 14 15 ± 4 1·5 ± 0·1 10 ± 7 74 ± 10 53 ± 11 26 ± 11 8 ± 9 8 ± 55 12 ± 3 1·5 ± 0·1 5 ± 2 70 ± 14 59 ± 13 41 ± 9 11 ± 6 13 ± 66 10 ± 2 1·4 ± 0·1 4 ± 1 68 ± 12 66 ± 14 45 ± 16 8 ± 4 20 ± 9
Winter 0* 25 ± 3 39 ± 12 1·2 ± 0·2 49 ± 18 48 ± 20 18 ± 8 8 ± 6 2 ± 2 2 ± 31995 1 20 ± 3 39 ± 12 1·4 ± 0·2 27 ± 21 67 ± 24 39 ± 25 23 ± 20 3 ± 4 4 ± 5
2 18 ± 2 39 ± 12 1·5 ± 0·1 14 ± 16 79 ± 21 50 ± 21 20 ± 11 2 ± 3 5 ± 63 13 ± 3 39 ± 12 1·5 ± 0·1 1 ± 1 83 ± 12 63 ± 17 35 ± 20 6 ± 2 10 ± 144 9 ± 1 39 ± 12 1·3 ± 0·1 0 ± 0 74 ± 13 72 ± 12 57 ± 20 11 ± 4 15 ± 145 7 ± 2 40 ± 12 1·2 ± 0·2 0 ± 0 64 ± 15 62 ± 14 56 ± 17 17 ± 6 19 ± 176 6 ± 2 39 ± 11 1·1 ± 0·2 0 ± 0 56 ± 16 56 ± 16 52 ± 16 17 ± 7 27 ± 21
Spring 0* 18 ± 2 20 ± 3 1·3 ± 0·2 20 ± 6 74 ± 6 57 ± 5 30 ± 5 5 ± 9 1 ± 21994 1 13 ± 2 1·5 ± 0·0 6 ± 5 81 ± 14 67 ± 7 44 ± 7 7 ± 5 6 ± 5
2 12 ± 2 1·4 ± 0·0 4 ± 5 72 ± 16 64 ± 10 42 ± 10 16 ± 10 7 ± 83 10 ± 3 1·4 ± 0·1 2 ± 7 69 ± 15 62 ± 13 43 ± 13 15 ± 9 14 ± 124 7 ± 1 1·3 ± 0·1 1 ± 2 54 ± 14 51 ± 15 42 ± 15 22 ± 13 24 ± 95 5 ± 1 1·0 ± 0·2 0 ± 0 42 ± 18 41 ± 17 37 ± 17 22 ± 8 36 ± 136 4 ± 1 0·9 ± 0·2 0 ± 0 35 ± 20 35 ± 20 32 ± 20 18 ± 4 47 ± 207 3 ± 1 0·7 ± 0·2 0 ± 0 25 ± 13 25 ± 15 24 ± 16 17 ± 11 57 ± 248 2 ± 1 0·5 ± 0·2 0 ± 0 16 ± 14 16 ± 14 16 ± 14 19 ± 14 64 ± 249 2 ± 1 0·4 ± 0·2 0 ± 0 12 ± 12 12 ± 12 12 ± 12 18 ± 14 69 ± 22
10 1 ± 1 0·3 ± 0·2 0 ± 0 10 ± 10 10 ± 10 10 ± 10 17 ± 13 72 ± 19Spring 0* 16 ± 2 25 ± 6 1·7 ± 0·1 14 ± 9 76 ± 6 57 ± 4 29 ± 4 8 ± 3 2 ± 21995 1 14 ± 2 26 ± 8 1·7 ± 0·1 6 ± 6 81 ± 7 61 ± 6 39 ± 6 9 ± 3 5 ± 4
2 12 ± 2 25 ± 6 1·6 ± 0·1 3 ± 6 80 ± 8 66 ± 4 47 ± 5 9 ± 4 9 ± 43 10 ± 2 25 ± 7 1·5 ± 0·1 1 ± 1 74 ± 12 64 ± 8 47 ± 9 12 ± 6 14 ± 74 7 ± 2 26 ± 7 1·4 ± 0·2 0 ± 0 60 ± 5 56 ± 3 44 ± 10 21 ± 11 20 ± 85 6 ± 1 26 ± 8 1·1 ± 0·1 0 ± 0 46 ± 2 45 ± 2 38 ± 5 25 ± 8 29 ± 96 5 ± 1 24 ± 7 1·1 ± 0·2 0 ± 0 42 ± 5 41 ± 5 36 ± 3 24 ± 4 35 ± 27 4 ± 1 24 ± 6 0·8 ± 0·1 0 ± 0 32 ± 5 32 ± 5 31 ± 4 25 ± 11 43 ± 88 2 ± 1 21 ± 6 0·6 ± 0·2 0 ± 0 22 ± 10 22 ± 10 22 ± 10 20 ± 14 58 ± 189 2 ± 1 20 ± 7 0·5 ± 0·2 0 ± 0 20 ± 9 20 ± 9 20 ± 9 17 ± 12 63 ± 19
10 2 ± 1 20 ± 7 0·4 ± 0·3 0 ± 0 17 ± 14 17 ± 14 17 ± 14 18 ± 10 65 ± 21
*Survey 0 represents the day on which we initiated drawdowns.
JPE
_763.fm P
age 992 Wednesday, N
ovember 13, 2002 8:07 P
M

993Waterbird communities and wetland drawdown
© 2002 British Ecological Society, Journal of Applied Ecology, 39,987–1001
winter drawdowns, but declined on wetlands in springsoon after drawdown began. Teal habitat (5–20 cm)followed a curvilinear pattern for all drawdowns, exceptwinter 1994 when habitat area steadily increased.Because wetlands in winter held little shallow water(< 15 cm) at the start of drawdown, increases in theamount of shorebird habitat were dramatic. Estimatedmean (± SD) topographic variation among drawdownwetlands was 42 cm (± 1 cm) in winter 1994, and 30 cm(± 4 cm) in winter 1995.
Wetland area was not a significant covariate of cumu-lative waterbird richness in any experiment. Duringboth winter experiments, more waterbird species usedwetlands undergoing drawdown than control wetlands(1994: 27 ± 2 species on drawdown wetlands vs. 18 ± 3on controls, t = 4·37, P = 0·007; 1995: 21 ± 2 species vs.17 ± 2 species, t = 2·60, P = 0·04). In contrast, duringspring the total number of species that used drawdownwetlands was just as high as in winter, but no differentfrom controls (1994: 26 ± 3 species vs. 22 ± 8 species, t =0·91, P = 0·39; 1995: 23 ± 1 species vs. 19 ± 3 species,t = 2·00, P = 0·12).
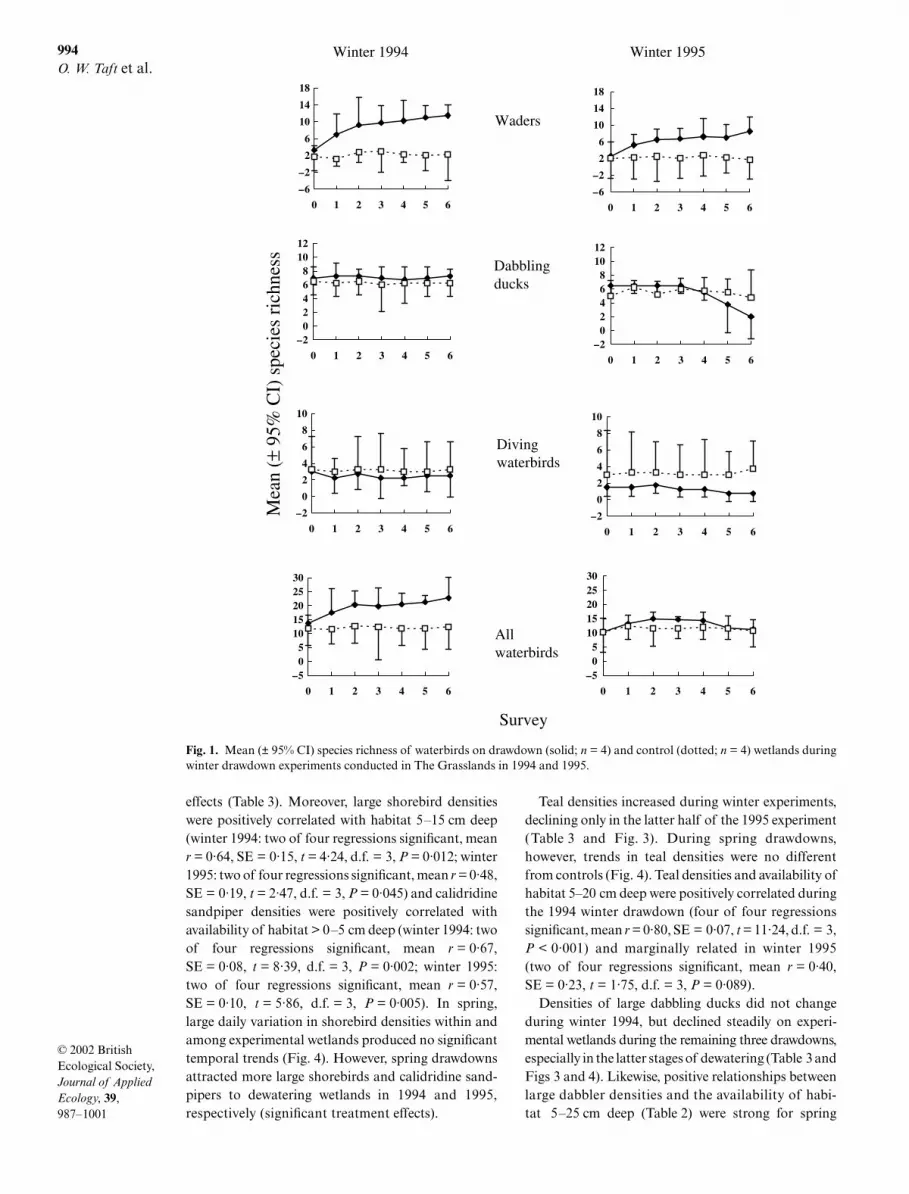
Temporal trends in species richness differed amongwaterbird groups and seasons, and wetland area was
not a significant covariate of drawdown response formost (14 of 16) analyses (Table 3 and Figs 1 and 2).Wader richness increased dramatically during draw-downs in winter (time–treatment interaction) but notspring. Winter trends resulted in treatment effects ofgreater richness of waders using drawdown wetlandsthan controls. In contrast, during winter 1995 andspring 1994 richness of dabbling ducks and divingwaterbirds declined in the latter half of drawdownswhile remaining unchanged on controls. Changes inrichness of all waterbird species combined were notsignificant for any experiment, although increasesapproached significance in winter 1994 (P < 0·10),resulting in a significant overall treatment effect. Nonethe less, we detected positive relationships betweentotal species richness and wetland depth diversity(Table 2) during both winter experiments (1994: twoof four wetland regressions significant, mean r = 0·55,SE = 0·22, t = 2·52, d.f. = 3, P = 0·04; 1995: two of fourregressions significant, mean r = 0·69, SE = 0·05, t =13·54, d.f. = 3, P < 0·001).
Compared with control sites, densities of shorebirdguilds increased markedly on experimental wetlandsduring winter (Fig. 3), resulting in overall treatment
Table 3. Results from s comparing changes in waterbird species richness and density (birds per ha) among treatments(drawdown and control) during four drawdown experiments conducted in The Grasslands in the winter and spring of 1994–95.Results focus on significant trend responses (interactions; in bold) and significant treatment effects (see Figs 1–4 for effect size)
Winter 1994† Winter 1995† Spring 1994‡ Spring 1995§
Trend Treatment Trend Treatment Trend Treatment Trend Treatment
Richness§Waders F = 3·01 F = 39·31 F = 5·86 F = 6·83 F = 1·75 F = 4·96 F = 1·31†† F = 52·36††
P = 0·02* P < 0·01* P < 0·01* P = 0·04* P = 0·09 P = 0·07 P = 0·27 P < 0·01*Dabbling ducks F = 0·20 F = 1·80 F = 3·97 F = 0·73 F = 2·09 F = 0·68 F = 1·15 F = 2·64
P = 0·97 P = 0·23 P = 0·02* P = 0·43 P = 0·12 P = 0·44 P = 0·35 P = 0·22Diving waterbirds F = 0·25 F = 0·42 F = 2·37 F = 5·69 F = 4·88 F = 2·91 F = 1·11 F = 25·35††
P = 0·95 P = 0·54 P = 0·05* P = 0·05* P < 0·01* P = 0·14 P = 0·39 P = 0·10All waterbirds F = 2·01 F = 14·58 F = 1·42 F = 1·59 F = 1·21 F = 1·02 F = 1·86 F = 3·48
P = 0·09 P < 0·01* P = 0·23 P = 0·25 P = 0·30 P = 0·35 P = 0·08 P = 0·14Density¶Large F = 1·68 F = 0·15 F = 4·94 F = 0·11 F = 1·98 F = 1·26 F = 2·79 F = 0·07Dabbling ducks P = 0·16 P = 0·71 P < 0·01* P = 0·75 P = 0·05* P = 0·30 P = 0·04* P = 0·80Teal F = 5·66 F = 4·74 F = 3·11 F = 3·19 F = 0·86 F = 0·00 F = 1·68 F = 3·97
P < 0·01* P = 0·07 P = 0·05* P = 0·12 P = 0·57 P = 0·99 P = 0·12 P = 0·12Large shorebirds F = 4·09 F = 47·28 F = 2·79 F = 12·43 F = 0·59 F = 2·36 F = 0·63 F = 10·81
P = 0·02* P < 0·01* P = 0·04* P = 0·01* P = 0·82 P = 0·17 P = 0·78 P = 0·03*Calidridine F = 4·04 F = 32·27 F = 19·14 F = 20·97 F = 1·71 F = 13·39 F = 2·06 F = 3·84Sandpipers P = 0·04* P < 0·01* P < 0·01* P < 0·01* P = 0·10 P = 0·01* P = 0·11 P = 0·12
†Seven time periods for analyses. Treatment degrees of freedom (d.f.) = 1, error (subject) d.f. = 6, trend d.f. = 6, error (time) d.f. = 36.‡Eleven time periods for analyses. Treatment d.f. = 1, error (subject) d.f. = 6, trend d.f. = 10, error (time) d.f. = 60.§Eleven time periods for analyses. Treatment d.f. = 1, error (subject) d.f. = 4, trend d.f. = 10, error (time) d.f. = 40.¶All response variables square-root transformed except densities of large shorebirds and calidridine sandpipers in winter (log10-transformed).††Equals trend and treatment model terms adjusted for significant effect of wetland area: F = 9·89, P = 0·005 for wader richness; F = 11·31, P = 0·04 for diving waterbird richness. For both tests, treatment d.f. = 1, area d.f. = 1, error (subject) d.f. = 3, trend d.f. = 10, error (time) d.f. = 30.
JPE_763.fm Page 993 Wednesday, November 13, 2002 8:07 PM
994O. W. Taft et al.
© 2002 British Ecological Society, Journal of Applied Ecology, 39,987–1001
effects (Table 3). Moreover, large shorebird densitieswere positively correlated with habitat 5–15 cm deep(winter 1994: two of four regressions significant, meanr = 0·64, SE = 0·15, t = 4·24, d.f. = 3, P = 0·012; winter1995: two of four regressions significant, mean r = 0·48,SE = 0·19, t = 2·47, d.f. = 3, P = 0·045) and calidridinesandpiper densities were positively correlated withavailability of habitat > 0–5 cm deep (winter 1994: twoof four regressions significant, mean r = 0·67,SE = 0·08, t = 8·39, d.f. = 3, P = 0·002; winter 1995:two of four regressions significant, mean r = 0·57,SE = 0·10, t = 5·86, d.f. = 3, P = 0·005). In spring,large daily variation in shorebird densities within andamong experimental wetlands produced no significanttemporal trends (Fig. 4). However, spring drawdownsattracted more large shorebirds and calidridine sand-pipers to dewatering wetlands in 1994 and 1995,respectively (significant treatment effects).
Teal densities increased during winter experiments,declining only in the latter half of the 1995 experiment(Table 3 and Fig. 3). During spring drawdowns,however, trends in teal densities were no differentfrom controls (Fig. 4). Teal densities and availability ofhabitat 5–20 cm deep were positively correlated duringthe 1994 winter drawdown (four of four regressionssignificant, mean r = 0·80, SE = 0·07, t = 11·24, d.f. = 3,P < 0·001) and marginally related in winter 1995(two of four regressions significant, mean r = 0·40,SE = 0·23, t = 1·75, d.f. = 3, P = 0·089).
Densities of large dabbling ducks did not changeduring winter 1994, but declined steadily on experi-mental wetlands during the remaining three drawdowns,especially in the latter stages of dewatering (Table 3 andFigs 3 and 4). Likewise, positive relationships betweenlarge dabbler densities and the availability of habi-tat 5–25 cm deep (Table 2) were strong for spring
Fig. 1. Mean (± 95% CI) species richness of waterbirds on drawdown (solid; n = 4) and control (dotted; n = 4) wetlands duringwinter drawdown experiments conducted in The Grasslands in 1994 and 1995.
JPE_763.fm Page 994 Wednesday, November 13, 2002 8:07 PM

995Waterbird communities and wetland drawdown
© 2002 British Ecological Society, Journal of Applied Ecology, 39,987–1001
experiments (1994: three of four wetland regressionssignificant, mean r = 0·68, SE = 0·06, t = 11·29, d.f. =3, P < 0·001; 1995: two of three regressions signifi-cant, mean r = 0·63, SE = 0·13, t = 5·00, d.f. = 2, P =0·019) and approached significance in winter 1995(two of four regressions significant, mean r = 0·46,SE = 0·22, t = 2·08, d.f. = 3, P = 0·064).
Discussion
Drawdowns influenced waterbird community struc-ture on managed wetlands during all four experiments(Table 4). Overall, dewatering wetlands providedgreater diversity and habitat amount to more speciesand numbers of waterbirds than did flooded wetlands.
Shorebirds responded to drawdowns most dramatic-ally in winter. Dabblers and divers, however, ceasedusing wetlands towards the end of dewatering, regard-less of season. Finally, teal responses were intermediatebetween shorebirds and the deeper-water species,increasing in abundance on wetlands in winter butdecreasing in abundance towards the end of thecomplete drawdown in winter 1995.
Experimental approaches to evaluating land man-agement are relatively rare in wildlife research (Elphick1997; Erwin et al. 2000), primarily because rigorousexperimentation with sufficient statistical power isdifficult at large spatial scales. None the less, resultsfrom experiments hold greater inferential and predic-tive power, despite the challenges. We acknowledge
Fig. 2. Mean (± 95% CI) species richness of waterbirds on drawdown (solid; n = 4 in 1994, n = 3 in 1995) and control (dotted; n= 4 in 1994, n = 3 in 1995) wetlands during spring drawdown experiments conducted in The Grasslands in 1994 and 1995.
JPE_763.fm Page 995 Wednesday, November 13, 2002 8:07 PM

996O. W. Taft et al.
© 2002 British Ecological Society, Journal of Applied Ecology, 39,987–1001
that other unmeasured variables (e.g. differences ininvertebrate communities and vegetation structureamong replicates) might have confounded treatments.However, the risk of such was minimized by using anexperimental approach. Further, although samplesizes were small, we believe that a sizeable number ofresponses to drawdown were not spurious. Significanttrends were consistent among experiments of the samemagnitude or the same season (Table 4), indicating thatthe trends detected were not artefacts of the number oftests. Moreover, the correlations corroborated - , as changes in habitat availability explained mostsignificant changes in waterbird use of wetlands.
By observing the structure of waterbird communitiesafter each reduction in depth, we determined the depth
range at which managed wetlands in the flooded phasesupported the richest and most abundant bird assem-blage. In winter, wetlands supported the richest assem-blage and greatest numbers of waterbirds when theywere 10–20 cm in average depth (Figs 1 and 3 andTable 2). Within this interval, communities were rep-resented by species from all three waterbird groups,and shorebird densities peaked before dabbling ducksbegan to decline in abundance. The 10–20 cm depthinterval also coincided with greatest habitat diversity,when all habitats were simultaneously available, and inmost cases when no more than 5% of a wetland’s mud-flat was exposed (Table 2; Williams 1996). In particu-lar, the winter 1994 partial drawdown illustrated thatlowering water levels merely 10 cm below traditionallevels can substantially increase use by more speciesand individuals. Weber & Haig (1996) evaluatedresponse to extremely slow (10 cm month−1) winterdrawdowns, and found that large numbers of shorebirds
Fig. 3. Mean (± 95% CI) density of waterbirds on drawdown (solid; n = 4) and control (dotted; n = 4) wetlands during winterdrawdown experiments conducted in The Grasslands in 1994 and 1995.
JPE_763.fm Page 996 Wednesday, November 13, 2002 8:07 PM

997Waterbird communities and wetland drawdown
© 2002 British Ecological Society, Journal of Applied Ecology, 39,987–1001
used wetlands whereas waterfowl numbers appearedunaffected. Similarly, Rundle & Fredrickson (1981)observed that teal and geese were attracted to wetlandsmanaged for shorebirds, and Bird, Pettygrove & Eadie(2000) observed wintering waterfowl using shallowflooded (< 10 cm) rice fields.
It is important to emphasize that habitat diversity ata given average depth of a wetland depends on theunderlying topography (Fredrickson & Taylor 1982;Skagen & Knopf 1994; Colwell & Taft 2000). Trans-posing this relationship, greater topographic variationin a wetland will broaden the range of average depthsover which multiple habitats will be available to birds.For The Grasslands, where topographic variationwas 30–42 cm on average, wetlands provided maxi-mum diversity of foraging depths in the relatively wide
average depth range of 10–20 cm. From experimentalmanipulations of wetlands of known topography, ourdata corroborate and refine most assertions regardingdepth ranges for optimal waterbird use (e.g. 15–20 cmfor relatively level flooded rice fields, Elphick & Oring1998; < 20 cm for wetlands with variable topography,Colwell & Taft 2000; < 25 cm for wetlands of unknowntopography, Fredrickson & Taylor 1982; Fredrickson& Reid 1986; Fredrickson 1991).
Birds respond to the heterogeneity of habitats at severalspatial scales (Wiens 1985), from the landscape (e.g. amosaic of wetlands), to the site (e.g. individual wetlands),
Fig. 4. Mean (± 95% CI) density of waterbirds on drawdown (solid; n = 4 in 1994, n = 3 in 1995) and control (dotted; n = 4 in 1994,n = 3 in 1995) wetlands during spring drawdown experiments conducted in The Grasslands in 1994 and 1995.
JPE_763.fm Page 997 Wednesday, November 13, 2002 8:07 PM

998O. W. Taft et al.
© 2002 British Ecological Society, Journal of Applied Ecology, 39,987–1001
to the microsite scale (e.g. foraging areas within wet-lands). Accordingly, scale of investigation may influ-ence the patterns detected (Wiens, Rotenbery & VanHorne 1987). Because ephemerality is a dominantcharacteristic of natural wetlands (Fredrickson & Reid1990), waterbirds have evolved flexible behaviour totake advantage of water level fluctuations at a variety ofscales (Kushlan 1989; Skagen & Knopf 1993, 1994). Asit is unlikely that all resource needs can be indefinitelymet by one wetland patch, aquatic birds probablysupplement their resource intake by using multiplewetlands within a mosaic (sensu Dunning, Danielson& Pulliam 1992; Farmer & Parent 1997). Indeed, non-breeding shorebirds move frequently among individualwetlands in the winter, enabling them to find suitablehabitat on a landscape scale (Skagen & Knopf 1993;Warnock, Page & Stenzel 1995; Warnock & Takekawa1996). Although we only observed habitat use at onespatial scale (individual wetlands), responses may havebeen mediated by regional habitat availability eachseason.
Our results suggest that the regional availability ofshallow water (< 20 cm) in winter may be limiting forshallow-water species. Before winter drawdowns, shal-low habitat was scarce on flooded wetlands, whereas inspring evaporation resulted in roughly 40% of wetlandareas having habitat less than 15 cm deep (Table 2).
Seasonal differences in shorebird numbers observed onsurvey 0 mirrored this contrast. While spring wetlandssupported a sizeable number of large shorebirds beforeexperiments began, there were few shorebirds onwetlands at drawdown initiation in winter. Significantparallel increases in the abundance of shorebirds andtheir habitats in winter suggest that individuals trackedhabitat within wetlands. We expected to see greaterdensities of shorebirds on dewatering wetlands duringspring migration. However, while maximum densitiesof calidridine sandpipers were high and comparable topeak densities in winter, abundances varied greatlyamong surveys within wetlands. These patterns suggestthat shorebirds were distributed across the manydewatering wetlands in spring. Such transitory use ofwetlands by migrating shorebirds occurs elsewhere(Velasquez 1992).
Teal exhibited patterns similar to shorebirds. In fact,Isola et al. (2000) observed that the American green-winged teal in The Grasslands foraged in habitats lessthan 15 cm deep (95% CI of 11·4–14·6 cm). Thus tealalso may have been constrained to find shallow habitatin winter, indicated by their strong increase with theavailability of habitat on dewatering wetlands in winterbut not in spring. Although this pattern may be explainedpartly by more teal residing in the region in winter, wesuspect that teal did not respond to spring drawdowns
Table 4. Summary of waterbird responses to experimental drawdowns conducted in The Grasslands in winter and spring of1994–95. Arrows signify significant increasing (↑ ) or decreasing (↓ ) trend response ( interaction); ‘Yes’ indicatessignificant positive relationship between group species richness and habitat diversity (Brillouin Index) or between guild densityand habitat availability; ‘–’ signifies no significant trend or association; ‘(0·10)’ indicates a trend or relationship that approachedformal significant (P < 0·10)
Drawdown experiment
Winter 1994* Winter 1995 Spring 1994 Spring 1995
RichnessWaders
Trend ↑ ↑ ↑ (0·10) –Dabbling ducks
Trend – ↓ ↓ –Diving waterbirds
Trend – ↓ ↓ –All waterbirds
Trend ↑ (0·10) – – ↑ (0·10)Relationship Yes Yes – –
DensityCalidridine sandpipers
Trend ↑ ↑ – –Relationship Yes Yes – –
Large shorebirdsTrend ↑ ↑ – –Relationship Yes Yes – –
TealTrend ↑ ↑ , ↓ – –Relationship Yes Yes (0·10) – –
Large dabbling ducksTrend – ↓ ↓ ↓Relationship – Yes (0·10) Yes Yes
*Partial drawdown.
JPE_763.fm Page 998 Wednesday, November 13, 2002 8:07 PM

999Waterbird communities and wetland drawdown
© 2002 British Ecological Society, Journal of Applied Ecology, 39,987–1001
because habitat was widely available in the regionduring spring.
For dabbling ducks and diving waterbirds, datasuggest that regional availability of deep-water habitatsin spring influenced birds in a converse manner tothat observed for shorebirds and teal. These species leftdewatering wetlands as soon as their habitats began todecline in availability in winter (usually mid-drawdown),whereas they remained on wetlands for longer periodsin spring despite losses of habitat. Such seasonaldifferences in wetland departures may indicate thatindividuals could find preferred flooded foraginghabitats nearby in winter but not in spring. Similardeclines in dabbler abundance have been linked toregional availability of flooded habitat elsewhere(Duncan et al. 1999). That large dabblers did notrespond to the winter 1994 drawdown despite an initialincrease in hectares at intermediate depths (5–25 cm)further implies that their habitat was not regionallylimiting in winter.
Limitation of shallow habitats in winter may because for concern, as access to food during the non-breeding season can be a significant density-dependentcause of mortality in shorebirds (Goss-Custard 1979).During winter experiments, mean shorebird densitiesreached 200 birds ha−1, exceeding responses to drawdownselsewhere (Rundle & Fredrickson 1981; Hands,Ryan & Smith 1991) and comparable to densitiesobserved where only one wetland was dewatered amidsta flooded landscape (Velasquez 1992). Such sustainedhigh densities may ultimately depress the overwintersurvival of individuals via competition or invertebratefood depletion (Goss-Custard 1979; Van Horne 1983).Additionally, peak teal densities on dewatering winterwetlands were twice those at any time in spring. TheGrasslands teal potentially competes for the sameresources as shorebirds in winter, as invertebrates areimportant prey for ducks especially when protein de-mands increase for egg-laying and moult (Miller 1987).
Our data indicate that Grassland managers shouldprovide more shallow habitat during the winter. Winterwetlands dewatered for cattle pasture are typicallycompleted in a few days and collectively occur onlyfor a few weeks. These drawdowns may not provideshallow-water species with enough time to exploitavailable resources fully (Eldridge 1992; Helmers 1992)and may not support the shallow-water bird commu-nity through a 5-month winter. Shallow habitat canbe increased either by conducting more winter draw-downs or managing winter water levels at shalloweroverall depths. Because increasing the number ofwinter drawdowns in The Grasslands would adverselyaffect moist-soil management by dewatering wetlandsprematurely (Connelly 1979), we suggest that managersmaintain flooded wetlands in winter at intermediate(e.g. 10–20 cm) average depths until ready for draw-down. However, with evaporation at 1·5 cm day−1
towards spring, such wetlands may still expose mud-flats earlier than is optimal. Thus, we suggest wetlands
maintained at the upper end of 10–20 cm (i.e. 15–20 cm) should provide sufficient habitat while also min-imizing premature mudflat exposure; managers shouldperiodically raise water levels to keep wetlands dynam-ically flooded around this average (Fredrickson & Reid1990). This scheme enables managers to sustain habitatfor waterfowl in winter, and to complete drawdowns inspring when large numbers of shorebirds are migrating.
In this study, wetlands at intermediate depths (10–20 cm) still provided diving waterbird habitat (> 25 cmdeep; Table 2) but diving waterbird richness declinedwhen wetlands reached average depths below 15 cm(complete winter 1995 drawdown). Such a responsefurther supports maintaining wetlands at average depthsof 15–20 cm. However, a more conservative approachwould be to maintain a small number of wetlandswithin a given wetland complex exclusively for divers.
Irrespective of depth management, invertebrateresources must be abundant and periodically replen-ished if habitats are to function for extended periods(Miller 1987; Krapu & Reinecke 1992; Rehfisch 1994;Davis & Smith 1998). Invertebrate productivity isinfluenced by wetland plant composition, organic debris,temperature, substrate manipulations and floodingregimes (Neckles, Murkin & Cooper 1990; Rehfisch1994; Batzer, De Szalay & Resh 1997; Sanders 2000;Ausden, Sutherland & James 2001). Cycles of rainfalland evaporation should provide temporary refugefor invertebrates, but if water levels remain constantshorebirds may deplete resources (Eldridge 1992;Helmers 1992). Further data are required on the effectsof fluctuating water levels on invertebrate recruitmentand depletion by birds (Piersma 1987).
Responses of waterbird communities to depth mani-pulations in The Grasslands provide an example formultispecies management on other wetlands. Ourrecommendations particularly apply to other locationswhere waterbird communities, basin topographies,vegetation structure, management capabilities andgoals are similar. For complexes that primarily supportdabblers and shorebirds, the following recommenda-tions should lead to efficient management for a diversecommunity. We hope that these will be incorporatedwhere appropriate by practitioners and agenciesinvolved in wetland management and policy (Ormerodet al. 2002).1. Knowledge of local topography will help to deter-mine the average depths necessary to provide adiversity of waterbird habitats. While a wetland isflooded, topography (range of depths) can be estimatedfrom water depths measured along two transects atroughly 45° to the prevailing slope of the underlyingwetland bottom. Wetland restoration to create gentleslopes and undulating bottom topographies will broadenthe average depth range at which multiple habitats willbecome available.
JPE_763.fm Page 999 Wednesday, November 13, 2002 8:07 PM

1000O. W. Taft et al.
© 2002 British Ecological Society, Journal of Applied Ecology, 39,987–1001
2. For many managed wetlands, spring is consideredthe most important season in which to provide habitatfor migrant shorebirds. For locales with a sizeablepopulation of wintering shorebirds in addition to springmigrants, our data indicate that it may be appropriateto shift some of the management focus from springdrawdowns to greater availability of shallow water inwinter. This can generally be achieved by increasing thenumber of winter drawdowns or by lowering winterwater levels. For such locales, winter drawdowns orlowered water levels may be a more effective and effi-cient use of resources (personnel, time, funding) thanmore spring drawdowns when there is a regional excessof shallow water.3. For complexes managed for moist-soil plants andthus where winter drawdowns are not feasible, managerscan maintain winter water levels at low average depthsto accommodate a diverse regional community withoutdepreciating waterfowl habitat. We recommend aver-age depths between 15 and 20 cm, or 10–25 cm wheretopography is more variable than in The Grasslands.In localities where the management focuses on water-fowl, managing for deeper average depths will be satis-factory (20–25 cm); if few diving species winter in anarea, shallower depths will suffice (10–15 cm). It maybe necessary to manage individual wetlands exclusivelyfor species associated with the extreme ends of the depthspectrum (e.g. diving waterbirds and shorebirds), espe-cially where they comprise a large component of thewinter community.
Acknowledgements
We appreciate the advice and field support from M.Anderson, D. Garrison, T.L. George, S. Harris, T.Poole, F. Reid and D. Woolington. We thank theowners of the hunt clubs who allowed land access andpermitted wetland manipulation. C. Feldheim, J. Isolaand M. Taft provided invaluable field assistance. Webenefited from discussions with G. Allen, T. Arnold,M. Beck, S. Dodd, C. Elphick, C. Feldheim and W.D.Shuford. R. Botzler, T.L. George and two anonymousreferees commented on drafts of this paper. Financialand logistical support was provided by the Institute forWetland and Waterfowl Research (Ducks UnlimitedInc.), California Department of Fish and Game, Grass-land Water District, and the Oakland Land and CattleCompany.
References
American Ornithologists’ Union (1998) Check-list of NorthAmerican Birds: The Species of Birds of North America fromthe Arctic Through Panama, Including the West Indies andHawaiian Islands. American Ornithologists’ Union, Wash-ington, DC.
Ausden, M., Sutherland, W.J. & James, R. (2001) The effectsof flooding lowland wet grassland on soil macroinverte-brate prey of breeding wading birds. Journal of AppliedEcology, 38, 320–338.
Baker, M.C. (1979) Morphological correlates of habitatselection in a community of shorebirds (Charadriiformes).Oikos, 33, 121–126.
Baldassarre, G.A. & Fischer, D.H. (1984) Food habits of fallmigrant shorebirds on the Texas High Plains. Journal ofField Ornithology, 55, 220–229.
Batzer, D.P., De Szalay, F. & Resh, V.H. (1997) Opportunisticresponse of a benthic midge (Diptera: Chironomidae) tomanagement of California seasonal wetlands. Environ-mental Entomology, 26, 215–222.
Bird, J.A., Pettygrove, G.S. & Eadie, J.M. (2000) The impactof waterfowl foraging on the decomposition of rice straw:mutual benefits for rice growers and waterfowl. Journal ofApplied Ecology, 37, 728–741.
California Department of Fish and Game (1987–96) PeriodicWaterfowl Survey. California Department of Fish andGame, Sacramento, CA.
Colwell, M.A. & Taft, O.W. (2000) Waterbird communities inmanaged wetlands of varying water depth. Waterbirds, 23,45–55.
Connelly, D.P. (1979) Propagation of Selected Native MarshPlants in the San Joaquin Valley. Wildlife ManagementLeaflet 15. California Department of Fish and Game,Sacramento, CA.
Davis, C.A. & Smith, L.M. (1998) Ecology and managementof migrant shorebirds in the Playa Lakes region of Texas.Wildlife Monographs, 140, 1–45.
Duncan, P., Hewison, A.J.M., Houte, S., Rosoux, R.,Tournebize, T., Dubs, F., Burel, F. & Bretagnolle, V. (1999)Long-term changes in agricultural practices and wildfowlingin an internationally important wetland, and their effectson the guild of wintering ducks. Journal of Applied Ecology,36, 11–23.
Dunning, J.B., Danielson, B.J. & Pulliam, H.R. (1992)Ecological processes that affect populations in complexlandscapes. Oikos, 65, 169–175.
Eldridge, J. (1992) Management of Habitat for Breeding andMigrating Shorebirds in the Midwest. Leaflet 13.2.14. USFish and Wildlife Service, Washington, DC.
Elphick, C.S. (1997) Experimental approaches to shorebirdhabitat management. International Wader Studies, 9, 20–28.
Elphick, C.S. & Oring, L.W. (1998) Winter management ofCalifornian rice fields for waterbirds. Journal of AppliedEcology, 35, 95–108.
Erwin, R.M., Laubhan, M.K., Cornely, J.E. & Bradshaw,D.M. (2000) Managing wetlands for waterbirds: how man-agers can make a difference in improving habitat to supporta North American bird conservation plan. Strategies forBird Conservation: The Partners in Flight Planning Process(eds R. Bonney, D.N. Pashley, R.J. Cooper & L. Niles),pp. 82–87. US Dept of Agriculture, Forest Service, RockyMountain Research Station, Fort Collins, CO.
Farmer, A.H. & Parent, A.H. (1997) Effects of the landscapeon shorebird movements at spring migration stopovers.Condor, 99, 698–707.
Fredrickson, L.H. (1991) Strategies for Water Level Mani-pulations in Moist-Soil Systems. Leaflet 13.4.6. US Fish andWildlife Service, Washington, DC.
Fredrickson, L.H. & Laubhan, M.K. (1995) Land UseImpacts and Habitat Preservation in the Grasslands of WesternMerced County, California. Grassland Water District, LosBanos, CA.
Fredrickson, L.H. & Reid, F.A. (1986) Wetland and riparianhabitats: a nongame management overview. Managementof Nongame Wildlife in the Midwest: A Developing Art (edsJ.B. Hale, L.B. Best & R.L. Clawson), pp. 59–96. TheWildlife Society, Grand Rapids, MI.
Fredrickson, L.H. & Reid, F.A. (1990) Impacts of hydrologicalteration on management of freshwater wetlands. Man-agement of Dynamic Ecosystems (ed. J.M. Sweeney),pp. 71–90. The Wildlife Society, West Lafayette, IN.
JPE_763.fm Page 1000 Wednesday, November 13, 2002 8:07 PM

1001Waterbird communities and wetland drawdown
© 2002 British Ecological Society, Journal of Applied Ecology, 39,987–1001
Fredrickson, L.H. & Taylor, T.S. (1982) Management ofSeasonally Flooded Impoundments for Wildlife. ResourcePublication 148. US Fish and Wildlife Service, Washington,DC.
Goss-Custard, J.D. (1979) Effect of habitat loss on thenumbers of overwintering shorebirds. Shorebirds in MarineEnvironments (ed. F.A. Pitelka), pp. 167–177. CooperOrnithological Society, Berkeley, CA.
Hands, H.M., Ryan, M.R. & Smith, J.W. (1991) Migrantshorebird use of marsh, moist-soil, and flooded agriculturalhabitats. Wildlife Society Bulletin, 19, 457–464.
Heitmeyer, M.E., Connelly, D.P. & Pederson, R.L. (1989)The Central, Imperial, and Coachella Valleys of California.Habitat Management for Migrating and Wintering Water-fowl in North America (eds L.M. Smith, R.L. Pederson &R.M. Kaminski), pp. 475–505. Texas Tech UniversityPress, Lubbock, TX.
Helmers, D.L. (1992) Shorebird Management Manual. WesternHemisphere Shorebird Reserve Network, Manomet, MA.
Hunter, L., Canevari, P., Myers, J.P. & Payne, L.X. (1991)Shorebird and Wetland Conservation in the Western Hemi-sphere. Technical Publication 12. International Council forBird Preservation, Cambridge, UK.
Hurlbert, S.H. (1984) Pseudoreplication and the design ofecological field experiments. Ecological Monographs, 54,187–211.
Isola, C.R., Colwell, M.A., Taft, O.W. & Safran, R.J. (2000)Interspecific differences in habitat use of shorebirds andwaterfowl foraging in managed wetlands of California’sSan Joaquin Valley. Waterbirds, 23, 196–203.
Krapu, G.L. & Reinecke, K.J. (1992) Foraging ecology andnutrition. Ecology and Management of Breeding Waterfowl (edsB.D.J. Batt, A.D. Afton, M.G. Anderson, C.D. Ankney,D.H. Johnson, J.A. Kadlec & G.L. Krapu), pp. 1–29. Uni-versity of Minnesota Press, Minneapolis, MN.
Krebs, C.J. (1989) Ecological Methodology. Harper CollinsPublishers, New York, NY.
Kushlan, J.A. (1989) Avian use of fluctuating wetlands.Freshwater Wetlands and Wildlife, CONF-8603101, DOESymposium Series No. 61 (eds R.R. Sharitz & J.W. Gibbons),pp. 593–604. USDOE Office of Scientific and TechnicalInformation, Oak Ridge, TN.
Laubhan, M.K. & Fredrickson, L.H. (1993) Integratedwetland management: concepts and opportunities.Transactions of the North American Wildlife and NaturalResources Conference, 58, 323–334.
Miller, M.R. (1987) Fall and winter foods of northern pintailsin the Sacramento Valley, California. Journal of WildlifeManagement, 51, 405–414.
Mitsch, W.J. & Gosselink, J.G. (2000) Wetlands, 3rd edn.Elsevier Science, New York, NY.
Nagarajan, R. & Thiyagesan, K. (1996) Waterbirds and sub-strate quality of the Pichavaram wetlands, southern India.Ibis, 138, 710–721.
Neckles, H.A., Murkin, H.R. & Cooper, J.A. (1990) Influencesof seasonal flooding on macroinvertebrate abundance inwetland habitats. Freshwater Biology, 23, 311–322.
Ormerod, S.J., Barlow, N.D., Marshall, E.J.P. & Kerby, G.(2002) The uptake of applied ecology. Journal of AppliedEcology, 39, 1–7.
Piersma, T. (1987) Production by intertidal benthic animalsand limits to their predation by shorebirds: a heuristicmodel. Marine Ecology Progress Series, 38, 187–196.
Pöysä, H. (1983) Resource utilization pattern and guildstructure in a waterfowl community. Oikos, 40, 295–307.
Rehfisch, M.M. (1994) Man-made lagoons and how theirattractiveness to waders might be increased by manipulat-ing the biomass of an insect benthos. Journal of AppliedEcology, 31, 383–401.
Reid, F.A. (1993) Managing wetlands for waterbirds.Transactions of the North American Wildlife and NaturalResources Conference, 58, 345–350.
Rundle, W.D. & Fredrickson, L.H. (1981) Managing seasonallyflooded impoundments for migrant rails and shorebirds.Wildlife Society Bulletin, 9, 80–87.
SAS Institute (1995) SAS/STAT User’s Guide, Version 6·11.SAS Institute Inc., Cary, NC.
Sanders, M.D. (2000) Enhancing food supplies for waders:inconsistent effects of substratum manipulations on aquaticinvertebrate biomass. Journal of Applied Ecology, 37, 66–76.
Shuford, W.D., Page, G.P. & Hickey, C.M. (1998) Patternsand dynamics of shorebird use of California’s CentralValley. Condor, 100, 227–244.
Skagen, S.K. & Knopf, F.L. (1993) Toward conservation ofmidcontinental shorebird migrations. Conservation Biology,7, 533–541.
Skagen, S.K. & Knopf, F.L. (1994) Migrating shorebirds andhabitat dynamics at a prairie wetland complex. WilsonBulletin, 106, 91–105.
Stevens, J. (1992) Applied Multivariate Statistics for theSocial Sciences, 2nd edn. L. Erlbaum Associates, Hillsdale,NJ.
Van Horne, B. (1983) Density as a misleading indicator ofhabitat quality. Journal of Wildlife Management, 47, 893–901.
Velasquez, C.R. (1992) Managing artificial saltpans as water-bird habitat: species’ responses to water level manipulation.Colonial Waterbirds, 15, 43–55.
Warnock, N., Page, G.W. & Stenzel, L.E. (1995) Non-migratorymovements of dunlins on their California winteringgrounds. Wilson Bulletin, 107, 131–139.
Warnock, S.E. & Takekawa, J.Y. (1996) Wintering site fidelityand movement patterns of Western Sandpipers Calidrismauri in the San Francisco Bay estuary. Ibis, 138, 160–167.
Weber, L.M. & Haig, S.M. (1996) Shorebird use of SouthCarolina managed and natural coastal wetlands. Journal ofWildlife Management, 60, 73–82.
Wiens, J.A. (1985) Vertebrate response to environmentalpatchiness in arid and semiarid ecosystems. The Ecology ofNatural Disturbance and Patch Dynamics (eds S.T.A. Pickett& P.S. White), pp. 169–193. Academic Press, Orlando, FL.
Wiens, J.A., Rotenbery, J.T. & Van Horne, B. (1987) Habitatoccupancy patterns of North American shrubsteppe birds:the effects of spatial scale. Oikos, 48, 132–147.
Williams, O.E. (1996) Waterbird responses to late winter andearly spring drawdowns of moist-soil managed wetlands inCalifornia’s San Joaquin Valley. MS Thesis. HumboldtState University, Arcata, CA.
Received 8 October 2001; final copy received 24 July 2002
JPE_763.fm Page 1001 Wednesday, November 13, 2002 8:07 PM


![Responses to elevated [CO 2] of a short rotation, multispecies poplar plantation: the POPFACE/EUROFACE experiment](https://img.pdfslide.net/doc/110x75/6333539fb94d623842022464/responses-to-elevated-co-2-of-a-short-rotation-multispecies-poplar-plantation.jpg)


