Embed Size (px)
Citation preview
West Virginia Property Tax Briefing Paper
By Amy Higginbotham
Arzu Sen Dr. Tami Gurley-Calvez
Bureau of Business and Economic Research College of Business and Economics
West Virginia University 2009
i
Table of Contents
Page(s) Introduction ...........................................................................................................................1 History of the West Virginia Property Tax ...........................................................................2-4 Current State of the West Virginia Property Tax ..................................................................5-27
Property Tax Rates ....................................................................................................5-11 Assessed Valuations ..................................................................................................12-14 Taxes Levied .............................................................................................................15-18 Distribution of Property Tax Revenue ......................................................................19 Real Property Sales Ratio Assessment .....................................................................20-21 West Virginia Property Tax Compared to the Nation ..............................................22-23 West Virginia Property Tax Compared to Surrounding States .................................24-27
West Virginia Property Tax Incidence ..................................................................................28
Literature Review of Local Property Taxation and Service Provision ..................................29-30 Future of the West Virginia Property Tax ............................................................................31-32
Works Cited ..........................................................................................................................33-35
ii
List of Figures Page(s) Figure 1: West Virginia Total Average Rate of Levy on Each $100 Assessed
Valuation ...................................................................................................................6 Figure 2: West Virginia Average Rate of Levy on Each $100 Assessed Valuation
By Purpose ................................................................................................................8 Figure 3: West Virginia Per Capita Property Tax By Purpose .............................................9 Figure 4: Assessed Valuations of Property: West Virginia ..................................................12 Figure 5: Inflation-Adjusted Assessed Valuations of Property by Class: West Virginia .....13 Figure 6: Taxes Levied on Classified Assessed Valuations by Class: West Virginia ..........15 Figure 7: Inflation-Adjusted Taxes Levied on Classified Assessed Valuations by
Class: West Virginia .................................................................................................17
iii
List of Tables Page(s)
Table 1: 1932 Tax Limitation Amendment ..........................................................................2 Table 2: Current West Virginia Property Classifications .....................................................5 Table 3: West Virginia 2008 Property Tax Rates .................................................................6 Table 4: West Virginia Average Rate of Levy .....................................................................7 Table 5: West Virginia Property Tax Rates By County and Class .......................................10 Table 6: West Virginia Tax Rate Changes By County .........................................................11 Table 7: West Virginia Assessed Valuations of Property By County ..................................14 Table 8: Current West Virginia Property Taxes Levied .......................................................16 Table 9: Taxes Levied on Classified Assessed Valuations by County .................................18 Table 10: Distribution of Taxes Levied: West Virginia .......................................................19 Table 11: West Virginia Real Property Sales-Ratio Study ...................................................21 Table 12: Total State-Local Property Tax per Capita and per $100 of Personal Income, 2005..........................................................................................................23 Table 13: General Property Tax Information for West Virginia and Surrounding States ....25 Table 14: Circuit Breaker Programs for Homeowners and Renters: 2002 ............................26 Table 15: Homestead Exemption Programs: 2005 ................................................................27 Table 16: Tax Burden as a Share of Family Income for Non Elderly Families 2002 ...........28
1
Introduction Since its conception, the property tax has been the most scrutinized and misunderstood tax in the United States. Property taxes in localities across the nation are levied on both real and personal property and are ad valorem, meaning they are levied based on the value of the item being taxed. Even though it is often criticized and unpopular with taxpayers, the property tax remains one of the primary sources of revenue for local governments across the nation due to its dependability and stability. Compared to the income or sales tax, the property tax is difficult to avoid and thus provides adequate revenue for localities to offer the quantity and quality of public services local voters choose. The West Virginia property tax is not an exception to the scrutiny. Since its conception in 1863, the West Virginia property tax has been criticized, misunderstood, and modified but still remains the major source of revenue for counties, municipalities, and boards of education. While the property tax has been highly disliked and scrutinized in the state, West Virginia’s property tax is one of the lowest per capita and per personal income in the nation. The purpose of this report is to first give insight into how the property tax has evolved over the course of West Virginia’s history as well as show the current structure of the tax including rates, assessed valuations, and revenue disbursements. The report will also address policies in neighboring states, tax incidence or who ultimately pays the property tax, and options for legislative changes to the property tax.
2
History of the West Virginia Property Tax
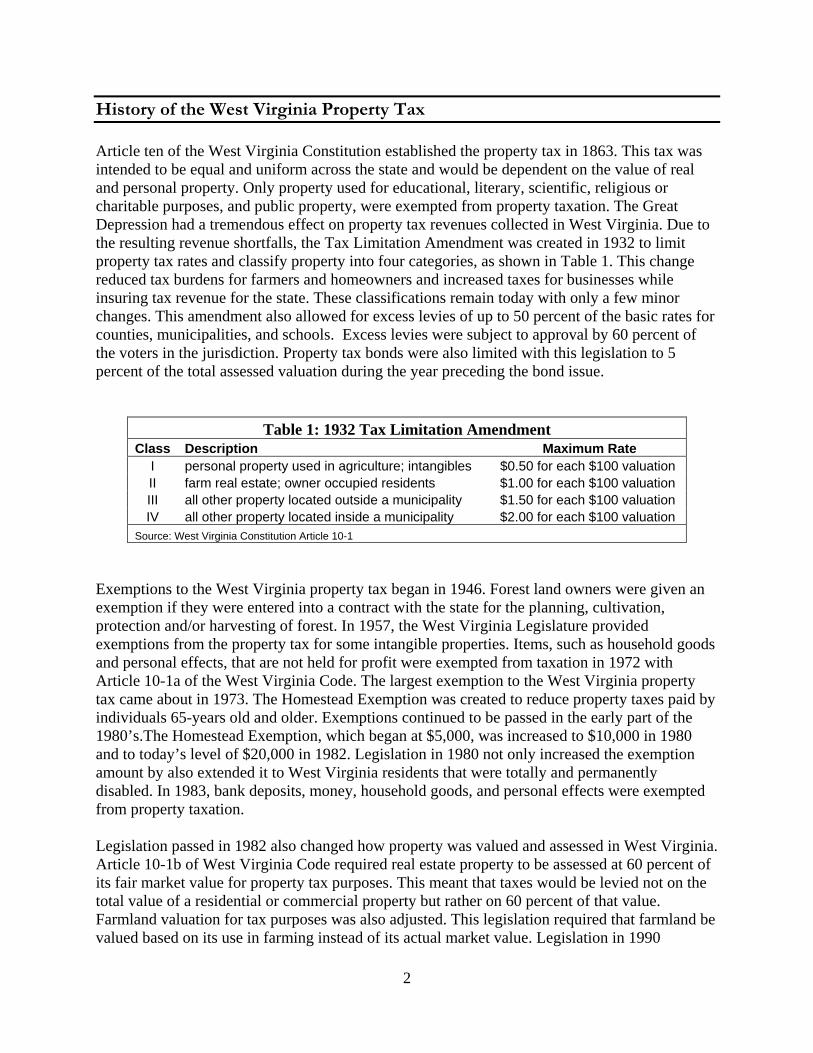
Article ten of the West Virginia Constitution established the property tax in 1863. This tax was intended to be equal and uniform across the state and would be dependent on the value of real and personal property. Only property used for educational, literary, scientific, religious or charitable purposes, and public property, were exempted from property taxation. The Great Depression had a tremendous effect on property tax revenues collected in West Virginia. Due to the resulting revenue shortfalls, the Tax Limitation Amendment was created in 1932 to limit property tax rates and classify property into four categories, as shown in Table 1. This change reduced tax burdens for farmers and homeowners and increased taxes for businesses while insuring tax revenue for the state. These classifications remain today with only a few minor changes. This amendment also allowed for excess levies of up to 50 percent of the basic rates for counties, municipalities, and schools. Excess levies were subject to approval by 60 percent of the voters in the jurisdiction. Property tax bonds were also limited with this legislation to 5 percent of the total assessed valuation during the year preceding the bond issue.
Table 1: 1932 Tax Limitation Amendment Class Description Maximum Rate
I personal property used in agriculture; intangibles $0.50 for each $100 valuation II farm real estate; owner occupied residents $1.00 for each $100 valuation III all other property located outside a municipality $1.50 for each $100 valuation IV all other property located inside a municipality $2.00 for each $100 valuation
Source: West Virginia Constitution Article 10-1
Exemptions to the West Virginia property tax began in 1946. Forest land owners were given an exemption if they were entered into a contract with the state for the planning, cultivation, protection and/or harvesting of forest. In 1957, the West Virginia Legislature provided exemptions from the property tax for some intangible properties. Items, such as household goods and personal effects, that are not held for profit were exempted from taxation in 1972 with Article 10-1a of the West Virginia Code. The largest exemption to the West Virginia property tax came about in 1973. The Homestead Exemption was created to reduce property taxes paid by individuals 65-years old and older. Exemptions continued to be passed in the early part of the 1980’s.The Homestead Exemption, which began at $5,000, was increased to $10,000 in 1980 and to today’s level of $20,000 in 1982. Legislation in 1980 not only increased the exemption amount by also extended it to West Virginia residents that were totally and permanently disabled. In 1983, bank deposits, money, household goods, and personal effects were exempted from property taxation. Legislation passed in 1982 also changed how property was valued and assessed in West Virginia. Article 10-1b of West Virginia Code required real estate property to be assessed at 60 percent of its fair market value for property tax purposes. This meant that taxes would be levied not on the total value of a residential or commercial property but rather on 60 percent of that value. Farmland valuation for tax purposes was also adjusted. This legislation required that farmland be valued based on its use in farming instead of its actual market value. Legislation in 1990
3
continued to change property assessment procedures. With the Appraisal Act of 1990, assessors were required to now assess property at the 60 percent of true market value in three-year cycles with annual adjustments. Since this complicated the assessors’ valuation process, this act also formed a property valuation training and procedures commission to provide assistance with the process. Legislation in 1991 began to limit growth in property tax revenue. With §11-8-6e of the West Virginia Code, legislators set a maximum limit of 1 percent for annual increases in property tax revenues for county commissions and municipalities. This 1 percent limit was expanded to tax revenues for boards of education in 2004 with §11-8-6f of the constitution. Legislation in 2007 increased the limit to 2 percent for boards of education only. This limitation is applied to tax revenue that would be collected on all classes of property minus the total assessed values of newly created property that were not assessed in the previous year’s tax books. While this 1 percent maximum is intended to limit increases in total property tax payments, rates can be increased by more than the 1 percent limit. Governing bodies for each of the levying jurisdictions can hold public hearings and put the increase of property tax rates up to vote. However, rate increases that cause total collections to be above the 1 or 2 percent limit are not fully applied. The increased rate is only applied to the point where the revenue limit is reached. For example, a board of education might implement a 0.3 percentage point increase in the property tax rate but if the revenue limit is reached with a 0.1 percentage point increase, only the 0.1 percentage point increase will be applied in the current year. The full 0.3 percentage point increase would be applied in subsequent years provided that the revenue limit is not reached under the full increase. All intangible property was exempted from property taxation in 1997 with the passage of §11-1C-1b. These intangibles included, but were not limited to, notes, bonds, bills, stocks, and accounts receivable. Property tax relief to low income residents and senior citizens began in 2007. In that year, the first refundable property tax credit in West Virginia was created. Senate bill 541 provided for a refundable credit for individuals paying in excess of 4 percent of their household income. This credit began January 1, 2008 and provides refunds between $10 and $1,000 to qualifying residents. In 2008, the Senior Citizen Tax Deferral Act allowed for a new refundable tax credit to seniors, over the age of 65. Beginning in 2009, seniors will have the option of deferring payment of any residential property tax increase in excess of $300 until they either sell their home or when their estate is settled or if their income is less than $25,000 they can receive a refundable tax credit. In 2008, the Special Aircraft Property Valuation Act reduced personal property taxes on business use aircraft by up to 95 percent beginning in FY 2009. This legislation was established for all aircraft owned or leased by commercial airlines or private carriers. This legislation allows these aircraft to be assessed for property tax purposes by the county assessors or Board of Public Works according to their salvage value. This property tax assessment change was imposed in an effort to increase the number of aircraft locating in the stat and accrue the economic and fiscal benefits associated with additional services provided to operate and maintain such aircraft.
4
Also, in 2008, all personal property employed exclusively in agriculture was no longer subject to property taxation in West Virginia. Legislative action changed West Virginia Code §11-3-9 to provide this exemption on agricultural personal property and thus eliminating any property from being subject to Class I property taxes.
5
Current State of the West Virginia Property Tax
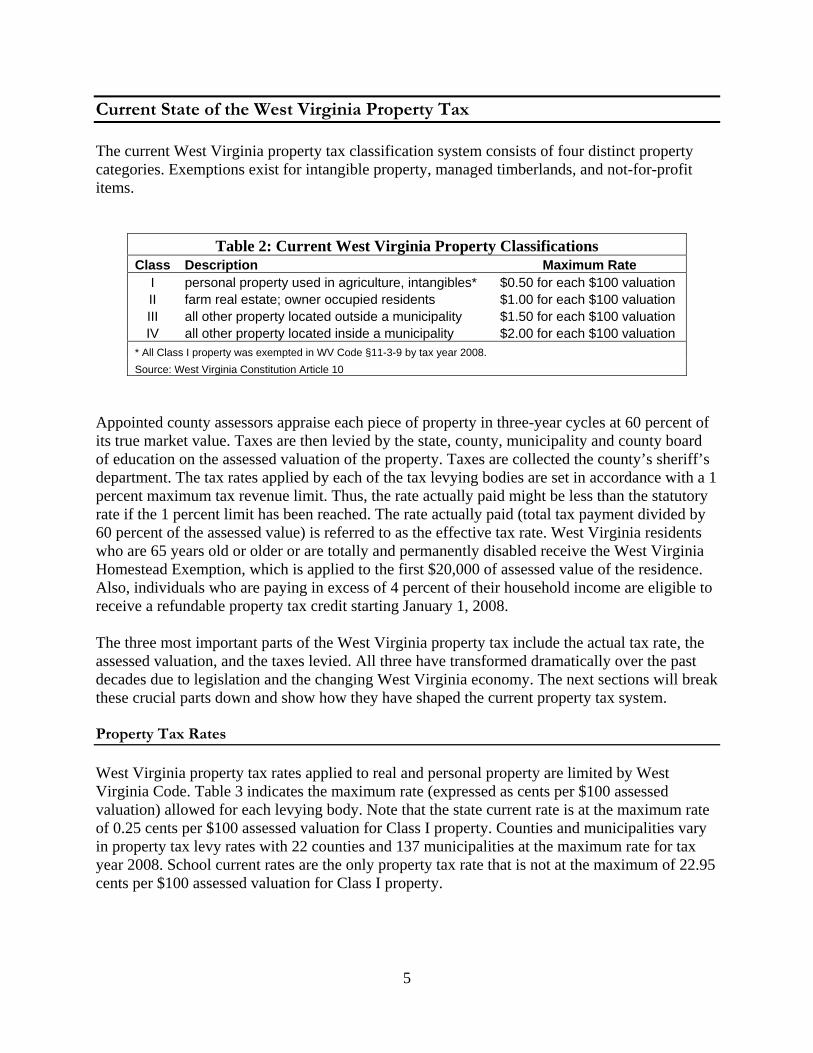
The current West Virginia property tax classification system consists of four distinct property categories. Exemptions exist for intangible property, managed timberlands, and not-for-profit items.
Table 2: Current West Virginia Property Classifications Class Description Maximum Rate
I personal property used in agriculture, intangibles* $0.50 for each $100 valuation II farm real estate; owner occupied residents $1.00 for each $100 valuation III all other property located outside a municipality $1.50 for each $100 valuation IV all other property located inside a municipality $2.00 for each $100 valuation
* All Class I property was exempted in WV Code §11-3-9 by tax year 2008. Source: West Virginia Constitution Article 10
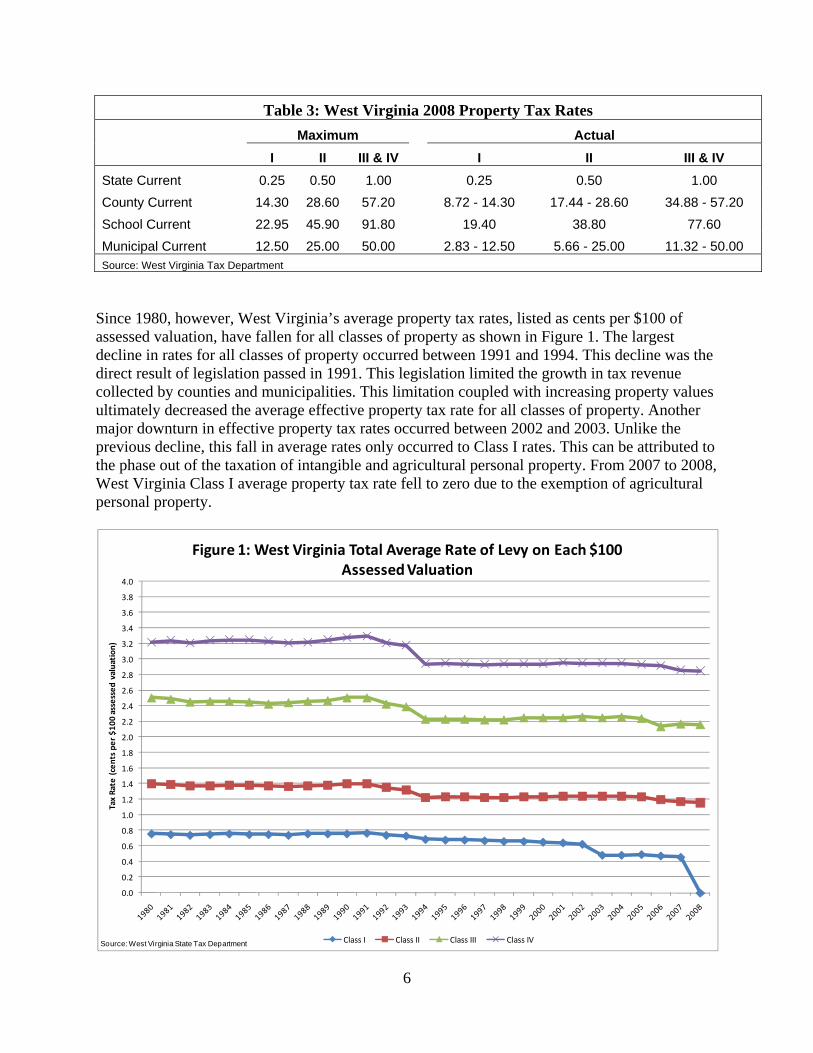
Appointed county assessors appraise each piece of property in three-year cycles at 60 percent of its true market value. Taxes are then levied by the state, county, municipality and county board of education on the assessed valuation of the property. Taxes are collected the county’s sheriff’s department. The tax rates applied by each of the tax levying bodies are set in accordance with a 1 percent maximum tax revenue limit. Thus, the rate actually paid might be less than the statutory rate if the 1 percent limit has been reached. The rate actually paid (total tax payment divided by 60 percent of the assessed value) is referred to as the effective tax rate. West Virginia residents who are 65 years old or older or are totally and permanently disabled receive the West Virginia Homestead Exemption, which is applied to the first $20,000 of assessed value of the residence. Also, individuals who are paying in excess of 4 percent of their household income are eligible to receive a refundable property tax credit starting January 1, 2008. The three most important parts of the West Virginia property tax include the actual tax rate, the assessed valuation, and the taxes levied. All three have transformed dramatically over the past decades due to legislation and the changing West Virginia economy. The next sections will break these crucial parts down and show how they have shaped the current property tax system. Property Tax Rates West Virginia property tax rates applied to real and personal property are limited by West Virginia Code. Table 3 indicates the maximum rate (expressed as cents per $100 assessed valuation) allowed for each levying body. Note that the state current rate is at the maximum rate of 0.25 cents per $100 assessed valuation for Class I property. Counties and municipalities vary in property tax levy rates with 22 counties and 137 municipalities at the maximum rate for tax year 2008. School current rates are the only property tax rate that is not at the maximum of 22.95 cents per $100 assessed valuation for Class I property.
6
Table 3: West Virginia 2008 Property Tax Rates Maximum Actual I II III & IV I II III & IV
State Current 0.25 0.50 1.00 0.25 0.50 1.00 County Current 14.30 28.60 57.20 8.72 - 14.30 17.44 - 28.60 34.88 - 57.20 School Current 22.95 45.90 91.80 19.40 38.80 77.60 Municipal Current 12.50 25.00 50.00 2.83 - 12.50 5.66 - 25.00 11.32 - 50.00 Source: West Virginia Tax Department
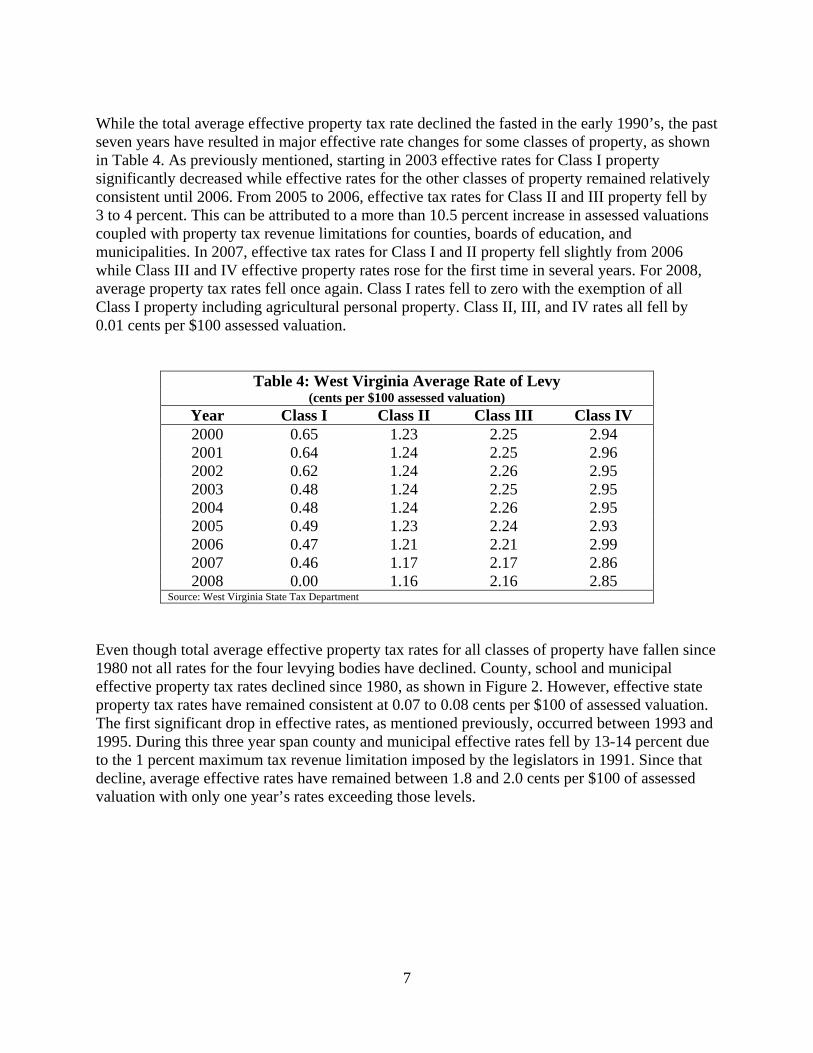
Since 1980, however, West Virginia’s average property tax rates, listed as cents per $100 of assessed valuation, have fallen for all classes of property as shown in Figure 1. The largest decline in rates for all classes of property occurred between 1991 and 1994. This decline was the direct result of legislation passed in 1991. This legislation limited the growth in tax revenue collected by counties and municipalities. This limitation coupled with increasing property values ultimately decreased the average effective property tax rate for all classes of property. Another major downturn in effective property tax rates occurred between 2002 and 2003. Unlike the previous decline, this fall in average rates only occurred to Class I rates. This can be attributed to the phase out of the taxation of intangible and agricultural personal property. From 2007 to 2008, West Virginia Class I average property tax rate fell to zero due to the exemption of agricultural personal property.
0.0
0.2
0.4
0.6
0.8
1.0
1.2
1.4
1.6
1.8
2.0
2.2
2.4
2.6
2.8
3.0
3.2
3.4
3.6
3.8
4.0
Tax Rate (cents pe
r $1
00 assessed valuation)
Figure 1: West Virginia Total Average Rate of Levy on Each $100 Assessed Valuation
Class I Class II Class III Class IVSource: West Virginia State Tax Department
7
While the total average effective property tax rate declined the fasted in the early 1990’s, the past seven years have resulted in major effective rate changes for some classes of property, as shown in Table 4. As previously mentioned, starting in 2003 effective rates for Class I property significantly decreased while effective rates for the other classes of property remained relatively consistent until 2006. From 2005 to 2006, effective tax rates for Class II and III property fell by 3 to 4 percent. This can be attributed to a more than 10.5 percent increase in assessed valuations coupled with property tax revenue limitations for counties, boards of education, and municipalities. In 2007, effective tax rates for Class I and II property fell slightly from 2006 while Class III and IV effective property rates rose for the first time in several years. For 2008, average property tax rates fell once again. Class I rates fell to zero with the exemption of all Class I property including agricultural personal property. Class II, III, and IV rates all fell by 0.01 cents per $100 assessed valuation.
Table 4: West Virginia Average Rate of Levy (cents per $100 assessed valuation)
Year Class I Class II Class III Class IV 2000 0.65 1.23 2.25 2.94 2001 0.64 1.24 2.25 2.96 2002 0.62 1.24 2.26 2.95 2003 0.48 1.24 2.25 2.95 2004 0.48 1.24 2.26 2.95 2005 0.49 1.23 2.24 2.93 2006 0.47 1.21 2.21 2.99 2007 0.46 1.17 2.17 2.86 2008 0.00 1.16 2.16 2.85
Source: West Virginia State Tax Department
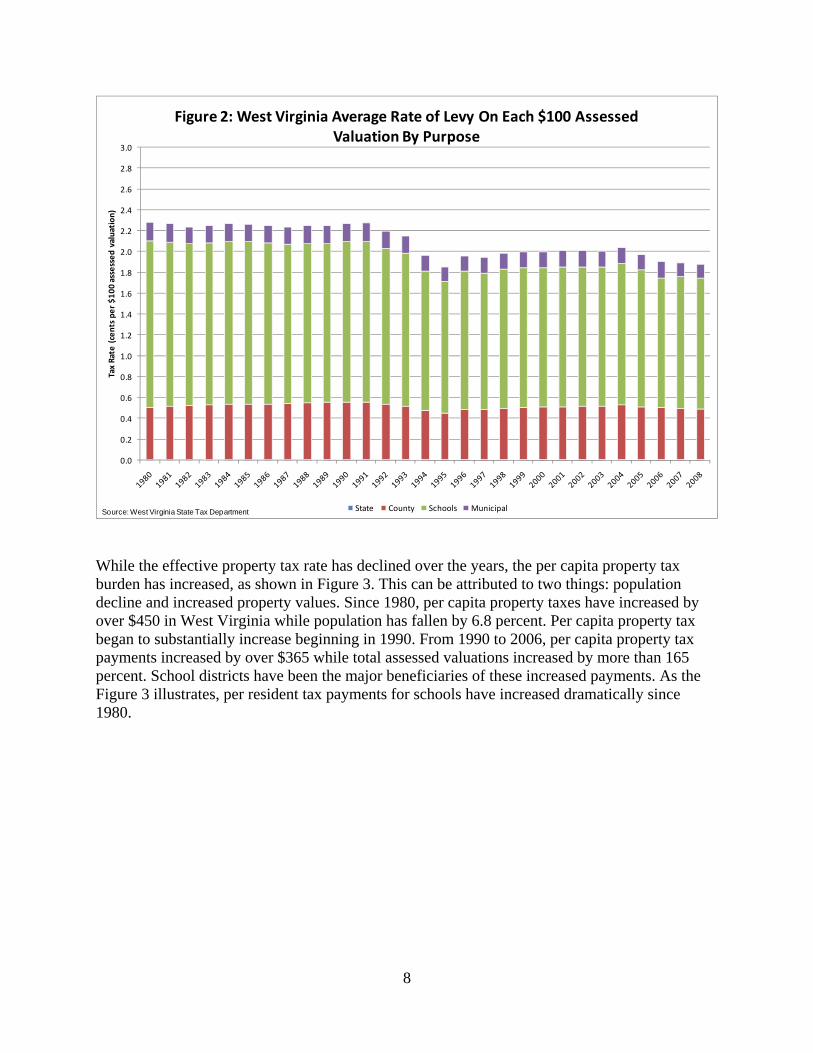
Even though total average effective property tax rates for all classes of property have fallen since 1980 not all rates for the four levying bodies have declined. County, school and municipal effective property tax rates declined since 1980, as shown in Figure 2. However, effective state property tax rates have remained consistent at 0.07 to 0.08 cents per $100 of assessed valuation. The first significant drop in effective rates, as mentioned previously, occurred between 1993 and 1995. During this three year span county and municipal effective rates fell by 13-14 percent due to the 1 percent maximum tax revenue limitation imposed by the legislators in 1991. Since that decline, average effective rates have remained between 1.8 and 2.0 cents per $100 of assessed valuation with only one year’s rates exceeding those levels.
8
0.0
0.2
0.4
0.6
0.8
1.0
1.2
1.4
1.6
1.8
2.0
2.2
2.4
2.6
2.8
3.0
Tax Rate (cents pe
r $1
00 assessed valuation)
Figure 2: West Virginia Average Rate of Levy On Each $100 Assessed Valuation By Purpose
State County Schools MunicipalSource: West Virginia State Tax Department
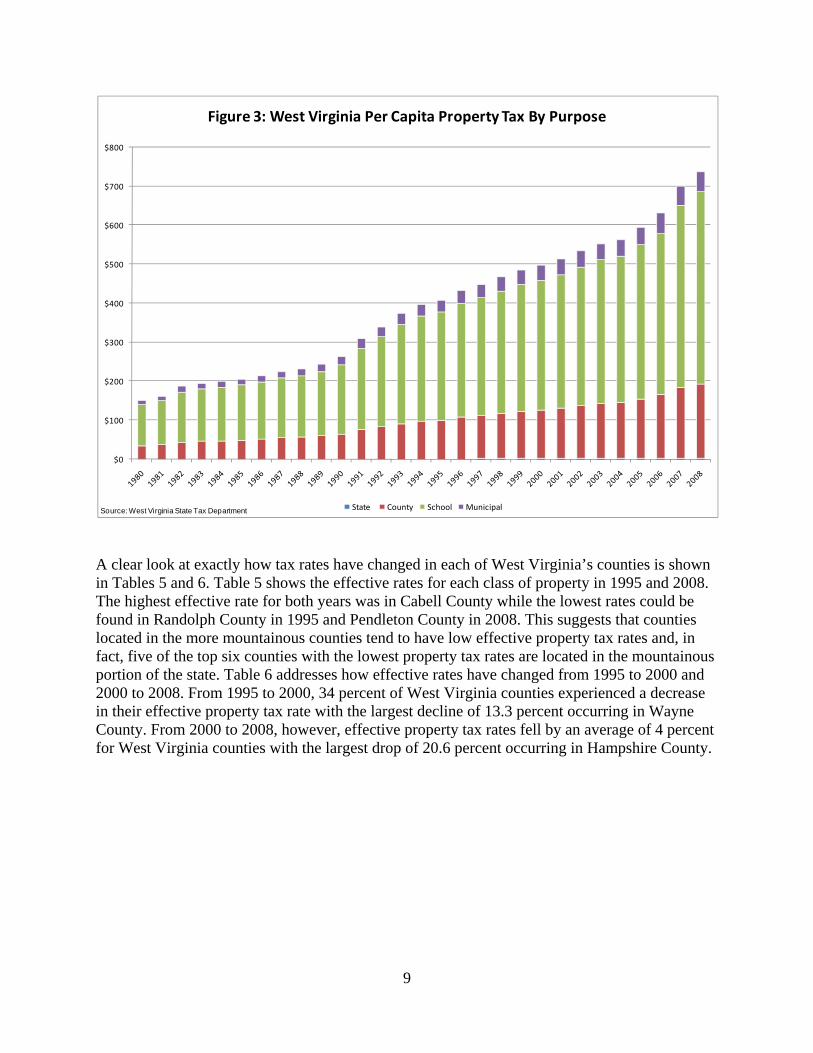
While the effective property tax rate has declined over the years, the per capita property tax burden has increased, as shown in Figure 3. This can be attributed to two things: population decline and increased property values. Since 1980, per capita property taxes have increased by over $450 in West Virginia while population has fallen by 6.8 percent. Per capita property tax began to substantially increase beginning in 1990. From 1990 to 2006, per capita property tax payments increased by over $365 while total assessed valuations increased by more than 165 percent. School districts have been the major beneficiaries of these increased payments. As the Figure 3 illustrates, per resident tax payments for schools have increased dramatically since 1980.
9
$0
$100
$200
$300
$400
$500
$600
$700
$800
Figure 3: West Virginia Per Capita Property Tax By Purpose
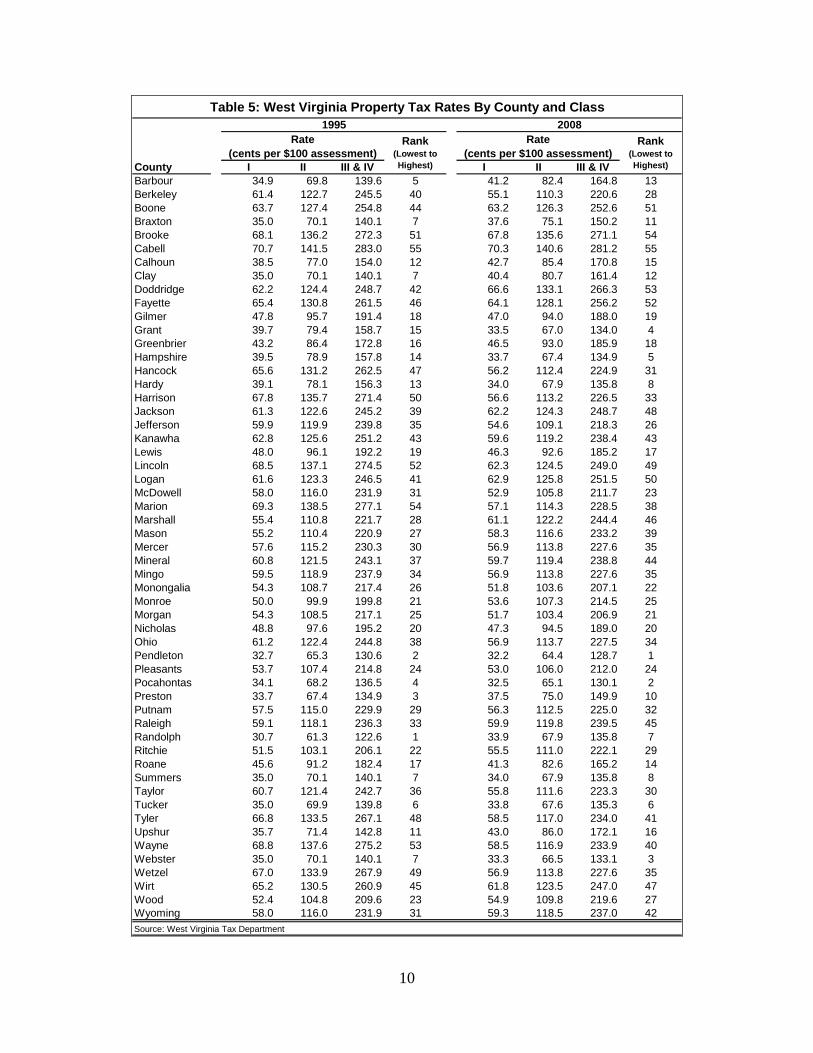
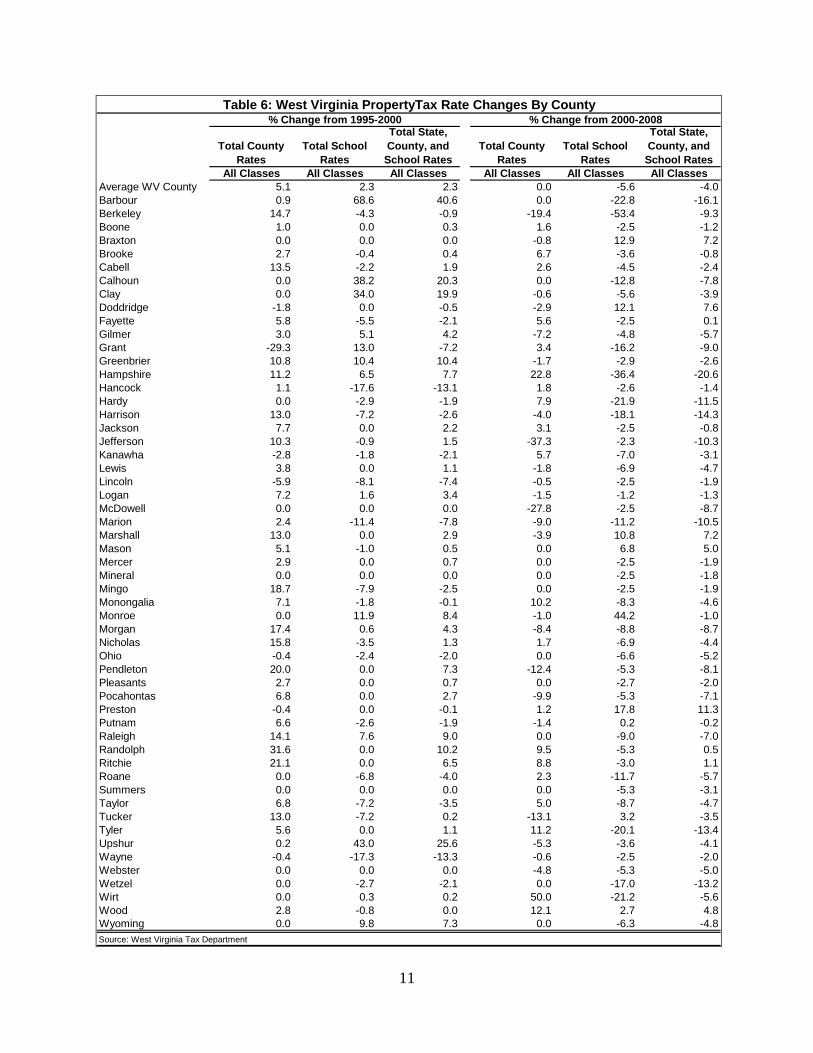
State County School MunicipalSource: West Virginia State Tax Department A clear look at exactly how tax rates have changed in each of West Virginia’s counties is shown in Tables 5 and 6. Table 5 shows the effective rates for each class of property in 1995 and 2008. The highest effective rate for both years was in Cabell County while the lowest rates could be found in Randolph County in 1995 and Pendleton County in 2008. This suggests that counties located in the more mountainous counties tend to have low effective property tax rates and, in fact, five of the top six counties with the lowest property tax rates are located in the mountainous portion of the state. Table 6 addresses how effective rates have changed from 1995 to 2000 and 2000 to 2008. From 1995 to 2000, 34 percent of West Virginia counties experienced a decrease in their effective property tax rate with the largest decline of 13.3 percent occurring in Wayne County. From 2000 to 2008, however, effective property tax rates fell by an average of 4 percent for West Virginia counties with the largest drop of 20.6 percent occurring in Hampshire County.
10
County I II III & IV I II III & IVBarbour 34.9 69.8 139.6 5 41.2 82.4 164.8 13Berkeley 61.4 122.7 245.5 40 55.1 110.3 220.6 28Boone 63.7 127.4 254.8 44 63.2 126.3 252.6 51Braxton 35.0 70.1 140.1 7 37.6 75.1 150.2 11Brooke 68.1 136.2 272.3 51 67.8 135.6 271.1 54Cabell 70.7 141.5 283.0 55 70.3 140.6 281.2 55Calhoun 38.5 77.0 154.0 12 42.7 85.4 170.8 15Clay 35.0 70.1 140.1 7 40.4 80.7 161.4 12Doddridge 62.2 124.4 248.7 42 66.6 133.1 266.3 53Fayette 65.4 130.8 261.5 46 64.1 128.1 256.2 52Gilmer 47.8 95.7 191.4 18 47.0 94.0 188.0 19Grant 39.7 79.4 158.7 15 33.5 67.0 134.0 4Greenbrier 43.2 86.4 172.8 16 46.5 93.0 185.9 18Hampshire 39.5 78.9 157.8 14 33.7 67.4 134.9 5Hancock 65.6 131.2 262.5 47 56.2 112.4 224.9 31Hardy 39.1 78.1 156.3 13 34.0 67.9 135.8 8Harrison 67.8 135.7 271.4 50 56.6 113.2 226.5 33Jackson 61.3 122.6 245.2 39 62.2 124.3 248.7 48Jefferson 59.9 119.9 239.8 35 54.6 109.1 218.3 26Kanawha 62.8 125.6 251.2 43 59.6 119.2 238.4 43Lewis 48.0 96.1 192.2 19 46.3 92.6 185.2 17Lincoln 68.5 137.1 274.5 52 62.3 124.5 249.0 49Logan 61.6 123.3 246.5 41 62.9 125.8 251.5 50McDowell 58.0 116.0 231.9 31 52.9 105.8 211.7 23Marion 69.3 138.5 277.1 54 57.1 114.3 228.5 38Marshall 55.4 110.8 221.7 28 61.1 122.2 244.4 46Mason 55.2 110.4 220.9 27 58.3 116.6 233.2 39Mercer 57.6 115.2 230.3 30 56.9 113.8 227.6 35Mineral 60.8 121.5 243.1 37 59.7 119.4 238.8 44Mingo 59.5 118.9 237.9 34 56.9 113.8 227.6 35Monongalia 54.3 108.7 217.4 26 51.8 103.6 207.1 22Monroe 50.0 99.9 199.8 21 53.6 107.3 214.5 25Morgan 54.3 108.5 217.1 25 51.7 103.4 206.9 21Nicholas 48.8 97.6 195.2 20 47.3 94.5 189.0 20Ohio 61.2 122.4 244.8 38 56.9 113.7 227.5 34Pendleton 32.7 65.3 130.6 2 32.2 64.4 128.7 1Pleasants 53.7 107.4 214.8 24 53.0 106.0 212.0 24Pocahontas 34.1 68.2 136.5 4 32.5 65.1 130.1 2Preston 33.7 67.4 134.9 3 37.5 75.0 149.9 10Putnam 57.5 115.0 229.9 29 56.3 112.5 225.0 32Raleigh 59.1 118.1 236.3 33 59.9 119.8 239.5 45Randolph 30.7 61.3 122.6 1 33.9 67.9 135.8 7Ritchie 51.5 103.1 206.1 22 55.5 111.0 222.1 29Roane 45.6 91.2 182.4 17 41.3 82.6 165.2 14Summers 35.0 70.1 140.1 7 34.0 67.9 135.8 8Taylor 60.7 121.4 242.7 36 55.8 111.6 223.3 30Tucker 35.0 69.9 139.8 6 33.8 67.6 135.3 6Tyler 66.8 133.5 267.1 48 58.5 117.0 234.0 41Upshur 35.7 71.4 142.8 11 43.0 86.0 172.1 16Wayne 68.8 137.6 275.2 53 58.5 116.9 233.9 40Webster 35.0 70.1 140.1 7 33.3 66.5 133.1 3Wetzel 67.0 133.9 267.9 49 56.9 113.8 227.6 35Wirt 65.2 130.5 260.9 45 61.8 123.5 247.0 47Wood 52.4 104.8 209.6 23 54.9 109.8 219.6 27Wyoming 58.0 116.0 231.9 31 59.3 118.5 237.0 42Source: West Virginia Tax Department
Table 5: West Virginia Property Tax Rates By County and Class
Rank (Lowest to Highest)
1995Rank
(Lowest to Highest)
Rate (cents per $100 assessment)
Rate (cents per $100 assessment)
2008
11
Total County Rates
Total School Rates
Total State, County, and School Rates
Total County Rates
Total School Rates
Total State, County, and School Rates
All Classes All Classes All Classes All Classes All Classes All ClassesAverage WV County 5.1 2.3 2.3 0.0 -5.6 -4.0Barbour 0.9 68.6 40.6 0.0 -22.8 -16.1Berkeley 14.7 -4.3 -0.9 -19.4 -53.4 -9.3Boone 1.0 0.0 0.3 1.6 -2.5 -1.2Braxton 0.0 0.0 0.0 -0.8 12.9 7.2Brooke 2.7 -0.4 0.4 6.7 -3.6 -0.8Cabell 13.5 -2.2 1.9 2.6 -4.5 -2.4Calhoun 0.0 38.2 20.3 0.0 -12.8 -7.8Clay 0.0 34.0 19.9 -0.6 -5.6 -3.9Doddridge -1.8 0.0 -0.5 -2.9 12.1 7.6Fayette 5.8 -5.5 -2.1 5.6 -2.5 0.1Gilmer 3.0 5.1 4.2 -7.2 -4.8 -5.7Grant -29.3 13.0 -7.2 3.4 -16.2 -9.0Greenbrier 10.8 10.4 10.4 -1.7 -2.9 -2.6Hampshire 11.2 6.5 7.7 22.8 -36.4 -20.6Hancock 1.1 -17.6 -13.1 1.8 -2.6 -1.4Hardy 0.0 -2.9 -1.9 7.9 -21.9 -11.5Harrison 13.0 -7.2 -2.6 -4.0 -18.1 -14.3Jackson 7.7 0.0 2.2 3.1 -2.5 -0.8Jefferson 10.3 -0.9 1.5 -37.3 -2.3 -10.3Kanawha -2.8 -1.8 -2.1 5.7 -7.0 -3.1Lewis 3.8 0.0 1.1 -1.8 -6.9 -4.7Lincoln -5.9 -8.1 -7.4 -0.5 -2.5 -1.9Logan 7.2 1.6 3.4 -1.5 -1.2 -1.3McDowell 0.0 0.0 0.0 -27.8 -2.5 -8.7Marion 2.4 -11.4 -7.8 -9.0 -11.2 -10.5Marshall 13.0 0.0 2.9 -3.9 10.8 7.2Mason 5.1 -1.0 0.5 0.0 6.8 5.0Mercer 2.9 0.0 0.7 0.0 -2.5 -1.9Mineral 0.0 0.0 0.0 0.0 -2.5 -1.8Mingo 18.7 -7.9 -2.5 0.0 -2.5 -1.9Monongalia 7.1 -1.8 -0.1 10.2 -8.3 -4.6Monroe 0.0 11.9 8.4 -1.0 44.2 -1.0Morgan 17.4 0.6 4.3 -8.4 -8.8 -8.7Nicholas 15.8 -3.5 1.3 1.7 -6.9 -4.4Ohio -0.4 -2.4 -2.0 0.0 -6.6 -5.2Pendleton 20.0 0.0 7.3 -12.4 -5.3 -8.1Pleasants 2.7 0.0 0.7 0.0 -2.7 -2.0Pocahontas 6.8 0.0 2.7 -9.9 -5.3 -7.1Preston -0.4 0.0 -0.1 1.2 17.8 11.3Putnam 6.6 -2.6 -1.9 -1.4 0.2 -0.2Raleigh 14.1 7.6 9.0 0.0 -9.0 -7.0Randolph 31.6 0.0 10.2 9.5 -5.3 0.5Ritchie 21.1 0.0 6.5 8.8 -3.0 1.1Roane 0.0 -6.8 -4.0 2.3 -11.7 -5.7Summers 0.0 0.0 0.0 0.0 -5.3 -3.1Taylor 6.8 -7.2 -3.5 5.0 -8.7 -4.7Tucker 13.0 -7.2 0.2 -13.1 3.2 -3.5Tyler 5.6 0.0 1.1 11.2 -20.1 -13.4Upshur 0.2 43.0 25.6 -5.3 -3.6 -4.1Wayne -0.4 -17.3 -13.3 -0.6 -2.5 -2.0Webster 0.0 0.0 0.0 -4.8 -5.3 -5.0Wetzel 0.0 -2.7 -2.1 0.0 -17.0 -13.2Wirt 0.0 0.3 0.2 50.0 -21.2 -5.6Wood 2.8 -0.8 0.0 12.1 2.7 4.8Wyoming 0.0 9.8 7.3 0.0 -6.3 -4.8
% Change from 1995-2000Table 6: West Virginia PropertyTax Rate Changes By County
Source: West Virginia Tax Department
% Change from 2000-2008
12
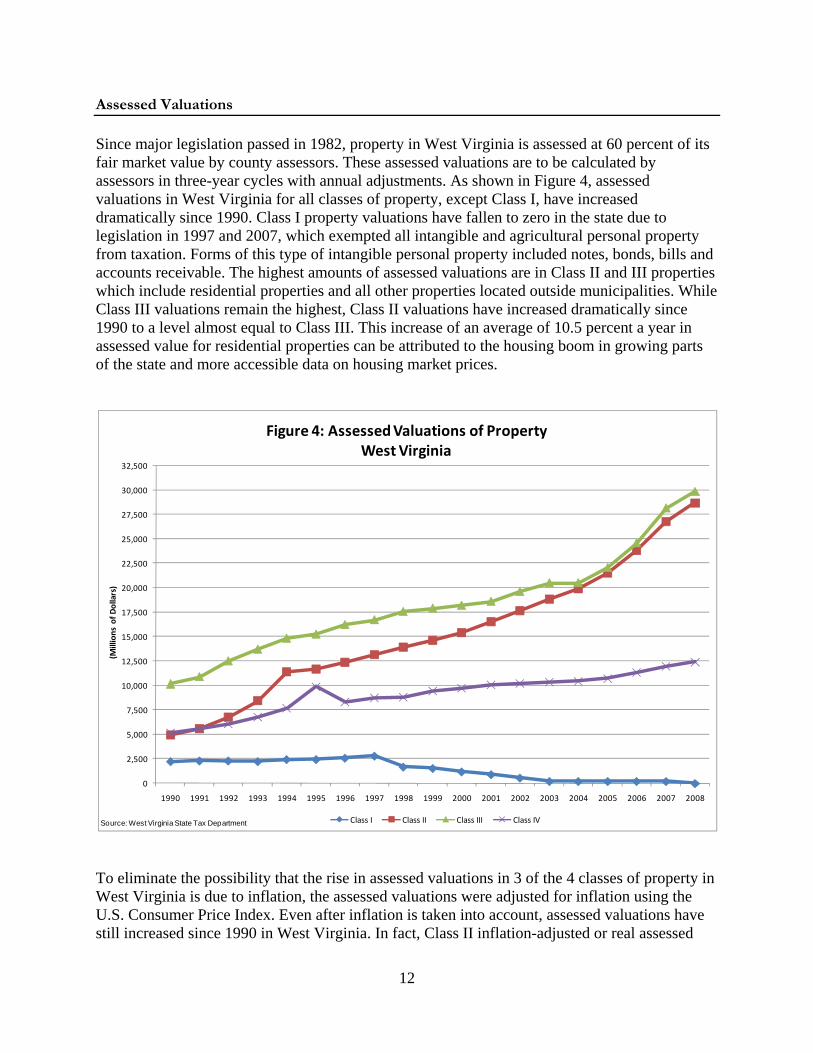
Assessed Valuations Since major legislation passed in 1982, property in West Virginia is assessed at 60 percent of its fair market value by county assessors. These assessed valuations are to be calculated by assessors in three-year cycles with annual adjustments. As shown in Figure 4, assessed valuations in West Virginia for all classes of property, except Class I, have increased dramatically since 1990. Class I property valuations have fallen to zero in the state due to legislation in 1997 and 2007, which exempted all intangible and agricultural personal property from taxation. Forms of this type of intangible personal property included notes, bonds, bills and accounts receivable. The highest amounts of assessed valuations are in Class II and III properties which include residential properties and all other properties located outside municipalities. While Class III valuations remain the highest, Class II valuations have increased dramatically since 1990 to a level almost equal to Class III. This increase of an average of 10.5 percent a year in assessed value for residential properties can be attributed to the housing boom in growing parts of the state and more accessible data on housing market prices.
0
2,500
5,000
7,500
10,000
12,500
15,000
17,500
20,000
22,500
25,000
27,500
30,000
32,500
1990 1991 1992 1993 1994 1995 1996 1997 1998 1999 2000 2001 2002 2003 2004 2005 2006 2007 2008
(Millions of D
ollars)
Figure 4: Assessed Valuations of PropertyWest Virginia
Class I Class II Class III Class IVSource: West Virginia State Tax Department To eliminate the possibility that the rise in assessed valuations in 3 of the 4 classes of property in West Virginia is due to inflation, the assessed valuations were adjusted for inflation using the U.S. Consumer Price Index. Even after inflation is taken into account, assessed valuations have still increased since 1990 in West Virginia. In fact, Class II inflation-adjusted or real assessed
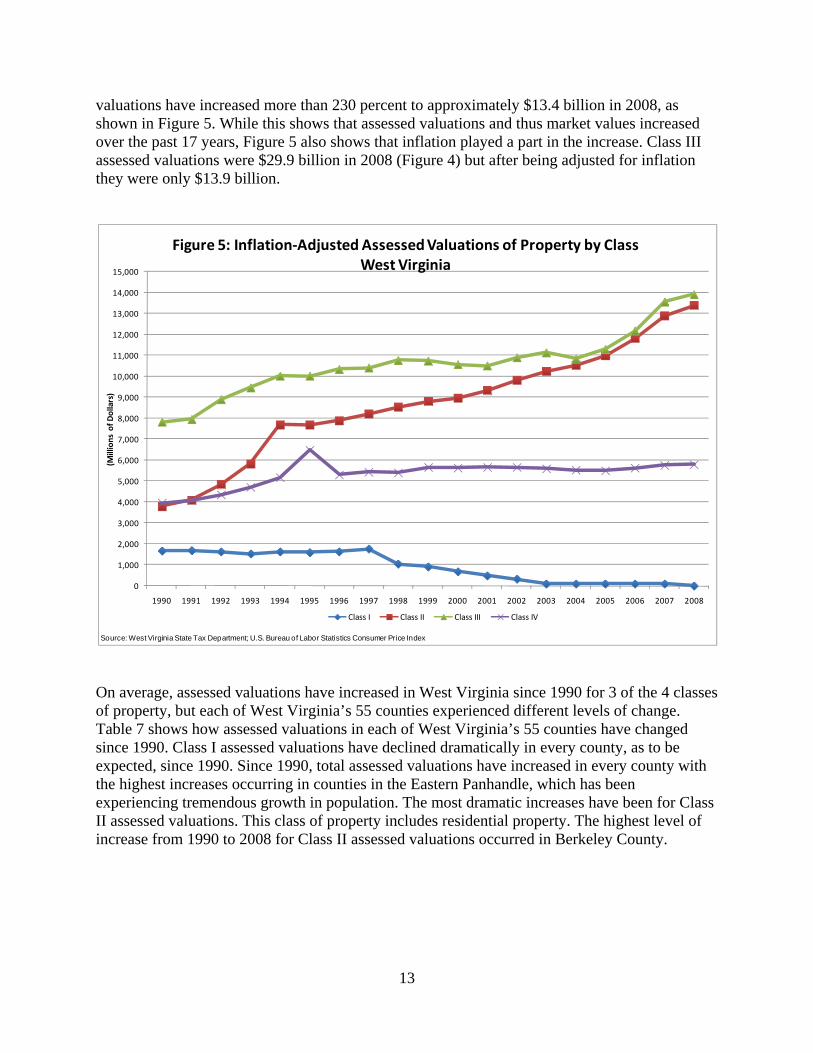
13
valuations have increased more than 230 percent to approximately $13.4 billion in 2008, as shown in Figure 5. While this shows that assessed valuations and thus market values increased over the past 17 years, Figure 5 also shows that inflation played a part in the increase. Class III assessed valuations were $29.9 billion in 2008 (Figure 4) but after being adjusted for inflation they were only $13.9 billion.
0
1,000
2,000
3,000
4,000
5,000
6,000
7,000
8,000
9,000
10,000
11,000
12,000
13,000
14,000
15,000
1990 1991 1992 1993 1994 1995 1996 1997 1998 1999 2000 2001 2002 2003 2004 2005 2006 2007 2008
(Millions of D
ollars)
Figure 5: Inflation‐Adjusted Assessed Valuations of Property by ClassWest Virginia
Class I Class II Class III Class IV
Source: West Virginia State Tax Department; U.S. Bureau of Labor Statistics Consumer Price Index On average, assessed valuations have increased in West Virginia since 1990 for 3 of the 4 classes of property, but each of West Virginia’s 55 counties experienced different levels of change. Table 7 shows how assessed valuations in each of West Virginia’s 55 counties have changed since 1990. Class I assessed valuations have declined dramatically in every county, as to be expected, since 1990. Since 1990, total assessed valuations have increased in every county with the highest increases occurring in counties in the Eastern Panhandle, which has been experiencing tremendous growth in population. The most dramatic increases have been for Class II assessed valuations. This class of property includes residential property. The highest level of increase from 1990 to 2008 for Class II assessed valuations occurred in Berkeley County.
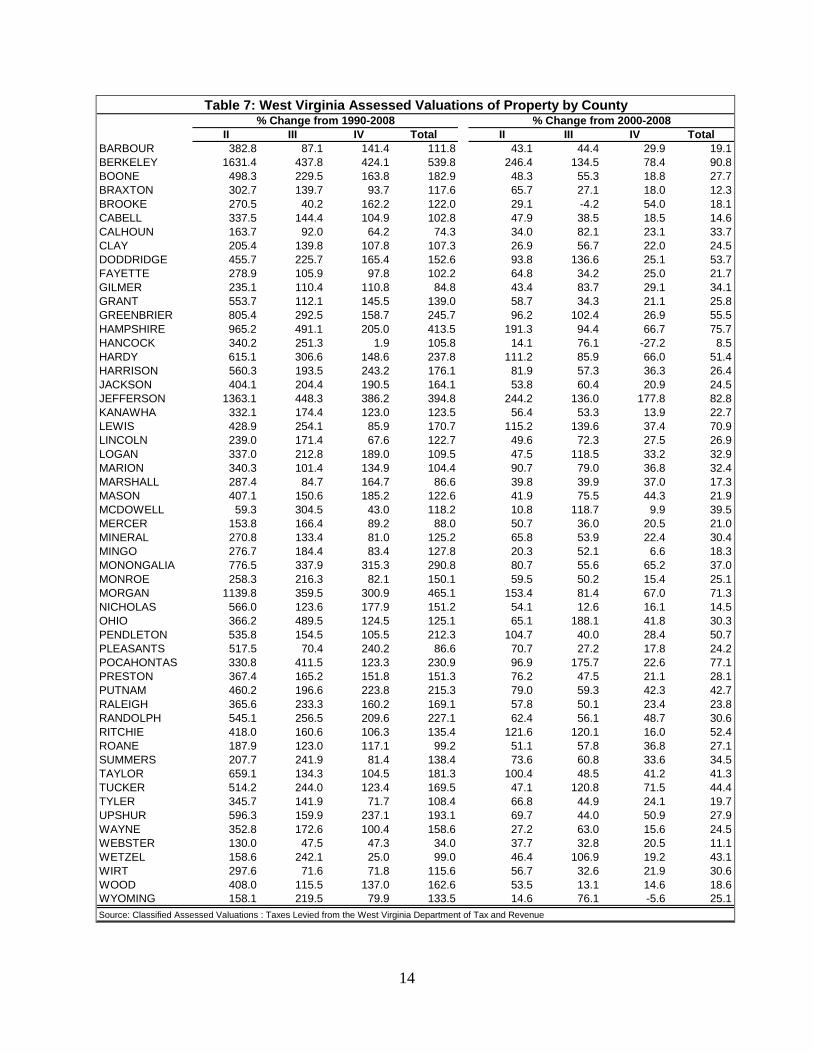
14
II III IV Total II III IV TotalBARBOUR 382.8 87.1 141.4 111.8 43.1 44.4 29.9 19.1BERKELEY 1631.4 437.8 424.1 539.8 246.4 134.5 78.4 90.8BOONE 498.3 229.5 163.8 182.9 48.3 55.3 18.8 27.7BRAXTON 302.7 139.7 93.7 117.6 65.7 27.1 18.0 12.3BROOKE 270.5 40.2 162.2 122.0 29.1 -4.2 54.0 18.1CABELL 337.5 144.4 104.9 102.8 47.9 38.5 18.5 14.6CALHOUN 163.7 92.0 64.2 74.3 34.0 82.1 23.1 33.7CLAY 205.4 139.8 107.8 107.3 26.9 56.7 22.0 24.5DODDRIDGE 455.7 225.7 165.4 152.6 93.8 136.6 25.1 53.7FAYETTE 278.9 105.9 97.8 102.2 64.8 34.2 25.0 21.7GILMER 235.1 110.4 110.8 84.8 43.4 83.7 29.1 34.1GRANT 553.7 112.1 145.5 139.0 58.7 34.3 21.1 25.8GREENBRIER 805.4 292.5 158.7 245.7 96.2 102.4 26.9 55.5HAMPSHIRE 965.2 491.1 205.0 413.5 191.3 94.4 66.7 75.7HANCOCK 340.2 251.3 1.9 105.8 14.1 76.1 -27.2 8.5HARDY 615.1 306.6 148.6 237.8 111.2 85.9 66.0 51.4HARRISON 560.3 193.5 243.2 176.1 81.9 57.3 36.3 26.4JACKSON 404.1 204.4 190.5 164.1 53.8 60.4 20.9 24.5JEFFERSON 1363.1 448.3 386.2 394.8 244.2 136.0 177.8 82.8KANAWHA 332.1 174.4 123.0 123.5 56.4 53.3 13.9 22.7LEWIS 428.9 254.1 85.9 170.7 115.2 139.6 37.4 70.9LINCOLN 239.0 171.4 67.6 122.7 49.6 72.3 27.5 26.9LOGAN 337.0 212.8 189.0 109.5 47.5 118.5 33.2 32.9MARION 340.3 101.4 134.9 104.4 90.7 79.0 36.8 32.4MARSHALL 287.4 84.7 164.7 86.6 39.8 39.9 37.0 17.3MASON 407.1 150.6 185.2 122.6 41.9 75.5 44.3 21.9MCDOWELL 59.3 304.5 43.0 118.2 10.8 118.7 9.9 39.5MERCER 153.8 166.4 89.2 88.0 50.7 36.0 20.5 21.0MINERAL 270.8 133.4 81.0 125.2 65.8 53.9 22.4 30.4MINGO 276.7 184.4 83.4 127.8 20.3 52.1 6.6 18.3MONONGALIA 776.5 337.9 315.3 290.8 80.7 55.6 65.2 37.0MONROE 258.3 216.3 82.1 150.1 59.5 50.2 15.4 25.1MORGAN 1139.8 359.5 300.9 465.1 153.4 81.4 67.0 71.3NICHOLAS 566.0 123.6 177.9 151.2 54.1 12.6 16.1 14.5OHIO 366.2 489.5 124.5 125.1 65.1 188.1 41.8 30.3PENDLETON 535.8 154.5 105.5 212.3 104.7 40.0 28.4 50.7PLEASANTS 517.5 70.4 240.2 86.6 70.7 27.2 17.8 24.2POCAHONTAS 330.8 411.5 123.3 230.9 96.9 175.7 22.6 77.1PRESTON 367.4 165.2 151.8 151.3 76.2 47.5 21.1 28.1PUTNAM 460.2 196.6 223.8 215.3 79.0 59.3 42.3 42.7RALEIGH 365.6 233.3 160.2 169.1 57.8 50.1 23.4 23.8RANDOLPH 545.1 256.5 209.6 227.1 62.4 56.1 48.7 30.6RITCHIE 418.0 160.6 106.3 135.4 121.6 120.1 16.0 52.4ROANE 187.9 123.0 117.1 99.2 51.1 57.8 36.8 27.1SUMMERS 207.7 241.9 81.4 138.4 73.6 60.8 33.6 34.5TAYLOR 659.1 134.3 104.5 181.3 100.4 48.5 41.2 41.3TUCKER 514.2 244.0 123.4 169.5 47.1 120.8 71.5 44.4TYLER 345.7 141.9 71.7 108.4 66.8 44.9 24.1 19.7UPSHUR 596.3 159.9 237.1 193.1 69.7 44.0 50.9 27.9WAYNE 352.8 172.6 100.4 158.6 27.2 63.0 15.6 24.5WEBSTER 130.0 47.5 47.3 34.0 37.7 32.8 20.5 11.1WETZEL 158.6 242.1 25.0 99.0 46.4 106.9 19.2 43.1WIRT 297.6 71.6 71.8 115.6 56.7 32.6 21.9 30.6WOOD 408.0 115.5 137.0 162.6 53.5 13.1 14.6 18.6WYOMING 158.1 219.5 79.9 133.5 14.6 76.1 -5.6 25.1
Table 7: West Virginia Assessed Valuations of Property by County
Source: Classified Assessed Valuations : Taxes Levied from the West Virginia Department of Tax and Revenue
% Change from 1990-2008 % Change from 2000-2008
15
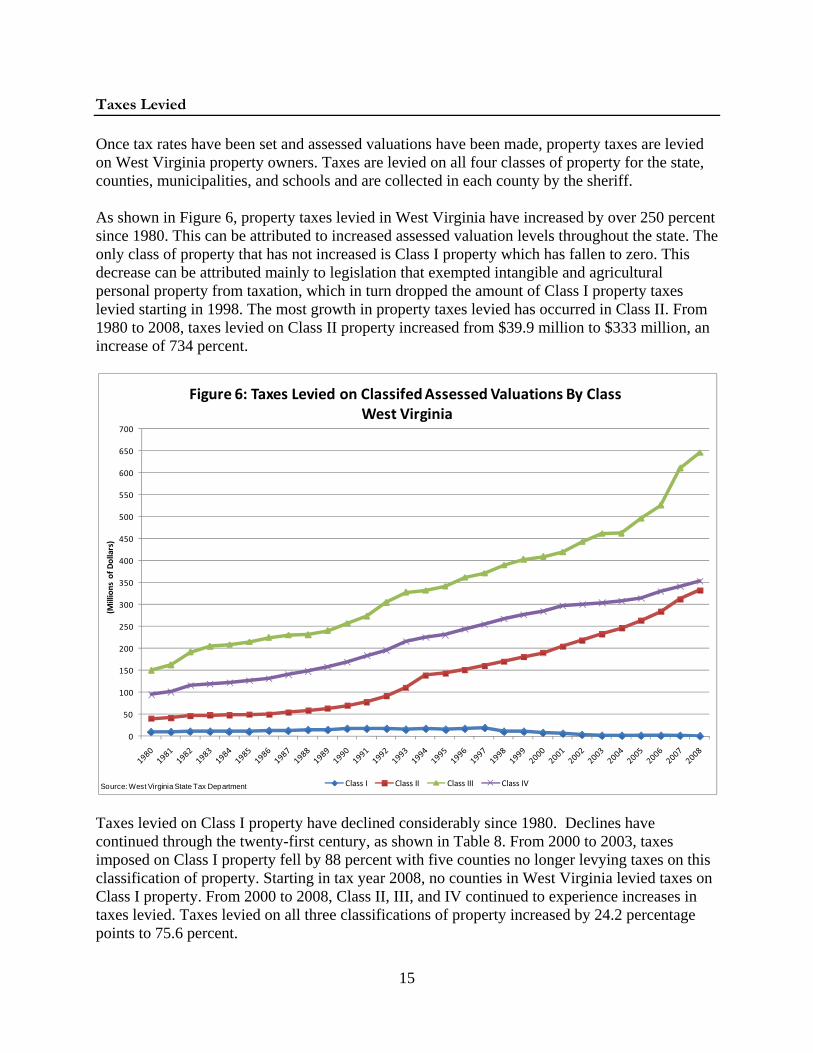
Taxes Levied Once tax rates have been set and assessed valuations have been made, property taxes are levied on West Virginia property owners. Taxes are levied on all four classes of property for the state, counties, municipalities, and schools and are collected in each county by the sheriff. As shown in Figure 6, property taxes levied in West Virginia have increased by over 250 percent since 1980. This can be attributed to increased assessed valuation levels throughout the state. The only class of property that has not increased is Class I property which has fallen to zero. This decrease can be attributed mainly to legislation that exempted intangible and agricultural personal property from taxation, which in turn dropped the amount of Class I property taxes levied starting in 1998. The most growth in property taxes levied has occurred in Class II. From 1980 to 2008, taxes levied on Class II property increased from $39.9 million to $333 million, an increase of 734 percent.
0
50
100
150
200
250
300
350
400
450
500
550
600
650
700
(Millions of D
ollars)
Figure 6: Taxes Levied on Classifed Assessed Valuations By ClassWest Virginia
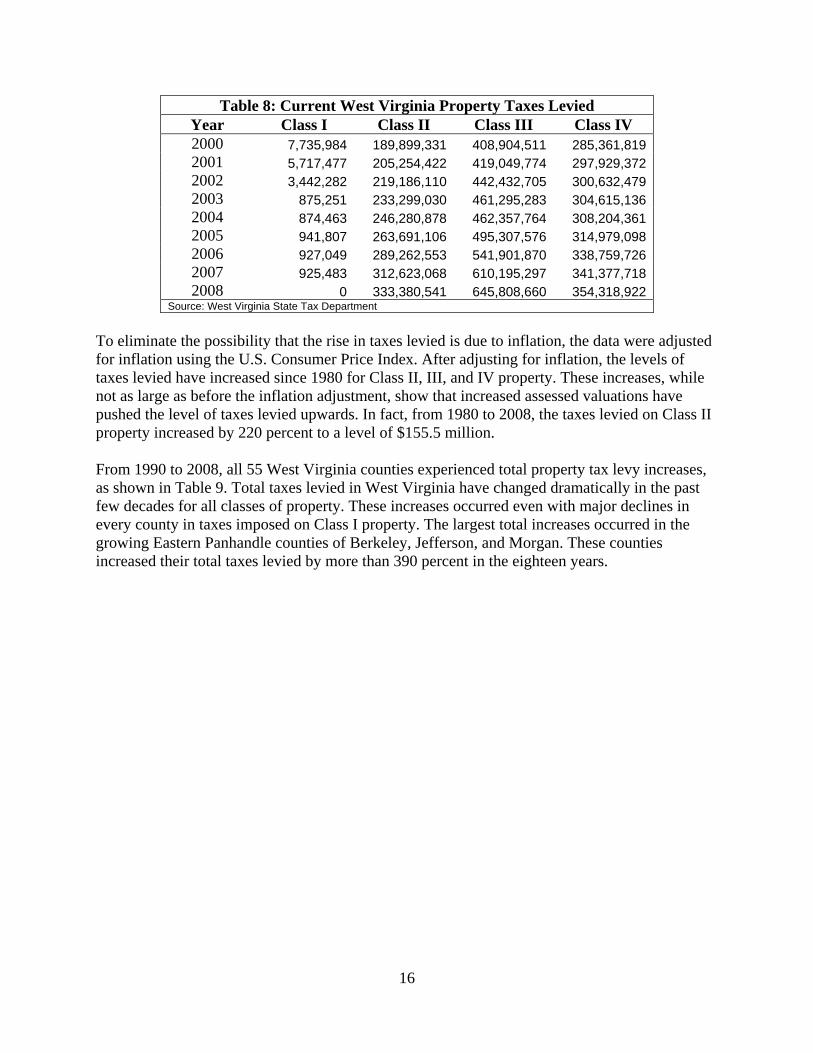
Class I Class II Class III Class IVSource: West Virginia State Tax Department Taxes levied on Class I property have declined considerably since 1980. Declines have continued through the twenty-first century, as shown in Table 8. From 2000 to 2003, taxes imposed on Class I property fell by 88 percent with five counties no longer levying taxes on this classification of property. Starting in tax year 2008, no counties in West Virginia levied taxes on Class I property. From 2000 to 2008, Class II, III, and IV continued to experience increases in taxes levied. Taxes levied on all three classifications of property increased by 24.2 percentage points to 75.6 percent.
16
Table 8: Current West Virginia Property Taxes Levied Year Class I Class II Class III Class IV 2000 7,735,984 189,899,331 408,904,511 285,361,819 2001 5,717,477 205,254,422 419,049,774 297,929,372 2002 3,442,282 219,186,110 442,432,705 300,632,479 2003 875,251 233,299,030 461,295,283 304,615,136 2004 874,463 246,280,878 462,357,764 308,204,361 2005 941,807 263,691,106 495,307,576 314,979,098 2006 927,049 289,262,553 541,901,870 338,759,726 2007 925,483 312,623,068 610,195,297 341,377,718 2008 0 333,380,541 645,808,660 354,318,922
Source: West Virginia State Tax Department
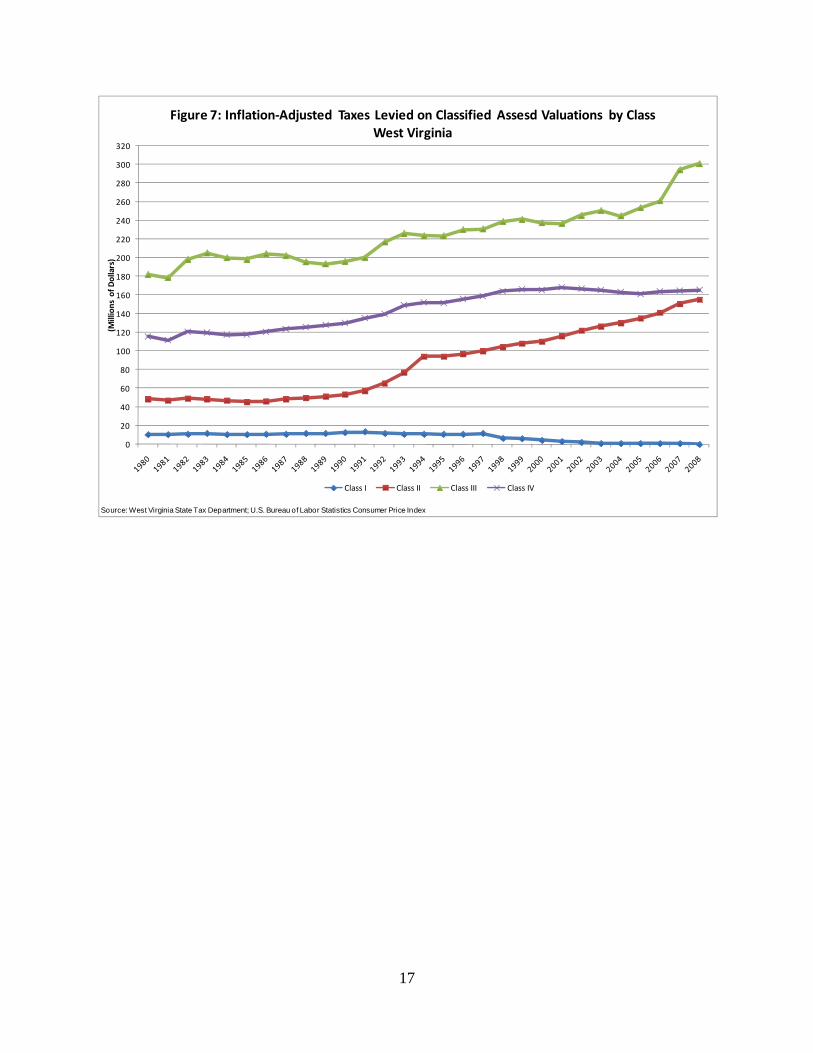
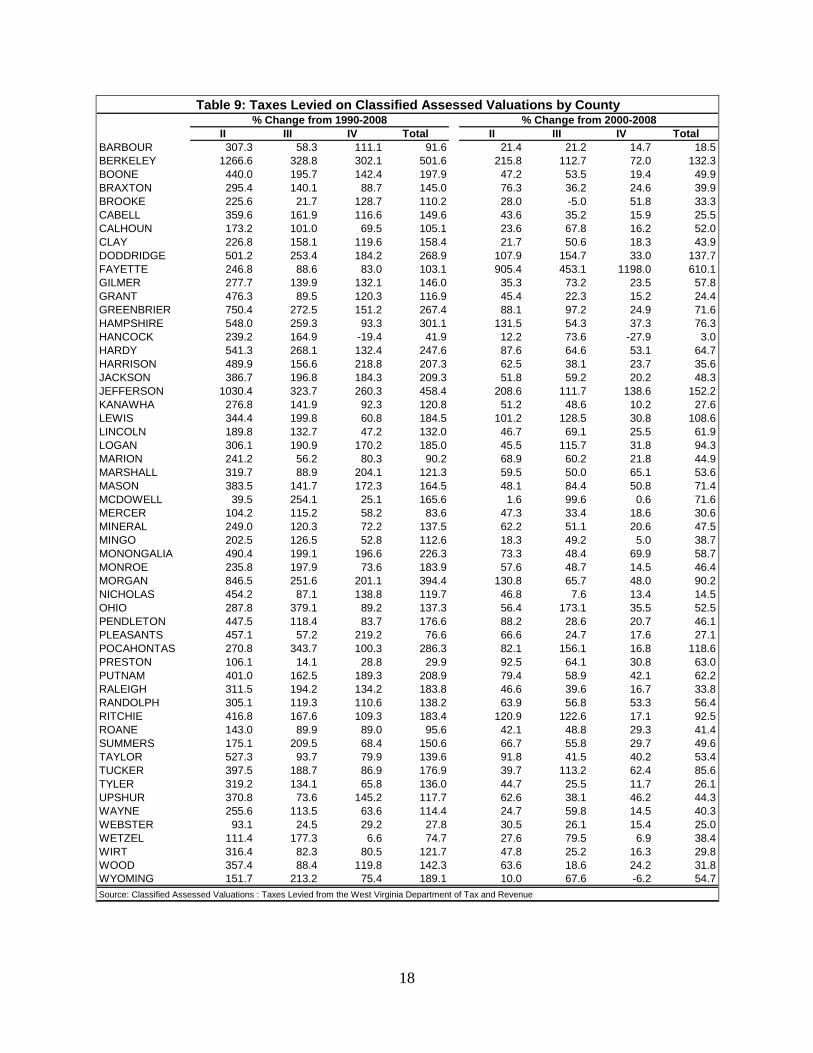
To eliminate the possibility that the rise in taxes levied is due to inflation, the data were adjusted for inflation using the U.S. Consumer Price Index. After adjusting for inflation, the levels of taxes levied have increased since 1980 for Class II, III, and IV property. These increases, while not as large as before the inflation adjustment, show that increased assessed valuations have pushed the level of taxes levied upwards. In fact, from 1980 to 2008, the taxes levied on Class II property increased by 220 percent to a level of $155.5 million. From 1990 to 2008, all 55 West Virginia counties experienced total property tax levy increases, as shown in Table 9. Total taxes levied in West Virginia have changed dramatically in the past few decades for all classes of property. These increases occurred even with major declines in every county in taxes imposed on Class I property. The largest total increases occurred in the growing Eastern Panhandle counties of Berkeley, Jefferson, and Morgan. These counties increased their total taxes levied by more than 390 percent in the eighteen years.
17
0
20
40
60
80
100
120
140
160
180
200
220
240
260
280
300
320
(Millions of D
ollars)
Figure 7: Inflation‐Adjusted Taxes Levied on Classified Assesd Valuations by ClassWest Virginia
Class I Class II Class III Class IV
Source: West Virginia State Tax Department; U.S. Bureau of Labor Statistics Consumer Price Index
18
II III IV Total II III IV TotalBARBOUR 307.3 58.3 111.1 91.6 21.4 21.2 14.7 18.5BERKELEY 1266.6 328.8 302.1 501.6 215.8 112.7 72.0 132.3BOONE 440.0 195.7 142.4 197.9 47.2 53.5 19.4 49.9BRAXTON 295.4 140.1 88.7 145.0 76.3 36.2 24.6 39.9BROOKE 225.6 21.7 128.7 110.2 28.0 -5.0 51.8 33.3CABELL 359.6 161.9 116.6 149.6 43.6 35.2 15.9 25.5CALHOUN 173.2 101.0 69.5 105.1 23.6 67.8 16.2 52.0CLAY 226.8 158.1 119.6 158.4 21.7 50.6 18.3 43.9DODDRIDGE 501.2 253.4 184.2 268.9 107.9 154.7 33.0 137.7FAYETTE 246.8 88.6 83.0 103.1 905.4 453.1 1198.0 610.1GILMER 277.7 139.9 132.1 146.0 35.3 73.2 23.5 57.8GRANT 476.3 89.5 120.3 116.9 45.4 22.3 15.2 24.4GREENBRIER 750.4 272.5 151.2 267.4 88.1 97.2 24.9 71.6HAMPSHIRE 548.0 259.3 93.3 301.1 131.5 54.3 37.3 76.3HANCOCK 239.2 164.9 -19.4 41.9 12.2 73.6 -27.9 3.0HARDY 541.3 268.1 132.4 247.6 87.6 64.6 53.1 64.7HARRISON 489.9 156.6 218.8 207.3 62.5 38.1 23.7 35.6JACKSON 386.7 196.8 184.3 209.3 51.8 59.2 20.2 48.3JEFFERSON 1030.4 323.7 260.3 458.4 208.6 111.7 138.6 152.2KANAWHA 276.8 141.9 92.3 120.8 51.2 48.6 10.2 27.6LEWIS 344.4 199.8 60.8 184.5 101.2 128.5 30.8 108.6LINCOLN 189.8 132.7 47.2 132.0 46.7 69.1 25.5 61.9LOGAN 306.1 190.9 170.2 185.0 45.5 115.7 31.8 94.3MARION 241.2 56.2 80.3 90.2 68.9 60.2 21.8 44.9MARSHALL 319.7 88.9 204.1 121.3 59.5 50.0 65.1 53.6MASON 383.5 141.7 172.3 164.5 48.1 84.4 50.8 71.4MCDOWELL 39.5 254.1 25.1 165.6 1.6 99.6 0.6 71.6MERCER 104.2 115.2 58.2 83.6 47.3 33.4 18.6 30.6MINERAL 249.0 120.3 72.2 137.5 62.2 51.1 20.6 47.5MINGO 202.5 126.5 52.8 112.6 18.3 49.2 5.0 38.7MONONGALIA 490.4 199.1 196.6 226.3 73.3 48.4 69.9 58.7MONROE 235.8 197.9 73.6 183.9 57.6 48.7 14.5 46.4MORGAN 846.5 251.6 201.1 394.4 130.8 65.7 48.0 90.2NICHOLAS 454.2 87.1 138.8 119.7 46.8 7.6 13.4 14.5OHIO 287.8 379.1 89.2 137.3 56.4 173.1 35.5 52.5PENDLETON 447.5 118.4 83.7 176.6 88.2 28.6 20.7 46.1PLEASANTS 457.1 57.2 219.2 76.6 66.6 24.7 17.6 27.1POCAHONTAS 270.8 343.7 100.3 286.3 82.1 156.1 16.8 118.6PRESTON 106.1 14.1 28.8 29.9 92.5 64.1 30.8 63.0PUTNAM 401.0 162.5 189.3 208.9 79.4 58.9 42.1 62.2RALEIGH 311.5 194.2 134.2 183.8 46.6 39.6 16.7 33.8RANDOLPH 305.1 119.3 110.6 138.2 63.9 56.8 53.3 56.4RITCHIE 416.8 167.6 109.3 183.4 120.9 122.6 17.1 92.5ROANE 143.0 89.9 89.0 95.6 42.1 48.8 29.3 41.4SUMMERS 175.1 209.5 68.4 150.6 66.7 55.8 29.7 49.6TAYLOR 527.3 93.7 79.9 139.6 91.8 41.5 40.2 53.4TUCKER 397.5 188.7 86.9 176.9 39.7 113.2 62.4 85.6TYLER 319.2 134.1 65.8 136.0 44.7 25.5 11.7 26.1UPSHUR 370.8 73.6 145.2 117.7 62.6 38.1 46.2 44.3WAYNE 255.6 113.5 63.6 114.4 24.7 59.8 14.5 40.3WEBSTER 93.1 24.5 29.2 27.8 30.5 26.1 15.4 25.0WETZEL 111.4 177.3 6.6 74.7 27.6 79.5 6.9 38.4WIRT 316.4 82.3 80.5 121.7 47.8 25.2 16.3 29.8WOOD 357.4 88.4 119.8 142.3 63.6 18.6 24.2 31.8WYOMING 151.7 213.2 75.4 189.1 10.0 67.6 -6.2 54.7
Table 9: Taxes Levied on Classified Assessed Valuations by County
Source: Classified Assessed Valuations : Taxes Levied from the West Virginia Department of Tax and Revenue
% Change from 1990-2008 % Change from 2000-2008
19
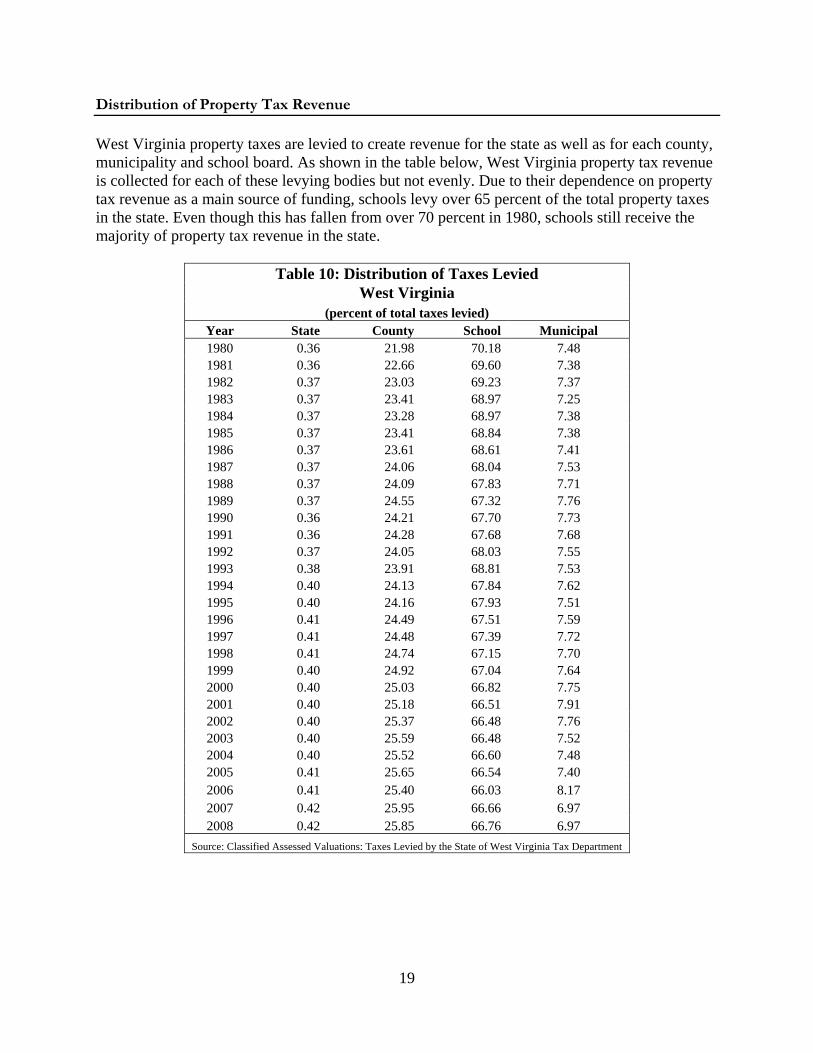
Distribution of Property Tax Revenue West Virginia property taxes are levied to create revenue for the state as well as for each county, municipality and school board. As shown in the table below, West Virginia property tax revenue is collected for each of these levying bodies but not evenly. Due to their dependence on property tax revenue as a main source of funding, schools levy over 65 percent of the total property taxes in the state. Even though this has fallen from over 70 percent in 1980, schools still receive the majority of property tax revenue in the state.
Table 10: Distribution of Taxes Levied West Virginia
(percent of total taxes levied) Year State County School Municipal 1980 0.36 21.98 70.18 7.48 1981 0.36 22.66 69.60 7.38 1982 0.37 23.03 69.23 7.37 1983 0.37 23.41 68.97 7.25 1984 0.37 23.28 68.97 7.38 1985 0.37 23.41 68.84 7.38 1986 0.37 23.61 68.61 7.41 1987 0.37 24.06 68.04 7.53 1988 0.37 24.09 67.83 7.71 1989 0.37 24.55 67.32 7.76 1990 0.36 24.21 67.70 7.73 1991 0.36 24.28 67.68 7.68 1992 0.37 24.05 68.03 7.55 1993 0.38 23.91 68.81 7.53 1994 0.40 24.13 67.84 7.62 1995 0.40 24.16 67.93 7.51 1996 0.41 24.49 67.51 7.59 1997 0.41 24.48 67.39 7.72 1998 0.41 24.74 67.15 7.70 1999 0.40 24.92 67.04 7.64 2000 0.40 25.03 66.82 7.75 2001 0.40 25.18 66.51 7.91 2002 0.40 25.37 66.48 7.76 2003 0.40 25.59 66.48 7.52 2004 0.40 25.52 66.60 7.48 2005 0.41 25.65 66.54 7.40 2006 0.41 25.40 66.03 8.17 2007 0.42 25.95 66.66 6.97 2008 0.42 25.85 66.76 6.97
Source: Classified Assessed Valuations: Taxes Levied by the State of West Virginia Tax Department
20
Real Property Sales Ratio Study The West Virginia State Tax Department currently conducts an annual Real Property Sales Ratio Study for each county in West Virginia. This study analyzes real property assessments as compared to property sales in each county. This study calculates an assessment/sales ratio for all sales in the county, determines the median ratio. This information is used to determine whether assessors are properly assessing real property at the required 60 percent of market value. Table 11 shows each county’s real property assessment/real property sales median ratio for tax years 2001 to 2007. For tax year 2001, two counties, Hancock and Lewis, did not appear to comply with the West Virginia Property Valuation Training and Procedures Commission standards of an assessment/sales ratio of between 54 percent and 66 percent. That number doubled in 2007, the ratio shows that four counties did not properly assess real property. Note that real property sales data is collected by the county assessor’s offices and then sent to the West Virginia Tax Department. The tax department also calculates the coefficient of dispersion (COD) in each county by year. The COD is used to determine how close each county’s ratios are arrayed about the median ratio. A large COD indicates that a great disparity exists in the assessment of property while a small COD indicates that the assessment ratios are clustered at the median and indicates more homogeneous assessments. For compliance purposes, the West Virginia Property Valuation Training and Procedures Commission requires counties to have a COD of 20 or less. For 2001, nine counties had a higher than required COD while in 2007 only four counties were not in compliance.
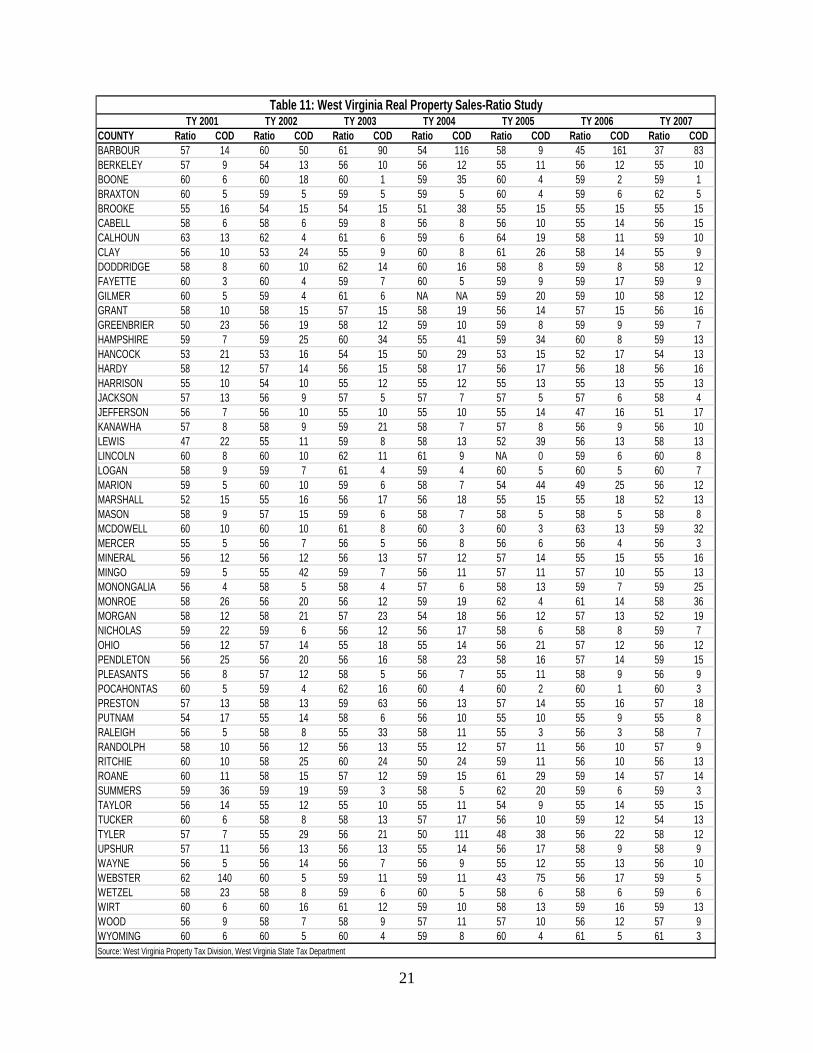
21
COUNTY Ratio COD Ratio COD Ratio COD Ratio COD Ratio COD Ratio COD Ratio CODBARBOUR 57 14 60 50 61 90 54 116 58 9 45 161 37 83BERKELEY 57 9 54 13 56 10 56 12 55 11 56 12 55 10BOONE 60 6 60 18 60 1 59 35 60 4 59 2 59 1BRAXTON 60 5 59 5 59 5 59 5 60 4 59 6 62 5BROOKE 55 16 54 15 54 15 51 38 55 15 55 15 55 15CABELL 58 6 58 6 59 8 56 8 56 10 55 14 56 15CALHOUN 63 13 62 4 61 6 59 6 64 19 58 11 59 10CLAY 56 10 53 24 55 9 60 8 61 26 58 14 55 9DODDRIDGE 58 8 60 10 62 14 60 16 58 8 59 8 58 12FAYETTE 60 3 60 4 59 7 60 5 59 9 59 17 59 9GILMER 60 5 59 4 61 6 NA NA 59 20 59 10 58 12GRANT 58 10 58 15 57 15 58 19 56 14 57 15 56 16GREENBRIER 50 23 56 19 58 12 59 10 59 8 59 9 59 7HAMPSHIRE 59 7 59 25 60 34 55 41 59 34 60 8 59 13HANCOCK 53 21 53 16 54 15 50 29 53 15 52 17 54 13HARDY 58 12 57 14 56 15 58 17 56 17 56 18 56 16HARRISON 55 10 54 10 55 12 55 12 55 13 55 13 55 13JACKSON 57 13 56 9 57 5 57 7 57 5 57 6 58 4JEFFERSON 56 7 56 10 55 10 55 10 55 14 47 16 51 17KANAWHA 57 8 58 9 59 21 58 7 57 8 56 9 56 10LEWIS 47 22 55 11 59 8 58 13 52 39 56 13 58 13LINCOLN 60 8 60 10 62 11 61 9 NA 0 59 6 60 8LOGAN 58 9 59 7 61 4 59 4 60 5 60 5 60 7MARION 59 5 60 10 59 6 58 7 54 44 49 25 56 12MARSHALL 52 15 55 16 56 17 56 18 55 15 55 18 52 13MASON 58 9 57 15 59 6 58 7 58 5 58 5 58 8MCDOWELL 60 10 60 10 61 8 60 3 60 3 63 13 59 32MERCER 55 5 56 7 56 5 56 8 56 6 56 4 56 3MINERAL 56 12 56 12 56 13 57 12 57 14 55 15 55 16MINGO 59 5 55 42 59 7 56 11 57 11 57 10 55 13MONONGALIA 56 4 58 5 58 4 57 6 58 13 59 7 59 25MONROE 58 26 56 20 56 12 59 19 62 4 61 14 58 36MORGAN 58 12 58 21 57 23 54 18 56 12 57 13 52 19NICHOLAS 59 22 59 6 56 12 56 17 58 6 58 8 59 7OHIO 56 12 57 14 55 18 55 14 56 21 57 12 56 12PENDLETON 56 25 56 20 56 16 58 23 58 16 57 14 59 15PLEASANTS 56 8 57 12 58 5 56 7 55 11 58 9 56 9POCAHONTAS 60 5 59 4 62 16 60 4 60 2 60 1 60 3PRESTON 57 13 58 13 59 63 56 13 57 14 55 16 57 18PUTNAM 54 17 55 14 58 6 56 10 55 10 55 9 55 8RALEIGH 56 5 58 8 55 33 58 11 55 3 56 3 58 7RANDOLPH 58 10 56 12 56 13 55 12 57 11 56 10 57 9RITCHIE 60 10 58 25 60 24 50 24 59 11 56 10 56 13ROANE 60 11 58 15 57 12 59 15 61 29 59 14 57 14SUMMERS 59 36 59 19 59 3 58 5 62 20 59 6 59 3TAYLOR 56 14 55 12 55 10 55 11 54 9 55 14 55 15TUCKER 60 6 58 8 58 13 57 17 56 10 59 12 54 13TYLER 57 7 55 29 56 21 50 111 48 38 56 22 58 12UPSHUR 57 11 56 13 56 13 55 14 56 17 58 9 58 9WAYNE 56 5 56 14 56 7 56 9 55 12 55 13 56 10WEBSTER 62 140 60 5 59 11 59 11 43 75 56 17 59 5WETZEL 58 23 58 8 59 6 60 5 58 6 58 6 59 6WIRT 60 6 60 16 61 12 59 10 58 13 59 16 59 13WOOD 56 9 58 7 58 9 57 11 57 10 56 12 57 9WYOMING 60 6 60 5 60 4 59 8 60 4 61 5 61 3Source: West Virginia Property Tax Division, West Virginia State Tax Department
Table 11: West Virginia Real Property Sales-Ratio StudyTY 2001 TY 2002 TY 2003 TY 2004 TY 2005 TY 2006 TY 2007
22
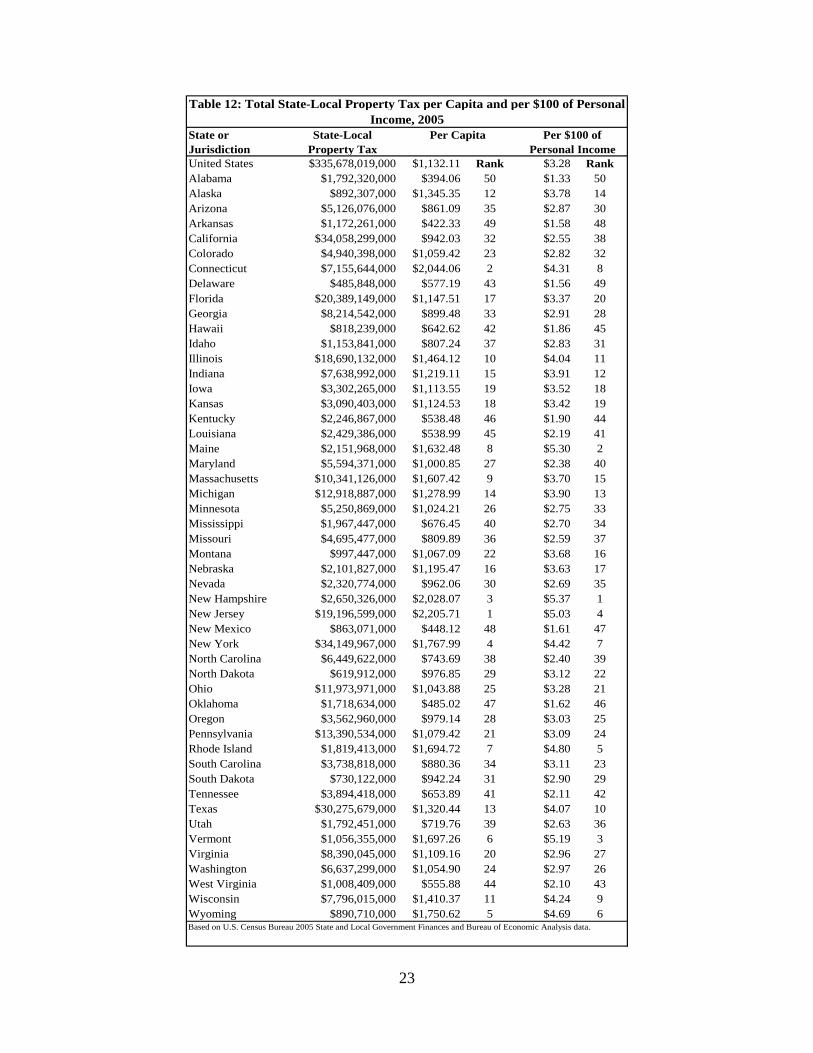
West Virginia Property Tax Compared to the Nation In comparison to the rest of the United States, West Virginia’s property tax is quite low, as shown in Table 2. According to state and local government finance data, West Virginia ranked 44th lowest in the nation for state and local property taxes per capita. The highest ranked state was New Jersey, whose per capita property tax level exceeded $2,200 for 2005. The lowest level of property tax per capita was found in Alabama, whose 2005 level was $394.06. When comparing property tax revenue per $100 of personal income1, West Virginia ranked 43 with a level of $2.10. New Hampshire had the highest amount at $5.37 per $100 of personal income in 2005. Alabama was also the lowest state for property tax per $100 of personal income.
1 State personal income is income that is received by, or on behalf of, persons who live in the state. It is calculated as the sum of wage and salary disbursements, supplements to wages and salaries, proprietors' income with inventory valuation adjustment (IVA) and private capital consumption adjustment (CCAdj), rental income of persons with CCAdj, personal dividend income, personal interest income, and personal current transfer receipts, less contributions for government social insurance. Estimates of state personal income are presented by the place of residence of the income recipients. All estimates of state personal income are in current dollars (not adjusted for inflation).
23
State or Jurisdiction
State-Local Property Tax
United States $335,678,019,000 $1,132.11 Rank $3.28 RankAlabama $1,792,320,000 $394.06 50 $1.33 50Alaska $892,307,000 $1,345.35 12 $3.78 14Arizona $5,126,076,000 $861.09 35 $2.87 30Arkansas $1,172,261,000 $422.33 49 $1.58 48California $34,058,299,000 $942.03 32 $2.55 38Colorado $4,940,398,000 $1,059.42 23 $2.82 32Connecticut $7,155,644,000 $2,044.06 2 $4.31 8Delaware $485,848,000 $577.19 43 $1.56 49Florida $20,389,149,000 $1,147.51 17 $3.37 20Georgia $8,214,542,000 $899.48 33 $2.91 28Hawaii $818,239,000 $642.62 42 $1.86 45Idaho $1,153,841,000 $807.24 37 $2.83 31Illinois $18,690,132,000 $1,464.12 10 $4.04 11Indiana $7,638,992,000 $1,219.11 15 $3.91 12Iowa $3,302,265,000 $1,113.55 19 $3.52 18Kansas $3,090,403,000 $1,124.53 18 $3.42 19Kentucky $2,246,867,000 $538.48 46 $1.90 44Louisiana $2,429,386,000 $538.99 45 $2.19 41Maine $2,151,968,000 $1,632.48 8 $5.30 2Maryland $5,594,371,000 $1,000.85 27 $2.38 40Massachusetts $10,341,126,000 $1,607.42 9 $3.70 15Michigan $12,918,887,000 $1,278.99 14 $3.90 13Minnesota $5,250,869,000 $1,024.21 26 $2.75 33Mississippi $1,967,447,000 $676.45 40 $2.70 34Missouri $4,695,477,000 $809.89 36 $2.59 37Montana $997,447,000 $1,067.09 22 $3.68 16Nebraska $2,101,827,000 $1,195.47 16 $3.63 17Nevada $2,320,774,000 $962.06 30 $2.69 35New Hampshire $2,650,326,000 $2,028.07 3 $5.37 1New Jersey $19,196,599,000 $2,205.71 1 $5.03 4New Mexico $863,071,000 $448.12 48 $1.61 47New York $34,149,967,000 $1,767.99 4 $4.42 7North Carolina $6,449,622,000 $743.69 38 $2.40 39North Dakota $619,912,000 $976.85 29 $3.12 22Ohio $11,973,971,000 $1,043.88 25 $3.28 21Oklahoma $1,718,634,000 $485.02 47 $1.62 46Oregon $3,562,960,000 $979.14 28 $3.03 25Pennsylvania $13,390,534,000 $1,079.42 21 $3.09 24Rhode Island $1,819,413,000 $1,694.72 7 $4.80 5South Carolina $3,738,818,000 $880.36 34 $3.11 23South Dakota $730,122,000 $942.24 31 $2.90 29Tennessee $3,894,418,000 $653.89 41 $2.11 42Texas $30,275,679,000 $1,320.44 13 $4.07 10Utah $1,792,451,000 $719.76 39 $2.63 36Vermont $1,056,355,000 $1,697.26 6 $5.19 3Virginia $8,390,045,000 $1,109.16 20 $2.96 27Washington $6,637,299,000 $1,054.90 24 $2.97 26West Virginia $1,008,409,000 $555.88 44 $2.10 43Wisconsin $7,796,015,000 $1,410.37 11 $4.24 9Wyoming $890,710,000 $1,750.62 5 $4.69 6
Per Capita Per $100 of Personal Income
Table 12: Total State-Local Property Tax per Capita and per $100 of Personal Income, 2005
Based on U.S. Census Bureau 2005 State and Local Government Finances and Bureau of Economic Analysis data.
24
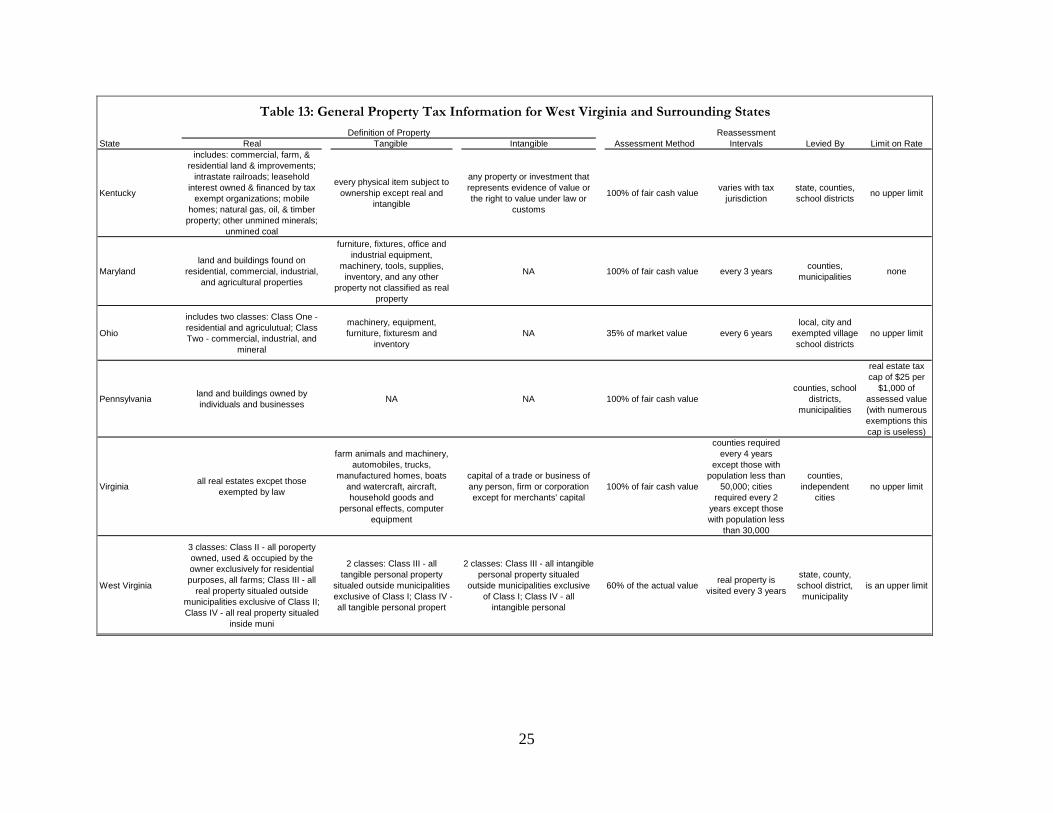
West Virginia Property Tax Compared to Surrounding States The West Virginia property tax system is unique compared to the tax systems of neighboring states, as shown in Table 13. The other five states tax only real property within the state or categorize property as real, tangible, or intangible for tax purposes. While West Virginia does tax real, tangible and intangible property, its tax system separates property by type, either agricultural or residential, and by location, either within or outside a municipality.
The way property is assessed is also different in the West Virginia tax system. Except for Ohio, West Virginia is the only state that assesses property below 100 percent of the fair market value of the property. West Virginia calculates the fair market value of property and this assesses it at 60 percent of that level while Ohio assesses property at a low 35 percent of true market value. Reducing the assessment level reduces property tax revenue, all else equal.
While all six states allow counties to levy taxes on property, only West Virginia and Kentucky levy property taxes at the state level. However, West Virginia’s state property tax rate is low compared to tax rates applied by counties, municipalities and boards of education. The relative size of the Kentucky state property tax rate varies depending on the type of property being taxed. For instance, properties such as farm and commercial land are taxed at lower rates by the state while other properties such as alcohol production facilities are only taxed at the state level.
Limitations on property tax rates only exist in West Virginia and Pennsylvania. West Virginia sets maximum rate levels in addition to limiting revenue growth to 1 percent per year, which further reduces effective tax rates. Pennsylvania sets a tax cap of $25 per $1,000 of assessed value.
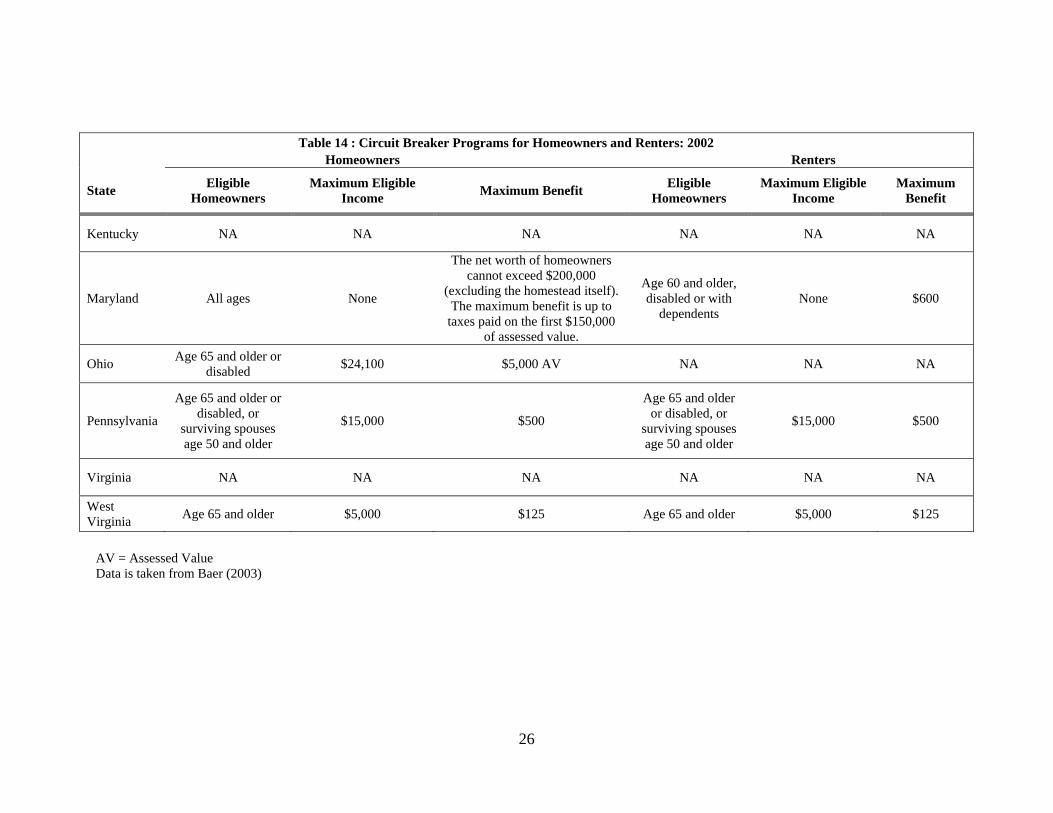
Circuit breaker programs differ between states as well. Circuit breaker programs usually relieve the property tax burden by setting income thresholds, which property taxes cannot exceed. Homeowners and renters whose property taxes are above the threshold receive a rebate of some or all of their property taxes. A summary of neighboring circuit breaker policies in 2002 is presented in Table 14. While Kentucky and Virginia do not offer circuit breaker programs, Ohio has circuit breakers for homeowners only and the other states offer circuit breakers for both homeowners and renters. West Virginia sets maximum eligible income at $5,000 while Ohio sets it at $24,100 (for homeowners only) and Pennsylvania sets it at $15,000. West Virginia altered its circuit breaker aid for residents in 2007 providing a refundable credit for individuals paying in excess of 4 percent of their household income. In addition, starting in 2009, seniors will have the option of deferring payment of any residential property tax increase in excess of $300 until they either sell their home or when their estate is settled. If their income is less than $25,000 they can receive a refundable tax credit.
25
Real Tangible Intangible
Kentucky
includes: commercial, farm, & residential land & improvements;
intrastate railroads; leasehold interest owned & financed by tax
exempt organizations; mobile homes; natural gas, oil, & timber
property; other unmined minerals; unmined coal
every physical item subject to ownership except real and
intangible
any property or investment that represents evidence of value or the right to value under law or
customs
100% of fair cash value varies with tax jurisdiction
state, counties, school districts no upper limit
Marylandland and buildings found on
residential, commercial, industrial, and agricultural properties
furniture, fixtures, office and industrial equipment,
machinery, tools, supplies, inventory, and any other
property not classified as real property
NA 100% of fair cash value every 3 years counties, municipalities none
Ohio
includes two classes: Class One - residential and agriculutual; Class Two - commercial, industrial, and
mineral
machinery, equipment, furniture, fixturesm and
inventoryNA 35% of market value every 6 years
local, city and exempted village school districts
no upper limit
Pennsylvania land and buildings owned by individuals and businesses NA NA 100% of fair cash value
counties, school districts,
municipalities
real estate tax cap of $25 per
$1,000 of assessed value (with numerous exemptions this cap is useless)
Virginia all real estates excpet those exempted by law
farm animals and machinery, automobiles, trucks,
manufactured homes, boats and watercraft, aircraft, household goods and
personal effects, computer equipment
capital of a trade or business of any person, firm or corporation except for merchants' capital
100% of fair cash value
counties required every 4 years
except those with population less than
50,000; cities required every 2
years except those with population less
than 30,000
counties, independent
citiesno upper limit
West Virginia
3 classes: Class II - all poroperty owned, used & occupied by the owner exclusively for residential purposes, all farms; Class III - all
real property situaled outside municipalities exclusive of Class II; Class IV - all real property situaled
inside muni
2 classes: Class III - all tangible personal property
situaled outside municipalities exclusive of Class I; Class IV -all tangible personal propert
2 classes: Class III - all intangible personal property situaled
outside municipalities exclusive of Class I; Class IV - all
intangible personal
60% of the actual value real property is visited every 3 years
state, county, school district,
municipalityis an upper limit
Table 13: General Property Tax Information for West Virginia and Surrounding States
Levied By Limit on RateDefinition of Property
State Assessment MethodReassessment
Intervals
26
Table 14 : Circuit Breaker Programs for Homeowners and Renters: 2002 Homeowners Renters
State Eligible Homeowners
Maximum Eligible Income Maximum Benefit Eligible
Homeowners Maximum Eligible
Income Maximum
Benefit
Kentucky NA NA NA NA NA NA
Maryland All ages None
The net worth of homeowners cannot exceed $200,000
(excluding the homestead itself). The maximum benefit is up to
taxes paid on the first $150,000 of assessed value.
Age 60 and older, disabled or with
dependents None $600
Ohio Age 65 and older or disabled $24,100 $5,000 AV NA NA NA
Pennsylvania
Age 65 and older or disabled, or
surviving spouses age 50 and older
$15,000 $500
Age 65 and older or disabled, or
surviving spouses age 50 and older
$15,000 $500
Virginia NA NA NA NA NA NA
West Virginia Age 65 and older $5,000 $125 Age 65 and older $5,000 $125
AV = Assessed Value Data is taken from Baer (2003)
27
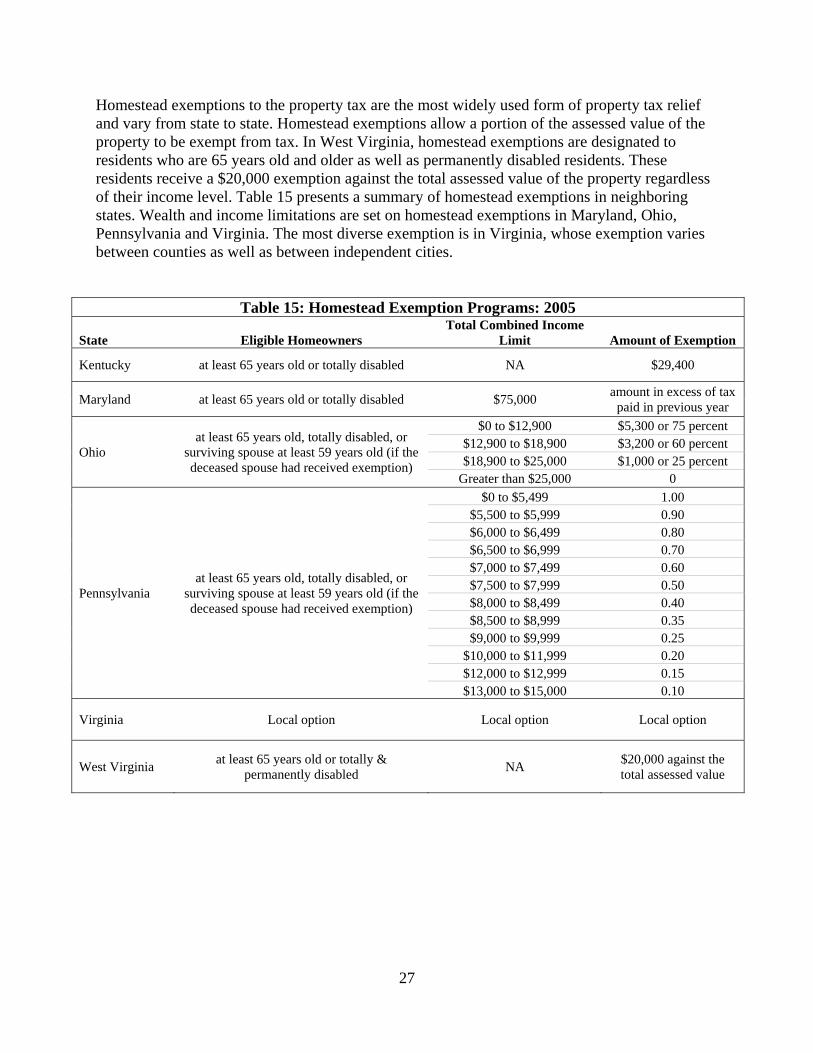
Homestead exemptions to the property tax are the most widely used form of property tax relief and vary from state to state. Homestead exemptions allow a portion of the assessed value of the property to be exempt from tax. In West Virginia, homestead exemptions are designated to residents who are 65 years old and older as well as permanently disabled residents. These residents receive a $20,000 exemption against the total assessed value of the property regardless of their income level. Table 15 presents a summary of homestead exemptions in neighboring states. Wealth and income limitations are set on homestead exemptions in Maryland, Ohio, Pennsylvania and Virginia. The most diverse exemption is in Virginia, whose exemption varies between counties as well as between independent cities.
Table 15: Homestead Exemption Programs: 2005
State Eligible Homeowners Total Combined Income
Limit Amount of Exemption
Kentucky at least 65 years old or totally disabled NA $29,400
Maryland at least 65 years old or totally disabled $75,000 amount in excess of tax paid in previous year
Ohio at least 65 years old, totally disabled, or
surviving spouse at least 59 years old (if the deceased spouse had received exemption)
$0 to $12,900 $5,300 or 75 percent $12,900 to $18,900 $3,200 or 60 percent $18,900 to $25,000 $1,000 or 25 percent
Greater than $25,000 0
Pennsylvania at least 65 years old, totally disabled, or
surviving spouse at least 59 years old (if the deceased spouse had received exemption)
$0 to $5,499 1.00 $5,500 to $5,999 0.90 $6,000 to $6,499 0.80 $6,500 to $6,999 0.70 $7,000 to $7,499 0.60 $7,500 to $7,999 0.50 $8,000 to $8,499 0.40 $8,500 to $8,999 0.35 $9,000 to $9,999 0.25
$10,000 to $11,999 0.20 $12,000 to $12,999 0.15 $13,000 to $15,000 0.10
Virginia Local option Local option Local option
West Virginia at least 65 years old or totally & permanently disabled NA $20,000 against the
total assessed value
28
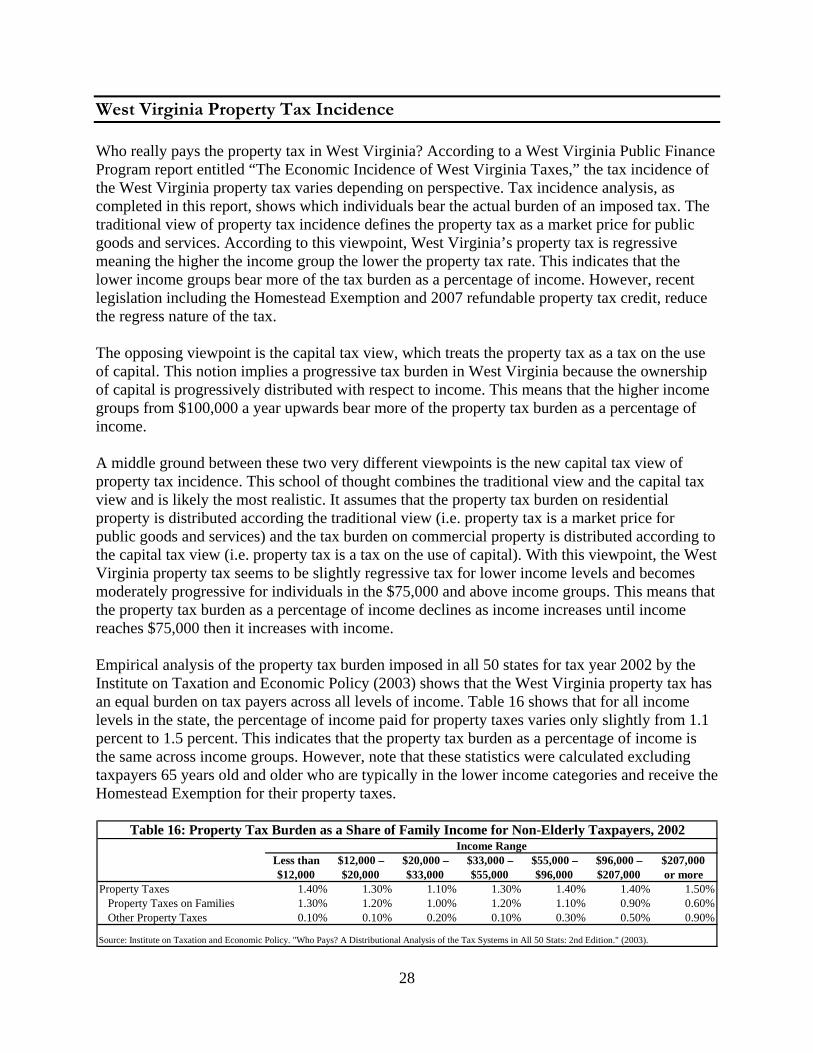
West Virginia Property Tax Incidence Who really pays the property tax in West Virginia? According to a West Virginia Public Finance Program report entitled “The Economic Incidence of West Virginia Taxes,” the tax incidence of the West Virginia property tax varies depending on perspective. Tax incidence analysis, as completed in this report, shows which individuals bear the actual burden of an imposed tax. The traditional view of property tax incidence defines the property tax as a market price for public goods and services. According to this viewpoint, West Virginia’s property tax is regressive meaning the higher the income group the lower the property tax rate. This indicates that the lower income groups bear more of the tax burden as a percentage of income. However, recent legislation including the Homestead Exemption and 2007 refundable property tax credit, reduce the regress nature of the tax. The opposing viewpoint is the capital tax view, which treats the property tax as a tax on the use of capital. This notion implies a progressive tax burden in West Virginia because the ownership of capital is progressively distributed with respect to income. This means that the higher income groups from $100,000 a year upwards bear more of the property tax burden as a percentage of income. A middle ground between these two very different viewpoints is the new capital tax view of property tax incidence. This school of thought combines the traditional view and the capital tax view and is likely the most realistic. It assumes that the property tax burden on residential property is distributed according the traditional view (i.e. property tax is a market price for public goods and services) and the tax burden on commercial property is distributed according to the capital tax view (i.e. property tax is a tax on the use of capital). With this viewpoint, the West Virginia property tax seems to be slightly regressive tax for lower income levels and becomes moderately progressive for individuals in the $75,000 and above income groups. This means that the property tax burden as a percentage of income declines as income increases until income reaches $75,000 then it increases with income. Empirical analysis of the property tax burden imposed in all 50 states for tax year 2002 by the Institute on Taxation and Economic Policy (2003) shows that the West Virginia property tax has an equal burden on tax payers across all levels of income. Table 16 shows that for all income levels in the state, the percentage of income paid for property taxes varies only slightly from 1.1 percent to 1.5 percent. This indicates that the property tax burden as a percentage of income is the same across income groups. However, note that these statistics were calculated excluding taxpayers 65 years old and older who are typically in the lower income categories and receive the Homestead Exemption for their property taxes.
Less than $12,000 – $20,000 – $33,000 – $55,000 – $96,000 – $207,000$12,000 $20,000 $33,000 $55,000 $96,000 $207,000 or more
Property Taxes 1.40% 1.30% 1.10% 1.30% 1.40% 1.40% 1.50% Property Taxes on Families 1.30% 1.20% 1.00% 1.20% 1.10% 0.90% 0.60% Other Property Taxes 0.10% 0.10% 0.20% 0.10% 0.30% 0.50% 0.90%
Income RangeTable 16: Property Tax Burden as a Share of Family Income for Non-Elderly Taxpayers, 2002
Source: Institute on Taxation and Economic Policy. "Who Pays? A Distributional Analysis of the Tax Systems in All 50 Stats: 2nd Edition." (2003).
29
Literature Review of Local Property Taxation and Service Provision Research on the issue of local property taxation has mainly focused on studies of tax incidence and the effects of the property tax on the value of residential housing and residential location decisions. Key results indicate that property taxes and local public services affect residential location decisions, property values and migration patterns, and property tax rate limits constrain education spending. Mixed results on the Issue of Who Actually Pays the Property Tax The issue of who ultimately bears the burden of the property tax is still one of the most controversial issues in state and local public finance. Scholars disagree about whether a local property tax is a benefit tax, in the sense that those who bear a higher property tax burden than receive higher benefits from public services. Correspondingly, studies examining the incidence of the property tax on rental housing do not reach a consensus about the portion of the tax that is shifted onto renters. While some studies fail to find evidence of shifting (Orr, 1968; Heinberg and Oates, 1970), others find significant forward shifting to renters (Orr, 1970; Hyman and Pasour, 1973; Dusansky, Ingber and Karatjas, 1981). A provocative contribution to the literature by Carroll and Yinger (1994) finds evidence that landlords bear a large fraction of a property tax increase and the average burden on landlords varies from 84 to 91 cents per dollar of the tax increase. Overall, the authors also find that landlords face a minimum burden of 67 cents per property tax dollar. These results imply that the property tax on rental housing is far short of being a benefit tax. Lower Property Taxes Might Attract Potential Migrants and Increase Property Values Tiebout (1956) suggested that potential migrants weigh the benefits of a locality’s services against their tax liability and locate to the area most compatible with their tax/public service preferences. Many empirical studies have examined whether high property taxes reduce the demand for housing and decrease overall property values and whether an increase in the quality of local public services attract migrants and increase property values (Oates, 1969; 1973; Edel and Sclar, 1974; Gustely, 1976; King, 1977; Rosen and Fullerton, 1977; Brasington, 2000; Goodman and Thibodeau, 1998; Haurin and Brasington, 1996; Haughwout, 1997). Studies consistently find that property tax differentials are capitalized negatively into property values and an increase in the quality of public services is capitalized into higher land and house prices. People do appear willing to pay more to live in a community which provides a high quality of public services or in a community which provides the same program of public services with lower tax rates. Dowding, John and Biggs (1994) review the economic literature on different implications of the Tiebout hypothesis and conclude that most empirical studies find evidence of some capitalization and the capitalization rates vary between 30 and 70 percent, implying that some families are sensitive to fiscal differentials in their relocation decisions. They also conclude that there is strong evidence which supports the notion that wealthy households move to avoid redistributive, or progressive, taxes. Capitalization studies imply that capitalization rates differ between the interior and edge of an urban area. Evidence suggests that capitalization rates of taxes and services are lower at the edge of an urban area where housing developer activity is
30
stronger and higher toward the interior of an urban area where housing supply is less elastic (Brasington, 2002). A sizeable literature attempts to measure the effect of local taxes and services on migration flows. Studies show that difference in state and local policies have an important impact on human migration patterns. This is in-line with the findings of the capitalization literature. In a world with incomplete capitalization, we expect to see some migration in response to the uncapitalized fiscal surpluses. Consequently, several studies on net interstate migration find that migrants prefer areas with lower property taxes (Cebula, 1973; 1974a; 1974b; 1978; Cebula and Kohn, 1975). Another interesting finding from the literature is that white migrants prefer areas with lower property taxes whilst nonwhite migrants are insensitive to property tax levels. Property Tax Rate Limits Constrain Education Spending In 1978, the state of California implemented Proposition 13, which limits the annual growth in property tax revenues to 2.5 percent, inspiring state governments throughout the U.S. to implement property tax limits. One area of literature that has emerged since the implementations of property tax limits examines the effectiveness of tax limits on constraining government spending. Many studies find strong evidence that public spending is lower or grows slower in jurisdictions facing binding tax limits (Poterba and Ruben, 1995; Dye and McGuire, 1997; Figlio, 1998; Bradbury, Mayer and Case, 2001). A recent study by Hill and Shone (2008) examines the impact of “Homestead Property Tax Credit”, also referred as property tax assessment caps, among Maryland counties on education spending. The state of Maryland grants counties and municipalities the right to set the assessment cap, which creates unique within state differences in tax limitations. The results of the study indicate that stricter assessment caps lower property tax revenues and constrain education spending. Specifically, they estimated that a one-percentage point lower assessment cap is associated with a $3.9 million loss in property tax revenue and a $7.5 million loss in overall education expenditures.
31
The Future of the West Virginia Property Tax Over time, legislation has shaped the property tax system to try to fit the current West Virginia economic climate. However, changes in the economy, including substantial growth in parts of the state, and a rapidly aging population have prompted the state to look at even further into modernizing the property tax. Currently, property is categorized and taxed, with few modifications, according to legislation passed just after the Great Depression, which was designed to lessen taxes on residents and farmers of the state and depend on the majority of revenue from businesses. Based on analyses of who actually bears the burden of the tax regardless of who writes the check, it is unclear whether this goal is being met. In the current West Virginia economy, residents and business alike face rapidly increasing market values for property. These issues have led to the rethinking of how property is assessed and taxed in the state as well as what exemptions are needed for residences and businesses. Proposals to Change the West Virginia Property Tax System West Virginia Tax Modernization Project Extensive analysis of the West Virginia property tax has been completed by the West Virginia Tax Modernization Project Team. This analysis looked at the current structure of the state’s property tax system and came up with the most logical, efficient and effective ways to alter the system to better suit the current West Virginia economy as well as the future economy. The goal of this group was to improve the assessment and collection of property taxes. To attain this goal the Tax Modernization Group proposed several changes to the current structure. These changes range from the State Tax Department using all sales in a county instead of a select number in the calculation of the Real Property Sales Ratio to redefining the classification of a farm as it relates to property taxation. The team’s suggestions for immediate modernizing of the current property tax system are as follows:
• Allow more extensive sharing of information for property tax collection and enforcement • Allow all local governments to share in the collection costs associated with the collection
of delinquent property taxes • Increase the state’s role in real property sales data collection for the Real Property Sales
Ratio Study • Update the definition of “farm” • Allow for the elimination of the property tax growth formula restrictions and levy rate
rollback for all levels of government The Tax Modernization Project Team also suggested that more investigation and analysis should be done on the timing of property tax returns and assessments. The group determined that the West Virginia Legislature should overhaul the existing reporting deadlines and requirements for assessment of all real and personal property. As the group indicated, the current system does not follow a logical pattern for assessments or for accurately adjusting the state’s school aid funding formula. A more uniform system for these dates would allow for better communication and a more accurate assessment of funding used for public education.
32
Another Alternative to Changes the West Virginia Property Tax System Income Qualifications for the Homestead Exemption West Virginia Code §11-6B-1 lays out the current structure of the Homestead Exemption. It maintains that the only qualifications for this property tax exemption are for homeowners who use and occupy the homestead for residential purposes to be 65 years old or older or be totally and completely disabled. Thus the Homestead Exemption in the state does not make restrictions in regards to income. Many states, including Maryland, Ohio, Pennsylvania, and several counties in Virginia, use income limitations for their homestead exemptions to maintain that the tax break is for low income elderly residents.
33
Works Cited
Baer, David. “State Programs and Practices for Reducing Residential Property Taxes.” AARP Public Policy Institute, May 2003. Bradbury, Katharine L., Christopher J. Mayer and Karl E. Case. “Property Tax Limits, Local Fiscal Behavior, and Property Values: Evidence from Massachusetts under Proposition 2½.” Journal of Public Economics, 80, 287-311, 2001. Brasington, David M. “Edge versus Center: Finding Common Ground in the Capitalization Debate.” Journal of Urban Economics, 52, 524–541, 2002. Brasington, David, M. “Demand and Supply of Public School Quality in Metropolitan Areas: The Role of Private Schools.” Journal of Regional Science, 40, 583–605, 2000. Caroll, Robert J. and John Yinger. “Is the Property Tax a Benefit Tax? The Case of Rental Housing.” National Tax Journal, 47, 295-316, June 1994. Cebula, Richard J and Robert M. Kohn. “Public Policies and Migration Patterns in the United States.” Public Finance, 30, 186-196, 1975. Cebula, Richard J. “An Empirical Note on the Tiebout-Tullock Hypothesis.” Quarterly Journal of Economics, 92, 705-711, 1978. Cebula, Richard J. “Interstate Migration and the Tiebout Hypothesis: An Analysis According to Race, Sex and Age.” Journal of the American Statistical Association, 69, 876-879, 1974a. Cebula, Richard J. “Labor Migration and the Cost of Living.” Review of Regional Studies, 3, 121-124, 1973. Cebula, Richard J. “Local Government Policies and Migration: An Analysis for SMSAs in the United States.” Public Choice, 19, 85-93, 1974b. “Classified Assessed Valuations: Taxes Levied.” State of West Virginia State Tax Department. 1995-2008. Dowding, Keith, Peter John and Stephen Biggs. “Tiebout: A Survey of the Empirical Literature.” Urban Studies, 31, 767-797, 1994. Dushansky, Richard, Melvin Ingber and Nicholas Karatjas. “The Impact of Property Taxation on Housing Values and Rents.” Journal of Urban Economics, 10, 240-55, September 1981. Dye, Richard F. and Therese J.McGuire. “The Effect of Property Tax Limitation Measures on Local Government Fiscal Behavior.” Journal of Public Economics, 66, 469–487, 1997.
34
Edel, Matthew and Elliot Sclar. “Taxes, Spending and Property Values: Supply Adjustment in a Tiebout-Oates Model.” Journal of Political Economy, 2, 941-954, 1974. Figlio, David N. “Short-term Effects of a 1990s-era Property Tax Limit: Panel Evidence on Oregon’s Measure 5.” National Tax Journal, 51, 55–70, 1998. Goodman, Allen C. and Thomas G. Thibodeau. “Housing Market Segmentation.” Journal of Housing Economics, 7, 121–143, 1998. Gustely, Richard D. “Local Taxes, Expenditures and Urban Housing: A Reassessment of the Evidence.” Southern Economic Journal, 42, 659-665, 1976. Haughwout, Andrew F. “Central City Infrastructure Investment and Suburban House Values.” Regional Science and Urban Economics, 27, 199–215, 1997. Haurin, Donald R. and David M. Brasington. “The Impact of School Quality on Real House Prices: Interjurisdictional Effects.” Journal of Housing Economics, 5, 351–368, 1996. Heinberg, John D. and Wallace E. Oates. “The Incidence of Differential Property Taxes on Urban Housing: A Comment and Some Further Evidence.” National Tax Journal, 23, 92-8, March 1970. Hill, Brian and Bryan Shone. “Impacts of Property Tax Limitations on Education Spending.” Paper Presented at the National Tax Association’s 100th Annual Conference on Taxation, Columbus, OH, November, 2007. Hyman, David N. and E. C. Pasour, Jr. “Property Tax Differentials and Residential Rents in North Carolina.” National Tax Journal, 26, 303-7, June 1973. Kent, Calvin A. and Elizabeth Pardue. “Changes in Property Tax, Revenue, and Exemptions 1999 to 2007.” Prepared for Interim Education Subcommittee C. November 2008. King, A. Thomas. “Estimating Property Tax Capitalization: A Critical Comment.” Journal of Political Economy, 85, 425-431, 1977. McIntyre, Robert S. et al. “Who Pays? A Distributional Analysis of the Tax Systems in All 50 States: 2nd Edition.” Institute on Taxation and Economic Policy. January 2003. Oates, Wallace E. “The Effect of Property Taxes and Local Public Spending on Property Values: An Empirical Study of Tax Capitalization and the Tiebout Hypothesis.” Journal of Political Economy, 77, 957-971, 1969. Oates, Wallace E. “The Effect of Property Taxes and Local Public Spending on Property Values: A Reply and Further Results.” Journal of Political Economy, 81, 1004-1008, 1973.
35
Orr, Larry L. “The Incidence of Differential Property Taxes on Urban Housing.” National Tax Journal, 21, 253-62, September 1968. Orr, Larry L. “The Incidence of Differential Property Taxes on Urban Housing: A Response.” National Tax Journal, 23, 99-101, March 1970. Poterba, James M. and Kim S. Rueben. “The Effect of Property Tax Limits on Wages and Employment in the Local Public Sector.” American Economic Review, 85, 384–389, 1995. “Rates of Levy: State, County, School and Municipal.” West Virginia State Auditor. 1995-2008. Rosen, Harvey S. and David J. Fullerton. “A Note on Local Tax Rates, Public Benefit Levels, and Property Values.” Journal of Political Economy, 85, 433-440, 1977. “The 2006 Report of the West Virginia Tax Modernization Project.” West Virginia Department of Revenue. October 2006. “The ITEP Guide to Fair State and Local Taxes.” Institute on Taxation and Economic Policy. February 2005. Tiebout, Charles M. “A Pure Theory of Local Expenditures.” Journal of Political Economy, 64, 416-424, 1956. “West Virginia Assessment Ratio Study.” State of West Virginia State Tax Department Property Tax Division. Yakovlev, Pavel; Mehment Serkan Tosun and Arzu Sen. “The Economic Incidence of West Virginia Taxes.” West Virginia Public Finance Property Special Report. May 2007.


