Embed Size (px)
Citation preview

PLUS:
QUALITY PROGRESS
PPutting Best Practices to WorkQ
UA
LITY PROG
RESS | JUN
E 2015 C
ULTU
RE VO
LUM
E 48/NU
MBER 6
www.qualityprogress.com | June 2015
VOC goes social p. 24
Tools to overcome improvement impediments p. 30
Addressing deficiencies builds ultimate strength p. 16
The Global Voice of QualityTM
WHERE ARE YOURWEAKNESSES?


QUALITY COUNCIL OF INDIANAOnline Orders: www.qualitycouncil.comPhone Orders: 800-660-4215Fax Orders: 812-533-4216Mail Orders: QCI Order Department,
602 W. Paris Ave., W. Terre Haute, IN 47885-1124
Certification Training Materials
PRIMERSOur Primers are the most widely used texts for certification training. They can be taken into the exam. QCI offers 16 different Primers.
SOLUTION TEXTSDetailed solutions to all questions in the corresponding Primer.
CD-ROMSInteractive software to assist students preparing for ASQ exams.

What’s Online in the ASQ Knowledge Center?
Access this month’s featured content and more Web exclusives in the ASQ Knowledge Center at asq.org/knowledge-center/featured.html.
CASE STUDYImproving Efficiency in Contract Procurement Process Saves Chicago Public Schools Millions
Learn how tools like value stream mapping and the fishbone diagram helped the third largest school district in the United States streamline a contract procurement process, saving millions of dollars.
WEBCASTThe 8D Problem-Solving Process
This introductory overview of the 8D problem-solving process includes discussion of how 8D compares to plan-do-check-act (PDCA), total quality management (TQM), and Six Sigma define, measure, analyze, improve, and control (DMAIC) processes.
The Global Voice of QualityTMCERTIFICATION MEMBERSHIP PUBLICATIONSTRAINING CONFERENCES
BENCHMARKING Sample Cost of Quality Calculations
See example calculations and perspectives from other organizations attempting to quantify the value of quality within their businesses.

FEATURES
• Volviendo a los Fundamentos Back to Basics translated into Spanish.
• QP on the Go Take QP’s digital format with you on your laptop computer, mobile device or tablet.
• Weigh In Rate and comment on QP’s feature articles and tell us what you think.
• Top Picks See a selection of QP’s articles recommended by editors.
www.qualityprogress.comONLY @
PROBLEM SOLVING What’s Your Next Move?Instead of staying focused on simply solving problems, organizations must address areas of their business where there’s a shortfall of competence and capabilities to resist toppling.
by David Hansen
CUSTOMER SATISFACTION Like AbilitiesThe challenges of understanding and engaging customers in today’s ever-growing online world and winning their trust.
by Shu Liu
ORGANIZATIONAL CHANGEAssessing the LandscapeThe lean Six Sigma rapid improvement method can help you evaluate your organization’s business environment and pinpoint where improvements are needed most.
by Owen Ramsay
PROCESS IMPROVEMENTChange in Flow An engineering firm modified the classic plan-do-check-act cycle to suit its own quality processes and handle complex projects for customers.
by Raj C. Patel
16
24
30
ContentsPutting Best Practices to Work | June 2015 | www.qualityprogress.com
38
16
38
QP • www.qualityprogress.com4
LogOn• The rewards of coaching.• Conducting an accurate FMEA.
Expert Answers• Repercussions of delaying an audit.
Keeping Current • Retailers amp up app offerings.• Manufacturers moving to the clouds.
Mr. Pareto Head
QP Toolbox
QP Reviews
DEPARTMENTS
Up FrontCulture flub.
PerspectivesLearn the organization’s culture before tackling its projects.
Quality in the First Person Four steps to cultivating cultural intelligence.
Career Corner Recertification made easy with electronic media.
Statistics RoundtableTapping into statistical engineering to solve problems.
Standards Outlook Bringing back high-quality customer service.
One Good IdeaState your problem by first answering the five Ws.
BONUSBack to BasicsReducing defects with control plans and PFMEA.
Mail Quality Progress/ASQ600 N. Plankinton Ave.Milwaukee, WI 53203Telephone Fax 800-248-1946 414-272-1734414-272-8575
Email Follow protocol of first initial and full last name followed by @asq.org (for example, [email protected]).
Article Submissions Quality Progress is a peer-reviewed publica-tion with 85% of its feature articles written by quality professionals. For information about submitting an article, call Valerie Ellifson at 800-248-1946 x7373, or email [email protected].
Author GuidelinesTo learn more about the manuscript review process, helpful hints before submitting a manuscript and QP’s 2015 editorial planner, click on “Author Guidelines” at www. qualityprogress.com under “Tools and Resources.“
Photocopying Authorization Authorization to photocopy items for internal or personal use or the internal or personal use of specific clients is granted by Quality Progress provided the fee of $1 per copy is paid to ASQ or the Copyright Clear-ance Center, 222 Rosewood Drive, Danvers, MA 01923, 978-750-8400. Copying for other purposes requires the express permission of Quality Progress. For permission, write Quality Progress, PO Box 3005, Milwaukee, WI 53201-3005, call 414-272-8575 x7406, fax 414-272-1734 or email [email protected].
Photocopies, Reprints And MicroformArticle photocopies are available from ASQ at 800-248-1946. To purchase bulk reprints (more than 100), contact Barbara Mitrovic at ASQ, 800-248-1946. For microform, contact ProQuest Information and Learning, 300 N. Zeeb Road, Ann Arbor, MI 48106, 800-521-0600 x2888, international 734-761-4700, www.il.proquest.com.
Membership and Subscriptions For nearly 70 years, ASQ has been the worldwide provider of information and learn-ing opportunities related to quality. In addi-tion, ASQ membership offers information, networking, certification and educational opportunities to help quality profession-als obtain practical solutions to the many problems they face each day. Subscriptions to Quality Progress are one of the many benefits of ASQ membership. To join, call 800-248-1946.
List RentalsOrders for ASQ’s member and nonmember buyer lists can be purchased by contacting Michael Costantino at the Infogroup/Edith Roman List Management Co., 402-836-6626 or fax 845-620-1885.
COLUMNS
QUALITY PROGRESS
Quality Progress (ISSN 0033-524X) is published monthly by the American Society for Quality, 600 N. Plankinton Ave., Milwaukee, WI 53203. Editorial and advertising offices: 414-272-8575. Periodicals postage paid at Milwaukee, WI, and at additional mailing offices. Institutional subscriptions are held in the name of a company, corporation, government agency or library. Requests for back issues must be prepaid and are based on availability: ASQ members $17 per copy; nonmembers $25 per copy. Canadian GST #128717618, Canadian Publications Mail Agreement #40030175. Canada Post: Return undeliverables to 2835 Kew Drive, Windsor, ON N8T 3B7. Prices are subject to change without prior notification. © 2015 by ASQ. No claim for missing issues will be accepted after three months following the month of publication of the issue for domestic addresses and six months for Canadian and international addresses.Postmaster: Please send address changes to the American Society for Quality, PO Box 3005, Milwaukee, WI 53201-3005. Printed in USA.
ASQ’s Vision: By making quality a global priority, an organizational imperative and a personal ethic, the American Society for Quality becomes the community for everyone who seeks quality technology, concepts or tools to improve themselves and their world.
- THE DRIVER DIAGRAMA quality improvement tool for building and testing theories.
- TURNING ON THE LIGHT BULBTransforming how people think about quality and understand their own organizations.
QP
5
10
48
50
52
55
71
72
6
8
12
15
66
68
NEXT MONTH
72
12
SPECIAL SECTION ASQ’S 2015 SOFTWARE SHOWCASE AND DIRECTORY p. 58

UPFRONT
Culture FlubOnline customer feedback takes offTHOSE WHO KNOW me know I have been cursed by the air travel gods. So you will
not be surprised to learn that on my recent trip to Nashville in May for the World Confer-
ence on Quality and Improvement that my flights were delayed by several hours on the
way there and the way back; mechanical issues were the culprit.
In the first instance, the delay was going to cause me to miss my connection, so I
called the airline to rebook. After the rep and I agreed on my contingency itinerary, I
asked, “Is there any sort of accountability here? Do I get any voucher or compensation
for my inconvenience?” The rep paused and said: “We really don’t do that anymore.” Sigh.
When I asked the same question on social media a few hours later, I was quickly sent a
voucher to use toward a future flight.
This raises two issues in my mind:
• Customer feedback mechanisms are changing: For better or worse, customers are
taking to various new media to voice their preferences and pains. Why did my complaint
get such immediate attention on Twitter (I didn’t even use my ASQ handle)? I’m not sure,
but it’s obvious the airline has put resources toward quickly and efficiently addressing
issues in that medium. Does this mean your organization needs to be doing more to look
for and act on customer feedback in different channels?
• Culture: Why were some employees so empowered and responsive, while others
seemed clueless even though they represent the same company? Shouldn’t they all be
espousing the same values, practices and processes? Shouldn’t the culture ensure that
training and messages are consistent?
Both of these issues are addressed in this month’s article mix. First, “Like Abilities,”
p. 24, looks at how social media is becoming a prevalent forum for customer feedback—
and explains what your organization can do to respond.
The author references an American Express study that showed seven of 10 complain-
ing customers will do business again with the organization if it handles their complaints
properly, and 19 of 20 customers will do so if the organization solves their problems
quickly. Think of your own experiences—sounds about right to me!
Organizational culture is such a far-reaching concept that it could be argued it’s
interwoven in almost every QP article. This month’s mix includes articles on cultures of
continuous improvement, including “What’s Your Next Move?” p. 16, on improving compe-
tencies and capabilities to pave the way to bigger wins, and “Assessing the Landscape,”
p. 30, on using lean Six Sigma to reveal areas that require the most attention. QP
Seiche Sanders
Editor
EXECUTIVE EDITOR ANDASSOCIATE PUBLISHERSeiche Sanders
ASSOCIATE EDITORMark Edmund
ASSISTANT EDITORAmanda Hankel
MANUSCRIPT COORDINATORValerie Ellifson
COPY EDITORSusan E. Daniels
CONTRIBUTING EDITORTyler Gaskill
ART DIRECTORMary Uttech
GRAPHIC DESIGNERSandy Wyss
PRODUCTION Cathy Milquet
ADVERTISING PRODUCTIONBarbara Mitrovic
DIGITAL PRODUCTION SPECIALISTSJulie StroikJulie Wagner
MEDIA SALESNaylor LLCLou BrandowKrys D’AntonioNorbert Musial
MEDIA SALES ADMINISTRATORKathy Thomas
MARKETING ADMINISTRATORMatt Meinholz
EDITORIAL OFFICESPhone: 414-272-8575Fax: 414-272-1734
ADVERTISING OFFICESPhone: 866-277-5666
ASQ ADMINISTRATIONCEO William J. Troy
Senior LeadershipAndrew BainesMichael BarryAjoy BoseLynelle KorteBrian J. LeHouillierLaurel Nelson-Rowe
To promote discussion of issues in the field of quality and ensure coverage of all responsible points of view, Quality Progress publishes articles representing conflicting and minor-ity views. Opinions expressed are those of the authors and not necessarily of ASQ or Quality Progress. Use of the ASQ logo in advertisements does not necessarily constitute endorsement of that particular product or service by ASQ.
QUALITY PROGRESS
QP
June 2015 • QP 5

QP • www.qualityprogress.com6
LOGONCoaching on the jobIn response to “Quality Bulldogs” (April
2015, pp. 30-33): I have always felt like
coaching gives back more than it takes
personally and professionally.
As a manager, I find myself
frequently “coaching up” my
co-workers. When I was hired
in my current role, I made no
mistake that I was a coach,
and my end state was to have
a high-functioning team that
cooperated and collaborated
with other parts of the com-
pany so that we (our team) could become
a resource for other departments, and I
meant every word of it.
What the article describes is one part
motivation, one part diagnostics (assess-
ing strengths and weaknesses) and one
part training (drills). Coaching is one of
those ways we can sharpen the blade
because it requires us to do the things
described in the article and more, such
as conflict management, behavioral man-
agement, game management (resource
allocation) and planning.
I haven’t coached in more than
20 years but a friend of mine at work
needed help because the league his son
played in did not have enough coaches,
so I told him I would help. It has been
great and has given me a new perspec-
tive on things I can do or do differently
in my professional role.
Mike Alumbaugh
Derby, KS
Making the most of FMEAI fully agree with the author of “No Fin-
ish Line,” (April 2015, pp. 34-38). Failure
Seen&Heard
StayConnectedFind the latest news, quips and targeted content from QP staff.
Executive Editor & Associate Publisher Seiche Sanders: @ASQ_Seiche
Associate Editor Mark Edmund: @ASQ_Mark
Assistant Editor Amanda Hankel: @ASQ_Amanda
Contributing Editor Tyler Gaskill: @ASQ_Tyler
www.facebook.com/
groups/43461176682
www.linkedin.com/groups/quality-progress-magazine-asq-1878386
mode and effects analysis (FMEA) is a
document that is based on the estima-
tion in the initial stage based on the past
knowledge gained. As the knowledge
about the customer requirements chang-
es, so does the severity factor.
Also, the field returns or inter-
nal failures refine the estimates
of the occurrence. These must
be drilled back into the FMEA
to make it closer to reality. The
more accurate the FMEA is, the
more useful a tool it will be.
Rajan Bhagwat
Chetananagar, Nasik, India
Focus on valueIn response to “Tell Me What I Don’t
Know” (April 2015, pp. 42-43): As
an internal auditor, sometimes we
concentrate on nonvalue-adding sections.
I recommend every auditor read this
article and start practicing this way of
auditing. I am definitely going to start
applying this method.
Nompumelelo Masiko
Saxonwald, Johannesburg,
Gauteng, South Africa
Tune In
In the latest episode of ASQ TV,
learn how to introduce quality
to your workplace. The episode
includes: how a plant manager
made quality fun, how the absence
of quality can create disaster and
introducing lean and 5S principles
to mainstream audiences. The next
episode covering
teams is available
June 16. Visit http://
videos.asq.org to
access the full video
library.
Your comment hereWe want to hear from you!
Submit comments, questions or
opinions about the articles in QP
by sending them to editor@asq.
org or commenting on the article
pages at www.qualityprogress.com.
Your comments could appear in an
upcoming edition of LogOn.
ALSO ON DECK:
QUALITY PROGRESS
PPutting Best Practices to WorkQ
UA
LITY PROG
RESS | APRIL 2015
QU
ALITY IN
SPORTS
VOLU
ME 48/N
UM
BER 4
The Global Voice of QualityTM
www.qualityprogress.com | April 2015
Soccer team gets a kick out of quality p. 30 No finish line for FMEA p. 34
GETTING RESULTS
IN THE GAME
DRIVING PERFORMANCE
SPECIAL EDITION
p. 18
Improving Athletes’
p. 25
Performance

June 2015 • QP 7
QPQUALITY PROGRESS
PAST CHAIRStephen K. Hacker, Transformation Systems
International, LLC
CHAIRCecilia Kimberlin, Kimberlin LLC (retired – Abbott)
CHAIR-ELECTPatricia La Londe, CareFusion
TREASUREREric Hayler, BMW Manufacturing
SECRETARYWilliam J. Troy, ASQ
PARLIAMENTARIANSue Campbell, ASQ
DIRECTORSDonald Brecken, Ferris State UniversityHeather L. Crawford, Apollo EndosurgeryRaymond R. Crawford, Parsons BrinckerhoffHa C. Dao, Emerson Climate Technologies Inc.Benito Flores, Universidad de MonterreyJulia K. Gabaldón, Quality New MexicoEdwin G. Landauer, Clackamas Community CollegeDavid B. Levy, Boyce Technologies, Inc. Sylvester (Bud) M. Newton, Jr., AlcoaDaniella A. Picciotti, BechtelSteven J. Schuelka, SJS ConsultingKush K. Shah, General MotorsJames B. Shore, Quality Lean Solutions, LLCJason Spiegler, Camstar Systems Inc.Joal Teitelbaum, Escritório de EngenhariaG. Geoffrey Vining, Virginia Tech, Department of Statistics
QP EDITORIAL REVIEW BOARDRandy Brull, chair
Administrative Committee Brady Boggs, Randy Brull, Jane Campanizzi, Larry Haugh, Jim Jaquess, Gary MacLean,R. Dan Reid, Richard Stump
Technical ReviewersAndy Barnett, Matthew Barsalou, David Bonyuet, David Burger, Bernie Carpenter, L.N. Prabhu Chandrasekaran, Ken Cogan, Linda Cubalchini-Tra-vis, Ahmad Elshennawy, Mark Gavoor, Kunita Gear, Daniel Gold, T. Gourishankar, Roberto Guzman, Ellen Hardy, Lynne Hare, Ray Klotz, Tom Kubiak, William LaFollette, Pradip Mehta, Larry Picciano, Gene Placzkowski, Tony Polito, Peter Pylipow, Imran Ahmad Rana, John Richards, James Rooney, Brian Scullin, Amitava Sengupta, Mohit Sharma, A.V. Srinivas, Joe Tunner, Manu Vora, Keith Wagoner, Jack Westfall, Doron Zilbershtein
QUICK POLL RESULTS Each month at www.qualityprogress.com, visitors can take an informal survey. Here are the numbers from last month‘s Quick Poll:
May was the month of ASQ’s World Conference on Quality Improvement in Nashville. Which famous Milwaukeean would you like to see as next year’s keynote speaker when the conference is in Milwaukee?
Visit www.qualityprogress.com for the latest question:
What efforts most enhance an organization’s culture?• Providing frequent opportunities for employees’ feedback.• Involving the entire workforce in improvement initiatives.• Hosting fun, team-building activities.• Offering benefits, such as training and tuition reimbursement.• Encouraging risk-taking.• Leadership engaging with frontline staff.
QP
QualityNewsTODAYRecent headlines from ASQ’s global news service(All URLs case sensitive)
Toyota Reinvents the FactoryToyota has spent the past four years rethinking its principles of mass production. What has resulted is arguably the most significant reboot of the modern production line since Henry Ford’s 1913 Model T line began rolling. (http://bit.ly/reinventfactory)
FAA Expands Commercial Drone TestingA new Federal Aviation Administration (FAA) program will test the expanded use of drones for commercial purposes, including flying over urban areas and over distances farther than the pilot can see. (http://bit.ly/dronetesting)
Get your questions answeredHave a burning quality question? Let QP’s experts help. Submit your questions online at http://asq.org/qualityprogress/expert-answers/form.html, or email them to [email protected], and we’ll help you find an answer. Standards videos addedAdditional videos continue to be added to ASQ’s Standards Channel. Visit http://videos.asq.org/asq-standards-channel to view the videos and learn more about the ISO 9001 and 14001 revisions.
www.qualityprogress.com
ONLINE EXTRAS@
WANT THE LATEST QUALITY-RELATED NEWS AND ANALYSIS? The QNT Weekly enewsletter, available exclusively to ASQ members, delivers it every Friday.
Subscribe now at http://email.asq.org/subscribe/qntwk.
Henry Winkler (”The Fonz” in Milwaukee-based TV show “Happy Days”).Gene WilderSteve MillerHank AaronBud SeligFrank Caliendo
35.7%
14.2%
17.8%25%
3.5%3.5%

QP • www.qualityprogress.com8
Required definitionsQ: I believe that the vision and mission
statements for an organization certified
to ISO/TS 16949 are its quality policy and
quality objectives, respectively, so there
is no need to define vision and mission
separately again. Am I correct?
Ganesan Ramaswamy
Chennai, Tamil Nadu, India
A: ISO/TS 16949 is a technical specifica-
tion that contains quality management
system requirements specific to the au-
tomotive sector. It is based on ISO 9001,
therefore it defaults to the ISO 9000
definitions of general terms, such as
vision, mission, quality policy and quality
objectives.
Vision and mission statements are not
ISO/TS 16949-specified requirements.
Further, they are not equivalent terms to
quality policy or objectives, both of which
are ISO/TS 16949-specified requirements.
Vision (clause 3.4.10), mission (clause
3.4.11), quality policy (clause 3.4.9), objec-
tives (clause 3.7.1) and quality objectives
(clause 3.7.2) are all defined in the draft
international standard of ISO 9000:2015.
Vision is what the organization aspires
to become while mission is the purpose
statement of the organization. These
items are defined by top management.
An objective is a result to be achieved,
while quality objectives are results to be
achieved specifically related to quality.
R. Dan Reid
Director of standards and consulting
Omnex Engineering and Management
Ann Arbor, MI
Postponing an auditQ: If a force majeure event (an event
that cannot be anticipated or controlled)
affects an organization during the time
that the annual surveillance audit was to
be done, can the surveillance audit be
postponed until after the conclusion of
the force majeure period without losing
ISO 9001 certification? Will it result in
a certificate lapse rectified with pass-
ing the rescheduled surveillance audit
loss, or loss of certification—requiring
the next audit to be a certification audit
instead of a surveillance audit? Or is it
up to the registrar? In this case, assume
the surveillance schedule delay is three
months or less, and the organization has
an excellent International Organization
for Standardization audit track record.
A: With regard to the frequency of
surveillance audits as well as deferral
of an audit as a result of force majeure,
it’s important to know that all reputable
registrars or certification bodies (CB) are
accredited by an accreditation body (AB)
such as ANSI-ASQ National Accreditation
Board (ANAB). This is intended to ensure
a consistent approach for issuance of
certifications by CBs.
To maintain certification, the CB may
conduct periodic surveillance audits.
Registered or certified organizations
must be recertified every three years or
prior to the expiration date listed on their
certification certificate.
Surveillance audits are conducted
by the registrar to verify the organiza-
tion’s continued implementation of ISO
9001 as well as the improvement of the
effectiveness of its quality management
system (QMS). Registrars may increase or
decrease the frequency of surveillance
audits based on the maturity level of the
organization’s QMS.
For this reason, the frequencies at
EXPERTANSWE RS

June 2015 • QP 9
which surveillance audits are conducted
may vary, but are usually scheduled an-
nually. Other situations that may affect
actual frequency of surveillance audits
may be the availability of auditors or,
possibly, unusual situations being experi-
enced by the auditee or organization.
As previously mentioned, recertifica-
tion audits are required to be conducted
every three years. A registrar typically
does not have the authority to extend
any organization’s ISO 9001 certification
beyond the expiration date as shown on
the certificate.
I would suggest that the certifica-
tion contract agreement between your
organization and the registrar be reviewed
to determine how conditions of force
majeure are to be addressed. This review
should be followed up with a discussion
with the registrar to ensure there will be
no impact on your organization’s existing
QMS certification.
For more information about surveil-
lance audits and other information
regarding CBs, review the International
Accreditation Forum (IAF) guidance
document “Application of ISO/IEC Guide
65:1996, Issue 3 (IAF GD 2006).” A copy
of this document can be downloaded at
www.iaf.nu.
Bill Aston
Managing director, Aston Technical
Consulting Services LLC
Kingwood, TX
Role of an audit observerQ: One of our customers wants to partici-
pate as an observer in an upcoming audit.
I’ve not been able to find much informa-
tion about the role of observers—what
they can and cannot do. For instance, I
assume they cannot ask questions during
the audit interview process. Is there an
appropriate checklist for observers to
follow—a list of do’s and don’ts?
A: While there isn’t a standard checklist
of do’s and don’ts to reference, keep
these rules in mind:
The auditors should be notified of a
presence of the observer in advance.
Depending on the type of audit, there are
times where this may not be allowed.
The customer should sign a confiden-
tiality agreement on not disclosing any
information outside the audit process.
The rules should be established as part of
this confidentiality agreement.
An observer (customer) may not en-
gage in any part of the audit.
The observer may not interfere in any
aspect of the audit (may not provide opin-
ions, argue a finding, speak for or against
a finding or use the audit information for
a future punitive measure).
If questioned during the audit, the
observer should explain the role as an
observer. Ideally, this should be brought
to the attention of the auditor in advance.
These basic rules ensure that the
audit is not compromised in any way
and the customer’s request to witness
the audit is conducted in a professional
manner.
Dilip A. Shah
President
E = mc3 Solutions
Medina, OH
EXPERTANSWE RSA registrar typically does not have the authority to extend any organization’s ISO 9001 certification beyond the expiration date shown on the certificate.
EXPERT ADVICEStumped by a tough quality question? Don’t worry. QP’s subject matter experts are here to help. Submit your question at www.qualityprogress.com, or send it to [email protected], and we will help you find a solution.

QP • www.qualityprogress.com10
PERSPECTIVES BY MANOJ SHARMA AND VARDAYINI SHARMA
Discovering the Right PathBefore tackling a project, learn about the organization’s culture
AT NYU’S SPRING 2014 graduation,
Janet Yellen, chair of the U.S. Federal
Reserve, said: “You won’t succeed all the
time. Finding the right path in life, more
often than not, involves some missteps.”
She described the work her colleagues
did to limit the impact of the financial
crisis: “Some of their efforts didn’t work,
but they didn’t give up.” The experience
taught Yellen that a person’s response to
inevitable setbacks matters as much as
the balance of victories and defeats.
Often, improvement practitioners must
deliver successful projects and nudge an
organization forward in its improvement
journey. Finding the right path involves
dealing with uncertainty because of an
organization’s unique culture and past
experiences. When things are uncertain,
we lack clear answers. As a result, initial
efforts may not work or the team could
easily misstep.
In such situations, our response to
inevitable setbacks is key to guiding the
improvement journey forward. Direct
confrontation, tactics to overwhelm oppo-
sition, hard-selling solutions or uncompro-
mising positions often create negativity
that leads to stonewalling, disengagement
and painful memories of the improvement
initiative. In other words: All pain, no gain.
At a pharmacy within a large hospital
in a public healthcare system, we found
that several improvement projects under-
taken led to lighting fires in several areas,
which roiled staff. Despite the effort, the
project led to poor results in the annual
staff survey and no visible improvements.
Later, major management intervention
was needed to ameliorate the union staff.
Needless to say, management was
afraid to pursue more improvement
projects due to the negative experience.
Experienced staff felt that a meaningful
improvement opportunity wasn’t selected.
“They don’t know what they are doing,”
one member said. The narrative had
changed to one of complete failure. Every-
one believed, “It won’t work here.”
Assess the current stateBefore selecting a project, take the orga-
nization’s pulse. Interact with all levels of
management and staff, get a sense of what
they do and identify key challenges that
exist. Identify any initiatives launched in
the past, the reason for undertaking those
initiatives, how they were managed and
supported, and how different parts of the
organization adapted to the changes.
HR professionals often recommend this
approach in gauging an organization’s cul-
ture before fully committing to a project.
Has the organization undertaken similar
projects in the past? How was the experi-
ence and outcome? Developing these
insights before starting work on a lean
project helped us craft a better strategy by
addressing three key issues:
1. Address the past bad experience.
At this pharmacy site, past experience was
negative because of the project’s poor im-
plementation, unheard staff concerns and
users being unable to see credible benefits
to doing the project. In such situations,
building the initiative’s credibility by de-
livering a positive engagement experience
from the start, understanding the pace of
change an organization can sustain, deliv-
ering observable benefits and addressing
staff concerns fairly is important for the
adoption to become grass roots. The pur-
pose of making change must be real and
must flow from an actual situation or the
organization’s needs and communicated to
employees in an honest way.
2. Use early engagement, inquiry,
problem solving and negotiations
to win over employees. Given these
circumstances, when we started a lean
project to improve drug packaging and
distribution, we engaged managers and
frontline staff from the beginning to
explain in an authentic way what we were
doing. We asked simple questions such
as “What problems are you having?” and
“Can you explain this further?” for every-
one to further understand the problem.
We explained why the improvement
project was meaningful and how the proj-
ect would be done. Employees’ feedback
was incorporated in the action plan. In
some ways, you are using inquiry, problem
solving and negotiation. By using this ap-
proach in our project, staff members felt
they were heard, and their problems were
understood and considered when develop-
ing the project and deploying solutions.
3. Frame it right. After implemen-
tation, we discussed the improvement
experience with management and staff
in a realistic manner and highlighted
successes and challenges. This helped
reframe the narrative from creating some-
thing that is perfect to steadily improving
the service—recognizing the benefits and
challenges in the journey needed over
time.
At another pharmacy site within a large
public hospital, staff had an unfavorable
attitude toward improvements because they
seemed uncomfortable with anything new
and different. “Things have not changed
here in a long time,” some said. There are
many industries such as public healthcare
in which the pace of change is slow.

June 2015 • QP 11
In addition, this local site management
feared unintended negative consequences
of making changes to drug packaging,
inventory and distribution to nursing units
and patients. Due to interrelationships
in a complex healthcare system, a small
change can affect many others.
Small stepsAt this site, we took an incremental im-
provement approach, which can be viewed
as less threatening. “While the sugges-
tion to change an organizational process
often evokes fears of a costly, drawn-out
campaign requiring a deep level of support
from a lot of different internal and exter-
nal constituencies, it turns out that very
simple interventions can produce power-
ful change for individuals and organiza-
tions,” wrote behavioral economists John
Beshears and Francesca Gino.
The first project at this site aimed
at reducing the waste of an expensive
critical intravenous drug, an issue flagged
by the site’s local purchasing staff. The
solution was targeted and proved to be
easy to adopt. This allowed the site to
get comfortable with the change, which
reduced fear of new solutions. The success
of this small improvement project had a
major impact because it created a positive
climate, allowing for the adoption of new
solutions and laying the foundation for
future improvement projects.
For another project, managers at
suburban pharmacy sites—despite senior
management’s consent—had refused to
implement an inventory model aimed at
facilitating a hub-spoke drug distribution
model. During talks with the managers,
we realized the managers felt the project
had been thrust on them in the past with-
out enough understanding of local issues
and without any implementation support.
Further, staff feared it would lose
control if drug distribution was central-
ized because the staff was accustomed
to running site operations independently.
Because managers were not on board, it
was not possible to access frontline staff
to implement the change.
We also found that local management’s
decision-making style was different than
the site manager’s. So, our strategy consist-
ed of directly engaging line managers and
adapting the approach for different styles.
Underappreciated managersIn almost all the projects at public
healthcare pharmacy services, we found
that staff tended to rely on the immediate
manager more than outsiders or senior
management. Because staff reports daily
to line managers, line managers tend to be
more aware of hidden commitments and
interpersonal dynamics.
Most importantly, line managers
directly control resources and have a
strong influence on when and where to
deploy them. Seasoned senior executives
tend to be aware of this, so they consult
line managers before consenting to a
new initiative for their position and other
potential issues.
As we met line managers at suburban
pharmacy sites, we explained the model,
what we were doing, why we are doing it,
how the model worked and steps to imple-
ment it. We ensured end-to-end support
while acknowledging a loss of indepen-
dence from the centralized distribution.
With line managers on board, they
arranged our visit to interact directly
with the union staff at each site to explain
the changes, understand site-specific
concerns and incorporate those site-
specific issues in the implementation plan.
Whether at a local site project or at an
organizationwide initiative, engagement of
the line managers is critical to success.
Decision-making approachFor a manager of a suburban site, we had
to explain the situation, propose op-
tions and discuss various options before
selecting a preferred course of action. At
one of the large hospital pharmacy sites,
local management preferred consensus
amongst managers before committing
to a course of action. At another large
hospital pharmacy site, the site director’s
consent was most important. Awareness
of these differences helped us avoid the
angst of unmet expectations and stalled
projects that had happened in the past at
these sites.
The process of finding the right path for
an organization involves learning about its
unique cultural context and past experi-
ences. Use preliminary insights to deploy
a best-estimate strategy, learn from
results and build on what worked and
what didn’t until you find the formula that
works well for an organization.
In some ways, you’re experimenting
with an organization. Fortunately, there are
several approaches available from areas as
diverse as HR, negotiations and behavioral
economics to aid the discovery process. QP
BIBLIOGRAPHYBeshears, John, and Francesca Gino, “To Change Employee
or Customer Behavior, Start Small,” Harvard Business Review blogs, Sept. 19, 2014, http://tinyurl.com/hbr-small.
Conger, Jay, “The Neccessary Art of Persuasion,” Harvard Business Review, May-June 1998, http://tinyurl.com/hbr-art.
Luecke, Richard, Negotiations (Harvard Business Essentials), Harvard Business School Press, 2003.
Meyerson, Debra E., Tempered Radicals: How People Use Difference to Inspire Change at Work, Harvard Business School Press, 2001.
Myers, Erin, The Culture Map: Breaking Through the Invisible Boundaries of Global Business, PublicAffairs, 2014.
MANOJ SHARMA is process improve-ment consultant at Alberta Health Services in Edmonton. An ASQ member and ASQ-certified Black Belt, Sharma holds an MBA from the University of Michigan in Ann Arbor and a master’s degree in industrial engineering from the University of Arizona in Tucson.
VARDAYINI SHARMA has held several HR management roles, including head of HR at Gilpin Travel Management and Shachihata India in Mumbai. She holds manage-ment degrees from the University of Toronto and the University of Mumbai.

M
QP • www.qualityprogress.com12
CUSTOMER EXPERIENCE
When App-licableRetailers take to apps to enhance shopper experience and collect data
KEEPINGCURRE NTMany brick-and-mortar stores—from
small independents to national chains—
are applying a new strategy to compete
with online retailers: customized in-store
apps.
The self-contained software that can
be downloaded to mobile devices such
as phones and tablets is being used more
to attract shoppers to stores’ physical
locations, improve the in-store customer
experience, make customers feel more
efficient on their shopping excursions and,
of course, get them to spend more money.
“More and more transactions are
moving online, and you can see the
beginnings of store owners starting to
realize they should change their strategy,”
said Jeremy Neren, founder and head of
business development at GrocerKey Inc.,
a Madison, WI, startup that partners with
stores to help them sell online and deliver
locally. “The way they’ve done business
for 100 years doesn’t apply anymore.”1
Dedicated in-store apps have become
a popular way for stores to lure shoppers
into considering more products and, at
the same time, convince them they have
discovered must-have deals that save
dollars.
For instance, Walgreens, the national
pharmacy chain, has an app that lets cus-
tomers navigate snacks and medications
with in-store product searches, receive
clip-and-save coupons, and fill prescrip-
tions with a few taps, all on mobile
devices.2
Wal-Mart and Target, too, have been
enhancing their mobile apps and seeing
their traffic increase. For instance, 44
million people accessed Walmart.com and
Wal-Mart’s mobile app through portable
devices in the United States in March,
many more than the 38 million individu-
als who accessed the web store through
their PCs. For the same month, Target
had 23 million visitors to its mobile app
compared to 20 million from PCs.3
These retail chains have “invested
in building greater functionality in their
mobile apps, which make them an ever
more useful tool, whether you are in store
or not,” wrote Michael Exstein, an analyst
at Credit Suisse, an international financial
services holding company that researched
the retail app situation. “Both Wal-Mart’s
and Target’s apps can show you the prices
and aisle locations of anything you put in
your mobile shopping list.”4
Retailers are banking on the apps
pulling shoppers into more purchases
along the way. While customers shop
with the Walgreens app, for instance,
they can search for store inventory, map
the layout for easy access and receive
messages about in-store offers.5
At a locally owned Piggly Wiggly gro-
cery store in Mayville, WI, an app keeps
a running total of a shopper’s selected
items, automatically applies discounts
and allows the shopper to sail through a
special checkout line.6
The app also lets customers get sav-
ings on products and gain loyalty points
during their grocery runs and gives manu-
facturers the ability to deliver coupons on
the spot. When a customer scans a bag of
brat buns, for instance, Johnsonville Sau-
sage can immediately send the customer
an enticing coupon for brats.7
Data gatheringThe apps also give product manufacturers
data that show them how much individual
shoppers will spend on particular items,
allowing them to target specific demo-
graphics.8
Taking things one step further, some
retailers have incorporated technology to
create physical heat maps of customer
movements throughout a store and cap-
ture crucial customer data to improve the
in-store experience, just as they would
with customers navigating a website to
browse products and make purchases.9
For customers without the app,
retailers also can use beacons to record
their actions and send notifications via
Bluetooth. If retailers provide free Wi-Fi
to customers—or they’re connected to a
private network—retailers can still moni-
tor their movements.10
Shopper expectationsHeat maps may seem extreme for many
shoppers accustomed to simply walking
into a store clutching a list of groceries

June 2015 • QP 13
KEEPINGCURRE NTNAME: Amit Chatterjee.
RESIDENCE: New Delhi, India.
EDUCATION: Bachelor’s degree in instrumentation and control
engineering from the Indian Institute of Technology in Kharagpur.
INTRODUCTION TO QUALITY: The essence of quality was introduced to Chatterjee
while he worked for a Fortune 500 organization in the process automation and control
industry in 1992. He was handling customer problems with manufacturing processes
during field visits with service engineers. His sales team had
not understood requirements and applications in depth, and
the customer was frustrated. Resolving the problem made him
appreciate the need for integrating quality into everything the
organization did to maximize the customer experience and
enhance value. Quality needed to be led by top leadership, he
learned, and not handled in a limited way. After that, Chatterjee
resolved to learn more about quality.
CURRENT JOB: ASQ India’s managing director since November 2010, responsible for
establishing operations, building and leading a team of professionals, and facilitating
member leaders in India to pursue ASQ’s mission and execute growth strategies.
PREVIOUS JOBS: Chatterjee started his professional career as a production execu-
tive with Cadbury and later worked in various roles with technology giants Emerson
Electric, Honeywell, Tata Group and the Federation of Indian Chambers of Commerce
and Industry.
ASQ ACTIVITIES: He serves as both a member leader and ASQ staff member, integrating
the objectives with the common purpose of fulfilling ASQ’s global mission by linking it
to the cause of India’s and the South Asia region’s socioeconomic development process
through quality-based methods, leveraging ASQ’s body of knowledge, best practices and
the extensive community of member leaders keen on contributing to the mission.
OTHER ACTIVITIES/ACHIEVEMENTS: Volunteer activities with professional groups
such as the Institute of Electrical and Electronics Engineers, the Project Management
Institute, the Quality Council of India, Lal Bahadur Shastri National Academy of Admin-
istration, Confederation of Indian Industry, All India Management Association and the
IndoAmerican Chamber of Commerce.
RECENT HONORS: Recently elected to ASQ’s 2014 class of fellows.
PERSONAL: Wife, Sudipta, and daughter, Ashmita.
FAVORITE WAYS TO RELAX: Listening to light classical music, reading, walking and
physical fitness.
QUALITY QUOTE: Quality is the passionate pursuit of excellence.
QWho’s Who in
(continues on p. 14)
scribbled on the back of an envelope and
holding a stack of coupons cut from Sun-
day’s newspaper.
A recent study by Accenture, a manage-
ment consulting and technology services
company, however, shows that when it
comes to mobile and in-store integration,
many consumers are expecting these tech-
nologies—and more—from retailers.
Based on a recent survey of 750 U.S. con-
sumers and an analysis of how U.S. retailers
operate across multiple sales channels, the
Accenture study’s data indicated retailers
must enhance their mobile commerce of-
ferings and improve the in-store shopping
experience to stay competitive.11
Nearly one in three survey respondents
said the second biggest improvement retail-
ers must make in the consumer shopping
experience is to integrate the use of three
sales channels—physical stores, online sites
and mobile devices—and address a demand
for price consistency among all three of
these outlets.
Addressing these deficiencies in in-store
and mobile integration will improve the
shopping experience for consumers,
Accenture reported, and provide several
new avenues for marketing to loyal cus-
tomers.12
Too much to handle?Some warn an onslaught of apps and tech-
nology could actually harm the customer
experience. Apps can potentially be incon-
sistent with a brand’s messaging, wrote
Geoff Gower, executive creative director at
a London digital direct marketing agency.13
“Apps remain a powerful tool for brands
to connect with their customers in real time,
while keeping them informed and engaged,”
Gower wrote. “However, too often a brand’s
app can present a disjointed experience
when compared to the message on its web-
site or in-store.”14

QP • www.qualityprogress.com14
KEEPINGCURRENT
HEALTHCARE SURVEY
BETTER COMMUNICATION COULD HELP LOWER COSTSStrengthening communication between caregivers and patients
should be a top priority for reducing healthcare costs and improv-
ing the patient experience, according to a new ASQ poll of U.S.
healthcare quality improvement professionals.
More than 80% of respondents to the recent poll said
improving communications between patients and
healthcare staff is the No. 1 factor in improving
patient experience. Recent studies, however,
have found physicians spend less than 10
minutes on average with patients during an
office visit.
The 250-plus ASQ members in the health-
care quality profession who took the survey
also ranked the following factors as keys to
improving patient experience, reducing costs
and increasing profitability for healthcare
organizations:
• Strong leaders who prioritize a patient-centered
philosophy among staff and promote an organized sys-
tem in which patients know what to expect and when—67%.
• Viewing patient experience and service delivery as equal
priorities for financial and clinical performance measure-
ments—60%.
• Ease of access to treatment across the entire continuum of
care (for example, via accountable care organizations)—52%.
Survey respondents said many of the factors that could
improve patient experience, however, have hurdles that make
implementation difficult, including:
• Payment and regulatory systems that are documentation-
heavy, taking care teams away from the patient—47%.
• Fragmented and uncoordinated patient care (for
example, multiple hand-offs, communication
barriers and lack of a nationally integrated
healthcare information system)—46%.
• Governance and senior leadership that
does not set an example for or support staff
engagement—45%.
Surveyed experts ranked the following
methods as having the greatest potential
to help healthcare organizations improve
patient experience:
• Employee engagement programs that demon-
strate staff input is valued—60%.
• Leadership development that focuses on seeing opera-
tions from the frontlines—60%.
• Lean systems at all levels of an organization such as strategy
deployment and cross-functional and daily management—52%.
For more on the survey, visit www.asq.org/media-room/press-
releases/2015/20150416-better-commmunication-experience.
html.
In-store apps (continued from p. 13)
Nancy Childs, a food marketing profes-
sor at St. Joseph’s University in Philadel-
phia, published a study about retail grocery
store apps and found digital shoppers said
they use apps because of convenience,
economics and personalization.15
On the other hand, some complained
apps had slow response times in stores,
and shoppers had concerns about privacy
and being hit up to take surveys.
“This privacy issue is not new. As they
would say, ‘The horse left the barn.’ We’re
accustomed to sharing information to
receive convenience, to receive access
maybe to some economic discounts,”
Childs said.16
—compiled by Mark Edmund,
associate editor
REFERENCES1. Kathleen Gallagher, “Madison Start-Ups Put Digital Tech-
nology in the Grocery Aisles,” Milwaukee Journal Sentinel, April 8, 2015, www.jsonline.com/business/madison-start-
ups-put-digital-technology-in-the-
grocery-aisles-b99473381z1-299144341.html.
2. Hilary Milnes, “Walgreens Uses Mobile Apps to Solve In-
Store Headaches,” Digiday, May 4, 2015, https://digiday.
com/brands/walgreens-uses-mobile-apps-solve-store-
headaches.
3. George Zack, “Mobile Apps Seem to Be Fueling Traffic
Growth for Wal-Mart Stores Inc., Target: Credit Suisse,”
Bidness Etc., May 5, 2015, www.bidnessetc.com/41855-
mobile-apps-seem-to-be-fueling-traffic-growth-
for-walmart-stores-inc-target.
4. Ibid.
5. Milnes, “Walgreens Uses Mobile Apps to Solve In-Store
Headaches,” see reference 2.
6. Gallagher, “Madison Start-Ups Put Digital Technology in
the Grocery Aisles,” see reference 1.
7. Ibid.
8. Ibid.
9. Roberto Ugo, “Four Surprising Ways Retailers Can Lever-
age Heat Maps,” Apparel, May 6, 2015, http://apparel.
edgl.com/news/four-surprising-ways-retailers-can-
leverage-heat-maps99946.
10. Ibid.
11. Pete Roesler, “Why Customers Want an Integrated
Mobile and In-Store Experience,” The Business Jour-
nals, April 17, 2015, www.bizjournals.com/bizjour-
nals/how-to/growth-strategies/2015/04/integrated-
mobile-and-instore-experience.html?page=all.
12. Ibid.
13. Geoff Gower, “Do Grocery Apps Complicate the
Customer Shopping Experience?” The Drum, April
22, 2015, www.thedrum.com/opinion/2015/04/22/
do-grocery-apps-complicate-customer-shopping-
experience.
14. Ibid.
15. CBS Miami, “Grocery Store Apps Can Save You
Money,” April 24, 2015, http://miami.cbslocal.
com/2015/04/24/grocery-store-apps-can-save-you-
money.
16. Patricia Lopez, “Apps to Save Time and Money
While Grocery Shopping,” ABC 13 Eyewitness
News, March 11, 2015, http://abc13.com/shopping/
apps-to-save-time-and-money-while-grocery-
shopping/550554.

June 2015 • QP 15
KEEPINGCURRENT
Mr. Pareto Head BY MIKE CROSSEN
TECHNOLOGY
MANUFACTURERS MOVING TO THE CLOUDSA majority of manufacturers use public or private cloud
services for more than two applications, according to a recent
survey by IDC CloudView, a research and consulting firm.
Specifically, 66% of manufacturers worldwide are using
public clouds, while 68% are using private clouds. Applications
can include software and activities related to purchasing and
supply chain management. In the United States, 41% of manu-
facturers are accessing IT resources via public clouds.
A public cloud is a computing model that involves a service
provider making resources such as software or data storage
available over the internet. A private cloud is enterprise com-
puting architecture that’s protected by a firewall for better
security and reliability and dedicated to a single organization
with customized options.
Public and private clouds can help organizations streamline
processes, monitor projects and save money on technology
infrastructure.
The IDC CloudView report also said that cloud services and
cloud architecture’s share of annual IT budget allocations will
increase 27% in the next two years for manufacturers who
responded to the survey.
“Manufacturers are in the midst of a digital transformation
in which third-platform technologies are absolutely essential
to the way they do business and in the products and services
they provide to their customers, said Kimberly Knickle, re-
search director of IDC Manufacturing Insights.
“Consequently, a strategic approach to adopting cloud is
absolutely essential,” she said.
A new ASQ conference dedicated to quality standards will take
place Nov. 9-10 in Indianapolis.
The theme of the International Conference on Quality Stan-
dards is “Enhancing Customer Experience Through Standards
Implementation.” The event will feature speakers and sessions
covering insights into International Organization for Standardiza-
tion directives, ways to enhance the customer experience through
standards implementation and using standards to improve busi-
ness outcomes.
ASQ certification testing also will be taking place at the confer-
ence site on Nov. 8. For more information about the event and up-
dates on speakers and sessions, visit http://asq.org/conferences/
quality-standards/2015/index.html.
ASQ
NEW CONFERENCE FOCUSES ON STANDARDS
The number of ASQ member units recognized
by the Performance Award and Recogni-
tion (PAR) committee at last month’s ASQ
World Conference on Quality and Im-
provement. The PAR program is divided
into PAR performance awards and PAR
innovation awards and is intended to
recognize sections and divisions for in-
novative best practices. For a list of award
recipients, visit http://tinyurl.com/par-
award-list. For more details about the program,
visit http://tinyurl.com/asq-par.
81BYTHENUMBERS

What’s Your
by David HansenIn 50 Words Or Less • Many continuous
improvement programs focus on realizing improvements through problem solving but neglect to address areas with insufficient capabilities in place.
• Often, these programs lack a clear improve-ment strategy and organizations choose inadequate methods to support that strategy.
• Learn about a frame-work for designing improvement methods to increase capability building.

June 2015 • QP 17
WE WANT TO solve problems, but how should we? Continuous
improvement initiatives are deployed everywhere, and we use all types of
improvement methods based on the scientific method—such as root cause
analysis—to identify and solve problems, and resolve conflict and issues.
The focus on eliminating problems, however, draws attention away from
another aspect of continuous improvement: strengthening the capabilities
that an organization needs to achieve operational goals. Competence build-
ing is best achieved with improvement methods that focus on reinforcing
competences by learning from successful experiences and discussing pre-
ferred future states.
So, should shop floor management focus on problem solving or compe-
tence building?
PROBLEM SOLVING
How to find the right improvement strategy and methods for your organization
Next Move?

QP • www.qualityprogress.com18
This article presents an improvement framework
for deciding whether to focus on realizing improve-
ments or building competences, taking into account
the role of different improvement methods. The
framework builds on a European multiyear case
study at a manufacturing facility and has been empir-
ically tested for designing better methods to match
improvement strategies.
Understanding improvementOrganizations’ ability to learn and improve has been
a critical competence in operations and quality man-
agement for decades,1 but improvement comes in dif-
ferent shapes, as this anecdote reveals:
Sam was frustrated because the machine had been
down for days due to a trivial problem. Finally, the de-
fect was found, and the machine was running again,
but Sam was not yet satisfied. He knew this would
happen again and that the organization was incapable
of coordinating improvement efforts well. He invited
key stakeholders to a workshop series that eventually
redesigned the daily performance meeting structure
and training of team leaders. The result was better
coordination among units, faster problem solving,
and better quality and efficiency.
First, Sam eliminated a performance problem, and
second, he strengthened the organization’s compe-
tence to solve future problems. Improvement activi-
ties can either target productivity directly or enhance
the ability to identify improvement potential in the or-
ganization. Continuous improvement programs there-
fore should consider how they affect two dimensions:
1. Realization efficiency.
2. Improvement competence.
Both are important dimensions, but the optimal
balance depends on the organization’s operations
strategy.
Realization efficiency is the ability to achieve im-
provement based on the existing improvement poten-
tial. For example, how well an organization executes
on the available ideas for increasing quality or effi-
ciency (as in Sam’s story) and how they affect lead
times, scrap, the work environment and the develop-
ment of new products.
Improvement competence is defined as the organi-
zation’s ability to identify improvement potential, and
it can be quantified as the rate that new improvement
ideas are developed multiplied by their average im-
provement potential. Improvement competence thus
depends on the engagement of people (their ability to
identify problems and opportunities), analytical skills,
and organizational elements such as management, co-
ordination (as in Sam’s story), alignment between im-
provement goals and organizational direction.
Choosing an improvement strategyHigh levels of realization efficiency and improvement
competence are often described as dynamic capabil-
ity—that is, “a learned and stable pattern of collec-
tive activity through which the organization system-
atically generates and modifies its operating routines
in pursuit of improved effectiveness.”2
An organization cannot focus all of its efforts
on realization without losing focus on competence
building, and vice versa. Consequently, an explicit
choice of where to focus efforts should be made. A
shrinking telecom business, for example, may need
expert-driven rationalization for awhile to survive,
while a new manufacturing facility may need to focus
on employee empowerment to begin its improvement
journey.
Consequently, every organization should actively
decide on an improvement strategy—balancing ef-
forts between realization efficiency and improvement
competence, depending on current needs and future
plans. This also implies a strategic decision of how
much effort to invest in continuous improvement.
Figure 1 shows an improvement strategy framework
Improvement strategy framework / FIGURE 1
Realizationefficiency
High
Low
Low High
Improvementcompetence
Expert-drivenrationalization
Effective continuous
improvement(dynamic capability)
Employeeempowerment
Firefighting

June 2015 • QP 19
that can be used to assess an organization’s current
state and choose a desired future state.
The figure shows four generic strategies:
1. Expert-driven rationalization means focusing on re-
alization over competence building.
2. Employee empowerment means building compe-
tence with limited focus on realization.
3. Firefighting means only limited investment in real-
ization and competence building.
4. Effective continuous improvement means dedi-
cated focus on realization efficiency and compe-
tence—that is, dynamic capability.
Aligning the strategy and methodsAn organization’s improvement strategy goals can
be achieved through an improvement program that
appropriately balances improvement realization
and improvement competence. Researcher Gopesh
Anand and colleagues described how a program
should consider three elements:3
1. Purpose (aligning improvement goals with organi-
zational goals, for example).
2. People (developing employee skills, for example).
3. Process (improvement methods, for example).
While most improvement programs actively con-
sider the purpose and people elements, few discuss
the process element, and thus unconsciously use
problem solving based on the scientific method.
Other improvement methods are centered on
learning processes, co-creation of visions and en-
hancement of strengths.4 Competence building de-
mands weeks of reinforcing positive experiences and
repeating desired behavior to develop new neuro-
logical pathways5—sometimes requiring daily focus
on positive deviations and practice. The palette of
improvement methods leads to how an organization
develops its realization efficiency and improvement
competence.
Consider this example: A machine cleaning pro-
cess had doubled in the time it took. During daily per-
formance monitoring, the concern was raised, and a
team was assigned to solve the issue. Through prob-
lem solving, the team quickly identified the cause of
poor performance, fixed it and efficiently realized an
improvement for returning performance to standard.
A subsequent interview with the team revealed an in-
crease in realization efficiency but no increase in im-
provement competence because team members had
focused on fixing rather than learning.
Later, the team tried an alternative improvement
method—appreciative inquiry—on a similar prob-
lem. Instead of analyzing causes of poor behavior, the
team identified factors that would improve perfor-
mance. Through a creative process, the team hit on
the novel idea of cleaning the machine during mainte-
nance stops. Another interview revealed this method
increased the team’s improvement competence by in-
cluding broader scope and more ideas, although it did
not increase its realization efficiency.
Consequently, the improvement strategy should
explicitly determine the choice of improvement meth-
od instead of having the method inadvertently dictate
the strategy.
The power of problem solvingDifferent methods balance the development of real-
ization efficiency and improvement competence. In
continuous improvement, problem solving by root
cause analysis is a widely used method. Through in-
vestigating undesired events and understanding their
causes, the method ensures permanent solutions to
problems by eliminating the problem’s root cause.6,7
Specific methods include W. Edwards Deming’s plan-
do-check-act cycle, Six Sigma’s define, measure,
analyze, improve and control method, and lean’s A3
systematic problem solving (Toyota business pro-
cesses).8, 9
Most problem-solving activities10 are initiated as
the result of a gap between a target condition and
the measured actual condition. In general, most
PROBLEM SOLVING
Root cause problem- solving method / FIGURE 2
2. What caused it?1. What is the problem?
3. Use cause analysis tofind countermeasure.
Planning phase
Doing phase
Root cause Problem
Root cause No problem

QP • www.qualityprogress.com20
problem-solving methods can be simplified into three
steps, known as the three C’s:11
1. Understand the concern.
2. Investigate the root cause.
3. Implement the countermeasure.
After stating the problem concern and grasping
the current situation, more and more information is
gradually collected to identify the direct cause of the
problem—that is, where the problem occurs. Next, the
underlying root cause can be found by analysis—for ex-
ample, by asking Why questions such as, “Why did the
direct cause happen?” and “Why did the cause of the
cause happen?” Finally, a countermeasure is devised
that can eliminate the root cause and ensure the prob-
lem will not recur.
Root cause problem solving can lead to single or
double-loop learning,12 depending on how the root cause
analysis is conducted and the chosen countermeasure.
Figure 2 (p. 19) illustrates the problem-solving
method. The planning phase shows the concern step
followed by cause analysis. During the doing phase,
cause knowledge is used to identify a countermeasure
to solve the problem.
The power of problem solving is its efficiency in find-
ing a solution through a systematic approach that en-
ables it to be taught and used widely in organizations.13
Problem solving is criticized for inhibiting learning,
however, because it can limit the problem space with
constraints created by the initial problem definition.14,15
Root cause analysis uses reasoning based on norma-
tive causality—that is, solutions within existing mental
models that tend to focus on incremental improvements
rather than architectural or systemic improvements.16,17
Furthermore, problem solving tends to focus on techni-
cal improvements and not sufficiently on the necessary
cultural transformation and competence building of
people and teams.18
Appreciative inquiryDavid L. Cooperrider and Suresh Srivastva developed
the appreciative inquiry improvement method, which
focuses on building improvement competence.19 Cooper-
rider’s research showed cultural change occurred faster
and more creatively when change efforts focused on ex-
panding existing success experiences rather than iden-
tifying problems to eliminate.20 Based on this finding,
appreciative inquiry was developed as a method for de-
fining preferred future states and building competence
to reach them. Table 1 describes the underlying princi-
ples of appreciative inquiry.
The appreciative inquiry method can be initiated
from either a problem or an opportunity through:
1. Defining an affirmative topic—a compelling
and attractive question for which the answer initi-
ates desired change. An affirmative topic reformula-
tion transforms a statement such as: “The problem to
solve is the team’s low productivity and high absen-
teeism” into the question, “How do we become a high-
performance team in which everyone uses their top
strengths every day?” The difference in engagement
and opportunities for action is remarkable and shows
the simultaneity principle in action. This question alone
begins an improvement journey.
2. Discovery of success factors already existing
in the organization for answering the affirmative
topic (for example, positive experiences, strengths,
knowledge and motivations). By sharing stories that il-
luminate success factors, the positive principle is put
into action.
3. Creation of a shared future state. Here, as
many participants as possible are engaged in co-creat-
ing and visualizing the preferred future state. This acti-
vates constructionist and anticipatory principles.
4. Design of solutions for realizing the future
state. The solutions should be provocative in that they
make people think and act in new ways.21 Successful
initiatives often create a guiding metaphor that contin-
1. Anticipatory principle: Actions are guided by images and expectations of the future—that is, positive future images create positive actions.
2. Constructionist principle: Everyone who must be part of the change should participate in the construction process to understand the new future.
3. Poetic principle: The issues that get attention grow in peoples’ minds; the change must develop and sustain a new language for the desired future state.
4. Positive principle: Building momentum for change requires positive affect and social bonding such as hope, excitement, inspiration and urgent purpose.
5. Simultaneity principle: Change begins with the questions asked, and analysis cannot be isolated from implementation.
Source: David L. Cooperrider, Diana Whitney and Jackie M. Stavros, Appreciative Inquiry Handbook, Crown Custom Publishing, 2008.
Five principles of appreciative inquiry / TABLE 1

June 2015 • QP 21
ues all the way until implementation.22
5. Implementation and turning designs into
action. Often, initiatives that create transformational
change drive prioritization based on engagement and
personal initiative rather than planning the change.23
Figure 3 illustrates appreciative inquiry. First, the
problem (or opportunity) is reframed into an affirmative
topic, success factors are identified and a desired future
state is visualized. The doing phase uses the success
factors for designing and realizing the improvement.
Figure 3 shows appreciative inquiry as future ori-
ented, creating improvement by elevating competence
in the system. The method assumes that cause-relation-
ship understanding is not necessary to create improve-
ment; you need to understand only the desired future
state and how to get there.
Frank C. Johnston and Duane P. Beck highlight
the power of the positive approach applied to lean Six
Sigma and highlight how elements from positive psy-
chology can help create an empowered and a more pro-
ductive workforce.24 Accordingly, appreciative inquiry
brings competence-building elements into the improve-
ment method:
• In the affirmative topic step, by broadening the solu-
tion space and generating new social assumptions.25, 26
• In the success factor analysis by accelerating learning
through success experiences focus,27, 28 reinforcement
of positive behavior,29 surfacing tacit knowledge30 and
by raising social relations and expectations.31
• In the future state visualization step by creating
shared purpose and positive future images.32
Broader frameworkAs illustrated, problem solving and appreciative in-
quiry methods differ in how they initiate improvement,
describe goals and collect knowledge. Problem solving
focuses on realization and appreciative inquiry on com-
petence building.
The two methods’ steps can be used to form an im-
provement method framework that visualizes a combi-
nation of possibilities (see Figure 4, p. 22). The six cir-
cles represent improvement steps, and the arrows show
possible combinations. Each combination represents
an alternative improvement method. For example:
• Problem solving starts with the problem statement
(one), followed by cause analysis (three) and finishes
with the design of solutions (six).
• Appreciative inquiry starts with affirmative topic
choice (two), success factor analysis (four), followed
by future state visualization (three) and finally the
design of solutions (six).
Although the two methods seem mutually exclusive,
they are not. Some methods combine steps from each.
For example, the Toyota Kata33 (steps one, three, four
and six) and the Solutions Focus method34 (steps one,
two, five and six).
Adding new methods to your paletteThe improvement method framework can be used to
design a palette of methods supporting any specific
improvement strategy, as steps on the left side in
Figure 4 emphasize realization and the steps on the
right side emphasize competence building. Here are
three methods based on empirical exploration of the
framework:
1. Learn from daily success. Step two: Ask, “How
can we elevate the best of what we already do?” Step
five: Monitor daily performance and use anything
exceeding the expected as an opportunity to initiate
systematic success factor analysis. Step six: Rein-
force the success factors and repeat the successes in
the future.
2. Share the problem-solving perspective. Step one:
Define the problem and grasp the current situation.
Step three: Gather stakeholders and create a shared
visualization about the future. Step four: Analyze
problem causes to the root. Step six: Identify coun-
termeasures to eliminate problems and realize the
desired future state.
3. Solve problems by competence building. Step
PROBLEM SOLVING
Appreciative inquiry improvement method / FIGURE 3
2. What are oursucess factors?
1. Formulate affirmativetopic.
3. What is the preferred future?
4. Use success factors todesign improvement.
Planning phase
Doing phase
Problem Visualize
Affirmativetopic
Improvement

QP • www.qualityprogress.com22
one: Define the problem and grasp the current situ-
ation. Step three: Gather stakeholders to create a
shared vision of the future. Step five: Identify success
factors for realizing the shared vision’s elements. Step
six: Identify initiatives that turn the success factors
into solutions to the problem.
Taking the next stepImprovement efforts should address realization efficien-
cy and competence building. An improvement strategy
should explicitly choose how to balance efforts. Because
different improvement methods develop realization effi-
ciency and competence building differently, the methods
also should be actively chosen.
Examples in the article show how improvement
methods can be designed to support different improve-
ment strategies. A framework for designing methods
for a particular improvement strategy shows how ele-
ments of problem solving and appreciative inquiry can
be combined for more comprehensive improvement
methods for daily improvement activities.
The art of defining and operating an improvement
strategy is a key competence in successful quality and
operations management. What’s your next step? QP
REFERENCES AND NOTE1. Chris A. Voss, “Paradigms of Manufacturing Strategy Revisited,” International
Journal of Operations and Production Management, Vol. 25, No. 12, 2005, pp. 1,223-1,227.
2. Maurizio Zollo and Sidney G. Winter, “Deliberate Learning and the Evolution of Dynamic Capabilities,” Organization Science, Vol. 13, No. 3, 2002, pp. 339-351.
3. Gopesh Anand, Peter T. Ward, Mohan V. Tatikonda and David A. Schilling, “Dy-namic Capabilities Through Continuous Improvement Infrastructure,” Journal of Operations Management, Vol. 27, 2009, pp. 444-461.
4. Pernille H. Brun and Mikkel Ejsing, Leading From a Strength-Based Perspec-
tive, Danish Psychological Publishers, 2012.5. David Rock and Jeffrey Schwartz, “The Neuroscience of Leadership,”
Strategy+Business, Issue 43, 2006.6. John R. Dew, “In Search of the Root Cause,” Quality Progress, March 1991, pp.
97-102.7. A.V. Hill, The Encyclopedia of Operations Management, Pearson Educational,
2012.8. Jeffrey K. Liker, The Toyota Way—14 Management Principles From the World’s
Greatest Manufacturer, McGraw-Hill, 2004, pp. 256.9. John Shook, Managing to Learn—Using the A3 Management Process to Solve
Problems, Gain Agreement, Mentor and Lead, Lean Enterprise Institute, 2008.10. In this article, all these scientific methods are referred to as problem solving.11. Rick Delbridge and Harry Barton, “Organizing for Continuous Improvement:
Structures and Roles in Automotive Components Plants,” International Journal of Operations and Production Management, Vol. 22, No. 6, 2002, pp. 680-692.
12. Chris Argyris, “Double Loop Learning, Teaching and Research,” Academy of Management Learning and Education, Vol. 1, No. 2, 2002, pp. 206-218.
13. Mike Rother, Toyota Kata—Managing People for Improvement, McGraw-Hill, 2010.
14. Michel Avital, “Innovation in Information Systems Education: Accelerated Systems Analysis and Design With Appreciative Inquiry—An Action Learning Approach,” Communications of the Association for Information Systems, Vol. 15, 2005, pp. 289-314.
15. Frank J. Barrett, “Creating Appreciative Learning Cultures,” Organizational Dynamics, Vol. 24, 1995, pp. 36-49.
16. Mark Paradies, “Under Scrutiny,” Quality Progress, April 2010, pp. 32-37.17. Mary J. Benner and Michael L. Tushman, “Exploitation, Exploration and
Process Management: The Productivity Dilemma Revisited,” Academy of Management Review, Vol. 28, No. 2, 2003, pp. 238-256.
18. Jeffrey K. Liker and Gary Convis, The Toyota Way to Lean Leadership, McGraw-Hill, 2011.
19. David L. Cooperrider and Suresh Srivastva, “Appreciative Inquiry in Organiza-tional Life,” Research in Organizational Change and Development, Vol. 1, 1987, pp. 129-169.
20. Ibid.21. David L. Cooperrider, Diana Whitney and Jackie M. Stavros, Appreciative
Inquiry Handbook, Crown Custom Publishing, 2008.22. Ibid.23. Gervashe R. Bushe and Aniq F. Kassam, “When Is Appreciative Inquiry Trans-
formational? A Meta-Case Analysis,” Journal of Applied Behavioral Science, Vol. 41, No. 2, 2005, pp. 161-181.
24. Frank C. Johnston and Duane P. Beck, “The Power of Positive,” Quality Prog-ress, February 2012, pp. 18-23.
25. Avital, “Innovation in Information Systems Education: Accelerated Systems Analysis and Design With Appreciative Inquiry—an Action Learning Approach,” see reference 14.
26. Kenneth J. Gergen, “Toward Generative Theory,” Journal of Personality and Social Psychology, Vol. 36, No. 11, 1978, pp. 1,344-1,360.
27. Daniel S. Kirschenbaum, Arnold M. Ordman, Andrew J. Tomarken and Robert Holtzbauer, “Effects of Differential Self-Monitoring and Level of Mastery on Sports Performance: Brain Power Bowling,” Cognitive Therapy and Research, Vol. 6, No. 3, 1982, pp. 335-342.
28. Barrett, “Creating Appreciative Learning Cultures,” see reference 14.29. Rock, “The Neuroscience of Leadership,” see reference 5.30. Ikujiro Nonaka, “The Knowledge-Creating Company,” Harvard Business
Review, Vol. 7, 2007, pp. 162-171.31. Robert Rosenthal, “Interpersonal Expectancy Effects: A 30-Year Perspec-
tive,” Current Directions in Psychological Science, Vol. 3, No. 6, 1994, pp. 176-179.
32. David L. Cooperrider, “Positive Image, Positive Action: The Affirmative Basis of Organizing,” which appears in Cooperrider, Peter F. Sorensen, Diana Whitney and Therese F. Yaeger’s Appreciative Inquiry: Rethinking Human Organization Toward a Positive Theory of Change, Stipes Publishing, 2000, pp. 29-53.
33. Rother, Toyota Kata—Managing People for Improvement, see reference 13.34. Paul Z. Jackson and Mark McKergow, The Solutions Focus: Making Coaching
and Change Simple, Nicholas Brealey Publishing, 2007.
Improvement method framework / FIGURE 4
Realizationfocus
High
Low
Low HighCompetencebuilding focus
Design ofsolutions
(6)
Future statevisualization
(3)
Successfactor analysis
(5)
Affirmativetopic choice
(2)
Causeanalysis
(4)
Problemstatement
(1)
DAVID HANSEN is a senior consultant at Resonans in København, Denmark. He holds a doctorate in man-agement engineering from the Technical University of Denmark in Lyngby. He is an associate member of ASQ.
PROBLEM SOLVING

Check out the LATEST Memory Joggers available from ASQ Quality Press!
Conflict at a Glance Memory JoggerThis guide will help you understand common types of conflicts, body language, ineffective and effective dialog, and the power of good listening skills. Learn the simple steps of a conflict management approach, whether you are cultivating a new mindset and way of interacting as a supervisor or as a member of a team or community group, or if you are mediating a dispute between people.
Item: P1581
The Risk Management Memory JoggerThis guide will help you deal with the potentially rocky road of opportunity and risk. It begins with a road map and a five-step plan for how to proceed, including the “rules of the road” such as key terms to know, pitfalls to avoid, and tips that will keep you moving toward your goals.
Item: P1580
The Trust Memory Jogger
Learn how to cultivate trust and relate to people in your organization, and your suppliers, so that all of you can be successful and profitable and feel good about achieving your goals. This book can help you move to a higher level in your relationships and give you the power to feel confident about each step you take in bettering your own trustworthiness and in building trust with others.
Item: P1579
CERTIFICATION MEMBERSHIP PUBLICATIONSTRAINING CONFERENCES
Learn more about these books through the Quality Press bookstore at asq.org/quality-press.
This Month’s Top Pick!


June 2015 • QP 25
CUSTOMER SATISFACTION
by Shu Liu
In 50 Words Or Less • For personal product re-
views, today’s customers rely on other consumers’ online comments.
• To better understand the voice of their custom-ers, organizations are leveraging vast amounts of online consumer infor-mation.
• Beyond providing quality products and services, organizations must gain trust by engaging cus-tomers on social media and cultivating trust agents.
Like AbilitiesEngaging customers through social media is a key to earning trust
AFTER MUSICIAN Dave Carroll’s United Air-
line’s flight landed, he and other passengers watched with
horror through the airplane windows as baggage handlers
threw guitars onto the tarmac. Carroll, a member of the
band Sons of Maxwell, later arrived at the baggage carou-
sel and found his guitar—broken.
During the next nine months, Carroll filed claims in
numerous ways, but the only response he received from
the airline was a firm, “No.” Finally, the musician produced
a music video, “United Breaks Guitars,” and posted it on
YouTube. It immediately went viral—viewed by nearly 14
million people—and ultimately, it created a dip in United’s
shares that cost the airline $180 million.1

QP • www.qualityprogress.com26
This public relations disaster is an example of how
an organization can rapidly lose its reputation in to-
day’s Information Age.
Online trust Today, trust levels toward governments and corpora-
tions are at historical lows. In fact, economists have
found lack of trust to be one of the reasons for the re-
cent global recession.2
Conversely, our trust in what friends, or even
strangers, say online is gaining ground every day. Con-
sumers feel connected with each other on the internet,
and they believe most of the online reviews posted by
others with common interests are unbiased.
A study conducted in 2008 by Nielson reported 81%
of consumers consulted online reviews prior to their
holiday purchases and 90% of people trust peer recom-
mendations, but only 14% trust advertisements.3 In the
past 20 years, there has been an upward trend in trust-
ing online information—from information sharing to
handling of credit information. Now, this trust is creat-
ing new online marketplaces.4
Customer empowermentTechnology has completely changed the business land-
scape, giving individual customers powerful voices.
Historically, 96% of frustrated customers did not both-
er to complain, but 67% of them would not buy from
that organization again.5 Today, anyone can leave his or
her reviews on various online sites, such as Facebook,
Twitter, Google+, Bing, Yahoo Local, Yelp and Insider
Pages.
The 2012 American Express Global Customer
Service Barometer report showed that, on average, a
happy customer would tell 42 people through social
media about his or her pleasant experiences, while a
frustrated customer would tell 53 people through so-
cial media.6
This new form of word-of-mouth reviewing dis-
seminates quickly while keeping its original integrity
and traceability intact.7 It forces organizations to be
transparent and responsive. An organization can no
longer ignore customer complaints because customers
are just one Google search away from the answers. An
organization’s reputation can be easily blemished by
reviews from just a few unhappy customers.
In this new age, only organizations that deliver great
products and services will be able to survive, but this is
only the first step. More must be done to win custom-
ers’ trust through continuous quality improvement and
by using powerful internet technologies.
Voice of the customerWhen customers can easily post their comments on-
line, organizations must monitor and listen to these
voices. Active listening helps them make changes to
their products and services to meet customers’ needs,
quickly solve problems voiced in complaints, discover
new opportunities and avoid making the mistake of de-
livering something customers don’t want.
When listening, get to know each online speaker by
asking five W’s: Who is this person? What is this person
talking about? From what perspective (where) is this
person speaking? When is this person talking, and why
is this person commenting?8
Many online listening tools are available (see Table
1). Although advanced listening systems are not free,
they provide a systematic way to tap into a high vol-
ume of conversations and to generate real-time analy-
ses more cost-effectively than using traditional mar-
keting research.
Analyze big dataBecause the amount of data added every second is
huge, you must build a system to store and analyze it:
Welcome to the big data world. Big data are collec-
tions of data sets that are too big and complex to
be processed using traditional databases and data
processing tools.9
Prediction is at the center of big data—applying
mathematics to huge datasets to infer probabilities.10
Free listening tools Advanced listening systems
Google alerts Meltwater Buzz
Technorati blog search Parature
Twitter search Radian6
Facebook search Sysomos
YouTube search Cision
TweetBeep
Source: Dave Kerpen, Likeable Social Media: How to Delight Your Customers, Create an Irresistible Brand, and Be Generally Amazing on Facebook (& Other Social Networks), McGraw-Hill, 2011.
Online listening tools / TABLE 1

June 2015 • QP 27
Big data analysis helps organizations understand cus-
tomers’ needs and wants to make smart business deci-
sions.
Handling big data is not easy. A study found more
than 70% of executives think they are incapable of le-
veraging what data are saying, and more than 50% of
organizations do not know how to make business deci-
sions based on predictive analytics.11 In a world that
“datafies” everything, however, only the organizations
that master big data have a chance to outperform their
competitors and widen their leads.12
Analyzing what people “like” on social media, for
example, will help organizations understand what
consumers will buy in the future. A leading sport shoe
producer analyzed real-time messages on social media
during the 2010 World Cup to interpret the sentiments
behind the comments. By doing so, the organization
was able to quickly fine-tune its sponsorship activities
and rapidly adjust its advertising themes and product
launch strategies.13
The following are examples of quality tools that are
powerful in customer data analysis:
• Fishbone diagrams can find the root causes of a
quality problem.
• A Pareto chart can highlight the most important
quality issue.
• Affinity diagrams can be applied to organize large
amounts of data and information into a grouping
based on natural relationships.
• Interrelationship digraphs can display all the inter-
related cause-and-effect relationships and factors in
a complex problem.
• Quality function deployment can transfer the voice
of customers into design quality.14
Engage customersEngaging communication with customers has always
been important to gain an advantage on competitors.
To get in today’s customers’ minds, however, organi-
zations must use social media and other online tools
to foster communication between organizations and
customers, and among customers. This is especially
important in attracting and engaging young, tech-savvy
customers.
A study conducted by Synovate and Microsoft
found 28% of 18 to 24-year-olds talked about a brand
on a discussion forum, and they were more willing
than the rest of the population to add brand contents
to their text messages, web homepages and social net-
working sites.15
If you provide a platform for your customers to
connect, share information, learn from one another
and grow together, your customers will realize you
are committed to them. They will form an online com-
munity around your brand that creates a sense of trust
and loyalty.
A Best Buy Facebook fan, for example, is 5.3 times
more likely to purchase merchandise from the organi-
zation than those who aren’t Facebook fans. Custom-
ers who “like” Wal-Mart on Facebook are four times
more likely to buy there than the average person.16
There are many ways to engage your customers on-
line, but these three are essential:
1. Ask questions—You can use the unlimited on-
line space to cater to your customers directly, ask-
ing what their needs and expectations are. You
can, for example, ask them about their best and
worst experience with your products and ser-
vices, and what you can do to better serve them.
You also can ask them what they’d like you to add
to your online communities and what they think of
your social media home pages.17
2. Invite customers to join your online com-
munities—Although you can offer incentives
to get them to jump in, the best attraction is the
quality of your communities. Make them a place
for people to laugh, share, connect and learn.
On Facebook, for example, 1-800-Flowers in-
vited its customers to join the conversation and
win prizes. NYC Quits offers free support for quit-
ting smoking, and Stride Rite invites moms to
connect with other moms. Facebook launched
Facebook Stories in 2010 to celebrate its mile-
stone of 500 million users and encourage peo-
ple to share their stories of using Facebook.
In your online communities, you also can conduct
crowdsourcing—an act of outsourcing your own
tasks to the citizens of your communities and asking
their help to solve a problem.18
3. Share your own stories with your custom-
ers—Your customers experience an emotional con-
nection with your organization when they hear the
stories about how your organization was born, how
it changed a customer’s life or how your employees
love their jobs. Share these wonderful stories online.
On your website’s “about us” page, convert your
CUSTOMER SATISFACTION

QP • www.qualityprogress.com28
mission statement into actual conversations with
your customers, showing you truly care about them
and put effort into connecting with them.19
Respond to complaintsA study showed seven of 10 complaining custom-
ers will do business again with the organization if it
handles their complaints properly, and 19 out of 20
customers will do so if the organization solves their
problems swiftly.20
Online complaints are easy to find, and they quickly
identify areas for improvement. Unlike ineffective or-
ganizations that try to either ignore or obfuscate online
complaints, effective organizations always embrace
them as opportunities for improvement.
Dave Keppen, author of Likeable Social Media, rec-
ommends a two-step process for responding to online
complaints. First, post a public response: “I’m sorry
you had an issue, John. Please see the private message
we sent you to resolve the matter.” By sending this
message, you publicly show you listen to your custom-
ers and act on their complaints quickly.
Next, immediately send a private message to John:
“Sorry you had a bad experience, John. If you email
us with your account information, we’ll try to resolve
the issue as quickly as possible.” By taking the issue
into a private exchange, you avoid making public the
back-and-forth communications that could prolong the
negative situation.21
Ensure you have enough resources available to an-
swer complaints within 24 hours. In case of a complaint
surge, you must at least send out a response such as,
“I’m sorry. We’ll look into that and get back to you with
a private message within 72 hours.” Do not delete any
complaint unless it is obscene, profane or offensive.22
A common mistake many organizations make is ne-
glecting customers who praise them, and it’s probably
because nobody will get fired for not responding to a
happy customer. These organizations don’t realize that
retaining happy customers is as important as comfort-
ing unhappy ones.
A happy customer who uses social media will tell
more than four times as many people about his or her
pleasant experiences than will a person has who does
not use social media.23
Another study showed an organization’s customer
attrition rate can reach 50% in five years if the orga-
nization does not communicate well with customers.
On the other hand, if an organization increases its cus-
tomer retention rate by just 5%, its profits can increase
up to 95%.24
Remember that the average person on Facebook
has about 130 friends. When you thank your custom-
ers, grab the opportunity to expand your reputation
by asking, “Do you have any friends who would be
appropriate for me to talk to?” or “Thanks! Could you
please let your friends know about your experience
with us?”25
Online communication with happy customers can
create ongoing conversations. After you respond to
a compliment, the customer may continue talking to
you, join your online community or even become one
of your brand ambassadors—the customers who love
your organization so much that they’re happy to spread
the good word for you.26
Become trust agentsThese methods can win your customers’ trust online,
but the tasks must be done by people inside your orga-
nization who are able to use the internet to build influ-
ence, improve reputation and earn trust. They’re called
trust agents,27 and they have six characteristics:
1. They develop their own ways of doing things.
Through consistent experimentation, trust agents
continuously find better ways to do things. It helps
them stand out and establish themselves as the ex-
perts who are trusted by other people in the field.
Because they are the inventors of the new methods,
they set rules for others to follow. Marching to a dif-
ferent drummer is about standing out.
2. They are one of us. These agents are competent
and reliable. They listen carefully to their customers
and speak honestly and openly on Twitter, blogs or
websites. They’re eager to serve their online com-
munities. They frequently interact with customers
and are always the first to initiate a relationship.
They are therefore regarded by customers as “one of
us,” and being one of us is about belonging.
3. They leverage the Archimedes effect. They al-
ways use a certain amount of effort to maximize
their unique abilities. The Archimedes effect is
about leverage. Trust agents take what works and
move the value into something else. If something
is less valuable to one person, the agent moves it
to someone who can benefit from its greater value.
They spend time doing what they do best, and they

June 2015 • QP 29
always try new things.
4. They become the source. This is about developing
access. Trust agents are in the center of a network
and skillful at spreading ideas to their audiences.
They make building relationships a high priority and
reach out to individuals, thus constantly improving
the connections among the members of their online
communities. Trust agents use networks to effec-
tively complete projects, find resources and reach
the right people at the right time.
5. They have strong people skills. Trust agents de-
velop understanding and know how to empower
people, when to improve relationships and when to
step away. They communicate with their customers
in a real and thoughtful way. They interact with cus-
tomers on customers’ terms.
6. They build an army. They strive to build an army
of trust agents in their organizations, believing the
results will be tremendous when everyone contrib-
utes.28
Technology presents organizations great challenges
and opportunities. On the one hand, it’s difficult to do
business when trust isn’t previously established and
customers have access to vast amounts of informa-
tion. On the other hand, the internet allows organiza-
tions to reach out to large audiences, listen to them
actively and analyze data from customers’ comments
to improve the quality of their products and services.
Organizations can engage customers in caring on-
line communities and respond quickly to their com-
plaints and compliments. To do so, they must develop
an army of trust agents who are capable of humanizing
their businesses online.
Those organizations, combined with their quality
products and services, will win customers’ trust and
build their reputations in the marketplace. QP
REFERENCES1. Eddie Wrenn, “The Sweet Music of Revenge: Singer Pens YouTube Hit After
United Airlines Breaks His Guitar ... and Shares Plunge 10%,” Dailymail.com, July 24, 2009, http://tinyurl.com/unitedcarroll.
2. R. Bradley Harmon, How to Create, Protect and Promote Your 5 Star Reputation Online, ABC’s Legacy LLC, 2012.
3. Larry Weber, Marketing to the Social Web: How Digital Customer Com-munities Build Your Business, second edition, Wiley, 2009.
4. Rachel Botsman, “The Currency of the New Economy Is Trust,” Ted.com, www.ted.com/talks/rachel_botsman_the_currency_of_the_new_ economy_is_trust.html.
5. Michael W. Michelson Jr., “Turning Complaints Into Cash,” American Sales-man, Vol. 48, No. 12, p. 22.
6. American Express, “Social Media Raises the Stakes for Customer Service,” http://about.americanexpress.com/news/pr/2012/gcsb.aspx.
7. Erik Qualman, Socialnomics: How Social Media Transforms the Way We Live and Do Business, second edition, Wiley, 2012.
8. Chuck Hermann, “The Five Ws of Social Media Listening,” Social Media Explorer, Aug. 18, 2009, www.socialmediaexplorer.com/social-media-marketing/the-five-ws-of-social-media-listening.
9. Wikipedia, “Big Data,” http://en.wikipedia.org/wiki/big_data.10. Shu Liu, “Breaking Down Barriers,” Quality Progress, January 2014, pp.
17-22.11. Qualman, Socialnomics, see reference 7.12. Victor Mayer-Schonberger and Kenneth Cukier, Big Data: A Revolution
That Will Transform How We Live, Work and Think, Eamon Dolan/Houghton Mifflin Harcourt, 2013.
13. Marc Teerlink and Michael Haydock, “Customer Analytics Pay Off: Driving Top-Line Growth by Bringing Science to the Art of Marketing,” IBM Global Business Services Executive Report, September, 2011.
14. Nancy R. Tague, The Quality Toolbox, second edition, ASQ Quality Press, 2010.
15. Webwire, “Young Adults Eager to Engage With Brands Online, Global Research From Microsoft and Synovate Reveals,” Nov. 11, 2008, www.webwire.com/viewpressrel.asp?aid=79517#.usnf6_rdske.
16. Rahul Dubey, “Facebook Fans Are Brand Advocates: Forrester,” July 3, 2012, www.exchange4media.com/47065_facebook-fans-are-brand-advocates-forrester.html.
17. Dave Kerpen, Likeable Social Media: How to Delight Your Customers, Cre-ate an Irresistible Brand, and Be Generally Amazing on Facebook (& Other Social Networks), McGraw-Hill, 2011.
18. Ibid.19. Ibid.20. American Express, “Social Media Raises the Stakes for Customer Service,”
see reference 6.21. Kerpen, Likeable Social Media, see reference 17.22. Ibid.23. American Express, “Social Media Raises the Stakes for Customer Service,”
see reference 6.24. Qualman, Socialnomics, see reference 7.25. Kerpen, Likeable Social Media, see reference 17.26. Ibid.27. Chris Brogan, Trust Agents: Using the Web to Build Influence, Improve
Reputation and Earn Trust, second edition, Wiley, 2010.28. Ibid.
CUSTOMER SATISFACTION
SHU LIU is a lean Six Sigma Master Black Belt at Hexion Inc. in Houston. He holds a doctorate in chemistry from Virginia Polytechnic Institute and State University in Blacksburg. A senior member of ASQ, Liu is an ASQ-certified Six Sigma Black Belt and manager of quality/orga-nizational excellence.
Organizations don’t realize that retaining happy customers is as important as comforting unhappy ones.

Assessing the
In 50 Words Or Less • To achieve organiza-
tional change, the entire workforce must be included and engaged in the efforts.
• The first step is to take a close look at the orga-nization’s business en-vironment—everything from internal processes to competition and customer expectations.
• Business environment analysis tools help in understanding where improvement is needed.
Start with business environment analysis tools to implement organizational change
by Owen Ramsay

June 2015 • QP
SUCCESSFULLY LEADING performance improvement
initiatives in any organization, whether a hospital, processing plant, non-
profit organization or unionized government agency, requires an approach
or method that captures the imagination and interest of the organization’s
entire workforce.
One such approach is the lean Six Sigma rapid improvement method
(LSSRIM), which emphasizes analyzing the business environment as the
first step of the organizational improvement process.
ORGANIZATIONAL CHANGE
31
QP • www.qualityprogress.com32
Consider four cases, each with the goal of organiza-
tional improvement:
1. In 2008, one of the many challenges facing the
management team of ASQ’s Long Island, NY, Section
was to determine an effective path for improving qual-
ity and cost of service to members.
To address these challenges, the section leadership
team conducted a comprehensive appraisal of the sec-
tion’s internal and external environment before deter-
mining suitable actions to assign to improvement teams.
2. In the summer of 2013, an intermediate school
facing competition from a chartered school program
was under considerable pressure to satisfy a range of
expectations that included student performance and
financial accountability.
The school’s principal and his management team
adopted the LSSRIM model, which transformed the
school’s approach to education by redirecting goals
and processes toward the expectation of achieving the
same high-quality education for all students. The team
wanted to emphasize academic standards, teaching
techniques and greater accountability through leader-
ship, and to support programs for excellence equally
in all departments.
The business environment was assessed using
LSSRIM to gain insight into the factors likely to in-
fluence the workforce. This was the first step in the
team’s quest to enact radical change to generate break-
through results in effectiveness and performance.
3. The top management for a cement production
company in the Caribbean was frustrated about its
inability to shape business outcomes and manage its
own destiny and the destiny of its unionized staff.
Previous change initiatives had involved workers
who were resistant to change. This made the organiza-
tion’s leaders unsure whether they had the resolve to
transform the organization by adopting a new vision in
a changing and competitive marketplace.
During an eight-week period of applying the envi-
ronmental analysis component of LSSRIM, top man-
agement stimulated the creativity, innovation and
passion needed by its workforce to envision new op-
portunities for the organization.
4. A few years ago, a semiautonomous government
agency used the environmental analysis component of
LSSRIM to transform the traditional-thinking mindset
and culture of its management and staff. Transforma-
tion required that each staff member understood and
became aligned with top management’s priorities.
During the process, staff members made deep per-
sonal changes needed to be more effective at their jobs.
The results were significant performance improve-
ments in process speed and customer satisfaction.
What is LSSRIM?LSSRIM draws from many tools and methods:
• Lean Six Sigma precepts.
• The suppliers, inputs, process core activities,
output, customers, competitors and expectations
(SIPOCCE) method.
• Strengths, weaknesses, opportunities and threats
(SWOT) analysis.
• The political, economic, social, technological, legal
and environmental (PESTLE) business environ-
ment analysis tool.
• Balanced scorecard principles.
• The core values of the Malcolm Baldrige Perfor-
mance Excellence Award program (see Figure 1).
The lean Six Sigma component of LSSRIM involves
leadership engagement, customer-driven strategic
goals and infrastructure deployment, emphasizing the
importance of critical-to-success engagement and top
management buy-in of a customer-centric, team-orient-
ed business strategy.
Delivering high-value results through the appropri-
ate and timely use of resources is achieved by selecting
the right people and projects, improving process cycle
time, and conducting error-elimination management.
The processes and principles associated with value-
based management—as defined in complexity value
stream maps (CVSM)—combined with the structured
improvement opportunities provided through the de-
fine, measure, analyze, improve, control and sustain
model provide the data-driven inputs to the lean Six
Sigma process. These tools are used to achieve break-
through performance in realizing customer-driven stra-
tegic goals.
Business environment analysis toolsThe suppliers, inputs, process, outputs and customers
(SIPOC), SWOT and PESTLE approaches are often
used as strategic planning tools in the early stages of
the development process. Important considerations
related to competitors and customer expectations,
however, are often not factored into the environmen-
tal analysis and planning processes. This compromis-

June 2015 • QP 33
es the employees’ timely buy-in to the or-
ganization’s value propositions; therefore,
a SIPOCCE diagram was used in place of
the SIPOC.
A value proposition is a promise of
value to be delivered to a customer and a
belief by the customer that the perceived
value will be experienced. The objectives
of the environmental analysis must be to
identify and understand the factors that af-
fect the strategic relationships within spe-
cific market opportunities that are likely
to affect alignment in the organization and
the realization of its value propositions.
SIPOCCE diagramA SIPOCCE diagram is a foundational tech-
nique for Six Sigma management and im-
provement. It builds on the principles of a
SIPOC diagram. The seven major elements
of the SIPOCCE diagram are:
1. Supplier—the person or organiza-
tion providing resources (information,
materials or service) to the process. The
relationship with the supplier must drive competitive
advantage and provide a high degree of competitive
differentiation. Interactions should go beyond pur-
chasing and fulfillment transactions. Organizations
should focus on having strong, long-term relationships
with strategic suppliers.
2. Input—the information, materials or service the
supplier provides that is expended in an organization’s
operation to achieve output or a result. These are pur-
chased items—everything the organization pays for,
such as materials used in production, supplies, freight,
utilities, local taxes, labor and contributions (in the
case of nonprofits).
3. Process—the set of action steps that transforms
inputs into outputs by adding customer value. This is
a sequence of interdependent and linked procedures
that, at every stage, consume one or more resources
(employee time, energy, machines or money) to con-
vert inputs (data, material and parts) into outputs.
These outputs serve as inputs for the next stage until a
known goal or end result is reached.1
4. Output—the final product or service resulting
from the process. These are products and services
generated as a result of the organization’s being in
business for the benefit of customers, employees, com-
munity and shareholders.
5. Customer—the person, process or organization
that receives the output.
6. Competitors—Knowing who competitors are
and what they are offering can help the organization
make its products, services and marketing stand out.
It will enable an organization to set its prices competi-
tively and help it respond to rival marketing campaigns
with its own initiatives.
Consider the products or services competitors pro-
vide, how they market to customers, the prices they
charge, how they distribute and deliver, the devices they
employ to enhance customer loyalty and what back-up
service they offer. Think about competitors’ brand and
design values, whether they innovate in terms of busi-
ness methods as well as products, the size and caliber
of their staffs and how extensively they use IT.
Check into who owns the competitors, read annual
reports if they’re public companies, and look at their me-
dia activities by checking their websites and advertising.2
7. Expectations—the primary customer value
proposition for each product offered. Customers hold
explicit and implicit performance expectations for attri-
ORGANIZATIONAL CHANGE
Lean Six Sigma rapid improvement methods framework / FIGURE 1
Core valuesSIPOCCE, PESTLE and SWOT analyses
Customer-driven
strategicgoals
Selectingthe rightpeople
and projects
Process cycletime and error
eliminationmanagement
Infrastructuredeployment
plan
ResultsLeadershipengagement
CVSM, DMAICS, balanced scorecard
CVSM = complexity value stream mapDMAICS = define, measure, analyze, improve, control and sustainPESTLE = political, economic, social, technological, legal and environmentalSIPOCCE = suppliers, inputs, process core activities, output, customers, competitors and expectationsSWOT = strengths, weaknesses, opportunities and threats
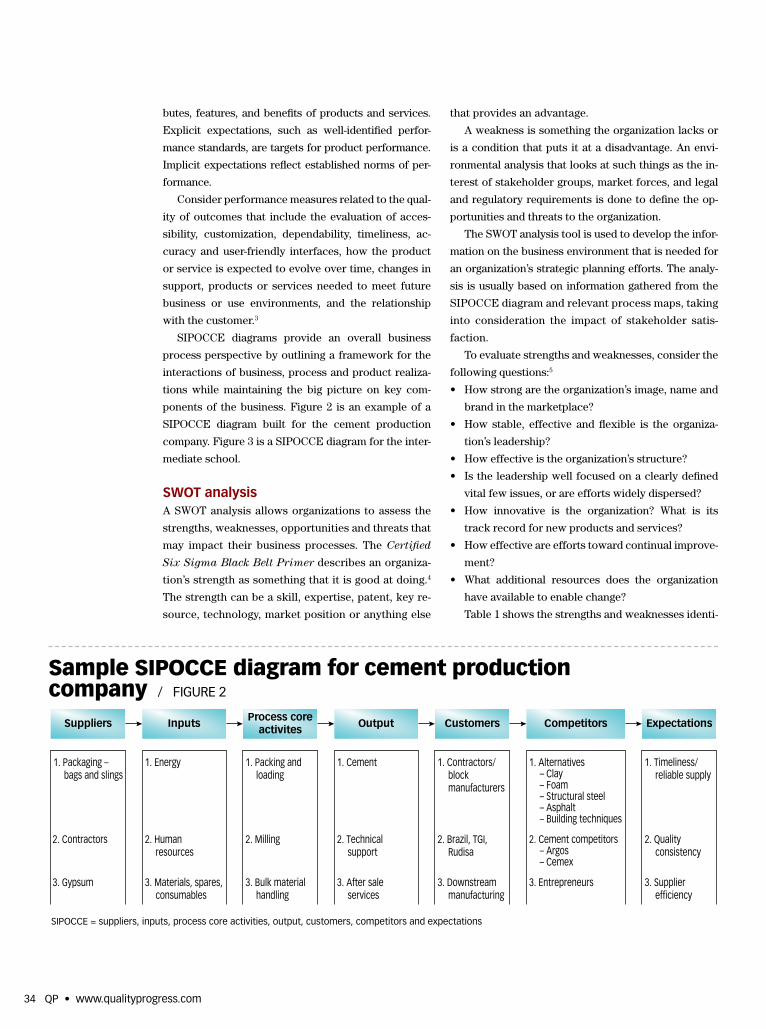
QP • www.qualityprogress.com34
butes, features, and benefits of products and services.
Explicit expectations, such as well-identified perfor-
mance standards, are targets for product performance.
Implicit expectations reflect established norms of per-
formance.
Consider performance measures related to the qual-
ity of outcomes that include the evaluation of acces-
sibility, customization, dependability, timeliness, ac-
curacy and user-friendly interfaces, how the product
or service is expected to evolve over time, changes in
support, products or services needed to meet future
business or use environments, and the relationship
with the customer.3
SIPOCCE diagrams provide an overall business
process perspective by outlining a framework for the
interactions of business, process and product realiza-
tions while maintaining the big picture on key com-
ponents of the business. Figure 2 is an example of a
SIPOCCE diagram built for the cement production
company. Figure 3 is a SIPOCCE diagram for the inter-
mediate school.
SWOT analysisA SWOT analysis allows organizations to assess the
strengths, weaknesses, opportunities and threats that
may impact their business processes. The Certified
Six Sigma Black Belt Primer describes an organiza-
tion’s strength as something that it is good at doing.4
The strength can be a skill, expertise, patent, key re-
source, technology, market position or anything else
that provides an advantage.
A weakness is something the organization lacks or
is a condition that puts it at a disadvantage. An envi-
ronmental analysis that looks at such things as the in-
terest of stakeholder groups, market forces, and legal
and regulatory requirements is done to define the op-
portunities and threats to the organization.
The SWOT analysis tool is used to develop the infor-
mation on the business environment that is needed for
an organization’s strategic planning efforts. The analy-
sis is usually based on information gathered from the
SIPOCCE diagram and relevant process maps, taking
into consideration the impact of stakeholder satis-
faction.
To evaluate strengths and weaknesses, consider the
following questions:5
• How strong are the organization’s image, name and
brand in the marketplace?
• How stable, effective and flexible is the organiza-
tion’s leadership?
• How effective is the organization’s structure?
• Is the leadership well focused on a clearly defined
vital few issues, or are efforts widely dispersed?
• How innovative is the organization? What is its
track record for new products and services?
• How effective are efforts toward continual improve-
ment?
• What additional resources does the organization
have available to enable change?
Table 1 shows the strengths and weaknesses identi-
Sample SIPOCCE diagram for cement production company / FIGURE 2
Suppliers Inputs Process coreactivites Output Customers Competitors Expectations
1. Packaging –bags and slings
2. Contractors
3. Gypsum
1. Energy
2. Human resources
3. Materials, spares, consumables
1. Packing and loading
2. Milling
3. Bulk material handling
1. Cement
2. Technical support
3. After sale services
1. Contractors/block manufacturers
2. Brazil, TGI, Rudisa
3. Downstream manufacturing
1. Alternatives– Clay– Foam– Structural steel– Asphalt– Building techniques
2. Cement competitors– Argos– Cemex
3. Entrepreneurs
1. Timeliness/reliable supply
2. Qualityconsistency
3. Supplier efficiency
SIPOCCE = suppliers, inputs, process core activities, output, customers, competitors and expectations

June 2015 • QP 35
fied for ASQ’s Long Island, NY, Section. Table 2 (p.
36) shows the opportunities and threats identified
for ASQ’s Long Island, NY, Section.
When evaluating opportunities and threats, con-
sider:
• What viable business sectors are not being served?
• How are demographics or values changing in the
business communities?
• To enhance the effectiveness of programs or
services offered, with whom should the organiza-
tion pursue opportunities of partnership or alli-
ance?
• Does the likely future economic situation pose
risks or potential rewards?
PESTLE analysisA PESTLE analysis is a useful tool for understanding
risks associated with market opportunities.6 For the
purposes of strategic planning, alignment and buy-
in, it is important for employees to understand the
PESTLE factors that influence an organization’s abil-
ity to meet the needs of its stakeholders.
Discussions on each aspect of the PESTLE analy-
sis should center on determining the external factors
that may influence an organization’s ability to realize
its value proposition. Examples of discussion points
to consider are:
• Political—the extent of government intervention
ORGANIZATIONAL CHANGE
Sample SIPOCCE diagram for intermediate school / FIGURE 3
Suppliers Inputs Process coreactivites Output Customers Competitors Expectations
North Shore-LIJ = North Shore-Long Island Jewish Health SystemSIPOCCE = suppliers, inputs, process core activities, output, customers, competitors and expectationsY-City = an after-school program at school that is offered by the Young Men’s Christian Association (YMCA)
Pool of students grants
Partnership with hospitals
Y-City funds
Y-City funds
Legal systems
Instructors, bus services, parent support, student participation
Security, permits, parent support, student participation
Student interest, parent involvement
Applications, fliers, emails
Application, program planning for instruction
Vendor license, fliers, email, application
Legal outreach
North Shore-LIJ
“Y” after school
Ivy key
Students in eighth grade
Students in seventh andeighth grade
Students
Students in seventh grade
No competition district- wide; competes with each other for entry based on ethnicity
None; other middle schools
Beacon program
Other middle schools
Internship in a law firm, exposure and financial support to college life
Enrichment and improvement content in life skills
Entrance into one of the nine specialized high schools
Interest in medical field/science
Strengths Weaknesses
Strength of image Education and professional development
Publicity (lack of)
Stability and effectiveness of leadership
Professional recognition Attendance—increase membership; decrease apathy among members
Effectiveness of ASQ-LI’s structure
Intersection and collaboration with other sections and societies
Membership commitment
Is ASQ-LI’s leadership focused on the vital few issues or are efforts widely dispersed?
Interesting and well-timed meetings
Outreach—how and why members come
Innovation—new services offered
Networking Less attendance at meetings
Efforts toward continual improvement
ASQ-LI TV (too new to tell)
Social media presence
Availability of resources
Partner with other professional societies; outside sponsors; reach out to local organizations
Source: ASQ-LI Newsletter, Jan. 2014ASQ-LI = ASQ Long Island, NY, Section
Strengths and weaknesses of ASQ section / TABLE 1

QP • www.qualityprogress.com36
that impacts the organization’s ability to
meet its obligations. For many organiza-
tions, the interactions with government
institutions, elected officials and policy-
oriented activists shape the business
environment in ways that have direct
implications for their bottom lines. Top
management must be conscious of and
plan for the risk arising out of regulatory
and the legislative arenas that may im-
pact strategic goals and objectives.
• Economic—availability and sources
of monies for investment opportuni-
ties related to capacity, infrastructure
and expansion needs. As part of the
economic environment analysis, the
totality of economic factors, such as
employment, income, inflation rates,
interest rates, productivity and wealth,
that influence the buying behavior of
consumers and institutions also should
be examined.7
Opportunities Threats
What viable business sectors are not being served?
IT, education, healthcare, food, civic, government, retail, environment, legal, regulatory agencies, life science
Job market changing (how to market yourself)
Business community changes—demographics/values
Loss of military/space jobs, defense, pharmaceutical, age group skewing (lack of new blood, housing, taxes)
Value of certification (market it to management)
Partnership/alliances—to enhance the effectiveness of programs/services offered by ASQ-LI
IT, APICS, Eng LI, food technology, schools and nonprofit (collaboration)
Membership growth
Risks/potential rewards posed due to future economic situation
Generally risky; sell ASQ to improve organization (now is the time to invest); prevent/improve (proactive rather than reactive); training costs—not affordable; other areas (benefits)
Source: ASQ-LI Newsletter, January 2014ASQ-LI = ASQ Long Island, NY, SectionEng LI = engineering organizations in Long Island, NY
Sample factors Considerations Factors to consider
Political The extent of government intervention that affects an organization’s ability to compete.
The regional Action Plan for Prevention and Control of Contamination by Mercury.
Economic Availability of monies for investment opportunities related to capacity, infrastructure and expansion needs.
Agency is a self-financed organization that generates revenue and undertakes expenditure programs to fulfill its mandate.
Social Consider efforts to understand:
• The needs of the diverse staff culture.
• Challenges to the access of information on services especially in rural and river communities.
• The concomitant opportunities related to those needs.
Aging population, HIV/AIDS and other health issues affect the number of persons who are fit, healthy and employable.
Technological Projecting needs for differentiable technology that will provide quality and efficient services at lower costs.
New technologies needed for the development of non-traditional minerals development and introduction of cleaner minerals.
Legal The legal and regulatory impositions under which the commission operates.
The occupational health, safety and environmental regulations and their impact on staff and service delivery.
Implementation of the national protected areas system—legal challenges.
Environmental Impact of mining on the environment—environmental management.
Exploitation of uranium minerals.
Turbidity in waterways from hydraulic mining tailings management activities.
Increasingly stringent national and international conservation initiatives and competing land-use issues.
PESTLE = political, economic, social, technological, legal and environmental
Opportunities and threats that affect or are likely to affect ASQ-LI’s performance / TABLE 2
An example of a PESTLE analysis conducted at government agency / TABLE 3

June 2015 • QP 37
• Cultural—educational, economic and social needs
of a diverse staff culture. The cultural environment
of a business can be integral to an organization’s suc-
cess or failure. Effective leadership and teamwork
often lead to a positive and harmonious workplace
environment, which in turn leads to greater produc-
tivity and enhanced levels of customer satisfaction.
• Technological—needs for differentiable technology
that will provide quality and efficient services at low-
er costs. Some technological factors to consider in-
clude web terminology; technology legislation; inter-
net and broadband; and information security, costs,
efficiency and productivity. All can have an impact on
the goals and objectives of the business processes.
• Legal—the legal and regulatory impositions under
which the business operates. This includes occupa-
tional health, safety and environmental regulations
and their impact on staff and service delivery. This
also includes the impact of business operations on
the environment and environmental management.
• Environmental—the occupational health, safety
and environmental regulations and their impact on
staff and service delivery; the environmental impact
of business operations on the environment; and en-
vironmental management.
Table 3 shows an example of a PESTLE analysis
conducted for a government agency.
Improvement is all-inclusiveFor the goals of the strategic planning process to be real-
ized and effectively supported, an organization’s culture
must be changed. Every employee must be given the op-
portunity to contribute by listening and sharing his or
her views on issues, goals and objectives. Successfully
executed SIPOCCE, SWOT and PESTLE analyses will:
• Address the concerns and needs of the subcultures
within the organization.
• Support the employees’ perception of being treated
as equal and valued parts of the organization.
• Accelerate the employee buy-in process.
• Enhance the quality of the relationship between
staff and top management.
• Facilitate the alignment process as the challenges
to the realization of the strategic goals and objec-
tives are defined and acted on by the organization’s
top management.
The imperative is for all employees of an organiza-
tion to understand and have a complete picture of the
business environment that is influencing their organi-
zation. Involving employees in decision-making will
build their commitment and lead to better decisions
affecting business processes.
It is critical to any improvement effort that top man-
agement engages employees as partners in the change
process. By working as a team on the analysis of the
business environment, top management is able to:
• Communicate throughout the organization the pri-
orities of the change effort.
• Create a culture that supports change.
• Demonstrate partnership with its workers.
LSSRIM provides top management an efficient and
effective management tool to successfully achieve
alignment and early buy-in via the SIPOCCE, SWOT
and PESTLE quality management tools. Remember, to
achieve timely buy-in, the expectations and the busi-
ness environment affecting those expectations must
be clearly defined and understood by all. QP
REFERENCES1. BusinessDictionary.com, “Economic environment,” http://bit.ly/1REztmF
(case sensitive).2. Info Entrepreneurs, “Understand Your Competitors,” http://bit.ly/1Fko4oK
(case sensitive).3. Scott Smith, “Customer Expectations: 7 Types All Exceptional
Researchers Must Understand,” Dec. 10, 2012, www.qualtrics.com/blog/customer-expectations.
4. Quality Council of Indiana, Certified Six Sigma Black Belt Primer, fourth edition, 2013.
5. Russell T. Westcott, The Certified Manager of Quality/Organizational Excellence Handbook, fourth edition, ASQ Quality Press, 2013.
6. Wikipedia, “PEST,” http://en.wikipedia.org/wiki/PEST_analysis (case sensitive).
7. BusinessDictionary.com, “Economic environment,” see reference 1.
ORGANIZATIONAL CHANGE
OWEN RAMSAY is a lead assessor for Lloyd's Register Quality Assurance (LRQA) Inc. in Houston. He has a master’s degree in electri-cal engineering from Arizona State University in Tempe. A senior member of ASQ, Ramsay is an ASQ-certified quality management, audi-tor, engineer, quality systems lead auditor and Six Sigma Black Belt.
The cultural environment of a business can be integral to an organization’s success or failure.

CHANGE IN FLOW
In 50 Words Or Less • To suit its own quality
processes, an engineer-ing firm modified the classic plan-do-check-act cycle.
• The planning, executing, evaluating and improv-ing (PEEI) cycle lets Ambitech better handle complex projects for clients in industries such as oil refinery, petrochemical, chemical and food.
• The cycle has become the centerpiece of Am-bitech’s quality culture.
Modified PDCA cycle becomes centerpiece of engineering firm’s quality culture
by Raj C. Patel

June 2015 • QP 39
CHANGE IN FLOW
“THE CUSTOMER DESERVES to receive
exactly what we have promised to produce,” Philip B.
Crosby wrote in his classic work, Quality is Free.1 But
how do organizations ensure this happens?
Most customers want the highest quality services at
the lowest possible price. Some customers treat service
organizations, such as engineering firms, as commodi-
ties. To provide customers the most bang for their buck
and exceed customer expectations, firms must closely
evaluate each customer’s project to customize the execu-
tion of the services.
PROCESS IMPROVEMENT

QP • www.qualityprogress.com40
That’s where quality comes into play. There are
many definitions of the word quality. A simple defini-
tion is conformance to requirements. Figure 1 shows
the Deming cycle, which defines quality improvement
with the plan-do-check-act (PDCA) cycle.2
Ambitech Engineering Corp., an international en-
gineering firm headquartered in Downers Grove, IL,
took quality and PDCA one step further. To suit its own
quality process and better handle complex projects for
clients such as ExxonMobil, Citgo, British Petroleum,
Universal Oil Products and Valero, Ambitech adjusted
the classic PDCA cycle. Figure 2 shows the modified
process, which consists of planning, executing, evalu-
ating and improving (PEEI) phases. The project execu-
tion elements associated with the PEEI cycle are fur-
ther defined in Figure 3.
PlanningProjects are completed efficiently with high quality
when the project scope is defined, a reasonable sched-
ule is developed and the project is funded appropri-
ately. This can be accomplished by front-end loading
(FEL)—or pre-project planning—for a complex and
sizable project.
Depending on the project’s complexity and the cli-
ent’s corporate funding approval requirements, FEL
documents and cost estimates can be developed to
achieve expected accuracy levels (for example, 25% or
10%). The accuracy of cost estimates, for example, influ-
ences the contingency required for the project to man-
age unknowns not identified during the project’s defini-
tion stage and potential design development changes.
Taking time to review and define the project’s scope,
schedule and budget—even without the FEL efforts—
helps minimize scope creep and schedule delays that
can lead to cost overruns. That, however, doesn’t mean
you must spend a great deal of time and effort to define
the project.
The time and effort required at the planning stage
depends on the level of accuracy desired of the cost
estimate. Well-established guidelines exist for the per-
centage of engineering efforts required for the targeted
accuracy of cost estimates.3
Most large corporations have experienced engineer-
ing personnel who help define a project and understand
the balance required between cost and schedule. Small-
er organizations—with limited or no engineering staff—
may not be well equipped to adequately define a proj-
ect. Starting the project immediately with aggressive
resource loading to show the client you’re responsive
to an aggressive completion date could end up requiring
more time and money if the project is poorly defined.
An engineering firm is responsible for helping the
client define the project and establish a realistic and
achievable end date. This requires thinking through
key project milestones—engineering, procurement
and construction—with their predecessors and suc-
cessors to understand whether the client-established
end date can be achieved. This step is crucial to map-
ping the execution strategy and discussing pros and
cons of an aggressive end date with a client.
Considering the client’s input, project management
at Ambitech further refines project scope and develops
a high-level schedule at an early stage to establish end-
date expectations. Scope and schedule commitments
are discussed in detail in a project-defining document
that’s reviewed and approved by the client. A typical
project-defining document covers the topics shown in
Figure 4 (p. 42).
This document becomes the basis for the engi-
neering agreement. During this stage,
project management also focuses on
understanding client expectations and
preferences so they can be woven into
the design.
The planning continues throughout
the project cycle and must be adjusted as
the scope changes and delays occur that
are beyond project management’s con-
trol. Project management plays a crucial
part at the planning stage and through-
out the project duration for a successful
project execution.
PEEI cycle / FIGURE 2PDCA cycle / FIGURE 1
Plan
DoAct
Check
Planning
ExecutingImproving
Evaluating

June 2015 • QP 41
ExecutingThe executing stage consists of engineering, checking,
procurement and construction. These steps must be
completed efficiently to ensure a project starts suc-
cessfully on time.
Engineering: Upon award of a new project, Am-
bitech’s project management fine-tunes the project-
defining document and develops a resource-loaded
schedule with the help of the cost control engineer,
who uses Primavera P6 scheduling software. Primav-
era P6 allows overlaying of all the projects managed
simultaneously at Ambitech, which helps in planning
for the required resources.
The schedule includes detailed engineering, pro-
curement and construction activities that are logically
tied to the preceding and succeeding activities. As-
signed task durations are based on the usually challeng-
ing but achievable availability of design information
and resources. Project management reviews the scope,
schedule, budget and client expectations with the proj-
ect team members at the project kick-off meeting.
It is crucial to monitor the design inputs, such as
the client’s information, vendor drawings and internal
engineering activities. Equally important to initial plan-
ning is updating the schedule to reflect the completion
percentage for activities and delays of information flow.
PROCESS IMPROVEMENT
Elements of PEEI cycle / FIGURE 3
Participation by quality function
• Identify areas for improvement and ways to improve—from lessons learned, quality audits and client feedback.
• Communicate to management.
• Follow up to ensure implementation.
• Evaluate improvement benefits.
• Define project scope.
• Create project-defining document for FEL or engineering phase.
• Develop schedule.
• Create budget.
• Hold KOM—internal and external—with client.
• Refine project defining document and develop budget and schedule for next phase.
Activities performed by quality function
• Lessons learned.
• Client feedback for quality survey.
• Review and update of corporate procedures.
• Development of new corporate procedures.
• Conducting of quality audit.
• KOM, document distribution matrix, needs list.
• Weekly project status meeting.
• Deliverables development.
• Checking—self checking, independent departmental checking, office check, field check.
• Design review.
• Department manager’s approval.
• Client approval.
• Issuance of drawings for bid, purchase and construction.
• Construction—engineering support, construction supervision and management, and RFI resolution.
• Check out and start up.
FEL = front-end loading
PEEI = planning, executing, evaluating and improving
KOM = kick-off meeting
RFI = request for information
Planning
Executing
Improving
Evaluating
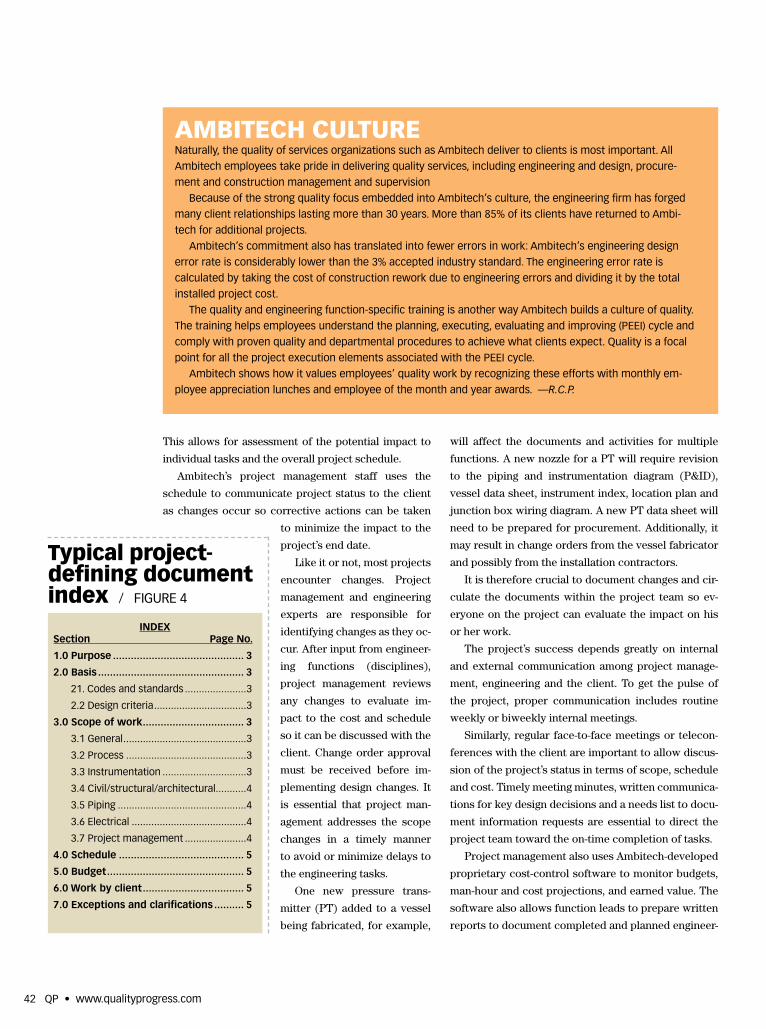
This allows for assessment of the potential impact to
individual tasks and the overall project schedule.
Ambitech’s project management staff uses the
schedule to communicate project status to the client
as changes occur so corrective actions can be taken
to minimize the impact to the
project’s end date.
Like it or not, most projects
encounter changes. Project
management and engineering
experts are responsible for
identifying changes as they oc-
cur. After input from engineer-
ing functions (disciplines),
project management reviews
any changes to evaluate im-
pact to the cost and schedule
so it can be discussed with the
client. Change order approval
must be received before im-
plementing design changes. It
is essential that project man-
agement addresses the scope
changes in a timely manner
to avoid or minimize delays to
the engineering tasks.
One new pressure trans-
mitter (PT) added to a vessel
being fabricated, for example,
will affect the documents and activities for multiple
functions. A new nozzle for a PT will require revision
to the piping and instrumentation diagram (P&ID),
vessel data sheet, instrument index, location plan and
junction box wiring diagram. A new PT data sheet will
need to be prepared for procurement. Additionally, it
may result in change orders from the vessel fabricator
and possibly from the installation contractors.
It is therefore crucial to document changes and cir-
culate the documents within the project team so ev-
eryone on the project can evaluate the impact on his
or her work.
The project’s success depends greatly on internal
and external communication among project manage-
ment, engineering and the client. To get the pulse of
the project, proper communication includes routine
weekly or biweekly internal meetings.
Similarly, regular face-to-face meetings or telecon-
ferences with the client are important to allow discus-
sion of the project’s status in terms of scope, schedule
and cost. Timely meeting minutes, written communica-
tions for key design decisions and a needs list to docu-
ment information requests are essential to direct the
project team toward the on-time completion of tasks.
Project management also uses Ambitech-developed
proprietary cost-control software to monitor budgets,
man-hour and cost projections, and earned value. The
software also allows function leads to prepare written
reports to document completed and planned engineer-
QP • www.qualityprogress.com42
Typical project-defining document index / FIGURE 4
INDEX Section Page No.
1.0 Purpose ............................................ 3
2.0 Basis ................................................. 3
21. Codes and standards ......................3
2.2 Design criteria .................................3
3.0 Scope of work .................................. 3
3.1 General ............................................3
3.2 Process ...........................................3
3.3 Instrumentation ..............................3
3.4 Civil/structural/architectural...........4
3.5 Piping ..............................................4
3.6 Electrical .........................................4
3.7 Project management ......................4
4.0 Schedule .......................................... 5
5.0 Budget .............................................. 5
6.0 Work by client .................................. 5
7.0 Exceptions and clarifications .......... 5
AMBITECH CULTURENaturally, the quality of services organizations such as Ambitech deliver to clients is most important. All
Ambitech employees take pride in delivering quality services, including engineering and design, procure-
ment and construction management and supervision
Because of the strong quality focus embedded into Ambitech’s culture, the engineering firm has forged
many client relationships lasting more than 30 years. More than 85% of its clients have returned to Ambi-
tech for additional projects.
Ambitech’s commitment also has translated into fewer errors in work: Ambitech’s engineering design
error rate is considerably lower than the 3% accepted industry standard. The engineering error rate is
calculated by taking the cost of construction rework due to engineering errors and dividing it by the total
installed project cost.
The quality and engineering function-specific training is another way Ambitech builds a culture of quality.
The training helps employees understand the planning, executing, evaluating and improving (PEEI) cycle and
comply with proven quality and departmental procedures to achieve what clients expect. Quality is a focal
point for all the project execution elements associated with the PEEI cycle.
Ambitech shows how it values employees’ quality work by recognizing these efforts with monthly em-
ployee appreciation lunches and employee of the month and year awards. —R.C.P.

June 2015 • QP 43
ing activities along with the schedule, budget and areas
of concern.
Project management uses the reports from this soft-
ware for monthly project-status reviews with senior
management and as a supporting document for monthly
status reports to the client.
All of Ambitech’s engineering documents follow
revision control and are processed through the docu-
ment management system (DMS). Similarly, all vendor
documents received by Ambitech for review and use in
design activities are processed through DMS. The DMS
allows engineers and designers to access the latest
documents for design and provides a history of changes
made to the documents.
Checking: “Quality means doing it right when no
one is looking,” Henry Ford once said.4 Everyone’s goal
at Ambitech is to prepare the document error-free the
first time. Is it possible to achieve that goal every time?
Because we’re all human, the answer is, “No.”
It is therefore imperative to have documents and
drawings—also defined as deliverables—checked ap-
propriately. Checking the deliverables is an ongoing
process. A well-organized process with proper docu-
mentation ensures all engineering and procurement de-
liverables are checked before documents are issued for
client approval, bid, purchase and construction.
Ambitech’s quality process requires all engineering,
cost estimate and procurement documents prepared for
the procurement and construction purposes to progress
through these six steps:
1. Self-check: The document originator reviews the
document before issuing it to the independent
checker.
2. Checking: The document is checked by an indepen-
dent checker from the department that generated it.
The checker makes sure the design meets the scope
and complies with the client, Ambitech and applica-
ble industry standards, specifications and codes.
PROCESS IMPROVEMENT
Quality check points / FIGURE 5
Project manager
Pre-project planning
Project manager
(defines project]
Kick-off meeting
Primary function
(develops controlling
documents)
Primary function
(finalizes documents)
Primary/supporting
function
(develops arrangements)
Supporting functions
(provide input)
Supporting functions
(provide input)
Supporting functions
(provide documents)
Supporting functions
(provide documents)
Primary/supporting
function
(finalizes arrangement)
Project team
(reviews project
execution)
Project performance evaluation,
project critique meeting,
best pratices and lessons
learned
Project team
(issues final documents)
Project team
(develops final documents)
Design basis
review meeting
Design basis
review meeting
Layout review
meeting
1 4
3
15 13
5
6
9
8 11
10
2 7
16 14 12
Quality check point
Process step

QP • www.qualityprogress.com44
3. Office check: The checked document is issued to
project team members for review and comment.
This step ensures the document conforms to the
scope requirement and that information and design
are consistent across all functions’ documents.
4. Design review: All function leads who have input
or output from the document, the project manager,
a quality representative and the department special-
ist meet to review the document. This step ensures
the document not only complies with the project
scope, but also reflects all applicable design chang-
es, is safe and can be constructed. For a complex
project, a construction representative also is invited
to this design review meeting to provide input.
5. Department manager’s approval: The revised
document that addresses actions developed during
the design review meeting is given to the depart-
ment manager for approval.
6. Document issuance: The document is issued with
a transmittal to the client and vendor for its intend-
ed purpose—approval, bid, purchase or construc-
tion.
Quality Quality 10 Commandments
• Quality means doing it right when no one is looking.
• There is one rule for the industrialist: Make the best quality of goods possible at the lowest cost possible, paying the highest wages possible.
• Obstacles are those frightful things you see when you take your eyes off the goal.
—Henry Ford
• We must define quality as conformance to requirements if we are to manage it.
• Quality management is a systematic way of guaranteeing that organized activities happen the way they are planned.
• Quality improvement has no chance unless the individuals are ready to recognize that improvement is necessary.
• Make a commitment to a standard, communicate it, recognize performance and then recycle.
• It is much less expensive to prevent errors than to rework, scrap or service them.
—Philip B. Crosby, Quality Is Free
1. Identify and reduce variation.
2. Experiment to optimize.
3. Establish and maintain databases.
4. Embrace statistics.
5. Standardize procedures and audit for compliance.
6. Design for manufacturability.
7. Communicate with suppliers.
8. Plan for quality.
9. Teach quality.
10. Document improvement and corrective actions.
Quality topics for daily staff huddles / TABLE 1
HUDDLE UPThe safety of Ambitech employees visiting the operating facility is important. Most of Ambitech’s custom-
ers—refinery and petrochemical companies—require that all personnel visiting the job site receive the cli-
ent’s site-specific training and training from a third party, such as Three Rivers Manufacturers Association.
All of Ambitech’s employees visiting client sites to collect design information and be part of the
construction support comply with the client’s safety training. They also are trained in compliance with ap-
plicable Occupational Safety and Health Administration requirements at Ambitech by our safety staff.
Contractors working at construction sites typically start their days with safety huddles—a review of
a short safety topic. To further emphasize the importance of quality and safety to the daily activities of
executing projects, Ambitech has expanded that huddle concept for all of our employees at headquarters
in Downers Grove, IL, and 11 branch offices. Employees are encouraged to start all meetings with a discus-
sion on safety and quality topics.
To facilitate this, all our conference rooms have a deck of cards—prepared by the safety and quality
departments—for safety and quality topics. Table 1 provides some examples of quality topics that have
helped kick off daily huddles.
All meeting attendees sign an attendance sheet. Every month, one safety and one quality attendance
sheet is selected and all persons on the list (employee and client) receive American Express gift cards as a
thank you for making safety and quality part of their everyday activities. —R.C.P.

June 2015 • QP 45
Figure 5 (p. 43) shows a project execution block di-
agram Ambitech follows. The quality department par-
ticipates in all of the steps identified as quality check
points. As part of step four, the primary function—pro-
cess department—prepares P&ID in step three using
input from the supporting functions such as instru-
mentation, mechanical, piping and electrical.
The piping specification and equipment list received
from the mechanical department as part of step five
also is used for P&ID development. The P&ID finalized
in step six is reviewed by the project team members in
step seven. Another function—piping or mechanical —
prepares the layout documents in step eight as defined,
and go through steps nine, 10, 11 and 12. The revised
documents are reviewed by the project team in step 14
in the design review meeting.
Procurement: All engineering documents and
specifications for equipment, instruments and electri-
cal components are used to procure material and so-
licit bids from construction contractors.
Construction: This step includes construction,
system check out and start up. Ambitech’s involvement
in this step depends on the scope of services. We sim-
ply may be answering a request for information (RFI)
from contractors, or we may have full responsibility
for construction supervision or construction manage-
ment. For construction supervision or construction
management responsibility, the construction manager
uses Ambitech’s own Construction Management Field
Procedures Manual—developed based on experience
and industry best practices—to oversee the contrac-
tor’s work.
RFIs are reviewed and resolved by the appropriate
engineering functions. Any resulting design changes
made to the documents go through a repeated check-
ing process.
EvaluatingThe quality department randomly audits the entire
project team or a single function to assess its confor-
mance to Ambitech’s protocols as defined in proce-
dures. Deficiencies and recommendations noted in the
PROCESS IMPROVEMENT
Category What went right? What went wrong? What would you change?
Front-end loading
Constructability
Scope development
Design basis
Front-end engineering/design
Permitting
Pre-HAZOP
Learning and benchmarking
Project management
Project organization
Communications—internal/external
Reporting
Meetings—frequency, effectiveness
Scope management
Client management
Process detailed design
Process design
Design reviews
Process data to mechanical
Process data to instrumentation
PHA
Other
HAZOP = hazard and operability study PHA = process hazard analysis
Lessons-learned matrix / TABLE 2
audit report are discussed with the audited parties so
necessary improvements can be made.
At the project’s conclusion, the project manager or-
ganizes a lessons-learned meeting to discuss successes
and challenges. This meeting, attended by the project
team members, a quality representative and appropri-
ate senior management, covers:
• What went right so that we can continue doing it.
• What the challenges were and what can be done to
avoid similar situations in the future.
• What kinds of changes are necessary to improve fu-
ture project execution.
The project manager issues a spreadsheet (see Ta-
ble 2, p. 45) to the project team members for feedback.
The spreadsheet lists activities associated with proj-
ect management, engineering functions, deliverables,
schedule, cost, quality of deliverables, responsiveness,
project closing, and information exchange and com-
munication within engineering functions, and between
Ambitech and the client.
Open and candid discussion is fostered at the meet-
ing so team members can provide opinions, comments
and recommendations. The comments received before
and during the meeting are summarized on the spread-
sheet and used to conduct a similar meeting with the
client.
Ambitech uses the lessons-learned meetings as a
way to identify necessary improvements to work and
information flow, and to understand any additional cli-
ent expectations. This is so we can adjust the internal
and external processes—with client, vendors and con-
tractors—to improve future executions.
The quality department seeks client feedback about
Ambitech’s performance on the project scope, bud-
get, schedule, quality and responsiveness. Client feed-
back—positive and negative—is shared with project
management, department managers and senior man-
agement so appropriate attention is given to the areas
rated lower by the client.
ImprovingIn his book, Juran on Leadership for Quality, Joseph
M. Juran wrote, “Improvement means the organized
creation of beneficial change; the attainment of unprec-
edented level of performance.”5 Ambitech considers
improvement to be a continuous process, and we take
every opportunity to capitalize on it, particularly using
information from lessons-learned meetings.
As covered in the evaluating phase, the areas of im-
provement identified through the quality audit, the les-
sons learned meeting and client feedback are reviewed
by the appropriate parties so the execution process can
be adjusted for improved performance in future proj-
ects.
One example of a lesson learned—based on feed-
back from new clients—implemented at Ambitech is
the establishment of an alignment meeting with each
new client before we engage engineering staff for the
proposal activities. The meeting allows us to learn
about:
• The client’s culture.
• The client’s expectations for the level of detail re-
quired on the deliverable, specifications and stan-
dards (client, Ambitech or industry) to be used for
design.
• The client’s involvement for review and approval.
• A responsibilities breakdown between the client
and Ambitech.
Commitment to qualityAmbitech’s own PEEI cycle and the steps it takes to
ensure all of its employees have quality training and
are engaged in quality initiatives show just how much
quality has become an essential part of this engineering
firm’s culture.
Ambitech’s PEEI cycle and its quality manage-
ment plan—consisting of various processes, pro-
cedures, trainings, software, tools and recognition
programs—has become the foundation of everything
Ambitech does to ensure it delivers the highest qual-
ity to customers. QP
REFERENCES1. Philip B. Crosby, Quality Is Free, McGraw-Hill, 1979, p. 82.2. Mary Walton, The Deming Management Method, Perigee Trade, 1988, pp.
86-88.3. Michael R. Nosbisch, “Cost Estimate Classification System—As Applied in
Engineering, Procurement and Construction for the Process Industries,” presentation, Association for the Advancement of Cost Engineering Interna-tional Recommended Practice No. 18R-97, Feb. 2, 2005.
4. BrainyQuote, www.brainyquote.com/quotes/quotes/h/henryford106096.html.
5. Joseph M. Juran, Juran on Leadership for Quality: An Executive Handbook, Free Press, 1989.
QP • www.qualityprogress.com46
PROCESS IMPROVEMENT
RAJ C. PATEL is director of quality at Ambitech Engineering Corp. in Downers Grove, IL. He holds a master’s degree in organic chemistry from University Schools of Sciences in Ahmedabad, India. He is a member of ASQ.

ASQ certification is a cornerstone of your career growth. You immediately establish yourself as a recognized expert in your field, resulting in promotions, higher salaries, greater demand for your services, and an advantage over your competition. Invest in your career and your future with an ASQ certification. Apply for the upcoming October 2015 exam!
Upcoming Application Deadline: August 14, 2015
Exam Date: October 3, 2015
Get Your ASQ Certification
For more information or to apply for an exam, visit asq.org/cert.
The Global Voice of QualityTMCERTIFICATION MEMBERSHIP PUBLICATIONSTRAINING CONFERENCES

QP • www.qualityprogress.com48
Become the ChangeA four-step model to cultivate cultural intelligence
AS A QUALITY director for a small,
nonprofit organization, I noticed a
general lack of understanding about
quality, as well as an inability to use
it to address problems and processes
throughout the organization. To change
this, I became the change I sought.
Change can be large or small, evolu-
tionary or revolutionary, sought after or
resisted. I chose sought after.
Between 50 and 75% of change pro-
grams fail because of their approach.
Some are too large and too wide.1 I
wanted to focus my changes on quality
and giving the organization an under-
standing of quality—what it meant and
how to use it to move the organization
forward.
My approach actually followed a
four-step model of cultural intelligence
(cultural quotient or CQ) (see Figure
1). CQ is the capability to function
effectively across national, ethnic and
organizational cultures.2
1. CQ drive: the motivational dimen-
sion of CQ that shows interest and con-
fidence. There are three subdimensions
of CQ drive:
• Intrinsic motivation—the degree
to which you derive enjoyment from
culturally diverse situations.
• Extrinsic motivation—the tangi-
ble benefits you gain from culturally
diverse experiences.
• Self-efficacy—the confidence that
you will be effective in cross-cultur-
al encounters.3
I had the drive and motivation to
become the change I sought. I knew I
pursued something that was near and
dear to me, and if given the chance, this
opportunity would benefit the organiza-
tion.
2. CQ knowledge: understand-
ing cross-cultural issues and differ-
ences—the cognitive dimension of the
CQ research—referring to the leader’s
knowledge about culture and its role in
shaping how business is
done.4 I realized that the
culture needed to change
for quality to resonate
throughout the organiza-
tion.
At that time, the culture
believed quality was the
sole job of the quality
director, and anything
having to do with quality
was addressed by that
position. This meant that
small things, such as inef-
ficient processes, were
not addressed unless the
quality director addressed
them.
To improve performance, you need
a new culture—one that consistently
produces go-to people.5 At this nonprofit
organization, there was only one go-to
person when it came to quality.
3. CQ strategy: strategizing and
making sense of culturally diverse expe-
riences, referring to the leader’s ability
to strategize when crossing cultures.
The three subdimensions of CQ strategy
include:
• Awareness—being in tune with
what’s going on in ourselves and
others.
• Planning—taking time to prepare
for a cross-cultural encounter by
anticipating how to approach the
people, topic and situation.
• Checking—monitoring our interac-
tions to see whether our plans and
expectations were appropriate.6
I understood this, and that’s when I
decided to create Brown Bag University:
During the lunch hour, basic quality
tools were taught to anyone who wanted
to attend. By making it voluntary, I
gained attendance of a cross-organiza-
tional culture of workers, supervisors
and managers.
4. CQ action: changing verbal and
nonverbal actions appropriately when
interacting cross-culturally—the be-
havioral dimension of CQ—refers to the
leader’s ability to act appropriately in a
range of cross-cultural situations.7
The sessions were interactive. More
than 160 employees during a six-month
period were taught quality tools such as
flowcharts, cause and effect diagrams,
scatter diagrams, Pareto analysis,
histograms, check sheets and control
charts.
QUALITY IN THE FIRST PERSON BY JESSE STEVENSON

ity required equal attention to other
functions, developing the Juran trilogy
of quality planning, quality control and
quality improvement.10
We must get to a place where quality
is a norm, a belief that the quality of a
product or process is at least of equal
or greater importance than the mere
quantity produced.
This belief results in decisions favor-
ing quality: defective items do not get
passed down the line or out the door,
and chronic errors and delays are cor-
rected.11 QP JESSE STEVENSON is currently a doctoral student in business administration in quality systems management at the National Graduate School in Falmouth, MA, where he earned a master’s degree in quality systems manage-ment. He is an ASQ senior member
and ASQ-certified quality improvement associate, Six Sigma Black Belt and manager of quality/organizational excellence.
SHARE YOUR QUALITY STORYIf you have a first-person quality story to share, read the Quality in the First Person column guidelines under the “Tools & Resources” tab at www.qualityprogress.com and learn how to get published in QP.
In addition, employees were intro-
duced to concepts such as specific,
measureable, attainable, relevant,
time-bound goals and plan-do-check-act
cycles. By doing this, employees learned
how to use tools to solve problems and
help understand processes—the culture
began to change.
People were now thinking of quality,
and there was no longer just one go-to
person. Many employees knew how to
use quality tools to address problems
and set goals. The culture change was
slowly taking place, and I became the
change.
I wasn’t alone in making this hap-
pen. It may have been my idea and
vision, but it wasn’t possible without
support from upper management. For
any change to be successful, or have a
chance at success, you must mobilize
commitment, and it’s the difference
between success and failure.8
Quality should not be the sole re-
sponsibility of one individual—it must
be a culture. Quality gurus such as W.
Edwards Deming and Joseph M. Juran
understood this. In one of his 14 points
(point No. 6, “Institute training on the
job”)9, Deming shows how important he
believes this to be.
Juran felt that managing for qual-
QP • www.qualityprogress.com1
The four-step dimensional model of cultural intelligence / FIGURE 1
Cultural intelligence
CQ Strategy (Metacognitive CQ)
Awareness
Planning
Checking
CQ Action (Behavioral CQ)
Verbal
Nonverbal
Speech acts
CQ Knowledge (Cognitive CQ)
Cultural systems
Cultural norms and values
CQ Drive (Motivational CQ)
Intrinisic
Extrinsic
Self-effi cacy
CQ = cultural quotient
June 2015 • QP 49
REFERENCES1. Marcella Bremer, Organizational Culture Change:
Unleashing Your Organization’s Potential in Circles of 10, Kikker Groep, 2012.
2. David Livermore, Leading With Cultural Intelligence: The New Secret to Success, AMACOM, 2009.
3. Ibid.4. Ibid.5. Roger Connors and Tom Smith, Change the Culture,
Change the Game: The Breakthrough Strategy for Energizing Your Organization and Creating Account-ability for Results, Portfolio, 2011.
6. Livermore, Leading With Cultural Intelligence: The New Secret to Success, see reference 2.
7. Ibid.8. Brien Palmer, Making Change Work: Practical Tools
for Overcoming Human Resistance to Change, ASQ Quality Press, 2004.
9. W. Edwards Deming, Out of the Crisis, Massachu-setts Institute of Technology, 1982.
10. Bill Wortman, Certified Six Sigma Green Belt Primer, second edition, Quality Council of Indiana, 2012.
11. Joseph A. DeFeo and William W. Barnard, Juran In-stitute’s Six Sigma Breakthrough and Beyond: Quality Performance Breakthrough Methods, McGraw-Hill, 2004.
Quality should not be the sole responsibility of one individual—it must be a culture.

QP • www.qualityprogress.com50
CAREER CORNER BY RAY HARKINS
Kindling the FlameRecertifying made easy through emerging electronic media
IF YOU’VE NEVER considered obtaining
an ASQ certification, you should know
there is a positive correlation between
holding a certification and earning po-
tential. According to the 2013 QP Salary
Survey, a supplier quality engineer who
holds a Six Sigma Black Belt certifica-
tion earns an average of 26.2% more than
his uncertified counterpart.1 While this
income premium varies by position and
certification type, it’s obvious that, in
general, holding a certification generates
more earning potential.
As a certification holder, I understand
obtaining a certification is only half of
the battle—retaining it is the other half.
Certain ASQ certifications, such as qual-
ity process analyst and quality technician,
are designated as vocational. After candi-
dates meet the minimum experience and
educational requirements and pass the
multiple-choice exam, they retain these
as lifetime achievements without further
requirements.
Other certifications, however, such
as calibration technician and reliability
engineer, are considered professional
certifications, and they require recerti-
fication every three years by obtaining
a minimum number of recertification
units (RU) within the respective body of
knowledge (BoK).2
A quality professional can obtain RUs
through various means and under several
categories such as employment, meet-
ings, publishing and others. But with the
explosion of online training available
through websites and programs such as
iTunes U, YouTube and edX, it’s easy to
obtain RUs at no cost and without leaving
your home or office.
Online earningUnder the category of professional de-
velopment, you can
earn RUs by attend-
ing an ASQ division
conference or simi-
lar training events.
Online events, such
as webinars, also
are acceptable, and
they’re useful learn-
ing tools because
the speakers can
share graphics,
videos and other
content with a group
over the internet.
Organizations often
will record their we-
binars and archive
them on their web-
sites for future on-demand viewing, and
you can easily find them through online
searches (see Table 1).
Another way to accrue RUs is by
taking courses offered by a college or
technical organization, either in person
or online. To qualify for RUs under this
category (courses for student credit), the
course must apply to at least one area of
your certification’s BoK or be considered
job enhancing. Recently though, a new
course format emerged: massively open
online courses (MOOC).
MOOCs are university-level courses
with no admission requirements, offered
entirely online and almost always free to
students. Harvard and many other world-
class universities have created MOOCs
that cover a broad range of subjects,
including numerous science, technol-
ogy and business courses (introduction
to computer programming, mechanical
behavior of materials and supply chain
fundamentals).
MOOCs typically include a video-
based lecture series, periodic quizzes, as-
signments and forums that allow students
and faculty to interact and evaluate their
work. You can find MOOCs on sites such
as edX, Coursera and Canvas Network. If
you haven’t tried this fascinating learning
opportunity, you’re missing out on a rap-
idly developing educational trend.
Watch and learnThe category of electronic media al-
lows you to earn RUs at home, and it’s
somewhat of a catchall for audio books,
training videos and other digital content
that directly apply to a certification’s
BoK. Two media outlets—YouTube and

June 2015 • QP 51
iTunes—are great sources for content
related to the quality profession.
With more than a billion unique users
every month and 300 hours of new video
content uploaded every minute,3 YouTube
is a behemoth among websites. Assum-
ing you don’t live in a cave, you already
know it’s the world’s preeminent video
library, and beyond all those videos of
cats and people falling down, there’s a
vast amount of educational and training
content that’s perfect for certification
holders looking to stock up on electronic
media RUs.
Some users prefer searching You-
Tube’s various channels for RU-worthy
content. You can start with the education
channel and move through subheadings
such as law, medicine and languages.
Table 2 highlights instructional channels
that may be relevant to quality profes-
sionals.
Another juggernaut in the world of
electronic media is the iTunes Store,
available through Apple’s iTunes soft-
ware. Within the iTunes Store, users
can access millions of digital media files
including informational podcasts or con-
tent on iTunes U directories.
While podcasts (formatted as audio
or video files) mostly consist of news,
entertainment and edutainment, the dili-
gent seeker can find expertly produced
podcast episodes on language learning,
public speaking, curriculum development
and much more.
iTunes U was established by Apple
specifically to house and distribute
podcasts created by universities and
learning institutions around the world.
Today, iTunes U boasts more than 75,000
lectures from more than 800 institutions
on a wide spectrum of diverse topics.
Socrates is often attributed as saying,
“Education is the kindling of a flame,
not the filling of a vessel.”4 Likewise,
one of the primary goals of ASQ’s cer-
tification program is to encourage the
continual growth of quality profession-
als through career-long learning, and
now more than ever, this learning is just
a click away. QP
REFERENCES AND NOTE1. Max Christian Hansen, “Certifiably Valuable,” Quality
Progress, December 2013, pp. 45-51.2. See asq.org/cert/recertification for complete details on
the recertification process.3. Aaron Davis, “Digital World; You Are the Music,” Explora-
tion.io, http://exploration.io/2014-youtube-statistics.4. “Socrates Quotes,” Thinkexist.com, http://tinyurl.com/
socratesedu.
RAY HARKINS is the quality manager of the Ohio Star Forge Co. in Warren. He earned a bachelor’s degree in mechanical engineering technology from the University of Akron in Ohio. Harkins, a senior member, is an ASQ-certified quality engineer, technician, auditor and calibration technician.
WHY CERTIFY? Watch ASQ TV’s video, “Why Certify?” to learn about the benefits of becoming certified, as well as the impact it had on a Six Sigma Black Belt’s career. Watch it at http://videos.asq.org/why-certify.
Organization Topic examples
Engineering News-Record Construction, contract negotiation and project management
Stanford Center for Professional Development
Decision making, risk management and human-computer interaction
Cisco WebEx Business leadership, agile management and cloud computing
American Institute of Steel Construction
Metallurgy, welding and fastening systems
Engineering for Change Renewable energy, emerging technologies and sustainability
Organization Topic examples
MIT OpenCourseWare Math, physics, computer science and economics
National Programme on Technology Enhanced Learning
Chemistry, electronics, technology, metallurgy and design
Yale Courses Engineering, finance, psychology and statistics
Columbia Business School Business law, entrepreneurship, public policy and global finance
Eli the Computer Guy Networking, web design, mobile technologies and ecommerce
Organizations with online webinar libraries / TABLE 1
Quality-related channels / TABLE 2
Obtaining a certification is only half of the battle—retaining it is the other half.

QP • www.qualityprogress.com52
STATISTICS ROUNDTABLE BY ROGER W. HOERL AND RONALD D. SNEE
Guiding BeaconUsing statistical engineering principles for problem solving
QUALITY PROFESSIONALS are often
faced with solving major organizational
problems such as: “Customers are com-
plaining about the quality of our product
and returning it”; “Our major process is
producing an unacceptable amount of
defective product”; or “The regulatory
agency has identified a major environmen-
tal problem associated with one of our
operations.”
How should quality professionals ap-
proach such problems, which are clearly
not textbook with one correct answer?
Where should they begin the problem-
solving effort? What should be consid-
ered? How can the projects be set up for
success? The fundamentals of statistical
engineering can provide valuable guidance
for these types of complex problems.
Statistical engineering has been defined
as: “The study of how to best utilize
statistical concepts, methods and tools,
and integrate them with information
technology and other relevant sciences
to generate improved results.”1 Applica-
tions of this discipline produce improved
results because statistical engineering is
grounded on sound underlying principles
that address the critical elements of ef-
fective problem solving. In short, the key
elements of the principles of statistical
engineering are (see Figure 1):
• Proper understanding of the problem
context.
• A well-defined strategy for problem
solution.
• Evaluation of the pedigree of the as-
sociated data and information.
• Integration of sound subject matter
knowledge with data analysis.
• Sequential approaches involving the
testing of existing hypotheses and
development of new hypotheses.
Understanding problem contextProblem context is everything we know
about the problem, including its history,
what has been tried before, the technology
involved and political considerations at
play. Too often, data analysis begins with
the data. This can be seen in various data
analysis competitions, such as those on
kaggle.com. Keep in mind, however, that
the data are not the problem; the problem
is the problem. That is, we should view
data as a “how,” and the original problem
trying to be solved as the “what.”
Once we are clear on the problem we
are trying to solve and its context, we
can determine the type and amount of
data needed to solve it. Conversely, if
we already have data, clarification of the
problem helps determine how the data can
be best used to solve the problem. “Data
have no meaning in themselves; they are
meaningful only in relation to a conceptual
model of the phenomenon studied,”2 wrote
George Box, Bill Hunter and Stu Hunter.
In addition, the best technical or
business solution is not always the best
statistical solution. For example, we may
determine from initial analysis of exist-
ing data that they are not appropriate or
sufficient for solving the problem at hand;
additional, better quality data are needed.
Performing sophisticated or detailed
analysis of the current data would simply
waste time at this point.
In other cases, a simple analysis is all
that is needed because the answer is obvi-
ous from basic graphs. The bottom line is
that the context of the problem, not statis-
tical metrics, determines the best business
solution and the level of sophistication
needed.
Well-defined strategySome practitioners have a favorite tool,
whether it is multiple regression, time-se-
ries analysis or a nonparametric method.

June 2015 • QP 53
Unfortunately, favorite tools can be more
of a hindrance than a help to problem
solving. Practitioners can fall into the
trap captured eloquently by the saying: “If
all you have is a hammer, every problem
looks like a nail.” In other words, practi-
tioners may use favorite tools even when
they are not the best approach, or when
they are not appropriate at all.
Similarly, the approach of trying vari-
ous modeling approaches and picking the
one that maximizes a quantitative metric,
such as R2 or root mean square error
(RMSE), can provide some insight, but
rarely produces an actionable model. Most
problems are too complex to be adequate-
ly reduced to maximizing one quantitative
metric. Rather, an overall strategy or plan
of attack is needed for complex problems.
A strategy is a plan of action designed
to achieve a major goal. In other words,
it is a high-level game plan to win. For
example, some problems have a known
solution, and we just need to figure out
how to deploy the solution. Others have
no known solution, and root causes must
be identified and evaluated.3 The nature of
the problem should guide our approach,
which requires strategic thinking rather
than tools-based thinking.
Unfortunately, we have found that the
word “strategy” is rarely used in technical
textbooks. Conversely, good problem-solv-
ers develop a plan of attack to match the
particular problem, and of course, need
to remain flexible to revise their strategy
when the unexpected turns up, as is often
the case.
For example, authors Box, Hunter, and
Hunter provide an overall approach to
using design of experiments and model
building in a sequential manner to empiri-
cally optimize processes.4 This approach,
often referred to as response surface
methodology, is not simply a collection of
designs and models, but an overall strat-
egy for attacking such problems. Quality
and statistical professions need more of
these types of strategies.
Data pedigreeMany statistics textbooks discuss the
importance of sample size on statistical
analyses and provide formulas for deter-
mining appropriate sample size. Unfor-
tunately, very little is typically said about
data quality. The quote from Box, Hunter
and Hunter noted earlier is a welcome but
rare exception.
The assumption seems to be that “all
data are created equal.” If only that were
true. Practitioners who have had to collect
their own data know how challenging it
can be to collect good data. Missing values
and variables, poor measurement pro-
cesses and collinearity between the inde-
pendent variables are just a few problems
typically encountered. No amount of data
or sophisticated data mining algorithms
will salvage a bad data set.
The key point is that rather than jump-
ing into analyses, practitioners should
always carefully consider data quality first:
where it came from, how it was collected,
who collected it, over what time frame,
the measurement system used and the
associated science and engineering. This
type of information is called the data pedi-
gree because it describes the background
and history of the data, much like a show
dog’s pedigree documents its credentials.
Data should always be considered guilty
until proven innocent.
In many cases, the data are sufficient to
answer some questions, but not to solve
the overall problem. More data, collected
differently, are often required, based on
analysis of the original data. Further, the
sophistication of any models developed
should be based on the needs of the
problem and the data pedigree, and should
never be more complex than can be ad-
equately supported by the current data.
Subject matter knowledgeWhen analyzing data, it can be tempting to
put data into the computer, push buttons
on sophisticated software packages and
believe the resulting output. In addition to
the potential problems noted earlier, this
approach also ignores the key principle
that data should always be interpreted
in light of our existing subject matter or
“domain” knowledge. This is everything
we know about the underlying science or
theory of the process of interest. Without
a good understanding of the process that
produced the data, we are susceptible to
making egregious errors in analysis.
George Cobb and Stephen Gelbach
illustrated this point with data on heart
disease among pipe, cigarette and cigar
smokers.5 A straightforward analysis of
the data indicates that cigar and pipe
smokers have higher rates of heart disease
than cigarette smokers, and that this dif-
ference is statistically significant. Does
this seem surprising?
A closer look with additional data
reveals that pipe smokers are much older
than cigarette smokers on average. After
the age difference is taken into account,
the analysis clearly shows that cigarette
smoking is a more dangerous contributor
to heart disease than is pipe smoking.
Similarly, while the first author (Hoerl)
Underlying principles of statistical engineering / FIGURE 1
Statisticalengineering
Problemcontext
Solutionstrategy
Datapedigree
Subjectmatter
knowledge
Sequentialapproach

QP • www.qualityprogress.com54
STATISTICS ROUNDTABLE
was working for Scott Paper Co., his
analysis of paper towel data indicated that
paper towel strength was positively corre-
lated with absorbency—how much water
the towel could hold. When he presented
this analysis to Scott engineers, he was
laughed off the stage.
It turned out that the fundamental sci-
ence of papermaking shows that strength
and absorbency of towels are inherently
negatively correlated. With tail between
his legs, Hoerl reevaluated the data
pedigree. In this case, the data happened
to come from two different papermaking
processes. After the data were stratified
by papermaking technology, the expected
negative correlation was apparent.6
In both cases, naive analysis of the data
presented produced not only incorrect
answers, but conclusions that were the
exact opposite of the correct conclusions.
Good subject matter knowledge not only
helps to avoid such blunders, but also can
guide us in identifying the most appropri-
ate data to solve the problem, and then
help us interpret it correctly.
Of course, sometimes data will chal-
lenge our subject matter knowledge and
require us to rethink hypotheses. This is
how learning occurs and how data analy-
sis can spark creativity. New theory still
must build on previous theory, however.
Most old sayings point us in the right
direction. However, the saying, “The data
speak for themselves” is dead wrong. Data
never speak for themselves, but require
sound subject matter knowledge to be
properly analyzed and interpreted.
Sequential approachesYou might get the impression from sta-
tistics textbooks that proper analysis of
one data set satisfactorily addresses most
problems. Unfortunately, resolving tough
problems is usually more difficult than
that and requires a sequential approach
using multiple data sets and statistical
methods. As noted previously, an overall
strategy is required, and this strategy
typically incorporates multiple phases and
data sets.
For example, the Framingham Heart
Study (FHS)7 was initiated in 1948 and
continues to collect data and analyze
it today. The FHS has produced major
breakthroughs in identifying risk factors
for heart disease, such as smoking, high
blood pressure, high blood cholesterol
and obesity.
By using a sequential mindset, prac-
titioners get to use hindsight to their
advantage. That is, after reviewing the
initial data, they can quickly see which
hypotheses have been validated and what
surprises there might be. The surprises
lead to reevaluation of existing subject
matter knowledge, as noted previously,
and to new theories.
New sets of data, specifically identified
to evaluate the new theories, then can be
collected. The cycle continues with new
knowledge gained at each step in the pro-
cess. Through a sequential approach, data
collection and analysis fit into the overall
scientific discovery process. Statistical
methods test existing hypotheses and also
help generate new hypotheses—that is,
statistical methods properly applied in a
sequential approach spark innovation and
creativity.
Guidance for problem solvingSolving large, complex and unstructured
problems is difficult and goes well beyond
solving typical textbook problems. Guid-
ance is needed so practitioners don’t re-
invent the wheel with each new problem.
The fundamental principles of statistical
engineering can guide our efforts and
significantly increase our learning curves
and chances of success. QP
REFERENCES AND NOTES1. Roger W. Hoerl and Ronald D. Snee, “Statistical Thinking
and Methods in Quality Improvement: A Look Toward the Future,” Quality Engineering, Vol. 22, No. 3, 2010, pp. 119-129.
2. George E.P. Box, William G. Hunter and J. Stuart Hunter, Statistics for Experimenters, John Wiley & Sons, 1978, p. 291.
3. Ronald D. Snee and Roger W. Hoerl, “One Size Does Not Fit All,” Quality Progress, May 2013, pp. 48-50.
4. George E.P. Box, J. Stuart Hunter and William G. Hunter, Statistics for Experimenters, second edition, John Wiley & Sons, 2005.
5. George W. Cobb and Stephen Gelbach, “Statistics in the Courtroom: United States v. Kristen Gilbert,” Statistics: A Guide to the Unknown, Thomson/Brooks Cole, 2006.
6. For this analysis on paper towel strength, read Roger W. Hoerl and Ronald D. Snee’s Statistical Thinking: Improving Business Performance, second edition, John Wiley and Sons, 2012, p. 171.
7. For more information about Framingham Heart Study, visit www.framinghamheartstudy.org.
© 2015 Roger W. Hoerl and Ronald D. Snee
Practitioners who have had to collect their own data know how challenging it can be to collect good data.
ROGER W. HOERL is a Brate-Peschel assistant professor of statistics at Union College in Schenectady, NY. He has a doctorate in applied statistics from the University of Delaware in Newark. Hoerl is an ASQ fellow, a recipient of the ASQ’s Shewhart Medal and Brumbaugh Award and an
academician in the International Academy for Quality.
RONALD D. SNEE is president of Snee Associates LLC in Newark, DE. He has a doctorate in applied and mathematical statistics from Rutgers University in New Brunswick, NJ. Snee has received ASQ’s Shewhart and Grant Medals. He is an ASQ fellow and an academician in the International
Academy for Quality.

June 2015 • QP 55
STANDARDS OUTLOOK BY LES SCHNOLL
Disappearing Act How to bring back high-quality customer service
WE HAVE all heard the adage that the
customer is always right. It’s been drilled
into our heads, and we are told that we
will experience significant consequences
should we fail to abide by that philosophy.
Unfortunately, in the United States and
most of the rest of the world, customer
service has all but disappeared.
You’ve probably heard of poster children
for poor customer service—Comcast and
United Airlines, for example.1 You also have
likely experienced poor customer service in
the past. It becomes more difficult to deal
with each time you experience it.
Personally, I’m at a point where I will not
put up with the nonsense any longer. Orga-
nizations doing business in the United States
must get their acts together and learn what
customer service and satisfaction mean.
Service standardsOne of the lesser-known series of interna-
tional quality standards is the ISO 10000 se-
ries, which relates to customer satisfaction.
These standards can be used individually or
in combination to maintain and improve an
organization’s customer processes.
ISO 10001:2007—Quality manage-
ment—Customer satisfaction—Guide-
lines for codes of conduct for organi-
zations2 contains guidance on codes
of conduct for organizations related to
customer satisfaction. These codes of
conduct can decrease the probability of
problems arising and can eliminate causes
of complaints and disputes that can de-
crease customer satisfaction.
ISO 10002:2014—Quality manage-
ment—Customer satisfaction—Guide-
lines for complaints handling in organi-
zations3 contains guidance on the internal
handling of product-related complaints.
This guidance can help to preserve cus-
tomer satisfaction and loyalty by helping
organizations resolve complaints effec-
tively and efficiently.
ISO 10003:2007—Quality manage-
ment—Customer satisfaction—Guide-
lines for dispute resolution external to
organizations4 contains guidance on the
resolution of disputes regarding product-
related complaints that could not be satis-
factorily resolved internally. ISO 10003 can
help to minimize customer dissatisfaction
stemming from unresolved complaints.
ISO 10004:2012—Quality manage-
ment—Customer satisfaction—Guide-
lines for monitoring and measuring5
provides guidance on defining and
implementing processes to monitor and
measure customer satisfaction and is
intended for use by organizations to satisfy
customers external to the organization.
These topics are lightly addressed in
several other International Organization
for Standardization (ISO) standards such
as ISO 9001 and ISO 13485, but they are of
minimal impact when it comes to organiza-
tions’ day-to-day activities.
Trends and analysisWhile these standards may be a great place
to start to build an organization’s processes
for meeting or exceeding customer require-
ments and expectations, it is basically left
to an individual organization to implement
those processes and determine suitable
metrics. Unfortunately, most domestic orga-
nizations fail to measure the right things.
This is where an organization such as
the Institute of Customer Service (ICS),
based in London, helps to fill a void. Every
January, the ICS publishes a report, The
State of Customer Satisfaction in the
United Kingdom. In the 2015 report, ICS’s
CEO Joanna Causon said:
U.K. customers are now, on average, less
satisfied with the service they receive
than at any point since July 2010. I
believe that these results reflect pro-
found shifts in the market environment.
Deteriorating aspects of customer experience / FIGURE 1
Ave
rage
cu
sto
mer
sco
re in
UK
CS
I
Jan.2013
July2013
Jan.2014
July2014
Jan.2015
8.5
8
7.5
7
6.5
6
5.5
5
4.5
4
Competence of staffHelpfulness of staffProduct/service rangeSpeed of service in personAvailability of support (website)Reputation of the organizationEase of getting through by phoneSpeed of response (writing)Staff doing what they say they will do (complaints)Handling of the complaintSpeed of resolving your complaint
UKCSI = U.K. Customer Service Index

QP • www.qualityprogress.com56
LES SCHNOLL has more than 35 years of experience in industries regulated by the Food and Drug Administra-tion. He is a senior member of ASQ and an ASQ-certified quality engineer, auditor and quality manager. A former member of the U.S. technical advisory group to International Organization for
Standardization technical committee 176, Schnoll wrote The Regulatory Compliance Almanac (Paton Press, 2001, 2008). He is the principal of Quality Docs LLC, providing quality and regulatory consulting services to FDA-regulated industries. He also teaches several courses in master’s degree programs on regulatory affairs at Arizona State University in Tempe and Northeastern University in Boston.
Customers’ expectations have evolved
rapidly, leading to an ever-growing desire
for convenience, speed and value. More-
over, we expect the service experience to
be more personalized than before, with
organizations expected to anticipate our
current and potentially future needs.6
Several key findings in this year’s report
include:
• The downward trend in customer satis-
faction continues.
• Only two sectors have improved cus-
tomer satisfaction.
• Customer segments offer contrasting
levels of satisfaction.
• Service drives customer engagement,
trust and loyalty.
• Satisfaction ratings related to speed,
complaints and staff issues have fallen.
• Employee engagement is strongly linked
with customer satisfaction.
The report further concludes there is
a range of environmental factors that are
forcing organizations to fundamentally
rethink their relationships with customers.
These include:
• Decline in trust.
• Diversity of customer segments.
• An intense focus on value.
• Changing attitudes to ethics and sustain-
ability.
• Emotional factors.
• Multiple communication channels and
technology.
• Employee management.
• Levels of investment in customer service.
The report includes an analysis of trends
impacting customer satisfaction. Figure
1 (p. 55) depicts 11 (of 28) metrics that
have most contributed to the decline in
customer satisfaction scores. Speed and
responsiveness, complaint processes, and
employee behavior and attitude were the
leading causes in the decrease of customer
satisfaction.
Finally, the report recommends which
areas organizations should focus on to en-
hance their levels of customer satisfaction.
These 11 areas are:
1. A strategic leadership commitment to
customer service.
2. Measurement across the whole
customer experience.
3. Consistency across channels.
4. Investment in customer insight.
5. Co-creation of services.
6. Proactive employee engagement
strategies.
7. Equipping people with skills and
confidence.
8. Problem prevention.
9. Benchmarking organizations from other
sectors.
10. Collaborating within and beyond the
organization.
11. Increasing agility and innovation
capabilities.
Downward spiralSo, where do we go from here? In 1986, the
Technical Assistance Research Programs
Institute published a report that concluded
that at any one time, 25% of customers are
dissatisfied enough with service to stop do-
ing business with an organization.7 Yet, only
4% will complain.
The research also indicated custom-
ers change suppliers for only a few basic
reasons:
• Someone dies (1%).
• Change in geographical location (3%).
• Friendships (5%).
• Competition (9%).
• Indifference by an employee of
the supplier (68%).
It’s been almost 30 years since the
report, and conditions have not improved.
In fact, they have probably deteriorated.
Individually, it is difficult to change poor
attitudes and even worse treatment. Poor
publicity and a significant event are the
only ways organizations providing poor
customer service will change.
I continue to insist on outstanding
customer service and, fortunately, I can
find it in some businesses. If I am incensed
enough about how I’m treated, I simply find
another place to spend my money.
As a business owner myself, I cer-
tainly don’t want to become known as the
“Comcast of consultants.” Let’s not forget:
Quality includes customer service. As QP
readers and members of ASQ—an organiza-
tion with quality in its name—it is up to us
to lead the way. QP
REFERENCES AND NOTE1. Max Nisen, “The 15 Worst Companies for Customer Service,”
Business Insider, Jan. 8, 2013, http://bit.ly/worstservice.2. International Organization for Standardization, ISO
10001:2007—Quality management—Customer satisfac-tion—Guidelines for codes of conduct for organizations, http://bit.ly/ISO100023007.
3. International Organization for Standardization, ISO 10002:2014—Quality management—Customer satisfac-tion—Guidelines for complaints handling in organizations, http://bit.ly/ISO100022014.
4. International Organization for Standardization, ISO 10003:2007—Quality management—Customer satisfac-tion—Guidelines for dispute resolution external to organiza-tions, http://bit.ly/ISO100032007.
5. International Organization for Standardization, ISO 10004:2012—Quality management—Customer satisfac-tion—Guidelines for monitoring and measuring, http://bit.ly/ISO100042012.
6. Institute of Customer Service, The State of Customer Sat-isfaction in the United Kingdom, January 2015. A complete, free copy of the summary report can be accessed at http://bit.ly/icsexecsummary.
7. Technical Assistance Research Programs Institute, Consumer Complaint Handling in America: An Update Study, U.S. Office of Consumer Affairs, 1986.
STANDARDS OUTLOOK
STANDARDS CORNERRevision timing updateISO 14001:2015 will now be published in
September 2015, instead of June or July
2015, as previously thought. This is due
to the amount of meeting time it took to
agree on the last set of draft comments.
ISO 9001:2015 is still on schedule to be
published in September 2015.

Incorporate plan-do-study-act (PDSA) and the seven different quality tools to
improve your processes, resulting in higher productivity and overall greater pro� t.
The Global Voice of QualityTMCERTIFICATION MEMBERSHIP PUBLICATIONSTRAINING CONFERENCES
Visitasq.org/qualitytools to learn more.
PDSA plus QToolsTM is your go-to resource.
ASQ RELIABILITY DIVISION
Interested in weeklong training in the � eld of reliability engineering? Visit us in Orlando, FL, this July for a wide variety of training offerings!
Sign up for one or more!
MONDAY, JULY 27, 2015Statistics for Reliability AnalysisMarc Banghart
Root Cause Analysis/Problem SolvingDavid Auda
TUESDAY, JULY 28, 2015Introduction to Reliability EngineeringMarc Banghart
New Product Development Steps for Mission Effectiveness and Failure PreventionDavid Auda
WEDNESDAY, JULY 29, 2015Weibull AnalysisJim Breneman
Failure Modes and Effects Analysis (FMEA)James McLinn
THURSDAY, JULY 30, 2015Introduction to Monte Carlo SimulationJim Breneman
Accelerated Life Test (ALT)James McLinn
For more information—including complete course descriptions, pricing information, and registration and cancellation policies—visit www.asqrd.org/awards-2/orlando-courses.
Hotel Information: Homewood Suites for Orlando • 11400 Marbella Palm Court • Orlando, FL 32836+1 407-239-4540 Use the discount code “ASQ” when calling to book your room $400 per course for Reliability Division members $500 per course for non-Reliability Division members
57June 2015 • QP


59June 2015 • QP
2015 Software Showcase
and Directory The right quality software solution can open up countless possibilities to leverage your data, solve complex problems or just help your organization operate more efficiently.
Let the ASQ 2015 Software Showcase and Directory help. In this special section, you’ll find listings of the premier providers in each of these categories. Contact information and areas of specialty are also included.
Special Advertising Section

Get the whole story. Time and again, since 1982, Statgraphics products have provided innovative quality assurance solutions to major corporations around the globe and across the industrial spectrum. The new Version 17 is packed with tools you need to visualize your business in a novel and enlightened new way.
Attain the confidence to act decisively. Discover trends. Gain perspective. Achieve goals. Increase revenue and profitability. Chart your success!
Now there are three choices…
Statgraphics Centurion XVII - over 230 procedures from basic statistics to design of experiments. Powerful new features include the Deviation Dashboard and 18 other Statlets for dynamic data visualization.
Statgraphics Sigma express - adds a Six Sigma DMAIC menu to Microsoft Excel.
Statgraphics stratus - brings statistical analysis and data visualization to the Cloud. Use on your PC, Mac, tablet or smartphone.
See the forest and the trees.
540.428.0084 or [email protected]
XVII
optimize processes
increase ROI
eliminate defects
decrease costs
reduce scrap

Special Advertising Section
2015 Software Showcase and Directory
BSI 12950 Worldgate Drive, 8th FloorHerndon, VA 20170 Phone: 888-429-6178 www.bsi-entropy.comEntropyTM Software provides a powerful business improvement solution that significantly reduces the cost and effort to proactively manage risk, quality and sustainability activities. AUDITING • CORRECTIVE ACTION • DOCUMENT MANAGEMENT • ISO 9000 • ISO 14000 • MANAGEMENT • PREVENTIVE ACTION • PROBLEM SOLVING • QS-9000/TS 16949 • QUALITY ASSURANCE • SOFTWARE • SUPPLIER QUALITY ASSURANCE • TRAINING
CloudQMS Phone: 855-256-8376 www.cloudqms.comAUDITING • CALIBRATION • COMPUTERS • CONSULTING • CORRECTIVE ACTION • CUSTOMER SERVICE • CUSTOMIZED SOFTWARE DEVELOPMENT • DATA ACQUISITION • DOCUMENT MANAGEMENT • E-COMMERCE • GAGE REPEATABILITY AND REPRODUCIBILITY • INSPECTION • ISO 9000 • ISO 14000 • MANAGEMENT • MEASUREMENT • PREVENTIVE ACTION • PROBLEM SOLVING • PROCESS DOCUMENTATION/MAPPING • QS-9000/TS 16949 • QUALITY ASSURANCE • RECALL MANAGEMENT • RELIABILITY • SOFTWARE • SUPPLIER QUALITY ASSURANCE • TEST PREPARATION • TRAINING • OTHER
CyberMetrics Corporation1523 W. Whispering Wind Drive, Suite 100Phoenix, AZ 85085Phone: 800-777-7020www.cybermetrics.comOver 12,000 facilities worldwide choose CyberMetrics software solutions to manage gages, calibrations, preventive maintenance and supplier quality while maintaining standards compliance and reducing costs.AUDITING • CALIBRATION • COMPUTERS • CONSULTING • CORRECTIVE ACTION • CUSTOMIZED SOFTWARE DEVELOPMENT • DOCUMENT MANAGEMENT • GAGE REPEATABILITY AND REPRODUCIBILITY • ISO 9000 • MANAGEMENT • MEASUREMENT • PREVENTIVE ACTION • QS-9000/TS 16949 • QUALITY ASSURANCE • RECALL MANAGEMENT • RELIABILITY • SIX SIGMA • SOFTWARE • SUPPLIER QUALITY ASSURANCE • TRAINING • OTHER
DataNet Quality Systems29200 Northwestern Highway, 3rd Floor Southfield, MI 48034Phone: 248-357-2200www.winspc.comDataNet Quality Systems delivers continuous improvement software and services that empower manufacturers to transform their product and process quality through real-time statistical process control (SPC).CAPABILITY STUDIES • COMPUTERS • CONSULTING • CORRECTIVE ACTION • CUSTOMER SERVICE • CUSTOMIZED SOFTWARE DEVELOPMENT • DATA ACQUISITION • DESIGN OF EXPERIMENT • GAGE REPEATABILITY AND REPRODUCIBILITY • INSPECTION • MEASUREMENT • PREVENTIVE ACTION • SIX SIGMA • SOFTWARE • STATISTICAL METHODS • STATISTICAL PROCESS CONTROL • SUPPLIER QUALITY ASSURANCE • TRAINING
DocXellent 257 Main Street Norwich, CT 06360 Phone: 860-887-2900 www.docxellent.com DocXellent, Inc. is a U.S.-based creator of ensur, an integrated
document control and quality management application for manufacturing, laboratories and life sciences across the globe.AUDITING • COMPUTERS • CORRECTIVE ACTION • CUSTOMER SERVICE • DOCUMENT MANAGEMENT • ISO 9000 • PREVENTIVE ACTION • QUALITY ASSURANCE • SOFTWARE • TRAINING
EtQ Inc. 399 Conklin St., Suite 208 Farmingdale, NY 11735 Phone: 516-293-0949 www.etq.com EtQ is the leading enterprise quality and compliance management software for identifying, mitigating and preventing high-risk events through integration, automation and collaboration.AUDITING • CALIBRATION • CORRECTIVE ACTION • DOCUMENT MANAGEMENT • INSPECTION • ISO 9000 • ISO 14000 • MANAGEMENT • PREVENTIVE ACTION • PROCESS DOCUMENTATION/MAPPING • QS-9000/TS 16949 • QUALITY ASSURANCE • QUALITY FUNCTION AND DEPLOYMENT • RECALL MANAGEMENT • SOFTWARE • SUPPLIER QUALITY ASSURANCE • TRAINING • OTHER
InfinityQS12601 Fair Lakes CircleFairfax VA 22033Phone: 703-961-0200www.infinityqs.comInfinityQS is the global authority on manufacturing intelligence (MI) and enterprise quality, delivering real-time visibility and actionable insight on the shop floor, across the enterprise and throughout the supply chain. AUDITING • BENCHMARKING • CALIBRATION • CAPABILITY STUDIES • CORRECTIVE ACTION • CUSTOMIZED SOFTWARE DEVELOPMENT • DATA ACQUISITION • DESIGN OF EXPERIMENTS • GAGE REPEATABILITY AND REPRODUCIBILITY • INSPECTION • ISO 9000 • ISO 14000 • MANAGEMENT • MEASUREMENT • PREVENTIVE ACTION • PROBLEM SOLVING • QS-9000/TS 16959 • QUALITY ASSURANCE • RELIABILITY • SIG SIGMA • SOFTWARE • STATISTICAL METHODS • STATISTICAL PROCESS CONTROL • SUPPLIER QUALITY ASSURANCE • TAGUCHI TECHNIQUES • TEST PREPARATION • TRAINING • OTHER
Intelex TechnologiesPhone: 416-599-6009, x290www.intelex.comAUDITING • CORRECTIVE ACTION • CUSTOMIZED SOFTWARE DEVELOPMENT • DOCUMENT MANAGEMENT • INSPECTION • ISO 9000 • ISO 14000 • PREVENTIVE ACTION • QS-9000/TS 16949 • QUALITY ASSURANCE • SOFTWARE • SUPPLIER QUALITY ASSURANCE • TRAINING • OTHER
IQS25000 Country Club Blvd., Suite 120North Olmsted, OH, 44070 Phone: 440-333-1344 www.iqs.com IQS is for all of those who just can’t get needed and timely quality information. IQS offers proven, off-the-shelf, flexible software for managing quality and compliance.AUDITING • CALIBRATION • CAPABILITY STUDIES • CONSULTING • CORRECTIVE ACTION • CUSTOMER SERVICE • DOCUMENT MANAGEMENT • GAGE REPEATABILITY AND REPRODUCIBILITY • INSPECTION • ISO 9000 • ISO 14000 • PREVENTIVE ACTION • QS-9000/TS 16949 • QUALITY ASSURANCE • SOFTWARE • STATISTICAL PROCESS CONTROL • SUPPLIER QUALITY ASSURANCE • TRAINING
61June 2015 • QP

Outliers don’tscare me.
Fearless Data AnalysisAnalyzing data is easy with Minitab Statistical Software. A built-in Assistant guides you through the entire process, from picking the right tool to performing your analysis and interpreting your results. You know your business. Minitab provides the confidence you need to improve it.
w w w. m i n i t a b . c o m
62 QP • www.qualityprogress.com

Special Advertising Section
2015 Software Showcase and Directory
KPI Fire4956 N 300 W, Suite 333Provo, UT 84604 Phone: 208-473-1010 www.kpifire.com Make lean Six Sigma actually work and prove it with KPI Fire. We offer intuitive, affordable hoshin kanri (strategy deployment), KPI Dashboard and project management software.CONSULTING • CORRECTIVE ACTION • CUSTOMIZED SOFTWARE DEVELOPMENT • DATA ACQUISITION • ISO 9000 • MANAGEMENT • MEASUREMENT • PREVENTIVE ACTION • PROBLEM SOLVING • PROCESS DOCUMENTATION/MAPPING • QUALITY FUNCTION AND DEPLOYMENT • SIX SIGMA • SOFTWARE • STATISTICAL PROCESS CONTROL • TRAINING
Minitab Inc.Quality Plaza1829 Pine Hall Road State College, PA 16801-3008 Phone: 800-448-3555 www.minitab.com Minitab is the leading provider of software for quality improvement. More than 90 percent of Fortune 100 companies use Minitab Statistical Software, our flagship product. CAPABILITY STUDIES • DESIGN OF EXPERIMENT • GAGE REPEATABILITY AND REPRODUCIBILITY • RELIABILITY • SIX SIGMA • SOFTWARE • STATISTICAL METHODS • STATISTICAL PROCESS CONTROL • TAGUCHI TECHNIQUES • TRAINING
QI Macros for Excel2696 S. Colodado Boulevard, Suite 555Denver, CO 80222Phone: 303-765-9144www.qimacros.comYou don’t have to be a statistician to start getting immediate results with the QI Macros for Excel! Get a free 30-day trial: PC and Mac.CAPABILITY STUDIES • CONSULTING • CUSTOMIZED SOFTWARE DEVELOPMENT • DESIGN OF EXPERIMENT • GAGE REPEATABILITY AND REPRODUCIBILITY • PREVENTIVE ACTION • QS-9000/TS 16949 • QUALITY ASSURANCE • QUALITY FUNCTION AND DEPLOYMENT • SIX SIGMA • SOFTWARE • STATISTICAL METHODS • STATISTICAL PROCESS CONTROL • TAGUCHI TECHNIQUES • TRAINING
QiSOFT 2 E. Bryan Street, Suite 1515 Savannah, GA 31401 Phone: 912-790-7990 www.qisoft.com QiSOFT works with manufacturing organizations worldwide to improve the speed and accuracy of data capture, interpretation and visualization; all key factors in driving continuous quality improvement.CAPABILITY STUDIES • DATA ACQUISITION • DOCUMENT MANAGEMENT • PROCESS DOCUMENTATION/MAPPING • QUALITY ASSURANCE • SIX SIGMA • SOFTWARE • STATISTICAL METHODS • STATISTICAL PROCESS CONTROL • SUPPLIER QUALITY ASSURANCE
RealityCharting®
8524 W. Gage Blvd., Suite A289Kennewick, WA 99336Phone: 206-922-7910www.realitycharting.comRealityCharting® is an intuitive problem-solving application with
built-in integrity measures that support effective solutions users identify following the Apollo Root Cause Analysis™ methodology. CONSULTING • CORRECTIVE ACTION • CUSTOMIZED SOFTWARE DEVELOPMENT • DOCUMENT MANAGEMENT • ISO 9000 • ISO 14000 • PREVENTIVE ACTION • PROBLEM SOLVING • QUALITY ASSURANCE • RELIABILITY • SIX SIGMA • SOFTWARE • SUPPLIER QUALITY ASSURANCE • TRAINING
SigmaXL305 King St. West, Suite 503 Kitchener, ON N2G 1B9 Canada Phone: 416-236-5877 www.sigmaxl.com SigmaXL + Excel = easy statistical and graphical analysis. SigmaXL and DiscoverSim are cost-effective, powerful, user-friendly and ideal for lean Six Sigma training! Get a free 30-day trial.CAPABILITY STUDIES • DESIGN OF EXPERIMENT • GAGE REPEATABILITY AND REPRODUCIBILITY • RELIABILITY • SIMULATION • SIX SIGMA • SOFTWARE • STATISTICAL METHODS • STATISTICAL PROCESS CONTROL
Statpoint Technologies Inc. Warrenton, VA, 20186 Phone: 540-428-0084 800-232-7828www.statgraphics.com Statpoint Technologies offers 33 years of pioneering features. The newly released Statgraphics XVII predictive analytics software contains 230+ statistical procedures, Statlets for dynamic visualization and a wide array of advanced procedures.CAPABILITY STUDIES • COMPUTERS • CONSULTING • CUSTOMIZED SOFTWARE DEVELOPMENT • DESIGN OF EXPERIMENT • GAGE REPEATABILITY AND REPRODUCIBILITY • PROBLEM SOLVING • QUALITY ASSURANCE • QUALITY FUNCTION AND DEPLOYMENT • RELIABILITY • SIMULATION • SIX SIGMA • SOFTWARE • STATISTICAL METHODS • STATISTICAL PROCESS CONTROL • TAGUCHI TECHNIQUES • TRAINING
VERSE Solutions 399 Conklin Street, Suite 208 Farmingdale, NY 11735 Phone: 516-293-0949 www.versesolutions.com VERSE is a dedicated cloud-based quality management system that provides the dynamic performance of an on-premises solution without the long-term commitment.AUDITING • CALIBRATION • CORRECTIVE ACTION • DOCUMENT MANAGEMENT • ISO 9000 • PREVENTIVE ACTION • QS-9000/TS 16949 • QUALITY ASSURANCE • SOFTWARE • SUPPLIER QUALITY ASSURANCE • TRAINING
VKS – Visual Knowledge Share 1241 Cascades Blvd. Chateauguay, QC Canada J6J 4Z2 Phone: 855-201-4656 www.vksapp.com VKS is a browser-based application used to create and share visual work instructions in a step-by-step format to operators on the shop-floor. DATA ACQUISITION • INSPECTION • PROCESS DOCUMENTATION/MAPPING • QUALITY ASSURANCE • SOFTWARE • STATISTICAL PROCESS CONTROL • TRAINING • WORK INSTRUCTIONS
63June 2015 • QP

4 Works in Excel - PC and Mac Compatible
4 Easy Point and Click Interface
4 Built-in Rules Automatically Choose the Right Chart
4 Learn in Minutes
QIMacros
$229
KnowWare International, Inc. | 888.468.1537 | www.qimacros.com
PER LICENSE
Chart the Right Course: SPC Software for Excel
ONLY
Apollo Root Cause Analysis™ By Dean L. Gano
Free Book Software Solutions
Enter the code below to get your copy
CODE: ASQ2015
www.realitycharting.com ◆ (US) 206-922-7910 ◆ (US) 877-722-2770 ◆ [email protected]
RC Simplified™ provides a text entry interface that simply asks the questions a facilitator would ask. As answers are provided a Realitychart is created. There is no training needed to use this application.
Using RealityCharting® increases the quality of your analysis by providing expert guidance and structure supporting the Apollo Root Cause Analysis method.
RC Coach™ offers a self-paced online learning experience designed to teach how RealityCharting® can be used to understand and solve your most pressing problems.
RC Pro™ is an advanced enterprise software solution that provides the power of a database and presents information with meaningful analytics and visual reporting. Please call for a quote.
Go to realitycharting.com/rcbook Go to realitycharting.com/downloads for software and 30-day trial
realitycharting.com/rcbook
64 QP • www.qualityprogress.com

65June 2015 • QP

Power take-offsTwin Disc has released a remote over
center power take-off (PTO), the RO
111/211. The RO 111/211 can be engaged
and disengaged remotely by way of
a control valve or electronic control.
Hydraulic or pneumatic actuation is
achieved through ports, making access to
the fittings straight forward.
The design of the PTO allows for side
load and inline applications. It is ideal for
industries such as agriculture, construc-
tion, manufacturing, marine, mining,
timber and oil and gas production. The
units are installed to original equipment
manufacturing or custom settings.
• Email: [email protected].
• Visit: www.twindisc.com.
Marking system
5S Supply has announced the Gauge
Range marking system in three
styles: starter pack, standard
pack and super pack. Refill
packs for each style are
also available. The mark-
ing system uses trans-
lucent self-adhesive
sheets in red, yellow
and green to make for
marking gauges so us-
ers can see if equipment
is in the correct operating
range.
The gauge marking sys-
tem comes pre-cut, with com-
mon sizes and additional full sheets
to customize. The sheets are made from
5-year outdoor-grade vinyl.
• Call: 888-453-2657.
• Visit: www.gaugerange.com.
FlowmeterKrohne’s Optiswirl 4200 vortex flowme-
ter is used to measure conducting and
nonconducting liquids, gases and steam.
It can be used for internal monitoring of
energy flows for saturated and super-
heated steam or hot water, and heat
metering applications. It is also ideal for
applications like steam boiler monitor-
ing, burner consumption measurement
or compressed air network monitoring,
including free air delivery applications.
The Optiswirl 4200 is available in a re-
mote version equipped with a field hous-
ing converter with a connection cable
up to 164 ft. Temperature and pressure
compensation options also are available,
which enable calculation of standard flow
volume under fluctuating pressures and
temperatures.
• Visit: www.us.krohne.com.
• Email: [email protected].
Power entry moduleSchurter’s power entry module, the KFA
series, is equipped with an additional
ground line choke to suppress high fre-
quency interference arising from ground
loops on the ground line. The added
ground line choke improves asymmetric
attenuation in higher frequencies in medi-
cal filter versions. The ground line choke
isolates the equipment chassis against
high frequencies and the equipment
ground from the ground on the line power
connection.
The KFA is suited for medical equip-
ment required to use low leakage filters
for increased patient safety. The reduced
QP • www.qualityprogress.com66
•
•
•
•
QPTOOLBOX
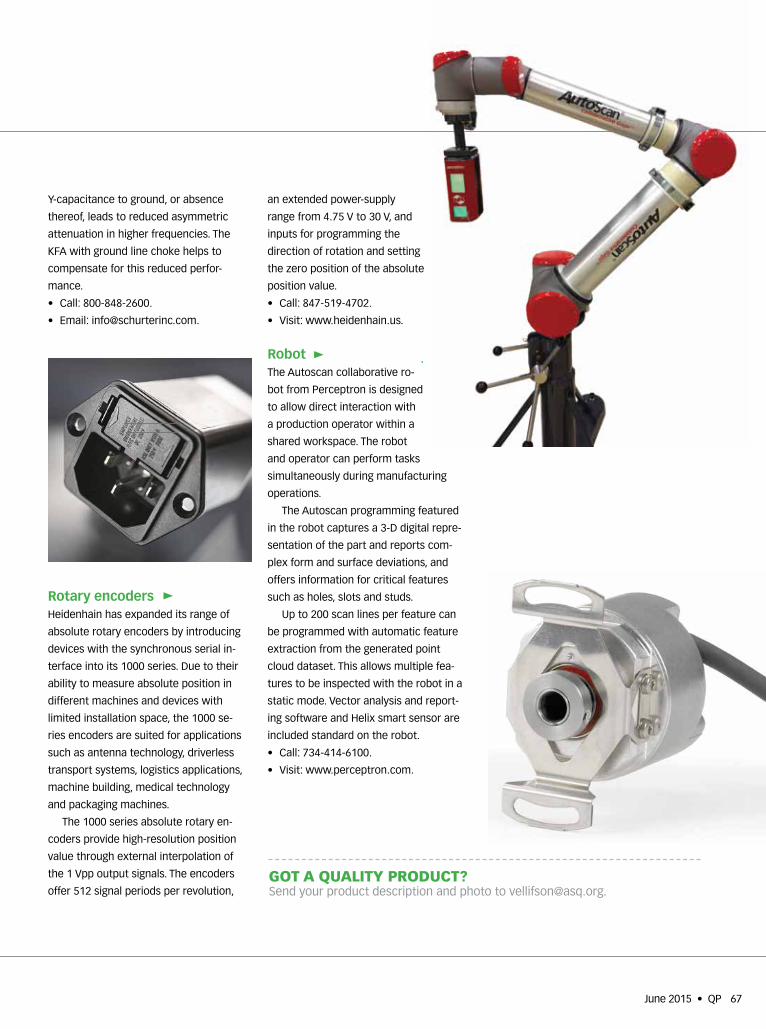
June 2015 • QP 67
Y-capacitance to ground, or absence
thereof, leads to reduced asymmetric
attenuation in higher frequencies. The
KFA with ground line choke helps to
compensate for this reduced perfor-
mance.
• Call: 800-848-2600.
• Email: [email protected].
Rotary encodersHeidenhain has expanded its range of
absolute rotary encoders by introducing
devices with the synchronous serial in-
terface into its 1000 series. Due to their
ability to measure absolute position in
different machines and devices with
limited installation space, the 1000 se-
ries encoders are suited for applications
such as antenna technology, driverless
transport systems, logistics applications,
machine building, medical technology
and packaging machines.
The 1000 series absolute rotary en-
coders provide high-resolution position
value through external interpolation of
the 1 Vpp output signals. The encoders
offer 512 signal periods per revolution,
an extended power-supply
range from 4.75 V to 30 V, and
inputs for programming the
direction of rotation and setting
the zero position of the absolute
position value.
• Call: 847-519-4702.
• Visit: www.heidenhain.us.
RobotThe Autoscan collaborative ro-
bot from Perceptron is designed
to allow direct interaction with
a production operator within a
shared workspace. The robot
and operator can perform tasks
simultaneously during manufacturing
operations.
The Autoscan programming featured
in the robot captures a 3-D digital repre-
sentation of the part and reports com-
plex form and surface deviations, and
offers information for critical features
such as holes, slots and studs.
Up to 200 scan lines per feature can
be programmed with automatic feature
extraction from the generated point
cloud dataset. This allows multiple fea-
tures to be inspected with the robot in a
static mode. Vector analysis and report-
ing software and Helix smart sensor are
included standard on the robot.
• Call: 734-414-6100.
• Visit: www.perceptron.com.
GOT A QUALITY PRODUCT?Send your product description and photo to [email protected].
•
•

QP • www.qualityprogress.com
Long-Term Care Administration and Management: Effective Practices and Quality Programs in EldercareDarlene Yee-Melichar, Cristina M. Flores
and Edwin P. Cabigao, editors, Springer
Publishing Co., 2014, 392 pp., $95 (book).
Eldercare is a
growing service
business requiring
innovative thinking
to provide quality
programs to the
world’s growing
elder population.
The authors note
that long-term care
(LTC) is a complex continuum of care ser-
vices. More than 70% of people 65 years
and older will require some LTC. Readers
of this book will find tools to maximize
quality of care and quality of life for older
adults in LTC communities.
The book is comprised of three sec-
tions. The first section identifies LTC's
many options: LTC at home; community-
based programs and services; natu-
rally occurring retirement communities;
assisted living communities; continuing
care retirement communities and skilled
nursing facilities.
The second section discusses current
issues in LTC such as: the need to enhance
and better manage client care; preventing
elder abuse and neglect; retaining a well-
trained and committed staff. This section
also mentions business issues such as
marketing, finance, and managing litigation
and arbitration issues.
The third section offers ideas on effec-
tive practices and quality programs. The
book also includes case study practices
that incorporate federal and state regula-
tions for long-term communities. There
are quality gaps pointed out in caring for
older adults that require using cognitive
assessments for benchmarking, documen-
tation for monitoring pain management
and communication plans for coordinating
health services as a patient is transitioned
between care centers.
Quality in eldercare is important today
because palliative care and hospice
services are in demand and a driving force
for quality improvements in healthcare.
This book is an excellent and resourceful
reference for professionals in the field,
especially quality professionals involved
with the complex continuum of healthcare
services.
John Lanczycki
West Springfield, MA
Sustainable Innovation Strategy: Creating Value in a World of Finite ResourcesChristophe Sempels and Jonas Hoffman,
Palgrave Macmillan, 2013, 272 pp., $47
(book).
The purpose of
this book is to
provide ideas and
actions for leaders
incorporating sus-
tainability as they
build tomorrow’s
business mod-
els. It starts with
the premise that
organizations are part of the problem and
the solution. An organization’s capacity to
create and capture value is due to strat-
egy, business model and value proposition
to its target markets. Economic activity
cannot be separated from the natural envi-
ronment and social fabric.
The authors propose that organizations
will need to move from a linear economy
to a circular economy (reduction, reuse,
and recycling). Organizations are encour-
aged to minimize material use, maximize
consecutive use cycles and increase col-
lection and redistribution efficiency.
To do this, the authors introduce
the sustainable business model canvas
(SBMC). The SBMC substitutes a triple
bottom line (people, planet and profits)
for a single bottom line: money. Topic
discussions help build the foundation
upon which a business model can be
built. Multiple case studies show how
some organizations already have made
the transition from resource reliance to
sustainable models. There are extensive
comments, notes, illustrations, tables and
an excellent index.
If a business can’t align economic,
environmental and social issues, the only
credible future is change. This book helps
define the possible options and ask the
right questions to build or continue a suc-
cessful and sustainable business.
Marc A. Feldman
Houston
Unpacking Open Innovation: Highlights From A Co-Evolutionary InquiryManlio Del Giudice, Maria Rosaria Della
Peruta, and Elias G. Carayannis, Palgrave
Macmillan, 2013, 202 pp., $105 (book).
The authors developed this series to
examine the dynamics of innovation and
entrepreneurship in the context of glo-
balization. They explore why some areas
grow and others stagnate, and measure
QPREVIEWS
68

the effects and implications in a trans-
disciplinary context that takes historical
evolution and geographical location into
account.
This work focuses on understanding
the emerging research field of open in-
novation, strongly influenced by Henry W.
Chesbrough. This newly formed discipline
can be described as exploiting some-
thing new and not obvious, and using the
newly found opportunity in the innova-
tion process through the establishment
of formal and informal relationships. In
this regard, the authors investigate this
new research field at a stage that contin-
ues to evolve.
The chapters cover significant topics in
business literature highlighting the most
relevant trends in publications regarding
open innovation. It also analyzes fields
of inquiry that present opportunities for
significant results.
The book covers
why open innova-
tion capacities and
tools are deployed
by organizations,
how innovation
can be measured,
the role of open
innovation among
the various innovation tools available to
companies, and the role of open innova-
tion in today’s economy.
Helping connect this scholarly research
to working professionals is the important
considerations learned by the review of
case studies regarding the implementa-
tion of open innovation in General Motors,
Philips and BSH Hausgeräte GmbH. The
authors also discuss how to turn the lofty
concept of open innovation into useful
reality in any business.
While the authors attempt to link these
ideas to solid ground, the highly sophis-
ticated, scholarly approach results in a
work more relevant and useful to business
scholars and researchers.
Dale Farris
Groves, Texas
Statistical Process Control for ManagersVictor E. Sower, Business Expert Press,
2014, 170 pp., $43.95 (book).
Statistical process control (SPC), devel-
oped by Walter A. Shewhart and later
popularized by W. Edwards Deming, is an
important part of any quality improvement
program today. This book provides a con-
ceptual understanding of SPC, and focuses
on how it works and why managers should
consider using it in their operations.
The book addresses different types
of causes of variation, the idea behind
a control chart, and how to interpret
and use them for process improvement.
Process capability and how to measure
and interpret capability indexes are ad-
dressed, and variable and attribute data is
discussed. Several
short examples,
often related to
industry, are used
for illustration. The
book provides a
basic understand-
ing of what is going
on, but does not
address much of
the tedious calculations.
It is not easy to explain statistical tech-
niques without being lost in symbols and
formulas, and still give a fairly correct and
helpful description. I think the author has
succeeded in creating a good balance. This
is a nice and easy-to-understand book on
SPC basics.
Bengt Klefsjö
Sweden
69
Advertisers IndexADVERTISER PAGE PHONE WEB ASQ Reliability Division 57 www.asqrd.org
BSI America Inc. 59 800-862-4977 www.bsiamerica.com
CyberMetrics Corp. OBC 800-777-7020 www.cybermetrics.com
EtQ Inc. IFC 516-293-0949 www.etq.com
KPI Fire 62 208-473-1010 www.kpifire.com
Minitab Inc. 62 800-448-3555 www.minitab.com
QI Macros for Excel 64 303-756-9144 www.qimacros.com
Quality Council of Indiana 1 800-660-4215 www.qualitycouncil.com
Reality Charting 64 206-922-7910 www.realitycharting.com
SigmaXL 58 888-744-6295 www.sigmaxl.com
StatPoint Technologies Inc. 60 540-428-0084 www.statgraphics.com
VERSE 65 516-293-0949 www.versesolutions.com
VKS Ltd. 65 855-201-4656 www.vksapp.com
June 2015 • QP

QP • www.qualityprogress.com70
PROFESSIONALSERVICESFor information on placing an ad, contact Media Sales at 866-277-5666.
IMDS Data• We can create your data and submit within
72 hours• We do the work and invoice you• References found on our website• Based in the United States
www.imdsdata.org • 734-205-8874
TQM ASSOCIATES INC.“we’re here to support you”
• Established in 1994• Women-Owned
• Quality Assurance Professionals• Across the U.S. and Worldwide
• Temporary or Permanent• Source Inspection
• Surveys• Audits
• Expediting
800-424-4729 3990 Old Town Ave. #C109Fax 619-297-3251 San Diego, CA 92110tqmassociates.com email: [email protected]
Classroom Training Aids…G Quincunx BoardsG Sampling BowlsG Catapults G Deming FunnelsG And lots more …
Visit us at: www.qualitytng.comEmail [email protected] for brochure
Ph: 248-641-7030 Fax: 248-641-7031PO Box 611 Troy, MI 48099-0611
For Accredited Certification Look for the Symbol of Quality
ISO 9001 ▪ AS 9100 ▪ ISO/TS 16949 ISO 14001 ▪ ISO 13485 ▪ ISO 22000
OHSAS 18001 ▪ FSSC 22000 SQF ▪ SQF Ethical Sourcing
Call 800.795.3641 www.eaglecertificationgroup.com
EAGLE Certification Group includes EAGLE Registrations Inc. and EAGLE Food Registrations Inc.
Consulting Services for FDA Regulated Industry
Over 25 years of experience and expertise in FDA & ISO Quality Systems Compliance: QSR/QMS,
Design/Change Control, Verification/Validation, FMEA, Risk Management, Audits, CAPA and FDA Remediation.
* www.BioQuality.net 214-336-8650 *
This � rst-of-its-kind global study now offers a self-assessment tool that will identify strengths and opportunities within your quality culture and offer suggestions to accelerate organizational growth and performance.
Take the online self-assessment today at cultureofquality.org.
ACCELERATING GROWTH AND PERFORMANCE IN THE ENTERPRISE
BUILDING A CULTURE OF QUALITY
A Joint Research Study by ASQ and Forbes Insights
The Global Voice of QualityTM
Here’s a great way to improve quality or implement a
Quality Management System and it’s FREE!
qmscapa.net

The Statement Problem Address problems by first answering the five Ws
AN IMPORTANT FIRST step in cor-
recting a poorly performing process, or
improving a marginally capable one, is
recognizing that there is a gap between
what is and what should be occurring in
the process.
Appropriate process metrics provide a
way to measure process changes and pro-
vide information about the size of the gap.
Beyond metrics, additional insight into the
problem is needed to ensure an organiza-
tion is efficiently and effectively attacking
the correct issues.
The problem statement provides a way
to clearly add detail about the gap. More-
over, a well-crafted problem statement in
a project charter helps the sponsor under-
stand the problem environment, leading to
better project-approval decisions.
The problem statement should be a
concise description of the facts that need
to be addressed and should answer the
five Ws (who, where, what, when and
why.) Notice that the H, or the how, isn’t
included because that’s what the inves-
tigative efforts hopefully will uncover
as the underlying root cause for the gap.
Knowing the facts associated with the
gap, investigation and resolution of the
problem can be done in the least amount
of time at the lowest cost.
The difficulty with developing a problem
statement is that, oftentimes, it’s assumed
that everyone knows what the problem is.
Inevitably, a poorly crafted, or incorrect,
problem statement is generated.
When the reason for a problem is pre-
sumed to be known a priori, two possible
versions of the problem statement may
result. In one case, the problem statement
is extremely sparse in information and
detail, such as: “Our department has been
getting complaints from our customers.”
At the other extreme, a priori knowl-
edge may lead to a detailed, but com-
pletely wrong problem statement or one
that jumps to identifying the solution,
such as: “We need to retrain the work
order processors because they are taking
too long and causing our customers to
complain about our department being
slow to respond.”
As you can see, both prob-
lem statements sound OK, but
are inadequate for investing
valuable resources in closing
the problem gap.
How do you develop a good
problem statement based on
facts surrounding the problem?
One method is to write things
down to try to capture the prob-
lem. This can be an ineffective
approach, especially for novices
who struggle to put thoughts
into a detailed and coherent
statement. Crafting the problem
statement is like writing for an
English composition assignment, so why
not use the same idea of working from an
outline?
The outline can be represented as a
problem statement matrix that includes
clues for capturing the five Ws (see Table
1). The facts needed to fill in the matrix
can be found through targeted interviews,
historical data or high-level preliminary
investigations that are quickly done at low
costs.
The matrix is used to write the detailed
problem statement: “Our work order
processing department has been averaging
10% more complaints each month during
the past three months after introducing
the new Excel 2013 tool to manage work
orders for all organizational departments.”
In this example, the focused problem
statement was instrumental in guiding ef-
forts that found and fixed an incorrect cell
formula used to calculate work order due
dates.
Sometimes, during the analyze phase
of the Six Sigma define, measure, analyze,
improve and control method, the original
problem statement is found to be incor-
rect based on new information uncovered
about the gap.1 The problem statement
matrix can again be used to capture new
details and facts for crafting a focused
problem statement. QP
REFERENCE1. Anthony Manos and Chad Vincent, The Lean Handbook:
A Guide to the Bronze Certification Body of Knowledge, ASQ Quality Press, 2012, p. 141.
MAX KUSH is principal consultant at the lean/Six Sigma consulting firm of MSK Consulting Group in Rio Rancho, NM. He has an MBA from Georgia College and State University in Milledgeville, GA. He is a senior member of ASQ and is an ASQ-certified Six Sigma Black Belt.
ONE GOOD IDEA BY MAX KUSH
What is the problem? Average number of complaints increased 10%.
Who is experiencing the problem?
All submitting departments.
Where is the problem occurring?
Work order processing department.
When does the problem occur?
Each month during the last three months.
Why does the problem occur (recent changes in the process?—5 Ms)
Introduced a new Excel 2013 tool for processing work orders.
5 Ms = man (personnel), machine, material, methods and Mother Nature (internal and external environmental factors)
The problem statement matrix / TABLE 1
June 2015 • QP 71

QP • www.qualityprogress.com72
1+1 = Zero DefectsReduce defects, partner your control plan with PMFEA
A CONTROL plan is a document that
helps you plan and allows you to control
the products you make and the processes
used during the creation of those prod-
ucts. It consists of the product description
and the process characteristics necessary
to ensure the quality of the final product.
This information is an important ad-
dition to the detection and prevention
controls listed in the process failure mode
and effects analysis (PFMEA), and the two
documents are meant to be used together.
Because it is a supplement to the PFMEA
and not a replacement, everything on
the control plan must be shown on the
PFMEA: It explains the why and what of
the process and product controls, while
the control plan explains how they should
be implemented, how often, how many
and the what if analysis.
Consider an example of the relation-
ship between the PFMEA and the control
plan. Specifically, the process of mold-
ing and injecting the plastic for a simple
transparent ruler. The overall size of the
ruler is important for the customer. If the
ruler is too small or too large, it will be in-
accurate. If you look at the PFMEA for the
ruler, it will list various failure modes with
the effects of the failures and their causes,
and it will list the prevention controls and
the detection controls.
Process and resultsPrevention controls focus on the pro-
cess and detection controls focus on the
processes’s results. In this example, we
consider a prevention control, monitor-
ing the machine settings, and a detection
control, measuring the size of the ruler.
The control plan would provide more
information and connect the controls to
the process and product itself. On the con-
trol plan, the machine settings would be a
process characteristic, and the thickness
of the ruler would be a product charac-
teristic. The control
plan includes the
process and product
specifications (shot
size—5 grams, ruler
thickness—3 mil-
limeters), measure-
ment techniques
(machine display,
calipers) and the
sample sizes and in-
spection frequencies
(once per shift, five
pieces per hour).
The control
methods (machine
setting check sheet
and statistical pro-
cess control chart)
and reaction plans also are included in
the control plan. The reaction plans give
instructions regarding how to react to a
failure (quarantine the product since the
last inspection and notify the supervisor).
The control plan gives detailed instruc-
tions to the employees about how to imple-
ment the controls defined in the PFMEA,
ensuring alignment between the PFMEA,
the shop floor and proper execution of the
controls.
Because product quality is only an
output of the process, controlling the
process characteristics is more important
than controlling the product characteris-
tics. This is how pairing the control plan
with the PFMEA can save an organization
money: They identify the prevention con-
trols and implement them by monitoring
the process itself.
This is completely different from
isolating your focus on the process results
(product quality). In this example, if
the relationships between the machine
settings, other process inputs and the
product characteristics were completely
understood, any defective products could
be avoided. This is a method to reach zero
defects and reduce costs.
Control plans, in conjunction with
PFMEA, can be used to prevent problems
and save organizations money by identify-
ing prevention controls and ensuring their
successful implementation. QP
BACK TO BASICS BY CHRIS HERMENITT
CHRIS HERMENITT is the vice president of quality North America for Henkel Adhesive Technologies in Madison Heights, MI. He is a doctoral candidate at Northcentral University in Prescott Valley, AZ, and he earned his master’s degree in engineering management from Eastern Michigan University in Ypsilanti. He is a senior
member of ASQ and an ASQ-certified quality technician.

Looking for a way to advance your career? Becoming an ASQ member could be the answer! Gain extended access to the Knowledge Center—a resource full of books, publications, and more that will help further your understanding of quality and how it’s applicable to your life. As an ASQ member, you’ll receive special discounts on certifications, training materials, and more. Being a member of ASQ will guide you in your journey as you continue to learn about quality.
Advance your career by becoming an ASQ member!
Learn more at asq.org/membership.
The Global Voice of QualityTMCERTIFICATION MEMBERSHIP PUBLICATIONSTRAINING CONFERENCES

Comprehensive Analysisof Your Calibration Data and Trends
1-800-777-7020 +1 (480) 922-7300 www.cybermetrics.com
Recommended by Auditors and Trusted by Quality Professionals for Over 25 Years
Contact us now for your FREE trial of GAGEtrak, the #1 calibration management software in the world.
Calibration Management Software
• Create thorough, customized reports to analyze and stay ahead of trends, forecast workloads, improve efficiency and minimize costs; an optional reporting utility allows reporting access to those who do not require the full functionality of GAGEtrak
• Track gage locations, issue/return and usage history
• Track calibration procedure history
• Maintain standards traceability
• Monitor calibrations, both scheduled and unscheduled, and alternate schedules
• Conduct gage R&R analysis (MSA 4th Edition)
• Maintain FDA and ISO compliance - GAGEtrak is auditor-recommended
• Automatically adjust calibration frequency - A1 and A3
• Seamlessly transition from paper records or other software
Para software y servicios en Español, favor de contactarnos en nuestra oficina en México al 01-800-681-1565, (33) 3641-4070 o en CyberMetrics.mx.


