Embed Size (px)
Citation preview
arX
iv:a
stro
-ph/
9901
240v
2 2
1 Ja
n 19
99submitted to the Astrophysical Journal
Preprint typeset using LATEX style emulateapj v. 04/03/99
WHERE ARE THE MISSING GALACTIC SATELLITES?
Anatoly A. Klypin, Andrey V. Kravtsov, and Octavio Valenzuela
Astronomy Department, New Mexico State University, Box 30001, Dept. 4500, Las Cruces, NM 88003-0001
Francisco Prada
Instituto de Astronomia, Apartado Postal 877, 22900 Ensenada, Mexico
submitted to the Astrophysical Journal
ABSTRACT
According to the hierarchical clustering scenario, galaxies are assembled by merging and accretion ofnumerous satellites of different sizes and masses. This ongoing process is not 100% efficient in destroyingall of the accreted satellites, as evidenced by the satellites of our Galaxy and of M31. Using publisheddata, we have compiled the circular velocity (Vcirc) distribution function (VDF) of galaxy satellites inthe Local Group. We find that within the volumes of radius of 570 kpc (400 h−1 kpc assuming theHubble constanta h = 0.7) centered on the Milky Way and Andromeda, the average VDF is roughlyapproximated as n(> Vcirc) ≈ 45(Vcirc/10 km s−1)−1h3Mpc−3 for Vcirc in the range ≈ 10 − 70 km s−1.The observed VDF is compared with results of high-resolution cosmological simulations. We find that theVDF in models is very different from the observed one: n(> Vcirc) ≈ 1200(Vcirc/10 km s−1)−2.75h3Mpc−3.Cosmological models thus predict that a halo of the size of our Galaxy should have about 50 dark mattersatellites with circular velocity > 20 km s−1 and mass > 3×10⁸M⊙ within a 570 kpc radius. This numberis significantly higher than the approximate dozen satellites actually observed around our Galaxy. Thedifference is even larger if we consider abundance of satellites in simulated galaxy groups similar to theLocal Group. The models predict ∼ 300 satellites inside a 1.5 Mpc radius, while there only ∼ 40 satellitesare observed in the Local Group. The observed and predicted VDFs cross at ≈ 50km s−1, indicatingthat the predicted abundance of satellites with Vcirc ∼> 50 km s−1 is in reasonably good agreement withobservations.
We conclude, therefore, that unless a large fraction of the Local Group satellites has been missed inobservations, there is a dramatic discrepancy between observations and hierarchical models, regardlessof the model parameters. We discuss several possible explanations for this discrepancy including identi-fication of some satellites with the High Velocity Clouds observed in the Local Group, and the existenceof dark satellites that failed to accrete gas and form stars due either to the expulsion of gas in thesupernovae-driven winds or to gas heating by the intergalactic ionizing background.
aAssuming H0 = 100h km s−1Mpc−1.
Subject headings: cosmology: theory – galaxy formation – methods: numerical
1. INTRODUCTION
Satellites of galaxies are important probes of the dynam-ics and masses of galaxies. Currently, analysis of satellitedynamics is one of the best methods of estimating themasses within large radii of our Galaxy and of the LocalGroup (e.g., Einasto & Lynden-Bell 1982; Lynden-Bell etal. 1983; Zaritsky et al. 1989; Fich & Tremaine 1991),as well as the masses of other galaxies (Zaritsky & White1994; Zaritsky et al. 1997). Although the satellites ofthe Milky Way and Andromeda galaxy have been studiedfor a long period of time, their number is still uncertain.More and more satellites are being discovered (Irwin etal. 1990; Whiting et al. 1997; Armandroff et al. 1998;Karachentseva & Karachentsev 1998) with a wide rangeof properties; some of them are relatively large and lumi-nous and have appreciable star formation rates (e.g., M33and the Large Magellanic Cloud; LMC). Exempting thestrange case of IC10, which exhibits a high star formationrate (0.7M⊙yr−1; Mateo 1998), most of the satellites aredwarf spheroidals and dwarf ellipticals with signs of onlymild star-formation of 10−3M⊙yr−1. The star formation
history of the satellites shows remarkable diversity: almostevery galaxy is a special case (Grebel 1998; Mateo 1998).This diversity makes it very difficult to come up with a sim-ple general model for formation of satellites in the LocalGroup. Because of the generally low star formation rates,it is not unexpected that the metallicities of the satellitesare low: from ≈ 10−2 for Draco and And III to ≈ 10−1 forNGC 205 and Pegasus (Mateo 1998). There are indica-tions that properties of the satellites correlate with theirdistance to the Milky Way (MW) or Andromeda, withdwarf spheroidals and dwarf ellipticals being closer to thecentral galaxy (Grebel 1997). Overall, about 40 satellitesin the Local Group have been found.
Formation and evolution of galaxy satellites is still anopen problem. According to the hierarchical scenario,small dark matter (DM) halos should on average collapseearlier than larger ones. To some degree, this is supportedby observations of rotation curves of dark-matter dom-inated dwarfs and low-surface-brightness galaxies. Thecurves indicate that the smaller the maximum circularvelocity, the higher the central density of these galaxies.
1
2 KLYPIN ET AL.
This is expected from the hierarchical models in whichthe smaller galaxies collapse earlier when the density ofthe Universe was higher (Kravtsov et al. 1998; Kormendy& Freeman 1998). Thus, it is likely that the satellitesof the MW galaxy were formed before the main body ofthe MW was assembled. Some of the satellites may havesurvived the very process of the MW formation, whereasothers may have been accreted by the MW or by the Lo-cal Group at later stages. Indeed this sequence forms thebasis of the currently popular semi-analytical models ofgalaxy formation (e.g., Somerville & Primack 1998, andreferences therein).
There have been a number of efforts to use the LocalGroup as a cosmological probe. Peebles et al. (1989)modeled formation of the Local Group by gravitationalaccretion of matter onto two seed masses. Kroeker &Carlberg (1991) found pairs of “galaxies” in cosmologi-cal simulations and used them to estimate the accuracy oftraditional mass estimates. Governato et al. (1997) stud-ied the velocity field around Local Group candidates indifferent cosmological models and Blitz et al.(1998) simu-lated a group of galaxies and compared their results withthe observations of the high-velocity clouds in the LocalGroup.
Nevertheless, despite significant effort, theoretical pre-dictions of the abundance and properties of the satel-lites are far from been complete. One of the difficultiesis the survival of satellites inside halos of large galaxies.This numerically challenging problem requires very high-resolution simulations in a cosmological context and hasbeen addressed in different ways. In the classical approach(e.g., Lin & Lynden-Bell 1982; Kuhn 1993; Johnston et al.1995), one assumes a realistic potential for the MW, a den-sity profile for the satellites (usually an isothermal modelwith a central core), and numerically follows a satelliteas it orbits around the host galaxy. This approach lendsmany valuable insights into the physical processes oper-ating on the satellites and alleviates some of the numer-ical problems. It lacks, however, one important feature:connection with the cosmological background. The hostgalaxy is implicitly assumed to be stable over many billionsof years which may not be realistic for a typical galaxyformed hierarchically. Moreover, the assumed isothermaldensity profile of the satellite is different from profiles oftypical dark matter halos formed in hierarchical models(Navarro, Frenk & White 1997). Last but not least, theabundances of the satellites can only be predicted if theformation of the satellites and of the parent galaxy is mod-elled self-consistently. Thus, more realistic cosmologicalsimulations are necessary.
Unfortunately, until recently numerical limitations pre-vented the usage of cosmological simulations to addresssatellite dynamics. Namely, dissipationless simulationsseemed to indicate that DM halos do not survive oncethey fall into larger halos (e.g., White 1976; van Kampen1995; Summers et al. 1995). It appears, however, that thepremature destruction of the DM satellites inside the virialradius of larger halos was largely due to numerical effects(Moore, Katz, Lake 1996; Klypin et al. 1997 (KGKK)).Indeed, recent high-resolution simulations show that hun-dreds of galaxy-size DM halos do survive in clusters of
galaxies (KGKK; Ghigna et al. 1997; Colın et al. 1998).Encouraged by this success, we have undertaken a studyof the survival of satellites in galaxy-size halos.
Dynamically, galactic halos are different from cluster-size halos (mass ∼> 1014h−1 M⊙). Clusters of galaxies arerelatively young systems in which most of the satellite ha-los have had time to make only a few orbits. Galaxies areon average significantly older, enabling at least some oftheir satellites to orbit for many dynamical times. Thisincreases the likelihood of the satellite being destroyed ei-ther from numerical effects of the simulation or the realprocesses of dynamical friction and tidal stripping. Thedestruction of the satellites is, of course, counteracted byaccretion of the new satellites in an ongoing process ofgalaxy formation. It is clear, therefore, that to predictthe abundances and properties of galactic satellites, oneneeds to model self-consistently both the orbital dynam-ics of the satellites and the formation process of the parenthalo in a cosmological setting. In this paper we present re-sults from a study of galactic satellite abundances in high-resolution simulations of two popular variants of the ColdDark Matter (CDM) models. As will be described below,the dissipationless simulations used in our study are largeenough to encompass a cosmologically significant volumeand, at the same time, have sufficient resolution to makethe numerical effects negligible.
The paper is organized as follows. In §2 we present thedata that we use to estimate the observed velocity functionof satellites of our Galaxy and M31. Cosmological simula-tions are presented and discussed in §3. We compare thepredicted and observed velocity functions in §4 to showthat the models predict considerably more lower masssatellites than is actually observed in the Local Group.In §5 and 6 we discuss possible interpretation and impli-cations of our results and summarize our conclusions.
2. SATELLITES IN THE LOCAL GROUP
There are about 40 known galaxies in the Local Group(Mateo 1998). Most of them are dwarf galaxies with ab-solute magnitudes of MV ≈ −10 − 15. While more andmore galaxies are being discovered, most of the new galax-ies are very small and faint making it seem unlikely thattoo many larger satellites have been missed. Therefore, wehave decided to consider only relatively massive satelliteswith estimated rotational velocity or three-dimensional ve-locity dispersion of stars larger than 10 km/s. In order tosimplify the situation even further, we estimate the num-ber of satellites per central galaxy. There is a number ofarguments why this is reasonable. First, it makes compar-ison with cosmological models much more straightforward.This is justified to some degree by the fact that the satel-lites in the Local Group cluster around either the MW orM31 and there are only a few very remote ones of unclearassociation with a central galaxy. We also believe that theestimate of the satellite abundance per galaxy is more ac-curate because it is relatively straightforward to find thevolume of the sample, which would be more difficult if wewere to deal with the Local Group as a whole1.
Using published results (Mateo 1998), we have com-piled a list of satellites of the Milky Way and of the M31with estimated circular velocities above the threshold of
1One of the problems would be choice of the outer boundary of the sample volume.
WHERE ARE GALACTIC SATELLITES? 3
Table 1
Satellites of the MW and Andromeda
Vcirc Milky Way Andromeda Average Comments(km/s) 286/571kpc 286/571kpc 286/571kpc
10 11 /13 13 /15 12/14 Sculptor Carina Sextans LeoIIAndI-III,V,VI, CAS Pegasus
15 7 /9 7 /8 7/8.5 Phoenix Fornax LeoI UrsMin Draco Sagit Lgs320 2 /3 6 /7 4/5 IC161330 2 /3 6 /6 4/4.5 SMC NGC6822 IC10 NGC147 NGC18550 1 /1 3 /3 2/2 LMC70 0 /0 3 /3 1.5/1.5 M33 M32 NGC205
10 km/s. In our estimate of abundances, we have not at-tempted to decide whether a satellite is bound to its cen-tral galaxy or not. Satellites have been simply counted ifthey lie within a certain radius from the center of theirparent galaxy. We have chosen two radii to make thecounts. The counts of DM satellites were made for thesame radii. The radii were chosen rather arbitrarily to be200h−1 kpc and 400h−1 kpc. For a Hubble constant ofh = 0.7 (H0 = 100h km/s/Mpc), which was assumed forour most realistic cosmological model and which is con-sistent with current observational results, the radii are286 kpc and 571 kpc. The smaller radius is close to atypical virial radius of a Milky Way size halo in our simula-tions. The larger radius allows us to probe larger volumes(and, thus, gives better statistics) both in simulations andin observations. Unfortunately, observational data maybecome less complete for this radius.
Since we cannot estimate the luminosities of galaxies as-sociated with DM satellites in dissipationless simulations,we have chosen circular velocity Vcirc to characterize boththe dark halos and the satellite galaxies. The circularvelocity can be estimated for galaxies (with some uncer-tainties) and for the DM halos. For spiral and irregulargalaxies we used the rotational velocity, which is usuallymeasured from 21 cm HI observations. For ellipticals anddwarf spheroidals we used observed line-of-sight velocitydispersion of stars, which was multiplied by
√3 to give
an estimate of Vcirc. Using our numerical simulations weconfirmed that this gives a reasonably accurate estimateof Vcirc with an error less than ∼ 10% − 20%. Table1 lists the number of satellites with Vcirc larger than agiven value (first column) for the Milky Way galaxy (sec-ond column) and M31 (third column). The forth columngives the average number of satellites and the fifth columnlists names of the satellites in given velocity bin. Figures4 and 5, discussed in detail below, present the cumulativecircular velocity distribution of the observed satellites inMW and M31 within 286 kpc and 571 kpc radius from thecentral galaxies.
A few special cases should be mentioned. There areno measurements of velocity dispersion for AND I-III andthe other two satellites of M31, AND V and VI, do nothave measured magnitudes. Given that they all seem tohave the properties of a dwarf spheroidal, we think it isreasonable to expect that they have Vcirc in the range
10-20 km/s. Details of recent measurements of differentproperties of these satellites of the M31 can be found inArmandroff et al. (1998) and Grebel (1998). We also in-cluded CAS dSph (Grebel & Guhathakurta, 1998) in ourlist with Vcirc in the range (10 − 20) km s−1. One satel-lite (AND II) can be formally included in both lists (MWand M31). It is 271 kpc from the M31, but being at thedistance of 525 kpc from MW it is should also be countedas the MW satellite. Since this is the only such case, wehave decided to count it only once – as a satellite of M31.
3. COSMOLOGICAL MODELS AND SIMULATIONS
To estimate the satellite abundances expected in thehierarchical models, we have run simulations of two rep-resentative cosmologies. Parameters of the models andsimulations are given in Table 2, where Ω0 is the densityparameter of the matter at z = 0, σ8 is the rms of densityfluctuations on 8h−1Mpc scale estimated by the linear the-ory at present time using the top-hat filter. Other param-eters given in Table 2 specify the numerical simulations:mass of dark a matter particle, mparticle, defines the massresolution, number of time-steps at the lowest/highest lev-els of resolution, size of the simulation box, and the num-ber of dark matter particles. Numbers on resolution referto the size of the smallest resolution elements (cells) in thesimulations.
The simulations have been performed using the Adap-tive Refinement Tree (ART) N -body code (Kravtsov,Klypin & Khokhlov 1997). The ART code reaches highforce resolution by refining the mesh in all high-densityregions with an automated refinement algorithm. TheΛCDM simulation used here was used in Kravtsov et al.(1998) and we refer the reader to that paper for detailsand tests. Additional tests and comparisons with a moreconventional AP3M code will be presented in Knebe et al.(1999). The CDM simulation differs from the ΛCDM sim-ulations only in the cosmological parameters and size ofthe simulation box. Our intent was to use the much morerealistic ΛCDM model for comparisons with observations,and to use the CDM model to test whether the predictionsdepend sensitively on cosmology and to somewhat broadenthe dynamical range of the simulations. Jumping ahead,we note here that results of the CDM simulation are closeto those of the ΛCDM simulation as far as the circularvelocity function of satellites is concerned. This indicates
4 KLYPIN ET AL.
Table 2
Parameters of simulations
Model Ω0 h σ8 mparticle Nsteps Resolution Box Npart
(h−1M⊙) (h−1pc) (h−1Mpc)
SCDM 1.0 0.5 1.0 2.05 × 10⁶ 650-40,000 150 2.5 1283
ΛCDM 0.3 0.7 1.0 1.66 × 10⁷ 650-40,000 450 7.5 1283
that we are dealing with general prediction of hierarchi-cal scenarios, not particular details of the ΛCDM model.Nevertheless, we do expect that some details of statisticsand dynamics of the satellites may depend on parametersof the cosmological models.
The size of the simulation box is defined by the require-ment of high mass resolution and by the total number ofparticles used in our simulations. DM halos can be iden-tified in simulations if they have more than ∼ 20 particles(KGKK). Small satellites of the MW and Andromeda havemasses of ∼ (1 − 5) × 108M⊙. Thus, mass of a particle inthe simulation should be quite small: ∼< 107M⊙. There-
fore, the number of particles in our simulations (1283) dic-tates the box size of only a few megaparsec across. Thisputs significant constraints on our results. The number ofmassive halos, for example, is quite small. In the CDMsimulation we have only three halos with circular velocitylarger than 140 km s−1. The number of massive halos inthe ΛCDM simulation is higher (eight).
The important issue for our study is the reliable identi-fication of satellite halos. The problems associated withhalo identification within high-density regions are dis-cussed in KGKK. In this study we use a halo finding al-gorithm called Bound Density Maxima (BDM; see KGKKand Colın et al. 1998). The source code and descriptionof the version of the BDM algorithm used here can befound in Klypin & Holtzman (1997). The main idea ofthe BDM algorithm is to find positions of local maxima inthe density field smoothed at a certain scale and to applyphysically motivated criteria to test whether the identifiedsite corresponds to a gravitationally bound halo. The al-gorithm then computes various properties and profiles foreach of the bound halos and constructs a uniform halo cat-alog ready to be used for analysis. In this study we will usethe maximum circular velocity as the halo’s defining prop-erty. This allows us to avoid the problem of ambiguousmass assignment (see KGKK for discussion) and makes iteasier to compare the results to observations.
The density maxima are identified using a top-hat fil-ter with radius rs (“search radius”). The search is per-formed starting from a large number of randomly placedpositions (“seeds”) and proceeds by moving the center ofmass within a sphere of radius rs iteratively until conver-gence. In order to make sure that we use a sufficientlylarge number of seeds, we used the position of every tenthparticle as a seed. Therefore, the number of seeds by farexceeds the number of expected halos. The search radiusrs also defines the minimum allowed distance between twohalos. If the distance between centers of any of the two
halos is < 2rs, only one halo (the more massive of thetwo) is left in the catalog. A typical value for the searchradius is (5 − 10)h−1 kpc. We set a lower limit for thenumber of particles inside the search radius N(< rs): ha-los with N(< rs) < 6 are not included in the catalog.We also exclude halos which have less than 20 bound par-ticles and exclude halos with circular velocity less than10 km s−1. Some halos may have significant substructurein their cores due, for example, to an incomplete merger.Such cases appear in the catalogs as multiple (2-3) ha-los with very similar properties (mass, velocity, radius) atsmall separations. Our strategy is to count these as a sin-gle halo. Specific criteria used to identify such cases are:(1) distance between halo centers is ∼< 30h−1 kpc, (2) theirrelative velocity in units of the rms velocity of particles inthe halos ∆v/v is less than 0.15, and (3) the difference inmass is less than factor 1.5. If all the criteria are satisfied,only the most massive halo was kept in the catalog.
The box size of the simulations clearly puts limitationson sizes and masses of halos. In a few megaparsec box, onedoes not find large groups or filaments. The mean densityin the simulation boxes, however, is equal to the mean den-sity of the Universe, and thus we expect our simulations tobe representative of the field population of galaxies (galax-ies not in the vicinity of massive clusters and groups). TheLocal Group and field galaxies are therefore our main tar-gets. Nevertheless, even in the small boxes used in thispaper, the number of halos is very substantial. We find1000 – 2000 halos of different masses and circular veloci-ties in each simulation. This number is large enough for areliable statistical analysis.
4. SATELLITES: PREDICTIONS AND OBSERVATIONS
Figure 1 presents the velocity distribution function, de-fined as the number of halos in a given circular velocityinterval per unit volume, in two ΛCDM simulations. Thesmaller-box simulation is the one that we use in our furtheranalysis. To estimate whether the halo velocity functionis affected by the small-box size, we compare the small-box result with results from the larger, 60h−1 Mpc box,simulation used in Colın et al. (1998). The latter followedthe evolution of 2563 particles and had a mass resolutionof 1.1×10⁹h−1 M⊙. In the small box, the total number ofhalos with Vcirc > 10 km s−1 and Vcirc > 20 km s−1 is 1716(1066) for the lowest threshold of 20 bound particles. Thenumbers change slightly if a more stringent limit of 25 par-ticles is assumed: 1556 (1052). In the overlapping range ofcircular velocities Vcirc = (100 − 200) km s−1 the velocityfunction of the small box agrees very well with that of the
WHERE ARE GALACTIC SATELLITES? 5
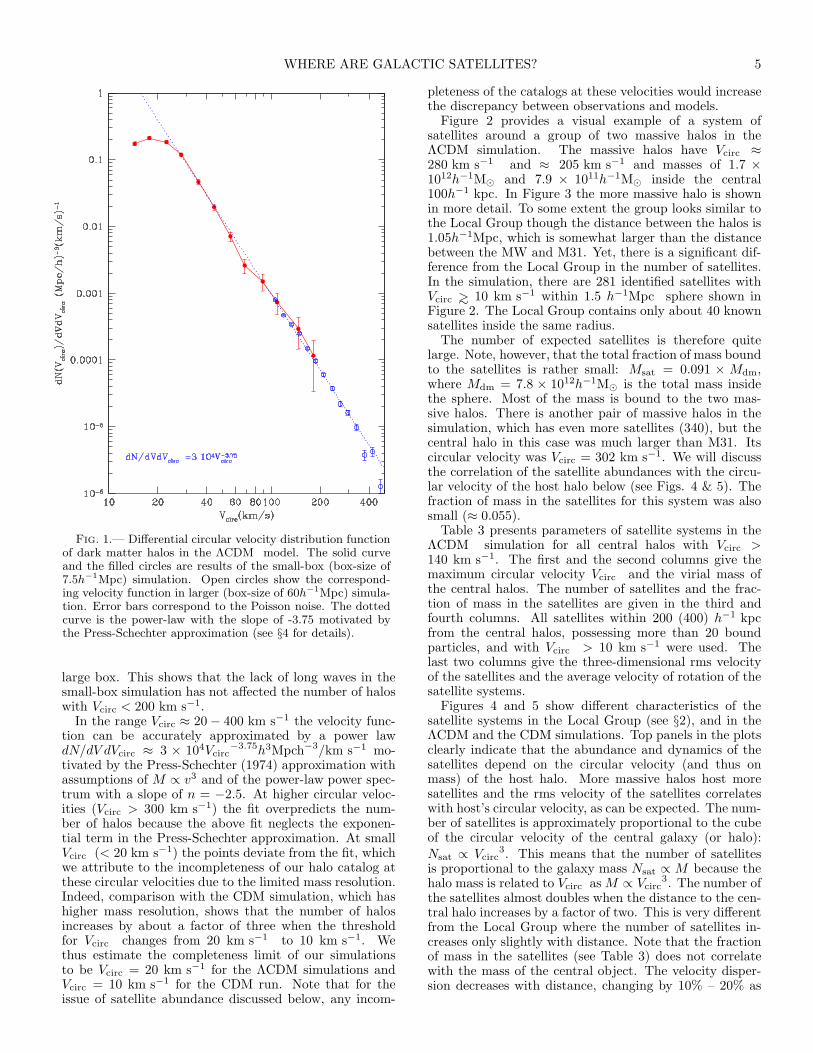
Fig. 1.— Differential circular velocity distribution functionof dark matter halos in the ΛCDM model. The solid curveand the filled circles are results of the small-box (box-size of7.5h
−1Mpc) simulation. Open circles show the correspond-ing velocity function in larger (box-size of 60h
−1Mpc) simula-tion. Error bars correspond to the Poisson noise. The dottedcurve is the power-law with the slope of -3.75 motivated bythe Press-Schechter approximation (see §4 for details).
large box. This shows that the lack of long waves in thesmall-box simulation has not affected the number of haloswith Vcirc < 200 km s−1.
In the range Vcirc ≈ 20 − 400 km s−1 the velocity func-tion can be accurately approximated by a power lawdN/dV dVcirc ≈ 3 × 10⁴Vcirc
−3.75h3Mpch−3/km s−1 mo-tivated by the Press-Schechter (1974) approximation withassumptions of M ∝ v3 and of the power-law power spec-trum with a slope of n = −2.5. At higher circular veloc-ities (Vcirc > 300 km s−1) the fit overpredicts the num-ber of halos because the above fit neglects the exponen-tial term in the Press-Schechter approximation. At smallVcirc (< 20 km s−1) the points deviate from the fit, whichwe attribute to the incompleteness of our halo catalog atthese circular velocities due to the limited mass resolution.Indeed, comparison with the CDM simulation, which hashigher mass resolution, shows that the number of halosincreases by about a factor of three when the thresholdfor Vcirc changes from 20 km s−1 to 10 km s−1. Wethus estimate the completeness limit of our simulationsto be Vcirc = 20 km s−1 for the ΛCDM simulations andVcirc = 10 km s−1 for the CDM run. Note that for theissue of satellite abundance discussed below, any incom-
pleteness of the catalogs at these velocities would increasethe discrepancy between observations and models.
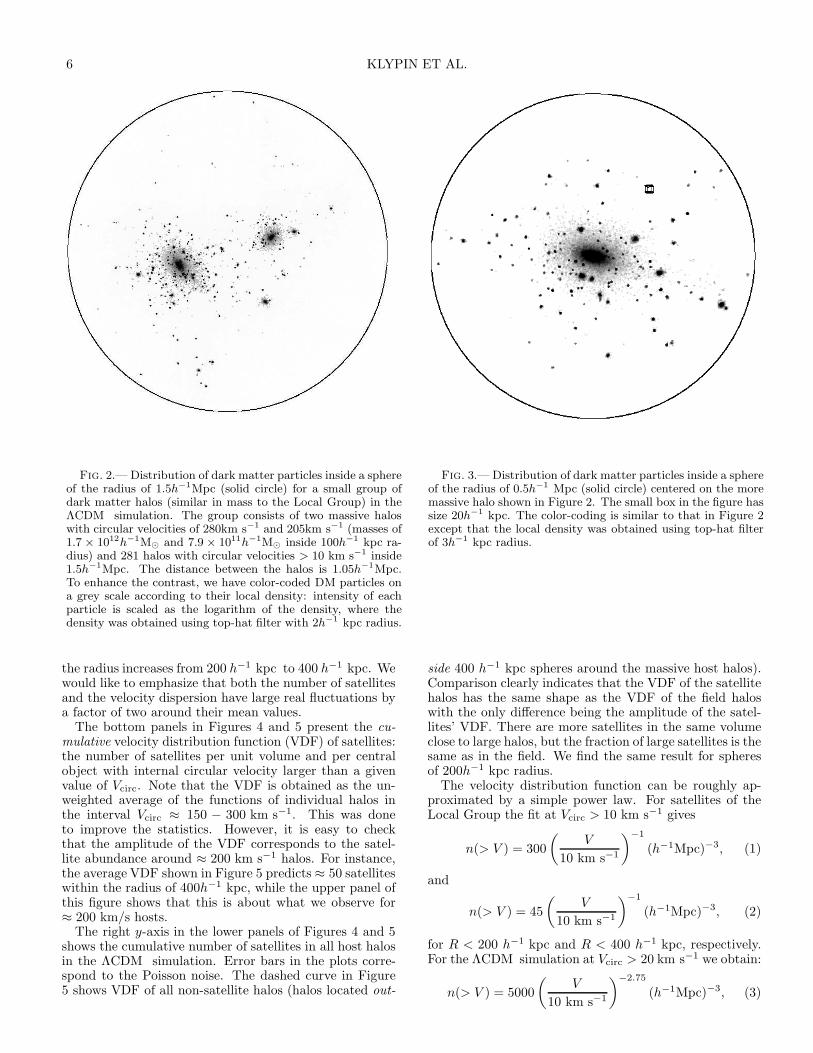
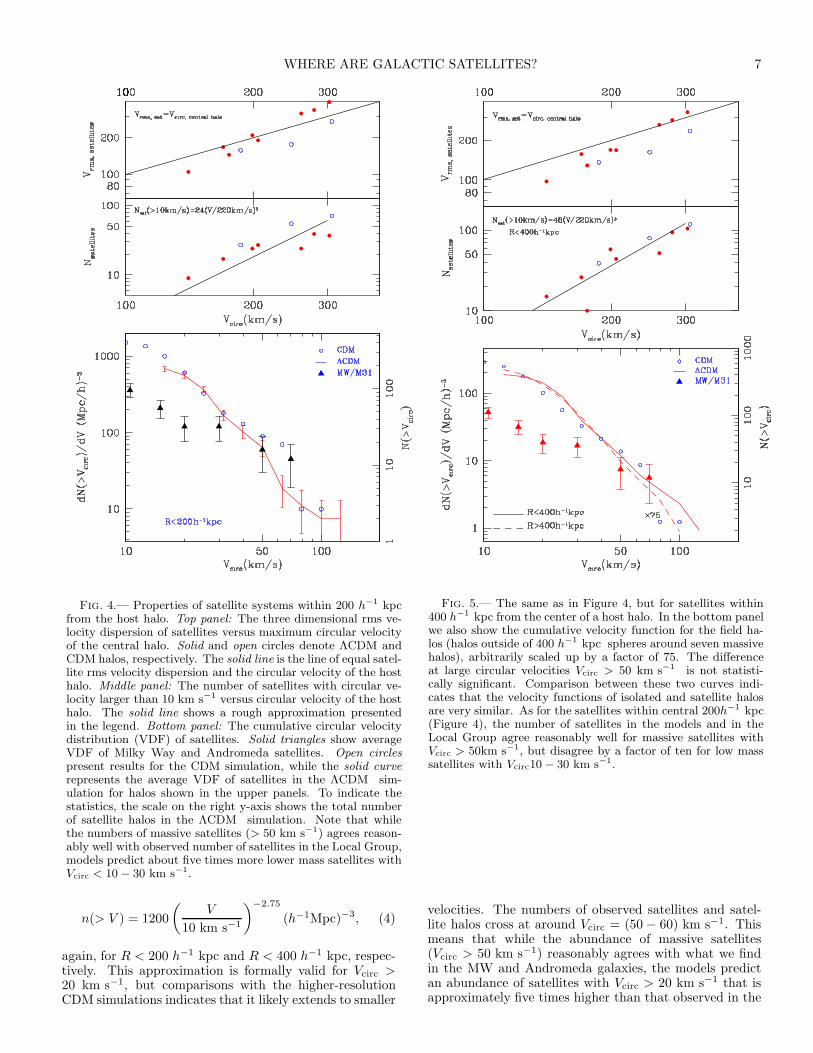
Figure 2 provides a visual example of a system ofsatellites around a group of two massive halos in theΛCDM simulation. The massive halos have Vcirc ≈280 km s−1 and ≈ 205 km s−1 and masses of 1.7 ×10¹²h−1M⊙ and 7.9 × 10¹¹h−1M⊙ inside the central100h−1 kpc. In Figure 3 the more massive halo is shownin more detail. To some extent the group looks similar tothe Local Group though the distance between the halos is1.05h−1Mpc, which is somewhat larger than the distancebetween the MW and M31. Yet, there is a significant dif-ference from the Local Group in the number of satellites.In the simulation, there are 281 identified satellites withVcirc ∼> 10 km s−1 within 1.5 h−1Mpc sphere shown inFigure 2. The Local Group contains only about 40 knownsatellites inside the same radius.
The number of expected satellites is therefore quitelarge. Note, however, that the total fraction of mass boundto the satellites is rather small: Msat = 0.091 × Mdm,where Mdm = 7.8 × 10¹²h−1M⊙ is the total mass insidethe sphere. Most of the mass is bound to the two mas-sive halos. There is another pair of massive halos in thesimulation, which has even more satellites (340), but thecentral halo in this case was much larger than M31. Itscircular velocity was Vcirc = 302 km s−1. We will discussthe correlation of the satellite abundances with the circu-lar velocity of the host halo below (see Figs. 4 & 5). Thefraction of mass in the satellites for this system was alsosmall (≈ 0.055).
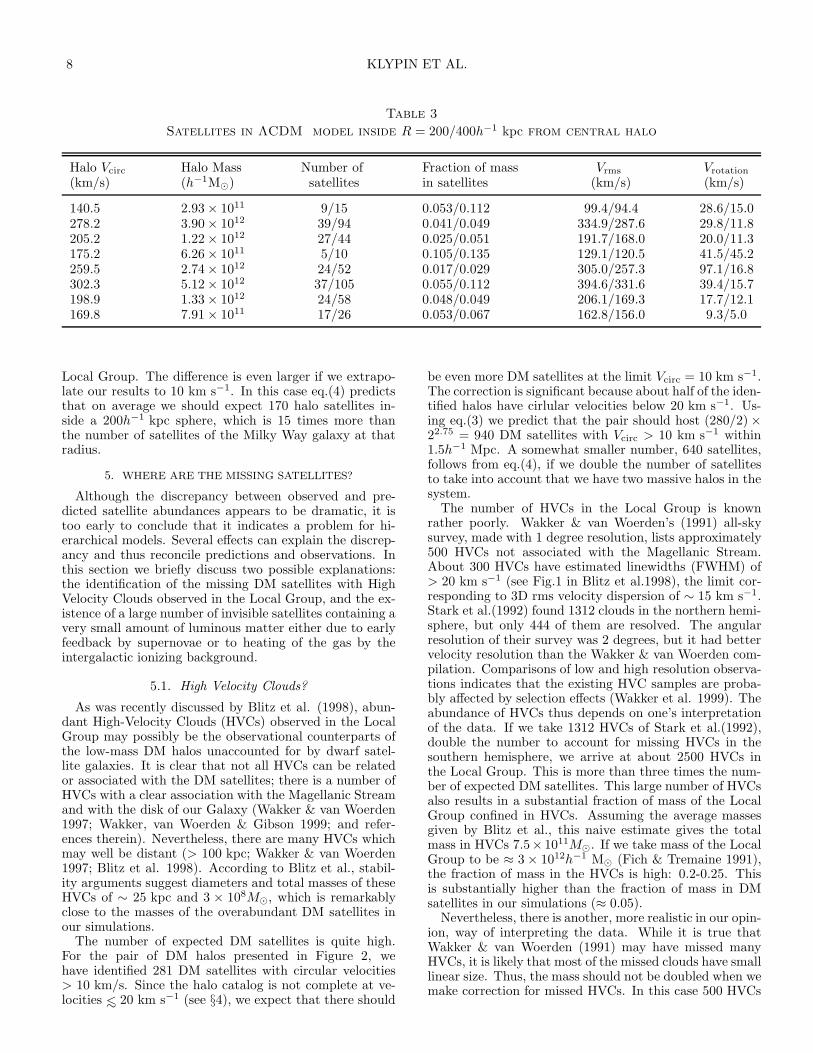
Table 3 presents parameters of satellite systems in theΛCDM simulation for all central halos with Vcirc >140 km s−1. The first and the second columns give themaximum circular velocity Vcirc and the virial mass ofthe central halos. The number of satellites and the frac-tion of mass in the satellites are given in the third andfourth columns. All satellites within 200 (400) h−1 kpcfrom the central halos, possessing more than 20 boundparticles, and with Vcirc > 10 km s−1 were used. Thelast two columns give the three-dimensional rms velocityof the satellites and the average velocity of rotation of thesatellite systems.
Figures 4 and 5 show different characteristics of thesatellite systems in the Local Group (see §2), and in theΛCDM and the CDM simulations. Top panels in the plotsclearly indicate that the abundance and dynamics of thesatellites depend on the circular velocity (and thus onmass) of the host halo. More massive halos host moresatellites and the rms velocity of the satellites correlateswith host’s circular velocity, as can be expected. The num-ber of satellites is approximately proportional to the cubeof the circular velocity of the central galaxy (or halo):Nsat ∝ Vcirc
3. This means that the number of satellitesis proportional to the galaxy mass Nsat ∝ M because thehalo mass is related to Vcirc as M ∝ Vcirc
3. The number ofthe satellites almost doubles when the distance to the cen-tral halo increases by a factor of two. This is very differentfrom the Local Group where the number of satellites in-creases only slightly with distance. Note that the fractionof mass in the satellites (see Table 3) does not correlatewith the mass of the central object. The velocity disper-sion decreases with distance, changing by 10% – 20% as
6 KLYPIN ET AL.
Fig. 2.— Distribution of dark matter particles inside a sphereof the radius of 1.5h
−1Mpc (solid circle) for a small group ofdark matter halos (similar in mass to the Local Group) in theΛCDM simulation. The group consists of two massive haloswith circular velocities of 280km s−1 and 205km s−1 (masses of1.7 × 1012
h−1M⊙ and 7.9 × 10¹¹
h−1M⊙ inside 100h
−1 kpc ra-dius) and 281 halos with circular velocities > 10 km s−1 inside1.5h
−1Mpc. The distance between the halos is 1.05h−1Mpc.
To enhance the contrast, we have color-coded DM particles ona grey scale according to their local density: intensity of eachparticle is scaled as the logarithm of the density, where thedensity was obtained using top-hat filter with 2h
−1 kpc radius.
Fig. 3.— Distribution of dark matter particles inside a sphereof the radius of 0.5h
−1 Mpc (solid circle) centered on the moremassive halo shown in Figure 2. The small box in the figure hassize 20h
−1 kpc. The color-coding is similar to that in Figure 2except that the local density was obtained using top-hat filterof 3h
−1 kpc radius.
the radius increases from 200 h−1 kpc to 400 h−1 kpc. Wewould like to emphasize that both the number of satellitesand the velocity dispersion have large real fluctuations bya factor of two around their mean values.
The bottom panels in Figures 4 and 5 present the cu-mulative velocity distribution function (VDF) of satellites:the number of satellites per unit volume and per centralobject with internal circular velocity larger than a givenvalue of Vcirc. Note that the VDF is obtained as the un-weighted average of the functions of individual halos inthe interval Vcirc ≈ 150 − 300 km s−1. This was doneto improve the statistics. However, it is easy to checkthat the amplitude of the VDF corresponds to the satel-lite abundance around ≈ 200 km s−1 halos. For instance,the average VDF shown in Figure 5 predicts ≈ 50 satelliteswithin the radius of 400h−1 kpc, while the upper panel ofthis figure shows that this is about what we observe for≈ 200 km/s hosts.
The right y-axis in the lower panels of Figures 4 and 5shows the cumulative number of satellites in all host halosin the ΛCDM simulation. Error bars in the plots corre-spond to the Poisson noise. The dashed curve in Figure5 shows VDF of all non-satellite halos (halos located out-
side 400 h−1 kpc spheres around the massive host halos).Comparison clearly indicates that the VDF of the satellitehalos has the same shape as the VDF of the field haloswith the only difference being the amplitude of the satel-lites’ VDF. There are more satellites in the same volumeclose to large halos, but the fraction of large satellites is thesame as in the field. We find the same result for spheresof 200h−1 kpc radius.
The velocity distribution function can be roughly ap-proximated by a simple power law. For satellites of theLocal Group the fit at Vcirc > 10 km s−1 gives
n(> V ) = 300
(
V
10 km s−1
)−1
(h−1Mpc)−3, (1)
and
n(> V ) = 45
(
V
10 km s−1
)−1
(h−1Mpc)−3, (2)
for R < 200 h−1 kpc and R < 400 h−1 kpc, respectively.For the ΛCDM simulation at Vcirc > 20 km s−1 we obtain:
n(> V ) = 5000
(
V
10 km s−1
)−2.75
(h−1Mpc)−3, (3)
WHERE ARE GALACTIC SATELLITES? 7
Fig. 4.— Properties of satellite systems within 200 h−1 kpc
from the host halo. Top panel: The three dimensional rms ve-locity dispersion of satellites versus maximum circular velocityof the central halo. Solid and open circles denote ΛCDM andCDM halos, respectively. The solid line is the line of equal satel-lite rms velocity dispersion and the circular velocity of the hosthalo. Middle panel: The number of satellites with circular ve-locity larger than 10 km s−1 versus circular velocity of the hosthalo. The solid line shows a rough approximation presentedin the legend. Bottom panel: The cumulative circular velocitydistribution (VDF) of satellites. Solid triangles show averageVDF of Milky Way and Andromeda satellites. Open circlespresent results for the CDM simulation, while the solid curverepresents the average VDF of satellites in the ΛCDM sim-ulation for halos shown in the upper panels. To indicate thestatistics, the scale on the right y-axis shows the total numberof satellite halos in the ΛCDM simulation. Note that whilethe numbers of massive satellites (> 50 km s−1) agrees reason-ably well with observed number of satellites in the Local Group,models predict about five times more lower mass satellites withVcirc < 10 − 30 km s−1.
Fig. 5.— The same as in Figure 4, but for satellites within400 h
−1 kpc from the center of a host halo. In the bottom panelwe also show the cumulative velocity function for the field ha-los (halos outside of 400 h
−1 kpc spheres around seven massivehalos), arbitrarily scaled up by a factor of 75. The differenceat large circular velocities Vcirc > 50 km s−1 is not statisti-cally significant. Comparison between these two curves indi-cates that the velocity functions of isolated and satellite halosare very similar. As for the satellites within central 200h
−1 kpc(Figure 4), the number of satellites in the models and in theLocal Group agree reasonably well for massive satellites withVcirc > 50km s−1, but disagree by a factor of ten for low masssatellites with Vcirc10 − 30 km s−1.
n(> V ) = 1200
(
V
10 km s−1
)−2.75
(h−1Mpc)−3, (4)
again, for R < 200 h−1 kpc and R < 400 h−1 kpc, respec-tively. This approximation is formally valid for Vcirc >20 km s−1, but comparisons with the higher-resolutionCDM simulations indicates that it likely extends to smaller
velocities. The numbers of observed satellites and satel-lite halos cross at around Vcirc = (50 − 60) km s−1. Thismeans that while the abundance of massive satellites(Vcirc > 50 km s−1) reasonably agrees with what we findin the MW and Andromeda galaxies, the models predictan abundance of satellites with Vcirc > 20 km s−1 that isapproximately five times higher than that observed in the
8 KLYPIN ET AL.
Table 3
Satellites in ΛCDM model inside R = 200/400h−1 kpc from central halo
Halo Vcirc Halo Mass Number of Fraction of mass Vrms Vrotation
(km/s) (h−1M⊙) satellites in satellites (km/s) (km/s)
140.5 2.93 × 10¹¹ 9/15 0.053/0.112 99.4/94.4 28.6/15.0278.2 3.90 × 10¹² 39/94 0.041/0.049 334.9/287.6 29.8/11.8205.2 1.22 × 10¹² 27/44 0.025/0.051 191.7/168.0 20.0/11.3175.2 6.26 × 10¹¹ 5/10 0.105/0.135 129.1/120.5 41.5/45.2259.5 2.74 × 10¹² 24/52 0.017/0.029 305.0/257.3 97.1/16.8302.3 5.12 × 10¹² 37/105 0.055/0.112 394.6/331.6 39.4/15.7198.9 1.33 × 10¹² 24/58 0.048/0.049 206.1/169.3 17.7/12.1169.8 7.91 × 10¹¹ 17/26 0.053/0.067 162.8/156.0 9.3/5.0
Local Group. The difference is even larger if we extrapo-late our results to 10 km s−1. In this case eq.(4) predictsthat on average we should expect 170 halo satellites in-side a 200h−1 kpc sphere, which is 15 times more thanthe number of satellites of the Milky Way galaxy at thatradius.
5. WHERE ARE THE MISSING SATELLITES?
Although the discrepancy between observed and pre-dicted satellite abundances appears to be dramatic, it istoo early to conclude that it indicates a problem for hi-erarchical models. Several effects can explain the discrep-ancy and thus reconcile predictions and observations. Inthis section we briefly discuss two possible explanations:the identification of the missing DM satellites with HighVelocity Clouds observed in the Local Group, and the ex-istence of a large number of invisible satellites containing avery small amount of luminous matter either due to earlyfeedback by supernovae or to heating of the gas by theintergalactic ionizing background.
5.1. High Velocity Clouds?
As was recently discussed by Blitz et al. (1998), abun-dant High-Velocity Clouds (HVCs) observed in the LocalGroup may possibly be the observational counterparts ofthe low-mass DM halos unaccounted for by dwarf satel-lite galaxies. It is clear that not all HVCs can be relatedor associated with the DM satellites; there is a number ofHVCs with a clear association with the Magellanic Streamand with the disk of our Galaxy (Wakker & van Woerden1997; Wakker, van Woerden & Gibson 1999; and refer-ences therein). Nevertheless, there are many HVCs whichmay well be distant (> 100 kpc; Wakker & van Woerden1997; Blitz et al. 1998). According to Blitz et al., stabil-ity arguments suggest diameters and total masses of theseHVCs of ∼ 25 kpc and 3 × 10⁸M⊙, which is remarkablyclose to the masses of the overabundant DM satellites inour simulations.
The number of expected DM satellites is quite high.For the pair of DM halos presented in Figure 2, wehave identified 281 DM satellites with circular velocities> 10 km/s. Since the halo catalog is not complete at ve-locities ∼< 20 km s−1 (see §4), we expect that there should
be even more DM satellites at the limit Vcirc = 10 km s−1.The correction is significant because about half of the iden-tified halos have cirlular velocities below 20 km s−1. Us-ing eq.(3) we predict that the pair should host (280/2) ×22.75 = 940 DM satellites with Vcirc > 10 km s−1 within1.5h−1 Mpc. A somewhat smaller number, 640 satellites,follows from eq.(4), if we double the number of satellitesto take into account that we have two massive halos in thesystem.
The number of HVCs in the Local Group is knownrather poorly. Wakker & van Woerden’s (1991) all-skysurvey, made with 1 degree resolution, lists approximately500 HVCs not associated with the Magellanic Stream.About 300 HVCs have estimated linewidths (FWHM) of> 20 km s−1 (see Fig.1 in Blitz et al.1998), the limit cor-responding to 3D rms velocity dispersion of ∼ 15 km s−1.Stark et al.(1992) found 1312 clouds in the northern hemi-sphere, but only 444 of them are resolved. The angularresolution of their survey was 2 degrees, but it had bettervelocity resolution than the Wakker & van Woerden com-pilation. Comparisons of low and high resolution observa-tions indicates that the existing HVC samples are proba-bly affected by selection effects (Wakker et al. 1999). Theabundance of HVCs thus depends on one’s interpretationof the data. If we take 1312 HVCs of Stark et al.(1992),double the number to account for missing HVCs in thesouthern hemisphere, we arrive at about 2500 HVCs inthe Local Group. This is more than three times the num-ber of expected DM satellites. This large number of HVCsalso results in a substantial fraction of mass of the LocalGroup confined in HVCs. Assuming the average massesgiven by Blitz et al., this naive estimate gives the totalmass in HVCs 7.5× 10¹¹M⊙. If we take mass of the LocalGroup to be ≈ 3 × 10¹²h−1 M⊙ (Fich & Tremaine 1991),the fraction of mass in the HVCs is high: 0.2-0.25. Thisis substantially higher than the fraction of mass in DMsatellites in our simulations (≈ 0.05).
Nevertheless, there is another, more realistic in our opin-ion, way of interpreting the data. While it is true thatWakker & van Woerden (1991) may have missed manyHVCs, it is likely that most of the missed clouds have smalllinear size. Thus, the mass should not be doubled when wemake correction for missed HVCs. In this case 500 HVCs
WHERE ARE GALACTIC SATELLITES? 9
(as in Wakker & van Woerden sample studied by Blitz etal.) with average dark matter mass of 3×10⁸h−1 M⊙ givein total 1.5 × 10¹¹h−1 M⊙ or 0.05 of the mass of the Lo-cal Group. This is consistent with the fraction of massin DM satellites which we find in our numerical simula-tions. It should be kept in mind that the small HVCs maycontribute very little to the total mass in the clouds.
As we have shown above, the number density of DMsatellites is a very strong function of their velocity:dn(V )/dV ∝ V −3.75. If the cloud velocity function is assteep as that of the halos, this might explain why changesof parameters of different observational samples producevery large differences in the numbers of HVCs. The massof a DM satellite is also a strong function of velocity:M ∝ V 3. As the result, the total mass in satellites withvelocity less than V is ∝ V 2.25. The conclusion is thatthe mass is in the most massive and rare satellites. If thesame is true for the HVCs, we should not double the masswhen we find that a substantial number of small HVCswere missed in a catalog.
To summarize, it seems plausible that observationaldata on HVCs are compatible with a picture where ev-ery DM satellite either hosts a dwarf galaxy (a rare caseat small Vcirc) or an HVC. This picture relies on the largedistances to the HVCs and can be either confirmed or fal-sified by the upcoming observations (Wakker et al. 1999).Note, however, that at present the observed properties ofHVCs (mainly the abundances, distances, and linewidths)are so uncertain that a more quantitative comparison isimpossible.
5.2. Dark satellites?
There are at least two physical processes that have likelyoperated during the early stages of galaxy formation andcould have resulted in the existence of a large number ofdark (invisible) satellites. The first process is gas ejec-tion by supernovae-driven winds (e.g., Dekel & Silk 1996;Yepes et al. 1997; Mac Low & Ferrara 1998). This pro-cess assumes at least one initial starformation episode, andthus should produce some luminous matter inside the hostDM satellites. Indeed, this process may explain the ob-served properties of the dwarf spheroidal galaxies in theLocal Group (e.g., Dekel & Silk 1996; Peterson & Cald-well 1993; Hirashita, Takeuchi & Tamura 1998). It is notclear whether this process can also produce numerous verylow mass-to-light ratio systems missed in the current ob-servational surveys. It is likely that some low-luminositysatellites have still been missed in observations, since sev-eral faint galaxies have been discovered in the Local Groupjust during the last few years (see §1). What seems un-likely, however, is that observations have missed so many.This may still be the case if missed satellites are very faint(almost invisible), but more theoretical work needs to bedone to determine whether gas ejection can produce nu-merous very faint systems. The recent work by Hirashitaet al. (1998) shows that this process may be capable of pro-ducing very high mass-to-light ratio (M/L up to ∼ 1000)systems of mass ∼< 108h−1 M⊙.
Another possible mechanism is prevention of gas col-lapse into or photoevaporation of gas from low-mass sys-tems due to the strong intergalactic ionizing background(e.g., Rees 1986; Efstathiou 1992; Thoul & Weinberg 1996;Quinn, Katz & Efstathiou 1996; Weinberg, Hernquist &
Katz 1997; Navarro & Steinmetz 1997; Barkana & Loeb1999). Numerical simulations by Thoul & Weinberg (1996)and by Quinn et al. (1996) show that the ionizing back-ground can inhibit gas collapse into halos with circularvelocities ∼< 30km s−1. These results are in general agree-ment with more recent simulations by Weinberg et al.(1997) and Navarro & Steinmetz (1997).
As explained by Thoul & Weinberg, accretion of inter-galactic gas heated by the ionizing background into dwarf
∼< 30km s−1 systems is delayed or inhibited because thegas has to overcome pressure support and is, therefore,much slower to turn around and collapse. If the collapsemay be delayed until relatively late epochs (z ∼< 1), manylow-mass DM satellites may have been accreted by the Lo-cal Group without having a chance to accrete gas and formstars. This would clearly explain the discrepancy betweenthe abundance of dark matter halos in our simulations andobserved luminous satellites in the Local Group. Moreinterestingly, a recent study by Barkana & Loeb (1999)shows that gas in small (Vcirc ∼< 20 km s−1) halos wouldbe photoevaporated during the reionization epoch even ifthe gas had a chance to collapse and virialize prior to that.
These results indicate that the ionizing background, ofthe amplitude suggested by the lack of the Gunn-Petersoneffect in quasar spectra, can lead to the existence of nu-merous dark (invisible) clumps of dark matter orbitingaround the Milky Way and other galaxies and thus war-rants further study of the subject. It would be interestingto explore potential observational tests for the existence ofdark satellites, given the abundances predicted in hierar-chical models. One such feasible tests, examined recentlyby Widrow & Dubinski (1998), concerns the effects of DMsatellites on microlensing statistics in the Milky Way halo.
6. CONCLUSIONS
We have presented a study of the abundance and circu-lar velocity distribution of galactic dark matter satellitesin hierarchical models of structure formation. Numericalsimulations of the ΛCDM and CDM models predict thatthere should be a remarkably large number of dark mattersatellites with circular velocities Vcirc ≈ 10 − 20 km s−1
orbiting our galaxy – approximately a factor of five morethan the number of satellites actually observed in thevicinity of the Milky Way or Andromeda (see §4). Thisdiscrepancy appears to be robust: effects (numerical orphysical) would tend to produce more dark matter satel-lites, not less. For example, dissipation in the baryoniccomponent can only make the halos more stable and in-crease their chance to survive.
Although the discrepancy between the observed and pre-dicted satellite abundances appears to be dramatic, it istoo early to conclude that it indicates a problem for hierar-chical models. Several effects can explain the discrepancyand thus reconcile the predictions and observations. Ifwe discard the possibility that ≈ 80% of the Local Groupsatellites have been missed in observations, we think thatthe discrepancy may be explained by (1) identification ofthe overabundant DM satellites with the High VelocityClouds observed in the Local Group or by (2) physical pro-cesses such as supernovae-driven winds and gas heating bythe ionizing background during the early stages of galaxyformation (see §5). Alternative (1) is attractive becausethe sizes, velocity dispersions, and abundance of the HVCs
10 KLYPIN ET AL.
appear to be consistent with the properties of the over-abundant low-mass halos. These properties of the cloudsare deduced under assumptions that they are located atlarge (∼> 100 kpc) distances which should be testable inthe near future with new upcoming surveys of the HVCs.Alternative (2) means that the halos of galaxies in the Lo-cal Group (and other galaxies) may contain substantialsubstructure in the form of numerous invisible clumps ofdark matter. This second possibility is interesting enoughto merit further detailed study of the above effects on the
evolution of gas in low-mass dark matter halos.
We are grateful to Jon Holtzman and David Spergelfor comments and discussions. This work was funded bythe NSF grant AST-9319970, the NASA grant NAG-5-3842, and the NATO grant CRG 972148 to the NMSU.Our numerical simulations were done at the NationalCenter for Supercomputing Applications (NCSA; Urbana-Champaign, Illinois).
REFERENCES
Armandroff, T.E., Davies, J.E., Jacoby, G.H. 1998, AJ, 116, 2287Barkana, R., & Loeb, A. 1999, ApJ, submitted (astro-ph/9901114)Blitz, L., Spergel, D., Teuben, P., Hartmann, D., Burton, W.B., 1998,
ApJ, submitted, astro-ph/9803251Colın, P., Klypin, A.A., Kravtsov, A.V., Khokhlov, A.M. 1998, ApJ,
submitted (astro-ph/9809202)Einasto, J., Lynden-Bell,D., 1982, MNRAS, 199, 67Dekel, A., & Silk, J. 1986, ApJ, 303, 39Efstathiou, G. 1992, MNRAS, 256, 43Einasto, J., & Lynden-Bell, D. 1982, MNRAS, 199, 67Fich, M., & Tremaine S. 1991, ARA& A, 29, 409Ghigna, S., Moore, B., Governato, F., Lake, G., Quinn, T., Stadel,
J. 1998, MNRAS, submitted (astro-ph/9801192)Governato, F., Moore, B., Cen, R., Stadel,J., Lake, G., Quinn,T.,
1997, New Astronomy, 2, 91Grebel, E.K. 1997, Reviews of Mod. Astronomy, 10, 29Grebel, E.K. 1998, To appear in the proceedings of the XVIIIth
Moriond conference on ”Dwarf Galaxies and Cosmology”, LesArcs, March 1998, T. X. Thuan et al. (eds. (astro-ph/9806191)
Grebel, E.K., Guhathakurta, P. 1998, ApJL, 511, in pressHirashita, H., Kamaya, H., & Takeuchi, T.T. 1998, ApJ, 504, L83Irwin, M.J., Bunclark, P.S., Bridgeland, M.T., McMahon, R.G. 1990,
MNRAS, 244, 16PJohnston, K.V., Spergel, D., Hernquist, L., 1995, ApJ, 451, 598Karachentseva, V.E., & Karachentsev, I.D. 1998, A&AS, 127, 409Kauffmann, G., Nusser, A., & Steinmetz, M. 1997, MNRAS, 286,
795Klypin, A.A., & Holtzman, J. 1997, preprint astro-ph/9712217 (see
also http://astro.nmsu.edu∼aklypin/pmcode.html)Klypin, A.A., Gottlober, S., Kravtsov, A.V., Khokhlov, A.M.. 1998,
ApJ accepted (astro-ph/9708191) (KGKK)Knebe, A., Kravtsov, A.V., Gottlober, S., Klypin, A.A. 1999, in
preparationKormendy, J., & Freeman, K.C. 1998, Bulletin AAS, 193, 2105Kravtsov, A.V., Klypin, A.A., Khokhlov, A.M. 1997, ApJS, 111, 73Kravtsov, A.V., Klypin, A.A., Bullock, J.S., Primack, J.R. 1998,
ApJ, 502, 48Kroeker, T., & Carlberg, R., 1991, ApJ, 376, 1Kuhn, J.R., 1993 ApJ, 409, L13
Lin, D.N.C., Lynden-Bell, D., 1982, MNRAS, 198, 707Lynden-Bell, D., Cannon, R.D., Godwin, P.J. 1983, MNRAS, 204,
87Mac Low, M.-M., & Ferrara, A. 1998, ApJ, submittedMateo, M.L. 1998, ARA&A, 36, 435Moore, B., Katz, N., & Lake, G. 1996, ApJ, 457, 455Navarro, J.F., Frenk, C., & White, S.D.M. 1997, ApJ, 490, 493
(NFW)Navarro, J.F., & Steinmetz, M. 1997, ApJ, 478, 13Peebles, P.J.E., Melott, A., Holmes, M, Jiang, L.R., 1989, ApJ, 345,
108Peterson, R.C., & Caldwell, N. 1993, AJ, 105, 1411Press, W.H., & Shechter, P. 1974, ApJ, 187, 425Quinn, T., Katz, N., & Efstathiou, G. 1996, MNRAS, 278, P49Rees, M.J. 1986, MNRAS, 218, 25Somerville, R.S., & Primack, J.R. 1998, MNRAS, in press
(astro-ph/9802268)Stark, A.A., Gammie, C.F., Wilson, R.W., Bally, J., Linke, R.A.,
Heiles, C., & Hurwitz, M. 1992, ApJS, 79, 77Summers, F.J., Davis, M., & Evrard, A.E. 1995, ApJ, 454, 1Thoul, A.A., & Weinberg, D.H. 1996, ApJ, 465, 608van Kampen, E. 1995, MNRAS, 273, 295Wakker, B.P., van Woerden, H. 1991, A&A, 250, 509Wakker, B.P., van Woerden, H. 1997, ARA&A, 35, 217Wakker, B.P., van Woerden, H., Gibson, B.K. 1999, to appear in
Stromlo Workshop on High Velocity Clouds, B.K. Gibson andM.E. Putman (eds.), (astro-ph/9901029)
Weinberg, D.H., Hernquist, L., Katz, N. 1997, ApJ, 477, 8Whiting, A.B., Irwin, M.J., Hau, G.K.T. 1997, AJ, 114, 996White, S.D.M. 1976, MNRAS, 177, 717Weinberg, D., Hernquist, L., Katz, N., 1997, ApJ, 477, 8Widrow, L.M., & Dubinski, J. 1998, ApJ, 504, 12Yepes, G., Kates, R., Khokhlov, A., & Klypin, A. 1997, MNRAS,
284, 235Zaritsky, D., Olszewski, E.W., Schommer, R.A., Peterson, R.C.,
Aaronson, M., 1989, ApJ., 345, 759Zaritsky, D., White, S.D.M.,1994, ApJ., 435, 599Zaritsky, D., Smith, R., Frenk, C., & White, S.D.M.,1997, ApJ., 478,
39


