Embed Size (px)
Citation preview

Industrial and Corporate Change, Volume 19, Number 6, pp. 1997–2039
doi:10.1093/icc/dtq056
Advance Access published November 11, 2010
Why some firms persistently out-perform
others: investigating the interactions
between innovation and exporting
strategies
Keiko Ito* and Sebastien Lechevalier**
Although heterogeneity in the performance of firms is a well-established stylized
fact, we still lack full understanding of its origins and the reasons why it persists.
Instead of assuming that performance differences are exogenous, this article
focuses on two endogenous strategies—innovation and global engagement—
and interprets them as two ways to accumulate knowledge and improve firms’
capabilities. We are particularly interested in analyzing interactions between
these strategies and their effect on firms’ performance. By using a firm-level
panel dataset drawn from a Japanese large-scale administrative survey for the
years 1994–2003, we first find that innovation and exporting strategies are
characterized by complementarities, which define coherent productive models or
patterns of learning. Second, we show that these different strategies lead to various
performances in terms of productivity and survival. Third, by using a propensity
score-matching approach, we show that these differences in performance are last-
ing. Overall, our article shows that the interaction of innovation and export invest-
ments is a source of permanent differences in performance among firms.
JEL classification: L23, L25, O33, B52.
1. Introduction
Heterogeneity in the performance of firms has long been recognized and it has been
studied as a well-established fact even before the seminal papers of Nelson (1981,
*Keiko Ito, Faculty of Economics, Senshu University, 2-1-1, Higashimita, Tama-ku, Kawasaki-shi,
Kanagawa 234-8500, Japan. e-mail: [email protected]
**Sebastien Lechevalier, Ecole des Hautes Etudes en Sciences Sociales, Paris, France. e-mail:
� The Author 2010. Published by Oxford University Press on behalf of Associazione ICC. All rights reserved.
by guest on Decem
ber 31, 2010icc.oxfordjournals.org
Dow
nloaded from

1991). Further, it has been found that performance differences are persistent, concern
firms of similar size, and pertain within narrowly defined industry sectors
(Bartelsman and Doms, 2000). However, understanding of why some firms or
plants persistently perform better is still limited. We know that technology and gov-
ernance explain many observed differences,1 but we have not fully identified the
origin of this heterogeneity. Moreover, economic models generally assume that per-
formance differences are exogenous, making it difficult to explain how firms’ en-
dogenous strategic choices interact.
This is particularly important because complementarities between strategic
choices may help to define few possible strategies and explain why performance
differences may be structural and therefore persistent.2 This set of difficulties has
been clearly identified by Bartelsman and Doms (2002): “What are the factors under-
lying productivity growth? Some of the factors that have recently been examined
include managerial ability, technology, human capital, and regulation. Although
these factors are all thought to be important, not much is known about their relative
importance or about the way they interact. (. . .) In summary, the issue of technology
is a component of the many choices facing individual producers. By trying to isolate
the effects of technology choice on productivity, one may obscure the rich set of
concerns facing producers as they attempt to meet the market.”
The theoretical and empirical literature on international engagement and prod-
uctivity at the micro level offers a good example of this difficulty and may be central
in understanding performance dispersion among firms, especially during the recent
decades characterized by globalization. The prediction of Helpman et al. (2004) has
been verified by several empirical contributions: internationally engaged firms
(through export and/or FDI) are larger and perform better. We have here an unam-
biguous stylized fact regarding differences of performance among firms. However, we
are far from any convincing explanations of the origins of these different perform-
ances. In the model of Helpman et al. (2004), productivity levels are assumed to be
drawn casually from a probability distribution, and firms’ strategies depend on the
level of their production costs (including trade costs and costs of operating abroad).
The same applies to the more specific relation between exports and productivity.
Since the seminal paper of Bernard and Jensen (1999), hundreds of papers have
investigated this link. The basic finding is that there is a selection process through
1As for technology, see, for example, Nelson (1991); Dosi and Malerba (1996); Dosi et al. (2000).
Furthermore, Bloom and Van Reenen (2007) have recently analyzed the impact of diverse modes of
organization (including governance) on performance. Geroski et al. (2009) is another interesting
contribution, which shows that innovation, combined with sound financial status (e.g. low debt), is
a source of persistently superior performance.
2Among other possible reasons for this persistence, one has been emphasized by various authors: the
nature of technological knowledge is tacit, and it is difficult to transfer or to imitate best practices
(see Dosi et al., 2000).
1998 K. Ito and S. Lechevalier
by guest on Decem
ber 31, 2010icc.oxfordjournals.org
Dow
nloaded from

which “better” firms enter the export market; however, there is no clear evidence that
they learn from exporting. This double result is characteristic of the problem men-
tioned earlier. First, identifying a self-selection process is an initial step in under-
standing the heterogeneous performance of firms, but it does not explain the origin
of performance differences. In particular, it does not allow us to evaluate the role of
firms’ deliberate investment decisions to increase productivity. Second, disregarding
the potential learning effects of exporting impedes us from analyzing how global
engagement may be a further source of intra-industry diversity. To overcome these
difficulties, some papers have tried to explain why it is difficult to trace an effect from
export to performance and have identified a possible missing link between them,
which improves the absorptive capacity of firms, that is, their ability to learn from
exporting: innovation (Aw et al., 2005, 2009; Castellani and Zanfei, 2007).
Therefore, what has to be done is clear. First, analyze the endogenous source of
performance differences by investigating the impact of strategies in innovation and
international engagement. Then, analyze the interrelations of these strategies to de-
termine if their complementarities create permanent differences in performance. Our
focus has to be understood as follows. The meaning of these complementarities is
that a specific firm’s choice to invest in one activity is conditioned by another
investment, especially if the effect of this particular investment depends on previous
investments. If these complementarities are significant, they may help to define co-
herent alternative productive models (Oı, 1983) or patterns of learning (Dosi and
Malerba, 1996). Of course, firms are not locked into any given productive pattern of
learning and may switch successfully from one productive model to another. An
important task is then to identify coherent and viable strategies.
This article takes up this challenge by investigating the case of Japanese firms. This
case is particularly interesting because an increasing dispersion of performance has
been observed since the mid-1990s (Fukao and Kwon, 2006; Ito and Lechevalier,
2009). A key issue is to determine if this increasing dispersion is temporary or lasting.
Moreover, Ito and Lechevalier (2009) investigate the determinants of intra-industry
productivity dispersion and report three findings at the industry level: (i) the effect of
exports and imports is positive; (ii) the effects of information and communication
technologies (ICTs) and of capital stock ratio are negative; and (iii) the effect of R&D
intensity is insignificant.
Notwithstanding these results, it may be misleading to conclude that export
strategies are a source of performance dispersion and innovation strategies are not.
In this article, we go one step further in analyzing how things operate at the micro
level and which types of firms performed better than others. As an alternative to
approaches that implicitly postulate that initial differences in productivity come
from luck of the draw, we aim to define underlying modes of production that
may be defined by the interaction of internationalization and R&D strategies.
Following recent papers (Roper and Love, 2002; Baldwin and Gu, 2004; Aw et al.,
2005, 2009; Criscuolo et al., 2005; Castellani and Zanfei, 2007; Damijan et al., 2008),
Interactions between innovation and exporting strategies 1999
by guest on Decem
ber 31, 2010icc.oxfordjournals.org
Dow
nloaded from

we distinguish firms according to their decisions to export and to innovate. Our
article is particularly influenced by the empirical strategy of Aw et al. (2005), which
investigates the case of Taiwanese firms in the electrical machinery sector. In using a
more comprehensive database that covers all the manufacturing industries, we ba-
sically confirm their results in the case of Japanese firms, characterized by higher
capabilities on average, higher R&D participation rate but lower export ratio.
Moreover, we extend this previous study in using a complementary empirical meth-
odology that allows us to analyze the impact of changes in export or R&D strategies
and evaluate the persistence of the impact of these strategies on performance.
More precisely, our contribution can be summarized as follows. First, we confirm
the complementarities between investments in R&D and exporting in the case of
discrete choices but not for intensities. Based on these investment choices, we define
four strategies that are stable enough to constitute different productive models or
cognitive models. Second, we show that these four strategies are associated with vari-
ous performances in terms of productivity and survival. In fact, it is possible to
establish a performance ranking with the exporting and innovative firms being the
best-performing, followed by the innovative firms, exporting firms, and firms that do
not participate in either activity. Third, by using propensity score matching, we
examine the effects on the evolution of firms’ performance when they change their
strategies. We find that firms can significantly improve their productivity growth rate
after they start exporting only in the case where they have already conducted R&D
activities and accumulated some knowledge internally. Moreover, such firms exhibit
higher productivity growth rates than firms that did not start exporting, even 3 years
after they started exporting. It means that differences in performance are long lasting.
In sum, our article shows that innovation and exporting interact to produce per-
manent differences in performance among firms. To obtain these results, we use the
Basic Survey of Japanese Business Structure and Activities (BSBSA, or kigyo katsudo
kihon chosa), a large-scale administrative survey conducted annually by the Japanese
Ministry of Economy, Trade and Industry (METI), for the years 1994–2003.
The remainder of this article proceeds as follows. In Section 2, we argue that
literature concerning international engagement, innovation, and productivity per-
formance is potentially important for understanding the causes of persistent per-
formance dispersion among firms. In Section 3, we present basic facts about
productivity dispersion among Japanese firms, and we specify how patterns of in-
novation and export strategies may be creating a new divide among Japanese firms.
In Section 4, we model firms’ strategies in innovation and export as well as prod-
uctivity patterns. In Section 5, we present empirical results showing that the innov-
ation and export decisions are highly path-dependent and these two decisions are
interrelated. Moreover, our empirical results suggest that R&D and export involve-
ment have complementary effects on productivity growth. In Section 6, using the
propensity score-matching technique, we examine how changes of innovation and
export strategies affect productivity growth. The final section offers conclusions.
2000 K. Ito and S. Lechevalier
by guest on Decem
ber 31, 2010icc.oxfordjournals.org
Dow
nloaded from

2. Heterogeneity of firms and interactions betweeninnovation and exporting strategies: theoreticalbackground
2.1 Why do firms differ?
The recognition and analysis of heterogeneity among firms have become widespread
and no longer demarcate differing theoretical approaches. However, it is fair to credit
evolutionist approaches for making heterogeneity a central object of research and for
proposing several theoretical models whose explanatory power has not yet been
challenged. Nevertheless, important empirical contributions outside these theoretical
frameworks have been made for more than 15 years. This is particularly true for the
question of why some firms persistently perform better than others, for which our
understanding is still poor. The answer to this question depends heavily on which
micro theory of the firm is adopted. If one assumes that an optimal form of cor-
porate organization exists, then differences among firms are only temporary and due
to a process of convergence that is imperfect because of adjustment costs and fric-
tions. However, many empirical studies have emphasized that these differences across
firms are persistent and concern firms of similar size within identical institutional
and sector contexts. Therefore another theory of the firm is needed. An evolutionist
approach is a good candidate, as it allows thinking of discretionary firm differences
(Nelson, 1991; Lechevalier, 2007). In a world where optimization is far from the
norm and adaptive approaches to organizational problems are often the solutions,
one may understand why firms differ in their organization and performance.
The purpose of this article is not to test the validity of evolutionary or standard
approaches. However, beyond the distinction between these two paradigms, we are
particularly interested in cognitive approaches to the firm, results of which are
summarized by Dosi and Malerba (1996): “The answer stemming from the ‘evolu-
tionary’ theory of the firm here is, on the contrary, that (. . .) one should expect
persistent differences in strategies and performances grounded in diverse learning
patterns.” Cognitive approaches (or a “competence-based theory of the firm”) regard
firms as “learning organizations.” Because competencies are highly appropriable by
firms and difficult to transfer across firms, they may also be related to the notion of
“intangible assets” (Itami, 1987). In this perspective, the key source of productivity
advantages, and hence of heterogeneity, is firms’ accumulation of technological
capabilities. Firms intentionally accumulate knowledge to increase competitiveness
relative to their main rivals in the final product market.
How might we define different patterns of learning and test their existence em-
pirically? We face here a well-known difficulty, as there are no fully satisfying proxies
for “dynamic capabilities.” Our strategy is to reinterpret variables available in gov-
ernment surveys—R&D spending and export intensity—from the cognitive point of
view of the analysis of firms’ capabilities. The cognitive dimension of R&D has been
Interactions between innovation and exporting strategies 2001
by guest on Decem
ber 31, 2010icc.oxfordjournals.org
Dow
nloaded from

well known since the seminal paper of Cohen and Levinthal (1989). However, the
cognitive dimension of exports has been recognized only recently and less unani-
mously. The process of learning-by-exporting possibly explains why globally engaged
firms are more productive than domestic firms, but the empirical evidence remains
mixed (Bernard and Jensen, 1999; Aw et al., 2005; Castellani and Zanfei, 2007;
Greenaway and Kneller, 2007; Wagner, 2007). In particular, Greenaway and
Kneller (2007) distinguish among three types of learning effects associated with ex-
ports: interaction with foreign competitors, increasing scale, and increased compe-
tition as stimulus for innovation. Combined, R&D and exports give a satisfying
(albeit incomplete) picture of the cognitive problem that firms face.3 Moreover,
they should be considered as central from a strategic point of view, which should
be differentiated from the capabilities point of view (Dosi and Malerba, 1996). R&D
and export strategies are indeed parts of firms’ strategies to accumulate competences
and are therefore crucial for firms’ success.
The next question is the following: if R&D and export are efficient sources of new
knowledge, why do not all firms commit to them?4 One reason is a self-selection
process through which highly productive firms have higher probability to engage in
R&D and exports. But there are more important reasons. First, learning is a costly
and multidimensional process and thus difficult to replicate (Dosi and Malerba,
1996). More important, the benefits of investments will not be identical for all
firms because of differences in absorptive capacity. Ultimately, these differences
lead to the emergence and are the consequences of different “patterns of learning”
(Dosi and Malerba, 1996), for which the benefits of R&D and exporting differ.
We call these patterns of learning “productive models,” and we define them as
follows, by reference to Oı (1983): a productive model refers not only to the cost
and profit functions but also to different knowledge modes.5 To put it differently,
firms are on different productive tracks.
Finally, let us emphasize a merit of focusing on innovation and exporting strate-
gies. A potential problem for any analysis focusing on heterogeneity is to recognize
patterns in the ocean of diversity and therefore avoid tautological or idiosyncratic
statements such as “firms are diverse because each firm is unique.” In focusing on
R&D and export, we exclude other important sources of heterogeneity. However, our
3We do not claim to be exhaustive with this approach of the firm focusing on R&D and exports.
Other variables could be analyzed from the viewpoint of a cognitive approach: FDI and import
ratio, for example, are similar ways to acquire knowledge. Also, human resource management is a
condition of the diffusion of the knowledge within the firm.
4For example, 45% of firms in our sample invest neither in R&D nor in exports, approximately 50%
are not conducting R&D, and 75% are not exporting (see Section 3.3).
5For example, Criscuolo et al. (2005) give an idea of the nature of the “productive mode” of globally
engaged firms: “firms that operate globally devote more resources to assimilate knowledge from
abroad and generate more innovations and productivity improvement.”
2002 K. Ito and S. Lechevalier
by guest on Decem
ber 31, 2010icc.oxfordjournals.org
Dow
nloaded from

discrete approach enables us to recognize four basic strategies (no R&D and no
export, only export, only R&D, and R&D and export). Finding some complementa-
rities allows us to identify a limited number of “models” and notable persistent or
structural differences among them. Subsequently, it is interesting to check whether
differences in innovation and exporting strategies (e.g. exporting or not-exporting)
are discrete or continuous. In this latter case, levels of R&D spending and of export
intensity matter, and we may find additional differences within given productive
models defined by discrete investment choices. Thus, we consider discrete and con-
tinuous variables in our empirical investigation.
2.2 Defining productive models based on the interactions betweeninnovation and exporting strategies
Even if, a priori and theoretically, examining interactions between innovations
and exporting strategies is useful for analyzing different patterns of learning, we
must first understand the possible sources of interactions between these two
variables.
First, let us recall that the initial goal of the literature investigating interactions
between innovations and exporting strategies is to assess whether a learning-by-
exporting effect exists. As already mentioned, the literature produces little evidence
that firms learn from exporting and that exports enhance productivity (Greenaway
and Kneller, 2007; Wagner, 2007). Then, considering the prospect of a missing link
between exports and productivity gains, some papers have introduced “innovation”
to better explain the potential positive impact of exporting on productivity (Roper
and Love, 2002; Aw et al., 2005, 2009; Castellani and Zanfei, 2007; Damijan et al.,
2008, among others). Basically, these papers conclude that there are complementa-
rities between exporting and innovation.6 Moreover, innovation strategies may ex-
plain why exporting improves productivity in some cases but not in others. The
crucial point is that firms differ in their international engagement according to their
endogenous choices to invest in competence-creation and innovation.
It is then important to specify the nature of the interactions between export and
innovation strategies that make them substitutes or complements. While most stu-
dies that investigate these interactions find a significant positive relationship, it is
worth noting that the results of Wakelin (1998) are more ambiguous. Estimated
across all firms, Wakelin’s results suggest that innovating firms are less likely to
enter export markets than non-innovating firms. Also, large innovative firms are
more likely to export than smaller innovative firms. The most probable explanation
is the cost of entering export markets. The basic explanation for substitution effects
6Some studies contradict this general story. For example, Damijan and Kostevc (2006) find that
exporting increases the capacity utilization rate rather than stimulating efficiency.
Interactions between innovation and exporting strategies 2003
by guest on Decem
ber 31, 2010icc.oxfordjournals.org
Dow
nloaded from
between exports and innovation is therefore related to a simple trade-off in the
affectation of limited resources.
However, the majority of studies find a complementary effect between exports
and innovation. To understand this positive relationship, it is first useful to refer to
trade theories (Roper and Love, 2002). Resource-based or endowment models help
us to understand why firms that invest in innovation have incentives to export goods
with high technological content. An alternate (but non-exclusive) interpretation
emphasizes the technological advantage of firms that invest in R&D in implementing
new technologies or in developing new products or processes. The distinction be-
tween product and process innovations is a second way to analyze two possible bases
of the complementary relations between exports and innovation and their influence
on productivity (Damijan et al., 2008). On one hand, the firm’s decision to innovate
a product may drive its decision to start exporting; on the other hand, an increase in
exporting may increase a firm’s sales and thus its productivity by increasing process
innovations.
As a whole, the presiding rationale for positive interactions between exporting and
innovation is that both are potential channels for acquiring knowledge (Aw et al.,
2005; Criscuolo et al., 2005; Castellani and Zanfei, 2007). This interpretation is
therefore sympathetic to cognitive approaches to the firm presented in Section 2.1.7
3. The increasing heterogeneity of Japanese firms and therole of exporting and R&D strategies in defining anew divide across firms
3.1 Increasing heterogeneity of performance during the Lost Decade and
its determinants
Studies using different methodologies have found that productivity dispersion
increased in Japan from the mid-1990s (Fukao and Kwon, 2006; Lechevalier, 2007;
Ito and Lechevalier, 2009)8. For example, Ito and Lechevalier (2009) proceed in
a way similar to Faggio et al. (2007) and find that both manufacturing and
non-manufacturing industries experienced increasing heterogeneity of performance
7Although we recognize there are other possible interpretations, our article does not intend to
discriminate between these different interpretations. For example, Wakasugi et al. (2008) emphasize
the cost motive as one possible source of the positive interactions between exports and innovation.
On the one hand, innovative firms have to seek a larger market in order to cover R&D costs.
Therefore, R&D firms are more likely to start exporting. On the other hand, firms have to pay
some fixed costs to start exporting. In order to pay these fixed costs, firms should be more pro-
ductive. In order to become more productive, firms conduct R&D.
8Fukao and Kwon (2006) and Ito and Lechevalier (2009) used the BSBSA database presented in
Section 3.2.
2004 K. Ito and S. Lechevalier
by guest on Decem
ber 31, 2010icc.oxfordjournals.org
Dow
nloaded from

[measured by labor productivity and total-factor productivity (TFP)] at the micro-
level between 1994 and 2003. Moreover, contrary to the case of the UK, investigated
by Faggio et al. (2007), they find that the increase in dispersion is more pronounced
in the case of the manufacturing than the non-manufacturing sector.
Investigating the determinants of this increasing dispersion in the case of the
manufacturing industries, Ito and Lechevalier (2009) then find that increasing
export ratios at the industry level increase the intra-industry productivity dispersion
at the firm level. This contradicts predictions by Antras and Helpman (2004).
Therefore, the following issue is at stake: is this finding explained by cumulative
learning-by-exporting effects in conjunction with self-selection effects (more pro-
ductive firms self-select to the export market and then become more productive
because of learning effects)? One motivation of this article is to detect this cumulative
effect.
Another characteristic of Japanese firms’ increasing dispersion since the
mid-1990s deserves mention: although size and sector still matter, the increasing
dispersion and the emergence of different productive models extend beyond
former size and sector categories. It means that we observe the emergence of different
productive models and different productivity within the narrowly defined sectors
and for firms of similar size.
3.2 Description of the data set, measurement of productivity, and variables
We use firm-level panel data underlying the BSBSA conducted annually by METI.9
Our data cover the period from 1994 to 2003. As we are analyzing R&D and inter-
nationalization strategies, we focus on manufacturing industries.
Although three-digit industry information is available in the survey, our analysis
is based on the JIP micro-data industry classification, which consists of 30 manu-
facturing sectors.10 We drop from our dataset all firms for which data on sales,
number of employees, total wages, tangible fixed assets, depreciation, or intermediate
9The survey covers all firms with at least 50 employees or 30 million yen of paid-in capital in the
Japanese manufacturing, mining, commerce, and several other service sectors. The survey contains
detailed information on firm-level business activities such as the three-digit industry in which the
firm operates, its number of employees (including a breakdown of the number of employees by firm
division), sales, purchases, exports, and imports (including a breakdown of the destinations of sales
and exports and the origin of purchases and imports), R&D and patents, the number of domestic
and overseas subsidiaries, and various other financial data such as costs, profits, investment, and
assets. The compilation of the microdata of the METI survey was conducted as part of the project
“Japan’s Productivity and Economic Growth” at the Research Institute of Economy, Trade and
Industry (RIETI).
10The list of these 30 sectors is shown in Ito and Lechevalier (2009), Table 1. Deflators for output,
input, and capital prices, etc. are not available at the three-digit industry level. In order to utilize the
JIP Database 2006 price deflators, we reclassified industries according to the 40 JIP microdata
industry classifications.
Interactions between innovation and exporting strategies 2005
by guest on Decem
ber 31, 2010icc.oxfordjournals.org
Dow
nloaded from

inputs are not positive or are missing for at least 1 year. After this screening, our
unbalanced panel dataset contains approximately 12,000 firms.
Utilizing the firm-level panel data, we construct two kinds of productivity meas-
ures—labor productivity and TFP. Although we are aware of some limitations in the
interpretation of TFP, we use both measures for robustness check purpose. We have
no information about working hours at the firm level, so we calculate labor prod-
uctivity as the real value added per employee. Real value added is calculated as real
output minus real intermediate input using industry-level price deflators from the
JIP Database 2006. We calculate TFP for each firm based on the production function
estimated using the semi-parametric estimation technique suggested by Levinsohn
and Petrin (2003).11,12
3.3 Toward a new divide among Japanese firms? Patterns of export and R&Dstrategies and their effect on performance
As mentioned in Section 2, we divide our sample of firms into four groups: (A) firms
that do not invest in R&D or export, (B) firms that invest only in R&D, (C) firms
that export only, and (D) firms that invest in R&D and export.13 That is, among
11For details of the definition and source of each variable for the TFP calculation, see the
Appendix A1.
12We also calculated TFP in a non-parametric way, following Good et al. (1997). Although we
obtained consistent results regardless of the methodology, the Levinsohn and Petrin TFP measure
looks less cyclical than the relative TFP measure and we therefore employ the Levinsohn and Petrin
TFP measure in this article.
13As for R&D investment, we basically use R&D expenditure data. For a given firm, if R&D ex-
penditure 40, we define this firm as a R&D firm. The same principle applies to the definition of
exporters: if exports 40, we define the firm as an exporter. Of course, some may criticize this
definition of R&D firms because there would be several alternative measures to define R&D
firms (Wakelin, 1998; Roper and Love, 2002; Castellani and Zanfei, 2007; Damijan et al., 2008).
Although our database includes information on firms’ R&D activities, information on product
innovation or process innovation is unfortunately not available. We primarily use R&D expenditure
data, although we also examined other measures for firms’ R&D activities as described in detail
below. Moreover, as for international engagement strategies, we focus on exports and do not take
FDI into account. Although our database includes information on FDI and it would be interesting
to examine differences in exporting firms and FDI firms, we decided to focus on exports for several
reasons. First, previous studies, such as Head and Ries (2001) and Kiyota and Urata (2008), con-
firmed the complementary relationship between exports and FDI. Kiyota and Urata (2008) find that
multinational firms emerge from being exporters and that they make a decision on whether to
undertake FDI. Second, in our database, the total number of exporting firms is much larger than the
total number of FDI firms (respectively 34,526 and 22,939 for the period 1994–2003); moreover,
approximately half the total number of exporting firms (17,188) are engaged in FDI, whereas
three-quarters of the total number of FDI firms are exporting. Third, the value of exports is available
in our database, while we have information on number of foreign affiliates only in the case of FDI
and we have no detailed information with which we can evaluate the size or importance of FDI.
2006 K. Ito and S. Lechevalier
by guest on Decem
ber 31, 2010icc.oxfordjournals.org
Dow
nloaded from
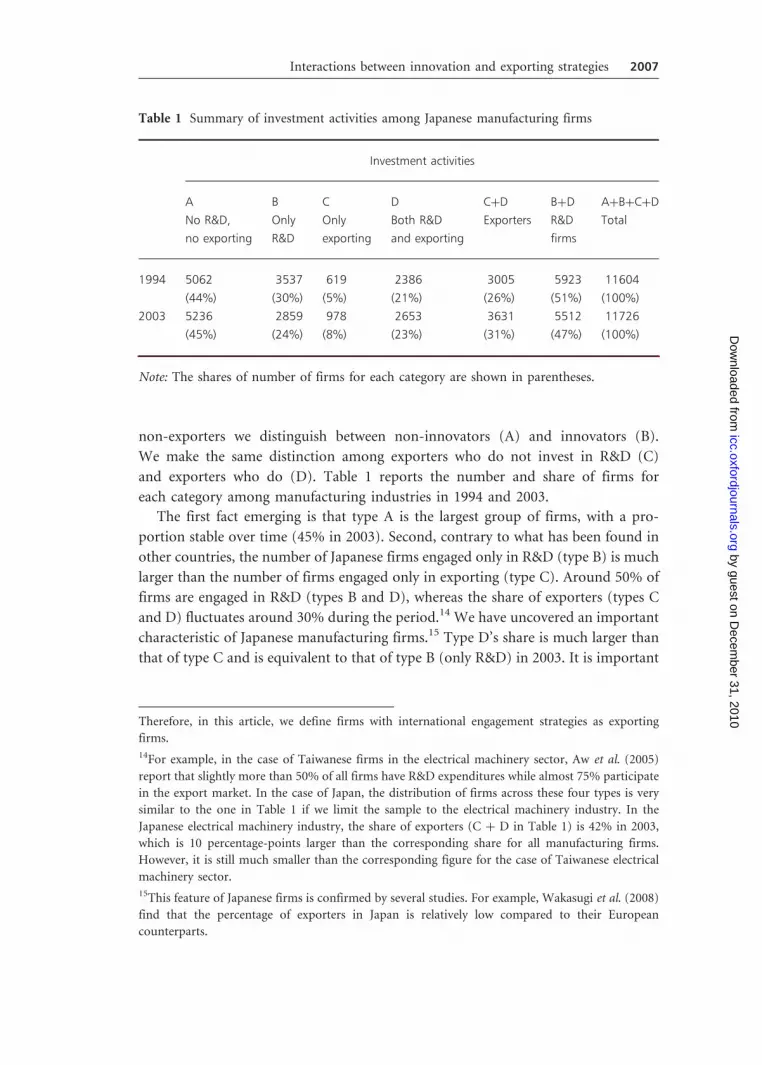
non-exporters we distinguish between non-innovators (A) and innovators (B).
We make the same distinction among exporters who do not invest in R&D (C)
and exporters who do (D). Table 1 reports the number and share of firms for
each category among manufacturing industries in 1994 and 2003.
The first fact emerging is that type A is the largest group of firms, with a pro-
portion stable over time (45% in 2003). Second, contrary to what has been found in
other countries, the number of Japanese firms engaged only in R&D (type B) is much
larger than the number of firms engaged only in exporting (type C). Around 50% of
firms are engaged in R&D (types B and D), whereas the share of exporters (types C
and D) fluctuates around 30% during the period.14 We have uncovered an important
characteristic of Japanese manufacturing firms.15 Type D’s share is much larger than
that of type C and is equivalent to that of type B (only R&D) in 2003. It is important
Table 1 Summary of investment activities among Japanese manufacturing firms
Investment activities
A B C D CþD BþD AþBþCþD
No R&D,
no exporting
Only
R&D
Only
exporting
Both R&D
and exporting
Exporters R&D
firms
Total
1994 5062 3537 619 2386 3005 5923 11604
(44%) (30%) (5%) (21%) (26%) (51%) (100%)
2003 5236 2859 978 2653 3631 5512 11726
(45%) (24%) (8%) (23%) (31%) (47%) (100%)
Note: The shares of number of firms for each category are shown in parentheses.
Therefore, in this article, we define firms with international engagement strategies as exporting
firms.
14For example, in the case of Taiwanese firms in the electrical machinery sector, Aw et al. (2005)
report that slightly more than 50% of all firms have R&D expenditures while almost 75% participate
in the export market. In the case of Japan, the distribution of firms across these four types is very
similar to the one in Table 1 if we limit the sample to the electrical machinery industry. In the
Japanese electrical machinery industry, the share of exporters (C þ D in Table 1) is 42% in 2003,
which is 10 percentage-points larger than the corresponding share for all manufacturing firms.
However, it is still much smaller than the corresponding figure for the case of Taiwanese electrical
machinery sector.
15This feature of Japanese firms is confirmed by several studies. For example, Wakasugi et al. (2008)
find that the percentage of exporters in Japan is relatively low compared to their European
counterparts.
Interactions between innovation and exporting strategies 2007
by guest on Decem
ber 31, 2010icc.oxfordjournals.org
Dow
nloaded from

to note that the share of exporters increased from 26% to 31% between 1994 and
2003, whereas the share of firms engaged in R&D decreased from 51% to 47%.
The analysis based on Table 1 is largely static. A dynamic analysis needs to be
performed indicating how investment decisions in R&D and in exports persist
or change over time. Table 2 reports the average transition matrix of investment
activities for Japanese manufacturing firms between years t and tþ 1 for the period
1994–2003. More precisely, the columns report the number and share of firms that
initiate or cease investment activity in year tþ 1 compared to year t. Several broad
transition patterns emerge. First, the more investment activities a firm has in year t,
the lowest probability it has to exit in year tþ 1. Second, the more investment
activities a firm has, the higher is the probability it will undertake other investments.
Third, the flows regarding exporting decisions (stop/start) are lower than the flows
regarding R&D decisions. As a whole, the results suggest a strong path dependence in
the investment strategies of firms.16 This stability corresponds to a first condition
that allows us to consider these various strategies as different productive models as
emphasized in Section 2.
The next question is to identify whether there are regularities that characterize
each of these four groups of firms. Table 3 reports some basic indicators. The most
obvious stylized fact is that R&D and exporting firms are the largest (irrespective of
Table 2 Average transition matrix of investment activities between years t and tþ 1
(1994–2003)
Investment activity
in year t (average number
of firm in year t)
Average number of firms by New activity in tþ 1
Start R&D Stop R&D Start exporting Stop exporting Exit
No R&D, no exporting (5215) 354 110 772
(6.8%) (2.1%) (14.8%)
R&D only (3232) 384 170 360
(11.9%) (5.3%) (11.2%)
Exporting only (796) 129 79 110
(16.2%) (9.9%) (13.8%)
R&D and exporting (2504) 144 143 258
(5.8%) (5.7%) (10.3%)
Note: The shares of number of firms which started or stopped an activity in year tþ 1 for each
of the four categories in year t are shown in parentheses.
16Of course, a firm is never definitively locked into a productive model. It can change its status.
Section 6 investigates the impact of these changes of status on performance.
2008 K. Ito and S. Lechevalier
by guest on Decem
ber 31, 2010icc.oxfordjournals.org
Dow
nloaded from

Table 3 Basic characteristics of each group of firms in 2003
A B C D
No R&D,
no exporting
R&D
only
t-test Exporting
only
t-test R&D and
exporting
t-test
Value added per
employee (million yen
per person)
7.93 10.20 *** 10.61 *** 14.56 ***
ln TFP *** *** ***
Capital per employee
(million yen per
person)
10.51 13.58 *** 11.77 *** 15.66 ***
R&D intensity (R&D
expenditure/sales, %)
0 1.32 *** 0 n.a. 2.63 ***
Research worker share 1.31 5.32 *** 3.18 *** 8.77 ***
Export ratio (exports/
sales, %)
0 0 n.a. 10.67 *** 12.90 ***
Size (employment,
persons)
164.83 329.65 *** 203.99 *** 790.23 ***
Size (capital, million yen) 1894.46 5605.70 *** 3406.60 *** 16,851.19 ***
Size (sales, million yen) 5836.35 14,689.35 *** 10,048.25 *** 60,452.74 ***
Debt asset ratio (%) 69.97 64.89 *** 68.30 * 58.66 ***
Foreign ownership
share (%)
0.51 0.89 ** 3.12 *** 5.12 ***
Annual wage payment
(million yen per
person)
4.36 4.96 *** 4.78 *** 5.79 ***
Administrative worker
share (%)
11.62 14.93 *** 13.29 *** 17.09 ***
Firm age (years) 37.33 42.36 *** 40.84 *** 46.75 ***
Number of firms 4964 2683 920 2511
Note: The figures for value added, capital per employee, capital, and sales and wage rate are
reported in million yen. R&D intensity, research worker share, export ratio, debt–asset ratio,
and foreign capital share, and administrative worker share are expressed in percentage.
All figures are mean values for each group in 2003.
Two-tailed t-tests are conducted to check whether the mean values for each group B, C,
or D are statistically different from the mean values for group A. ***, **, and * indicate the
1%, 5%, and 10% significance levels, respectively.
n.a.¼ not applicable.
Interactions between innovation and exporting strategies 2009
by guest on Decem
ber 31, 2010icc.oxfordjournals.org
Dow
nloaded from

the indicator considered), oldest, and most productive. Moreover, some indicators
deserve specific attention. Human resources management is different across the four
types of firms: the highest wages are found, in decreasing order, in D, B, C, and
A firms. This ranking corresponds to the productivity ranking of firms but also to
the education ranking of the workforce, when it is proxied by the share of admin-
istrative workers. As for financial variables, differences among groups of firms are
also striking. Not surprisingly, D firms have the highest foreign capital ratio (5.12%).
Higher foreign capital ratios also distinguish exporting firms in comparison to A and
B firms (3.12% versus 0.51% and 0.89%). The picture that emerges is clear: the four
groups of firms differ significantly in their output (productivity) and cost structures
(e.g. wage rate).
Closer investigation into the differences in innovative behavior between exporters
and non-exporters reveals differences in their patterns of learning (Table 4). The use
of a unique criterion such as R&D expenditures to capture innovative behavior has
been constantly criticized, especially in the literature on export, innovation, and
productivity (Wakelin, 1998; Roper and Love, 2002; Castellani and Zanfei, 2007;
Damijan et al., 2008). The BSBSA asks additional questions related to the innovation
behavior of firms (e.g. number of in-house developed patents in use, R&D collab-
oration with firms in Japan and overseas, etc.). Although these questions are not
asked every year, responses indicate the innovation strategy of each group of firms.17
Table 4 allows us to focus on the comparison between exporting (CþD) and
non-exporting (AþB) firms. First, as mentioned above, the percentage of firms
conducting R&D among exporters is much larger than among non-exporters, re-
gardless of the measure of innovative behavior. Differences in the R&D collaborative
behavior of exporting and non-exporting firms are also striking, particularly in
regard to the R&D collaboration with firms overseas. From these simple statistics,
it appears that innovation behavior is systematically different between exporters and
non-exporters. Investment in exports seems to go hand-in-hand with a more intense
focus on innovation; innovation and exporting are not substitutes but rather are
complementary.
The final question we pose in this section is whether these different strategies
affect performance. To evaluate the effect of investment strategies on performance,
we compare labor productivity premiums for B, C, and D firms versus A firms
(Table 5).18 To estimate productivity premiums, we run a series of estimations in
which the dependent variable is productivity and in which we introduce industry
dummies and year dummies for B, C, and D firms. We run these estimations for each
year and for the entire period 1994–2003. The largest premium is for investment
17However, it is worth noting that this exercise has limits: data on patent numbers, for example, do
not distinguish between firms that failed to answer the question and firms that replied but had no
patents in a given year.
18We did the same exercise with TFP and found that the pattern is similar.
2010 K. Ito and S. Lechevalier
by guest on Decem
ber 31, 2010icc.oxfordjournals.org
Dow
nloaded from

decisions combining R&D and exports (32.47% over the period 1994–2003).
Moreover, the R&D premium is larger than the exporting premium.19
The following points emerge from this basic statistical analysis. First, exporting
and innovation strategies are complementary. Second, taking their interaction into
account makes it possible to define groups of firms according to different productive
Table 4 Basic indicator of firms’ innovative behavior by internationalization status in 1994
and 2003
Exporters Non-exporters
Year 1994
No. of firms 3005 8599
(100.0) (100.0)
R&D expenditure40 2386 3537
(79.4) (41.1)
In-house R&D expenditure40 2354 3442
(78.3) (40.0)
No. of in-house developed patents in use40 1678 1642
(55.8) (19.1)
Had a formal unit devoted to conducting R&D 2124 3416
(70.7) (39.7)
Year 2003
No. of firms 3631 8095
(100.0) (100.0)
R&D expenditure40 2653 2859
(73.1) (35.3)
In-house R&D expenditure40 2610 2784
(71.9) (34.4)
No. of in-house developed patents in use40 2005 1580
(55.2) (19.5)
Had a formal unit devoted to conducting R&D 2433 3082
(67.0) (38.1)
Had R&D collaboration with firms in Japan 339 286
(9.3) (3.5)
Had R&D collaboration with firms overseas 79 19
(2.2) (0.2)
Note: We assume that firms that did not reply to R&D-related questions are not involved with
the activity. The percentage shares of number of firms are in parentheses.
19We do a more systematic exercise in Section 5.2 by introducing survival probability.
Interactions between innovation and exporting strategies 2011
by guest on Decem
ber 31, 2010icc.oxfordjournals.org
Dow
nloaded from

models that produce lasting differences. This statistical picture must be confirmed by
econometric estimation.
4. Empirical methodology
To investigate complementary effects of R&D and exporting on the persistent dis-
persion in performance among firms, we borrow the analytical framework in Aw
et al. (2005). For the first step, we examine the determinants of decisions to invest in
R&D and to participate in the export market, and we examine the determinants of
the intensity with which firms engage in these two activities. Our second step is to
examine the effect these two activities have upon the firm’s productivity growth.
4.1 Determinants of investment in R&D activities and exporting
Before analyzing the complementary effect of R&D and exporting on productivity,
we first examine the link between R&D and exporting. We wish to test whether firms’
innovation decisions affect export performance and, conversely, whether export per-
formance affects innovation decisions. Following Aw et al. (2005) and Damijan et al.
Table 5 Labor productivity premiums for different categories of firms by comparison to
No-R&D and No-exporting firms
Labor
productivity
B C D
Only R&D
premium
Only Exporting
Premium
Both R&D and
Exporting Premium
1994 17.83 15.85 28.76
1995 18.58 13.56 32.41
1996 17.75 15.57 33.19
1997 16.67 15.72 32.9
1998 17.01 14.46 30.2
1999 17.72 12.24 31.16
2000 18 13.21 32.41
2001 15.77 10.94 30.65
2002 15.43 13.84 33.66
2003 16.48 15.87 35.8
1994–2003 17.32 14.26 32.47
Note: Numbers are the coefficients of a regression in which labor productivity is the dependent
variable; years and industry dummies have been introduced; all coefficients are significant
at 1%.
2012 K. Ito and S. Lechevalier
by guest on Decem
ber 31, 2010icc.oxfordjournals.org
Dow
nloaded from
(2008), we model joint decisions to export and to invest in R&D, and we estimate the
model using bivariate probit regression.
We assume that expected profits of firm i, which is engaged in R&D or exporting
in year tþ 1, depend on the firm’s characteristics in the current year t. Those char-
acteristics include the firm’s age, size, foreign ownership ratio, credit constraints,
level of productivity, and stocks of knowledge accumulated through R&D and from
international engagement. Therefore, the probabilities of R&D and exporting for
firm i in year tþ 1 are written as
ProbðR&Di, tþ1 ¼ 1Þ ¼ f ðXi, t ,!i, t , Di, t Þ ð1Þ
ProbðEXPi, tþ1 ¼ 1Þ ¼ f ðXi, t ,!i, t , Di, t Þ ð2Þ
where R&D denotes an indicator variable for innovator status and EXP denotes an
indicator variable for export status.20 As described in the previous section, we use
information on R&D expenditures to define the firm’s status as an innovator. That is,
the R&D variable takes 1 if a firm reports positive R&D expenditures and 0 other-
wise. In the case of export status, the EXP variable takes 1 if a firm is an exporter and
0 otherwise. X is a vector of variables for firm characteristics that affect decisions to
innovate and export. For X, we include firm age, size measured by the log of capital
stock, wage rate, a dummy variable with a value of 1 for firms with more than one
plant, foreign capital ratio, debt-asset ratio, and capital–labor ratio (only for the
labor productivity specification). We also include the level of productivity (!) to
capture the possibility that more productive firms self-select into R&D activities or
exporting. We employ labor productivity (value added per employee) and TFP as the
productivity measures. Following Aw et al. (2005), we include the productivity level
squared to account for nonlinear effects of productivity on the probabilities of R&D
and exporting. D represents dummy variables indicating whether the firm i is
engaged in R&D and/or exporting.
The dummy variables for R&D and/or exporting status are of primary interest for
studying the link between R&D and exporting. We include three dummy variables: a
dummy for firms engaged in R&D and exporting, another for firms that are only
exporters, and the third for firms engaged only in R&D. The corresponding coeffi-
cients show whether current R&D/exporting status affects the decision to conduct
R&D activities/exporting in the next period. If there are complimentary effects
of R&D and exporting on a firm’s profitability, we can expect that exporters (in-
novators) are more likely to be innovators (exporters).
Moreover, we can expect that firms that already export are more likely to export
in the next period because their export-related costs—for example, fixed costs for
20It is worth noting that participation decision in exporting is much discussed in the trade literature,
it is not so much in the case of the R&D literature, one exception being Bond et al. (2003). We are
grateful to an anonymous referee for drawing our attention to this point.
Interactions between innovation and exporting strategies 2013
by guest on Decem
ber 31, 2010icc.oxfordjournals.org
Dow
nloaded from

collecting information on foreign markets and creating sales channels in foreign
countries—are lower for exporters than for non-exporters. By the same token, we
can expect that firms already engaged in R&D will remain engaged in R&D. Similar
to the case of exporting, conducting R&D activities would incur some fixed costs
such as costs for researching promising technologies, creating R&D divisions, and
looking for people who can be engaged in R&D activities. Therefore, if such fixed
costs are lower for firms already engaged in R&D, firms with R&D activities are more
likely to conduct R&D in the next period. Given the complementary effects of R&D
and exporting and the cost effects, we can expect that firms engaged in R&D and
exporting are more likely to be innovators or exporters in the next period.
By estimating Equations (1) and (2) simultaneously as a bivariate probit model,
we allow for correlation between their residuals. Table 6 describes the variables
used in our econometric analysis.21
Although we can analyze determinants of investing in R&D or of exporting by
estimating the discrete choice models, we cannot examine determinants of R&D
intensity and export intensity with discrete choice models. Therefore, we estimate
the following intensity equations in order to examine impacts of knowledge accu-
mulated from firms’ current R&D activities and/or international engagement on the
R&D or export intensities in the next period. As with the discrete choice models
presented in Equations (1) and (2), we assume that R&D or export intensities in year
tþ 1 depend on firm characteristics, the level of productivity, and R&D and export
intensities in the current year t.
R&D intensity i, tþ1 ¼ f ðXi, t ,!i, t , R&D intensityi, t , EXP intensityi, t Þ ð3Þ
EXP intensityi, tþ1 ¼ f ðXi, t ,!i, t , R&D intensityi, t , EXP intensityi, t Þ ð4Þ
where R&D intensity denotes the ratio of R&D expenditure to total sales and EXP
intensity denotes the ratio of exports to total sales.
Finally, let us emphasize that, in this investigation of the determinants of invest-
ment in R&D and exporting, we are facing serious problems of endogeneity, as
these two investments are endogenous choice variables of the firm. It makes the
identification of the causal effects between these two variables particularly challen-
ging, especially in the absence of any good external instrumental variable. In this
article, we successively resort to two strategies to try to deal with this problem. First,
we investigate different timing, in assuming weak exogeneity and in looking at the
impact of past decisions on future outcomes (e.g. GMM estimates in Table 8). The
main problem is that it hinges on the absence of serial correlation. Second, we are
21We realize that firm-level and industry-level factors are important in analyzing a firm’s strategy
and performance. However, we control only for industry-level factors by including industry dummy
variables because we are more interested in the interaction of current firm-level strategies—i.e.,
R&D and exporting—in determining the firm’s strategy and performance in the next period.
2014 K. Ito and S. Lechevalier
by guest on Decem
ber 31, 2010icc.oxfordjournals.org
Dow
nloaded from

using a matching approach (in Section 6), which provides a more satisfying solution
but that relies on the conditional independence assumption, which is unlikely to be
satisfied.22
4.2 Complementary effects of R&D and exporting on productivity growth
After examining the link between R&D and exporting, we estimate the complemen-
tary effect of investment in R&D and participation in export markets on a firm’s
productivity growth. We follow Aw et al. (2005) in estimating jointly a productivity
evolution equation and an equation for firm survival, taking into account the selec-
tion bias arising from random factors affecting a firm’s survival in period tþ 1 as well
as its productivity in that year. If a firm’s productivity goes under some threshold
level, this firm is likely to bankrupt, so that it drops out from our dataset. As for a
surviving firm’s productivity, we assume that the firm’s productivity level evolves
Table 6 Definition of variables
Variables Definition
log (age) Years in operation in logarithm
log (K) Real capital stock in logarithm
log (wage rate) Annual total wage payment per employee (million yen per person)
in logarithm
Multiplant dummy A dummy variable that takes 1 if the firm has more than one production
establishment
Foreign capital ratio Foreign ownership share (%)
Debt–asset ratio Debt–asset ratio measured as total liabilities divided by total assets
ln (KL ratio) Capital–labor ratio, calculated as the real capital stock divided by the number
of employees (million yen per person), in logarithm
lnVAP Labor productivity, Value added per employee in logarithm
lnVAP2 Labor productivity squared
lnTFP TFP level calculated by the Levinsohn–Petrin method
lnTFP2 TFP squared
RDEXP A dummy variable that takes 1 if the firm invests in both R&D and exporting
EXPONLY A dummy variable that takes 1 if the firm invests in only exporting
RDONLY A dummy variable that takes 1 if the firm invests in only R&D
EXP intensity Export intensity, calculated as the ratio of exports to domestic output
R&D intensity R&D intensity, calculated as R&D expenditure divided by sales
22We are very grateful to an anonymous referee for having made this critical point.
Interactions between innovation and exporting strategies 2015
by guest on Decem
ber 31, 2010icc.oxfordjournals.org
Dow
nloaded from
over time as a Markov process, in which the firm’s acquisition of knowledge through
R&D and/or exporting affects the probability distribution of future productivity
levels. Therefore, the productivity evolution equation is specified as:
!i, tþ1 ¼ f ð!i, t , Di, t Þ ð5Þ
where !it denotes the level of productivity for firm i in year t and Dit denotes dummy
variables indicating that firm i is engaged in R&D activities and/or exporting in year
t. We assume that the firm i’s survival in year tþ 1 (SURVi,tþ1¼ 1) depends on
the productivity, !it, other firms characteristics, Xit, and R&D and/or exporting
status, Dit.
The survival equation is specified as:
ProbðSURVi, tþ1 ¼ 1Þ ¼ f ðXi, t ,!i, t , Di, t ,!i, t�Di, t Þ ð6Þ
The selection equation for the existing firms is represented as:
SURVi, tþ1 ¼1 if Z 0i, t� þ �i, tþ1 � 0;
0 otherwise:
(ð7Þ
where SURV denotes a dummy variable with a value of 1 if a firm continues operat-
ing in year tþ 1 and 0 otherwise, !it*Dit denotes the interaction terms of firm
productivity and R&D and/or export status. Z’i,t is a transposed vector of variables
for firm characteristics, Xit, productivity, !it, R&D and/or exporting status, Dit, and
cross-terms of productivity and R&D and/or exporting status, !it*Dit. � denotes a
vector of coefficients for. Z’i,t. Following Aw et al. (2005), we jointly estimate
Equations (5), (7) and (8) employing Heckman’s sample selection framework to
examine whether firms’ R&D/exporting status (represented by D) affects their
future productivity.
5. Analyzing the interactions of innovation and exportingstrategies and their effect on performance
The goal of our empirical investigation is to analyze how innovation and ex-
port strategies interact and affect performance. Therefore, our first step is not a
systematic analysis of the determinants of these two investment decisions but
rather an analysis of the complementarities between them. As we outlined in
Section 4, our investigation does not rest on a structural model of investment deci-
sions but on a reduced form allowing us to study the interactions of innovation and
export decisions. Having then shown that complementarities do exist, in the second
step of this empirical analysis, we study the independent impact of these decisions
on the performance of firms and, more importantly, their joint effect on
performance.
2016 K. Ito and S. Lechevalier
by guest on Decem
ber 31, 2010icc.oxfordjournals.org
Dow
nloaded from

5.1 Investigating complementarities between investments in R&Dand exports
Results from the bivariate probit model presented by Equations (1) and (2) in
Section 4 are reported in Table 7.23 The first two columns show the results using
labor productivity as a measure of productivity while the second two columns show
the results using TFP.24
We start our comments with an analysis of how a firm’s current status as
an innovator or exporter affects future decisions to invest in R&D or exporting.
The status variables we consider are proxies for the knowledge stock internally
accumulated through R&D and the knowledge stock externally accumulated through
exporting. We find significantly positive coefficients for all status variables (RDEXP,
EXPONLY, and RDONLY) in all cases. Our findings are contrary to previous studies
which found that results differ depending on the type of investment. For example,
Aw et al. (2005) found greater persistence in the case of exports than in the case of
R&D. However, we find a strong persistence for both investments. Firms that pres-
ently export are likely to export in the next period, and firms that conduct R&D
are likely to continue R&D in the next period. It might be because their current
involvement in R&D (or exporting) should lower the fixed costs of engaging in R&D
(or exporting) in the next period.
Moreover, firms engaged only in R&D in the current period are more likely to be
an exporter in the next period than are firms that do not currently invest in either
activity. Similarly, firms engaged only in exporting in the current period are more
likely to conduct R&D in the next period than are firms not engaged in either
activity.25 This result implies there are complementarities between R&D and
23We also used a multi-nominal probit model to specify the probability of choosing one of four
possible combinations: No R&D and No Exporting, R&D only, Exporting only, and R&D and
Exporting. The multi-nominal probit estimation also provides results that are consistent with the
bivariate probit estimation results. These results are available upon request to the authors.
24As for the modeling of the lagged structure, we test the impact of all present characteristics in year
t on the investment decisions in year tþ 1. That is, we consider 1-year lag. We also assume that
present investment decisions are exogenous and look at the impact of current decisions on future
investment decisions. Therefore, the estimated coefficients may be biased due to endogeneity and
serial correlations. However, it is difficult to find a strictly exogenous instrument variable. We then
tried to estimate the same model taking the 3-year lag, where such problems should have been
mitigated, and got very similar results. These results are available upon request to the authors.
25However, we should interpret this result with caution. Both R&D and exporting are endogenous
choices of the firm. Even though we allow for correlation between residuals of the R&D decision
equation and the exporting decision equation by employing a bivariate probit estimation, the
endogeneity problem still remains, because no appropriate instrument variables are available.
Therefore, we cannot say anything about the causal effects of R&D (or exporting) on decisions
of exporting (or R&D). Our results suggest that current R&D (or exporting) decision is positively
associated with the future exporting (or R&D) decision, but we cannot conclude that current R&D
Interactions between innovation and exporting strategies 2017
by guest on Decem
ber 31, 2010icc.oxfordjournals.org
Dow
nloaded from

Table 7 Discrete investment activity equation (bivariate probit estimation)
Dependent variable: R&D or Exporting decision in year (tþ 1)
(1) (2)
R&D Exporting R&D Exporting
log (age) 0.064*** 0.067*** 0.072*** 0.077***
(0.011) (0.014) (0.011) (0.014)
log (K) 0.201*** 0.140*** 0.102*** 0.063***
(0.009) (0.009) (0.006) (0.006)
log (wage rate) 0.161*** 0.088*** 0.086*** 0.019
(0.027) (0.034) (0.026) (0.032)
Multiplant dummy 0.039*** 0.110*** 0.066*** 0.133***
(0.013) (0.015) (0.012) (0.015)
Foreign capital ratio �0.162** 0.403*** �0.167** 0.431***
(0.072) (0.085) (0.069) (0.082)
Debt–asset ratio �0.102*** �0.124*** �0.103*** �0.124***
(0.027) (0.031) (0.026) (0.031)
ln (KL ratio) �0.162*** �0.127***
(0.011) (0.013)
lnVAP 0.137*** 0.074
(0.042) (0.052)
lnVAP2�0.030*** �0.020*
(0.009) (0.010)
lnTFP 0.081*** 0.071***
(0.016) (0.019)
lnTFP2�0.012*** �0.004
(0.002) (0.002)
RDEXP 2.428*** 3.063*** 2.506*** 3.209***
(0.071) (0.085) (0.026) (0.032)
EXPONLY 0.448*** 3.038*** 0.402*** 3.031***
(0.086) (0.112) (0.033) (0.042)
RDONLY 2.056*** 0.294*** 2.369*** 0.251***
(0.060) (0.076) (0.025) (0.028)
lnVAP*RDEXP 0.020 0.064
(0.035) (0.042)
lnVAP*EXPONLY �0.032 0.009
(0.044) (0.058)
lnVAP*RDONLY 0.141*** �0.015
(0.032) (0.040)
lnTFP*RDEXP 0.005 0.002
(0.008) (0.010)
lnTFP*EXPONLY 0.003 �0.013
(0.010) (0.013)
lnTFP*RDONLY 0.020** �0.012
(0.008) (0.009)
Rho 0.118*** 0.126***
(0.014) (0.013)
No. of observations 91580 92932
Chi-squared 57,063.5 58,109.7
Log likelihood �45,706.3 �46,545.3
Note: Heteroskedasticity-robust standard errors (clustered within a firm) are in parentheses
with ***, **, and * indicating the 1%, 5%, and 10% significance levels, respectively. A constant
term is not reported. All equations include three-digit industry dummy variables and year
dummy variables.
2018 K. Ito and S. Lechevalier
by guest on Decem
ber 31, 2010icc.oxfordjournals.org
Dow
nloaded from

exporting. In addition, we find that firms engaged in R&D and exporting are most
likely to continue R&D or exporting. This finding also suggests complementarities
between R&D and exporting. One possible explanation is that returns on exporting
may be greater for firms with in-house capabilities to assimilate knowledge gained
from exporting. At the same time, returns on R&D also may be greater for firms that
export to sell their high-tech and higher value-added products in foreign markets.
As for the interaction terms of the current productivity level and the current
R&D/exporting status (the final three interaction terms in Table 7), we find that
among all firms engaged only in R&D, the more productive firms are more likely to
continue R&D in the future. This conclusion is implied by the significantly positive
coefficients of lnVAP*RDONLY and lnTFP*RDONLY. On the other hand, looking at
productivity variables (lnVAP, lnVAP2, lnTFP, and lnTFP2), we find that the current
level of productivity affects positively with diminishing effects R&D investment
decisions, but not export decisions (in the case of labor productivity specification).
These results suggest that productivity strongly affects future R&D decisions and may
imply that given increasing uncertainties in R&D outcomes, only high-productivity
firms can afford sunk costs attendant to R&D investment.
Our results identify several other determinants of firms’ future investment deci-
sions. Older, larger, or multi-plant firms are more likely to conduct R&D and/or to
initiate exporting. In the majority of cases, we obtain significantly positive coeffi-
cients suggesting that firms with higher wages are more likely to be innovators and/or
exporters. It may be interpreted that human resource management policies and
investment decisions are connected and that firms with more skilled and high-paid
workers tend to be innovators and/or exporters. As for financial variables, debt–asset
ratio negatively affects all investment decisions, which is particularly consistent with
arguments that financial constraints are important determinants of R&D investment
(e.g. Hall, 2002). The foreign capital ratio affects export decisions positively and R&D
decisions negatively. Foreign investors may provide information about foreign mar-
kets to help firms begin exporting, or foreign investors prefer firms with a higher
potential to export. Although it is difficult to interpret the significantly negative
coefficient of the foreign capital ratio on the R&D decision, foreign investors may
avoid firms that try to initiate R&D because R&D activities are less likely to bring
short-run profits. Finally, we mention that Rho values are positive and statistically
significant for both labor productivity and TFP specifications, suggesting a positive
correlation between residuals of the R&D decision equation and the export decision
(or exporting) activity leads to the future exporting (or R&D) activity. Damijan et al. (2008)
identify the causality between R&D decision and exporting decision, employing the propensity
score-matching technique. Although we tried to apply the matching technique to investigate the
causal effect, the matching results hardly satisfied the balancing property test, we did not use this
methodology.
Interactions between innovation and exporting strategies 2019
by guest on Decem
ber 31, 2010icc.oxfordjournals.org
Dow
nloaded from

equation. It means that shocks that lead a firm to participate in one activity tend to
lead it to participate in both.
We should mention that our status dummy variables (RDEXP, EXPONLY, and
RDONLY) may be inappropriate proxies for the knowledge stocks accumulated
internally through R&D and/or accumulated externally through exporting. We
construct other measures for the knowledge stock accumulated through R&D and
estimate the bivariate probit model presented by equations (1) and (2) in Section 4.
Our first alternative measure is a dummy variable that takes a value of 1 if a firm has
a formal unit devoted to conducting R&D and 0 otherwise. Our second alternative
measure is a dummy variable that takes a value of 1 if a firm has a positive number of
in-house developed patents in use and 0 otherwise. The estimation results are shown
in Appendix Table A1. We obtain results largely consistent with those in Table 7
and find strong persistence in both R&D and exporting decisions. Moreover, as in
Table 7, firms engaged in both R&D and exporting are most likely to continue
exporting and R&D in all cases in Appendix Table A1. However, the persistence in
the R&D decision is weaker if we use the patent dummy variable as a proxy for
internal knowledge stock.
Although it is important to consider alternative measures for knowledge stocks,
we continue primarily using R&D expenditure as its proxy for several reasons.
First, in the following econometric analyses, it is easier to construct a variable for
R&D intensity with R&D expenditure information than by enumerating the units
devoted to R&D or the number of internally developed patents in use. Second, R&D
expenditure better indicates the size and importance of R&D than does the number
of units formally devoted to R&D. Third, many firms do not report patent infor-
mation; therefore, we lose many observations by employing the patent variable in our
analysis.
The next step is to consider the intensity with which firms engage in R&D or
exporting (Table 8). We estimate intensity Equations (3) and (4) in Section 4. It is
difficult to construct useful measures of interactions between a firm’s current export
intensity and R&D intensity26. Therefore, we replace the three R&D/exporting status
variables with two intensity measures. Although we can estimate the equations via
the Tobit method, including observations with zero R&D intensity or zero export
intensity, we estimate each equation using only firms with positive R&D or export
intensities. This approach accounts for possibilities that there are significant differ-
ences in the impact of the independent variables on the probabilities of R&D (or ex-
26It is simply because both export intensity and R&D intensity variables are less than one by def-
inition, so that the interaction term of these two variables becomes smaller than the original
non-interacted term. One possible alternative would be to use the interaction term of export
intensity and R&D dummy variables (or R&D intensity and exporter dummy variables).
2020 K. Ito and S. Lechevalier
by guest on Decem
ber 31, 2010icc.oxfordjournals.org
Dow
nloaded from

porting) and on propensity to R&D (or export).27 Moreover, to address potential
endogeneity problems we estimate both equations using the GMM method proposed
by Blundell and Bond (1998) and present the results in Table 8. Compared with
results of the probit specifications in Table 7, the GMM estimation results in Table 8
show that many independent variables lose their significance and that R&D and
export intensities have been largely determined by these intensities in the past.
Although R&D intensity is affected negatively by the debt–asset ratio, we find
strong persistence in R&D intensity and export intensity. These results suggest that
firms with higher R&D (or export) intensity are more likely to have a higher R&D
(or export) intensity in the next period. We do not find a significant interaction
effect in the case of the intensity equations: firms with a higher export (or R&D)
intensity do not necessarily have a higher R&D (export) intensity in the next period.
Moreover, we do not find a significant role of productivity in determining the
intensities of R&D and exporting. This is consistent with findings by Aw et al.
(2005) that productivity is not significant in determining export intensity.
5.2 Survival and productivity equations: estimating the joint impact ofexporting and innovation strategies on performance
So far, we have found a strong persistence in investments in R&D and in exporting.
In addition, we have discovered an interaction effect that makes firms engaged in
R&D (or exporting) more likely to continue these activities in the next period. Our
results suggest that investments in R&D and exporting are complementary.
Therefore, in this sub-section, we examine whether R&D and exporting have com-
plementary effects on a firm’s productivity by jointly estimating Equations (5) and
(6) presented in Section 4.2.
Table 9 reports results of the joint estimation of survival and productivity equa-
tions.28 Columns (1) and (2) show the results using status dummy variables
(RDEXP#, EXPONLY#, and RDONLY#) defined based on R&D expenditure infor-
mation. In order to check robustness, columns (3), (4), (5), and (6) show the results
using two alternative definitions for the status dummy variables. For the columns (3)
and (4), the criterion is whether the firm has a formal unit devoted to R&D; for the
27Wakelin (1998) and Roper and Love (2002), estimating the determinants of export decisions and
propensity to export, show that the restricted Tobit model was rejected, implying there are import-
ant differences between determinants of export decisions and determinants of propensity to export.
28We also tried to estimate the same model taking the 3-year lag and obtained very similar results to
those in Table 8. We should note that there is a risk to identify a firm as an exit firm if the number
of employees decreased to less than 50, because the BSBSA covers firms with 50 employees or more.
In order to avoid this threshold effect, we conduct the same estimations restricting our sample to
firms with 70 employees or more. Again, we obtained similar results. These results are available
upon request to the authors.
Interactions between innovation and exporting strategies 2021
by guest on Decem
ber 31, 2010icc.oxfordjournals.org
Dow
nloaded from
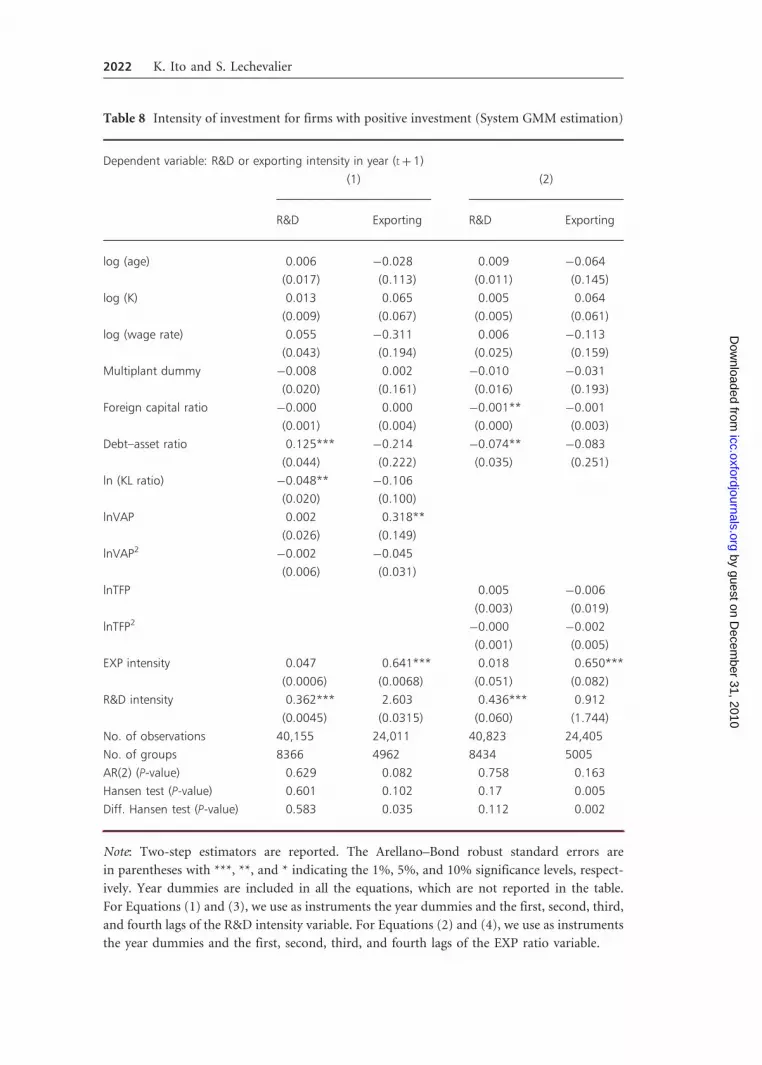
Table 8 Intensity of investment for firms with positive investment (System GMM estimation)
Dependent variable: R&D or exporting intensity in year (tþ 1)
(1) (2)
R&D Exporting R&D Exporting
log (age) 0.006 �0.028 0.009 �0.064
(0.017) (0.113) (0.011) (0.145)
log (K) 0.013 0.065 0.005 0.064
(0.009) (0.067) (0.005) (0.061)
log (wage rate) 0.055 �0.311 0.006 �0.113
(0.043) (0.194) (0.025) (0.159)
Multiplant dummy �0.008 0.002 �0.010 �0.031
(0.020) (0.161) (0.016) (0.193)
Foreign capital ratio �0.000 0.000 �0.001** �0.001
(0.001) (0.004) (0.000) (0.003)
Debt–asset ratio 0.125*** �0.214 �0.074** �0.083
(0.044) (0.222) (0.035) (0.251)
ln (KL ratio) �0.048** �0.106
(0.020) (0.100)
lnVAP 0.002 0.318**
(0.026) (0.149)
lnVAP2�0.002 �0.045
(0.006) (0.031)
lnTFP 0.005 �0.006
(0.003) (0.019)
lnTFP2�0.000 �0.002
(0.001) (0.005)
EXP intensity 0.047 0.641*** 0.018 0.650***
(0.0006) (0.0068) (0.051) (0.082)
R&D intensity 0.362*** 2.603 0.436*** 0.912
(0.0045) (0.0315) (0.060) (1.744)
No. of observations 40,155 24,011 40,823 24,405
No. of groups 8366 4962 8434 5005
AR(2) (P-value) 0.629 0.082 0.758 0.163
Hansen test (P-value) 0.601 0.102 0.17 0.005
Diff. Hansen test (P-value) 0.583 0.035 0.112 0.002
Note: Two-step estimators are reported. The Arellano–Bond robust standard errors are
in parentheses with ***, **, and * indicating the 1%, 5%, and 10% significance levels, respect-
ively. Year dummies are included in all the equations, which are not reported in the table.
For Equations (1) and (3), we use as instruments the year dummies and the first, second, third,
and fourth lags of the R&D intensity variable. For Equations (2) and (4), we use as instruments
the year dummies and the first, second, third, and fourth lags of the EXP ratio variable.
2022 K. Ito and S. Lechevalier
by guest on Decem
ber 31, 2010icc.oxfordjournals.org
Dow
nloaded from

columns (5) and (6), it is whether the firm has a positive number of in-house
developed patents in use. We employ both labor productivity and TFP as a prod-
uctivity variable.
As for the survival equations, the most important result is that investment
decisions in R&D and export affect probability of survival except in instances
where patent information is the measure of R&D status [columns (5) and (6)]. In
sum, we find that R&D is the best insurance against failure. That is particularly so for
firms doing only R&D, for which the coefficient is larger than for firms engaged in
both R&D and export. Our result is consistent with results concerning export-only
firms, whose decision has no significant impact on probability of survival, whatever
the case we consider. Our result contradicts previous results by Bernard and Jensen
(1999), according to whom exporting improves a firm’s probability of survival.29
As for cross terms regarding productivity level and investment choices, nearly all
estimated coefficients are not statistically significant, except for a slightly significant
negative coefficient for the interaction term of labor productivity and R&D only
[columns (1) and (3)]. Although it is difficult to interpret this negative coefficient, it
may imply that firms doing R&D try to operate as long as possible because of high
fixed R&D costs even though their productivity is not high.
As for other determinants of firm survival, we find without surprise that the older,
larger (as proxied by the capital stock), or more productive firms (with a diminishing
effect) are more likely to survive in the next period. Firms with a higher debt–asset
ratio or foreign capital ratio are more likely to fail. As regards the survival equations
in columns (5) and (6), the coefficients on R&D/export status variables are neither
significant nor consistent with those in columns (1) to (4), even though coefficients
of other variables are generally consistent for all cases. As shown in Table 9, the
number of observations for columns (5) and (6) is smaller because patent informa-
tion is limited. The small sample size may contribute to the insignificant results for
survival equations in columns (5) and (6).
29Bernard and Jensen (1999) define “exit” as the case where a plant closes down. However, in our
firm-level data set, we cannot distinguish whether the firm was really shut down, merged by another
firm, or just scaled down up to a size below the threshold of 50 employees. Therefore, our results
regarding the relationship between exporting and survival may come from the misidentification of
the exit firms. Although we checked the robustness to the threshold employment size as mentioned
in the previous footnote, we do not have information to identify whether the firms dropped from
the dataset were merged or not. Even though we may be able to check the merged firms using
information such as M&A data compiled by private think tanks, the data matching would be an
extremely meticulous task because the firm identification codes are not shared between the METI
survey we use and any other privately published databases. Because of such data constraints, we
should be cautious when we interpret our results. We thank an anonymous referee for drawing our
attention on this point.
Interactions between innovation and exporting strategies 2023
by guest on Decem
ber 31, 2010icc.oxfordjournals.org
Dow
nloaded from

Tab
le9
Su
rviv
alan
dp
rod
uct
ivit
yeq
uat
ion
s
(1)
(2)
(3)
(4)
(5)
(6)
Surv
ival
Pro
du
ctiv
ity
Surv
ival
Pro
du
ctiv
ity
Surv
ival
Pro
du
ctiv
ity
Surv
ival
Pro
du
ctiv
ity
Surv
ival
Pro
du
ctiv
ity
Surv
ival
Pro
du
ctiv
ity
Pro
du
ctiv
ity
vari
able
lnV
AP
lnTF
Pln
VA
Pln
TFP
lnV
AP
lnTF
P
R&
Dva
riab
leR&
Dex
pen
dit
ure
sR&
Dex
pen
dit
ure
sR&
Dd
epar
tmen
tR&
Dd
epar
tmen
tPa
ten
tsPa
ten
ts
log
(ag
e)0
.05
7**
*0
.07
3**
*0
.05
8**
*0
.07
2**
*0
.11
4**
*0
.13
2**
*
(0.0
11
)(0
.01
1)
(0.0
11
)(0
.01
1)
(0.0
23
)(0
.02
3)
log
(K)
0.1
87
***
0.0
52
***
0.1
93
***
0.0
53
***
0.1
41
***
0.0
49
***
(0.0
08
)(0
.00
6)
(0.0
08
)(0
.00
6)
(0.0
14
)(0
.01
0)
log
(wag
era
te)
0.0
21
�0
82
***
0.0
30
�0
76
***
0.0
28
�0
.04
7
(0.0
27
)(0
.02
5)
(0.0
27
)(0
.02
5)
(0.0
50
)(0
.04
9)
Mu
ltip
lan
td
um
my
�0
.01
40
.01
4�
0.0
10
0.0
23
*0
.02
40
.04
8**
(0.0
13
)(0
.01
2)
(0.0
13
)(0
.01
2)
(0.0
24
)(0
.02
4)
Fore
ign
cap
ital
rati
o�
0.4
63
***
�0
.45
6**
*�
0.4
63
***
�0
.45
5**
*�
0.3
63
***
�0
.35
6**
*
(0.0
63
)(0
.06
0)
(0.0
63
)(0
.06
0)
(0.0
94
)(0
.09
4)
Deb
t–as
set
rati
o�
0.2
29
***
�0
.21
7**
*�
0.2
32
***
�0
.21
8**
*�
0.1
61
***
�0
.15
0**
*
(0.0
27
)(0
.02
7)
(0.0
27
)(0
.02
7)
(0.0
50
)(0
.05
0)
ln(K
Lra
tio
)�
0.1
81
***
�0
.18
1**
*�
0.1
44
***
-0.1
44
***
(0.0
11
)(0
.01
1)
(0.0
21
)(0
.02
1)
Pro
du
ctiv
ity
0.4
53
***
0.7
65
***
0.1
53
***
0.8
92
***
0.4
48
***
0.7
67
***
0.1
55
***
0.8
93
***
0.4
11
***
0.7
60
***
0.1
22
***
0.9
09
***
(0.0
50
)(0
.00
6)
(0.0
16
)(0
.00
8)
(0.0
52
)(0
.00
6)
(0.0
16
)(0
.00
8)
(0.1
08
)(0
.01
1)
(0.0
32
)(0
.01
2)
Pro
du
ctiv
ity2
�0
.09
6**
*�
0.0
21
***
�0
.09
4**
*�
0.0
21
***
�0
.08
6**
*�
0.0
14
***
(0.0
13
)(0
.00
2)
(0.0
13
)(0
.00
2)
(0.0
20
)(0
.00
3)
RD
EX
P#0
.12
1*
0.0
83
***
0.0
86
***
0.0
89
***
0.1
39
**0
.07
7**
*0
.05
8**
0.0
93
***�
0.0
63
0.0
78
***�
0.0
81
0.0
80
***
(0.0
67
)(0
.00
4)
(0.0
24
)(0
.00
8)
(0.0
67
)(0
.00
3)
(0.0
23
)(0
.00
9)
(0.1
43
)(0
.00
7)
(0.0
53
)(0
.01
7)
EX
PON
LY#
0.0
33
0.0
44
***�
0.0
15
0.0
51
***�
0.0
18
0.0
47
***
0.0
33
0.0
47
***
0.4
08
*0
.02
5**
�0
.00
70
.02
3
(0.0
78
)(0
.00
5)
(0.0
31
)(0
.01
2)
(0.0
72
)(0
.00
4)
(0.0
31
)(0
.01
1)
(0.2
19
)(0
.01
1)
(0.0
73
)(0
.02
4)
RD
ON
LY#
0.1
75
***
0.0
38
***
0.1
07
***
0.0
35
***
0.1
47
***
0.0
28
***
0.0
92
***
0.0
34
***�
0.0
54
0.0
29
***�
0.0
87
*0
.03
2**
(0.0
48
)(0
.00
3)
(0.0
21
)(0
.00
6)
(0.0
47
)(0
.00
3)
(0.0
21
)(0
.00
6)
(0.1
35
)(0
.00
6)
(0.0
52
)(0
.01
6)
(co
nti
nu
ed)
2024 K. Ito and S. Lechevalier
by guest on Decem
ber 31, 2010icc.oxfordjournals.org
Dow
nloaded from

Tab
le9
Co
nti
nu
ed
(1)
(2)
(3)
(4)
(5)
(6)
Surv
ival
Pro
du
ctiv
ity
Surv
ival
Pro
du
ctiv
ity
Surv
ival
Pro
du
ctiv
ity
Surv
ival
Pro
du
ctiv
ity
Surv
ival
Pro
du
ctiv
ity
Surv
ival
Pro
du
ctiv
ity
Pro
du
ctiv
ity
vari
able
lnV
AP
lnTF
Pln
VA
Pln
TFP
lnV
AP
lnTF
P
R&
Dva
riab
leR&
Dex
pen
dit
ure
sR&
Dex
pen
dit
ure
sR&
Dd
epar
tmen
tR&
Dd
epar
tmen
tPa
ten
tsPa
ten
ts
Pro
du
ctiv
ity*
RD
EX
P#�
0.0
41
�0
.00
5�
0.0
64
*�
0.0
10
�0
.02
0�
0.0
02
(0.0
34
)(0
.00
7)
(0.0
34
)(0
.00
7)
(0.0
75
)(0
.01
7)
Pro
du
ctiv
ity*
EX
PON
LY#�
0.0
24
�0
.00
90
.01
00
.00
5�
20
7*
�0
.01
9
(0.0
41
)(0
.00
9)
(0.0
38
)(0
.00
9)
(0.1
11
)(0
.02
3)
Pro
du
ctiv
ity*
RD
ON
LY#�
0.0
46
*�
0.0
01
�0
.04
7*
0.0
02
�0
.01
9�
0.0
00
(0.0
26
)(0
.00
7)
(0.0
26
)(0
.00
7)
(0.0
73
)(0
.01
7)
No
.o
fo
bse
rvat
ion
s1
03
,62
01
05
,17
41
03
,62
01
05
17
43
53
61
35
94
1
Rh
o0
.07
12
***
0.1
33
***
0.0
61
2**
*0
.13
5**
*0
.02
61
0.0
34
6
(0.0
17
)(0
.02
2)
(0.0
18
)(0
.02
2)
(0.0
29
)(0
.02
3)
Wal
dte
stfo
r
H0:
Rh
o¼
0
17
.43
***
34
.24
***
10
.98
***
35
.29
***
0.7
92
.33
Ch
i-sq
uar
ed8
9,5
79
.67
81
,88
1.4
88
,36
5.8
78
43
92
.13
26
02
.63
45
95
8.4
Log
likel
iho
od
�6
0,2
03
.7�
15
2,0
58
.0�
60
,27
3.3
�1
52
06
8.7
�1
91
73
.7�
52
14
6.3
Not
e:H
eter
osk
edas
tici
ty-r
ob
ust
stan
dar
der
rors
(clu
ster
edw
ith
ina
firm
)ar
ein
par
enth
eses
wit
h**
*,**
,an
d*
ind
icat
ing
the
1%
,5
%,
and
10
%si
gnif
ican
ce
leve
ls,
resp
ecti
vely
.A
con
stan
tte
rmis
no
tre
po
rted
.A
lleq
uat
ion
sin
clu
de
3-d
igit
ind
ust
ryd
um
my
vari
able
san
dye
ard
um
my
vari
able
s.
Interactions between innovation and exporting strategies 2025
by guest on Decem
ber 31, 2010icc.oxfordjournals.org
Dow
nloaded from

As for the productivity evolution, our main result in Table 9 is that decisions
regarding investment in export and R&D strongly affect future productivity. This
result holds for both labor productivity and TFP, regardless of how the R&D variable
is defined. Coefficients for the firm’s engagement in both R&D and exporting
(RDEXP#) are larger than those of firms engaged only in exporting (EXPONLY#)
or only in R&D (RDONLY#), suggesting that R&D and export involvement have
complementary effects on productivity. The estimated result in the productivity
Equation (1) in Table 9 shows that firms that invest in both R&D and exporting
in the current year have 8.3% higher labor productivity than firms that do not invest
in either of these two activities in the next year. In addition, firms that only export or
conduct only R&D have, on average, 4.4% and 3.8% higher productivity, respect-
ively, than firms without these activities in the next period. This indicates that firms
investing in either exporting or R&D can realize higher productivity in the next
period. However, the much larger coefficients for RDEXP# than EXPONLY# and
RDONLY# suggest that strong complementarities exist for R&D and exporting activ-
ities. A similar hierarchy is observed in most cases. Finally, in all the cases in Table 9,
the coefficient of the current productivity level is positive and significant, suggesting
the strong persistence of performance ranking among firms.
6. Investigating the impact on performance of changesin firms’ strategies
6.1 Matching approach
In the previous section, we found that R&D and export experience have comple-
mentary effects on a firm’s productivity. Our results also suggested that R&D and/or
exporting status were highly path-dependent: firms that presently conduct R&D and/
or export are highly likely to continue such activities in the next period. A possible
interpretation of these results is that the complementary effects and path-dependence
of these strategies may create persistent differences in performance among firms.
However, the analysis in the previous section says nothing about mechanisms
behind the interaction of innovation and export on performance.
Therefore, in this section, we use a different methodology, namely a propensity
score matching technique in combination with a difference-in-differences (DID)
estimator, to analyze whether or not the productivity growth rate is improved
when a firm changed its R&D and/or exporting strategies. Although we cannot dir-
ectly figure out mechanisms behind the interaction of innovation and export on
performance, i.e. how R&D and exporting interplay and whether their interplay
has lasting effects on productivity, the following analysis in this section may provide
clues to understand these mechanisms.
2026 K. Ito and S. Lechevalier
by guest on Decem
ber 31, 2010icc.oxfordjournals.org
Dow
nloaded from

Moreover, by undertaking propensity score matching and the DID technique, we
also address possible endogeneity problems.30 First, we identify the probability of
initiating R&D or exporting for firms in our dataset (a “propensity score”). The
propensity score is defined by Rosenbaum and Rubin (1983) as the conditional
probability of assignment to a particular treatment given the pre-treatment
characteristics:
p xð Þ � Pr z ¼ 1jxf g ¼ E zjxf g ð8Þ
where z¼ {0, 1} is the indicator of receiving the treatment and x is a vector of
observed pretreatment characteristics. Rosenbaum and Rubin (1983) show that if
the recipient of the treatment is randomly chosen within cells defined by x, it is also
random within cells defined by the values of the single-index variable p(x). Therefore,
for each treatment case, if the propensity score p(x) is known, the Average effect of
Treatment on the Treated (ATT) can be estimated as follows:
�ATT ¼ E y1 � y0jz ¼ 1� �
¼ E E y1 � y0jz ¼ 1, pðxÞ� �� �
¼ E E y1jz ¼ 1, pðxÞ� �
� E y0jz ¼ 0, pðxÞ� �
jz ¼ 1� � ð9Þ
where y1 and y0 denote the potential outcomes in the two counterfactual situations
of treatment and no treatment, respectively. Therefore, ATT can be estimated as
the average difference between outcome of recipients and non-recipients of the
treatment for which propensity scores p(x) are identical.
We focus on the difference in ex post performance between treated firms and
non-treated firms. Treatment z denotes whether a firm initiates R&D or exporting.
The propensity score is calculated by estimating a probit model that represents a
firm’s probability of initiating R&D or exporting. Our probit estimation model is
specified as Equation (1) in the case of determinants of R&D investment and Equation
(2) in the case of determinants of exporting. However, we replace the dummy vari-
ables indicating whether a firm engages in R&D or exporting with variables indicating
the intensity of its R&D or exporting activities (Appendix Table A2). Then, a
non-R&D (or non-exporting) firm which did not start R&D (or exporting) in the
subsequent period is matched with a firm that had a “closest” propensity score to start
R&D (or exporting) with this non-R&D (or non-exporting) firm and that actually did
initiate R&D (or exporting). We match firms separately for each year and industry
using the one-to-one nearest neighbor matching method.31 In the second stage, we
30This is another (technical) reason for the matching approach. Although the Heckman sample
selection approach employed in the previous section controls for selection bias that arises from
endogenous firm exit, other possible endogeneity problems are not solved: for example, firms that
expect higher productivity in the future may invest in R&D and exporting.
31Our matching procedure is implemented in Stata 10 using a modified version of the procedure
provided by Leuven and Sianesi (2003). The probit estimation results and the balancing property
test results are available upon request to the authors.
Interactions between innovation and exporting strategies 2027
by guest on Decem
ber 31, 2010icc.oxfordjournals.org
Dow
nloaded from

estimate a DID estimator to evaluate the causal effect of the treatment on performance
variables. The propensity score-matching technique should identify matched firms
that satisfy an assumption that, conditional on observables, the non-treated outcomes
are independent of treated status. Nonetheless, the propensity score is conditional on
only a limited number of observable characteristics, implying that unobservable,
time-invariant, firm-specific effects may not be fully removed after propensity score
matching. Therefore, by comparing productivity growth rates of treated firms and
non-treated firms (DID estimator), we can reduce these unobservable effects and
obtain more robust estimates. The ATT can be estimated as Equation (9) above,
which, in this study, is equivalent to the following equation:
�ATT�DID ¼1
n
Xn
1y1
treatment yearþs � y1pre�treatment year
� ��
1
n
Xn
1y0
treatment yearþs � y0pre�treatment year
� � ð10Þ
where n denotes the number of observations and y denotes productivity variables.
In order to examine complementary effects of R&D and exporting on productivity
growth, we first examine the effect of participation in export markets for firms engaged
in R&D but not exporting and for firms that are not engaged in R&D or exporting.
Then, we examine the effect of conducting R&D for firms already engaged in exporting
but not R&D and for firms that are neither engaged in R&D nor exporting.
6.2 The matching results
For the first case, we select firms that were not engaged in exporting but were con-
ducting R&D in year t� 1. We compare productivity growth rates of firms that
began exporting in year t and firms that did not begin exporting in year t. We
exclude firms that were not exporting in year t� 1 but were exporting before year
t� 1; we did so in order to eliminate biases that may arise from firms’ earlier ex-
perience in exporting. DID results are shown in Table 10. The upper panels show the
DID estimators measured as Equation (10) using labor productivity as a productivity
variable. The lower panel shows the DID estimators based on TFP. Both upper
and lower panels show that productivity growth is significantly higher for firms
that started exporting in year t and that the difference in productivity growth does
not clearly diminish over time. In the case of labor productivity, for example, firms
that started exporting in year t show 4.6% higher productivity growth during the
period from pre-treatment year (t� 1) to year tþ 1, compared with firms that did
not start exporting in year t. Moreover, firms that started exporting in year t still
show 4.6% higher productivity growth 3 years after they started exporting. For firms
already engaged in R&D, we observe that exporting produced a significant and per-
sistent impact on productivity growth regardless of the productivity indicator we
consider.
2028 K. Ito and S. Lechevalier
by guest on Decem
ber 31, 2010icc.oxfordjournals.org
Dow
nloaded from

However, when we examine the effects of initiating exports on firms inexperi-
enced in R&D and exporting, no DID estimator is statistically significant (Table 10).
The insignificant DID estimators in Table 10 suggest that exporting does not con-
tribute to productivity growth when the firm does not engage in R&D. We may
interpret the results as firms without technological capabilities cannot enjoy a return
on their exposure to the export market.
For the next step, we select firms that were not engaged in R&D but were export-
ing in year t� 1. We compare productivity growth of firms that initiated R&D in
year t and firms that did not. Table 10 shows that productivity growth for exporters
that initiated R&D in year t is not significantly higher than for exporters that did not
initiate R&D in year t. This result may indicate a substantial time lag before R&D
contributes to productivity. That lag may be because firms need time to build
technological capabilities to absorb external knowledge acquired from the export
market. Another possibility is that initiating R&D may incur start-up costs that
lower productivity. On the other hand, Table 9 shows the result for effects of starting
R&D for firms without experience in R&D and exporting. The only significant DID
estimators pertain to labor productivity growth rate 3 years after initiating R&D.
In addition, firms that started R&D in year t show 5.1% higher TFP growth com-
pared with firms not starting R&D in year t, although the DID estimator is not
statistically significant. The result implies that starting R&D may have somewhat
positive effects on productivity growth with at least a 3-year time lag.
In sum, we find that initiating exports improves productivity significantly and
persistently among firms that have accumulated internal knowledge through R&D.
This finding implies strong complementarities between R&D and exporting for prod-
uctivity growth. However, mechanisms behind these complementarities are not
straightforward. That is, exporting firms lacking R&D cannot boost productivity
in the short run, even after undertaking R&D activities.
Some may interpret these results as suggesting that firms with R&D experience
possess absorptive capacity for external knowledge through exporting. In other
words, firms can learn from exporting. However, the complementarities between
R&D and exporting may be more than learning-by-exporting. This could be the
case particularly in developed countries such as Japan. As the importance of inter-
national division of labor grows for Japanese manufacturers, only firms with techno-
logical capabilities can improve productivity by shifting domestic production toward
high value-added and moving low value-added production overseas. Clearly, we need
to anatomize core technologies, destinations of exports, and the type of products that
firms export in order to understand the mechanism of complementarities. However,
the results of our analysis at least indicate that firms, which already accumulated
internal knowledge, may be able to further improve the productivity by starting
exporting, whereas it would take more time for non-R&D firms to build techno-
logical capabilities through R&D activities.
Interactions between innovation and exporting strategies 2029
by guest on Decem
ber 31, 2010icc.oxfordjournals.org
Dow
nloaded from
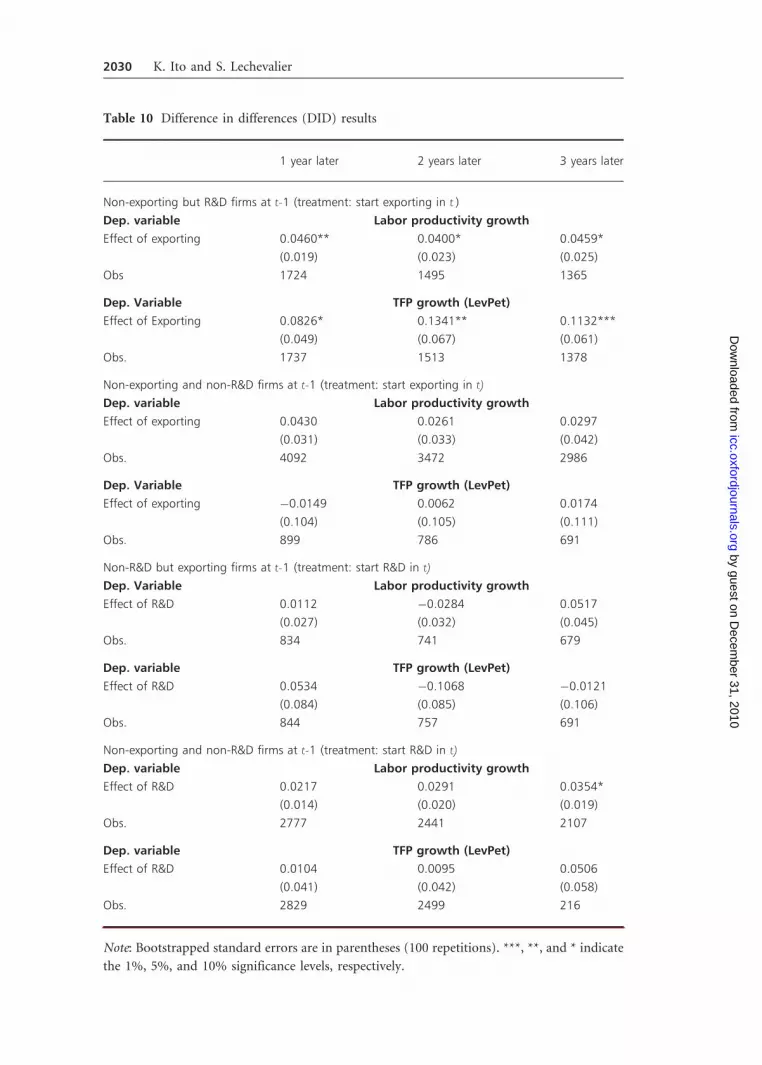
Table 10 Difference in differences (DID) results
1 year later 2 years later 3 years later
Non-exporting but R&D firms at t-1 (treatment: start exporting in t )
Dep. variable Labor productivity growth
Effect of exporting 0.0460** 0.0400* 0.0459*
(0.019) (0.023) (0.025)
Obs 1724 1495 1365
Dep. Variable TFP growth (LevPet)
Effect of Exporting 0.0826* 0.1341** 0.1132***
(0.049) (0.067) (0.061)
Obs. 1737 1513 1378
Non-exporting and non-R&D firms at t-1 (treatment: start exporting in t)
Dep. variable Labor productivity growth
Effect of exporting 0.0430 0.0261 0.0297
(0.031) (0.033) (0.042)
Obs. 4092 3472 2986
Dep. Variable TFP growth (LevPet)
Effect of exporting �0.0149 0.0062 0.0174
(0.104) (0.105) (0.111)
Obs. 899 786 691
Non-R&D but exporting firms at t-1 (treatment: start R&D in t)
Dep. Variable Labor productivity growth
Effect of R&D 0.0112 �0.0284 0.0517
(0.027) (0.032) (0.045)
Obs. 834 741 679
Dep. variable TFP growth (LevPet)
Effect of R&D 0.0534 �0.1068 �0.0121
(0.084) (0.085) (0.106)
Obs. 844 757 691
Non-exporting and non-R&D firms at t-1 (treatment: start R&D in t)
Dep. variable Labor productivity growth
Effect of R&D 0.0217 0.0291 0.0354*
(0.014) (0.020) (0.019)
Obs. 2777 2441 2107
Dep. variable TFP growth (LevPet)
Effect of R&D 0.0104 0.0095 0.0506
(0.041) (0.042) (0.058)
Obs. 2829 2499 216
Note: Bootstrapped standard errors are in parentheses (100 repetitions). ***, **, and * indicate
the 1%, 5%, and 10% significance levels, respectively.
2030 K. Ito and S. Lechevalier
by guest on Decem
ber 31, 2010icc.oxfordjournals.org
Dow
nloaded from

7. Conclusions
In this study, we use a large-scale administrative survey conducted by METI to
analyze why some Japanese firms persistently performed better than others during
the period 1994–2003. We focus on innovation and export as two strategies for a firm
to increase its knowledge stock and therefore its capabilities. Our main findings can
be summarized as follows. First, we find strong persistence in R&D and export
decisions, contrary to previous studies (e.g. Aw et al., 2005) that found stronger
persistence for exports. Second, strong complementarities exist between R&D invest-
ment and exporting, when discrete choices are considered.32 This pair of results
confirms that interactions between innovation and exporting strategies define coher-
ent productive models or patterns of learning. Third, we show that firms’ endogenous
choices regarding innovation and exports affect their performance, both in terms of
productivity and survival. It is possible to establish a stable ranking of performance
based on the strategies of firms. Fourth, our matching analysis allows us to go one
step further than this previous analysis, whose methodology is inspired by Aw et al.
(2005). Our results indeed reveal that changes in the firms’ strategies significantly
and persistently improve their productivity in cases where firms which have accu-
mulated internal knowledge through R&D start exporting. Moreover, the comple-
mentary effects of innovation and exporting strategies are lasting, not temporary.
As a whole, these results show that the interplay of innovation and export is a source
of permanent differences in performance among firms.
We believe our research suggests several implications for understanding the het-
erogeneity of firms and their performance. First, it is true that technology is one
major source of performance differences among firms (Nelson, 1981, 1991; Dosi
et al., 2000), but this conclusion must be nuanced: choices of technology interact
with other strategic choices such as global engagement, including export decisions.
It is misleading to focus solely on the impact of technology on the performance
dispersion of firms; adopting a cognitive approach to the firm may define patterns
of learning based on innovation and exporting strategies. This approach allows
integrating, in a unified framework, varieties of firms’ choices that influence learning
processes. By adopting a broader view we can understand why, beyond the trade-offs
implicit in investing limited resources, firms have incentives to invest in R&D and
exports: namely, they benefit from the complementarities existing between these
investments. The greater accumulation of knowledge is not only due to the invest-
ment of more resources; it is also related to the fact that they learn more from more
sources such as suppliers and customers.
32This result does not hold when one considers export or R&D intensities, confirming results of
previous studies [e.g. Wakelin (1998) or Ropper and Love (2002)] according to which there im-
portant differences between determinants of discrete choices and intensities for exports as well as for
R&D.
Interactions between innovation and exporting strategies 2031
by guest on Decem
ber 31, 2010icc.oxfordjournals.org
Dow
nloaded from

The second implication of this article concerns the permanent/temporary nature
of performance differences among firms. The literature discussing exports, innov-
ation, and performance offers contradictory results. For example, Roper and Love
(2002) find some permanent differences between innovators and non-innovators,
whereas Damijan and Kostevc (2006) find that differences in performance are tran-
sitory. As a whole, our results conform to Geroski et al. (1993), who explicitly
distinguish between the transitory benefits of introducing a new product and the
permanent benefits of innovation process that transform firms’ internal capabilities.
We are able to give an example related to exports that supports their conclusion that
innovators are better able than non-innovators to realize the benefits of spill-overs,
thus improving relative performance.
However, our contribution faces some limitations. First, learning behavior is
not the only possible explanation for complementarities between innovation and
exporting strategies. For example, costs may be a mechanism behind the comple-
mentarities we find. Our article does not allow discriminating between different
interpretations. In regard to this first limitation, it is important to underline that
what can be learned from exporting depends deeply on the firm’s standing on the
technological frontier. From this point of view, the mechanisms can be variables
depending on the country, the sectors, and the firms. Second, even if we tried to
introduce better proxies for innovation strategies and knowledge, our approach,
which relies heavily on R&D data, is not completely satisfying from this point of
view; the same applies for exporting that constitutes only part of global engage-
ment, even if, in the case of Japanese firms, it has been found to be strongly
complementary with other dimensions such as FDI. Third, the analysis of comple-
mentarities between innovation and exporting strategies is certainly an important
step. However, from this analysis, we cannot conclude anything regarding the
causality between the two strategies. As already mentioned above, both innovation
and exporting strategies are endogenously determined, and it would be extremely
difficult to identify the causal effects of one on the other, unless we could find
appropriate exogenous instrument variables. Although estimating a structural
model (e.g. Aw et al. 2009) or employing a matching technique (e.g. Damijan
et al. 2008) may help to identify the causal effect, it would still be challenging
to identify the causality. Nevertheless, it is certainly important to anatomize the
causality to understand the mechanism of complementary effects of these strategies.
Fourth, we have not identified the reasons why a firm changed its innovation and/
or exporting status, though we found a strong path-dependence in the status. This
is another challenging issue because shocks which affect the status change are often
unobserved by researchers. Finally, it is necessary to better understand the inter-
actions between innovation and global engagement on the one hand, and firms’
organizational characteristics on the other hand. These are directions for future
research.
2032 K. Ito and S. Lechevalier
by guest on Decem
ber 31, 2010icc.oxfordjournals.org
Dow
nloaded from

Acknowledgements
We are grateful to two anonymous referees and to G. Dosi for their helpful com-
ments. Usual caveats apply.
References
Antras, P. and E. Helpman (2004), ‘Global sourcing,’ Journal of Political Economy, 112(3),
555–580.
Aw, B. Y., M. Roberts and T. Winston (2005), ‘The complementary role of exports and R&D
investments as sources of productivity growth,’ Working Articles No 11774, NBER.
Aw, B. Y., M. Roberts and D. Y. Xu (2009), ‘R&D investment, exporting, and productivity
dynamics,’ Working Articles No 14670, NBER.
Baldwin, J. and W. Gu (2004), ‘Trade liberalization: export-market participation,
productivity growth, and innovation,’ Oxford Review of Economic Policy, 20(3), 373–392.
Bartelsman, E. and M. Doms (2000), ‘Understanding productivity: lessons from longitudinal
microdata,’ Journal of Economic Literature, 38(3), 569–594.
Bernard, A. and B. Jensen (1999), ‘Exceptional exporter performance: cause, effect, or both?’
Journal of International Economics, 47(1), 2–26.
Bloom, N. and J. van Reenen (2007), ‘Measuring and explaining management practices across
firms and countries,’ The Quarterly Journal of Economics, 122(4), 1351–1408.
Blundell, R. and S. Bond (1998), ‘Initial conditions and moment restrictions in dynamic panel
data models,’ Journal of Econometrics, 87(1), 111–143.
Bond, S., D. Harhoff and J. van Reenen (2003), ‘Investment, R&D and financial constraints
in Britain and Germany,’ CEP Discussion Articles No 595.
Castellani, D. and A. Zanfei (2007), ‘Internationalisation, innovation and productivity: how
do firms differ in Italy?’ The World Economy, 30(1), 151–176.
Cohen, W. and D. Levinthal (1989), ‘Innovation and learning: the two faces of R&D,’
Economic Journal, 99(397), 569–596.
Criscuolo, C., J. Haskel and M. Slaughter (2005), ‘Global Engagement and the Innovation
Activities of Firms,’ Working Articles No 11479, NBER.
Damijan, J., C. Kostevc and S. Polanec (2008), ‘From innovation to exporting or vice versa?
causal link between innovation activity and exporting in Slovenian microdata,’ LICOS
Discussion Article 204/2008, LICOS Centre for Institutions and Economic Performance,
Katholieke Universiteit Leuven.
Damijan, J. and C. Kostevc (2006), ‘Learning-by-exporting: continuous productivity improve-
ments or capacity utilization effects? evidence from Slovenian Firms,’ Review of World
Economics, 142(5), 596–614.
Dosi, G. and F. Malerba (eds) (1996), Organization and Strategy in the Evolution of the
Enterprise. MacMillan Press: Basingstoke.
Interactions between innovation and exporting strategies 2033
by guest on Decem
ber 31, 2010icc.oxfordjournals.org
Dow
nloaded from

Dosi, G., R. Nelson and S. Winter (eds) (2000), The Nature and Dynamics of Organizational
Capabilities. Oxford University Press: Oxford.
Faggio, G., K. G. Salvanes and J. van Reenen (2007), ‘The evolution of inequality in prod-
uctivity and wages: Panel data evidence,’ CEP Discussion Article 821, Centre for Economic
Performance, London School of Economics.
Fukao, K. and H. U. Kwon (2006), ‘Why did Japan’s TFP growth slow down in the lost
decade? An empirical analysis based on firm-level data of manufacturing firms,’ Japanese
Economic Review, 57(2), 195–228.
Geroski, P., T. Kretschmer and C. Walters (2009), ‘Corporate productivity growth: champions,
leaders, and laggards,’ Economic Inquiry, 47(1), 1–17.
Geroski, P., S. Machin and J. van Reenen (1993), ‘The profitability of innovating firms,’
RAND Journal of Economics, 24(2), 192–211.
Good, D. H., M. I. Nadiri and R. C. Sickles (1997), ‘Index number and factor demand
approaches to the estimation of productivity,’ in M. H. Pesaran and P. Schmidt (eds),
Handbook of Applied Econometrics: Microeconomics, Vol. II, Blackwell: Oxford.
Greenaway, D. and R. Kneller (2007), ‘Firm heterogeneity, exporting and foreign direct
investment,’ Economic Journal, 117(517), F134–F161.
Hall, B. (2002), ‘The financing of research and development,’ Oxford Review of Economic
Papers, 18, 35–51.
Head, K. and J. Ries (2001), ‘Overseas investment and firm exports,’ Review of International
Economics, 9(1), 101–122.
Helpman, E., M. Melitz and S. Yeaple (2004), ‘Export versus FDI with heterogeneous firms,’
American Economic Review, 94(1), 303–316.
Itami, H. (1987), Mobilizing Invisible Assets. Harvard University Press: Cambridge, Mass.
Ito, K. and S. Lechevalier (2009), ‘The evolution of productivity dispersion of firms. A reevalua-
tion of its determinants in the case of Japan,’ Review of World Economics, 145(3), 404–429.
Kiyota, K. and S. Urata (2008), ‘The role of multinational firms in international trade: the case
of Japan,’ Japan and the World Economy, 20(3), 333–352.
Lechevalier, S. (2007), ‘The diversity of capitalism and heterogeneity of firms. a case study of
Japan during the lost decade,’ Evolutionary and Institutional Economics Review, 4(1), 113–142.
Leuven, E. and B. Sianesi (2003), ‘PSMATCH2: Stata module to perform full Mahalanobis and
propensity score matching, common support graphing, and covariate imbalance testing,’
Statistical Software Components.
Levinsohn, J. and A. Petrin (2003), ‘Estimating production functions using inputs to control
for unobservables,’ Review of Economic Studies, 702(2), 313–341.
Nelson, R. (1981), ‘Research on productivity growth and productivity differences: dead ends
and new departures,’ Journal of Economic Literature, 19(3), 1029–1064.
Nelson, R. (1991), ‘Why do firms differ, and how does it matter?’ Strategic Management
Journal, 12, 67–74.
2034 K. Ito and S. Lechevalier
by guest on Decem
ber 31, 2010icc.oxfordjournals.org
Dow
nloaded from

Oı, W. (1983), ‘Heterogeneous firms and the organization of production,’ Economic Inquiry,
21(2), 147–171.
Roper, S. and J. Love (2002), ‘Innovation and export performance: evidence from the UK and
German manufacturing plants,’ Research Policy, 31, 1081–1102.
Rosenbaum, P. and D. Rubin (1983), ‘The central role of the propensity score in observational
studies for causal effects,’ Biometrika, 70(1), 45–55.
Wagner, J. (2007), ‘Exports and productivity: a survey of the evidence from firm-level data,’
The World Economy, 30(1), 68–82.
Wakasugi, R., Y. Todo, H. Sato et al. (2008), ‘The internationalization of Japanese firms: new
findings based on firm-level data,’ Discussion Article 08-E-036, RIETI.
Wakelin, K. (1998), ‘Innovation and export behaviour at the firm level,’ Research Policy, 26,
828–841.
Appendix A: Variable construction and data sources
Output: Except for the commerce sector, gross output is defined as firms’ total sales.
For the commerce sector, gross output is measured as sales minus expenses for
purchased materials. Gross output is deflated by the output deflator taken from
the JIP Database 2006.
Intermediate inputs: For the commerce sector, intermediate inputs are calculated
as (Cost of salesþOperating costs) � (WagesþDepreciation costsþ Expenses for
purchased materials). The intermediate inputs of other sectors are defined as (Cost
of salesþOperating costs) � (WagesþDepreciation costs). Intermediate inputs are
deflated by the intermediate input deflator taken from the JIP Database 2006.
Labor input: As labor input, we used each firm’s total number of workers multi-
plied by the sector’s working hours taken from the JIP Database 2006.
Capital Stock: For capital stock, the only data available are the nominal book
values of tangible fixed assets. Using these data, we calculated the net capital stock
of firm i in industry j in constant 1995 prices as follows:
Kit ¼ BVit � ðINKjt=IBVjt Þ
where BVit represents the book value of firm i’s tangible fixed assets in year t, INKjt
stands for the net capital stock of industry j in constant 1995 prices, and IBVjt
denotes the book value of industry j’s capital. INKjt was calculated as follows.
First, as a benchmark, we took the data on the book value of tangible fixed assets
in 1975 from the Financial Statements Statistics of Corporations published by Ministry
of Finance. We then converted the book value of year 1975 into the real value in
constant 1995 prices using the investment deflator taken from the JIP Database 2006.
Second, the net capital stock of industry j, INKjt, for succeeding years was calculated
using the perpetual inventory method. The sectoral depreciation rate used is taken
from the JIP Database 2006.
Interactions between innovation and exporting strategies 2035
by guest on Decem
ber 31, 2010icc.oxfordjournals.org
Dow
nloaded from

Tab
leA
1B
ivar
iate
pro
bit
esti
mat
ion
resu
lts
usi
ng
alte
rnat
ive
mea
sure
sfo
rR
&D
acti
viti
es
Dep
end
ent
vari
able
:R&
Do
rex
po
rtd
ecis
ion
inye
ar(tþ
1)
(1)
(2)
(3)
(4)
(5)
(6)
R&
DExp
ort
ing
R&
DExp
ort
ing
R&
DExp
ort
ing
R&
DExp
ort
ing
R&
DExp
ort
ing
R&
DExp
ort
ing
Pro
du
ctiv
ity
vari
able
lnV
AP
lnTF
Pln
VA
Pln
TFP
lnV
AP
lnTF
P
Dep
end
ent
vari
able
for
R&
Dch
oic
e
R&
Dd
epar
tmen
tR&
Dd
epar
tmen
tR&
Dex
pen
dit
ure
sR&
Dex
pen
dit
ure
sR&
Dd
epar
tmen
tR&
Dd
epar
tmen
t
Exp
lan
ato
ryva
riab
le
for
R&
Dst
atu
s
R&
Dd
epar
tmen
tR&
Dd
epar
tmen
tPa
ten
tsPa
ten
tsPa
ten
tsPa
ten
ts
log
(ag
e)0
.07
4**
*0
.06
7**
*0
.08
5**
*0
.07
5**
*0
.07
0**
�0
.00
20
.09
1**
*0
.01
40
.04
7�
0.0
02
0.0
81
**0
.01
5
(0.0
12
)(0
.01
4)
(0.0
12
)(0
.01
4)
(0.0
30
)(0
.02
4)
(0.0
29
)(0
.02
4)
(0.0
33
)(0
.02
4)
(0.0
32
)(0
.02
4)
log
(K)
0.1
60
***
0.1
44
***
0.0
84
***
0.0
64
***
0.2
43
***
0.1
51
***
0.1
47
***
0.0
68
***
0.2
97
***
0.1
52
***
0.1
85
***
0.0
69
***
(0.0
08
)(0
.00
09
)(0
.00
5)
(0.0
06
)(0
.02
2)
(0.0
13
)(0
.01
4)
(O.O
10
)(0
.02
0)
(0.0
13
)(0
.01
4)
(0.0
10
)
log
(wag
era
te)
0.0
31
0.1
03
***�
0.0
37
0.0
39
0.1
94
***
0.0
75
0.1
38
**�
0.0
12
�0
.09
60
.07
1�
0.1
89
***�
0.0
17
(0.0
28
)(0
.03
4)
(0.0
26
)(0
.03
2)
(0.0
60
)(0
.05
3)
(0.0
59
)(0
.05
2)
(0.0
62
)(0
.05
3)
(0.0
62
)(0
.05
2)
Mu
ltip
lan
td
um
my
�0
.11
1**
*0
.13
5**
*�
0.0
90
***
0.1
60
***
0.0
51
0.0
71
***
0.0
77
**0
.09
5**
*�
0.4
31
***
0.0
69
***�
0.4
02
***
0.0
93
***
(0.0
13
)(0
.01
5)
(0.0
13
)(0
.01
5)
(0.0
32
)(0
.02
4)
(0.0
31
)(0
.02
4)
(0.0
34
)(0
.02
4)
(0.0
33
)(0
.02
4)
Fore
ign
cap
ital
rati
o�
0.1
34
*0
.39
9**
*�
0.1
31
*0
.42
5**
*�
0.1
47
0.0
94
�0
.13
40
.15
4�
0.4
37
***
0.0
80
)�
0.3
96
***
0.1
40
(0.0
72
)(0
.08
4)
(0.0
69
)(0
.08
2)
(0.1
41
)(0
.12
0)
(0.1
34
)(0
.12
1)
(0.1
47
)(0
.12
0)
(0.1
41
)(0
.12
1)
Deb
t–as
set
rati
o�
0.0
99
***�
0.1
22
***�
0.0
92
***�
0.1
20
***�
0.1
25
*�
0.2
45
***�
0.1
09
�0
.22
2**
*�
0.2
37
***�
0.2
47
***�
0.2
08
***�
0.2
24
***
(0.0
27
)(0
.03
1)
(0.0
26
)(0
.03
1)
(0.0
68
)(0
.05
0)
(0.0
67
)(0
.04
9)
(0.0
72
)(0
.05
0)
(0.0
72
)(0
.04
9)
ln(K
Lra
tio
)�
0.1
18
***�
0.1
32
***
�0
.18
6**
*�
0.1
62
***
�0
.23
2**
*�
0.1
63
***
(0.0
11
)(0
.01
3)
(0.0
30
)(0
.02
1)
(0.0
29
)(0
.02
1)
Pro
du
ctiv
ity
0.0
80
**0
.11
1**
0.0
61
***
0.0
72
***
0.2
37
***
0.1
51
0.0
72
**0
.07
2**
0.0
89
0.1
50
0.0
60
0.0
73
**
(0.0
38
)(0
.05
5)
(0.0
16
)(0
.01
9)
(0.0
90
)(0
.10
2)
(0.0
36
)(0
.03
3)
(0.0
95
)(0
.10
2)
(0.0
38
)(0
.03
3)
Pro
du
ctiv
ity2
�0
.03
0**
*�
0.0
19
*�
0.0
08
***�
0.0
04
�0
.04
2**
*�
0.0
21
�0
.01
7**
*�
0.0
06
*�
0.0
51
***�
0.0
21
�0
.01
1**
�0
.00
6*
(0.0
09
)(0
.01
1)
(0.0
02
)(0
.00
2)
(0.0
16
)(0
.01
4)
(0.0
04
)(0
.00
3)
(0.0
17
)(0
.01
5)
(0.0
04
)(0
.00
3)
RD
EX
P#2
.56
3**
*3
.22
0**
*2
.78
4**
*3
.19
3**
*0
.74
1**
*3
.02
4**
*0
.65
1**
*3
.04
5**
*0
.26
0*
3.0
24
***
0.5
73
***
3.0
46
***
(0.0
71
)(0
.08
4)
(0.0
27
)(0
.03
1)
(0.1
48
)(0
.18
1)
(0.0
60
)(0
.06
1)
(0.1
51
)(0
.18
1)
(0.0
62
)(0
.06
1)
EX
PON
LY#
0.2
72
***
2.9
15
***
0.2
35
***
2.9
94
***
0.1
78
2.9
47
***
0.1
59
***
2.8
60
***
0.2
72
2.9
38
***
0.1
88
**2
.86
0**
*
(0.0
85
)(0
.10
5)
(0.0
32
)(0
.04
0)
(0.2
29
)(0
.29
2)
(0.0
77
)(0
.08
6)
(0.2
26
)(0
.29
3)
(0.0
79
)(0
.08
6)
(co
nti
nu
ed)
2036 K. Ito and S. Lechevalier
by guest on Decem
ber 31, 2010icc.oxfordjournals.org
Dow
nloaded from

Tab
leA
1C
on
tin
ued
Dep
end
ent
vari
able
:R&
Do
rex
po
rtd
ecis
ion
inye
ar(tþ
1)
(1)
(2)
(3)
(4)
(5)
(6)
R&
DExp
ort
ing
R&
DExp
ort
ing
R&
DExp
ort
ing
R&
DExp
ort
ing
R&
DExp
ort
ing
R&
DExp
ort
ing
Pro
du
ctiv
ity
vari
able
lnV
AP
lnTF
Pln
VA
Pln
TFP
lnV
AP
lnTF
P
Dep
end
ent
vari
able
for
R&
Dch
oic
e
R&
Dd
epar
tmen
tR&
Dd
epar
tmen
tR&
Dex
pen
dit
ure
sR&
Dex
pen
dit
ure
sR&
Dd
epar
tmen
tR&
Dd
epar
tmen
t
Exp
lan
ato
ryva
riab
le
for
R&
Dst
atu
s
R&
Dd
epar
tmen
tR&
Dd
epar
tmen
tPa
ten
tsPa
ten
tsPa
ten
tsPa
ten
ts
RD
ON
LY#
2.1
42
***
0.3
31
***
2.5
51
***
0.2
12
***
0.3
53
**0
.30
9*
0.3
96
***
0.0
04
0.0
91
0.3
11
*0
.28
0**
*0
.00
4
(0.0
59
)(0
.07
6)
(0.0
26
)(0
.02
8)
(0.1
37
)(0
.17
4)
(0.0
54
)(0
.05
9)
(0.1
39
)(0
.17
4)
(0.0
56
)(0
.05
9)
Pro
du
ctiv
ity*
RD
EX
P#0
.08
4**
�0
.02
50
.01
7*
�0
.00
3�
0.0
62
�0
.01
40
.00
40
.01
40
.14
3*
�0
.01
40
.00
40
.01
4
(0.0
35
)(0
.04
2)
(0.0
09
)(0
.01
0)
(0.0
76
)(0
.09
1)
(0.0
18
)(0
.01
9)
(0.0
77
)(O
.O9
1)
(0.0
19
)(0
.01
9)
Pro
du
ctiv
ity*
EX
PON
LY#�
0.0
43
0.0
46
0.0
24
**�
0.0
06
0.0
02
�0
.02
0�
0.0
11
�0
.02
6�
0.0
30
�0
.01
5�
0.0
14
�0
.02
7
(0.0
43
)(0
.05
3)
(0.0
10
)(0
.01
3)
(0.1
17
)(0
.14
6)
(0.0
25
)(0
.02
8)
(0.1
14
)(0
.14
7)
(0.0
25
)(0
.02
8)
Pro
du
ctiv
ity*
RD
ON
LY#
0.1
98
***�
0.0
64
0.0
20
**�
0.0
06
0.0
31
�0
.13
9�
0.0
05
�0
.02
00
.12
5*
�0
.14
0�
0.0
19
�0
.02
0
(0.0
32
)(0
.04
0)
(0.0
08
)(0
.00
9)
(0.0
73
)(0
.08
8)
(0.0
17
)(0
.01
9)
(0.0
73
)(0
.08
8)
(0.0
17
)(0
.01
9)
Rh
o0
.09
94
***
0.1
03
***
0.0
94
7**
*0
.10
3**
*0
.08
04
***
0.0
90
9**
*
(0.0
14
)(0
.01
4)
(0.0
16
)(0
.01
6)
(0.0
15
)(0
.01
5)
No
.o
fo
bse
rvat
ion
s9
1,5
80
92
,93
23
2,3
41
32
86
23
23
41
32
86
2
Ch
i-sq
uar
ed5
9,9
37
.06
0,8
03
.01
3,7
60
.71
41
91
.81
34
17
.21
38
17
.1
Log
likel
iho
od
�4
3,3
55
.7�
44
,08
4�
22
,43
3.9
�2
28
66
.1�
24
23
2.9
�2
47
62
.5
Not
e:H
eter
osk
edas
tici
ty-r
ob
ust
stan
dar
der
rors
(clu
ster
edw
ith
ina
firm
)ar
ein
par
enth
eses
wit
h**
*,**
,an
d*
ind
icat
ing
the
1%
,5
%,
and
10
%si
gnif
ican
ce
leve
ls,
resp
ecti
vely
.A
con
stan
tte
rmis
no
tre
po
rted
.A
lleq
uat
ion
sin
clu
de
thre
e-d
igit
ind
ust
ryd
um
my
vari
able
san
dye
ard
um
my
vari
able
s.
Interactions between innovation and exporting strategies 2037
by guest on Decem
ber 31, 2010icc.oxfordjournals.org
Dow
nloaded from

Tab
leA
2P
rob
ites
tim
atio
nre
sult
sfo
rR
&D
or
exp
ort
ing
dec
isio
n
Dep
end
ent
vari
able
:R&
Do
rex
po
rtd
ecis
ion
inye
ar(tþ
1)
(1)
(2)
(3)
(4)
(5)
(6)
(7)
(8)
Stat
us
inye
art�
1N
o-e
xpo
rtin
g
bu
tR&
D
No
-exp
ort
ing
bu
tR&
D
No
-exp
ort
ing
and
No
-R&
D
No
-exp
ort
ing
and
No
-R&
D
No
-R&
D
bu
tex
po
rtin
g
No
-R&
D
bu
tex
po
rtin
g
No
-exp
ort
ing
and
No
-R&
D
No
-Exp
ort
ing
and
No
-R&
D
Trea
tmen
tin
year
tExp
ort
ing
Exp
ort
ing
Exp
ort
ing
Exp
ort
ing
R&
DR&
DR&
DR&
D
Pro
du
ctiv
ity
vari
able
lnV
AP
lnTF
Pln
VA
Pln
TFP
lnV
AP
lnTF
Pln
VA
Pln
TFP
log
(ag
e)0
.04
10
.04
9�
0.0
03
�0
.00
8�
0.1
18
**�
0.1
04
*0
.00
70
.00
2
(0.0
31
)(0
.03
1)
(0.0
33
)(0
.03
2)
(0.0
47
)(0
.04
7)
(0.0
22
)(0
.02
1)
log
(K)
0.0
85
***
0.0
40
***
0.1
51
***
0.0
57
***
0.1
53
***
0.0
75
***
0.1
84
***
0.0
76
***
(0.0
18
)(0
.01
4)
(O.O
26
)(0
.01
6)
(0.0
29
)(0
.02
3)
(0.0
18
)(0
.01
1)
log
(wag
era
te)
0.1
09
0.1
13
0.1
57
*0
.04
80
.16
80
.11
3�
0.0
33
�0
.12
3**
(0.0
73
)(0
.06
9)
(0.0
90
)(0
.08
4)
(0.1
21
)(0
.11
7)
(0.0
59
)(0
.05
4)
Mu
ltip
lan
td
um
my
0.1
13
***
0.1
25
***
0.1
33
***
0.1
60
***
0.0
25
0.0
59
0.0
54
**0
.07
2**
*
(0.0
33
)(0
.03
2)
(0.0
38
)(0
.03
7)
(0.0
58
)(0
.05
7)
(0.0
26
)(0
.02
5)
Fore
ign
cap
ital
rati
o0
.00
00
.00
10
.00
9**
*0
.00
9**
*�
0.0
04
*�
0.0
04
*0
.00
40
.00
4
(0.0
02
)(0
.00
2)
(0.0
03
)(0
.00
3)
(0.0
02
)(0
.00
2)
(0.0
03
)(0
.00
3)
Deb
t–as
set
rati
o�
0.0
15
�0
.01
9�
0.0
09
�0
.01
4�
0.0
65
�0
.05
20
.09
3*
0.0
96
*
(0.0
71
)(0
.07
0)
(0.0
08
1)
(0.0
81
)(0
.12
2)
(0.1
21
)(0
.05
4)
(0.0
54
)
ln(K
Lra
tio
)�
0.0
83
***
�0
.11
8**
*�
13
5**
*�
0.1
54
***
(0.0
28
)(0
.03
2)
(0.0
47
)(0
.02
2)
Pro
du
ctiv
ity
�0
.05
90
.01
1�
0.0
59
0.0
50
0.0
75
0.0
74
0.2
89
***
0.1
10
***
(0.1
06
)(0
.04
0)
(0.1
21
)(0
.04
9)
(0.1
75
)(0
.06
3)
(0.1
05
)(0
.03
5)
Pro
du
ctiv
ity2
0.0
16
0.0
02
0.0
10
�0
.00
4�
0.0
14
�0
.00
6�
0.0
49
*�
0.0
19
***
(0.0
24
)(0
.00
6)
(0.0
31
)(0
.00
7)
(0.0
42
)(0
.00
9)
(0.0
27
)(0
.00
5)
R&
Din
ten
sity
4.4
14
***
4.3
48
***
n.a
.n
.a.
n.a
.n
.a.
n.a
.n
.a.
(0.8
57
)(0
.85
2)
(co
nti
nu
ed)
2038 K. Ito and S. Lechevalier
by guest on Decem
ber 31, 2010icc.oxfordjournals.org
Dow
nloaded from

Tab
leA
2C
on
tin
ued
Dep
end
ent
vari
able
:R&
Do
rex
po
rtd
ecis
ion
inye
ar(tþ
1)
(1)
(2)
(3)
(4)
(5)
(6)
(7)
(8)
Stat
us
inye
art�
1N
o-e
xpo
rtin
g
bu
tR&
D
No
-exp
ort
ing
bu
tR&
D
No
-exp
ort
ing
and
No
-R&
D
No
-exp
ort
ing
and
No
-R&
D
No
-R&
D
bu
tex
po
rtin
g
No
-R&
D
bu
tex
po
rtin
g
No
-exp
ort
ing
and
No
-R&
D
No
-Exp
ort
ing
and
No
-R&
D
Trea
tmen
tin
year
tExp
ort
ing
Exp
ort
ing
Exp
ort
ing
Exp
ort
ing
R&
DR&
DR&
DR&
D
Pro
du
ctiv
ity
vari
able
lnV
AP
lnTF
Pln
VA
Pln
TFP
lnV
AP
lnTF
Pln
VA
Pln
TFP
EX
Pin
ten
sity
n.a
.n
.a.
n.a
.n
.a.
�0
.20
7�
0.2
16
n.a
.n
.a.
(0.1
76
)(0
.17
1)
No
.o
fo
bse
rvat
ion
s2
2,3
49
22
,70
03
0,3
48
30
,71
13
89
73
95
93
04
67
30
83
9
Ch
i-sq
uar
ed4
20
.69
40
4.1
73
85
.63
37
3.2
42
13
.87
20
9.6
26
42
.00
62
9.3
8
Log
likel
iho
od
�3
91
6.5
�3
91
7.5
�2
53
8.0
�2
55
8.8
�1
37
2.7
�1
39
8.7
�6
07
1.8
�6
17
0.3
Not
e:H
eter
osk
edas
tici
ty-r
ob
ust
stan
dar
der
rors
(clu
ster
edw
ith
ina
firm
)ar
ein
par
enth
eses
wit
h**
*,**
,an
d*
ind
icat
ing
the
1%
,5
%,
and
10
%
sign
ific
ance
leve
ls,
resp
ecti
vely
.A
con
stan
tte
rmis
no
tre
po
rted
.A
lleq
uat
ion
sin
clu
de
3-d
igit
ind
ust
ryd
um
my
vari
able
san
dye
ard
um
my
vari
able
s.
n.a
.,n
on
-ap
pli
cab
le.
Interactions between innovation and exporting strategies 2039
by guest on Decem
ber 31, 2010icc.oxfordjournals.org
Dow
nloaded from


