Embed Size (px)
Citation preview
Postprint: Janssen H, Blocken B, Roels S, Carmeliet J, 2007. Wind-driven rain as a boundary condition for HAM simulations:Analysis of simplified modelling approaches, Building and Envi-ronment, 52: 1555-1567. doi: 10.1016/j.buildenv.2006.10.001
WIND-DRIVEN RAIN AS A BOUNDARY CONDITION FOR HAM SIMULATIONS:
ANALYSIS OF SIMPLIFIED MODELLING APPROACHES
HANS JANSSEN1, BERT BLOCKEN, STAF ROELS AND JAN CARMELIET2
Department of Civil Engineering Laboratory of Building Physics Katholieke Universiteit Leuven
Kasteelpark Arenberg 40 3001 Leuven
Belgium
ABSTRACT
While the numerical simulation of moisture transfer inside building components is cur-rently undergoing standardisation, the modelling of the atmospheric boundary conditi-ons has received far less attention. This article analyses the modelling of the wind-driven-rain load on building facades by partial simplification of a complex CFD-based method along the lines of the European Standard method. The results indicate that the directional dependence of the wind-dri-ven-rain coefficient is not of substantial importance. A constant wind-driven-rain coeffi-cient appears to be an oversimplification though: the full variability with the perpendicu-lar wind speed and horizontal rain intensity should be preserved, where feasible, for im-proved estimations of the moisture transfer in building components. In a conclusive paragraph, it is moreover shown that the dependence of the surface moisture transfer coefficient on wind speed has an equally important influence on the moisture transfer in building components.
KEYWORDS
HAM, wind-driven rain, driving rain, evaporation, surface moisture transfer coefficient
INTRODUCTION
Knowledge of the hygric behaviour of building components is of serious importance for different building physics issues. Insight into a building component’s hygric behaviour is evidently needed when analysing durability problems of existing components, or when assessing the expected performances of newly developed components. The moisture transfer inside building components also affects the interior climate though, and hence plays a role in interior air quality and energy performance. The moisture transfer inside building components moreover determines the moisture regime at the exterior surface, and thus influences esthetical appearance, by playing a part in soiling phenomena and algae formation.
1 Author to whom correspondence should be addressed Hans Janssen, Technical University of Denmark, Department of Civil Engineering, Brovej – building 118, 2800 Kgs. Lyngby, Denmark, tel.: +45 4525 5025, Fax: +45 4588 3282, email: [email protected] 2 Also at: Faculty of Building and Architecture, Building Physics Group, Technical University Eindhoven, P.O. Box 513, 5600 MB Eindhoven, The Netherlands

2
Until recently, the Glaser method was accepted as the standard [1] calculation tool for such evaluation of building components’ hygric behaviour, but its restrictions – station-ary, no liquid transfer, no air transfer – make it only rarely reliably applicable. Present-ly, application of hygrothermal simulation programs for the evaluation [2,3] or optimisa-tion [4,5] of the hygric performance of building components is becoming general prac-tice. Currently, numerical simulation of moisture transfer in building components is undergo-ing standardisation [6], to which a quality assessment methodology was recently added [7]. Both are restricted though to moisture and heat transfer inside permeable building components, and do not thoroughly discuss the atmospheric boundary conditions. The dependability of hygrothermal simulations under atmospheric excitation cannot be gua-ranteed however without an accurate modelling of these phenomena. This article con-centrates on the atmospheric moisture load, presumed the largest and most important uncertainty. The ensuing study reveals that wind-driven rain is the main moisture source for perme-able building facades and investigates the required level of detail in implementations of wind-driven rain as a boundary condition in hygrothermal simulations. This study focu-ses on the long-term ‘moisture response’ of building facades, which is represented by the variation of average and surface moisture contents over the course of a year. The yearly wind-driven rain and evaporative drying amounts are however also incorporated in the comparison. Other ‘shorter-term’ wind-driven rain related phenomena, such as runoff and water penetration, are discussed only secondarily. This analysis, based on hygrothermal simulations of building components, piecewisely simplifies a complex CFD based formulation [8] for wind-driven rain along the concepts of the European Standard on wind-driven rain [9], in order to evaluate the acceptability of the differing features of both approaches. More specifically, this article investigates the significance of the dependency of the wind-driven-rain coefficients on rain intensity, wind speed and wind direction. In the final paragraph the resulting conclusions are put into a larger perspective, by sketching the effect of the surface moisture transfer coeffi-cients on evaporative drying, the primary moisture removal mechanism for permeable building facades.
NUMERICAL SIMULATION OF MOISTURE AND HEAT TRANSFER IN BUILDING COMPONENTS
All results presented in this article are achieved by numerical solution of the standard partial differential equations for coupled moisture and heat transfer in porous building materials, combined with the complete formulations for the atmospheric hygrothermal boundary conditions. Air transfer, and the consequent advective transfer of moisture and heat, is not included in this analysis. Further details on the numerical simulation model can be found in [10]. In this article, the formulations for the atmospheric mois-ture load are concisely repeated.
Atmospheric moisture load
As long as the building facade’s exterior surface does not reach capillary saturation, the moisture exchange with the atmosphere ges comprises wind-driven rain Rwdr and vapour exchange Ee (all in kg/m²s):
wdr eR Eesg (1)
In this numerical model, wind-driven rain is calculated from the wind-driven-rain index, the product of reference wind speed U (m/s) – at 10 m height in the upstream undistur-bed flow – and horizontal rainfall intensity Rh (kg/m²s) – through a horizontal plane – by use of the wind-driven-rain coefficient α (s/m) [11]:

3
wdr hR UR (2)
All arriving wind-driven rain is assumed to be retained by the surface: splash-off is thus neglected. When the exterior surface reaches capillary saturation though, the moisture flow supplied to the surface may exceed the possible inflow into the component: the ex-cess is assumed to be discarded from the system as runoff. Evaporative exchange Ee is described as:
e m,e v,e v,esE h p p (3)
where hm,e is the surface moisture transfer coefficient (s/m), and pv,e and pv,es are the air and surface vapour pressure (both in Pa).
Wind-driven-rain coefficients
All wind-driven rain coefficients employed in this study are adapted from the CFD simu-lations in [12]. The numerical methodology to obtain these coefficients was validated by comparison with full-scale measurements by Blocken and Carmeliet [8]. Blocken and Carmeliet applied a three-step approach to compute the wind-driven-rain coefficients:
1. Steady-state wind flow pattern The steady-state wind flow patterns around the buildings are simulated with CFD, for wind speeds from 0 to 10 m/s and for deviations between wind direction θ and the surface normal φ (both in ° from North) of 0°, 22°, 45° and 67°. The Reynolds Averaged Navier-Stokes equations and continuity equation are solved applying the control volume method (with commercial code Fluent 5.4). Closure is obtained by use of the realisable k- turbulence model. Results are numerical values for wind speeds, pressure and the turbulence quantities at the centre of each volume.
2. Raindrop trajectories With the obtained wind flow patterns, rain drop trajectories are calculated for rain drop diameters from 0.5 to 6 mm. Rain drops are injected from a horizontal plane located in the upstream-undisturbed wind flow, high above the ground: its location must allow injected rain drops to reach the terminal fall velocity (vertical) and wind velocity (horizontal) before entering the flow pattern disturbed by the presence of the building and its surroundings.
3. Specific and integrated catch ratio, and wind-driven-rain coefficient Comparison of the horizontal rain drop density with the density of wind-driven drops arriving at the building facade defines the specific (for a rain-drop diameter d) catch ratio’s ηd,θ = Rwdr,d/Rh,d. ηθ (= Rwdr/Rh) is obtained with integration over the rain-drop spectrum. Division of ηθ by wind speed U yields the wind-driven rain coefficient αθ.
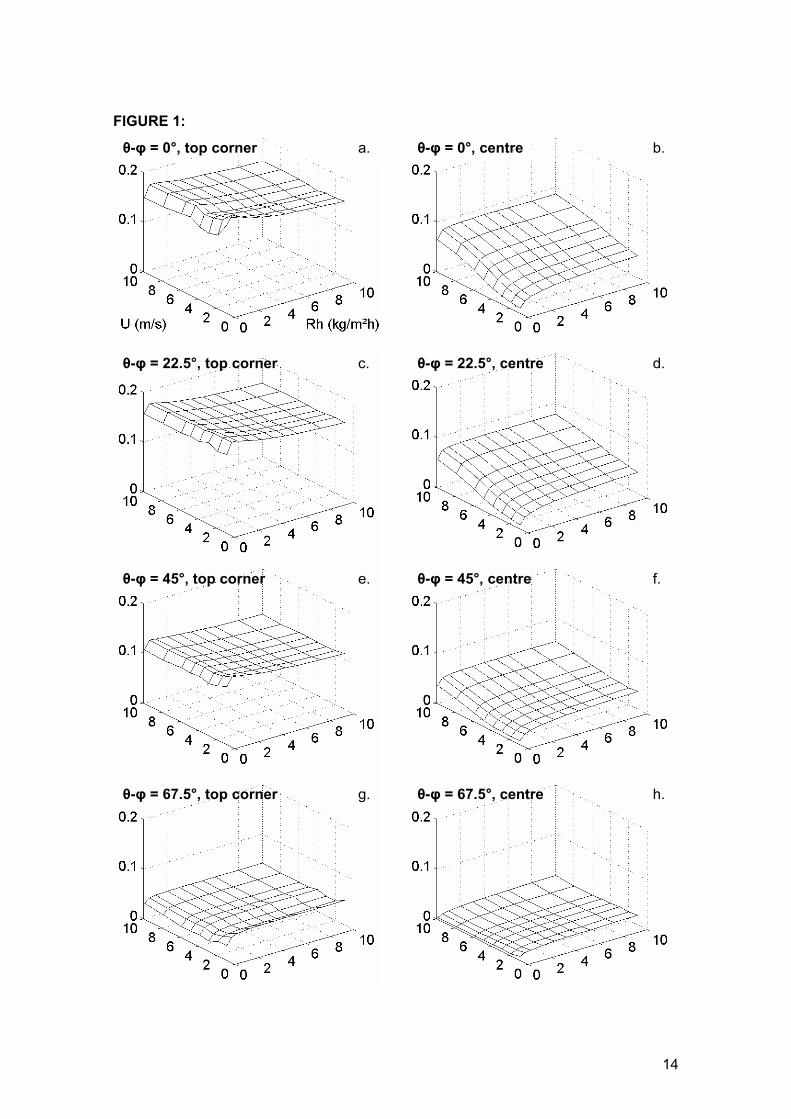
The resulting αθ(Rh,U,θ-φ) relations are depicted in Figure 1, for the left top corner and centre of a cubic (10 x 10 x10 m³) building’s facade. It is apparent that αθ depends on the location on the facade, the deviation between wind direction and surface normal, the wind speed and the horizontal rain intensity. Whereas αθ may be practically inde-pendent of Rh and U for the top corner, it varies substantially at the centre of the faca-de. Blocken and Carmeliet [13] state that, in reality, wind-driven-rain coefficients vary substantially with Rh, U and θ-φ for most locations on most buildings.
Surface moisture transfer coefficients
The surface moisture transfer coefficients applied in the simulations are calculated from the wind speed and wind direction [14], presuming conformity between the thermal and hygric boundary layer near the surface (Lewis analogy):
4
9m,e loc
loc loc
h 7.7 10 1.7V 5.1
V 1.8U 0.2 (windward) V 0.4U 1.7 (leeward)
(4)
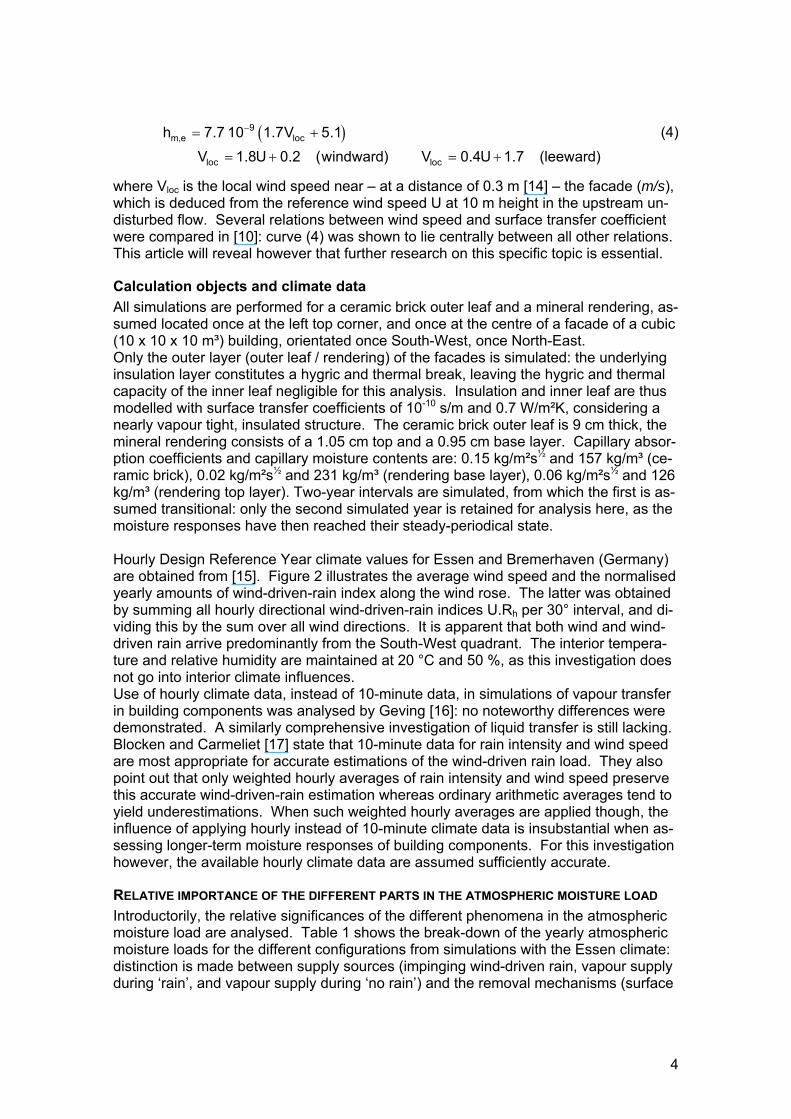
where Vloc is the local wind speed near – at a distance of 0.3 m [14] – the facade (m/s), which is deduced from the reference wind speed U at 10 m height in the upstream un-disturbed flow. Several relations between wind speed and surface transfer coefficient were compared in [10]: curve (4) was shown to lie centrally between all other relations. This article will reveal however that further research on this specific topic is essential.
Calculation objects and climate data
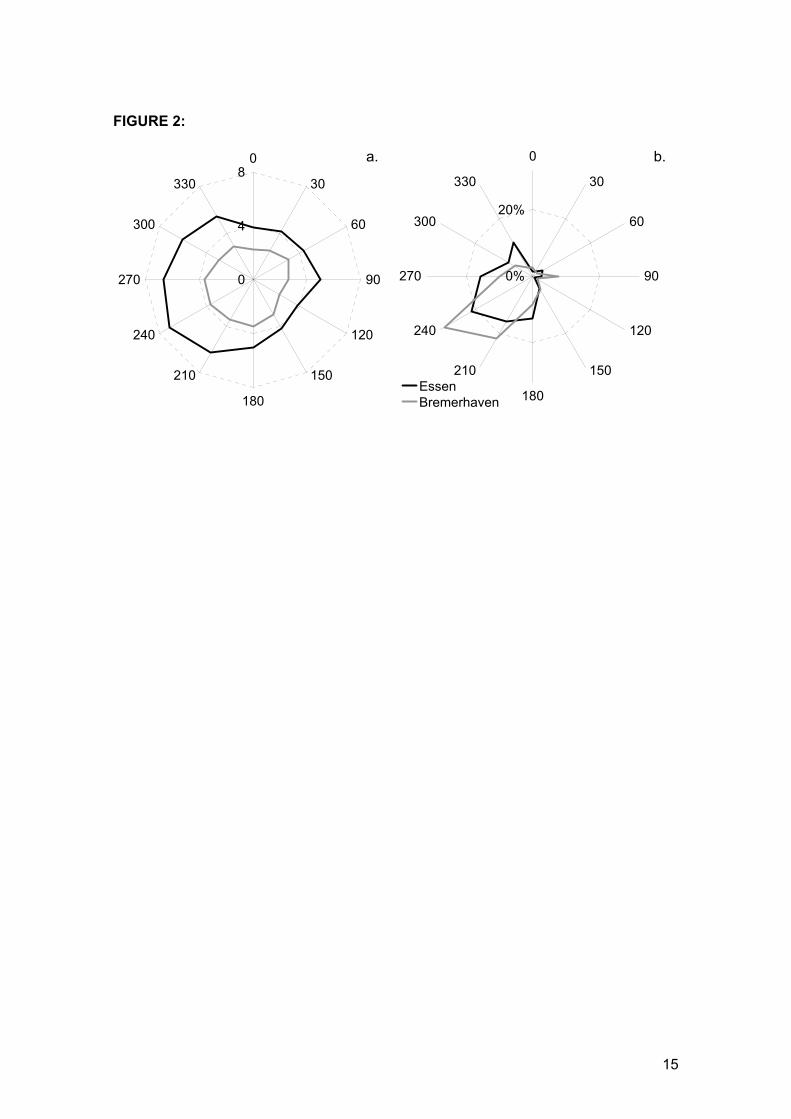
All simulations are performed for a ceramic brick outer leaf and a mineral rendering, as-sumed located once at the left top corner, and once at the centre of a facade of a cubic (10 x 10 x 10 m³) building, orientated once South-West, once North-East. Only the outer layer (outer leaf / rendering) of the facades is simulated: the underlying insulation layer constitutes a hygric and thermal break, leaving the hygric and thermal capacity of the inner leaf negligible for this analysis. Insulation and inner leaf are thus modelled with surface transfer coefficients of 10-10 s/m and 0.7 W/m²K, considering a nearly vapour tight, insulated structure. The ceramic brick outer leaf is 9 cm thick, the mineral rendering consists of a 1.05 cm top and a 0.95 cm base layer. Capillary absor-ption coefficients and capillary moisture contents are: 0.15 kg/m²s½ and 157 kg/m³ (ce-ramic brick), 0.02 kg/m²s½ and 231 kg/m³ (rendering base layer), 0.06 kg/m²s½ and 126 kg/m³ (rendering top layer). Two-year intervals are simulated, from which the first is as-sumed transitional: only the second simulated year is retained for analysis here, as the moisture responses have then reached their steady-periodical state. Hourly Design Reference Year climate values for Essen and Bremerhaven (Germany) are obtained from [15]. Figure 2 illustrates the average wind speed and the normalised yearly amounts of wind-driven-rain index along the wind rose. The latter was obtained by summing all hourly directional wind-driven-rain indices U.Rh per 30° interval, and di-viding this by the sum over all wind directions. It is apparent that both wind and wind-driven rain arrive predominantly from the South-West quadrant. The interior tempera-ture and relative humidity are maintained at 20 °C and 50 %, as this investigation does not go into interior climate influences. Use of hourly climate data, instead of 10-minute data, in simulations of vapour transfer in building components was analysed by Geving [16]: no noteworthy differences were demonstrated. A similarly comprehensive investigation of liquid transfer is still lacking. Blocken and Carmeliet [17] state that 10-minute data for rain intensity and wind speed are most appropriate for accurate estimations of the wind-driven rain load. They also point out that only weighted hourly averages of rain intensity and wind speed preserve this accurate wind-driven-rain estimation whereas ordinary arithmetic averages tend to yield underestimations. When such weighted hourly averages are applied though, the influence of applying hourly instead of 10-minute climate data is insubstantial when as-sessing longer-term moisture responses of building components. For this investigation however, the available hourly climate data are assumed sufficiently accurate.
RELATIVE IMPORTANCE OF THE DIFFERENT PARTS IN THE ATMOSPHERIC MOISTURE LOAD
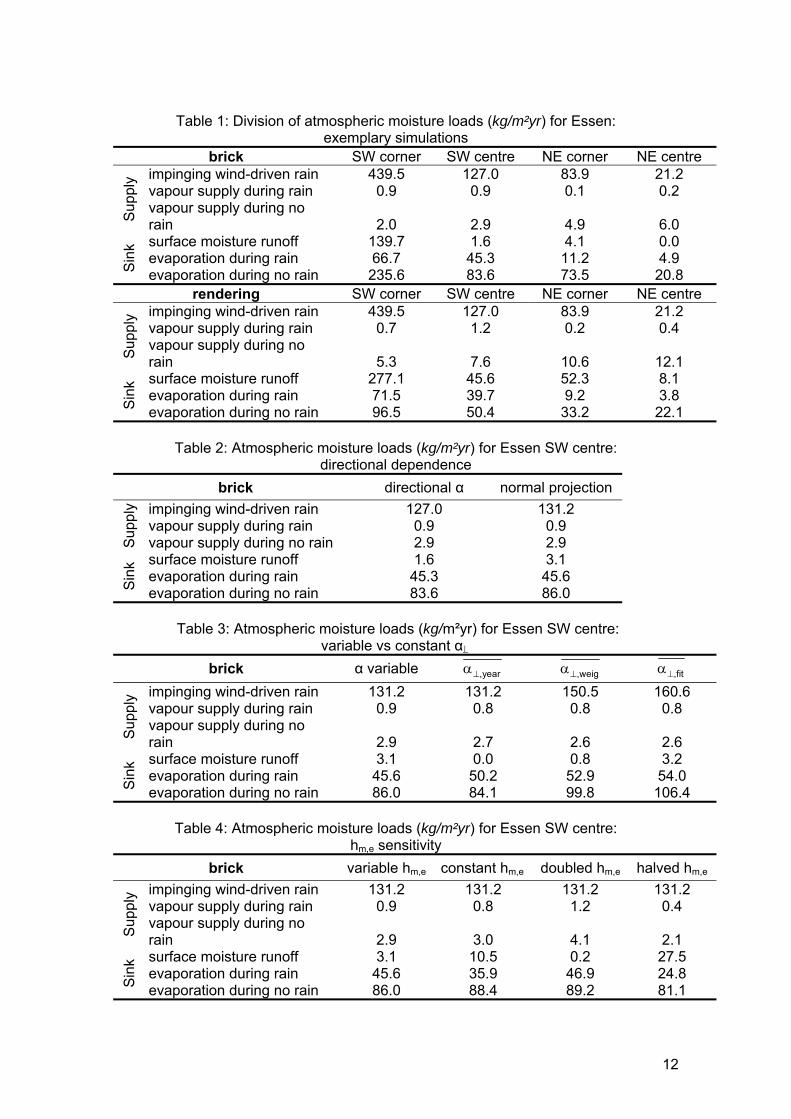
Introductorily, the relative significances of the different phenomena in the atmospheric moisture load are analysed. Table 1 shows the break-down of the yearly atmospheric moisture loads for the different configurations from simulations with the Essen climate: distinction is made between supply sources (impinging wind-driven rain, vapour supply during ‘rain’, and vapour supply during ‘no rain’) and the removal mechanisms (surface
5
moisture runoff, evaporation during ‘rain’ and evaporation during ‘no rain’). The SW orientation appears as most exposed, due to the leading SW-W wind-driven-rain direction in the Essen climate (Figure 2). Table 1 also indicates the sheltered na-ture of the facade’s centre (Figure 1): far less impinging wind-driven rain is observed. Wind-driven rain forms the primary supply mechanism: vapour supply only has a (very) secondary impact, even for less exposed orientations and locations. Evaporation forms the main removal mechanism, assisted by runoff for very exposed locations and orientations. Part of the evaporation occurs during the rain spells, thus reducing the amount of moisture supplied to the building facade. It is noticed that the rendering yields more runoff due to its smaller hygric sorptivity and capacity. Moisture runoff is assumed to disappear from the system: Table 1 reveals though that runoff may form an important moisture source for underlying locations. A first step to-wards the combined simulation of moisture transfer in building materials and film flow runoff is documented in [18]. Similar proportions are found for the Bremerhaven climate and for different insulation levels (results not shown). It is easily concluded that reliable simulations of moisture transfer in permeable building facades necessitate a correct modelling of wind-driven rain and of evaporative drying. This article primarily focuses on the implementation of wind-driven rain, but in a final paragraph also discusses the evaporative drying, to put the findings on wind-driven rain in a larger perspective.
MOISTURE RESPONSE SENSITIVITY TO WIND-DRIVEN RAIN MODELLING
In the prior simulations, wind-driven rain was determined from the wind-driven-rain in-dex with the CFD based wind-driven-rain coefficients αθ, which depend on horizontal rain intensity, wind speed and wind direction [13]:
wdr h hR R ,U, UR (5)
Accurate modelling of wind-driven rain must hence be based on representative data for Rh, U and θ, and the whole αθ(Rh,U,θ-φ) relationship. The issue of representative data is not discussed in this paper: this topic is tackled in [17]. This study presumes hourly climate data as sufficiently accurate, and focuses on the αθ(Rh,U,θ-φ) dependence. The use of
1. the projected wind-driven-rain index U·cos(θ-φ)·Rh combined with wind-driven-rain coefficients for perpendicular wind α only:
wdr h h h hR R ,Ucos Ucos R R ,U' U'R (6)
where U’ is the normally projected wind speed (m/s); and 2. one constant – Rh and U’ independent – value for α ;
is computationally attractive however, and both simplifications are conceptually implied in prEN 15927-3 [9], the European Standard on the calculation of wind-driven-rain load. Their acceptability when assessing moisture responses of building facades has though not been examined yet.
Directional dependence of the wind-driven-rain coefficient α
In the prior exemplary simulations, directional αθ were used when calculating the wind-driven rain. As such αθ were available only for discrete deviations θ-φ (0°, 22.5°, 45°, 67.5°), intermediary directions were projected on the nearest existing αθ-direction. It is assumed that such small-angle-projections do not disturb the analysis. The directional dependence of wind-driven rain can be simplified though: by projecting the wind speed U on the normal to the facade, combined with α for perpendicular wind (Equation (6)), a simplification commonly applied in hygrothermal simulation models [15,19].

6
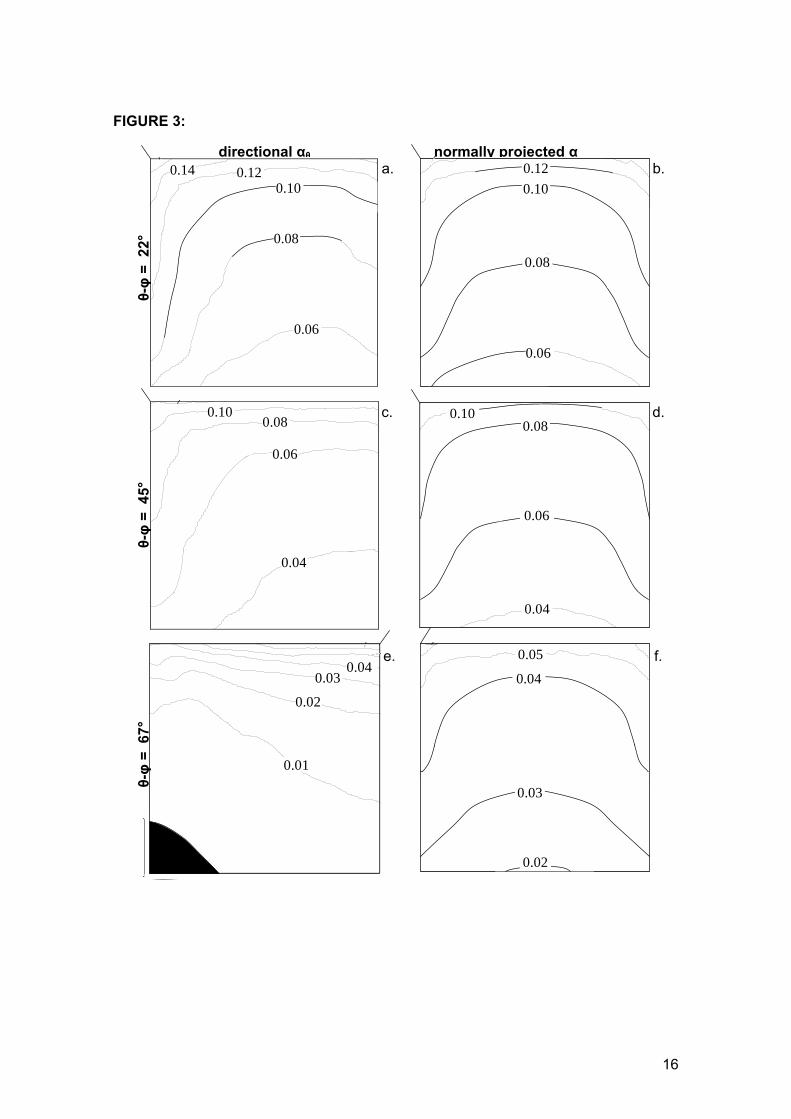
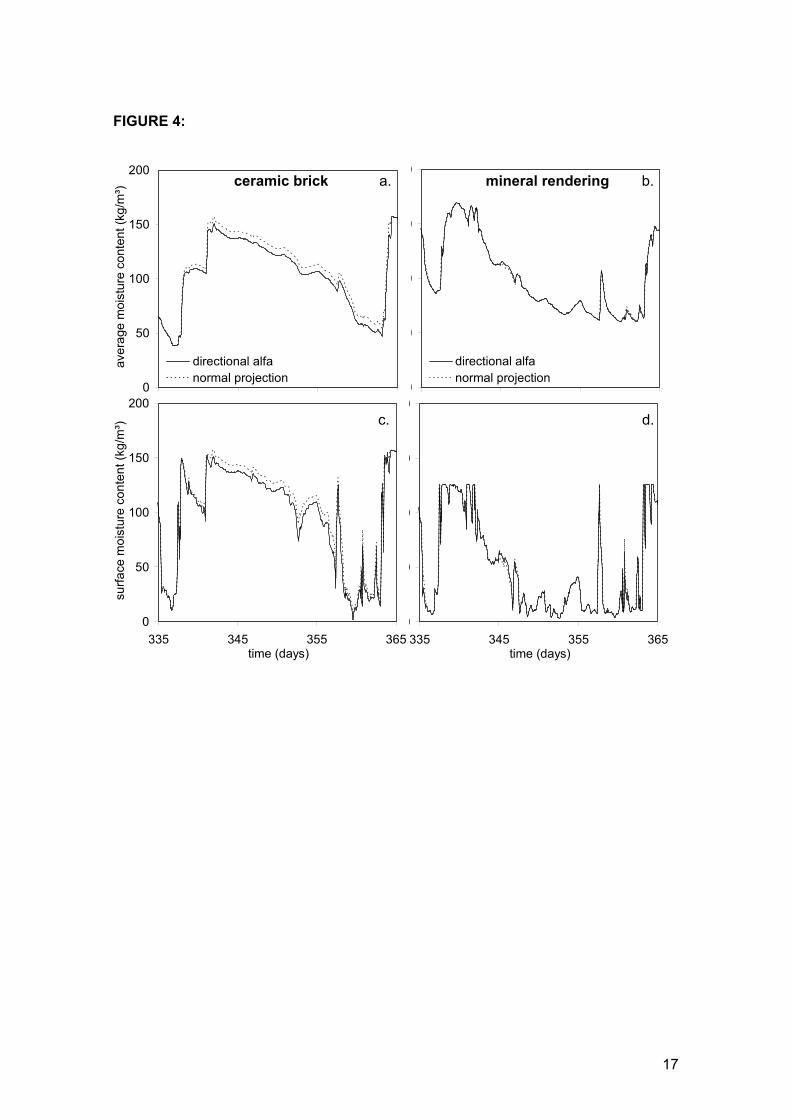
CFD results from Blocken and Carmeliet [20] indicate though that such projection might give rise to serious errors. Figure 3 shows the distributions of the wind-driven-rain co-efficient (Rh: 1 kg/m²h, U: 10 m/s) over the facade for the directional and projection ap-proach. The left column depicts the directional αθ, while the right column contains the equivalent normally projected α, equal to α ·cos(θ-φ). It is clear that both approaches deviate significantly, particularly for larger θ-φ. The effect on the moisture response of building facades has however not been investigated yet. The exemplary simulations, using directional αθ, are complemented by simulations ap-plying the normal projection. Results for Essen SW centre are brought together graph-ically in Figure 4: the facades’ moisture responses are exemplified by the variations of surface and average moisture contents in the outer leaf/rendering over a year. These are only depicted though for a winter month, since the low wind-driven rain and exten-sive drying yield only minor moisture content variations in the summer. The alphanu-merical results for the yearly moisture loads are collected in Table 2. While Figure 3 indicates serious deviations between directional and normally projected wind-driven-rain coefficients, even for the centre of the facade, these are not observed in the moisture responses of the building facades. A further analysis of separate wind-driven-rain events indicates that the largest share of the wind-driven rain on the facade stems from wind directions closest to the normal: 65 % of the yearly impinging wind-dri-ven rain amount on Essen SW centre arrives from wind directions |θ-φ| < 30°, for which projection errors are smallest (Figure 3). For Bremerhaven SW centre, this is 76 %. This observation can also be deduced from Figure 1: the magnitude of αθ declines with increasing deviation between wind direction and surface normal. The large θ-φ, which yield the largest projection errors (Figure 3), do not contribute substantially to the total wind-driven-rain amount, and can thus not largely affect the moisture responses. This conclusion slightly deteriorates though for facades orientated parallel to the main wind-driven rain direction, for which an important share of wind-driven rain arrives from shearing directions. These are the 150°-180° and 300°-330° orientations for the Essen and Bremerhaven climates (Figure 2). Analysis of these (and other) orientations shows that even then the deviations remain limited for the most exposed locations (the two top corners, Figures 1 & 3) on the facades: the yearly wind-driven-rain loads in the directio-nal and the projection approach deviate generally just up to a few percents, with an ex-ceptional peak to 10 %. The least exposed centre location yields a similar conclusion: deviations remain limited. Larger differences are observed at mid-height of the lateral sides, where also Blocken and Carmeliet [20] noted the largest errors: the deviation in yearly wind-driven-rain loads may peak up to 20 %, but is generally lower. When interpreting these differences, a few nuances should be kept in mind. All these total differences in yearly wind-driven-rain load are the accumulation of small differen-ces built up progressively over the year: they are not the result of massively wrong es-timations at a limited number of points in time. Such facades with orientations parallel to the main wind-driven-rain direction moreover receive only half (or less) the amounts of wind-driven rain on the more heavily exposed SW facades. The locations for which the largest deviations are obtained (mid-height of lateral sides) furthermore only catch half the amounts of wind-driven rain of their respective top corners. While relative de-viations up to 20 % are obtained, the corresponding absolute deviations can hence be considered minor. On the other hand, the analysis has solely been performed for two European climates (Essen and Bremerhaven). The wind-driven-rain roses (Figure 2.b) point out though that especially Bremerhaven yields a strongly orientated wind-driven-rain load, which is apt to create large deviations between the directional and projection approach.
7
While fundamentally not valid [20], it is concluded that when modelling wind-driven rain as a boundary condition in hygrothermal simulations of building components, the pro-jection approach is acceptable: wind-driven rain calculations with the projected wind speed and the wind-driven-rain coefficient for perpendicular wind can be assumed suf-ficiently accurate. An exception has to be made for climates where the largest part of the wind-driven rain arrives from a very narrow slice of the wind rose: in that case the directional dependence of the wind-driven-rain coefficients cannot be neglected. For the remainder of this article however, normal projection is applied when determining wind-driven-rain coefficients. The deviations obtained in this study and in [20], both investigating the influence of the projection approach on wind-driven rain, largely differ in order of magnitude. An expla-nation can be found in their different approaches. Blocken and Carmeliet study sepa-rate rain events with a specific Rh, U and θ-φ, and the largest deviations are found for large θ-φ. This study on the other hand compares long-term moisture responses (ave-rage and surface moisture contents over a year), accumulating the effects of separate rain events. For most locations on facades with most orientations, the rain events with small θ-φ always yield a fair share of the total wind-driven rain load, due to their propor-tionally larger wind-driven-rain coefficients (Figure 1). As the directional-projection de-viations are smallest (Figure 3) for such small θ-φ, the global deviation between the di-rectional and projection approach remains limited.
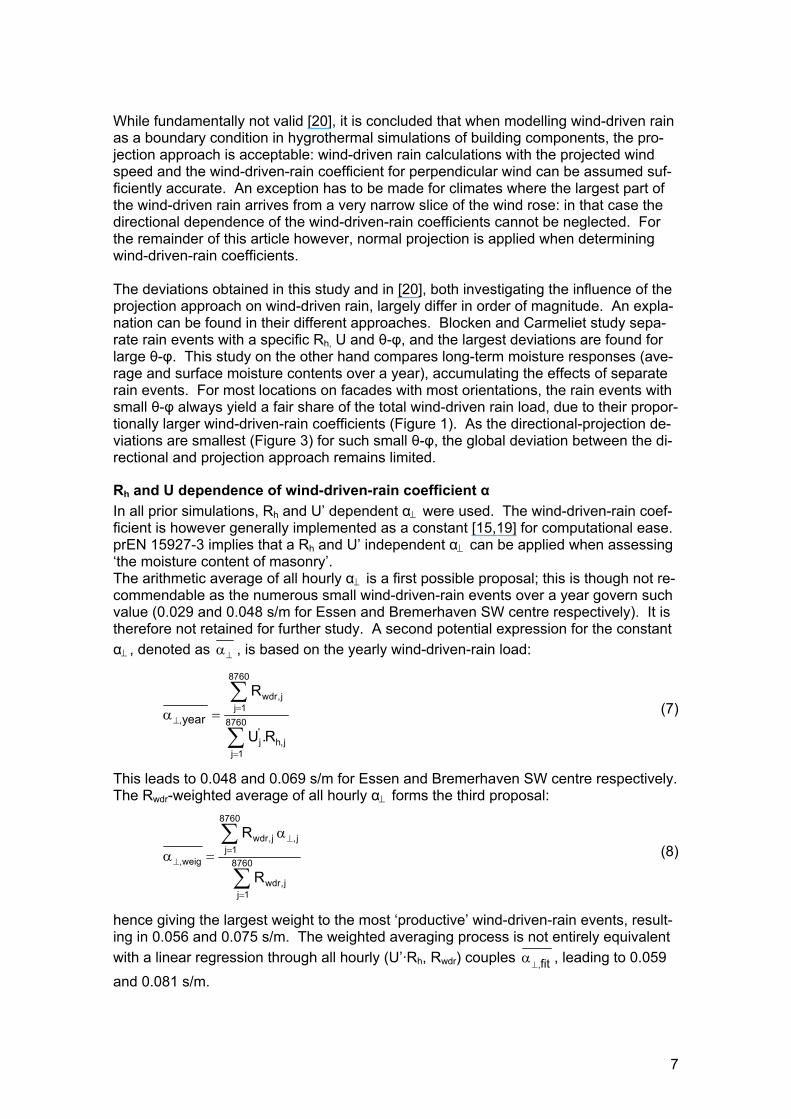
Rh and U dependence of wind-driven-rain coefficient α
In all prior simulations, Rh and U’ dependent α were used. The wind-driven-rain coef-ficient is however generally implemented as a constant [15,19] for computational ease. prEN 15927-3 implies that a Rh and U’ independent α can be applied when assessing ‘the moisture content of masonry’. The arithmetic average of all hourly α is a first possible proposal; this is though not re-commendable as the numerous small wind-driven-rain events over a year govern such value (0.029 and 0.048 s/m for Essen and Bremerhaven SW centre respectively). It is therefore not retained for further study. A second potential expression for the constant
α , denoted as , is based on the yearly wind-driven-rain load:
8760
wdr,jj 1
, 8760'j h,j
j 1
year
R
U .R
(7)
This leads to 0.048 and 0.069 s/m for Essen and Bremerhaven SW centre respectively. The Rwdr-weighted average of all hourly α forms the third proposal:
8760
wdr,j ,jj 1
,weig 8760
wdr,jj 1
R
R
(8)
hence giving the largest weight to the most ‘productive’ wind-driven-rain events, result-ing in 0.056 and 0.075 s/m. The weighted averaging process is not entirely equivalent
with a linear regression through all hourly (U’·Rh, Rwdr) couples ,fit , leading to 0.059
and 0.081 s/m.

8
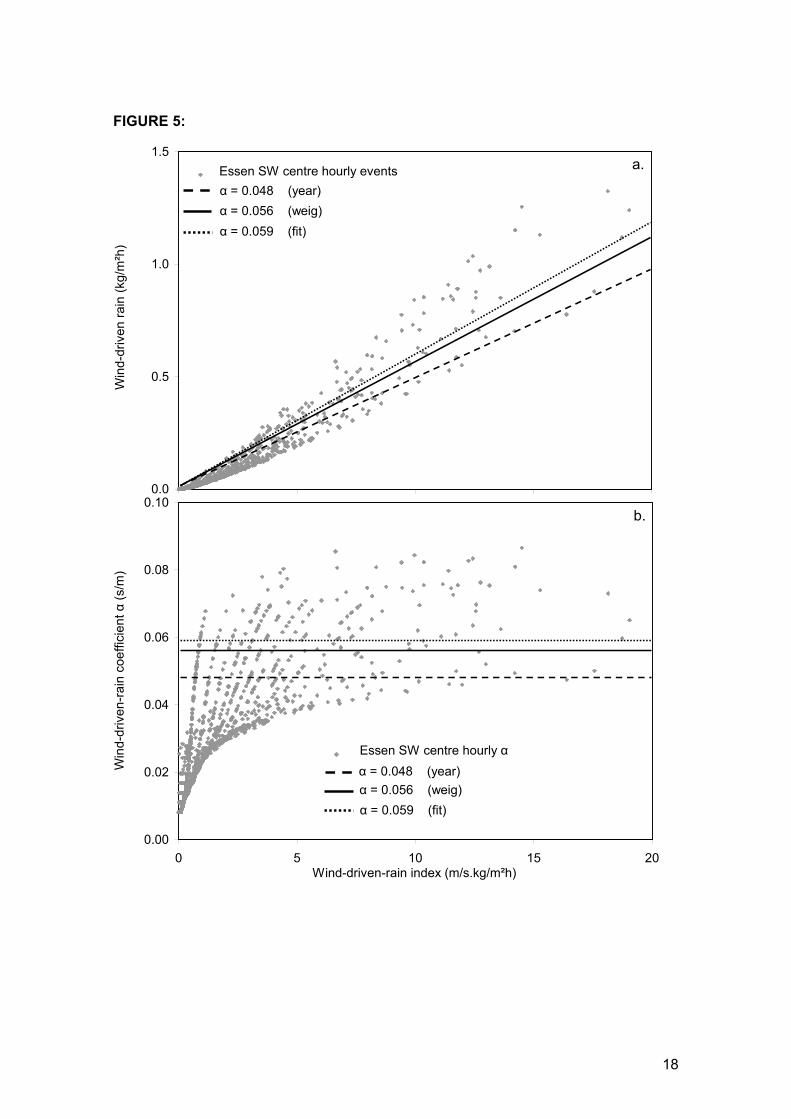
Figure 5 gives a graphical comparison of the proposed values for Essen. It is clear that
,year will underestimate almost all large wind-driven-rain events, whereas these will
be better represented when using ,weigh or ,fit . All proposed values however
tend to overestimate the smaller wind-driven-rain events. Complementary simulations
with the three retained proposals for are carried out: results are brought together in Figure 6 and Table 3.
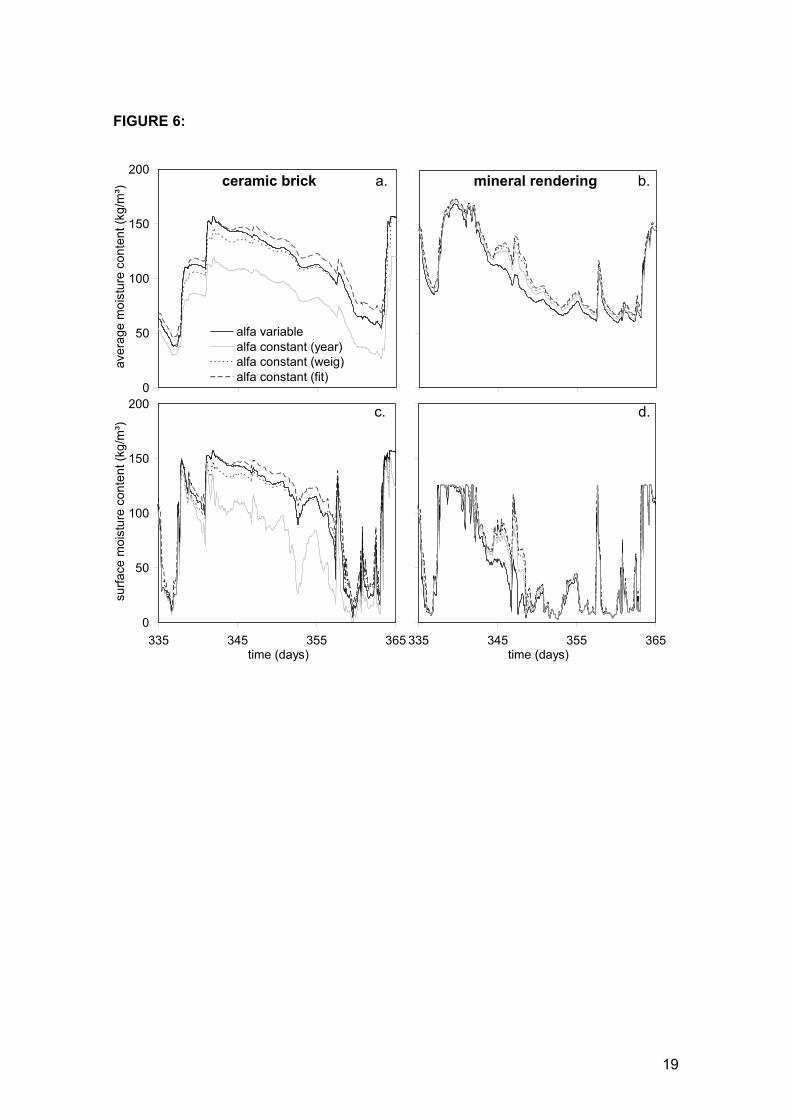
The use of ,weigh or ,fit affects the moisture response of the ceramic brick outer
leaf, but its effect is not ruinous: a fair agreement is obtained (Figure 6). The total year-ly wind-driven-rain loads are overestimated however (Table 3). The rendering does not allow such distinct conclusions, due to the disturbing influence of runoff. These overes-timations occur mainly for the small wind-driven rain events of summer (Figure 5) when extensive drying prevents accumulation of deviations: the summer moisture responses are not substantially affected. It is noted that the overestimations of wind-driven rain hence also affect the estimated evaporative drying amounts (Table 3). Figure 6 and
Table 3 indicate that ,weigh gives a slightly better agreement than ,fit .
The use of ,year on the other hand gives rise to clearly deviating moisture responses
for the ceramic brick (Figure 6). While leading to the expected total yearly wind-driven-rain load (Table 3), the temporal distribution is not predicted well: further analysis of the
separate wind-driven-rain events shows that this specific value underestimates the large wind-driven-rain events of winter (Figure 5).
At first sight, it can be concluded that use of a constant is acceptable for hygrother-mal simulations of building components. The examples above do however demonstra-te that different values are suitable for simulating the hourly varying moisture response or the total yearly wind-driven-rain load. The values do furthermore depend on climate: all three coefficients differed for Essen and Bremerhaven, due to differing concurrence of wind and rain at those locations. Note that such climatic dependency is not incorpo-
rated in the European Standard. It is finally remarked that a determination of ,weigh
and ,fit implicitly requires the knowledge of the full α (Rh,U’) dependence. The only
reconciliation of these observations is to recommend the use of the complete α (Rh,U’) relation in hygrothermal simulations, and not reduce the wind-driven-rain coefficients to one constant value. To avoid complex and time-consuming CFD simulations before any hygrothermal simu-lation a proposal of Blocken [11] is reiterated here: the compilation of a wind-driven-rain catalogue, where the full α (Rh,U’) relations for different buildings and building configu-rations could be brought together, and be made available to the building physics com-munity.
Modelling of wind-driven-rain: conclusions
It has been verified that calculations of wind-driven rain based on projected wind speed and perpendicular wind-driven-rain coefficient can be assumed sufficiently accurate for hygrothermal simulations of building components, when concentrating on the long-term moisture responses of the facade. While the projection approach is fundamentally not valid [20], it has been shown that, for most locations on facades with most orientations, the deviations are not significant. An exception has to be made for climates with a very narrow wind-driven rain rose, where the directional dependence of the wind-driven-rain

9
coefficient cannot be neglected.
It has also been shown that use of the constant ,weigh or ,fit does not substantial-
ly affect the hourly varying moisture responses. These values do however unavoidably
differ from ,year , are not independent of climate, and implicitly require knowledge of
the complete α (Rh,U’) relation for their estimation. For all these reasons, implementa-tion of the variability of α with Rh and U’ is recommended in hygrothermal simulations of building components .
MOISTURE RESPONSE SENSITIVITY TO MODELLING OF EVAPORATIVE DRYING
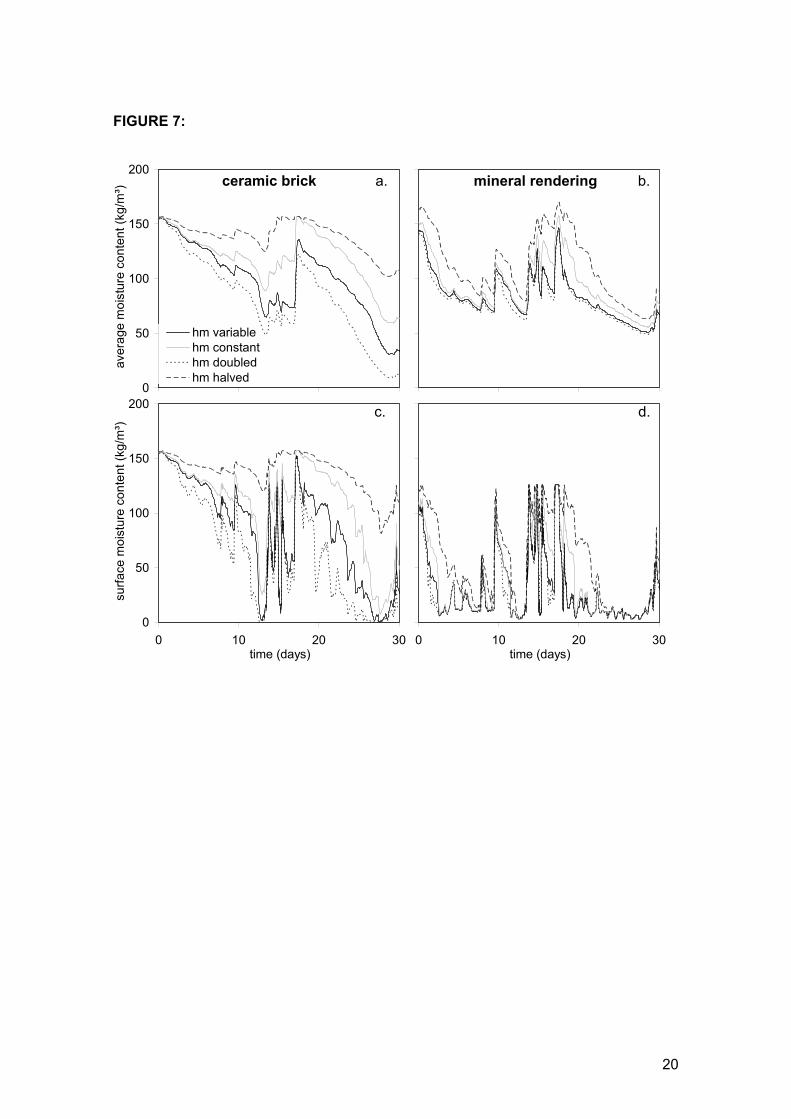
Wind-driven rain forms the key moisture supply source for permeable building facades, with only a (very) secondary role for vapour supply, for the locations considered in this study. The main removal role on the other hand is taken up by evaporative drying: the convective water vapour transport from the surface to the air. The evaporative drying modelling is only tentatively discussed here, to put the findings on wind-driven rain in a larger perspective. The major uncertainty when modelling evaporative drying is the surface moisture trans-fer coefficient hm,e. In all prior simulations, hm,e was calculated from the wind speed and wind direction (4). Surface moisture transfer coefficients are though usually implemen-ted as a constant, and various values are found in the literature. To exemplify the sen-sitivity of the moisture responses to hm,e, three further simulations are added to the vari-able hm,e simulation. In the first, hm,e is considered a constant and equal to 9.6 10-8 s/m, the average (windward & leeward) value for the yearly averaged wind speed (3.1 m/s) for Essen. Hagentoft et al. [7] typically use 20.0 10-8 s/m, whereas [6] suggests 4.7 10-8 s/m, respectively nearly double and half our value. In the second and third simulation, thus, hm,e is doubled and halved, respectively. Results are brought together in Figure 7 and Table 4. Moisture responses are now illustrated for the drier January, whereas the wetter December was used for the wind-driven rain graphs. Figure 7 and Table 4 suggest that both hm,e’s order of magnitude and its variations with U are crucial when modelling evaporative drying: the moisture responses are fairly dif-ferent. It can be observed that mainly evaporation during rain is affected by changes of the surface moisture transfer coefficient, which is partially compensated by changing runoff amounts. The deviations in moisture responses would thus be even larger for an outer layer with such sorptivity and capacity that no compensating runoff would occur. Given the wet state of the outer layer, hm,e forms the primary resistance for evaporative drying. Changes in hm,e hence considerably affect the moisture responses. It must be noted that the observed differences are of similar magnitude as those in the analysis of the wind-driven-rain implementation. The correct modelling of surface moisture trans-fer coefficients – including their variation with wind speed – hence is equally important. The knowledge of the spatial and temporal variation of the surface transfer coefficient is however scarce . If reliable simulations of moisture transfer in building components are desired, more research on this topic is required. CFD, shown to be a powerful tool for the estimation of wind-driven rain, may also form a potent instrument here.
CONCLUSIONS
In this article, the sensitivity of hygrothermal simulations of building facades to the level of detail in modelling the wind-driven rain has been analysed. For the locations investi-gated here (Essen & Bremerhaven), wind-driven rain appears to be the main moisture supply for permeable facades, while evaporative drying appears to be the primary loss mechanism. The study mainly focused on the correct modelling of the wind-driven rain. The modelling results indicate that for most locations on facades with most orientations
10
in most climates, the directional dependence of the wind-driven-rain coefficient is not of substantial importance when assessing the long-term moisture response of permeable building components. The directional αθ(Rh,U, θ-φ) can be replaced by α (Rh,U’), to be used in combination with the projected wind-driven-rain index U·cos(θ-φ)·Rh.
The use of a constant , on the other hand, appears to be an oversimplification. Im-plementation of the whole α (Rh,U’) relation is recommended where feasible. To avoid complex and time-consuming CFD-simulations before any hygrothermal simulation, the idea of a wind-driven-rain catalogue was reiterated. In a final paragraph, it has been shown that the moisture responses of building facades are as sensitive to the modelling of evaporative drying, specifically the surface moisture transfer coefficient. Whereas reliable prediction methods exist for α (Rh,U’), these are lacking for the hm,e(U,θ-φ) dependence. Further research on this topic is hence encou-raged.
ACKNOWLEDGEMENT
The results presented in this paper have been obtained within the frame of the SBO IWT 03175 project ‘Structural damage due to dynamic excitations: a multi-disciplinary approach’, funded by ‘IWT Vlaanderen’, the Institute for the Promotion of Innovation by Science and Technology in Flanders. The second author is a postdoctoral fellow of the FWO-Flanders (Research Fund Flanders). This financial support is gratefully acknowl-edged.
REFERENCES
[1]. EN 13788: Hygrothermal performance of building components and building ele-ments - Internal surface temperature to avoid critical surface humidity and inter-stitial condensation - Calculation methods 2001.
[2]. Zillig W, Lenz K, Sedlbauer K, Krus M. Condensation on facades – influence of construction type and orientation. In proceedings of “2nd International Conference on Building Physics” 2003, Leuven, Belgium, pp. 437-444.
[3]. Holm A, Künzel HM. Two-dimensional transient heat and moisture simulations of rising damp with WUFI2d. In proceedings of “2nd International Conference on Building Physics” 2003, Leuven, Belgium, pp. 363-367.
[4]. Mukhopadhyaya P, Kumaran K, Rousseau M, Tariku F, Van Reenen D. Applica-tion of hygrothermal analyses to optimise exterior wall design . In proceedings of “2nd International Conference on Building Physics” 2003, Leuven, Belgium, pp. 417-426.
[5]. Scheffler G, Grunewald J. Material Development and optimisation supported by numerical simulation for a capillary-active inside insulation material. In proceed-ings of “2nd International Conference on Building Physics” 2003, Leuven, Bel-gium, pp. 77-85.
[6]. prEN 15026: Hygrothermal performance of building components and building elements – Assessment of moisture transfer by numerical simulation.
[7]. Hagentoft C-E, Kalagasidis AS, Adl-Zarrabi B, Roels S, Carmeliet C, Hens H, Grunewald J, Funk M, Becker R, Shamir D, Adan O, Brocken H, Kumaran K, Djebbar R. Assessment method of numerical prediction models for combined heat, air and moisture transfer in building components: benchmarks for one-dimensional cases. Journal of Thermal Envelope and Building Science 2004, 27:327-352.
[8]. Blocken B, Carmeliet J. Spatial and temporal distribution of driving rain on a low-rise building. Wind and Structures 2002, 5:441-462.
[9]. prEN 15927-3: Hygrothermal performance of buildings – Climatic data – Part 3: Calculation of a driving rain index for vertical surfaces from hourly wind and rain

11
data (under approval). [10]. Janssen H, Blocken B, Carmeliet J. Conservative modelling of the moisture and
heat transfer in building components under atmospheric excitation. International Journal for Heat and Mass Transfer 2005, in press.
[11]. Blocken B, Carmeliet J. A review of wind-driven rain research in building science. Journal of Wind Engineering and Industrial Aerodynamics 2004; 92(13):1079-1130. (doi:10.1016/j.jweia.2004.06.003)
[12]. Blocken B, Carmeliet J. The influence of the wind-blocking effect by a building on its wind-driven rain exposure. Journal of Wind Engineering and Industrial Aero-dynamics 2006; 94(2): 101-127 (doi:10.1016/j.jweia.2005.11.001).
[13]. Blocken B, Carmeliet J. The wind-driven rain relationship and the wind-driven rain coefficient revisited. In preparation for Building and Environment.
[14]. Sharples S. Full scale measurements of convective energy losses from exterior building surfaces. Building and Environment 1984, 19:31-39.
[15]. Grunewald J. Diffusiver und konvektiver Stoff- und Energietransport in kapillar-porösen Baustoffen. Doctoral dissertation 1997, Tecnische Universität Dresden, Germany (in German).
[16]. Geving S. Averaging of climatic data and its effect on moisture transfer calcula-tions. IEA Annex 24, report T2-N-94/04, 1994.
[17]. Blocken B, Roels S, Carmeliet J. A combined CFD-HAM approach for wind-driven rain on building facades. Journal of Wind Engineering and Industrial Aero-dynamics 2006, submitted for publication.
[18]. Blocken B, Janssen H, Carmeliet J. On the modelling of runoff of driving rain on a capillary active surface. In proceedings of the “11th Symposium of Building Physics” 2002, Dresden, Germany, pp. 400-408.
[19]. Karagiozis AN, Salonvaara M, Holm A, Künzel H. Influence of wind-driven rain data on hygrothermal performance. In proceedings of “Eighth International IBPSA Conference” 2003, Eindhoven, The Netherlands, pp. 627-634.
[20]. Blocken B, Carmeliet C. On the validity of the cosine projection in wind-driven rain calculations on buildings. In press for Building and Environment 2006. (doi:10.1016/j.buildenv.2005.05.002)
12
Table 1: Division of atmospheric moisture loads (kg/m²yr) for Essen: exemplary simulations
brick SW corner SW centre NE corner NE centre
Sup
ply impinging wind-driven rain 439.5 127.0 83.9 21.2
vapour supply during rain 0.9 0.9 0.1 0.2 vapour supply during no rain 2.0 2.9 4.9 6.0
Sin
k surface moisture runoff 139.7 1.6 4.1 0.0 evaporation during rain 66.7 45.3 11.2 4.9 evaporation during no rain 235.6 83.6 73.5 20.8
rendering SW corner SW centre NE corner NE centre
Sup
ply impinging wind-driven rain 439.5 127.0 83.9 21.2
vapour supply during rain 0.7 1.2 0.2 0.4 vapour supply during no rain 5.3 7.6 10.6 12.1
Sin
k surface moisture runoff 277.1 45.6 52.3 8.1 evaporation during rain 71.5 39.7 9.2 3.8 evaporation during no rain 96.5 50.4 33.2 22.1
Table 2: Atmospheric moisture loads (kg/m²yr) for Essen SW centre:
directional dependence
brick directional α normal projection
Sup
ply impinging wind-driven rain 127.0 131.2
vapour supply during rain 0.9 0.9 vapour supply during no rain 2.9 2.9
Sin
k surface moisture runoff 1.6 3.1 evaporation during rain 45.3 45.6 evaporation during no rain 83.6 86.0
Table 3: Atmospheric moisture loads (kg/m²yr) for Essen SW centre:
variable vs constant α
brick α variable ,year ,weig ,fit
Sup
ply impinging wind-driven rain 131.2 131.2 150.5 160.6
vapour supply during rain 0.9 0.8 0.8 0.8 vapour supply during no rain 2.9 2.7 2.6 2.6
Sin
k surface moisture runoff 3.1 0.0 0.8 3.2 evaporation during rain 45.6 50.2 52.9 54.0 evaporation during no rain 86.0 84.1 99.8 106.4
Table 4: Atmospheric moisture loads (kg/m²yr) for Essen SW centre:
hm,e sensitivity
brick variable hm,e constant hm,e doubled hm,e halved hm,e
Sup
ply impinging wind-driven rain 131.2 131.2 131.2 131.2
vapour supply during rain 0.9 0.8 1.2 0.4 vapour supply during no rain 2.9 3.0 4.1 2.1
Sin
k surface moisture runoff 3.1 10.5 0.2 27.5 evaporation during rain 45.6 35.9 46.9 24.8 evaporation during no rain 86.0 88.4 89.2 81.1

13
FIGURE CAPTIONS
FIGURE 1: Wind-driven-rain coefficient αθ (Rh,U, θ-φ) (Rh and Rwdr in kg/m²h) for the left top corner (a,c,e,g) and centre (b,d,f,h) of a cubic (10x10x10 m³) building’s facade, as a function of rainfall intensity Rh wind speed U, and wind direction deviation -. FIGURE 2: Directional roses for average wind speed (m/s) (a) and normalised wind-driven-rain index (b) for Essen and Bremerhaven. FIGURE 3: Comparison of directional (a,c,e) and normally projected (b,d,f) α, for Rh = 1 kg/m²h and U = 10 m/s along wind direction θ [20]. FIGURE 4: Average (a,b) and surface (c,d) moisture contents of the ceramic brick (a,c) and rendering (b,d) for SW centre in December under Essen climate: directional de-pendence. FIGURE 5: Comparison of different constant α values with variable α for Essen SW centre, for the wind-driven-rain relation (6) (a) and the hourly α values (b). FIGURE 6: Average (a,b) and surface (c,d) moisture contents of the ceramic brick (a,c) and rendering (b,d) for SW centre in December under Essen climate: variable versus constant α . FIGURE 7: Average (a,b) and surface (c,d) moisture contents of the ceramic brick (a,c) and rendering (b,d) for SW centre in January under Essen climate: sensitivity to hm,e.
14
FIGURE 1:
θ-φ = 0°, top corner a. θ-φ = 0°, centre b.
θ-φ = 22.5°, top corner c. θ-φ = 22.5°, centre d.
θ-φ = 45°, top corner e. θ-φ = 45°, centre f.
θ-φ = 67.5°, top corner g. θ-φ = 67.5°, centre h.
15
FIGURE 2:
0
4
80
30
60
90
120
150
180
210
240
270
300
330
0%
20%
0
30
60
90
120
150
180
210
240
270
300
330
EssenBremerhaven
a. b.
16
0.04
0.06
0.080.10
FIGURE 3:
0.100.08
0.06
0.04
0.12
0.10
0.08
0.06
0.120.14 0.12
0.08
0.06
0.10
0.05
0.02
0.03
0.040.04
0.03
0.01
0.02
θ-φ
= 2
2°
θ-φ
= 4
5°
θ-φ
= 6
7°
normally projected α directional αθ a. b.
c. d.
e. f.
17
FIGURE 4:
0
50
100
150
200
ave
rage
moi
stur
e c
ont
ent (
kg/m
³)
directional alfanormal projection
0
0
0
0
0
directional alfanormal projection
0
50
100
150
200
335 345 355 365time (days)
surf
ace
mo
istu
re c
on
ten
t (kg
/m³)
0
0
0
0
0
335 345 355 365time (days)
ceramic brick a. mineral rendering b.
c. d.
18
FIGURE 5:
0.0
0.5
1.0
1.5
Win
d-d
rive
n r
ain
(kg
/m²h
)
α = 0.048 (year)
α = 0.056 (weig)
α = 0.059 (fit)
Essen SW centre hourly events
0.00
0.02
0.04
0.06
0.08
0.10
0 5 10 15 20Wind-driven-rain index (m/s.kg/m²h)
Win
d-d
rive
n-r
ain
co
effi
cie
nt α
(s/
m)
α = 0.048 (year)
α = 0.056 (weig)
α = 0.059 (fit)
Essen SW centre hourly α
a.
b.
19
FIGURE 6:
0
50
100
150
200
ave
rag
e m
ois
ture
co
nte
nt (
kg/m
³)
alfa variablealfa constant (year)alfa constant (weig)alfa constant (fit)
0
50
100
150
200
335 345 355 365time (days)
surf
ace
mo
istu
re c
on
ten
t (kg
/m³)
335 345 355 365time (days)
ceramic brick a. mineral rendering b.
c. d.
20
FIGURE 7:
0
50
100
150
200
ave
rag
e m
ois
ture
co
nte
nt (
kg/m
³)
hm variablehm constanthm doubledhm halved
0
50
100
150
200
0 10 20 30time (days)
surf
ace
mo
istu
re c
on
ten
t (kg
/m³)
0 10 20 30time (days)
ceramic brick a. mineral rendering b.
c. d.

21
BIOGRAPHY Hans Janssen earned his Ph.D. in 2002 at the Katholieke Universiteit Leuven, with highest distinction, on “The influence of soil moisture transfer on building heat loss via the ground”. He is currently working as a postdoctoral researcher at the Laboratory of Building Physics at the Katholieke Universiteit Leuven. His current topics of interest focus on the transfers of heat, air and moisture in building materials and their associated me-chanical effects, with an emphasis on the numerical modelling of these phenomena. Bert Blocken is a post-doctoral research engineer of the FWO-Flanders (Fund for Sci-entific Research, Flanders) working at the Laboratory of Building Physics, Department of Civil Engineering, Katholieke Universiteit Leuven. He graduated from this university in 1998 on the thesis “Damage detection based on dynamic system identification”. In 2004, he defended his Ph.D. thesis “Wind-driven rain on buildings – measurements, numerical modelling and applications” at the same university and is currently involved in the postdoctoral research project “Multi-scale modelling of wind-driven rain as a boundary condition for research in building physics and earth sciences”. Staf Roels is associated professor at the Laboratory of Building Physics, Department of Civil Engineering, Katholieke Universiteit Leuven. He earned his Ph.D. in 2000 on 'Modelling unsaturated moisture transport in heterogeneous limestone'. His main re-search interests include experimental and numerical analysis of heat, air and moisture transport in porous materials and building enclosures with special emphasis on hetero-geneous and cracked materials and the use of X-ray computer tomography for mois-ture transfer analysis and non destructive testing of materials. Jan Carmeliet is full professor at the Laboratory of Building Physics, Department of Civil Engineering, Katholieke Universiteit Leuven (Belgium) and at the Building Physics Group, Faculty of Building and Architecture, Eindhoven University of Technology (The Netherlands). He earned his Ph.D. at the Katholieke Universiteit Leuven in 1992 on the thesis “Durability of fibre-reinforced renderings for outside insulation: a probabilistic approach based on the non-local continuum damage mechanics.” He has published more than 50 papers in international journals. He currently leads a large number of Ph.D., post-doctoral and other research projects in the area of heat and moisture trans-fer and in the area of damage mechanics in building materials, among which the post-doctoral research projects of the first and second author.