Embed Size (px)
Citation preview
1
Working with UML:A Software Design Process Based on Inspections for the
Unified Modeling Language
Guilherme H. Travassos♥ Forrest Shull Jeffrey CarverCOPPE/PESC
Federal University of Rio de JaneiroP.O. Box 68511
Rio de Janeiro RJ 21945-970BRASIL
55 21 590 [email protected]
Fraunhofer Center - MarylandUniversity of Maryland
4321 Hartwick Road, Suite 500College Park MD 20742
USA301-403-8970
♥ESEGDepar tment of Computer Science
University of MarylandCollege Park MD 20742
USA 301-405-2721

2
Table of ContentsList of Tables and Figures ............................................................................................................................................ 21. Introduction............................................................................................................................................................... 42. The Unified Modeling Language (UML) ................................................................................................................. 7
2.1 Different Perspectives to Improve Design Modeling.......................................................................................... 93. Software Process Activities.................................................................................................................................... 11
3.1 Development Activities..................................................................................................................................... 123.2 Quality Assurance and Verification and Validation Activities......................................................................... 15
3.2.1 Measurement.............................................................................................................................................. 193.2.2 Inspections................................................................................................................................................. 233.2.3 Testing ....................................................................................................................................................... 29
4. The Example........................................................................................................................................................... 324.1 Requirements Activities.................................................................................................................................... 344.2 High Level Design Activities............................................................................................................................ 37
4.2.1 Step 1: Class Diagrams and Class Descriptions......................................................................................... 394.2.2 Step 2: Interaction and State Diagrams...................................................................................................... 424.2.3 Step 3: Refining Class Diagrams............................................................................................................... 464.2.4 Step 4: Package and Activities diagrams................................................................................................... 48
4.3 Low Level Design Activities............................................................................................................................ 515. Maintenance or Evolution....................................................................................................................................... 54
5.1 Process.............................................................................................................................................................. 555.2 Understanding................................................................................................................................................... 55
5.1.1 PBR............................................................................................................................................................ 575.1.2 OORT ........................................................................................................................................................ 58
5.3 Example............................................................................................................................................................ 596. The Road Ahead ..................................................................................................................................................... 61Bibliography ............................................................................................................................................................... 62
List of Tables and FiguresTable 2.1 - UML artifact categories............................................................................................................................ 10Figure 3.1 – The basic Software Life Cycle ............................................................................................................... 11Figure 3.2: High-level design activities, using artifacts created during the requirements phase and during PBR
requirements inspections..................................................................................................................................... 12Figure 3.3: Representation of various defect types that can occur during software development. ............................. 18Table 3.1 – Types of software defects, with generic definitions................................................................................. 19Table 3.2: Metrics discussed in this chapter for each phase of the lifecycle............................................................... 23Table 3.3 – Types of software defects, with specific definitions for the requirements and design............................. 27Figure 3.4: The set of OORTs (each arrow represents one technique) that has been defined for various design
artifacts................................................................................................................................................................ 29Table 4.1 - Glossary.................................................................................................................................................... 33Figure 4.1 - A use case diagram and the specific description for one of the use cases identified............................... 36Figure 4.2 - An example of an UML Class Diagram.................................................................................................. 40Figure 4.3 - An example of a class description........................................................................................................... 41Figure 4.4 - An example of a sequence diagram......................................................................................................... 43Figure 4.5 - A Collaboration Diagram........................................................................................................................ 44Figure 4.6 - A Statechart ............................................................................................................................................. 45Figure 4.7 - A Refined Class Diagram for Gas Station Control System..................................................................... 46Table 4.3 GSCS Metrics and values........................................................................................................................... 48Figure 4.8 – An example of a Package Diagram......................................................................................................... 49Figure 4.9 – An Activity diagram............................................................................................................................... 50Figure 4.10 - An example of a component Diagram................................................................................................... 53Figure 4.11 - A deployment diagram.......................................................................................................................... 53Figure 5.1: Inserting Maintenance activities in the software process......................................................................... 55Figure 5.2 – New Gas Station Requirement................................................................................................................ 58Figure 5.3 – Evolved Use Cases................................................................................................................................. 60

3
Figure 5.4 – Evolved Class Diagram.......................................................................................................................... 61Figure 5.5 – Sequence Diagram.................................................................................................................................. 62

4
1. IntroductionThis text describes a simple and effective Object Oriented software design process
template having UML as the modeling language and extensively using inspections to support the
construction and maintenance of software products. Besides, a survey of specific literature
regarding UML and Object Oriented paradigm is presented along the text. This software design
process uses a sequential organization based on the waterfall approach for two reasons: to help
with the explanation of design activities in the context of this text and to make available a
standard process that can be continuously improved by developers. This process does not result
in a loss of generality in this discussion because after developers understand the process they
have freedom to reorganize all of the component phases. The activities that were considered for
such a software process template are requirements specification, high and low level design,
coding and testing. However, we have inserted inspection activities at various points in the
lifecycle to help address quality issues, as explained in section 3.3.1.
We have concentrated on describing only activities that specifically use the OO paradigm
and make use of UML. So, elicitation of requirements (Leite and Freeman, 1991), an important
task in the context of software development, is not considered here in detail. Different techniques
and methods can be used for requirements elicitation and description (Finkelstein et al., 1994).
Requirements descriptions are paradigm-independent and must be chosen based on customer
needs (IEEE, 1993). System scenario descriptions (use-cases) are part of the requirements
specification and are produced after the problem is described. We consider this as part of the OO
design, because the way that scenarios are described can impact future design solutions. Use
cases are a good mechanism to help identify basic concepts and give an indication of the
functionality of the system. The functional requirements and problem domain concepts described
by the requirements and use cases arrange the information used to produce the high level design,
a set of UML artifacts. Then, these design artifacts are evolved to include non-functional
requirements and the features that deal with the computational side of the problem, or the
solution domain. These evolved artifacts are the low-level design. The result of this process will
be a set of models ready for coding and testing.
Generally, a software development process defines the way real world concepts should be
represented, interpreted and transformed into a working software system. Typically, the software
development process is guided by a strategy or paradigm. There are some paradigms, such as

5
structured (or functional) and data-oriented (Pfleeger, 1998) that are well established. Although
these paradigms can be used to specify and design systems for different types of problems, their
use impacts the quality and productivity of software development. In these paradigms,
developers do not use a consistent notation throughout the software lifecycle. This reduces their
freedom to reorganize these activities to fit the software life cycle models of their organization.
The Object-Oriented (OO) paradigm has emerged to address such issues. Although no “perfect”
development paradigm exists (since effective software development also addresses issues beyond
tailoring the software process), the OO paradigm has demonstrated its capability for supporting
software process improvements in situations where other models were not suitable (Lockman
and Salasin, 1990). The OO paradigm’s use of the logical constructs (Meyer, 1997) of class,
object, inheritance, polymorphism, aggregation, composition and message to describe concepts
and build artifacts across the software life-cycle improves the software process, because it:
1) Allows developers to use a consistent notation with a common set of constructs
across phases, increasing their communication throughout different development
phases;
2) Deals with well-defined components, protected by encapsulation (data and
functionality) and displaying their corresponding interfaces, which allows the
organization of the development activities using different software life-cycle models
(Pressman, 1997), and;
3) Can be used as a criterion to identify possible parallel development tasks, speeding up
the full development process.
OO Design is a set of activities (scenario description, high and low level design)
concerned with the representation of real world concepts (as described by the requirement
descriptions) as a collection of discrete objects that incorporate both data structure and behavior.
These concepts must be somehow extracted from the requirements1 to guide the construction of
the artifacts that represent system scenarios, and high and low level design (Jalote, 1997).
The technical literature describes several OO notations. A notation when associated with
a software development process is called a methodology. For instance, methodologies such as
1 Requirements can be specified using a number of notations, from natural language to formal specifications. In thecontext of this work we consider that requirements are organized and described using natural language. It does notresult in any loss of generality of our discussion, since OO design is concerned with translating the meaning ofsystem requirements regardless of their notation.

6
OMT (Rumbaugh et al., 1992), BOOCH (1994), OOSE (Jacobson et al., 1992), FUSION
(Coleman et al., 1993) have been suggested. All of these methodologies are based on a specific
software development process and use their own syntax and notation in trying to define a broad-
spectrum software development methodology. However, it is not easy to define a software
development methodology, which is general enough to fit all software development contexts and
domains. Each of these methodologies is suitable for specific systems (or problem domains), but
not for all systems. Because different methodologies use different design representations it is
difficult to compare information among projects that used different methodologies, even if those
projects are from the same problem domain. These kinds of difficulties can be avoided by using
a homogeneous notation (modeling language) and a standard software design process.
One of the perceived benefits of the Object-Oriented paradigm is that developers can use
it for different software processes and life cycles. Regardless of the paradigm and the software
life cycle used to plan the software process a common set of activities is present, namely
requirements specification, design (including high and low level issues), coding and testing.
Using this basic set of activities a template for OO design can be created, showing how the
activities can be represented using a homogenous notation. Additionally, (Kitchenham et al.,
1999) argued that software maintenance processes are similar to software development
processes, which makes this template with slight modification also suitable to software evolution
and maintenance.
Developers can tailor this software process to their specific development context while
continuing to use the same modeling language. These modeling languages represent an
interesting way of using OO constructs to describe problem domain concepts. By providing
graphical representation for these constructs, these languages simplify the representation and
allow developers to highlight important information about the problem domain. Moreover, they
provide a well-specified and homogenous set of constructs to capture the different object
perspectives (static and dynamic) making the representation of the information consistent and
reusable across different projects.
The Unified Modeling Language (UML) is an example of such a language. Several
companies and organizations around the world have used it and it has been adopted as an Object
Management Group (OMG) standard (OMG, 1999). Developers are using UML for more than
just representing design diagrams. Several tasks concerned with software architecture modeling

7
(Conallen, 1999), pattern descriptions (Larsen, 1999), design formalization (Shroff and France,
1997), measurement supporting (Uemura et al., 1998) and OO software inspection (Travassos et
al., 1999) have been accomplished using UML artifacts or extended UML artifacts. UML can
also be used to represent high-level abstraction concepts, such as software process models (Jäger
et al., 1999), meta models (Evans and Kent, 1999) and domain analysis models (Morisio et al.,
2000) or physical concepts, such as resources (Selic, 2000) and correlated engineers fields
(Epstein and Sandhu, 1999).
UML does not have a software process associated with it. Several software life cycles
and processes using UML exist for different contexts and domain applications. Some software
process models can be used as frameworks to organize and configure design activities. A few
examples are Catalysis (D'Souza and Wills, 1998), RUP (Krutchen, 1999), Unified Software
Process (Jacobson et al., 1999) and Open (Graham et al., 1997). Although strong, most of these
models impose a high cost, as they are based on automated tools and require some training and
detailed planning. Moreover, their weakness in providing techniques or guidance for defect
detection in artifacts and the difficulty of adapting them to specific classes of problems, such as
e-commerce or real-time systems, make the decision of whether to adopt them a complicated and
risky task.
This text has 6 sections including this introduction. Section 2 deals with a short
description of UML and how the artifacts are classified. Section 3 describes the design activities
and a process for applying them. In section 4 a small example is described and used to illustrate
the use of UML, including requirements, high level and some of the low level design issues. In
section 5, maintenance is considered along with proposals on how the basic development process
discussed in section 3 can be modified to support software evolution and maintenance. Section 6
concludes this text.
2. The Unified Modeling Language (UML)In recent years, the use of the OO paradigm to support systems development and
maintenance has grown. Unlike other paradigms, such as structured or data-oriented
development where developers are able to use several different methodologies and notations
(Pressman, 1997), the unification of different techniques provided a standard way to represent
the software artifacts. One of these standards, representing a notation and modeling language,
used by several companies and developers around the world is UML – The Unified Modeling

8
Language. As stated in (Booch, 1999), “ the UML has found widespread use: it has been applied
successfully to build systems for tasks as diverse as e-commerce, command and control,
computer games, medical electronics, banking, insurance, telephony, robotics, and avionics.”
In 1995, the first UML proposal was produced by combining work by Grady Booch
(1994) and James Rumbaugh (1992) and released as version 0.8. Subsequently, Ivar Jacobson's
contributions (Jacobson et al., 1992) were integrated into releases 0.9 and 0.91 in 1996. Since
then, developers and companies around the world have been working together on its
improvement. By integrating different techniques and mechanisms proven effective on industrial
projects, the draft evolved through multiple version. These efforts resulted in the development of
UML 1.1, which was added to the list of technologies adopted by the Object Management Group
(OMG) in November of 1997. OMG has assumed the responsibility of organizing the continued
evolution of the standard (Kobryn, 1999). In this text the OMG UML standard version 1.3,
released in 1999, has been used (OMG, 1999).
Four objectives guided the development of UML (OMG, 1999) and are reflected in
version 1.3:
1) Enable the modeling of systems (and not just software) using object-oriented concepts
The UML artifacts explore basic software development concepts, such as abstraction,
information hiding and hierarchy as well as object oriented paradigm constructs, such as
class, inheritance, composition and polymorphism (Meyer, 1997). Additionally, it provides
techniques to support development, organization, and packaging, and mechanisms to
represent the software architecture and deployable components. These features cover
different aspects of software development and enable UML to represent not only systems but
also software models.
2) Establish an explicit coupling to conceptual as well as executable artifacts
By describing the problem using different perspectives (e.g. static and dynamic views),
UML allows developers to capture all the relationships and information structures as well as
all the behaviors and object state modifications. Also, specific object constraints and features
can be formalized and explicitly connected to the concepts, making the models reliable and
able to be verified and validated.
3) Address the issues of scale inherent in complex, mission-critical systems

9
Because UML does not have standard techniques and processes and can be used in
different approaches (top-down and bottom-up) engineers are able to deal with different level
of abstraction and formalism, which is required when modeling and building software for
different application domains. Moreover, the syntax of the modeling language makes
available a homogeneous set of constructs supported by a well-defined set of techniques and
that can be organized throughout the software development process to break down and
reduce problem representation complexity.
4) Create a modeling language usable by both humans and machines
Although the intention is not to provide a standard framework to implement and integrate
CASE tools, UML guarantees the same semantics and understanding for its constructs. This
normalization of the representation plays an important role when developers are recognizing
and describing problem domains, allowing the same information to be interpreted by
different developers. It also stimulates different vendors to provide CASE tools for
supporting the language, by defining a consistent and standard set of models to specify and
build integration mechanisms for sharing information among different tools.
This section will not discuss all the definitions of UML and its possible uses. Instead, it gives
an overview about the different artifacts that can be created and the relationships among them. In
section 4, concepts and artifacts will be used to build an example application. The reader who
desires a more complete view of UML may find some of the following works useful: An
introductory text about UML can be found in (Fowler and Scott, 2000). It describes basic
concepts and gives small examples on how the artifacts can be used to represent different
projects situations. Rumbaugh (Rumbaugh et al., 1999) prepared a UML reference manual and
Booch (Booch et al., 1999) developed a tutorial describing how developers can use UML while
performing different design activities. However, if more information is still necessary, the
complete set of definitions and formalized concepts can be found in (OMG, 1999). Object
oriented concepts and definitions can be found in (Booch, 1994) and (Meyer, 1997).
2.1 Different Perspectives to Improve Design ModelingAlthough UML artifacts can be classified in different ways (e.g. the UML draft 1.3
describes the different types of documents, including use case diagrams, class diagrams,
behavior diagrams and implementation diagrams) this text classifies UML software artifacts into
three general categories: Static, Dynamic and Descriptive. There is a strong connection among
10
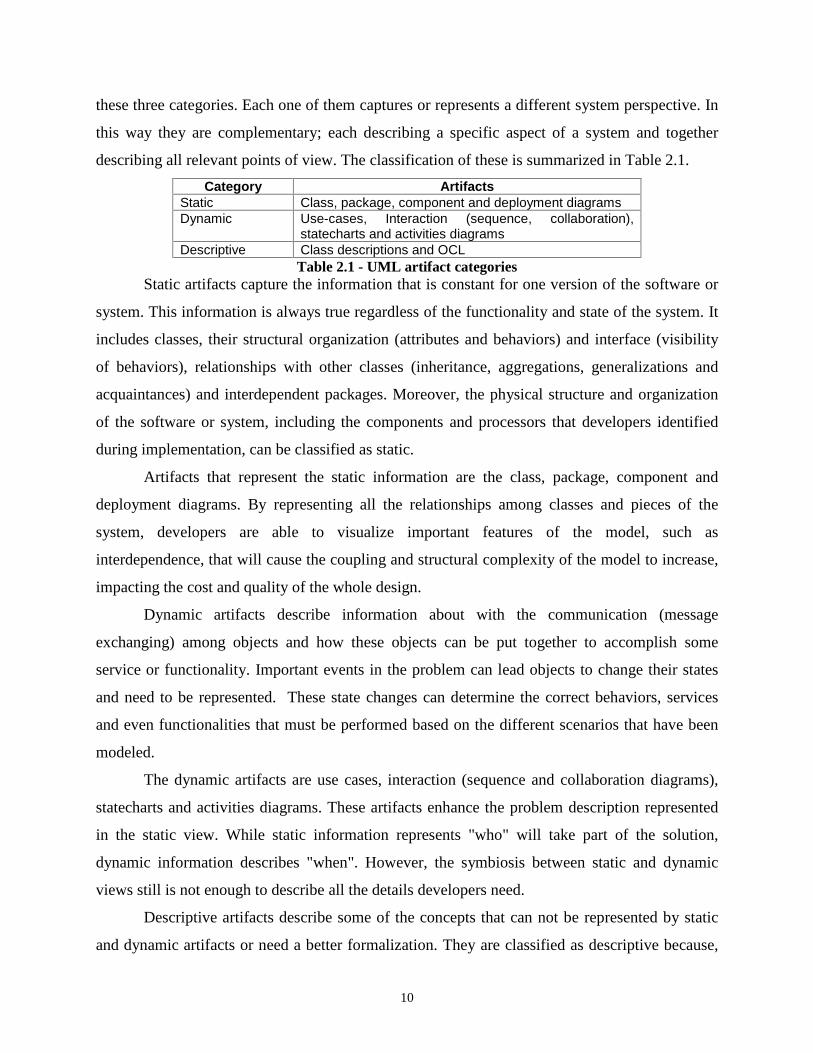
these three categories. Each one of them captures or represents a different system perspective. In
this way they are complementary; each describing a specific aspect of a system and together
describing all relevant points of view. The classification of these is summarized in Table 2.1.
Category ArtifactsStatic Class, package, component and deployment diagramsDynamic Use-cases, Interaction (sequence, collaboration),
statecharts and activities diagramsDescriptive Class descriptions and OCL
Table 2.1 - UML ar tifact categor iesStatic artifacts capture the information that is constant for one version of the software or
system. This information is always true regardless of the functionality and state of the system. It
includes classes, their structural organization (attributes and behaviors) and interface (visibility
of behaviors), relationships with other classes (inheritance, aggregations, generalizations and
acquaintances) and interdependent packages. Moreover, the physical structure and organization
of the software or system, including the components and processors that developers identified
during implementation, can be classified as static.
Artifacts that represent the static information are the class, package, component and
deployment diagrams. By representing all the relationships among classes and pieces of the
system, developers are able to visualize important features of the model, such as
interdependence, that will cause the coupling and structural complexity of the model to increase,
impacting the cost and quality of the whole design.
Dynamic artifacts describe information about with the communication (message
exchanging) among objects and how these objects can be put together to accomplish some
service or functionality. Important events in the problem can lead objects to change their states
and need to be represented. These state changes can determine the correct behaviors, services
and even functionalities that must be performed based on the different scenarios that have been
modeled.
The dynamic artifacts are use cases, interaction (sequence and collaboration diagrams),
statecharts and activities diagrams. These artifacts enhance the problem description represented
in the static view. While static information represents "who" will take part of the solution,
dynamic information describes "when". However, the symbiosis between static and dynamic
views still is not enough to describe all the details developers need.
Descriptive artifacts describe some of the concepts that can not be represented by static
and dynamic artifacts or need a better formalization. They are classified as descriptive because,

11
regardless of the formalism, they use basically a textual format to describe the concepts. The
class descriptions, which are similar to data dictionaries of conventional methods, are an
example of this type of artifact. They contain complimentary information about artifacts and the
formalization for some of the objects features (e.g. constraints, conditions, assertives) using the
object constraint language -OCL (Warmer and Kleppe, 1999).
Although all these artifacts can be produced during design, UML does not impose any
order or precedence among them. Rather, developers have the freedom to decide the most
affordable configuration. Descriptive artifacts are normally used with the other diagrams to
support the description of information represented in the different perspectives. The following
section shows a design process that can be used to build UML artifacts. Readers can find further
information and examples for all of these artifacts in section 4.
Figure 3.1 – The basic Software L ife Cycle
3. Software Process ActivitiesA framework for the basic software life cycle using UML is shown in Figure 3.1. The
process begins with a set of requirements for a new system and ends when the executable files
exist. In between, the process proceeds through a number of activities, represented here by
rectangles. The horizontal arrows show the sequence of development activities and curved
arrows represent inspections, in which the software artifact being produced during a specific
activity is reviewed and potentially improved before the next activity can begin2. Throughout the
life cycle, process tracking, management and quality assurance activities proceed in parallel with
2 Although inspections are applicable at many stages of the lifecycle, in this text we will concentrate on two phasesin particular: requirements and high level design.
NewRequirements
RequirementsSpecification
High LevelDesign
Low LevelDesign
Coding andTesting
Object Or iented ReadingPerspective Based Reading
ProjectPlan
Process Tracking, Management and Quality Assurance
Object filesExecutables
Artifacts,Object Files,Executables
System Repository

12
development activities, as determined by the project plan. This figure shows the information
produced throughout the software life cycle being stored in a repository, which we recommend
to allow for the reusing this information.
In this section, we look in more detail at the process activities involved in the high- and
low-level design activities, drawing connections where relevant to the other activities in the
lifecycle that influence, or are influenced by, the design.
Figure 3.2: High-level design activities, using artifacts created dur ing the requirements phase anddur ing PBR requirements inspections.
3.1 Development ActivitiesEntire books have been written describing development processes that use UML. Some
recommended examples are (D’Souza and Wills, 1998), (Eriksson and Penker, 1997), (Douglass,
1999) and (Jacobson, 1999). In this chapter, we describe a high-level outline of the process,
identifying important design steps and dependencies between artifacts. Our goal is not to provide
a complete and definitive lifecycle process, but to enable the reader to understand the various
process dependencies in sufficient detail that they can reorganize the activities, if desired, into a
development process that suits their environment.
Figure 3.2 represents the activities within and leading up to High-Level Design (HLD).
Before HLD can begin a set of requirements, at some level of detail, using some notation is
High Level Design Activities
Step 2
Requirements Activities
CRC Noteson classes
Potentialtest cases
Use Cases
RequirementsSpecification
Interactiondiagrams
Class diag.(1st version)
Class diag.(2nd version)
Class diag.(final version)
Packagediagram
Statediagrams
Activitydiagram
Step 1
Step 3
Step 4
ClassDescription
ClassDescription
ClassDescription
ClassDescription
Grey boxes representfinished artifacts producedduring the process.

13
produced during the requirements phase. We recommend the use of a requirements inspection,
before beginning HLD, to ensure that the requirements specified are as correct and complete as
possible, and adequately represent the needs of the customer. Although a choice of inspection
methods exists, Figure 3.2 illustrates the use of PBR, a particular approach to performing
requirements inspections in which reviewers produce initial artifacts as they look for
requirements defects from different points of view. (PBR is described in more detail in Section
3.2.2.) Using PBR has the advantage of producing an initial set of test cases, which can be used
later in the lifecycle, and some information about potential classes, which leads into HLD
activities. PBR also produces a representation of system functionalities, which contain important
information for HLD. In this example, we have chosen use cases as a functional representation,
although other choices are possible. In other environments, use cases can be produced without
PBR, and indeed may be the only representation used for specifying requirements.
HLD activities themselves typically begin with the creation of a first draft of the class
diagram. Based on an understanding of the requirements, the designers first identify candidate
classes in the design space, i.e. the important real-world entities and their associated behaviors,
that should be modeled by the system in order to solve the problem specified in the requirements.
Use cases also contain important information for identifying potential classes since they help
identify the set of functionality of the system, and the actors and other systems that participate in
it. A process such as CRC cards (Wirfs-Brock et al., 1990) may be used (either as part of the
PBR inspections or as a separate design activity) to start the process. It is important not to engage
in over-analysis at this point, as classes will almost surely be discarded, added, or modified over
time as the domain is better understood. At this step of the design, as in others, the class
description is continually changed to reflect changes in the way the classes themselves are
defined.
The next set of activities (step 2 in Figure 3.2) is to construct the interaction and state
diagrams, describing in more detail the behavior of the classes (as identified in the class diagram)
to achieve the system functionality (as described in the requirements specification and use cases).
While accomplishing this, the designer typically gains new insights about the set of necessary
classes and their internal structures. Thus a new version of the class diagram is produced (step 3)
as the classes are updated with information about their dynamic behaviors.

14
As a last step, the class diagram is scrutinized with an eye to implementation. If the
diagram is large enough that describing an overall implementation approach is unwieldy, it may
be divided into packages that reflect the logical groupings of the system classes, allowing it to be
broken into chunks for easier communication and planning. Similarly, activity diagrams may be
created, using the use cases to suggest the high-level business processes in the system to provide
a more concise overview of system functionality.
At the end of HLD, a set of artifacts has been produced (consisting of the class
description and class, interaction, and state diagrams, and possibly including package and
activity diagrams) that describes the real-world entities from the problem domain. An inspection
of the HLD is recommended at this point in the process to ensure that developers have
adequately understood the problem before defining the solution. (That is, the emphasis of the
inspection should be on high-level comprehension rather than low-level details of the
architecture.) Since low-level designs use the same basic diagram set as the high-level design,
but adding more detail, reviews of this kind can help ensure that low-level design starts from a
high-quality base. To provide a concrete discussion of the inspection process, we introduce
OORT inspections, described further in Section 3.2.2. Unlike PBR, OORT inspections do not
produce new artifacts, but result solely in updated versions of the existing HLD artifacts.
These HLD artifacts are further refined in Low Level Design (LLD), in which details
regarding system implementation are added. The first step of LLD is to adjust the set of design
artifacts to the implementation domain. It is at this point that classes are introduced into the
model that represents entities in the software-based solution but not the real world, such as
abstract data types or screen displays. New methods and attributes may be introduced that reflect
how objects will communicate with one another in the programming language chosen, not how
high-level messages will be exchanged to achieve the solution.
A second step is to design the system’s specific interfaces, such as user interfaces and
database solutions (if necessary). Also at this stage, an approach to task management is defined.
Any changes necessary to the system classes in order to use these interfaces are reflected in the
class description, which is used as input to the next step, in which all of the design artifacts are
updated to be consistent with the new implementation details and interfaces specified.
Based on these updated artifacts, a number of final activities are undertaken before
coding starts, such as developing a test plan and undertaking coding preparation.

15
3.2 Quality Assurance and Verification and Validation ActivitiesVerification and validation (V&V) activities check whether the system being developed
can meet the requirements of the customer. To do this, a typical V&V activity focuses on some
artifacts produced during the software lifecycle to ascertain if they are correct in themselves
(verification) and accurately describe the system that should be produced (validation). V&V
activities are often known as “quality assurance” activities since they are concerned with
ensuring the quality of the system being developed, either directly by evaluating the system
itself, or indirectly by evaluating the quality of the intermediate artifacts used to produce the
system (Pressman, 1997).
At a high level, there are three types of V&V activities. Measurement activities attempt to
assess the quality of a design by assessing certain structural characteristics. The challenge lies in
finding appropriate and feasible metrics for the qualities of interest. For example, designers
might be interested in evaluating the modifiability of their design, perhaps because several later
versions of the system are expected and it would be worthwhile to minimize the effort required
for maintenance in each case. A quality attribute such as this one cannot be measured directly, so
the designers instead might choose to measure some other attribute that is measurable and yet
provides some insight into the ease of making modifications. Using product metrics in this way
requires some kind of baseline data or heuristic information, so that the resulting values can be
evaluated. Measurement in the UML/OO paradigm is discussed in Section 3.2.1.
In contrast, inspection and testing, two other V&V activities, attempt to ensure software
quality by finding defects from various artifacts produced during the lifecycle. Inspection
activities require humans to review an artifact and think about whether it is of sufficient quality
to support the development of a quality system. There are different types of inspection
techniques that represent different strategies for organizing people's roles during the inspections
for keeping reviewers focused on the important aspects of the artifact they are inspecting.
Inspections are discussed in more detail in section 3.2.2, in which the discussion is illustrated by
two specific inspection approaches: Perspective-Based Reading, which is tailored to inspections
of requirements documents, and Object-Oriented Reading Techniques, which are tailored for OO
design inspections.
Testing is a V&V activity that is appropriate for evaluating software artifacts for which
some dynamic behavior or structural feature can be studied. Testing attempts to understand the

16
quality of the artifact, for instance, by comparing the observed behavior to that which is
expected. Typically, testing is applied to code, which can of course be compiled or interpreted
and run directly. However, testing can also be applied to other artifacts; for example,
requirements and design represented in a formal language can be “ run” using simulation and the
results studied (Cangussu et al., 1995). In this discussion, we will confine ourselves to discussing
code testing and how it can be affected by design decisions. In Section 3.2.3, we will also look
briefly at some of the different types of testing techniques that face particular challenges in the
OO/UML paradigm.
These different types of V&V activities are not in competition. Rather, some combination
is necessary for the production of quality software. Unfortunately, too often development efforts
rely entirely on code testing and do not invest in other V&V activities, notably inspections, on
artifacts earlier in the lifecycle. Relying exclusively on testing in this way means that defects are
not found until the end of the lifecycle, when they are most expensive to fix. Additionally, over-
reliance on testing often feeds a tendency of developers to pay less attention to careful design
and code production (on the assumption that testing will catch any of the resulting problems).
Such an approach can lead to difficulties since it is rarely possible to “ test in” quality; low-
quality code with multiple patches does not often end up being high-quality code in the end
(Perry, 2000). In contrast, augmenting testing with other V&V activities earlier in the lifecycle
means that misconceptions about the system can be caught early. For example, requirements
inspections can help identify problems with the way a planned system would address customer
needs before an inappropriate design has been created. Design inspections can identify problems
with the system architecture or design before significant effort has been invested in coding,
which may have to be redone if problems are detected later. Inspections cannot replace testing
but are an investment that helps “build-in” quality from the beginning and avoid later rework.
Defects in Software Ar tifacts. Both inspection and testing have the same goal: to find
defects in the particular software artifact under review. To get an operational definition of what
exactly a “defect” is, we introduce some terms based on the IEEE standard terminology (IEEE,
1987):
• An error is a defect in the human thought process made while trying to understand given
information, to solve problems, or to use methods and tools. In the context of software
17
design, an error is a basic misconception concerning how the system should be designed to
meet the needs of a user or customer.
• A fault is a concrete manifestation of an error within a software artifact. One error may cause
several faults and various errors may cause identical faults.
• A failure is a departure of the operational software system behavior from user expected
requirements. A particular failure may be caused by several faults and some faults may never
cause a failure.
For the sake of convenience, we will use the term defect as a generic term, to refer to a
fault or failure. However, it should be clear that when we discuss the defects found by software
inspections, we are really referring to faults. A fault in some static artifact, such as a system
design, is important insofar as it can lead to a system implementation in which failures occur.
Defects found by testing, on the other hand, are always failures of the software that can then be
traced back to faults in a software artifact during debugging.
When we look for a precise definition of a defect, capable of guiding a V&V activity, we
face the problem that what constitutes a defect is largely situation-dependent. For example, if
there are strong performance requirements on a system, then any description of the system that
might lead to those performance requirements being unfulfilled contains a defect; however, for
other systems with fewer performance constraints the same artifacts could be considered
perfectly correct. Similarly, the types of defects we are interested in for a textual requirements
document could be very different from what we would look for in a graphical design
representation.
We can avoid this difficulty by identifying broad classes of defects and then instantiating
those classes for specific circumstances. For our own work on developing inspection processes,
we have found a useful classification that is based on the idea of the software development
lifecycle as a series of transformations of a system description to increasingly formal notations.
For example, we can think of a set of natural-language requirements as a loose description of a
system that is transformed into high- and low-level designs, more formal descriptions of the
same basic set of functionality. Eventually these designs are translated into code, which is more
formal still, but still describes the same set of functionality (hopefully) as was set forth in the
original requirements.

18
So what can go wrong during such transformations? Figure 3.3 presents a simplified view
of the problem, in which all of the relevant information has to be carried forward from the
previous phase into a new form, and has to be specified in such a way that it can be further
refined in the next phase. The ideal case is shown by arrow 1, in which a piece of information
from the artifact created in the previous phase of development is correctly translated into its new
form in the artifact in the current phase. There is, however, the possibility that necessary
information is somehow left out of the new artifact (arrow 2) or translated into the new artifact
but in an incorrect form (arrow 3). In the current phase artifact, there is always the possibility
that extraneous information has been entered (arrow 4), which could lead to confusion in the
further development of the system, or that information has been specified in such a way as to
make the document inconsistent with itself (arrow 5). A related possibility is that information has
been specified ambiguously, leading to multiple interpretations in the next phase (arrows 6), not
all of that may be correct or appropriate3.
Figure 3.3: Representation of var ious defect types that can occur dur ing software development.
These generic defect classes can be made more specific, to guide V&V activities for
various circumstances. Examples of this are given for specific inspections in Section 3.2.2. Table
3.1 summarizes these defect classes. It is important to note that the classes are not orthogonal
(i.e., a particular defect could possibly fit into more than one category) but are intended to give
an idea of the set of possible defects that can occur.
3 Of course, Figure 3.3 is a simplified view. In reality, many of the implied 1-to-1 mappings do not hold. There maybe multiple artifacts created in each stage of the lifecycle, and the information in a particular phase can influencemany aspects of the artifact created in the next phase. For example, one requirement from a requirementsspecification can impact many components of the system design. When notational differences are taken into account
?
?
PreviousDevelopmentPhase
CurrentPhase
NextPhase
1
2
3
4
56

19
3.2.1 MeasurementSoftware development projects desiring some insight into the product being produced and
the process being applied use metrics to measure important information about the project. Many
companies have full-scale measurement programs that operate alongside software development
activities, collecting a standard set of metrics across multiple projects to facilitate the tracking of
development progress. The most sophisticated of these use some sort of measurement framework
to ensure that the metrics being collected are tied directly to the business goals of the company.
For example, the GQM paradigm (van Solingen and Berghout, 1999) makes explicit the
connection between overall goals, specific questions that must be answered to achieve the goals,
and the metrics that collect information capable of answering the questions.
Table 3.1 – Types of software defects, with gener ic definitions.
Developers and project managers have found metrics useful for:
• evaluating software quality (e.g. by measuring system reliability),
• understanding the design process (e.g. by measuring how much effort is being spent, and on
what activities),
• identifying product problems (e.g. by identifying overly complex modules in the system),
• improving solutions (e.g. by understanding the effectiveness of design techniques and how
they can be better tailored to the users), and
• acquiring design knowledge (e.g. by measuring the size of the design being produced).
Two of the most often-measured attributes of an OO design are coupling and cohesion.
Coupling refers to the degree of interdependence between the parts of a design. One class is
(e.g. textual requirements are translated into a graphical design description) it becomes apparent why performing
Defect General DescriptionOmission Necessary information about the system has been omitted from the
software artifact.Incorrect Fact Some information in the software artifact contradicts information in
the requirements document or the general domain knowledge.Inconsistency Information within one part of the software artifact is inconsistent
with other information in the software artifact.Ambiguity Information within the software artifact is ambiguous, i.e. any of a
number of interpretations may be derived that should not be theprerogative of the developer doing the implementation.
ExtraneousInformation
Information is provided that is not needed or used.
20
coupled to another class when methods declared in one class use methods or attributes of the
other class. High coupling in a design can indicate an overly complex or poorly constructed
design that will likely be hard to understand. This measure can also indicate potential problems
with maintenance since changes to a highly coupled class are likely to impact many other classes
in the design. Cohesion refers to the internal consistency within parts of the design.
Semantically, cohesion is measured by whether there is a logical consistency among the names,
methods, and attributes of classes in the design. Syntactically, cohesion can be measured by
whether a class has different methods performing different operations on the same set of
attributes, which may indicate a certain logical consistency among the methods. A lack of
cohesion can also indicate a poorly-constructed design since it implies that classes have methods
that would not logically be expected to belong to them, indicating that the domain may not have
been modeled correctly and pointing to potential maintenance problems (Coad and Yourdon,
1991).
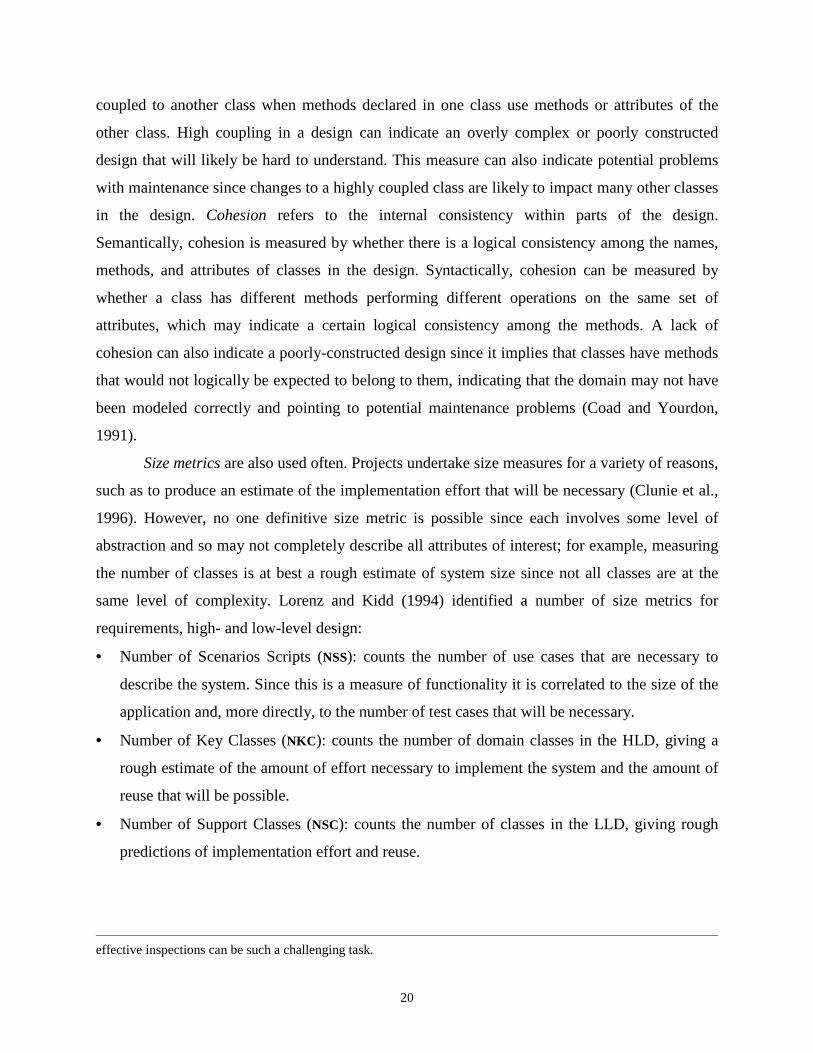
Size metrics are also used often. Projects undertake size measures for a variety of reasons,
such as to produce an estimate of the implementation effort that will be necessary (Clunie et al.,
1996). However, no one definitive size metric is possible since each involves some level of
abstraction and so may not completely describe all attributes of interest; for example, measuring
the number of classes is at best a rough estimate of system size since not all classes are at the
same level of complexity. Lorenz and Kidd (1994) identified a number of size metrics for
requirements, high- and low-level design:
• Number of Scenarios Scripts (NSS): counts the number of use cases that are necessary to
describe the system. Since this is a measure of functionality it is correlated to the size of the
application and, more directly, to the number of test cases that will be necessary.
• Number of Key Classes (NKC): counts the number of domain classes in the HLD, giving a
rough estimate of the amount of effort necessary to implement the system and the amount of
reuse that will be possible.
• Number of Support Classes (NSC): counts the number of classes in the LLD, giving rough
predictions of implementation effort and reuse.
effective inspections can be such a challenging task.

21
• Average Number of Support Classes per Key Class (ANSC): measures the degree of
expansion of the system from HLD to LLD, giving an estimate of how much of the system is
necessary for implementation-level details.
• Number of Subsystems (NSUB): a rough size measure based on larger aggregates of system
functionality.
• Class Size (CS): for an individual class, this metric is defined as the total number of
operations plus the number of attributes (both including inherited features).
• Number of Operations Overridden by a Subclass (NOO)
• Number of Operations Added by a Subclass (NOA)
• Specialization Index (SI): defined as (NOO x level in the hierarchy)/(Total methods in the
class)
Metrics exist to measure other attributes of designs besides size. Often, these metrics
attempt to somehow measure design complexity, on the assumption that more complex designs
are harder for human developers to understand and consequently harder to develop and maintain.
Perhaps the most well-known of these metrics sets was proposed by Chidamber and Kemerer
(1994):
• Weighted Methods per Class (WMC): measures a class by summing the complexity measures
assigned to each of the class’ methods, motivated by the idea that the number and complexity
of a class’ methods are correlated with the effort required to implement that class. Another
use of this metric is suggested by the heuristic that classes with large numbers of methods are
likely to be more application specific, and hence candidates for reuse.
• Depth of Inheritance (DIT): measures the depth at which a class appears in an inheritance
hierarchy. Classes deeper in the hierarchy are likely to inherit a larger number of methods
and attributes, making their behavior more difficult to predict.
• Number of Children (NOC): measures the number of subclasses that directly inherit from a
given class. A high NOC value typically indicates that a class should be tested more
extensively, since such classes may represent a misuse of subclassing, but definitely have an
extensive influence on the design.
• Coupling Between Objects (CBO): measures the number of other classes to which a class is
coupled. Extensive coupling indicates higher complexity (and hence suggests more testing is
necessary) but also signals a likely difficulty in reusing the class.

22
• Response for a Class (RFC): measures the number of methods belonging to the class that can
be executed in response to a message. The higher the value, the more complex testing and
debugging of that class are likely to be.
• Lack of Cohesion in Methods (LCOM ): measures the degree to which the methods of a class
make use of the same attributes. More overlap among the attributes used is assumed to signal
more cohesiveness among the methods. A lack of cohesion increases complexity, increasing
the likelihood of development errors, and typically indicates that this class should be split
into two or more subclasses.
The popularity of the Chidamber and Kemerer metrics for describing designs has led to a
few extensions to be proposed, so that the range of measures could be tailored to particular
needs. For example, Lie and Henry (1993) introduced two new metrics that were useful for the
commercial systems (implemented in an OO dialect of Ada) they were studying:
• Message Passing Coupling (MPC): calculated as the number of “send” statements defined in
a class.
• Data Abstraction Coupling (DAC): calculated as the number of abstract data types used in the
measured class but defined in another class of the system.
And, Basili, Briand, and Melo (1995) introduced a version of the Chidamber and Kemerer
metrics tailored to C++:
• WMC: redefined so that all methods have complexity 1 (i.e. the metric is a count of the
number of methods in a class) and “ friend” operators do not count.
• DIT: measures the number of ancestors of a class.
• NOC: measures the number of direct descendants for each class.
• CBO: redefined so that a class is coupled to another if it uses its member functions and/or
attributes.
• RFC: measures the number of functions directly invoked by member functions or operators of
a class.
• LCOM : defined as the number of pairs of member functions without shared instance
variables, minus the number of pairs of member functions with shared instance variables.
The Table 3.2 summarizes the metrics discussed in this section and connects them with
the lifecycle stages for which they are appropriate.

23
3.2.2 InspectionsSoftware inspections are a type of V&V activity that can be performed throughout the
software lifecycle. Because they rely on human understanding to detect defects, they have the
advantage that they can be done as soon as a software work artifact is written and can be used on
a variety of different artifacts and notations. Because they are typically done by a team, they are
a useful way of passing technical expertise as to good and bad aspects of software artifacts
among the participants. And, because they get developers familiar with the idea of reading each
other’s artifacts, they can lead to more readable artifacts being produced over time. On the other
hand, because they rely on human effort, they are affected by nontechnical issues: reviewers can
have different levels of relevant expertise, can get bored if asked to review large artifacts, can
have their own feelings about what is or is not important, or can be affected by political or
personal issues. For this reason, there has been an emphasis on defining processes that people
can use for performing effective inspections.
Table 3.2: Metr ics discussed in this chapter for each phase of the lifecycle.
Req.Descr iption
High-LevelDesign
Low-LevelDesign
Coding Testing
Lorenz & KiddNSS XNKC X XNSC XANSC XNSUB X XCS X X XNOO X X X XNOA X X XSI X X X XChidamber & KemererWMC X X XDIT X X XNOC X X XCBO X XRFC X XLCOM X X X

24
Most of the current work on inspections owes a large debt to the very influential works of
(Fagan, 1986) and (Gilb and Graham, 1993). In both, the emphasis is on the inspection method4,
in which the following phases are identified:
• Planning: In this phase, the scope, artifact, and participants for the inspection are decided.
The relevant information and materials are distributed to each inspector, and their
responsibilities are explained to them, if necessary.
• Detection: The inspectors review the artifact on their own, identifying defects or other quality
issues they encounter.
• Collection: The inspectors meet as a team to discuss the artifact, and any associated problems
they feel may exist. A definitive list of the issues raised by the team is collected and turned
over to the author of the artifact.
• Correction: The author updates the artifact to reflect the concerns raised by the inspection
team.
The methods do not, however, give any guidelines to the reviewer as to how defects should
be found in the detection phase; both assume that the individual review of these documents can
already be done effectively. Having been the basis for many of the review processes now in
place (e.g., at NASA (1993)), (Fagan, 1986) and (Gilb and Graham, 1993) have inspired the
direction of much of the research in this area, which has tended to concentrate on improving the
review method. Proposed improvements to Fagan’s method often center on the importance and
cost of the meeting. For example, researchers have proposed:
• Introducing additional meetings, such as the root cause analysis meeting of (Gilb and
Graham, 1993).
• Eliminating meetings in favor of straightforward data collection (Votta, 1993).
More recent research has tried to understand better the benefits of inspection meetings.
Surprisingly, such studies have reported that, while they may have other benefits, inspection
meetings do not contribute significantly to the number of defects found (Votta, 1993)(Porter,
1995). That is, team meetings do not appear to provide a significantly more complete list of
defects than if the actual meeting had been dispensed with and the union of the individual
4 In this text we distinguish a “ technique” from a “method” as follows: A technique is a series of steps, at some levelof detail, that can be followed in sequence to complete a particular task. We use the term “method” as defined in(Basili, 1996), “a management-level description of when and how to apply techniques, which explains not only howto apply a technique, but also under what conditions the technique’s application is appropriate.”

25
reviewers’ defect lists taken. This line of research suggests that efforts to improve the review
technique, that is, the process used by each reviewer to find defects in the first place, could be of
benefit.
One approach to doing this is provided by software reading techniques. A reading
technique is a series of steps for the individual analysis of a software product to achieve the
understanding needed for a particular task (Basili et al., 1996). Reading techniques increase the
effectiveness of individual reviewers by providing guidelines that they can use, during the
detection phase of a software inspection, to examine (or “ read”) a given software document and
identify defects. Rather than leave reviewers to their own devices reading techniques attempt to
capture knowledge about best practices for defect detection into a procedure that can be
followed.
In our work we have defined the following goals for inspection techniques:
• Systematic: Specific steps of the individual review process should be defined.
• Focused: Different reviewers should be asked to focus on different aspects of the document,
thus having unique (not redundant) responsibilities.
• Allowing controlled improvement: Based on feedback from reviewers, specific aspects of the
technique should be able to be identified and improved.
• Tailorable: The technique should be customizable to a specific project and/or organization.
• Allows training: It should be possible to train the reviewers for applying the technique.
In this section, we look at reading techniques that directly support the production of
quality software designs: PBR, which ensures that the artifacts input to HLD are of high quality,
and OORTs, which evaluate the quality of the HLD itself.
A Requirements Inspection Technique: Perspective-Based Reading (PBR)
A set of inspection techniques known as Perspective-Based Reading (PBR) was created
for the domain of requirements inspections. PBR is designed to help reviewers answer two
important questions about the requirements they are inspecting:
• How do I know what information in these requirements is important to check?
• Once I have found the important information, how do I identify defects in that information?
PBR exploits the observation that different information in the requirements is more or
less important for the different uses of the document. That is, the ultimate purpose of a
26
requirements document is to be used by a number of different people to support tasks throughout
the development lifecycle. Conceivably, each of those persons finds different aspects of the
requirements important for accomplishing his or her task. If we could ask all of the different
people who use the requirements to review it from their own point of view, then we would
expect that all together they would have reviewed the whole document (since any information in
the document is presumably there to help somebody do his or her job).
Thus, in a PBR inspection each reviewer on a team is asked to take the perspective of a
specific user of the requirements being reviewed. His or her responsibility is to create a high-
level version of the work products that a user of the requirements would have to create as part of
his or her normal work activities. For example, in a simple model of the software lifecycle we
could expect the requirements document to have three main uses in the software lifecycle:
• As a description of the needs of the customer: The requirements describe the set of
functionality and performance constraints that must be met by the final system.
• As a basis for the design of the system: The system designer has to create a design that can
achieve the functionality described by the requirements, within the allowed constraints.
• As a point of comparison for system test: The system’s test plan has to ensure that the
functionality and performance requirements have been correctly implemented.
In such an environment, a PBR inspection of the requirements would ensure that each
reviewer evaluated the document from one of those perspectives, creating some model of the
requirements to help focus their inspection: an enumeration of the functionality described by the
requirements, a high-level design of the system, and a test plan for the system, respectively. The
objective is not to duplicate work done at other points of the software development process, but
to create representations that can be used as a basis for the later creation of more specific work
products and that can reveal how well the requirements can support the necessary tasks.
Once reviewers have created relevant representations of the requirements, they still need
to determine what defects may exist. To facilitate that task, the PBR techniques provide a set of
questions tailored to each step of the procedure for creating the representation. As the reviewer
goes through the steps of constructing the representation, he or she is asked to answer a series of
questions about the work being done. There is one question for every applicable type of defect.
(The defect types, tailored specifically to the requirements phase, are given in Table 3.3.) When
the requirements do not provide enough information to answer the questions, this is usually a

27
good indication that they do not provide enough information to support the user of the
requirements, either. This situation should lead to one or more defects being reported so that they
can be fixed before the requirements need to be used to support that task later in the product
lifecycle.
More information, including example techniques for the three perspectives identified
above, is available at http://fc-md.umd.edu/reading/reading.html.
Table 3.3 – Types of software defects, with specific definitions for the requirements and design
Design Inspection Techniques: Object-Or iented Reading Techniques (OORTs)
In PBR, reviewers are asked to develop abstractions, from different points of view, of the
system described by the requirements because requirements notations do not always facilitate the
identification of important information and location of defects by an inspector. For an OO
design, in contrast, the abstractions of important information already exist: the information has
Defect Applied to requirements Applied to designOmission (1) some significant requirement related to
functionality, performance, design constraints,attributes or external interface is not included; (2)responses of the software to all realizable classes ofinput data in all realizable classes of situations is notdefined; (3) missing sections of the requirementsdocument; (4) missing labeling and referencing offigures, tables, and diagrams; (5) missing definition ofterms and units of measures (ANSI, 1984).
One or more design diagrams thatshould contain some concept fromthe general requirements or from therequirements document do notcontain a representation for thatconcept.
Incorrect Fact A requirement asserts a fact that cannot be true underthe conditions specified for the system.
A design diagram contains amisrepresentation of a conceptdescribed in the general requirementsor requirements document.
Inconsistency Two or more requirements are in conflict with oneanother.
A representation of a concept in onedesign diagram disagrees with arepresentation of the same concept ineither the same or another designdiagram.
Ambiguity A requirement has multiple interpretations due tomultiple terms for the same characteristic, or multiplemeanings of a term in a particular context.
A representation of a concept in thedesign is unclear, and could cause auser of the document (developer,low-level designer, etc.) tomisinterpret or misunderstand themeaning of the concept.
ExtraneousInformation
Information is provided that is not needed or used. The design includes information that,while perhaps true, does not apply tothis domain and should not beincluded in the design

28
already been described in a number of separate models or diagrams (e.g. state machines, class
diagrams) as discussed at the end of the previous section.
However, the information in the abstractions has to be checked for defects, and reading
techniques can still supply a benefit by providing a procedure for individual inspection of the
different diagrams, although unique properties of the OO paradigm must be addressed. In an
object-oriented design we have graphical representations of the domain concepts instead of the
natural-language representation found in the requirements document. Another feature of object
oriented designs that has to be accounted for is the fact that while the different documents within
the design all represent the system, they present different views of the information.
A set of Object-Oriented Reading Techniques (OORTs) has been developed for this
purpose, focused on a particular set of defects that was defined by tailoring the generic defect
definitions from Table 1 to the domain of OO designs (Table 3.3). For example, the information
in the artifact must be compared to the general requirements in order to ensure that the system
described by the artifact matches the system that is supposed to be built. Similarly, a reviewer of
the artifact must also use general domain knowledge to make sure that the artifact describes a
system that is meaningful and can be built. At the same time, irrelevant information from other
domains should typically be prevented from appearing in the artifact, since it can only hurt
clarity. Any artifact should also be analyzed to make sure that it is self-consistent and clear
enough to support only one interpretation of the final system.
The PBR techniques for requirements are concerned mainly with checking the
correctness of the document itself (making sure the document was internally consistent and
clearly expressed, and whether the contents did not contradict any domain knowledge). A major
difference in the OORTs is that for checking the correctness of a design, the reading process
must be twofold. As in requirements inspection, the correctness and consistency of the design
diagrams themselves must of course be verified (through “horizontal reading” 5) to ensure a
consistent document. But a frame of reference is necessary in order to assess design correctness.
Thus it is also necessary to verify the consistency between design artifacts and the system
5 Horizontal reading refers to reading techniques that are used to read documents built in the same software lifecycle phase. (SeeFigure 3.4.) Consistency among documents is the most important feature here.

29
requirements (through “vertical reading” 6), to ensure that the system design is correct with
respect to the functional requirements.
The OORTs consist of a family of techniques in which a separate technique has been
defined for each set of diagrams that could usefully be compared against each other. For
example, sequence diagrams need to be compared to state machines to detect whether, for a
specific object, there are events, constraints or data (described in the state machine) that could
change the way that messages are sent to it (as specified in the sequence diagram). The
advantage of this approach is that a project engaged in design inspections can select from this
family only the subset of techniques that correspond to the subset of artifacts they are using, or
that are particularly important for a given project. The full set of horizontal and vertical reading
techniques is defined as illustrated in Figure 3.4. Each line between the software artifacts
represents a reading technique that has been defined to read one against the other.
These techniques have been demonstrated to be feasible and helpful in finding defects
(Shull et al., 1999) (Travassos et al., 1999). More information about the OORTs, including a
technical report describing how these techniques were defined, is available at http://fc-
md.umd.edu/reading/reading.html.
Figure 3.4: The set of OORTs (each ar row represents one technique) that has been defined forvar ious design ar tifacts.
3.2.3 TestingTesting is a V&V activity that is performed toward the end of the lifecycle (or, more
precisely, toward the end of some iteration through the development process), once executable
code has been produced. It is a relatively expensive activity; it typically takes great ingenuity to
6 Vertical reading refers to reading techniques that are used to read documents built in different software lifecycle phases. (SeeFigure 3.4.) Traceability between the phases is the most important feature here.
RequirementsDescriptions
Use-Cases
� � � � � � � � � � � � � � � � � � � � � �
� � � � � � � � �� � � � �
ClassDiagrams
ClassDescriptions
State MachineDiagrams
InteractionDiagrams
(Sequence)� � � � � � � � � � � ! " � # � � � � � � �

30
exercise all of the important features of a system under realistic conditions and notice
discrepancies from the expected results, not to mention tracing the system failures observed
during execution back to the relevant faults in the code. Nevertheless, it remains an essential way
of ensuring the quality of the system. Due to this expense, however, exhaustive testing is not
feasible in most situations, and so it is important for development projects to have a well
thought-out test plan that allocates time and resources in such a way as to provide effective
coverage of the system. A number of general testing approaches have been developed and in this
section we describe briefly how they map to systems developed using OO/UML and what types
of difficulties are introduced by the new paradigm.
A test plan is a general document for the entire project that identifies the scope of the
testing effort, the general approach to be taken, and a schedule of testing activities. Regardless of
the paradigm by which a system has been developed, a good test plan will also include:
• a test unit specification, listing the modules to be tested and the data used during testing;
• a listing of the features to be tested (possibly including functionality, performance, and
design constraints);
• the deliverables resulting from the test activities (which might be a list of the test cases used,
detailed testing results, a summary report, and/or data about code coverage);
• personnel allocation, identifying the persons responsible for performing the different
activities.
Also independent of the development paradigm are the criteria for a good test plan:
effectiveness (ideally, it should result in all of the defects in the product being fixed), a lack of
redundancy (effort is spent efficiently), completeness (important features of the system are not
missed during testing), and the right level of complexity.
Planning a system-wide test plan should make use of three different test techniques.
These techniques are complementary, meaning that no one technique covers all the important
aspects of a system; rather, effort should be allocated to testing of each type to a greater or lesser
degree, depending on how much it meets the needs of the particular system being developed.
These three techniques are:
• Functional (black-box) testing (Beizer, 1995): Test cases are built based on the functionality
that has been specified for the system, with the objective of ensuring that the system behaves
correctly under all conditions. Because this technique is concerned with the system’s

31
behavior, not implementation, approaches developed for other programming paradigms can
be used on OO systems without change, such as equivalence partitioning, boundary value
analysis, and cause-effect graphing.
• Structural (white-box) testing (Binder, 1999), (Perry, 2000): Test cases are built based on the
internal structure of the software, with the objective of ensuring that all possible execution
paths through the code will produce correct results. The nature of OO programming, in which
data flow can be distributed among objects, each of which maintains its own separate state,
introduces some complexities which are described below, under “unit testing.” Structural
testing approaches can be based on control flow, data flow, or program complexity. There is
ongoing research as to how these approaches can be adapted to OO/UML (Kung et al., 1998)
but there are no practical techniques as yet.
• Defect-based testing: Test cases are built to target likely classes of defects. Approaches
include defect seeding (in which a set of defects is seeded into the code before testing begins,
to get some idea of the effectiveness of the testing activities), mutation testing for unit testing
(Offutt, 1995), and interface mutation for integration testing (Delamaro and Maldonado,
1996). Although work has been done on identifying useful classes of defects for use in the
testing of structured programs, little has been published as to which types of defects are most
useful to focus on in OO development.
Testing usually proceeds through multiple levels of granularity, and techniques from each
of the above types may be applied at each level. Testing may proceed from unit testing, in which
individual components of the system are tested in isolation, to integration testing, in which
components are tested while working together, to system and acceptance testing, in which the
system is tested as an operational whole. Development with OO/UML does not change testing at
the system level, because the goal there is to test functionality independent of the underlying
implementation, but does affect testing at other levels:
• Unit testing: Unit testing is complicated in OO/UML, first and foremost because it is not
generally agreed upon what the “unit” should represent. In structured programming, the unit
is generally taken to be a code module, but in OO/UML, it can be a method, a class, or some
larger aggregation of classes such as a package. Aside from the matter of notation there are
still significant technical difficulties. Inheritance and polymorphism introduce challenges
because they allow many execution paths to exist that are not easy to identify from inspecting

32
the class. Additionally, object states cause complications because the different states an
object can be in, and how these states affect the responses to messages, must be taken into
account during testing.
• Integration testing: No matter how the “unit” is defined, OO systems will typically have a
higher number of components, that need to be integrated earlier in the development cycle,
than a non-OO system. On top of that, managing integration testing in UML/OO can be quite
complex since typically a simple calling tree does not exist; objects do not exist statically
throughout the lifetime of the system but are created and deleted while responding to
triggering events. Thus the number of interactions between components will be much higher
than it would be for a non-OO system. It is important to remember that, for these reasons,
some interaction problems will not be apparent until many objects have been implemented
and activated, relatively late in the testing process.
4. The ExampleThis section illustrates how developers can use the previously defined design process to
build UML artifacts, by describing the design of an example system. The example explains the
development of a hypothetical system for a self-service gas station, from the completion of
requirements to the beginning of coding. As we proceed through the example, we define and
explain the various types of design diagrams created.
The gas station in this example allows customers to purchase gas (self-service), to pay for
maintenance work done on their cars and to lease parking spots. Some local businesses have
billing accounts set up to receive a monthly bill, instead of paying at the time of purchase. There
is always a cashier on-duty at the gas station to accept cash payments or perform system
maintenance, as necessary.
The requirements we are concerned with for the purposes of the example are excerpts
from the requirements document describing the Gas Station Control System (GSCS), and
describe how the system receives payment from the customer. A customer has the option to be
billed at the time of purchase, or to be sent a monthly bill and pay at that time. Customers can
always pay via cash or credit card. Table 4.1 describes some concepts about this part of the
problem.

33
Concept DescriptionCreditcardreader
The credit card reader is a separate piece of hardware mounted at each gas pump. The internaloperations of the credit card reader, and the communications between the GSCS and the card reader,are outside the scope of this document. When the customer swipes his or her credit card through thecard reader, the card reader reads the credit card number and sends it to the GSCS. If the credit cardnumber cannot be read correctly, an invalid token is sent to the GSCS instead.
Creditcardsystem
The credit card system is a separate system, maintained by a credit card company. The internaloperations of the credit card system, and the communications between the GSCS and the credit cardsystem, are outside the scope of this document. The GSCS sends a credit card number and purchaseamount to the credit card system in order to charge a customer’s account; the credit card companylater reimburses the gas station for the purchase amount.
Gas Pump The customer uses the gas pump to purchase gas from the gas station. The internal operations of thegas pump, and the communications between the gas pump and the GSCS, are outside the scope ofthis document. The gas pump is responsible for recognizing when the customer has finisheddispensing gas, and for communicating the amount of gas and dollar amount of the purchase to theGSCS at this time.
Gas PumpInterface
The gas pump interface is a separate piece of hardware mounted at each gas pump. The internaloperations of the gas pump interface, and the communications between the gas pump interface andthe GSCS, are outside the scope of this document. The gas pump interface receives a message fromthe GSCS and displays it for use by the customer. The gas pump interface also allows the customer tochoose from a number of options, and communicates the option chosen to the GSCS.
Cashier’sinterface
The cashier’s interface is a separate piece of hardware mounted at the cashier’s station. The internaloperations of the cashier’s interface, and the communications between the cashier’s interface and theGSCS, are outside the scope of this document. The cashier’s interface is capable of displayinginformation received from the GSCS. The cashier’s interface is also able to accept input from thecashier, including numeric data, and communicate it to the GSCS.
Customer The customer is the client of the Gas Station. Only registered customer can pay bills monthly. Name,address, telephone number and account number are the features that will describe a registeredcustomer.
Table 4.1 - Glossary
The functional requirements that were defined for the billing part of the gas station
system are as follows. As in any other system development, the initial set of requirements
obtained from discussion with the customer may contain some errors that could potentially
impact system quality.
1. After the purchase of gasoline, the gas pump reports the number of gallons purchased to theGSCS. The GSCS updates the remaining inventory.
2. After the purchase of gasoline, the gas pump reports the dollar amount of the purchase to theGSCS. The maximum value of a purchase is $999.99. The GSCS then causes the gas pumpinterface to query the customer as to payment type.
2.1. The customer may choose to be billed at the time of purchase, or to be sent a monthly bill. Ifbilling is to be done at time of purchase, the gas pump interface queries the customer as towhether payment will be made by cash or credit card. If the purchase is to be placed on a monthlybill, the gas pump interface instructs the customer to see the cashier. If an invalid or no responseis received, the GSCS bills at the time of purchase.
3. If the customer has selected to pay at the time of purchase, he or she can choose to pay by cash orcredit card. If the customer selects cash, the gas pump interface instructs the customer to see thecashier. If the customer selects credit card, the gas pump interface instructs the customer to swipehis or her credit card through the credit card reader. If an invalid or no selection is made, theGSCS will default to credit card payment.
4. If payment is to be made by credit card, then the card reader sends the credit card number to theGSCS. If the GSCS receives an invalid card number, than a message is sent to the gas pump

34
interface asking the customer to swipe the card through the card reader again. After the accountnumber is obtained, the account number and purchase price are sent to the credit card system, andthe GSCS and gas pump interface are reset to their initial state. The purchase price sent can be upto $10000.
5. The cashier is responsible for accepting the customer’s payment and making change, if necessary.When payment is complete, the cashier indicates this on the cashier’s interface. The GSCS andthe gas pump interface then return to the initial state.
6. If payment is to be made by monthly bill, the purchase price is displayed on the cashier’sinterface. The cashier selects an option from the cashier’s interface, alerting the GSCS that thepayment will be placed on a monthly bill. The GSCS then prompts the cashier to enter the billingaccount number.
6.1. The customer must give the billing account number to the cashier, who then enters it at thecashier’s interface. If a valid billing account number is entered, then the billing account number,purchase price, and a brief description of the type of transaction is logged. If an invalid billingaccount number is entered, an error message is displayed and the cashier is prompted to enter itagain. The cashier must also have the option to cancel the operation, in which case the cashier’sinterface reverts to showing the purchase price and the cashier can again either receive cash orindicate that monthly billing should be used.
7. To pay a monthly bill, the customer must send the payment along with the billing accountnumber. The cashier enters monthly payments by first selecting the appropriate option from thecashier’s interface. The GSCS then sends a message to the cashier’s interface prompting thecashier to enter the billing account number, the amount remitted, and the type of payment. If anyof these pieces of information are not entered or are invalid, payment cannot be processed; anerror message will be displayed, and the cashier’s interface will be returned to the previousscreen. If the type of payment is credit card, the credit card account number must also be entered,and then the paper credit card receipt will be photocopied and stored with the rest of the year’sreceipts.
8. Unless otherwise specified, if the GSCS receives invalid input it will send an error message to thecashier’s interface. The cashier will be expected to take appropriate action, which may involveshutting the system down for maintenance.
Performance and extensibility, two non-functional requirements (Chung et al., 1999) that can
influence decisions regarding low level design were also used:
1. The system must always respond to customer input within 5 minutes.2. The system should be easy to extend, so that if necessary another payment option (e.g. bankcard) can
be added with minimal effort.
4.1 Requirements ActivitiesThe problem description and requirements were generated first. Then, the requirements
were inspected to ensure they were of high enough quality to support high-level design and fully
represented the functionality needed to build the system. This requirements inspection was done
using PBR. For this system we used the customer and tester perspectives because during the
inspection we were able to identify defects while producing artifacts capturing the system’s
functionalities (use cases) and information (test cases) that might be used later for application

35
testing. The use cases in particular were felt to be a useful representation of the system
functionality and worth the time required for their creation, since they provide a very
understandable format for communication between system designers and the customers.
Moreover, use cases feed into later stages of the lifecycle by helping identify objects, develop
testing plans, and develop documentation. So, this representation was expected to provide
additional benefits for developers as well as to be useful for validating whether the system met
the customer’s expectations.
Applying PBR to the gas station requirements resulted in the identification of some defects.
The two perspectives helped the readers find different kinds of defects. First, by using the tester
perspective, an omission was found in the requirement 5. Domain knowledge indicated that the
cashier needs to know the purchase price if he/she is to handle the cash transaction. The tester
perspective allowed the reader to see that because all inputs have not been specified, the
requirement cannot be tested. Also using the tester perspective, a defect of extraneous
information was found in requirement 7. The requirement states that receipts are copied and
stored. However, such activity is clearly outside the scope of the system. It can not be tested for
during system test.
Using the customer perspective, an incorrect fact was identified in requirement 3. By using
domain knowledge the customer recognized that defaulting to credit card payment is an incorrect
response. Because this functionality should not have been implemented the way it was described,
the defect was categorized as an incorrect fact. Also, the customer perspective helped uncover
that requirement 6.1 has an ambiguous description that could result in a number of different
implementations. “A brief description of the type of transaction” seems like a reasonable
requirement, but exactly what information is stored? What does “ transaction type” mean?
Purchase of gas/maintenance? Paid in full/partial payment? Paid by credit card/cash/monthly
bill?
The use cases produced by PBR were the first UML design artifact produced for this
project. Figure 4.1 shows a use case diagram highlighting its components and corresponding
description. (There is a wide variation among organizations and even projects as to how formally
use cases are specified. In the example system, an English description was used for the system
functionality.) The use-case diagrams model the system’s functionalities by showing descriptive
scenarios of how external participants interact with the system, both identifying the events that

36
occur and describing the system responses for these events. Use case diagrams can also represent
relationships (association, extend, generalization and include) among use cases or between actors
and use cases. An association is the relationship between an actor and a use case. In the figure an
example is the line between “Customer” and “billing services” . An extend relationship shows
that one use case is being augmented by the behaviors of other use case. In the figure an example
of this the relationship between “parking” and “billing services.” The generalization shows that
one use case is a specialization of another one, e.g. “Paying Monthly Bills” in relation to “Paying
by Cash” while the include relationship shows that an instance of one specific use case will also
include the sequence of events specified by another use case.
Figure 4.1 - A use case diagram and the specific descr iption for one of the use cases identified.
refuel
parking
maintenance
Paying By cash
Paying by credit card
CustomerCredit Card
Administration
Paying Monthly Bills
billing services
Cashier
ACTOR
USE CASE
GENERALIZATION
Specific use case for “ Paying Monthly Bills” :Customer sends payment and account number to the cashier that selects the payment option and mustinform account number amount remitted and type of payment. If any of these information are not entered,payment can not be completed (cashier interface will display a message) and the operation will becancelled.Types of payments:1) by cash
Cashier informs account number and amount been paid2) by credit card Cashier informs credit card, amount and account number Gas Station ask Credit Card System to authorize payment
if authorization is ok payment is madeif payment is not authorized or failed Cashier receives a message describing that payment wasnot able to be processed. Cashier must repeat operation once more before cancel all the operation

37
PBR uses the equivalence partitioning technique (Jalote, 1997) to read and produce test
cases. Test cases help identify defects and provide a starting point for real test cases of the
system (so developers don’ t have to start from scratch at that phase.)
For example, the following test cases were produced for requirement 2:
Requirement Number: 2Description of Input: dollar amount of purchase
Valid Equiv. sets: Valid dollar amts.Test cases: $100
$13.95Test result: Instruct gas pump inter face
to query for payment typeInvalid Equiv. sets: Negative dollar amts.
dollar amts. > $999.99Test cases: -$5.00
$1000.00Test result: display er ror at cashier inter face
The same approach was used to build the test cases for each requirement and identify
defects. When readers finished the requirement inspections, the potential defects were evaluated
and fixed in the requirements. At this point, there is a choice as to whether the requirements
should be re-inspected, depending on the number of defects and problems that were found. For
this system, one inspection was deemed to be sufficient. At the end of this phase, a set of fixed
requirements, corresponding test cases and use cases, was available to continue the design
process.
4.2 High Level Design ActivitiesAt this point, all the concepts specified by the requirements have been reviewed and a
high level representation for the functionalities was identified and modeled by the use case
diagrams. The next step was to organize those concepts and functionalities using a different
paradigm. From this point until the end of integration testing, all the activities were driven by the
object-oriented paradigm. The main issue was: how problem features (concepts and
functionalities) could be classified and organized to allow developers to design an object
oriented solution for the problem.
The use cases and requirements descriptions are the basis for the high-level design
activities (see figure 3.2). They represent the domain knowledge necessary to describe the
features and make them understandable to the development team. The static and dynamic
properties of the system need to be modeled. Moreover, use cases and requirements descriptions

38
are used in design inspection because they represent the truth about the problem, and allow the
solution space to be limited for the developers.
As we stated in Section 3, UML artifacts can be built in any order. Developers can tailor
a development process to fit their needs. In our example development process, a draft class
diagram was produced first in order to explore the organization of the domain concepts. Class
Descriptions were produced and enhanced through all the design activities, regardless of the type
of artifact being built. Therefore, a first draft for the class description was also produced.
Subsequent activities refined the class diagram and described the functionalities that had to be
part of the solution. Doing so, developers explored a design perspective focused on the domain
concepts rather than just the functionalities of the system. We have observed that the use of such
approach drives designers to model essential domain elements, independent from the solution,
and being more suitable for future reuse.
This initial picture of the basic elements of the problem gave designers the ability to
model the functionalities and understand how external events impact the life cycle of the objects
and system. It was also possible to identify the different chunks of the problem, allowing the
identification of different classes packages. Classes were grouped into packages by their
structure or type of services they offered. By doing so, developers got some information that was
used to improve the definition of the application architecture, for instance, grouping all classes
that contain interfaces for external systems into one package.
Next, the dynamic behavior of the system was modeled by creating the sequence and
state diagrams. Using this information, the Class Diagram was then refined. All along the way,
the Class Descriptions were updated to be consistent with the information in the other diagrams.
Finally the Package and Activity diagrams were created. Each of these will be explained in more
detail below.
Once UML design artifacts are built, developers can apply inspections to verify their
consistency and then validate them against the requirements and use cases used to define the
problem. Object-Oriented Reading Techniques (OORTs) were used to support inspections of
UML high level design artifacts in the context of this design process.
After finding and fixing high-level design defects, which sometimes can imply some
modifications in the requirements and use cases, developers had a complete set of quality design
artifacts representing the framework to be used for continuing design. The next steps included
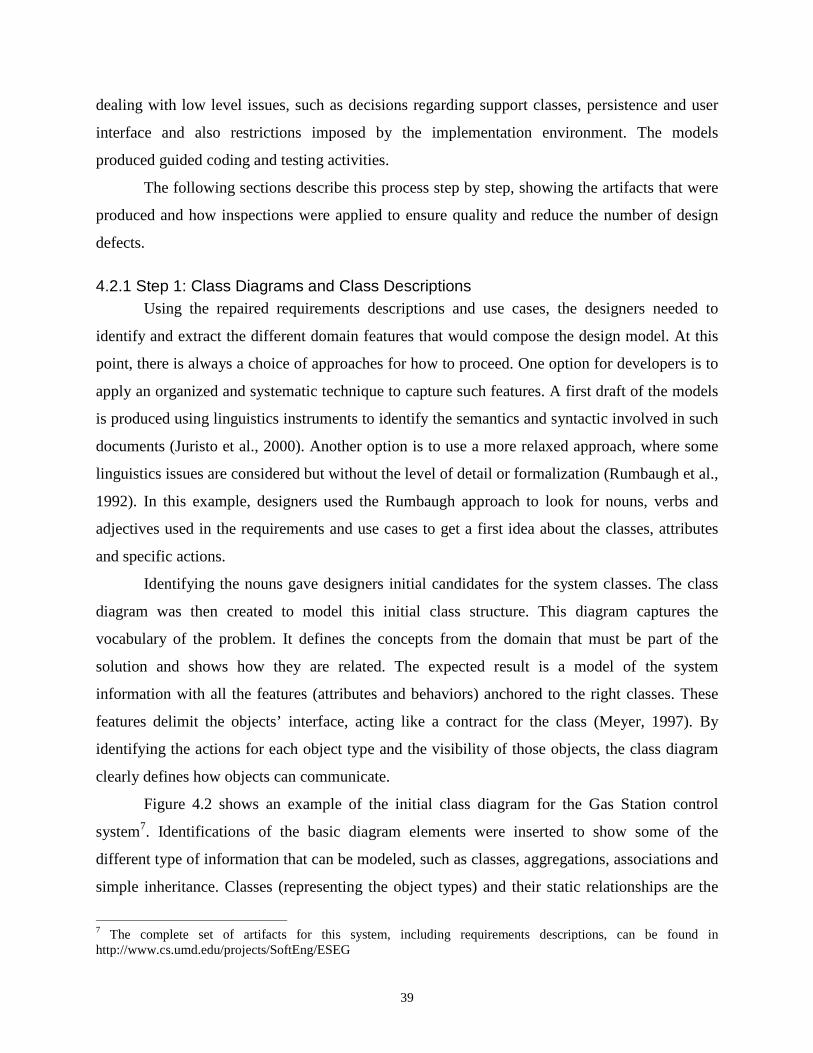
39
dealing with low level issues, such as decisions regarding support classes, persistence and user
interface and also restrictions imposed by the implementation environment. The models
produced guided coding and testing activities.
The following sections describe this process step by step, showing the artifacts that were
produced and how inspections were applied to ensure quality and reduce the number of design
defects.
4.2.1 Step 1: Class Diagrams and Class DescriptionsUsing the repaired requirements descriptions and use cases, the designers needed to
identify and extract the different domain features that would compose the design model. At this
point, there is always a choice of approaches for how to proceed. One option for developers is to
apply an organized and systematic technique to capture such features. A first draft of the models
is produced using linguistics instruments to identify the semantics and syntactic involved in such
documents (Juristo et al., 2000). Another option is to use a more relaxed approach, where some
linguistics issues are considered but without the level of detail or formalization (Rumbaugh et al.,
1992). In this example, designers used the Rumbaugh approach to look for nouns, verbs and
adjectives used in the requirements and use cases to get a first idea about the classes, attributes
and specific actions.
Identifying the nouns gave designers initial candidates for the system classes. The class
diagram was then created to model this initial class structure. This diagram captures the
vocabulary of the problem. It defines the concepts from the domain that must be part of the
solution and shows how they are related. The expected result is a model of the system
information with all the features (attributes and behaviors) anchored to the right classes. These
features delimit the objects’ interface, acting like a contract for the class (Meyer, 1997). By
identifying the actions for each object type and the visibility of those objects, the class diagram
clearly defines how objects can communicate.
Figure 4.2 shows an example of the initial class diagram for the Gas Station control
system7. Identifications of the basic diagram elements were inserted to show some of the
different type of information that can be modeled, such as classes, aggregations, associations and
simple inheritance. Classes (representing the object types) and their static relationships are the
7 The complete set of artifacts for this system, including requirements descriptions, can be found inhttp://www.cs.umd.edu/projects/SoftEng/ESEG

40
basic information represented by class diagrams. A class representation has a name, encapsulated
attributes and behaviors, together with their restrictions (constraints). The main static
relationships for classes are subtype (e.g. Gas is a Product) and associations, which can be
expanded to acquaintances (e.g. a Registered Customer makes a Purchase), aggregation
(Inventory consists of Products) and composition (e.g. a Purchase is part of a Bill).
Figure 4.2 - An example of an UML Class Diagram
Subclasses (subtypes) are modeled by specialization. An inheritance mechanism asserts
that a subclass inherits all the features from the superclass. This means that all the attributes (data
structures), behaviors (services) and relationships described in one class (superclass) are
immediately available for its subclasses. Single (one superclass) and multiple (more than one
superclass) inheritances are both possible. In the example, because the class “Parking” is a
subclass of “Services” , it contains the attribute “Discount_Rate” and it also receives the ability to
Part
Part_Code : longDiscount_Rate : float
Car_MaintenancePrice : float = 150.00
Parking_Spot
Place : text
ParkingPrice : float = 5.00
Gas
Min_Quantity = 100Current_Quantity : floatPrice : float = 1.09
RefuelGallons : float
price() : float
0..*
0..*
0..*
0..*
0..1
1
0..1
10..*
1
0..*
1
Periodic_Messages
Warning_Letters
Delivery_date : date
MessageText : text
BillIssue_Date : DatePayment_Date : Dateamount_paid : float
Registered Customername : textaddress : textAccount_number : numberPhone_number : long
0..*
1..*
0..*0..*
0..*
0..*
0..*
1..*
0..*
1
0..*
1
Product
Min_Quantity : intCurrent_Quantity : floatPrice : float
price()
Gas_Ordering System<<Interface>>
Parts_Ordering System<<Interface>>Inventory
1
1
1
1..*1..*
1
1
1
1
1
1
1
Services
Discount_Rate : float
price() : float PurchasePurchase_Date : dateTax : float
1..*
1
1..*
1
1
0..*
1
0..*
1..*
11
1..*
inheritance
association
aggregation multiplicity
Class name
attributes
behaviors

41
communication with the “Purchases” class. Abstract classes are used to improve the model by
clarifying the classification and organization of the classes. However, abstract classes can not be
instantiated.
Associations represent the relationships among instances of a class (e.g. a Registered
Customer makes a Purchase), but conceptually are shown as relationships among classes. Roles
and the number of objects that take part in the relationship (association multiplicity) can be
assigned for each side of the relationship. A Registered Customer can make 0 or more purchases,
but each purchase can be made by only one customer. Relationships can also be used to
represent the navigability perspectives (e.g. to give an idea about which object is the client) and
specify the visibility to the objects.
At this point in the design process, designers realized that the reasons behind their
decision to create a Registered Customer class may be lost if more information about this class
and its attributes was not captured. As a result, the Class Description was created and more
information was inserted. This included the meaning of the class as well as behavior
specifications and details about relationships and multiplicity. This could also include the
constraints and restriction formalization using the Object Constraint language (OCL),
specification of interfaces and communications such as defined by the CORBA standard and also
the UML models mapping to XML provided by the XMI specifications (OMG, 1999).
Figure 4.3 - An example of a class descr iption
Class name: Registered CustomerDocumentation: The customer is the client of the Gas Station. Only registered customer can pay bills monthly.External Documents defining the class: GlossaryCardinality: n Superclasses: none Inter face:
Attr ibutes:Name: text : It represents the name of a customer. First + last name is the normal way that a name isrepresented
address : text : This is the mail address for the customer. An address should be described using the followingformat: 1999 The Road Ave. apt. 101
Gas Station City - State – Zip Codeaccount_number : long: Customer account number is the numeric identification of the customer in thecontext of the Gas Station control Systemphone_number : long : a phone number to the customer: (area code)-prefix-numberOperations: none

42
Figure 4.3 shows the class description example generated for the Registered Customer
class. Words in bold represent the template fields used on this project. Words in italic are types
for the attributes. There is one description like this for each class in the class diagram.
The class description artifact complements the information described by the other
diagrams. It holds detailed descriptions for classes, attributes, behaviors, associations and
consequently all other important characteristics that need to be described but cannot be done by
other diagrams. It acts as a data dictionary and it is not formally defined by the UML standard,
because it is an implicit document produced during design. Because there is no standard template
for this artifact, one can be derived directly from the diagrams to ensure consistency. The Class
description evolves throughout the design process and at the end must hold all the information
necessary to begin low level design.
4.2.2 Step 2: Interaction and State DiagramsAt this point, developers already had a better view about the problem. They modeled the
use cases and produced a first class diagram. The Class Diagram does not show how the
behaviors can be put together to accomplish the functionality. Most behaviors are the basic
functions for the classes. So, designers needed to understand the functionalities that are required
and how to combine the behaviors to accomplish them. The relationships on the Class Diagram
specify only which objects are related to one another, not the specific behavior or message
exchanged between them. To continue development, it was necessary to show how information
should flow among the objects, represented by the sequence of messages and the data they carry.
• The use cases contained the information the developers needed to describe system
functionality. However, they described functionalities and events using an informal
notation. They do not clearly represent how objects interact and which messages are
exchanged, but merely describe the different scenarios.
Aside from functionality, conditions and constraints are also described by use cases, and
more explicitly, by the requirements descriptions. A condition describes what must be true for
the functionality to be executed. A constraint must always be true regardless of the system
functionality.
Interaction diagrams met the needs of developers at this point because they represent
system functionalities more formally. These diagrams model the use case scenarios including
their conditions and constraints. Basically, interaction diagrams provide a way of showing which

43
messages are exchanged between objects to accomplish the services and functionalities of the
system. Typically, each use case has one associated interaction diagram. However, for complex
use cases more than one interaction diagram can exist, breaking down the use case complexity
while capturing the messages and services necessary to represent the whole functionality.
There are two forms of interaction diagrams: sequence and collaboration. Sequence
diagrams show the flow of messages between objects arranged in chronological order. Normally,
an actor or an event initiates a messages sequence. Some designers suggest that sequence
diagrams are the best form of interaction diagrams to be used when modeling real-time
specifications or complex scenarios (OMG, 1999).
Figure 4.4 - An example of a sequence diagram
Figure 4.4 shows an example of a sequence diagram for the scenario (pay by cash)
represented in Figure 4.1. Object lifelines, a box at the top of a dashed vertical line, represent
objects. An object lifeline holds all interactions over time in which the object participates to
achieve a particular functionality. An object that shows up in different sequence diagrams has
different lifelines, one for each sequence diagram. For example “Bill” could show up in this
: Gas Station Bill : Bill :Cashier_terminal
display _message(text)
"OperationFailed"
[information isok]
pay _monthlybycash(account number, amount)monthlybill _cash(account number, amount)
IsClientRegistered (account number)
update _bill(amount, payment date)
get _bill( )
Object’s life line
Time
: RegisteredCustomer

44
sequence diagram as well as “Paying by Credit Card.” An arrow between object lifelines is a
message, or stimuli, (labeled with at least a name). For example “get_bill()” , where the origin is
“Registered Customer” and the receiver is “Gas Station” . Each message is usually associated
with one behavior encapsulated by the receiving object's class. Additional modeling situaions
that can be captured include: Self-delegation (an object sends a message to itself such as
IsClientRegistered(account number)), condition (to indicate conditions that must be observed to
send or receive a specific message, such as [information is ok]), and iteration marker (that
indicates a message can be sent several times to multiple receiver objects). The order of
messages in the sequence is represented by their position on the object lifeline, beginning at the
top.
Collaboration diagrams are a combination of sequence diagrams with object diagrams
and display the flow of events (usually associated with messages) between objects. They show
the relationships among the objects and the different roles that objects play in the relationships.
Figure 4.5 displays the collaboration diagram for the sequence diagram of Figure 4.4. Objects, in
this case, are represented as a box, for example “Gas Station” . The arrows indicate the messages
(events) sent within the given use case, for example “display_message(text).” Message order is
shown by numbers instead of by position as used in sequence diagrams. So,
“1:pay_monthlybycash” is followed by “2:monthlybill_cash” , and so on.
Figure 4.5 - A Collaboration Diagram
Interaction diagrams are adequate for capturing the collaboration among objects.
Regardless of the form used, designers can see which objects and messages are used to capture
: GasStation
: Cashier_terminal
Bill : Bill : RegisteredCustomer
3: IsClientRegistered(account number)
5: update_bill(amount, payment date)
2: monthlybill_cash(account number, amount)
6: display_message(text)
4: get_bill( )1: pay_monthlybycash(account number, amount)

45
the functionalities of the system. However, functionalities are represented in an isolated manner.
By this we mean that this describes each scenario without considering the other ones. But, some
systems are heavily affected by external events. For these systems, some classes have very
dynamic instances. This dynamism occurs because of the changing states of the objects due to
external events. The designers of this system decided that this system fell into this class.
Because of this the designers found it difficult to understand each specific class by itself.
Because the object states can impose constraints on the use of the object, they can affect
the functionality of the system. In these cases, modeling of the different situations that change
the state of the object is worthwhile. This model helps identify the events and the actions that
cause state changes. It supports the comprehension of an object’s life cycle and specification of
the constraints that will drive objects to be in a consistent state.
Figure 4.6 - A Statechar t
The designers decided that this was necessary information for this system. So, they
created the UML diagram that captures the states of an object and its events, called a statechart
(Harel and Naamad, 1996). Figure 4.6 shows a statechart for the Inventory class. This diagram
describes the basic state information about the states themselves (the cumulative results of the
object behavior, or the collection of attributes value for a specific instance, for instance “ordering
gas” and “ ordering parts” ) and transitions (a system event, or external occurrence that induces a
system or object state change, for instance “gas delivery” or “parts delivery”). Actions can also
be associated with states. Doing so, designers can specify which action is triggered when the
object reaches a specific state, keeps the current state or leaves the current state. For example,
when the state “ low gas” is reached the action of “order gas” should be triggered. Constraints
[Guard]/Action
Initial state
normal stocklow gas
ordering gas ordering parts
low partslow gas
gas delivery
[quantity < minimum]/order gas
low parts
quantity < minimumparts delivery
final state
stateEvent

46
(guards) are normally associated with transitions, showing when objects can change from one
state to another. In this case, when the quantity is less than some minimum value, the “ low gas”
state is entered. Additionally, nesting can break down inherently complex states when necessary.
It is common to find projects that do not make use of state diagrams. However, when
these diagrams are used, their combination with interaction diagrams represent a way to identify
testing scenarios and prepare complimentary test cases for the system (Vieira and Travassos,
1998), (Offutt and Abdurazik, 1999).
Figure 4.7 - A Refined Class Diagram for Gas Station Control System
Part
Part_Code : longDiscount_Rate : float
Car_Maintenance
Price : float = 150.00
0..n
0..n
0..n
0..n
Parking
Price : float = 5.00
Gas
Min_Quantity = 100Current_Quantity : floatPrice : float = 1.09
Refuel
Gallons : float
price() : float
0..n
1
0..n
1
Periodic_Messages
Product
Min_Quantity : intCurrent_Quantity : floatPrice : float
price() : float
Gas_Ordering System<<Interface>>
Parts_Ordering System<<Interface>>
Warning_Letters
Delivery_date : date
Message
Text : text
Bill
Issue_Date : DatePayment_Date : Dateamount_paid : float
price()taxes()customer()purchases()add_purchase(customer, amount, date)update_bill(amount, payment date)
0..n
0..n
0..n
0..n
Purchase
Purchase_Date : dateTax : float
1..n
1
1..n
1
Services
Discount_Rate : float
price() : float1..n1 1..n1
Credit_Card System(from External Systems)
<<Interface>>
Gas Pump
ask_for_payment() : Integerask_for_ccnumber() : Longdisplay_message(text)pay_by_creditcard()pay_by_cash()pay_monthly()ends_pump()()
<<Interface>>
Registered Customer
name : textaddress : textAccount_number : numberPhone_number : long
new_payment_type_request()get_bill() : Bill
1..n
0..n
1..n
0..n
0..n1 0..n1
1
0..n
1
0..n
Parking_Spot
Place : text
0..1
1
0..1
1
Gas Station
Name : textCode : number
dormant_accounts()refuel()refuel_charge()get_CC_number()monthlybill_cash()monthlybill_creditcard()
IsClientRegistered()untitled()calc_refuel_price()
1
1
1
1
1
1..n
1
1..n
1..n
1
Inventory
1..n
1
1..n
1
1
1
1
1
1
1
1
1
1 111
1
1..n
ordergas()

47
4.2.3 Step 3: Refining Class Diagrams
At this point, designers have a first draft for most of the diagrams and specifications for
the functionalities. However, the models are not completely defined and specified since typically
additional services or messages will need to be used to model the dynamic view. This is normal
and represents how designers are organizing the design, finding new features, grouping
behaviors, or even identifying new services that are necessary or make sense when the objects
are combined to extract the required functionalities. New classes can show up during dynamic
modeling to hold new services. The messages that are used by the objects and the information
they carry can be identified. The object’s interface to the external world is defined and must be
represented in the class diagram and fully specified in the class description.
For the gas station example, some results from this step can be seen in Figure 4.7. New
classes were inserted based on services used to represent required functionalities (e.g. Gas
Station). Attributes types and methods signatures were identified (e.g. Bill features). Moreover,
some actors needed to be represented as classes (e.g. interfaces to the external actor) to allow for
the communication between the system’s objects and external participants (e.g. Gas Pump and
Credit Card interfaces). As expected, new information was described in the class description, to
better specify the new behaviors, attributes and other features.
After dynamic modeling of the GSCS, designers decided to prepare a first set of product
measures. Having updated the class diagram, the classes were expected to be more stable at this
point, with most of the functionality described. These measures were expected to be useful
during low level design as a way to identify complex classes or class hierarchies, and thus to
provide some guidance about which part of the design structure must be modified to reduce
structural design complexity (Henderson-Sellers, 1996)(Travassos and Andrade, 1999) or to
identify the classes that are more fault prone (Basili et al., 1995). Section 3.3.1 described some
metrics that can be used to measure the product. The values determined for the metrics WMC,
DIT, NOC and CBO for some classes of the GSCS (recall Figure 4.7) are shown in Table 4.3.
Having all these artifacts, developers now had completed a broad view of the problem.
Although it was not possible to guarantee that the design was complete, decisions about
packaging and internal structuring could take place. But, before that, object-oriented reading
techniques were applied to identify possible defects in the design and ensure that such decisions
were made on a sound basis.

48
As discussed in Section 3.2.2, Object-Oriented Reading Techniques (OORTs) are a set of
reading techniques that have been tailored for defect detection in high-level object-oriented
design documents. Horizontal reading ensures that all the design artifacts represent the same
system and tends to find more defects of inconsistency and ambiguity. For instance, when the
diagrams from Figures 4.4 and 4.7 were inspected, at least 3 possible defects (discrepancies)
were found using a horizontal reading technique (class diagram against sequence diagrams):
1) gas station class has no representation for the message get_bill();
2) there is no Cashier_terminal class described in the class diagram;
3) gas station sends a message to an object that seems to not exist.
Table 4.3 GSCS Metr ics and valuesThe first discrepancy is an inconsistency. If gas station object receives the get_bill()
message, it means that its class must have a description for such a message. Developers could not
be sure whether or not the message get_bill() was appropriate and necessary in the context of the
system, but the OORT did raise the question by highlighting the discrepancy between the
diagrams. Discrepancies 2 and 3 are potential defects, but it was not possible to know if they
were real defects just by using the information in the design artifacts. Designers reviewed the
discrepancy list as a team to discuss which ones were real defects and needed to be fixed prior to
vertical reading. Discrepancies that were not seen as real defects were good candidates for
further evaluation by vertical reading after the high level design was completed.
4.2.4 Step 4: Package and Activities diagramsThe development of complex systems demands significant management efforts. The
identification of the parts of the system that will be implemented and their distribution among the
development team is one of the important management tasks. UML provides a diagram, the
package diagram, that can be used to represent the high level grouping of classes. Designers can
Class Name WMC DIT NOC CBOServices 1 0 3 1
Refuel 1 1 0 2Car_Maintenance 1 1 0 2
Product 1 0 2 1Gas 1 1 0 2Part 1 1 0 2
Registered Customer 2 0 0 4Gas Station 9 0 0 5

49
Customers
+ Registered Customer+ Purchase+ Bill+ Message+ Periodic_Messages+ Warning_Letters
Services
+ Services+ Refuel+ Parking+ Car_Maintenance
Products
+ Gas+ Part+ Product+ Inventory
External Systems
+ Gas Pump+ Credit_Card System+ Parts_Ordering System+ Gas_Ordering System
Gas Station
+ Gas Station+ Parking_Spot
package
dependency
group classes by different characteristics such as structure, hierarchy or even functionality. These
diagrams are used to represent how designers broke down a large and complex system into
smaller units, clustering the classes in well-defined parts, called packages. To guarantee that the
information about the dependencies between classes is not lost, package diagrams allow for the
representation of such a dependencies between the packages. For the GSCS system, after
dynamic modeling and the associated changes to the class diagram, the system was felt to be of
sufficient complexity for package diagrams to be useful. Figure 4.8 shows the package diagram
created for the system.
Figure 4.8 – An example of a Package DiagramUsually, a dependency between two classes exists if changes to the definition of one class
may cause changes to the other one. In this case, dependencies can be listed as 1) a class (object)
sends a message to another class; 2) a class has another class as part of its data, and 3) a class
mentions another one as a parameter to one of its behaviors. When any two classes from
different packages have dependencies between them, the packages that hold them also have a
dependency. For large projects this is vital information because developers can use it to identify
which packages must be integrated or will be impacted when modifications are introduced.
Developers can control the level of granularity at which they are grouping and defining
packages, for instance, by nesting packages within other packages.
Dependencies between packages support design decisions. For example, based on
dependency information developers can identify which packages and parts of the static design
must be rearranged to reduce system coupling. Also, by identifying the classes that can be
grouped, developers can produce useful information for testing activities, for example to bind a

50
start
join
fork
activity
order gas
wait for gas
normalize stock
stock low
order parts
wait for parts
gas low parts low
adjust stock
parts deliveredgas delivered
gas ordered parts ordered
PartsInventoryGas
end
swimlanes
set of system concepts that may be tested together. Information regarding package contents and
visibility may be shown by the diagram.
Activity diagrams can be more useful for certain types of systems, mainly those that
involve multiple threads, and need to detail which internal events will happen after the system
receives an external event from an actor. Different from state diagrams, activity diagrams
represent the services that must be accomplished when internal events happen. They can be used
to model activity flow of services (functionality). Despite this difference, activity diagrams have
some similarities to statecharts. Activities are similar to states while events are similar to
transitions. They are useful to represent functionalities that involve more than one class and set
of services. Activity diagrams are useful when modeling business processes. An example of this
diagram with some of its elements can be found in Figure 4.9.
Figure 4.9 – An Activity diagramAt this point, all the UML high level design artifacts had been produced. Horizontal
reading was applied and the discrepancies identified as defects were solved and fixed. However,
some of the reported discrepancies were still unresolved. Vertical reading was then applied to
ensure that design artifacts represented the same system described by the requirements and use-
cases. Because documents from different life cycle phases, using different levels of abstraction
and detail, were compared, vertical reading found more defects of omission and incorrect fact.
51
For example, horizontal reading had determined that the sequence diagram from figure
4.4 was consistent with all the other high-level design artifacts. Applying a vertical reading
technique (sequence diagrams against use cases) it was read against the use case represented in
Figure 4.1. This sequence diagram intends to capture the use case "pay by cash", which is a
specialization of "pay monthly bills" use case. Although representing the same functionality,
the reading technique was needed to compare the diagrams due to the different levels of
abstraction used. Use cases normally describe the scenarios using high abstraction. Readers need
to explore these differences when inspecting the documents.
Two different scenarios can be seen in the context of the use case. For instance, the use
case scenario "Customer sends payment" was captured by the message
pay_monthlybycash(account number, amount). The sequence of messages monthlybill_cash,
IsClient registered, update_bill and display_message captured the scenario "Cashier verifies
information and receive payment". However, the message get_bill() did not seem to be part of
the use case (a customer already has the bill before paying it) and should not be part of the
sequence diagram. This message had been marked as a discrepancy when horizontal reading was
applied. The use of the vertical reading techniques identified that it was a real defect that must be
fixed before low level design.
After all the high-level UML design artifacts were inspected and the defects fixed, a
stable description for the problem was ready. These models were important during low level
design, the next design activity.
4.3 Low Level Design Activities
As stated earlier, one of the benefits of UML is that designers use the same set of
constructs to represent the different aspects of the system, making the transition from
requirements to high-level design to low-level design a smooth process. The results from the
high level design compose the problem domain design. They must be modified and extended to
include all technical restrictions imposed by the different resources (e.g. development
environments, programming languages, computer architectures and so on) that will be used to
build the software and by the non-functional requirements, such as performance, usability and
maintainability. One necessary modification may be caused by the reuse of early projects and
coded classes, which impose the reorganization of the current classes and relationships. Another

52
could be the level of inheritance that must be observed now due to characteristics available in the
programming language. Low level issues, such as the definition of low abstraction classes or
even the detailed description for an algorithm, are important for this design phase.
The types of diagrams produced in low level design are basically the same ones that were
produced for high level design. The main difference is the level of detail. Moreover, new classes
will show up to deal with persistence, management and user interface issues. Methods will have
their signatures fully described and the models will be prepared in such way that programmers
can use them as the basis for coding and testing activities, including the specification of the
components and the different devices that will compose the final solution.
Different software components support the description of the solution for a problem.
Each component normally represents a physical module of code. Although a package can hold
more than one component, components can be viewed as a low-level package representation.
Sometimes, a class that belongs to a specific package can be present or used in different
components depending on the type of functionality the developer is representing.
A component diagram shows the components implemented in the system, together with
their communication lines (dependencies). Dependencies highlight the coupling among
components and specify which interface for the component is being used. This diagram is
normally produced when designers have a clear definition about the solution and have already
defined the architecture for the software.
The information captured by components diagrams support the identification of system
integration interdependencies. This specific type of information will be useful when planning
testing and defining delivery and maintenance priorities. Figure 4.10 shows an example of a
component diagram.
Component diagrams represent system organization from the software perspective. For
some system types (e.g. web-based applications, distributed applications) the physical
relationship between software and hardware plays an important role in describing how the
system will be distributed and organized for deployment. UML provides deployment diagrams to
describe this type of information.

53
$ % & ' ( % ( ) * +, - * . / & & * -
0 % - 1- / % 1 / -
2 * 1 / 2
0 0' 3 & ( / 2
$ % &4 - 1 / - ) + 5 ' 3 & ( / 2
, % - ( & * - 1 / - ) + 5' 3 & ( / 2
687:9<;>=@?BADC
EGF CIH<A F AKJ 9>L
M =NCOAD98PRQ<7SC
H@QN7:TNJ ?UQ<C
VIL<AWQN7SX F ?UQZY[J A]\Q_^NASQN7SL FN` C]a<CIASQ<PbC
Figure 4.10 - An example of a component Diagram
By representing the different pieces of hardware (nodes, such as devices, sensors,
computers and so on), and the communication paths (connections) between nodes, deployment
diagrams help to clarify the existing integration features, allowing for the identification of
possible communication bottlenecks or that demand specific infrastructure for testing and
evaluation.
Figure 4.11 - A deployment diagram
Some designers suggest combining components with deployment diagrams, showing the
components inside the corresponding nodes. Doing so, they get the benefits of both
representations using just one diagram. Figure 4.11 shows a deployment diagram in its standard
form.
There is much written describing low level design activities. To produce a complete list
here is not feasible. However, the reader who is motivated by these discussions can find some of

54
the following works useful: a classical text about OO design and the use of design patterns to
describe software solutions can be found in (Gamma et al., 1995). It describes useful design
concepts and suggests patterns for the different design situations. The discussions are focused on
the structural organization of the models. Although it does not use UML as the modeling
language (the authors used OMT, one of the UML roots), their descriptions are clear enough to
allow the immediate mapping to UML. A complimentary text can be found in (Buschmann et al.,
1996). (Meyer, 1997) has an in depth discussion about basic types and objects exploring different
issues such as management and persistence. (Henderson-Sellers, 1996) raises some useful
discussions about design complexity and suggests some ways to use metrics to identify high
structural complexity design parts.
5. Maintenance or EvolutionThe process model shown in Figure 3.1 has a definite end point for the development
process (delivery to the customer). This is a useful abstraction, but currently in industry very few
systems are built in their entirety and then shipped to the customer. Most software development
involves some type of incremental development, or enhancement-type maintenance. Incremental
development can be defined as a process whereby the system is broken into smaller pieces and
the goal of each release is to add a new piece to the software. For more information on
incremental development see (Pressman, 1997), (Pfleeger, 1998). In these development or
maintenance cases, software development takes place in the presence of some set of reusable
assets.
We use the term reusable assets to refer to the set of artifacts in existence from any
operational system that needs to be expanded, improved, updated or otherwise modified. The
system could be some sort of a legacy system (Markosian et al., 1994) where the system is many
years old, a current system of which the next release is being produced, or anything in between.
The reusable assets will consist of the artifacts from all of the lifecycle phases mentioned
previously. This includes, for example: a requirements document, design documents, and code.
The goal in incremental development or maintenance is to perform the given task with
least amount of effort while reusing as much as possible from the set of reusable assets. In this
section, we discuss a modified form of the software process that takes advantage of UML and
meets those needs.

55
5.1 ProcessThe software development process from Section 1 must be augmented to allow
developers to decide what pieces from the set of the reusable assets are candidates to be reused in
the new or evolved system. These pieces could include requirements, design, code, or test plans.
Specifically, activities must be added to the process that allows for the understanding of the
reusable assets. Figure 5.1 shows the new development process. The activities above the dotted
line are the same ones that appeared in Figure 3.1. The activities that appear below the dotted
line have been added for the new process. The new activities have been added to take into
account the reusable assets when developing the new or evolved system. Before a developer can
decide whether or not to use any of the reusable assets, they must first understand those assets.
We have found that the UML diagrams can be very useful in this process of understanding.
NewRequirements
RequirementsSpecification
High LevelDesign
Low LevelDesign
Coding andTesting
PBR Customerperspective for evolving
OO Vertical readingfor evolving
Object Or iented Reading
Integration mismatches identification
RequirementsDescriptions
High levelDesign Artifacts
Low levelDesign artifacts
Source Code
Perspective Based Reading
ProjectPlan
Process Tracking, Management and Quality Assurance
Source code
Artifacts,Object Files,Executables
System Repository
Figure 5.1: Inser ting Maintenance activities in the software process
5.2 UnderstandingAs stated earlier, the goal of the understanding activities is to support the comprehension
of the reusable assets. In order for a developer to effectively use the existing requirements or
design, s/he must first understand the artifacts themselves, as well as what needs to be done.
These understanding activities are important to developers because they allow for the
identification of the important pieces from the set of reusable assets that can be (re)used for the
new system. Understanding activities should be used for three tasks within the software lifecycle:
(1) to understand the old requirements, (2) to understand the old design and (3) to determine
what the integration mismatches are.

56
When a developer is evolving or maintaining a system, in general, there will be more
requirements retained from the old system than new ones added. Because of this, it makes sense
to reuse as much of the existing requirements as possible. But, before a developer can
effectively reuse those requirements they must be understood. When examining the old
requirements, developers strive to understand which domain level concepts are present in or
absent from those requirements in the context of the new requirements that have been received.
The main goal here is to determine, on a high level, if the old set of requirements is in conflict
with the new requirements, or if the old requirements can simply be modified to include the new
requirements. If the developer can efficiently reuse the existing requirements, it could have a
positive effect on the cost and effort of the new system.
Likewise, once the developers have created the new set of requirements, they must
examine the existing design with the goal in mind of understanding that design. When
developers examine the old design, they need to determine if the way that the domain was
represented will allow the new requirements to be added. The old design must be understood
from the point of view of whether the earlier design decisions conflict with a newly added
requirement, or if the old design allows itself to be modified to include the new requirements.
By reading the old design for understanding, the developers acquire enough knowledge to create
a design for the new system, reusing as much of the old design as possible. Again, if this reuse is
efficient, it could have a positive effect on the cost, effort, and complexity of the new system.
Integration mismatches are a way to describe problems that may be encountered when
using COTS. In this case, the reusable assets can be viewed as a COTS. Therefore, the
developers must determine if the new design and the reusable assets are compatible. For a more
complete discussion of this topic see (Yakimovitch et al., 1999).
Although these types of understanding activities exist in most software life cycles,
developers traditionally have accomplished them with little or no guidance. This means that the
developers normally examine the artifacts in an ad-hoc fashion and try to identify the features
which they consider to be important. From earlier research, we have seen that, in general,
developers tend to be more effective at performing an inspection or reading task when using a
technique rather than doing it in an unguided fashion. The reason for this is that the techniques
help the reader to better focus on the task at hand, and accomplish the important steps necessary
for its successful completion.

57
Earlier in this text we mentioned two techniques, PBR and OORTs, that were designed
for use in the process of defect detection. These techniques were defined to be useful with the
UML artifacts. As we began to look more closely at this issue and reexamine the techniques, we
became aware that those techniques appeared to, with slight modifications, allow the developers
to understand the document(s) being inspected, rather than to find defects in the document. In
the following sections, we will discuss how PBR and OORTs can be used in the process of
understanding for evolving a system.
5.1.1 PBRThe necessary starting point in this process is the requirements. This is because the
requirements determine, at the highest level, what pieces of the reusable assets can be reused in
the new system. When developing the next version of a system, two important artifacts are
present: (1) the set of requirements describing what is to be added to the system, and (2) the
requirements and use cases from the existing reusable assets. To begin determining how much
of the reusable assets can be reused, the developer must examine these two sets of requirements
and use cases to find out where potential discrepancies lie.
This examination can be done by reading the documents. This reading is usually
performed in some ad-hoc manner. The Perspective Based Reading techniques that were
discussed in Section 4.1.1 for examining a new set of requirements can also be used in this
understanding process. A developer can take the new set of requirements and read these against
the requirements and use cases from the set of reusable assets to determine where the
discrepancies lie. The goal of this is to come up with a new set of requirements that contains both
the old and the new requirements. Here only the customer perspective of PBR is used. This is
because the type of information that is gathered by this perspective most closely resembles the
type of information that is necessary to evolve the requirements.
The main task of the reader here is to determine what has to be ‘ fixed’ or changed so that
the new requirement can be added to the existing system. There are many situations that the
reader is looking for. Using the PBR’s customer perspective, the reader first examines the
participants. It must be determined whether the participants in the new system are the same as
those in the old system. For example, new participants may need to be added, names of
participants may need to be changed for consistency, or the way that a participant interacts with
the system may change.

58
The next thing that readers look at is product functionality. The reader will examine the
existing use-cases to determine if they cover the new functionality. If they do not, then either
new use-cases must be created, or the old use-cases must be modified to handle the new
functionality. The reader also needs to determine if the relationships between the participants,
discussed above, and these product functions remain the same in the new system, or if changes
must be made. The result of this process is a list of these discrepancies that aids the developers
in integrating the new requirements and the set of requirements taken from the reusable assets.
5.1.2 OORTOnce a developer has come up with a new set of requirements describing the new system,
the next step is to create a design for this system. Again, this is typically done in some sort of
ad-hoc fashion. Here developers are interested in doing similar tasks to what was accomplished
in the requirements phase. Now that a set of requirements has been created that includes the new
requirements, the UML design documents from the set of reusable assets must be read against
this set of requirement to determine where the discrepancies lie.
When we speak of discrepancies here, we are referring, at an abstract level, to the
information gap between the old and the new system. This may include the fact that new classes
must be added to the design to support the new requirements. Or, new attributes and behaviors
may need to be added to existing classes to support the new functionality. The way that classes
interact and pass messages may need to be changed also to support the structure of the new
system.
Figure 5.2 – New Gas Station Requirement
The Object Oriented Reading Techniques, and more specifically, the Vertical Reading
techniques discussed in Section 3.2.2 are well suited for this task. The reason that Vertical
Reading can be used here, is that when performing Vertical Reading, a reader examines a set of
requirements against the UML diagrams of a design. The main difference that arises when these
Monthly bill payments will now be accepted using a credit card over the Internet. The customer mustaccess the Gas Station homepage. The customer will log in using his account number and password.The password is assigned by the Gas Station at the time of account creation. The customer is presentedwith the amount of his current bill. The customer then enters the amount they wish to pay and theircredit card information. The credit card information is verified by the system. If verification succeeds,the bill is updated in the system. If it fails, the customer is presented with the reason for failure, andgiven a chance to try again.
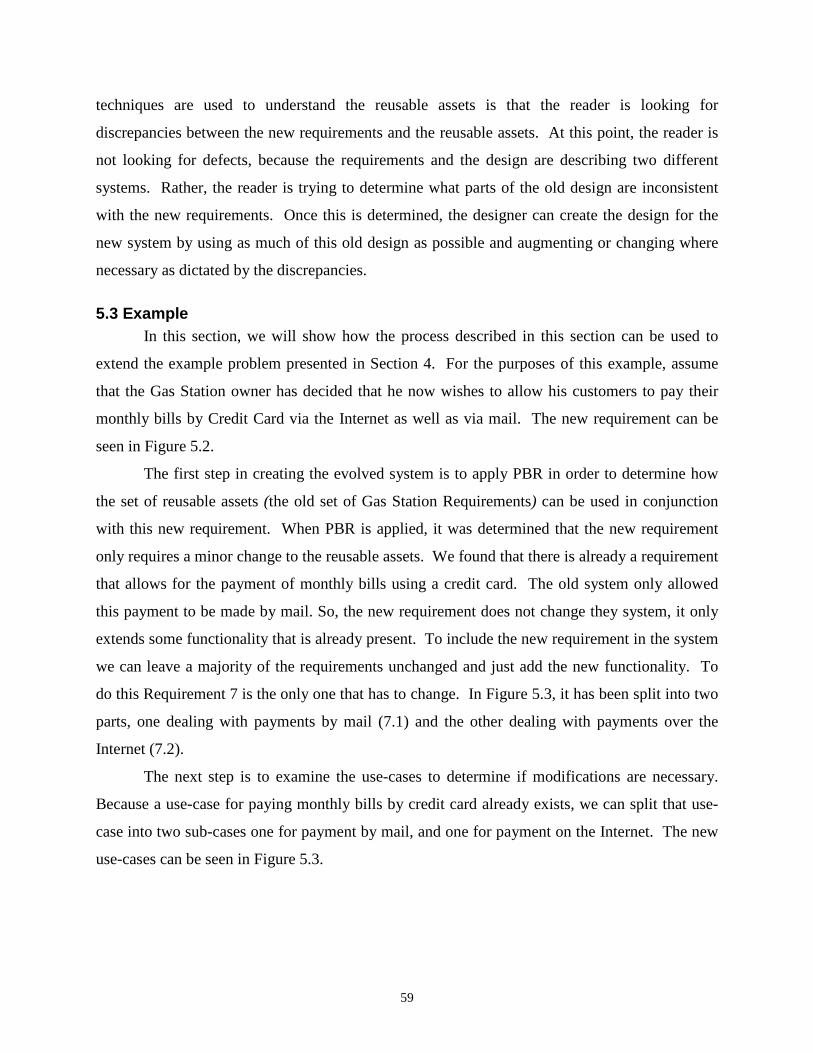
59
techniques are used to understand the reusable assets is that the reader is looking for
discrepancies between the new requirements and the reusable assets. At this point, the reader is
not looking for defects, because the requirements and the design are describing two different
systems. Rather, the reader is trying to determine what parts of the old design are inconsistent
with the new requirements. Once this is determined, the designer can create the design for the
new system by using as much of this old design as possible and augmenting or changing where
necessary as dictated by the discrepancies.
5.3 ExampleIn this section, we will show how the process described in this section can be used to
extend the example problem presented in Section 4. For the purposes of this example, assume
that the Gas Station owner has decided that he now wishes to allow his customers to pay their
monthly bills by Credit Card via the Internet as well as via mail. The new requirement can be
seen in Figure 5.2.
The first step in creating the evolved system is to apply PBR in order to determine how
the set of reusable assets (the old set of Gas Station Requirements) can be used in conjunction
with this new requirement. When PBR is applied, it was determined that the new requirement
only requires a minor change to the reusable assets. We found that there is already a requirement
that allows for the payment of monthly bills using a credit card. The old system only allowed
this payment to be made by mail. So, the new requirement does not change they system, it only
extends some functionality that is already present. To include the new requirement in the system
we can leave a majority of the requirements unchanged and just add the new functionality. To
do this Requirement 7 is the only one that has to change. In Figure 5.3, it has been split into two
parts, one dealing with payments by mail (7.1) and the other dealing with payments over the
Internet (7.2).
The next step is to examine the use-cases to determine if modifications are necessary.
Because a use-case for paying monthly bills by credit card already exists, we can split that use-
case into two sub-cases one for payment by mail, and one for payment on the Internet. The new
use-cases can be seen in Figure 5.3.

60
Figure 5.3 – Evolved Use Cases
Now that we have the evolved requirements and use cases, the next step is to modify the
design so that it includes the new requirements. When applying OORTs we determined that the
only change to the class diagram that was needed was to add a new class to model the homepage.
We also determined that a new sequence diagram was needed to model the new use case of
“Payment over Internet” . These new diagrams can been seen in Figure 5.4 and 5.5 respectively.
refuel
parking
maintenance
Paying By cash
Paying by credit card
Customer Credit CardAdministration
Paying Monthly Bills
billing services
Cashier
Paying By Mail Paying over Internet
Specific Use Case for “ Paying by Credit Card” :Types of Credit Card Payments:1) Paying By Mail
Customer sends payment and account number to the cashier.Cashier selects the payment option and enters account number, amount remitted, and type ofpayment. If any of these information are not entered, payment can not be completed (cashierinterface will display a message) and the operation will be cancelled.
Gas Station ask Credit Card System to authorize paymentif authorization is ok payment is madeif payment is not authorized or failed Cashier receives a message describing that payment wasnot able to be processed. Cashier must repeat operation once more before cancel all theoperation.
2) Paying over InternetCustomer logs on to the homepage and account number and password.System prompts will bill amount.Customer enters amount to pay and credit card infoGas Station ask Credit Card system to authorize payment.If authorization is OK, payment is madeIf authorization fails, customer receives message describing that payment could not be made.Customer my try 1 more time or cancel operation.

61
Figure 5.4 – Evolved Class Diagram
6. The Road AheadSoftware design is a great challenge. Increasing product commercialization, rapidly
changing technologies, shorter deadlines, the Internet, and other factors are radically changing
the software industry daily. Narrow software engineering training is making the design of
software a more complex problem each day (Clark, 2000).
Well-engineered software needs good software engineering. Software developers are
demanding new techniques and instruments from software engineers to support their software
design. Deadlines are constantly short. Quality and productivity needs to be high. Costs must be
low. Flexibility for change is necessary to follow technology and users requests. All these factors
surround software design.
Part
Part_Code : longDiscount_Rate : float
Car_Maintenance
Price : float = 150.00
0..*
0..*
0..*
0..*
Gas
Min_Quantity = 100Current_Quantity : floatPrice : float = 1.09
Refuel
Gallons : float
price() : float
0..*
1
0..*
1
Periodic_Messages
Warning_Letters
Delivery_date : date
Services
Discount_Rate : float
price() : float
Message
Text : text
Bill
Issue_Date : DatePayment_Date : Dateamount_paid : float
price()taxes()customer()purchases()add_purchase(customer, amount, date)update_bill(amount, payment date)
0..*
0..*
0..*
0..*
Purchase
Purchase_Date : dateTax : float
1..*
1
1..*
1
1..*1 1..*1
Parking
Price : float = 5.00
Product
Min_Quantity : int
Current_Quantity : float
Price : float
price() : float
Gas_Ordering System<<Interface>>
Parts_Ordering System<<Interface>> Credit_Card System
(from External
<<Interface>>
Gas Pump
ask_for_payment() : Integerask_for_ccnumber() : Longdisplay_message(text)pay_by_creditcard()pay_by_cash()pay_monthly()ends_pump()()
<<Interface>>
Registered Customer
name : textaddress : textAccount_number : numberPhone_number : long
new_payment_type_request()get_bill() : Bill
1..*
0..*
1..*
0..*
0..*1
0..*1
1
0..*
1
0..*
Parking_Spot
Place : text
0..1
1
0..1
1
Inventory
1..*
1
1..*
1
1
1
1
1
1
1
1
1
Homepage
login()pay_by_creditcard()
Gas Station
Name : textCode : number
dormant_accounts()refuel()refuel_charge()get_CC_number()monthlybill_cash()monthlybill_creditcard()IsClientRegistered()untitled()calc_refuel_price()
1
1
1
1
1
1..*
1
1..*
1..*
1
1..*
1
1 11 1
ordergas()

62
Figure 5.5 – Sequence Diagram
The software design process described in this text tries to deal with some of these issues
without building one more complication for designers. Using a standard notation (UML) and a
combination of simple techniques (PBR and OORTs) and models (waterfall software life cycle)
we described how developers can prepare the design of an application accomplishing a few
activities at the same time that can reduce the number of defects. In addition, the same ideas
were shown to be useful to evolve or maintain the UML artifacts for a software product.
Although not complete as a software development process it can be tailored to fit in
different software processes frameworks or be used as the basis for defining more complete
software processes.
BibliographyBasili, V. R., Briand, L. C. and Melo, W. L. , IEEE Transactions on Software Engineering, A
Validation of Object-Oriented Design Metrics as Quality Indicators. Volume 22, Number10, pp 751-761, October 1996.
Basili, V., Caldiera, G., Lanubile, F., and Shull, F. (1996). Studies on reading techniques. InProc. of the Twenty-First Annual Software Engineering Workshop, SEL-96-002, pages59-65, Greenbelt, MD, December.
Customer :Customer
GasStation :Gas Station
Credit card :Credit_Card System
Bill : BillHomepage :Homepage
Customers :Registered Customer
"operationfailed"
[response time <30 secs]
IsClientRegistered(accountnumber)
update_bill(amount, payment date)
pay_bycreditcard(account number, amount,cc_number)
monthlybill_creditcard(account number, cc number,amount)
authorize_payment(cc_number, amount,date)
display_message(text)
get_bill( )
login(account, password)

63
Beizer, B. (1995). Black-Box Testing : Techniques for Functional Testing of Software andSystems. John Wiley & Sons. ISBN 0471120944
Binder, R. V. (1999). Testing Object-Oriented Systems: Models, Patterns, and Tools. Addison-Wesley Pub Co. ISBN 0201809389
Booch, G. (1994). Object-Oriented Analysis and Design, Prentice-Hall.
Booch, G. (1999). UML in Action, Communications of the ACM, vol. 42, No. 10, pp. 26-28,October.
Booch, G.; Rumbaugh, J. and Jacobson, I. (1999). The Unified Modeling Language User Guide.Addison-Wesley Object Technology Series. Addison-Wesley. ISBN 0201571684.
Buschmann, F.; Meunier, R.; Rohnert, H., Sommeerlad, P. and Stahl, M. (1996). Pattern-Oriented Software Architecture: A System of Patterns. New York: John Wiley and Sons.
Cangussu, J.W.L.; Penteado, R.A.D. ; Masiero, P.C.; Maldonado, J.C. (1995). Validation ofStatecharts Based on Programmed Execution, Journal of Computing and Information,Vol. 1 (2), ISSN 1201-8511 (CD-ROM Issue), Special Issue of the Proceedings of the 7thInternational Conference on Computer and Information ICCI’95, Peterborough, Ontario,CA, July.
Chidamber, S.R. and Kemerer, C. F. (1994). A Metrics Suite for Object Oriented Design, IEEETransactions on Software Engineering, vol.20, number 6, June.
Clark, D. (2000). Are Too Many Programmers Too Narrowly Trained?. IEEE Computer, vol. 33number 6, pp. 12-15, June.
Coad, P. and Yourdon, E. (1991). Object-Oriented Design. Yourdon Press Computing Series.ISBN: 0136300707
Coleman , D.; Bodoff, S. and Arnold, P. (1993). Object-Oriented Development: The FusionMethod. Prentice Hall; ISBN 0-133-38823-9.
Conallen, J. (1999). Modeling Web Application Architectures with UML. Communications ofthe ACM, vol. 42, number 10, pp. 63-70, October.
Clunie, C.; Werner, C.; Rocha, A. (1996). How to Evaluate the Quality of Object-OrientedSpecifications. 6th International Conference on Software Quality. Ottawa, Canada,pp.283-293.
Chung, L.; Nixon, B. A.; Yu, e. and Mylopoulos, J. (1999). Non-Functional Requirements inSoftware Engineering. Kluwer Academic Publishers. ISBN 0792386663.
Delamaro, M. E. and Maldonado, J.C. (1996). Integration Testing Using Interface Mutation. VIIInternational Symposium on Software Reliability Engineering (ISSRE), White Plains -NY, pp 112-121, November.
Douglass, B. P. (1999). Doing Hard Time: Developing Real-Time Systems with UML, Objects,Frameworks and Patterns, Addison-Wesley Pub Co; ISBN: 0201498375
D’Souza, D. F. and Wills, A. C. (1998). Objects, Components, and Frameworks With UML : TheCatalysis Approach. Addison-Wesley Pub Co; ISBN 0201310120
Eriksson, H. and Penker, M. (1997). UML Toolkit. John Wiley & Sons; ISBN 0471191612.

64
Epstein, P. and Sandhu, R. (1999). Towards a UML based approach to role engineering.Proceedings of the fourth ACM workshop on role-based access control on Role-basedaccess control, pp. 135-143. October, Fairfax, VA USA
Evans, A. and Kent, S. (1999). Core Meta-Modeling Semantics of UML: The pUML Approach.In the Proceedings of the Second International Conference on the Unified ModelingLanguage - UML’99. Fort Collins, Colorado, USA.
Fagan, M., (1976). Design and code inspections to reduce errors in program development. IBMSystems Journal, 15(3):182-211
Finkelstein, A.; Krammer, J. and Nuseibeth, B. (eds.) (1994). Software Process Modeling andTechnology, John Wiley and Sons Inc.
Fowler, M. and Scott, K. (2000). UML Distilled: A Brief Guide to the Standard Object ModelingLanguage, Second Edition, Addison-Wesley. ISBN 020165783X
Gamma, E.; Helm, R.; Johnson, R. and Vlissides, J. (1995). Design Patterns: Elements ofReusable Object-Oriented Software. Addison-Wesley.
Gilb, T. and Graham, D. (1993). Software Inspection. Addison-Wesley, Reading, MA.
Graham, I. M.; Henderson-Sellers, B. and Younessi, H. (1997). The OPEN ProcessSpecification, Addison-Wesley, Harlow, UK.
Harel, D. and Naamad, A. (1996). The STATEMATE semantics of statecharts. ACMTransactions on Software Engineering and Methodology. Volume 5, Issue 4, pp. 293-333.
Henderson-Sellers, B. (1996). Object-Oriented Metrics: Measures of Complexity. Prentice Hall,Inc. ISBN 0132398729.
IEEE Std 830-1993. (1993). Recommended Practice for Software Requirements Specifications.New York: Software Engineering Standards Committee of the IEEE Computer Society.
IEEE (1987). Software Engineering Standards. IEEE CS Press.
Jacobson, I.; Christerson, M.; Jonsson, P. and Övergaard, G. (1992). Object-Oriented SoftwareEngineering: A Use Case Driven Approach. (revised printing). Addison-Wesley
Jacobson, I.; Booch, G. and Rumbaugh, J. (1999). The Unified Software Development Process.Addison-Wesley, ISBN 0201571684.
Jäger, D.; Schleicher, A. and Westfechtel, B. (1999). Using UML for Software ProcessModeling. Proceedings of the 7th European Engineering Conference held jointly with the7th ACM SIGSOFT symposium on Foundations of Software Engineering, pp. 91-108.September, Toulouse France.
Jalote, P. (1997). An Integrated approach to Software Engineering. Second Edition. Springer.ISBN 0387948996
Juristo, N., Moreno, A. M. and López, M. (2000). How to Use Linguistic Instruments for Object-Oriented Analysis. IEEE Software, pp. 80-89, May/June
Kitchenham, B. A.; Travassos, G.H., von Mayrhauser, A.; Niessink, F.; Shneidewind, N. F.,Singer, J., Takada, S., Vehvilainen, R., Yang, H. (1999). Towards an Ontology of

65
Software Maintenance, Journal of Software Maintenance: Research and Practice, volume11, issue 6, pp. 365-389, John Wiley & Sons.
Kobryn, C. (1999). UML 2001: A Standardization Odyssey. Communications of the ACM, vol.42, number 10, pp. 29-37, October.
Krutchen, P. (1999) The Rational Unified Process: An Introduction, Addison-Wesley, Reading,Mass.
Kung, C.; Hsia, P.; Gao, J. and Kung, D. C. (1998).Testing Object-Oriented Software. October,IEEE Computer Society ISBN 0818685204
Larsen, G. (1999). Designing Component-Based Frameworks Using Patterns in the UML.Communications of the ACM, vol. 42, number 10, pp. 38-45, October.
Leite, J. C. S. P. and Freeman, P. A. (1991). Requirements Validation Through ViewpointResolution. IEEE Transactions on Software Engineering: Vol. 17, N. 1, pp. 1253-1269.
Lie, W. and Henry, S. (1993). Object-oriented metrics that predict maintainability, Journal ofSystems and Software. 23(2):111-122.
Lorenz, M., and J. Kidd (1994). Object-Oriented Software Metrics, Prentice-Hall.
Lockman, A. and Salasin, J. (1990). A procedure and tools for transition engineering.Proceedings of the fourth ACM SIGSOFT symposium on Software developmentenvironments, pp. 157-172. December, Irvine, CA USA.
Markosian, L.; Newcomb, P.; Brand, R.; Burson, S. and Kitzmiller, T. (1994). Using an enablingtechnology to reengineer legacy systems. Communications of the ACM. Volume 37,Issue 5, Pages 58-70.
Meyer, B. (1997). Object-Oriented Software Construction. Second Edition. Prentice-Hall. ISBN0-13-629155-4
Morisio, M., Travassos, G. H. and Stark, M. (2000). Extending UML to support DomainAnalysis. In the Proceedings of the 15th IEEE International Conference on Automatedsoftware Engineering. Grenoble, France, September.
NASA. (1993). National Aeronautics and Space Administration, Office of Safety and MissionAssurance. "Software Formal Inspections Guidebook". Report NASA-GB-A302, August1993.
Offutt, J. (1995). Practical Mutation Testing. Twelfth International Conference on TestingComputer Software, pages 99--109, Washington, DC, June.
Offutt, J. and Abdurazik, A. (1999). Generating Tests from UML Specifications. SecondInternational Conference on the Unified Modeling Language (UML99), Fort Collins, CO,October.
OMG - Object Management Group, Inc. (1999). UML V1.3 - Unified Modeling LanguageSpecification, Version 1.3. June (http://www.omg.org)
Perry, W. (2000). Effective Methods for Software Testing. John Wiley and Sons, Inc. 2nd
Edition. ISBN 047135418X
Pfleeger, S. (1998). Software Engineering: Theory and Practice. Prentice-Hall. ISBN013624842X

66
Pressman, R. (1997). Software Engineering: A Practitioner’s Approach. Fourth Edition.McGraw-Hill. ISBN 0070521824
Porter, A., Votta Jr., L., Basili, V. (1995). Comparing Detection Methods for SoftwareRequirements Inspections: A Replicated Experiment. IEEE Transactions on SoftwareEngineering, 21(6): 563-575, June.
Rumbaugh, J.; Blaha, M.; Premerlani, W.; Eddy, F. and Lorenson, W.(1992). Object-OrientedModeling and Design. Prentice-Hall. ISBN 0136298419
Rumbaugh, J.; Jacobson, I. and Booch, G. (1999). The Unified Modeling Language ReferenceManual. Addison-Wesley Object Technology Series. Addison-Wesley. ISBN020130998X.
Selic, B. (2000). A Generic Framework for Modeling Resources with UML, IEEE Computer, pp.64-69, June.
Shroff, M. and France, R.B. (1997). Towards a formalization of UML class structures in Z. Inthe Proceedings of the COMPSAC’97 - 21st International Computer Software andApplications Conference.
Shull, F.; Travassos, G. H.; Carver, J. and Basili, V. R. (1999). Evolving a Set of Techniques forOO Inspections. Technical Report CS-TR-4070, UMIACS-TR-99-63, University ofMaryland, October. On line at http://www.cs.umd.edu/Dienst/UI/2.0/Describe/ncstrl.umcp/CS-TR-4070
Travassos, G. H.; Andrade, R. S. (1999). Combining Metrics, Principles and Guidelines forObject Oriented Complexity Reduction, Workshop on Quantitative Approaches in ObjectOriented Software Engineering, ECOOP’99, Lisbon, Portugal, June.
Travassos, G.; Shull, F.; Fredericks, M. and Basili, V. (1999). Detecting Defects in Object-Oriented Designs: Using Reading Techniques to Improve Software Quality. In theProceedings of the Conference on Object-Oriented Programming, Systems, Languages,and Applications (OOPSLA), Denver, Colorado, 1999.
Uemura, T.; Kusumoto, S. and Inoue, K. (1998). Function Point Measurement Tool for UMLDesign Specification. In the Proceedings of the 6th International Symposium on SoftwareMetrics.
van Solingen, R. and Berghout, E. (1999). The Goal/Question/Metric Method: A Practical Guidefor Quality Improvement of Software Development. McGrawn Hill. ISBN 0077095537
Vieira, M. E. R. and Travassos, G. H. (1998). An Approach to Perform Behavior Testing inObject-Oriented Systems, Proceedings of the Technology of Object-Oriented Languages- TOOLS 27, Beijing, China, IEEE Computer Society, ISBN 0-8186-9096-8
Votta Jr., L. G. (1993). Does Every Inspection Need a Meeting?. ACM SIGSOFT SoftwareEngineering Notes, 18(5): 107-114, December.
Yakimovitch, D.; Travassos, G. H. and Basili, V. R. (1999). A Classification of ComponentsIncompatibilities for COTS Integration, 24th Annual Software Engineering Workshop,NASA/SEL, Greenbelt, USA, Dezembro, 1999.
Warmer, J. B. and Kleppe, Anneke G. (1999). Object Constraint Language : Precise ModelingWith Uml. Addison-Wesley Pub Co. ISBN 0201379406.

67
Wirfs-Brock, R., Wilkerson, B. and Wiener, L. (1990). Designing Object-Oriented Software.Prentice Hall; ISBN 0136298257.


