Embed Size (px)
Citation preview
World Sustainable Development Outlook 2010
Edited by Allam Ahmed
and Gale T C Rigobert

World Association for Sustainable Development
(WASD) Eighth International Conference
WORLD SUSTAINABLE DEVELOPMENT OUTLOOK 2010 can be ordered from WASD:
WORLD ASSOCIATION FOR SUSTAINABLE DEVELOPMENT (WASD)SPRU – Science and Technology Policy ResearchThe Freeman Centre, University of SussexBrighton BN1 9QE, United Kingdom
Address for correspondence:
WASDPO Box 64607London SW8 9ATUnited Kingdom
Website: www.worldsustainable.orgE-mail: [email protected]
Copyright© 2010 World Association for Sustainable Development (WASD)
ISBN (Print) 978-1-907106-15-6 (Print)ISBN (ebook) 978-1-907106-16-3 (CD)
No part of this publication may be reproduced stored or transmitted in any material form or by any means (including electronic, mechanical, photocopying, recording or otherwise) without the prior written permission of WASD and/or the Editor, except in accordance with the provisions of the Copyright Designs and Patents Act 1988 or under the terms of a licence issued by the Copyright Licensing Agency Ltd or the Copyright Clearance Center Inc.
No responsibility for the views expressed in this book is assumed by the Editor or WASD.
• v •
Acknowledgements ........................................................................................... ix
Welcome ......................................................................................................... xi
Preface ......................................................................................................... xiii
1. The Future Of The U.S. Dollar As An International Key Currency .......................... 1 Buks Wessels
2. Patterns Of Caribbean Livelihoods ................................................................ 13 Corinne Gregoire
3. Stem Cell Innovation System In India: Emerging Scenario And Future Challenges ...................................................................................... 23
Shashank Shekhar Tiwari
4. The Case For A Preventative Approach To Chronic Non-Communicable Diseases (Cncds) In Trinidad And Tobago ................................................................... 39
Dindial Ramrattan
5. Sustainable Development Through The Inclusion Of Business Incubators: A Swot Analysis ......................................................................................... 51
Hanadi Mubarak Al-Mubaraki
6. Reducing Waste In Transport Operations ........................................................ 65 Henrik Sternberg and Kent Lumsden
7. Crime In Trinidad And Tobago: Trends And Implications ................................... 75 Maxine Hunte and Leigh-Ann Waldropt Bonair
8. The Potential Role Of The Caribbean Diaspora In Science, Technology And Industrial Policy .................................................................................. 93
Jason Jackson
9. Cruising Out Of Control? Dealing With The Environmental Impacts Of Cruise Tourism In The Caribbean ...........................................................................103
Jaya Ramlall
10. The dynamics and consequences of population ageing in trinidad and tobago: a call for responsible planning for sustainable development .................111
Jennifer Rouse, Vasudev Ramkissoon and Pemba Ramdoo
11. The impact of the financial crisis on investors in countries governed by Islamic banking and finance: the case of the Dubai World standstill .............125
Kaitlyn Busler
12. The turtle village trust, Trinidad and Tobago: sustainability through strategic bridging, green alliance and enviropreneurship .................................139
Kalim U. Shah and Robin Marin
Contents
vi • Contents
13. Bridging transportation gaps in Latin America and the Caribbean: Prospects and potential for maritime transportation cooperation in Trinidad and Tobago and Venezuela..............................................................149
Khellon Quacy Roach and Raymond Mark Kirton
14. Productive Capacity: A Platform for Institutional Change and Sustainable Development. The Case for Developing Economies ..........................................161
Lamya Kanoo
15. Opportunities for the use of computer-assisted instruction in enhancing the quality and coverage of education delivery in Guyana at the general secondary school level ....................................................................167
Louis Dodson and Dianna A. DaSilva
16. A holistic approach to organisational learning in manufacturing: a model and a research agenda ...................................................................179
Marcia Nathai-Balkissoon and Kit Fai Pun
17. Embedding social capital in place and community: towards a new paradigm for the Caribbean food system .......................................................189
Marisa Wilson
18. Cost Minimisation Through Interest-Free Micro Credit To Micro Entrepreneurs: A Case Of Bangladesh ...........................................................199
Mohammed Nurul Alam
19. The role of Oman development bank in financing small and medium scale industries ........................................................................................209
S. Hemavathy Nithyanandhan
20. Gendered applications of the carbon footprint: the use of carbon management tools to highlight the effect of gender on sustainable lifestyles .....217
Nolana E. Lynch
21. The uphill climb for environment and development: the challenges of rapid urban development in Trinidad and Tobago ...................................................229
Rudo Udika
22. Caribbean home town associations: an untapped resource for impacting development in the CARIBBEAN region .........................................................241
Samantha C. Joseph, Roger Hosein and Martin Franklin
23. Rethinking postsecondary, technical and vocational training for the 21st century ............................................................................................253
Patrice Parris Searles
24. Can IT and ITES be an Engine of Growth? An empirical analysis ........................265 Seema Joshi
25. Stimulating Diasporic Tourism As A Niche Market For Caribbean Tourism: The Case Of Guyana And Toronto .................................................................279
Sherma Roberts
Contents • vii
26. Disaggregating demographic factors of labour change in Trinidad and Tobago ..................................................................................291
Sonkarley T. Beaie
27. Capital structure determinants: Malaysian evidence ........................................305 Subba Reddy Yarram
28. Assessing actions towards sustainable logistics: a framework ...........................317 Vendela Santén and Sönke Behrends
29. Foreign Direct Investment Effect On East Asian Productivity ............................329 Elsadig Musa Ahmed
30. Rethinking globalisation: building institutional capacity for development .........339 Amer Al-Roubaie and Niren Vyas
31. Diasporic tourism and investment in Suriname1 .............................................353 Keith Nurse
32. The aged, a lost and dying society: implying the importance of a gerontological framework for addressing their needs in the Caribbean ...............365
Kenneth A. Niles
33. Multinational hotel companies and sustainable tourism in the Okavango Delta, Botswana .........................................................................377
Joseph E. Mbaiwa
34. Is biodiversity important to ecosystem functioning? Yes! How can we best protect and preserve biodiversity? ...............................................................389
Queen Charlene Grant
35. St. John, U.S.V.I.: Analysis of their Donkey’s Impact upon the Island’s Habitat ........................................................................................401
Queen Charlene Grant
36. Strategic Developmental Opportunities From Diaspora Tourism: The Jamaican Perspective ...........................................................................413
Natasha Kay Mortley
37. An Overview On The Development Of Integrated Bioenergy Devices For Improvement Of Quality Of Life Of Poor People ..............................................429
Abdeen Mustafa Omer
38. Evaluating the impact of changes in international trade policy on the sugar industry of Jamaica: an integrated assessment approach .................................451
Anthony Clayton, K’adamwe K’nIfe and Andrew Spencer
39. Alien labourers and development processes the case of Montserrat ...................463 Godfrey C. St. Bernard
40. Sustaining The Future Well Being Of Our Children: An Empirical Analysis Of Breastfeeding Practices In Trinidad And Tobago .............................................481
Godfrey C. St. Bernard

• ix •
Acknowledgements
This year’s WASD Conference was made possible because of the invaluable input of many persons and institutions. On behalf of WASD, I wish to extend my deepest thanks to the following individuals and institutions for their generosity and unwavering support.
The Honourable Stephenson King, Minister for Finance Economic Affairs and National Development and Prime Minister of Saint Lucia.
Professor Clement K Sankat, Pro-Vice Chancellor and Campus Principal, The University of the West Indies, St. Augustine, Trinidad and Tobago
Dr. Hamid Ghany, Dean, Faculty of Social Sciences, The University of the West Indies, St. Augustine, Trinidad and Tobago.
SEQUA gGmbH Saint Lucia, West Indies.Ministry of Finance Economic Affairs and National Development,
Saint Lucia, West Indies. Ministry of Physical Development, Environment and Housing,
Saint Lucia, West Indies. Ministry of Education and Culture, Saint Lucia, West Indies.
Ministry of External Affairs, International Trade and Investment, Saint Lucia, West Indies.
ECFH, East Caribbean Financial Holding Limited, Castries, Saint Lucia, West Indies.ECCB, Eastern Caribbean Central Bank, St. Kitts, West Indies.
JE Bergasse Ltd., Saint Lucia, Castries, West Indies.General Business and Technical Services Ltd., Castries, Saint Lucia.
Microwest Tech Depot, Castries, Saint Lucia, West Indies.St Lucia Distillers Group of Companies, Roseau, Saint Lucia, West Indies.
Executive Club/Tropical Holidays Ltd, Rodney Bay, Gros-Islet, Saint LuciaThe Royal Saint Lucia Police Force.
UWI Marketing and Communications, The University of the West Indies, St. Augustine Campus, Trinidad and Tobago, West Indies
Institute of International Relations, The University of the West Indies, St. Augustine Campus, Trinidad and Tobago, West Indies.
The University of the West Indies, Mona Campus, JamaicaShridath Ramphal Centre for International Trade Law, Policy and Services, The University of the West Indies, Cave Hill Campus, Barbados, West Indies.
Gale T C RigobertConference Chair
WASD2010Saint Lucia

• xi •
Welcome Gale T C Rigobert Conference Chair
The theme of this year’s conference “Towards Epistemic Sovereignty: (Re)-thinking Development in a Changing Global Political Economy” is born out of an intellectual curiosity embedded in “Caribbean thought”. It seeks to respond to an earlier call decades ago for Third World peoples to define their own realities and construct pragmatic responses suited to their particularities. The ill-effects of the current global financial and economic crisis on both developed and developing countries have provoked raging debates about the merits and demerits of globalization, neoliberalism and unfettered markets.
The various sub-themes discussed here, it is hoped, will pique the interest of scholars, practitioners, policy makers and civil society and encourage persons to consider alterna-tive explanations for the Third World problematique of underdevelopment in its multiple manifestations. This critical interrogation will serve as a first step towards “constructing a way forward”.
I am delighted that Saint Lucia is host to this year’s WASD conference. Saint Lucia boasts two Nobel Laureates, Sir Arthur Lewis and Derek Walcott. These preeminent Saint Lucian scholars epitomize the excellence and brilliance of a people who have broken free from the shackles of physical and mental enslavement. Their work challenges the epistemologi-cal primacy of Western thought and situates the specificity of the Third World experience at the centre of their thinking. Their success in so doing in the fields of Development Economics and Literature respectively, is no easy feat. They have set examples that every Caribbean person, every citizen of the Third World should endeavour to emulate.
Even while achieving those lofty heights, Saint Lucians have not lost touch with their essential humanity. Our cultural norms reflect that we are truly a simple and humble peo-ple. Our response to the recent catastrophe caused by Hurricane Tomas is testimony to the resilience of a people who have forged a culture that is uniquely Saint Lucian. A people who employ the maxim “I am my brother’s keeper” exemplified by the notion Koudmen, a tradition that is deeply embedded in the psyche of our people. This is what empowers us to weather any storm, to pick up the pieces and to rebuild on a strong foundation of resourcefulness, togetherness, generosity and spirituality.
Saint Lucia is also known for its breathtaking natural and scenic beauty, lovely beaches, lush vegetation, friendly people and easy going lifestyle. It is no wonder that yet again it has been voted one of the top honeymoon destinations! Saint Lucia has so much to offer and it is my pleasure to welcome you to the land of the majestic Pitons and Helen of the West Indies.
I wish you a productive conference and an enjoyable stay.
Gale T C RigobertSaint Lucia 2010

Allam Ahmed Sussex University, UK
Gale T C Rigobert Conference Chair, The University of the West Indies, St. Augustine, Trinidad and Tobago
We are pleased to present the seventh volume of World Sustainable Development Outlook series, OUTLOOK 2010. The focus of Outlook 2010 is Towards Epistemic Sovereignty: (Re)-thinking Development in a Changing Global Political Economy. The different chap-ters in this volume are selected from the 2010 International Conference of World Association for Sustainable Development (WASD).
The WASD 2010 conference is jointly organized with The University of the West Indies, St. Augustine and under the distinguished patronage of Honourable Stephenson King, the Prime Minister of Saint Lucia. The objective of the WSAD2010 conference is to question the intrinsic ideological value of neoliberal thinking and methodologies; and to assess whether neoliberal approaches to development are appropriate for the socio-eco-nomic challenges that beset Third World nations.
The theme of this year’s WASD international conference is “Towards Epistemic Sovereignty: (Re)-thinking Development in a Changing Global Political Economy”. The theme is indeed apt and very timely. Over the last two years the world has been reeling from the pressures of the worst global economic and financial crisis since the 1930s. Both devel-oped and developing countries have been adversely affected, and there have been calls for a serious interrogation of the epistemological merits of free market economics.
The World Sustainable Development Outlook series has this year attracted scholars from the world over distinguishing the publication as a truly global product; both in the var-ied national and cultural origins of the contributors as well as the range of topics and case studies covered. The perspectives presented here challenge traditional development thought and seek to present avant garde ways of thinking about achieving sustainable development (SD) particularly in developing countries (DCs). Outlook 2010 covers a range of topics that ensemble endeavour to address growing concerns about the problematique of third world underdevelopment, even after decades of experimentation with one development strategy or another; all of which failed to deliver the majority of the world’s population from the bowels of poverty.
In the Caribbean region, changing weather patterns and rising sea levels render small island states (SIDS) even more susceptible to vicious hurricanes, flash floods, longer droughts all of which have adverse negative effects on their productive capacity and ability to generate much needed foreign exchange to finance their development.
The earthquake in Haiti, the floods in Pakistan, and recently Hurricane Tomas in the Caribbean are poignant reminders that responsible use of our natural and physical resources
Preface
• xiii •
xiv • Contents
are not born out of wishful thinking about what ought to be, but must be essential elements of sustainable development practices. Deterioration of the physical environment, therefore, is a major challenge for all countries, especially those of the Third World whose potential for development is already seriously hampered by other vulnerabilities.
There are too, concerns about health security, energy security and food security in particular. The softer issues of social and environmental consideration are often relegated to the back burner in favour of what are seen narrowly as the hard issues of politics …! However, energy, economic, health, environmental and social security are interrelated and give definition to the overall socio-economic wellbeing of a nation. Thankfully, these are gaining resonance with development practitioners, international donor agencies and gov-ernments as critical variables in the development equation. It is imperative, therefore, that Third World countries embrace a more holistic approach to development.
The theoretical perspectives presented here, provide a framework for understanding and presenting solutions that take into account a variety of international, institutional and intellectual approaches. In so doing, there must also be an acknowledgment of the lessons learnt from those who have gone before and have had some measure of success, and a desire on the part of developing nations to emulate their example, albeit in part.
This volume provides the impetus for the cross-fertilisation of knowledge – across physical boundaries, cultures and epistemic schools. The rich exchange of knowledge emphasises the inter-relationship among the various issues, and makes it easier to arrive at solutions to the multifaceted problems of underdevelopment in our various countries and regions. Perhaps we shall get closer to a better future. A future that sees the Third World employing more sustainable approaches to socio-economic growth and easing its way out of the conundrum of underdevelopment.
There was a tremendous response to the call-for-papers, with more than 100 abstracts and papers submitted, covering a wide range of themes. Naturally the task of selecting which papers to publish became an arduous one. We have finally selected forty papers which cover a range of topics and reflect cutting edge research in the social and hard sciences.
The key themes addressed in the book are:Economics, Business and Trade•Migration and Brain Circulation•Diasporic Tourism •Social Capital and Sustainable Development •Changing Demography of the World and the Implications for Policy Making•ICTs in Higher Learning and Development•Science, Technology and Innovation •The Environment and Development•Transport Studies and•Accounting, Banking and Finance •
We are confident that the ideas presented here will trigger a rich debate amongst scholars, researchers and policymakers, and will stimulte further thinking in the various areas. We are cognizant of the fact that socio-economic and technical analyses on their own will not provide a satisfactory solution to the multifarious problem of underdevelopment.
Contents • xv
We often forget the cultural backdrop agianst which development needs to take place and the critical need for a psyche of development as a precursor to achieving significant socio-econmic growth. Therefore, we hope that this book will help to provide an overview of the latest perspectives on the ways in which we in the Third World can rethink our reality, embrace who we are as a people and leverage our intrinsic strengths upon which the foun-dation of any development rests.
Finally, we would like to congratulate the authors for their valuable contribution and we are grateful to all reviewers for graciously offering their critical and insightful comments that have enriched the quality of the chapters in this volume. Our most sincere thanks go to all of the keynote speakers and presenters who shared with us their expertise and knowledge. We would like also to thank all those who gave generously of their time and talent in making the WASD 2010 conference a success.
—Allam Ahmed and Gale T C RigobertSaint Lucia, November 2010

Copyright © 2010 WASD
World Sustainable Development Outlook 2010
1
THE FUTURE OF THE U.S. DOLLAR AS AN INTERNATIONAL
KEY CURRENCY
Buks Wessels*University of the Free State, South Africa
Abstract: For the past 60 years and more the international monetary system’s need for international money was discharged by the U.S. dollar as the supreme international currency. Although the dollar’s global role is still virtu-ally unchallenged, worrying cracks are appearing in the supporting economic determinants of the dollar’s key currency status. This paper analyzes the need for an international means of payment, the attributes of the key currency country and the determinants of key currency status. The paper indicates that certain characteristics of and trends in the U.S. economy supporting its key currency status have reached disquieting negative magnitudes that do not augur well for the future of the dollar. Nevertheless, the absence of a currency competitor, the strength of network externalities and historical inertia will, together with the dominant milieu role played by the United States, possibly keep the dollar in its superior position for a considerable time to come.
Keywords: dollar supremacy; American hegemony; key currency status; international liquidity.
INTRODUCTION
International economic activities require a specific and distinguished monetary unit to facilitate international transactions and this unit serves as the key currency of the world economy. Similar to a domestic econ-omy the selected international key currency functions as a medium of exchange, a store of value and a unit of account. The success-ful execution of these functions is a pre- requisite for enhancing the countries’ welfare through global investment and trade and for the fluid working of foreign exchange markets. In a domestic economy, the choice of a monetary medium is decreed
by the sovereign government and its man-agement is left to a central bank. In the international economy, no sovereign body or supra-national institution has the final say in determining the type and manage-ment of the international monetary unit. Consequently, various monetary units were used in the past to fulfill a key currency function and included not only metals such as gold and silver, but also various for-eign currencies such as the British pound, French franc, German mark, Japanese yen, U.S. dollar (hereafter dollar) and more recently the euro. The selection of a particu-lar international money as the key currency
* Corresponding author: University of the Free State, South Africa; e-mail: [email protected]
2 B. Wessels
is mainly determined by international mar-ket forces and the selection is resolved by various financial, economic and political determinants.
The foundational importance of money, in general, and international money, in particular, arises from the fact that money is a collective good, which means that the benefit of money to a user derives from the fact that other transactors also use it for the same purpose (De Grauwe, 1996, p.2). The larger the number of transactors that utilise a particular means of money, the greater its utility and the wider its network externalities because of its self- reinforcing and mutually supporting char-acter. Important is that transactors will only hold a specific means of payment or key currency if they have the confidence that its inherent purchasing power will be pro-tected and defended by the issuer or supplier (De Grauwe, 1996, p.2). Since trust is cru-cial, the issuer of a particular international money unit will have to put in place certain measures to ensure the stability and credibil-ity of its money. As a reward, the incumbent supplier of international money can procure various monetary and political power-based advantages such as seignior age profits and ease of international funding. However, lurk-ing behind the initial advantages are less vis-ible disadvantages or costs that only become operative and apparent at a later stage of the key currency’s existence. Over time, these costs inevitably erode the initial benefits, thus casting doubt over the future durability and stability of the specific monetary instru-ment as international money. This increas-ingly seems to be the enfolding future fate of U.S. dollar, and this phenomenon com-prises the focus point of this paper.
In order to evaluate the future of the dol-lar, this paper briefly explains the following:
(1) elucidates the need for and functions of an international key currency, (2) focuses on the fulfillment of these functions by the dollar, (3) analyses the underlying determi-nants of key currency status, (4) highlights the advantages that key currency hegemony bestow on the United States, (5) investigates the evolving threats that the key currency status of the dollar inevitably provoke over time and (6) explores the consequences of the weakening economic determinants for the dollar caused by such threats.
THE NEED FOR AND FUNCTIONS OF INTERNATIONAL LIQUIDITY
A key currency, such as the dollar, is a cur-rency used by transactors outside its country of origin and performs the same three func-tions as a national currency inside a coun-try. They are as follows:
1 As a medium of exchange, a key currency is used as a vehicle or transactional cur-rency for private purpose and as an inter-vention currency for public use.
2 As a unit of account, a key currency is used in private international transac-tions as a quotation currency and in case of international public transactions as an anchor or pegging currency.
3 As a store of value, a key currency is used for international private asset investment/ debt and in an international public capacity as a foreign exchange reserve currency.
In a world with a multitude of countries investing and trading with each other on a continuous basis the use of only one par-ticular key currency constitutes a collective good that dramatically reduces transaction costs as more and more transactors use it
3U.S. dollar as an international key currency
because others are also using it. Efficiency gains are achieved because international transactions have to pass through fewer foreign exchange markets and this not only reduces the set-up costs for market makers, but also reduces transaction costs because of the bigger volume of transactions (Lim, 2006, p.5). Consequently, a key currency not only improves efficient management of information and the minimisation of search costs, but also facilitates risk diversifica-tion (Norloff, 2009b, p.422)—and it is here where the dollar has more transactional and projecting power than any other currency.
As a vehicle currency used to buy inter-national goods and do services and in its official use as an intervention currency, the use of a key currency depends on its transac-tion cost. The latter is reflected in the com-petitive bid-ask spreads quoted by dealers in the foreign exchange markets. In case of the dollar, these spreads are low due to com-petition and the enormous daily amounts that are traded. These payments are effected by banks and here the ‘network’ or ‘thick-ness’ of externalities is very important (Portes and Rey, 1997, p.10). These features provide strategic externalities since it creates persistence in the use of an incumbent key currency, making it difficult for upcom-ing currency powers to replace it. There is a strong evidence of strategic externalities stemming from low liquidity premia, and there are low premia because of the cur-rency’s international circulation which has the potential to create persistence, implying that money and trade are indeed comple-ments (Flandreau and Jobst, 2009, p.662). Accordingly, governments will use the key currency as a means of intervening in for-eign exchange markets to defend the value of their own or other currencies (Norloff, 2009b, p.423). The vehicle currency role makes it quite natural for central banks
to use dollars for intervention in foreign exchange because intervention is cheaper in markets that are highly developed and where buying and selling spreads are less.
Flowing from the foregoing, a key cur-rency is also used as a unit of account because the price of strategic international export and import goods, services and assets are quoted in that currency as is the case with oil, gold, other metals, various types of grain, etc. which are all quoted in dollars. As a result, various governments will use the currency to track the value of the key currency in order to determine the price of their own currency such as dollar pegging or fixing against the dollar in order to establish an exchange value for their trade.
The third or store of value function of a key currency refers to the amount of the cur-rency held in countries’ foreign exchange reserves. As store of value, private actors hold their assets and investments in the key currency because it has a relatively stable exchange rate ensuring that its value will not erode. This implies that the currency is also a good international reserve currency for governments to hold as a store of value (Norloff, 2009b, p.423). For the United States this has a double benefit because it holds its own currency as an international reserve currency without carrying foreign exchange rate risks.
EXECUTION OF THE FUNCTIONS OF A KEY CURRENCY BY THE DOLLAR
The dollar clearly and pervasively domi-nates as reserve currency, vehicle currency as well as invoice currency. According to the BIS (2007), the dollar constituted 86% and the euro 37% (out of 200) of the turnover in traditional foreign exchange markets.
4 B. Wessels
Generally, it also makes sense to use the dollar as a unit of account to quote prices because the United States is the biggest economy in the world and has a high share of global GDP, international trade and also has enormous financial markets. In this regard, Goldberg and Tille (2009) focus on the role of a key currency in trade invoic-ing and not only highlight the drivers of trade invoicing but also the dominance of the dollar in many instances. This follows because of the vastness of the economy and trade of the United States, and also because of the depth, resilience and breadth of its capital markets. Governments will also determine monetary policy in terms of the dollar exchange rate or even fix to it: there are in fact 40 euro pegs and 60 dollar pegs (Norloff, 2009b, p.428).
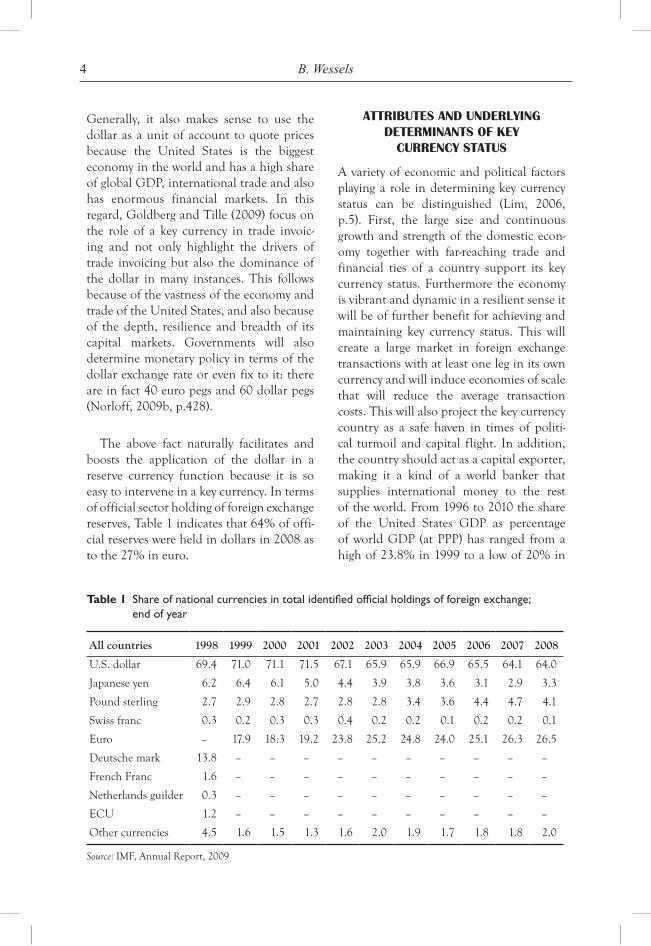
The above fact naturally facilitates and boosts the application of the dollar in a reserve currency function because it is so easy to intervene in a key currency. In terms of official sector holding of foreign exchange reserves, Table 1 indicates that 64% of offi-cial reserves were held in dollars in 2008 as to the 27% in euro.
ATTRIBUTES AND UNDERLYING DETERMINANTS OF KEY
CURRENCY STATUS
A variety of economic and political factors playing a role in determining key currency status can be distinguished (Lim, 2006, p.5). First, the large size and continuous growth and strength of the domestic econ-omy together with far-reaching trade and financial ties of a country support its key currency status. Furthermore the economy is vibrant and dynamic in a resilient sense it will be of further benefit for achieving and maintaining key currency status. This will create a large market in foreign exchange transactions with at least one leg in its own currency and will induce economies of scale that will reduce the average transaction costs. This will also project the key currency country as a safe haven in times of politi-cal turmoil and capital flight. In addition, the country should act as a capital exporter, making it a kind of a world banker that supplies international money to the rest of the world. From 1996 to 2010 the share of the United States GDP as percentage of world GDP (at PPP) has ranged from a high of 23.8% in 1999 to a low of 20% in
Table 1 Share of national currencies in total identified official holdings of foreign exchange; end of year
All countries 1998 1999 2000 2001 2002 2003 2004 2005 2006 2007 2008
U.S. dollar 69.4 71.0 71.1 71.5 67.1 65.9 65.9 66.9 65.5 64.1 64.0
Japanese yen 6.2 6.4 6.1 5.0 4.4 3.9 3.8 3.6 3.1 2.9 3.3
Pound sterling 2.7 2.9 2.8 2.7 2.8 2.8 3.4 3.6 4.4 4.7 4.1
Swiss franc 0.3 0.2 0.3 0.3 0.4 0.2 0.2 0.1 0.2 0.2 0.1
Euro – 17.9 18.3 19.2 23.8 25.2 24.8 24.0 25.1 26.3 26.5
Deutsche mark 13.8 – – – – – – – – – –
French Franc 1.6 – – – – – – – – – –
Netherlands guilder 0.3 – – – – – – – – – –
ECU 1.2 – – – – – – – – – –
Other currencies 4.5 1.6 1.5 1.3 1.6 2.0 1.9 1.7 1.8 1.8 2.0
Source: IMF, Annual Report, 2009
5U.S. dollar as an international key currency
2010, which is far higher than the share of 13% for China in 2010 and the 15% of the euro area in 2010 (Economy Watch, 2010), thereby confirming the United States domi-nance in the world economy.
Second, the aspiring key currency must provide exchange convenience and a high level of liquidity in order to minimise transaction costs (Cohen, 2008, p.3). Accordingly, the key currency country must have free, well-regulated, broad, deep, effi-cient and resilient financial markets with sufficient liquidity and a high degree of openness. The United States excels in this area, especially in equity and money mar-kets, although the euro area has vast bond markets. In addition, the key currency coun-try must have convertibility of currency that are unaffected by exchange controls.
Third, widespread confidence in the future value of the key currency is needed to complement the vastness of its economy. The currency must, thus, have a stable purchas-ing power and exchange rate. Confidence in a currency’s purchasing power is reflected in its price stability, and this is especially important since the currency is used for working balances by the private sector and as official reserves by the official sector. Such confidence assures holders that the value of currency will not be inflated away (Lim, 2006). For the United States the per-centage change in CPI from 1992 to 2009 ranged between a high of 3.4% in 2005 and a low of –0.36% in 2009 (IFS, 2009). Although relatively higher at times than that of Germany, France and Japan, the CPI inflation index for the United States is in step with what is required of a key currency supplier.
A fourth important determinant is politi-cal stability. This provides the guarantee that the state will not collapse (Lim, 2006, p.7)
and it also sustains the country’s underlying economic and monetary stability. Political stability enhances the safe haven feature of a key currency because it contributes to its power projection and strengthens the aloofness of the country in order to play a strategic world political role. As the most dominant country regarding military spend-ing, troop deployment and political power projection, the United States has no equal in this area.
Fifthly, as mentioned before, a key cur-rency must provide a wide transactional and strategic transactional network affording it with universal acceptability by others. The networking attributes of the dollar seems clear from the fact that less than 30% of world trade is with the United States, but almost 70% of central bank reserves are kept in dollars. This also explains why most com-modities are quoted and traded in dollars.
Finally, the existence of inertia with regard to replacing the key currency makes it very difficult to replace the dollar despite its waning economic and trade role in the global economy. Users of the dollar as key currency become locked-in into history and become path dependent, ensuring a domi-nant position to the dollar that is very dif-ficult to dislodge (refer ‘Consequences of the weakening underlying economic fun-damentals of the dollar’).
From an overarching perspective, the preceding economic and political determi-nants and features of the dollar as key cur-rency interact in a mutual beneficial way in the process of strengthening the basis upon which the dollar’s supremacy rests. Most important is that the foregoing determi-nants should be viewed in a dynamic way since some of the economic features can and will be quantatively and qualitatively modified by the assumption of key currency
6 B. Wessels
status. Over time, the evolution in the deter-minants can even impact negatively on the key currency features and provoke a confi-dence crisis which might erode the suprem-acy of the currency and open the way for another currency to replace it.
ADVANTAGES OF KEY CURRENCY HEGEMONY TO THE UNITED STATES
One of the principal points of critique against the dollar as key currency stems from the fact that the United States can finance its foreign deficits by creating its own finance by supplying dollars to a dollar-hungry world. The United States can, there-fore, remain a debtor nation without having to borrow money. Since about 68% of the world’s foreign reserves are held in dollars and 88% of daily foreign exchange trade in foreign exchange markets takes place in dollars (IMF, 2009), the accumulated dol-lar holdings abroad provide finance for the United States balance of payments (BOPs) deficits and allow the United States to run bigger deficits much easier than other coun-tries. The key currency status of the dollar also provides the United States with more macro-economic policy flexibility since it does not face the usual financial constraints other countries do when they run current account or budget deficits. This beneficial situation handsomely permits the United States to enhance its domestic economic growth, employment and the expansion of its political power base.
The position of the dollar as the world’s primary international currency not only bring about higher living standards and wealth levels to U.S. citizens, but also lowers the costs of treasury and other financing. These funds are then invested at higher rates of return in other countries. In reality, this is a formerly underestimated benefit for the
United States and emphasises that it extracts a higher investment return differential in the form of a higher rate of return on its assets abroad than what it pays on liabilities that foreigners keep in the United States—and foreign investors in the United States don’t even demand a higher return despite the possibility and risk of a depreciation in the dollar (Norrloff, 2009, p.2). Moreover, these hegemonic benefits bestowed on the United States by the dollar are more persis-tent and sustainable because of the earlier mentioned inertia in replacing the dollar as the incumbent key currency. The preceding benefits of the dollar as key currency allowed the United States to spend far more than it earned so that the its national expenditure has actually exceeded the national income by more than 20% during recent years, a large part of which is spent on consump-tion (Persaud, 2009, p.1).
Extending the dollar benefits further is the fact that dollar currency notes, of which about 60% circulate outside the United States, also brings in seigniorage profit that allows it to obtain real resources/imports almost costless (Portes and Rey, 1997). The United States seignior age profit reached an amount of approximately $43 billion in 2008 and in effect the use of the dollar as key currency provides an interest free loan to the United States.
The foregoing economic benefits of monetary hegemony also provide the United States with substantial political benefits since the country is internally better insulated from external influences. Internationally the United States has more leverage on other countries’ affairs and can pursue its own foreign policy objectives without constraint (Portes and Rey, 1997, p.3). The key currency status of the dollar provides the United States with increased political leverage and capacity, and therefore
7U.S. dollar as an international key currency
structural power—it can set and determine international agendas and even their out-comes as to what should be done and how Kirshner (2008, p.425). It is clear, therefore, that the key currency domination of the dol-lar translates into political domination and vice versa.
THREATS TO THE KEY CURRENCY STATUS OF THE DOLLAR
A worrisome feature of the U.S. economy is the steep increase in its budget deficit. From a surplus of 2.37% of GDP in 2000 the budget moved into a deficit of –3.48% in 2004 and even –11.2% in 2009, where the latter amounts to $1.6 trillion (CBO, 2009, p.2; U.S. government spending, 2010). Similarly, U.S. government’s gross public debt as percentage of GDP has risen from 57% in 2000 to 64% in 2007, and then shot up to more than 90% (more than $13 tril-lion) in 2010. These are disturbing figures not befitting the supplier of a key currency since they harbour serious dangers not only for future U.S. inflation, interest rates and the deficit on the current account, but also for the trust in the dollar which is sup-posed to be backed-up by the sound macro- economic fundamentals of a key currency hegemon. The United States has lived beyond its means since 1983 and this under-mines the dollar’s reputation.
Equally disturbing are the deficits on the United States external accounts, especially the current account. In reality, a key cur-rency supplier should be a debtor nation and run moderate deficits on its external accounts. However, the current account deficit of the United States has moved into dangerous terrain during the past 10 or more years. This radiates serious doubts regarding the sustainability of the United States trade position and hence the dollar’s position as a key currency. From an amount
of –$398 billion in 2001 the deficit increased to –$803.5 billion in 2006, thereafter drop-ping to –$706.1 billion in 2008 and –$420 billion because of the world wide reces-sion (BEA, 2010). Disconcerting is that the deficit tripled from 1997 to 2000 and the United States current account deficit moved towards 8% of GDP in 2008, thereafter sub-siding to 3% at the end of 2009. This huge deficit means that the United States has to rely on the implicit costs for other nations of not financing its current account as assur-ance that financing will continue (Lucarelli, 2007, p.1). Bergsten (2007, pp.1–2) also affirms that the huge and growing trade and current account imbalances represent the single greatest threat to the stability and prosperity of both the United States and the world economy. He shows that the external deficit has risen by $100 billion per year during the 4 years up to 2007 and that this trajectory is clearly unsustainable.
Adding to the above predicament of the dollar is the problem regarding one of the broadest measures of a nation’s financial balance sheet or the amount that a nation’s residents owe to the rest of the world, namely the net international investment position (NIIP). Since the United States debt is denominated in dollars and its assets mostly in other currencies it means that if the dollar depreciates the United States NIIP increases. However, the NIIP of the United States has deteriorated during the past three decades (BEA, 2010) and it reflects in an increase in foreign debt and has drasti-cally weakened. Interesting, however, is that despite this huge deterioration in NIIP the net inflow of investment income has nev-ertheless remained positive until 2005 and this anomaly suggests that the United States is still performing its role of foremost finan-cial intermediary and is still enjoying huge exorbitant privileges because of the dollar’s supremacy and hegemony.
8 B. Wessels
CONSEQUENCES OF THE WEAKENING UNDERLYING ECONOMIC
FUNDAMENTALS OF THE DOLLAR
The foregoing threats to the dollar con-firm the current concern about the unsus-tainability of the U.S. debt/GDP ratio, its debt/export ratio and its current account/GDP ratio since these suggest that the day of reckoning for the United States and the dollar is in the offing. In fact, Gray (2006, p.3) is of the opinion that the United States has reached a systemic vulnerability with huge adverse potential because of a loom-ing Achilles’ heel in its economy, namely, that the key currency hegemon (United States) will exhaust the ability of its cur-rency to retain the confidence of its holders. The dilemma is that the United States has become a waning hegemon but the prosper-ity of the rest of the world depends on the increase in the gap between its imports and exports. It is going to be difficult to keep the dollar above suspicion because international net worth (INW) will inevitably decline. This will make depreciation in its currency imminent and might trigger a capital flight of enormous proportions. Indeed, the ongo-ing accumulation of international disserving by the international net and the consequent steady decline in its INW, which is financed by non-residents acquiring more dollar assets, show that a high probability of a loss of confidence exists, which might eventually create such a crisis (Gray, 2006, p.6).
Since the international net cannot expect to be bailed out indefinitely, this will not only stop its benefits obtained from seignior age and the phenomenon of borrowing cheap and lending high, but also its exorbi-tant privileges pointed out in previous sec-tions. The uncomfortable truth is that the United States as the biggest world power has also become the biggest debtor which means that it is now dependent on the discretionary financial acts and generosity
of other countries to maintain its high standard of living and consumption. The preceding dilemma can go on as long as foreigners are willing to accumulate dollar assets such as U.S. bonds and treasury bills, thereby, financing the U.S. deficits but simultaneously contributing to the explod-ing U.S. foreign debt. This cannot last and Lucarelli (2007, p.7) correctly states that the United States is caught in a debt trap because it must attract ever increasing net inflows of capital to cover its ever-increasing current account deficits. This suggests that the United States over-extended defi-cits might take their toll and its financial empire might implode on itself. If so, the dollar’s value will slump and housing and equity markets will drop sharply, causing the entire economy to follow suit.
Bergsten (2007, p.9) agrees that the huge deficit on the current account can trigger a huge drop in the exchange rate of the dollar and a subsequent deep recession or stagfla-tion. This will trigger a financial stampede which will be difficult to stop. It can easily evolve into a minsky moment with cascad-ing bankruptcies and financial defaults. In fact, as the sub-prime crisis of 2007 and beyond has demonstrated financial and foreign exchange markets are prone to self-reinforcing financial instability and the stronger the conduits of impact between the international markets and the lower the reserves/liquidity ratio the quicker will be the contagion and the more serious the fol-lowing systemic crisis (compare Gray, 2006, pp.78–80).
Should the economic crisis indeed occur, far ranging political consequences that will restrain the United States political and military operations abroad will no doubt ensue (Kirshner, 2008, p.426). The reduced economic and financial power will have to be emulated by a decreased political power
9U.S. dollar as an international key currency
profile. If, as expected, the United States is no longer the world’s largest economy by the mid-21st century, India and China will overtake not only the United States, but also Western Europe and Japan as well (Persaud, 2009, p.3). This underscores the fact even further that the United States should reduce its external deficits, balance its budget and adapt to an international system where the dollar and the United States is not central and supreme anymore and where interna-tional monetary co-operation in a round table fashion should be conducted in the interest of the global economy.
However, real the foregoing scenario may be the effect of inertia, tradition and hys-teresis in a key currency sphere that should never be underestimated. History has shown that, as was the case with the British pound as key currency, regimes do not change over-night. Therefore, save for a catastrophic currency crisis, the preceding disturbing sce-nario concerning the dollar’s future might not happen overnight. It will be difficult to dislodge the dollar because of its incum-bency advantages and because the euro is unlikely to supplant the dollar (Norloff, 2009a, p.17). This is even true due to the continuous debt crisis that has plagued the euro area since 2010 when some of its founding members (PIIGS) encountered serious fiscal and other economic problems. Consequently, the dollar’s dominance can last longer though it is not the most stable currency and despite the U.S. economic deficits and problems and even though the dollar’s future lies increasingly in the hands of other counties. Due to political reasons and also of its high stakes that all countries of the global economy have in the well-being of the dollar and its future, capital flight might not ensue because the damage so caused will be a collective one and might be prevented by mutual interest and joint inter-national participation to ensure an optimal
global financial future. A systematic, orderly retreat by the dollar from its prominence is, therefore, a realistic probability and a soft landing for the dollar seems to be a more probable outcome than a crash landing. But this does not take away from the fact that a co-ordinated effort to solve the immi-nent international currency and economic crisis is a matter of primary concern and should be tackled as soon as possible in a joint reform process to urgently reform the international monetary system towards a less dollar-centred one. The important challenge will be to create an environment where national sovereignty and pride will have to play second fiddle in order to find global solutions for future political peace and economic prosperity. History reveals that such an optimal outcome will neither come about naturally or easily, nor without intense political power struggles.
CONCLUSIONS
The dollar has been the supreme key cur-rency of the world economy for more than 60 years and did not have a serious con-tender during its reign. This is still the case today. The dollar fulfilled and currently still fulfills all the key functions expected of a key currency and this is clearly manifested in its dominance in all three functions of an international money unit. However, justifiable concerns about the weakening U.S. economy and the erosion in the fun-damental requirements for upholding the status of the dollar emerged during the past decade. Legitimate unease regarding the United States waning economic strength and its increasing internal and external deficits and indebtedness cast uncertainty over the future credibility of the dollar and its ability to continuously serve the global economy as a key currency. The dimen-sions of some of the economic problems in the U.S. economy has taken on such
10 B. Wessels
proportions that there is a realistic prob-ability that their further weakening might cause a world-wide economic crisis with substantial contagious potential. However, if committed international cooperation and joint dedication to finding solutions for the pending international dilemma can be mustered, the possibility of a contagious international crisis can be avoided. In the interim the remaining economic and politi-cal power of the United States, the absence of a strong competitor for the dollar and the reality of inertia, hysteresis and path-dependence in case of the dollar’s key cur-rency role will ensure that it will remain the dominant key currency for longer than just the immediate future.
REFERENCES
Bank for International Settlements (BIS) (2007) Triennial Central Bank Survey of Foreign Exchange and Derivative Market Activity, Basel, Switzerland.
Bergsten, F.C. (2007) The Current Account Deficit and the US Economy. Testimony Before the Budget Committee of the United States Senate, Online: www.iie.com/publications/papers/print.cfm?researchid=705&doc=pub, accessed 26/03/10).
Bureau of Economic Analysis (BEA) (2010) US International Transactions Accounts Data, May 2010. Washington, D.C.
Cohen, B.J. (2008) Toward a Leaderless Currency System, UC Santa Barbara: Global and International Studies, Online: http:// escholarship.org/uc/item/2dd5364j, accessed 12/02/10.
Congressional Budget Office (CBO) (2009) The Budget and Economic Outlook: An Update, Online: http://www.cbo.gov/ftpdocs/105xx/doc10521/2009BudgetUpdate_Summary.pdf, accessed 28/05/10.
De Grauwe, P. (1996) International Money. Postwar Trends and Theories, 2nd ed., Oxford University Press, Oxford.
Economy Watch (2010) GDP Share of World Total, Online: http://www.economywatch.com/economic-statistics/economic-indicators/, accessed 2/06/10.
Flandreau, M. and Jobst, C. (2009) ‘The empirics of international currencies: network externalities, history and persistence’, The Economic Journal, Vol. 119, pp.643–664.
Goldberg, L. and Tille, C. (2009) What Drives the Invoicing of International Trade?, Online: http://www.voxeu.org/index.php?q=node/4316, accessed 17/05/10).
Gray, H.P. (2006) The Exhaustion of the Dollar. Its Implications for Global Prosperity, Palgrave, New York.
International Monetary Fund (IMF) (2009) Annual Report, Washington D.C.
International Monetary Fund (IFS). (2009) International Financial Statistics, Washington D.C.
Kirshner, J. (2008) ‘Dollar primacy and American power: What’s at stake?’, Review of International Political Economy, Vol. 15, pp.418–438.
Lim, I-G. (2006) The Euro’s challenge to the dollar: different views from economists and evidence from COFER (Currency Composition of Foreign Exchange Reserves) and other data, IMF Working Paper WP/06/153, IMF, Washington D.C.
Lucarelli, B. (2007) The United States Empire of Debt, Online: http://www.nodo50.org/cubasigloXXI/congreso08/conf4_lucarelli.pdf, accessed 12/02/10.
Norloff, C. (2009a) Advantages of Monetary Hegemony, Paper presented at the IUHEID Political Science Colloqium, 19 May 2009, Geneva, Switzerland.
Norloff, C. (2009b) ‘Key currency competition. The euro versus the dollar’, Cooperation and Conflict: Journal of the Nordic International Studies Association, Vol. 44, pp.420–442.
Persaud, A. (2009) When Currency Empires Fall, Online: http://www.gresham.ac.uk/event.asp?PageId=45&EventId=260, accessed 10/05/10.

11U.S. dollar as an international key currency
Portes, R. and Rey, H. (1997) The Emergence of the Euro as an International Currency, Online: http://faculty.london.edu/hrey/ecopolicy.pdf, accessed 25/02/10.
US Government Spending (2010) US Federal Debt as Percent of GDP, Online: http://www.
usgovernmentspending.com/downchart_gs. php?year=1980_2010&view=1&expand=&units=p&fy=fy11&chart=H0- fed&bar=0&stack=1&size=m&title=US%20Federal%20Debt%20As%20Percent%20Of%20GDP&state=US&color=c&local=s, accessed 02/06/10).

Copyright © 2010 WASD
World Sustainable Development Outlook 2010
13
PATTERNS OF CARIBBEAN LIVELIHOODS
Corinne Gregoire*Cipriani College of Labour and Cooperative Studies, Trinidad and Tobago
Abstract: Developing and maintaining a pattern of sustainable livelihood (SL) is dependent upon the use to which we put our resources, particularly, our natural resources. SL is dependent upon five principal components; namely the vulnerability context, livelihood assets, transforming structures and processes, livelihood strategies and livelihood outcomes. DFID (1999), DFID, FAO, IFAD, UNDP, WFP (2001) liveli-hood assets also have many components one of which is natural assets/capital. Once the environment is shocked the natural assets are directly affected and all other types of assets and principal components become inoperable. The livelihood outcomes of the Caribbean people, poor and otherwise, are therefore linked to these natural as-sets. The objective of this study is to possibly shape and create ways of developing and maintaining patterns that can lead to SLs. It should focus on the available natural resources, access to and optimal use of, which can transit into the best livelihood outcomes specifically for the poor. Basically, the outcome should be a body of knowledge that can contribute to SLs within the Caribbean. This is done with the use of two case studies of Caribbean islands, namely St. Vincent and the Grenadines (SVG) and Grenada. This paper is divided into four sections. Section one provides the background for the paper and briefly introduces the concept of SL. Section two outlines the SL approach. Section three provides an application of the SL approach in SVG and Grenada from two varying standpoints. Section four makes concluding remarks on the types and the sustainability of the livelihood strategies and outcomes.
Keywords: sustainable livelihoods; Caribbean context.
INTRODUCTION
Sustainable livelihood (SL), introduced by the Brundtland Commission on Environment and Development in the 1980s, began as ‘an approach to maintain or enhance resource productivity, secure own-ership of and access to assets, resources and income-earning activities as well as to ensure adequate stocks and flows of food and cash to meet basic needs. It was a reflection of
the growing recognition that food security was not merely a problem of agricultural productivity but was a problem of poverty in all its multi faceted dimensions’1. The 1992 UNCED2 initiated the first expan-sion in the context of Agenda 21. It stated that ‘SL could serve as an integrating factor that allows policies to address devel-opment, sustainable resource management and poverty eradication simultaneously’3.
* Corresponding author: Cipriani College of Labour and Cooperative Studies, Trinidad and Tobago; e-mail: [email protected]
14 C. Gregoire
As such, many authors have contributed to the definition(s) which has evolved today.
The most basic, well known and widely accepted definition of a livelihood and as such SL upon which some form of con-sensus has been made was developed by Chambers and Conway (1992)4.
A livelihood in its simplest sense is a means of gaining a living. A livelihood comprises the capabilities, assets (stores, resources, claims and access) and activities required for a means of living: a livelihood is sustainable when it can cope with and recover from stress and shocks, maintain or enhance its capabilities and assets, and provide SL opportunities for the next gen-eration and which contributes net benefits to other livelihoods at the local and global levels and in the short and long-term.
Modified versions of this definition have been generally adopted, with few variations from authors and organizations. Carney’s 19985 definition is much the same as Chambers and Conway 1992 with the excep-tion that the emphasis is on the intergenera-tional component. Scoones, 19986, focuses on not undermining the natural resource base. Farrington et al, 19997 focus is on both of these issues. Soussan et al 2003 contin-ued the discussion of livelihood similarly to Scoones 1998: focusing on resources and more so natural resources. The link made was poverty to natural resources usage. Ellis 20008 emphasizes access to assets and the activities that are impacted by social relations and institutions. Wallman 19849, considered a livelihood as an umbrella concept, which suggests that social life is layered and that these layers overlap. Singh and Titi (1994)10 saw it incorporating the idea of change and uncertainty and is located analytically in the concept of a socio-ecological system.11 Messer and Townsley 2003 stated it is basically the means that a household uses to achieve
that well-being and sustain it. Krantz 2001 believed it is an attempt to go beyond the tra-ditional definitions and approaches to pov-erty eradication to include vulnerability and social exclusion.
Carswell et al. (1997)12 thought that the definitions being put forward were some-times unclear inconsistent and narrow, only adding to the model but not really defin-ing it. Scoones (1998) resultantly retracted to that outlined by Chambers and Conway (1992) stating that SL could be disaggregated into different sub-components namely, cre-ation of working days, poverty reduction, well-being and capabilities, livelihood adap-tation, vulnerability and resilience, natural resource base sustainability.
The term livelihood and thus SL is, there-fore, derived from a set of wider issues. It includes much of the broader debate about the relationships between poverty and envi-ronment13. The concept of livelihood and as such SL is a combination of many ideas and interests. It draws on many elements of development and in its achievement trade-offs between productivity, equity and sus-tainability are critical. The important thing to recognise about the term is that it is always subject to negotiation; to allow con-tradictions and trade-offs between different elements of the composite definition to be recognised.
THE SUSTAINABLE LIVELIHOOD APPROACH (SLA)
The SLA is a way of thinking about the objectives, scope and priorities for devel-opment. It is a discretely a defined way of working that is distinct from and contrasts with other approaches. It is evolutionary rather than revolutionary, meaning that it is sometimes difficult to ascribe benefits—or difficulties—specifically to the use of SLA,
15Patterns of Caribbean livelihoods
rather than to good development practice. The SLA or in some cases the livelihood approach has been developed and used by many development agencies namely UNDP, CARE, DFID, OXFAM, IFAD, PGIEP and LAL14. It can be used primarily as an ana-lytical framework (or tool) for programme planning and assessment or as a programme in itself. There are three basic features com-mon to most approaches:
1 The focus is on the livelihoods of the poor.
2 The approach rejects the standard pro-cedure of conventional approaches of taking a specific sector as an entry point (agriculture, water or health).
3 The approach places great emphasis on involving people in both the identifica-tion and the implementation of activi-ties where appropriate.
For the purpose of this paper, two approaches, DFID (the conventional) and IFAD (considering improvements in DFID) will be outlined.
DFID
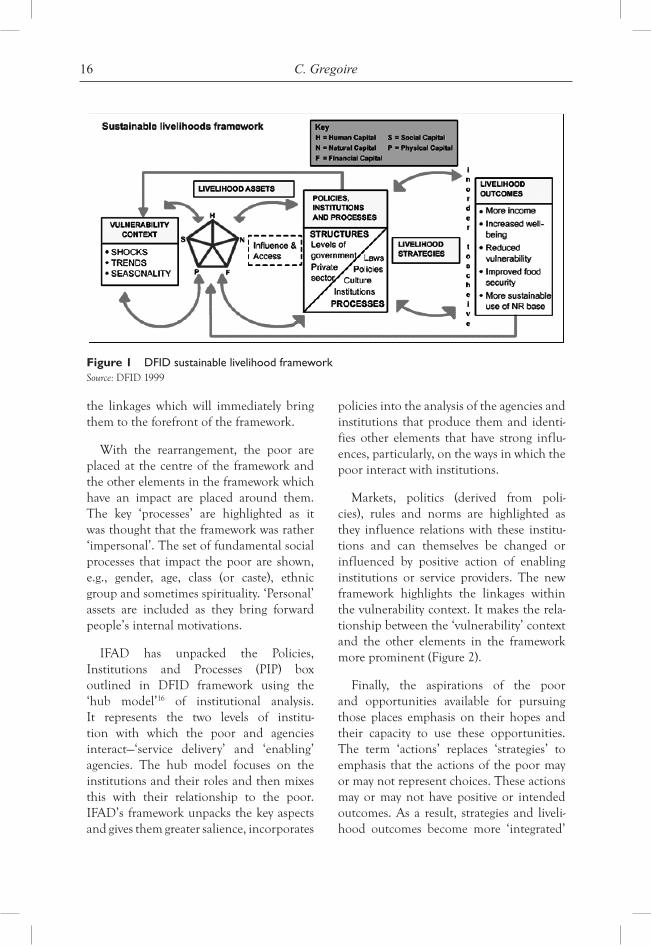
DFID SLA is based on a framework—a way of understanding how households derive their livelihoods by drawing on capabilities and assets to develop livelihood strategies com-posed of a range of activities. It defines and categorises the different types of assets and entitlements, which households have access to and examines the different factors in the local and wider environment that influence household livelihood security. It looks at the connections between the local or micro situ-ation and actors, institutions and processes at work in the wider world.
The DFID framework does not provide any explicit definition of what exactly con-stitutes poverty. It is premised from the
viewpoint that poverty is context-specific and requires case-by-case investigation. It is an analytical structure which aims to empower stakeholders to engage in well thought-out, logical, systematic and rational debate on the factors affecting livelihoods, livelihood opportunities, their importance and methods of interaction, where it concerns poverty reduction. The framework, therefore, aids the identification of appropriate entry points for support of livelihoods. In particular, the framework performs the following:
• providesa checklistof important issuesand sketches out the way these link to each other
• draws attention to core influences andprocesses and
• emphasises the multiple interactionsbetween the various factors which affect livelihoods15.
The framework, however, does not provide an exhaustive list of the issues to be con-sidered, does not work in a linear manner and is not intended to be an exact model of reality. It can be used as a planning and assessment tool, i.e., it can be used in both planning new development activities and assessing the contribution to livelihood sustainability made by existing activities. It should be adapted to meet the needs of any given circumstance. The framework is depicted in Figure 1.
IFAD
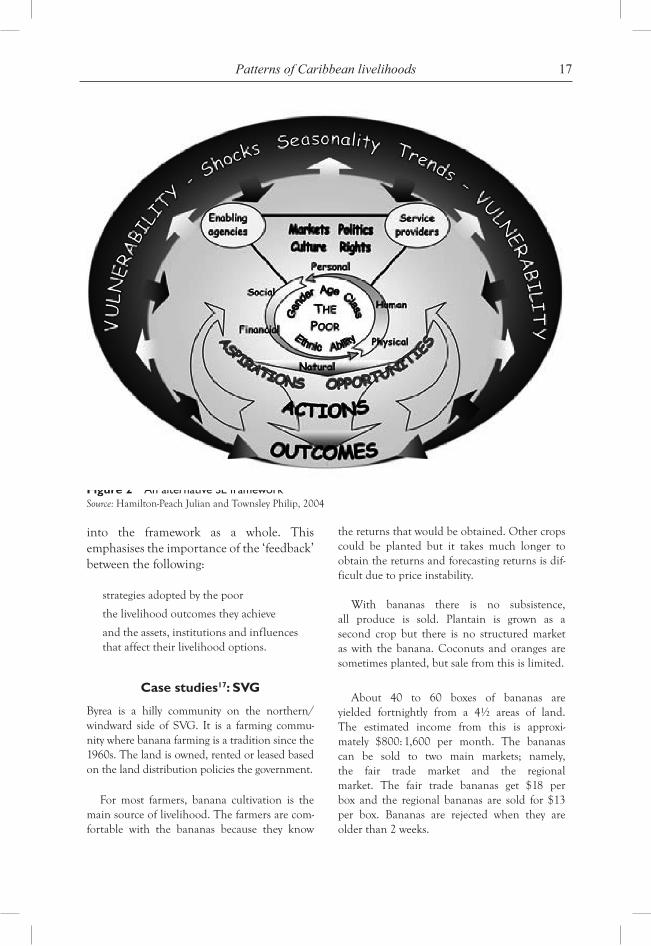
IFAD SLA is geared towards the enhance-ment of the methodology that development practitioners use to impact positively the live-lihoods of the poor. It results from changes that would have been applied to the DFID framework. It is less ‘sequential’ than the DFID framework and proposes to rearrange the framework placing more emphasis on
16 C. Gregoire
the linkages which will immediately bring them to the forefront of the framework.
With the rearrangement, the poor are placed at the centre of the framework and the other elements in the framework which have an impact are placed around them. The key ‘processes’ are highlighted as it was thought that the framework was rather ‘impersonal’. The set of fundamental social processes that impact the poor are shown, e.g., gender, age, class (or caste), ethnic group and sometimes spirituality. ‘Personal’ assets are included as they bring forward people’s internal motivations.
IFAD has unpacked the Policies, Institutions and Processes (PIP) box outlined in DFID framework using the ‘hub model’16 of institutional analysis. It represents the two levels of institu-tion with which the poor and agencies interact—‘service delivery’ and ‘enabling’ agencies. The hub model focuses on the institutions and their roles and then mixes this with their relationship to the poor. IFAD’s framework unpacks the key aspects and gives them greater salience, incorporates
policies into the analysis of the agencies and institutions that produce them and identi-fies other elements that have strong influ-ences, particularly, on the ways in which the poor interact with institutions.
Markets, politics (derived from poli-cies), rules and norms are highlighted as they influence relations with these institu-tions and can themselves be changed or influenced by positive action of enabling institutions or service providers. The new framework highlights the linkages within the vulnerability context. It makes the rela-tionship between the ‘vulnerability’ context and the other elements in the framework more prominent (Figure 2).
Finally, the aspirations of the poor and opportunities available for pursuing those places emphasis on their hopes and their capacity to use these opportunities. The term ‘actions’ replaces ‘strategies’ to emphasis that the actions of the poor may or may not represent choices. These actions may or may not have positive or intended outcomes. As a result, strategies and liveli-hood outcomes become more ‘integrated’
Figure 1 DFID sustainable livelihood frameworkSource: DFID 1999
17Patterns of Caribbean livelihoods
into the framework as a whole. This emphasises the importance of the ‘feedback’ between the following:
strategies adopted by the poor
the livelihood outcomes they achieve
and the assets, institutions and influences that affect their livelihood options.
Case studies17: SVG
Byrea is a hilly community on the northern/windward side of SVG. It is a farming commu-nity where banana farming is a tradition since the 1960s. The land is owned, rented or leased based on the land distribution policies the government.
For most farmers, banana cultivation is the main source of livelihood. The farmers are com-fortable with the bananas because they know
the returns that would be obtained. Other crops could be planted but it takes much longer to obtain the returns and forecasting returns is dif-ficult due to price instability.
With bananas there is no subsistence, all produce is sold. Plantain is grown as a second crop but there is no structured market as with the banana. Coconuts and oranges are sometimes planted, but sale from this is limited.
About 40 to 60 boxes of bananas are yielded fortnightly from a 4½ areas of land. The estimated income from this is approxi-mately $800: 1,600 per month. The bananas can be sold to two main markets; namely, the fair trade market and the regional market. The fair trade bananas get $18 per box and the regional bananas are sold for $13 per box. Bananas are rejected when they are older than 2 weeks.
Figure 2 An alternative SL frameworkSource: Hamilton-Peach Julian and Townsley Philip, 2004
18 C. Gregoire
The inputs into the process include labour, fertilizer, transport for manure, twine, boxes and packaging. Seasonal workers are usually employed one day—harvest day. Legislation outlines a mini-mum of $27EC. However, workers can be paid $40/50 EC per day. Fertilizer/chemical was priced at $120 per bag. Transport of manure $5 per bag and 12–16 bags are normally used. Twine boxes and packaging material were not charged.
The industry has declined severely from 8000 to 1200 banana farmers. Production has also declined not only because of this but also because of the changes in soil quality and the inabil-ity to apply frequent applications of fertilizer. Production is based on manure and the amount that can be afforded. Bananas were more profit-able to cultivate when there were less regulations (GAP and fair trade policies) to mitigate environ-mental impact.
The farmers believe that to keep the industry sustainable, the cost of inputs must be reduced and the price of the finished product must be increased.
With the occurrence of natural disasters—storms, hurricanes and heavy rains—farmers experience a ‘crops spoil’ as some are blown off the trees and what remains ripen prematurely. With hurricanes, there is also a ‘wind crop’. However, farmers can access insurance to help them get financing to replant what was lost. The insurance can go towards getting inputs at a discount or free. It is funded by a deduction by the Banana Growers Association. However, to access it 20% or more of the crops had to be damaged. The insurance is paid based on production. If someone had planted a small amount and all of it was damaged/lost then there is no compensation.
Issues
With the Caribbean having two main sea-sons, seasonality cannot be overemphasised within the vulnerability context. For half of the year, the weather conditions can vary from heavy rains to hurricanes, creating uncertainty and affecting livelihoods.
There is little control over natural assets. Framers have access to their recently regu-larised portion of land.
The farmers of SVG have little input into the major policies that affect them. GAP and fair trade policies filter down and are then combined with Windward Islands Farmers Association (WINFA) and the Banana Growers Association (BGA) poli-cies. At the latter two institutions farmers may have inputs. These policies affect the markets and prices for these products.
The strategies utilised are constant. The farmers are mainly mature female head of households who choose agriculture and depend on it solely for their livelihood. They try to reduce cost by helping each other at harvest time and reaping for each other in the event of sickness. The banana is the crop of choice, other crops are rarely harvested.
ANALYSIS
The livelihoods of the farmers are depen-dent upon the natural assets: the land, the water, the manure, etc. They are improved by the drive to achieve environmental sus-tainability. However, sustainability is based on four dimensions—economic, institu-tional, social and environmental. To achieve economic sustainability some farmers have migrated away from traditional agriculture into illegal products18 resulting in misuse of the natural assets. Institutional and social sustainability is based on their membership in local institutions.
Additionally, the climatic conditions can easily place farmers in precarious situ-ations distorting the strategies and the out-comes. Incomes can be affected due to these changes.
19Patterns of Caribbean livelihoods
GRENADA
Soubise is a coastal community located mid-way along the eastern coast of Grenada in the parish of St. Andrew. This community is well-known as a village of fishermen.
Soubise was impacted by Hurricane Ivan and Emily in 2004 and 2005, respectively. The livelihoods of the fishermen were adversely affected. Their boats and engines were destroyed and this resulted in a loss of income for them. Furthermore, fishermen were unable to catch fish or even command prices or incomes similar to the pre-Ivan and Emily period because there was an overall decline in the demand for fish in the post-disaster period. Currently residents on the coastline (including many fishermen) are experiencing flooding in their homes and back-yards whenever there is heavy precipitation. This is as a result of the close proximity of their homes to the sea. In some instances, this distance could be as little as three metres away from the water on the shore line. Generally, all the houses of the interviewees were damaged by Hurricane Ivan and Emily.
Mental health impacts on children and other family members included shock, worrying, stress, fear of rainfall, fear of the sea and fear of separation from their family members. The Impact of Hurricane Ivan on Household Income Hurricane Ivan damaged the boats and engines of six of the seven fishermen in the sample popu-lation. Fishermen were unable to return to the sea immediately after this hurricane because of poor weather conditions and damage to their boats. As a result, they lost income.
Among the fishermen, some did not restart their trade until between 2 to 18 months in some instances. In one instance, a fisherman did not resume his operations until 1 month after Hurricane Emily in 2005. The female vendor interviewed from the sample population indi-cated that she was unemployed for 1 month. In addition, the unemployed mother stated that her daughter was unemployed for 6 months as a result of the impact of Hurricane Ivan. The incomes of two individuals were not negatively affected by the passage of Hurricane Ivan and Emily. These
included a nurse and a shop co-owner. In the lat-ter instance, sales and income increased in the post-disaster period.
Issues
The impact of inclement weather during the rainy season and its potential to develop into tropical storms and hurricanes can severely affect livelihoods. It directly impacts on the ability of the fishermen and on the safety of their tools and equipment to undertake productive work. Their activities can be hampered by as little as rough seas bulletins to hurricanes.
The natural asset for fishermen is the sea—the Caribbean Sea and the Atlantic Ocean. Fishing is an extractive livelihood. Catchment is affected by many factors including climatic changes, over which there is limited predictability.
The fishermen of Grenada need to have greater input into the policies that affect them, particularly those concerning disaster management. Their input may be able to lesson down time when disasters occur.
ANALYSIS
The extractive livelihoods of the fishermen make them vulnerable. They are improvised by environmental conditions—natural disas-ters which is becoming more frequent due to factors such as climate change. Their ability to effectively and efficiently execute a livelihood strategy and their ability to cre-ate positive livelihood outcomes, creating or increasing incomes, is affected.
For farmers to maintain their strat-egy, additional costing must be incurred to secure and store equipment through extreme conditions. Funding for such must be given or costing subsidized.
20 C. Gregoire
CONCLUSION
The achievement of SLs focuses on three main issues: development, poverty reduction and sustainable resource manage-ment simultaneously. Within any Caribbean island the achievement of this will present a challenge. However, this is a challenge that can be undertaken.
Caribbean economies are extractive, agrarian and in some exceptional cases industrial. Regardless of which is dominant, natural resources are at the centre. If there is any shock to the natural environment the notion of building a SL is threatened. Protection, management and optimal use of are imperative to striving for development and poverty reduction.
The two cases have presented an illustra-tion of the Caribbean reality. It requires thought into the plan of action that can be taken to help the Caribbean people when their main source of livelihoods have been disrupted. It is specific as it gives greater depth to the help that is required by per-sons whose livelihoods are dependent upon natural resources and where there is little control. This is of great concern as these micro impacts have the potential to impact on the wider economy.
The question that results is how to create SLs within the Caribbean. Will the two models outlined help to achieve this? General guidelines include the following:
• Understandinghowthecultureofthesecountries can be helpful in policy devel-opment and implementation.
• Understanding of the livelihood strate-gies and the outcomes expected by the people who undertake them.
• Understanding of the institutions andthe way institution and the policies cre-ated by them affect livelihoods.
Caribbean economies are small and as such can be used as a pilot to undertake a SL analysis on a nationwide scale. This will facilitate the exploration of the SL concepts and help to adapt livelihoods to become more sustainable.
REFERENCES
Cahn, M. (2003) Sustainable Livelihoods Approach: Concept and Practice, Online: http://www.dev-net.org.nz/conf2002/papers/Cahn_Miranda.pdf, accessed 12/01/2010.
Chambers and Conway. (1992) Sustainable Rural Livelihoods: Practical Concepts for the 21st Century IDS Discussion Paper 296, Online: http://www.eldis.org/vfile/upload/1/document/0708/DOC12443.pdf, accessed 16/01/2010.
John, L. (2006) From growing ganja to planting trees: stimulating legal livelihoods and watershed management in Saint Vincent through payments from public utilities. A report on the Integrated Forest Management and Development Programme (IFMDP) and Forest User Groups of St. Vincent and the Grenadines
Krantz, L. (2001) The Sustainable Livelihood Approach to Poverty Reduction An Introduction, Online: http://www.catie.ac.cr/CatieSE4/htm/Pagina%20web%20curso/readings/krantz.pdf, accessed 06/01/2010.
Messer Norman and Townsley Philip (2003): Local institutions and livelihoods: Guidelines for analysis http://www.fao.org/docrep /006/y5084e/y5084e00.HTM accessed 22/04/2010
Naresh, S. (1996) Community Adaptation and Sustainable Livelihoods: Basic Issues and Principles, Online: http://www.sustainable-livelihoods.com/pdf/employmentnatural.pdf, accessed 09/02/10.
Naresh, S. and Gilman, J. (2000) Employment and Natural Resources Management: A Livelihoods Approach to Poverty Reduction, Online: http://www.sustainable-livelihoods.com/pdf/employmentnatural.pdf, accessed 09/02/10.
Naresh, S. and Gilman, J. (2002) Making Livelihoods More Sustainable, Online: http://
21Patterns of Caribbean livelihoods
www.undp.org/sl/Documents/documents.htm, accessed 09/02/10.
Scoones, I. (1998) Sustainable Rural Livelihoods A Framework for Analysis IDS Working Paper 72, Online: www.ids.ac.uk, accessed 16/01/10.
Soussan et al. (2003) Improving Policy-Livelihood Relationships in South Asia Briefing Note 3, A model of sustainable livelihoods, Online: http://www.york.ac.uk/inst/sei/prp/pdfdocs/3%20livelihoods%20factsheet.pdf, accessed 06/01/2010.
The Sustainable Economic Development Unit (SEDU) (2008) Identification and Analysis of the Linkages between Poverty and the Environment in the OECS Case studies of Grenada, St. Vincent & the Grenadines, St. Lucia and Dominica.
University of Professional Educators (2006) What is a Livelihood? Online: http://www.livelihood.wur.nl/?id=24, accessed 16/10/09.
NOTES
1 Naresh, S and Gilman, J (2000, 2002).
2 United Nations Conference on Environment and Development.
3 Naresh, S and Gilman, J (2000, 2002).
4 University of Professional Educators, 2006 and Cahn M, 2003.
5 Cited in Soussan et al., 2003.
6 Quoted in Cahn, 2003.
7 Quoted in Cahn, 2003.
8 Cited in University of Professional Educators, 2006
9 Cited in University of Professional Educators, 2006
10 Cited in Naresh C., 1996.
11 A socio-ecological system is the space in which political, cultural, religious, social, economic, biological and geo-physical factors
of an environment simultaneously interact with and in combination with each other to produce a variety of functions, processes and products, which shape the way a community makes its living in a given ecozone.
12 Cited in Scoones, 1998.
13 Scoones, 1998.
14 UNDP: United Nations Development Programme, CARE: Cooperative for As-sistance and Relief, DFID: United Kingdom Department for International Development, OXFAM: Oxford Committee for Famine Relief, IFAD: International Fund for Agricul-tural Development, PGIEP: Policy Guidelines for Integrating Environmental Planning and LAL: Learning about Livelihoods.
15 DFID, 1999.
16 The hub model focuses on the institutions and their roles and then mixes this with their relationship to the poor.
17 The SLA can be applied in the review of existing projects/programmes, even if the original intent and design of these were not focused on SLA. This paper would be drawing on the livelihood analysis done as part of SEDU 2008 and provides the basis for the SVG and Grenada case studies. The main objective of the case studies were to conduct a micro-economic analysis on the impact of Hurricane Ivan and Emily on the livelihoods of fishermen and individuals in Grenada and on the impact of GAP and Fair Trade Policies on the livelihoods of farmers in SVG to validate the macro–micro poverty environment relationship and more specifically to highlight the relationship between poverty and natural disaster vulner-ability and poverty and natural disaster dependence.
18 John L, 2006.

Copyright © 2010 WASD
World Sustainable Development Outlook 2010
23
STEM CELL INNOVATION SYSTEM IN INDIA: EMERGING SCENARIO
AND FUTURE CHALLENGES
Shashank Shekhar Tiwari†
University of Nottingham, UK
Pranav N. Desai*Jawaharlal Nehru University, India
Abstract: The present paper is an attempt to explore the emerging stem cell innovation system in India. It is contended that the social capital in terms of linkages of various sorts can no longer be ignored to strengthen the innovation system and that the co-evolution of technology and institutions is yet to emerge. It seems that given the nature of complex technologies involved, there is a greater need felt for R&D and training collaboration and hence linkages of various types are taking place. For shaping futures for a balanced growth of this sector, the institutions in India will have to be geared towards greater coordination, promotion of greater knowledge flows at national as well international levels. This paper also analyses the strengths and barriers in the development of rapidly growing stem cell research in India along with future challenges.
Keywords: stem cell research; India; sectoral system of innovation; linkages.
INTRODUCTION
In recent years stem cell has emerged as a sector with potential to treat a wide range of debilitating diseases and disability. Stem cell innovations have become a major focus not only for government policy initiatives and investment but have also heralded benefits for both health care and bio-technology industries. Globally, the stem cell industry is a billion dollar market. The global market size for stem cell therapy in 2006 was estimated to be US $26 billion and is projected to
reach US $96 billion by 2015 (Business Standard, 2008) and consequently stem cell research is becoming increasingly com-petitive. Research in the United States, European Union and Asia is moving apace with increasing level of government sup-port (UKSCI Report, 2005). The stem cell sector has witnessed a rapid growth world-wide. This is reflected from the fact that merely in a four-year period, the figure for number of firms has increased from 33 (Laysaght and Hazlehurst, 2003) to 166 during 2002–06 (Martin et al., 2006).
*Corresponding author: Jawaharlal Nehru University, India; e-mail: [email protected]†University of Nottingham, UK; e-mail: [email protected]
24 S.S. Tiwari and P.N. Desai
Given the huge ‘disease burden’ (Darr et al., 2007; Reddy et al., 2005), the need for cell therapy, diagnostics and medicines, the claim of the stem cells need to be exploited to the fullest. Countries across the world have evolved their own policies to take advantage from the stem cell development.
India has also taken significant steps to establish an advantageous position in global stem cell market. Indian stem cells market is growing at a rate of 15% per annum and is expected to hit US $540 million by the year 2010 (Express Pharma, 2007). The Government of India is very much supportive of the stem cell research, which is clear from the fact that the government has invested US $500 million in the last 3 years. The private players have not lagged behind and have made significant investments (Express Pharma, 2007). Thus, it is not surprising that India is projected as global player in this sector.
However, given the nature of stem cell research that involves complex technolo-gies also demands a commensurate R&D support. Transforming basic scientific research into viable therapeutic applications requires significant amount of funding, human resources and infrastructure. Simultaneously commercialising of R&D requires rigorous clinical testing and consumer demand.
Stem cell research does involve several contentious issues posing challenges of socioeconomic, political and ethical in nature. The commercial path of stem cells entails trust of international scientific, industrial and financial communities. If trust disappears market vanishes (Salter et al., 2007). It has become most crucial after the South Korea’s Hwang affairs. In this back drop, the present paper has attempted to analyse the stem cell sector in India using sectoral system of innovation as an analytical framework. The main thrust of
this paper is to trace out the linkages among different players in the Indian stem cell sector, along with an overview of stem cell research in India.
The paper is divided into 6 sections. Section 2 deals with the analytical frame work. Section 3 discusses the structure of stem cell research in India. Role of institu-tions is highlighted in Section 4. Section 5 explores the emerging scenario of stem cell research in India, Finally, it is contended that the social capital in terms of linkages of various types can no longer be ignored to strengthen the innovation system and that the co-evolution of technology and institu-tions is yet to emerge.
ANALYTICAL FRAMEWORK
The present study is carried out from a perspective of the sectoral system innova-tion without assigning any causal priority as against other perspectives like the national innovation system (NIS) or the international system of innovation (ISI) (Desai, 2009). The innovation system in any country con-sists of Institutions (laws, regulations, rules, habits, etc.), the political process, the public research infrastructure (universities, research institutes, support from public sources, etc.), financial institutions, skills (labour force), etc. that affect how it generates, disseminates, acquires and applies knowledge.
To explore the technological dynamism of innovation, its various phases, and how this influences and is influenced by the wider social, Institutional, and economic frameworks has been the main focus of this type of analysis (Fagerberg, 2005).
Tapping global knowledge is another pow-erful way to facilitate technological change through channels such as FDI, technology transfer, trade and technology licensing.
25Stem cell innovation system in India
The NIS approach that rightly recognised the interactions between socioeconomic, political and institutional factors in the NIS within the national boundaries has not only visualised its crucial role in the developing countries but also the increasing significance of international cooperation in the catch-ing up process (Freeman, 1995). However, the relationship between NIS and ISI has been de-emphasised. There are other schol-ars (Desai, 2009; Fromhold-Eisebith, 2006) who perceive the effective linkages between the NIS, regional innovation system and ISI as beneficial for evolving balanced science, technology and innovation policies for the developing countries. Without assigning any causal priority to any of these levels, it is argued that these linkages would provide adequate understanding of the interactions between the international institutional fac-tors, R&D collaboration, migration and return migration of knowledge workers and other linkages.
Many scholars pursuing sectoral system approach view the interactions between (a) knowledge and technology domain, (b) actors and networks, (c) institutions and (d) learning as essential components for innovation (Malerba, 2005). According to them the successful innovation is heavily dependent upon the role of ‘organisation’ (firms as well as non-firm organisations) and the prevalent ‘institutions’ (rules of the game). Firms are viewed as key actors in the innovation process. However firms do not innovate in isolation. In the innovation pro-cess firms interact with other firms as well as non-firms organisation. Here institutions play an important role in their linkages. The linkages are viewed as key elements of the innovative and production processes. Moreover, the SSI perspective provides a focus on the sectoral specificities like in this case the challenges of the special raw mate-rial that is being used. It is in the preced-
ing context that the structure of stem cell research in India is analysed.
STRUCTURE OF STEM CELL RESEARCH IN INDIA
India is relatively a new player in the stem cell arena. Although at the nascent stage but Indian stem cell market is growing rapidly with promising stem cell therapies. India is seen as a potential player in the global stem cell market by offering cost effective treatments in comparison to developed countries. There are significant numbers of research laboratories, hospitals and firms that are active in this area (Greenwood, et al., 2006; Lander et al., 2008; Sharma, 2006) and a few universities have also taken initiatives.
Most of research in the area of stem cells is carried out through public sector, especially government research laboratories. Presently, more than 40 academic institutions and research laboratories including government and private hospitals are involved in stem cell research. At least nine private firms are also active in this area. Most of them are engaged in the area of stem cell cord blood banking. The reason might be that stem cell cord blood banking requires less expertise in comparison to technologies required for the embryonic and adult stem cells.
Research laboratories
Stem cell research is mostly carried out by public research laboratories in India. The focus is mainly on the adult stem cell research. Different research laboratories are engaged in different area of adult stem cells. In comparison to adult stem cells, a few research laboratories are working in the area of embryonic stem cells, even after the favourable environment compared to the western countries.
26 S.S. Tiwari and P.N. Desai
National Centre for Biological Sciences (NCBS) Bangalore is one of the leading research laboratories in the country. It is active in embryonic as well as adult stem cells. Its three human embryonic stem cell (hESC) lines are eligible for National Institute of Health (NIH) funding. NCBS has able to characterise those cell lines, although at present it is not available for the researcher (NIH websites).
NCBS, Jawaharlal Nehru Centre for Advance Scientific Research (JNCASR), Bangalore and Bangalore Assisted Conception Centre (BACC), Bangalore in a joint effort has developed hESC lines which are accepted by the steering commit-tee of UK stem cell bank (UK stem cell bank websites http://www.ukstemcellbank.org.uk/accepted.html).
National Centre for Cell Sciences (NCCS), Pune has conducted animal and pre-clinical analyses of bone marrow stem cell injections for pancreatic regeneration. NCCS scientists are interested in the clinical trials for diabetes. They are in the process to establish a team of clinicians, scientists, and patients to act as a platform for the trial (Lander et al., 2008).
National Brain Research Centre (NBRC), Manesar is active in the area of neural stem cells. The centre is also working in the area of embryonic stem cell research (Sharma, 2006).
Centre for Cellular and Molecular Biology (CCMB), Hyderabad is also one of the leading research laboratories in the field of stem cells. It has set up a stem cell facil-ity centre in association with Department of Science and Technology (DST) and Nizam’s Institutes of Medical Sciences (NIMS), Hyderabad. The facility centre will work in both basic and applied research. The role
of NIMS is to provide patient pool for the CCMB (The Financial Express, 2006).
Central Leather Research Institute (CLRI), Chennai is presently focused on the engineering tissue by seeding scaffolds with stem cells. It is interested in to have collaboration with private sector to further development of their research findings (Lander et al., 2008).
Institute of Immunohaematology, Mumbai conducts research in the field of haematopotic stem cells. It has two American and two Indian patents and it filed one American and Indian patent, respectively (personal communication, Dipika Mohanty)1.
Hospitals
In India quite significant numbers of pub-lic and private hospitals are involved in the stem cell research and therapy. They are involved in both basic and applied research. They are also offering various kinds of stem cell base therapies to the patients Hospitals have linkages with the various stem cells firms and research laboratories. In this way knowledge flows from basic researcher to the clinicians.
India’s one of the largest research- intensive hospital, All India Institutes of Medical Sciences (AIIMS), New Delhi conducts basic and applied research. They are also involved in clinical trials and pilot treatments. The stem cell facility was estab-lished in 2005. AIIMS is working in the area of adult and cord blood stem cells. Limbal, haematopotic, mesenchymal, cancer and epidermal stem cells is the main focus. It offers various therapies to the patients. So far more than 300 patients underwent stem cell transplantation for various diseases (Express Healthcare, 2007).
27Stem cell innovation system in India
Sir Ganga Ram Hospital, New Delhi is active in stem cell transplantation. It has tied up with Life Cell, a cord blood bank-ing firm based in Chennai for the stem cell therapy (The Times of India, 2006).
Sankara Nethrayalya, an eye hospital based in Chennai is in the process of estab-lishing a stem cell research centre in the field of ophthalmology. Christian Medical College and Hospitals has established a stem cell research centre in collaboration with Department of Biotechnology (DBT) for the translational research in the field of stem cells (Lander et al., 2008).
LV Prasad Eye Institute (LVPEI), a non-profit hospital at Hyderabad works in the area of corneal and limbal adult stem cells. It offers therapies to the eye patients. LVPEI has developed its own ocular surface recon-struction method. It is claimed that by this method 500 patients has been treated with the success rate of 70%. The treatments of LVPEI are supported by DBT, the Hyderabad eye research foundation and Champalimaud foundation. Till date half of the patient is treated free of costs (Lander et al., 2008).
However, the work of LVPEI was criti-cised by an international team of ophthal-mologists (Gulf Times, 2007).
The Nu Tech Mediworld clinic run by a private medical practitioner in Delhi is offering hope to treat motor neuron disease using stem cells but the poor condition of the clinic, a lack of sophisticated equipment and no peer review of therapies raises con-cern (Amelia, 2007).
Firms
Reliance Life Sciences Pvt. Ltd. (RLS), Mumbai; Stempeutics Research Pvt. Ltd., Bangalore and Nichi-In Centre for
Regenerative Medicine (NCRM), Chennai are leading firms in India which are active in the different area of stem cell research i.e. embryonic, adult and cord blood stem cells.
Reliance Life Science Pvt. Ltd.
RLS is the initiative of Reliance group, one of the largest private sector enterprises in India. It is engaged in embryonic, adult as well as cord blood stem cells.
RLS is playing a key role in developing the stem cell technology in India. It has three American and five Indian patents in the field of stem cells (USPTO and IPO data base). Its seven hESC lines are eligible for U.S. federal funding along with NCBS, Bangalore. However the cell lines developed by RLS are yet too categorised.
RLS has collaborated with different gov-ernment research laboratories and hospitals for the stem cell research. It deposited its embryonic stem cell lines at NCCS Pune that can be obtained from the NCCS for the research purpose. Similarly stem cell facilities are offered by the RLS in collabo-ration with NCBS, Bangalore.
In the area of ophthalmology it is collabo-rated with AIIMS, New Delhi and Aditya Jyot Eye Hospital, Mumbai for the clinical trials. It has collaboration with Sir Hurkisondas Nurrotumdas Hospital, Mumbai for cardiac stem cells. RLS provides its services to hos-pital in extraction of stem cells from bone marrow (Dutta, 2006). The RLS has set up stem cell research laboratory at this hospital for the purpose.
Reliance is working with different hospi-tals for clinical trials of different cell based therapies. After successful trials, there is a planning to commercialise these therapies through hospitals across the country.
28 S.S. Tiwari and P.N. Desai
Stempeutics Research Pvt. Ltd.
Stempeutics focuses on adult and embry-onic stem cell research. In adult stem cells the thrust is on mesenchymal, cardiac and neural stem cells. It is also working on the finding cures for debilitating dis-eases like Alzheimer’s and Parkinson’s diseases. Stempeutics developed the sophisticated technology for the stem cell clinical trials. It is recognised by the Indian Council of Medical Research (ICMR) for the clinical trials in stem cells research. Recently, Stempeutics has filed six patents in India and five internationally (The Hindu, 2008).
Stempeutics is keen to work with different hospital, research institutes, phar-maceuticals and different biotech sector companies as well as clinical research organ-isation for clinical trials. Stempeutics offers stem cell therapies in collaboration with Manipal Hospital, Bangalore and Kasturba Medical College, Manipal (The Hindu, 2008). Currently Stempeutics focuses on deriving stem cells from bone marrow and using them to begin research on their different products lines. Stempeutics has eight research groups, working on stem cell research and they are expected to reach at therapy stage in next eight to ten years. To enhance knowledge base in the area of stem cell research, Stempeutics is active in collaboration with different overseas universities.
Stempeutics has opened a facility centre in Malaysia. It has been the first interna-tional firm in the country to get the bion-exus status in Malaysia by the Malaysian Biotechnology Corporation. BioNexus Status is a designation awarded to qualify-ing biotechnology companies making them eligible for privileges contained within the BioNexus Bill of Guarantees. Stempeutics with support of Malaysian Biotechnology
Corporation in April 2008 launched the Stem Cells Operational and Professional Excellence (SCOPE) programme in Malaysia. This SCOPE programme is basi-cally related with talent creation in the field of stem cells.
Nichi-In Centre for Regenerative Medicine
NCRM is an Indo-Japan join venture firm. It is spin-off from Nichi-In Bio-Science Ltd. It is established in 2005. NCRM mainly focuses on autologous adult stem cells, like lim-bal, haematopotic, mesenchymal liver and corneal endothelial precursors stem cells. They are not conducting any research work either on embryonic stem cells or umbilical cord blood stem cells. It works in collabora-tion with different institutes in Japan which include both public and private. The insti-tute in Japan either prepares the basic mate-rials or technology for the NCRM. It is active in collaboration for either research or clinical application of stem cells.
In India, it has collaboration in both research and clinical application of stem cells in different areas with different hospi-tals and institutes. The collaboration is basi-cally for two purposes. The first one is in the area stem cell research and second one for the stem cell treatments. In stem cell treatment collaboration, NCRM provides services such as stem cell isolation and NK cells expansion, etc. to the hospitals based on MoU. The responsibility of the NCRM is limited at the service stage and documenta-tion of the same only. The hospitals take care of clinical assessment, harvesting and appli-cation of stem cells (Express Pharma, 2008).
Academic institutions
Some of the universities in India either started courses on stem cell biology or engaged themselves in stem cell research.
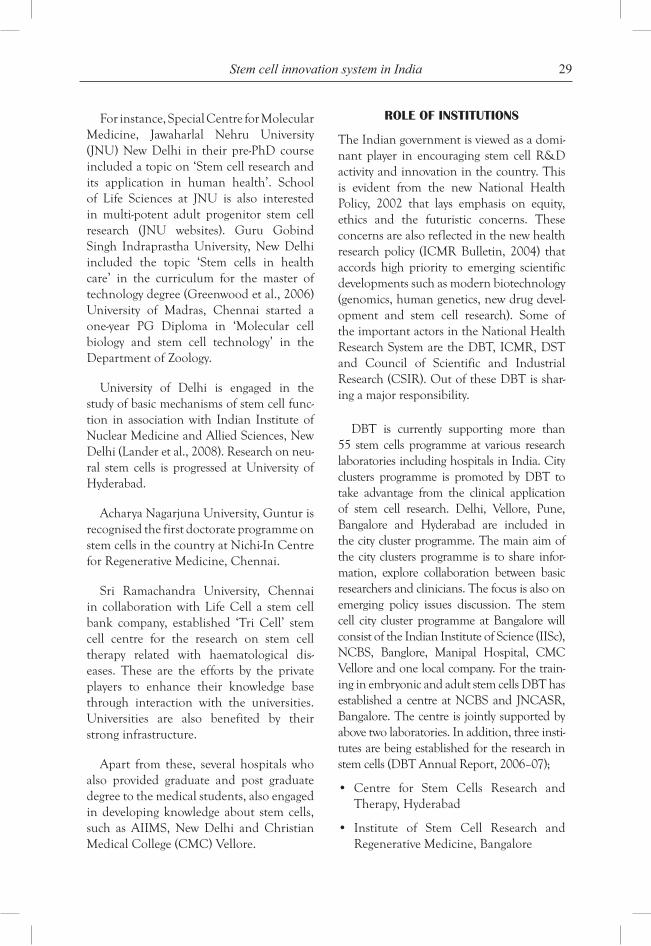
29Stem cell innovation system in India
For instance, Special Centre for Molecular Medicine, Jawaharlal Nehru University (JNU) New Delhi in their pre-PhD course included a topic on ‘Stem cell research and its application in human health’. School of Life Sciences at JNU is also interested in multi-potent adult progenitor stem cell research (JNU websites). Guru Gobind Singh Indraprastha University, New Delhi included the topic ‘Stem cells in health care’ in the curriculum for the master of technology degree (Greenwood et al., 2006) University of Madras, Chennai started a one-year PG Diploma in ‘Molecular cell biology and stem cell technology’ in the Department of Zoology.
University of Delhi is engaged in the study of basic mechanisms of stem cell func-tion in association with Indian Institute of Nuclear Medicine and Allied Sciences, New Delhi (Lander et al., 2008). Research on neu-ral stem cells is progressed at University of Hyderabad.
Acharya Nagarjuna University, Guntur is recognised the first doctorate programme on stem cells in the country at Nichi-In Centre for Regenerative Medicine, Chennai.
Sri Ramachandra University, Chennai in collaboration with Life Cell a stem cell bank company, established ‘Tri Cell’ stem cell centre for the research on stem cell therapy related with haematological dis-eases. These are the efforts by the private players to enhance their knowledge base through interaction with the universities. Universities are also benefited by their strong infrastructure.
Apart from these, several hospitals who also provided graduate and post graduate degree to the medical students, also engaged in developing knowledge about stem cells, such as AIIMS, New Delhi and Christian Medical College (CMC) Vellore.
ROLE OF INSTITUTIONS
The Indian government is viewed as a domi-nant player in encouraging stem cell R&D activity and innovation in the country. This is evident from the new National Health Policy, 2002 that lays emphasis on equity, ethics and the futuristic concerns. These concerns are also reflected in the new health research policy (ICMR Bulletin, 2004) that accords high priority to emerging scientific developments such as modern biotechnology (genomics, human genetics, new drug devel-opment and stem cell research). Some of the important actors in the National Health Research System are the DBT, ICMR, DST and Council of Scientific and Industrial Research (CSIR). Out of these DBT is shar-ing a major responsibility.
DBT is currently supporting more than 55 stem cells programme at various research laboratories including hospitals in India. City clusters programme is promoted by DBT to take advantage from the clinical application of stem cell research. Delhi, Vellore, Pune, Bangalore and Hyderabad are included in the city cluster programme. The main aim of the city clusters programme is to share infor-mation, explore collaboration between basic researchers and clinicians. The focus is also on emerging policy issues discussion. The stem cell city cluster programme at Bangalore will consist of the Indian Institute of Science (IISc), NCBS, Banglore, Manipal Hospital, CMC Vellore and one local company. For the train-ing in embryonic and adult stem cells DBT has established a centre at NCBS and JNCASR, Bangalore. The centre is jointly supported by above two laboratories. In addition, three insti-tutes are being established for the research in stem cells (DBT Annual Report, 2006–07);
• Centre for Stem Cells Research andTherapy, Hyderabad
• Institute of Stem Cell Research andRegenerative Medicine, Bangalore
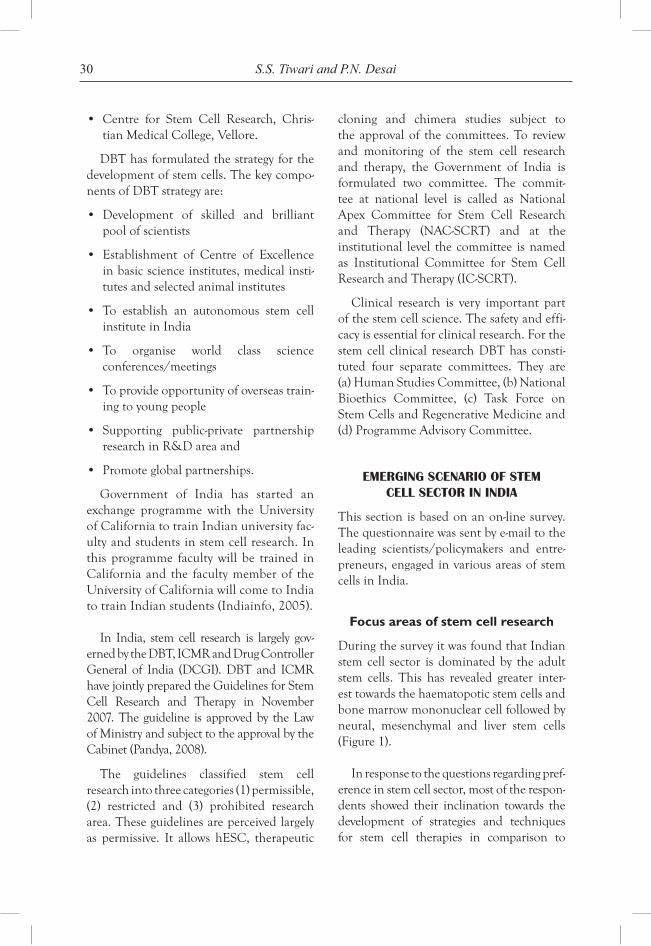
30 S.S. Tiwari and P.N. Desai
• Centre for Stem Cell Research, Chris-tian Medical College, Vellore.
DBT has formulated the strategy for the development of stem cells. The key compo-nents of DBT strategy are:
• Development of skilled and brilliantpool of scientists
• Establishment of Centre of Excellencein basic science institutes, medical insti-tutes and selected animal institutes
• To establish an autonomous stem cellinstitute in India
• To organise world class scienceconferences/meetings
• Toprovideopportunityofoverseastrain-ing to young people
• Supporting public-private partnershipresearch in R&D area and
• Promoteglobalpartnerships.
Government of India has started an exchange programme with the University of California to train Indian university fac-ulty and students in stem cell research. In this programme faculty will be trained in California and the faculty member of the University of California will come to India to train Indian students (Indiainfo, 2005).
In India, stem cell research is largely gov-erned by the DBT, ICMR and Drug Controller General of India (DCGI). DBT and ICMR have jointly prepared the Guidelines for Stem Cell Research and Therapy in November 2007. The guideline is approved by the Law of Ministry and subject to the approval by the Cabinet (Pandya, 2008).
The guidelines classified stem cell research into three categories (1) permissible, (2) restricted and (3) prohibited research area. These guidelines are perceived largely as permissive. It allows hESC, therapeutic
cloning and chimera studies subject to the approval of the committees. To review and monitoring of the stem cell research and therapy, the Government of India is formulated two committee. The commit-tee at national level is called as National Apex Committee for Stem Cell Research and Therapy (NAC-SCRT) and at the institutional level the committee is named as Institutional Committee for Stem Cell Research and Therapy (IC-SCRT).
Clinical research is very important part of the stem cell science. The safety and effi-cacy is essential for clinical research. For the stem cell clinical research DBT has consti-tuted four separate committees. They are (a) Human Studies Committee, (b) National Bioethics Committee, (c) Task Force on Stem Cells and Regenerative Medicine and (d) Programme Advisory Committee.
EMERGING SCENARIO OF STEM CELL SECTOR IN INDIA
This section is based on an on-line survey. The questionnaire was sent by e-mail to the leading scientists/policymakers and entre-preneurs, engaged in various areas of stem cells in India.
Focus areas of stem cell research
During the survey it was found that Indian stem cell sector is dominated by the adult stem cells. This has revealed greater inter-est towards the haematopotic stem cells and bone marrow mononuclear cell followed by neural, mesenchymal and liver stem cells (Figure 1).
In response to the questions regarding pref-erence in stem cell sector, most of the respon-dents showed their inclination towards the development of strategies and techniques for stem cell therapies in comparison to
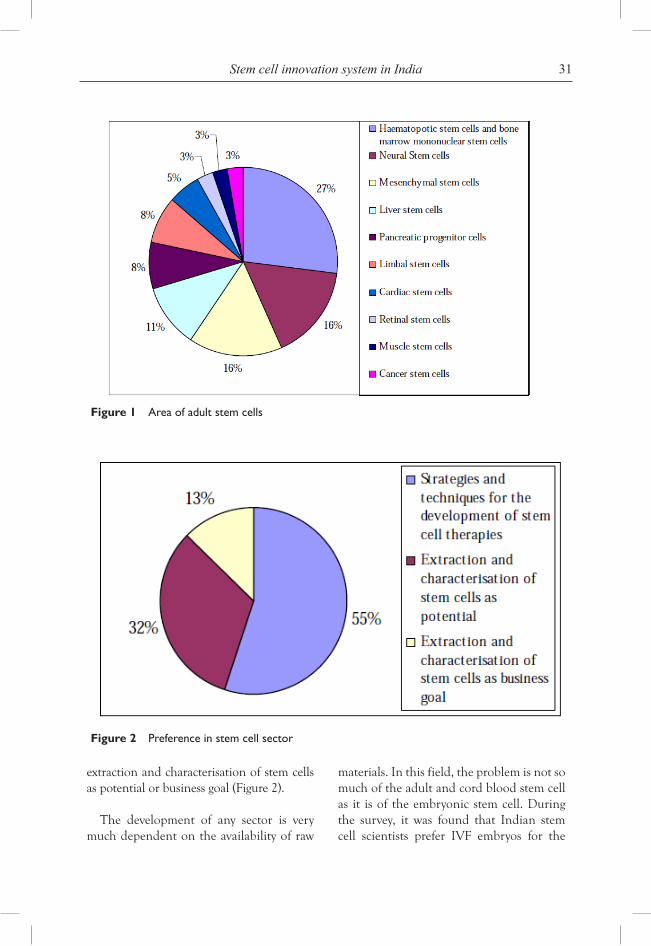
31Stem cell innovation system in India
extraction and characterisation of stem cells as potential or business goal (Figure 2).
The development of any sector is very much dependent on the availability of raw
materials. In this field, the problem is not so much of the adult and cord blood stem cell as it is of the embryonic stem cell. During the survey, it was found that Indian stem cell scientists prefer IVF embryos for the
Figure 1 Area of adult stem cells
Figure 2 Preference in stem cell sector
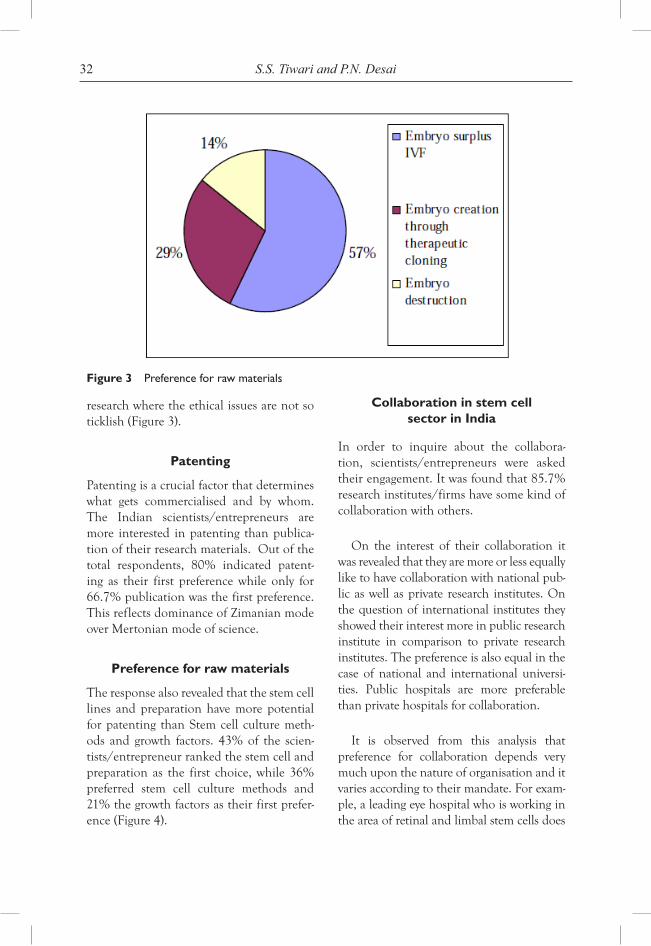
32 S.S. Tiwari and P.N. Desai
research where the ethical issues are not so ticklish (Figure 3).
Patenting
Patenting is a crucial factor that determines what gets commercialised and by whom. The Indian scientists/entrepreneurs are more interested in patenting than publica-tion of their research materials. Out of the total respondents, 80% indicated patent-ing as their first preference while only for 66.7% publication was the first preference. This reflects dominance of Zimanian mode over Mertonian mode of science.
Preference for raw materials
The response also revealed that the stem cell lines and preparation have more potential for patenting than Stem cell culture meth-ods and growth factors. 43% of the scien-tists/entrepreneur ranked the stem cell and preparation as the first choice, while 36% preferred stem cell culture methods and 21% the growth factors as their first prefer-ence (Figure 4).
Collaboration in stem cell sector in India
In order to inquire about the collabora-tion, scientists/entrepreneurs were asked their engagement. It was found that 85.7% research institutes/firms have some kind of collaboration with others.
On the interest of their collaboration it was revealed that they are more or less equally like to have collaboration with national pub-lic as well as private research institutes. On the question of international institutes they showed their interest more in public research institute in comparison to private research institutes. The preference is also equal in the case of national and international universi-ties. Public hospitals are more preferable than private hospitals for collaboration.
It is observed from this analysis that preference for collaboration depends very much upon the nature of organisation and it varies according to their mandate. For exam-ple, a leading eye hospital who is working in the area of retinal and limbal stem cells does
Figure 3 Preference for raw materials
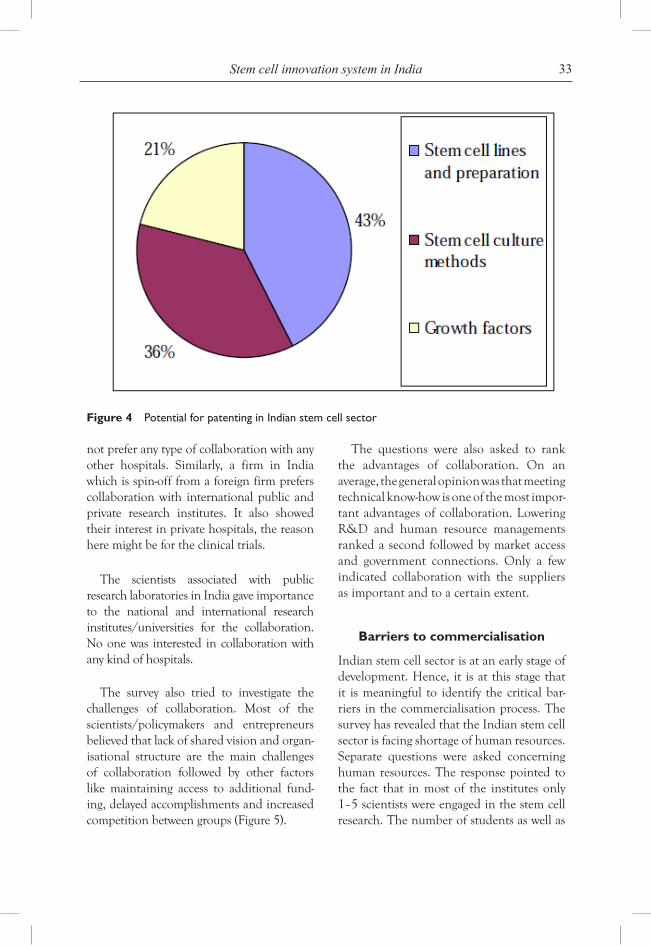
33Stem cell innovation system in India
not prefer any type of collaboration with any other hospitals. Similarly, a firm in India which is spin-off from a foreign firm prefers collaboration with international public and private research institutes. It also showed their interest in private hospitals, the reason here might be for the clinical trials.
The scientists associated with public research laboratories in India gave importance to the national and international research institutes/universities for the collaboration. No one was interested in collaboration with any kind of hospitals.
The survey also tried to investigate the challenges of collaboration. Most of the scientists/policymakers and entrepreneurs believed that lack of shared vision and organ-isational structure are the main challenges of collaboration followed by other factors like maintaining access to additional fund-ing, delayed accomplishments and increased competition between groups (Figure 5).
The questions were also asked to rank the advantages of collaboration. On an average, the general opinion was that meeting technical know-how is one of the most impor-tant advantages of collaboration. Lowering R&D and human resource managements ranked a second followed by market access and government connections. Only a few indicated collaboration with the suppliers as important and to a certain extent.
Barriers to commercialisation
Indian stem cell sector is at an early stage of development. Hence, it is at this stage that it is meaningful to identify the critical bar-riers in the commercialisation process. The survey has revealed that the Indian stem cell sector is facing shortage of human resources. Separate questions were asked concerning human resources. The response pointed to the fact that in most of the institutes only 1–5 scientists were engaged in the stem cell research. The number of students as well as
Figure 4 Potential for patenting in Indian stem cell sector
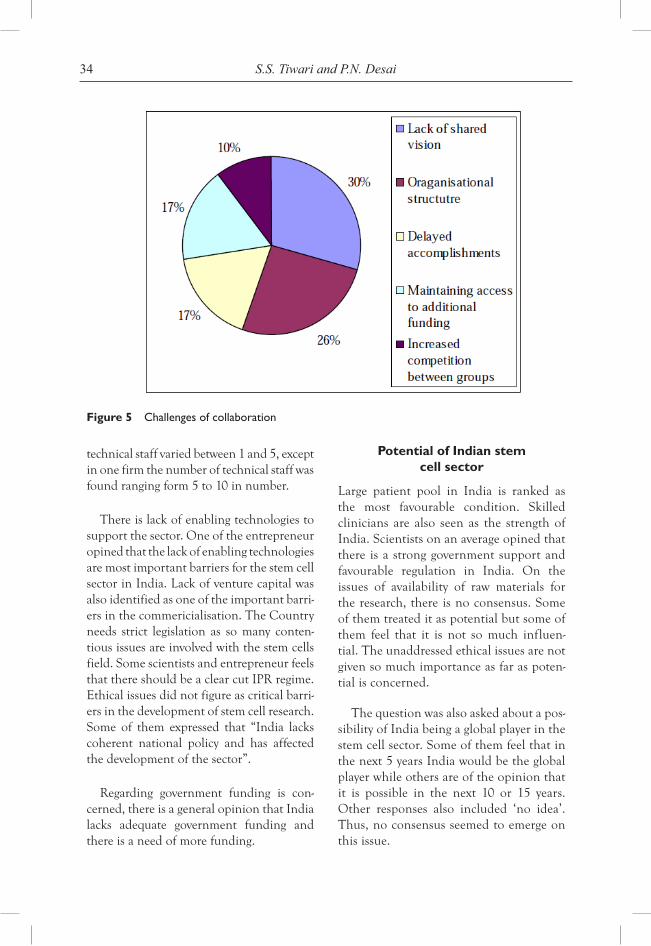
34 S.S. Tiwari and P.N. Desai
technical staff varied between 1 and 5, except in one firm the number of technical staff was found ranging form 5 to 10 in number.
There is lack of enabling technologies to support the sector. One of the entrepreneur opined that the lack of enabling technologies are most important barriers for the stem cell sector in India. Lack of venture capital was also identified as one of the important barri-ers in the commericialisation. The Country needs strict legislation as so many conten-tious issues are involved with the stem cells field. Some scientists and entrepreneur feels that there should be a clear cut IPR regime. Ethical issues did not figure as critical barri-ers in the development of stem cell research. Some of them expressed that “India lacks coherent national policy and has affected the development of the sector”.
Regarding government funding is con-cerned, there is a general opinion that India lacks adequate government funding and there is a need of more funding.
Potential of Indian stem cell sector
Large patient pool in India is ranked as the most favourable condition. Skilled clinicians are also seen as the strength of India. Scientists on an average opined that there is a strong government support and favourable regulation in India. On the issues of availability of raw materials for the research, there is no consensus. Some of them treated it as potential but some of them feel that it is not so much influen-tial. The unaddressed ethical issues are not given so much importance as far as poten-tial is concerned.
The question was also asked about a pos-sibility of India being a global player in the stem cell sector. Some of them feel that in the next 5 years India would be the global player while others are of the opinion that it is possible in the next 10 or 15 years. Other responses also included ‘no idea’. Thus, no consensus seemed to emerge on this issue.
Figure 5 Challenges of collaboration
35Stem cell innovation system in India
CONCLUSION
It is observed that though the Indian stem cell innovation system is in nascent stage, there are clear indications of rapid growth and the co-evolution of technology and institutions is yet to emerge. The preceding analysis has identified the following features of the pathways to the future of the Indian stem cell innovation system.
• The public research laboratories andhospitals have emerged as the dominant actors in this sector and the university system plays a moderate role. Only a few private firms are engaged in research and are largely engaged in cord blood bank-ing rather than the adult and embryonic stem cells research. As far as hospitals are concerned, both private and government hospitals are conducting research offer-ing stem cell therapies to the patients. However, there are concerns over these therapies in the absence of peer review.
• Thoughthereareconsciousattemptsbythe Government of India to introduce promotional and regulatory policies, it seems that the institutions have lagged behind technology. The stem cell sec-tor in India is jointly regulated by DBT, ICMR and DCGI. Because of multiple agencies, administration would be not very smooth and hassle free. In this con-text, perhaps India needs a single apex body for governing the stem cell science. It is pertinent to note here that the DBT had constituted many committees for governing the development of stem cells in the country. Out of these only a few committees have become functional.
• Stemcellsectoristechnologyintensive—the sector needs strong knowledge and technology base. Keeping this in view, government seems to be active in enhanc-ing knowledge base in this field. It has opened an exclusive stem cell research
centre. The DBT through its city cluster programme has attempted to establish linkages among the frontier research centres of the respective cities. In the city cluster programme a local company is also included which could be a public–private linkage.
• These linkages encourage knowledgeflow among different players in the sec-tor. However, the study finds that lack of shared vision and organisational struc-ture act as barriers in establishing strong linkages.
• Recently, the government has intro-duced new guidelines for this sector that are considered to be relatively permissive compared to other countries. It permits research on human embryonic stem cells, therapeutic cloning as well as chimeras studies. On the other hand, it prohibited reproductive cloning and some other research on embryos. However, these guidelines are not stringent and legally binding. There are possibilities of viola-tion and violator can’t be punished. The study finds that absence of effective legis-lation is one of the barriers in the devel-opment of stem cell research in India. It affects the international collaborations and commercial linkages.
• Adult stem cells and cord blood bank-ing turned out to be a dominant area of research in India rather than the embry-onic stem cell research. As the adult stem cells have lesser capacity of differentia-tion than embryonic stem cells, the com-mercial value is not so high. The work in this area is not getting apace as it requires more focussed R&D.
• There are noticeable efforts to buildup human resource base as reflected in various university programmes at dif-ferent levels. An interesting point to be noted is that there are private firms
36 S.S. Tiwari and P.N. Desai
that are collaborating with the Indian as well foreign universities for introducing doctoral programmes. This is perhaps a good indication of creating knowledge and technology base.
• Linkages are important for the sectoralgrowth. On examination of linkages, it was found that firms, research laboratories and hospitals have developed linkages with each other along with international collaboration.
• A largepatientpoolwith geneticdiver-sity and skilled clinicians in India is an additional strength.
• Therearemanybarrierstocommerciali-sation of stem cell research in India such as lack of enabling technologies: lack of venture capitals and relatively inad-equate funding. These constraints have posed serious challenges.
Finally, it seems that given the nature of complex technologies involved greater is the need felt for R&D and training collaboration and hence linkages of various types are tak-ing place. For shaping futures for a balanced growth of this sector, the institutions in India will have to be geared towards greater coor-dination, promotion of greater knowledge flows at national as well international levels.
REFERENCES
Amelia, G. (2007) ‘Doubts over gene cures’, The Observer, 03 June, Online: http://www. guardian.co.uk/world/2007/jun/03/health.india, accessed 23/04/08.
CCMB Floats Facility for Stem Cell Research (2006) The Financial Express, 10 May, Online: http://www.financialexpress.com/news/CCMB-floats-facility-for-stem-cell-research/167478/, accessed 15/03/08.
Darr, A.S., Singer, P.A., Deepa, L.P., Pramming, S.K., David, R.M., Beaglehole, R., Bernstein, A., Borysiewicz, L.K., Colagiuri, S., Ganguly, N.,
Glass, R.I., Finegood, D.T., Koplan J., Nabel, E.G., George, S., Sarrafzadegan, N., Smith, R., Yach, D. and Bell, J. (2007) ‘Grand challenges in chronic non-communicable diseases’, Nature, Vol. 450, pp.494–496.
DBT Annual Report 2006–2007, Online: http://dbtindia.nic.in/publication/public.html, accessed 15/04/08.
Desai, P.N. (2009) ‘Globalization of innova-tions: changing nature of India’s science and technology cooperation policy’, International Journal of Institutions and Economies, Vol. 1, pp.52–77.
Dutta, R. (2006) ‘Hope for the weak-hearted; H N hospital started stem cell therapy for MI patients’, Express Health Care Management, Online: http://www.expresshealthcaremgmt.com/200601/research01.shtml, accessed 16/02/08.
Fagerberg, J. (2005) Innovation: a guide to the literature, in Fagerberg, J., Mower, C.D. and Nelson, R.R. (Eds.): The Oxford Handbook of Innovation, Oxford University Press, New York, pp.1–26.
Freeman, C. (1995) ‘The national system of innovation in historical perspective’, Cambridge Journal of Economics, Vol. 19, pp.5–24.
Fromhold-Eisebith, M. (2006) ‘Effectively linking international, national and regional innovation systems: insights from India and Indonesia’, in Lundvall, B.-Å., Intarakumnerd, P. and Vang, J. (Eds.): Asia’s Innovation Systems in Transition, Edward Elgar Publishing Limited, Cheltenham, UK.
Greenwood, H.L., Thorsteinsdóttir, H., Perry, G., Renihan, J., Singer, P.A. and Darr A.S. (2006) ‘Regenerative medicine: new opportunities for developing countries’, International Journal of Biotechnology, Vol. 8, pp.60–77.
Guidelines for Stem Cell Research and Therapy (2007) Online: http://www.icmr.nic.in/stem_cell/stem_cell_guidelines.pdf, accessed 10/04/08.
ICMR (2004) ‘Health Research Policy’, ICMR Bulletin, Vol. 34, pp.9–10.
37Stem cell innovation system in India
India to Tie up with UCSF for Training in Stem Cell (2005) Indiainfo.com, 13 June, Online: http://news.indiainfo.com/2005/06/13/1306stem-cell.html, accessed 20/01/08.
Lab for Stem Cell Research Opened (2008) The Hindu, 12 July, Online: http://www.thehindu.com/2008/07/12/stories/2008071259240300.htm, accessed 15/07/08.
Lander, B., Thorsteinsdóttir, H., Singer, P.A. and Daar, A.S. (2008) ‘Harnessing stem cells for health needs in India’, Cell Stem Cell, Vol. 3, pp.11–15.
Laysaght, M.J. and Hazlehurst, A.L. (2003) ‘Private sector development of stem cell technology and therapeutic cloning’, Tissue Engineering Vol. 9, pp.555–561.
Malerba, F. (2005) ‘Sectoral system: how and why innovation differs across sectors’, in Fagerberg, J., Mowery, D.C. and Nelson, R.R. (Eds.): The Oxford Handbook of Innovation, Oxford University Press, Oxford, pp.380–406.
Martin, P.A., Coveney, C., Kraft, A., Brown, N. and Bath, P. (2006) ‘Commercial develop-ment of stem cell technology: lessons from the past, strategies for the future’, Regenerative Medicine Vol. 1, pp.801–807.
NCRM Starts PhD Programme in Stem Cell Research (2008) Express Pharma, 1–15 May, Online: http://www.expresspharmaonline.com/20080515/market08.shtml, accessed 30/06/08.
Neha L. (2006) ‘Freeze newborns’ blood to fight ailments’, The Times of India, 24 July 2006.
Pandya, S.K. (2008) ‘Stem cell transplantation in India: tall claims, questionable ethics’, Indian Journal of Medical Ethics, Vol. 5, pp.16–18.
Reddy, K S., Shah, B.,Varghese, C. and Ramadoss, A. (2005) ‘Responding to the
threat of chronic disease in India’, Lancet, Vol. 366, pp.1746–1751.
Salter, B., Cooper, M., Dickins, A. and Cardo, V. (2007) ‘Stem cell in India: emerging economics and the politics of globalization’, Regenerative Medicine, Vol. 75, No. 2, pp.75–90.
Selling Stem Cells (2007) Express Pharma, 1–15 December, Online: http://www.expressphar-maonline.com/20071215/mmlarket01.sht, accessed 05/01/08.
Sharma, A. (2006) Stem cell research in India: emerging scenario and policy concerns’, Asian Biotechnology and Development Review, Vol. 8, No. 3, pp.43–53.
Stem Cell Research Making Progress in India (2008) Business Standard, 19 February, Online: http://www.ibef.org/artdisplay.aspx?art_id=17972&cat_id=60, accessed 12/03/08.
Stem Cell Therapy (2007) ‘The holy grail of medicine’, Express Health Care, April 2007, Online: http://www.expresshealthcaremgmt.com/200704/coverstory01.shtml.
Stem Cell Transplant for Eye Repair Raises Concern (2007) Gulf Times, 18 January, Online: www.gulftimes.com/site/topics/article.asp?cu_no=2&item_no=128025&version=1& template_id=40&parent_id=22, accessed 20/04/08.
UK Stem Cell Initiative: Reports and Recommendations (2005) Online: http://www.advisorybodies.doh.gov.uk/uksci/ uksci-reportnov05.pdf, accessed 15/12/07.
NOTE
1 Ex-Director Institute of Immunohaematology, Mumbai.

Copyright © 2010 WASD
World Sustainable Development Outlook 2010
39
THE CASE FOR A PREVENTATIVE APPROACH TO CHRONIC NON-COMMUNICABLE
DISEASES (CNCDs) IN TRINIDAD AND TOBAGO
Dindial Ramrattan*University of West Indies, Trinidad and Tobago
Abstract: The Caribbean region has experienced an epidemiological transition from communicable diseases to chronic non-communicable diseases (CNCDs) over the past few decades. The case of Trinidad and Tobago has been no different. The main objective of this paper is to highlight some of the effects of this transition as well as to increase awareness of the need to foster a preventative approach to healthcare that fully takes this changing disease profile into account. The epidemiological transition has led to a change in the scope and functions of the health system. Given that the major health-based threats to the human capital development of Trinidad and Tobago are no longer diseases that are transferred from person to person but are, in fact, largely brought on by lifestyle choices, healthcare systems should now focus on prevention in the form of marketing, awareness drives and advertising to name a few. A significant economic burden will be imposed upon the society if a prevention-based approach to CNCDs is not adopted. The preventative approach will allow the country to mitigate some of the future health impacts that the population may face and Trinidad and Tobago stands to benefit greatly, via productivity and welfare gains, if CNCD-related issues are tackled prior to their onset rather than later on when these diseases have already taken root.
Keywords: preventative; healthcare; chronic non-communicable; Trinidad and Tobago; transition; human capital.
INTRODUCTION
This paper seeks to address an issue that has become relevant in the provision of any type of healthcare. When one analyses the basic dynamics of the provision of modern day healthcare, the concept of preventative healthcare is most apparent. Care and treat-ment as the primary form of healthcare is now being modified to suit the changing
demographics of the health system. The realisation of the increased impacts of chronic diseases on the population has now increased the focus on a healthy population.
Many will argue that due to the evolving nature of the world economies, differing threats have been realised across generations.
*Corresponding author: University of West Indies, Trinidad and Tobago; e-mail: [email protected]
40 D. Ramrattan
A timeline of major diseases occurring at various time periods include incidents such as the outbreaks of scurvy in the 1800s, the 1900s had outbreaks of rickets and cholera, 1930s and 1940s fell prey to the West Nile virus and malaria, the 1960s saw the re-emergence of cholera and the 1980s and onwards are characterised by HIV/AIDS and various chronic diseases (Alleyne, 2010).
The transition from one form of disease to another has characterised the various econ-omies over time. The sailors and merchants of the 1800s contracted diseases related to their hygiene and nature of work. The envi-ronment and basic hygiene practices also led to mosquito-borne diseases and infec-tious diseases such as cholera. While these diseases were highly contagious, diseases such as diabetes, HIV/AIDS and hyperten-sion are non-communicable but have the same far-reaching consequences.
In a strict sense, preventative healthcare focuses on altering one’s diet, maintain-ing adequate levels of physical activity and restricting the intake of harmful substances such as alcohol and tobacco. However, one must remember that due to the increasing levels of pollution in the atmosphere, larger amounts of toxins in our water supply and chemical alteration of food produced, there are increasing unnatural additives to our ‘natural body and operational system’. The act of reducing the intake of some of these unnatural substances should also count as preventative healthcare.
The United States (US) Environmental Protection Agency (EPA) focuses on health risk as being equal to the product of hazard and exposure (EPA, 2010). In fact, if there were a reduction of either factor, there would be a reduction of health risk, thus
engaging in preventative healthcare. It is with this assumption in mind that leads the paper to focus on preventative healthcare across the board. Arguably, a major, unclas-sified aspect of cancer causation and other medical ills is the levels of pollution of vari-ous types (Ui, 1992). The case of Japan and various health complications arising out of the coal mining industry has been well documented (Ui, 1992).
Preventative healthcare must be viewed as any action that attempts to mitigate, if not negate, any adverse health conditions. Under this definition, even the impacts of diseases such as cholera, malaria and scurvy (to name a few) would have been ultimately reduced through preventative healthcare. In this regard, this is not a new concept by any means but it is a concept that must be altered to address the particular disease cat-egory of concern, as each disease category would require a different approach to fight-ing against it.
DEVELOPMENT AND CHANGING HEALTH PATTERNS
Over time, the world has witnessed a vari-ety of changes in the ailments that affect various populations. The Caribbean has witnessed a changing of its healthcare pat-terns and social situations over time. The Caribbean faced poverty related infections and malnutrition in the 1930s. The 1960s saw the growth of public health policy in the region and the 1970s saw a reduction of infectious diseases (Alleyne, 2010).
While these positive strides were made, the 1980s and 1990s were characterised by the region battling the onset of HIV/AIDS and chronic non-communicable diseases (CNCDs) (Alleyne, 2010). There are devel-opment associated links to the changes in
41The case for a preventative approach to CNCDs
the lifestyles of persons and an increase in the cases of cardiovascular diseases (CVDs) and cancer. These links are illustrated through the data that indicates in the more advanced, industrialised countries, CVDs and cancer account for just under two-thirds of all deaths (Alleyne, 2010).
It is under this consideration that the changing epidemiological pattern may war-rant a new way of thinking. The change from infectious communicable diseases to CNCDs and lifestyle diseases means that health systems must now attempt to develop a mech-anism that encourages persons to be continu-ously aware of their health. The conditions under which persons now operate on a daily basis are leading to diseases that reflect our choice of lifestyle. Another worrying point is that a lot of the present day conditions are irreversible/chronic, such that once present their impacts remain for life and we can only attempt to mitigate the negative results.
The health of a country’s population is impacted upon by various factors, such as the environment in which the people live, the level of education and the state of economic growth. It must be noted that this is a two-way relationship with the health of the individual also impacting upon these factors (Over, 1992). The UN Millennium Development Goals (MDGs) have placed focus on particular health concerns and their reduction within a particular time frame.
The Report of the Caribbean Commission on Health and Development (CCHD, 2006) brought forward many of the issues that are mostly present in the societies of the Caribbean region today. The report identi-fied the fact that the region has seen a decline in the total fertility rate over the past two decades, which is thus expected to lead to an increased dependency ratio. It is estimated
that the region will witness an elderly popu-lation (greater than 60 years old) of approxi-mately 18% by the year 2025.
While the report suggests that this would lead to an increased dependent population, it must be noted that there exists the oppor-tunity for persons to work post-retirement on a contractual basis. This ability is depen-dent on many factors, one of which is the health of the individual in question.
The CCHD (2006) also conducted a mor-tality analysis at 5 year intervals, for the period 1985–2000. This analysis painted a picture of CNCDs being the leading cause of death in the region. The CCHD (2006) further attrib-uted these causes of death to common factors across the region such as those identified ear-lier (eating habits, physical inactivity, obesity, tobacco and alcohol use). The CCHD (2006) report also makes mention of ethnic consid-erations; gender aspects and socio-economic impacts when considering the impacts of cer-tain diseases in particular countries.
The American Heart Association, 2010 (AHA, 2010) has estimated that 516,000 coronary artery bypasses were performed in 2001 in the United States. These prohibitive procedures can greatly reduce the numbers of heart attacks affecting the world’s population today. This is just one measure of attempting to mitigate the various mortality and morbid-ity aspects of such diseases. The nature of the diseases worldwide speaks to a need to coun-ter the effects before they occur.
The AHA (2010) continues by referring to the decline in death rates from CVDs being due, in large measure, to the public’s adapta-tion of more healthy behaviors and lifestyles. The AHA continues to advocate the adoption of preventative strategies that will alleviate a lot of the hefty final costs of treatment.
42 D. Ramrattan
The World Health Organization (WHO, 2010) has forecasted that chronic condi-tions will be the leading cause of disability by the year 2020. The long run cost of this will only serve to place great strains on the health care systems of the world. The report continues by focusing on the fact that, ‘the costs of lost production due to diabetes are five times the direct health care costs’. In this regard, the indicators point to expen-diture on prevention serving to save a lot more than curative measures.
The WHO also makes a mention of a current deficiency in healthcare systems (WHO, 2010). The fact that current sys-tems are responsive in nature, responding to symptoms and not attempting to prevent is the mould in which we currently operate. The report continues by outlining systems in the United States, Brazil and India that focus on providing chronic disease treatment to a degree of success. The U.S. example actually provided a system that had an almost identi-cal cost per capita as the prevailing systems but was more effective in terms of access, treatment and waiting times.
The report closed by advocating systems aimed at early detections, increasing physi-cal activity and focusing on diet, nutrition and curtailing adverse habits. The argument is made that any reduction in risky behav-iours, improper diet and physical activity can have a large degree of positive long term impacts. This would occur through the reduction in demand for healthcare and by extension, the cost of healthcare.
THE SITUATION AT HAND FOR TRINIDAD AND TOBAGO
Trinidad and Tobago benefits from a wealth of natural resources and a strong, devel-oping economy. The country has made
great strides over the years in achieving all time low rates of unemployment and the increased levels of economic growth (Budget Statement, 2007). However, due to the global financial crisis the growth rate has slowed and is expected to fall into nega-tive, occurring alongside a higher unemploy-ment rate; but it was noted that the country continued to operate at full employment even with the increased unemployment rate (Budget Statement, 2010).
In this time of developmental changes and increased impact of globalization within the country, there have been various health related changes that have taken place. The annual data shows various changes that have taken place within the population.
Table 1 shows that over the 30-year period, 1973–2003 there have been reduc-tions in the percentage of deaths caused by heart disease, cerebrovascular diseases, pneumonia and bronchitis, emphysema and asthma. However, the deaths caused by malignant neoplasm (cancer), diabetes mellitus and AIDS have shown increases. The percentage of deaths caused by diabetes mellitus has more than doubled overtime. AIDS only became a reality for Trinidad and Tobago in 1983, with its associated rate more than tripling in a 20-year period.
The data speaks to vast increases with the traditionally considered forms of lifestyle diseases, with the exception of diseases of the heart, as a percent of total deaths. The increasing percentage of deaths attributed to these diseases is showing a change in the nature of diseases with which hospitals have to deal.
A major positive factor is the fact that the percentage of deaths caused by heart disease has fallen by close to 50%. The
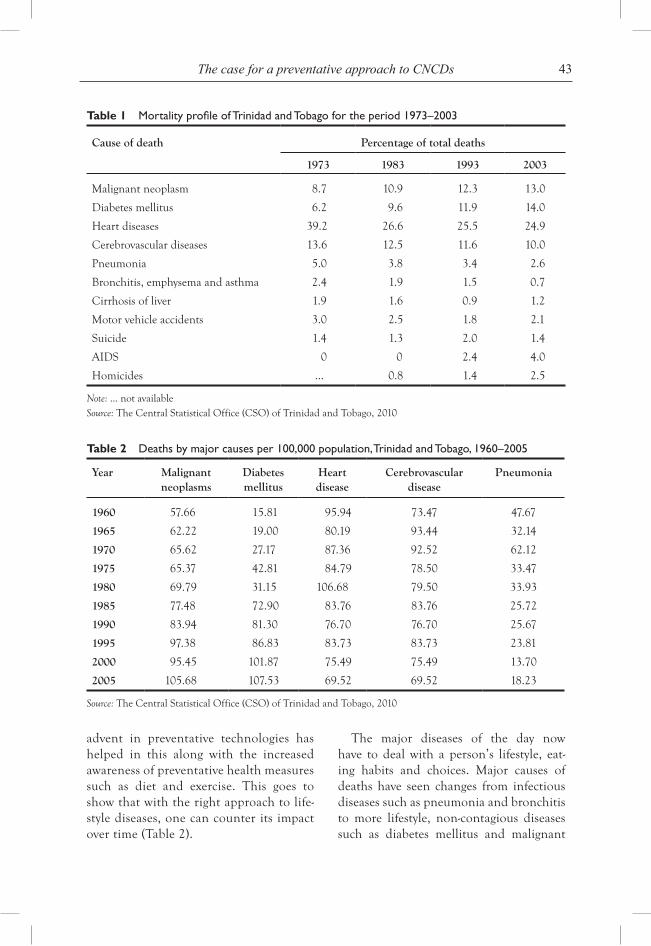
43The case for a preventative approach to CNCDs
advent in preventative technologies has helped in this along with the increased awareness of preventative health measures such as diet and exercise. This goes to show that with the right approach to life-style diseases, one can counter its impact over time (Table 2).
The major diseases of the day now have to deal with a person’s lifestyle, eat-ing habits and choices. Major causes of deaths have seen changes from infectious diseases such as pneumonia and bronchitis to more lifestyle, non-contagious diseases such as diabetes mellitus and malignant
Table 1 Mortality profile of Trinidad and Tobago for the period 1973–2003
Cause of death Percentage of total deaths
1973 1983 1993 2003
Malignant neoplasm 8.7 10.9 12.3 13.0
Diabetes mellitus 6.2 9.6 11.9 14.0
Heart diseases 39.2 26.6 25.5 24.9
Cerebrovascular diseases 13.6 12.5 11.6 10.0
Pneumonia 5.0 3.8 3.4 2.6
Bronchitis, emphysema and asthma 2.4 1.9 1.5 0.7
Cirrhosis of liver 1.9 1.6 0.9 1.2
Motor vehicle accidents 3.0 2.5 1.8 2.1
Suicide 1.4 1.3 2.0 1.4
AIDS 0 0 2.4 4.0
Homicides … 0.8 1.4 2.5
Note: … not availableSource: The Central Statistical Office (CSO) of Trinidad and Tobago, 2010
Table 2 Deaths by major causes per 100,000 population, Trinidad and Tobago, 1960–2005
Year Malignant neoplasms
Diabetes mellitus
Heart disease
Cerebrovascular disease
Pneumonia
1960 57.66 15.81 95.94 73.47 47.67
1965 62.22 19.00 80.19 93.44 32.14
1970 65.62 27.17 87.36 92.52 62.12
1975 65.37 42.81 84.79 78.50 33.47
1980 69.79 31.15 106.68 79.50 33.93
1985 77.48 72.90 83.76 83.76 25.72
1990 83.94 81.30 76.70 76.70 25.67
1995 97.38 86.83 83.73 83.73 23.81
2000 95.45 101.87 75.49 75.49 13.70
2005 105.68 107.53 69.52 69.52 18.23
Source: The Central Statistical Office (CSO) of Trinidad and Tobago, 2010
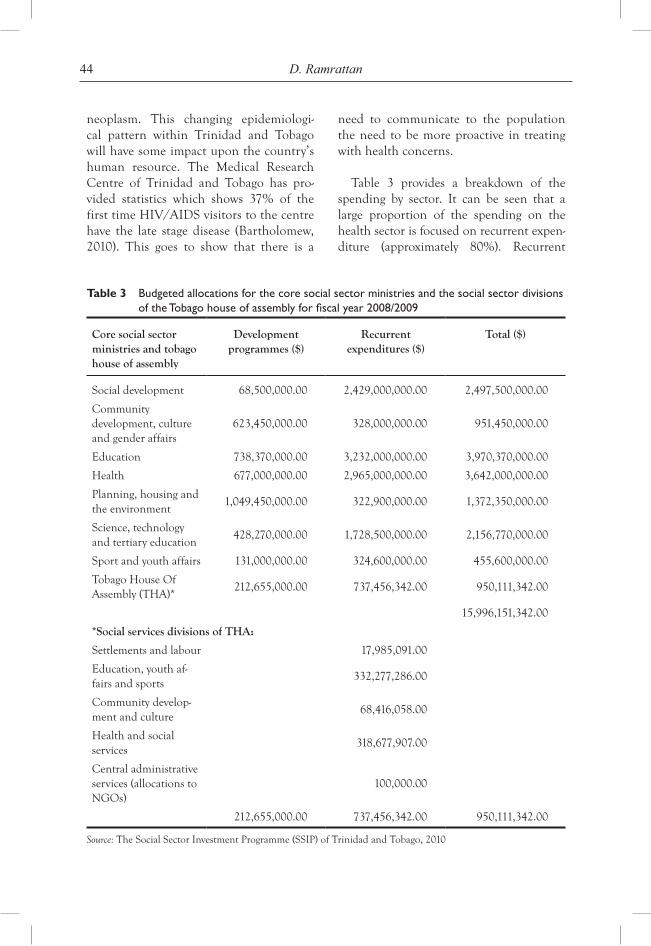
44 D. Ramrattan
neoplasm. This changing epidemiologi-cal pattern within Trinidad and Tobago will have some impact upon the country’s human resource. The Medical Research Centre of Trinidad and Tobago has pro-vided statistics which shows 37% of the first time HIV/AIDS visitors to the centre have the late stage disease (Bartholomew, 2010). This goes to show that there is a
need to communicate to the population the need to be more proactive in treating with health concerns.
Table 3 provides a breakdown of the spending by sector. It can be seen that a large proportion of the spending on the health sector is focused on recurrent expen-diture (approximately 80%). Recurrent
Table 3 Budgeted allocations for the core social sector ministries and the social sector divisions of the Tobago house of assembly for fiscal year 2008/2009
Core social sector ministries and tobago house of assembly
Development programmes ($)
Recurrent expenditures ($)
Total ($)
Social development 68,500,000.00 2,429,000,000.00 2,497,500,000.00
Community development, culture and gender affairs
623,450,000.00 328,000,000.00 951,450,000.00
Education 738,370,000.00 3,232,000,000.00 3,970,370,000.00
Health 677,000,000.00 2,965,000,000.00 3,642,000,000.00
Planning, housing and the environment
1,049,450,000.00 322,900,000.00 1,372,350,000.00
Science, technology and tertiary education
428,270,000.00 1,728,500,000.00 2,156,770,000.00
Sport and youth affairs 131,000,000.00 324,600,000.00 455,600,000.00
Tobago House Of Assembly (THA)*
212,655,000.00 737,456,342.00 950,111,342.00
15,996,151,342.00
*Social services divisions of THA:
Settlements and labour 17,985,091.00
Education, youth af-fairs and sports
332,277,286.00
Community develop-ment and culture
68,416,058.00
Health and social services
318,677,907.00
Central administrative services (allocations to NGOs)
100,000.00
212,655,000.00 737,456,342.00 950,111,342.00
Source: The Social Sector Investment Programme (SSIP) of Trinidad and Tobago, 2010
45The case for a preventative approach to CNCDs
expenditure includes programmes such as Chronic Disease Assistance Programme (CDAP). Issues, such as lack of hospital beds and access to required facilities could also receive increased attention should the preventative measures be successful.
Furthermore, preventative measures and increased awareness initiatives at an early stage allow for a greater spread of persons who are informed about the causes of dis-eases. In focusing attempts on education drives, advertising and public forums, one is able to reach a wider cross section of per-sons with the same types of activities.
The health sector is given a large portion of total government spending within the social sector. The health sector receives 23% of the total allocation, which is second only to education, a sector that receives a quar-ter of social sector spending. This shows the priority placed on the health sector as a component of social security.
There exists a situation within the coun-try whereby the health sector is allocated a major portion of government spending, thus, any attempts to create a health sector that is efficient and responsive to the popu-lation will be of importance to the country. This spending on the health sector justifies the need for a focused and efficient mode of service delivery.
The programmes of the Ministry of Health also include the provision of CDAP. This programme provides free prescription drugs and 53 pharmaceutical items for 12 diseases inclusive of diabetes, hypertension and cardiac conditions. The spending on these conditions in the form of medication places a responsive cost on the society. These pro-visions are made to persons suffering from some form of ailment, however, programs aimed at preventing or mitigating the pres-ence of these diseases could greatly reduce
these end costs and at the same time benefit other social sector initiatives as more alloca-tions would then be available for other areas of need.
In addition, some measures would facili-tate a collaborative effort between various national ministries. This would serve as an ability to achieve various goals of develop-ment at the same time and thus allow for more effective spending. For example, a planned daily exercise initiative at various recreational parks could meet both the man-dates of Ministry of Sport and Youth Affairs and the Ministry of Health in the fight against chronic diseases. A walk rather than drive initiative will aid in the fight against some types of diseases and the protection of the environment and at the same time reduce individuals’ expenditure on fuel.
From the information presented Trinidad and Tobago should focus some of its ener-gies on the incorporation of preventative healthcare into its planning. Initiatives that have previously been used have attempted to reform the health sector in a manner that allows for the streamlining and mod-ernisation of its operations. The country has focused initiatives towards the levels of primary and secondary schooling.
The country has incorporated the preven-tative health care strategy, to some extent, with some of the policies that have already been implemented. These include:
• Expansion of services offered underCDAP
• Implementation of policies on ageing,national youth policy, policy on persons with disabilities and the national work-place policy on HIV/AID
• PassageofTobaccoControlAct2009
• Implementation of breathalyzer test-ing on the nation’s roadways (possible
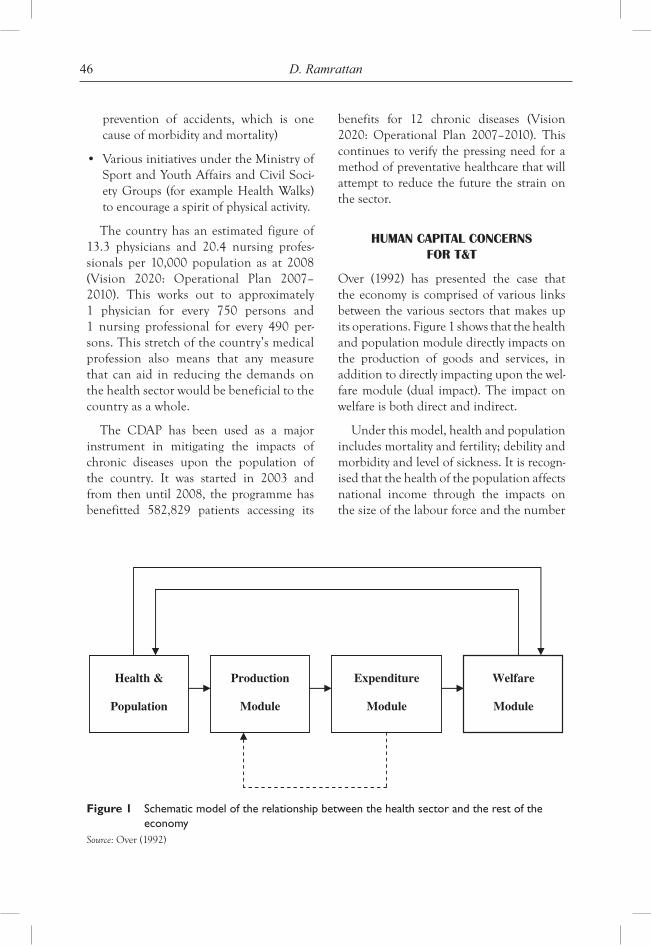
46 D. Ramrattan
prevention of accidents, which is one cause of morbidity and mortality)
• VariousinitiativesundertheMinistryofSport and Youth Affairs and Civil Soci-ety Groups (for example Health Walks) to encourage a spirit of physical activity.
The country has an estimated figure of 13.3 physicians and 20.4 nursing profes-sionals per 10,000 population as at 2008 (Vision 2020: Operational Plan 2007–2010). This works out to approximately 1 physician for every 750 persons and 1 nursing professional for every 490 per-sons. This stretch of the country’s medical profession also means that any measure that can aid in reducing the demands on the health sector would be beneficial to the country as a whole.
The CDAP has been used as a major instrument in mitigating the impacts of chronic diseases upon the population of the country. It was started in 2003 and from then until 2008, the programme has benefitted 582,829 patients accessing its
benefits for 12 chronic diseases (Vision 2020: Operational Plan 2007–2010). This continues to verify the pressing need for a method of preventative healthcare that will attempt to reduce the future the strain on the sector.
HUMAN CAPITAL CONCERNS FOR T&T
Over (1992) has presented the case that the economy is comprised of various links between the various sectors that makes up its operations. Figure 1 shows that the health and population module directly impacts on the production of goods and services, in addition to directly impacting upon the wel-fare module (dual impact). The impact on welfare is both direct and indirect.
Under this model, health and population includes mortality and fertility; debility and morbidity and level of sickness. It is recogn-ised that the health of the population affects national income through the impacts on the size of the labour force and the number
Figure 1 Schematic model of the relationship between the health sector and the rest of the economy
Source: Over (1992)
47The case for a preventative approach to CNCDs
of healthy life days. Health plays a key role in ensuring that the output of a country is at an optimal level and as such the level of expenditure is important in ensuring that decision makers are able to maximise the full potential of the workforce.
When the work of Over (1992) is con-sidered the importance of maintaining a healthy workforce is evident. The need to ensure that a country maintains a level of productivity that maximises the factors of production being used cannot be under-stated. It is this impact on the level of productivity and by extension, the Gross National Product (GNP) that forms one of the major arguments for state provision of healthcare. These impacts have served to strengthen the case that the fallout of rev-enue and even increased welfare payments due to morbidity or mortality is often a major reminder of the importance of invest-ing in the health of a country.
However, when a decision is taken to spend the public funds on healthcare, it must be managed equitably and efficiently. Baker and van der Gaag (1993) place partic-ular emphasis on mentioning that the level of one’s national economic development does not necessarily correlate positively to improvements within the health system of a country. They alluded to the need for poli-cies that directly or indirectly impact on the population’s health. Further, their work mentions the need to channel resources into the provision of basic services and treat and prevent diseases at an earlier stage.
There are many distortions within the provision of healthcare that various authors have articulated. The differences between urban and rural healthcare formed an integral part of the early literature on the health systems around the world. Authors have argued that there are many barriers to
accessing these services, if and when pro-vided, within the rural communities and poorer regions of many countries. Barriers include the cost of travel to and from health facilities; loss of earnings when seeking and receiving healthcare; and various cul-tural perceptions with regards to health practices.
Further, arising out of the CCHD (2006) report, it was previously mentioned that the expected percentage of the population over 60 within the region is expected to hover around an estimated 18% by 2025. This suggests that the additional pressures on economies to facilitate the health needs of this population segment. However, it must be recognised that these persons form a cadre of knowledge and skills that could suitably be tapped to ensure the effective development of their respective fields.
For this to take place, these persons must be in sound health and should be able to continue functioning in a working environ-ment. The availability of suitable preventa-tive health practices in their earlier years would lead to their ability to remain in good health/physical standing with fewer requirements for care and treatment. An effective health system would not only lead to an increase in life expectancy but also an increase in the productive years of the country’s workforce. Using the same argu-ment, any prevention in new cases of mor-bidity and/or disability (preventing ability to work) allows for a maximization of the productive capacity of the workforce.
This increase in the output of the factors of production, i.e., labour could help to push the economy’s production possibility curve outwards. This would because of the fact that a factor of production is now able to continue producing beyond its expected duration. In this regard, proper preventative
48 D. Ramrattan
health systems mixed with efficient care and treatment allows for an expansion of the country’s output.
Furthermore, reductions in the cases of disability and retirement also reduce the amount of welfare payments that the state is required to provide. This reduced expendi-ture could be reinvested, thus ensuring that the health system continues to meet the population’s changing requirements. The ability of these persons to continue working will potentially lead to increases in revenue through the capturing of income taxes and further injections into the flow of income, through the spending power of the addi-tional workers.
The fight against poverty will also be aided as preventative measures that reduce cases of mortality, morbidity and disability of heads of households will allow for persons to continue sustaining their families. In addition, in the cases where the person benefiting from the prevention is not the head of the household, there is also an economic benefit. In both outlined cases, the disposable income of the family is greater than if they had cause to pur-sue medical treatment. Money that would have been previously utilised in treatment and care programmes can now be chan-neled to various other needs. Medical expenses; medical supplies and loss of earnings all contribute to a considerable portion of a family’s income, especially a family/household at the lower socioeconomic level. If the state were to aid in provision of medical needs, it would be losing resources that could have been channeled in different areas.
This paper is in no way arguing against state provision of welfare grants and required medical needs for the vulnerable. On the contrary, it seeks to argue that policies and cases of prevention that are delivered to a
wider cross section of the public are more effective than dealing with individual cases of treatment and care.
The human capital of any country is vital to its sustainability. Trinidad and Tobago depends highly on the sup-plies of oil and natural gas that exist, in addition to the services and agricultural sectors that form part of its economy. T&T’s significant dependence on the “people aspect” of its economy makes the need for a healthy and responsive work-force all the more critical. A health system that treats with afflictions before they are able to impact negatively on the production process is therefore a vital component for the country’s growth and development.
CONCLUSION
The country must now seek to ensure that the health sector is monitored as a dynamic system that needs to be mindful of the changing nature of its operations. The preventative aspects of its service pro-vision must be incorporated across social sectors. The operations of the various arms of government must utilise the collaborative approach in ensuring that the goals of the various sectors are not treated in isolation.
Various awareness and activity programs should be used to translate the message to the populace that the fight against the diseases of the day is everyone’s business, everyday and everywhere. These initiatives must suit the desired target group and should appeal to them in some form or fashion. Health walks/fairs, educational advertising, school engagement and even legislature forms part and parcel of the preventative fight against diseases (Buddelmeyer and Cai, 2009).
The health sector has been identified as having strong relations with other social concerns. Poverty, productivity and good
49The case for a preventative approach to CNCDs
family functioning can all be affected by the status of a person’s health. There exists a dual causality between these factors and as such the health of the population can also be affected by these factors. It is with this in mind that the need for full and effective collaboration is required.
There are various resource constraints placed on the health sector and it is recogn-ised that treating with prevention could ease some of these constraints. Therefore, there should be some monitoring of the changes overtime attributable to the implementation of a preventative strategy to ensure that its goals are being met in a cost effective man-ner. The nation’s population deserves a health system of the highest standard but at the same time must be informed enough to make choices that will lessen their demands on such a resource constrained system. To facilitate optimal functioning of the health sector, all stakeholders must recognise the role that they have to play, and meet their obligations in a timely and effective manner.
BIBLIOGRAPHY
Alleyne, G. (2010) The Challenges of Caribbean Public Health, Guest presentation made on 17 April 2010 at the HEU, Centre for Health Economics, University of the West Indies (UWI), St. Augustine, Trinidad and Tobago.
Baker, J. and van der Gaag, J. (1993) ‘Equity in health care and health care financing: evidence from five developing countries’, in Eddy van Doorslaer and Adam, W. (Eds): Equity in the Finance and Delivery of Health Care: An International Perspective, Oxford University Press, Oxford.
Bartholomew, C. (2010) ‘The true picture of AIDS in Trinidad and Tobago’, Trinidad and Tobago Express, 10 May 2010, Online: http://www.trinidadexpress.com/index.pl/article_features?id=161658063
Buddelmeyer, H. and Cai, L. (2009) ‘Interrelated dynamics of health and poverty
in Australia’, The Institute for the Study of Labour (IZA) Discussion Paper No. 4602 (November 2009), Online: http://ftp.iza.org/dp4602.pdf
Caribbean Commission on Health and Development (CCHD) (2006) Report of the Caribbean Commission on Health and Development, Ian Randle Publishers, Kingston.
Over, M. (1992) ‘The health sector in a developing economy’, in Economics for Health Sector Analysis: Concepts and Cases, The World Bank, Washington, D.C.
Trinidad and Tobago. Central Statistical Office (CSO) (2010) Annual Statistical Digests (multiple years), Port of Spain, CSO, Trinidad.
Trinidad and Tobago. Central Statistical Office (CSO) (2010) Population, Social and Vital Statistics (multiple years). Port of Spain, Trinidad: CSO.
Trinidad and Tobago. Ministry of Finance (2007) Budget Statement 2007–2008, Online: http://www.finance.gov.tt/docu-ments/publications/pub9.pdf
Trinidad and Tobago. Ministry of Finance (2010) Budget Statement 2010–2011, Online: http://www.finance.gov.tt/documents/ publications/pub985D6E.pdf
Trinidad and Tobago. Ministry of Planning, Housing and the Environment (2010) Vision 2020: Operational Plan 2007–2010, Online: http://www.vision2020.info.tt/pdf/Vision%202020%20Operational%20Plan%202007–2010.pdf
Trinidad and Tobago. Ministry of Social Development (2010) Social Sector Investment Programme (SSIP), Online: http://www.finance.gov.tt/documents/ publications/pub8605BF.pdf
Ui, J. (1992) Industrial Pollution in Japan, United Nations University Press, Online: http://www.unu.edu/unupress/unupbooks/uu35ie/uu35ie00.htm#
United Nations Department of Economic and Social Affairs (2002) World Population Ageing: 1950–2050, United Nations, New York, Online: http://www.un.org/esa/population/publications/worldageing19502050/
50 D. Ramrattan
World Health Organization (WHO) (2005) Preventing Chronic Diseases: A Vital Investment, Online: http://whqlibdoc.who.int/publications/2005/9241563001_eng.pdf, WHO Press, Geneva.
WEBSITES
American Heart Association (AHA) Website. (2010). Preventive Health Care: AHA Scientific Position, http://www.americanheart.org/pre-senter.jhtml?identifier=4734
Pan American Health Organization (PAHO) Website. (2001). Country Health Profile: Trinidad and Tobago, http://www.paho.org/english/sha/prfltrt.htm
Trinidad and Tobago. Ministry of Health Website. (2010) Annual Statistical Report
2004–2005, http://www.health.gov.tt/ sitepages/default.aspx?id=122
Trinidad and Tobago. T&T Today Website. (2010) http://www.undp.org.tt/TT-Today/index.html
United Nations Department of Economic and Social Affairs. Division for Sustainable Development Website. (2010) Protecting and Promoting Human Health, http://www.un.org/esa/dsd/agenda21/res_agenda21_06.shtml
United Nations Population Fund (UNFPA) Website. (2010) Population Ageing, http:// caribbean.unfpa.org/popageing.htm
World Health Organization (WHO) Website. (2010) Fact Sheet: Integrating Prevention into Health Care, http://www.who.int/mediacentre/factsheets/fs172/en/
Copyright © 2010 WASD
World Sustainable Development Outlook 2010
51
SUSTAINABLE DEVELOPMENT THROUGH THE INCLUSION OF BUSINESS INCUBATORS:
A SWOT ANALYSIS
Hanadi Mubarak Al-Mubaraki*Kuwait University, Kuwait
Michael Busler†
Richard Stockton College, USA
Abstract: The main goal of business incubators is to produce successful firms that will leave the program financially viable, sustainable and independent. Critical to the definition of an incubator are the provisions of management guidance, technical assistance and consulting, which are tailored to young, growing com-panies. Business incubators contribute to the economy and also play active roles in the local, regional and national economic development. Business incubators, however, cannot by themselves transform an economy and should be integrated into a broader economic policy reform, which usually includes infrastructure in-vestment and financing options. Business, incubators must adapt internationally. In the Gulf Cooperation Council (GCC) countries, this adaptation leads to the support of diverse economies, the commercialisation of new technologies, job cre-ation and wealth building. The purpose of this research is to identify the strengths, weaknesses, opportunities and threats business incubators face. The methodology is based on two approaches. First, a literature review and then an examination of an international case study. The conclusion section provides guidance, suggestions and recommendations.
Keywords: business incubators; sustainability; economic development; Gulf cooperation council states; case study; entrepreneurial.
INTRODUCTION
In the United States and Europe it was rec-ognised that fresh strategies were needed to help regenerate crisis sectors, regions and communities with a rapid rise in unemployment resulting from the collapse
of traditional industries. The origins can be traced back to Western industrialised countries in the late 1970s and early 1980s. At the same time, business incubators began to be used as instruments to support innovation and technology transfer.
* Corresponding author: Kuwait University, Kuwait; e-mail: [email protected]†Richard Stockton College, USA; e-mail: [email protected]
52 H.M. Al-Mubaraki and M. Busler
Lalkaka (2001) sums up the evolution of the incubator concept as the first generation incubators in the 1980s that were essentially offering affordable space and shared facili-ties to carefully selected entrepreneurial groups. In the 1990s the need was recognised for supplementing the work space with counselling, skills enhancement and networking services to access professional support and seed capital, for tenants within the facility and affiliates outside. This led to the second generation incubator, although many in the developing countries are still stuck in the original business incubation. Starting in 1998, a new incubation model emerged in parallel towards creating growth-potential, tech-based ventures (Lalkaka, 2001).
Incubators are now in fashion having an effect on strategic challenges making them increasingly the object of policy-makers’ attention because they are relevant to a large number of debates on economic and social policy. First is job creation in which the incubators are seen as effective tools for creating self-employment opportunities, conventional product or service companies and high-growth companies. Incubators are also used to develop innovation, transfer technology and impart an entrepreneurial spirit. Second is economic development in which the incubators are used as much for spurring regional economic development and establishing industry clusters as they are for revitalising urban environments and industry. Finally are the international net-works in which the incubators can also be used to develop international networks of small- and medium-sized companies SME.
Incubator is a tool to gather and orches-trate existing forces to facilitate company creation. It does not create the sound; it makes the music. An incubator located in a poor entrepreneurial environment, whether it is a town, university or company, will have
little impact. In addition, the success of an incubation program depends on the follow-ing important characteristics. First, the flex-ibility and adaptability in a wide range of contexts. Second, they have demonstrated their profitability and their effectiveness. An average of 85% to 90% of companies graduating from incubators is still in busi-ness 5 years later. The cost per job created ranges from $1,100 in the United States to 4,000 euros ($3,590) in Europe. Third, they are increasingly becoming centres for international interaction that help entrepre-neurs get in contact with difficult-to-access overseas networks. Finally, incubators are places of communication for making incu-batees effective in numerous environments. Business incubators add value to companies and entrepreneurs who undertake a compre-hensive and detailed review of the incuba-tion program in which they are interested.
The benefits of business incubators can be of many types depending on the stakehold-ers such as tenants, government, research institutes and universities, businesses, the local and international community.
Tenants: They enhance the chances of success, raise credibility, help improve skills and facilitate access to mentors, information and seed capital.
Government: The incubator helps over-come market failures, promotes regional development, generates jobs, incomes and taxes, and becomes a demonstration of the political commitment to small businesses.
Research institutes and universities: The business incubation centre (BIC) helps strengthen interactions between uni-versity and research industry, promotes research commercialisation and gives opportunities for faculty/graduate stu-dents to better utilise their capabilities.
53A SWOT analysis
Businesses: The BIC can develop opportu-nities for acquiring innovations, supply chain management and spin-offs and help them meet their social responsibilities.
The local community: It creates self-esteem and an entrepreneurial culture together with local incomes as a majority of gradu-ating businesses stay within the area.
The international community: It generates opportunities of trade and technology transfer between client companies and their host incubators, a better under-standing of business culture and facili-tated exchanges of experience through associations and alliances.
The National Business Incubation Association (NBIA) of the United States defines business incubators as entities that ‘accelerate the successful development of entrepreneurial companies through an array of business support resources and services, developed or orchestrated by incubator management and offered both in the incu-bator and through its network of contacts’ (NBIA, 2005).
Business incubators are used as eco-nomic development tools by almost all countries. Typically, an incubator provides a safe haven for a firm in its early stages of growth through a mix of tangible and intangible services from the perspective of local economic development in mix-use type as core services, space and shared ser-vices, administrative assistance, consulting, coaching/training/networking and access to financing. Moreover, the main targets are small commercial product or service companies. The primary objectives are job creation, revitalisation, economic develop-ment, support to particular target groups or industries and development of companies and clusters.
BUSINESS INCUBATION MODELS SUSTAINABLE WORLDWIDE
United States model
Incubators in the United States are well established, numerous, often innovative and located at the heart of an environment that encourages entrepreneurism. They vary widely; however, public and private enti-ties often work together. Some university-based incubators are very dynamic. Other universities develop technology transfer mechanisms in response to their states’ massive investments in scientific research. Entrepreneurship education is thriving with the help of major foundations and the NBIA has become a driving force for business incubation. The goals of business incubation are to increase awareness and understanding of business incubation among entrepreneurs and community lead-ers and to strive for greater excellence in these incubator programs.
The United States has the largest num-ber of business incubator programs in the world. In many ways the United States has been a pioneer in this industry and the growth has been rapid from less than a 100 in the 1980s to about 1,800 in the 2010 (NBIA, 2010). The U.S. government has played a predominant role in supporting incubators with legislative allocations for economic development and job creation. They have also provided support at both the local and federal level by providing sponsor-ship (NBIA, 2010).
In addition to the incubators started by government authorities and agencies, 20% are associated with universities and/or science parks. Due to the success of the Stanford Research Park starting in 1951 and the Research Triangle Park in North Carolina in 1959, state and local economic development programs have thought to
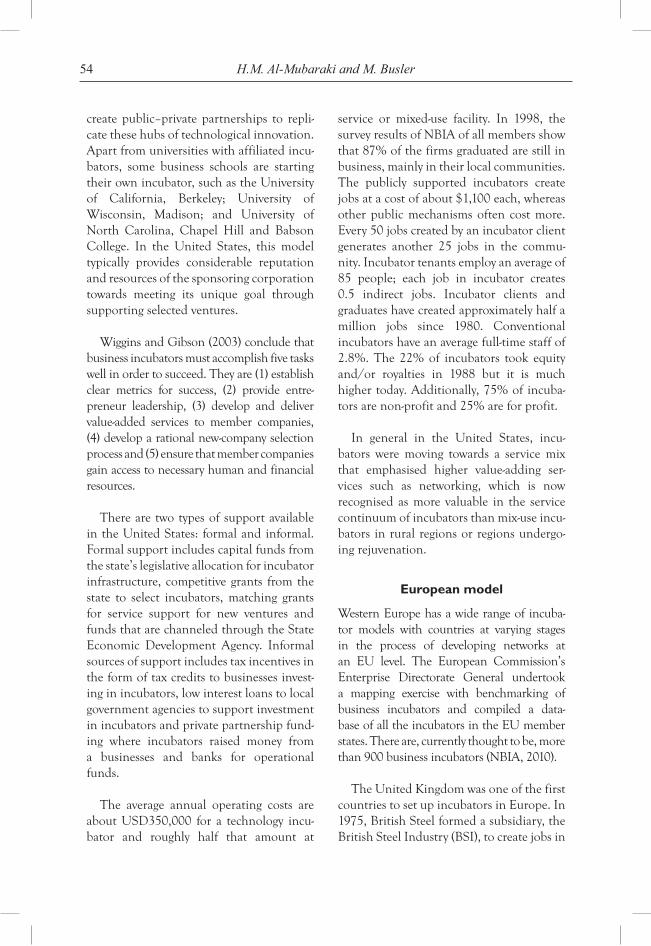
54 H.M. Al-Mubaraki and M. Busler
create public–private partnerships to repli-cate these hubs of technological innovation. Apart from universities with affiliated incu-bators, some business schools are starting their own incubator, such as the University of California, Berkeley; University of Wisconsin, Madison; and University of North Carolina, Chapel Hill and Babson College. In the United States, this model typically provides considerable reputation and resources of the sponsoring corporation towards meeting its unique goal through supporting selected ventures.
Wiggins and Gibson (2003) conclude that business incubators must accomplish five tasks well in order to succeed. They are (1) establish clear metrics for success, (2) provide entre-preneur leadership, (3) develop and deliver value-added services to member companies, (4) develop a rational new-company selection process and (5) ensure that member companies gain access to necessary human and financial resources.
There are two types of support available in the United States: formal and informal. Formal support includes capital funds from the state’s legislative allocation for incubator infrastructure, competitive grants from the state to select incubators, matching grants for service support for new ventures and funds that are channeled through the State Economic Development Agency. Informal sources of support includes tax incentives in the form of tax credits to businesses invest-ing in incubators, low interest loans to local government agencies to support investment in incubators and private partnership fund-ing where incubators raised money from a businesses and banks for operational funds.
The average annual operating costs are about USD350,000 for a technology incu-bator and roughly half that amount at
service or mixed-use facility. In 1998, the survey results of NBIA of all members show that 87% of the firms graduated are still in business, mainly in their local communities. The publicly supported incubators create jobs at a cost of about $1,100 each, whereas other public mechanisms often cost more. Every 50 jobs created by an incubator client generates another 25 jobs in the commu-nity. Incubator tenants employ an average of 85 people; each job in incubator creates 0.5 indirect jobs. Incubator clients and graduates have created approximately half a million jobs since 1980. Conventional incubators have an average full-time staff of 2.8%. The 22% of incubators took equity and/or royalties in 1988 but it is much higher today. Additionally, 75% of incuba-tors are non-profit and 25% are for profit.
In general in the United States, incu-bators were moving towards a service mix that emphasised higher value-adding ser-vices such as networking, which is now recognised as more valuable in the service continuum of incubators than mix-use incu-bators in rural regions or regions undergo-ing rejuvenation.
European model
Western Europe has a wide range of incuba-tor models with countries at varying stages in the process of developing networks at an EU level. The European Commission’s Enterprise Directorate General undertook a mapping exercise with benchmarking of business incubators and compiled a data-base of all the incubators in the EU member states. There are, currently thought to be, more than 900 business incubators (NBIA, 2010).
The United Kingdom was one of the first countries to set up incubators in Europe. In 1975, British Steel formed a subsidiary, the British Steel Industry (BSI), to create jobs in
55A SWOT analysis
steel closure areas. Both in the United States and in Europe, the well business incubation concept evolved gradually. In Germany, the University of Berlin established the first incubator in 1983, aiming at facilitat-ing the transfer of research findings to the industry. In 1985, France created an incuba-tor within the Sofia Antipolis Technology Park. Germany has 33% of the incubators in EUs member states. The first technology centres were set up in the Western part of the country during the early 1980s and has Europe’s largest business incubator associa-tion. The feature of German incubators is linked mostly with universities and R&D institutes. France has 21% of incubators in EUs member states, which is a large num-ber; however, only 50 of them meet the ‘minimum standard’ to the total of 192 pro-grams. The United Kingdom has just 16% of the total with about 144 business incuba-tion programs.
European Business and Innovation Centre Network (EBNs)—BIC observatory 2009 report demonstrates the European model for all member level. The network experienced an increase in the number of BICs demonstrating the business and inno-vation support model and is highly relevant, efficient and always more embedded in the strategies of local economic development. The core focus is on all types of innovation and BICs have demonstrated a high capabil-ity of adapting their models and their activi-ties to them.
In the European model, with 25 years experience, the BIC has become increas-ingly adequate and flexible enough to adapt itself to the changing surroundings and is capable of remaining up-front on the spear of innovation. It is not by coincidence that large companies are showing more and more interest in the BIC model and are get-ting in touch with the network as a viable
source of innovation detection. EBNs qual-ity system, which was created 5 years ago to manage the EC-BIC logo for the European Commission, has assured a high level of quality that contributes to the achievement of the results of the network in terms of pro-motion and networking. EBNs objective is to keep those levels high.
The BIC mission, which remains and needs to be the creation of innovative enterprises and the introduction of inno-vation within the existing SMEs, can bet-ter be reached if appropriate and effective agreements are carried out with other local stakeholders and with other specific and specialised service-oriented organisations which can increase the delivery of a more holistic, collaborative and efficient, sup-port to the end-users, the innovation-based entrepreneurs of tomorrow’s Europe.
The BICs network confirming the funda-mental role of BICs as local development instruments within their regions has been recognised by the local and national policy makers and has confirmed BICs ‘public interest’ mission. Among those, 14% of BIC report is being a private body and 78% are non-profit. The legal status of the BICs shows that over 50% of the BICs represen-tations are either public bodies or public equivalent bodies. The physical incubation activities, among the 82% of BICs, which supply the service, 45% own the incubator buildings. Average square metres available for incubation activities of owned incuba-tors are 2945 in 2007 and 3159 in 2008. In addition, the average incubator space occu-pancy rate was 83% in 2007, 78% in 2008 and, finally, the average incubation time is 3 years.
The performance of tenants in incubators with average number of tenant companies in the incubators operated by BICs in the
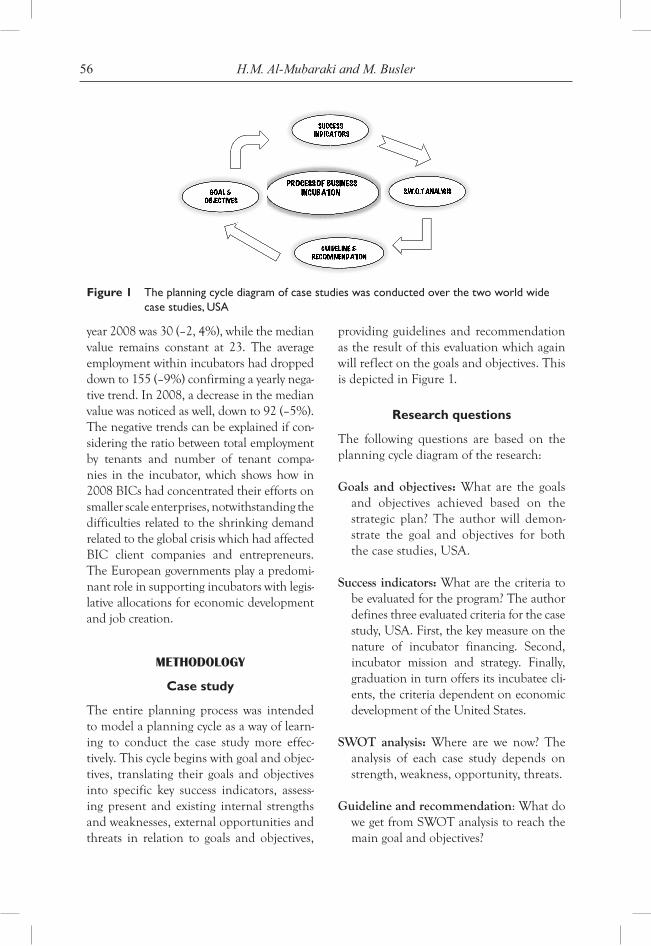
56 H.M. Al-Mubaraki and M. Busler
year 2008 was 30 (–2, 4%), while the median value remains constant at 23. The average employment within incubators had dropped down to 155 (–9%) confirming a yearly nega-tive trend. In 2008, a decrease in the median value was noticed as well, down to 92 (–5%). The negative trends can be explained if con-sidering the ratio between total employment by tenants and number of tenant compa-nies in the incubator, which shows how in 2008 BICs had concentrated their efforts on smaller scale enterprises, notwithstanding the difficulties related to the shrinking demand related to the global crisis which had affected BIC client companies and entrepreneurs. The European governments play a predomi-nant role in supporting incubators with legis-lative allocations for economic development and job creation.
METHODOLOGY
Case study
The entire planning process was intended to model a planning cycle as a way of learn-ing to conduct the case study more effec-tively. This cycle begins with goal and objec-tives, translating their goals and objectives into specific key success indicators, assess-ing present and existing internal strengths and weaknesses, external opportunities and threats in relation to goals and objectives,
providing guidelines and recommendation as the result of this evaluation which again will reflect on the goals and objectives. This is depicted in Figure 1.
Research questions
The following questions are based on the planning cycle diagram of the research:
Goals and objectives: What are the goals and objectives achieved based on the strategic plan? The author will demon-strate the goal and objectives for both the case studies, USA.
Success indicators: What are the criteria to be evaluated for the program? The author defines three evaluated criteria for the case study, USA. First, the key measure on the nature of incubator financing. Second, incubator mission and strategy. Finally, graduation in turn offers its incubatee cli-ents, the criteria dependent on economic development of the United States.
SWOT analysis: Where are we now? The analysis of each case study depends on strength, weakness, opportunity, threats.
Guideline and recommendation: What do we get from SWOT analysis to reach the main goal and objectives?
Figure 1 The planning cycle diagram of case studies was conducted over the two world wide case studies, USA
57A SWOT analysis
Data collection methods
Data was collected through structured inter-views with incubator managing director and case study. The case study was conducted in the Maryland Technology Development Corporation (TEDCO) [Melton R, 2010; pers. Comm.., Entrepreneurial Innovation, May] the largest incubation program in the United States. The criteria of evaluation in the case study are incubator mission and strategic plan-ning, incubator finances and incubator gradu-ation. Detailed designed questions in each interview with the managing director of the program in the Unites States as a key personal were used. Furthermore, SWOT analysis was done based on the interview and case study.
CASE STUDIES: SWOT ANALYSIS
USA case studies: Maryland Technology Development
Corporation (TEDCO)
Technology continues to be the driving force for the new economy and is critical to Maryland’s future. Maryland is richly endowed with technol-ogy assets—the largest concentration of federal laboratories of any state in the nation, nationally recognised research universities, a federal con-tractor base with a specialty in science, security and communications and an emergent biotech-nology cluster.
In order to maximise these technology assets, the TEDCO was created by the State Legislature in 1998. First, to assist in transferring to the private sector and commercialising the results and products of scientific research and develop-ment (R&D) conducted by colleges and universi-ties. Second, to assist in the commercialisation of technology developed in the private sector. Finally, to foster the commercialisation of R&D and to create and sustain businesses throughout all regions of the state.
The vision of TEDCO is that Maryland will become internationally recognised as one of the
nation’s premier 21st century locations for tech-nology and technology-based economic develop-ment. According to the TEDCOs, its mission is to foster the development of a technology-driven economy that will create and sustain businesses throughout all regions of the state of Maryland. TEDCOs identified role is to be Maryland’s leading source of funding for seed capital and entrepreneurial business assistance for the development, transfer and commercialisation of technology.
The goals and objectives of business incuba-tion is to encourage, promote, stimulate and support the R&D activity through the use of different investments, which leads to commer-cialisation of new products and services by small businesses. Business incubators can provide sig-nificant benefits by helping to create successful businesses that generate wealth and job opportu-nities to their regions and states. It is important to assess the economic impacts of incubators to understand their outcomes and provide support for increased activities. It provides decision mak-ers with a better understanding of the state’s capacity for incubators and the potential to rea-lise further economic development outcomes from increased investment in incubation.
RTI International (2007) conducted a com-prehensive study of the (TEDCO). Maryland currently has 19 Maryland technology incuba-tors and 7 proposed incubator projects. The majority of these incubators are located in Baltimore, Montgomery, Howard and Prince George’s counties. Technology incubators can also be found in other areas of the state, includ-ing Frederick, Anne Arundel, Allegany, Garrett and Washington counties. The study had three significant objectives. The first was the economic impact analysis of the technology incubators on Maryland’s economy, the second objective was to analyse the state’s capacity for new technology incubators and the final objective was to exam-ine the needs of incubator graduates and ways to help these graduate companies to continue to be successful after leaving the incubators.
The key results and findings of RTI interna-tional are summarised below, all figure are related
58 H.M. Al-Mubaraki and M. Busler
to TEDCO in 2006. The technology incubators in Maryland increased gross state product by $1.2 billion. The total annual employment impact of technology incubators was 14,044 new full-time employees in the state (5,374 direct employees and 8,670 indirect employees). The new jobs contributed $845 million in annual salary and benefits to Maryland households. The technology incubators in the state increased the state and local tax revenue by approximately $104 million per year. Maryland has the potential to sup-port new high-tech incubators, as evidenced by the state’s strong high-tech economy, abundant research, concentration in high tech employ-ment and exceptional political support. Gross state product contributions totalled $1.2 billion to increased state output by $2.7 billion per year. They contributed $104 million in state and local taxes. For every $1 of incubator assistance fund-ing provided by TEDCO tenant, companies con-tributed $1,800 dollars to Maryland’s gross state product. TEDCO made an average investment of $120 per incubator company job.
TEDCO 2010 annual report provided $287,500 to 12 incubator programs (16 dis-tinct physical facilities) to provide directed and targeted business assistance to their tenant and affiliate companies. The funding was used for a variety of business assistance services that these incubators would not have been able to provide otherwise.
Maryland Technology Development Corporation
U.S. case studies: SWOT analysis
Strength
First is the economic development, which facilitates the creation of businesses and fos-ter their growth in all regions of the state through the commercialisation of technol-ogy. Second, the funding is that Maryland’s leading source of funding for technology transfer and development programs and entrepreneurial business assistance. In facial year FY 2008 the summary of incu-bator development fund was approximately
10 million. Third, is the job creation where Maryland has a strong high-tech industry with over 15,000 establishments employing almost 200,000 in 2006. The average annual pay for high-tech jobs was $75,000, more than 60% higher than the statewide aver-age annual wage of $46,000. Fourth, is that the Science Park, which is the local economy opening of new workplaces follow by sci-ence park with high positional in high-tech. Fifth is that the networking that is between incubator manger to share experience in 19 programs. Sixth is that the feasibility studies for financial support. Seventh is the different funded program in which university partnership, angle of capital venture and TEDCO incubators included. Eighth is that the state of Maryland support in which Maryland universities has the national average in spinning out new companies. TEDCO has been working closely with the various university technology licensing offices to identify barriers to new business formation and has identified specific needs, including sophisticated market analysis and business strategy development. Ninth is Award 2008 in which Maryland Incubator Company Awarded of the Year 2008. Tenth is that research and development for that aca-demic R&D totalled $2,357 million in 2005. The fourth highest in the nation and surpasses North Carolina, Massachusetts and Virginia. Finally is that federal labs in which there are over 40 research centres in Maryland, including a significant presence of federal labs and prominent university institutes.
Opportunities
First is Maryland 21st century; Maryland will become internationally recognised as one of the premier 21st century locations for technology and technology-based economic development. Second is the four proposed incubator and accelerator projects in
59A SWOT analysis
Baltimore, Dorchester and Montgomery with incubator type of the project (TEDCO, 2008). The third is targetting incubator, energy and cyber security (Melton, 2010). Fourth is concentrated industries, the three most concen-trated industries are management, scientific and technical consulting services; computer systems design and related services and com-munications equipment manufacturing. Fifth is ACTIVATE PROGRAM, Achieving the Commercialisation of Technology in Ventures through Applied Training for Entrepreneurs (ACTIVATE). The program was initially funded by a National Science Foundation Partnership for innovation grant awarded in the summer of 2004. The $600,000 grant supported three 1-year classes. TEDCO provided the required $60,000 matching funds. At the conclu-sion of the third year, ACTIVATE had far exceeded its goals in creating new compa-nies. Finally, is BioMaryland 2020, a strate-gic plan for the Life Sciences in Maryland. This comprehensive 10-year plan reflects our state’s identification of the bioscience industry as a strategic priority and is the result of significant assessment and delib-eration over the past 18 months by mem-bers of the Maryland Life Sciences Advisory Board (LSAB). LSAB and its seven working groups have more than 100 leaders involved in bioscience development in Maryland which are drawn broadly from industry, education, federal laboratories and state and local economic development organi-sations who helped to shape this strategic plan (TEDCO, 2010).
Weakness
No such weaknesses have been noticed in the incubation program; specifically TEDCO is the largest program in United States. The director of the program said there are three main points. First is lack of support to hire incubator manager. Second
is lack of consultancy or resources inside the program. Finally, it is the unqualified feasi-bility study of accompany to be inside the incubator.
Threats
The impact of international economic crises effects the government funding worldwide the resulting in loss funds for some business incubation program
RECOMMENDATIONS AND GUIDELINES
From the results of analysis case studies, business incubation seems to have a highly positive impact on the economic develop-ment and act as a powerful tool with the new international currency for the new economy. Our key activities for inclusion of business incubation are the following. First is long-term economic development in which it becomes a tool for the community helping to diversify the economy and increase tax revenue. Second is the high technology cor-ridors in which it accelerates the moderni-sation and diversification of the region’s economy, stimulate new enterprise and attract new investment with great potential for innovation. Third is suitability of a new small- or medium-sized firm for survival. Fourth is dynamic model of self sustainable, efficient business. Fifth is to generate jobs and income beyond those directly employed and paid through the incubator’s tenants.
The guidelines are as follows: first is platform for policy decisions in which it provides a plat-form for joint cross-partner policy decisions. Second is fostering, supporting enterprise and inno-vation is helping to create the best environment for businesses to start-up and grow. Third is the high value-added businesses by developing the region’s science parks and R&D centres, improving collaboration between universities
60 H.M. Al-Mubaraki and M. Busler
and supporting business investment and growth. Fourth is the new economy currency for business incubation as an international cur-rency for new economy with three outcomes: entrepreneurship, innovation and creativ-ity. Fifth is the risk-taking, it can help change attitudes towards personal initiative, innova-tion, risk-taking and entrepreneurship. Sixth is entrepreneurship which helps entrepreneurs to start their own businesses and gives them an advantage over new non-incubator firms. Finally is commercialisation of new technology to create direct or indirect job opportunities with new sector of innovation.
CONCLUSION
Business incubation models have been discussed based on the United States and European models. Business incubation will become internationally recognised as one of the premier 21st century locations for technology transfer, commercialisation and technology-based economic development. In conclusion, one practical example by one large business illustrate the adoption of business incubation as a case study aimed at promoting business incubation as a pow-erful tool for economic development. The case study is the TEDCO with its primary mission to facilitate the creation of businesses and foster their growth in all regions of the state through the commercialisation of tech-nology with the core objectives divided into four goals. First, it supports transferring to the private sector and commercialising the results and products of scientific R&D conducted by colleges and universities. Second, it assists in the commercialisation of technology developed in the private sec-tor. Third, it fosters the commercialisation of R&D to create and sustain businesses throughout all regions of the state. Finally, it promotes entrepreneurship and the cre-ation of jobs in technology-related industry by establishing and supporting effective
business incubators throughout the state that provides adequate physical space and programs to increase or accelerate business success in the field of technology. The key role of TEDCO, Maryland is to be a leading source of funding for technology transfer and development programs and entrepre-neurial business assistance.
This study has focused first, on the nature of incubator financing. Second, on the incubator mission and strategy. Finally, graduation, it in turn offers its incubatee clients. The case study depends on the economic development of each country business incubation module in the United States. The SWOT analysis of each case study reflects the strength of each program complies with the mission and objectives with great opportunity as the future plans and performance of each program in the U.S. TEDCO case study weakness. First, lack of support to hire incubator manager. Second, lack of consultancy or resources inside the program. Finally, unqualified feasibility study of accompany to be inside the incubator.
The threats and the weaknesses are the hardest to explore in some respects. This is due to the fact that the incubator is part of a wider business economic development activity aligned to be applied worldwide with great success as discussed by the author in this paper. The total number of incuba-tor worldwide is more than 7000 in number (NBIA, 2010).
In conclusion, Figure 2 presents the summary of the paper. Business incuba-tors are used as economic development tools by almost of all countries. Typically, an incubator provides a safe haven for a firm in its early stages of growth through a mix of tangible and intangible services from the perspective of local economic
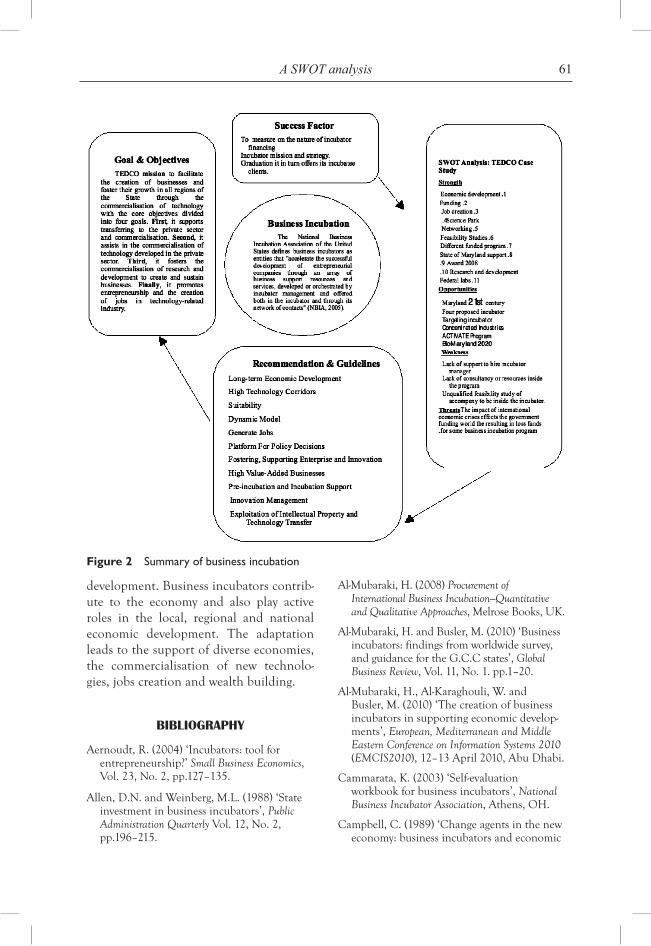
61A SWOT analysis
development. Business incubators contrib-ute to the economy and also play active roles in the local, regional and national economic development. The adaptation leads to the support of diverse economies, the commercialisation of new technolo-gies, jobs creation and wealth building.
BIBLIOGRAPHY
Aernoudt, R. (2004) ‘Incubators: tool for entrepreneurship?’ Small Business Economics, Vol. 23, No. 2, pp.127–135.
Allen, D.N. and Weinberg, M.L. (1988) ‘State investment in business incubators’, Public Administration Quarterly Vol. 12, No. 2, pp.196–215.
Al-Mubaraki, H. (2008) Procurement of International Business Incubation—Quantitative and Qualitative Approaches, Melrose Books, UK.
Al-Mubaraki, H. and Busler, M. (2010) ‘Business incubators: findings from worldwide survey, and guidance for the G.C.C states’, Global Business Review, Vol. 11, No. 1. pp.1–20.
Al-Mubaraki, H., Al-Karaghouli, W. and Busler, M. (2010) ‘The creation of business incubators in supporting economic develop-ments’, European, Mediterranean and Middle Eastern Conference on Information Systems 2010 (EMCIS2010), 12–13 April 2010, Abu Dhabi.
Cammarata, K. (2003) ‘Self-evaluation workbook for business incubators’, National Business Incubator Association, Athens, OH.
Campbell, C. (1989) ‘Change agents in the new economy: business incubators and economic
Figure 2 Summary of business incubation
62 H.M. Al-Mubaraki and M. Busler
development’, Economic Development Review, Vol. 7, No. 2, pp.56–59.
Chandra, A. and Fealey, T. (2009) ‘Business incubation in the United States, China and Brazil: a comparison of role of government’, International Journal of Entrepreneurship, Vol. 13, pp.67–86.
Creswell, J.W. (2009) Research Design: Qualitative and Quantitative Approaches, SAGE Publications, Thousand Oaks.
CSES (Centre for Strategy and Evaluation Services) (2002) Final Report, ‘Benchmarking of business incubators, for European Commission enterprise directorate—general’.
Davenport, T.H., Prusak, L. and Wilson, H.J. (2003) ‘Who’s bringing you hot ideas and how are you responding? Harvard Business Review, Vol. 81, No. 2, pp.58–64.
DeVellis, R.F. (2003) Scale Development: Theory and Applications, 2nd ed., SAGE Publications, Thousand Oaks, California.
Donor Committee for Small Enterprise Development (1998) ‘Business development services for SMEs—preliminary guidelines for donor funded interventions’, World Bank.
Eisenhardt, K.M. (1989) ‘Building theories from case study research’, Academy of Management Review, Vol. 14, pp.532–550.
European Business and Innovation Centre Network (2008) BIC observatory facts and figures.
European Business and Innovation Centre Network (EBN) (2009) BIC observatory facts and figures.
European Commission (2002) Business innova-tion centres: an instrument for regional development and for the enterprises.
Global Entrepreneurship Monitor (2007) Executive Summary.
Gonzalez, M. and Lucea R. (2001) ‘The Evolution of Business Incubation’.
Hackett, S.M. and Dilts, D.M. (2004a) ‘A real options-driven theory of business incubation’, The Journal of Technology Transfer, Vol. 29, No. 1, pp.41–54.
Hackett, S.M. and Dilts, D.M. (2004b) ‘A systematic review of business incubation
research’, Journal of Technology Transfer, Vol. 29, No. 1, pp.55–82.
Joseph, P.E (Jr) (2009) ‘Business incubation as strategy’, Business Strategy Series, Vol. 10, No. 3, pp.156–166.
Knopp, L. (2007) ‘Across state lines: US incubators report how state governments support business incubation’, NBIA Review, Vol. 23, No. 4, pp.6–9.
Lalkaka, R. (2000) ‘Emerging incubation models for the new economy, workshop on new economy and entrepreneurial business creation in Mediterranean countries’, International Center for Science, Trieste.
Lalkaka, R. (2001) Best Practices in Business Incubation: Lessons (yet to be) Learned, Business and Technology Development Strategies LLC, New York, Brussels.
Lalkaka, R. and Shaffer, D. (1999) ‘Nurturing entrepreneurs, creating enterprises: technology business incubation in Brazil’, International Conference on Effective Business Development Services, March 2–3, Rio de Janeiro, Brazil.
Lewis, D.A. (2001) ‘Does technology incubation work? A critical review’, The National Center for Neighborhood and Brownfields Redevelopment.
Lyons, T. (2000) ‘Birthing economic develop-ment: how effective are Michigan’s business incubators? Social Science Research Bureau, Michigan State University, Michigan.
Maryland Technology Development Corporation (TEDCO) (2010) Annual Report, Fiscal Year 2008, Development, Retrieved from ABI/INFORM Global. (Document ID: 1105634131).
McKinnon, S. and Hayhow, S. (1998) State of the Business Incubation Industry, NBIA Publications, Ohio.
Molnar, L.A. et al. (1997) Business Incubation Works, NBIA Publications, Athens, Ohio.
Moore, G.C. and Benbasat, I. (1991) ‘Development of an instrument to measure the perceptions of adopting an information technology innovation’, Information Systems Research, Vol. 2, No. 2, pp.411–433.
NBIA (National Business Incubator Association) (2005) What is Business
63A SWOT analysis
Incubation? Consulted 25 May 2007, Online: http://www.nbia.org/resource_Centre/what_is/index.php, accessed 20/0510.
NBIA (National Business Incubator Association) (2006) State of the Business Incubation Industry, NBIA Publications, Athens, OH.
NBIA (National Business Incubator Association) (2010) Online: http://www.nbia.org/resource_library/faq/#13, accessed 26/05/10.
Patton, D., Warren, L. and Bream, D. (2009) ‘Elements that underpin high-tech business incubation processes’, Journal of Technology Transfer, Vol. 34, No. 6, pp.621–636.
Peters, L., Rice, M.P. and Sundararajan, M. (2004) ‘The role of incubators in the entrepreneurial process’, Journal of Technology Transfer, Vol. 29, No. 1, pp.83–91.
RESI (Research and Consulting) (2001) Maryland Business Incubator Impact Analysis, Online: http://www.mary landtedco.org/_media/pdf/BioMaryland2020.pdf, accessed 26/05/10.
RTI International (2007) ‘Study Maryland incubator impact analysis and evaluation of incubator capacity’, Maryland Technology Development Corporation (TEDCO), Online:
http://www.marylandtedco.org/_media/pdf/BioMaryland2020.pdf, accessed 26/05/10.
Scaramuzzi, E. (2002) ‘Incubators in developing countries: status and development perspectives’, Info Dev Program. The World Bank, Washington DC.
TEDCO (MARYLAND Technology Development Corporation) (2010) Online: http://www.marylandtedco. org/_media/pdf/BioMaryland2020.pdf, accessed 26/05/10.
Temali, M. (2002) The Community Economic Development Hand Book, Amherst h. Wilder Foundation, USA.
Voisey, P., Gornall, L., Jones, P. and Thomas, B. (2006) ‘The measurement of success in a business incubation project’, Journal of Small Business and Enterprise Development, Vol. 13, No. 3, pp.454–468.
Wiggins, J. and Gibson, D.V. (2003) ‘Overview of US incubators and the case of the Austin technology incubator’, International Journal of Entrepreneurship and Innovation Management, Vol. 3, Nos. 1, 2, pp.56–66.
Wolfe, C., Adkins, D. and Sherman, H. (2001) Best Practices in Action: Guidelines for Incubating First Class Incubation Programs, NBIA, Athens, OH.

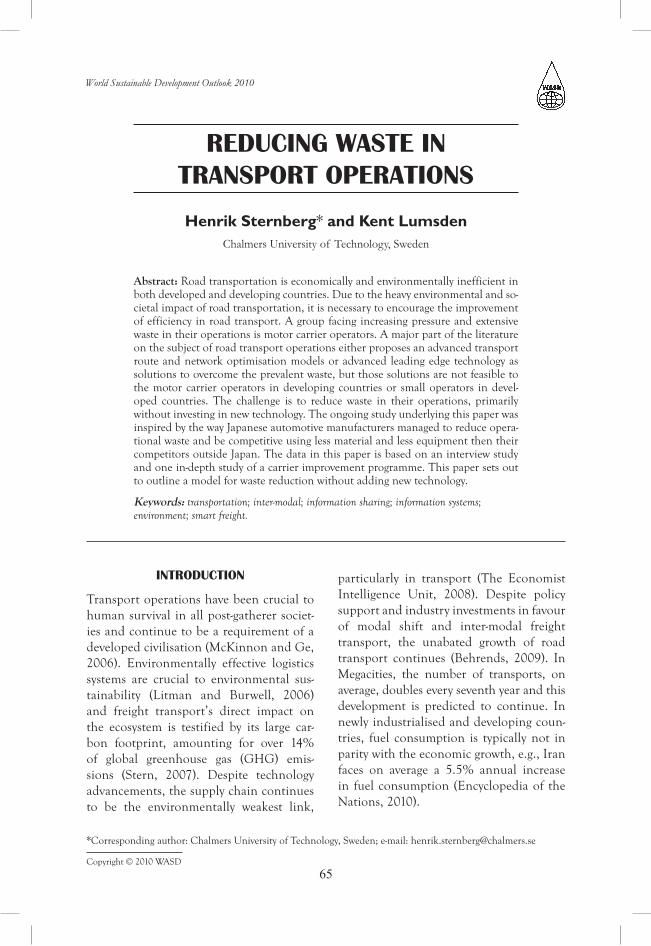
Copyright © 2010 WASD
World Sustainable Development Outlook 2010
65
REDUCING WASTE IN TRANSPORT OPERATIONS
Henrik Sternberg* and Kent LumsdenChalmers University of Technology, Sweden
Abstract: Road transportation is economically and environmentally inefficient in both developed and developing countries. Due to the heavy environmental and so-cietal impact of road transportation, it is necessary to encourage the improvement of efficiency in road transport. A group facing increasing pressure and extensive waste in their operations is motor carrier operators. A major part of the literature on the subject of road transport operations either proposes an advanced transport route and network optimisation models or advanced leading edge technology as solutions to overcome the prevalent waste, but those solutions are not feasible to the motor carrier operators in developing countries or small operators in devel-oped countries. The challenge is to reduce waste in their operations, primarily without investing in new technology. The ongoing study underlying this paper was inspired by the way Japanese automotive manufacturers managed to reduce opera-tional waste and be competitive using less material and less equipment then their competitors outside Japan. The data in this paper is based on an interview study and one in-depth study of a carrier improvement programme. This paper sets out to outline a model for waste reduction without adding new technology.
Keywords: transportation; inter-modal; information sharing; information systems; environment; smart freight.
INTRODUCTION
Transport operations have been crucial to human survival in all post-gatherer societ-ies and continue to be a requirement of a developed civilisation (McKinnon and Ge, 2006). Environmentally effective logistics systems are crucial to environmental sus-tainability (Litman and Burwell, 2006) and freight transport’s direct impact on the ecosystem is testified by its large car-bon footprint, amounting for over 14% of global greenhouse gas (GHG) emis-sions (Stern, 2007). Despite technology advancements, the supply chain continues to be the environmentally weakest link,
particularly in transport (The Economist Intelligence Unit, 2008). Despite policy support and industry investments in favour of modal shift and inter-modal freight transport, the unabated growth of road transport continues (Behrends, 2009). In Megacities, the number of transports, on average, doubles every seventh year and this development is predicted to continue. In newly industrialised and developing coun-tries, fuel consumption is typically not in parity with the economic growth, e.g., Iran faces on average a 5.5% annual increase in fuel consumption (Encyclopedia of the Nations, 2010).
* Corresponding author: Chalmers University of Technology, Sweden; e-mail: [email protected]
66 H. Sternberg and K. Lumsden
Independent of location in the world, transportation is considered wasteful and inefficient (McKinnon and Ge, 2006; Nanos-Pino et al., 2005; Sternberg and Stefansson, 2010). Looking specifically at transport operations, long waiting times for truck drivers (Ha et al., 2007; Sternberg, 2008), driver motivation issues and union related issues (Kerkvliet and McMullen, 1997), inefficiencies in loading and unloading (Tjokroamidjojo et al., 2006), slow admin-istration (Sternberg, 2008) and inefficien-cies related to slow modal shift (Woodburn, 2006) are some of the issues discussed. Other frequently noted inefficiencies are related to security-related procedures in logistics operations (Sternberg, 2008). The Motor Carrier Efficiency Study (MCES) literature review was a study financed by the U.S. Department of Transportation with the aim of identifying inefficiencies in motor carrier operations. The study identi-fied inefficiencies belonging to five differ-ent categories: equipment/asset utilisation, fuel economy and fuel waste, loss and theft, safety losses (i.e., crashes) and administra-tive waste (data and information processing) (U.S. Department of Transportation, 2008). The study pointed out that there are poten-tial economic gains, both for the carrier and the society in general, in overcoming inef-ficiencies, i.e., reducing waste. According to Blücher and Öjmertz (2008), waste is often used instead of the term—or as a result of—inefficiency. Inefficient is defined as ‘not producing desired results; wasteful’, and ineffective is defined as ‘lacking the ability or skill to perform effectively; inadequate’. In traditional improvement work, the focus is often on optimising the value adding pro-cesses, but there is more potential gain if one reduces the operational waste. Hence, it is important for carrier operators to under-stand waste in their operations, as a first crucial step in order to improve efficiency and thus reduce the environmental impact of transportation. In this paper, all activities
carried out by a transport operator that do not involve the physical movement of goods are considered waste.
A major part of the literature on the subject of road transport operations either proposes advanced transport route and network optimisation models or advanced leading edge technology as solutions to over-coming the prevalent waste (Crainic et al., 2009), but those solutions are typically not feasible to the motor carrier operators in newly industrialised or developing countries nor small operators in developed countries. Hence, the challenge and research question this paper sets out to explore is: How can methodological improvements reduce waste in carrier operations?
The studies underlying this paper were inspired by the way Japanese automotive manufacturers managed to reduce opera-tional waste and be competitive using less material and less equipment then their com-petitors outside Japan (Liker, 2004). This paper sets out to outline a normative model for waste reduction without heavy invest-ments in, e.g., information systems. It does not go in depth into technical possibilities, e.g., increasing tire pressure, how to decrease waste in truck transport operations.
LITERATURE FRAMEWORK
The goal of this section is to establish a common terminology for the paper and explain the terms and definitions that are used throughout the analysis. This paper gives an introduction to logistics manage-ment, green logistics and smart logistics systems.
Several studies have shown that reduc-ing environmental impact is generally cost-saving and financially sustainable for companies (Wu, 1994). Truck transports have the largest share in the pollution from
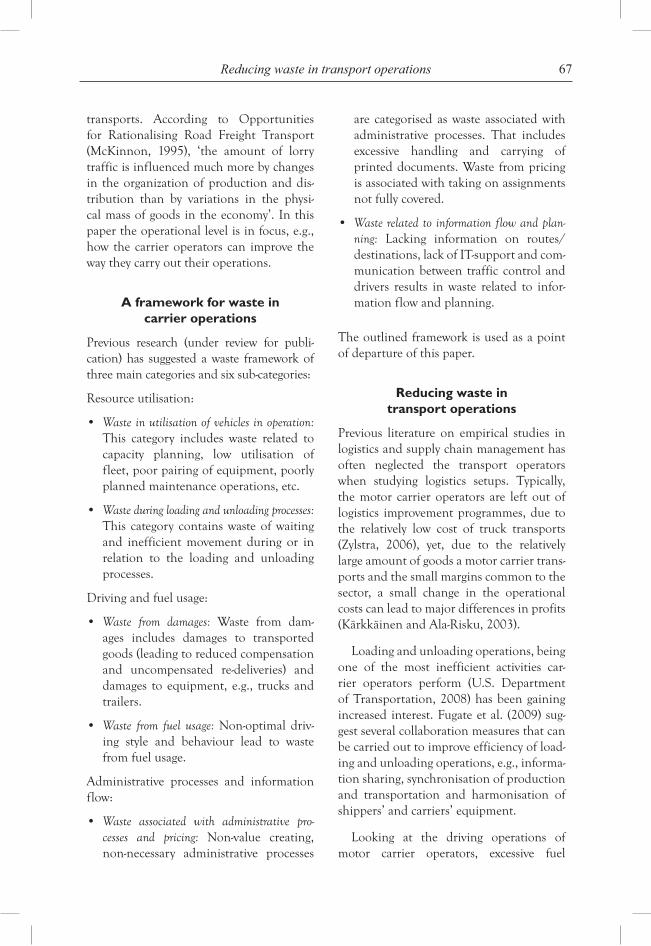
67Reducing waste in transport operations
transports. According to Opportunities for Rationalising Road Freight Transport (McKinnon, 1995), ‘the amount of lorry traffic is influenced much more by changes in the organization of production and dis-tribution than by variations in the physi-cal mass of goods in the economy’. In this paper the operational level is in focus, e.g., how the carrier operators can improve the way they carry out their operations.
A framework for waste in carrier operations
Previous research (under review for publi-cation) has suggested a waste framework of three main categories and six sub-categories:
Resource utilisation:
• Waste in utilisation of vehicles in operation: This category includes waste related to capacity planning, low utilisation of fleet, poor pairing of equipment, poorly planned maintenance operations, etc.
• Waste during loading and unloading processes: This category contains waste of waiting and inefficient movement during or in relation to the loading and unloading processes.
Driving and fuel usage:
• Waste from damages: Waste from dam-ages includes damages to transported goods (leading to reduced compensation and uncompensated re-deliveries) and damages to equipment, e.g., trucks and trailers.
• Waste from fuel usage: Non-optimal driv-ing style and behaviour lead to waste from fuel usage.
Administrative processes and information flow:
• Waste associated with administrative pro-cesses and pricing: Non-value creating, non-necessary administrative processes
are categorised as waste associated with administrative processes. That includes excessive handling and carrying of printed documents. Waste from pricing is associated with taking on assignments not fully covered.
• Waste related to information flow and plan-ning: Lacking information on routes/destinations, lack of IT-support and com-munication between traffic control and drivers results in waste related to infor-mation flow and planning.
The outlined framework is used as a point of departure of this paper.
Reducing waste in transport operations
Previous literature on empirical studies in logistics and supply chain management has often neglected the transport operators when studying logistics setups. Typically, the motor carrier operators are left out of logistics improvement programmes, due to the relatively low cost of truck transports (Zylstra, 2006), yet, due to the relatively large amount of goods a motor carrier trans-ports and the small margins common to the sector, a small change in the operational costs can lead to major differences in profits (Kärkkäinen and Ala-Risku, 2003).
Loading and unloading operations, being one of the most inefficient activities car-rier operators perform (U.S. Department of Transportation, 2008) has been gaining increased interest. Fugate et al. (2009) sug-gest several collaboration measures that can be carried out to improve efficiency of load-ing and unloading operations, e.g., informa-tion sharing, synchronisation of production and transportation and harmonisation of shippers’ and carriers’ equipment.
Looking at the driving operations of motor carrier operators, excessive fuel
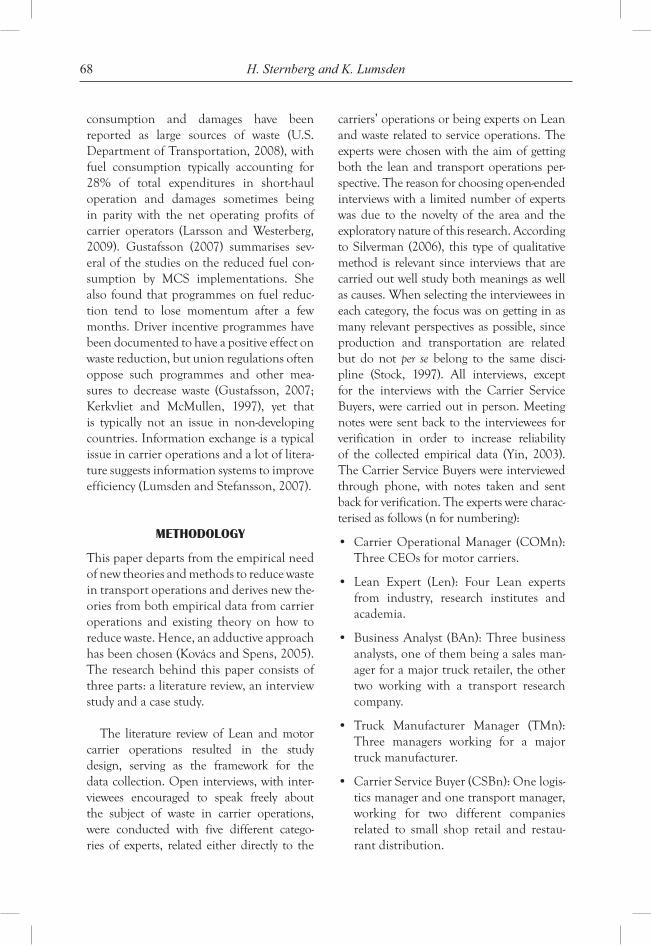
68 H. Sternberg and K. Lumsden
consumption and damages have been reported as large sources of waste (U.S. Department of Transportation, 2008), with fuel consumption typically accounting for 28% of total expenditures in short-haul operation and damages sometimes being in parity with the net operating profits of carrier operators (Larsson and Westerberg, 2009). Gustafsson (2007) summarises sev-eral of the studies on the reduced fuel con-sumption by MCS implementations. She also found that programmes on fuel reduc-tion tend to lose momentum after a few months. Driver incentive programmes have been documented to have a positive effect on waste reduction, but union regulations often oppose such programmes and other mea-sures to decrease waste (Gustafsson, 2007; Kerkvliet and McMullen, 1997), yet that is typically not an issue in non-developing countries. Information exchange is a typical issue in carrier operations and a lot of litera-ture suggests information systems to improve efficiency (Lumsden and Stefansson, 2007).
METHODOLOGY
This paper departs from the empirical need of new theories and methods to reduce waste in transport operations and derives new the-ories from both empirical data from carrier operations and existing theory on how to reduce waste. Hence, an adductive approach has been chosen (Kovács and Spens, 2005). The research behind this paper consists of three parts: a literature review, an interview study and a case study.
The literature review of Lean and motor carrier operations resulted in the study design, serving as the framework for the data collection. Open interviews, with inter-viewees encouraged to speak freely about the subject of waste in carrier operations, were conducted with five different catego-ries of experts, related either directly to the
carriers’ operations or being experts on Lean and waste related to service operations. The experts were chosen with the aim of getting both the lean and transport operations per-spective. The reason for choosing open-ended interviews with a limited number of experts was due to the novelty of the area and the exploratory nature of this research. According to Silverman (2006), this type of qualitative method is relevant since interviews that are carried out well study both meanings as well as causes. When selecting the interviewees in each category, the focus was on getting in as many relevant perspectives as possible, since production and transportation are related but do not per se belong to the same disci-pline (Stock, 1997). All interviews, except for the interviews with the Carrier Service Buyers, were carried out in person. Meeting notes were sent back to the interviewees for verification in order to increase reliability of the collected empirical data (Yin, 2003). The Carrier Service Buyers were interviewed through phone, with notes taken and sent back for verification. The experts were charac-terised as follows (n for numbering):
• CarrierOperationalManager (COMn):Three CEOs for motor carriers.
• Lean Expert (Len): Four Lean expertsfrom industry, research institutes and academia.
• BusinessAnalyst (BAn):Threebusinessanalysts, one of them being a sales man-ager for a major truck retailer, the other two working with a transport research company.
• Truck Manufacturer Manager (TMn):Three managers working for a major truck manufacturer.
• CarrierServiceBuyer(CSBn):Onelogis-tics manager and one transport manager, working for two different companies related to small shop retail and restau-rant distribution.
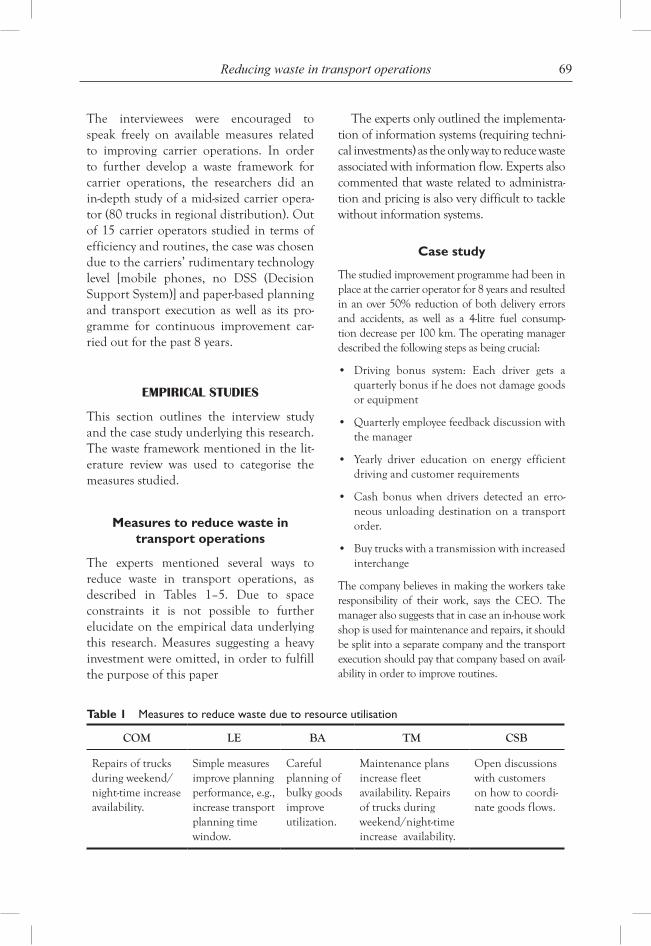
69Reducing waste in transport operations
The interviewees were encouraged to speak freely on available measures related to improving carrier operations. In order to further develop a waste framework for carrier operations, the researchers did an in-depth study of a mid-sized carrier opera-tor (80 trucks in regional distribution). Out of 15 carrier operators studied in terms of efficiency and routines, the case was chosen due to the carriers’ rudimentary technology level [mobile phones, no DSS (Decision Support System)] and paper-based planning and transport execution as well as its pro-gramme for continuous improvement car-ried out for the past 8 years.
EMPIRICAL STUDIES
This section outlines the interview study and the case study underlying this research. The waste framework mentioned in the lit-erature review was used to categorise the measures studied.
Measures to reduce waste in transport operations
The experts mentioned several ways to reduce waste in transport operations, as described in Tables 1–5. Due to space constraints it is not possible to further elucidate on the empirical data underlying this research. Measures suggesting a heavy investment were omitted, in order to fulfill the purpose of this paper
The experts only outlined the implementa-tion of information systems (requiring techni-cal investments) as the only way to reduce waste associated with information flow. Experts also commented that waste related to administra-tion and pricing is also very difficult to tackle without information systems.
Case study
The studied improvement programme had been in place at the carrier operator for 8 years and resulted in an over 50% reduction of both delivery errors and accidents, as well as a 4-litre fuel consump-tion decrease per 100 km. The operating manager described the following steps as being crucial:
• Driving bonus system: Each driver gets aquarterly bonus if he does not damage goods or equipment
• Quarterlyemployeefeedbackdiscussionwiththe manager
• Yearly driver education on energy efficientdriving and customer requirements
• Cash bonus when drivers detected an erro-neous unloading destination on a transport order.
• Buytruckswithatransmissionwithincreasedinterchange
The company believes in making the workers take responsibility of their work, says the CEO. The manager also suggests that in case an in-house work shop is used for maintenance and repairs, it should be split into a separate company and the transport execution should pay that company based on avail-ability in order to improve routines.
Table 1 Measures to reduce waste due to resource utilisation
COM LE BA TM CSB
Repairs of trucks during weekend/ night-time increase availability.
Simple measures improve planning performance, e.g., increase transport planning time window.
Careful planning of bulky goods improve utilization.
Maintenance plans increase fleet availability. Repairs of trucks during weekend/night-time increase availability.
Open discussions with customers on how to coordi-nate goods flows.
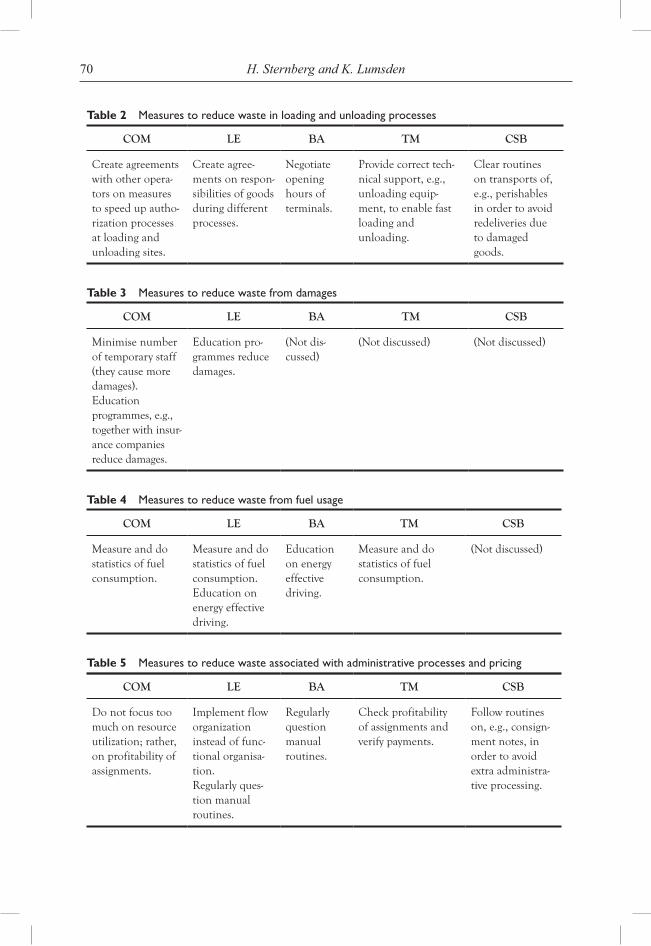
70 H. Sternberg and K. Lumsden
Table 2 Measures to reduce waste in loading and unloading processes
COM LE BA TM CSB
Create agreements with other opera-tors on measures to speed up autho-rization processes at loading and unloading sites.
Create agree-ments on respon-sibilities of goods during different processes.
Negotiate opening hours of terminals.
Provide correct tech-nical support, e.g., unloading equip-ment, to enable fast loading and unloading.
Clear routines on transports of, e.g., perishables in order to avoid redeliveries due to damaged goods.
Table 3 Measures to reduce waste from damages
COM LE BA TM CSB
Minimise number of temporary staff (they cause more damages).Education programmes, e.g., together with insur-ance companies reduce damages.
Education pro-grammes reduce damages.
(Not dis-cussed)
(Not discussed) (Not discussed)
Table 4 Measures to reduce waste from fuel usage
COM LE BA TM CSB
Measure and do statistics of fuel consumption.
Measure and do statistics of fuel consumption.Education on energy effective driving.
Education on energy effective driving.
Measure and do statistics of fuel consumption.
(Not discussed)
Table 5 Measures to reduce waste associated with administrative processes and pricing
COM LE BA TM CSB
Do not focus too much on resource utilization; rather, on profitability of assignments.
Implement flow organization instead of func-tional organisa-tion.Regularly ques-tion manual routines.
Regularly question manual routines.
Check profitability of assignments and verify payments.
Follow routines on, e.g., consign-ment notes, in order to avoid extra administra-tive processing.
71Reducing waste in transport operations
ANALYSIS
The aim of the analysis is to triangulate the findings from the literature, the interview study and the case study, in order to give some normative indications on measures to decrease waste in carrier operations. Due to the different types of carrier operators, dif-ferent environments, legislations, etc., this research needs further testing and valida-tion in newly industrialised and developing countries.
Framework of measures to decrease waste
Based on the previously outlined framework research (under review for publication), sug-gested measures have been compiled into the suggested framework.
Resource utilisation:
• Waste in utilisation of vehicles in operation: Optimise routines for maintenance and service in order to reach high availability of resources as suggested by the empirical study. Developing relations with frequent customers in order to develop improved routing was suggested by both literature and interviewees.
• Waste during loading and unloading pro-cesses: In order to develop improved load-ing/unloading routines, cooperation between different actors was suggested by both literature and interviewees. Clear routines and responsibilities were pointed out by several interviewees as crucial to avoid waste during loading and unloading processes.
Driving and fuel usage:
• Waste from damages: Both the intervie-wees and the case study pointed out edu-cation and monetary incentives as key
measures to decrease waste from damages on goods, vehicles or other equipment.
• Waste from fuel usage: Education and, if possible, follow-up on fuel consumption as well as simple technical modifications were suggested as measures to reduce operational waste related to fuel usage.
Administrative processes and information flow:
• Waste associated with administrative processes and pricing: Carrier managers recommend not taking on non-profitable assign-ments, but rather to let a truck stand still. Lean experts, business analysts and the case study suggested flow based adminis-tration and continuous improvement to improve operations.
• Waste related to information flow and planning: Information systems necessary—requiring investments.
CONCLUSION
Achieving environmental and financial sustainability is a huge challenge for the logistics industry and in particular for the transport operators, who face increasing pressure to improve environmental sustain-ability and at the same time face decreasing operating margins in a highly commoditised sector. Of course this paper has not out-lined a solution to these issues, but rather it suggests simple measures and continuous improvement to decrease operational waste in transport operations. This paper gives a normative managerial contribution by aspiring to inspire carrier operating manag-ers to review internal efficiency of transport operations. The theoretical contribution of this paper is a basic framework for measures to improve carrier operations without mon-etary investments.
72 H. Sternberg and K. Lumsden
ACKNOWLEDGEMENTS
The authors would like to thank the European Commission for financing the project Logistics 4 Life—this research has emerged as a side-product from the research work carried out in that project. The authors would also like to thank the gradu-ate students Rikard Larsson and Emma Westerberg for carrying out several of the interviews, and motor carrier expert Peter Jenni for his extensive assistance on this research.
REFERENCES
Behrends, S. (2009) Sustainable Freight Transport from an Urban Perspective, Licentiate Thesis, Chalmers University of Technology,Gothenburg, Sweden.
Blucher, D. and Öjmertz, B. ( 2008) Challenge your Process! An Introduction to Lean Production, Gothenburg, Sweden, Swerea IVF.
Crainic, T.G., Gendreau, M. and Potvin, J.-Y. (2009) ‘Intelligent freight transportation systems: assessment and the contribution of operations research’, Transportation Research Part C, Vol. 17, No. 6, pp.541–557.
Encyclopedia of the Nations (2010) Iran, Online: http://www.nationsencyclopedia.com/economies/Asia-and-the-Pacific/Iran.html, accessed 1 June 2010.
Fugate, B.S., Davis-Sramek, B. and Goldsby, T.J. (2009) ‘Operational collaboration between shippers and carriers in the transportation industry’, The International Journal of Logistics Management, Vol. 20, No. 3, pp.425–447.
Gustafsson, S. (2007) Miljö kopplat till löne- och belöningssystem inom transport- och åkeribranschen, Master’s thesis, Chalmers University of Technology, Gothenburg, Sweden.
Ha, J., Hagen, A. and Mulahmetovic, A. (2007) Smart Vehicles in Transportation, IT-University, Gothenburg, Sweden.
Kärkkäinen, M. and Ala-Risku, T. (2003) Facilitating the Integration of SME’s to Supply
Networks with Lean IT Solutions, eChallenges 2003 conference, Bologna, Italy.
Kerkvliet, J. and Mcmullen, S.B. (1997) ‘The impact of unionization on motor carrier costs’, Economic Inquiry, Vol. 35, No. 2, pp.271–284.
Kovács, G. and Spens, K.M. (2005) ‘Abductive reasoning in logistics research’, International Journal of Physical Distribution and Logistics Management, Vol. 35, No. 2, pp.132–144.
Larsson, R. and Westerberg, E. (2009) Applying Lean in Haulers’ Operations, Master’s thesis, Chalmers University of Technology, Gothenburg, Sweden.
Liker, J. (2004) The Toyota Way: 14 Management Principles form the World’s Greatest Manufacturer, CWL Publishing Enterprises, New York.
Litman, T. and Burwell, D. (2006) ‘Issues in sustainable transportation’, International Journal of Global Environmental Issues, Vol. 6, No. 4, pp.331–347.
Lumsden, K. and Stefansson, G. (2007) ‘Smart freight to enhance control of supply chains’, International Journal of Logistics Systems and Management, Vol. 3, No. 3, pp.315–329.
Mckinnon, A.C. (1995) Opportunities for Rationalising Road Freight Transport, London, UK, Church House.
Mckinnon, A.C. and Ge, Y. (2006) ‘The potential for reducing empty running by trucks: a retrospective analysis’, International Journal of Physical Distribution and Logistics Management, Vol. 36, No. 5, pp.391–410.
Nanos-Pino, J., Carrera-Gomez, G., Coto-Millán, P., Inglada, V. and Pesquera González, M. (2005) ‘Technical efficiency of road haulage firms’, Transportation Research Record: Journal of the Transportation, Vol. 19, No. 6, pp.26–32.
Silverman, D. (2006) Interpreting Qualitative Data, SAGE Publications Ltd, London.
Stern, N. (2007) The Economics of Climate Change: The Stern Review, Cambridge University Press, Cambridge.
Sternberg, H. (2008) ‘Transportation visibility and information sharing—a case study of actors’ requirements’, World Review on Intermodal Transportation, Vol. 2, No. 1, pp.54–71.
73Reducing waste in transport operations
Sternberg, H. and Stefansson, G. (2010) ‘Applying the prinpciples of lean—the seven wastes of motor carrier operations’, in Aarlbjörn, (Ed.): Nofoma, Proceedings of the Nofoma Conference, 2010 Aarhus, Denmark.
Stock, J.R. (1997) ‘Applying theories from other disciplines to logistics’, International Journal of Physical Distribution and Logistics Management, Vol. 27, No. 9, pp.515–539.
The Economist Intelligence Unit (2008) Under the Spotlight: The Transition of Environmental Risk Management, The Economist Intelligence Unit, London, UK.
Tjokroamidjojo, D., Kutanoglu, E. and Taylor, D. (2006)‘Quantifyingthevalueofadvanceload information in truckload trucking’, Transportation Research Part E, Vol. 42, No. 4, pp.340–357.
U.S. Department of Transportation (2008) The 2006 Annual Motor Carrier Efficiency
Study Report to Congress. Springfield, Federal Motor Carrier Safety Administration, Virginia.
Woodburn, A.G. (2006) ‘The non-bulk market for rail freight in Great Britain’, Journal of Transport Geography, Vol. 14, No. 4, pp.299–308.
Wu, H.-J. and Dunn, S.C. (1994) ‘Environmentally responsible logistics systems’, International Journey of Physical Distribution and Logistics Management, Vol. 25, No. 2, pp.20–38.
Yin, R.K. (2003) Case Study Research—Design and Methods, SAGE Publications, Thousand Oaks.
Zylstra, K.D. (2006) Lean Distribution: Applying Lean Manufacturing to Distribution, Logistics, and Supply Chain, John Wiley & Sons, Inc., Hoboken, NJ.

Copyright © 2010 WASD
World Sustainable Development Outlook 2010
75
CRIME IN TRINIDAD AND TOBAGO: TRENDS
AND IMPLICATIONS
Maxine Hunte* and Leigh-Ann Waldropt BonairUniversity of the West Indies, Trinidad and Tobago
Abstract: Crime represents a substantial development challenge in the Caribbean region. In Trinidad and Tobago, crime is a high priority issue that consumes public and government attention. Consequently, the government is confronted with increasing pressure to implement effective policy to respond to the escalating crime. This paper attempts to explore the changing nature and trends in crime in Trinidad and Tobago. It particularly focuses on the upsurge in violent (serious) crimes, with special emphasis on homicides and its ‘juvenisation’. The paper also discusses the implications of these demographic changes and proposes appropriate crime reduction strategies.
Keywords: Crime, homicide, youth, crime reduction strategies, Trinidad and Tobago
INTRODUCTION
Trinidad and Tobago, one of the leading economies in the Caribbean, is a major regional producer of oil and gas and the single largest supplier of liquefied natu-ral gas (LNG) to the United States1. This country also has one of the highest growth rates and per capita incomes in Latin America2 and in 2009 its 64th ranking on the Human Development Index (HDI) placed it in the category of high human development3. However, as the country progresses towards developed nation status, its inability to successfully apprehend the destabilising forces of crime and violence has impacted negatively on the country’s image and development agenda. Trinidad and Tobago’s overall crime rate has esca-lated significantly within the last decade and according to the results of successive
opinion polls crime is the ‘single most important issue facing the nation’4.
Moreover, there has been a surge in mur-ders during the last few years which have been attributed to a proliferation of illegal guns, drugs and gangs. Consequently, the government is confronted with increasing pressure to expeditiously implement effec-tive policies to arrest the crime situation, particularly as it pertains to the escalating homicide rates.
This paper will, therefore, discuss the current crime trends in Trinidad and Tobago and identify some of the main characteristicsof homicides within the country for the period 2000–2010. It will also provide some strategic recommenda-tions for the effective designof crime and violence reduction interventions.
*Corresponding author: University of the West Indies, Trinidad and Tobago; e-mail: [email protected]
76 M. Hunte and L.-A.W. Bonair
BRIEF REVIEW—HISTORICAL BACKGROUND, DEFINITION
AND THEORY
Comparable to other Caribbean societies, Trinidad and Tobago’s historical underpin-ning is characterised by violence rooted in its legacy of colonialism, slavery and inden-tureship5. The sustained levels of violence and mortality during this era meant that by the end of the 19th century a ‘culture of vio-lence’ had become well entrenched in the Caribbean colonies (Brereton, 2010) and according to Youseff (2010) it transformed into an implosive and self-perpetuating force that conditions contemporary human social interaction.
In the post-independence era, crime rose to the national agenda in the early 1980s following the sharp contraction of the economy after the oil boom of the 1970s. Crime was largely explained as an outcome of the economic recession, which increased levels of unemployment and poverty. Comparatively, crime remained relatively steady in the 1990s and exhibited a declin-ing murder rate by mid-1990s (Sookram et al., 2009).
At the dawn of the 21st century, the widespread concern of crime and violence surfaced again at the top of the national governance agenda. Regionally, it became priority in 2001 with the establishment of the CARICOM Task Force on Crime and Security. Today, the Caribbean, along with Latin America, now ranks amongst the most violent regions in the world. In fact, the English-speaking Caribbean has one of the highest murder rates in the world at 30 per 100,000 persons (UNODC, 2007).
Crime can be defined as an intentional act or omission in violation of criminal law (statutory or case law), committed without defence or justification, and sanctioned
by the state as a felony or misdemeanor (Tappan, 1960)6.
Multiple theoretical frameworks have been advanced to explain criminal behav-iour in the Caribbean. Montoute and Anyanwu (2009), for example, pointed to the ‘social change’ model, where crime is explained as a normal offspring of develop-ment. This model essentially delineates a relationship between crime and the disinte-gration of norms and values of the moderni-sation process. Pryce (2007), on the other hand, posited that it is the type of develop-ment model that is relevant, as developing countries have been victims of exploitative models7.
Additionally, Strain Models of delin-quency have been frequently utilised to explain crime among the region’s youth. These models suggest that crime results from an inability to achieve desired goals through conventional means and as such young people resort to innovative means to achieve financial gain, power, status and identity (Hunte, 2006). In the contempo-rary period, the global, extra-regional con-text weighs heavily on crime discussions; through the exposition of the drug-crime nexus and ‘weaponisation’ of the region8.
However, in addressing the problem of crime and homicide, sufficient attention must be paid to the youth crime-nexus. Regional and local statistics point to the greater incidence of homicide among the youth, both as victims and offenders, indi-cating the ‘juvenization’ of homicide.
Regionally, WHO (2001), discovered that homicides was the second leading cause of death among young males in the Americans aged 15–24, in 10 out of the 21 countries that they reviewed with populations greater than 1 million. For instance, in Jamaica
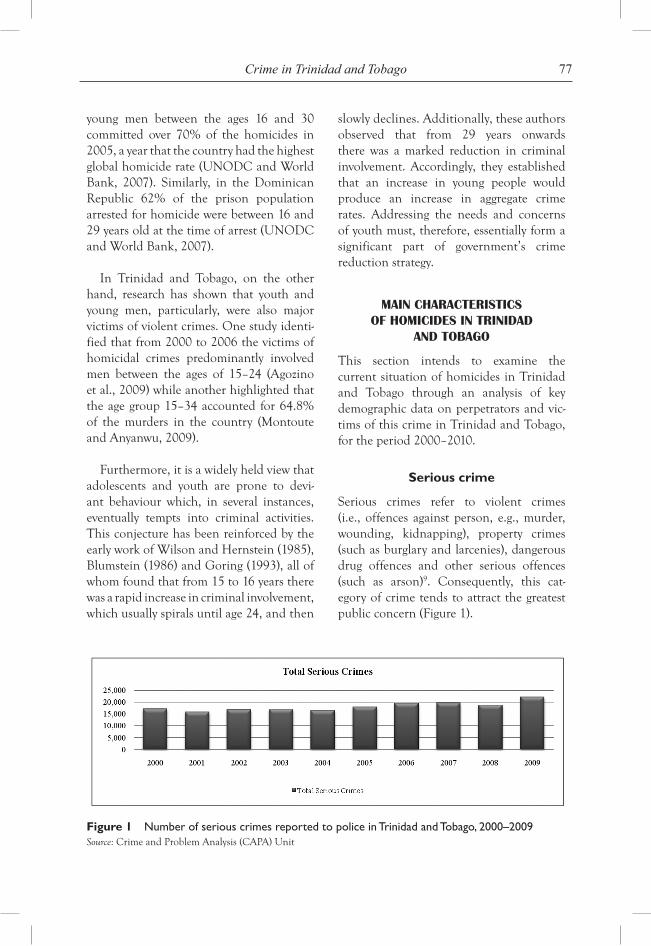
77Crime in Trinidad and Tobago
young men between the ages 16 and 30 committed over 70% of the homicides in 2005, a year that the country had the highest global homicide rate (UNODC and World Bank, 2007). Similarly, in the Dominican Republic 62% of the prison population arrested for homicide were between 16 and 29 years old at the time of arrest (UNODC and World Bank, 2007).
In Trinidad and Tobago, on the other hand, research has shown that youth and young men, particularly, were also major victims of violent crimes. One study identi-fied that from 2000 to 2006 the victims of homicidal crimes predominantly involved men between the ages of 15–24 (Agozino et al., 2009) while another highlighted that the age group 15–34 accounted for 64.8% of the murders in the country (Montoute and Anyanwu, 2009).
Furthermore, it is a widely held view that adolescents and youth are prone to devi-ant behaviour which, in several instances, eventually tempts into criminal activities. This conjecture has been reinforced by the early work of Wilson and Hernstein (1985), Blumstein (1986) and Goring (1993), all of whom found that from 15 to 16 years there was a rapid increase in criminal involvement, which usually spirals until age 24, and then
slowly declines. Additionally, these authors observed that from 29 years onwards there was a marked reduction in criminal involvement. Accordingly, they established that an increase in young people would produce an increase in aggregate crime rates. Addressing the needs and concerns of youth must, therefore, essentially form a significant part of government’s crime reduction strategy.
MAIN CHARACTERISTICS OF HOMICIDES IN TRINIDAD
AND TOBAGO
This section intends to examine the current situation of homicides in Trinidad and Tobago through an analysis of key demographic data on perpetrators and vic-tims of this crime in Trinidad and Tobago, for the period 2000–2010.
Serious crime
Serious crimes refer to violent crimes (i.e., offences against person, e.g., murder, wounding, kidnapping), property crimes (such as burglary and larcenies), dangerous drug offences and other serious offences (such as arson)9. Consequently, this cat-egory of crime tends to attract the greatest public concern (Figure 1).
Figure 1 Number of serious crimes reported to police in Trinidad and Tobago, 2000–2009Source: Crime and Problem Analysis (CAPA) Unit
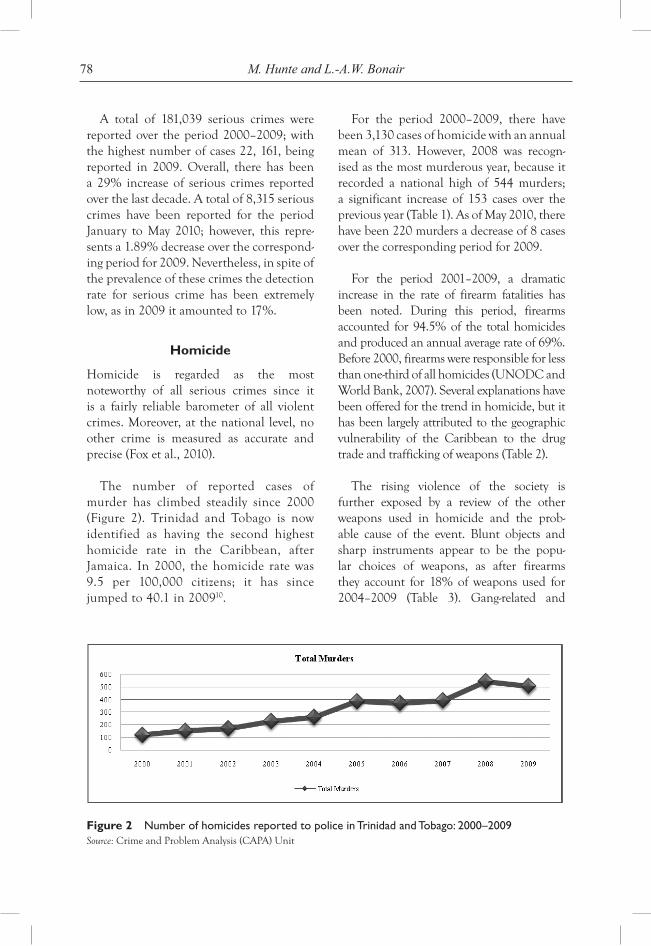
78 M. Hunte and L.-A.W. Bonair
A total of 181,039 serious crimes were reported over the period 2000–2009; with the highest number of cases 22, 161, being reported in 2009. Overall, there has been a 29% increase of serious crimes reported over the last decade. A total of 8,315 serious crimes have been reported for the period January to May 2010; however, this repre-sents a 1.89% decrease over the correspond-ing period for 2009. Nevertheless, in spite of the prevalence of these crimes the detection rate for serious crime has been extremely low, as in 2009 it amounted to 17%.
Homicide
Homicide is regarded as the most noteworthy of all serious crimes since it is a fairly reliable barometer of all violent crimes. Moreover, at the national level, no other crime is measured as accurate and precise (Fox et al., 2010).
The number of reported cases of murder has climbed steadily since 2000 (Figure 2). Trinidad and Tobago is now identified as having the second highest homicide rate in the Caribbean, after Jamaica. In 2000, the homicide rate was 9.5 per 100,000 citizens; it has since jumped to 40.1 in 200910.
For the period 2000–2009, there have been 3,130 cases of homicide with an annual mean of 313. However, 2008 was recogn-ised as the most murderous year, because it recorded a national high of 544 murders; a significant increase of 153 cases over the previous year (Table 1). As of May 2010, there have been 220 murders a decrease of 8 cases over the corresponding period for 2009.
For the period 2001–2009, a dramatic increase in the rate of firearm fatalities has been noted. During this period, firearms accounted for 94.5% of the total homicides and produced an annual average rate of 69%. Before 2000, firearms were responsible for less than one-third of all homicides (UNODC and World Bank, 2007). Several explanations have been offered for the trend in homicide, but it has been largely attributed to the geographic vulnerability of the Caribbean to the drug trade and trafficking of weapons (Table 2).
The rising violence of the society is further exposed by a review of the other weapons used in homicide and the prob-able cause of the event. Blunt objects and sharp instruments appear to be the popu-lar choices of weapons, as after firearms they account for 18% of weapons used for 2004–2009 (Table 3). Gang-related and
Figure 2 Number of homicides reported to police in Trinidad and Tobago: 2000–2009Source: Crime and Problem Analysis (CAPA) Unit
79Crime in Trinidad and Tobago
robbery-related incidents were recorded as the most common causes of homicide accounting for 21% and 10%, respectively. Gang-related murders have also shown a dras-tic increase from 2004 to 2009, an increase of over 400%.
Data for the period 2004–2009 indicate that approximately 2,453 persons were
victims of murder. Of this group, males were disproportionately represented as both homicide victims and offenders (Table 4). Males account for 90.5% of victims and 94.5% of offenders. In terms of ethnicity, persons of African descent represent 76.7% of homicide victims and 65.5% offend-ers; whereas persons of East Indian and mixed decent account for 16% and 5.5%
Table 1 Number of murders committed in Trinidad and Tobago using a firearm, 2000–2009
Year Number of murders committed with firearms
Total number of murders
Percent murders committed with firearms (%)
2001 82 151 54
2002 102 171 60
2003 158 229 69
2004 182 260 70
2005 272 389 70
2006 268 370 72
2007 303 388 78
2008 430 543 79
2009 362 503 72
Source: Crime and Problem Analysis (CAPA) Unit11
Table 2 Type of weapons used to commit murder and probable causes
Type of weapons 2004 2005 2006 2007 2008 2009 Total
Blunt objects 20 31 28 25 20 26 150
Sharp instruments 31 54 48 41 55 64 293
Other 24 24 22 13 17 34 134
Unknown 3 8 4 6 21 17 59
Probable cause
Altercation 28 37 34 27 28 40 194
Domestic violence 9 12 19 10 33 18 101
Drug related 7 5 16 15 27 45 115
Gang related 25 51 37 29 224 137 503
Robbery 45 25 22 27 55 59 233
Other 9 13 20 4 25 65 136
Unknown 137 246 222 276 151 139 1171
Source: Crime and Problem Analysis (CAPA) Unit12
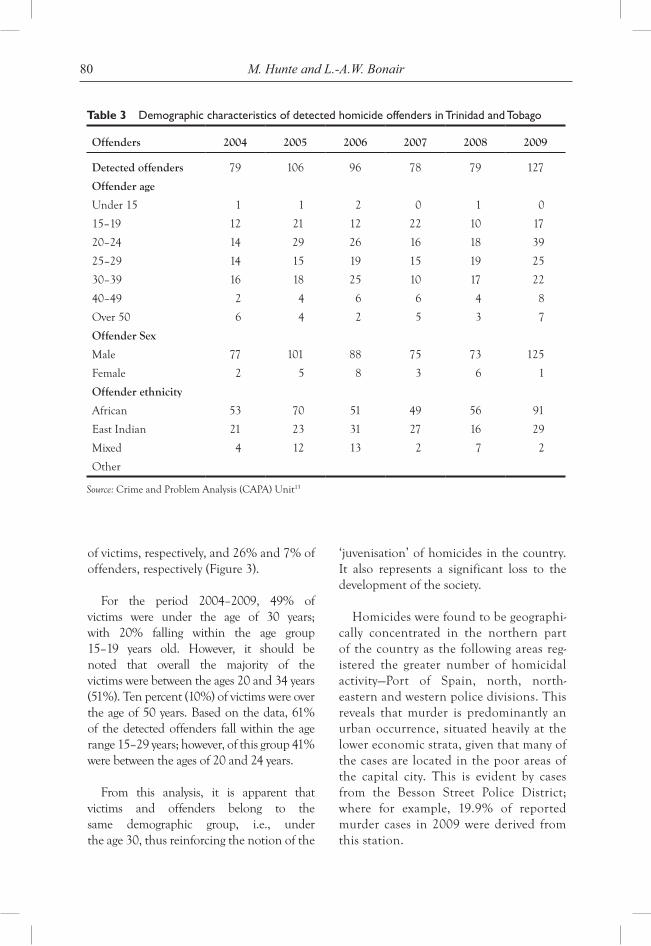
80 M. Hunte and L.-A.W. Bonair
of victims, respectively, and 26% and 7% of offenders, respectively (Figure 3).
For the period 2004–2009, 49% of victims were under the age of 30 years; with 20% falling within the age group 15–19 years old. However, it should be noted that overall the majority of the victims were between the ages 20 and 34 years (51%). Ten percent (10%) of victims were over the age of 50 years. Based on the data, 61% of the detected offenders fall within the age range 15–29 years; however, of this group 41% were between the ages of 20 and 24 years.
From this analysis, it is apparent that victims and offenders belong to the same demographic group, i.e., under the age 30, thus reinforcing the notion of the
‘juvenisation’ of homicides in the country. It also represents a significant loss to the development of the society.
Homicides were found to be geographi-cally concentrated in the northern part of the country as the following areas reg-istered the greater number of homicidal activity—Port of Spain, north, north-eastern and western police divisions. This reveals that murder is predominantly an urban occurrence, situated heavily at the lower economic strata, given that many of the cases are located in the poor areas of the capital city. This is evident by cases from the Besson Street Police District; where for example, 19.9% of reported murder cases in 2009 were derived from this station.
Table 3 Demographic characteristics of detected homicide offenders in Trinidad and Tobago
Offenders 2004 2005 2006 2007 2008 2009
Detected offenders 79 106 96 78 79 127
Offender age
Under 15 1 1 2 0 1 0
15–19 12 21 12 22 10 17
20–24 14 29 26 16 18 39
25–29 14 15 19 15 19 25
30–39 16 18 25 10 17 22
40–49 2 4 6 6 4 8
Over 50 6 4 2 5 3 7
Offender Sex
Male 77 101 88 75 73 125
Female 2 5 8 3 6 1
Offender ethnicity
African 53 70 51 49 56 91
East Indian 21 23 31 27 16 29
Mixed 4 12 13 2 7 2
Other
Source: Crime and Problem Analysis (CAPA) Unit13
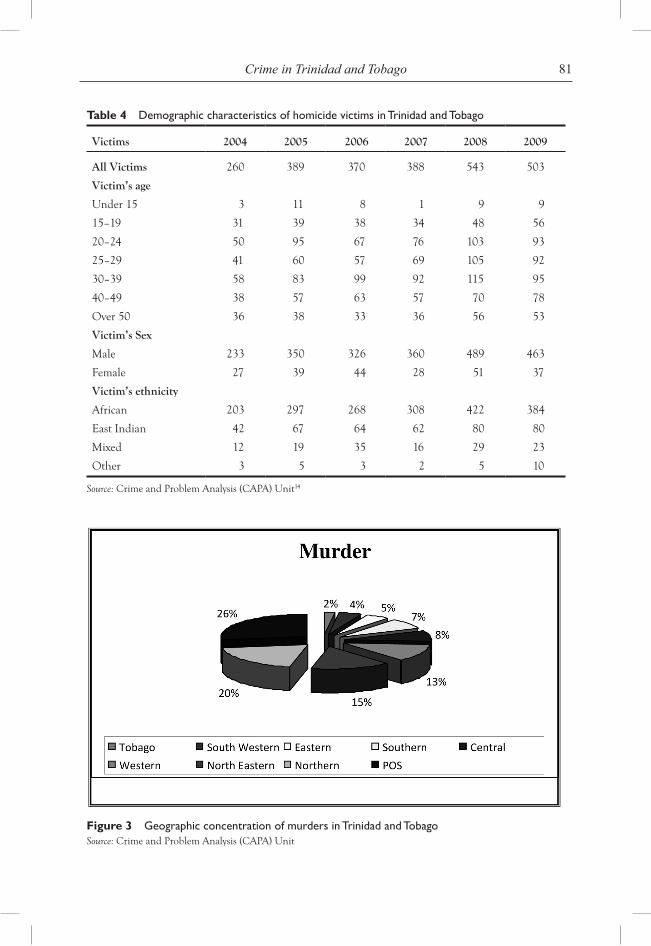
81Crime in Trinidad and Tobago
Table 4 Demographic characteristics of homicide victims in Trinidad and Tobago
Victims 2004 2005 2006 2007 2008 2009
All Victims 260 389 370 388 543 503
Victim’s age
Under 15 3 11 8 1 9 9
15–19 31 39 38 34 48 56
20–24 50 95 67 76 103 93
25–29 41 60 57 69 105 92
30–39 58 83 99 92 115 95
40–49 38 57 63 57 70 78
Over 50 36 38 33 36 56 53
Victim’s Sex
Male 233 350 326 360 489 463
Female 27 39 44 28 51 37
Victim’s ethnicity
African 203 297 268 308 422 384
East Indian 42 67 64 62 80 80
Mixed 12 19 35 16 29 23
Other 3 5 3 2 5 10
Source: Crime and Problem Analysis (CAPA) Unit14
Figure 3 Geographic concentration of murders in Trinidad and TobagoSource: Crime and Problem Analysis (CAPA) Unit
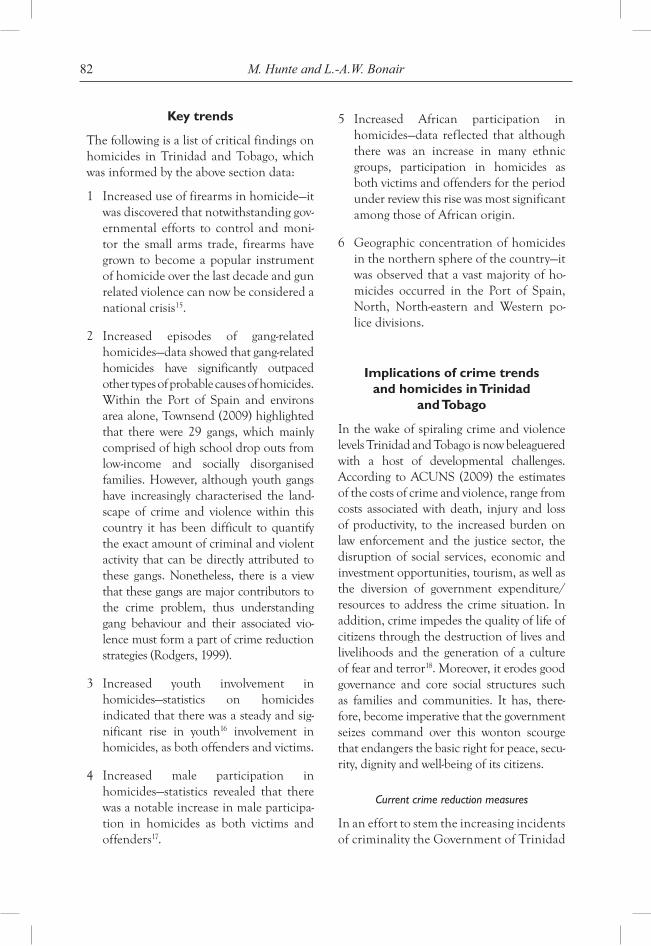
82 M. Hunte and L.-A.W. Bonair
Key trends
The following is a list of critical findings on homicides in Trinidad and Tobago, which was informed by the above section data:
1 Increased use of firearms in homicide—it was discovered that notwithstanding gov-ernmental efforts to control and moni-tor the small arms trade, firearms have grown to become a popular instrument of homicide over the last decade and gun related violence can now be considered a national crisis15.
2 Increased episodes of gang-related homicides—data showed that gang-related homicides have significantly outpaced other types of probable causes of homicides. Within the Port of Spain and environs area alone, Townsend (2009) highlighted that there were 29 gangs, which mainly comprised of high school drop outs from low-income and socially disorganised families. However, although youth gangs have increasingly characterised the land-scape of crime and violence within this country it has been difficult to quantify the exact amount of criminal and violent activity that can be directly attributed to these gangs. Nonetheless, there is a view that these gangs are major contributors to the crime problem, thus understanding gang behaviour and their associated vio-lence must form a part of crime reduction strategies (Rodgers, 1999).
3 Increased youth involvement in homicides—statistics on homicides indicated that there was a steady and sig-nificant rise in youth16 involvement in homicides, as both offenders and victims.
4 Increased male participation in homicides—statistics revealed that there was a notable increase in male participa-tion in homicides as both victims and offenders17.
5 Increased African participation in homicides—data reflected that although there was an increase in many ethnic groups, participation in homicides as both victims and offenders for the period under review this rise was most significant among those of African origin.
6 Geographic concentration of homicides in the northern sphere of the country—it was observed that a vast majority of ho-micides occurred in the Port of Spain, North, North-eastern and Western po-lice divisions.
Implications of crime trends and homicides in Trinidad
and Tobago
In the wake of spiraling crime and violence levels Trinidad and Tobago is now beleaguered with a host of developmental challenges. According to ACUNS (2009) the estimates of the costs of crime and violence, range from costs associated with death, injury and loss of productivity, to the increased burden on law enforcement and the justice sector, the disruption of social services, economic and investment opportunities, tourism, as well as the diversion of government expenditure/resources to address the crime situation. In addition, crime impedes the quality of life of citizens through the destruction of lives and livelihoods and the generation of a culture of fear and terror18. Moreover, it erodes good governance and core social structures such as families and communities. It has, there-fore, become imperative that the government seizes command over this wonton scourge that endangers the basic right for peace, secu-rity, dignity and well-being of its citizens.
Current crime reduction measures
In an effort to stem the increasing incidents of criminality the Government of Trinidad
83Crime in Trinidad and Tobago
and Tobago has adopted a holistic, multi-pronged approach that relies heavily on partnerships and agreements with both the regional and international community.
The Ministry of National Security is mandated to provide citizens with reliable access to security services, protection of the country’s borders, rehabilitation and reinte-gration of offenders, as well as security from impeding natural disasters19. The govern-ment has sought to achieve these objectives through the following initiatives20:
• ThetransformationoftheTrinidadandTobago police and prison service.
• ThemodernisationandexpansionoftheCoast Guard.
• Strengthening of the legislative frame-work and enactment of anti-crime legislation.
• Theimplementationofanationalstrat-egy to eliminate illicit drugs and the intro-duction of stringent control measures.
• Institutional strengthening and infra-structural improvement.
• The establishment of units such asSpecialist Anti-Crime Unit of Trinidad and Tobago (SAUTT) and Crime and Problem Analysis (CAPA) Unit.
• The implementation of community-based initiatives such as Crime Stoppers 555 Hotline and the Citizen’s Security Programme (CSP).
• Theintroductionofvariousyouth-oriented initiatives, such as training programmes targetting disadvantaged and at risk youth—such as CCC, MILAT and MYPART21.
However, in spite of these measures, the war on crime has been severely debilitated
by understaffing in the police service, perceived police corruption, lack of resources for border control and deficiencies in the criminal justice system, which includes backlog in the courts and unimplemented legislation (Refworld, 2009).
It should also be noted that the govern-ment has implemented a host of social pro-grammes, which indirectly have an impact on crime and violence. In fact, there is a strong belief that crime reduction efforts should seek to incorporate more social strat-egies since research has shown that some crimes are spurred by socio-economic prob-lems (Jenson and Howard, 1999).
The way forward—recommended interventions and strategies
Although there was an increase in serious crimes between 2000 and 2009, the enormous leap in homicides for the same period has wrested national attention and propelled this type of crime to the fore of most discussions. This section would, there-fore, review major trends emerging out of the analysis and propose recommendations that can be employed by the government to effectively address them and their overall impact on homicides and crime.
Based on the key trends identified in a previous section, homicides in Trinidad and Tobago appear to be a predominantly gang-based phenomenon that involves to a great extent the use of firearms by and on young males of African descent within the northern corner of the country.
As such strategies geared towards attack-ing the problem of crime and particularly homicides must incorporate approaches that would specifically attend these dynamics. Accordingly, a multi-faceted, inter-disciplinary approach is therefore required. Cognizant of
84 M. Hunte and L.-A.W. Bonair
this reality, the following interventions and options are proposed:
1 Strategies to address firearm homicides a Cate Buchanan of the Human Security
and Small Arms Programme, Geneva in arguing that men are the majority of users and victims of small arms violence, highlighted that there was a relationship between masculinity and weapons use and misuse (IRIN, 2006) and as such interventions should be designed to tackle this complex relationship.
b U.S. Department of Justice in the 1990s identified three points of inter-vention that were key to any strategy or programme designed to reduce fire-arm violence: Interrupt sources of ille-gal guns, deter illegal possession and carrying of guns and respond to illegal gun use.
c Given the vulnerability of youth to the use of firearms, an emphasis on at-risk or gun involved youth must be a focus of firearm reduction initia-tives. Reducing the demand for fire-arms among young men is important (McIntyre and Weiss, 200322); along with their opportunities to access guns. Moreover, those who have already been immersed into a gun culture should also be targeted (Shaw, 2005). Programmes must, therefore, seek to introduce positive alternatives to the streets and an opportunity to engage in purposeful activity. There is also international consensus that policies and programmes that invest in and support youth through preventative approaches are more effective than incarceration or exclusion. As part of a long-term solution, there must also be an emphasis on reducing those fac-tors that have also placed this group at risk, and protective factors should
be strengthened. At risk youth involve-ment in programme planning and delivery is also increasingly recognised as an effective intervention strategy (Shaw, 2005).
d A comprehensive gun reduction strat-egy requires a partnership with the community, law enforcement, the court system and social service agencies and the adoption of a public health and community safety perspective23. Critical to success of this partnership is the level of awareness of the public on firearm use and abuse. The government must seek to promote public awareness on illegal fire arm use and its contribution to spiraling murder rate in Trinidad and Tobago, the importance of con-trolling firearms and an understanding of the relationship between gun crime and illegal firearms on the streets. Awareness-raising does not simply con-tribute to the success of gun control initiatives, since it facilitates attitudinal changes towards gun use and is based on the recognition that law enforcement cannot do it alone. Notwithstanding this, the government must also be com-mitted to an aggressive enforcement of existing and future firearm laws.
2 Strategies to address gang-related homicides
a Strategies to address gang-related violence should encourage alterna-tive lifestyles, prevent young people from joining gangs, and advocate zero tolerance enforcement activity towards gangs, community policing, education programmes, peer men-toring and youth outreach services (Bellis, 2010).
b Strategies that focus solely on repress-ing or incarcerating gang members have not proven successful in pre-venting or reducing gang violence24,
85Crime in Trinidad and Tobago
particularly in areas such as Central America. Based on U.S. experience, certain key elements for tackling gang-related violence has been identified (i.e., the OJJDP25 or Spergel model). These strategies include: community mobilisation, provision of opportuni-ties (i.e., in education, training and employment,) social intervention, sup-pression and organisational change and development (i.e., the develop-ment and implementation of policies and procedures that result in the most effective use of resources within and across agencies) (Levine, 2006). It has been found that comprehensive, multi-sectoral and community-orien-tated approaches have been successful (Bellis, 2010).
c Young children who are still impression-able and not yet seduced by guns, gangs and crimes should be targetted through ‘pre-fix’ prevention programmes, since these types of intervention have great and long lasting impacts (Fox and Swatt, 2008).
3 Community-based strategies
a Community mobilisation is increas-ingly recognised as an important strategy that provides a framework to encourage participation, cooperation and collaboration in tackling debilitat-ing community issues (Kim-Ju et al., 2008). Therefore crime and homicide reduction strategies should be rooted in the community. Additionally, law enforcement agencies must engage high risk communities and partner with them in the fight against commu-nity crime. Mobilizing communities to prevent violence involves engaging communities in supporting, develop-ing and implementing prevention strat-egies that motivate change. Possible
strategies include community education and building support among key stake-holders for prevention efforts. The community mobilization approach is neither top down nor bottom up, rather it seeks to bring resources into the community, and mobilize and reorganize existing community assets. This approach therefore facilitates the development of culturally appropriate and sensitive interventions that meet the needs of the community (Kim-Ju et al., 2008). A few examples of this type of arrangement can be found in the United States in form of programmes such as High Point Intervention, Project Safe Neighborhoods and Operation Ceasefire, all of which have adopted a multi-agency approach that relied on both federal and com-munity level partnerships. However, it has been noted that efforts to create safe and peaceful communities must be accompanied by other commu-nity development activities, such as increased access to employment and housing opportunities26.
b Community dialogue ‘is an approach of community development that emphasises the various voices in the community and how these voices can impact the community’.27 It is also a useful process to ensure bet-ter decisions and community action and it embraces the basic principles of shared responsibility, participa-tory decision making and a just pub-lic sphere28. Communities should, therefore, be provided with opportu-nities to speak openly on the crime and violence. These sessions would provide ideal platforms for the com-munity to gather in conjunction with civil society organisations, policy mak-ers and government practitioners to identify and reflect upon the major
86 M. Hunte and L.-A.W. Bonair
causes of causes crime and violence in the community; draw on lessons and experiences and encourage joint and mutually beneficial community activi-ties that strengthen interaction and enhance social cohesion29. Community dialogue is, therefore, integral to find-ing practical and effective solutions to deal with community-based crime and violence.
4 Social programmes/strategies
a Although various political directorates have implemented a tremendous num-ber of anti-social initiatives, many of these programmes are not sustainable because they are either conducted for a short duration or fail to offer sustain-able opportunities for young people to engage in positive or pro-social behav-iours. Furthermore, governments have boasted of the successes of these pro-grammes, but there is a gross lack of continuous monitoring and evaluation of such social programmes. Very few tracer studies or impact evaluations are conducted to determine the effective-ness of these programmes, whether they have met their expressed objectives or the extent to which they have facilitated their desired social outcomes. Some participants also tend to hop from pro-gramme to programme without any real demonstration that new skills and com-petencies have been acquired. There is, therefore, a great need to improve the monitoring and evaluative capacity of social interventions and design pro-grammes towards a more sustainable outcome. Such evaluations would also inform future policy and programme development (Gonzales, 2009).
b Programmes that are designed to address the particular issues con-fronting at risk, young men in the
society should also be encouraged since homicides have been found to be a predominantly young male enter-prise. Moreover, young men must be empowered to make positive lifestyle decisions and youth should not be seen simply as part of the problem, but instead they should be given an opportunity to contribute to turn-ing the tide of crime and violence in the society. Brown (1998) argued that youth must be given the space to legiti-mise their voice in the delinquency discourse30. Such an approach encour-ages meaningful youth participation in the development of effective youth programmes, policies and services (Beyond Border, 2008).
c There is also a need to shift towards resilience building of both youth and their families. Traditionally, the focus has been on reducing or eliminating the problem behaviour of youth, but there should also be a simultaneous focus on strengthening that which is positive in the life of the at risk youth. Accordingly, an overemphasis on deficits should be replaced with a focus on capacities and strengths (i.e., adopt a strength-based approach) (Bernard, 1997).
d Government’s crime and homicide reduction strategies must be based on ‘evidence-based practices’. Research over the last decade has demonstrated the reliability and effectiveness of a variety of programmes, once implemented cor-rectly, produce results (Seave, 201031). Identifying successful programmes that are relevant and appropriate to our social and cultural context has extreme value for national investments in reduc-tion strategies. Once again, this will call for a rigorous assessment of current programmes to determine their quality and effectiveness. Programmes may have to be revamped or tweaked to replicate
87Crime in Trinidad and Tobago
initiatives that have been proven suc-cessful in the regional and interna-tional arenas. Ineffective or harmful programmes are simply a waste of scare prevention funding and resources32. Adopting evidence-based programmes, however, may require challenging the status quo because often what works is at odds with politics and ‘tough on crime’ campaigns33.
e Traditionally, the criminal justice system has focused its attention on offenders while negligible attention has been paid to victims of violent crime and their families. Punishment of the offender is simply one requirement for victim jus-tice. Victims argue that they also need financial assistance, information, social support, etc. (Sullivan, 2010). In spite of the fact that the Trinidad and Tobago government currently provides finan-cial compensation for victims of violent crime through the Criminal Injuries Compensation Act 1999, much more needs to be done. Appropriate resources at varying levels (i.e., psychological, financial, social and medical) should be made available to victims of crime and their families for them to improve and rebuild their lives, in both the short-term and the long-term. It, therefore, calls for a shift from an offender-oriented approach to a victim-oriented approach where the needs of all victims can be met. Herman (2004) argues for parallel justice for victims and greater victim-oriented policies.
CONCLUSION
Trinidad and Tobago in the midst of economic wealth and prosperity is witnessing an unprecedented escalation in homicides that has shattered the security of its citizenry and continues to undermine the
social and developmental goals of this twin island state.
It has, therefore, become imperative that the government of the day acts with great expediency to stem the proliferation of this and other types of crimes that have been strongly associated with youth gangs, gun violence and drugs.
Crime and violence must, therefore, be recognised as a public health problem that must be attacked through an inclusive and participatory approach. Interventions are likely to be effective if they are evidence-based, tailored to and supported by the local community, multi-pronged and sus-tainable. Primary prevention must also be a paramount priority in the government’s strategic approach. Responding to the development challenges posed by increasing crime and violence also requires strong gov-ernment will and determination, as well as continuity (Shaw, 2007).
REFERENCES
Address by Senator the Honourable, Martin Joseph, Minister of National Security, Trinidad and Tobago on the occasion of the Opening of the Specialist Crime Academy, July 2006.
Address by Senator the Honourable, Martin Joseph, Minister of National Security, Trinidad and Tobago at the Public Consultation on Crime in Tobago, May 2007.
Address by the Honourable Minister of State in the Ministry of National Security, Trinidad and Tobago for the National Strategy to Eliminate Illicit Drugs, June 2005.
Address by Veronica Belgrave, Deputy Permanent Secretary, Ministry of National Security, Trinidad and Tobago on the com-missioning of the San Juan Comprehensive Cadet Force Unit, December 2007.
Agozino, B., Ben B., Elizabeth, W. and Godfrey, B. (2009) Guns, Crime and Social Order in the West Indies, Criminology and
88 M. Hunte and L.-A.W. Bonair
Criminal Justice 2009, Online: http://www.iansa.org/regions/camerica/documents/guns-crime-WIndies-ccjAug09.pdf, accessed 24/05/10.
Alfonso, S. (2009) ACUNS Annual Meeting: Global Governance of Security and Crime Prevention, Lessons from the Caribbean.
Bailey, B. and Suzanne M.C. (2008) The Missing Generation: A Situational Analysis of Adolescents (10–14) in the Caribbean Community, UNICEF 2008, Online: http://www.unicef.org/barbados/spmapping/Implementation/youth/2008_LitReviewCaricom.pdf, accessed 28/05/2010.
Bellis, M.A., Lisa, J., Hughes, K. and Hughes, S. (2010) ‘Preventing and Reducing Armed Violence: What Works? Background Paper: Oslo Conference on Armed Violence’, Liverpool John Moores University, Centre For Public Health, The World Health Organization Department of Violence and Injury Prevention and Disability and The UNDP Bureau for Crisis Prevention and Recovery, April 2010, Online: http://www.cph.org.uk/show Publication.aspx?pubid=643
Bernard, B. (1997)‘Turning it around for all youth: from risk to resilience’, Eric Digest 1997, Online: http://www.resilnet.uiuc.edu/library/dig126.html, accessed 02/07/10.
Beyond Border, Sri Lanka. Principles of Meaningful Youth Participation (2008) Online: http://beyondborders.wordpress.com/2008/07/08/principles-of-meaningful-youth-participation/, accessed 02/07/10.
Blumstein, A. (1986) Criminal Careers and ‘Career Criminals’, National Academy Press, Washington D.C.
Brereton, B. (2010) ‘The historical background of the culture of violence in Trinidad and Tobago’, Caribbean Review of Gender Studies, No. 4. www.sta.uwi.edu/crgs/february2010/abstracts/BridgetBrereton.pdf, accessed 05/07/10.
Brodeur, J.-P. and Geneviève, O. (2004) ‘What is a crime? A secular answer’, in Law Commission of Canada (Ed.): What Is a Crime? UBC Press, The University of British Columbia, Vancouver, pp.1–33.
Brown, S. (1998) Understanding Youth and Crime. Open University Press, Buckingham.
Centre for the Study and Prevention of Violence. Blueprints for Violence Prevention, Institute of Behavioral Sciences, University of Colorado, Colorado, Online: http://www.colorado.edu/cspv/blueprints/, accessed 02/07/10.
Dominic, C. (2008) ‘Analysis: UK gun crime figure’, BBC News, 31 January 2008, Online: http://news.bbc.co.uk/2/hi/uk_news/6960431.stm, accessed 24/06/10.
Ferguson, C.J. (Ed.) (2010) Violent Crime and Social Implications, SAGE Publications, California.
Fionda, J. (2005) Devils and Angels: Youth Policy and Crime, Hart Publishing, Portland.
Fox, J.A. and Zawitz, M.W. (2010) ‘Homicide trends in the United States’, Bureau of Justice Statistics, Online: http://bjs.ojp.usdoj.gov/content/homicide/homtrnd.cfm
Fox, J.A. and Swat, M.L. (2008) The Recent Surge in Homicides Involving Young Black Males and Guns: Time to Reinvest in Prevention and Crime Control, Northeastern University, Boston, Online: www.jfox.neu.edu/.../Fox%20Swatt%20Homicide%20Report%20Dec% 2029%202008.pdf
Geneva Declaration Secretariat (2008) Global Burden of Armed Violence, Geneva Declaration Secretariat, Switzerland, accessed 02/07/10.
Geneva Declaration Secretariat (2008) The Geneva Declaration Process: Placing the Link between Armed Violence and Development on the International Agenda, Online: http://www.unhcr.org/refworld/docid/494a47532.html, accessed 02/07/10
Geneva Declaration Secretariat (2008) Armed Violence Prevention and Reduction: A Challenge for Achieving the Millennium Development Goals, Online: http://www.unhcr.org/refworld/docid/494a4b952.html, accessed 02/07/10.
Gonzales, M. (2009) Reducing Armed Violence in the Caribbean: Challenges to Civil Society, The Ploughshares Monitor, Vol. 30, No. 2, Ontario, Canada, Online: www.plough-shares.ca/libraries/monitor/pdf2010spring.pdf, accessed 17/07/10.
Greenwood, P. (2010) Preventing and Reducing Youth Crime and Violence: Using Evidence Based Practices, Governor’s Office of Gang and
89Crime in Trinidad and Tobago
Youth Violence Policy, California, Online: www.nursefamilypartnership.org/.../CA_GOGYVP_Greenwood_1-27-10, accessed 04/07/10
Hartung, G. and Samuel P. Demographic Factors as Determinants of Crime Rates, Proceedings of the 35th Brazilian Economics Meeting, 2007, Online: http://www.abep.nepo.unicamp.br/SeminarioPopulacao PobrezaDesigualdade2007/docs/SemPopPob07_1062.pdf
Herman, S. (2004) Supporting and Protecting Victims: Making it Happen, National Victims Conference, London, England, Online: www.ncvc.org, accessed 11/05/10
Hunte, M. (2006) A Qualitative and Achievement among Low Income Youth in Trinidad, Paper presented at SALISES 7th Annual Conference, Barbados, 29–31 March, SALISES Publications.
Institute of Healing and Memories (2009) A Dialogue on Community Violence, The Trauma Centre for Survivors of Violence and Torture, September 2009, Online: www.irct.org/Admin/Public/DWSDownload.aspx?File...on...23, South Afirca, accessed 02/07/10.
Integrated Regional Information Networks (2010) In-Depth: Guns Out of Control: The Continuing Threat of Small Arms. Kenya: Illegal Small Arms Fuel Ethnic Strife and Crime, Online: http://www.irinnews.org/InDepthMain.aspx?InDepthId=8& ReportId=58959&Country=Yes, accessed 04/07/10.
Integrated Regional Information Networks (IRIN) (2006) In-Depth: Guns Out of Control: The Continuing Threat of Small Arms, May 2006, Online: www.irinnews.org/ webspecials/small-arms/default.asp, accessed 04/07/10.
Jenson, J.M. and Howard, M.H. (Eds.) (1999) Youth Violence. Current Research and Recent Practice Innovations, National Association of Social Workers Press, Washington D.C.
Justice Policy Institute. Chapter 8: Real Solutions to Youth Violence: Evidence Based Practices, Online: www.justicepolicy.org/.../07-07_Ch8_GangWars_GC-PS-AC-JJ.pdf
Kim-Ju, G., Mark, G.Y., Cohen, R., Garcia-Santiago, O. and Nguyen, P. (2008). ‘Community Mobilization and its Application to Youth Violence Prevention’, American Journal of Preventative Medicine, Vol. 34, No. 3s, pp.S5–S12, accessed 29/06/10.
Kohn, R. (2001) ‘Homicide among adolescents in the Americas: a growing epidemic’, Bulletin of the World Health Organization, Vol. 79, No. 2.
Levitt, S.D. and Lance L. (2001) ‘The determinants of Juvenile crime,’ in Jonathan, G. (Ed.): Risky Behavior Among Youths: An Economic Analysis, University of Chicago Press, Chicago, accessed 16/06/10 pp.327–374.
Levine, C. (2006) Testimony on Youth Violence Prevention, New Jersey Senate Law and Public Safety and Veterans’ Affairs Committee Hearing, New Jersey Institute of Social Justice, 20 November 2006, Online: www.njisj.org/.../NJISJYouthViolencePrevention Testimony_Final_112006.pdf, accessed 04/07/10 New Jersey.
Michigan State University (2009) ‘National anti-gun violence program largely successful’, Science Daily, November 2009, Online: http://www.sciencedaily.com/releases/2009/11/091109142127.htm
Montoute, A. and Anyanwu, D. (2009) A Situational Analysis of Gun Related Crime in the Caribbean: The Case of Trinidad & Tobago; Antigua & Barbuda; St Vincent & the Grenadines and St. Lucia, Paper presented at The Coalition for Development and the Reduction of Armed Violence, pp.2.
National Institute of Justice (2009) Gun Violence Programs: Project Safe Neighborhoods, 12 June 2009, Online: http://www.ojp.usdoj.gov/nij/topics/crime/gun-violence/prevention/project-safe-neighborhoods.htm, accessed 28/05/10.
National Institute of Justice. Gun Violence Prevention, Online: http://www.ojp.usdoj.gov/nij/topics/crime/gun-violence/ prevention/welcome.htm
Pryce, K. (2007) ‘Towards a Caribbean Criminology’, in Ramesh, D. (Ed.): Crime Delinquency and Justice: A Caribbean
90 M. Hunte and L.-A.W. Bonair
Reader, Ian Randle Publisher, Kingston, pp.3–18.
Refworld (2009) Trinidad and Tobago: Crime; Government Actions to Fight Crime, Including Crime Linked to Gangs and Organized Crime (2007–2009), Immigration and Refugee Board of Canada, Trinidad and Tobago.
Rodgers, D. (1999) Youth Gangs and Violence in Latin America and the Caribbean: A Literature Survey, LCR Sustainable Development Working Paper No. 4, Urban Peace Program Series, World Bank, Online: www.ansarilawfirm.com/.../Youth-Gangs-and-Violence-in-Latin-America.pdf, accessed 02/07/10.
Shaw, M. (2005) Youth and Gun Violence: The Outstanding Case for Prevention, International Centre for the Prevention of Crime, Online: www.crime-prevention-intl.org/uploads/media/pub_188_1.pdf, accessed 02/07/10.
Shaw, M. (2007) Comparative Approaches to Urban Crime Prevention Focusing on Youth, International Centre for the Prevention of Crime, Online: www.crime-prevention-intl.org/uploads/media/pub_188_1.pdf, accessed 02/07/10.
Sheppard, D. (1999) Strategies to Reduce Gun Violence, OJJDP Fact Sheet, #93, Office of Juvenile Justice and Delinquency Prevention, Online: www.ncjrs.gov/ pdffiles1/fs9993.pdf, accessed 02/07/10
Sookram, S., Maukesh B., Kerry S.-R. and George, S. (2009) A Time Series Analysis of Crime in Trinidad and Tobago, Working Papers, Paper 2009:20, SALISES Publications, Online: http://sta.uwi.edu/salises/pubs/ workingpapers/ATimeSeriesAnalysis OfCrimeTrinidadandTobago.pdf, United State.
Strategic Services Agency (2008) Annual Report 2007: Status of Serious Crime in Trinidad and Tobago, SALISES Publications.
Sullivan, S. (2010) ‘The Harper crime agenda is not a crime victim agenda’, The Hill Times, Online: www.crcvc.ca, accessed 02/06/10
The Caribbean Country Management Team (2004) Impact of Crime on Business
and the Investment Climate in Jamaica, World Bank, Online: www.siteresources.worldbank.org/INTLAWJUSTINST/.../JamaicaPaper.pdf, accessed 26/06/10.
The Future of Children. Best Practices in Juvenile Justice Reform, Online: www.princeton.edu/futureofchildren/publications/.../18_02_Highlights.pdf, accessed 27/06/10.
The Government of the Republic of Trinidad and Tobago. (2009) Vision 2020 Operational Plan 2007—2010: 2008—2009 Progress Report, Ministry of Planning, Housing and the Environment
The Jerusalem Inter-Cultural Centre. Community Dialogue: Introduction, The Jerusalem Inter-Cultural Centre, Online: www.jicc.org.il/, accessed 04/07/10.
Townsend, D. (2009) No Other Life: Gangs, Guns and Governance in Trinidad and Tobago, Small Arms Survey, Graduate Institute of International and Development Studies, Geneva.
United Nations Office on Drugs and Crime and the Latin America and the Caribbean Region of the World Bank (2007) Crime, Violence, and Development: Trends, Costs, and Policy Options in the Caribbean, United Nations Office on Drugs and Crime and the Latin America and the Caribbean Region of the World Bank, Report No. 37820, Online: http://www.unodc.org/pdf/research/Cr_and_Vio_Car_E.pdf, accessed 11/05/10.
University of Richmond (2003) Neighborhood Crime Prevention and Safety, Online: www. solutionsforamerica.org, accessed 02/07/10.
U.S. Department of Justice—Community Relations Service (2003) Community Dialogue Guide: Conducting a Discussion on Race, Online: www.justice.gov/crs/pubs/ dialogueguide.pdf, accessed 03/07/10.
Youseff, V. (2010) The Culture of Violence in Trinidad and Tobago: A Case Study, Caribbean Review of Gender Studies, No. 4, Online: www.sta.uwi.edu/crgs/february2010/abstracts/editorial.pdf, accessed 03/07/10.
Wilson, J.Q. and Hernstein, R.J. (1985) Crime and Human Nature, Touchstone Books, New York.
91Crime in Trinidad and Tobago
NOTES
1 http://www.traveldocs.com/tt/economy.htm
2 http://www.economywatch.com/world_economy/trinidad-and-tobago/
3 Barbados is the only Caribbean country catergorised as very high human develop-ment ranked as 37 on the HDI, 2009.
4 Opinion Leaders’ Panel 2009 Wave 14 Report.
5 The complexity of this historical legacy has been analysed in other works and so will not be repeated here.
6 Cited in Brodeur and Geneviève Ouellet, 2004.
7 Cited in Montoute and Anyanwu, 2009.
8 Agozino et al., 2009.
9 Strategic Services Agency, Annual Report 2007.
10 Calculated using the 2000 census popula-tion of 1,262,366.
11 Please note, figures are provisional and subject to revision.
12 Please note, figures are provisional and subject to revision.
13 Please note: figures are provisional and subject to revision.
14 Please note: figures are provisional and subject to revision.
15 According to the UN Department of Disarma-ment Affairs, over 600 million small arms and light weapons circulate worldwide. Hence, the ease of availability of small arms has made crime more violent and fatal. The Small Arms Survey estimates that 300,000 people world-wide are shot dead over the course of a year and gun homicide accounts for 200,000 of these deaths, the majority occurring in Latin America and the Caribbean (IRIN, 2006).
16 This trend was noted particularly in the age group 15–29.
17 Globally, men are identified as the primary perpetrators and victims of armed violence. But armed violence has a disproportionate impact on women and children, where as a result of their vulnerability, they often have the greatest burden to bear (IRIN, 2006).
18 Geneva Declaration Secretariat, June 2008.
19 Martin Joseph, 2006.
20 Taken from public addresses of the Minister of National Security.
21 CCC – Civilian Conservation Corps, MILAT – Military Led Academic Training, MYPART – Military Youth programme of Apprenticeship and Reorientation Training.
22 Cited in Shaw, 2005.
23 U.S. National Institute of Justice; Shaw, 2005.
24 Justice Policy Institute www.justicepolicy.org
25 Office of Juvenile Justice and Delinquency Prevention, U.S. Department of Justice.
26 University of Richmond. 2003. Neighborhood Crime Prevention and Safety; www.solutionsforamerica.org
27 Jerusalem Inter-Cultural Centre.
28 Jerusalem Inter-Cultural Centre.
29 Institute of Healing and Memories.
30 Cited in Hunte, 2006.
31 Paul Seave is Director of Governor’s Office of Gang and Youth Violence Policy, California.
32 Blueprints, Centre for the Study and Prevention of Violence, Colorado.
33 The Future of Children, www.futureofchil-dren.org

Copyright © 2010 WASD
World Sustainable Development Outlook 2010
93
THE POTENTIAL ROLE OF THE CARIBBEAN DIASPORA
IN SCIENCE, TECHNOLOGY AND INDUSTRIAL POLICY
Jason Jackson*
Abstract: This paper addresses the key guiding questions of the International Development Research Centre (IDRC) project1 assessing strategic opportunities for Caribbean migration from brain circulation: ‘How can source countries exploit the benefits of brain circulation?’, by concentrating on the role of diasporas as conduits of tacit knowledge and technology. This research primarily engages with recent literature on the ‘new’ industrial policy that emphasises the role of the movement of skilled persons and focused, strategic interactions between the government and the private sector. As such, it focuses on the potential benefits of institutional mechanisms of engaging with the diaspora by government and home country private sector as a means of facilitating transformation of the region’s productive sector. The analysis focuses on the diasporic relationship between Jamaica and the United States.
PART I: RESEARCH OVERVIEW
Introduction
The purpose of this paper is to outline the key areas of focus for this on-going research on the role of Caribbean diasporas in sci-ence, technology and industrial policy. It addresses the key guiding question of the IDRC project2 considering strategic oppor-tunities for Caribbean migration from brain circulation: ‘How can source countries exploit the benefits of brain circulation?’, by focusing on the role of diasporas as con-duits of tacit knowledge and technology. This research primarily engages with recent literature on the ‘new’ industrial policy that emphasises the role of the movement of skilled persons and focused, strategic inter-actions between policymakers, scientists
and technologists in the region and in the diaspora, and the private sector. As such it focuses on the potential benefits of insti-tutional mechanisms of engaging with the diaspora by government, the private sector and domestic science and technology com-munity as a means of facilitating transfor-mation of the region’s productive sector.
Caribbean productive sector development
A critical assumption underpinning this proposal and the key challenge facing the region is its narrow and relatively unsophis-ticated production structure. Countries in the region are heavily reliant on a few goods and services, primarily agricultural or min-eral commodities and tourism, and the vast
* Corresponding author: e-mail: [email protected], [email protected]
94 J. Jackson
majority of these goods and services are of low value-added and technology intensity. Import-substituting manufacturing sectors have been under increasing pressure since the 1980s with increased trade liberalisation while export-oriented sectors have suffered from wider shifts in the global architecture of production that has seen manufactur-ing increasingly move to Mexico, south-east Asia and most recently, China. This dynamic has contributed to departure from a regional development model with an agri-cultural and manufacturing base to one that is increasingly reliant on export-oriented services, with potentially negative distribu-tional implications given the skill profile of the regional labor force (Marshall, 2002). Offshore financial services activities, in par-ticular, have been held by regional policy-makers to present a ray of hope but have yet to live up to expectations, particularly with most regional activities being of relatively low sophistication and minimal value-added. More recently, the industry has suffered due to changes in international regulations led by the Organisation for Economic Co-operation and Development (OECD) aimed at curtail-ing offshore tax havens and money launder-ing, as well as the current financial crisis. This has posed a major challenge for the region in terms of its wider strategies for engagement with a changing global capitalist economy (c.f. Marshall, 2007).
How can the region address these chal-lenges in the productive sector and concom-itant problems of rising unemployment, inequality and social disintegration? Where should the focus be as countries struggle to conceptualise a new productive sector strategy? Rodrik and Hausman (2003) argue that the key challenge facing middle income developing countries, particularly those with small economies or narrow production structures such as those in the Caribbean, is learning what products—broadly defined—can be produced competitively. That is,
while in principle there is very large range of products that entrepreneurs and policy-makers could focus on, ‘discovering’ which of those products a given country or firm is good at is a highly risky and uncertain process. Standard economic analysis would seek an answer through comparative advan-tage, e.g., in ‘labour-intensive manufactured goods’, but as Rodrik and Hausman (2003) note, this provides little practical advice as there are thousands of potential products one could choose. A quick glance at the six-digit harmonised schedule (HS), which cat-egorises trade products for customs purpose reveals around 5,000 different commodity groups. How is one to choose? Predictions of international trade models based on factor-endowments turn out to be ‘too coarse to have much operational value’, while management consultants also seem to be of little help (Rodrik and Hausman, 2003). An alternative approach to productive sec-tor development must move beyond static comparative advantage to consider the more product-specific nature of global competi-tion. They, thus, characterise the economic development challenge facing developing countries as one of ‘self-discovery’, where countries are faced with the difficult task of identifying areas of productive potential.
A central element of this approach is ensuring the availability of knowledge and technology to facilitate entry into new areas of productive activity of increasing sophis-tication. In this view technology is seen as tacit, thus rendering its transfer and absorp-tion subject to high costs as well as signifi-cant uncertainty in the local adaptation process (c.f the work of Richard Nelson, Sanjaya Lall and Larry Westphal). The tacit nature of technology has important impli-cations for its transfer, which is critical for local industrial upgrading, as it can only be acquired through face-to-face interactions. This usually requires the movement of skilled people, which historically has meant
95The potential role of the Caribbean diaspora
foreign experts but in today’s context high-lights the potential value of skilled diasporas who combine scientific training and techni-cal skills with local knowledge.
Institutional innovations for industrial development
There are both institutional as well as tech-nical elements of this approach. Rodrik (2004) argues that current approaches to industrial policy are concerned with govern-ment and the private sector sharing informa-tion about externalities; it is about strategic interactions aimed at addressing obstacles to industrial restructuring and identifying new economic opportunities: ‘industrial policy is a discovery process—where firms and the government learn about underly-ing costs and opportunities and engage in strategic coordination’. In this view, the problem of productive sector development is re-conceptualised as demand rather than sup-ply constrained, an approach which seems to have significant utility in the context of capacity under-utilisation, as reflected in high rates of unemployment and excess physical production capacity across the Caribbean.
Thus while older approaches to industrial policy focused narrowly on the financial requirements of industrial development, more recent considerations pay closer atten-tion to institutional interactions between gov-ernment and private interests, as a means of information sharing geared towards iden-tifying new activities and promoting struc-tural transformation. It recognises that the requirements of economic development—particularly the identification of new areas of activity—are constantly changing in line with a dynamic and complex global econ-omy. It also recognises that connections with the world economy are necessary but insufficient requirements; it is the nature of engagement with the global economy—particularly the quality of search functions
and the structural characteristics of collabo-ration with other actors that determines success (Sabel, 2009). Ricardo Hausmann, Richard Nelson, Dani Rodrik, Charles Sabel, Ben Ross Schneider, and Joseph Stiglitz are just a few of the scholars from different disciplines that are spearheading theoretical and policy-based developments within this institutional approach.
Critically, this new approach is being taken on board by one of the key interna-tional development organisations. The Inter-American Development Bank has recently adopted a research programme aimed at revisiting the role of industrial policy under the term ‘productive sector policies’. It is worth noting at this point that in some respect, the role of public–private interactions is nothing new. Government interaction with business is held to be at the core of the success of the East Asian tigers in Alice Amsden and Robert Wade’s semi-nal country studies on Korea and Taiwan. This approach, thus, represents a reconsid-eration of the key institutional elements of successful East Asian development policy. However, while the re-engagement with industrial policy is a positive development in wider development policy research and practice, industrial policy still retains the intellectual and political baggage from the now sterile state versus market debates of the 1980s and 1990s. It remains to be seen how other powerful development actors within and outside the region this approach will respond to this new approach.
Institutional mechanisms for diasporic engagement
The lack of institutionalised channels of engagement with the private sector is thus a major deficiency of Caribbean industrial policymaking. This becomes especially clear in the context of the existence of a skilled diaspora, as diasporas are a key source of
96 J. Jackson
knowledge that is largely been ignored by regional governments. This is particularly a problematic thing given to the stagnation of the region’s productive sectors and econo-mies over the past few decades. In order to re-ignite structural transformation and improve the quality of the region’s insertion in the global political economy there needs to be a shift to more knowledge and tech-nology intensive activities. However, the key challenge for all countries in making this shift lies in the difficulties of institut-ing mechanisms of information exchange to facilitate the identification of new pro-ductive activities and the knowledge and technology transfer that can make them competitive. This is where the diaspora is of greatest potential benefit. Historically, the cross-border movement of persons has been a critical factor in the transfer of tacit knowl-edge and technology necessary for successful industrial development. Historical evidence is drawn from England during the industrial revolution and then from follower countries like United States, Germany, Japan; and later Taiwan, Korea, China and Ireland. Other countries like India with a large highly skilled diaspora have had less success in engaging diaspora through formal policy institutional channels but diasporas have nevertheless played an important informal role, particularly, through networks of high technology entrepreneurs such as Indus Entrepreneurs (TiE).
The role of the diaspora in Taiwan deserves special attention. The key factor in the Taiwanese case was the institutional connections between Taiwanese officials and members of the Taiwanese diaspora, particularly those who studied at American universities and remained to take jobs in the U.S. high-technology sector. Taiwanese officials sought industrial policy advice from members of the highly-skilled Taiwanese diaspora who were resident in the United
States. Tapping the diaspora was a key strategy for facilitating technology trans-fer and cross-border technological learn-ing. ‘Taiwanese officials began traveling to Silicon Valley in the 1960s and 1970s, long before most of the world was aware of its exis-tence. Senior economic ministers studied the Silicon Valley experience and institutionalised mechanisms for eliciting advice on technology and industrial policy from the region’s community of US-educated Taiwanese engineers’ (Saxenian, 2001). Indeed, under the advice of their Silicon Valley based diaspora, Taiwanese policymakers attempted to mimic many other aspects of the Silicon Valley model, including links between industry and pub-lic research institutions and the creation of venture capital industry to provide the financial support necessary for an inher-ently high-risk industry.
Given the need to identify new areas of activity and foster supporting technology transfer why has there been so little effort to engage the diaspora? Certainly, the fact that the vast majority of highly-skilled Caribbean people live outside of their home countries is well known. Table 1 provides a comparative view of global migration flows. It shows that while large countries have the highest number of total skilled migrants, small Caribbean countries have by far the highest migration rates. It reveals that five Caribbean countries—Guyana, Jamaica, St. Vincent, Grenada and Haiti have between 80% and 90% of their university-educated citizens living overseas.
Fortunately, there have been some recent attempts to devise a diaspora strategy in the region. The Jamaican government’s diaspora conferences and various initiatives conducted in Jamaica and in the United States through its embassies and consul-ates are the key example. However, while this interest in the diaspora is welcome,
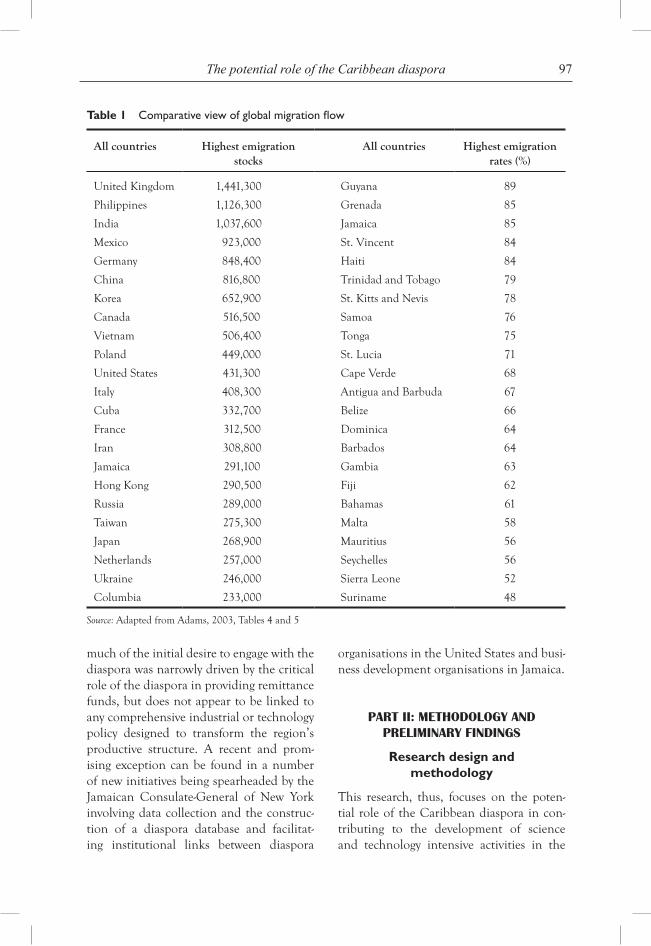
97The potential role of the Caribbean diaspora
much of the initial desire to engage with the diaspora was narrowly driven by the critical role of the diaspora in providing remittance funds, but does not appear to be linked to any comprehensive industrial or technology policy designed to transform the region’s productive structure. A recent and prom-ising exception can be found in a number of new initiatives being spearheaded by the Jamaican Consulate-General of New York involving data collection and the construc-tion of a diaspora database and facilitat-ing institutional links between diaspora
organisations in the United States and busi-ness development organisations in Jamaica.
PART II: METHODOLOGY AND PRELIMINARY FINDINGS
Research design and methodology
This research, thus, focuses on the poten-tial role of the Caribbean diaspora in con-tributing to the development of science and technology intensive activities in the
Table 1 Comparative view of global migration flow
All countries Highest emigration stocks
All countries Highest emigration rates (%)
United Kingdom 1,441,300 Guyana 89
Philippines 1,126,300 Grenada 85
India 1,037,600 Jamaica 85
Mexico 923,000 St. Vincent 84
Germany 848,400 Haiti 84
China 816,800 Trinidad and Tobago 79
Korea 652,900 St. Kitts and Nevis 78
Canada 516,500 Samoa 76
Vietnam 506,400 Tonga 75
Poland 449,000 St. Lucia 71
United States 431,300 Cape Verde 68
Italy 408,300 Antigua and Barbuda 67
Cuba 332,700 Belize 66
France 312,500 Dominica 64
Iran 308,800 Barbados 64
Jamaica 291,100 Gambia 63
Hong Kong 290,500 Fiji 62
Russia 289,000 Bahamas 61
Taiwan 275,300 Malta 58
Japan 268,900 Mauritius 56
Netherlands 257,000 Seychelles 56
Ukraine 246,000 Sierra Leone 52
Columbia 233,000 Suriname 48
Source: Adapted from Adams, 2003, Tables 4 and 5
98 J. Jackson
region. Specifically, it considers the institu-tional mechanisms necessary to engage the diaspora, particularly scientists and technol-ogists, in a productive manner. It focuses specifically on a single country and sector: biotechnology in Jamaica. Jamaican biotech is chosen because there has been significant effort put into the development of the sec-tor at the policy, research though to a lesser extent industry and private sector levels. Not only has there been a significant policy effort, but also there has been a history of interactions between researchers in Jamaica and those in the diaspora, and also between academic researchers and industries. While selecting a single country and industry case based on might be seen as limiting the varia-tion that might otherwise be gained from a multi-country or industry approach, this choice of research design is justified by the focus on this research on the process of diaspora interactions. Recent developments in qualitative and case research methodology have provided theoretical and philosophical justification for this approach (George and Bennett, 2005). Further, comparison with other country cases outside of the Caribbean will provide critical variation for interpreting the results of the research. The latter will, thus, draw upon the experiences of success-ful country cases such as Taiwan and Ireland which have developed high technology sectors with significant help from their diasporas to identify theoretical and policy based lessons that might be applicable in the Jamaican and wider Caribbean context3.
This research relies on qualitative data collection methods, particularly elite inter-views with key figures in the Jamaican, wider Caribbean and diasporic science com-munities, policymakers and senior manag-ers in private sector industries that can benefit from biotechnology (such as agricul-ture and food processing). These will be sup-plemented by analysis of policy documents
and other primary and secondary texts that provide insights into the manner in which members of the Jamaican diaspora have engaged with their counterparts at home.
Preliminary findings
Interviews were conducted with policymak-ers and University of the West Indies (UWI) scientists in Jamaica during 19–24 April. Even though these are very early discussions in the context of the research a clear pattern began to emerge as to the challenges fac-ing diaspora engagement in biotechnology research in the region. Interview respondents consistently noted that efforts had been made between members of the science community in Jamaica and members of the diaspora to forge collaborative relationships but these had been hindered by the following:
1 The lack of an appropriate model or set of institutional arrangements to facili-tate dialogue, engagement and collabora-tion. This was seen as arising as a result of (amongst other things):
a A mismatch between diasporic and local researchers’ approaches to research;
b misunderstandings of incentives/motivations;
c lack of an effective strategy; all of which are related to and highlight
d weaknesses in Jamaica’s innovation system.
2 Limited financial and other material resources for supporting collaborative work.
Other critical issues that were pointed out in the interviews concern the extent to which policymakers and the private sector were interested and engaged in developments in the biotechnology sector. In summary, there was an increased interest on the part of the agricultural community much of which was
99The potential role of the Caribbean diaspora
driven by a renewed focus on the agriculture sector by the government of Jamaica (espe-cially under the leadership of the current Minister). These renewed efforts coincided well with new efforts at UWI to support research in agriculture (including biotechnol-ogy). However, there were major questions and concerns about the approach of private industry/the private sector to the science and technology research and development. In general, respondents felt that industry paid inadequate attention to potentially profitable and industry-supporting research that was being conducted in Jamaica. This was attributed to a number of shortcomings on the part of local industry/private sector including:
1 short-term time horizons;
2 conservatism among the private sector/capitalist class;
3 the extent to which the local private sec-tor was dominated by a traders focus on ‘buying and selling’ rather than a capital-ist focus investing in productive activity;
4 lack of knowledge about local research activities and their potential commercial applications and benefits;
5 lack of confidence in the value of the local research (e.g., when in need of solutions to technical challenges major firms were more likely to tap technical skills/science research in Canada than in Jamaica); again, many of these issues were (or could be) attributed to;
6 weaknesses in Jamaica’s innovation system.
BIBLIOGRAPHY
Adams, R. and Page, J. (2003) ‘International Migration, Remittances and Poverty in Developing Countries’, World Bank Policy Research Working Paper 3179, December 2003, Online: www.worldbank.org
Agrawal, A., Kapur, D. and McHale, J. (2004) Defying Distance: Examining the Influence of the Diaspora on Scientific Knowledge Flows
Cervantes, M. and Guellec, D. (2002) The Brain Drain: Old Myths, New Realities, Directorate for Science, Technology and Industry, OECD, Online: www.oecd.org/migration
Chang, H.-J. (2009) Industrial Policy: Can We Go Beyond an Unproductive Confrontation? A Plenary Paper for ABCDE (Annual World Bank Conference on Development Economics), 22–24 June 2009, Seoul, South Korea.
Cimoli, M., Dosi, G. and Stiglitz, J. (2008) ‘Conclusion: the future of industrial policies in the new millennium: toward a knowledge-centered development agenda’, in Cimoli, M., Dosi, G. and Stiglitz, J. (Eds.): The Political Economy of Capabilities Accumulation: The Past and Future of Policies for Industrial Development, Oxford University Press, New York.
Cimoli, M., Dosi, G. and Stiglitz, J. (2008) ‘Preface’, in Cimoli, M., Dosi, G. and Stiglitz, J. (Eds.): The Political Economy of Capabilities Accumulation: the Past and Future of Policies for Industrial Development, Oxford University Press, New York.
Cimoli, M., Dosi, G., Nelson, R. and Stiglitz, J. (2006) Institutions and Policies Shaping Industrial Development: An Introductory Note, Paper prepared for the Task Force on ‘Industrial Policies and Development’, within the Initiative for Policy Dialogue (IPD), Columbia University.
Commander, S., Chanda, R., Kangasniemi, M. and Winters, A. (2003) Must Skilled Migration be a Brain Drain? Evidence from the Indian Software Industry, IZA Discussion Paper No. 1422, December 2004, Online: www.iza.org
Commander, S., Kangasniemi, M. and Winters, A. (2003) The Brain Drain: Curse or Boon? IZA Discussion Paper No. 809, Online: www.iza.org
Doner, R. (2009) The Politics of Uneven Development: Thailand’s Economic Growth in Comparative Perspective, Cambridge University Press, New York.
Evans, P. (1995) Embedded Autonomy: States and Industrial Transformation, Princeton University Press, Princeton.
100 J. Jackson
George, A. and Bennett, A. (2005) Case Studies and Theory Development in the Social Sciences, MIT Press, Cambridge.
Hausmann, R. and Rodrik, D. (2006) ‘Doomed to choose: industrial policy as predicament’, (unpublished paper).
Hausmann, R., Rodrik, D. and Sabel, C. (2007) ‘Reconfiguring industrial policy: a framework with an application to South Africa’, (unpublished paper).
Kapur, D. (2001) ‘Diasporas and technology transfer’, Journal of Human Development, Vol. 2, No. 2.
Kerr, W. (2005) ‘Ethnic scientific communi-ties and international technology diffusion’, (unpublished draft), 15 September 2005, Online: http://people.bu.edu/furman/html/seminars/
Lowell, L. and Gerova, S. (2004) Diasporas and Economic Development: State of Knowledge, Paper prepared for the World Bank, Institute for the Study of International Migration, Georgetown University.
Marshall, D. (2002) ‘At whose service? Caribbean state posture, merchant capital and the export services option’, Third World Quarterly, Vol. 23, No 4, pp.725–751.
Marshall, D. (2007) ‘The new international financial architecture and Caribbean OFCs: confronting financial stability discourse’, Third World Quarterly, Vol. 28, No. 5, pp.917–938.
Melo, A. and Rodriguez-Clare, A. (2006) Productive Development Policies and Supporting Institutions in Latin America and the Caribbean, Inter-American Development Bank Competitive Studies Series Working Paper C-106, Online: http://ideas.repec.org/p/idb/wpaper/1005.html
Meyer, J.-B. (2003) Policy Implications of the Brain Drain’s Changing Face, Science and Development Network, Online: http://www.scidev.net/ dossiers/index.cfm?fuseaction=policybrief& dossier=10&policy=24
National Science Foundation (2004) Science and Engineering Indicators 2004.
Obukhova, E. (2009) When does Brokerage Work? Brain Circulation and Organizational
Performance, Draft Working Paper, MIT Sloan School of Management.
Pack, H. and Saggi, K. (2006) ‘Is there a case for industrial policy? A critical survey’, World Bank Research Observer, Vol. 2, No. 2, pp.267–297.
Rodrik, D. (2007) ‘Industrial policy for the twenty-first century’, in One Economics, Many Recipes, Princeton University Press, Princeton.
Rodrik, D. and Hausman, R. (2003) Economic Development as Self Discovery, Mimeo.
Sabel, C. (2009) What Industrial Policy is Becoming: Taiwan, Ireland, and Finland as Guides to the Future of Industrial Policy, Paper prepared for the Inter-American Development Bank.
Saxenian, A. (2001) Taiwan’s Hsinchu Region: Imitator and Partner for Silicon Valley, Revised Draft, SIEPR Discussion Paper No. 00-44, Stanford Institute for Economic Policy Research, June 2001.
Saxenian, A. (2007) The New Argonauts: Regional Advantage in a Global Economy, Harvard University Press, Cambridge, MA.
NOTES
1 IDRC Project 105228: Strategic Opportuni-ties for Caribbean Migration: Brain Circulation and Diasporic Tourism and Investment, being undertaken by the Shridath Ramphal Centre for International Law, Trade Policy and Services, University of the West Indies, in partnership with the Canadian-based Centre for Trade Policy and Law, University of Carleton.
2 IDRC Project 105228: Strategic Opportuni-ties for Caribbean Migration: Brain Circulation and Diasporic Tourism and Investment, being undertaken by the Shridath Ramphal Centre for International Law, Trade Policy and Services, University of the West Indies, in partnership with the Canadian-based Centre for Trade Policy and Law, University of Carleton.

101The potential role of the Caribbean diaspora
3 Finally, while most research on the potential role of diasporas has overwhelmingly assumed positive benefits of diasporic engagement, the research is also cognizant of critiques of diaspora approaches, such as that put forward by Obukhova (2009) suggesting that brain circulation may have some detrimental effects
on organisational performance by receiving (source country) firms. This heightens the need for careful and open analysis of the institutional mechanisms/dimensions of brain circulation and the range of social, economic and political effects they can have on the home country.

Copyright © 2010 WASD
World Sustainable Development Outlook 2010
103
CRUISING OUT OF CONTROL? DEALING WITH
THE ENVIRONMENTAL IMPACTS OF CRUISE TOURISM IN THE CARIBBEAN
Jaya Ramlall*University of the West Indies, Trinidad and Tobago
Abstract: Initiated on a small-scale, today the cruise industry has sought to market the ship as the destination itself offering a multi-generational experience with endless activities onboard to meet the demands of its diverse clientele and thus virtually eliminating the need for port calls. Ranked as the number one cruise destination due to its archipelagic nature, the Caribbean welcomes millions of visitors annually. This paper seeks to focus on the environmental issues which arise due to the cruise industry in the Caribbean and further threaten the longevity of the tourist industry which depends on the environmental assets of the region. Furthermore, current strategies governing the industry will be examined with its shortcomings highlighted. Consequently, recommendations will be put forth based on best practices which can be tailored to ensure that the cruise industry poses no threat to the Caribbean but brings only positive attributes to the territory.
Keywords: cruise tourism; marine pollution; Caribbean; MARPOL; eco-cruises; carrying capacity.
INTRODUCTION
Tourism refers to the movement of individuals to a destination away from their normal place of origin for business or lei-sure for a period of over 24 hours but less than 1 year. Traditionally, tourism products were designed for mass tourism. That is, the market clientele was never specified and countries simply marketed their products to a general audience with the typical tag line advocating the ‘Triple S’ syndrome of sun, sea and sand. Today, with increasing global competitiveness of destinations, offering
the same attractions is no longer adequate. The tourism industry now needs to develop niche markets and/or practice a degree of exclusivity if it is to survive amongst the competing destinations. The former factor contributes significantly to the overwhelm-ing success of the cruise industry.
The initiation of the cruise industry was propelled by the ‘transformation of an increasingly obsolete maritime transatlantic travel into trend-setting leisure vacation’ (Cruise Industry News, 2010). Post World
*Corresponding author: University of the West Indies, Trinidad and Tobago; e-mail: [email protected]
104 J. Ramlall
War II technological advancements saw dra-matic changes in the face of the cruise indus-try as vessel size increased, carrying capacity multiplied and infrastructural developments facilitated stop over visits. The ideal cruise sought to market the ship as the product itself rather than depending on stop over visits by providing numerous activities for its diverse patrons. Such activities range from ice skating, rock climbing, casinos, swim-ming pools and even water parks on board.
The Caribbean dominates the total cruise itineraries with almost 40% in 2008 (Florida-Caribbean Cruise Association, 2009). Located within the ideal tropical climate and surrounded by wide expanses of the Caribbean Sea, this volcanic chain of islands produces an idyllic setting for a cruise route. In addition to its natural characteris-tics, the Caribbean territories are rich in attractions ranging from ecological resources to cultural appeals and even historical prod-ucts. Furthermore, the territories are seeking to promote their area through continuous infrastructural development to facilitate the cruise ships such as bigger ports and more onshore services. Thus, with a wide diversity in the unique product offerings of individual islands and increasing infrastructural capaci-ties, the Caribbean is held in high regard as an ideal cruise destination.
The focus of this paper is to investigate the environmental impacts of the cruise industry in the Caribbean and the defi-ciencies of current strategies governing the industry. Subsequently, recommendations would be offered for the region to consider in a bid to minimise or even eradicate the adverse impacts of the cruise industry in the Caribbean region.
The cruise industry has always sparked end-less controversy concerning its footprint on the environment, with special interest on the
fragile marine environments which are a habi-tat to numerable ecosystems. These delicate ecosystems, namely coral reefs, sea grass beds and wetlands, not only perform a productive function by providing food and nurseries, but also have a protective function to offer by acting as a natural line of defence against natu-ral hazards such as storm surges. In addition, it is important to recognise the significance of the marine environment to the cruise industry. The marine ecosystems, aquatic organisms and physical beauty are the core of the mag-netism of the cruise industry. Thus, given the great importance of the marine environment, any hint of degradation is a great cause for concern and demands immediate action. Key environmental issues arising due to the cruise industry to be highlighted are marine pollu-tion, improper anchoring sites, unregulated infrastructural developments and congestion.
Marine pollution continues to be an overwhelming challenge in the Caribbean, especially due to the cruise tourism industry (Uebersax, 1996), as it is estimated that a general cruise ship capacity of 2,000 passen-gers and 1,000 crew members can generate waste in amounts of a small city (Adams, 2002). There are seven basic sources of marine pollution from cruise ships as illus-trated in Table 1.
The critical adverse effect of improper black water disposal is eutrophication. Eutrophication refers to the over growth of algae, due to the excessive nutrient in the water as derived from the waste. This leads to the restriction of oxygen and sunlight from being penetrated through the waters for the other marine organisms. Thus, these marine species are easily suffocated and prone to death, thereby threatening their existence.
Grey water also threatens ecosystems as the chemicals included in the waste water can be harmful to the delicate marine organisms
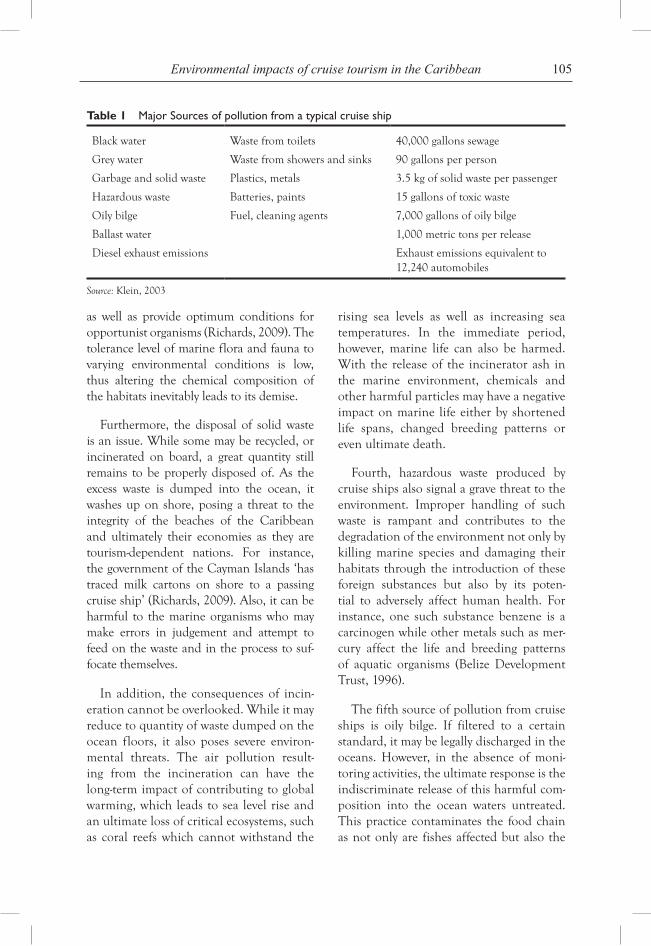
105Environmental impacts of cruise tourism in the Caribbean
as well as provide optimum conditions for opportunist organisms (Richards, 2009). The tolerance level of marine flora and fauna to varying environmental conditions is low, thus altering the chemical composition of the habitats inevitably leads to its demise.
Furthermore, the disposal of solid waste is an issue. While some may be recycled, or incinerated on board, a great quantity still remains to be properly disposed of. As the excess waste is dumped into the ocean, it washes up on shore, posing a threat to the integrity of the beaches of the Caribbean and ultimately their economies as they are tourism-dependent nations. For instance, the government of the Cayman Islands ‘has traced milk cartons on shore to a passing cruise ship’ (Richards, 2009). Also, it can be harmful to the marine organisms who may make errors in judgement and attempt to feed on the waste and in the process to suf-focate themselves.
In addition, the consequences of incin-eration cannot be overlooked. While it may reduce to quantity of waste dumped on the ocean floors, it also poses severe environ-mental threats. The air pollution result-ing from the incineration can have the long-term impact of contributing to global warming, which leads to sea level rise and an ultimate loss of critical ecosystems, such as coral reefs which cannot withstand the
rising sea levels as well as increasing sea temperatures. In the immediate period, however, marine life can also be harmed. With the release of the incinerator ash in the marine environment, chemicals and other harmful particles may have a negative impact on marine life either by shortened life spans, changed breeding patterns or even ultimate death.
Fourth, hazardous waste produced by cruise ships also signal a grave threat to the environment. Improper handling of such waste is rampant and contributes to the degradation of the environment not only by killing marine species and damaging their habitats through the introduction of these foreign substances but also by its poten-tial to adversely affect human health. For instance, one such substance benzene is a carcinogen while other metals such as mer-cury affect the life and breeding patterns of aquatic organisms (Belize Development Trust, 1996).
The fifth source of pollution from cruise ships is oily bilge. If filtered to a certain standard, it may be legally discharged in the oceans. However, in the absence of moni-toring activities, the ultimate response is the indiscriminate release of this harmful com-position into the ocean waters untreated. This practice contaminates the food chain as not only are fishes affected but also the
Table 1 Major Sources of pollution from a typical cruise ship
Black water Waste from toilets 40,000 gallons sewage
Grey water Waste from showers and sinks 90 gallons per person
Garbage and solid waste Plastics, metals 3.5 kg of solid waste per passenger
Hazardous waste Batteries, paints 15 gallons of toxic waste
Oily bilge Fuel, cleaning agents 7,000 gallons of oily bilge
Ballast water 1,000 metric tons per release
Diesel exhaust emissions Exhaust emissions equivalent to 12,240 automobiles
Source: Klein, 2003
106 J. Ramlall
birds that depend on the fish as a source of food, leading to fatal repercussions on human life.
Another detrimental source of pollution via cruise ship activities is ballast water. This is water intake from the ocean to maintain stability of the vessel as the fuel is depleted. The ballast water needs to be emptied when refuelling occurs, usually at ports. With releases being up to 1,000 metric tons, it raises many environmental issues. The main issue with ballast is the introduction of non-native species. When ballast water is captured in the sea, the marine organisms present are also taken up. However, when this is released in areas far from its origins there is displacement of species due to increased competition for space. Worse yet is if the invasive species are able to suppress the original species and lead to its depletion. Thus ballast water may destroy ecosystems, disrupt food chains, change behavioural patterns of species and even introduce for-eign diseases which the original species are not immune to and cannot tolerate. One major incident where ballast water has adversely affected the health of the human population was the introduction of cholera in South America at a port in Peru, 1991, which led to an epidemic affecting millions of lives (Global Ballast Water Management Programme).
The final source of pollution from cruise ships to be examined is the diesel exhaust emissions, contributing signifi-cantly to the greenhouse effect and exac-erbating the situation of global warming. One major issue is burning of bunker fuel which produces toxic air pollution which can have severe health implications as the pollution travels inland (Environment News Service, 2010). Hence, it is quite apparent that pollution from cruise ships
demands great attention due to the vast amounts of different types of waste pro-duced by these vessels.
In addition to pollution, another critical threat to the integrity of the environment as a result of cruise ship activity is their anchor-ing systems. To accommodate on shore visits, ships are compelled to anchor near shore. Anchors can severely damage fragile ecosystems under its great weight, which may be up to 5 tons and this contributes not only to the loss of habitats, but also threat-ens the existence of dependent biodiversity. Research in the Grand Cayman Island has shown that 3150 m2 of reef was destroyed by one cruise ship in one day (Smith, 1988). Thus, these cherished ecosystems which attract visitors are degraded by the same tourism industry which may ultimately lead to its demise. This is reinforced by Lane (2001) stating that ‘tourism can destroy the future it promises because it can ren-der a destination spoilt destination, which becomes unfashionable and redundant’.
The aforementioned threats to the envi-ronment are basically limited to the marine area. However, the impact of cruise ships extends onto the shores as well. To accom-modate the cruise ships, ports of call require certain facilities such as deep water har-bours, multiple berthing facilities, fender systems and much more (Atherley, 2003). However, such infrastructural developments jeopardise the environment, as any other coastal infrastructure. With the expansion or construction of port facilities, marine communities are displaced and/or habitats are destroyed. In addition, those species that actually do survive may be threatened by ongoing port activities such as dredging, pollution and anchors as highlighted ear-lier. These environmental costs skyrocket with increasing demands by multiple ships
107Environmental impacts of cruise tourism in the Caribbean
to dock at the port. This intensifies the envi-ronmental effects and may create another environmental issue, which is congestion especially since environmental thresholds are not measured to determine the carrying capacity of the port.
To deal with the environmental issues outlined, numerous tactics have been employed. International conventions dic-tating marine pollution rules as well as national legislative and institutional frame-works along with individual policies and programmes are some of the initiatives embarked upon to effectively deal with the environmental crisis of the cruise industry. However, shortcomings and inefficiencies of these attempts have severely hindered their success and it is critical to rectify the situation in the interest of the environment and the cruise industry which depends on the environment for its survival.
The International Convention for the Prevention of Pollution from Ships (73/78) MARPOL has effectively put in place regu-lations concerning pollution by oil, harmful substances, sewage and garbage from ships (IMO, 2002). It specifies the rate of discharge that is accepted based on criteria such as ship capacity, geographical location and even the age of the ship. From this international convention, local laws and regulations have been devised by individual territories in the Caribbean such as Barbados (Oil Pollution) Act, 1994. Some general regulations postu-lated include the restriction of air pollution and waste disposal within 12 miles of any land and the prohibition of ballast water exchange 200 nautical miles from land and in areas of less than 200 metres depth (IMO, 2002). In addition, it must be acknowledged that these regulations are accompanied by penalties ranging from fines to clean up costs as well as recovery costs due to damages.
Despite these regulations, pollution has continued as evident by the fines paid by cruise liners. One such incident involves the Royal Caribbean cruise line who was fined US$27 million for oil pollution near the Puerto Rican coast in 1994 (Campbell, 2006). The shortcomings of these regula-tions lay not in the rules themselves but rather the actual enforcement capabilities by relevant authorities. Inadequate resources are a major crippling factor as a lack of capital, trained personnel and advanced technological equipment reduce monitor-ing abilities. Thus, without a powerful enforcement body, ships seem to ignore the environmental laws.
In addition to the lack of enforcement, the legislation is ineffective due to the absence of the necessary infrastructure to support the laws. While the rules insist on waste dis-posal on land, many Caribbean territories have expressed concerns with their inability to facilitate such amenities due to numer-ous factors including space and financial constraints (Richards, 2009). Attempts to impose a head tax of US$1.50 in Grenada in 1999, to cover the costs of a landfill to accommodate disposal of waste from cruise ships, proved futile as ships took the option to make calls at ports with fewer obligations (Rosenfeld, 2010).
This triggers the surfacing of another obsta-cle. That is, while Caribbean territories are seeking ways to recuperate the costs incurred to develop the necessary infrastructure, their approach is rendered futile due to the compe-tition amongst the territories to gain increas-ing numbers of port calls. Moreover, attempts are further undermined as cruise ships have expressed their independence through their possession of private port of calls, e.g., Coco Cay in the Bahamas owned by Royal Caribbean (Anonymous, 2005).
108 J. Ramlall
Nevertheless, despite the hindrances to eliminating marine pollution by cruise ships there have been strategies through-out the world which can be applied as best practices to the Caribbean territories. For the success of these strategies, one critical factor is the unification of nations as a col-lective approach to establish policies will be heeded as a much stronger effort. Thus, with fees such as docking fees and head tax being applied at a constant rate throughout the region with no price undercutting, greater revenue will be generated without compro-mising individual territories. Furthermore, a unified position on zero tolerance for improper waste disposal would be more effective as the ships would be left with no alternative destinations to make port calls in the region.
Along with improving regional co- operation, the Caribbean should seek to establish a mutually beneficial relationship with the cruise liners. By eliminating antago-nism, both parties can engage in discussions to determine the best approach to ensure sustainable cruise tourism practices in the region. That is, they can introduce innova-tive ways to utilise the resources without jeopardising the future of the environment and also the cruise industry. Plans could include the creation of a fund to finance infrastructural developments which will inevitably benefit the ships upon docking.
Another successful initiative to control marine pollution by cruise ships is the mandatory presence of Ocean Rangers on board the vessels to manage waste disposal and simultaneously increase enforcement capacity (Henry, 2008). Also, the provision of incentives for crew members and even passengers to report any suspicious activi-ties can ensure that cruise ships monitor their activities. This is quite effective as in the 1990s, Princess Cruise was fined half
million dollars and the passenger who pro-vided a video as evidence was awarded half the sum (Campbell, 2007).
Together with the reinforcement of laws and accompanying proper monitoring, cruise ships throughout the world have taken the ini-tiative to develop ‘eco-cruises’ (Underwood, 2009). These practices serve as great lessons for cruise ships traversing the Caribbean region. Firstly, recycling programmes should be encouraged to minimise waste generation. For instance, on board Disney Cruise lines, cooking oil was reused to fuel machinery at ports in private islands saving 8,000 gallons of fuel in 2008 (Underwood, 2009). They also recycle hazardous substances such as alumin-ium thereby reducing the amount of waste to be disposed. Moreover, water treatment makes a significant contribution to reducing marine pollution. Holland America cruise line passes their bilge water through two systems of treat-ment while Celebrity Cruises purifies their black water and returns it to the sea in almost pristine conditions (Underwood, 2009).
Another best practice which can be suc-cessfully adopted by Caribbean cruise liners is improving fuel efficiency to ultimately reduce air pollution and minimise the cre-ation of fuel wastes. Plug in power stations at ports are highly effective not only in using less fuel but also reducing harmful gases, especially in proximity to the populated coastal areas. Also, simple methods that can be considered to reduce fuel demand include the tinting of windows to lower the need for air conditioning units, which is highly applicable to the region. The geo-graphical location of the Caribbean in the tropical climatic zone also makes it ideal to install solar panels as done on Celebrity Cruises (Underwood, 2009). This clean source of energy minimises the production of oily wastes and air pollution. Hence, it is quite evident that multiple avenues exist
109Environmental impacts of cruise tourism in the Caribbean
to reduce and ultimately eliminate marine pollution derived from cruise ships.
In addition to marine pollution, another environmental issue demanding attention is the anchoring of cruise ships. While pro-tected areas have been designated through-out the Caribbean there has been little of no monitoring of these areas. To effectively tackle this threat, it is first critical to conduct mapping studies using advance technology such as Geographic Information Systems to identify and delineate ecologically sensitive areas. These areas require strict monitor-ing and should be deemed as no anchoring zones to ensure the longevity of the fragile marine ecosystems. Hence, the role of hon-est, dedicated and trained professionals is critical to the success of this policy and this should be the role of the government to appoint adequate numbers of persons given the demands of individual territories.
The environmental issue of coastal infra-structural development has been given over-whelming attention in the Caribbean. Most territories have devised an Integrated Coastal Zone Management Act and established detailed Coastal Zone Management Plans whereby restrictions are imposed, officers appointed for monitoring purposes and pen-alties clearly outlined. However, the major shortcoming of these efforts is the failure to administer sufficient resources to deliver results. Baseline information is severely lim-ited and mapping procedures are outdated and inadequate. Thus, instruments such as coastal setbacks are being imposed without scientific knowledge. Furthermore, approval is granted to development projects without proper evaluation thereby contributing to the rampant environmental degradation. The key initiative to be undertaken to com-bat this rapid coastal development is by con-ducting Environmental Impact Assessments (EIAs) to guide the approval of projects.
However, these EIAs need to be done by professionals in the relevant field and unbi-ased bodies to be reliable and accurate.
Moreover, to deal with congestion of port facilities, stringent policies are to be adopted and enforced as done in Bermuda. Their restrictions include six vessels per week, 6,500 visitors per day and imposed an annual maximum visitor number of 200,000 (Anonymous, 2005). Upon conducting car-rying capacity assessments of individual ter-ritories, similar limits can be imposed and thereby ensure the sustainable management of the port facility and the environment.
CONCLUSION
Consequently, it is quite evident that the cruise industry threatens the very assets which it depends on for its longevity—the environment. Despite regulations, policies and practices in place to eradicate these threatening characteristics, attempts have been crippled by numerous factors such as a lack of resources and enforcement capabili-ties to name a few. Yet, global best practices have been highlighted and its applicability to the Caribbean region has been justified for adoption by cruise liners in the region. Nevertheless, recommendations are not to be implemented in a vacuum. To ensure the ultimate success, unity is required to set international standards and also to ensure that these standards are adequately enforced and not act as mere window dress-ing. In addition it is necessary to gain the participation and involvement of all rel-evant stakeholders from the cruise owners, visitors, governments and even employees. Agreements must be based on mutual understanding and intensive collaboration. Thus, to avoid its own self-destruction, the stakeholders of the cruise industry need to take control and steer their ships onto the path of sustainable cruise tourism.
110 J. Ramlall
BIBLIOGRAPHY
ACS-AEC. Sustainable Tourism: Caribbean Trends, Perspectives and Experiences, Gederi.
Adams, M. (2002) U.S. Keeps Wary Eye on Cruise Ships for More Pollution.
Anonymous (2005) Issues and Challenges in Caribbean Cruise Ship Tourism.
Associated Press (2009) Caribbean Slow to Plug Cruise Ship Waste, from World Environment- msnbc.com, Online: http://www.msnbc.msn.com/id/29415019/, retrieved 29/03/09.
Atherley, K. (2003) Cruise Industry Related-Challenges Facing Caribbean, OAS, Barbados.
Belize Development Trust (1996) Cruising for Trouble: Stemming the Tide of Cruise Pollutions, Belize Development Trust, Belize.
Campbell, D. (2006) Tourism in the Caribbean: An Environmental Concern.
Campbell, F.A. (2007) Whispers and Waste, UNEP.
Cruise Industry News (2010) CLIA: The State of the Cruise Industry in 2010, Online: http://www.cruiseindustrynews.com/ cruise-news/3604-12010-clia-the-state-of-the-cruise-industry-in-2010.html/, retrieved 20/05/10.
Environment News Service (2010) Dirty Bunker Fuel Banned for Large Ships in U.S., Canadian Water, ENS, UK, London.
Florida-Caribbean Cruise Association (2009) Cruise Industry Overview-2009, FCCA, Miami.
Global Ballast Water Management Programme. Ten of the Most Unwanted, International Maritime Organisation, UK, London.
Gulliksen, V. (2008) The Cruise Industry. Springer Science.
Henry, D. (2008) Cruise Control: How a Small Band of Activists Fought Alaska’s Tour Industry—And Won. Earth Island Journal.
IMO (2002) Ballast Water Management, International Maritime Organisation.
IMO (2002) International Convention for the Prevention of Pollution from Ships, 1973, International Maritime Organisation.
King, L. and Lowe, V. (2000) The Impact of Tourism in the Caribbean.
Klein, R. (2003) Cruising: Out of Control—The Cruise Industry, The Environment, Workers and the Maritimes, Canadian Centre for Policy Alternatives, Nova Scotia.
Raluca, C. and Gheorghe, M. Impact of Cruising Industry on Local Destination.
Richards, M. (2009) Cruise Ships Using Caribbean Sea as Dump, Now Public News Coverage, Online: http://www.nowpublic.com/ environment/cruise-ships-using-caribbean-sea-dump, retrieved 29/03/09.
Rosenfeld, D. (2010) Dirty Waters: The Politics of Ocean Pollution, DC Bureau.
Seidl, A., Giuliano, F., Pratt, L., Castro, R. and Majano, A.M. (2005) Cruise Tourism and Community Economics in Central America and the Caribbean: The Case of Costa Rica, CLACDS.
Smith, S.H. (1988) ‘Cruise ships: a serious threat to coral reefs and associated organ-isms’, Ocean and Shoreline Management, Vol. 11, pp.231–248.
Spracklin, B. Environmentally Cruise Ships an Oxymoron?
Uebersax, M.B. (1996) Indecent Proposal: Cruise Ship Pollution in the Caribbean.
Underwood, K. (2009) 7 Ocean-Friendly Eco Cruises Hitting the High Seas, Tree Hugger, Sacramento.
Copyright © 2010 WASD
World Sustainable Development Outlook 2010
111
THE DYNAMICS AND CONSEQUENCES OF POPULATION
AGEING IN TRINIDAD AND TOBAGO: A CALL FOR
RESPONSIBLE PLANNING FOR SUSTAINABLE DEVELOPMENT
Jennifer Rouse*, Vasudev Ramkissoon and Pemba Ramdoo
Ministry of the People and Social Development, Trinidad and Tobago, W.I.
Abstract: Of the competing forces threatening to destabilise nations around the world, population ageing appears a lightweight in a ring of undisputed heavy-weights. However, global demographic trends indicate ageing populations are set to initiate a revolution, heralding a crisis unprecedented in world history. Like other developing nations, Trinidad and Tobago finds itself at the forefront of this phenomenon with 12% (156,000 persons) of its total population aged 60 years and over. Through the development pillar of Vision 2020: Nurturing a Caring Society, programmes have been developed/implemented to treat with elderly issues in the society. Though there is expansive literature about the ageing demographic in developed nations, very little is known about population ageing in the Caribbean region and by extension the developing world. There are issues unique to Trinidad and Tobago that cannot be fully addressed by the traditional First World response, as local research has indicated. This paper provides a comparative framework for understand-ing ageing in the Caribbean region and its implications for sustainable development. The researchers highlight the challenges and significant gains made with regard to poli-cy in Trinidad and Tobago, and possible areas that may foster a society for all ages.
Keywords: population ageing; challenges; social security; sustainable development; elderly, Trinidad and Tobago, Caribbean.
INTRODUCTION
Modern history associates the 1950s with the Cold War and the growing power of the Communist Red Army. But current popu-lation trends dictate that the 1950s must
also be remembered for the rise of the ‘grey army’, which is more popularly known as the ‘baby boomers’. Their march throughout the decades from post World War II to the present day has been silent and understated,
* Corresponding author: Ministry of the People and Social Development, Trinidad and Tobago, W.I; e-mail: [email protected]
112 J. Rouse
but their conquest has been global, and already one has begun to revolutionise the world. The ‘grey army’ or the elderly popu-lation has been growing steadily since the 1950s according to United Nations data. The proportion of older persons in the world has grown from 8% in 1950 to 11% in 2009, with this figure expected to reach 22% in 2050.
Though this may be considered a human achievement in some regard, largely due to improved healthcare and sanitation, pop-ulation ageing is well placed to initiate a crisis never before seen in the world. This ageing phenomenon refers to an increas-ing proportion of elderly persons within an overall population (Kinsella, 1996). Demographers refer to it as the ‘demo-graphic transition’—a gradual process wherein a society moves from a situation of high rates of fertility and mortality, to one of low rates of fertility and mortality (Kinsella, 1996). Another operating factor would be the migration rates in a country. This third factor must not be ignored in the case of the Caribbean and, in particu-lar, Trinidad and Tobago.
As this study highlights, the present socio-economic indicators reveal that the system as it is in the region is untenable to bear the exponential growth of the elderly population. Through international man-date and government policy, Trinidad and Tobago has made some provisions for its ageing population. However, the demo-graphic transition is occurring so fast, that it is imperative that Trinidad and Tobago adopt a more proactive approach if it has to successfully meet with this challenge. The reason for this is population ageing carries with it the power to destabilize social, politi-cal and economic systems. As one of the more developed countries in a region char-acterised by a fast growing ageing populace, it is important that Trinidad and Tobago
lead the way in fashioning a response that validates the importance of our elderly pop-ulation and the part they will play in secur-ing a sustainable future.
The United Nations classify a country as ‘ageing’ when 10% or more of its popu-lation is over the age of 60 years. In 2002, data from the Central Statistical Office in Trinidad and Tobago revealed that 10% of the population was over the age of 60 years. The significance of this finding was that Trinidad and Tobago was a part of that select group of countries within the developing world having an ‘ageing population’, which is representative of the demographic trend within the region. At present, the elderly population of Trinidad and Tobago stands at 12% or 156,000 persons over the age of 60 years (Central Statistical Office, 2000) According to the UN World Population Prospects (2008), the percentage of persons in Trinidad and Tobago aged 60 years and over is projected to be 17.7% in 2025 and expected to grow to 30.1% in 2050.
DYNAMICS AND CHALLENGES OF POPULATION AGEING IN TRINIDAD
AND TOBAGO
The potential support ratio
The Potential Support Ratio (PSR), like the Parent Support Ratio, is a measurement of the intergenerational support in a country (UN, 2008). With regard to population ageing, the PSR addresses whether a country has the human capacity in terms of its labour supply, to maintain their ageing non-working populace. It is measured as the number of persons aged 15–64 years who are able to support a person aged 65 years and over. In 2000, in Trinidad and Tobago the PSR was 10.3 persons aged 15–64, to every person 65 years and older. Trinidad and Tobago can expect approximately 70% or more drastic declines in its PSR
113The dynamics and consequences of population ageing in Trinidad and Tobago
over the next 50 years, with countries like Barbados, Bahamas, Suriname and St. Vincent and the Grenadines also projected to experience declines similar to Trinidad and Tobago (UN World Population Ageing, 2006). The major implication arising from the decreasing PSR in Trinidad and Tobago is the government’s likely inability to fund social security programs in the future (Rawlings, 2010). The Economic Commission for Latin American Countries 2007 Report noted that:
Publicly funded social protection schemes are only sustainable when the taxable labor-force is of reasonable size and appropriate tax-collection mechanisms are in place. On the other hand, contributory systems are putting a heavier burden on the individual and its employer. Right now both systems seem to be financially solid; however the growing numbers of beneficiaries will chal-lenge their financial sustainability. Also with an estimated half of the population working in the informal sector quite often, at or below subsistence level, chances are they will never contribute, but at various stages in their lives will need to draw on the support systems. (p.16)
The Caribbean now experiences a ratio of 10 persons aged 15–64 to every per-son 65 years and older. By 2050, the ratio is expected to decrease sharply to about 3 persons aged 15–64 to every person aged 65 years (UN World Population Ageing, 2009). These projections can be considered problem-atic, if only one-third of all elderly persons in the Caribbean are receiving one form or the other of government pension (ECLAC, 2004).
In this regard, migratory trends in Trinidad and Tobago should be of major concern, since inter-regional flows have been growing in the last decade, with labour mov-ing from Guyana, and to a lesser extent the Eastern Caribbean States, to Trinidad and Tobago (ECLAC, 2004, p.7). In addition, the
majority of these workers are mostly unskilled agricultural workers or persons working in construction or the service industries. Alternatively, Trinidad’s expanded and more affordable education system has resulted in a larger share of skilled workers migrating to developed countries. The PSR is, therefore, compromised in Trinidad and Tobago, espe-cially since the net migration data are not quantified by the Central Statistical Office.
The dependency ratio
The total dependency ratio is the num-ber of persons under the age of 15 plus persons aged 65 years or older per one hundred persons aged 15–64 years (UN World Population Ageing, 1950–2050). It is used to measure potential support needs based on the belief that per-sons under the age of 15 years and over 65 years will more or less be dependent on the working age population. Trinidad and Tobago’s old age dependency ratio is 9.7 and is expected to increase to 44.4% by 2050. The ratio in the Caribbean will increase in 2009 from 10 to 31 (UN World Population Ageing, 2009). The report also noted that the child component in the total depen-dency ratio will become similar to that of the old-age dependency ratio by 2050. Yet, public expenditure has tended to favour young dependents. The significance of the increase is that government is quite likely to spend an increased amount of money on the elderly in the society as opposed to the smaller base of youth dependents, which will be a significant departure from tradi-tional public expenditure on dependents.
The parent support ratio
The Parent Support Ratio is the other mea-sure of intergenerational support. It is defined as the number of persons 85 years and over to every one hundred persons in the age
114 J. Rouse
group 50–64 years (UN World Population Ageing, 1950–2050). This indicator is signif-icant because it assumes that persons in the 50–64 years age cohort are the caregivers of their parents. According to the UN World Population Ageing (2009), Trinidad and Tobago’s current Parent Support Ratio is 4.8. In 2050, this ratio is expected to increase to 19.3 older persons aged 85 years and over to every one hundred persons aged 50–64 years, thus signifying a much larger dependency on the younger generations in the coming years. As noted in a 2004 ECLAC study, most devel-oped countries have programmes and policies that work in conjunction with or completely replace the need for informal support systems. The study further noted that:
Such logistics are generally not in place in the less developed regions as is the case of the Caribbean, where this responsibil-ity is more or less entirely taken on by the family network, quite often supported through an informal community-based support system. (p.21)
In recent years, this form of support has become more challenging for the family. In 2007, ECLAC noted:
Reliance on family and relatives is becoming less and less an option with the socio-economic transformations that have begun to impact on the life styles of people in the Caribbean. Out-migration of the younger generation, increasing full-time employment of females in the formal labour-market and rising costs of living, to only name a few, are making traditional self-help, co-residence with family mem-bers and community togetherness no lon-ger a viable option. (p.5)
The decreasing ability to depend on informal networks for support in old age is likely to increase the need for govern-ment support in Trinidad and Tobago and elsewhere in the Anglophone Caribbean.
Loneliness
Another area for consideration is the low level of interaction of the elderly in the society. Data from a survey which was commissioned by the Ministry of Social Development high-lighted that loneliness was a major cause for concern for elderly persons in Trinidad and Tobago (Camejo, 1999). In an independent study, Rawlings (2008) noted that:
… older persons reported that loneliness for them was one of the most significant con-cerns. Thirty-three percent of the sample of 845 elderly males and females reported feelings of loneliness. What was also signifi-cant… was that though many individuals were lonely, only 16% lived alone. (p.7)
This finding reveals that although the majority of those in the study, who reported being lonely, lived with other household members, a low level of interaction with the elderly could be present also in families/households. A brief report in the American Journal of Psychiatry (2005) noted that depression in old age was strongly correlated with loneliness (p.178, Vol. 165). If loneliness is to be deemed a quality of life indicator, then in the future a significant segment of the older population could suffer from a decreased quality of life, in their later years, if current lifestyle trends to continue unchecked. Loneliness could, therefore, become a human rights issue also, since the equal right to happiness should be secure and attainable irrespective of age.
Life expectancy
The average life expectancy in 2009 among the elderly in Trinidad and Tobago is 74.8 years. This figure is projected to reach 78.6 years in 2025 and increase to 80.5 years in 2050 (UN World Population Ageing, 2009). On average, the life expectancy throughout the Anglophone Caribbean is similar, with an average life expectancy of
115The dynamics and consequences of population ageing in Trinidad and Tobago
75.5 years in 2025 increased to 77.6 years in 2050. This is considered a positive con-sequence of advancements in technology and biomedicine, which have increased life expectancy in the young and the old. A report by Yeobah (2002) stated that the Caribbean region has been so successful in addressing issues of mortality, fertility and population growth that international funding agencies are reducing their financial support for its population activities. The report fur-ther explained that as a result, governments would have to face an increased demand for healthcare and geriatric services to serve the ageing populace.
The 2000 Census of Trinidad and Tobago revealed that diabetes, hypertension, arthritis and heart disease were the leading causes of hospitalisation and mortality. As it stands, the medical system has not been engineered to support the specific demand of elderly patients and the chronic illnesses from which they suffer. The World Health Organisation (WHO) estimates that long-term therapy for chronic illnesses is only 50% in developed countries, and is even lower in developing countries (WHO, 2003).
Another variable within the life expec-tancy indicator is the feminisation of the elderly population. In Trinidad and Tobago, women on average currently have a life expectancy of 75.1 compared to 66.7 for men (World Population Prospects: The 2008 Revision Population Database, 2008). This is on par with the life expectancy pat-terns between the genders in other parts of the Caribbean and by extension the world where women are expected to live longer than men. Such a disparity in the genders points to the fact that there is need for a gender-based approach that would exam-ine how the physiological and socially constructed differences between men and women determine different health needs and outcomes (Eldermire, 1997).
Labour force participation
In the Caribbean, as it is in other parts of the world, male participation in the labour force exceeds that of their female counter-parts in all age groups. Data on illiteracy rates from UN World Population Ageing (2009) show a distinctly negative gender bias towards women, which is more pronounced in the ‘young-old’ (60–74) and the ‘oldest-old’ (85+) categories. Various research studies have contended this has been the result of less socio-economic opportunities for women such as education, and explain why fewer women are employed in the formal sector and over represented in the informal sector. This obser-vation is supported by the Caribbean Health Research Council Report (2008), which stated that women are most likely to be left out from pension schemes since they have worked either at home or in the informal sector (The Caribbean Ageing Project CHRC, 2008).
What this alludes to is that women are largely dependent on the men in their lives who are dying relatively younger, and on a smaller network of family members due to lower fertility rates and migrating children. In the 2009 study, Rawlings noted that many elders reported having to make major sacri-fices as they could not meet their financial needs and as much as 41% of women stated that the family was an important source of income. This pointed to the inadequacy of the financial arrangements for elderly citi-zens in Trinidad and Tobago.
FIRST WORLD RESPONSE
For the purpose of this study, the research-ers have used the United States to represent ageing trends in the developed world. The two-fold reason for this is that in recent decades there has been a cultural shift in the Caribbean towards American norms and values, which have punctuated the West Indian cultural fab-ric. Additionally, migratory patterns have also
116 J. Rouse
exacerbated the ageing phenomenon, and have significantly impacted the ageing issue in the region. Trinidad and Tobago’s pluralis-tic society also could serve as a microcosm of America’s culturally diverse population.
Similar to the developing world, the growth rate of the American population has slowed as a result of the decline in the fertility rate while its proportion of elderly persons has grown due to increased life expectancy (UN World Population Ageing, 2009). This group of elderly Americans currently comprises 17.9% of the population and is growing at a rate of 2.7% annually, which is faster than the entire population growth rate of 1.0%.
This means that the PSR per person in America between the ages of 15 and 64 years has decreased and is becoming a major con-cern for the United States as the ‘baby boom-ers’ generation (of persons born between 1946 and 1964) begin to retire in 2011. By 2025, the PSR is projected to fall to 3.4%, and will further decrease to 2.9% in 2050 (UN World Population Ageing, 2009). The result is a grow-ing fiscal gap and future problems for social security support. The present financial crisis makes this clear in a comparative study of the costs related to the fiscal crisis and to those related to population ageing. In addressing the issue of ageing populations in the devel-oped world, the International Monetary Fund (IMF) opined that the recent global financial crisis was a featherweight compared to age-related spending. Comparing the costs of the financial crisis it noted that:
… in the longer term these costs will be dwarfed by age-related spending. Looking ahead to the period between now and 2050, it predicted that for advanced coun-tries, the fiscal burden of the crisis [will be] about 10% of the ageing-related cost. The other 90% will be extra spending on pensions, health and long-term care. (The Economist, 2009)
A notable element in this dependency issue is the divergence between the ‘young-old’ and the ‘oldest-old’. In the United States, the ‘oldest-old’ account for 3.8% of the population and are growing at a faster rate than any other age group. The United Nations further indicated that approxi-mately 12 million Americans are over the age of 80 years and this figure will increase to 32 million in 2050 (World Population Ageing, 2009). This means that more financing and a lot more policy initiatives would be required to increase and improve long- term care facilities as the ‘oldest-old’ become more frail.
The Centre for Strategic and International Studies (CSIS), a think-tank in Washington, DC, calculates that if noth-ing is done, the cost of state pensions in developed countries will almost double, from an average of 7.7% of GDP presently to about 15% by 2050 (The Economist, 2009). The report also noted that if things remain the same public expenditure on healthcare would also rise steeply, so by 2050 the developed world would be spending nearly a quarter of its GDP on pension and health. The United States and the rest of the developed world are left with few options to deal with the demographic transition.
The United Nations
The United Nations has been monitoring the demographic transition since the 1950s and hosted the First World Assembly on Ageing in 1982 in Austria (Resolution 37/51). The recommendations of this Assembly first required that governments of developed countries, in particular, take primary respon-sibility for ageing by implementing the rec-ommendations of the Vienna International Plan of Action. Largely due to ad hoc social programmes for older persons and faulty indicators to measure its ageing population,
117The dynamics and consequences of population ageing in Trinidad and Tobago
Trinidad and Tobago’ response to this First World mandate was tardy.
In 2000, Trinidad and Tobago’s government, in response to comments that were made at a local symposium held in 1999 on the status of social welfare issues in Trinidad and Tobago, embarked on the for-mulation of a National Policy on Ageing. The policy was based on the principles endorsed by the United Nation’s Vienna International Plan of Action on Aging 1982 (Resolution 37/51), and the United Nation’s Principles for Older Persons promulgated in 1991-care, independence, participation, dignity and self fulfillment. The first draft of the national policy on ageing was subsequently completed in July 2001. (Rouse, 2004)
In accordance with the recommenda-tions of the I982 Vienna Plan of Action on Ageing, governments were required to: (i) take primary responsibility for ageing through implementing the recommenda-tions of the International Plan of Action, (ii) mainstream ageing by introducing it into national development frameworks to be championed by the different groups in the society; (iii) create an environment through democratic rule and human rights for all to foster positive change in the lives of the elderly, (iv) encourage the role of NGOs in treating with elderly concerns, (v) create agencies and committees to highlight ageing in the society and facilitate the opening of elderly persons organizations and (vi) imple-ment national data collection and analysis to facilitate policy planning.
Madrid International Plan of Action on Ageing (MIPAA)
In 2002, Trinidad and Tobago became a signatory to the United Nation’s Second World Assembly on Ageing in Spain, out
of which the Madrid International Plan of Action on Ageing was produced, to serve as a blueprint for government in the develop-ing countries. Since then, the government has embarked on various projects and championed various initiatives to improve the lives of the elderly in the country, with the hallmark establishment of the Division of Ageing in 2003 in the Ministry of Social Development. The division serves as an umbrella agency to focus ageing initiatives in Trinidad and Tobago.
In addition to the recommendations of the Vienna Plan of Action, MIPAA detailed growing areas of concern for older people such as HIV/AIDS, violence and abuse, and access to health services and social protection.
CHALLENGES FACED IN TRINIDAD AND TOBAGO
Income and social security
In Trinidad and Tobago, there are mainly two pension systems available: contribu-tory and non-contributory plans (ECLAC, 2003). Contributory pension systems pro-vide income for post-retirement years for those who have contributed financially over a certain period of their working lives, which takes the form of National Insurance Scheme (NIS) social security benefits. However, informal sector workers, the self employed and those who never worked are excluded. Non-contributory pension sys-tems supply income for retirement to public sector monthly-paid workers; and public assis-tance in the form of old age pension (OAP) is paid to eligible beneficiaries aged 65 years and over. Generally, broad entitlements are offered to the latter but are quite often not well targetted (World Bank, 1996).
According to Rouse (2004), there were administrative problems that arose from
118 J. Rouse
the operation of the two schemes (OAP and NIS), such as: (i) inadequate funding to meet expenditure for pension payments to OAP recipients, (ii) complaints from pensioners about not receiving their checks on a regu-lar and timely basis from the postal system, (iii) delays of up to 8 months between appli-cation for benefit and actual payment to pensioners, (iv) overcrowding of banks and post offices during the first week of each month by pensioners, (v) the anomaly of the non-contributory OAP paying higher bene-fits than the contributory NIS, (vi) consider-able overlap with the clientele of OAP and NIS due to the qualifying threshold, (vii) the fraudulent cashing of checks after the death of pensioners and (viii) the increase in the number of pensioners accessing the OAP was not met by a corresponding increase in staff at the Social Welfare Division to deliver an efficient and timely service.
At present in Trinidad and Tobago the welfare system is based on a means-test approach, on which pension experts report that income testing is administratively diffi-cult and can stigmatise its recipients/benefi-ciaries (Help Age International, 2006). The alternative to the existing pension format is a universal age based scheme. Since 2001, Latin American and Caribbean countries have made gradual efforts to increase pen-sion coverage and quality, however there are persistent inequities and inequalities that call for more far reaching public policy decisions to expand protection to the entire population (ECLAC, 2006).
Health protection
According to ECLAC (2006), Latin American and Caribbean countries are fac-ing both old and new challenges in the field of health policy. The latter relate to changes in demand that require new services and treatments, while the former have to do with
the region’s shortcomings in terms of equal access to timely and quality health services, lack of human and financial resources and problems of articulation between the vari-ous levels of the healthcare system and the public and private sectors. Through empiri-cal data it has been revealed that there is a major need emerging in the society for increased primary healthcare.
Increasing life expectancy is undoubtedly a sign of social and economic development. However the quality of years is even more important. If medical treatments postpone deaths from chronic conditions but do not delay the onset of the conditions them-selves or their disabling consequences, the result could be an expansion of morbidity and disability over the life course of indi-viduals. (United Nations, 2007)
Most studies undertaken in the Caribbean reiterate that as an individual grow old the prevalence of chronic non-communicable disease conditions such as heart ailments, Alzheimer’s, cancer and diabetes increase (National Policy on Ageing for Trinidad and Tobago, 2006). However, little attention has been placed on the provision of primary healthcare as opposed to secondary health-care in Trinidad and Tobago. The situation is further exacerbated by the migration of the young and middle-aged cohorts of the population to North America and Europe, which leads to the concomitant decline of care giving and by extension primary healthcare.
To date, the main programme that is geared towards providing homecare to the population of the elderly in Trinidad and Tobago is the Geriatric Adolescent Partnership Programme (GAPP). This pro-gramme was developed in 1993 as a pilot programme under the aegis of the Ministry of Community Development, Culture and
119The dynamics and consequences of population ageing in Trinidad and Tobago
Gender Affairs, to bridge the gap between young people aged 17–25 years and older persons, through training and provision of services in geriatric care. The demographic context within which the programme emerged provided the main rationale for its development, since alongside a grow-ing elderly population there also existed a large group of unemployed high school graduates.
But, in spite of administrative constraints, there was a positive impact on 90% of those older persons who received care from train-ees, and a corresponding sensitisation of 90% of the trainees who completed the course.
In addition to a dearth of primary health-care facilities, another challenge was the inadequacy of elderly care institutions in the country. It is estimated that approximately 1% of older persons live in institutions designed for the elderly (Camejo, 1999). The administration and delivery of care to the elderly at any Home for the aged cater for four or more persons and currently oper-ate in accordance with the amended Private Hospitals Act No. 12 of 1989 Chapter 29:03. While the Act outlines the conditions to operate a Home, Camejo’s survey showed that many of the stipulated conditions were not always adhered to.
The Private Hospitals Act is to be super-ceded by the Homes for Older Persons Act No. 20 of 2007, which is proposed for proc-lamation. This legislation will regulate and monitor all Homes and elderly care facili-ties through the establishment of an inspec-torate, which will ensure that international standards of care are enforced.
Specialised care for older adults is in the early stages in the region’s countries (ECLAC, 2007). Primary healthcare targets older persons with some level of dependency
and includes a series of actions carried out in the older persons’ residence to enable them to remain living at home in their usual environment. One of the main advantages of these services is that they reduce institu-tionalisation and hospitalisation costs while slowing down the deterioration functions associated with old age. The need for a pro-vision of primary healthcare by the state relates to changes in demand due to an age-ing society. It would require new services in healthcare in order to promote health and well-being into old age.
Socio-economic
The access to home improvements for the elderly in Trinidad and Tobago varies in degrees according to their geographic loca-tions. In Latin America and the Caribbean, the striking unevenness in the demographic transition between urban and rural areas has resulted in a more intense ageing pro-cess in the former (ECLAC, 2007). Recent statistics show that one of the main needs of the elderly population in Trinidad and Tobago relates to housing, as evidenced by numerous requests of the elderly for home repairs through the Division of Ageing’s Help Desk.
Thus, the ageing process is taking place in a context of housing shortages and problems with basic housing and living conditions. Housing and its environment strongly influ-ence older people’s quality of life, both in the objective spheres of living conditions and assets and in the sphere of subjective or per-ceived well being (CELADE, 2003). Housing and local environment policies should, there-fore, be designed on the basis of a renewed vision of social inclusion for all, and housing programmes for both rural and urban areas could, therefore, play a significant part in helping older people to develop a fuller range of activities and social contacts.
120 J. Rouse
Undue financial pressures are often placed on grandparents who parent their grandchildren primarily due to migrant par-ents (ECLAC, 2003). According to Camejo (1999), 75% of the elderly depend on OAP for their economic well being. Despite being dependent on pension, the elderly have proven to be major players in the social sup-port system in the Caribbean since women who are regarded as the de facto caregivers of the elderly have joined the workforce in increasing numbers. Yet, the elderly often face employment difficulties to re-enter the job market largely due to ageism (i.e., dis-crimination against the elderly) and in some instances are challenged by technological advancements. In Trinidad and Tobago, migration of young and middle aged cohorts particularly to North America and Europe could impact negatively on the nation’s aged. Certain island nations, for example, have experienced a combination of working-age adults, immigration of elderly retirees from other countries and return migration of for-mer emigrants who are above the average population age: all three factors contribute to population ageing (Kinsella, 1996).
Investigations revealed that of growing significance in Trinidad and Tobago is the alarming increase of HIV/AIDS cases, and the economic and social impact on the nation’s ageing. This phenomenon is shown to cause epidemiological concerns as well, since it impinges on the mortality and mor-bidity rates, which are another component of population ageing. Trinidad and Tobago is headed towards economic and social cri-sis if HIV/AIDS infection trends continue. With the most economically active and pro-ductive population groups being the most affected by the epidemic, severe social and economic repercussions are inevitable. A macro-economic study by local Prof. Karl Theodore (2001) predicted by 2005, stated that the impact of HIV/AIDS would reduce
the country’s gross domestic product by 4.2%, its savings by 10% and its investment by 15.5%. Estimates placed 2.5% of Trinidad and Tobago’s sexually active population between the ages of 15 and 35 as living with the disease. In more recent media reports, homicide, drug abuse, vehicular accidents, incarceration and social displacement are some of the major issues affecting the male population aged 15–45 years, which could also negatively impact the number of poten-tial caregivers in society.
DEVELOPMENTS IN POLICY
Income security
The drive for income security has been ongo-ing in Trinidad and Tobago for the past 10 years. As mentioned earlier, retired public officers benefit from a non-contributory pension scheme and contributory social security pension, while the government has made periodic increments to the Senior Citizens Grant (formerly known as Old Age Pension) as shown in Figure 1. The increased expenditure reflects both an increase in the number of beneficiaries and also an increase in the dollar values of the grants.
In 2008, an increase in the minimum National Insurance Pension to $2,000 monthly was achieved and served to benefit 60,000 pensioners. In making an analysis of the computation of the government’s pension structure, a comparison of the amounts is made in relation to the national poverty line.
The Senior Citizens Grant falls within a large enough safety net from the poverty line to indicate a relatively low level of indigence and poverty amongst the elderly in Trinidad and Tobago. In 2010, Trinidad and Tobago issued another increase in the Senior Citizens Grant, which shifted the minimum quantum upward to $2,500 monthly.
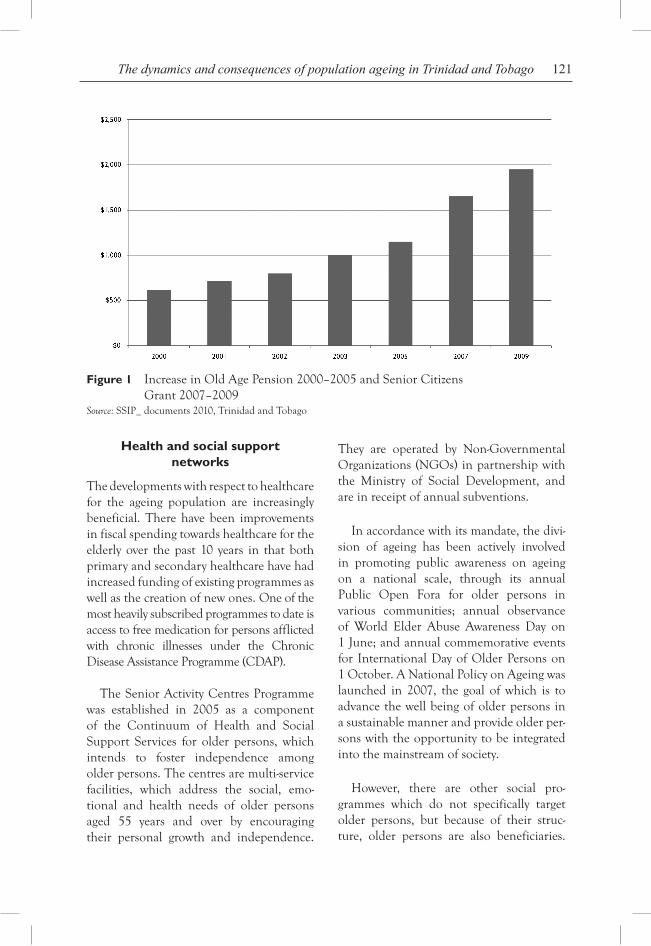
121The dynamics and consequences of population ageing in Trinidad and Tobago
Health and social support networks
The developments with respect to healthcare for the ageing population are increasingly beneficial. There have been improvements in fiscal spending towards healthcare for the elderly over the past 10 years in that both primary and secondary healthcare have had increased funding of existing programmes as well as the creation of new ones. One of the most heavily subscribed programmes to date is access to free medication for persons afflicted with chronic illnesses under the Chronic Disease Assistance Programme (CDAP).
The Senior Activity Centres Programme was established in 2005 as a component of the Continuum of Health and Social Support Services for older persons, which intends to foster independence among older persons. The centres are multi-service facilities, which address the social, emo-tional and health needs of older persons aged 55 years and over by encouraging their personal growth and independence.
They are operated by Non-Governmental Organizations (NGOs) in partnership with the Ministry of Social Development, and are in receipt of annual subventions.
In accordance with its mandate, the divi-sion of ageing has been actively involved in promoting public awareness on ageing on a national scale, through its annual Public Open Fora for older persons in various communities; annual observance of World Elder Abuse Awareness Day on 1 June; and annual commemorative events for International Day of Older Persons on 1 October. A National Policy on Ageing was launched in 2007, the goal of which is to advance the well being of older persons in a sustainable manner and provide older per-sons with the opportunity to be integrated into the mainstream of society.
However, there are other social pro-grammes which do not specifically target older persons, but because of their struc-ture, older persons are also beneficiaries.
Figure 1 Increase in Old Age Pension 2000–2005 and Senior Citizens Grant 2007–2009
Source: SSIP_ documents 2010, Trinidad and Tobago
122 J. Rouse
The Social Welfare Division in the Ministry of Social Development is charged with the responsibility for the equitable, transpar-ent and timely provision of services to meet some of the social and financial needs of the less fortunate members of society. Among the services from which the elderly benefit are public assistance, food subsidy, free bus passes, free eyeglasses, free hearing aids, free wheelchairs, burial assistance, urgent temporary assistance, dietary grant, hous-ing grant, clothing grant and the purchase of household items .The Social Welfare Division, together with the Housing Development Corporation (HDC), provide home improvement assistance and most of the beneficiaries are the elderly.
There are a number of NGOs whose pro-grammes are beneficial to the elderly. One such organisation is the St. Vincent de Paul Society (SVP), which is operated and man-aged by the Roman Catholic Church. This organisation, in addition to operating Homes for the elderly, also provides food baskets to the needy, including the elderly. Some of the other NGOs which impact the elderly with the provision of goods and services include the Foundation for the Enhancement and Enrichment of Life (FEEL), the Trinidad and Tobago Association of Retired Persons (TTARP), the Alzheimers Association, the Soroptomist International and the Coterie of Social Workers.
RECOMMENDATIONS FOR A WAY FORWARD
The following are the recommendations to overcome the problems faced by the elderly:
• DevelopmentsinSocialSecurity
In addressing the social security needs of older persons, the key strategy would be to devise mechanisms to ensure that the dignity
of older persons is maintained while access-ing the benefits of the social security system.
• DevelopmentsinIncomeSecurityand Employment
Sustainable purchasing power is a foremost concern of individuals as they approach their senior years, and declining options in the job market and fixed income status become realities. In this regard, there will be initiatives involving collaborative efforts among relevant agencies.
• Developmentsinhealth
Training in geriatric care for family mem-bers, care providers and healthcare workers should be enhanced; community healthcare services should be strengthened and a regu-latory framework should be established by government to ensure that quality standards of care for the elderly are provided in public/private care facilities.
• Developmentsinsocialsupportfor the elderly
Initiatives for older persons to acquire affordable property or access to support should be promoted, legislation should be provided to combat various forms of violence and abuse of the elderly and mech-anisms should be established to assist the elderly in care-provider roles.
CONCLUSION
It has been demonstrated that the traditional First World response to population ageing classifies the phenomenon primarily as an economic issue, given the stress exerted upon the social security and healthcare sys-tems and immigration policies as three areas negatively impacted by the challenges of an ageing population.
123The dynamics and consequences of population ageing in Trinidad and Tobago
The situation in Trinidad and Tobago, however, is more multi-faceted. There are needs that are specific to this country’s elderly that must be dealt with at social and cultural levels using a participatory approach involv-ing older persons themselves. The agencies responsible for societal development must, therefore, seek to ensure that issues asso-ciated with ageing and older persons are integrated into national development plans which are culturally sensitive. Continuous review and evaluation of social and legislative policy objectives, and the measures outlined in policy will be essential components of the activities of the various state agencies charged with the responsibility of national develop-ment. This is to ensure that the relevance and effectiveness of the National Policy on Ageing are not compromised.
BIBLIOGRAPHY
Camejo, A. (1999) A Survey of Living Conditions of Persons 60 years and Over, Ministry of Social Development, Port-of-Spain, Trinidad.
Caribbean Health Research Project (2008) The Caribbean Ageing Project, Caribbean and Health Research Council (CHRC) and The University of the West Indies, Mona and Universitie de Montreal, Inter-American Development Bank, Washington, DC.
Central Statistical Office (2000) Population and Household Census of Trinidad and Tobago for 2000, Ministry of Planning and Development, Republic of Trinidad and Tobago.
Cloos, P., Allen, C.F., Alvarado, B.E., Zunzuneguis, M.V., Simeon, D.T. and Eldermire- Shearer, D. (2009) Active Ageing: A Qualitative Study in Six Caribbean Countries, Cambridge University Press, Cambridge.
ECLAC (2002) The Phenomenon of Ageing and the Situation of Older Persons in the Caribbean (LC/CAR/G.616), ECLAC Subregional Headquarters for the Caribbean Port-of-Spain, Trinidad and Tobago.
ECLAC/CDCC, UNFPA (2003) Report of the Caribbean Subregional Meeting to Assess the
Implementation of the Programme of Action of the International Conference on Population and Development 10 Years after its Adoption, Trinidad and Tobago.
ECLAC (2004) Population Ageing in the Caribbean: Longevity and Quality of Life (LC/CAR/L.26), ECLAC Subregional Headquarters for the Caribbean Port-of-Spain, Trinidad and Tobago.
ECLAC/CELADE (2003) Older Persons in Latin America and the Caribbean, Situation and Policies. Regional Intergovernmental Conference on Ageing, Santiago, Chile, November 2003.
ECLAC/CDCC (2004) Population Ageing in the Caribbean: An Inventory of Policies and Programmes and Future Challenges (LC/CAR/G.772/Corr.1), ECLAC Subregional Headquarters for the Caribbean Port-of-Spain, Trinidad and Tobago.
ECLAC (2006) Shaping the Future of Social Protection: Access, Financing and Solidarity (LC/G.2294), March, 2006, Santiago, Chile.
ECLAC (2007) Changing Population Age Structures and Their Implications on Socio-economic Development in the Caribbean (LC/CAR/L.98/Rev. 2), ECLAC Subregional Headquarters for the Caribbean Port-of-Spain, Trinidad and Tobago.
ECLAC (2007) Population Ageing in the Caribbean: A Four Country Study (LC/CAR/L. 128), ECLAC Subregional Headquarters for the Caribbean Port-of-Spain, Trinidad and Tobago.
Eldermire, D. (1997) ‘The Jamaican elderly: A socio-economic perspective and policy implications’, Social and Economic Studies, Vol. 46, No. 1, pp.75–93.
Government of the Republic of Trinidad and Tobago (2010) Social Sector Investment Programme (SSIP), The Government Printery, Port-of-Spain, Trinidad.
Help Age International (2006) Why Social Pensions are Needed Now, Help Age International, London, UK..
Kaneda, T. (2006) A Critical Window for Policymaking on Population Aging in Developing Countries. (electronic version), Population Reference Bureau, Washington DC.
124 J. Rouse
Kaneda, T. (2006) Health Care Challenges for Developing Countries with Aging Populations (electronic version), Population Reference Bureau, Washington DC.
Kinsella, K. (1996) ‘Ageing and the family: present and future demographic issues’, in Bleiszner, R. and Bedford, V.H. (Eds.): Ageing and the Family: Theory and Research, Praeger, Westport, Connecticut, pp.32–57.
Ministry of Social Development (2006) National Policy on Ageing for Trinidad and Tobago, Docucentre Limited, Port-of-Spain, Trinidad.
National Insurance Board of Trinidad and Tobago (2010). Online: http://www.nibtt.co.tt/benefits/benefitsguide.htm accessed 20/05/10.
Rawlings, J. (2009) The Reality of Older Women in Trinidad and Tobago: Some Social and Economic and Health Concerns, Working Paper, Public Health and Primary Care Unit, Department of Paraclinical Sciences, Faculty of Medical Sciences, UWI, Trinidad.
Rawlings, J. (2010) ‘Ageing in the Caribbean; exploring some major concerns for family and society’, SALISES Conference on Turmoil and Turbulence in Small Developing States: Going Beyond Survival, 24–26 March 2010, Port of Spain, Trinidad.
Rouse, J. (2004) A Case Study of Aging Policy in Trinidad and Tobago: The Role of Interest Groups in Defining New Policy Initiatives (Doctoral dissertation), Lodged at University of Maryland Baltimore County (UMBC), Policy Sciences Dept., Baltimore, Maryland, USA and at The University of the West Indies, St. Augustine (West Indian Reference Library).
Stek, M.L., Vinkers, D.J., Gussekloo, J., Aartjan T.F., Beekman, M.D., van der Mast, R.C. and Westendorp, R.G.J. (2005) ‘Is depres-sion in old age fatal only when people feel lonely?’, The American Journal of Psychiatry, Vol. 162, pp.178–180.
The Economist (2009) ‘A slow-burning fuse: a special report on ageing populations’, The Economist, pp.1–8, Online: http://www.weforum.org/pdf/GLF/ASlowBurningFuse.pdf, accessed 20/05/10.
Theodore, K. (2001) HIV/AIDS in the Caribbean: Economic Issues—Impact and Investment Response, Commission on Macroeconomics and Health Working Paper Series, Paper No. WG1:1, Cambridge, Massachusetts, Harvard University, Center for International Developments; and Geneva, World Health Organization.
Trinidad Guardian Newspaper (2010) Ex-Judges Want Bigger Pensions, 18 March, p.5, Trinidad Publishing Company Ltd.
UN Department of Economic and Social Affairs Population Division (2002) World Population Ageing 1950–2050, Sales No.E.02.XIII.3, United Nations, New York.
UN Department of Economic and Social Affairs of the United Nations Secretariat (2008) World Population Prospects: The 2008 Revision, Online: http://esa.un.org/unpp.
United Nations (2007) Development In an Ageing World, World Economic and Social Survey 2007 (ST/ESA/314-E/2007/50/Rev.1).
World Bank (1996) Poverty Reduction and Human Resource Development in the Caribbean, Washington, DC.
WHO (2003) Adherence to Long-Term Therapies: Evidence for Action, WHO, Geneva.
Yeboah, D.A. (2002) Caribbean Countries “Pay” for Successfully Addressing Population Issues (electronic version), Population Reference Bureau, Washington DC, Online: http://www.prb.org/Articles/2002/ CaribbeanCountries8220Pay8221 forSuccessfullyAddressingPopulationIssues. aspxhttp://www.prb.org/Articles/2006/ HealthCareChallengesforDeveloping CountrieswithAgingPopulations.aspx
Copyright © 2010 WASD
World Sustainable Development Outlook 2010
125
The impacT of The financial crisis on invesTors in
counTries governed by islamic banking and finance: The case of The dubai World
sTandsTill
Kaitlyn Busler*Columbia University, USA
Michael Busler†
The Richard Stockton College, USA
Abstract: The financial crisis has had a devastating impact on financial markets in the US and other western countries. Particularly hard hit were investors who purchased mortgaged backed securities, since as the value of the asset declined below the amount of debt, investors took large losses. Countries that follow Islamic Banking and Finance (IBF) have largely been spared this loss due to the types of bonds that are allowed. This research summarises the problem in the Western World and then compares it to a similar problem faced by Dubai World who had a ‘standstill’ when they were unable to make a required payment. It appears that holders of Dubai World sukuk will be spared losses because of Islamic banking laws. We examine both the short term and long term effects.
Keywords: financial crisis; Islamic banking; sukuk; Dubai World.
inTroducTion
In the US, government policy has always encouraged home ownership. As early as 1932 when then president Herbert Hoover said, “As a people we need, at all times, the encouragement of home ownership” govern-ment policy has followed this view. Through government sponsored home mortgages and special tax treatment for homeowners
who could deduct home mortgage interest expense from their tax liability, government policy attempted to get as many households as possible to own, rather than rent, homes. In 1994, the US government made a concen-trated effort to increase the percentage of households that own homes from the exist-ing 62% to 70%. This was accomplished when the Clinton Administration set a
* Corresponding author: Columbia University, USA; e-mail: [email protected]†The Richard Stockton College, USA; e-mail: [email protected]
126 K. Busler and M. Busler
‘National Homeownership Strategy’ which had the goal to put forth “financing strate-gies fueled by creativity to help homeowners who lacked the cash to buy a home or the income to make the down payments.”
Government policy influenced market conditions through stimulation of demand. This was accomplished by lowering the credit standards necessary to qualify for mortgages. While this may appear to cre-ate more risk for banks and mortgage com-panies that issued mortgages, Fannie Mae and Freddie Mac, quasi public agencies, were willing and eager to purchase these ‘sub-prime’ mortgages from the originators. Thus the default risk was transferred from the mortgage originator to the quasi public agencies who eventually would package and sell the mortgages to the investment com-munity (Makin, 2009).
After 2000, this effort intensified in three areas. Firstly, the Federal Reserve’s interest rate policy drove down the cost of borrow-ing to historic lows. Secondly, the govern-ment created special loan programs so that even those who could not afford home ownership became qualified. And thirdly, the private agencies that determine security risk and value were overly generous in their assessment of financial derivatives which were collateralised by mortgages.
Between 1997 and 2006, the price of a typical American house increased by over 120% (The Economist, 2008). This surge in housing prices resulted in many hom-eowners refinancing their homes, but more specifically, increasing spending by taking out second mortgages secured by the price appreciation. An increase in loan packag-ing, marketing incentives, such as easy ini-tial terms and a long-term trend of rising housing prices, encouraged borrowers to assume difficult mortgages in the belief they
would be able to quickly refinance at more favourable terms sometime in the future. In the financial markets, investment bankers cre-ated Asset- and Mortgage-Backed Securities (ABS and MBS) and Collateralised Debt Obligations (CDO), which derived their value from variable rate auto loans, credit cards, mortgage payments and housing prices. These securities were assigned safe ratings by the credit rating agencies who assumed historic default rates. This enabled financial institutions to obtain investor funds to finance sub-prime lending, extend-ing the housing bubble while generating extremely large fees. Sub-prime, adjustable rate mortgages remained below 10% of all mortgage originations until 2004, when they spiked to nearly 20% and remained there through 2006 (Bernanke, 2007).
By September 2008, the upward adjust-ments to the mortgage rates resulted in increases in defaults forcing the average US housing price to decline over 20% from the 2006 peak (Standard and Poor’s, 2008). High default rates on sub-prime and adjust-able rate mortgages began to increase quickly thereafter. As housing prices declined, major global financial institutions that had borrowed and invested heavily in sub-prime MBS reported significant losses. Falling prices also resulted in homes worth less than the mortgage loan, providing a finan-cial incentive for the homeowner to enter foreclosure. As prices continued to decline, borrowers with adjustable-rate mortgages could not refinance to avoid higher pay-ments associated with rising interest rates so defaults increased further. In 2008, lend-ers began foreclosure proceedings on nearly 2.3 million properties, an 81% increase from 2007. By August of 2008, 9.2% of all US mortgages outstanding were either delinquent or in foreclosure. One year later, this figure rose to 14.4% (Standard and Poor’s, 2008).
127The impact of the financial crisis on investors
The collapse of a US housing market led to a global housing bubble collapse, which caused the value of securities tied to real estate pricing to plummet, damaging financial institutions globally. Questions regarding bank solvency, declines in credit availability, the lack of liquidity, and dam-aged investor confidence, all had an impact on global stock markets, where securities suf-fered large losses during late 2008 and early 2009. Economies worldwide slowed during this period as credit tightened and inter-national trade declined (World Economic Outlook, 2009).
The oil price surge and dubai World
Another important part of the financial crisis as it relates to Dubai World and their standstill, is the oil price surge that was cre-ated following the collapse in the housing bubble. The price of a barrel of crude oil nearly tripled from $50 in 2007 to a peak of $147 in July of 2008. As the financial crisis began to take hold in late 2008, oil prices plummeted by nearly 75% to a low of $37 in December 2008 (Futures Trading Charts, 2008). The price of oil is the life-blood of the Persian Gulf economy, espe-cially in Dubai, where high oil prices are a crucial support to Dubai property values. Real Estate, the other mainstay for Dubai, was quick to follow the US housing market collapse and plummeting oil prices. With prices for real estate falling, big develop-ers such as Nakheel, a subsiary of Dubai World, began halting construction and laying-off staff.
The extremely large decrease in the price of oil hit the Middle East very hard in 2009. The reversal of capital inflows combined with deterioration in external financing conditions created serious prob-lems for the region. Local property and
equity markets were put under intense pressure, domestic liquidity conditions deteriorated and credit spreads soared for some firms (World Economic Outlook, 2009). Financial system strains emerged in a number of countries and many sov-ereign wealth funds suffered substantial losses from investments in global markets. Furthermore, export growth and tourism revenues sharply declined. Particularly in the UAE, the exit of external funds, which had entered the country on speculation of a currency revaluation, contributed to a large contraction in liquidity, a sizable fall in property and equity prices, and substan-tial pressure in the banking system (World Economic Outlook, 2009).
More specifically, Dubai had been strug-gling with a very large debt burden since the bursting of the property bubble in the fall of 2008. The UAE entities were aggressive borrowers in international markets over the previous years, with Dubai Inc. entities leading the way. In total, UAE raised $135 billion from external public syndicated loan and bond markets during 2006–2008, an amount equivalent to 53% of GDP, the highest of any major emerging mar-ket. Additionally, the local banking sector experienced rapid credit growth, averaging around 33% annually for the prior three years (Nazim, 2009). The total credit port-folio of the UAE banking sector reached an estimated $275 billion in June 2009 which was 108% of GDP. While specific informa-tion about Dubai Inc. in particular is not public information, analysts estimate that banks in Dubai and Abu Dhabi have lent a total of $40 billion to Dubai Inc. entities, and a further $20 billion to the Dubai gov-ernment. Added to the $47 billion of Dubai Inc. cross-border debt of loans and bonds, it can be estimated that the total borrowing of Dubai Inc. corporations was approximately $75 billion (Razgallah, 2009).
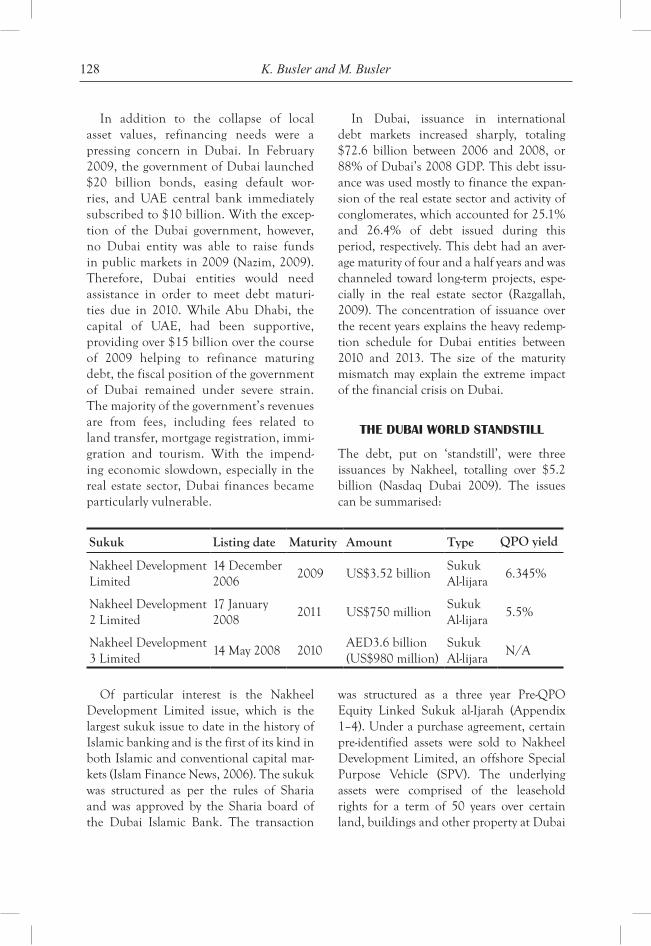
128 K. Busler and M. Busler
In addition to the collapse of local asset values, refinancing needs were a pressing concern in Dubai. In February 2009, the government of Dubai launched $20 billion bonds, easing default wor-ries, and UAE central bank immediately subscribed to $10 billion. With the excep-tion of the Dubai government, however, no Dubai entity was able to raise funds in public markets in 2009 (Nazim, 2009). Therefore, Dubai entities would need assistance in order to meet debt maturi-ties due in 2010. While Abu Dhabi, the capital of UAE, had been supportive, providing over $15 billion over the course of 2009 helping to refinance maturing debt, the fiscal position of the government of Dubai remained under severe strain. The majority of the government’s revenues are from fees, including fees related to land transfer, mortgage registration, immi-gration and tourism. With the impend-ing economic slowdown, especially in the real estate sector, Dubai finances became particularly vulnerable.
In Dubai, issuance in international debt markets increased sharply, totaling $72.6 billion between 2006 and 2008, or 88% of Dubai’s 2008 GDP. This debt issu-ance was used mostly to finance the expan-sion of the real estate sector and activity of conglomerates, which accounted for 25.1% and 26.4% of debt issued during this period, respectively. This debt had an aver-age maturity of four and a half years and was channeled toward long-term projects, espe-cially in the real estate sector (Razgallah, 2009). The concentration of issuance over the recent years explains the heavy redemp-tion schedule for Dubai entities between 2010 and 2013. The size of the maturity mismatch may explain the extreme impact of the financial crisis on Dubai.
The dubai World sTandsTill
The debt, put on ‘standstill’, were three issuances by Nakheel, totalling over $5.2 billion (Nasdaq Dubai 2009). The issues can be summarised:
Sukuk Listing date Maturity Amount Type QPO yield
Nakheel Development Limited
14 December 2006
2009 US$3.52 billionSukuk Al-lijara
6.345%
Nakheel Development 2 Limited
17 January 2008
2011 US$750 millionSukuk Al-lijara
5.5%
Nakheel Development 3 Limited
14 May 2008 2010AED3.6 billion (US$980 million)
Sukuk Al-lijara
N/A
Of particular interest is the Nakheel Development Limited issue, which is the largest sukuk issue to date in the history of Islamic banking and is the first of its kind in both Islamic and conventional capital mar-kets (Islam Finance News, 2006). The sukuk was structured as per the rules of Sharia and was approved by the Sharia board of the Dubai Islamic Bank. The transaction
was structured as a three year Pre-QPO Equity Linked Sukuk al-Ijarah (Appendix 1–4). Under a purchase agreement, certain pre-identified assets were sold to Nakheel Development Limited, an offshore Special Purpose Vehicle (SPV). The underlying assets were comprised of the leasehold rights for a term of 50 years over certain land, buildings and other property at Dubai
129The impact of the financial crisis on investors
Waterfront. This sukuk’s structure was the first of its kind in Islamic capital markets. Originally planned at US$2.5 billion, the issue was oversubscribed by more than 2.5 times and closed at US$3.52 billion. The Qualifying Public Offering (QPO) yield does not reflect the actual coupon payments of the bond, as they float depending on the profit earned by Nakheel. The QPO yield is used for comparison to traditional bonds so that the sukuk can be priced competitively.
sukuks and convenTional WesTern sTyle bonds
At first glance, the details of the sukuks may appear as conventional bonds, as they pay semi-annual coupons. However, the sukuk al-ijara is compliant with Sharia, as the semi-annual payments are considered to be rent charges for the leasing of assets, in this case land. Nakheel technically sells the $3.52 billion of sukuk assets to the SPV promising to buy it back at $3.52 billion at the end of three years. The SPV will lease out the underlying assets to Nakheel and Nakheel will pay ‘rent’ every six months to the SPV. The SPV will collect the semi-annual rents and distribute them to sukuk holders. At maturity, the sukuk holder sells his sukuk back to the SPV at face value. In cases of default, the long lease would be repurchased by Nakheel and that deferred rental payment would be made.
In order to comprehend the role of Islamic Banking and Finance (IBF) in the Dubai World debt standstill, we must be able to distinguish between conventional and Islamic bonds. Conventional bonds do not represent ownership on the part of the bond holders in the commercial or indus-trial enterprises for which the bonds were issued. Rather, they document the interest-bearing debt owed to the bondholders by the
issuer, the owner of the enterprise. With the exception of zero-coupon bonds, regular inter-est payments are made to the bondholders. The amount of interest can be fixed or floating, but does not reflect a percentage of actual profits. Bonds guarantee the return of prin-cipal when redeemed at maturity, regardless of whether the enterprise was profitable or otherwise. Whatever profits may have been earned by the enterprise accrue entirely and exclusively to the issuer.
Generally, sukuk represent ownership shares in assets that bring revenues and pro-duce profit, like leased assets. In reference to coupons, most of the sukuk that have been issued are identical to conventional bonds with regard to the distribution of profits from their enterprises at percentages based on interest rates (LIBOR or EIBOR). In order to justify this practice, the issuers include a paragraph in the contract which states that if the actual profits from the enterprise exceed the percentage based on interest rates, then that amount of excess shall be paid in its entirety to the enterprise manager as an incentive for the manager to manage effectively (Usmani, 2009). If the actual profits are less than the prescribed per-centage, then the manager may take it upon himself to pay out the difference (between the actual profits and the prescribed per-centage) to the sukuk holders, as an interest free loan to the sukuk holders. Then, that loan will be recovered by the lending man-ager either from the amounts in excess of the interest rate during subsequent periods, or from lowering the cost of repurchasing assets at the time the sukuk are redeemed. Virtually all of the sukuk issued today guar-antee the return of principal to the sukuk holders at maturity, in exactly the same way as conventional bonds. This is accomplished by means of a binding promise from either the issuer or the manager to repurchase the
130 K. Busler and M. Busler
assets represented by the sukuk at the stated price at which these were originally pur-chased by the sukuk holders at the begin-ning of the process, regardless of their true or market value at maturity (Usmani, 2009). It should be noted that what is being called an ‘incentive’ in these sukuk may not truly be an incentive but rather a method for mar-keting sukuk on basis of interest rates. In order for sukuk to be purchased by investors around the world, they need to be compa-rable to traditional bonds. Providing a fixed numerical interest rate allows the bonds to be priced efficiently on the market.
In September 2009, Dubai World announced that they were in the process of rescheduling $12 billion of debt. Dubai Ruler Sheikh Mohammed reassured Dubai investors, as he said during a press confer-ence that he was ‘not worried’ about Dubai’s ability to repay its debts (Al Maktoum, 2009a,b). In October 2009, Dubai World claimed that the organisational restructur-ing was nearly over and that it would be able to save $800 million over the next three years. They also cut their global workforce by 15%. On 25 November, the government of Dubai announced that it had raised $5 billion from two Abu Dhabi govern-ment owned banks, National Bank of Abu Dhabi and Al Hilal Bank, as part of its $20 billion long term bond program. Hours later, the government of Dubai announced that Dubai World would be restructured to address its financial obligations. As a first step, Dubai World intended to ask creditors to Dubai World and its entity, Nakheel, for a standstill and extend maturities until at least 30 May 2010. The government also specified that the $5 billion raised earlier in the day was not linked to this restructuring.
On the following day, 26 November Sheikh Ahmed bin Saeed Al Maktoum, Chairman of the Supreme Fiscal Committee
(SFC) of Dubai issued a statement explaining that the Dubai World restructuring was care-fully planned and is needed to take decisive action to address Dubai World’s debt bur-den. Two days later, the Abu Dhabi Central Bank announced that it ‘stands behind’ the banking system, including branches of for-eign banks operating in the country, and launched a special liquidity facility to support local banks (Nazim, 2009). On 14 December, the Chairman of the SFC issued another statement on behalf of the government of Dubai, detailing a set of actions in relation to Dubai World. According to the Chairman, the government of Dubai had been working closely with the Abu Dhabi Government and the UAE Central Bank since the debt stand-still was announced, to assess the impact of Dubai World on the UAE economy, banking system and investor confidence.
In his statement, the Chairman laid out a specific course of action to provide support to Dubai World. The government of Abu Dhabi would create the Dubai Financial Support Fund (DFSF) and had agreed to fund $10 billion to satisfy a series of forth-coming debt obligations of Dubai World. The first step was the authorisation of $4.1 billion from the government of Dubai to pay the sukuk obligations that were due on 14 December. The remaining $5.9 bil-lion would be used for interest expenses and working capital expenses through 30 April 2010. In his closing remarks, the Chairman twice stressed that his actions are to ‘best serve the interests of all stakeholders’ (Al Maktoum, 2009a,b).
The shorT Term impacT of a sTandsTill
The repercussions of the Dubai World debt standstill were felt immediately in the finan-cial markets and have had a lasting impact on the debt capital markets, particularly for
131The impact of the financial crisis on investors
IBF. Throughout the months following the event, there was much speculation on how Nakheel and Dubai World would raise funds to pay their obligation, if the bonds would be discounted, and if Abu Dhabi would step in to help. On 25 March 2010, four months after the event, Dubai World and Nakheel announced proposals for the restructuring of their liabilities. The Sheikh spoke about the plans in a press conference, explaining how the plans “would ensure Dubai World and Nakheel are key contributors to the strong economic future of the Emirate of Dubai and the wider United Arab Emirates.” Nakheel’s comprehensive recapitalisation plan offered creditors 100% of agreed amounts owed and the fulfillment of its obligations to custom-ers through the prompt completion of near term projects. Under the recapitalisation plan, the Government of Dubai, through the DFSF, committed to provide approxi-mately $8 billion of new money directly to Nakheel to fund operations and settle lia-bilities. In addition, the DFSF proposed to convert its existing $1.2 billion debt claim in Nakheel into equity. The support from the Government of Dubai would be con-ditional upon the creditors agreeing to the plan. However, ahead of the agreement an initial $1.5 billion of the new funds from the DFSF would be made available as required to Nakheel to fund contractors to continue building near-term development projects.
Dubai World presented a proposal to all of its creditors offering to recapitalise Dubai World. The Government of Dubai, acting through the DFSF, would convert $8.9 billion of debt and claims into equity, representing 38% of the total amount of standalone debt and guarantees of the company. Additionally, the DFSF would commit to fund up to $1.5 billion of cash into Dubai World to fund the company’s working capital and interest payment commitments that would arise from the new debt facilities. Non-DFSF
creditors would receive 100% principal repay-ment through the issuance of new debt with five and eight year maturities. Although both announcements were positive in terms of pro-viding investors with clarity, the plan failed to reassure investors of a declining credit risk. In essence, Dubai World creditors would be rely-ing upon asset sales and dividends for even-tual principal repayment.
long Term impacT of a sTandsTill and The role of ibf
While it is too early to assess the long-term consequences of the Dubai World debt standstill, it is possible to determine the role that IBF played in the event. In July 2006, East Cameron Partners LP became the first US company to issue sukuk. The company subsequently defaulted on their sukuk and declared bankruptcy in October 2008. The case still remains in the courts, as a bankruptcy judge in Louisiana is deciding the fate of sukuk holders, and whether they actually own a portion of the company’s oil and gas. A typical US investor would want to have the sukuk classified by the court as debt, not as equity, even though that goes against the Sharia characterisation, because in court, if it’s classified as debt, then the debtors receive preference before equity holders in terms of receiving funds.
While currently Dubai World is far from declaring bankruptcy, the concern over whether sukuk is actually debt or equity is a pressing matter. If the foundational prin-ciple of sukuk is profit and loss sharing, one may wonder if sukuk is closer to equity than debt. In order to evaluate if ‘debt standstill’ is the correct term for the incident of Dubai World, a further analysis of Nakheel’s sukuk al-ijara is needed.
It is often said that sukuk are compara-ble to conventional asset-backed securities
132 K. Busler and M. Busler
that provide investors with ownership in a specified underlying real asset found on the balance sheet of the issuing company. The sukuk of the debt standstill were of al-ijara structure, which are especially similar to ABS. In conventional finance, assets (credit card loans, auto loans), or mortgages, are pooled and put into a SPV. The ABS repre-sent claims on the principal and payments on the loans in the pool, through securitiza-tion, in which the securities are usually sold as bonds. New issues of ABS carry higher estimated yields than US Treasury securi-ties. Many corporate bonds, of comparable maturity and credit quality, also carry higher yields as investors demand a higher interest rate to compensate for prepayment risk and resulting uncertainty in the average life of an ABS.
According to Sharia, sukuk must be tied to actual assets. In sukuk al-ijara, the under-lying assets are ‘sold’ to the SPV which issued the sukuk, who then ‘rents’ the asset back to the company. The company pays ‘rent’ to the sukuk holders. In Nakheel’s sukuk contracts, it states that the issuer will buy back the underlying assets at full price at maturity. This is exactly why Dubai was forced to have a ‘standstill’. They were unable to pay the Nakheel Development Limited sukuk that was maturing on 14 December 2009. Instead, they asked for creditors to defer payment for six months, a time Dubai World felt would be sufficient to raise the funds to pay back its creditors in full. In the US, however, this would not be the case. Many investors who owned ABS and MBS that defaulted received only a frac-tion of their initial investment.
Although the Federal Reserve intervened to fund the purchase of these securitised products, many investors around the world suffered significant losses. The investors in Dubai World and Nakheel however, may
not experience the same magnitude of loss if they hold their positions. If they decided to sell their sukuks on the secondary market, they will likely suffer losses. Nakheel sukuks were purchased at 110% on the dollar in the beginning of the issue; after the standstill announcement, they were trading at 60% on the dollar (Bryan-Low, 2009). However, while it is unknown if investors will receive their full principal in the short-term, it is likely that they will receive their full invest-ment at some point in time due to contrac-tual agreement outlined in the sukuk.
Although creditors and debtors have come to an agreement on both Nakheel and Dubai’s recapitalisation plans, we might wonder what may have happened had this dilemma been brought to court. Islamic jurisprudence may have rejected the per-missibility of principal protection of sukuk investors, but scholarly opinion may have permitted repayment of the original asset value at the time of issuance. According to Sharia, in general, issuers cannot guar-antee principal through the repurchase of underlying assets for a fixed nominal value or offer a credit guarantee. Any repurchase can only occur at net value or fair market value. However, since the Nakheel trans-action involved commercial leasehold properties, the legal action consistent with current AAOIFI recommendations on sukuk al-ijara would have permitted repayments up to the amount of remaining lease pay-ments or original asset value, which would have resulted in a forbearance on interest.
Sharia law requires payoffs from time-contingent profit/loss sharing arrange-ments; this principle is tied to contractual certainty associated with direct ownership. However, the original terms and condi-tions of the Nakheel sukuk ruled out such direct asset linkage. Investor claims arising from the sukuk were considered only asset-
133The impact of the financial crisis on investors
based, not secured asset-backed, handing investors ownership of the cash flows but not of the assets themselves. In terms of the risk/return profile, asset-backed sukuk are arguably closer to an equity position because sukuk holders own the underly-ing asset and have no recourse to the origi-nator in the event of a payment shortfall. On the other hand, asset-based sukuk, like Nakheel’s sukuk al-ijara, are closer to debt because sukuk holders have recourse to the originator if there is a shortfall in pay-ments. The ijara sukuk with a repurchase agreement at par creates a stream of rental income from the underlying asset. However, Nakheel’s contract had a repurchase clause where the issuer repurchases the asset at par in cases of default, making the instrument debt. The sukuk holders have no recourse to take possession of the asset; their claims are transformed into unsecured debt obliga-tions against the issuer. Therefore, if sukuk holders keep their position, it is likely they will receive their investment back in full. Because the debt of the Dubai World stand-still was a sukuk al-ijara, a debt instrument of IBF, investors are likely better off. The returns to investors of conventional bonds or ABS in default are likely less than those of sukuk holders.
The lack of precedenT
This better-off analysis is mainly hypo-thetical due to the lack of precedence in the issue. In May 2009, Investment Dar Company, the Kuwait owner of half of Aston Martin Lagonda Limited, missed a payment on $100 million of debt, becoming the first Gulf company to default on Islamic bonds. In June 2009, the Saad Group, part of the struggling family-owned conglomerate based in Saudi Arabia, began restructuring due to its inability to make payments on $650 million sukuk. Banks and investors are estimated to be owed more than $20 billion
by the Saad Group and its subsidiaries, and lenders have taken legal action against the company in New York, the Cayman Islands and the Gulf. The legal proceedings against both of these companies, and for East Cameron Partners, are still currently under-way. Therefore, accurately predicting the results of Dubai World’s debt standstill is virtually impossible.
In the UAE, there is no precedent for a restructuring of the size of Dubai World and Nakheel, and its government owner-ship. As a result, investors will be watching events related to the Nakheel bonds for a road map for future restructurings in the region. How the underlying legal structures would fare in a court of law in compari-son with conventional bonds is uncertain. Although sukuk must comply with Islamic law, they are governed as well by the secu-lar law under which they are issued, like bonds. In the case of Dubai World, a bail-out by Abu Dhabi has obviated the need to address this question directly. In addition, the role and efficacy of Sharia governance arrangements and due diligence for Sharia compliance have attracted attention. Given the relatively early stage of development of sukuk in particular and of IBF in general, sukuk are likely to continue to evolve.
In some ways, the Dubai World case is a typical example of what happens at the end stage of a real estate cycle. Commercial real estate always involves what economist Hyman Minsky calls Ponzi finance (Minsky, 1982). In the Ponzi finance stage, busi-ness cash flows are not sufficient to meet current debt payments nor does expected income meet future payment require-ments. Therefore the company lacks the ability to pay either interest or principal payments and must depend on borrowing in order to finance debt commitments. For Dubai World, the collapsing real estate
134 K. Busler and M. Busler
market in Dubai, combined with diminish-ing tourism revenues, significantly decreased their income. They were unable to meet their debt obligations and were forced to call a standstill. Luckily for Dubai World, the government of Dubai and the govern-ment of UAE in Abu Dhabi stepped in to support them. Without the support of the government, it is likely the Dubai World debt standstill would have triggered a larger catastrophic event for Dubai World and the region.
conclusions
It appears that the financial crisis in the Western world was fueled by government efforts to relax borrowing standards so that more citizens could purchase homes using ‘sub-prime’ mortgages. Ultimately these mortgages were packaged and used to back securities that would derive value from increased payments. When adjust-able rate mortgage holders experienced large increase in payments and when the houses that collateralised the mortgages began to loose value, defaults increased. Lenders foreclosed on homes causing the mortgaged back securities to lose most of their value. This set off a chain of events that crippled credit markets and ultimately lead to a world wide recession, as investors suffered large losses.
In countries that follow Islamic Banking, this financial meltdown essentially did not occur. The reason seems to be that inves-tors will likely not suffer any losses. Even when a ‘standstill’ (the western equivalent of a default) occurs, the result is that inves-tors will likely not lose any of their capital.
Our assessment is that Islamic bank-ing minimises the risk to investors since they are not likely to ever suffer losses.
With Western banking, losses could occur, thereby increasing risk. The conclusion then, is that Islamic banking places virtually all of the risk on the borrow (the entrepre-neur). This increased risk increases the cost to the entrepreneur so that fewer projects may be undertaken. It is possible, that while Islamic banking protects the investor, it places extra burdens on borrowers who may become reluctant to take on additional projects. This could result in slowing overall development. Admittedly more research is needed in this area.
references
Al Maktoum, S.B.S. (2009a) Statement, 14 December 2009.
Al Maktoum, S.B.S. (2009b) Statement, 9 September 2009.
Bernanke, B. (2007) Speech at the Federal Reserve Bank of Chicago’s 43rd Annual Conference on Bank Structure and Competition, Board of Governs of the Federal Reserve System, Chicago, Illinois, 17 May 2007.
Bryan-Low, C. (2009) ‘Dubai restructuring poses questions’, The Wall Street Journal, 3 December 2009.
Minsky, H.P. (1982) ‘Can ‘It’ Happen Again? Essays on Instability and Finance’, Finance and Profits: The Changing Nature of American Business Cycles, M.E. Sharpe.
Nazim, Z. (2009) ‘Cutting through the haze: further thoughts on Dubai Inc.’, Emerging Markets Credit Research, J.P. Morgan, 20 November 2009.
Nisar, S. (2010) ‘Islamic bonds (sukuk): its intro-duction and application’, Finance in Islam: Learning Islamic Finance, Online: http://www.financeislam.com/article/8/1/546, Accessed 24/04/10.
Pollard, J. and Samers, M. (2007) ‘Islamic banking and finance: postcolonial political economy and the decentring or economic geography’, Royal Geographical Society and the Institute of British Geographers.
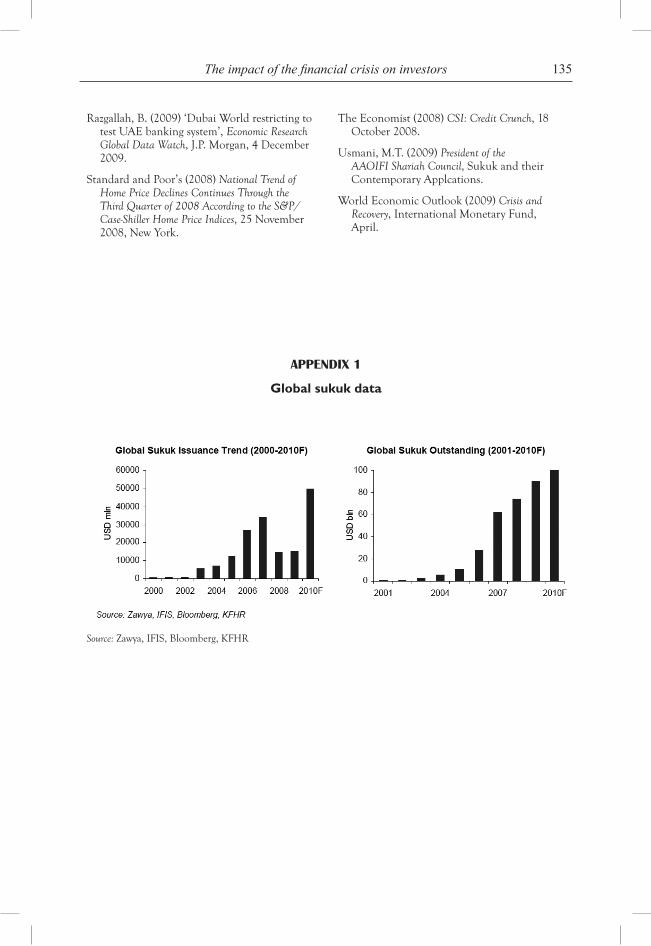
135The impact of the financial crisis on investors
Razgallah, B. (2009) ‘Dubai World restricting to test UAE banking system’, Economic Research Global Data Watch, J.P. Morgan, 4 December 2009.
Standard and Poor’s (2008) National Trend of Home Price Declines Continues Through the Third Quarter of 2008 According to the S&P/Case-Shiller Home Price Indices, 25 November 2008, New York.
The Economist (2008) CSI: Credit Crunch, 18 October 2008.
Usmani, M.T. (2009) President of the AAOIFI Shariah Council, Sukuk and their Contemporary Applcations.
World Economic Outlook (2009) Crisis and Recovery, International Monetary Fund, April.
appendiX 1
Global sukuk data
Source: Zawya, IFIS, Bloomberg, KFHR
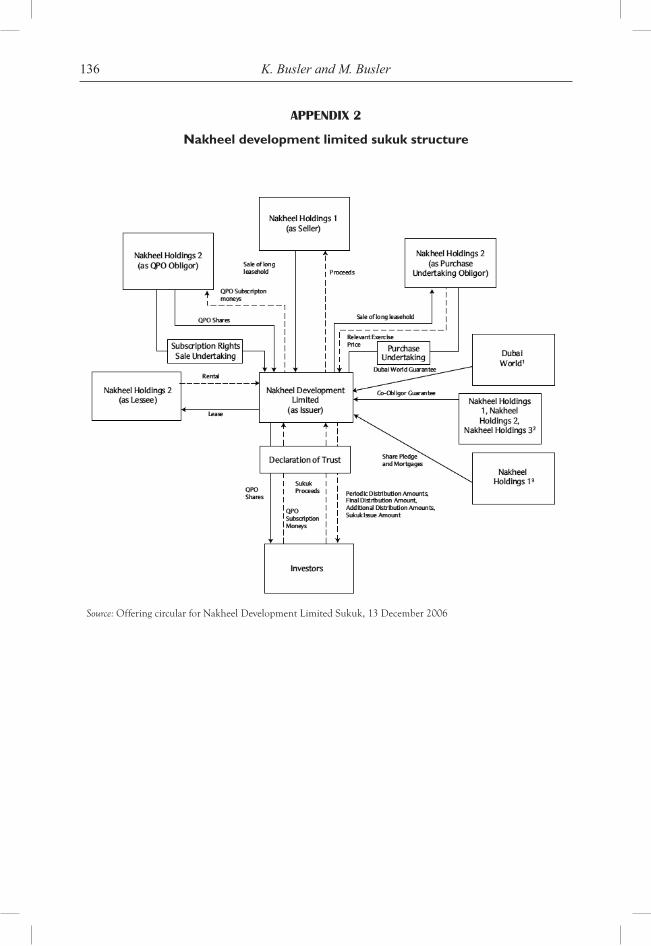
136 K. Busler and M. Busler
appendiX 2
Nakheel development limited sukuk structure
Source: Offering circular for Nakheel Development Limited Sukuk, 13 December 2006
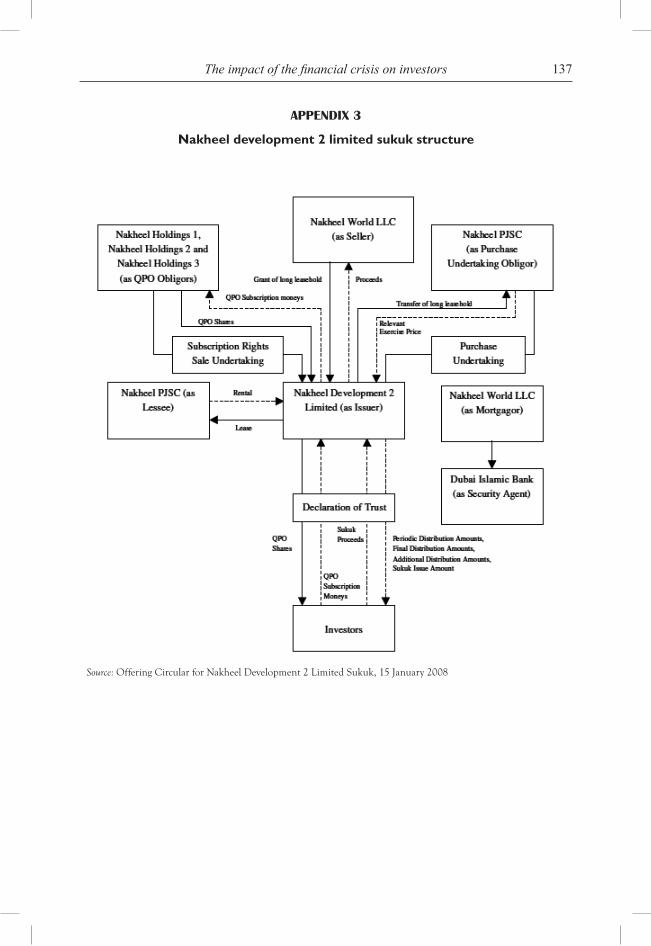
137The impact of the financial crisis on investors
appendiX 3
Nakheel development 2 limited sukuk structure
Source: Offering Circular for Nakheel Development 2 Limited Sukuk, 15 January 2008
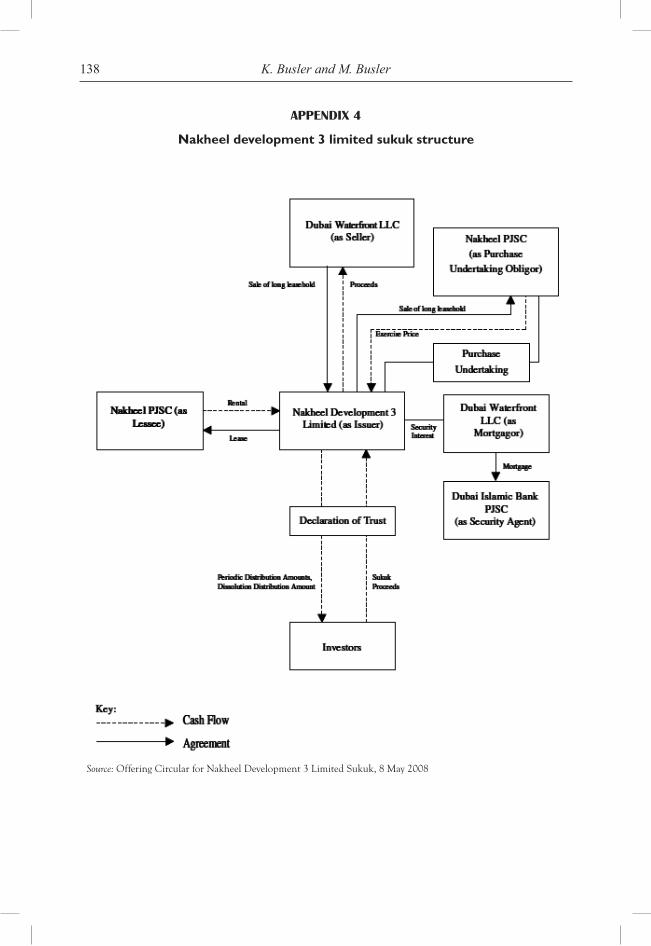
138 K. Busler and M. Busler
appendiX 4
Nakheel development 3 limited sukuk structure
Source: Offering Circular for Nakheel Development 3 Limited Sukuk, 8 May 2008
Copyright © 2010 WASD
World Sustainable Development Outlook 2010
139
The TurTle village TrusT, Trinidad and Tobago:
susTainabiliTy Through sTraTegic bridging, green alliance and enviropreneurship
Kalim U. Shah* and Robin MarinUniversity of Trinidad and Tobago,
Abstract: The Turtle Village Trust (TVT) is a consortium of stakeholders including the Trinidad and Tobago government, the villages of the North East coast of the island and BHP Billiton, a major multinational corporation with operations in that vicinity. The central objectives of the TVT are conservation of the large populations of seasonally visiting leatherback turtles and the socio-economic enhancement of the North East region which has historically consisted of poor and rural communities, largely dependent on agriculture and fisheries livelihoods. This paper analyses the motives, incentives, costs and benefits of each of the key stakeholders in building, operating and expanding this collaborative sustainable development and conservation model. We discuss these relationships and stakeholder dynamics in the theoretical contexts of green alliances which focus on mutual benefits between partners; envi-ropreneurship which emphasises non-confrontational stakeholder engagement and operational effectiveness; and strategic bridging that establishes operational linkages, provides shared resources and avoids duplicity of efforts among partners. Emerg-ing from this analysis is a sustainable best practice model for government-private sector-NGO collaboration which can be applied to conservation and socio-economic development efforts in other developing countries.
Keywords: strategic bridging; enviropreneurship; green alliances; socio-economic development; turtle conservation; small island developing states.
inTroducTion
In the twin-island state of Trinidad and Tobago where one of the largest popula-tions of nesting leatherback sea turtles can be found, five community groups or Non-Governmental Organisations (NGOs) have become involved in leatherback turtle
conservation for quite a number of years. Turtle conservation was proving to be a challenge to these five NGOs (Nature Seekers Incorporated, Fishing Pond Turtle Conservation Group (FPTCG), Grande Riviere Nature Tour Guide Association, and SOS Tobago) in the areas of obtaining
*Corresponding author: University of Trinidad and Tobago; e-mail: [email protected]
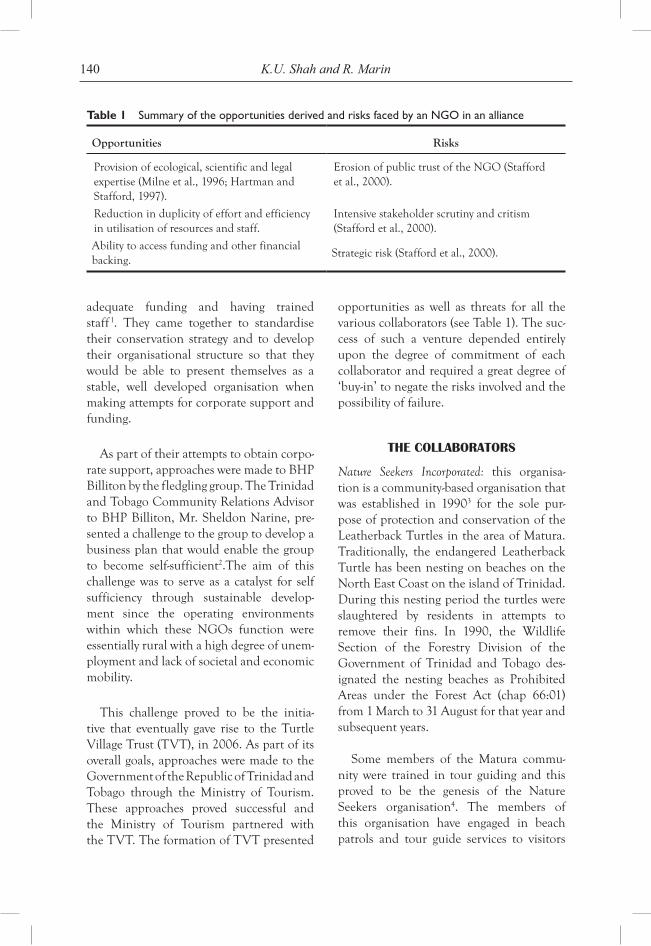
140 K.U. Shah and R. Marin
adequate funding and having trained staff 1. They came together to standardise their conservation strategy and to develop their organisational structure so that they would be able to present themselves as a stable, well developed organisation when making attempts for corporate support and funding.
As part of their attempts to obtain corpo-rate support, approaches were made to BHP Billiton by the fledgling group. The Trinidad and Tobago Community Relations Advisor to BHP Billiton, Mr. Sheldon Narine, pre-sented a challenge to the group to develop a business plan that would enable the group to become self-sufficient2.The aim of this challenge was to serve as a catalyst for self sufficiency through sustainable develop-ment since the operating environments within which these NGOs function were essentially rural with a high degree of unem-ployment and lack of societal and economic mobility.
This challenge proved to be the initia-tive that eventually gave rise to the Turtle Village Trust (TVT), in 2006. As part of its overall goals, approaches were made to the Government of the Republic of Trinidad and Tobago through the Ministry of Tourism. These approaches proved successful and the Ministry of Tourism partnered with the TVT. The formation of TVT presented
opportunities as well as threats for all the various collaborators (see Table 1). The suc-cess of such a venture depended entirely upon the degree of commitment of each collaborator and required a great degree of ‘buy-in’ to negate the risks involved and the possibility of failure.
The collaboraTors
Nature Seekers Incorporated: this organisa-tion is a community-based organisation that was established in 19903 for the sole pur-pose of protection and conservation of the Leatherback Turtles in the area of Matura. Traditionally, the endangered Leatherback Turtle has been nesting on beaches on the North East Coast on the island of Trinidad. During this nesting period the turtles were slaughtered by residents in attempts to remove their fins. In 1990, the Wildlife Section of the Forestry Division of the Government of Trinidad and Tobago des-ignated the nesting beaches as Prohibited Areas under the Forest Act (chap 66:01) from 1 March to 31 August for that year and subsequent years.
Some members of the Matura commu-nity were trained in tour guiding and this proved to be the genesis of the Nature Seekers organisation4. The members of this organisation have engaged in beach patrols and tour guide services to visitors
Table 1 Summary of the opportunities derived and risks faced by an NGO in an alliance
Opportunities Risks
Provision of ecological, scientific and legal expertise (Milne et al., 1996; Hartman and Stafford, 1997).
Erosion of public trust of the NGO (Stafford et al., 2000).
Reduction in duplicity of effort and efficiency in utilisation of resources and staff.
Intensive stakeholder scrutiny and critism (Stafford et al., 2000).
Ability to access funding and other financial backing.
Strategic risk (Stafford et al., 2000).
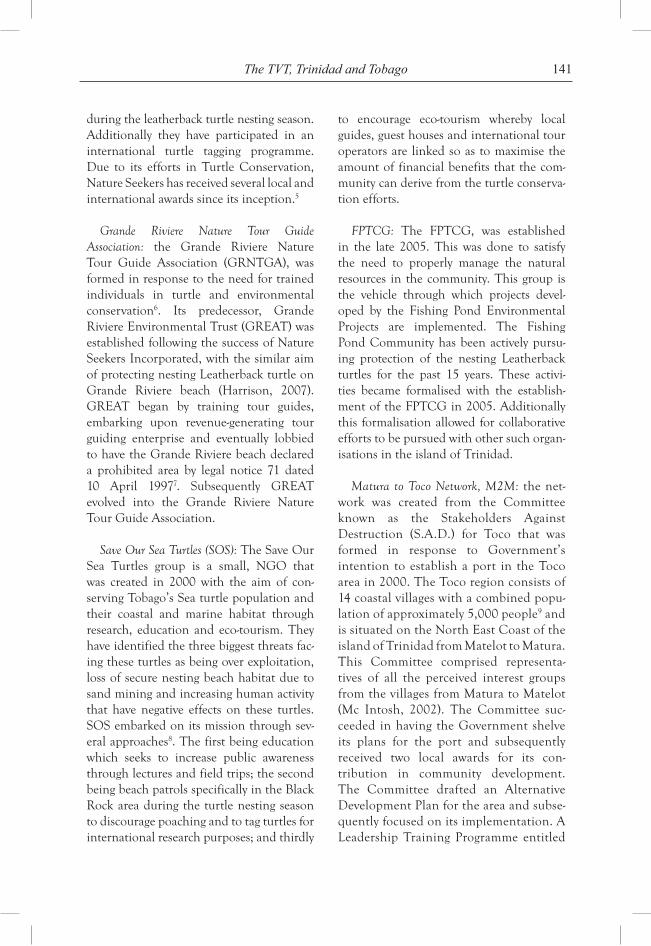
141The TVT, Trinidad and Tobago
during the leatherback turtle nesting season. Additionally they have participated in an international turtle tagging programme. Due to its efforts in Turtle Conservation, Nature Seekers has received several local and international awards since its inception.5
Grande Riviere Nature Tour Guide Association: the Grande Riviere Nature Tour Guide Association (GRNTGA), was formed in response to the need for trained individuals in turtle and environmental conservation6. Its predecessor, Grande Riviere Environmental Trust (GREAT) was established following the success of Nature Seekers Incorporated, with the similar aim of protecting nesting Leatherback turtle on Grande Riviere beach (Harrison, 2007). GREAT began by training tour guides, embarking upon revenue-generating tour guiding enterprise and eventually lobbied to have the Grande Riviere beach declared a prohibited area by legal notice 71 dated 10 April 19977. Subsequently GREAT evolved into the Grande Riviere Nature Tour Guide Association.
Save Our Sea Turtles (SOS): The Save Our Sea Turtles group is a small, NGO that was created in 2000 with the aim of con-serving Tobago’s Sea turtle population and their coastal and marine habitat through research, education and eco-tourism. They have identified the three biggest threats fac-ing these turtles as being over exploitation, loss of secure nesting beach habitat due to sand mining and increasing human activity that have negative effects on these turtles. SOS embarked on its mission through sev-eral approaches8. The first being education which seeks to increase public awareness through lectures and field trips; the second being beach patrols specifically in the Black Rock area during the turtle nesting season to discourage poaching and to tag turtles for international research purposes; and thirdly
to encourage eco-tourism whereby local guides, guest houses and international tour operators are linked so as to maximise the amount of financial benefits that the com-munity can derive from the turtle conserva-tion efforts.
FPTCG: The FPTCG, was established in the late 2005. This was done to satisfy the need to properly manage the natural resources in the community. This group is the vehicle through which projects devel-oped by the Fishing Pond Environmental Projects are implemented. The Fishing Pond Community has been actively pursu-ing protection of the nesting Leatherback turtles for the past 15 years. These activi-ties became formalised with the establish-ment of the FPTCG in 2005. Additionally this formalisation allowed for collaborative efforts to be pursued with other such organ-isations in the island of Trinidad.
Matura to Toco Network, M2M: the net-work was created from the Committee known as the Stakeholders Against Destruction (S.A.D.) for Toco that was formed in response to Government’s intention to establish a port in the Toco area in 2000. The Toco region consists of 14 coastal villages with a combined popu-lation of approximately 5,000 people9 and is situated on the North East Coast of the island of Trinidad from Matelot to Matura. This Committee comprised representa-tives of all the perceived interest groups from the villages from Matura to Matelot (Mc Intosh, 2002). The Committee suc-ceeded in having the Government shelve its plans for the port and subsequently received two local awards for its con-tribution in community development. The Committee drafted an Alternative Development Plan for the area and subse-quently focused on its implementation. A Leadership Training Programme entitled
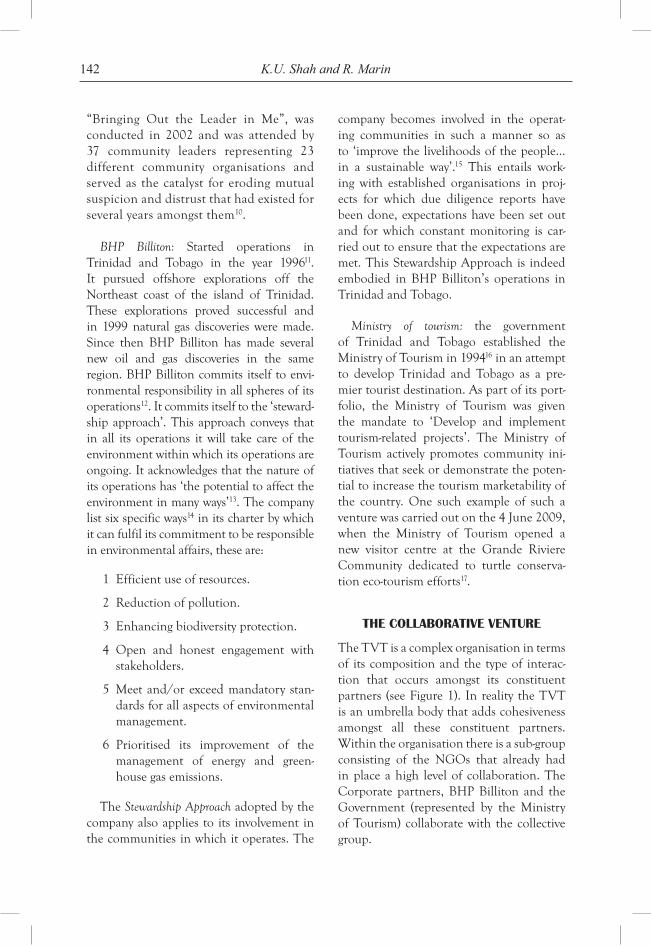
142 K.U. Shah and R. Marin
“Bringing Out the Leader in Me”, was conducted in 2002 and was attended by 37 community leaders representing 23 different community organisations and served as the catalyst for eroding mutual suspicion and distrust that had existed for several years amongst them10.
BHP Billiton: Started operations in Trinidad and Tobago in the year 199611. It pursued offshore explorations off the Northeast coast of the island of Trinidad. These explorations proved successful and in 1999 natural gas discoveries were made. Since then BHP Billiton has made several new oil and gas discoveries in the same region. BHP Billiton commits itself to envi-ronmental responsibility in all spheres of its operations12. It commits itself to the ‘steward-ship approach’. This approach conveys that in all its operations it will take care of the environment within which its operations are ongoing. It acknowledges that the nature of its operations has ‘the potential to affect the environment in many ways’13. The company list six specific ways14 in its charter by which it can fulfil its commitment to be responsible in environmental affairs, these are:
1 Efficient use of resources.
2 Reduction of pollution.
3 Enhancing biodiversity protection.
4 Open and honest engagement with stakeholders.
5 Meet and/or exceed mandatory stan-dards for all aspects of environmental management.
6 Prioritised its improvement of the management of energy and green-house gas emissions.
The Stewardship Approach adopted by the company also applies to its involvement in the communities in which it operates. The
company becomes involved in the operat-ing communities in such a manner so as to ‘improve the livelihoods of the people…in a sustainable way’.15 This entails work-ing with established organisations in proj-ects for which due diligence reports have been done, expectations have been set out and for which constant monitoring is car-ried out to ensure that the expectations are met. This Stewardship Approach is indeed embodied in BHP Billiton’s operations in Trinidad and Tobago.
Ministry of tourism: the government of Trinidad and Tobago established the Ministry of Tourism in 199416 in an attempt to develop Trinidad and Tobago as a pre-mier tourist destination. As part of its port-folio, the Ministry of Tourism was given the mandate to ‘Develop and implement tourism-related projects’. The Ministry of Tourism actively promotes community ini-tiatives that seek or demonstrate the poten-tial to increase the tourism marketability of the country. One such example of such a venture was carried out on the 4 June 2009, when the Ministry of Tourism opened a new visitor centre at the Grande Riviere Community dedicated to turtle conserva-tion eco-tourism efforts17.
The collaboraTive venTure
The TVT is a complex organisation in terms of its composition and the type of interac-tion that occurs amongst its constituent partners (see Figure 1). In reality the TVT is an umbrella body that adds cohesiveness amongst all these constituent partners. Within the organisation there is a sub-group consisting of the NGOs that already had in place a high level of collaboration. The Corporate partners, BHP Billiton and the Government (represented by the Ministry of Tourism) collaborate with the collective group.
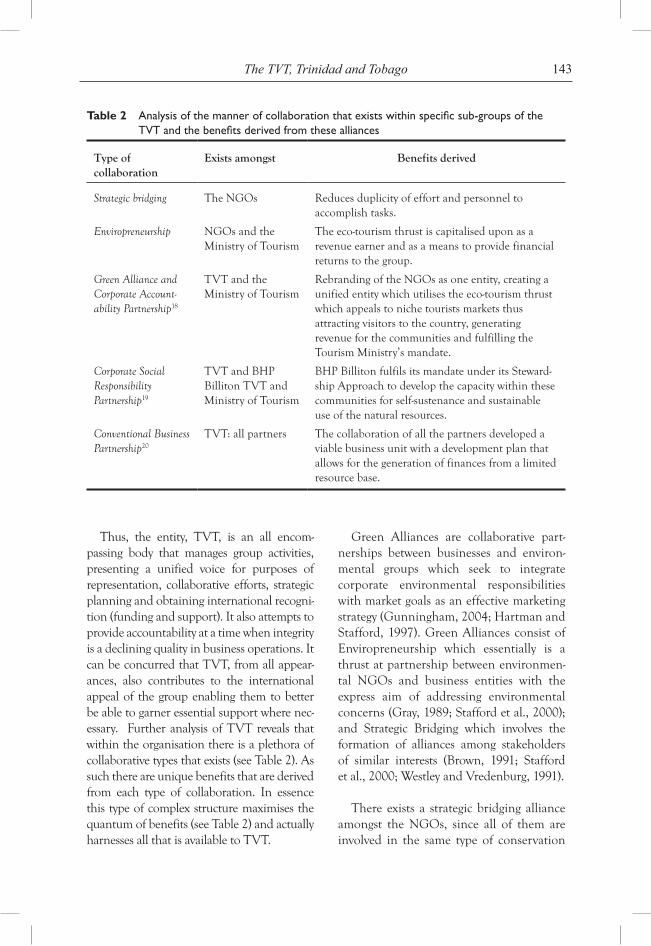
143The TVT, Trinidad and Tobago
Table 2 Analysis of the manner of collaboration that exists within specific sub-groups of the TVT and the benefits derived from these alliances
Type of collaboration
Exists amongst Benefits derived
Strategic bridging The NGOs Reduces duplicity of effort and personnel to accomplish tasks.
Enviropreneurship NGOs and the Ministry of Tourism
The eco-tourism thrust is capitalised upon as a revenue earner and as a means to provide financial returns to the group.
Green Alliance and Corporate Account-ability Partnership18
TVT and the Ministry of Tourism
Rebranding of the NGOs as one entity, creating a unified entity which utilises the eco-tourism thrust which appeals to niche tourists markets thus attracting visitors to the country, generating revenue for the communities and fulfilling the Tourism Ministry’s mandate.
Corporate Social Responsibility Partnership19
TVT and BHP Billiton TVT and Ministry of Tourism
BHP Billiton fulfils its mandate under its Steward-ship Approach to develop the capacity within these communities for self-sustenance and sustainable use of the natural resources.
Conventional Business Partnership20
TVT: all partners The collaboration of all the partners developed a viable business unit with a development plan that allows for the generation of finances from a limited resource base.
Thus, the entity, TVT, is an all encom-passing body that manages group activities, presenting a unified voice for purposes of representation, collaborative efforts, strategic planning and obtaining international recogni-tion (funding and support). It also attempts to provide accountability at a time when integrity is a declining quality in business operations. It can be concurred that TVT, from all appear-ances, also contributes to the international appeal of the group enabling them to better be able to garner essential support where nec-essary. Further analysis of TVT reveals that within the organisation there is a plethora of collaborative types that exists (see Table 2). As such there are unique benefits that are derived from each type of collaboration. In essence this type of complex structure maximises the quantum of benefits (see Table 2) and actually harnesses all that is available to TVT.
Green Alliances are collaborative part-nerships between businesses and environ-mental groups which seek to integrate corporate environmental responsibilities with market goals as an effective marketing strategy (Gunningham, 2004; Hartman and Stafford, 1997). Green Alliances consist of Enviropreneurship which essentially is a thrust at partnership between environmen-tal NGOs and business entities with the express aim of addressing environmental concerns (Gray, 1989; Stafford et al., 2000); and Strategic Bridging which involves the formation of alliances among stakeholders of similar interests (Brown, 1991; Stafford et al., 2000; Westley and Vredenburg, 1991).
There exists a strategic bridging alliance amongst the NGOs, since all of them are involved in the same type of conservation
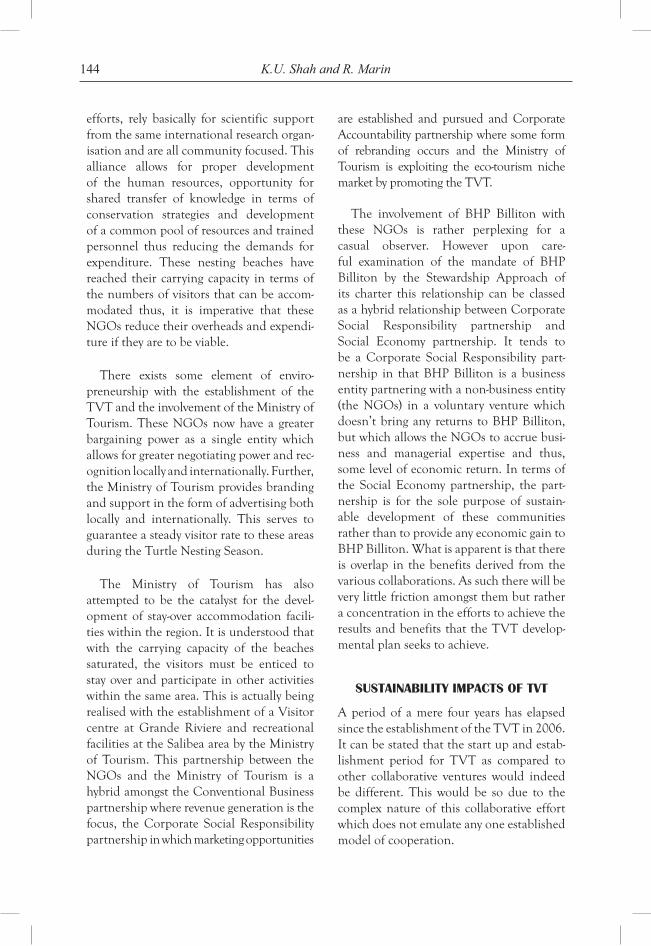
144 K.U. Shah and R. Marin
efforts, rely basically for scientific support from the same international research organ-isation and are all community focused. This alliance allows for proper development of the human resources, opportunity for shared transfer of knowledge in terms of conservation strategies and development of a common pool of resources and trained personnel thus reducing the demands for expenditure. These nesting beaches have reached their carrying capacity in terms of the numbers of visitors that can be accom-modated thus, it is imperative that these NGOs reduce their overheads and expendi-ture if they are to be viable.
There exists some element of enviro-preneurship with the establishment of the TVT and the involvement of the Ministry of Tourism. These NGOs now have a greater bargaining power as a single entity which allows for greater negotiating power and rec-ognition locally and internationally. Further, the Ministry of Tourism provides branding and support in the form of advertising both locally and internationally. This serves to guarantee a steady visitor rate to these areas during the Turtle Nesting Season.
The Ministry of Tourism has also attempted to be the catalyst for the devel-opment of stay-over accommodation facili-ties within the region. It is understood that with the carrying capacity of the beaches saturated, the visitors must be enticed to stay over and participate in other activities within the same area. This is actually being realised with the establishment of a Visitor centre at Grande Riviere and recreational facilities at the Salibea area by the Ministry of Tourism. This partnership between the NGOs and the Ministry of Tourism is a hybrid amongst the Conventional Business partnership where revenue generation is the focus, the Corporate Social Responsibility partnership in which marketing opportunities
are established and pursued and Corporate Accountability partnership where some form of rebranding occurs and the Ministry of Tourism is exploiting the eco-tourism niche market by promoting the TVT.
The involvement of BHP Billiton with these NGOs is rather perplexing for a casual observer. However upon care-ful examination of the mandate of BHP Billiton by the Stewardship Approach of its charter this relationship can be classed as a hybrid relationship between Corporate Social Responsibility partnership and Social Economy partnership. It tends to be a Corporate Social Responsibility part-nership in that BHP Billiton is a business entity partnering with a non-business entity (the NGOs) in a voluntary venture which doesn’t bring any returns to BHP Billiton, but which allows the NGOs to accrue busi-ness and managerial expertise and thus, some level of economic return. In terms of the Social Economy partnership, the part-nership is for the sole purpose of sustain-able development of these communities rather than to provide any economic gain to BHP Billiton. What is apparent is that there is overlap in the benefits derived from the various collaborations. As such there will be very little friction amongst them but rather a concentration in the efforts to achieve the results and benefits that the TVT develop-mental plan seeks to achieve.
susTainabiliTy iMpacTs oF TvT
A period of a mere four years has elapsed since the establishment of the TVT in 2006. It can be stated that the start up and estab-lishment period for TVT as compared to other collaborative ventures would indeed be different. This would be so due to the complex nature of this collaborative effort which does not emulate any one established model of cooperation.
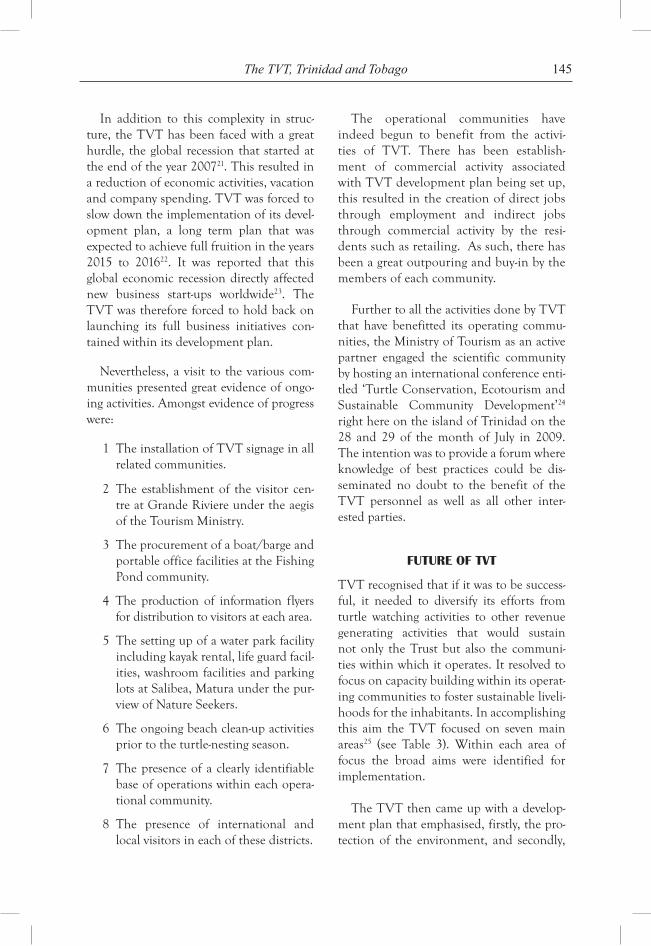
145The TVT, Trinidad and Tobago
In addition to this complexity in struc-ture, the TVT has been faced with a great hurdle, the global recession that started at the end of the year 200721. This resulted in a reduction of economic activities, vacation and company spending. TVT was forced to slow down the implementation of its devel-opment plan, a long term plan that was expected to achieve full fruition in the years 2015 to 201622. It was reported that this global economic recession directly affected new business start-ups worldwide23. The TVT was therefore forced to hold back on launching its full business initiatives con-tained within its development plan.
Nevertheless, a visit to the various com-munities presented great evidence of ongo-ing activities. Amongst evidence of progress were:
1 The installation of TVT signage in all related communities.
2 The establishment of the visitor cen-tre at Grande Riviere under the aegis of the Tourism Ministry.
3 The procurement of a boat/barge and portable office facilities at the Fishing Pond community.
4 The production of information flyers for distribution to visitors at each area.
5 The setting up of a water park facility including kayak rental, life guard facil-ities, washroom facilities and parking lots at Salibea, Matura under the pur-view of Nature Seekers.
6 The ongoing beach clean-up activities prior to the turtle-nesting season.
7 The presence of a clearly identifiable base of operations within each opera-tional community.
8 The presence of international and local visitors in each of these districts.
The operational communities have indeed begun to benefit from the activi-ties of TVT. There has been establish-ment of commercial activity associated with TVT development plan being set up, this resulted in the creation of direct jobs through employment and indirect jobs through commercial activity by the resi-dents such as retailing. As such, there has been a great outpouring and buy-in by the members of each community.
Further to all the activities done by TVT that have benefitted its operating commu-nities, the Ministry of Tourism as an active partner engaged the scientific community by hosting an international conference enti-tled ‘Turtle Conservation, Ecotourism and Sustainable Community Development’24 right here on the island of Trinidad on the 28 and 29 of the month of July in 2009. The intention was to provide a forum where knowledge of best practices could be dis-seminated no doubt to the benefit of the TVT personnel as well as all other inter-ested parties.
FuTure oF TvT
TVT recognised that if it was to be success-ful, it needed to diversify its efforts from turtle watching activities to other revenue generating activities that would sustain not only the Trust but also the communi-ties within which it operates. It resolved to focus on capacity building within its operat-ing communities to foster sustainable liveli-hoods for the inhabitants. In accomplishing this aim the TVT focused on seven main areas25 (see Table 3). Within each area of focus the broad aims were identified for implementation.
The TVT then came up with a develop-ment plan that emphasised, firstly, the pro-tection of the environment, and secondly,
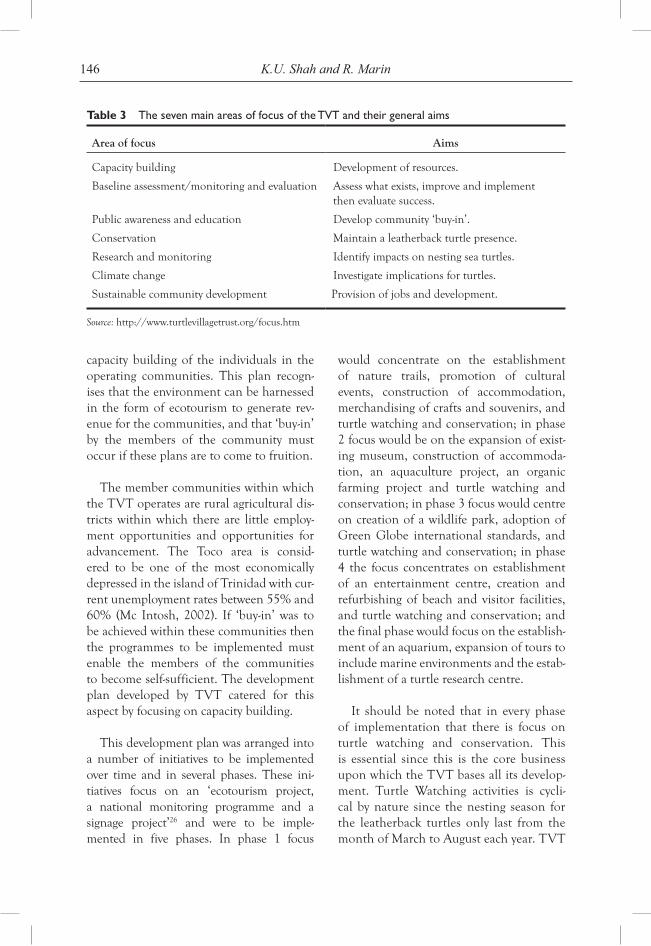
146 K.U. Shah and R. Marin
capacity building of the individuals in the operating communities. This plan recogn-ises that the environment can be harnessed in the form of ecotourism to generate rev-enue for the communities, and that ‘buy-in’ by the members of the community must occur if these plans are to come to fruition.
The member communities within which the TVT operates are rural agricultural dis-tricts within which there are little employ-ment opportunities and opportunities for advancement. The Toco area is consid-ered to be one of the most economically depressed in the island of Trinidad with cur-rent unemployment rates between 55% and 60% (Mc Intosh, 2002). If ‘buy-in’ was to be achieved within these communities then the programmes to be implemented must enable the members of the communities to become self-sufficient. The development plan developed by TVT catered for this aspect by focusing on capacity building.
This development plan was arranged into a number of initiatives to be implemented over time and in several phases. These ini-tiatives focus on an ‘ecotourism project, a national monitoring programme and a signage project’26 and were to be imple-mented in five phases. In phase 1 focus
would concentrate on the establishment of nature trails, promotion of cultural events, construction of accommodation, merchandising of crafts and souvenirs, and turtle watching and conservation; in phase 2 focus would be on the expansion of exist-ing museum, construction of accommoda-tion, an aquaculture project, an organic farming project and turtle watching and conservation; in phase 3 focus would centre on creation of a wildlife park, adoption of Green Globe international standards, and turtle watching and conservation; in phase 4 the focus concentrates on establishment of an entertainment centre, creation and refurbishing of beach and visitor facilities, and turtle watching and conservation; and the final phase would focus on the establish-ment of an aquarium, expansion of tours to include marine environments and the estab-lishment of a turtle research centre.
It should be noted that in every phase of implementation that there is focus on turtle watching and conservation. This is essential since this is the core business upon which the TVT bases all its develop-ment. Turtle Watching activities is cycli-cal by nature since the nesting season for the leatherback turtles only last from the month of March to August each year. TVT
Table 3 The seven main areas of focus of the TVT and their general aims
Area of focus Aims
Capacity building Development of resources.
Baseline assessment/monitoring and evaluation Assess what exists, improve and implement then evaluate success.
Public awareness and education Develop community ‘buy-in’.
Conservation Maintain a leatherback turtle presence.
Research and monitoring Identify impacts on nesting sea turtles.
Climate change Investigate implications for turtles.
Sustainable community development Provision of jobs and development.
Source: http://www.turtlevillagetrust.org/focus.htm
147The TVT, Trinidad and Tobago
will use the revenue generated from the turtle watching activities to fund develop-ment of other projects that will in turn generate revenue after initial start up and allow for further expansion.
There are several positives derived from TVT, these include the possibility of col-laboration amongst NGOs in the form of strategic bridging to achieve common outcomes; and the involvement of busi-ness in a professional capacity to guide the development of business plans and to lend management expertise; the involvement of Government to provide branding.
TVT is certainly an entity that can be replicated in the sustainable management of Common Pool Resources. TVT is an example of Sustainable self-governance of Common-Pool Resources. It manages a shared commons amongst several NGOs and operates within the principles as out-lined by Ostrom (1990).
reFerences
BBC News (2010a) Global Recession Knocks Start-Ups, Online: http://news.bbc.co.uk/2/hi/8455361.stm, Retrieved on 2 March 2010.
BBC News (2010b) Global Recession Timeline, Online: http://news.bbc.co.uk/2/hi/business/8242825.stm, Retrieved on 2 March 2010.
BHP Billiton (2010) Angostura Development, Online: http://www.bhpbilliton.com/bbContentRepository/News/RelatedContent/Angostura120303, Last Retrieved on 1 March 2010.
BHP Billiton (2009) BHP Billiton Charter, Online: http://www.bhpbilliton.com/bbContentRepository/docs/workingWith-Integrity, Retrieved on 30 November 2009.
Brown, L.D. (1991) ‘Bridging organisations and sustainable development’, Human Relations, Vol. 44, No. 8, pp.807–831.
Gray, B. (1989) Collaborating: Finding Common Ground for Multiparty Problems, Jossey-Bass: San Francisco, CA.
Gunningham, N. (2004) Green Alliances: Conflict or Cooperation in Environmental Policy, Working paper Series, Australian Centre for Environmental Law.
Hartman, C. and Stafford, E. (1997) ‘Green alliances: building new business with environmental groups’, Long Range Planning, Vol. 30, No. 2, April 1997, pp.184–196.
Mc Intosh, S. (2002) Toco Charts its own Development: A Case Study from Trinidad and Tobago of Effective Local Advocacy and Participation, S.A.D. For Toco. Prepared for Islands of the World vii Conference, June 2002, Prince Edward Island, Canada.
Milne, G.R., Iyer, E.S. and Gooding-Williams, S. (1996) ‘Environmental organisation alliance relationships within and across nonpofit, business, and government sectors’, Journal of Public Policy and Marketing, Vol. 15, No. 2, pp.203–215.
Ministry of Tourism (2010a) Developing a Turtle Community, Online: http://www.tourism.gov.tt/applicationloader.asp?app=newsarticles&cmd=view&articleid=161&prev=, Retrieved on 21 February 2010.
Ministry of Tourism (2010b) International Conference on Turtle Conservation, Online: http://www.tourism.gov.tt/ applicationloader.asp?app=articles&id=950, Last Retrieved on 2 March 2010.
Ministry of Tourism (2010c) Our Role, Online: http://www.tourism.gov.tt/ applicationloader.asp?app=articles&id=762, Retrieved on 21 February 2010.
Nature Seekers (2010a) About Nature Seekers, Online: http://natureseekers.org/about.html, Retrieved on 20 February 2010.
Nature Seekers (2010b) Achievements, Online: http://natureseekers.org/achievements.html, Retrieved on 20 February 2010.
Nature Seekers (2010c) History and Background of Nature Seekers, Online: http://natureseekers.org/history.html, Retrieved on 20 February 2010.
148 K.U. Shah and R. Marin
Ostrom, E. (1990) Governing the Commons: The Evolution of Institutions for Collective Action, Cambridge University Press, Cambridge.
Reed, A.M. and Reed, D. (2009) ‘Partnerships for development: four models of business involvement’, Journal of Business Ethics, Vol. 90, pp.3–37.
SAD For Toco (2010b) Our History, Online: http://www.toco.interconnection.org/ history.htm, Retrieved on 21 February 2010.
SAD For Toco (2010a) Matura to Matelot Network, Online: http://www.toco. interconnection.org/mtom.htm, Retrieved on 21 February 2010.
SAD For Toco (2010c) The Toco Region, Online: http://www.toco.interconnection.org/tocoregion.htm, Retrieved on 21 February 2010.
SOS Tobago (2010) SOS Projects, Online: http://www.sos-tobago.org/SOS%20Projects.html, Retrieved on 21 February 2010.
Stafford, E.R., Polonsky, M.J. and Hartman, C.L. (2000) ‘Environmental NGO-Business collaboration and strategic bridging: a case analysis of the Greenpeace-Foron alliance’, Business Strategy and the Environment, Vol. 9, pp.122–135.
The GEF Small Grants Programme (2010) Marine Turtle Protection, Online: http://sgp.undp.org/web/projects/873/ marine_turtle_protection_tri_92_g51_ 2101_007.html, Retrieved on 21 February 2010.
Turtle Village Trust (2010a) Areas of Focus, Online: http://www.turtlevillagetrust.org/focus.htm, Retrieved on 1 March 2010.
Turtle Village Trust (2010b) History, Online: http://www.turtlevillagetrust.org/history.htm, Retrieved on 28 February 2010.
Turtle Village Trust (2010c) Some of TVT Partners, Online: http://www. turtlevillagetrust.org/partners.htm, Retrieved on 21 February 2010.
Turtle Village Trust (2010d) TVT Activities, Online: http://www.turtlevillagetrust.org/activities.htm, Retrieved on 1 March 2010.
Westley, F. and Vredenburg, H. (1991) ‘Strategic bridging: the collaboration between environ-mentalists and business in the marketing of green products’, Journal of Applied Behavioural Science, Vol. 27, No. 1, pp.65–90.
noTes
1 Turtle Village Trust (2010b).
2 Pers. Communication with S. Mc Latchie of SAD.
3 Source: Nature Seekers (2010a).
4 Source: Nature Seekers (2010c).
5 Nature Seekers (2010b).
6 Turtle Village Trust (2010c).
7 The GEF Small Grants Programme (2010).
8 SOS Tobago (2010).
9 SAD For Toco (2010c).
10 SAD For Toco (2010a)
11 BHP Billiton (2010).
12 Source: BHP Billiton (2009).
13 ibid, p.34.
14 ibid.
15 ibid, p.30.
16 Ministry of Tourism (2010c).
17 Ministry of Tourism (2010a).
18 After Reed and Reed (2009).
19 ibid.
20 ibid.
21 BBC News (2010b).
22 Personal correspondence with S. Narine. Chairman of TVT, 2009
23 BBC News (2010a).
24 Ministry of Tourism (2010b).
25 Turtle Village Trust (2010a).
26 Turtle Village Trust (2010d).
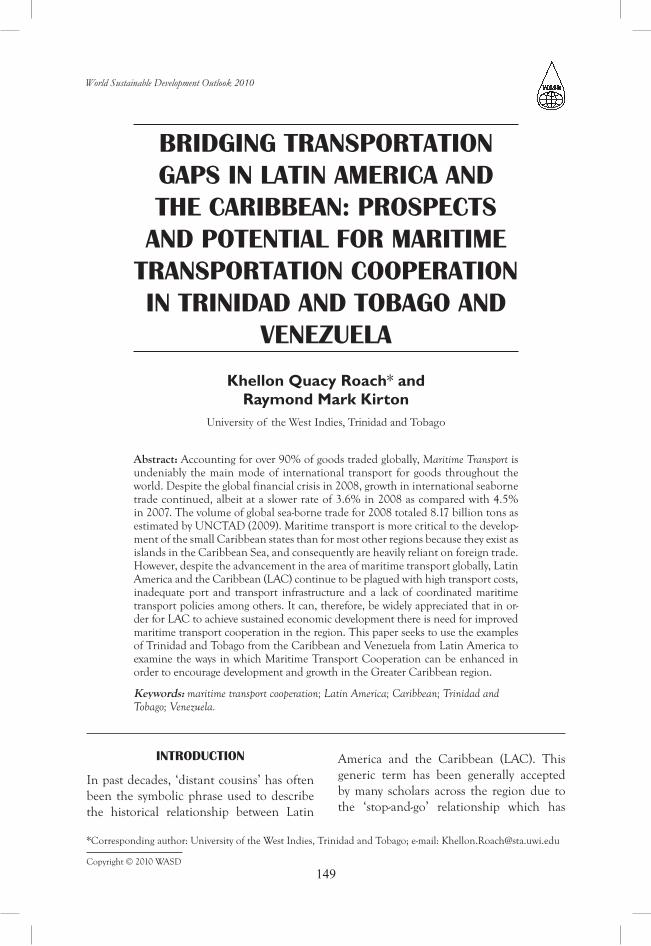
Copyright © 2010 WASD
World Sustainable Development Outlook 2010
149
Bridging transportation gaps in Latin america and the cariBBean: prospects
and potentiaL for maritime transportation cooperation in trinidad and toBago and
VenezueLa
Khellon Quacy Roach* and Raymond Mark Kirton
University of the West Indies, Trinidad and Tobago
Abstract: Accounting for over 90% of goods traded globally, Maritime Transport is undeniably the main mode of international transport for goods throughout the world. Despite the global financial crisis in 2008, growth in international seaborne trade continued, albeit at a slower rate of 3.6% in 2008 as compared with 4.5% in 2007. The volume of global sea-borne trade for 2008 totaled 8.17 billion tons as estimated by UNCTAD (2009). Maritime transport is more critical to the develop-ment of the small Caribbean states than for most other regions because they exist as islands in the Caribbean Sea, and consequently are heavily reliant on foreign trade. However, despite the advancement in the area of maritime transport globally, Latin America and the Caribbean (LAC) continue to be plagued with high transport costs, inadequate port and transport infrastructure and a lack of coordinated maritime transport policies among others. It can, therefore, be widely appreciated that in or-der for LAC to achieve sustained economic development there is need for improved maritime transport cooperation in the region. This paper seeks to use the examples of Trinidad and Tobago from the Caribbean and Venezuela from Latin America to examine the ways in which Maritime Transport Cooperation can be enhanced in order to encourage development and growth in the Greater Caribbean region.
Keywords: maritime transport cooperation; Latin America; Caribbean; Trinidad and Tobago; Venezuela.
introduction
In past decades, ‘distant cousins’ has often been the symbolic phrase used to describe the historical relationship between Latin
America and the Caribbean (LAC). This generic term has been generally accepted by many scholars across the region due to the ‘stop-and-go’ relationship which has
*Corresponding author: University of the West Indies, Trinidad and Tobago; e-mail: [email protected]
150 R.M. Kirton and K.Q. Roach
characterised the interactions between these two sub-regions since the 1960s.
More contemporarily however, as we enter the second decade of the 21st cen-tury, the global economy is emerging with a different face. This phenomenon is not only reflected in the reconfiguration of the G8 to the G20, but also, one can observe that countries such as Brazil, Russia, India, China and South Africa commonly known as the BRICS in addition to the NEXT 11 Group of countries, and Asia and Venezuela are on the rise and can be seen as the most significant changes in the Global South.
Cognizant of this reality, leading offi-cials of LAC are now entering into several new dimensions of cooperation including energy, food, environmental and physical infrastructure integration. This new thrust towards greater and more diverse areas of Latin America-Caribbean cooperation is reflected in several instances, most nota-bly, the first ever Latin America-Caribbean Summit on Integration and Development in Bahia, Brazil in 2008, the Unity Summit in Cancun, Mexico in 2010 and more recently the first Brazil-CARICOM Summit in Brasília, Brazil in April 2010. These meetings coupled with quite a few other developments taking place in the hemisphere such as the Initiative for the Integration of Regional Infrastructure in South America (IIRSA), undoubtedly sig-nal a ‘new day’ in Latin America-Caribbean relations.
While the new areas of cooperation (including but not limited to energy, infra-structure, environmental, security) iden-tified by the leaders of LAC are indeed becoming more prominent, noticeably, the area of Maritime Transport has not received sufficient attention, especially
given its importance in the 21st century not only globally but to both sub-regions. The Caribbean Sea and other surrounding waters is one area which offers a unique prospect for the independent nations of the Caribbean and Latin America to engage in effective functional cooperation for the long term benefit of all.
the importance of maritime transport gLoBaLLY
Maritime transport accounts for over 90% of merchandise traded globally making it the main mode of international transport for goods throughout the world. According to recent estimates, international seaborne trade for 2007 stood at 8.02 billion tons, a volume that represents an increase in excess of 4% from 2006 (UNCTAD, 2008). Main bulks (which includes iron ore, grain, coal, bauxite/alumina and phosphate) in addition to other dry cargo accounted for the largest share of goods loaded (66%) in that year, while oil accounted for the remaining 34% (UNCTAD, 2008) See Table 1 below.
The importance of maritime transport to the world economy is not only demonstrated in its position as the main mode of trans-port for goods traded globally as indicated above, but more so, it is confirmed by its continued growth despite the global finan-cial crisis. In 2008, growth in international seaborne trade continued, although at a slower rate of 3.6% as compared with 4.5% in 2007 (UNCTAD, 2009). The volume of global seaborne trade for 2008 totaled 8.17 billion tons according to UNCTAD estimates. The resilience of seaborne trans-port noted by its continuous growth in the face of economic and financial turmoil thus illustrates both the critical function and the great dependence of the world economy on its operation.
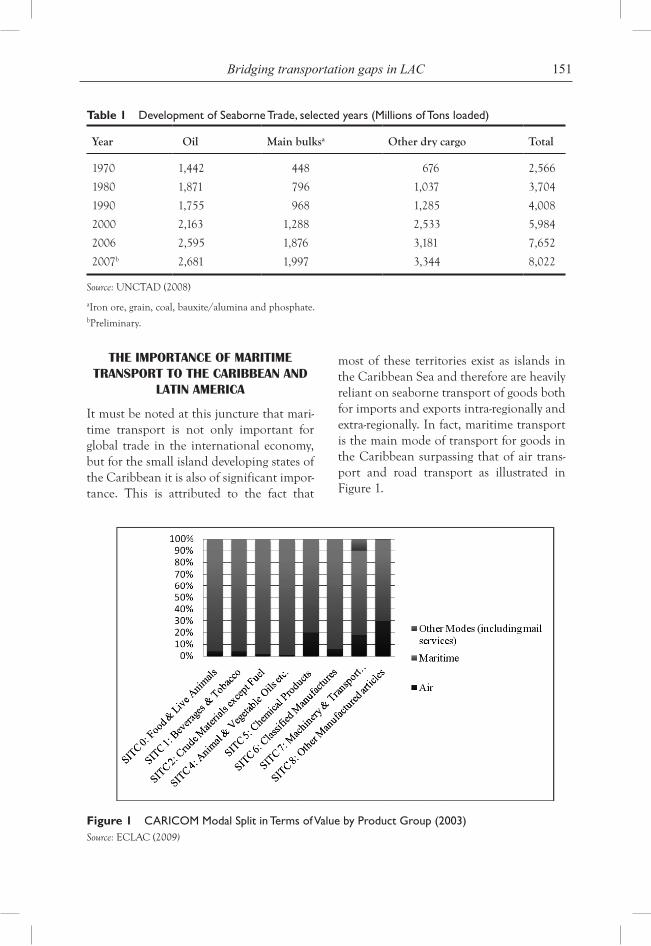
151Bridging transportation gaps in LAC
the importance of maritime transport to the cariBBean and
Latin america
It must be noted at this juncture that mari-time transport is not only important for global trade in the international economy, but for the small island developing states of the Caribbean it is also of significant impor-tance. This is attributed to the fact that
most of these territories exist as islands in the Caribbean Sea and therefore are heavily reliant on seaborne transport of goods both for imports and exports intra-regionally and extra-regionally. In fact, maritime transport is the main mode of transport for goods in the Caribbean surpassing that of air trans-port and road transport as illustrated in Figure 1.
Table 1 Development of Seaborne Trade, selected years (Millions of Tons loaded)
Year Oil Main bulksa Other dry cargo Total
1970 1,442 448 676 2,566
1980 1,871 796 1,037 3,704
1990 1,755 968 1,285 4,008
2000 2,163 1,288 2,533 5,984
2006 2,595 1,876 3,181 7,652
2007b 2,681 1,997 3,344 8,022
Source: UNCTAD (2008)
aIron ore, grain, coal, bauxite/alumina and phosphate.bPreliminary.
Figure 1 CARICOM Modal Split in Terms of Value by Product Group (2003)Source: ECLAC (2009)
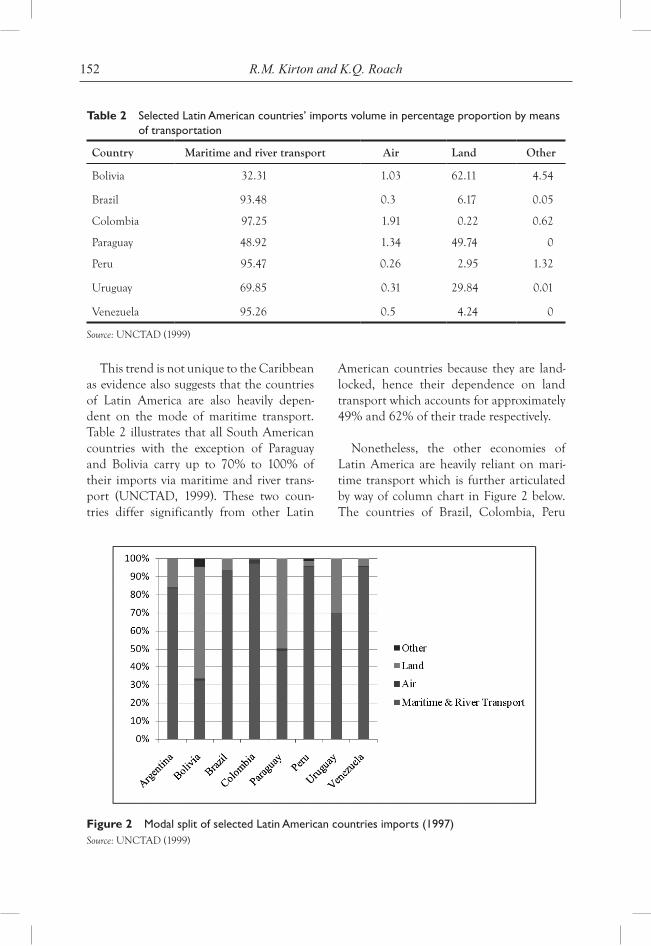
152 R.M. Kirton and K.Q. Roach
This trend is not unique to the Caribbean as evidence also suggests that the countries of Latin America are also heavily depen-dent on the mode of maritime transport. Table 2 illustrates that all South American countries with the exception of Paraguay and Bolivia carry up to 70% to 100% of their imports via maritime and river trans-port (UNCTAD, 1999). These two coun-tries differ significantly from other Latin
American countries because they are land-locked, hence their dependence on land transport which accounts for approximately 49% and 62% of their trade respectively.
Nonetheless, the other economies of Latin America are heavily reliant on mari-time transport which is further articulated by way of column chart in Figure 2 below. The countries of Brazil, Colombia, Peru
Table 2 Selected Latin American countries’ imports volume in percentage proportion by means of transportation
Country Maritime and river transport Air Land Other
Bolivia 32.31 1.03 62.11 4.54
Brazil 93.48 0.3 6.17 0.05
Colombia 97.25 1.91 0.22 0.62
Paraguay 48.92 1.34 49.74 0
Peru 95.47 0.26 2.95 1.32
Uruguay 69.85 0.31 29.84 0.01
Venezuela 95.26 0.5 4.24 0
Source: UNCTAD (1999)
Figure 2 Modal split of selected Latin American countries imports (1997)Source: UNCTAD (1999)
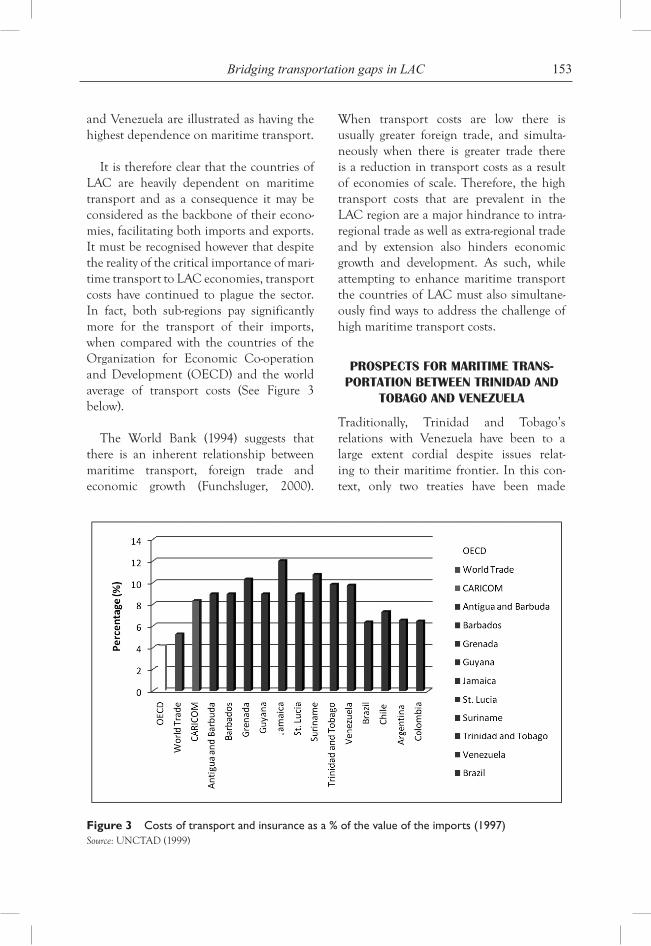
153Bridging transportation gaps in LAC
and Venezuela are illustrated as having the highest dependence on maritime transport.
It is therefore clear that the countries of LAC are heavily dependent on maritime transport and as a consequence it may be considered as the backbone of their econo-mies, facilitating both imports and exports. It must be recognised however that despite the reality of the critical importance of mari-time transport to LAC economies, transport costs have continued to plague the sector. In fact, both sub-regions pay significantly more for the transport of their imports, when compared with the countries of the Organization for Economic Co-operation and Development (OECD) and the world average of transport costs (See Figure 3 below).
The World Bank (1994) suggests that there is an inherent relationship between maritime transport, foreign trade and economic growth (Funchsluger, 2000).
When transport costs are low there is usually greater foreign trade, and simulta-neously when there is greater trade there is a reduction in transport costs as a result of economies of scale. Therefore, the high transport costs that are prevalent in the LAC region are a major hindrance to intra-regional trade as well as extra-regional trade and by extension also hinders economic growth and development. As such, while attempting to enhance maritime transport the countries of LAC must also simultane-ously find ways to address the challenge of high maritime transport costs.
prospects for maritime trans-portation BetWeen trinidad and
toBago and VenezueLa
Traditionally, Trinidad and Tobago’s relations with Venezuela have been to a large extent cordial despite issues relat-ing to their maritime frontier. In this con-text, only two treaties have been made
Figure 3 Costs of transport and insurance as a % of the value of the imports (1997)Source: UNCTAD (1999)
154 R.M. Kirton and K.Q. Roach
to delimit the maritime spaces between Trinidad and Tobago and Venezuela. The first is the Treaty between the UK and the United States of Venezuela in 1942 which related to submarine areas extending from the respective territories. This treaty was later inherited by Trinidad and Tobago in 1962 in light of its transition to indepen-dence. The increase in energy exploitation by the two states thereafter led to a further delimitation of the existing boundaries in 1990, which extended the delimitation boundaries subscribed to in 1942.
This 1990 Treaty on the delimitation of marine and submarine areas between Trinidad and Tobago and Venezuela states in its preamble that both states will “resolve in a true spirit of cooperation and friendship to settle permanently as good neighbours the limits of the marine and submarine areas within which respective Governments exercise sovereignty, sover-eign rights and jurisdiction through the establishment of a precise and equitable maritime boundary between the two coun-tries” (United Nations, 1990). As such, it can be noted that maritime relations between the two states have been handled with great diplomacy throughout the years.
Trusted diplomatic activity between the two oil producing neighbours regarding their maritime frontier has been strength-ened with the recent signing of the ‘unit-ization of reserves’ accord, a long awaited agreement to develop natural gas reserves on their maritime border. Not only will the signing of this accord develop natural gas reserves but it will also avoid future conflicts about what quantities should be afforded to each side. Trinidad and Tobago’s Minister of Energy, Mrs. Carolyn Seepersad-Bachan is reported as saying that, “it is the first of its kind in the region and speaks volumes
for how much we as nations and as an entire region have matured in our cross-border rela-tions” (Energy-Pedia, 2010). In light of these developments one can therefore posit that relations between Trinidad and Tobago and Venezuela have entered into a new phase despite their traditional distant relations. Therefore, new areas of cooperation must be envisioned, and one of which seems to have great prospects is maritime transport cooperation.
Short Sea Shipping (SSS)
Trinidad is situated as the southernmost island of the Caribbean archipelago and thus sits just above the South American mainland. Venezuela is situated as the north-ernmost country on the South American mainland and thus sits just under the Caribbean archipelago of islands. In fact, to emphasise the close geographic proxim-ity between Trinidad and Venezuela, it can be noted that both countries are washed by three oceans, namely, the Caribbean Sea, the Gulf of Paria and the Columbus Channel. At the closest point Trinidad is just 7 miles off the Venezuelan coast, which is actually closer that Tobago which is approximately 20 miles northeast of Trinidad (See Map 1 below).
It is in this context (close geographic proximity) that SSS must be considered as an option to enhance maritime transport relations between Trinidad and Tobago and Venezuela. SSS does not have a concise definition that is recognised internationally, however, for the purpose of this paper SSS shall refer to “commercial waterborne trans-portation that does not transit the wider ocean. It is an alternative form of com-mercial maritime transportation between the ports of a nation as well as between a nation’s ports and the ports of adjacent countries” (ECLAC, 2005).
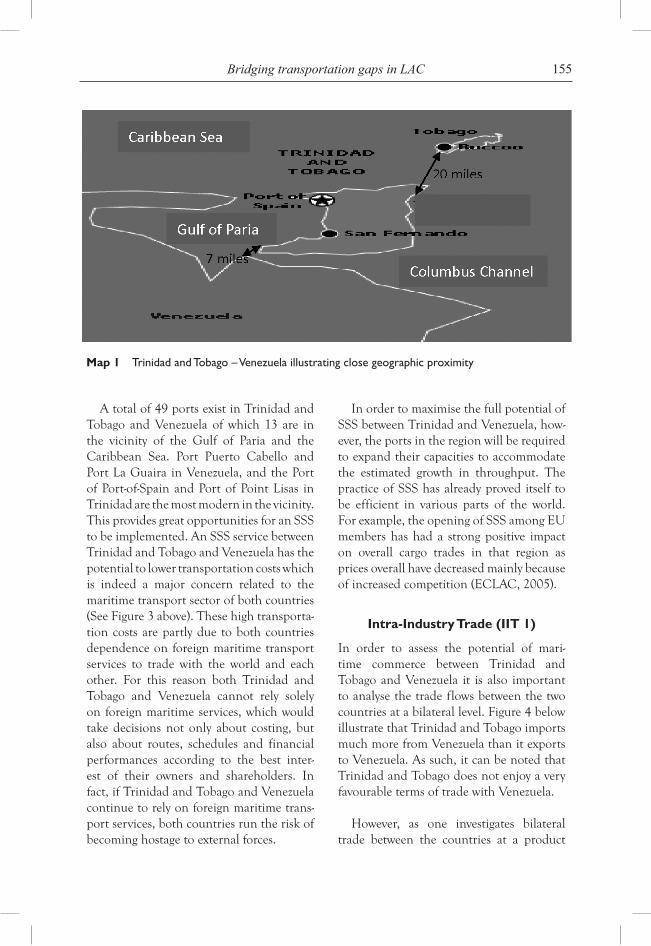
155Bridging transportation gaps in LAC
A total of 49 ports exist in Trinidad and Tobago and Venezuela of which 13 are in the vicinity of the Gulf of Paria and the Caribbean Sea. Port Puerto Cabello and Port La Guaira in Venezuela, and the Port of Port-of-Spain and Port of Point Lisas in Trinidad are the most modern in the vicinity. This provides great opportunities for an SSS to be implemented. An SSS service between Trinidad and Tobago and Venezuela has the potential to lower transportation costs which is indeed a major concern related to the maritime transport sector of both countries (See Figure 3 above). These high transporta-tion costs are partly due to both countries dependence on foreign maritime transport services to trade with the world and each other. For this reason both Trinidad and Tobago and Venezuela cannot rely solely on foreign maritime services, which would take decisions not only about costing, but also about routes, schedules and financial performances according to the best inter-est of their owners and shareholders. In fact, if Trinidad and Tobago and Venezuela continue to rely on foreign maritime trans-port services, both countries run the risk of becoming hostage to external forces.
In order to maximise the full potential of SSS between Trinidad and Venezuela, how-ever, the ports in the region will be required to expand their capacities to accommodate the estimated growth in throughput. The practice of SSS has already proved itself to be efficient in various parts of the world. For example, the opening of SSS among EU members has had a strong positive impact on overall cargo trades in that region as prices overall have decreased mainly because of increased competition (ECLAC, 2005).
Intra-Industry Trade (IIT 1)
In order to assess the potential of mari-time commerce between Trinidad and Tobago and Venezuela it is also important to analyse the trade flows between the two countries at a bilateral level. Figure 4 below illustrate that Trinidad and Tobago imports much more from Venezuela than it exports to Venezuela. As such, it can be noted that Trinidad and Tobago does not enjoy a very favourable terms of trade with Venezuela.
However, as one investigates bilateral trade between the countries at a product
Map 1 Trinidad and Tobago – Venezuela illustrating close geographic proximity
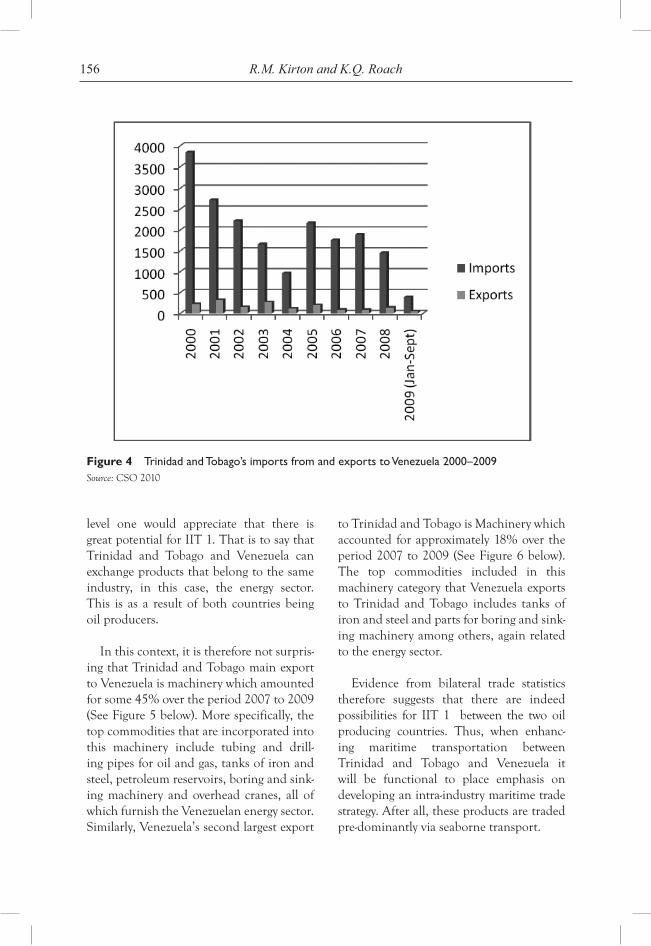
156 R.M. Kirton and K.Q. Roach
level one would appreciate that there is great potential for IIT 1. That is to say that Trinidad and Tobago and Venezuela can exchange products that belong to the same industry, in this case, the energy sector. This is as a result of both countries being oil producers.
In this context, it is therefore not surpris-ing that Trinidad and Tobago main export to Venezuela is machinery which amounted for some 45% over the period 2007 to 2009 (See Figure 5 below). More specifically, the top commodities that are incorporated into this machinery include tubing and drill-ing pipes for oil and gas, tanks of iron and steel, petroleum reservoirs, boring and sink-ing machinery and overhead cranes, all of which furnish the Venezuelan energy sector. Similarly, Venezuela’s second largest export
to Trinidad and Tobago is Machinery which accounted for approximately 18% over the period 2007 to 2009 (See Figure 6 below). The top commodities included in this machinery category that Venezuela exports to Trinidad and Tobago includes tanks of iron and steel and parts for boring and sink-ing machinery among others, again related to the energy sector.
Evidence from bilateral trade statistics therefore suggests that there are indeed possibilities for IIT 1 between the two oil
producing countries. Thus, when enhanc-ing maritime transportation between Trinidad and Tobago and Venezuela it will be functional to place emphasis on developing an intra-industry maritime trade strategy. After all, these products are traded pre-dominantly via seaborne transport.
Figure 4 Trinidad and Tobago’s imports from and exports to Venezuela 2000–2009Source: CSO 2010
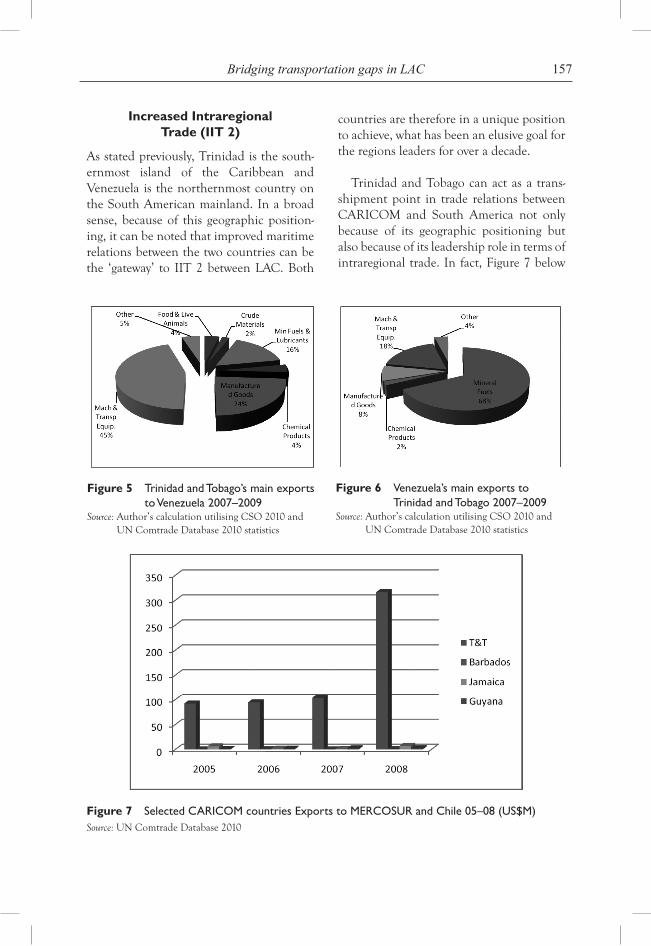
157Bridging transportation gaps in LAC
Increased Intraregional Trade (IIT 2)
As stated previously, Trinidad is the south-ernmost island of the Caribbean and Venezuela is the northernmost country on the South American mainland. In a broad sense, because of this geographic position-ing, it can be noted that improved maritime relations between the two countries can be the ‘gateway’ to IIT 2 between LAC. Both
countries are therefore in a unique position to achieve, what has been an elusive goal for the regions leaders for over a decade.
Trinidad and Tobago can act as a trans-shipment point in trade relations between CARICOM and South America not only because of its geographic positioning but also because of its leadership role in terms of intraregional trade. In fact, Figure 7 below
Figure 5 Trinidad and Tobago’s main exports to Venezuela 2007–2009
Source: Author’s calculation utilising CSO 2010 and UN Comtrade Database 2010 statistics
Figure 6 Venezuela’s main exports to Trinidad and Tobago 2007–2009
Source: Author’s calculation utilising CSO 2010 and UN Comtrade Database 2010 statistics
Figure 7 Selected CARICOM countries Exports to MERCOSUR and Chile 05–08 (US$M)Source: UN Comtrade Database 2010
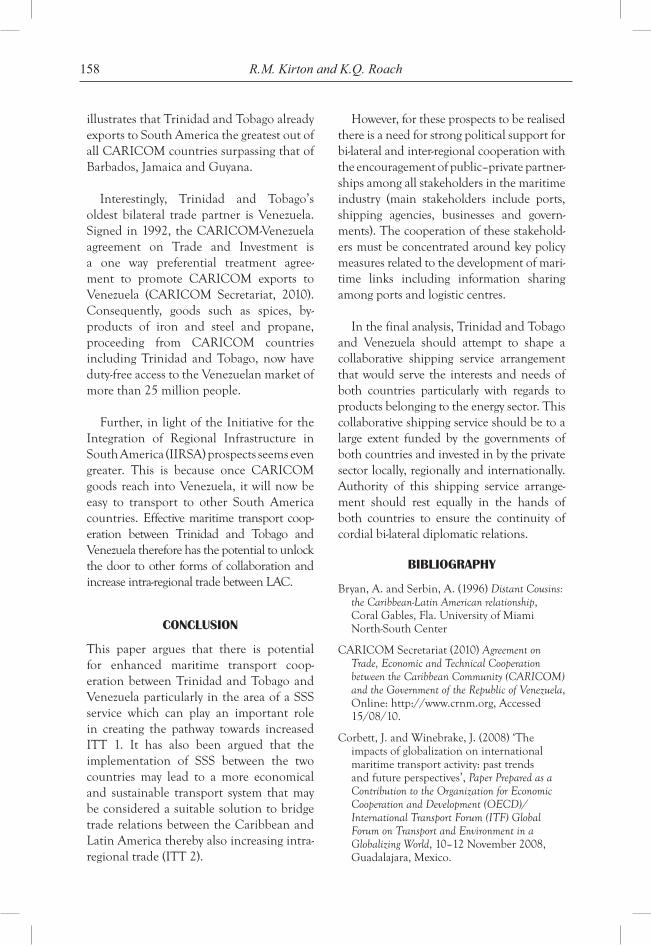
158 R.M. Kirton and K.Q. Roach
illustrates that Trinidad and Tobago already exports to South America the greatest out of all CARICOM countries surpassing that of Barbados, Jamaica and Guyana.
Interestingly, Trinidad and Tobago’s oldest bilateral trade partner is Venezuela. Signed in 1992, the CARICOM-Venezuela agreement on Trade and Investment is a one way preferential treatment agree-ment to promote CARICOM exports to Venezuela (CARICOM Secretariat, 2010). Consequently, goods such as spices, by-products of iron and steel and propane, proceeding from CARICOM countries including Trinidad and Tobago, now have duty-free access to the Venezuelan market of more than 25 million people.
Further, in light of the Initiative for the Integration of Regional Infrastructure in South America (IIRSA) prospects seems even greater. This is because once CARICOM goods reach into Venezuela, it will now be easy to transport to other South America countries. Effective maritime transport coop-eration between Trinidad and Tobago and Venezuela therefore has the potential to unlock the door to other forms of collaboration and increase intra-regional trade between LAC.
concLusion
This paper argues that there is potential for enhanced maritime transport coop-eration between Trinidad and Tobago and Venezuela particularly in the area of a SSS service which can play an important role in creating the pathway towards increased ITT 1. It has also been argued that the implementation of SSS between the two countries may lead to a more economical and sustainable transport system that may be considered a suitable solution to bridge trade relations between the Caribbean and Latin America thereby also increasing intra-regional trade (ITT 2).
However, for these prospects to be realised there is a need for strong political support for bi-lateral and inter-regional cooperation with the encouragement of public–private partner-ships among all stakeholders in the maritime industry (main stakeholders include ports, shipping agencies, businesses and govern-ments). The cooperation of these stakehold-ers must be concentrated around key policy measures related to the development of mari-time links including information sharing among ports and logistic centres.
In the final analysis, Trinidad and Tobago and Venezuela should attempt to shape a collaborative shipping service arrangement that would serve the interests and needs of both countries particularly with regards to products belonging to the energy sector. This collaborative shipping service should be to a large extent funded by the governments of both countries and invested in by the private sector locally, regionally and internationally. Authority of this shipping service arrange-ment should rest equally in the hands of both countries to ensure the continuity of cordial bi-lateral diplomatic relations.
BiBLiographY
Bryan, A. and Serbin, A. (1996) Distant Cousins: the Caribbean-Latin American relationship, Coral Gables, Fla. University of Miami North-South Center
CARICOM Secretariat (2010) Agreement on Trade, Economic and Technical Cooperation between the Caribbean Community (CARICOM) and the Government of the Republic of Venezuela, Online: http://www.crnm.org, Accessed 15/08/10.
Corbett, J. and Winebrake, J. (2008) ‘The impacts of globalization on international maritime transport activity: past trends and future perspectives’, Paper Prepared as a Contribution to the Organization for Economic Cooperation and Development (OECD)/International Transport Forum (ITF) Global Forum on Transport and Environment in a Globalizing World, 10–12 November 2008, Guadalajara, Mexico.
159Bridging transportation gaps in LAC
Clarke, F. (1994) ‘Regional integration theory and the association of Caribbean States: the issue of the Widening Caricom’, Paper Presented at the 19th Annual Conference of the Caribbean Studies Association on the Theme: The Caribbean and Global Regionalization: Facing Challenges in the New Environment, Working Group No.8: Regionalization, Integration and Intergovernmental Organizations, 23–28 May.
ECLAC (2005) Bridging Infrastructural Gaps in Central America: Prospects and Potential for Maritime Transport, Natural Resources and Infrastructure Division, Santiago, Chile.
ECLAC (2000) Report of the Experts Meeting on Maritime Transport in the Caribbean, Port-of-Spain, Trinidad and Tobago 14–15 September 2000 (Jointly organized by the Transport Unit, ECLAC, Santiago, and the ECLAC Sub-regional Headquarters for the Caribbean, Port-of-Spain).
ECLAC (2009) Maritime Sector and Ports in the Caribbean: The Case of CARICOM Countries, United Nations Publication.
Energy Pedia (2010) Trinidad and Venezuela to Sign Gas Fields Deal, Online: http://www.energy-pedia.com, Accessed 15/08/10.
Funchsluger, J. (2000) ECLAC Consultant An analysis of maritime transport and its costs for the Caribbean, ECLAC.
Girvan, N. (2007) ‘Reflections on the treatment of asymmetries in Caribbean-Latin American Relations’, Paper Prepared for CDB Panel, Caracas, 29 May.
Hall, K. and Benn, D. (2000) Contending with Destiny: the Caribbean in the 21st Century, Kingston, Jamaica: Ian Randle Publishers.
Hogan, J. (2005) Maritime Transportation, Ports and Shipping, Regional Maritime Programme, Secretariat of the Pacific Community, Suva, Fiji.
IADB (2009) Trade Logistic and Regional Integration in Latin America and the Caribbean, IDB Working Paper Series #IDB – WP – 148.
Ince, B. (1979) Contemporary International Relations of the Caribbean, St. Augustine, Trinidad/Tobago, Institute of International Relations, UWI.
Kirton, C. (2006) Promoting Economic Links between the Integration Schemes of Latin America
and the Caribbean, A CARICOM Perspective on Selected Issues, Trinidad UNECLAC.
Kline, H. and Wiarda, H. (2001) An Introduction to Latin American Politics and Development, Westview Press.
Lewis, P. (2005) ‘Unequal negotiations: small states in the new global economy’, Journal of Eastern Caribbean Studies, Vol. 30, No. 1, March, pp.54–107.
Lewis, V. (2005) ‘Configurations of Caribbean regionalism in the hemisphere and global settings’, Journal of Caribbean International Relations, No.1 Trinidad, UWI Institute of International Relations.
Lewis, V. (2009) ‘Trinidad and Tobago-Eastern Caribbean States integration initiative’, Task Force Report, Port-of-Spain: Office of the Prime Minister, Vol. 2, xxi, p.377.
Ramsaran, R. (1993) Caribbean Economic Policy and South-South Co-operation: Issues Arising from the South Commission Report. The Challenge to the South, The Macmillan Press Ltd.
Rodrigue, J. (2010) ‘Maritime transportation: drivers for the shipping and port industries’, Paper Prepared as a Contribution to the International Transport Forum 2010 – Transport and Innovation: Unleashing the Potential, 26 January 2010, Paris.
Sanders, R. (2005) The Crumbled Small: The Commonwealth Caribbean in World Politics, London, Hansib Publications.
Serbin, A. (1991) ‘The Caricom states and the group of three: a new partnership between Latin America and the Non-Hispanic Caribbean?’ Journal of Inter-American Studies and World Affairs, Vol. 33, No. 2 (Summer).
UNCTAD (1999) Review of Maritime Transport, UNCTAD/RMT (99)/1.
UNCTAD (2002) Review of Maritime Transport, UNCTAD/RMT/2002.
UNCTAD (2008) Review of Maritime Transport, UNCTAD/RMT/2008.
UNCTAD (2009) Review of Maritime Transport, UNCTAD/RMT/2009.
United Nations (1990) Treaty between the Republic of Trinidad and Tobago and the Republic of Venezuela on the Delimitation of Marine and Submarine Areas, 18 April 1990.

Copyright © 2010 WASD
World Sustainable Development Outlook 2010
161
Productive caPacity: a Platform for institutional
change and sustainable develoPment. the case for
develoPing economies
Lamya Kanoo*Ahlia University, Kingdom of Bahrain
Abstract: Globalisation of the world economies has brought about a fragile balance between the opportunities and risks for developing markets. The develop-ment of productive capacity depends on the policy choices, which a nation adopts to manage its domestic infrastructure and national economy with that of the global economies market requirements. The institutional structures of developing economies have developed incrementally towards a dualistic market production structure, lacking domestic market coherence and sustainability. Therefore, creat-ing an institutional infrastructure gap that requires dynamic institutional change, productive capacity measures and deliberate policies to deter path dependency and encourage sustainability.
Keywords: globalisation; policy choices; domestic infrastructure; productive capacity; dualistic market infrastructure gap; path dependency.
introduction
The productive capacity of a nation creates a potentiality of its economic growth and sustainability. Within all markets, there are potential for static or dynamic growth and development resulting from factors such as productive resources, entrepreneurial capa-bilities and production linkages that have incrementally and situation-specifically developed over time. Moreover, as the increasing integration of the developing economies into the global economy is taking place a potential for positive global market
integration encompassing the development of positive productive capacities, through capital accumulation, technological progress and most importantly structural change. On the other side, there is an equal potentiality for the global economy to encourage market development that is unequal and limited within certain domestic market spheres creating instability.
It maybe suggested that the role of insti-tutional infrastructure is the common link that holds the potentiality for creating a
* Corresponding author: Ahlia University, Kingdom of Bahrain, Bahrain; e-mail: [email protected]
162 L. Kanoo
framework for adaptive capacity measures, resulting in sustainable development. The institutional link addresses the fact that there is a noteworthy and differentiated pattern of institutional matrices underlying market exchanges. A similar pattern of institutional development has emerged in advanced market economies of the first world and is being observed in emerging and transitional economies. Hence, the need to address the relationship between sustainable market conditions and institutional development is to identify the characteristics of adaptive efficient features and productive capacity. Moreover, encouraging international devel-opmental policy to support the concept of institutional transformation, as a precursor for sustainable development.
concePt of institutions
In order to address the concept of institu-tions as a framework for development, it is essential to know how it maybe defined and the parameters that are set for this definition.
Institutions as viewed through a Northian perspective is defined as the formal rules and informal constraints including their enforcement mechanisms, such as transac-tion costs, which underlie economic and political exchange and shape human inter-action. Institutions provide the incentive structure for the behaviour of political, economic and other organisations. North (1990, 1994, 2005) argues that economic change and development essentially depend on the adaptive efficiency of a country’s institutional matrix, i.e. a society’s dynamic capability and capacity to craft institutions which are productive, broadly accepted and fair, stable and yet sufficiently flexible to adapt to new circumstances as a response to exogenous shocks or to growing tensions inherent to society’s development.
Productive capacities, on the other hand, are used by international developmental policy agents to describe a basket of policy measures that can be adopted to encourage development. The United Nations, in its programme of LDCs (2001) suggests that the focus should be on both the structural and supply side constraints and encompasses physical infrastructure, technology, human resources, enterprise development, tech-nological capabilities as magic bullets for economic growth and poverty reduction.
Within the sphere of productive capacity building there are three main elements that form the concept, firstly, productive resources, entrepreneurial capabilities and finally production linkages. As these con-cepts take shape, each play a pivotal role in determining the capacity of a developing economy and institutional structure.
Within the three basic elements of pro-ductive capacity building, the middle link begins to emerge as the main link that is responsible for binding the other elements together.
Entrepreneurial capabilities are the core competencies and dynamic or technological capabilities agent. This core group incorpo-rates the sources of authority and control within the developing economies, accu-rately defined by Fukuda-Parr et al. (UNDP, 2002) as a ‘process by which individuals, groups, institutions and societies increase there abilities to (1) perform core functions, solve problems and define and achieve objectives and (2) understand and deal with their development needs in a broad context and in a sustainable manner’. In relation to role of entrepreneurial capabilities within the dynamics of institutional development a clear picture emerges on the importance this core group has on dynamic institu-tional change. North (1990, 2005) sets the
163Productive Capacity
parameters on the definition of the insti-tutional environment, ‘the set of political, social and legal ground rules that establish the basis for production, exchange and dis-tribution, …and institutional arrangements, regular relationships amongst economic agents which govern the way in which they cooperate and compete’.
core comPonents
The effects of e.ntrepreneurial capabilities developing institutional matrices are more successfully noticeable when they result in rapid capital accumulation and potential profit investment opportunities. Hall (2005) suggests that the key lies in the perspective which regards political action as driven by the interests of individual actors, which means that ‘politics is usually about who gets what, when, where and how’. Moreover, as Ahrens (2002) view the effects of this core sector as an actor-centred and rationalist approach, VoC theory conceptualises the political economy as an environment popu-lated with entrepreneurial actors seeking to advance their interests as they construe them and looking for ways to make institu-tions work for them.
Another component of productive capacity is the concept of cumulative causa-tion in which the accumulation of knowl-edge, indigenous market experience from the existing institutional and production infrastructure is used as a platform for a developing economy. Cumulative causa-tion is a gradual and incremental process of market and institutional transforma-tion. Hence, capital accumulation, techno-logical progress and structural change are dynamic and cumulative processes and are always in a state of transformation, progres-sive or regressive. In relation to addressing the problem of developmental institutional
infrastructure gaps, a process of market development will result from the emerging variety of conditions. A complementarity effect results as developing markets create the required frame work for institutional structures. The notion of complementarity Miller (2005) implies that ‘it is not possible for a capitalist regime to easily switch from one system to the other. Self-reinforcing differences imply diversity in the other hand, have their competitive advantage in industries where success is based on building up cumulative knowledge and company-specific skills. Incremental inno-vation prevails in this system’.
Finally, globalisation and global integration of emerging economies creates new opportunities for transformation and development. As a result, capital accumula-tions, technological and structural change with the growth of demand, require the creation of viable domestic markets to sustain development. Globalisation of the market economies involves an, ‘increasing flow of goods and resources across national borders and the emergence of a comple-mentarity set of organisational structures to manage the expending network of interna-tional activity and transactions’ (UNCATD, 1997). With the global integration of developing economies into one global economy, a link is created between the dif-ferent components of productive capacity. The role of entrepreneurial capabilities, in which the actors, groups and organisations direct the resources of industry and market development towards the requirements of global market demands. Hence, through the process of cumulative causation a grad-ual and incremental knowledge of domes-tic market formation emerges. Creating the conditions for developing markets, and in turn, a complementarity effect triggers institutional infrastructure change and transformation.
164 L. Kanoo
the dark side of globalisation
However, there is a dark side to globalisa-tion in which the developing nations will experience an uneven domestic market and institutional infer structure gap making it vulnerable and unsustainable. “It has been shown that the unevenness of globalisation processes has been associated with increas-ing inter-country inequality, as well as widen-ing the gap between the richest and poorest countries (Svedberg, 2004; Milanovic, 2005). Hence, dualistic productions infer structure of domestic markets and institu-tional development is encouraged. Uneven aspect of a hierarchical production network is created depending on the requirements of the market system at that time.
The policy implications that are required to address the problem of fractured and uneven market development of developing economies are vast. The risks of being inte-grated within the global economy can bring a successful international integrated economy or a divided dualistic economic path depen-dent development. It is the responsibility of the developing economies to pursue and adopt the appropriate policy measures that will manage their integration into the global economy. The intended outcome for policy makers of cohesive market and infrastructure development maybe achieved by utilising productive capacities measures because they focus on the whole process of market devel-opment as a cohesive entity that requires all aspects of the domestic market to develop equally. The link between economic growth and poverty reduction is constantly being evaluated. Viewing demand and supply side conditions/constraints in relation to achiev-ing a balanced market system. For instance, catering to relax supply side constraints using indigenous cumulative causation capacities and reinforcing local processes of economic growth.
That policy makers view the domestic market using productive capacity measures, such as entrepreneurial capabilities the core and controlling sector of the economy since developing economies are enterprise and activity specific emphasising economic growth at an individual’s micro level instead of the broader macro level.
Policy makers make the distinction between the growth of productive resources in actual terms and potential terms (fully uti-lised) and the underutilisation of resources, the potential gap of growth rates including the roles of demand and supply. This would help highlight the conditions that encour-age economic growth and poverty-reducing schemes that target pro-poor growth which are more poverty reducing. The path towards development is viewed by many as a cumulative and step-by-step approach.
But in most cases it is still path depen-dent. Policy makers objectives is to build on the infer structure that is already in existence because they view development strategies as an evolutionary process emphasising the key links between economic growth, productive capacity and institutional infrastructure development.
conclusion
The increasing integration of developing national economies into the global econ-omy has created new opportunities for an easy access to new markets, technological knowledge and capital.
On the other end of the globalisation spectrum lies the dark side of the global economy that is responsible for creating a divided and dualistic market and institu-tional infrastructure gap that will lead devel-oping economies into path dependency.
165Productive Capacity
The role of productive capacities measures depends on the policy choices which a developing economy adopts to develop its local market infrastructure. Capital accu-mulation, technological change and struc-tural change are the main components of productive capacities. There is a pivotal link between the roles of productive capacities measures, institutional and infrastructure development and market sustainability.
references
Ahrens, J. (2002) Governance and Economic Development. A Comparative Institutional Analysis, Edward Elgar, Cheltenham and Northampton.
Ahrens. J. and Mengeringhaus, P. (2006) ‘Institutional change and economic transition: market-enhancing governance, Chinese-style’, European Journal of Comparative Economics, Vol. 3, pp. 75–102.
Fukuda-Parr, S., Lopes, C. and Malik, K. (2002) Capacity for Development: New Solutions for Old Problems, Earthscan and UNDP, New York.
Hall, P.A. (2005) Institutional complementar-ity—causes and effects, in: CROUCH, Colin et al. (2005):
Dialogue on ‘Institutional Complementarity and Political Economy’, in: Socio-Economic Review, vol. 3, pp. 359–382.
Hall, P.A. and Soskice, D. (2001) (Eds.) Varieties of Capitalism. The Institutional Foundations of Comparative Advantage, Oxford Press, New York.
Miller, M. (2005) (Ed.). Worlds of Capitalism—Institutions, Governance and Economic Change in the Era of Globalization, Routledge, New York.
Milanovic, B. (2005) Worlds Apart: Measuring International and Global Inequality, Princeton University Press, Princeton.
North, D. (1990, 1994, 2005) Institutional Change and Economic Performance, Cambridge University Press, Cambridge.
United Nations. (2006) The Least Developed Countries Report 2006, What are Productive Capacities, NewYork.
UNCTAD. (1997). Trade and Development Report 1997, Globalization, Distribution and Growth, United Nations Report.
UNCTAD. (2004). The Least Developed Countries Report 2004, Linking International Trade with Poverty Reduction, United Nations Publication.

Copyright © 2010 WASD
World Sustainable Development Outlook 2010
167
OppOrtunities fOr the use Of cOmputer-assisted
instructiOn in enhancing the quality and cOverage Of educatiOn delivery in guyana at the general
secOndary schOOl level
Louis Dodson* and Dianna A. DaSilvaUniversity of Guyana, Guyana
Abstract: The main thesis of this paper is that Information and Communication Technologies (ICTs) hold tremendous opportunities for enhancing the quality and coverage of public goods in developing countries. Within this context, the paper examines, through a SWOT analysis, the opportunity for using Computer-Assisted Instruction (CAI) to enhance the quality and coverage of education delivery in Guy-ana at the General Secondary School (GSS) level. Its main conclusion in this regard, is that through the use of CAI, the negative effects which the shortages of trained teachers have on the quality of education delivery at the GSS level, can be reduced if not eliminated. Noteworthy, CAI can be used to support Conventional Teacher-Centered Instruction (CTCI). In addition, it can serve to reduce urban-rural inequal-ity in terms of access to quality secondary education. The paper considers, however, that these opportunities must be predicated on an understanding of the character-istic weaknesses of the education system and the related possible threats to effective application of ICT to education delivery. Of import are the informal dynamics that inter-play in the use of certain ICT in schools, namely computers; the risk of erosion of local educational materials and tools for learning given current indig-enous capacity weaknesses and the increased marketability of trained teachers for the foreign market where the application of ICT to learning occurs on a high-er level. However, this paper suggests that with prudent policy approaches, the weaknesses can be overcome, the threats can be minimised and therefore the opportunities can be accomplished. In this regard, this paper concludes with policy recommendations.
Keywords: Universal Primary Education; Universal Secondary Education; Information Communication Technologies (ICTs); General Secondary Schools; Computer-Assisted Instruction; conventional teacher-centered mode teacher-centered; student-centered.
*Corresponding author: University of Guyana, Guyana; e-mail: [email protected]
168 L. Dodson and D.A. DaSilva
intrOductiOn
Having moved closer towards achieving Millennium Development Goal (MDG) 2 – Universal Primary Education (UPE), the Government of Guyana (GOG), in 2003, embarked on a policy of delivering Universal Secondary Education (USE) (MOE, 2008). This was, seemingly, in recognition that poor access to secondary education can serve to reverse the accomplishment of UPE. Lavy (1996) found that improving access to sec-ondary education in Ghana, did not only improve enrollment at the secondary level but also incentivized the completion of primary school. Similarly, Clemens (2004, p.19) observes that “no country today has achieved over 90% primary net enrollment without having at least roughly 35% second-ary net enrollment”.
As reflected in the 2008–2013 Ministry of Education Strategic Plan (MOESP), USE for Guyana seems to be an issue more of quality than access. The strategy is therefore focused on amalgamating lower secondary schools, which followed a different pro-gramme, deemed to be lower in quality, into General Secondary Schools (GSSs)1 (MOE op. cit.). As a result, all secondary students would be able to present themselves for the Caribbean Secondary Education Certificate (CSEC)2 or an alternative competency-based certificate (ibid).
As reflected also in the 2008–2013 MOESP, good student performance – grades 1 to 3 proficiency – at the CSEC examina-tion is indicative of the delivery of a good quality of secondary education. This is not an implausible measurement. It is within that context, however, that the delivery of USE seems daunting and unachievable.
Student performance at the CSEC examination in core subject areas – English A, Mathematics, Biology, Chemistry, and Physics – remains very poor by the MOESP’s
measurement (ibid.). This is attributed to, among other factors, the continuous short-ages of trained teachers and the resorting to untrained teachers which results in poor quality of secondary education delivery (ibid.). The shortages of trained secondary teachers seem to be a permanent feature in Guyana. Every year, Guyana loses, to foreign education providers, a significant portion of its trained secondary teachers before the age of retirement (ibid.). In fact, for many devel-oping countries, secondary trained teachers are the hardest segment for the teaching profession to attract and most difficult to retain (World Bank, 2005).
According to ‘anecdotal evidence … bet-ter salary options are a major reason’ for the migration of trained secondary teachers from Guyana (MOE op. cit.). And sadly, ‘Guyana in the near future’ will not be able to ‘compete with salaries offered outside of the country’ (ibid.). Sad as the situation may be, however, retreating from the delivery of USE cannot be an option, for it has implica-tions for the sustainable accomplishment of UPE. This makes imperative the need for finding ways by which the quality of second-ary education delivery, insofar as it is nega-tively affected by the continuous shortages of trained teachers, can be enhanced.
One such way can be the use of Information and Communication Technologies (ICTs). Owing to the fact that information and com-munication are at the very center of educa-tion delivery (Blurton, 1999), then ICT can be used to support conventional teacher-centered mode of education delivery. ICT are a diverse set of technological tools and resources used to create, store, communi-cate, display, and manage information by electronic means (UNESCO, 2007). They include such technologies as radio, television, video, DVD, telephone (both fixed line and mobile phones), satellite systems, and com-puter and network hardware and software, as
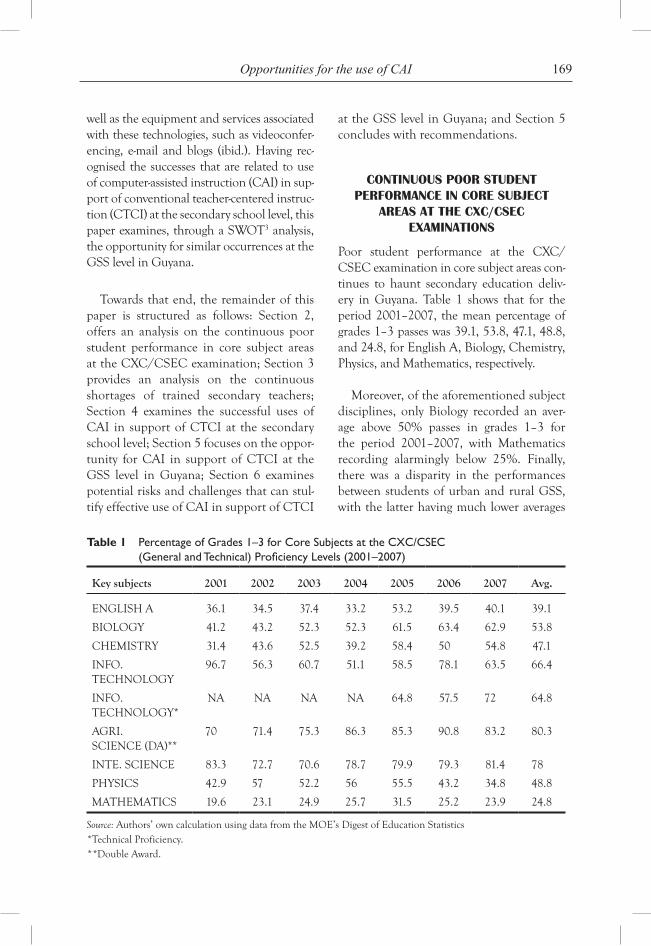
169Opportunities for the use of CAI
well as the equipment and services associated with these technologies, such as videoconfer-encing, e-mail and blogs (ibid.). Having rec-ognised the successes that are related to use of computer-assisted instruction (CAI) in sup-port of conventional teacher-centered instruc-tion (CTCI) at the secondary school level, this paper examines, through a SWOT3 analysis, the opportunity for similar occurrences at the GSS level in Guyana.
Towards that end, the remainder of this paper is structured as follows: Section 2, offers an analysis on the continuous poor student performance in core subject areas at the CXC/CSEC examination; Section 3 provides an analysis on the continuous shortages of trained secondary teachers; Section 4 examines the successful uses of CAI in support of CTCI at the secondary school level; Section 5 focuses on the oppor-tunity for CAI in support of CTCI at the GSS level in Guyana; Section 6 examines potential risks and challenges that can stul-tify effective use of CAI in support of CTCI
at the GSS level in Guyana; and Section 5 concludes with recommendations.
cOntinuOus pOOr student perfOrmance in cOre suBJect
areas at the cXc/csec eXaminatiOns
Poor student performance at the CXC/CSEC examination in core subject areas con-tinues to haunt secondary education deliv-ery in Guyana. Table 1 shows that for the period 2001–2007, the mean percentage of grades 1–3 passes was 39.1, 53.8, 47.1, 48.8, and 24.8, for English A, Biology, Chemistry, Physics, and Mathematics, respectively.
Moreover, of the aforementioned subject disciplines, only Biology recorded an aver-age above 50% passes in grades 1–3 for the period 2001–2007, with Mathematics recording alarmingly below 25%. Finally, there was a disparity in the performances between students of urban and rural GSS, with the latter having much lower averages
Table 1 Percentage of Grades 1–3 for Core Subjects at the CXC/CSEC (General and Technical) Proficiency Levels (2001–2007)
Key subjects 2001 2002 2003 2004 2005 2006 2007 Avg.
ENGLISH A 36.1 34.5 37.4 33.2 53.2 39.5 40.1 39.1
BIOLOGY 41.2 43.2 52.3 52.3 61.5 63.4 62.9 53.8
CHEMISTRY 31.4 43.6 52.5 39.2 58.4 50 54.8 47.1
INFO. TECHNOLOGY
96.7 56.3 60.7 51.1 58.5 78.1 63.5 66.4
INFO. TECHNOLOGY*
NA NA NA NA 64.8 57.5 72 64.8
AGRI. SCIENCE (DA)**
70 71.4 75.3 86.3 85.3 90.8 83.2 80.3
INTE. SCIENCE 83.3 72.7 70.6 78.7 79.9 79.3 81.4 78
PHYSICS 42.9 57 52.2 56 55.5 43.2 34.8 48.8
MATHEMATICS 19.6 23.1 24.9 25.7 31.5 25.2 23.9 24.8
Source: Authors’ own calculation using data from the MOE’s Digest of Education Statistics*Technical Proficiency.**Double Award.
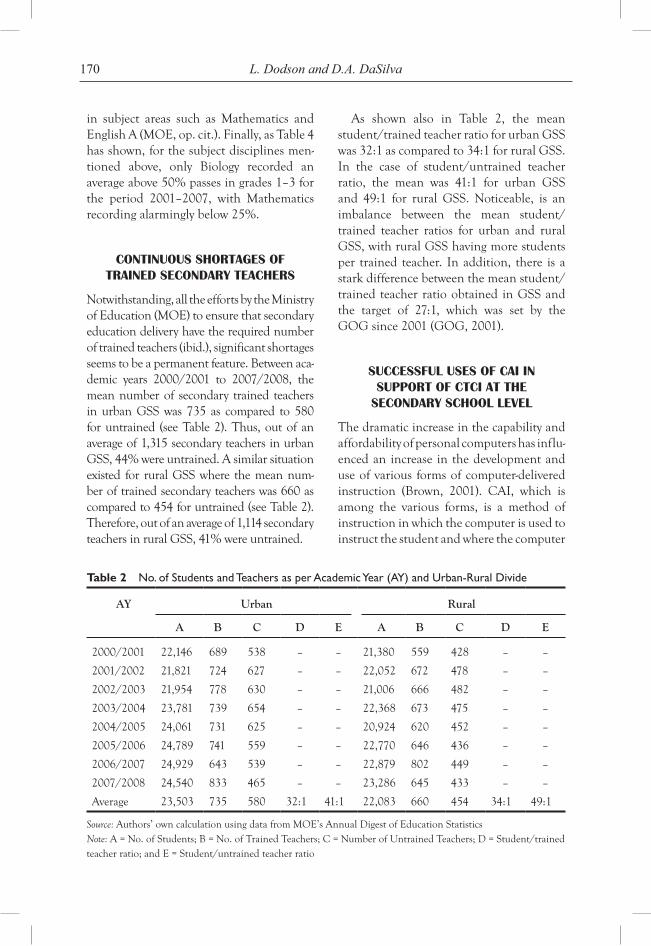
170 L. Dodson and D.A. DaSilva
in subject areas such as Mathematics and English A (MOE, op. cit.). Finally, as Table 4 has shown, for the subject disciplines men-tioned above, only Biology recorded an average above 50% passes in grades 1–3 for the period 2001–2007, with Mathematics recording alarmingly below 25%.
cOntinuOus shOrtages Of trained secOndary teachers
Notwithstanding, all the efforts by the Ministry of Education (MOE) to ensure that secondary education delivery have the required number of trained teachers (ibid.), significant shortages seems to be a permanent feature. Between aca-demic years 2000/2001 to 2007/2008, the mean number of secondary trained teachers in urban GSS was 735 as compared to 580 for untrained (see Table 2). Thus, out of an average of 1,315 secondary teachers in urban GSS, 44% were untrained. A similar situation existed for rural GSS where the mean num-ber of trained secondary teachers was 660 as compared to 454 for untrained (see Table 2). Therefore, out of an average of 1,114 secondary teachers in rural GSS, 41% were untrained.
As shown also in Table 2, the mean student/trained teacher ratio for urban GSS was 32:1 as compared to 34:1 for rural GSS. In the case of student/untrained teacher ratio, the mean was 41:1 for urban GSS and 49:1 for rural GSS. Noticeable, is an imbalance between the mean student/trained teacher ratios for urban and rural GSS, with rural GSS having more students per trained teacher. In addition, there is a stark difference between the mean student/trained teacher ratio obtained in GSS and the target of 27:1, which was set by the GOG since 2001 (GOG, 2001).
successful uses Of cai in suppOrt Of ctci at the
secOndary schOOl level
The dramatic increase in the capability and affordability of personal computers has influ-enced an increase in the development and use of various forms of computer-delivered instruction (Brown, 2001). CAI, which is among the various forms, is a method of instruction in which the computer is used to instruct the student and where the computer
Table 2 No. of Students and Teachers as per Academic Year (AY) and Urban-Rural Divide
AY Urban Rural
A B C D E A B C D E
2000/2001 22,146 689 538 – – 21,380 559 428 – –
2001/2002 21,821 724 627 – – 22,052 672 478 – –
2002/2003 21,954 778 630 – – 21,006 666 482 – –
2003/2004 23,781 739 654 – – 22,368 673 475 – –
2004/2005 24,061 731 625 – – 20,924 620 452 – –
2005/2006 24,789 741 559 – – 22,770 646 436 – –
2006/2007 24,929 643 539 – – 22,879 802 449 – –
2007/2008 24,540 833 465 – – 23,286 645 433 – –
Average 23,503 735 580 32:1 41:1 22,083 660 454 34:1 49:1
Source: Authors’ own calculation using data from MOE’s Annual Digest of Education StatisticsNote: A = No. of Students; B = No. of Trained Teachers; C = Number of Untrained Teachers; D = Student/trained teacher ratio; and E = Student/untrained teacher ratio
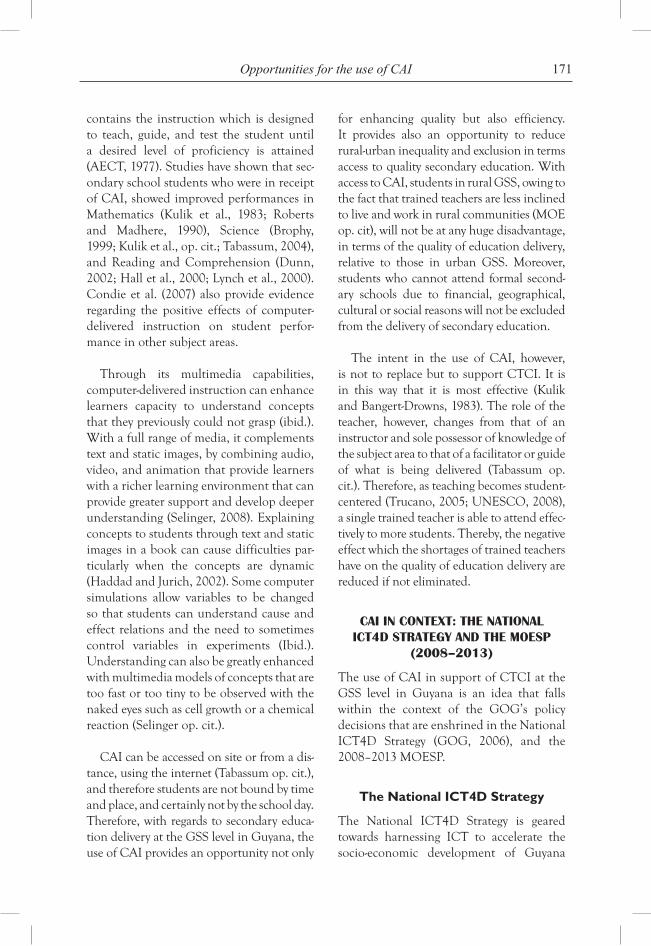
171Opportunities for the use of CAI
contains the instruction which is designed to teach, guide, and test the student until a desired level of proficiency is attained (AECT, 1977). Studies have shown that sec-ondary school students who were in receipt of CAI, showed improved performances in Mathematics (Kulik et al., 1983; Roberts and Madhere, 1990), Science (Brophy, 1999; Kulik et al., op. cit.; Tabassum, 2004), and Reading and Comprehension (Dunn, 2002; Hall et al., 2000; Lynch et al., 2000). Condie et al. (2007) also provide evidence regarding the positive effects of computer-delivered instruction on student perfor-mance in other subject areas.
Through its multimedia capabilities, computer-delivered instruction can enhance learners capacity to understand concepts that they previously could not grasp (ibid.). With a full range of media, it complements text and static images, by combining audio, video, and animation that provide learners with a richer learning environment that can provide greater support and develop deeper understanding (Selinger, 2008). Explaining concepts to students through text and static images in a book can cause difficulties par-ticularly when the concepts are dynamic (Haddad and Jurich, 2002). Some computer simulations allow variables to be changed so that students can understand cause and effect relations and the need to sometimes control variables in experiments (Ibid.). Understanding can also be greatly enhanced with multimedia models of concepts that are too fast or too tiny to be observed with the naked eyes such as cell growth or a chemical reaction (Selinger op. cit.).
CAI can be accessed on site or from a dis-tance, using the internet (Tabassum op. cit.), and therefore students are not bound by time and place, and certainly not by the school day. Therefore, with regards to secondary educa-tion delivery at the GSS level in Guyana, the use of CAI provides an opportunity not only
for enhancing quality but also efficiency. It provides also an opportunity to reduce rural-urban inequality and exclusion in terms access to quality secondary education. With access to CAI, students in rural GSS, owing to the fact that trained teachers are less inclined to live and work in rural communities (MOE op. cit), will not be at any huge disadvantage, in terms of the quality of education delivery, relative to those in urban GSS. Moreover, students who cannot attend formal second-ary schools due to financial, geographical, cultural or social reasons will not be excluded from the delivery of secondary education.
The intent in the use of CAI, however, is not to replace but to support CTCI. It is in this way that it is most effective (Kulik and Bangert-Drowns, 1983). The role of the teacher, however, changes from that of an instructor and sole possessor of knowledge of the subject area to that of a facilitator or guide of what is being delivered (Tabassum op. cit.). Therefore, as teaching becomes student- centered (Trucano, 2005; UNESCO, 2008), a single trained teacher is able to attend effec-tively to more students. Thereby, the negative effect which the shortages of trained teachers have on the quality of education delivery are reduced if not eliminated.
cai in cOnteXt: the natiOnal ict4d strategy and the mOesp
(2008–2013)
The use of CAI in support of CTCI at the GSS level in Guyana is an idea that falls within the context of the GOG’s policy decisions that are enshrined in the National ICT4D Strategy (GOG, 2006), and the 2008–2013 MOESP.
The National ICT4D Strategy
The National ICT4D Strategy is geared towards harnessing ICT to accelerate the socio-economic development of Guyana
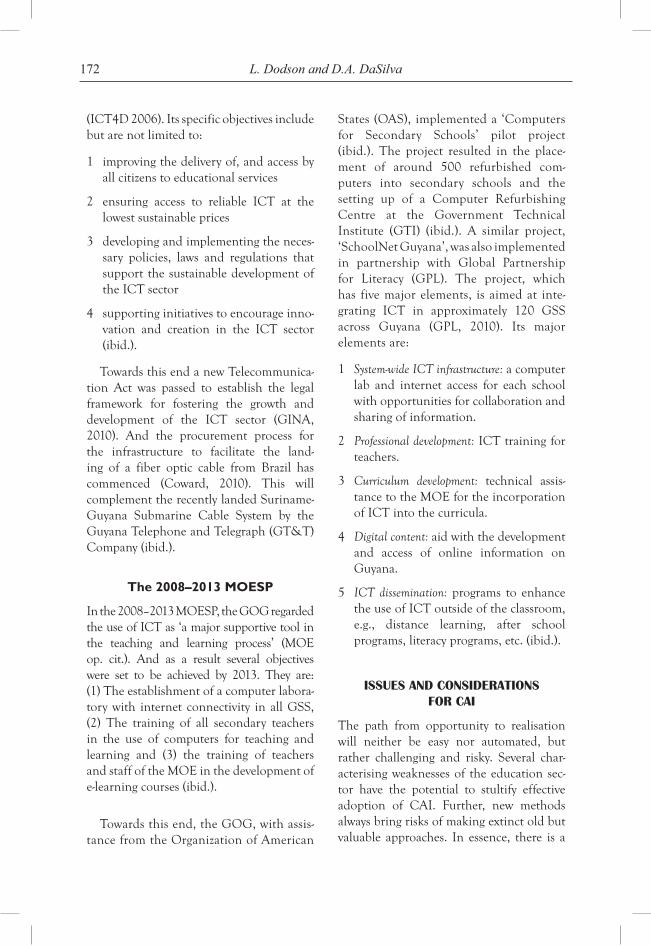
172 L. Dodson and D.A. DaSilva
(ICT4D 2006). Its specific objectives include but are not limited to:
1 improving the delivery of, and access by all citizens to educational services
2 ensuring access to reliable ICT at the lowest sustainable prices
3 developing and implementing the neces-sary policies, laws and regulations that support the sustainable development of the ICT sector
4 supporting initiatives to encourage inno-vation and creation in the ICT sector (ibid.).
Towards this end a new Telecommunica-tion Act was passed to establish the legal framework for fostering the growth and development of the ICT sector (GINA, 2010). And the procurement process for the infrastructure to facilitate the land-ing of a fiber optic cable from Brazil has commenced (Coward, 2010). This will complement the recently landed Suriname-Guyana Submarine Cable System by the Guyana Telephone and Telegraph (GT&T) Company (ibid.).
The 2008–2013 MOESP
In the 2008–2013 MOESP, the GOG regarded the use of ICT as ‘a major supportive tool in the teaching and learning process’ (MOE op. cit.). And as a result several objectives were set to be achieved by 2013. They are: (1) The establishment of a computer labora-tory with internet connectivity in all GSS, (2) The training of all secondary teachers in the use of computers for teaching and learning and (3) the training of teachers and staff of the MOE in the development of e-learning courses (ibid.).
Towards this end, the GOG, with assis-tance from the Organization of American
States (OAS), implemented a ‘Computers for Secondary Schools’ pilot project (ibid.). The project resulted in the place-ment of around 500 refurbished com-puters into secondary schools and the setting up of a Computer Refurbishing Centre at the Government Technical Institute (GTI) (ibid.). A similar project, ‘SchoolNet Guyana’, was also implemented in partnership with Global Partnership for Literacy (GPL). The project, which has five major elements, is aimed at inte-grating ICT in approximately 120 GSS across Guyana (GPL, 2010). Its major elements are:
1 System-wide ICT infrastructure: a computer lab and internet access for each school with opportunities for collaboration and sharing of information.
2 Professional development: ICT training for teachers.
3 Curriculum development: technical assis-tance to the MOE for the incorporation of ICT into the curricula.
4 Digital content: aid with the development and access of online information on Guyana.
5 ICT dissemination: programs to enhance the use of ICT outside of the classroom, e.g., distance learning, after school programs, literacy programs, etc. (ibid.).
issues and cOnsideratiOns fOr cai
The path from opportunity to realisation will neither be easy nor automated, but rather challenging and risky. Several char-acterising weaknesses of the education sec-tor have the potential to stultify effective adoption of CAI. Further, new methods always bring risks of making extinct old but valuable approaches. In essence, there is a
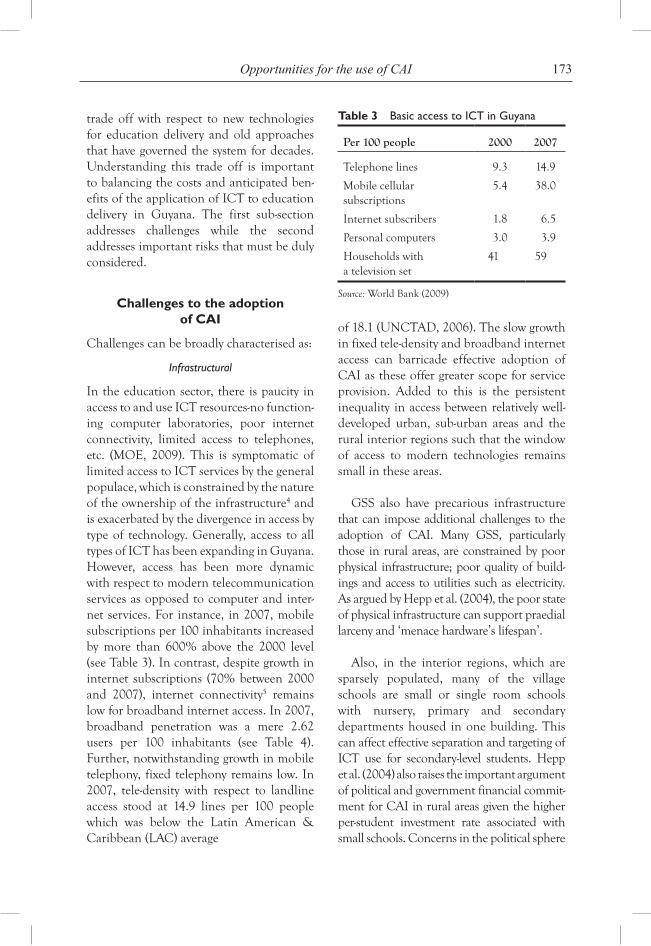
173Opportunities for the use of CAI
trade off with respect to new technologies for education delivery and old approaches that have governed the system for decades. Understanding this trade off is important to balancing the costs and anticipated ben-efits of the application of ICT to education delivery in Guyana. The first sub-section addresses challenges while the second addresses important risks that must be duly considered.
Challenges to the adoption of CAI
Challenges can be broadly characterised as:
Infrastructural
In the education sector, there is paucity in access to and use ICT resources-no function-ing computer laboratories, poor internet connectivity, limited access to telephones, etc. (MOE, 2009). This is symptomatic of limited access to ICT services by the general populace, which is constrained by the nature of the ownership of the infrastructure4 and is exacerbated by the divergence in access by type of technology. Generally, access to all types of ICT has been expanding in Guyana. However, access has been more dynamic with respect to modern telecommunication services as opposed to computer and inter-net services. For instance, in 2007, mobile subscriptions per 100 inhabitants increased by more than 600% above the 2000 level (see Table 3). In contrast, despite growth in internet subscriptions (70% between 2000 and 2007), internet connectivity5 remains low for broadband internet access. In 2007, broadband penetration was a mere 2.62 users per 100 inhabitants (see Table 4). Further, notwithstanding growth in mobile telephony, fixed telephony remains low. In 2007, tele-density with respect to landline access stood at 14.9 lines per 100 people which was below the Latin American & Caribbean (LAC) average
Table 3 Basic access to ICT in Guyana
Per 100 people 2000 2007
Telephone lines 9.3 14.9
Mobile cellular subscriptions
5.4 38.0
Internet subscribers 1.8 6.5
Personal computers 3.0 3.9
Households with a television set
41 59
Source: World Bank (2009)
of 18.1 (UNCTAD, 2006). The slow growth in fixed tele-density and broadband internet access can barricade effective adoption of CAI as these offer greater scope for service provision. Added to this is the persistent inequality in access between relatively well-developed urban, sub-urban areas and the rural interior regions such that the window of access to modern technologies remains small in these areas.
GSS also have precarious infrastructure that can impose additional challenges to the adoption of CAI. Many GSS, particularly those in rural areas, are constrained by poor physical infrastructure; poor quality of build-ings and access to utilities such as electricity. As argued by Hepp et al. (2004), the poor state of physical infrastructure can support praedial larceny and ‘menace hardware’s lifespan’.
Also, in the interior regions, which are sparsely populated, many of the village schools are small or single room schools with nursery, primary and secondary departments housed in one building. This can affect effective separation and targeting of ICT use for secondary-level students. Hepp et al. (2004) also raises the important argument of political and government financial commit-ment for CAI in rural areas given the higher per-student investment rate associated with small schools. Concerns in the political sphere
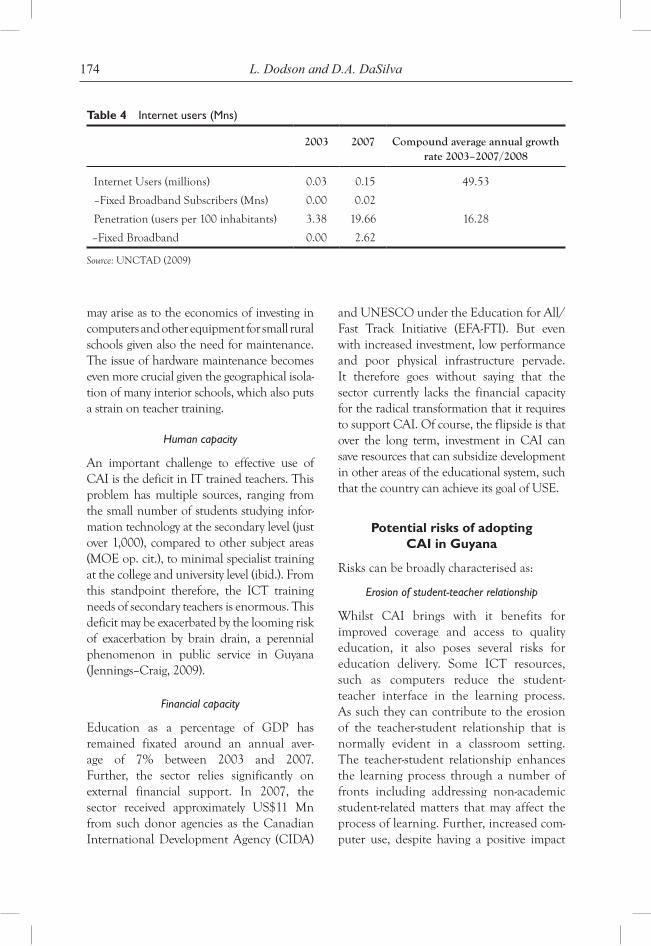
174 L. Dodson and D.A. DaSilva
may arise as to the economics of investing in computers and other equipment for small rural schools given also the need for maintenance. The issue of hardware maintenance becomes even more crucial given the geographical isola-tion of many interior schools, which also puts a strain on teacher training.
Human capacity
An important challenge to effective use of CAI is the deficit in IT trained teachers. This problem has multiple sources, ranging from the small number of students studying infor-mation technology at the secondary level (just over 1,000), compared to other subject areas (MOE op. cit.), to minimal specialist training at the college and university level (ibid.). From this standpoint therefore, the ICT training needs of secondary teachers is enormous. This deficit may be exacerbated by the looming risk of exacerbation by brain drain, a perennial phenomenon in public service in Guyana (Jennings–Craig, 2009).
Financial capacity
Education as a percentage of GDP has remained fixated around an annual aver-age of 7% between 2003 and 2007. Further, the sector relies significantly on external financial support. In 2007, the sector received approximately US$11 Mn from such donor agencies as the Canadian International Development Agency (CIDA)
and UNESCO under the Education for All/Fast Track Initiative (EFA-FTI). But even with increased investment, low performance and poor physical infrastructure pervade. It therefore goes without saying that the sector currently lacks the financial capacity for the radical transformation that it requires to support CAI. Of course, the flipside is that over the long term, investment in CAI can save resources that can subsidize development in other areas of the educational system, such that the country can achieve its goal of USE.
Potential risks of adopting CAI in Guyana
Risks can be broadly characterised as:
Erosion of student-teacher relationship
Whilst CAI brings with it benefits for improved coverage and access to quality education, it also poses several risks for education delivery. Some ICT resources, such as computers reduce the student-teacher interface in the learning process. As such they can contribute to the erosion of the teacher-student relationship that is normally evident in a classroom setting. The teacher-student relationship enhances the learning process through a number of fronts including addressing non-academic student-related matters that may affect the process of learning. Further, increased com-puter use, despite having a positive impact
Table 4 Internet users (Mns)
2003 2007 Compound average annual growth rate 2003–2007/2008
Internet Users (millions) 0.03 0.15 49.53
–Fixed Broadband Subscribers (Mns) 0.00 0.02
Penetration (users per 100 inhabitants) 3.38 19.66 16.28
–Fixed Broadband 0.00 2.62
Source: UNCTAD (2009)
175Opportunities for the use of CAI
on learning, introduces informal dynamics into the classroom that can diminish teacher capacity to control the classroom.
Culture intrusion in education delivery
The lack of human and technical capac-ity for education programme development using ICT increases the likelihood of the erosion of domestic indigenous educational materials and tools and culture intrusion in education delivery. This is primarily because there is likely to be reliance on foreign-devised training materials. Further, even where some technical capacity exists for the development of indigenous educational materials utilis-ing ICT, limited capacity to keep up-to-date with changing hard and software can still contribute to the intrusion of other cultures in education delivery. This is similar to what obtains in many academic textbooks used at the University level. Because of limited capacity to devise illustrations and examples that takes developing countries’ context into consideration, many universities in develop-ing countries utilise textbooks that provide examples pertaining to developed countries.
pOlicy recOmmendatiOns
1 Follow through on the policy decisions as enshrined in the National ICT4D Strategy the MOESP 2008–2013.
2 Study the successes of other coun-tries with a view of adopting a similar approach regarding the use of CAI to support CTCI.
3 Further the liberalisation of communica-tion services in Guyana to expand the window of access to modern ICT tech-nologies in the sub-urban and rural inte-rior regions.
4 Consider offering majors in ICT at CPCE and UG.
5 Pursue more and consolidate existing pub-lic–private partnerships in the delivery of secondary education using ICTs.
BiOgraphy
Louis Dodson is Lecturer of Public Policy in the Department of Government and International Affairs of the University of Guyana. He received a diploma in Public Management and a Bachelor of Science Degree in International Relations from the University of Guyana. He, then, received a Master of Science Degree in International Development: Industry, Trade and Development, from the University of Manchester. His research interest centers on government and public policy. His pub-lic policy background includes 3 years of experience as a senior government officer, with the Government of Guyana.
Dianna DaSilva holds a B.Sc. (Credit.) in Economics from the University of Guyana and a M.Sc. (Distinction) in International Trade Policy from the University of the West Indies, Cave Hill Campus. She is a researcher/lecturer at the Institute of Development Studies, University of Guyana. Her profes-sional skills include statistical analysis, tech-nical and academic writing. Her technical writing experience includes; co-authoring the National Institutional Assessment of the Agricultural Sector for Climate Change Adaptation under a Caribbean Community Climate Change Centre-funded project. She has also presented papers at various confer-ences including the 7th Quest for Global Competitiveness Conference, University of Puerto Rico.
references
AECT (1977) Educational Technology: Definition and Glossary of Terms, Association for Educational Communications and Technology, Vol. 1, Washington, DC.
176 L. Dodson and D.A. DaSilva
Blurton, C. (1999) ‘New directions of ICT-Use in education’, in Tawfik, M., Bartagnon, G. and Courrier, Y. (Eds.): World Communication and Information Report, United Nations Educational, Scientific and Cultural Organization (UNESCO), Paris, France, pp.46–61.
Brophy, K.A. (1999) ‘Is computer-assisted instruction effective in the science classroom?’ Masters Abstracts International, Vol. 37, No. 5 (UMI No. 1393859).
Brown, K.G. (2001) ‘Using computers to deliver training: Which employees learn and why?’ Personnel Psychology, Vol. 54, pp.271–296.
Clemens, M. (2004) The Long Walk to School: International Education Goals in Historical Perspective, Working Paper, No. 37, Center for Global Development, Washington, DC.
Condie, R., Munro, B., Seagraves, L. and Kenesson, S. (2007) The Impact of ICT in Schools: A Landscape Review, Becta Research Publication, Strathclyde.
Dunn, C.A. (2002) An Investigation of the Effects of Computer Assisted Reading Instruction Versus Traditional Reading Instruction on Selected High School Freshmen, Unpublished Dissertation, Loyola University, Chicago.
GINA (2010) Government of Guyana Passes New Telecommunication Law, Government Information Agency, Georgetown, Guyana.
GOG (2001) The Guyana Poverty Reduction Strategy Paper, Government of Guyana, Georgetown.
GOG (2006) National ICT4D Strategy, Online: http:// www.ict4d.gov.gy, Accessed 10/04/10.
GPL (2010) SchoolNet Guyana: A Literacy Project Aimed at Computerizing all Secondary Schools in Guyana, Online: http://www.globalpartner-shipforliteracy.org/.
Haddad, W. and Jurich, S. (2002) ‘ICT for education: potential and potency’, in Haddad, W. and Drexler, A. (Eds.): Technologies for Education: Potentials, Parameters, and Prospects, Academy for Educational Development, Washington, DC, pp.28–40.
Hall, T. et al. (2000) ‘Computer assisted instruction in reading for students with
learning disabilities: a research synthesis’, Education and Treatment of Children, Vol. 23, No. 2, pp.173–193.
Hepp, P.K., Hinostroza, E.S., Lava, E.M. and Rehbein, L.F. (2004) Technology in Schools: Education, ICT and the Knowledge Society, Online: http://www. siteresources. worldbank.org/EDUCATION/Resources/278200, Accessed 10/04/10.
Jennings-Craig, Z. (2009) Hard Road to Travel: The Challenges of Initial Teacher Training in Guyana, Unpublished.
Kulik, J.A. and Bangert-Drowns, R.L. (1983) ‘Effectiveness of technology in precollege mathematics and science teaching’, Journal of Educational Technology Research, Vol. 12, No. 2, pp.137–158.
Kulik, J.A., Bangert, R.L. and Williams, G.W. (1983) ‘Effects of computer-based teaching on secondary school students’, Journal of Educational Psychology, Vol. 75, No. 1, pp.19–26.
Lavy, V. (1996) ‘School supply constraints and children’s educational outcomes in rural Ghana’, Journal of Development Economics, Vol. 51, No. 2, pp.291–314.
Lynch, L. et al. (2000) ‘Computer-assisted reading intervention in a secondary school: an evaluation study’, British Journal of Educational Technology, Vol. 4, No. 31, pp.333–348.
MOE (2009) Reforming Teacher Education and Training in Guyana, Ministry of Education, Georgetown, Guyana.
MOE (2008) Strategic Plan 2008-2013, Ministry of Education, Georgetown, Guyana.
Roberts, V.A. and Madhere, S. (1990) Resource Laboratory Program for Computer Assisted Instruction (CAI) 1989-1990, Evaluation report, Washington, DC.
Selinger, M. (2008) ‘ICT in education: catalyst for development’, in Unwin, T. (Ed.): ICT4D: Information and Communication Technology for Development, Cambridge University, Press Cambridge.
Coward, S. (2010) Guyana: President Discloses Plan for Second Fibre Optic Cable from Brazil, Stabroek News, Georgetown, Guyana.
177Opportunities for the use of CAI
Tabassum, R. (2004) ‘Effect of Computer Assisted Instruction (CAI) on the secondary schools students’ achievement in science’, Doctoral Thesis, University of Arid Agriculture, Unpublished.
Trucano, M. (2005) Knowledge Maps: ICT in Education, infoDev/World Bank, Washington, DC.
UNCTAD (2006) Information Economy Report: The Development Perspective, United Nations Conference on Trade and Development, United Nations, New York.
UNESCO (2007) The UNESCO ICT in Education Programme, United Nations Educational, Scientific and Cultural Organization, Bangkok, Thailand.
UNESCO (2008) ICT Competency Standards for Teachers: Competency Standards Modules, United Nations Educational, Scientific and Cultural Organization, Paris, France.
World Bank (2005) Expanding Opportunities and Building Competencies for Young People: A New Agenda for Secondary Education, World Bank, Washington, DC.
nOtes
1 Notwithatnding, that there are several private GSS, the focus of this paper will be only on public GSS.
2 CSEC is the successor of the Caribbean Examination Certificate (CXC).
3 Strengths, Weaknesses, Opportunities, and Threats.
4 The ICT infrastructure for fixed telephony in Guyana is monopolised by the Guyana Telephone and Telegraph Company (GT&T), which has control over national and interna-tional voice and data transmission.
5 The GT&T provides connectivity to the internet to end-users via a combination of Dial-up, Digital Subscriber Line (DSL) and wireless technologies, directly and indirectly through; privately-operated internet services providers and country-wide public internet access points (internet cafes) (ICT4D 2006).

Copyright © 2010 WASD
World Sustainable Development Outlook 2010
179
A holistic ApproAch to orgAnisAtionAl leArning in mAnufActuring: A model
And A reseArch AgendA
Marcia Nathai-Balkissoon* and Kit Fai PunUniversity of the West Indies, Trinidad & Tobago
Abstract: Structuring learning and maximising the use of knowledge in manufacturing organisations can further Trinidad and Tobago’s (T&T) quest to diversify its energy-based economy, promote sustainable development and enhance the creativity and competence of its population. Existing Organisational Learning (OL) and Knowledge Management (KM) models have not sufficiently integrated soft elements (e.g., culture) and hard elements (e.g., technology) to enable direct application within T&T’s manufacturing sector. This paper discusses the conceptual foundations of OL/KM, and identifies several key OL/KM elements (such as culture, KM tools and instruments, learning processes and learning practices) that would be used to devise a holistic manufacturing OL model. A research agenda is also presented, by which the model would be validated.
Keywords: Knowledge Management; KM; Organisational Learning; OL; holistic model; Trinidad and Tobago; T&T.
introduction
The Republic of Trinidad and Tobago intends to develop competent and inno-vative people. T&T’s work to establish a knowledge-based economy lags similar attempts by many other countries by 15 to 20 years, and from the challenges faced by other countries, it is obvious that develop-ing the values and structures that are key to knowledge-based economies does not happen serendipitously. T&T’s advantage is that it can benefit from the conceptual and empirical work that has been done in Knowledge Management (KM) and its related field, Organisational Learning
(OL). Charting the course would be simplified were there an available guiding framework or model, but a single holistic model does not exist to cover the wide-ranging spectrum of concerns that are spanned by KM and OL, nor have any models been derived for cultures and conditions similar to those of T&T.
Diversifying T&T’s energy-based economy will include the investment of great effort to strengthen and propel the country’s non-en-ergy sector. At least two of the seven priority industries identified for development by the T&T Government (Printing and Packaging
*Corresponding author: University of the West Indies, Trinidad & Tobago; e-mail: [email protected]
180 M. Nathai-Balkissoon and K.F. Pun
and Food & Beverage) belong to the man-ufacturing sector (Ministry of Trade and Industry, 2007). Based on informal discus-sions with several persons in the manufactur-ing sector, it appears that there is a tendency to retain the status quo for much longer than is advantageous. The manufacturing indus-try needs to establish systems to recruit and develop people who want to learn and inno-vate, and it needs to develop an outlook that recognises learning and enhancement as part of our job functions, rather than something we do when there is time.
Without a structured OL system, the cycle of loss of expertise and competitive advan-tage will persist. The organisation and the new incumbent find themselves at a disad-vantage, as past decisions may lose context, developmental plans may go into hiberna-tion or may even regress, the organisation may lose out on opportunities for growth through process improvement, enhanced market share and income increases, or it may even suffer due to reduction of income or loss of job opportunities.
conceptuAl foundAtions of ol And km
What are KM and OL?
According to Gupta et al. (2000), the term KM refers to the need to capture, collate, organise, process and transfer knowledge in support of organisational processes including planning, decision-making and learning. The separate field of OL also arose to support organisa-tional needs related to learning, adaptation and performance excellence (Senge, 1992). Firestone and McElroy (2004) and Zuber-Skerritt (2005) point our that, while KM has traditionally been seen as an IT-intensive function, this is a limiting viewpoint as KM partners with OL to support the human and organisational needs of our industries (Lin and Lee, 2005; Shah et al., 2007).
OL and KM research
Most of the empirical research on OL and KM has been limited to ‘traditional western economies’, i.e., countries such as the USA and parts of Western and Northern Europe (Walczak, 2008). Some work has also been done in other countries like Jordan (Jamali et al., 2009) and Taiwan (Lin and Lee, 2005) but these were either case studies or studies performed in developing countries and so the work could not be generalised for application in wider (international) practice. This work proposes to study a wide cross section of the manufacturing companies in T&T, and there-fore would enable the formulation and testing of an OL model than can be applied through-out the country. Furthermore, given the simi-larities between T&T’s culture and that of other Caribbean islands, the OL model may find wider regional application as well.
Key elements of OL and KM
Many studies have been done in the fields of KM and OL, with several perspectives having been offered, and a wide range of concep-tual models being proposed. Some empirical models have also been developed, but there has not yet been a holistic model that seeks to combine the field’s wide range of consid-erations (e.g., learning processes, organisation culture, organisation structure, KM and learn-ing practices). In this section, several of the contributions from the field are considered.
Organisation structure and culture
Knowledge utilisation depends on several factors, including the degree of organisation structure (Menon and Varadarajan, 1992), trust and partnership within an informa-tion and innovation culture (Edwards and Kidd, 2003; Menon and Varadarajan, 1992, and organisational culture generally Bapuji and Crossan, 2004; Chang and Lee, 2007). These factors would likely address such issues as corporate policies that support
181A holistic approach to OL in manufacturing
learning, empowerment, openness to new ideas, tolerance for mistakes, establish-ment of performance expectations, reward and incentive policies, and even partnering beyond organisational borders. Holtshouse (1999) points out that elements of leader-ship, for example Knowledge Leadership, also impact on knowledge utilisation.
Learning processes
Over the years, learning has been recognised to take place at three different levels: single loop learning where the organisation corrects errors and learns in increments (Argyris and Schon, 1978), double loop learning where the organisation seeks more proactively, to correct and prevent problems (Akgun et al., 2003; Wang and Ahmed, 2003), and triple loop learning (Wang and Ahmed, 2003), through which organisations ‘learn to learn’ or learn strategically, a mode of learning that is prac-ticed by only the most mature organisations. Wang and Ahmed (2003) further emphasise that learning progresses more effectively once organisations recognise the value of organisa-tion unlearning so that they do not wait for current concepts to fail-in-use.
Many authors have discussed the intrica-cies of how learning takes place in organisa-tions. Significant concepts include systems thinking as discussed by Senge (1992), social and cognitive interaction (Akgun et al., 2003), and individual, group and OL cycles that enable individual and collective conversion of emerging knowledge to be embedded in processes, systems and organi-sational culture (Sanchez, 2005). Lee and Roth (2007) are proponents of the emerg-ing view that OL is not just the sum of the learning of individuals and groups, but it is its own form of learning.
Learning tools and practices
A valuable concept is that of tacit knowledge being innately held and being difficult
to codify and capture. One practitioner’s tacit, experiential or living knowledge must be transferred through conversion into explicit knowledge (e.g., through mentoring and storytelling) and back again into tacit knowledge held by another practitioner (Polanyi, 1958). The SECI Model concep-tualised a knowledge spiral through which tacit knowledge is converted to explicit knowledge in order to be shared by one person and back again to tacit knowledge when internalised and adopted by another person, through the continuing sequential process of Socialisation, Externalisation, Combination and Internalisation (Nonaka and Takeuchi, 1995).
The SECI Model also seems well-aligned with Kolb’s (1984) Learning Styles Cycle, which illustrated the value of four stages of learning, namely experiential learning, observation and reflection, abstract con-ceptualisation and active experimentation. Other -models promote active learning styles from both personal (Zuber-Skerritt, 2005) and social perspectives (Boisot, 1998). The establishment of learning practices that are embedded in the organisation’s culture, and that are supported by KM and other tools and instruments are valuable contributors to OL.
Cognitive ability
Finally, cognitive ability is a key OL need (Akgun et al., 2003), in order to effectively utilise learning tools, implement practices, maintain and improve processes and sys-tems, and contribute within and influence the organisation’s culture.
studY hYpotheses
The considerations of several existing mod-els illustrate that, while each model addresses important concerns, there is no one model that is holistic and empirically validated to suit the context of a developing country such as T&T.
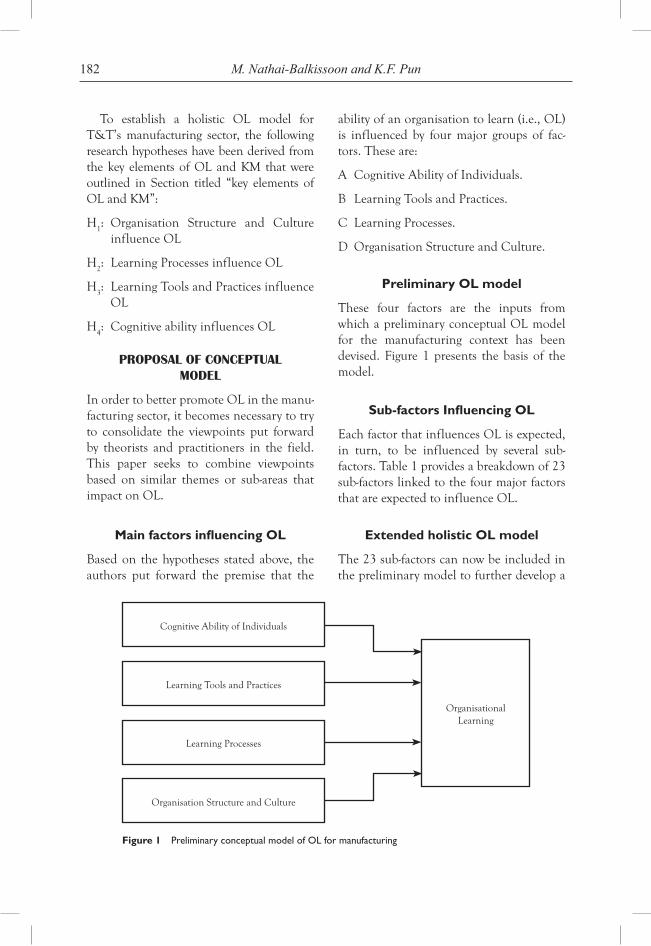
182 M. Nathai-Balkissoon and K.F. Pun
To establish a holistic OL model for T&T’s manufacturing sector, the following research hypotheses have been derived from the key elements of OL and KM that were outlined in Section titled “key elements of OL and KM”:
H1: Organisation Structure and Culture
influence OL
H2: Learning Processes influence OL
H3: Learning Tools and Practices influence
OL
H4: Cognitive ability influences OL
proposAl of conceptuAl model
In order to better promote OL in the manu-facturing sector, it becomes necessary to try to consolidate the viewpoints put forward by theorists and practitioners in the field. This paper seeks to combine viewpoints based on similar themes or sub-areas that impact on OL.
Main factors influencing OL
Based on the hypotheses stated above, the authors put forward the premise that the
ability of an organisation to learn (i.e., OL) is influenced by four major groups of fac-tors. These are:
A Cognitive Ability of Individuals.
B Learning Tools and Practices.
C Learning Processes.
D Organisation Structure and Culture.
Preliminary OL model
These four factors are the inputs from which a preliminary conceptual OL model for the manufacturing context has been devised. Figure 1 presents the basis of the model.
Sub-factors Influencing OL
Each factor that influences OL is expected, in turn, to be influenced by several sub-factors. Table 1 provides a breakdown of 23 sub-factors linked to the four major factors that are expected to influence OL.
Extended holistic OL model
The 23 sub-factors can now be included in the preliminary model to further develop a
Organisational Learning
Cognitive Ability of Individuals
Learning Tools and Practices
Learning Processes
Organisation Structure and Culture
Figure 1 Preliminary conceptual model of OL for manufacturing
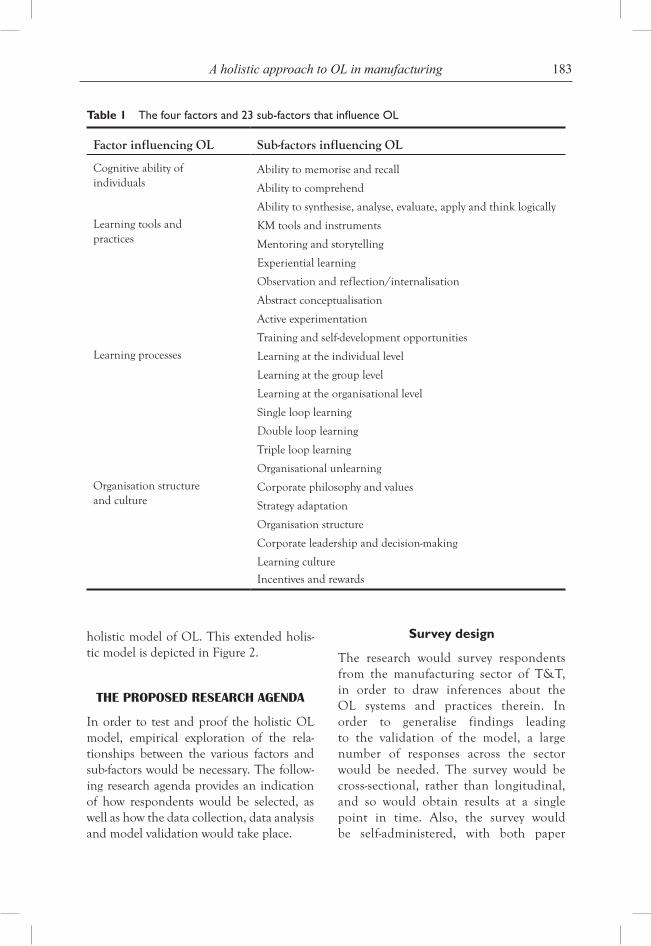
183A holistic approach to OL in manufacturing
holistic model of OL. This extended holis-tic model is depicted in Figure 2.
the proposed reseArch AgendA
In order to test and proof the holistic OL model, empirical exploration of the rela-tionships between the various factors and sub-factors would be necessary. The follow-ing research agenda provides an indication of how respondents would be selected, as well as how the data collection, data analysis and model validation would take place.
Survey design
The research would survey respondents from the manufacturing sector of T&T, in order to draw inferences about the OL systems and practices therein. In order to generalise findings leading to the validation of the model, a large number of responses across the sector would be needed. The survey would be cross-sectional, rather than longitudinal, and so would obtain results at a single point in time. Also, the survey would be self-administered, with both paper
Factor influencing OL Sub-factors influencing OL
Cognitive ability of individuals
Ability to memorise and recall
Ability to comprehend
Ability to synthesise, analyse, evaluate, apply and think logically
Learning tools and practices
KM tools and instruments
Mentoring and storytelling
Experiential learning
Observation and reflection/internalisation
Abstract conceptualisation
Active experimentation
Training and self-development opportunities
Learning processes Learning at the individual level
Learning at the group level
Learning at the organisational level
Single loop learning
Double loop learning
Triple loop learning
Organisational unlearning
Organisation structure and culture
Corporate philosophy and values
Strategy adaptation
Organisation structure
Corporate leadership and decision-making
Learning culture
Incentives and rewards
Table 1 The four factors and 23 sub-factors that influence OL
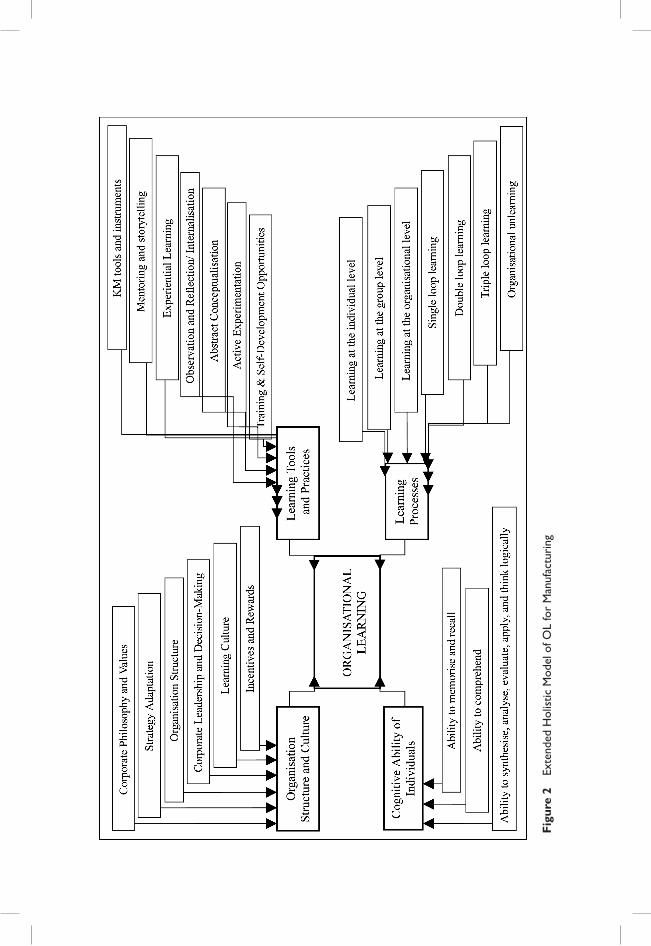
Figu
re 2
Ex
tend
ed H
olis
tic M
odel
of O
L fo
r M
anuf
actu
ring
185A holistic approach to OL in manufacturing
versions and electronic versions of the questionnaire being used depending on the preference of respondents.
Population to be surveyed
It would be difficult to survey all manu-facturing enterprises in T&T, since one comprehensive listing of the entire popula-tion is not held in an accessible database. However, organised membership listings of manufacturing companies’ contact infor-mation are maintained by groups such as the T&T Manufacturers’ Association (TTMA), Trinidad and Tobago Chamber of Industry and Commerce (TTCIC), The Energy Chamber of T&T (ECTT) and Point Lisas Chamber of Industry and Commerce (PLCIC). The largest listing of manufactur-ing enterprises (209) is held by the TTMA; therefore the survey would utilise the TTMA’s publicly accessible database to seek responses from those 209 companies, as a minimum.
Questionnaire development, piloting and revision
A Questionnaire organised around the four factors and the 23 sub-factors would be developed using a Likert-scale to promote clearer interpretation and better quality of responses. The draft questionnaire would be piloted (Creswell, 2009) in a small num-ber of manufacturing organisations in order to check content validity of the instrument and improve the structure, format, scales and understandability of the instrument’s items. The final questionnaire survey items would clearly represent the variables related to each of the four hypotheses.
Questionnaire survey
The revised questionnaire would target a wide cross-section of T&T’s manufacturing
enterprises, with at least 209 companies being approached, as mentioned before. Multiple responses would be sought from each company surveyed, so that the data would represent the opinions of employees, supervisors and managers.
In addition to using introductory/ explanatory letters and confidentiality clauses, collaboration with the TTMA is expected to positively impact on the frequency and quality of survey responses.
Follow-up would be done to evaluate non-response rates, and to contact the tar-get audience in order to encourage ques-tionnaire completion and returns.
Analysis of data
Completed questionnaires would be analy-sed according to the following process:
1 Response data would be collated to reflect the number of responses and non- responses to the survey.
2 Analysis consisting of basic descriptive statistics (e.g., mean, standard deviation and ranges) would be performed for each question item.
3 The instrument would be reviewed for validity by considering content valid-ity, concurrent validity and construct validity.
4 Reliability measurement of the instru-ment, looking at internal consistency, as well as test-retest correlations.
5 Calculation of scores for each company respondent, by averaging Likert response data to determine a score for every state-ment on the questionnaire.
6 Calculation of scores for each company by averaging the scores of all respon-
186 M. Nathai-Balkissoon and K.F. Pun
dents from that particular company, by statement, and then further averaging to obtain scores for each of the factors A, B, C and D.
7 Determination of measures of statisti-cal significance and correlation fac-tors in order to comment on whether the hypotheses were supported, and to determine suitability of the conceptual model. The multivariate statistical analy-sis would likely be conducted using the Statistical Package for Social Sciences (SPSS), Linear Structural Relations System (LISREL) for confirmatory factor analysis, and possibly canonical correla-tion analysis to investigate relationships between pairs of factors.
8 Evaluation and discussion of consis-tency or variability that was highlighted through the data analysis.
Model refinement and validation
Once the correlation and other quantita-tive data have been calculated, the hypoth-eses and the holistic OL model would be refined. Thereafter, a final phase of model validation would be done through data collection through one or two case studies.
discussion
As mentioned earlier, there have been rela-tively few empirical studies to support the OL/KM models that have been published. Furthermore, as noted by Walczak (2008), the dearth of studies outside of ‘traditional western economies’ has created difficulty for developing countries to obtain and adopt a model to fit their context. This research would contribute to the work needed from the developing country context and, while intended for use in T&T, may find applications in other developing countries,
especially the Caribbean Region. Further research should also be done across the Caribbean Region as a whole, as this would lead to the development of an OL model for the entire region, as it moves toward regional integration.
As the research is focusing on the man-ufacturing sector in T&T, there would be benefits from going forward to do further research to examine OL in other sectors, especially those sectors targeted for growth by the Government of T&T.
The research would be conducted through the administration of a question-naire especially developed for this exercise. Use of a questionnaire was considered most appropriate for the purpose as this tool would be economical to adminis-ter, consistent in its survey of the topics/factors of interest, require only a small amount of time from respondents (there-fore making questionnaire returns more likely), and allow data to be collected in a short timeframe from a wide range of respondents (Creswell, 2009) and across a wide geographic area. Case studies and interviews would limit the number of per-sons who could be surveyed, due to the longer timeframes required to collect and analyse data from both the perspectives of the researcher and the respondent.
Based on anecdotal information available to the author, an industry response rate of between 30% and 50% is typical in T&T. The survey approach would include follow up to attempt to influence higher response rates from the target audience. Also, the fact that the questionnaire would allow for anonymity of respondents may enhance participants’ willingness to respond to more sensitive topics (e.g., about leadership or cognitive issues) as they may be perceived as non-threatening issues in the questionnaire format.
187A holistic approach to OL in manufacturing
Design of the questionnaire items will be critical, as the questions must be self-explanatory and comprehensive. Review of successful questionnaires, such as the Dimensions of the Learning Organisation Questionnaire (DLOQ) (Watkins and Marsick, 1998) should inform the develop-ment of the research instrument for this study, in order to positively influence the structure and crafting of the items. Special attention must be paid to the construction of the questionnaire itself, including layout and question validity (i.e., construct and reli-ability), and the methodology has indicated that there would be a piloting stage geared toward pre-testing the instrument to iden-tify problems and guide revisions before the actual survey would be performed.
conclusions
This paper has reviewed several contribu-tions to the related fields of KM and OL, with particular focus placed on understand-ing significant factors which other authors have recognised as contributing to KM and/or OL.
Grounded in the review and the author’s own opinions, a holistic OL model, based on four main hypotheses, has been proposed for the manufacturing sector in T&T.
The paper has also proposed a research agenda to empirically test and validate the conceptual OL model in order to quantify the impact of various factors on OL, spe-cific to the context of T&T’s manufactur-ing sector.
The research is being done in a develop-ing country, a context in which there has been a recognised paucity of empirical work; it would make a meaningful contri-bution to the field as very little insight is available from the perspective of developing countries, generally, and no research has
been found within the Caribbean region, in the field of OL and/or KM.
AcknoWledgements
The authors thank the School for Graduate Studies and Research and the Faculty of Engineering of the University of the West Indies for their support of this study.
BiogrAphY
Marcia Nathai-Balkissoon is a research student pursuing a Ph.D. in Industrial Engineering at The University of the West Indies. She holds a B.Sc. degree in Industrial Engineering and an M.Sc. degree in Engineering Management and her research interests are in the areas of industrial engineering and organisational learning. She is a Registered Professional Engineer in Trinidad and Tobago and is the Quality Assurance Manager at the National Training Agency of Trinidad and Tobago.
Kit Fai Pun is presently the Chair Professor of Industrial Engineering (IE) and the coor-dinator of IE Group in the Department of Mechanical and Manufacturing Engineering of the University. He serves as the Deputy Dean in Research and Postgraduate Student Affairs for the Faculty of Engineering. Professor Pun is a Chartered Engineer in the UK and is the Chairperson of the Technology Management Council of the IEEE Trinidad and Tobago Section. His research activities include industrial engineering, engineering management, quality management, perfor-mance measurement, innovation and infor-mation technology/systems.
references
Akgun, A.E., Lynn, G.S. and Byrne, J.C. (2003) ‘Organizational learning: a socio-cognitive framework’, Human Relations, Vol. 56, No. 7, pp.839–868.
188 M. Nathai-Balkissoon and K.F. Pun
Argyris, C. and Schon, D.A. (1978) Organizational Learning: A Theory of Action Perspective, Addison-Wesley, New York.
Bapuji, H. and Crossan, M. (2004) ‘From questions to answers: reviewing organizational learning research’, Management Learning, Vol. 35, No. 4, pp.397–417.
Boisot, M.H. (1998) Knowledge Assets: Securing Competitive Advantage in the Information Economy, Oxford University Press, New York.
Chang, S.C. and Lee, M.S. (2007) ‘A study on relationship among leadership, organizational culture, the operation of learning organization and employees’ job satisfaction’, The Learning Organisation, Vol. 14, No. 2, pp.155–185.
Creswell, J.W. (2009) Research Design: Qualitative, Quantitative, and Mixed Methods Approaches, 3rd ed., Sage Publications, Thousand Oaks.
Edwards, J.S. and Kidd, J.B. (2003) ‘Knowledge management sans frontiers’, The Journal of the Operational Research Society, Vol. 54, No. 2, pp.130–139.
Firestone, J.M. and McElroy, M.W. (2004) ‘Organizational learning and knowledge management: the relationship’, The Learning Organization, Vol. 11, Nos. 2/3, pp.177–184.
Gupta, B., Iyer, L.S. and Aronson, J.E. (2000) ‘Knowledge management: practices and challenges’, Industrial Management and Data Systems, Vol. 100, No. 1, pp.17–21.
Holtshouse, D. (1999) ‘Ten knowledge domains: model of a knowledge-driven company?’ Knowledge and Process Management, Vol. 6, No. 1, pp.3–8.
Jamali, D., Sidani, Y. and Zouein, C. (2009) ‘The learning organization: tracking progress in a developing country – a comparative analysis using the DLOQ’, The Learning Organization, Vol. 16, No. 2, pp.103–121.
Kolb, D. (1984) Experiential Learning: Experience as the Source of Learning and Development, Prentice-Hall, Englewood Cliffs.
Lee, Y.J. and Roth, W.M. (2007) ‘The individual/collective dialectic in the learning organization’, The Learning Organization, Vol. 14, No. 2, pp.92–107.
Lin, H.F. and Lee, G.G. (2005) ‘Impact of organizational learning and knowledge management factors on e-business adoption’, Management Decision, Vol. 43, No. 2, pp.171–188.
Menon, A. and Varadarajan, P.R. (1992) ‘A model of marketing knowledge use within firms’, Journal of Marketing, Vol. 56, No. 4, pp.53–71.
Ministry of Trade and Industry (2007) MTI Downloads, Online: http://www.tradeind.gov.tt/MTI%20Downloads/Docs.htm#Strategic Plans, accessed 10/04/10.
Nonaka, I. and Takeuchi, H. (1995) The Knowledge-Creating Company: How Japanese Companies Create the Dynamics of Innovation, Oxford University Press, New York.
Polanyi, M. (1958) Personal Knowledge, University of Chicago Press, Chicago.
Sanchez, R. (2005) Knowledge Management and Organizational Learning: Fundamental Concepts for Theory and Practice, Lund Institute of Economic Research Working Paper Series.
Senge, P. (1992) The Fifth Discipline: The Art and Practice of the Learning Organisation, Century Business.
Shah H., Eardley, A. and Wood-Harper, T. (2007) ‘ALTAR in action: knowledge management’, European Journal of Information Systems, Vol. 16, No. 6, pp.771–779.
Walczak, S. (2008) ‘Knowledge management and organizational learning: an international research perspective’, The Learning Organization, Vol. 15, No. 6, pp.486–494.
Wang, C.L. and Ahmed, P.K. (2003) ‘Organisational learning: a critical review’, The Learning Organization, Vol. 10, No. 1, pp.8–17.
Watkins, K.E. and Marsick, V.J. (1998) Dimensions of the Learning Organization Questionnaire, Partners for the Learning Organization, Warwick.
Zuber-Skerritt, O. (2005) ‘A model of values and actions for personal knowledge management’, Journal of Workplace Learning, Vol. 17, Nos. 1/2, pp.49–64.
Copyright © 2010 WASD
World Sustainable Development Outlook 2010
189
EmbEdding social capital in placE and community:
towards a nEw paradigm for thE caribbEan food systEm
Marisa Wilson*University of West Indies, Trinidad and Tobago
Abstract: Economic ideas of social capital often narrow the social domain to transactions based on individualised motivations (i.e., profit) leaving out more social possibilities which may or may not involve maximising personal consumption (i.e., fights for ‘social justice,’ nationalism). This narrowing of vision has real-life consequences, implicated not only in dominant economic theory, but also in socio-economic policies for ‘development.’ In order to tackle challenges to local and regional food security in the Caribbean, we must open policy-making to more encompassing (Dumont, 1966) motivations for economic behaviour linked to the creation of social identities within and between people. As a step towards this end, the author incorporates Sen’s concept of commitment and related theories of identity formation into analyses of food production in the Caribbean, and Cuba in particular.
Keywords: social capital; development; food security; Caribbean; commitment; Cuba.
introduction
If the idea of social capital in economics is a process, then it is a very specific one. Indeed, some may even argue that the very expression ‘social capital’ is a contradic-tion in terms. While ‘capital’ implies a link between human and object (whether real or imaginary, i.e., derivatives), the origins of the word ‘social’—‘to follow’ (Callon and Latour, 1981, p.283)—involve human-to-human rela-tions. In this paper, I argue that the narrow view of social capital presently dominating economic debates about development policy has practical effects. These are related to the very act of ‘translating’ (Latour, 1981) social
needs and identities into universal motiva-tions for all economic behaviour. Models for social capital that attempt to account for the interface between society and econom-ics in utilitarian terms are largely based on three assumptions. They are (1) that social networks are driven by a collection of indi-viduals who strive to optimise their personal preferences, especially remuneration in money, (2) that this kind of social ‘network-ing’ (and, as implicated in what follows, it is just one kind) is positive for the well-being (read: ‘development’) of collective group-ings, such as nation states and (3) that those who uphold the utilitarian idea of social
*Corresponding author: University of West Indies, Trinidad and Tobago; e-mail: [email protected]
190 M. Wilson
capital have the authority as ‘macro-actors’ to define ‘micro-social’ action (Callon and Latour, 1981) in causal terms.
In what follows, I will break down the assumptions (especially the first and third)1 in terms of the dominant idea of social capi-tal in economics and by extension, ‘devel-opment’. First, it is briefly argued that the idea of social capital in economics not only obstructs the analyst from seeing economic action as embedded in social, cultural and historical contexts, but in reifying its own underlying premises, actively shapes the way economic behaviour is thought about and carried out. As indicated in the first assumption, the dominant view of social capital relegates all non-maximising motivations driving, for example, the production, distribution and consumption of food, into epistemological and empirical ‘black boxes’ (Callon and Latour, 1981). Indeed, social capital as a prevalent idea in economic development manifests a general rule of ‘translation’ described by Callon and Latour (1981): the act of defining simplifies reality to the exclusion of alternative, exist-ing modes of thought and practice.
As with any normative interpretation of social behaviour, economic concepts such as social capital emphasise and actively shape certain aspects of social reality, to the exclusion of others (assumption no. 3). This kind of categorical switching from theory to practice has significant implica-tions for the present and future state of rural (and urban) ‘development’ in the Caribbean and elsewhere. A purely utilitar-ian understanding of social networks may, for example, lead to policies that reinforce existing patterns of optimising behaviour (i.e., the conversion of agricultural lands into profit-making, industrial enterprise), instead of policies that further the liveli-hoods and locally-defined well-being of
rural Caribbean communities (i.e., sustain-ing and empowering people to maintain ties to land and community).
If one goes beyond universalistic con-ceptions of social capital to consider the way social networks work in particular communities—later, the focus will be in Cuba—it becomes clear that the parameters of social capital are more profound than that which the narrow model permits. Switching from the formal model to ethnographic reality allows for a more realistic account of socio-economic transactions. Using analyti-cal tools spearheaded in economics by Sen (1977, 2002), this kind of knowledge may be made relevant and accessible to develop-ment policy-makers.
The ultimate basis of this argument is that if we are to ever come close to insti-tuting local and regional food security in the Caribbean, we must get beyond the telescopic association between social capital and individualised economic assets. Indeed, I argue that it is the very situatedness (in space and time) of forms of motivation not based on personal gain that provide our only hope for establishing and/or re-establishing ties not only between people and people, but also between people and their environ-ment. These links are increasingly important given the urgency of the food question in the Caribbean and elsewhere.
what bEhaVioural and utilitarian Economists
lEaVE out
Revitalised in the aftermath of the latest global economic crisis, the recent shift from ‘rationality’ to ‘behaviour’ in the discipline of economics has sparked further interest in ‘non-economic’ factors that influence eco-nomic decision making such as one’s fam-ily, history of drug use or education. This
191Embedding social capital in place and community
so-called ‘social’ turn in economics has not led to a concomitant revolution in para-digms (Kuhn, 1962), however. Indeed, it is no more than another detour towards the same destination.
Legitimised by neurological and psycho-logical findings that link chemical changes in the brain to social competition (Delgado et al., 2008), behavioural economists claim that economic actions may be ‘irrational’ when treated as social performance, i.e., in an auction, bidding more than a commod-ity’s economic value due to the adrenaline-induced desire to win. They do so, however, in static, lab settings which disregard long-term social relations.
In a similar fashion, utilitarian theorists of social capital consider individual moti-vation in terms of cost-benefit calculations that occur at particular moments in time, even if influenced by long-term psychological factors such as a past steeped in criminality. Both theoretical frameworks (the behav-iouralists and the utilitarians) treat indi-vidual, psychologically-informed economic decisions as independent variables, while synchronic, often artificial social contexts become dependent variables. That one set of theorists (the behaviouralists) argue for ‘irrationality’ while the other (the utilitar-ians) argue for ‘rational’ decision-making has little to do with their shared assump-tion that long-term social processes may be treated as exogenous to an individual’s eco-nomic behaviour. Indeed, neither view of economic decision-making considers how dyachronic and contextualised aspects of culture, history and society influence indi-vidual identities and decision-making.
Critics of the utilitarian approach to individual economic behaviour (Davis, 2003, 2004; Sen, 1977, 2002; Williams, 1973) have countered standard assumptions
in economics, arguing that an individual’s agency to choose between social motivations (i.e., sympathy, altruism, commitment), on the one hand, and self-interest, on the other, is entirely endogenous to the economic process. Davis (2003, 2004) has recently taken the critique further, contending that personal identities are, in fact, realised through the creation and maintenance of social identifications (Davis, 2004, p.22). These arguments incorporate the time dimension, a factor which has so far been largely ignored2. In what follows, I attempt to uncover the economic relevance of both situated and long-term processes through which personal and social identities meet.
finE’s critiQuE of utilitarian ViEws of social capital:
bEcKEr VErsus sEn
As Fine (1998, 2010) has steadily argued, it seems that most theorists of social forms of ‘capital’ in economics—at least those on the utilitarian side—treat the social as a mere appendage to fixed economic trans-actions between maximising individuals. Indeed, far from drawing from the long history of insights and analytical tools estab-lished by other social scientists (Fine, 1998, p.50), dominant views of social capital in economics, such as that upheld by Nobel Prize winning economist, Gary Becker, ignore all motivations for socio-economic behaviour that stray from the realm of self-interest. Moreover, formal models that aim to describe the relation between economics and society perpetuate their own existence by ensuring a kind of bounded and univer-sal consistency. Being politically-oriented, they establish normative frameworks with real-life implications.
One extremely utilitarian account of social capital, highly criticised by Fine (1998, p.50) and others (Bourdieu, 2005)
192 M. Wilson
is Gary Becker’s approach, which one might see as an extension of his human capital theory and the ‘new household economics’. While Becker’s work on the various humanised ‘capitals’ may be the apex of economic abstraction, it is relevant for our purpose because Becker himself spearheaded the general shift in economics away from the purely economic domain and towards more non-economic or social domains (Fine, 1998, p.50; though arguably this shift is more towards social and neuro-psychology than sociology or anthropology).
In contrast to Sen’s (1977, 2002) theory of ‘commitment’, to which we shall soon return, Becker sees no instances where ‘higher-order [or “meta”; Sen, 1977] rank-ings of economic decisionmaking are either necessary or useful in understanding behaviour, since ethics and culture affect behaviour in the same general way as do other determinants of utility and preferences’ (Becker 1996, p.18; cited by Fine, 1998, p.58). In this view, maximising individual levels of consumption—whether in the form of financial capital or commodities—is the sole motivation for economic decision making. Social motivations which may not depend on optimising personal consump-tion are left out. In Sen’s terms,
A person is given one preference order-ing [that of maximizing his self-interest], and as and when the need arises this is supposed to reflect his interests, repre-sent his welfare, summarise his idea of what should be done, and describe his actual choices and behaviour. Can one preference ordering do all these things? … The purely economic man is indeed close to being a social moron. (Sen, 1977, pp.335–336)
In addition to treating the universal indi-vidual and his social context as exogenous to the economic process, Becker draws a
parallel between ‘stocks’ of social capital and all other forms of physical and eco-nomic capital. Indeed, as Fine (1998, p.58) argues, Becker treats social capital in the same way as any other tangible commodity to be added and subtracted to one’s per-sonal assets, based on his or her preferences. In terms of the Caribbean food system, this means that forms of physical capital such as land and machinery are placed in the same light as forms of social capital such as agro-business skills and connections, or indeed, work motivation.
If all social and economic forms are treated equally as capital transacted between individuals, however, then it is just one more logical step to reason that persons with claims to social capital start on a level playing ground, competing in synchronic, horizontal networks that extend through-out space, as the idea of a net would imply. Imbalances of power hindering local and regional food security, which have developed over time, then become irrelevant to socio-economic analysis.
Confining the model to economic valua-tions also leaves unearthed ecological consid-erations. Indeed, the constant degradation and down-grading of prime agricultural land to residential or industrial districts in places like Trinidad is a trend beset by the very motivations this kind of economic analysis encourages. Such exclusions are not only matters of epistemology, but also of hegemony.
The issue of most concern with univer-salising concepts such as social capital is not that they are based on a single ‘prefer-ence ordering’ (Sen, 1977, pp.335–336): the maximisation of personal welfare—in a neoliberal world, this is certainly the pri-mary motivation for many exchanges, social or otherwise—it is rather that they place all
193Embedding social capital in place and community
social transactions into this light, relegating other relations among humans and between humans and things (i.e., environments) to the realm of irrelevant, immeasurable dark-ness. Such perspectives not only obscure political economic, ecological and social realities embedded in long-term social relations—consider the constant ideological and political struggle between agricultural productivism and globally uneven terms of trade—but also rest on the imposing ground of prescriptive model making. In time, and with paradigmatic and authoritative rigor, the theoretical model of reality becomes a substantive model or blueprint for reality (Geertz, 1973, p.93).
In Callon and Latour’s (1981) terms, formal models in economics become ‘macro-actors’ that over time, gain author-ity to translate reality for ‘micro-actors’. The dominant account is then reified to the point that ‘micro-actors’ (i.e., small farmers) sometimes lose the ability to deter-mine and decide upon alternative paths of action:
An actor says what I want, what I know, what I can do, marks out what is possible and what is impossible, what is social and what is technical ... How could I possibly resist when ... that is the correct transla-tion of my unformulated wishes? (Callon and Latour, 1981, p.288)
There are, as always, exceptions to the rule. One is the perspective of Nobel Prize winning economist, Amartya Sen, on the interface between society and economics, which draws from Bernard Williams’s work on the inseparability of personal from social identities (Davis, 2004, pp.20–21). In a general attack on utilitarianism, Williams (1973) writes of collective values that over-ride self-interest in philosophical terms. Sen uses similar ideas for economics, redirect-ing formal analyses of economic decision
making to wider considerations of the deci-sion makers’ social world. Both theorists argue that rules and norms for social identi-fication have an ‘intrinsic, non-instrumental value’ (Davis, 2004, p.20), which provides the base on which personal identities are built. In practical terms, this means that a farmer’s decision to, say, sell his produce to a particular vendor, may be based more on a shared identity (i.e., familial relations) than the farmer’s desire to maximise his profit. I will return to similar examples later in the context of rural work and exchange in Cuba.
Instead of starting from the premise that the maximising individual (and long-term social relations) may be treated as independent variables, exogenous to the formal model (Davis, 2004), Sen takes an individual’s ‘sense of commitment to some particular group, say to the neighbourhood or to the social class to which he belongs’ (Sen, 1977, p.337) as his starting point. His model ‘explain[s] the personal identity of individual economic agents relationally, or through their interactions with others’ (Davis, 2004, p.23, emphasis in the original). Sen’s nuanced treatment of the embeddedness (Dumont, 1980 [1966]) of economics in society, which most likely draws from the work of Polanyi (1957 [1944]), opens the way to a more situated model of and for social capital the relations between society and economics.
commitmEnt, idEntity- formation and rural worK and
EXchangE in cuba: towards a nEw paradigm of social capital
Sen’s idea of commitment and related analyses of identity formation may fortify the oft-unstable bridge linking formal eco-nomic thought to more qualitative fields such as anthropology. And anthropology,
194 M. Wilson
in particular, has much to offer as it aims to link theory to ethnographic and his-torical contexts, revealing how shared val-ues become socially and, thus, personally important through long-term social pro-cesses. If one draws from anthropology to explain real-life economic decision making, the implications of non-instrumental, tran-scendental values (Dumont, 1980 [1966]; whether normative or not) residing above individuals become clear.
Not surprisingly (given the persistence of Cold War dichotomies), the commu-nist government’s normative view of the interface between economics and society inverts the dominant economists’ version of social capital, prioritising collective duty over personal motivation. The ideological framework that legitimises the commu-nist system in Cuba—with all its historical and emotional symbols—has, to use the neoliberal economist’s term, ‘trickled- down’ somewhat, affecting economic transactions on the ground. Thus Che Guevara’s asceticism and Fidel Castro’s idea of dedication through work and self-sacrifice have, with the passing of time, really influenced the way Cuban people make economic choices. Indeed, as argued elsewhere (Wilson, 2009, 2010), overarching (and often enforced) values such as the defence of collective needs over monetary rewards complicate the idea that social networks in Cuba are based on personal motivations alone (for a related analysis, see Pertierra, 2007).
In rural Cuba, where the author con-ducted ethnographic fieldwork from 2005 to 2007, the food system is thus linked not only to a global market driven by individual preferences and rules of supply and demand—take U.S. markets for basic foods, for example, which contribute to a significant percentage of dietary intake
on the island—but also to a national value system: the product of Cuba’s particular political and intellectual history. Indeed, while Cubans have partly incorporated the consumerist culture of their northern neighbour, they are also influenced by ideas that have shaped Cuban society over time.
One way to demonstrate this point is to consider work motivation in the Cuban agricultural sector. While economists such as Becker would make a direct link between work motivation in labour-intensive activi-ties such as agriculture, on one hand, and individual remuneration, on the other I suggest that such factors only tell part of the story. Becker comments specifi-cally on communist forms of economic organisation, claiming that ‘every com-munist regime, regardless of culture, failed to achieve any lasting reorientation. Since pay was not sensitive to how hard people worked, they invariably chose to work little, no matter what culture’ (Becker, 1996, p.17, cited in Fine, 1998, p.68). The remaining part of this paper disputes this claim with ethnographic data that brings Sen’s idea of commitment into the analyti-cal toolkit.
Before this, however, it is important to point out that Cubans do not always want to pursue their own self interest. To be sure, wages in Cuba are very low given the Cuban government’s skewed policies of remunera-tion in a dual economy, and agricultural workers often show their sentiments with their feet. However, Cubans (like most other people) have ‘multiple, conflicting social identifications’ (Davis, 2004, p.14, in refer-ence to Folbre, 1994), only some of which conform to the idea of the individual max-imising his personal benefits. Thus, while some motivations for economic behaviour in Cuba reflect the premise that social
195Embedding social capital in place and community
networking maximises the satisfaction of individual interests (which, according to the dominant paradigm, increases the ‘growth’ of national economies), the author has also witnessed economic exchanges moti-vated by personal commitments to people and nation (and by extension, land). These kinds of transactions cannot be explained by psychological, neurological or ‘natural’ factors of homogenous individuals; rather, they must be treated as social events or per-formances, enacted for particular audiences and based on particular social rules for eco-nomic behaviour.
A convenient place to start is the norma-tive view of work in Cuba. With the slogan ‘from each according to his needs, to each according to his ability,’ the official account of work is tied to social values, one of which is commitment to the Cuban nation. As in other post-Soviet places, work in Cuba has a kind of ‘transactional value’ (Humphrey, 1998, p.306), which opens up opportunities for benefits, such as land acquisition. One of the most dedicated farmers, Eduardo, had volunteered for the construction bri-gades of the 1970s and 1980s and helped to build many of the houses presently resided in by agronomists from the nearby univer-sity. Eduardo’s efforts certainly helped his chances of obtaining land during the most recent land reforms of the past two decades, as well as support (apoyo) from the univer-sity, such as access to information and bio-inputs.
But it was not just communist norms that prompted Eduardo and his family to prefer social over monetary transactions. His wife, Mariela, made this aspect of their farming business most clear when she expressed her anger with a woman who had come to the house to buy produce. While the woman who had visited ‘could have’ brought milk from her family’s goat as a ‘gift’ to Eduardo’s
family, which would have been exchanged for produce, the woman was ‘stupid’ since she only brought money. Mariela stressed that they always preferred to help others with what they produced and were happy when people brought items of use to the family. In her terms ‘it is not money, it is the feeling one gets knowing you are help-ing someone.’ She concluded her complaint about the woman on a metaphorical note, ‘One hand washes the other, but the two together can wash the face’.
Though Eduardo did engage in mar-ket transactions in selling produce to visi-tors, like his wife he preferred personalised exchanges—usually in kind—conducted on his farm to monetary exchanges. He claimed that his farm was more successful because of these exchange relationships, which com-bined market and non-market/barter trans-actions. One example that stands out is the relationship between Eduardo and one of his buyers of mint. In exchange for the lat-ter’s continued business, Eduardo proudly told that he ‘controlled’ the mint-buyer’s mujer or, as Trinidadians would say, his ‘out-side woman’. He made me understand that the mint-buyer had several mujeres, and that in order to keep this secret, his wife would need to be ‘controlled’ by invitations to the farm or other distractions.
Along with personalised exchanges based on long-term commitments, more exten-sive forms of social commitment came into play. For instance, Eduardo’s position of ‘excellent’ in the tier system of the state- sponsored Urban Agriculture Programme (UAP) was clearly an important step towards his personal access to inputs and knowledge, as well as to retaining his land according to the rules of the Cuban state. But his posi-tioning within the UAP was also framed in social terms. Eduardo proudly told me that he was the one that ‘all of the people in Cuba
196 M. Wilson
can go to for agroecological knowledge. … Everyone in Cuba has access to my number. They call me, and I give them information, based on what I have learnt here [on my farm].’ He and his family clearly felt a sense of pride and prestige in their work.
I have the best tasting produce in all of Cuba. It’s all organic. It takes more work, but I currently I get the same price as everyone else. I don’t mind working hard because my produce is healthier for my family and for my customers. I also like making my farm beautiful.
In contrast to the assumption that workers only work for monetary remuneration, the example of Eduardo shows that work may also be prompted by personal attachments to land and community. Moreover, While most economists would argue that work done in the home (classified as non-market) offers fewer opportunities for national growth and ‘development’ than work done in the (legal) labour market (Folbre and Nelson, 2000, p.129), a qualitative distinction must be made between, for example, cooking in the house-hold and manufacturing industrial foods in the factory (or factory farm). While the first involves established social relations between members of the household and the ‘worker’ (e.g., the housewife) the second involves mostly arbitrary relations between boss and ‘labourer’. Thus, while work in the household involves emotional commitments to family members (i.e., a Cuban woman puts ‘love’ into her meals)3 or indeed, to the entire com-munity (i.e., Eduardo) that in the factory may or may not be based on social commitments.
The contrast between household and fac-tory reveals the distinction between the idea of the labourer as a mere cog in the develop-mental apparatus and the mother, father or child who puts in time for the betterment of his or her family members. Margaret Jane Radin illustrates this difference by
designating ‘work’ as a special category, as opposed to commodified labour:
It is possible to think of work as always containing a non-commodified human element … Workers make money but are also at the same time givers. Money does not fully motivate them to work, nor does it exhaust the value of their activ-ity. Work is understood not as separate from life and self, but rather as part of the worker, and indeed constitutive of her. Nor is work understood as separate from relations with other people. (Folbre and Nelson, 2000, p.132)
As with the rewards reaped for household work (i.e., well-fed children), the benefits from economic activities based on long-term com-mitments to people and place are not always commensurable with monetary or capital returns, lying as they do within the domain of economic ‘externalities’ such as the envi-ronment or collective well being. Moreover, I have argued that the very act of equating eco-nomic value with all social values has real-life consequences, as ‘“rich” markets embedded in local communities’ shift to ‘“thinner,” more impersonal’ interactions (Folbre and Nelson, 2000, p.137). If fields such as sociology and anthropology are to truly influence econom-ics and ‘development,’ it must be understood that market values do not and cannot entirely replace the who, the what and the where of long-term socio-economic processes.
conclusion
So what does all this mean for the use of social capital to ensure food security in the Caribbean? To start with, it means that the drive to do agricultural work—even in non-communist societies—is not always based on economic motivations alone, especially for people who have developed a sense of commitment to land and community. It also means that the dominant idea of social
197Embedding social capital in place and community
capital may hinder rather than help our understanding of how such social processes work on the ground.
But of course, just as Putnam (2000) can-not re-create the early era of American civic society, neither can we re-order the struc-ture of Caribbean history, characterised as it is by ‘reconstituted’ peasants (Mintz, 1985) who may associate agricultural work and local produce with a fractured colonial past. At present, people are trying to re-link Caribbean people and places by promoting regional identity through economic unity. I have tried, however, to show that identifi-cation processes are complex and situated, and so economic unification can never mean total social unification.
Given the historical and hegemonic shifts away from agriculture and towards ‘modern’ industry, it is hard to know how one may begin to re-establish commitment as a basis for economic activity within the food system. First, we must work to prevent cases like the closure of Caroni (1975) Ltd4. —where farmers and local consumers alike had already established commitments to place and community—to recur. Indeed, we must recognize the role of commitment in the Caribbean food system—from the social and ecological relations a farmer has to his land and community to the way that people value commodities. To do so, we may, for example, encourage those efforts that are already being done in educating the public about local foods and their uses.
If we are to re-align the social, environ-mental and political economic aspects of land, people and production in the Caribbean, a revolution in paradigms is surely needed. Indeed, as I have tried to show in this paper, models for society that rely primarily on maximising motivations are as inadequate as they are unjust.
rEfErEncEs
Becker, G. (1996) Accounting for Tastes, Harvard University Press, Cambridge.
Bourdieu, P. (2005) The Social Structures of the Economy, translated by Chris Turner, Polity, Cambridge.
Callon, M. and Latour, B. (1981) ‘Unscrewing the big leviathan: how actors macrostructure reality and how sociologists help them to do so,’ in Knorr-Cetina, K.D. and Cicourel, A.V. (Eds.): Advances in Social Theory and Methodology: Toward an Integration of Micro- and Macro-Sociologies, Routledge and Kegan Paul, Boston.
Davis, J. (2003) The Theory of the Individual in Economics, Routledge, London.
Davis, J. (2004) Identity and Commitment, Presented at the Workshop on Rationality and Commitment, 13–15 May, University of St. Gallen.
Delgado, M.R., Schotter, A., Ozbay, E.Y. and Phelps, E.A. (2008) ‘Understanding overbidding: using the neutral circuitry of reward to design economic auctions’, Science, Vol. 321, No. 5897, pp.1849–1852.
Dumont, L. [1966] (1980) Homo Hierarchicus: The Caste System and its Implications, The University of Chicago Press, Chicago and London.
Fine, B. (1998) ‘The triumph of economics or “rationality” can be dangerous to your reasoning’, in Carrier, J. and Miller, D. (Eds.): Virtualism: A New Political Economy, Berg, Oxford, New York.
Fine, B. (2010) Theories of Social Capital: Researchers Behaving Badly, Pluto Press, London and New York.
Folbre, N. (1994) Who Pays for the Kids? Gender and the Structures of Constraint, Routledge, London.
Folbre, N. and Nelson, J.A. (2000) ‘For love or money – or both?’, Journal of Economic Perspectives, Vol. 14, No. 4, pp.123–40.
Geertz, C. (1973) The Interpretation of Cultures: Selected Essays, Basic Books, New York.
Kuhn, T.S. (1962) The Structure of Scientific Revolutions, University of Chicago Press, Chicago.
198 M. Wilson
Mintz, S. (1985) Sweetness and Power: The Place of Sugar in Modern History, Penguin Books, New York.
Parry, J. and Bloch, M. (1989) ‘Introduction’, in Money and the Morality of Exchange, Cambridge University Press, Cambridge.
Pertierra, A.C. (2007) Cuba: The Struggle For Consumption, Doctoral thesis, London, University College.
Polanyi, K. [1944] (1957) The Great Transformation: The Political and Economic Origins of Our Time, Beacon Press, Boston.
Putnam, R. (2000) Bowling Alone: The Collapse and Revival of American Community, Simon and Schuster, New York.
Sen, A. (1977) ‘Rational fools: a critique of the behavioral foundations of economic theory’, Philosophy and Public Affairs, Vol. 6, pp.317–344.
Sen, A. (2002) Rationality and Freedom, Belknap Press, Cambridge, MA.
Williams, B. (1973) ‘Integrity’, in Smart, J. and Williams, B. (Eds.): Utilitarianism: For and Against, Cambridge University Press, Cambridge.
Wilson, M.L. (2009) ‘Food as a good versus food as a commodity: contradictions between state and market in Tuta, Cuba’, Journal of the Anthropological Society of Oxford, Vol. 1, No. 1, pp.25–51
Wilson, M.L. (2010) ‘La Lucha de Provisiones [the Fight for Provisions], National and Local Moral Economies of Food Provisioning in Tuta, Cuba, D.Phil. Thesis in Social and Cultural Anthropology, University of Oxford.
notEs
1 The second I have dealt with in the intro-duction to Wilson 2010.
2 Though see Parry and Bloch, 1989.
3 When serving any meal, my humble Cuban ‘mother’ would always say ‘it is not the best meal, but it is made with love’.
4 Caroni (1975) Ltd. was a statutory company in Trinidad, which provided a market for small-scale sugarcane growers. After the closure of the company in 2007, these small farmers were re-located from their families’ lands, mostly to industrial areas.
Copyright © 2010 WASD
World Sustainable Development Outlook 2010
199
COST MINIMISATION THROUGH INTEREST-FREE MICRO CREDIT TO MICRO ENTREPRENEURS:
A CASE OF BANGLADESH
Mohammed Nurul Alam*Sultan Qaboos Universrity, Sultanate of Oman
Abstract: The purpose of the paper is to present the result of an empirical review as to how and to what extent the interest-free microfinance to micro entrepreneurs contributes in minimising different cots of both the lender and the borrowers. An institutional-network theoretical approach is used to study the phenomenon. A qualitative nature of research methodology is used while studying this particular phenomenon. A multiple explanatory case study was adopted as a research strategy in order to focus on contemporary phenomenon within the real life context of different rural-based micro entrepreneurs and their relationships with the lending organisations. Interest-free microfinance by Islamic banks is characterised by a close supervision and an in-kind type of financing, which contributes greatly in promot-ing lender-borrower network relationships between the bank and the rural based micro entrepreneurs. Such network relationships result in minimising exchange costs and other business related costs of both the borrowers and the lending organi-sations. The study was mainly concerned with rural-based micro entrepreneurs who are engaged in grass-root type entrepreneurs like poultry and diary firm, handloom industry, etc. Particular reference is made here to the facts of rural-based micro en-trepreneurs and their relationships with Islamic banks in Bangladesh.
Keywords: operating and other costs; interest-free micro credit’ micro entrepreneurs; institutions; networks; Islamic banks; Bangladesh; interest-free financing modes; qualitative method; in kind loans.
INTRODUCTION
With a population of over 1501 million, Bangladesh provides a large consumer market for potential industries. It does, moreover, hold one of the lowest wage structures in the world. The comparative advantage of Bangladesh lies primarily in its agro-processing industries, but besides agri-culture, the rural-based micro enterprise
(ME) sector in Bangladesh is a potentially lucrative field of investment (IPPF, 2001). In spite of its major contributions towards eco-nomic development, the rural-based micro entrepreneurs in Bangladesh suffer from lack in working capital, institutional credit facili-ties and poor management. There are many formal and informal financing organisations that are functioning in the money market of
*Corresponding author: Sultan Qaboos Universrity, Sultanate of Oman; e-mail: [email protected]/ [email protected]
200 M.N. Alam
Bangladesh. Formal financing institutions like government- and privately-owned com-mercial banks normally give loans to large and medium scale industries (Alam, 2009). Cooperative banks in the country although gives loans to the rural-based MEs, they con-fine their credit giving activities mainly to the members of the bank (BIDS 1981, 1988, 1989, 1990). One of the specialised and well known micro-credit giving organisations in Bangladesh called ‘Grameen Bank’ (Nabi, 1990; Yunus, 1993) also gives micro credit to the rural-based micro entrepreneurs espe-cially the rural poor women. Besides many NGOs, moneylenders in rural Bangladesh are also an important source of lending funds to the rural-based micro entrepreneurs.
Due to the shortage of capital, rural-based micro entrepreneurs are compelled to borrow funds from local moneylenders at a high rate of interest. In recent years, dif-ferent Islamic banks in Bangladesh started lending interest-free microfinance to differ-ent rural-based MEs. In comparison with microfinance by conventional banks and other informal financing organisations the ‘interest-free microfinance’ is found as one of the challenging and contributing lending tools, which contributes greatly in creating job opportunities for unemployed rural poor and in enhancing the economic growth in the country. The lending procedures followed by Islamic banks also contribute greatly in mini-mising different costs related to exchange functions and other business activities of both the lender and the borrowers.
BACKGROUND AND LITERATURE REVIEW
In least developed countries, as in developing countries in general, micro entrepreneurs play significant roles in the elimination of the unemployment problem, which remains a serious impediment to a nation’s economic growth. Although the large-scale industries
are involved in mass-production and invest large amounts of capital, these industries are mostly urban based. Consequently, large-scale industries fail to play a significant role in solving unemployment problems related to the rural people. This is exactly where micro entrepreneurs succeed better (Anderson and Khambata, 1982; Ashe and Cosslett, 1989; Little, 1988; Little et al., 1987; Macuja, 1981; UNDP, 1993). In relation to the role of micro entrepreneurs, Anderson and Khambata (1982) and Macuja (1981) argues that the rate of labour absorption by this sector is significantly higher relative to that of large-scale industries.
However, studies shows that due to various problems, such as the lack of sufficient funds caused by inadequate infrastructural and institutional arrangements and shortcomings in the area of marketing and distribution, the growth of the MEs in the rural areas are less pronounced than could be expected (Alam, 2009, 2003). The slow growth of MEs, in turn, results in the migration of manpower from rural to the urban areas, which ulti-mately increases problems, such as overcrowd-ing, increased competition for fewer jobs etc., in the urban areas. Moreover, due to the limited job opportunities such urbanisation additionally hampers the nation’s economy. Myrdal (1968) in this regard observed that a rapid destruction of rural level or cottage industry would not only eliminate a source of supplementary rural income, but would also accentuate the push towards urbanisation and further aggravate congestion in urban areas (Farooque, 1958; Urbe-Echevarria, 1992).
RESEARCH METHODOLOGY
Research method
The research methodology applied in the study is of a qualitative nature (Jick, 1979; Merriam, 1998; Patton, 1985; Sherman and Webb, 1988). A qualitative type of research
201Cost minimisation through interest-free micro credit to micro entrepreneurs
is characterised by a collection of data directly from respondents in the field. A multiple explanatory case study (Yin, 1994) method was adopted as a research strategy in order to focus on contemporary phenom-enon within the real life context of different rural-based micro entrepreneurs.
As a part of data collection processes, interviews were conducted to officials of dif-ferent Islamic banks and their customers. The total time spent for collecting required data from the field was 6 months. The initial data collection was done in the year 1998, while officials of different Islamic banks were interviewed. During the second and the third field trip in 1999 and 2000, respectively, interviews were conducted to 360 grass-root level micro entrepreneurs; the clienteles of different Islamic banks in the country. Respondents interviewed are belongs to dif-ferent grass-root level MEs like poultry, diary, handloom and handicraft industries.
The respondents interviewed are of dif-ferent age group ranging from 18 years to 45 years old and 60% of the respondents are women. Interviews were conducted in different remote areas the country. These are, for example, Khulna, Barisal, Dhaka, Chittagong and Cox’s Bazar. An average of 1:30 hours time was spent for each respon-dent while conducting interviews.
Regarding the collection of data from the field a direct interview method was used. While conducting interviews the following steps were taken.
• Both formal and informal means ofinterview methods were used.
• Structuredandsemistructuredquestion-naires were prepared and the same were used while interviewing respondents. The questionnaire was used depending on the circumstances and the qualifica-tions of the respondents.
• Audio tap recorder used to recordrespondents answers. Where the use of tap was found difficult the answers were recorded in the note book.
• Questionnaires were prepared keepingdifferent issues into considerations like, lending procedures, bank-customer rela-tionships and also other issues related to microfinance to micro entrepreneurs.
• Subsequenttotheinterviewrecordedtapwas replayed and data recorded in the spread sheet. The similar was applied with the data that were recorded as notes.
• Basedontheinterviewsandrespondentsinformation data were arranged and ana-lyzed from the theoretical perspective.
Almost all respondents interviewed are clienteles of different Islamic banks in the country. However, it was observed that many of them used take loans from differ-ent financing organisations like, govern-ment commercial banks, different NGOs and informal money lenders, before they started taking loans from Islamic banks.
Theoretical framework
The concept of an ‘Institutional-Network’ theoretical frame of reference (Alam, 2002), is used to study this particular phenom-enon. The Institutional-Network theoretical concept is developed based on Whitley’s (1992a) ‘Business System’ institutional approach and Jansson’s (2002) ‘Network Institutional Model’.
To study the impact and influence of ‘interest-free microfinance’ to the rural-based micro entrepreneurs, based on Whitley’s ‘Business System (BS)’ financial organisa-tions of similar types in Bangladesh are categorised into different financial Systems, for example; market-based financing system (MBFS) such as conventional banks, Islamic
202 M.N. Alam
Financing Systems (IFSs) such as different Islamic banks, cooperative financing system (CFS) and traditional money lending system (TMLS) viewed as particular arrangements of hierarchy-market relations that become institutionalised and relatively successful in a particular context. A similar arrange-ment is also done to institutionalise differ-ent rural-based MEs. Various MEs of similar nature are thus, grouped into three different ME systems, such as grass-root level (GL), season-based (SB) and semi-mechanised (SM) ME systems. Financing organisations and MEs under different financing systems and micro entrepreneurs under different ME systems are regarded as economic actors acting within these organisational fields.
The present study mainly focuses on the lender-borrower network relationships between financing organisations under IFSs and the grass-root level MEs under Grass-Root Level Micro Enterprises System (GLMES)
CONCEPTS OF DIFFERENT COSTS: FROM LENDER AND BORROWERS’
PERSPECTIVES
This section discusses different types of costs which are involved while carrying out the exchange functions between the lender and the borrowers.
Information costs: Information costs are the costs that are occurred by both fund-ing organisations and borrowers to collect information before they start their financial activities
Distance Costs: Distance costs on the other hand the lending organisations are urban oriented, it increases the distance costs of the rural-based micro entrepreneurs. Similarly, it also has a negative impact on the costs of the lending organisation.
Administrative and supervision costs: Relating to the above discussion it may also be mentioned that a close supervision of customers business and the borrowed funds require both the administrations costs and as well as supervision costs.
Contract costs: Another type of costs normally incurred by the lenders and the borrowers is to make loan agreement or contract between the lenders and the bor-rowers. These costs also differ from organi-sation to organisation.
Legal costs: In case any customer becomes defaulter financing organisations first of all apply various means to realise the debts or to make the borrowers agree to repay the loan. When they fail to realise their debts after applying all possible means, the financing organisations as their second and the final steps take legal actions. This pro-cedure normally costs a lot to the lending organisation.
INTERST-FREE LOAN GIVING PROCEDURES: AN EMPIRICAL
REVIEW
Different Islamic banks in Bangladesh give loans to micro entrepreneurs on a (Bai-Muajjal) Cost plus Profit under deferred Payment (CPPUDP) mode of Islamic financing. The procedures that are normally followed by the Islamic banks in Bangladesh to give loans to its clientless are mentioned below:
• Thebankcontactpotentialcustomersinrural areas through their old clienteles in the locality or through religious and political leaders.
• Oncecustomersareselectedtogiveloansthey are given the idea of the interest-free loans and explain the nature of the mode of investment.
203Cost minimisation through interest-free micro credit to micro entrepreneurs
• Once a formal communication beginswith customers the bank officials arrange meeting to them regularly and advise them to form a group consisting of five members. Each group must select a group member. This is one of the con-ditions to obtain loans. A group may consists of different professions micro entrepreneurs.
• Groupleadersarerequiredtoform a team. A team consists of five group leaders. In each team, one member is selected as a team leader. Team leaders looks after the welfare of the team members and each member who is the group leader of his or her group keep contact the members of the group.
• Itismustforeachmemberinthegroupto save a certain amount of money with the bank foe being eligible to get loans. The amount of invested fund may vary from TK. 25 or a maximum of TK. 502 every week. The savings is done for 10 weeks
• Once a groupmember fails to pay thedeposit in any week other members in the group are held liable and would be asked to assist the defaulter.
• The team member who also work asexecutive for the group collect savings and handover the same to the bank offi-cials who visit them at the end of the week.
• Each members need to open a bankaccount with the bank where weekly savings are deposited. These types of sav-ings accounts are called ‘Profit and Loss Savings Accounts’ (Mudaraba Savings Accounts).
• Thebankhandlestheweeklysumofsav-ings quite carefully because a customer’s deposit figure must exceed 5% of the loan amount he/she applied for. No
customer is entitled to receive any loan from the bank, until the said targeted savings (exceeding 5%) is deposited with the bank.
• Once the savingperiodends thegroupleaders arrange a meeting with all the individual members of each group. In this general meeting, decides on loan amount and a list of each members request is handed to the bank offi-cer. After considering this request and the saving positions of each applicant the bank takes final decision to give credit.
• Theloansaregiveninkindratherthancash. Once the loan is sanctioned to a customer, he/she need to select supplier of materials or goods and bring invoices from the supplier.
• Oncethebankissatisfiedwiththeinvoiceprices, the quantity of materials, etc., he/she made necessary arrangement to pay the money directly to the suppliers.
• As per CPPUDP mode of finance thebank add profits to the invoice price that the customer presents to the bank and debit the amount paid to supplier plus profit charged to customer’s account.
• Asasecuritymeasure,thecustomershasto produce their land property title docu-ments as well as a letter of recommenda-tion either from a person notarised by the bank or from an influential customer of the bank in the locality.
The repayment of loans, including prof-its, is normally divided into a number of equal installments. The banks fixed the installment rate of repayment of the loan. This repayment time starts two weeks after the customer receives the loan or soon after the product is ready for sale in the mar.
204 M.N. Alam
ANALYSIS OF EMPIRICAL FINDINGS
The results of the interviews to the respon-dents; the rural-based micro entrepreneurs in different parts of Bangladesh is reviewed in the following section. It includes an anal-yses of the interviews conducted with differ-ent Islamic bank and their borrowers 360 micro entrepreneur belonging to the Grass-root level Micro Entrepreneur Systems (GLMES). The discussion and analysis high-light on how and to what extent interest-free micro finance to micro entrepreneurs by Islamic minimises different cots of both the lender and the borrowers.
The minimisation of costs from the lender’s perspective
Information costs: Islamic banks normally follow the informal procedures to collect information about the rural based custom-ers. In this regard, collection of information through the local religious leaders, religious organisations, etc., may be worth mention-ing. It is observed that these people volun-tarily work for the bank staff as they think from the religious point of view it is one of their moral obligations to guide people to the Islamic way if life in their business investments. This in turn reduces the infor-mation costs of the financing organisations in the IFS in compare to the traditional banks who mostly follow formal procedures in lending funds.
Distance costs: In order to reduce the dis-tance costs, Islamic banks normally give loan to those micro entrepreneurs who live within 15 km of the bank branch. Thus, bank offi-cials may directly supervise their borrowed funds. Due to the limitation of distances within 15 km the distance costs reduce to a greater extent. The policy of the IFS thus saves their distance costs by following a unique policy as ‘bank to come to the customer rather than customers to go to the bank’.
Administrative and supervision costs: The group-wise loan system of the Islamic banks assists the organisations to minimise the administrative and supervision costs. Since, the team members know every group leader and group leaders are closely linked with the group members an automatic check up and supervision of the use of borrowed fund is done.
Contract costs: Islamic banks supply cus-tomers with a simple form to be filled while processing the loan application. In order to give relief to the rural based small entre-preneurs from unnecessary paper works or other complicated formalities, the bank follows simple procedures for making an agreement. By accepting such sort of simple procedure Islamic banks reduces their con-tract costs.
Legal costs: Since Islamic banks does give micro credit to micro entrepreneurs in kind, they become more vigilant in controlling the entire exchange activities from differ-ent angles i.e. from supplier of raw materi-als, guarantors, local leaders, etc. Thus, the lending policies of the bank itself help these organisations to realise their debts from the customers in due time. As a result of this, Islamic banks are able to avoid unnecessary aggravation of default cases and also save the legal costs.
Cost minimisation from borrowers’ perspective:
Information costs: It is observed from the study that almost all micro entrepreneurs interviewed collected information about the Islamic banks and also about the interest- free funding by the banks from different sources.
Due to the cooperation and assistance from different sources, micro
205Cost minimisation through interest-free micro credit to micro entrepreneurs
entrepreneurs interviewed were able to collect information about the lending organisation and also the interest-free lending procedures. Different religious organisations and the religious leaders in the locality where interviews were con-ducted played a major role in this regard, the number of which constitutes about 49% and 17%, respectively. They did the job as a part of their religious obligations for which respondents need not to incur any costs.
Marketing and selling costs: The rural-based micro entrepreneurs normally lack in sufficient funds to promote their products in the local as well as in foreign markets. The bank officials responsible for micro entrepreneurs normally keep records of the products that different customers pro-duce with the borrowed funds. They inform about the products of one customer to the other. In this way a unique network is devel-oped among their clienteles. This policy of the bank results in promoting customers sales and also the marketing of products. Thus, the Islamic banks assist in facilitat-ing their clienteles in marketing and selling their products without any costs.
Distance costs: It is mentioned in the ear-lier discussion that the officials of Islamic banks normally visit their clienteles; the rural micro entrepreneur to render their financing services, rather the customers go to the banks. In order to facilitate custom-ers these banks established their branches in many local areas of the country. The loan procedure is arranged in such a way that such that bank official is required to pay a regular visit to their clienteles regularly and supervise their activities. This policy of the bank saves borrowers transportation costs and also save times. It was noted that the majority of the grass root level micro entre-preneurs are women. It becomes very tough for them to pay visit to banks frequently due
to their busy schedule at home and also due to the lack of sufficient funds. The loan giv-ing policy of the banks, thus save their dis-tance by bringing the services down to the filed to customers, rather than customers going to the bank.
Costs of procuring materials and goods: It is mentioned earlier that the Islamic bank gives loans to their customers in ‘kind’ rather than in cash. According to this policy of the bank, once the loans are sanctioned, the clienteles of the bank must produce invoice of the raw materials or goods they intend to buy from a supplier. The bank, up on the satisfaction of the invoice price and other conditions, ask the suppliers to supply goods directly to the clienteles prem-ises. The bank later pays the supplier the due amount. This policy of the bank ulti-mately reduces the procurement costs of the customer.
Loan processing costs: The bank through the group leaders and team leaders organ-ise the paper works for opening the bank account for every member in the group. The entire process is carried out in a simple manner and the customers need not initiate account with a huge amount of deposits. In almost all traditional banks in the country one may not open an account unless they deposit a certain amount of money as an ini-tial deposit in their savings account. Islamic banks do not impose such restrictions on their clienteles; the rural-based micro entre-preneurs. This policy of the bank ultimately minimises the loan processing costs of their customers.
CONCLUSION
In conclusion it may be said that the interest-free micro credit by Islamic banks minimise different costs of both the lender and the borrowers. The last but not the least
206 M.N. Alam
the entire loan giving policy of the bank saves both money and time for micro entre-preneurs. It is also concluded from the study that the micro entrepreneurs with their lit-tle savings and borrowed funds wish to have a maximum returns from their invested funds. Once, the lions share of earning are spent for various expenses as mentioned above, they might not realise their ultimate goals. This, in return, it results in mental stress and worries. The unique loan giving policy of the Islamic banks as mentioned above and the close supervision and moni-toring of borrowed funds not only minimise the borrowers and lenders costs in different aspects of exchange activities, but also save time and energy which ultimately assist them to get rid of mental anxieties, frustra-tions and worries.
The research findings also reveal that even though the majority of the rural-based micro entrepreneurs are poor, yet they have skill and expertise. Besides financial assis-tance, they need proper guide as to how to utilise their borrowed funds in a productive way and how to minimise cots and maximise earnings. Interest-free loans are supervisory types of credit given to their customers by Islamic banks. The bank could make best use of their invested funds once they take measures to direct and supervise borrow-ers’ activities and assist them in minimising their exchange and other business-related costs. The very lending process of Islamic banks to the rural-based micro entrepre-neurs is found as one of the best procedures in minimising borrowers’ costs in compari-son with the other traditional banks in the country.
REFERENCES
Alam, M.N. (2002) Financing Small and Cottage Industries in Sudan by Islamic Banks: An Institutional-Network Approach, Ph.D. Thesis, University Press, Lund.
Alam M.N. (2003) ‘Institutionalization and development of saving habits through Bai-Muajjal mode of Islamic banking finance (A unique means of mobilizing rural savings towards productive sources)’, Managerial Finance, Selected Financial Institutional Structures and Policy Perspective, Vol. 29, No. 2/3, pp.3–22.
Alam, M.N. (2009) Empowering Small Entrepreneurs by Islamic Banks: A Study of Lender-Borrowers Network Relationships Between Small Entrepreneurs and Different Financing Organizations, LAP LAMBERT Academic Publishing, Sarbrucken, Germany.
Anderson, D. and Khambata, F. (1982) Financing Small-Scale Industries And Agriculture in Developing Countries, The Merits and Limitations Of Commercial Policies, World Bank Staff Working Paper, No. 518, World Bank, Washington DC.
Ashe, J. and Cosselett, C.E. (1989) Credit for the poor Past Activities and Future Directions for the United Nations Development Programme, UNDP Policy Discussion Paper, United Nations Publications, New York.
BIDS (1981) Rural Industries Study Project, Bangladesh Institute of Development Studies, Final Report, February, Dhaka.
BIDS (1988) Rural Industrializations as a Tool for Rural-Urban Integration in Bangladesh, Research Report No. 84 BIDS, Dhaka.
BIDS (1989) Informal Financial Market and the Handloom and Small Scale Cotton Textile Sector in Bangladesh, Research Report No. 102 BIDS, Dhaka.
BIDS (1990) Rural Informal Financial Matters in Bangladesh: An Overview, Research Report No. 126 BIDS, Dhaka.
Farooque, Q.H. (1958) Small-Scale and Cottage Industries as a Means of Providing Better Opportunities for Labour in India, Ailgarh Muslim University Publication, Aligarh.
IPPF (2001) International Planned Parenthood Federation, Bangladesh Real Lives Issue six, February 2001, Online: http://www.ippf.org/regions/sar/rl/issue6/bangladesh_stats.htm
Jansson, H. (2002) International Business Management in Emerging Markets, Global Institutions and Networks, Book Manuscript, Baltic Business School, University of Kalmar.
207Cost minimisation through interest-free micro credit to micro entrepreneurs
Jick, T.D. (1979) Mixing qualitative and quantitative methods, triangulation in action’, Administrative Science Quarterly, Vol. 24, pp.602–611.
Little, M.D. (1988) ‘Small manufacturing enterprises and employment in developing countries’, Asian Development Review, Vol. 6, No. 2.
Little Ian, M.D., Dipak, M. and John M.P. (Jr) (1987) Small Manufacturing Enterprise, Oxford University Press, New York.
Macuja, P.C. (1981) ‘Small scale industry devel-opment in the Philippines’, Small Industry Bulletin for Asia and Pacific, United Nations, New York, No. l.21, pp.182–189.
Merriam, S.B. (1998) Qualitative Research and Case Study Applications in Education, Revised and Expanded from Case Study Research, Jossey-Bass publishers, San Francisco.
Myrdal, G. (1968) Asian Drama: An inquiry Into the Poverty of Nations, Pantheon, A Division of Random House, New York.
Nabi, K.A. (1990) Grameen Bank Model and Its Replication in the USA, Minar Offset Printer, Chittagong.
Patton, M.Q. (1985) ‘Quality in qualitative research: methodological principles and recent development’, Invited Addresss to Division J of the American Educational Research Association, April 1985, Chicago.
Sherman, R.R. and Webb, R.B. (1988) ‘Qualitative research in education: a focus’, in Sherman, R.R. and Webb, R.B. (Eds.):
Qualitative Research in Education: Focus and Methods, Falmer Press, Bristol, PA.
Urbe-Echevarria, F. (1992) Small-Scale Industrial Development, Policy and Strategic Issues, Institute of Social Studies, Working paper, Series No. 117, The Hague, Netherlands.
Whitley, R.D. (1992a) ‘The comparative analysis of business systems, societies, firms and markets: the social structuring of business systems’, in Whitley, R. (Ed.): European Business Systems, SAGE Publications, London.
Whitley, R.D. (1992b) Business System in Asia: Firms Markets and Societies, SAGE Publications, London.
Yin, R.K. (1994) Case Study Research, Design and Methods, SAGE Publications, Beverly Hills.
Yunus, M. (1993) ‘Dr. Mohammad Yunus and his Grameen bank’, Embassy Of People’s Republic Of Bangladesh, Stockholm.
NOTES
1 Population and Development Indicator for Asia and Pacific (2008) ESCAP South and South West Asia, Mid 2007 ESCAP Region. http://www.unescap.org/esid/psis/population/database/data_sheet/2007/DataSheet2007.pdf
2 100 USD is equal to 70.32674, Online: http://www.oanda.com/convert/classic, accessed 01/04/10.

Copyright © 2010 WASD
World Sustainable Development Outlook 2010
209
The role of oman developmenT bank in
financing small and medium scale indusTries
S. Hemavathy Nithyanandhan*Mazoon College, Sultanate of Oman
Abstract: The Oman Development Bank (ODB) was established in the year 1976 under the Royal Decree No 31/76. The ODB is the first specialised development bank started in Sultanate for the purpose of contributing to the economic and so-cial development in the country. ODB is attracted by more local and foreign invest-ments created many investment opportunities in development projects by providing the funds, technical support and advice to its clients especially in the establish-ments of Small and Medium Scale Enterprises (SMEs). The objective of this study is to analyse the role of ODB in financing the small and medium scale industries with the aid of qualitative data. The study analyses the approved loans in region wise. To study the effectiveness of ODB in financing small and medium scale industries in sector wise. The study period is from 2006 to 2009. The analysis and findings of this study provide useful information for bankers, policy makers and to the customers who seek to start SMEs in Sultanate.
Keywords: Sultanate; Oman Development Bank; ODB; Small and Medium scale Enterprises; SMEs.
inTroducTion
The Oman economy has grown strongly over recent decades, with oil at the heart of this growth story. Real GDP has seen a high growth rate since 1980, regularly out-pacing world averages. From 2000 to 2008, average real GDP growth was 5.5%. On the prevailing higher oil prices, robust domes-tic demand, increased non-oil exports and investment climate, the preliminary esti-mates of the national accounts indicate a Financial Year 2008, GDP growth at cur-rent prices at about 40%. This could result
in a nominal GDP of RO 22.4 billion. This is achieved amidst the global financial and economic crisis and the national economy showed steady growth in financial year 2008. (Annual Report – OBD, 2008).
It is expected that the GDP at constant prices to grow by more than 10% in finan-cial year 2008. The oil revenues for 2008 are expected to be higher by 55.7% compared to the previous year backed by 51.4% increase in oil prices along with 6.6% increase in pro-duction. The non-oil activities are expected
*Corresponding author: Mazoon College, Sultanate of Oman; e-mail: [email protected]
210 S.H. Nithyanandhan
to show 26.7% Year-on-Year growth with the presence of strong domestic demand and increased exports. The inflation rates were on the rise, with the rate for the period (January–October 2008) amounting to about 12.4% compared with about 5.3% for the same period of 2007 (Source: Ministry of National Economy).
The five years economic development plans in the Sultanate form the corner-stone of sustainable economic develop-ment, on the same track comes the Seventh Five Year Plan 2006–2010 to ensure the Government’s plan to push the wheel of national economy ahead. The Seventh Five Year Plan 2006–2010 gives Omani national economy a new momentum. Its main aim is to push the economic diversification wheel forward towards self sufficiency, through development of tourism, industry, fisheries and agricultural sectors, along with providing for export. It also aims at developing Small and Medium Scale Enterprises (SMEs) and accelerating the development of non- petroleum sectors at the rate of 7.5% per year (Annual Report – ODB, 2007).
The Seventh Five Year Plan is considered as the biggest development plan executed by the Government. The total public expendi-ture on the Seventh Five Year Plan is approx-imately at RO.20,896 million. The plan endeavours to reinforce the competitiveness of the national economy, to improve its pro-duction, and to raise the investment rate to the gross production through petrochemi-cal and tourism projects.
According to the Seventh Plan the total revenues expected during the plan will reach RO.18,636 million in that RO.12,884 which are net petroleum revenues and RO.5,752 million is non-petroleum revenues.
With respect to the five year development plans, Oman Development Bank (ODB)
plays an important role, because it provides an effective tool in supporting private sector to contribute effectively to the achievement of the functions assigned to it in the plan. As one of the financers of lending plans and programs the bank provides loans starting from big loans, to medium and small loans, to very small loans.
origin of odb
The beginnings of the emergence of ODB goes back to 1976 when it was launched vide Royal Decree No.31/76. ODB is the first specialised developmental bank in the Sultanate for the purpose of contrib-uting to the economic and social devel-opment of the country. ODB celebrates three decades of dedicated, beneficial and effective developmental banking service in the country. ODB has contributed effec-tive role in creating plenty of employment opportunities for Omanis in the economy. It also attracted more local and foreign investments and created many investment opportunities in developmental projects by providing the necessary funds, tech-nical support and advice to its clients, especially in the establishment of SMEs. These SMEs covered different fields of investments in all sectors of development, serving many economic and social develop-mental and service projects and purposes (Al Markazi, 2008).
During these 30 years, the bank passed many milestones, the most salient of which was the merger of ODB and Oman Bank of Agriculture and Fisheries under the name of ODB. ODB’s lending limit was raised to RO.1 million, and its capital was increased to RO.40 million in addition to the permis-sion of the bank to finance working capital. The end of the year 2009 was the fourth year of implementation of the strategic plan for 2005–2010. During the past four years, the bank has witnessed fundamental
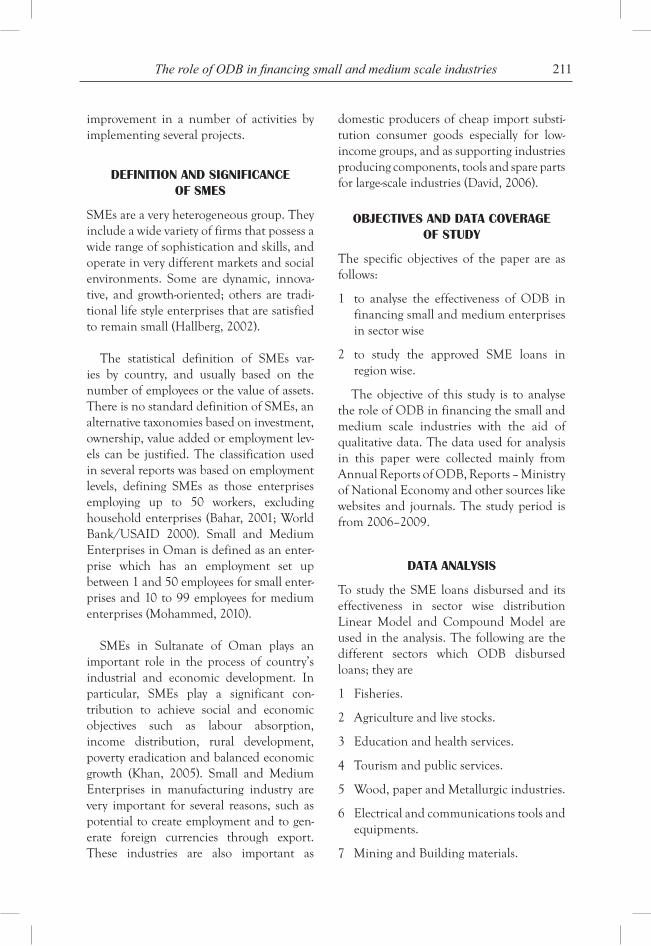
211The role of ODB in financing small and medium scale industries
improvement in a number of activities by implementing several projects.
definiTion and significance of smes
SMEs are a very heterogeneous group. They include a wide variety of firms that possess a wide range of sophistication and skills, and operate in very different markets and social environments. Some are dynamic, innova-tive, and growth-oriented; others are tradi-tional life style enterprises that are satisfied to remain small (Hallberg, 2002).
The statistical definition of SMEs var-ies by country, and usually based on the number of employees or the value of assets. There is no standard definition of SMEs, an alternative taxonomies based on investment, ownership, value added or employment lev-els can be justified. The classification used in several reports was based on employment levels, defining SMEs as those enterprises employing up to 50 workers, excluding household enterprises (Bahar, 2001; World Bank/USAID 2000). Small and Medium Enterprises in Oman is defined as an enter-prise which has an employment set up between 1 and 50 employees for small enter-prises and 10 to 99 employees for medium enterprises (Mohammed, 2010).
SMEs in Sultanate of Oman plays an important role in the process of country’s industrial and economic development. In particular, SMEs play a significant con-tribution to achieve social and economic objectives such as labour absorption, income distribution, rural development, poverty eradication and balanced economic growth (Khan, 2005). Small and Medium Enterprises in manufacturing industry are very important for several reasons, such as potential to create employment and to gen-erate foreign currencies through export. These industries are also important as
domestic producers of cheap import substi-tution consumer goods especially for low- income groups, and as supporting industries producing components, tools and spare parts for large-scale industries (David, 2006).
obJecTives and daTa coverage of sTudY
The specific objectives of the paper are as follows:
1 to analyse the effectiveness of ODB in financing small and medium enterprises in sector wise
2 to study the approved SME loans in region wise.
The objective of this study is to analyse the role of ODB in financing the small and medium scale industries with the aid of qualitative data. The data used for analysis in this paper were collected mainly from Annual Reports of ODB, Reports – Ministry of National Economy and other sources like websites and journals. The study period is from 2006–2009.
daTa analYsis
To study the SME loans disbursed and its effectiveness in sector wise distribution Linear Model and Compound Model are used in the analysis. The following are the different sectors which ODB disbursed loans; they are
1 Fisheries.
2 Agriculture and live stocks.
3 Education and health services.
4 Tourism and public services.
5 Wood, paper and Metallurgic industries.
6 Electrical and communications tools and equipments.
7 Mining and Building materials.
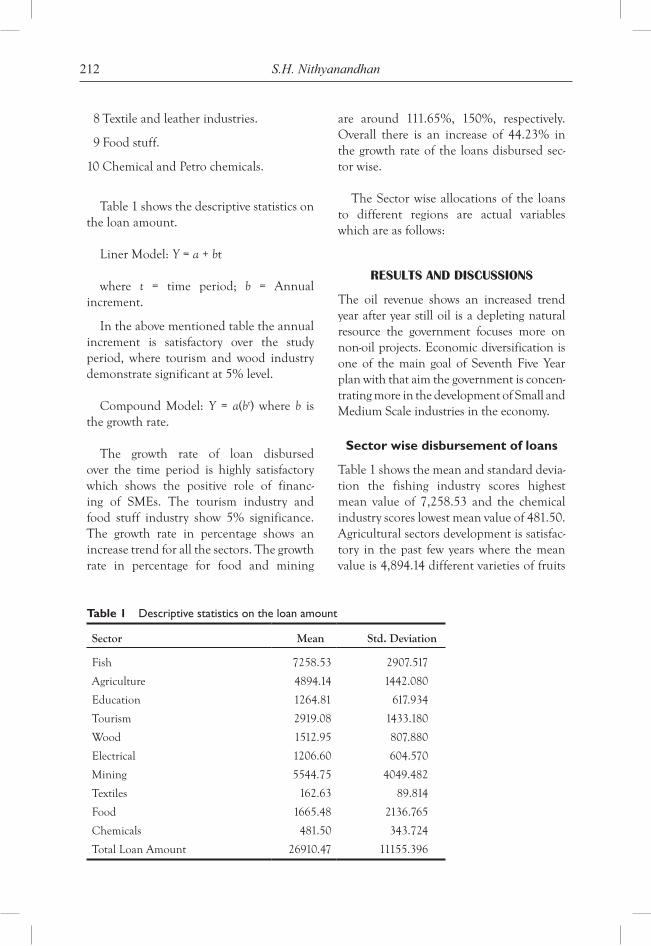
212 S.H. Nithyanandhan
Table 1 Descriptive statistics on the loan amount
Sector Mean Std. Deviation
Fish 7258.53 2907.517
Agriculture 4894.14 1442.080
Education 1264.81 617.934
Tourism 2919.08 1433.180
Wood 1512.95 807.880
Electrical 1206.60 604.570
Mining 5544.75 4049.482
Textiles 162.63 89.814
Food 1665.48 2136.765
Chemicals 481.50 343.724
Total Loan Amount 26910.47 11155.396
8 Textile and leather industries.
9 Food stuff.
10 Chemical and Petro chemicals.
Table 1 shows the descriptive statistics on the loan amount.
Liner Model: Y = a + bt
where t = time period; b = Annual increment.
In the above mentioned table the annual increment is satisfactory over the study period, where tourism and wood industry demonstrate significant at 5% level.
Compound Model: Y = a(bt) where b is the growth rate.
The growth rate of loan disbursed over the time period is highly satisfactory which shows the positive role of financ-ing of SMEs. The tourism industry and food stuff industry show 5% significance. The growth rate in percentage shows an increase trend for all the sectors. The growth rate in percentage for food and mining
are around 111.65%, 150%, respectively. Overall there is an increase of 44.23% in the growth rate of the loans disbursed sec-tor wise.
The Sector wise allocations of the loans to different regions are actual variables which are as follows:
resulTs and discussions
The oil revenue shows an increased trend year after year still oil is a depleting natural resource the government focuses more on non-oil projects. Economic diversification is one of the main goal of Seventh Five Year plan with that aim the government is concen-trating more in the development of Small and Medium Scale industries in the economy.
Sector wise disbursement of loans
Table 1 shows the mean and standard devia-tion the fishing industry scores highest mean value of 7,258.53 and the chemical industry scores lowest mean value of 481.50. Agricultural sectors development is satisfac-tory in the past few years where the mean value is 4,894.14 different varieties of fruits
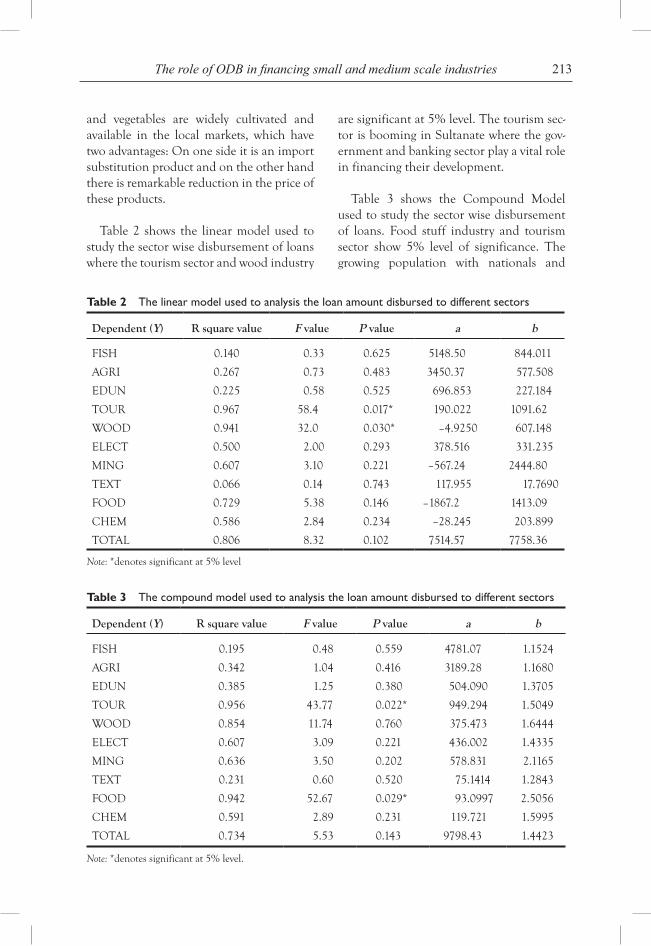
213The role of ODB in financing small and medium scale industries
Table 2 The linear model used to analysis the loan amount disbursed to different sectors
Dependent (Y) R square value F value P value a b
FISH 0.140 0.33 0.625 5148.50 844.011
AGRI 0.267 0.73 0.483 3450.37 577.508
EDUN 0.225 0.58 0.525 696.853 227.184
TOUR 0.967 58.4 0.017* 190.022 1091.62
WOOD 0.941 32.0 0.030* –4.9250 607.148
ELECT 0.500 2.00 0.293 378.516 331.235
MING 0.607 3.10 0.221 –567.24 2444.80
TEXT 0.066 0.14 0.743 117.955 17.7690
FOOD 0.729 5.38 0.146 –1867.2 1413.09
CHEM 0.586 2.84 0.234 –28.245 203.899
TOTAL 0.806 8.32 0.102 7514.57 7758.36
Note: *denotes significant at 5% level
Table 3 The compound model used to analysis the loan amount disbursed to different sectors
Dependent (Y) R square value F value P value a b
FISH 0.195 0.48 0.559 4781.07 1.1524
AGRI 0.342 1.04 0.416 3189.28 1.1680
EDUN 0.385 1.25 0.380 504.090 1.3705
TOUR 0.956 43.77 0.022* 949.294 1.5049
WOOD 0.854 11.74 0.760 375.473 1.6444
ELECT 0.607 3.09 0.221 436.002 1.4335
MING 0.636 3.50 0.202 578.831 2.1165
TEXT 0.231 0.60 0.520 75.1414 1.2843
FOOD 0.942 52.67 0.029* 93.0997 2.5056
CHEM 0.591 2.89 0.231 119.721 1.5995
TOTAL 0.734 5.53 0.143 9798.43 1.4423
Note: *denotes significant at 5% level.
and vegetables are widely cultivated and available in the local markets, which have two advantages: On one side it is an import substitution product and on the other hand there is remarkable reduction in the price of these products.
Table 2 shows the linear model used to study the sector wise disbursement of loans where the tourism sector and wood industry
are significant at 5% level. The tourism sec-tor is booming in Sultanate where the gov-ernment and banking sector play a vital role in financing their development.
Table 3 shows the Compound Model used to study the sector wise disbursement of loans. Food stuff industry and tourism sector show 5% level of significance. The growing population with nationals and
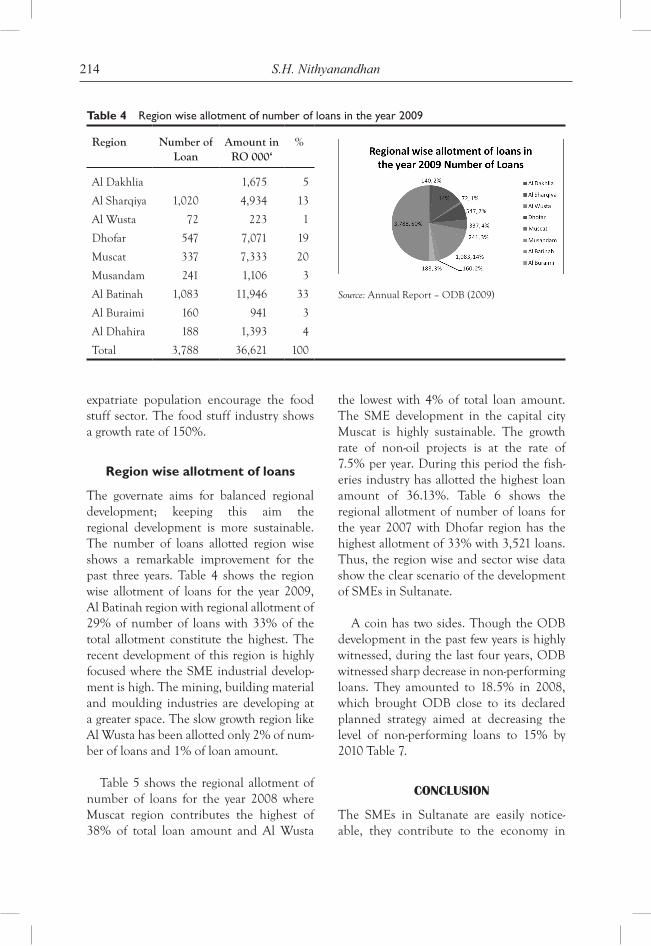
214 S.H. Nithyanandhan
Table 4 Region wise allotment of number of loans in the year 2009
Region Number of Loan
Amount in RO 000‘
%
Al Dakhlia 1,675 5
Al Sharqiya 1,020 4,934 13
Al Wusta 72 223 1
Dhofar 547 7,071 19
Muscat 337 7,333 20
Musandam 241 1,106 3
Al Batinah 1,083 11,946 33
Al Buraimi 160 941 3
Al Dhahira 188 1,393 4
Total 3,788 36,621 100
Source: Annual Report – ODB (2009)
expatriate population encourage the food stuff sector. The food stuff industry shows a growth rate of 150%.
Region wise allotment of loans
The governate aims for balanced regional development; keeping this aim the regional development is more sustainable. The number of loans allotted region wise shows a remarkable improvement for the past three years. Table 4 shows the region wise allotment of loans for the year 2009, Al Batinah region with regional allotment of 29% of number of loans with 33% of the total allotment constitute the highest. The recent development of this region is highly focused where the SME industrial develop-ment is high. The mining, building material and moulding industries are developing at a greater space. The slow growth region like Al Wusta has been allotted only 2% of num-ber of loans and 1% of loan amount.
Table 5 shows the regional allotment of number of loans for the year 2008 where Muscat region contributes the highest of 38% of total loan amount and Al Wusta
the lowest with 4% of total loan amount. The SME development in the capital city Muscat is highly sustainable. The growth rate of non-oil projects is at the rate of 7.5% per year. During this period the fish-eries industry has allotted the highest loan amount of 36.13%. Table 6 shows the regional allotment of number of loans for the year 2007 with Dhofar region has the highest allotment of 33% with 3,521 loans. Thus, the region wise and sector wise data show the clear scenario of the development of SMEs in Sultanate.
A coin has two sides. Though the ODB development in the past few years is highly witnessed, during the last four years, ODB witnessed sharp decrease in non-performing loans. They amounted to 18.5% in 2008, which brought ODB close to its declared planned strategy aimed at decreasing the level of non-performing loans to 15% by 2010 Table 7.
conclusion
The SMEs in Sultanate are easily notice-able, they contribute to the economy in
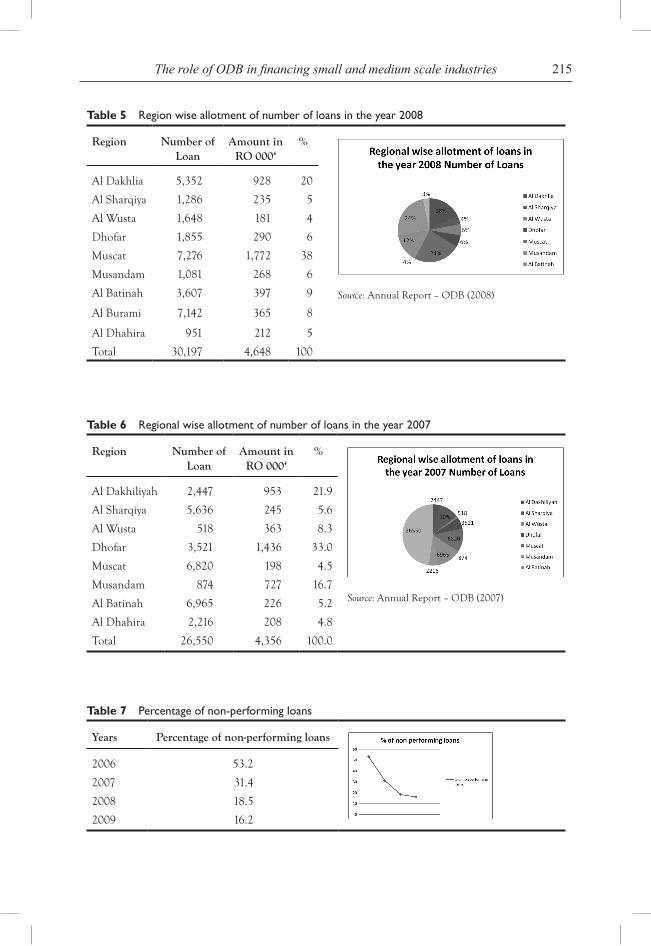
215The role of ODB in financing small and medium scale industries
Table 6 Regional wise allotment of number of loans in the year 2007
Region Number of Loan
Amount in RO 000‘
%
Al Dakhiliyah 2,447 953 21.9
Al Sharqiya 5,636 245 5.6
Al Wusta 518 363 8.3
Dhofar 3,521 1,436 33.0
Muscat 6,820 198 4.5
Musandam 874 727 16.7
Al Batinah 6,965 226 5.2
Al Dhahira 2,216 208 4.8
Total 26,550 4,356 100.0
Source: Annual Report – ODB (2007)
Table 7 Percentage of non-performing loans
Years Percentage of non-performing loans
2006 53.2
2007 31.4
2008 18.5
2009 16.2
Table 5 Region wise allotment of number of loans in the year 2008
Region Number of Loan
Amount in RO 000‘
%
Al Dakhlia 5,352 928 20
Al Sharqiya 1,286 235 5
Al Wusta 1,648 181 4
Dhofar 1,855 290 6
Muscat 7,276 1,772 38
Musandam 1,081 268 6
Al Batinah 3,607 397 9
Al Burami 7,142 365 8
Al Dhahira 951 212 5
Total 30,197 4,648 100
Source: Annual Report – ODB (2008)
216 S.H. Nithyanandhan
terms of output of goods and services; creation of employment opportunities at relatively low capital cost; reducing income disparities; develop a pool of skilled and semi-skilled workers as a basis for the future industrial expansion; it improves forward and backward linkages between economi-cally, socially and geographically diverse sectors of the economy; it provides oppor-tunities for developing and adapting appro-priate technological approaches, which is often a great to the progressive economic development.
references
Bahar, H. (2001) ‘Financing for micro- enterprises, small, medium-sized and cottage industries: Bangladesh perspective’, Conference Paper – ESCAP-ADB Joint Workshop on Mobilizing Domestic Finance for Development: Reassesment of Bank Finance and Debt Markets in Asia.
David, A.A. (2006) ‘The role of small scale industries in Nigeria Economy’.
Efforts of Oman Development Bank in Financing SMEs in the country (2008) Al Markazi (Publication of the Central Bank of Oman).
Hallberg, K. (2002) ‘A market-oriented strategy for small and medium scale enterprises’, Part 63, pp.29 and 32.
Khan, A.R. (2005) ‘The role of small and medium scale industries in the development of rural sector’, Economic Review, Vol. 17.
Mohammed, M.I.A. (2010) ‘The role of public economic programmes in developing small and medium enterprises: the case study of the Sultanate of Oman’, PhD – Abstract (University of Malaysia).
Report, A. (2006) Oman Development Bank.
Report, A. (2007) Oman Development Bank.
Report, A. (2008) Oman Development Bank.
Report, A. (2009) Oman Development Bank.
Copyright © 2010 WASD
World Sustainable Development Outlook 2010
217
Gendered applications of the carbon footprint: the use of carbon manaGement
tools to hiGhliGht the effect of Gender on
sustainable lifestyles
Nolana E. Lynch*University of the West Indies, Trinidad & Tobago
Abstract: Discussion on the phenomenon of climate change has bombarded our society within recent times. Scientists are consistently doing research, which shows that many decades of development have caused a rapid increase of green-house gases within the Earth’s atmosphere. This has exacerbated the natural global warming effect and supports claims that the Earth’s climatic cycle is being altered. In an attempt to reduce the percentage of greenhouse gases being emitted in the atmosphere, the concept of Carbon Management and the Carbon Footprint were established. These tools are used to promote more sustainable resource consumption patterns. In order to effectively promote any new pattern of behaviour, however, gender differences should be considered. Due to the first and second waves of feminist theories, gender has been given consideration in public policies and programmes in developed countries. Developing countries are gradually including gender at such levels. Even though gender equality is still a controversial issue, there is the need for gender considerations in all decision-making processes to ensure that sustainable development is achieved. For this study, a gender analysis was conducted on carbon footprint data to identify whether there is a difference in sustainable practices between the male and female gender. The strengths and weaknesses within each sub-group were analysed. Emphasis was placed on how the socially-accepted behaviours of each gender affected their energy usage, consumption and waste management practices. The detailed findings can be used to develop public awareness campaigns and programmes specially designed to fit the needs of each gender, hence promoting equal development opportunities and ensuring that national sustainable development objectives are achieved in a shorter timeframe.
Keywords: sustainable lifestyles; gender analysis; carbon footprint; consumption; energy efficiency; carbon management; carbon neutrality.
*Corresponding author: University of the West Indies, Trinidad & Tobago; e-mail: [email protected]; [email protected]
218 Nolana E. Lynch
introduction
Sustainable development can only be achieved through long-term investments in economic, human and environmental capi-tal and the female half of the world’s human capital is undervalued and underutilized the world over (Organisation for Economic Cooperation and Development, 2008). This gender difference is a hindrance to achieving holistic development. Climate change issues bombarding our society have increased the need to achieve sustainability at all levels. If sustainable concepts are utilised it will allow human beings to better manage the rate at which resources are consumed. The use of resources result in the production of green-house gases and as such sustainable develop-ment will assist in the reduction of green-house gases in the atmosphere.
In an attempt to combat climate change issues and promote sustainability, Carbon Management principles and greenhouse gas inventories were introduced to assist societ-ies worldwide. The Carbon Footprint is a by-product of both these initiatives. This tool allows the analysis of carbon dioxide emissions for areas such as transportation, electricity usage, material consumption and waste generation. Knowledge of this allows an individual or an organisation to reduce emissions and thus reduce the total carbon footprint value.
The main outcome of carbon footprint analyses is to reduce emissions to the small-est possible value, tending towards zero. A zero carbon footprint means that for every metric tonne of Carbon Dioxide emit-ted, one metric tonne of Carbon Dioxide is removed from the atmosphere. At this point, an individual or an organisation has achieved carbon neutrality; however, moving towards a carbon neutral lifestyle involves a conscious effort to use eco-friendly transportation options, sustainable energy practices, sustainable consumption
and waste management strategies. After implementing more sustainable habits, carbon footprint will reduce immensely. It is impossible to live on the earth and utilise zero resources; a portion is necessary for sus-tenance. The carbon emitted from utilising these minimum resources is the optimum carbon footprint. A body can then choose to become carbon neutral by investing in carbon offsetting programmes or actions that will further reduce the carbon foot-print to zero.
The objective of sustainability is to cur-tail man’s exorbitant consumption habits, manage the use of natural resources and as a result control the rate of greenhouse gas emissions. There are varying patterns of response due to differing roles portrayed by men and women in society. For the purpose of this study, gender is defined as the socially constructed roles of men and women, including expectations of their character-istics, likely behaviours and the roles that each sex is expected to fulfill as taught by society. A gender analysis on the carbon footprint of men and women would yield results that reflect the differences between the role of men and women1. Sources show that women tend to have lower consump-tion patterns and carbon footprints and thus a lower impact on the environment (Organisation for Economic Cooperation and Development, 2008) and this may be due to the conflicting manner in which men and women view the environment.
With sustainability and equality as forefront issues, the carbon footprint pro-motes sustainable usage of resources and is important not only for public awareness but for public implementation. Conducting a gender analysis on these assessments will assist in highlighting the contrasting needs of groups in society. It will assist in determining which programmes should be developed to address the manner in which
219Gendered applications of the carbon footprint
women reduce their carbon footprint? What media can be used to encourage men to have a lesser impact on the environ-ment? Similarly, a national study can reap benefits for a nation, as sustainable devel-opment will be faster established as citizens adapt to responsible consumption. A trans-formed partnership based on equality of the genders is pertinent in obtaining sustain-able development objectives.
This study will allow the reader to view carbon footprints through a different per-spective. Do women generally have a lower impact on the environment than men? Are women more conscious of their lifestyles, therefore sub-consciously performing their routine in a more sustainable manner? Can these sustainable practices be linked to the stereotypical ‘gender role’ of women?
literature reVieW
Men’s lifestyles and consumer patterns, whether they are rich or poor, tend to be more resource-intensive and less sustainable than women’s (Johnsson-Latham, 2006). Expressing a more feminine footprint would result in a smaller impact on the environ-ment as well as better access to goods and services that take into account the needs of both women and men (Organisation for Economic Cooperation and Development, 2008). In terms of individual footprint analyses,
“many behaviors that contribute to these emissions could be modified, for example, by purchasing compact fluorescent bulbs (purchasing behaviors), increasing one’s refrigerator temperature (non-purchasing, one-time behaviors), regularly shutting off the lights (repeated behaviors or hab-its), or insulating one’s hot water heater (complex behaviors that require expert assistance or are costly)” (Robinson and Armel, 2008).
It is said that changes in these individual-level behaviours can play a major role in slowing down climate change. “Reliable and valid tools for measuring the frequency, dura-tion, or intensity of behaviors such as these, in conjunction with tools that provide accu-rate information about their Greenhouse Gas footprints, may help reduce emissions” (Robinson and Armel, 2008). With the information obtained by evaluating your personal carbon footprint, behavioural change may occur. This was shown in approximately 40 studies wherein providing individuals with feedback on their residen-tial electricity use, resulted in reductions of 5–15%, with the greater reductions occurring with more frequent or disaggregated feed-back (Darby, 2006). One author, Mr. John Cossham described being green as “doing whatever you can. It is not about wearing hair shirts and spending vast amounts of money. You might invest some money…but you save in the long run”. “Being a vegetarian or vegan is actually one of the best things you can do to lower your CO
2 emissions. If you
have a diet that is heavy on milk, cheese and meat, then you have a much higher hidden carbon footprint – the emissions that are a by-product of the production of those foods” (Cossman, 2009). He further describes being green as not solely based on sacrifices, but enjoying a better quality of life. Personally, he does not fly, he goes on local vacations, he is satisfied with his cur-rent vehicle, but would rather walk or cycle to most places. Many measures have been implemented by Mr. Cossman, for him to produce a carbon footprint of 0.45 tonnes of carbon dioxide annually. Ultimately he does not expect persons to give up things immediately, but in general, gradually and consistently, and resultantly minimising their impact on the environment.
Assessment of the carbon footprint is relatively a new concept which encourages individuals and organisations to manage
220 Nolana E. Lynch
their carbon output by initially analysing what processes comprise their carbon out-put, calculating a value for this output and then identifying methods that can be used to reduce this carbon output. Mr. Andrew Hoffman in his book Carbon Strategies: How Leading Companies are Reducing their Climate Change Footprint states that,
“Nearly all companies measure direct emissions and most measure indirect emissions… Companies can measure actual emissions or develop estimates using fuel- or material-based calculations. The former approach may be more expen-sive and labour-intensive but the latter is complicated by the variety of methodolo-gies that exist for calculating emissions” (Hoffman, 2007).
There is no fixed method to conduct a carbon footprint analysis, also known as an emissions profile assessment. In light of this, companies have either developed new systems for measuring and tracking emission reductions or hired a carbon management consultancy company to conduct a carbon management programme for their organisa-tion. These assessments usually involve the use of standard calculations, from systems such as the Greenhouse Gas Protocol or the Environmental Management System (EMS) under ISO14001.
Just as sustainability is being introduced into development policies, so also is gender issues. Due to the constant research and lob-bying of active feminists worldwide, policy-makers are now being pressured to ensure that policies are gender sensitive. “Gender analysis is an innovative process that enables government and non-government organisations to analyse whether proposed and existing policies, programs and services produce equally beneficial outcomes for diverse groups of women and men” (Gender
Analysis: Making policies, programmes and services gender aware, 2005). However, on a smaller scale a gender analysis is ideal to map the differences in attitude and behaviour between men and women when analysing various social issues.
The relationship between women and nature is such that there is a similar-ity between patriarchal violence against women, ‘other’ people and nature (Mies and Shiva, 1993), hence, the development of eco-feminists and eco-feminism principles. Wherever women acted against ecological destruction, they realised that “in denying this patriarchy we are loyal to future genera-tions and to life and to this planet itself” (Mies and Shiva, 1993). This eco-feminist principle, is also the basis of sustainable development. The Brundtland Report (Our Common Future) defined sustainable development as development that meets the needs of the present, without compromis-ing the ability of future generations to meet their own needs. This concept allows a shift from the previous perception that develop-ment is equivalent to economic growth, and as such, this current development challenge “provides a promising momentum for femi-nist methodology, thinking and practice to fulfill a useful role” (Harcourt, 1994). Since the beginning of the 1990s, feminist environmental researchers have been trying to make visible the ecological, social and gender-specific conditions of global produc-tion as well as the consumption of goods and services (Littig, 2001). The importance of sustainable lifestyles became of utmost importance as sustainable development principles came to the forefront. The comparison of women’s consumer behav-iour and expenses with those of men has so far only rarely been an object of social scientific analysis, even in the newer envi-ronmentally oriented studies (Nava, 1992). This study serves as pioneering research
221Gendered applications of the carbon footprint
in attempting to quantitatively analyse the effects that male and female behavior have on the environment.
methodoloGy
The study incorporated research of both a qualitative and quantitative nature. Initially, secondary data on the Carbon Footprint was collected. Extensive research was con-ducted on the calculations used in analysing greenhouse gas emissions and carbon foot-print analyses conducted on individuals as well as organisations. Standard calculation bodies were examined; some included the Greenhouse gas Protocol and ISO14001 – Environmental Management Systems. After much research into the available stan-dards, the Greenhouse Gas Protocol (www.ghgprotocol.org) was chosen. This body has created a wide range of spreadsheets which allows the conversion of energy into the amount of carbon dioxide emissions in metric tonnes. The questionnaire was then constructed to obtain data for the main sec-tors that contribute to greenhouse gas emis-sions. These areas include:
1 Transportation
2 Energy Use at Home
3 Food
4 Waste.
The first two categories are referred to as direct emissions, as energy is burnt when persons use their car, electricity or other fuel types. The latter two are described as indirect emissions, as greenhouse gases are produced in manufacturing food, and transporting it to the purchase point, and energy is also utilised in transporting and discarding waste. The questionnaire was distributed to the sample and data was extracted to obtain values for the amount of carbon dioxide emissions per sector. After the quantitative analysis, the
data was separated by gender. A gender analy-sis was conducted consequent to this in both a quantitative and qualitative manner.
discussion
It can be said that sustainable development is achieved when the current generation meets its needs without compromising the needs of future generations. At present, man’s con-sumption rates have been rapidly increasing as evidenced in the increase of global warm-ing and climate variability. As highlighted previously, energy usage results in the emis-sion of greenhouse gases. Energy is any form of fuel and resources used in transporta-tion, electricity generation, consumption and waste disposal. If man reduces their consumption rate, it decreases the amount of carbon dioxide emitted over a period. If this reduction occurs progressively the con-centration of greenhouse gases in the atmo-sphere will decrease, thus decreasing the rate at which global warming is occurring. This strategy is two-fold, as the reduction of consumption not only decreases the rate of global warming, but also increases the rate at which sustainable development objectives are achieved. This statement directly shows how the carbon footprint is used as a mea-sure of sustainability, seeing that it measures the amount of carbon dioxide being emit-ted, less of which indicates closer proximity to sustainable practices.
Recent studies show that
“sustainable development requires the full and equal participation of women at all levels. It is clearly inappropriate to address problems, identify the appropriate strate-gies, or to implement the solutions if only half of the people concerned are involved in the process. Gender equity is an essen-tial building block in sustainable develop-ment” (Hemmati and Gardiner, 2002).
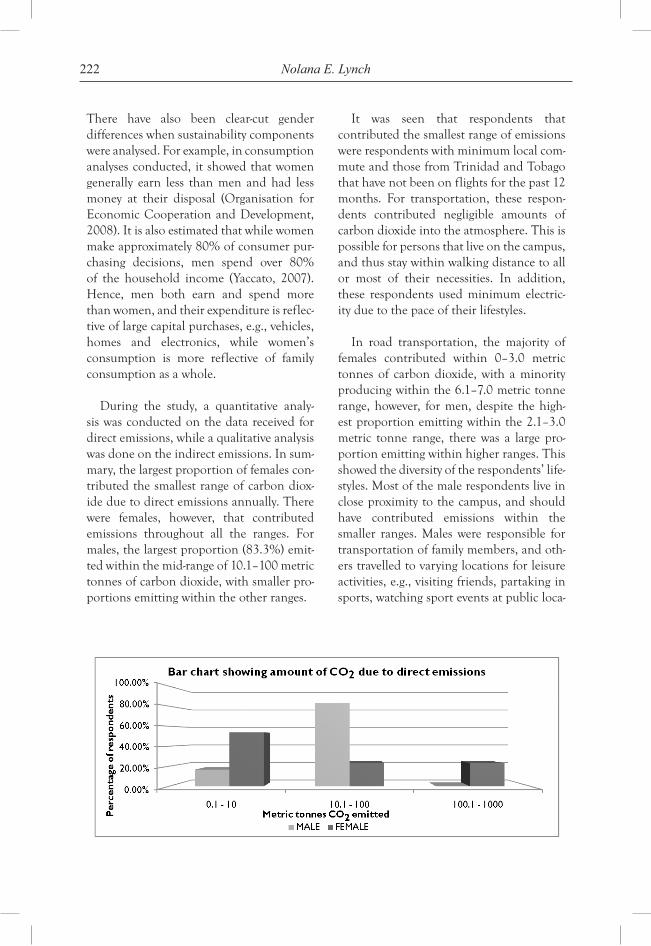
222 Nolana E. Lynch
There have also been clear-cut gender differences when sustainability components were analysed. For example, in consumption analyses conducted, it showed that women generally earn less than men and had less money at their disposal (Organisation for Economic Cooperation and Development, 2008). It is also estimated that while women make approximately 80% of consumer pur-chasing decisions, men spend over 80% of the household income (Yaccato, 2007). Hence, men both earn and spend more than women, and their expenditure is reflec-tive of large capital purchases, e.g., vehicles, homes and electronics, while women’s consumption is more reflective of family consumption as a whole.
During the study, a quantitative analy-sis was conducted on the data received for direct emissions, while a qualitative analysis was done on the indirect emissions. In sum-mary, the largest proportion of females con-tributed the smallest range of carbon diox-ide due to direct emissions annually. There were females, however, that contributed emissions throughout all the ranges. For males, the largest proportion (83.3%) emit-ted within the mid-range of 10.1–100 metric tonnes of carbon dioxide, with smaller pro-portions emitting within the other ranges.
It was seen that respondents that contributed the smallest range of emissions were respondents with minimum local com-mute and those from Trinidad and Tobago that have not been on flights for the past 12 months. For transportation, these respon-dents contributed negligible amounts of carbon dioxide into the atmosphere. This is possible for persons that live on the campus, and thus stay within walking distance to all or most of their necessities. In addition, these respondents used minimum electric-ity due to the pace of their lifestyles.
In road transportation, the majority of females contributed within 0–3.0 metric tonnes of carbon dioxide, with a minority producing within the 6.1–7.0 metric tonne range, however, for men, despite the high-est proportion emitting within the 2.1–3.0 metric tonne range, there was a large pro-portion emitting within higher ranges. This showed the diversity of the respondents’ life-styles. Most of the male respondents live in close proximity to the campus, and should have contributed emissions within the smaller ranges. Males were responsible for transportation of family members, and oth-ers travelled to varying locations for leisure activities, e.g., visiting friends, partaking in sports, watching sport events at public loca-
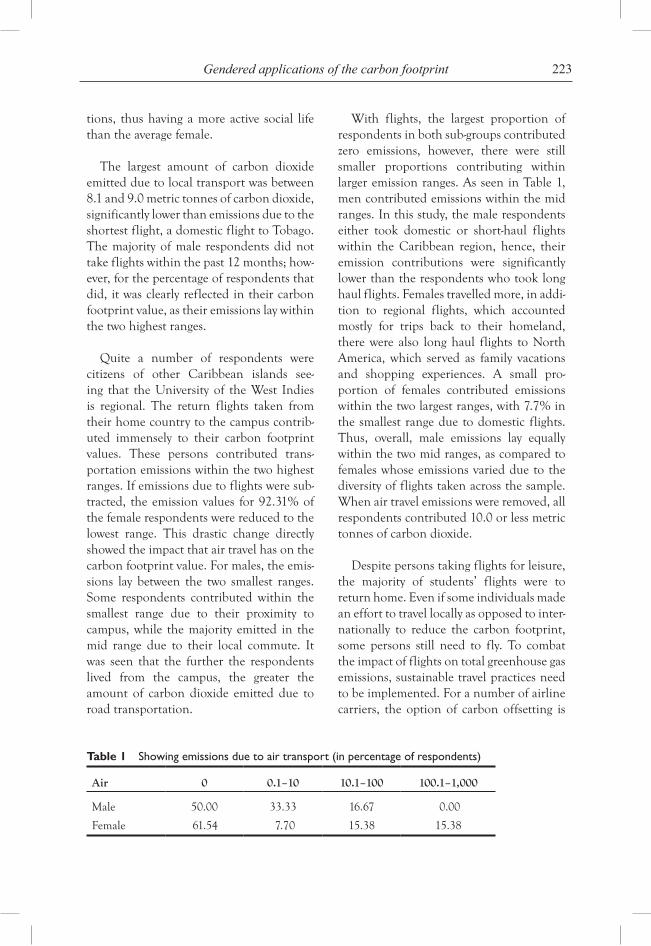
223Gendered applications of the carbon footprint
tions, thus having a more active social life than the average female.
The largest amount of carbon dioxide emitted due to local transport was between 8.1 and 9.0 metric tonnes of carbon dioxide, significantly lower than emissions due to the shortest flight, a domestic flight to Tobago. The majority of male respondents did not take flights within the past 12 months; how-ever, for the percentage of respondents that did, it was clearly reflected in their carbon footprint value, as their emissions lay within the two highest ranges.
Quite a number of respondents were citizens of other Caribbean islands see-ing that the University of the West Indies is regional. The return flights taken from their home country to the campus contrib-uted immensely to their carbon footprint values. These persons contributed trans-portation emissions within the two highest ranges. If emissions due to flights were sub-tracted, the emission values for 92.31% of the female respondents were reduced to the lowest range. This drastic change directly showed the impact that air travel has on the carbon footprint value. For males, the emis-sions lay between the two smallest ranges. Some respondents contributed within the smallest range due to their proximity to campus, while the majority emitted in the mid range due to their local commute. It was seen that the further the respondents lived from the campus, the greater the amount of carbon dioxide emitted due to road transportation.
With flights, the largest proportion of respondents in both sub-groups contributed zero emissions, however, there were still smaller proportions contributing within larger emission ranges. As seen in Table 1, men contributed emissions within the mid ranges. In this study, the male respondents either took domestic or short-haul flights within the Caribbean region, hence, their emission contributions were significantly lower than the respondents who took long haul flights. Females travelled more, in addi-tion to regional flights, which accounted mostly for trips back to their homeland, there were also long haul flights to North America, which served as family vacations and shopping experiences. A small pro-portion of females contributed emissions within the two largest ranges, with 7.7% in the smallest range due to domestic flights. Thus, overall, male emissions lay equally within the two mid ranges, as compared to females whose emissions varied due to the diversity of flights taken across the sample. When air travel emissions were removed, all respondents contributed 10.0 or less metric tonnes of carbon dioxide.
Despite persons taking flights for leisure, the majority of students’ flights were to return home. Even if some individuals made an effort to travel locally as opposed to inter-nationally to reduce the carbon footprint, some persons still need to fly. To combat the impact of flights on total greenhouse gas emissions, sustainable travel practices need to be implemented. For a number of airline carriers, the option of carbon offsetting is
Air 0 0.1–10 10.1–100 100.1–1,000
Male 50.00 33.33 16.67 0.00
Female 61.54 7.70 15.38 15.38
Table 1 Showing emissions due to air transport (in percentage of respondents)
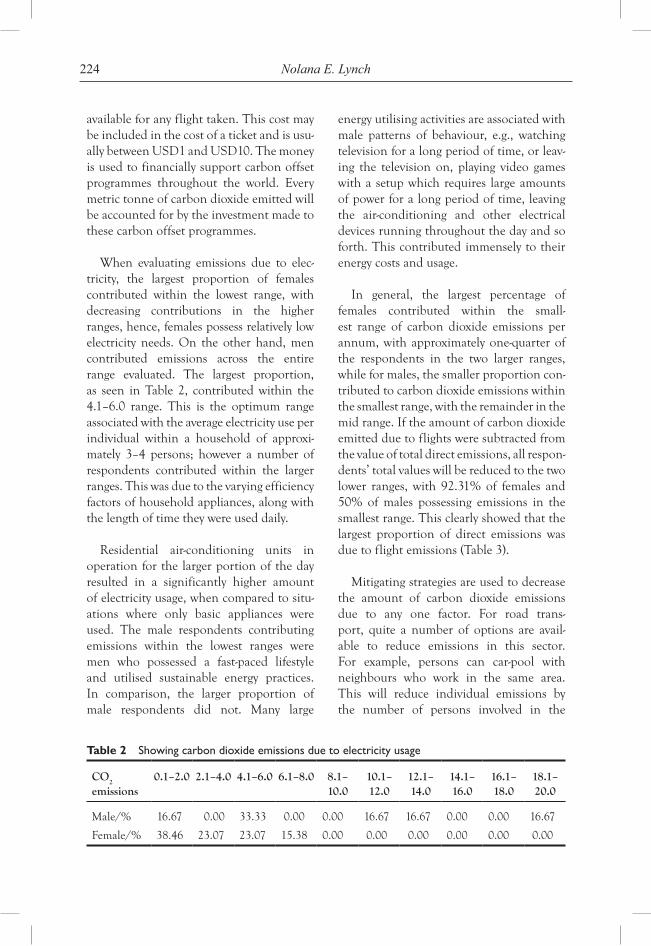
224 Nolana E. Lynch
available for any flight taken. This cost may be included in the cost of a ticket and is usu-ally between USD1 and USD10. The money is used to financially support carbon offset programmes throughout the world. Every metric tonne of carbon dioxide emitted will be accounted for by the investment made to these carbon offset programmes.
When evaluating emissions due to elec-tricity, the largest proportion of females contributed within the lowest range, with decreasing contributions in the higher ranges, hence, females possess relatively low electricity needs. On the other hand, men contributed emissions across the entire range evaluated. The largest proportion, as seen in Table 2, contributed within the 4.1–6.0 range. This is the optimum range associated with the average electricity use per individual within a household of approxi-mately 3–4 persons; however a number of respondents contributed within the larger ranges. This was due to the varying efficiency factors of household appliances, along with the length of time they were used daily.
Residential air-conditioning units in operation for the larger portion of the day resulted in a significantly higher amount of electricity usage, when compared to situ-ations where only basic appliances were used. The male respondents contributing emissions within the lowest ranges were men who possessed a fast-paced lifestyle and utilised sustainable energy practices. In comparison, the larger proportion of male respondents did not. Many large
energy utilising activities are associated with male patterns of behaviour, e.g., watching television for a long period of time, or leav-ing the television on, playing video games with a setup which requires large amounts of power for a long period of time, leaving the air-conditioning and other electrical devices running throughout the day and so forth. This contributed immensely to their energy costs and usage.
In general, the largest percentage of females contributed within the small-est range of carbon dioxide emissions per annum, with approximately one-quarter of the respondents in the two larger ranges, while for males, the smaller proportion con-tributed to carbon dioxide emissions within the smallest range, with the remainder in the mid range. If the amount of carbon dioxide emitted due to flights were subtracted from the value of total direct emissions, all respon-dents’ total values will be reduced to the two lower ranges, with 92.31% of females and 50% of males possessing emissions in the smallest range. This clearly showed that the largest proportion of direct emissions was due to flight emissions (Table 3).
Mitigating strategies are used to decrease the amount of carbon dioxide emissions due to any one factor. For road trans-port, quite a number of options are avail-able to reduce emissions in this sector. For example, persons can car-pool with neighbours who work in the same area. This will reduce individual emissions by the number of persons involved in the
CO2 emissions
0.1–2.0 2.1–4.0 4.1–6.0 6.1–8.0 8.1– 10.0
10.1–12.0
12.1–14.0
14.1–16.0
16.1–18.0
18.1–20.0
Male/% 16.67 0.00 33.33 0.00 0.00 16.67 16.67 0.00 0.00 16.67
Female/% 38.46 23.07 23.07 15.38 0.00 0.00 0.00 0.00 0.00 0.00
Table 2 Showing carbon dioxide emissions due to electricity usage
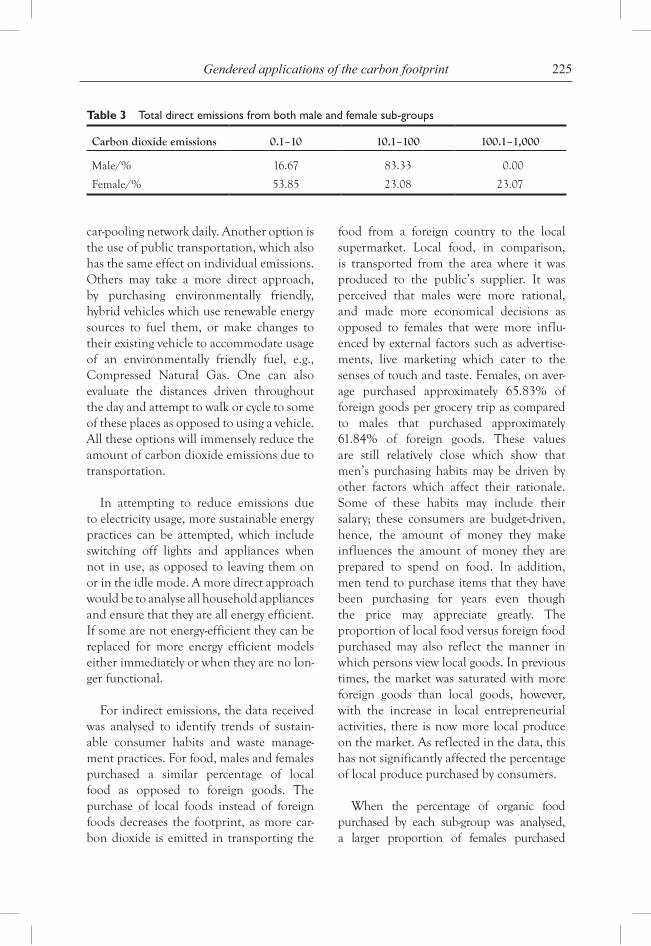
225Gendered applications of the carbon footprint
car-pooling network daily. Another option is the use of public transportation, which also has the same effect on individual emissions. Others may take a more direct approach, by purchasing environmentally friendly, hybrid vehicles which use renewable energy sources to fuel them, or make changes to their existing vehicle to accommodate usage of an environmentally friendly fuel, e.g., Compressed Natural Gas. One can also evaluate the distances driven throughout the day and attempt to walk or cycle to some of these places as opposed to using a vehicle. All these options will immensely reduce the amount of carbon dioxide emissions due to transportation.
In attempting to reduce emissions due to electricity usage, more sustainable energy practices can be attempted, which include switching off lights and appliances when not in use, as opposed to leaving them on or in the idle mode. A more direct approach would be to analyse all household appliances and ensure that they are all energy efficient. If some are not energy-efficient they can be replaced for more energy efficient models either immediately or when they are no lon-ger functional.
For indirect emissions, the data received was analysed to identify trends of sustain-able consumer habits and waste manage-ment practices. For food, males and females purchased a similar percentage of local food as opposed to foreign goods. The purchase of local foods instead of foreign foods decreases the footprint, as more car-bon dioxide is emitted in transporting the
food from a foreign country to the local supermarket. Local food, in comparison, is transported from the area where it was produced to the public’s supplier. It was perceived that males were more rational, and made more economical decisions as opposed to females that were more influ-enced by external factors such as advertise-ments, live marketing which cater to the senses of touch and taste. Females, on aver-age purchased approximately 65.83% of foreign goods per grocery trip as compared to males that purchased approximately 61.84% of foreign goods. These values are still relatively close which show that men’s purchasing habits may be driven by other factors which affect their rationale. Some of these habits may include their salary; these consumers are budget-driven, hence, the amount of money they make influences the amount of money they are prepared to spend on food. In addition, men tend to purchase items that they have been purchasing for years even though the price may appreciate greatly. The proportion of local food versus foreign food purchased may also reflect the manner in which persons view local goods. In previous times, the market was saturated with more foreign goods than local goods, however, with the increase in local entrepreneurial activities, there is now more local produce on the market. As reflected in the data, this has not significantly affected the percentage of local produce purchased by consumers.
When the percentage of organic food purchased by each sub-group was analysed, a larger proportion of females purchased
Table 3 Total direct emissions from both male and female sub-groups
Carbon dioxide emissions 0.1–10 10.1–100 100.1–1,000
Male/% 16.67 83.33 0.00
Female/% 53.85 23.08 23.07
226 Nolana E. Lynch
organic food. Females, in some cases, tend to be more informed, and were more willing to make healthier choices, even if they were more expensive. This, when compared to males who were more focused on purchasing affordably or habitually, may have been less willing to purchase organic food if more expensive, even though it reduced their carbon footprint.
The cultivation of a vegetable garden also reduces the carbon footprint, as food is grown in the back yard and no vehicular emissions are generated for its transporta-tion. In evaluating the respondents’ produc-tion of a vegetable garden, 50% of males indicated having a garden as opposed to 38.46% of the females. It appeared to be more convenient for males in this study to cultivate a garden as they possessed a larger living space, when compared to females that lived in rooms or apartments with little to no backyard space or land area. Furthermore, males had a greater capacity and need to produce the gardens as most of them lived with their immediate family as opposed to the young predominantly single women. A few females, however, managed to cultivate vegetable gardens, especially those who lived with their families or those with balconies that allowed the cultivation of a seasoning garden. This contributed to a small portion of their food needs.
In terms of waste, females possessed on average, a lower amount of waste generated per month when compared to males. This was due, once again, to the female’s lifestyle, where most time was spent on campus and as such, waste generated was disposed of on the campus and absorbed as the institution’s waste generation as opposed to a personal waste generation. Males, however, possibly purchased more, had a more integrated fam-ily life, spent more time at home hence pro-ducing a higher waste average per person. For compost heaps, a larger proportion of females
used their organic waste to develop a heap at home. It was seen that all respondents possess-ing a compost heap also possessed a vegetable garden thus, it can be assumed that the com-post heap was used to fertilise the crops being nurtured in the gardens. As a result, the nutri-ent cycle was continued through recycling of waste. The development of these compost heaps, also aided in decreasing the overall carbon footprint. Reducing waste involves the reduction of overall consumption, along with reusing and recycling material regularly. As such, the amount of emissions due to dispos-ing personal waste will decrease as the amount of waste generated decreases.
From the overall findings, no respon-dent conducted a carbon neutral lifestyle, that is, no one operated at a net zero car-bon footprint. It is recommended that all respondents implement mitigation mea-sures to further reduce the carbon footprint value and account for the remaining metric tonnes of carbon dioxide being emitted.
acKnoWledGements
First, I would like to thank my Lord and Saviour Jesus Christ for guiding me through the entire process, from initiation of this project in June 2009 to now. My supervisors during this period, Mr. Ivan Salick of EOG Resources Limited, Ms. Sybele Williams, Physics Lecturer, University of the West Indies and Mrs. Grace Sirju-Charran, Lecturer, Gender and Science, University of the West Indies. Each supervisor was instru-mental to the development of three differ-ent phases of the project. Without their knowledge and assistance, it would not have come to fruition. To my parents, who served as editors and constructive critiques, I am truly grateful. To my peers, thanks for tak-ing the time to participate in this exercise, learn more about the carbon footprint and living this journey with me.
227Gendered applications of the carbon footprint
bioGraphy
Nolana E. Lynch is a 22-year-old national of Trinidad and Tobago actively engaged in achieving environmental and sustainable development objectives at the local, regional and international levels. She holds a B.Sc. Honours degree in Environmental and Natural Resources Management and Physics. Since 2006 she has passionately conducted extensive research on individuals’ impact on the rate of climate change, the use of carbon management tools and the significance of gender in sustainable development. In light of this, she was one of ten persons, recently selected as a Caribbean Climate Champion for the British Council’s International Climate Generation programme.
references
Cossman, J. (2009) ‘How to reduce your carbon footprint’. The Ecologist, February, pp.60–61.
Darby, S. (2006) The Effectiveness of Feedback on Energy Consumption: A Review for DEFRA of the Literature on Metering, Billing and Direct Displays, Review: Environmental Change Institute, Oxford: Oxford University Press.
David Suzuki Foundation (2009) David Suzuki Foundation, Online: http://www. davidsuzuki.org/Climate_Change/What_You_Can_Do/carbon_offsets.asp, accessed 29/03/09.
Gender Analysis: Making Policies, Programmes and Services Gender Aware (2005) State of Western Australia: Office for Women's Policy.
Harcourt, W. (1994) ‘Negotiating positions in the sustainable development debate: situating the feminist perspective’, in Harcourt, W. (Eds.): Feminist Perspectives on Sustainable Development, pp.11–25, Rome: Zed Books Limited and Society for International Development.
Hemmati, M. and Gardiner, R. (2002) Gender and Sustainable Development, Briefing Paper, Henrich Boll Foundation, Berlin.
Hoffman, A. (2007) Carbon Strategies: How Leading Companies are Reducing their Climate Change Footprint, The University of Michigan Press, Michigan.
Institute for Global Environmental Strategies (2006) National Inventories, Institute for Global Environmental Strategies.
Johnsson-Latham, G. (2006) Do Women Leave a Smaller Ecological Footprint than Men? Swedish Ministry of Sustainable Development, Stockholm.
Littig, B. (2001) Feminist Perspectives on Environment and Society, Pearson Hall, Essex.
Mies, M. and Shiva, V. (1993) Ecofeminism, Spinifex, Melbourne.
Nava, M. (1992) Changing Cultures: Feminism, Youth and Consumerism, Sage, London.
Organisation for Economic Cooperation and Development (2008) Gender and Sustainable Development: Maximising the Economic, Social and Environmental Role of Women. Contribution to UN Commision on Sustainable Development, OECD Horizontal Programme on Sustainable Development.
Robinson, T.N. and Armel, C.K. (2008) In Armel, K.C. and Robinson, T.N. (Eds.): Tools for Measuring Individual's Climate Behaviours and Greenhouse Gas Impact. News and Analysis, Environmental Law Institute, Washington, DC.
Warren, K.J. (2000) Ecofeminist Philosophy: A Western Perspective on What it is and Why It Matters, Rowman and Littlefield Publishers Incorporated, Maryland.
Yaccato, J.T. (2007) The 80% Minority: Reaching the Real World of Women Consumers.
note
1 A Gender analysis is defined by Vibrant Communities, Status of Women, Canada as a tool for examining the differences between the roles that men and women play, the different levels of power they hold, their differing needs, constraints and opportuni-ties and the impact of these differences on their lives.

Copyright © 2010 WASD
World Sustainable Development Outlook 2010
229
The uphill climb for environmenT and
developmenT: The challenges of rapid urban developmenT
in Trinidad and Tobago
Rudo Udika*University of the West Indies, Trinidad and Tobago
Abstract: Rapid urban development has become the major demographic trend complicating attempts towards sustainable development in Trinidad and Tobago. Historically, the nation demonstrates a skewed pattern of urban development focused along the southern foothills of the Northern Range. As urban development proceeds unchecked, there have been intolerable consequences for the environ-ment and development. The degradation of terrestrial, marine and coastal resources has been heightened by an inability of the authorities to resolve the urban develop-ment challenges impacting the small islands. To date, urban sprawl continues to claim prime agricultural lands; fragment forest cover and pollute terrestrial, coastal and marine ecosystems. Physical planning seeks to prescribe spatial order to appro-priate land uses and control the quantum of urban development that is allowed. Challenges towards the delivery of an integrated approach to land use planning have severe implications on the national attempt to move forward.
Keywords: urban sprawl; sustainable development; integrated land use planning.
*Corresponding author: University of the West Indies, Trinidad and Tobago; e-mail: [email protected]
inTroducTion
Trinidad and Tobago are the two most southerly islands in the Caribbean Sea. The islands host a population of about 1.3 million people. Trinidad is located just 11 km off the northeastern coast of Venezuela and has a total land area of about 4,828 square km. The smaller island of Tobago has an area of approximately 300 square km and is about 40 km northeast of Trinidad (Figure 1). The energy sector is the main driver of Trinidad and Tobago’s
economy. However, amidst some attempts towards economic diversification, the World Resources Institute (WRI) notes that on the island of Tobago tourism is the largest eco-nomic sector with fishing being the second largest (WRI, 2008).
In the Small Island Developing State (SIDS) of Trinidad and Tobago, like other Caribbean SIDS, the pattern of urban development is chained to its colonial influences. Caribbean cities were initi-ated by the governing colonial systems as
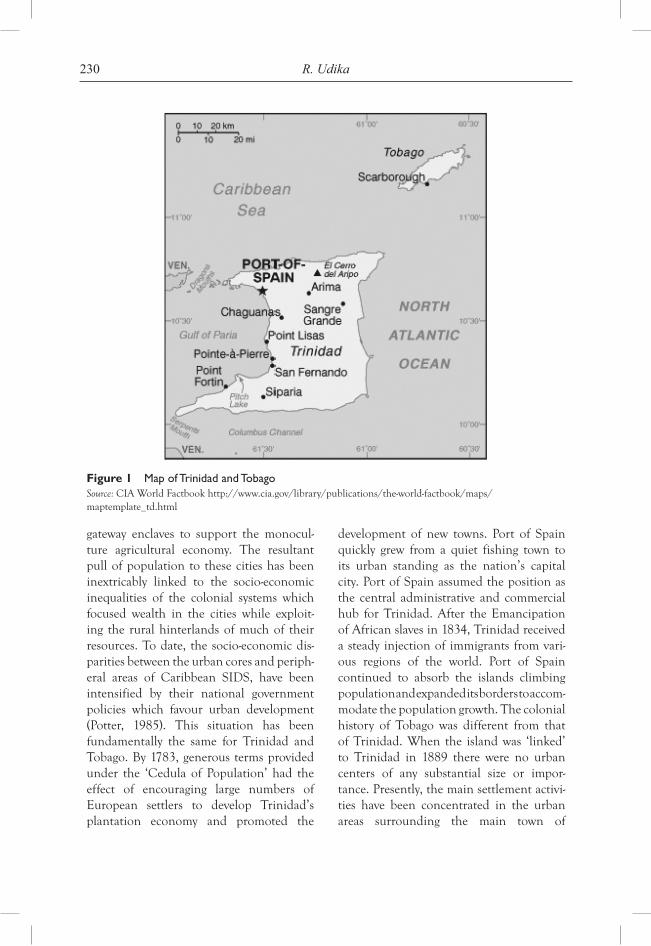
230 R. Udika
gateway enclaves to support the monocul-ture agricultural economy. The resultant pull of population to these cities has been inextricably linked to the socio-economic inequalities of the colonial systems which focused wealth in the cities while exploit-ing the rural hinterlands of much of their resources. To date, the socio-economic dis-parities between the urban cores and periph-eral areas of Caribbean SIDS, have been intensified by their national government policies which favour urban development (Potter, 1985). This situation has been fundamentally the same for Trinidad and Tobago. By 1783, generous terms provided under the ‘Cedula of Population’ had the effect of encouraging large numbers of European settlers to develop Trinidad’s plantation economy and promoted the
development of new towns. Port of Spain quickly grew from a quiet fishing town to its urban standing as the nation’s capital city. Port of Spain assumed the position as the central administrative and commercial hub for Trinidad. After the Emancipation of African slaves in 1834, Trinidad received a steady injection of immigrants from vari-ous regions of the world. Port of Spain continued to absorb the islands climbing population and expanded its borders to accom-modate the population growth. The colonial history of Tobago was different from that of Trinidad. When the island was ‘linked’ to Trinidad in 1889 there were no urban centers of any substantial size or impor-tance. Presently, the main settlement activi-ties have been concentrated in the urban areas surrounding the main town of
Figure 1 Map of Trinidad and TobagoSource: CIA World Factbook http://www.cia.gov/library/publications/the-world-factbook/maps/ maptemplate_td.html
231The uphill climb for environment and development
Scarborough. While the twin islands have unique pasts they face shared development challenges incurred by the uneven distri-bution of their urban population and the sprawling pattern of unmanaged urban development.
The predominant contemporary urban land use trends are marked by rapid rates of unmanaged urban development in Trinidad and Tobago. To date, urban set-tlers have consumed the major low lying regions and increasingly encroach on the adjacent hillsides. The striking growth in hillside housing development; illegal hillside settlements; improper agricultural activi-ties on the slopes; and deforestation, are symptomatic of an inability of land use planning measures to marshal the limited human, financial and technical resources towards an integrated legislative and administrative approach to meet the urban development challenges.
Environmental degradation has pro-ceeded with inadequate checks in the Caribbean. Satterthwaite (1999) affirms that achieving sustainable development in Caribbean SIDS hinges on the promotion of long-term environmental stewardship of the limited natural resources. To this end there must be a critical recognition of what is at stake. Urban land use challenges are at the heart of the public policy problem involving land use planning. This paper uses Trinidad and Tobago as a case study to explore the environmental impacts of unmanaged urban settlement development, paying special attention to the impact of hillside housing development on the nation’s environmental resources. It thereaf-ter examines the constraints affecting urban land use planning and highlights the issues that need to be considered in formulating measures towards sustainable development.
Finally, this paper provides conclusionary statements on the way forward for sound land use planning towards managing the issues of rapid urban development.
The spraWling urban developmenT seTTing
With exception given only to the over-all rapid growth of the global population, urbanisation has stamped its claim as the dominant demographic trend from the late 20th century and into the future. While urbanisation is a global phenomenon, it has become catalysed by the growth patterns underway in the developing world. Since the 1980s the greater portion of the world’s urban population has been contributed by developing countries. This heralds a shift in the traditional view of urban areas. Customarily, urban areas have largely functioned as the fulcrum for development. They act as the centers for trade, commerce and industry that underpin national and regional economic growth. Although traditionally the concen-tration of people in towns and cities has been known to bring great benefits and opportunities, the current way that urban growth is taking place cannot ensure an acceptable, minimum, quality of life for a vast number of urban residents (Hague et al., 2006). For SIDSs, this is a troubling reality. Agenda 21 ominously recognised SIDS as a special case for environment and development. Already, more than 50% of the populations of SIDS are urban dwell-ers. For these coastal entities with lim-ited landmasses and few natural resource endowments, urbanisation threatens their attempts to move towards sustainable devel-opment. As a consequence of rapid urbani-sation there has been a sprawling number of urban residents who seek out survival with little regard to the cost the environment
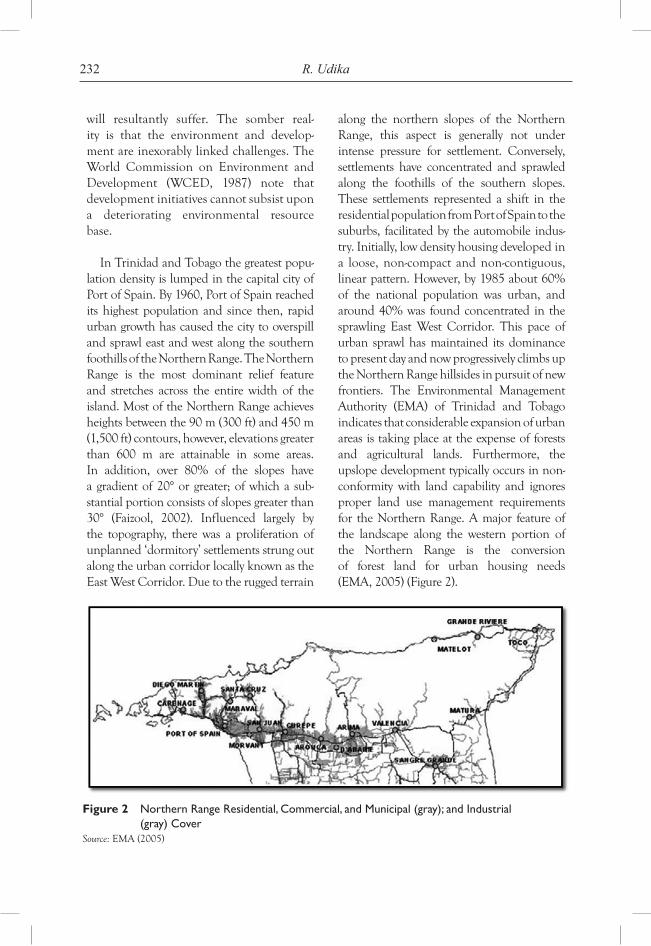
232 R. Udika
will resultantly suffer. The somber real-ity is that the environment and develop-ment are inexorably linked challenges. The World Commission on Environment and Development (WCED, 1987) note that development initiatives cannot subsist upon a deteriorating environmental resource base.
In Trinidad and Tobago the greatest popu-lation density is lumped in the capital city of Port of Spain. By 1960, Port of Spain reached its highest population and since then, rapid urban growth has caused the city to overspill and sprawl east and west along the southern foothills of the Northern Range. The Northern Range is the most dominant relief feature and stretches across the entire width of the island. Most of the Northern Range achieves heights between the 90 m (300 ft) and 450 m (1,500 ft) contours, however, elevations greater than 600 m are attainable in some areas. In addition, over 80% of the slopes have a gradient of 20° or greater; of which a sub-stantial portion consists of slopes greater than 30° (Faizool, 2002). Influenced largely by the topography, there was a proliferation of unplanned ‘dormitory’ settlements strung out along the urban corridor locally known as the East West Corridor. Due to the rugged terrain
along the northern slopes of the Northern Range, this aspect is generally not under intense pressure for settlement. Conversely, settlements have concentrated and sprawled along the foothills of the southern slopes. These settlements represented a shift in the residential population from Port of Spain to the suburbs, facilitated by the automobile indus-try. Initially, low density housing developed in a loose, non-compact and non-contiguous, linear pattern. However, by 1985 about 60% of the national population was urban, and around 40% was found concentrated in the sprawling East West Corridor. This pace of urban sprawl has maintained its dominance to present day and now progressively climbs up the Northern Range hillsides in pursuit of new frontiers. The Environmental Management Authority (EMA) of Trinidad and Tobago indicates that considerable expansion of urban areas is taking place at the expense of forests and agricultural lands. Furthermore, the upslope development typically occurs in non-conformity with land capability and ignores proper land use management requirements for the Northern Range. A major feature of the landscape along the western portion of the Northern Range is the conversion of forest land for urban housing needs (EMA, 2005) (Figure 2).
Figure 2 Northern Range Residential, Commercial, and Municipal (gray); and Industrial (gray) Cover
Source: EMA (2005)
233The uphill climb for environment and development
The climbing sprawl of urban develop-ment unto the nation’s hillsides has raised concerns about the national ability to strike the balance between development and envi-ronmental conservation in order to pursue a path towards sustainable development. Baban et al. (2008) lament that the increase in unmanaged hillside development has caused environmental, social and economic problems in Trinidad and Tobago. They assert that the population has a tendency to make demands on the environment to sup-port activities that are essential for their well being and development, yet, these demands, particularly when driven by unplanned rapid development, tend to have a negative impact and degrade the environment.
The environmenTal challenges of rapid urban developmenT
The current pattern of rapid urban develop-ment has ferociously consumed the environ-ment with little regard for the consequences. Prevailing urban development activities leave a plethora of natural resources vul-nerable to degradation. As production and consumption are concentrated in urban areas, the surrounding ecosystems have been affected through deforestation; land degradation; loss of biodiversity; and soil, air and water contamination. This section looks at the major impacts of rapid urban development on the terrestrial, coastal, and marine resources of Trinidad and Tobago.
Terrestrial resources at risk
Within the main urban centers there are few, and rapidly declining, easily develop-able sites. Unfortunately, these preferred development locations correspond to the largest acreages of good soils. The soils of this twin island state are divided into seven Land Capability Classes, Class I being the best for agriculture and subsequently
Class VII being the most unsuitable. In Trinidad the largest acreages of good agri-cultural lands, Classes I and II, soils occur within the foothills and valleys of the Northern Range. Likewise, in Tobago sig-nificant areas of good agricultural lands occur in the south west of the island where the greatest development demands arise. Already, urban development has consumed many tracts of prime agricultural lands. Spence (2010) laments that in Trinidad and Tobago some of the best agricultural lands have been utilised for urban housing and industry. To make matters worse, this has been done at the consequence of sound agricultural production, as many agriculture projects have been left to contend with poor agricultural land.
Facilitated by modern architecture and engineering technology, improved means of mobility and economic wealth, the hillsides of Trinidad and Tobago have experienced dramatic increases in urban population. As hillsides are in a state of dynamic equilib-rium, disturbance by human induced forces which result in the removal of vegetative cover have consequences such as erosion, slope failure, accelerated run off and peren-nial flooding. Strikingly, along the western portion of the Northern Range extensive tracts of forest land have been converted to urban housing needs. These locations are also the site of considerable gully and sheet erosion (EMA, 2005). Along these hillsides, housing construction sites were noted as contributing high sediment loads to the drainage systems. Furthermore, as these sites often remain in a barren state for prolonged durations of time, they can contribute con-siderably to downstream river siltation. This in turn, has been linked to flooding in the low lying areas. The EMA notes that the de-silting of the Caroni River was under-taken in 1983 at a cost of approximately US$3.66 million. A 1993 study revealed
234 R. Udika
that about US$583,300 was spent on the dredging of the Port of Spain harbour, where the main cause of sedimentation has been the sediment plume from the Caroni River as it enters the Gulf of Paria with an estimated load of 500,000 cubic meters of silt (EMA, 2005). In Tobago the Courland watersheds, of the mountainous Main Ridge region, have similarly been affected. The Concordia soils of this watershed experienced annual losses from bare soil of 100 to 150 tonnes per hectare (LesFouris, 2008). Heavy sediment loads in watercourses also increase the cost of potable water production. This directly impacts on the availability of water to meet domestic, agricultural, industrial, and other national demands (LesFouris, 2008).
The EMA (2005) indicates that Northern Range watersheds are the most significant contributors to the freshwater supply for the island of Trinidad. In Trinidad, the larg-est aquifers are the sand and gravel alluvial fan types which outcrop at the base of the Northern Range and spread southwards to the central range. Forde (2002) indicates that 28% of the total potable water supply is obtained from these groundwater resources. However, these aquifers also coincide with the sites of greatest development pressures. As a result of urbanisation progressively encroaching on the recharge areas there has been a decline in the quality and quantity of groundwater supplies (Forde, 2002). In particular, illegal settlements have laid siege on the Northern Range hillsides with dev-astating effects. The EMA (2005) indicates that illegal squatting has increased tremen-dously over the years, resulting in large tracts of State and private lands being utilised in an unsustainable manner. Residential squatting communities are generally asso-ciated with poverty, overcrowding, limited basic infrastructure and amenities, and
poor sanitary conditions. Krishnarayan and Pantin (2002) indicate that sanitation facilities in squatter settlements are inad-equate given the current and projected levels of development and the poor dis-posal practices which contribute to increas-ing levels of faecal coliform and resultant pollution of the groundwater resources. Squatters have been described as the cul-prits of an ‘environmental disaster’ under-way in the Northern Range. These illegal settlements have been a matter of growing concern because of the problems attendant on deforestation, erosion and increasing siltation, pollution and flood damages in the river valleys (Glenn et al., 1993). Driver (2002) states that the western half of the hills, above the East West Corridor, are universally seen as damaged beyond repair as a result of the squatter who has illegally cleared hillsides either for housing or ‘slash and burn’ agriculture. In relation to the surface freshwater exploited by the Water and Sewerage Authority (WASA) of Trinidad and Tobago, approximately 80% is located in the Northern Range. WASA spends about US$2.23 million per month in order to purchase 10% of its water sup-ply from a local desalination plant. It is estimated that it would cost WASA about US$214.33 million annually if the surface waters supplied by the Northern Range had to be substituted with the desalination water at this price (EMA, 2005). Tobago’s Main Ridge is the oldest protected forest in the western world having been desig-nated as a protected Crown reserve in 1776 as ‘woods for the protection of the rains’. The Courland Watershed, already noted as a site of severe erosion, is the island’s largest watershed and the most important source of fresh water to southwest Tobago (WRI, 2008). The importance of forest cover for Trinidad and Tobago cannot be overemphasised.
235The uphill climb for environment and development
Coastal and marine resources at risk
Essentially, SIDS are considered coastal entities due to their limited landmasses and unique biophysical features. Clarke (1996), defined the coastal zone from a spatial perspective, stating that the coastal zone includes all those areas that drain out to the sea and those that are periodically inundated by the tides or are permanently covered by the sea down to the edge of the continental shelf where the sea bottom slopes rapidly to the deep sea. In terms of the relationships and interactions, the coastal zone refers to all the contiguous marine and land areas that are linked by direct physical, biological or human interaction as a result of drainage, tides, resource utilisation and waste discharges (Wade and Webber, 2002). Undoubtedly, Trinidad and Tobago is sig-nificantly dependent on the quality of its marine environment and associated coastal resources, particularly to support tourism; fisheries; cultural and recreational activities; and provide protective services.
Coral reef-associated tourism and recreation is estimated to have contrib-uted between US$100 and $130 million to the national economy in 2006. Coral reef associated fisheries are an important cul-tural tradition and livelihood. The annual economic benefits of these fisheries is esti-mated at between US$0.8 and 1.3 million. Coral reefs also provide shoreline protection services in reduced erosion and wave damage valued between US$18 and $33 million per year. These economic contributions are sig-nificant compared to Tobago’s GDP, which was $286 million in 2006. Furthermore, the annual direct economic contribution of coral reef associated fisheries is estimated to be US$0.7–1.1 million. Additional indi-rect impacts from the need for boats, fuel, nets, etc. are estimated at about
US$0.1–0.2 million, resulting in a total eco-nomic impact of about US$0.8–1.1 million per year in Tobago. Coral reef-associated fisheries have a smaller economic impact compared to tourism, but provide other important values including jobs, cultural value and social importance. All of these goods and services have been threatened by the unmanaged urban development underway. Increased sediment loads in watercourses caused by deforestation in the Courland watershed has impacted the qual-ity of the run-off, and damaged the health of the islands coral reefs. In the nearwater locations of coral reefs, heavy sediment loads have been known to choke and impair the growth of coral reefs. Additionally, coral reef degradation has been linked to over nourishment by sewage. Rapid urban development without adequate support infrastructure was led to a major sewage pollution problem and the degradation of Tobago’s natural environment. WRI (2008) indicates that many illegal urban settlements lack adequate sewage treatment. Lewsey et al. (2004) indicate that the physical circu-lation patterns which characterise the region cause pollution and runoff to become con-centrated in nearby coastal areas and can have a severe and cumulative effect on the coastal ecosystem resources in the area. Additionally, beaches are the main base for both domestic and international tourism in Trinidad and Tobago. They are also impor-tant nesting sites for sea turtles such as the famed leather back turtle. Beaches therefore contribute to biological diversity and can generate employment and income through eco-tourism initiatives (LesFouris, 2008). A 2007 study by the Caribbean Industrial Research Institute (CARIRI) to monitor water quality of selected recreational areas in Trinidad and Tobago revealed microbiological contamination of the waters at several sites. The contamination was related, inter alia,
236 R. Udika
to hillside activities without the appropriate infrastructure, generating contaminated run-off and other pollution (CARIRI, 2007).
The SIDS Programme of Action (SIDS-PoA) asserts that “sustainable development in Small Island Developing States depends largely on coastal and marine resources” notes Toppin-Allahar (2001). As such, the degradation of coastal and marine resources as result of rapid urban development is a serious threat for Trinidad and Tobago.
The challenging land use planning setting
Within the English-speaking Caribbean all the territories have legislation which deals with land use planning based on an inher-ited British Town and Country Planning legislation as part of its colonial legacy. Under these enactments, the minister with responsibility for land use planning has the ultimate decision making power with regard to such matters. The planning laws also provide for the preparation of a hierar-chy of development plans to guide land use decisions, and the revision of these plans to ensure that they remain up to date. In terms of development control, the enactments provide for the grant or refusal of permis-sion for development projects in accor-dance with the prescribed land use plans and other established planning policies. However, in most instances, there has been a failure to ensure that land use plans are revised as prescribed in the legislation and so oftentimes these plans are not relevant to contemporary needs.
Urban planning and development is bemoaned with many challenges in Trinidad and Tobago. These challenges include out-dated and out of touch legislative and admin-istrative frameworks, insufficient resources, political obstacles and circumvention of
public participation in the planning process. The planning system in Trinidad is governed by the Town and Country Planning Act Ch. 35:01. It was initially entitled the Town and Country Planning Ordinance, 1960 and was proclaimed on 1 August 1969. This legisla-tion was based in large part on the landmark English Town and Country Planning Act of 1947. Although the Trinidad and Tobago Town and Country Planning Act, like the English planning legislation from which it was modeled, is an Act to make provision for the orderly and progressive development of land, the present pattern of urban devel-opment leaves much to be desired.
Under the Trinidad and Tobago Town and Country Planning Act, ‘development’ is defined as the carrying out of building, engineering, mining or other operations, in, on, over or under land, the making of material change of use of buildings or other land, or the subdivision of land. The ‘day to day’ administrative planning functions have been delegated by the Minister to the Town and Country Planning Division. The Town and Country Planning Act could be considered the primary legislation regulat-ing urban development in Trinidad and Tobago. However, since its implementation over 50 years ago, there have been no sub-stantial adjustments to the Act. As such, the current practices of land use planning have not been adequately responsive to the dynamic socio-economic conditions and have led to a number of legislative and administrative challenges for the Town and Country Planning Division (Amos, 1988).
According to LesFouris (2008), land use decisions are basically guided by the 1984 National Physical Development Plan, pre-pared in accordance with the provisions of the Town and Country Planning Act, Chapter 35:01, which made proposals for the use and development of land in the
237The uphill climb for environment and development
country until the year 2000. Plan revision is a requirement by law. The National Physical Development Plan is legally required to be revised every five years but has not been revised since 1984. In absence of a revised National Physical Development Plan, pol-icy statements have been formulated as a ‘solution’. However, policy statements do not have any legal gumption. The pres-ent situation reflects an archaic and inap-propriate scenario for land use planning. Furthermore, the planning regime currently operates in such a way that economic plan-ning is undertaken separately from land use planning. Each of which is carried out without adequate reference to the other (LesFouris, 2008). Additionally, there is an absence any clearly articulated urban land-use policy which is presented in a single document. Instead, there are numerous pieces of legislation related to various envi-ronmental issues, dispersed among several governmental entities that have the respon-sibility for administering them. This is a sure recipe for confusion if land use planning is to maintain validity and momentum with the dynamic nature of economic, social and environmental challenges facing the society.
Trinidad and Tobago’s limited land space faces heavy competition from various user demands. Yet, the land use planning land-scape is spotted with sectoral approaches to planning and environmental management, turf lines drawn between various sectors and singular responses to planning and resource management. A lack of integrated approaches to land use planning is steadily leading to the irreversible degradation of resources. The absence of collaborative approaches amongst the technocrats has been mirrored by the lack of participation with the public. In varying degrees the Town and Country Planning Act of Trinidad and Tobago requires public participation in the development planning process. However,
there have been numerous instances when the public has been neglected (Mycoo, 2002). This has led to the rancorous criti-cisms of planners being stuck in a top down, centralised planning culture where they practice ‘ivory tower’ planning.
Additionally, enforcement of the leg-islation for regulating unauthorised urban development is weak or sometimes non-existent. The present legislation does not provide for the prompt cessation of unauthorised development. The demand-ing human and financial capacity, com-bined with the lengthy process involved in enforcing the legislation leaves a situation ripe for exploitation by developers. That is, by the time the matter reaches the courts, the extent of the damage may be already quite severe and in some instances the development may have reached completion and leaves the landscape irreversibly altered. Added to this, no enforcement of plan-ning regulations by the Town and Country Planning Division can take place after four years have elapsed.
planning The WaY forWard
Birkland et al. (2003) indicates that the most promising way to yield ecological benefits while mitigating damage to people and the environment is to discourage inappropriate land use. Given the realities of the irrevers-ible rapid urban development underway in the twin island Republic; there is an imme-diate need for sound measures for urban land use planning and management. To address the environmental and developmen-tal issues impacting Trinidad and Tobago as a result of the rapid urban development there is a critical need to adopt the sound principles of integrated land use plan-ning. Planning decisions should be based upon a methodology that incorporates an integrated island system management or
238 R. Udika
‘ridge-to-reef’ approach that recognises the intimate link between land and the coastal and marine resources. Planning therefore must be allowed to operate in an environ-ment that has the requisite legislative and administrative structures to facilitate the integration of the social, economic, and envi-ronmental realms in the movement towards the sustainable development of nation.
There is a pressing need for the review of the land use planning legislation. This must be done with a genuine intention of effecting the necessary revisions for protect-ing the environment. These efforts must include greater participation of the public in the decision making process, as well as, strengthening of the capability of the rel-evant agencies to take enforcement action against violations of the law. Land use plan-ning professionals must be empowered with the proper tools and technical know how to manage urban development. Appropriate legislation, policy and institutional frame-works must form the solid foundation upon which urban land use development builds.
references
Amos, F. (1988) Role and Administration of Town and Country Planning, UNCHS Technical Assistant Project, Ministry of Planning and Mobilization, Port of Spain.
Baban, S. et al. (2008) ‘Managing development in the hillsides of Trinidad and Tobago using geoinformatics’, Sustainable Development, Vol. 16, No. 5, pp.314–328.
Birkland, T. et al. (2003) ‘River ecology and flood hazard mitigation’, Natural Hazards Review, Vol. 4, No. 1.
CARIRI (2007) Final Report on Water Quality Monitoring of Selected Recreational Areas in Trinidad and Tobago, Prepared for the EMA.
Clarke, J.R. (1996) Coastal Zone Management Handbook, Boca Raton Florida, Lewis Publishers.
Driver, T. (2002) ‘Watershed management, private property and squatters in the northern range’, Trinidad. IDS Bulletin, Vol. 33, No. 1, pp.84–93.
EMA (2005) Northern Range Assessment 2005, Report of an Assessment of the Northern Range, TT: People and the Northern Range, State of the Environment Report 2004.
Faizool, S. (2002) ‘Watershed Management of the Northern range in Trinidad and Tobago’, Forestry Division, Paper Presented at a Regional
Dialogue Hosted by the Natural Resources Management Unit of the Organization of Eastern Caribbean States, St. Lucia, 25–27 February, 2002, p.47.
Forde (2002) In Goodbody, I. and Thomas-Hope, E. (Eds.): Natural Resource Management for Sustainable Development in the Caribbean, Canoe Press Kingston.
Glenn, M. et al. (1993) ‘Squatter regularisation: problems and prospects’, Third World Planning Review, Vol. 15, No. 3, pp.249–262.
Hague et al. (2006) Making Planning Work: A Guide to Approaches and Skills, ITDG Pub.
LesFouris (2008) ‘Sustainable development issues facing the agricultural and industrial sectors in Trinidad and Tobago’, Sir Arthur Lewis Memorial Conference, 25–27 September, St. Augustine.
Lewsey, C. et al. (2004) ‘Assessing climate change impacts on coastal infrastructure in the Eastern Caribbean’, Marine Policy, Vol. 28, pp.393–409.
Krishnarayan and Pantin (2002) Incentives for Watershed Management in Trinidad: results of a brief diagnostic CANARI Technical Report No. 3.
Mycoo, M. (2002) ‘Adopting integrated coastal planning and management: a case study of Trinidad’, International Development Planning Review, Vol. 24, No. 3, pp.227–248.
Potter, R. (1985) Urbanisation and Planning in the 3rd World: Spatial Perceptions and Public Participation Croom Helm, Kent.
Satterthwaite, D. (1999) Sustainable Cities, Earthscan Pub, London.

239The uphill climb for environment and development
Spence, J. (2010) Best Use of Land. Trinidad and Tobago Express, Online: http://www. trinidadexpress.com/commentaries/ 99083764.html, accessed 23/07/10.
Toppin-Allahar, C. (2001) ‘A comparative analy-sis of environmental impact assessment law and planning practice in the commonwealth caribbean’, The Caribbean Law Review, Vol. II, No. 1, p.24, Caribbean Law Publishing Company.
KingstonUNHABITAT et al. (2002) Sustainable Cities: Achieving Agenda 21.
Wade, B. and Webber, D. (2002) ‘Coastal zone management’, in Goodbody, I. and Thomas-Hope, E. (Eds.): Natural Resource Management for Sustainable Development in the Caribbean, : Canoe Press, Kingston.
WCED (1987) Our Common Future, Oxford University Press.
WRI (2008) Coastal Capital – The Economic Contribution of Tobago’s Coral Reefs, Online: http://www.buccooreef.org/ economic.html.

Copyright © 2010 WASD
World Sustainable Development Outlook 2010
241
Caribbean home town assoCiations: an untapped resourCe for impaCting
development in the Caribbean region
Samantha C. Joseph*, Roger Hosein and Martin Franklin
University of the West Indies, Trinidad and Tobago
Abstract: The Caribbean has one of the largest diasporas with a wealth of resources that can be leveraged for the development of the region. The members of the Carib-bean diaspora form part of various Home Town Associations (HTAs) which have the ability to impact development in the region in many ways. Notwithstanding, the Caribbean Diaspora has remained an underutilised resource for decades. This paper seeks to examine the potential of Caribbean HTAs not only as an avenue to harness collective remittance flows for increasing foreign currency flows to the region but also to contribute to the social, cultural and economic development of the Caribbean region. HTAs can serve as an indirect engine of economic development in the Caribbean region. This can be further facilitated by the Caribbean embassies in the various metropolitan countries. The paper concludes by emphasising the point that the HTAs must be embraced by a facilitating mechanism in order for these to be included in the region’s developmental plans.
Keywords: Home Town Associations; HTAs; embassies; remittances; economic development.
introduCtion
The Caribbean has one of the largest net migration rates and has evolved from being a net importer of labour to a net exporter (Nurse, 2004). The widening of the income gap amongst different regions in the world as well as an increase in labour shortages has spurred a continued increase in migration rates in the Caribbean region. Given that globalisation has brought with it the inte-gration of systems including the temporary
and permanent movement of people across national borders, it is important for diaspo-ras to be included into the region’s devel-opment plans. This is justified by the large share of educated Caribbean people who have migrated from the region to many met-ropolitan countries (Mishra, 2006). These migrants maintain a strong connection with the home country and through a variety of channels are able to contribute to the devel-opment of their home country.
*Corresponding author: University of the West Indies, Trinidad and Tobago; e-mail: [email protected]
242 S.C. Joseph et al.
The members of the diaspora form them-selves into many organisations and asso-ciations called Home Town Associations (HTAs). These associations are usually social networks through which migrants can obtain moral and financial support from coethnics while adjusting to life in the host country (Alarcon, 2000; Levitt, 2001). Orozco (2000) defined an HTA as:
“Organizations which comprise of migrants who are from the same commu-nity or country of origin who reside in a distinct community in the host country. They may be formally or informally orga-nized and their activities and purposes can be cultural, political, social and economical.”
HTAs usually begin as informal groups that seek out people with similar nationality to establish ties and bonds as well as a support framework (Somerville et al., 2008, p.5). Over time these groups develop into for-mal associations that extend their support not only to co-nationals in the host coun-try but also to households of family, friends and communities in the home country (Somerville et al., 2008). An HTA usually collects membership fees from its members once it has become a formal group.
HTAs range from student alumni groups, religious groups and or groups who assist new migrants in the host country as well as communities in the home country (Fagen, 2009, p.4). Members of HTAs are able to socialise, solidify cultural values and bond at events such as picnics, dances and soccer games, etc. It has been argued that HTA is a new name for immigrants who want to affirm their identities and loyalties and maintain ties to their home country by con-tributing in some way to its development process. In this context, HTAs represent a channel through which members can con-tribute and improve on the conditions in their home country (ibid).
The members of HTAs help in promoting change in the home country via their contri-bution to the social, cultural, economic and political dimensions of the home economy. Such promotion helps to develop critical sectors and communities. In addition, the diaspora via HTAs and other voluntary groups help to reduce the level of poverty in various countries (Escobar and Janssen, 2006). The HTAs can be viewed as having the ability to function as effective agents for Caribbean development in areas such as education, health, culture, community beautification and development as well as promote a sense of identity amongst them-selves (Smith, 2006). HTAs usually support activities geared towards the development of certain areas in the home country relat-ing to:
“Technology, hospital and school con-struction to adult education and profes-sional training. They also give volunteered time and money to directly deliver medical services, bring equipment and medicines to hospitals, provide psycho social coun-seling for the traumatized and create art spaces for local talent. Individual “remit-ters” of means who are not members of HTAs frequently support activities that have a collective impact and a target popu-lation that is more national than local in scope” (Fagen, 2009, p.4).
The English speaking Caribbean is yet to examine the wealth of resources which is concentrated in the Caribbean diaspora and the potential role of Caribbean HTAs to impact the region socially, economi-cally, culturally and politically. This paper examines HTAs in the the United States of America and Canada and the potential for these associations to favourably impact different aspects of development in the respective Caribbean economies.
The rest of this paper proceeds as follows: Section 1, examines the motive behind
243Caribbean HTAs: an uptapped resource
migrants joining HTAs; Section 2, is an examination of the literature regarding the development potential of HTAs in various regions via different avenues; Section 3 summarises the sample survey of HTAs in the USA and Canada and the final sec-tion presents the conclusion and policy recommendations.
Migrants motive for joining HTAs
The importance of diaspora associations has not been at the forefront of the development literature. Most HTAs evolve as informal net-works, as these associations evolve they develop a formal structure and take on a name, obtain a charter by law, collect membership fees as well as they elect a leader and committee members (Hirabayashi, 1993, p.14).
In examining the motives behind migrants becoming part of HTAs, many scholars have advocated that migrants forming part of HTAs do so based on the motive of belong-ing and emotional attachment (Gupta and Ferguson, 1997). Migrants want to remain connected to their home country and generally want to feel like they are part of something bigger than themselves. Migrants join these HTAs to maintain a sense of identity and belonging. Even though they may not have the desire to return to the home country, they still become members of these HTAs so that they can make their contributions (ibid).
The status motive is another explanation for migrants joining HTAs in the host coun-try. This motive is based on the concept that people usually interpret their status from a historical perspective. Further, if an individ-ual’s status is made known amongst his/her peers who belong to a community, this pro-vides a context for the individual to express his/her status and identity. This would not be readily available in the host country except in the HTAs. Therefore, migrants
may wish to join these associations for this purpose. As it relates to Mexican migrants, Goldring (1998) noted that they;
“…continue to orient their lives in part around their places of origin, maintain-ing transnational spaces and multiple identities, because these localities `pro-vide a special context in which people can improve their social position and perhaps their power, make claims about their changing status and have it appropriately valorized, and also participate in chang-ing their place of origin so that it becomes more consistent with their changing expectation of status.” (p.167).
The status motive is usually evident at functions hosted by these associations and attended by large groups of migrants from the same community or country. Mountz and Wright (1996, p.416) observed that;
“In a village in Oaxaca, migrants and their families who engage in fiesta sponsorship sometimes spend more than their total annual income on a particular celebration. The size of investment exemplifies the extreme material competition for success-ful migrant status at work in the village.”
It has also been argued that migrants form part of HTAs as a means of gaining access to employment opportunities provided by the associations in the place of destination. This is known as the Option motive for joining HTAs. Migrants see these HTAs as having a wide range of options and opportunities which can make their lives better. Most times these associations based on their con-nections with various stakeholders in the host country are able to get employment opportunities for migrants. Roberts and Morris (2003) argue that these associations are the place where much of the exchange of available information on employment opportunities occurs. This in itself increases the membership of the network. The sup-port given to migrants and their family in
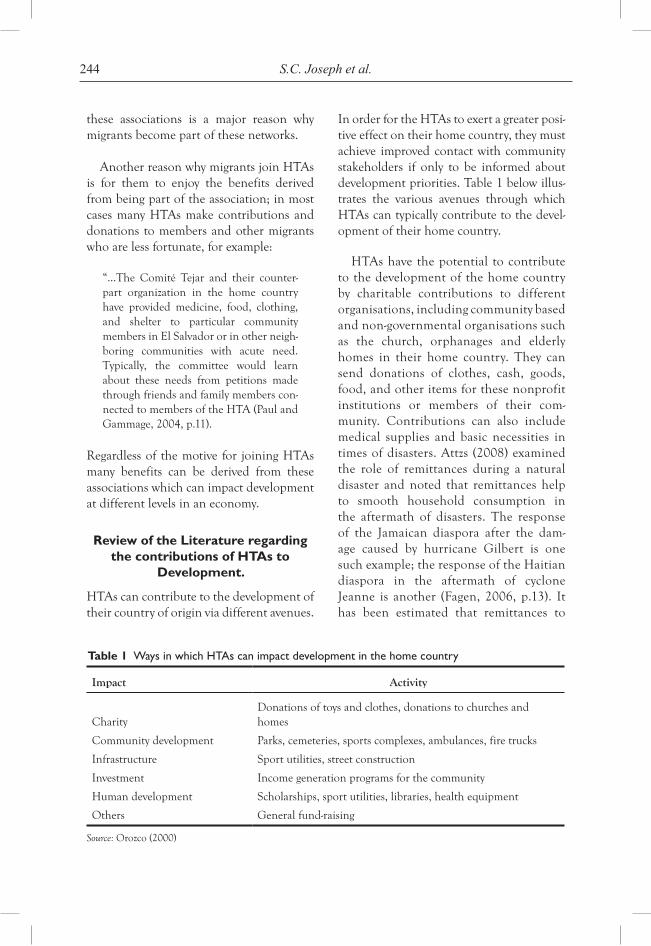
244 S.C. Joseph et al.
these associations is a major reason why migrants become part of these networks.
Another reason why migrants join HTAs is for them to enjoy the benefits derived from being part of the association; in most cases many HTAs make contributions and donations to members and other migrants who are less fortunate, for example:
“…The Comité Tejar and their counter-part organization in the home country have provided medicine, food, clothing, and shelter to particular community members in El Salvador or in other neigh-boring communities with acute need. Typically, the committee would learn about these needs from petitions made through friends and family members con-nected to members of the HTA (Paul and Gammage, 2004, p.11).
Regardless of the motive for joining HTAs many benefits can be derived from these associations which can impact development at different levels in an economy.
Review of the Literature regarding the contributions of HTAs to
Development.
HTAs can contribute to the development of their country of origin via different avenues.
In order for the HTAs to exert a greater posi-tive effect on their home country, they must achieve improved contact with community stakeholders if only to be informed about development priorities. Table 1 below illus-trates the various avenues through which HTAs can typically contribute to the devel-opment of their home country.
HTAs have the potential to contribute to the development of the home country by charitable contributions to different organisations, including community based and non-governmental organisations such as the church, orphanages and elderly homes in their home country. They can send donations of clothes, cash, goods, food, and other items for these nonprofit institutions or members of their com-munity. Contributions can also include medical supplies and basic necessities in times of disasters. Attzs (2008) examined the role of remittances during a natural disaster and noted that remittances help to smooth household consumption in the aftermath of disasters. The response of the Jamaican diaspora after the dam-age caused by hurricane Gilbert is one such example; the response of the Haitian diaspora in the aftermath of cyclone Jeanne is another (Fagen, 2006, p.13). It has been estimated that remittances to
Impact Activity
CharityDonations of toys and clothes, donations to churches and homes
Community development Parks, cemeteries, sports complexes, ambulances, fire trucks
Infrastructure Sport utilities, street construction
Investment Income generation programs for the community
Human development Scholarships, sport utilities, libraries, health equipment
Others General fund-raising
Table 1 Ways in which HTAs can impact development in the home country
Source: Orozco (2000)
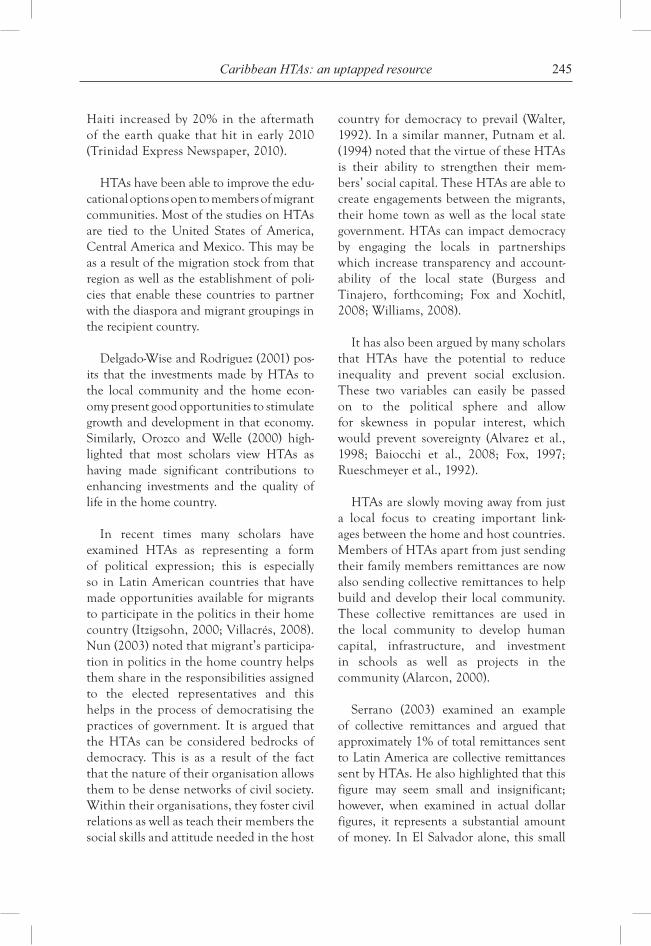
245Caribbean HTAs: an uptapped resource
Haiti increased by 20% in the aftermath of the earth quake that hit in early 2010 (Trinidad Express Newspaper, 2010).
HTAs have been able to improve the edu-cational options open to members of migrant communities. Most of the studies on HTAs are tied to the United States of America, Central America and Mexico. This may be as a result of the migration stock from that region as well as the establishment of poli-cies that enable these countries to partner with the diaspora and migrant groupings in the recipient country.
Delgado-Wise and Rodriguez (2001) pos-its that the investments made by HTAs to the local community and the home econ-omy present good opportunities to stimulate growth and development in that economy. Similarly, Orozco and Welle (2000) high-lighted that most scholars view HTAs as having made significant contributions to enhancing investments and the quality of life in the home country.
In recent times many scholars have examined HTAs as representing a form of political expression; this is especially so in Latin American countries that have made opportunities available for migrants to participate in the politics in their home country (Itzigsohn, 2000; Villacrés, 2008). Nun (2003) noted that migrant’s participa-tion in politics in the home country helps them share in the responsibilities assigned to the elected representatives and this helps in the process of democratising the practices of government. It is argued that the HTAs can be considered bedrocks of democracy. This is as a result of the fact that the nature of their organisation allows them to be dense networks of civil society. Within their organisations, they foster civil relations as well as teach their members the social skills and attitude needed in the host
country for democracy to prevail (Walter, 1992). In a similar manner, Putnam et al. (1994) noted that the virtue of these HTAs is their ability to strengthen their mem-bers’ social capital. These HTAs are able to create engagements between the migrants, their home town as well as the local state government. HTAs can impact democracy by engaging the locals in partnerships which increase transparency and account-ability of the local state (Burgess and Tinajero, forthcoming; Fox and Xochitl, 2008; Williams, 2008).
It has also been argued by many scholars that HTAs have the potential to reduce inequality and prevent social exclusion. These two variables can easily be passed on to the political sphere and allow for skewness in popular interest, which would prevent sovereignty (Alvarez et al., 1998; Baiocchi et al., 2008; Fox, 1997; Rueschmeyer et al., 1992).
HTAs are slowly moving away from just a local focus to creating important link-ages between the home and host countries. Members of HTAs apart from just sending their family members remittances are now also sending collective remittances to help build and develop their local community. These collective remittances are used in the local community to develop human capital, infrastructure, and investment in schools as well as projects in the community (Alarcon, 2000).
Serrano (2003) examined an example of collective remittances and argued that approximately 1% of total remittances sent to Latin America are collective remittances sent by HTAs. He also highlighted that this figure may seem small and insignificant; however, when examined in actual dollar figures, it represents a substantial amount of money. In El Salvador alone, this small
246 S.C. Joseph et al.
percentage amounted to US$15 million and is invested in a range of poor communi-ties across the country (Crowell, 2003).
HTAs are also perceived as a form of transnationalism1, i.e., the social and politi-cal aspect. Levitt (2002) examined social networks such as HTAs and concluded that HTAs are expressions of transnationalism. Members of HTAs usually join out of self interest; however, this may sometimes lead to collective intent, especially when these members gain status from their positions and membership in the HTA.
This study therefore builds on the exist-ing literature on HTAs as well as creates new knowledge.
Empirical study of Caribbean HTAs in USA and Canada
Methodology
The aim of this study is to provide some quantitative analysis in assessing the poten-tial of Caribbean HTAs to serve as an engine for growth and development in the Caribbean region through the contributions HTAs make to the social, cultural, economic and physical development of the local com-munity and economy of the home country.
The methodology adopted was a sample survey which was conducted amongst forty two (42) Caribbean HTAs. Membership in these HTAs came from nationals of Caribbean countries such as St. Lucia, Guyana, Jamaica, Grenada and Haiti who reside in the USA and Canada. These coun-tries were chosen because they have the higher rates of migration from the Caribbean and receive larger share of remittances to the Caribbean. The sample size consisted of 10% of the listing of all registered HTAs in the USA and Canada, as provided by the embassies of the respective home country.
The research instrument was a structured questionnaire which was executed on the presidents of each HTA within the sample. The questionnaire sought to collect pri-mary data on the HTAs willingness to con-tribute to their home country, their func-tions as an association, their relation with the local government in the home country and the obstacles that they face in making a greater contribution to the home coun-try. The questionnaire also probed whether or not these HTAs have been making con-tributions to their home country and if so, the type and extent of these contributions. A purposive sampling approach was employed as to ensure representation from the top recipients of remittances in CARICOM and the countries with the larger migration rate.
Analysis of survey results
In the sample survey of Caribbean HTAs, the respondents constituted HTAs from Guyana, St. Lucia, Jamaica, Grenada, and Haiti who operate in the USA and Canada. Of the 42 HTAs interviewed; 12 were Guyanese, 3 were St. Lucian, 5 Grenadian, 10 were from Jamaica and 12 were from Haiti. With regards to mem-bership, the Guyanese HTAs have an average of 600 members per HTA, compared to 150 members for the Grenadian HTAs, 800 for Jamaican, 200 for St. Lucia and 1,000 members for the Haitian HTAs. The data suggest that the Haitian and Guyanese HTAs have a larger membership than the other HTAs. This is consistent with the fact that these countries have a larger volume of migrants and they are also the top recipients of remittances in the Caribbean, namely 53% and 16%, respectively of GDP for Haiti and Guyana (Fajnzylber and López, 2007). However, it is important to note that the paying members of these associations are much less than those who support the associations and take part in their activities. Approximately half of these members are
247Caribbean HTAs: an uptapped resource
actually paying members, while the other half give their support but do no pay the mem-bership fees. The catchment area for these association in the USA spanned New York, New Jersey, Georgia, Washington, as well as Atlanta. The associations from Canada rep-resented cities such as Toronto, Montreal, Ottawa and New Brunswick.
All the HTAs communicate with their members on a monthly basis with the excep-tion of two HTAs from Guyana who meet on a weekly basis and one from Jamaica which meets quarterly. Similarly, all the HTAs communicate with their members through meetings and use emails and telephones as media of communication. In addition, 15% of all the HTAs utilised newsletters to com-municate with their members; while 6% uti-lise their website on the world wide web.
At the HTAs’ monthly meetings, the presi-dents of all the HTAs admitted to discussing issues and events in the home country; these include issues that the members of the HTAs are facing in the host country as well as fund-raising and cultural activities. To a smaller extent 26% and 13%, respectively of all the HTAs discussed investment and employment opportunities in the home country.
About 65% of the HTAs indicated that they have programs in their associations that allow members to contribute to the development of the home country. About 60% of the HTAs that have these programs also have scholarship programs that provide students from the home country with an opportunity to study in the USA or Canada and pay the fees associated with their pro-gram of study. Other HTAs contribute to the home country through programs which support elderly and children homes, provide educational supplies such as computers to the schools in their home country, feeding programs, provision of medical supplies to
local hospitals as well as embarked on com-munity development programs. Many of the Haitian HTAs have programs that support food and agricultural production as well as efficient water supply and animal rearing in the home country.
All the HTAs admitted that their mem-bership frequently ask questions relating to how they could contribute to the devel-opment of their home country. Two of the HTAs postulated that citizens of the host country have also approached them regarding investment opportunities in the home country. This means that the HTAs can act as virtual announcement boards for investment opportunities in the home countries. Only 21% of HTAs claimed that stakeholders in the home country have con-tacted them regarding investment oppor-tunities. These investment opportunities included real estate, small businesses, stock, bonds and shares, educational and health services.
The presidents of all the HTAs claimed that they do not provide much support for members who are interested in investing their financial, human capital and eco-nomic resources in the home country. They admitted that the only assistance that they give to their members in that regard is in the form of general information and the contact numbers of their relevant embassy represen-tative who could shed light on investment opportunities in their country of origin.
About 86% of all the HTAs acknowl-edged that they make a direct contribution to the home country through collective remittances donated to the local commu-nites, community development projects, the paving of streets, cemeteries, as well as street lights for local communities. The HTAs also make contributions to the educational sys-tem by providing educational supplies such
248 S.C. Joseph et al.
as computers for high schools in the local community. The HTAs also provide scholar-ships for members of the local community to further their education in metropolitan country. They also admitted to contrib-uting to the health system of the home country by providing medical supplies to various home country community health centers as well as contributions to elderly homes and orphanages. They also make charitable contributions to the home coun-try especially in times of natural diasasters, as in the case of Grenada and Haiti, where the HTAs from these two countries admit-ted to making a significant contribution to the home county. For example, all the Grenadian HTAs interviewed admitted that when Grenada was hit by a devasting huri-cane, they sent food and medical supplies as well as financial resources to assist with the rebuilding of Grenada. Many members of the HTA also flew to Grenada to give whatever assistance they could with regard to shelter, housing and medical support. Similar trends followed for Haiti which was also hit by a huricane and more recently, an earthquake.
All the HTAs noted that their mem-bers would be willing to take part in pro-grams which allowed them to transfer their skills and knowledge to the home coun-try. However, this iniative has not been launched. Hence, they are unable to make a contribution in that regard.
With the exception of two HTAs from Haiti, all presidents of the HTAs noted that they do not have a direct relationship with the government of their respective home country. The two HTAs from Haiti which admitted to having a relationship with some of the government ministries in the home country, also admitted to having contact with local government bodies. However, all the HTAs admitted to having a relationship
with their respective embassies and that the members of the respective embassies sup-port their cultural and fund raising activi-ties. The presidents of the St. Lucian HTAs admitted that a representative of the govern-ment visited them recently concerning the upcoming Homecoming being planned by the Government of St. Lucia for members of the Diaspora. This ‘Homecoming 2010’ will be held in July 2010; members of the HTAs and St. Lucian diaspora are encour-aged to come home to discuss ways in which the government can help them, as well as avenues through which they can make a greater contribution to the development of the St. Lucian economy.
When asked whether the government of their respective home country contacts them in relation to any investment, trad-ing or employment opportunities, all of the HTAs noted that they have never been contacted by their respective government regarding these activities; the HTAs had a similar response regarding being contacted by the private sector in their home country with such opportunities. All the HTAs con-firmed that they supported the activities and functions of other HTAs in the host coun-try especially their fund raising activities.
When asked about some of the avenues through which they can make a greater con-tribution to the home country, the majority (75%) of HTAs admitted to being able to make a greater contribution to the home country through education, health sup-plies for the local community, community development though collective remittances for the building of roads and beautification of the community. A minority (10%) also admitted that they can contribute to the home country by investments in various business initiatives in the home country. Some (15%) of the HTAs indicated their interest in contributing to elderly homes
249Caribbean HTAs: an uptapped resource
and orphanages in the home country as well as the development of local commu-nity schools. A very important point which stood out is that there are no incentives for the diaspora to contribute to the home country or to invest in the home country. The Haitian HTAs expressed the view that there should be more Haitian ownership of Haitian enterprises and activities.
Notwithstanding, the HTAs believe that some of the key factors which will allow them to make these contributions to their home country include funding, informa-tion on the assistance that the home coun-try needs with respect to certain projects and support from the government and pri-vate sector in the home country. A major factor which affects many of the HTAs is the lack of assistance in shipping supplies to the home country. Many of the HTAs are faced with the challenge of shipping expenses. Although they may want to contribute to their local community in a bigger way, they are faced with high shipping cost and receive no support from the government in the home country; hence they are unable to make significant contributions.
One HTA from Haiti proposed that there is a need for the leaders and stakeholders in the home country to host forums where they can engage the diaspora on issues as well as the needs of the home country and those of the members of their diaaspora. Through such forums, they can arrive at solutions which will benefit both the home country and the diaspora. The Presidents of some of the Haitian HTAs also admitted that one of the main problems that they face is the issue of illegal immigrants. Given the fact that a large share of the Haitian diaspora is illegal in the host country, they may be unwilling to partipate in certain activities in the host country as well as activities to support the home country.
Conclusions and policy recommendations
It is evident that Caribbean HTAs are willing to contribute to the development of their respective economies; however, the right mechanisms are not in place to facilitate this contribution. It is important for the respective stakeholders and deci-sion makers to recognise the importance of these diaspora groups as part of their development plan. Hence, they should cre-ate policies which will allow the respective countries to tap into the resources of these diaspora associations.
This paper therefore argues that there is a need to form closer relationships with Caribbean HTAs. This can be initiated and facilitated by the respective governments who need to pay closer attention to support-ing these associations. Therefore, the respec-tive stakeholders in the home country will be able to call on these associations to assist them in different areas of development in the home country. Without an existing relationship, there would be no incentive or need for these HTAs to make a greater contribution to the home country.
The governments of the various CARICOM member states need to set up a small unit or department in the Ministry of Foreign Affairs to deal specifically with diaspora relations. Some Caribbean gov-ernments (namely Dominica and Jamaica) have already initiated this unit, while oth-ers are lagging behind. It is important for all the Caribbean countries to achieve con-sensus on the importance of the Caribbean diaspora to the region. These units will be charged with the responsibility of creating programs geared towards increasing educa-tion, health, sports, housing and shelter, community and infrastructural develop-ment. Governments should target these HTAs as stakeholders in the delivery of such programs.
250 S.C. Joseph et al.
Given the large number and range of Caribbean associations, it is essential to establish an umbrella association such as a union that governs all these HTAs; this will make the HTAs less informal as well as give them more leverage, both in the home and host countries. This will also allow for greater recognition of these Caribbean associations and would make communication much easier and faster as the respective countries can communicate directly with the umbrella association for the dissemination of relevant information to member associations.
Given the close proximity of Caribbean embassies to Caribbean diaspora associa-tions, the respective governments need to assign roles to these embassies regarding these HTAs. The embassies can serve as the intermediary between the HTAs and the home country and can be the liaison for both parties. The embassies will be the mechanism through which the members of the Caribbean diaspora will stay in touch with the home country. Caribbean embas-sies in serving as a facilitator between the Caribbean diaspora and the home country would allow the members of the Caribbean HTAs to make a greater contribution to the development of their home country through economic transfers, direct diaspora invest-ment, community development, political involvement, charity and the development of social services and infrastructure.
It is crucial to establish a skill database of all the HTAs and their membership. This database will provide information on the size and compositions of these HTAs as well as their pool of skills and exper-tise. The availability of such data on the Caribbean diaspora and its groupings is a very important factor for the successful engagement of these HTAs. This will allow the home country to network and collabo-rate with these HTAs as well as identify
local needs and set programs according to these needs. Similarly, these embassies and Foreign Service units must facilitate more opportunities for trade, investment, skill and knowledge transfers to the members of the Caribbean HTAs, thereby stimulating growth and development in the region.
It is also important for the governments of the respective Caribbean countries to arrange meetings and conventions where they can meet with the representatives of the different Caribbean HTAs. At these meetings or conventions the representatives of the HTAs can discuss the issues faced by their nationals abroad and the help and support that they require from the respec-tive stakeholders in the home country. The government officials can also discuss the help and support that they would need from these associations. These meetings and discussions can be the stepping stone in building and strengthening the relationship between the governments of the respective Caribbean countries and the various HTAs in the USA and Canada.
The region also needs to scale up its research efforts to better understand the Caribbean diaspora, their interest, their location and the help and support that they need in order to effectively contribute to the development of the region. Such research can also investigate non-financial influences, gender differences in remittance behaviour, and other issues related to diaspora and development. This research can be sup-ported by the respective governments as well as collaborative partnership between the diaspora and the private sector.
referenCes
Alarcon, R. (2000) ‘The development of the hometown associations in the United States and the use of social remittances in Mexico’,
251Caribbean HTAs: an uptapped resource
in de la Garza, R.O. and Lowell, B.L. (Eds.): Sending Money Home, New York: Rowman & Littlefield Publishers, Inc.
Alvarez, S., Dagnino, E. and Escobar, A. (1998) Cultures of Politics, Politics of Cultures: Re-Visioning Latin American Social Movements, Westview Press, Boulder.
Attzs, M. (2008) Natural Disasters and Remittances: Exploring the Linkages between Poverty, Gender and Disaster Vulnerability in Caribbean SIDS, Research Paper No. 2008/61.
Baiocchi, G., Heller, P. and Silva, M.K. (2008) ‘Making space for civil society: institutional reforms and local democracy in Brazil’, Social Forces,Vol. 86, No. 3.
Burgess, K. and Tinajero, B. (in press) ‘Collective remittances as non-state transna-tional transfers: patterns of transnationalism in Mexico and El Salvador’ in Brown, S. (Ed.): Non-State Transnational Transfers.
Crowell, D. (2003) Presentation at Roundtable at The George Washington University, 12 November 2003, Washington, DC.
Delgado-Wise, R. and Rodriguez, H. (2001) ‘The emergence of collective migrants and their role in Mexico’s local and regional development’, Canadian Journal of Development Studies.
Fagen, P.W. (2006) Remittances in Crises: A Haiti Case Study, Published by Humanitarian Policy Group at the Overseas Development Institute, London.
Fagen, P.W. (2009) Migration, Development and Social Services, Policy Brief #6 February 2009.
Fajnzylber, P. and López, J.H. (2007) Close to Home: The Development Impact of Remittances in Latin America, World Bank, Washington, DC.
Fox, J. (1997). ‘The difficult transition from clientalism to citizenship: lessons from Mexico’, in Chalmers, D., Scott, M. and Piester, K. (Eds.): The New Politics of Inequality in Latin America, Oxford University Press, New York.
Fox, J. and Xochitl, B. (2008) ‘Migrant organization and hometown impacts in rural Mexico’, Journal of Agrarian Change, Vol. 8, Nos. 2 and 3, April and July 2008.
Gupta, A. and Ferguson, J. (1997) ‘Culture, power, place: ethnography at the end of an era’, in Gupta, A. and Ferguson, J. (Eds.): Culture, Power, Place: Explorations in Critical Anthropology, Duke University Press: Durham and London.
Goldring, L. (1998) ‘From market membership to transnational citizenship? The changing politization of transnational social spaces’, l’Ordinaire Latino- American, pp.173–174 .
Hamilton, K. (2003) Migration and Development: Blind Faith and Hard-to-Find Facts, Migration Policy Institute, 1 November 2003.
Hirabayashi, L.R. (1993) ‘The politicization of regional identities among mountain Zapotec migrants in Mexico City’, in Altamirano, T. and Hirabayashi, L.R. (Eds.): Migrants, Regional Identities and Latin American Cities, Society for Latin American Anthropology Publication Series, 13, American Anthropological Association: Washington, DC.
Itzigsohn, J. (2000) Immigration and the Boundaries of Citizenship: The Institutions of Immigrants’ Political Transnationalism, International Migration Review.
Latapi, A.E. and Janssen, E. (2006) Migration, the Diaspora and Development: The Case of Mexico, International Institute of Labour Studies, Discussion Paper DP/167/2006, Decent Work Research Programme.
Levitt, P. (2001) Transnational Villagers, University of California Press, Berkeley.
Mishra, P. (2006) ‘Emigration and brain drain: evidence from the caribbean’, International Monetary Fund Working Paper, WP/06/25.
Mountz, A. and Wright, R. (1996) ‘Daily life in the transnational migrant community of San Agustín, Oaxaca, and Poughkeepsie, New York’, Diaspora, Vol. 5, No. 3, pp.403–428.
Nun, J. (2003) Democracy: Government of the People or Government of the Politicians? Lanham, MD: Rowman & Littlefield.
Nurse, K. (2004) Migration, Diaspora and Development, Universidad Autonoma de Zacatecas & Canadian Foundation for the Americas, Zacatecas, Mexico, October 2004.
252 S.C. Joseph et al.
Orozco, M. and Welle, K. (2000) Hometown Associations and Development: A Look at Ownership, Sustainability, Correspondence and Replicability, Inter-American Development Bank.
Paul, A. and Gammage, S. (2004) Hometown Associations and Development: The Case of El Salvador, Destination D.C. Working Paper, Number 3, Women’s Studies Department, George Washington.
Putnam, R., Robert, L. and Nanetti, R. (1994) Making Democracy Work: Civic Traditions in Modern Italy, Princeton: Princeton University Press.
Rueschemeyer, D., Evelyne H. Stephens and John D. Stephens. (1992) Capitalist Development and Democracy, Polity Press, Cambridge.
Roberts, K.D. and Morris, M.D.S. (2003) Fortune, Risk, and Remittances: An Application of Option Theory to Participation in Village-Based Migration Networks, The International Migration Review.
Smith, R.C. (2006) Mexican New York: Transnational Lives of New Immigrants, University of California Press, Berkeley.
Somerville, W., Durana, J. and Terrazas, A.M. (2008) Home Town Association: An untapped Resource for Immigrant Integration, July 2008.
Serrano, P. (2003) ‘Remesas familiares y colectivas de los emigrantes
centroamericanos en los Estados Unidos’, Comercio Exterior, Vol. 50, No. 4.
Villacrés (2008) From Subjects to Citizens: Migrant Hometown Associations as Vehicles for Deepening Democracy.
Walzer, M. (1992) ‘The civil society argument’, in Mouffe, C. (Ed.): Dimensions of Radical Democracy: Pluralism, Citizenship, Community, London, New York, pp.89–107.
Williams, H. (2008) From Visibility to Voice: The Emerging Power of Migrants in Mexican Politics, George Mason University: Global Migration and Transnational Politics Series, Working Paper #4, March 2008.
Zabin, C. and Escula, L. (2002) From Civic Association to Political Participation: Mexican Associations and Mexican Immigrant Political Empowerment in Los Angelos, Fontera Norte, Vol. 14.
note
1 This involves groups of migrants that maintain relationships and connections with home and host societies’. These dynamics of migrant cross-border engagements encompass a range of activities including but not limited to: remittance sending, social networks, economic relationships, cultural practices, and political participation.
Copyright © 2010 WASD
World Sustainable Development Outlook 2010
253
Rethinking postsecondaRy, technical and vocational
tRaining foR the 21st centuRy
Patrice Parris Searles*University of the West Indies, Trinidad & Tobago
Abstract: For years, governments, administrators and policy makers emphasise the need to provide postsecondary youth who possess little or no educational qualifi-cations, opportunities to gain marketable skills and occupational competencies. Skills development factors heavily into many country’s poverty reduction and development thrusts. In Trinidad and Tobago, a number of craft and technical/vocational training programmes have as such, been established to facilitate the increased employability of these ‘at risk’ individuals. While there exists international research on a range of areas associated with Technical/Vocational Education and Training (TVET) among the educationally disadvantaged, few local research efforts have specifically evaluated the implications of the current TVET framework to the sustainable development of the country. This paper seeks to fill that informational gap. In particular, the paper assesses the degree of alignment between the design and objectives of one major postsecondary, technical/vocational training pro-gramme and the occupational needs of the country. Moreover, this paper reviews the overall effectiveness of this training initiative in terms of its stated objectives of achieving increased employability and marketability of its graduates. Ultimately the researcher points to possible deficiencies in the current arrangement of post-secondary, technical vocational training and its servicing of the nation’s ‘at risk’ youth.
Keywords: technical; vocational training; youth employment; human capital development.
intRoduction
Many claim that Technical/vocational Education and Training (TVET) plays acrucial role in producing and distributing the knowl-edge that modern societies require for produc-tivity and survival (Boodhai, 2009; Supersad, 2000; UNESCO, 2001). For example, the International Labour Organisation (ILO) is often cited as identifying technical/vocational
training as an appropriate ‘instrument’ for nations to promote worker employability and sustainable development, through the enhancement of human capital (Supersad, 2000, 2006). Technical/vocational training is therefore viewed, as an effective response to ensuring that certain disadvantaged groups in society have plausible opportunities to secure decent work.
*Corresponding author: University of the West Indies, Trinidad & Tobago; e-mail: [email protected]
254 P.P. Searles
Internationally, the youth rank among these disadvantaged. Global figures indicate that young people aged 15 to 24 represent nearly half the world’s jobless although they account for only 25% of the ‘working age’ population (ILO, 2004). Within Trinidad and Tobago specifically, the 15–24 year old cohort accounts for 45.2% on the nation’s unemployed, though they represent only 21.6% of the total labour force (Central Statistical Office, 2008).
The ILO further estimates that approxi-mately 70 million of the world’s youth are cur-rently out of work, seeking employment and available for hire (Brewer, 2004; ILO, 2002). Not surprisingly, socially disadvantaged youth generally experience even greater difficulties in securing employment. The ILO further proj-ects that over the next ten years roughly 450 million new jobseekers will emerge globally.
The increased demands for workers pos-sessing higher levels of education and skills translate into strong employment growth for the more educated individuals and the reverse for the less educated (Bills, 2004). Labour market and human capital studies reveal that education and training, there-fore, represent critical investments into an individual’s future productivity and employ-ability (Becker, 1993; Davenport, 1999). In recognition of the role that skill levels play in youth unemployment, many governments around the globe identify education and training as essential preconditions to enable young people to enter the labour market.
technical/vocational tRaining in tRinidad and toBago
In Trinidad and Tobago, the roots of technical/vocational training can be traced to 1906 when the Board of Industrial Training was established to provide the technical training needed to generate skilled
craftsmen (Supersad, 2000). After many Caribbean nations gained Independence, they found themselves confronting the stark reality that there was a non-existent supply of the technical skills needed for economic development and survival (Sangster, 1990). As a direct result, priority was given to the establishment of technical training institu-tions to satisfy this obvious need.
In Trinidad and Tobago, the first full time technical institute was established in 1943 in the form of the Junior Technical School of San Fernando (Supersad, 2000). Its success served as the impetus for the establishment of the San Fernando Technical Institute and the John Donaldson Technical Institute in 1954 and 1964, respectively.
In an effort to continue to satisfy the economy’s need for not only master crafts-men, but also a cadre of workers with the competencies to assist skilled technicians, the Ministry of Education’s Draft Education Plan 1968–1983 proposed the creation of a new type of school within the formal educa-tion system (Supersad, 2000). These newly arranged institutions emphasised both aca-demic and technical/vocational courses.
Over time, a further evolution of the technical/vocational training arena in Trinidad and Tobago occurred. Outside of the technical/vocational training that exists in the formal school system, a number of informal, private and state sponsored train-ing institutions emerged to service post-secondary youth. These institutes facilitate the training and development needs of the thousands of young persons who annually emerge out of the formal education system without attaining adequate certification (Sangster, 1990; Supersad, 2000).
The Government of Trinidad and Tobago has actively increased the numbers of
255Rethinking postsecondary, technical and vocational training
postsecondary, technical/vocational training opportunities available to this nation’s unemployed and under-skilled youth. Many of these programmes are geared toward the delivery of pre-craft and craft training to young persons with little or no marketable skills or educational qualifica-tions. Examples of these initiatives include the Youth Training and Employment Partnership Programme (YTEPP), Helping You Prepare for Employment (HYPE), Multi-Sector Skills Training Programme (MUST), the Civilian Conservation Corp (CCC), On the Job Training (OJT) and the Youth Apprenticeship Programme in Agriculture (YAPA).
today’s Reality
The Government of Trinidad and Tobago has actively sought to position this nation to assume ‘developed country’ status by the year 2020. The Government has proclaimed openly that the overall objective of this plan is to:
“…create an environment where citizens can enjoy an enhanced quality of life in the areas of education, health, housing and personal security, comparable to the high-est standards obtained in modern societ-ies” (Trinidad and Tobago. Ministry of Planning and Development, 2004, p.1).
Education and training appear, therefore, to hold prominence in the Government of Trinidad and Tobago’s plans. To this end, the 2009 fiscal year saw the State expending approximately $1,694.2 million TTD for pro-grammes and projects geared toward develop-ing a solid educational foundation within the society. Additionally, $483.6 million TTD were spent on youth training and development initiatives. (Trinidad and Tobago. Ministry of Social Development, 2009, p.80).
Despite the ever increasing expen-diture in the education and training
sectors, some challenge the value added by these government sponsored initiatives. Criticisms have been levelled that these programmes simply mask the unemploy-ment rate of the country. Commentators have suggested that the job opportunities created by these initiatives can be more appropriately described as “handouts and temporary employment at low wages” (Trinidad Newsday, 2007). The suspicion is that these initiatives are really, social welfare programmes designed to keep the grass-root population occupied rather than facilitate true social mobility.
Of critical note is the report of the Cabinet – appointed Task Force to Coordinate Monitoring and Evaluation in the Social Sector, that cautioned that these youth training programmes may have a “tendency to generate certain undesirable consequences” (Trinidad and Tobago. Ministry of Social Development, 2007). Of specific concern to the members of this Taskforce was the possible ‘learned help-lessness’ that sometimes accompanied these initiatives.
With the introduction of stipend pay-ments to participants of these training pro-grammes, there is growing recognition that some individuals simply migrate from pro-gramme to programme and never truly enter-ing the employment arena. The data appear to point to the possibility that these initia-tives can therefore dampen productivity.
Moreover, a number of structural and operational deficiencies continue to plague the TVET framework of Trinidad and Tobago (Boodhai, 2009; DAH Consulting, 2008; Ministry of Social Development, 2007; Parris, 2010). These challenges include:
• Aproliferationoftrainingprovidersandprogrammes that largely reflect a duplica-tion of training opportunities and organ-isational/operational arrangements.
256 P.P. Searles
• Acriticaloverlapoftheclientstargeted,the teaching or training resources and training facilities sourced.
• TVET programmes compete amongstthemselves, to the extent that there is growing evidence of poaching of trainees and teaching staff from one programme to the next.
• Littleornorigorousimplementationofnational standards for quality control of programme content, delivery and curricula.
• Many of these programmes were con-ceptualised and established years ago in response to specific needs and mandates. Since then few have undergone robust reviews of their underpinning objectives.
• Systems for effective monitoring andevaluation are non-existent within many programmes.
• Thecountry’slabourmarketcontinuestohighlight persistent vacancies among some occupations and surpluses in others.
• WithintheindividualTVETinitiatives,the attrition rates range between 17% and 25%.
• Therecontinuestobeanegativepublicperception, image and status of TVET in Trinidad and Tobago.
testing the pudding
In order to accurately evaluate the effective-ness and relevance of postsecondary, techni-cal vocational training initiatives on the lives of ‘at risk’ youth in Trinidad and Tobago, this study opted to critically evaluate the empirical evidence from one of the coun-try’s most longstanding TVET programme. Through this assessment the author provides a realistic sketch of TVET’s applicability to the country’s sustainable development.
For this study, 14 Focus Group Discussion (FGD) sessions were coordinated. Eight (8) focus group sessions were held with trainees from North, South and Central Trinidad, as well as from Tobago. These group discus-sions ascertained trainees’ experiences, per-ceptions and opinions as they related to their postsecondary, technical/vocational training. In a like manner, six (6) focus group sessions were also conducted among youth who had dropped out of the selected technical/voca-tional programme in North Trinidad, South Trinidad, Central Trinidad and Tobago
In order to perform a holistic, comprehen-sive review the study additionally utilised the strategic plan, mission and vision statements, reports, handbooks, manuals and brochures of the selected postsecondary, technical/vocational programme as comparison for the expressed needs and expectations of trainees. As a secondary step, the institution’s course offerings were compared to the needs of the Trinidad and Tobago economy, to determine its alignment to industry demands. Moreover, the study performed a series of Independent Sample T – Test to measure the likelihood of trainees
1 finding employment
2 finding higher tiered occupations and
3 securing higher wages than other ‘at risk’ youth with no additionally training.
theMatic issues Raised in the fg sessions
Motivation for training
Youths who participated in postsecondary, technical/vocational training highlighted that there were a number of motivations for pursuing TVET. The most common reason for pursuing training appeared to be associ-ated with personal development.

257Rethinking postsecondary, technical and vocational training
In this regard, respondents indicated that they wanted to broaden their knowledge base for some personal, non-occupational reason. As such, some trainees were not specifically interested in technical/ vocational training as a mechanism for attaining skills that could lead to employ-ment within the wider job market. Though some trainees were not greatly concerned about the employment aspect, the responses, point to an economic consideration for the desire for technical/vocational training.
“I find that hairdressers so expensive these days and I like doing things with my hair so I say I should learn to do it properly….”
“We have a real old car. It working but barely and I don’t have the funds to really fix it up so I feel if I get some training I could fix it up myself.”
“I want to learn to cook so I could show off my skills…I living on my own now so I can’t keep buying food.”
Another motivation voiced by a num-ber of participants within the discussion was that technical/vocational training rep-resented a means of keeping themselves mentally and socially occupied while they awaited some transition in their lives.
“I was home doing nothing so I come and did a course.”
“I was looking for something to do before going and repeat my CXC subjects. Something to just keep me occupied and cool my mind before going back to the serious book work.”
“…to fill the time between finishing school and getting a job.”
Of note is the fact that only a few par-ticipants admitted that they intended to use
the training that they pursued as a stepping stone to wage employment.
“I didn’t get too many subjects in school so I needed something that I feel could bring in the money for me. So I can get a job that I could do as a career.”
“I wasn’t sure what I should really do but I figure I should make sure and do a trade that I can survive off of.”
Analysis of the recorded focus group ses-sions further revealed that for most respon-dents, the knowledge and skills gained as a result of the technical/vocational training was a backup strategy for employment and not necessarily the primary focus of the training. The interviewed youths believed that in the event that they were unable to secure traditional employment they would be able to survive in the short term as a result of their training.
“Having a skill is very important because if you can’t get a job you can use what you learn to make some money in the mean time.”
“Once you have a skill you never really unemployed.”
In the long term, it was further confirmed by some respondents that self-employment and micro-enterprise were their ambition. Once again, the common belief appeared to be that the use of these skills for entrepre-neurship would be in supplement to their ‘real’ jobs.
Technical/vocational choice
While some participants indicated that they were interested in specific technical/ vocational areas for various reasons, a prede-termined interest was not reflective of a note-worthy amount of the interviewed youths.
258 P.P. Searles
Notably, since most participants were not greatly interested in the employability of the skills pursued, the actual courses enrolled in appeared to be selected in an extremely ad hoc manner.
“I just pick a course from what they had.”
“I wanted to do a trade but I wasn’t sure what I would like so I did fabricating, weld-ing, food preparation and woodworking.”
“I wanted to do Hairdressing but the class was full so I did dress making instead.”
TVET expectations
The data suggest that almost unanimously participants expected the postsecondary, technical/vocational training to fill some gap in their life as it related to technical ‘know how’. Participants expressed the firm belief that there would only be utility to training if its final outcome was the mastery of the techniques and processes relevant to the specific technical/vocational areas. This view was held despite the fact that partici-pating youths admitted they were not abso-lutely aware what some technical/vocational areas entailed, even in generic terms.
“I only have an idea about how and what it (the technical/ vocational area) like, so I feel that if I do training like this I would come out with that gap filled. I mean I should really understand everything that it call for.”
Training articulation
These youths placed a great deal of trust in the tutoring staff of these programmes. The belief appeared to be that since these men and women are ‘experts’ in their individual areas, they should be able to point trainees in the direction of the next step in their technical/vocational training.
“The tutors suppose to know …they should be telling you to go here, then there to advance your training.”
“They would show you the start…explain and show you what is the next step if you want to extend what you have learnt.”
Value of TVET certification
When the discussions moved toward the value placed upon the successful attainment of an official certificate at the end of training, a few common views emerged. Specifically, many (if not all) respondents claimed to rec-ognise the general merit of possessing the official certification. For these young adults, the certificate represented irrefutable proof that they were knowledgeable to perform given task competently.
“The certificate very important since it shows what you can do. Employers like to see the paper before they give you a job.”
“If I didn’t get a certificate I would feel like I wasted my time and energy. Like I can’t even learn a skill that needs me to use my hands instead of my brain.”
Despite this appreciation for an official certification, the discussion revealed that attainment of this final document was not critical for their survival or future. Among respondents who claimed to be only inter-ested in the technical/vocational train-ing for personal development, there was no need to use the certificate for employ-ment and thus its valuation was less than originally conceived. Among those focused upon the labour market, there was a view that they could still gain employment with-out it.
“A certificate only really important if you looking for work in the area and even then you could just go on a site and the
259Rethinking postsecondary, technical and vocational training
foreman would ask you to do X, Y and Z and if you can do it you get hired.”
Personal benefits
The analysed data pinpoint that for many participants, the enrolment and pursuit of these technical/vocational courses serve to increase their self confidence and esteem. A common view among respondents was the belief that despite their past, low aca-demic achievements, their postsecondary, technical/vocational training allowed them to once again believe in their individual ability to gain and retain knowledge. All respondents indicated that they felt a great deal of pride in showcasing their competen-cies and skills.
“Now I can show off my skills for people who never thought I could do anything like that.”
“I feel so good when my friends and them asking me for help to do some-thing and I know what to do and how to do it.”
“It feels real cool because at least I reach somewhere. I learn something new.”
Another pattern to emerge out of the focus group sessions was the increased tech-nical/vocational clarity reported by many of the interviewed participants. These young persons confirmed that for many of them, they only possessed a vague notion of what the individual technical/vocational areas entailed prior to enrolment within these courses.
The study’s findings indicate that partici-pation within the postsecondary, technical training allowed trainees to truly determine if their interest in the specific areas was strong enough to be sustained over time. This knowledge thus allowed participants
to do some internal evaluation about their future goals and objectives.
Society’s perceptions
Despite the pride and self confidence expressed by participants the study revealed that many of them did not feel that society extended to them the same levels of respect and appreciation. Many respondents indi-cated varying degrees of frustration and marginalisation as a result of society’s per-ception that they were incapable of contrib-uting to the nation.
“Society see you as a dunce (unintelligent) if you doing a trade. All people talk about is who has passes in this and that.”
“Although I didn’t do so well in school …at least I still trying to do something posi-tive. People don’t see that.”
“They does want you to feel like if going for a trade is because you stupid. Like they don’t realise you still have to read and write and understand in order to do a skill too.”
institution – tRainee alignMent
When the official goals and operational framework (as supported by documentary evidence) were compared to the expecta-tions and opinions expressed by the study’s ‘at risk’ youth some mis – matches and suc-cesses were identified. Table 1 summarised these findings.
laBouR MaRket Benefits
Utilising the data from the institution’s Tracer Study of Graduates 2000–2007, the study evaluated the statistical differ-ences between ‘ at risk’ participants and ‘at risk’ non-participants’ employment status,
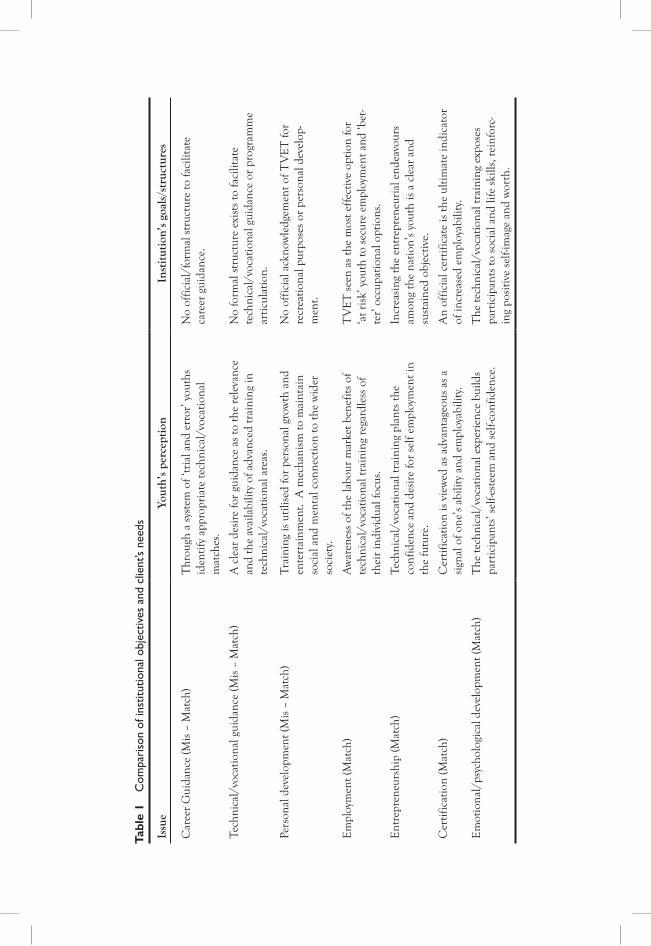
Tabl
e 1
Com
pari
son
of in
stitu
tiona
l obj
ectiv
es a
nd c
lient
’s ne
eds
Issu
eYo
uth’
s pe
rcep
tion
Inst
itut
ion’
s go
als/
stru
ctur
es
Car
eer
Gui
danc
e (M
is –
Mat
ch)
Thr
ough
a s
yste
m o
f ‘tr
ial a
nd e
rror
’ you
ths
iden
tify
appr
opri
ate
tech
nica
l/vo
catio
nal
mat
ches
.
No
offic
ial/
form
al s
truc
ture
to fa
cilit
ate
care
er g
uida
nce.
Tech
nica
l/vo
catio
nal g
uida
nce
(Mis
– M
atch
)A
cle
ar d
esir
e fo
r gu
idan
ce a
s to
the
rele
vanc
e an
d th
e av
aila
bilit
y of
adv
ance
d tr
aini
ng in
te
chni
cal/
voca
tiona
l are
as.
No
form
al s
truc
ture
exi
sts
to fa
cilit
ate
tech
nica
l/vo
catio
nal g
uida
nce
or p
rogr
amm
e ar
ticul
atio
n.
Pers
onal
dev
elop
men
t (M
is –
Mat
ch)
Trai
ning
is u
tilis
ed fo
r pe
rson
al g
row
th a
nd
ente
rtai
nmen
t. A
mec
hani
sm to
mai
ntai
n so
cial
and
men
tal c
onne
ctio
n to
the
wid
er
soci
ety.
No
offic
ial a
ckno
wle
dgem
ent o
f TV
ET
for
recr
eatio
nal p
urpo
ses
or p
erso
nal d
evel
op-
men
t.
Em
ploy
men
t (M
atch
)A
war
enes
s of
the
labo
ur m
arke
t ben
efits
of
tech
nica
l/vo
catio
nal t
rain
ing
rega
rdle
ss o
f th
eir
indi
vidu
al fo
cus.
TV
ET
see
n as
the
mos
t eff
ectiv
e op
tion
for
‘at r
isk’
you
th to
sec
ure
empl
oym
ent a
nd ‘b
et-
ter’
occ
upat
iona
l opt
ions
.
Ent
repr
eneu
rshi
p (M
atch
)Te
chni
cal/
voca
tiona
l tra
inin
g pl
ants
the
conf
iden
ce a
nd d
esir
e fo
r se
lf em
ploy
men
t in
the
futu
re.
Incr
easi
ng th
e en
trep
rene
uria
l end
eavo
urs
amon
g th
e na
tion’
s yo
uth
is a
cle
ar a
nd
sust
aine
d ob
ject
ive.
Cer
tific
atio
n (M
atch
)C
ertif
icat
ion
is v
iew
ed a
s ad
vant
ageo
us a
s a
sign
al o
f one
’s a
bilit
y an
d em
ploy
abili
ty.
An
offic
ial c
ertif
icat
e is
the
ultim
ate
indi
cato
r of
incr
ease
d em
ploy
abili
ty.
Em
otio
nal/
psyc
holo
gica
l dev
elop
men
t (M
atch
)T
he te
chni
cal/
voca
tiona
l exp
erie
nce
build
s pa
rtic
ipan
ts’ s
elf-e
stee
m a
nd s
elf-c
onfid
ence
.T
he te
chni
cal/
voca
tiona
l tra
inin
g ex
pose
s pa
rtic
ipan
ts to
soc
ial a
nd li
fe s
kills
, rei
nfor
c-in
g po
sitiv
e se
lf-im
age
and
wor
th.
261Rethinking postsecondary, technical and vocational training
occupational level and income level. In this study, the t-test of independent samples gen-erated values of t = 1.006, 2.933 and 3.566, respectively (Table 2).
These results indicate that there was no significant difference between the employment rates of ‘at risk’ youth who participated in postsecondary, technical/ vocational training and ‘at risk’ youth who had not. Participants of the postsecondary, technical/vocational programme though did have a higher likelihood on securing higher tiered occupational levels than their ‘at risk’ counterparts. Moreover, there was a significant difference between the income levels of ‘at risk’ youth who participated in postsecondary, technical/vocational train-ing and those who had not.
institution – industRy alignMent
Utilising the National Training Agency’s 2005 National Employer Survey, the researcher reviewed the employment oppor-tunities or needs highlighted by employers. These employer responses were used to determine whether or not there was evi-dence that the skills being offered by the said TVET programme were being demanded by employers (Table 3).
conclusion and RecoMMendations
The evidence confirmed that the national labour projections and demands in the
occupational areas offered by the selected training provider were extremely small. These occupational demands were also largely confined to the lower tiered, semi skilled occupations. The largest labour market projection was highlighted in the Personal Services Sector with 28% of the projected job opportunities expected to emerge in this sector. In quantifiable terms though, this 28% represented only 150 new vacancies. As such, while the techni-cal/vocational areas offered by the selected postsecondary, technical/vocational pro-gramme, did satisfy occupational demands within the local economy, there was a mis-match in the quantities of persons trained. The research determined that the numbers of persons trained outweighed the actual quantities required by employers.
Faced, with this labour market reality there is a critical need for TVET to be more responsive to the demands of the labour market. Training institutions should actively engage representa-tives of the labour market and determine the occupational areas in demand.
Overall, the comparison of the programme’s official objectives and focus, against the expec-tations and needs of its clients, identified a few areas that warrant revisiting in light of the sustainable development needs of Trinidad and Tobago. Specifically, the data revealed that despite a clear need for career guidance strategies aimed specifically at the recipients of postsecondary, technical/vocational training no systems existed within the evaluated post-secondary, technical/vocational programme
Table 2 Results of the studies independent sample T–Test
Dimension T–Value Degree of freedom Significance
Employment rate 1.006 485 0.315
Occupational tier 2.933 515 0.004
Wage level 3.566 443 0.000
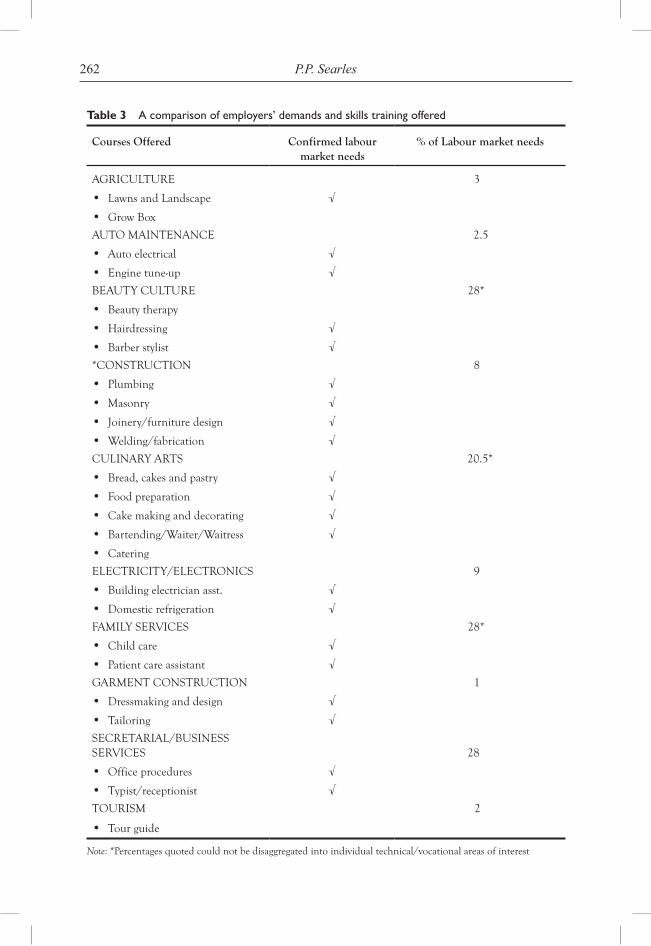
262 P.P. Searles
Table 3 A comparison of employers’ demands and skills training offered
Courses Offered Confirmed labour market needs
% of Labour market needs
AGRICULTURE 3
• Lawns and Landscape √
• Grow Box
AUTO MAINTENANCE 2.5
• Auto electrical √
• Engine tune-up √
BEAUTY CULTURE 28*
• Beauty therapy
• Hairdressing √
• Barber stylist √
*CONSTRUCTION 8
• Plumbing √
• Masonry √
• Joinery/furniture design √
• Welding/fabrication √
CULINARY ARTS 20.5*
• Bread, cakes and pastry √
• Food preparation √
• Cake making and decorating √
• Bartending/Waiter/Waitress √
• Catering
ELECTRICITY/ELECTRONICS 9
• Building electrician asst. √
• Domestic refrigeration √
FAMILY SERVICES 28*
• Child care √
• Patient care assistant √
GARMENT CONSTRUCTION 1
• Dressmaking and design √
• Tailoring √
SECRETARIAL/BUSINESS SERVICES 28
• Office procedures √
• Typist/receptionist √
TOURISM 2
• Tour guide
Note: *Percentages quoted could not be disaggregated into individual technical/vocational areas of interest
263Rethinking postsecondary, technical and vocational training
to address this demand in any structured or formalised manner.
In a similar vein, ‘at risk’ youth voiced a desire to be guided in terms of the avenues and opportunities for advanced training in specific technical/vocational areas. Again the study found that the institution did not possess any systems to facilitate such techni-cal/vocational training guidance.
The bases upon the course offering within the TVET programme evaluated in this study, the youth participants are exposed to a limited number of occupational or career options. This situation may result in restricted technical/vocational awareness among these young persons and as such, may also result in their aspirations being confined to a small number of career paths. The onus may reside with training institu-tions to provide the resources and guidance needed for ‘at risk’ youth to match innate interest or ability to the labour market train-ing opportunities.
The data confirmed that the institution’s focus upon the development and reinforce-ment of positive personal/emotional devel-opment, social and life skills was in keep-ing with trainees’ desires and expectation. Likewise, the analysis showed that there was harmony between the entrepreneurial devel-opment systems of the technical/vocational programmes and trainees’ aspirations.
In terms of the viewpoints and under-standings associated with the labour mar-ket emphasis of national postsecondary, technical/vocational training and the value of the award of official certification at the end of such courses of study, this exercise highlighted a partial alignment between clients and the institution. In other words, the institution’s emphasis or framework in these two areas, serviced the needs and expectations of some clients.
The data indicate that despite the insti-tution’s emphasis upon job training for increased marketability and employabil-ity among its ‘at risk’ participants, the technical/vocational training provided did not appear to increase these indi-viduals’ chances of securing employment. Specifically, the data highlight that there was no statistical difference between the generated employment rates among the TVET participants and other ‘at risk’ non-TVET participants.
Using another dimension of occupational effectiveness, the study, however, confirmed that the programme’s training did provide an occupational advantage to its ‘at risk’ par-ticipants. Specifically, the study determined that there is a greater likelihood of these vocationally – trained graduates securing higher tiered occupations, commensurate with higher salaries, than their non-partic-ipating counterparts. This finding concurs with those of other regional and interna-tional studies (Kemple, 2004; Kennedy, 1989; Neuman and Ziderman, 1998).
Additionally, the data appear to indicate that for many ‘at risk’ youth there remains a strong desire to be accepted by and participate within traditional, mainstream society. The attraction of the ‘white collar’ jobs to these persons has implication to their appreciation and accessing of available, postsecondary, technical/vocational training opportunities. Furthermore, for TVET to assume a more effective role in the nations development thrust, concerted effort must be expended to change society’s negative, tainted view of vocational training and its recipients.
RefeRences
Becker, G.S. (1993) Human Capital: A Theoretical and Empirical Analysis with Special Reference to Education, 3rd ed., The University of Chicago Press, Chicago.
264 P.P. Searles
Bills, D.B. (2004) The Sociology of Education and Work, Blackwell Publishing, United Kingdom.
Boodhai, N. (2009) Vocational education services in the Caricom Single Market and Economy (CSME), Draft Concept Paper, Arthur Lok Jack Graduate School of Business, University of the West Indies, St Augustine.
Brewer, L. (2004) Youth at Risk: The Role of Skills Development in Facilitating the Transition to Work, International Labour Organization, Geneva, Switzerland.
DAH Consulting (2008) Sector Evaluation of Selected Youth Training Programmes, Draft Report, Ministry of Social Development, Port of Spain, Trinidad.
Davenport, T. (1999) Human Capital, Jossey – Bass, San Francisco, California.
ILO (2002) Youth and Work: Global Trends, International Labour Organisation, Geneva, Switzerland.
ILO (2004) Global Employment Trends, International Labour Organisation, Geneva, Switzerland.
Kemple, J. (2004) Career Academies: Impacts on Labour Outcomes and Educational Attainment, Manpower Demonstration Research Corp., New York.
Kennedy, Coreen Arlette. 1989. Technical – vocational education and youth unemployment in Barbados. Master’s Thesis, the University of the West Indies, Cave Hill, Barbados.
Neuman, Shoshana, and Adrian Ziderman. 1998. Vocational education in Israel: Wage effects of the VocEd – Occupation match. Journal of Human Resources Vol. 34, No. 2, pp.407–420.
Newsday (2007) ‘UNC challenges CSO stats’, Trinidad and Tobago Newsday, 27 February.
Parris, P.M. (2010) ‘Postsecondary, technical, vocational training and its’ ‘at risk’ participants’, Doctoral Thesis, University of the West Indies, St Augustine.
Sangster, A. (1990) ‘Developments in technical, vocational education and training in the Caribbean – future trends and needs’, Paper Presented at the Commonwealth of Learning Conference, Hong Kong.
Supersad, C.G. (2000) ‘The genesis and evolution of technical, vocational education and training in Trinidad and Tobago’, Paper Presented at the Regional Conference on a Caribbean TVET System, Port of Spain, Trinidad and Tobago.
Supersad, M. (2006) Decent Work and Vocational Training: The Role of the Stated and the Social Partners, Working Paper, Ministry of Labour, Manpower Development and Industrial Relations, Trinidad and Tobago.
Trinidad and Tobago. Ministry of Planning and Development (2004) Public Sector Investment Programme 2005 – Vision 2020 Ensuring Our Future Survival, Ministry of Planning and Development, Port of Spain, Trinidad and Tobago.
Trinidad and Tobago. Ministry of Social Development. 2007. Cabinet Appointed Taskforce to Coordinate Monitoring and Evaluation in the Social Sector. Port of Spain, Trinidad and Tobago: Ministry of Social Development.
Trinidad and Tobago. Ministry of Social Development. 2009. Social Sector Investment Programme 2010 – Vision 2020 Ensuring Our Future Survival. Port of Spain, Trinidad and Tobago: Ministry of Social Development.
UNESCO (2001) Revised Recommendation Concerning Technical Vocational Education (2001), UNESCO – UNEVOC International Centre, Paris, France.
Copyright © 2010 WASD
World Sustainable Development Outlook 2010
265
Can IT and ITES bE an EngInE of growTh? an EmpIrICal
analySIS
Seema Joshi*University of Delhi, India
Abstract: India emerged as one of the fastest growing economies of the world during the 1990s because of the spectacular dynamism shown by the services sector. India’s services sector has been burgeoning fast and one of the major driver’s of the growth of services sector is Information Technology (IT) and Information Technol-ogy Enabled Services (ITES). It is well documented in literature that IT impacts growth by different channels. In this study we try to empirically verify the question: Can IT and ITES be an engine of growth? Using micro-level data of 100 households of 20 IT and ITES firms along with secondary data we tried to estimate the extent of indirect employment generation at macro-level and the share of IT and ITES in total employment and total value added. According to our study, one job for skilled professional employed in IT and ITES spins off jobs for 0.48 semi-skilled, low skills or unskilled workers. As per our estimates, the 16 lakh workers who are expected to be directly employed in IT sector in the FY 2008 would generate secondary em-ployment for 7,68,000 people which would constitute 0.16% of total employment. However, the share of consumption expenditure of 16 lakh professionals would be 20% of total value added. Assuming the consumption expenditure of the IT and ITES workers and total value added to be the same/constant when we tried to assess the contribution of consumption expenditure of 2.3 million workers (who are projected to be directly absorbed by IT sector by 2010, NASSCOM, 2005) to total value added it comes out to be 29% of total value added. The study says that the proportion of IT-ITES in total employment may be small but its contribution to total value added is still very high. Indeed IT and ITES can be an engine of growth in India’s economy by way of generating demand impulses in the economy as has been hypothesised and shown through the present study. Keeping in view the contributions of this sector and its huge untapped potential as evident from the present study and various other studies, there is a need for introduction and implementation of policy initiatives to address the challenges faced by this sector and to sustain the growth driven by the services sector.
Keywords: fastest growing economies; spectacular dynamism; the services sector; burgeoning fast; major driver’s of the growth; IT and ITES engine of growth; employment generation.
*Corresponding author: University of Delhi, India; e-mail: [email protected]
266 S. Joshi
InTrodUCTIon
India emerged as one of the fastest growing economies of the world during the 1990s mainly because of the remarkable perfor-mance of the services sector. India’s services sector has shown highly impressive growth being driven primarily by the Information Technology (IT) and Information Techno-logy Enabled Services (ITES). India became 10th largest exporter of services (Prasad, 2007a) in the world in the year 2007. As per the Global Services Location Index 2007, India has emerged as a top destination for off shoring. “The country continues to be the ‘nerve-centre’ for global sourcing with over 2/3rd of the Fortune 500 and a major-ity of the Global 2000 firms leveraging global service delivery-now sourcing from India” (NASSCOM, 2008). Not only this, the WNS ‘2008 Global Outsourcing 100’ survey reveals that 20 Indian companies are among the world’s top hundred in outsourcing (The Hindustan Times, 3 May 2008).
Though the impact of IT sometimes fails to be visible, “the country’s IT industry reflects in every way possible the vibrancy of India shin-ing” (Natrajan, 2004, p.14). Indian IT compa-nies rode high on the growth wave as is reflected by the fact that four Indian companies joined the billion dollar club viz. Tata Consultancy Services (TCS), (July 2003) and Infosys, Wipro and Bharati Televenture (telecom player) in April 2004. TCS was the first company to touch $1 billion in yearly revenue, and subsequently it became the first to touch $1 billion in one quarter in 2007 (De, 2007). That India has been on the global companies’ radar for quite some time gets further reflected in the fact that more than 15 Chief Executive officers (CEOs) of leading IT and Telecom companies visited India in less than five months in 2007 (Prasad, 2007b).
The IT industry is growing at a rapid pace. The direct impact of the IT industry
on development is tremendous and its potential is huge. The share of IT and ITES in Gross Domestic Product (GDP) increased from 1.2% in 1997–98 to 5.5% of GDP in the financial year (FY) 2008. Exports increased from $4.8 billion in 1997–1998 to $64 billion in FY 2008. Not only this, this sector is expected to directly employ 1.6 million professionals in FY 2008. In addition to direct employment, this sector is expected to generate huge indirect employ-ment also. As per NASSCOM (2005) esti-mates, 2.3 million direct and 6.5 million indirect jobs will be created by this sector by 2010. Given the rate at which this sector has been growing, the Indian IT industry is definitely gearing up to scale new heights.
The spectacular performance of IT and ITES segment of the services sector along with its huge untapped potential moti-vated us to empirically verify whether IT and ITES could be an engine of growth? To answer this question we begin by pro-viding a brief overview of the literature on linkages between IT and economic develop-ment. Section 3, provides the IT landscape in India. In Section 4, the research question is raised. Section 5 discusses sources of data, methodology and the empirical results have been reported in Section 6. Section 7, gives conclusions and policy implications.
IT and EConomIC dEVElopmEnT
Identifying the drivers of economic growth ranks among the most important issues that economists have focused on. Several stud-ies in Pohjola (2001) have found significant returns on ICT investments in developing as well as developed countries. The spectac-ular success of the IT industry in India has stimulated interest among academicians on the potential role that IT can play in India’s economic development (Adeya, 2002; Arora and Athreye, 2002; Bhatnagar and Schware,
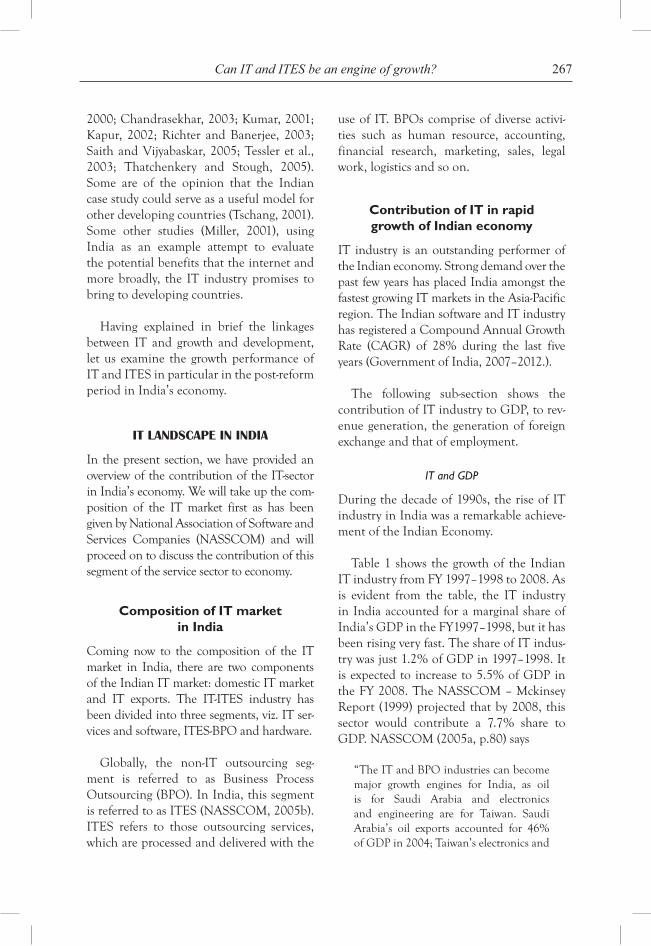
267Can IT and ITES be an engine of growth?
2000; Chandrasekhar, 2003; Kumar, 2001; Kapur, 2002; Richter and Banerjee, 2003; Saith and Vijyabaskar, 2005; Tessler et al., 2003; Thatchenkery and Stough, 2005). Some are of the opinion that the Indian case study could serve as a useful model for other developing countries (Tschang, 2001). Some other studies (Miller, 2001), using India as an example attempt to evaluate the potential benefits that the internet and more broadly, the IT industry promises to bring to developing countries.
Having explained in brief the linkages between IT and growth and development, let us examine the growth performance of IT and ITES in particular in the post-reform period in India’s economy.
IT landSCapE In IndIa
In the present section, we have provided an overview of the contribution of the IT-sector in India’s economy. We will take up the com-position of the IT market first as has been given by National Association of Software and Services Companies (NASSCOM) and will proceed on to discuss the contribution of this segment of the service sector to economy.
Composition of IT market in India
Coming now to the composition of the IT market in India, there are two components of the Indian IT market: domestic IT market and IT exports. The IT-ITES industry has been divided into three segments, viz. IT ser-vices and software, ITES-BPO and hardware.
Globally, the non-IT outsourcing seg-ment is referred to as Business Process Outsourcing (BPO). In India, this segment is referred to as ITES (NASSCOM, 2005b). ITES refers to those outsourcing services, which are processed and delivered with the
use of IT. BPOs comprise of diverse activi-ties such as human resource, accounting, financial research, marketing, sales, legal work, logistics and so on.
Contribution of IT in rapid growth of Indian economy
IT industry is an outstanding performer of the Indian economy. Strong demand over the past few years has placed India amongst the fastest growing IT markets in the Asia-Pacific region. The Indian software and IT industry has registered a Compound Annual Growth Rate (CAGR) of 28% during the last five years (Government of India, 2007–2012.).
The following sub-section shows the contribution of IT industry to GDP, to rev-enue generation, the generation of foreign exchange and that of employment.
IT and GDP
During the decade of 1990s, the rise of IT industry in India was a remarkable achieve-ment of the Indian Economy.
Table 1 shows the growth of the Indian IT industry from FY 1997–1998 to 2008. As is evident from the table, the IT industry in India accounted for a marginal share of India’s GDP in the FY1997–1998, but it has been rising very fast. The share of IT indus-try was just 1.2% of GDP in 1997–1998. It is expected to increase to 5.5% of GDP in the FY 2008. The NASSCOM – Mckinsey Report (1999) projected that by 2008, this sector would contribute a 7.7% share to GDP. NASSCOM (2005a, p.80) says
“The IT and BPO industries can become major growth engines for India, as oil is for Saudi Arabia and electronics and engineering are for Taiwan. Saudi Arabia’s oil exports accounted for 46% of GDP in 2004; Taiwan’s electronics and
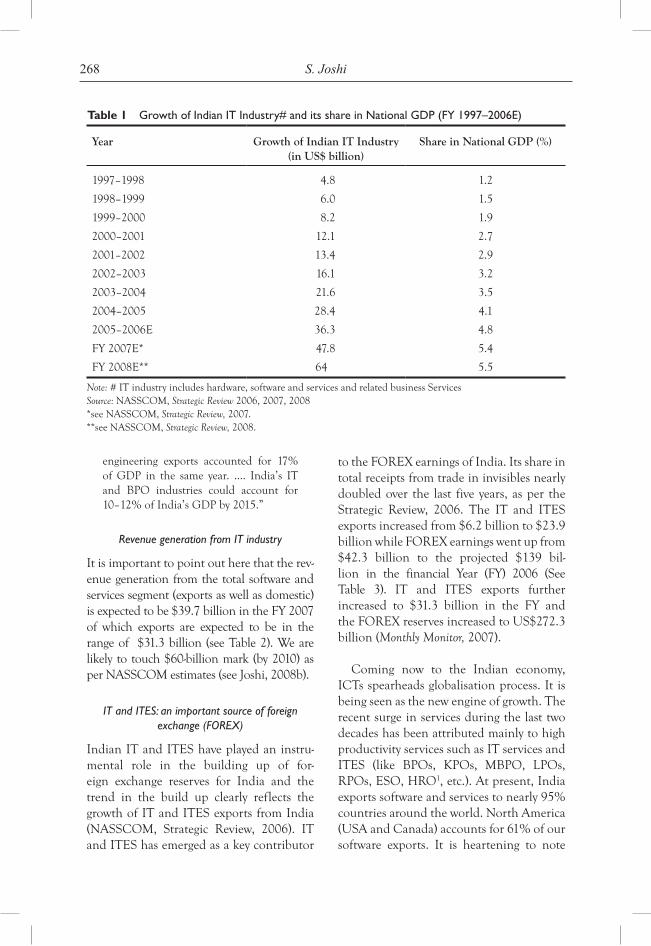
268 S. Joshi
engineering exports accounted for 17% of GDP in the same year. …. India’s IT and BPO industries could account for 10–12% of India’s GDP by 2015.”
Revenue generation from IT industry
It is important to point out here that the rev-enue generation from the total software and services segment (exports as well as domestic) is expected to be $39.7 billion in the FY 2007 of which exports are expected to be in the range of $31.3 billion (see Table 2). We are likely to touch $60-billion mark (by 2010) as per NASSCOM estimates (see Joshi, 2008b).
IT and ITES: an important source of foreign exchange (FOREX)
Indian IT and ITES have played an instru-mental role in the building up of for-eign exchange reserves for India and the trend in the build up clearly reflects the growth of IT and ITES exports from India (NASSCOM, Strategic Review, 2006). IT and ITES has emerged as a key contributor
to the FOREX earnings of India. Its share in total receipts from trade in invisibles nearly doubled over the last five years, as per the Strategic Review, 2006. The IT and ITES exports increased from $6.2 billion to $23.9 billion while FOREX earnings went up from $42.3 billion to the projected $139 bil-lion in the financial Year (FY) 2006 (See Table 3). IT and ITES exports further increased to $31.3 billion in the FY and the FOREX reserves increased to US$272.3 billion (Monthly Monitor, 2007).
Coming now to the Indian economy, ICTs spearheads globalisation process. It is being seen as the new engine of growth. The recent surge in services during the last two decades has been attributed mainly to high productivity services such as IT services and ITES (like BPOs, KPOs, MBPO, LPOs, RPOs, ESO, HRO1, etc.). At present, India exports software and services to nearly 95% countries around the world. North America (USA and Canada) accounts for 61% of our software exports. It is heartening to note
Table 1 Growth of Indian IT Industry# and its share in National GDP (FY 1997–2006E)
Year Growth of Indian IT Industry (in US$ billion)
Share in National GDP (%)
1997–1998 4.8 1.2
1998–1999 6.0 1.5
1999–2000 8.2 1.9
2000–2001 12.1 2.7
2001–2002 13.4 2.9
2002–2003 16.1 3.2
2003–2004 21.6 3.5
2004–2005 28.4 4.1
2005–2006E 36.3 4.8
FY 2007E* 47.8 5.4
FY 2008E** 64 5.5
Note: # IT industry includes hardware, software and services and related business ServicesSource: NASSCOM, Strategic Review 2006, 2007, 2008*see NASSCOM, Strategic Review, 2007.**see NASSCOM, Strategic Review, 2008.
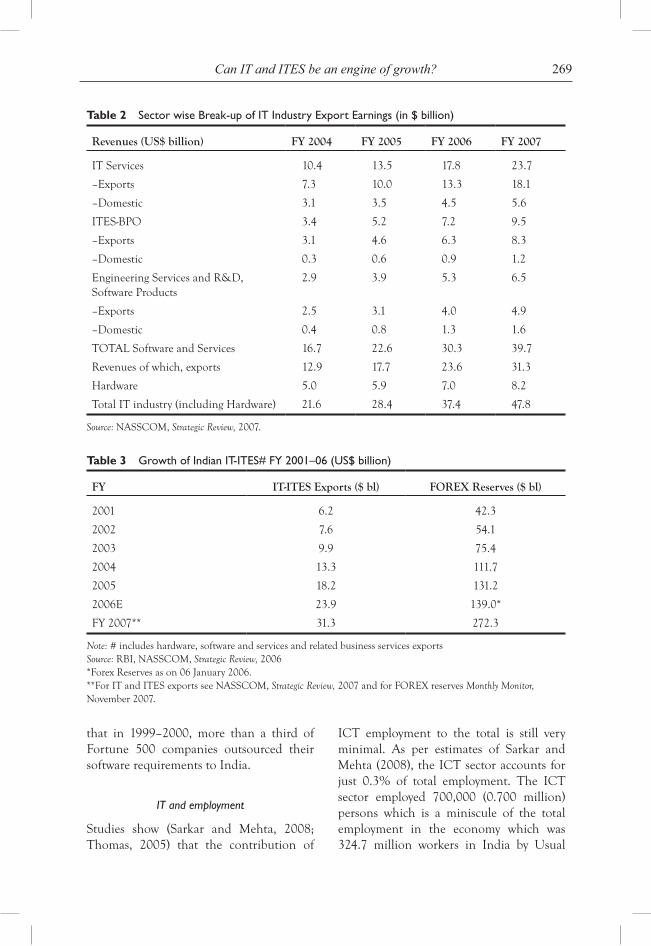
269Can IT and ITES be an engine of growth?
that in 1999–2000, more than a third of Fortune 500 companies outsourced their software requirements to India.
IT and employment
Studies show (Sarkar and Mehta, 2008; Thomas, 2005) that the contribution of
ICT employment to the total is still very minimal. As per estimates of Sarkar and Mehta (2008), the ICT sector accounts for just 0.3% of total employment. The ICT sector employed 700,000 (0.700 million) persons which is a miniscule of the total employment in the economy which was 324.7 million workers in India by Usual
Revenues (US$ billion) FY 2004 FY 2005 FY 2006 FY 2007
IT Services 10.4 13.5 17.8 23.7
–Exports 7.3 10.0 13.3 18.1
–Domestic 3.1 3.5 4.5 5.6
ITES-BPO 3.4 5.2 7.2 9.5
–Exports 3.1 4.6 6.3 8.3
–Domestic 0.3 0.6 0.9 1.2
Engineering Services and R&D, Software Products
2.9 3.9 5.3 6.5
–Exports 2.5 3.1 4.0 4.9
–Domestic 0.4 0.8 1.3 1.6
TOTAL Software and Services
Revenues of which, exports
16.7
12.9
22.6
17.7
30.3
23.6
39.7
31.3
Hardware 5.0 5.9 7.0 8.2
Total IT industry (including Hardware) 21.6 28.4 37.4 47.8
Table 2 Sector wise Break-up of IT Industry Export Earnings (in $ billion)
Source: NASSCOM, Strategic Review, 2007.
FY IT-ITES Exports ($ bl) FOREX Reserves ($ bl)
2001 6.2 42.3
2002 7.6 54.1
2003 9.9 75.4
2004 13.3 111.7
2005 18.2 131.2
2006E 23.9 139.0*
FY 2007** 31.3 272.3
Table 3 Growth of Indian IT-ITES# FY 2001–06 (US$ billion)
Note: # includes hardware, software and services and related business services exportsSource: RBI, NASSCOM, Strategic Review, 2006*Forex Reserves as on 06 January 2006.**For IT and ITES exports see NASSCOM, Strategic Review, 2007 and for FOREX reserves Monthly Monitor, November 2007.
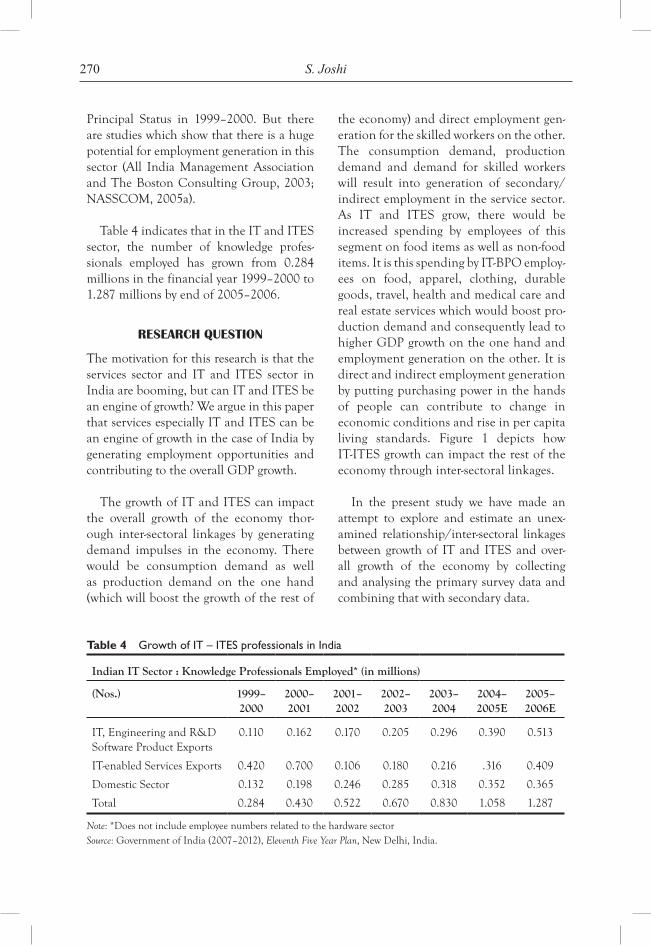
270 S. Joshi
Principal Status in 1999–2000. But there are studies which show that there is a huge potential for employment generation in this sector (All India Management Association and The Boston Consulting Group, 2003; NASSCOM, 2005a).
Table 4 indicates that in the IT and ITES sector, the number of knowledge profes-sionals employed has grown from 0.284 millions in the financial year 1999–2000 to 1.287 millions by end of 2005–2006.
rESEarCh QUESTIon
The motivation for this research is that the services sector and IT and ITES sector in India are booming, but can IT and ITES be an engine of growth? We argue in this paper that services especially IT and ITES can be an engine of growth in the case of India by generating employment opportunities and contributing to the overall GDP growth.
The growth of IT and ITES can impact the overall growth of the economy thor-ough inter-sectoral linkages by generating demand impulses in the economy. There would be consumption demand as well as production demand on the one hand (which will boost the growth of the rest of
the economy) and direct employment gen-eration for the skilled workers on the other. The consumption demand, production demand and demand for skilled workers will result into generation of secondary/ indirect employment in the service sector. As IT and ITES grow, there would be increased spending by employees of this segment on food items as well as non-food items. It is this spending by IT-BPO employ-ees on food, apparel, clothing, durable goods, travel, health and medical care and real estate services which would boost pro-duction demand and consequently lead to higher GDP growth on the one hand and employment generation on the other. It is direct and indirect employment generation by putting purchasing power in the hands of people can contribute to change in economic conditions and rise in per capita living standards. Figure 1 depicts how IT-ITES growth can impact the rest of the economy through inter-sectoral linkages.
In the present study we have made an attempt to explore and estimate an unex-amined relationship/inter-sectoral linkages between growth of IT and ITES and over-all growth of the economy by collecting and analysing the primary survey data and combining that with secondary data.
Indian IT Sector : Knowledge Professionals Employed* (in millions)
(Nos.) 1999–2000
2000–2001
2001–2002
2002–2003
2003–2004
2004–2005E
2005–2006E
IT, Engineering and R&D Software Product Exports
0.110 0.162 0.170 0.205 0.296 0.390 0.513
IT-enabled Services Exports 0.420 0.700 0.106 0.180 0.216 .316 0.409
Domestic Sector 0.132 0.198 0.246 0.285 0.318 0.352 0.365
Total 0.284 0.430 0.522 0.670 0.830 1.058 1.287
Table 4 Growth of IT – ITES professionals in India
Note: *Does not include employee numbers related to the hardware sectorSource: Government of India (2007–2012), Eleventh Five Year Plan, New Delhi, India.
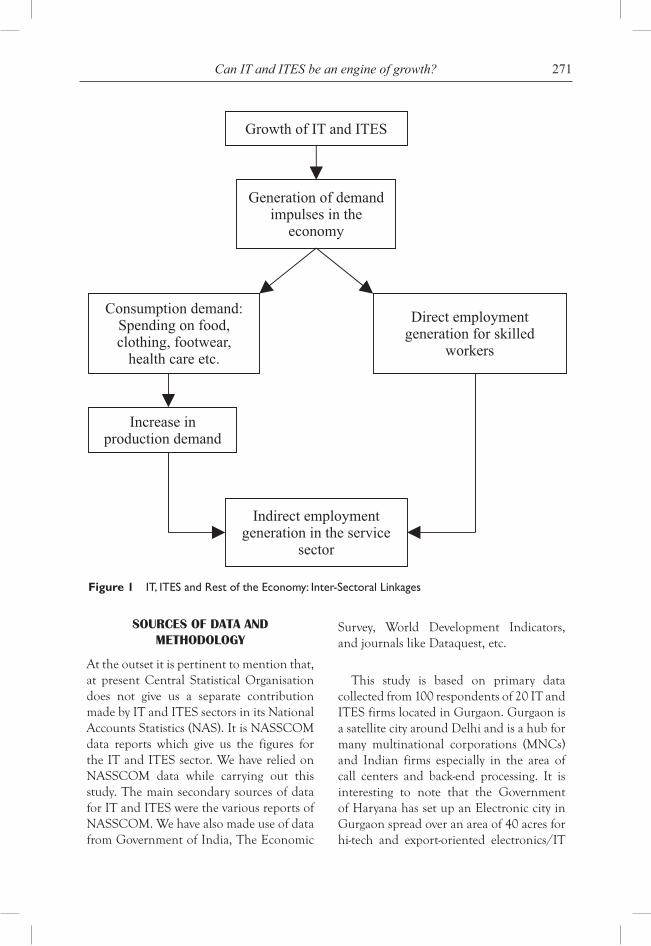
271Can IT and ITES be an engine of growth?
SoUrCES of daTa and mEThodology
At the outset it is pertinent to mention that, at present Central Statistical Organisation does not give us a separate contribution made by IT and ITES sectors in its National Accounts Statistics (NAS). It is NASSCOM data reports which give us the figures for the IT and ITES sector. We have relied on NASSCOM data while carrying out this study. The main secondary sources of data for IT and ITES were the various reports of NASSCOM. We have also made use of data from Government of India, The Economic
Survey, World Development Indicators, and journals like Dataquest, etc.
This study is based on primary data collected from 100 respondents of 20 IT and ITES firms located in Gurgaon. Gurgaon is a satellite city around Delhi and is a hub for many multinational corporations (MNCs) and Indian firms especially in the area of call centers and back-end processing. It is interesting to note that the Government of Haryana has set up an Electronic city in Gurgaon spread over an area of 40 acres for hi-tech and export-oriented electronics/IT
Figure 1 IT, ITES and Rest of the Economy: Inter-Sectoral Linkages
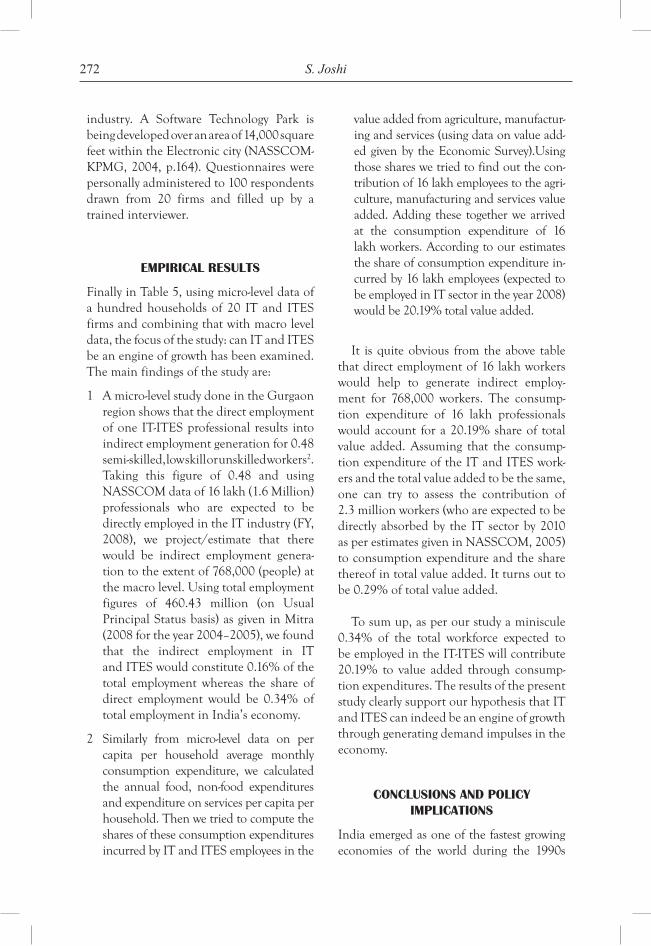
272 S. Joshi
industry. A Software Technology Park is being developed over an area of 14,000 square feet within the Electronic city (NASSCOM-KPMG, 2004, p.164). Questionnaires were personally administered to 100 respondents drawn from 20 firms and filled up by a trained interviewer.
EmpIrICal rESUlTS
Finally in Table 5, using micro-level data of a hundred households of 20 IT and ITES firms and combining that with macro level data, the focus of the study: can IT and ITES be an engine of growth has been examined. The main findings of the study are:
1 A micro-level study done in the Gurgaon region shows that the direct employment of one IT-ITES professional results into indirect employment generation for 0.48 semi-skilled, low skill or unskilled workers2. Taking this figure of 0.48 and using NASSCOM data of 16 lakh (1.6 Million) professionals who are expected to be directly employed in the IT industry (FY, 2008), we project/estimate that there would be indirect employment genera-tion to the extent of 768,000 (people) at the macro level. Using total employment figures of 460.43 million (on Usual Principal Status basis) as given in Mitra (2008 for the year 2004–2005), we found that the indirect employment in IT and ITES would constitute 0.16% of the total employment whereas the share of direct employment would be 0.34% of total employment in India’s economy.
2 Similarly from micro-level data on per capita per household average monthly consumption expenditure, we calculated the annual food, non-food expenditures and expenditure on services per capita per household. Then we tried to compute the shares of these consumption expenditures incurred by IT and ITES employees in the
value added from agriculture, manufactur-ing and services (using data on value add-ed given by the Economic Survey).Using those shares we tried to find out the con-tribution of 16 lakh employees to the agri-culture, manufacturing and services value added. Adding these together we arrived at the consumption expenditure of 16 lakh workers. According to our estimates the share of consumption expenditure in-curred by 16 lakh employees (expected to be employed in IT sector in the year 2008) would be 20.19% total value added.
It is quite obvious from the above table that direct employment of 16 lakh workers would help to generate indirect employ-ment for 768,000 workers. The consump-tion expenditure of 16 lakh professionals would account for a 20.19% share of total value added. Assuming that the consump-tion expenditure of the IT and ITES work-ers and the total value added to be the same, one can try to assess the contribution of 2.3 million workers (who are expected to be directly absorbed by the IT sector by 2010 as per estimates given in NASSCOM, 2005) to consumption expenditure and the share thereof in total value added. It turns out to be 0.29% of total value added.
To sum up, as per our study a miniscule 0.34% of the total workforce expected to be employed in the IT-ITES will contribute 20.19% to value added through consump-tion expenditures. The results of the present study clearly support our hypothesis that IT and ITES can indeed be an engine of growth through generating demand impulses in the economy.
ConClUSIonS and polICy ImplICaTIonS
India emerged as one of the fastest growing economies of the world during the 1990s
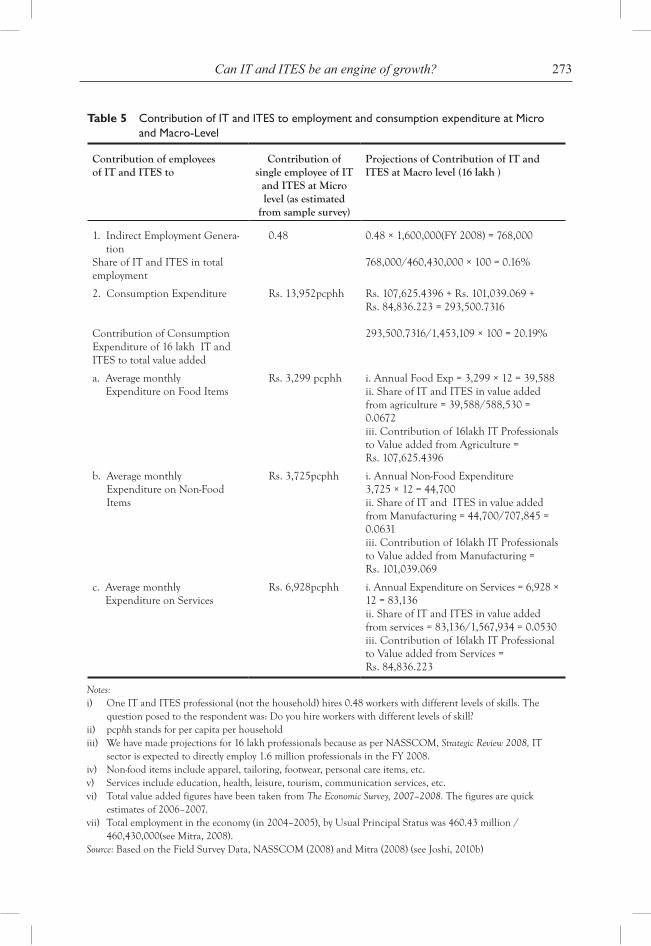
273Can IT and ITES be an engine of growth?
Contribution of employees of IT and ITES to
Contribution of single employee of IT
and ITES at Micro level (as estimated
from sample survey)
Projections of Contribution of IT and ITES at Macro level (16 lakh )
1. Indirect Employment Genera-tion
Share of IT and ITES in total employment
0.48 0.48 × 1,600,000(FY 2008) = 768,000
768,000/460,430,000 × 100 = 0.16%
2. Consumption Expenditure
Contribution of Consumption Expenditure of 16 lakh IT and ITES to total value added
Rs. 13,952pcphh Rs. 107,625.4396 + Rs. 101,039.069 + Rs. 84,836.223 = 293,500.7316
293,500.7316/1,453,109 × 100 = 20.19%
a. Average monthly Expenditure on Food Items
Rs. 3,299 pcphh i. Annual Food Exp = 3,299 × 12 = 39,588ii. Share of IT and ITES in value added from agriculture = 39,588/588,530 = 0.0672iii. Contribution of 16lakh IT Professionals to Value added from Agriculture = Rs. 107,625.4396
b. Average monthly Expenditure on Non-Food Items
Rs. 3,725pcphh i. Annual Non-Food Expenditure 3,725 × 12 = 44,700ii. Share of IT and ITES in value added from Manufacturing = 44,700/707,845 = 0.0631iii. Contribution of 16lakh IT Professionals to Value added from Manufacturing = Rs. 101,039.069
c. Average monthly Expenditure on Services
Rs. 6,928pcphh i. Annual Expenditure on Services = 6,928 × 12 = 83,136ii. Share of IT and ITES in value added from services = 83,136/1,567,934 = 0.0530iii. Contribution of 16lakh IT Professional to Value added from Services = Rs. 84,836.223
Notes: i) One IT and ITES professional (not the household) hires 0.48 workers with different levels of skills. The
question posed to the respondent was: Do you hire workers with different levels of skill?ii) pcphh stands for per capita per householdiii) We have made projections for 16 lakh professionals because as per NASSCOM, Strategic Review 2008, IT
sector is expected to directly employ 1.6 million professionals in the FY 2008.iv) Non-food items include apparel, tailoring, footwear, personal care items, etc.v) Services include education, health, leisure, tourism, communication services, etc.vi) Total value added figures have been taken from The Economic Survey, 2007–2008. The figures are quick
estimates of 2006–2007.vii) Total employment in the economy (in 2004–2005), by Usual Principal Status was 460.43 million /
460,430,000(see Mitra, 2008).Source: Based on the Field Survey Data, NASSCOM (2008) and Mitra (2008) (see Joshi, 2010b)
Table 5 Contribution of IT and ITES to employment and consumption expenditure at Micro and Macro-Level
274 S. Joshi
because of the remarkable performance of the services sector. India’s services sector has been burgeoning fast and one of the major driver’s of the growth of the services sector is IT and ITES. It is well documented in lit-erature that IT impacts growth by different channels. In this study we try to empirically verify the question: Can IT and ITES be an engine of growth? Using micro-level data of a hundred households of 20 IT and ITES firms and combining this with macro level data, the present study points out that the proportion of IT-ITES in total employment may be small but the contribution of this to total value added is still very high. The point worth appreciating is that this sector came to the fore after 1991 (BPOs in 1993) and within 15–17 years the contribution of this sector to our economy is really commendable whether to GDP, revenue or foreign exchange genera-tion and employment (though it may be min-imal at present). There is a huge potential of growth in this sector as is apparent from this study and as has been reported in various studies (Joshi, 2006b, 2010b).
In view of the above-mentioned findings of the study indicating the huge employment generation potential of IT and ITES and the contribution of this sector to value added, there is an urgent need to handle the chal-lenges faced by this sector. It is important to point out here that the sustainability of the impressive growth of the Indian economy has been questioned in the con-text of some persisting challenges in the form of lack of social infrastructure (Joshi, 2003, 2006d), physical infrastructure; IT infrastructure (Joshi, 2006a, 2008b), agri-cultural and industrial sector reforms, rupee appreciation and U.S. sub-prime crisis, increasing regional disparities (reflected in digital divide), etc. All these problems can adversely affect the IT and ITES growth. Besides, there are challenges peculiar to the field of IT and ITES like rising labour
costs, rapid growth in demand for talented manpower/quality staff, high attrition rate, outsourcing backlash etc are some other limiting factors (Joshi, 2006c, 2008a). The growth of IT and ITES is having social, economic, health, ethical and environ-mental implications also (Joshi, 2006c, 2008c). Further, delay in the promotion of conducive/enabling business environment and good governance will disqualify us from catching up with the global giants in terms of world-wide presence and scale. Recent “The Satyam saga raises serious questions about the key parts of India’s financial ecosystem” (Srinivas, 2009, p.29). The big-ger question that needs to be addressed in the light of this corporate fraud of an entrepreneurial firm like Satyam is: what kind of business environment and business culture will help to promote and demon-strate good corporate good governance. It is also important to point out here that the measurement of output , productiv-ity, non-availability of data or availability of data after a time lag are the other prob-lems confronted with in the case of services in general and IT-ITES in particular. The problem gets further compounded because these new species of services (like IT, ITES, etc.) are new entrants in the national accounts and there is a lack of develop-ment of concepts. Further, the quality of each unit of the same service varies from the others. Therefore, it is too difficult to achieve the same level of output in terms of quality as has been pointed out in Cowell (1984). Further, quality improvements stemming from the application of new technologies are extremely hard to measure (Joshi, 2008d). In view of the above prob-lems which can adversely impact the growth of the high potential IT and ITES segment; there is an urgent need for policy interven-tion to address the above-referred problems if India is really keen to sustain a growth driven by the services sector in India.
275Can IT and ITES be an engine of growth?
bIography
Dr Seema Joshi is presently working as Associate Professor of Economics, Department of Commerce, Kirori Mal College, University of Delhi, Delhi. She was on deputation to Indian Institute of Public Administration, New Delhi from 1 September 2005 to 08 May 2007 as Associate Professor of Urban Management. She was the first recipient of Sir Ratan Tata Fellowship at Senior Fellow level at Institute of Economic Growth, New Delhi (02 July 2007–30 June 2008). Her areas of research interest include issues related to tertiary sec-tor, social sector and urban management. She has published and presented several papers in national and international conferences.
rEfErEnCES
Adeya, C. (2002) ‘ITs and poverty: a literature review’, Online: www.Network. Idrc.ca/ev.php?URL_ID=24718&URL_DO=DO_TOPIC&URL_SECTION.
All India Management Association and The Boston Consulting Group (2003) ‘India’s new opportunity—2020’, Report of the High Level Strategic Group, Online: http://www.ibef.org/download/India, Retrieved 6/02/10, New Opportunity.pdf.
Arora, A. and Athreye, S. (2002) ‘The software industry and india’s economic development’, Information Economics and Policy, Vol. 14, pp.253–273.
Bhatnagar, S. and Schware, R. (Eds.) (2000) Information Communication Technologies in Rural Development, World Bank Institute, World Bank, Washington, DC.
Chandrasekhar, C.P. (2003) The Diffusion of Information Technology and the Implications for Development: A Perspective based on the Indian Experience, Online: www.networkodeas.org/featart/feb2003/IT_Bangalore_Paper.pdf.
Cowell, D.W. (1984) The Marketing of Services, Heinemann, London.
De, R. (2007) ‘A billion, a quarter”, Dataquest, February 15, pp.94–95.
Institute of Economic Growth (2007) Monthly Monitor, November.
Government of India (2007–2012), Eleventh Five Year Plan, New Delhi, India.
Joshi, S. (2003) ‘Social sector: need for reprior-itisation’, Southern Economist, 15 September.
Joshi, S. (2006a) ‘Tertiary sector in developing economies—its nature and relative growth’, in Upadhyay, V.N. et al. (Eds.): Productivity and Quality: A Multidisciplinary Perspective, Tata McGraw Hill Publishers, New Delhi.
Joshi, S. (2006b) ‘Employment Generation Potential in the Organised Retail Sector in Urban Areas’, Nagarlok, September–December.
Joshi, S. (2006c) ‘From conventional to new services: broadened scope of tertiary sector’, Indian Journal of Labour Economics, April–June.
Joshi, S. (2006d) ‘Impact of economic reforms on social sector expenditure in India’, Economic and Political Weekly, Vol. XLI, No. 4, Jan 28–Feb 3.
Joshi, S. (2008a) Growth and Structure of Tertiary Sector in Developing Economies, Academic Foundation, Delhi.
Joshi, S. (2008b) ‘Who will be the main Global IT Services Hub: India or China?’, Asia- Pacific Trade and Investment Review, Vol. 4.
Joshi, S. (2008c) ‘Is “Services Hub” of the World becoming an e-Junkyard?’ Presented a paper in National Seminar on WTO Provisions on Trade and Environment held on 15th and 16th February, 2008 at School of Economics, Devi Ahilya University, Indore.
Joshi, S. (2008d) ‘Service sector in India’s economy: performance, problems and prospects’, Country Paper Presentation in Asian Productivity Organization (APO) Project on Study Meeting on Expansion and Development of the Service Industry in Asia from 17–20 June, 2008 at Seoul, Republic of Korea.
Joshi, S. (2010a) ‘From the ‘Hindu Rate of Growth’ to ‘Unstoppable India’: Has the services sector played a role?, The Service Industries Journal, First Published on 10 March 2010 (iFirst), Routledge, U.K.
Joshi, S. (2010b) ‘The ageing societies vis-a-vis the workforce bulge: a window of
276 S. Joshi
opportunity for India’, in Moneer Alam and Armando Barrientos (Eds.): Demographics, Employment and Old Age Security: Emerging Trends and Challenges in South Asia, Macmillan India, New Delhi.
Kapur, D. (2002) ‘The causes and consequence of India’s IT Boom’, India Review, Vol. 1, No. 2, pp.91–110.
Kumar, N. (2001) ‘Indian software industry development—international and national perspectives’, Economic and Political Weekly, Vol. 36, No. 45, pp.4278–4290.
Miller, R.R. (2001) ‘Leapfrogging? India’s Information Technology Industry and the Internet’, International Finance Corporation, The World Bank, Washington.
Mitra, A. (2008) ‘Tertiary sector growth: issues and facts’, Artha Beekshan, Vol. 16, No. 4, pp.39–69.
NASSCOM –McKinsey Report (1999) New Delhi.
NASSCOM-KPMG Study (2004) Choosing a Location for Offshore Operations in India.
NASSCOM (2005a) ‘Extending India’s leadership of the Global IT and BPO industries’, NASSCOM-McKinsey Report 2005, New Delhi.
------- (2005b) Strategic Review, New Delhi.
--- (2006) Strategic Review, New Delhi.
--- (2007) Strategic Review, New Delhi.
--- (2008) Strategic Review, New Delhi.
Natrajan, G. (2004) ‘NASSCOM and the art of ‘Feel Good’ creation’, Dataquest, 29 February, p.14.
Pohjola, M. (Ed.) (2001) Information Technology, Productivity ad Economic Growth: International Evidence and Implications for Economic Development, Oxford University Press, New York.
Prasad, H.A.C. (2007a) Strategy for India’s Services Sector: Broad Contours, Working paper No.1/2007-Department of Economic Affairs, Ministry of Finance, Government of India, p.5.
Prasad, S. (2007b) ‘Destination India’, Dataquest, 15 June, pp.104–105.
Report of the Study Team on Human Resource Development (2007) Electronics Information and Planning, Vol. 34, Nos. 5–6, February–March.
Richter, F-J. and Banerjee, P. (Eds.) (2003) The Knowledge Economy in India, Palgrave Macmillian, Hampshire.
Saith, A. and Vijyabaskar, M. (2005) ICTs and Indian Economic Development: Economy, Work, Regulation, Sage Publication, New Delhi and London.
Sarkar, S. and Mehta, B.S. (2008) ‘Employment profile of the ICT Sector in India’, in Hashim, S.R. and Siddharthan, N.S. (Eds.): High Tech Industries, Employment and Global Competitiveness, India, Routledge.
Srinivas, S. (2009) ‘Shocked and Awed’, Buisness World, 19 January, pp.28–32.
Tessler, S., Avron, B. and Nagy, H. (2003) ‘National software industry development’, The Electronic Journal on Information Systems in Developing Countries, Vol. 13, No. 10, pp.1–17.
Thatchenkery, T. and Stough, R.R. (2005) Information Communication Technology and Economic Development: Learning From the Indian Experience, Edward Elgar Publishing Ltd., UK.
The Hindustan Times Business (2008), 20 Indian Companies among World’s Top 100 in Outsourcing, 3 May, p.25.
Thomas, J.J. (2005) ‘New technologies for India’s development’, India Development Report.
Tschang, T. (2001) The Basic Characteristics of Skills and Organizational Capabilities in the Indian Software Industry, ADB Institute Working paper N. 13, Tokyo, February.
noTES
1 BPOs stands for Business Process Outsourcing, KPOs for Knowledge Process Outsourcing, MBPOs for Medical Business Process Outsourcing, LPOs for Legal Process Outsourcing, RPOs for Research Process Outsourcing , ESOs

277Can IT and ITES be an engine of growth?
for Engineering Process Outsourcing and HROs for Human Resource Outsourcing.
2 We would like to point out here that the semi-skilled, low skill or unskilled workers were hired by the respondent and not by the other members of the household. Even if is
argued that these workers were hired not by the respondent but by other members of the HH, the fact remains that it is only when household income got supplemented that these different categories of low skill workers were hired.

Copyright © 2010 WASD
World Sustainable Development Outlook 2010
279
STIMULATING DIASPORIC TOURISM AS A NICHE MARKET FOR CARIBBEAN TOURISM: THE
CASE OF GUYANA AND TORONTO1
Sherma Roberts*University of West Indies, Barbados
Abstract: The global financial crisis has led the Caribbean tourism industry to search for new products and markets. Diaspora tourism presents an opportunity to explore a new market niche in the face of increasing global competition, and chang-ing consumer psychographics. This study examines the workings of diaspora tour-ism as it emanates from the global city of Toronto and impacts on the diasporic homeland of Guyana.
Keywords: diaspora; diasporic tourism; sustainable tourism; Guyana; Toronto.
INTRODUCTION
The emergence of the notion of sustainable tourism development one can reasonably argue provided a legitimate space for the discussion and analysis of diaspora tourism. With its emphasis on critiquing the negative impacts associated with mass tourism and a concomitant embrace of alternative forms of tourism which are said to be more economi-cally, socially, culturally and environmentally sustainable, sustainable tourism sought to move the focus towards tourism development that is socially and culturally compatible with the destination, that spread the benefits of tourism that reduce leakages and that is more conscious of environmental stewardship. In other words, alternative forms of tourism is
regarded as being empowering to the com-munity, financially beneficial, premised upon local lifestyles, identity and values, and fosters more meaningful relationships between hosts and guests (Brohman 1996; Scheyvens, 2002). These forms of tourism have manifested themselves in wine tourism, festival tourism, heritage tourism, ecotourism, sport tourism, adventure tourism, gastronomic tourism, ethnic tourism, etc. To date, no mention has been made of how diasporic communities (a stock of people born in a country and living in another country) can meaningfully be included under the umbrella of alternative tourism to deliver the suggested benefits discussed above. Given that the diaspora in large part remains connected to their homeland through various
*Corresponding author: The Depatment of Management Studies, University of West Indies, Cave Hill Campus, Barbados; e-mail: [email protected] on-going research presented in this conference paper is part of an IDRC funded project on Strategic Oppor-tunities in Migration: Brain Circulation, Diaspora Tourism and Investment, being undertaken by the Shridath Ramphal Centre for International Trade, Policy and Services, University of the West Indies, Cave Hill Campus in partnership with the Centre for Trade Policy and Law, Carleton University.
280 S. Roberts
kinship and other networks, are less vulner-able to changing trends and tastes (Scheyvens, 2007), are committed to cross-border collaboration through alumni associations, community groups, and other migrant net-works (Schmid, n.d), are culturally in sync, and are often among the skilled and qualified professionals that left their birth countries—it would seem obvious that this should be a key target segment for Destination Marketing Organisations (DMOs). With respect to the Caribbean diaspora’s tourism and develop-mental potential, Springer (2008) notes that:
the [Caribbean] diaspora is intellectually rich and financially strong and has been only partially exploited by Caribbean marketers…..In New York City, the eas-ily harvested “low lying fruit” includes Caribbean-Americans who have not been consistently courted except by a few desti-nation…Caribbean-Americans have high disposable incomes, own their own homes and arguably spend more money “on island” than the mainstream American visitor…..” (www. spiceislander.com)
Data estimates suggest that the net migra-tion rate for the Caribbean is one of the highest in the world (United Nations 2003 cited in Schmid n.d)—upwards of over 5 million people. Among the countries with the highest migration losses are Guyana and Jamaica with 89% and 85%, respectively. The 2006 census data for Canada reveals that 191, 930 migrants from the Caribbean and Bermuda now reside in Canada with 91% residing in Toronto (www.statcan.ca). The significant movement of human capital from the Caribbean is compounded by the fact that ‘it is not surplus or under-employed labour that is the main group of migrants. Instead it is the highly skilled and educated’ (Nurse, 2004). Carrington and Detragiache (1998 cited in Nurse, 2004) estimate that the across the region migrants with tertiary education ranges from 22% to 47%—the lat-ter being the case of Trinidad and Tobago.
For Guyana, the migration rate among the well-educated is approximately 77%. Not surprisingly, remittances from the Caribbean have been quite sizeable. In 2006, remit-tance flows from the Caribbean including Cuba and the Dominican Republic, exclud-ing Guyana, Suriname and Belize—totalled US$8.3 billion (ECLAC, 2008). The high-est remittance receiving countries in the region are Dominican Republic: US$2.4 bil-lion, Jamaica: US$1.5 billion, Haiti: US$1.0 billion and Guyana: US$0.1 billion (Kirton, 2006). Between 2001 and 2005, remittances accounted for 18.8% of Guyana’s GDP and 26% of goods exports (ECLAC, 2008).
The social, cultural and economic ties that the diaspora maintains with the land of their birth either through return visits, donations of goods, information exchange, remittances, etc., alert us to the fact that this segment has the potential to be a primary vehicle for the socio-economic sustainability of their home-land and in this case Guyana. The current global economic crisis which has led to double-digit decline in arrival figures from traditional source markets of the United Kingdom and the United States and in some instances Canada, for many Caribbean coun-tries, should also force DMOs to consider alternative segments, such as the diaspora and markets. While the Caribbean Tourism Organisation has sought to join forces and resources with Travel Span to develop and promote special packages geared towards the diaspora, a lot more needs to be done in terms of deliberate action by individual countries. This study therefore seeks to examine the current socio-economic sustain-ability contribution of travel and tourism as it relates to the Guyanese diaspora resident in Toronto, and the developmental impacts arising as a result of these movements. The paper also explores the mechanisms and pol-icy environment that are required to increase the diaspora tourism contributions and developmental benefits.
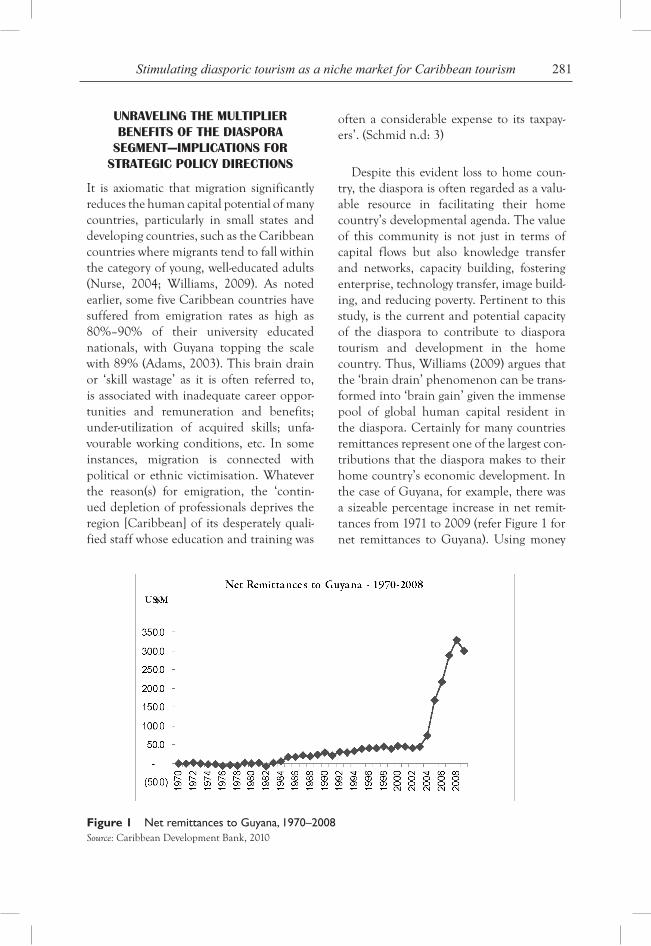
281Stimulating diasporic tourism as a niche market for Caribbean tourism
UNRAVELING THE MULTIPLIER BENEFITS OF THE DIASPORA
SEGMENT—IMPLICATIONS FOR STRATEGIC POLICY DIRECTIONS
It is axiomatic that migration significantly reduces the human capital potential of many countries, particularly in small states and developing countries, such as the Caribbean countries where migrants tend to fall within the category of young, well-educated adults (Nurse, 2004; Williams, 2009). As noted earlier, some five Caribbean countries have suffered from emigration rates as high as 80%–90% of their university educated nationals, with Guyana topping the scale with 89% (Adams, 2003). This brain drain or ‘skill wastage’ as it is often referred to, is associated with inadequate career oppor-tunities and remuneration and benefits; under-utilization of acquired skills; unfa-vourable working conditions, etc. In some instances, migration is connected with political or ethnic victimisation. Whatever the reason(s) for emigration, the ‘contin-ued depletion of professionals deprives the region [Caribbean] of its desperately quali-fied staff whose education and training was
often a considerable expense to its taxpay-ers’. (Schmid n.d: 3)
Despite this evident loss to home coun-try, the diaspora is often regarded as a valu-able resource in facilitating their home country’s developmental agenda. The value of this community is not just in terms of capital flows but also knowledge transfer and networks, capacity building, fostering enterprise, technology transfer, image build-ing, and reducing poverty. Pertinent to this study, is the current and potential capacity of the diaspora to contribute to diaspora tourism and development in the home country. Thus, Williams (2009) argues that the ‘brain drain’ phenomenon can be trans-formed into ‘brain gain’ given the immense pool of global human capital resident in the diaspora. Certainly for many countries remittances represent one of the largest con-tributions that the diaspora makes to their home country’s economic development. In the case of Guyana, for example, there was a sizeable percentage increase in net remit-tances from 1971 to 2009 (refer Figure 1 for net remittances to Guyana). Using money
Figure 1 Net remittances to Guyana, 1970–2008Source: Caribbean Development Bank, 2010
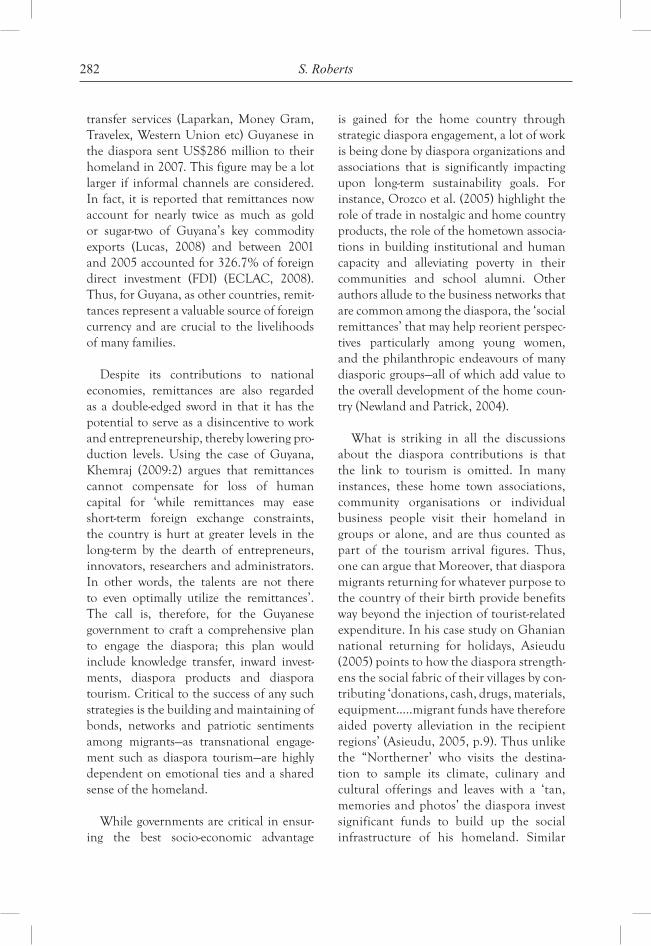
282 S. Roberts
transfer services (Laparkan, Money Gram, Travelex, Western Union etc) Guyanese in the diaspora sent US$286 million to their homeland in 2007. This figure may be a lot larger if informal channels are considered. In fact, it is reported that remittances now account for nearly twice as much as gold or sugar-two of Guyana’s key commodity exports (Lucas, 2008) and between 2001 and 2005 accounted for 326.7% of foreign direct investment (FDI) (ECLAC, 2008). Thus, for Guyana, as other countries, remit-tances represent a valuable source of foreign currency and are crucial to the livelihoods of many families.
Despite its contributions to national economies, remittances are also regarded as a double-edged sword in that it has the potential to serve as a disincentive to work and entrepreneurship, thereby lowering pro-duction levels. Using the case of Guyana, Khemraj (2009:2) argues that remittances cannot compensate for loss of human capital for ‘while remittances may ease short-term foreign exchange constraints, the country is hurt at greater levels in the long-term by the dearth of entrepreneurs, innovators, researchers and administrators. In other words, the talents are not there to even optimally utilize the remittances’. The call is, therefore, for the Guyanese government to craft a comprehensive plan to engage the diaspora; this plan would include knowledge transfer, inward invest-ments, diaspora products and diaspora tourism. Critical to the success of any such strategies is the building and maintaining of bonds, networks and patriotic sentiments among migrants—as transnational engage-ment such as diaspora tourism—are highly dependent on emotional ties and a shared sense of the homeland.
While governments are critical in ensur-ing the best socio-economic advantage
is gained for the home country through strategic diaspora engagement, a lot of work is being done by diaspora organizations and associations that is significantly impacting upon long-term sustainability goals. For instance, Orozco et al. (2005) highlight the role of trade in nostalgic and home country products, the role of the hometown associa-tions in building institutional and human capacity and alleviating poverty in their communities and school alumni. Other authors allude to the business networks that are common among the diaspora, the ‘social remittances’ that may help reorient perspec-tives particularly among young women, and the philanthropic endeavours of many diasporic groups—all of which add value to the overall development of the home coun-try (Newland and Patrick, 2004).
What is striking in all the discussions about the diaspora contributions is that the link to tourism is omitted. In many instances, these home town associations, community organisations or individual business people visit their homeland in groups or alone, and are thus counted as part of the tourism arrival figures. Thus, one can argue that Moreover, that diaspora migrants returning for whatever purpose to the country of their birth provide benefits way beyond the injection of tourist-related expenditure. In his case study on Ghanian national returning for holidays, Asieudu (2005) points to how the diaspora strength-ens the social fabric of their villages by con-tributing ‘donations, cash, drugs, materials, equipment…..migrant funds have therefore aided poverty alleviation in the recipient regions’ (Asieudu, 2005, p.9). Thus unlike the “Northerner’ who visits the destina-tion to sample its climate, culinary and cultural offerings and leaves with a ‘tan, memories and photos’ the diaspora invest significant funds to build up the social infrastructure of his homeland. Similar
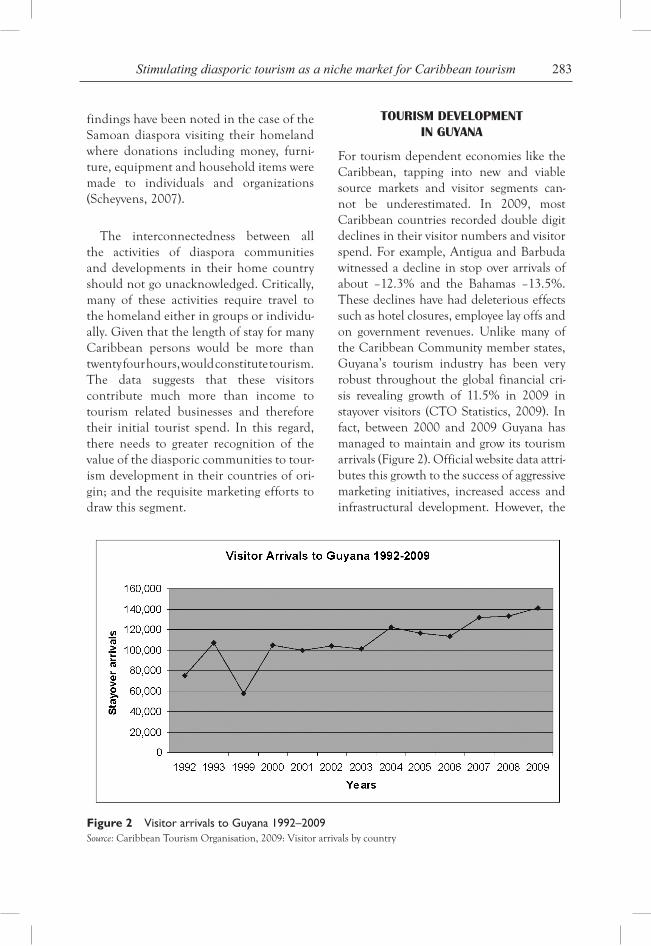
283Stimulating diasporic tourism as a niche market for Caribbean tourism
findings have been noted in the case of the Samoan diaspora visiting their homeland where donations including money, furni-ture, equipment and household items were made to individuals and organizations (Scheyvens, 2007).
The interconnectedness between all the activities of diaspora communities and developments in their home country should not go unacknowledged. Critically, many of these activities require travel to the homeland either in groups or individu-ally. Given that the length of stay for many Caribbean persons would be more than twenty four hours, would constitute tourism. The data suggests that these visitors contribute much more than income to tourism related businesses and therefore their initial tourist spend. In this regard, there needs to greater recognition of the value of the diasporic communities to tour-ism development in their countries of ori-gin; and the requisite marketing efforts to draw this segment.
TOURISM DEVELOPMENT IN GUYANA
For tourism dependent economies like the Caribbean, tapping into new and viable source markets and visitor segments can-not be underestimated. In 2009, most Caribbean countries recorded double digit declines in their visitor numbers and visitor spend. For example, Antigua and Barbuda witnessed a decline in stop over arrivals of about –12.3% and the Bahamas –13.5%. These declines have had deleterious effects such as hotel closures, employee lay offs and on government revenues. Unlike many of the Caribbean Community member states, Guyana’s tourism industry has been very robust throughout the global financial cri-sis revealing growth of 11.5% in 2009 in stayover visitors (CTO Statistics, 2009). In fact, between 2000 and 2009 Guyana has managed to maintain and grow its tourism arrivals (Figure 2). Official website data attri-butes this growth to the success of aggressive marketing initiatives, increased access and infrastructural development. However, the
Figure 2 Visitor arrivals to Guyana 1992–2009Source: Caribbean Tourism Organisation, 2009: Visitor arrivals by country
284 S. Roberts
growth in numbers has not been concomitant to increases in tourism receipts.
While the data sourced to date does not provide a comprehensive year on year pic-ture of the purpose of visit of travelers to Guyana, there is high likelihood that the majority of travel to Guyana includes the Visiting Friends and Relatives (VFR) seg-ment that may be from the diaspora. Data from the Caribbean Tourism Organisation (2010) show that in 2009, of the 88,549 Guyanese that visited Guyana, 66% were holiday makers and 16% made up the VFR segment. Interestingly, visitors who were not born in Guyana accounted for 13% of the visitor arrivals in that same year. One can perhaps infer that this segment comprises friends and second generation Guyanese who were born overseas.
With respect to accommodation prefer-ences, data in 2004 and 2006 reveal that in both years about 85.2% of visitors to Guyana
stay in private accommodation while only 14% stay in hotels, suggesting a big VFR market coming from Guyana’s key markets. Figure 3 shows that the United States is by far Guyana’s largest source market, followed by the Caribbean and then Canada.
The Canadian market represents an area where Guyana can grow its diasporic tour-ism segment. Given that travel and tour-ism contributes 8.3% to Guyana’s Gross Domestic Product (GDP) with international tourism receipts of US$50 million (www.sta-tisticsguyana.gov.gy) a lot more can be done to attract this segment, a high percentage of whom may be diaspora peoples. From a marketing perspective, what requires further investigation is the motivation for returning home and the activities of the Guyanese diaspora once in the homeland. This intel-ligence can assist tourism policy makers and industry practitioners to create or improve the current tourism product of Guyana, so that the diaspora spend are maximised.
Figure 3 Arrivals to Guyana by generating marketsSource: Caribbean Tourism Organisation, 2009
285Stimulating diasporic tourism as a niche market for Caribbean tourism
In terms of institutional arrangements, the Guyana Tourism Authority (GTA) was established by an Act of Parliament in 2002 and has been given the responsibility inter alia to market and promote Guyana as tourism destination (Guyana Tourism Authority Act, 2002). The GTA is headed by the Ministry of Tourism, Industry and Commerce. The National Development Strategy 2001–2010 has recognised the ben-efits of pursuing tourism as a development strategy and has identified the niche prod-ucts that Guyana’s industry should focus on including nature, adventure, heritage, cruise ship eco-tourism, eco-tourism and so. What is striking is that there seems to be a disso-nance between this policy directive and the key reasons why persons visit Guyana. The development strategy has also outlined a num-ber of objectives and strategies that should be implemented to ensure that the objectives are met—one of them being the establishment of the Guyana Tourism Authority. To date, how-ever, there is no cohesive tourism policy that drives tourism development in Guyana. The other major stakeholder involved in tourism is the Tourism and Hotel Association of Guyana (THAG) which is a voluntary organization that works in close collaboration with the Ministry and the GTA to promote Guyana and main-tain standards within the industry (THAG: www.exploreguyana.org).
One can argue that like Trinidad and Tobago which has a buoyant oil and gas sec-tor, Guyana’s involvement in tourism has been minimal given the relative success of its other productive export sectors such as gold, sugar, rice, bauxite, and remittances. In contrast to the other Caribbean coun-tries (except Grenada and Dominica) which record double digits in tourism contribution to Gross Domestic Product (GDP) from 2002 to 2006, Guyana’s tourism sector con-tribution was 2.2% (ECLAC, 2008). In one sense, this minimal dependence is laudable.
However, it is argued that the figures can be improved if Guyana takes a more strategic and active approach in developing its key market segments, and in particular, its ‘hid-den gold’ the diaspora market.
PRELIMINARY FINDINGS
Against the foregoing discussion, this study offers the following observations regarding the current socio-economic sustainability contribution of travel and tourism as it relates to the Guyanese diaspora resident in Toronto, and the developmental impacts arising as a result of these movements.
1. Segmenting the Diaspora Tourist to Guyana
Qualitative data suggests that the diaspora visitor to Guyana still belongs to the first generation segment, although there is grow-ing interest among the second generation—particularly those born in Canada. Second generation migrants, born in Guyana, but who were taken to Canada as children, present a more complex picture. One per-spective suggests that because most of their immediate family is resident in Canada, they feel no compunction to return to Guyana but would rather choose to visit other des-tinations. Another view is that their fond childhood memories serve as motivator for several return visits. The primary motiva-tor identified by interviewees is the desire by the diaspora to reconnect with family. Diaspora tourism was also recognised as ‘the backbone of the product…while we say that we are an eco-destination the diaspora has demonstrated that they are Guyana’s greatest asset’. With respect to booking preferences, the majority still book their travel through the traditional travel agent; although it is suspected that the younger generation would take advantage of on-line booking engines.
286 S. Roberts
2. Facilitating Environment for Courting the Diaspora
While the GTA admits that its greatest share of arrivals over the years has come from the diaspora–with Canada being its third largest market-there has been no delib-erate marketing strategy geared towards the diaspora segment. Arguably, one of the reasons for this is the relatively small budget that the GTA operates with. In fact, unlike many of its Caribbean counterparts, GTA has no overseas marketing offices that liaise with tour operators, travel agencies and other vendors. Much of this type of work, on a more minimal basis, is done through the Guyana Consulate in Toronto, who has no personnel that is skilled or dedicated to marketing efforts. What has tended to hap-pen in terms of reaching the diaspora mar-ket is that the GTA has had to work closely with its overseas offices using specific events such as Caribana and Last Lap Lime. The urgent need for a more substantial market-ing budget was made by one respondent:
we need to spend about US$100,00–200,000. on marketing. Why couldn’t we get the US$1 million that went to Haiti to market Guyana? We need the funds to place Guyana on the map. Companies like us can the piggy back on destination awareness. Put GY$1 million into market-ing. The government seems to be expect-ing someone else to do it (Captain Gerald Gouveia, 2010).
The internet is also being used by the GTA as an intermediary for information sharing with the diaspora. In 2010, this use of the electronic media is very rudimentary as destination sites are moving towards more integrated marketing systems where products can be bought by the ‘e-booker’. Perhaps, in acknowledgement that tourism is growing in importance in Guyana, the president in 2009 summoned all heads of missions to Guyana to a retreat with the specific aim of promoting
Guyana overseas. While this effort is laud-able, the generally steady increase in tourism arrivals and expenditure should signal to the government that more needs to be done in terms of the reaching its overseas diaspora for tourism and other purposes.
Unlike the other tourism-dependent Caribbean island states that make a point of having a separate line item in their bud-gets for tourism receipts, in Guyana tour-ism receipts is subsumed under services. As such, agencies such as the GTA and the THAG are hard pressed to make a strong case to the central government for an increase in their operational and marketing budgets. Moreover, the evidence suggests that the GTA operates without a written marketing plan. In a global tourism space where destinations are becoming increas-ingly sophisticated in data collection, data mining and strategic marketing- all geared to increase their market share—the GTA is undermining its success by failing to craft a marketing plan. This is also critical failing as according to the vice-president of THAG ‘the diaspora has continued to show an interest in Guyana….especially the second generation, who wants to know where they came from, and more about the food, cul-ture and people of their parents’.
Access to Guyana is also a major hin-drance in increasing this key market seg-ment for Guyana. Visitors to Guyana from all of their major markets must transit via Port-of-Spain, Trinidad. This situation wors-ened after 2001 when Guyana Airways was declared insolvent in 2001 and its successor Guyana Air in 2003. While Guyanese trav-elers have been the recipients and subjects of unkind remarks and high airfares, it does not seem that the transport links between Guyana and its source markets would change anytime soon. One reason for this is the heavy fines that are imposed on air-line by the receiving country once drugs and
287Stimulating diasporic tourism as a niche market for Caribbean tourism
other related substances are found on board a national carrier.
3. Accommodation Patterns and Activities of the Diaspora
The GTA indicates that about 20% of the diaspora market stays in hotel accommo-dation. This is particularly so when they have been away for a long time and when they are accompanied by their families. It is also suggested that these persons tend to stay in accommodation within or close to Georgetown. The THAG respondent notes that with the exception of Roirama Tours, who have a presence in the Toronto mar-ket, the accommodation providers have not been packaging for the diaspora market. It seems that the potential for increasing diaspora business is definitely present but that the hoteliers may lack the know-how to tap into this very lucrative segment. The majority of Guyanese though, choose to stay with families so that they can utilize their funds to rent cars and minivans and spend in the local markets and offer financial sup-port while they are in Guyana. According to one respondent ‘we need to get the message to them [the diaspora] that the hotels are offering value for money’.
Militating against increased use of paid accommodation by the diaspora is the issue of standards. For Guyana which has many eco-lodges, small hotels in rural areas, bread and breakfasts operating across the rural and urban regions, the question of stan-dards is most critical in managing risk and safety and ensuring a positive visitor experi-ence. Many of the smaller providers operate with no or low standards; for example, no proper entrance or exit, fire alarms, etc.—all of which are unacceptable to a very exposed diaspora. The Government of Guyana recently enacted legislation governing stan-dards for all accommodation, resorts in the interior and tour guides and tour operators.
The THAG has been asked by the GTA to act as the monitoring agency for the success-ful implementation of the standards. To date, very little has been done in terms of implementation as there is a cost factor for accommodation providers.
The activities that the diaspora engages in while in the home country centre around heritage tours and family outings. Visiting migrants, especially those with families, will visit the museums around Georgetown and go on short trail tours, river tours around Georgetown and soft adventure tours that are no more than an hour and a half. The hard adventure tours that go into the inte-rior of Guyana do not seem to be attractive to Guyanese returning home on holidays either because of the expense and/or the distance and experience. Two migrant Guyanese also suggested that while they would like to visit Kaieteur Falls the infra-structure—transport and general access is unreliable and the price prohibitive, espe-cially for a family of four.
4. Foreign Direct Investment
The Guyana government works through Go Invest (Guyanese Invest)—an export promo-tion company—to facilitate FDI. The major functions of Go Invest are to assist with information and intelligence on the behalf of potential investors, to liaise with agencies for the investor, to provide fiscal waivers, to service micro enterprises and to match buy-ers and sellers. The agency recognizes the economic advantage and market potential of Guyanese huge diaspora and has strategi-cally gone about using the Consulates and Missions across North America to increase awareness in the diaspora of local products and services. Chief Executive Officer of Go Invest states that ‘the strategy was to go to these expos as a group and build presence among Guyanese in the diaspora as well as build a bigger market presence in the main
288 S. Roberts
markets. We also addressed Guyanese wishing to do business back home’. So that, in 2007, FDI generated by Guyanese-Canadians amounted to US$25,125 (Go Invest, 2008). This was across a number of sectors but with leading investments in the mining and agricultural sectors. The direct employment created as a result of these jobs was about 268 placements (Go Invest, 2008).
the Guyanese diaspora has been investing in Guyana over the last three years; this is because the political situation has settled. In 2002, the overseas Guyanese projects that we worked with were fifteen. In 2009, we have 83 projects. Note that not all companies go through Go Invest so that the numbers of diaspora investments may be even larger. (CEO, Go Invest)
One of the challenges identified in maximizing foreign investment through diaspora channels is the race tension that exists between Afro and Indo Guyanese and that is transposed on their migrant environments. Emerging out of a National Competitiveness Strategy a Diaspora Unit was set up in Guyana to facilitate increased business opportunities for the diaspora in the Guyana. However, this Unit disinte-grated and one of the reasons given was that the initiative was somehow ‘owned’ by the Indian-Guyanese diaspora to the exclusion of the blacks. The Chairman of the Private Sector Commission (PVC) pointed out that ‘the diaspora in Canada is divided along the lines of race and class, so that when I go to Toronto and all present at the business meet-ing are Indiana, it does not make sense….’
5. Diaspora Engagement through Alumni Associations
Where the diaspora contribution to socio-economic sustainability appears to be strongest are in the areas of home town and alumni associations. Contributions
from alumni include book and furniture donations, building or refurbishing science laboratories, establishing computer labs in schools and providing on-going internet access. Most of these alumni association have chapters in the major cities, includ-ing Toronto. Elaborating on the contribu-tion of the Toronto Chapter, the secretary of the Bishop’s High School Old Students Association states ‘the Toronto chapter….they have given the computer lab and com-puters. They also pay for security service at the lab on a monthly basis. They pay the ADSL fees to allow students to have inter-net access at the school’.
Alumni associations appear to be the back-bone of many schools in Guyana, and their support is crucial to the development and con-tinuation of many of the schools programme. Among many migrants there is a strong desire to give back and the alumni is perhaps one of the key mechanisms to contribute in a trans-parent and accountable manner. The data also reveals that the alumni associations often serve as fertile ground for the development of other social and business networks that can stimulate significant investment in the coun-try of origin. Pertinently, also is that many of these home town associations host reunions whether bi-annual or tri-annual in their home country and these events are associated with sizeable multiplier effects (Braunlich and Nadkarni, 1995).
CONCLUSION
The thrust towards tourism premised upon sustainability principles carries with it ben-efits for the destination such as increased local employment, ownership of the tour-ism superstructure, entrepreneurial oppor-tunities, the empowerment of women and marginalized groups, valorization of indig-enous culture, preservation of local norms and values, etc. Diaspora tourism with its
289Stimulating diasporic tourism as a niche market for Caribbean tourism
emotional, cultural, economic and social links to the homeland has the potential to deliver many of these benefits. The data has shown that Guyana is well-placed to maximize this niche in the Canadian mar-ket place given the continuous growth in arrivals that has been shown. Additionally, a lot of work is being undertaken by vari-ous groups within the Guyanese diaspora in Toronto that have implications for sus-tained socio-economic development. The government of Guyana needs to recog-nize the interconnections in these various transnational activities and be deliberate in crafting a diaspora strategy that aims at cohesion but also at exploiting the com-parative advantages that these circulatory activities contain.
BIBLIOGRAPHY
Adams, R. and Page, J. (2003) ‘International Migration, Remittances and Poverty in Developing Countries’, World Bank Policy Research Working Paper 3179, December 2003, Online: www.worldbank.org.
Asieudu, A. (2005) ‘Some benefits of migrants’ return visits to Ghana’, Population, Space and Place, Vol. 11, pp.1–11.
Braunlich, C. and Nadkarni, N. (1995) ‘The importance of the VFR market to the hotel industry’, The Journal of Tourism Studies, Vol. 6, No. 1, pp.38–47.
Brohman, J. (1996) ‘New directions in tourism for the third world’, Annals of Tourism Research, Vol. 23, No. 1, pp.48–70.
Bureau of Statistics A Government of Guyana Agency (2009) Online: www.statisticsguyana.gov.gy, accessed 4/11/09.
Caribbean Tourism Organisation. Tourism Statistics for the Caribbean (2009) Online: www.onecaribbean.org, accessed 4/11/09.
Caribbean Tourism Organisation (2010) Tourism Arrivals by Purpose of Visit for Guyana, accessed by personal communication.
Citizenship and Immigration Canada (2008) Facts and Figures: Immigration Overview,
Permanent and Temporary Residents, Online: www.cic.gc.ca, accessed 7/02/10.
Cronin, L. (1990) ‘A strategy for tourism and sustainable development’, World Leisure and Recreation Research, Vol. 32, No. 3, pp.12–18.
Dahles, H. (1999) ‘Tourism and small entrepreneurs in developing countries: a theoretical perspective’, in Dahles, H. and Bras, K. (Eds.): Tourism and Small Entrepreneurs, Development, National Policy and Entrepreneurial Culture: Indonesian Cases, Cognizant Communications, USA, pp.1–19.
Duval, D.T. (2003) ‘When hosts become guests: return visits and diasporic identities in a Commonwealth Eastern Caribbean community’, Current Issues in Tourism, Vol. 6, No. 4, pp.267–308.
Economic Commission for Latin America and the Caribbean (2003) A Review of Caribbean Tourism in the 1990s and at the Beginning of the New Century, ECLAC, Port-of-Spain.
Economic Commission for Latin America and the Caribbean (2008) The United States Subprime Mortgage Crisis and Its Implications for the Caribbean. Port-of-Spain: ECLAC.
Go Invest (2008) Sectoral Analysis of Foreign Direct Investment 2008, Go Invest, Guyana.
Guyana Tourism Authority Act (2002) Government of the Republic of Guyana.
Hall, C.M. and Duval, D.T. (2004) ‘Linking diasporas and tourism: transnational mobilities of Pacific Islanders resident in New Zealand’, in Coles, T. and Timothy, D.J. (Eds.): Tourism, Diasporas and Space, Routledge, London, pp.78–94.
Hunter, C. (1995) ‘On the need to re-conceptualise sustainable tourism development’, Journal of Sustainable Tourism, Vol. 3, No. 3, pp.155–165.
Jackson, R. (1990) ‘VFR tourism: is it underestimated?’, The Journal of Tourism Studies, Vol. 1, No. 2, pp.10–17.
Jessop, D. (2010) ‘The Caribbean needs a co-ordinated regional strategy for its worldwide diaspora’, Starbroek News, 28 March 2010, Online: www.starbroeknews.com, accessed 6/04/10.
290 S. Roberts
Khemraj, T. (2009) ‘Are remittances pivotal to Guyana’s development’, Starbroek News, 8 July 2009, Online: www.starbroeknews.com, accessed 21/03/10.
King, B. (1994) ‘What is ethnic tourism? An Australian perspective’, Tourism Management, Vol. 15, No. 3, pp.173–176.
Kirton, C. (2006) Unlocking the Potential of Remittances in Guyana: Remittances Mobilization Through Microfinance Institutions, The University of the West Indies, Jamaica.
Lucas, R. (2008) ‘Guyana’s most valuable export-its people’, Starbroek News, 25 July 2008, Online: www.starbreknews.com, accessed 22/04/10.
Newland, K. and Patrick, E. (2004) Beyond Remittances: The Role of the Diaspora in Poverty Reduction in their Countries of Origin, Migration Policy Institute, Washington.
Nurse, K. (2004) Diaspora, Migration and Development in the Caribbean, FOCAL—Caribbean Foundation for the America, Policy Paper 04-6.
Orozco, M., Lowell, L., Bump, M. and Fedewa, R. (2005) Transnational Engagement, Remittances and their relationship to Development in Latin America and the Caribbean, Institute for the Study of International Migration, Georgetown University.
Ritchie, J. and Spencer, L. (1994) ‘Qualitative data analysis for applied policy research’, in Bryan, A. and Burgess, R. (Eds.): Analyzing Qualitative Data, Routledge, London, pp.173–193.
Rodenburg, E. (1980) ‘The effects of scale on economic development: tourism in Bali, Annals of Tourism Research, Vol. 7, pp.177–196.
Russell, D., Martin, A. and Ferrance, W. (1996) ‘Striving for sustainability and financial self-sufficiency: Nelson’s Dockyard National Park, Antigua’, in Harrison, L. and
Husbands, W. (Eds.): Practising Responsible Tourism—International Case Studies in Tourism Planning, Policy and Development, Wiley and Sons, Canada, pp.216–238.
Scheyvens, R. (2002) Tourism for Development: Empowering Communities, Prentice Hall, Harlow, England.
Scheyvens, R. (2007) ‘Poor cousins no more: valuing the development potential of domestic and diaspora tourism’, Progress in Development Studies, Vol. 7, No. 4, pp.307–325.
Schmid. K. (n.d) Migration in the Caribbean: Brain-Drain, Remittances-Diaspora, ECLAC, Port of Spain.
Seaton, A.V. and Tagg. S. (1995) ‘Disaggregating friends and relatives in VFR tourism research: the Northern Ireland evidence 1991-1993’, The Journal of Tourism Studies, Vol. 6, No. 1, pp.6–18.
Skeldon, R. (2004) More than Remittances: Other Aspects of the Relationship Between Migration and Development, Online: www.un.org/populationdivision/, accessed 29/03/10.
Springer, B. (2008) Courting the Diaspora, Online: www.spiceislander.com, accessed on 6/04/08.
Statistics Canada (2007) Immigrant Population by Birth, by Census Metropolitan Area, Online: www.statcan.ca, accessed 26/04/10.
Tourism and Hotel Association of Guyana (2010) Online: www.exploreguyana.org, accessed 12/02/10.
Yuan, T., Fridgen, J. and O’Leary, J. (1995) ‘Visiting friends and relatives travel market: the Dutch case’, The Journal of Tourism Studies, Vol. 6, No. 1, pp.19–26.
Williams, F. (2009) Harnessing Human Capital: The African Diaspora, Online: www. africagoodnews.com/diaspora, accessed 22/04/10.
Copyright © 2010 WASD
World Sustainable Development Outlook 2010
291
Disaggregating Demographic factors of labour change in
triniDaD anD tobago
Sonkarley T. Beaie*Bureau of Statistics, Guyana
Abstract: Age pattern of labour force participation for women is generally observed to be irregular in many countries; showing withdrawal and re-entry into labour force several times during the course of their active lives. In contrast to Trinidad and Tobago, the age pattern does not seem to present this undulated feature; and besides, the number of working women has tremendously increased, but there is no recent study to indicate the component parts of these changes in comparison to men. This paper attempts to investigate these changes by constructing a series of male and fe-male labour force life tables, which are useful in studying labour force entry on ac-count of population growth and the desire to participate as factors of labour force supply, and deaths and retirements on the other hand, as depletion factors. The find-ings may provide ways for policy-makers to determine appropriate estimates of work life expectancy for workers who suffer a loss of earnings due to injury or death.
Keywords: Labour force, Working life expectancy, Total life expectancy, Labour force replenishment, Labour force replacement rate, Labour force replacement ratio, Age pattern of work, Active years and Inactive years.
introDuction
An overview of age pattern of work in Trinidad and Tobago
The age pattern of women’s participation rates in Trinidad and Tobago is dome shape, rising gradually from low to a maximum point, and thereafter falling consistently to a bare minimum within the retirement age groups, generally depicting the overall age pattern of labour force participation for men. Beaie (2009) noted that the dif-ferences between the two are presumably due to low participation rates of women as compared to men. The pattern is contrary for women in many countries, where Cotter
et al. (2004) described women’s age pattern of participation as double maxima pattern; noting that the likelihood that an average woman will be in the labour force varies sub-stantially over her life; and that many of them exit the labour force when they become moth-ers; as such, labour force participation rates have traditionally been lower for women in the late 1920s through early 1940s than they were for younger women or older women.
Similarly, United Nations (1968) emphasised that one major problem which generally limits the interpretation of female economically active life tables is the pattern
*Corresponding author: Bureau of Statistics, Guyana; e-mail: [email protected]
292 S.T. Beaie
of their participation rates. In many coun-tries, women withdraw and re-enter labour force several times during the course of their active lives; thus, making it impos-sible to apply the assumption, “all persons who enter the labour force at any time in their lives do so prior to the age at which the activity rate reaches its maximum, and no survivors retire into inactive status prior to that age”. They are not alone to com-ment on the way women work. For example, Amara and Braima (2006) said caution needs to be exercised in making direct comparison in working life expectancies between males and females because of the peculiar nature of female employment. Females are more likely to have their working life interrupted for vari-ous reasons such as marriage, pregnancy, etc. than males, and Mallela and Wilcox-Gok (2003) using what they called ‘fuller models’, concluded that marital status and the number of dependent children have significant influ-ence on women’s probability of employment.
Noting the findings of the earlier research-ers, the 2000 census results for Trinidad and Tobago showed tremendous changes in the size of female labour force exemplified by the age pattern described; but, there is no recent study to show the demographic components of these changes in comparison to the men.
Objectives of the study
This study attempts to analyse the quantita-tive aspects of the male and female labour force in 2000, by constructing a series of labour force life tables, which are useful in studying the process of growth and struc-tural changes of the labour force. The spe-cific objectives include to:
• compute the length of active life
• calculate the loss of active years by mortality
• estimate basic indices of labour force growth, such as labour force entry and replacement rates, and rates due to losses by deaths and retirements and other related measures and
• conclude and make recommendations.
methoDologY
By definition, the Working Life Expectancy (WLE) refers to the average number of years that a person is likely to spend in the labour force during his/her lifetime. It begins with a hypothetical cohort of 10,000 newborns, who are subject to age-specific mortality risks and rates of labour force accession.
Data requirements
The following data are required in the computation of an abridged working life table:
• population in five year age groups
• deaths in five year age groups or mor-tality life tables for males and females and
• age specific labour force participation rates.
Assumptions
The construction of the abridged work-ing life tables follows an earlier techniques developed by the United Nations (1968) and Kpedekpo (1969), which were based on the following assumptions:
• that all persons who enter the labour force at any time in their lives do so prior to the age at which the activ-ity rate reaches its maximum, and no
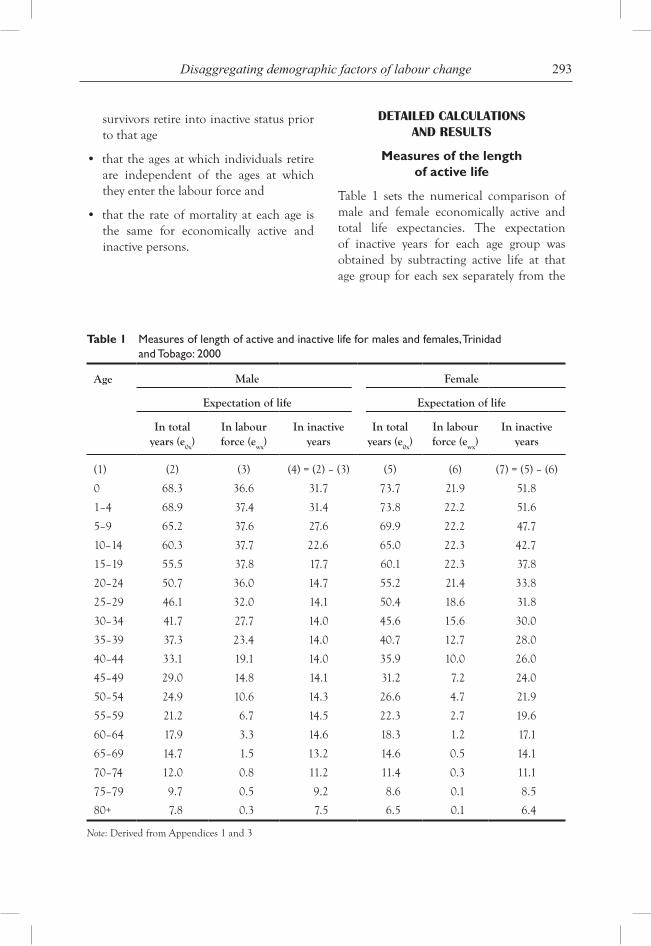
293Disaggregating demographic factors of labour change
survivors retire into inactive status prior to that age
• that the ages at which individuals retire are independent of the ages at which they enter the labour force and
• that the rate of mortality at each age is the same for economically active and inactive persons.
DetaileD calculations anD results
Measures of the length of active life
Table 1 sets the numerical comparison of male and female economically active and total life expectancies. The expectation of inactive years for each age group was obtained by subtracting active life at that age group for each sex separately from the
Table 1 Measures of length of active and inactive life for males and females, Trinidad and Tobago: 2000
Age Male Female
Expectation of life Expectation of life
In total years (e0x)
In labour force (ewx)
In inactive years
In total years (e0x)
In labour force (ewx)
In inactive years
(1) (2) (3) (4) = (2) – (3) (5) (6) (7) = (5) – (6)
0 68.3 36.6 31.7 73.7 21.9 51.8
1–4 68.9 37.4 31.4 73.8 22.2 51.6
5–9 65.2 37.6 27.6 69.9 22.2 47.7
10–14 60.3 37.7 22.6 65.0 22.3 42.7
15–19 55.5 37.8 17.7 60.1 22.3 37.8
20–24 50.7 36.0 14.7 55.2 21.4 33.8
25–29 46.1 32.0 14.1 50.4 18.6 31.8
30–34 41.7 27.7 14.0 45.6 15.6 30.0
35–39 37.3 23.4 14.0 40.7 12.7 28.0
40–44 33.1 19.1 14.0 35.9 10.0 26.0
45–49 29.0 14.8 14.1 31.2 7.2 24.0
50–54 24.9 10.6 14.3 26.6 4.7 21.9
55–59 21.2 6.7 14.5 22.3 2.7 19.6
60–64 17.9 3.3 14.6 18.3 1.2 17.1
65–69 14.7 1.5 13.2 14.6 0.5 14.1
70–74 12.0 0.8 11.2 11.4 0.3 11.1
75–79 9.7 0.5 9.2 8.6 0.1 8.5
80+ 7.8 0.3 7.5 6.5 0.1 6.4
Note: Derived from Appendices 1 and 3
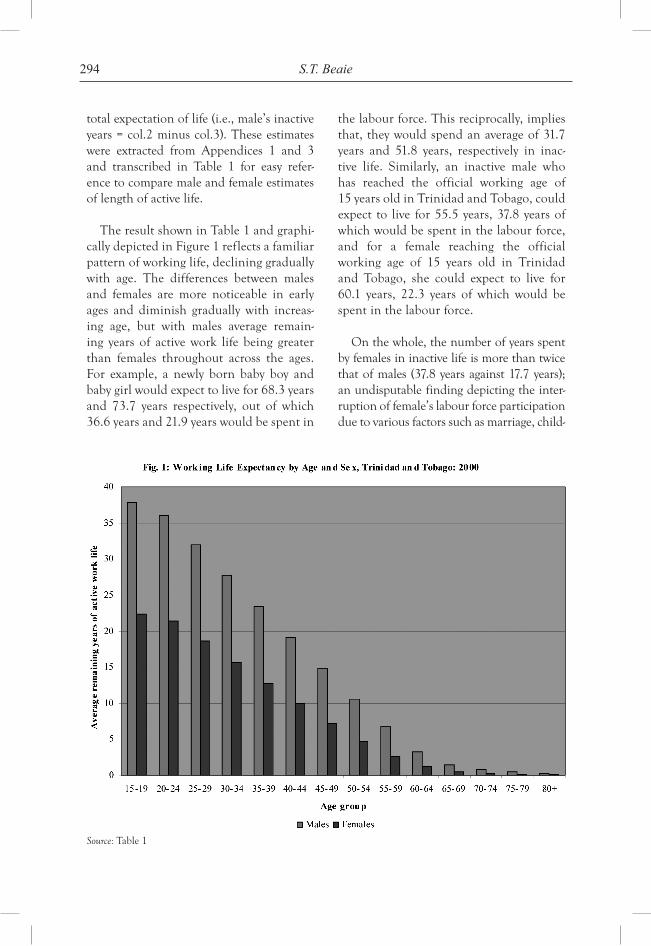
294 S.T. Beaie
total expectation of life (i.e., male’s inactive years = col.2 minus col.3). These estimates were extracted from Appendices 1 and 3 and transcribed in Table 1 for easy refer-ence to compare male and female estimates of length of active life.
The result shown in Table 1 and graphi-cally depicted in Figure 1 reflects a familiar pattern of working life, declining gradually with age. The differences between males and females are more noticeable in early ages and diminish gradually with increas-ing age, but with males average remain-ing years of active work life being greater than females throughout across the ages. For example, a newly born baby boy and baby girl would expect to live for 68.3 years and 73.7 years respectively, out of which 36.6 years and 21.9 years would be spent in
the labour force. This reciprocally, implies that, they would spend an average of 31.7 years and 51.8 years, respectively in inac-tive life. Similarly, an inactive male who has reached the official working age of 15 years old in Trinidad and Tobago, could expect to live for 55.5 years, 37.8 years of which would be spent in the labour force, and for a female reaching the official working age of 15 years old in Trinidad and Tobago, she could expect to live for 60.1 years, 22.3 years of which would be spent in the labour force.
On the whole, the number of years spent by females in inactive life is more than twice that of males (37.8 years against 17.7 years); an undisputable finding depicting the inter-ruption of female’s labour force participation due to various factors such as marriage, child-
Source: Table 1
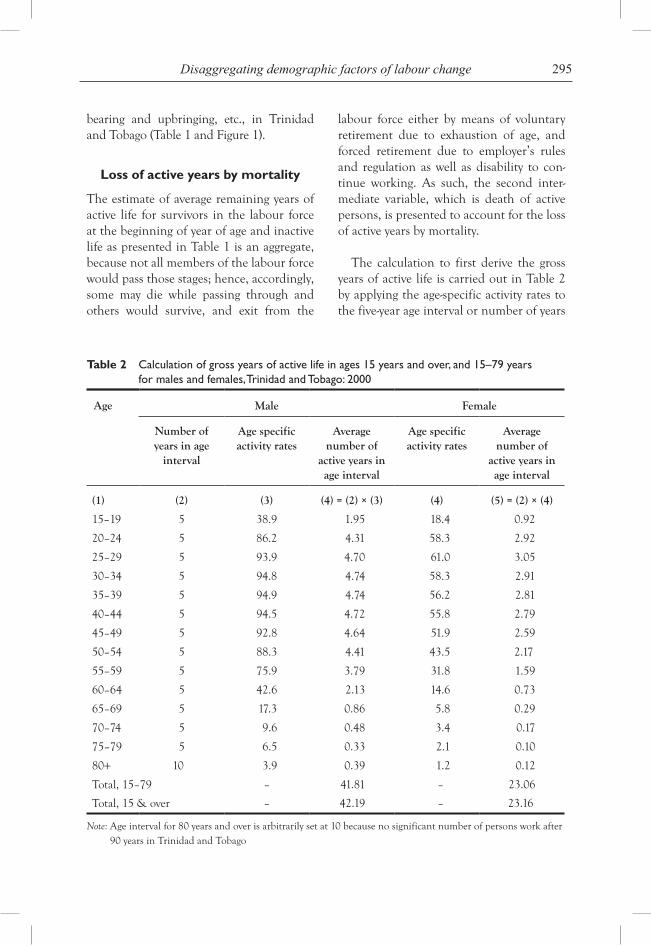
295Disaggregating demographic factors of labour change
bearing and upbringing, etc., in Trinidad and Tobago (Table 1 and Figure 1).
Loss of active years by mortality
The estimate of average remaining years of active life for survivors in the labour force at the beginning of year of age and inactive life as presented in Table 1 is an aggregate, because not all members of the labour force would pass those stages; hence, accordingly, some may die while passing through and others would survive, and exit from the
labour force either by means of voluntary retirement due to exhaustion of age, and forced retirement due to employer’s rules and regulation as well as disability to con-tinue working. As such, the second inter-mediate variable, which is death of active persons, is presented to account for the loss of active years by mortality.
The calculation to first derive the gross years of active life is carried out in Table 2 by applying the age-specific activity rates to the five-year age interval or number of years
Table 2 Calculation of gross years of active life in ages 15 years and over, and 15–79 years for males and females, Trinidad and Tobago: 2000
Age Male Female
Number of years in age
interval
Age specific activity rates
Average number of
active years in age interval
Age specific activity rates
Average number of
active years in age interval
(1) (2) (3) (4) = (2) × (3) (4) (5) = (2) × (4)
15–19 5 38.9 1.95 18.4 0.92
20–24 5 86.2 4.31 58.3 2.92
25–29 5 93.9 4.70 61.0 3.05
30–34 5 94.8 4.74 58.3 2.91
35–39 5 94.9 4.74 56.2 2.81
40–44 5 94.5 4.72 55.8 2.79
45–49 5 92.8 4.64 51.9 2.59
50–54 5 88.3 4.41 43.5 2.17
55–59 5 75.9 3.79 31.8 1.59
60–64 5 42.6 2.13 14.6 0.73
65–69 5 17.3 0.86 5.8 0.29
70–74 5 9.6 0.48 3.4 0.17
75–79 5 6.5 0.33 2.1 0.10
80+ 10 3.9 0.39 1.2 0.12
Total, 15–79 – 41.81 – 23.06
Total, 15 & over – 42.19 – 23.16
Note: Age interval for 80 years and over is arbitrarily set at 10 because no significant number of persons work after 90 years in Trinidad and Tobago
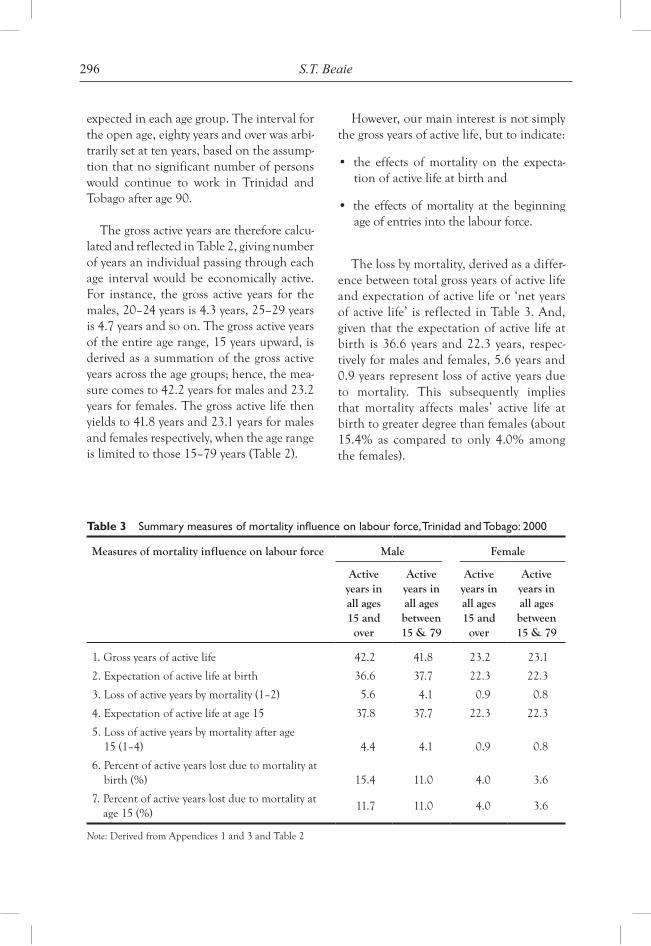
296 S.T. Beaie
expected in each age group. The interval for the open age, eighty years and over was arbi-trarily set at ten years, based on the assump-tion that no significant number of persons would continue to work in Trinidad and Tobago after age 90.
The gross active years are therefore calcu-lated and reflected in Table 2, giving number of years an individual passing through each age interval would be economically active. For instance, the gross active years for the males, 20–24 years is 4.3 years, 25–29 years is 4.7 years and so on. The gross active years of the entire age range, 15 years upward, is derived as a summation of the gross active years across the age groups; hence, the mea-sure comes to 42.2 years for males and 23.2 years for females. The gross active life then yields to 41.8 years and 23.1 years for males and females respectively, when the age range is limited to those 15–79 years (Table 2).
However, our main interest is not simply the gross years of active life, but to indicate:
• the effects of mortality on the expecta-tion of active life at birth and
• the effects of mortality at the beginning age of entries into the labour force.
The loss by mortality, derived as a differ-ence between total gross years of active life and expectation of active life or ‘net years of active life’ is reflected in Table 3. And, given that the expectation of active life at birth is 36.6 years and 22.3 years, respec-tively for males and females, 5.6 years and 0.9 years represent loss of active years due to mortality. This subsequently implies that mortality affects males’ active life at birth to greater degree than females (about 15.4% as compared to only 4.0% among the females).
Table 3 Summary measures of mortality influence on labour force, Trinidad and Tobago: 2000
Measures of mortality influence on labour force Male Female
Active years in all ages 15 and
over
Active years in all ages between 15 & 79
Active years in all ages 15 and
over
Active years in all ages between 15 & 79
1. Gross years of active life 42.2 41.8 23.2 23.1
2. Expectation of active life at birth 36.6 37.7 22.3 22.3
3. Loss of active years by mortality (1–2) 5.6 4.1 0.9 0.8
4. Expectation of active life at age 15 37.8 37.7 22.3 22.3
5. Loss of active years by mortality after age 15 (1–4) 4.4 4.1 0.9 0.8
6. Percent of active years lost due to mortality at birth (%) 15.4 11.0 4.0 3.6
7. Percent of active years lost due to mortality at age 15 (%)
11.7 11.0 4.0 3.6
Note: Derived from Appendices 1 and 3 and Table 2
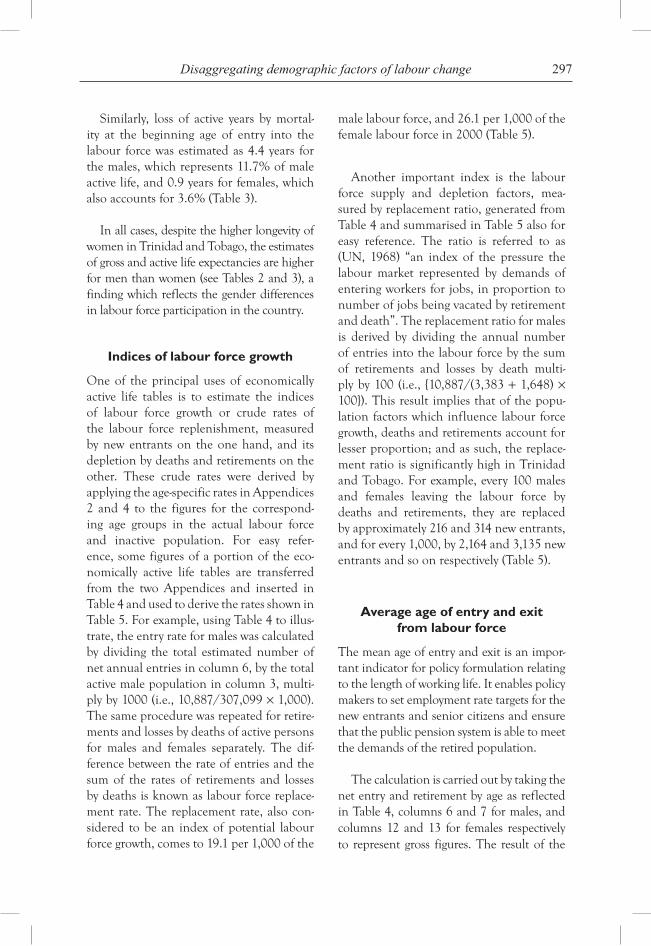
297Disaggregating demographic factors of labour change
Similarly, loss of active years by mortal-ity at the beginning age of entry into the labour force was estimated as 4.4 years for the males, which represents 11.7% of male active life, and 0.9 years for females, which also accounts for 3.6% (Table 3).
In all cases, despite the higher longevity of women in Trinidad and Tobago, the estimates of gross and active life expectancies are higher for men than women (see Tables 2 and 3), a finding which reflects the gender differences in labour force participation in the country.
Indices of labour force growth
One of the principal uses of economically active life tables is to estimate the indices of labour force growth or crude rates of the labour force replenishment, measured by new entrants on the one hand, and its depletion by deaths and retirements on the other. These crude rates were derived by applying the age-specific rates in Appendices 2 and 4 to the figures for the correspond-ing age groups in the actual labour force and inactive population. For easy refer-ence, some figures of a portion of the eco-nomically active life tables are transferred from the two Appendices and inserted in Table 4 and used to derive the rates shown in Table 5. For example, using Table 4 to illus-trate, the entry rate for males was calculated by dividing the total estimated number of net annual entries in column 6, by the total active male population in column 3, multi-ply by 1000 (i.e., 10,887/307,099 × 1,000). The same procedure was repeated for retire-ments and losses by deaths of active persons for males and females separately. The dif-ference between the rate of entries and the sum of the rates of retirements and losses by deaths is known as labour force replace-ment rate. The replacement rate, also con-sidered to be an index of potential labour force growth, comes to 19.1 per 1,000 of the
male labour force, and 26.1 per 1,000 of the female labour force in 2000 (Table 5).
Another important index is the labour force supply and depletion factors, mea-sured by replacement ratio, generated from Table 4 and summarised in Table 5 also for easy reference. The ratio is referred to as (UN, 1968) “an index of the pressure the labour market represented by demands of entering workers for jobs, in proportion to number of jobs being vacated by retirement and death”. The replacement ratio for males is derived by dividing the annual number of entries into the labour force by the sum of retirements and losses by death multi-ply by 100 (i.e., {10,887/(3,383 + 1,648) × 100}). This result implies that of the popu-lation factors which influence labour force growth, deaths and retirements account for lesser proportion; and as such, the replace-ment ratio is significantly high in Trinidad and Tobago. For example, every 100 males and females leaving the labour force by deaths and retirements, they are replaced by approximately 216 and 314 new entrants, and for every 1,000, by 2,164 and 3,135 new entrants and so on respectively (Table 5).
Average age of entry and exit from labour force
The mean age of entry and exit is an impor-tant indicator for policy formulation relating to the length of working life. It enables policy makers to set employment rate targets for the new entrants and senior citizens and ensure that the public pension system is able to meet the demands of the retired population.
The calculation is carried out by taking the net entry and retirement by age as reflected in Table 4, columns 6 and 7 for males, and columns 12 and 13 for females respectively to represent gross figures. The result of the
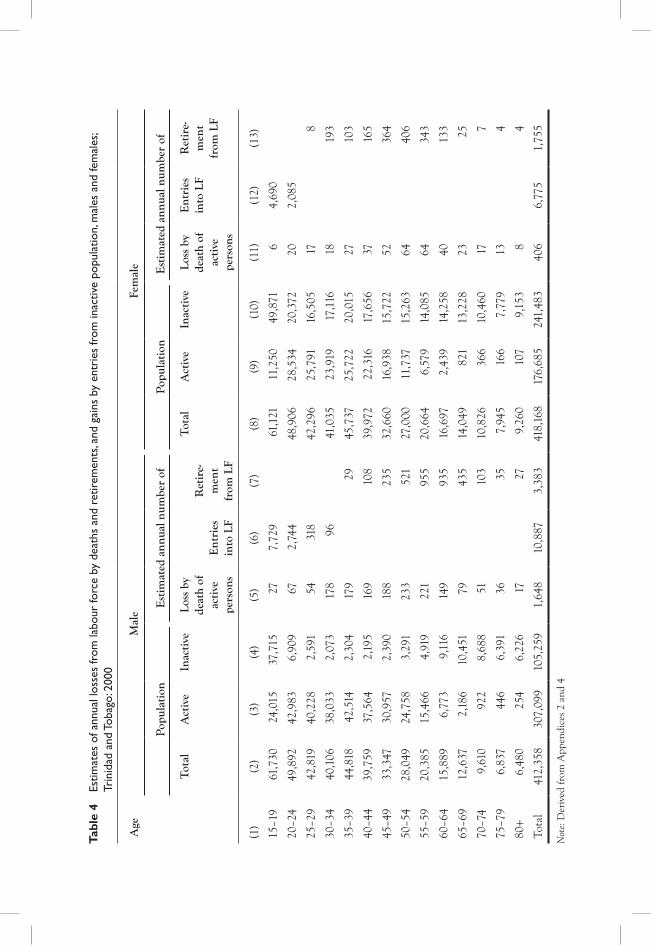
Tabl
e 4
Estim
ates
of a
nnua
l los
ses
from
labo
ur fo
rce
by d
eath
s an
d re
tirem
ents
, and
gai
ns b
y en
trie
s fr
om in
activ
e po
pula
tion,
mal
es a
nd fe
mal
es;
Trin
idad
and
Tob
ago:
200
0
Age
M
ale
Fem
ale
Popu
lati
onE
stim
ated
ann
ual n
umbe
r of
Popu
lati
onE
stim
ated
ann
ual n
umbe
r of
Tota
lA
ctiv
eIn
acti
veLo
ss b
y de
ath
of
acti
ve
pers
ons
Ent
ries
in
to L
F
Ret
ire-
men
t fr
om L
F
Tota
lA
ctiv
eIn
acti
veLo
ss b
y de
ath
of
acti
ve
pers
ons
Ent
ries
in
to L
FR
etir
e-m
ent
from
LF
(1)
(2)
(3)
(4)
(5)
(6)
(7)
(8)
(9)
(10)
(11)
(12)
(13)
15–1
961
,730
24,0
1537
,715
277,
729
61
,121
11,2
5049
,871
64,
690
20–2
449
,892
42,9
836,
909
672,
744
48
,906
28,5
3420
,372
202,
085
25–2
942
,819
40,2
282,
591
5431
8
42,2
9625
,791
16,5
0517
8
30–3
440
,106
38,0
332,
073
178
96
41,0
3523
,919
17,1
1618
19
3
35–3
944
,818
42,5
142,
304
179
29
45,7
3725
,722
20,0
1527
10
3
40–4
439
,759
37,5
642,
195
169
10
839
,972
22,3
1617
,656
37
165
45–4
933
,347
30,9
572,
390
188
23
532
,660
16,9
3815
,722
52
364
50–5
428
,049
24,7
583,
291
233
52
127
,000
11,7
3715
,263
64
406
55–5
920
,385
15,4
664,
919
221
95
520
,664
6,57
914
,085
64
343
60–6
415
,889
6,77
39,
116
149
93
516
,697
2,43
914
,258
40
133
65–6
912
,637
2,18
610
,451
79
435
14,0
4982
113
,228
23
25
70–7
49,
610
922
8,68
851
10
310
,826
366
10,4
6017
7
75–7
96,
837
446
6,39
136
35
7,94
516
67,
779
13
4
80+
6,48
025
46,
226
17
279,
260
107
9,15
38
4
Tota
l41
2,35
830
7,09
910
5,25
91,
648
10,8
873,
383
418,
168
176,
685
241,
483
406
6,77
51,
755
Not
e: D
eriv
ed fr
om A
ppen
dice
s 2
and
4
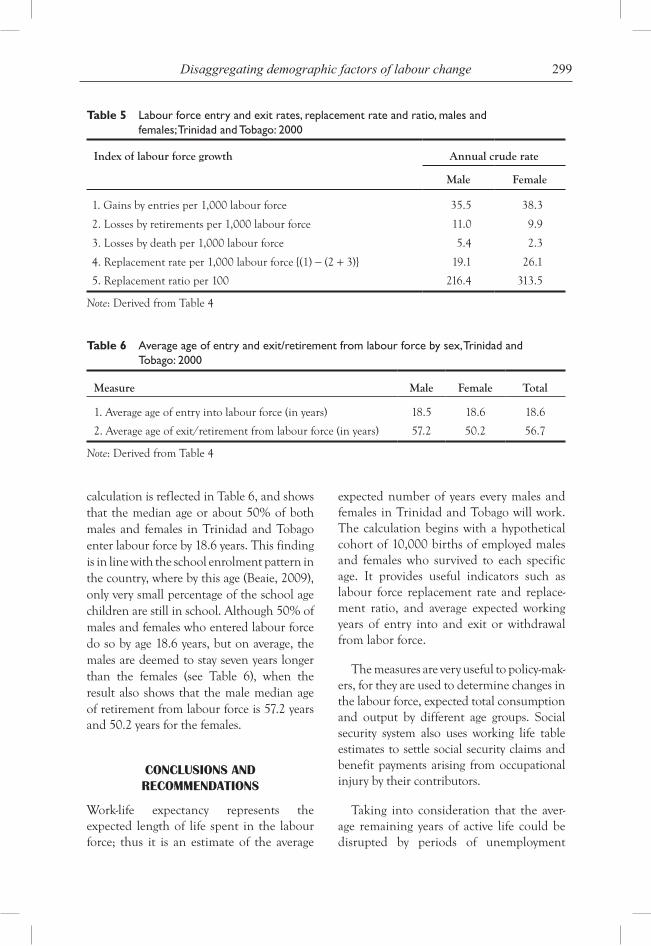
299Disaggregating demographic factors of labour change
calculation is reflected in Table 6, and shows that the median age or about 50% of both males and females in Trinidad and Tobago enter labour force by 18.6 years. This finding is in line with the school enrolment pattern in the country, where by this age (Beaie, 2009), only very small percentage of the school age children are still in school. Although 50% of males and females who entered labour force do so by age 18.6 years, but on average, the males are deemed to stay seven years longer than the females (see Table 6), when the result also shows that the male median age of retirement from labour force is 57.2 years and 50.2 years for the females.
conclusions anD recommenDations
Work-life expectancy represents the expected length of life spent in the labour force; thus it is an estimate of the average
expected number of years every males and females in Trinidad and Tobago will work. The calculation begins with a hypothetical cohort of 10,000 births of employed males and females who survived to each specific age. It provides useful indicators such as labour force replacement rate and replace-ment ratio, and average expected working years of entry into and exit or withdrawal from labor force.
The measures are very useful to policy-mak-ers, for they are used to determine changes in the labour force, expected total consumption and output by different age groups. Social security system also uses working life table estimates to settle social security claims and benefit payments arising from occupational injury by their contributors.
Taking into consideration that the aver-age remaining years of active life could be disrupted by periods of unemployment
Table 6 Average age of entry and exit/retirement from labour force by sex, Trinidad and Tobago: 2000
Measure Male Female Total
1. Average age of entry into labour force (in years) 18.5 18.6 18.6
2. Average age of exit/retirement from labour force (in years) 57.2 50.2 56.7
Note: Derived from Table 4
Table 5 Labour force entry and exit rates, replacement rate and ratio, males and females; Trinidad and Tobago: 2000
Index of labour force growth Annual crude rate
Male Female
1. Gains by entries per 1,000 labour force 35.5 38.3
2. Losses by retirements per 1,000 labour force 11.0 9.9
3. Losses by death per 1,000 labour force 5.4 2.3
4. Replacement rate per 1,000 labour force {(1) − (2 + 3)} 19.1 26.1
5. Replacement ratio per 100 216.4 313.5
Note: Derived from Table 4
300 S.T. Beaie
arising from factors such as occupational injuries, redundancies, sickness, etc., one would conclude that working life for females in Trinidad and Tobago is short, despite the longevity of females as com-pared to the males. Also, the high labour force replacement ratio means that the job market in Trinidad and Tobago would have to create additional jobs of 54% and 68%, respectively, of whatever existing size of males and females exiting from labour force annually in order to curb with the sur-plus labour supply. However, these results requires further investigations, for instance, using cohort activity rates over a long period technique adopted by Durand (1948) or using multivariate approach to determine factors that influence women’s decision to enter labour force in Trinidad and Tobago.
Finally, the low working life for females implies that there is a need to set clear targets to increase the participation rate of women and establish policy to delay their exit from the labour force. Apart from this, research on developing working life tables for Trinidad and Tobago should be prioritized because of its usefulness. In the absence of such scien-tific means of computing benefits, lawyers or the court system in Trinidad and Tobago may arrive at compensation claims arbitrarily or rely on guess work for workers affected due to injuries or death.
biographY
The Author is a Professor of Demography and Statistics at the University of Liberia. At the time of preparing this paper, he was serving the Government and the People of Guyana (assigned to the Bureau of Statistics) as a Consultant to the 2012 Population and
Housing Census project. He is a Liberian, and in 1989 graduated with a Master of Philosophy Degree in Demography from the United Nations – Cairo Demographic Centre (CDC), Egypt. Contact email: [email protected]
references
Amara, P.S. and Braima, S.J. (2006) Working Life Tables, in Republic of Sierra Leone 2004 Population and Housing Census, Life Tables for Sierra Leone, Online: http://www. statistics.sl/2004%20Pop.%20&%20Hou.%20Census%20Analytical%20Reports/2004%20Population%20and%20Housing%20Census%20Report%20on%20Life%20Tables.pdf
Beaie, S. T. (2009) CARICOM Capacity Development Programme (CCDP) 2000 Round of Population and Housing Census Data Analysis Sub-Project, National Census Report, Trinidad and Tobago
Cotter, D.A., Hermsen, J.M. and Vanneman, R. (2004) Gender Inequality at Work Prepared for the Russell Sage Foundation and Population Reference Bureau, Online: http://www.bsos.umd.edu/socy/vanneman/papers/Cotteretal.pdf
Durand, J.D. (1948) Labour Force in the United States, 1890 – 1960, New York, Social Science Research Council.
Kpedekpo, G.M.K. (1969) ‘Working life tables for males in Ghana 1960’, Journal of the American Statistical Association, Vol. 62, No. 320.
Mallela, D. and Wilcox-Gok, V. (2003) Employment Experience as a Predictor of Current Employment, Department of Economics, Northern Illinois University, Online: http://www.niu.edu/econ/research_series/art200315.pdf
United Nations (1968) Methods of Analysing Census Data on Economic Activities of the Population, UNDESA, Population Studies, No. 43.
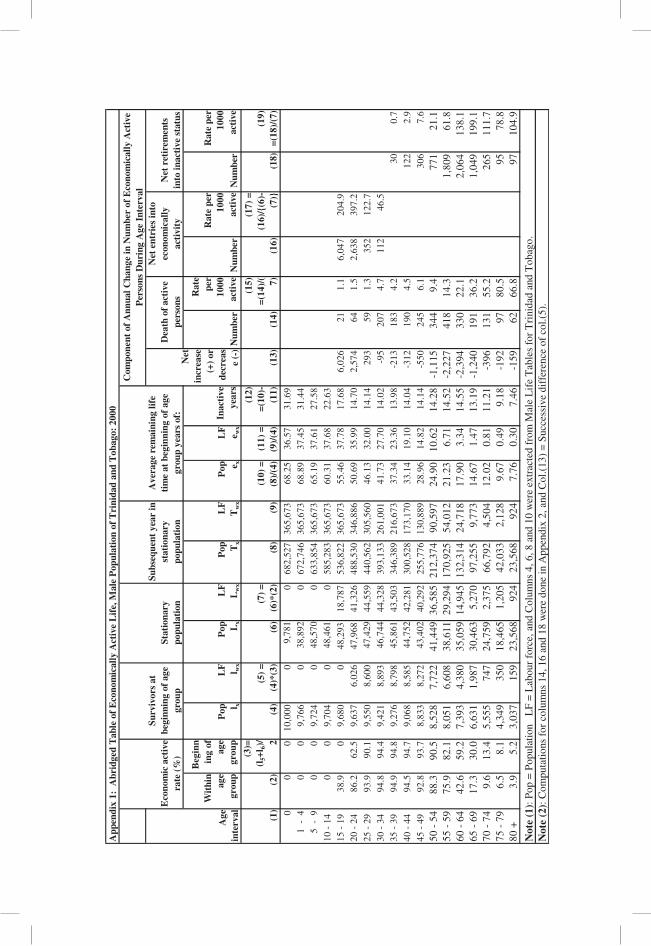
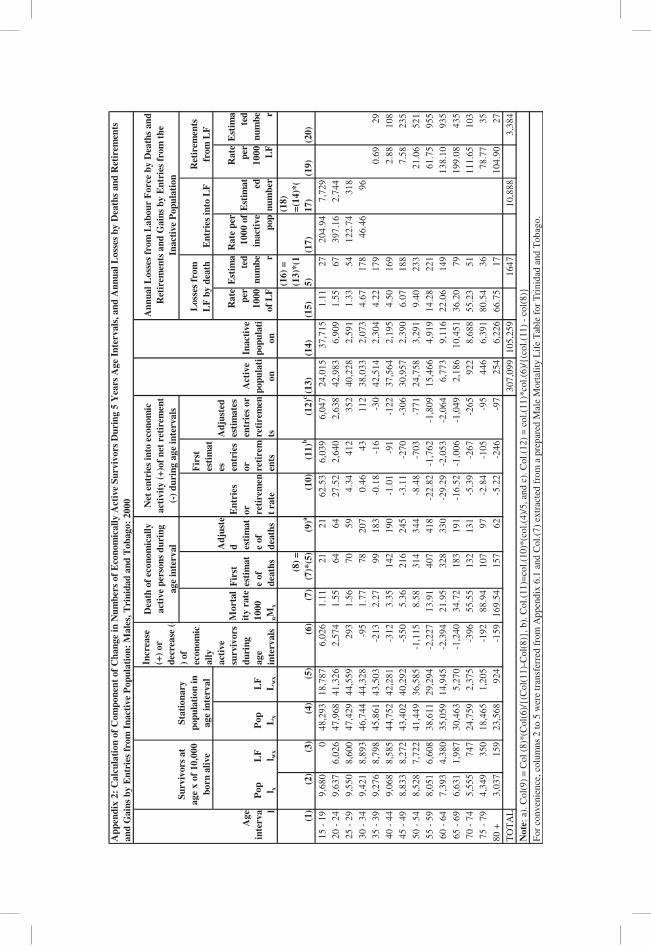
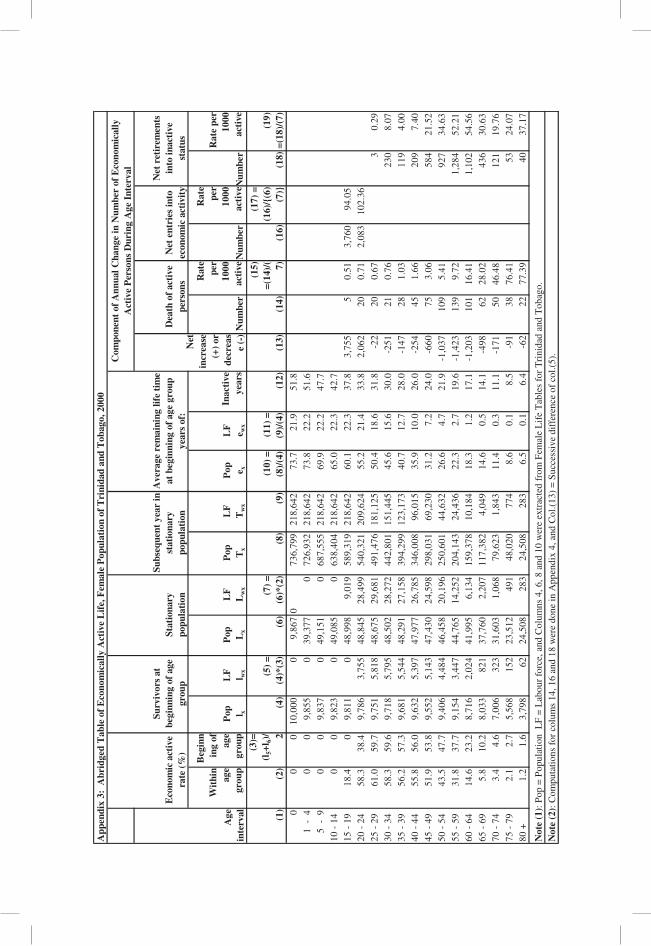
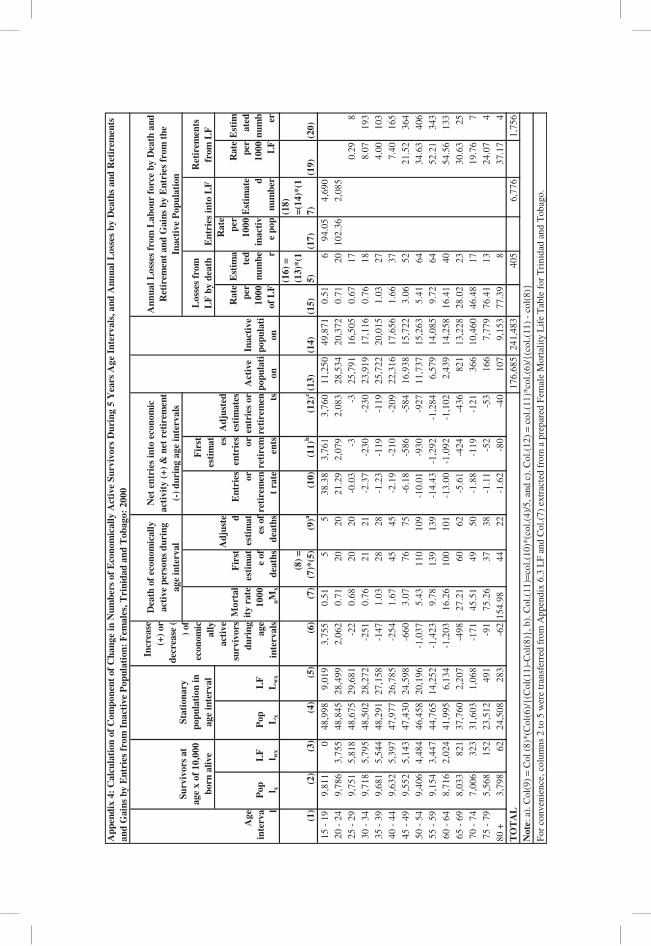
Copyright © 2010 WASD
World Sustainable Development Outlook 2010
305
Capital struCture determinants: malaysian
evidenCe
Subba Reddy Yarram*University of New England, Australia
Abstract: The present study analyses the capital structure choice of Malaysian firms for the period 1993–2003. Debt levels have increased substantially after the 1997 East Asian Financial Crisis. Analysis shows that tangibility has no significant influ-ence on leverage in both pre-crisis and post-crisis periods. This finding contradicts the findings of earlier studies. Similarly profitability does not appear to have any influence on leverage during both pre-crisis and post-crisis periods. Size has signifi-cant negative influence on leverage in both pre and post-crisis periods. One plau-sible reason could be that investors have more information about large companies and are willing to supply equity to these firms as suggested by information based theories of capital structure. Growth as expected has significant negative influence on leverage in both periods. This is consistent with information based theories of capital structure that suggest that growth firms face more uncertainty compared to stable mature firms and may therefore choose to have less leverage. Tax-based explanations of capital structure suggest that presence of Non-Debt Tax Shields (NDTS) obviates the need for leverage. However, analysis shows that NDTS has positive impact on leverage in both periods thus rendering tax-based explanations untenable in the Malaysian context. Liquidity has significant negative influence during the pre-crisis period while it has no significant influence during the post-crisis period. Volatility has significant influence on leverage though the degree of influence appears to be small in both periods. Stock price performance has negative influence on leverage in both periods indicating possible equity offerings rather than debt offerings as firms may be timing their equity issues. Thus there is support for information based explanations of capital structure.
Keywords: capital structure; emerging markets; financial crisis.
intrOduCtiOn
Several countries in ASEAN including Malaysia had experienced favourable eco-nomic conditions prior to the East Asian Financial Crisis in late 1990s. After the crisis, surprising many analysts, Malaysian economy along with some of the other econ-omies recovered rapidly. During a period
spanning three decades prior to the crisis, manufacturing and services sectors have increased their share of GDP and employ-ment while agriculture sector has shown declining contribution in Malaysia. Much of the growth was attributed to the economic initiatives undertaken in Malaysia under the New Economic Policy (NEP) which
*Corresponding author: University of New England, Australia; e-mail: [email protected]
306 S.R. Yarram
had been introduced in the aftermath of the 1969 social unrest. Since independence from British in 1957 to date – one political party – UMNO and its coalition National Barisan – remained in power and one politi-cal leader – Mohathir Mohamad – held the top position of Prime Minister for 22 years. While it is plausible to imagine the positive influence of apparent political stability on the economy, it is equally plausible to iden-tify roots of entrenched vested interests.
Given the domineering effects of political factors and government policies, Malaysia may offer new insights into the working of corporate firms. Given the emerging market setting – institutional features are different from those of the USA and UK – the present study may throw interesting insights on the determinants of capital structure choice. The study is also relevant given the recent debate on causes of the financial crisis in East Asia. Two arguments are put forth as leading to the crisis. One view is that external shocks in the form of drop in demand and scant work-ing capital led to a bleeding corporate sector. Another view is that the firms followed impru-dent policies and assumed disproportionately high levels of risk that ultimately led to the crisis. Claessens et al. (2000) find evidence in support of arguments that firm-specific fac-tors including weak financial structures have increased the risk level of firms. The present study therefore analyses the changes in financial leverage in corporate firms prior to and after the 1997 financial crisis. Further, given the importance of tangibility, profitabil-ity, size, growth and Non-Debt Tax Shields (NDTS) as shown by earlier literature, the relative influence of these factors on leverage prior to and after 1997 is also examined.
This study is organised as follows. We first discuss relevant literature in the follow-ing Section, followed by a review of insti-tutional setting in Malaysia that may have
a bearing on capital structure choice. We then describe the database employed in the present study and definitions of variables used. In the following Section, we provide a discussion of results and the last Section provides conclusions.
Literature review
Starting with the seminal work of Modigliani and Miller (1958), a vast amount of lit-erature has examined the issues relating to capital structure of corporate firms. While Modigliani and Miller identify the condi-tions under which the capital structure choice is redundant for the value of the firm, subsequent studies have identified condi-tions under which capital structure may become relevant for value maximisation.
Barclay and Smith (2005) classify the theoretical basis of capital structure deter-minants as falling under
1 tax-based explanations
2 theories relating to contracting costs and
3 theories based on information costs.
Tax-based explanations suggest that in the presence of taxes, capital structure may have relevance for value of a firm. In the absence of personal taxes and in the pres-ence of corporate taxes, firms have incen-tives to add more debt as interest payments on the debt are tax deductible for the firm and therefore firms can derive tax benefits by adding debt in their capital structure. However, personal taxes on interest income may reduce the benefits of debt as debt holders may require higher pre-tax returns. Thus firms may not derive full extent of tax shield benefits with additional debt. However, tax-based explanations do not take into account other possible benefits and costs of debt.
307Capital structure determinants
For instance, theories relating to contacting costs suggest that increased debt may lead to higher probability of financial distress and therefore may lead firms to resort to use of less debt. Financial distress costs may have direct and indirect costs. Direct costs are a function of size of firm (Warner, 1977) and they relate to bankruptcy process and the expenses relat-ing to legal procedures. For large firms, these costs are not considerable where as they may be very significant for small firms. The indirect costs relate to under-investment problem (Myers, 1977). Firms facing financial distress may not invest even if positive net present value projects are available because the value created may only accrue to debt holders as they have priority in claims leaving equity holders uninterested in any such new investments. While too much debt may cause underin-vestment, too little debt may cause over-investment (Jensen, 1986) as managers may pursue their self-promoting or empire building activities when firms are saddled with lot of ‘free cash flow’. Thus theories relating to contracting costs suggest that agency costs and legal and institutional framework may have significant influence on firms’ capital structure.
Theories based on information costs suggest that insiders are better informed about the prospects of firms compared to outside stakeholders and capital structure changes may be a consequence of actions of managers to time the market or wanting to signal to market their confidence. Thus firms may not issue equity when managers believe that the firm is undervalued and may issue debt to raise finances. Managers may issue equity when they think that the firm is overvalued. Managers may also be trying to signal to the market information – particularly positive information – about the firm by buying back shares or by initiating
dividends or by increasing dividend payout. Since it is costly for firms to imitate these signals, firms may use these methods to convey information about firms to outside investors. Information-based arguments also suggest that firms may follow a peck-ing order in their choice of raising funds in that they may first use all available internal funds and if these funds are not adequate to purse the investments available, they may raise external debt. Only in extreme circumstances, they would resort to using external equity.
Given the above broad theoretical under-pinnings, a number of studies – (Bradley et al., 1984; Harris and Raviv, 1991; Rajan and Zingales, 1995) – have attempted to identify factors determining capital struc-ture in the U.S. and other countries. Most of these studies identify tangibility, profit-ability, size and growth as the important determinants of capital structure (Rajan and Zingales, 1995).
Tangibility of assets implies that in case of liquidation fixed assets could help credi-tors claim as much of cash flow that is due to them. Intangible assets on the other hand may loose their value in liquidation and therefore may be a concern for credi-tors. Tangible assets could be more easily accepted as collateral and therefore may reduce the agency cost of debt (Rajan and Zingales, 1995). Theories relating to con-tracting costs suggest that highly leveraged firms may underinvest as suggested by Myers (1977). Firms with higher intangible assets will therefore avoid debt because of underinvestment problem as suggested by Myers. Firms with more intangible assets may therefore be forced to issue equity rather than debt (Scott, 1977). Therefore a positive relationship can be expected between tangibility of assets and leverage. However, Rajan and Zingales raise a caveat
308 S.R. Yarram
as Berger and Udell (1994) find that firms with closer relationships with banks need not have as much collateral as otherwise would be required. They therefore propose that in bank oriented economies firms may have higher levels of leverage even with rela-tively less tangible assets compared to firms in market oriented economies.
Theoretical relationship between profit-ability and leverage is mixed. Theories based on information costs suggest that profitable firms that accumulate more retained earn-ings may use these funds as a first priority for investments as suggested by pecking order theory rather than raising funds externally (Myers and Majluf, 1984). Profitability and leverage therefore may be negatively related. Agency theory on the other hand predicts a positive relationship between leverage and profitability when the market for cor-porate control is competitive and that firms would be forced to use debt as they would be required to payout cash (Jensen, 1986). Lenders too would be willing lend more to a firm with positive cash flows as suggested by theories based contacting costs. Profitability and leverage may therefore be positively related.
Theoretical relationship between size and leverage again is not clear. Large firms are often diversified and they are less likely to fail. Given this they may be able to attract more debt. Therefore size and lever-age are positively related. On the other hand, investors have more information about large firms compared to small firms and therefore may be willing to supply more equity as suggested by information-based theories.
Growth firms are expected to face more uncertainty compared to stable mature firms and this may imply that they may deliberately have only smaller amount of
financial leverage with a view to keep the combined leverage at manageable levels or risk preference in commensuration with that of shareholders. Further information asymmetry may be greater for firms that are rapidly growing than for stable firms and managers may try to time equity issues when firms are overvalued.
Several studies show evidence on the rela-tionship between the above variables and leverage. Harris and Raviv (1991) find that leverage is a direct function of fixed assets, NDTS, investment opportunities, and firm size and is an inverse function of volatil-ity, advertising expenditure, probability of bankruptcy, profitability and uniqueness of the product. Rajan and Zingales (1995) analyse the capital structure choice of firms in major developed countries. They find that the debt levels are similar in G-7 coun-tries and that the differences in debt levels are not on account of differences in insti-tutional mechanisms. They find evidence of positive influence of tangibility, negative influence of market-to-book ratio – a proxy for growth opportunities – and profitability on leverage. They also find that large firms issue less equity. Miguel and Pindado (2001) analyse the capital structure of firms in Spain and find that the use of private debt rather than public debt reduces the trans-action cost for firms targeting their capital structure.
Deesomsak et al. (2004) find varying influence of firm-specific factors such as tangibility, size, profitability, growth, NDTS and liquidity before the pre and post-1997 crisis and suggest that capital structure decision may be affected by country- specific considerations. Wiwattanakantang (1999) find evidence of tax effect, signaling effect and agency cost influencing financ-ing decisions in Thailand before the crisis period.
309Capital structure determinants
Malaysian context
Rajan and Zingales (1995) suggest that fac-tors such as bankruptcy code, tax code, and the market for corporate control may influ-ence aggregate capital structure.
In Malaysia, firms are allowed investment tax allowance of 60% of qualifying capital expenditure for a period of five years. Firms are allowed to offset this allowance against 70% of statutory income each year. Unused tax allowances can be carried forward for a period of five years. Similarly firms in Malaysia are also given pioneer status and are exempt from taxes partially on their income. Firms with this status pay taxes only on 30% of their statutory income. Similarly companies can also make use of reinvest-ment allowance and accelerated capital allowance (US-ASEAN Business Council, 2003). These NDTS imply that the firms using this benefit in Malaysia may have less leverage. Financial distress costs in Malaysia may be considerable given the nature of information asymmetry and agency rela-tionships. Further, given the close nexus between business groups and politicians, banks who are the major suppliers of credit may not be monitoring the companies that borrow from them. Bankruptcy proceedings in Malaysia may be initiated at the behest of companies themselves or by creditors according to Chapter 10 of the Companies Act (1965) (Nagano, 2003).
Similarly, given thrust of government policies for equity participation and employment of ‘Bumiputera’, capital struc-ture decisions may not be based entirely on economic considerations. The market for corporate control is far less efficient in Malaysia compared to developed markets as takeovers are unusual and would not meet success unless approved by concerned gov-ernment agencies. Similarly, companies can not mount takeover defences easily as the
government and its agencies keep a strict control on corporate activities. Further, the managerial labour market is not competi-tive as there are restrictions on recruitment and compensation of employees at all levels including senior management.
In the aftermath of recent east Asian eco-nomic crisis a number of initiatives have been undertaken with a view to improve corporate governance practices and compet-itiveness in the economy. A Capital Market Masterplan has been drawn to improve functioning of capital markets and consoli-date the banking sector. The erstwhile Kula Lumpur Stock Exchange has been demu-tualized and renamed as Bursa Malaysia. There has been a change in political leader-ship and the new government has promised to combat corruption and improve its eco-nomic management.
Given the above, it would be interesting to analyse the Malaysian situation. We spe-cifically trace changes in leverage before and after the East Asian crisis. We also analyse the influence of tangibility, profitability, size, growth, NDTS, liquidity, volatility of earnings and share price performance on leverage. We further study whether these variables have similar influence in the post-crisis period. Given the emerging market setting, some of the theories of capital struc-ture such as information-based explanations may have more relevance for Malaysia than other theories such as tax-based explanations or contracting cost based explanations.
Empirical analysis and findings
The sample of firms for the present study is drawn from stocks listed on Bursa Malaysia (formerly Kuala Lumpur Stock Exchange). We study Malaysia given its emerging market context and the expected information asym-metry and agency problems. Examination of
310 S.R. Yarram
emerging markets may be more appropriate given the degree of information asymme-try, and incompleteness of markets. Agency problems are more severe in emerging mar-kets such as Malaysia compared to devel-oped markets such as USA and UK.
All financial firms are excluded from the study as their financial policies are subject to higher degree of regulation. Information on financial variables has been sourced from Datastream. To start with we have an unbalanced sample of 671 firms. We divide the sample period into 2 distinct periods – 1993–1996 as pre-crisis and 2000–2003 as post-crisis. We exclude the intervening crisis and possible adjustment period.
Out of the 671 firms for which we have financial data, 403 firms have been listed after the crisis period. In other words, only 268 firms have financial data for at least one year in the pre-crisis as well as post-crisis periods. We exclude the latter 403 firms that have been listed after the 1997 crisis period in order to reduce the concentration of small firms as recent firms tend to be small in size compared to established firms. Exclusion of 403 firms from the sample reduces the potential bias towards smaller firms.
The final sample of 268 firms come from predominantly the Main Board of Bursa Malaysia (246 firms), where as 2nd Board (14 firms) and Mesdaq (8 firms) are also represented. Similarly majority of the firms are in industrial sector (77 firms) followed by trade and services (64 firms), properties (47 firms), consumer products (33 firms), construction (20 firms), technology (8 firms) and infrastructure (4 firms).
We measure leverage as a ratio of total debt over the four year period in each of the two sub-periods to sum of total debt, market
value of equity and book value of preference shares over the same four year period. We measure leverage in both pre- and post-crisis periods. Use of aggregates rather than aver-ages avoids estimation of leverages that are influenced by extreme values.
Leverage on average has increased from the pre-crisis period to the post-crisis period (Table 1). Median leverage during the pre-crisis period stood at 16.33% and has increased to 23.44% after the crisis. During the crisis, Malaysian corporate firms have shown very high levels of median leverage of 40.51% compared to pre- and post-crisis periods. Change in leverage is statistically significant at 95% confidence level (Table 2). The increase in leverage during the crisis and in the subsequent years could be on account of depressed stock prices. The Composite Index of the Kuala Lumpur Stock Exchange stood at a level of 663.4 at the end of financial year 1996 and has fallen to 466.7 at the end of 1997, 235.3 at the end of 1998, 426.2 at the end of 1999 and hov-ered around that level since then ending at a level of 497.6 at the end of 1994. Another probable reason for the increased leverage could be on account of restructuring of debt for a large number of firms. Thus on the whole leverage has gone up considerably from the pre- to post-crisis.
Tangibility is measured as a ratio of total net fixed assets to total assets. There is no statistically significant change in tan-gibility from pre-crisis period to post-crisis period. Average tangible assets before the crisis stood at 43.9% and have not changed much after the crisis (45.9%), though they appear to have increased marginally during the crisis. Falling investment in new net fixed assets could possibly be the reason for stagnating tangible assets. Profitability is measured as a ratio of earnings before interest, tax and depreciation to total assets.
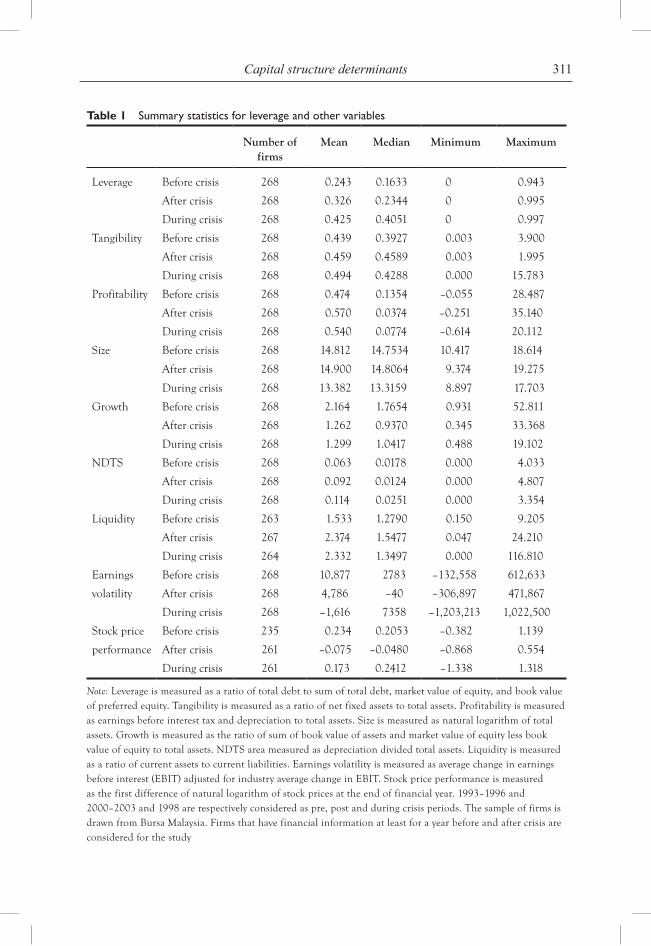
311Capital structure determinants
Table 1 Summary statistics for leverage and other variables
Number of firms
Mean Median Minimum Maximum
Leverage Before crisis 268 0.243 0.1633 0 0.943
After crisis 268 0.326 0.2344 0 0.995
During crisis 268 0.425 0.4051 0 0.997
Tangibility Before crisis 268 0.439 0.3927 0.003 3.900
After crisis 268 0.459 0.4589 0.003 1.995
During crisis 268 0.494 0.4288 0.000 15.783
Profitability Before crisis 268 0.474 0.1354 –0.055 28.487
After crisis 268 0.570 0.0374 –0.251 35.140
During crisis 268 0.540 0.0774 –0.614 20.112
Size Before crisis 268 14.812 14.7534 10.417 18.614
After crisis 268 14.900 14.8064 9.374 19.275
During crisis 268 13.382 13.3159 8.897 17.703
Growth Before crisis 268 2.164 1.7654 0.931 52.811
After crisis 268 1.262 0.9370 0.345 33.368
During crisis 268 1.299 1.0417 0.488 19.102
NDTS Before crisis 268 0.063 0.0178 0.000 4.033
After crisis 268 0.092 0.0124 0.000 4.807
During crisis 268 0.114 0.0251 0.000 3.354
Liquidity Before crisis 263 1.533 1.2790 0.150 9.205
After crisis 267 2.374 1.5477 0.047 24.210
During crisis 264 2.332 1.3497 0.000 116.810
Earnings Before crisis 268 10,877 2783 –132,558 612,633
volatility After crisis 268 4,786 –40 –306,897 471,867
During crisis 268 –1,616 7358 –1,203,213 1,022,500
Stock price Before crisis 235 0.234 0.2053 –0.382 1.139
performance After crisis 261 –0.075 –0.0480 –0.868 0.554
During crisis 261 0.173 0.2412 –1.338 1.318
Note: Leverage is measured as a ratio of total debt to sum of total debt, market value of equity, and book value of preferred equity. Tangibility is measured as a ratio of net fixed assets to total assets. Profitability is measured as earnings before interest tax and depreciation to total assets. Size is measured as natural logarithm of total assets. Growth is measured as the ratio of sum of book value of assets and market value of equity less book value of equity to total assets. NDTS area measured as depreciation divided total assets. Liquidity is measured as a ratio of current assets to current liabilities. Earnings volatility is measured as average change in earnings before interest (EBIT) adjusted for industry average change in EBIT. Stock price performance is measured as the first difference of natural logarithm of stock prices at the end of financial year. 1993–1996 and 2000–2003 and 1998 are respectively considered as pre, post and during crisis periods. The sample of firms is drawn from Bursa Malaysia. Firms that have financial information at least for a year before and after crisis are considered for the study
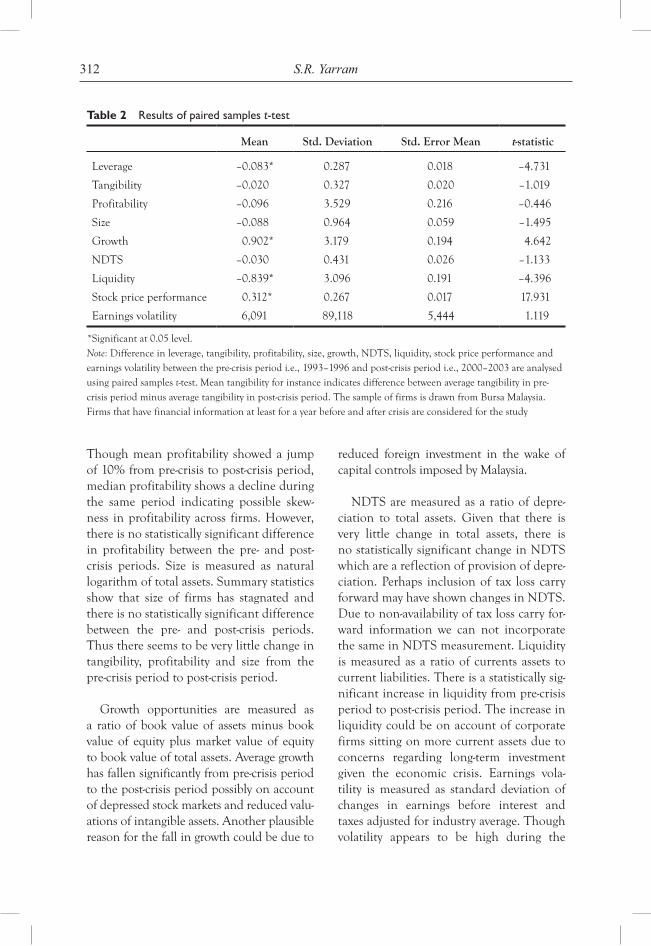
312 S.R. Yarram
Though mean profitability showed a jump of 10% from pre-crisis to post-crisis period, median profitability shows a decline during the same period indicating possible skew-ness in profitability across firms. However, there is no statistically significant difference in profitability between the pre- and post-crisis periods. Size is measured as natural logarithm of total assets. Summary statistics show that size of firms has stagnated and there is no statistically significant difference between the pre- and post-crisis periods. Thus there seems to be very little change in tangibility, profitability and size from the pre-crisis period to post-crisis period.
Growth opportunities are measured as a ratio of book value of assets minus book value of equity plus market value of equity to book value of total assets. Average growth has fallen significantly from pre-crisis period to the post-crisis period possibly on account of depressed stock markets and reduced valu-ations of intangible assets. Another plausible reason for the fall in growth could be due to
reduced foreign investment in the wake of capital controls imposed by Malaysia.
NDTS are measured as a ratio of depre-ciation to total assets. Given that there is very little change in total assets, there is no statistically significant change in NDTS which are a reflection of provision of depre-ciation. Perhaps inclusion of tax loss carry forward may have shown changes in NDTS. Due to non-availability of tax loss carry for-ward information we can not incorporate the same in NDTS measurement. Liquidity is measured as a ratio of currents assets to current liabilities. There is a statistically sig-nificant increase in liquidity from pre-crisis period to post-crisis period. The increase in liquidity could be on account of corporate firms sitting on more current assets due to concerns regarding long-term investment given the economic crisis. Earnings vola-tility is measured as standard deviation of changes in earnings before interest and taxes adjusted for industry average. Though volatility appears to be high during the
Table 2 Results of paired samples t-test
Mean Std. Deviation Std. Error Mean t-statistic
Leverage –0.083* 0.287 0.018 –4.731
Tangibility –0.020 0.327 0.020 –1.019
Profitability –0.096 3.529 0.216 –0.446
Size –0.088 0.964 0.059 –1.495
Growth 0.902* 3.179 0.194 4.642
NDTS –0.030 0.431 0.026 –1.133
Liquidity –0.839* 3.096 0.191 –4.396
Stock price performance 0.312* 0.267 0.017 17.931
Earnings volatility 6,091 89,118 5,444 1.119
*Significant at 0.05 level.Note: Difference in leverage, tangibility, profitability, size, growth, NDTS, liquidity, stock price performance and earnings volatility between the pre-crisis period i.e., 1993–1996 and post-crisis period i.e., 2000–2003 are analysed using paired samples t-test. Mean tangibility for instance indicates difference between average tangibility in pre-crisis period minus average tangibility in post-crisis period. The sample of firms is drawn from Bursa Malaysia. Firms that have financial information at least for a year before and after crisis are considered for the study
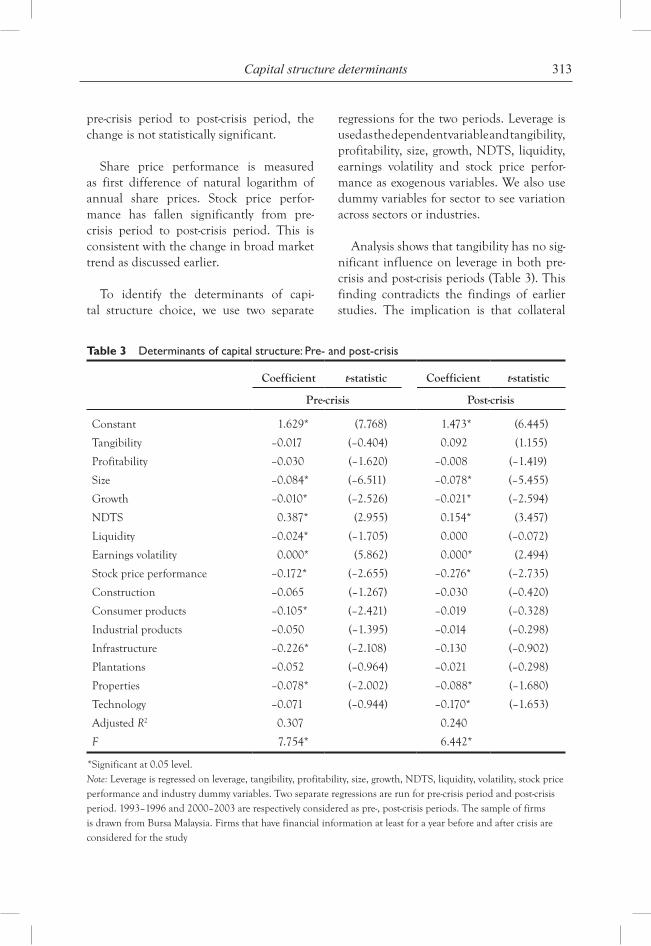
313Capital structure determinants
pre-crisis period to post-crisis period, the change is not statistically significant.
Share price performance is measured as first difference of natural logarithm of annual share prices. Stock price perfor-mance has fallen significantly from pre-crisis period to post-crisis period. This is consistent with the change in broad market trend as discussed earlier.
To identify the determinants of capi-tal structure choice, we use two separate
regressions for the two periods. Leverage is used as the dependent variable and tangibility, profitability, size, growth, NDTS, liquidity, earnings volatility and stock price perfor-mance as exogenous variables. We also use dummy variables for sector to see variation across sectors or industries.
Analysis shows that tangibility has no sig-nificant influence on leverage in both pre-crisis and post-crisis periods (Table 3). This finding contradicts the findings of earlier studies. The implication is that collateral
Table 3 Determinants of capital structure: Pre- and post-crisis
Coefficient t-statistic Coefficient t-statistic
Pre-crisis Post-crisis
Constant 1.629* (7.768) 1.473* (6.445)
Tangibility –0.017 (–0.404) 0.092 (1.155)
Profitability –0.030 (–1.620) –0.008 (–1.419)
Size –0.084* (–6.511) –0.078* (–5.455)
Growth –0.010* (–2.526) –0.021* (–2.594)
NDTS 0.387* (2.955) 0.154* (3.457)
Liquidity –0.024* (–1.705) 0.000 (–0.072)
Earnings volatility 0.000* (5.862) 0.000* (2.494)
Stock price performance –0.172* (–2.655) –0.276* (–2.735)
Construction –0.065 (–1.267) –0.030 (–0.420)
Consumer products –0.105* (–2.421) –0.019 (–0.328)
Industrial products –0.050 (–1.395) –0.014 (–0.298)
Infrastructure –0.226* (–2.108) –0.130 (–0.902)
Plantations –0.052 (–0.964) –0.021 (–0.298)
Properties –0.078* (–2.002) –0.088* (–1.680)
Technology –0.071 (–0.944) –0.170* (–1.653)
Adjusted R2 0.307 0.240
F 7.754* 6.442*
*Significant at 0.05 level.Note: Leverage is regressed on leverage, tangibility, profitability, size, growth, NDTS, liquidity, volatility, stock price performance and industry dummy variables. Two separate regressions are run for pre-crisis period and post-crisis period. 1993–1996 and 2000–2003 are respectively considered as pre-, post-crisis periods. The sample of firms is drawn from Bursa Malaysia. Firms that have financial information at least for a year before and after crisis are considered for the study
314 S.R. Yarram
does not play a major role in securing credit in economies such as Malaysia. Similarly profitability does not appear to have any influence on leverage during both pre-crisis and post-crisis periods. Closer relationship with banks as pointed out by Berger and Udell (1994), or political nexus as suggested by Todd and Mitton (2005) may enable firms to secure credit in emerging markets such as Malaysia.
Size has significant negative influence on leverage in both pre- and post-crisis periods. One plausible reason could be that inves-tors have more information about large companies and are willing to supply equity to these firms as suggested by information based theories of capital structure. Growth as expected has significant negative influ-ence on leverage in both periods. This is consistent with information-based theories of capital structure that suggest that growth firms face more uncertainty compared to stable mature firms and may therefore choose to have less leverage.
Tax-based explanations of capital struc-ture suggest that presence of NDTS obviates the need for leverage. However, analysis shows that NDTS has positive impact on leverage in both periods thus rendering tax-based explanations untenable in the Malaysian context.
Liquidity has significant negative influ-ence during the pre-crisis period while it has no significant influence during the post-crisis period. Volatility has significant influence on leverage though the degree of influence appears to be small in both periods. Stock price performance has negative influence on leverage in both periods indicating possible equity offerings rather than debt offerings as firms may be timing their equity issues. Thus there is support for information based expla-nations of capital structure.
Property and technology sectors have significant negative influence on leverage during the post-crisis period while prop-erties, infrastructure, consumer product sectors have significant negative influence on leverage during pre-crisis period.
COnClusiOn
The present study analyses the changes in capital structure of Malaysian firms before and after the East Asian crisis. Further it analyses the determinants of leverage in the pre-crisis and post-crisis periods. A sample of 268 non-financial firms is drawn from Bursa Malaysia for the purpose of study. We consider two 4-year windows – 1993–1996 as pre-crisis period and 2000–2003 as post-crisis period. Given the institutional setting, Malaysia offers new insights into capital structure choice of corporate firms. Unlike the USA and UK, Malaysian firms are subject to more control and are subject to political influence. Further, the corporate control market and market for managerial labour are to a greater degree less com-petitive compared to developed markets. Analysis shows that leverage has gone up substantially in Malaysian corporate sector in the post-crisis period compared to pre-crisis period. However, it is hard to believe that it’s a strategic choice of corporate firms to have higher degree of leverage. The increased leverage is possibly on account of depressed stock markets and perhaps due to debt restructuring in the light of recent cri-sis. Tangibility, profitability and size have not shown any significant changes in the post-crisis period compared to pre-crisis period. Further, growth opportunities in Malaysia seems to have dwindled after the crisis as capital controls and other government poli-cies perhaps repelled foreign capital.
Analysis of determinants shows that growth, NDTS, liquidity, volatility and
315Capital structure determinants
stock price performance have significant influence on leverage both in the pre-crisis and post-crisis periods. Tangibility and prof-itability are found to have no significant influence on capital structure choice. The findings of present study support informa-tion-based explanations of capital structure.
reFerenCes
Barclay, M.J. and Smith, C.W. (2005) ‘The capital structure puzzle: the evidence revisited’, Journal of Applied Corporate Finance, Vol. 17, No. 1, pp.8–17.
Berger, A. and Udell, G. (1994) Lines of Credit, Collateral, and Relationship Lending in Small Firm Finance, Mimeo, Board of Governors of the Federal Reserve System.
Bradley, M., Jarrell, G.A. and Kim, E.H. (1984) ‘On the existence of an optimal capital structure: theory and evidence’, Journal of Finance, Vol. 39, No. 3, pp.857–879.
Claessens, S., Djankov, S. and Xu, L.C. (2000) ‘Corporate performance in the East Asian financial crisis’, The World Bank Research Observer, Vol. 15, No. 1, pp.23–46.
Deesomsak, R., Paudyal, K. and Pescetto, G. (2004) ‘The determinants of capital structure: evidence from the Asia Pacific region’, Journal of Multinational Financial Management, Vol. 14, No. 2, pp.387–405.
Harris, M. and Raviv, A. (1991) ‘The theory of capital structure’, Journal of Finance, Vol. 46, No. 1, pp.297–355. http://www.us-asean.org/Malaysia/business_guide/Tax_System.asp, US-ASEAN Business Council (2003)
Jensen, M.C. (1986) ‘Agency cost of free cash flow, corporate finance and takeovers’, American Economic Review, Vol. 76, No. 1, pp.323–339.
Miguel, A.D. and Pindado, J. (2001) ‘Determinants of capital structure: new evidence from Spanish panel data’, Journal of Corporate Finance, Vol. 7, No. 1, pp.77–99.
Modigliani, F. and Miller, M.H. (1958) ‘The cost of capital, corporation finance and the theory of investment’, American Economic Review, Vol. 68, No. 1, pp.261–297.
Myers, S.C. (1977) ‘Determinants of corporate borrowing’, Journal of Financial Economics, Vol. 5, No. 1, pp.147–175.
Myers, S.C. and Majluf, N.S. (1984) ‘The capital structure puzzle’, Journal of Finance, Vol. 39, No. 2, pp.575–592.
Nagano, M. (2003) Determinants of Corporate Capital Structure in East Asia: are there differences from the Industrialized Countries? Waseda University Institute of Finance, WIFS-04-002.
Rajan, R.G. and Zingales, L. (1995) ‘What do we know about capital structure? Some evidence from international data’, Journal of Finance, Vol. 50, No. 3, pp.1421–1460.
Scott, J. (1977) ‘Bankruptcy, secured debt, and optimal capital structure’, Journal of Finance, Vol. 32, No. 1, pp.1–19.
Warner, J. (1977) ‘Bankruptcy costs: some evidence’, Journal of Finance, Vol. 32, No. 1, pp.337–347.
Wiwattanakantang, Y. (1999) ‘An empirical study on the determinants of the capital structure of Thai firms’, Pacific-Basin Finance Journal, Vol. 7, No. 2, pp.371–403.

Copyright © 2010 WASD
World Sustainable Development Outlook 2010
317
assessing actions towards sustainable logistics:
a framework
Vendela Santén* and Sönke BehrendsChalmers University of Technology, Sweden
Abstract: Sustainability includes a variety of aspects, e.g., environment, economy and society, related to each other in different ways. Most studies concerning sus-tainable logistics do not reflect these relations, since they deal with one issue at a time (e.g., CO
2 – emissions or congestion), have a short- and medium time
perspective, and seldom take into account impacts on other systems, e.g., energy or land-use systems. In order to develop long-term strategies towards sustainable logistics, actors in the logistics system require knowledge about the complexity of the problem and the interdependencies of their actions. Hence, there is a need for a holistic framework for sustainable logistics including all aspects of sustainability, the relevant logistics actions as well as their interdependencies. This paper takes a first step towards developing such a holistic framework. The suggested framework includes the relations between decision areas in material and transport level at one hand and the logistical and environmental sustainability goals at the other. The authors argue that decisions in the transport level have a direct affect to both logis-tical and environmental goals, while material flow decisions are of major concern for logistical goals. Furthermore, logistics systems that integrate material flow and transport flow decision making will be more successful in meeting logistical and environmental goals, thus leading to more sustainable logistics. In order to identify more sustainable logistics solutions, there must be a raised awareness about the key factors linking decision areas and performances.
Keywords: sustainable logistics; holistic view; framework.
introduction
Sustainability is most commonly defined as combining economic development with environmental concerns as well as social responsibility, also called the triple bottom line (Norman and MacDonald, 2004). One difficulty in the issue of sus-tainable logistics is how to simultaneously strive toward economic benefits, a reduced impact on the eco-system and social respon-sibility. Decreasing product life cycles and
increasing product values have led to innovative logistics approaches like JIT with less storage and more frequent deliv-eries (Chopra, 2003) in order to increase service levels and reduce tied-up capital. The implications for freight transport are a rising demand for the shipping and deliv-ery of smaller units in a higher frequency, an increasing importance of time, reliabil-ity and speed. As a consequence, many industries have increased their reliance on
*Corresponding author: Chalmers University of Technology, Sweden; e-mail: [email protected]
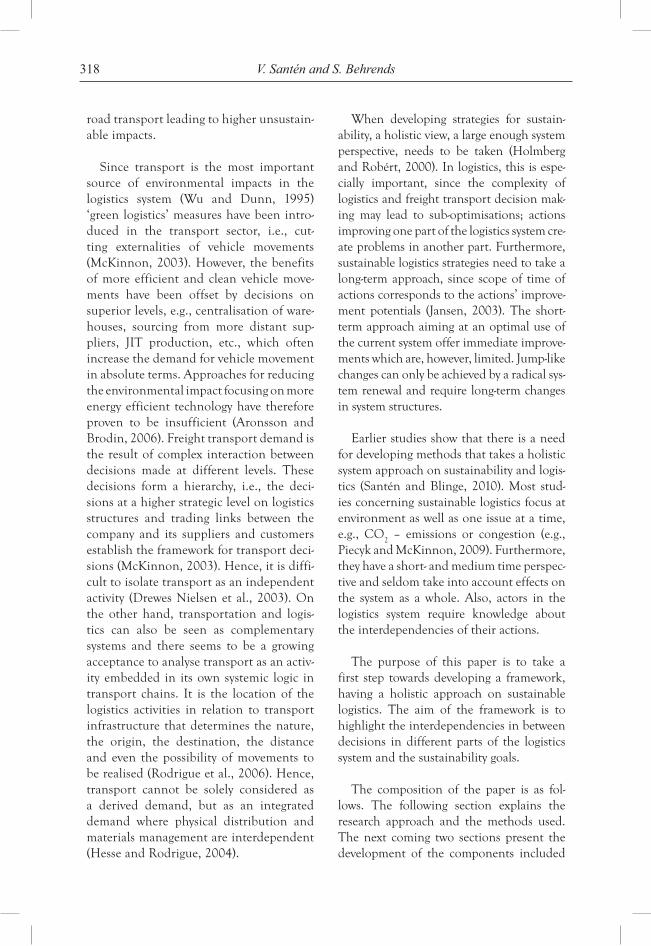
318 V. Santén and S. Behrends
road transport leading to higher unsustain-able impacts.
Since transport is the most important source of environmental impacts in the logistics system (Wu and Dunn, 1995) ‘green logistics’ measures have been intro-duced in the transport sector, i.e., cut-ting externalities of vehicle movements (McKinnon, 2003). However, the benefits of more efficient and clean vehicle move-ments have been offset by decisions on superior levels, e.g., centralisation of ware-houses, sourcing from more distant sup-pliers, JIT production, etc., which often increase the demand for vehicle movement in absolute terms. Approaches for reducing the environmental impact focusing on more energy efficient technology have therefore proven to be insufficient (Aronsson and Brodin, 2006). Freight transport demand is the result of complex interaction between decisions made at different levels. These decisions form a hierarchy, i.e., the deci-sions at a higher strategic level on logistics structures and trading links between the company and its suppliers and customers establish the framework for transport deci-sions (McKinnon, 2003). Hence, it is diffi-cult to isolate transport as an independent activity (Drewes Nielsen et al., 2003). On the other hand, transportation and logis-tics can also be seen as complementary systems and there seems to be a growing acceptance to analyse transport as an activ-ity embedded in its own systemic logic in transport chains. It is the location of the logistics activities in relation to transport infrastructure that determines the nature, the origin, the destination, the distance and even the possibility of movements to be realised (Rodrigue et al., 2006). Hence, transport cannot be solely considered as a derived demand, but as an integrated demand where physical distribution and materials management are interdependent (Hesse and Rodrigue, 2004).
When developing strategies for sustain-ability, a holistic view, a large enough system perspective, needs to be taken (Holmberg and Robért, 2000). In logistics, this is espe-cially important, since the complexity of logistics and freight transport decision mak-ing may lead to sub-optimisations; actions improving one part of the logistics system cre-ate problems in another part. Furthermore, sustainable logistics strategies need to take a long-term approach, since scope of time of actions corresponds to the actions’ improve-ment potentials (Jansen, 2003). The short-term approach aiming at an optimal use of the current system offer immediate improve-ments which are, however, limited. Jump-like changes can only be achieved by a radical sys-tem renewal and require long-term changes in system structures.
Earlier studies show that there is a need for developing methods that takes a holistic system approach on sustainability and logis-tics (Santén and Blinge, 2010). Most stud-ies concerning sustainable logistics focus at environment as well as one issue at a time, e.g., CO
2 – emissions or congestion (e.g.,
Piecyk and McKinnon, 2009). Furthermore, they have a short- and medium time perspec-tive and seldom take into account effects on the system as a whole. Also, actors in the logistics system require knowledge about the interdependencies of their actions.
The purpose of this paper is to take a first step towards developing a framework, having a holistic approach on sustainable logistics. The aim of the framework is to highlight the interdependencies in between decisions in different parts of the logistics system and the sustainability goals.
The composition of the paper is as fol-lows. The following section explains the research approach and the methods used. The next coming two sections present the development of the components included
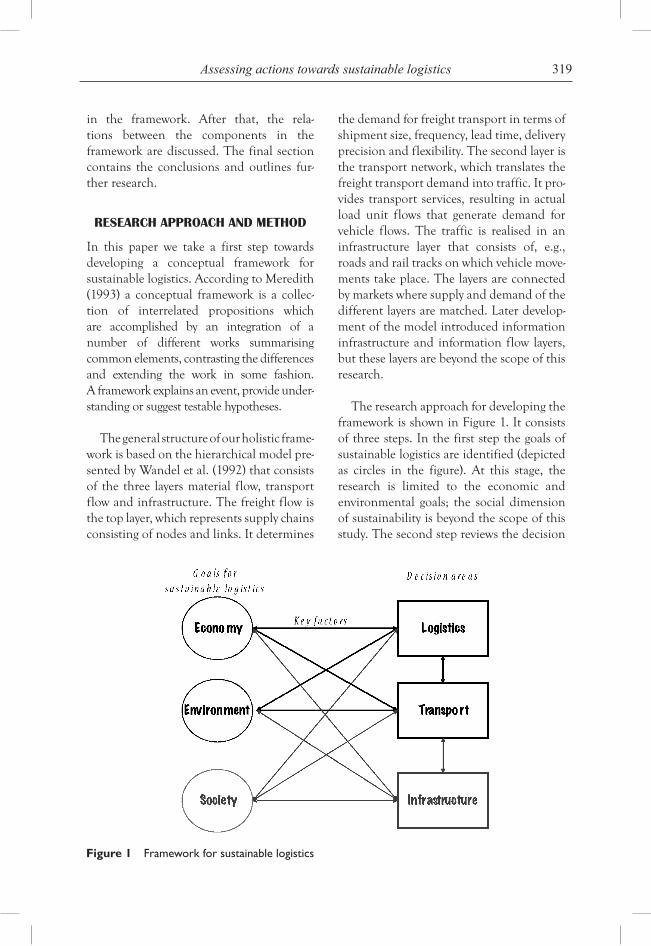
319Assessing actions towards sustainable logistics
in the framework. After that, the rela-tions between the components in the framework are discussed. The final section contains the conclusions and outlines fur-ther research.
researcH aPProacH and metHod
In this paper we take a first step towards developing a conceptual framework for sustainable logistics. According to Meredith (1993) a conceptual framework is a collec-tion of interrelated propositions which are accomplished by an integration of a number of different works summarising common elements, contrasting the differences and extending the work in some fashion. A framework explains an event, provide under-standing or suggest testable hypotheses.
The general structure of our holistic frame-work is based on the hierarchical model pre-sented by Wandel et al. (1992) that consists of the three layers material flow, transport flow and infrastructure. The freight flow is the top layer, which represents supply chains consisting of nodes and links. It determines
the demand for freight transport in terms of shipment size, frequency, lead time, delivery precision and flexibility. The second layer is the transport network, which translates the freight transport demand into traffic. It pro-vides transport services, resulting in actual load unit flows that generate demand for vehicle flows. The traffic is realised in an infrastructure layer that consists of, e.g., roads and rail tracks on which vehicle move-ments take place. The layers are connected by markets where supply and demand of the different layers are matched. Later develop-ment of the model introduced information infrastructure and information flow layers, but these layers are beyond the scope of this research.
The research approach for developing the framework is shown in Figure 1. It consists of three steps. In the first step the goals of sustainable logistics are identified (depicted as circles in the figure). At this stage, the research is limited to the economic and environmental goals; the social dimension of sustainability is beyond the scope of this study. The second step reviews the decision
Figure 1 Framework for sustainable logistics
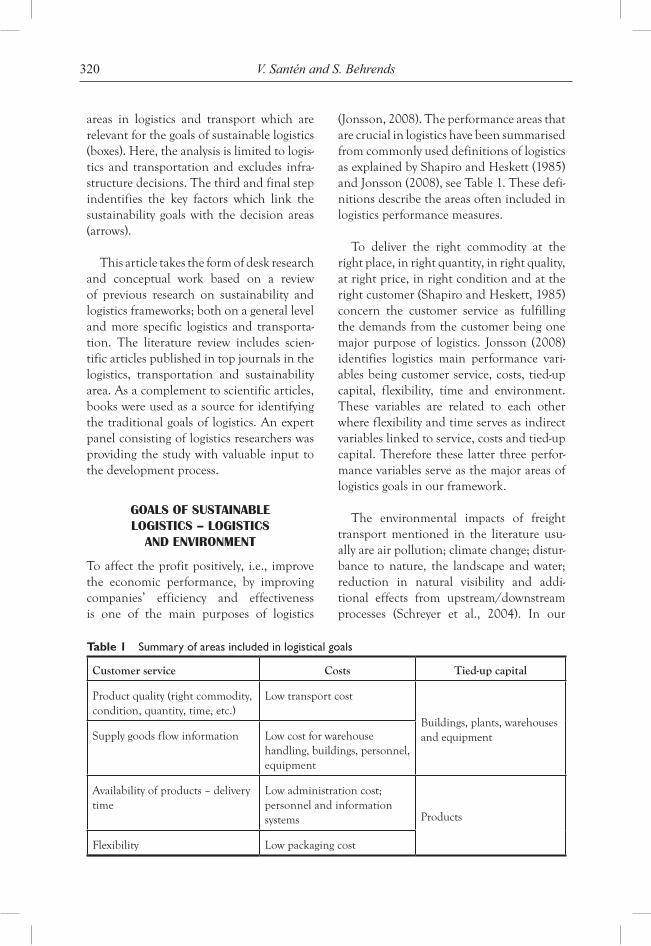
320 V. Santén and S. Behrends
areas in logistics and transport which are relevant for the goals of sustainable logistics (boxes). Here, the analysis is limited to logis-tics and transportation and excludes infra-structure decisions. The third and final step indentifies the key factors which link the sustainability goals with the decision areas (arrows).
This article takes the form of desk research and conceptual work based on a review of previous research on sustainability and logistics frameworks; both on a general level and more specific logistics and transporta-tion. The literature review includes scien-tific articles published in top journals in the logistics, transportation and sustainability area. As a complement to scientific articles, books were used as a source for identifying the traditional goals of logistics. An expert panel consisting of logistics researchers was providing the study with valuable input to the development process.
goals of sustainable logistics – logistics
and enVironment
To affect the profit positively, i.e., improve the economic performance, by improving companies’ efficiency and effectiveness is one of the main purposes of logistics
(Jonsson, 2008). The performance areas that are crucial in logistics have been summarised from commonly used definitions of logistics as explained by Shapiro and Heskett (1985) and Jonsson (2008), see Table 1. These defi-nitions describe the areas often included in logistics performance measures.
To deliver the right commodity at the right place, in right quantity, in right quality, at right price, in right condition and at the right customer (Shapiro and Heskett, 1985) concern the customer service as fulfilling the demands from the customer being one major purpose of logistics. Jonsson (2008) identifies logistics main performance vari-ables being customer service, costs, tied-up capital, flexibility, time and environment. These variables are related to each other where flexibility and time serves as indirect variables linked to service, costs and tied-up capital. Therefore these latter three perfor-mance variables serve as the major areas of logistics goals in our framework.
The environmental impacts of freight transport mentioned in the literature usu-ally are air pollution; climate change; distur-bance to nature, the landscape and water; reduction in natural visibility and addi-tional effects from upstream/downstream processes (Schreyer et al., 2004). In our
Table 1 Summary of areas included in logistical goals
Customer service Costs Tied-up capital
Product quality (right commodity, condition, quantity, time, etc.)
Low transport cost
Buildings, plants, warehouses and equipmentSupply goods flow information Low cost for warehouse
handling, buildings, personnel, equipment
Availability of products – delivery time
Low administration cost; personnel and information systems Products
Flexibility Low packaging cost
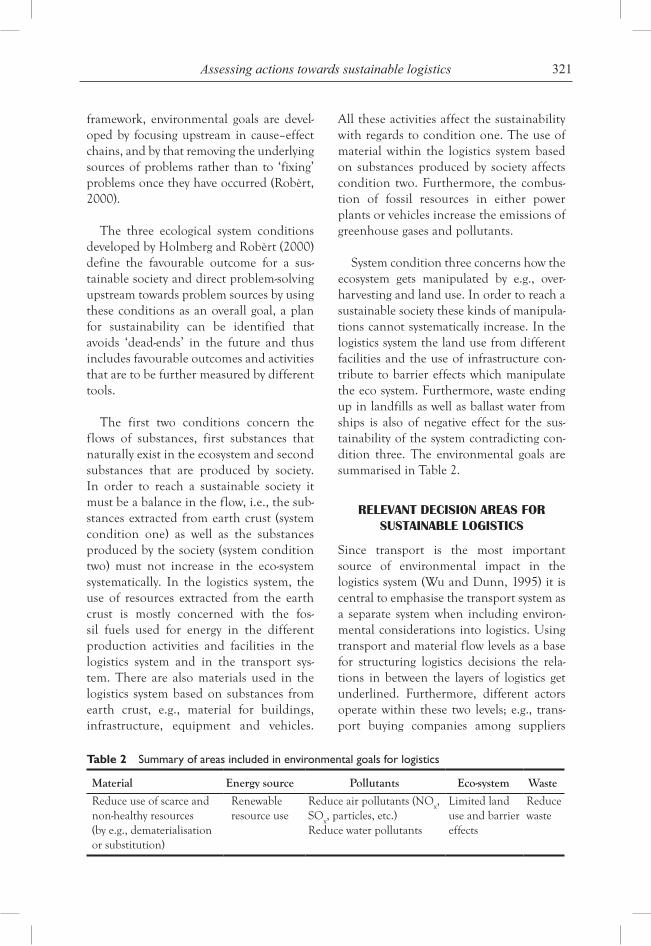
321Assessing actions towards sustainable logistics
framework, environmental goals are devel-oped by focusing upstream in cause–effect chains, and by that removing the underlying sources of problems rather than to ‘fixing’ problems once they have occurred (Robèrt, 2000).
The three ecological system conditions developed by Holmberg and Robèrt (2000) define the favourable outcome for a sus-tainable society and direct problem-solving upstream towards problem sources by using these conditions as an overall goal, a plan for sustainability can be identified that avoids ‘dead-ends’ in the future and thus includes favourable outcomes and activities that are to be further measured by different tools.
The first two conditions concern the flows of substances, first substances that naturally exist in the ecosystem and second substances that are produced by society. In order to reach a sustainable society it must be a balance in the flow, i.e., the sub-stances extracted from earth crust (system condition one) as well as the substances produced by the society (system condition two) must not increase in the eco-system systematically. In the logistics system, the use of resources extracted from the earth crust is mostly concerned with the fos-sil fuels used for energy in the different production activities and facilities in the logistics system and in the transport sys-tem. There are also materials used in the logistics system based on substances from earth crust, e.g., material for buildings, infrastructure, equipment and vehicles.
All these activities affect the sustainability with regards to condition one. The use of material within the logistics system based on substances produced by society affects condition two. Furthermore, the combus-tion of fossil resources in either power plants or vehicles increase the emissions of greenhouse gases and pollutants.
System condition three concerns how the ecosystem gets manipulated by e.g., over-harvesting and land use. In order to reach a sustainable society these kinds of manipula-tions cannot systematically increase. In the logistics system the land use from different facilities and the use of infrastructure con-tribute to barrier effects which manipulate the eco system. Furthermore, waste ending up in landfills as well as ballast water from ships is also of negative effect for the sus-tainability of the system contradicting con-dition three. The environmental goals are summarised in Table 2.
releVant decision areas for sustainable logistics
Since transport is the most important source of environmental impact in the logistics system (Wu and Dunn, 1995) it is central to emphasise the transport system as a separate system when including environ-mental considerations into logistics. Using transport and material flow levels as a base for structuring logistics decisions the rela-tions in between the layers of logistics get underlined. Furthermore, different actors operate within these two levels; e.g., trans-port buying companies among suppliers
Table 2 Summary of areas included in environmental goals for logistics
Material Energy source Pollutants Eco-system Waste
Reduce use of scarce and non-healthy resources (by e.g., dematerialisation or substitution)
Renewable resource use
Reduce air pollutants (NOx,
SOx, particles, etc.)
Reduce water pollutants
Limited land use and barrier effects
Reduce waste
322 V. Santén and S. Behrends
in supply chain in material flow level and transport operators in the transport flow level. To distinguish in between these two levels facilitate to understand other actors systems as well as to see the interface in between them.
Decision making in logistics can further be classified into three time perspectives: strategic, tactical and operational (Jonsson, 2008). The strategic perspective broadly shapes the logistics structure and sets the general guidelines for decisions taken at the tactical level, which determines goals, rules and limits for the operational level (Crainic and Laporte, 1997). In the remainder of this section the relevant decision areas concern-ing material flow and transport flow are indentified and categorised according their time perspective, i.e., strategic, tactical and operational.
Material flow
The logistics decisions on this level are shap-ing the demand for transportation, between and within companies or organisations and from suppliers to customers (Wandel et al., 1992). It is about how these companies and organisations are located, what markets to serve from each company and what sup-pliers to choose set the overall amount of transport needed. Furthermore, how to manage the planning of material within each company, what inventory level to have, etc. set the characteristics of what kind of transports needed.
Three type of decisions can be included in the strategic perspective; decisions about sourcing, production and distribution. Firstly, sourcing network is about choices regarding which suppliers to use and also about choices regarding if some production units should be outsourced externally or not. Secondly, production network regards the production such as location and capacity of
production units. Thirdly, distribution net-work is about number of markets and choices about warehouses and its location. All three network decision areas regard the structure of the different types of nodes in the network; its location, its capacity and the number of each type of node (Aronsson and Brodin, 2006; Jonsson, 2008; McKinnon, 2003; Schmidt and Wilhelm, 2000). Management of material flow is about production level in the plant, assembly policy, inventory level, shipment sizes (Schmidt and Wilhelm, 2000) and order quantities (Jonsson, 2008). The operational perspective concerns deci-sions such as scheduling deliveries of the final products to customers (Schmidt and Wilhelm, 2000), placing purchasing orders to suppliers (Jonsson, 2008) and selecting carriers for performing the actual transport (Wu and Dunn, 1995).
Transport flow
Strategic perspective concerns transport net-work design including decisions about location, capacity and type of nodes for transhipments. Woxenius (2007) defines six significantly dif-ferent theoretical designs from the perspective of transport system operator: direct link, cor-ridor, hub-and-spoke, connected hubs, static routes and dynamic routes. The networks differ in logistical requirements for their operation and in transport efficiency (Hesse and Rodrigue, 2004). Direct links between sender and receiver are easy to operate, but at the expense of efficiency since they often cre-ate less-than-full-load as well as empty return problems. Consolidation of freight in hub-and-spoke and corridor networks increases efficiency through scale economies but the logistical requirements for consolidating shipments belonging to different origins and destinations are extensive. Tactical perspec-tive concerns management of vehicle flow which concerns scheduling of vehicles and choice of transport mode. There are five basic trans-port modes for carrying out the movement
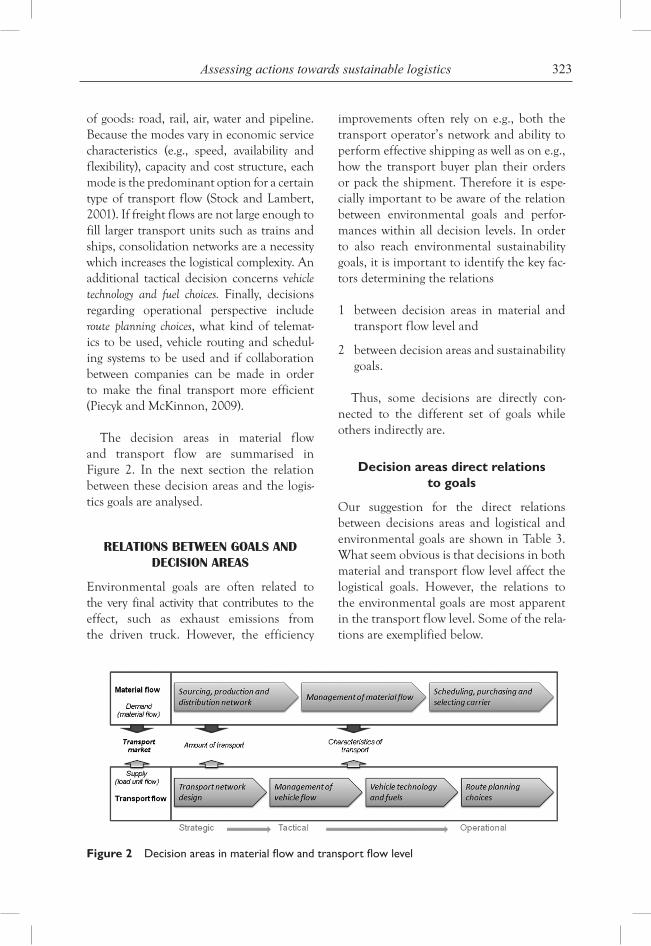
323Assessing actions towards sustainable logistics
of goods: road, rail, air, water and pipeline. Because the modes vary in economic service characteristics (e.g., speed, availability and flexibility), capacity and cost structure, each mode is the predominant option for a certain type of transport flow (Stock and Lambert, 2001). If freight flows are not large enough to fill larger transport units such as trains and ships, consolidation networks are a necessity which increases the logistical complexity. An additional tactical decision concerns vehicle technology and fuel choices. Finally, decisions regarding operational perspective include route planning choices, what kind of telemat-ics to be used, vehicle routing and schedul-ing systems to be used and if collaboration between companies can be made in order to make the final transport more efficient (Piecyk and McKinnon, 2009).
The decision areas in material flow and transport flow are summarised in Figure 2. In the next section the relation between these decision areas and the logis-tics goals are analysed.
relations between goals and decision areas
Environmental goals are often related to the very final activity that contributes to the effect, such as exhaust emissions from the driven truck. However, the efficiency
improvements often rely on e.g., both the transport operator’s network and ability to perform effective shipping as well as on e.g., how the transport buyer plan their orders or pack the shipment. Therefore it is espe-cially important to be aware of the relation between environmental goals and perfor-mances within all decision levels. In order to also reach environmental sustainability goals, it is important to identify the key fac-tors determining the relations
1 between decision areas in material and transport flow level and
2 between decision areas and sustainability goals.
Thus, some decisions are directly con-nected to the different set of goals while others indirectly are.
Decision areas direct relations to goals
Our suggestion for the direct relations between decisions areas and logistical and environmental goals are shown in Table 3. What seem obvious is that decisions in both material and transport flow level affect the logistical goals. However, the relations to the environmental goals are most apparent in the transport flow level. Some of the rela-tions are exemplified below.
Figure 2 �Decision�areas�in�material�flow�and�transport�flow�level
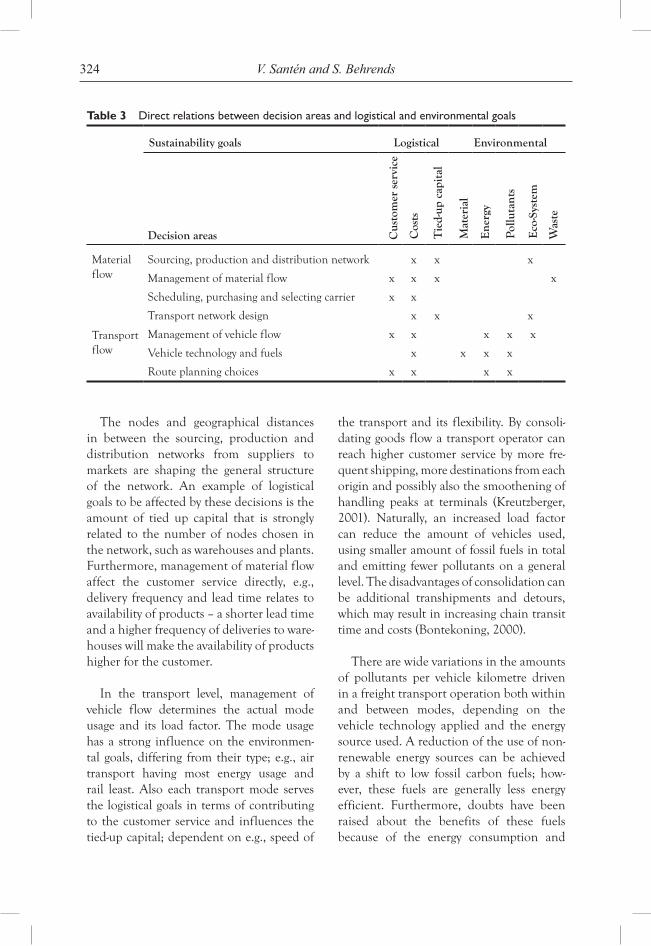
324 V. Santén and S. Behrends
The nodes and geographical distances in between the sourcing, production and distribution networks from suppliers to markets are shaping the general structure of the network. An example of logistical goals to be affected by these decisions is the amount of tied up capital that is strongly related to the number of nodes chosen in the network, such as warehouses and plants. Furthermore, management of material flow affect the customer service directly, e.g., delivery frequency and lead time relates to availability of products – a shorter lead time and a higher frequency of deliveries to ware-houses will make the availability of products higher for the customer.
In the transport level, management of vehicle flow determines the actual mode usage and its load factor. The mode usage has a strong influence on the environmen-tal goals, differing from their type; e.g., air transport having most energy usage and rail least. Also each transport mode serves the logistical goals in terms of contributing to the customer service and influences the tied-up capital; dependent on e.g., speed of
the transport and its flexibility. By consoli-dating goods flow a transport operator can reach higher customer service by more fre-quent shipping, more destinations from each origin and possibly also the smoothening of handling peaks at terminals (Kreutzberger, 2001). Naturally, an increased load factor can reduce the amount of vehicles used, using smaller amount of fossil fuels in total and emitting fewer pollutants on a general level. The disadvantages of consolidation can be additional transhipments and detours, which may result in increasing chain transit time and costs (Bontekoning, 2000).
There are wide variations in the amounts of pollutants per vehicle kilometre driven in a freight transport operation both within and between modes, depending on the vehicle technology applied and the energy source used. A reduction of the use of non-renewable energy sources can be achieved by a shift to low fossil carbon fuels; how-ever, these fuels are generally less energy efficient. Furthermore, doubts have been raised about the benefits of these fuels because of the energy consumption and
Table 3 Direct relations between decision areas and logistical and environmental goals
Sustainability goals Logistical Environmental
Decision areas
Material flow
Sourcing, production and distribution network x x x
Management of material flow x x x x
Scheduling, purchasing and selecting carrier x x
Transport flow
Transport network design x x x
Management of vehicle flow x x x x x
Vehicle technology and fuels x x x x
Route planning choices x x x x
Cus
tom
er s
ervi
ce
Cos
ts
Tie
d-up
cap
ital
Mat
eria
l
Ene
rgy
Pollu
tant
s
Eco
-Sys
tem
Was
te
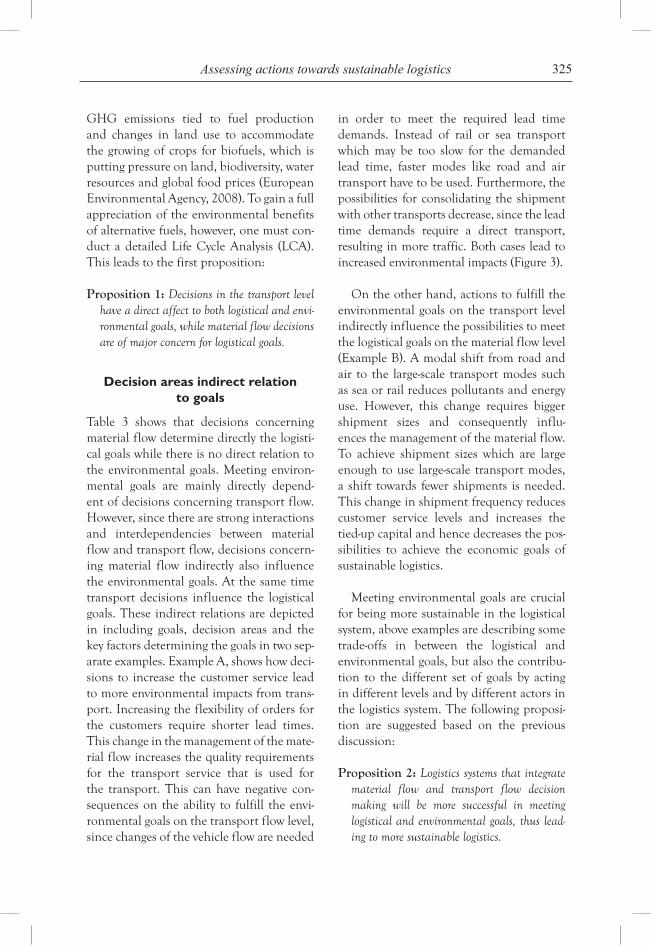
325Assessing actions towards sustainable logistics
GHG emissions tied to fuel production and changes in land use to accommodate the growing of crops for biofuels, which is putting pressure on land, biodiversity, water resources and global food prices (European Environmental Agency, 2008). To gain a full appreciation of the environmental benefits of alternative fuels, however, one must con-duct a detailed Life Cycle Analysis (LCA). This leads to the first proposition:
Proposition 1: Decisions in the transport level have a direct affect to both logistical and envi-ronmental goals, while material flow decisions are of major concern for logistical goals.
Decision areas indirect relation to goals
Table 3 shows that decisions concerning material flow determine directly the logisti-cal goals while there is no direct relation to the environmental goals. Meeting environ-mental goals are mainly directly depend-ent of decisions concerning transport flow. However, since there are strong interactions and interdependencies between material flow and transport flow, decisions concern-ing material flow indirectly also influence the environmental goals. At the same time transport decisions influence the logistical goals. These indirect relations are depicted in including goals, decision areas and the key factors determining the goals in two sep-arate examples. Example A, shows how deci-sions to increase the customer service lead to more environmental impacts from trans-port. Increasing the flexibility of orders for the customers require shorter lead times. This change in the management of the mate-rial flow increases the quality requirements for the transport service that is used for the transport. This can have negative con-sequences on the ability to fulfill the envi-ronmental goals on the transport flow level, since changes of the vehicle flow are needed
in order to meet the required lead time demands. Instead of rail or sea transport which may be too slow for the demanded lead time, faster modes like road and air transport have to be used. Furthermore, the possibilities for consolidating the shipment with other transports decrease, since the lead time demands require a direct transport, resulting in more traffic. Both cases lead to increased environmental impacts (Figure 3).
On the other hand, actions to fulfill the environmental goals on the transport level indirectly influence the possibilities to meet the logistical goals on the material flow level (Example B). A modal shift from road and air to the large-scale transport modes such as sea or rail reduces pollutants and energy use. However, this change requires bigger shipment sizes and consequently influ-ences the management of the material flow. To achieve shipment sizes which are large enough to use large-scale transport modes, a shift towards fewer shipments is needed. This change in shipment frequency reduces customer service levels and increases the tied-up capital and hence decreases the pos-sibilities to achieve the economic goals of sustainable logistics.
Meeting environmental goals are crucial for being more sustainable in the logistical system, above examples are describing some trade-offs in between the logistical and environmental goals, but also the contribu-tion to the different set of goals by acting in different levels and by different actors in the logistics system. The following proposi-tion are suggested based on the previous discussion:
Proposition 2: Logistics systems that integrate material flow and transport flow decision making will be more successful in meeting logistical and environmental goals, thus lead-ing to more sustainable logistics.
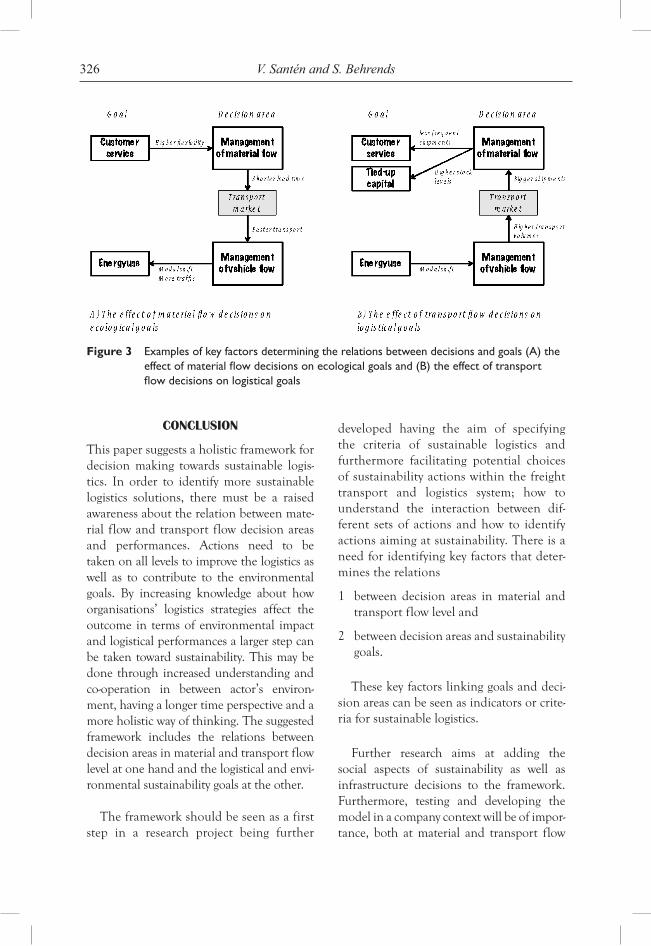
326 V. Santén and S. Behrends
conclusion
This paper suggests a holistic framework for decision making towards sustainable logis-tics. In order to identify more sustainable logistics solutions, there must be a raised awareness about the relation between mate-rial flow and transport flow decision areas and performances. Actions need to be taken on all levels to improve the logistics as well as to contribute to the environmental goals. By increasing knowledge about how organisations’ logistics strategies affect the outcome in terms of environmental impact and logistical performances a larger step can be taken toward sustainability. This may be done through increased understanding and co-operation in between actor’s environ-ment, having a longer time perspective and a more holistic way of thinking. The suggested framework includes the relations between decision areas in material and transport flow level at one hand and the logistical and envi-ronmental sustainability goals at the other.
The framework should be seen as a first step in a research project being further
developed having the aim of specifying the criteria of sustainable logistics and furthermore facilitating potential choices of sustainability actions within the freight transport and logistics system; how to understand the interaction between dif-ferent sets of actions and how to identify actions aiming at sustainability. There is a need for identifying key factors that deter-mines the relations
1 between decision areas in material and transport flow level and
2 between decision areas and sustainability goals.
These key factors linking goals and deci-sion areas can be seen as indicators or crite-ria for sustainable logistics.
Further research aims at adding the social aspects of sustainability as well as infrastructure decisions to the framework. Furthermore, testing and developing the model in a company context will be of impor-tance, both at material and transport flow
Figure 3 �Examples�of�key�factors�determining�the�relations�between�decisions�and�goals�(A)�the�effect�of�material�flow�decisions�on�ecological�goals�and�(B)�the�effect�of�transport�flow�decisions�on�logistical�goals
327Assessing actions towards sustainable logistics
level. Examples of questions to be raised are: Is the framework useful in order to identify possible actions to be taken at different areas of decisions? What key factors determine the effects from actions taken? Are these key factors possible to measure and follow up? What data are available in practice?
biograPHy
Biographical note Vendela Santén: Vendela Santén is since 2009 a PhD student in the division of Logistics and Transportation at Chalmers University of Technology. She is part of a research project that focus at sus-tainable logistics and competitiveness. Her research is about methods of how to assess logistics actions towards sustainability from a systems perspective. She has a MSc degree from 2006 within the subject of indus-trial ecology from Chalmers University of Technology. After her studies she worked for three years as a consultant within the area of sustainable logistics and transportation.
Biographical note Sönke Behrends: Sönke Behrends is a PhD candidate in Logistics and Transportation specialis-ing on sustainable freight transport. He holds a diploma in Transport Engineering from HanoverUniversity and an MSc in Management of Logistics and Transportation from Chalmers. He has worked in sev-eral European research projects on freight transport in urban areas and intermodal transport. He is an assistant lecturer and course administrator of a master course as well as a guest lecturer on the subject of sustainable transport and mobility.
references
Aronsson, H.K. and Brodin, M.H. (2006) ‘The environmental impact of changing logistics structures’, The International Journal of Logistics Management, Vol. 17, pp.394–415.
Bontekoning, Y.M. (2000) ‘The importance of new-generation freight-terminals for intermodal transport’, Journal of Advanced Transportation, Vol. 34, pp.391–413.
Chopra, S. (2003) ‘Designing the distribution network in a supply chain’, Transportation Research Part E: Logistics and Transportation Review, Vol. 39, pp.123–140.
Crainic, T.G. and Laporte, G. (1997) ‘Planning models for freight transportation’, European Journal of Operational Research, Vol. 97, pp.409–438.
Drewes Nielsen, L., Homann Jespersen, P., Petersen, T. and Gjesing Hansen, L. (2003) ‘Freight transport growth – a theoretical and methodological framework’, European Journal of Operational Research, Vol. 144, pp.295–305.
European Environmental Agency (2008) Climate for a Transport Change – TERM 2007: Indicators Tracking Transport and Environment in the European Union, European Environmental Agency, Copenhagen.
Hesse, M. and Rodrigue, J-P. (2004) ‘The transport geography of logistics and freight distribution’, Journal of Transport Geography, Vol. 12, pp.171–184.
Holmberg, J. and Robért, K.H. (2000) ‘Backcasting from non-overlapping sustainability principles – a framework for strategic planning’, International Journal of Sustainable Development and World Ecology, Vol. 7, pp.280–285.
Jansen, L. (2003) ‘The challenge of sustainable development’, Journal of Cleaner Production, Vol. 11, pp.231–245.
Jonsson, P. (2008) Logistics and Supply Chain Management, McGraw-Hill Education, Berkshire.
Kreutzberger, E. (2001) ‘Strategies to achieve a quality leap in intermodal rail or barge transportation’, IEEE Intelligent Transportation Systems Conference, Oakland, CA, USA.
Mckinnon, A. (2003) ‘Logistics and the environment’, in Hensher, D.A. and Button, K.J. (Eds.): Handbook of Transport and the Environment, Elsevier Ltd., London, UK.
Meredith, J. (1993) ‘Theory building through conceptual methods’, International Journal of
328 V. Santén and S. Behrends
Operations and Production Management, Vol. 13, pp.3–11.
Norman, W. and MacDonald, C. (2004) ‘Getting to the bottom of “Triple Bottom Line”’, Business Ethics Quarterly, Vol. 14, pp.243–262 + 345.
Piecyk, M.I. and McKinnon, A.C. (2010) ‘Forecasting the carbon footprint of road freight transport in 2020’, International Journal of Production Economics, Vol. 128, No. 1, pp.31–42.
Robèrt, K-H. (2000) ‘Tools and concepts for sustainable development, how do they relate to a general framework for sustainable development, and to each other?’ Journal of Cleaner Production, Vol. 8, pp.243–254.
Rodrigue, J-P., Slack, B. and Comtois, C. (2006) The Geography of Transport Systems, Abingdon, Oxon, England; New York, Routledge.
Santén, V. and Blinge, M. (2010) ‘Actions for more sustainable freight transport – a comparison between theory and practice’, in: The 12th World Conference on transport Research, 11–15 july, Lisbon.
Schmidt, G. and Wilhelm, W.E. (2000) ‘Strategic tactical and operational decisions in multi-national logistics networks: a review and discussion of modelling issues’,
International Journal of Production Research, Vol. 38, pp.1501–1523.
Schreyer, C., Maibach, M., Schneider, C., Rothengatter, W., Doll, C. and Schmedding, D. (2004) External Costs of Transport – Update Study, INFRAS, IWW Universität Karlsruhe, Zürich, Karlsruhe.
Shapiro, R.D. and Heskett, J.L. (1985), Logistics Strategy: Cases and Concepts, West Publishing, St Paul, MN.
Stock, J.R. and Lambert, D.M. (2001) Strategic Logistics Management, McGraw-Hill, New York.
Wandel, S., Ruijgrok, C. and Nemoto, T. (1992) ‘Relationships among shifts in logistics, transport, traffic and informatics’,in Huge, M. and Storhagen, N. (Eds.): Logistiska Framsteg – Nordiska forskningsperspektiv på logistik och materialadministration, Studentlitteratur, Lund.
Woxenius, J. (2007) ‘Generic framework for transport network designs: applications and treatment in intermodal freight transport literature’, Transport Reviews, Vol. 27, pp.733–749.
Wu, H-J. and Dunn, S.C. (1995) ‘Environmentally responsible logistics systems’, International Journal of Physical Distribution and Logistics Management, Vol. 25, pp.20–38.
Copyright © 2010 WASD
World Sustainable Development Outlook 2010
329
FOREIGN DIRECT INVESTMENT EFFECT ON EAST ASIAN
PRODUCTIVITY
Elsadig Musa Ahmed*Multimedia University, Malaysia
Abstract: This study empirically measures the impact of foreign direct investment (FDI) on productivity of ASEAN5 (Malaysia, Indonesia, Philippines, Singapore and Thailand) plus 2 (China and South Korea). Analytical interpretations in this paper have successfully corrected the defects of the predecessor study through a statistical estimation by way of arriving at the coefficients of the explanatory variables being used by econometric approach. A second step in a routine procedure has effectively plugged the parameters of the variables into a modified model in order to calculate the growth rates of productivity indicators being used by growth accounting. The examination envisages a key finding that the productivity growth of the aforesaid ASEAN5 and China has been ‘input-driven’. However, South Korea is moving towards productivity driven. As reflected from the comparison among the results of total factor productivity (TFP) growth. The study also exposes a fact that the impact of FDI has been positive in the countries under considerations.
Keywords: ASEAN5 plus 2; FDI; TFP growth; input-driven.
INTRODUCTION
Following the free trade agreements between most of the countries around the global the foreign direct investment (FDI) had found its way to the majority of the countries in general and East Asian region in particular. In this regard, South Korea reserved FDI out unless necessary for technology access or exports, joint venture and licensing encour-aged. It sustained drive to create giant private conglomerates to internalise mar-kets, lead heavy industry and create export brands. Ambitious local research and devel-opment (R&D) in advanced industry, heavy
investment in technology infrastructure, as well as targeting of strategic technologies was implemented. Moreover in Singapore case, aggressive targeting and screening of Transnational Corporations (TNCs), directed into high value-added activities. Whereas, in the case of other Association of Southeast Asian Nations (ASEAN) countries the FDI is generating most of the economic activities from the hypermarkets activities to industrial, services and most of the economic activities and it considered to be the most significant factor of economic growth in these countries.
*Corresponding author: Multimedia University, Malaysia; e-mail: [email protected], [email protected]
330 E.M. Ahmed
Contrasting others economist and analysts who forecast an eventual Asian supe-riority, Krugman (1994) believes that Asian economic growth rates will taper off signifi-cantly, well before a convergence with today’s world economic leaders. Krugman concludes that rapid growth in the Asian newly indus-trialised countries (NICs) has been the result of three primary factors. First is the transi-tion of labour from rural to industrial, the second is the education of these workers and the third contributing factor is the catching-up effect in the capital stock. What is critically lacking, Krugman argues, is an ability to innovate in technology. According to Krugman’s empirical estimates, almost all of the rapid growth in the developing economies of Asia can be accounted for by the above two factors: increased labour force participation rates and a building of the capi-tal stock. Consequently, total factor produc-tivity (TFP) has shown little or no growth as increases in labour and capital account for the economic growth that has been occur-ring. Following the convergence hypothesis, we would conclude that ultimately many of the NICs of East Asia will achieve living standards enjoyed in Japan and The United States before settling into a steady-state level of growth. If current trends continue, China will emerge as the world’s leading economic power before the middle of the twenty-first century. Other nations in the region such as Singapore, Thailand, Indonesia, Malaysia, and several others, will reside contentedly alongside the U.S. and Japan as economi-cally powerful nations. As a region, Asia will dominate the world economy.
Oguchi et al. (2002), state that FDI helped economic growth in many Asian countries during the 1970s and 1990s. For example, Malaysia actively accepted foreign investment to accelerate its economic growth during that period. One merit of FDI that is often men-tioned is technology transfer that accompa-nies new investments. Host economies expect
direct productivity improvements with FDI as well as indirect spillover effects. However, the results of empiric studies on the effects of FDI on productivity are not clear. For example, Oguchi (1994) compared produc-tion functions of Korean and Japanese firms that were operating in the Masan free trade zone and determined that Korean firms were more productive. Ramstetter (1993) also found that there was no significant difference in the production functions of Thai local manufacturing firms and foreign operating in Thailand. Lichtenberg and de la Potteries (1996) examined the effects of FDI on productivity by cross section analy-sis of 13 countries and did not find signifi-cant positive effects. In contrast, Ramstetter compared foreign multinationals and local firms in Asian countries and found that for-eign multinationals tended to rate higher than local firms in many characteristics (i.e., labour productivity, capital deepening, capi-tal productivity). Thus, empiric results on the productivity effects of FDI are not clear.
There are various possible reasons for these seemingly unexpected results. Young (1991) points out that when the FDI requires adjustments in the host economy, including adjustment of labour allocations and qual-ity, it takes time to take full advantage of the potential of new technology. Narayanan and Guan (1994) examined technology transfer in the electrical and electronics industries in Malaysia and found that, to have successful technology transfer, the receiving country must be ready to absorb new technology. In cases where labour is not ready for new tech-nology, improvement in productivity cannot be realised with FDI. Another possible reason is that, in some cases, FDI might introduce technology that is obsolete in the supplying economy and that is not necessarily more pro-ductive than technology in the host country.
This paper seeks to study the impact of FDI on productivity of ASEAN5 plus 2.
331FDI effect on East Asian productivity
This paper gives details of as follows. Section 2 contains descriptions on the esti-mation methods employed in this paper, Section 3 demonstrates details of the data. Results of the empirical analysis are explained in Section 4. Finally, Section 5 presents the conclusions.
METHODOLOGY AND ESTIMATION PROCEDURES
In this study, Cobb-Douglas production function and the Solow’s residual have been used as modified model to fill the gaps of both estimations which had previously cast doubts on the results generated.
The modified Cobb-Douglas production function in this research has followed the con-ventional growth accounting framework util-ised by Stigler (1947), Abramovitz (1956), and Kendrick (1956) to our study. This approach was initially developed by Solow (1956, 1957), finally brought to fruition by Kendrick (1961) and further refined by Denison (1962, 1979), Griliches and Jorgenson (1962), Jorgenson et al. (1987), Dewan and Kraemer (2000), used by Lee and Khatri (2003) and modified by Elsadig (2006). This approach provides wider space for decomposition of contributions of factor inputs and technological change to economic growth. This provides empirical evidence on the contributions of aggregate physical capital, employment and FDI to Gross Domestic Product (GDP) growth for a panel of developed and developing countries, including the ASEAN-5 plus 2 countries.
Production function is given in Equation (1):
GDPit = F(Kit, Lit; FDIit; Tit) (1)
where for Country i = 1, 2, …,7 in Year t = 1965–2006, the output GDP is annual real GDP, and the inputs are: real aggre-gate physical capital K, number of persons
employed L, real FDI and time T, that prox-ies for TFP as a technological progress of these countries.
The Cobb-Douglas production func-tion for Country i (i = 1, 2, …,7) in Year t (t = 1965–2006) is given in Equation (2):
∆lnGDPit = a + α.∆lnKit + β.∆lnLit + λ.∆lnFDIit + εit (2)
where
α is the output elasticity with respect to aggregate physical capital
β is the output elasticity with respect to aggregate labour
λ is the output elasticity with respect to FDI
a is the intercept or constant of the model1
εit is the residual term2
ln is the logarithm to transform the variables.
∆ is the difference operator denoting proportionate change rate.
εit is the random error term in the
model, representing the net influ-ence of all unmeasured factors. This is explained as the combination of the quality of the inputs involved, those proxies for the TFP growth.
This model is based on econometric esti-mation had gap of being based on the coeffi-cients of the estimated explanatory variables (as a homogenous measure of the explana-tory variables) and there is no calculation of contributions of productivity indicators of these explanatory variables.
Moreover, this study effectively attempts to close the gap of the divisia translog index approach that was developed by Jorgenson
332 E.M. Ahmed
et al. (1987). This approach which involves explicit specification of a production func-tion has major drawback such as inability to evaluate its reliability using statistical models, thus casting doubts on its results. Therefore, the current study provides a statistical analysis for estimating the coef-ficients of the explanatory variables that have been used for econometric approach (Equation 2). These coefficients were substi-tuted into the model (Equation 3). The divi-sia translog index approach was then used to calculate the growth rates and the con-tributions of productivity indicators which include the calculation of the residual of the model called TFP growth and the output growth that are used by growth accounting approach.
Since the intercept (a) in Equation (2) has no position in the calculation of the pro-ductivity growth indicators, a second step was proposed, which calculates the growth rates of productivity indicators transform-ing Equation (2) as an extension of the basic growth accounting framework, the Cobb-Douglas production function is specified in the parametric form of the above equation as follows:
∆lnTFPit = ∆InGDPit – [α.∆InKit + β.∆InLit + λ.∆InFDlit] (3)
where the weights are given by the aver-age value shares as follows: -
∆InGDPit is the growth rate contribution of output
α.∆InKit is the contribution of the aggre-gate physical capital
β.∆InLit is the contribution of the aggreagate labour
λ.∆InFDlit is the contribution of the FDI
∆InTFPit is the total factor productivity contribution
The framework decomposes the growth of GDP into the contributions of the rates of growth of the aggregate physical capital, labour and FDI, plus a residual term typi-cally referred to as the contribution rate of TFP.
SOURCES OF DATA
The data for this paper were collected from various sources. Real gross domestic prod-uct, real aggregate fixed capital, number of employment and real FDI were collected from Asian Development Bank: Key indi-cators of developing Asia and Pacific coun-tries, Statistical and Data Systems Division, and international financial statistics of International Monetary Fund, yearbook. As well as from the individual countries databases, World Development Indicators and the International Labour Organisation
RESULTS AND DISCUSSION
Autoregressive estimator has been applied to Equation (2) of the model being generated from Cobb-Douglas production function to measure the shift in the production func-tions of ASEAN-5 plus 2. An annual time series data over the period of 1960–2006 for real GDP, real aggregate physical capital, number of employment and real FDI were employed for the individual countries.
In view of the fact that the model used in this study was specified in first differences and the calculated growth rates were used in the discussion of results and findings of the study, the model was found to be station-ary. In addition, Table 1 presents the results of the unit root tests conducted. Likewise, Engle and Granger (2003), state that if economic relationships are specified in first differences instead of levels, the statistical difficulties due to non-stationary variables can be avoided because the differenced
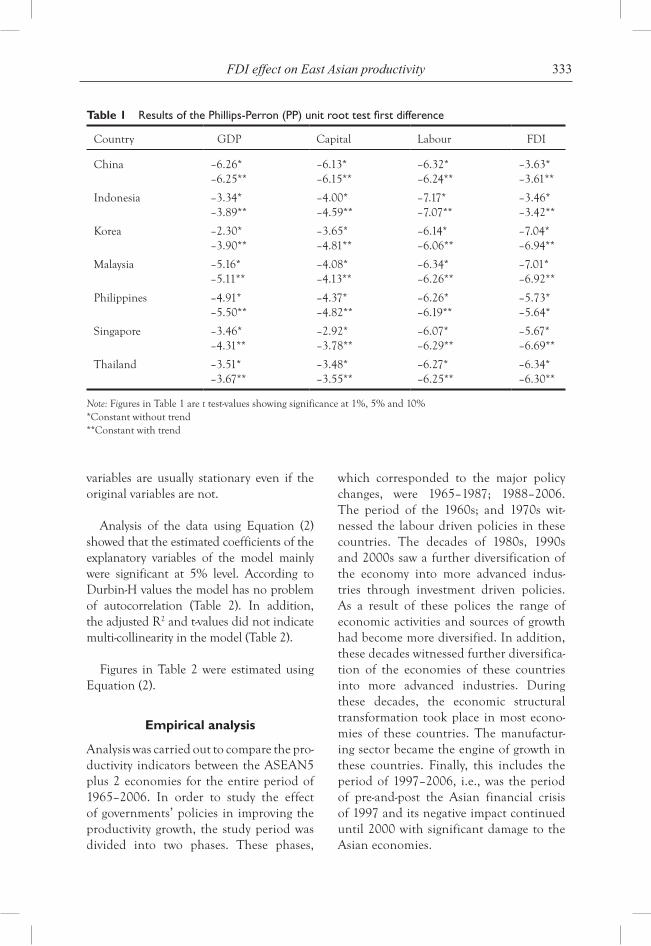
333FDI effect on East Asian productivity
variables are usually stationary even if the original variables are not.
Analysis of the data using Equation (2) showed that the estimated coefficients of the explanatory variables of the model mainly were significant at 5% level. According to Durbin-H values the model has no problem of autocorrelation (Table 2). In addition, the adjusted R2 and t-values did not indicate multi-collinearity in the model (Table 2).
Figures in Table 2 were estimated using Equation (2).
Empirical analysis
Analysis was carried out to compare the pro-ductivity indicators between the ASEAN5 plus 2 economies for the entire period of 1965–2006. In order to study the effect of governments’ policies in improving the productivity growth, the study period was divided into two phases. These phases,
which corresponded to the major policy changes, were 1965–1987; 1988–2006. The period of the 1960s; and 1970s wit-nessed the labour driven policies in these countries. The decades of 1980s, 1990s and 2000s saw a further diversification of the economy into more advanced indus-tries through investment driven policies. As a result of these polices the range of economic activities and sources of growth had become more diversified. In addition, these decades witnessed further diversifica-tion of the economies of these countries into more advanced industries. During these decades, the economic structural transformation took place in most econo-mies of these countries. The manufactur-ing sector became the engine of growth in these countries. Finally, this includes the period of 1997–2006, i.e., was the period of pre-and-post the Asian financial crisis of 1997 and its negative impact continued until 2000 with significant damage to the Asian economies.
Country GDP Capital Labour FDI
China –6.26*–6.25**
–6.13*–6.15**
–6.32*–6.24**
–3.63*–3.61**
Indonesia –3.34*–3.89**
–4.00*–4.59**
–7.17*–7.07**
–3.46*–3.42**
Korea –2.30*–3.90**
–3.65*–4.81**
–6.14*–6.06**
–7.04*–6.94**
Malaysia –5.16*–5.11**
–4.08*–4.13**
–6.34*–6.26**
–7.01*–6.92**
Philippines –4.91*–5.50**
–4.37*–4.82**
–6.26*–6.19**
–5.73*–5.64*
Singapore –3.46*–4.31**
–2.92*–3.78**
–6.07*–6.29**
–5.67*–6.69**
Thailand –3.51*–3.67**
–3.48*–3.55**
–6.27*–6.25**
–6.34*–6.30**
Table 1 Results of the Phillips-Perron (PP) unit root test first difference
Note: Figures in Table 1 are t test-values showing significance at 1%, 5% and 10% *Constant without trend**Constant with trend
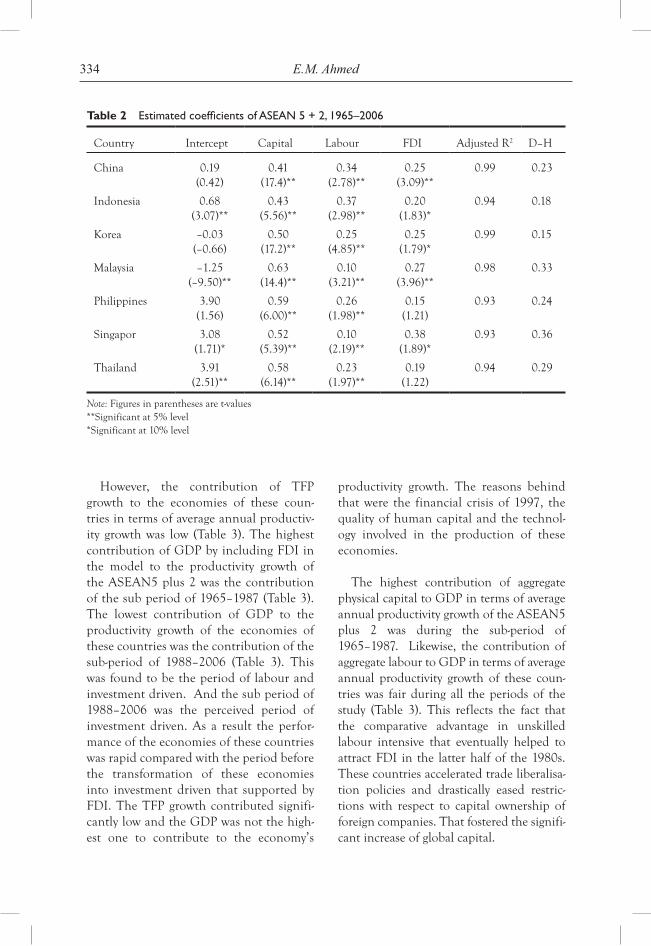
334 E.M. Ahmed
However, the contribution of TFP growth to the economies of these coun-tries in terms of average annual productiv-ity growth was low (Table 3). The highest contribution of GDP by including FDI in the model to the productivity growth of the ASEAN5 plus 2 was the contribution of the sub period of 1965–1987 (Table 3). The lowest contribution of GDP to the productivity growth of the economies of these countries was the contribution of the sub-period of 1988–2006 (Table 3). This was found to be the period of labour and investment driven. And the sub period of 1988–2006 was the perceived period of investment driven. As a result the perfor-mance of the economies of these countries was rapid compared with the period before the transformation of these economies into investment driven that supported by FDI. The TFP growth contributed signifi-cantly low and the GDP was not the high-est one to contribute to the economy’s
productivity growth. The reasons behind that were the financial crisis of 1997, the quality of human capital and the technol-ogy involved in the production of these economies.
The highest contribution of aggregate physical capital to GDP in terms of average annual productivity growth of the ASEAN5 plus 2 was during the sub-period of 1965–1987. Likewise, the contribution of aggregate labour to GDP in terms of average annual productivity growth of these coun-tries was fair during all the periods of the study (Table 3). This reflects the fact that the comparative advantage in unskilled labour intensive that eventually helped to attract FDI in the latter half of the 1980s. These countries accelerated trade liberalisa-tion policies and drastically eased restric-tions with respect to capital ownership of foreign companies. That fostered the signifi-cant increase of global capital.
Country Intercept Capital Labour FDI Adjusted R2 D–H
China 0.19(0.42)
0.41(17.4)**
0.34(2.78)**
0.25(3.09)**
0.99 0.23
Indonesia 0.68(3.07)**
0.43(5.56)**
0.37(2.98)**
0.20(1.83)*
0.94 0.18
Korea –0.03(–0.66)
0.50(17.2)**
0.25(4.85)**
0.25(1.79)*
0.99 0.15
Malaysia –1.25(–9.50)**
0.63(14.4)**
0.10(3.21)**
0.27(3.96)**
0.98 0.33
Philippines 3.90(1.56)
0.59(6.00)**
0.26(1.98)**
0.15(1.21)
0.93 0.24
Singapor 3.08(1.71)*
0.52(5.39)**
0.10(2.19)**
0.38(1.89)*
0.93 0.36
Thailand 3.91(2.51)**
0.58(6.14)**
0.23(1.97)**
0.19(1.22)
0.94 0.29
Table 2 Estimated coefficients of ASEAN 5 + 2, 1965–2006
Note: Figures in parentheses are t-values**Significant at 5% level*Significant at 10% level
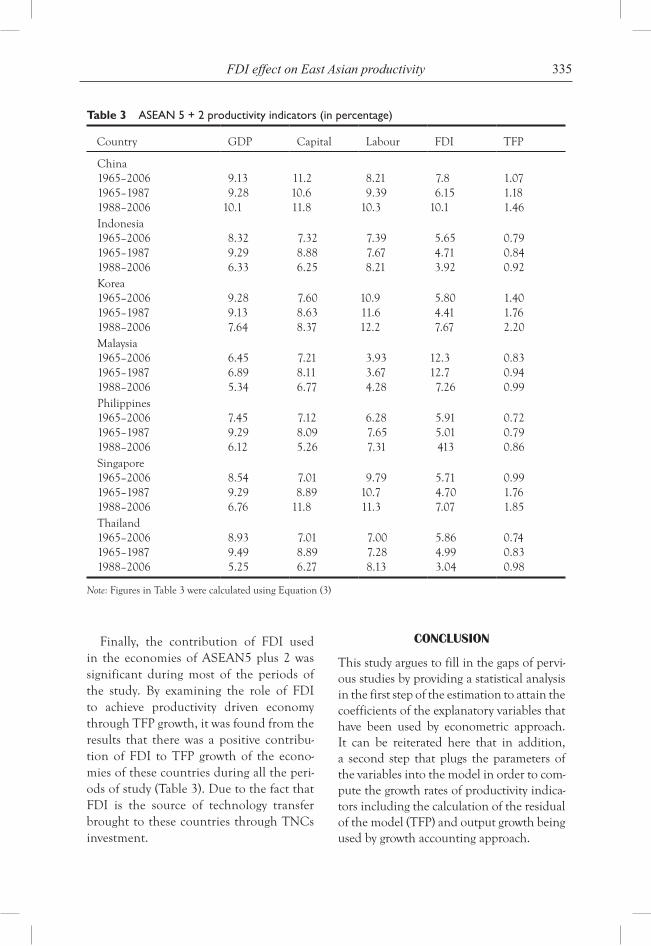
335FDI effect on East Asian productivity
Finally, the contribution of FDI used in the economies of ASEAN5 plus 2 was significant during most of the periods of the study. By examining the role of FDI to achieve productivity driven economy through TFP growth, it was found from the results that there was a positive contribu-tion of FDI to TFP growth of the econo-mies of these countries during all the peri-ods of study (Table 3). Due to the fact that FDI is the source of technology transfer brought to these countries through TNCs investment.
CONCLUSION
This study argues to fill in the gaps of pervi-ous studies by providing a statistical analysis in the first step of the estimation to attain the coefficients of the explanatory variables that have been used by econometric approach. It can be reiterated here that in addition, a second step that plugs the parameters of the variables into the model in order to com-pute the growth rates of productivity indica-tors including the calculation of the residual of the model (TFP) and output growth being used by growth accounting approach.
Country GDP Capital Labour FDI TFP
China 1965–20061965–19871988–2006
9.139.28
10.1
11.210.611.8
8.219.39
10.3
7.86.15
10.1
1.071.181.46
Indonesia1965–20061965–19871988–2006
8.329.296.33
7.328.886.25
7.397.678.21
5.654.713.92
0.790.840.92
Korea1965–20061965–19871988–2006
9.289.137.64
7.608.638.37
10.911.612.2
5.804.417.67
1.401.762.20
Malaysia1965–20061965–19871988–2006
6.456.895.34
7.218.116.77
3.933.674.28
12.312.77.26
0.830.940.99
Philippines 1965–20061965–19871988–2006
7.459.296.12
7.128.095.26
6.287.657.31
5.915.01413
0.720.790.86
Singapore1965–20061965–19871988–2006
8.549.296.76
7.018.89
11.8
9.7910.711.3
5.714.707.07
0.991.761.85
Thailand 1965–20061965–19871988–2006
8.939.495.25
7.018.896.27
7.007.288.13
5.864.993.04
0.740.830.98
Table 3 ASEAN 5 + 2 productivity indicators (in percentage)
Note: Figures in Table 3 were calculated using Equation (3)
336 E.M. Ahmed
The results show that the productivity growth of ASEAN5 plus China is input driven. On the other hand, South Korea is moving towards productivity driven; this is supported by the ability of its companies to compete in international markets of prod-ucts and investment. The study also finds that the impact of FDI is positive with little contribution to TFP growth. These findings are in line with the findings of the studies undertaken by Young (1992, 1995) and Kim and Lau (1994), in which the authors state that other Asian newly industrialised countries’ productivity was input driven. Sarel (1996) also expressed concerns that some East Asian countries may face the same fate as the Soviet Union. His percep-tion bears reasonable assumptions as these countries invested primarily in labour and capital rather than in technology over the past few decades and there was no real technological drive that can sustain the progress of the industrial development. According to Krugman (1994), the high growth rates in East Asian are, however, not sustainable because Asian growth has come primarily from increases in the amount of labour and capital rather than in TFP (i.e., knowledge and techni-cal change). At some point, according to his argument, it will no longer be possible to continue raising levels of capital and labour. Consequently, East Asian growth rates must eventually fall in the absence of improvements in TFP.
These results also confirmed that FDI had a very significant role in achieving higher output growth that produced by these economies through using huge input to produce output. Thanks to FDI that helped the manufacturing sector to become the engine of economic growth instead of agricultural sector when economic struc-tural transformation took place at these economies in 1980s.
REFERENCES
Abramovitz, M. (1956) ‘Resource and output trends in the United States since 1870’, American Economic Review, Vol. 46, No. 2, pp.5–23.
Denison, E.F. (1962) The Sources of Economic Growth in the United States and the Alternative Before Use, Supplementary Paper, Committee for Economic Development, New York, pp.229–255.
Denison, E.F. and Edward, V. (1979) Accounting of Slower Economic Growth: The United States in the 1970s’, The Brooking Institution, Washington.
Dewan, S. and Kraemer, K.L. (2000) ‘Information technology and productivity: evidence from country-level data’, Management Science, Vol. 46, No. 4, pp.548–562.
Elsadig, M.A. (2006) ‘Carbon dioxide emissions, impact on Malaysia’s manufacturing productivity growth’, World Review of Science, Technology and Sustainable Development, Vol. 3, No. 1, pp.58–69.
Elsadig, M.A. (2006) ‘ICT and human capital role in achieving knowledge-based economy: applications on Malaysia’s manufacturing’, Journal of Information and Knowledge Management, Vol. 5, No. 2, pp.117–128.
Engle RF, Granger, CWJ (2003) Time-series Econometric: Cointegration and Autoregressive Conditional Heteroskedasticity, Advanced information on the Bank of Sweden Prize in Economic Sciences in Memory of Alfred Nobel.
Griliches, Z. and Jorgenson D.W. (1962) ‘Capital theory: technical progress and capital structure, sources of measured productivity change capital input’, American Economic Review, Vol. 52, No. 1, pp.50–61.
Jorgenson D.W., Gollop F.M. and Fraumenri B. (1987) Productivity and US Economic Growth. North Holland Publishing, Amsterdam.
Kendrick, J.W. (1956) ‘Producative trends capital and labour’, Review of Economics and Statistics, Vol. 38, No. 3, pp.248–257.
Kendrick, J.W. (1961) Productivity Trends in the United States, Princeton, Princeton.
337FDI effect on East Asian productivity
Kim, J. (II) and Lau, L. (1994) ‘The sources of economic growth of the East Asian newly industrialised countries’, Journal of Japanese and International Economies, Vol. 8, pp.235–271.
Krugman, P. (1994) ‘The myth of Asia’s miracle’, Foreign Affairs, November/December, pp.62–78.
Lee, I.H. and Khatri, Y. (2003) Information Technology and Productivity Growth in Asia, IMF Working Paper, WP/03/15.
Lichtenberg, F.R. and de la Potteries, B.V.P. (1996) International R & D Spill-over: A Re-examination’, National Bureau of Economic Research Working Paper 5668.
Narayanan, S. and Guan, C.K. (1994) Technology Transfer to Malaysia: Cases of Electrical and Electronics Industry in Penang Area, United Nations Development Program, Kuala Lumpur, Malaysia.
Oguchi, N. (1994) ‘The growth of the Korean economy and foreign capital’, in Ichimurs, S. and Masumoto, Y. (Eds.): Econometric Models of Asia-Pacific Economics, Springer-Verlag, Tokyo, New York, pp.363–500.
Oguchi, N. Amdzah, N.A.M., Bakar, Z., Abidin, R.Z. and Shafii, M. (2002) ‘Productivity of foreign and domestic firms in the Malaysian manufacturing industry’, Asian Economic Journal, Vol. 16, No. 3, pp.215–228.
Ramstetter, E.D. (1993) Production Technology in Foreign and Local Firms in Thai Manufacturing, Discussion Paper No. 8, Graduate School of International Development, Nagoya University, Nagoya, Japan.
Sarel, M. (1996) Growth in East Asia: What We Can and Cannot Infer, IMF Working Paper
95/98, International Monetary Fund, Washington DC.
Solow, R.M. (1956) ‘The production function and the theory of capital’, Review of Economics Studies, Vol. 23, pp.101–108.
Solow R.M. (1957) ‘Technical change and the aggregate production function’, Review of Economics and Statistics, Vol. 39, pp.312–320.
Stigler, G.J. (1947) ‘Trends in output and employment’, National Bureau of Economic Research, New York.
Young, A. (1991) ‘A tale of two cities: factor accumulation and technical change in Hong Kong and Singapore’, National Bureau of Economic Research Macroeconomic Annual, Vol. 7, pp.13–54.
Young, A. (1992) ‘A tale of two cities: factor accumulation and technological change in Hong-Kong and Singapore’, National Bureau of Economic Research, Macroeconomics Annual, pp.13–54.
Young, A. (1995) ‘The tyranny of numbers: confronting the statistical realities of the East Asian growth experience’, Quarterly Journal of Economics, Vol. 110, pp.641–680.
NOTES
1 The intercept term, as usual, gives the mean or average effect on dependent variable of all the variables excluded from the model.
2 The residual term proxies for the total factor productivity growth that accounts for the technological progress of the economy through the quality of input terms.

Copyright © 2010 WASD
World Sustainable Development Outlook 2010
339
Rethinking globalisation: building institutional
capacity foR development
Amer Al-Roubaie* and Niren VyasAhlia University, Kingdom of Bahrain
Abstract: The main purpose of this paper is to highlight the importance of rethinking development by building institutional infrastructure capable of managing and organising change. In particular, attention will be paid to economic institutions, including markets, states, both knowledge and financial systems and innovation. These institutions influence the process of development by directly contributing to economic growth through the better utilisation of human and natural resources of society. In recent years, the rise of globalisation has been putting pressure on coun-tries to compete in global markets through the liberalisation of trade and finance and the privatisation of the local economy. Such trends have made development more complex by increasing dependency and creating uncertainty about global imbalances. In this paper more attention will be paid to poverty reduction as an important goal for institutional development.
Keywords: Institutions, Development, Capacity Building, Globalization, Poverty, finance, Human capital
intRoduction
Economic development is a multi- dimensional concept not only comprising economic and financial factors, but also social, political, environmental, religious and cultural inputs. It constitutes complex processes which require making sound decisions, formulating appropriate macro-economic policies, constructing effective planning methods, building institutional capacity, maintaining peace and promoting equity. Given these broad and ambitious objectives, no development policy is capable of delivering without the collective efforts of all members of society. Otherwise, devel-opment will continue to suffer from the lack of direction and slow transformation.
The challenges facing developing countries are of tremendous magnitudes which may require the assistance and cooperation of both national and international institu-tions. Poverty alleviation, investment allo-cation, global integration, environmental degradation, information dissemination and knowledge creation are among the pressing challenges that most developing countries need to overcome if development is to take place. Building adequate institutional capac-ity for development is a necessary condition in order to facilitate change and promote development. The allocation of resources requires making decisions, implementing projects, as well as creating mechanisms for achieving equity through production and
*Corresponding author: Ahlia University, Kingdom of Bahrain; e-mail: [email protected]
340 A. Al-Roubaie and N. Vyas
distribution. In addition, effective admin-istration, good management, and efficient organisation could speed up the process of development by enhancing the implemen-tation of various decisions concerning the allocation of resources. To this end, building institutional capacity allows for leapfrogging by surpassing several developmental stages.
the meaning of development and its dimensions
Economic development is a process of structural change which involves building human, physical and institutional infra-structures capable of fostering change and promoting development. In this regard, the institutional structure of the state is vital in order to support rapid socio-economic transformation and to sustain development. Speeding up the process of development would require effective managerial, organi-sational and administrative systems capable of allocating the resources of society in a productive manner.
As a process of structural change, eco-nomic development involves the transfor-mation into a new stage of the entire soci-ety, including the social order. Under such circumstances, not only is change in the eco-nomic sphere required, but change is also required in terms of the social, cultural and political features of society. Development is concerned with the local conditions, and therefore, without taking into consideration the indigenous characteristics of the local environment, it is likely that development will suffer from social discontent, political unrest and group disagreement. Past experi-ence has shown that very few countries were able to achieve satisfactory socio-economic progress and meet development objectives. However, the task of development has become more complex due to the pluralistic nature of world societies and by virtue of
the variations among the socio-cultural fea-tures of different groups.
The challenges facing developing coun-tries are more complex and cannot expect to be resolved through the capabilities of individuals, groups, enterprises and organi-sations alone. Issues like poverty allevia-tion, education, health, income and wealth distribution, environmental degradation, resource allocation, investment decisions and economic planning and policies, are national objectives which need to be collec-tively addressed. Being a multidimensional approach, economic development is about making choices with regard to how the scarce resources in society are allocated to meet such challenges. In other words, pub-lic participation in the process of develop-ment becomes vital in order to achieve the broad objectives of society. In most devel-oping countries, the exclusion of certain groups or sectors is responsible for income inequalities and economic deprivation.
The adoption or adaptation of Western models and theories without modification to suit the local conditions may indeed slow down growth and hinder rapid transforma-tion. The institutional set up in Western countries is a product of modernity driven by the materialistic and individualistic desire to derive pleasure and gain profit. The interest of the society, on the other hand, is served through the hidden hands of vari-ous individual activities acting to maximise their benefits. In contrast, in many develop-ing countries economic development is still driven by traditional values and indigenous knowledge which is incompatible with mod-ern technology and scientific application. Access to global knowledge and information will add value to development by encourag-ing rapid growth and higher productivity. Modern science and technology is a product of the Western civilisation, the application
341Rethinking globalisation: building institutional capacity for development
of which could negatively impact the indig-enous system of production and the ecology of non-Western societies.
The complex nature of development underscores the importance of planning, monitoring, reviewing, managing and orga-nising factors of production to ensure that the process of transformation meets the national objective. Implementing such tasks requires the building of effective institutions capable of supervising and making necessary adjustments if such is required, i.e., an effec-tive institutional infrastructure is required to provide the necessary incentives for both the public and private sectors to fully par-ticipate in the process of development.
Currently, the increasing global inequali-ties between the developed and developing countries are making the process of devel-opment more complicated. The developing countries depend on the global markets to support their capacity to import, particularly in terms of capital goods and technology. A high degree of concentration on trade subjects the economies of these countries to a high degree of instability due to the busi-ness cycle and changes in the economic and trade policies of industrial countries. The global factor movements are influenced by the decisions of key players, including the industrial countries, multinational corpora-tions and special interest groups. The bar-gaining powers of the developing countries are constrained by virtue of their weak influ-ence over trade movements and by disagree-ments among member countries to negotiate collectively. Almost two decades have passed since the establishment of the World Trade Organisation (WTO), and still an agreement to settle the outstanding issues concerning world trade has yet to be reached.
Income inequality is common among developing countries, which is a reflection
of the failure of development policies to correct gross imbalances and redistribute income in an equitable manner. E.g., the income earned as a result of rapid economic growth in India in recent years has contrib-uted little towards increasing the income share of the poor in terms of total income. Almost 73% of the population in India lives on less than $2 a day. Reducing inequali-ties and redistributing gains from economic growth in an equitable manner depends on the institutional structure of the society. If laws, policies and decisions are not imple-mented, this implies that the institutional structure is inadequate in terms of achiev-ing the development objectives. In a democ-racy, the government is accountable to the people, and therefore, it must ensure that equity will be enjoyed by all members of society. Equity is concerned with fairness, freedom and justice which all citizens must enjoy without discrimination and free from bias towards race, creed, culture or language. Towards that end, equitable development becomes vital in order to foster economic growth and enhance the capabilities of a society so that society may leap forward.
The allocation of resources is at the cen-tre of any development policy. In develop-ing countries, resources are usually scarce, and therefore, making good use of the existing resources accelerates the process of development. The drive for rapid develop-ment depends on leadership and the role the government plays in financing public projects. The aim of government policies is to choose between alternatives and sub-sequently select the best options available in order to maximise the benefits of public expenditure. Ultimately, that expenditure enhances the capacity of a society to build physical infrastructures and human capi-tal which are needed in order to induce change and accelerate the process of development.
342 A. Al-Roubaie and N. Vyas
human development and economic pRogRess
In recent years emphasis in development studies has shifted towards human develop-ment as an alternative approach to socio-economic transformation. Since the early 1990s, the United Nations has been publish-ing Human Development Reports recognis-ing the need for human development as a core requirement for rapid socio-economic progress. Human development is concerned with increasing the capabilities of people so that they may participate in decision mak-ing and actively contribute to the economy. This is done through education, refining skills, good health, equal opportunity and higher income levels. The ultimate objective of development is to fulfill the desires and hopes of people for a better lifestyle and for a more promising future.1
Building institutions specifically for learn-ing and training are vital for socio-economic transformation. These institutions could have a determining impact on the overall growth process by increasing the leapfrog-ging capabilities of society and determine the path for sustainable development. The human factor plays a key role in the process of development. Sound macroeconomic policies and effective investment decisions are a reflection of the capabilities of peo-ple, which also includes knowledge, skills, information, motivation and creativity. The creativity of a people depends on the ability to apply, absorb and create knowledge that may be used to create employment opportu-nities and generate wealth.
In developing countries, investment in education should be designed to meet the immediate challenges facing development. Education is a public good and therefore, no individual or group should be excluded from learning. This is to ensure that every citizen is given the equal opportunity to learn and
contribute to development. Furthermore, education is an important component of human rights which should be made avail-able to all citizens regardless of colour, race, religion, gender and social status. Under such circumstances, the poor will be afforded equal opportunity to acquire knowledge and become active in the economy.
building institutions foR development
Institutions are about establishing rules and guidelines which provide direction for both public and private agents to function. These rules enable various agents to make deci-sions in a manner which increase productiv-ity and enhance communications. Efficient institutions have the capability to foster growth by providing the necessary support and incentives for people and organisations to work and earn profit. In a free market economy, the risk of doing business repre-sents an important element in decision mak-ing. Under such circumstances, institutions provide a shield against risk by increasing market confidence and encouraging inves-tors to make sound decisions. In developing countries, institutions could minimise mar-ket risks by providing protection for those willing to conduct business. As pointed out by Douglass North,
“they provide incentives and disincentives for people to behave in certain ways; and if they are effective they structure and provide incentives and also structure eco-nomic, political and social activity.”2
Institutions allow human and physical resources to be mobilised in an efficient manner increasing the process of economic potential to create jobs, generate wealth, alleviate poverty and accelerate economic growth. They enhance public participation by providing opportunities to all people to
343Rethinking globalisation: building institutional capacity for development
engage in economic activities. In the case of developing countries, effective institutions could also reduce costs and allow for a better utilisation of savings by channelling them into productive investments. In addition, due to low degree of research undertaking and the inadequacy of educational institu-tions in developing countries, building insti-tutional capacity increases the prospects of innovation, i.e., institutions allow people to use their skills and limited resources in more productive ways. Economic development is about the enforcement of rules and creat-ing conditions to support higher growth. As explained by the World Bank,
“Institutions are rules, enforcement mech-anisms, and organizations…. Distinct from policies, which are the goals and desired outcomes, institutions are the rules, including behavioral norms, by which agents interact-and the organizations that implement rules and codes of conduct to achieve desired outcomes.”3
Without adequate institutions, the soci-ety will have limited opportunities to pro-mote economic diversification and reduce poverty. Today, economic development is no longer confined to local resources and markets alone, it also comprises external dimensions, i.e., more choices are given to producers through global markets. In most developing countries, economic activities are limited due to market constraints and inadequate linkages to stimulate growth. Thus the challenge facing governments is to establish institutions capable of accelerating the process of development and fostering economic growth. Similarly, the existence of monopolies and market imperfections hin-der competition and slows down the work-ing of markets, i.e., building institutional capacity eases the power of monopolies and widens the scope of competition by allow-ing individuals, groups and companies to participate in economic activities.
The experience of a number of coun-tries with institutional building has shown that institutions positively contributed to development.4 It is important to keep in mind however, that duplicate institutions, particularly Western institutions, may not necessarily be as effective if instituted in other countries. E.g., institutions in coun-tries with a high level of corruption may be in conflict with the rules and conditions practiced in the market economy. In other words, in societies where governments are not in control of market forces, it would be difficult for institutions to work. On its part, the government passes laws and introduces measures to regulate the market and correct imperfections. However, the effectiveness of institutions depends on the capabilities of human capital to implement government rules and manage market activities. Building institutions is not an easy task and is costly for many countries. To this end, develop-ing countries may need support in building their institutional structure by reaching out to industrial countries and international institutions for assistance. The experience of many countries with institutional build-ing may be a learning process for the devel-oping countries.
institutions foR poveRty Reduction
In most developing countries, poverty reduc-tion remains among the most pressing prob-lems encountered by national governments, individuals, groups, non-governmental organisations, private institutions, interna-tional bodies and various other religious and social societies. Poverty means that a large number of people were denied the chance to participate in development. Poor people lack the financial, educational, technical, economic and political means required in order to gain access to resources and mar-kets. State institutions could minimise the
344 A. Al-Roubaie and N. Vyas
risk of exclusion by providing the necessary funding, increasing schooling and learning, building adequate training centres, estab-lishing a legal system, and introducing fair and equitable tax policies in order to ensure equity and reduce inequality. Without gov-ernment support, the poor may not be able to gain access to resources nor will they be able to fully participate in development and contribute to the economy. Economically, institutions empower the poor by allowing them to explore their potential and contrib-ute to the productivity of the economy.
Jeffery Sachs identifies six major capitals which poor countries need to create in order to promote development. These six are:
1 human capital
2 business capital
3 infrastructure
4 natural capital
5 public institutional capital and
6 knowledge capital.
The fifth classification is defined by Sachs as; “the commercial law, judicial sys-tems, government services and policing that underpin the peaceful and prosperous division of labor.”5 The building of public institutional capital becomes necessary for development. As productivity increases and market expands, intervention by the government is needed to resolve conflicts and regulate the market. In the early stages of development, markets are not expected to function in an efficient manner. Government interference could minimise the power of monopolies and reduce the mismanagement of resources.
Development is not possible without solving the ills of poverty. Unfortunately, poverty is a man-made problem and is not necessarily related to the lack of resources.
In other words, poverty is a product of human action driven by greed, power, influ-ence and discriminatory practices. Amongst the developing countries, Africa is very rich in resources but very poor in human resource management. Income inequali-ties are common in most African countries where a small percentage of the population own the bulk of income leaving the major-ity poor and desperate. The right to food is a moral condition that every society must provide. As pointed out by the United Nations,
“The right to food is, first of all, a basic human right enshrined in international law. It is the right of every person to have continuous access to the resources neces-sary to produce, earn or purchase enough food, not only to prevent hunger, but also to ensure health and well-being. The right to food provides a coherent framework within which to address critical gover-nance dimensions of the fight against hunger and gives voice to a wide array of relevant groups and individuals. It estab-lishes principles that govern decision-making and implementation processes, namely participation, non-discrimination, transparency and empowerment. It also provides a legal framework – based on the concepts of rights and obligations – and mechanisms for increased accountability and the rule of law.”6
financial institutions foR development
Microfinance has become widely used in financing small businesses and farmers worldwide. The objective of microfinance is to provide financial assistance to poor peo-ple and other unprivileged groups whose access to finance from conventional banks is limited due to the lack of assets or collateral to support loan guarantees. Microfinance could have a significant impact on national programs to combat poverty. It empowers
345Rethinking globalisation: building institutional capacity for development
the poor, especially women, with the finan-cial means to invest and gain access to the market. Today, micro-finance is becoming the fastest growing form of financing rural projects worldwide. In some countries, It has been integrated into the national devel-opment plans to balance development by increasing investment allocation in rural areas. As a financial institution, micro- finance has the tendency to reduce pov-erty by creating business opportunities and developing partnerships. The poor, farmers in particular, are vulnerable to price fluc-tuations which impact earnings, increase unemployment, discourage production and reduce trade. Not only does microfinance have a direct impact on income recipients, but it also impacts the village economy through higher linkages and greater diversi-fication. The success of the Grameen Bank, also referred to as the Bank of the Poor, in helping millions of poor farmers, mainly women, participate in the economy has pro-vided incentives for many countries to sup-port microfinance in combating poverty.
Helping the poor to become integrated into the local economy requires an efficient and affordable financial system able to fund small entrepreneurs and provide financial support to those lacking assets or credit to acquire funds from conventional banks. It is difficult to function in modern economies without financial markets and institutions. They provide some key services which foster economic growth, facilitate the production of goods and services, encourage investment, accumulate savings, enhance competitive-ness and allocate the resources of society. Today, there are a variety of financial insti-tutions and markets which play a significant role in promoting economic productivity, generating wealth, reducing inequalities, and alleviating poverty. Unfortunately, most of those financial services are not provided in most developing countries, which, in
turn, hinder efforts to stimulate develop-ment and speed up socio-economic change. As the economy grows, more financial ser-vices are needed to support rising demand for investment, as expected.
The financial system will be more effec-tive if it is adequately regulated by the gov-ernment through the legal system and other regulatory institutions. Unregulated finan-cial institutions could increase economic and financial vulnerability by making the economy sensitive to changes in market con-ditions both locally and globally. The need for such regulations is more urgent today than at any other time due to the increas-ing interdependencies of financial markets. Globalisation has increased economic and financial vulnerabilities which has negatively impacted the development programs of devel-oping countries. The recent global financial crisis has spilled over into many countries via the financial system causing unemployment, social intolerance, economic slowdowns and political instability. In this regard, the pur-pose of regulatory measures is to ensure ade-quate financial management and to reduce the risk of financial instability.
the Role of the state
In all states, public institutions are provided by the government to deliver services to the public and promote socio-economic devel-opment. The state has the power of enforce-ment, and therefore, those institutions have the authority to make changes and influence the pace of development. Public institutions affect the allocation of resources and impact the way a society makes choices concerning the production, consumption and distribu-tion of resources among various economic agents. Effective institutions are those with adequate regulatory rules which ensure that the utilisation of resources is done in a pro-ductive manner through market freedom
346 A. Al-Roubaie and N. Vyas
and equal opportunity for all individuals so that they may participate in the economy. In such an economy, those with no mate-rial and financial support or political influ-ence are able to gain access to markets and resources.
The institutional structure of the state provides rights to ownership and control over resources. In most developing coun-tries, such rights are denied to those with-out assets, especially people in rural areas and the poor. This undermines the ability of the poor to gain access to financial sup-port and increase their participation in the market. Government support programs to alleviate poverty could be enforced by using its influence over economic development by making sure that the poor are given a fair share in the process. Market motivation to make money and enrich oneself leaves little room for those with no resources to enter the market. Corruption and monopolies cause market imperfections, which must be corrected by enforcing certain rules and providing equity in market participation. In some developing countries where cor-ruption is so deeply rooted, without state interference to fight corruption and reduce the risk of monopolistic control over the market, the ability to ensure equity and enhance participation will be limited. In modern time, markets require information to flow freely and competition to take place without being constrained by the power of a few players. Institutions facilitate the free-dom of the market by providing access to all economic agents to participate in economic activities and take advantage of the market. However, corruption undermines the abil-ity of the state to function by reducing the effectiveness of its institutions to correct market imperfections.
Having well-defined institutions mini-mises the impact economic and financial
crises such as the one currently sweeping across countries worldwide. Whether it is local or global, economic crisis may slow down the pace of development by impact-ing the capabilities of people, especially the poor, to maintain their enterprises from being marginalised. State institutions pro-vide mechanisms to regulate financial insti-tutions and impose restrictions on lending activities. E.g., the 1997 Asian crisis made a considerable impact on the economies of the region including Malaysia, Thailand, Indonesia, Singapore and South Korea. None of those countries had adequate insti-tutional infrastructures needed to mange globalisation. Policies to liberalise and pri-vatise lacked regulatory measures needed in order to support the local industries and sta-bilise the value of the national currency. As a consequence, millions of people lost their jobs which only led to a worsening wave of poverty and an increase in social tensions.
With the exception of a few, institutional infrastructures in most developing coun-tries provide a limited degree of protec-tion, i.e., social safety nets for employees, especially for low wage earners. Social safety nets in many countries are part of the wel-fare system provided through government institutions in the form of subsidies, old age security, health insurance, food security and various other national programs which mostly benefit the poor.
institutions foR the enviRonment and sustainable development
Since the late 1980s, the environment has been widely viewed as a core feature of sustainable development. The con-cept of sustainability was stressed upon in 1987 at the World Commission on the Environment and Development (WCED) in the Brundtland Report calling for a common future based on a new approach
347Rethinking globalisation: building institutional capacity for development
linking development to the environment. Sustainable development helps society achieve a higher level of human satisfaction through the better utilisation of resources and self-reliant development. It seeks to cre-ate a balance between the present and future without depleting the society’s resources. As an alternative approach, sustainable devel-opment requires an undertaking of struc-tural reforms and building institutional capacity to create a balance between the present and future consumption. In other words, sustainable development has to do with managing natural resources, including protection for the environment, to ensure that society’s basic needs are met.
Government institutions could strengthen such a balance by preserving the natural envi-ronment. In most developing countries, the poor, including the rural population, depend heavily on natural resources for their sur-vival, and therefore, preserving the natural environment becomes necessary for sustain-able development. The capitalist system of production is based on the excessive exploi-tation of natural resources and industrial expansion. Capitalism seeks higher profits through market controls with little heed of the long-term conservation concerns of the environment. Market competition allows producers to produce material goods and technology which will be sold on the global market arenas but with inadequate environ-mental protection policies.
For over 200 years of colonial history, many developing countries have witnessed the massive exploitation of natural resources resulting in significant damage to the envi-ronment. Today, those countries continue to suffer from a heavy dependence on the global markets for the export of raw materi-als and primary products. Correcting such a mode of production requires a new insti-tutional set up, to restructure production
and reduce the dependency on the global markets. This is not possible for many devel-oping countries, given the limitation of resources, and the need to be sustained at the current rate of resource exploitation.
Technology has become a prime factor in development sustainability. In developing countries, most technology used in produc-tion is imported from advanced countries. In some cases, technology is not environmen-tally suitable to reduce the risk of pollution and promote environmental management. Thus, it is crucial to conduct a selection process before adopting foreign technology. Governments must ensure that technologies are environmentally friendly and are suited to the local conditions. However, technolo-gies should be carefully evaluated by state institutions to ensure their safety and suit-ability for the local economy. Without proper institutions to enforce certain stan-dards in the employment of technologies, the consequences could be environmentally costly. The process of selection must also address the employment issue by not using capital intensive technology in countries with high unemployment rates.
The development of rural areas requires an investment in agricultural production and in research and development to encour-age innovation and increase productivity. In other words, building local capacity for innovation in agriculture must become policy priority in all developing countries. Most technologies used in agriculture are developed by industrial countries with little consideration to the existing condi-tions in developing countries. Agricultural production is determined by local inputs including climate and the availability of water resources. Among others, indigenous knowledge and traditional practices are important for the development of rural areas. Unfortunately, local knowledge is
348 A. Al-Roubaie and N. Vyas
often treated as inferior and is typically ignored when national planning policies are adopted. Such attitudes must be reversed by establishing institutions which provide incentives to make use of local inputs and develop those inputs through research and development. On the other hand, making use of global knowledge enhances the pro-cess of development by introducing new methods and different techniques in agri-cultural production. Increasing productivity in agriculture will have a positive impact on income and employment and will eventu-ally reduce poverty in rural areas. Building capabilities for scientific and technological development in agriculture is vital in order to promote sustainable development and to integrate the rural areas into the national economy. Effective institutions must create a balance between the urban and rural areas to ensure that agriculture will be given pri-ority in national planning. As stated in the Human Development Report of 1992,
“One of the greatest threats to sustainable human and economic development comes from the downward spiral of poverty and environmental degradation that threatens current and future generations… the poor are disproportionately threatened by the environmental hazards and health risks posed by pollution, inadequate housing, poor sanitation, polluted water and a lack of other basic services. Many of these already deprived people also live in the most ecologically vulnerable areas.”7
globalisation and inteRnational institutions
Over the last few decades, the rise of economic globalisation has increased global financial and trade transactions to levels never experienced before. Currently, the global GDP stands at about USD60 tril-lion which reflects the productivity of the world economy as measured in terms of
goods and services produced and traded. In 2008, world trade accounted for about USD30 trillion which is a manifestation of the complex nature of globalization and the depth of global interdependence. It is difficult for nations to foster economic growth and enhance productivity without trade, i.e., it increases a country’s capacity to produce more through the access to tech-nology, finance, knowledge, information and skill. In other words, there is a need for institutional support to encourage trade and secure access to global markets.
In developing countries, most of the poor live in rural areas where production for export occurs. Rural populations become sensitive to changes in trade; this reflects the relationship between poverty alleviation and trade transactions. Export trade represents the main income both to households and governments in many developing countries. The 1997 Asian crisis had a severe impact on employment and income across Asia which affected the lives of millions of the poor. It was perhaps the inadequacy of government institutions in Indonesia that left people without protection against the activities of multinational businesses and the declining global demand. In many countries, the fail-ure to mange globalisation was responsible for the increasing economic vulnerability and balance of payments imbalances.8
Under the regime of globalisation, the sovereignty of the state over the economy is likely to be weakened. Globalisation makes the economies of many countries vulnerable due to the fact that the state may have difficulty making decisions without taking into consideration the regulatory measures imposed by international institu-tions including the WTO, the International Monetary Fund (IMF), the World Bank and several other international bodies. Most developing countries have no real say in the
349Rethinking globalisation: building institutional capacity for development
global decision-making process, and there-fore, their institutions become incapable of respond to global shocks.
In this age of global interdependence, technology has become an important tool in reducing poverty and enhancing the capabilities of people to compete in the mar-ket place. Although, the world has become widely connected with Information and Communication Technologies (ICTs), mil-lions of the poor throughout developing countries remain unconnected. The digital divide between rich and poor countries has become a determining factor in cultivat-ing opportunities offered by globalisation. Governments in developing countries must build ICT capacity to ensure that the poor are connected to markets both at home and abroad. These technologies improve access to services especially in areas related to edu-cation, learning, health and market infor-mation. In addition, building ICT capacity can play an important role in connecting remote areas and providing government services that support access to knowledge and information. With regard to regional integration and economic linkages, con-nectivity facilitates economic and trade transactions.
In poor countries where connectivity is yet to be implemented, sharing information and working jointly to enhance economic development through regional institu-tions and other government support pro-grams will reduce the risk of a global crisis. Regional institutions could become more effective in alleviating poverty due to the collective nature of their objectives, which are to share resources and information to meet regional development requirements. Governments in developing countries have begun to recognise the importance of insti-tutions for development and are increasingly building institutional capacities to provide
a variety of public services. In South East Asia, including Malaysia and Singapore, its success in achieving rapid economic growth is largely attributed to the building of institutional capacity which has facilitated equity and provided incentives for devel-opment. Malaysia is the first country to achieve the implementation of the United Nations Millennium Development Goal in which poverty eradication is considered the ultimate target.
conclusion
This objective of this paper is to highlight the importance of institutions to foster economic growth and sustain develop-ment. The complex nature of development requires careful managerial, organisational, and technological inputs capable of organ-ising production and managing the flows of economic transactions in both local and global arenas. Democratic governments are responsible for the welfare of their citizens by providing adequate public services to ensure economic diversification, poverty eradication, financial stabilisation and balance of payments equilibrium. Achieving these objectives requires that the state builds institutional capacity to manage the economy and deliver the necessary services needed in order to accelerate the process of change. Through its institutions, the state influences the allocation of resources and redistributes income and wealth to ensure equity, equality and fairness. Market imper-fections may create inequality and distort equity.
In developing countries where resources are limited, corrupted markets leads to an increase in mismanagement and reduces efficiency. The prospect of promoting higher growth and building a just society free of poverty, inequality and corrup-tion, depends on the ability of the state to
350 A. Al-Roubaie and N. Vyas
deliver in the interest of all its citizens. If development is to succeed, a balanced approach is needed to ensure that the rights of every individual to live well, to work, to earn an income, and to fulfill his/her basic needs, is guaranteed. Promoting such objectives ultimately depends on the structure and effectiveness of government institutions and their capacity to mobilise resources and promote equity. No soci-ety today will be able to claim progress without efficient institutions. Due to the aggressive nature of man, greed, and by virtue of market competition, the govern-ment can regulate and supervise economic transactions to ensure that the rights of everybody are secured.
biogRaphy
Amer Al-Roubaie received his Ph.D. from McGill University in Montreal, Canada. Currently Professor Al-Roubaie is the Dean of the College of Business and Finance, Ahlia University, Bahrain. He has written and published widely. His latest publica-tion is 4-volume set on Islamic Banking and Finance jointly edited by Shafiq Alvi.
Dr. Niren Vyas has an undergraduate degree in Electrical Engineering, an MBA from Cleveland State University, USA, and Ph.D. in Marketing from the University of South Carolina, USA. He has worked in international corporations located on three continents: Asia, Europe, and North America for 27 years and has worked in aca-demia for 14 years, the last 9 years as the Dean of the Business School at the University of South Carolina(USC) in Aiken, before his retirement as Distinguished Professor Emeritus in July, 2003.
Last Feruary, Dr. Vyas was invited at Queeen Rania Center for Entreprenuer-
ship, in Amman, Jordan to conduct a work-shop on Strategic Planning. In May, 2009, he gave four day seminar in Doha, Qatar, to government officials on “Managing Change”. He also delivered a talk on “Teaching Beyond Textbooks” in Nov. 2008 at American Studies Center in Bahrain. He is a Rotarian and has worked on several joint Rorary projects to help educational institutions in Nepal and India.
His current research areas are: ‘Need for Increased Corporate Transparency’, ‘Renewable Energy Sources’ and Spirituality in Organizations’. He has presented papers on these subjects at various conferences.
RefeRences
Brohman, J. (1996) Popular Development, Blackwell, Oxford.
Cypher, J.M. and Dietz, J.L. (1997) The Process of Economic Development, Routledge, London.
Elliott, J.A. (1994) An Introduction to Sustainable Development: The Developing World, Routledge, London.
Held, D. and McGrew, A. (2007) Globalization Theory: Approaches and Controversies, Polity Press, Cambridge.
Jorgenson, A. and Kick, E. (Eds.) Globalization and the Environment, Brill, Leiden.
Lipton, M. (1997) Defining and Measuring Poverty: Conceptual Issues, United Nations, Human Development Papers 1997, United Nations, New York.
Melanie S. Milo, Integrated Financial Supervision: An Institutional Perspective for the Philippines, ADB Institute Discussion Paper No. 81, October 2007. See www.adbi.org/discussion-paper/2007/10/25/2381
Sachs, W. (Ed.) (1995) The Development Dictionary, Zed Books Lte., London.
United Nations (1992) Poverty Alleviation and Sustainable Development: Goals in Conflict? United Nations, New York.
351Rethinking globalisation: building institutional capacity for development
World Bank (2002) World Development Report 2002, Building Institutions for Markets, World Bank, Washington.
World Bank (2010) World Development Report 2010, World Bank, Washington.
notes
1 See United Nations, United Nations Development Programme, Human Development Report, several issues.
2 United Nations, United Nations Economic Commission for Europe, discussion paper series No. 2003.2, (Geneva: October, 2003), p.1.
3 World Bank (2002).
4 See World Bank (2002).
5 Jeffrey Sachs, The End of Poverty (London: Penguin Books, 2005), pp.244–245.
6 United Nations, Food and Agriculture Organization (FAO), The State of Food Insecurity in the World: Economic Crisis – Impacts and Lessons Learned (Rome: United Nations, 2009), pp.44–45.
7 United Nations (1992).
8 See Benjamin R. Quinones, Eradicating Poverty in the Asia-Pacific Region, Asia-Pacific Development Monitor, Vol. I, No. II, 1999.

Copyright © 2010 WASD
World Sustainable Development Outlook 2010
353
Diasporic tourism anD investment in suriname1
Keith Nurse*Shridath Ramphal Centre for International Trade Law, Policy and Services.
University of the West Indies, Cave Hill Campus, Barbados.
Abstract: This paper seeks to go beyond the remittances discourse and engage in a discussion on the importance of diasporic tourism, which has been a key driver of the region’s economic growth for the last decade. In fact the Surinamese Diaspora which represents only 2% of the Netherlands population is actually a very significant 72% of share of Suriname’s population, and by extension provides a considerable contri-bution to Suriname’s tourism industry. The paper examines the level of diasporic tourism engagement between the Suriname and its diaspora in the Netherlands. To aid the disaggregation of data available for analysis, an assessment of the terminol-ogy used to define the diaspora visitors and establish their own self-identification and classification, is key to this research. Also provided is an analysis of the political economy of the Caribbean regarding the competitiveness issues and development impact of diasporic tourism on both small and large regional enterprises.
Keywords: Diaspora; Diasporic Tourism; Suriname; the Netherlands.
introDuction
The diasporic economy is a critical and expanding feature of the economy and society of Suriname. Indeed, it can be argued that Suriname has one of the larg-est diasporic economies in relative terms. Remittances, brain drain and other associ-ated flows tend to dominate the landscape and make a substantial impact (Gowricharn, 2004; Gowricharn and Schuster, 2001; Van Niekerk, 2004, 2005). While there is some literature and debate on the remittances and brain drain element there is scant focus on the diasporic tourism element. Much of the literature on the Surinamese diaspora deals
with the issues of cultural identity, ethnic-ity and nationality concerns (Boissevain and Grotenberg, 1986; Domingo, 1982). An example of this is how the Indian or Hindustani population of Suriname is viewed as part of South Asian migration to Europe rather than as Caribbean migration to Europe (Rambocus, 1989; van der Burg, 2004). In this sense some of the literature does not capture the ‘twice-diasporized’ nature of Caribbean migration (Hall, 1997).
The aim of this study is to document the nature and scope of diasporic tourism in Suriname and to determine the propensity of
*Corresponding author: University of the West Indies, Barbados; e-mail: [email protected] on-going research presented in this conference paper is part of an IDRC funded project on Strategic Opportunities in Migration: Brain Circulation, Diaspora Tourism and Investment, being undertaken by the Shridath Ramphal Centre for International Trade, Policy and Services, University of the West Indies, Cave Hill Campus in partnership with the Centre for Trade Policy and Law, Carleton University.
354 K. Nurse
migrants to engage in this form of trade, to assess the potential for encouraging increased levels of diasporic tourism and identifying potential areas to capitalise on this emigrant driven tour-ism. It will also identify ways in which diasporic tourism flows can benefit from improved ICTs capabilities.
The study looks specifically at the flow of tourists between Suriname and global cities in the Netherlands (i.e., Amsterdam, Rotterdam, Utrecht, The Hague), the coun-try which accounts for the largest share of the Surinamer diaspora. The choice of Suriname-Amsterdam as a case study is apt given the existing migration and travel patterns. Amsterdam is the main source of arrivals into Suriname from Europe and the rest of the world by a significant margin on account of the high concentration of the Surinamer diasporic community in this and other major cities in the Netherlands.
This paper provides a situational analysis of the global and regional dimensions of diasporic tourism through a review of pub-lished works and an examination of existing data on diasporic tourism. An assessment of key stakeholders is also provided based on a survey of service providers, intermedi-aries and facilitators to assess the threats, opportunities weaknesses and strengths of the various stakeholders.
tHe suriname economY
Suriname is one of the smallest countries on the South American continent with a popula-tion of 436,935. With a land area of 163,000 sq km and an average of 2.5 persons per sq km it is also one of the countries with the lowest den-sities. Population growth (0.13% per annum) has been very slow in recent years largely on account of sizable emigration flows, mostly to the Netherlands, the former colonial master.1 As a former colony, Dutch language and cul-ture dominate the identity and landscape of
the country. Economic and political ties with the Netherlands also persist through invest-ment and aid flows as well as airline routes and tourism arrivals (Buddingh, 2001).
In political and economic terms Suriname is considered a Caribbean coun-try as exemplified by its membership in CARICOM. Suriname has an economic profile very similar to most Caribbean countries. It has a high dependence on a narrow range of traditional low value-added exports, principally resource-based and agri-cultural commodities (alumina, bauxite, gold, oil, bananas, rice, fish, etc.) which accounts for the largest share of the foreign exchange earnings and GDP contribution. Indeed, 8% of the export earnings, 50% of GDP and one-quarter of central government revenues come from the economic activities of three commodities, alumina, gold and oil.2 Such a narrow economic base and high volatility in global prices for these commod-ities in recent years have made for difficult macro-economic conditions. It is also critical to note that Suriname is estimated to have as much as seventy percent of its population under the poverty line. These structural fac-tors underline the need for greater economic diversification of the Suriname economy.
tHe surinamese Diaspora
As a former Dutch colony there are strong linkages between Suriname and the Netherlands in terms of migration as well as travel routes and patterns. Emigration to the Netherlands has a long tradition since colonial times but it is on the eve of inde-pendence in 1975 that a massive outflow of approximately 50,000 nationals occurs. The next big wave of emigration happens in the years 1979–1980 when the Netherlands were due to introduce visa requirements. At this time it is estimated that 30,000 per-sons emigrated (Van Niekerk, 2005, p.2). As such close to 20% of the population migrated
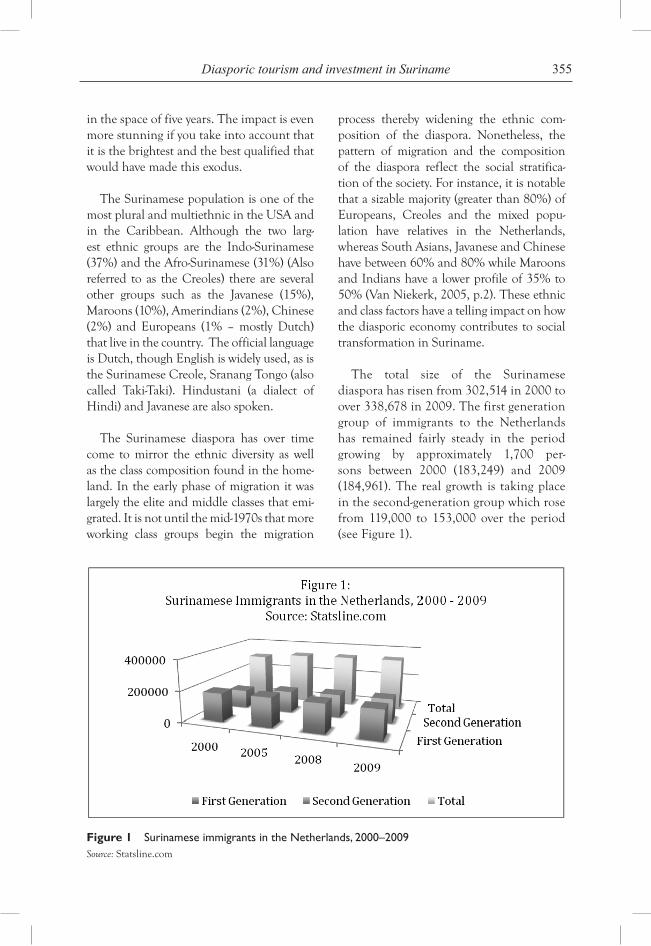
355Diasporic tourism and investment in Suriname
in the space of five years. The impact is even more stunning if you take into account that it is the brightest and the best qualified that would have made this exodus.
The Surinamese population is one of the most plural and multiethnic in the USA and in the Caribbean. Although the two larg-est ethnic groups are the Indo-Surinamese (37%) and the Afro-Surinamese (31%) (Also referred to as the Creoles) there are several other groups such as the Javanese (15%), Maroons (10%), Amerindians (2%), Chinese (2%) and Europeans (1% – mostly Dutch) that live in the country. The official language is Dutch, though English is widely used, as is the Surinamese Creole, Sranang Tongo (also called Taki-Taki). Hindustani (a dialect of Hindi) and Javanese are also spoken.
The Surinamese diaspora has over time come to mirror the ethnic diversity as well as the class composition found in the home-land. In the early phase of migration it was largely the elite and middle classes that emi-grated. It is not until the mid-1970s that more working class groups begin the migration
process thereby widening the ethnic com-position of the diaspora. Nonetheless, the pattern of migration and the composition of the diaspora reflect the social stratifica-tion of the society. For instance, it is notable that a sizable majority (greater than 80%) of Europeans, Creoles and the mixed popu-lation have relatives in the Netherlands, whereas South Asians, Javanese and Chinese have between 60% and 80% while Maroons and Indians have a lower profile of 35% to 50% (Van Niekerk, 2005, p.2). These ethnic and class factors have a telling impact on how the diasporic economy contributes to social transformation in Suriname.
The total size of the Surinamese diaspora has risen from 302,514 in 2000 to over 338,678 in 2009. The first generation group of immigrants to the Netherlands has remained fairly steady in the period growing by approximately 1,700 per-sons between 2000 (183,249) and 2009 (184,961). The real growth is taking place in the second-generation group which rose from 119,000 to 153,000 over the period (see Figure 1).
Figure 1 Surinamese immigrants in the Netherlands, 2000–2009Source: Statsline.com
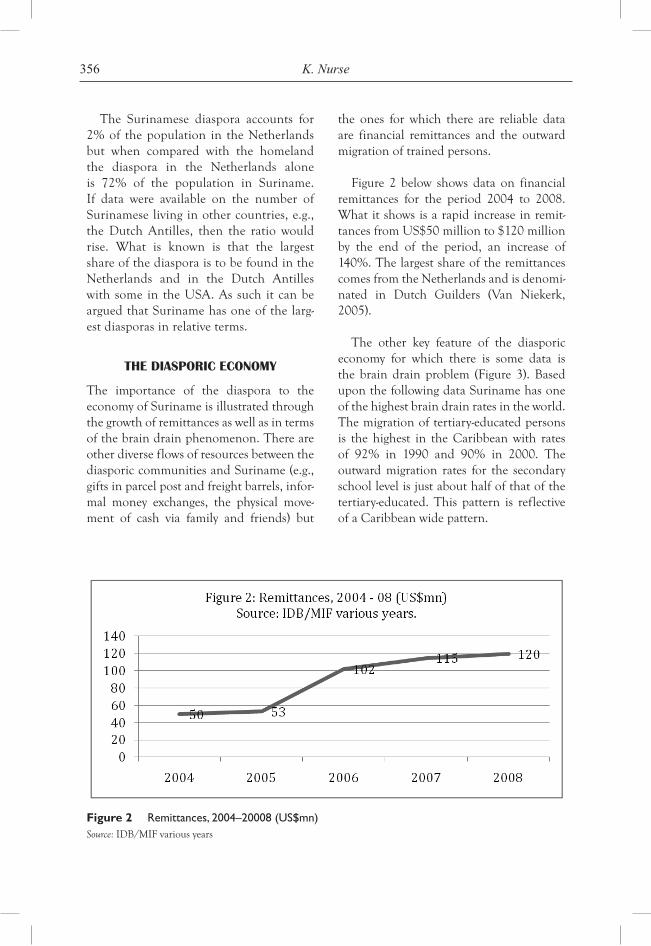
356 K. Nurse
The Surinamese diaspora accounts for 2% of the population in the Netherlands but when compared with the homeland the diaspora in the Netherlands alone is 72% of the population in Suriname. If data were available on the number of Surinamese living in other countries, e.g., the Dutch Antilles, then the ratio would rise. What is known is that the largest share of the diaspora is to be found in the Netherlands and in the Dutch Antilles with some in the USA. As such it can be argued that Suriname has one of the larg-est diasporas in relative terms.
tHe Diasporic economY
The importance of the diaspora to the economy of Suriname is illustrated through the growth of remittances as well as in terms of the brain drain phenomenon. There are other diverse flows of resources between the diasporic communities and Suriname (e.g., gifts in parcel post and freight barrels, infor-mal money exchanges, the physical move-ment of cash via family and friends) but
the ones for which there are reliable data are financial remittances and the outward migration of trained persons.
Figure 2 below shows data on financial remittances for the period 2004 to 2008. What it shows is a rapid increase in remit-tances from US$50 million to $120 million by the end of the period, an increase of 140%. The largest share of the remittances comes from the Netherlands and is denomi-nated in Dutch Guilders (Van Niekerk, 2005).
The other key feature of the diasporic economy for which there is some data is the brain drain problem (Figure 3). Based upon the following data Suriname has one of the highest brain drain rates in the world. The migration of tertiary-educated persons is the highest in the Caribbean with rates of 92% in 1990 and 90% in 2000. The outward migration rates for the secondary school level is just about half of that of the tertiary-educated. This pattern is reflective of a Caribbean wide pattern.
Figure 2 Remittances, 2004–20008 (US$mn)Source: IDB/MIF various years
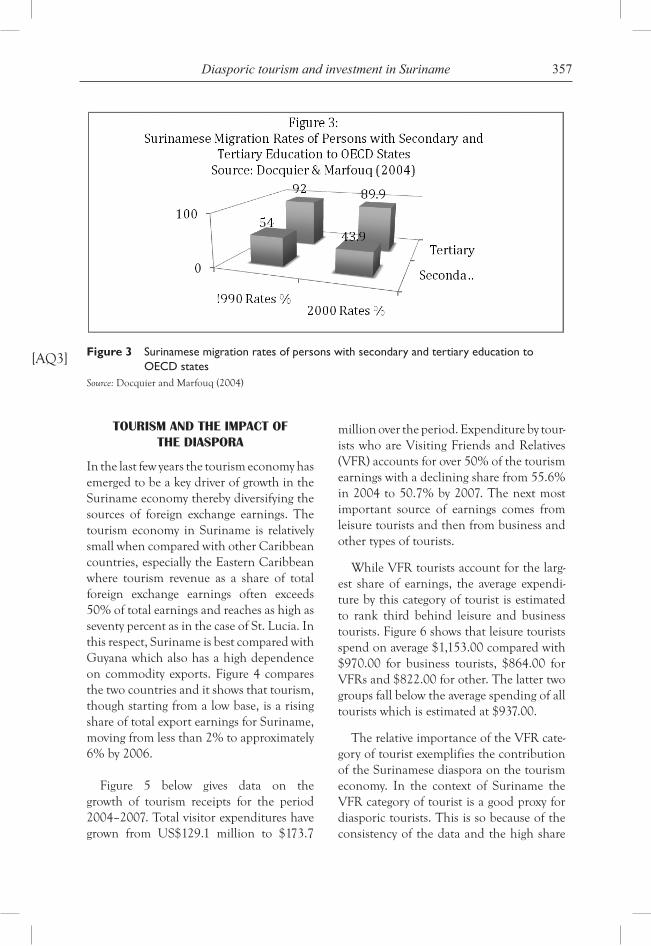
357Diasporic tourism and investment in Suriname
tourism anD tHe impact oF tHe Diaspora
In the last few years the tourism economy has emerged to be a key driver of growth in the Suriname economy thereby diversifying the sources of foreign exchange earnings. The tourism economy in Suriname is relatively small when compared with other Caribbean countries, especially the Eastern Caribbean where tourism revenue as a share of total foreign exchange earnings often exceeds 50% of total earnings and reaches as high as seventy percent as in the case of St. Lucia. In this respect, Suriname is best compared with Guyana which also has a high dependence on commodity exports. Figure 4 compares the two countries and it shows that tourism, though starting from a low base, is a rising share of total export earnings for Suriname, moving from less than 2% to approximately 6% by 2006.
Figure 5 below gives data on the growth of tourism receipts for the period 2004–2007. Total visitor expenditures have grown from US$129.1 million to $173.7
million over the period. Expenditure by tour-ists who are Visiting Friends and Relatives (VFR) accounts for over 50% of the tourism earnings with a declining share from 55.6% in 2004 to 50.7% by 2007. The next most important source of earnings comes from leisure tourists and then from business and other types of tourists.
While VFR tourists account for the larg-est share of earnings, the average expendi-ture by this category of tourist is estimated to rank third behind leisure and business tourists. Figure 6 shows that leisure tourists spend on average $1,153.00 compared with $970.00 for business tourists, $864.00 for VFRs and $822.00 for other. The latter two groups fall below the average spending of all tourists which is estimated at $937.00.
The relative importance of the VFR cate-gory of tourist exemplifies the contribution of the Surinamese diaspora on the tourism economy. In the context of Suriname the VFR category of tourist is a good proxy for diasporic tourists. This is so because of the consistency of the data and the high share
Figure 3 Surinamese migration rates of persons with secondary and tertiary education to OECD states
Source: Docquier and Marfouq (2004)
[AQ3]
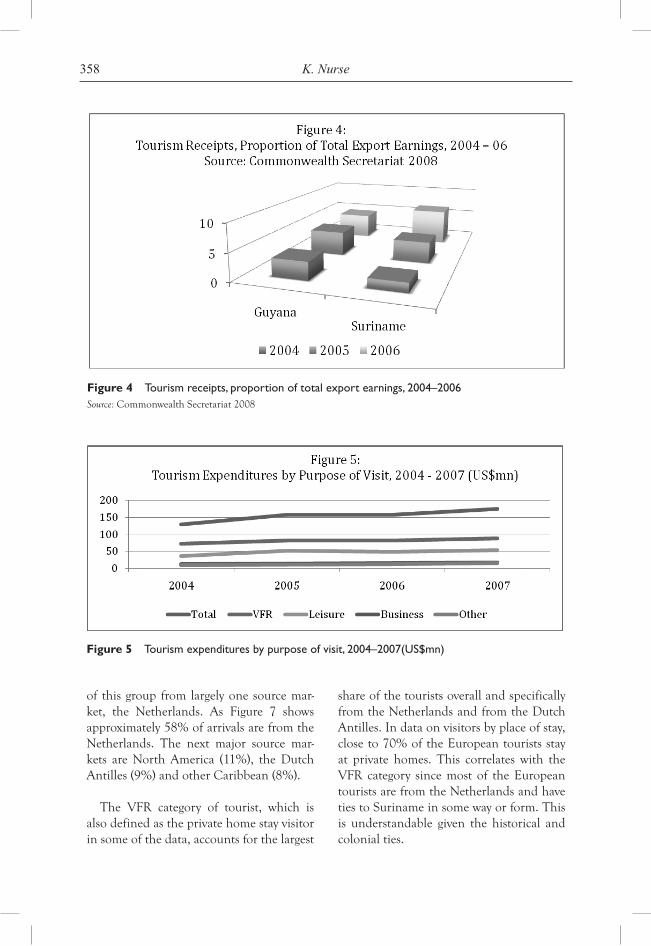
358 K. Nurse
Figure 4 Tourism receipts, proportion of total export earnings, 2004–2006Source: Commonwealth Secretariat 2008
of this group from largely one source mar-ket, the Netherlands. As Figure 7 shows approximately 58% of arrivals are from the Netherlands. The next major source mar-kets are North America (11%), the Dutch Antilles (9%) and other Caribbean (8%).
The VFR category of tourist, which is also defined as the private home stay visitor in some of the data, accounts for the largest
share of the tourists overall and specifically from the Netherlands and from the Dutch Antilles. In data on visitors by place of stay, close to 70% of the European tourists stay at private homes. This correlates with the VFR category since most of the European tourists are from the Netherlands and have ties to Suriname in some way or form. This is understandable given the historical and colonial ties.
Figure 5 Tourism expenditures by purpose of visit, 2004–2007(US$mn)
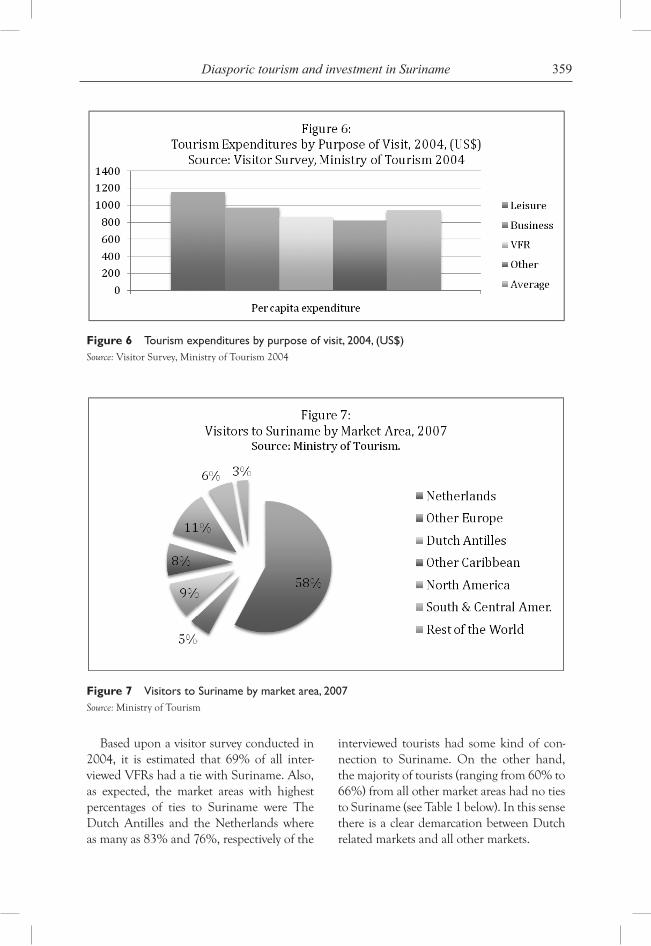
359Diasporic tourism and investment in Suriname
Figure 6 Tourism expenditures by purpose of visit, 2004, (US$)Source: Visitor Survey, Ministry of Tourism 2004
Figure 7 Visitors to Suriname by market area, 2007Source: Ministry of Tourism
Based upon a visitor survey conducted in 2004, it is estimated that 69% of all inter-viewed VFRs had a tie with Suriname. Also, as expected, the market areas with highest percentages of ties to Suriname were The Dutch Antilles and the Netherlands where as many as 83% and 76%, respectively of the
interviewed tourists had some kind of con-nection to Suriname. On the other hand, the majority of tourists (ranging from 60% to 66%) from all other market areas had no ties to Suriname (see Table 1 below). In this sense there is a clear demarcation between Dutch related markets and all other markets.
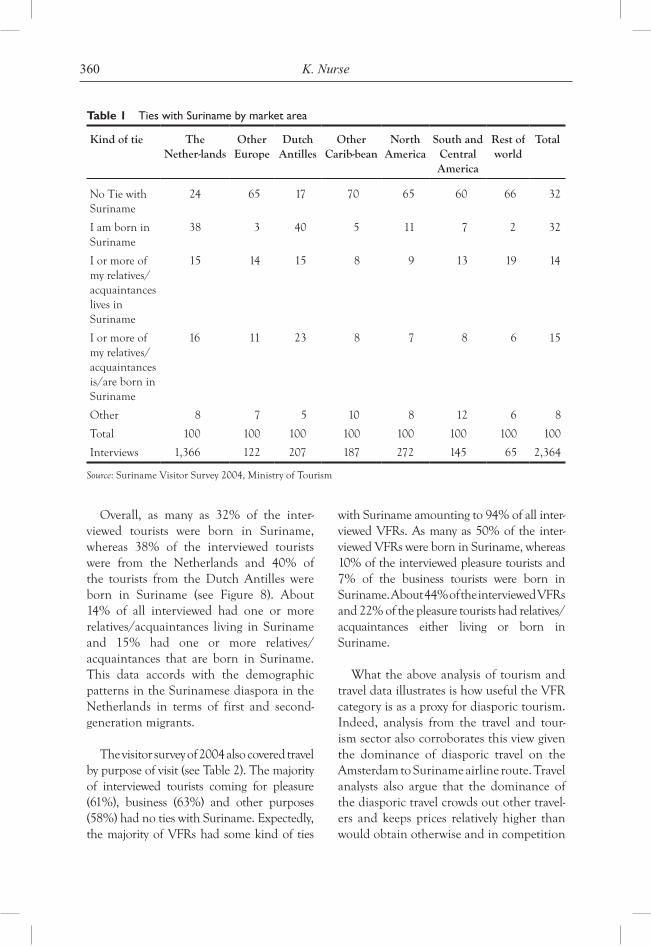
360 K. Nurse
Overall, as many as 32% of the inter-viewed tourists were born in Suriname, whereas 38% of the interviewed tourists were from the Netherlands and 40% of the tourists from the Dutch Antilles were born in Suriname (see Figure 8). About 14% of all interviewed had one or more relatives/acquaintances living in Suriname and 15% had one or more relatives/ acquaintances that are born in Suriname. This data accords with the demographic patterns in the Surinamese diaspora in the Netherlands in terms of first and second-generation migrants.
The visitor survey of 2004 also covered travel by purpose of visit (see Table 2). The majority of interviewed tourists coming for pleasure (61%), business (63%) and other purposes (58%) had no ties with Suriname. Expectedly, the majority of VFRs had some kind of ties
with Suriname amounting to 94% of all inter-viewed VFRs. As many as 50% of the inter-viewed VFRs were born in Suriname, whereas 10% of the interviewed pleasure tourists and 7% of the business tourists were born in Suriname. About 44% of the interviewed VFRs and 22% of the pleasure tourists had relatives/ acquaintances either living or born in Suriname.
What the above analysis of tourism and travel data illustrates is how useful the VFR category is as a proxy for diasporic tourism. Indeed, analysis from the travel and tour-ism sector also corroborates this view given the dominance of diasporic travel on the Amsterdam to Suriname airline route. Travel analysts also argue that the dominance of the diasporic travel crowds out other travel-ers and keeps prices relatively higher than would obtain otherwise and in competition
Table 1 Ties with Suriname by market area
Kind of tie The Nether-lands
Other Europe
Dutch Antilles
Other Carib-bean
North America
South and Central America
Rest of world
Total
No Tie with Suriname
24 65 17 70 65 60 66 32
I am born in Suriname
38 3 40 5 11 7 2 32
I or more of my relatives/acquaintances lives in Suriname
15 14 15 8 9 13 19 14
I or more of my relatives/acquaintances is/are born in Suriname
16 11 23 8 7 8 6 15
Other 8 7 5 10 8 12 6 8
Total 100 100 100 100 100 100 100 100
Interviews 1,366 122 207 187 272 145 65 2,364
Source: Suriname Visitor Survey 2004, Ministry of Tourism
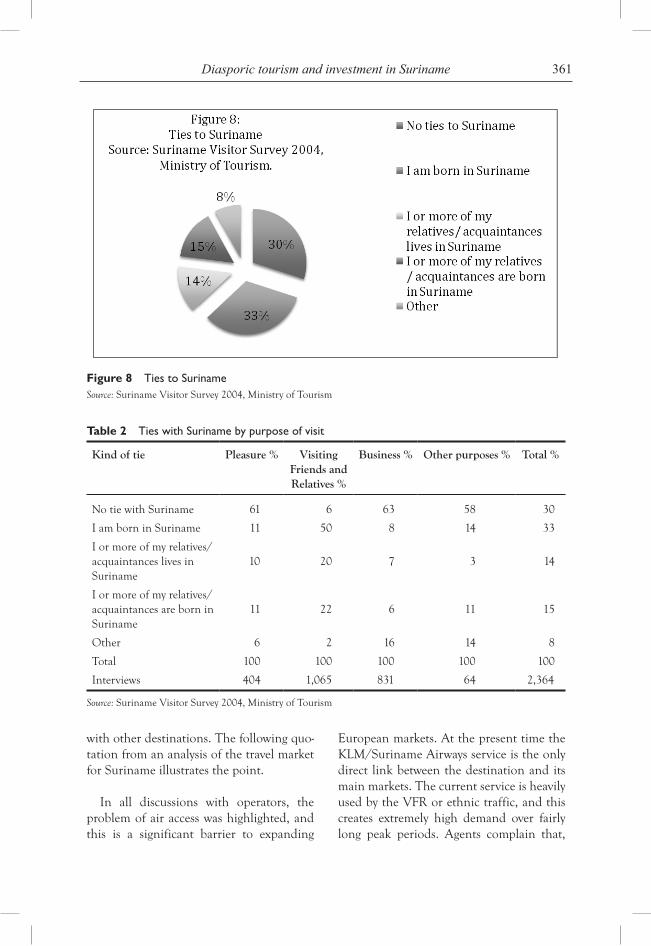
361Diasporic tourism and investment in Suriname
Figure 8 Ties to SurinameSource: Suriname Visitor Survey 2004, Ministry of Tourism
Table 2 Ties with Suriname by purpose of visit
Kind of tie Pleasure % Visiting Friends and Relatives %
Business % Other purposes % Total %
No tie with Suriname 61 6 63 58 30
I am born in Suriname 11 50 8 14 33
I or more of my relatives/acquaintances lives in Suriname
10 20 7 3 14
I or more of my relatives/acquaintances are born in Suriname
11 22 6 11 15
Other 6 2 16 14 8
Total 100 100 100 100 100
Interviews 404 1,065 831 64 2,364
Source: Suriname Visitor Survey 2004, Ministry of Tourism
with other destinations. The following quo-tation from an analysis of the travel market for Suriname illustrates the point.
In all discussions with operators, the problem of air access was highlighted, and this is a significant barrier to expanding
European markets. At the present time the KLM/Suriname Airways service is the only direct link between the destination and its main markets. The current service is heavily used by the VFR or ethnic traffic, and this creates extremely high demand over fairly long peak periods. Agents complain that,
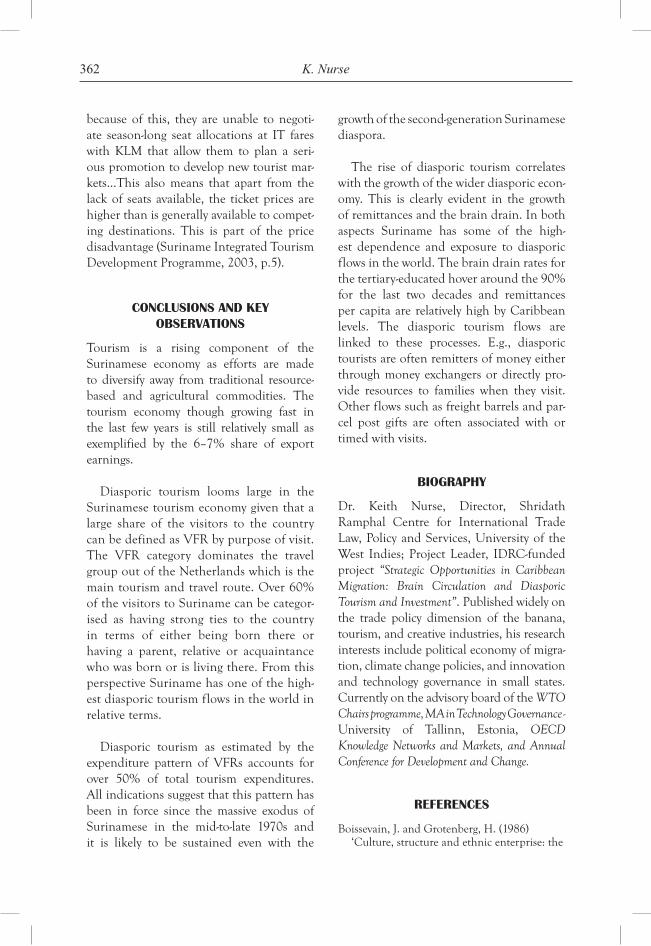
362 K. Nurse
because of this, they are unable to negoti-ate season-long seat allocations at IT fares with KLM that allow them to plan a seri-ous promotion to develop new tourist mar-kets…This also means that apart from the lack of seats available, the ticket prices are higher than is generally available to compet-ing destinations. This is part of the price disadvantage (Suriname Integrated Tourism Development Programme, 2003, p.5).
concLusions anD KeY oBservations
Tourism is a rising component of the Surinamese economy as efforts are made to diversify away from traditional resource-based and agricultural commodities. The tourism economy though growing fast in the last few years is still relatively small as exemplified by the 6–7% share of export earnings.
Diasporic tourism looms large in the Surinamese tourism economy given that a large share of the visitors to the country can be defined as VFR by purpose of visit. The VFR category dominates the travel group out of the Netherlands which is the main tourism and travel route. Over 60% of the visitors to Suriname can be categor-ised as having strong ties to the country in terms of either being born there or having a parent, relative or acquaintance who was born or is living there. From this perspective Suriname has one of the high-est diasporic tourism flows in the world in relative terms.
Diasporic tourism as estimated by the expenditure pattern of VFRs accounts for over 50% of total tourism expenditures. All indications suggest that this pattern has been in force since the massive exodus of Surinamese in the mid-to-late 1970s and it is likely to be sustained even with the
growth of the second-generation Surinamese diaspora.
The rise of diasporic tourism correlates with the growth of the wider diasporic econ-omy. This is clearly evident in the growth of remittances and the brain drain. In both aspects Suriname has some of the high-est dependence and exposure to diasporic flows in the world. The brain drain rates for the tertiary-educated hover around the 90% for the last two decades and remittances per capita are relatively high by Caribbean levels. The diasporic tourism flows are linked to these processes. E.g., diasporic tourists are often remitters of money either through money exchangers or directly pro-vide resources to families when they visit. Other flows such as freight barrels and par-cel post gifts are often associated with or timed with visits.
BiograpHY
Dr. Keith Nurse, Director, Shridath Ramphal Centre for International Trade Law, Policy and Services, University of the West Indies; Project Leader, IDRC-funded project “Strategic Opportunities in Caribbean Migration: Brain Circulation and Diasporic Tourism and Investment”. Published widely on the trade policy dimension of the banana, tourism, and creative industries, his research interests include political economy of migra-tion, climate change policies, and innovation and technology governance in small states. Currently on the advisory board of the WTO Chairs programme, MA in Technology Governance - University of Tallinn, Estonia, OECD Knowledge Networks and Markets, and Annual Conference for Development and Change.
reFerences
Boissevain, J. and Grotenberg, H. (1986) ‘Culture, structure and ethnic enterprise: the
363Diasporic tourism and investment in Suriname
Surinamese of Amsterdam’, Ethnic and Racial Studies, Vol. 9, No. 1, pp.1–23.
Buddingh, H. (2001) ‘Failure of model decolonization: Dutch-Surinamese economic relations’, in Hoefte, R. and Meel, P. (Eds.): 20th Century Surinam: Continuities and Discontinuities in a New World Society, Ian Randle Publishers and KITLV Press, Kingston and Leiden, pp.71–90.
Docquier, F. and Marfouk, A. (2004), Measuring the International Mobility of Skilled Workers. World Bank Policy Research Working Paper, No. 3381, World Bank, Washington, DC.
Domingo, V.A. (1982) ‘Is there group development after migration? The case of Surinamers in the Netherlands’, New Community, Vol. 10, No. 1, pp.95–105.
Gowricharn, R. (2004) ‘Moral capital in Surinamese transnationalism’, Ethnic and Racial Studies, Vol. 27, No. 4, pp.607–621.
Gowricharn, R. and Schuster, J. (2001) ‘Diaspora and transnationalism: the case of the Surinamese in the Netherlands’, in Hoefte, R. and Meel, P. (Eds.): 20th Century Surinam. Continuities and Discontinuities in a New World Society, Ian Randle Publishers and KITLV Press, Kingston and Leiden, pp.155–173.
Hall, S. (1997) ‘Caribbean culture: future trends’, Caribbean Quarterly, Vol. 43, No. 1, pp.25–34.
Rambocus, S. (1989) ‘Surinam Hindustani in Holland’, in Jagat K. Motwani and Jyoti Barot-Motwani (Eds.): Global Migration of Indians, New York, pp.106–110.
Suriname Integrated Tourism Development Programme (2003) Tourism Markets in the Netherlands, Occassional Tourism Planning and Research Paper, Vol. 1.
van der Burg, C. (2004) ‘The Hindu diaspora in The Netherlands: Halfway between local structures and global ideologies’, in Jacobsen, K.A. and Pratap, K.P. (Eds.) South Asians in the Diaspora: Histories and Religious Traditions, Leiden.
Van Niekerk, M. (2004) ‘Afro-Caribbeans and Indo-Caribbeans in the Netherlands. Premigration legacies and social mobility’, International Migration Review, Vol. 38, No. 2, pp.158–183.
Van Niekerk, M. (2005) Surinam Country Study (Report on Informal Remittance Systems in Africa, Caribbean and Pacific (ACP) countries (Ref: RO2CS008)) 2005.
notes
1 For economic data on Suriname see http://ckmportal.eclacpos.org.
2 See UNECLAC (2009), Economic Survey of the Caribbean, 2007–2008.

Copyright © 2010 WASD
World Sustainable Development Outlook 2010
365
The aged, a losT and dying socieTy: implying
The imporTance of a geronTological framework for addressing Their needs
in The caribbean
Kenneth A. Niles*University of the West Indies, Trinidad and Tobago
Abstract: The objective of this paper is to assess the extent to which family connectivity and intergenerational links are maintained in social programs designed to address the needs of senior citizens in the Caribbean. This paper also aims to compare the extent to which family connectivity and intergenerational links are in-cluded in government and government-assisted social programs for senior citizens. Moreover the paper emphasise the need for a gerontological approach, inclusive of biological, psychological and social elements, to address the needs of older per-sons in Caribbean society. The study is informed by a qualitative methodology. More specifically, a case study approach was employed to obtain primary data from homes for the aged in Trinidad and Guyana. Purposive sampling was employed to select the institutions reviewed. The cases include a community home for the aged in Trinidad, a government home for the Aged in Trinidad and a government home for the aged in Guyana. These homes were selected to allow for a comparison of the situation in government homes in Trinidad and Guyana, and to facilitate a comparison of a fully-run government home versus a government-assisted home in Trinidad. Participant-observation was the main data-collection approach used. Site visits were made in which residents and staff was interviewed on the activities of the home and observations were made of the surroundings including building infrastructure and resident interaction. The findings show the inadequacies and insensitivities towards the residents by the ineptness of the government policies and the lack of empathy among family members. There is also the historical data that continue to support the evidence of the lost society. There is hope of an inter-generational society which offers meaningful life to the aged who can manage the biological, psychological and social elements within their environment.
Keywords: Older Persons; Gerontological; Intergenerational; Person-fit; Environmental Press; Theories; Polices
*Corresponding author: University of the West Indies, Trinidad and Tobago; e-mail: [email protected]
366 K.A. Niles
inTrodUcTion
Today’s society is in a stream of develop-ment that focuses on the future without paying sufficient attention to our histories. We need to be reminded that success is forthcoming when you comprehend where you came from so that you can go forward. It is these old things that are discarded to make way for the new; yet it is these things that steer us into new inventions and is pointing to the need to integrate the old with the future. It is apparent that an old person, full of bias, is trapped in a forgotten mode of almost becoming extinct – waiting to retire, to be forgotten.
Within the context of modernisation there are the elements of education and literacy which creates a dynamic of change for the older person and the young. In addi-tion, economic technology accompanied by rapid globalisation, has led to the emer-gence of several theories and concepts that would embrace the need for the participa-tion of the older person who would have had much experience and expertise that would benefit any industry or organisation. As society grapples with new dimensions of reeducation and modern health promo-tion, the elderly could definitely become a new power within the development of any nation. There is also the reality of the inter-generational perspective that impacts the elderly who is challenged with renewed roles and responsibilities to maintain respect and honour. Disengagement theory will have no grounds to push the elderly into stagnation and despair; instead, the evidence of inte-gration and participation will prevail. Surely the concept of a dying and lost society is challenged towards a new identifiable posi-tion within any nation.
The structure of our society is shaped by the policies and theories that are daily presented and argued by the politicians and
policy-makers of our day. These reformers are, at most times, insensitive and irrespon-sive to pertinent, contemporary issues as well to the relevant stakeholders that ought to be considered in making their lives enjoy-able. There is need to examine the reali-ties of the absence of qualitative data and facts that prove the lack of integration of and intimacy with the variables for societal reform that represent an unbiased approach or proposition. I recommend a geronto-logical framework that would sensitize the key actors to a comprehensive approach to empower the growing population of the elderly in Caribbean society.
In the context of progress, it is impos-sible to go forward without identifying family structures focusing on the roles they play within a social and a person-fit environ-ment. When we consider the older person as a variable for change, it is important to identify the family support system that would fundamentally inform the protocol for national policies in any dynamic. The family‘s position would subsequently clar-ify the extent of the involvement as needs surfaces. The reality of functioning elder person is the availability of support and caregiving.
One may envisage balance through the nuclear family or the extended family where long term care and support is consistent as in contrast to the reconstituted family, the single family or even the same sex family which has less physical and social support for the aged (Hooyman and Kiyak, 2002).
We might find the ‘young old’ cohort (ages 60–74) not obviously in need for this intervention because they may not be as bio-logically or psychologically challenged. The other two (2) cohorts – ‘old old’ (75–84) and the ‘oldest old’ (85 till) are more likely to agree to support and any intervention
367The aged, a lost and dying society
to assist in maintaining their identity and dignity. This would be the time to desire and adopt new roles and be involved in new activities to prove their ability to continue as inclusive citizens.
The theories of Continuity and Social Exchange support the concepts of the inter-generational perspectives and truly give opportunity of the elderly to acknowledge their capacity to be mentors and consultants for the modern world. Social Inclusion and participation is not an alternative to empow-ering the elderly; it is the process for creating awareness and involvement that would moti-vate the older person to live as a citizen.
Presently, the Ministry of Social Development in the Trinidad and Tobago government has established within its National Policy on Ageing, a component that seeks to promote older persons as facilitators and mentors (National Policy on Ageing for Trinidad and Tobago, 2007). It further encourages older persons towards academic, cultural and sporting programmes for employment and accessibility.
This section on inclusion, shows that the aged has need of the younger generation for its continuance. The population index is increasing, showing that the majority of older persons in a nation are more than ten (10%) of the population. This would affect retirement plans, as the elderly would have the physical and psychological acumen to maintain employment. Therefore the depen-dency ratio, where the elderly is supported by the younger generation (19 to 59 years), will change to have the elderly supporting the younger. The elderly will be healthier and empowered to be able to sustain the needs of the younger generation. It would become apparent that the elderly would not only need the children and grandchildren but the reverse would be equally evident.
I submit an argument presenting facts that every stakeholder is in the process of ageing and the aged is a needed factor in any design for change and progress. Today they may be retired and financially chal-lenged but tomorrow they are even more needed to redefine social integration within any given society. Here in the Caribbean there must be no indifference; the aged has to be accepted and the question would be – is there a dying and lost society? There is enough evidence to declare the func-tionality of the elderly and to prove that gerontological processes would protect their dignity and esteem.
Additionally, I would also present an argument that promotes the creation of a better lifestyle and dynamics for better care, socially, biologically, psychologically and environmentally for the elderly within a family context.
liTeraTUre reView
The apparent lifestyle of the elderly is stereo-typed by the society. The word old has a cul-tural interpretation which creates exclusion and certainly encourages deviation from the norm. There are terms that are used and there are innuendos that are implied in ref-erence to the aged; it is as if their presence causes a subconscious response. No one desires to be slowed down or to entertain an unintelligent conversation or to be bothered with disabled functions. That world must not connect with the present; the young is definitely opposed to the old; the systems now have no interpretations for the old. Let us separate the old from the rest; who would notice – they are unproductive; surely this is ageism (Cavanaugh and Blanchard-Fields, 2006).
In reality, the life expectancy has increased and there are going to be more elderly persons
368 K.A. Niles
within the next 50 years. Therefore, there is a need to encourage negotiations to consider health, financial and security issues. The idea of generalising and focusing only on what financial assistance the elderly needs, suggests an infringement on their human rights. This would definitively demand the need for a gerontological framework – the environmen-tal, biological, psychological and social per-spectives in order to educate the masses.
The environment is an alien aspect of the life of the aged. The roads, the transport sys-tem, signs, public buildings provide no easy access. How then can the elderly survive in the local community? Environmental press allows for negotiation and change as manag-ers and directors would have to facilitate the older person without prejudice to become a viable employee or asset to their organi-sation; the same principle should apply to parks and resorts. The evidence of present day infrastructure speaks to the insensitivity to ongoing strengths and competencies that are need in every sector. There are the issues of wear and tear of the body, the slowing of the biological clock though they are all physical issues, would not affect the intel-lectual capacities of the older worker who continues to provide quality service.
The literature’s major concern lies within the psychological aspect. The issues per-taining to depression and dementia cause dysfunction and fears, especially in public spaces. Zarit and Zarit (2007) shares the concern about employment being affected by the mental health problems of persons having to going on early retirement. There were less older persons in the 1950s work-ing, but now with the Baby Boomers there would be more elderly employed because of the increased opportunities for advance-ment and employment.
Another reality is the Empty Nest Syndrome, where all the children have
left home and the parents are without the dependence of the children and have to muster the physical and mental strength to maintain their lifestyles. There is also the issue of living on a smaller budget with no additional financial help. The elderly must become adaptable to new paradigms and procedures that would give rise to learning new roles and responsibilities, and find-ing the best means for reorientation and comfort that is needed for continuance (Hooyman and Kiyak, 2002; Wilmoth and Ferraro, 2007).
Socially, families and even government agencies operate in the confines of exclu-sion and so there is the continual feeling of disengagement among the aged. The con-cept of loss of identity further probes the mind and the fear of losing one’s role in the society is a crucial issue. The thought of decadence instead of continuous prog-ress and development cripples the psycho-logical development of the aged. Who is to say when they are to stop learning or when they are not incapable of academic research or academic achievements? We are to be forewarned that this cohort represents much scope for intellectual stimulation as their life course is challenged by the increasing volume of aids and technology. Do we hear a cry for societal protection? Do we consider the need for continuity, to maintain their level of par-ticipation and function?
There is a much greater need at this age for entertainment and social interaction; retirement has to present another paradigm instead of isolation or loss of community life. Morrison (1988) postulates the need to consider the roles that will clarify the views of work and retirement and in context – the issues of future trends.
There is need to define an approach to adopt a social construct void of ageism with the view to explaining the ideology of social
369The aged, a lost and dying society
marginalisation of older adults. We ought to project specific theories that will focus on active construction for later life. This will provide a sense of continuity that creates opportunities for activity and identity; an alternative to the disengagement and activ-ity theories (Cavanaugh and Whitbourne, 1999).
Are we ready to bridge the real gaps that concern the issues of exclusion and misrep-resentation? Are we willing to access support systems that are relevant to the needs of the aged? We need to investigate the intergen-erational theories and adopt the primary principles that will release the aged from the feelings of non-existence. We can structure kinship relationship that will involve the elderly and provide the necessary framework for their tomorrows. A multigenerational family and community is even welcomed and will cause the cohesion in sharing and experiencing the variety of dimensions form all ages (Hooyman and Kiyak, 2002).
The negative spectrum presented by the Sandwich Generation and the Cluttered Nest does inform that there are weaknesses in the approach to development through the intergenerational perspective. The sandwich generation would have the stress of managing the parent and his or her fam-ily. The diverse needs and objectives within the home might not allow the elder to fully trust the care of the child within a socially and financial context. One may decide that the home structure would give the children an opportunity to bond with the grandpar-ent and be mentored. The cluttered nest does not encourage intimacy and partici-pation because of the child and the grand-children normally return under stressful conditions. The elder might be prone to pursue employment to avoid the discom-forts of the present conditions. The alterna-tive is isolation – withdrawal and eventually depression. This conflict does not end in
separation but lends to an understanding where there are neutral positions (Binstock and George, 1995).
We must entertain the thought that age-ing is a separate issue from social integra-tion or even gender advancement. We can provide the infrastructure that offers an even keel platform where there is no win-win or lose-lose position, but a compassion-ate understanding for the way forward. The many theories that have been adopted are influenced by the forces of development. The biological, psychological and socio-cul-tural and life-cycle forces have contributed having a clear reflection of an intergenera-tional factor (Cavanaugh and Whitbourne, 1999).
The reality of needs is supported by the inferences of the ardent player whose intent is to dichotomize and even marginalise the aged so as to create another world for them. Children and grandchildren ought to play an integral part in the development of the elderly. There ought to be the sensitivity to the evolution of change due to history and global economic transformation that directly mares progress. The young mind needs to be re-oriented, the young entrepre-neur must assist, and the young grandchild can give the needed direction for socio-cultural change. We all can be contributors towards a wholesome active society.
The intergenerational perspective has its disadvantage as a construct within the socio-cultural and psychological context but also presents a position that verifies the reality of integrated support for the family mem-ber. Whether or not there are identifiable evidences that will encourage social activity, there must be a definition of the boundar-ies that oppose. The person-environment perspective affords interaction that is sensi-tive to the social and psychological needs of the aged and we further define that there is
370 K.A. Niles
the need for adjustment to ongoing societal requirements (Hooyman and Kiyak, 2002). The opportunities are therefore present to create the environment that facilitates the cultures of the aged creating the privileges for harmonious interaction and providing the mechanisms for an intergenerational discipline.
The future relations between grandpar-ents and grandchildren will no longer suf-fer from segregation and isolation but has a definite hope in an integrated intergen-erational world that offers the sensitivity for support and understanding (Pipher, 1999). Pipher (1999), also shows how illness creates the diversity and challenges the equilibrium within the home. The means to address situations from the elder’s position is not an intellectual act. The aged ought to know how to behave. Lebow and Kane (1999) has offered counselling services to the children and the grandchildren to help them live peaceable with parents and grandparents.
The biological wear and tear continues to put relations at risk because there is no apparent adult way to handle change and difference. The thought of seeing ones par-ent behaving strangely or displaying differ-ent movements, is painful and awkward; but here is no preparedness for this and the issue of obligation creates emotional tur-moil as one decides how to support or not. There is the interpretation of time, space; need and desire are all elements of interpre-tation which lends into the cultural norms of caregiving. The idea of placing a parent into a ‘home’, is not acceptable but is toler-ated to help the family members continue with their lifestyles.
Lebow and Kane (1999), in their case studies have had to address the fears of disempowerment and wastefulness – the aged becoming redundant and not being
an asset, even at home. Their participation is controlled by the decisions made by the generations and the elderly has been voided of rights. The ultimate move to an assisted living home is feared and there are reactions that precipitate conflict among family mem-bers. The question is how I can be func-tional and inclusive without the input of my co-dependants; there is need to negotiate to find favourable solutions – a way forward.
meThodology
The study is informed by a qualitative meth-odology. More specifically, a case study approach was employed to obtain primary data from homes for the aged in Trinidad and Guyana.
Purposive sampling was employed to select the institutions reviewed. The cases included a community home for the aged in Trinidad, a government home for the aged in Trinidad and a government home for the aged in Guyana. These homes were selected to allow for a comparison of the situation in community homes in Trinidad and Guyana, and to facilitate a comparison of a fully-run government home versus the community home in Trinidad.
Participant-observation was the main data-collection approach used. Site visits were made during which residents and staff was interviewed on the medical and social activities of the home and observations were made of the surroundings including build-ing infrastructure and resident interaction.
An ethnographic method was employed as I personally moved back to my parents’ home for a period of four (4) days. The opportunity provided data to support and discuss the theories that concern the changed lifestyles. I observed the differ-ences in their social, psychological and
371The aged, a lost and dying society
biological needs today as opposed to how it was 25 years ago. It also provided the envi-ronment to assess the intergenerational functions and its outcomes. They represent the ‘old old’ cohort, 75–84 years.
inTerVenTion
Allow me to introduce the intervention that supports the analysis of the Caribbean need for the family integration within the social fabric of the aged and the appreciation for a multi-intergenerational discipline for the elderly. The data sampling was taken from Guyana and Trinidad and Tobago to show the public and private care-giving process. The data also reveals the lack of sensitivity to basic needs and the lack of infrastruc-ture to support a progressive geriatric pro-gramme. Somewhat humanized, there is need to identify a gerontological framework that will facilitate the biological, psychologi-cal and social aspects of the ageing process.
Ageism is an unnecessary factor in any society as it creates an environment for ste-reotyping and stigmatism. The data further addressed these issues that gave a clearer understanding of the older person behav-iour from the home to the community and to the wider society. There would be the realisation of a positive and inclusive society that demands respect and participation.
More intense would be the intergen-erational link that is so vital for a support-ive framework that will create a theory of inclusion. The need for this is indicative of the transitional lifestyle for all cohorts. I observed a government facility and a pri-vately operated home for senior citizens in Guyana and Trinidad and Tobago.
Number 1 home, originally an alms-house, was founded in 1874 and like most buildings in Guyana, it is made of wood.
Unfortunately, the infrastructure of the building easily attested to its years of use. The exterior of the building was drab in appearance. While standing outside the building, the team looked gingerly at win-dow panes that looked weak: one window on the third floor looked as though it would fall off if a slight gust of wind blew by. The grounds were not well manicured. On enter-ing, a few residents were seen roaming the premises. They too mirrored the drabness of the buildings with their tattered, soiled clothing.
The three-storey building had no infra-structural provisions for the movement of residents with ambulatory problems or residents in wheelchairs. According to the nurse, a stretcher is used to transport resi-dents down the stairs when the need arises.
The Home is government run. It falls under the auspices of the Ministry of Labour, Human Services and Social Security. Room and board is free for residents. There is a Physiotherapy Department which is run by the Ministry of Health. There is also a Sewing Room and Dispensary, all humble in their appearance as was the rest of the building. At the time of the visit, the home had 8 wards: 4 male and 4 female. Overall, there were 243 residents: 122 male and 121 female. Gender is the only denominator used to assign resi-dents to wards. Patients with mental disor-ders are kept in the same wards with those who are not. There is no age distinction on the wards. A few of the residents were under 50 years of age – some are in their 1920s. They are kept at the home because of a physi-cal and/or mental problem. Youth who were abandoned in the State hospital because of a mental or physical disability are transferred to the Home at age 20.
The staff was comprised of nurses and medics: medics assess the patients and
372 K.A. Niles
prescribe medication; the nurses administer medication. There used to be doctors on the ward, but now, when necessary, residents are referred to the Georgetown hospital. The Home does not have an ambulance of its own, but depends on that of the hospital. However, the ambulance at the hospital is not always readily available. There are three (3) shifts: 7 am to 3 pm; 1 pm to 9 pm and 8:30 pm to 7:30 pm.
This is the final home for most of the residents. In the past four years, only three (or four) residents returned to their family. Family involvement was minimal but the camaraderie spirit there encouraged the residents to maintain a posture of hope and goodwill one to the other. There were less than five (5) persons who were able to return to any active lifestyle. One mitigating factor for reemployment was that the retire-ment age is fifty-five (55) years; this policy provided no hope for inclusion or participa-tion within the Public Service.
The number 2 home was more accessible than the other facility and had a more inti-mate staff. The director had been trained as nurse and the other staff members were untrained medically except of the training in Geriatric Nursing. The control at this home was encouraged by the frequent visits of family members; they were more given to attending to their parent or grand-parent’s needs in this environment. The infrastruc-ture was less risky and allowed for freer dia-logue and recreation among the residents. The family members had a sense of belong-ing that provided a social and psychological therapeutic dynamic.
In Trinidad, the number 3 home had been modified to accommodate the elderly and to provide specific health services for older persons. At this home, which serves as a hospital to patients with other illnesses,
the infrastructure was modern and allowed for proper access and ventilation. The medi-cal staff was all trained and the management sought to be consistent with a gerontologi-cal framework that encouraged safety and comfort. There were ambulances available and auxiliary staff served at the facility.
The patients were not intimate with each other or the staff and seemed to enjoy the solitude and quiet, which also had a thera-peutic effect to the elderly. The major set-back was the minimal visits to the residents. Families did not visit frequently; neither did they participate in conversations dur-ing their visit. The emptiness within the relationship echoed the lack of intergenera-tional identity and support. Several reasons were cited – the general ignorance of the ailment and the medical condition of the grandparent or parent; the personal agen-das and the subjective attitude towards the elderly. However, there were conversations among the persons who were visiting other loved ones.
Though the conditions were modern and afforded comfort and access, this did not create a positive attitude with a hope to be inclusive and establish a sense of belong-ing. There was no community spirit present and loneliness was often the experience of the elderly patient at the home. The nurs-ing staff gave their professional support and maintained the medical procedures which provided a balance emotional condition.
At the number 4 home the residents were responsible for their rooms and their upkeep. There was access to public places and those who were physically capable, had the opportunity to go to the nearby town to purchase groceries and medication. The physically challenged had to depend on the small part-time staff and family members for assistance. In this home, the infrastructure
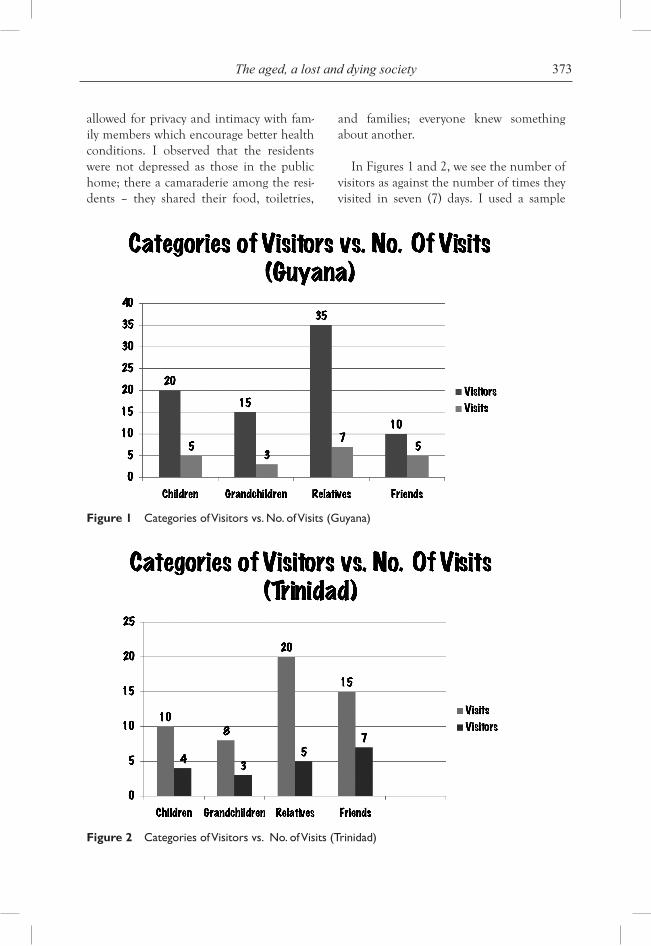
373The aged, a lost and dying society
allowed for privacy and intimacy with fam-ily members which encourage better health conditions. I observed that the residents were not depressed as those in the public home; there a camaraderie among the resi-dents – they shared their food, toiletries,
and families; everyone knew something about another.
In Figures 1 and 2, we see the number of visitors as against the number of times they visited in seven (7) days. I used a sample
Figure 1 Categories of Visitors vs. No. of Visits (Guyana)
Figure 2 Categories of Visitors vs. No. of Visits (Trinidad)
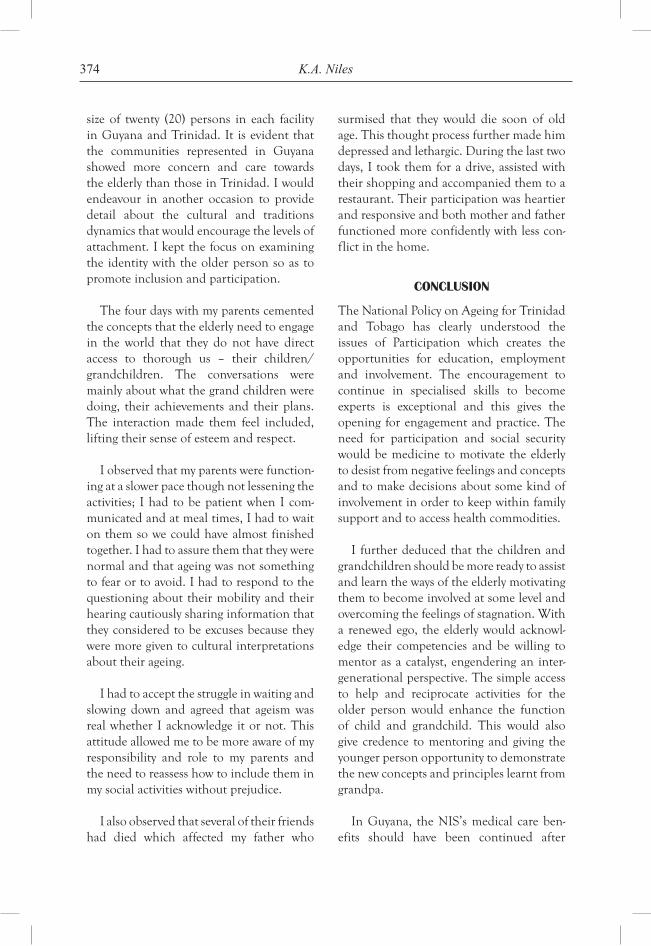
374 K.A. Niles
size of twenty (20) persons in each facility in Guyana and Trinidad. It is evident that the communities represented in Guyana showed more concern and care towards the elderly than those in Trinidad. I would endeavour in another occasion to provide detail about the cultural and traditions dynamics that would encourage the levels of attachment. I kept the focus on examining the identity with the older person so as to promote inclusion and participation.
The four days with my parents cemented the concepts that the elderly need to engage in the world that they do not have direct access to thorough us – their children/grandchildren. The conversations were mainly about what the grand children were doing, their achievements and their plans. The interaction made them feel included, lifting their sense of esteem and respect.
I observed that my parents were function-ing at a slower pace though not lessening the activities; I had to be patient when I com-municated and at meal times, I had to wait on them so we could have almost finished together. I had to assure them that they were normal and that ageing was not something to fear or to avoid. I had to respond to the questioning about their mobility and their hearing cautiously sharing information that they considered to be excuses because they were more given to cultural interpretations about their ageing.
I had to accept the struggle in waiting and slowing down and agreed that ageism was real whether I acknowledge it or not. This attitude allowed me to be more aware of my responsibility and role to my parents and the need to reassess how to include them in my social activities without prejudice.
I also observed that several of their friends had died which affected my father who
surmised that they would die soon of old age. This thought process further made him depressed and lethargic. During the last two days, I took them for a drive, assisted with their shopping and accompanied them to a restaurant. Their participation was heartier and responsive and both mother and father functioned more confidently with less con-flict in the home.
conclUsion
The National Policy on Ageing for Trinidad and Tobago has clearly understood the issues of Participation which creates the opportunities for education, employment and involvement. The encouragement to continue in specialised skills to become experts is exceptional and this gives the opening for engagement and practice. The need for participation and social security would be medicine to motivate the elderly to desist from negative feelings and concepts and to make decisions about some kind of involvement in order to keep within family support and to access health commodities.
I further deduced that the children and grandchildren should be more ready to assist and learn the ways of the elderly motivating them to become involved at some level and overcoming the feelings of stagnation. With a renewed ego, the elderly would acknowl-edge their competencies and be willing to mentor as a catalyst, engendering an inter-generational perspective. The simple access to help and reciprocate activities for the older person would enhance the function of child and grandchild. This would also give credence to mentoring and giving the younger person opportunity to demonstrate the new concepts and principles learnt from grandpa.
In Guyana, the NIS’s medical care ben-efits should have been continued after
375The aged, a lost and dying society
retirement specifically to help the elderly; new senior citizens institutions should have been built to specifications which ensured that all the special services necessary for the comfort and security of the aged were in place. Further, a programme of home-help for them would have been instituted; and facilities for adult training to give retirees a chance to update their skills and enable them to con-tinue to contribute to the development of our society would have been put in place.
From this research, I would recommend that the policy-makers could use qualitative results to inform policy and legislature. This method exposes the reality of the older per-son’s thought, competencies and strengths and also their weaknesses, which would create a comprehensive framework for further action.
I would therefore conclude that the future of the elder is secured financially when they are afforded the space, time and support to be fully integrated within the society as con-tributing citizens. Retirement would have a new meaning and psychologically the older person would not succumb to depression and would also have a healthier lifestyle – empowered for tomorrow.
biography
Dr. Kenneth Niles a psychologist and therapist is also a lecturer/tutor in Social Gerontology at the University of the West Indies, St Augustine. He has recently com-pleted a five module post-doctoral pro-gramme in Geropsychology at the University
of Colorado Springs, Colorado. He has pre-sented papers in the field of Gerontology at several fora in the region and internation-ally and is presently doing research in the area of Elder Rights and Elder Abuse. He also works with the hearing impaired.
references
and Issues, Springer Publishing Company, New York.
Binstock, R. and George, L. (1995) Handbook of Aging and the Social Cavanaugh, J.C and Blanchard-Fields (2006) Adult Development and Aging, Thomas Learning Inc., USA.
Cavanaugh, J.C. and Whitbourne, S.K. (1999) Gerontology – An Corporation.
Development, Division of Ageing.
Fundamentals of Assessment and Treatment, The Guildford Press, New Hooyman, N.R. and Kiyak, H.A. (2002) Social Gerontology – A Interdisciplinary Perspective, The Oxford University Press, London.
Lebow, G. and Kane, B. (1999) Coping with Your Difficult Older Morrison, M.H. (1988) The World and I, The Washington Times Multidisciplinary Perspective, Pearson, Allyn and Bacon, USA.
National Policy on Ageing for Trinidad and Tobago (2007) The Ministry of Social Parents, Harper Collins Publishers.
Piper, M. (1999) Another Country, The Berkley Publishing Company.
Sciences, The Academic Press, London.
Wilmoth, J.M. and Ferraro, K.F. (2007) Gerontology, Perspectives York.
Zarit, S.H. and Zarit, J.M. (2007) Mental Disorders in Older Adults,

Copyright © 2010 WASD
World Sustainable Development Outlook 2010
377
Multinational hotel coMpanies and sustainable tourisM in the okavango
delta, botswana
Joseph E. Mbaiwa*University of Botswana, Botswana
Abstract: Multinational hotel companies operate accommodation facilities in nature-based tourism destinations of many developing countries. This paper uses the sustainable tourism framework to examine the relationship between the hotel industry and the wildlife-based tourism in the Okavango Delta, Botswana. The paper further examines the socio-economic and environmental impacts of the hotel industry in the Delta. Through the use of primary and secondary data sources, results indicate that the hotel tourism industry in the Okavango Delta is lucrative. The industry relies on multinational hotel tourism companies originating from rich countries and South Africa. Hotels and lodges in Delta offer game drives, walking safaris, boating, accommodation and restaurant services. Its socio-economic impacts include employment, income and infrastructure development. Negative impacts are: revenue leakages, poor jobs for citizens and the failure to alleviate rural poverty. Sustainable tourism approaches which include citizen participation in tourism can reduce the negative impacts of the hotel industry.
Keywords: hotel industry; multinational companies; wildlife-based tourism; international tourism.
introduction
The global tourism industry has been on the increase in recent decades. This is particularly so because on the increasing number of international tourist arrivals espe-cially in developing countries. According to UNWTO (2009), international tourist arriv-als reached 922 million in 2008 (up by 1.9% on 2007). International tourism receipts grew to USD944 billion (euro 642 billion) in 2008, corresponding to an increase in real terms of 1.8% on 2007. Receipts from inter-national passenger transport are estimated
at USD165 billion, bringing the total of international tourism receipts including passenger transport (i.e., visitor export) to USD1.1 trillion or over USD3 billion a day. However, international tourist arrivals declined by 8% between January and April 2009, probably due to the global economic downturn. Nevertheless, the UNWTO believes the industry is robust and estimates there will be 1.6 billion visitor arrivals in 2020. Africa recorded a growth of 3% in 2009 despite the global economic downturn (UNWTO, 2009). In Botswana, the tourism
*Corresponding author: University of Botswana, Botswana; e-mail: [email protected]
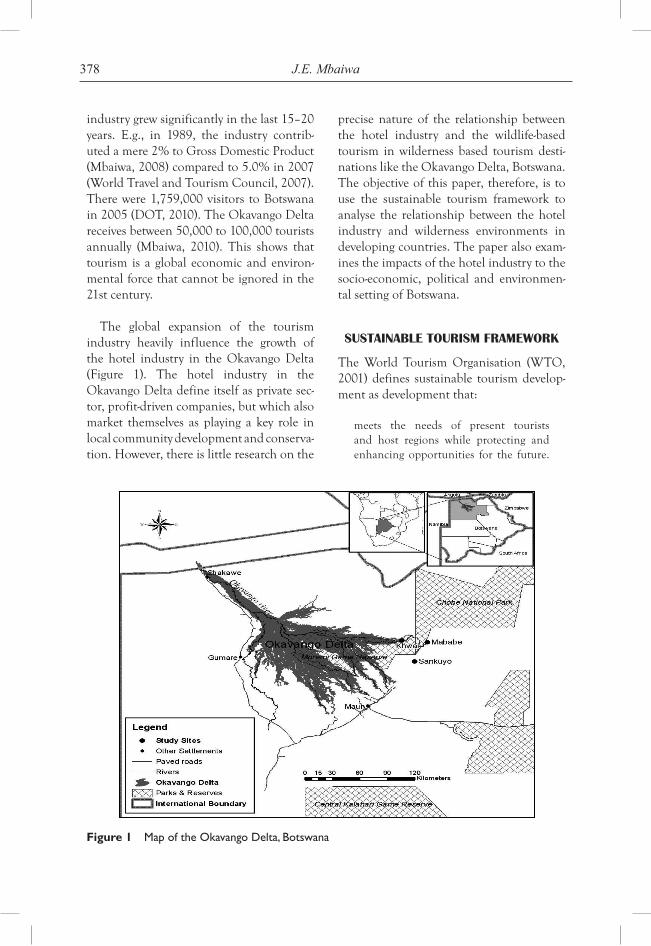
378 J.E. Mbaiwa
industry grew significantly in the last 15–20 years. E.g., in 1989, the industry contrib-uted a mere 2% to Gross Domestic Product (Mbaiwa, 2008) compared to 5.0% in 2007 (World Travel and Tourism Council, 2007). There were 1,759,000 visitors to Botswana in 2005 (DOT, 2010). The Okavango Delta receives between 50,000 to 100,000 tourists annually (Mbaiwa, 2010). This shows that tourism is a global economic and environ-mental force that cannot be ignored in the 21st century.
The global expansion of the tourism industry heavily influence the growth of the hotel industry in the Okavango Delta (Figure 1). The hotel industry in the Okavango Delta define itself as private sec-tor, profit-driven companies, but which also market themselves as playing a key role in local community development and conserva-tion. However, there is little research on the
precise nature of the relationship between the hotel industry and the wildlife-based tourism in wilderness based tourism desti-nations like the Okavango Delta, Botswana. The objective of this paper, therefore, is to use the sustainable tourism framework to analyse the relationship between the hotel industry and wilderness environments in developing countries. The paper also exam-ines the impacts of the hotel industry to the socio-economic, political and environmen-tal setting of Botswana.
sustainable tourisM FraMework
The World Tourism Organisation (WTO, 2001) defines sustainable tourism develop-ment as development that:
meets the needs of present tourists and host regions while protecting and enhancing opportunities for the future.
Figure 1 Map of the Okavango Delta, Botswana
379Multinational hotel companies and sustainable tourism
It is envisaged as leading to management of all resources in such a way that eco-nomic, social and aesthetic needs can be fulfilled while maintaining cultural integrity, essential ecological processes, biological diversity and life support systems.
Prosser (1994) and Liu (2003) adds that in tourism development, there are four forces of social change that should drive sustainability in tourism, these are: the dis-satisfaction with existing products; growing environmental awareness and cultural sen-sitivity; realisation by destination regions of the precious resources they possess and their vulnerability; and, the changing attitudes of developers and tour operators. Tosun (2001, pp.290–291) notes that sustainable tourism development is informed by the following six principles:
• Sustainable tourism should contributeto the satisfaction of basic and felt needs of those hitherto excluded in local tour-ist destinations.
• Sustainable tourism should reduceinequality and absolute poverty in local tourist destinations.
• Sustainable tourism should contributeto the emergence of necessary condi-tions in tourist destinations which will lead local people to gain self-esteem and to feel free from the evils of want, igno-rance and squalor. Sustainable tourism should help host communities to be free or emancipated from alienating material conditions of life and from social servi-tude to nature, ignorance, other people, misery, institution and dogmatic beliefs.
• Sustainable tourism should acceleratenot only national economic growth, but also regional and local economic growth. This growth must be shared fairly across the social spectrum.
• Sustainable tourism should achieve theabove principles indefinitely without compromising the ability of future gen-erations to meet their own need.
Tosun (2001) argues that from these prin-ciples, sustainable tourism must be regarded as an adaptive paradigm capable of address-ing widely different situations and articulat-ing different goals. In this regard, Tosun argues that as an adaptive paradigm, sus-tainable tourism is a multi-disciplinary and broad concept touching upon a wide range of issues such as economic development policy, environmentally matters, social fac-tors, structure of the international tourism system. Wall (1997) argues that if tourism is to become sustainable, it should be eco-nomically viable, socio-culturally sensitive and environmentally friendly in destination areas.
The concept of sustainable tourism devel-opment has its own critics such as Harrison (1996) and Liu (2003). Liu states that the sustainable tourism development debate is patchy, disjointed and often flawed with false assumptions and arguments. Harrison says, the debate is ‘muddy pool’. According to Sharpley (2000), sustainable develop-ment advocates a holistic perspective, i.e., development can only be sustainable if it is considered within a global political, socio-economic and ecological context. Sharpley argues that at first sight, the underlying philosophy of sustainable tourism devel-opment appears to embrace a holistic planning. However, sustainable tourism presupposes a balanced triangular relation-ship between host areas and host commu-nities, tourists and the tourism industry where there is no one stakeholder upsets the equilibrium (Lane, 1994). Lane argues that such a scenario where one stakeholder does not upset the equilibrium is likely to be ideal than practical. Sharpley (2000)
380 J.E. Mbaiwa
argues that despite the acceptance that tourism should be integrated into national and local development strategies, the focus of sustainable tourism development is usu-ally inwards or product centred. The fact that the tourism industry is complex, frag-mented, multi-sectoral and profit oriented in nature, the operationlisation of sustain-able development is fraught with problems (Hunter, 1995; Sharpley, 2000). Because of this problem, sustainable tourism strategies in practice tend to focus on localized and small-scale development projects without much attention beyond its local or regional boundaries (Sharpley, 2000). The different sectors of tourism include varying degrees of environmentally sound policies, there is lit-tle evidence of a common development and business philosophy according to sustain-able principles across the industry (Forsyth, 1995; Sharpley, 2000).
Although there are numerous criticisms that sustainable tourism has been subjected to, it is globally accepted that ‘real’ develop-ment should adhere to the principles of sustainable development (WCED, 1987). Proponents of sustainable tourism develop-ment argue that it holds a considerable prom-ise as a vehicle for addressing the problems of negative tourism impacts and maintaining its long-term viability (Liu, 2003). Bramwell and Lane (1993) describe sustainable tourism as a positive approach intended to reduce the ten-sions and friction created by complex interac-tions between the tourism industry, tourists, the environment and the host communities so that the long-term capacity and quality of both natural and human resources can be maintained. As such, sustainable tourism is considered to be a goal that is applicable to all tourism ventures regardless of scale (Hardy et al., 2002). This means tourism as an eco-nomic activity should also adhere to the prin-ciples of sustainable development for it to be sustainable.
MethodologY
Data for this paper were derived from both primary and secondary sources. Secondary data sources consisted of articles and reports on tourism development in the Okavango Delta. This included government policy doc-uments, consultancy reports, community-based tourism reports and other cultural and wildlife-based tourism reports. Information derived from these sources includes histori-cal development of the hotel industry in the Okavango Delta. Primary data were derived from ongoing tourism research particularly by this author in the Okavango Delta dat-ing back to 1998. Brochures and pamphlets on tourism development by the different hotel tourism companies operating in the Okavango Delta were also used. Websites of these hotel tourism companies were also vis-ited to derive information on the number of rooms and beds, prices charged in these accommodation facilities and the owner-ship of these facilities.
results and discussion
The size of accommodation facilities
The accommodation or hotel sector is one of the primary sectors in the tourism indus-try. The type of ownership of the sector and who derives more benefits, particularly the revenue, can be used to determine the sus-tainability of tourism in destination areas. In Botswana, the number of beds in hotels, motels, lodges and camps grew by approxi-mately 22% from1984 to 1988. The number of beds grew from 960 in 1984 to 3,257 by 1998, representing an approximately 71% increase in the 14-year period (Mbaiwa, 2002). The Department of Tourism (2010) indicates that in 2009 there were 380 licensed and fixed tourist accommodation facilities in Botswana. These facilities have 6,511 rooms with 11,275 beds (Table 1). The
381Multinational hotel companies and sustainable tourism
Department of Tourism (2010) further notes that in 2009 the Okavango region had the highest number of accommodation facilities. The Okavango Delta had a total of 116 facili-ties with 1,125 rooms and 2,129 beds (Table 1).The Delta, therefore, contains the highest number of accommodation facilities.
The general conclusion that can be made about hotels and lodges in Botswana is that they have increased in the last 20 years. The fact that the Okavango Delta has the highest number of hotels and lodges shows that critical role that wildlife-based tourism plays in the socio-economic development of Botswana.
Ownership of accommodation facilities
The hotel and accommodation sector in the Okavango Delta is predominately owned by foreign companies and investors. E.g., a recent survey has shown that 53.8% of the accommodation facilities are 100% owned by foreign safari companies, about 27.7% are jointly owned between Botswana citizen
and non-citizen companies while 18.5% are fully owned by Botswana citizen com-panies. This means that foreign companies and investors have an influence in about 81.5% of the accommodation facilities in the Okavango Delta (Mbaiwa, 2005b). Multinational hotels in the Okavango Delta own more than one lodge or camp. As shown in Table 2, Okavango Wilderness Safaris is the largest company, with over 19 camps and lodges in the different parts of the Okavango Delta. Most of these companies also operate in neighbour-ing countries of South Africa, Namibia, Zimbabwe and Zambia (Mbaiwa, 2002). This, therefore, explains the multinational aspect of the hotel industry in Botswana and Southern Africa.
The domination of accommodation facil-ities by foreign companies and investors sug-gests that much of the revenue generated in the accommodation sector does not accrue to local companies. Studies (e.g., BDTP, 1999) have shown that that Botswana retains less that 29% of the total revenue generated from tourism in the country. E.g, in 1997,
Table 1 Accommodation capacity by region
Region Number of facilities Rooms Beds
South East 44 1,602 2,787
North East 57 1,119 1,734
Okavango 116 1,125 2,129
Chobe 26 765 1,588
Kgalagadi 17 160 255
Kweneng 14 240 343
Kgatleng 2 25 40
Southern 11 216 323
Ghanzi 14 221 345
Central 79 1,038 1,731
Total 380 6,511 11,275
Source: Department of Tourism (2010)
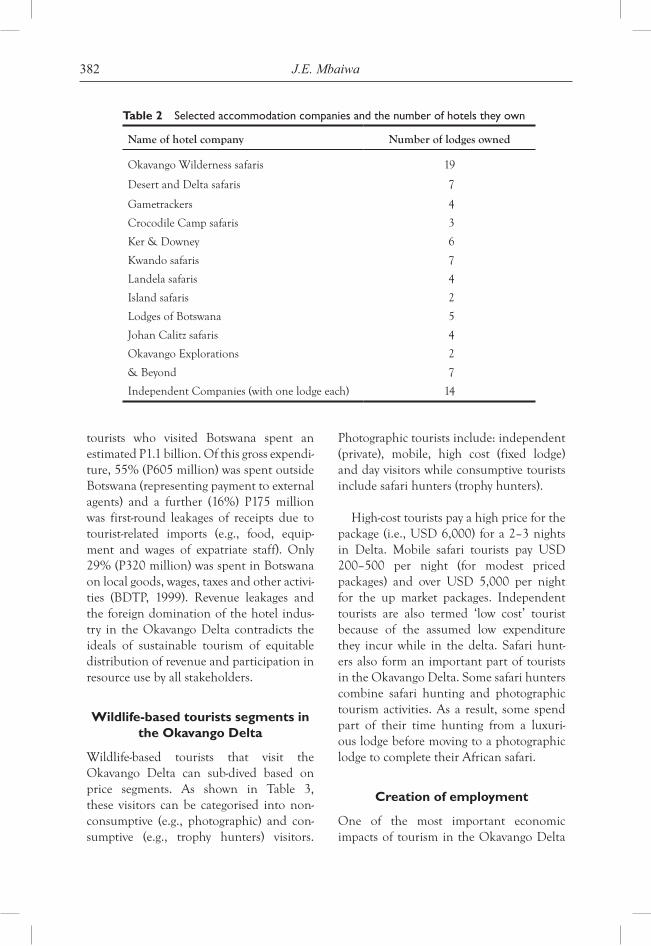
382 J.E. Mbaiwa
tourists who visited Botswana spent an estimated P1.1 billion. Of this gross expendi-ture, 55% (P605 million) was spent outside Botswana (representing payment to external agents) and a further (16%) P175 million was first-round leakages of receipts due to tourist-related imports (e.g., food, equip-ment and wages of expatriate staff). Only 29% (P320 million) was spent in Botswana on local goods, wages, taxes and other activi-ties (BDTP, 1999). Revenue leakages and the foreign domination of the hotel indus-try in the Okavango Delta contradicts the ideals of sustainable tourism of equitable distribution of revenue and participation in resource use by all stakeholders.
Wildlife-based tourists segments in the Okavango Delta
Wildlife-based tourists that visit the Okavango Delta can sub-dived based on price segments. As shown in Table 3, these visitors can be categorised into non-consumptive (e.g., photographic) and con-sumptive (e.g., trophy hunters) visitors.
Photographic tourists include: independent (private), mobile, high cost (fixed lodge) and day visitors while consumptive tourists include safari hunters (trophy hunters).
High-cost tourists pay a high price for the package (i.e., USD 6,000) for a 2–3 nights in Delta. Mobile safari tourists pay USD 200–500 per night (for modest priced packages) and over USD 5,000 per night for the up market packages. Independent tourists are also termed ‘low cost’ tourist because of the assumed low expenditure they incur while in the delta. Safari hunt-ers also form an important part of tourists in the Okavango Delta. Some safari hunters combine safari hunting and photographic tourism activities. As a result, some spend part of their time hunting from a luxuri-ous lodge before moving to a photographic lodge to complete their African safari.
Creation of employment
One of the most important economic impacts of tourism in the Okavango Delta
Table 2 Selected accommodation companies and the number of hotels they own
Name of hotel company Number of lodges owned
Okavango Wilderness safaris 19
Desert and Delta safaris 7
Gametrackers 4
Crocodile Camp safaris 3
Ker & Downey 6
Kwando safaris 7
Landela safaris 4
Island safaris 2
Lodges of Botswana 5
Johan Calitz safaris 4
Okavango Explorations 2
& Beyond 7
Independent Companies (with one lodge each) 14
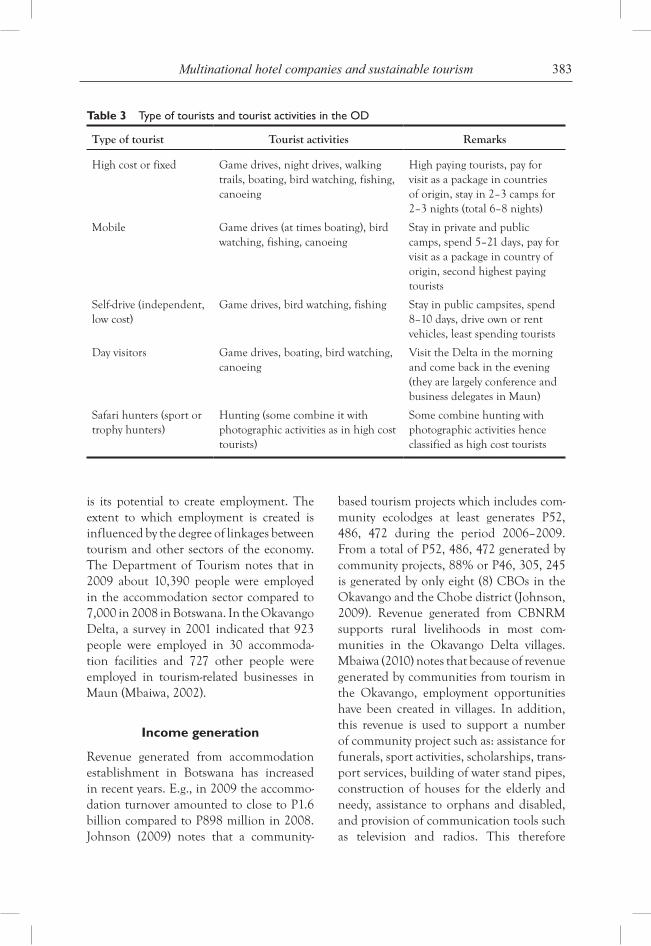
383Multinational hotel companies and sustainable tourism
is its potential to create employment. The extent to which employment is created is influenced by the degree of linkages between tourism and other sectors of the economy. The Department of Tourism notes that in 2009 about 10,390 people were employed in the accommodation sector compared to 7,000 in 2008 in Botswana. In the Okavango Delta, a survey in 2001 indicated that 923 people were employed in 30 accommoda-tion facilities and 727 other people were employed in tourism-related businesses in Maun (Mbaiwa, 2002).
Income generation
Revenue generated from accommodation establishment in Botswana has increased in recent years. E.g., in 2009 the accommo-dation turnover amounted to close to P1.6 billion compared to P898 million in 2008. Johnson (2009) notes that a community-
based tourism projects which includes com-munity ecolodges at least generates P52, 486, 472 during the period 2006–2009. From a total of P52, 486, 472 generated by community projects, 88% or P46, 305, 245 is generated by only eight (8) CBOs in the Okavango and the Chobe district (Johnson, 2009). Revenue generated from CBNRM supports rural livelihoods in most com-munities in the Okavango Delta villages. Mbaiwa (2010) notes that because of revenue generated by communities from tourism in the Okavango, employment opportunities have been created in villages. In addition, this revenue is used to support a number of community project such as: assistance for funerals, sport activities, scholarships, trans-port services, building of water stand pipes, construction of houses for the elderly and needy, assistance to orphans and disabled, and provision of communication tools such as television and radios. This therefore
Table 3 Type of tourists and tourist activities in the OD
Type of tourist Tourist activities Remarks
High cost or fixed Game drives, night drives, walking trails, boating, bird watching, fishing, canoeing
High paying tourists, pay for visit as a package in countries of origin, stay in 2–3 camps for 2–3 nights (total 6–8 nights)
Mobile Game drives (at times boating), bird watching, fishing, canoeing
Stay in private and public camps, spend 5–21 days, pay for visit as a package in country of origin, second highest paying tourists
Self-drive (independent, low cost)
Game drives, bird watching, fishing Stay in public campsites, spend 8–10 days, drive own or rent vehicles, least spending tourists
Day visitors Game drives, boating, bird watching, canoeing
Visit the Delta in the morning and come back in the evening (they are largely conference and business delegates in Maun)
Safari hunters (sport or trophy hunters)
Hunting (some combine it with photographic activities as in high cost tourists)
Some combine hunting with photographic activities hence classified as high cost tourists
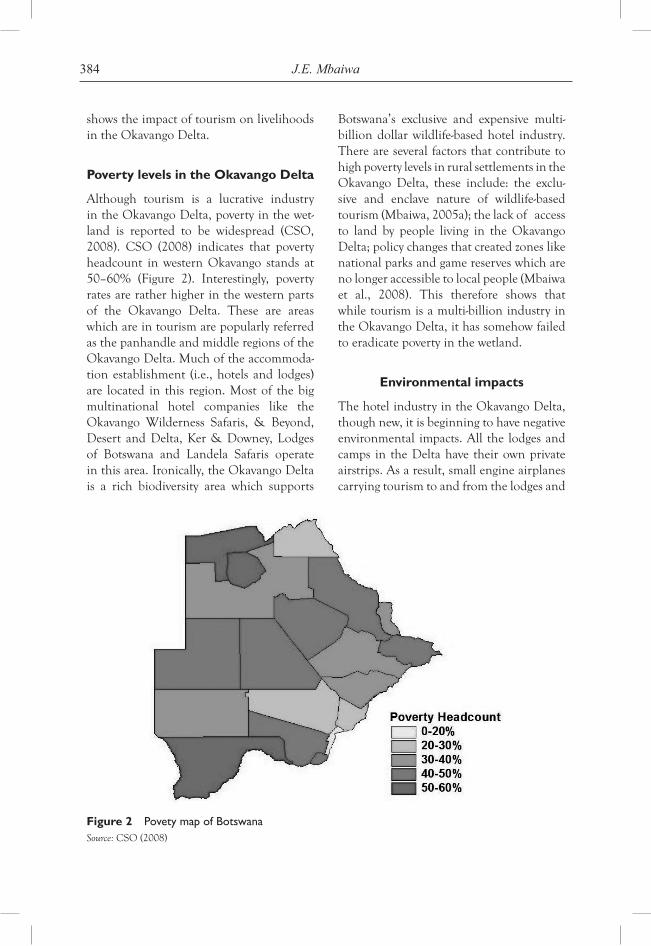
384 J.E. Mbaiwa
shows the impact of tourism on livelihoods in the Okavango Delta.
Poverty levels in the Okavango Delta
Although tourism is a lucrative industry in the Okavango Delta, poverty in the wet-land is reported to be widespread (CSO, 2008). CSO (2008) indicates that poverty headcount in western Okavango stands at 50–60% (Figure 2). Interestingly, poverty rates are rather higher in the western parts of the Okavango Delta. These are areas which are in tourism are popularly referred as the panhandle and middle regions of the Okavango Delta. Much of the accommoda-tion establishment (i.e., hotels and lodges) are located in this region. Most of the big multinational hotel companies like the Okavango Wilderness Safaris, & Beyond, Desert and Delta, Ker & Downey, Lodges of Botswana and Landela Safaris operate in this area. Ironically, the Okavango Delta is a rich biodiversity area which supports
Botswana’s exclusive and expensive multi-billion dollar wildlife-based hotel industry. There are several factors that contribute to high poverty levels in rural settlements in the Okavango Delta, these include: the exclu-sive and enclave nature of wildlife-based tourism (Mbaiwa, 2005a); the lack of access to land by people living in the Okavango Delta; policy changes that created zones like national parks and game reserves which are no longer accessible to local people (Mbaiwa et al., 2008). This therefore shows that while tourism is a multi-billion industry in the Okavango Delta, it has somehow failed to eradicate poverty in the wetland.
Environmental impacts
The hotel industry in the Okavango Delta, though new, it is beginning to have negative environmental impacts. All the lodges and camps in the Delta have their own private airstrips. As a result, small engine airplanes carrying tourism to and from the lodges and
Figure 2 Povety map of BotswanaSource: CSO (2008)
385Multinational hotel companies and sustainable tourism
camps are reported to be causing noise pol-lution (Mbaiwa, 2002). Noise pollution by small engine aircraft is also related to that caused by engine boats in the area. Roodt (1998) states that a total of 32 power boats of which 26 belong to safari operators and six to government, are currently licensed for use the Xakanaxa area. The fast movement of motor boats creates wakes which disturb nesting birds, mammals and reptiles which live in water. Crocodiles and hippos seek undisturbed areas and the presence of too many boats in the Okavango Delta disturbs these species. Roodt (1998) states that hip-pos, which were in large numbers seven years ago, have already moved out in the Xakanaxa lagoon. The disturbance of ani-mal habitats by motorized tourism presum-ably impacts the wildlife numbers negatively of the delta.
The high volume of tourists visiting the Okavango Delta has reached levels where the amount of garbage generated has increased and is beginning to negatively impact on the delta environment (Mbaiwa, 2002). The problem of waste is characterized by failure to dispose domestic waste following proper waste-disposal procedures in tourist camps. Septic tanks for wastewater collection in hotels is posing threats of ground-water contamination and pollution (McCarthy et al., 1994). Studies (e.g., by McCarthy et al. (1994) and Aqualogic (2009)) indicate that septic tanks for human waste are not constructed following any environmental standards, and in some camps such tanks do not exist except for the ‘pit latrines’. Many tourist camps in the Okavango Delta rely on borehole water to supply camp needs, and moreover discharge waste and sewage efflu-ent into the ground-water (McCarthy et al., 1994). This situation creates the potential for contamination of drinking water sup-plies. The water table in the Okavango Delta is high and the soils are sandy with
a high permeability. Pollutants can thus travel much greater distances into the soils. The water table in the Okavango Delta is usually less than 1 m below the surface dur-ing flood seasons; as a result, discharge of effluent into ground-water is unavoidable (McCarthy et al., 1994). Bluegreen algae (Microcystis sp.) have been recorded in the Okavango system, and these can be toxic under bloom conditions (NRP, 2000). As a result, the potential for ground-water con-tamination with nitrate from septic tank drainage in areas where ground-water is close to the surface (10 m or less), and con-tamination by faecal bacteria and possibly viable pathogens could occur if septic tanks are situated in areas where ground-water is at 1 m or less beneath the surface (NRP, 2000). This scenario suggests that water pollution might be possible in areas around tourist camps and lodges in the Okavango Delta.
conclusion
The tourism industry has stimulated the development of a variety of allied infra-structure and facilities, such as hotels, lodges and camps, airport and airstrips, in the Okavango region. Through its backward linkages, wholesale and retail businesses have also been established, especially in Maun, to offer various goods to the tourist industry. Tourism in the Okavango Delta also provides employ-ment opportunities to local communities and it is a significant source of foreign exchange for Botswana. Despite its positive socio-economic impacts, the industry is beginning to have negative environmental impacts in the area such as the destruc-tion of the area’s ecology through driving outside the prescribed trails, noise pollu-tion and poor waste management. This, therefore, suggests that tourism in the Okavango Delta has socio-economic and
386 J.E. Mbaiwa
environmental impacts, issues which are addressed in order to achieve sustainability in tourism development in the wetland.
biographY
Joseph Mbaiwa holds a Ph.D. in Tourism Sciences from Texas A&M University. He is currently holds a position of Associate Professor of Tourism Studies at the University of Botswana’s Okavango Research Institute based in Maun, Botswana. His research interests are on tourism development, rural livelihoods and conservation.
reFerences
Aqualogic (2009), Consultancy for the Assessment of Liquid Waste Systems of Tourism Establishments in the Okavango Delta and Transportation, Handling and Storage of Hazardous Substances in the Okavango Delta. Biokavango Project, Maun, University of Botswana.
Botswana Tourism Development Programme (1999) Tourism Economic Impact Assessment, Department of Tourism, Gaborone.
Bramwell, B. and Lane, B. (1993) ‘Interpretation and sustainable tourism: the potentials and pitfalls’, Journal of Sustainable Tourism, Vol. 1, No. 2, pp.71–80.
Central Statistic Office (CSO) (2008) Poverty Map of Botswana, Ministry of Finance and Development Planning, Gaborone.
Department of Tourism (DOT) (2010) A Statistical Review of Tourism 2009, Department of Tourism, Gaborone.
Forsyth, T. (1995) Business attitudes to sustainable tourism: Self-regulation in the UK outgoing tourism industry. Journal of Sustainable Tourism Vol. 3, No. 4, pp.210–231.
Hardy, H., Beeton, R.J.S. and Pearson, L. (2002) ‘Sustainable tourism: an overview of the concept and its position in relation to conceptualisation of tourism’, Journal of Sustainable Tourism, Vol. 10, No. 6, pp.475–496.
Harrison, D. (1996) ‘Sustainability and tourism: reflections from a muddy pool’, in Briguglio, L., Archer, B., Jafari, J. and Wall, G. (Eds.): Sustainable Tourism in Islands and Small States, pp.69–89, Pinter, London.
Hunter, C. (1997) ‘Sustainable tourism as an adaptive paradigm’, Annals of Tourism Research, Vol. 24, No. 4, pp.850–867.
Johnson, S. (2009). State of CBNRM Report 2009. Botswana National CBNRM Forum, Gaborone, Botswana.
Lane, B. (1994). Sustainable Rural Tourism strategies: a tool for development and conservation. Journal of Sustainable Tourism, Vol. 2, Nos. 1&2, pp.102–111.
Liu, Z. (2003) ‘Sustainable tourism development: a critique’, Journal of Sustainable Tourism, Vol. 11, No. 6, pp.459–475.
Mbaiwa, J.E. (2002) The Socio-Economic and Environmental Impacts of Tourism Development in the Okavango Delta, Botswana, Harry Oppenheimer Okavango Research Centre, University of Botswana, Maun, p.144.
Mbaiwa, J.E. (2005a) ‘Enclave tourism and its socio-economic impacts in the Okavango Delta, Botswana’, Tourism Management, Vol. 26, No. 2, pp.157–172.
Mbaiwa, J.E. (2005b) ‘The problems and prospects of sustainable tourism develop-ment in the Okavango Delta, Botswana’, Journal of Sustainable Tourism, Vol. 13, No. 3, pp.203–227.
Mbaiwa, J.E., Ngwenya, B.N. and Kgathi, D.L. (2008) ‘Contending with unequal and privileged access to natural resources and land in the Okavango Delta, Botswana’, Singapore Tropical Geographical Journal, Vol. 29, No. 2, pp.155–172.
Mbaiwa, J.E. (2010) Tourism, Livelihoods and Conservation: The Case of the Okavango Delta, Botswana, Lambert Academic Publishers, Saarbrucken, p.188.
McCarthy, T.S., Ellery, W.N. and Gieske, A. (1994) ‘Possible ground water pollution by sewage effluent at camps in the Okavango Delta: suggestions for its prevention’, Botswana Notes and Records, No. 26, pp.129–138.
387Multinational hotel companies and sustainable tourism
NRP (2000) Management Plan for the Okavango River Panhandle: Progress report 3, NRP, Maun.
Prosser, R. (1994) ‘Societal change and the growth in alternative tourism’, in Cater, E. and Lowman, G. (Eds.): Ecotourism: A Sustainable Option, John Wiley and Sons Ltd, New York, pp.19–37.
Roodt, V. (1998) Ecological Impact of Tourism on the Xakanaxa Area of Moremi Game Reserve, Unpublished Report, Maun.
Sharpley, R. (2000) ‘Tourism and sustainable development: exploring the theoretical divide’, Journal of Sustainable Tourism, Vol. 8, No. 1, pp.1–19.
Tosun, C. (2001) ‘Challenges of sustainable tourism development in the developing world: the case of Turkey’, Tourism Management, Vol. 22, No. 3, pp.289–303.
United Nations World Tourism Organization (2009) UNWTO World Tourism Barometer, World Tourism Organization, Madrid, Spain.
Wall, G. (1997) ‘Is ecotourism sustainable?’ Environmental Management, Vol. 21, No. 4, pp.483–491.
World Commission on Environment and Development (WCED) (1987) Our Common Future, Oxford University Press, London.
World Tourism Organization (2001) Tourism market Trends, WTO, Madrid, Spain.
World Travel and Tourism Council (2007) Botswana: The Impact of Travel and Tourism on Jobs and the Economy, World Travel & Tourism Council, London.

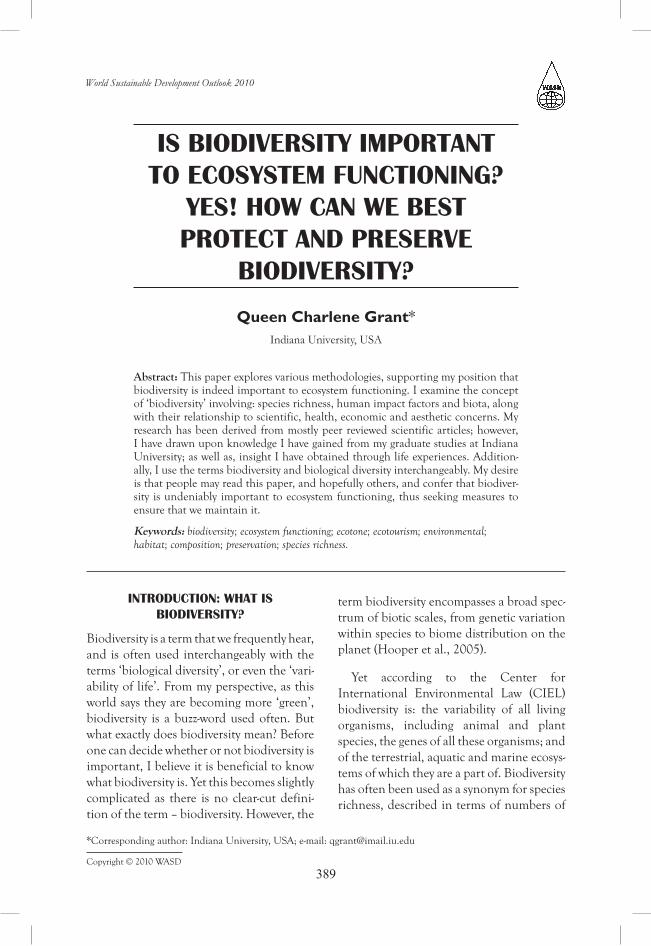
Copyright © 2010 WASD
World Sustainable Development Outlook 2010
389
Is bIodIversIty Important to ecosystem functIonIng?
yes! How can we best protect and preserve
bIodIversIty?
Queen Charlene Grant*Indiana University, USA
Abstract: This paper explores various methodologies, supporting my position that biodiversity is indeed important to ecosystem functioning. I examine the concept of ‘biodiversity’ involving: species richness, human impact factors and biota, along with their relationship to scientific, health, economic and aesthetic concerns. My research has been derived from mostly peer reviewed scientific articles; however, I have drawn upon knowledge I have gained from my graduate studies at Indiana University; as well as, insight I have obtained through life experiences. Addition-ally, I use the terms biodiversity and biological diversity interchangeably. My desire is that people may read this paper, and hopefully others, and confer that biodiver-sity is undeniably important to ecosystem functioning, thus seeking measures to ensure that we maintain it.
Keywords: biodiversity; ecosystem functioning; ecotone; ecotourism; environmental; habitat; composition; preservation; species richness.
IntroductIon: wHat Is bIodIversIty?
Biodiversity is a term that we frequently hear, and is often used interchangeably with the terms ‘biological diversity’, or even the ‘vari-ability of life’. From my perspective, as this world says they are becoming more ‘green’, biodiversity is a buzz-word used often. But what exactly does biodiversity mean? Before one can decide whether or not biodiversity is important, I believe it is beneficial to know what biodiversity is. Yet this becomes slightly complicated as there is no clear-cut defini-tion of the term – biodiversity. However, the
term biodiversity encompasses a broad spec-trum of biotic scales, from genetic variation within species to biome distribution on the planet (Hooper et al., 2005).
Yet according to the Center for International Environmental Law (CIEL) biodiversity is: the variability of all living organisms, including animal and plant species, the genes of all these organisms; and of the terrestrial, aquatic and marine ecosys-tems of which they are a part of. Biodiversity has often been used as a synonym for species richness, described in terms of numbers of
*Corresponding author: Indiana University, USA; e-mail: [email protected]
390 Q.C. Grant
entities; such as, how many genotypes, spe-cies or ecosystems; the evenness of their dis-tribution, the differences in their functional traits and their interactions (Hooper et al., 2005). Theoretically, these definitions and the countless others’ are similar enough that it should be possible to get a general under-standing of what is meant when speaking about biodiversity.
wHy Is bIodIversIty Important?
I have always believed that biodiversity is important, period. There is much data concluding that biodiversity supports spe-cific processes; such as, communities with higher biodiversity are believed to contain specialists which are absent in less diverse communities; such as, pollinators of cer-tain plants. Biological diversity is strongly correlated with ecosystem process rates and also important for the delivery of ecosystem services (Schläpfer, 1999). Thus biodiversity may influence rates of ecosystem processes, with increasing, decreasing or stabilising rates (Giller et al., 2002).
Biodiversity should be added to species composition, disturbance, nutrient supply and climate as a major controller of popula-tion and ecosystem dynamics and structure (Tilman, 1999). Ecological experiments, observations and theoretical developments show that ecosystem properties depend greatly on biodiversity in terms of the func-tional characteristics of organisms present in the ecosystem and the distribution and abundance of those organisms over space and time (Hooper et al., 2005). Concern is growing that high rates of species extinction could be detrimental to ecosystem services (Giller et al., 2002).
There is an unassailable relationship between soil biodiversity and ecosystem
functioning, as it is obvious that soils can-not perform ecosystem services such as decomposition, nutrient cycling and dis-ease suppression without an array of soil organisms being present (Brussaard, 1997). Biodiversity plays a major role in the functioning of critical transition zones, or ecotones, which are zones that form an interface between major terrestrial and aquatic habitats (Freckman et al., 1997), such as those between soils and ground-water or between land and freshwater habitats (Giller et al., 2002).
Human Impacts on bIodIversIty
Altered biodiversity has led to widespread concern for a number of markets (such as, ecotourism, ‘mining’ for medicines) and non-markets (such as, ethical, aesthetic) reasons (Hooper et al., 2005). Currently, most ecosystems are experiencing loss of biodiversity associated with the activities of human expansion (Naeem et al., 1994). It is very obvious and quite sad that humans are obliterating biological diversities, in a simi-lar fashion as St. Johns’ goats, donkeys and hogs munch around the island denuding the hillsides fostering soil erosion. However, we humans are supposed to know better; whereas, goats are assumed not to know any better. Could it be that humans have the equal intelligence of goats and donkeys? I further question, then why do humans fre-quently destroy our ecosystems jeopardizing its’ biodiversity?
Increasing domination of ecosystems by humans is steadily transforming them into impoverished systems (Loreau et al., 2001). Therefore, it is no surprise that the U.S. Fish and Wildlife Service (USFWS) have recognised these issues and have established a formal four-factor priority system used to rank species for recovery projects:
391Is biodiversity important to ecosystem functioning?
1 degree of threat
2 recovery potential
3 taxonomy
4 conflict with development (Metrick et al., 1998).
Human domination of the biosphere is rapidly altering the capacity of ecosystems to provide a variety of essential services; we therefore need to develop a better under-standing of theses ecological underpinnings and integrate this knowledge into a socio-economic context to develop better policies and plans to manage them (Kremen et al., 2005).
During our history, some insect vectors have dispersed into new habitats by phoresy as one organism transports another often by flight or wind, yet human-aided trans-port has been responsible for the arrival and spread of most invasive vectors, such as fleas, lice and mosquitoes (Pongsiri et al., 2009). This may not seem like much of an issue, but as humans move into ecosys-tems, disturbing biodiversity, often foreign species may detrimentally invade current species causing negative consequences to biodiversity, possibly even causing extinc-tion. Although all species may eventually go extinct, humans are negatively affecting biodiversity; as well as, accelerating the rate at which species are lost on a global scale (Freckman et al., 1997).
Natural ecosystems and ecosystems impacted by human activities differ in both compositions and diversity (Tilman, 1999). One of the costs of human domination of Earth’s ecosystem is increasing global bio-geographical homogeneity caused by the widespread introduction of non-native flora and fauna into new areas. This anthropo-genic form of invasion, sometimes termed
‘biological pollution’ has caused loss of bio-diversity globally, particularly on oceanic islands (Daszak et al., 2000). Additionally, the abundant diversity of life forms that have evolved on Earth is beginning to disappear. This decline in life on Earth is both a consequence of anthropogenic cli-mate change and more directly a response to anthropogenic modification of natural habitats (Dobson, 2005).
specIes rIcHness
Biological diversity is measured by the amount of genetic variation, including the richness of species; as well as, the richness of the many different types of ecosystems (Freckman et al., 1997). The scientific com-munity has come to a broad consensus on many aspects concerning the relationship between biodiversity and ecosystem func-tioning, including many points relevant to the management of ecosystems (Hooper et al., 2005). Ecosystem management is undoubtedly an intricate feature actively used and needed in maintaining and pro-tecting biodiversity.
Communities of species and their asso-ciated biological, chemical and physical processes collectively known as ecosystems drive the Earth’s bio-geochemical pro-cesses (Naeem et al., 1994). Yet, ecological understanding of most ecosystem services remains rudimentary, impeding progress in identifying targets for conservation and management (Kremen et al., 2005). Ecological experiments, observations and theoretical developments show that ecosys-tem properties depend greatly on biodiver-sity in terms of functional characteristics of organisms present in ecosystems and the distribution and abundance of those organisms over space and time (Hooper et al., 2005).
392 Q.C. Grant
bIodIversIty and wHat we Know
Scientific
Loss of species may be compounded by subsequent loss of function within a frag-mented bio-diverse ecosystem (Giller et al., 2002). Research has shown that sus-ceptibility to invasion by exotic species is strongly influenced by species composition and, under similar environmental condi-tions, generally decreases with increasing species richness (Hooper et al., 2005). In some instances, species that contribute the most to biodiversity function are also some of the most sensitive to disturbances; con-sequently, these non-random extinction sequences often lead to the loss of entire functional bio-diverse groups (Kremen et al., 2005). However, several other factors, such as: propagule pressure, disturbance regime and resource availability, also strongly influence invasion success and often override effects of species richness in comparison across different sites or ecosystems (Hooper et al., 2005).
What we know of past, present and projected rates of habitat change, species extinction and human population growth, combined with development suggests some profoundly disturbing conclusions about the future of the earth’s biosphere (Giller et al., 2002); moreover, we already know that the spread of vectors and disease affects both people and wildlife.
Ecological communities are capable of behaving in qualitatively different ways when species are lost (Kremen et al., 2005). Never before has ecology been of such criti-cal importance in tackling the major social and economic problems that the world faces, and this role poses challenges to the subject itself as a scientific discipline (Giller et al., 2002). Most diverse ecosystem func-tion research has focused on the role of
species richness in influencing function, but ecosystem functioning also depends upon the identities, densities, biomasses, and interactions of populations of contrib-uting species within a community, as well as, the aggregate abundance and spatial and temporal variation of these attributes (Kremen et al., 2005).
Patterns are beginning to emerge con-cerning community changes that are leading to rapid loss of biodiversity func-tion. As natural communities lose species (disassemble) in a non-random manner, as some species are more prone to extirpa-tion while other species are quite robust, communities in which disassembly itself is non-random will often lose function more rapidly than bio-diverse communi-ties in which a random order of species removal is imposed (Kremen et al., 2005). Yet, changes in plant diversity, particularly through habitat alteration, fragmentation, and deforestation, can increase the risk of diseases, such as malaria transmission through effects on mosquito’s (Pongsiri et al., 2009).
The loss of predators can cause dramatic changes in ecosystem processes and func-tioning, as predator removal is likely to be harmful when parasites are highly viru-lent, macro-parasites are aggregated in their prey, hosts are long-lived and predators select infected prey (Pongsiri et al., 2009). Changes in ecosystem process are visually apparent here in Bloomington with the flux of deer within our neighbourhoods munch-ing on gardens – of which I don’t mind. Yet more importantly, at least in my opinion, is that recent studies have shown that declines in predators can also affect the transmission of parasitic illnesses (Pongsiri et al., 2009), which of course can and often does affect a bio-diverse communities’ ability to properly function in a healthy way.
393Is biodiversity important to ecosystem functioning?
Health
It has been proposed that we are in the midst of a new epidemiologic transition, in which globalisation and ecological dis-ruption appear to be associated with newly emerging infectious. Diseases, as well as, reemerging infections previously thought to be under control; furthermore, it appears that this recent emergence and reemergence of infectious diseases appears to be driven by globalisation and ecological disruption (Pongsiri et al., 2009).
Historically, wildlife diseases have been considered important only when agricul-ture or human health have been threatened. However, due to outbreaks of diseases in endangered species, increasing veterinary involvement, and advances in host-parasite population biology, the threat of wildlife diseases is now taken more seriously (Daszak et al., 2000), especially when human health is affected. For instance, people and live-stock living near forest fragments with monkeys exchange gastrointestinal bacteria at accelerated rates (Pongsiri et al., 2009), as the spread of vectors and disease affects both people and wildlife.
Communities of hosts characterised by high species richness or evenness are likely to contain a high proportion of hosts that are inefficient in transmitting disease agents to a feeding vector; a phenomenon called the ‘dilution effect’ (Schmidt et al., 2001). During recorded history, some insect vectors have dispersed into new habitats by phoresy as one organism transports another often by flight or wind, but human-aided trans-port has been responsible for the arrival and spread of most invasive vectors, such as fleas, lice and mosquitoes (Pongsiri et al., 2009). This may not seem like much of an issue, but as humans move into ecosystems disturbing biodiversity often foreign species may detrimentally invade current species
causing negative consequences to the biodi-versity, possibly even causing extinction.
Similar loss of biodiversity occurs when disease is introduced into young populations (Daszak et al., 2000). Perhaps the clearest link between biodiversity and human health is through the spread of invasive species and pathogens (Pongsiri et al., 2009). Thus, more diverse communities could simultane-ously decrease infection prevalence, while increasing the population density of vec-tor-borne diseases with unpredictable net effects on disease risk on humans (Schmidt et al., 2001). Links between biodiversity and human health occur from the micro-bial level to that of the habitat. Mechanistic pathways that lead from changes in biodi-versity to human health can occur at the genetic, microbial and organismal – host or vector species, community and habitat lev-els (Pongsiri et al., 2009).
Aesthetic/recreational/ psychological
There are non-disease health consequences of biodiversity loss, such as psychological well-being that have been investigated. At the level of microbial diversity, reduced exposure to natural microbial diversity has been linked to decreased immune tolerance to allergens (Pongsiri et al., 2009). What are the consequences of such largely anthropo-genic changes in biodiversity on the goods and services that ecosystems provide to humans (Hooper et al., 2005)?
Every human being enjoys some form of outdoor ‘recreational’ activity, and whether they know it or not, their outdoor activity requires a healthy ecosystem and biodiver-sity is intricately related to the health of an ecosystem. It does not matter what the activ-ity is; it could be sailing, skiing, hiking or a number of other options, including walking
394 Q.C. Grant
a dog; yet many activities humans enjoy directly depend upon a biological diverse system. Conversely, there is significant conservation pressure to conserve top carnivores, such as tigers (Panthera tigris), wolves (Canis lupus) and fish as they are seen as species that provide a heightened spiritual and recreational quality to ecosystems (Dobson et al., 2006).
Human activities have been and are continuing to change the environment on both local and global scales. Many of these alterations are leading to dramatic changes in the biotic structure and composition of ecological communities, either from the loss of species or from the introduction of exotic species. Such changes can readily change the ways ecosystems work (Hooper et al., 2005).
Economic
The defining limitation of the economics of biodiversity preservation is the lack of a common denominator or natural anchor (Metrick et al., 1998). For instance on the landscape level, biodiversity conservation in the Amazon has been linked to the mitigation of vector borne diseases and the resulting impact on economic well-being, measured by macroeconomic indicators; such as, gross domestic product, exports, imports and national investments (Pongsiri et al., 2009). The provisioning of sustaining goods and services obtained from natural ecosystems is a strong economic justifica-tion for the conservation of biological diver-sity, as ecologists predict that decreases in biodiversity will lead to reductions in ecosys-tem functioning and provisions of services (Dobson et al., 2006).
Animals offer numerous benefits to biodi-versity health and are not just for those who like to admire their aesthetic beauty, such as bird watchers and nature photographers.
But when we look at top predators, such as lions (Panthera leo) and tigers (Panthera tigris) they also offer vast economic benefits as they are a major draw for ecotourism. However, as humans erode ecosystems through anthropogenic activities, we begin to see a sequential loss of the economic goods and services related to that ecosystems biodiver-sity. Changes in components of the Earth’s biodiversity causes concern for ethical and aesthetic reasons, but they also have a strong potential to alter ecosystem properties and the goods and services they provide to humanity (Hooper et al., 2005).
we don’t Know wHat we don’t Know!
It is believed by some, including myself that human activity: groundwater contamina-tion, pollution, salinization, channelization and dam building are destroying the biodi-versity in subsurface habitats and domains. However what is unclear is whether or not changes in diversity of these habitats will alter ecosystem processes and the provision of essential ecosystem services (Freckman et al., 1997). Even though comparative stud-ies have begun to reveal the extent to which functional substitutions alter ecosystem properties; such as: productivity, decom-position rates, nutrient cycling, resistance and resilience to perturbations (Loreau et al., 2001); I question do we fully know and understand all of the affects altering ecosystems and how this truly affects bio-diversity? How can we? What kind of time frame are we looking at?
Diversity loss at regional scales and dis-persal limitations due to landscape frag-mentation will very likely reduce the pool of potential colonists at local scales and hence the potential for local compositional adjust-ments to environmental changes (Loreau et al., 2001); but to what degree? There is
395Is biodiversity important to ecosystem functioning?
a consensus that at least some minimum number of species is essential for ecosystem functioning under constant conditions and that a larger number of species is probably essential for maintaining the stability of biodiversity processes in changing environ-ments (Loreau et al., 2001). But what is it?
Since we really don’t know, I conclude that we would be much better off if we do our best to maintain biodiversity within all ecosystems and do our best to work with nature and all of her creatures. Compared with aboveground habitats, we know very lit-tle about the natural patterns of diversity for species in soils and sediments, either in dis-turbed or pristine environments (Freckman et al., 1997). I question, shouldn’t we seek to understand what’s beneath the ground before we start digging it up?
bIota dIversIty consIderatIons
Attempts to assess the functional impor-tance of biodiversity in ecosystems continue to stimulate debate on the potential impacts of biodiversity losses (Schläpfer, 1999). Having a range of species that respond dif-ferently to different environmental pertur-bations can stabilise ecosystem process rates in response to disturbances and variation in abiotic conditions (Hooper et al., 2005). This is a major consideration that should be taken into account when contemplating altering any biological diversity.
Diversity of biota contributes to making subsurface domains a critical and dynamic centre for global ecosystem processes, includ-ing nutrient turnover; nutrient uptake by plants and algae; formation and decay of soil organic matter; nitrogen fixation; meth-ane consumption and production; N
2O
and N2 production; CO
2 consumption and
production; soil and sediment development and stabilisation; oxygenation of soils and
sediments; production of organic acids that weather rocks; transport and degradation of pollutants; food sources for higher organ-isms and provision of clean water (Freckman et al., 1997).
Using practices that maintain a diversity of organisms of different functional effect and functional response types will help preserve a range of management options (Hooper et al., 2005). However, as we seem to become more so-called technically advanced; we seem to find newer ways to destroy the ecosystem. I question, is this something we really want to do?
Because biodiversity both responds to and influences ecosystem properties, understanding feedbacks involved is neces-sary to integrate results from experimental communities with patterns seen at broader scales (Hooper et al., 2005). This suggests that a diversity of species is essential to maintain decomposition, and is only one example of the connectedness between bio-diversity and ecosystem processes that are critical for a sustainable earth (Freckman et al., 1997). Therefore, I conclude that the inter-connectedness between biodiversity and ecosystem processes is vital for us to have and maintain a sustainable bio-diverse earth.
Issues: specIes Loss and dIsturbance
Studies on the role of diversity in deter-mining ecosystem function are numerous, yet often examine communities whose structures differ markedly from those pro-viding services in real landscapes, besides; such studies generally been restricted to a small set of ecosystem processes (Kremen et al., 2005). Given the intricate nature and specifications of each ecosystem, it is virtu-ally impossible to examine various biodiver-sities by observing small sets of ecosystem
396 Q.C. Grant
processes, yet this is what is sometimes done due to timing, money and lack of knowledge.
Species vary in the amount and type of contribution they make to a process; hence loss of a species may be incompletely com-pensated for by the other functionally simi-lar species. Conversion of natural systems for productive use usually involves strong reductions of a systems’ ‘organismic’ diver-sity; accordingly, a growing number of recent studies address this functional relationship between the biological diversity of ecosys-tems and specific ecosystem properties and processes concluding that biological diver-sity is strongly correlated with ecosystem process rates and these same processes are, to a varying extent, also important for the delivery of ecosystem services (Schläpfer, 1999).
Not all species interact equally with other species, as the effects of losing a particular species could propagate throughout the ecosystem in unknown and unpredictable ways (Freckman et al., 1997). It’s suggested that biodiversity loss, plus loss of genetic resources, loss of productivity, loss of eco-system buffering against ecological pertur-bation and loss of aesthetic commercially valuable resources may alter or impair ser-vices that ecosystems provide (Naeem et al., 1994).
gLobaL cLImate cHange and bIodIversIty
It is estimated that 13% of terrestrial land surface managed by major U.S. cities near forested watersheds could be managed for urban water use alone, but now that the Kyoto Protocol has been ratified, this could potentially finance the reforestation of 3.4 million hectares per year for carbon sequestration in developing countries (Kremen et al., 2005). The links between
changes in ecosystems, biodiversity and infectious diseases are complex; more inter-estingly, these links may involve other social and global environmental changes, such as climate change, migration and population growth (Pongsiri et al., 2009).
It is thought that climate change could lead to gradual losses of species as abiotic conditions begin to exceed species toler-ance limits, and that such losses could be random with respect to species effects on any given ecosystem process, leading to patterns of process response to changes in diversity similar to those observed in ran-domly assembled communities (Loreau et al., 2001).
Likely patterns of extinction and inva-sion need to be linked to different drivers of global change, the forces that structure communities, and controls on ecosys-tem properties for the development of effective management and conservation strategies (Hooper et al., 2005). How soil and sediment species responsible for carbon mineralisation will be affected by global change and the impact of this on global carbon budgets, is being examined (Freckman et al., 1997). Further, higher biodiversity communities consumed more CO
2 than lower communities (Naeem
et al., 1994).
recommendatIons
For starters, I believe there should be a clearly defined definition of the term biodi-versity that is acknowledged as the standard within the legal, scientific and academia worlds. I know that this is probably much easier said than done; however, with numer-ous variations defining biodiversity there is always room for uncertainty and manipula-tion of biodiversity considering what term one chooses to use. Developing a detailed theoretical and empirical understanding
397Is biodiversity important to ecosystem functioning?
of how ecosystems are organised and how we can reassemble damaged ecosystems are some of the ultimate goals of ecology (Dobson, 2005).
To manage ecosystem services, we need to better understand how realistic changes in all of these aspects of community struc-ture, acting singly or together, affect the magnitude and the stability of the ecosys-tem service over space and time, as ecologi-cal communities are capable of behaving in qualitatively different ways when species are lost (Kremen et al., 2005).
Despite some uncertainties about the mechanisms and circumstances under which diversity influences ecosystem prop-erties, incorporating diversity effects into policy and management is essential, espe-cially in making decisions involving large temporal and spatial scales (Hooper et al., 2005). Research is necessary for manage-ment plans that consider linkages between ecosystems; such as agriculture, municipal water agencies and marine shipping har-bour (Freckman et al., 1997).
An essential factor in developing regional, national and global indices of biological diversity is our need to inform the public about biodiversity change and to illustrate how the quality of human life is intimately coupled with the wellbeing of other species (Dobson, 2005). Larger organ-isms are relatively well studied, though the estimates of species on earth are relatively vague; however, more research needs to be done among invertebrates, particularly insects and marine invertebrates to aid in the development of a more complete and systematic knowledge and understanding of the taxonomic relatedness of species (Giller et al., 2002).
Perhaps we could implement a three-step comprehensive research program specifically
used to define the ‘ecology of an ecosystem service’ that would include:
1 identifying the species or other entities that are key ‘ecosystem service provid-ers’ and measuring their functional contributions
2 assessing the key environmental factors that influence the ability of these species to provide services; and
3 measuring the spatiotemporal scale over which providers and services operate (Kremen et al., 2005).
To effectively manage ecosystem services in this ever-changing world, we need to know how human activities affect key species or functional groups that provide these ser-vices, including the spatial and temporal scales of both disturbance and recovery (Kremen et al., 2005). It is suggested that a major underlying issue concerning main-taining or increasing biodiversity: is how we can better determine basic priorities concerning biodiversity? Further, if we con-sider this statement to be valid, as I think we should, perhaps we now need to develop a cost-effectiveness formula or criterion that can be used to rank priorities among biodi-versity preserving projects under a limited budget constraint (Metrick et al., 1998). As always money is the major factor in every-thing in this life.
concLusIon
I strongly believe that biodiversity is of the utmost importance to ecosystem function-ing. There is much research exploring the relationship between biodiversity and eco-system functioning supporting my position, as I have writing about throughout this paper.
Human domination of the biosphere is rapidly altering the composition, structure, and function of ecosystems often eroding
398 Q.C. Grant
their capacity to provide services critical to human survival (Kremen et al., 2005). However, the core of the problem of bio-diversity preservation today seems to lie in specifying the objective that we are trying to preserve (Metrick et al., 1998). Different ecosystem processes respond differently to loss of biodiversity (Naeem et al., 1994).
As biodiversity declines through habi-tat modification and other anthropogenic disturbances, how can we quantify the changes in goods and services that directly affect human health and economic welfare (Dobson, 2005)? Research involving small sets of ecosystem processes is hardly suffi-cient to assess how biodiversity loss affects the current and future abilities of an ecosys-tem to provide crucial services, or to devise appropriate management strategies (Kremen et al., 2005).
We must honestly confront the core problems of economic tradeoffs, because good stewardship of bio-diverse natural habi-tats, like almost everything else we want in this world, is subject to budget constraints (Metrick et al., 1998). However, we need to better understand how realistic changes of biodiversity of a community structure, act-ing singly or together, affect the magnitude and the stability of the ecosystem service over space and time (Kremen et al., 2005).
Ecological information is needed in order to design both policies and markets properly (Kremen et al., 2005); yet, recent studies at the interface of biodiversity and health are helping to elucidate how changes in biological diversity affect health-related outcomes, but policies that are derived from basic research still need to be designed and implemented (Pongsiri et al., 2009).
Biodiversity loss affects large-scale patterns of productivity and hinges on the
shape and steepness of the local dependence of productivity on diversity (Loreau et al., 2001). Diversity is also important in both fauna and flora species, as each contributes to a healthy ecosystem in their own way. If ecosystems and nature reserves are able to maintain top predators, such as wolves (Canis lupus), lions (Panthera leo) and tigers (Panthera tigris), it is likely that they will also contain healthy communities and popula-tions of many species that perform a diver-sity of ecosystem services at lower trophic levels (Dobson et al., 2006). Actually, I just want to make sure that my feline friends are around, but being able to directly link them to healthy bio-diverse communities is a plus for me!
bIograpHy
Queen Charlene Grant is a May 2010 graduate of Indiana University’s, School of Public and Environmental Affairs (SPEA). She earned both a Master of Science Environmental Science (concentration: Applied Ecology) and a Master of Public Administration (concentration: Sustainable Development). Her research centers on global wildlife conservation initiatives and environmental resources sustainable prac-tices. Basically, seeking ways to effectively implement and manage policies that allow us human animals to enjoy and utilize envi-ronmental resources; while at the same time, allowing other animals the same courtesy. Much of her interest and research involves parts of the Caribbean; she has lived in St. Thomas.
references
Brussaard, L. (December 1997) ‘Biodiversity and ecosystem functioning in soil’, Ambio, Vol. 26, No. 8, pp.563–570.
Center for International Environmental Law (CIEL) (ND) (2009) What is biodiversity and
399Is biodiversity important to ecosystem functioning?
why is it important? Online: http://www.ciel.org/Biodiversity/WhatIsBiodiversity.html.
Daszak, P., Cunningham, A.A. and Hyatt, A.D. (21 January 2000) ‘Emerging infectious diseases of wildlife – threats to biodiversity and human health’, Science, Vol. 287, pp.443–449.
Dobson, A. (28 February 2005) ‘Monitoring global rates of biodiversity change: challenges that arise in meeting the convention on biological diversity (CBD) 2010 Goals’, Philosophical Transactions: Biological Sciences, Vol. 360, No. 1454, pp.229–241.
Dobson, A., Lodge, D., Alder, J., Cumming, G.S., Keymer, J., McGlade, J., Mooney, H., Rusak, J.A., Sala, O., Wolters, V., Wall, D., Winfree, R. and Xenopoulos, M.A. (August 2006) ‘Habitat loss, trophic collapse and the decline of ecosystem services, Ecology, Vol. 87, No. 8, pp.1915–1924.
Freckman, D.W., Blackburn, T.H., Brussaard, L., Hutchings, P., Palmer, M.A. and Snelgrove, P.V.R. (December 1997) ‘Linking biodiversity and ecosystem functioning of soils and sedi-ments’, Ambio, Vol. 26, No. 8, pp.556–562.
Giller, P.S. and O’Donovan, G. (December 2002) ‘Biodiversity and ecosystem function: Do species matter? Biodiversity: a natural resource’, Biology and Environment: Proceedings of the Royal Irish Academy, Vol. 102B, No. 3, pp.129–139.
Hooper, D.U., Chapin III, F.S., Ewel, J.J., Hector, A., Inchausti, P., Lavorel, S., Lawton, J.H., Lodge, D.M., Loreau, M., Naeem, S., Schmid, B., Setälä, H., Symstad, A.J., Vandermeer, J. and Wardle, D.A. (February 2005) ‘Effects of biodiversity on ecosystem functioning: a consensus of current knowledge’, Ecological Monographs, Vol. 75, No. 1, pp.3–35.
Kremen, C. and Ostfeld, R.S. (December 2005) ‘A call to ecologists: measuring, analyzing, and managing ecosystem services’, Frontiers in Ecology and the Environment, Vol. 3, No. 10, pp.540–548.
Loreau, M., Naeem, S., Inchausti, P., Bengtsson, J., Grime, J.P., Hector, A., Hooper, D.U., Huston, M.A.D., Raffaelli, D., Schmid, B., Tilman, D. and Wardle, D.A. (26 October 2001) ‘Biodiversity and ecosystem functioning: current knowledge and future challenges’, Science, Vol. 294, pp.804–808.
Metrick, A. and Weitzman, M.L. (Summer 1998) ‘Conflicts and choices in biodiversity preservation’, The Journal of Economic Perspectives, Vol. 12, No. 3, pp.21–34.
Naeem, S., Thompson, L.J., Lawler, S.P., Lawton, J.H. and Woodfin, R.M. (21 April 1994) ‘Declining biodiversity can alter the performance of ecosystems’, Nature, Vol. 368, pp.734–737.
Pongsiri, M.J., Roman, J., Ezenwa, V.O., Goldberg, T.L., Koren, H.S., Newbold, S.C., Ostfeld, R.S., Pattanayak, S.K. and Salkeld, D.J. (December 2009) ‘Biodiversity loss affects global disease ecology’, BioScience, Vol. 59, No. 11, pp.945–954.
Schläpfer, F. (February 1999) ‘Expert estimates about effects of biodiversity on ecosystem processes and services’, Oikos, Vol. 84, No. 2, pp.346–352.
Schmidt, K.A. and Ostfeld, R.S. (March 2001) ‘Biodiversity and the dilution effect in disease ecology’, Ecology, Vol. 82, No. 3, pp.609–619.
Tilman, D. (July 1999) ‘The ecological consequences of changes in biodiversity: a search for general principles. MacArthur Award Lecture’, Ecology, Vol. 80, No. 5, pp.1455–1474.

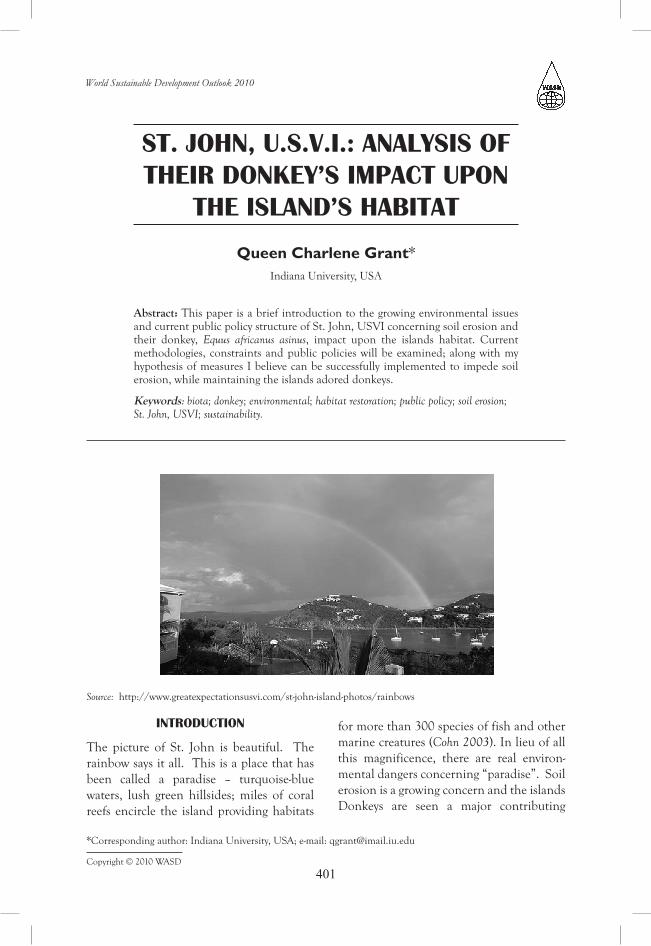
Copyright © 2010 WASD
World Sustainable Development Outlook 2010
401
St. John, U.S.V.I.: AnAlySIS of theIr Donkey’S ImpAct Upon
the ISlAnD’S hAbItAt
Queen Charlene Grant*Indiana University, USA
Abstract: This paper is a brief introduction to the growing environmental issues and current public policy structure of St. John, USVI concerning soil erosion and their donkey, Equus africanus asinus, impact upon the islands habitat. Current methodologies, constraints and public policies will be examined; along with my hypothesis of measures I believe can be successfully implemented to impede soil erosion, while maintaining the islands adored donkeys.
Keywords: biota; donkey; environmental; habitat restoration; public policy; soil erosion; St. John, USVI; sustainability.
IntroDUctIon
The picture of St. John is beautiful. The rainbow says it all. This is a place that has been called a paradise – turquoise-blue waters, lush green hillsides; miles of coral reefs encircle the island providing habitats
for more than 300 species of fish and other marine creatures (Cohn 2003). In lieu of all this magnificence, there are real environ-mental dangers concerning “paradise”. Soil erosion is a growing concern and the islands Donkeys are seen a major contributing
*Corresponding author: Indiana University, USA; e-mail: [email protected]
Source: http://www.greatexpectationsusvi.com/st-john-island-photos/rainbows
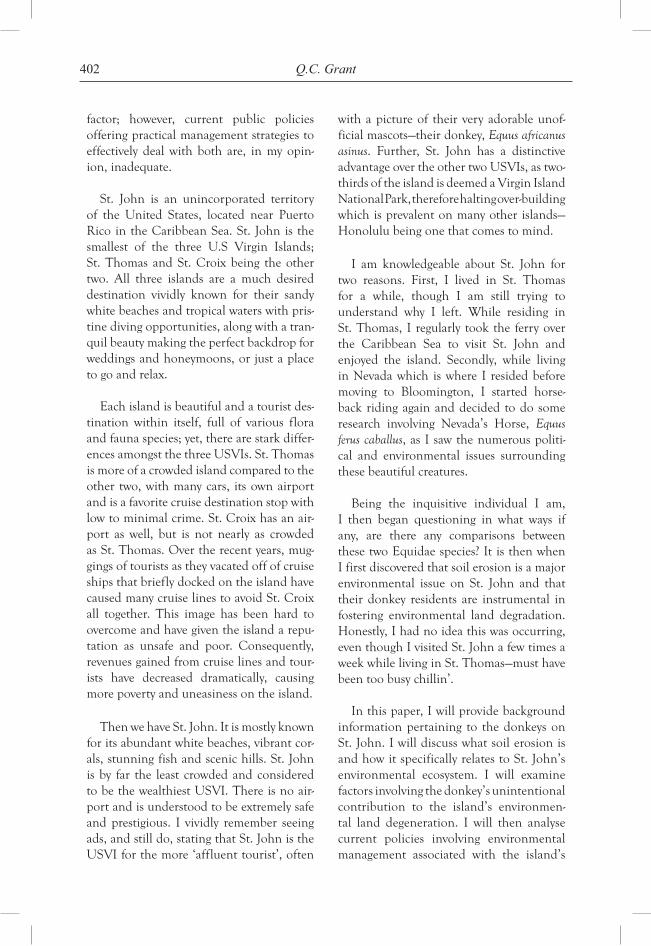
402 Q.C. Grant
factor; however, current public policies offering practical management strategies to effectively deal with both are, in my opin-ion, inadequate.
St. John is an unincorporated territory of the United States, located near Puerto Rico in the Caribbean Sea. St. John is the smallest of the three U.S Virgin Islands; St. Thomas and St. Croix being the other two. All three islands are a much desired destination vividly known for their sandy white beaches and tropical waters with pris-tine diving opportunities, along with a tran-quil beauty making the perfect backdrop for weddings and honeymoons, or just a place to go and relax.
Each island is beautiful and a tourist des-tination within itself, full of various flora and fauna species; yet, there are stark differ-ences amongst the three USVIs. St. Thomas is more of a crowded island compared to the other two, with many cars, its own airport and is a favorite cruise destination stop with low to minimal crime. St. Croix has an air-port as well, but is not nearly as crowded as St. Thomas. Over the recent years, mug-gings of tourists as they vacated off of cruise ships that briefly docked on the island have caused many cruise lines to avoid St. Croix all together. This image has been hard to overcome and have given the island a repu-tation as unsafe and poor. Consequently, revenues gained from cruise lines and tour-ists have decreased dramatically, causing more poverty and uneasiness on the island.
Then we have St. John. It is mostly known for its abundant white beaches, vibrant cor-als, stunning fish and scenic hills. St. John is by far the least crowded and considered to be the wealthiest USVI. There is no air-port and is understood to be extremely safe and prestigious. I vividly remember seeing ads, and still do, stating that St. John is the USVI for the more ‘affluent tourist’, often
with a picture of their very adorable unof-ficial mascots—their donkey, Equus africanus asinus. Further, St. John has a distinctive advantage over the other two USVIs, as two-thirds of the island is deemed a Virgin Island National Park, therefore halting over-building which is prevalent on many other islands— Honolulu being one that comes to mind.
I am knowledgeable about St. John for two reasons. First, I lived in St. Thomas for a while, though I am still trying to understand why I left. While residing in St. Thomas, I regularly took the ferry over the Caribbean Sea to visit St. John and enjoyed the island. Secondly, while living in Nevada which is where I resided before moving to Bloomington, I started horse-back riding again and decided to do some research involving Nevada’s Horse, Equus ferus caballus, as I saw the numerous politi-cal and environmental issues surrounding these beautiful creatures.
Being the inquisitive individual I am, I then began questioning in what ways if any, are there any comparisons between these two Equidae species? It is then when I first discovered that soil erosion is a major environmental issue on St. John and that their donkey residents are instrumental in fostering environmental land degradation. Honestly, I had no idea this was occurring, even though I visited St. John a few times a week while living in St. Thomas—must have been too busy chillin’.
In this paper, I will provide background information pertaining to the donkeys on St. John. I will discuss what soil erosion is and how it specifically relates to St. John’s environmental ecosystem. I will examine factors involving the donkey’s unintentional contribution to the island’s environmen-tal land degeneration. I will then analyse current policies involving environmental management associated with the island’s
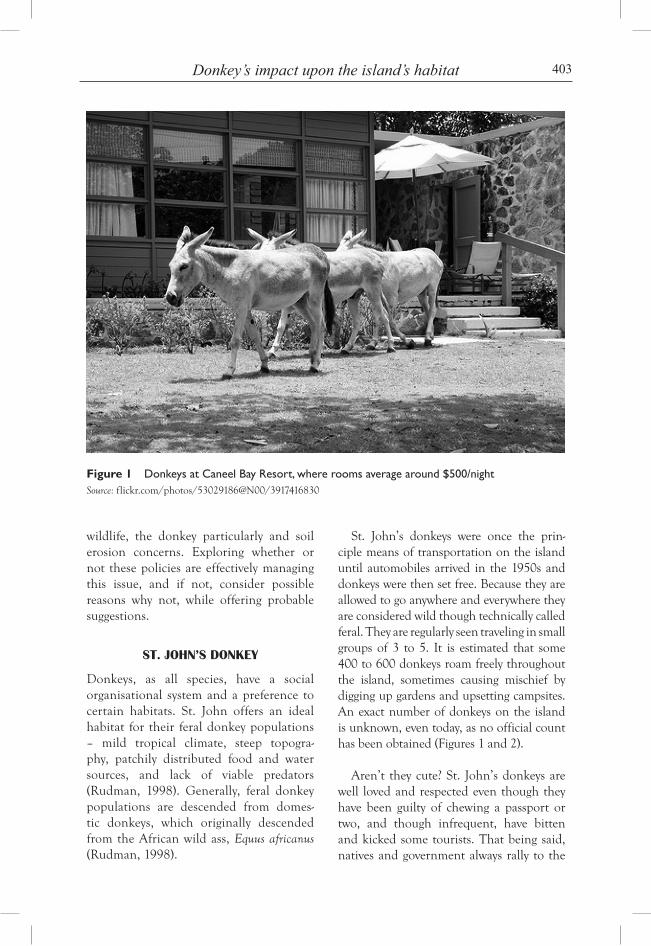
403Donkey’s impact upon the island’s habitat
wildlife, the donkey particularly and soil erosion concerns. Exploring whether or not these policies are effectively managing this issue, and if not, consider possible reasons why not, while offering probable suggestions.
St. John’S Donkey
Donkeys, as all species, have a social organisational system and a preference to certain habitats. St. John offers an ideal habitat for their feral donkey populations – mild tropical climate, steep topogra-phy, patchily distributed food and water sources, and lack of viable predators (Rudman, 1998). Generally, feral donkey populations are descended from domes-tic donkeys, which originally descended from the African wild ass, Equus africanus (Rudman, 1998).
St. John’s donkeys were once the prin-ciple means of transportation on the island until automobiles arrived in the 1950s and donkeys were then set free. Because they are allowed to go anywhere and everywhere they are considered wild though technically called feral. They are regularly seen traveling in small groups of 3 to 5. It is estimated that some 400 to 600 donkeys roam freely throughout the island, sometimes causing mischief by digging up gardens and upsetting campsites. An exact number of donkeys on the island is unknown, even today, as no official count has been obtained (Figures 1 and 2).
Aren’t they cute? St. John’s donkeys are well loved and respected even though they have been guilty of chewing a passport or two, and though infrequent, have bitten and kicked some tourists. That being said, natives and government always rally to the
Figure 1 Donkeys at Caneel Bay Resort, where rooms average around $500/nightSource: flickr.com/photos/53029186@N00/3917416830
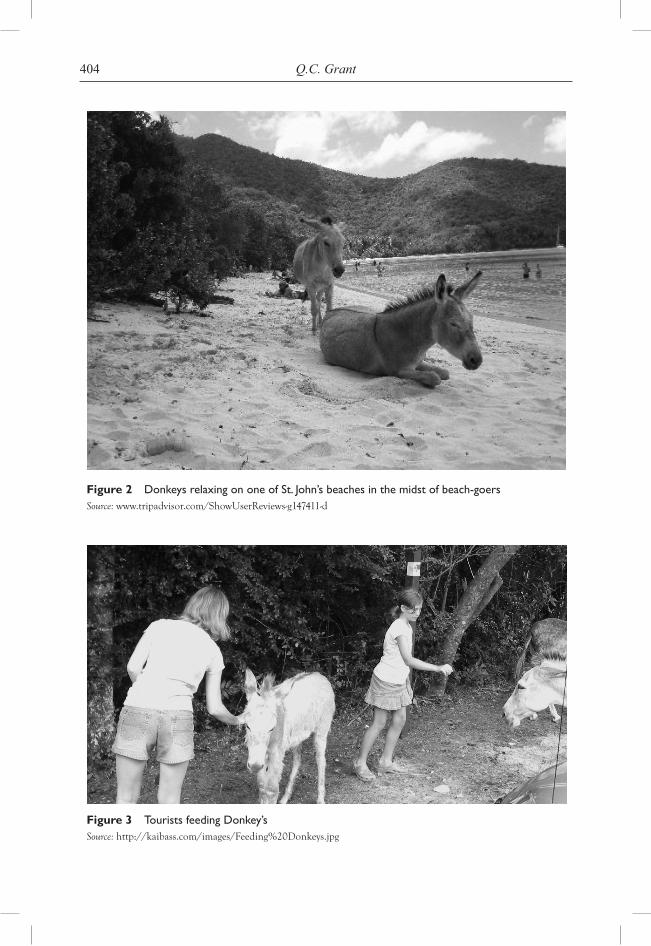
404 Q.C. Grant
Figure 2 Donkeys relaxing on one of St. John’s beaches in the midst of beach-goersSource: www.tripadvisor.com/ShowUserReviews-g147411-d
Figure 3 Tourists feeding Donkey’sSource: http://kaibass.com/images/Feeding%20Donkeys.jpg
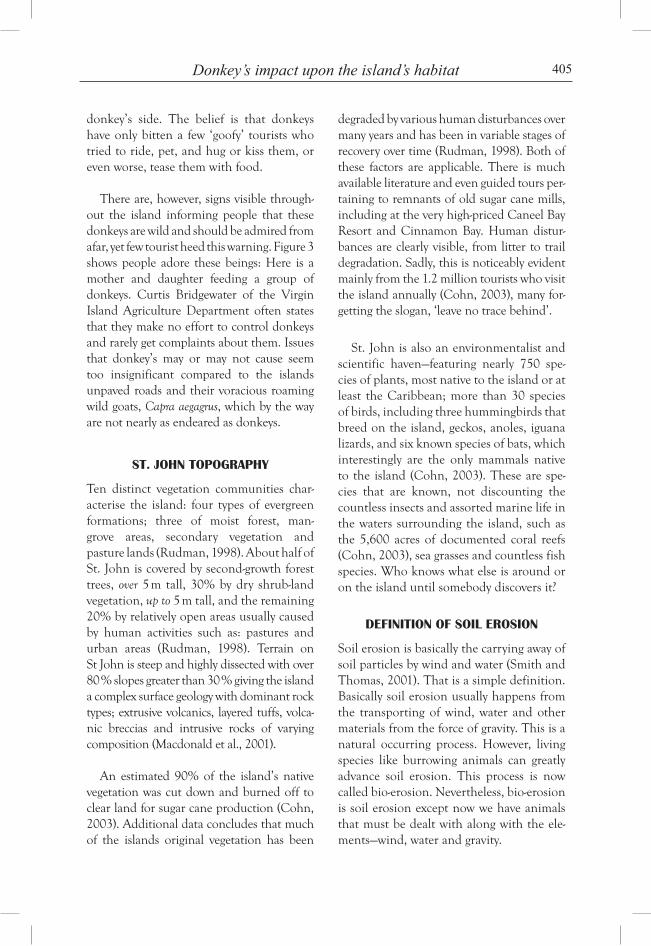
405Donkey’s impact upon the island’s habitat
donkey’s side. The belief is that donkeys have only bitten a few ‘goofy’ tourists who tried to ride, pet, and hug or kiss them, or even worse, tease them with food.
There are, however, signs visible through-out the island informing people that these donkeys are wild and should be admired from afar, yet few tourist heed this warning. Figure 3 shows people adore these beings: Here is a mother and daughter feeding a group of donkeys. Curtis Bridgewater of the Virgin Island Agriculture Department often states that they make no effort to control donkeys and rarely get complaints about them. Issues that donkey’s may or may not cause seem too insignificant compared to the islands unpaved roads and their voracious roaming wild goats, Capra aegagrus, which by the way are not nearly as endeared as donkeys.
St. John topoGrAphy
Ten distinct vegetation communities char-acterise the island: four types of evergreen formations; three of moist forest, man-grove areas, secondary vegetation and pasture lands (Rudman, 1998). About half of St. John is covered by second-growth forest trees, over 5 m tall, 30% by dry shrub-land vegetation, up to 5 m tall, and the remaining 20% by relatively open areas usually caused by human activities such as: pastures and urban areas (Rudman, 1998). Terrain on St John is steep and highly dissected with over 80 % slopes greater than 30 % giving the island a complex surface geology with dominant rock types; extrusive volcanics, layered tuffs, volca-nic breccias and intrusive rocks of varying composition (Macdonald et al., 2001).
An estimated 90% of the island’s native vegetation was cut down and burned off to clear land for sugar cane production (Cohn, 2003). Additional data concludes that much of the islands original vegetation has been
degraded by various human disturbances over many years and has been in variable stages of recovery over time (Rudman, 1998). Both of these factors are applicable. There is much available literature and even guided tours per-taining to remnants of old sugar cane mills, including at the very high-priced Caneel Bay Resort and Cinnamon Bay. Human distur-bances are clearly visible, from litter to trail degradation. Sadly, this is noticeably evident mainly from the 1.2 million tourists who visit the island annually (Cohn, 2003), many for-getting the slogan, ‘leave no trace behind’.
St. John is also an environmentalist and scientific haven—featuring nearly 750 spe-cies of plants, most native to the island or at least the Caribbean; more than 30 species of birds, including three hummingbirds that breed on the island, geckos, anoles, iguana lizards, and six known species of bats, which interestingly are the only mammals native to the island (Cohn, 2003). These are spe-cies that are known, not discounting the countless insects and assorted marine life in the waters surrounding the island, such as the 5,600 acres of documented coral reefs (Cohn, 2003), sea grasses and countless fish species. Who knows what else is around or on the island until somebody discovers it?
DefInItIon of SoIl eroSIon
Soil erosion is basically the carrying away of soil particles by wind and water (Smith and Thomas, 2001). That is a simple definition. Basically soil erosion usually happens from the transporting of wind, water and other materials from the force of gravity. This is a natural occurring process. However, living species like burrowing animals can greatly advance soil erosion. This process is now called bio-erosion. Nevertheless, bio-erosion is soil erosion except now we have animals that must be dealt with along with the ele-ments—wind, water and gravity.
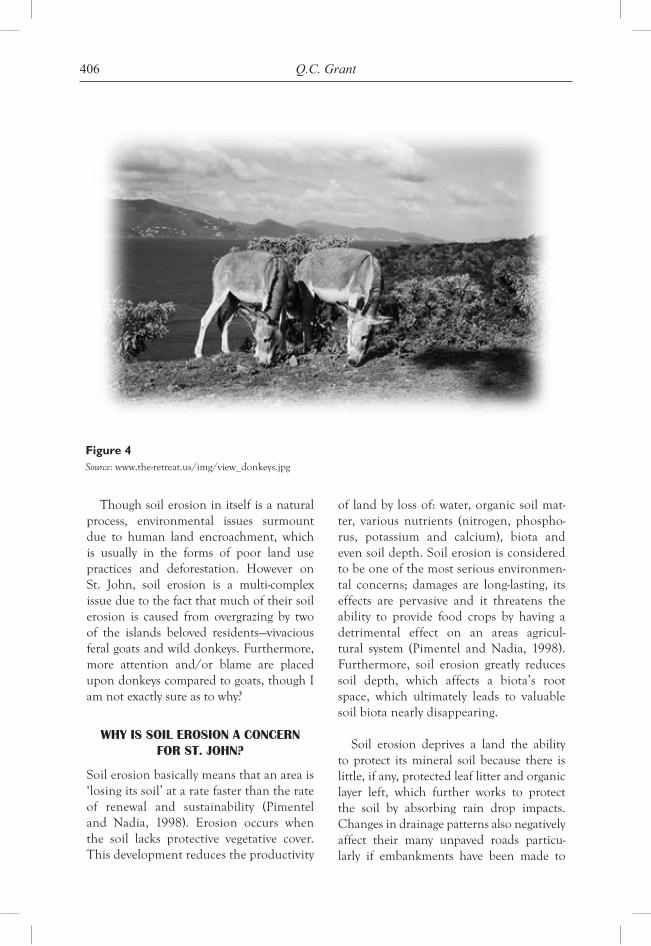
406 Q.C. Grant
Though soil erosion in itself is a natural process, environmental issues surmount due to human land encroachment, which is usually in the forms of poor land use practices and deforestation. However on St. John, soil erosion is a multi-complex issue due to the fact that much of their soil erosion is caused from overgrazing by two of the islands beloved residents—vivacious feral goats and wild donkeys. Furthermore, more attention and/or blame are placed upon donkeys compared to goats, though I am not exactly sure as to why?
Why IS SoIl eroSIon A concern for St. John?
Soil erosion basically means that an area is ‘losing its soil’ at a rate faster than the rate of renewal and sustainability (Pimentel and Nadia, 1998). Erosion occurs when the soil lacks protective vegetative cover. This development reduces the productivity
of land by loss of: water, organic soil mat-ter, various nutrients (nitrogen, phospho-rus, potassium and calcium), biota and even soil depth. Soil erosion is considered to be one of the most serious environmen-tal concerns; damages are long-lasting, its effects are pervasive and it threatens the ability to provide food crops by having a detrimental effect on an areas agricul-tural system (Pimentel and Nadia, 1998). Furthermore, soil erosion greatly reduces soil depth, which affects a biota’s root space, which ultimately leads to valuable soil biota nearly disappearing.
Soil erosion deprives a land the ability to protect its mineral soil because there is little, if any, protected leaf litter and organic layer left, which further works to protect the soil by absorbing rain drop impacts. Changes in drainage patterns also negatively affect their many unpaved roads particu-larly if embankments have been made to
Figure 4Source: www.the-retreat.us/img/view_donkeys.jpg
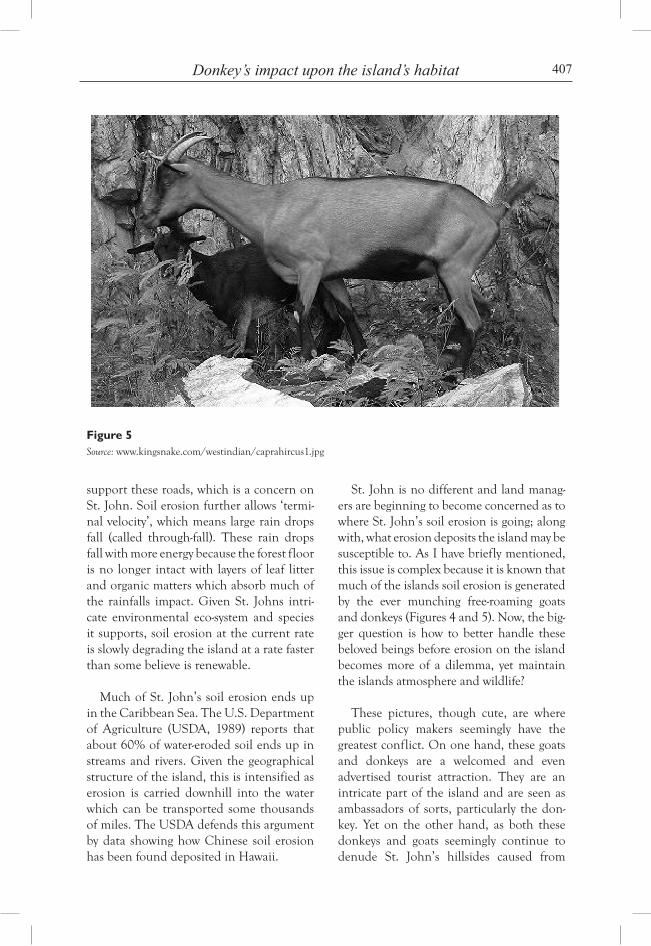
407Donkey’s impact upon the island’s habitat
support these roads, which is a concern on St. John. Soil erosion further allows ‘termi-nal velocity’, which means large rain drops fall (called through-fall). These rain drops fall with more energy because the forest floor is no longer intact with layers of leaf litter and organic matters which absorb much of the rainfalls impact. Given St. Johns intri-cate environmental eco-system and species it supports, soil erosion at the current rate is slowly degrading the island at a rate faster than some believe is renewable.
Much of St. John’s soil erosion ends up in the Caribbean Sea. The U.S. Department of Agriculture (USDA, 1989) reports that about 60% of water-eroded soil ends up in streams and rivers. Given the geographical structure of the island, this is intensified as erosion is carried downhill into the water which can be transported some thousands of miles. The USDA defends this argument by data showing how Chinese soil erosion has been found deposited in Hawaii.
St. John is no different and land manag-ers are beginning to become concerned as to where St. John’s soil erosion is going; along with, what erosion deposits the island may be susceptible to. As I have briefly mentioned, this issue is complex because it is known that much of the islands soil erosion is generated by the ever munching free-roaming goats and donkeys (Figures 4 and 5). Now, the big-ger question is how to better handle these beloved beings before erosion on the island becomes more of a dilemma, yet maintain the islands atmosphere and wildlife?
These pictures, though cute, are where public policy makers seemingly have the greatest conflict. On one hand, these goats and donkeys are a welcomed and even advertised tourist attraction. They are an intricate part of the island and are seen as ambassadors of sorts, particularly the don-key. Yet on the other hand, as both these donkeys and goats seemingly continue to denude St. John’s hillsides caused from
Figure 5Source: www.kingsnake.com/westindian/caprahircus1.jpg
408 Q.C. Grant
their continuous munching, concern is mounting because heavy grazing is known to reduce vegetation enough to increase the rate of erosion.
Yes, there are other wildlife species on this island that munch on hillsides, such as their deer population and feral pigs, but by far, more soil bio-erosion is caused by their goats and donkeys. In addition, the influx of tourists is not helping this matter either, but of course is a significant financial attri-bute to the island. Again, more attention is placed on donkeys as major contributors to the islands soil erosion issues.
St. John’S pUblIc polIcy concernInG theIr DonkeyS,
fInAlly
Invasive tourists, munching goats and donkeys, and heavy rains each instigate, in its own way, St. John’s soil erosion dilemma. However, for public policy makers effectively dealing with all entities is complicated. Tourists bring in much needed money; goats and donkeys are ‘cute’ and an acceptable part of this islands life. Heavy rain is beyond human control plus it keeps everything nice and green.
Interestingly, there really is no clear cut public policy on how to better manage the goats or donkeys in attempts to curb soil ero-sion they cause by denuding hillsides as they munch around the island. Some fencing has been erected, though this was mainly to deter donkey’s from ‘visiting’ the $400 and up per night resorts and munching on tour-ists belongings. For some reasons, goats do not ‘visit’ tourists as donkeys do?
Although both species interfere with live-stock grazing and other land uses, causing an unbalance in the natural eco-balance of the island, donkeys are more visible and are believed to alter vegetation more so than any
other wildlife by spreading seeds to places where such plants do not normally grow. Further, donkeys are selective eaters, which allow plants that they don’t eat to take over areas. In 1994, it was documented that the effect of these animals on runoff and soil ero-sion is difficult to quantify because of lack of data from both grazed and undisturbed sites (Macdonald et al., 1997). As we enter into year 2010, this statement is basically the same.
I did discover one Virgin Island Coastal Habitat Restoration Project through Watershed Stabilisation as I searched the internet. This is a two-year project, awarded in 2009, funded through the National Oceanic and Atmospheric Administration (NOAA), awarding a $2.8 million stimulus grant to reduce watershed runoff and pro-tect coastal and marine habitats. However, as most available money for island soil erosion studies, this grant is to be used to ‘help reduce impacts of sediment in storm water runoff, on our coral reefs’, according to Virgin Island Resources Conservation and Development (V.I.RC&D) Council President, Marcia Taylor (See http://www.usvircd.org/NOAA-ARRA_Grant.htm). Though this information is not a peer-reviewed article, it does give insight into the lack of money ($2.8 million is a very small amount) being available for research and specifically relates to coral reefs.
Some island biologists along with policy makers are beginning to put more focus on soil erosion, but from two different eco-logical perspectives and concerns. One is in response to storm events where runoff gen-eration from unpaved roads, which most of St. John is unpaved, is profoundly altering the roads and hillside landscapes; indirectly this is environmentally related though the emphasis is on the road, not soil erosion (Macdonald et al., 1997). These studies further investigate implications for island
409Donkey’s impact upon the island’s habitat
planning and development used in guiding road design and impacts incurred of exist-ing roads due to soil erosion (Macdonald et al., 1997). Yet, these studies are not structured public policies but do affect the Islands government ability and willingness to take action declaring what can, could and should be done to alter soil erosion.
Throughout my research for this paper, I discovered an employment ad for part-time, temporary field lab assistants to work on St. John in Coral Bay and Fish Bay area’s implementing a land-based environmen-tal monitoring project soil erosion study. However, it is unclear if this research will analyze erosion caused by wildlife, donkey’s particularly or natural occurring environ-mental factors.
Another emphasis used to encourage soil erosion analysis is in response to how soil erosion runoff negatively affects the coral reefs surrounding the island. There is much more interest and money available in this area of study and polices affect such. Suggestions have been made that paving dirt roads and implementing standard sediment control practices can greatly reduce current sediment yields and possible adverse effects on the marine ecosystems surrounding the island (Macdonald et al., 1997). But there were no suggestions mentioned about effec-tively handling munching donkeys. Concerns have been addressed regarding high erosion and sedimentation because of their poten-tially adverse effects on marine water clarity, mangroves, salt ponds, and beaches of St. John (Macdonald et al., 1997). There were no concerns mentioned about effectively handling donkeys or any wildlife.
Yet again, the emphasis is not on soil erosion itself. Without getting into too much detail about coral reefs, I will say that they are their own industry monitored
and protected by an endless number of public policies, governmental agencies and Non-governmental organisations (NGO’s). For instance, the U.S. General Accounting Office (USGAO) is studying some 12,700 acres of submerged land off St. John because the Virgin Islands government claims the 1974 Territorial Submerged Lands Act gave them ownership (Cohn, 2003). But this Act exempted submerged lands adjacent to federal lands such as the already existing Virgin Island National Park.
Although no definitive report has been issued on this matter there is much atten-tion on this. I suspect this is largely because beyond protecting the reefs, resolving this dispute could determine where and under what conditions local fisherman can oper-ate (Cohn, 2003). However, what is surpris-ing to me is that I could not find any defi-nite public policies in place dictating how and what St. John should do to alter, con-trol and ultimately deter soil erosion that is known to be caused from their ever-roaming goats and donkeys munching on the island hillsides. Peer reviewed articles on this spe-cific subject seem to be non-existent. And again, more blame is pointed towards the donkeys as the culprit, compared any of the other wildlife on the island.
recommenDAtIonS
It is a known fact that St. John’s free- roaming donkeys and goats denude the hillsides expediting soil erosion. It is also known that soil erosion has many negative environmental impacts. However, as one who loves the island life and wildlife there, I advocate that there must be a definite and clear public policy in place to handle this situation before some entity states it is out-of-hand. The development and imple-mentation of land-use planning and sedi-ment-control practices have been severely
410 Q.C. Grant
hindered on St. John by the lack of informa-tion on natural and historic rates of erosion and the delivery of eroded material through the stream network to the marine environ-ment (Macdonald et al., 1997). Further, research concludes that their unpaved roads generate runoff and erosion in response to most storm events (Macdonald et al., 2001). Could this be a factor as to limited research and policies related to donkeys?
This paper includes several pictures pur-posely. I do believe that the ‘cuteness’ of St. John’s donkey has a lot to do with the lack of management and policy pertaining to them. Officials really do not even know how many donkeys are on the island. Nearly every bro-chure advertising St. John mentions their donkeys, but rarely the goats. Donkeys are a major tourist attraction, generating revenue and culturally accepted as part of St. John’s island life and attitude.
An extremist view would say ‘kill the donkeys and goats’! That will never happen—thank goodness. But I do advocate taking measures to fence off parts of the more eroded hillsides where these species have caused greater damage. It is not practi-cal to seek caging the animals or restricting them per say, for this goes against the free-spirited nature of the island.
In my ecological research and readings there seems to be three methods which when used together have been shown to combat soil erosion. (1) Re-vegetation: A fancy name for replanting and rebuild-ing the disturbed soil areas. (2) Deliberate planning: A planning process used specifi-cally for the development of implementing re-vegetation to better ensure success. (3) Suppression of grazing and fire, though fire is not an issue in this instance. Use healthy and non-invasive ways to deter donkeys and from munching on the newly re-vegetation.
conclUSIon
I understand that this is a very strenuous and long-lasting project that will need numerous workers and constant monitoring. I hypoth-esise that interest and money will surmount once a successful proposal is presented to the right entities. Goals and objectives must be clear and attainable. The public policy initiated must demonstrate a specific course of action to be taken and clearly define the roles of all governmental and NGO’s involved. I further argue that a knowledge-able, efficient and charismatic public policy administrator, perhaps someone like myself, would be able to successfully involve organi-sations such as: the Student Conservation Association and AmeriCorps just to name a few, to work on this long-lasting environ-mental sustainable project, along with offi-cial governmental agencies.
The increased fragility due to past mis-management, and high demand for the ben-efits derived from island forests combine to leave little room for error in the manage-ment of forest resources (Lugo et al., 1981). That was nearly 30 years ago and soil erosion management policies have still not yet been affectively implemented. Acknowledging soil erosion cannot be sustained indefinitely (Lugo et al., 1981) states: many Caribbean islands have laws and regulations designed to curb soil erosion, unfortunately as long as energy consumption continues to expand without proper environmental conserva-tion measures, it is unlikely that these laws will help; indeed they have not done so since they were first formulated in the 1700s. I question if St. John is amongst the ‘many’ islands? Either way, policies must be implemented rather than just written down, utilising enlightening science and aggressive management techniques, adher-ing to formulated policies, if St. John is to protect their islands ecosystem and all of its inhabitants.
411Donkey’s impact upon the island’s habitat
referenceS
Cohn, J. (2003) ‘Americas’, Paradise in Peril, Vol. 55, No. 1, pp.6–13.
Lugo, A.E., Ralph, S. and Sandra, B. (1981) ‘Ambio’, Tropical Forests in the Caribbean, Vol. 10, No. 6, pp.318–324.
Macdonald, L.H., Donald, A.M. and William, D.E. (1997) ‘Environmental Management’, Paradise Threatened: Land Use and Erosion on St. John, US Virgin Islands; Vol. 21, No. 6, pp.851–863.
Macdonald, L.H., Robert, S.W. and Donald, A.M. (2001) ‘Earth surface processes and landforms’, Runoff and Road Erosion at the Plot
and Road Segment Scales, St John, US Virgin Islands, Vol. 26, No. 3, pp.251–272.
Pimentel, D. and Nadia, K. (1998) ‘Ecosystems’, Ecology of Soil Erosion in Ecosystem, Vol. 1, No. 5, pp.416–426.
Rudman, R. (1998) ‘Applied animal behaviour science’, The Social Organization of Feral Donkeys (Equus asinus) on a Small Caribbean island St. John US Virgin Islands, Vol. 60, No. 2–3, pp.211–228.
Smith, R.L. and Thomas, S. (2001) Textbook: ‘Ecology and Field Biology’, Publisher: Prentice Hall, Ecology and Field Biology, Edition 6:76. ISBN: 9780321042903

Copyright © 2010 WASD
World Sustainable Development Outlook 2010
413
STRATEGIC DEVELOPMENTAL OPPORTUNITIES FROM DIASPORA TOURISM:
THE JAMAICAN PERSPECTIVE1
Natasha Kay Mortley*University of the West Indies, Jamaica
Abstract: This paper, which is based on ongoing research, explores some of the socio-economic benefits associated with the return to Jamaica of non-resident Jamaicans living in London. These short return visits to one’s homeland or place of origin, birth or heritage is referred to as Diaspora tourism and is an important element in the migration-tourism nexus. The paper will examine the motivations for Diaspora tourists visiting Jamaica from London, one of the major global cities that Jamaicans have historically migrated to. Based on the analysis of in depth interviews conducted in Jamaica and London with key stakeholders, as well as a situational analysis of secondary data, the paper will explore the patterns and motivations behind Diaspora tourism. It will also examine the economic, social, cultural, political and environmen-tal impacts of this movement on Jamaica and further explore strategic opportunities for trade and investment and the implications for future development for Jamaica.
Keywords: Diaspora tourism, Jamaica, London, strategic opportunities, developmental potential
INTRODUCTION
When one examines the advertisements, the link with ‘our country’ becomes much more concrete. The pages are stuffed with advertisements for shipping lines, airlines, freight handlers, money transfer services (send your cash in a flash one says), plots for sale in Jamaica, architects, removal companies, vacation accommodation and export houses selling tropicalized refrig-erators… (Cohen, 1997)
The above is a typical portrayal of the ancestral homeland in the Weekly Gleaner,
a popular Caribbean newspaper in the UK. It is also indicative of the strength of a transnational Caribbean identity and the emotional attachments that Caribbean migrants have with their home countries. This attachment is often accompanied by a sense of loyalty, belonging, yearning to return and sometimes obligations to the homeland. It is within this context that Jamaican Diaspora tourism will be exam-ined in this paper. Within the context of transnationalism, return and attachment, the impact of Diaspora tourism and its
*Corresponding author: University of the West Indies, Barbados; e-mail: [email protected] This on-going research presented in this conference paper is part of an IDRC funded project on Strategic Opportunities in Migration: Brain Circulation, Diaspora Tourism and Investment, being undertaken by the Shridath Ramphal Centre for International Trade, Policy and Services, University of the West Indies, Cave Hill Campus in partnership with the Centre for Trade Policy and Law, Carleton University.
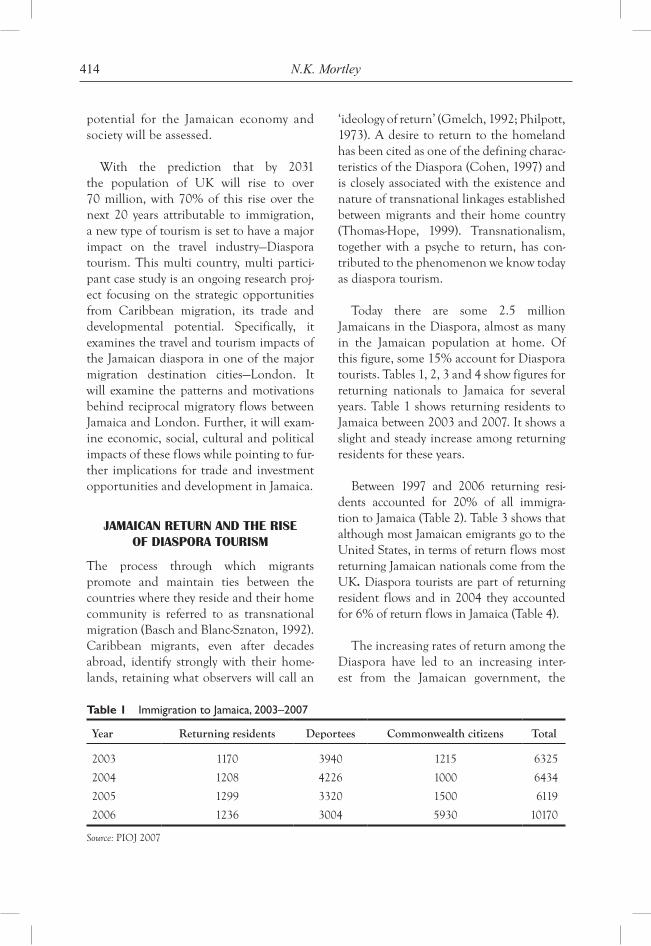
414 N.K. Mortley
potential for the Jamaican economy and society will be assessed.
With the prediction that by 2031 the population of UK will rise to over 70 million, with 70% of this rise over the next 20 years attributable to immigration, a new type of tourism is set to have a major impact on the travel industry—Diaspora tourism. This multi country, multi partici-pant case study is an ongoing research proj-ect focusing on the strategic opportunities from Caribbean migration, its trade and developmental potential. Specifically, it examines the travel and tourism impacts of the Jamaican diaspora in one of the major migration destination cities—London. It will examine the patterns and motivations behind reciprocal migratory flows between Jamaica and London. Further, it will exam-ine economic, social, cultural and political impacts of these flows while pointing to fur-ther implications for trade and investment opportunities and development in Jamaica.
JAMAICAN RETURN AND THE RISE OF DIASPORA TOURISM
The process through which migrants promote and maintain ties between the countries where they reside and their home community is referred to as transnational migration (Basch and Blanc-Sznaton, 1992). Caribbean migrants, even after decades abroad, identify strongly with their home-lands, retaining what observers will call an
‘ideology of return’ (Gmelch, 1992; Philpott, 1973). A desire to return to the homeland has been cited as one of the defining charac-teristics of the Diaspora (Cohen, 1997) and is closely associated with the existence and nature of transnational linkages established between migrants and their home country (Thomas-Hope, 1999). Transnationalism, together with a psyche to return, has con-tributed to the phenomenon we know today as diaspora tourism.
Today there are some 2.5 million Jamaicans in the Diaspora, almost as many in the Jamaican population at home. Of this figure, some 15% account for Diaspora tourists. Tables 1, 2, 3 and 4 show figures for returning nationals to Jamaica for several years. Table 1 shows returning residents to Jamaica between 2003 and 2007. It shows a slight and steady increase among returning residents for these years.
Between 1997 and 2006 returning resi-dents accounted for 20% of all immigra-tion to Jamaica (Table 2). Table 3 shows that although most Jamaican emigrants go to the United States, in terms of return flows most returning Jamaican nationals come from the UK. Diaspora tourists are part of returning resident flows and in 2004 they accounted for 6% of return flows in Jamaica (Table 4).
The increasing rates of return among the Diaspora have led to an increasing inter-est from the Jamaican government, the
Table 1 Immigration to Jamaica, 2003–2007
Year Returning residents Deportees Commonwealth citizens Total
2003 1170 3940 1215 6325
2004 1208 4226 1000 6434
2005 1299 3320 1500 6119
2006 1236 3004 5930 10170
Source: PIOJ 2007
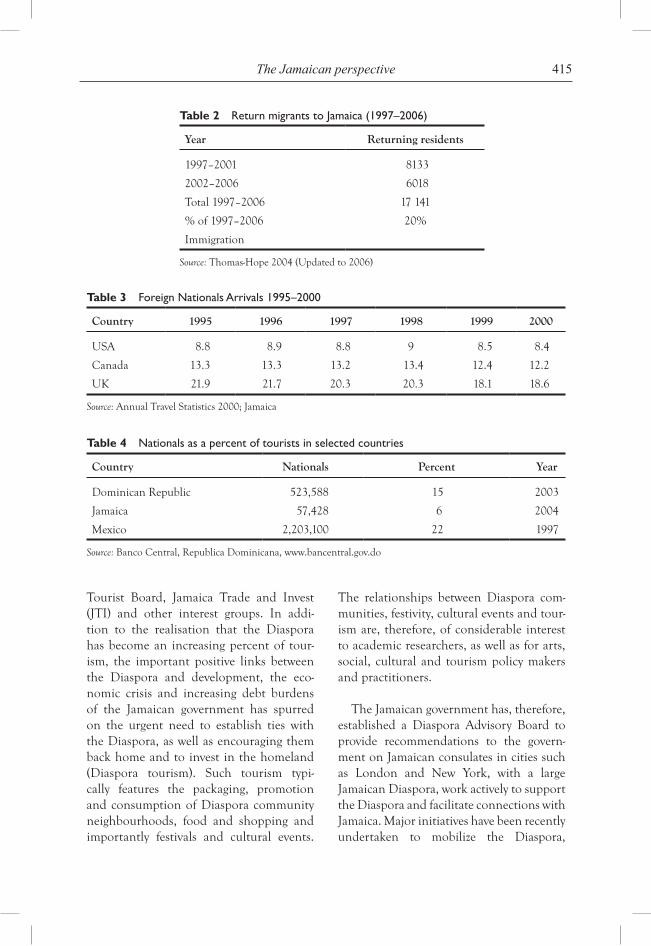
415The Jamaican perspective
Table 2 Return migrants to Jamaica (1997–2006)
Year Returning residents
1997–2001 8133
2002–2006 6018
Total 1997–2006 17 141
% of 1997–2006 20%
Immigration
Source: Thomas-Hope 2004 (Updated to 2006)
Table 3 Foreign Nationals Arrivals 1995–2000
Country 1995 1996 1997 1998 1999 2000
USA 8.8 8.9 8.8 9 8.5 8.4
Canada 13.3 13.3 13.2 13.4 12.4 12.2
UK 21.9 21.7 20.3 20.3 18.1 18.6
Source: Annual Travel Statistics 2000; Jamaica
Table 4 Nationals as a percent of tourists in selected countries
Country Nationals Percent Year
Dominican Republic 523,588 15 2003
Jamaica 57,428 6 2004
Mexico 2,203,100 22 1997
Source: Banco Central, Republica Dominicana, www.bancentral.gov.do
Tourist Board, Jamaica Trade and Invest (JTI) and other interest groups. In addi-tion to the realisation that the Diaspora has become an increasing percent of tour-ism, the important positive links between the Diaspora and development, the eco-nomic crisis and increasing debt burdens of the Jamaican government has spurred on the urgent need to establish ties with the Diaspora, as well as encouraging them back home and to invest in the homeland (Diaspora tourism). Such tourism typi-cally features the packaging, promotion and consumption of Diaspora community neighbourhoods, food and shopping and importantly festivals and cultural events.
The relationships between Diaspora com-munities, festivity, cultural events and tour-ism are, therefore, of considerable interest to academic researchers, as well as for arts, social, cultural and tourism policy makers and practitioners.
The Jamaican government has, therefore, established a Diaspora Advisory Board to provide recommendations to the govern-ment on Jamaican consulates in cities such as London and New York, with a large Jamaican Diaspora, work actively to support the Diaspora and facilitate connections with Jamaica. Major initiatives have been recently undertaken to mobilize the Diaspora,
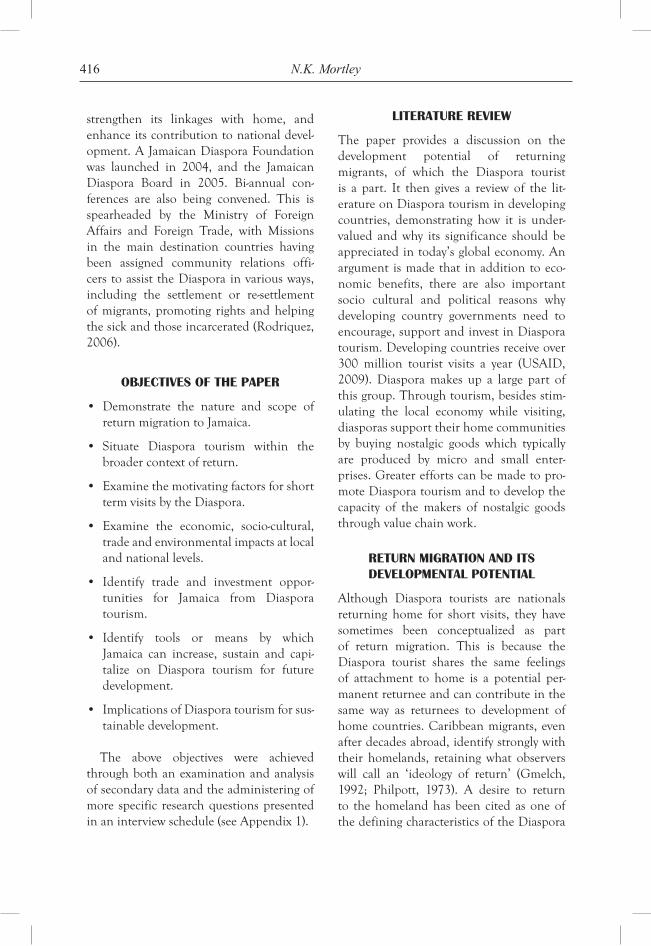
416 N.K. Mortley
strengthen its linkages with home, and enhance its contribution to national devel-opment. A Jamaican Diaspora Foundation was launched in 2004, and the Jamaican Diaspora Board in 2005. Bi-annual con-ferences are also being convened. This is spearheaded by the Ministry of Foreign Affairs and Foreign Trade, with Missions in the main destination countries having been assigned community relations offi-cers to assist the Diaspora in various ways, including the settlement or re-settlement of migrants, promoting rights and helping the sick and those incarcerated (Rodriquez, 2006).
OBJECTIVES OF THE PAPER
• Demonstrate the nature and scope ofreturn migration to Jamaica.
• Situate Diaspora tourism within thebroader context of return.
• Examinethemotivatingfactorsforshortterm visits by the Diaspora.
• Examine the economic, socio-cultural,trade and environmental impacts at local and national levels.
• Identify trade and investment oppor-tunities for Jamaica from Diaspora tourism.
• Identify tools or means by whichJamaica can increase, sustain and capi-talize on Diaspora tourism for future development.
• ImplicationsofDiasporatourismforsus-tainable development.
The above objectives were achieved through both an examination and analysis of secondary data and the administering of more specific research questions presented in an interview schedule (see Appendix 1).
LITERATURE REVIEW
The paper provides a discussion on the development potential of returning migrants, of which the Diaspora tourist is a part. It then gives a review of the lit-erature on Diaspora tourism in developing countries, demonstrating how it is under-valued and why its significance should be appreciated in today’s global economy. An argument is made that in addition to eco-nomic benefits, there are also important socio cultural and political reasons why developing country governments need to encourage, support and invest in Diaspora tourism. Developing countries receive over 300 million tourist visits a year (USAID, 2009). Diaspora makes up a large part of this group. Through tourism, besides stim-ulating the local economy while visiting, diasporas support their home communities by buying nostalgic goods which typically are produced by micro and small enter-prises. Greater efforts can be made to pro-mote Diaspora tourism and to develop the capacity of the makers of nostalgic goods through value chain work.
RETURN MIGRATION AND ITS DEVELOPMENTAL POTENTIAL
Although Diaspora tourists are nationals returning home for short visits, they have sometimes been conceptualized as part of return migration. This is because the Diaspora tourist shares the same feelings of attachment to home is a potential per-manent returnee and can contribute in the same way as returnees to development of home countries. Caribbean migrants, even after decades abroad, identify strongly with their homelands, retaining what observers will call an ‘ideology of return’ (Gmelch, 1992; Philpott, 1973). A desire to return to the homeland has been cited as one of the defining characteristics of the Diaspora
417The Jamaican perspective
(Cohen, 1997) and is closely associated with the existence and nature of transnational linkages established between migrants and their home country (Thomas-Hope, 1999). Return migrant has important implications for the development of the home country. It has been argued that returnees bring back human, financial and social capital gained abroad (Olesen, 2003). Return migrants have the potential to make different kinds of contributions to national development—some through their skills, educational and professional experience, others through remittances and the financial capital which they transfer for investment or as retirement income.
Ghosh (2000) argues that one of the two most important factors in determining whether return will benefit local develop-ment is the preparedness of the returnee. This depends on the ability of migrants to obtain and share current information about their places of origin, such as that pertain-ing to business opportunities, labour market openings and housing market conditions (Sorensen et al., 2003). The second factor according to Ghosh (2000) is the extent to which the country of origin provides an enabling social, economic and institutional environment in which the returnee can effec-tively make a contribution. Indeed problems such as poor infrastructure, limited social services and corruption not only make it more difficult for returnees to contribute to local development but it can also act as strong deterrent to return (Olesen, 2003).
This study purports that the transnational practices enacted by social networks can be seen to contribute to the propitious condi-tions required for return to benefit develop-ment even though migrants do not actually return home. This can be achieved by main-taining affinity with home, channeling and
disseminating information about home and contributing to the creation of an enabling environment for investment.
According to Henry (1990), other bene-fits include that fact that financial resources, whether spent in the Caribbean or in host countries, are nonetheless spent on Caribbean goods and services in one form or the other. While this has not been quan-tified, it is still clear that Caribbean goods abroad and the promotion of Caribbean culture and its export are directly linked to the existence of large and active Caribbean communities abroad (Nurse, 2004; Thomas-Hope, 2004).
The potential developmental impact of the Diaspora has been increasingly rec-ognised in the literature especially in light of lobbying by several Diaspora communi-ties to get governments and international agencies to recognize their contributions to home. For example, Meyer and Brown (1999) found that 41 expatriate knowledge networks existed at that time and that they promoted themselves and the potential ben-efits of knowledge and skills transfer. There is a large reservoir of social capital associated with these Diaspora networks. They offer a wide scope for tourism, ethic, specialty and niche markets (Nurse, 2004). However, strat-egies for maximizing their benefits have yet to be elaborated either in terms of human resource development schemes or in terms of trade relations. The Caribbean has yet to formulate a concrete strategy to tap into diasporic communities as a viable means to diversify their economies and for further regional development. All of these afore-mentioned developments and issues within the migration literature have served to influ-ence a re-conceptualization of skilled labour migration and are relevant to the study of nurse migration.
418 N.K. Mortley
VALUING THE DEVELOPMENTAL POTENTIAL OF DIASPORA TOURISTS
While governments spend millions in investments in foreign tourists, little attempt has been made to attract or encourage overseas based nationals to visits home. Diaspora tourisms deserve greater consideration and investment given their potential benefit to local and national development (indicated above). Diaspora tourists also have the potential to become permanent returnees and thus make more long terms contributions and investments in home countries.
Developing countries’ tourism efforts rarely target Diaspora tourists. Barkin (2001) notes that the Mexican government focuses current efforts on meeting the needs of for-eign, high-end and high-spending tourists. Evenamongcountrieswithspecificpoliciesto support domestic or Diaspora tourists, practical commitments doesn’t often live up to the rhetoric, for instance, while the Kenyan Domestic Tourism Council has an impressive set of objectives, it is hard to see how they might be achieved when the gov-ernment still devotes most of its resources to promote international tourism. The bias against domestic and Diaspora tourists has to do with government’s preoccupation to move tourism upscale and attract foreign exchange.
Travel by both domestic and Diaspora tourists can expand their knowledge and understanding of home country with sub-sequent increase in national pride. Themes such as identity, belonging and nation building are key in Diaspora maintaining meaningful ties with homelands.
When nationals return home for holi-day or family function, they bring foreign exchange as well as rekindle cultural links
which ensure enduring economic and social ties with home (Coles and Timothy, 2004). They may be an important source of foreign direct investment. Barkin (2001) found that when expats returned to Mexico on holiday their actions had significant developmen-tal benefits. As well as giving money and gifts to family members and spending in local areas, they also supported community organisations such as schools and religious groups.
Asiedu (2005) found that Ghanian nationals returning home for visits spend 2769 pounds on average including inter-national travel, 585 was spent on inciden-tals such as contributions to community funds and expenses for funerals, 433 used to purchase food and entertainment for family and friends, 274 on commercial accommodation.
The links between social connections and economic development should not be over looked. Lew and Wong (2004) show how travel home by members of the Chinese Diaspora can build social capital and thus economic development. Many of the 60 million ethnic Chinese who live abroad belong to voluntary overseas Chinese associations that contribute funds to help develop home area. For example, contribu-tions by American Chinese from Taishan country between 1978 and 1998 amounted to 14 million U.S. dollars and funded numer-ous educational, medical and infrastruc-tural projects in that area (Lew and Wong, 2004).
Duval’s (2003) research on EasternCaribbean Diaspora in Toronto revealed that maintenance of social and cultural ties was a key motivator for return visits. Potter (2005) found that second-generation Caribbean persons returning to their
419The Jamaican perspective
homelands—most of whom brought skills with them that were in high demand, had almost all visited their home country a no of times before deciding to emigrate.
METHODOLOGY
This study adopts a case study approach, and therefore, provides an exploration of a bounded system or a case (or mul-tiple cases) over time through detailed in depth data collection involving multiple sources of information rich in context (Creswell 1998). The bounded system is bounded by time and place and the case could be an individual, event, activity or programme. A multi country approach has been adopted with stakeholders from Jamaica and London being interviewed on their knowledge on, lived experiences and views on the issue of Diaspora tourism for Jamaica.
The first stage of the study involved a review of the relevant literature, govern-ment policy documents, available data and other documents on Diaspora tourism. This is intended to identify the existence and evolution of any policy or practical plans for the Diaspora and their develop-ment potential. Secondly, key stakeholders have been identified through snowball sam-pling and chain referrals and interviewed through face to face interviews. All inter-views were audio taped (with the consent of the participants) and notes were made during the interviews. Interviews generally lasted between 60 and 90 minutes. Finally, there has been some participant observa-tion for this study. The researcher has attended and observed two major work-shops with Diaspora and interest groups in Jamaica. The first workshop ‘Knowledge Networks for Connecting Jamaica and its Diaspora’ funded by the EC/UN aimed
at a more structured engagement with the Jamaican Diaspora, especially through links to community projects. The second workshop or working group meeting was hosted by the Jamaica Diaspora Institute at the University of the West Indies, Mona and brought together key stakeholders to discuss the set up of a web portal and data-bases for the Jamaican Diaspora so that they can connect, communicate and get together more effectively.
To date 10 in-depth interviews have been conducted both in Jamaica and London. The study in ongoing and hopes to interview another ten stakeholders, bring the total to 20. The second round of interviewing will be conducted this June at the Jamaica Diaspora Convention taking place in Ocho Rios Jamaica June 14th to 17th 2010. Some 900 delegates from the Diaspora are expected to attend and will be coming from the United States, Canada and the UK. This conven-tion provides an excellent opportunity not only to target stakeholders in the Diaspora who can be interviewed for this study, but it also allows for after interview engagement and discussions with Diaspora groups over a 3-day period.
SITUATIONAL ANALYSIS
This section examines data on arrivals to Jamaica (non-resident Jamaicans and for-eign nationals) from major destination countries.
Table 5 shows arrivals to Jamaica from the major destinations from 2006 to 2009. The figures which are the most cur-rent (January 2010) were obtained from the Jamaica Tourist Board in London dur-ing fieldwork conducted there. While the figures represent all tourist arrivals from those main destination regions, it should
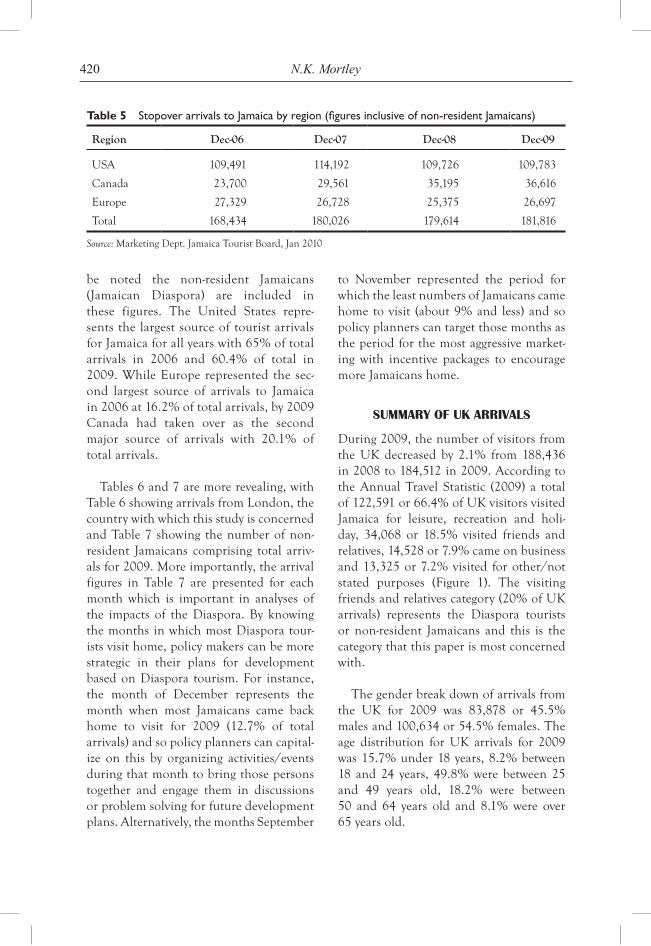
420 N.K. Mortley
be noted the non-resident Jamaicans (Jamaican Diaspora) are included in these figures. The United States repre-sents the largest source of tourist arrivals for Jamaica for all years with 65% of total arrivals in 2006 and 60.4% of total in 2009.WhileEuroperepresentedthesec-ond largest source of arrivals to Jamaica in 2006 at 16.2% of total arrivals, by 2009 Canada had taken over as the second major source of arrivals with 20.1% of total arrivals.
Tables 6 and 7 are more revealing, with Table 6 showing arrivals from London, the country with which this study is concerned and Table 7 showing the number of non-resident Jamaicans comprising total arriv-als for 2009. More importantly, the arrival figures in Table 7 are presented for each month which is important in analyses of the impacts of the Diaspora. By knowing the months in which most Diaspora tour-ists visit home, policy makers can be more strategic in their plans for development based on Diaspora tourism. For instance, the month of December represents the month when most Jamaicans came back home to visit for 2009 (12.7% of total arrivals) and so policy planners can capital-ize on this by organizing activities/eventsduring that month to bring those persons together and engage them in discussions or problem solving for future development plans. Alternatively, the months September
to November represented the period for which the least numbers of Jamaicans came home to visit (about 9% and less) and so policy planners can target those months as the period for the most aggressive market-ing with incentive packages to encourage more Jamaicans home.
SUMMARY OF UK ARRIVALS
During 2009, the number of visitors from the UK decreased by 2.1% from 188,436 in 2008 to 184,512 in 2009. According to the Annual Travel Statistic (2009) a total of 122,591 or 66.4% of UK visitors visited Jamaica for leisure, recreation and holi-day, 34,068 or 18.5% visited friends and relatives, 14,528 or 7.9% came on business and13,325or7.2%visited forother/notstated purposes (Figure 1). The visiting friends and relatives category (20% of UK arrivals) represents the Diaspora tourists or non-resident Jamaicans and this is the category that this paper is most concerned with.
The gender break down of arrivals from the UK for 2009 was 83,878 or 45.5% males and 100,634 or 54.5% females. The age distribution for UK arrivals for 2009 was 15.7% under 18 years, 8.2% between 18 and 24 years, 49.8% were between 25 and 49 years old, 18.2% were between 50 and 64 years old and 8.1% were over 65 years old.
Table 5 Stopover arrivals to Jamaica by region (figures inclusive of non-resident Jamaicans)
Region Dec-06 Dec-07 Dec-08 Dec-09
USA 109,491 114,192 109,726 109,783
Canada 23,700 29,561 35,195 36,616
Europe 27,329 26,728 25,375 26,697
Total 168,434 180,026 179,614 181,816
Source: Marketing Dept. Jamaica Tourist Board, Jan 2010
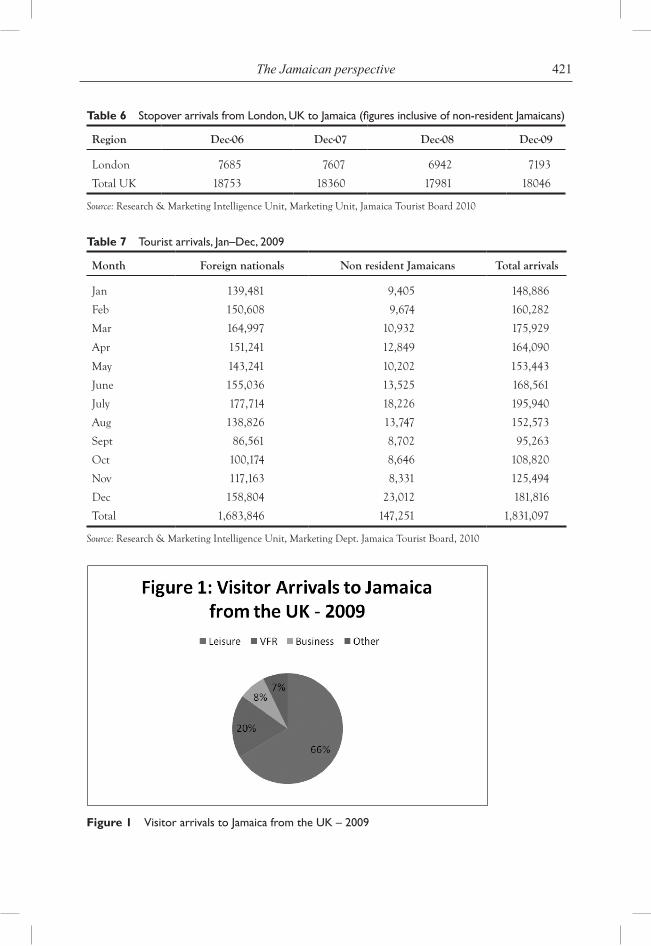
421The Jamaican perspective
Table 6 Stopover arrivals from London, UK to Jamaica (figures inclusive of non-resident Jamaicans)
Region Dec-06 Dec-07 Dec-08 Dec-09
London 7685 7607 6942 7193
Total UK 18753 18360 17981 18046
Source: Research & Marketing Intelligence Unit, Marketing Unit, Jamaica Tourist Board 2010
Table 7 Tourist arrivals, Jan–Dec, 2009
Month Foreign nationals Non resident Jamaicans Total arrivals
Jan 139,481 9,405 148,886
Feb 150,608 9,674 160,282
Mar 164,997 10,932 175,929
Apr 151,241 12,849 164,090
May 143,241 10,202 153,443
June 155,036 13,525 168,561
July 177,714 18,226 195,940
Aug 138,826 13,747 152,573
Sept 86,561 8,702 95,263
Oct 100,174 8,646 108,820
Nov 117,163 8,331 125,494
Dec 158,804 23,012 181,816
Total 1,683,846 147,251 1,831,097
Source: Research & Marketing Intelligence Unit, Marketing Dept. Jamaica Tourist Board, 2010
Figure 1 Visitor arrivals to Jamaica from the UK – 2009
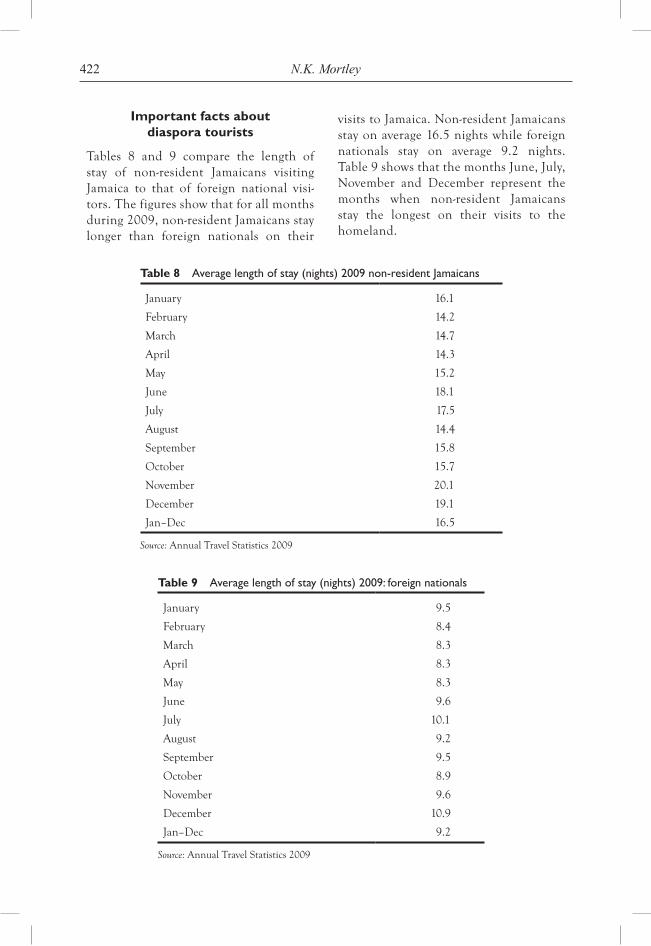
422 N.K. Mortley
Important facts about diaspora tourists
Tables 8 and 9 compare the length of stay of non-resident Jamaicans visiting Jamaica to that of foreign national visi-tors. The figures show that for all months during 2009, non-resident Jamaicans stay longer than foreign nationals on their
visits to Jamaica. Non-resident Jamaicans stay on average 16.5 nights while foreign nationals stay on average 9.2 nights. Table 9 shows that the months June, July, November and December represent the months when non-resident Jamaicans stay the longest on their visits to the homeland.
Table 8 Average length of stay (nights) 2009 non-resident Jamaicans
January 16.1
February 14.2
March 14.7
April 14.3
May 15.2
June 18.1
July 17.5
August 14.4
September 15.8
October 15.7
November 20.1
December 19.1
Jan–Dec 16.5
Source: Annual Travel Statistics 2009
Table 9 Average length of stay (nights) 2009: foreign nationals
January 9.5
February 8.4
March 8.3
April 8.3
May 8.3
June 9.6
July 10.1
August 9.2
September 9.5
October 8.9
November 9.6
December 10.9
Jan–Dec 9.2
Source: Annual Travel Statistics 2009
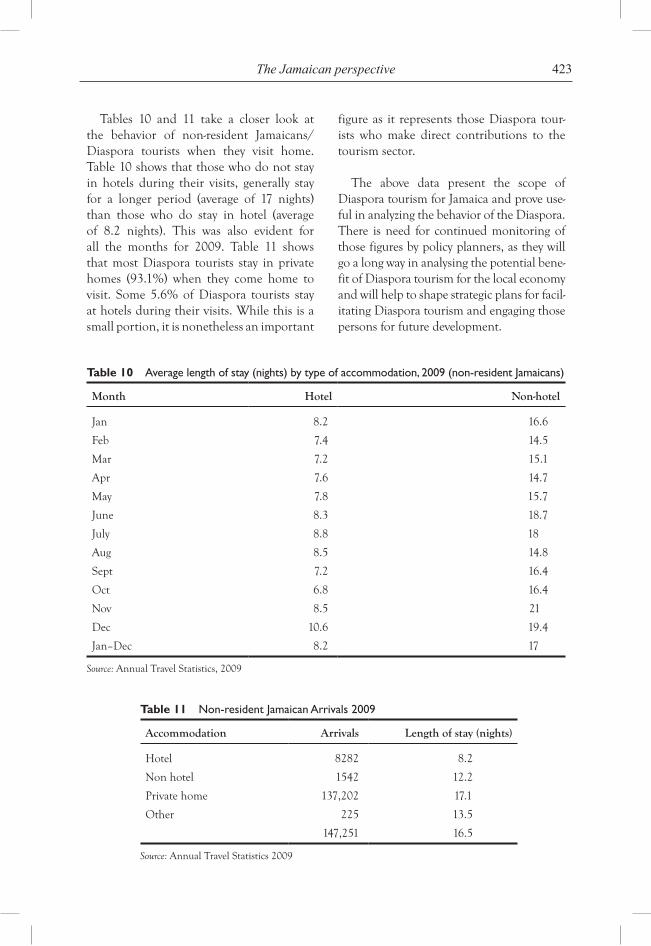
423The Jamaican perspective
Tables 10 and 11 take a closer look at the behavior of non-resident Jamaicans/Diaspora tourists when they visit home. Table 10 shows that those who do not stay in hotels during their visits, generally stay for a longer period (average of 17 nights) than those who do stay in hotel (average of 8.2 nights). This was also evident for all the months for 2009. Table 11 shows that most Diaspora tourists stay in private homes (93.1%) when they come home to visit. Some 5.6% of Diaspora tourists stay at hotels during their visits. While this is a small portion, it is nonetheless an important
figure as it represents those Diaspora tour-ists who make direct contributions to the tourism sector.
The above data present the scope of Diaspora tourism for Jamaica and prove use-ful in analyzing the behavior of the Diaspora. There is need for continued monitoring of those figures by policy planners, as they will go a long way in analysing the potential bene-fit of Diaspora tourism for the local economy and will help to shape strategic plans for facil-itating Diaspora tourism and engaging those persons for future development.
Table 10 Average length of stay (nights) by type of accommodation, 2009 (non-resident Jamaicans)
Month Hotel Non-hotel
Jan 8.2 16.6
Feb 7.4 14.5
Mar 7.2 15.1
Apr 7.6 14.7
May 7.8 15.7
June 8.3 18.7
July 8.8 18
Aug 8.5 14.8
Sept 7.2 16.4
Oct 6.8 16.4
Nov 8.5 21
Dec 10.6 19.4
Jan–Dec 8.2 17
Source: Annual Travel Statistics, 2009
Table 11 Non-resident Jamaican Arrivals 2009
Accommodation Arrivals Length of stay (nights)
Hotel 8282 8.2
Non hotel 1542 12.2
Private home 137,202 17.1
Other 225 13.5
147,251 16.5
Source: Annual Travel Statistics 2009
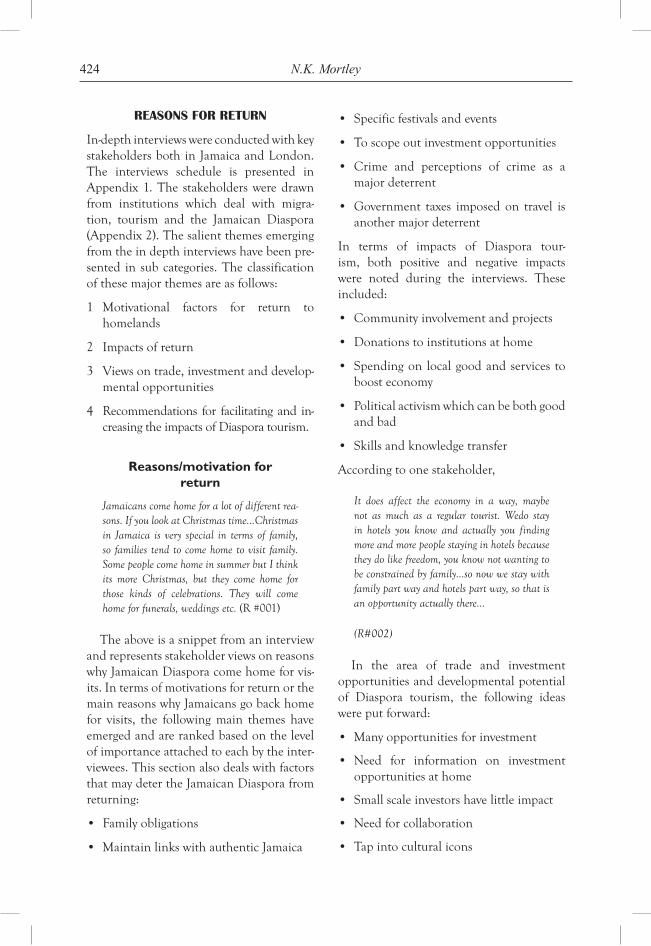
424 N.K. Mortley
REASONS FOR RETURN
In-depth interviews were conducted with key stakeholders both in Jamaica and London. The interviews schedule is presented in Appendix 1. The stakeholders were drawn from institutions which deal with migra-tion, tourism and the Jamaican Diaspora (Appendix 2). The salient themes emerging from the in depth interviews have been pre-sented in sub categories. The classification of these major themes are as follows:
1 Motivational factors for return to homelands
2 Impacts of return
3 Views on trade, investment and develop-mental opportunities
4 Recommendations for facilitating and in-creasing the impacts of Diaspora tourism.
Reasons/motivation for return
Jamaicans come home for a lot of different rea-sons. If you look at Christmas time…Christmas in Jamaica is very special in terms of family, so families tend to come home to visit family. Some people come home in summer but I think its more Christmas, but they come home for those kinds of celebrations. They will come home for funerals, weddings etc. (R #001)
The above is a snippet from an interview and represents stakeholder views on reasons why Jamaican Diaspora come home for vis-its. In terms of motivations for return or the main reasons why Jamaicans go back home for visits, the following main themes have emerged and are ranked based on the level of importance attached to each by the inter-viewees. This section also deals with factors that may deter the Jamaican Diaspora from returning:
• Familyobligations
• MaintainlinkswithauthenticJamaica
• Specificfestivalsandevents
• Toscopeoutinvestmentopportunities
• Crime and perceptions of crime as amajor deterrent
• Government taxes imposedon travel isanother major deterrent
In terms of impacts of Diaspora tour-ism, both positive and negative impacts were noted during the interviews. These included:
• Communityinvolvementandprojects
• Donationstoinstitutionsathome
• Spendingonlocalgoodandservicestoboost economy
• Politicalactivismwhichcanbebothgoodand bad
• Skillsandknowledgetransfer
According to one stakeholder,
It does affect the economy in a way, maybe not as much as a regular tourist. Wedo stay in hotels you know and actually you finding more and more people staying in hotels because they do like freedom, you know not wanting to be constrained by family…so now we stay with family part way and hotels part way, so that is an opportunity actually there…
(R#002)
In the area of trade and investment opportunities and developmental potential of Diaspora tourism, the following ideas were put forward:
• Manyopportunitiesforinvestment
• Need for information on investmentopportunities at home
• Smallscaleinvestorshavelittleimpact
• Needforcollaboration
• Tapintoculturalicons
425The Jamaican perspective
The development potential of the Jamaican Diaspora in London has been linked to the strength of UK dollar and disposal income of the Diaspora. For instance, one stake-holder noted:
UK Diaspora are seen as economically very powerful…for the past few years the economy has been strong and the UK pound is very strong in Jamaica (R#004)
In conceptualising the impacts of Diaspora tourism, we may place these short-term visits within the migration return and circulation framework. When migration is conceptualised as a circular process, the debate then takes on a new direction. The circularity of migration is evidenced by not only the return of emigrants to the home country, but also when they go back and forth, maintain attachments with the home community and there is circulation of people, goods, technologies and ideas. In the latter case, the analytical construct of ‘social location’ becomes relevant. Social location according to Mahler and Pessar (2006) provides a reference term for how individuals and groups are situated in multiple, intersecting and mutually con-stituting hierarchies of gender, race, class, ethnicity, nationality, etc. This has ben-efits for source or home countries because according to Commander et al. (2003) through return, networks or repatriation, such as through remittances, emigrants provide essential inputs to new businesses and productive activities in the home coun-tries. These are important aspects of the development of the national economies in home countries.
This study found social capital benefits from Diaspora tourism in the form of social networks and links forged between home and destination countries. The existence of these networks suggest there is a wide scope for investment, as well as trade in goods,
services and culture which could be facili-tated by and capitalized upon by Caribbean governments for national long-term devel-opment. As Diaspora tourism grows, it can also lead to a burgeoning tourist industry through the increase also of international tourists. This is because the Diaspora may also encourage friends and persons in their international networks to visit as well, lead-ing to greater visibility and investment opportunities for the Caribbean region.
Finally, in terms of recommendations for future policy on increasing linkages with the Diaspora and facilitating the developmental potential from Diaspora tourism, the inter-viewees noted:
• DiasporainLondonneedsinformation(general information)
• Need for greater collaboration amongvarious Diaspora groups
• Institutions need to facilitate theDiaspora
• NeedtomeetregularlywiththeJamaicangovernment/ outreach to the Diasporacommunity
• Need for specifically tailored packagesfor the Diaspora (different from other tourists)
This paper is part of on-going research and has presented preliminary findings on the strategic opportunities from Diaspora tourism for Jamaica. The research intends to continue with data collection and stake-holder interviewing during June and July. Data analysis will be completed in August and then the final paper will be completed by September at the conclusion of the research. The researcher intends to place the findings within the conceptual and theoretical frameworks and make recom-mendations for viable and strategic policies for realizing the potential for development for Jamaica.
426 N.K. Mortley
REFERENCES
Asiedu, A. (2005). ‘Some benefits of migrants’ return visits to Ghana’, Population, Space and Place, Vol. 11, pp.1–11.
Basch, L. and Blanc-Sznaton, C. (1992) Towards a Transnational Perspective on Migration: Race, Class, Ethnicity and Nationalism Reconsidered, New York Academy of Sciences, New York.
Byron, M. (1999) ‘Migration as a way of life: Nevis and the post-war labour movement to Britain’, in King, R. and Connell, J. (Eds.):Small Worlds, Global Lives: Islands and Migration, Continuum International Publishing Group, pp.115–136.
Cohen, R. (1997) Global Diasporas: An Introduction, UCL Press, London
Commander, S. et al. (2003) The Brain Drain: Curse or Boon? Discussion Paper Series, No. 809 June 2003.
Creswell, J. (1998) Qualitative Inquiry and Research Design: Choosing Among Five Traditions,SAGEPublications,ThousandOaks, CA.
Ghosh, B. (2000) Return Migration: Journey of Hope or Despair? IOM and the UN, Geneva.
Gmelch, G. (1992) Double Passage: The Lives of Caribbean Migrants Abroad and Back Home. University of Michigan Press, Ann Arbor.
Jamaica Tourist Board (2009) Annual Travel Statistics 2009.
Jamaica Tourist Board (2010) Figures on Stopover Arrivals, Research and marketing Intelligence Unit, Marketing Department.
Lapointe, M. (2004) Diasporas in Caribbean Development: Rapporteur’s Report, The Inter American Dialogue.
Mahler, S. and Pessar, P. (2006) ‘Gender matters: ethnographers bring gender from the periphery to the core of migration studies’, International Migration Review, Vol. 40, No. 1, pp.27–63.
Maingot,A.(1999)‘Emigrationdynamicsinthe Caribbean: the cases of Haiti and the DominicanRepublic’,inAppleyard(Ed.):Emigration Dynamics in Developing Countries, Ashgate, Brookfield, VT.
Mishra,P.(2006)Emigrationandbraindrain:EvidencefromtheCaribbean,IMFWorkingPapers
Nurse, K. (2004) Diaspora, Migration and Development in the Caribbean, Focal – Policy Paper, Sept. 4–6, pp.3–10.
Olesen, H. (2003) ‘Migration, return and development: an institutional perspective’, inVanHear,N.andSorensen,N.(Eds.):The Migration-Development Nexus, IOM, Geneva, pp.133–157.
Orozco, M. (2005) ‘Transnationalism and development: Trends and opportunities in Latin America’, in Maimbo, S.M. and Ratha, D.(Ed.):Remittances: Development impact and future prospects, The World Bank Paper (WP/06/25),pp.307–330.
PAHO (2007) Basic Indicator Data Base, Online:http://www.paho.org/english/dd/ais/coredata.htm
Philpott, S.B. (1973) West Indian Migration: The Montserrat Case, Humanities Press, New York.
Planning Institute of Jamaica (PIOJ) (1972) EconomicandSocialSurveyofJamaica(ESSJ).
Planning Institute of Jamaica (PIOJ) (1996) CitedbyMars,P.andYoung,A.(Eds.):Caribbean Labour Politics: Legacies of Cheddi Jagan and Michael Manley, Wayne State University Press, 2004.
Planning Institute of Jamaica (PIOJ) (2007) EconomicandSocialSurveyofJamaica(ESSJ).
Rodriquez, A. (2006) Jamaican Ambassador to Peru, 2006. Statement at the Special International Conference at Ministerial Level of Developing Countries with Substantial
Scheyvens, R. (2007) Poor cousins no more: Valuing the development potential of domestic and diaspora tourism. Progress in development studies, 7, 4 (2007): 307–325
Simmons, A. and Guengant, J.P. (1992) ‘Caribbean exodus and the world system’, in Kritz,M.etal.(Eds.):International Migration Systems: A Global Approach, Clarendon Press, Oxford, pp.94–114.
Sorensen, N. et al. (2003) ‘Migration development and conflict: state of the art
427The Jamaican perspective
overview’, in Van Hear, N. and Sorensen, N. (Eds.):The Migration Development Nexus, IOM International Migrant Flows, Lima, Peru, 15–16 May 2006, Geneva pp.5–46.
Thomas-Hope,E.(1999)‘Emigrationdynamicsin the Anglophone Caribbean’, in by Appleyard,R.(Ed.):International Migration Today: Trends and Prospects, University ofWesternAustralia(UNESCO), pp.232–284.
Thomas-Hope,E.(2000)Trends and Patterns of Migration to and from the Caribbean Countries, Documento Presentado en el Simposio Sobre Migración.
Thomas-Hope,E.(2004)Migration Situation Analysis, Policy And Programme Needs for Jamaica, The Planning Institute of Jamaica, PIOJ and UNFPA, Kingston.
Thomas-Hope,E.(2005).‘CurrenttrendsandissuesinCaribbeanmigration’,inEconomicCommission on Latin America and the Caribbean(Ed.):Regional and International Migration in the Caribbean and Its Impacts on Sustainable Development: Compendium on Recent Research on Migration in the Caribbean, Trinidad and Tobago, Port-of-Spain, pp.53–67.
United Nations Secretariat, Population Division (2002) International Migration, Wallchart,ST/ESA/SER.A/219,SalesNo.E03.XIII.3.
USAID(2009)Onlinehttp://www.usaid.gov/our_work/global_partnerships/gda/ remittances.html
WorldTravelMarket(2007)Online:http://www.4hoteliers.com/4hots_nshw.php?mwi=3716

Copyright © 2010 WASD
World Sustainable Development Outlook 2010
429
AN OVERVIEW ON THE DEVELOPMENT OF INTEGRATED
BIOENERGY DEVICES FOR IMPROVEMENT OF QUALITY OF LIFE OF POOR PEOPLE
Abdeen Mustafa Omer*Energy Research Institute (ERI), Sudan
Abstract: Sudan is enjoyed with abundant solar, wind, hydro and biomass resources. Like many tropical countries, Sudan has ample biomass resources that can be efficiently exploited in a manner that is both profitable and sustainable. Fuel-wood farming offers cost-effective and environmentally friendly energy solutions for Sudan, with the added benefit of providing sustainable livelihoods in rural areas. Biogas from biomass appears to have potential as an alternative energy in Sudan, which is potentially rich in biomass resources. This is an overview of some salient points and perspectives of biomass technology in Sudan. This current literature is reviewed regarding the ecological, social, cultural and economic impacts of bio-mass technology. This article provides an overview of biomass energy activities and highlights future plans concerning optimum technical and economical utilisation of biomass energy available in Sudan.
Keywords: Sudan; biomass energy; biofuels; biogas; bioheat; utilisation and development.
INTRODUCTION
There is strong scientific evidence that the average temperature of the earth’s surface is rising. This was a result of the increased concentration of carbon dioxide (CO
2),
and other greenhouse gases (GHGs) in the atmosphere as released by burning fossil fuels. This global warming will eventually lead to substantial changes in the world’s climate, which will, in turn, have a major impact on human life and the environment. Energy use reductions can be achieved by minimising the energy demand, by rational
energy use, by recovering heat and the use of more green energies. This study was a step towards achieving this goal. The adop-tion of green or sustainable approaches to the way in which society is run is seen as an important strategy in finding a solution to the energy problem. The key factors to reducing and controlling CO
2, which is the
major contributor to global warming, are the use of alternative approaches to energy generation and the exploration of how these alternatives are used today and may be used in the future as green energy sources.
*Corresponding author: Energy Research Institute (ERI), Sudan; e-mail: [email protected]
430 A.M. Omer
Even with modest assumptions about the availability of land, comprehensive fuel-wood farming programmes offer significant energy, economic and environmental ben-efits. These benefits would be dispersed in rural areas where they are greatly needed and can serve as linkages for further rural economic development. The nations as a whole would benefit from savings in foreign exchange, improved energy security, and socio-economic improvements. With a nine-fold increase in forest—plantation cover, the nation’s resource base would be greatly improved. The international community would benefit from pollution reduction, cli-mate mitigation and the increased trading opportunities that arise from new income sources. The non-technical issues, which have recently gained attention include: (1) environmental and ecological factors, e.g., carbon sequestration, reforestation and revegetation; (2) renewables as a CO
2 neu-
tral replacement for fossil fuels; (3) greater recognition of the importance of renewable energy, particularly modern biomass energy carriers, at the policy and planning levels; (4) greater recognition of the difficulties of gathering good and reliable biomass energy data, and efforts to improve it and (5) stud-ies on the detrimental health efforts of bio-mass energy particularly from traditional energy users. This study discusses a compre-hensive review of biomass energy sources, environment and sustainable development. This includes all the biomass energy tech-nologies, energy efficiency systems, energy conservation scenarios, energy savings and other mitigation measures necessary to reduce climate change.
Energy is an essential factor in develop-ment since it stimulates, and supports eco-nomic growth; and development. Fossil fuels, especially oil and natural gas, are finite in extent, and should be regarded as deplet-ing assets, and efforts are oriented to search
for new sources of energy. The clamour all over the world for the need to conserve energy and the environment has intensified as traditional energy resources continue to dwindle whilst the environment becomes increasingly degraded. Biomass energy sup-ply in Sudan contributed 87% of total energy supply since 1980s. The basic form of bio-mass comes mainly from firewood, charcoal and crop residues. Out of total fuel wood and charcoal supplies 92% was consumed in household sector with most of firewood consumption in the rural areas (Omer and Fadalla, 2003). Alternatively, energy sources can potentially help fulfil the acute energy demand and sustain economic growth in many regions of the world. Bioenergy is beginning to gain importance in the global fight to prevent climate change. The scope for exploiting organic waste as a source of energy is not limited to direct incineration or burning refuse-derived fuels. Biogas, bio-fuels and woody biomass are other forms of energy sources that can be derived from organic waste materials. These renewable energy sources have significant potential in the fight against climate change.
Therefore as a renewable energy source, biomass (especially fuelwood) seems inter-esting because its share of the total energy production at 87% is high and the tech-niques for converting it to useful energy are easy. On the other hand, biomass may, how-ever, see greatly expanded use in response to the environmental problems caused by fossil fuel use in the country. Agriculture is the backbone of economic and social devel-opment in Sudan. Biomass resources play a significant role in energy supply in Sudan as shown in Tables 1 and 2. Cooking is largely done with firewood 45% and charcoal 30% (Rossi et al., 1990). Hence, 75% of total energy per annum, representing roughly 3 million metric tons of forest reserves, and agricultural residues comes mainly from
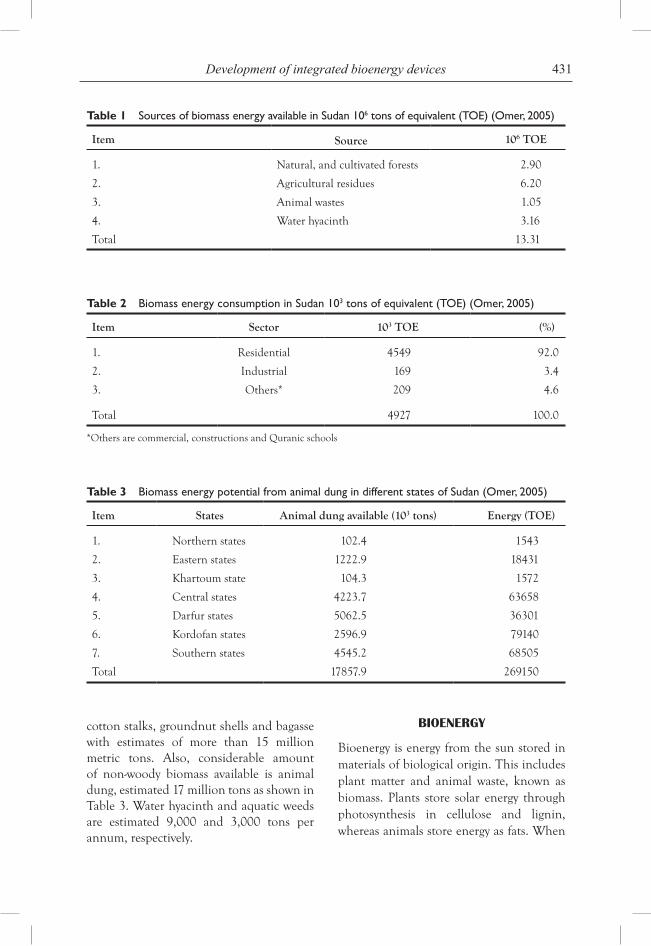
431Development of integrated bioenergy devices
cotton stalks, groundnut shells and bagasse with estimates of more than 15 million metric tons. Also, considerable amount of non-woody biomass available is animal dung, estimated 17 million tons as shown in Table 3. Water hyacinth and aquatic weeds are estimated 9,000 and 3,000 tons per annum, respectively.
BIOENERGY
Bioenergy is energy from the sun stored in materials of biological origin. This includes plant matter and animal waste, known as biomass. Plants store solar energy through photosynthesis in cellulose and lignin, whereas animals store energy as fats. When
Table 1 Sources of biomass energy available in Sudan 106 tons of equivalent (TOE) (Omer, 2005)
Item Source 106 TOE
1. Natural, and cultivated forests 2.90
2. Agricultural residues 6.20
3. Animal wastes 1.05
4. Water hyacinth 3.16
Total 13.31
Table 2 Biomass energy consumption in Sudan 103 tons of equivalent (TOE) (Omer, 2005)
Item Sector 103 TOE (%)
1. Residential 4549 92.0
2. Industrial 169 3.4
3. Others* 209 4.6
Total 4927 100.0
*Others are commercial, constructions and Quranic schools
Table 3 Biomass energy potential from animal dung in different states of Sudan (Omer, 2005)
Item States Animal dung available (103 tons) Energy (TOE)
1. Northern states 102.4 1543
2. Eastern states 1222.9 18431
3. Khartoum state 104.3 1572
4. Central states 4223.7 63658
5. Darfur states 5062.5 36301
6. Kordofan states 2596.9 79140
7. Southern states 4545.2 68505
Total 17857.9 269150
432 A.M. Omer
burned, these sugars break down and release energy exothermically, releasing carbon dioxide, heat and steam. The by-products of this reaction can be cap-tured and manipulated to create power, commonly called bioenergy. Biomass is considered renewable because the carbon is taken out of the atmosphere and replen-ished more quickly than the millions of years required for fossil fuels to form. The use of biofuels to replace fossil fuels con-tributes to a reduction in the overall release of carbon dioxide into the atmosphere and hence helps to tackle global warming. The range of waste treatment technologies that are tailored to produce bioenergy is grow-ing. There are a number of key areas of bioenergy from wastes including (but not limited to) biogas, biofuels and bioheat. When considering using bioenergy, it is important to take into account the overall emission of carbon in the process of elec-tricity production (NFA, 1994).
BIOMASS CHP
Combined heat and power (CHP) instal-lations are quite common in greenhouses, which grow high-energy, input crops (e.g., salad vegetables, pot plants, etc.). Scientific assumptions for a short-term energy strat-egy suggest that the most economically effi-cient way to replace the thermal plants is to modernise existing power plants to increase their energy efficiency and to improve their environmental performance. However, util-isation of wind power and the conversion of gas-fired CHP plants to biomass would significantly reduce Sudan’s dependence on imported fossil fuels. Although a lack of generating capacity is forecasted in the long-term, utilisation of the existing renewable energy potential and the huge possibilities for increasing energy efficiency are sufficient to meet future energy demands in Sudan in the short term.
A total shift towards a sustainable energy system is a complex and long process, but is one that can be achieved within a period of about 20 years. Implementation will require initial investment, long-term national strate-gies and action plans. However, the changes will have a number of benefits including: a more stable energy supply than at present and major improvement in the environ-mental performance of the energy sector, and certain social benefits. A vision used a methodology and calculations based on computer modelling that utilised:
• Data from existing governmentalprogrammes.
• Potential renewable energy sources andenergy efficiency improvements.
• Assumptionsforfutureeconomygrowth.
• Informationfromstudiesandsurveysonthe recent situation in the energy sector.
In addition to realising the economic potential identified by the National Energy Savings Programme, a long-term effort lead-ing to a 3% reduction in specific electricity demand per year after 2020 is proposed. This will require further improvements in building codes and continued information on energy efficiency.
The environmental NGOs in Sudan are urging the government to adopt sustainable development of the energy sector by:
• Diversifyingofprimaryenergysourcestoincrease the contribution of renewable and local energy resources in the total energy balance.
• Implementingmeasures for energy effi-ciency increase at the demand side and in the energy transformation sector.
The price of natural gas is set by a number of market and regulatory factors that include:
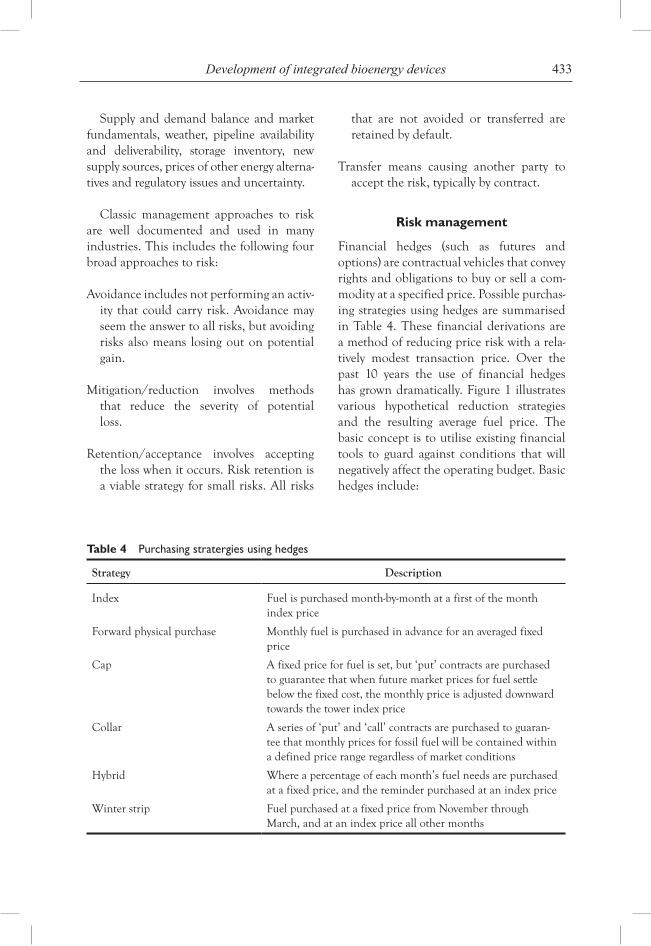
433Development of integrated bioenergy devices
Supply and demand balance and market fundamentals, weather, pipeline availability and deliverability, storage inventory, new supply sources, prices of other energy alterna-tives and regulatory issues and uncertainty.
Classic management approaches to risk are well documented and used in many industries. This includes the following four broad approaches to risk:
Avoidance includes not performing an activ-ity that could carry risk. Avoidance may seem the answer to all risks, but avoiding risks also means losing out on potential gain.
Mitigation/reduction involves methods that reduce the severity of potential loss.
Retention/acceptance involves accepting the loss when it occurs. Risk retention is a viable strategy for small risks. All risks
that are not avoided or transferred are retained by default.
Transfer means causing another party to accept the risk, typically by contract.
Risk management
Financial hedges (such as futures and options) are contractual vehicles that convey rights and obligations to buy or sell a com-modity at a specified price. Possible purchas-ing strategies using hedges are summarised in Table 4. These financial derivations are a method of reducing price risk with a rela-tively modest transaction price. Over the past 10 years the use of financial hedges has grown dramatically. Figure 1 illustrates various hypothetical reduction strategies and the resulting average fuel price. The basic concept is to utilise existing financial tools to guard against conditions that will negatively affect the operating budget. Basic hedges include:
Table 4 Purchasing stratergies using hedges
Strategy Description
Index Fuel is purchased month-by-month at a first of the month index price
Forward physical purchase Monthly fuel is purchased in advance for an averaged fixed price
Cap A fixed price for fuel is set, but ‘put’ contracts are purchased to guarantee that when future market prices for fuel settle below the fixed cost, the monthly price is adjusted downward towards the tower index price
Collar A series of ‘put’ and ‘call’ contracts are purchased to guaran-tee that monthly prices for fossil fuel will be contained within a defined price range regardless of market conditions
Hybrid Where a percentage of each month’s fuel needs are purchased at a fixed price, and the reminder purchased at an index price
Winter strip Fuel purchased at a fixed price from November through March, and at an index price all other months
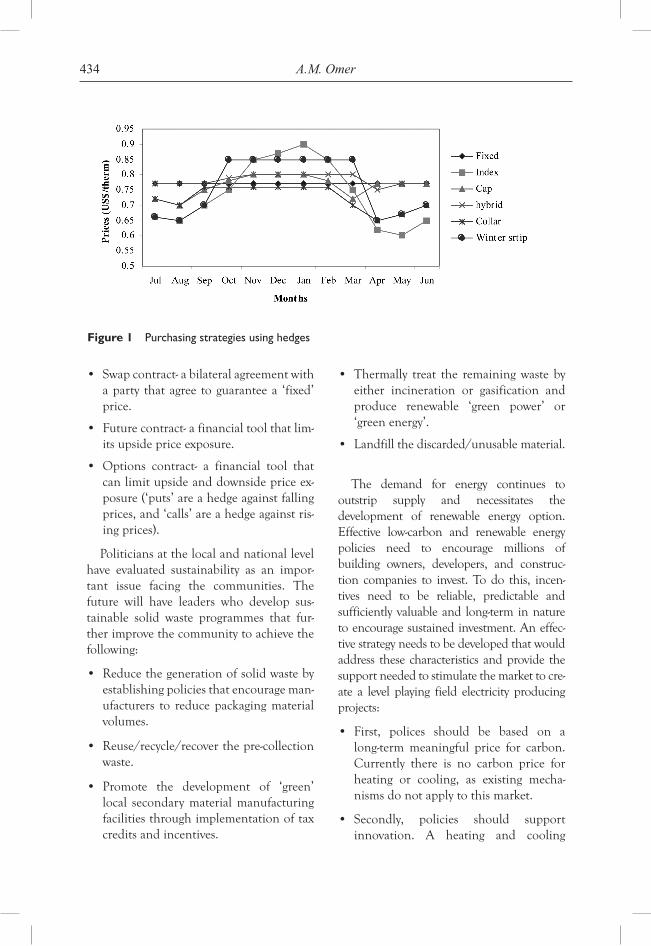
434 A.M. Omer
• Swapcontract-abilateralagreementwitha party that agree to guarantee a ‘fixed’ price.
• Futurecontract-afinancialtoolthatlim-its upside price exposure.
• Options contract- a financial tool thatcan limit upside and downside price ex-posure (‘puts’ are a hedge against falling prices, and ‘calls’ are a hedge against ris-ing prices).
Politicians at the local and national level have evaluated sustainability as an impor-tant issue facing the communities. The future will have leaders who develop sus-tainable solid waste programmes that fur-ther improve the community to achieve the following:
• Reducethegenerationofsolidwastebyestablishing policies that encourage man-ufacturers to reduce packaging material volumes.
• Reuse/recycle/recoverthepre-collectionwaste.
• Promote the development of ‘green’local secondary material manufacturing facilities through implementation of tax credits and incentives.
• Thermally treat the remainingwastebyeither incineration or gasification and produce renewable ‘green power’ or ‘green energy’.
• Landfillthediscarded/unusablematerial.
The demand for energy continues to outstrip supply and necessitates the development of renewable energy option. Effective low-carbon and renewable energy policies need to encourage millions of building owners, developers, and construc-tion companies to invest. To do this, incen-tives need to be reliable, predictable and sufficiently valuable and long-term in nature to encourage sustained investment. An effec-tive strategy needs to be developed that would address these characteristics and provide the support needed to stimulate the market to cre-ate a level playing field electricity producing projects:
• First, polices should be based on along-term meaningful price for carbon. Currently there is no carbon price for heating or cooling, as existing mecha-nisms do not apply to this market.
• Secondly, policies should supportinnovation. A heating and cooling
Figure 1 Purchasing strategies using hedges
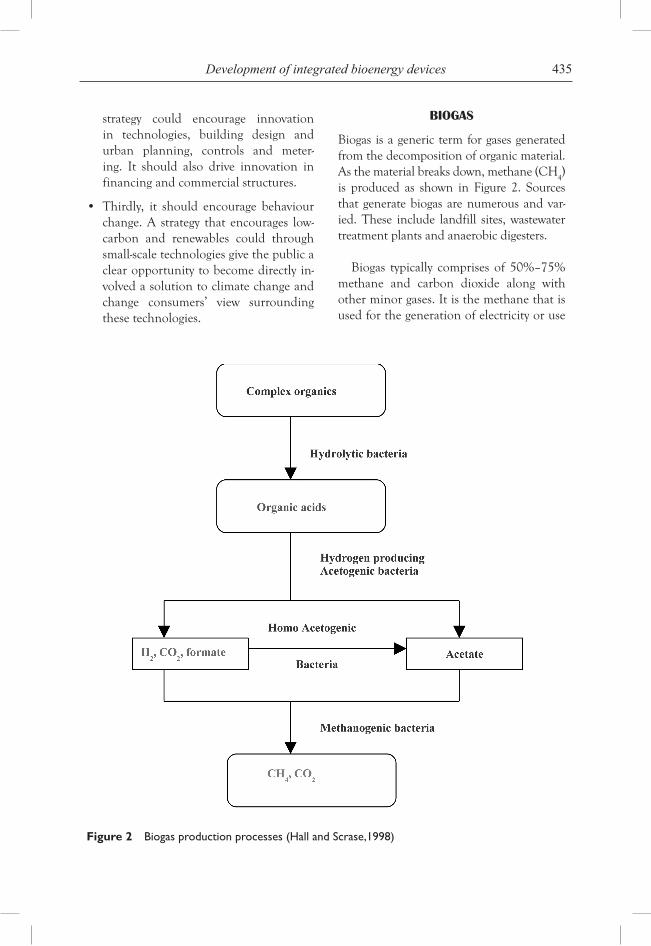
435Development of integrated bioenergy devices
strategy could encourage innovation in technologies, building design and urban planning, controls and meter-ing. It should also drive innovation in financing and commercial structures.
• Thirdly, it should encourage behaviourchange. A strategy that encourages low-carbon and renewables could through small-scale technologies give the public a clear opportunity to become directly in-volved a solution to climate change and change consumers’ view surrounding these technologies.
BIOGAS
Biogas is a generic term for gases generated from the decomposition of organic material. As the material breaks down, methane (CH
4)
is produced as shown in Figure 2. Sources that generate biogas are numerous and var-ied. These include landfill sites, wastewater treatment plants and anaerobic digesters.
Biogas typically comprises of 50%–75% methane and carbon dioxide along with other minor gases. It is the methane that is used for the generation of electricity or use
Figure 2 Biogas production processes (Hall and Scrase,1998)
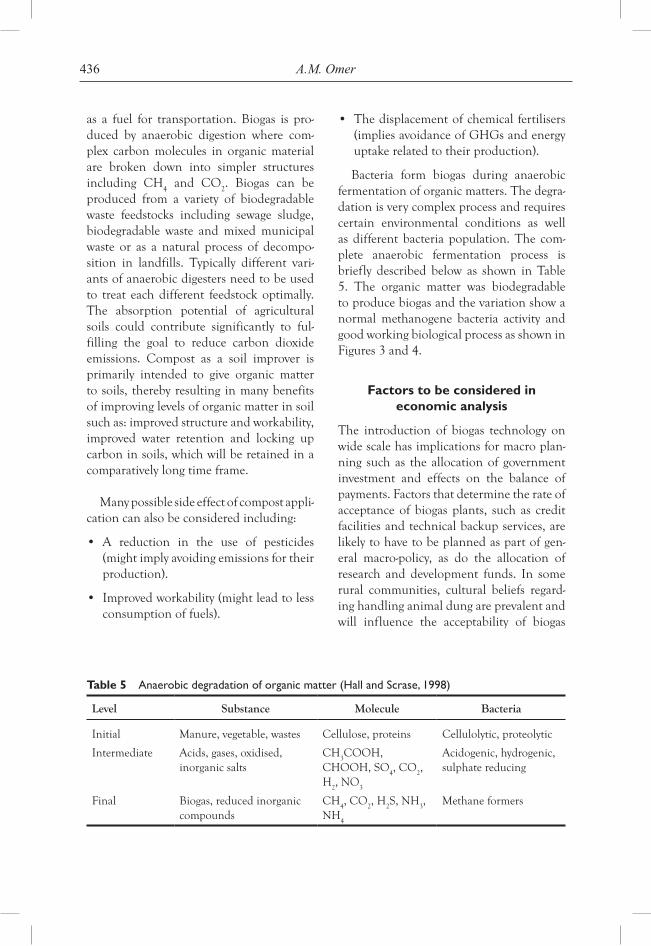
436 A.M. Omer
as a fuel for transportation. Biogas is pro-duced by anaerobic digestion where com-plex carbon molecules in organic material are broken down into simpler structures including CH
4 and CO
2. Biogas can be
produced from a variety of biodegradable waste feedstocks including sewage sludge, biodegradable waste and mixed municipal waste or as a natural process of decompo-sition in landfills. Typically different vari-ants of anaerobic digesters need to be used to treat each different feedstock optimally. The absorption potential of agricultural soils could contribute significantly to ful-filling the goal to reduce carbon dioxide emissions. Compost as a soil improver is primarily intended to give organic matter to soils, thereby resulting in many benefits of improving levels of organic matter in soil such as: improved structure and workability, improved water retention and locking up carbon in soils, which will be retained in a comparatively long time frame.
Many possible side effect of compost appli-cation can also be considered including:
• A reduction in the use of pesticides(might imply avoiding emissions for their production).
• Improvedworkability(mightleadtolessconsumption of fuels).
• Thedisplacementofchemicalfertilisers(implies avoidance of GHGs and energy uptake related to their production).
Bacteria form biogas during anaerobic fermentation of organic matters. The degra-dation is very complex process and requires certain environmental conditions as well as different bacteria population. The com-plete anaerobic fermentation process is briefly described below as shown in Table 5. The organic matter was biodegradable to produce biogas and the variation show a normal methanogene bacteria activity and good working biological process as shown in Figures 3 and 4.
Factors to be considered in economic analysis
The introduction of biogas technology on wide scale has implications for macro plan-ning such as the allocation of government investment and effects on the balance of payments. Factors that determine the rate of acceptance of biogas plants, such as credit facilities and technical backup services, are likely to have to be planned as part of gen-eral macro-policy, as do the allocation of research and development funds. In some rural communities, cultural beliefs regard-ing handling animal dung are prevalent and will influence the acceptability of biogas
Table 5 Anaerobic degradation of organic matter (Hall and Scrase, 1998)
Level Substance Molecule Bacteria
Initial Manure, vegetable, wastes Cellulose, proteins Cellulolytic, proteolytic
Intermediate Acids, gases, oxidised, inorganic salts
CH3COOH,
CHOOH, SO4, CO
2,
H2, NO
3
Acidogenic, hydrogenic, sulphate reducing
Final Biogas, reduced inorganic compounds
CH4, CO
2, H
2S, NH
3,
NH4
Methane formers
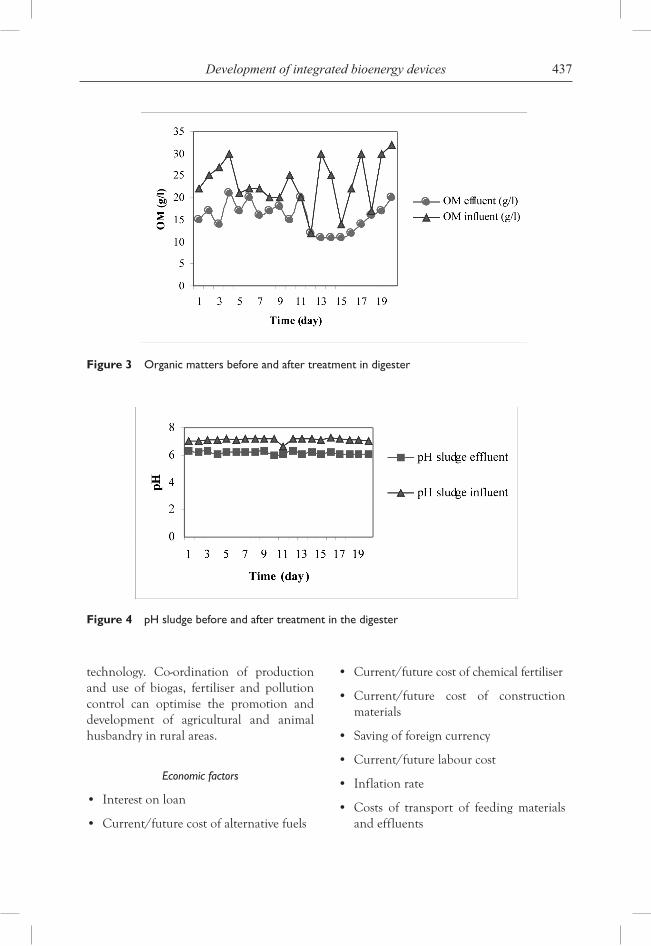
437Development of integrated bioenergy devices
technology. Co-ordination of production and use of biogas, fertiliser and pollution control can optimise the promotion and development of agricultural and animal husbandry in rural areas.
Economic factors
• Interestonloan
• Current/futurecostofalternativefuels
• Current/futurecostofchemicalfertiliser
• Current/future cost of constructionmaterials
• Savingofforeigncurrency
• Current/futurelabourcost
• Inflationrate
• Costs of transport of feedingmaterialsand effluents
Figure 3 Organic matters before and after treatment in digester
Figure 4 pH sludge before and after treatment in the digester
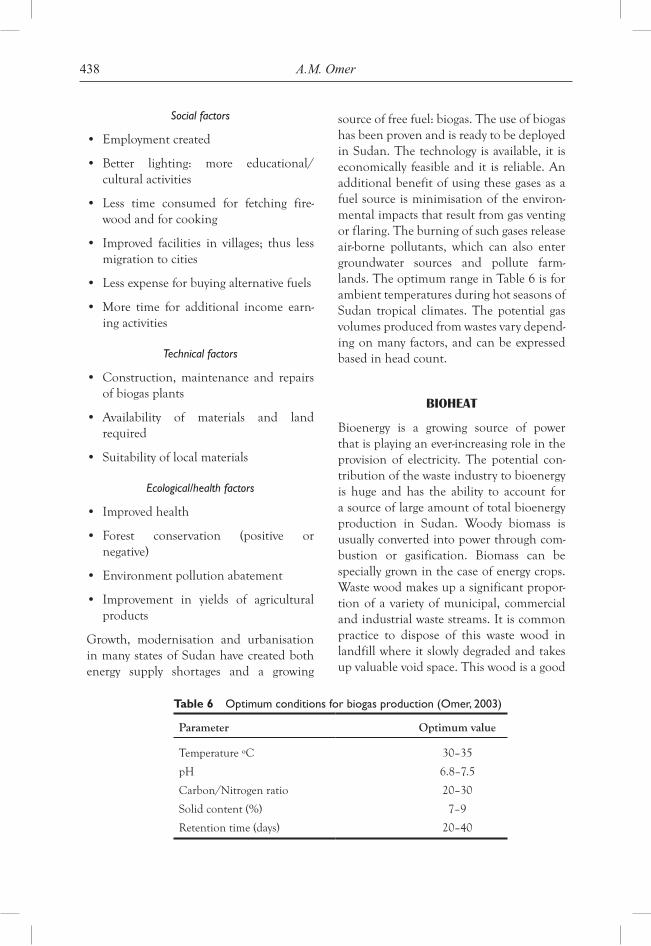
438 A.M. Omer
Social factors
• Employmentcreated
• Better lighting: more educational/ cultural activities
• Less time consumed for fetching fire-wood and for cooking
• Improved facilities in villages; thus lessmigration to cities
• Lessexpenseforbuyingalternativefuels
• More time for additional income earn-ing activities
Technical factors
• Construction,maintenance and repairsof biogas plants
• Availability of materials and landrequired
• Suitabilityoflocalmaterials
Ecological/health factors
• Improvedhealth
• Forest conservation (positive ornegative)
• Environmentpollutionabatement
• Improvement in yields of agriculturalproducts
Growth, modernisation and urbanisation in many states of Sudan have created both energy supply shortages and a growing
source of free fuel: biogas. The use of biogas has been proven and is ready to be deployed in Sudan. The technology is available, it is economically feasible and it is reliable. An additional benefit of using these gases as a fuel source is minimisation of the environ-mental impacts that result from gas venting or flaring. The burning of such gases release air-borne pollutants, which can also enter groundwater sources and pollute farm-lands. The optimum range in Table 6 is for ambient temperatures during hot seasons of Sudan tropical climates. The potential gas volumes produced from wastes vary depend-ing on many factors, and can be expressed based in head count.
BIOHEAT
Bioenergy is a growing source of power that is playing an ever-increasing role in the provision of electricity. The potential con-tribution of the waste industry to bioenergy is huge and has the ability to account for a source of large amount of total bioenergy production in Sudan. Woody biomass is usually converted into power through com-bustion or gasification. Biomass can be specially grown in the case of energy crops. Waste wood makes up a significant propor-tion of a variety of municipal, commercial and industrial waste streams. It is common practice to dispose of this waste wood in landfill where it slowly degraded and takes up valuable void space. This wood is a good
Table 6 Optimum conditions for biogas production (Omer, 2003)
Parameter Optimum value
Temperature ºC 30–35
pH 6.8–7.5
Carbon/Nitrogen ratio 20–30
Solid content (%) 7–9
Retention time (days) 20–40
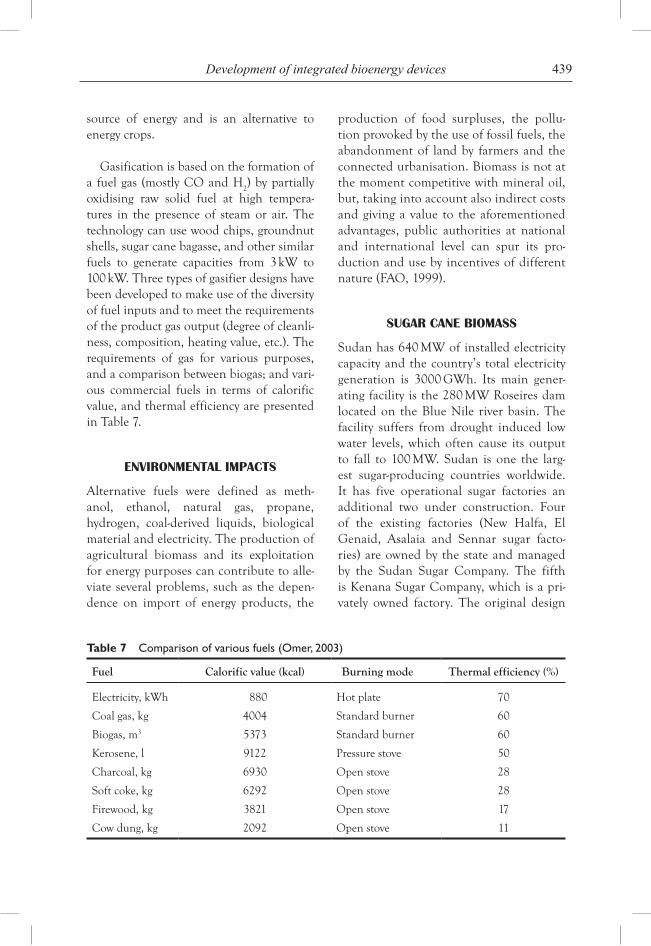
439Development of integrated bioenergy devices
source of energy and is an alternative to energy crops.
Gasification is based on the formation of a fuel gas (mostly CO and H
2) by partially
oxidising raw solid fuel at high tempera-tures in the presence of steam or air. The technology can use wood chips, groundnut shells, sugar cane bagasse, and other similar fuels to generate capacities from 3 kW to 100 kW. Three types of gasifier designs have been developed to make use of the diversity of fuel inputs and to meet the requirements of the product gas output (degree of cleanli-ness, composition, heating value, etc.). The requirements of gas for various purposes, and a comparison between biogas; and vari-ous commercial fuels in terms of calorific value, and thermal efficiency are presented in Table 7.
ENVIRONMENTAL IMPACTS
Alternative fuels were defined as meth-anol, ethanol, natural gas, propane, hydrogen, coal-derived liquids, biological material and electricity. The production of agricultural biomass and its exploitation for energy purposes can contribute to alle-viate several problems, such as the depen-dence on import of energy products, the
production of food surpluses, the pollu-tion provoked by the use of fossil fuels, the abandonment of land by farmers and the connected urbanisation. Biomass is not at the moment competitive with mineral oil, but, taking into account also indirect costs and giving a value to the aforementioned advantages, public authorities at national and international level can spur its pro-duction and use by incentives of different nature (FAO, 1999).
SUGAR CANE BIOMASS
Sudan has 640 MW of installed electricity capacity and the country’s total electricity generation is 3000 GWh. Its main gener-ating facility is the 280 MW Roseires dam located on the Blue Nile river basin. The facility suffers from drought induced low water levels, which often cause its output to fall to 100 MW. Sudan is one the larg-est sugar-producing countries worldwide. It has five operational sugar factories an additional two under construction. Four of the existing factories (New Halfa, El Genaid, Asalaia and Sennar sugar facto-ries) are owned by the state and managed by the Sudan Sugar Company. The fifth is Kenana Sugar Company, which is a pri-vately owned factory. The original design
Table 7 Comparison of various fuels (Omer, 2003)
Fuel Calorific value (kcal) Burning mode Thermal efficiency (%)
Electricity, kWh 880 Hot plate 70
Coal gas, kg 4004 Standard burner 60
Biogas, m3 5373 Standard burner 60
Kerosene, l 9122 Pressure stove 50
Charcoal, kg 6930 Open stove 28
Soft coke, kg 6292 Open stove 28
Firewood, kg 3821 Open stove 17
Cow dung, kg 2092 Open stove 11
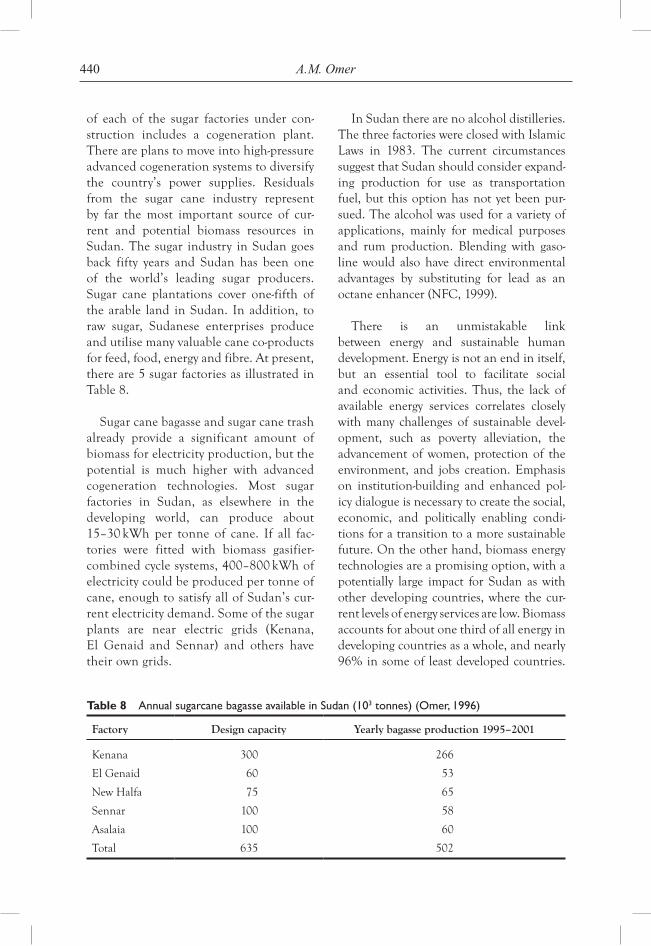
440 A.M. Omer
of each of the sugar factories under con-struction includes a cogeneration plant. There are plans to move into high-pressure advanced cogeneration systems to diversify the country’s power supplies. Residuals from the sugar cane industry represent by far the most important source of cur-rent and potential biomass resources in Sudan. The sugar industry in Sudan goes back fifty years and Sudan has been one of the world’s leading sugar producers. Sugar cane plantations cover one-fifth of the arable land in Sudan. In addition, to raw sugar, Sudanese enterprises produce and utilise many valuable cane co-products for feed, food, energy and fibre. At present, there are 5 sugar factories as illustrated in Table 8.
Sugar cane bagasse and sugar cane trash already provide a significant amount of biomass for electricity production, but the potential is much higher with advanced cogeneration technologies. Most sugar factories in Sudan, as elsewhere in the developing world, can produce about 15–30 kWh per tonne of cane. If all fac-tories were fitted with biomass gasifier-combined cycle systems, 400–800 kWh of electricity could be produced per tonne of cane, enough to satisfy all of Sudan’s cur-rent electricity demand. Some of the sugar plants are near electric grids (Kenana, El Genaid and Sennar) and others have their own grids.
In Sudan there are no alcohol distilleries. The three factories were closed with Islamic Laws in 1983. The current circumstances suggest that Sudan should consider expand-ing production for use as transportation fuel, but this option has not yet been pur-sued. The alcohol was used for a variety of applications, mainly for medical purposes and rum production. Blending with gaso-line would also have direct environmental advantages by substituting for lead as an octane enhancer (NFC, 1999).
There is an unmistakable link between energy and sustainable human development. Energy is not an end in itself, but an essential tool to facilitate social and economic activities. Thus, the lack of available energy services correlates closely with many challenges of sustainable devel-opment, such as poverty alleviation, the advancement of women, protection of the environment, and jobs creation. Emphasis on institution-building and enhanced pol-icy dialogue is necessary to create the social, economic, and politically enabling condi-tions for a transition to a more sustainable future. On the other hand, biomass energy technologies are a promising option, with a potentially large impact for Sudan as with other developing countries, where the cur-rent levels of energy services are low. Biomass accounts for about one third of all energy in developing countries as a whole, and nearly 96% in some of least developed countries.
Table 8 Annual sugarcane bagasse available in Sudan (103 tonnes) (Omer, 1996)
Factory Design capacity Yearly bagasse production 1995–2001
Kenana 300 266
El Genaid 60 53
New Halfa 75 65
Sennar 100 58
Asalaia 100 60
Total 635 502
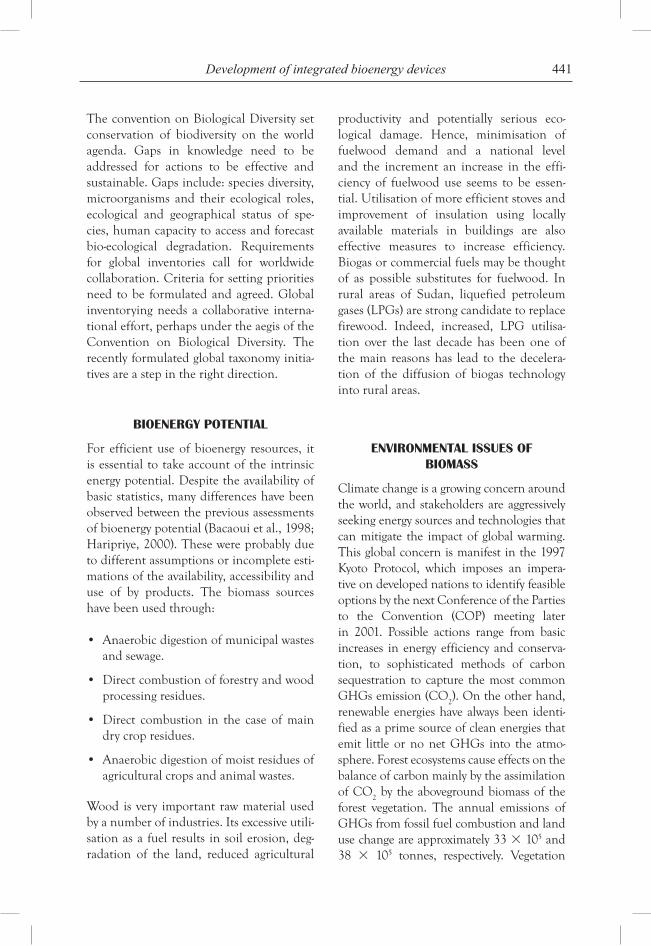
441Development of integrated bioenergy devices
The convention on Biological Diversity set conservation of biodiversity on the world agenda. Gaps in knowledge need to be addressed for actions to be effective and sustainable. Gaps include: species diversity, microorganisms and their ecological roles, ecological and geographical status of spe-cies, human capacity to access and forecast bio-ecological degradation. Requirements for global inventories call for worldwide collaboration. Criteria for setting priorities need to be formulated and agreed. Global inventorying needs a collaborative interna-tional effort, perhaps under the aegis of the Convention on Biological Diversity. The recently formulated global taxonomy initia-tives are a step in the right direction.
BIOENERGY POTENTIAL
For efficient use of bioenergy resources, it is essential to take account of the intrinsic energy potential. Despite the availability of basic statistics, many differences have been observed between the previous assessments of bioenergy potential (Bacaoui et al., 1998; Haripriye, 2000). These were probably due to different assumptions or incomplete esti-mations of the availability, accessibility and use of by products. The biomass sources have been used through:
• Anaerobicdigestionofmunicipalwastesand sewage.
• Directcombustionofforestryandwoodprocessing residues.
• Direct combustion in the case ofmaindry crop residues.
• Anaerobicdigestionofmoistresiduesofagricultural crops and animal wastes.
Wood is very important raw material used by a number of industries. Its excessive utili-sation as a fuel results in soil erosion, deg-radation of the land, reduced agricultural
productivity and potentially serious eco-logical damage. Hence, minimisation of fuelwood demand and a national level and the increment an increase in the effi-ciency of fuelwood use seems to be essen-tial. Utilisation of more efficient stoves and improvement of insulation using locally available materials in buildings are also effective measures to increase efficiency. Biogas or commercial fuels may be thought of as possible substitutes for fuelwood. In rural areas of Sudan, liquefied petroleum gases (LPGs) are strong candidate to replace firewood. Indeed, increased, LPG utilisa-tion over the last decade has been one of the main reasons has lead to the decelera-tion of the diffusion of biogas technology into rural areas.
ENVIRONMENTAL ISSUES OF BIOMASS
Climate change is a growing concern around the world, and stakeholders are aggressively seeking energy sources and technologies that can mitigate the impact of global warming. This global concern is manifest in the 1997 Kyoto Protocol, which imposes an impera-tive on developed nations to identify feasible options by the next Conference of the Parties to the Convention (COP) meeting later in 2001. Possible actions range from basic increases in energy efficiency and conserva-tion, to sophisticated methods of carbon sequestration to capture the most common GHGs emission (CO
2). On the other hand,
renewable energies have always been identi-fied as a prime source of clean energies that emit little or no net GHGs into the atmo-sphere. Forest ecosystems cause effects on the balance of carbon mainly by the assimilation of CO
2 by the aboveground biomass of the
forest vegetation. The annual emissions of GHGs from fossil fuel combustion and land use change are approximately 33 105 and 38 105 tonnes, respectively. Vegetation
442 A.M. Omer
and in particular forests, can be managed to sequester carbon. Management options have been identified to conserve and seques-ter up to 90 Pg C in the forest sector in the next century, through global afforestation (WB, 1990; BOS, 2003). This option may become a necessity (as recommended at the Framework Convention on Climate Change meeting held in Kyoto), but a preventative approach could be taken, reducing total GHGs emissions by substituting biomass for fossil fuels in electricity production.
Simply sequestering carbon in new for-ests is problematic because trees cease sequestering once they reach maturity, and as available land is used up the cost of fur-ther afforestation will grow. Indeed the cost of reducing the build-up of GHGs in the atmosphere is already lower for fossil fuel substitution than for sequestration, since fast growing energy crops are more efficient at carbon removal, and because revenue is generated by the scale of electricity. Some biomass fuel cycles can also provide the additional benefits of enhanced carbon stor-age. The relative merits of sequestration ver-sus fossil fuel substitution are still debated. The flow of carbon during the life cycle of the biomass should determine whether it is better left standing, used as fuel or used as long-lived timber products. Where there are existing forests in good condition there is general agreement that they should not be cut for fuel and replanted. This principle also concurs with the guidelines for nature protection, i.e., energy crops should never displace land uses of high ecological value. Where afforestation is undertaken, how-ever, fossil fuel substitution, both by using wood fuel and using timber as a renewable raw material, should be more sustainable and less costly approach than sequestration could also be used to displace the harvest of more ecologically valuable forests.
BIOMASS AND SUSTAINABILITY
There is an unmistakable link between energy and sustainable human develop-ment. Energy is not an end in itself, but an essential tool to facilitate social and eco-nomic activities. Thus, the lack of available energy services correlates closely with many challenges of sustainable development, such as poverty alleviation, the advancement of women, protection of the environment and jobs creation. Emphasis on institution-building and enhanced policy dialogue is necessary to create the social, economic, and politically enabling conditions for a transition to a more sustainable future. On the other hand, biomass energy technolo-gies are a promising option, with a poten-tially large impact for Sudan as with other developing countries, where the current levels of energy services are low. Biomass accounts for about one third of all energy in developing countries as a whole, and nearly 96% in some of least developed countries (WB, 1990; BOS, 2003).
The convention on biological diversity set conservation of biodiversity on the world agenda. Gaps in knowledge need to be addressed for actions to be effective and sustainable. Gaps include: species diversity, microorganisms and their ecological roles, ecological and geographical status of spe-cies, human capacity to access and forecast bio-ecological degradation. Requirements for global inventories call for worldwide collaboration. Criteria for setting priorities need to be formulated and agreed. Global inventorying needs a collaborative interna-tional effort, perhaps under the aegis of the Convention on Biological Diversity. The recently formulated global taxonomy initia-tives are a step in the right direction.
The debate over an international climate change regime has thus far focused primarily
443Development of integrated bioenergy devices
on efficiency concerns in developed coun-tries. In the international negotiations over the control of climate change, the develop-ing countries so far have assumed few obli-gations. At present, this debate has not pro-gressed very far. There are several reasons for this impasse. First, there is a distinction between cost effectiveness (where in the world should the control be undertaken in order to minimise the global costs of con-trol) and equity (who should bear the costs of mitigation and abatement resulting from climate change) that has not been adequately clarified and agreed upon by the parties to the Protocol. Second, the global control or anthropogenic climate change will require complex cooperative efforts among a large number of individual nations. This coop-erative effort will have to be based on a thorough understanding of how the various participating nations contribute to the pro-cess of global climate change, and how that process affects them. One of the fundamen-tal principles of environmental policy is that the polluter pays for using the environment and the use of natural resources. This is one way of imposing responsibility for environ-mental consequences on the party causing the environmental damage. In the context of environmental taxes, it is the polluter who pays, which is one reason why taxes are so suitable as an instrument for environ-mental policy. With respect to the causes of global warming, and the obligations, which were adopted at the Kyoto Conference, it is useful to examine the possible role of such economic instruments.
DISCUSSIONS
This article envisages the ways of integrated development of CHP sector in Sudan. However, the assumptions and objectives seem to be applicable to other developing countries having plenty of agricultural,
forest and animal resources. The process of biomass power generation would certainly reduce dependence on imported fossil fuel and provides a clear indication in reducing the GHG emissions in the environment and it could claim carbon credit more effec-tively. Most of the heat is produced by large CHP plants (gas-fired combined cycle plants using natural gas, biomass, waste or biogas). DH is energy efficient because of the way the heat is produced and the required tempera-ture level is an important factor. Buildings can be heated to temperature of 21oC and domestic hot water (DHW) can be supplied with a temperature of 55oC using energy sources that are most efficient when produc-ing low temperature levels (<95oC) for the DH water. Most of these heat sources are CO
2 neutral or emit low levels. Only a few
of these sources are available to small indi-vidual systems at a reasonably cost, whereas DH schemes because of the plant’s size and location can have access to most of the heat sources and at a low cost. Low temperature DH, with return temperatures of around 30o–40oC can utilise the following heat sources:
• EfficientuseofCHPbyextractingheatat low calorific value (CV).
• Efficientuseofbiomassorgasboilersbycondensing heat in economisers.
• Efficient utilisation of geothermalenergy.
• Directutilisationofexcesslowtempera-ture heat from industrial processes.
• Efficientuseof large-scale solarheatingplants.
Heat tariffs may include a number of com-ponents such as: a connection charge, a fixed charge and a variable energy charge. Also, consumers may be incentivised to lower the return temperature. Hence, it is difficult to
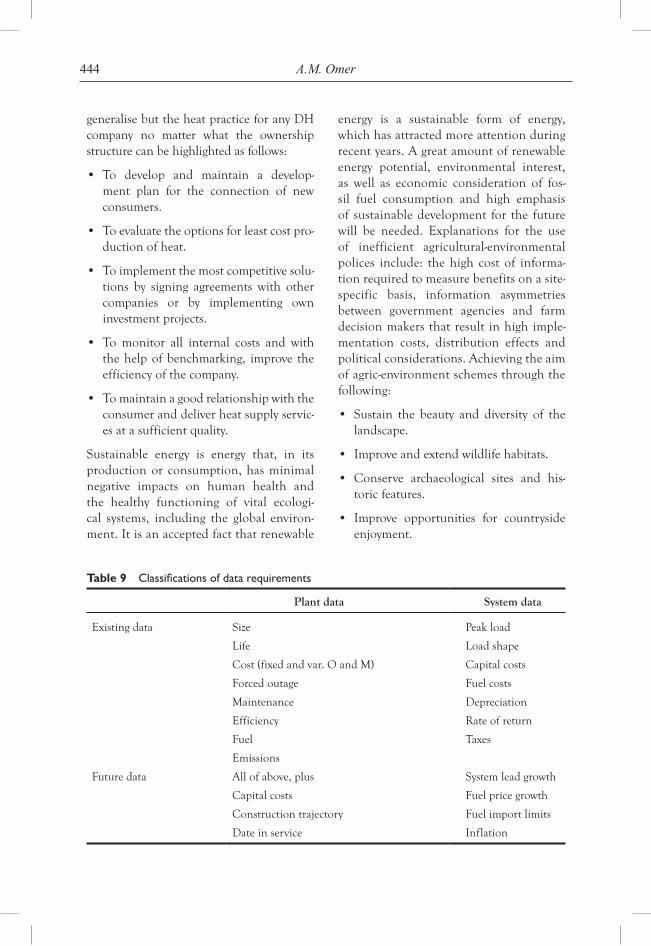
444 A.M. Omer
generalise but the heat practice for any DH company no matter what the ownership structure can be highlighted as follows:
• To develop and maintain a develop-ment plan for the connection of new consumers.
• Toevaluatetheoptionsforleastcostpro-duction of heat.
• Toimplementthemostcompetitivesolu-tions by signing agreements with other companies or by implementing own investment projects.
• Tomonitor all internal costs and withthe help of benchmarking, improve the efficiency of the company.
• Tomaintainagoodrelationshipwiththeconsumer and deliver heat supply servic-es at a sufficient quality.
Sustainable energy is energy that, in its production or consumption, has minimal negative impacts on human health and the healthy functioning of vital ecologi-cal systems, including the global environ-ment. It is an accepted fact that renewable
energy is a sustainable form of energy, which has attracted more attention during recent years. A great amount of renewable energy potential, environmental interest, as well as economic consideration of fos-sil fuel consumption and high emphasis of sustainable development for the future will be needed. Explanations for the use of inefficient agricultural-environmental polices include: the high cost of informa-tion required to measure benefits on a site-specific basis, information asymmetries between government agencies and farm decision makers that result in high imple-mentation costs, distribution effects and political considerations. Achieving the aim of agric-environment schemes through the following:
• Sustain the beauty and diversity of thelandscape.
• Improveandextendwildlifehabitats.
• Conserve archaeological sites and his-toric features.
• Improve opportunities for countrysideenjoyment.
Table 9 Classifications of data requirements
Plant data System data
Existing data Size Peak load
Life Load shape
Cost (fixed and var. O and M) Capital costs
Forced outage Fuel costs
Maintenance Depreciation
Efficiency Rate of return
Fuel Taxes
Emissions
Future data All of above, plus System lead growth
Capital costs Fuel price growth
Construction trajectory Fuel import limits
Date in service Inflation
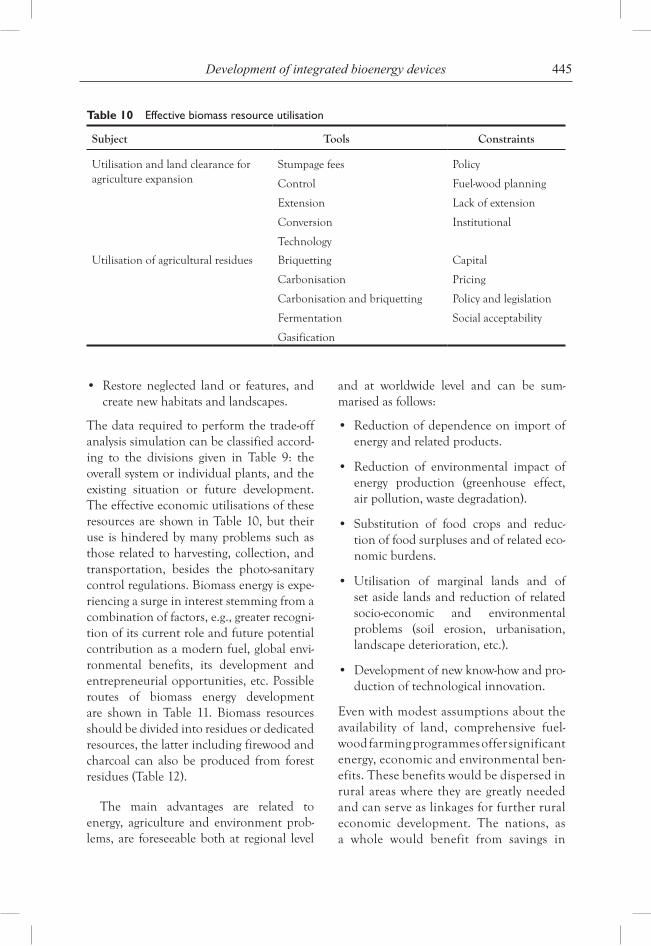
445Development of integrated bioenergy devices
Table 10 Effective biomass resource utilisation
Subject Tools Constraints
Utilisation and land clearance for agriculture expansion
Stumpage fees
Control
Extension
Conversion
Technology
Policy
Fuel-wood planning
Lack of extension
Institutional
Utilisation of agricultural residues Briquetting
Carbonisation
Carbonisation and briquetting
Fermentation
Gasification
Capital
Pricing
Policy and legislation
Social acceptability
• Restoreneglected landor features, andcreate new habitats and landscapes.
The data required to perform the trade-off analysis simulation can be classified accord-ing to the divisions given in Table 9: the overall system or individual plants, and the existing situation or future development. The effective economic utilisations of these resources are shown in Table 10, but their use is hindered by many problems such as those related to harvesting, collection, and transportation, besides the photo-sanitary control regulations. Biomass energy is expe-riencing a surge in interest stemming from a combination of factors, e.g., greater recogni-tion of its current role and future potential contribution as a modern fuel, global envi-ronmental benefits, its development and entrepreneurial opportunities, etc. Possible routes of biomass energy development are shown in Table 11. Biomass resources should be divided into residues or dedicated resources, the latter including firewood and charcoal can also be produced from forest residues (Table 12).
The main advantages are related to energy, agriculture and environment prob-lems, are foreseeable both at regional level
and at worldwide level and can be sum-marised as follows:
• Reductionofdependenceonimportofenergy and related products.
• Reduction of environmental impact ofenergy production (greenhouse effect, air pollution, waste degradation).
• Substitution of food crops and reduc-tion of food surpluses and of related eco-nomic burdens.
• Utilisation of marginal lands and ofset aside lands and reduction of related socio-economic and environmental problems (soil erosion, urbanisation, landscape deterioration, etc.).
• Developmentofnewknow-howandpro-duction of technological innovation.
Even with modest assumptions about the availability of land, comprehensive fuel-wood farming programmes offer significant energy, economic and environmental ben-efits. These benefits would be dispersed in rural areas where they are greatly needed and can serve as linkages for further rural economic development. The nations, as a whole would benefit from savings in
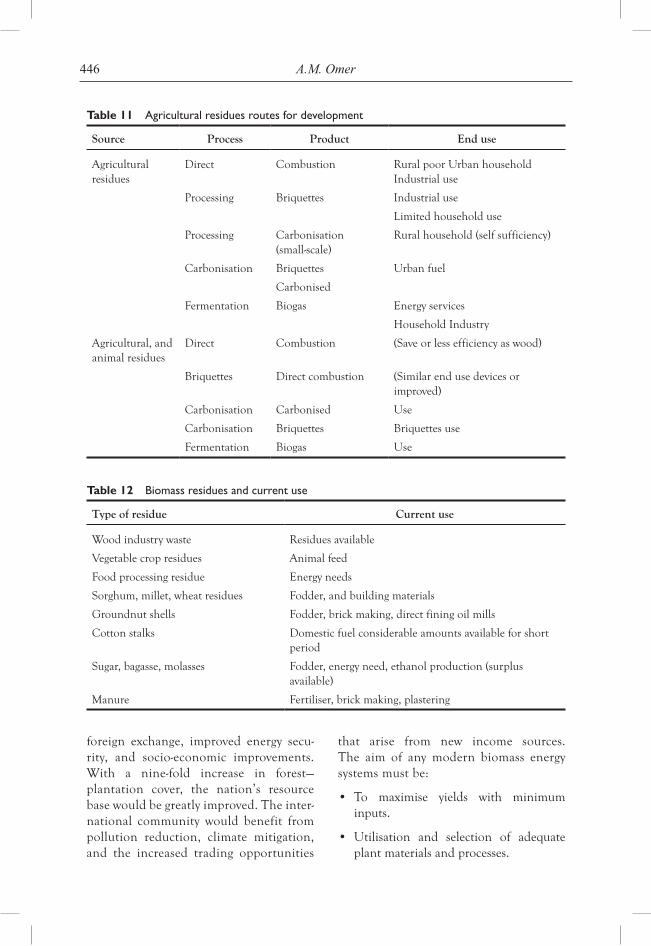
446 A.M. Omer
Table 11 Agricultural residues routes for development
Source Process Product End use
Agricultural residues
Direct Combustion Rural poor Urban household Industrial use
Processing Briquettes Industrial use
Limited household use
Processing Carbonisation (small-scale)
Rural household (self sufficiency)
Carbonisation Briquettes Urban fuel
Carbonised
Fermentation Biogas Energy services
Household Industry
Agricultural, and animal residues
Direct Combustion (Save or less efficiency as wood)
Briquettes Direct combustion (Similar end use devices or improved)
Carbonisation Carbonised Use
Carbonisation Briquettes Briquettes use
Fermentation Biogas Use
Table 12 Biomass residues and current use
Type of residue Current use
Wood industry waste Residues available
Vegetable crop residues Animal feed
Food processing residue Energy needs
Sorghum, millet, wheat residues Fodder, and building materials
Groundnut shells Fodder, brick making, direct fining oil mills
Cotton stalks Domestic fuel considerable amounts available for short period
Sugar, bagasse, molasses Fodder, energy need, ethanol production (surplus available)
Manure Fertiliser, brick making, plastering
foreign exchange, improved energy secu-rity, and socio-economic improvements. With a nine-fold increase in forest— plantation cover, the nation’s resource base would be greatly improved. The inter-national community would benefit from pollution reduction, climate mitigation, and the increased trading opportunities
that arise from new income sources. The aim of any modern biomass energy systems must be:
• To maximise yields with minimuminputs.
• Utilisation and selection of adequateplant materials and processes.
447Development of integrated bioenergy devices
• Optimum use of land, water, andfertiliser.
• Create an adequate infrastructure andstrong R and D base.
Furthermore, investigating the potential to make use of more and more of its waste. Household waste, vegetable market waste, and waste from the cotton stalks, leather, and pulp; and paper industries can be used to produce useful energy either by direct incineration, gasification, diges-tion (biogas production), fermentation, or cogeneration. Therefore, effort has to be made to reduce fossil energy use and to promote green energies, particularly in the building sector. Energy use reduc-tions can be achieved by minimising the energy demand, by rational energy use, by recovering heat and the use of more green energies. This study was a step towards achieving that goal. The adoption of green or sustainable approaches to the way in which society is run is seen as an important strategy in finding a solution to the energy problem. The key factors to reducing and controlling CO
2, which is the major con-
tributor to global warming, are the use of alternative approaches to energy genera-tion and the exploration of how these alter-natives are used today and may be used in the future as green energy sources. Even with modest assumptions about the avail-ability of land, comprehensive fuel-wood farming programmes offer significant energy, economic and environmental ben-efits. These benefits would be dispersed in rural areas where they are greatly needed and can serve as linkages for further rural economic development. The nations as a whole would benefit from savings in foreign exchange, improved energy secu-rity, and socio-economic improvements. With a nine-fold increase in forest – planta-tion cover, a nation’s resource base would be greatly improved. The international community would benefit from pollution
reduction, climate mitigation, and the increased trading opportunities that arise from new income sources.
There is a huge availability of biomass energy resources in Sudan. These resources are scatterly distributed all over the coun-try. In western Sudan, there are briquetting of groundnut shells plants in operation at Nyala and El Obeid. In central Sudan, briquetting plants of cotton stalk installed at Wad El Shafie. In southern Sudan, bio-gas plants in operation using water hya-cinth. Sugarcane bagasse and sugarcane trash already provide a significant amount of biomass for electricity generation. It is known that sugarcane is a perennial crop and sugarcane bagasse available in a particu-lar period of the year. The bagasse-gasifier plants in Kenana are used as standby or at the peak times or if there is any problem in main grid.
CONCLUSION
Sudan is an agricultural country with fertile land, plenty of water resources, livestock, forestry resources, and agricultural residues. Sudan energy showed the domination of biomass more than 80% and the household sector consumed more than 70% of the total biomass. Thus the Sudanese energy institu-tions adopted a strategy focusing on the promotion of conservation measures and introduction of alternative techniques such as direct briquetting and charring oil avail-able agricultural residues and aquatic weeds. Water hyacinth (Eichhornia crassipes solms) is a free-floating aquatic plant, which causes much trouble for navigation in Sudan par-ticularly along White Nile from Kosti up to Malakal (200,000 tons of wet water hyacinth annually). The water hyacinth as a wet sub-strate represents a promising candidate for biogas production by an aerobic fermentation and has been practiced since mid seventies in Sudan. In Sudan, there are currently over
448 A.M. Omer
200 installed biogas units and in operation, covering a wide range of scales appropriate to family, community, or industrial uses for cooking, water pumping and electricity gen-eration. The agricultural residues and animal wastes are the main sources of feedstock for larger-scale biogas plants. The production energy from agricultural biomass seems a realistic option for the future. Some solu-tions are technically feasible in short term. In some cases environmental, social and politic considerations justify their immediate exploi-tation even if economic evaluations of merely direct production costs do not justify at the moment the investments necessary. Biomass is a renewable energy source, which can be con-verted into liquid fuels and/or gas fuels with different technologies available today. Ethanol production via fermentation, extraction and extractive-distillation is one such method and has been practiced for long time in most devel-oping countries with agricultural surplus. However, the intensive adaptive research and development activities still needed. The imple-mentation of biomass energy technologies will help rural needs such as food security, water supply, health cares, education and communi-cations. It can also have many other additional social, economic benefits such as warmer and healthier homes, lower fuel bills and company running costs and indirectly jobs. This study was a step towards achieving this goal. The adoption of green or sustainable approaches to the way in which society is run is seen as an important strategy in finding a solution to the energy problem.
RECOMMENDATIONS
1. The Introduction of biogas technology on wide scale has implications for macro plan-ning such as the allocation of government investment and effects on the balance of payments. Factors that determine the rate of acceptance of biogas plants, such as
credit facilities and technical backup ser-vices, are likely to have to be planned as part of general macro-policy, as do the allocation of research and development funds.
2. In some rural communities, cultural beliefs regarding handling animal dung are prevalent and will influence the acceptability of biogas technology.
3. Co-ordination of production and use of biogas, fertiliser and pollution control can optimise the promotion and devel-opment of agricultural and animal hus-bandry in rural areas.
4. Biogas technology cannot only provide fuel, but also important for compre-hensive utilisation of biomass forestry, animal husbandry, fishery, evoluting the agricultural economy, protecting the environment, realising agricultural recy-cling, as well as improving the sanitary conditions, in rural areas.
5. It is important to support biomass applied research and exchange expe-riences with other countries that are advanced in this field. In mean time, the biomass energy can help to save exhaust-ing the oil wealth. The diminishing agri-cultural land may hamper biogas energy development but appropriate technologi-cal and resource management techniques will offset the effects. The goals should be achieved through:
• Review and exchange of informa-tion on computer models and man-uals useful for economic evaluation of biogas from biomass energy.
• Exchangeandcompileinformationon methodologies for economic analysis and results.
• Investigation of the constraints onthe implementation of the commer-cial supply of biogas energy.
449Development of integrated bioenergy devices
• Investigationoftherelationsbetweensupplies and demand for the feed-stock from different industries.
• Documentation of the methodsand principles for evaluation of indirect consequences as effects on growth, silvicultural treatment and employment.
• People are requested to constructbiogas plants by themselves in order to reduce costs. In remote areas, the costs for materials increase by about 15–20% due to transportation.
6. Due to the lack of knowledge and aware-ness, villagers cannot be expected to understand the benefits of deforestation control, nutrient conservation, or health improvement. A poor rural peasant is very hesitant to enter a new venture. The nega-tive attitude towards the use of nightsoil varies from place to place, but when it occurs, it is a major obstacle to the imple-mentation of biogas technology.
REFERENCES
Bacaoui, A., Yaacoubi, A., Dahbi, C., Bennouna, J. and Mazet, A. (1998) ‘Activated carbon production from Moroccan olive wastes-influence of some factors’, Environmental Technology, Vol. 19, pp.1203–1212.
Bank of Sudan (BOS) (2003) Annual Report, Khartoum, Sudan.
FAO (1999) State of the World’s Forest, FAO, Rome.
Hall, O. and Scrase, J. (1998) ‘Will biomass be the environmentally friendly fuel of the future?’, Biomass and Bioenergy, Vol. 15, pp.357–367.
Haripriye, G. (2000) ‘Estimation of biomass in India forests’, Biomass and Bioenergy, Vol. 19, pp.245–258.
National Forestry Administration (NFA) (1994) Forestry Handbook, Khartoum, Sudan.
National Forestry Corporation (NFC) (1999) Sudan Forestry and Wood-fuel Resources Assessment, Khartoum, Sudan.
Omer, A.M. (1996) ‘Renewable energy potential and future prospects in Sudan’, Agriculture Development in Arab World, Vol. 3, pp.4–13.
Omer, A.M. (2005) ‘Biomass energy potential and future prospect in Sudan’, Renewable and Sustainable Energy Review, Vol. 9, pp.1–27.
Omer, A.M. and Yemen, F. (2003) ‘Biogas energy technology in Sudan’, Renewable Energy, Vol. 28, No. 3, pp.499–507.
Rossi, S., Arnone, S., Lai, A., Lapenta, E. and Sonnino, A. (1990) ‘ENEA’s activities for developing new crops for energy and industry’, in Grassi, G., Gosse, G. and dos Santos, G. (Eds.): Biomass for Energy and Industry, Elsevier Applied Science, London and New York, pp.107–113.
World Bank (WB) (1990) Sudan forestry sector review, Khartoum, Sudan, pp.15–29.

Copyright © 2010 WASD
World Sustainable Development Outlook 2010
451
Evaluating thE impact of changEs in intErnational
tradE policy on thE sugar industry of Jamaica: an intEgratEd assEssmEnt
approach1
Anthony Clayton,* K’adamwe K’nIfe and Andrew Spencer
University of the West Indies, Jamaica
Abstract: Most of Jamaica has been subject to settlement and development. It is still biologically diverse, with many endemic species, but this biodiversity is now under threat. The sugar industry, which does particular damage to rivers and reefs, has only survived because of EU subsidies, which are now being phased out. It is therefore being prepared for divestment, and refocused on ethanol production to reduce oil imports. It appears that this plan may have already failed, because it de-pended on factors (external trade regimes and tariffs) which are not under Jamaica’s control, so a new policy is urgently needed. This project applied the Integrated Assessment (IA) methodology described in the UNEP-WCMC/ETB document ‘Biodiversity in Integrated Assessment of Trade Policies’ in the Agriculture Sector to examine the impact of policy changes on Jamaica’s sugar industry, and the impli-cations for the economy, employment, society, environment and biodiversity. The study identified several possible future scenarios for the industry, and developed a solution that would achieve a range of goals, moving away from extensive, low-value forms of agriculture to intensive, high-value forms, increasing revenue, profits and skill transfer, while simultaneously reducing environmental impact.
Keywords: integrated assessment; IA; Jamaica; sugar industry; scenarios and biodiversity.
introduction
The Convention on Biological Diversity (CBD), established in 1992, defines biodi-versity as comprising the variety of life on Earth; the combination of diverse life forms and their various interactions with each other and with the physical environment that
has made the planet habitable for humans (CBD, 2006). In 2002, the Conference of the Parties of the Convention adopted a strategic plan “to achieve, by 2010, a sig-nificant reduction of the current rate of biodiversity loss at the global, regional and national level, as a contribution to poverty
*Corresponding author: University of the West Indies, Jamaica; e-mail: [email protected]
452 A. Clayton, K. K’nIfe and A. Spencer
alleviation and to the benefit of all life on Earth”. In order to assess progress towards the 2010 biodiversity target, the Conference of the Parties also established supporting goals and targets and identified indicators for evaluating biodiversity status and trends. Jamaica is a signatory to the CBD.
One reason for concern is that biodiver-sity loss disrupts ecosystem functions, mak-ing ecosystems more vulnerable to shocks and disturbances, less resilient and less able to supply humans with necessary services. The damage to coastal communities from floods and storms, e.g., can increase dramati-cally where protective wetland habitats have been lost or degraded. According to CBD (2006), “Garnering the political will to halt ecosystem degradation will depend on clearly demonstrating to policy makers and society at large the full contribution made by eco-systems to poverty alleviation efforts and to national economic growth more generally”.
Jamaica like many other developing coun-tries must find approaches which maintain biodiversity while generate enterprise to sus-tain growth and development of its economy. Most of Jamaica has been subject to settle-ment and development. It is still biologically diverse, with many endemic species, but this biodiversity is now under threat (NEPA, 2002). The sugar industry, which does par-ticular damage to rivers and reefs, has only survived because of European Union (EU) subsidies, which are now being phased out. It is therefore being prepared for divestment, and refocused on ethanol production to reduce oil imports. It appears that this plan may have already failed, because it depended on factors (external trade regimes and tariffs) which are not under Jamaica’s control, so a new policy is urgently needed.
This project applied the Integrated Assessment (IA) methodology described in the United Nations Environment
Programme UNEP-WCMC/ETB docu-ment ‘Biodiversity in Integrated Assessment of Trade Policies in the Agriculture Sector’ to examine the impact of policy changes on Jamaica’s sugar industry, and the implica-tions for the economy, employment, society, environment and biodiversity.
The primary research involved an exten-sive series of interviews and site visits. The secondary research involved a review of the literature; surveys, studies, technical assess-ments and reports. The project examined the main social, economic, historical and path-dependency, trade-related, technological, institutional, environmental, developmen-tal, energy, resource and environmental factors involved. Additionally the study identified several possible future scenarios for the industry, and developed a solution that would achieve a range of goals, mov-ing away from extensive, low-value forms of agriculture to intensive, high-value forms, increasing revenue, profits and skill transfer, while simultaneously reducing environmen-tal impact. It also presented policy options for achieving optimal attainable outcomes and for anticipating and mitigating any seri-ous negative social or environmental effects arising from extensive changes in land use, with particular regard to the implications for Jamaica’s biodiversity.
intEgratEd assEssmEnt
According to UNEP (2007), “Integrated assessment is used to evaluate the envi-ronmental, social and economic impacts of trade policies, providing policy makers and trade negotiators with information necessary for decision making that sup-ports sustainable development”. It is an interdisciplinary exercise, which combines the interpretation and communication of expertise from various relevant disciplines in a way that highlights the economic, social and environmental impacts associated with
453Evaluating the impact of changes in international trade policy
a policy. The methodology have six key stages, these are;
1 understanding the policy context
2 determining the focus
3 assessing the impacts
4 developing policy recommendations
5 implementing policy recommendations and
6 monitoring and evaluating the imple-mentation of the recommendations.
Understanding the policy context and determining the focus are considered as ex-ante IA, while implementing policy recom-mendations and monitoring and evaluation are considered Ex-post IA with the policy being revised on the basis of the monitor-ing results. Annex I – the IA Process, pro-vides more detail of the IA approach. The project has two phase, the first phase covers stages 1–4, which has been the focus of this project) while stages 5–6 is to be carried out subsequently.
thE policy contEXt
Identifying the rationale for conducting the assessment and explicating the general policy context is crucial in conducting the IA. Sugar was introduced to Jamaica as early as 1494 (Ehrlich, 1970; Lawson, 1971) Jamaica became the world’s largest sugar producer and remained the world’s largest sugar exporter throughout the 18th and early 19th centuries, supplying Britain, the USA and Europe. However today Jamaica’s sugar industry now has costs of production that are among the highest in the African, Caribbean and Pacific (ACP) group of coun-tries . The industry also suffers from a num-ber of other structural and institutional weaknesses (Thornhill, 2007), including run-down capital assets, a crumbling road network that places logistical constraints
on the economic transportation of har-vested cane, shortages of field workers, and a high turnover of professional staff. Finally, Jamaica is a small island, which perma-nently prevents Jamaica from attaining the economies of scale of the world’s large sugar producers, such as Brazil and Australia.2
Currently over 130 countries now pro-duce sugar, and world sugar production was nearly 143 million tonnes in 2002, so Jamaica’s share of world production is now negligible (about 0.1%).3 There has been an equally dramatic reduction in the number of estates and distilleries (from 670 in 1832 to 7 in 2006), the tonnage of sugar pro-duced has slumped (from 514,450 tonnes in 1965 to 124,206 in 2005), the contribution to export earnings has fallen (from 49% in 1952 to 1.8% in 2006), and the contribution to GDP has fallen (from 9% in 1953 to 0.8% in 2006). Jamaica’s sugar industry has con-tinued to survive over the last three decades largely because of the Sugar Protocol, set up in 1975 between the EU and the 18 ACP sugar-producing countries, which gave these countries access to the EU market and guar-anteed, preferential prices (which averaged three times the world price) for an indefinite duration (Mitchell, 2005; Thornhill, 2007). However, the Sugar Protocol was costly, did little to encourage development and was the subject of repeated complaints at the WTO, so the EU announced in September 2007 that the arrangements of the sugar protocol could no longer be maintained, this would be replaced by a new Economic Partnership Agreement (EPA).
thE focus
With the emergence of the EPA the Jamaican government is forced to make adjustment to it modus operandi in the sugar industry. In carrying out the assessment it was critical therefore to determine the specific issues to the considered given this emerging trade
454 A. Clayton, K. K’nIfe and A. Spencer
policy; the impact of changes in trade regimes on the Jamaican sugar industry, possible future scenarios and policy options, and the associated implications for the environment and biodiversity. Identifying the social, eco-nomic and environmental implications of each of the most likely future scenarios for the industry and to develop a model that would give a better array of social, economic and environmental outcomes for Jamaica became the fundamental imperative for the Jamaican government.
thE impact
On the 1 January 2008 the traditional trade preferences afforded by the EU to the Caribbean members of the ACP were replaced by a single EPA. As part of a transi-tion to open markets and reciprocity (albeit with differential liberalisation timetables; immediate removal of tariffs by the EU and up to 25 years by the Caribbean states) the price regime for sugar supplied by the ACP countries to the EU started to undergo phased price reductions as part of a man-aged transition to market prices. Within this scenario it seemed unlikely that the Jamaican sugar industry could survive.
The Planning Institute of Jamaica (PIOJ) report Jamaica Country Strategy for the Adaptation of the Sugar Industry 2006–2015 argued that there would be significant socio, economic consequences for Jamaica. These include: The loss of €24 million per annum in foreign exchange export earnings by 2010, with cumulative losses of €184 million over the ten years from 2006–2015, with implica-tions for the medium-term socio-economic targets. The exit of small cane farmers from the industry, which might lead to the shut-down of raw sugar production at a number of government-owned estates consequently resulting in a loss of direct employment. Losses in producer and household income,
significant reductions in the purchases of capital goods and intermediate goods and services as well as loss of government rev-enue. Additionally this would result in: Increase in migration from rural to urban areas, growth of informal human settle-ments (squatter communities) around cities, increase in poverty levels, loss of social ben-efits provided by sugar estates and increase in the levels of crime and health problems in the regions most affected.
The Government therefore decided to
1 diversify the products currently being derived from sugar cane and
2 privatise the industry (PIOJ, 2006, pp.8–9).
The diversification plan focused on etha-nol, partly because Jamaica is dependent on imported crude oil for over 90% of its energy needs, so any displacement of demand for gasoline would help to reduce the negative balance of payments. This gives three possible future scenarios.
1 The plan will succeed, in which case there will be a significant increase in the land area utilised for cane production for ethanol. This is likely to have nega-tive consequences for river and coastal water quality, although the contribution to mitigating climate change would have to be offset against these impacts.
2 The diversification plan will not succeed, in which case much of the land might become available for other forms of land use, such as housing, tourism or forestry. Alternatively, it might revert to scrub. Some options could be environmentally positive, but much would depend on the management of the process of change.
3 The third possible future which is the primary recommendation of the study, multi-objective optimisation, was there-
455Evaluating the impact of changes in international trade policy
fore developed by the project team to demonstrate a possible solution that could achieve a range of developmental goals, moving away from extensive, low-value forms of agriculture to intensive, high-value forms, increasing revenue, profits and skill transfer, while simulta-neously reducing environmental impact.
Each scenario has significant implications for environmental protection and biodiver-sity conservation.
policy rEcommEndations
The recommended scenario of a multiple objective optimisation formed the context and basis for policy recommendations. Jamaica has been severely impacted by a number of recent developments, includ-ing the sharp rises in the price of oil and grains. These highlighted Jamaica’s current lack of both energy and food security. The loss of trade preferences is also exposing the uncompetitive nature of the sugar industry. A hybrid, multi-objective plan might there-fore have a better chance of success. E.g., a managed, partial diversification of the cane lands into a combination of more intensive, higher-value uses might include the follow-ing elements:
• Value-added agriculture, includingfood (including yam, potatoes, cassava, dasheen, breadfruit and other complex carbohydrates), and high-value plant extracts (such as oleoresins and fla-vonoids) for export. The latter would involve a departure from mass commod-ity markets, which involve competition based on price, and redirection towards niche markets, which involve competi-tion based on quality and marketing; are typically low-volume, but offer better margins.
• Mixed development, with a mosaic ofinterconnected land uses, including
agriculture, new housing developments, light industrial plants and green spaces.
• Tourism, with a major expansion of conventional recreational tourism, eco-tourism and heritage tourism, and health and retirement tourism.
With regard to the first element, one poten-tial value-added market was the subject of a scoping study by Clayton and Staple-Ebanks (2002). This focused on the devel-opment of nutraceuticals and functional foods, defined as those purchased primarily because they deliver an additional health or nutritional benefit (Leighton, 2000). The market was recently valued at US$24.2bn, with Japan accounting for over half of the total (LFRI, 2004). This kind of high-value market has the potential to demand-pull a range of new business opportunities in agriculture and agro-processing for farmers and processors in Jamaica. Diversification into the production of oleoresins, fla-vonoids and similar high value products would create higher economic returns and generate employment opportunities in the rural areas, thus easing the transition. The value of the exports would be signifi-cantly higher while the weight would be significantly lower, thus improving value to weight ratios, largely eliminating the trans-port cost penalty of island production and increasing profit margins. The higher costs of production in Jamaica would not be a serious impediment, as the ingredient cost in a nutraceuticals product can be less than 1% of the final consumer price. India can produce ginger, e.g., at about 1/7th of the Jamaican cost, but this advantage becomes less important when it has relatively little impact on the final price. Another advan-tage is that customers in the nutraceuticals and functional foods industry typically require oleoresins or other processed frac-tions, standardised and refined to a high level of purity before export. This means
456 A. Clayton, K. K’nIfe and A. Spencer
that both production and extraction stages would be based in Jamaica, capturing the value-added.
With regard to biofuels, a more durable option might be to source initially from Brazil, pending the development of third-generation solutions (such as algal biodie-sel) that do not create the same demands for land or water.
With regard to food security, former sugar lands could be used to produce alternatives to imported wheat and rice, including com-plex carbohydrates such as yam, potatoes, cassava, dasheen and breadfruit; these are healthier alternatives.
This combination would achieve a range of developmental goals, moving away from extensive, low-value forms of agriculture to intensive, high-value forms, increasing revenue, profits and skill transfer, while simultaneously reducing environmental impact.
Importantly the scenario highlighted positives in economic social and biodiver-sity impacts. The fate of the sugar industry has significant social, economic and envi-ronmental implications. This approach would, stem losses in the industry, generate export revenues and create employment. It would also reduce the spread of infor-mal settlements, increase percentage with proper housing and land title, reduce the rate of violent crime, decrease poverty and improve health status. The environmen-tal implications are even more profound. It would reduce pollution of inland and coastal waters with e.g., agrochemicals, silt, etc., improved coral reef health, reduced air pollution, save endangered species, reduce the rates of soil erosion, enhance greater tree cover, especially mangroves
and on plains and facilitate carbon seques-tration. Annex II provides data on the various social, economic and environmental/ biodiversity indicators through which the performance of the scenario can be evalu-ated in the future.
findings and conclusion of rEsEarch
The research unearthed a number of con-cerns for the Jamaican agriculture sector and the sugar industry in general. Most importantly it provides a way forward for the country, which facilitates improvement, is in the quality of life of the people and growth in the economy while maintaining the biodiversity of the country it is clear that:
• MostofJamaicahasbeensubjecttoset-tlement and development, but it is still rated 5th in the islands of the world for endemic plants. There is also a high level of endemism for snails, crabs, amphib-ians, reptiles and land birds. Many wild species make significant contributions to Jamaica’s economy, but some are now endangered.
• The most rapid loss of biodiversity isincurred when land is first converted for agricultural production. Sugar was introduced to the Caribbean in the late 15th century, so the most rapid loss was probably incurred when the industry was expanding throughout the 17th and 18th centuries. The environmental impacts associated with the industry today are therefore determined primarily by its routine operations.
• Themainimpactsarecausedbysurgesof cane mill effluents which are some-times discharged directly into streams and end up in coastal waters, along with
457Evaluating the impact of changes in international trade policy
run-off agro-chemicals. The effluents are high in organic matter, and can also include heavy metals, oil, grease, clean-ing agents and alcohol by-products. This reduces oxygen levels in the water, kill-ing fish and crustaceans and promoting algal blooms, which damage the coral reefs.
• These impacts are exacerbated by long-term under-investment in the industry, as the plants are old, badly maintained and inefficient, with higher economic and environmental costs. Other factors include poor management, lack of envi-ronmental awareness and weak environ-mental regulation.
Jamaica was once the largest sugar exporter in the world, but the industry is now uncompetitive and accounts for just 0.1% of world output. It has survived because of EU subsidies, which are being phased out. It is now being prepared for divestment, and focused on ethanol production to reduce oil imports. It is not clear whether this plan will succeed; it depends on factors (exter-nal trade regimes and tariffs) which are not under Jamaica’s control.
There are several possible future scenarios for the industry. The current government plan might succeed, in which case the ‘idle’ cane lands will be brought back into produc-tion, or the plan will fail, in which case land will revert to scrub or become available for development, forestry or other forms of agri-culture. Each option has significant impli-cations for environmental and biodiversity conservation. Other, potentially better policy options are possible; the example given here would achieve a range of developmental goals by integrating social, economic and environ-mental objectives. This would involve a tran-sition from extensive, low-value agriculture to intensive, high-value production, increasing
revenues, profits and skills, while simultane-ously reducing environmental impact.
A major concern however is, there are serious gaps in the data on Jamaica’s biodi-versity, although some preliminary work has been done. A key element of an implemen-tation phase would include the construc-tion of a database and set of bio-indicators, so that future policy decisions could be bet-ter informed in this regard.
rEfErEncEs
Clayton, A. and Staple-Ebanks, C. (2002) Nutraceuticals and Functional Foods: A New Development Opportunity for Jamaica: Market-Scoping Study: Technical report for the National Commission on Science and Technology, EFJ, Jamaica.
Convention on Biological Diversity (2006) Global Biodiversity Outlook, Brazil, March.
Ehrlich, A.S. (1970) East Indian Cane Workers in Jamaica, Doctoral thesis, The University of Michigan.
Lawson, S. (1971) Jamaica’s Sugar Industry: An Inquiry into the Social and Economic Repercussions of a Declining Industry, Thesis, New York University, New York.
Leighton, P. (2000) ‘Up and coming markets: opportunities and issues from a Darwinian perspective’, Nutraceuticals World, October.
Mitchell, D. (2005) Sugar in the Caribbean: Adjusting to Eroding Preferences. World Ban Policy Research Working Paper 3802, World Bank, Washington, DC.
National Environment and Planning Agency (2002) Towards a National Strategy and Action Plan on Biological Diversity in Jamaica.
Thornhill, S. (2007) Safeguarding the Benefits of the ACP – EU Sugar Protocol in the context of the EPA Negotiations, Final Draft Report.
United Nations Environment Programme (2007) Incorporating Biodiversity into integrated Assessment of Trade Policy in the Agriculture Sector.
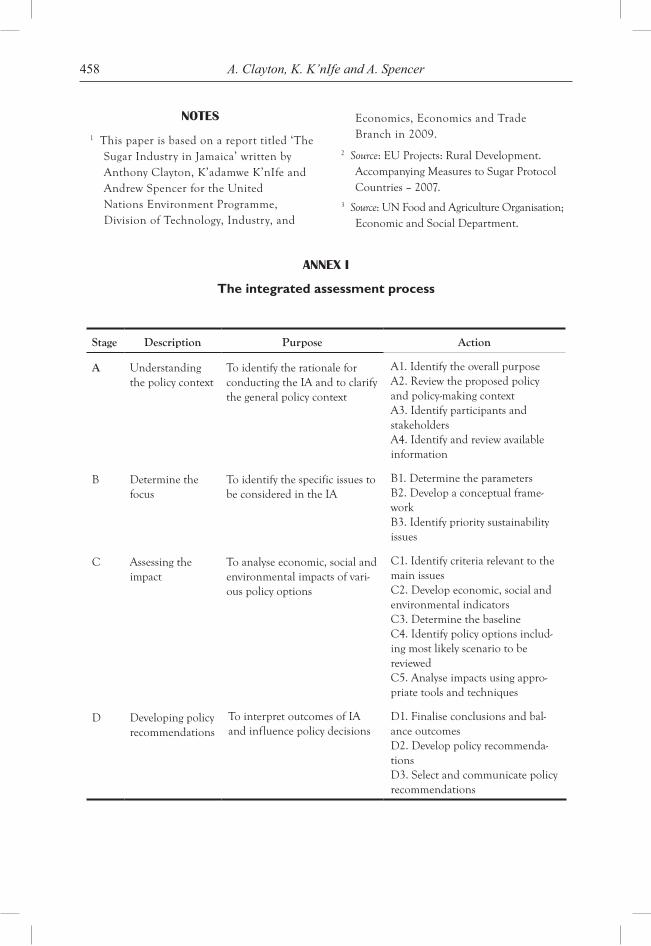
458 A. Clayton, K. K’nIfe and A. Spencer
notEs
1 This paper is based on a report titled ‘The Sugar Industry in Jamaica’ written by Anthony Clayton, K’adamwe K’nIfe and Andrew Spencer for the United Nations Environment Programme, Division of Technology, Industry, and
Economics, Economics and Trade Branch in 2009.
2 Source: EU Projects: Rural Development. Accompanying Measures to Sugar Protocol Countries – 2007.
3 Source: UN Food and Agriculture Organisation; Economic and Social Department.
annEX i
The integrated assessment process
Stage Description Purpose Action
A Understanding the policy context
To identify the rationale for conducting the IA and to clarify the general policy context
A1. Identify the overall purpose A2. Review the proposed policy and policy-making context A3. Identify participants and stakeholders A4. Identify and review available information
B Determine the focus
To identify the specific issues to be considered in the IA
B1. Determine the parameters B2. Develop a conceptual frame-work B3. Identify priority sustainability issues
C Assessing the impact
To analyse economic, social and environmental impacts of vari-ous policy options
C1. Identify criteria relevant to the main issuesC2. Develop economic, social and environmental indicators C3. Determine the baseline C4. Identify policy options includ-ing most likely scenario to be reviewedC5. Analyse impacts using appro-priate tools and techniques
D Developing policy recommendations
To interpret outcomes of IA and influence policy decisions
D1. Finalise conclusions and bal-ance outcomesD2. Develop policy recommenda-tions D3. Select and communicate policy recommendations
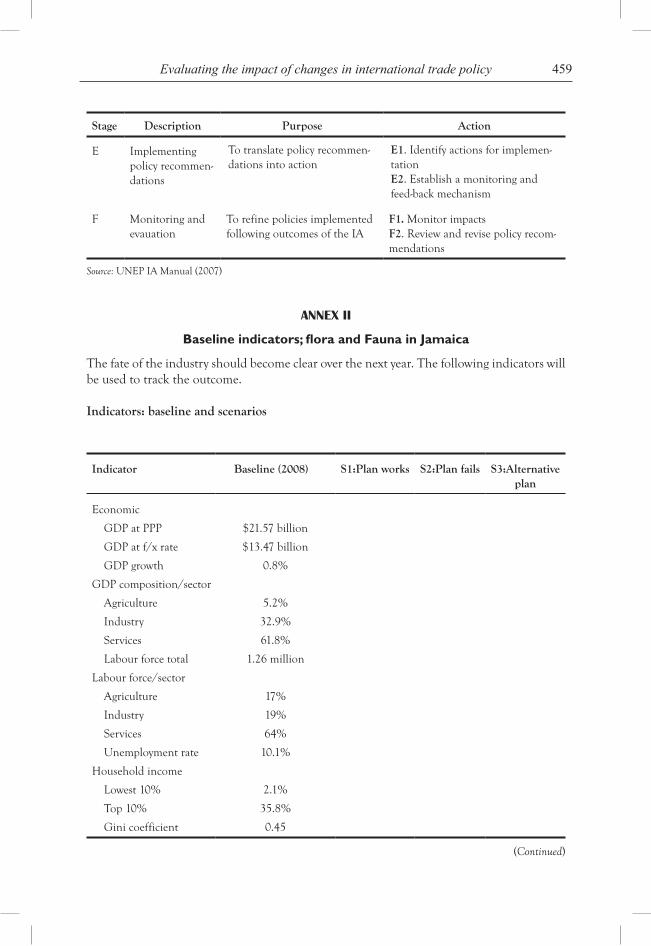
459Evaluating the impact of changes in international trade policy
Stage Description Purpose Action
E Implementing policy recommen-dations
To translate policy recommen-dations into action
E1. Identify actions for implemen-tationE2. Establish a monitoring and feed-back mechanism
F Monitoring and evauation
To refine policies implemented following outcomes of the IA
F1. Monitor impactsF2. Review and revise policy recom-mendations
Source: UNEP IA Manual (2007)
annEX ii
Baseline indicators; flora and Fauna in Jamaica
The fate of the industry should become clear over the next year. The following indicators will be used to track the outcome.
Indicators: baseline and scenarios
Indicator Baseline (2008) S1:Plan works S2:Plan fails S3:Alternative plan
Economic
GDP at PPP $21.57 billion
GDP at f/x rate $13.47 billion
GDP growth 0.8%
GDP composition/sector
Agriculture 5.2%
Industry 32.9%
Services 61.8%
Labour force total 1.26 million
Labour force/sector
Agriculture 17%
Industry 19%
Services 64%
Unemployment rate 10.1%
Household income
Lowest 10% 2.1%
Top 10% 35.8%
Gini coefficient 0.45
(Continued)
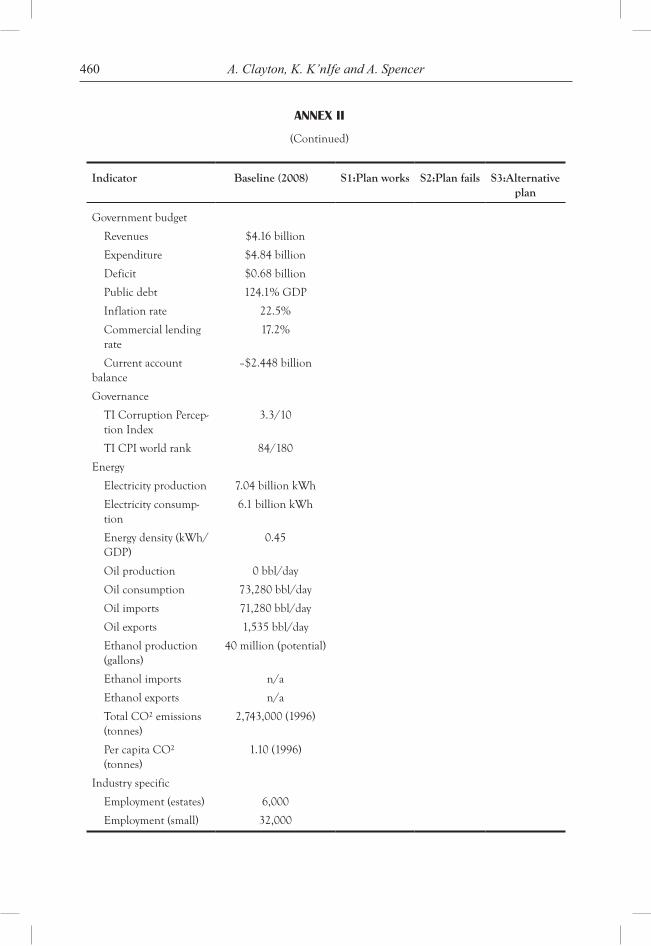
460 A. Clayton, K. K’nIfe and A. Spencer
Indicator Baseline (2008) S1:Plan works S2:Plan fails S3:Alternative plan
Government budget
Revenues $4.16 billion
Expenditure $4.84 billion
Deficit $0.68 billion
Public debt 124.1% GDP
Inflation rate 22.5%
Commercial lending rate
17.2%
Current account balance
–$2.448 billion
Governance
TI Corruption Percep-tion Index
3.3/10
TI CPI world rank 84/180
Energy
Electricity production 7.04 billion kWh
Electricity consump-tion
6.1 billion kWh
Energy density (kWh/GDP)
0.45
Oil production 0 bbl/day
Oil consumption 73,280 bbl/day
Oil imports 71,280 bbl/day
Oil exports 1,535 bbl/day
Ethanol production (gallons)
40 million (potential)
Ethanol imports n/a
Ethanol exports n/a
Total CO² emissions (tonnes)
2,743,000 (1996)
Per capita CO² (tonnes)
1.10 (1996)
Industry specific
Employment (estates) 6,000
Employment (small) 32,000
annEX ii
(Continued)
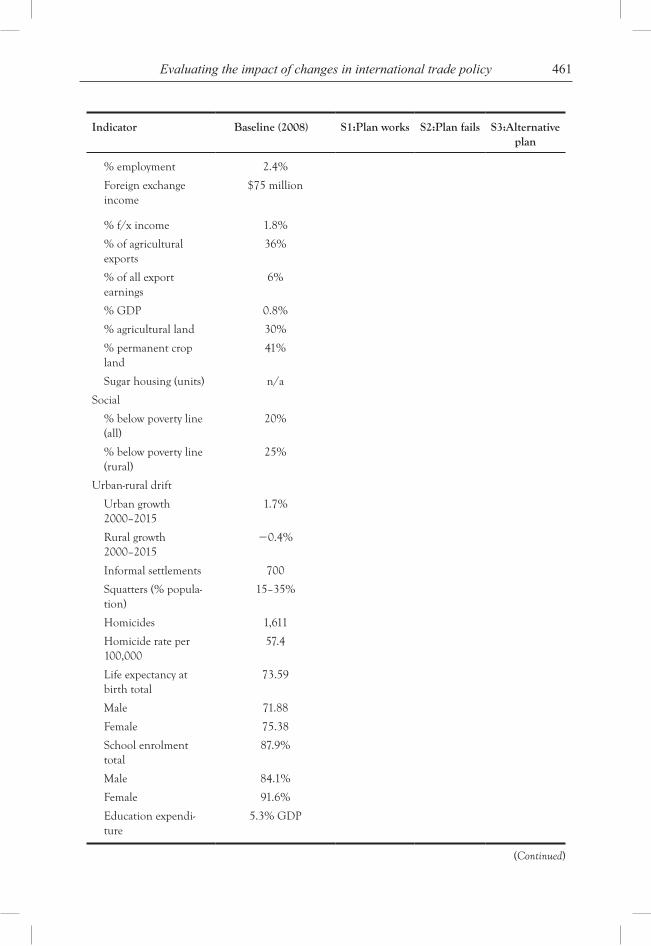
461Evaluating the impact of changes in international trade policy
Indicator Baseline (2008) S1:Plan works S2:Plan fails S3:Alternative plan
% employment 2.4%
Foreign exchange income
$75 million
% f/x income 1.8%
% of agricultural exports
36%
% of all export earnings
6%
% GDP 0.8%
% agricultural land 30%
% permanent crop land
41%
Sugar housing (units) n/a
Social
% below poverty line (all)
20%
% below poverty line (rural)
25%
Urban-rural drift
Urban growth 2000–2015
1.7%
Rural growth 2000–2015
0.4%
Informal settlements 700
Squatters (% popula-tion)
15–35%
Homicides 1,611
Homicide rate per 100,000
57.4
Life expectancy at birth total
73.59
Male 71.88
Female 75.38
School enrolment total
87.9%
Male 84.1%
Female 91.6%
Education expendi-ture
5.3% GDP
(Continued)
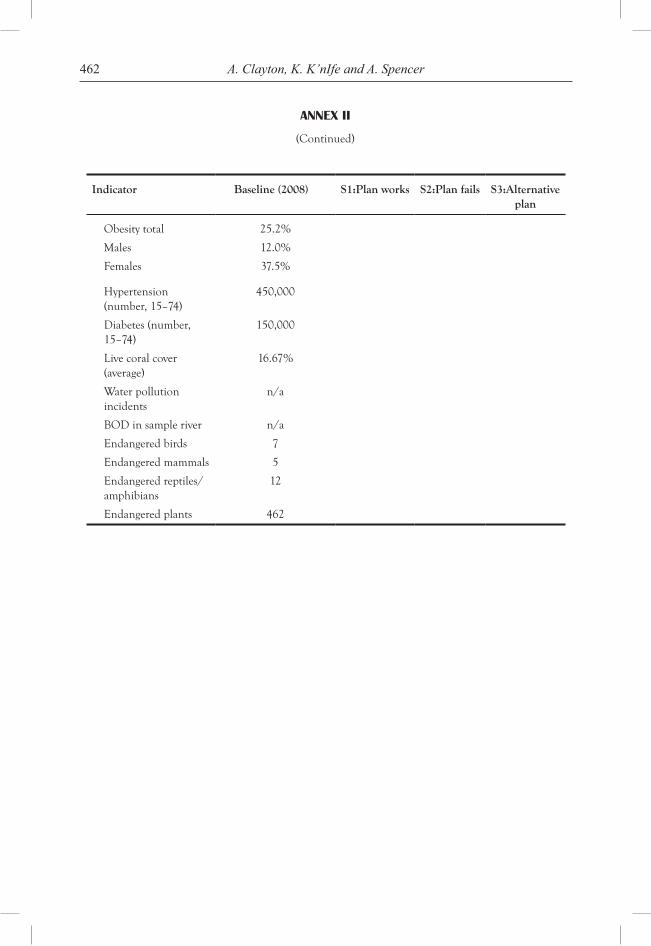
462 A. Clayton, K. K’nIfe and A. Spencer
Indicator Baseline (2008) S1:Plan works S2:Plan fails S3:Alternative plan
Obesity total 25.2%
Males 12.0%
Females 37.5%
Hypertension (number, 15–74)
450,000
Diabetes (number, 15–74)
150,000
Live coral cover (average)
16.67%
Water pollution incidents
n/a
BOD in sample river n/a
Endangered birds 7
Endangered mammals 5
Endangered reptiles/amphibians
12
Endangered plants 462
annEX ii
(Continued)
Copyright © 2010 WASD
World Sustainable Development Outlook 2010
463
Alien lAbourers And development processes the
cAse of montserrAt
Godfrey C. St. Bernard*University of the West Indies, Trinidad and Tobago
Abstract: This paper strives to assess the characteristic features of the ‘alien labourers’ and the range of services that they render in the island of Montserrat. Data are drawn from secondary data contained in the archives of the Labour Commis-sioner’s Office. The data have been re-formatted and analysed in SPSS. The study seeks to examine characteristics associated with tenure and labour market services rendered by such labourers. The findings are interpreted in the context of develop-ment initiatives pursued by the Government of Montserrat and articulated in the island’s Sustainable Development Plan.
Keywords: work permits; labour market; foreign workers; Sustainable Development; Montserrat; economic migrants; sexual division of labour; population dynamics.
introduction
Montserrat is located in the eastern Caribbean chain of islands and covers a land area of 102.7 sq km (39.5 sq miles). Located 43 km (25 miles) to the south-west of Antigua and 43 km (25 miles) north-west of Guadeloupe, Montserrat is 17.6 km (11 miles) in length and 11.2 km (7 miles) in width. Topographically, Montserrat is mountainous consisting of volcanic peaks that rise to an altitude of about 900 m (3,000 feet) above sea level. Moreover, flat coastal land is rarely available and unlike many of its neighbouring Caribbean islands, has black sand beaches. The island has been characterised by a very small popu-lation. According to Fergus (2004), the first official census count in 1678 resulted in a population size of 3,674, a little more than two-thirds of whom were white, either of
English, Irish or Scottish stock with the Irish representing more than a half. By 1871, the island’s population size was 8,693 and had increased by 40.5% at the beginning of the 20th century amounting to 12,215 in 1901. The population of Montserrat was known to have eclipsed 14,000 by 1946. By the 1960s, the population of Montserrat declined to between 11,000 and 12,000 persons and was sustained at such levels throughout the 1970s and 1980s.
With the onset of the 1990s, Montserrat had begun to show signs of substantial recov-ery after being devastated by Hurricane David in the 1980s. However, such recovery was short-lived as geomorphological factors had gained momentum and were due to spawn radical change for the social, economic and environmental sustainability of Montserrat
* Corresponding author: University of the West Indies, Trinidad and Tobago; e-mail: [email protected], [email protected]
464 G.C. St. Bernard
and its peoples. Since 1995, the Soufriere Hills Volcano has been active and with the onset of the new millennium, the status remains unchanged. From the standpoint of the island’s population size, the gravity of such volcanic activity resulted in declines from well over 11,000 in the 1980s to just above 10,000 by 1995. By 1998, the popu-lation of Montserrat had declined to 2,726 and by the end of the 1990s, the island’s population was approaching 3,500. The mid-1990s was characterised by phenomenal out-migration due to the volcanic activity on the island. Insofar as the first major sign of volcanic activity became manifest in 1995, between 1996 and 1998, the loss due to net migration had amounted to more than 70% of the island’s population, the vast majority of whom would have been evacuees. In fact, the reversal of the island’s sex ratio since 1998 in favour of a preponderance of males suggests that women were the principal evacuees. By mid-2004, there appeared to be some recov-ery with respect to population size with the number of residents on the island being in the vicinity of 4,500.
Prior to 1997, approximately 60% of the island’s population consisted of persons 15–64 years and hence in primary working-age groups. However, by the late 1990s, that proportion had declined as a result of the evacuation of persons mainly those aged 15–64 years. In addition, the late 1990s were characterised by increases in the proportion of the population consisting of elderly per-sons 65 years or older. At the height of the volcanic crisis during 1998, this proportion exceeded 20%. According to St. Bernard (2006), “the volcanic crisis precipitated the aging of the Montserratian population as emigrants and evacuees appeared to be persons of school-age and working-age who sought refuge in other countries where they could have sustained age-related life stage functions”. In order to rebuild Montserrat
in the aftermath of the volcanic eruptions of the mid-1990s, the Government of Montserrat commissioned a Sustainable Development Plan 1998–2002 that was directed towards the development of the northern third of Montserrat, greater effi-ciency and effectiveness of the public sector, partnership and promotion of the private sector, protection of the vulnerable and pro-motion of social welfare.
Since 2002, the threat posed by the level of uncertainty due to living in the shadow of an active volcano has loomed unabated. Nonetheless, the Government of Montserrat has been desirous of establish-ing mechanisms to enable residents and in particular, Montserratians to sustain a liveli-hood in Montserrat. As a consequence, the Government embarked upon the develop-ment of a second Sustainable Development Plan for the period 2003–2007. This appeared to be a worthy intervention insofar as the population of Montserrat had begun to increase since 1999 due to immigration and to some extent, the return of former residents who sought refuge in a number of countries. This has had implica-tions for the age structure of the island’s population with the onset of the new mil-lennium and particularly since 2000, has resulted in an increase in the relative size of the working-age population to just over 60% of the island’s population. At the same time, the aging process in Montserrat seems quite evident with the proportion of the population 65 years or older stabilising at approximately 16% during the early years of the new millennium.
rAtionAle for the studY
The goal of the Sustainable Development Plan 2003–2007 is to transform Montserrat into a service-oriented and export-led econ-omy. It hinges upon six strategic objectives,
465Alien labourers and development processes the case of Montserrat
one of which is “to promote the retention of the present population and encourage the return of Montserratians from over-seas.” In order to attain sustainable develop-ment and enhance systems in productive, social and public spheres, the Government of Montserrat has to consider national demographic attributes of the island’s population. To this end, the Sustainable Development Plan advocates the need to increase the size of the island’s population. St. Bernard (2006) identifies migration as the principal medium through which any kind of population growth could be achieved in Montserrat. This is due principally to the pros-pect of fertility levels that are either sustained at relatively low levels or even declining to the extent that the island may experience reduc-tions in the absolute number of births in the coming years. At the same time, the annual number of deaths is likely to rise in the com-ing years due principally to population aging.
The following quotation epitomises the option available to the Government of Montserrat in its quest to facilitate sustain-able development through fostering popula-tion growth:
Migration is the “wild card” that will deter-mine whether the size of the Montserratian population increases or decreases and the pace at which such change occurs across time. Moreover, levels of migration are less predictable given the myriad forces that influence migratory behaviour. Given the more predictable nature of fertility and mortality when compared to migration, migration is likely to be the lever through which Montserratian authorities might be able to effect desirable changes in popu-lation size and demographic outcomes to facilitate the island’s development initia-tives (St. Bernard, 2006, pp.38–39).
Based upon projections, the relative sizes of the young working age sub-population
between the ages of 25 years and 44 years are likely to decline throughout the first two decades of the new millennium. The prospect of such an outcome exerts pressure on the Labour Commisioner’s Office with regard to granting additional work permits to aliens to fulfill the requirements of the workforce. Moreover, this reinforces the need for Montserratian authorities to pur-sue strategies that would increase positive net migration across time and according to St. Bernard (2006), this can only be accom-plished, first of all, by retaining natives, attracting natives living abroad and encour-aging them to return, and by continuing the grant of work permits providing that steps are taken to monitor outcomes and regulate the process.
This study is predicated upon the fact that the island has been significantly affected by the volcanic eruption. Apart from the long-term social and economic impacts of the volcanic crisis, there had been a process of depopulation that gained momentum with the impending fate of the volcanic eruption. Despite the emergent threat of sustained volcanic activity, the Government wishes to foster population growth as a means of stimulating sustainable development on the island. Accordingly, the paper supports the view that sustained levels of immigration is the most realistic mechanism for attain-ing population growth and quite apart from Montserratian natives, such immi-gration is to be fueled by alien population groups principally from other neighbour-ing Caribbean islands but also from other interesting international sources. The main thrust of the paper is therefore to examine variations on the basis of gender, coun-tries of origin and the period of entry into Montserrat among alien workers who have successfully obtained work permits to work in Montserrat. Additionally, the paper seeks to examine interesting associations
466 G.C. St. Bernard
between individuals’ attributes such as gen-der, age, country of origin, period of entry into Montserrat and type of economic activ-ity as means of gauging their prospective implications for sustainable development in Montserrat. These major concerns will form the basis of a systematic discussion which may spawn further questions and interest that should inform further research initiatives.
literAture revieW
Unlike several of the other English-speaking Caribbean islands, Montserrat has not been the target of much demographic research. Ebanks (1987) and Daly (1996) constitute two noteworthy contributions to demo-graphic analyses targeting Montserrat. Ebanks (1987) was part of a larger initia-tive undertaken under the auspices of the CARICOM Secretariat and provided an overall assessment of demographic patterns in the 1980s. Altogether, he concluded that the components of demographic change were such that natural increase marginally eclipsed the loss due to migration result-ing in a small net gain in annual popula-tion sizes during the period. Daly (1996) was also part of a similar CARICOM initiative one decade later and analysed demographic patterns emerging out of the 1991 Population and Housing Census for Montserrat. In so doing, she supported claims made by Ebanks (1987) regarding lower fertility levels and population aging. She also recognized that the relative size of the population in working-age groups was higher in 1991 than at the times of the censuses conducted in 1980 or 1970 and concluded that such outcomes were con-sistent with initiatives geared towards the creation of more jobs and fostering self-employment opportunities. In a later study, St. Bernard (2006) traced demographic pat-terns throughout the 1990s and in the early years of the new millennium. In addition,
he analysed population projection for Montserrat terminating in 2025 and made general observations that are consistent with those of Ebanks (1987) and Daly (1996) that revealed slow rates of popula-tion growth and population aging.
Given that this paper is premised on migration being the principal lever to effect population growth in Montserrat, migratory patterns and their impact from a develop-mental standpoint are central to informing discussions that emerge out of this paper. By Caribbean standards, there is a wide and varied literature targeting migratory move-ment. In the 1950s, 1960s and 1970s, the literature concentrated principally upon emigration from Caribbean countries and subsequent outcomes associated with such emigration (Anderson, 1985; Cooper, 1985; Ebanks et al., 1979; Girling, 1974; Maunder, 1955; Roberts and Mills, 1958; Roberts, 1981; Tidrick, 1966). Such migration had been primarily due to pressures associated with over-population, and in particular, job shortages that had begun subsequent to the emancipation of slavery and intensified across time. In the post-World War II era, such problems had intensified further and several countries in the region had become net losers of population due to migration. This reinforced the importance of studying emigration, if only to examine its effects on the development status of countries. The impact of emigration is also manifest in terms of the brain drain which is deemed to have a negative impact on national develop-ment. This has been the focus of research in Guyana (Boodhoo and Baksh, 1981) and in Trinidad and Tobago (Rampersad and Pujadas, 1970).
Insofar as the process of emigration was gaining momentum, studies targeting the impact of remittances and the phenom-enon of return migration were inevitable. According to Stinner et al. (1982):
467Alien labourers and development processes the case of Montserrat
Migrants to the metropole and to other societies within the region do return and this return conveys important demo-graphic, socio-economic and political implications for the original sending society and the migrants themselves (pp.xxxix)
Since the 1980s, there has been a prolifera-tion of studies of immigration and in partic-ular, that which focuses upon return migra-tion in the context of Caribbean societies (Byron, 1994, 2000; Conway et al., 2009; De Souza, 1998, 2005; Gmelch, 1987; Muschkin, 1993; Plaza, 2002; Rubenstein, 1982; St. Bernard, 2005, 2006; Thomas-Hope, 1985, 1999). Moreover, two edited volumes addressing the dynamics of return migration from different perspectives have added considerably to the scholarly litera-ture (Plaza and Henry, 2006; Potter et al., 2005). While these studies have focused primarily on return migration to countries such as Jamaica, Barbados, Puerto Rico, St. Kitts and Nevis and Trinidad and Tobago, the two edited volumes have attempted to be a bit more broad-based in terms of the range of countries covered in their respective texts. With the exception of Puerto Rico, many of the other countries reviewed have been characterised by steady flows of returnees who had been emigrants mainly to the UK and to a lesser extent, the USA and Canada during the decades of the 1950s and 1960s.
For Caribbean societies, the phenom-enon of elderly returnees is likely to per-sist and even gain momentum during the early years of the 21st century. Due princi-pally to the aging of earlier waves of North Atlantic Caribbean migrants, a number of Caribbean countries can expect increasing numbers of elderly returnees from the USA and Canada. Generally speaking, Byron (2000) noted that return migration from the USA and Canada is likely to become much more commonplace beyond 2000.
She also noted that there is likely to be an influx of younger returnees due primarily to contractual labour involving agricultural farm workers who have been drawn from a number of Caribbean islands to work in the USA and Canada. The impact of glo-balisation and the proliferation of indus-tries in sectors such as tourism, retail sales and “hi-tech” activities constitute a second set of factors that she identified as being instrumental in prompting the return of younger returnees to their Caribbean homelands. A third factor was the depor-tation of young Caribbean nationals who violated visa restrictions or had criminal records. Increasingly, Caribbean nationals have been migrating to the North Atlantic for short sojourns during which they can earn sufficient income to fund major domestic projects such as housing.
The return of second-generation Caribbean migrants is an important factor that has been documented in recent studies of return migration among younger persons of Caribbean heritage. Plaza (2002) exam-ines the adjustment experiences of second-generation British Caribbean returnees to Barbados and Jamaica. He noted that factors associated with race, skin colour and gender were principal motivators of their decision to return to the Caribbean. According to Plaza (2002), this group of returnees gener-ally secure professional jobs but at the same time, experience great difficulty from their local peers in making the transition to a pro-fessional life in the Caribbean.
Based upon fieldwork conducted during the mid-1960s, Philpott (1973) examined West Indian migratory processes with a view towards discerning their implications within institutional spheres in small domes-tic settings. His study focused specifically on the island of Montserrat where migration to Britain was heavily concentrated in the 20–45 age group. In his view, such emigration
468 G.C. St. Bernard
was consistent with a ‘migrant ideology’ that was based upon a high likelihood of return – a prospect being stimulated by domestic commitments in the form of remit-tances to the island. Philpott (1973) also documented cases in which Montserratians embraced ‘migration ideologies’ and returned to the island to become petty entrepreneurs investing in ‘rum shops’, transportation and agriculture. While such decisions enhanced the social status of the returnees within domestic spheres, the outcomes were short-lived insofar as the Montserratian economy was incapable of guaranteeing them a sus-tainable livelihood. The end result was the eventual re-migration of several returnees.
These reviews touch on several dimen-sions of return migration focusing primar-ily on selectivity and direction, motivation for return, consequences and the exercise of choice by considering re-migration The con-sequences of return migration and choices associated with re-migration are somewhat related insofar as the latter is often contin-gent on the former as observed in Philpott (1973) and Plaza (2002). This study is unique insofar as it departs from former studies that have focused attention on emigrants and return migrants and instead throws light upon economic migrants in a host territory.
post-volcAnic sociAl outcomes
Based upon qualitative accounts, St. Bernard (2006) documents some experiences of the population of Montserrat in the aftermath of the volcanic crisis. While young people and their respective families had migrated and in many instances, have never returned to Montserrat, older folk who initially migrated have returned resulting in further population aging and an increase in the need for public geriatric care. The volcanic crisis has also spawned the migration of nurses and other skilled health care professionals, and there have been problems recruiting nurses to fill
the void despite reductions in the number of positions. Generally speaking, Montserratian nurses employed abroad have not been demonstrating a willingness to return to Montserrat. This is further compounded by the presence of an active volcano, non- competitive remuneration packages and a high cost of living, these being among the main factors militating against positive recruit-ment outcomes with regard to retaining skilled healthcare professionals and other classes of professional workers in Montserrat.
Familial unification and discontent are instrumental in influencing migratory deci-sions including the length of sojourns abroad. Based upon qualitative accounts, the volcanic crisis precipitated familial disruption as wives and children left for England leaving husbands and fathers behind. According to one of the key informants in this study, there have been instances when such disruptions were deemed indefinite with husbands/fathers continu-ing to live in Montserrat. Such episodes are associated with increased prospects for the onset of separation, mental problems and infidelity, all of which, further militate against familial reunification in Montserrat. As such, wives and children are less likely to return to Montserrat. From a theoretical standpoint, the concept of migration inertia is relevant insofar as the longer an individual’s migratory sojourn abroad, the lower the probability of return to his/her country of origin.
methodoloGY
The principal unit of analysis is the applicant for work permits that have been approved between the late 1990s and April 2005. The focus is upon applicants who have sub-mitted their first applications in any given year. Thus, applicants who have submitted applications for renewals or variations in any given year, have not been enumerated for analysis. Altogether, 652 cases are to be analysed statistically. It is expected that
469Alien labourers and development processes the case of Montserrat
number of first applications is likely to con-stitute a measure of the ceiling with respect to population injections due to immigra-tion as a result of work permit grants.
Data were obtained from the Labour Commissioner’s Office, Department of Labour, The Government of Montserrat. Such data were stored as archival data in EXCEL format, imported into SPSS and meticulously edited using manual and com-puter edits for the purposes of data cleaning and improving data quality. In the SPSS for-mat, the data are analysed using very simple descriptive statistics such as frequency distri-butions and cross-tabulations. Due to small population sizes, the analysis of specific small populations has been avoided to con-ceal applicants’ identities. The results are interpreted systematically based upon the principles associated with frequency distri-butions and cross-tabulations as a means of answering the important questions.
mAJor findinGs
For the period between the late 1990s and April 2005, Table 1 shows that there were approximately 652 first applications for work permits requested by foreigners who sought to participate in gainful employ-ment in Montserrat. This number should represent an upper limit in terms of foreign-ers’ entry into Montserrat for the purpose of participating in labour market activi-ties. In the Pre-2000 period, there were 117 applications. This coincided with the volcanic crisis and the period of recovery which followed the major volcanic episodes of the late 1990s. In 2000, the number of applications exceeded 100 but the number declined subsequently and on a continuous basis to 63 in 2003. By 2004, the number of applications more than doubled that of the previous year and numbered 144. Moreover, between January 2005 and April 2005, there were 47 applications.
According to Table 1, the majority of applicants have been male submitting 410 or approximately 63% of the 652 applica-tions. Approximately 68% of the applicants have been under 35 years among whom, the majority is observed to be under 25 years. More than half of the applicants number-ing 346 or approximately 53% are observed to have been born in Guyana. Noteworthy numbers of applicants are also evident in the case of persons born in Jamaica (125), Dominica (56), Dominican Republic (43) and India (26).
chArActeristics of Alien lAbourers – AGe And countrY
of oriGin
Table 2 shows that the number of applica-tions approved for males outnumber the number approved for females in the Pre-2000 period as well as annually during the early years of the 2000s. For applicants in the majority of age groups, this pattern per-sists across the various periods under review. Irrespective of the various periods under review, applicants who have been issued work permits are mostly under 35 years, this being evident irrespective of applicants’ sex. Table 3 shows that a much larger number of applications were approved for applicants born in Guyana and to a lesser extent, those born in Jamaica than was the case for appli-cants who were born in other countries. This was evident for the various periods under review and is likely to be a function of variation in the frequency of applications for work permits from nationals of the dif-ferent countries. Thus, it would appear that Guyanese and Jamaican nationals apply for such work permits more frequently than nationals of other countries and therefore obtain such approvals more frequently. The presence of nationals from the Dominican Republic, Dominica and India is also worth noting despite their more variable pattern across the period. Nationals from a number
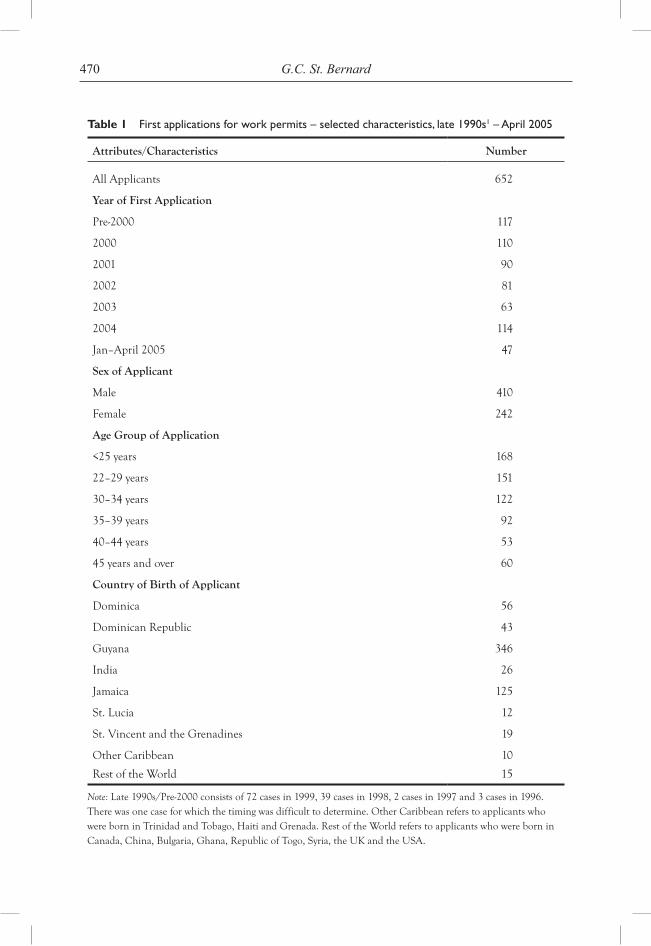
470 G.C. St. Bernard
Table 1 First applications for work permits – selected characteristics, late 1990s1 – April 2005
Attributes/Characteristics Number
All Applicants 652
Year of First Application
Pre-2000 117
2000 110
2001 90
2002 81
2003 63
2004 114
Jan–April 2005 47
Sex of Applicant
Male 410
Female 242
Age Group of Application
<25 years 168
22–29 years 151
30–34 years 122
35–39 years 92
40–44 years 53
45 years and over 60
Country of Birth of Applicant
Dominica 56
Dominican Republic 43
Guyana 346
India 26
Jamaica 125
St. Lucia 12
St. Vincent and the Grenadines 19
Other Caribbean 10
Rest of the World 15
Note: Late 1990s/Pre-2000 consists of 72 cases in 1999, 39 cases in 1998, 2 cases in 1997 and 3 cases in 1996. There was one case for which the timing was difficult to determine. Other Caribbean refers to applicants who were born in Trinidad and Tobago, Haiti and Grenada. Rest of the World refers to applicants who were born in Canada, China, Bulgaria, Ghana, Republic of Togo, Syria, the UK and the USA.
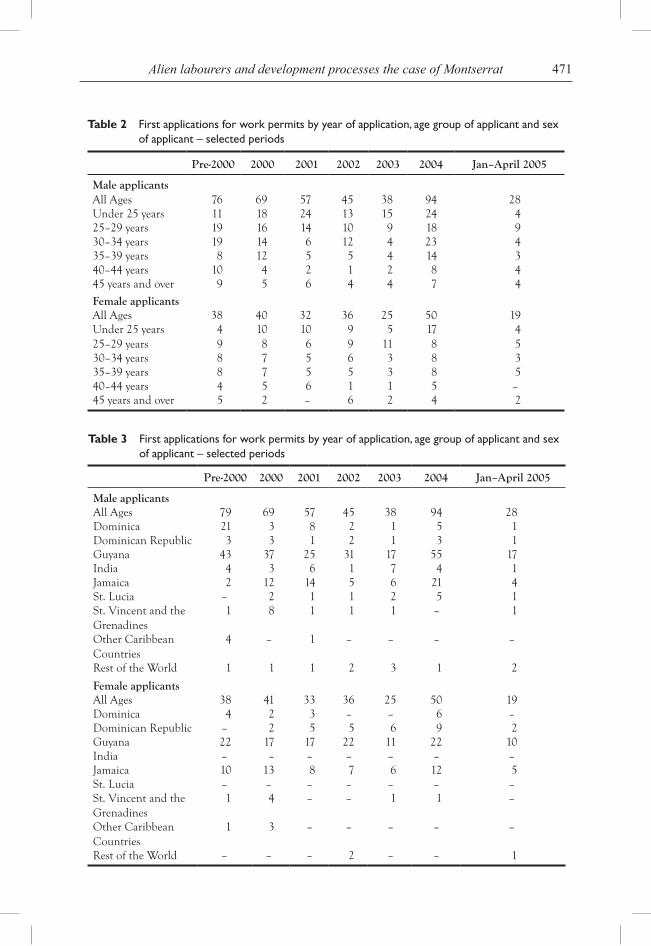
471Alien labourers and development processes the case of Montserrat
Table 2 First applications for work permits by year of application, age group of applicant and sex of applicant – selected periods
Pre-2000 2000 2001 2002 2003 2004 Jan–April 2005
Male applicantsAll Ages 76 69 57 45 38 94 28Under 25 years 11 18 24 13 15 24 425–29 years 19 16 14 10 9 18 930–34 years 19 14 6 12 4 23 435–39 years 8 12 5 5 4 14 340–44 years 10 4 2 1 2 8 445 years and over 9 5 6 4 4 7 4
Female applicantsAll Ages 38 40 32 36 25 50 19Under 25 years 4 10 10 9 5 17 425–29 years 9 8 6 9 11 8 530–34 years 8 7 5 6 3 8 335–39 years 8 7 5 5 3 8 540–44 years 4 5 6 1 1 5 –45 years and over 5 2 – 6 2 4 2
Table 3 First applications for work permits by year of application, age group of applicant and sex of applicant – selected periods
Pre-2000 2000 2001 2002 2003 2004 Jan–April 2005
Male applicantsAll Ages 79 69 57 45 38 94 28Dominica 21 3 8 2 1 5 1Dominican Republic 3 3 1 2 1 3 1Guyana 43 37 25 31 17 55 17India 4 3 6 1 7 4 1Jamaica 2 12 14 5 6 21 4St. Lucia – 2 1 1 2 5 1St. Vincent and the Grenadines
1 8 1 1 1 – 1
Other Caribbean Countries
4 – 1 – – – –
Rest of the World 1 1 1 2 3 1 2
Female applicantsAll Ages 38 41 33 36 25 50 19Dominica 4 2 3 – – 6 –Dominican Republic – 2 5 5 6 9 2Guyana 22 17 17 22 11 22 10India – – – – – – –Jamaica 10 13 8 7 6 12 5St. Lucia – – – – – – –St. Vincent and the Grenadines
1 4 – – 1 1 –
Other Caribbean Countries
1 3 – – – – –
Rest of the World – – – 2 – – 1
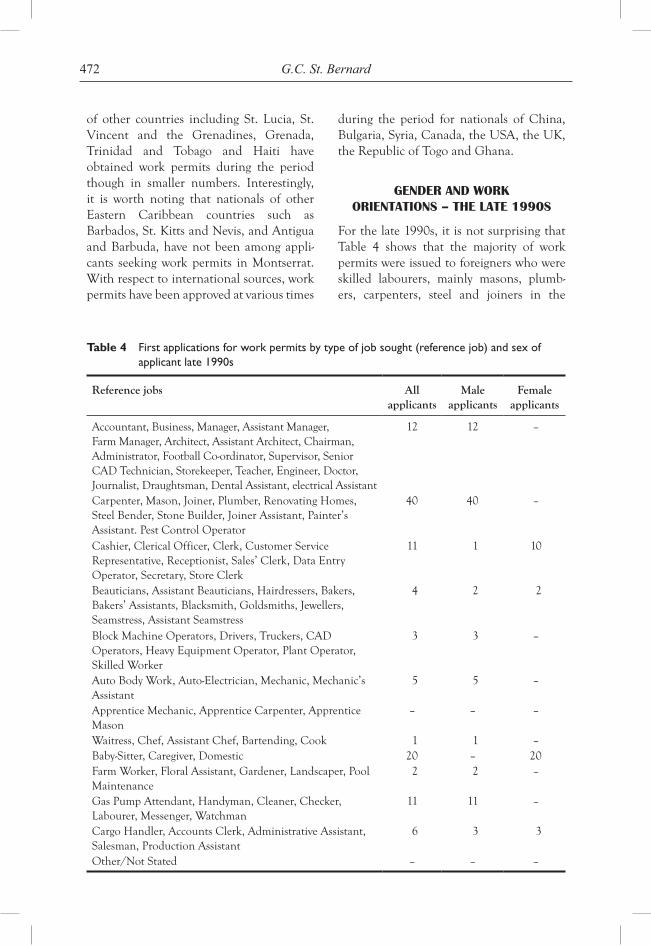
472 G.C. St. Bernard
of other countries including St. Lucia, St. Vincent and the Grenadines, Grenada, Trinidad and Tobago and Haiti have obtained work permits during the period though in smaller numbers. Interestingly, it is worth noting that nationals of other Eastern Caribbean countries such as Barbados, St. Kitts and Nevis, and Antigua and Barbuda, have not been among appli-cants seeking work permits in Montserrat. With respect to international sources, work permits have been approved at various times
during the period for nationals of China, Bulgaria, Syria, Canada, the USA, the UK, the Republic of Togo and Ghana.
Gender And WorK orientAtions – the lAte 1990s
For the late 1990s, it is not surprising that Table 4 shows that the majority of work permits were issued to foreigners who were skilled labourers, mainly masons, plumb-ers, carpenters, steel and joiners in the
Table 4 First applications for work permits by type of job sought (reference job) and sex of applicant late 1990s
Reference jobs All applicants
Male applicants
Female applicants
Accountant, Business, Manager, Assistant Manager, Farm Manager, Architect, Assistant Architect, Chairman, Administrator, Football Co-ordinator, Supervisor, Senior CAD Technician, Storekeeper, Teacher, Engineer, Doctor, Journalist, Draughtsman, Dental Assistant, electrical Assistant
12 12 –
Carpenter, Mason, Joiner, Plumber, Renovating Homes, Steel Bender, Stone Builder, Joiner Assistant, Painter’s Assistant. Pest Control Operator
40 40 –
Cashier, Clerical Officer, Clerk, Customer Service Representative, Receptionist, Sales’ Clerk, Data Entry Operator, Secretary, Store Clerk
11 1 10
Beauticians, Assistant Beauticians, Hairdressers, Bakers, Bakers’ Assistants, Blacksmith, Goldsmiths, Jewellers, Seamstress, Assistant Seamstress
4 2 2
Block Machine Operators, Drivers, Truckers, CAD Operators, Heavy Equipment Operator, Plant Operator, Skilled Worker
3 3 –
Auto Body Work, Auto-Electrician, Mechanic, Mechanic’s Assistant
5 5 –
Apprentice Mechanic, Apprentice Carpenter, Apprentice Mason
– – –
Waitress, Chef, Assistant Chef, Bartending, Cook 1 1 –Baby-Sitter, Caregiver, Domestic 20 – 20Farm Worker, Floral Assistant, Gardener, Landscaper, Pool Maintenance
2 2 –
Gas Pump Attendant, Handyman, Cleaner, Checker, Labourer, Messenger, Watchman
11 11 –
Cargo Handler, Accounts Clerk, Administrative Assistant, Salesman, Production Assistant
6 3 3
Other/Not Stated – – –
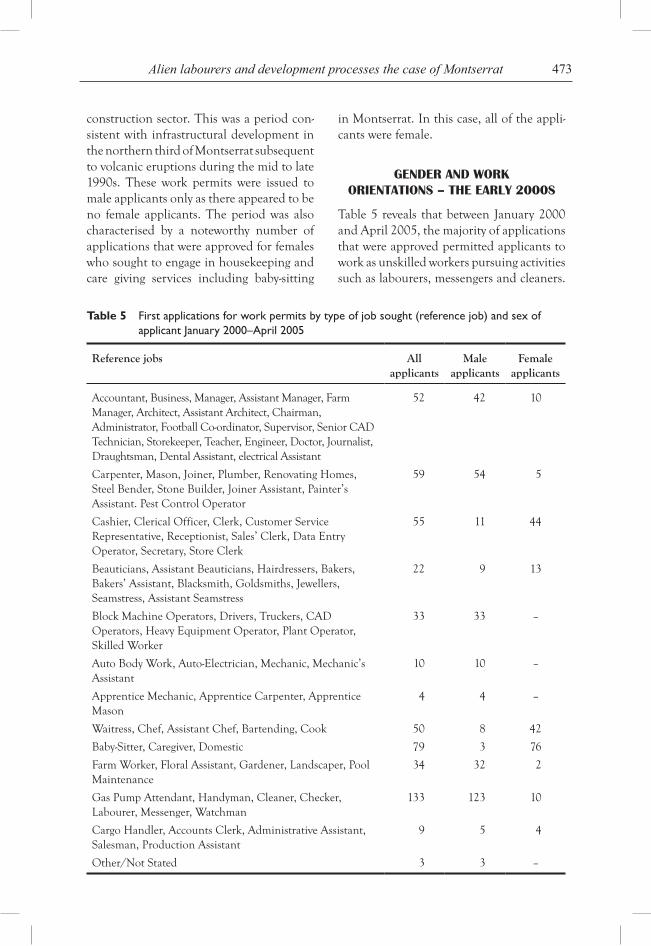
473Alien labourers and development processes the case of Montserrat
construction sector. This was a period con-sistent with infrastructural development in the northern third of Montserrat subsequent to volcanic eruptions during the mid to late 1990s. These work permits were issued to male applicants only as there appeared to be no female applicants. The period was also characterised by a noteworthy number of applications that were approved for females who sought to engage in housekeeping and care giving services including baby-sitting
in Montserrat. In this case, all of the appli-cants were female.
Gender And WorK orientAtions – the eArlY 2000s
Table 5 reveals that between January 2000 and April 2005, the majority of applications that were approved permitted applicants to work as unskilled workers pursuing activities such as labourers, messengers and cleaners.
Table 5 First applications for work permits by type of job sought (reference job) and sex of applicant January 2000–April 2005
Reference jobs All applicants
Male applicants
Female applicants
Accountant, Business, Manager, Assistant Manager, Farm Manager, Architect, Assistant Architect, Chairman, Administrator, Football Co-ordinator, Supervisor, Senior CAD Technician, Storekeeper, Teacher, Engineer, Doctor, Journalist, Draughtsman, Dental Assistant, electrical Assistant
52 42 10
Carpenter, Mason, Joiner, Plumber, Renovating Homes, Steel Bender, Stone Builder, Joiner Assistant, Painter’s Assistant. Pest Control Operator
59 54 5
Cashier, Clerical Officer, Clerk, Customer Service Representative, Receptionist, Sales’ Clerk, Data Entry Operator, Secretary, Store Clerk
55 11 44
Beauticians, Assistant Beauticians, Hairdressers, Bakers, Bakers’ Assistant, Blacksmith, Goldsmiths, Jewellers, Seamstress, Assistant Seamstress
22 9 13
Block Machine Operators, Drivers, Truckers, CAD Operators, Heavy Equipment Operator, Plant Operator, Skilled Worker
33 33 –
Auto Body Work, Auto-Electrician, Mechanic, Mechanic’s Assistant
10 10 –
Apprentice Mechanic, Apprentice Carpenter, Apprentice Mason
4 4 –
Waitress, Chef, Assistant Chef, Bartending, Cook 50 8 42
Baby-Sitter, Caregiver, Domestic 79 3 76
Farm Worker, Floral Assistant, Gardener, Landscaper, Pool Maintenance
34 32 2
Gas Pump Attendant, Handyman, Cleaner, Checker, Labourer, Messenger, Watchman
133 123 10
Cargo Handler, Accounts Clerk, Administrative Assistant, Salesman, Production Assistant
9 5 4
Other/Not Stated 3 3 –
474 G.C. St. Bernard
Such work permits were issued principally to male applicants insofar as females appeared not to have indicated any interest in pur-suing such work. Additionally, foreigners sought work in housekeeping and care-giv-ing chores, hospitality-related work, as pro-fessional and associated technicians, skilled tradespersons, and clerical and secretarial workers. Whether in the Pre-2000 period or in the early years of the 2000s, males over-whelmingly outnumber females with respect to applications that had been approved for work sought as professionals and associated technicians, skilled tradespersons, equip-ment and machine operators, auto-repairs, agricultural and landscaping and unskilled workers. In contrast, females overwhelmingly outnumber males with respect to applications that have been submitted and approved for work sought in clerical and secretarial activi-ties, hospitality, and housekeeping and care-giving chores. Such outcomes are consistent with the notion that gender-related labour patterns abound in alien labourers’ pursuit of work in Montserrat.
mAle WorK orientAtions And countrY of oriGin
With reference to country of origin, Table 6 examines the distribution of males who were granted work in different occupational activities in Montserrat. Among Guyanese male applicants, the majority were permit-ted to work as unskilled workers, in particu-lar as labourers. In addition, applications were approved for Guyanese males to pur-sue activities in a wide array of jobs, most notably as skilled tradespersons and as work-ers in agriculture and landscaping activities. Guyanese males were also granted permits to work as goldsmiths and jewellers.
Except for engaging in a narrower array of work activities, a similar pattern was evident among male applicants born in
Jamaica with the largest number of appli-cants being granted work permits, observed to be engaged in activities akin to unskilled work, skilled trades, and agriculture and landscaping. Though on a much smaller scale, the orientation towards different kinds of jobs pursued by male applicants from the Dominican Republic is similar to that of Jamaican and Guyanese males. However, the array of jobs is observed to be even narrower than that observed among the Jamaicans.
Compared to nationals from Guyana, Jamaica and the Dominican Republic, a dif-ferent pattern emerges when one examines variations in the work-related activities of Indian and Dominican nationals who had been permitted to work in Montserrat. In the case of the Indians, the vast majority were permitted to work in professional, manage-rial and supervisory capacities. With respect to Dominican nationals, a larger number of approvals were granted to pursue work as skilled tradespersons and as equipment and machine operators than as labourers or as workers in agriculture. Thus, there appears to be a pattern of economic activity that is somewhat linked to social and economic characteristics that might be associated with applicants’ country of birth.
femAle WorK orientAtions And countrY of oriGin
Table 7 turns attention towards the dis-tribution of females who were granted work permits to work in Montserrat during the early years of the 2000s. Whether Guyanese, Jamaican or from the Dominican Republic, the majority of applicants were permitted to work as housekeepers and caregivers. A notable number of Guyanese applicants appeared to have applied for work and were granted permits to work as tradespersons in male
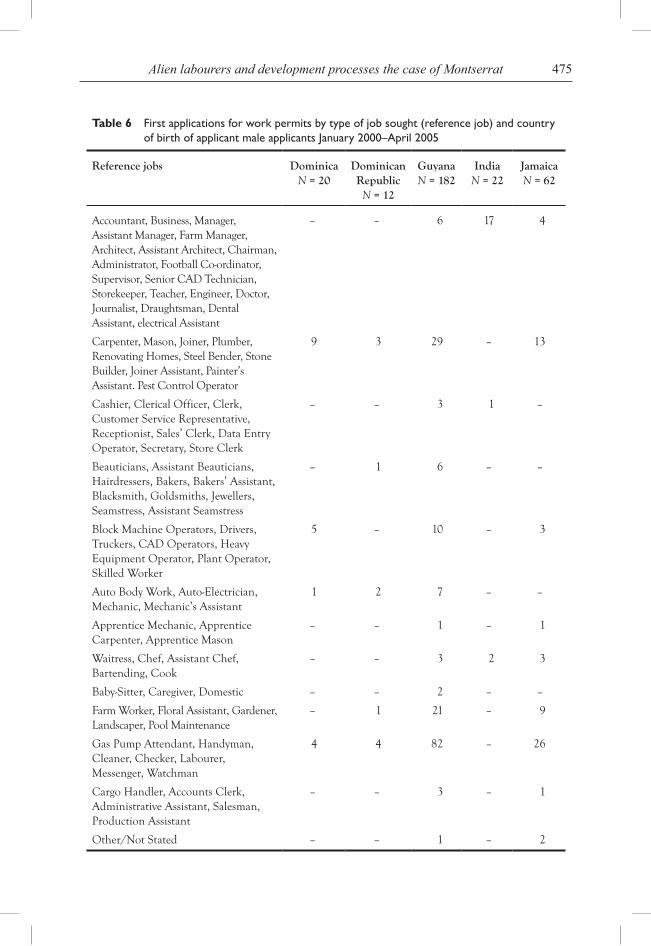
475Alien labourers and development processes the case of Montserrat
Table 6 First applications for work permits by type of job sought (reference job) and country of birth of applicant male applicants January 2000–April 2005
Reference jobs Dominica N = 20
Dominican Republic N = 12
Guyana N = 182
India N = 22
Jamaica N = 62
Accountant, Business, Manager, Assistant Manager, Farm Manager, Architect, Assistant Architect, Chairman, Administrator, Football Co-ordinator, Supervisor, Senior CAD Technician, Storekeeper, Teacher, Engineer, Doctor, Journalist, Draughtsman, Dental Assistant, electrical Assistant
– – 6 17 4
Carpenter, Mason, Joiner, Plumber, Renovating Homes, Steel Bender, Stone Builder, Joiner Assistant, Painter’s Assistant. Pest Control Operator
9 3 29 – 13
Cashier, Clerical Officer, Clerk, Customer Service Representative, Receptionist, Sales’ Clerk, Data Entry Operator, Secretary, Store Clerk
– – 3 1 –
Beauticians, Assistant Beauticians, Hairdressers, Bakers, Bakers’ Assistant, Blacksmith, Goldsmiths, Jewellers, Seamstress, Assistant Seamstress
– 1 6 – –
Block Machine Operators, Drivers, Truckers, CAD Operators, Heavy Equipment Operator, Plant Operator, Skilled Worker
5 – 10 – 3
Auto Body Work, Auto-Electrician, Mechanic, Mechanic’s Assistant
1 2 7 – –
Apprentice Mechanic, Apprentice Carpenter, Apprentice Mason
– – 1 – 1
Waitress, Chef, Assistant Chef, Bartending, Cook
– – 3 2 3
Baby-Sitter, Caregiver, Domestic – – 2 – –
Farm Worker, Floral Assistant, Gardener, Landscaper, Pool Maintenance
– 1 21 – 9
Gas Pump Attendant, Handyman, Cleaner, Checker, Labourer, Messenger, Watchman
4 4 82 – 26
Cargo Handler, Accounts Clerk, Administrative Assistant, Salesman, Production Assistant
– – 3 – 1
Other/Not Stated – – 1 – 2
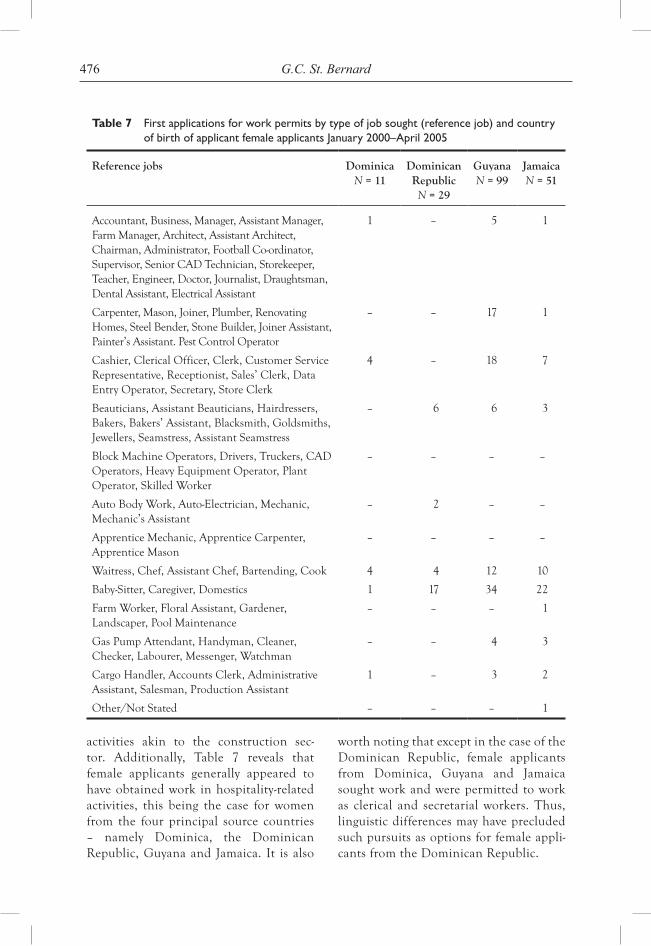
476 G.C. St. Bernard
Table 7 First applications for work permits by type of job sought (reference job) and country of birth of applicant female applicants January 2000–April 2005
Reference jobs Dominica N = 11
Dominican Republic N = 29
Guyana N = 99
Jamaica N = 51
Accountant, Business, Manager, Assistant Manager, Farm Manager, Architect, Assistant Architect, Chairman, Administrator, Football Co-ordinator, Supervisor, Senior CAD Technician, Storekeeper, Teacher, Engineer, Doctor, Journalist, Draughtsman, Dental Assistant, Electrical Assistant
1 – 5 1
Carpenter, Mason, Joiner, Plumber, Renovating Homes, Steel Bender, Stone Builder, Joiner Assistant, Painter’s Assistant. Pest Control Operator
– – 17 1
Cashier, Clerical Officer, Clerk, Customer Service Representative, Receptionist, Sales’ Clerk, Data Entry Operator, Secretary, Store Clerk
4 – 18 7
Beauticians, Assistant Beauticians, Hairdressers, Bakers, Bakers’ Assistant, Blacksmith, Goldsmiths, Jewellers, Seamstress, Assistant Seamstress
– 6 6 3
Block Machine Operators, Drivers, Truckers, CAD Operators, Heavy Equipment Operator, Plant Operator, Skilled Worker
– – – –
Auto Body Work, Auto-Electrician, Mechanic, Mechanic’s Assistant
– 2 – –
Apprentice Mechanic, Apprentice Carpenter, Apprentice Mason
– – – –
Waitress, Chef, Assistant Chef, Bartending, Cook 4 4 12 10
Baby-Sitter, Caregiver, Domestics 1 17 34 22
Farm Worker, Floral Assistant, Gardener, Landscaper, Pool Maintenance
– – – 1
Gas Pump Attendant, Handyman, Cleaner, Checker, Labourer, Messenger, Watchman
– – 4 3
Cargo Handler, Accounts Clerk, Administrative Assistant, Salesman, Production Assistant
1 – 3 2
Other/Not Stated – – – 1
activities akin to the construction sec-tor. Additionally, Table 7 reveals that female applicants generally appeared to have obtained work in hospitality-related activities, this being the case for women from the four principal source countries – namely Dominica, the Dominican Republic, Guyana and Jamaica. It is also
worth noting that except in the case of the Dominican Republic, female applicants from Dominica, Guyana and Jamaica sought work and were permitted to work as clerical and secretarial workers. Thus, linguistic differences may have precluded such pursuits as options for female appli-cants from the Dominican Republic.
477Alien labourers and development processes the case of Montserrat
some reflection And concludinG remArKs
Montserrat is a small island that is still exposed to an uncertain future as long as volcanic activity persists in the Soufriere Hills. Notwithstanding this, there are native Montserratians determined to eke out a live-lihood on the fraction of the island, deemed to be habitable. The paper supports the view that population growth is critical to sustain-able development initiatives in Montserrat and that such growth can only be achieved through immigration which is likely to con-stitute aliens seeking work in Montserrat more so than the return of Montserratian natives. CARICOM nationals from Guyana, Jamaica and Dominica and Hispanics from the Dominican Republic constitute the vast majority of alien labourers who sought work in Montserrat during the late 1990s and between 2000 and April 2005. Also noteworthy is the notable presence of a very small Indian sub-population from Asia.
The data on first applications for work permits reveal that males outnumbered females and that applicants were young pri-marily in their twenties and early thirties, the latter being the case whether applicants were male or female. On an annual basis, the number of first applications by males exceeded the number by females, this being especially evident in the case of Guyanese applicants. Prior to 2001, the number of first applications by males from the Dominican Republic exceeded that of their female coun-terparts. However, between 2001 and April 2005, the number of applicants by females from the Dominican Republic exceeded that by males.
Notwithstanding a small number of first applications to pursue professional and technical work, the majority of applications were submitted by applicants who sought work in construction activities, as caregiv-ers and domestics, or as unskilled workers
during the latter half of the 1990s A clear sexual division of work aspirations was evi-dent with males submitting virtually every application for professional and techni-cal work, construction work and unskilled labour and females submitting every appli-cation for work as caregivers and domestics. Since 2000 and until April 2005, there was very little change in the pattern that emerged in the late 1990s, the main differ-ences being a proliferation of applications to pursue skilled work and tertiary-level ser-vices, and a small but increasing presence of female applicants interested in pursuing work in primarily male domains. It is also noteworthy that large numbers of applica-tions for unskilled work, care-giving and domestic activities, and construction work were submitted by applicants from Guyana and Jamaica.
Considering some of the observations that emerge in the context of work permit applications, there appear to be a number of important implications for initiatives geared toward attaining sustainable devel-opment in Montserrat. The preponderance of male applicants has the effect of increas-ing the sex ratio, this being further exacer-bated by the fact that applicants are mostly in their 20s and early 30s. Notwithstanding the ‘youth bias’ which seems characteristic of foreign workers and its impact in retard-ing the pace of ageing and cushioning the elderly dependency burden, population projections are consistent with prospec-tive increases in the proportion of the population 65 years or older. The latter is concomitant with a growing need for care-giving services which have primarily been female domains and may result in increas-ing numbers of females seeking work per-mits to undertake such work in the future. The fact that work permits have been issued enabling foreign workers to pursue specific kinds of activities suggests that there is a shortage in the native Montserratian labour
478 G.C. St. Bernard
market to fill all of the gaps. This is particu-larly true with respect to construction work and unskilled work which have been main activities pursued by foreign workers from Guyana and Jamaica.
In essence, work permit recipients have filled some important gaps in areas where Montserrat may not have critical mass among its native residents. Foreign workers particularly those from Guyana and Jamaica have been instrumental in broadening the tax base for increasing revenue through direct taxes and public services. Through their services, they have facilitated post-vol-canic recovery efforts in Montserrat by vir-tue of their economic contribution which has been a major feature of their sojourn in Montserrat irrespective of their ulterior motives. Their efforts along with those of native Montserratians have been critical to the preservation of institutions, whether social, economic, political or cultural. Such institutions, having been preserved, albeit with subtle inherent changes, are likely to spawn outcomes that are harbingers for sustainable development through the pro-motion of change providing that temporal changes within the wide array of institu-tional spheres, reflect some form of amelio-ration characterised by greater access to con-dition and opportunity on one hand and thrusts toward greater equality and equity on the other.
Notwithstanding the uncertainty sur-rounding the future of the volcanic activity, the Government of Montserrat continues to strive towards the attain-ment of sustainable development. Being constrained by the shadow of an active volcano and the despair that character-ises the lives of residents, native as well as foreign, human life continues to thrive in Montserrat and will continue to thrive if
not interrupted by the forces of nature. To this end, the Government of Montserrat has to embrace a ‘quasi-open’ migration policy that makes allowances to accom-modate new waves of immigrants as there is likely to be persistent leakage as natives emigrate and foreign workers continue their search for pastures deemed to be greener than Montserrat.
bioGrAphY
Dr. Godfrey St. Bernard obtained his Ph.D. in Social Demography from the University of Western Ontario, London, Ontario, Canada in 1993 and is currently employed at the Sir Arthur Lewis Institute of Social and Economic Studies (SALISES – for-merly the Institute of Social and Economic Research (ISER) in the University of the West Indies, St. Augustine Campus, Trinidad and Tobago. His current research interests include social measurement, pop-ulation dynamics in Caribbean societies and human development challenges. His publications treat with the major scholarly domains that are central to his research.
references
Anderson, P. (1985) Migration and Development in Jamaica, ISER Paper #2, The Institute of Social and Economic Research, The University of the West Indies, Mona, Jamaica.
Boodhoo, M.J. and Baksh, A. (1981) The Impact of Brain Drain on Development: A Case Study of Guyana, Percetakan Intisari, Kuala Lumpur, Malaysia.
Byron, M. (1994) Post-War Caribbean Migration to Britain: The Unfinished Cycle, Aldershot, Avebury.
Byron, M. (2000) ‘Return migration to the Eastern Caribbean: comparative experiences and policy implications’, Social and Economic Studies, Vol. 49, No. 4.
479Alien labourers and development processes the case of Montserrat
Conway, D., Potter, R.P. and St. Bernard, G. (2009) ‘Returning youthful Trinidadian migrants: prolonged Sojourners’ transitional experiences’, in Conway, D. and Potter, R.B. (Eds.): Return Migration of the Next Generations – 21st Century Transitional Mobility, Ashgate Publishing Limited.
Cooper, D. (1985) ‘Migration from Jamaica in the 1970s: political protest or economic pull’, International Migration Review, Vol. 19, No. 4.
Daly, O. (1996) An Analysis of the 1991 Population and Housing Census for Montserrat, CARICOM Secretariat, Georgetown.
De Souza, R.M. (1998) ‘The spell of the Cascadura: West Indian Return Migration’, in Klak, T. (Ed.): Globalization and Neo-Liberalization – The Caribbean Context, Rowan and Littlefield Publishers, Inc.
De Souza, R.M. (2005) ‘No place like home: returnee retention and rejection in the Caribbean homeland’, in Conway, D. and Potter, R. (Eds.): The Experience of Return Migration in the Caribbean, Ashgate Publishers.
Ebanks, G.E. (1987) Montserrat and its People – A Demographic Analysis, CARICOM Secretariat, Georgetown.
Ebanks, G.E., George, P.M. and Nobbe, C.E. (1979) ‘Emigration from Barbados, 1951–1970’, Social and Economic Studies, Vol. 28, No. 2.
Fergus, H. (2004) Montserrat – History of a Caribbean Colony, 2nd edition, Macmillan Caribbean.
Girling, R.K. (1974) ‘The migration of human capital from the third world: the implications and some data on the Jamaican Case’, Social and Economic Studies, Vol. 23, No. 1.
Gmelch, G. (1987) ‘Work, innovation and investment: the impact of return migrants in Barbados’, Human Organization, Vol. 46, No. 2, pp.131–140.
Maunder, W.F. (1955) ‘The new Jamaican emigrant’, Journal of Social and Economic Studies, Vol. 4, No. 1, pp.38–83.
Muschkin, C. (1993) ‘Consequences for return migration status for employment in Puerto
Rico’, International Migration Review, Vol. 27, No. 1, pp.79–102.
Philpott, S.B (1973) West Indian Migration – The Montserrat Case, Athlone Press, London.
Plaza, D. (2002) ‘The socio-cultural adjustment of second generation British Caribbean ‘Return’ migrants to Barbados and Jamaica’, Journal of Eastern Caribbean Studies, Vol. 27, No. 4, pp.135–160.
Plaza, D.E. and Henry, F. (Eds.) (2006) Returning to the Source – The Final Stage of the Caribbean Migration Circuit, University of the West Indies Press.
Potter, R.B., Conway, D. and Phillips, J. (Eds.) (2005) The Experience of Return Migration – Caribbean Perspectives, Ashgate Publishing Limited.
Rampersad, F. and Pujadas, L. (1970) The Emigration of Professional, Supervisory, Middle Level and skilled Manpower from Trinidad and Tobago 1962–1968 Brain Drain, Central Statistical Office, Port of Spain, Trinidad and Tobago.
Roberts, G.W. (1981) ‘Currents of external migration affecting the West Indies – A Summary’, Revista InterAmericana, Vol. 11, No. 3.
Roberts, G.W. and Mills, D.O. (1958) ‘A study of external migration affecting Jamaica 1953–1955’, Journal of Social and Economic Studies, Vol. 7, No. 2.
Rubenstein, H. (1982) ‘The impact of remittances in the rural english-speaking Caribbean: notes on the literature’, in William-Stinner, F., de Alburquerque, K. and Bryce-Laporte, R.S. (Eds.): Return Migration and Remittances – Developing a Caribbean Perspective, Smithsonian Institute.
St. Bernard, G. (2005) ‘Return migration to Trinidad and Tobago: motives, consequences and the prospect of re-migration’, in Conway, D. and Potter, (Eds.): The Experience of Return Migration in the Caribbean, Ashgate Publishing Limited.
St. Bernard, G. (2006) Montserrat Demographic Study, Development Unit, Brades, Montserrat.

480 G.C. St. Bernard
Stinner, W., de Albuquerque, K. and Bryce-Laporte, R.S. (1982) ‘Preface’, Return Migration and Remittances: Developing a Caribbean Perspective, Research Institute for Immigration and Ethnic Studies, Smithsonian Institute, Washington, DC.
Thomas-Hope, E.M. (1985) ‘Return migration and its implications for Caribbean development’, in Pastor, R. (Ed.): Migration and Development in the Caribbean: The
Unexpected Connection, Westview Press Boulder, Colorado, pp.157–177.
Thomas-Hope, E.M. (1999) ‘Return migration to Jamaica and its development potential’, International Migration, Vol. 37, No. 1, pp.183–205.
Tidrick, G. (1966) ‘Some aspects of Jamaican migration to the United Kingdom’, Journal of Social and Economic Studies, Vol. 15, No. 1, pp.22–39.
Copyright © 2010 WASD
World Sustainable Development Outlook 2010
481
SUSTAINING THE FUTURE WELL BEING OF OUR CHILDREN:
AN EMPIRICAL ANALYSIS OF BREASTFEEDING PRACTICES IN TRINIDAD AND TOBAGO
Godfrey C. St. Bernard*University of the West Indies, Trinidad and Tobago
Abstract: Breastfeeding is a critical dimension of children’s prospective health and eventual wellbeing as adults. According to WHO/UNICEF, recommended standards for breastfeeding require that infants be breastfed exclusively for the first six months with continued breastfeeding for 2 years or more. This is an important concern given women’s recent thrusts in labour market pursuits including their initiatives toward advancing their education and training attributes and their careers. The paper examines whether or not, appropriate feeding standards have been practiced among 424 children under 2 years and the extent to which a range of socio-economic factors such as socio-economic status, mother’s education, mother’s participation in the labour force, mother’s age, place of residence and sex of child, impact upon variation in such feeding standards. The data are drawn from the Trinidad and Tobago MICS which was conducted under the auspices of the Ministry of Social Development, The Government of Trinidad and Tobago in 2006. With respect to socio-economic status, labour market experiences and the need to fulfill educational and training requirements, the paper makes recommendations for treating mother’s breastfeeding practices in the postpartum period as such practices impact subsequent human development capabilities of the next generation.
Keywords: Child Nutrition, Child Health, human development, female labour force participation, motherhood, workplace nurseries, breastfeeding
INTRODUCTION
rationale for the study
The future well being of nations is largely contingent upon national policy prescrip-tions and attendant circumstantial, attitudi-nal and behavioural characteristics that have thrived and in many instances, continue to persist in myriad institutional spheres and
especially among individuals who shape outcomes in such institutional spheres and in civil society. To this end, any concern about the future must consider children as principal targets of intervention and as such, embrace a dynamic rather than static model of development. In part, today’s problems and development challenges are the outcomes of yesteryears’ errors and
*Corresponding author: University of the West Indies, Trinidad and Tobago; e-mail: [email protected]
482 G.C. St. Bernard
shortcomings. Moreover, the socio-cultural evolution of individuals and their respec-tive primary and secondary groups appear to be at variable levels notwithstanding the systematic frameworks within which they thrive and survive. Whether in the context of individuals or groups, such variable phases of evolution are indicative of discrepancies that are deemed to be either favourable or unfavourable when considered in relation to advances largely associated with techno-logical progress, the evolution of ideas and knowledge and individuals’ states of con-sciousness which strike a balance between co-operation and competition.
Sustainable development thrusts ought to place children centre-stage, this being adequately reflected by Bellamy (2001). Specifically, she noted:
….It is deeply ironic that despite wide-spread concern about the lack of sustain-able development in numerous countries around the world, government leaders, policy makers, and development agents seem blinded to the one investment opportunity with almost guaranteed returns—ensuring children a good start in life … (Bellamy, 2001, p.4)
Bellamy (2001) reinforces the importance of investing in the early years of children’s lives and in particular, the importance of such investment to the personal human development of children. She notes that in the first 36 months of children’s lives, they learn to talk, walk, sense and reason, the latter being critical in their ability to eventually evaluate attitudes and behaviour. Not surprisingly, Bellamy (2001) considers this 3-year period as critical in determining subsequent life experiences and fortunes at later stages of childhood and undoubtedly in adolescent and adult stages of one’s life. While recognising gains due to late achieve-ment whether in the context of improved
health, educational advancement or overall human development, Bellamy (2001) con-tends that deprivation in the early years of life has a deleterious effect on children preventing them from attaining their full potential. In essence, such deprivation and the absence of what she has labelled ‘the right start’ could be deemed an important factor in sustaining inequity and inequality.
Health, education and nutrition are considered to be the most critical domains within which early childhood interventions are likely to have the most profound impact on the human development of children. To this end, a range of interventions such as those reinforcing the importance of good hygiene and sanitation practices, sustained immunisation programmes, the prevention of malnutrition, the observance of proper exposure to breastfeeding, improved physical growth, the early detection and subsequent treatment of disabilities, and breastfeed-ing as a psychosocial stimulant, have been hailed as worthy. In the context of Trinidad and Tobago, this study focuses on feeding practices in the first two years of life with a view to gaining insights that could be instrumental in enhancing social policy prescriptions seeking to promote sustain-able human development. Women’s recent thrust towards advancing their education and training attributes is consistent with observations that reflect their greater partici-pation in the labour force. Notwithstanding the fact that fertility levels have been declin-ing over the past three decades, greater levels of female labour force participation could have negative consequences for feed-ing practices meted out to infants.
WHO/UNICEF recommends that infants be breastfed exclusively for the first six months with continued breastfeeding for at least 2 years. The establishment of such standards by WHO/UNICEF reinforces
483Sustaining the future well being of our children
the advantage of exclusive breastfeeding over alternative feeding practices. Moreover, several bio-medical studies have identified a host of benefits including stronger immunity to diseases, reduced prospects of infant and childhood morbidity, superior intellectual and motor skills development, enhanced psy-chosocial stimulation and in general, greater probabilities of survival into adulthood as principal gains associated with infants’ expo-sure to exclusive breastfeeding. The latter can be attributed to the observed links between exposure to being breastfed and reduced risks of succumbing to chronic diseases.
The World Fit for Children Goal states that children should be exclusively breastfed for 6 months and continue to be breastfed with safe, appropriate and adequately complementary feeding up to 2 year of age and beyond. As such, WHO/UNICEF have advanced four key recommendations to be pursued by countries seeking to attain adequate feeding standards. The recommen-dations include: (a) exclusive breastfeeding for the first six months of infants’ lives; (b) continued breastfeeding for 2 years or more; (c) safe, appropriate and adequate complementary foods beginning at 6 months and (d) complementary feeding at a rate of 2 times per day for 6–8 month olds and 3 times per day for 9–11 month olds. Indicators such as the proportion of mothers initiating breastfeeding within one hour of birth, the exclusive breastfeed-ing rate for infants less than 6 months old, the proportion of infants under 1 year that were observed to be adequately fed and the proportion of children under 5 years that continued breastfeeding beyond their first birthday for at least 2 years, all constitute useful measures for gauging exposure to breastfeeding among infants and children.
Based on data from the Trinidad and Tobago MICS 2000, it was estimated that
10% of children aged less than 3 months were exclusively breastfed. However, based on the Trinidad and Tobago MICS 2006, 12.8% of children less than 6 months old were estimated to have been exclusively breastfed and as such, adequately fed. Among infants 6–11 months, a higher pro-portion amounting to 27.7% was estimated to have been adequately fed. With respect to infants under 1 year, approximately one-fifth (20.5%) were estimated to have been adequately fed.
Insofar as breastfeeding and more specifically exclusive breastfeeding early in children’s lives appear to be associated with maximising potential gains in their lifetime achievements, investment in the promotion of adequate breastfeeding stan-dards is a primary option that is worth investigating. In the event that exercising such an option yields interventions that are mobilised, targeting becomes a criti-cal issue and the demographics of poten-tial beneficiaries, whether at individual or institutional levels, should be systemati-cally determined and evaluated in order to enhance the effectiveness and efficiency of requisite interventions. In particular, the differential effects of characteristics associated with attributes such as mothers’ socio-economic status, education, partici-pation in the labour force, age and place of residence emerge as critical correlates in gauging variations in children’s exposure to breastfeeding.
These attributes constitute levers through which social policy prescriptions can treat with promoting mechanisms for achieving sustainable human development through enhancing prospects for improv-ing innate characteristics associated with individuals’ education, health, longevity of life and overall well being. Notwithstanding that this study is specifically focused on
484 G.C. St. Bernard
nutritional practices in early childhood, its findings should set the stage for emergent insights deemed to be critical in reinforcing the virtues of investing in early childhood. Apart from its positive consequences for the later lives of individuals, investing in early childhood years have potentially long term impacts on economic returns due to reductions in real expenditure in areas such as remedial education, health care and rehabilitation. From a social stand-point, there are prospects of a lower like-lihood of emergent social and economic disparities and gender inequalities. From an international standpoint, greater pros-pects of equality and elevated standards of human capability are likely to enhance the competitiveness of populations on a global scale.
The principal purpose of the study is to describe variable patterns of breastfeeding practices that children are exposed to dur-ing their first two years of life and hence, to advance strategies that would facilitate breastfeeding practices tantamount to the World Fit for Children Goals. As a result, the study strives to answer four principal questions which are as follows:
(i) What is the prevalence of breastfeeding and its variability across critical age groups in the context of children during the first 24 months of their lives?
(ii) For such children, which sub-populations of children exhibit the most favour-able and the least favourable breast-feeding bearing in mind international recommendations?
(iii) Which children’s characteristics, if any, emerge as significant in targeting efforts towards more favourable breastfeeding standards?
(iv) What are some of the main implica-tions of the study’s findings and what
recommendations seem to be most worthwhile?
LITERATURE REVIEW
Butz (1977) examines the costs and benefits of breastfeeding based upon an economic model. Having examined interactions involv-ing a host of factors, namely, the supply and demand for female labour, price of staple foods, the availability of alternative weaning foods, the availability and price of effective contraceptives, and infants’ survival chances, he concludes that economic development and its concomitant transfer of functions away from the home into public domains. In order to offset the costs associated with breast-feeding, he recommends the use of high qual-ity weaning foods and the identification of mechanisms that would enable women to breastfeed despite changing value systems.
In a demographic account, Peterson and Da Vanzo (1992) examine factors that result in differential breastfeeding practices meted out to infants by teenag-ers on one hand and older women on the other. They associate the lower likelihood of breastfeeding among teenagers to inter-vening factors such as lower educational attainment, lower income, being single and concern about physical appearance. Huffman (1984) seeks to evaluate the impact of breastfeeding on fertility regula-tion in developing countries. Accordingly, she recognises a host of sociological and behavioural factors that are associated with women’s breastfeeding practices, specifi-cally, prevalence and duration. Such factors include urbanisation, maternal education and socio-economic status, each of which acts through a number of intervening vari-ables such as socio-cultural factors, health services, women’s employment status and the availability of breast milk substitutes to determine fertility outcomes.
485Sustaining the future well being of our children
Dettwyler (1988) conducted an ethno-graphic study of infant-feeding among urban women in Mali and found that breast milk was observed to be the primary feedstock for infants, an observation that was inimical to those in urban settings where breastfeeding was not found to be as prevalent. Accordingly, the relatively higher prevalence of breastfeeding was inter-preted to be principally due to economic constraints, pro-breastfeeding government policies and beliefs about the value of breast milk, the latter in particular, being linked to cultural nuances associated with conceptions of maternal kinship on the basis breastfeeding.
Dettwyler and Fishman (1992) bring anthropological insights to bear upon inter-preting the relationship between infant feed-ing practices and growth. They highlight the ethnocentrism as a characteristic feature thwarting explanations of this relation-ship based on insights derived from other disciplinary perspectives. They emphasise the significance of cultural and individual beliefs in shaping maternal behavior that manifest itself in the form of feeding prac-tices. Baer (1981) also claims that societal breastfeeding trends are a function of col-lective choices embraced by individual mothers and that such choices could only be examined through understanding the factors that influence mothers’ eventual feeding practices. He notes that mothers’ eventual choices depend on their exposure to opportunities for breastfeeding and their motivation towards breastfeeding. These factors are indicative of cultural imperatives that mix and combine to spawn different responses from women in different cultural settings and thus consistent with the views of Dettwyler and Fishman (1992).
With respect to breastfeeding prac-tices in developing countries, a review by
Baer (1981) highlighted a declining preva-lence and shorter duration-times as char-acteristic features. His concern for the promotion of breastfeeding arose out of his concern about the widespread use of feeding-bottles and its perceived negative consequences for health and economic well being of households and the national economy as a whole. He noted that illness as a result of children’s inability to resist diseases often results in additional medi-cal costs to families and taxpayers who support the national health care system. Moreover, reliance on artificial feeding incurs further costs to the economy placing strain on scarce foreign reserves in devel-oping nations. Baer (1981) also alludes to the contraceptive effect of breastfeeding and its impact upon lengthening birth intervals, an outcome that has been posi-tively associated with child survival. These concerns are also borne out in the work of Huffman and Lamphere (1984) who note that breastfeeding impacts child survival indirectly through nutrient intake, longer birth intervals due to postpartum anovula-tion and its anti-infective properties.
Van Langdingham et al. (1991) laud the benefits of promoting breastfeeding in countries characterised by low con-traceptive prevalence rates, little supple-mentation of breast milk, low nutritional status of women and sexual taboos against sexual relationships during peri-ods of breastfeeding. Having reviewed a number of empirical studies, Van Langdingham et al (1991), pp.134–135) conclude that ‘frequent and intensive breastfeeding clearly reduces the risk of pregnancy in many developing countries’. They also note that a decline in breast-feeding, all other factors equal, would increase infant mortality, child mortality and fertility. Knodel (1977) has also associ-ated declining levels of breastfeeding with
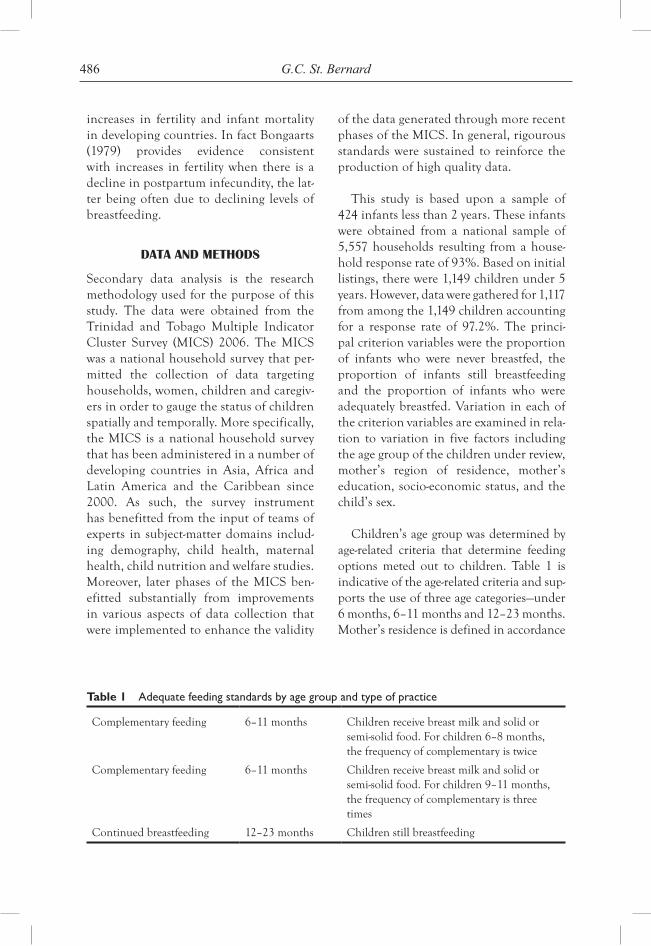
486 G.C. St. Bernard
increases in fertility and infant mortality in developing countries. In fact Bongaarts (1979) provides evidence consistent with increases in fertility when there is a decline in postpartum infecundity, the lat-ter being often due to declining levels of breastfeeding.
DATA AND METHODS
Secondary data analysis is the research methodology used for the purpose of this study. The data were obtained from the Trinidad and Tobago Multiple Indicator Cluster Survey (MICS) 2006. The MICS was a national household survey that per-mitted the collection of data targeting households, women, children and caregiv-ers in order to gauge the status of children spatially and temporally. More specifically, the MICS is a national household survey that has been administered in a number of developing countries in Asia, Africa and Latin America and the Caribbean since 2000. As such, the survey instrument has benefitted from the input of teams of experts in subject-matter domains includ-ing demography, child health, maternal health, child nutrition and welfare studies. Moreover, later phases of the MICS ben-efitted substantially from improvements in various aspects of data collection that were implemented to enhance the validity
of the data generated through more recent phases of the MICS. In general, rigourous standards were sustained to reinforce the production of high quality data.
This study is based upon a sample of 424 infants less than 2 years. These infants were obtained from a national sample of 5,557 households resulting from a house-hold response rate of 93%. Based on initial listings, there were 1,149 children under 5 years. However, data were gathered for 1,117 from among the 1,149 children accounting for a response rate of 97.2%. The princi-pal criterion variables were the proportion of infants who were never breastfed, the proportion of infants still breastfeeding and the proportion of infants who were adequately breastfed. Variation in each of the criterion variables are examined in rela-tion to variation in five factors including the age group of the children under review, mother’s region of residence, mother’s education, socio-economic status, and the child’s sex.
Children’s age group was determined by age-related criteria that determine feeding options meted out to children. Table 1 is indicative of the age-related criteria and sup-ports the use of three age categories—under 6 months, 6–11 months and 12–23 months. Mother’s residence is defined in accordance
Table 1 Adequate feeding standards by age group and type of practice
Complementary feeding 6–11 months Children receive breast milk and solid or semi-solid food. For children 6–8 months, the frequency of complementary is twice
Complementary feeding 6–11 months Children receive breast milk and solid or semi-solid food. For children 9–11 months, the frequency of complementary is three times
Continued breastfeeding 12–23 months Children still breastfeeding
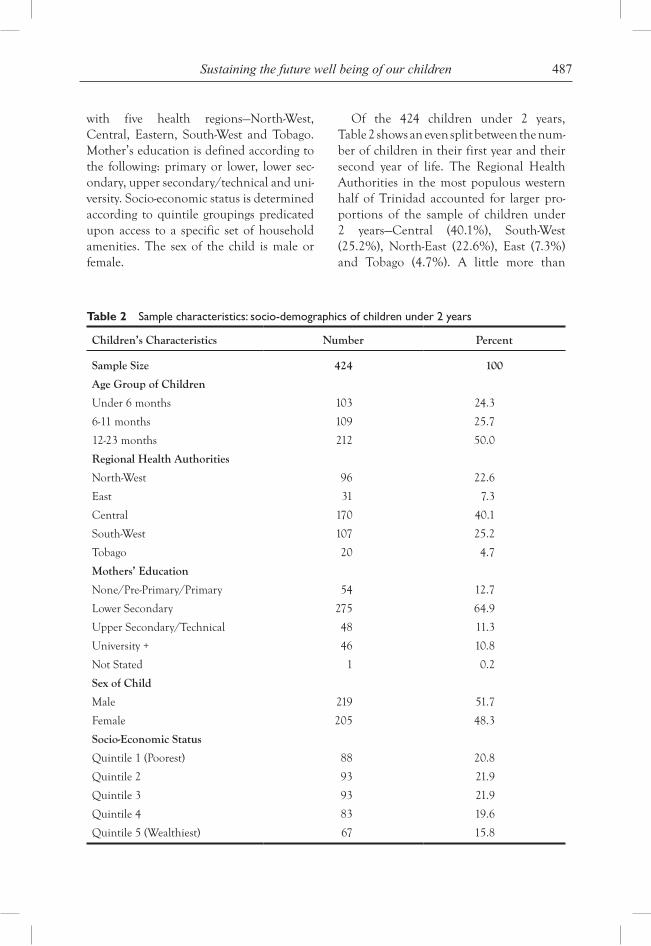
487Sustaining the future well being of our children
with five health regions—North-West, Central, Eastern, South-West and Tobago. Mother’s education is defined according to the following: primary or lower, lower sec-ondary, upper secondary/technical and uni-versity. Socio-economic status is determined according to quintile groupings predicated upon access to a specific set of household amenities. The sex of the child is male or female.
Of the 424 children under 2 years, Table 2 shows an even split between the num-ber of children in their first year and their second year of life. The Regional Health Authorities in the most populous western half of Trinidad accounted for larger pro-portions of the sample of children under 2 years—Central (40.1%), South-West (25.2%), North-East (22.6%), East (7.3%) and Tobago (4.7%). A little more than
Table 2 Sample characteristics: socio-demographics of children under 2 years
Children’s Characteristics Number Percent
Sample Size 424 100
Age Group of Children
Under 6 months 103 24.3
6-11 months 109 25.7
12-23 months 212 50.0
Regional Health Authorities
North-West 96 22.6
East 31 7.3
Central 170 40.1
South-West 107 25.2
Tobago 20 4.7
Mothers’ Education
None/Pre-Primary/Primary 54 12.7
Lower Secondary 275 64.9
Upper Secondary/Technical 48 11.3
University + 46 10.8
Not Stated 1 0.2
Sex of Child
Male 219 51.7
Female 205 48.3
Socio-Economic Status
Quintile 1 (Poorest) 88 20.8
Quintile 2 93 21.9
Quintile 3 93 21.9
Quintile 4 83 19.6
Quintile 5 (Wealthiest) 67 15.8
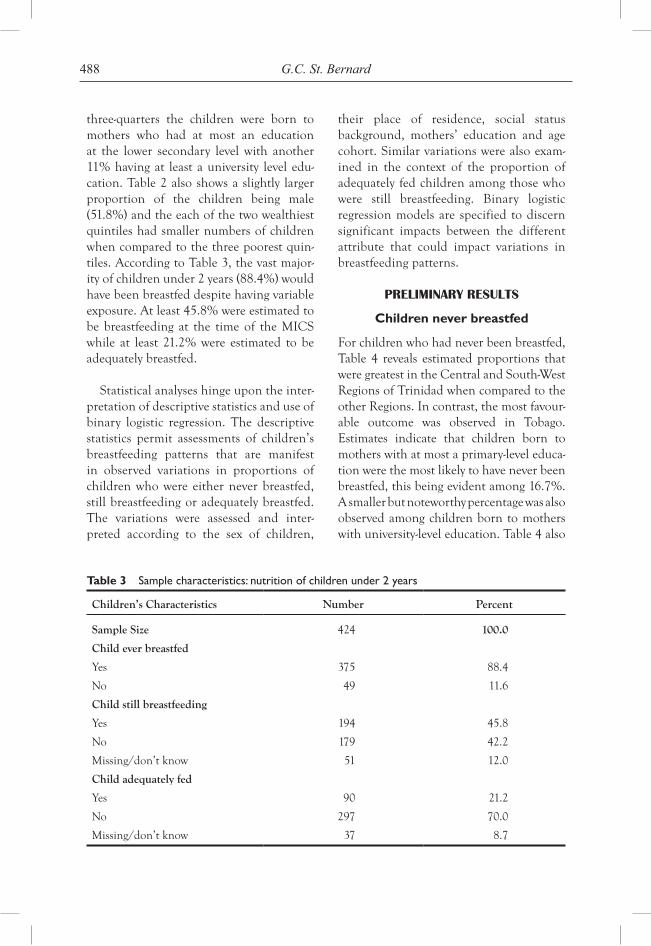
488 G.C. St. Bernard
three-quarters the children were born to mothers who had at most an education at the lower secondary level with another 11% having at least a university level edu-cation. Table 2 also shows a slightly larger proportion of the children being male (51.8%) and the each of the two wealthiest quintiles had smaller numbers of children when compared to the three poorest quin-tiles. According to Table 3, the vast major-ity of children under 2 years (88.4%) would have been breastfed despite having variable exposure. At least 45.8% were estimated to be breastfeeding at the time of the MICS while at least 21.2% were estimated to be adequately breastfed.
Statistical analyses hinge upon the inter-pretation of descriptive statistics and use of binary logistic regression. The descriptive statistics permit assessments of children’s breastfeeding patterns that are manifest in observed variations in proportions of children who were either never breastfed, still breastfeeding or adequately breastfed. The variations were assessed and inter-preted according to the sex of children,
their place of residence, social status background, mothers’ education and age cohort. Similar variations were also exam-ined in the context of the proportion of adequately fed children among those who were still breastfeeding. Binary logistic regression models are specified to discern significant impacts between the different attribute that could impact variations in breastfeeding patterns.
PRELIMINARY RESULTS
Children never breastfed
For children who had never been breastfed, Table 4 reveals estimated proportions that were greatest in the Central and South-West Regions of Trinidad when compared to the other Regions. In contrast, the most favour-able outcome was observed in Tobago. Estimates indicate that children born to mothers with at most a primary-level educa-tion were the most likely to have never been breastfed, this being evident among 16.7%. A smaller but noteworthy percentage was also observed among children born to mothers with university-level education. Table 4 also
Table 3 Sample characteristics: nutrition of children under 2 years
Children’s Characteristics Number Percent
Sample Size 424 100.0
Child ever breastfed
Yes 375 88.4
No 49 11.6
Child still breastfeeding
Yes 194 45.8
No 179 42.2
Missing/don’t know 51 12.0
Child adequately fed
Yes 90 21.2
No 297 70.0
Missing/don’t know 37 8.7
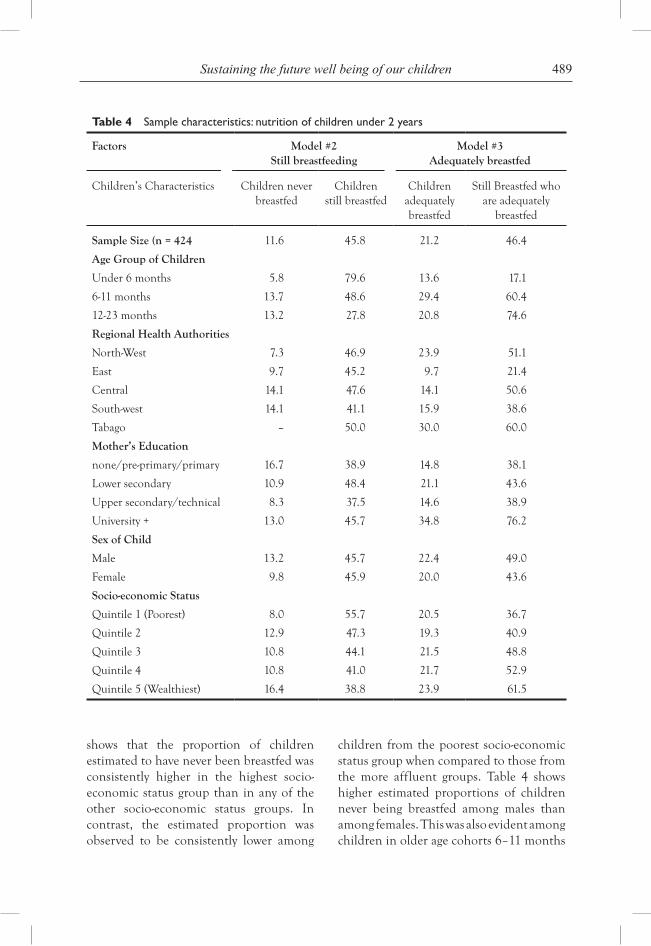
489Sustaining the future well being of our children
Table 4 Sample characteristics: nutrition of children under 2 years
Factors Model #2 Still breastfeeding
Model #3 Adequately breastfed
Children’s Characteristics Children never breastfed
Childrenstill breastfed
Children adequatelybreastfed
Still Breastfed who are adequately
breastfed
Sample Size (n = 424 11.6 45.8 21.2 46.4
Age Group of Children
Under 6 months 5.8 79.6 13.6 17.1
6-11 months 13.7 48.6 29.4 60.4
12-23 months 13.2 27.8 20.8 74.6
Regional Health Authorities
North-West 7.3 46.9 23.9 51.1
East 9.7 45.2 9.7 21.4
Central 14.1 47.6 14.1 50.6
South-west 14.1 41.1 15.9 38.6
Tabago – 50.0 30.0 60.0
Mother’s Education
none/pre-primary/primary 16.7 38.9 14.8 38.1
Lower secondary 10.9 48.4 21.1 43.6
Upper secondary/technical 8.3 37.5 14.6 38.9
University + 13.0 45.7 34.8 76.2
Sex of Child
Male 13.2 45.7 22.4 49.0
Female 9.8 45.9 20.0 43.6
Socio-economic Status
Quintile 1 (Poorest) 8.0 55.7 20.5 36.7
Quintile 2 12.9 47.3 19.3 40.9
Quintile 3 10.8 44.1 21.5 48.8
Quintile 4 10.8 41.0 21.7 52.9
Quintile 5 (Wealthiest) 16.4 38.8 23.9 61.5
shows that the proportion of children estimated to have never been breastfed was consistently higher in the highest socio- economic status group than in any of the other socio-economic status groups. In contrast, the estimated proportion was observed to be consistently lower among
children from the poorest socio-economic status group when compared to those from the more affluent groups. Table 4 shows higher estimated proportions of children never being breastfed among males than among females. This was also evident among children in older age cohorts 6–11 months
490 G.C. St. Bernard
and 12–23 months than among those under 6 months.
Children still breastfeeding
For children who were still breastfeeding, Table 4 reveals estimated proportions that were least favourable in the south-west region of Trinidad when compared to the other regions. There appeared to be little or no difference across the rest of the Regions in Trinidad while Tobago exhibited the most favourable outcome with about half of the children under 2 years being estimated to have been still breastfeeding. On exam-ining the relationship between children’s socio-economic status and the proportion still breastfeeding, preliminary observations in Table 4 are consistent with a negative association. Thus, children in higher socio- economic status groups exhibit less favour-able current breastfeeding. While it is estimated that 38% of the children in the highest socio-economic status group had been still breastfeeding, as much as 55.7% of the children in the poorest socio-eco-nomic status group exhibited similar cur-rent breastfeeding. Compared to children born to mothers with secondary or univer-sity-level education, those born to mothers who attained no more than primary-level education were the least likely to have been still breastfeeding, the estimated proportion being 38.9%. Not surprisingly, estimated proportions show that older children were less likely to be still breastfeeding than their younger counterparts. While just over a quarter (27.8%) of the children aged 12–23 months were still breastfeeding, the cor-responding estimate among those under 6 months was 79.6%.Among those 12–23 months, however, it is not likely that every-one would continue breastfeeding until their second birthdays. Whether male or female, the preliminary results were not consistent with differences in current breastfeeding.
Children adequately breastfed
For children who were adequately breastfed, Table 4 reveals estimated proportions that were least favourable in the East Region of Trinidad when compared to the other Regions. In contrast, Tobago exhibited the most favourable outcome with about 30% of the children under 2 years being estimated to have been adequately breastfed. There does not appear to be much variation in estimated proportions that were adequately fed in each of the social status groups though the most favourable outcomes were evident among those in the highest group in which just 23.9% of the children under 2 years were adequately fed. It is worth noting that children born to mothers who attained a university-level education were more likely to have been adequately fed when compared to children whose moth-ers attained lower levels of education. This was the case for as much as 34.8% of the former set of children. Table 4 shows that children under 6 months were more likely than those aged 6–11 months and 12–23 months to have been adequately breastfed. For children under 6 months, the estimated proportion was 13.6% and is cause for some concern given the delicate life stage of these infants. Whether male or female, the pre-liminary results do not reflect marked dif-ferences in the proportion of children who had been adequately fed.
For children who had been still breast-feeding, it is useful to gauge the extent to which they had been adequately breastfed. This was more likely to be the case among children in older rather than younger age groups and suggest that mothers who contin-ued breastfeeding beyond 6 months and well into their children’s second year of life could have had greater knowledge and awareness of the benefits associated with breastfeeding and as such, embraced recommended “best practice” standards. This explanation may
491Sustaining the future well being of our children
also apply in the case of children born to mothers who attained university-level education. Specifically, they exhibited rela-tively higher estimated proportions when compared to children who had been born to mothers with lower levels of education.
The results contained in Table 4 are consistent with a positive association between socio-economic status and the proportion of children adequately breastfed among those who were still breastfeeding. Given the negative association that has been consistent with the observed link between socio-economic status and chil-dren’s lifetime exposure to breastfeeding, the prospect of a positive association might be indicative of a small but committed core of children born to better educated mothers who are fully aware of the benefits to be derived from adhering to recommended standards and as such, have embraced such standards much more so than their coun-terparts in lower socio-economic status groups.
MULTIVARIATE ANALYSES
Insofar as the preliminary descriptive analyses provided useful insights regard-ing variations in children’s exposure to children’s exposure to breastfeeding, mul-tivariate analyses have been pursued using binary logistic regression to assess varia-tions in the likelihood of, still breastfeed-ing and being adequately breastfed. These analyses are pursued in the context of the five explanatory factors and provide a basis for discerning the extent to which inferential statistics would corroborate the preliminary findings presented ear-lier. The impact of each of the factors on the likelihood of children’s exposure to breastfeeding is examined controlling for the other four factors. The binary logistic regression results are presented in Table 5
and significant estimates are determined in accordance with a level of significance of 5%. The results reflect outcomes for two models that permit assessments of varia-tions in the likelihood of being still breast-fed and being adequately breastfed.
Model #1 examines variations in the probability of being still breastfed accord-ing to the five factors. Of the two models, Model #1 is the only one that is significant with R2 ranging between 22% and 29.4%.The Hosmer and Lemeshow Test is not sig-nificant and thus consistent with a good fit between observed and expected probabili-ties of being still breastfed.
Children’s age group is the only factor with a significant impact on the probability of being still breastfed. Relative to children 12-23 months, the probability of still being breastfed among children under 6 months is greater by a factor of 15 and among children 6-11 months by a factor of 3. The evidence from this sample suggest that none of the other factors has a significant impact on the probability of still being breastfed.
A small sub-sample size precluded further analyses of variation in the probabil-ity of children never being breastfed. Additionally, Table 5 shows that Model #2 does not account for any significant variation in the probability of being adequately breastfed. These outcomes are principally functions of the sample size and in particular, the small proportions of children that actually never breastfed or are being adequately breastfed. While the preliminary findings based on descriptive statistics permit hypotheses about the links between the five factors and variation in children’s exposure to the breastfeeding, a study relying upon a larger sample is required to assess the significance of hypothesised linkages
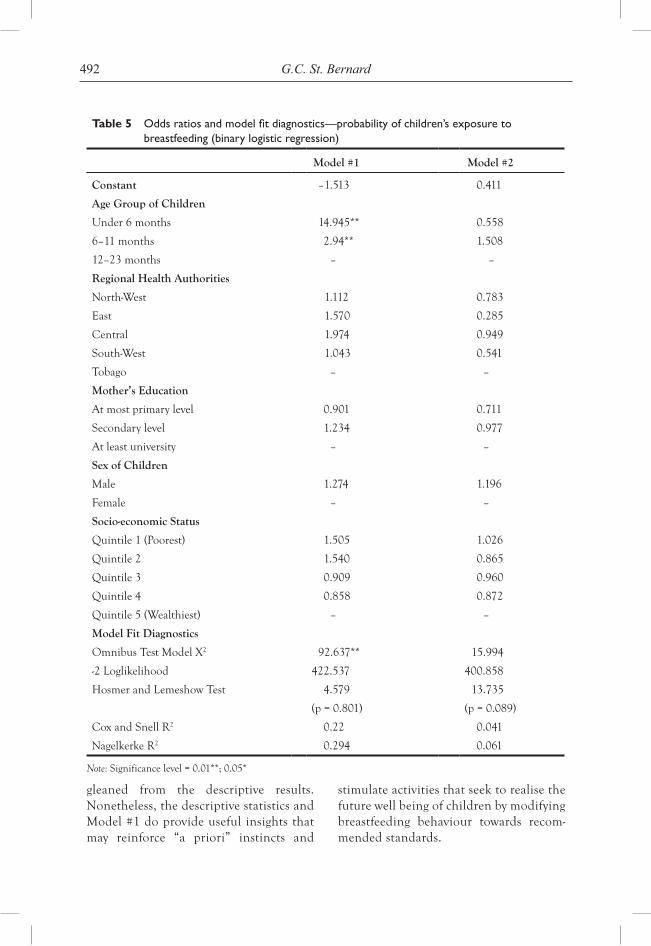
492 G.C. St. Bernard
Table 5 Odds ratios and model fit diagnostics—probability of children’s exposure to breastfeeding (binary logistic regression)
Model #1 Model #2
Constant –1.513 0.411
Age Group of Children
Under 6 months 14.945** 0.558
6–11 months 2.94** 1.508
12–23 months – –
Regional Health Authorities
North-West 1.112 0.783
East 1.570 0.285
Central 1.974 0.949
South-West 1.043 0.541
Tobago – –
Mother’s Education
At most primary level 0.901 0.711
Secondary level 1.234 0.977
At least university – –
Sex of Children
Male 1.274 1.196
Female – –
Socio-economic Status
Quintile 1 (Poorest) 1.505 1.026
Quintile 2 1.540 0.865
Quintile 3 0.909 0.960
Quintile 4 0.858 0.872
Quintile 5 (Wealthiest) – –
Model Fit Diagnostics
Omnibus Test Model X2 92.637** 15.994
-2 Loglikelihood 422.537 400.858
Hosmer and Lemeshow Test 4.579 13.735
(p = 0.801) (p = 0.089)
Cox and Snell R2 0.22 0.041
Nagelkerke R2 0.294 0.061
Note: Significance level = 0.01**; 0.05*
gleaned from the descriptive results. Nonetheless, the descriptive statistics and Model #1 do provide useful insights that may reinforce “a priori” instincts and
stimulate activities that seek to realise the future well being of children by modifying breastfeeding behaviour towards recom-mended standards.
493Sustaining the future well being of our children
DISCUSSION
According to Ministry of Social Development (2008:16), “The World Fit for Children Goal states that children should be exclusively breastfed for 6 months and continue to be breastfed with safe, appro-priate and adequately complementary feeding for up to 2 years of life and beyond”. Given estimated exposure to breastfeeding among children, countries such as Trinidad and Tobago should not only strive for greater prevalence rates of breastfeeding that would be manifest in increases in the proportions still breastfeeding and as a consequence adequately breastfed; they should also strive to attain greater equality and equity in these outcomes across sub- populations predicated upon the five factors central to this study.
In the context of the experience of chil-dren in each of the five Regions, Tobago exhibits outcomes that approximate standards that the other Regions should approximate. This may require further research hinging upon qualitative research designs that explore substantive differences in breastfeeding behaviour which could be determined on the basis of socio-cultural differences. While the descriptive statistics do not provide much evidence of any differ-ences in children’s exposure to breastfeeding based on their sex, their age group appears to have a noteworthy impact on whether or not they are still being breastfed.
Some important recommendations emerge out of these results. First, there ought to be efforts geared toward increasing children’s exposure to breastfeeding closer to recommended standards targeting children in every age group, in particular 6–11 months and 12–23 months. Second, there should be no significant differences between children 6–11 months and 12–23 months with respect to their probabilities of being
still breastfed or being adequately fed. Third, line ministries responsible for health and social development on a national scale along with non-government organisations promot-ing improvements in child nutrition should target young women and prospective moth-ers and reinforce the virtues of adhering to recommended breastfeeding standards dur-ing pre-natal visits and other fora that pre-pare them for motherhood. Artificial means can be promoted to extract breast milk thereby facilitating the mobility of mothers and eliminating levels of perceived discom-fort. Prospects of greater mobility among mothers and levels of perceived discomfort have the effect of precipitating the termina-tion of breastfeeding prematurely.
Mother’s education and the socio- economic background of the child do exhibit similar associations with respect to the probability of children being exposed to various breastfeeding practices. The descriptive statistics show that the pro-portion of children never being breast-fed and the proportion being adequately breastfed varies favorably in relation to increases in mothers’ educational status and higher socio-economic status among children. This reinforces the need for ele-vating levels of awareness and knowledge of the virtues of sustaining recommended breastfeeding practices among mothers of children in lower socio-economic status groups. The negative association between the proportion of children still breastfeed-ing relative to mothers’ educational status and the socio-economic status of children is likely to be a function of greater gain-ful participation in the labour force among mothers who were more educated and likely to belong to higher socio-economic status groups. In particular, such activities may impact negatively on the continua-tion of breastfeeding among children 6–11 months and 12–23 months.
494 G.C. St. Bernard
To overcome such a situation, workplaces particularly those in the public and private sectors may wish to consider the establish-ment of childcare facilities/day nurseries that would sustain the bond between mothers and their infants during their first two years of life. This could be realised if the government considers granting tax concessions to private sector organizations adopting such ‘employ-ee-driven’ policies with the long term interest of the nation at the forefront. It is also worth noting that having greater ability to access and embrace alternative means of infant nutri-tion has been a further contributory factor in the negative association between the propor-tion of children still breastfeeding and their socio-economic background. Nevertheless, the evidence is indicative of greater levels of awareness and knowledge of the virtues that are consistent with the sustenance of adequate breastfeeding patterns in the cases of children from the highest socio-economic status group relative to the rest. An ultimate goal would be to increase the proportions of children who, on one hand, should be still breastfeeding and on the other, proportions of children adequately breastfed; this being the case for children in lower socio-economic status groups and with mothers having lower levels of education, principally at the primary level or lower.
CONCLUDING REMARKS
Based upon the results contained in this study, there does not appear to be signifi-cant knowledge of internationally recom-mended breastfeeding standards in Trinidad and Tobago. Such lack of knowledge is over-whelmingly manifest and impacts negatively on breastfeeding practices among children under 6 months during a most critical time in their lives. Thus, the vast majority of infants have ceased being breastfed by their first birthday. This means that there is a need to discern opportunistic and motivational
factors that impact such an outcome, espe-cially if antecedent cultural nuances exist. This can only be accomplished through further research that embraces qualitative research designs. It is also important that future research initiatives target specific larger samples of young children under 2 years to permit the generation of more reliable estimates which should permit tests of hypotheses borne out by preliminary observations emerging from this study.
Sustainable national development hinges upon the attainment of high standards regarding children’s education, health, and nutrition. These three domains constitute central pillars that ought to be the focus of investment in early childhood (Bellamy, 2001). This study has focused primar-ily on breastfeeding as a manifestation of child nutrition. It has recognised WHO/UNICEF recommendations which suggest that infants should be breastfed exclusively for the first six months with continued breastfeeding for at least 2 years. Five key attributes were examined to discern their impact on the probability of adopting spe-cific sets of breastfeeding practices. Though limited in number, the five key attributes throw light on prospective levers through which social policy prescriptions can treat with the thrust towards outcomes deemed to be consistent with achieving sustainable human development. This study is explor-atory insofar as it has established a platform for a more comprehensive interrogation of emergent linkages whether in the context of different spatial settings or in the same spa-tial settings in different time periods.
BIOGRAPHY
Dr. Godfrey St. Bernard obtained his Ph.D. in Social Demography from the University of Western Ontario, London, Ontario, Canada in 1993 and is currently employed at the Sir Arthur Lewis Institute of Social
495Sustaining the future well being of our children
and Economic Studies (SALISES - formerly the Institute of Social and Economic Research (ISER) in the University of the West Indies, St. Augustine Campus, Trinidad and Tobago. His current research interests include social measurement, pop-ulation dynamics in Caribbean societies and human development challenges. His publications treat with the major scholarly domains that are central to his research.
REFERENCES
Baer, E.C. (1981) ‘Promoting breastfeeding: a national responsibility’, Studies in Family Planning, Vol. 12, No. 4, pp.198–206.
Bellamy, Carol (2001) “Summary” The State of the World’s Children – Early Childhood, UNICEF
Bongaarts, J. (1979) ‘Breastfeeding performance and child survival: strategies for research’, Population and Development Review, Vol. 10, No. 4, pp.93–116.
Butz, W.T. (1977) Economic Aspects of Breastfeeding, Rand Paper Series, No. P-5801, p. 25, Santa Monica, The Rand Corporation, California.
Dettwyler, K.A (1988) ‘More than nutri-tion: breastfeeding in urban mali’, Medical
Anthropology Quarterly, Vol. 2, No. 2, pp.172–183.
Dettwyler, K.A. and Fishman, C. (1992) ‘Infant feeding practices and growth’, Annual Review of Anthropology, Vol. 21, pp.171–204.
Huffman, S.L. (1984) ‘Determinants of breastfeeding in developing countries: over-view and policy implications’, Studies in Family Planning, Vol. 15, No. 4, pp.170–183.
Huffman, S.L. and Lamphere, B. (1984) ‘Breastfeeding performance and child survival: strategies for research’, Population and Development Review, Vol. 10, pp.93–116.
Knodel, J. (1977) ‘Breastfeeding and population growth’, Science, Vol. 198, pp.1111.
Ministry of Social Development (2008) Multiple Indicator Cluster Survey 2008, UNICEF, Trinidad and Tobago.
Peterson, C.E. and Da Vanzo, J. (1992) ‘Why are teenagers in the United States less likely to breastfeed than older women?, Demography, Vol. 29, No. 3, pp.431–450.
Van Langdingham, M; Trussell, J. and Grummer-Strawn, L. (1991) ‘Contraceptive and health benefits of breastfeeding: a review of the recent evidence’, International Family Planning Perspectives, Vol. 17, No. 4, pp.131–136.


