Embed Size (px)
Citation preview

February 28, 2021
SIP Performance - Regular Plan - Growth Option
Past performance may or may not be sustained in the future. ^Assuming `10,000 invested systematically on the first Business Day of every month over a period of time. CAGR returns are computed after accounting for the cash flow by using XIRR method (investment internal rate of return) for Regular Plan - Growth Option. The above investment simulation is for illustrative purposes only and should not be construed as a promise on minimum returns and safeguard of capital. Since Inception Date = Date of First allotment in the Scheme/Plan
Past performance may or may not be sustained in the future. #NIFTY 500 (Total Returns Index) ##NIFTY 50 (Total Returns Index). Inception Date: January 01, 1995. The scheme is managed by Mr. Prashant Jain since June 20, 2003. Returns greater than 1 year period are Compounded Annualised (CAGR). Load is not taken into consideration for computation of above performance(s). Different plans viz. Regular Plan and Direct Plan have different expense structure. The expenses of the Direct Plan under the scheme will be lower to the extent of the distribution expenses/commission charged in the Regular Plan. Since Inception Date = Date of First allotment in the Scheme/Plan. Returns as on February 26, 2021.
Performance - Regular Plan - Growth Option NAV as at February 26, 2021 ̀810.555 (per unit)
@since inception
A SIP of ` 10,000 @
in HDFC Flexi Cap Fund (Erstwhile HDFC Equity Fund)
would be `8.85 Cr. today ^
Call your Mutual Fund Distributor / Registered Investment Adviser Today.
*Investors should consult their financial advisers, if in doubt about whether the product is suitable for them.
HDFC Flexi Cap Fund (Erstwhile HDFC Equity Fund)(An Open-ended Dynamic Equity Scheme Investing Across Large Cap, Mid Cap, Small Cap Stocks) is suitable for investors who are seeking*:
To generate long-term capital appreciation/income
Investments predominantly in equity & equity-related instruments
For latest riskometers, please refer to www.hdfcfund.com
INVESTORS UNDERSTAND THAT THEIR PRINCIPAL WILL BE AT VERY HIGH RISK
Please refer Page No. 66 for performance of other schemes managed by Prashant Jain.
SIP Investments Since Inception 15 year SIP 10 year SIP 5 year SIP
Total Amount Invested (` ‘000)Market Value as on February 26, 2021 (`‘000)Returns (Annualised) (%)Market Value of SIP in Benchmark# (` ‘000)Benchmark Returns (Annualised) (%)#
3,140.00 88,544.96
20.75 31,399.97
14.78
1,800.00 5,362.79
13.40 4,933.99
12.43
1,200.00 2,393.91
13.26 2,472.91
13.87
600.00 848.98 13.90
877.64 15.25
Period Scheme Returns (%) BenchmarkReturns (%)#
Additional BenchmarkReturns (%)##
Value of investment of (`) 10,000
Last 1 YearLast 3 YearsLast 5 YearsSince Inception
33.508.91
17.5718.29
33.3710.8617.3111.79
31.2712.8817.2911.31
Scheme (`) Benchmark (`)# Additional Benchmark (`)##
13,33912,91422,456
810,555
13,32613,62122,207
185,049
13,11714,37822,189
165,074

2 February 2021
Fund ManagerAn employee of the asset management company such as a mutual fund or life insurer, who manages investments of the scheme. He is usually part of a larger team of fund managers and research analysts.
Application Amount for Fresh SubscriptionThis is the minimum investment amount for a new investor in a mutual fund scheme.
Minimum Additional AmountThis is the minimum investment amount for an existing investor in a mutual fund scheme.
Yield to MaturityThe Yield to Maturity or the YTM is the rate of return anticipated on a bond if held until maturity. YTM is expressed as an annual rate. The YTM factors in the bond’s current market price, par value, coupon interest rate and time to maturity.
SIPSIP or systematic investment plan works on the principle of making periodic investments of a fixed sum. It works similar to a recurring bank deposit. For instance, an investor may opt for an SIP that invests Rs 500 every 15th of the month in an equity fund for a period of three years.
NAVThe NAV or the net asset value is the total asset value per unit of the mutual fund after deducting all related and permissible expenses. The NAV is calculated at the end of every business day. It is the value at which the investor enters or exits the mutual fund.
BenchmarkA group of securities, usually a market index, whose performance is used as a standard or benchmark to measure investment performance of mutual funds, among other investments. Some typical benchmarks include the NIFTY, SeNSex, BSe200, BSe500, 10-Year Gsec.
Entry LoadA mutual fund may have a sales charge or load at the time of entry and/or exit to compensate the distributor/agent. entry load is charged at the time an investor purchases the units of a mutual fund.
The entry load is added to the prevailing NAV at the time of investment. For instance, if the NAV is Rs. 100 and the entry load is 1 %, the investor will enter the fund at Rs. 101. (Note: SeBI, vide circular dated June 30, 2009 has abolished entry load and mandated that the upfront commission to distributors will be paid by the investor directly to the distributor, based on his assessment of various factors including the service rendered by the distributor).
Exit Loadexit load is charged at the time an investor redeems the units of a mutual fund. The exit load is reduced from the prevailing NAV at the time of redemption. The investor will receive redemption proceed at net value of NAV less Exit Load. For instance if the NAV is Rs. 100 and the exit load is 1%, the investor will receive Rs. 99.
Modified DurationModified duration is the price sensitivity and the percentage change in price for a unit change in yield.
Standard Deviation
Standard deviation is a statistical measure of the range of an investment’s performance. When a mutual fund has a high standard deviation, its means its range of performance is wide, implying greater volatility.
Sharpe Ratio
The Sharpe Ratio, named after its founder, the Nobel Laureate William Sharpe, is a measure of risk-adjusted returns. It is calculated using standard deviation and excess return to determine reward per unit of risk.
Beta Ratio (Portfolio Beta)
Beta is a measure of an investment’s volatility vis-a-vis the market. Beta of less than 1 means that the security will be less volatile than the market. A beta of greater than 1 implies that the security’s price will be more volatile than the market.
Average portfolio PE (Average P/E)
It is price to earnings ratio of the stocks calculated for the entire portfolio on a weighted average basis.
Average portfolio price to book ratio (Average P/BV)
It is price to book value of the stocks calculated for the entire portfolio on a weighted average basis.
Average portfolio dividend yield (Average Dividend Yield)
It is dividend yield of the stocks calculated for the entire portfolio on a weighted average basis.
Net Equity
Net equity level is the net equity exposure percentage adjusted for any derivative positions in stocks or index for hedging or rebalancing purpose.
R Squared
It is a statistical measure of how closely the portfolio returns are correlated with its benchmark.
AUM
AUM or assets under management refers to the recent / updated cumulative market value of investments managed by a mutual fund or any investment firm.
Holdings
The holdings or the portfolio is a mutual fund’s latest or updated reported statement of investments/securities. These are usually displayed in terms of percentage to net assets or the rupee value or both. The objective is to give investors an idea of where their money is being invested by the fund manager.
Nature of Scheme
The investment objective and underlying investments determine the nature of the mutual fund scheme. For instance, a mutual fund that aims at generating capital appreciation by investing in stock markets is an equity fund or growth fund. Likewise, a mutual fund that aims at capital preservation by investing in debt markets is a debt fund or income fund. each of these categories may have sub-categories.
Rating Profile
Mutual funds invest in securities after evaluating their creditworthiness as disclosed by the ratings. A depiction of the mutual fund in various investments based on their ratings becomes the rating profile of the fund. Typically, this is a feature of debt funds.
HOW TO READ FACTSHEET
Sharpe RatioSharpe Ratio is a risk to reward ratio, it measures portfolio returns generated in excess to the investment in risk-free asset, for per unit of total risk taken. While, positive Sharpe ratio indicates, portfolio compensating investors with excess returns (over risk-free rate) for the commensurate risk taken; negative Sharpe ratio indicates, investors are better off investing in risk-free assets.
BetaBeta (ß) of a portfolio is a number indicating the relation between portfolio returns with that of the market index i.e. it measure the volatility, or systematic risk, of a portfolio in comparison to the market as a whole.
Standard DeviationA statistical measure that defines expected volatility/risk associated with a portfolio. This explains the variation/deviation from the average returns delivered by the portfolio. A higher standard deviation means higher volatility (risk) and a lower standard deviation means lower volatility.
Risk Free ReturnThe theoretical rate of return of an investment with safest (zero risk) investment in a country.
4 Indexation Benefit
l Long Term Capital Gains (holding period of over 3 years) from Debt Mutual Funds are taxed at 20% plus applicable surcharge and cess with the benefit of indexation.
l Government notifies Cost Inflation Index (CII) for each financial year taking into consideration the prevailing inflation levels.
l The cost of acquistion for computation of tax is adjusted for inflation using CII, thereby reducing the capital gains from tax perspective.
l An investment made into a debt fund towards the end of a financial year (say, in March 2020) and held for a little over 3 years (say, in April 2023) would be eligible for application of CII over 5 financial years, resulting in 4 indexation benefit.
Total Expense RatioTotal expenses charged to scheme for the month expressed as a percentage to average monthly net assets.
Tracking ErrorTracking error indicates how closely the portfolio return is tracking the benchmark Index return. It measures the deviation between portfolio return and benchmark index return. A lower tracking error indicates portfolio closely tracking benchmark index and higher tracking error indicates portfolio returns with higher deviation from benchmark index returns.
Average MaturityWeighted average maturity of the securities in scheme.
Portfolio Yield (Yield To Maturity)Weighted average yield of the securities in scheme portfolio.
Portfolio Turnover RatioPortfolio Turnover Ratio is the percentage of a fund’s holdings that have changed in a given year. This ratio measures the fund’s trading activity, which is computed by taking the lesser of purchases or sales and dividing by average monthly net assets.
Modified DurationA formula that expresses the measurable change in the value of a security in response to a change in interest rates. Modified duration of portfolio can be used to anticipate the change in market value of portfolio for every change in portfolio yield.
Macaulay Duration (Duration)Macaulay Duration (Duration) measures the price volatility of fixed income securities. It is often used in the comparison of interest rate risk between securities with different coupons and different maturities. It is defined as the weighted average time to cash flows of a bond where the weights are nothing but the present value of the cash flows themselves. It is expressed in years/days. The duration of a fixed income security is always shorter than its term to maturity, except in the case of zero coupon securities where they are the same.
GLOSSARY

February 2021 3
Market Review
Market Review continued on next page
Source for various data points: Bloomberg, NSDL, CMIE, RBI, Kotak Institutional Research, Worldometers.info, World Bank, Daily valuation provided by ICRA/CRISIL.
Macroeconomic Update
Global economy continued to recover at a healthy pace in February 2021 with data from US and Europe pointing at better than expected revival while China continued to grow at a steady pace. Key developments during the month include pick up in pace of roll out of vaccines in advanced economies, additional stimulus of USD 1.9 trillion announced by US, rise in sovereign yields of major economies, etc. Indian economy also grew at a firm pace with high frequency indicators pointing at fast pace normalisation.
Update on COVID-19: Number of infected cases globally rose to ~115 million by 28 February 2021 as compared to ~103 million cases on 31 January 2021. The new cases addition fell during the month driven by lower number of cases in major countries like US, UK, France, Germany, Russia etc. While the restrictions imposed in past two months continues in many countries, roll out of vaccination picked up pace in February 2021. Estimates suggest that many of the advanced economies are likely to achieve herd immunity by end of 2021. In India, the total infected cases rose to ~11.1 million from ~10.8 million last month. However, new cases, which were trending down in first half of the month, increased during the second half. However, till now the increase is relatively localised with top 5 states accounting for more than 80% of the new cases. Few states like Maharashtra have imposed restrictions in certain districts and implementing social distancing measures with more strictness. As on 28 February 2021, the active cases and fatality rate in India were largely stable at ~0.17 million and ~1.4% indicating high recovery rate.
Pace of economic recovery healthy, albeit slower than last month: The high frequency indicators continue to point at steady economic revival although the pace seems to have moderated slightly. Good improvement was witnessed in PV and tractor registrations, PMIs, GST collections, retail digital transactions, etc. However, growth in activity indicators like railway tonnage movement, power demand, etc. moderated compared to a previous month.
YoY Growth (%) Jun-20 Sep-20 Dec-20 Jan-21 Feb-21Railway tonnage movement -7.8 15.3 8.6 8.8 5.5 Power demand -10.5 4.6 5.0 4.8 3.4 Average E-Way bill generated -12.7 9.6 15.9 10.5 13.8Average Daily import duty collection -30.1 -2.7 41.3 27.3 25.5 Manufacturing PMI* 47.2 56.8 56.4 57.7 57.5 Services PMI* 33.7 49.8 52.3 52.8 55.3Gross GST Collection -9.0 3.9 11.6 8.1 7.4 Unemployment rate 10.2 6.7 9.1 6.5 6.9 Average Daily Retail E-transactions^ 46.7 67.4 65.8 60.8 71.7 PV registration@ -26.3 31.9 35.0 4.1 17.92W registration@ -37.8 -11.0 13.5 -7.8 -16.4Tractor registration@ 6.9 88.1 42.3 16.2 28.2
Source: Raildrishti.com, MOFSL, gstn.org.in, www.icegate.gov.in, CMIE, PIB, RBI, vaahan.parivahan.gov.in,
* Does not reflect yoy change; number >50 reflects expansions and number <50 reflects contraction compared to previous month; ^ sum of UPI+IMPS; @ February 2021 figures are preliminary data and are subject to revision.
Data suggests that revival is strengthening and economy is nearing pre-COVID-19 level. In our view, growth is likely to improve going forward as the remaining impacted sectors of economy normalise. However, rising number of COVID-19 cases, though concentrated in few states only, can result in imposition of higher restrictions which can hinder the pace of revival.
GDP growth back in positive territory, outlook remains positive: After 2 quarters of consecutive contraction, GDP rebounded well and registered a 0.4% YoY growth in Q3FY21. The improvement was broad based with all sub-segments performing better than last quarter. Private consumption (PFCE) and Government consumption (GFCE) registered a significantly lower contraction at -2.4% and -1.1% YoY. Notably, investments (GCF) growth turned positive at 2.1%. While exports continued to contract, pace of contraction of imports was significantly lower than last quarter indicating normalising domestic demand. On overall basis, contribution from net exports turned negative after two successive quarters of positive contribution.
On the GVA side, the story was similar with all major segments registering good improvement compared to last quarter. While agriculture growth continued to trend higher, Industry growth
also turned positive led by improvement in manufacturing and construction. Contraction in services also moderated but services related to trade, hotels, etc. continue to be impacted.
Quarter ended (YoY,%) 30-09-2020
31-12-2020 Quarter ended (YoY,%) 30-09-
202031-12-2020
GDP -7.3 0.4 GVA -7.3 1.0
Private Consumption -11.3 -2.4 Agriculture, forestry & fishing 3.0 3.9
Government Consumption -24.0 -1.1 Industry -3.0 2.7
Gross Capital Formation -7.8 2.1 Manufacturing -1.5 1.6 Gross fixed capital formation -6.8 2.6 Construction -7.2 6.2
Exports -2.1 -4.6 Services -11.3 -1.0
Imports -18.2 -4.6 Trade, hotels, transport etc. -15.3 -7.7
The CSO has revised up its GVA growth forecast to -6.5% from -7.2% for FY21 and revised down its GDP forecast to -8.0% from -7.5% earlier. The divergent revision is primarily on account of higher food and fertiliser subsidies expected in Q4FY21 based on revised budget estimates. To recall, GDP is equal to GVA plus net indirect taxes (Indirect taxes less subsidies). Hence, rise in subsidies (although significant proportion of it is transfer to liability from FCI books to Government books) resulted in GDP growth being revised downwards despite upward revision in GVA estimates.
RetailInflationcontinuestomoderateinJanuary2021,likelytoremainrangeboundgoing forward: Supported by favourable base and sequential fall in key vegetable prices, CPI further moderated to 4.1% in January 2021 from 4.6% a month ago. Items of key vegetables like potatoes, tomatoes, etc. fell resulting in food & beverage indices falling. Fuel & light was higher driven by rise in prices of LPG, kerosene, etc. Further, Core CPI remained at elevated level on back of YoY growth in precious metals (gold, silver etc.), cable charges, barber cost, etc. Multitude of factors like slow resumption in supply, good recovery in demand, cost push pressure, etc. contributed towards elevated core CPI.
YoY,% Dec-20 Jan-21 Change in %CPI 4.6 4.1 -0.5Food & beverages 3.9 2.7 -1.2Fuel and Light 2.9 3.9 1.0Housing 3.2 3.2 0.0Core CPI@ 5.6 5.5 -0.1
Source: CMIE; @-CPI excluding food, fuel, transportation & housing
Inflation is likely to inch up going forward as the favourable base effect starts to wane away and recent increase in prices of major food items like onions, tomatoes, edible oil, rice, etc. Further, rise in international crude prices can keep fuel inflation high too. Again, given the improvement in demand, rising WPI and possibility of pass through of prices to consumer, core CPI is also unlikely to moderate significantly. However, in our view, the CPI is likely to remain within RBI’s target range over the foreseeable future.
WPI rises in January 2021, likely to trend higher: Wholesale inflation increased to 2% in January 2021 compared to 1.2% in December 2020 and 3.5% in the corresponding month last year. The uptick in wholesale inflation during January 2021 was primarily on account of notable jump in the manufacturing WPI (5.1%) which rose to near 8-year high. This was partially offset by lower food article inflation (majorly due to base effect) and fuel inflation. The rise in core WPI was driven by broad based increase in prices of items led by higher basic metal prices (in line with rise in international commodity prices), textile, gems & jewellery, etc.
% Dec-20 Jan-21 ChangeWPI 1.2 2.0 0.8
Primary articles -1.6 -2.2 -0.6Food articles -1.1 -2.8 -1.7Crude petroleum & gas -23.5 -15.0 8.5
Fuel & power -8.7 -4.8 3.9Mineral oils -11.2 -8.7 2.4Electricity -10.7 -0.4 10.3
Manufactured products 4.2 5.1 0.9 Core WPI (WPI ex food and fuel) 3.3 4.8 1.5

4 February 2021
Given the rally in global commodity prices, possible return of pricing power to producers and favourable base effect, WPI is likely to trend higher which in turn can put upward pressure on CPI.
TradeDeficitmoderatesinFebruary2021,likelytowidengoingforward:Trade deficit in February 2021 moderated compared to last month driven by lower net oil and Non-Oil Non-Gold* (NONG) deficit. This was partly offset by significant increase in the gold imports. While the NONG exports were largely flat but Non-Oil Non-Gold (NONG) imports fell month on month primarily on account of lower imports of coal & briquette, electronic goods and chemicals.
Amount in USD billion Jan-21 Feb-21# Change (%)Trade Deficit / (Surplus) 14.5 12.9 -11.4
Net Oil imports 7.2 6.5 -10.4Net Gold imports* 3.4 5.0 48.1Deficit ex of oil & gold 3.9 1.4 -65.0
Source: CMIE, Ministry of Commerce; # - preliminary data, * includes net imports of gold, silver and precious stones adjusted for gems and jewellery exports; NM – Not meaningful
For FY21, trade deficit has been considerably lower and with limited impact on net services exports, the current account is likely to be in surplus on full year basis. Going into FY22, trade deficit is likely to widen on back of rise in crude oil prices and normalisation of domestic demand and current account is likely to be in deficit. However, outlook on Balance of Payment (BoP) is comfortable on back of robust capital flows and large foreign exchange reserves (USD 584 billion as on 19 February 2021). INR ended the month lower at 73.5 against the USD, 0.7% lower than last month.
Commodity prices witness a sharp increase: Most commodity prices registered an increase in February 2021 driven by optimism around rollout of vaccine and good recovery observed in major economies. Crude oil prices increased sharply as US oil production was impacted due to snow storm is select regions. Gold prices moderated compared to last month because of rise in risk-on sentiment and US yields.
% Change Market price (USD)*
Feb-21 (m-o-m) FYTD21^
Brent Crude (Per barrel) 66.1 18.3 190.8Gold (per ounce) 1,734 (6.1) 9.9Steel (per tonne) 4,878 7.8 43.5Zinc (per tonne) 2,821 10.0 51.1Copper (per tonne) 9,173 16.4 91.2Aluminium (per tonne) 2,149 8.4 44.0Lead (per tonne) 2,107 4.7 23.1
Source: Bloomberg; *Market prices as on February 28, 2021; ^ change in prices since end-March 2020, m-o-m- Month on Month
Summary and Conclusion
India is amongst the very few major economies like China, Taiwan, Vietnam, etc. which has registered positive growth in Q3FY21. This along with improvement in economic activity indicators highlights that economy has normalised to a large extent and growth is likely to witness sequential improvement. Given this backdrop, FY22 is likely to see a good growth aided by favourable base effect, impact of fiscal and monetary measures and improvement in global economy. While the current account is likely to deteriorate sequentially, outlook on balance of payment remains comfortable on back of large forex reserves and stable capital flows given the ample global liquidity.
Apart from the above, outlook of Indian manufacturing sector is positive as it stands to benefit from shift of global manufacturing from China to other emerging markets and favourable policy measures announced by Indian Government. This should also provide a good growth impulse to Indian economy.
Equity Market Update
The stellar performance of equities continued in February 2021 with NIFTY 50 ending the month higher by ~6% compared to previous month. The NIFTY 50 reached all-time high during the month post the announcement of growth and capex focussed Union budget, good recovery momentum, pick up in pace of vaccination globally, optimism around additional fiscal deficit by US Government, etc. However, it corrected in last 10 days of the month driven by the rising concerns of inflation in US, fear of sooner than expected unwinding of monetary stimulus, rise in US treasury yields, etc. The midcaps and smallcaps outperformed largecaps during the month. Amongst sectoral indices, Metal, Power, Banking, Oil and Gas and capital goods were best performing sectors while FMCG, IT and healthcare underperformed.
Global equities performance was also buoyant with major indices in key countries ending the month in positive. The tables below give the details of performance of key domestic and global indices.
% Change in Indices Feb-21 FYTD21^
S&P BSE India Auto 3.7 113.5
S&P BSE India Bankex 12.5 76.8
S&P BSE India Capital Goods 10.5 96.0
S&P BSE India FMCG (2.1) 16.7
S&P BSE India Healthcare 1.1 71.7
S&P BSE India Metal 24.4 140.1
S&P BSE India Power 20.7 75.5
S&P BSE India Oil & Gas 12.5 55.1
S&P BSE India IT (1.6) 90.2
S&P BSE SENSEX 6.1 66.6
NIFTY 50 6.6 69.0
NIFTY Midcap 100 11.3 98.8
NIFTY Smallcap 12.2 123.9
% Change Feb-21 FYTD21^
S&P 500 2.6 47.5
FTSE 1.2 14.3
DAX 2.6 38.8
CAC 5.6 29.7
Nikkei 4.7 53.1
Hang Seng 2.5 22.8
KOSPI 1.2 71.7
Shanghai 0.7 27.6
MSCI Emerging Market Index 0.7 57.8
^ change since end-March 2020
During the month, FPIs bought equity worth USD 3.5 billion, as compared to net inflows of USD 2.7 billion in the previous month. Cumulative FPI inflows into equity increased to USD 35.6 billion in 11MFY21 as against net inflows of USD 9.6 billion in similar period last year.
Domestic equity oriented mutual funds recorded net outflows of INR 14,901 crore in January 2021 compared to net outflow of INR 18,486 crore a month ago. In first ten months of FY21, net outflows from domestic equity oriented mutual fund schemes was INR 69,217 crore as against net inflows of INR 42,927 crore during the same period last year.
Corporate earnings in Q3FY21 were better than expected and resulted in broad based earnings upgrades. Results of Oil and gas, Banks, NBFCs, Utilities, Metals, consumer staples, Auto and consumer durables were better than expected while those of Pharma, Infrastructure and Industrials were largely in line with expectations. Notably, Q3FY21 was one of the best earning quarter in last 6 years (since September 2014) and registered a PAT growth of 31% despite marginal de-growth in revenue (Source: MOFSL, Universe 193 companies covered by MOFSL & have declared results till 18 February 2021). The good growth was driven by better than expected recovery in demand, higher realisation, cost rationalisation, etc. Specifically, lower provisioning in banks, improvement in execution in Infrastructure, higher ARPU in telecom sector, higher spreads in metals, etc. supported the growth in earnings. We expect that some of these factors are likely to sustain over the near to medium term. Further, budget with its focus on growth and capex revival augurs well for new investment cycle and corporate credit growth.
Market Review Contd...
Market Review continued on next page
Source for various data points: Bloomberg, NSDL, CMIE, RBI, Kotak Institutional Research, Worldometers.info, World Bank, Daily valuation provided by ICRA/CRISIL.

February 2021 5
CY NIFTY50 Returns
Top 5 contributors CY NIFTY50
ReturnsTop 5
contributors
2005 39.1 48.9 2014 33.4 38.8
2006 46.2 45.8 2015 (2.8) n.a.
2007 57.1 47.7 2016 4.5 72.8
2008 (51.2) n.a. 2017 30.3 48.4
2009 77.9 38.1 2018 4.6 152.2
2010 19.5 53.5 2019 13.5 81.3
2011 (23.6) n.a. 2020 16.1 81.7
2012 29.9 49.8 2M2021 3.9 75.3
2013 8.5 102.3
n.a. – not applicable
Since the lows seen in March 2020, NIFTY 50 has risen significantly and has decisively crossed its pre-COVID-19 highs. However, it should be viewed in context that, over past 10 year and 15 year NIFTY 50 returns are ~11% CAGR, largely in line with growth in nominal GDP growth. Again, while the rally has been sharp, till 2020 it was relatively polarised with top 5 stocks accounting for high proportion of returns (refer table). In the first 2 months of 2021, the broader market has outperformed but is still lagging NIFTY 50 returns compared to the long term average (refer chart).
NIFTY Market cap to Total Market capitalisation near its historic Peak
For the graphs above, the X-axis represents calendar year; Source: Bloomberg
An interesting aspect of market is the considerable divergence in valuations across sectors compared to their long term averages. The same has been presented in the table below
Sector Valuations P/E# Auto Consumer staples*
Consumer Discretionary
Oil and gas Cement IT
servicesValuation multiple 23.2 50.7 59.0 15.8 30.3 23.610Y Average Valuations 15.8 39.4 42.5 11.0 21.9 17.7Premium / (discount)^ 47% 29% 39% 43% 39% 33%
Sector Valuations P/E# Pharma PrivateBanks P/B Metals Tobacco PSU
Banks P/BElectric utilities
Valuation multiple 24.3 2.8 9.3 15.9 1.0 8.010Y Average Valuations 22.2 2.5 10.3 24.2 1.1 11.0Premium / (discount)^ 9% 13% -9% -34% -6% -28%
# - as on 28 February 2021. *ex tobacco; ^to Long term (LT) averageSource: Kotak Institutional Equities. Stocks are part of Kotak Institutional Equities universe. Automobile and Oil & Gas valuations are high due to one company. Excluding these, the multiples are 25x for Auto & 7.6x for Oil & Gas vs 10 year average multiple of 18x & 9x respectively.
Outlook
As on 28 February 2021, NIFTY 50 was trading near 21.6x FY22E and 18.2x FY23E price to earnings ratio. In our view, these are reasonable multiples, especially given the low interest rate environment and improving economic activity. Further, the gap between 10Y Gsec and 1Y-Forward NIFTY 50 Earning yield* stood at 1.5%, below its 10-year average of 1.8%. *Earning yield = 1/(one year forward P/E).
10Y GSec and NIFTY Earning Yield
Source: Kotak Institutional Equities
Further, though NIFTY 50 has risen significantly, one should be mindful that NIFTY 50 returns over past 10 years are essentially similar to growth in nominal GDP and also that the rally has been relatively polarised (refer the comments above).
Considering the above, markets hold promise over the medium to long term, in our opinion and specifically, there is good value in select pockets of the market. Good sequential improvement in economic activity, strong improvement in corporate profitability, lower cost of capital, comfortable external scenario, monetary and fiscal measures undertaken along with relatively better placed rural economy also supports this optimism.
In view of the above, in our opinion, there is merit in increasing allocation to equities in a phased manner or in staying invested as the case may be (for those with a medium to long term view and in line with individual risk appetite). Significant rise in spread of COVID-19, unwinding of expansionary fiscal and monetary stimulus, significant rise in crude oil prices, higher than expected NPAs post the moratorium, etc. are key risks in the near term.
.
Market Review Contd...
Market Review continued on next page
Source for various data points: Bloomberg, NSDL, CMIE, RBI, Kotak Institutional Research, Worldometers.info, World Bank, Daily valuation provided by ICRA/CRISIL.

6 February 2021
Debt Market Update
Month of February 2021 was a volatile month for Debt markets. The 10-year Gsec yields rose considerably during the month driven by additional INR 800 billion market borrowings announced by Central Government in February-March 2021 and considerably higher than expected fiscal deficit for FY22. The rise was exacerbated by increase in oil prices, higher US yields and regular devolvement of Government auctions by RBI indicating muted demand for Gsecs. RBI tried to assuage the volatility by conducting OMOs, announcing operation TWIST, etc. The 10Y benchmark Gsec yields ended the month at 6.23%, 32 bps higher than last month. The spread between 10 Year AAA rated corporate bond and 10Y Gsec also widened during the month.
The table below gives a summary view of movement of key rates and liquidity.
Jan-21 Feb-21 Change (%)
10Yr G-Sec Yield (%, 5.85 GoI 2030)^ 5.91 6.23 0.32AAA 10Year Corporate Bond Yields (%)# 6.58 7.19 0.61AAA 10Y corporate bond spread against 10Y benchmark (bps)@ 67 96 0.29
Average net liquidity absorbed / (infused) by RBI* (INR billion) (approx.) 5,623 6,095 8.4
MIBOR Overnight Rate (%) 3.47 3.47 -*Average net daily liquidity infused / absorbed through Liquidity Adjustment Facility, exports refinance, marginal standing facility and term repos/reverse repos; ^ - bi-annual yield; # annualised yields; @ - Spreads have been calculated by subtracting non-annualised Gsec yields from annualised corporate bond yields
Average net interbank liquidity surplus grew in last month supported by higher Government spending, OMO purchases, foreign exchange purchases by RBI and soft credit growth vis-a-vis deposit growth. However, with CRR set to increase to 3.5% from 3% of NDTL by end-March 2021, liquidity should reduce by end of next month.
FPI flows in debt markets have been weak in the current financial year. In February 2021, FPI sold net debt (including Voluntary Retention Route) of USD 0.3 billion compared to ~USD 0.7 billion in last month. On a cumulative basis, in 11MFY21, net FPI outflows from debt markets was USD 3.2 billion compared to net inflows of USD 2.1 billion during the same period last financial year.
Outlook
In its MPC meeting held in February 2021, RBI left the policy repo rates and accommodative stance unchanged. The minutes of MPC meeting released later during the month noted the improvement in economic activity and showed concerns on core CPI being at elevated levels. It also highlighted upside risks to inflation and appeared mindful of high system liquidity. However, MPC members felt that there is continued need for nurturing nascent growth and decided to leave the rates and stance unchanged.
Since the last few months, multiple global and domestic developments have impacted the yields adversely. These include – significant rise in crude prices and other major commodities, jump in 10Y US treasury yields, rising concern of market that global inflation can surprise on upside and consequently US Fed can roll back policy measures sooner than expected. Further, adverse domestic developments like significantly higher than expected supply of market borrowings, relaxation of fiscal consolidation timeline by 3 years, rise in domestic fuel prices, concerns over rise in WPI and its trickledown effect on CPI, etc. have also caused the Gsec yields to rise. We expect that these factors will continue to impact Gsec yields, at least in the near term and thus, yields are likely to trade with an upward bias. Further, high SLR holding of PSU banks and signs of broad based improvement in economic activity can also push yields higher.
However, as has been the case over the past year or so, we believe RBI will continue to use conventional and unconventional tools going forward as well, thus, limiting the increase in Gsec yields. This was demonstrated in RBI conducting OMOs despite high system liquidity and allowing higher HTM limits for SLR investments done in FY22. Further, RBI has been proactively communicating that it will manage Government borrowings in a non-disruptive manner and will ensure “orderly evolution of the yield curve”. RBI Governor also
highlighted in the MPC minutes that “normalisation of CRR opens up space for a variety of market operations to inject additional liquidity” hinting at possibility of further OMO purchases. These statements and actions of RBI should cap any significant rise in yields. Further, comfortable outlook on Balance of Payment and ample global liquidity also bode well for lower yields in India.
In view of the above, we expect yields to trade with an upward bias though the upside should be limited, to a certain extent. The risk to this view is that the fiscal deficit turns out to be lower than anticipated due to lower expenditure and / or better than expected tax collections along with lower inflation from Q2FY22 onwards. Considering the above, we continue to recommend investment in short to medium duration debt funds, albeit in a staggered manner over a period of time, depending on investors’ risk appetite
While credit environment still warrants caution, opportunities exist in select pockets of non-AAA rated bonds as their spreads relative to AAA rated bonds are still trading at attractive level. Hence, allocation to credit oriented schemes or funds with some non-AAA exposure can be maintained / increased in a phased manner, in line with individual risk appetite..
Spread of AA over AAA Corporate bonds
Long Term Average spread of AA over AAA over 10 years
GlOSSARYARPU Average Revenue Per User
CPI Consumer Price IndexCRR Cash Reserve RatioCSO Central Statistics OfficeFCI Food Corporation of IndiaFPI Foreign Portfolio InvestmentGCF Gross Capital FormationGDP Gross Domestic Product
GFCE Government Final Consumption ExpenditureGVA Gross Value AddedHTM Held To MaturityIMPS Immediate Payment System
M-o-M Month on MonthMPC Monetary Policy CommitteeNBFC Non-Banking Financial CompanyNDTL Net Demand and Time LiabilitiesNPA Non-Performing AssetsOMO Open Market OperationPAT Profit After Tax
PFCE Private Final Consumption ExpenditurePMI Purchasing Managers’ IndexPSU Public Sector UndertakingSLR Statutory Liquidity RatioUPI United Payment InterfaceWPI Wholesale Price Index
Market Review Contd...
Source for various data points: Bloomberg, NSDL, CMIE, RBI, Kotak Institutional Research, Worldometers.info, World Bank, Daily valuation provided by ICRA/CRISIL.

7 February 2021
CONTENTS
PAGE NO.
WEAlTH CREATION
HDFC Flexi Cap Fund (Erstwhile HDFC Equity Fund) .............................. 8
HDFC Capital Builder Value Fund ........................................................ 9
HDFC Top 100 Fund ........................................................................... 10
HDFC Mid-Cap Opportunities Fund ..................................................... 11
HDFC Small Cap Fund ........................................................................ 12
HDFC Growth Opportunities Fund ...................................................... 13
HDFC Focused 30 Fund ...................................................................... 14
HDFC Infrastructure Fund .................................................................. 15
HDFC Balanced Advantage Fund ........................................................ 16-17
HDFC Hybrid Equity Fund ................................................................... 18-19
HDFC Multi-Asset Fund ...................................................................... 20-21
HDFC NIFTY 50 ETF ............................................................................ 22
HDFC Index Fund - NIFTY 50 Plan ....................................................... 23
HDFC SENSEx ETF .............................................................................. 24
HDFC Index Fund - SeNSex Plan ......................................................... 25
HDFC Gold ETF .................................................................................. 61
HDFC Gold Fund ................................................................................ 62
HDFC Banking ETF ............................................................................. 63
HDFC Dividend Yield Fund ................................................................. 64
HDFC Housing Opportunities Fund ..................................................... 65
TAx SAVINGS
HDFC Taxsaver .................................................................................. 26
RETIREMENT PLANNING
HDFC Retirement Savings Fund - Equity Plan ....................................... 29
HDFC Retirement Savings Fund - Hybrid Equity Plan ............................ 30-31
HDFC Retirement Savings Fund - Hybrid Debt Plan .............................. 32
PAGE NO.
CHIlDREN'S FUTURE
HDFC Children’s Gift Fund ................................................................. 27-28
REgUlAR INCOME
HDFC Equity Savings Fund ................................................................. 33-34
HDFC Hybrid Debt Fund ..................................................................... 35-36
HDFC Arbitrage Fund ......................................................................... 37-38
HDFC Corporate Bond Fund ............................................................... 39-40
HDFC Credit Risk Debt Fund ............................................................... 41-42
HDFC Banking and PSU Debt Fund ..................................................... 43-44
HDFC Gilt Fund.................................................................................. 45
HDFC Dynamic Debt Fund .................................................................. 46
HDFC Income Fund ........................................................................... 47
HDFC Medium Term Debt Fund .......................................................... 48-49
HDFC Short Term Debt Fund .............................................................. 50-51
HDFC Low Duration Fund ................................................................... 52-53
HDFC Money Market Fund ................................................................. 54
HDFC Floating Rate Debt Fund ........................................................... 55
HDFC Ultra Short Term Fund .............................................................. 56-57
HDFC Liquid Fund .............................................................................. 58-59
HDFC Overnight Fund ........................................................................ 60
Performance details of schemes managed by respective fund managers ............................................. 66
Scheme performance summary - Regular Plans ................................. 67-71
Scheme performance summary - Direct Plans .................................... 72-79
Performance of Permitted Category FPI Portfolio ............................... 80
Dividend History ............................................................................... 81-82
Disclaimer ....................................................................................... 83
gOAl BASED SOlUTIONS
WEAlTH CREATION These schemes aim to increase wealth over the long term by investing predominantly in equity instruments and are suitable for investors with high risk appetite and relatively higher investment horizon.
TAx SAVINGS This scheme is eligible to provide tax deduction under Section 80C and also aims to increase wealth over the long term. This is an ideal solution for investors who would like to create wealth and save tax.
CHIlDREN'S FUTURE This scheme aims to help you achieve your specific financial goal of planning for child’s future expenses like higher education, etc.
RETIREMENT PLANNING These schemes aim to help you achieve your specific financial goal of retirement planning.
REgUlAR INCOME These schemes aim to provide stable income and are ideal for investors with low to medium risk appetite who wish to receive regular income to meet their periodic expenses.
Disclaimer: Investors are requested to note that the above goal based solutions should not be construed as financial planning solution/recommendation by the Fund/AMC. It does not in any manner, indicate or imply either the quality of any particular Scheme or guarantee any specific performance/returns. Such solutions must be tailored to investor’s individual situation and objectives and therefore, investors should consult their financial advisors to ascertain whether a product is suitable for them.
February 2021 8
SIP PERFORMANCE ^ - Regular Plan - growth OptionSince Inception
SIP15 year
SIP10 year
SIP5 year
SIP3 year
SIP1 year
SIPTotal Amount Invested (` ‘000) 3,140.00 1,800.00 1,200.00 600.00 360.00 120.00 Mkt Value As on February 26, 2021 (` ‘000) 88,544.96 5,362.79 2,393.91 848.98 474.99 169.99 Returns (%) 20.75 13.40 13.26 13.90 18.97 87.28 Benchmark Returns (%) # 14.78 12.43 13.87 15.25 19.92 72.06 Additional Benchmark Returns (%) ## 13.75 12.16 13.41 15.70 19.47 66.33
Assuming ` 10,000 invested systematically on the first Business Day of every month over a period of time. CAGR returns are computed after accounting for the cash flow by using xIRR method (investment internal rate of return) for Regular Plan - Growth Option. The above investment simulation is for illustrative purposes only and should not be construed as a promise on minimum returns and safeguard of capital.
Face Value per Unit: ` 10 unless otherwise specified, + Industry Classification as recommended by AMFI, Data is as of February 28, 2021 unless otherwise specified.
PERFORMANCE ^ - Regular Plan - growth OptionDate Period Scheme
Returns (%)
Benchmark Returns
(%)#
Additional Benchmark
Returns (%) ##
Value of ` 10,000 investedScheme (`) Benchmark
(`)#Additional
Benchmark (`)##
Feb 28, 20 Last 1 Year 33.50 33.37 31.27 13,339 13,326 13,117Feb 28, 18 Last 3 Years 8.91 10.86 12.88 12,914 13,621 14,378Feb 29, 16 Last 5 Years 17.57 17.31 17.29 22,456 22,207 22,189Jan 01, 95 Since Inception 18.29 11.79 11.31 810,555 185,049 165,074
Returns greater than 1 year period are compounded annualized (CAGR). Performance of dividend option under the schemes for the investors would be net of distribution tax, if any. N.A. Not Available. For performance of other schemes managed by Prashant Jain, please refer page 66. Different plans viz. Regular Plan and Direct Plan have a different expense structure. The expenses of the Direct Plan under the Scheme will be lower to the extent of the distribution expenses / commission charged in the Regular Plan. As NIFTY 50 TRI data is not available since inception of the scheme, additional benchmark performance is calculated using composite CAGR of NIFTY 50 PRI values from January 1, 1995 to June 29, 1999 and TRI values since June 30, 1999. For Performance of Direct Plan, refer page no. 72. For FPI Portfolio, refer page no. 80.
This product is suitable for investors who are seeking ~
l to generate long-term capital appreciation / income
l investment predominantly in equity & equity related instruments
VeryHigh
Low to
Moderate
Low
Moderate ModeratelyHigh High
RISKOMETERInvestors understand that their principal will be at
very high risk
~ Investors should consult their financial advisers, if in doubt about whether the product is suitable for them. ^Past performance may or may not be sustained in the future. Since Inception Date = Date of First allotment in the Scheme / Plan.
Load is not taken into consideration for computation of performance.
(An open ended dynamic equity scheme investingacross large cap, mid cap, small cap stocks)
Company Industry+ % to NAV
EqUITY & EqUITY RElATED
• State Bank of India Banks 10.49
• ICICI Bank Ltd. Banks 8.18
• Larsen and Toubro Ltd. Construction Project 6.19
• Infosys Ltd. Software 5.50
• NTPC Ltd. Power 5.05
• Coal India Ltd. Minerals/Mining 4.81
• ITC Ltd. Consumer Non Durables 4.67
• Axis Bank Ltd. Banks 4.03
• Power Finance Corporation Ltd. Finance 3.30
• Lupin Ltd. Pharmaceuticals 2.89
ReC Ltd. Finance 2.88
Bharti Airtel Ltd. Telecom - Services 2.62
Power Grid Corporation of India Ltd. Power 2.48
Tata Motors Ltd. Auto 2.28
Bharat Petroleum Corporation Ltd. Petroleum Products 2.19
Sun Pharmaceutical Industries Ltd. Pharmaceuticals 2.14
GAIL (India) Ltd. Gas 2.13
Reliance Industries Ltd. Petroleum Products 2.08
Bank of Baroda Banks 1.55
Aurobindo Pharma Ltd. Pharmaceuticals 1.52
Cipla Ltd. Pharmaceuticals 1.50
HDFC Bank Ltd. Banks 1.47
CeSC Ltd. Power 1.35
Ambuja Cements Ltd. Cement 1.27
Hindustan Aeronautics Ltd. Aerospace & Defence 1.22
Indian Railways Finance Corporation Ltd. Finance 1.09
Kalpataru Power Transmission Ltd. Power 1.07
Hindustan Petroleum Corporation Ltd. Petroleum Products 1.06
Praj Industries Ltd. Industrial Capital Goods 1.02
Bharat Dynamics Ltd. Aerospace & Defence 1.00
SBI Cards and Payment Services Ltd. Finance 0.99
Mahindra & Mahindra Ltd. Auto 0.97
CG Power and Industrial Solutions Ltd. Industrial Capital Goods 0.88
Vedanta Ltd. Non - Ferrous Metals 0.87
BeML Ltd. Industrial Capital Goods 0.84
HCL Technologies Ltd. Software 0.60
Company Industry+ % to NAV
Wipro Ltd. Software 0.60
ABB India Ltd. Industrial Capital Goods 0.56
Oil & Natural Gas Corporation Ltd. Oil 0.49
SKF India Ltd. Industrial Products 0.41
Ramco Systems Ltd. Software 0.39
Time Technoplast Ltd. Industrial Products 0.23
Hindustan Construction Company Ltd. Construction Project 0.13
Simplex Infrastructures Ltd. Construction 0.07Sub Total 97.06Preference SharesZee entertainment enterprises Ltd. Media & entertainment @Sub Total @Total 97.06Cash, Cash equivalents and Net Current Assets 2.94
Grand Total 100.00
• Top Ten Holdings, @ Less than 0.01%
PORTFOLIO
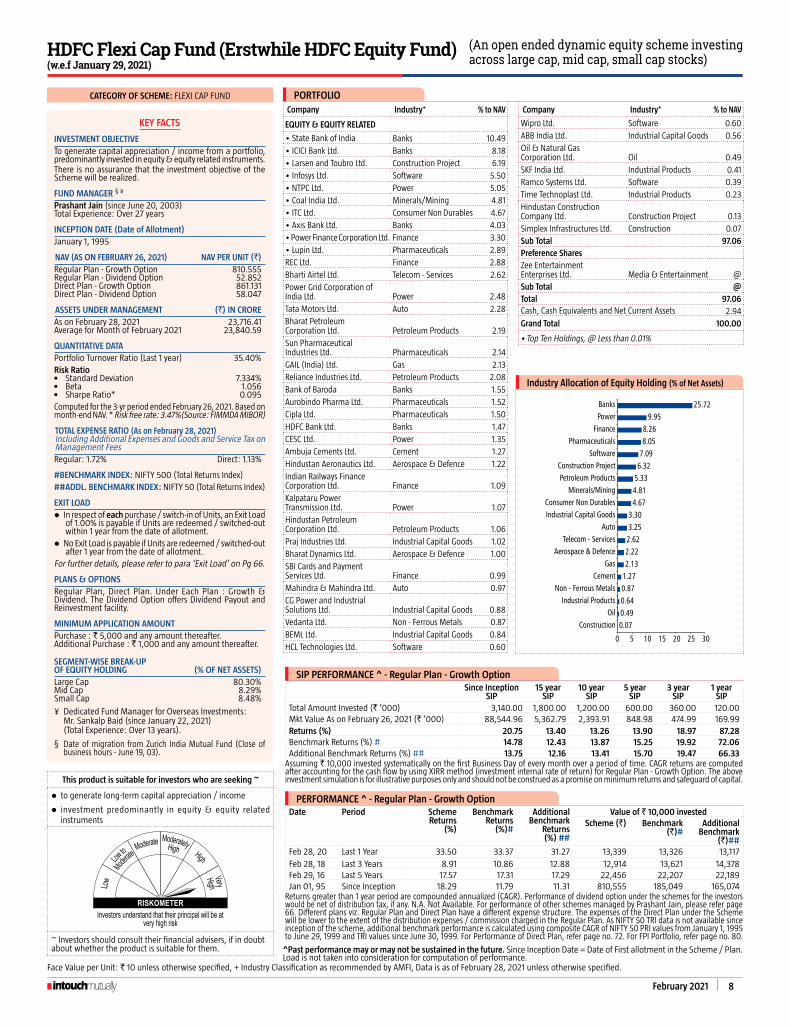
Industry Allocation of Equity Holding (% of Net Assets)
0.070.490.640.871.272.132.222.623.253.30
4.674.815.336.327.098.058.26
9.9525.72
0 5 10 15 20 25 30
ConstructionOil
Industrial ProductsNon - Ferrous Metals
CementGas
Aerospace & DefenceTelecom - Services
AutoIndustrial Capital GoodsConsumer Non Durables
Minerals/MiningPetroleum Products
Construction ProjectSoftware
PharmaceuticalsFinance
PowerBanks
KEY FACTS
INVESTMENT OBjECTIVETo generate capital appreciation / income from a portfolio, predominantly invested in equity & equity related instruments.There is no assurance that the investment objective of the Scheme will be realized.
FUND MANAgER § ¥
Prashant Jain (since June 20, 2003)
Total experience: Over 27 years
INCEPTION DATE (Date of Allotment)January 1, 1995
NAV (AS ON FEBRUARY 26, 2021) NAV PER UNIT (`)Regular Plan - Growth Option 810.555Regular Plan - Dividend Option 52.852Direct Plan - Growth Option 861.131Direct Plan - Dividend Option 58.047
ASSETS UNDER MANAgEMENT (`) IN CROREAs on February 28, 2021 23,716.41Average for Month of February 2021 23,840.59
qUANTITATIVE DATAPortfolio Turnover Ratio (Last 1 year) 35.40%Risk Ration Standard Deviation 7.334%n Beta 1.056n Sharpe Ratio* 0.095Computed for the 3-yr period ended February 26, 2021. Based on month-end NAV. * Risk free rate: 3.47%(Source: FIMMDA MIBOR)
TOTAL ExPENSE RATIO (As on February 28, 2021)Including Additional expenses and Goods and Service Tax on Management FeesRegular: 1.72% Direct: 1.13%
#BENCHMARK INDEX: NIFTY 500 (Total Returns Index)##ADDl. BENCHMARK INDEX: NIFTY 50 (Total Returns Index)
EXIT lOADl In respect of each purchase / switch-in of Units, an exit Load
of 1.00% is payable if Units are redeemed / switched-out within 1 year from the date of allotment.
l No exit Load is payable if Units are redeemed / switched-out after 1 year from the date of allotment.
For further details, please refer to para ‘Exit Load’ on Pg 66.
PLANS & OPTIONSRegular Plan, Direct Plan. Under each Plan : Growth & Dividend. The Dividend Option offers Dividend Payout and Reinvestment facility.
MINIMUM APPlICATION AMOUNTPurchase : ` 5,000 and any amount thereafter.Additional Purchase : ` 1,000 and any amount thereafter.
SEgMENT-WISE BREAK-UP OF EqUITY HOlDINg (% OF NET ASSETS)Large Cap 80.30%Mid Cap 8.29%Small Cap 8.48%
¥ Dedicated Fund Manager for Overseas Investments: Mr. Sankalp Baid (since January 22, 2021) (Total experience: Over 13 years).
§ Date of migration from Zurich India Mutual Fund (Close of business hours - June 19, 03).
CATEgORY OF SCHEME: FLExI CAP FUND
HDFC Flexi Cap Fund (Erstwhile HDFC Equity Fund) (w.e.f January 29, 2021)

9 February 2021
Company Industry+ % to NAVEqUITY & EqUITY RElATED• HDFC Bank Ltd. Banks 9.87• ICICI Bank Ltd. Banks 9.24• Infosys Ltd. Software 8.68• Axis Bank Ltd. Banks 5.96• Bharti Airtel Ltd. Telecom - Services 4.63• Reliance Industries Ltd. Petroleum Products 2.64• NTPC Ltd. Power 2.50• State Bank of India Banks 2.45• Larsen and Toubro Ltd. Construction Project 2.39• HCL Technologies Ltd. Software 2.16Sun Pharmaceutical Industries Ltd. Pharmaceuticals 2.00Bharat Petroleum Corporation Ltd. Petroleum Products 1.74Cipla Ltd. Pharmaceuticals 1.63SBI Life Insurance Company Ltd. Finance 1.55Lupin Ltd. Pharmaceuticals 1.51MphasiS Ltd. Software 1.42ITC Ltd. Consumer Non Durables 1.37United Breweries Ltd. Consumer Non Durables 1.32Mahindra & Mahindra Ltd. Auto 1.25Voltas Ltd. Consumer Durables 1.22Godrej Consumer Products Ltd. Consumer Non Durables 1.20L&T Technology Services Ltd. Software 1.16Dilip Buildcon Ltd. Construction Project 1.14Ambuja Cements Ltd. Cement 1.13Radico Khaitan Ltd. Consumer Non Durables 1.12Tata Motors Ltd. Auto 1.09Aditya Birla Fashion and Retail Ltd. Retailing 1.05Bajaj Auto Ltd. Auto 1.05Cholamandalam Investment & Finance Finance 1.05Bharat electronics Ltd. Industrial Capital Goods 1.03Petronet LNG Ltd. Gas 1.03CanFin Homes Ltd. Finance 1.00UltraTech Cement Ltd. Cement 1.00The Phoenix Mills Ltd. Construction 0.99GAIL (India) Ltd. Gas 0.97Muthoot Finance Ltd. Finance 0.95Ashoka Buildcon Ltd. Construction Project 0.94Bosch Ltd. Auto Ancillaries 0.92Hindalco Industries Ltd. Non - Ferrous Metals 0.92United Spirits Ltd. Consumer Non Durables 0.90Multi Commodity exchange of India Ltd. Finance 0.86Central Depository Services (India) Ltd. Finance 0.81endurance Technologies Ltd. Auto Ancillaries 0.80Tech Mahindra Ltd. Software 0.77TCI express Ltd. Transportation 0.74UTI Asset Management Company Ltd. Finance 0.73Gujarat Pipavav Port Ltd. Transportation 0.72
Company Industry+ % to NAVChambal Fertilizers & Chemicals Ltd. Fertilisers 0.65Advanced enzyme Technologies Ltd. Consumer Non Durables 0.62CG Power and Industrial Solutions Ltd. Industrial Capital Goods 0.62Mishra Dhatu Nigam Ltd. Ferrous Metals 0.61Bharat Dynamics Ltd. Aerospace & Defence 0.60Equitas Small Finance Bank Ltd. Banks 0.60Hindustan Petroleum Corporation Ltd. Petroleum Products 0.54Indoco Remedies Ltd. Pharmaceuticals 0.52Jamna Auto Industries Ltd. Auto Ancillaries 0.52Prestige estates Projects Ltd. Construction 0.50Quess Corp Ltd. Services 0.37AIA engineering Ltd. Industrial Products 0.20Bajaj electricals Ltd. Consumer Durables 0.19RailTel Corporation of India Ltd. Telecom - Services 0.15Sadbhav Infrastructure Project Ltd. (Corporate Guarantee of Sadbhav engineering Ltd.) Construction Project 0.08Siti Networks Ltd. Media & entertainment 0.03Aurobindo Pharma Ltd. Pharmaceuticals 0.02Sub Total 98.42Cash, Cash equivalents and Net Current Assets 1.58Grand Total 100.00• Top Ten Holdings
PORTFOLIO
SIP PERFORMANCE ^ - Regular Plan - growth Option
Since Inception SIP
15 year SIP
10 year SIP
5 year SIP
3 year SIP
1 year SIP
Total Amount Invested (` ‘000) 3,250.00 1,800.00 1,200.00 600.00 360.00 120.00 Mkt Value As on February 26, 2021 (` ‘000) 52,429.10 5,380.21 2,421.24 812.78 456.40 163.32 Returns (%) 16.91 13.44 13.47 12.13 16.13 74.74 Benchmark Returns (%) # N.A. 12.43 13.87 15.25 19.92 72.06 Additional Benchmark Returns (%) ## 13.42 12.16 13.41 15.70 19.47 66.33
Assuming ` 10,000 invested systematically on the first Business Day of every month over a period of time. CAGR returns are computed after accounting for the cash flow by using xIRR method (investment internal rate of return). The above investment simulation is for illustrative purposes only and should not be construed as a promise on minimum returns and safeguard of capital.
PERFORMANCE ^ - Regular Plan - growth OptionDate Period Scheme
Returns (%)
Benchmark Returns
(%)#
Additional Benchmark
Returns (%) ##
Value of ` 10,000 invested
Scheme (`) Benchmark (`)#
Additional Benchmark
(`)##Feb 28, 20 Last 1 Year 31.46 33.37 31.27 13,137 13,326 13,117Feb 28, 18 Last 3 Years 5.82 10.86 12.88 11,848 13,621 14,378Feb 29, 16 Last 5 Years 15.53 17.31 17.29 20,569 22,207 22,189Feb 01, 94 Since Inception 14.02 N.A. 10.74 349,426 N.A. 158,678
Returns greater than 1 year period are compounded annualized (CAGR). Performance of dividend option under the schemes for the investors would be net of distribution tax, if any. N.A. Not Available. For performance of other schemes managed by Amit B. Ganatra, please refer page 66. Different plans viz. Regular Plan and Direct Plan have a different expense structure. The expenses of the Direct Plan under the Scheme will be lower to the extent of the distribution expenses / commission charged in the Regular Plan. As NIFTY 50 TRI data is not available since inception of the scheme, additional benchmark performance is calculated using composite CAGR of NIFTY 50 PRI values from February 1, 1994 to June 29, 1999 and TRI values since June 30, 1999. For Performance of Direct Plan, refer page no. 77.
Face Value per Unit: ` 10 unless otherwise specified, + Industry Classification as recommended by AMFI, Data is as of February 28, 2021 unless otherwise specified.
This product is suitable for investors who are seeking ~
l to generate long-term capital appreciation / income in the long term
l investment primarily in undervalued stocks
VeryHigh
Low to
Moderate
Low
Moderate ModeratelyHigh High
RISKOMETERInvestors understand that their principal will be at
very high risk
~ Investors should consult their financial advisers, if in doubt about whether the product is suitable for them. ^Past performance may or may not be sustained in the future. Since Inception Date = Date of First allotment in the Scheme / Plan.
Load is not taken into consideration for computation of performance.
(An open ended equity scheme following a value investment strategy)HDFC Capital Builder Value Fund
Industry Allocation of Equity Holding (% of Net Assets)
0.030.200.370.600.610.650.921.051.411.461.491.652.002.132.242.503.394.554.784.925.686.536.95
14.1928.12
0 5 10 15 20 25 30Media & Entertainment
Industrial ProductsServices
Aerospace & DefenceFerrous Metals
FertilisersNon - Ferrous Metals
RetailingConsumer Durables
TransportationConstruction
Industrial Capital GoodsGas
CementAuto Ancillaries
PowerAuto
Construction ProjectTelecom - Services
Petroleum ProductsPharmaceuticals
Consumer Non DurablesFinance
SoftwareBanks
KEY FACTS
INVESTMENT OBjECTIVE
To achieve capital appreciation/income in the long term by primarily investing in undervalued stocks.
There is no assurance that the investment objective of the Scheme will be realized.
FUND MANAgER ¥
Amit B. Ganatra (since May 21, 2020)
Total experience: Over 17 years
INCEPTION DATE (Date of Allotment)
February 1, 1994
NAV (AS ON FEBRUARY 26, 2021) NAV PER UNIT (`)
Regular Plan - Growth Option 349.426Regular Plan - Dividend Option 23.513Direct Plan - Growth Option 375.367Direct Plan - Dividend Option 26.515
ASSETS UNDER MANAgEMENT (`) IN CRORE
As on February 28, 2021 4,459.57Average for Month of February 2021 4,549.56
qUANTITATIVE DATA
Portfolio Turnover Ratio (Last 1 year) 108.42%
Risk Ration Standard Deviation 6.920%n Beta 1.028n Sharpe Ratio* 0.063
Computed for the 3-yr period ended February 26, 2021. Based on month-end NAV. * Risk free rate: 3.47%(Source: FIMMDA MIBOR)
TOTAL ExPENSE RATIO (As on February 28, 2021)Including Additional expenses and Goods and Service Tax on Management Fees
Regular: 2.05% Direct: 1.10%
#BENCHMARK INDEX: NIFTY 500 (Total Returns Index)
##ADDl. BENCHMARK INDEX: NIFTY 50 (Total Returns Index)
EXIT lOAD
l In respect of each purchase / switch-in of Units, an exit Load of 1.00% is payable if Units are redeemed / switched-out within 1 year from the date of allotment.
l No exit Load is payable if Units are redeemed / switched-out after 1 year from the date of allotment.
For further details, please refer to para ‘Exit Load’ on Pg 66.
PLANS & OPTIONS
Regular Plan, Direct Plan. Under each Plan : Growth & Dividend. The Dividend Option offers Dividend Payout and Reinvestment facility.
MINIMUM APPlICATION AMOUNT
Purchase : ` 5,000 and any amount thereafter.Additional Purchase : ` 1,000 and any amount thereafter.
¥ Dedicated Fund Manager for Overseas Investments: Mr. Sankalp Baid (since January 22, 2021) (Total experience: Over 13 years).
CATEgORY OF SCHEME: VALUE FUND

February 2021 10
CATEgORY OF SCHEME: LARGE-CAP FUND
Face Value per Unit: ` 10 unless otherwise specified, + Industry Classification as recommended by AMFI, Data is as of February 28, 2021 unless otherwise specified.
KEY FACTS
INVESTMENT OBjECTIVETo provide long-term capital appreciation/income by investing predominantly in Large-Cap companies.There is no assurance that the investment objective of the Scheme will be realized.
FUND MANAgER § ¥
Prashant Jain (since June 20, 2003)
Total experience: Over 27 years
INCEPTION DATE (Date of Allotment)October 11, 1996
NAV (AS ON FEBRUARY 26, 2021) NAV PER UNIT (`)Regular Plan - Growth Option 584.294Regular Plan - Dividend Option 49.330Direct Plan - Growth Option 615.772Direct Plan - Dividend Option 53.478
ASSETS UNDER MANAgEMENT (`) IN CROREAs on February 28, 2021 19,194.01Average for Month of February 2021 19,558.97
qUANTITATIVE DATAPortfolio Turnover Ratio (Last 1 year) 36.30%Risk Ration Standard Deviation 6.739%n Beta 1.022n Sharpe Ratio* 0.098Computed for the 3-yr period ended February 26, 2021. Based on month-end NAV. * Risk free rate: 3.47%(Source: FIMMDA MIBOR)
TOTAL ExPENSE RATIO (As on February 28, 2021)Including Additional expenses and Goods and Service Tax on Management FeesRegular: 1.85% Direct: 1.23%
#BENCHMARK INDEX: NIFTY 100 (Total Returns Index)
##ADDl. BENCHMARK INDEX: S&P BSe SeNSex (Total Returns Index)
EXIT lOADl In respect of each purchase / switch-in of Units, an exit Load
of 1.00% is payable if Units are redeemed / switched-out within 1 year from the date of allotment.
l No exit Load is payable if Units are redeemed / switched-out after 1 year from the date of allotment.
For further details, please refer to para ‘Exit Load’ on Pg 66.
PLANS & OPTIONSRegular Plan, Direct Plan. Under each Plan : Growth & Dividend. The Dividend Option offers Dividend Payout and Reinvestment facility.
MINIMUM APPlICATION AMOUNTPurchase : ` 5,000 and any amount thereafter.Additional Purchase : ` 1,000 and any amount thereafter.
SEgMENT-WISE BREAK-UP OF EqUITY HOlDINg (% OF NET ASSETS)Large Cap 90.85%Mid Cap 5.94% Small Cap 0.89%§ Date of migration from Zurich India Mutual Fund (Close
of business hours - June 19, 03).
¥ Dedicated Fund Manager for Overseas Investments: Mr. Sankalp Baid (since January 22, 2021) (Total experience: Over 13 years).
This product is suitable for investors who are seeking ~
l to generate long-term capital appreciation / income
l investment predominantly in Large-Cap companies
VeryHigh
Low to
Moderate
Low
Moderate ModeratelyHigh High
RISKOMETERInvestors understand that their principal will be at
very high risk
~ Investors should consult their financial advisers, if in doubt about whether the product is suitable for them.
SIP PERFORMANCE ^ - Regular Plan - growth OptionSince Inception
SIP15 year
SIP10 year
SIP5 year
SIP3 year
SIP1 year
SIPTotal Amount Invested (` ‘000) 2,930.00 1,800.00 1,200.00 600.00 360.00 120.00 Mkt Value As on February 26, 2021 (` ‘000) $$ 45,908.55 5,028.58 2,290.08 828.35 461.15 163.25 Returns (%) $$ 18.74 12.65 12.43 12.90 16.86 74.62 Benchmark Returns (%) # N.A. 12.53 13.63 15.19 18.91 65.26 Additional Benchmark Returns (%) ## 14.58 12.47 13.87 16.62 20.00 64.29
Assuming ` 10,000 invested systematically on the first Business Day of every month over a period of time. CAGR returns are computed after accounting for the cash flow by using xIRR method (investment internal rate of return) for Regular Plan - Growth Option. The above investment simulation is for illustrative purposes only and should not be construed as a promise on minimum returns and safeguard of capital.
PERFORMANCE ^ - Regular Plan - growth OptionDate Period Scheme
Returns (%) $$
Benchmark Returns
(%)#
Additional Benchmark
Returns (%) ##
Value of ` 10,000 investedScheme (`)
$$Benchmark
(`)#Additional
Benchmark (`)##
Feb 28, 20 Last 1 Year 30.59 31.10 29.90 13,049 13,100 12,981Feb 28, 18 Last 3 Years 8.98 11.91 14.22 12,939 14,010 14,894Feb 29, 16 Last 5 Years 16.72 17.19 17.89 21,657 22,098 22,764Oct 11, 96 Since Inception 19.11 N.A. 13.71 712,434 N.A. 229,721
Returns greater than 1 year period are compounded annualized (CAGR). Performance of dividend option under the schemes for the investors would be net of distribution tax, if any. N.A. Not Available. $$ All dividends declared prior to the splitting of the Scheme into Dividend & Growth Options are assumed to be reinvested in the units of the Scheme at the then prevailing NAV (ex-dividend NAV). For performance of other schemes managed by Prashant Jain, please refer page 66. Different plans viz. Regular Plan and Direct Plan have a different expense structure. The expenses of the Direct Plan under the Scheme will be lower to the extent of the distribution expenses / commission charged in the Regular Plan. For Performance of Direct Plan, refer page no. 72. For FPI Portfolio, refer page no. 80.
^Past performance may or may not be sustained in the future. Since Inception Date = Date of First allotment in the Scheme / Plan. Load is not taken into consideration for computation of performance.
(An open ended equity scheme predominantly investing in large cap stocks)HDFC Top 100 Fund
Company Industry+ % to NAV
EqUITY & EqUITY RElATED• HDFC Bank Ltd. Banks 8.45
• ICICI Bank Ltd. Banks 7.70
• State Bank of India Banks 6.98
• Infosys Ltd. Software 5.61
• Reliance Industries Ltd. Petroleum Products 4.94
• Larsen and Toubro Ltd. Construction Project 4.69
• ITC Ltd. Consumer Non Durables 4.23
• Housing Development Finance Corporation Ltd.£ Finance 4.15
• Axis Bank Ltd. Banks 3.90
• NTPC Ltd. Power 3.67
Coal India Ltd. Minerals/Mining 3.66
Bharti Airtel Ltd. Telecom - Services 3.41
Lupin Ltd. Pharmaceuticals 2.40
Tata Motors Ltd. Auto 2.39
Hindustan Petroleum Corporation Ltd. Petroleum Products 2.18
Power Finance Corporation Ltd. Finance 2.03
Sun Pharmaceutical Industries Ltd. Pharmaceuticals 1.96
Power Grid Corporation of India Ltd. Power 1.93
Bharat Petroleum Corporation Ltd. Petroleum Products 1.91
ReC Ltd. Finance 1.84
Tata Consultancy Services Ltd. Software 1.56
Ambuja Cements Ltd. Cement 1.20
Cipla Ltd. Pharmaceuticals 1.19
HCL Technologies Ltd. Software 1.11
GAIL (India) Ltd. Gas 1.03
Mahindra & Mahindra Ltd. Auto 1.01
Aurobindo Pharma Ltd. Pharmaceuticals 0.91
Siemens Ltd. Industrial Capital Goods 0.91
CeSC Ltd. Power 0.89
SBI Cards and Payment Services Ltd. Finance 0.89
Oil & Natural Gas Corporation Ltd. Oil 0.88
Bharat electronics Ltd. Industrial Capital Goods 0.81
Hero MotoCorp Ltd. Auto 0.74
Bajaj Auto Ltd. Auto 0.62
Vedanta Ltd. Non - Ferrous Metals 0.60
Tech Mahindra Ltd. Software 0.59
Wipro Ltd. Software 0.58
Maruti Suzuki India Ltd. Auto 0.55
Company Industry+ % to NAV
Indus Towers Ltd. Telecom - equipment & Accessories 0.50
SBI Life Insurance Company Ltd. Finance 0.50
Indian Oil Corporation Ltd. Petroleum Products 0.49
Bank of India Banks 0.37
Hindalco Industries Ltd. Non - Ferrous Metals 0.36
Bank of Baroda Banks 0.28
ABB India Ltd. Industrial Capital Goods 0.25
InterGlobe Aviation Ltd. Transportation 0.25
NHPC Ltd. Power 0.22
Tata Steel Ltd. Ferrous Metals 0.20
Container Corporation of India Ltd. Transportation 0.11
LIC Housing Finance Ltd. Finance 0.03
Sub Total 97.66Preference SharesZee entertainment enterprises Ltd. Media & entertainment @
Sub Total @Total 97.66Cash, Cash equivalents and Net Current Assets 2.34
Grand Total 100.00• Top Ten Holdings, £ Co-sponsor, @ Less than 0.01%
PORTFOLIO
Industry Allocation of Equity Holding (% of Net Assets)
0.200.360.500.880.961.031.201.973.413.664.234.695.316.466.71
9.449.459.52
27.68
0 5 10 15 20 25 30
Ferrous MetalsTransportation
Telecom - Equipment & AccessoriesOil
Non - Ferrous MetalsGas
CementIndustrial Capital Goods
Telecom - ServicesMinerals/Mining
Consumer Non DurablesConstruction Project
AutoPharmaceuticals
PowerFinance
SoftwarePetroleum Products
Banks

11 February 2021
Company Industry+ / Rating % to NAVEqUITY & EqUITY RElATED• Cholamandalam Investment
& Finance Finance 6.13• Balkrishna Industries Ltd. Auto Ancillaries 4.54• Sundram Fasteners Ltd. Auto Ancillaries 3.91• Aarti Industries Ltd. Chemicals 3.53• Voltas Ltd. Consumer Durables 3.21• Max Financial Services Ltd. Finance 3.20• Bharat Electronics Ltd. Industrial Capital Goods 3.18• Crompton Greaves Consumer
electricals Ltd. Consumer Durables 2.77• Ipca Laboratories Ltd. Pharmaceuticals 2.62• Atul Ltd. Chemicals 2.57Apollo Tyres Ltd. Auto Ancillaries 2.11Supreme Industries Ltd. Industrial Products 2.11Tata Chemicals Ltd. Chemicals 2.11City Union Bank Ltd. Banks 2.08Tata Consumer Products Ltd. Consumer Non Durables 2.04Indian Hotels Company Ltd. Hotels/Resorts & Other
Recreational Activities 1.99Carborundum Universal Ltd. Industrial Products 1.97Tube Investments of India Ltd. Auto Ancillaries 1.93Aurobindo Pharma Ltd. Pharmaceuticals 1.77Cholamandalam Financial Holdings Ltd. Finance 1.69SKF India Ltd. Industrial Products 1.63Whirlpool of India Ltd. Consumer Durables 1.63Jindal Steel & Power Ltd. Ferrous Metals 1.61Dilip Buildcon Ltd. Construction Project 1.56exide Industries Ltd. Auto Ancillaries 1.52KeC International Ltd. Construction Project 1.48KNR Construction Ltd. Construction 1.41AIA engineering Ltd. Industrial Products 1.40VST Industries Ltd. Consumer Non Durables 1.37Persistent Systems Ltd. Software 1.29The Federal Bank Ltd. Banks 1.29Nippon Life India Asset Management Ltd. Finance 1.23Redington (India) Ltd. Transportation 1.23Oracle Financial Ser Software Ltd. Software 1.18RBL Bank Ltd. Banks 1.17Trent Ltd. Retailing 1.03Power Finance Corporation Ltd. Finance 1.02ReC Ltd. Finance 1.02Glenmark Pharmaceuticals Ltd. Pharmaceuticals 1.01Blue Star Ltd. Consumer Durables 0.96Mahindra & Mahindra Financial Services Ltd. Finance 0.96Solar Industries India Ltd. Chemicals 0.87Karur Vysya Bank Ltd. Banks 0.73Symphony Ltd. Consumer Durables 0.73Indian Bank Banks 0.69Schaeffler India Ltd. Industrial Products 0.68Greenlam Industries Ltd. Consumer Durables 0.63Grindwell Norton Ltd. Industrial Products 0.62Gujarat Fluorochemicals Ltd. Chemicals 0.58Navneet education Ltd. Media & entertainment 0.53
Company Industry+ / Rating % to NAVDelta Corp Ltd. Hotels/Resorts & Other
Recreational Activities 0.52RITeS Ltd. engineering Services 0.52Greenply Industries Ltd. Consumer Durables 0.50Cummins India Ltd. Industrial Products 0.48Greenpanel Industries Ltd. Consumer Durables 0.48Edelweiss Financial Services Ltd. Finance 0.45Union Bank of India Banks 0.45Coforge Ltd. Software 0.42Vardhman Textiles Ltd. Textiles - Cotton 0.39Jagran Prakashan Ltd. Media & entertainment 0.38Arvind Ltd. Textile Products 0.37Strides Pharma Science Ltd. Pharmaceuticals 0.36Vesuvius India Ltd. Industrial Products 0.34Mahindra Holidays & Resorts Ind Ltd.
Hotels/Resorts & Other Recreational Activities 0.32
Dhanuka Agritech Ltd. Pesticides 0.30Torrent Pharmaceuticals Ltd. Pharmaceuticals 0.19Arvind Fashions Ltd. Retailing 0.17The Anup engineering Ltd. Industrial Capital Goods 0.13GFL Ltd. Chemicals 0.10Sub Total 95.39Preference SharesZee entertainment enterprises Ltd. Media & entertainment @Sub Total @Total 95.39Cash, Cash equivalents and Net Current Assets 4.61Grand Total 100.00• Top Ten Holdings, @ Less than 0.01%
CATEgORY OF SCHEME: MID CAP FUND
KEY FACTS
INVESTMENT OBjECTIVETo provide long-term capital appreciation/income by investing predominantly in Mid-Cap companies.There is no assurance that the investment objective of the Scheme will be realized.
FUND MANAgER ¥
Chirag Setalvad (since June 25, 2007)
Total experience: Over 21 years
INCEPTION DATE (Date of Allotment)June 25, 2007
NAV (AS ON FEBRUARY 26, 2021) NAV PER UNIT (`)Regular Plan - Growth Option 72.576Regular Plan - Dividend Option 29.918Direct Plan - Growth Option 77.585Direct Plan - Dividend Option 39.047
ASSETS UNDER MANAgEMENT (`) IN CROREAs on February 28, 2021 26,306.34Average for Month of February 2021 26,027.64
qUANTITATIVE DATAPortfolio Turnover Ratio (Last 1 year) 12.82%Risk Ration Standard Deviation 7.662%n Beta 0.902n Sharpe Ratio* 0.090Computed for the 3-yr period ended February 26, 2021. Based on month-end NAV. * Risk free rate: 3.47%(Source: FIMMDA MIBOR)
TOTAL ExPENSE RATIO (As on February 28, 2021)Including Additional expenses and Goods and Service Tax on Management FeesRegular: 1.79% Direct: 1.04%
#BENCHMARK INDEX: NIFTY Midcap 100 (Total Returns Index) ##ADDl. BENCHMARK INDEX: NIFTY 50 (Total Returns Index)
EXIT lOADl In respect of each purchase / switch-in of Units, an exit Load
of 1.00% is payable if Units are redeemed / switched-out within 1 year from the date of allotment.
l No exit Load is payable if Units are redeemed / switched-out after 1 year from the date of allotment.
For further details, please refer to para ‘Exit Load’ on Pg 66.
PLANS & OPTIONSRegular Plan, Direct Plan. Under each Plan : Growth & Dividend. The Dividend Option offers Dividend Payout and Reinvestment facility.
MINIMUM APPlICATION AMOUNTPurchase : ` 5,000 and any amount thereafter.Additional Purchase : ` 1,000 and any amount thereafter.
SEgMENT-WISE BREAK-UP OF EqUITY HOlDINg (% OF NET ASSETS)Large Cap 3.99%Mid Cap 66.12% Small Cap 25.25%
¥ Dedicated Fund Manager for Overseas Investments: Mr. Sankalp Baid (since January 22, 2021) (Total experience: Over 13 years).
SIP PERFORMANCE ^ - Regular Plan - growth Option
Since Inception SIP
10 year SIP
5 year SIP
3 year SIP
1 year SIP
Total Amount Invested (` ‘000) 1,650.00 1,200.00 600.00 360.00 120.00 Mkt Value As on February 26, 2021 (` ‘000) 6,252.16 2,977.43 866.06 492.15 169.11 Returns (%) 17.76 17.33 14.71 21.53 85.63 Benchmark Returns (%) # 13.92 14.80 14.40 22.37 97.53 Additional Benchmark Returns (%) ## 12.34 13.41 15.70 19.47 66.33
Assuming ` 10,000 invested systematically on the first Business Day of every month over a period of time. CAGR returns are computed after accounting for the cash flow by using xIRR method (investment internal rate of return) for Regular Plan - Growth Option. The above investment simulation is for illustrative purposes only and should not be construed as a promise on minimum returns and safeguard of capital.
PERFORMANCE ^ - Regular Plan - growth Option
Date Period Scheme Returns
(%)
Benchmark Returns
(%)#
Additional Benchmark
Returns (%) ##
Value of ` 10,000 invested
Scheme (`) Benchmark (`)#
Additional Benchmark
(`)##
Feb 28, 20 Last 1 Year 34.25 39.85 31.27 13,414 13,972 13,117Feb 28, 18 Last 3 Years 8.34 6.79 12.88 12,713 12,177 14,378Feb 29, 16 Last 5 Years 17.46 16.24 17.29 22,352 21,217 22,189Jun 25, 07 Since Inception 15.58 12.03 10.68 72,576 47,308 40,077
Returns greater than 1 year period are compounded annualized (CAGR). Performance of dividend option under the schemes for the investors would be net of distribution tax, if any. For performance of other schemes managed by Chirag Setalvad, please refer page 66. Different plans viz. Regular Plan and Direct Plan have a different expense structure. The expenses of the Direct Plan under the Scheme will be lower to the extent of the distribution expenses / commission charged in the Regular Plan. For Performance of Direct Plan, refer page no. 72.
Face Value per Unit: ` 10 unless otherwise specified, + Industry Classification as recommended by AMFI, Data is as of February 28, 2021 unless otherwise specified.
This product is suitable for investors who are seeking ~
l to generate long-term capital appreciation / income
l investment predominantly in Mid-Cap companies
VeryHigh
Low to
Moderate
Low
Moderate ModeratelyHigh High
RISKOMETERInvestors understand that their principal will be at
very high risk
~ Investors should consult their financial advisers, if in doubt about whether the product is suitable for them. ^Past performance may or may not be sustained in the future. Since Inception Date = Date of First allotment in the Scheme / Plan.
Load is not taken into consideration for computation of performance.
(An open ended equity scheme predominantly investing in mid cap stocks)HDFC Mid Cap Opportunities Fund
PORTFOLIO
Industry Allocation of Equity Holding (% of Net Assets)
0.300.370.390.520.911.201.231.411.61
2.832.893.043.313.41
5.956.41
9.239.76
10.9114.01
15.70
0 2 4 6 8 10 12141618
PesticidesTextile ProductsTextiles - Cotton
Engineering ServicesMedia & Entertainment
RetailingTransportation
ConstructionFerrous Metals
Hotels, Resorts & Other Recreational ActivitiesSoftware
Construction ProjectIndustrial Capital GoodsConsumer Non Durables
PharmaceuticalsBanks
Industrial ProductsChemicals
Consumer DurablesAuto Ancillaries
Finance

February 2021 12
CATEgORY OF SCHEME: SMALL CAP FUND
KEY FACTS
INVESTMENT OBjECTIVETo provide long-term capital appreciation /income by investing predominantly in Small-Cap companies.There is no assurance that the investment objective of the Scheme will be realized.
FUND MANAgER § ¥
Chirag Setalvad (since June 28, 2014)
Total experience: Over 21 years
INCEPTION DATE (Date of Allotment)April 3, 2008
NAV (AS ON FEBRUARY 26, 2021) NAV PER UNIT (`)Regular Plan - Growth Option 52.322Regular Plan - Dividend Option 27.547Direct Plan - Growth Option 57.097Direct Plan - Dividend Option 35.216
ASSETS UNDER MANAgEMENT (`) IN CROREAs on February 28, 2021 10,033.36Average for Month of February 2021 9,918.27
qUANTITATIVE DATAPortfolio Turnover Ratio (Last 1 year) 10.20%Risk Ration Standard Deviation 8.278%n Beta 0.808n Sharpe Ratio* 0.053Computed for the 3-yr period ended February 26, 2021. Based on month-end NAV. * Risk free rate: 3.47%(Source: FIMMDA MIBOR)
TOTAL ExPENSE RATIO (As on February 28, 2021)Including Additional expenses and Goods and Service Tax on Management FeesRegular: 1.80% Direct: 0.95%
#BENCHMARK INDEX: NIFTY Smallcap 100 (Total Returns Index)##ADDl. BENCHMARK INDEX: NIFTY 50 (Total Returns Index)
EXIT lOADl In respect of each purchase / switch-in of Units, an exit Load
of 1.00% is payable if Units are redeemed / switched-out within 1 year from the date of allotment.
l No exit Load is payable if Units are redeemed / switched-out after 1 year from the date of allotment.
For further details, please refer to para ‘Exit Load’ on Pg 66.
PLANS & OPTIONSRegular Plan, Direct Plan. Under each Plan : Growth & Dividend. The Dividend Option offers Dividend Payout and Reinvestment facility.
MINIMUM APPlICATION AMOUNTPurchase : ` 5,000 and any amount thereafter.Additional Purchase : ` 1,000 and any amount thereafter.
SEgMENT-WISE BREAK-UP OF EqUITY HOlDINg (% OF NET ASSETS)Large Cap 1.59%Mid Cap 11.73%Small Cap 81.05%§ Date of migration from Morgan Stanley Mutual Fund
(Close of business hours - June 27, 14)¥ Dedicated Fund Manager for Overseas Investments: Mr. Sankalp Baid (since January 22, 2021) (Total experience: Over 13 years).
SIP PERFORMANCE ^ - Regular Plan - growth Option
Since Inception SIP
10 year SIP
5 year SIP
3 year SIP
1 year SIP
Total Amount Invested (` ‘000) 1,550.00 1,200.00 600.00 360.00 120.00 Mkt Value As on February 26, 2021 (` ‘000) 4,526.02 2,704.96 863.19 477.68 178.79 Returns (%) 15.44 15.54 14.58 19.37 104.19 Benchmark Returns (%) # 11.17 11.52 11.51 21.74 121.78 Additional Benchmark Returns (%) ## 12.84 13.41 15.70 19.47 66.33
Assuming ` 10,000 invested systematically on the first Business Day of every month over a period of time. CAGR returns are computed after accounting for the cash flow by using xIRR method (investment internal rate of return) for Regular Plan - Growth Option. The above investment simulation is for illustrative purposes only and should not be construed as a promise on minimum returns and safeguard of capital.
PERFORMANCE ^ - Regular Plan - growth Option
Date Period Scheme Returns
(%)
Benchmark Returns
(%)#
Additional Benchmark
Returns (%) ##
Value of ` 10,000 invested
Scheme (`) Benchmark (`)#
Additional Benchmark
(`)##
Feb 28, 20 Last 1 Year 39.75 43.44 31.27 13,962 14,330 13,117Feb 28, 18 Last 3 Years 4.53 -0.17 12.88 11,422 9,950 14,378Feb 29, 16 Last 5 Years 18.55 14.19 17.29 23,401 19,406 22,189Apr 03, 08 Since Inception 13.68 7.55 10.32 52,322 25,586 35,546
Returns greater than 1 year period are compounded annualized (CAGR). Performance of dividend option under the schemes for the investors would be net of distribution tax, if any. For performance of other schemes managed by Chirag Setalvad, please refer page 66. Different plans viz. Regular Plan and Direct Plan have a different expense structure. The expenses of the Direct Plan under the Scheme will be lower to the extent of the distribution expenses / commission charged in the Regular Plan. For Performance of Direct Plan, refer page no. 72.
Face Value per Unit: ` 10 unless otherwise specified, + Industry Classification as recommended by AMFI, Data is as of February 28, 2021 unless otherwise specified.
This product is suitable for investors who are seeking ~
l to generate long-term capital appreciation / income
l investment predominantly in Small-Cap companies
VeryHigh
Low to
Moderate
Low
Moderate ModeratelyHigh High
RISKOMETERInvestors understand that their principal will be at
very high risk
~ Investors should consult their financial advisers, if in doubt about whether the product is suitable for them. ^Past performance may or may not be sustained in the future. Since Inception Date = Date of First allotment in the Scheme / Plan.
Load is not taken into consideration for computation of performance.
(An open ended equity scheme predominantly investing in small cap stocks)HDFC Small Cap Fund
Company Industry+ % to NAV
EqUITY & EqUITY RElATED• Bajaj Electricals Ltd. Consumer Durables 5.92• Firstsource Solutions Ltd. Software 5.14• Sonata Software Ltd. Software 4.24• Persistent Systems Ltd. Software 3.63• Chambal Fertilizers &
Chemicals Ltd. Fertilisers 3.34• PNC Infratech Ltd. Construction 3.16• KEC International Ltd. Construction Project 2.61• Procter & Gamble Health Ltd. Pharmaceuticals 2.36• Aster DM Healthcare Ltd. Healthcare Services 2.17• Suprajit Engineering Ltd. Auto Ancillaries 2.06Finolex Industries Ltd. Industrial Products 2.03Advanced enzyme Technologies Ltd.
Consumer Non Durables 1.97
KeI Industries Ltd. Industrial Products 1.92Tata Metaliks Ltd. Ferrous Metals 1.85Sharda Cropchem Ltd. Pesticides 1.84Vardhman Textiles Ltd. Textiles - Cotton 1.84SKF India Ltd. Industrial Products 1.82Unichem Laboratories Ltd. Pharmaceuticals 1.70eClerx Services Ltd. Software 1.68Radico Khaitan Ltd. Consumer Non Durables 1.66Bajaj Consumer Care Ltd. Consumer Non Durables 1.62Kalpataru Power Transmission Ltd. Power 1.60Nilkamal Ltd. Industrial Products 1.60Aurobindo Pharma Ltd. Pharmaceuticals 1.59DCB Bank Ltd. Banks 1.59Great eastern Shipping Company Ltd. Transportation 1.55emami Ltd. Consumer Non Durables 1.50Bank of Baroda Banks 1.49La Opala RG Ltd. Consumer Durables 1.46T. V. Today Network Ltd. Media & entertainment 1.41Kirloskar Ferrous Industries Ltd. Ferrous Metals 1.38Redington (India) Ltd. Transportation 1.24Repco Home Finance Ltd. Finance 1.24Delta Corp Ltd. Hotels/Resorts & Other
Recreational Activities 1.20Gujarat Fluorochemicals Ltd. Chemicals 1.18Carborundum Universal Ltd. Industrial Products 1.11Astral Poly Technik Ltd. Industrial Products 1.06Atul Ltd. Chemicals 1.04NRB Bearing Ltd. Industrial Products 1.02Chalet Hotels Ltd. Hotels/Resorts & Other
Recreational Activities 1.00Indian Bank Banks 0.99JB Chemicals & Pharmaceuticals Ltd. Pharmaceuticals 0.97engineers India Ltd. Construction Project 0.96Gabriel India Ltd. Auto Ancillaries 0.91Goodyear India Ltd. Auto Ancillaries 0.85eIH Ltd. Hotels/Resorts & Other
Recreational Activities 0.81
Company Industry+ % to NAV
Insecticides (India) Ltd. Pesticides 0.79IFGL Refractories Ltd. (Erst IFGL Exports Ltd.) Industrial Products 0.66Shaily engineering Plastics Ltd. Industrial Products 0.66LG Balakrishnan & Bros Ltd. Auto Ancillaries 0.64The Federal Bank Ltd. Banks 0.64Power Mech Projects Ltd. Construction Project 0.54Sadbhav engineering Ltd. Construction Project 0.53D B Corp Ltd. Media & entertainment 0.49Oriental Carbon & Chemicals Ltd. Chemicals 0.48Transport Corporation of India Ltd. Transportation 0.48Vesuvius India Ltd. Industrial Products 0.45GNA Axles Ltd. Auto Ancillaries 0.41Apar Industries Ltd. Industrial Capital Goods 0.37Greenlam Industries Ltd. Consumer Durables 0.37Inox Leisure Ltd. Media & entertainment 0.36Greenply Industries Ltd. Consumer Durables 0.27Jagran Prakashan Ltd. Media & entertainment 0.24Atul Auto Ltd. Auto 0.23Taj GVK Hotels & Resorts Ltd. Hotels/Resorts & Other
Recreational Activities 0.22Equitas Small Finance Bank Ltd. Banks 0.15Time Technoplast Ltd. Industrial Products 0.06Sub Total 94.35Cash, Cash equivalents and Net Current Assets 5.65Grand Total 100.00• Top Ten Holdings
PORTFOLIO
Industry Allocation of Equity Holding (% of Net Assets)
0.230.371.241.601.842.172.502.632.703.163.233.233.273.34
4.644.864.87
6.626.75
8.0212.39
14.69
0 2 4 6 8 10 12 14 16
AutoIndustrial Capital Goods
FinancePower
Textiles - CottonHealthcare Services
Media & EntertainmentPesticidesChemicals
ConstructionFerrous Metals
Hotels, Resorts & Other Recreational ActivitiesTransportation
FertilisersConstruction Project
BanksAuto AncillariesPharmaceuticals
Consumer Non DurablesConsumer DurablesIndustrial Products
Software

13 February 2021
CATEgORY OF SCHEME: LARGE & MID CAP FUND
KEY FACTS
INVESTMENT OBjECTIVETo generate long term capital appreciation/income from a portfolio, predominantly invested in equity and equity related instruments. There is no assurance that the investment objective of the Scheme will be realized.
FUND MANAgER § ¥
gopal Agrawal (since July 16, 2020)
Total experience: Over 16 years
INCEPTION DATE (Date of Allotment)February 18, 1994
NAV (AS ON FEBRUARY 26, 2021) NAV PER UNIT (`)Regular Plan - Growth Option 146.084Regular Plan - Dividend Option 19.462Direct Plan - Growth Option 148.410Direct Plan - Dividend Option 23.605
ASSETS UNDER MANAgEMENT (`) IN CROREAs on February 28, 2021 1,956.32Average for Month of February 2021 1,930.36
qUANTITATIVE DATAPortfolio Turnover Ratio (Last 1 year) 12.05%Risk Ration Standard Deviation 7.067%n Beta 0.975n Sharpe Ratio* 0.108Computed for the 3-yr period ended February 26, 2021. Based on month-end NAV. * Risk free rate: 3.47%(Source: FIMMDA MIBOR)
TOTAL ExPENSE RATIO (As on February 28, 2021)Including Additional expenses and Goods and Service Tax on Management FeesRegular: 2.54% Direct: 1.84%
#BENCHMARK INDEX: NIFTY Large Midcap 250 (Total Returns Index)##ADDl. BENCHMARK INDEX: S&P BSe SeNSex (Total Returns Index)
EXIT lOADl In respect of each purchase / switch-in of Units, an exit Load
of 1.00% is payable if Units are redeemed / switched-out within 1 year from the date of allotment.
l No exit Load is payable if Units are redeemed / switched-out after 1 year from the date of allotment.
For further details, please refer to para ‘Exit Load’ on Pg 66.
PLANS & OPTIONSRegular Plan, Direct Plan. Under each Plan : Growth & Dividend. The Dividend Option offers Dividend Payout and Reinvestment facility.
MINIMUM APPlICATION AMOUNTPurchase : ` 5,000 and any amount thereafter.Additional Purchase : ` 1,000 and any amount thereafter.
SEgMENT-WISE BREAK-UP OF EqUITY HOlDINg (% OF NET ASSETS)Large Cap 56.08%Mid Cap 35.56%Small Cap 6.42%§ Date of migration from Morgan Stanley Mutual Fund (Close
of business hours - June 27, 14)
¥ Dedicated Fund Manager for Overseas Investments: Mr. Sankalp Baid (since January 22, 2021) (Total experience: Over 13 years).
PERFORMANCE ^ - Regular Plan - growth Option
Date Period Scheme Returns
(%) $$
Benchmark Returns
(%)#
Additional Benchmark
Returns (%) ##
Value of ` 10,000 invested
Scheme (`) $$
Benchmark (`)#
Additional Benchmark
(`)##
Feb 28, 20 Last 1 Year 36.01 36.50 29.90 13,590 13,639 12,981Feb 28, 18 Last 3 Years 10.05 11.01 14.22 13,326 13,674 14,894Feb 29, 16 Last 5 Years 14.94 18.54 17.89 20,054 23,391 22,764Feb 18, 94 Since Inception 11.52 N.A. 11.41 190,982 N.A. 185,548
Returns greater than 1 year period are compounded annualized (CAGR). Performance of dividend option under the schemes for the investors would be net of distribution tax, if any. N.A. Not Available. The Scheme, formerly a large cap fund, has undergone change in Fundamental attributes w.e.f. May 23, 2018 and become a Large and Mid-cap Fund. Accordingly, the Scheme’s benchmark has also changed. Hence, the past performance of the Scheme may not strictly be comparable with that of the new benchmark. As S&P BSe SeNSex TRI data is not available since inception of the scheme, additional benchmark performance is calculated using composite CAGR of S&P BSE SENSEx PRI values from February 18, 1994 to August 18, 1996 and TRI values since August 19, 1996. $$ All dividends declared prior to the splitting of the Scheme into Dividend & Growth Options are assumed to be reinvested in the units of the Scheme at the then prevailing NAV (ex-dividend NAV). For performance of other schemes managed by Gopal Agrawal, please refer page 66. Different plans viz. Regular Plan and Direct Plan have a different expense structure. The expenses of the Direct Plan under the Scheme will be lower to the extent of the distribution expenses / commission charged in the Regular Plan. For Performance of Direct Plan, refer page no. 78.
Face Value per Unit: ` 10 unless otherwise specified, + Industry Classification as recommended by AMFI, Data is as of February 28, 2021 unless otherwise specified.
This product is suitable for investors who are seeking ~
l to generate long-term capital appreciation/income
l investment predominantly in Large Cap and Mid Cap companies
VeryHigh
Low to
Moderate
Low
Moderate ModeratelyHigh High
RISKOMETERInvestors understand that their principal will be at
very high risk
~ Investors should consult their financial advisers, if in doubt about whether the product is suitable for them.
^Past performance may or may not be sustained in the future. Since Inception Date = Date of First allotment in the Scheme / Plan. Load is not taken into consideration for computation of performance.
(An open ended equity scheme investing in both large cap and mid cap stocks)HDFC Growth Opportunities Fund
Company Industry+ % to NAV
EqUITY & EqUITY RElATED• ICICI Bank Ltd. Banks 7.27• State Bank of India Banks 6.70• Infosys Ltd. Software 6.51• Reliance Industries Ltd. Petroleum Products 5.32• NTPC Ltd. Power 3.89• HDFC Bank Ltd. Banks 3.69• Tata Consumer Products Ltd. Consumer Non Durables 3.54• Bharat Electronics Ltd. Industrial Capital Goods 3.00• Bharat Petroleum
Corporation Ltd. Petroleum Products 3.00• Indian Railway Catering And
Tourism Corporation Ltd. Services 2.79emami Ltd. Consumer Non Durables 2.77Max Financial Services Ltd. Finance 2.59ITC Ltd. Consumer Non Durables 2.50Apollo Tyres Ltd. Auto Ancillaries 2.42Sun Pharmaceutical Industries Ltd. Pharmaceuticals 2.28GAIL (India) Ltd. Gas 1.84Indian Hotels Company Ltd. Hotels/Resorts & Other
Recreational Activities 1.72Tata Steel Ltd. Ferrous Metals 1.65Prestige estates Projects Ltd. Construction 1.64Trent Ltd. Retailing 1.63Larsen and Toubro Ltd. Construction Project 1.59Gujarat State Petronet Ltd. Gas 1.55Tata Motors Ltd. DVR Auto 1.53ACC Ltd. Cement 1.46Mindtree Consulting Ltd. Software 1.43Tata Chemicals Ltd. Chemicals 1.33Shriram Transport Finance Co. Ltd. Finance 1.32LIC Housing Finance Ltd. Finance 1.25Tata Motors Ltd. Auto 1.24NHPC Ltd. Power 1.18exide Industries Ltd. Auto Ancillaries 1.17CeSC Ltd. Power 1.13Mahanagar Gas Ltd. Gas 1.03Ambuja Cements Ltd. Cement 1.01Computer Age Management Services Finance 0.99Solar Industries India Ltd. Chemicals 0.91Lupin Ltd. Pharmaceuticals 0.88Jindal Steel & Power Ltd. Ferrous Metals 0.87Hindustan Petroleum Corporation Ltd. Petroleum Products 0.84Inox Leisure Ltd. Media & entertainment 0.84The Phoenix Mills Ltd. Construction 0.83Castrol India Ltd. Petroleum Products 0.79Sun TV Network Ltd. Media & entertainment 0.76
Company Industry+ % to NAV
Bharat Heavy electricals Ltd. Industrial Capital Goods 0.75Glenmark Pharmaceuticals Ltd. Pharmaceuticals 0.74Cholamandalam Investment & Finance Finance 0.66Power Finance Corporation Ltd. Finance 0.63Power Grid Corporation of India Ltd. Power 0.55Canara Bank Banks 0.46Titagarh Wagons Ltd. Industrial Capital Goods 0.31NBCC (India) Ltd. Construction 0.28NLC India Ltd. Power 0.20Indian Bank Banks 0.16Oil India Ltd. Oil 0.15Union Bank of India Banks 0.15Aurobindo Pharma Ltd. Pharmaceuticals 0.13SBI Cards and Payment Services Ltd. Finance 0.13Reliance Power Ltd. Power 0.09Indus Towers Ltd. Telecom - equipment
& Accessories 0.01Sub Total 98.08Cash, Cash equivalents and Net Current Assets 1.92Grand Total 100.00• Top Ten Holdings
PORTFOLIO
Industry Allocation of Equity Holding (% of Net Assets)
0.010.15
1.591.601.631.722.242.472.522.752.772.793.594.034.064.42
7.047.577.948.819.95
18.43
0 2 4 6 8101214161820
Telecom - Equipment & AccessoriesOil
Construction ProjectMedia & Entertainment
RetailingHotels, Resorts & Other Recreational Activities
ChemicalsCement
Ferrous MetalsConstruction
AutoServices
Auto AncillariesPharmaceuticals
Industrial Capital GoodsGas
PowerFinance
SoftwareConsumer Non Durables
Petroleum ProductsBanks
SIP PERFORMANCE ^ - Regular Plan - growth OptionSince Inception
SIP15 year
SIP10 year
SIP5 year
SIP3 year
SIP1 year
SIPTotal Amount Invested (` ‘000) 3,250.00 1,800.00 1,200.00 600.00 360.00 120.00 Mkt Value As on February 26, 2021 (` ‘000) $$ 26,202.35 4,360.44 2,313.59 854.88 486.98 169.02 Returns (%) $$ 13.03 10.98 12.62 14.18 20.76 85.45 Benchmark Returns (%) # N.A. 14.02 15.68 16.37 21.96 80.52 Additional Benchmark Returns (%) ## 13.83 12.47 13.87 16.62 20.00 64.29
Assuming ` 10,000 invested systematically on the first Business Day of every month over a period of time. CAGR returns are computed after accounting for the cash flow by using xIRR method (investment internal rate of return) for Regular Plan - Growth Option. The above investment simulation is for illustrative purposes only and should not be construed as a promise on minimum returns and safeguard of capital.

February 2021 14
CATEgORY OF SCHEME: FOCUSED FUND
KEY FACTS
INVESTMENT OBjECTIVE
To generate long term capital appreciation/income by investing in equity & equity related instruments of up to 30 companies.
There is no assurance that the investment objective of the Scheme will be realized.
FUND MANAgER ¥
gopal Agrawal (since July 16, 2020)
Total experience: Over 16 years
INCEPTION DATE (Date of Allotment)
September 17, 2004
NAV (AS ON FEBRUARY 26, 2021) NAV PER UNIT (`)
Regular Plan - Growth Option 89.202Regular Plan - Dividend Option 14.876Direct Plan - Growth Option 95.788Direct Plan - Dividend Option 17.014
ASSETS UNDER MANAgEMENT (`) IN CRORE
As on February 28, 2021 637.16Average for Month of February 2021 634.81
qUANTITATIVE DATA
Portfolio Turnover Ratio (Last 1 year) 23.83%
Risk Ration Standard Deviation 7.060%n Beta 1.014n Sharpe Ratio* 0.030Computed for the 3-yr period ended February 26, 2021. Based on month-end NAV. * Risk free rate: 3.47%(Source: FIMMDA MIBOR)
TOTAL ExPENSE RATIO (As on February 28, 2021)Including Additional expenses and Goods and Service Tax on Management Fees
Regular: 2.72% Direct: 1.47%
#BENCHMARK INDEX: NIFTY 500 (Total Returns Index)
##ADDl. BENCHMARK INDEX: S&P BSe SeNSex (Total Returns Index)
EXIT lOAD
l In respect of each purchase / switch-in of Units, an exit Load of 1.00% is payable if Units are redeemed / switched-out within 1 year from the date of allotment.
l No exit Load is payable if Units are redeemed / switched-out after 1 year from the date of allotment.
For further details, please refer to para ‘Exit Load’ on Pg 66.
PLANS & OPTIONS
Regular Plan, Direct Plan. Under each Plan : Growth & Dividend. The Dividend Option offers Dividend Payout and Reinvestment facility.
MINIMUM APPlICATION AMOUNT
Purchase : ` 5,000 and any amount thereafter.Additional Purchase : ` 1,000 and any amount thereafter.
¥ Dedicated Fund Manager for Overseas Investments: Mr. Sankalp Baid (since January 22, 2021) (Total experience: Over 13 years).
SIP PERFORMANCE ^ - Regular Plan - growth Option
Since Inception SIP
15 year SIP
10 year SIP
5 year SIP
3 year SIP
1 year SIP
Total Amount Invested (` ‘000) 1,980.00 1,800.00 1,200.00 600.00 360.00 120.00
Mkt Value As on February 26, 2021 (` ‘000) 5,272.42 4,070.02 2,028.07 756.10 442.93 162.14
Returns (%) 10.94 10.16 10.14 9.22 14.02 72.57
Benchmark Returns (%) # 12.88 12.43 13.87 15.25 19.92 72.06
Additional Benchmark Returns (%) ## 13.15 12.47 13.87 16.62 20.00 64.29
Assuming ̀ 10,000 invested systematically on the first Business Day of every month over a period of time. CAGR returns are computed after accounting for the cash flow by using xIRR method (investment internal rate of return) for Regular Plan - Growth Option. The above investment simulation is for illustrative purposes only and should not be construed as a promise on minimum returns and safeguard of capital.
PERFORMANCE ^ - Regular Plan - growth Option
Date Period Scheme Returns
(%)
Benchmark Returns
(%)#
Additional Benchmark
Returns (%) ##
Value of ` 10,000 invested
Scheme (`) Benchmark (`)#
Additional Benchmark
(`)##
Feb 28, 20 Last 1 Year 28.11 33.37 29.90 12,803 13,326 12,981
Feb 28, 18 Last 3 Years 3.02 10.86 14.22 10,932 13,621 14,894
Feb 29, 16 Last 5 Years 13.17 17.31 17.89 18,559 22,207 22,764
Sep 17, 04 Since Inception 14.22 15.19 15.73 89,202 102,401 110,667
Returns greater than 1 year period are compounded annualized (CAGR). Performance of dividend option under the schemes for the investors would be net of distribution tax, if any. For performance of other schemes managed by Gopal Agrawal, please refer page 66. Different plans viz. Regular Plan and Direct Plan have a different expense structure. The expenses of the Direct Plan under the Scheme will be lower to the extent of the distribution expenses / commission charged in the Regular Plan. For Performance of Direct Plan, refer page no. 78.
Face Value per Unit: ` 10 unless otherwise specified, + Industry Classification as recommended by AMFI, Data is as of February 28, 2021 unless otherwise specified.
This product is suitable for investors who are seeking ~
l to generate long-term capital appreciation / income
l investments in equity & equity related instruments of up to 30 companies
VeryHigh
Low to
Moderate
Low
Moderate ModeratelyHigh High
RISKOMETERInvestors understand that their principal will be at
very high risk
~ Investors should consult their financial advisers, if in doubt about whether the product is suitable for them. ^Past performance may or may not be sustained in the future. Since Inception Date = Date of First allotment in the Scheme / Plan.
Load is not taken into consideration for computation of performance.
[An open ended equity scheme investing in maximum 30 stocks in large-cap, mid-cap and small-cap category (i.e. Multi-Cap)]HDFC Focused 30 Fund
Company Industry+ / Rating % to NAV
EqUITY & EqUITY RElATED
• ICICI Bank Ltd. Banks 7.57
• State Bank of India Banks 7.11
• HDFC Bank Ltd. Banks 6.74
• Reliance Industries Ltd. Petroleum Products 6.55
• Larsen and Toubro Ltd. Construction Project 6.23
• Infosys Ltd. Software 5.76
• NTPC Ltd. Power 4.12
• ITC Ltd. Consumer Non Durables 3.94
• Bharat Petroleum Corporation Ltd. Petroleum Products 3.77
• Axis Bank Ltd. Banks 3.64
Bharti Airtel Ltd. Telecom - Services 3.54
Bharat electronics Ltd. Industrial Capital Goods 2.88
Lupin Ltd. Pharmaceuticals 2.85
Power Grid Corporation of India Ltd. Power 2.69
Hindustan Petroleum Corporation Ltd. Petroleum Products 2.47
Garden Reach Shipbuilders & engineers Ltd. Aerospace & Defence 2.21
Burger King India Ltd. Consumer Non Durables 2.15
ACC Ltd. Cement 2.04
Kalpataru Power Transmission Ltd. Power 1.92
Ambuja Cements Ltd. Cement 1.82
GAIL (India) Ltd. Gas 1.78
Gujarat Pipavav Port Ltd. Transportation 1.74
Avenue Supermarts Ltd. Retailing 1.73
SBI Cards and Payment Services Ltd. Finance 1.72
Tata Steel Ltd. Ferrous Metals 1.68
Company Industry+ / Rating % to NAV
Hindustan Aeronautics Ltd. Aerospace & Defence 1.54
Indigo Paints Ltd. Consumer Non Durables 1.52
CeSC Ltd. Power 1.33
Coal India Ltd. Minerals/Mining 1.18
Sub Total 94.22
Cash, Cash equivalents and Net Current Assets 5.78
Grand Total 100.00
• Top Ten Holdings
PORTFOLIO
Industry Allocation of Equity Holding (% of Net Assets)
1.18
1.68
1.72
1.73
1.74
1.78
2.85
2.88
3.54
3.75
3.86
5.76
6.23
7.61
10.06
12.79
25.06
0 5 10 15 20 25 30
Minerals/Mining
Ferrous Metals
Finance
Retailing
Transportation
Gas
Pharmaceuticals
Industrial Capital Goods
Telecom - Services
Aerospace & Defence
Cement
Software
Construction Project
Consumer Non Durables
Power
Petroleum Products
Banks

15 February 2021
CATEgORY OF SCHEME: THEMATIC FUND
KEY FACTS
INVESTMENT OBjECTIVE
To seek long-term capital appreciation/income by investing predominantly in equity and equity related securities of companies engaged in or expected to benefit from the growth and development of infrastructure.There is no assurance that the investment objective of the Scheme will be realized.
FUND MANAgER ¥
Rakesh Vyas (since June 01, 2019)
Total experience: Over 15 years
INCEPTION DATE (Date of Allotment)
March 10, 2008
NAV (AS ON FEBRUARY 26, 2021) NAV PER UNIT (`)
Regular Plan - Growth Option 16.306Regular Plan - Dividend Option 9.734Direct Plan - Growth Option 17.401Direct Plan - Dividend Option 13.349
ASSETS UNDER MANAgEMENT (`) IN CRORE
As on February 28, 2021 567.86Average for Month of February 2021 562.38
qUANTITATIVE DATA
Portfolio Turnover Ratio (Last 1 year) 25.99%
Risk Ration Standard Deviation 9.949%n Beta 1.367n Sharpe Ratio* -0.038
Computed for the 3-yr period ended February 26, 2021. Based on month-end NAV. * Risk free rate: 3.47%(Source: FIMMDA MIBOR)
TOTAL ExPENSE RATIO (As on February 28, 2021)Including Additional expenses and Goods and Service Tax on Management Fees
Regular: 2.58% Direct: 1.87%
#BENCHMARK INDEX: NIFTY 500 (Total Returns Index)##ADDl. BENCHMARK INDEX: NIFTY 50 (Total Returns Index)
EXIT lOAD
l In respect of each purchase / switch-in of Units, an exit Load of 1.00% is payable if Units are redeemed / switched-out within 1 year from the date of allotment.
l No exit Load is payable if Units are redeemed / switched-out after 1 year from the date of allotment.
For further details, please refer to para ‘Exit Load’ on Pg 66.
PLANS & OPTIONS
Regular Plan, Direct Plan. Under each Plan : Growth & Dividend. The Dividend Option offers Dividend Payout and Reinvestment facility.
MINIMUM APPlICATION AMOUNT
Purchase : ` 5,000 and any amount thereafter.Additional Purchase : ` 1,000 and any amount thereafter.
¥ Dedicated Fund Manager for Overseas Investments: Mr. Sankalp Baid (since January 22, 2021) (Total experience: Over 13 years).
SIP PERFORMANCE ^ - Regular Plan - growth Option
Since Inception SIP
10 year SIP
5 year SIP
3 year SIP
1 year SIP
Total Amount Invested (` ‘000) 1,560.00 1,200.00 600.00 360.00 120.00 Mkt Value As on February 26, 2021 (` ‘000) 2,185.52 1,513.14 640.07 414.38 174.56 Returns (%) 5.02 4.54 2.56 9.41 96.01 Benchmark Returns (%) # 13.20 13.87 15.25 19.92 72.06 Additional Benchmark Returns (%) ## 12.80 13.41 15.70 19.47 66.33
Assuming ` 10,000 invested systematically on the first Business Day of every month over a period of time. CAGR returns are computed after accounting for the cash flow by using xIRR method (investment internal rate of return) for Regular Plan - Growth Option. The above investment simulation is for illustrative purposes only and should not be construed as a promise on minimum returns and safeguard of capital.
PERFORMANCE ^ - Regular Plan - growth Option
Date Period Scheme Returns
(%)
Benchmark Returns
(%)#
Additional Benchmark
Returns (%) ##
Value of ` 10,000 invested
Scheme (`) Benchmark (`)#
Additional Benchmark
(`)##
Feb 28, 20 Last 1 Year 23.39 33.37 31.27 12,332 13,326 13,117Feb 28, 18 Last 3 Years -6.96 10.86 12.88 8,055 13,621 14,378Feb 29, 16 Last 5 Years 6.23 17.31 17.29 13,529 22,207 22,189Mar 10, 08 Since Inception 3.84 10.40 10.22 16,306 36,086 35,339
Returns greater than 1 year period are compounded annualized (CAGR). Performance of dividend option under the schemes for the investors would be net of distribution tax, if any. For performance of other schemes managed by Rakesh Vyas, please refer page 66. Different plans viz. Regular Plan and Direct Plan have a different expense structure. The expenses of the Direct Plan under the Scheme will be lower to the extent of the distribution expenses / commission charged in the Regular Plan. For Performance of Direct Plan, refer page no. 78.
Face Value per Unit: ` 10 unless otherwise specified, + Industry Classification as recommended by AMFI, Data is as of February 28, 2021 unless otherwise specified.
This product is suitable for investors who are seeking ~
l to generate long-term capital appreciation / income
l investment predominantly in equity and equity related securities of companies engaged in or expected to benefit from the growth and development of infrastructure
VeryHigh
Low to
Moderate
Low
Moderate ModeratelyHigh High
RISKOMETERInvestors understand that their principal will be at
very high risk
~ Investors should consult their financial advisers, if in doubt about whether the product is suitable for them.
^Past performance may or may not be sustained in the future. Since Inception Date = Date of First allotment in the Scheme / Plan. Load is not taken into consideration for computation of performance.
(An open ended equity scheme following infrastructure theme)HDFC Infrastructure Fund
Company Industry+ % to NAV
EqUITY & EqUITY RElATED
• State Bank of India Banks 8.64
• ICICI Bank Ltd. Banks 8.11
• Larsen and Toubro Ltd. Construction Project 7.84
• Coal India Ltd. Minerals/Mining 5.53
• J.Kumar Infraprojects Ltd. Construction 5.40
• NTPC Ltd. Power 5.40
• Dilip Buildcon Ltd. Construction Project 4.00
• JMC Projects (India) Ltd. Construction 3.76
• Centum Electronics Ltd. Industrial Capital Goods 3.40
• CESC Ltd. Power 3.38
Gujarat Pipavav Port Ltd. Transportation 3.21
Bharti Airtel Ltd. Telecom - Services 3.18
Computer Age Management Services Finance 2.91
Ashoka Buildcon Ltd. Construction Project 2.66
Hindustan Construction Company Ltd. Construction Project 2.55
Power Finance Corporation Ltd. Finance 2.40
SBI Cards and Payment Services Ltd. Finance 2.23
Axis Bank Ltd. Banks 2.17
Ambuja Cements Ltd. Cement 2.10
HDFC Bank Ltd. Banks 1.89
Indigo Paints Ltd. Consumer Non Durables 1.70
Tata Steel Ltd. Ferrous Metals 1.58
Dynamatic Technologies Ltd. Auto Ancillaries 1.56
ReC Ltd. Finance 1.53
Repco Home Finance Ltd. Finance 1.51
Hindalco Industries Ltd. Non - Ferrous Metals 1.48
Reliance Industries Ltd. Petroleum Products 1.28
Burger King India Ltd. Consumer Non Durables 1.13
Premier explosives Ltd. Chemicals 1.00
Birla Corporation Ltd. Cement 0.97
Bharat Petroleum Corporation Ltd. Petroleum Products 0.76
Company Industry+ % to NAV
MeP Infrastructure Developers Ltd. Transportation 0.47
RITeS Ltd. engineering Services 0.44
Sadbhav Infrastructure Project Ltd. (Corporate Guarantee of Sadbhav engineering Ltd.) Construction Project 0.39
Texmaco Rail & engineering Ltd. Industrial Capital Goods 0.39
Simplex Infrastructures Ltd. Construction 0.35
Prestige estates Projects Ltd. Construction 0.26
CG Power and Industrial Solutions Ltd. Industrial Capital Goods 0.02
Sub Total 97.58
Cash, Cash equivalents and Net Current Assets 2.42
Grand Total 100.00
• Top Ten Holdings
PORTFOLIO
Industry Allocation of Equity Holding (% of Net Assets)
0.44
1.00
1.48
1.56
1.58
2.04
2.83
3.07
3.18
3.68
3.81
5.53
8.78
9.77
10.58
17.44
20.81
0 5 10 15 20 25
Engineering Services
Chemicals
Non - Ferrous Metals
Auto Ancillaries
Ferrous Metals
Petroleum Products
Consumer Non Durables
Cement
Telecom - Services
Transportation
Industrial Capital Goods
Minerals/Mining
Power
Construction
Finance
Construction Project
Banks

February 2021 16
Face Value per Unit: ` 10 unless otherwise specified, + Industry Classification as recommended by AMFI, Data is as of February 28, 2021 unless otherwise specified. ....Contd on next page
Note: @@Effective close of business hours of June 1, 2018, HDFC Prudence Fund merged with HDFC Growth Fund (HDFC Balanced Advantage Fund after changes in fundamental attributes). As the portfolio characteristics and the broad investment strategy of HDFC Balanced Advantage Fund is similar to that of erstwhile HDFC Prudence Fund, the track record (i.e. since inception date, dividend history, etc.) and past performance of erstwhile HDFC Prudence Fund has been considered, in line with SEBI circular on Performance disclosure post consolidation/ merger of scheme dated April 12, 2018.
(An open ended balanced advantage fund)HDFC Balanced Advantage Fund Company Industry+ / Rating % to NAV
EqUITY & EqUITY RElATED• State Bank of India Banks 11.14• ICICI Bank Ltd. Banks 5.20• Larsen and Toubro Ltd. Construction Project 4.85• NTPC Ltd. Power 4.82• Coal India Ltd. Minerals/Mining 4.58• ITC Ltd. Consumer Non Durables 4.38• Infosys Ltd. Software 4.03• Power Finance Corporation Ltd. Finance 3.47• REC Ltd. Finance 2.39• Axis Bank Ltd. Banks 2.21Lupin Ltd. Pharmaceuticals 1.92Hindustan Petroleum Corporation Ltd. Petroleum Products 1.73Hindustan Aeronautics Ltd. Aerospace & Defence 1.66GAIL (India) Ltd. Gas 1.54Sun Pharmaceutical Industries Ltd. Pharmaceuticals 1.46Bharti Airtel Ltd. Telecom - Services 1.45Power Grid Corporation of India Ltd. Power 1.35Bharat Petroleum Corporation Ltd. Petroleum Products 1.18Bank of Baroda Banks 1.06NHPC Ltd. Power 1.05Aurobindo Pharma Ltd. Pharmaceuticals 0.85Apollo Tyres Ltd. Auto Ancillaries 0.81Vedanta Ltd. Non - Ferrous Metals 0.77Tata Motors Ltd. Auto 0.75Mishra Dhatu Nigam Ltd. Ferrous Metals 0.70Gujarat Pipavav Port Ltd. Transportation 0.68Chambal Fertilizers & Chemicals Ltd. Fertilisers 0.64Cipla Ltd. Pharmaceuticals 0.55Just Dial Ltd. Software 0.51Garden Reach Shipbuilders & engineers Ltd. Aerospace & Defence 0.44BeML Ltd. Industrial Capital Goods 0.43Ashoka Buildcon Ltd. Construction Project 0.41Spicejet Ltd. Transportation 0.40SBI Cards and Payment Services Ltd. Finance 0.38CeSC Ltd. Power 0.37Great eastern Shipping Company Ltd. Transportation 0.34Savita Oil Technologies Ltd. Petroleum Products 0.34NLC India Ltd. Power 0.30Orient Cement Ltd. Cement 0.30Apar Industries Ltd. Industrial Capital Goods 0.26Lakshmi Machine Works Ltd. Industrial Capital Goods 0.26J.Kumar Infraprojects Ltd. Construction 0.24Indian Railways Finance Corporation Ltd. Finance 0.23Bharat electronics Ltd. Industrial Capital Goods 0.20Bharat Dynamics Ltd. Aerospace & Defence 0.18Canara Bank Banks 0.17Kirloskar Pneumatic Ltd. Industrial Products 0.17Muthoot Finance Ltd. Finance 0.17Computer Age Management Services Finance 0.16CG Power and Industrial Solutions Ltd. Industrial Capital Goods 0.15JMC Projects (India) Ltd. Construction 0.15Ramco Systems Ltd. Software 0.14Transport Corporation of India Ltd. Transportation 0.14Gujarat Industries Power Co. Ltd. Power 0.13RailTel Corporation of India Ltd. Telecom - Services 0.13Techno electric & engin. Co. Ltd. Construction Project 0.13Time Technoplast Ltd. Industrial Products 0.13Wheels India Ltd. Auto Ancillaries 0.11Birla Corporation Ltd. Cement 0.10RITeS Ltd. engineering Services 0.10Sagar Cements Ltd. Cement 0.10Dynamatic Technologies Ltd. Auto Ancillaries 0.08Titagarh Wagons Ltd. Industrial Capital Goods 0.08
Company Industry+ / Rating % to NAV
Sterlite Technologies Ltd. Telecom - equipment & Accessories 0.07
Texmaco Rail & engineering Ltd. Industrial Capital Goods 0.07Union Bank of India Banks 0.07SJVN Ltd. Power 0.06Heranba Industries Ltd. Pesticides 0.05Punjab National Bank Banks 0.05Hindustan Construction Company Ltd. Construction Project 0.04Sterling and Wilson Solar Construction Project 0.04MeP Infrastructure Developers Ltd. Transportation 0.03S Chand and Company Ltd. Media & entertainment 0.02Timken India Ltd. Industrial Products 0.02Sub Total 75.67EqUITY RElATEDBrookfield India Real estate Trust 0.75Sub Total 0.75Total 76.42DEBT & DEBT RElATEDCREDIT EXPOSURE (NON PERPETUAl)Housing Development Finance Corporation Ltd.£ CRISIL - AAA 0.78LIC Housing Finance Ltd. CRISIL - AAA 0.57State Bank of India CRISIL - AAA 0.48Vedanta Ltd. CRISIL - AA- 0.42Pipeline Infrastructure Pvt. Ltd. CRISIL - AAA 0.39Muthoot Finance Ltd. ICRA - AA 0.37ReC Ltd. CRISIL - AAA 0.28Bharat Petroleum Corporation Ltd. CRISIL - AAA 0.24Bajaj electricals Ltd. ICRA - A 0.23Tata Steel Ltd. CARe - AA 0.22Coastal Gujarat Power Ltd. (Corporate Guarantee of Tata Power) CARe - AA(Ce) 0.20Indian Railways Finance Corporation Ltd. CRISIL - AAA 0.19export - Import Bank of India CRISIL - AAA 0.13Fullerton India Credit Company Ltd. CRISIL - AAA 0.13Power Grid Corporation of India Ltd. CRISIL - AAA 0.13National Bank for Agriculture & Rural Development ICRA - AAA 0.06Sub Total 4.82CREDIT EXPOSURE (PERPETUAl BONDS)State Bank of India (AT1, BASeL III, Perpetual) CRISIL - AA+ 1.91Canara Bank (AT1, BASeL III, Perpetual) CRISIL - AA 1.68ICICI Bank Ltd. (AT1, BASeL III, Perpetual) CARE - AA+ 1.13Punjab National Bank (AT1, BASeL III, Perpetual) CRISIL - AA- 1.13Union Bank of India (AT1, BASeL III, Perpetual) CARe - AA- 0.75HDFC Bank Ltd. (AT1, BASeL III, Perpetual) CRISIL - AA+ 0.66Bank of Baroda (AT1, BASeL III, Perpetual) CRISIL - AA+ 0.54Canara Bank (AT1, BASeL III, Perpetual) CARe - AA 0.38Punjab National Bank (AT1, BASeL III, Perpetual) IND - AA 0.35Union Bank of India (AT1, BASeL III, Perpetual) CRISIL - AA- 0.08Tata Steel Ltd. (Perpetual) CARe - AA- 0.07Axis Bank Ltd. (AT1, BASeL III, Perpetual) CRISIL - AA+ 0.06Sub Total 8.74Total 13.56MUTUAl FUND UNITSHDFC SeNSex Exchange Traded Fund 0.04Sub Total 0.04Cash, Cash equivalents and Net Current Assets 9.98Grand Total 100.00• Top Ten Holdings, £ Co-sponsor
PORTFOLIO
KEY FACTS
INVESTMENT OBjECTIVE
To provide long term capital appreciation / income from a dynamic mix of equity and debt investments.
There is no assurance that the investment objective of the Scheme will be realized.
FUND MANAgER ¥
Prashant Jain (since June 20, 2003)§ @@
Total experience: Over 27 years
INCEPTION DATE@@
February 01, 1994
NAV (AS ON FEBRUARY 26, 2021) NAV PER UNIT (`)
Regular Plan - Growth Option 239.783Regular Plan - Dividend Option 27.014Direct Plan - Growth Option 252.162Direct Plan - Dividend Option 29.371
ASSETS UNDER MANAgEMENT (`) IN CRORE
As on February 28, 2021 40,967.61Average for Month of February 2021 41,502.02
qUANTITATIVE DATAPortfolio Turnover Ratio 41.19%Average Maturity * 1.21 yearsMacaulay Duration * 1.06 yearsModified Duration * 1.00 yearsYield to Maturity * 4.95%
* Computed on the invested amount for debt portfolio.
TOTAL ExPENSE RATIO (As on February 28, 2021)Including Additional expenses and Goods and Service Tax on Management Fees
Regular: 1.60% Direct: 1.05%
#BENCHMARK INDEX: NIFTY 50 Hybrid Composite Debt 65:35 Index
##ADDl. BENCHMARK INDEX: NIFTY 50 (Total Returns Index)
EXIT lOAD
l In respect of each purchase / switch-in of Units, upto 15% of the units may be redeemed without any exit load from the date of allotment.
l Any redemption in excess of the above limit shall be subject to the following exit load:
n exit load of 1.00% is payable if Units are redeemed / switched-out within 1 year from the date of allotment of units.
l No exit Load is payable if Units are redeemed / switched-out after 1 year from the date of allotment.
For further details, please refer to para ‘Exit Load’ on Pg 66.
PLANS & OPTIONS
Regular Plan, Direct Plan. Under each Plan : Growth & Dividend. The Dividend Option offers Dividend Payout and Reinvestment facility.
MINIMUM APPlICATION AMOUNT
Purchase : ` 5,000 and any amount thereafter.Additional Purchase : ` 1,000 and any amount thereafter.
¥ Dedicated Fund Manager for Overseas Investments: Mr. Sankalp Baid (since January 22, 2021) (Total experience: Over 13 years).§ Date of migration of erstwhile HDFC Prudence Fund from
Zurich India Mutual Fund (Close of business hours - June 19, 03).
(The Scheme underwent Change in Fundamental Attributes i.e. change in Asset Allocation Pattern w.e.f. March 14, 2019).
CATEgORY OF SCHEME: BALANCED ADVANTAGE FUND

17 February 2021
This product is suitable for investors who are seeking ~
l to generate long-term capital appreciation / income
l investments in a mix of equity and debt instruments
VeryHigh
Low to
Moderate
Low
Moderate ModeratelyHigh High
RISKOMETERInvestors understand that their principal will be at
very high risk
~ Investors should consult their financial advisers, if in doubt about whether the product is suitable for them.
SIP PERFORMANCE ^ - Regular Plan - growth OptionSince Inception
SIP15 year
SIP10 year
SIP5 year
SIP3 year
SIP1 year
SIPTotal Amount Invested (` ‘000) 3,250.00 1,800.00 1,200.00 600.00 360.00 120.00 Mkt Value As on February 26, 2021 (` ‘000) $$ 72,051.95 5,378.21 2,333.25 817.93 461.83 160.09 Returns (%) $$ 18.66 13.43 12.78 12.39 16.96 68.78 Benchmark Returns (%) # N.A. 11.37 12.22 13.86 16.79 42.35 Additional Benchmark Returns (%) ## 13.42 12.16 13.41 15.70 19.47 66.33
Assuming ` 10,000 invested systematically on the first Business Day of every month over a period of time. CAGR returns are computed after accounting for the cash flow by using xIRR method (investment internal rate of return) for Regular Plan - Growth Option. The above investment simulation is for illustrative purposes only and should not be construed as a promise on minimum returns and safeguard of capital.
PERFORMANCE ^ - Regular Plan - growth OptionDate Period Scheme
Returns (%) $$
Benchmark Returns
(%)#
Additional Benchmark
Returns (%) ##
Value of ` 10,000 invested
Scheme (`) $$
Benchmark (`)#
Additional Benchmark
(`)##Feb 28, 20 Last 1 Year 28.53 24.79 31.27 12,844 12,471 13,117Feb 28, 18 Last 3 Years 8.53 12.46 12.88 12,782 14,218 14,378Feb 29, 16 Last 5 Years 15.35 14.80 17.29 20,415 19,932 22,189Feb 01, 94 Since Inception 18.01 N.A. 10.74 887,428 N.A. 158,678
Returns greater than 1 year period are compounded annualized (CAGR). Performance of dividend option under the schemes for the investors would be net of distribution tax, if any. N.A. Not Available. Scheme performance may not strictly be comparable with that of its Additional Benchmark in view of balanced nature of the scheme where a portion of scheme’s investments are made in debt instruments. $$ All dividends declared prior to the splitting of the Scheme into Dividend & Growth Options are assumed to be reinvested in the units of the Scheme at the then prevailing NAV (ex-dividend NAV). For performance of other schemes managed by Prashant Jain, please refer page 66. Different plans viz. Regular Plan and Direct Plan have a different expense structure. The expenses of the Direct Plan under the Scheme will be lower to the extent of the distribution expenses / commission charged in the Regular Plan. As NIFTY 50 TRI data is not available since inception of the scheme, additional benchmark performance is calculated using composite CAGR of NIFTY 50 PRI values from February 1, 1994 to June 29, 1999 and TRI values since June 30, 1999. For Performance of Direct Plan, refer page no. 72. For FPI Portfolio, refer page no. 80.
^Past performance may or may not be sustained in the future. Since Inception Date = Date of First allotment in the Scheme / Plan. Load is not taken into consideration for computation of performance.
Portfolio Classification By Asset Class (%)
n equity 76.42
n Credit exposure 13.56
n Mutual Fund Units 0.04
n Cash, Cash equivalents and Net Current Assets 9.98
Portfolio Classification By Rating Class (%)
n equity 76.42n AAA/AAA(SO)/A1+/A1+(SO) &
equivalent 3.38n AA+ 4.30n AA/AA- 5.65n A+ & Below 0.23n Mutual Fund Units 0.04n Cash, Cash equivalents and Net
Current Assets 9.98
(An open ended balanced advantage fund)HDFC Balanced Advantage Fund .....Contd from previous page
Industry Allocation of Equity Holding (% of Net Assets)
0.020.050.070.100.320.500.640.700.750.771.001.141.451.541.581.592.283.25
4.384.584.684.785.47
6.808.08
19.90
0 5 10 15 20 25Media & Entertainment
PesticidesTelecom - Equipment & Accessories
Engineering ServicesIndustrial Products
CementFertilisers
Ferrous MetalsAuto
Non - Ferrous MetalsAuto Ancillaries
ConstructionIndustrial Capital Goods
GasTelecom - Services
TransportationAerospace & Defence
Petroleum ProductsConsumer Non Durables
Minerals/MiningSoftware
PharmaceuticalsConstruction Project
FinancePowerBanks

February 2021 18
Company Industry+ / Rating % to NAV
EqUITY & EqUITY RElATED
• ICICI Bank Ltd. Banks 8.04
• HDFC Bank Ltd. Banks 7.00
• Infosys Ltd. Software 4.65
• Larsen and Toubro Ltd. Construction Project 4.55
• Reliance Industries Ltd. Petroleum Products 4.52
• Housing Development Finance Corporation Ltd.£ Finance 4.49
• State Bank of India Banks 3.47
• ITC Ltd. Consumer Non Durables 3.11
• Axis Bank Ltd. Banks 3.10
Aurobindo Pharma Ltd. Pharmaceuticals 2.99
Bharat electronics Ltd. Industrial Capital Goods 2.58
Tata Steel Ltd. Ferrous Metals 2.27
KeC International Ltd. Construction Project 1.96
Bharti Airtel Ltd. Telecom - Services 1.90
Power Grid Corporation of India Ltd. Power 1.90
Atul Ltd. Chemicals 1.76
UPL Ltd. Pesticides 1.48
SKF India Ltd. Industrial Products 1.27
Vedanta Ltd. Non - Ferrous Metals 1.24
Indusind Bank Ltd. Banks 1.23
PNC Infratech Ltd. Construction 1.13
Hindustan Petroleum Corporation Ltd. Petroleum Products 1.04
Bharat Petroleum Corporation Ltd. Petroleum Products 0.97
Bank of Baroda Banks 0.88
Redington (India) Ltd. Transportation 0.85
Mahindra Holidays & Resorts Ind Ltd.
Hotels/Resorts & Other Recreational Activities 0.76
Vardhman Textiles Ltd. Textiles - Cotton 0.50
Persistent Systems Ltd. Software 0.45
Sharda Cropchem Ltd. Pesticides 0.43
Zensar Technologies Ltd. Software 0.42
Carborundum Universal Ltd. Industrial Products 0.41
Tamilnadu Newsprint & Papers Ltd. Paper 0.36
Kalpataru Power Transmission Ltd. Power 0.34
Sadbhav engineering Ltd. Construction Project 0.22
Jagran Prakashan Ltd. Media & entertainment 0.17
MM Forgings Ltd. Industrial Products 0.17
Cholamandalam Financial Holdings Ltd. Finance 0.15
Navneet education Ltd. Media & entertainment 0.15
Sub Total 72.91
EqUITY RElATED
Brookfield India Real estate Trust 0.36
Sub Total 0.36
Total 73.27
Company Industry+ / Rating % to NAV
DEBT & DEBT RElATED
gOVERNMENT SECURITIES (CENTRAl/STATE)
7.16 GOI 2023 Sovereign 1.68
6.84 GOI 2022 Sovereign 1.10
8.2 GOI 2025 Sovereign 1.09
7.35 GOI 2024 Sovereign 0.91
8.24 GOI 2033 Sovereign 0.61
8.4 GOI 2024 Sovereign 0.31
8.6 GOI 2028 Sovereign 0.25
8.13 GOI 2045 Sovereign 0.13
8.83 GOI 2023 Sovereign 0.02
8.2 GOI 2022 Sovereign 0.01
SUB TOTAL 6.11
CREDIT EXPOSURE (NON PERPETUAl)
• Tata Sons Ltd. CRISIL - AAA 3.23
LIC Housing Finance Ltd. CARe - AAA / CRISIL - AAA 1.70
Coastal Gujarat Power Ltd. (Corporate Guarantee of Tata Power) CARe - AA(Ce) 1.45
Shriram Transport Finance Co. Ltd. CRISIL - AA+ / IND - AA+ 1.20
Power Finance Corporation Ltd. CRISIL - AAA / ICRA - AAA 1.18
ReC Ltd. CARe - AAA / CRISIL - AAA / IND - AAA 0.79
Shriram City Union Finance Ltd. CRISIL - AA 0.57
Bajaj electricals Ltd. ICRA - A 0.54
Muthoot Finance Ltd. ICRA - AA 0.41
National Bank for Agriculture & Rural Development CRISIL - AAA 0.40
HDFC Bank Ltd. CRISIL - AAA 0.31
Punjab National Bank ICRA - AA 0.17
ICICI Bank Ltd. CARe - AAA 0.15
Kalpataru Power Transmission Ltd. CRISIL - AA 0.15
Hindalco Industries Ltd. CRISIL - AA 0.06
Sub Total 12.31
CREDIT EXPOSURE (PERPETUAl BONDS)
Axis Bank Ltd. (AT1, BASeL III, Perpetual) CRISIL - AA+ 2.06
Punjab National Bank (AT1, BASeL III, Perpetual) CRISIL - AA- 0.59
State Bank of India (AT1, BASeL III, Perpetual) CRISIL - AA+ 0.29
Canara Bank (AT1, BASeL III, Perpetual) CARe - AA 0.17
Union Bank of India (AT1, BASeL III, Perpetual) CRISIL - AA- 0.12
Sub Total 3.23
Total 21.65
MUTUAl FUND UNITS
HDFC NIFTY 50 Exchange Traded Fund 1.14
Sub Total 1.14
Cash, Cash equivalents and Net Current Assets 3.94
gRAND TOTAl 100.00
l Top Ten Holdings, £ Co-sponsor
CATEgORY OF SCHEME: AGGRESSIVE HYBRID FUND
Face Value per Unit: ` 10 unless otherwise specified, + Industry Classification as recommended by AMFI, Data is as of February 28, 2021 unless otherwise specified.
Note: @@ Effective close of business hours of June 1, 2018, HDFC Balanced Fund merged with HDFC Premier Multi Cap Fund (HDFC Hybrid Equity Fund after changes in fundamental attributes). As the portfolio characteristics and the broad investment strategy of HDFC Hybrid Equity Fund is similar to that of erstwhile HDFC Balanced Fund, the track record (i.e. since inception date dividend history, etc) and past performance of erstwhile HDFC Balanced Fund has been considered, in line with SEBI circular on Performance disclosure post consolidation/ merger of scheme dated April 12, 2018.
(An open ended hybrid scheme investing predominantly in equity and equity related instruments)HDFC Hybrid Equity Fund
PORTFOLIO
KEY FACTS
INVESTMENT OBjECTIVE
The investment objective of the Scheme is to generate capital appreciation / income from a portfolio, predominantly of equity & equity related instruments. The Scheme will also invest in debt and money market instruments.
There is no assurance that the investment objective of the Scheme will be realized.
FUND MANAgER ¥
Chirag Setalvad (since April 2, 2007)@@
Total experience: Over 21 years
INCEPTION DATE@@
September 11, 2000
NAV (AS ON FEBRUARY 26, 2021) NAV PER UNIT (`)
Regular Plan - Growth Option 67.544Regular Plan - Dividend Option 12.971Direct Plan - Growth Option 71.185Direct Plan - Dividend Option 14.034
ASSETS UNDER MANAgEMENT (`) IN CRORE
As on February 28, 2021 17,537.16Average for Month of February 2021 17,882.37
qUANTITATIVE DATA
Portfolio Turnover Ratio (Last 1 year) 7.89%Average Maturity * 2.18 yearsMacaulay Duration * 1.79 yearsModified Duration * 1.71 yearsYield to Maturity * 5.40%
* Computed on the invested amount for debt portfolio.
TOTAL ExPENSE RATIO (As on February 28, 2021)Including Additional expenses and Goods and Service Tax on Management Fees
Regular: 1.79% Direct: 1.15%
#BENCHMARK INDEX: NIFTY 50 Hybrid Composite Debt 65:35 Index
##ADDl. BENCHMARK INDEX: NIFTY 50 (Total Returns Index)
EXIT lOAD
l In respect of each purchase/switch-in of Units, upto 15% of the units may be redeemed without any exit load from the date of allotment.
l Any redemption in excess of the above limit shall be subject to the following exit load:
n exit load of 1.00% is payable if Units are redeemed / switched-out within 1 year from the date of allotment of units.
l No exit Load is payable if Units are redeemed / switched-out after 1 year from the date of allotment.
For further details, please refer to para ‘Exit Load’ on Pg 66.
PLANS & OPTIONS
Regular Plan, Direct Plan. Under each Plan : Growth & Dividend. The Dividend Option offers Dividend Payout and Reinvestment facility.
MINIMUM APPlICATION AMOUNT
Purchase : ` 5,000 and any amount thereafter.Additional Purchase : ` 1,000 and any amount thereafter.
SEgMENT-WISE BREAK-UP OF EqUITY HOlDINgS (% OF NET ASSETS)
Large Cap 57.94%Mid Cap 5.66%Small Cap 9.28%
¥ Dedicated Fund Manager for Overseas Investments: Mr. Sankalp Baid (since January 22, 2021) (Total experience: Over 13 years).

19 February 2021
SIP PERFORMANCE ^ - Regular Plan - growth Option
Since Inception SIP
15 year SIP
10 year SIP
5 year SIP
3 year SIP
1 year SIP
Total Amount Invested (` ‘000) 2,460.00 1,800.00 1,200.00 600.00 360.00 120.00 Mkt Value As on February 26, 2021 (` ‘000) 15,945.08 5,833.09 2,486.55 831.34 465.03 156.07 Returns (%) 15.86 14.37 13.97 13.05 17.46 61.43 Benchmark Returns (%) # N.A. 11.37 12.22 13.86 16.79 42.35 Additional Benchmark Returns (%) ## 14.75 12.16 13.41 15.70 19.47 66.33
Assuming ` 10,000 invested systematically on the first Business Day of every month over a period of time. CAGR returns are computed after accounting for the cash flow by using xIRR method (investment internal rate of return) for Regular Plan - Growth Option. The above investment simulation is for illustrative purposes only and should not be construed as a promise on minimum returns and safeguard of capital.
PERFORMANCE ^ - Regular Plan - growth Option
Date Period Scheme Returns
(%)
Benchmark Returns
(%)#
Additional Benchmark
Returns (%) ##
Value of ` 10,000 invested
Scheme (`) Benchmark (`)#
Additional Benchmark
(`)##
Feb 28, 20 Last 1 Year 28.27 24.79 31.27 12,819 12,471 13,117Feb 28, 18 Last 3 Years 9.19 12.46 12.88 13,015 14,218 14,378Feb 29, 16 Last 5 Years 14.92 14.80 17.29 20,039 19,932 22,189Sep 11, 00 Since Inception 15.57 N.A. 13.44 193,425 N.A. 132,306
Returns greater than 1 year period are compounded annualized (CAGR). Performance of dividend option under the schemes for the investors would be net of distribution tax, if any. N.A. Not Available. Scheme performance may not strictly be comparable with that of its Additional Benchmark in view of hybrid nature of the scheme where a portion of scheme’s investments are made in debt instruments. For performance of other schemes managed by Chirag Setalvad, please refer page 66. Different plans viz. Regular Plan and Direct Plan have a different expense structure. The expenses of the Direct Plan under the Scheme will be lower to the extent of the distribution expenses / commission charged in the Regular Plan. For Performance of Direct Plan, refer page no. 72.
^Past performance may or may not be sustained in the future. Since Inception Date = Date of First allotment in the Scheme / Plan. Load is not taken into consideration for computation of performance.
Face Value per Unit: ` 10 unless otherwise specified, + Industry Classification as recommended by AMFI, Data is as of February 28, 2021 unless otherwise specified.
This product is suitable for investors who are seeking ~
l to generate long-term capital appreciation / income.
l investments predominantly in equity & equity related instruments. The Scheme will also invest in debt and money market instruments.
VeryHigh
Low to
Moderate
Low
Moderate ModeratelyHigh High
RISKOMETERInvestors understand that their principal will be at
very high risk
~ Investors should consult their financial advisers, if in doubt about whether the product is suitable for them.
PORTFOlIO ClASSIFICATION BY ASSET ClASS (%)
n equity 73.27
n G-Sec 6.11
n Credit exposure 15.54
n Mutual Fund Units 1.14
n Cash, Cash equivalents and Net Current Assets 3.94
PORTFOlIO ClASSIFICATION BY RATINg ClASS (%)
n equity 73.27n Sovereign 6.11n AAA/AAA(SO)/A1+/A1+(SO) &
equivalent 7.76n AA+ 3.55n AA/AA- 3.69n A+ & Below 0.54n Mutual Fund Units 1.14n Cash, Cash equivalents and Net
Current Assets 3.94
(An open ended hybrid scheme investing predominantly in equity and equity related instruments)HDFC Hybrid Equity Fund .....Contd from previous page
Industry Allocation of Equity Holding (% of Net Assets)
0.320.360.500.760.851.241.491.761.851.901.912.242.272.582.993.114.645.526.536.73
23.72
0 5 10 15 20 25
Media & EntertainmentPaper
Textiles - CottonHotels, Resorts & Other Recreational Activities
TransportationNon - Ferrous Metals
ConstructionChemicals
Industrial ProductsTelecom - Services
PesticidesPower
Ferrous MetalsIndustrial Capital Goods
PharmaceuticalsConsumer Non Durables
FinanceSoftware
Petroleum ProductsConstruction Project
Banks

February 2021 20
SIP PERFORMANCE ^ - Regular Plan - growth Option
Since Inception SIP
15 year SIP
10 year SIP
5 Year SIP
3 Year SIP
1 Year SIP
Total Amount Invested (` ‘000) 1,870.00 1,800.00 1,200.00 600.00 360.00 120.00 Mkt Value As on February 26, 2021 (` ‘000) 4,256.07 3,976.88 2,017.21 798.10 454.09 144.24 Returns (%) 9.84 9.89 10.04 11.40 15.77 40.32 Benchmark Returns (%) # N.A. N.A. 11.95 13.86 16.71 36.34 Additional Benchmark Returns (%) ## 12.30 12.16 13.41 15.70 19.47 66.33
Assuming ` 10,000 invested systematically on the first Business Day of every month over a period of time. CAGR returns are computed after accounting for the cash flow by using xIRR method (investment internal rate of return) for Regular Plan - Growth Option. The above investment simulation is for illustrative purposes only and should not be construed as a promise on minimum returns and safeguard of capital.
PERFORMANCE ^ - Regular Plan - growth Option
Date Period Scheme Returns
(%)
Benchmark Returns
(%)#
Additional Benchmark
Returns (%) ##
Value of ` 10,000 invested
Scheme (`) Benchmark (`)#
Additional Benchmark
(`)##
Feb 28, 20 Last 1 Year 22.89 23.32 31.27 12,282 12,325 13,117Feb 28, 18 Last 3 Years 9.39 12.88 12.88 13,086 14,377 14,378Feb 29, 16 Last 5 Years 10.25 14.35 17.29 16,288 19,547 22,189Aug 17, 05 Since Inception 9.47 N.A. 13.66 40,808 N.A. 73,139
Returns greater than 1 year period are compounded annualized (CAGR). Performance of dividend option under the schemes for the investors would be net of distribution tax, if any. N.A. Not Available. The Scheme formerly, a debt oriented hybrid fund, has undergone change in Fundamental attributes w.e.f. May 23, 2018 and become a multi asset fund investing in equities, debt and gold related instruments. Accordingly, the Scheme’s benchmark has also changed. Hence, the performance of the Scheme from inception till May 22, 2018 may not strictly be comparable with those of the new benchmark and the additional benchmark. Scheme performance may not strictly be comparable with that of its Additional Benchmark in view of hybrid nature of the scheme where a portion of scheme’s investments are made in debt instruments and gold related instruments. For performance of other schemes managed by Amit B. Ganatra (Equities), Anil Bamboli (Debt), Krishan Kumar Daga (Gold and Arbitrage) and Arun Agarwal (Arbitrage) please refer page 66. Different plans viz. Regular Plan and Direct Plan have a different expense structure. The expenses of the Direct Plan under the Scheme will be lower to the extent of the distribution expenses / commission charged in the Regular Plan. For Performance of Direct Plan, refer page no. 78.
Face Value per Unit: ` 10 unless otherwise specified, + Industry Classification as recommended by AMFI, Data is as of February 28, 2021 unless otherwise specified.
This product is suitable for investors who are seeking ~
l to generate long-term capital appreciation/incomel investments in a diversified portfolio of equity & equity
related instruments, debt & money market instruments and Gold related instruments
VeryHigh
Low to
Moderate
Low
Moderate ModeratelyHigh High
RISKOMETERInvestors understand that their principal will be at
very high risk
~ Investors should consult their financial advisers, if in doubt about whether the product is suitable for them.
^Past performance may or may not be sustained in the future. Since Inception Date = Date of First allotment in the Scheme / Plan. Load is not taken into consideration for computation of performance.
(An open ended scheme investing in equity and equity related instruments, debt & money market instruments and gold related instruments)HDFC Multi-Asset Fund
Industry Allocation of Equity Holding (% of Net Assets)
0.150.220.460.490.530.690.690.710.770.931.541.551.992.052.06
4.206.236.73
8.9114.64
0 2 4 6 8 10 12 14 16
PesticidesRetailing
Aerospace & DefenceIndustrial Products
GasFerrous Metals
Healthcare ServicesIndustrial Capital Goods
AutoChemicals
Consumer DurablesAuto AncillariesPharmaceuticals
Telecom - ServicesPower
Petroleum ProductsFinance
Consumer Non DurablesSoftware
Banks
KEY FACTS
INVESTMENT OBjECTIVEThe objective of the Scheme is to generate long term capital appreciation/income by investing in a diversified portfolio of equity & equity related instruments, debt & money market instruments and Gold related instruments.There is no assurance that the investment objective of the Scheme will be realized.
FUND MANAgER ¥
Amit B. Ganatra (equities) (since June 12, 2020)
Total experience - Over 17 years; Anil Bamboli (Debt) (since August 17, 2005)
Total experience: Over 23 years &Krishan Kumar Daga (Gold and Arbitrage) (since May 23, 2018)Total experience: Over 22 yearsArun Agarwal (Arbitrage) (since August 24, 2020)
Total experience: Over 22 years
INCEPTION DATE (Date of Allotment)August 17, 2005
NAV (AS ON FEBRUARY 26, 2021) NAV PER UNIT (`)Regular Plan - Growth Option 40.808Regular Plan - Dividend Option 14.549Direct Plan - Growth Option 43.046Direct Plan - Dividend Option 16.095
ASSETS UNDER MANAgEMENT (`) IN CROREAs on February 28, 2021 620.54Average for Month of February 2021 574.88
qUANTITATIVE DATAPortfolio Turnover Ratio 55.10%
TOTAL ExPENSE RATIO (As on February 28, 2021)Including Additional expenses and Goods and Service Tax on Management FeesRegular: 2.42% Direct: 1.27%
#BENCHMARK INDEX: 90% NIFTY 50 Hybrid Composite Debt 65:35 Index + 10% Domestic Price of Gold##ADDl. BENCHMARK INDEX: NIFTY 50 (Total Returns Index)
EXIT lOADl In respect of each purchase / switch-in of Units, 15% of the
units (“the limit”) may be redeemed without any exit Load from the date of allotment.
l Any redemption in excess of the above limit shall be subject to the following exit load:
t exit Load of 1.00% is payable if units are redeemed / switched out within 12 months from the date of allotment.
l No exit Load is payable if units are redeemed / switched out after 12 months from the date of allotment.
For further details, please refer to para ‘Exit Load’ on Pg 66.
PLANS & OPTIONSRegular Plan, Direct Plan. Under each Plan : Growth & Dividend. The Dividend Option offers Dividend Payout and Reinvestment facility.
MINIMUM APPlICATION AMOUNTPurchase : ` 5,000 and any amount thereafter.Additional Purchase : ` 1,000 and any amount thereafter.¥ Dedicated Fund Manager for Overseas Investments: Mr. Sankalp Baid (since January 22, 2021) (Total experience: Over 13 years).
(The Scheme underwent Change in Fundamental Attributes i.e. change in Asset Allocation Pattern w.e.f. March 14, 2019).
Portfolio Classification By Asset Class (%)
n equity 67.04
n G-Sec, T-Bills 4.03
n Credit exposure 6.69
n Gold ETF 13.65
n Cash, Cash equivalents and Net Current Assets 8.59
Portfolio Classification By Rating Class (%)
n equity 67.04n Sovereign 4.03n AAA/AAA(SO)/A1+/A1+(SO) &
equivalent 2.65n AA/AA- 3.23n A+ & Below 0.81n Gold ETF 13.65n Cash, Cash equivalents and Net
Current Assets 8.59
Cash and Cash equivalents include overnight deployment of Cash in Tri-Party Repos
CATEgORY OF SCHEME: MULTI ASSET ALLOCATION FUND

21 February 2021
Company Industry+ / Rating % to NAV (Hedged & Unhedged)
% exposure of Derivative
EqUITY & EqUITY RElATED
• HDFC Bank Ltd. Banks 6.93 0.00
• Infosys Ltd. Software 5.20 0.00
• ICICI Bank Ltd. Banks 5.00 0.00
• Housing Development Finance Corporation Ltd.£ Finance 3.94 0.00
• Reliance Industries Ltd. Petroleum Products 3.54 0.00
• Axis Bank Ltd. Banks 3.33 0.62
• ITC Ltd. Consumer Non Durables 2.24 1.23
• Tata Steel Ltd. Ferrous Metals 1.97 1.28
Bharti Airtel Ltd. Telecom - Services 1.87 0.00
Maruti Suzuki India Ltd. Auto 1.58 0.81
HCL Technologies Ltd. Software 1.55 0.00
Adani Ports & Special economic Zone Transportation 1.52 1.52
Power Grid Corporation of India Ltd. Power 1.14 0.00
Tata Consumer Products Ltd. Consumer Non Durables 1.12 0.00
Asian Paints Ltd. Consumer Non Durables 1.10 1.10
Hindustan Unilever Ltd. Consumer Non Durables 1.05 0.00
Cipla Ltd. Pharmaceuticals 1.03 0.00
Titan Company Ltd. Consumer Durables 1.03 0.26
emami Ltd. Consumer Non Durables 1.01 0.00
United Spirits Ltd. Consumer Non Durables 0.98 0.98
Dr Reddys Laboratories Ltd. Pharmaceuticals 0.96 0.00
NTPC Ltd. Power 0.92 0.00
SBI Life Insurance Company Ltd. Finance 0.91 0.00
Burger King India Ltd. Consumer Non Durables 0.90 0.00
Godrej Consumer Products Ltd. Consumer Non Durables 0.85 0.00
Hindustan Petroleum Corporation Ltd. Petroleum Products 0.85 0.85
Apollo Hospitals enterprise Ltd. Healthcare Services 0.69 0.00
Sonata Software Ltd. Software 0.67 0.00
Bharat Petroleum Corporation Ltd. Petroleum Products 0.66 0.00
ACC Ltd. Cement 0.63 0.63
eicher Motors Ltd. Auto 0.63 0.63
Aarti Industries Ltd. Chemicals 0.62 0.00
endurance Technologies Ltd. Auto Ancillaries 0.59 0.00
Dabur India Ltd. Consumer Non Durables 0.55 0.00
Mindtree Consulting Ltd. Software 0.54 0.00
Coforge Ltd. Software 0.53 0.00
Gujarat Gas Ltd. Gas 0.53 0.00
Whirlpool of India Ltd. Consumer Durables 0.52 0.00
UTI Asset Management Company Ltd. Finance 0.51 0.00
Shaily engineering Plastics Ltd. Industrial Products 0.49 0.00
IIFL Wealth Management Ltd. Finance 0.48 0.00
Balkrishna Industries Ltd. Auto Ancillaries 0.46 0.00
Hindustan Aeronautics Ltd. Aerospace & Defence 0.46 0.00
Bharat electronics Ltd. Industrial Capital Goods 0.45 0.00
Indusind Bank Ltd. Banks 0.42 0.42
Company Industry+ / Rating % to NAV (Hedged & Unhedged)
% exposure of Derivative
Oracle Financial Ser Software Ltd. Software 0.42 0.00
Britannia Industries Ltd. Consumer Non Durables 0.41 0.41
Jamna Auto Industries Ltd. Auto Ancillaries 0.41 0.00
Repco Home Finance Ltd. Finance 0.39 0.00
Bajaj Auto Ltd. Auto 0.38 0.38
Tata Consultancy Services Ltd. Software 0.38 0.38
Rossari Biotech Ltd. Chemicals 0.31 0.00
The Anup engineering Ltd. Industrial Capital Goods 0.26 0.00
La Opala RG Ltd. Consumer Durables 0.25 0.00
VST Industries Ltd. Consumer Non Durables 0.24 0.00
Trent Ltd. Retailing 0.22 0.00
RailTel Corporation of India Ltd. Telecom - Services 0.18 0.00
Sharda Cropchem Ltd. Pesticides 0.15 0.00
Suprajit engineering Ltd. Auto Ancillaries 0.09 0.00
Sub Total 67.04
DEBT & DEBT RElATED
gOVERNMENT SECURITIES (CENTRAl/STATE)
• 6.17 GOI 2021 Sovereign 2.44
Sub Total 2.44
T-BIllS
364 Days Tbill Mat 220421 Sovereign 0.80
364 Days Tbill Mat 290721 Sovereign 0.79
Sub Total 1.59
CREDIT EXPOSURE (NON PERPETUAl)
Housing Development Finance Corporation Ltd.£ CRISIL - AAA 1.78
Vedanta Ltd. CRISIL - AA- 1.61
Power Finance Corporation Ltd. CRISIL - AAA 0.87
INOx Wind Infrastructure Services Ltd. CRISIL - AA(Ce) 0.80
Sub Total 5.06
CREDIT EXPOSURE (PERPETUAl BONDS)
Union Bank of India (AT1, BASeL III, Perpetual) CARe - AA- 0.82
TATA International Ltd. (Perpetual) CARe - A 0.81
Sub Total 1.63
Total 10.72
MUTUAl FUND UNITS
• HDFC Gold Exchange Traded Fund 13.65
Sub Total 13.65
OTHERS
Cash, Cash equivalents and Net Current Assets 8.59
Sub Total 8.59
Grand Total 100.00
• Top Ten Holdings, £ Co-sponsor
Outstanding exposure in derivative instruments (` in Crore) 71.62
Hedged position in Equity & Equity related instruments
Outstanding derivative exposure (% age) 11.54
Face Value per Unit: ` 10 unless otherwise specified, + Industry Classification as recommended by AMFI, Data is as of February 28, 2021 unless otherwise specified.
(An open ended scheme investing in equity and equity related instruments, debt & money market instruments and gold related instruments)HDFC Multi-Asset Fund ...Contd from previous page
PORTFOLIO
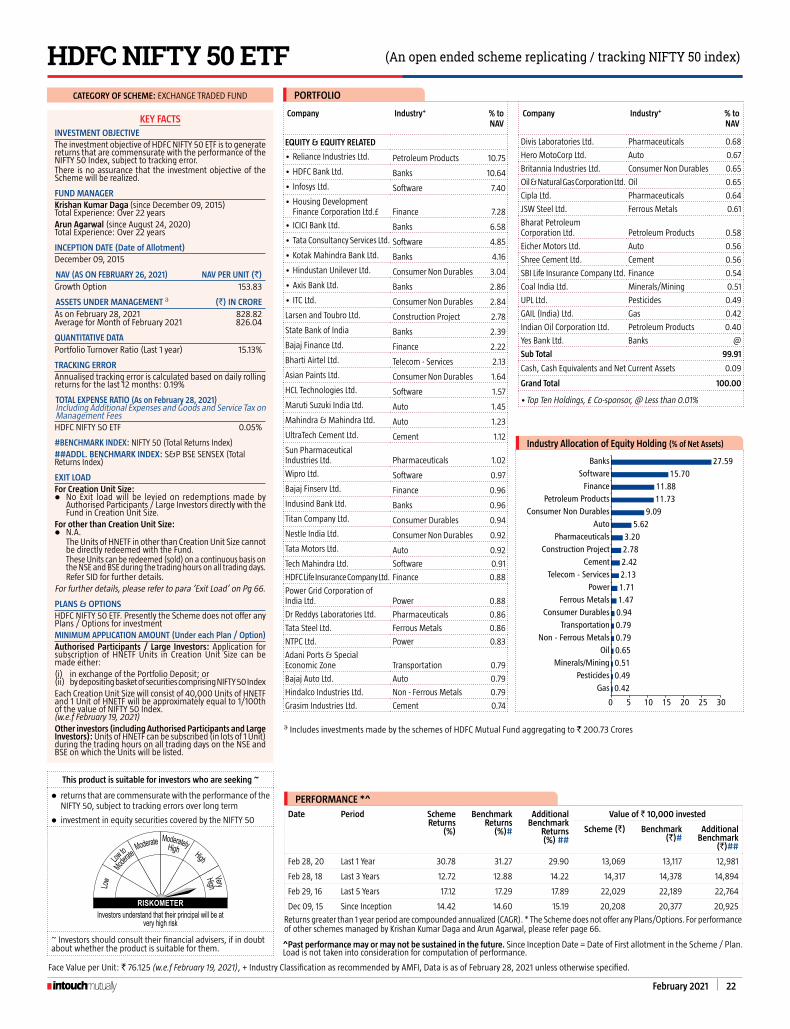
February 2021 22
CATEgORY OF SCHEME: ExCHANGE TRADED FUND
KEY FACTSINVESTMENT OBjECTIVEThe investment objective of HDFC NIFTY 50 ETF is to generate returns that are commensurate with the performance of the NIFTY 50 Index, subject to tracking error.There is no assurance that the investment objective of the Scheme will be realized.
FUND MANAgERKrishan Kumar Daga (since December 09, 2015)
Total experience: Over 22 yearsArun Agarwal (since August 24, 2020)
Total experience: Over 22 years
INCEPTION DATE (Date of Allotment)December 09, 2015
NAV (AS ON FEBRUARY 26, 2021) NAV PER UNIT (`)Growth Option 153.83
ASSETS UNDER MANAgEMENT j (`) IN CROREAs on February 28, 2021 828.82Average for Month of February 2021 826.04
qUANTITATIVE DATAPortfolio Turnover Ratio (Last 1 year) 15.13%
TRACKINg ERRORAnnualised tracking error is calculated based on daily rolling returns for the last 12 months: 0.19%
TOTAL ExPENSE RATIO (As on February 28, 2021)Including Additional expenses and Goods and Service Tax on Management FeesHDFC NIFTY 50 ETF 0.05%
#BENCHMARK INDEX: NIFTY 50 (Total Returns Index)##ADDl. BENCHMARK INDEX: S&P BSe SeNSex (Total Returns Index)
EXIT lOADFor Creation Unit Size:l No exit load will be levied on redemptions made by
Authorised Participants / Large Investors directly with the Fund in Creation Unit Size.
For other than Creation Unit Size:l N.A. The Units of HNETF in other than Creation Unit Size cannot
be directly redeemed with the Fund. These Units can be redeemed (sold) on a continuous basis on
the NSe and BSe during the trading hours on all trading days. Refer SID for further details.For further details, please refer to para ‘Exit Load’ on Pg 66.
PLANS & OPTIONSHDFC NIFTY 50 ETF. Presently the Scheme does not offer any Plans / Options for investmentMINIMUM APPlICATION AMOUNT (Under each Plan / Option)Authorised Participants / large Investors: Application for subscription of HNETF Units in Creation Unit Size can be made either: (i) in exchange of the Portfolio Deposit; or (ii) by depositing basket of securities comprising NIFTY 50 Index Each Creation Unit Size will consist of 40,000 Units of HNETF and 1 Unit of HNETF will be approximately equal to 1/100th of the value of NIFTY 50 Index. (w.e.f February 19, 2021)Other investors (including Authorised Participants and large Investors): Units of HNETF can be subscribed (in lots of 1 Unit) during the trading hours on all trading days on the NSe and BSe on which the Units will be listed.
Face Value per Unit: ` 76.125 (w.e.f February 19, 2021), + Industry Classification as recommended by AMFI, Data is as of February 28, 2021 unless otherwise specified.
PERFORMANCE *^
Date Period Scheme Returns
(%)
Benchmark Returns
(%)#
Additional Benchmark
Returns (%) ##
Value of ` 10,000 invested
Scheme (`) Benchmark (`)#
Additional Benchmark
(`)##
Feb 28, 20 Last 1 Year 30.78 31.27 29.90 13,069 13,117 12,981
Feb 28, 18 Last 3 Years 12.72 12.88 14.22 14,317 14,378 14,894
Feb 29, 16 Last 5 Years 17.12 17.29 17.89 22,029 22,189 22,764
Dec 09, 15 Since Inception 14.42 14.60 15.19 20,208 20,377 20,925
Returns greater than 1 year period are compounded annualized (CAGR). * The Scheme does not offer any Plans/Options. For performance of other schemes managed by Krishan Kumar Daga and Arun Agarwal, please refer page 66.
This product is suitable for investors who are seeking ~
l returns that are commensurate with the performance of the NIFTY 50, subject to tracking errors over long term
l investment in equity securities covered by the NIFTY 50
VeryHigh
Low to
Moderate
Low
Moderate ModeratelyHigh High
RISKOMETERInvestors understand that their principal will be at
very high risk
~ Investors should consult their financial advisers, if in doubt about whether the product is suitable for them. ^Past performance may or may not be sustained in the future. Since Inception Date = Date of First allotment in the Scheme / Plan.
Load is not taken into consideration for computation of performance.
j Includes investments made by the schemes of HDFC Mutual Fund aggregating to ` 200.73 Crores
(An open ended scheme replicating / tracking NIFTY 50 index)HDFC NIFTY 50 ETF
Company Industry+ % to NAV
EqUITY & EqUITY RElATED
• Reliance Industries Ltd. Petroleum Products 10.75
• HDFC Bank Ltd. Banks 10.64
• Infosys Ltd. Software 7.40
• Housing Development Finance Corporation Ltd.£ Finance 7.28
• ICICI Bank Ltd. Banks 6.58
• Tata Consultancy Services Ltd. Software 4.85
• Kotak Mahindra Bank Ltd. Banks 4.16
• Hindustan Unilever Ltd. Consumer Non Durables 3.04
• Axis Bank Ltd. Banks 2.86
• ITC Ltd. Consumer Non Durables 2.84
Larsen and Toubro Ltd. Construction Project 2.78
State Bank of India Banks 2.39
Bajaj Finance Ltd. Finance 2.22
Bharti Airtel Ltd. Telecom - Services 2.13
Asian Paints Ltd. Consumer Non Durables 1.64
HCL Technologies Ltd. Software 1.57
Maruti Suzuki India Ltd. Auto 1.45
Mahindra & Mahindra Ltd. Auto 1.23
UltraTech Cement Ltd. Cement 1.12
Sun Pharmaceutical Industries Ltd. Pharmaceuticals 1.02
Wipro Ltd. Software 0.97
Bajaj Finserv Ltd. Finance 0.96
Indusind Bank Ltd. Banks 0.96
Titan Company Ltd. Consumer Durables 0.94
Nestle India Ltd. Consumer Non Durables 0.92
Tata Motors Ltd. Auto 0.92
Tech Mahindra Ltd. Software 0.91
HDFC Life Insurance Company Ltd. Finance 0.88
Power Grid Corporation of India Ltd. Power 0.88
Dr Reddys Laboratories Ltd. Pharmaceuticals 0.86
Tata Steel Ltd. Ferrous Metals 0.86
NTPC Ltd. Power 0.83
Adani Ports & Special economic Zone Transportation 0.79
Bajaj Auto Ltd. Auto 0.79
Hindalco Industries Ltd. Non - Ferrous Metals 0.79
Grasim Industries Ltd. Cement 0.74
Company Industry+ % to NAV
Divis Laboratories Ltd. Pharmaceuticals 0.68
Hero MotoCorp Ltd. Auto 0.67
Britannia Industries Ltd. Consumer Non Durables 0.65
Oil & Natural Gas Corporation Ltd. Oil 0.65
Cipla Ltd. Pharmaceuticals 0.64
JSW Steel Ltd. Ferrous Metals 0.61
Bharat Petroleum Corporation Ltd. Petroleum Products 0.58
eicher Motors Ltd. Auto 0.56
Shree Cement Ltd. Cement 0.56
SBI Life Insurance Company Ltd. Finance 0.54
Coal India Ltd. Minerals/Mining 0.51
UPL Ltd. Pesticides 0.49
GAIL (India) Ltd. Gas 0.42
Indian Oil Corporation Ltd. Petroleum Products 0.40
Yes Bank Ltd. Banks @
Sub Total 99.91
Cash, Cash equivalents and Net Current Assets 0.09
Grand Total 100.00
• Top Ten Holdings, £ Co-sponsor, @ Less than 0.01%
PORTFOLIO
Industry Allocation of Equity Holding (% of Net Assets)
0.420.490.510.650.790.790.941.471.712.132.422.783.20
5.629.09
11.7311.88
15.7027.59
0 5 10 15 20 25 30
GasPesticides
Minerals/MiningOil
Non - Ferrous MetalsTransportation
Consumer DurablesFerrous Metals
PowerTelecom - Services
CementConstruction Project
PharmaceuticalsAuto
Consumer Non DurablesPetroleum Products
FinanceSoftware
Banks

23 February 2021
CATEgORY OF SCHEME: INDEx FUND
Company Industry+ % to NAV
EqUITY & EqUITY RElATED• Reliance Industries Ltd. Petroleum Products 10.79• HDFC Bank Ltd. Banks 10.68• Infosys Ltd. Software 7.43• Housing Development
Finance Corporation Ltd.£ Finance 7.30• ICICI Bank Ltd. Banks 6.60• Tata Consultancy Services Ltd. Software 4.87• Kotak Mahindra Bank Ltd. Banks 4.17• Hindustan Unilever Ltd. Consumer Non Durables 3.05• Axis Bank Ltd. Banks 2.88• ITC Ltd. Consumer Non Durables 2.85Larsen and Toubro Ltd. Construction Project 2.79State Bank of India Banks 2.40Bajaj Finance Ltd. Finance 2.23Bharti Airtel Ltd. Telecom - Services 2.14Asian Paints Ltd. Consumer Non Durables 1.64HCL Technologies Ltd. Software 1.58Maruti Suzuki India Ltd. Auto 1.46Mahindra & Mahindra Ltd. Auto 1.24UltraTech Cement Ltd. Cement 1.13Sun Pharmaceutical Industries Ltd. Pharmaceuticals 1.03Wipro Ltd. Software 0.98Indusind Bank Ltd. Banks 0.97Titan Company Ltd. Consumer Durables 0.94Bajaj Finserv Ltd. Finance 0.93Nestle India Ltd. Consumer Non
Durables 0.92Tata Motors Ltd. Auto 0.92Tech Mahindra Ltd. Software 0.91HDFC Life Insurance Company Ltd. Finance 0.88Power Grid Corporation of India Ltd. Power 0.88Dr Reddys Laboratories Ltd. Pharmaceuticals 0.86Tata Steel Ltd. Ferrous Metals 0.86NTPC Ltd. Power 0.83Hindalco Industries Ltd. Non - Ferrous Metals 0.80Adani Ports & Special economic Zone Transportation 0.79Bajaj Auto Ltd. Auto 0.79Grasim Industries Ltd. Cement 0.75Divis Laboratories Ltd. Pharmaceuticals 0.69Hero MotoCorp Ltd. Auto 0.67
Company Industry+ % to NAV
Oil & Natural Gas Corporation Ltd. Oil 0.65Britannia Industries Ltd. Consumer Non Durables 0.64Cipla Ltd. Pharmaceuticals 0.64JSW Steel Ltd. Ferrous Metals 0.61Bharat Petroleum Corporation Ltd. Petroleum Products 0.58Shree Cement Ltd. Cement 0.57eicher Motors Ltd. Auto 0.56SBI Life Insurance Company Ltd. Finance 0.54Coal India Ltd. Minerals/Mining 0.51UPL Ltd. Pesticides 0.49GAIL (India) Ltd. Gas 0.42Indian Oil Corporation Ltd. Petroleum Products 0.40Yes Bank Ltd. Banks @Sub Total 100.24Cash, Cash equivalents and Net Current Assets -0.24Grand Total 100.00• Top Ten Holdings, £ Co-sponsor, @ Less than 0.01%
KEY FACTS
INVESTMENT OBjECTIVE
The investment objective of the Scheme is to generate returns that are commensurate with the performance of the NIFTY 50 Index, subject to tracking errors.
There is no assurance that the investment objective of the Scheme will be realized.
FUND MANAgER
Krishan Kumar Daga (since October 19, 2015)
Total experience: Over 22 years
Arun Agarwal (since August 24, 2020)
Total experience: Over 22 years
INCEPTION DATE (Date of Allotment)
July 17, 2002
NAV (AS ON FEBRUARY 26, 2021) NAV PER UNIT (`)
Regular Plan - Growth Option 133.0978Direct Plan - Growth Option 135.0135
ASSETS UNDER MANAgEMENT (`) IN CRORE
As on February 28, 2021 2,576.78Average for Month of February 2021 2,582.65
qUANTITATIVE DATA
Portfolio Turnover Ratio (Last 1 year) 20.77%
TRACKINg ERROR
Annualised tracking error is calculated based on daily rolling returns for the last 12 months: 0.31%
TOTAL ExPENSE RATIO (As on February 28, 2021)Including Additional expenses and Goods and Service Tax on Management Fees
Regular: 0.30% Direct: 0.10%
#BENCHMARK INDEX: NIFTY 50 (Total Returns Index)
##ADDl. BENCHMARK INDEX: S&P BSe SeNSex (Total Returns Index)
EXIT lOAD
l In respect of each purchase / switch-in of Units, an exit Load of 0.25% is payable if Units are redeemed / switched-out within 3 days from the date of allotment.
l No exit load is payable if units are redeemed / switched out after 3 days from the date of allotment.
For further details, please refer to para ‘Exit Load’ on Pg 66.
PLANS & OPTIONS
Regular Plan, Direct Plan. Each Plan offers Growth Option only.
MINIMUM APPlICATION AMOUNT
Purchase : ` 5,000 and any amount thereafter.Additional Purchase : ` 1,000 and any amount thereafter.
SIP PERFORMANCE ^ - Regular Plan - growth Option
Since Inception SIP
15 year SIP
10 year SIP
5 year SIP
3 year SIP
1 year SIP
Total Amount Invested (` ‘000) 2,240.00 1,800.00 1,200.00 600.00 360.00 120.00 Mkt Value As on February 26, 2021 (` ‘000) 8,281.59 4,393.23 2,335.64 873.46 473.53 158.27 Returns (%) 12.59 11.07 12.80 15.06 18.75 65.43 Benchmark Returns (%) # 14.41 12.16 13.41 15.70 19.47 66.33 Additional Benchmark Returns (%) ## 14.93 12.47 13.87 16.62 20.00 64.29
Assuming ` 10,000 invested systematically on the first Business Day of every month over a period of time. CAGR returns are computed after accounting for the cash flow by using xIRR method (investment internal rate of return) for Regular Plan - Growth Option. The above investment simulation is for illustrative purposes only and should not be construed as a promise on minimum returns and safeguard of capital.
PERFORMANCE ^ - Regular Plan - growth Option
Date Period Scheme Returns
(%)
Benchmark Returns
(%)#
Additional Benchmark
Returns (%) ##
Value of ` 10,000 invested
Scheme (`) Benchmark (`)#
Additional Benchmark
(`)##
Feb 28, 20 Last 1 Year 30.13 31.27 29.90 13,003 13,117 12,981Feb 28, 18 Last 3 Years 12.27 12.88 14.22 14,147 14,378 14,894Feb 29, 16 Last 5 Years 16.62 17.29 17.89 21,565 22,189 22,764Jul 17, 02 Since Inception 14.71 16.87 17.52 128,896 182,312 202,222
Returns greater than 1 year period are compounded annualized (CAGR). Since inception returns are calculated on ` 10.3260 (allotment price). For performance of other schemes managed by Krishan Kumar Daga and Arun Agarwal, please refer page 66. Different plans viz. Regular Plan and Direct Plan have a different expense structure. The expenses of the Direct Plan under the Scheme will be lower to the extent of the distribution expenses / commission charged in the Regular Plan. For Performance of Direct Plan, refer page no. 79.
Face Value per Unit: ` 10.3260, + Industry Classification as recommended by AMFI, Data is as of February 28, 2021 unless otherwise specified.
This product is suitable for investors who are seeking ~
l returns that are commensurate with the performance of the NIFTY 50, subject to tracking errors over long term
l investment in equity securities covered by the NIFTY 50
VeryHigh
Low to
Moderate
Low
Moderate ModeratelyHigh High
RISKOMETERInvestors understand that their principal will be at
very high risk
~ Investors should consult their financial advisers, if in doubt about whether the product is suitable for them. ^Past performance may or may not be sustained in the future. Since Inception Date = Date of First allotment in the Scheme / Plan.
Load is not taken into consideration for computation of performance.
(An open ended scheme replicating / tracking NIFTY 50 index)HDFC Index Fund - NIFTY 50 Plan
PORTFOLIO
Industry Allocation of Equity Holding (% of Net Assets)
0.420.490.510.650.790.800.941.471.712.142.452.793.22
5.649.10
11.7711.88
15.7727.70
0 5 10 15 20 25 30
GasPesticides
Minerals/MiningOil
TransportationNon - Ferrous Metals
Consumer DurablesFerrous Metals
PowerTelecom - Services
CementConstruction Project
PharmaceuticalsAuto
Consumer Non DurablesPetroleum Products
FinanceSoftware
Banks

February 2021 24
CATEgORY OF SCHEME: ExCHANGE TRADED FUND
KEY FACTS
INVESTMENT OBjECTIVEThe investment objective of HDFC SENSEx ETF is to generate returns that are commensurate with the performance of the S&P BSe SeNSex Index, subject to tracking errors.There is no assurance that the investment objective of the Scheme will be realized.
FUND MANAgERKrishan Kumar Daga (since December 09, 2015)
Total experience: Over 22 yearsArun Agarwal (since August 24, 2020)
Total experience: Over 22 years
INCEPTION DATE (Date of Allotment)December 09, 2015
NAV (AS ON FEBRUARY 26, 2021) NAV PER UNIT (`)Growth Option 522.83
ASSETS UNDER MANAgEMENT j (`) IN CROREAs on February 28, 2021 91.94Average for Month of February 2021 94.69
qUANTITATIVE DATAPortfolio Turnover Ratio (Last 1 year) 66.87%
TRACKINg ERRORAnnualised tracking error is calculated based on daily rolling returns for the last 12 months: 0.10%
TOTAL ExPENSE RATIO (As on February 28, 2021)Including Additional expenses and Goods and Service Tax on Management FeesHDFC SeNSex ETF 0.05%
#BENCHMARK INDEX: S&P BSe SeNSex (Total Returns Index)##ADDl. BENCHMARK INDEX: NIFTY 50 (Total Returns Index)
EXIT lOADFor Creation Unit Size:l No exit load will be levied on redemptions made by
Authorised Participants / Large Investors directly with the Fund in Creation Unit Size.
For other than Creation Unit Size:l N.A. The Units of HSxETF in other than Creation Unit Size cannot
be directly redeemed with the Fund. These Units can be redeemed (sold) on a continuous basis on
the NSe and BSe during the trading hours on all trading days. Refer SID for further details.For further details, please refer to para ‘Exit Load’ on Pg 66.
PLANS & OPTIONSHDFC SENSEx ETF. Presently the Scheme does not offer any Plans / Options for investment
MINIMUM APPlICATION AMOUNT (Under each Plan / Option)Authorised Participants / large Investors: Application for subscription of HSxETF Units in Creation Unit Size can be made either: (i) in exchange of the Portfolio Deposit; or (ii) by depositing basket of securities comprising S&P BSe
SeNSex IndexEach Creation Unit Size will consist of 10,000 Units of HSxETF and 1 Unit of HSxETF will be approximately equal to 1/100th of the value of S&P BSe SeNSex Index.(w.e.f February 19, 2021) Other investors (including Authorised Participants and large Investors): Units of HSxETF can be subscribed (in lots of 1 Unit) during the trading hours on all trading days on the NSe and BSe on which the Units will be listed.
Face Value per Unit: ` 250.361 (w.e.f February 19, 2021), + Industry Classification as recommended by AMFI, Data is as of February 28, 2021 unless otherwise specified.
PERFORMANCE *^
Date Period Scheme Returns
(%)
Benchmark Returns
(%)#
Additional Benchmark
Returns (%) ##
Value of ` 10,000 invested
Scheme (`) Benchmark (`)#
Additional Benchmark
(`)##
Feb 28, 20 Last 1 Year 29.68 29.90 31.27 12,959 12,981 13,117
Feb 28, 18 Last 3 Years 14.11 14.22 12.88 14,853 14,894 14,378
Feb 29, 16 Last 5 Years 17.89 17.89 17.29 22,761 22,764 22,189
Dec 09, 15 Since Inception 15.14 15.19 14.60 20,883 20,925 20,377
Returns greater than 1 year period are compounded annualized (CAGR). * The Scheme does not offer any Plans/Options. For performance of other schemes managed by Krishan Kumar Daga and Arun Agarwal, please refer page 66.
This product is suitable for investors who are seeking ~
l returns that are commensurate with the performance of the S&P BSe SeNSex, subject to tracking errors over long term
l investment in equity securities covered by the S&P BSe SeNSex
VeryHigh
Low to
Moderate
Low
Moderate ModeratelyHigh High
RISKOMETERInvestors understand that their principal will be at
very high risk
~ Investors should consult their financial advisers, if in doubt about whether the product is suitable for them. ^Past performance may or may not be sustained in the future. Since Inception Date = Date of First allotment in the Scheme / Plan.
Load is not taken into consideration for computation of performance.
j Includes investments made by the schemes of HDFC Mutual Fund aggregating to ` 40.97 Crores
(An open ended scheme replicating / tracking S&P BSE SENSEX index)HDFC SENSEX ETF
Company Industry+ % to NAV
EqUITY & EqUITY RElATED
• Reliance Industries Ltd. Petroleum Products 12.53
• HDFC Bank Ltd. Banks 11.61
• Infosys Ltd. Software 8.53
• Housing Development Finance Corporation Ltd.£ Finance 8.50
• ICICI Bank Ltd. Banks 7.67
• Tata Consultancy Services Ltd. Software 5.66
• Kotak Mahindra Bank Ltd. Banks 4.33
• Axis Bank Ltd. Banks 3.55
• Hindustan Unilever Ltd. Consumer Non Durables 3.54
• ITC Ltd. Consumer Non Durables 3.32
Larsen and Toubro Ltd. Construction Project 3.24
State Bank of India Banks 2.78
Bajaj Finance Ltd. Finance 2.58
Bharti Airtel Ltd. Telecom - Services 2.49
Asian Paints Ltd. Consumer Non Durables 1.91
HCL Technologies Ltd. Software 1.84
Maruti Suzuki India Ltd. Auto 1.70
Mahindra & Mahindra Ltd. Auto 1.43
UltraTech Cement Ltd. Cement 1.31
Sun Pharmaceutical Industries Ltd. Pharmaceuticals 1.20
Indusind Bank Ltd. Banks 1.12
Bajaj Finserv Ltd. Finance 1.09
Titan Company Ltd. Consumer Durables 1.09
Nestle India Ltd. Consumer Non Durables 1.06
Tech Mahindra Ltd. Software 1.06
Company Industry+ % to NAV
Power Grid Corporation of India Ltd. Power 1.02
Dr Reddys Laboratories Ltd. Pharmaceuticals 1.00
NTPC Ltd. Power 0.97
Bajaj Auto Ltd. Auto 0.92
Oil & Natural Gas Corporation Ltd. Oil 0.75
Sub Total 99.80
Cash, Cash equivalents and Net Current Assets 0.20
Grand Total 100.00
• Top Ten Holdings, £ Co-sponsor
PORTFOLIO
Industry Allocation of Equity Holding (% of Net Assets)
0.75
1.09
1.31
1.99
2.20
2.49
3.24
4.05
9.83
12.17
12.53
17.09
31.06
0 5 10 15 20 25 30 35
Oil
Consumer Durables
Cement
Power
Pharmaceuticals
Telecom - Services
Construction Project
Auto
Consumer Non Durables
Finance
Petroleum Products
Software
Banks

25 February 2021
CATEgORY OF SCHEME: INDEx FUND
KEY FACTS
INVESTMENT OBjECTIVE
The investment objective of the Scheme is to generate returns that are commensurate with the performance of the S&P BSe SeNSex Index, subject to tracking errors.
There is no assurance that the investment objective of the Scheme will be realized.
FUND MANAgER
Krishan Kumar Daga (since October 19, 2015)
Total experience: Over 22 years
Arun Agarwal (since August 24, 2020)
Total experience: Over 22 years
INCEPTION DATE (Date of Allotment)
July 17, 2002
NAV (AS ON FEBRUARY 26, 2021) NAV PER UNIT (`)
Regular Plan - Growth Option 438.6489Direct Plan - Growth Option 445.7811
ASSETS UNDER MANAgEMENT (`) IN CRORE
As on February 28, 2021 1,962.95Average for Month of February 2021 1,956.48
qUANTITATIVE DATA
Portfolio Turnover Ratio (Last 1 year) 28.08%
TRACKINg ERROR
Annualised tracking error is calculated based on daily rolling returns for the last 12 months: 0.19%
TOTAL ExPENSE RATIO (As on February 28, 2021)Including Additional expenses and Goods and Service Tax on Management Fees
Regular: 0.30% Direct: 0.10%
#BENCHMARK INDEX: S&P BSe SeNSex (Total Returns Index)
##ADDl. BENCHMARK INDEX: NIFTY 50 (Total Returns Index)
EXIT lOAD
l In respect of each purchase / switch-in of Units, an exit Load of 0.25% is payable if Units are redeemed / switched-out within 3 days from the date of allotment.
l No exit load is payable if units are redeemed / switched out after 3 days from the date of allotment.
For further details, please refer to para ‘Exit Load’ on Pg 66.
PLANS & OPTIONS
Regular Plan, Direct Plan. Each Plan offers Growth Option only.
MINIMUM APPlICATION AMOUNT
Purchase : ` 5,000 and any amount thereafter.Additional Purchase : ` 1,000 and any amount thereafter.
SIP PERFORMANCE ^ - Regular Plan - growth Option
Since Inception SIP
15 year SIP
10 year SIP
5 year SIP
3 year SIP
1 year SIP
Total Amount Invested (` ‘000) 2,240.00 1,800.00 1,200.00 600.00 360.00 120.00 Mkt Value As on February 26, 2021 (` ‘000) 8,656.80 4,505.85 2,393.31 893.15 477.06 157.17 Returns (%) 12.99 11.37 13.26 15.97 19.28 63.42 Benchmark Returns (%) # 14.93 12.47 13.87 16.62 20.00 64.29 Additional Benchmark Returns (%) ## 14.41 12.16 13.41 15.70 19.47 66.33
Assuming ` 10,000 invested systematically on the first Business Day of every month over a period of time. CAGR returns are computed after accounting for the cash flow by using xIRR method (investment internal rate of return) for Regular Plan - Growth Option. The above investment simulation is for illustrative purposes only and should not be construed as a promise on minimum returns and safeguard of capital.
Face Value per Unit: ` 32.1610, + Industry Classification as recommended by AMFI, Data is as of February 28, 2021 unless otherwise specified.
This product is suitable for investors who are seeking ~
l returns that are commensurate with the performance of the S&P BSe SeNSex, subject to tracking errors over long term.
l investment in equity securities covered by the S&P BSe SeNSex.
VeryHigh
Low to
Moderate
Low
Moderate ModeratelyHigh High
RISKOMETERInvestors understand that their principal will be at
very high risk
~ Investors should consult their financial advisers, if in doubt about whether the product is suitable for them. ^Past performance may or may not be sustained in the future. Since Inception Date = Date of First allotment in the Scheme / Plan.
Load is not taken into consideration for computation of performance.
PERFORMANCE ^ - Regular Plan - growth Option
Date Period Scheme Returns
(%)
Benchmark Returns
(%)#
Additional Benchmark
Returns (%) ##
Value of ` 10,000 invested
Scheme (`) Benchmark (`)#
Additional Benchmark
(`)##
Feb 28, 20 Last 1 Year 28.92 29.90 31.27 12,883 12,981 13,117Feb 28, 18 Last 3 Years 13.53 14.22 12.88 14,627 14,894 14,378Feb 29, 16 Last 5 Years 17.30 17.89 17.29 22,193 22,764 22,189Jul 17, 02 Since Inception 15.06 17.52 16.87 136,392 202,222 182,312
Returns greater than 1 year period are compounded annualized (CAGR). Since inception returns are calculated on ` 32.1610 (allotment price). For performance of other schemes managed by Krishan Kumar Daga and Arun Agarwal, please refer page 66. Different plans viz. Regular Plan and Direct Plan have a different expense structure. The expenses of the Direct Plan under the Scheme will be lower to the extent of the distribution expenses / commission charged in the Regular Plan. For Performance of Direct Plan, refer page no. 79.
Note: Effective close of business hours of May 25, 2018, HDFC Index Fund - SENSEx Plan (the Scheme) underwent changes in Fundamental Attributes and HDFC Index Fund - SENSEx Plus Plan was merged therein. As the portfolio structuring of the Scheme is continued, its past performance is provided, in line with SeBI circular on Performance disclosure post consolidation/ merger of scheme dated April 12, 2018.
(An open ended scheme replicating / tracking S&P BSE SENSEX index)HDFC Index Fund - SENSEX Plan
Company Industry+ % to NAV
EqUITY & EqUITY RElATED
• Reliance Industries Ltd. Petroleum Products 12.75
• HDFC Bank Ltd. Banks 11.82
• Infosys Ltd. Software 8.68
• Housing Development Finance Corporation Ltd.£ Finance 8.65
• ICICI Bank Ltd. Banks 7.80
• Tata Consultancy Services Ltd. Software 5.76
• Kotak Mahindra Bank Ltd. Banks 4.41
• Axis Bank Ltd. Banks 3.61
• Hindustan Unilever Ltd. Consumer Non Durables 3.60
• ITC Ltd. Consumer Non Durables 3.37
Larsen and Toubro Ltd. Construction Project 3.30
State Bank of India Banks 2.83
Bajaj Finance Ltd. Finance 2.63
Bharti Airtel Ltd. Telecom - Services 2.53
Asian Paints Ltd. Consumer Non Durables 1.95
HCL Technologies Ltd. Software 1.87
Maruti Suzuki India Ltd. Auto 1.73
Mahindra & Mahindra Ltd. Auto 1.46
UltraTech Cement Ltd. Cement 1.34
Sun Pharmaceutical Industries Ltd. Pharmaceuticals 1.22
Indusind Bank Ltd. Banks 1.14
Titan Company Ltd. Consumer Durables 1.11
Bajaj Finserv Ltd. Finance 1.10
Nestle India Ltd. Consumer Non Durables 1.09
Tech Mahindra Ltd. Software 1.08
Power Grid Corporation of India Ltd. Power 1.04
Company Industry+ % to NAV
Dr Reddys Laboratories Ltd. Pharmaceuticals 1.02
NTPC Ltd. Power 0.98
Bajaj Auto Ltd. Auto 0.94
Oil & Natural Gas Corporation Ltd. Oil 0.77
Sub Total 101.58
Cash, Cash equivalents and Net Current Assets -1.58
Grand Total 100.00
• Top Ten Holdings, £ Co-sponsor
PORTFOLIO
Industry Allocation of Equity Holding (% of Net Assets)
0.77
1.11
1.34
2.02
2.24
2.53
3.30
4.13
10.01
12.38
12.75
17.39
31.61
0 5 10 15 20 25 30 35
Oil
Consumer Durables
Cement
Power
Pharmaceuticals
Telecom - Services
Construction Project
Auto
Consumer Non Durables
Finance
Petroleum Products
Software
Banks

February 2021 26
CATEgORY OF SCHEME: eQUITY LINKeD SAVINGS SCHeMe
KEY FACTS
INVESTMENT OBjECTIVE
To generate capital appreciation / income from a portfolio, comprising predominantly of equity & equity related instruments.There is no assurance that the investment objective of the Scheme will be realized.
FUND MANAgER ¥
Amit B. Ganatra (since August 24, 2020)
Total experience: Over 17 years
INCEPTION DATE (Date of Allotment)
March 31, 1996
NAV (AS ON FEBRUARY 26, 2021) NAV PER UNIT (`)
Regular Plan - Growth Option 582.317Regular Plan - Dividend Option 51.654Direct Plan - Growth Option 612.383Direct Plan - Dividend Option 60.162
ASSETS UNDER MANAgEMENT (`) IN CRORE
As on February 28, 2021 8,016.42Average for Month of February 2021 8,182.42
qUANTITATIVE DATA
Portfolio Turnover Ratio (Last 1 year) 38.54%
Risk Ration Standard Deviation 6.568%n Beta 0.964n Sharpe Ratio* 0.032
Computed for the 3-yr period ended February 26, 2021. Based on month-end NAV. * Risk free rate: 3.47%(Source: FIMMDA MIBOR)
TOTAL ExPENSE RATIO (As on February 28, 2021)Including Additional expenses and Goods and Service Tax on Management Fees
Regular: 1.84% Direct: 1.34%
#BENCHMARK INDEX: NIFTY 500 (Total Returns Index)
##ADDl. BENCHMARK INDEX: NIFTY 50 (Total Returns Index)
EXIT lOAD
Nil
PLANS & OPTIONS
Regular Plan, Direct Plan. Under each Plan : Growth & Dividend. The Dividend Option offers Dividend Payout facility.
MINIMUM APPlICATION AMOUNT
Purchase : ` 500 and in multiples of ` 500 thereafter.Additional Purchase : ̀ 500 and in multiples of ̀ 500 thereafter.
lOCK-IN PERIOD
3 years from the date of allotment of the respective Units
¥ Dedicated Fund Manager for Overseas Investments: Mr. Sankalp Baid (since January 22, 2021) (Total experience: Over 13 years).
SIP PERFORMANCE ^ - Regular Plan - growth OptionSince Inception
SIP15 year
SIP10 year
SIP5 year
SIP3 year
SIP1 year
SIPTotal Amount Invested (` ‘000) 2,990.00 1,800.00 1,200.00 600.00 360.00 120.00 Mkt Value As on February 26, 2021 (` ‘000) $$ 74,167.80 4,386.14 2,066.79 748.74 431.14 155.64 Returns (%) $$ 21.12 11.05 10.50 8.82 12.14 60.63 Benchmark Returns (%) # 15.11 12.43 13.87 15.25 19.92 72.06 Additional Benchmark Returns (%) ## 14.04 12.16 13.41 15.70 19.47 66.33
Assuming ` 10,000 invested systematically on the first Business Day of every month over a period of time. CAGR returns are computed after accounting for the cash flow by using xIRR method (investment internal rate of return) for Regular Plan - Growth Option. The above investment simulation is for illustrative purposes only and should not be construed as a promise on minimum returns and safeguard of capital.
PERFORMANCE ^ - Regular Plan - growth OptionDate Period Scheme
Returns (%) $$
Benchmark Returns
(%)#
Additional Benchmark
Returns (%) ##
Value of ` 10,000 investedScheme (`)
$$Benchmark
(`)#Additional
Benchmark (`)##
Feb 28, 20 Last 1 Year 24.60 33.37 31.27 12,453 13,326 13,117Feb 28, 18 Last 3 Years 3.39 10.86 12.88 11,051 13,621 14,378Feb 29, 16 Last 5 Years 13.49 17.31 17.29 18,824 22,207 22,189Mar 31, 96 Since Inception 22.16 13.94 12.72 1,468,943 259,037 198,075
Returns greater than 1 year period are compounded annualized (CAGR). Performance of dividend option under the schemes for the investors would be net of distribution tax, if any. $$ All dividends declared prior to the splitting of the Scheme into Dividend & Growth Options are assumed to be reinvested in the units of the Scheme at the then prevailing NAV (ex-dividend NAV). For performance of other schemes managed by Amit B. Ganatra, please refer page 66. Different plans viz. Regular Plan and Direct Plan have a different expense structure. The expenses of the Direct Plan under the Scheme will be lower to the extent of the distribution expenses / commission charged in the Regular Plan. For Performance of Direct Plan, refer page no. 77. As TRI data is not available since inception of the scheme, additional benchmark performance is calculated using composite CAGR of NIFTY 50 PRI values from Mar 29, 96 (Data for March 31, 96 is not available) to Jun 29, 99 and TRI values since Jun 30, 99. As NIFTY 500 TRI data is not available for March 31, 96, benchmark performance is calculated from March 29, 96.
Face Value per Unit: ` 10 unless otherwise specified, + Industry Classification as recommended by AMFI, Data is as of February 28, 2021 unless otherwise specified.
This product is suitable for investors who are seeking ~
l to generate long-term capital appreciation / income
l investment predominantly of equity & equity related instruments
VeryHigh
Low to
Moderate
Low
Moderate ModeratelyHigh High
RISKOMETERInvestors understand that their principal will be at
very high risk
~ Investors should consult their financial advisers, if in doubt about whether the product is suitable for them.
^Past performance may or may not be sustained in the future. Since Inception Date = Date of First allotment in the Scheme / Plan. Load is not taken into consideration for computation of performance.
(An open ended equity linked savings scheme with a statutory lock in of 3 years and tax benefit)HDFC TaxSaver
Company Industry+ % to NAVEqUITY & EqUITY RElATED• HDFC Bank Ltd. Banks 9.74• ICICI Bank Ltd. Banks 9.45• Infosys Ltd. Software 9.09• Reliance Industries Ltd. Petroleum Products 5.58• Bharti Airtel Ltd. Telecom - Services 4.16• Axis Bank Ltd. Banks 3.26• State Bank of India Banks 2.94• Bharat Petroleum
Corporation Ltd. Petroleum Products 2.59• Cipla Ltd. Pharmaceuticals 2.59• Hindustan Unilever Ltd. Consumer Non Durables 2.59ITC Ltd. Consumer Non Durables 2.34NTPC Ltd. Power 2.12Larsen and Toubro Ltd. Construction Project 2.00Kotak Mahindra Bank Ltd. Banks 1.79Voltas Ltd. Consumer Durables 1.72HCL Technologies Ltd. Software 1.68L&T Technology Services Ltd. Software 1.59Persistent Systems Ltd. Software 1.57Maruti Suzuki India Ltd. Auto 1.47Tata Consumer Products Ltd. Consumer Non Durables 1.42Lupin Ltd. Pharmaceuticals 1.38Crompton Greaves Consumer electricals Ltd. Consumer Durables 1.30Ambuja Cements Ltd. Cement 1.29Tata Motors Ltd. Auto 1.20Apollo Hospitals enterprise Ltd. Healthcare Services 1.19Power Grid Corporation of India Ltd. Power 1.15endurance Technologies Ltd. Auto Ancillaries 1.14Tata Steel Ltd. Ferrous Metals 1.14Bharat electronics Ltd. Industrial Capital Goods 1.12HDFC Life Insurance Company Ltd. Finance 1.05The Phoenix Mills Ltd. Construction 1.01GAIL (India) Ltd. Gas 0.98Aurobindo Pharma Ltd. Pharmaceuticals 0.94United Spirits Ltd. Consumer Non Durables 0.92Titan Company Ltd. Consumer Durables 0.86Mahanagar Gas Ltd. Gas 0.84Torrent Pharmaceuticals Ltd. Pharmaceuticals 0.80Dabur India Ltd. Consumer Non Durables 0.79Multi Commodity exchange of India Ltd. Finance 0.74Hindustan Petroleum Corporation Ltd. Petroleum Products 0.71Procter & Gamble Health Ltd. Pharmaceuticals 0.71SBI Cards and Payment Services Ltd. Finance 0.71Whirlpool of India Ltd. Consumer Durables 0.70Oracle Financial Ser Software Ltd. Software 0.64Kalpataru Power Transmission Ltd. Power 0.60Computer Age Management Services Finance 0.58Teamlease Services Ltd. Commercial Services 0.53Syngene International Ltd. Pharmaceuticals 0.52AIA engineering Ltd. Industrial Products 0.48ABB India Ltd. Industrial Capital Goods 0.47
Company Industry+ % to NAVTCI express Ltd. Transportation 0.47Solar Industries India Ltd. Chemicals 0.41Dixon Technologies (India) Ltd. Consumer Durables 0.31Sadbhav engineering Ltd. Construction Project 0.26eClerx Services Ltd. Software 0.23Somany Home Innovation Ltd. Construction 0.17Hindustan Construction Company Ltd. Construction Project 0.15Dynamatic Technologies Ltd. Auto Ancillaries 0.11Sadbhav Infrastructure Project Ltd. (Corporate Guarantee of Sadbhav engineering Ltd.) Construction Project 0.06MPS Ltd. Software 0.05Siti Networks Ltd. Media & entertainment @Sub Total 98.40DEBT & DEBT RElATEDCREDIT EXPOSURE (NON PERPETUAl)Muthoot Finance Ltd. ICRA - AA 0.32Sub Total 0.32CREDIT EXPOSURE (PERPETUAl BONDS)Punjab National Bank (AT1, BASeL III, Perpetual) IND - AA 0.32Sub Total 0.32Total 0.64Cash, Cash equivalents and Net Current Assets 0.96Grand Total 100.00• Top Ten Holdings
PORTFOLIO
Industry Allocation of Equity Holding (% of Net Assets)
0.410.470.480.531.141.181.191.251.291.591.822.472.673.083.874.164.89
6.948.068.88
14.8527.18
0 5 10 15 20 25 30
ChemicalsTransportation
Industrial ProductsCommercial Services
Ferrous MetalsConstruction
Healthcare ServicesAuto Ancillaries
CementIndustrial Capital Goods
GasConstruction Project
AutoFinance
PowerTelecom - Services
Consumer DurablesPharmaceuticals
Consumer Non DurablesPetroleum Products
SoftwareBanks

27 February 2021
CATEgORY OF SCHEME: CHILDREN’S FUND
KEY FACTS
INVESTMENT OBjECTIVE
To generate capital appreciation / income from a portfolio of equity & equity related instruments and debt and money market instruments.
There is no assurance that the investment objective of the Scheme will be realized.
FUND MANAgER ¥
Chirag Setalvad (since April 2, 2007)
Total experience - Over 21 years
INCEPTION DATE (Date of Allotment)
March 2, 2001
NAV (AS ON FEBRUARY 26, 2021) NAV PER UNIT (`)
Regular Plan 153.700Direct Plan 164.277
ASSETS UNDER MANAgEMENT (`) IN CRORE
As on February 28, 2021 4,234.12Average for Month of February 2021 4,254.69
qUANTITATIVE DATA
Portfolio Turnover Ratio (Last 1 year) 16.91%Average Maturity * 2.46 yearsMacaulay Duration * 2.03 yearsModified Duration * 1.94 yearsYield to Maturity * 5.26%* Computed on the invested amount for debt portfolio.
TOTAL ExPENSE RATIO (As on February 28, 2021)Including Additional expenses and Goods and Service Tax on Management Fees
Regular: 2.03% Direct: 1.13%
#BENCHMARK INDEX: NIFTY 50 Hybrid Composite Debt 65:35 Index
##ADDl. BENCHMARK INDEX: NIFTY 50 (Total Returns Index)
EXIT lOAD
Nil
PLANS & OPTIONS
Regular Plan, Direct Plan.
MINIMUM APPlICATION AMOUNT
Purchase : ` 5,000 and any amount thereafter.Additional Purchase : ` 1,000 and any amount thereafter.
lOCK-IN PERIOD
Fresh investments by investors including SIP/ STP registrations, etc (effective May 23, 2018):Lock-in period will be compulsory. Lock-in period shall be earlier ofl 5 Years from the date of allotment; orl Until the Unit holder (being the beneficiary child) attains
the age of majority (i.e. completion of 18 years)¥ Dedicated Fund Manager for Overseas Investments: Mr. Sankalp Baid (since January 22, 2021) (Total experience: Over 13 years).
(Ω) eligibility (of Unit holder) : Children less than 18 years of age as on the date of investment by the Investor / Applicant are eligible as Unit holders in the Scheme. (π) Personal Accident Insurance Cover for Parent / Legal Guardian (upto the age of 80 years) of the Unit holder, equivalent to 10 times the cost value of the outstanding Units held by the Unit holder under all the applications / account statements / folios, subject to a maximum amount of ` 10 lakhs per Unit holder. The insurance premium in respect of the personal accident insurance cover will be borne by the AMC. This accident insurance cover is subject to conditions of the group personal accident insurance policy.
Face Value per Unit: ` 10 unless otherwise specified, + Industry Classification as recommended by AMFI, Data is as of February 28, 2021 unless otherwise specified.
[An open ended fund for investment for children having a lock-in for atleast 5 years or till the child attains age of majority (whichever is earlier)] ΩπHDFC Children's Gift Fund
Company Industry+ / Rating % to NAV
EqUITY & EqUITY RElATED
• HDFC Bank Ltd. Banks 6.62
• Reliance Industries Ltd. Petroleum Products 5.96
• ICICI Bank Ltd. Banks 4.93
• Infosys Ltd. Software 4.76
• Housing Development Finance Corporation Ltd.£ Finance 4.32
• Bajaj Finance Ltd. Finance 2.49
State Bank of India Banks 2.19
Coforge Ltd. Software 2.16
Larsen and Toubro Ltd. Construction Project 2.15
ITC Ltd. Consumer Non Durables 1.88
Century Plyboards (India) Ltd. Consumer Durables 1.53
Apollo Tyres Ltd. Auto Ancillaries 1.31
Bharat electronics Ltd. Industrial Capital Goods 1.30
Bharti Airtel Ltd. Telecom - Services 1.29
Kirloskar Pneumatic Ltd. Industrial Products 1.28
Aurobindo Pharma Ltd. Pharmaceuticals 1.19
UPL Ltd. Pesticides 1.19
Newgen Software Technologies Ltd. Software 1.11
Oracle Financial Ser Software Ltd. Software 1.07
Motherson Sumi Systems Ltd. Auto Ancillaries 1.06
Aster DM Healthcare Ltd. Healthcare Services 1.05
Ipca Laboratories Ltd. Pharmaceuticals 0.89
Balkrishna Industries Ltd. Auto Ancillaries 0.88
Finolex Industries Ltd. Industrial Products 0.82
Power Grid Corporation of India Ltd. Power 0.81
Carborundum Universal Ltd. Industrial Products 0.74
PNC Infratech Ltd. Construction 0.74
Axis Bank Ltd. Banks 0.71
Sonata Software Ltd. Software 0.70
Indian Hotels Company Ltd. Hotels/Resorts & Other Recreational Activities 0.67
Prince Pipes and Fittings Ltd. Industrial Products 0.66
Mahindra Holidays & Resorts Ind Ltd.
Hotels/Resorts & Other Recreational Activities 0.63
Tata Steel Ltd. Ferrous Metals 0.62
Voltamp Transformers Ltd. Industrial Capital Goods 0.62
Bank of Baroda Banks 0.55
Zensar Technologies Ltd. Software 0.54
Bharat Petroleum Corporation Ltd. Petroleum Products 0.53
Cholamandalam Financial Holdings Ltd. Finance 0.47
Vedanta Ltd. Non - Ferrous Metals 0.45
SKF India Ltd. Industrial Products 0.42
VST Industries Ltd. Consumer Non Durables 0.42
eClerx Services Ltd. Software 0.38
Company Industry+ / Rating % to NAV
Swaraj engines Ltd. Industrial Products 0.33
Vesuvius India Ltd. Industrial Products 0.31
V.S.T Tillers Tractors Ltd. Auto 0.25
Navneet education Ltd. Media & entertainment 0.24
engineers India Ltd. Construction Project 0.12
Jagran Prakashan Ltd. Media & entertainment 0.09
Sadbhav engineering Ltd. Construction Project 0.07
Blue Star Ltd. Consumer Durables 0.01
Yes Bank Ltd. Banks 0.01
Sub Total 65.52
DEBT & DEBT RElATED
gOVERNMENT SECURITIES (CENTRAl/STATE)
• 7.17 GOI 2028 Sovereign 4.07
8.28 GOI 2027 Sovereign 1.17
8.32 GOI 2032 Sovereign 0.79
6.79 GOI 2027 Sovereign 0.73
8.83 GOI 2023 Sovereign 0.69
8.15 GOI 2022 Sovereign 0.37
8.08 GOI 2022 Sovereign 0.25
8.6 GOI 2028 Sovereign 0.13
7.26 GOI 2029 Sovereign 0.12
8.2 GOI 2022 Sovereign 0.06
Sub Total 8.38
CREDIT EXPOSURE (NON PERPETUAl)
• Housing Development Finance Corporation Ltd.£ CRISIL - AAA 3.06
• Shriram Transport Finance Co. Ltd. CRISIL - AA+ 2.36
LIC Housing Finance Ltd. CRISIL - AAA 1.26
L&T Infrastructure Finance Ltd. CRISIL - AAA 0.97
Tata Sons Ltd. CRISIL - AAA 0.91
State Bank of India CRISIL - AAA 0.62
Power Finance Corporation Ltd. CRISIL - AAA 0.05
Britannia Industries Ltd. CRISIL - AAA 0.01
Sub Total 9.24
CREDIT EXPOSURE (PERPETUAl BONDS)
• Axis Bank Ltd. (AT1, BASeL III, Perpetual) CRISIL - AA+ 2.44
Bank of Baroda (AT1, BASeL III, Perpetual) CRISIL - AA+ 2.31
ICICI Bank Ltd. (AT1, BASeL III, Perpetual) CARE - AA+ 0.98
State Bank of India (AT1, BASeL III, Perpetual) CRISIL - AA+ 0.26
Sub Total 5.99
Total 23.61
Cash, Cash equivalents and Net Current Assets 10.87
Grand Total 100.00
• Top Ten Holdings, £ Co-sponsor
PORTFOLIO

February 2021 28
Face Value per Unit: ` 10 unless otherwise specified, + Industry Classification as recommended by AMFI, Data is as of February 28, 2021 unless otherwise specified.
This product is suitable for investors who are seeking ~
l capital appreciation over long term.
l investment in equity and equity related instruments as well as debt and money market instruments.
VeryHigh
Low to
Moderate
Low
Moderate ModeratelyHigh High
RISKOMETERInvestors understand that their principal will be at
very high risk
~ Investors should consult their financial advisers, if in doubt about whether the product is suitable for them.
SIP PERFORMANCE ^ - Regular Plan - growth Option
Since Inception SIP 15 year SIP 10 year SIP 5 Year SIP 3 Year SIP 1 Year SIP
Total Amount Invested (` ‘000) 2,400.00 1,800.00 1,200.00 600.00 360.00 120.00
Mkt Value As on February 26, 2021 (` ‘000) $ 14,332.63 5,948.16 2,506.54 842.15 463.81 151.92
Returns (%) $ 15.63 14.60 14.12 13.57 17.27 53.92
Benchmark Returns (%) # N.A. 11.37 12.22 13.86 16.79 42.35
Additional Benchmark Returns (%) ## 14.81 12.16 13.41 15.70 19.47 66.33
Assuming ̀ 10,000 invested systematically on the first Business Day of every month over a period of time. CAGR returns are computed after accounting for the cash flow by using xIRR method (investment internal rate of return) for Regular Plan - Growth Option. The above investment simulation is for illustrative purposes only and should not be construed as a promise on minimum returns and safeguard of capital. N.A. Not Available.
PERFORMANCE ^ - Regular Plan - growth Option
Date Period Scheme Returns
(%) $
Benchmark Returns
(%)#
Additional Benchmark
Returns(%) ##
Value of ` 10,000 invested
Scheme (`) $
Benchmark (`)#
Additional Benchmark(`)##
Feb 28, 20 Last 1 Year 26.61 24.79 31.27 12,652 12,471 13,117
Feb 28, 18 Last 3 Years 10.16 12.46 12.88 13,365 14,218 14,378
Feb 29, 16 Last 5 Years 15.37 14.80 17.29 20,435 19,932 22,189
Mar 02, 01 Since Inception 16.15 N.A. 14.40 199,810 N.A. 147,466
Returns greater than 1 year period are compounded annualized (CAGR). N.A. Not Available. Scheme performance may not strictly be comparable with that of its Additional Benchmark in view of balanced nature of the scheme where a portion of scheme’s investments are made in debt instruments. $ Adjusted for Bonus units declared under the Scheme. For performance of other schemes managed by Chirag Setalvad, please refer page 48. Different plans viz. Regular Plan and Direct Plan have a different expense structure. The expenses of the Direct Plan under the Scheme will be lower to the extent of the distribution expenses / commission charged in the Regular Plan. For Performance of Direct Plan, refer page no. 72.
^Past performance may or may not be sustained in the future. Since Inception Date = Date of First allotment in the Scheme / Plan. Load is not taken into consideration for computation of performance.
Portfolio Classification By Asset Class (%)
equity 65.52
G-Sec 8.38
Credit exposure 15.23
Cash, Cash equivalents and Net Current Assets 10.87
Portfolio Classification By Rating Class (%)
equity 65.52
Sovereign 8.38
AAA/AAA(SO)/A1+/A1+(SO) & equivalent 6.88
AA+ 8.35
Cash, Cash equivalents and Net Current Assets 10.87
[An open ended fund for investment for children having a lock-in for atleast 5 years or till the child attains age of majority (whichever is earlier)] ΩπHDFC Children's Gift Fund .....Contd from previous page
Industry Allocation of Equity Holding (% of Net Assets)
0.25
0.33
0.45
0.62
0.74
0.81
1.05
1.19
1.29
1.30
1.54
1.92
2.08
2.30
2.34
3.25
4.56
6.49
7.28
10.72
15.01
0 2 4 6 8 10 121416
Auto
Media & Entertainment
Non - Ferrous Metals
Ferrous Metals
Construction
Power
Healthcare Services
Pesticides
Telecom - Services
Hotels, Resorts & Other Recreational Activities
Consumer Durables
Industrial Capital Goods
Pharmaceuticals
Consumer Non Durables
Construction Project
Auto Ancillaries
Industrial Products
Petroleum Products
Finance
Software
Banks
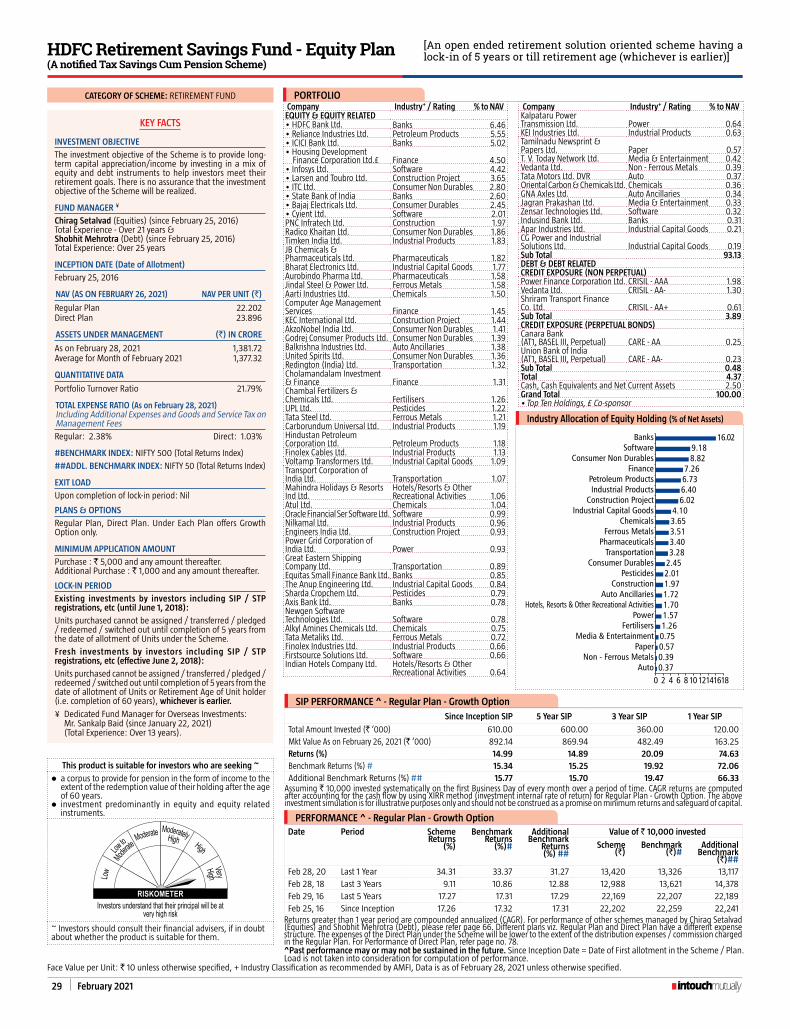
29 February 2021
CATEgORY OF SCHEME: RETIREMENT FUND
KEY FACTS
INVESTMENT OBjECTIVE
The investment objective of the Scheme is to provide long-term capital appreciation/income by investing in a mix of equity and debt instruments to help investors meet their retirement goals. There is no assurance that the investment objective of the Scheme will be realized.
FUND MANAgER ¥
Chirag Setalvad (Equities) (since February 25, 2016)
Total experience - Over 21 years &Shobhit Mehrotra (Debt) (since February 25, 2016)
Total experience: Over 25 years
INCEPTION DATE (Date of Allotment)
February 25, 2016
NAV (AS ON FEBRUARY 26, 2021) NAV PER UNIT (`)
Regular Plan 22.202Direct Plan 23.896
ASSETS UNDER MANAgEMENT (`) IN CRORE
As on February 28, 2021 1,381.72Average for Month of February 2021 1,377.32
qUANTITATIVE DATA
Portfolio Turnover Ratio 21.79%
TOTAL ExPENSE RATIO (As on February 28, 2021)Including Additional expenses and Goods and Service Tax on Management Fees
Regular: 2.38% Direct: 1.03%
#BENCHMARK INDEX: NIFTY 500 (Total Returns Index)
##ADDl. BENCHMARK INDEX: NIFTY 50 (Total Returns Index)
EXIT lOAD
Upon completion of lock-in period: Nil
PLANS & OPTIONS
Regular Plan, Direct Plan. Under Each Plan offers Growth Option only.
MINIMUM APPlICATION AMOUNT
Purchase : ` 5,000 and any amount thereafter.Additional Purchase : ` 1,000 and any amount thereafter.
lOCK-IN PERIOD
Existing investments by investors including SIP / STP registrations, etc (until june 1, 2018):
Units purchased cannot be assigned / transferred / pledged / redeemed / switched out until completion of 5 years from the date of allotment of Units under the Scheme.
Fresh investments by investors including SIP / STP registrations, etc (effective june 2, 2018):
Units purchased cannot be assigned / transferred / pledged / redeemed / switched out until completion of 5 years from the date of allotment of Units or Retirement Age of Unit holder (i.e. completion of 60 years), whichever is earlier.
¥ Dedicated Fund Manager for Overseas Investments: Mr. Sankalp Baid (since January 22, 2021) (Total experience: Over 13 years).
Face Value per Unit: ` 10 unless otherwise specified, + Industry Classification as recommended by AMFI, Data is as of February 28, 2021 unless otherwise specified.
PERFORMANCE ^ - Regular Plan - growth OptionDate Period Scheme
Returns (%)
Benchmark Returns
(%)#
Additional Benchmark
Returns (%) ##
Value of ` 10,000 invested
Scheme (`)
Benchmark (`)#
Additional Benchmark
(`)##Feb 28, 20 Last 1 Year 34.31 33.37 31.27 13,420 13,326 13,117Feb 28, 18 Last 3 Years 9.11 10.86 12.88 12,988 13,621 14,378Feb 29, 16 Last 5 Years 17.27 17.31 17.29 22,169 22,207 22,189Feb 25, 16 Since Inception 17.26 17.32 17.31 22,202 22,259 22,241
Returns greater than 1 year period are compounded annualized (CAGR). For performance of other schemes managed by Chirag Setalvad (equities) and Shobhit Mehrotra (Debt), please refer page 66. Different plans viz. Regular Plan and Direct Plan have a different expense structure. The expenses of the Direct Plan under the Scheme will be lower to the extent of the distribution expenses / commission charged in the Regular Plan. For Performance of Direct Plan, refer page no. 78.
This product is suitable for investors who are seeking ~
l a corpus to provide for pension in the form of income to the extent of the redemption value of their holding after the age of 60 years.
l investment predominantly in equity and equity related instruments.
VeryHigh
Low to
Moderate
Low
Moderate ModeratelyHigh High
RISKOMETERInvestors understand that their principal will be at
very high risk~ Investors should consult their financial advisers, if in doubt about whether the product is suitable for them.
^Past performance may or may not be sustained in the future. Since Inception Date = Date of First allotment in the Scheme / Plan. Load is not taken into consideration for computation of performance.
[An open ended retirement solution oriented scheme having a lock-in of 5 years or till retirement age (whichever is earlier)]HDFC Retirement Savings Fund - Equity Plan
(A notified Tax Savings Cum Pension Scheme)
Company Industry+ / Rating % to NAVEqUITY & EqUITY RElATED• HDFC Bank Ltd. Banks 6.46• Reliance Industries Ltd. Petroleum Products 5.55• ICICI Bank Ltd. Banks 5.02• Housing Development
Finance Corporation Ltd.£ Finance 4.50• Infosys Ltd. Software 4.42• Larsen and Toubro Ltd. Construction Project 3.65• ITC Ltd. Consumer Non Durables 2.80• State Bank of India Banks 2.60• Bajaj Electricals Ltd. Consumer Durables 2.45• Cyient Ltd. Software 2.01PNC Infratech Ltd. Construction 1.97Radico Khaitan Ltd. Consumer Non Durables 1.86Timken India Ltd. Industrial Products 1.83JB Chemicals & Pharmaceuticals Ltd. Pharmaceuticals 1.82Bharat electronics Ltd. Industrial Capital Goods 1.77Aurobindo Pharma Ltd. Pharmaceuticals 1.58Jindal Steel & Power Ltd. Ferrous Metals 1.58Aarti Industries Ltd. Chemicals 1.50Computer Age Management Services Finance 1.45KeC International Ltd. Construction Project 1.44AkzoNobel India Ltd. Consumer Non Durables 1.41Godrej Consumer Products Ltd. Consumer Non Durables 1.39Balkrishna Industries Ltd. Auto Ancillaries 1.38United Spirits Ltd. Consumer Non Durables 1.36Redington (India) Ltd. Transportation 1.32Cholamandalam Investment & Finance Finance 1.31Chambal Fertilizers & Chemicals Ltd. Fertilisers 1.26UPL Ltd. Pesticides 1.22Tata Steel Ltd. Ferrous Metals 1.21Carborundum Universal Ltd. Industrial Products 1.19Hindustan Petroleum Corporation Ltd. Petroleum Products 1.18Finolex Cables Ltd. Industrial Products 1.13Voltamp Transformers Ltd. Industrial Capital Goods 1.09Transport Corporation of India Ltd. Transportation 1.07Mahindra Holidays & Resorts Ind Ltd.
Hotels/Resorts & Other Recreational Activities 1.06
Atul Ltd. Chemicals 1.04Oracle Financial Ser Software Ltd. Software 0.99Nilkamal Ltd. Industrial Products 0.96engineers India Ltd. Construction Project 0.93Power Grid Corporation of India Ltd. Power 0.93Great eastern Shipping Company Ltd. Transportation 0.89Equitas Small Finance Bank Ltd. Banks 0.85The Anup engineering Ltd. Industrial Capital Goods 0.84Sharda Cropchem Ltd. Pesticides 0.79Axis Bank Ltd. Banks 0.78Newgen Software Technologies Ltd. Software 0.78Alkyl Amines Chemicals Ltd. Chemicals 0.75Tata Metaliks Ltd. Ferrous Metals 0.72Finolex Industries Ltd. Industrial Products 0.66Firstsource Solutions Ltd. Software 0.66Indian Hotels Company Ltd. Hotels/Resorts & Other
Recreational Activities 0.64
Company Industry+ / Rating % to NAVKalpataru Power Transmission Ltd. Power 0.64KeI Industries Ltd. Industrial Products 0.63Tamilnadu Newsprint & Papers Ltd. Paper 0.57T. V. Today Network Ltd. Media & entertainment 0.42Vedanta Ltd. Non - Ferrous Metals 0.39Tata Motors Ltd. DVR Auto 0.37Oriental Carbon & Chemicals Ltd. Chemicals 0.36GNA Axles Ltd. Auto Ancillaries 0.34Jagran Prakashan Ltd. Media & entertainment 0.33Zensar Technologies Ltd. Software 0.32Indusind Bank Ltd. Banks 0.31Apar Industries Ltd. Industrial Capital Goods 0.21CG Power and Industrial Solutions Ltd. Industrial Capital Goods 0.19Sub Total 93.13DEBT & DEBT RElATEDCREDIT EXPOSURE (NON PERPETUAl)Power Finance Corporation Ltd. CRISIL - AAA 1.98Vedanta Ltd. CRISIL - AA- 1.30Shriram Transport Finance Co. Ltd. CRISIL - AA+ 0.61Sub Total 3.89CREDIT EXPOSURE (PERPETUAl BONDS)Canara Bank (AT1, BASeL III, Perpetual) CARe - AA 0.25Union Bank of India (AT1, BASeL III, Perpetual) CARe - AA- 0.23Sub Total 0.48Total 4.37Cash, Cash equivalents and Net Current Assets 2.50Grand Total 100.00• Top Ten Holdings, £ Co-sponsor
PORTFOLIO
Industry Allocation of Equity Holding (% of Net Assets)
0.370.390.570.751.261.571.701.721.972.012.453.283.403.513.654.10
6.026.406.737.26
8.829.18
16.02
0 2 4 6 81012141618Auto
Non - Ferrous MetalsPaper
Media & EntertainmentFertilisers
PowerHotels, Resorts & Other Recreational Activities
Auto AncillariesConstruction
PesticidesConsumer Durables
TransportationPharmaceuticals
Ferrous MetalsChemicals
Industrial Capital GoodsConstruction Project
Industrial ProductsPetroleum Products
FinanceConsumer Non Durables
SoftwareBanks
SIP PERFORMANCE ^ - Regular Plan - growth Option
Since Inception SIP 5 Year SIP 3 Year SIP 1 Year SIP
Total Amount Invested (` ‘000) 610.00 600.00 360.00 120.00 Mkt Value As on February 26, 2021 (` ‘000) 892.14 869.94 482.49 163.25 Returns (%) 14.99 14.89 20.09 74.63 Benchmark Returns (%) # 15.34 15.25 19.92 72.06 Additional Benchmark Returns (%) ## 15.77 15.70 19.47 66.33
Assuming ` 10,000 invested systematically on the first Business Day of every month over a period of time. CAGR returns are computed after accounting for the cash flow by using xIRR method (investment internal rate of return) for Regular Plan - Growth Option. The above investment simulation is for illustrative purposes only and should not be construed as a promise on minimum returns and safeguard of capital.

February 2021 30
Face Value per Unit: ` 10 unless otherwise specified, + Industry Classification as recommended by AMFI, Data is as of February 28, 2021 unless otherwise specified.
[An open ended retirement solution oriented scheme having a lock-in of 5 years or till retirement age (whichever is earlier)]
HDFC Retirement Savings Fund - Hybrid Equity Plan(A notified Tax Savings Cum Pension Scheme)
Company Industry+ / Rating % to
NAV
EqUITY & EqUITY RElATED
• HDFC Bank Ltd. Banks 5.96
• ICICI Bank Ltd. Banks 5.10
• Reliance Industries Ltd. Petroleum Products 4.82
• Housing Development Finance Corporation Ltd.£ Finance 4.53
• Infosys Ltd. Software 4.35
• ITC Ltd. Consumer Non Durables 2.68
• Larsen and Toubro Ltd. Construction Project 2.65
State Bank of India Banks 2.28
Procter & Gamble Health Ltd. Pharmaceuticals 2.16
Bajaj electricals Ltd. Consumer Durables 1.99
Suprajit engineering Ltd. Auto Ancillaries 1.66
Cyient Ltd. Software 1.48
Aurobindo Pharma Ltd. Pharmaceuticals 1.37
UTI Asset Management
Company Ltd. Finance 1.29
Chambal Fertilizers &
Chemicals Ltd. Fertilisers 1.18
Redington (India) Ltd. Transportation 1.16
Balrampur Chini Mills Ltd. Consumer Non Durables 1.09
Sonata Software Ltd. Software 1.09
Bharat electronics Ltd. Industrial Capital Goods 1.08
KeC International Ltd. Construction Project 1.06
Hindustan Petroleum
Corporation Ltd. Petroleum Products 1.02
Timken India Ltd. Industrial Products 1.00
Nilkamal Ltd. Industrial Products 0.98
Power Grid Corporation of
India Ltd. Power 0.94
Balkrishna Industries Ltd. Auto Ancillaries 0.91
Oriental Carbon & Chemicals Ltd. Chemicals 0.91
Voltamp Transformers Ltd. Industrial Capital Goods 0.89
UPL Ltd. Pesticides 0.85
Mahindra Holidays & Resorts
Ind Ltd.
Hotels/Resorts & Other
Recreational Activities 0.80
Lumax Industries Ltd. Auto Ancillaries 0.78
Axis Bank Ltd. Banks 0.71
Vesuvius India Ltd. Industrial Products 0.70
Crompton Greaves Consumer
electricals Ltd. Consumer Durables 0.67
Tata Steel Ltd. Ferrous Metals 0.64
The Anup engineering Ltd. Industrial Capital Goods 0.56
Vedanta Ltd. Non - Ferrous Metals 0.51
Company Industry+ / Rating % to
NAV
Zensar Technologies Ltd. Software 0.51
Tamilnadu Newsprint &
Papers Ltd. Paper 0.45
Kalpataru Power
Transmission Ltd. Power 0.43
NRB Bearing Ltd. Industrial Products 0.41
Shaily engineering Plastics Ltd. Industrial Products 0.40
SKF India Ltd. Industrial Products 0.35
JB Chemicals &
Pharmaceuticals Ltd. Pharmaceuticals 0.33
Shree Pushkar Chemicals &
Fertilisers Ltd. Chemicals 0.25
Jagran Prakashan Ltd. Media & entertainment 0.18
Apar Industries Ltd. Industrial Capital Goods 0.16
Sadbhav engineering Ltd. Construction Project 0.13
Yes Bank Ltd. Banks @
Sub Total 65.45
DEBT & DEBT RElATED
gOVERNMENT SECURITIES (CENTRAl/STATE)
7.57 GOI 2033 Sovereign 2.33
6.67 GOI 2050 Sovereign 1.71
Sub Total 4.04
CREDIT EXPOSURE (NON PERPETUAl)
• Power Finance Corporation Ltd. CRISIL - AAA 4.61
• Embassy Office Parks REIT CRISIL - AAA 4.33
• Vedanta Ltd. CRISIL - AA- 2.62
Jamnagar Utilities & Power Pvt. Ltd. (erstwhile Reliance Utilities & Power Pvt. Ltd.) CRISIL - AAA 1.86
L&T Infrastructure Finance Ltd. CRISIL - AAA 1.81
Power Grid Corporation of
India Ltd. CRISIL - AAA 0.92
Reliance Industries Ltd. CRISIL - AAA 0.48
Sub Total 16.63
CREDIT EXPOSURE (PERPETUAl BONDS)
State Bank of India
(AT1, BASeL III, Perpetual) CRISIL - AA+ 1.52
Canara Bank
(AT1, BASeL III, Perpetual) CARe - AA 0.62
Sub Total 2.14
Total 22.81
Cash, Cash equivalents and Net Current Assets 11.74
Grand Total 100.00
• Top Ten Holdings, £ Co-sponsor, @ Less than 0.01%
PORTFOLIO
KEY FACTS
INVESTMENT OBjECTIVE
The investment objective of the Scheme is to provide long-term capital appreciation/income by investing in a mix of equity and debt instruments to help investors meet their retirement goals. There is no assurance that the investment objective of the Scheme will be realized.
FUND MANAgER ¥
Chirag Setalvad (Equities) (since February 25, 2016)
Total experience - Over 21 years &
Shobhit Mehrotra (Debt) (since February 25, 2016)
Total experience: Over 25 years
INCEPTION DATE (Date of Allotment)
February 25, 2016
NAV (AS ON FEBRUARY 26, 2021) NAV PER UNIT (`)
Regular Plan 21.314Direct Plan 22.937
ASSETS UNDER MANAgEMENT (`) IN CRORE
As on February 28, 2021 571.47Average for Month of February 2021 570.48
qUANTITATIVE DATA
Portfolio Turnover Ratio 23.59%Average Maturity * 4.41 yearsMacaulay Duration * 2.85 yearsModified Duration * 2.72 yearsYield to Maturity * 5.69%* Computed on the invested amount for debt portfolio.
TOTAL ExPENSE RATIO (As on February 28, 2021)Including Additional expenses and Goods and Service Tax on Management Fees
Regular: 2.46% Direct: 1.21%
#BENCHMARK INDEX: NIFTY 50 Hybrid Composite Debt 65:35 Index
##ADDl. BENCHMARK INDEX: NIFTY 50 (Total Returns Index)
EXIT lOAD
Upon completion of lock-in period: Nil
PLANS & OPTIONS
Regular Plan, Direct Plan. Under Each Plan offers Growth Option only.
MINIMUM APPlICATION AMOUNT
Purchase : ` 5,000 and any amount thereafter.Additional Purchase : ` 1,000 and any amount thereafter.
lOCK-IN PERIOD
Existing investments by investors including SIP / STP registrations, etc (until june 1, 2018):
Units purchased cannot be assigned / transferred / pledged / redeemed / switched out until completion of 5 years from the date of allotment of Units under the Scheme.
Fresh investments by investors including SIP / STP registrations, etc (effective june 2, 2018):
Units purchased cannot be assigned / transferred / pledged / redeemed / switched out until completion of 5 years from the date of allotment of Units or Retirement Age of Unit holder (i.e. completion of 60 years), whichever is earlier.
¥ Dedicated Fund Manager for Overseas Investments: Mr. Sankalp Baid (since January 22, 2021) (Total experience: Over 13 years).
(The Plan underwent Change in Fundamental Attributes i.e. change in Asset Allocation Pattern w.e.f. March 14, 2019).
CATEgORY OF SCHEME: RETIREMENT FUND

31 February 2021
Portfolio Classification By Asset Class (%)
n equity 65.45
n G-Sec 4.04
n Credit exposure 18.77
n Cash, Cash equivalents and Net Current Assets 11.74
Portfolio Classification By Rating Class (%)
n equity 65.45n Sovereign 4.04n AAA/AAA(SO)/A1+/A1+(SO) &
equivalent 14.01n AA+ 1.52n AA/AA- 3.24n Cash, Cash equivalents and Net
Current Assets 11.74
This product is suitable for investors who are seeking ~
l a corpus to provide for pension in the form of income to the extent of the redemption value of their holding after the age of 60 years.
l investment predominantly in equity and equity related instruments & balance in debt and money market instruments.
VeryHigh
Low to
Moderate
Low
Moderate ModeratelyHigh High
RISKOMETERInvestors understand that their principal will be at
very high risk
~ Investors should consult their financial advisers, if in doubt about whether the product is suitable for them.
PERFORMANCE ^ - Regular Plan - growth Option
Date Period Scheme Returns
(%)
Benchmark Returns
(%)#
Additional Benchmark
Returns (%) ##
Value of ` 10,000 invested
Scheme (`)
Benchmark (`)#
Additional Benchmark
(`)##
Feb 28, 20 Last 1 Year 27.18 24.79 31.27 12,710 12,471 13,117
Feb 28, 18 Last 3 Years 10.20 12.46 12.88 13,381 14,218 14,378
Feb 29, 16 Last 5 Years 16.28 14.80 17.29 21,252 19,932 22,189
Feb 25, 16 Since Inception 16.31 14.86 17.31 21,314 20,015 22,241
Returns greater than 1 year period are compounded annualized (CAGR). Scheme performance may not strictly be comparable with that of its Additional Benchmark in view of hybrid nature of the scheme where a portion of scheme’s investments are made in debt instruments. For performance of other schemes managed by Chirag Setalvad (equities) and Shobhit Mehrotra (Debt), please refer page 66. Different plans viz. Regular Plan and Direct Plan have a different expense structure. The expenses of the Direct Plan under the Scheme will be lower to the extent of the distribution expenses / commission charged in the Regular Plan. For Performance of Direct Plan, refer page no. 78.
^Past performance may or may not be sustained in the future. Since Inception Date = Date of First allotment in the Scheme / Plan. Load is not taken into consideration for computation of performance.
[An open ended retirement solution oriented scheme having a lock-in of 5 years or till retirement age(whichever is earlier)]
HDFC Retirement Savings Fund - Hybrid Equity Plan(A notified Tax Savings Cum Pension Scheme)
Industry Allocation of Equity Holding (% of Net Assets)
0.180.450.510.640.800.851.161.161.181.37
2.662.693.353.773.843.843.86
5.825.84
7.4314.05
0 2 4 6 8 10121416
Media & EntertainmentPaper
Non - Ferrous MetalsFerrous Metals
Hotels, Resorts & Other Recreational ActivitiesPesticides
TransportationChemicalsFertilisers
PowerConsumer Durables
Industrial Capital GoodsAuto Ancillaries
Consumer Non DurablesConstruction Project
Industrial ProductsPharmaceuticals
FinancePetroleum Products
SoftwareBanks
.....Contd from previous page
SIP PERFORMANCE ^ - Regular Plan - growth Option
Since Inception SIP 5 Year SIP 3 Year SIP 1 Year SIP
Total Amount Invested (` ‘000) 610.00 600.00 360.00 120.00
Mkt Value As on February 26, 2021 (` ‘000) 872.48 851.16 466.79 153.10
Returns (%) 14.10 14.01 17.72 56.04
Benchmark Returns (%) # 13.90 13.86 16.79 42.35
Additional Benchmark Returns (%) ## 15.77 15.70 19.47 66.33
Assuming ` 10,000 invested systematically on the first Business Day of every month over a period of time. CAGR returns are computed after accounting for the cash flow by using xIRR method (investment internal rate of return) for Regular Plan - Growth Option. The above investment simulation is for illustrative purposes only and should not be construed as a promise on minimum returns and safeguard of capital.

February 2021 32
CATEgORY OF SCHEME: RETIREMENT FUND
KEY FACTS
INVESTMENT OBjECTIVEThe investment objective of the Scheme is to provide long-term capital appreciation/income by investing in a mix of equity and debt instruments to help investors meet their retirement goals. There is no assurance that the investment objective of the Scheme will be realized.
FUND MANAgER ¥
Chirag Setalvad (Equities) (since February 26, 2016)
Total experience - Over 21 years &Shobhit Mehrotra (Debt) (since February 26, 2016)
Total experience: Over 25 years
INCEPTION DATE (Date of Allotment)February 26, 2016
NAV (AS ON FEBRUARY 26, 2021) NAV PER UNIT (`)Regular Plan 15.2584Direct Plan 16.3454
ASSETS UNDER MANAgEMENT (`) IN CROREAs on February 28, 2021 112.72Average for Month of February 2021 112.05
qUANTITATIVE DATAAverage Maturity * 6.21 yearsMacaulay Duration * 3.98 yearsModified Duration * 3.82 yearsYield to Maturity * 5.83%* Computed on the invested amount for debt portfolio.
TOTAL ExPENSE RATIO (As on February 28, 2021)Including Additional expenses and Goods and Service Tax on Management FeesRegular: 2.47% Direct: 1.17%
#BENCHMARK INDEX: NIFTY 50 Hybrid Composite Debt 15:85 Index##ADDl. BENCHMARK INDEX: CRISIL 10 Year Gilt Index
EXIT lOADUpon completion of lock-in period: Nil
PLANS & OPTIONSRegular Plan, Direct Plan. Under Each Plan offers Growth Option only.MINIMUM APPlICATION AMOUNTPurchase : ` 5,000 and any amount thereafter.Additional Purchase : ` 1,000 and any amount thereafter.
lOCK-IN PERIODExisting investments by investors including SIP / STP registrations, etc (until june 1, 2018):Units purchased cannot be assigned / transferred / pledged / redeemed / switched out until completion of 5 years from the date of allotment of Units under the Scheme. Fresh investments by investors including SIP / STP registrations, etc (effective june 2, 2018): Units purchased cannot be assigned / transferred / pledged / redeemed / switched out until completion of 5 years from the date of allotment of Units or Retirement Age of Unit holder (i.e. completion of 60 years), whichever is earlier.
¥ Dedicated Fund Manager for Overseas Investments: Mr. Sankalp Baid (since January 22, 2021) (Total experience: Over 13 years).
Face Value per Unit: ` 10 unless otherwise specified, + Industry Classification as recommended by AMFI, Data is as of February 28, 2021 unless otherwise specified.
PERFORMANCE ^ - Regular Plan - growth OptionDate Period Scheme
Returns (%)
Benchmark Returns
(%)#
Additional Benchmark
Returns (%) ##
Value of ` 10,000 investedScheme
(`)Benchmark
(`)#Additional
Benchmark (`)##
Feb 28, 20 Last 1 Year 9.64 12.18 4.92 10,961 11,215 10,490Feb 28, 18 Last 3 Years 6.69 10.30 8.94 12,142 13,417 12,927Feb 29, 16 Last 5 Years 8.58 10.25 7.34 15,089 16,281 14,246Feb 26, 16 Since Inception 8.81 10.32 7.57 15,258 16,350 14,409
Returns greater than 1 year period are compounded annualized (CAGR). Scheme performance may not strictly be comparable with that of its Additional Benchmark in view of hybrid nature of the scheme where a portion of scheme’s investments are made in equity instruments. For performance of other schemes managed by Chirag Setalvad (equities) and Shobhit Mehrotra (Debt), please refer page 66. Different plans viz. Regular Plan and Direct Plan have a different expense structure. The expenses of the Direct Plan under the Scheme will be lower to the extent of the distribution expenses / commission charged in the Regular Plan. For Performance of Direct Plan, refer page no. 78.
This product is suitable for investors who are seeking ~
l a corpus to provide for pension in the form of income to the extent of the redemption value of their holding after the age of 60 years.
l investment predominantly in debt and money market instruments & balance in equity and equity related instruments.
VeryHigh
Low to
Moderate
Low
Moderate ModeratelyHigh High
RISKOMETERInvestors understand that their principal will be at
moderately high risk~ Investors should consult their financial advisers, if in doubt about whether the product is suitable for them.
^Past performance may or may not be sustained in the future. Since Inception Date = Date of First allotment in the Scheme / Plan. Load is not taken into consideration for computation of performance.
Portfolio Classification By Asset Class (%)
n equity 14.32
n G-Sec 29.08
n Credit exposure 33.50
n Cash, Cash equivalents and Net Current Assets 23.10
Portfolio Classification By Rating Class (%)
n equity 14.32n Sovereign 29.08n AAA/AAA(SO)/A1+/A1+(SO)
& equivalent 15.91n AA+ 6.53n AA/AA- 11.06n Cash, Cash equivalents and
Net Current Assets 23.10
[An open ended retirement solution oriented scheme having a lock-in of 5 years or till retirement age (whichever is earlier)]
HDFC Retirement Savings Fund - Hybrid Debt Plan(A notified Tax Savings Cum Pension Scheme)
SIP PERFORMANCE ^ - Regular Plan - growth Option
Since Inception SIP 5 Year SIP 3 Year SIP 1 Year SIP
Total Amount Invested (` ‘000) 610.00 600.00 360.00 120.00 Mkt Value As on February 26, 2021 (` ‘000) 744.93 729.67 411.59 129.14 Returns (%) 7.82 7.79 8.95 14.71 Benchmark Returns (%) # 9.88 9.86 11.23 12.39 Additional Benchmark Returns (%) ## 6.88 6.85 7.64 1.06
Assuming ` 10,000 invested systematically on the first Business Day of every month over a period of time. CAGR returns are computed after accounting for the cash flow by using xIRR method (investment internal rate of return) for Regular Plan - Growth Option. The above investment simulation is for illustrative purposes only and should not be construed as a promise on minimum returns and safeguard of capital.
Company Industry+ / Rating % to NAVEqUITY & EqUITY RElATEDICICI Bank Ltd. Banks 1.31HDFC Bank Ltd. Banks 1.20Indigo Paints Ltd. Consumer Non Durables 0.85Reliance Industries Ltd. Petroleum Products 0.77Infosys Ltd. Software 0.64Larsen and Toubro Ltd. Construction Project 0.55Redington (India) Ltd. Transportation 0.49Bajaj electricals Ltd. Consumer Durables 0.48Coforge Ltd. Software 0.45ITC Ltd. Consumer Non Durables 0.45Chambal Fertilizers & Chemicals Ltd. Fertilisers 0.43Tata Steel Ltd. Ferrous Metals 0.41Axis Bank Ltd. Banks 0.37Finolex Cables Ltd. Industrial Products 0.36Timken India Ltd. Industrial Products 0.34State Bank of India Banks 0.33Avanti Feeds Ltd. Consumer Non Durables 0.32Voltamp Transformers Ltd. Industrial Capital Goods 0.31Blue Star Ltd. Consumer Durables 0.30Lumax Industries Ltd. Auto Ancillaries 0.26Newgen Software Technologies Ltd. Software 0.26GNA Axles Ltd. Auto Ancillaries 0.25SKF India Ltd. Industrial Products 0.24The Anup engineering Ltd. Industrial Capital Goods 0.23Mahindra Holidays & Resorts Ind Ltd.
Hotels/Resorts & Other Recreational Activities 0.22
Transport Corporation of India Ltd. Transportation 0.22Nilkamal Ltd. Industrial Products 0.21Vesuvius India Ltd. Industrial Products 0.21Oriental Carbon & Chemicals Ltd. Chemicals 0.20Navneet education Ltd. Media & entertainment 0.18Kalpataru Power Transmission Ltd. Power 0.17Power Grid Corporation of India Ltd. Power 0.17Hindustan Petroleum Corporation Ltd. Petroleum Products 0.16NRB Bearing Ltd. Industrial Products 0.16Aurobindo Pharma Ltd. Pharmaceuticals 0.15
Company Industry+ / Rating % to NAVInsecticides (India) Ltd. Pesticides 0.13Apar Industries Ltd. Industrial Capital Goods 0.12Time Technoplast Ltd. Industrial Products 0.12Poddar Pigments Ltd. Chemicals 0.11Bank of Baroda Banks 0.10Tamilnadu Newsprint & Papers Ltd. Paper 0.06Sadbhav engineering Ltd. Construction Project 0.03Sub Total 14.32DEBT & DEBT RElATEDgOVERNMENT SECURITIES (CENTRAl/STATE)• 6.19 GOI 2034 Sovereign 8.43• 7.57 GOI 2033 Sovereign 7.09• 7.5 GOI 2034 Sovereign 4.70• 6.79 GOI 2029 Sovereign 4.52• 6.67 GOI 2050 Sovereign 4.34Sub Total 29.08CREDIT EXPOSURE (NON PERPETUAl)• Vedanta Ltd. CRISIL - AA- 6.19• L&T Infrastructure Finance Ltd. CRISIL - AAA 5.98• Indian Railways Finance
Corporation Ltd. CRISIL - AAA 4.75• Shriram Transport Finance
Co. Ltd. CRISIL - AA+ 2.46Jamnagar Utilities & Power Pvt. Ltd. (erstwhile Reliance Utilities & Power Pvt. Ltd.) CRISIL - AAA 2.36Reliance Industries Ltd. CRISIL - AAA 1.85Tata Motors Ltd. CARe - AA- 1.25Power Finance Corporation Ltd. CRISIL - AAA 0.97Sub Total 25.81CREDIT EXPOSURE (PERPETUAl BONDS)• State Bank of India
(AT1, BASeL III, Perpetual) CRISIL - AA+ 4.07Union Bank of India (AT1, BASeL III, Perpetual) CARe - AA- 1.84Canara Bank (AT1, BASeL III, Perpetual) CARe - AA 1.78Sub Total 7.69Total 62.58Cash, Cash equivalents and Net Current Assets 23.10Grand Total 100.00• Top Ten Holdings
PORTFOLIO

33 February 2021
CATEgORY OF SCHEME: EqUITY SAVINGS FUND
KEY FACTS
INVESTMENT OBjECTIVE
To provide capital appreciation by investing in equity & equity related instruments, Arbitrage opportunities, and Debt & money market instruments.There is no assurance that the investment objective of the Scheme will be realized.
FUND MANAgER ¥
gopal Agrawal (equities) (since July 16, 2020)
Total experience: Over 16 years
Krishan Kumar Daga (Arbitrage) (since January 08, 2016)
Total experience: Over 22 years
Arun Agarwal (Arbitrage) (since August 24, 2020)
Total experience: Over 22 years
Anil Bamboli (Debt) (since September 17, 2004)
Total experience: Over 23 years
INCEPTION DATE (Date of Allotment)
September 17, 2004
NAV (AS ON FEBRUARY 26, 2021) NAV PER UNIT (`)
Regular Plan - Growth Option 42.823Regular Plan - Dividend Option 11.581Direct Plan - Growth Option 46.071Direct Plan - Dividend Option 12.753
ASSETS UNDER MANAgEMENT (`) IN CRORE
As on February 28, 2021 2,390.98Average for Month of February 2021 2,439.33
qUANTITATIVE DATA
Portfolio Turnover Ratio 32.34%Average Maturity * 1.85 yearsMacaulay Duration * 1.51 yearsModified Duration * 1.42 yearsYield to Maturity * 5.81%
* Computed on the invested amount for debt portfolio.
TOTAL ExPENSE RATIO (As on February 28, 2021)Including Additional expenses and Goods and Service Tax on Management Fees
Regular: 2.11% Direct: 1.36%
#BENCHMARK INDEX: 40% NIFTY 50 Arbitrage Index, 30% CRISIL Short Term Bond Fund Index and 30% NIFTY 50 (Total Returns Index)
##ADDl. BENCHMARK INDEX: CRISIL 10 year Gilt Index
EXIT lOAD
l In respect of each purchase / switch-in of Units, upto 15% of the units may be redeemed without any exit load from the date of allotment.
l Any redemption in excess of the above limit shall be subject to the following exit load:
n exit load of 1.00% is payable if Units are redeemed / switched-out within 1 year from the date of allotment of units.
l No exit Load is payable if Units are redeemed / switched-out after 1 year from the date of allotment.
For further details, please refer to para ‘Exit Load’ on Pg 66.
PLANS & OPTIONS
Regular Plan, Direct Plan. Under each Plan : Growth & Dividend. The Dividend Option offers Dividend Payout and Reinvestment facility.
MINIMUM APPlICATION AMOUNT
Purchase : ` 5,000 and any amount thereafter.Additional Purchase : ` 1,000 and any amount thereafter.
¥ Dedicated Fund Manager for Overseas Investments: Mr. Sankalp Baid (since January 22, 2021) (Total experience: Over 13 years).
This product is suitable for investors who are seeking ~l capital appreciation while generating income over medium to
long term.l provide capital appreciation and income distribution to the
investors by using equity and equity related instruments, arbitrage opportunities, and investments in debt and money market instruments.
VeryHighLow
to
Moderate
Low
Moderate ModeratelyHigh High
RISKOMETERInvestors understand that their principal will be at
moderately high risk~ Investors should consult their financial advisers, if in doubt about whether the product is suitable for them.
SIP PERFORMANCE ^ - Regular Plan - growth OptionSince Inception SIP 15 year SIP 10 year SIP 5 Year SIP 3 Year SIP 1 Year SIP
Total Amount Invested (` ‘000) 1,980.00 1,800.00 1,200.00 600.00 360.00 120.00 Mkt Value As on February 26, 2021 (` ‘000) 4,520.12 3,799.35 1,934.98 756.88 425.57 139.95 Returns (%) 9.30 9.35 9.25 9.26 11.24 32.90 Benchmark Returns (%) # N.A. N.A. 9.13 9.30 10.44 20.14 Additional Benchmark Returns (%) ## 6.90 6.99 7.34 6.85 7.64 1.06
Assuming ` 10,000 invested systematically on the first Business Day of every month over a period of time. CAGR returns are computed after accounting for the cash flow by using xIRR method (investment internal rate of return) for Regular Plan - Growth Option. The above investment simulation is for illustrative purposes only and should not be construed as a promise on minimum returns and safeguard of capital. N.A. Not Available.
PERFORMANCE ^ - Regular Plan - growth OptionDate Period^^ Scheme
Returns (%)
Benchmark Returns
(%)#
Additional Benchmark
Returns (%) ##
Value of ` 10,000 investedScheme (`) Benchmark
(`)#Additional
Benchmark (`)##
Feb 28, 20 Last 1 Year 17.22 12.92 4.92 11,717 11,288 10,490Feb 28, 18 Last 3 Years 7.09 8.72 8.94 12,278 12,849 12,927Feb 29, 16 Last 5 Years 11.50 9.83 7.34 17,231 15,980 14,246Sep 17, 04 Since Inception 9.24 N.A. 6.16 42,823 N.A. 26,754
^^Effective December 16, 2015, certain changes, including changes to fundamental attributes, were effected in the erstwhile HDFC Multiple Yield Fund, (an open ended income scheme) which was renamed as HDFC Equity Savings Fund, an open ended equity scheme. On account of these changes, the performance during the period(s) from September 17, 2004 to December 15, 2015 is not comparable.Returns greater than 1 year period are compounded annualized (CAGR). N.A. Not Available. Scheme performance may not strictly be comparable with that of its Additional Benchmark, since a portion of scheme’s investments are made in debt instruments. Performance of dividend option under the schemes for the investors would be net of distribution tax, if any. For performance of other schemes managed by Gopal Agrawal (Equities), Krishan Kumar Daga (Arbitrage), Arun Agarwal (Arbitrage) and Anil Bamboli (Debt), please refer page 66. Different plans viz. Regular Plan and Direct Plan have a different expense structure. The expenses of the Direct Plan under the Scheme will be lower to the extent of the distribution expenses / commission charged in the Regular Plan. For Performance of Direct Plan, refer page no. 79.^Past performance may or may not be sustained in the future. Since Inception Date = Date of First allotment in the Scheme / Plan. Load is not taken into consideration for computation of performance.
Face Value per Unit: ` 10 unless otherwise specified, + Industry Classification as recommended by AMFI, Data is as of February 28, 2021 unless otherwise specified. ...Contd on next page
Portfolio Classification By Rating Class (%)
n equity 65.60n Sovereign 8.37n AAA/AAA(SO)/A1+/A1+(SO)
& equivalent 3.20n AA/AA- 14.94n Cash, Cash equivalents and
Net Current Assets 7.89
(An open ended scheme investing in equity, arbitrage and debt)HDFC Equity Savings Fund
Industry Allocation of Equity Holding (% of Net Assets)
0.01
0.13
0.46
0.68
0.73
0.95
0.97
1.01
1.61
1.78
1.84
2.09
2.32
2.33
3.43
3.91
4.42
10.62
0 2 4 6 8 10 12
Media & Entertainment
Cement
Ferrous Metals
Aerospace & Defence
Minerals/Mining
Telecom - Services
Construction
Gas
Transportation
Finance
Pharmaceuticals
Power
Construction Project
Consumer Non Durables
Industrial Capital Goods
Petroleum Products
Software
Banks

February 2021 34
Face Value per Unit: ` 10 unless otherwise specified, + Industry Classification as recommended by AMFI, CD - Certificate of Deposit; CP - Commercial Papers. Data is as of February 28, 2021 unless otherwise specified.
(An open ended scheme investing in equity, arbitrage and debt) .....Contd from previous pageHDFC Equity Savings Fund
Company Industry+ / Rating % to NAV (Hedged & Unhedged)
% exposure of Derivative
EqUITY & EqUITY RElATED
• Housing Development Finance Corporation Ltd.£ Finance 6.64 6.64
• Reliance Industries Ltd. Petroleum Products 5.35 2.87
• Infosys Ltd. Software 3.91 0.00
• ICICI Bank Ltd. Banks 3.56 0.00
• HDFC Bank Ltd. Banks 3.52 0.00
• State Bank of India Banks 3.48 0.73
• Sun Pharmaceutical Industries Ltd. Pharmaceuticals 2.83 2.83
• Dr Reddys Laboratories Ltd. Pharmaceuticals 2.56 2.56
Larsen and Toubro Ltd. Construction Project 2.15 0.15
Bharti Airtel Ltd. Telecom - Services 2.08 1.13
Tata Steel Ltd. Ferrous Metals 1.84 1.38
Axis Bank Ltd. Banks 1.39 0.60
SBI Cards and Payment Services Ltd. Finance 1.32 0.00
Mahindra & Mahindra Ltd. Auto 1.23 1.23
Grasim Industries Ltd. Cement 1.22 1.22
JSW Steel Ltd. Ferrous Metals 1.21 1.21
BeML Ltd. Industrial Capital Goods 1.17 0.00
Titan Company Ltd. Consumer Durables 1.17 1.17
Gujarat Pipavav Port Ltd. Transportation 1.07 0.00
Lupin Ltd. Pharmaceuticals 1.06 0.36
Bharat Petroleum Corporation Ltd. Petroleum Products 1.05 0.00
GAIL (India) Ltd. Gas 1.01 0.00
NTPC Ltd. Power 0.85 0.00
United Spirits Ltd. Consumer Non Durables 0.76 0.20
Coal India Ltd. Minerals/Mining 0.73 0.00
Bharat electronics Ltd. Industrial Capital Goods 0.72 0.00
Power Grid Corporation of India Ltd. Power 0.69 0.00
Cipla Ltd. Pharmaceuticals 0.68 0.00
Hindustan Aeronautics Ltd. Aerospace & Defence 0.68 0.00
Aurobindo Pharma Ltd. Pharmaceuticals 0.66 0.20
JMC Projects (India) Ltd. Construction 0.65 0.00
ITC Ltd. Consumer Non Durables 0.64 0.00
Titagarh Wagons Ltd. Industrial Capital Goods 0.63 0.00
emami Ltd. Consumer Non Durables 0.57 0.00
elecon engineering Comapny Ltd. Industrial Capital Goods 0.56 0.00
Tata Consumer Products Ltd. Consumer Non Durables 0.56 0.00
NHPC Ltd. Power 0.55 0.00
Container Corporation of India Ltd. Transportation 0.54 0.00
Newgen Software Technologies Ltd. Software 0.51 0.00
Power Finance Corporation Ltd. Finance 0.46 0.00
Maruti Suzuki India Ltd. Auto 0.44 0.44
The Federal Bank Ltd. Banks 0.42 0.42
Hindustan Petroleum Corporation Ltd. Petroleum Products 0.38 0.00
Max Financial Services Ltd. Finance 0.37 0.37
Texmaco Rail & engineering Ltd. Industrial Capital Goods 0.35 0.00
Ashoka Buildcon Ltd. Construction Project 0.32 0.00
ITD Cementation India Ltd. Construction 0.32 0.00
Cadila Healthcare Ltd. Pharmaceuticals 0.20 0.20
Company Industry+ / Rating % to NAV (Hedged & Unhedged)
% exposure of Derivative
Orient Cement Ltd. Cement 0.13 0.00
Tech Mahindra Ltd. Software 0.11 0.11
UltraTech Cement Ltd. Cement 0.11 0.11
Pidilite Industries Ltd. Chemicals 0.10 0.10
Adani Ports & Special economic Zone Transportation 0.08 0.08
S Chand and Company Ltd. Media & entertainment 0.01 0.00
Biocon Ltd. Pharmaceuticals @Sub Total 65.60
Preference Shares
Zee entertainment enterprises Ltd. Media & entertainment @
Sub Total @
Total 65.60
DEBT & DEBT RElATED
gOVERNMENT SECURITIES (CENTRAl/STATE)
7.59 GOI 2026 Sovereign 0.67
6.97 GOI 2026 Sovereign 0.44
Sub Total 1.11
T-BIllS
364 Days Tbill - Mat 150721 Sovereign 2.07
182 Days Tbill Mat 040321 Sovereign 1.05
364 Days Tbill Mat 250321 Sovereign 1.04
364 Days Tbill Mat 300321 Sovereign 1.04
364 Days Tbill Mat 220721 Sovereign 1.03
364 Days Tbill Mat 290721 Sovereign 1.03
Sub Total 7.26
CREDIT EXPOSURE (NON PERPETUAl)
Power Finance Corporation Ltd. CRISIL - AAA 2.13
Vedanta Ltd. CRISIL - AA- 2.08
Shriram City Union Finance Ltd. CRISIL - AA 1.69
Indian Railways Finance Corporation Ltd. CRISIL - AAA 1.07
INOx Wind Infrastructure Services Ltd. CRISIL - AA(Ce) 0.62
Aarish Solar Power Pvt. Ltd. (Greenko) CARe - AA(Ce) 0.45
Sub Total 8.04
CREDIT EXPOSURE (PERPETUAl BONDS)
• Punjab National Bank (AT1, BASEL III, Perpetual) CRISIL - AA- 3.45
• Canara Bank (AT1, BASEL III, Perpetual) CARe - AA 2.36
Union Bank of India (AT1, BASeL III, Perpetual) IND - AA 2.15
Canara Bank (AT1, BASeL III, Perpetual) CRISIL - AA 1.07
Bank of Baroda (AT1, BASeL III, Perpetual) CARe - AA 0.43
Punjab National Bank (AT1, BASeL III, Perpetual) IND - AA 0.39
Union Bank of India (AT1, BASeL III, Perpetual) CARe - AA- 0.21
Union Bank of India (AT1, BASeL III, Perpetual) CRISIL - AA- 0.04
Sub Total 10.10
Total 26.51
Cash, Cash equivalents and Net Current Assets 7.89
Grand Total 100.00
• Top Ten Holdings, £ Co-sponsor, @ Less than 0.01%
Outstanding exposure in derivative instruments (` in Crore) 631.43
Hedged position in Equity & Equity related instruments
Outstanding derivative exposure (% age) 26.41
PORTFOLIO

35 February 2021
CATEgORY OF SCHEME: CONSERVATIVE HYBRID FUND
KEY FACTS
INVESTMENT OBjECTIVE
To generate income / capital appreciation by investing primarily in debt securities, money market instruments and moderate exposure to equities.
There is no assurance that the investment objective of the Scheme will be realized.
FUND MANAgER ¥
Prashant Jain (equities) (since December 26, 2003)
Total experience: Over 27 years &Shobhit Mehrotra (Debt) (since September 1, 2007)
Total experience: Over 25 years
INCEPTION DATE (Date of Allotment)
December 26, 2003
NAV (AS ON FEBRUARY 26, 2021) NAV PER UNIT (`)
Regular Plan - Growth Option 53.5331Regular Plan - Monthly Dividend Option 12.9054Regular Plan - Quarterly Dividend Option 13.7723Direct Plan - Growth Option 55.7298Direct Plan - Monthly Dividend Option 13.6950Direct Plan - Quarterly Dividend Option 14.6019
ASSETS UNDER MANAgEMENT (`) IN CRORE
As on February 28, 2021 2,438.64Average for Month of February 2021 2,455.62
qUANTITATIVE DATA
Average Maturity * 4.03 yearsMacaulay Duration * 3.16 yearsModified Duration * 2.99 yearsYield to Maturity * 7.19%* Computed on the invested amount for debt portfolio.
TOTAL ExPENSE RATIO (As on February 28, 2021)Including Additional expenses and Goods and Service Tax on Management Fees
Regular: 1.89% Direct: 1.47%
#BENCHMARK INDEX: NIFTY 50 Hybrid Composite Debt 15:85 Index
##ADDl. BENCHMARK INDEX: CRISIL 10 year Gilt Index
EXIT lOAD
l In respect of each purchase / switch-in of Units, 15% of the Units (“the limit”) may be redeemed without any exit load from the date of allotment.
l Any redemption in excess of the limit shall be subject to the following exit load:
n exit load of 1.00% is payable if Units are redeemed / switched-out within 1 year from the date of allotment of units.
l No exit load is payable if Units are redeemed / switched-out after 1 year from the date of allotment.
For further details, please refer to para ‘Exit Load’ on Pg 66.
PLANS & OPTIONS
Regular Plan, Direct Plan. Under each Plan : Growth, Monthly Dividend & Quarterly Dividend Option. The Dividend Option offers Dividend Payout and Reinvestment facility.
MINIMUM APPlICATION AMOUNT
Purchase: (Growth & Quarterly Dividend Option) - ` 5,000 and any amount thereafter. (Monthly Dividend Option) - ` 25,000 and any amount thereafter.Additional Purchase : ` 1,000 and any amount thereafter.
¥ Dedicated Fund Manager for Overseas Investments: Mr. Sankalp Baid (since January 22, 2021) (Total experience: Over 13 years).
Face Value per Unit: ` 10 unless otherwise specified, + Industry Classification as recommended by AMFI, CD - Certificate of Deposit; CP - Commercial Papers. Data is as of February 28, 2021 unless otherwise specified.
Company Industry+ / Rating % to NAV
EqUITY & EqUITY RElATED
State Bank of India Banks 2.38
ICICI Bank Ltd. Banks 1.96
ITC Ltd. Consumer Non Durables 1.59
Larsen and Toubro Ltd. Construction Project 1.59
Infosys Ltd. Software 1.55
NTPC Ltd. Power 1.33
Power Finance Corporation Ltd. Finance 1.08
Axis Bank Ltd. Banks 0.97
Coal India Ltd. Minerals/Mining 0.94
IRB Infrastructure Developers Ltd. Construction 0.88
Lupin Ltd. Pharmaceuticals 0.84
ReC Ltd. Finance 0.83
Apar Industries Ltd. Industrial Capital Goods 0.63
Bharti Airtel Ltd. Telecom - Services 0.63
SBI Cards and Payment Services Ltd. Finance 0.62
Sun Pharmaceutical Industries Ltd. Pharmaceuticals 0.61
NHPC Ltd. Power 0.60
Cipla Ltd. Pharmaceuticals 0.58
Ambuja Cements Ltd. Cement 0.56
Mishra Dhatu Nigam Ltd. Ferrous Metals 0.50
Hindustan Petroleum Corporation Ltd. Petroleum Products 0.49
Aurobindo Pharma Ltd. Pharmaceuticals 0.46
CG Power and Industrial Solutions Ltd. Industrial Capital Goods 0.41
Bharat Petroleum Corporation Ltd. Petroleum Products 0.40
Chambal Fertilizers & Chemicals Ltd. Fertilisers 0.39
HCL Technologies Ltd. Software 0.37
Power Grid Corporation of India Ltd. Power 0.36
Vedanta Ltd. Non - Ferrous Metals 0.36
MeP Infrastructure Developers Ltd. Transportation 0.28
Texmaco Rail & engineering Ltd. Industrial Capital Goods 0.18
Union Bank of India Banks 0.18
elecon engineering Comapny Ltd. Industrial Capital Goods 0.04
Titagarh Wagons Ltd. Industrial Capital Goods 0.02
Tata Motors Ltd. DVR Auto @
Sub Total 24.61
DEBT & DEBT RElATED
gOVERNMENT SECURITIES (CENTRAl/STATE)
5.77 GOI 2030 Sovereign 1.97
6.68 GOI 2031 Sovereign 1.03
5.85 GOI 2030 Sovereign 0.60
6.19 GOI 2034 Sovereign 0.49
6.97 GOI 2026 Sovereign 0.43
7.17 GOI 2028 Sovereign 0.43
6.79 GOI 2029 Sovereign 0.42
6.67 GOI 2050 Sovereign 0.40
GOI 2023 Sovereign 0.33
Company Industry+ / Rating % to NAV
6.45 GOI 2029 Sovereign 0.20
8.10% Tamil Nadu SDL - Mat 110325 Sovereign 0.11
7.73 GOI 2034 Sovereign 0.02
8.15 GOI 2026 Sovereign 0.02
Sub Total 6.45
CREDIT EXPOSURE (NON PERPETUAl)
• Vedanta Ltd. CRISIL - AA- 5.60
• TATA Housing Development Co Ltd. CARe - AA 5.21
• Pipeline Infrastructure Pvt. Ltd. CRISIL - AAA 4.41
• Sikka Port and Terminal Ltd. (erstwhile Reliance Ports and Terminals Ltd.) CRISIL - AAA 4.34
• Tata Motors Ltd. CRISIL - AA- 4.11
• DLF Ltd. ICRA - A+ 4.04
• Shriram City Union Finance Ltd. CARe - AA / CRISIL - AA 3.11
• National Bank for Agriculture & Rural Development
CRISIL - AAA / ICRA - AAA 2.92
• Shriram Transport Finance Co. Ltd. CRISIL - AA+ 2.89
• Indian Railways Finance Corporation Ltd. CRISIL - AAA 2.88
Talwandi Sabo Power Ltd. (Corporate Guarantee of Vedanta Ltd.) CRISIL - AA-(Ce) 2.84
ReC Ltd. CRISIL - AAA 2.54
Power Finance Corporation Ltd. CRISIL - AAA 2.29
Housing and Urban Development Corporation Ltd. CARe - AAA 2.22
National Highways Authority of India CRISIL - AAA 2.18
Andhra Pradesh expressway Ltd. (NHAI Annuity) ICRA - AAA 1.54
L&T Infrastructure Finance Ltd. CRISIL - AAA 1.45
First Business Receivables Trust (PTC backed by receivables from Reliance Corporate IT Park Ltd.) CRISIL - AAA(SO) 1.27
embassy Office Parks ReIT CRISIL - AAA 1.01
Hazaribagh Ranchi expressway Ltd. (NHAI Annuity) CARe - D 0.85
Coastal Gujarat Power Ltd. (Corporate Guarantee of Tata Power) CARe - AA(Ce) 0.79
JM Financial Products Ltd. ICRA - AA 0.26
Power Grid Corporation of India Ltd. CRISIL - AAA 0.23
Sub Total 58.98
CREDIT EXPOSURE (PERPETUAl BONDS)
Punjab National Bank (AT1, BASeL III, Perpetual) CRISIL - AA- 2.11
The Tata Power Company Ltd. (Perpetual) CRISIL - AA 1.66
Sub Total 3.77
Total 69.20
Cash, Cash equivalents and Net Current Assets 6.19
Grand Total 100.00
• Top Ten Holdings, @ Less than 0.01%
(An open ended hybrid scheme investing predominantly in debt instruments)HDFC Hybrid Debt Fund
PORTFOLIO

February 2021 36
Face Value per Unit: ` 10 unless otherwise specified, + Industry Classification as recommended by AMFI, Data is as of February 28, 2021 unless otherwise specified.
This product is suitable for investors who are seeking ~
l to generate long-term income / capital appreciation
l investments primarily in debt securities, money market instruments and moderate exposure to equities
VeryHigh
Low to
Moderate
Low
Moderate ModeratelyHigh High
RISKOMETERInvestors understand that their principal will be at
high risk
~ Investors should consult their financial advisers, if in doubt about whether the product is suitable for them.
SIP PERFORMANCE ^ - Regular Plan - growth Option
Since Inception SIP
15 year SIP 10 year SIP 5 Year SIP 3 Year SIP 1 Year SIP
Total Amount Invested (` ‘000) 2,070.00 1,800.00 1,200.00 600.00 360.00 120.00
Mkt Value As on February 26, 2021 (` ‘000) 5,105.76 3,809.17 1,902.55 737.94 420.58 134.04
Returns (%) 9.67 9.38 8.93 8.24 10.43 22.85
Benchmark Returns (%) # 9.14 9.25 9.60 9.86 11.23 12.39
Additional Benchmark Returns (%) ## 6.79 6.99 7.34 6.85 7.64 1.06
Assuming ` 10,000 invested systematically on the first Business Day of every month over a period of time. CAGR returns are computed after accounting for the cash flow by using xIRR method (investment internal rate of return) for Regular Plan - Growth Option. The above investment simulation is for illustrative purposes only and should not be construed as a promise on minimum returns and safeguard of capital.
PERFORMANCE ^ - Regular Plan - growth Option
Date Period Scheme Returns
(%)
Benchmark Returns
(%)#
Additional Benchmark
Returns (%) ##
Value of ` 10,000 invested
Scheme (`) Benchmark (`)#
Additional Benchmark (`)##
Feb 28, 20 Last 1 Year 13.12 12.18 4.92 11,308 11,215 10,490
Feb 28, 18 Last 3 Years 7.49 10.30 8.94 12,417 13,417 12,927
Feb 29, 16 Last 5 Years 9.74 10.25 7.34 15,909 16,281 14,246
Dec 26, 03 Since Inception 10.26 8.53 5.78 53,533 40,812 26,284
Returns greater than 1 year period are compounded annualized (CAGR). Performance of dividend option under the schemes for the investors would be net of distribution tax, if any. Scheme performance may not strictly be comparable with that of its Additional Benchmark in view of hybrid nature of the scheme where a portion of scheme’s investments are made in equity instruments. For performance of other schemes managed by Prashant Jain (equities) and Shobhit Mehrotra (Debt), please refer page 66. Different plans viz. Regular Plan and Direct Plan have a different expense structure. The expenses of the Direct Plan under the Scheme will be lower to the extent of the distribution expenses / commission charged in the Regular Plan. For Performance of Direct Plan, refer page no. 79.
^Past performance may or may not be sustained in the future. Since Inception Date = Date of First allotment in the Scheme / Plan. Load is not taken into consideration for computation of performance.
Note: Effective close of business hours of May 25, 2018, HDFC MF Monthly Income Plan – Long Term Plan (MIP-LTP) underwent changes in Fundamental Attributes and was renamed as HDFC Hybrid Debt Fund (HHDF) and HDFC MF Monthly Income Plan – Short Term Plan was merged therein. As the portfolio structuring of HHDF closely resembles the erstwhile MIP-LTP, the past performance of MIP-LTP is provided, in line with SeBI circular on Performance disclosure post consolidation/ merger of scheme dated April 12, 2018.
Portfolio Classification By Asset Class (%)
n equity 24.61
n G-Sec, SDL 6.45
n Credit exposure 62.75
n Cash, Cash equivalents and Net Current Assets 6.19
Portfolio Classification By Rating Class (%)
n equity 24.61n Sovereign 6.45n AAA/AAA(SO)/A1+/A1+(SO)
& equivalent 29.28n AA+ 2.89n AA/AA- 25.69n A+ & Below 4.89n Cash, Cash equivalents and
Net Current Assets 6.19
(An open ended hybrid scheme investing predominantly in debt instruments) .....Contd from previous pageHDFC Hybrid Debt Fund

37 February 2021
CATEgORY OF SCHEME: ARBITRAGE FUND
KEY FACTS
INVESTMENT OBjECTIVE
To generate income through arbitrage opportunities and debt & money market instruments.
There is no assurance that the investment objective of the Scheme will be realized.
FUND MANAgER ¥
Krishan Kumar Daga (since September 10, 2015)
Total experience: Over 22 years
Arun Agarwal (since August 24, 2020)
Total experience: Over 22 years
INCEPTION DATE (Date of Allotment)
October 23, 2007
NAV (AS ON FEBRUARY 26, 2021) NAV PER UNIT (`)
Retail PlanRegular Plan - Growth Option 23.329Regular Plan - Dividend Option 17.327Regular Plan - Quarterly Dividend Option 16.574Direct Plan - Growth Option 24.355Direct Plan - Quarterly Dividend Option 18.457
Wholesale PlanRegular Plan - Growth Option 23.887Regular Plan - Dividend Option 10.469Regular Plan - Monthly Dividend Option 10.947Direct Plan - Growth Option 15.365Direct Plan - Dividend Option 10.798Direct Plan - Monthly Dividend Option 10.544
ASSETS UNDER MANAgEMENT (`) IN CRORE
As on February 28, 2021 5,784.64Average for Month of February 2021 5,625.31
qUANTITATIVE DATA
Portfolio Turnover Ratio 237.42%Average Maturity * 103 daysMacaulay Duration * 103 daysModified Duration * 102 daysYield to Maturity * 3.93%* Computed on the invested amount for debt portfolio.
TOTAL ExPENSE RATIO (As on February 28, 2021)Including Additional expenses and Goods and Service Tax on Management Fees
Regular: 0.96% Direct: 0.41%
#BENCHMARK INDEX: NIFTY 50 Arbitrage Index
##ADDl. BENCHMARK INDEX: CRISIL 1 year T-Bill Index
EXIT lOAD
l In respect of each purchase / switch-in of Units, an exit Load of 0.25% is payable if Units are redeemed / switched-out within 1 month from the date of allotment.
l No exit Load is payable if Units are redeemed / switched-out after 1 month from the date of allotment.
For further details, please refer to para ‘Exit Load’ on Pg 66.
PLANS & OPTIONS
(Wholesale Plan) - Regular Plan, (Wholesale Plan) - Direct Plan.Under Each Plan : Growth & Dividend. Dividend Option offers Monthly Dividend Option and Normal Dividend Option with Payout and Reinvestment facility.
MINIMUM APPlICATION AMOUNT
Purchase/Additional Purchase: ̀ 1 lakh and any amount thereafter.
¥ Dedicated Fund Manager for Overseas Investments: Mr. Sankalp Baid (since January 22, 2021) (Total experience: Over 13 years).
Company Industry+ / Rating % to NAV
EqUITY & EqUITY RElATED (quantity fully hedged using Futures/Options)
EqUITY
• ICICI Bank Ltd. Banks 7.91
• Reliance Industries Ltd. Petroleum Products 5.12
• Housing Development Finance Corporation Ltd.£ Finance 3.21
• Sun Pharmaceutical Industries Ltd. Pharmaceuticals 3.16
• Adani Ports & Special economic Zone Transportation 2.99
• Tata Steel Ltd. Ferrous Metals 2.89
• Maruti Suzuki India Ltd. Auto 2.70
• Axis Bank Ltd. Banks 1.99
• Tata Consultancy Services Ltd. Software 1.89
Vedanta Ltd. Non - Ferrous Metals 1.78
Indusind Bank Ltd. Banks 1.73
Asian Paints Ltd. Consumer Non Durables 1.66
Hindustan Unilever Ltd. Consumer Non Durables 1.63
Bharti Airtel Ltd. Telecom - Services 1.61
HCL Technologies Ltd. Software 1.57
Grasim Industries Ltd. Cement 1.48
Larsen and Toubro Ltd. Construction Project 1.47
ITC Ltd. Consumer Non Durables 1.40
Tech Mahindra Ltd. Software 1.34
Lupin Ltd. Pharmaceuticals 1.18
Piramal enterprises Ltd. Finance 1.18
The Tata Power Company Ltd. Power 1.18
State Bank of India Banks 0.99
JSW Steel Ltd. Ferrous Metals 0.93
Tata Motors Ltd. Auto 0.88
Divis Laboratories Ltd. Pharmaceuticals 0.87
Indiabulls Housing Finance Ltd. Finance 0.80
Bharat Petroleum Corporation Ltd. Petroleum Products 0.75
Indian Oil Corporation Ltd. Petroleum Products 0.75
Cipla Ltd. Pharmaceuticals 0.70
Bajaj Finserv Ltd. Finance 0.64
Titan Company Ltd. Consumer Durables 0.56
Steel Authority Of India Ltd. Ferrous Metals 0.55
United Spirits Ltd. Consumer Non Durables 0.55
Shriram Transport Finance Co. Ltd. Finance 0.52
Canara Bank Banks 0.50
Tata Chemicals Ltd. Chemicals 0.39
Ambuja Cements Ltd. Cement 0.38
VODAFONE IDEA Ltd. Telecom - Services 0.37
Bajaj Auto Ltd. Auto 0.34
DLF Ltd. Construction 0.33
UPL Ltd. Pesticides 0.26
Jindal Steel & Power Ltd. Ferrous Metals 0.24
Dabur India Ltd. Consumer Non Durables 0.23
Bata India Ltd. Consumer Durables 0.22
Pidilite Industries Ltd. Chemicals 0.21
Mahindra & Mahindra Ltd. Auto 0.20
Tata Consumer Products Ltd. Consumer Non Durables 0.20
Aurobindo Pharma Ltd. Pharmaceuticals 0.19
eSCORTS Ltd. Auto 0.19
Infosys Ltd. Software 0.18
eicher Motors Ltd. Auto 0.16
Company Industry+ / Rating % to NAV
Petronet LNG Ltd. Gas 0.14
Hindustan Petroleum Corporation Ltd. Petroleum Products 0.10
Motherson Sumi Systems Ltd. Auto Ancillaries 0.10
ICICI Prudential Life Insurance Company Ltd. Finance 0.09
The Federal Bank Ltd. Banks 0.09
Zee entertainment enterprises Ltd. Media & entertainment 0.09
Dr Reddys Laboratories Ltd. Pharmaceuticals 0.08
NTPC Ltd. Power 0.08
UltraTech Cement Ltd. Cement 0.07
Bharat Forge Ltd. Industrial Products 0.05
Godrej Consumer Products Ltd. Consumer Non Durables 0.05
The Ramco Cements Ltd. Cement 0.05
Torrent Pharmaceuticals Ltd. Pharmaceuticals 0.05
Bharat electronics Ltd. Industrial Capital Goods 0.04
Indian Railway Catering And Tourism Corporation Ltd. Services 0.04
ACC Ltd. Cement 0.03
Britannia Industries Ltd. Consumer Non Durables 0.03
Glenmark Pharmaceuticals Ltd. Pharmaceuticals 0.03
Indraprastha Gas Ltd. Gas 0.02
Ashok Leyland Ltd. Auto 0.01
Bosch Ltd. Auto Ancillaries 0.01
SBI Life Insurance Company Ltd. Finance 0.01
TVS Motor Company Ltd. Auto 0.01
INFO EDGE (INDIA) Ltd. Software @
Manappuram Finance Ltd. Finance @
Mindtree Consulting Ltd. Software @
Sub Total 66.42
DEBT & DEBT RElATED
T-BIllS
• 364 Days Tbill Mat 250321 Sovereign 2.16
364 Days Tbill - Mat 070521 Sovereign 1.72
364 Days Tbill Mat 230921 Sovereign 1.70
364 Days Tbill Mat 100621 Sovereign 1.20
364 Days Tbill Mat 130521 Sovereign 0.86
364 Days Tbill Mat 150421 Sovereign 0.86
364 Days Tbill Mat 180321 Sovereign 0.86
364 Days Tbill Mat 220421 Sovereign 0.86
364 Days TBill - Mat 090921 Sovereign 0.85
364 Days Tbill Mat 220721 Sovereign 0.85
364 Days Tbill Mat 120821 Sovereign 0.51
364 Days Tbill Mat 290721 Sovereign 0.51
182 days Tbill Mat 180321 Sovereign 0.43
Sub Total 13.37
CREDIT EXPOSURE (NON PERPETUAl)
Housing Development Finance Corporation Ltd.£ CRISIL - AAA 1.76
Sub Total 1.76
Total 15.13
Cash, Cash equivalents and Net Current Assets 18.45
Grand Total 100.00
• Top Ten Holdings, £ Co-sponsor, @ Less than 0.01%
Outstanding exposure in derivative instruments (` in Crore) 3,859.30
Hedged position in Equity & Equity related instruments
Outstanding derivative exposure (% age) 66.72
Face Value per Unit: ` 10 unless otherwise specified, + Industry Classification as recommended by AMFI, Data is as of February 28, 2021 unless otherwise specified. ....Contd on next page
(An open ended scheme investing in arbitrage opportunities)HDFC Arbitrage FundPORTFOLIO

February 2021 38
This product is suitable for investors who are seeking ~
l income over short term.
l income through arbitrage opportunities between cash and derivative market and arbitrage opportunities within the derivative segment.
VeryHigh
Low to
Moderate
Low
Moderate ModeratelyHigh High
RISKOMETERInvestors understand that their principal will be at
low risk~ Investors should consult their financial advisers, if in doubt about whether the product is suitable for them.
Face Value per Unit: ̀ 10 unless otherwise specified, + Industry Classification as recommended by AMFI, CD - Certificate of Deposit; CP - Commercial Papers, Data is as of February 28, 2021 unless otherwise specified.
PERFORMANCE ^ - Wholesale Plan - Regular Plan - growth Option
Date Period Scheme Returns
(%)
Benchmark Returns
(%)#
Additional Benchmark
Returns (%) ##
Value of ` 10,000 invested
Scheme (`) Benchmark (`)#
Additional Benchmark
(`)##
Feb 28, 20 Last 1 Year 2.83 1.86 5.46 10,282 10,185 10,544Feb 28, 18 Last 3 Years 4.96 4.54 6.65 11,560 11,423 12,127Feb 29, 16 Last 5 Years 5.39 4.84 6.56 13,001 12,662 13,739Oct 23, 07 Since Inception 6.74 N.A. 6.45 23,887 N.A. 23,034
Returns greater than 1 year period are compounded annualized (CAGR). Performance of dividend option under the schemes for the investors would be net of distribution tax, if any. N.A. Not Available. Scheme performance is not strictly comparable with that of its Additional Benchmark since the scheme does not take directional call in equity markets but is limited to availing arbitrage opportunities, etc. For performance of other schemes managed by Krishan Kumar Daga and Arun Agarwal, please refer page 66. Different plans viz. Regular Plan and Direct Plan have a different expense structure. The expenses of the Direct Plan under the Scheme will be lower to the extent of the distribution expenses / commission charged in the Regular Plan. For Performance of Direct Plan, refer page no. 79.
^Past performance may or may not be sustained in the future. Since Inception Date = Date of First allotment in the Scheme / Plan. Load is not taken into consideration for computation of performance.
Portfolio Classification By Rating Class (%)
n equity 66.42
n Sovereign 13.37
n AAA/AAA(SO)/A1+/A1+(SO) & equivalent 1.76
n Cash, Cash equivalents and Net Current Assets 18.45
Portfolio Classification By Asset Class (%)
n equity 66.42
n T-Bills 13.37
n Credit exposure 1.76
n Cash, Cash equivalents and Net Current Assets 18.45
(An open ended scheme investing in arbitrage opportunities) .....Contd from previous pageHDFC Arbitrage Fund
Industry Allocation of Equity Holding (% of Net Assets)
0.04
0.04
0.05
0.09
0.11
0.16
0.26
0.33
0.60
0.78
1.26
1.47
1.78
1.98
2.01
2.99
4.49
4.61
4.98
5.75
6.26
6.45
6.72
13.21
0 2 4 6 8 10 12 14
Industrial Capital Goods
Services
Industrial Products
Media & Entertainment
Auto Ancillaries
Gas
Pesticides
Construction
Chemicals
Consumer Durables
Power
Construction Project
Non - Ferrous Metals
Telecom - Services
Cement
Transportation
Auto
Ferrous Metals
Software
Consumer Non Durables
Pharmaceuticals
Finance
Petroleum Products
Banks
SIP PERFORMANCE ^ - Regular Plan - growth Option
Since Inception SIP
10 year SIP
5 year SIP
3 year SIP
1 year SIP
Total Amount Invested (` ‘000) 1,610.00 1,200.00 600.00 360.00 120.00 Mkt Value As on February 26, 2021 (` ‘000) 2,504.80 1,627.61 678.51 384.68 121.96 Returns (%) 6.33 5.95 4.88 4.38 3.11 Benchmark Returns (%) # N.A. 5.59 4.36 3.95 2.69 Additional Benchmark Returns (%) ## 6.69 6.83 6.35 6.12 4.07
Assuming ` 10,000 invested systematically on the first Business Day of every month over a period of time. CAGR returns are computed after accounting for the cash flow by using xIRR method (investment internal rate of return) for Regular Plan - Growth Option. The above investment simulation is for illustrative purposes only and should not be construed as a promise on minimum returns and safeguard of capital.

39 February 2021
CATEgORY OF SCHEME: CORPORATE BOND FUND
KEY FACTSINVESTMENT OBjECTIVE
To generate income/capital appreciation through investments predominantly in AA+ and above rated corporate bonds.
There is no assurance that the investment objective of the Scheme will be realized.
FUND MANAgER ¥
Anupam Joshi (since October 27, 2015)
Total experience: Over 12 years
INCEPTION DATE (Date of Allotment)
June 29, 2010
NAV (AS ON FEBRUARY 26, 2021) NAV PER UNIT (`)
Regular Plan - Growth Option 24.6973Regular Plan - Dividend Option 16.7978Regular Plan - Quarterly Dividend Option 10.4918Direct Plan - Growth Option 24.9438Direct Plan - Dividend Option 17.1198Direct Plan - Quarterly Dividend Option 10.4178
ASSETS UNDER MANAgEMENT (`) IN CRORE
As on February 28, 2021 29,250.68Average for Month of February 2021 29,612.79
qUANTITATIVE DATA
Average Maturity * 4.26 yearsMacaulay Duration * 2.88 yearsModified Duration * 2.72 yearsYield to Maturity * 5.61%* Computed on the invested amount.
TOTAL ExPENSE RATIO (As on February 28, 2021)Including Additional expenses and Goods and Service Tax on Management Fees
Regular: 0.60% Direct: 0.30%
#BENCHMARK INDEX: NIFTY Corporate Bond Index
##ADDl. BENCHMARK INDEX: CRISIL 10 year Gilt Index
EXIT lOAD
Nil
PLANS & OPTIONS
Regular Plan, Direct Plan. Under both the Plans: Growth, Quarterly Dividend & Normal Dividend. Both Dividend options offer Payout and Reinvestment facilities.
MINIMUM APPlICATION AMOUNT
Purchase : ` 5,000 and any amount thereafter. Additional Purchase : ` 1,000 and any amount thereafter.
¥ Dedicated Fund Manager for Overseas Investments: Mr. Sankalp Baid (since January 22, 2021) (Total experience: Over 13 years).
Face Value per Unit: ` 10 unless otherwise specified, CD - Certificate of Deposit; CP - Commercial Papers, Data is as of February 28, 2021 unless otherwise specified.
This product is suitable for investors who are seeking ~
l income over short to medium term
l to generate income/capital appreciation through investments predominantly in AA+ and above rated corporate bonds
VeryHigh
Low to
Moderate
Low
Moderate ModeratelyHigh High
RISKOMETERInvestors understand that their principal will be at
moderate risk~ Investors should consult their financial advisers, if in doubt about whether the product is suitable for them.
Issuer Rating % to NAV
DEBT & DEBT RElATED
gOVERNMENT SECURITIES (CENTRAl/STATE)
• 6.97 GOI 2026 Sovereign 4.45
• 6.79 GOI 2027 Sovereign 3.69
• GOI 2033 Sovereign 3.26
8.24 GOI 2027 Sovereign 2.43
Central Government of India Loans 1.68
8.15 GOI 2026 Sovereign 0.86
7.03% Madhya Pradesh SDL - Mat 170231 Sovereign 0.74
8.33 GOI 2026 Sovereign 0.56
7.20% Uttar Pradesh SDL - ISD 240221 Mat 240231 Sovereign 0.31
6.49% Gujarat SDL ISD 021220 Mat 021229 Sovereign 0.23
8.21% Haryana SDL (UDAY) - Mat 310323 Sovereign 0.11
6.13 GOI 2028 Sovereign 0.05
Sub Total 18.37
CREDIT EXPOSURE (NON PERPETUAl)
• Housing Development Finance Corporation Ltd.£ CRISIL - AAA 8.92
• Power Finance Corporation Ltd. CARe - AAA / CRISIL - AAA / ICRA - AAA 8.18
• REC Ltd. CARe - AAA / CRISIL - AAA / IND - AAA 7.66
• LIC Housing Finance Ltd. CARe - AAA / CRISIL - AAA 7.58
• National Bank for Agriculture & Rural Development
CRISIL - AAA / ICRA - AAA 7.18
• State Bank of India CRISIL - AAA 5.78
• Reliance Industries Ltd. CRISIL - AAA / ICRA - AAA 5.13
National Highways Authority of India CARe - AAA / CRISIL - AAA 2.89
Mangalore Refinery and Petrochemicals Ltd.
CARe - AAA / CRISIL - AAA 2.88
UltraTech Cement Ltd. CRISIL - AAA 2.51
Indian Railways Finance Corporation Ltd. CRISIL - AAA 1.98
ONGC Petro additions Ltd. (OPAL) (Put on ONGC Ltd.) CARe - AAA(Ce) 1.47
Bajaj Finance Ltd. CRISIL - AAA 1.33
Chennai Petroleum Corp Ltd. CRISIL - AAA 1.33
Sundaram Finance Ltd. CRISIL - AAA / ICRA - AAA 1.16
Bank of Baroda CARe - AAA 1.09
Issuer Rating % to NAV
TATA Capital Housing Finance Ltd. CRISIL - AAA 1.03
Power Grid Corporation of India Ltd. CRISIL - AAA 0.92
Housing and Urban Development Corporation Ltd. CARe - AAA / IND - AAA 0.87
Pipeline Infrastructure Pvt. Ltd. CRISIL - AAA 0.83
Jamnagar Utilities & Power Pvt. Ltd. (erstwhile Reliance Utilities & Power Pvt. Ltd.) CRISIL - AAA 0.75
Food Corporation of India (Corporate guarantee from Govt of India)
CARe - AAA(Ce) / CRISIL - AAA(Ce) 0.74
export - Import Bank of India CRISIL - AAA 0.63
Britannia Industries Ltd. CRISIL - AAA 0.52
Indian Oil Corporation Ltd. CRISIL - AAA 0.52
Sikka Port and Terminal Ltd. (erstwhile Reliance Ports and Terminals Ltd.) CARe - AAA 0.52
Small Industries Development Bank CARe - AAA 0.44
NTPC Ltd. CRISIL - AAA 0.41
HDB Financial Services Ltd. CRISIL - AAA 0.38
Bajaj Housing Finance Ltd. CRISIL - AAA 0.37
Larsen and Toubro Ltd. CRISIL - AAA 0.34
National Housing Bank CRISIL - AAA 0.26
L&T Finance Ltd. CARe - AAA 0.20
NHPC Ltd. CARe - AAA 0.18
First Business Receivables Trust (PTC backed by receivables from Reliance Corporate IT Park Ltd.) CRISIL - AAA(SO) 0.12
Andhra Pradesh expressway Ltd. (NHAI Annuity) ICRA - AAA 0.11
Gujarat Road and Infra Co Ltd. CARe - AAA 0.09
Nuclear Power Corporation CRISIL - AAA 0.09
Tata Sons Ltd. CRISIL - AAA 0.07
ICICI Bank Ltd. CARe - AAA 0.04
Mahanagar Telephone Nigam Ltd. (Corporate guarantee from Govt of India) CRISIL - AAA(Ce) 0.04
Sub Total 77.54
Total 95.91
Cash, Cash equivalents and Net Current Assets 4.09
Grand Total 100.00
• Top Ten Holdings, £ Co-sponsor
Outstanding exposure in derivative instruments Interest Rate Swap (` in Crore) 3,900.00
Note: Effective close of business hours of May 8, 2018, HDFC Medium Term Opportunities Fund (HMTOF) underwent changes in Fundamental Attributes and was renamed as HDFC Corporate Bond Fund (HCBF) and HDFC Floating Rate Income Fund – Long Term Plan and HDFC Gilt Fund – Short Term Plan were merged therein. As the portfolio structuring of HCBF closely resembles the erstwhile HMTOF, the past performance of HMTOF is provided, in line with SEBI circular on Performance disclosure post consolidation/ merger of scheme dated April 12, 2018.
Portfolio Classification By Asset Class (%)
n G-Sec, SDL 18.37
n Credit exposure 77.54
n Cash, Cash equivalents and Net Current Assets 4.09
Portfolio Classification By Rating Class (%)
n Sovereign 18.37n AAA/AAA(SO)/A1+/A1+(SO)
& equivalent 77.54n Cash, Cash equivalents and
Net Current Assets 4.09
(An open ended debt scheme predominantly investing in AA+ and above rated corporate bonds)HDFC Corporate Bond Fund
PORTFOLIO
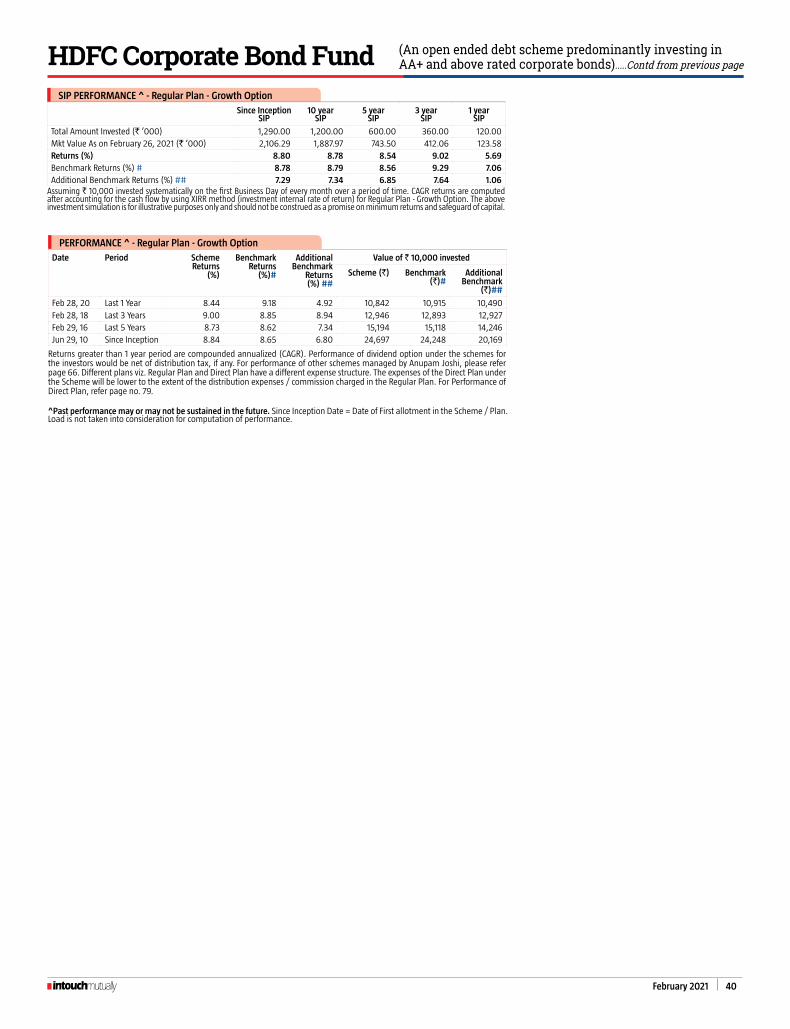
February 2021 40
PERFORMANCE ^ - Regular Plan - growth Option
Date Period Scheme Returns
(%)
Benchmark Returns
(%)#
Additional Benchmark
Returns (%) ##
Value of ` 10,000 invested
Scheme (`) Benchmark (`)#
Additional Benchmark
(`)##
Feb 28, 20 Last 1 Year 8.44 9.18 4.92 10,842 10,915 10,490Feb 28, 18 Last 3 Years 9.00 8.85 8.94 12,946 12,893 12,927Feb 29, 16 Last 5 Years 8.73 8.62 7.34 15,194 15,118 14,246Jun 29, 10 Since Inception 8.84 8.65 6.80 24,697 24,248 20,169
Returns greater than 1 year period are compounded annualized (CAGR). Performance of dividend option under the schemes for the investors would be net of distribution tax, if any. For performance of other schemes managed by Anupam Joshi, please refer page 66. Different plans viz. Regular Plan and Direct Plan have a different expense structure. The expenses of the Direct Plan under the Scheme will be lower to the extent of the distribution expenses / commission charged in the Regular Plan. For Performance of Direct Plan, refer page no. 79.
^Past performance may or may not be sustained in the future. Since Inception Date = Date of First allotment in the Scheme / Plan. Load is not taken into consideration for computation of performance.
(An open ended debt scheme predominantly investing in AA+ and above rated corporate bonds).....Contd from previous pageHDFC Corporate Bond Fund
SIP PERFORMANCE ^ - Regular Plan - growth Option
Since Inception SIP
10 year SIP
5 year SIP
3 year SIP
1 year SIP
Total Amount Invested (` ‘000) 1,290.00 1,200.00 600.00 360.00 120.00 Mkt Value As on February 26, 2021 (` ‘000) 2,106.29 1,887.97 743.50 412.06 123.58 Returns (%) 8.80 8.78 8.54 9.02 5.69 Benchmark Returns (%) # 8.78 8.79 8.56 9.29 7.06 Additional Benchmark Returns (%) ## 7.29 7.34 6.85 7.64 1.06
Assuming ` 10,000 invested systematically on the first Business Day of every month over a period of time. CAGR returns are computed after accounting for the cash flow by using xIRR method (investment internal rate of return) for Regular Plan - Growth Option. The above investment simulation is for illustrative purposes only and should not be construed as a promise on minimum returns and safeguard of capital.
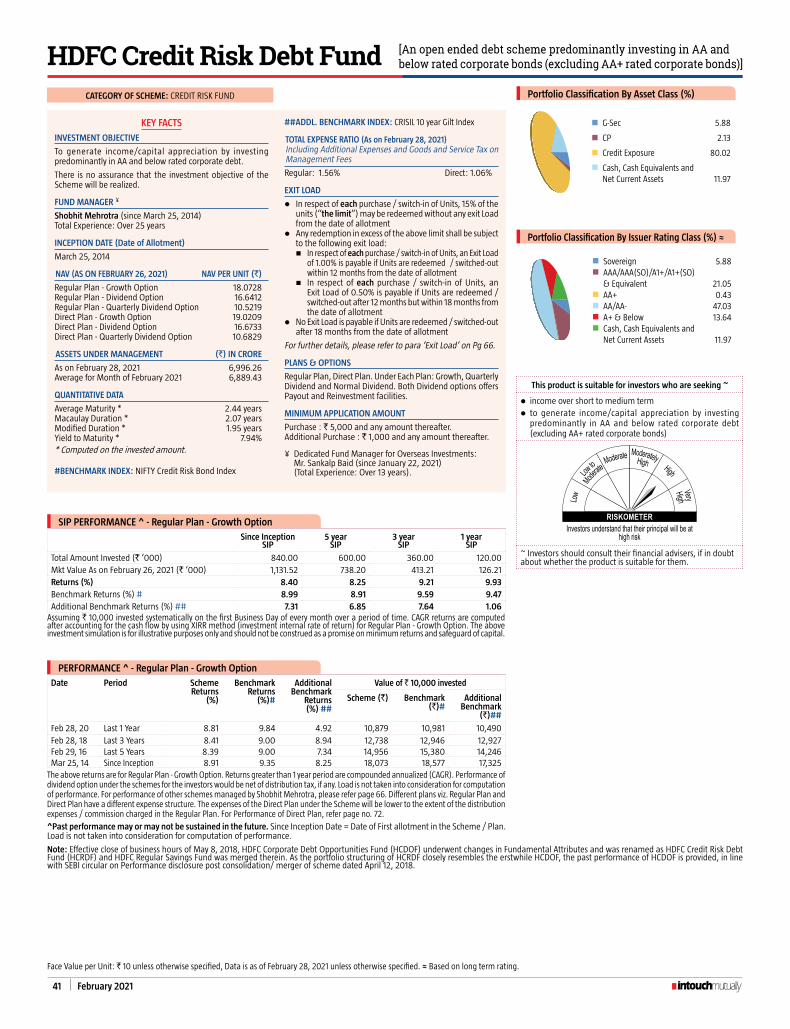
41 February 2021
CATEgORY OF SCHEME: CREDIT RISK FUND
KEY FACTS
INVESTMENT OBjECTIVE
To generate income/capital appreciation by investing predominantly in AA and below rated corporate debt.
There is no assurance that the investment objective of the Scheme will be realized.
FUND MANAgER ¥
Shobhit Mehrotra (since March 25, 2014)
Total experience: Over 25 years
INCEPTION DATE (Date of Allotment)
March 25, 2014
NAV (AS ON FEBRUARY 26, 2021) NAV PER UNIT (`)
Regular Plan - Growth Option 18.0728Regular Plan - Dividend Option 16.6412Regular Plan - Quarterly Dividend Option 10.5219Direct Plan - Growth Option 19.0209Direct Plan - Dividend Option 16.6733Direct Plan - Quarterly Dividend Option 10.6829
ASSETS UNDER MANAgEMENT (`) IN CRORE
As on February 28, 2021 6,996.26Average for Month of February 2021 6,889.43
qUANTITATIVE DATA
Average Maturity * 2.44 yearsMacaulay Duration * 2.07 yearsModified Duration * 1.95 yearsYield to Maturity * 7.94%* Computed on the invested amount.
#BENCHMARK INDEX: NIFTY Credit Risk Bond Index
##ADDl. BENCHMARK INDEX: CRISIL 10 year Gilt Index
TOTAL ExPENSE RATIO (As on February 28, 2021)Including Additional expenses and Goods and Service Tax on Management Fees
Regular: 1.56% Direct: 1.06%
EXIT lOAD
l In respect of each purchase / switch-in of Units, 15% of the units (“the limit”) may be redeemed without any exit Load from the date of allotment
l Any redemption in excess of the above limit shall be subject to the following exit load:
n In respect of each purchase / switch-in of Units, an exit Load of 1.00% is payable if Units are redeemed / switched-out within 12 months from the date of allotment
n In respect of each purchase / switch-in of Units, an exit Load of 0.50% is payable if Units are redeemed / switched-out after 12 months but within 18 months from the date of allotment
l No exit Load is payable if Units are redeemed / switched-out after 18 months from the date of allotment
For further details, please refer to para ‘Exit Load’ on Pg 66.
PLANS & OPTIONS
Regular Plan, Direct Plan. Under each Plan: Growth, Quarterly Dividend and Normal Dividend. Both Dividend options offers Payout and Reinvestment facilities.
MINIMUM APPlICATION AMOUNT
Purchase : ` 5,000 and any amount thereafter. Additional Purchase : ` 1,000 and any amount thereafter.
¥ Dedicated Fund Manager for Overseas Investments: Mr. Sankalp Baid (since January 22, 2021) (Total experience: Over 13 years).
PERFORMANCE ^ - Regular Plan - growth Option
Date Period Scheme Returns
(%)
Benchmark Returns
(%)#
Additional Benchmark
Returns (%) ##
Value of ` 10,000 invested
Scheme (`) Benchmark (`)#
Additional Benchmark
(`)##
Feb 28, 20 Last 1 Year 8.81 9.84 4.92 10,879 10,981 10,490Feb 28, 18 Last 3 Years 8.41 9.00 8.94 12,738 12,946 12,927Feb 29, 16 Last 5 Years 8.39 9.00 7.34 14,956 15,380 14,246Mar 25, 14 Since Inception 8.91 9.35 8.25 18,073 18,577 17,325
The above returns are for Regular Plan - Growth Option. Returns greater than 1 year period are compounded annualized (CAGR). Performance of dividend option under the schemes for the investors would be net of distribution tax, if any. Load is not taken into consideration for computation of performance. For performance of other schemes managed by Shobhit Mehrotra, please refer page 66. Different plans viz. Regular Plan and Direct Plan have a different expense structure. The expenses of the Direct Plan under the Scheme will be lower to the extent of the distribution expenses / commission charged in the Regular Plan. For Performance of Direct Plan, refer page no. 72.
This product is suitable for investors who are seeking ~
l income over short to medium terml to generate income/capital appreciation by investing
predominantly in AA and below rated corporate debt (excluding AA+ rated corporate bonds)
VeryHigh
Low to
Moderate
Low
Moderate ModeratelyHigh High
RISKOMETERInvestors understand that their principal will be at
high risk
~ Investors should consult their financial advisers, if in doubt about whether the product is suitable for them.
Note: Effective close of business hours of May 8, 2018, HDFC Corporate Debt Opportunities Fund (HCDOF) underwent changes in Fundamental Attributes and was renamed as HDFC Credit Risk Debt Fund (HCRDF) and HDFC Regular Savings Fund was merged therein. As the portfolio structuring of HCRDF closely resembles the erstwhile HCDOF, the past performance of HCDOF is provided, in line with SeBI circular on Performance disclosure post consolidation/ merger of scheme dated April 12, 2018.
Portfolio Classification By Asset Class (%)
n G-Sec 5.88
n CP 2.13
n Credit exposure 80.02
n Cash, Cash equivalents and Net Current Assets 11.97
Portfolio Classification By Issuer Rating Class (%) ≈
n Sovereign 5.88n AAA/AAA(SO)/A1+/A1+(SO)
& equivalent 21.05n AA+ 0.43n AA/AA- 47.03n A+ & Below 13.64n Cash, Cash equivalents and
Net Current Assets 11.97
[An open ended debt scheme predominantly investing in AA andbelow rated corporate bonds (excluding AA+ rated corporate bonds)]HDFC Credit Risk Debt Fund
Face Value per Unit: ` 10 unless otherwise specified, Data is as of February 28, 2021 unless otherwise specified. ≈ Based on long term rating.
SIP PERFORMANCE ^ - Regular Plan - growth Option
Since Inception SIP
5 year SIP
3 year SIP
1 year SIP
Total Amount Invested (` ‘000) 840.00 600.00 360.00 120.00 Mkt Value As on February 26, 2021 (` ‘000) 1,131.52 738.20 413.21 126.21 Returns (%) 8.40 8.25 9.21 9.93 Benchmark Returns (%) # 8.99 8.91 9.59 9.47 Additional Benchmark Returns (%) ## 7.31 6.85 7.64 1.06
Assuming ` 10,000 invested systematically on the first Business Day of every month over a period of time. CAGR returns are computed after accounting for the cash flow by using xIRR method (investment internal rate of return) for Regular Plan - Growth Option. The above investment simulation is for illustrative purposes only and should not be construed as a promise on minimum returns and safeguard of capital.
^Past performance may or may not be sustained in the future. Since Inception Date = Date of First allotment in the Scheme / Plan. Load is not taken into consideration for computation of performance.

February 2021 42
Company Industry+ / Security Rating
Issuer Rating % to NAV
DEBT & DEBT RElATED
gOVERNMENT SECURITIES (CENTRAl/STATE)
7.17 GOI 2028 Sovereign Sovereign 2.01
6.79 GOI 2027 Sovereign Sovereign 1.10
7.27 GOI 2026 Sovereign Sovereign 0.90
7.32 GOI 2024 Sovereign Sovereign 0.76
7.59 GOI 2026 Sovereign Sovereign 0.38
7.72 GOI 2025 Sovereign Sovereign 0.38
5.15 GOI 2025 Sovereign Sovereign 0.35
Sub Total 5.88
CREDIT EXPOSURE (NON PERPETUAl)
• Vedanta Ltd. CRISIL - AA- CRISIL - AA- 7.55
• DLF Ltd. ICRA - A+ CRISIL - A+ 5.68
• Tata Motors Ltd. CRISIL - AA- CRISIL - AA- 5.59
• IndInfravit Trust CRISIL - AAA CRISIL - AAA 5.06
• Shriram City Union Finance Ltd. CRISIL - AA CRISIL - AA 4.96
• Power Finance Corporation Ltd. CRISIL - AAA CRISIL - AAA 4.74
• Pipeline Infrastructure Pvt. Ltd. CRISIL - AAA CRISIL - AAA 4.15
• REC Ltd. CRISIL - AAA CRISIL - AAA 3.37
• Dilip Buildcon Ltd. CRISIL - A CRISIL - A 3.20
Sadbhav Infrastructure Project Ltd. (Corporate Guarantee of Sadbhav engineering Ltd.) CARE - BBB+(CE) CARE - BBB+(CE) 2.51
JM Financial Asset Reconstruction Co. ICRA - AA- CRISIL - AA- 2.32
Indiabulls Housing Finance Ltd. CARe - AA / CRISIL - AA CRISIL - AA 2.15
INOx Wind Infrastructure Services Ltd. CRISIL - AA(Ce) CRISIL - AA(Ce) 1.64
INOx Wind Ltd. CRISIL - AA(Ce) CRISIL - AA(Ce) 1.41
TVS Credit Services Ltd. CRISIL - AA- ICRA - A+ 1.06
Green Infra Wind energy Ltd. CRISIL - AA CRISIL - AA- 1.04
GeRA Development Pvt. Ltd. CARe - AA- CARe - AA- 0.96
NTPC Ltd. CRISIL - AAA CRISIL - AAA 0.93
Starlite Lighting Ltd. (Corporate Guarantee of Bajaj electrical Ltd.) ICRA - A(Ce) ICRA - A(Ce) 0.88
Aarish Solar Power Pvt. Ltd. (Greenko) CARe - AA(Ce) CARe - AA(Ce) 0.82
Aashman energy Pvt. Ltd. (Greenko) CARe - AA(Ce) CARe - AA(Ce) 0.82
Divyesh Power Pvt. Ltd. (Greenko) CARe - AA(Ce) CARe - AA(Ce) 0.82
elena Renewable energy Pvt. Ltd. (Greenko) CARe - AA(Ce) CARe - AA(Ce) 0.82
Pratyash Renewable Pvt. Ltd. (Greenko) CARe - AA(Ce) CARe - AA(Ce) 0.82
SeI Baskara Power Pvt. Ltd. (Greenko) CARe - AA(Ce) BRICKWORKS - AA-(SO) 0.82
SeI enerstar Renewable energy Pvt. Ltd. (Greenko) CARe - AA(Ce) CARe - AA(Ce) 0.82
Company Industry+ / Security Rating
Issuer Rating % to NAV
SeI Mihir energy Pvt. Ltd. (Greenko) CARe - AA(Ce) CARe - AA(Ce) 0.82
Shreyas Renewable energy Pvt. Ltd. (Greenko) CARe - AA(Ce) CARe - AA(Ce) 0.82
Zuvan energy Pvt. Ltd. (Greenko) CARe - AA(Ce) CARe - AA(Ce) 0.82
Sansar Trust Nov 2018 (PTC of pools from Shriram Transport Finance Co. Ltd.) ICRA - AAA(SO) ICRA - AAA(SO) 0.80
The Tata Power Company Ltd. CRISIL - AA ICRA - AA- 0.73
Indian Oil Corporation Ltd. CRISIL - AAA CRISIL - AAA 0.70
Gateway Distriparks Ltd. IND - AA- IND - AA- 0.60
MFL Securitisation Trust LxxxI (PTC of pools from Magma Fincorp Ltd.) CRISIL - AAA(SO) CRISIL - AAA(SO) 0.53
Shriram Transport Finance Co. Ltd. IND - AA+ CRISIL - AA+ 0.43
Indian Railways Finance Corporation Ltd. CRISIL - AAA CRISIL - AAA 0.39
L&T Infrastructure Finance Ltd. CRISIL - AAA CARe - AAA 0.37
Muthoot Finance Ltd. ICRA - AA ICRA - AA- 0.37
Tata Projects Ltd. IND - AA IND - AA 0.36
Hazaribagh Ranchi expressway Ltd. (NHAI Annuity) CARe - D CARe - D 0.31
Nuvoco Vistas Corporation Ltd. (100% subsidiary of Nirma Ltd. & erstwhile Lafarge India Ltd.) CRISIL - AA CRISIL - AA 0.26
JM Financial Credit Solutions Ltd. ICRA - AA CRISIL - AA 0.06
Reliance Industries Ltd. CRISIL - AAA CRISIL - AAA 0.01
Sub Total 73.32
CREDIT EXPOSURE (PERPETUAl BONDS)
• Punjab National Bank (AT1, BASeL III, Perpetual) CRISIL - AA- CARe - AA 4.01
Punjab National Bank (AT1, BASeL III, Perpetual) IND - AA CARe - AA 1.61
The Tata Power Company Ltd. (Perpetual) CRISIL - AA ICRA - AA- 0.58
Indian Bank (AT1, BASeL III, Perpetual) CRISIL - AA CARe - AA 0.36
Tata Steel Ltd. (Perpetual) CARe - AA- CARe - AA 0.14
Sub Total 6.70
Total 85.90
MONEY MARKET INSTRUMENTS
CP
Godrej Agrovet Ltd. ICRA - A1+ ICRA - AA 0.71
Steel Authority Of India Ltd. CRISIL - A1+ CARe - AA- 0.71
The Tata Power Company Ltd. CRISIL - A1+ ICRA - AA- 0.71
Sub Total 2.13
Total 2.13
Cash, Cash equivalents and Net Current Assets 11.97
Grand Total 100.00
• Top Ten Holdings
Face Value per Unit: ̀ 10 unless otherwise specified, + Industry Classification as recommended by AMFI, CD - Certificate of Deposit; CP - Commercial Papers, Data is as of February 28, 2021 unless otherwise specified.
[An open ended debt scheme predominantly investing in AA and below rated corporate bonds (excluding AA+ rated corporate bonds)] .....Contd from previous pageHDFC Credit Risk Debt Fund
PORTFOLIO

43 February 2021
CATEgORY OF SCHEME: BANKING AND PSU FUND
KEY FACTSINVESTMENT OBjECTIVETo generate income / capital appreciation through investments in debt and money market instruments consisting predominantly of securities issued by entities such as Scheduled Commercial Banks (SCBs), Public Sector undertakings (PSUs), Public Financial Institutions (PFIs), Municipal Corporations and such other bodies.
There is no assurance that the investment objective of the Scheme will be realized.
FUND MANAgER ¥
Anil Bamboli (since March 26, 2014)
Total experience: Over 23 years
INCEPTION DATE (Date of Allotment)March 26, 2014
NAV (AS ON FEBRUARY 26, 2021) NAV PER UNIT (`)Regular Plan - Growth Option 17.7255Regular Plan - Dividend Option 10.1237Direct Plan - Growth Option 18.1274Direct Plan - Dividend Option 9.9689
ASSETS UNDER MANAgEMENT (`) IN CROREAs on February 28, 2021 10,363.70Average for Month of February 2021 10,531.82
qUANTITATIVE DATAAverage Maturity * 3.13 yearsMacaulay Duration * 2.38 yearsModified Duration * 2.25 yearsYield to Maturity * 5.60%* Computed on the invested amount.
TOTAL ExPENSE RATIO (As on February 28, 2021)Including Additional expenses and Goods and Service Tax on Management FeesRegular: 0.81% Direct: 0.36%
#BENCHMARK INDEX: NIFTY Banking & PSU Index
##ADDl. BENCHMARK INDEX: CRISIL 10 year Gilt Index
EXIT lOADNil
PLANS & OPTIONSRegular Plan, Direct Plan. Under each Plan: Growth & Dividend Option (Weekly frequency). The Dividend Option offers Dividend Payout and Reinvestment facility.
MINIMUM APPlICATION AMOUNTPurchase : ` 5,000 and any amount thereafter. Additional Purchase : ` 1,000 and any amount thereafter.
¥ Dedicated Fund Manager for Overseas Investments: Mr. Sankalp Baid (since January 22, 2021) (Total experience: Over 13 years).
Face Value per Unit: ` 10 unless otherwise specified, Data is as of February 28, 2021 unless otherwise specified.
This product is suitable for investors who are seeking ~
l income over short to medium term.l to generate income / capital appreciation through investments
in debt and money market instruments consisting predominantly of securities issued by entities such as Scheduled Commercial Banks (SCBs), Public Sector undertakings (PSUs), Public Financial Institutions (PFIs), Municipal Corporations and such other bodies
VeryHigh
Low to
Moderate
Low
Moderate ModeratelyHigh High
RISKOMETERInvestors understand that their principal will be at
moderate risk
~ Investors should consult their financial advisers, if in doubt about whether the product is suitable for them.
Issuer Rating % to NAVDEBT & DEBT RElATEDgOVERNMENT SECURITIES (CENTRAl/STATE)6.79 GOI 2027 Sovereign 1.14
5.79 GOI 2030 Sovereign 0.97
6.97 GOI 2026 Sovereign 0.75
6.54% Karnataka SDL - ISD 091220 Mat 091230 Sovereign 0.40
5.85 GOI 2030 Sovereign 0.33
6.45 GOI 2029 Sovereign 0.10
Sub Total 3.69CREDIT EXPOSURE (NON PERPETUAl)• Power Finance
Corporation Ltd.CARe - AAA / CRISIL - AAA / ICRA - AAA 7.79
• REC Ltd. CRISIL - AAA / IND - AAA 6.74
• National Bank for Agriculture & Rural Development
CRISIL - AAA / ICRA - AAA 6.38
• State Bank of India CRISIL - AAA 5.99
• Housing and Urban Development Corporation Ltd. CARe - AAA 5.33
• Indian Railways Finance Corporation Ltd. CRISIL - AAA 5.21
• National Highways Authority of India CRISIL - AAA 3.52
• Hindustan Petroleum Corporation Ltd. CRISIL - AAA 2.70
• NHPC Ltd. CARe - AAA / ICRA - AAA 2.68
Food Corporation of India (Corporate guarantee from Govt of India) CARe - AAA(Ce) 2.34
ONGC Petro additions Ltd. (OPAL) (Put on ONGC Ltd.) CARe - AAA(Ce) 2.32
LIC Housing Finance Ltd. CRISIL - AAA 2.12
Mahanagar Telephone Nigam Ltd. (Corporate guarantee from Govt of India) CRISIL - AAA(Ce) 2.00
Housing Development Finance Corporation Ltd.£ CRISIL - AAA 1.75
Power Grid Corporation of India Ltd. CRISIL - AAA 1.53
Vedanta Ltd. CRISIL - AA- 1.39
Indian Oil Corporation Ltd. CRISIL - AAA 0.97
NTPC Ltd. CRISIL - AAA 0.96
The Tata Power Company Ltd. CRISIL - AA 0.77
Sikka Port and Terminal Ltd. (erstwhile Reliance Ports and Terminals Ltd.) CRISIL - AAA 0.75
export - Import Bank of India CRISIL - AAA 0.67
L&T Housing Finance Ltd. CRISIL - AAA 0.50
L&T Infrastructure Finance Ltd. CRISIL - AAA 0.50
TATA Capital Housing Finance Ltd. CRISIL - AAA 0.50
TMF Holdings Ltd. (Subsidiary of Tata Motors Ltd.) ICRA - AA- 0.29
Shriram Transport Finance Co. Ltd. IND - AA+ 0.24
Bank of Baroda CARe - AAA 0.21
Aashman energy Pvt. Ltd. (Greenko) CARe - AA(Ce) 0.10
Divyesh Power Pvt. Ltd. (Greenko) CARe - AA(Ce) 0.10
Issuer Rating % to NAVelena Renewable energy Pvt. Ltd. (Greenko) CARe - AA(Ce) 0.10
Pratyash Renewable Pvt. Ltd. (Greenko) CARe - AA(Ce) 0.10
SeI Baskara Power Pvt. Ltd. (Greenko) CARe - AA(Ce) 0.10
SeI enerstar Renewable energy Pvt. Ltd. (Greenko) CARe - AA(Ce) 0.10
SeI Mihir energy Pvt. Ltd. (Greenko) CARe - AA(Ce) 0.10
Shreyas Renewable energy Pvt. Ltd. (Greenko) CARe - AA(Ce) 0.10
Zuvan energy Pvt. Ltd. (Greenko) CARe - AA(Ce) 0.10
Hazaribagh Ranchi expressway Ltd. (NHAI Annuity) CARe - D 0.03
Small Industries Development Bank CARe - AAA 0.01
Sub Total 67.10CREDIT EXPOSURE (PERPETUAl BONDS)• Bank of Baroda (AT1, BASeL III, Perpetual) CARe - AA 4.22
Canara Bank (AT1, BASeL III, Perpetual) CARe - AA 2.57
State Bank of India (AT1, BASeL III, Perpetual) CRISIL - AA+ 2.19
Union Bank of India (AT1, BASeL III, Perpetual) CARe - AA- 1.79
Union Bank of India (AT1, BASeL III, Perpetual) CRISIL - AA- 1.19
Union Bank of India (AT1, BASeL III, Perpetual) IND - AA 1.05
Punjab National Bank (AT1, BASeL III, Perpetual) CRISIL - AA- 0.98
Bank of Baroda (AT1, BASeL III, Perpetual) CRISIL - AA+ 0.69
Punjab National Bank (AT1, BASeL III, Perpetual) IND - AA 0.65
ICICI Bank Ltd. (AT1, BASeL III, Perpetual) CARE - AA+ 0.58
Axis Bank Ltd. (AT1, BASeL III, Perpetual) CRISIL - AA+ 0.10
Sub Total 16.01Total 86.80MONEY MARKET INSTRUMENTSCP National Bank for Agriculture & Rural Development ICRA - A1+ 1.43
Sub Total 1.43CD Axis Bank Ltd. CRISIL - A1+ 2.89
Sub Total 2.89Total 4.32Cash, Cash equivalents and Net Current Assets 8.88
Grand Total 100.00• Top Ten Holdings, £ Co-sponsor
Outstanding exposure in derivative instruments Interest Rate Swap (` in Crore) 825.00
Portfolio Classification By Asset Class (%)
n G-Sec, SDL 3.69
n CP 1.43
n CD 2.89
n Credit exposure 83.11
n Cash, Cash equivalents and Net Current Assets 8.88
Portfolio Classification By Rating Class (%)
n Sovereign 3.69n AAA/AAA(SO)/A1+/A1+(SO)
& equivalent 67.80n AA+ 3.80n AA/AA- 15.80n A+ & Below 0.03n Cash, Cash equivalents and
Net Current Assets 8.88
(An open ended debt scheme predominantly investing in debt instruments of banks, public sector undertakings, public financial institutions and municipal bonds)HDFC Banking and PSU Debt Fund
PORTFOLIO

February 2021 44
PERFORMANCE ^ - Regular Plan - growth Option
Date Period Scheme Returns
(%)
Benchmark Returns
(%)#
Additional Benchmark
Returns (%) ##
Value of ` 10,000 invested
Scheme (`) Benchmark (`)#
Additional Benchmark
(`)##
Feb 28, 20 Last 1 Year 7.62 7.31 4.92 10,760 10,729 10,490Feb 28, 18 Last 3 Years 8.60 8.09 8.94 12,805 12,624 12,927Feb 29, 16 Last 5 Years 8.43 7.97 7.34 14,987 14,669 14,246Mar 26, 14 Since Inception 8.61 8.33 8.25 17,726 17,414 17,316
The above returns are for Regular Plan - Growth Option. Returns greater than 1 year period are compounded annualized (CAGR). Performance of dividend option under the schemes for the investors would be net of distribution tax, if any. For performance of other schemes managed by Anil Bamboli, please refer page 66. Different plans viz. Regular Plan and Direct Plan have a different expense structure. The expenses of the Direct Plan under the Scheme will be lower to the extent of the distribution expenses / commission charged in the Regular Plan. For Performance of Direct Plan, refer page no. 75.
^Past performance may or may not be sustained in the future. Since Inception Date = Date of First allotment in the Scheme / Plan. Load is not taken into consideration for computation of performance.
(An open ended debt scheme predominantly investing in debt instruments of banks, public sector undertakings, public financial institutions and municipal bonds)HDFC Banking and PSU Debt Fund
.....Contd from previous pageSIP PERFORMANCE ^ - Regular Plan - growth Option
Since Inception SIP
5 year SIP
3 year SIP
1 year SIP
Total Amount Invested (` ‘000) 840.00 600.00 360.00 120.00 Mkt Value As on February 26, 2021 (` ‘000) 1,128.71 736.56 410.10 123.72 Returns (%) 8.33 8.16 8.70 5.91 Benchmark Returns (%) # 7.85 7.70 8.21 4.84 Additional Benchmark Returns (%) ## 7.31 6.85 7.64 1.06
Assuming ` 10,000 invested systematically on the first Business Day of every month over a period of time. CAGR returns are computed after accounting for the cash flow by using xIRR method (investment internal rate of return) for Regular Plan - Growth Option. The above investment simulation is for illustrative purposes only and should not be construed as a promise on minimum returns and safeguard of capital.

45 February 2021
CATEgORY OF SCHEME: GILT FUND
KEY FACTSINVESTMENT OBjECTIVE
To generate credit risk-free returns through investments in sovereign securities issued by the Central Government and/or State Government.
There is no assurance that the investment objective of the Scheme will be realized.
FUND MANAgER ¥
Anil Bamboli (since September 1, 2007)
Total experience: Over 23 years
INCEPTION DATE (Date of Allotment)
July 25, 2001
NAV (AS ON FEBRUARY 26, 2021) NAV PER UNIT (`)
Regular Plan - Growth Option 42.9823Regular Plan - Dividend Option 11.7184Direct Plan - Growth Option 44.4020Direct Plan - Dividend Option 12.2271
ASSETS UNDER MANAgEMENT (`) IN CRORE
As on February 28, 2021 1,851.51Average for Month of February 2021 2,033.29
qUANTITATIVE DATA
Average Maturity * 6.11 yearsMacaulay Duration * 4.46 yearsModified Duration * 4.33 yearsYield to Maturity * 5.58%* Computed on the invested amount.
TOTAL ExPENSE RATIO (As on February 28, 2021)Including Additional expenses and Goods and Service Tax on Management Fees
Regular: 0.89% Direct: 0.44%
#BENCHMARK INDEX: CRISIL Dynamic Gilt Index
##ADDl. BENCHMARK INDEX: CRISIL 10 year Gilt Index
EXIT lOAD
Nil
PLANS & OPTIONS
Regular Plan, Direct Plan. Under both the Plans: Growth & Dividend Option (Dividend Option offers Dividend Payout and Reinvestment facility.
MINIMUM APPlICATION AMOUNT
Purchase : ` 5,000 and any amount thereafter. Additional Purchase : ` 1,000 and any amount thereafter.
¥ Dedicated Fund Manager for Overseas Investments: Mr. Sankalp Baid (since January 22, 2021) (Total experience: Over 13 years).
Face Value per Unit: ` 10 unless otherwise specified, Data is as of February 28, 2021 unless otherwise specified.
PERFORMANCE ^ - Regular Plan - growth Option
Date Period Scheme Returns
(%)
Benchmark Returns
(%)#
Additional Benchmark
Returns (%) ##
Value of ` 10,000 invested
Scheme (`) Benchmark (`)#
Additional Benchmark
(`)##
Feb 28, 20 Last 1 Year 5.69 6.62 4.92 10,567 10,661 10,490Feb 28, 18 Last 3 Years 7.76 9.47 8.94 12,512 13,116 12,927Feb 29, 16 Last 5 Years 8.08 8.41 7.34 14,746 14,972 14,246Jul 25, 01 Since Inception 7.72 8.33 N.A. 42,982 47,984 N.A.
Returns greater than 1 year period are compounded annualized (CAGR). N.A. Not Available. Performance of dividend option under the schemes for the investors would be net of distribution tax, if any. For performance of other schemes managed by Anil Bamboli, please refer page 66. Different plans viz. Regular Plan and Direct Plan have a different expense structure. The expenses of the Direct Plan under the Scheme will be lower to the extent of the distribution expenses / commission charged in the Regular Plan. For Performance of Direct Plan, refer page no. 75.
This product is suitable for investors who are seeking ~
l credit risk free returns over medium to long term
l to generate credit risk-free returns through investments in sovereign securities issued by the Central Government and / or State Government
VeryHigh
Low to
Moderate
Low
Moderate ModeratelyHigh High
RISKOMETERInvestors understand that their principal will be at
moderate risk
~ Investors should consult their financial advisers, if in doubt about whether the product is suitable for them.
^Past performance may or may not be sustained in the future. Since Inception Date = Date of First allotment in the Scheme / Plan. Load is not taken into consideration for computation of performance.
Portfolio Classification By Asset Class (%)
n T-bills, G-Sec, SDL 96.71
n Cash, Cash equivalents and Net Current Assets 3.29
Portfolio Classification By Rating Class (%)
n Sovereign 96.71n Cash, Cash equivalents and
Net Current Assets 3.29
(An open ended debt scheme investing in government securities across maturities)HDFC Gilt Fund
Issuer Rating % to NAV
DEBT & DEBT RElATED
gOVERNMENT SECURITIES (CENTRAl/STATE)
• 6.97 GOI 2026 Sovereign 12.10
• 7.17 GOI 2028 Sovereign 11.27
• 6.45 GOI 2029 Sovereign 10.77
• 6.79 GOI 2027 Sovereign 10.55
• 7.26 GOI 2029 Sovereign 10.44
• 6.79 GOI 2029 Sovereign 5.78
• 5.79 GOI 2030 Sovereign 4.15
5.77 GOI 2030 Sovereign 2.60
8.60% Rajasthan SDL- Mat 061128 Sovereign 1.46
7.83% Maharashtra SDL - ISD 080420 Mat 080430 Sovereign 1.41
7.73% Gujarat SDL - ISD 070420 Mat 080429 Sovereign 1.40
6.8 GOI 2060 Sovereign 1.34
8.24 GOI 2033 Sovereign 0.26
7.73 GOI 2034 Sovereign 0.18
Issuer Rating % to NAV
7.37 GOI 2023 Sovereign 0.14
7.95 GOI 2032 Sovereign 0.07
7.32 GOI 2024 Sovereign 0.06
8.97 GOI 2030 Sovereign 0.06
Sub Total 74.04
T-BIllS
• 182 days Tbill ISD 180221 Mat 190821 Sovereign 7.97
• 364 Days Tbill - Mat 070521 Sovereign 6.71
• 182 days Tbill ISD 110221 Mat 120821 Sovereign 6.65
91 Days Tbill Mat 290421 Sovereign 1.34
Sub Total 22.67
Total 96.71
Cash, Cash equivalents and Net Current Assets 3.29
Grand Total 100.00
• Top Ten Holdings
Outstanding exposure in derivative instruments Interest Rate Swap (` in Crore) 60.00
PORTFOLIO
SIP PERFORMANCE ^ - Regular Plan - growth Option
Since Inception SIP
15 year SIP 10 year SIP 5 Year SIP 3 Year SIP 1 Year SIP
Total Amount Invested (` ‘000) 2,360.00 1,800.00 1,200.00 600.00 360.00 120.00
Mkt Value As on February 26, 2021 (` ‘000) 5,094.59 3,307.22 1,804.05 709.86 400.90 121.25
Returns (%) 7.26 7.68 7.92 6.68 7.16 1.97
Benchmark Returns (%) # 7.86 8.20 8.46 7.90 8.57 2.10
Additional Benchmark Returns (%) ## N.A. 6.99 7.34 6.85 7.64 1.06
Assuming ` 10,000 invested systematically on the first Business Day of every month over a period of time. CAGR returns are computed after accounting for the cash flow by using xIRR method (investment internal rate of return) for Regular Plan - Growth Option. The above investment simulation is for illustrative purposes only and should not be construed as a promise on minimum returns and safeguard of capital.

February 2021 46
CATEgORY OF SCHEME: DYNAMIC BOND FUND
KEY FACTSINVESTMENT OBjECTIVE
To generate income / capital appreciation by investing in a range of debt and money market instruments.
There is no assurance that the investment objective of the Scheme will be realized.
FUND MANAgER ¥
Anil Bamboli (since February 16, 2004)
Total experience: Over 23 years
INCEPTION DATE (Date of Allotment)
April 28, 1997
NAV (AS ON FEBRUARY 26, 2021) NAV PER UNIT (`)
Regular Plan - Growth Option 67.5720Regular Plan - Quarterly Dividend Option 11.6673Regular Plan - Half-Yearly Dividend Option 11.2400Regular Plan - Yearly Dividend Option 13.1390Regular Plan - Normal Dividend Option 14.4760Direct Plan - Growth Option 71.7232Direct Plan - Quarterly Dividend Option 12.5156Direct Plan - Half-Yearly Dividend Option 12.6109Direct Plan - Yearly Dividend Option 14.0743Direct Plan - Normal Dividend Option 15.1017
ASSETS UNDER MANAgEMENT (`) IN CRORE
As on February 28, 2021 430.23Average for Month of February 2021 461.34
qUANTITATIVE DATA
Average Maturity * 3.91 yearsMacaulay Duration * 2.96 yearsModified Duration * 2.85 yearsYield to Maturity * 5.38%* Computed on the invested amount.
TOTAL ExPENSE RATIO (As on February 28, 2021)Including Additional expenses and Goods and Service Tax on Management Fees
Regular: 1.79% Direct: 1.26%
#BENCHMARK INDEX: CRISIL Dynamic Debt Index
##ADDl. BENCHMARK INDEX: CRISIL 10 year Gilt Index
EXIT lOAD
l In respect of each purchase / switch-in of Units, an exit Load of 0.50% is payable if Units are redeemed / switched-out within 6 months from the date of allotment.
l No exit Load is payable if Units are redeemed / switched-out after 6 months from the date of allotment.
For further details, please refer to para ‘Exit Load’ on Pg 66.
PLANS & OPTIONS
Regular Plan, Direct Plan. Under each Plan: Growth, Normal Dividend, Quarterly Dividend, Half Yearly Dividend, & Yearly Dividend. All Dividend Options offer Payout and Reinvestment facility.
MINIMUM APPlICATION AMOUNT
Purchase : ` 5,000 and any amount thereafter. Additional Purchase : ` 1,000 and any amount thereafter.
¥ Dedicated Fund Manager for Overseas Investments: Mr. Sankalp Baid (since January 22, 2021) (Total experience: Over 13 years).
Face Value per Unit: ` 10 unless otherwise specified, Data is as of February 28, 2021 unless otherwise specified.
PERFORMANCE ^ - Regular Plan - growth Option
Date Period Scheme Returns
(%)
Benchmark Returns
(%)#
Additional Benchmark
Returns (%) ##
Value of ` 10,000 invested
Scheme (`) Benchmark (`)#
Additional Benchmark
(`)##
Feb 28, 20 Last 1 Year 5.95 7.01 4.92 10,593 10,699 10,490Feb 28, 18 Last 3 Years 5.42 9.05 8.94 11,714 12,965 12,927Feb 29, 16 Last 5 Years 6.48 8.57 7.34 13,686 15,081 14,246Apr 28, 97 Since Inception 8.34 N.A. N.A. 67,572 N.A. N.A.
Returns greater than 1 year period are compounded annualized (CAGR). N.A. Not Available. Performance of dividend option under the schemes for the investors would be net of distribution tax, if any. For performance of other schemes managed by Anil Bamboli, please refer page 66. Different plans viz. Regular Plan and Direct Plan have a different expense structure. The expenses of the Direct Plan under the Scheme will be lower to the extent of the distribution expenses / commission charged in the Regular Plan. For Performance of Direct Plan, refer page no. 75.
This product is suitable for investors who are seeking ~
l income over medium to long term
l to generate income / capital appreciation by investing in a range of debt and money market instruments
VeryHigh
Low to
Moderate
Low
Moderate ModeratelyHigh High
RISKOMETERInvestors understand that their principal will be at
moderately high risk~ Investors should consult their financial advisers, if in doubt about whether the product is suitable for them.
^Past performance may or may not be sustained in the future. Since Inception Date = Date of First allotment in the Scheme / Plan. Load is not taken into consideration for computation of performance.
Portfolio Classification By Asset Class (%)
n G-Sec, SDL 32.54
n Credit exposure 58.35
n Cash, Cash equivalents and Net Current Assets 9.11
Portfolio Classification By Rating Class (%)
n Sovereign 32.54n AAA/AAA(SO)/A1+/A1+(SO)
& equivalent 22.96n AA/AA- 25.99n A+ & Below 9.40n Cash, Cash equivalents and
Net Current Assets 9.11
(An open ended dynamic debt scheme investing across duration)HDFC Dynamic Debt Fund
Issuer Rating % to NAV
DEBT & DEBT RElATED
gOVERNMENT SECURITIES (CENTRAl/STATE)
• 7.17 GOI 2028 Sovereign 12.12
• 6.45 GOI 2029 Sovereign 8.11
• 6.79 GOI 2029 Sovereign 4.74
7.42% Maharashtra SDL - Mat 110522 Sovereign 2.40
6.79 GOI 2027 Sovereign 2.39
8.68% Gujarat SDL - Mat 060223. Sovereign 1.24
6.97 GOI 2026 Sovereign 1.21
GOI 2023 Sovereign 0.18
8.26% Maharashtra SDL - ISD 120815 Mat 120825 Sovereign 0.15
8.19% Rajasthan SDL (UDAY Scheme- Strip Ix ) - ISD 230616 Mat 230626 Sovereign @
Sub Total 32.54
CREDIT EXPOSURE (NON PERPETUAl)
• Hazaribagh Ranchi expressway Ltd. (NHAI Annuity) CARe - D 9.40
• Reliance Industries Ltd. CRISIL - AAA 9.06
• State Bank of India CRISIL - AAA 6.27
• Vedanta Ltd. CRISIL - AA- 5.81
Issuer Rating % to NAV
• Mahanagar Telephone Nigam Ltd. (Corporate guarantee from Govt of India) CARe - AAA(Ce) 3.83
Jamnagar Utilities & Power Pvt. Ltd. (erstwhile Reliance Utilities & Power Pvt. Ltd.) CRISIL - AAA 3.64
INOx Wind Infrastructure Services Ltd. CRISIL - AA(Ce) 2.31
NTPC Ltd. CRISIL - AAA 0.16
Sub Total 40.48
CREDIT EXPOSURE (PERPETUAl BONDS)
• Canara Bank (AT1, BASeL III, Perpetual) CARe - AA 8.35
• Union Bank of India (AT1, BASeL III, Perpetual) CARe - AA- 4.75
Punjab National Bank (AT1, BASeL III, Perpetual) CRISIL - AA- 3.59
The Tata Power Company Ltd. (Perpetual) CRISIL - AA 1.18
Sub Total 17.87
Total 90.89
Cash, Cash equivalents and Net Current Assets 9.11
Grand Total 100.00
• Top Ten Holdings, @ less than 0.01%
Outstanding exposure in derivative instruments Interest Rate Swap (` in Crore) 40.00
PORTFOLIO
SIP PERFORMANCE ^ - Regular Plan - growth Option
Since Inception SIP
15 year SIP 10 year SIP 5 Year SIP 3 Year SIP 1 Year SIP
Total Amount Invested (` ‘000) 2,870.00 1,800.00 1,200.00 600.00 360.00 120.00
Mkt Value As on February 26, 2021 (` ‘000) 7,658.23 3,176.19 1,698.10 683.50 393.40 122.85
Returns (%) 7.44 7.19 6.76 5.17 5.88 4.51
Benchmark Returns (%) # N.A. 8.66 8.68 8.10 8.71 3.15
Additional Benchmark Returns (%) ## N.A. 6.99 7.34 6.85 7.64 1.06
Assuming ` 10,000 invested systematically on the first Business Day of every month over a period of time. CAGR returns are computed after accounting for the cash flow by using xIRR method (investment internal rate of return) for Regular Plan - Growth Option. The above investment simulation is for illustrative purposes only and should not be construed as a promise on minimum returns and safeguard of capital.

47 February 2021
CATEgORY OF SCHEME: MEDIUM TO LONG DURATION FUND
KEY FACTS
INVESTMENT OBjECTIVE
To generate income / capital appreciation through investments in debt and money market instruments.There is no assurance that the investment objective of the Scheme will be realized.
FUND MANAgER ¥
Shobhit Mehrotra (since September 11, 2007)
Total experience: Over 25 years
INCEPTION DATE (Date of Allotment)
September 11, 2000
NAV (AS ON FEBRUARY 26, 2021) NAV PER UNIT (`)
Regular Plan - Growth Option 46.1660Regular Plan - Quarterly Dividend Option 11.1989Regular Plan - Normal Dividend Option 14.5576Direct Plan - Growth Option 48.9267Direct Plan - Quarterly Dividend Option 12.0254Direct Plan - Normal Dividend Option 15.4725
ASSETS UNDER MANAgEMENT (`) IN CRORE
As on February 28, 2021 685.37Average for Month of February 2021 686.05
qUANTITATIVE DATA
Average Maturity * 7.02 yearsMacaulay Duration * 4.85 yearsModified Duration * 4.65 yearsYield to Maturity * 6.15%* Computed on the invested amount for debt portfolio.
TOTAL ExPENSE RATIO (As on February 28, 2021)Including Additional expenses and Goods and Service Tax on Management Fees
Regular: 2.22% Direct: 1.33%
#BENCHMARK INDEX: NIFTY Medium to Long Duration Debt Index
##ADDl. BENCHMARK INDEX: CRISIL 10 year Gilt Index
EXIT lOAD
l In respect of each purchase / switch-in of Units, an exit Load of 0.25% is payable if Units are redeemed / switched-out within 1 month from the date of allotment.
l No exit Load is payable if Units are redeemed / switched-out after 1 month from the date of allotment.
For further details, please refer to para ‘Exit Load’ on Pg 66.
PLANS & OPTIONS
Regular Plan, Direct Plan. Under each Plan : Growth, Quarterly Dividend & Normal Dividend. Both Dividend Options offer Payout and Reinvestment facility.
MINIMUM APPlICATION AMOUNT
Purchase : ` 5,000 and any amount thereafter.Additional Purchase : ` 1,000 and any amount thereafter.
¥ Dedicated Fund Manager for Overseas Investments: Mr. Sankalp Baid (since January 22, 2021) (Total experience: Over 13 years).
PERFORMANCE ^ - Regular Plan - growth Option
Date Period Scheme Returns
(%)
Benchmark Returns
(%)#
Additional Benchmark
Returns (%) ##
Value of ` 10,000 invested
Scheme (`) Benchmark (`)#
Additional Benchmark
(`)##
Feb 28, 20 Last 1 Year 4.96 7.63 4.92 10,495 10,761 10,490Feb 28, 18 Last 3 Years 7.18 9.12 8.94 12,309 12,990 12,927Feb 29, 16 Last 5 Years 7.10 8.59 7.34 14,091 15,093 14,246Sep 11, 00 Since Inception 7.76 N.A. N.A. 46,166 N.A. N.A.
Returns greater than 1 year period are compounded annualized (CAGR). N.A. Not Available. Performance of dividend option under the schemes for the investors would be net of distribution tax, if any. For performance of other schemes managed by Shobhit Mehrotra, please refer page 66. Different plans viz. Regular Plan and Direct Plan have a different expense structure. The expenses of the Direct Plan under the Scheme will be lower to the extent of the distribution expenses / commission charged in the Regular Plan. For Performance of Direct Plan, refer page no. 72.
Face Value per Unit: ` 10 unless otherwise specified, Data is as of February 28, 2021 unless otherwise specified.
This product is suitable for investors who are seeking ~
l income over medium to long term
l to generate income / capital appreciation through investments in debt and money market instruments
VeryHigh
Low to
Moderate
Low
Moderate ModeratelyHigh High
RISKOMETERInvestors understand that their principal will be at
moderate risk~ Investors should consult their financial advisers, if in doubt about whether the product is suitable for them.
^Past performance may or may not be sustained in the future. Since Inception Date = Date of First allotment in the Scheme / Plan. Load is not taken into consideration for computation of performance.
Portfolio Classification By Asset Class (%)
n G-Sec 44.87
n Credit exposure 39.99
n Cash, Cash equivalents and Net Current Assets 15.14
Portfolio Classification By Rating Class (%)
n Sovereign 44.87n AAA/AAA(SO)/A1+/A1+(SO)
& equivalent 26.13n AA+ 4.25n AA/AA- 9.61n Cash, Cash equivalents and
Net Current Assets 15.14
[An open ended medium term debt scheme investing in instruments such that the Macaulay Duration of the Portfolio is between 4 years and 7 years (Refer page 2 for definition of Macaulay Duration)]HDFC Income Fund
Issuer Rating % to NAV
DEBT & DEBT RElATED
gOVERNMENT SECURITIES (CENTRAl/STATE)
• 5.77 GOI 2030 Sovereign 9.12
• 7.57 GOI 2033 Sovereign 6.21
• 6.67 GOI 2050 Sovereign 4.99
• 7.26 GOI 2029 Sovereign 3.81
• 6.97 GOI 2026 Sovereign 3.80
6.68 GOI 2031 Sovereign 3.66
5.85 GOI 2030 Sovereign 3.55
6.19 GOI 2034 Sovereign 3.50
6.45 GOI 2029 Sovereign 2.91
6.79 GOI 2029 Sovereign 1.49
GOI 2023 Sovereign 0.94
8.2 GOI 2025 Sovereign 0.51
7.95 GOI 2032 Sovereign 0.38
9.15 GOI 2024 Sovereign @
Sub Total 44.87
Issuer Rating % to NAV
CREDIT EXPOSURE (NON PERPETUAl)
• Power Finance Corporation Ltd. CRISIL - AAA 8.32
• National Bank for Agriculture & Rural Development ICRA - AAA 5.84
• NTPC Ltd. CRISIL - AAA 3.92
Vedanta Ltd. CRISIL - AA- 3.63
Housing and Urban Development Corporation Ltd. CARe - AAA 3.56
IndInfravit Trust CRISIL - AAA 2.95
ReC Ltd. CRISIL - AAA 1.54
Sub Total 29.76
CREDIT EXPOSURE (PERPETUAl BONDS)
• Punjab National Bank (AT1, BASeL III, Perpetual) IND - AA 5.98
• State Bank of India (AT1, BASeL III, Perpetual) CRISIL - AA+ 4.25
Sub Total 10.23
Total 84.86
Cash, Cash equivalents and Net Current Assets 15.14
Grand Total 100.00
• Top Ten Holdings, @ less than 0.01%
PORTFOLIO
SIP PERFORMANCE ^ - Regular Plan - growth Option
Since Inception SIP
15 year SIP 10 year SIP 5 Year SIP 3 Year SIP 1 Year SIP
Total Amount Invested (` ‘000) 2,460.00 1,800.00 1,200.00 600.00 360.00 120.00
Mkt Value As on February 26, 2021 (` ‘000) 5,431.17 3,200.85 1,722.52 699.28 399.25 121.78
Returns (%) 7.14 7.28 7.04 6.08 6.88 2.82
Benchmark Returns (%) # N.A. 8.27 8.47 8.22 9.12 3.65
Additional Benchmark Returns (%) ## N.A. 6.99 7.34 6.85 7.64 1.06
Assuming ` 10,000 invested systematically on the first Business Day of every month over a period of time. CAGR returns are computed after accounting for the cash flow by using xIRR method (investment internal rate of return) for Regular Plan - Growth Option. The above investment simulation is for illustrative purposes only and should not be construed as a promise on minimum returns and safeguard of capital.

February 2021 48
CATEgORY OF SCHEME: MEDIUM DURATION FUND
KEY FACTS
INVESTMENT OBjECTIVE
To generate income / capital appreciation through investments in Debt and Money Market Instruments.
There is no assurance that the investment objective of the Scheme will be realized.
FUND MANAgER ¥
Shobhit Mehrotra (since September 1, 2007)
Total experience: Over 25 years
INCEPTION DATE (Date of Allotment)
February 6, 2002
NAV (AS ON FEBRUARY 26, 2021) NAV PER UNIT (`)
Regular Plan - Growth Option 42.9748Regular Plan - Dividend Option 16.3047Regular Plan - Fortnightly Dividend Option 10.0901Direct Plan - Growth Option 45.2384Direct Plan - Dividend Option 16.9342Direct Plan - Fortnightly Dividend Option 10.0904
ASSETS UNDER MANAgEMENT (`) IN CRORE
As on February 28, 2021 2,952.34Average for Month of February 2021 2,923.09
qUANTITATIVE DATA
Average Maturity * 4.00 yearsMacaulay Duration * 3.15 yearsModified Duration * 2.99 yearsYield to Maturity * 6.95%* Computed on the invested amount.
TOTAL ExPENSE RATIO (As on February 28, 2021)Including Additional expenses and Goods and Service Tax on Management Fees
Regular: 1.32% Direct: 0.49%
#BENCHMARK INDEX: NIFTY Medium Duration Debt Index
##ADDl. BENCHMARK INDEX: CRISIL 10 year Gilt Index
EXIT lOAD
Nil
PLANS & OPTIONS
Regular Plan, Direct Plan. Under both the Plans : Growth, Normal Dividend & Fortnightly Dividend. Both Dividend Options offer Payout and Reinvestment facility.
MINIMUM APPlICATION AMOUNT
Purchase : ` 5,000 and any amount thereafter. Additional Purchase : ` 1,000 and any amount thereafter.
¥ Dedicated Fund Manager for Overseas Investments: Mr. Sankalp Baid (since January 22, 2021) (Total experience: Over 13 years).
Face Value per Unit: ` 10 unless otherwise specified, Data is as of February 28, 2021 unless otherwise specified.
This product is suitable for investors who are seeking ~
l income over medium terml to generate income / capital appreciation through
investments in Debt and Money Market Instruments
VeryHigh
Low to
Moderate
Low
Moderate ModeratelyHigh High
RISKOMETERInvestors understand that their principal will be at
moderately high risk
~ Investors should consult their financial advisers, if in doubt about whether the product is suitable for them.
[An open ended medium term debt scheme investing in instruments such that the Macaulay Duration of the portfolio is between 3 years and 4 years (Refer page 2 for definition of Macaulay Duration)]HDFC Medium Term Debt Fund
Issuer Rating % to NAV
DEBT & DEBT RElATED
gOVERNMENT SECURITIES (CENTRAl/STATE)
• 6.18 GOI 2024 Sovereign 3.48
• 7.27 GOI 2026 Sovereign 3.21
• 7.59 GOI 2026 Sovereign 2.71
5.15 GOI 2025 Sovereign 2.02
7.26 GOI 2029 Sovereign 1.95
6.97 GOI 2026 Sovereign 1.76
GOI 2033 Sovereign 1.54
7.32 GOI 2024 Sovereign 0.90
5.79 GOI 2030 Sovereign 0.81
7.57 GOI 2033 Sovereign 0.72
6.79 GOI 2027 Sovereign 0.70
5.85 GOI 2030 Sovereign 0.66
5.22 GOI 2025 Sovereign 0.50
6.45 GOI 2029 Sovereign 0.34
5.77 GOI 2030 Sovereign 0.33
6.67 GOI 2050 Sovereign 0.33
Sub Total 21.96
CREDIT EXPOSURE (NON PERPETUAl)
• Power Finance Corporation Ltd. CRISIL - AAA 8.07
• Embassy Office Parks REIT CRISIL - AAA 5.08
• REC Ltd. CRISIL - AAA 4.56
• Housing Development Finance Corporation Ltd.£ CRISIL - AAA 4.21
• Vedanta Ltd. CRISIL - AA- 2.78
• NTPC Ltd. CRISIL - AAA 2.52
• TVS Credit Services Ltd. CRISIL - AA- 2.52
Green Infra Wind energy Ltd. CRISIL - AA 2.47
Shriram City Union Finance Ltd. CRISIL - AA 2.39
National Bank for Agriculture & Rural Development ICRA - AAA 2.16
Muthoot Finance Ltd. ICRA - AA 2.05
Sikka Port and Terminal Ltd. (erstwhile Reliance Ports and Terminals Ltd.) CRISIL - AAA 1.97
Tata Projects Ltd. IND - AA 1.90
INOx Wind Infrastructure Services Ltd. CRISIL - AA(Ce) 1.69
INOx Wind Ltd. CRISIL - AA(Ce) 1.68
Pipeline Infrastructure Pvt. Ltd. CRISIL - AAA 1.64
Tata Motors Finance Solutions Ltd. CARe - AA- 1.34
TATA Housing Development Co Ltd. CARe - AA 1.31
Copeland Jan 2020 (PTC of pools from Muthoot Capital Services Ltd.) CRISIL - AA(SO) 1.06
Indian Railways Finance Corporation Ltd. CRISIL - AAA 0.90
Reliance Industries Ltd. CRISIL - AAA 0.89
LIC Housing Finance Ltd. CRISIL - AAA 0.88
JM Financial Asset Reconstruction Co. ICRA - AA- 0.87
IndInfravit Trust CRISIL - AAA 0.86
National Housing Bank CRISIL - AAA 0.85
Mangalore Refinery and Petrochemicals Ltd. CARe - AAA 0.84
Issuer Rating % to NAV
Housing and Urban Development Corporation Ltd. CARe - AAA 0.83
NHPC Ltd. CARe - AAA 0.55
GeRA Development Pvt. Ltd. CARe - AA- 0.54
The Tata Power Company Ltd. CRISIL - AA 0.54
Indian Oil Corporation Ltd. CRISIL - AAA 0.52
Coastal Gujarat Power Ltd. (Corporate Guarantee of Tata Power) CARe - AA(Ce) 0.46
Tata Motors Ltd. CRISIL - AA- 0.34
Talwandi Sabo Power Ltd. (Corporate Guarantee of Vedanta Ltd.) CRISIL - AA-(Ce) 0.22
Aarish Solar Power Pvt. Ltd. (Greenko) CARe - AA(Ce) 0.15
Aashman energy Pvt. Ltd. (Greenko) CARe - AA(Ce) 0.15
Divyesh Power Pvt. Ltd. (Greenko) CARe - AA(Ce) 0.15
elena Renewable energy Pvt. Ltd. (Greenko) CARe - AA(Ce) 0.15
Pratyash Renewable Pvt. Ltd. (Greenko) CARe - AA(Ce) 0.15
SeI Baskara Power Pvt. Ltd. (Greenko) CARe - AA(Ce) 0.15
SeI enerstar Renewable energy Pvt. Ltd. (Greenko) CARe - AA(Ce) 0.15
SeI Mihir energy Pvt. Ltd. (Greenko) CARe - AA(Ce) 0.15
Shreyas Renewable energy Pvt. Ltd. (Greenko) CARe - AA(Ce) 0.15
Zuvan energy Pvt. Ltd. (Greenko) CARe - AA(Ce) 0.15
L&T Infrastructure Finance Ltd. CRISIL - AAA 0.04
Indiabulls Housing Finance Ltd. CRISIL - AA 0.03
Sub Total 63.06
CREDIT EXPOSURE (PERPETUAl BONDS)
Union Bank of India (BASeL III, Perpetual) BRICKWORKS - AA 1.70
Indian Bank (AT1, BASeL III, Perpetual) CRISIL - AA 1.68
Punjab National Bank (AT1, BASeL III, Perpetual) CRISIL - AA- 0.87
The Tata Power Company Ltd. (Perpetual) CRISIL - AA 0.86
TATA International Ltd. (Perpetual) CARe - A 0.85
Union Bank of India (AT1, BASeL III, Perpetual) BRICKWORKS - AA 0.85
Tata Steel Ltd. (Perpetual) CARe - AA- 0.61
Sub Total 7.42
Total 92.44
MONEY MARKET INSTRUMENTS
CP
Fedbank Financial Services Ltd. CRISIL - A1+ 1.13
Sub Total 1.13
Total 1.13
Cash, Cash equivalents and Net Current Assets 6.43
Grand Total 100.00
• Top Ten Holdings, £ Co-sponsor
PORTFOLIO

49 February 2021
.....Contd from previous page
PERFORMANCE ^ - Regular Plan - growth Option
Date Period Scheme Returns
(%)
Benchmark Returns
(%)#
Additional Benchmark
Returns (%) ##
Value of ` 10,000 invested
Scheme (`) Benchmark (`)#
Additional Benchmark
(`)##
Feb 28, 20 Last 1 Year 6.72 8.71 4.92 10,670 10,868 10,490Feb 28, 18 Last 3 Years 7.97 9.02 8.94 12,583 12,954 12,927Feb 29, 16 Last 5 Years 8.07 8.63 7.34 14,741 15,121 14,246Feb 06, 02 Since Inception 7.95 8.00 6.76 42,975 43,369 34,826
Returns greater than 1 year period are compounded annualized (CAGR). N.A. Not Available. Performance of dividend option under the schemes for the investors would be net of distribution tax, if any. For performance of other schemes managed by Shobhit Mehrotra, please refer page 66. Different plans viz. Regular Plan and Direct Plan have a different expense structure. The expenses of the Direct Plan under the Scheme will be lower to the extent of the distribution expenses / commission charged in the Regular Plan. For Performance of Direct Plan, refer page no. 72.
SIP PERFORMANCE ^ - Regular Plan - growth Option
Since Inception SIP
15 year SIP 10 year SIP 5 Year SIP 3 Year SIP 1 Year SIP
Total Amount Invested (` ‘000) 2,290.00 1,800.00 1,200.00 600.00 360.00 120.00
Mkt Value As on February 26, 2021 (` ‘000) 5,323.65 3,478.51 1,821.13 727.07 406.76 124.23
Returns (%) 8.16 8.29 8.10 7.64 8.14 6.74
Benchmark Returns (%) # 8.18 8.53 8.70 8.55 9.40 5.72
Additional Benchmark Returns (%) ## 6.68 6.99 7.34 6.85 7.64 1.06
Assuming ` 10,000 invested systematically on the first Business Day of every month over a period of time. CAGR returns are computed after accounting for the cash flow by using xIRR method (investment internal rate of return) for Regular Plan - Growth Option. The above investment simulation is for illustrative purposes only and should not be construed as a promise on minimum returns and safeguard of capital.
Portfolio Classification By Asset Class (%)
n G-Sec 21.96
n CP 1.13
n Credit exposure 70.48
n Cash, Cash equivalents and Net Current Assets 6.43
Portfolio Classification By Rating Class (%)
n Sovereign 21.96n AAA/AAA(SO)/A1+/A1+(SO) &
equivalent 38.50n AA/AA- 32.26n A+ & Below 0.85n Cash, Cash equivalents and Net
Current Assets 6.43
^Past performance may or may not be sustained in the future. Since Inception Date = Date of First allotment in the Scheme / Plan. Load is not taken into consideration for computation of performance.
[An open ended medium term debt scheme investing in instruments such that the Macaulay Duration of the portfolio is between 3 years and 4 years (Refer page 2 for definition of Macaulay Duration)]HDFC Medium Term Debt Fund

February 2021 50
CATEgORY OF SCHEME: SHORT DURATION FUND
Face Value per Unit: ` 10 unless otherwise specified, CD - Certificate of Deposit; CP - Commercial Papers. Data is as of February 28, 2021 unless otherwise specified.
KEY FACTS
INVESTMENT OBjECTIVE
To generate income / capital appreciation through investments in Debt and Money Market Instruments.
There is no assurance that the investment objective of the Scheme will be realized.
FUND MANAgER ¥
Anil Bamboli (since June 25, 2010)
Total experience: Over 23 years
INCEPTION DATE (Date of Allotment)
June 25, 2010
NAV (AS ON FEBRUARY 26, 2021) NAV PER UNIT (`)
Regular Plan - Growth Option 24.3991Regular Plan - Fortnightly Dividend Option 10.1944Regular Plan - Normal Dividend Option 16.4050Direct Plan - Growth Option 24.7649Direct Plan - Fortnightly Dividend Option 10.2946Direct Plan - Normal Dividend Option 16.5553
ASSETS UNDER MANAgEMENT (`) IN CRORE
As on February 28, 2021 17,398.21Average for Month of February 2021 17,731.73
qUANTITATIVE DATA
Average Maturity * 3.01 yearsMacaulay Duration * 2.33 yearsModified Duration * 2.21 yearsYield to Maturity * 5.62%* Computed on the invested amount.
TOTAL ExPENSE RATIO (As on February 28, 2021)Including Additional expenses and Goods and Service Tax on Management Fees
Regular: 0.74% Direct: 0.24%
#BENCHMARK INDEX: CRISIL Short Term Bond Fund Index
##ADDl. BENCHMARK INDEX: CRISIL 10 year Gilt Index
EXIT lOAD
Nil
PLANS & OPTIONS
Regular Plan, Direct Plan. Under each Plan: Growth, Fortnightly Dividend & Normal Dividend. Both Dividend options offer Payout and Reinvestment facilities.
MINIMUM APPlICATION AMOUNT
Purchase : ` 5,000 and any amount thereafter. Additional Purchase : ` 1,000 and any amount thereafter.
¥ Dedicated Fund Manager for Overseas Investments: Mr. Sankalp Baid (since January 22, 2021) (Total experience: Over 13 years).
This product is suitable for investors who are seeking ~
l income over short term.
l to generate income / capital appreciation through investments in Debt and Money Market Instruments
VeryHigh
Low to
Moderate
Low
Moderate ModeratelyHigh High
RISKOMETERInvestors understand that their principal will be at
moderate risk~ Investors should consult their financial advisers, if in doubt about whether the product is suitable for them.
[An open ended short term debt scheme investing in instruments such that the Macaulay Duration of the portfolio is between 1 year and 3 years (Refer page 2 for definition of Macaulay Duration)]HDFC Short Term Debt Fund
Issuer Rating % to NAVDEBT & DEBT RElATEDgOVERNMENT SECURITIES (CENTRAl/STATE)• 5.77 GOI 2030 Sovereign 2.136.79 GOI 2027 Sovereign 1.805.79 GOI 2030 Sovereign 1.306.97 GOI 2026 Sovereign 1.296.45 GOI 2029 Sovereign 0.865.22 GOI 2025 Sovereign 0.858.48% Karnataka SDL - Mat 171022 Sovereign 0.797.59 GOI 2026 Sovereign 0.745.85 GOI 2030 Sovereign 0.627.59% Gujarat SDL - Mat 150227 Sovereign 0.607.32 GOI 2024 Sovereign 0.557.89% Gujarat SDL - Mat 150525 Sovereign 0.467.17 GOI 2028 Sovereign 0.456.18 GOI 2024 Sovereign 0.307.27 GOI 2026 Sovereign 0.308.38% Karnataka SDL - Mat 311022 Sovereign 0.30GOI 2033 Sovereign 0.296.54% Karnataka SDL - ISD 091220 Mat 091230 Sovereign 0.287.26 GOI 2029 Sovereign 0.278.39% Rajasthan SDL - Mat 150323 Sovereign 0.157.15% Maharashtra SDL - Mat 131026 Sovereign 0.14Sub Total 14.47T-BIllS182 days Tbill ISD 180221 Mat 190821 Sovereign 1.41Sub Total 1.41CREDIT EXPOSURE (NON PERPETUAl)• Housing Development
Finance Corporation Ltd.£ CRISIL - AAA 6.47• REC Ltd. CRISIL - AAA 6.17• State Bank of India CRISIL - AAA 3.86• LIC Housing Finance Ltd. CARe - AAA / CRISIL - AAA 2.95• Power Finance Corporation Ltd. CARe - AAA / CRISIL -
AAA / ICRA - AAA 2.91• National Bank for Agriculture
& Rural Development CRISIL - AAA / ICRA - AAA 2.49• Vedanta Ltd. CRISIL - AA- 2.18• Cholamandalam Investment
& Finance ICRA - AA / ICRA - AA+ 2.02IndInfravit Trust CRISIL - AAA 1.97Mahanagar Telephone Nigam Ltd. (Corporate guarantee from Govt of India)
CARe - AAA(Ce) / CRISIL - AAA(Ce) 1.77
Larsen and Toubro Ltd. CRISIL - AAA 1.74Indian Railways Finance Corporation Ltd. CRISIL - AAA 1.71Housing and Urban Development Corporation Ltd. CARe - AAA 1.62Reliance Industries Ltd. CRISIL - AAA 1.60Coastal Gujarat Power Ltd. (Corporate Guarantee of Tata Power) CARe - AA(Ce) 1.50Motherson Sumi Systems Ltd. IND - AAA 1.44National Highways Authority of India CRISIL - AAA 1.20Fullerton India Credit Company Ltd. CRISIL - AAA 1.17Jamnagar Utilities & Power Pvt. Ltd. (erstwhile Reliance Utilities & Power Pvt. Ltd.) CRISIL - AAA 1.12First Business Receivables Trust (PTC backed by receivables from Reliance Corporate IT Park Ltd.) CRISIL - AAA(SO) 1.08Tata Steel Ltd. CARe - AA 1.07HDB Financial Services Ltd. CRISIL - AAA 1.01L&T Infrastructure Finance Ltd. CRISIL - AAA 0.89Sikka Port and Terminal Ltd. (erstwhile Reliance Ports and Terminals Ltd.) CARe - AAA / CRISIL - AAA 0.88Nabha Power Ltd. (Corporate Guarantee of L&T Ltd.) ICRA - AAA(Ce) 0.87
Issuer Rating % to NAVPower Grid Corporation of India Ltd. CRISIL - AAA 0.83Pipeline Infrastructure Pvt. Ltd. CRISIL - AAA 0.77Britannia Industries Ltd. CRISIL - AAA 0.60ONGC Petro additions Ltd. (OPAL) (Put on ONGC Ltd.) CARe - AAA(Ce) 0.59TATA Capital Housing Finance Ltd. CRISIL - AAA 0.59Sundaram Finance Ltd. CRISIL - AAA 0.58Hindustan Petroleum Corporation Ltd. CRISIL - AAA 0.57Tata Motors Finance Ltd. CRISIL - AA- 0.57Mobil Trust Series 10 (PTC of pools from Shriram City Union Finance Ltd.) CRISIL - AAA(SO) 0.54John Deere Financial India Pvt. Ltd. CRISIL - AAA 0.51Hindalco Industries Ltd. CRISIL - AA 0.39TMF Holdings Ltd. (Subsidiary of Tata Motors Ltd.) ICRA - AA- 0.35Fullerton India Home Finance Company Ltd. CARe - AAA 0.29Grasim Industries Ltd. CRISIL - AAA 0.29Indian Oil Corporation Ltd. CRISIL - AAA 0.29NTPC Ltd. CRISIL - AAA 0.29Shriram City Union Finance Ltd. CRISIL - AA 0.29Talwandi Sabo Power Ltd. (Corporate Guarantee of Vedanta Ltd.) CRISIL - AA-(Ce) 0.29Tata Capital Financial Services Ltd. ICRA - AAA 0.29NHPC Ltd. CARe - AAA 0.28Reliable Devices Trust (PTC backed by receivables from Reliance Retail Ltd.) ICRA - AAA(SO) 0.28Tata Motors Finance Solutions Ltd. CARe - AA- 0.28L&T Housing Finance Ltd. CRISIL - AAA 0.27The Tata Power Company Ltd. CRISIL - AA 0.25Manappuram Finance Ltd. CRISIL - AA 0.18SANSAR TRUST NOV 2018 (PTC of pools from Shriram Transport Finance Co. Ltd.) ICRA - AAA(SO) 0.16Inox Air Products Pvt. Ltd. CRISIL - AA+ 0.13Sub Total 62.44CREDIT EXPOSURE (PERPETUAl BONDS)• State Bank of India
(AT1, BASeL III, Perpetual) CRISIL - AA+ 3.08ICICI Bank Ltd. (AT1, BASeL III, Perpetual) CARE - AA+ 0.75Union Bank of India (AT1, BASeL III, Perpetual) CRISIL - AA- 0.56HDFC Bank Ltd. (AT1, BASeL III, Perpetual) CRISIL - AA+ 0.42Union Bank of India (AT1, BASeL III, Perpetual) IND - AA 0.38The Tata Power Company Ltd. (Perpetual) CRISIL - AA 0.29Bank of Baroda (AT1, BASeL III, Perpetual) CARe - AA 0.27Punjab National Bank (AT1, BASeL III, Perpetual) CRISIL - AA- 0.27Axis Bank Ltd. (AT1, BASeL III, Perpetual) CRISIL - AA+ 0.26Canara Bank (AT1, BASeL III, Perpetual) CARe - AA 0.06Punjab National Bank (AT1, BASeL III, Perpetual) IND - AA 0.06Sub Total 6.40Total 84.72MONEY MARKET INSTRUMENTSCPTata Teleservices Ltd. CRISIL - A1+ 0.69Sub Total 0.69CD Axis Bank Ltd. CRISIL - A1+ 2.00Sub Total 2.00Total 2.69Cash, Cash equivalents and Net Current Assets 12.59Grand Total 100.00• Top Ten Holdings, £ Co-sponsor
Outstanding exposure in derivative instruments Interest Rate Swap (` in Crore) 1,650.00
PORTFOLIO

51 February 2021
PERFORMANCE ^ - Regular Plan - growth Option
Date Period Scheme Returns
(%)
Benchmark Returns
(%)#
Additional Benchmark
Returns (%) ##
Value of ` 10,000 invested
Scheme (`) Benchmark (`)#
Additional Benchmark
(`)##
Feb 28, 20 Last 1 Year 8.15 7.50 4.92 10,812 10,748 10,490Feb 28, 18 Last 3 Years 8.74 8.53 8.94 12,854 12,782 12,927Feb 29, 16 Last 5 Years 8.36 8.16 7.34 14,938 14,797 14,246Jun 25, 10 Since Inception 8.71 8.26 6.85 24,399 23,356 20,297
Returns greater than 1 year period are compounded annualized (CAGR). Performance of dividend option under the schemes for the investors would be net of distribution tax, if any. For performance of other schemes managed by Anil Bamboli, please refer page 66. Different plans viz. Regular Plan and Direct Plan have a different expense structure. The expenses of the Direct Plan under the Scheme will be lower to the extent of the distribution expenses / commission charged in the Regular Plan. For Performance of Direct Plan, refer page no. 75.^Past performance may or may not be sustained in the future. Since Inception Date = Date of First allotment in the Scheme / Plan. Load is not taken into consideration for computation of performance.
[An open ended short term debt scheme investing in instruments such that the Macaulay Duration of the portfolio is between 1 year and 3 years (Refer page 2 for definition of Macaulay Duration)]HDFC Short Term Debt Fund
Portfolio Classification By Asset Class (%)
n T-bills, G-Sec, SDL 15.88
n CP 0.69
n CD 2.00
n Credit exposure 68.84
n Cash, Cash equivalents and Net Current Assets 12.59
Portfolio Classification By Rating Class (%)
n Sovereign 15.88n AAA/AAA(SO)/A1+/A1+(SO)
& equivalent 55.63n AA+ 6.07n AA/AA- 9.83n Cash, Cash equivalents and
Net Current Assets 12.59
.....Contd from previous page
SIP PERFORMANCE ^ - Regular Plan - growth Option
Since Inception SIP
10 year SIP
5 year SIP
3 year SIP
1 year SIP
Total Amount Invested (` ‘000) 1,290.00 1,200.00 600.00 360.00 120.00 Mkt Value As on February 26, 2021 (` ‘000) 2,082.04 1,866.32 740.21 410.65 123.89 Returns (%) 8.60 8.56 8.36 8.79 6.19 Benchmark Returns (%) # 8.37 8.37 8.04 8.41 5.42 Additional Benchmark Returns (%) ## 7.29 7.34 6.85 7.64 1.06
Assuming ` 10,000 invested systematically on the first Business Day of every month over a period of time. CAGR returns are computed after accounting for the cash flow by using xIRR method (investment internal rate of return) for Regular Plan - Growth Option. The above investment simulation is for illustrative purposes only and should not be construed as a promise on minimum returns and safeguard of capital.

February 2021 52
CATEgORY OF SCHEME: LOW DURATION FUND
KEY FACTSINVESTMENT OBjECTIVETo generate income / capital appreciation through investment in debt securities and money market instruments.There is no assurance that the investment objective of the Scheme will be realized.
FUND MANAgER ¥
Anupam Joshi (since October 27, 2015)
Total experience: Over 12 years
INCEPTION DATE (Date of Allotment)November 18, 1999
NAV (AS ON FEBRUARY 26, 2021) NAV PER UNIT (`)Regular Plan - Growth Option 44.8968Regular Plan - Daily Dividend Reinvestment Option 10.1416Regular Plan - Weekly Dividend Option 10.0924Regular Plan - Monthly Dividend Option 10.1424Direct Plan - Growth Option 47.4294Direct Plan - Daily Dividend Reinvestment Option 10.0644Direct Plan - Weekly Dividend Option 10.0931Direct Plan - Monthly Dividend Option 10.1456
ASSETS UNDER MANAgEMENT (`) IN CROREAs on February 28, 2021 25,094.26Average for Month of February 2021 25,021.14
qUANTITATIVE DATAAverage Maturity * 1.91 yearsMacaulay Duration * 357 daysModified Duration * 330 daysYield to Maturity * 4.75%* Computed on the invested amount.
TOTAL ExPENSE RATIO (As on February 28, 2021)Including Additional expenses and Goods and Service Tax on Management FeesRegular: 1.04% Direct: 0.44%
#BENCHMARK INDEX: NIFTY Low Duration Debt Index
##ADDl. BENCHMARK INDEX: CRISIL 1 year T-Bill Index
EXIT lOADNil
PLANS & OPTIONSRegular Plan, Direct Plan. each Plan offers Growth and Dividend Option. Dividend Option offers Daily Dividend Option with Reinvestment facility only and Weekly and Monthly Dividend Option with Payout and Reinvestment facility.
MINIMUM APPlICATION AMOUNTFor all Options (except Daily Dividend Option) Growth, Weekly and Monthly Dividend Option: Purchase: ` 5,000 and any amount thereafter. Additional Purchase : ` 1,000 and any amount thereafter. Daily Dividend Option : Purchase : ` 10,000 and any amount thereafter. Additional Purchase : ` 5,000 and any amount thereafter.
¥ Dedicated Fund Manager for Overseas Investments: Mr. Sankalp Baid (since January 22, 2021) (Total experience: Over 13 years).
Face Value per Unit: ` 10 unless otherwise specified, CD - Certificate of Deposit; CP - Commercial Papers. Data is as of February 28, 2021 unless otherwise specified.
This product is suitable for investors who are seeking ~
l income over short term.
l to generate income / capital appreciation through investmentin debt securities and money market instruments
VeryHigh
Low to
Moderate
Low
Moderate ModeratelyHigh High
RISKOMETERInvestors understand that their principal will be at
moderate risk
~ Investors should consult their financial advisers, if in doubt about whether the product is suitable for them.
[An open ended low duration debt scheme investing in instruments such that the Macaulay Duration of the portfolio is between 6 months and 12 months (Refer page 2 for definition of Macaulay Duration)]HDFC Low Duration Fund
Issuer Rating % to NAVDEBT & DEBT RElATEDgOVERNMENT SECURITIES (CENTRAl/STATE)• GOI 2033 Sovereign 5.607.8 GOI 2021 Sovereign 1.538.24 GOI 2027 Sovereign 1.536.97 GOI 2026 Sovereign 0.856.79 GOI 2027 Sovereign 0.748.95% Maharashtra SDL - Mat 070322 Sovereign 0.678.15 GOI 2026 Sovereign 0.448.33 GOI 2026 Sovereign 0.447.94 GOI 2021 Sovereign 0.25Sub Total 12.05T-BIllS• 182 days Tbill ISD 081020
Mat 080421 Sovereign 4.56182 Days Tbill Mat 250321 Sovereign 1.99364 Days Tbill - Mat 070521 Sovereign 0.99364 Days Tbill Mat 200521 Sovereign 0.79364 Days Tbill Mat 180321 Sovereign 0.60364 Days Tbill Mat 220421 Sovereign 0.40364 Days Tbill Mat 240621 Sovereign 0.12Sub Total 9.45CREDIT EXPOSURE (NON PERPETUAl)• Power Finance Corporation
Ltd.CARe - AAA / CRISIL - AAA / ICRA - AAA 6.13
• REC Ltd. CARe - AAA / CRISIL - AAA 4.43• National Bank for Agriculture
& Rural Development CRISIL - AAA / ICRA - AAA 4.41• Housing Development
Finance Corporation Ltd.£ CRISIL - AAA 3.80• LIC Housing Finance Ltd. CARe - AAA / CRISIL - AAA 3.11L&T Infrastructure Finance Ltd. CRISIL - AAA 2.39Vedanta Ltd. CRISIL - AA- 1.86Muthoot Finance Ltd. ICRA - AA 1.65Reliance Industries Ltd. CRISIL - AAA 1.39Reliable Devices Trust (PTC backed by receivables from Reliance Retail Ltd.) ICRA - AAA(SO) 1.31Food Corporation of India (Corporate guarantee from Govt of India) CARe - AAA(Ce) 1.26Nabha Power Ltd. (Corporate Guarantee of L&T Ltd.) ICRA - AAA(Ce) 1.20Shriram Transport Finance Co. Ltd. CRISIL - AA+ 0.89Larsen and Toubro Ltd. CRISIL - AAA 0.73Bharat Petroleum Corporation Ltd. CRISIL - AAA 0.71HDB Financial Services Ltd. CRISIL - AAA 0.67Aditya Birla Finance Ltd. ICRA - AAA 0.66Manappuram Finance Ltd. CARe - AA 0.61Power Grid Corporation of India Ltd. CRISIL - AAA 0.55Shriram City Union Finance Ltd. CARe - AA / CRISIL - AA 0.45TATA Capital Housing Finance Ltd. CRISIL - AAA 0.41embassy Office Parks ReIT CRISIL - AAA 0.39NTPC Ltd. CRISIL - AAA 0.39Bajaj Finance Ltd. CRISIL - AAA 0.37Housing and Urban Development Corporation Ltd. CARe - AAA 0.37Bharati Telecom Ltd. CRISIL - AA+ 0.31Mangalore Refinery and Petrochemicals Ltd. CARe - AAA 0.31Small Industries Development Bank CARe - AAA 0.31TMF Holdings Ltd. (Subsidiary of Tata Motors Ltd.) ICRA - AA- 0.24KKR India Financial Services Pvt. Ltd. CRISIL - AA 0.20Tata Motors Finance Solutions Ltd. CARe - AA- 0.20National Highways Authority of India
CARe - AAA / CRISIL - AAA 0.12
First Business Receivables Trust (PTC backed by receivables from Reliance Corporate IT Park Ltd.) CRISIL - AAA(SO) 0.12L&T Housing Finance Ltd. CARe - AAA 0.10Motherson Sumi Systems Ltd. IND - AAA 0.10Jamnagar Utilities & Power Pvt. Ltd. (erstwhile Reliance Utilities & Power Pvt. Ltd.) CRISIL - AAA 0.05Aarish Solar Power Pvt. Ltd. (Greenko) CARe - AA(Ce) 0.02Aashman energy Pvt. Ltd. (Greenko) CARe - AA(Ce) 0.02Divyesh Power Pvt. Ltd. (Greenko) CARe - AA(Ce) 0.02
Issuer Rating % to NAVelena Renewable energy Pvt. Ltd. (Greenko) CARe - AA(Ce) 0.02L&T Finance Ltd. CARe - AAA 0.02Pratyash Renewable Pvt. Ltd. (Greenko) CARe - AA(Ce) 0.02SeI Baskara Power Pvt. Ltd. (Greenko) CARe - AA(Ce) 0.02SeI enerstar Renewable energy Pvt. Ltd. (Greenko) CARe - AA(Ce) 0.02SeI Mihir energy Pvt. Ltd. (Greenko) CARe - AA(Ce) 0.02Shreyas Renewable energy Pvt. Ltd. (Greenko) CARe - AA(Ce) 0.02State Bank of India CRISIL - AAA 0.02Zuvan energy Pvt. Ltd. (Greenko) CARe - AA(Ce) 0.02Sub Total 42.44CREDIT EXPOSURE (PERPETUAl BONDS)• State Bank of India
(AT1, BASeL III, Perpetual) CRISIL - AA+ 2.75Canara Bank (AT1, BASeL III, Perpetual) CARe - AA 1.02State Bank of India (BASeL III, Perpetual) CRISIL - AA+ 1.01Union Bank of India (AT1, BASeL III, Perpetual) BRICKWORKS - AA 0.98Union Bank of India (AT1, BASeL III, Perpetual) CARe - AA- 0.96Bank of Baroda (AT1, BASeL III, Perpetual) CARe - AA 0.75Canara Bank (AT1, BASeL III, Perpetual) CRISIL - AA 0.71Union Bank of India (AT1, BASeL III, Perpetual) IND - AA 0.63Punjab National Bank (AT1, BASeL III, Perpetual) CRISIL - AA- 0.62Union Bank of India (BASeL III, Perpetual) BRICKWORKS - AA 0.60Axis Bank Ltd. (AT1, BASeL III, Perpetual) CRISIL - AA+ 0.41Indian Bank (AT1, BASeL III, Perpetual) CRISIL - AA 0.40Bank of Baroda (AT1, BASeL III, Perpetual) CRISIL - AA+ 0.34Union Bank of India (AT1, BASeL III, Perpetual) CRISIL - AA- 0.31Canara Bank (AT1, BASeL III, Perpetual) ICRA - AA 0.04Sub Total 11.53Total 75.47MONEY MARKET INSTRUMENTSCP• Tata Teleservices Ltd. CRISIL - A1+ 2.94National Bank for Agriculture & Rural Development ICRA - A1+ 1.09Indian Railways Finance Corporation Ltd. CRISIL - A1+ 0.99CanFin Homes Ltd. CARE - A1+ 0.78LIC Housing Finance Ltd. CRISIL - A1+ 0.60Sundaram BNP Paribas Home Finance Ltd. CRISIL - A1+ 0.58Tata Teleservices (Maharashtra) Ltd. CRISIL - A1+ 0.57Tata Motors Finance Ltd. CARE - A1+ 0.55Hindustan Zinc Ltd. CRISIL - A1+ 0.50Tata Projects Ltd. CRISIL - A1+ 0.39Fedbank Financial Services Ltd. CRISIL - A1+ 0.19Reliance Industries Ltd. CRISIL - A1+ 0.10Sub Total 9.28CD • Axis Bank Ltd. CRISIL - A1+ 2.59export - Import Bank of India CRISIL - AAA 1.78Bank of Baroda CRISIL - A1+ 1.29National Bank for Agriculture & Rural Development CRISIL - A1+ 0.59The Federal Bank Ltd. CARE - A1+ 0.40Indusind Bank Ltd. CRISIL - A1+ 0.10Sub Total 6.75Total 16.03Cash, Cash equivalents and Net Current Assets 8.50Grand Total 100.00• Top Ten Holdings, £ Co-sponsor
Outstanding exposure in derivative instruments Interest Rate Swap (` in Crore) 3,125.00
PORTFOLIO

53 February 2021
^Past performance may or may not be sustained in the future. Since Inception Date = Date of First allotment in the Scheme / Plan. Load is not taken into consideration for computation of performance.
Portfolio Classification by Asset Class (%)
n G-Sec, SDL, T-bills 21.50
n CP 9.28
n CD 6.75
n Credit exposure 53.97
n Cash, Cash equivalents and Net Current Assets 8.50
Portfolio Classification by Rating Class (%)
n Sovereign 21.50n AAA/AAA(SO)/A1+/A1+(SO) &
equivalent 51.86n AA+ 5.71n AA/AA- 12.43n Cash, Cash equivalents and Net
Current Assets 8.50
[An open ended low duration debt scheme investing in instruments such that the Macaulay Duration of the portfolio is between 6 months and 12 months (Refer page 2 for definition of Macaulay Duration)]HDFC Low Duration Fund
PERFORMANCE ^ - Regular Plan - growth Option
Date Period Scheme Returns
(%)
Benchmark Returns
(%)#
Additional Benchmark
Returns (%) ##
Value of ` 10,000 invested
Scheme (`) Benchmark (`)#
Additional Benchmark
(`)##
Feb 28, 20 Last 1 Year 7.22 5.92 5.46 10,720 10,591 10,544Feb 28, 18 Last 3 Years 7.42 7.23 6.65 12,392 12,326 12,127Feb 29, 16 Last 5 Years 7.40 7.35 6.56 14,288 14,256 13,739Nov 18, 99 Since Inception 7.31 N.A. 6.47 44,897 N.A. 37,988
Returns greater than 1 year period are compounded annualized (CAGR). N.A. Not Available. Performance of dividend option under the schemes for the investors would be net of distribution tax, if any. For performance of other schemes managed by Anupam Joshi, please refer page 66. Different plans viz. Regular Plan and Direct Plan have a different expense structure. The expenses of the Direct Plan under the Scheme will be lower to the extent of the distribution expenses / commission charged in the Regular Plan. For Performance of Direct Plan, refer page no. 73.
SIP PERFORMANCE ^ - Regular Plan - growth Option
Since Inception SIP
15 year SIP 10 year SIP 5 Year SIP 3 Year SIP 1 Year SIP
Total Amount Invested (` ‘000) 2,560.00 1,800.00 1,200.00 600.00 360.00 120.00
Mkt Value As on February 26, 2021 (` ‘000) 6,001.90 3,275.19 1,768.33 719.38 402.19 124.06
Returns (%) 7.34 7.56 7.54 7.22 7.37 6.46
Benchmark Returns (%) # N.A. 8.04 7.72 7.00 6.76 5.09
Additional Benchmark Returns (%) ## 6.36 6.62 6.83 6.35 6.12 4.07
Assuming ` 10,000 invested systematically on the first Business Day of every month over a period of time. CAGR returns are computed after accounting for the cash flow by using xIRR method (investment internal rate of return) for Regular Plan - Growth Option. The above investment simulation is for illustrative purposes only and should not be construed as a promise on minimum returns and safeguard of capital.
.....Contd from previous page

February 2021 54
n G-Sec, SDL, T-Bills 19.10
n CP 50.69
n CD 23.63
n Cash, Cash equivalents and Net Current Assets 6.58
Portfolio Classification by Asset Class (%)
n Sovereign 19.10
n AAA/AAA(SO)/A1+/A1+(SO) & equivalent 74.32
n Cash, Cash equivalents and Net Current Assets 6.58
Portfolio Classification by Rating Class (%)
CATEgORY OF SCHEME: MONEY MARKET FUND
KEY FACTSINVESTMENT OBjECTIVE
To generate income / capital appreciation by investing in money market instruments.
There is no assurance that the investment objective of the Scheme will be realized.
FUND MANAgER ¥
Anil Bamboli (since July 25, 2012)
Total experience: Over 23 years
Vikash Agarwal (since July 1, 2020)
Total Experience: Over 14 years
INCEPTION DATE (Date of Allotment)
November 18, 1999
NAV (AS ON FEBRUARY 26, 2021) NAV PER UNIT (`)
Regular Plan - Growth Option 4,399.1680Regular Plan - Daily Dividend Reinvestment Option 1,063.6400Regular Plan - Weekly Dividend Option 1,062.8953Direct Plan - Growth Option 4,453.6563Direct Plan - Daily Dividend Reinvestment Option 1,063.6400Direct Plan - Weekly Dividend Option 1,062.9116
ASSETS UNDER MANAgEMENT (`) IN CRORE
As on February 28, 2021 10,914.20Average for Month of February 2021 10,773.30
qUANTITATIVE DATA
Average Maturity * 128 daysMacaulay Duration * 127 daysModified Duration * 127 daysYield to Maturity * 3.75%* Computed on the invested amount.
TOTAL ExPENSE RATIO (As on February 28, 2021)Including Additional expenses and Goods and Service Tax on Management Fees
Regular: 0.35% Direct: 0.21%
#BENCHMARK INDEX: NIFTY Money Market Index
##ADDl. BENCHMARK INDEX: CRISIL 1 year T-Bill Index
EXIT lOAD
Nil
PLANS & OPTIONS
Regular Plan, Direct Plan. Each Plan offers Growth and Daily Dividend Option (with Reinvestment facility only). Weekly Dividend Option (with Payout and Reinvestment facility).
MINIMUM APPlICATION AMOUNT
Purchase : Under Growth Option and Weekly Dividend Option : ` 5,000 and any amount thereafter. Under Daily Dividend Option : ` 10,000 and any amount thereafter
Additional Purchase : Under Growth Option and Weekly Dividend Option : ̀ 1,000 and any amount thereafter. Under Daily Dividend Option : ` 5,000 and any amount thereafter
¥ Dedicated Fund Manager for Overseas Investments: Mr. Sankalp Baid (since January 22, 2021) (Total experience: Over 13 years).
PERFORMANCE ^ - Regular Plan - growth Option
Date Period Scheme Returns
(%) $$
Benchmark Returns
(%)#
Additional Benchmark
Returns (%) ##
Value of ` 10,000 invested
Scheme (`) $$
Benchmark (`)#
Additional Benchmark
(`)##
Feb 28, 20 Last 1 Year 6.05 4.69 5.46 10,604 10,468 10,544Feb 28, 18 Last 3 Years 7.15 6.38 6.65 12,299 12,038 12,127Feb 29, 16 Last 5 Years 7.04 6.72 6.56 14,046 13,843 13,739Nov 18, 99 Since Inception 7.22 N.A. 6.47 44,143 N.A. 37,988
Returns greater than 1 year period are compounded annualized (CAGR). N.A. Not Available. $$ All dividends declared prior to the splitting of the Scheme into Dividend & Growth Options are assumed to be reinvested in the units of the Scheme at the then prevailing NAV (ex-dividend NAV). Performance of dividend option under the schemes for the investors would be net of distribution tax, if any. For performance of other schemes managed by Anil Bamboli & Vikas Agarwal, please refer page 66. Different plans viz. Regular Plan and Direct Plan have a different expense structure. The expenses of the Direct Plan under the Scheme will be lower to the extent of the distribution expenses / commission charged in the Regular Plan. For Performance of Direct Plan, refer page no. 79.
Face Value per Unit: ` 1,000, CD - Certificate of Deposit; CP - Commercial Papers. Data is as of February 28, 2021 unless otherwise specified.
This product is suitable for investors who are seeking ~
l income over short term
l to generate income / capital appreciation by investing in money market instruments
VeryHigh
Low to
Moderate
Low
Moderate ModeratelyHigh High
RISKOMETERInvestors understand that their principal will be at
moderate risk
~ Investors should consult their financial advisers, if in doubt about whether the product is suitable for them.
^Past performance may or may not be sustained in the future. Since Inception Date = Date of First allotment in the Scheme / Plan. Load is not taken into consideration for computation of performance.
(An open ended debt scheme investing in money market instruments)HDFC Money Market Fund
Issuer Rating % to NAVDEBT & DEBT RElATEDgOVERNMENT SECURITIES (CENTRAl/STATE)• 8.2 GOI 2022 Sovereign 4.128.79 GOI 2021 Sovereign 1.426.17 GOI 2021 Sovereign 0.837.62% Maharashtra SDL - Mat 140321 Sovereign 0.10Sub Total 6.47T-BIllS• 182 Days Tbill Mat 040321 Sovereign 6.03182 days Tbill ISD 180221 Mat 190821 Sovereign 2.71182 Days Tbill Mat 110321 Sovereign 1.37364 Days Tbill Mat 180321 Sovereign 1.37182 days Tbill Mat 180321 Sovereign 0.69364 Days Tbill Mat 300321 Sovereign 0.46Sub Total 12.63Total 19.10MONEY MARKET INSTRUMENTSCP • Reliance Industries Ltd. CRISIL - A1+ 8.84• Hindustan Zinc Ltd. CRISIL - A1+ 4.96• Sun Pharmaceutical
Industries Ltd. CRISIL - A1+ 4.41• Tata Teleservices Ltd. CRISIL - A1+ 3.68LIC Housing Finance Ltd. CRISIL - A1+ 3.20Tata Motors Ltd. CRISIL - A1+ 2.74Manappuram Finance Ltd. CRISIL - A1+ 2.64Deutsche Investments India Pvt. Ltd. CRISIL - A1+ 2.61National Bank for Agriculture & Rural Development ICRA - A1+ 2.49CanFin Homes Ltd. CARE - A1+ 2.45SBI Global Factors Ltd. CRISIL - A1+ 2.20
Issuer Rating % to NAVTATA Housing Development Co Ltd. CARE - A1+ 1.75Housing Development Finance Corporation Ltd.£ CRISIL - A1+ 1.59Daimler Fin Ser (I) Pvt Ltd. CRISIL - A1+ 1.37Bajaj Housing Finance Ltd. CRISIL - A1+ 1.34TMF Holdings Ltd. (Subsidiary of Tata Motors Ltd.) CARE - A1+ 1.30Motilal Oswal Financial Services Ltd. CRISIL - A1+ 0.91ICICI Securities Ltd. CRISIL - A1+ 0.90Fullerton India Home Finance Company Ltd. CRISIL - A1+ 0.65Fedbank Financial Services Ltd. CRISIL - A1+ 0.44Tata Teleservices (Maharashtra) Ltd. CRISIL - A1+ 0.22Sub Total 50.69CD• National Bank for Agriculture
& Rural Development IND - A1+ 5.77• Bank of Baroda CRISIL - A1+ 4.35• Export - Import Bank of India CRISIL - A1+ 4.35• Small Industries
Development Bank ICRA - A1+ 3.89Axis Bank Ltd. CRISIL - A1+ 3.66The Federal Bank Ltd. CARE - A1+ 0.92Indusind Bank Ltd. CRISIL - A1+ 0.69Sub Total 23.63Total 74.32Cash, Cash equivalents and Net Current Assets 6.58Grand Total 100.00• Top Ten Holdings, £ Co-sponsor
PORTFOLIO
SIP PERFORMANCE ^ - Regular Plan - growth Option
Since Inception SIP
15 year SIP 10 year SIP 5 Year SIP 3 Year SIP 1 Year SIP
Total Amount Invested (` ‘000) 2,560.00 1,800.00 1,200.00 600.00 360.00 120.00
Mkt Value As on February 26, 2021 (` ‘000) $$ 6,060.00 3,288.10 1,759.15 711.05 396.70 122.85
Returns (%) $$ 7.42 7.61 7.44 6.75 6.45 4.52
Benchmark Returns (%) # N.A. 7.62 7.23 6.20 5.67 4.00
Additional Benchmark Returns (%) ## 6.36 6.62 6.83 6.35 6.12 4.07
Assuming ` 10,000 invested systematically on the first Business Day of every month over a period of time. CAGR returns are computed after accounting for the cash flow by using xIRR method (investment internal rate of return) for Regular Plan - Growth Option. The above investment simulation is for illustrative purposes only and should not be construed as a promise on minimum returns and safeguard of capital.
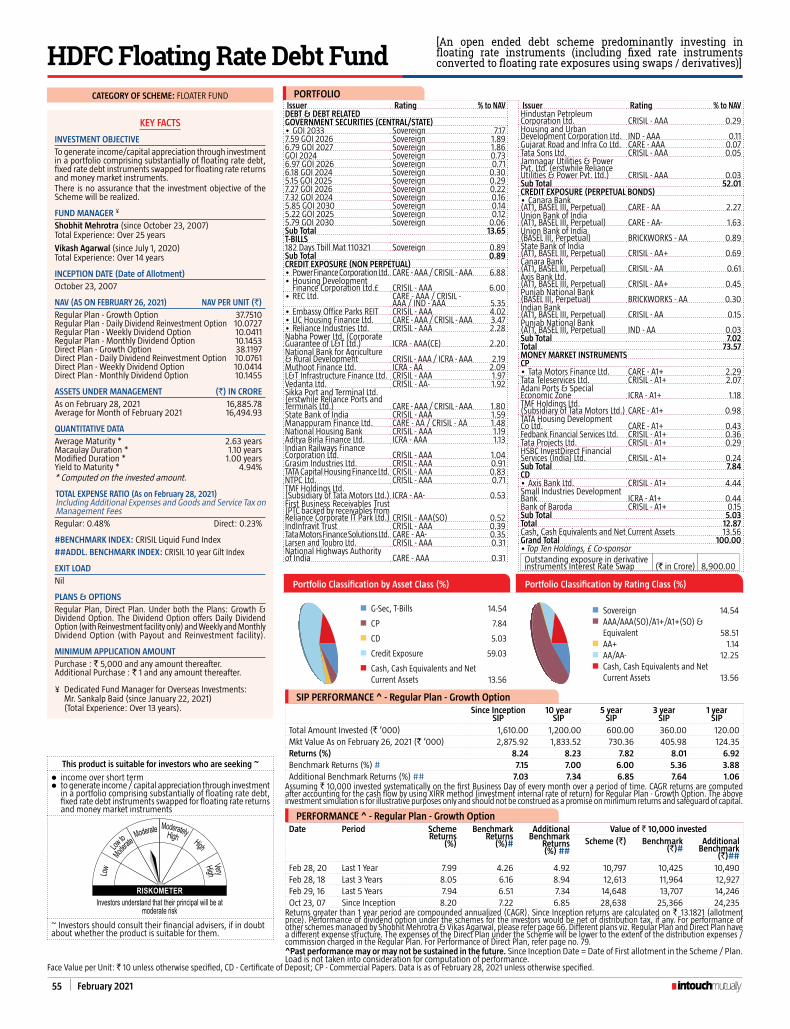
55 February 2021
PORTFOLIOIssuer Rating % to NAVDEBT & DEBT RElATEDgOVERNMENT SECURITIES (CENTRAl/STATE)• GOI 2033 Sovereign 7.177.59 GOI 2026 Sovereign 1.896.79 GOI 2027 Sovereign 1.86GOI 2024 Sovereign 0.736.97 GOI 2026 Sovereign 0.716.18 GOI 2024 Sovereign 0.305.15 GOI 2025 Sovereign 0.297.27 GOI 2026 Sovereign 0.227.32 GOI 2024 Sovereign 0.165.85 GOI 2030 Sovereign 0.145.22 GOI 2025 Sovereign 0.125.79 GOI 2030 Sovereign 0.06Sub Total 13.65T-BIllS182 Days Tbill Mat 110321 Sovereign 0.89Sub Total 0.89CREDIT EXPOSURE (NON PERPETUAl)• Power Finance Corporation Ltd. CARe - AAA / CRISIL - AAA 6.88• Housing Development
Finance Corporation Ltd.£ CRISIL - AAA 6.00• REC Ltd. CARe - AAA / CRISIL -
AAA / IND - AAA 5.35• Embassy Office Parks REIT CRISIL - AAA 4.02• LIC Housing Finance Ltd. CARe - AAA / CRISIL - AAA 3.47• Reliance Industries Ltd. CRISIL - AAA 2.28Nabha Power Ltd. (Corporate Guarantee of L&T Ltd.) ICRA - AAA(Ce) 2.20National Bank for Agriculture & Rural Development CRISIL - AAA / ICRA - AAA 2.19Muthoot Finance Ltd. ICRA - AA 2.09L&T Infrastructure Finance Ltd. CRISIL - AAA 1.97Vedanta Ltd. CRISIL - AA- 1.92Sikka Port and Terminal Ltd. (erstwhile Reliance Ports and Terminals Ltd.) CARe - AAA / CRISIL - AAA 1.80State Bank of India CRISIL - AAA 1.59Manappuram Finance Ltd. CARe - AA / CRISIL - AA 1.48National Housing Bank CRISIL - AAA 1.19Aditya Birla Finance Ltd. ICRA - AAA 1.13Indian Railways Finance Corporation Ltd. CRISIL - AAA 1.04Grasim Industries Ltd. CRISIL - AAA 0.91TATA Capital Housing Finance Ltd. CRISIL - AAA 0.83NTPC Ltd. CRISIL - AAA 0.71TMF Holdings Ltd. (Subsidiary of Tata Motors Ltd.) ICRA - AA- 0.53First Business Receivables Trust (PTC backed by receivables from Reliance Corporate IT Park Ltd.) CRISIL - AAA(SO) 0.52IndInfravit Trust CRISIL - AAA 0.39Tata Motors Finance Solutions Ltd. CARe - AA- 0.35Larsen and Toubro Ltd. CRISIL - AAA 0.31National Highways Authority of India CARe - AAA 0.31
Issuer Rating % to NAVHindustan Petroleum Corporation Ltd. CRISIL - AAA 0.29Housing and Urban Development Corporation Ltd. IND - AAA 0.11Gujarat Road and Infra Co Ltd. CARe - AAA 0.07Tata Sons Ltd. CRISIL - AAA 0.05Jamnagar Utilities & Power Pvt. Ltd. (erstwhile Reliance Utilities & Power Pvt. Ltd.) CRISIL - AAA 0.03Sub Total 52.01CREDIT EXPOSURE (PERPETUAl BONDS)• Canara Bank (AT1, BASeL III, Perpetual) CARe - AA 2.27Union Bank of India (AT1, BASeL III, Perpetual) CARe - AA- 1.63Union Bank of India (BASeL III, Perpetual) BRICKWORKS - AA 0.89State Bank of India (AT1, BASeL III, Perpetual) CRISIL - AA+ 0.69Canara Bank (AT1, BASeL III, Perpetual) CRISIL - AA 0.61Axis Bank Ltd. (AT1, BASeL III, Perpetual) CRISIL - AA+ 0.45Punjab National Bank (BASeL III, Perpetual) BRICKWORKS - AA 0.30Indian Bank (AT1, BASeL III, Perpetual) CRISIL - AA 0.15Punjab National Bank (AT1, BASeL III, Perpetual) IND - AA 0.03Sub Total 7.02Total 73.57MONEY MARKET INSTRUMENTSCP • Tata Motors Finance Ltd. CARE - A1+ 2.29Tata Teleservices Ltd. CRISIL - A1+ 2.07Adani Ports & Special economic Zone ICRA - A1+ 1.18TMF Holdings Ltd. (Subsidiary of Tata Motors Ltd.) CARE - A1+ 0.98TATA Housing Development Co Ltd. CARE - A1+ 0.43Fedbank Financial Services Ltd. CRISIL - A1+ 0.36Tata Projects Ltd. CRISIL - A1+ 0.29HSBC InvestDirect Financial Services (India) Ltd. CRISIL - A1+ 0.24Sub Total 7.84CD • Axis Bank Ltd. CRISIL - A1+ 4.44Small Industries Development Bank ICRA - A1+ 0.44Bank of Baroda CRISIL - A1+ 0.15Sub Total 5.03Total 12.87Cash, Cash equivalents and Net Current Assets 13.56Grand Total 100.00• Top Ten Holdings, £ Co-sponsorOutstanding exposure in derivative instruments Interest Rate Swap (` in Crore) 8,900.00
Portfolio Classification by Asset Class (%)
n G-Sec, T-Bills 14.54
n CP 7.84
n CD 5.03
n Credit exposure 59.03
n Cash, Cash equivalents and Net Current Assets 13.56
Portfolio Classification by Rating Class (%)
n Sovereign 14.54n AAA/AAA(SO)/A1+/A1+(SO) &
equivalent 58.51n AA+ 1.14n AA/AA- 12.25n Cash, Cash equivalents and Net
Current Assets 13.56
CATEgORY OF SCHEME: FLOATER FUND
KEY FACTS
INVESTMENT OBjECTIVETo generate income/capital appreciation through investment in a portfolio comprising substantially of floating rate debt, fixed rate debt instruments swapped for floating rate returns and money market instruments. There is no assurance that the investment objective of the Scheme will be realized.
FUND MANAgER ¥
Shobhit Mehrotra (since October 23, 2007)
Total experience: Over 25 years
Vikash Agarwal (since July 1, 2020)
Total Experience: Over 14 years
INCEPTION DATE (Date of Allotment)October 23, 2007
NAV (AS ON FEBRUARY 26, 2021) NAV PER UNIT (`)Regular Plan - Growth Option 37.7510Regular Plan - Daily Dividend Reinvestment Option 10.0727Regular Plan - Weekly Dividend Option 10.0411Regular Plan - Monthly Dividend Option 10.1453Direct Plan - Growth Option 38.1197Direct Plan - Daily Dividend Reinvestment Option 10.0761Direct Plan - Weekly Dividend Option 10.0414Direct Plan - Monthly Dividend Option 10.1455
ASSETS UNDER MANAgEMENT (`) IN CROREAs on February 28, 2021 16,885.78Average for Month of February 2021 16,494.93
qUANTITATIVE DATAAverage Maturity * 2.63 yearsMacaulay Duration * 1.10 yearsModified Duration * 1.00 yearsYield to Maturity * 4.94%* Computed on the invested amount.
TOTAL ExPENSE RATIO (As on February 28, 2021)Including Additional expenses and Goods and Service Tax on Management FeesRegular: 0.48% Direct: 0.23%
#BENCHMARK INDEX: CRISIL Liquid Fund Index
##ADDl. BENCHMARK INDEX: CRISIL 10 year Gilt Index
EXIT lOADNil
PLANS & OPTIONSRegular Plan, Direct Plan. Under both the Plans: Growth & Dividend Option. The Dividend Option offers Daily Dividend Option (with Reinvestment facility only) and Weekly and Monthly Dividend Option (with Payout and Reinvestment facility).
MINIMUM APPlICATION AMOUNTPurchase : ` 5,000 and any amount thereafter. Additional Purchase : ` 1 and any amount thereafter.
¥ Dedicated Fund Manager for Overseas Investments: Mr. Sankalp Baid (since January 22, 2021) (Total experience: Over 13 years).
Face Value per Unit: ` 10 unless otherwise specified, CD - Certificate of Deposit; CP - Commercial Papers. Data is as of February 28, 2021 unless otherwise specified.
PERFORMANCE ^ - Regular Plan - growth OptionDate Period Scheme
Returns (%)
Benchmark Returns
(%)#
Additional Benchmark
Returns (%) ##
Value of ` 10,000 investedScheme (`) Benchmark
(`)#Additional
Benchmark (`)##
Feb 28, 20 Last 1 Year 7.99 4.26 4.92 10,797 10,425 10,490Feb 28, 18 Last 3 Years 8.05 6.16 8.94 12,613 11,964 12,927Feb 29, 16 Last 5 Years 7.94 6.51 7.34 14,648 13,707 14,246Oct 23, 07 Since Inception 8.20 7.22 6.85 28,638 25,366 24,235
Returns greater than 1 year period are compounded annualized (CAGR). Since Inception returns are calculated on ` 13.1821 (allotment price). Performance of dividend option under the schemes for the investors would be net of distribution tax, if any. For performance of other schemes managed by Shobhit Mehrotra & Vikas Agarwal, please refer page 66. Different plans viz. Regular Plan and Direct Plan have a different expense structure. The expenses of the Direct Plan under the Scheme will be lower to the extent of the distribution expenses / commission charged in the Regular Plan. For Performance of Direct Plan, refer page no. 79.
This product is suitable for investors who are seeking ~
l income over short terml to generate income / capital appreciation through investment
in a portfolio comprising substantially of floating rate debt, fixed rate debt instruments swapped for floating rate returns and money market instruments
VeryHigh
Low to
Moderate
Low
Moderate ModeratelyHigh High
RISKOMETERInvestors understand that their principal will be at
moderate risk~ Investors should consult their financial advisers, if in doubt about whether the product is suitable for them.
^Past performance may or may not be sustained in the future. Since Inception Date = Date of First allotment in the Scheme / Plan. Load is not taken into consideration for computation of performance.
[An open ended debt scheme predominantly investing in floating rate instruments (including fixed rate instruments converted to floating rate exposures using swaps / derivatives)]HDFC Floating Rate Debt Fund
SIP PERFORMANCE ^ - Regular Plan - growth OptionSince Inception
SIP10 year
SIP5 year
SIP3 year
SIP1 year
SIPTotal Amount Invested (` ‘000) 1,610.00 1,200.00 600.00 360.00 120.00 Mkt Value As on February 26, 2021 (` ‘000) 2,875.92 1,833.52 730.36 405.98 124.35 Returns (%) 8.24 8.23 7.82 8.01 6.92 Benchmark Returns (%) # 7.15 7.00 6.00 5.36 3.88 Additional Benchmark Returns (%) ## 7.03 7.34 6.85 7.64 1.06
Assuming ` 10,000 invested systematically on the first Business Day of every month over a period of time. CAGR returns are computed after accounting for the cash flow by using xIRR method (investment internal rate of return) for Regular Plan - Growth Option. The above investment simulation is for illustrative purposes only and should not be construed as a promise on minimum returns and safeguard of capital.

February 2021 56
CATEgORY OF SCHEME: ULTRA SHORT DURATION FUND
KEY FACTSINVESTMENT OBjECTIVE
To generate income / capital appreciation through investment in debt securities and money market instruments.
There is no assurance that the investment objective of the Scheme will be realized.
FUND MANAgER ¥
Anil Bamboli (since September 25, 2018)
Total experience: Over 23 years
INCEPTION DATE (Date of Allotment)
September 25, 2018
NAV (AS ON FEBRUARY 26, 2021) NAV PER UNIT (`)
Regular Plan - Growth Option 11.7969Regular Plan - Daily Dividend Reinvestment Option 10.1030Regular Plan - Weekly Dividend Option 10.0536Regular Plan - Monthly Dividend Option 10.1536Direct Plan - Growth Option 11.8856Direct Plan - Daily Dividend Reinvestment Option 10.0920Direct Plan - Weekly Dividend Option 10.0540Direct Plan - Monthly Dividend Option 10.0539
ASSETS UNDER MANAgEMENT (`) IN CRORE
As on February 28, 2021 18,426.28Average for Month of February 2021 18,073.61
qUANTITATIVE DATA
Average Maturity * 154 daysMacaulay Duration * 141 daysModified Duration * 137 daysYield to Maturity * 3.92%* Computed on the invested amount.
TOTAL ExPENSE RATIO (As on February 28, 2021)Including Additional expenses and Goods and Service Tax on Management Fees
Regular: 0.64% Direct: 0.29%
#BENCHMARK INDEX: CRISIL Ultra Short Term Debt Index
##ADDl. BENCHMARK INDEX: CRISIL 1 year T-Bill Index
EXIT lOAD
Nil
PLANS & OPTIONS
Regular Plan, Direct Plan. Under both the Plans: Growth & Dividend Option. The Dividend Option offers Daily Dividend Option (with Reinvestment facility only) and Weekly and Monthly Dividend Option (with Payout and Reinvestment facility).
MINIMUM APPlICATION AMOUNT
Purchase : ` 5,000 and any amount thereafter. Additional Purchase : ` 1,000 and any amount thereafter.
¥ Dedicated Fund Manager for Overseas Investments: Mr. Sankalp Baid (since January 22, 2021) (Total experience: Over 13 years).
Face Value per Unit: ` 10 unless otherwise specified, CD - Certificate of Deposit; CP - Commercial Papers. Data is as of February 28, 2021 unless otherwise specified.
This product is suitable for investors who are seeking ~
l income over short terml income/capital appreciation through investment in debt
securities and money market instruments
VeryHigh
Low to
Moderate
Low
Moderate ModeratelyHigh High
RISKOMETERInvestors understand that their principal will be at
moderate risk
~ Investors should consult their financial advisers, if in doubt about whether the product is suitable for them.
[An open ended ultra-short term debt scheme investing in instruments such that the Macaulay Duration of the portfolio is between 3 months and 6 months (Refer page 2 for definition of Macaulay Duration)]HDFC Ultra Short Term Fund
Issuer Rating % to NAV
DEBT & DEBT RElATED
gOVERNMENT SECURITIES (CENTRAl/STATE)
8.35 GOI 2022 Sovereign 0.37
7.94 GOI 2021 Sovereign 0.27
Sub Total 0.64
T-BIllS
• 182 days Tbill ISD 081020 Mat 080421 Sovereign 2.70
• 364 Days Tbill Mat 220421 Sovereign 2.70
182 Days Tbill Mat 250321 Sovereign 0.54
364 Days Tbill Mat 180321 Sovereign 0.54
364 Days Tbill Mat 250321 Sovereign 0.54
364 Days Tbill Mat 100621 Sovereign 0.22
182 Days Tbill Mat 110321 Sovereign 0.14
182 days Tbill Mat 180321 Sovereign 0.14
Sub Total 7.52
CREDIT EXPOSURE (NON PERPETUAl)
• Housing Development Finance Corporation Ltd.£ CRISIL - AAA 8.34
• Aditya Birla Finance Ltd. ICRA - AAA 3.51
• REC Ltd. CRISIL - AAA 3.24
Power Finance Corporation Ltd. CARe - AAA / CRISIL - AAA 2.47
LIC Housing Finance Ltd. CARe - AAA / CRISIL - AAA 1.98
National Bank for Agriculture & Rural Development CRISIL - AAA / ICRA - AAA 1.94
Reliance Industries Ltd. CRISIL - AAA 1.70
L&T Infrastructure Finance Ltd. CRISIL - AAA 0.97
Sundaram Finance Ltd. CRISIL - AAA 0.68
L&T Finance Ltd. CARe - AAA / IND - AAA 0.56
TATA Capital Housing Finance Ltd. CRISIL - AAA 0.56
Tata Sons Ltd. CRISIL - AAA 0.54
Mobil Trust Series 10 (PTC of pools from Shriram City Union Finance Ltd.) CRISIL - AAA(SO) 0.51
Small Industries Development Bank CARe - AAA 0.51
John Deere Financial India Pvt. Ltd. CRISIL - AAA 0.46
Food Corporation of India (Corporate guarantee from Govt of India) CARe - AAA(Ce) 0.43
National Highways Authority of India CRISIL - AAA 0.36
First Business Receivables Trust (PTC backed by receivables from Reliance Corporate IT Park Ltd.) CRISIL - AAA(SO) 0.31
HDB Financial Services Ltd. CRISIL - AAA 0.19
Bajaj Finance Ltd. CRISIL - AAA 0.17
Aditya Birla Housing Finance Ltd. ICRA - AAA 0.09
Copeland Jan 2020 (PTC of pools from Muthoot Capital Services Ltd.) CRISIL - AAA(SO) 0.05
Sub Total 29.57
Total 37.73
Issuer Rating % to NAV
MONEY MARKET INSTRUMENTS
CP
• Reliance Industries Ltd. CRISIL - A1+ 5.77
• National Bank for Agriculture & Rural Development ICRA - A1+ 3.65
• Hindustan Zinc Ltd. CRISIL - A1+ 3.08
• Adani Ports & Special economic Zone ICRA - A1+ 2.71
• Bharat Oman Refineries Ltd. CRISIL - A1+ 2.71
Indian Railways Finance Corporation Ltd. CRISIL - A1+ 2.70
Manappuram Finance Ltd. CRISIL - A1+ 2.62
CanFin Homes Ltd. CARE - A1+ 2.11
Tata Teleservices Ltd. CRISIL - A1+ 2.02
Tata Motors Finance Ltd. CARE - A1+ 1.89
UPL Ltd. CARE - A1+ / CRISIL - A1+ 1.62
Sun Pharmaceutical Industries Ltd. CRISIL - A1+ 1.20
TATA Housing Development Co Ltd. CARE - A1+ 1.09
Bahadur Chand Investments Pvt. Ltd. CARE - A1+ 1.07
Tata Realty and Infrastructure Ltd. CRISIL - A1+ 1.07
Godrej Properties Ltd. CRISIL - A1+ 0.90
Kalpataru Power Transmission Ltd. CRISIL - A1+ 0.54
Motilal Oswal Financial Services Ltd. CRISIL - A1+ 0.54
SBI Global Factors Ltd. CRISIL - A1+ 0.54
Tata Projects Ltd. CRISIL - A1+ 0.53
TMF Holdings Ltd. (Subsidiary of Tata Motors Ltd.) CARE - A1+ 0.51
Rashtriya Chemicals and Fertilizers Ltd. CARE - A1+ 0.38
ICICI Securities Ltd. CRISIL - A1+ 0.27
Deutsche Investments India Pvt. Ltd. CRISIL - A1+ 0.26
Fedbank Financial Services Ltd. CRISIL - A1+ 0.26
SBI Cards and Payment Services Ltd. CRISIL - A1+ 0.13
Tata Teleservices (Maharashtra) Ltd. CRISIL - A1+ 0.13
Sub Total 40.30
CD
National Bank for Agriculture & Rural Development CRISIL - A1+ / IND - A1+ 2.50
Axis Bank Ltd. CRISIL - A1+ 1.36
Sub Total 3.86
Total 44.16
Cash, Cash equivalents and Net Current Assets 18.11
Grand Total 100.00
• Top Ten Holdings, £ Co-sponsorOutstanding exposure in derivative instruments Interest Rate Swap (` in Crore) 1,350.00
PORTFOLIO

57 February 2021
[An open ended ultra-short term debt scheme investing in instruments such that the Macaulay Duration of the portfolio is between 3 months and 6 months (Refer page 2 for definition of Macaulay Duration)]HDFC Ultra Short Term Fund
^Past performance may or may not be sustained in the future. Since Inception Date = Date of First allotment in the Scheme / Plan. Load is not taken into consideration for computation of performance.
Portfolio Classification by Asset Class (%)
n G-Sec, T-Bills 8.16
n CP 40.30n CD 3.86n Credit exposure 29.57n Cash, Cash equivalents and Net
Current Assets 18.11
Portfolio Classification by Rating Class (%)
n Sovereign 8.16n AAA/AAA(SO)/A1+/A1+(SO) &
equivalent 73.73n Cash, Cash equivalents and Net
Current Assets 18.11
PERFORMANCE ^ - Regular Plan - growth OptionDate Period Scheme
Returns (%)
Benchmark Returns
(%)#
Additional Benchmark
Returns (%) ##
Value of ` 10,000 investedScheme
(`)Benchmark
(`)#Additional
Benchmark (`)##
Feb 28, 20 Last 1 Year 5.91 5.57 5.46 10,589 10,556 10,544Sep 25, 18 Since Inception 7.05 7.03 6.88 11,797 11,791 11,750
Returns greater than 1 year period are compounded annualized (CAGR). Performance of dividend option under the schemes for the investors would be net of distribution tax, if any. For performance of other schemes managed by Anil Bamboli, please refer page 66. Different plans viz. Regular Plan and Direct Plan have a different expense structure. The expenses of the Direct Plan under the Scheme will be lower to the extent of the distribution expenses / commission charged in the Regular Plan. For Performance of Direct Plan, refer page no. 75.
SIP PERFORMANCE ^ - Regular Plan - growth Option
Since Inception SIP 1 Year SIP
Total Amount Invested (` ‘000) 300.00 120.00 Mkt Value As on February 26, 2021 (` ‘000) 324.48 123.05 Returns (%) 6.25 4.84 Benchmark Returns (%) # 6.23 4.86 Additional Benchmark Returns (%) ## 5.87 4.07
Assuming ` 10,000 invested systematically on the first Business Day of every month over a period of time. CAGR returns are computed after accounting for the cash flow by using xIRR method (investment internal rate of return) for Regular Plan - Growth Option. The above investment simulation is for illustrative purposes only and should not be construed as a promise on minimum returns and safeguard of capital.
.....Contd from previous page

February 2021 58
CATEgORY OF SCHEME: LIqUID FUND PORTFOLIO
KEY FACTS
INVESTMENT OBjECTIVE
To generate income through a portfolio comprising money market and debt instruments.
There is no assurance that the investment objective of the Scheme will be realized.
FUND MANAgER ¥
Anupam Joshi (since October 27, 2015)
Total experience: Over 12 years
INCEPTION DATE (Date of Allotment)
October 17, 2000
NAV (AS ON FEBRUARY 28, 2021)^^ NAV PER UNIT (`)
Regular Plan - Growth Option 4,006.9895Regular Plan - Daily Dividend Reinvestment Option 1,019.8200Regular Plan - Weekly Dividend Option 1,031.5433Regular Plan - Monthly Dividend Option 1,026.8111Direct Plan - Growth Option 4,034.4190Direct Plan - Daily Dividend Reinvestment Option 1,019.8200Direct Plan - Weekly Dividend Option 1,031.5603Direct Plan - Monthly Dividend Option 1,026.8280
ASSETS UNDER MANAgEMENT (`) IN CRORE
As on February 28, 2021 59,449.95Average for Month of February 2021 62,080.42
qUANTITATIVE DATA
Average Maturity * 52 daysMacaulay Duration * 52 daysModified Duration * 52 daysYield to Maturity * 3.27%* Computed on the invested amount.
TOTAL ExPENSE RATIO (As on February 28, 2021)Including Additional expenses and Goods and Service Tax on Management Fees
Regular: 0.30% Direct: 0.20%
#BENCHMARK INDEX: CRISIL Liquid Fund Index
##ADDl. BENCHMARK INDEX: CRISIL 1 year T-Bill Index
EXIT lOAD
l On investments made on or before October 19, 2019: NIL
l On investments (including through existing systematic plan registrations) made on or after October 20, 2019, as follows:
Units redeemed / switched-out within “X” days from the date
of allotment
Exit load as a % of redemption proceeds
Day 1 0.0070%Day 2 0.0065%Day 3 0.0060%Day 4 0.0055%Day 5 0.0050%Day 6 0.0045%Day 7 onwards Nil
PLANS & OPTIONS
Regular Plan, Direct Plan. Under both the Plans: Growth & Dividend Option. The Dividend Option offers Daily Dividend Option (Reinvestment facility only) and Weekly and Monthly Dividend Option (with Payout and Reinvestment facility).
MINIMUM APPlICATION AMOUNT
Purchase : Under Growth Option, Weekly Dividend Option and Monthly Dividend Option: ` 5,000 and any amount thereafter. Under Daily Dividend Option: ̀ 10,000 and any amount thereafter.Additional Purchase : Under Growth Option, Weekly Dividend Option and Monthly Dividend Option: ` 1,000 and any amount thereafter. Under Daily Dividend Option: ` 5,000 and any amount thereafter.
¥ Dedicated Fund Manager for Overseas Investments: Mr. Sankalp Baid (since January 22, 2021) (Total experience: Over 13 years).
^^Calculated on all calendar days.
Face Value per Unit: ` 1,000, CD - Certificate of Deposit; CP - Commercial Papers. Data is as of February 28, 2021 unless otherwise specified.
(An open ended liquid scheme)HDFC Liquid Fund
Company Rating % to NAV
DEBT & DEBT RElATED
gOVERNMENT SECURITIES (CENTRAl/STATE)
7.8 GOI 2021 Sovereign 0.03
Sub Total 0.03
T-BIllS
• 364 Days Tbill Mat 130521 Sovereign 9.95
• 364 Days Tbill Mat 200521 Sovereign 9.58
• 364 Days Tbill Mat 290421 Sovereign 5.41
• 364 Days Tbill Mat 220421 Sovereign 4.63
• 182 Days Tbill Mat 110321 Sovereign 3.48
• 91 Days Tbill - ISD 241220 Mat 250321 Sovereign 3.46
182 Days Tbill Mat 250321 Sovereign 2.30
91 Days Tbill Mat 130521 Sovereign 2.17
364 Days Tbill Mat 300321 Sovereign 1.75
91 Days Tbill Mat 180321 Sovereign 1.68
91 Days Tbill - Mat 110321 Sovereign 1.43
91 Days Tbill Mat 200521 Sovereign 1.09
182 days Tbill Mat 180321 Sovereign 0.69
91 Days Tbill Mat 040321 Sovereign 0.50
182 Days Tbill Mat 040321 Sovereign 0.34
364 Days Tbill - Mat 070521 Sovereign 0.18
364 Days Tbill Mat 110321 Sovereign 0.17
91 Days Tbill Mat 220421 Sovereign 0.17
364 Days Tbill Mat 250321 Sovereign 0.08
91 Days Tbill Mat 060521 Sovereign 0.07
364 Days Tbill Mat 180321 Sovereign 0.05
91 Days Tbill Mat 290421 Sovereign 0.01
Sub Total 49.19
CREDIT EXPOSURE (NON-PERPETUAl)
Indian Railways Finance Corporation Ltd. CARe - AAA 0.04
ReC Ltd. CRISIL - AAA 0.02
Sub Total 0.06
Total 49.28
MONEY MARKET INSTRUMENTS
CP
• National Bank for Agriculture & Rural Development ICRA - A1+ 8.48
• Bajaj Finance Ltd. CRISIL - A1+ 5.51
• Indian Oil Corporation Ltd. ICRA - A1+ 4.37
Company Rating % to NAV
• NTPC Ltd. CRISIL - A1+ 3.34
Reliance Industries Ltd. CRISIL - A1+ 3.13
Tata Teleservices (Maharashtra) Ltd. CRISIL - A1+ 2.53
Steel Authority Of India Ltd. CARE - A1+ 2.41
Reliance Retail ventures Ltd. CRISIL - A1+ 1.67
IIFL Finance Ltd. CRISIL - A1+ 1.26
Bharat Heavy electricals Ltd. CARE - A1+ 1.18
Indian Railways Finance Corporation Ltd. CRISIL - A1+ 1.17
NLC India Ltd. CARE - A1+ 1.09
Chennai Petroleum Corp Ltd. CRISIL - A1+ 0.96
Adani Ports & Special economic Zone ICRA - A1+ 0.84
Aditya Birla Finance Ltd. ICRA - A1+ 0.83
Infina Finance Pvt. Ltd. CRISIL - A1+ 0.79
JM Financial Capital Ltd. CRISIL - A1+ 0.67
Mangalore Refinery and Petrochemicals Ltd. CARE - A1+ 0.67
JM Financial Products Ltd. CRISIL - A1+ 0.59
Tata Teleservices Ltd. CRISIL - A1+ 0.52
Axis Finance Ltd. CRISIL - A1+ 0.34
ICICI SeCURITIeS Ltd. CRISIL - A1+ 0.34
Kotak Securities Ltd. CRISIL - A1+ 0.34
export - Import Bank of India CRISIL - A1+ 0.21
Kalpataru Power Transmission Ltd. CRISIL - A1+ 0.17
LIC Housing Finance Ltd. CRISIL - A1+ 0.17
The Tata Power Company Ltd. CRISIL - A1+ 0.15
Sub Total 43.73
CD
Barclays Bank IND - A1+ 0.42
The Federal Bank Ltd. CRISIL - A1+ 0.42
IDFC First Bank Ltd. CRISIL - A1+ 0.17
National Bank for Agriculture & Rural Development IND - A1+ 0.13
Axis Bank Ltd. CRISIL - A1+ 0.08
Sub Total 1.22
Total 44.95
Cash, Cash equivalents and Net Current Assets 5.77
Grand Total 100.00
• Top Ten Holdings

59 February 2021
This product is suitable for investors who are seeking ~
l regular income over short term
l to generate income through a portfolio comprising money market and debt instruments
VeryHigh
Low to
Moderate
Low
Moderate ModeratelyHigh High
RISKOMETERInvestors understand that their principal will be at
low to moderate risk
~ Investors should consult their financial advisers, if in doubt about whether the product is suitable for them.
(An open ended liquid scheme) .....Contd from previous pageHDFC Liquid Fund
PERFORMANCE ^ - Regular Plan - growth OptionDate Period Scheme
Returns (%)
Benchmark Returns
(%)#
Additional Benchmark
Returns (%) ##
Value of ` 10,000 investedScheme (`) Benchmark
(`)#Additional
Benchmark (`)##
Feb 21, 21 Last 7 days 2.93 3.48 4.89 10,006 10,007 10,009Feb 13, 21 Last 15 days 3.26 3.71 5.96 10,013 10,015 10,024Jan 31, 21 Last 1 Month 3.20 3.81 4.54 10,025 10,029 10,035Feb 29, 20 Last 1 Year 3.76 4.27 5.46 10,376 10,427 10,546Feb 28, 18 Last 3 Years 5.74 6.16 6.64 11,825 11,966 12,129Feb 29, 16 Last 5 Years 6.22 6.51 6.56 13,527 13,710 13,742Oct 17, 00 Since Inception 7.05 N.A. 6.39 40,070 N.A. 35,306
Returns less than 1 year period are simple annualized and greater than 1 year are compounded annualized (CAGR). N.A. Not Available. Performance of dividend option under the schemes for the investors would be net of distribution tax, if any. For performance of other schemes managed by Anupam Joshi, please refer page 66. Different plans viz. Regular Plan and Direct Plan have a different expense structure. The expenses of the Direct Plan under the Scheme will be lower to the extent of the distribution expenses / commission charged in the Regular Plan. For Performance of Direct Plan, refer page no. 74.
n G-Sec, T-Bills 49.22
n CP 43.73
n CD 1.22
n Credit exposure 0.06
n Cash, Cash equivalents and Net Current Assets 5.77
Portfolio Classification by Asset Class (%)
n Sovereign 49.22n AAA/AAA(SO)/A1+/A1+(SO) &
equivalent 45.01
n Cash, Cash equivalents and Net Current Assets 5.77
Portfolio Classification by Rating Class (%)
SIP PERFORMANCE ^ - Regular Plan - growth Option
Since Inception SIP
15 year SIP 10 year SIP 5 Year SIP 3 Year SIP 1 Year SIP
Total Amount Invested (` ‘000) 2,450.00 1,800.00 1,200.00 600.00 360.00 120.00
Mkt Value As on February 26, 2021 (` ‘000) 5,361.80 3,174.83 1,704.69 691.05 387.61 122.05
Returns (%) 7.10 7.18 6.84 5.61 4.89 3.25
Benchmark Returns (%) # N.A. 7.17 7.00 6.00 5.36 3.88
Additional Benchmark Returns (%) ## 6.36 6.62 6.83 6.35 6.12 4.07
Assuming ̀ 10,000 invested systematically on the first Business Day of every month over a period of time. CAGR returns are computed after accounting for the cash flow by using xIRR method (investment internal rate of return) for Regular Plan - Growth Option. The above investment simulation is for illustrative purposes only and should not be construed as a promise on minimum returns and safeguard of capital. SIP facility in the Scheme has been made available from November 12, 2020.
^Past performance may or may not be sustained in the future. Since Inception Date = Date of First allotment in the Scheme / Plan. Load is not taken into consideration for computation of performance.

February 2021 60
CATEgORY OF SCHEME: OVERNIGHT FUND
KEY FACTS
INVESTMENT OBjECTIVE
To generate returns by investing in debt and money market instruments with overnight maturity.
There is no assurance that the investment objective of the Scheme will be realized.
FUND MANAgER ¥
Anil Bamboli (since July 25, 2012)
Total experience: Over 23 years
INCEPTION DATE (Date of Allotment)
February 06, 2002
NAV (AS ON FEBRUARY 28, 2021)^^ NAV PER UNIT (`)
Regular Plan - Growth Option 3,032.4768Regular Plan - Daily Dividend Reinvestment Option 1,042.6600Direct Plan - Growth Option 3,049.9254Direct Plan - Daily Dividend Reinvestment Option 1,042.6600
ASSETS UNDER MANAgEMENT (`) IN CRORE
As on February 28, 2021 13,870.11Average for Month of February 2021 14,228.86
qUANTITATIVE DATA
Average Maturity * 1 dayMacaulay Duration * 1 dayModified Duration * 1 dayYield to Maturity * 3.23%* Computed on the invested amount.
TOTAL ExPENSE RATIO (As on February 28, 2021)Including Additional expenses and Goods and Service Tax on Management Fees
Regular: 0.20% Direct: 0.10%
#BENCHMARK INDEX: CRISIL Overnight Index
##ADDl. BENCHMARK INDEX: CRISIL 1 year T-Bill Index
EXIT lOAD
Nil
PLANS & OPTIONS
Regular Plan, Direct Plan. Each Plan offers Growth and Daily Dividend Option (with Reinvestment facility only).
MINIMUM APPlICATION AMOUNT
Purchase : Under Growth Option : ` 5,000 and any amount thereafter. Under Daily Dividend Option : ` 10,000 and any amount thereafter
Additional Purchase : Under Growth Option : ̀ 1,000 and any amount thereafter. Under Daily Dividend Option : ` 5,000 and any amount thereafter
¥ Dedicated Fund Manager for Overseas Investments: Mr. Sankalp Baid (since January 22, 2021) (Total experience: Over 13 years).
^^Calculated on all calendar days.
Face Value per Unit: ` 1,000, Data is as of February 28, 2021 unless otherwise specified. N.A. Not Available
PERFORMANCE ^ - Regular Plan - growth Option
Date Period Scheme Returns
(%)
Benchmark Returns
(%)#
Additional Benchmark
Returns (%) ##
Value of ` 10,000 invested
Scheme (`) Benchmark (`)#
Additional Benchmark
(`)##
Feb 21, 21 Last 7 days 2.81 3.04 4.89 10,005 10,006 10,009Feb 13, 21 Last 15 days N.A. N.A. N.A. N.A. N.A. N.A.Jan 31, 21 Last 1 Month 2.79 2.99 4.54 10,021 10,023 10,035Feb 28, 20 Last 1 Year 2.94 3.12 5.46 10,295 10,313 10,548Feb 28, 18 Last 3 Years 4.80 4.95 6.64 11,512 11,561 12,129Feb 29, 16 Last 5 Years 5.30 5.43 6.56 12,951 13,026 13,742Feb 06, 02 Since Inception 5.99 N.A. 6.07 30,325 N.A. 30,777
Returns less than 1 year period are simple annualized and greater than 1 year are compounded annualized (CAGR). N.A. Not Available. Performance of dividend option under the schemes for the investors would be net of distribution tax, if any. For performance of other schemes managed by Anil Bamboli, please refer page 66. Different plans viz. Regular Plan and Direct Plan have a different expense structure. The expenses of the Direct Plan under the Scheme will be lower to the extent of the distribution expenses / commission charged in the Regular Plan. For Performance of Direct Plan, refer page no. 75.
Cash, Cash equivalents and Net Current Assets 100.00
Portfolio Classification by Asset Class (%)
Cash, Cash equivalents and Net Current Assets 100.00
Portfolio Classification by Rating Class (%)
This product is suitable for investors who are seeking ~
l regular income over short term that may be in line with the overnight call rates
l to generate returns by investing in debt and money market instruments with overnight maturity
VeryHigh
Low to
Moderate
Low
Moderate ModeratelyHigh High
RISKOMETERInvestors understand that their principal will be at
low risk
~ Investors should consult their financial advisers, if in doubt about whether the product is suitable for them. ^Past performance may or may not be sustained in the future. Since Inception Date = Date of First allotment in the Scheme / Plan.
Load is not taken into consideration for computation of performance.
(An open ended debt scheme investing in overnight securities)HDFC Overnight Fund
Issuer Rating % to NAV
Cash, Cash equivalents and Net Current Assets 100.00
Grand Total 100.00
PORTFOLIO
SIP PERFORMANCE ^ - Regular Plan - growth Option
Since Inception SIP
15 year SIP 10 year SIP 5 Year SIP 3 Year SIP 1 Year SIP
Total Amount Invested (` ‘000) 2,290.00 1,800.00 1,200.00 600.00 360.00 120.00
Mkt Value As on February 26, 2021 (` ‘000) 4,279.72 2,922.76 1,621.88 676.42 383.01 121.83
Returns (%) 6.15 6.17 5.88 4.76 4.09 2.90
Benchmark Returns (%) # N.A. 6.22 6.03 4.90 4.27 3.09
Additional Benchmark Returns (%) ## 6.38 6.62 6.83 6.35 6.12 4.07
Assuming ̀ 10,000 invested systematically on the first Business Day of every month over a period of time. CAGR returns are computed after accounting for the cash flow by using xIRR method (investment internal rate of return) for Regular Plan - Growth Option. The above investment simulation is for illustrative purposes only and should not be construed as a promise on minimum returns and safeguard of capital. SIP facility in the Scheme has been made available from November 12, 2020.

61 February 2021
KEY FACTS
INVESTMENT OBjECTIVE
The investment objective of the Scheme is to generate returns that are in line with the performance of gold, subject to tracking errors.
There is no assurance that the investment objective of the Scheme will be realized.
Exchange Listed
BSe/NSe
Exchange Symbol/Scrip Code
BSE/NSE: HDFCMFGETF | 533230
ISIN
INF179K01CN1
Creation Unit Size
1,00,000 units of HDFC Gold ETF
FUND MANAgER
Krishan Kumar Daga (since October 19, 2015)
Total experience: Over 23 years
INCEPTION DATE (Date of Allotment)
August 13, 2010
NAV (AS ON FEBRUARY 26, 2021) NAV PER UNIT (`)
HDFC Gold ETF 41.0878
ASSETS UNDER MANAgEMENT (`) IN CRORE
As on February 28, 2021 2,142.81Average for Month of February 2021 2,143.61
TRACKINg ERROR
Annualised tracking error is calculated based on daily rolling returns for the last 12 months: 0.24%
TOTAL ExPENSE RATIO (As on February 28, 2021)Including Additional expenses and Goods and Service Tax on Management Fees
HDFC GOLD ETF 0.62%
#BENCHMARK INDEX: Domestic Price of Physical Gold
EXIT lOAD
For Creation Unit Size:l No exit load will be levied on redemptions made by
Authorised Participants / Large Investors directly with the Fund in Creation Unit Size.
For other than Creation Unit Size:l N.A. The Units of HGETF in other than Creation Unit Size cannot
be directly redeemed with the Fund. These Units can be redeemed (sold) on a continuous basis on
the NSe and BSe during the trading hours on all trading days. Refer SID for further details.
For further details, please refer to para ‘Exit Load’ on Pg 66.
PLANS & OPTIONS
Currently, there are no investment Plans/Options being offered under the Scheme.
MINIMUM APPlICATION AMOUNT
Authorised Participants: Application for subscription of HGETF Units directly with the Fund in Creation Unit Size at NAV based prices in exchange of Portfolio Deposit and Cash Component.
large Investors: Application for subscription of HGETF Units directly with the Fund in Creation Unit Size at NAV based prices by payment of requisite Cash as determined by the AMC only by means of payment instruction of Real Time Gross Settlement (RTGS) / National Electronic Funds Transfer (NEFT) or Funds Transfer Letter / Transfer Cheque of a bank where the Scheme has a collection account.
Other investors (including Authorised Participants and large Investors): Units of HGETF can be subscribed (in lots of 1 Unit) during the trading hours on all trading days on the NSe and BSe on which the Units are listed.
CATEgORY OF SCHEME: ExCHANGE TRADED FUND
This product is suitable for investors who are seeking ~
l returns that are commensurate with the performance of gold, subject to tracking errors, over long term
l investment predominantly in Gold bullion of 0.995 fineness
VeryHigh
Low to
Moderate
Low
Moderate ModeratelyHigh High
RISKOMETERInvestors understand that their principal will be at
moderately high risk
~ Investors should consult their financial advisers, if in doubt about whether the product is suitable for them.
Issuer Rating % to NAV
gOlD
Physical Gold (99.5% Purity) 97.89
Cash, Cash equivalents and Net Current Assets 2.11
Grand Total 100.00
PORTFOLIO
(An open ended scheme replicating / tracking performance of Gold)HDFC Gold Exchange Traded Fund
The Face Value per Unit is revised to ` 1 (earlier ` 100) and Allotment Price per unit is ` 18.0033 (earlier ` 1,800.3288) w.e.f. February 19, 2021. All return computations have been suitably adjusted for this change. Since inception returns are computed on the allotment price. Data is as of February 28, 2021 unless otherwise specified.
^Past performance may or may not be sustained in the future. Since Inception Date = Date of First allotment in the Scheme / Plan. Load is not taken into consideration for computation of performance.
PERFORMANCE * ^
Date Period Scheme Returns (%)
Benchmark Returns (%)#
Value of ` 10,000 invested
Scheme (`) Benchmark (`)#
Feb 28, 20 Last 1 Year 7.12 7.63 10,710 10,761Feb 28, 18 Last 3 Years 13.53 14.67 14,628 15,072Feb 29, 16 Last 5 Years 7.74 8.85 14,516 15,280Aug 13, 10 Since Inception 8.14 9.00 22,822 24,829
Returns less than 1 year period are simple annualized and greater than 1 year are compounded annualized (CAGR). * The Scheme does not offer any Plans/Options. For performance of other schemes managed by Krishan Kumar Daga, please refer page 66.
HDFC Gold ETF
n Gold 97.89
n Cash, Cash equivalents and Net Current Assets 2.11
Portfolio Classification by Asset Class (%) HDFC Gold ETF
n Gold 97.89
n Cash, Cash equivalents and Net Current Assets 2.11
Portfolio Classification by Rating Class (%)

February 2021 62
SIP PERFORMANCE ^ - Regular Plan - growth Option
Since Inception SIP
5 Year SIP
3 Year SIP
1 Year SIP
Total Amount Invested (` ‘000) 1,120.00 600.00 360.00 120.00 Mkt Value As on February 26, 2021 (` ‘000) 1,575.72 801.12 442.36 113.79 Returns (%) 7.14 11.55 13.93 -9.63 Benchmark Returns (%) # 8.41 12.40 14.44 -9.80 Additional Benchmark Returns (%) ## N.A. N.A. N.A. N.A.
Assuming ` 10,000 invested systematically on the first Business Day of every month over a period of time. CAGR returns are computed after accounting for the cash flow by using xIRR method (investment internal rate of return) for Regular Plan - Growth Option. The above investment simulation is for illustrative purposes only and should not be construed as a promise on minimum returns and safeguard of capital.
CATEgORY OF SCHEME: FUND OF FUND (DOMESTIC)
KEY FACTS
INVESTMENT OBjECTIVE
To seek capital appreciation by investing in units of HDFC Gold Exchange Traded Fund (HGETF).
There is no assurance that the investment objective of the Scheme will be realized.
FUND MANAgER
Krishan Kumar Daga (since October 19, 2015)
Total experience: Over 23 years
INCEPTION DATE (Date of Allotment)
November 01, 2011
NAV (AS ON FEBRUARY 26, 2021) NAV PER UNIT (`)
Regular Plan - Growth Option 14.7317Direct Plan - Growth Option 15.2000
ASSETS UNDER MANAgEMENT (`) IN CRORE
As on February 28, 2021 1,082.28Average for Month of February 2021 1,089.47
TOTAL ExPENSE RATIO (As on February 28, 2021)No Investment Management and Advisory Fees will be charged to the Scheme
Regular: 0.60% Direct: 0.25%
#BENCHMARK INDEX: Domestic Price of Physical Gold
EXIT lOAD
In respect of each purchase/switch-in of units-l An exit Load of 2% is payable if Units are redeemed/
switched-out within 6 months from the date of allotment.l An exit Load of 1% is payable if Units are redeemed/
switched-out after 6 months but within 1 year from the date of allotment.
l No exit Load is payable if Units are redeemed/switched-out after 1 year from the date of allotment.
For further details, please refer to para ‘Exit Load’ on Pg 66.
PLANS & OPTIONS
Regular Plan, Direct Plan. Each Plan offers Growth Option only.
MINIMUM APPlICATION AMOUNT
Purchase: Under Growth Option : ` 5,000 and any amount thereafter.
Additional Purchase : Under Growth Option : ` 1,000 and any amount thereafter.
Face Value per Unit: ` 10, Data is as of February 28, 2021 unless otherwise specified. N.A. Not Available
This product is suitable for investors who are seeking ~
l capital appreciation over long term
l investment in Units of HDFC Gold Exchange Traded Fund (HGETF). HGETF invests in gold bullion of 0.995 fineness
VeryHigh
Low to
Moderate
Low
Moderate ModeratelyHigh High
RISKOMETERInvestors understand that their principal will be at
moderately high risk
~ Investors should consult their financial advisers, if in doubt about whether the product is suitable for them.
(An open ended Fund of Fund scheme investing in HDFC Gold Exchange Traded Fund)HDFC Gold Fund
^Past performance may or may not be sustained in the future. Since Inception Date = Date of First allotment in the Scheme / Plan. Load is not taken into consideration for computation of performance.
Issuer Rating % to NAV
OTHERS
MUTUAl FUND UNITS
HDFC Gold Exchange Traded Fund 99.88
Cash, Cash equivalents and Net Current Assets 0.12
Grand Total 100.00
PORTFOLIO
PERFORMANCE ^ - Regular Plan - growth Option
Date Period Scheme Returns (%)
Benchmark Returns (%)#
Value of ` 10,000 invested
Scheme (`) Benchmark (`)#
Feb 28, 20 Last 1 Year 8.25 7.63 10,823 10,761Feb 28, 18 Last 3 Years 13.61 14.67 14,657 15,072Feb 29, 16 Last 5 Years 8.51 8.85 15,040 15,280Nov 01, 11 Since Inception 4.24 5.80 14,732 16,919
Returns less than 1 year period are simple annualized and greater than 1 year are compounded annualized (CAGR). N.A. Not Available. Performance of dividend option under the schemes for the investors would be net of distribution tax, if any. The investors will bear dual expenses i.e. the expenses charged, under the Scheme and underlying scheme (HDFC Gold Exchange Traded Fund) within the permissible limits. For performance of other schemes managed by Krishan Kumar Daga, please refer page 66. Different plans viz. Regular Plan and Direct Plan have a different expense structure. The expenses of the Direct Plan under the Scheme will be lower to the extent of the distribution expenses / commission charged in the Regular Plan. For Performance of Direct Plan, refer page no. 78.
HDFC Gold Fund
n Mutual Fund Units 99.88
n Cash, Cash equivalents and Net Current Assets 0.12
Portfolio Classification by Asset Class (%) HDFC Gold Fund
Cash, Cash equivalents and Net Current Assets 100.00
Portfolio Classification by Rating Class (%)

63 February 2021
Face Value per Unit: ` 223.31, + Industry Classification as recommended by AMFI, Data is as of February 28, 2021 unless otherwise specified. N.A. Not Available
KEY FACTS
INVESTMENT OBjECTIVE
The investment objective of the Scheme is to provide investment returns that, before expenses, closely correspond to the total returns of the Securities as represented by the NIFTY Bank Index, subject to tracking errors.
There is no assurance that the investment objective of the Scheme will be realized.
Exchange Listed
BSe/NSe
Exchange Symbol/Scrip Code
BSE/NSE: HBANKETF | 543224
ISIN
INF179KC1AN8
Creation Unit Size
12,500 units of HDFC Banking ETF
FUND MANAgER
Krishan Kumar Daga (since August 21, 2020)
Total experience: Over 23 years
Arun Agarwal (since August 24, 2020)
Total experience: Over 22 years
INCEPTION DATE (Date of Allotment)
August 21, 2020
NAV (AS ON FEBRUARY 26, 2021) NAV PER UNIT (`)
HDFC Banking ETF 347.86
ASSETS UNDER MANAgEMENT (`) IN CRORE
As on February 28, 2021 184.44Average for Month of February 2021 170.21
TOTAL ExPENSE RATIO (As on February 28, 2021)Including Additional expenses and Goods and Service Tax on Management Fees
HDFC BANKING ETF 0.16%
#BENCHMARK INDEX: NIFTY Bank (Total Returns Index)
##ADDl. BENCHMARK INDEX: NIFTY 50 (Total Returns Index)
EXIT lOAD
For Creation Unit Size:l No exit load will be levied on redemptions made by
Authorised Participants / Large Investors directly with the Fund in Creation Unit Size.
For other than Creation Unit Size:l N.A. The Units of the ETF in other than Creation Unit Size cannot
ordinarily be directly redeemed with the Fund. These Units can be redeemed (sold) on a continuous basis
on the exchange(s) where it is listed during the trading hours on all trading days.
Refer SID for further details.
For further details, please refer to para ‘Exit Load’ on Pg 66.
PLANS & OPTIONS
Currently, there are no investment Plans/Options being offered under the Scheme.
MINIMUM APPlICATION AMOUNT
Authorised Participants / large Investors: Application for subscription of the ETF Units in Creation Unit Size can be made either:
l in exchange of Cash* [as determined by the AMC equivalent to the cost incurred towards the purchase of predefined basket of securities that represent the underlying index (i.e. Portfolio Deposit)], Cash Component and other applicable transaction charges; or
l in exchange of Portfolio Deposit [i.e. by depositing basket of securities constituting NIFTY Bank Index] along with the cash component and applicable transaction charges.
Each Creation Unit Size will consist of 12,500 Units of the ETF and 1 Unit of the ETF will be approximately equal to 1/100th of the value of NIFTY Bank Index.
*Cash means payments shall be made only by means of payment instruction of Real Time Gross Settlement (RTGS) / National Electronic Funds Transfer (NEFT) or Funds Transfer Letter / Transfer Cheque of a bank where the Scheme has a collection account.
Redemption of Units of the ETF in Creation Unit Size will be allowed by means of exchange of Portfolio Deposit or in Cash.
Other investors (including Authorised Participants and large Investors): Units of the ETF can be subscribed (in lots of 1 Unit) during the trading hours on all trading days on the NSe and/ or BSe on which the Units will be listed.
CATEgORY OF SCHEME: ExCHANGE TRADED FUND
This product is suitable for investors who are seeking ~
l returns that are commensurate with the performance of the NIFTY Bank Index (Total Returns Index), subject to tracking error, over long term
l investment in equity securities covered by the NIFTY Bank Index
VeryHigh
Low to
Moderate
Low
Moderate ModeratelyHigh High
RISKOMETERInvestors understand that their principal will be at
very high risk
~ Investors should consult their financial advisers, if in doubt about whether the product is suitable for them.
Issuer Industry+ % to NAV
EqUITY & EqUITY RElATED
• HDFC Bank Ltd. Banks 26.05
• ICICI Bank Ltd. Banks 19.56
• Axis Bank Ltd. Banks 15.93
• State Bank of India Banks 13.27
• Kotak Mahindra Bank Ltd. Banks 12.36
• Indusind Bank Ltd. Banks 5.35
• Bandhan Bank Ltd. Banks 2.07
• The Federal Bank Ltd. Banks 1.48
• IDFC First Bank Ltd. Banks 1.18
• RBL Bank Ltd. Banks 0.94
Bank of Baroda Banks 0.91
Punjab National Bank Banks 0.87
Sub Total 99.97
Cash, Cash equivalents and Net Current Assets 0.03
Grand Total 100.00
• Top Ten Holdings
PORTFOLIO
(An open ended scheme replicating / tracking NIFTY Bank Index)HDFC Banking ETF
HDFC Banking ETF
n Banks 99.97
n Cash, Cash equivalents and Net Current Assets 0.03
Portfolio Classification by Asset Class (%)HDFC Banking ETF
n equity 99.97
n Cash, Cash equivalents and Net Current Assets 0.03
Portfolio Classification by Rating Class (%)
PERFORMANCE *^
Date Period Scheme Returns
(%)
Benchmark Returns
(%)#
Additional Benchmark
Returns (%) ##
Value of ` 10,000 invested
Scheme (`) Benchmark (`)#
Additional Benchmark
(`)##
Aug 31, 20 Last 6 Months 94.59 94.85 57.40 19,459 19,485 15,740
Simple annualized returns have been provided as per the extant guidelines since the scheme has completed 6 months but not 1 year. However, such returns may not be representative. Absolute returns of the Scheme for the 6 month period is 46.39%.
* The Scheme does not offer any Plans/Options. For performance of other schemes managed by Krishan Kumar Daga and Arun Agarwal, please refer page 66.
^Past performance may or may not be sustained in the future. Since Inception Date = Date of First allotment in the Scheme/Plan. Load is not taken into consideration for computation of performance.

February 2021 64
Face Value per Unit: ` 10 unless otherwise specified, + Industry Classification as recommended by AMFI, Data is as of February 28, 2021 unless otherwise specified.
This product is suitable for investors who are seeking ~
l capital appreciation over long term/regular income
l investment predominantly in equity and equity related Instruments of dividend yielding companies
VeryHigh
Low to
Moderate
Low
Moderate ModeratelyHigh High
RISKOMETERInvestors understand that their principal will be at
very high risk
~ Investors should consult their financial advisers, if in doubt about whether the product is suitable for them.
(An open ended equity scheme predominantly investing in dividend yielding stocks)HDFC Dividend Yield Fund
Company Industry+ % to NAV
EqUITY & EqUITY RElATED
• Hindustan Unilever Ltd. Consumer Non Durables 5.26
• Infosys Ltd. Software 5.15
• ITC Ltd. Consumer Non Durables 4.30
• Tata Consultancy Services Ltd. Software 3.17
• NTPC Ltd. Power 2.88
• Tech Mahindra Ltd. Software 2.77
• HCL Technologies Ltd. Software 2.74
• Tata Motors Ltd. Auto 2.65
• Inox Leisure Ltd. Media & entertainment 2.53
• quess Corp Ltd. Services 2.20
NHPC Ltd. Power 2.19
Chambal Fertilizers & Chemicals Ltd. Fertilisers 2.14
Dilip Buildcon Ltd. Construction Project 2.09
ICICI Bank Ltd. Banks 1.96
Indian Railway Catering and Tourism Corporation Ltd. Services 1.93
CeSC Ltd. Power 1.92
Wipro Ltd. Software 1.91
Indian Railways Finance Corporation Ltd. Finance 1.86
Coal India Ltd. Minerals/Mining 1.75
Vardhman Textiles Ltd. Textiles - Cotton 1.74
Greenply Industries Ltd. Consumer Durables 1.68
Tata Steel Ltd. Ferrous Metals 1.65
Sun Pharmaceutical Industries Ltd. Pharmaceuticals 1.57
Power Finance Corporation Ltd. Finance 1.56
Bharti Airtel Ltd. Telecom - Services 1.52
Tube Investments of India Ltd. Auto Ancillaries 1.48
Nestle India Ltd. Consumer Non Durables 1.41
Hindustan Petroleum Corporation Ltd. Petroleum Products 1.36
Ambuja Cements Ltd. Cement 1.35
ReC Ltd. Finance 1.34
PNC Infratech Ltd. Construction 1.32
State Bank of India Banks 1.28
HDFC Bank Ltd. Banks 1.26
emami Ltd. Consumer Non Durables 1.25
UPL Ltd. Pesticides 1.23
Axis Bank Ltd. Banks 1.19
Larsen and Toubro Ltd. Construction Project 1.19
Bharat electronics Ltd. Industrial Capital Goods 1.16
SKF India Ltd. Industrial Products 1.14
Carborundum Universal Ltd. Industrial Products 1.11
Zee entertainment enterprises Ltd. Media & entertainment 1.10
AIA engineering Ltd. Industrial Products 1.00
Trent Ltd. Retailing 1.00
Cholamandalam Financial Holdings Ltd. Finance 0.99
Oil & Natural Gas Corporation Ltd. Oil 0.97
Centum electronics Ltd. Industrial Capital Goods 0.95
Balrampur Chini Mills Ltd. Consumer Non Durables 0.94
GHCL Ltd. Chemicals 0.94
Company Industry+ % to NAV
Muthoot Finance Ltd. Finance 0.89
Mahindra & Mahindra Ltd. Auto 0.88
Finolex Cables Ltd. Industrial Products 0.86
Godrej Consumer Products Ltd. Consumer Non Durables 0.85
UTI Asset Management Company Ltd. Finance 0.85
Lupin Ltd. Pharmaceuticals 0.84
MM Forgings Ltd. Industrial Products 0.77
SBI Life Insurance Company Ltd. Finance 0.76
GAIL (India) Ltd. Gas 0.70
Mahindra Holidays & Resorts Ind Ltd.
Hotels/Resorts & Other Recreational Activities 0.48
RailTel Corporation of India Ltd. Telecom - Services 0.44
ICICI Securities Ltd. Finance 0.43
Sun TV Network Ltd. Media & entertainment 0.21
Hindustan Aeronautics Ltd. Aerospace & Defence 0.12Sub Total 97.16Cash, Cash equivalents and Net Current Assets 2.84
Grand Total 100.00
• Top Ten Holdings
PORTFOLIO
Industry Allocation of Equity Holding (% of Net Assets)
0.120.480.700.940.971.001.231.321.351.361.481.651.681.741.751.962.112.142.413.283.533.844.134.885.69
6.998.68
14.0115.74
0 2 4 6 8 1012141618Aerospace & Defence
Hotels, Resorts & Other Recreational ActivitiesGas
ChemicalsOil
RetailingPesticides
ConstructionCement
Petroleum ProductsAuto AncillariesFerrous Metals
Consumer DurablesTextiles - CottonMinerals/Mining
Telecom - ServicesIndustrial Capital Goods
FertilisersPharmaceuticals
Construction ProjectAuto
Media & EntertainmentServices
Industrial ProductsBanksPower
FinanceConsumer Non Durables
Software
KEY FACTS
INVESTMENT OBjECTIVE
To provide capital appreciation and/or dividend distribution by predominantly investing in a well-diversified portfolio of equity and equity related instruments of dividend yielding companies.
There is no assurance that the investment objective of the Scheme will be realized.
FUND MANAgER § ¥
gopal Agrawal (since December 18, 2020)
Total experience: Over 16 years
INCEPTION DATE (Date of Allotment)
December 18, 2020
NAV (AS ON FEBRUARY 26, 2021) NAV PER UNIT (`)
Regular Plan - Growth Option 10.752Regular Plan - Dividend Option 10.752Direct Plan - Growth Option 10.788Direct Plan - Dividend Option 10.788
ASSETS UNDER MANAgEMENT (`) IN CRORE
As on February 28, 2021 1,825.51Average for Month of February 2021 1,797.19
TOTAL ExPENSE RATIO (As on February 28, 2021)Including Additional expenses and Goods and Service Tax on Management Fees
Regular: 2.09% Direct: 0.32%
#BENCHMARK INDEX: NIFTY Dividend Opportunities 50 (Total Returns Index)
##ADDl. BENCHMARK INDEX: NIFTY 50 (Total Returns Index)
EXIT lOAD
l In respect of each purchase / switch-in of Units, an exit Load of 1.00% is payable if Units are redeemed / switched-out within 1 year from the date of allotment.
l No exit Load is payable if Units are redeemed / switched-out after 1 year from the date of allotment.
For further details, please refer to para ‘Exit Load’ on Pg 66.
PLANS & OPTIONS
Regular Plan, Direct Plan. Under each Plan : Growth & Dividend. The Dividend Option offers Dividend Payout and Reinvestment facility.
MINIMUM APPlICATION AMOUNT
Purchase : ` 5,000 and any amount thereafter.Additional Purchase : ` 1,000 and any amount thereafter.
¥ Dedicated Fund Manager for Overseas Investments: Mr. Sankalp Baid (since January 22, 2021) (Total experience: Over 13 years).
CATEgORY OF SCHEME: DIVIDEND YIELD FUND

February 2021 65
Face Value per Unit: ` 10 unless otherwise specified, + Industry Classification as recommended by AMFI, Data is as of February 28, 2021 unless otherwise specified.
This product is suitable for investors who are seeking ~
l capital appreciation over long term/regular incomel investment predominantly in equity and equity related
instruments of entities engaged in and/ or expected to benefit from the growth in housing and its allied business activities
VeryHigh
Low to
Moderate
Low
Moderate ModeratelyHigh High
RISKOMETERInvestors understand that their principal will be at
very high risk
~ Investors should consult their financial advisers, if in doubt about whether the product is suitable for them.
(An open ended equity scheme following housing and allied activities theme)HDFC Housing Opportunities Fund
Company Industry+ % to NAV
EqUITY & EqUITY RElATED
• Larsen and Toubro Ltd. Construction Project 10.02
• HDFC Bank Ltd. Banks 9.52
• ICICI Bank Ltd. Banks 7.98
• State Bank of India Banks 7.83
• NTPC Ltd. Power 7.62
• Housing Development Finance Corporation Ltd.£ Finance 7.15
• Ambuja Cements Ltd. Cement 6.98
• Axis Bank Ltd. Banks 6.78
• Ashoka Buildcon Ltd. Construction Project 2.89
• Power Grid Corporation of India Ltd. Power 2.58
GAIL (India) Ltd. Gas 2.49
Indian Railways Finance Corporation Ltd. Finance 2.46
Sagar Cements Ltd. Cement 1.74
Tata Steel Ltd. Ferrous Metals 1.74
Prestige estates Projects Ltd. Construction 1.67
Dilip Buildcon Ltd. Construction Project 1.54
Orient Cement Ltd. Cement 1.50
Bharat Petroleum Corporation Ltd. Petroleum Products 1.41
AkzoNobel India Ltd. Consumer Non Durables 1.21
Asian Paints Ltd. Consumer Non Durables 1.10
Bharat Dynamics Ltd. Aerospace & Defence 1.08
RBL Bank Ltd. Banks 1.04
NCL Industries Ltd. Cement 1.00
JMC Projects (India) Ltd. Construction 0.88
Petronet LNG Ltd. Gas 0.87
Crompton Greaves Consumer electricals Ltd. Consumer Durables 0.85
SBI Cards and Payment Services Ltd. Finance 0.72
Hindalco Industries Ltd. Non - Ferrous Metals 0.71
Birla Corporation Ltd. Cement 0.63
Finolex Cables Ltd. Industrial Products 0.54
PNC Infratech Ltd. Construction 0.52
Ge Power India Ltd. Industrial Capital Goods 0.46
Johnson Controls Hitachi Air Conditioning India Ltd. Consumer Durables 0.34
Repco Home Finance Ltd. Finance 0.32
Prism Johnson Ltd. Cement 0.31
HPL electric and Power Ltd. Consumer Durables 0.25
ITD Cementation India Ltd. Construction 0.19Sub Total 96.92
EqUITY RElATED
Brookfield India Real estate Trust 0.90Sub Total 0.90Total 97.82Cash, Cash equivalents and Net Current Assets 2.18
Grand Total 100.00
• Top Ten Holdings, £ Co-sponsor
PORTFOLIO Industry Allocation of Equity Holding (% of Net Assets)
0.46
0.54
0.71
1.08
1.41
1.44
1.74
2.31
3.36
4.16
10.20
10.65
12.16
14.45
33.15
0 5 10 15 20 25 30 35
Industrial Capital Goods
Industrial Products
Non - Ferrous Metals
Aerospace & Defence
Petroleum Products
Consumer Durables
Ferrous Metals
Consumer Non Durables
Gas
Construction
Power
Finance
Cement
Construction Project
BanksKEY FACTS
INVESTMENT OBjECTIVE
To provide long-term capital appreciation by investing predominantly in equity and equity related instruments of entities engaged in and/or expected to benefit from the growth in housing and its allied business activities.There is no assurance that the investment objective of the Scheme will be realized.
FUND MANAgER § ¥
Rakesh Vyas (since June 01, 2019)
Total experience: Over 17 years
INCEPTION DATE (Date of Allotment)
December 6, 2017
NAV (AS ON FEBRUARY 26, 2021) NAV PER UNIT (`)
Regular Plan - Growth Option 10.721Regular Plan - Dividend Option 10.721Direct Plan - Growth Option 11.091Direct Plan - Dividend Option 11.091
ASSETS UNDER MANAgEMENT (`) IN CRORE
As on February 28, 2021 2,071.83Average for Month of February 2021 2,205.52
qUANTITATIVE DATA
Portfolio Turnover Ratio (Last 1 year) 13.31%
Risk Ration Standard Deviation 7.418%n Beta 1.058n Sharpe Ratio* 0.039
Computed for the 3-yr period ended February 26, 2021. Based on month-end NAV. * Risk free rate: 3.47%(Source: FIMMDA MIBOR)
TOTAL ExPENSE RATIO (As on February 28, 2021)Including Additional expenses and Goods and Service Tax on Management Fees
Regular: 2.04% Direct: 0.95%
#BENCHMARK INDEX: India Housing & Allied Businesses Index (Total Returns Index)##ADDl. BENCHMARK INDEX: NIFTY 50 (Total Returns Index)
EXIT lOAD
Applicable only for units allotted after conversion of scheme into open-ended scheme i.e. on or after January 19, 2021:
In respect of each purchase / switch-in of Units, upto 15% of the units may be redeemed without any exit load from the date of allotment.
l Any redemption in excess of the above limit shall be subject to the following exit load: - exit load of 1.00% is payable if Units are redeemed / switched-out within 1 year from the date of allotment of units.
l No exit Load is payable if Units are redeemed / switched-out after 1 year from the date of allotment. No entry / exit Load shall be levied on bonus units and units allotted on dividend reinvestment.
Note: To clarify, Unitholders who acquired units on or before January 18, 2021, will not be charged exit load in respect of those units.
For further details, please refer to para ‘Exit Load’ on Pg 66.
PLANS & OPTIONS
Regular Plan, Direct Plan. Under each Plan : Growth & Dividend. The Dividend Option offers Dividend Payout and Reinvestment facility.
MINIMUM APPlICATION AMOUNT
Purchase : ` 5,000 and any amount thereafter*.Additional Purchase : ` 1,000 and any amount thereafter.*applicable if investing for the first time in a folio in the Scheme.
¥ Dedicated Fund Manager for Overseas Investments: Mr. Sankalp Baid (since January 22, 2021) (Total experience: Over 13 years).
CATEgORY OF SCHEME: THEMATIC FUND
[w.e.f January 19, 2021 (Erstwhile HDFC HOF - I - 1140D November 2017 (1)]
The date of inception/allotment of HDFC Housing opportunities Fund is December 6, 2017. The Scheme was launched as a close ended thematic Equity Scheme. The Scheme has been converted into open-ended scheme on January 19, 2021.
PERFORMANCE ^ - Regular Plan - growth OptionDate Period Scheme
Returns (%)
Benchmark Returns
(%)#
Additional Benchmark
Returns (%) ##
Value of ` 10,000 investedScheme (`) Benchmark
(`)#Additional
Benchmark (`)##
Feb 28, 20 Last 1 Year 23.96 37.72 31.27 12,388 13,760 13,117Feb 28, 18 Last 3 Years 2.51 11.99 12.88 10,772 14,041 14,378Dec 06, 17 Since Inception 2.18 12.52 13.50 10,721 14,634 15,050
Returns greater than 1 year period are compounded annualized (CAGR). Performance of dividend option under the schemes for the investors would be net of distribution tax, if any. N.A. Not Available. For performance of other schemes managed by Rakesh Vyas, please refer page 66. Different plans viz. Regular Plan and Direct Plan have a different expense structure. The expenses of the Direct Plan under the Scheme will be lower to the extent of the distribution expenses / commission charged in the Regular Plan. For Performance of Direct Plan, refer page no. 67.
^Past performance may or may not be sustained in the future. Since Inception Date = Date of First allotment in the Scheme / Plan. Load is not taken into consideration for computation of performance.

66 February 2021
Performance details of Schemes managed by respective Fund Managers
Sr. No. Name of the Fund Manager Funds Managed Page no.1 Mr. Prashant Jain HDFC Flexi Cap Fund (Erstwhile HDFC Equity Fund) 8
HDFC Top 100 Fund 10HDFC Balanced Advantage Fund 16-17HDFC Hybrid Debt Fund (Co-managed scheme) 35-36Permitted Category FPI Portfolio 80
2 Mr. Chirag Setalvad HDFC Mid-Cap Opportunities Fund 11HDFC Small Cap Fund 12HDFC Long Term Advantage Fund 67HDFC Hybrid Equity Fund 18-19HDFC Children’s Gift Fund 27-28HDFC Retirement Savings Fund - Equity Plan (Co-managed scheme) 29HDFC Retirement Savings Fund - Hybrid Equity Plan (Co-managed scheme) 30-31HDFC Retirement Savings Fund - Hybrid Debt Plan (Co-managed scheme) 32
3 Mr. Amit B. Ganatra HDFC Capital Builder Value Fund 9HDFC Dynamic PE Ratio Fund of Funds (Co-managed scheme) 71HDFC Multi-Asset Fund (Co-managed scheme) 20-21HDFC TaxSaver 26Closed ended schemes 71
4 Mr. Krishan Kumar Daga HDFC Arbitrage Fund (Co-managed scheme) 37-38HDFC Multi-Asset Fund (Co-managed scheme) 20-21HDFC Index Fund - SEnSEx Plan (Co-managed scheme) 25HDFC Index Fund - nIFTY 50 Plan (Co-managed scheme) 23HDFC SEnSEx ETF (Co-managed scheme) 24HDFC nIFTY 50 ETF (Co-managed scheme) 22HDFC Gold Exchange Traded Fund 61HDFC Gold Fund 62HDFC Equity Savings Fund (Co-managed scheme) 33-34HDFC Banking ETF (Co-managed scheme) 63
5 Mr. Shobhit Mehrotra HDFC Income Fund 47HDFC Medium Term Debt Fund 48-49HDFC Floating Rate Debt Fund (Co-managed scheme) 55HDFC Credit Risk Debt Fund 41-42HDFC Hybrid Debt Fund (Co-managed scheme) 35-36HDFC Retirement Savings Fund - Equity Plan (Co-managed scheme) 29HDFC Retirement Savings Fund - Hybrid Equity Plan (Co-managed scheme) 30-31HDFC Retirement Savings Fund - Hybrid Debt Plan (Co-managed scheme) 32Close ended schemes 67-68
6 Mr. Anil Bamboli HDFC Dynamic Debt Fund 46HDFC Short Term Debt Fund 50-51HDFC Gilt Fund 45HDFC Money Market Fund (Co-managed scheme) 54HDFC Ultra Short Term Fund 56-57HDFC Overnight Fund 60HDFC Banking and PSU Debt Fund 43-44HDFC Equity Savings Fund (Co-managed scheme) 33-34HDFC Multi-Asset Fund (Co-managed scheme) 20-21HDFC Dynamic PE Ratio Fund of Funds (Co-managed scheme) 71Close ended schemes 68-69
7 Mr. Anupam Joshi HDFC Liquid Fund 58-59HDFC Corporate Bond Fund 39-40HDFC Low Duration Fund 52-53Close ended schemes 69-71
8 Mr. Rakesh Vyas HDFC Infrastructure Fund 15HDFC Housing Opportunities Fund 65
9 Mr. Vikash Agarwal HDFC Floating Rate Debt Fund (Co-managed scheme) 55HDFC Money Market Fund (Co-managed scheme) 54
10 Mr. Gopal Agrawal HDFC Equity Savings Fund (Co-managed scheme) 33-34HDFC Focused 30 Fund 14HDFC Growth Opportunities Fund 13HDFC Dividend Yield Fund 64
11 Mr. Arun Agarwal HDFC Arbitrage Fund (Co-managed scheme) 37-38HDFC Equity Savings Fund (Co-managed scheme) 33-34HDFC Index Fund - SEnSEx Plan (Co-managed scheme) 25HDFC Index Fund - nIFTY 50 Plan (Co-managed scheme) 23HDFC SEnSEx ETF (Co-managed scheme) 24HDFC nIFTY 50 ETF (Co-managed scheme) 22HDFC Multi-Asset Fund (Co-managed scheme) 20-21HDFC Banking ETF (Co-managed scheme) 63
For performance details of Direct Plan, refer page 72-79
https://files.hdfcfund.com/s3fs-public/2020-07/FAQs%20on%20Stamp%20Duty.pdf
Exit Load : (i) no exit load shall be levied for switching between Options under the same Plan within a Scheme. (ii) Switch of investments to Direct Plan within the same Scheme shall be subject to applicable exit load, unless the investments were made without any distributor code. However, any subsequent switch-out or redemption of such investments from the Direct Plan will not be subject to any exit load. (iii) no exit load shall be levied for switch-out from Direct Plan to other Plan within the same Scheme. However, any subsequent switch-out or redemption of such investment from the other Plan shall be subject to exit load based on the original date of investment in the Direct Plan. (iv) Switch of investments between Plans under a Scheme having separate portfolios, will be subject to applicable exit load. (v) no exit load will be levied on Bonus Units and Units allotted on Dividend Re-investment. (vi) In case of Systematic Transactions such as SIP, GSIP, Flex SIP, STP, Flex STP, Swing STP, Flexindex; Exit Load, if any, prevailing on the date of registration / enrolment shall be levied.
Tax Benefits / Consequences : The Dividend Distribution Tax on distribution of income by equity oriented fund to all the investors shall be payable at the rate of 11.648%* and on distribution of income by other than equity oriented fund to an individual / HUF shall be payable at the rate of 29.12%* and at the rate of 34.944%* on distribution of income to any other investor. Such income distributed by the Scheme(s) is free from Income–tax in the hands of Investors. Units of the Scheme(s) are not subject to Wealth-tax and Gift-tax. Unit holders are required to pay Securities Transaction Tax (STT) at the rate of 0.001% at the time of redemption / switch-out of units of an equity-oriented fund. * including applicable surcharge, health and education cess.
Investors should be aware that the fiscal rules / tax laws may change and there can be no guarantee that the current tax position may continue indefinitely. In view of individual nature of tax consequences, each investor is advised to consult his / her own professional tax advisor.
Applicability of Stamp Duty : Effective July 1, 2020, in accordance with the amendment to the Indian Stamp Act, 1899, a stamp duty @ 0.005% of the transaction value would be levied on applicable mutual fund purchase transactions (including transactions carried through stock exchanges and depositories for units in demat mode). Thus, the number of units allotted on all the applicable mutual fund transactions would be reduced to the extent of levy of stamp duty.
Kindly refer to FAQs on Stamp Duty, for details on the nature of transactions and the rate of levy of stamp duty available on our website.

February 2021 67
SCHEME PERFORMANCE - REGULAR PLAN - GROWTH OPTION (FUND MANAGER-WISE)
Past performance may or may not be sustained in the future. Returns greater than 1 year period are compounded annualized (CAGR). Different plans viz. Regular Plan and Direct Plan have a different expense structure. The expenses of the Direct Plan under the Scheme will be lower to the extent of the distribution expenses / commission charged in the Regular Plan. Load is not taken into consideration for computation of performance. Since Inception Date = Date of First allotment in the Scheme / Plan. n.A.: not Available
Performance of close-ended schemes, being close-ended in nature, is not strictly comparable with that of open-ended schemes since the investment strategy for close-ended schemes is primarily buy-and-hold whereas open-ended schemes are actively managed.
CHIRAG SETALVAD
HDFC LONG TERM ADVANTAGE FUND NAV as on Feb 26, 2021 ` 460.141
Date Period Scheme Returns
(%)
Benchmark Returns
(%)#
Additional Benchmark
Returns (%) ##
Value of ` 10,000 invested
Scheme (`)
Benchmark (`)#
Additional Benchmark
(`)##
Feb 28, 20 Last 1 Year 32.07 29.90 31.27 13,197 12,981 13,117Feb 28, 18 Last 3 Years 10.37 14.22 12.88 13,439 14,894 14,378Feb 29, 16 Last 5 Years 18.01 17.89 17.29 22,880 22,764 22,189Jan 02, 01 Since Inception 20.91 15.01 14.43 460,141 167,637 151,479
# S&P BSE SEnSEx (Total Returns Index) ## nIFTY 50 (Total Returns Index). The scheme is managed by Mr. Chirag Setalvad since April 02, 2007.
SHOBHIT MEHROTRA
HDFC FMP 3360D MARCH 2014 (1) NAV as on Feb 26, 2021 ` 16.6589
Date Period Scheme Returns
(%)
Benchmark Returns
(%)#
Additional Benchmark
Returns (%) ##
Value of ` 10,000 invested
Scheme (`)
Benchmark (`)#
Additional Benchmark
(`)##
Feb 28, 20 Last 1 Year 7.18 6.92 4.92 10,716 10,690 10,490Feb 28, 18 Last 3 Years 9.08 9.23 8.94 12,977 13,030 12,927Feb 29, 16 Last 5 Years 8.81 8.69 7.34 15,251 15,168 14,246Mar 26, 14 Since Inception 7.64 9.29 8.25 16,659 18,506 17,316
# CRISIL Composite Bond Fund Index ## CRISIL 10 year Gilt Index. The scheme is managed by Mr. Shobhit Mehrotra since inception.
HDFC FMP 1430D JULY 2017 (1) NAV as on Feb 26, 2021 ` 12.7801
Date Period Scheme Returns
(%)
Benchmark Returns
(%)#
Additional Benchmark
Returns (%) ##
Value of ` 10,000 invested
Scheme (`)
Benchmark (`)#
Additional Benchmark
(`)##
Feb 28, 20 Last 1 Year 6.16 6.92 4.92 10,614 10,690 10,544Feb 28, 18 Last 3 Years 7.89 9.23 8.94 12,556 13,030 12,127Aug 01, 17 Since Inception 7.10 7.40 5.65 12,780 12,908 12,513
# CRISIL Composite Bond Fund Index ## CRISIL 10 year Gitl Index. The scheme is managed by Mr. Shobhit Mehrotra since inception.
HDFC FMP 1113D JUNE 2018 (1) NAV as on Feb 26, 2021 ` 12.4550
Date Period Scheme Returns
(%)
Benchmark Returns
(%)#
Additional Benchmark
Returns (%) ##
Value of ` 10,000 invested
Scheme (`)
Benchmark (`)#
Additional Benchmark
(`)##
Feb 28, 20 Last 1 Year 6.71 6.92 4.92 10,669 10,690 10,490Jun 14, 18 Since Inception 8.45 10.03 9.64 12,455 12,952 12,830
# CRISIL Composite Bond Fund Index ## CRISIL 10 year Gilt Index. The scheme is managed by Mr. Shobhit Mehrotra since inception.
HDFC FMP 1124D JUNE 2018 (1) NAV as on Feb 26, 2021 ` 12.5504
Date Period Scheme Returns
(%)
Benchmark Returns
(%)#
Additional Benchmark
Returns (%) ##
Value of ` 10,000 invested
Scheme (`)
Benchmark (`)#
Additional Benchmark
(`)##
Feb 28, 20 Last 1 Year 10.89 6.92 4.92 11,085 10,690 10,490Jun 29, 18 Since Inception 8.90 9.96 9.55 12,550 12,880 12,753
# CRISIL Composite Bond Fund Index ## CRISIL 10 year Gilt Index. The scheme is managed by Mr. Shobhit Mehrotra since inception.
HDFC FMP 1099D JUNE 2018 (1) NAV as on Feb 26, 2021 ` 12.3830
Date Period Scheme Returns
(%)
Benchmark Returns
(%)#
Additional Benchmark
Returns (%) ##
Value of ` 10,000 invested
Scheme (`)
Benchmark (`)#
Additional Benchmark
(`)##
Feb 28, 20 Last 1 Year 6.48 6.92 4.92 10,646 10,690 10,490Jun 28, 18 Since Inception 8.34 9.99 9.64 12,383 12,893 12,783
# CRISIL Composite Bond Fund Index ## CRISIL 10 year Gilt Index. The scheme is managed by Mr. Shobhit Mehrotra since inception.
HDFC FMP 1122D JULY 2018 (1) NAV as on Feb 26, 2021 ` 12.4346
Date Period Scheme Returns
(%)
Benchmark Returns
(%)#
Additional Benchmark
Returns (%) ##
Value of ` 10,000 invested
Scheme (`)
Benchmark (`)#
Additional Benchmark
(`)##
Feb 28, 20 Last 1 Year 6.80 6.92 4.92 10,678 10,690 10,490Jul 04, 18 Since Inception 8.56 9.88 9.42 12,435 12,838 12,698
# CRISIL Composite Bond Fund Index ## CRISIL 10 year Gilt Index. The scheme is managed by Mr. Shobhit Mehrotra since inception.
HDFC FMP 1133D JULY 2018 (1) NAV as on Feb 26, 2021 ` 12.2891
Date Period Scheme Returns
(%)
Benchmark Returns
(%)#
Additional Benchmark
Returns (%) ##
Value of ` 10,000 invested
Scheme (`)
Benchmark (`)#
Additional Benchmark
(`)##
Feb 28, 20 Last 1 Year 7.87 6.92 4.92 10,785 10,690 10,490Jul 25, 18 Since Inception 8.27 9.84 9.27 12,289 12,756 12,585
# CRISIL Composite Bond Fund Index ## CRISIL 10 year Gilt Index. The scheme is managed by Mr. Shobhit Mehrotra since inception.
HDFC FMP 1133D FEBRUARY 2019 (1) NAV as on Feb 26, 2021 ` 11.9546
Date Period Scheme Returns
(%)
Benchmark Returns
(%)#
Additional Benchmark
Returns (%) ##
Value of ` 10,000 invested
Scheme (`)
Benchmark (`)#
Additional Benchmark
(`)##
Feb 28, 20 Last 1 Year 8.41 6.92 4.92 10,839 10,690 10,490Mar 06, 19 Since Inception 9.43 10.22 8.96 11,955 12,125 11,853
# CRISIL Composite Bond Fund Index ## CRISIL 10 year Gilt Index. The scheme is managed by Mr. Shobhit Mehrotra since inception.
HDFC FMP 1126D MARCH 2019 (1) NAV as on Feb 26, 2021 ` 11.9196
Date Period Scheme Returns
(%)
Benchmark Returns
(%)#
Additional Benchmark
Returns (%) ##
Value of ` 10,000 invested
Scheme (`)
Benchmark (`)#
Additional Benchmark
(`)##
Feb 28, 20 Last 1 Year 8.40 6.92 4.92 10,837 10,690 10,490Mar 13, 19 Since Inception 9.36 10.07 8.93 11,920 12,072 11,827
# CRISIL Composite Bond Fund Index ## CRISIL 10 year Gilt Index. The scheme is managed by Mr. Shobhit Mehrotra since inception.
HDFC FMP 1127D MARCH 2019 (1) NAV as on Feb 26, 2021 ` 11.8425
Date Period Scheme Returns
(%)
Benchmark Returns
(%)#
Additional Benchmark
Returns (%) ##
Value of ` 10,000 invested
Scheme (`)
Benchmark (`)#
Additional Benchmark
(`)##
Feb 28, 20 Last 1 Year 8.27 6.92 4.92 10,824 10,690 10,490Mar 19, 19 Since Inception 9.08 10.06 8.93 11,843 12,049 11,811
# CRISIL Composite Bond Fund Index ## CRISIL 10 year Gilt Index. The scheme is managed by Mr. Shobhit Mehrotra since inception.
HDFC FMP 1120D MARCH 2019 (1) NAV as on Feb 26, 2021 ` 11.7898
Date Period Scheme Returns
(%)
Benchmark Returns
(%)#
Additional Benchmark
Returns (%) ##
Value of ` 10,000 invested
Scheme (`)
Benchmark (`)#
Additional Benchmark
(`)##
Feb 28, 20 Last 1 Year 8.21 6.92 4.92 10,819 10,690 10,490Mar 26, 19 Since Inception 8.92 9.85 8.82 11,790 11,983 11,768
# CRISIL Composite Bond Fund Index ## CRISIL 10 year Gilt Index. The scheme is managed by Mr. Shobhit Mehrotra since inception.
HDFC FMP 1118D MARCH 2019 (1) NAV as on Feb 26, 2021 ` 11.8276
Date Period Scheme Returns
(%)
Benchmark Returns
(%)#
Additional Benchmark
Returns (%) ##
Value of ` 10,000 invested
Scheme (`)
Benchmark (`)#
Additional Benchmark
(`)##
Feb 28, 20 Last 1 Year 8.23 6.92 4.92 10,821 10,690 10,490Mar 28, 19 Since Inception 9.13 9.80 8.75 11,828 11,968 11,748
# CRISIL Composite Bond Fund Index ## CRISIL 10 year Gilt Index. The scheme is managed by Mr. Shobhit Mehrotra since inception.

68 February 2021
SCHEME PERFORMANCE - REGULAR PLAN - GROWTH OPTION (FUND MANAGER-WISE)
SHOBHIT MEHROTRA....CONTINUED
Past performance may or may not be sustained in the future. Returns greater than 1 year period are compounded annualized (CAGR). Different plans viz. Regular Plan and Direct Plan have a different expense structure. The expenses of the Direct Plan under the Scheme will be lower to the extent of the distribution expenses / commission charged in the Regular Plan. Load is not taken into consideration for computation of performance. Since Inception Date = Date of First allotment in the Scheme / Plan. n.A.: not Available
Performance of close-ended schemes, being close-ended in nature, is not strictly comparable with that of open-ended schemes since the investment strategy for close-ended schemes is primarily buy-and-hold whereas open-ended schemes are actively managed.
HDFC FMP 1100D APRIL 2019 (1) NAV as on Feb 26, 2021 ` 11.8043
Date Period Scheme Returns
(%)
Benchmark Returns
(%)#
Additional Benchmark
Returns (%) ##
Value of ` 10,000 invested
Scheme (`)
Benchmark (`)#
Additional Benchmark
(`)##
Feb 28, 20 Last 1 Year 8.35 6.92 4.92 10,833 10,690 10,490May 08, 19 Since Inception 9.61 10.18 9.05 11,804 11,916 11,696
# CRISIL Composite Bond Fund Index ## CRISIL 10 year Gilt Index. The scheme is managed by Mr. Shobhit Mehrotra since inception.
ANIL BAMBOLI
HDFC FMP 1846D AUGUST 2013 (1) NAV as on Feb 26, 2021 ` 19.2010
Date Period Scheme Returns
(%)
Benchmark Returns
(%)#
Additional Benchmark
Returns (%) ##
Value of ` 10,000 invested
Scheme (`)
Benchmark (`)#
Additional Benchmark
(`)##
Feb 28, 20 Last 1 Year 11.02 6.92 4.92 11,099 10,690 10,490Feb 28, 18 Last 3 Years 9.07 9.23 8.94 12,973 13,030 12,927Feb 29, 16 Last 5 Years 8.44 8.69 7.34 14,992 15,168 14,246Aug 14, 13 Since Inception 9.03 9.36 7.73 19,201 19,639 17,530
# CRISIL Composite Bond Fund Index ## CRISIL 10 year Gilt Index. The scheme is managed by Mr. Anil Bamboli since inception.
HDFC FMP 1181D APRIL 2018 (1) NAV as on Feb 26, 2021 ` 12.4855
Date Period Scheme Returns
(%)
Benchmark Returns
(%)#
Additional Benchmark
Returns (%) ##
Value of ` 10,000 invested
Scheme (`)
Benchmark (`)#
Additional Benchmark
(`)##Feb 28, 20 Last 1 Year 6.41 6.92 4.92 10,639 10,690 10,490Apr 27, 18 Since Inception 8.13 9.47 9.11 12,486 12,929 12,809
# CRISIL Composite Bond Fund Index ## CRISIL 10 year Gilt Index. The scheme is managed by Mr. Anil Bamboli since inception.
HDFC FMP 1146D APRIL 2018 (1) NAV as on Feb 26, 2021 ` 12.3180
Date Period Scheme Returns
(%)
Benchmark Returns
(%)#
Additional Benchmark
Returns (%) ##
Value of ` 10,000 invested
Scheme (`)
Benchmark (`)#
Additional Benchmark
(`)##
Feb 28, 20 Last 1 Year 9.57 6.92 4.92 10,954 10,690 10,490May 10, 18 Since Inception 7.72 9.45 8.99 12,318 12,880 12,729
# CRISIL Composite Bond Fund Index ## CRISIL 10 year Gilt Index. The scheme is managed by Mr. Anil Bamboli since inception.
HDFC FMP 1434D MAY 2018 (1) NAV as on Feb 26, 2021 ` 12.8032
Date Period Scheme Returns
(%)
Benchmark Returns
(%)#
Additional Benchmark
Returns (%) ##
Value of ` 10,000 invested
Scheme (`)
Benchmark (`)#
Additional Benchmark
(`)##
Feb 28, 20 Last 1 Year 8.02 6.92 4.92 10,800 10,690 10,490May 09, 18 Since Inception 9.21 9.43 8.97 12,803 12,877 12,727
# CRISIL Composite Bond Fund Index ## CRISIL 10 year Gilt Index. The scheme is managed by Mr. Anil Bamboli since inception.
HDFC FMP 1134D MAY 2018 (1) NAV as on Feb 26, 2021 ` 12.5042
Date Period Scheme Returns
(%)
Benchmark Returns
(%)#
Additional Benchmark
Returns (%) ##
Value of ` 10,000 invested
Scheme (`)
Benchmark (`)#
Additional Benchmark
(`)##
Feb 28, 20 Last 1 Year 6.53 6.92 4.92 10,651 10,690 10,490May 24, 18 Since Inception 8.42 9.82 9.41 12,504 12,954 12,823
# CRISIL Composite Bond Fund Index ## CRISIL 10 year Gilt Index. The scheme is managed by Mr. Anil Bamboli since inception.
HDFC FMP 1119D JUNE 2018 (1) NAV as on Feb 26, 2021 ` 12.4990
Date Period Scheme Returns
(%)
Benchmark Returns
(%)#
Additional Benchmark
Returns (%) ##
Value of ` 10,000 invested
Scheme (`)
Benchmark (`)#
Additional Benchmark
(`)##
Feb 28, 20 Last 1 Year 6.68 6.92 4.92 10,667 10,690 10,490Jun 08, 18 Since Inception 8.54 10.03 9.64 12,499 12,973 12,848
# CRISIL Composite Bond Fund Index ## CRISIL 10 year Gilt Index. The scheme is managed by Mr. Anil Bamboli since inception.
HDFC FMP 1280D OCTOBER 2018 (1) NAV as on Feb 26, 2021 ` 12.5263
Date Period Scheme Returns
(%)
Benchmark Returns
(%)#
Additional Benchmark
Returns (%) ##
Value of ` 10,000 invested
Scheme (`)
Benchmark (`)#
Additional Benchmark
(`)##
Feb 28, 20 Last 1 Year 8.31 6.92 4.92 10,828 10,690 10,490Oct 11, 18 Since Inception 9.92 10.63 9.99 12,526 12,720 12,545
# CRISIL Composite Bond Fund Index ## CRISIL 10 year Gilt Index. The scheme is managed by Mr. Anil Bamboli since inception.
HDFC FMP 1344D OCTOBER 2018 (1) NAV as on Feb 26, 2021 ` 12.5397
Date Period Scheme Returns
(%)
Benchmark Returns
(%)#
Additional Benchmark
Returns (%) ##
Value of ` 10,000 invested
Scheme (`)
Benchmark (`)#
Additional Benchmark
(`)##
Feb 28, 20 Last 1 Year 9.16 6.92 4.92 10,913 10,690 10,490Oct 24, 18 Since Inception 10.13 10.49 9.67 12,540 12,637 12,418
# CRISIL Composite Bond Fund Index ## CRISIL 10 year Gilt Index. The scheme is managed by Mr. Anil Bamboli since inception.
HDFC FMP 1274D OCTOBER 2018 (1) NAV as on Feb 26, 2021 ` 12.5039
Date Period Scheme Returns
(%)
Benchmark Returns
(%)#
Additional Benchmark
Returns (%) ##
Value of ` 10,000 invested
Scheme (`)
Benchmark (`)#
Additional Benchmark
(`)##
Feb 28, 20 Last 1 Year 8.26 6.92 4.92 10,823 10,690 10,490Oct 17, 18 Since Inception 9.91 10.55 9.77 12,504 12,675 12,467
# CRISIL Composite Bond Fund Index ## CRISIL 10 year Gilt Index. The scheme is managed by Mr. Anil Bamboli since inception.
HDFC FMP 1261D OCTOBER 2018 (1) NAV as on Feb 26, 2021 ` 12.4094
Date Period Scheme Returns
(%)
Benchmark Returns
(%)#
Additional Benchmark
Returns (%) ##
Value of ` 10,000 invested
Scheme (`)
Benchmark (`)#
Additional Benchmark
(`)##
Feb 28, 20 Last 1 Year 7.40 6.92 4.92 10,738 10,690 10,490Oct 25, 18 Since Inception 9.65 10.49 9.66 12,409 12,633 12,411
# CRISIL Composite Bond Fund Index ## CRISIL 10 year Gilt Index. The scheme is managed by Mr. Anil Bamboli since inception.
HDFC FMP 1260D OCTOBER 2018 (1) NAV as on Feb 26, 2021 ` 12.4839
Date Period Scheme Returns
(%)
Benchmark Returns
(%)#
Additional Benchmark
Returns (%) ##
Value of ` 10,000 invested
Scheme (`)
Benchmark (`)#
Additional Benchmark
(`)##
Feb 28, 20 Last 1 Year 7.96 6.92 4.92 10,793 10,690 10,490Oct 31, 18 Since Inception 10.01 10.50 9.64 12,484 12,613 12,387
# CRISIL Composite Bond Fund Index ## CRISIL 10 year Gilt Index. The scheme is managed by Mr. Anil Bamboli since inception.
HDFC FMP 1265D OCTOBER 2018 (1) NAV as on Feb 26, 2021 ` 12.4530
Date Period Scheme Returns
(%)
Benchmark Returns
(%)#
Additional Benchmark
Returns (%) ##
Value of ` 10,000 invested
Scheme (`)
Benchmark (`)#
Additional Benchmark
(`)##
Feb 28, 20 Last 1 Year 8.38 6.92 4.92 10,836 10,690 10,490nov 01, 18 Since Inception 9.90 10.45 9.55 12,453 12,597 12,361
# CRISIL Composite Bond Fund Index ## CRISIL 10 year Gilt Index. The scheme is managed by Mr. Anil Bamboli since inception.
HDFC FMP 1246D NOVEMBER 2018 (1) NAV as on Feb 26, 2021 ` 12.3848
Date Period Scheme Returns
(%)
Benchmark Returns
(%)#
Additional Benchmark
Returns (%) ##
Value of ` 10,000 invested
Scheme (`)
Benchmark (`)#
Additional Benchmark
(`)##
Feb 28, 20 Last 1 Year 8.36 6.92 4.92 10,833 10,690 10,490nov 20, 18 Since Inception 9.87 10.34 9.49 12,385 12,504 12,286
# CRISIL Composite Bond Fund Index ## CRISIL 10 year Gilt Index. The scheme is managed by Mr. Anil Bamboli since inception.

February 2021 69
SCHEME PERFORMANCE - REGULAR PLAN - GROWTH OPTION (FUND MANAGER-WISE)
ANIL BAMBOLI....CONTINUED
Past performance may or may not be sustained in the future. Returns greater than 1 year period are compounded annualized (CAGR). Different plans viz. Regular Plan and Direct Plan have a different expense structure. The expenses of the Direct Plan under the Scheme will be lower to the extent of the distribution expenses / commission charged in the Regular Plan. Load is not taken into consideration for computation of performance. Since Inception Date = Date of First allotment in the Scheme / Plan. n.A.: not Available
Performance of close-ended schemes, being close-ended in nature, is not strictly comparable with that of open-ended schemes since the investment strategy for close-ended schemes is primarily buy-and-hold whereas open-ended schemes are actively managed.
HDFC FMP 1232D NOVEMBER 2018 (1) NAV as on Feb 26, 2021 ` 12.3607
Date Period Scheme Returns
(%)
Benchmark Returns
(%)#
Additional Benchmark
Returns (%) ##
Value of ` 10,000 invested
Scheme (`)
Benchmark (`)#
Additional Benchmark
(`)##
Feb 28, 20 Last 1 Year 8.41 6.92 4.92 10,839 10,690 10,490nov 28, 18 Since Inception 9.88 10.13 9.04 12,361 12,423 12,150
# CRISIL Composite Bond Fund Index ## CRISIL 10 year Gilt Index. The scheme is managed by Mr. Anil Bamboli since inception.
HDFC FMP 1224D DECEMBER 2018 (1) NAV as on Feb 26, 2021 ` 12.2479
Date Period Scheme Returns
(%)
Benchmark Returns
(%)#
Additional Benchmark
Returns (%) ##
Value of ` 10,000 invested
Scheme (`)
Benchmark (`)#
Additional Benchmark
(`)##
Feb 28, 20 Last 1 Year 8.35 6.92 4.92 10,833 10,690 10,490Dec 06, 18 Since Inception 9.53 9.68 8.37 12,248 12,285 11,961
# CRISIL Composite Bond Fund Index ## CRISIL 10 year Gilt Index. The scheme is managed by Mr. Anil Bamboli since inception.
HDFC FMP 1218D DECEMBER 2018 (1) NAV as on Feb 26, 2021 ` 12.2650
Date Period Scheme Returns
(%)
Benchmark Returns
(%)#
Additional Benchmark
Returns (%) ##
Value of ` 10,000 invested
Scheme (`)
Benchmark (`)#
Additional Benchmark
(`)##
Feb 28, 20 Last 1 Year 8.33 6.92 4.92 10,830 10,690 10,490Dec 12, 18 Since Inception 9.67 9.76 8.34 12,265 12,286 11,937
# CRISIL Composite Bond Fund Index ## CRISIL 10 year Gilt Index. The scheme is managed by Mr. Anil Bamboli since inception.
HDFC FMP 1211D DECEMBER 2018 (1) NAV as on Feb 26, 2021 ` 12.1991
Date Period Scheme Returns
(%)
Benchmark Returns
(%)#
Additional Benchmark
Returns (%) ##
Value of ` 10,000 invested
Scheme (`)
Benchmark (`)#
Additional Benchmark
(`)##
Feb 28, 20 Last 1 Year 8.23 6.92 4.92 10,821 10,690 10,490Dec 19, 18 Since Inception 9.49 9.44 7.75 12,199 12,187 11,777
# CRISIL Composite Bond Fund Index ## CRISIL 10 year Gilt Index. The scheme is managed by Mr. Anil Bamboli since inception.
HDFC FMP 1203D DECEMBER 2018 (1) NAV as on Feb 26, 2021 ` 12.1761
Date Period Scheme Returns
(%)
Benchmark Returns
(%)#
Additional Benchmark
Returns (%) ##
Value of ` 10,000 invested
Scheme (`)
Benchmark (`)#
Additional Benchmark
(`)##
Feb 28, 20 Last 1 Year 8.35 6.92 4.92 10,832 10,690 10,490Dec 27, 18 Since Inception 9.50 9.44 7.93 12,176 12,163 11,800
# CRISIL Composite Bond Fund Index ## CRISIL 10 year Gilt Index. The scheme is managed by Mr. Anil Bamboli since inception.
HDFC FMP 1196D DECEMBER 2018 (1) NAV as on Feb 26, 2021 ` 12.1577
Date Period Scheme Returns
(%)
Benchmark Returns
(%)#
Additional Benchmark
Returns (%) ##
Value of ` 10,000 invested
Scheme (`)
Benchmark (`)#
Additional Benchmark
(`)##
Feb 28, 20 Last 1 Year 8.37 6.92 4.92 10,835 10,690 10,490Jan 03, 19 Since Inception 9.51 9.74 8.42 12,158 12,212 11,899
# CRISIL Composite Bond Fund Index ## CRISIL 10 year Gilt Index. The scheme is managed by Mr. Anil Bamboli since inception.
HDFC FMP 1190D JANUARY 2019 (1) NAV as on Feb 26, 2021 ` 12.1426
Date Period Scheme Returns
(%)
Benchmark Returns
(%)#
Additional Benchmark
Returns (%) ##
Value of ` 10,000 invested
Scheme (`)
Benchmark (`)#
Additional Benchmark
(`)##
Feb 28, 20 Last 1 Year 8.35 6.92 4.92 10,832 10,690 10,490Jan 09, 19 Since Inception 9.52 9.72 8.57 12,143 12,189 11,917
# CRISIL Composite Bond Fund Index ## CRISIL 10 year Gilt Index. The scheme is managed by Mr. Anil Bamboli since inception.
HDFC FMP 1182D JANUARY 2019 (1) NAV as on Feb 26, 2021 ` 12.1197
Date Period Scheme Returns
(%)
Benchmark Returns
(%)#
Additional Benchmark
Returns (%) ##
Value of ` 10,000 invested
Scheme (`)
Benchmark (`)#
Additional Benchmark
(`)##
Feb 28, 20 Last 1 Year 8.43 6.92 4.92 10,840 10,690 10,490Jan 17, 19 Since Inception 9.53 9.84 8.84 12,120 12,193 11,958
# CRISIL Composite Bond Fund Index ## CRISIL 10 year Gilt Index. The scheme is managed by Mr. Anil Bamboli since inception.
HDFC FMP 1175D JANUARY 2019 (1) NAV as on Feb 26, 2021 ` 12.0825
Date Period Scheme Returns
(%)
Benchmark Returns
(%)#
Additional Benchmark
Returns (%) ##
Value of ` 10,000 invested
Scheme (`)
Benchmark (`)#
Additional Benchmark
(`)##
Feb 28, 20 Last 1 Year 8.47 6.92 4.92 10,845 10,690 10,490Jan 23, 19 Since Inception 9.45 9.99 8.94 12,083 12,209 11,966
# CRISIL Composite Bond Fund Index ## CRISIL 10 year Gilt Index. The scheme is managed by Mr. Anil Bamboli since inception.
HDFC FMP 1168D JANUARY 2019 (1) NAV as on Feb 26, 2021 ` 12.0677
Date Period Scheme Returns
(%)
Benchmark Returns
(%)#
Additional Benchmark
Returns (%) ##
Value of ` 10,000 invested
Scheme (`)
Benchmark (`)#
Additional Benchmark
(`)##
Feb 28, 20 Last 1 Year 8.40 6.92 4.92 10,837 10,690 10,490Jan 30, 19 Since Inception 9.47 9.98 8.87 12,068 12,185 11,931
# CRISIL Composite Bond Fund Index ## CRISIL 10 year Gilt Index. The scheme is managed by Mr. Anil Bamboli since inception.
HDFC FMP 1154D FEBRUARY 2019 (1) NAV as on Feb 26, 2021 ` 11.9936
Date Period Scheme Returns
(%)
Benchmark Returns
(%)#
Additional Benchmark
Returns (%) ##
Value of ` 10,000 invested
Scheme (`)
Benchmark (`)#
Additional Benchmark
(`)##
Feb 28, 20 Last 1 Year 8.46 6.92 4.92 10,844 10,690 10,490Feb 13, 19 Since Inception 9.33 9.92 8.60 11,994 12,126 11,832
# CRISIL Composite Bond Fund Index ## CRISIL 10 year Gilt Index. The scheme is managed by Mr. Anil Bamboli since inception.
HDFC FMP 1146D FEBRUARY 2019 (1) NAV as on Feb 26, 2021 ` 11.9947
Date Period Scheme Returns
(%)
Benchmark Returns
(%)#
Additional Benchmark
Returns (%) ##
Value of ` 10,000 invested
Scheme (`)
Benchmark (`)#
Additional Benchmark
(`)##
Feb 28, 20 Last 1 Year 8.46 6.92 4.92 10,844 10,690 10,490Feb 21, 19 Since Inception 9.44 10.14 8.88 11,995 12,149 11,871
# CRISIL Composite Bond Fund Index ## CRISIL 10 year Gilt Index. The scheme is managed by Mr. Anil Bamboli since inception.
ANUPAM JOSHI
HDFC FMP 1158D FEBRUARY 2018 (1) NAV as on Feb 26, 2021 ` 12.4994
Date Period Scheme Returns
(%)
Benchmark Returns
(%)#
Additional Benchmark
Returns (%) ##
Value of ` 10,000 invested
Scheme (`)
Benchmark (`)#
Additional Benchmark
(`)##
Feb 28, 20 Last 1 Year 5.97 6.92 4.92 10,596 10,690 10,490Feb 28, 18 Last 3 Years 7.75 9.23 8.94 12,507 13,030 12,927Feb 27, 18 Since Inception 7.72 9.18 8.81 12,499 13,016 12,882
# CRISIL Composite Bond Fund Index ## CRISIL 10 year Gilt Index. The scheme is managed by Mr. Anupam Joshi since inception.
HDFC FMP 1150D MARCH 2018 (1) NAV as on Feb 26, 2021 ` 12.4136
Date Period Scheme Returns
(%)
Benchmark Returns
(%)#
Additional Benchmark
Returns (%) ##
Value of ` 10,000 invested
Scheme (`)
Benchmark (`)#
Additional Benchmark
(`)##
Feb 28, 20 Last 1 Year 5.79 6.92 4.92 10,577 10,690 10,490Mar 07, 18 Since Inception 7.53 9.20 8.83 12,414 12,998 12,867
# CRISIL Composite Bond Fund Index ## CRISIL 10 year Gilt Index. The scheme is managed by Mr. Anupam Joshi since inception.

70 February 2021
SCHEME PERFORMANCE - REGULAR PLAN - GROWTH OPTION (FUND MANAGER-WISE)
Past performance may or may not be sustained in the future. Returns greater than 1 year period are compounded annualized (CAGR). Different plans viz. Regular Plan and Direct Plan have a different expense structure. The expenses of the Direct Plan under the Scheme will be lower to the extent of the distribution expenses / commission charged in the Regular Plan. Load is not taken into consideration for computation of performance. Since Inception Date = Date of First allotment in the Scheme / Plan. n.A.: not Available
Performance of close-ended schemes, being close-ended in nature, is not strictly comparable with that of open-ended schemes since the investment strategy for close-ended schemes is primarily buy-and-hold whereas open-ended schemes are actively managed.
ANUPAM JOSHI....CONTINUED
HDFC FMP 1208D MARCH 2018 (1) NAV as on Feb 26, 2021 ` 12.6924
Date Period Scheme Returns
(%)
Benchmark Returns
(%)#
Additional Benchmark
Returns (%) ##
Value of ` 10,000 invested
Scheme (`)
Benchmark (`)#
Additional Benchmark
(`)##
Feb 28, 20 Last 1 Year 10.52 6.92 4.92 11,049 10,690 10,490Mar 16, 18 Since Inception 8.41 9.01 8.53 12,692 12,902 12,737
# CRISIL Composite Bond Fund Index ## CRISIL 10 year Gilt Index. The scheme is managed by Mr. Anupam Joshi since inception.
HDFC FMP 1143D MARCH 2018 (1) NAV as on Feb 26, 2021 ` 12.4293
Date Period Scheme Returns
(%)
Benchmark Returns
(%)#
Additional Benchmark
Returns (%) ##
Value of ` 10,000 invested
Scheme (`)
Benchmark (`)#
Additional Benchmark
(`)##
Feb 28, 20 Last 1 Year 6.18 6.92 4.92 10,616 10,690 10,490Mar 13, 18 Since Inception 7.62 9.14 8.77 12,429 12,958 12,828
# CRISIL Composite Bond Fund Index ## CRISIL 10 year Gilt Index. The scheme is managed by Mr. Anupam Joshi since inception.
HDFC FMP 1147D MARCH 2018 (1) NAV as on Feb 26, 2021 ` 12.4019
Date Period Scheme Returns
(%)
Benchmark Returns
(%)#
Additional Benchmark
Returns (%) ##
Value of ` 10,000 invested
Scheme (`)
Benchmark (`)#
Additional Benchmark
(`)##
Feb 28, 20 Last 1 Year 6.22 6.92 4.92 10,621 10,690 10,490Mar 22, 18 Since Inception 7.60 9.03 8.55 12,402 12,891 12,723
# CRISIL Composite Bond Fund Index ## CRISIL 10 year Gilt Index. The scheme is managed by Mr. Anupam Joshi since inception.
HDFC FMP 1145D MARCH 2018 (1) NAV as on Feb 26, 2021 ` 12.3888
Date Period Scheme Returns
(%)
Benchmark Returns
(%)#
Additional Benchmark
Returns (%) ##
Value of ` 10,000 invested
Scheme (`)
Benchmark (`)#
Additional Benchmark
(`)##
Feb 28, 20 Last 1 Year 6.18 6.92 4.92 10,616 10,690 10,490Mar 23, 18 Since Inception 7.57 9.00 8.54 12,389 12,879 12,719
# CRISIL Composite Bond Fund Index ## CRISIL 10 year Gilt Index. The scheme is managed by Mr. Anupam Joshi since inception.
HDFC FMP 1177D MARCH 2018 (1) NAV as on Feb 26, 2021 ` 12.5972
Date Period Scheme Returns
(%)
Benchmark Returns
(%)#
Additional Benchmark
Returns (%) ##
Value of ` 10,000 invested
Scheme (`)
Benchmark (`)#
Additional Benchmark
(`)##
Feb 28, 20 Last 1 Year 10.27 6.92 4.92 11,024 10,690 10,490Mar 28, 18 Since Inception 8.23 8.72 8.14 12,597 12,766 12,569
# CRISIL Composite Bond Fund Index ## CRISIL 10 year Gilt Index. The scheme is managed by Mr. Anupam Joshi since inception.
HDFC FMP 1183D APRIL 2018 (1) NAV as on Feb 26, 2021 ` 12.3361
Date Period Scheme Returns
(%)
Benchmark Returns
(%)#
Additional Benchmark
Returns (%) ##
Value of ` 10,000 invested
Scheme (`)
Benchmark (`)#
Additional Benchmark
(`)##
Feb 28, 20 Last 1 Year 6.28 6.92 4.92 10,626 10,690 10,490Apr 17, 18 Since Inception 7.60 8.90 8.39 12,336 12,767 12,598
# CRISIL Composite Bond Fund Index ## CRISIL 10 year Gilt Index. The scheme is managed by Mr. Anupam Joshi since inception.
HDFC FMP 1141D AUGUST 2018 (1) NAV as on Feb 26, 2021 ` 12.4276
Date Period Scheme Returns
(%)
Benchmark Returns
(%)#
Additional Benchmark
Returns (%) ##
Value of ` 10,000 invested
Scheme (`)
Benchmark (`)#
Additional Benchmark
(`)##
Feb 28, 20 Last 1 Year 11.16 6.92 4.92 11,113 10,690 10,490Aug 14, 18 Since Inception 8.93 9.88 9.39 12,428 12,704 12,561
# CRISIL Composite Bond Fund Index ## CRISIL 10 year Gilt Index. The scheme is managed by Mr. Anupam Joshi since inception.
HDFC FMP 1105D AUGUST 2018 (1) NAV as on Feb 26, 2021 ` 12.3733
Date Period Scheme Returns
(%)
Benchmark Returns
(%)#
Additional Benchmark
Returns (%) ##
Value of ` 10,000 invested
Scheme (`)
Benchmark (`)#
Additional Benchmark
(`)##
Feb 28, 20 Last 1 Year 7.30 6.92 4.92 10,728 10,690 10,490Aug 08, 18 Since Inception 8.69 9.83 9.28 12,373 12,710 12,547
# CRISIL Composite Bond Fund Index ## CRISIL 10 year Gilt Index. The scheme is managed by Mr. Anupam Joshi since inception.
HDFC FMP 1113D AUGUST 2018 (1) NAV as on Feb 26, 2021 ` 12.3666
Date Period Scheme Returns
(%)
Benchmark Returns
(%)#
Additional Benchmark
Returns (%) ##
Value of ` 10,000 invested
Scheme (`)
Benchmark (`)#
Additional Benchmark
(`)##
Feb 28, 20 Last 1 Year 8.38 6.92 4.92 10,836 10,690 10,490Aug 14, 18 Since Inception 8.72 9.88 9.39 12,367 12,704 12,561
# CRISIL Composite Bond Fund Index ## CRISIL 10 year Gilt Index. The scheme is managed by Mr. Anupam Joshi since inception.
HDFC FMP 1105D AUGUST 2018 (2) NAV as on Feb 26, 2021 ` 12.3127
Date Period Scheme Returns
(%)
Benchmark Returns
(%)#
Additional Benchmark
Returns (%) ##
Value of ` 10,000 invested
Scheme (`)
Benchmark (`)#
Additional Benchmark
(`)##
Feb 28, 20 Last 1 Year 6.93 6.92 4.92 10,691 10,690 10,490Aug 29, 18 Since Inception 8.68 10.09 9.70 12,313 12,715 12,603
# CRISIL Composite Bond Fund Index ## CRISIL 10 year Gilt Index. The scheme is managed by Mr. Anupam Joshi since inception.
HDFC FMP 1122D AUGUST 2018 (1) NAV as on Feb 26, 2021 ` 12.2981
Date Period Scheme Returns
(%)
Benchmark Returns
(%)#
Additional Benchmark
Returns (%) ##
Value of ` 10,000 invested
Scheme (`)
Benchmark (`)#
Additional Benchmark
(`)##
Feb 28, 20 Last 1 Year 6.87 6.92 4.92 10,685 10,690 10,490Sep 05, 18 Since Inception 8.70 10.44 10.11 12,298 12,793 12,696
# CRISIL Composite Bond Fund Index ## CRISIL 10 year Gilt Index. The scheme is managed by Mr. Anupam Joshi since inception.
HDFC FMP 1487D AUGUST 2018 (1) NAV as on Feb 26, 2021 ` 12.5357
Date Period Scheme Returns
(%)
Benchmark Returns
(%)#
Additional Benchmark
Returns (%) ##
Value of ` 10,000 invested
Scheme (`)
Benchmark (`)#
Additional Benchmark
(`)##
Feb 28, 20 Last 1 Year 11.06 6.92 4.92 11,103 10,690 10,490Sep 04, 18 Since Inception 9.53 10.40 10.14 12,536 12,784 12,710
# CRISIL Composite Bond Fund Index ## CRISIL 10 year Gilt Index. The scheme is managed by Mr. Anupam Joshi since inception.
HDFC FMP 1115D SEPTEMBER 2018 (1) NAV as on Feb 26, 2021 ` 12.3713
Date Period Scheme Returns
(%)
Benchmark Returns
(%)#
Additional Benchmark
Returns (%) ##
Value of ` 10,000 invested
Scheme (`)
Benchmark (`)#
Additional Benchmark
(`)##
Feb 28, 20 Last 1 Year 7.04 6.92 4.92 10,702 10,690 10,490Sep 12, 18 Since Inception 9.03 10.63 10.37 12,371 12,822 12,747
# CRISIL Composite Bond Fund Index ## CRISIL 10 year Gilt Index. The scheme is managed by Mr. Anupam Joshi since inception.
HDFC FMP 1381D SEPTEMBER 2018 (1) NAV as on Feb 26, 2021 ` 12.6650
Date Period Scheme Returns
(%)
Benchmark Returns
(%)#
Additional Benchmark
Returns (%) ##
Value of ` 10,000 invested
Scheme (`)
Benchmark (`)#
Additional Benchmark
(`)##
Feb 28, 20 Last 1 Year 8.48 6.92 4.92 10,846 10,690 10,490Sep 19, 18 Since Inception 10.16 10.58 10.21 12,665 12,781 12,677
# CRISIL Composite Bond Fund Index ## CRISIL 10 year Gilt Index. The scheme is managed by Mr. Anupam Joshi since inception.

February 2021 71
ANUPAM JOSHI....CONTINUED
SCHEME PERFORMANCE - REGULAR PLAN - GROWTH OPTION (FUND MANAGER-WISE)
Past performance may or may not be sustained in the future. Returns greater than 1 year period are compounded annualized (CAGR). Different plans viz. Regular Plan and Direct Plan have a different expense structure. The expenses of the Direct Plan under the Scheme will be lower to the extent of the distribution expenses / commission charged in the Regular Plan. Load is not taken into consideration for computation of performance. Since Inception Date = Date of First allotment in the Scheme / Plan. n.A.: not Available
Performance of close-ended Scheme is not strictly comparable with that of open-ended schemes since the investment strategy for close-ended schemes is primarily buy and hold whereas open ended schemes are actively managed.
HDFC FMP 1372D SEPTEMBER 2018 (1) NAV as on Feb 26, 2021 ` 12.6209
Date Period Scheme Returns
(%)
Benchmark Returns
(%)#
Additional Benchmark
Returns (%) ##
Value of ` 10,000 invested
Scheme (`)
Benchmark (`)#
Additional Benchmark
(`)##
Feb 28, 20 Last 1 Year 8.33 6.92 4.92 10,830 10,690 10,490Sep 28, 18 Since Inception 10.11 10.67 10.08 12,621 12,776 12,612
# CRISIL Composite Bond Fund Index ## CRISIL 10 year Gilt Index. The scheme is managed by Mr. Anupam Joshi since inception.
AMIT B. GANATRA
HDFC EOF - II - 1126D MAY 2017 (1) NAV as on Feb 26, 2021 ` 11.3040
Date Period Scheme Returns
(%)
Benchmark Returns
(%)#
Additional Benchmark
Returns (%) ##
Value of ` 10,000 invested
Scheme (`)
Benchmark (`)#
Additional Benchmark
(`)##
Feb 28, 20 Last 1 Year 18.96 31.27 29.90 11,891 13,117 12,981Feb 28, 18 Last 3 Years 2.87 12.88 14.22 10,886 14,378 14,894Jun 15, 17 Since Inception 3.36 13.32 14.51 11,304 15,890 16,518
# nIFTY 50 (Total Returns Index) ## S&P BSE SEnSEx (Total Returns Index). The scheme is managed by Mr. Amit B. Ganatra from May 21, 2020.
HDFC EOF - II - 1100D JUNE 2017 (1) NAV as on Feb 26, 2021 ` 10.7980
Date Period Scheme Returns
(%)
Benchmark Returns
(%)#
Additional Benchmark
Returns (%) ##
Value of ` 10,000 invested
Scheme (`)
Benchmark (`)#
Additional Benchmark
(`)##
Feb 28, 20 Last 1 Year 15.68 31.27 29.90 11,564 13,117 12,981Feb 28, 18 Last 3 Years 2.71 12.88 14.22 10,835 14,378 14,894Jul 17, 17 Since Inception 2.15 12.48 13.76 10,798 15,299 15,941
# nIFTY 50 (Total Returns Index) ## S&P BSE SEnSEx (Total Returns Index). The scheme is managed by Mr. Amit B. Ganatra from May 21, 2020.
CO-MANAGED BY ANIL BAMBOLI & AMIT B. GANATRA
HDFC DYNAMIC PE RATIO FUND OF FUNDS NAV as on Feb 26, 2021 ` 22.8351
Date Period Scheme Returns
(%)
Benchmark Returns
(%)#
Additional Benchmark
Returns (%) ##
Value of ` 10,000 invested
Scheme (`)
Benchmark (`)#
Additional Benchmark
(`)##
Feb 28, 20 Last 1 Year 23.48 24.79 31.27 12,341 12,471 13,117Feb 28, 18 Last 3 Years 8.48 12.46 12.88 12,763 14,218 14,378Feb 29, 16 Last 5 Years 14.12 14.80 17.29 19,349 19,932 22,189Feb 06, 12 Since Inception 9.54 11.88 13.02 22,835 27,657 30,327
# nIFTY 50 Hybrid Composite Debt 65:35 Index ## nIFTY 50 (Total Returns Index). Scheme performance may not strictly be comparable with that of its Additional Benchmark in view of hybrid nature of the scheme where a portion of scheme’s investments are made in equity instruments. The scheme is co-managed by Mr. Amit B. Ganatra from May 21, 2020 & Mr. Anil Bamboli from June 28, 2014.
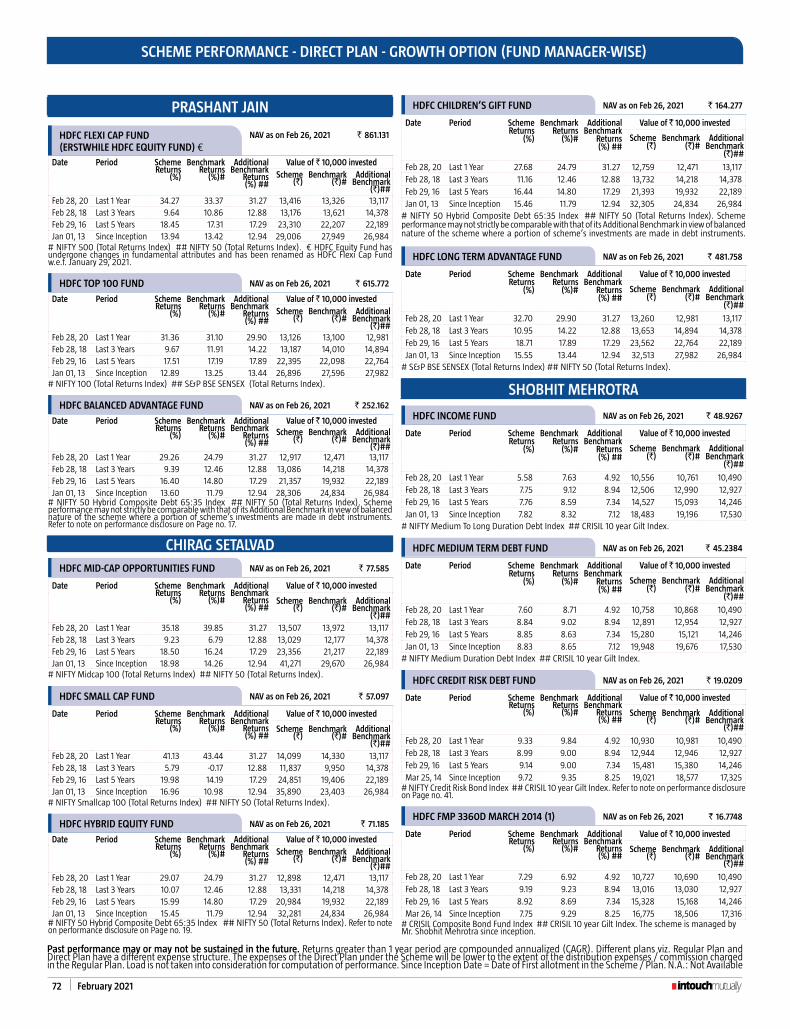
72 February 2021
SCHEME PERFORMANCE - DIRECT PLAN - GROWTH OPTION (FUND MANAGER-WISE)
PRASHANT JAIN
HDFC FLExI CAP FUND (ERSTWHILE HDFC EqUITY FUND) €
NAV as on Feb 26, 2021 ` 861.131
Date Period Scheme Returns
(%)
Benchmark Returns
(%)#
Additional Benchmark
Returns (%) ##
Value of ` 10,000 invested Scheme
(`)Benchmark
(`)#Additional
Benchmark (`)##
Feb 28, 20 Last 1 Year 34.27 33.37 31.27 13,416 13,326 13,117Feb 28, 18 Last 3 Years 9.64 10.86 12.88 13,176 13,621 14,378Feb 29, 16 Last 5 Years 18.45 17.31 17.29 23,310 22,207 22,189Jan 01, 13 Since Inception 13.94 13.42 12.94 29,006 27,949 26,984
# nIFTY 500 (Total Returns Index) ## nIFTY 50 (Total Returns Index). € HDFC Equity Fund has undergone changes in fundamental attributes and has been renamed as HDFC Flexi Cap Fund w.e.f. January 29, 2021.
HDFC TOP 100 FUND NAV as on Feb 26, 2021 ` 615.772
Date Period Scheme Returns
(%)
Benchmark Returns
(%)#
Additional Benchmark
Returns (%) ##
Value of ` 10,000 invested Scheme
(`)Benchmark
(`)#Additional
Benchmark (`)##
Feb 28, 20 Last 1 Year 31.36 31.10 29.90 13,126 13,100 12,981Feb 28, 18 Last 3 Years 9.67 11.91 14.22 13,187 14,010 14,894Feb 29, 16 Last 5 Years 17.51 17.19 17.89 22,395 22,098 22,764Jan 01, 13 Since Inception 12.89 13.25 13.44 26,896 27,596 27,982
# nIFTY 100 (Total Returns Index) ## S&P BSE SEnSEx (Total Returns Index).
HDFC BALANCED ADVANTAGE FUND NAV as on Feb 26, 2021 ` 252.162
Date Period Scheme Returns
(%)
Benchmark Returns
(%)#
Additional Benchmark
Returns (%) ##
Value of ` 10,000 invested Scheme
(`)Benchmark
(`)#Additional
Benchmark (`)##
Feb 28, 20 Last 1 Year 29.26 24.79 31.27 12,917 12,471 13,117Feb 28, 18 Last 3 Years 9.39 12.46 12.88 13,086 14,218 14,378Feb 29, 16 Last 5 Years 16.40 14.80 17.29 21,357 19,932 22,189Jan 01, 13 Since Inception 13.60 11.79 12.94 28,306 24,834 26,984
# nIFTY 50 Hybrid Composite Debt 65:35 Index ## nIFTY 50 (Total Returns Index). Scheme performance may not strictly be comparable with that of its Additional Benchmark in view of balanced nature of the scheme where a portion of scheme’s investments are made in debt instruments. Refer to note on performance disclosure on Page no. 17.
CHIRAG SETALVAD
HDFC MID-CAP OPPORTUNITIES FUND NAV as on Feb 26, 2021 ` 77.585
Date Period Scheme Returns
(%)
Benchmark Returns
(%)#
Additional Benchmark
Returns (%) ##
Value of ` 10,000 invested
Scheme (`)
Benchmark (`)#
Additional Benchmark
(`)##Feb 28, 20 Last 1 Year 35.18 39.85 31.27 13,507 13,972 13,117Feb 28, 18 Last 3 Years 9.23 6.79 12.88 13,029 12,177 14,378Feb 29, 16 Last 5 Years 18.50 16.24 17.29 23,356 21,217 22,189Jan 01, 13 Since Inception 18.98 14.26 12.94 41,271 29,670 26,984
# nIFTY Midcap 100 (Total Returns Index) ## nIFTY 50 (Total Returns Index).
HDFC SMALL CAP FUND NAV as on Feb 26, 2021 ` 57.097
Date Period Scheme Returns
(%)
Benchmark Returns
(%)#
Additional Benchmark
Returns (%) ##
Value of ` 10,000 invested
Scheme (`)
Benchmark (`)#
Additional Benchmark
(`)##Feb 28, 20 Last 1 Year 41.13 43.44 31.27 14,099 14,330 13,117Feb 28, 18 Last 3 Years 5.79 -0.17 12.88 11,837 9,950 14,378Feb 29, 16 Last 5 Years 19.98 14.19 17.29 24,851 19,406 22,189Jan 01, 13 Since Inception 16.96 10.98 12.94 35,890 23,403 26,984
# nIFTY Smallcap 100 (Total Returns Index) ## nIFTY 50 (Total Returns Index).
HDFC HYBRID EqUITY FUND NAV as on Feb 26, 2021 ` 71.185
Date Period Scheme Returns
(%)
Benchmark Returns
(%)#
Additional Benchmark
Returns (%) ##
Value of ` 10,000 invested Scheme
(`)Benchmark
(`)#Additional
Benchmark (`)##
Feb 28, 20 Last 1 Year 29.07 24.79 31.27 12,898 12,471 13,117Feb 28, 18 Last 3 Years 10.07 12.46 12.88 13,331 14,218 14,378Feb 29, 16 Last 5 Years 15.99 14.80 17.29 20,984 19,932 22,189Jan 01, 13 Since Inception 15.45 11.79 12.94 32,281 24,834 26,984
# nIFTY 50 Hybrid Composite Debt 65:35 Index ## nIFTY 50 (Total Returns Index). Refer to note on performance disclosure on Page no. 19.
HDFC CHILDREN’S GIFT FUND NAV as on Feb 26, 2021 ` 164.277
Date Period Scheme Returns
(%)
Benchmark Returns
(%)#
Additional Benchmark
Returns (%) ##
Value of ` 10,000 invested
Scheme (`)
Benchmark (`)#
Additional Benchmark
(`)##
Feb 28, 20 Last 1 Year 27.68 24.79 31.27 12,759 12,471 13,117Feb 28, 18 Last 3 Years 11.16 12.46 12.88 13,732 14,218 14,378Feb 29, 16 Last 5 Years 16.44 14.80 17.29 21,393 19,932 22,189Jan 01, 13 Since Inception 15.46 11.79 12.94 32,305 24,834 26,984
# nIFTY 50 Hybrid Composite Debt 65:35 Index ## nIFTY 50 (Total Returns Index). Scheme performance may not strictly be comparable with that of its Additional Benchmark in view of balanced nature of the scheme where a portion of scheme’s investments are made in debt instruments.
HDFC LONG TERM ADVANTAGE FUND NAV as on Feb 26, 2021 ` 481.758
Date Period Scheme Returns
(%)
Benchmark Returns
(%)#
Additional Benchmark
Returns (%) ##
Value of ` 10,000 invested
Scheme (`)
Benchmark (`)#
Additional Benchmark
(`)##
Feb 28, 20 Last 1 Year 32.70 29.90 31.27 13,260 12,981 13,117Feb 28, 18 Last 3 Years 10.95 14.22 12.88 13,653 14,894 14,378Feb 29, 16 Last 5 Years 18.71 17.89 17.29 23,562 22,764 22,189Jan 01, 13 Since Inception 15.55 13.44 12.94 32,513 27,982 26,984
# S&P BSE SEnSEx (Total Returns Index) ## nIFTY 50 (Total Returns Index).
SHOBHIT MEHROTRA
HDFC INCOME FUND NAV as on Feb 26, 2021 ` 48.9267
Date Period Scheme Returns
(%)
Benchmark Returns
(%)#
Additional Benchmark
Returns (%) ##
Value of ` 10,000 invested
Scheme (`)
Benchmark (`)#
Additional Benchmark
(`)##
Feb 28, 20 Last 1 Year 5.58 7.63 4.92 10,556 10,761 10,490Feb 28, 18 Last 3 Years 7.75 9.12 8.94 12,506 12,990 12,927Feb 29, 16 Last 5 Years 7.76 8.59 7.34 14,527 15,093 14,246Jan 01, 13 Since Inception 7.82 8.32 7.12 18,483 19,196 17,530
# nIFTY Medium To Long Duration Debt Index ## CRISIL 10 year Gilt Index.
HDFC MEDIUM TERM DEBT FUND NAV as on Feb 26, 2021 ` 45.2384
Date Period Scheme Returns
(%)
Benchmark Returns
(%)#
Additional Benchmark
Returns (%) ##
Value of ` 10,000 invested
Scheme (`)
Benchmark (`)#
Additional Benchmark
(`)##
Feb 28, 20 Last 1 Year 7.60 8.71 4.92 10,758 10,868 10,490Feb 28, 18 Last 3 Years 8.84 9.02 8.94 12,891 12,954 12,927Feb 29, 16 Last 5 Years 8.85 8.63 7.34 15,280 15,121 14,246Jan 01, 13 Since Inception 8.83 8.65 7.12 19,948 19,676 17,530
# nIFTY Medium Duration Debt Index ## CRISIL 10 year Gilt Index.
HDFC CREDIT RISk DEBT FUND NAV as on Feb 26, 2021 ` 19.0209
Date Period Scheme Returns
(%)
Benchmark Returns
(%)#
Additional Benchmark
Returns (%) ##
Value of ` 10,000 invested
Scheme (`)
Benchmark (`)#
Additional Benchmark
(`)##
Feb 28, 20 Last 1 Year 9.33 9.84 4.92 10,930 10,981 10,490Feb 28, 18 Last 3 Years 8.99 9.00 8.94 12,944 12,946 12,927Feb 29, 16 Last 5 Years 9.14 9.00 7.34 15,481 15,380 14,246Mar 25, 14 Since Inception 9.72 9.35 8.25 19,021 18,577 17,325
# nIFTY Credit Risk Bond Index ## CRISIL 10 year Gilt Index. Refer to note on performance disclosure on Page no. 41.
HDFC FMP 3360D MARCH 2014 (1) NAV as on Feb 26, 2021 ` 16.7748
Date Period Scheme Returns
(%)
Benchmark Returns
(%)#
Additional Benchmark
Returns (%) ##
Value of ` 10,000 invested
Scheme (`)
Benchmark (`)#
Additional Benchmark
(`)##
Feb 28, 20 Last 1 Year 7.29 6.92 4.92 10,727 10,690 10,490Feb 28, 18 Last 3 Years 9.19 9.23 8.94 13,016 13,030 12,927Feb 29, 16 Last 5 Years 8.92 8.69 7.34 15,328 15,168 14,246Mar 26, 14 Since Inception 7.75 9.29 8.25 16,775 18,506 17,316
# CRISIL Composite Bond Fund Index ## CRISIL 10 year Gilt Index. The scheme is managed by Mr. Shobhit Mehrotra since inception.
Past performance may or may not be sustained in the future. Returns greater than 1 year period are compounded annualized (CAGR). Different plans viz. Regular Plan and Direct Plan have a different expense structure. The expenses of the Direct Plan under the Scheme will be lower to the extent of the distribution expenses / commission charged in the Regular Plan. Load is not taken into consideration for computation of performance. Since Inception Date = Date of First allotment in the Scheme / Plan. n.A.: not Available

February 2021 73
SCHEME PERFORMANCE - DIRECT PLAN - GROWTH OPTION (FUND MANAGER-WISE)
HDFC FMP 1430D JULY 2017 (1) NAV as on Feb 26, 2021 ` 12.8258
Date Period Scheme Returns
(%)
Benchmark Returns
(%)#
Additional Benchmark
Returns (%) ##
Value of ` 10,000 invested
Scheme (`)
Benchmark (`)#
Additional Benchmark
(`)##
Feb 28, 20 Last 1 Year 6.27 6.92 4.92 10,625 10,690 10,490Feb 28, 18 Last 3 Years 8.00 9.23 8.94 12,593 13,030 12,927Aug 01, 17 Since Inception 7.21 7.40 5.65 12,826 12,908 12,173
# CRISIL Composite Bond Fund Index ## CRISIL 10 year Gilt Index. The scheme is managed by Mr. Shobhit Mehrotra since inception.
HDFC FMP 1113D JUNE 2018 (1) NAV as on Feb 26, 2021 ` 12.5470
Date Period Scheme Returns
(%)
Benchmark Returns
(%)#
Additional Benchmark
Returns (%) ##
Value of ` 10,000 invested
Scheme (`)
Benchmark (`)#
Additional Benchmark
(`)##
Feb 28, 20 Last 1 Year 6.73 6.92 4.92 10,671 10,690 10,490Jun 14, 18 Since Inception 8.74 10.03 9.64 12,547 12,952 12,830
# CRISIL Composite Bond Fund Index ## CRISIL 10 year Gilt Index. The scheme is managed by Mr. Shobhit Mehrotra since inception.
HDFC FMP 1124D JUNE 2018 (1) NAV as on Feb 26, 2021 ` 12.6618
Date Period Scheme Returns
(%)
Benchmark Returns
(%)#
Additional Benchmark
Returns (%) ##
Value of ` 10,000 invested
Scheme (`)
Benchmark (`)#
Additional Benchmark
(`)##
Feb 28, 20 Last 1 Year 10.91 6.92 4.92 11,088 10,690 10,490Jun 29, 18 Since Inception 9.26 9.96 9.55 12,662 12,880 12,753
# CRISIL Composite Bond Fund Index ## CRISIL 10 year Gilt Index. The scheme is managed by Mr. Shobhit Mehrotra since inception.
HDFC FMP 1099D JUNE 2018 (1) NAV as on Feb 26, 2021 ` 12.4741
Date Period Scheme Returns
(%)
Benchmark Returns
(%)#
Additional Benchmark
Returns (%) ##
Value of ` 10,000 invested
Scheme (`)
Benchmark (`)#
Additional Benchmark
(`)##
Feb 28, 20 Last 1 Year 6.50 6.92 4.92 10,648 10,690 10,490Jun 28, 18 Since Inception 8.64 9.99 9.64 12,474 12,893 12,783
# CRISIL Composite Bond Fund Index ## CRISIL 10 year Gilt Index. The scheme is managed by Mr. Shobhit Mehrotra since inception.
HDFC FMP 1122D JULY 2018 (1) NAV as on Feb 26, 2021 ` 12.5261
Date Period Scheme Returns
(%)
Benchmark Returns
(%)#
Additional Benchmark
Returns (%) ##
Value of ` 10,000 invested
Scheme (`)
Benchmark (`)#
Additional Benchmark
(`)##
Feb 28, 20 Last 1 Year 6.82 6.92 4.92 10,680 10,690 10,490Jul 04, 18 Since Inception 8.86 9.88 9.42 12,526 12,838 12,698
# CRISIL Composite Bond Fund Index ## CRISIL 10 year Gilt Index. The scheme is managed by Mr. Shobhit Mehrotra since inception.
HDFC FMP 1133D JULY 2018 (1) NAV as on Feb 26, 2021 ` 12.3792
Date Period Scheme Returns
(%)
Benchmark Returns
(%)#
Additional Benchmark
Returns (%) ##
Value of ` 10,000 invested
Scheme (`)
Benchmark (`)#
Additional Benchmark
(`)##
Feb 28, 20 Last 1 Year 7.89 6.92 4.92 10,787 10,690 10,490Jul 25, 18 Since Inception 8.57 9.84 9.27 12,379 12,756 12,585
# CRISIL Composite Bond Fund Index ## CRISIL 10 year Gilt Index. The scheme is managed by Mr. Shobhit Mehrotra since inception.
HDFC FMP 1133D FEBRUARY 2019 (1) NAV as on Feb 26, 2021 ` 12.0470
Date Period Scheme Returns
(%)
Benchmark Returns
(%)#
Additional Benchmark
Returns (%) ##
Value of ` 10,000 invested
Scheme (`)
Benchmark (`)#
Additional Benchmark
(`)##
Feb 28, 20 Last 1 Year 8.45 6.92 4.92 10,842 10,690 10,490Mar 06, 19 Since Inception 9.86 10.22 8.96 12,047 12,125 11,853
# CRISIL Composite Bond Fund Index ## CRISIL 10 year Gilt Index. The scheme is managed by Mr. Shobhit Mehrotra since inception.
HDFC FMP 1126D MARCH 2019 (1) NAV as on Feb 26, 2021 ` 12.0114
Date Period Scheme Returns
(%)
Benchmark Returns
(%)#
Additional Benchmark
Returns (%) ##
Value of ` 10,000 invested
Scheme (`)
Benchmark (`)#
Additional Benchmark
(`)##
Feb 28, 20 Last 1 Year 8.45 6.92 4.92 10,842 10,690 10,490Mar 13, 19 Since Inception 9.79 10.07 8.93 12,011 12,072 11,827
# CRISIL Composite Bond Fund Index ## CRISIL 10 year Gilt Index. The scheme is managed by Mr. Shobhit Mehrotra since inception.
HDFC FMP 1127D MARCH 2019 (1) NAV as on Feb 26, 2021 ` 11.9338
Date Period Scheme Returns
(%)
Benchmark Returns
(%)#
Additional Benchmark
Returns (%) ##
Value of ` 10,000 invested
Scheme (`)
Benchmark (`)#
Additional Benchmark
(`)##
Feb 28, 20 Last 1 Year 8.33 6.92 4.92 10,831 10,690 10,490Mar 19, 19 Since Inception 9.51 10.06 8.93 11,934 12,049 11,811
# CRISIL Composite Bond Fund Index ## CRISIL 10 year Gilt Index. The scheme is managed by Mr. Shobhit Mehrotra since inception.
HDFC FMP 1120D MARCH 2019 (1) NAV as on Feb 26, 2021 ` 11.8807
Date Period Scheme Returns
(%)
Benchmark Returns
(%)#
Additional Benchmark
Returns (%) ##
Value of ` 10,000 invested
Scheme (`)
Benchmark (`)#
Additional Benchmark
(`)##
Feb 28, 20 Last 1 Year 8.29 6.92 4.92 10,827 10,690 10,490Mar 26, 19 Since Inception 9.36 9.85 8.82 11,881 11,983 11,768
# CRISIL Composite Bond Fund Index ## CRISIL 10 year Gilt Index. The scheme is managed by Mr. Shobhit Mehrotra since inception.
HDFC FMP 1118D MARCH 2019 (1) NAV as on Feb 26, 2021 ` 11.8767
Date Period Scheme Returns
(%)
Benchmark Returns
(%)#
Additional Benchmark
Returns (%) ##
Value of ` 10,000 invested
Scheme (`)
Benchmark (`)#
Additional Benchmark
(`)##
Feb 28, 20 Last 1 Year 8.35 6.92 4.92 10,832 10,690 10,490Mar 28, 19 Since Inception 9.37 9.80 8.75 11,877 11,968 11,748
# CRISIL Composite Bond Fund Index ## CRISIL 10 year Gilt Index. The scheme is managed by Mr. Shobhit Mehrotra since inception.
HDFC FMP 1100D APRIL 2019 (1) NAV as on Feb 26, 2021 ` 11.8711
Date Period Scheme Returns
(%)
Benchmark Returns
(%)#
Additional Benchmark
Returns (%) ##
Value of ` 10,000 invested
Scheme (`)
Benchmark (`)#
Additional Benchmark
(`)##
Feb 28, 20 Last 1 Year 8.48 6.92 4.92 10,846 10,690 10,490May 08, 19 Since Inception 9.95 10.18 9.05 11,871 11,916 11,696
# CRISIL Composite Bond Fund Index ## CRISIL 10 year Gilt Index. The scheme is managed by Mr. Shobhit Mehrotra since inception.
ANUPAM JOSHI
HDFC CORPORATE BOND FUND NAV as on Feb 26, 2021 ` 24.9438
Date Period Scheme Returns
(%)
Benchmark Returns
(%)#
Additional Benchmark
Returns (%) ##
Value of ` 10,000 invested
Scheme (`)
Benchmark (`)#
Additional Benchmark
(`)##
Feb 28, 20 Last 1 Year 8.73 9.18 4.92 10,871 10,915 10,490Feb 28, 18 Last 3 Years 9.18 8.85 8.94 13,012 12,893 12,927Feb 29, 16 Last 5 Years 8.88 8.62 7.34 15,301 15,118 14,246Jan 01, 13 Since Inception 8.89 8.77 7.12 20,035 19,854 17,530
# nIFTY Corporate Bond Index ## CRISIL 10 year Gilt Index. Refer to note on performance disclosure on Page no. 40.
HDFC LOW DURATION FUND NAV as on Feb 26, 2021 ` 47.4294
Date Period Scheme Returns
(%)
Benchmark Returns
(%)#
Additional Benchmark
Returns (%) ##
Value of ` 10,000 invested
Scheme (`)
Benchmark (`)#
Additional Benchmark
(`)##Feb 28, 20 Last 1 Year 7.86 5.92 5.46 10,784 10,591 10,544Feb 28, 18 Last 3 Years 8.07 7.23 6.65 12,620 12,326 12,127Feb 29, 16 Last 5 Years 8.10 7.35 6.56 14,757 14,256 13,739Jan 01, 13 Since Inception 8.35 7.90 6.92 19,238 18,594 17,265
# nIFTY Low Duration Debt Index ## CRISIL 1 year T-Bill Index.
Past performance may or may not be sustained in the future. Returns greater than 1 year period are compounded annualized (CAGR). Different plans viz. Regular Plan and Direct Plan have a different expense structure. The expenses of the Direct Plan under the Scheme will be lower to the extent of the distribution expenses / commission charged in the Regular Plan. Load is not taken into consideration for computation of performance. Since Inception Date = Date of First allotment in the Scheme / Plan. n.A.: not Available
Performance of close-ended schemes, being close-ended in nature, is not strictly comparable with that of open-ended schemes since the investment strategy for close-ended schemes is primarily buy-and-hold whereas open-ended schemes are actively managed.
SHOBHIT MEHROTRA....CONTINUED

74 February 2021
SCHEME PERFORMANCE - DIRECT PLAN - GROWTH OPTION (FUND MANAGER-WISE)
HDFC LIqUID FUND NAV as on Feb 28, 2021 ` 4034.4190
Date Period Scheme Returns
(%)
Benchmark Returns
(%)#
Additional Benchmark
Returns (%) ##
Value of ` 10,000 invested
Scheme (`)
Benchmark (`)#
Additional Benchmark
(`)##Feb 21, 21 Last 7 days 3.03 3.48 4.89 10,006 10,007 10,009Feb 13, 21 Last 15 days 3.36 3.71 5.96 10,014 10,015 10,024Jan 31, 21 Last 1 Month 3.30 3.81 4.54 10,025 10,029 10,035Feb 29, 20 Last 1 Year 3.86 4.27 5.46 10,386 10,427 10,546Feb 28, 18 Last 3 Years 5.85 6.16 6.64 11,861 11,966 12,129Feb 29, 16 Last 5 Years 6.33 6.51 6.56 13,595 13,710 13,742Dec 31, 12 Since Inception 7.32 7.37 6.92 17,811 17,871 17,276
Returns less than 1 year period are simple annualized. # CRISIL Liquid Fund Index ## CRISIL 1 year T-Bill Index.
HDFC FMP 1158D FEBRUARY 2018 (1) NAV as on Feb 26, 2021 ` 12.5551
Date Period Scheme Returns
(%)
Benchmark Returns
(%)#
Additional Benchmark
Returns (%) ##
Value of ` 10,000 invested
Scheme (`)
Benchmark (`)#
Additional Benchmark
(`)##Feb 28, 20 Last 1 Year 6.13 6.92 4.92 10,612 10,690 10,490Feb 28, 18 Last 3 Years 7.91 9.23 8.94 12,562 13,030 12,927Feb 27, 18 Since Inception 7.88 9.18 8.81 12,555 13,016 12,882
# CRISIL Composite Bond Fund Index ## CRISIL 10 year Gilt Index. The scheme is managed by Mr. Anupam Joshi since inception.
HDFC FMP 1150D MARCH 2018 (1) NAV as on Feb 26, 2021 ` 12.5063
Date Period Scheme Returns
(%)
Benchmark Returns
(%)#
Additional Benchmark
Returns (%) ##
Value of ` 10,000 invested
Scheme (`)
Benchmark (`)#
Additional Benchmark
(`)##Feb 28, 20 Last 1 Year 6.05 6.92 4.92 10,603 10,690 10,490Mar 07, 18 Since Inception 7.80 9.20 8.83 12,506 12,998 12,867
# CRISIL Composite Bond Fund Index ## CRISIL 10 year Gilt Index. The scheme is managed by Mr. Anupam Joshi since inception.
HDFC FMP 1208D MARCH 2018 (1) NAV as on Feb 26, 2021 ` 12.8054
Date Period Scheme Returns
(%)
Benchmark Returns
(%)#
Additional Benchmark
Returns (%) ##
Value of ` 10,000 invested
Scheme (`)
Benchmark (`)#
Additional Benchmark
(`)##Feb 28, 20 Last 1 Year 10.86 6.92 4.92 11,082 10,690 10,490Mar 16, 18 Since Inception 8.73 9.01 8.53 12,805 12,902 12,737
# CRISIL Composite Bond Fund Index ## CRISIL 10 year Gilt Index. The scheme is managed by Mr. Anupam Joshi since inception.
HDFC FMP 1143D MARCH 2018 (1) NAV as on Feb 26, 2021 ` 12.5218
Date Period Scheme Returns
(%)
Benchmark Returns
(%)#
Additional Benchmark
Returns (%) ##
Value of ` 10,000 invested
Scheme (`)
Benchmark (`)#
Additional Benchmark
(`)##Feb 28, 20 Last 1 Year 6.44 6.92 4.92 10,643 10,690 10,490Mar 13, 18 Since Inception 7.89 9.14 8.77 12,522 12,958 12,828
# CRISIL Composite Bond Fund Index ## CRISIL 10 year Gilt Index. The scheme is managed by Mr. Anupam Joshi since inception.
HDFC FMP 1147D MARCH 2018 (1) NAV as on Feb 26, 2021 ` 12.4933
Date Period Scheme Returns
(%)
Benchmark Returns
(%)#
Additional Benchmark
Returns (%) ##
Value of ` 10,000 invested
Scheme (`)
Benchmark (`)#
Additional Benchmark
(`)##Feb 28, 20 Last 1 Year 6.49 6.92 4.92 10,647 10,690 10,490Mar 22, 18 Since Inception 7.87 9.03 8.55 12,493 12,891 12,723
# CRISIL Composite Bond Fund Index ## CRISIL 10 year Gilt Index. The scheme is managed by Mr. Anupam Joshi since inception.
HDFC FMP 1145D MARCH 2018 (1) NAV as on Feb 26, 2021 ` 12.4798
Date Period Scheme Returns
(%)
Benchmark Returns
(%)#
Additional Benchmark
Returns (%) ##
Value of ` 10,000 invested
Scheme (`)
Benchmark (`)#
Additional Benchmark
(`)##
Feb 28, 20 Last 1 Year 6.44 6.92 4.92 10,642 10,690 10,490Mar 23, 18 Since Inception 7.84 9.00 8.54 12,480 12,879 12,719
# CRISIL Composite Bond Fund Index ## CRISIL 10 year Gilt Index. The scheme is managed by Mr. Anupam Joshi since inception.
HDFC FMP 1177D MARCH 2018 (1) NAV as on Feb 26, 2021 ` 12.7093
Date Period Scheme Returns
(%)
Benchmark Returns
(%)#
Additional Benchmark
Returns (%) ##
Value of ` 10,000 invested
Scheme (`)
Benchmark (`)#
Additional Benchmark
(`)##
Feb 28, 20 Last 1 Year 10.60 6.92 4.92 11,057 10,690 10,490Mar 28, 18 Since Inception 8.56 8.72 8.14 12,709 12,766 12,569
# CRISIL Composite Bond Fund Index ## CRISIL 10 year Gilt Index. The scheme is managed by Mr. Anupam Joshi since inception.
HDFC FMP 1183D APRIL 2018 (1) NAV as on Feb 26, 2021 ` 12.4246
Date Period Scheme Returns
(%)
Benchmark Returns
(%)#
Additional Benchmark
Returns (%) ##
Value of ` 10,000 invested
Scheme (`)
Benchmark (`)#
Additional Benchmark
(`)##
Feb 28, 20 Last 1 Year 6.55 6.92 4.92 10,653 10,690 10,490Apr 17, 18 Since Inception 7.87 8.90 8.39 12,425 12,767 12,598
# CRISIL Composite Bond Fund Index ## CRISIL 10 year Gilt Index. The scheme is managed by Mr. Anupam Joshi since inception.
HDFC FMP 1141D AUGUST 2018 (1) NAV as on Feb 26, 2021 ` 12.5372
Date Period Scheme Returns
(%)
Benchmark Returns
(%)#
Additional Benchmark
Returns (%) ##
Value of ` 10,000 invested
Scheme (`)
Benchmark (`)#
Additional Benchmark
(`)##
Feb 28, 20 Last 1 Year 11.18 6.92 4.92 11,115 10,690 10,490Aug 14, 18 Since Inception 9.31 9.88 9.39 12,537 12,704 12,561
# CRISIL Composite Bond Fund Index ## CRISIL 10 year Gilt Index. The scheme is managed by Mr. Anupam Joshi since inception.
HDFC FMP 1105D AUGUST 2018 (1) NAV as on Feb 26, 2021 ` 12.4640
Date Period Scheme Returns
(%)
Benchmark Returns
(%)#
Additional Benchmark
Returns (%) ##
Value of ` 10,000 invested
Scheme (`)
Benchmark (`)#
Additional Benchmark
(`)##
Feb 28, 20 Last 1 Year 7.33 6.92 4.92 10,730 10,690 10,490Aug 08, 18 Since Inception 9.00 9.83 9.28 12,464 12,710 12,547
# CRISIL Composite Bond Fund Index ## CRISIL 10 year Gilt Index. The scheme is managed by Mr. Anupam Joshi since inception.
HDFC FMP 1113D AUGUST 2018 (1) NAV as on Feb 26, 2021 ` 12.4565
Date Period Scheme Returns
(%)
Benchmark Returns
(%)#
Additional Benchmark
Returns (%) ##
Value of ` 10,000 invested
Scheme (`)
Benchmark (`)#
Additional Benchmark
(`)##
Feb 28, 20 Last 1 Year 8.40 6.92 4.92 10,838 10,690 10,490Aug 14, 18 Since Inception 9.03 9.88 9.39 12,457 12,704 12,561
# CRISIL Composite Bond Fund Index ## CRISIL 10 year Gilt Index. The scheme is managed by Mr. Anupam Joshi since inception.
HDFC FMP 1105D AUGUST 2018 (2) NAV as on Feb 26, 2021 ` 12.4028
Date Period Scheme Returns
(%)
Benchmark Returns
(%)#
Additional Benchmark
Returns (%) ##
Value of ` 10,000 invested
Scheme (`)
Benchmark (`)#
Additional Benchmark
(`)##
Feb 28, 20 Last 1 Year 6.95 6.92 4.92 10,694 10,690 10,490Aug 29, 18 Since Inception 9.00 10.09 9.70 12,403 12,715 12,603
# CRISIL Composite Bond Fund Index ## CRISIL 10 year Gilt Index. The scheme is managed by Mr. Anupam Joshi since inception.
HDFC FMP 1122D AUGUST 2018 (1) NAV as on Feb 26, 2021 ` 12.3880
Date Period Scheme Returns
(%)
Benchmark Returns
(%)#
Additional Benchmark
Returns (%) ##
Value of ` 10,000 invested
Scheme (`)
Benchmark (`)#
Additional Benchmark
(`)##
Feb 28, 20 Last 1 Year 6.89 6.92 4.92 10,687 10,690 10,490Sep 05, 18 Since Inception 9.02 10.44 10.11 12,388 12,793 12,696
# CRISIL Composite Bond Fund Index ## CRISIL 10 year Gilt Index. The scheme is managed by Mr. Anupam Joshi since inception.
Past performance may or may not be sustained in the future. Returns greater than 1 year period are compounded annualized (CAGR). Different plans viz. Regular Plan and Direct Plan have a different expense structure. The expenses of the Direct Plan under the Scheme will be lower to the extent of the distribution expenses / commission charged in the Regular Plan. Load is not taken into consideration for computation of performance. Since Inception Date = Date of First allotment in the Scheme / Plan. n.A.: not Available
Performance of close-ended schemes, being close-ended in nature, is not strictly comparable with that of open-ended schemes since the investment strategy for close-ended schemes is primarily buy-and-hold whereas open-ended schemes are actively managed.
ANUPAM JOSHI....CONTINUED

February 2021 75
SCHEME PERFORMANCE - DIRECT PLAN - GROWTH OPTION (FUND MANAGER-WISE)
HDFC FMP 1487D AUGUST 2018 (1) NAV as on Feb 26, 2021 ` 12.7083
Date Period Scheme Returns
(%)
Benchmark Returns
(%)#
Additional Benchmark
Returns (%) ##
Value of ` 10,000 invested
Scheme (`)
Benchmark (`)#
Additional Benchmark
(`)##
Feb 28, 20 Last 1 Year 11.08 6.92 4.92 11,105 10,690 10,490Sep 04, 18 Since Inception 10.14 10.40 10.14 12,708 12,784 12,710
# CRISIL Composite Bond Fund Index ## CRISIL 10 year Gilt Index. The scheme is managed by Mr. Anupam Joshi since inception.
HDFC FMP 1115D SEPTEMBER 2018 (1) NAV as on Feb 26, 2021 ` 12.4620
Date Period Scheme Returns
(%)
Benchmark Returns
(%)#
Additional Benchmark
Returns (%) ##
Value of ` 10,000 invested
Scheme (`)
Benchmark (`)#
Additional Benchmark
(`)##
Feb 28, 20 Last 1 Year 7.07 6.92 4.92 10,705 10,690 10,490Sep 12, 18 Since Inception 9.36 10.63 10.37 12,462 12,822 12,747
# CRISIL Composite Bond Fund Index ## CRISIL 10 year Gilt Index. The scheme is managed by Mr. Anupam Joshi since inception.
HDFC FMP 1381D SEPTEMBER 2018 (1) NAV as on Feb 26, 2021 ` 12.7830
Date Period Scheme Returns
(%)
Benchmark Returns
(%)#
Additional Benchmark
Returns (%) ##
Value of ` 10,000 invested
Scheme (`)
Benchmark (`)#
Additional Benchmark
(`)##
Feb 28, 20 Last 1 Year 8.50 6.92 4.92 10,848 10,690 10,490Sep 19, 18 Since Inception 10.58 10.58 10.21 12,783 12,781 12,677
# CRISIL Composite Bond Fund Index ## CRISIL 10 year Gilt Index. The scheme is managed by Mr. Anupam Joshi since inception.
HDFC FMP 1372D SEPTEMBER 2018 (1) NAV as on Feb 26, 2021 ` 12.7195
Date Period Scheme Returns
(%)
Benchmark Returns
(%)#
Additional Benchmark
Returns (%) ##
Value of ` 10,000 invested
Scheme (`)
Benchmark (`)#
Additional Benchmark
(`)##
Feb 28, 20 Last 1 Year 8.35 6.92 4.92 10,832 10,690 10,490Sep 28, 18 Since Inception 10.47 10.67 10.08 12,720 12,776 12,612
# CRISIL Composite Bond Fund Index ## CRISIL 10 year Gilt Index. The scheme is managed by Mr. Anupam Joshi since inception.
ANIL BAMBOLI
HDFC DYNAMIC DEBT FUND NAV as on Feb 26, 2021 ` 71.7232
Date Period Scheme Returns
(%)
Benchmark Returns
(%)#
Additional Benchmark
Returns (%) ##
Value of ` 10,000 invested
Scheme (`)
Benchmark (`)#
Additional Benchmark
(`)##
Feb 28, 20 Last 1 Year 6.66 7.01 4.92 10,664 10,699 10,490Feb 28, 18 Last 3 Years 6.11 9.05 8.94 11,946 12,965 12,927Feb 29, 16 Last 5 Years 7.19 8.57 7.34 14,147 15,081 14,246Jan 01, 13 Since Inception 7.93 8.62 7.12 18,643 19,630 17,530
# CRISIL Dynamic Debt Index ## CRISIL 10 year Gilt Index.
HDFC SHORT TERM DEBT FUND NAV as on Feb 26, 2021 ` 24.7649
Date Period Scheme Returns
(%)
Benchmark Returns
(%)#
Additional Benchmark
Returns (%) ##
Value of ` 10,000 invested
Scheme (`)
Benchmark (`)#
Additional Benchmark
(`)##
Feb 28, 20 Last 1 Year 8.60 7.50 4.92 10,857 10,748 10,490Feb 28, 18 Last 3 Years 9.00 8.53 8.94 12,947 12,782 12,927Feb 29, 16 Last 5 Years 8.58 8.16 7.34 15,092 14,797 14,246Jan 01, 13 Since Inception 8.80 8.47 7.12 19,895 19,418 17,530
# CRISIL Short Term Bond Fund Index ## CRISIL 10 year Gilt Index.
HDFC ULTRA SHORT TERM FUND NAV as on Feb 26, 2021 ` 11.8856
Date Period Scheme Returns
(%)
Benchmark Returns
(%)#
Additional Benchmark
Returns (%) ##
Value of ` 10,000 invested
Scheme (`)
Benchmark (`)#
Additional Benchmark
(`)##
Feb 28, 20 Last 1 Year 6.23 5.57 5.46 10,622 10,556 10,544Sep 25, 18 Since Inception 7.38 7.03 6.88 11,886 11,791 11,750
# CRISIL Ultra Short Term Debt Index ## CRISIL 1 year T-Bill Index. The scheme is managed by Mr. Anil Bamboli since inception.
HDFC GILT FUND NAV as on Feb 26, 2021 ` 44.4020
Date Period Scheme Returns
(%)
Benchmark Returns
(%)#
Additional Benchmark
Returns (%) ##
Value of ` 10,000 invested
Scheme (`)
Benchmark (`)#
Additional Benchmark
(`)##
Feb 28, 20 Last 1 Year 6.16 6.62 4.92 10,614 10,661 10,490Feb 28, 18 Last 3 Years 8.19 9.47 8.94 12,661 13,116 12,927Feb 29, 16 Last 5 Years 8.52 8.41 7.34 15,050 14,972 14,246Jan 01, 13 Since Inception 8.41 8.25 7.12 19,323 19,087 17,530
# CRISIL Dynamic Gilt Index ## CRISIL 10 year Gilt Index.
HDFC BANkING AND PSU DEBT FUND NAV as on Feb 26, 2021 ` 18.1274
Date Period Scheme Returns
(%)
Benchmark Returns
(%)#
Additional Benchmark
Returns (%) ##
Value of ` 10,000 invested
Scheme (`)
Benchmark (`)#
Additional Benchmark
(`)##
Feb 28, 20 Last 1 Year 8.11 7.31 4.92 10,809 10,729 10,490Feb 28, 18 Last 3 Years 9.09 8.09 8.94 12,980 12,624 12,927Feb 29, 16 Last 5 Years 8.90 7.97 7.34 15,311 14,669 14,246Mar 26, 14 Since Inception 8.96 8.33 8.25 18,127 17,414 17,316
# nIFTY Banking & PSU Index ## CRISIL 10 year Gilt Index.
HDFC OVERNIGHT FUND NAV as on Feb 28, 2021 ` 3049.9254
Date Period Scheme Returns
(%)
Benchmark Returns
(%)#
Additional Benchmark
Returns (%) ##
Value of ` 10,000 invested
Scheme (`)
Benchmark (`)#
Additional Benchmark
(`)##
Feb 21, 21 Last 7 days 2.91 3.04 4.89 10,006 10,006 10,009Feb 13, 21 Last 15 days n.A. n.A. n.A. n.A. n.A. n.A.Jan 31, 21 Last 1 Month 2.89 2.99 4.54 10,022 10,023 10,035Feb 28, 20 Last 1 Year 3.04 3.12 5.46 10,305 10,313 10,548Feb 28, 18 Last 3 Years 4.90 4.95 6.64 11,544 11,561 12,129Feb 29, 16 Last 5 Years 5.39 5.43 6.56 13,000 13,026 13,742Dec 31, 12 Since Inception 6.35 6.43 6.92 16,536 16,637 17,276
Returns less than 1 year period are simple annualized. # CRISIL Overnight Index ## CRISIL 1 year T-Bill Index.
HDFC FMP 1846D AUGUST 2013 (1) NAV as on Feb 26, 2021 ` 19.6440
Date Period Scheme Returns
(%)
Benchmark Returns
(%)#
Additional Benchmark
Returns (%) ##
Value of ` 10,000 invested
Scheme (`)
Benchmark (`)#
Additional Benchmark
(`)##
Feb 28, 20 Last 1 Year 11.35 6.92 4.92 11,132 10,690 10,490Feb 28, 18 Last 3 Years 9.41 9.23 8.94 13,093 13,030 12,927Feb 29, 16 Last 5 Years 8.77 8.69 7.34 15,221 15,168 14,246Aug 14, 13 Since Inception 9.36 9.36 7.73 19,644 19,639 17,530
# CRISIL Composite Bond Fund Index ## CRISIL 10 year Gilt Index. The scheme is managed by Mr. Anil Bamboli since inception.
HDFC FMP 1181D APRIL 2018 (1) NAV as on Feb 26, 2021 ` 12.5744
Date Period Scheme Returns
(%)
Benchmark Returns
(%)#
Additional Benchmark
Returns (%) ##
Value of ` 10,000 invested
Scheme (`)
Benchmark (`)#
Additional Benchmark
(`)##
Feb 28, 20 Last 1 Year 6.67 6.92 4.92 10,666 10,690 10,490Apr 27, 18 Since Inception 8.41 9.47 9.11 12,574 12,929 12,809
# CRISIL Composite Bond Fund Index ## CRISIL 10 year Gilt Index. The scheme is managed by Mr. Anil Bamboli since inception.
HDFC FMP 1146D APRIL 2018 (1) NAV as on Feb 26, 2021 ` 12.4212
Date Period Scheme Returns
(%)
Benchmark Returns
(%)#
Additional Benchmark
Returns (%) ##
Value of ` 10,000 invested
Scheme (`)
Benchmark (`)#
Additional Benchmark
(`)##
Feb 28, 20 Last 1 Year 9.90 6.92 4.92 10,987 10,690 10,490May 10, 18 Since Inception 8.04 9.45 8.99 12,421 12,880 12,729
# CRISIL Composite Bond Fund Index ## CRISIL 10 year Gilt Index. The scheme is managed by Mr. Anil Bamboli since inception.
Past performance may or may not be sustained in the future. Returns greater than 1 year period are compounded annualized (CAGR). Different plans viz. Regular Plan and Direct Plan have a different expense structure. The expenses of the Direct Plan under the Scheme will be lower to the extent of the distribution expenses / commission charged in the Regular Plan. Load is not taken into consideration for computation of performance. Since Inception Date = Date of First allotment in the Scheme / Plan. n.A.: not Available
Performance of close-ended schemes, being close-ended in nature, is not strictly comparable with that of open-ended schemes since the investment strategy for close-ended schemes is primarily buy-and-hold whereas open-ended schemes are actively managed.
ANUPAM JOSHI....CONTINUED

76 February 2021
SCHEME PERFORMANCE - DIRECT PLAN - GROWTH OPTION (FUND MANAGER-WISE)
HDFC FMP 1434D MAY 2018 (1) NAV as on Feb 26, 2021 ` 12.8936
Date Period Scheme Returns
(%)
Benchmark Returns
(%)#
Additional Benchmark
Returns (%) ##
Value of ` 10,000 invested
Scheme (`)
Benchmark (`)#
Additional Benchmark
(`)##
Feb 28, 20 Last 1 Year 8.29 6.92 4.92 10,826 10,690 10,490May 09, 18 Since Inception 9.48 9.43 8.97 12,894 12,877 12,727
# CRISIL Composite Bond Fund Index ## CRISIL 10 year Gilt Index. The scheme is managed by Mr. Anil Bamboli since inception.
HDFC FMP 1134D MAY 2018 (1) NAV as on Feb 26, 2021 ` 12.5963
Date Period Scheme Returns
(%)
Benchmark Returns
(%)#
Additional Benchmark
Returns (%) ##
Value of ` 10,000 invested
Scheme (`)
Benchmark (`)#
Additional Benchmark
(`)##
Feb 28, 20 Last 1 Year 6.55 6.92 4.92 10,653 10,690 10,490May 24, 18 Since Inception 8.71 9.82 9.41 12,596 12,954 12,823
# CRISIL Composite Bond Fund Index ## CRISIL 10 year Gilt Index. The scheme is managed by Mr. Anil Bamboli since inception.
HDFC FMP 1119D JUNE 2018 (1) NAV as on Feb 26, 2021 ` 12.5892
Date Period Scheme Returns
(%)
Benchmark Returns
(%)#
Additional Benchmark
Returns (%) ##
Value of ` 10,000 invested
Scheme (`)
Benchmark (`)#
Additional Benchmark
(`)##
Feb 28, 20 Last 1 Year 6.71 6.92 4.92 10,669 10,690 10,490Jun 08, 18 Since Inception 8.82 10.03 9.64 12,589 12,973 12,848
# CRISIL Composite Bond Fund Index ## CRISIL 10 year Gilt Index. The scheme is managed by Mr. Anil Bamboli since inception.
HDFC FMP 1280D OCTOBER 2018 (1) NAV as on Feb 26, 2021 ` 12.6427
Date Period Scheme Returns
(%)
Benchmark Returns
(%)#
Additional Benchmark
Returns (%) ##
Value of ` 10,000 invested
Scheme (`)
Benchmark (`)#
Additional Benchmark
(`)##
Feb 28, 20 Last 1 Year 8.33 6.92 4.92 10,830 10,690 10,490Oct 11, 18 Since Inception 10.35 10.63 9.99 12,643 12,720 12,545
# CRISIL Composite Bond Fund Index ## CRISIL 10 year Gilt Index. The scheme is managed by Mr. Anil Bamboli since inception.
HDFC FMP 1344D OCTOBER 2018 (1) NAV as on Feb 26, 2021 ` 12.6283
Date Period Scheme Returns
(%)
Benchmark Returns
(%)#
Additional Benchmark
Returns (%) ##
Value of ` 10,000 invested
Scheme (`)
Benchmark (`)#
Additional Benchmark
(`)##
Feb 28, 20 Last 1 Year 9.49 6.92 4.92 10,946 10,690 10,490Oct 24, 18 Since Inception 10.46 10.49 9.67 12,628 12,637 12,418
# CRISIL Composite Bond Fund Index ## CRISIL 10 year Gilt Index. The scheme is managed by Mr. Anil Bamboli since inception.
HDFC FMP 1274D OCTOBER 2018 (1) NAV as on Feb 26, 2021 ` 12.6139
Date Period Scheme Returns
(%)
Benchmark Returns
(%)#
Additional Benchmark
Returns (%) ##
Value of ` 10,000 invested
Scheme (`)
Benchmark (`)#
Additional Benchmark
(`)##
Feb 28, 20 Last 1 Year 8.28 6.92 4.92 10,826 10,690 10,490Oct 17, 18 Since Inception 10.32 10.55 9.77 12,614 12,675 12,467
# CRISIL Composite Bond Fund Index ## CRISIL 10 year Gilt Index. The scheme is managed by Mr. Anil Bamboli since inception.
HDFC FMP 1261D OCTOBER 2018 (1) NAV as on Feb 26, 2021 ` 12.4823
Date Period Scheme Returns
(%)
Benchmark Returns
(%)#
Additional Benchmark
Returns (%) ##
Value of ` 10,000 invested
Scheme (`)
Benchmark (`)#
Additional Benchmark
(`)##
Feb 28, 20 Last 1 Year 7.67 6.92 4.92 10,765 10,690 10,490Oct 25, 18 Since Inception 9.93 10.49 9.66 12,482 12,633 12,411
# CRISIL Composite Bond Fund Index ## CRISIL 10 year Gilt Index. The scheme is managed by Mr. Anil Bamboli since inception.
HDFC FMP 1260D OCTOBER 2018 (1) NAV as on Feb 26, 2021 ` 12.5567
Date Period Scheme Returns
(%)
Benchmark Returns
(%)#
Additional Benchmark
Returns (%) ##
Value of ` 10,000 invested
Scheme (`)
Benchmark (`)#
Additional Benchmark
(`)##
Feb 28, 20 Last 1 Year 8.23 6.92 4.92 10,820 10,690 10,490Oct 31, 18 Since Inception 10.28 10.50 9.64 12,557 12,613 12,387
# CRISIL Composite Bond Fund Index ## CRISIL 10 year Gilt Index. The scheme is managed by Mr. Anil Bamboli since inception.
HDFC FMP 1265D OCTOBER 2018 (1) NAV as on Feb 26, 2021 ` 12.5781
Date Period Scheme Returns
(%)
Benchmark Returns
(%)#
Additional Benchmark
Returns (%) ##
Value of ` 10,000 invested
Scheme (`)
Benchmark (`)#
Additional Benchmark
(`)##
Feb 28, 20 Last 1 Year 8.40 6.92 4.92 10,838 10,690 10,490nov 01, 18 Since Inception 10.38 10.45 9.55 12,578 12,597 12,361
# CRISIL Composite Bond Fund Index ## CRISIL 10 year Gilt Index. The scheme is managed by Mr. Anil Bamboli since inception.
HDFC FMP 1246D NOVEMBER 2018 (1) NAV as on Feb 26, 2021 ` 12.4746
Date Period Scheme Returns
(%)
Benchmark Returns
(%)#
Additional Benchmark
Returns (%) ##
Value of ` 10,000 invested
Scheme (`)
Benchmark (`)#
Additional Benchmark
(`)##
Feb 28, 20 Last 1 Year 8.38 6.92 4.92 10,835 10,690 10,490nov 20, 18 Since Inception 10.22 10.34 9.49 12,475 12,504 12,286
# CRISIL Composite Bond Fund Index ## CRISIL 10 year Gilt Index. The scheme is managed by Mr. Anil Bamboli since inception.
HDFC FMP 1232D NOVEMBER 2018 (1) NAV as on Feb 26, 2021 ` 12.4505
Date Period Scheme Returns
(%)
Benchmark Returns
(%)#
Additional Benchmark
Returns (%) ##
Value of ` 10,000 invested
Scheme (`)
Benchmark (`)#
Additional Benchmark
(`)##
Feb 28, 20 Last 1 Year 8.43 6.92 4.92 10,841 10,690 10,490nov 28, 18 Since Inception 10.23 10.13 9.04 12,451 12,423 12,150
# CRISIL Composite Bond Fund Index ## CRISIL 10 year Gilt Index. The scheme is managed by Mr. Anil Bamboli since inception.
HDFC FMP 1224D DECEMBER 2018 (1) NAV as on Feb 26, 2021 ` 12.3497
Date Period Scheme Returns
(%)
Benchmark Returns
(%)#
Additional Benchmark
Returns (%) ##
Value of ` 10,000 invested
Scheme (`)
Benchmark (`)#
Additional Benchmark
(`)##
Feb 28, 20 Last 1 Year 8.38 6.92 4.92 10,835 10,690 10,490Dec 06, 18 Since Inception 9.94 9.68 8.37 12,350 12,285 11,961
# CRISIL Composite Bond Fund Index ## CRISIL 10 year Gilt Index. The scheme is managed by Mr. Anil Bamboli since inception.
HDFC FMP 1218D DECEMBER 2018 (1) NAV as on Feb 26, 2021 ` 12.3530
Date Period Scheme Returns
(%)
Benchmark Returns
(%)#
Additional Benchmark
Returns (%) ##
Value of ` 10,000 invested
Scheme (`)
Benchmark (`)#
Additional Benchmark
(`)##
Feb 28, 20 Last 1 Year 8.35 6.92 4.92 10,833 10,690 10,490Dec 12, 18 Since Inception 10.03 9.76 8.34 12,353 12,286 11,937
# CRISIL Composite Bond Fund Index ## CRISIL 10 year Gilt Index. The scheme is managed by Mr. Anil Bamboli since inception.
HDFC FMP 1211D DECEMBER 2018 (1) NAV as on Feb 26, 2021 ` 12.2911
Date Period Scheme Returns
(%)
Benchmark Returns
(%)#
Additional Benchmark
Returns (%) ##
Value of ` 10,000 invested
Scheme (`)
Benchmark (`)#
Additional Benchmark
(`)##
Feb 28, 20 Last 1 Year 8.26 6.92 4.92 10,824 10,690 10,490Dec 19, 18 Since Inception 9.87 9.44 7.75 12,291 12,187 11,777
# CRISIL Composite Bond Fund Index ## CRISIL 10 year Gilt Index. The scheme is managed by Mr. Anil Bamboli since inception.
Past performance may or may not be sustained in the future. Returns greater than 1 year period are compounded annualized (CAGR). Different plans viz. Regular Plan and Direct Plan have a different expense structure. The expenses of the Direct Plan under the Scheme will be lower to the extent of the distribution expenses / commission charged in the Regular Plan. Load is not taken into consideration for computation of performance. Since Inception Date = Date of First allotment in the Scheme / Plan. n.A.: not Available
Performance of close-ended schemes, being close-ended in nature, is not strictly comparable with that of open-ended schemes since the investment strategy for close-ended schemes is primarily buy-and-hold whereas open-ended schemes are actively managed.
ANIL BAMBOLI....CONTINUED

February 2021 77
SCHEME PERFORMANCE - DIRECT PLAN - GROWTH OPTION (FUND MANAGER-WISE)
HDFC FMP 1203D DECEMBER 2018 (1) NAV as on Feb 26, 2021 ` 12.2643
Date Period Scheme Returns
(%)
Benchmark Returns
(%)#
Additional Benchmark
Returns (%) ##
Value of ` 10,000 invested
Scheme (`)
Benchmark (`)#
Additional Benchmark
(`)##
Feb 28, 20 Last 1 Year 8.37 6.92 4.92 10,834 10,690 10,490Dec 27, 18 Since Inception 9.86 9.44 7.93 12,264 12,163 11,800
# CRISIL Composite Bond Fund Index ## CRISIL 10 year Gilt Index. The scheme is managed by Mr. Anil Bamboli since inception.
HDFC FMP 1196D DECEMBER 2018 (1) NAV as on Feb 26, 2021 ` 12.2520
Date Period Scheme Returns
(%)
Benchmark Returns
(%)#
Additional Benchmark
Returns (%) ##
Value of ` 10,000 invested
Scheme (`)
Benchmark (`)#
Additional Benchmark
(`)##
Feb 28, 20 Last 1 Year 8.39 6.92 4.92 10,837 10,690 10,490Jan 03, 19 Since Inception 9.90 9.74 8.42 12,252 12,212 11,899
# CRISIL Composite Bond Fund Index ## CRISIL 10 year Gilt Index. The scheme is managed by Mr. Anil Bamboli since inception.
HDFC FMP 1190D JANUARY 2019 (1) NAV as on Feb 26, 2021 ` 12.2305
Date Period Scheme Returns
(%)
Benchmark Returns
(%)#
Additional Benchmark
Returns (%) ##
Value of ` 10,000 invested
Scheme (`)
Benchmark (`)#
Additional Benchmark
(`)##
Feb 28, 20 Last 1 Year 8.37 6.92 4.92 10,835 10,690 10,490Jan 09, 19 Since Inception 9.89 9.72 8.57 12,231 12,189 11,917
# CRISIL Composite Bond Fund Index ## CRISIL 10 year Gilt Index. The scheme is managed by Mr. Anil Bamboli since inception.
HDFC FMP 1182D JANUARY 2019 (1) NAV as on Feb 26, 2021 ` 12.2083
Date Period Scheme Returns
(%)
Benchmark Returns
(%)#
Additional Benchmark
Returns (%) ##
Value of ` 10,000 invested
Scheme (`)
Benchmark (`)#
Additional Benchmark
(`)##
Feb 28, 20 Last 1 Year 8.45 6.92 4.92 10,842 10,690 10,490Jan 17, 19 Since Inception 9.91 9.84 8.84 12,208 12,193 11,958
# CRISIL Composite Bond Fund Index ## CRISIL 10 year Gilt Index. The scheme is managed by Mr. Anil Bamboli since inception.
HDFC FMP 1175D JANUARY 2019 (1) NAV as on Feb 26, 2021 ` 12.1819
Date Period Scheme Returns
(%)
Benchmark Returns
(%)#
Additional Benchmark
Returns (%) ##
Value of ` 10,000 invested
Scheme (`)
Benchmark (`)#
Additional Benchmark
(`)##
Feb 28, 20 Last 1 Year 8.49 6.92 4.92 10,847 10,690 10,490Jan 23, 19 Since Inception 9.87 9.99 8.94 12,182 12,209 11,966
# CRISIL Composite Bond Fund Index ## CRISIL 10 year Gilt Index. The scheme is managed by Mr. Anil Bamboli since inception.
HDFC FMP 1168D JANUARY 2019 (1) NAV as on Feb 26, 2021 ` 12.1670
Date Period Scheme Returns
(%)
Benchmark Returns
(%)#
Additional Benchmark
Returns (%) ##
Value of ` 10,000 invested
Scheme (`)
Benchmark (`)#
Additional Benchmark
(`)##
Feb 28, 20 Last 1 Year 8.42 6.92 4.92 10,839 10,690 10,490Jan 30, 19 Since Inception 9.91 9.98 8.87 12,167 12,185 11,931
# CRISIL Composite Bond Fund Index ## CRISIL 10 year Gilt Index. The scheme is managed by Mr. Anil Bamboli since inception.
HDFC FMP 1154D FEBRUARY 2019 (1) NAV as on Feb 26, 2021 ` 12.0863
Date Period Scheme Returns
(%)
Benchmark Returns
(%)#
Additional Benchmark
Returns (%) ##
Value of ` 10,000 invested
Scheme (`)
Benchmark (`)#
Additional Benchmark
(`)##
Feb 28, 20 Last 1 Year 8.48 6.92 4.92 10,846 10,690 10,490Feb 13, 19 Since Inception 9.74 9.92 8.60 12,086 12,126 11,832
# CRISIL Composite Bond Fund Index ## CRISIL 10 year Gilt Index. The scheme is managed by Mr. Anil Bamboli since inception.
HDFC FMP 1146D FEBRUARY 2019 (1) NAV as on Feb 26, 2021 ` 12.0880
Date Period Scheme Returns
(%)
Benchmark Returns
(%)#
Additional Benchmark
Returns (%) ##
Value of ` 10,000 invested
Scheme (`)
Benchmark (`)#
Additional Benchmark
(`)##
Feb 28, 20 Last 1 Year 8.48 6.92 4.92 10,846 10,690 10,490Feb 21, 19 Since Inception 9.86 10.14 8.88 12,088 12,149 11,871
# CRISIL Composite Bond Fund Index ## CRISIL 10 year Gilt Index. The scheme is managed by Mr. Anil Bamboli since inception.
AMIT B. GANATRA
HDFC TAxSAVER NAV as on Feb 26, 2021 ` 612.383
Date Period Scheme Returns
(%)
Benchmark Returns
(%)#
Additional Benchmark
Returns (%) ##
Value of ` 10,000 invested
Scheme (`)
Benchmark (`)#
Additional Benchmark
(`)##
Feb 28, 20 Last 1 Year 25.33 33.37 31.27 12,525 13,326 13,117Feb 28, 18 Last 3 Years 4.05 10.86 12.88 11,264 13,621 14,378Feb 29, 16 Last 5 Years 14.25 17.31 17.29 19,455 22,207 22,189Jan 01, 13 Since Inception 11.80 13.42 12.94 24,852 27,949 26,984
# nIFTY 500 (Total Returns Index) ## nIFTY 50 (Total Returns Index).
HDFC CAPITAL BUILDER VALUE FUND NAV as on Feb 26, 2021 ` 375.367
Date Period Scheme Returns
(%)
Benchmark Returns
(%)#
Additional Benchmark
Returns (%) ##
Value of ` 10,000 invested
Scheme (`)
Benchmark (`)#
Additional Benchmark
(`)##
Feb 28, 20 Last 1 Year 32.68 33.37 31.27 13,258 13,326 13,117Feb 28, 18 Last 3 Years 6.96 10.86 12.88 12,235 13,621 14,378Feb 29, 16 Last 5 Years 16.78 17.31 17.29 21,709 22,207 22,189Jan 01, 13 Since Inception 15.27 13.42 12.94 31,885 27,949 26,984
# nIFTY 500 (Total Returns Index) ## nIFTY 50 (Total Returns Index).
HDFC EOF - II - 1126D MAY 2017 (1) NAV as on Feb 26, 2021 ` 11.6800
Date Period Scheme Returns
(%)
Benchmark Returns
(%)#
Additional Benchmark
Returns (%) ##
Value of ` 10,000 invested
Scheme (`)
Benchmark (`)#
Additional Benchmark
(`)##Feb 28, 20 Last 1 Year 19.18 31.27 29.90 11,913 13,117 12,981Feb 28, 18 Last 3 Years 3.61 12.88 14.22 11,121 14,378 14,894Jun 15, 17 Since Inception 4.28 13.32 14.51 11,680 15,890 16,518
# nIFTY 50 (Total Returns Index) ## S&P BSE SEnSEx (Total Returns Index). The scheme is managed by Mr. Amit B. Ganatra from May 21, 2020.
HDFC EOF - II - 1100D JUNE 2017 (1) NAV as on Feb 26, 2021 ` 11.2020
Date Period Scheme Returns
(%)
Benchmark Returns
(%)#
Additional Benchmark
Returns (%) ##
Value of ` 10,000 invested
Scheme (`)
Benchmark (`)#
Additional Benchmark
(`)##Feb 28, 20 Last 1 Year 16.17 31.27 29.90 11,612 13,117 12,981Feb 28, 18 Last 3 Years 3.58 12.88 14.22 11,113 14,378 14,894Jul 17, 17 Since Inception 3.19 12.48 13.76 11,202 15,299 15,941
# nIFTY 50 (Total Returns Index) ## S&P BSE SEnSEx (Total Returns Index). The scheme is managed by Mr. Amit B. Ganatra from May 21, 2020.
Past performance may or may not be sustained in the future. Returns greater than 1 year period are compounded annualized (CAGR). Different plans viz. Regular Plan and Direct Plan have a different expense structure. The expenses of the Direct Plan under the Scheme will be lower to the extent of the distribution expenses / commission charged in the Regular Plan. Load is not taken into consideration for computation of performance. Since Inception Date = Date of First allotment in the Scheme / Plan. n.A.: not Available
ANIL BAMBOLI....CONTINUED
Performance of close-ended schemes, being close-ended in nature, is not strictly comparable with that of open-ended schemes since the investment strategy for close-ended schemes is primarily buy-and-hold whereas open-ended schemes are actively managed.
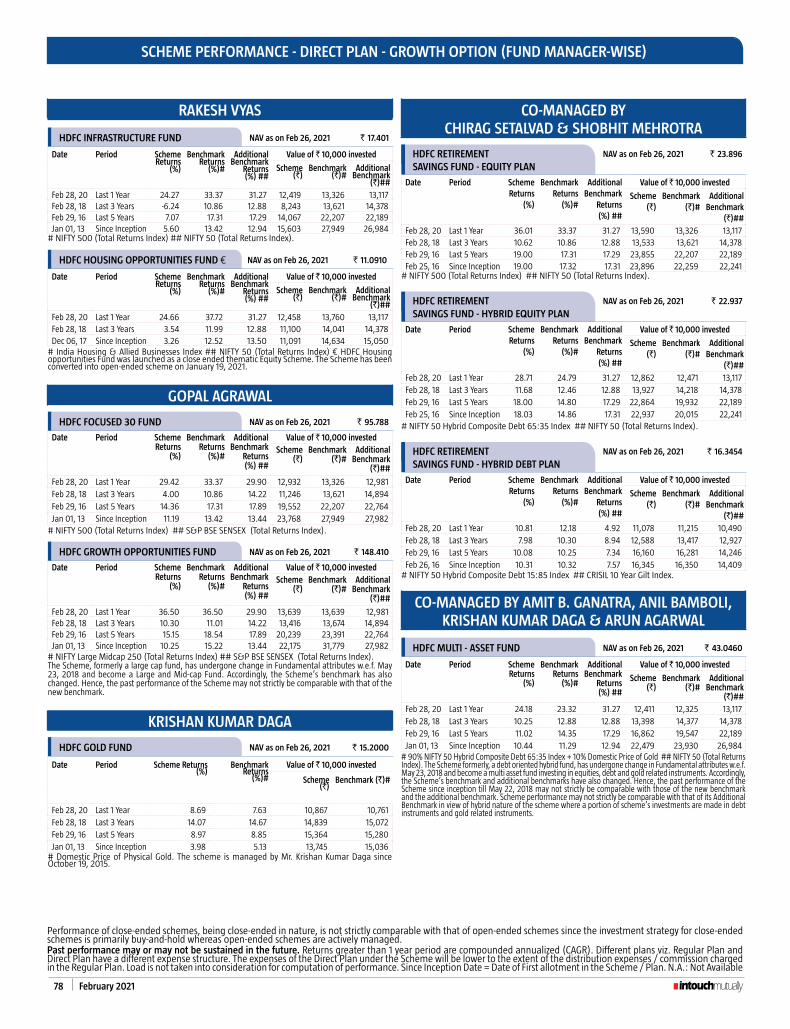
78 February 2021
SCHEME PERFORMANCE - DIRECT PLAN - GROWTH OPTION (FUND MANAGER-WISE)
RAkESH VYAS
HDFC INFRASTRUCTURE FUND NAV as on Feb 26, 2021 ` 17.401
Date Period Scheme Returns
(%)
Benchmark Returns
(%)#
Additional Benchmark
Returns (%) ##
Value of ` 10,000 invested
Scheme (`)
Benchmark (`)#
Additional Benchmark
(`)##Feb 28, 20 Last 1 Year 24.27 33.37 31.27 12,419 13,326 13,117Feb 28, 18 Last 3 Years -6.24 10.86 12.88 8,243 13,621 14,378Feb 29, 16 Last 5 Years 7.07 17.31 17.29 14,067 22,207 22,189Jan 01, 13 Since Inception 5.60 13.42 12.94 15,603 27,949 26,984
# nIFTY 500 (Total Returns Index) ## nIFTY 50 (Total Returns Index).
HDFC HOUSING OPPORTUNITIES FUND € NAV as on Feb 26, 2021 ` 11.0910
Date Period Scheme Returns
(%)
Benchmark Returns
(%)#
Additional Benchmark
Returns (%) ##
Value of ` 10,000 invested
Scheme (`)
Benchmark (`)#
Additional Benchmark
(`)##Feb 28, 20 Last 1 Year 24.66 37.72 31.27 12,458 13,760 13,117Feb 28, 18 Last 3 Years 3.54 11.99 12.88 11,100 14,041 14,378Dec 06, 17 Since Inception 3.26 12.52 13.50 11,091 14,634 15,050
# India Housing & Allied Businesses Index ## nIFTY 50 (Total Returns Index) € HDFC Housing opportunities Fund was launched as a close ended thematic Equity Scheme. The Scheme has been converted into open-ended scheme on January 19, 2021.
GOPAL AGRAWAL
HDFC FOCUSED 30 FUND NAV as on Feb 26, 2021 ` 95.788
Date Period Scheme Returns
(%)
Benchmark Returns
(%)#
Additional Benchmark
Returns (%) ##
Value of ` 10,000 invested Scheme
(`)Benchmark
(`)#Additional
Benchmark (`)##
Feb 28, 20 Last 1 Year 29.42 33.37 29.90 12,932 13,326 12,981Feb 28, 18 Last 3 Years 4.00 10.86 14.22 11,246 13,621 14,894Feb 29, 16 Last 5 Years 14.36 17.31 17.89 19,552 22,207 22,764Jan 01, 13 Since Inception 11.19 13.42 13.44 23,768 27,949 27,982
# nIFTY 500 (Total Returns Index) ## S&P BSE SEnSEx (Total Returns Index).
HDFC GROWTH OPPORTUNITIES FUND NAV as on Feb 26, 2021 ` 148.410
Date Period Scheme Returns
(%)
Benchmark Returns
(%)#
Additional Benchmark
Returns (%) ##
Value of ` 10,000 invested Scheme
(`)Benchmark
(`)#Additional
Benchmark (`)##
Feb 28, 20 Last 1 Year 36.50 36.50 29.90 13,639 13,639 12,981Feb 28, 18 Last 3 Years 10.30 11.01 14.22 13,416 13,674 14,894Feb 29, 16 Last 5 Years 15.15 18.54 17.89 20,239 23,391 22,764Jan 01, 13 Since Inception 10.25 15.22 13.44 22,175 31,779 27,982
# nIFTY Large Midcap 250 (Total Returns Index) ## S&P BSE SEnSEx (Total Returns Index). The Scheme, formerly a large cap fund, has undergone change in Fundamental attributes w.e.f. May 23, 2018 and become a Large and Mid-cap Fund. Accordingly, the Scheme’s benchmark has also changed. Hence, the past performance of the Scheme may not strictly be comparable with that of the new benchmark.
kRISHAN kUMAR DAGA
HDFC GOLD FUND NAV as on Feb 26, 2021 ` 15.2000
Date Period Scheme Returns (%)
Benchmark Returns
(%)#
Value of ` 10,000 invested
Scheme (`)
Benchmark (`)#
Feb 28, 20 Last 1 Year 8.69 7.63 10,867 10,761Feb 28, 18 Last 3 Years 14.07 14.67 14,839 15,072Feb 29, 16 Last 5 Years 8.97 8.85 15,364 15,280Jan 01, 13 Since Inception 3.98 5.13 13,745 15,036
# Domestic Price of Physical Gold. The scheme is managed by Mr. Krishan Kumar Daga since October 19, 2015.
CO-MANAGED BY CHIRAG SETALVAD & SHOBHIT MEHROTRA
HDFC RETIREMENT SAVINGS FUND - EqUITY PLAN
NAV as on Feb 26, 2021 ` 23.896
Date Period Scheme Returns
(%)
Benchmark Returns
(%)#
Additional Benchmark
Returns (%) ##
Value of ` 10,000 invested
Scheme (`)
Benchmark (`)#
Additional Benchmark
(`)##Feb 28, 20 Last 1 Year 36.01 33.37 31.27 13,590 13,326 13,117Feb 28, 18 Last 3 Years 10.62 10.86 12.88 13,533 13,621 14,378Feb 29, 16 Last 5 Years 19.00 17.31 17.29 23,855 22,207 22,189Feb 25, 16 Since Inception 19.00 17.32 17.31 23,896 22,259 22,241
# nIFTY 500 (Total Returns Index) ## nIFTY 50 (Total Returns Index).
HDFC RETIREMENTSAVINGS FUND - HYBRID EqUITY PLAN
NAV as on Feb 26, 2021 ` 22.937
Date Period Scheme Returns
(%)
Benchmark Returns
(%)#
Additional Benchmark
Returns (%) ##
Value of ` 10,000 invested
Scheme (`)
Benchmark (`)#
Additional Benchmark
(`)##Feb 28, 20 Last 1 Year 28.71 24.79 31.27 12,862 12,471 13,117Feb 28, 18 Last 3 Years 11.68 12.46 12.88 13,927 14,218 14,378Feb 29, 16 Last 5 Years 18.00 14.80 17.29 22,864 19,932 22,189Feb 25, 16 Since Inception 18.03 14.86 17.31 22,937 20,015 22,241
# nIFTY 50 Hybrid Composite Debt 65:35 Index ## nIFTY 50 (Total Returns Index).
HDFC RETIREMENT SAVINGS FUND - HYBRID DEBT PLAN
NAV as on Feb 26, 2021 ` 16.3454
Date Period Scheme Returns
(%)
Benchmark Returns
(%)#
Additional Benchmark
Returns (%) ##
Value of ` 10,000 invested
Scheme (`)
Benchmark (`)#
Additional Benchmark
(`)##Feb 28, 20 Last 1 Year 10.81 12.18 4.92 11,078 11,215 10,490Feb 28, 18 Last 3 Years 7.98 10.30 8.94 12,588 13,417 12,927Feb 29, 16 Last 5 Years 10.08 10.25 7.34 16,160 16,281 14,246Feb 26, 16 Since Inception 10.31 10.32 7.57 16,345 16,350 14,409
# nIFTY 50 Hybrid Composite Debt 15:85 Index ## CRISIL 10 Year Gilt Index.
CO-MANAGED BY AMIT B. GANATRA, ANIL BAMBOLI, kRISHAN kUMAR DAGA & ARUN AGARWAL
HDFC MULTI - ASSET FUND NAV as on Feb 26, 2021 ` 43.0460
Date Period Scheme Returns
(%)
Benchmark Returns
(%)#
Additional Benchmark
Returns (%) ##
Value of ` 10,000 invested
Scheme (`)
Benchmark (`)#
Additional Benchmark
(`)##Feb 28, 20 Last 1 Year 24.18 23.32 31.27 12,411 12,325 13,117Feb 28, 18 Last 3 Years 10.25 12.88 12.88 13,398 14,377 14,378Feb 29, 16 Last 5 Years 11.02 14.35 17.29 16,862 19,547 22,189Jan 01, 13 Since Inception 10.44 11.29 12.94 22,479 23,930 26,984
# 90% NIFTY 50 Hybrid Composite Debt 65:35 Index + 10% Domestic Price of Gold ## nIFTY 50 (Total Returns Index). The Scheme formerly, a debt oriented hybrid fund, has undergone change in Fundamental attributes w.e.f. May 23, 2018 and become a multi asset fund investing in equities, debt and gold related instruments. Accordingly, the Scheme’s benchmark and additional benchmarks have also changed. Hence, the past performance of the Scheme since inception till May 22, 2018 may not strictly be comparable with those of the new benchmark and the additional benchmark. Scheme performance may not strictly be comparable with that of its Additional Benchmark in view of hybrid nature of the scheme where a portion of scheme’s investments are made in debt instruments and gold related instruments.
Past performance may or may not be sustained in the future. Returns greater than 1 year period are compounded annualized (CAGR). Different plans viz. Regular Plan and Direct Plan have a different expense structure. The expenses of the Direct Plan under the Scheme will be lower to the extent of the distribution expenses / commission charged in the Regular Plan. Load is not taken into consideration for computation of performance. Since Inception Date = Date of First allotment in the Scheme / Plan. n.A.: not Available
Performance of close-ended schemes, being close-ended in nature, is not strictly comparable with that of open-ended schemes since the investment strategy for close-ended schemes is primarily buy-and-hold whereas open-ended schemes are actively managed.

February 2021 79
SCHEME PERFORMANCE - DIRECT PLAN - GROWTH OPTION (FUND MANAGER-WISE)
CO-MANAGED BY GOPAL AGRAWAL, ARUN AGARWAL, kRISHAN kUMAR DAGA & ANIL BAMBOLI
HDFC EqUITY SAVINGS FUND NAV as on Feb 26, 2021 ` 46.0710
Date Period Scheme Returns
(%)
Benchmark Returns
(%)#
Additional Benchmark
Returns (%) ##
Value of ` 10,000 invested
Scheme (`)
Benchmark (`)#
Additional Benchmark
(`)##Feb 28, 20 Last 1 Year 18.11 12.92 4.92 11,806 11,288 10,490Feb 28, 18 Last 3 Years 8.17 8.72 8.94 12,655 12,849 12,927Feb 29, 16 Last 5 Years 12.82 9.83 7.34 18,271 15,980 14,246Jan 01, 13 Since Inception 10.08 9.16 7.12 21,885 20,442 17,530
# 40% NIFTY 50 Arbitrage Index, 30% CRISIL Short Term Bond Fund Index and 30% NIFTY 50 (Total Returns Index) ## CRISIL 10 year Gilt Index. Scheme performance may not strictly be comparable with that of its Additional Benchmark, since a portion of scheme’s investments are made in equity instruments.
CO-MANAGED BY PRASHANT JAIN & SHOBHIT MEHROTRA
HDFC HYBRID DEBT FUND NAV as on Feb 26, 2021 ` 55.7298
Date Period Scheme Returns
(%)
Benchmark Returns
(%)#
Additional Benchmark
Returns (%) ##
Value of ` 10,000 invested
Scheme (`)
Benchmark (`)#
Additional Benchmark
(`)##
Feb 28, 20 Last 1 Year 13.58 12.18 4.92 11,354 11,215 10,490Feb 28, 18 Last 3 Years 8.00 10.30 8.94 12,594 13,417 12,927Feb 29, 16 Last 5 Years 10.31 10.25 7.34 16,331 16,281 14,246Jan 01, 13 Since Inception 9.55 9.38 7.12 21,050 20,780 17,530
# nIFTY 50 Hybrid Composite Debt 15:85 Index ## CRISIL 10 year Gilt Index. Refer to note on performance disclosure on Page no. 36.
CO-MANAGED BY ANIL BAMBOLI & AMIT B. GANATRA
HDFC DYNAMIC PE RATIO FUND OF FUNDS NAV as on Feb 26, 2021 ` 24.386
Date Period Scheme Returns
(%)
Benchmark Returns
(%)#
Additional Benchmark
Returns (%) ##
Value of ` 10,000 invested
Scheme (`)
Benchmark (`)#
Additional Benchmark
(`)##
Feb 28, 20 Last 1 Year 24.42 24.79 31.27 12,434 12,471 13,117Feb 28, 18 Last 3 Years 9.36 12.46 12.88 13,074 14,218 14,378Feb 29, 16 Last 5 Years 15.11 14.80 17.29 20,199 19,932 22,189Jan 01, 13 Since Inception 10.40 11.79 12.94 22,412 24,834 26,984
# nIFTY 50 Hybrid Composite Debt 65:35 Index ## nIFTY 50 (Total Returns Index). Scheme performance may not strictly be comparable with that of its Additional Benchmark in view of hybrid nature of the scheme where a portion of scheme’s investments are made in equity instruments. The scheme is co-managed by Mr. Amit B. Ganatra from May 21, 2020 & Mr. Anil Bamboli from June 28, 2014.
CO-MANAGED BY SHOBHIT MEHROTRA & VIkASH AGARWAL
HDFC FLOATING RATE DEBT FUND NAV as on Feb 26, 2021 ` 38.1197
Date Period Scheme Returns
(%)
Benchmark Returns
(%)#
Additional Benchmark
Returns (%) ##
Value of ` 10,000 invested
Scheme (`)
Benchmark (`)#
Additional Benchmark
(`)##
Feb 28, 20 Last 1 Year 8.23 4.26 4.92 10,820 10,425 10,490Feb 28, 18 Last 3 Years 8.24 6.16 8.94 12,680 11,964 12,927Feb 29, 16 Last 5 Years 8.10 6.51 7.34 14,760 13,707 14,246Jan 01, 13 Since Inception 8.47 7.37 7.12 19,419 17,864 17,530
# CRISIL Liquid Fund Index ## CRISIL 10 year Gilt Index. The Scheme is co-managed by Shobhit Mehrotra & Vikash Agarwal from July 01, 2020.
CO-MANAGED BY ANIL BAMBOLI & VIkASH AGARWAL
HDFC MONEY MARkET FUND NAV as on Feb 26, 2021 ` 4453.6563
Date Period Scheme Returns
(%)
Benchmark Returns
(%)#
Additional Benchmark
Returns (%) ##
Value of ` 10,000 invested
Scheme (`)
Benchmark (`)#
Additional Benchmark
(`)##
Feb 28, 20 Last 1 Year 6.22 4.69 5.46 10,620 10,468 10,544Feb 28, 18 Last 3 Years 7.35 6.38 6.65 12,368 12,038 12,127Feb 29, 16 Last 5 Years 7.24 6.72 6.56 14,182 13,843 13,739Dec 31, 12 Since Inception 7.87 7.53 6.93 18,563 18,092 17,272
# nIFTY Money Market Index ## CRISIL 1 year T-Bill Index. The Scheme is co-managed by Anil Bamboli & Vikash Agarwal from July 01, 2020.
CO-MANAGED BY kRISHAN kUMAR DAGA & ARUN AGARWAL
HDFC ARBITRAGE FUND - WHOLESALE PLAN NAV as on Feb 26, 2021 ` 15.365
Date Period Scheme Returns
(%)
Benchmark Returns
(%)#
Additional Benchmark
Returns (%) ##
Value of ` 10,000 invested
Scheme (`)
Benchmark (`)#
Additional Benchmark
(`)##
Feb 28, 20 Last 1 Year 3.39 1.86 5.46 10,338 10,185 10,544Feb 28, 18 Last 3 Years 5.50 4.54 6.65 11,741 11,423 12,127Feb 29, 16 Last 5 Years 5.94 4.84 6.56 13,342 12,662 13,739Apr 07, 14 Since Inception 6.43 5.67 7.04 15,365 14,626 15,985
# nIFTY 50 Arbitrage Index ## CRISIL 1 year T-Bill Index. Scheme performance is not strictly comparable with that of its Additional Benchmark since the scheme does not take directional call in equity markets but is limited to availing arbitrage opportunities, etc.
HDFC INDEx FUND - SENSEx PLAN NAV as on Feb 26, 2021 ` 445.7811
Date Period Scheme Returns
(%)
Benchmark Returns
(%)#
Additional Benchmark
Returns (%) ##
Value of ` 10,000 invested
Scheme (`)
Benchmark (`)#
Additional Benchmark
(`)##
Feb 28, 20 Last 1 Year 29.24 29.90 31.27 12,915 12,981 13,117Feb 28, 18 Last 3 Years 13.76 14.22 12.88 14,717 14,894 14,378Feb 29, 16 Last 5 Years 17.50 17.89 17.29 22,389 22,764 22,189Jan 01, 13 Since Inception 13.07 13.44 12.94 27,243 27,982 26,984
# S&P BSE SEnSEx (Total Returns Index) ## nIFTY 50 (Total Returns Index). Refer to note on performance disclosure on Page no. 25.
HDFC INDEx FUND - NIFTY 50 PLAN NAV as on Feb 26, 2021 ` 135.0135
Date Period Scheme Returns
(%)
Benchmark Returns
(%)#
Additional Benchmark
Returns (%) ##
Value of ` 10,000 invested
Scheme (`)
Benchmark (`)#
Additional Benchmark
(`)##
Feb 28, 20 Last 1 Year 30.36 31.27 29.90 13,027 13,117 12,981Feb 28, 18 Last 3 Years 12.48 12.88 14.22 14,226 14,378 14,894Feb 29, 16 Last 5 Years 16.83 17.29 17.89 21,754 22,189 22,764Jan 01, 13 Since Inception 12.57 12.94 13.44 26,278 26,984 27,982
# nIFTY 50 (Total Returns Index) ## S&P BSE SEnSEx (Total Returns Index).
Past performance may or may not be sustained in the future. Returns greater than 1 year period are compounded annualized (CAGR). Different plans viz. Regular Plan and Direct Plan have a different expense structure. The expenses of the Direct Plan under the Scheme will be lower to the extent of the distribution expenses / commission charged in the Regular Plan. Load is not taken into consideration for computation of performance. Since Inception Date = Date of First allotment in the Scheme / Plan. n.A.: not Available
Performance of close-ended schemes, being close-ended in nature, is not strictly comparable with that of open-ended schemes since the investment strategy for close-ended schemes is primarily buy-and-hold whereas open-ended schemes are actively managed.

80 February 2021
Managing Portfolio Since
Returns (%) (As on February 28, 2021)
Last 1 year (%) Last 3 years (%) Last 5 years (%)
Permitted Category FPI Portfolio (managed under a bilateral agreement under Regulation 24(b) and subject to applicable laws)
March 22, 2016 33.50 11.86 n.A.
Benchmark- MSCI India (Total Returns) 32.09 11.76 n.A.
Past performance may or may not be sustained in the future. Returns greater than 1 year period are compounded annualised (CAGR). The above returns are computed using the Time Weighted Rate of Return (TWRR) methodology, to make them more comparable with the mutual fund scheme's returns. Inception date is March 22, 2016. The performance is not comparable with the performance of the aforementioned scheme(s) of HDFC Mutual Fund due to differing investment objective/s and fundamental differences in asset allocation, investment strategy and the regulatory environment. The said disclosure is pursuant to SEBI Circular no. Cir/IMD/DF/7/2012 dated February 28, 2012 pertaining to Regulation 24(b) of SEBI (Mutual Funds) Regulations, 1996. FPI - Foreign Portfolio Investor.
PERFORMANCE OF PERMITTED CATEGORY FPI PORTFOLIO (MANAGED BY PRASHANT JAIN)

February 2021 81
DIVIDEND HISTORY ^
^ Past performance may or may not be sustained in the future. There is no assurance or guarantee to Unit holders as to rate/quantum of dividend distribution nor that the dividends will be paid regularly. After payment of the dividend, the per Unit nAV falls to the extent of the payout and statutory levy, if any. Please log on to www.hdfcfund.com for Record Date-wise listing of dividends declared.
HDFC Flexi Cap Fund (Erstwhile HDFC Equity Fund) (Past 3 years) Dividend Option
Record Date Regular Plan Direct Plan
Cum Div NAV (`)
Dividend per Unit (`) For Cum Div NAV (`)
Dividend per Unit (`) For
Individuals & HUF Others Individuals & HUF Others
Mar 22, 18 55.480 5.50 5.50 58.320 5.50 5.50Mar 20, 19 56.417 5.25 5.25 60.153 5.25 5.25Mar 19, 20 33.678 4.250 4.250 36.364 4.250 4.250
HDFC Top 100 Fund (Past 3 years) Dividend Option
Record Date Regular Plan Direct Plan
Cum Div NAV (`)
Dividend per Unit (`) For Cum Div NAV (`)
Dividend per Unit (`) For
Individuals & HUF Others Individuals & HUF Others
Mar 06, 18 54.454 6.00 6.00 56.705 6.00 6.00Mar 07, 19 52.212 5.50 5.50 55.052 5.50 5.50Mar 12, 20 43.674 5.00 5.00 46.622 5.00 5.00
HDFC Capital Builder Value Fund (Past 3 years) Dividend Option
Record Date Regular Plan Direct Plan
Cum Div NAV (`)
Dividend per Unit (`) For Cum Div NAV (`)
Dividend per Unit (`) For
Individuals & HUF Others Individuals & HUF Others
Feb 21, 19 26.710 2.75 2.75 28.618 2.75 2.75Feb 20, 20 24.565 2.75 2.75 26.809 2.75 2.75Feb 18, 21 26.933 2.75 2.75 30.026 2.75 2.75
HDFC Focused 30 Fund (Past 3 years) Dividend Option
Record Date Regular Plan Direct Plan
Cum Div NAV (`)
Dividend per Unit (`) For Cum Div NAV (`)
Dividend per Unit (`) For
Individuals & HUF Others Individuals & HUF Others
Feb 21, 19 16.853 1.75 1.75 18.257 1.75 1.75Feb 20, 20 16.110 1.75 1.75 17.776 1.75 1.75Feb 18, 21 17.040 1.75 1.75 - - -
HDFC Arbitrage Fundnormal Dividend Option (Past 3 months)
Record Date Wholesale Plan Direct Plan
Cum Div NAV (`)
Dividend per Unit (`) For Cum Div NAV (`)
Dividend per Unit (`) For
Individuals & HUF Others Individuals & HUF Others
Jul 23, 20 - - - 10.692 0.020 0.020 Oct 22, 20 10.383 0.030 0.030 10.778 0.090 0.090nov 19, 20 - - - 10.721 0.030 0.030
Monthly Dividend Option (Past 3 months)
Record Date Wholesale Plan Wholesale Plan - Direct Plan
Cum Div NAV (`)
Dividend per Unit (`) For Cum Div NAV (`)
Dividend per Unit (`) For
Individuals & HUF Others Individuals & HUF Others
Jul 23, 20 - - - 10.444 0.020 0.020 Oct 22, 20 10.856 0.030 0.030 10.527 0.090 0.090nov 19, 20 - - - 10.469 0.030 0.030
HDFC Growth Opportunities Fund (Past 3 years) Dividend Option
Record Date Regular Plan Direct Plan
Cum Div NAV (`)
Dividend per Unit (`) For Cum Div NAV (`)
Dividend per Unit (`) For
Individuals & HUF Others Individuals & HUF Others
Feb 28, 19 19.807 2.00 2.00 22.663 2.00 2.00Feb 27, 20 18.745 2.00 2.00 21.836 2.00 2.00Feb 25, 21 22.017 2.00 2.00 26.266 2.00 2.00
HDFC Mid-Cap Opportunities Fund (Past 3 years) Dividend Option
Record Date Regular Plan Direct Plan
Cum Div NAV (`)
Dividend per Unit (`) For Cum Div NAV (`)
Dividend per Unit (`) For
Individuals & HUF Others Individuals & HUF Others
Feb 28, 19 28.574 2.50 2.50 34.574 2.50 2.50Feb 27, 20 28.084 2.50 2.50 34.848 2.50 2.50Feb 25, 21 33.208 3.00 3.00 42.417 3.00 3.00
HDFC Small Cap Fund (Past 3 years) Dividend Option
Record Date Regular Plan Direct Plan
Cum Div NAV (`)
Dividend per Unit (`) For Cum Div NAV (`)
Dividend per Unit (`) For
Individuals & HUF Others Individuals & HUF Others
Mar 01, 17 22.892 2.00 2.00 24.040 2.00 2.00Mar 22, 18 28.810 2.75 2.75 30.776 1.00 1.00Mar 27, 19 25.955 2.50 2.50 30.135 0.99 0.99
HDFC Hybrid Equity Fund (Past 3 quarters) Dividend Option
Record Date Regular Plan Direct Plan
Cum Div NAV (`)
Dividend per Unit (`) For Cum Div NAV (`)
Dividend per Unit (`) For
Individuals & HUF Others Individuals & HUF Others
Dec 26, 19 11.4030 0.3200 0.3200 12.1830 0.3200 0.3200Sep 25, 20 10.3190 0.2500 0.2500 11.1000 0.2500 0.2500Dec 28, 20 12.1730 0.2500 0.2500 13.1370 0.2500 0.2500
HDFC Balanced Advantage Fund (Past 3 months) Dividend Option
Record Date Regular Plan Direct Plan
Cum Div NAV (`)
Dividend per Unit (`) For Cum Div NAV (`)
Dividend per Unit (`) For
Individuals & HUF Others Individuals & HUF Others
Dec 28, 20 25.080 0.230 0.230 - - -Jan 25, 21 25.304 0.230 0.230 27.458 0.230 0.230Feb 25, 21 27.907 0.230 0.230 30.320 0.230 0.230
HDFC TaxSaver (Past 3 years) Dividend Option(An open-ended equity linked savings scheme with a lock-in period of 3 years)
Record Date Regular Plan Direct Plan
Cum Div NAV (`)
Dividend per Unit (`) For Cum Div NAV (`)
Dividend per Unit (`) For
Individuals & HUF Others Individuals & HUF Others
Mar 15, 18 66.562 7.00 7.00 69.256 7.00 7.00Mar 14, 19 59.483 6.00 6.00 62.638 6.00 6.00Mar 12, 20 39.950 5.00 5.00 42.588 2.37 2.37
HDFC Infrastructure Fund (Past 3 years) Dividend Option
Record Date Regular Plan Direct Plan
Cum Div NAV (`)
Dividend per Unit (`) For Cum Div NAV (`)
Dividend per Unit (`) For
Individuals & HUF Others Individuals & HUF Others
Mar 23, 17 14.388 1.500 1.500 17.736 1.500 1.500Mar 15, 18 14.630 1.750 1.750 18.570 1.750 1.750Mar 27, 19 11.308 1.000 1.000 14.899 1.000 1.000
HDFC Hybrid Debt Fund Monthly Dividend Option (Past 3 months)
Record Date Regular Plan Direct Plan
Cum Div NAV (`)
Dividend per Unit (`) For Cum Div NAV (`)
Dividend per Unit (`) For
Individuals & HUF Others Individuals & HUF Others
Dec 28, 20 12.8515 0.0800 0.0800 13.6139 0.0800 0.0800Jan 25, 21 12.8668 0.0800 0.0800 13.6395 0.0800 0.0800Feb 25, 21 13.0866 0.0800 0.0800 13.8822 0.0800 0.0800
quarterly Dividend Option (Past 3 quarters)
Record Date Regular Plan Direct Plan
Cum Div NAV (`)
Dividend per Unit (`) For Cum Div NAV (`)
Dividend per Unit (`) For
Individuals & HUF Others Individuals & HUF Others
Mar 18, 20 12.2732 0.2400 0.2222 12.9046 0.2400 0.2222 Sep 25, 20 12.7280 0.2400 0.2400 13.4441 0.2400 0.2400Dec 28, 20 13.7013 0.2400 0.2400 14.5023 0.2400 0.2400
HDFC Equity Savings Fund (Past 3 quarters) Dividend Option
Record Date Regular Plan Direct Plan
Cum Div NAV (`)
Dividend per Unit (`) For Cum Div NAV (`)
Dividend per Unit (`) For
Individuals & HUF Others Individuals & HUF Others
Dec 26, 19 10.790 0.2210 0.2210 11.715 0.2210 0.2210Sep 25, 20 10.2810 0.2200 0.2200 11.2430 0.2200 0.2200Dec 28, 20 11.2210 0.2200 0.2200 12.3190 0.2200 0.2200

82 February 2021
DIVIDEND HISTORY ^
^ Past performance may or may not be sustained in the future. There is no assurance or guarantee to Unit holders as to rate/quantum of dividend distribution nor that the dividends will be paid regularly. After payment of the dividend, the per Unit nAV falls to the extent of the payout and statutory levy, if any. Please log on to www.hdfcfund.com for Record Date-wise listing of dividends declared.
HDFC Multi-Asset Fund (Past 3 years) Dividend Option
Record Date Regular Plan Direct Plan
Cum Div NAV (`)
Dividend per Unit (`) For Cum Div NAV (`)
Dividend per Unit (`) For
Individuals & HUF Others Individuals & HUF Others
Mar 03, 16 11.9008 0.7223 0.6692 12.5570 0.7223 0.6692Mar 09, 17 12.3216 0.7945 0.7361 13.1369 0.7945 0.7361Mar 01, 18 12.2077 0.7945 0.7361 13.1690 0.7945 0.7361
HDFC Income Fund (Past 3 quarters) quarterly Dividend Option
Record Date Regular Plan Direct Plan
Cum Div NAV (`)
Dividend per Unit (`) For Cum Div NAV (`)
Dividend per Unit (`) For
Individuals & HUF Others Individuals & HUF Others
Jun 25, 20 11.4735 0.2000 0.2000 12.2291 0.2000 0.2000 Sep 25, 20 11.4189 0.1500 0.1500 12.2001 0.1500 0.1500Dec 28, 20 11.5514 0.2000 0.2000 12.3723 0.2000 0.2000
HDFC Dynamic Debt Fundquarterly Dividend Option (Past 3 quarters)
Record Date Regular Plan Direct Plan
Cum Div NAV (`)
Dividend per Unit (`) For Cum Div NAV (`)
Dividend per Unit (`) For
Individuals & HUF Others Individuals & HUF Others
Jun 25, 20 11.8846 0.2000 0.2000 12.6560 0.2000 0.2000 Sep 25, 20 - - - 12.6821 0.2000 0.2000Dec 28, 20 11.9549 0.2000 0.2000 12.7980 0.2000 0.2000
Half-yearly (Dividend Option) (Past 2 years)
Record Date Regular Plan Direct Plan
Cum Div NAV (`)
Dividend per Unit (`) For Cum Div NAV (`)
Dividend per Unit (`) For
Individuals & HUF Others Individuals & HUF Others
Sep 25, 19 11.2879 0.1500 0.1389 - - -Mar 18, 20 11.3908 0.4000 0.3704 - - -Sep 25, 20 11.4630 0.4000 0.4000 - - -
Yearly (Dividend Option) (Past 3 years)
Record Date Regular Plan Direct Plan
Cum Div NAV (`)
Dividend per Unit (`) For Cum Div NAV (`)
Dividend per Unit (`) For
Individuals & HUF Others Individuals & HUF Others
Mar 26, 18 13.0626 0.4000 0.3706 13.6262 0.4000 0.3706Mar 25, 19 12.9184 0.3500 0.3241 13.5824 0.3500 0.3241Mar 18, 20 12.9884 0.5500 0.5093 13.7778 0.5500 0.5093
HDFC Corporate Bond Fundquarterly Dividend Option (Past 3 quarters)
Record Date Regular Plan Direct Plan
Cum Div NAV (`)
Dividend per Unit (`) For Cum Div NAV (`)
Dividend per Unit (`) For
Individuals & HUF Others Individuals & HUF Others
Jun 25, 20 10.8564 0.3810 0.3810 10.9295 0.3650 0.3650 Sep 25, 20 10.6503 0.2120 0.2120 10.7493 0.2910 0.2910Dec 28, 20 10.7407 0.1550 0.1550 10.7698 0.2640 0.2640
HDFC Gilt Fund(Dividend Option) (Past 3 quarters)
Record Date Regular Plan Direct Plan
Cum Div NAV (`)
Dividend per Unit (`) For Cum Div NAV (`)
Dividend per Unit (`) For
Individuals & HUF Others Individuals & HUF Others
Jun 25, 20 12.0405 0.2500 0.2500 12.5041 0.2500 0.2500 Sep 25, 20 11.8842 0.0500 0.0500 12.3650 0.0500 0.0500Dec 28, 20 12.1459 0.2000 0.2000 12.6549 0.2000 0.2000
HDFC Liquid FundMonthly Dividend Option (Past 3 months)
Record Date Regular Plan Direct Plan
Cum Div NAV (`)
Dividend per Unit (`) For Cum Div NAV (`)
Dividend per Unit (`) For
Individuals & HUF Others Individuals & HUF Others
Dec 01, 20 1029.3488 3.0488 3.0488 1029.4505 3.1505 3.1505Dec 28, 20 1028.2872 1.9872 1.9872 1028.3628 2.0628 2.0628Jan 25, 21 1028.4052 2.1052 2.1052 1028.4868 2.1868 2.1868Feb 22, 21 1028.8815 2.5815 2.5815 1028.9681 2.6681 2.6681
HDFC Floating Rate Debt FundMonthly Dividend Option (Past 3 months)
Record Date Regular Plan Direct Plan
Cum Div NAV (`)
Dividend per Unit (`) For Cum Div NAV (`)
Dividend per Unit (`) For
Individuals & HUF Others Individuals & HUF Others
Dec 01, 20 10.2335 0.0894 0.0894 10.2359 0.0918 0.0918Dec 28, 20 10.1920 0.0479 0.0479 10.1939 0.0498 0.0498Jan 25, 21 10.1615 0.0174 0.0174 10.1633 0.0192 0.0192Feb 22, 21 10.1461 0.0020 0.0020 10.1481 0.0040 0.0040
HDFC Low Duration FundMonthly Dividend Option (Past 3 months)
Record Date Regular Plan Direct Plan
Cum Div NAV (`)
Dividend per Unit (`) For Cum Div NAV (`)
Dividend per Unit (`) For
Individuals & HUF Others Individuals & HUF Others
Dec 01, 20 10.2138 0.0738 0.0738 10.2224 0.0799 0.0799Dec 28, 20 10.1813 0.0413 0.0413 10.1884 0.0459 0.0459Jan 25, 21 10.1657 0.0257 0.0257 10.1729 0.0304 0.0304Feb 22, 21 10.1537 0.0137 0.0137 10.1608 0.0183 0.0183
HDFC Credit Risk Debt Fundquarterly Dividend Option (Past 3 quarters)
Record Date Regular Plan Direct Plan
Cum Div NAV (`)
Dividend per Unit (`) For Cum Div NAV (`)
Dividend per Unit (`) For
Individuals & HUF Others Individuals & HUF Others
Jun 25, 20 10.5083 0.1970 0.1970 10.6425 0.2110 0.2110 Sep 25, 20 10.6294 0.3440 0.3440 10.7664 0.3590 0.3590Dec 28, 20 10.6803 0.2150 0.2150 10.8213 0.2050 0.2050
HDFC Ultra Short Term FundMonthly Dividend Option (Past 3 months)
Record Date Regular Plan Direct Plan
Cum Div NAV (`)
Dividend per Unit (`) For Cum Div NAV (`)
Dividend per Unit (`) For
Individuals & HUF Others Individuals & HUF Others
Dec 01, 20 10.1942 0.0442 0.0442 10.0968 0.0468 0.0468Dec 28, 20 10.1711 0.0211 0.0211 10.0731 0.0231 0.0231Jan 25, 21 10.1680 0.0180 0.0180 10.0701 0.0201 0.0201Feb 22, 21 10.1782 0.0282 0.0282 10.0804 0.0304 0.0304

Disclaimer: The views expressed herein are based on internal data, publicly available information and other sources believed to be reliable, but involve uncertainties that could cause actual events to differ materially from those expressed or implied in such statements. The document is given for general and information purpose and is neither an investment advice nor an offer to sell nor a solicitation. While due care has been exercised while preparing this document, HDFC Asset Management Company Limited (“HDFC AMC”) does not warrant the completeness or accuracy of the information. neither HDFC AMC, nor any person connected with it, accepts any liability arising from the use of this material. The recipient of this material should rely on their investigations and take their own professional advice. For latest riskometers, please refer www.hdfcfund.com
HDFC SEnSEx ETF, HDFC Index Fund - SEnSEx Plan (“Schemes”) is based on the S&P BSE SEnSEx Index. S&P® is a registered trademark of S&P Financial Services Limited (S&P). BSE® and SEnSEx® are registered trademarks of BSE Limited. The Schemes is not sponsored, endorsed marketed or promoted by S&P, BSE or their respective affiliates. Please refer to the Scheme Information Document for disclaimers w.r.t. S&P BSE SENSEX Index.
For HDFC nIFTY 50 ETF, HDFC Index Fund - nIFTY 50 Plan and HDFC Banking ETF: The Scheme of HDFC Mutual Fund (the “Product(s)”) are not sponsored, endorsed, sold or promoted by nifty Indices Limited [formerly India Index Services & Products Limited] (“nIL”). nIL does not make any representation or warranty, express or implied, to the owners of the Product(s) or any member of the public regarding the advisability of investing in securities generally or in the Product(s) particularly or the ability of the nIFTY Indices to track general stock market performance in India. The relationship of nIL with HDFC Asset Management Company Limited (“the Issuer/Licensee”) is only in respect of the licensing of the Indices and certain trademarks and trade names associated with such Indices which is determined, composed and calculated by nIL without regard to the Issuer /Licensee or the Product(s). nIL does not have any obligation to take the needs of the Issuer/Licensee or the owners of the Product(s) into consideration in determining, composing or calculating the nIFTY Indices. nIL is not responsible for or has participated in the determination of the timing of, prices at, or quantities of the Product(s) to be issued or in the determination or calculation of the equation by which the Product(s) is to be converted into cash. nIL has no obligation or liability in connection with the administration, marketing or trading of the Product(s).
nIL is engaged in the business of developing, constructing, compiling, computing and maintaining various equity indices. The relationship of nIL to HDFC AMC is only in respect of the rights granted to use certain trademarks and trade names of the Index in connection with the utilisation of the Index data relating to such Index. The Index is determined, composed and calculated by nIL without regard to HDFC AMC. nIL has no obligation to take the needs of HDFC AMC into consideration in determining, composing or calculating the nIFTY Indices.
nIL do not guarantee the accuracy and/or the completeness of nIFTY Indices or any data included therein and they shall have no liability for any errors, omissions, or interruptions therein. nIL make no warranty, express or implied, as to results to be obtained by HDFC AMC or any other person or entity from the use of nIFTY Indices or any data included therein. nIL make no express or implied warranties, and expressly disclaim all warranties of merchantability or fitness for a particular purpose or use with respect to the Index or any data included therein. Without limiting any of the foregoing, NIL expressly disclaim any and all liability for any damages or losses arising out of the use of NIFTY Indices or any data included therein by any third party, including any and all direct, special, punitive, indirect, or consequential damages (including lost profits), even if notified of the possibility of such damages. An investor, by subscribing or purchasing an interest in the Product(s), will be regarded as having acknowledged, understood and accepted the disclaimer referred to in Clauses above and will be bound by it.
WANT TO HAVE THE LATEST INFORMATION ABOUT US?
Visit us at www.hdfcfund.com
Telephone ServicesToll-free number: 1800 3010 6767 / 1800 419 7676
For any query or suggestions:-
Investors may contact us at:[email protected]
Distributors may contact us at:[email protected]
SMS: HDFCMF to 56767
Registered Office: HDFC House, 2nd Floor, H.T. Parekh Marg, 165-166 Backbay Reclamation, Churchgate, Mumbai - 400 020.
MUTUAL FUND INVESTMENTS ARE SUBJECT TO MARkET RISkS, READ ALL SCHEME RELATED DOCUMENTS CAREFULLY.
UPDATION OF PAN OF ALL UNITHOLDERS IN THE FOLIOS IS MANDATORY FOR PROCESSING OF REDEMPTION AND RELATED TRANSACTIONS
It is Mandatory to complete the kYC requirements for all unit holders, including for all joint holders and the guardian in case of folio of a minor investor. Accordingly, financial transactions (including redemptions, switches and all types of systematic plans) will not be processed if the unit holders have not completed kYC requirements
Date of Release: March 16, 2021

M U T U A L F U N D I N V E S T M E N T S A R E S U B J E C T T O M A R K E T R I S K S , R E A D A L L S C H E M E R E L A T E D D O C U M E N T S C A R E F U L LY.
To know more, contact your Mutual Fund Distributor / RegisteredInvestment Adviser or give a missed call on 73974 12345.
To generate long-term capital appreciation / income
Investments predominantly in equity & equity related instruments. The scheme will also invest in debt and money market instruments
HDFC Hybrid Equity Fund (An open-ended Hybrid Scheme investing predominantly in equity and equity relatedinstruments) is suitable for investors who are seeking*:
*Investors should consult their financial advisers, if in doubt about whether the product is suitable for them.
For latest riskometers, please refer to www.hdfcfund.com
Aim high withoutcompromising on stability.Presenting HDFC Hybrid Equity Fund.
INVESTORS UNDERSTAND THAT THEIR PRINCIPAL WILL BE AT VERY HIGH RISK


