Embed Size (px)
Citation preview
I.Introduction
There has always been, and will always be, a need to test products and
materials to prevent disasters. Critical physical parameters must be
measured to quantify performance and strength, ensuring our safety and
the safety of our environment.
Most commonly, the compressive strength of concrete is measured to
ensure that concrete delivered to a project meets the requirements of
the job specification and for quality control. It is important that
the concrete cylinder be cured in standard and tested for the
acceptance testing for specified strengths, verifying mixture
proportions for strength, and quality control by the concrete
producer.
The strength results of cured concrete cylinders are used for
determining the time at which a structure is permitted to put into
service and evaluating the adequacy of curing and protecting concrete
in the structure.
Concrete mixtures can be designed to provide a wide range of
mechanical and durability properties to meet the design requirements
of a structure. The compressive strength of concrete is the most
common performance measured used by engineers in designing buildings
and other structures. Compressive strength of concrete is the basis if
the mixture and water-cement ratio yields the maximum strength or if
the sample can sustain large loads.
Specifically the activity aims to:
1. Determine the slump of freshly made concrete with different
water-cement ratio for consistency.
1
2. Prepare cylindrical concrete specimen for testing compressive
strength.
3. Store and cure the specimen with varying number of days of
curing.
4. Determine the compressive strength of concrete with different
water-cement ratio and varying days of curing.
II. Materials and Methods
A. Materials
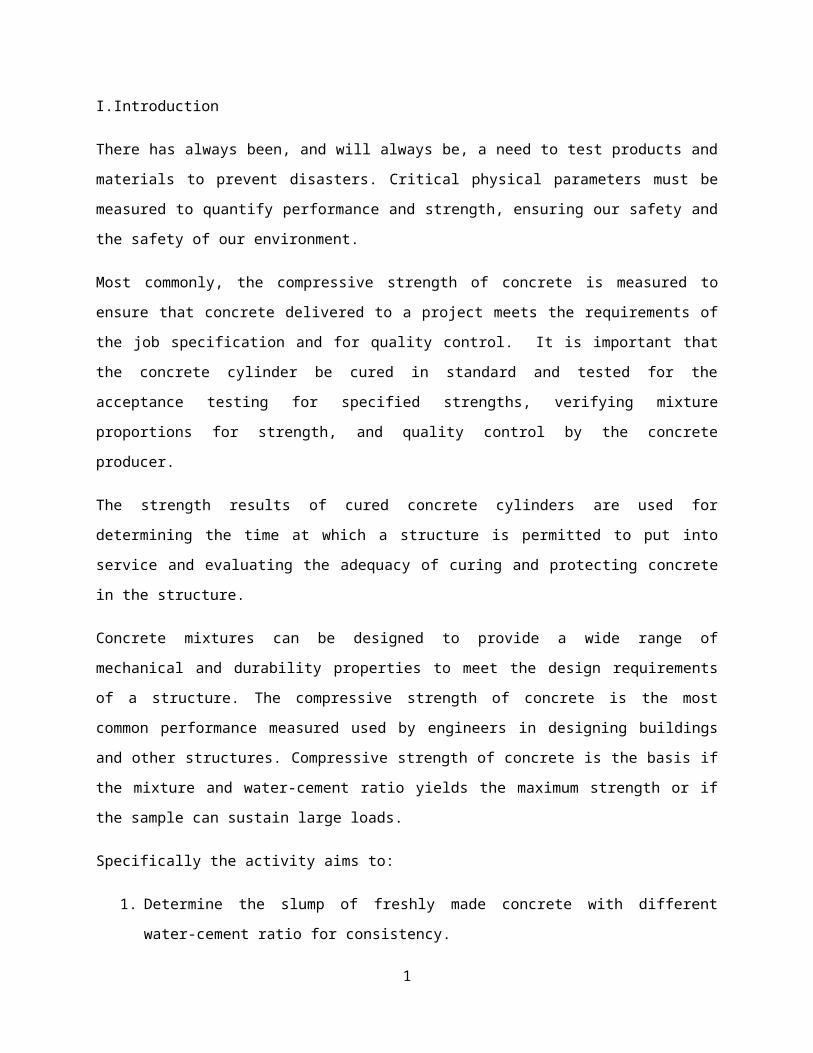
a. Cylindrical mold – A 6 x 12 inch (150 x 300mm) metal mold, use
where the concrete paste is placed and stored until it
hardens. Shown in figure 1 were the materials and equipment
used in the preparation of concrete specimen.
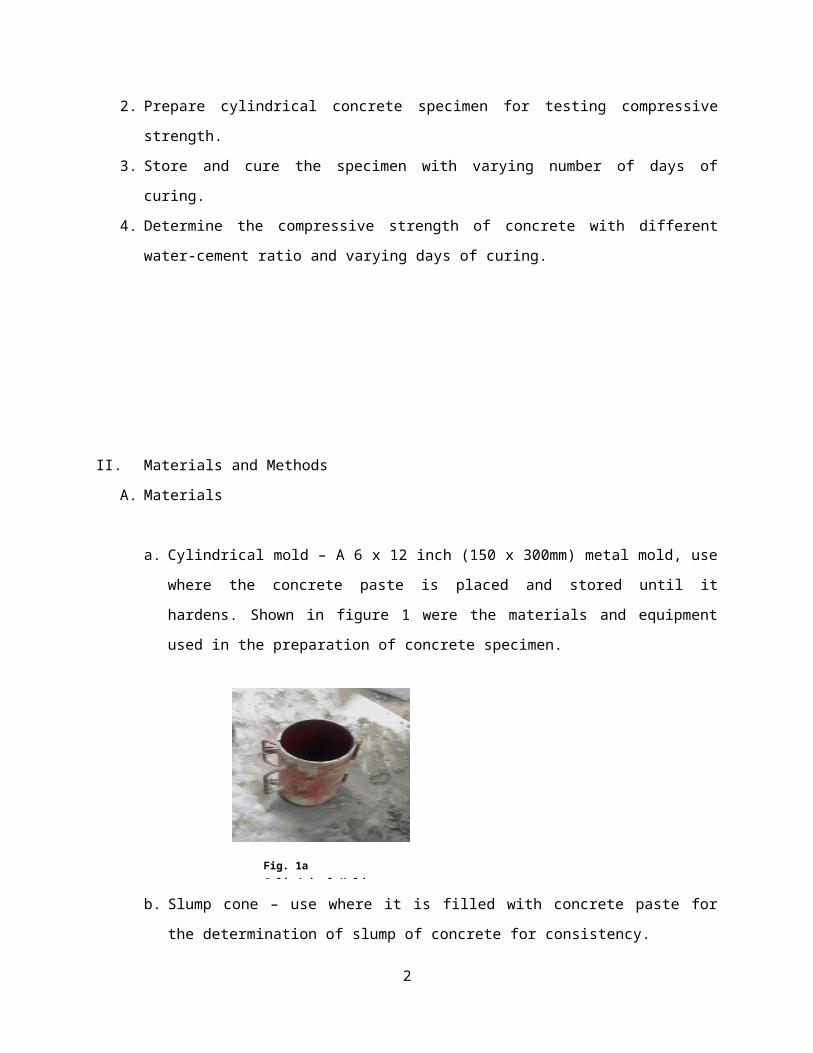
b. Slump cone – use where it is filled with concrete paste for
the determination of slump of concrete for consistency.
2
Fig. 1a Cylindrical Mold
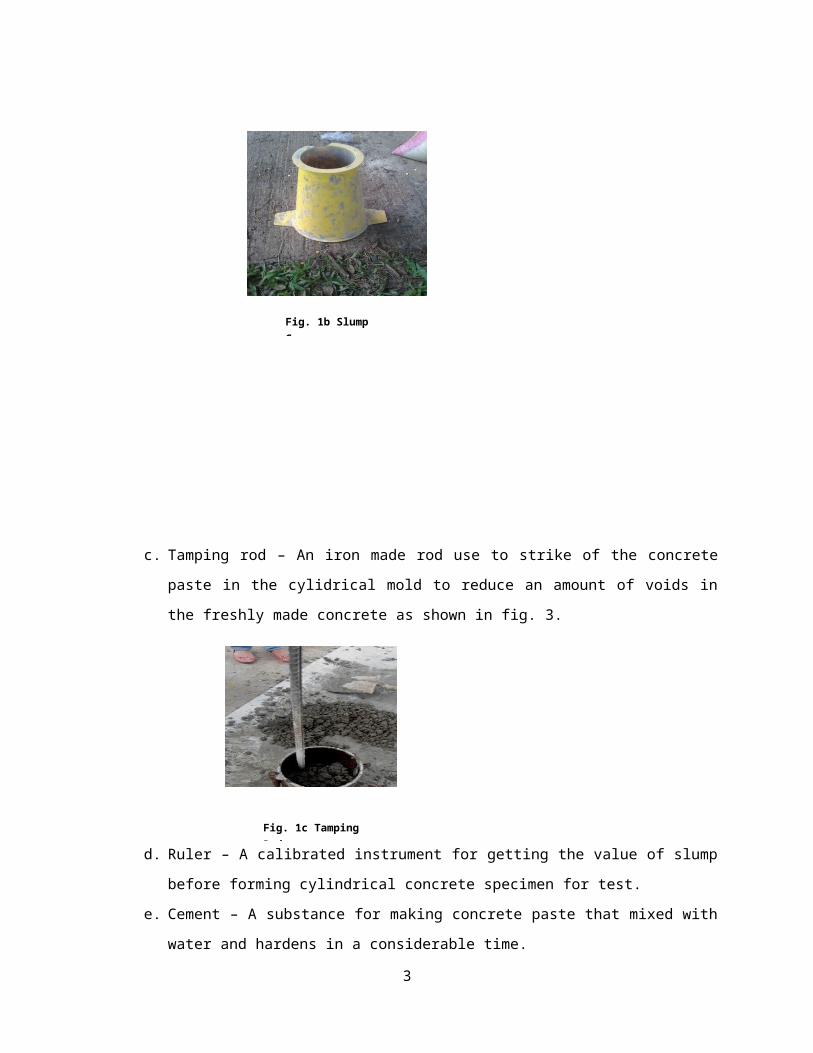
c. Tamping rod – An iron made rod use to strike of the concrete
paste in the cylidrical mold to reduce an amount of voids in
the freshly made concrete as shown in fig. 3.
d. Ruler – A calibrated instrument for getting the value of slump
before forming cylindrical concrete specimen for test.
e. Cement – A substance for making concrete paste that mixed with
water and hardens in a considerable time.
3
Fig. 1c Tamping Rod
Fig. 1b Slump Cone
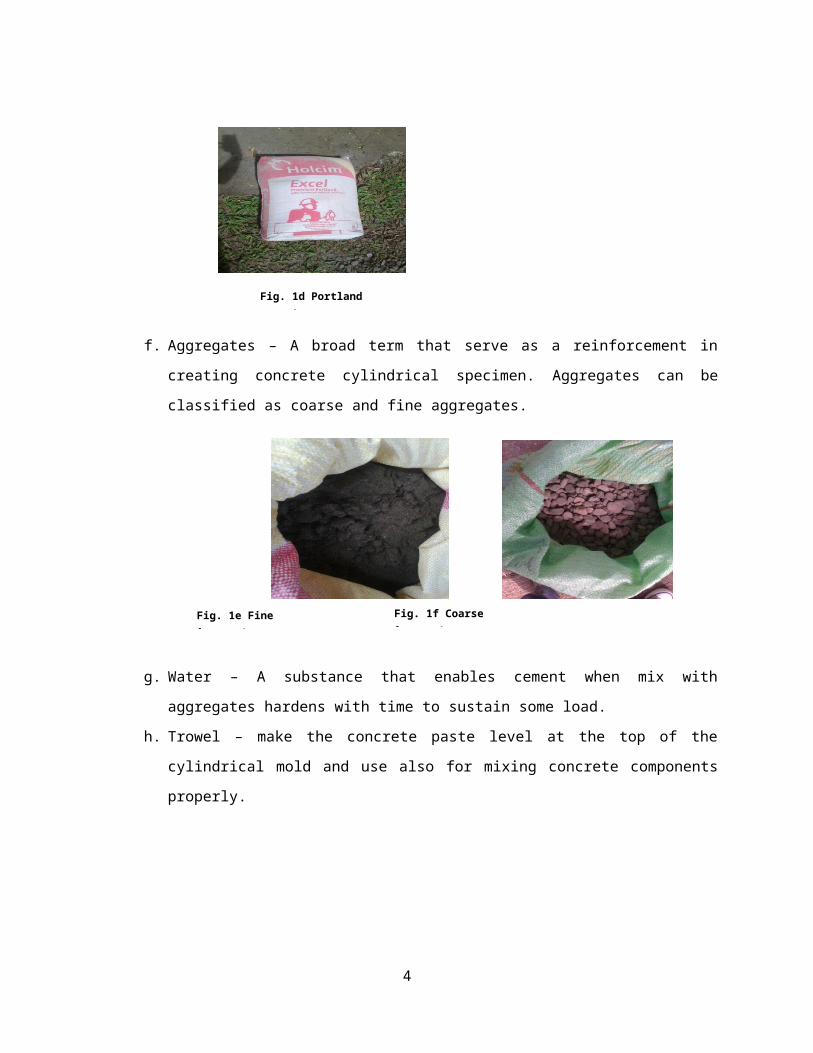
f. Aggregates – A broad term that serve as a reinforcement in
creating concrete cylindrical specimen. Aggregates can be
classified as coarse and fine aggregates.
g. Water – A substance that enables cement when mix with
aggregates hardens with time to sustain some load.
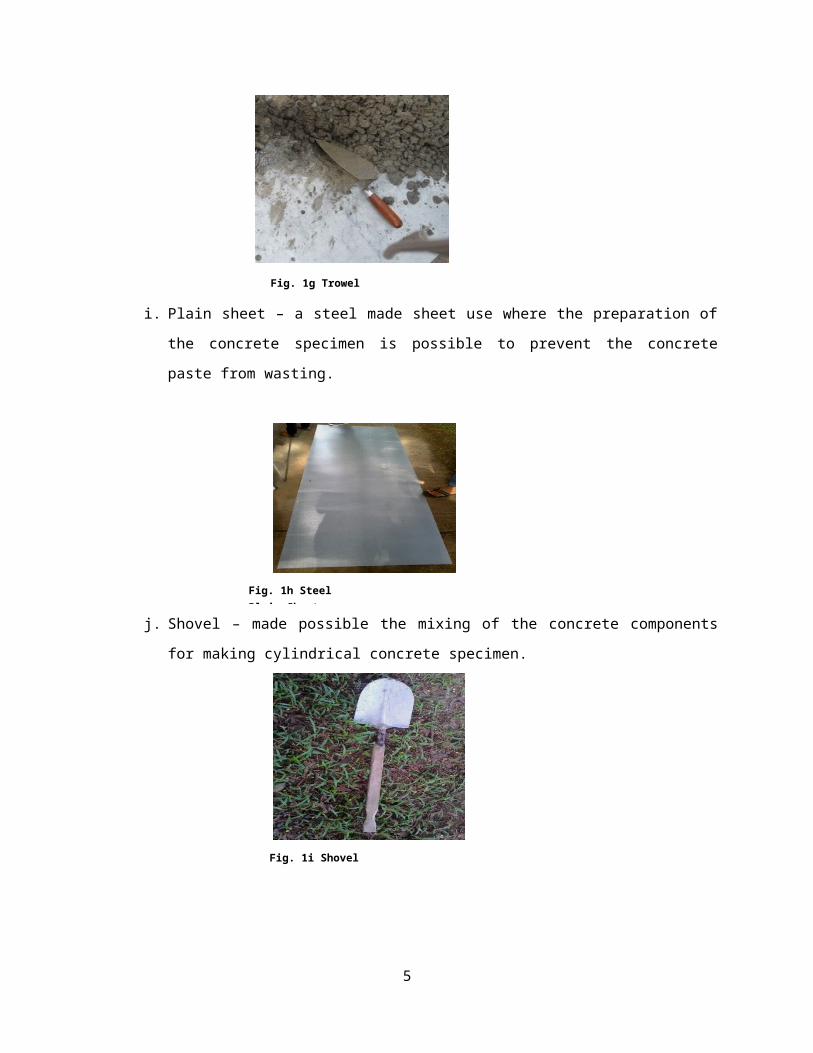
h. Trowel – make the concrete paste level at the top of the
cylindrical mold and use also for mixing concrete components
properly.
4
Fig. 1d Portland cement
Fig. 1e Fine Aggregates
Fig. 1f Coarse Aggregates
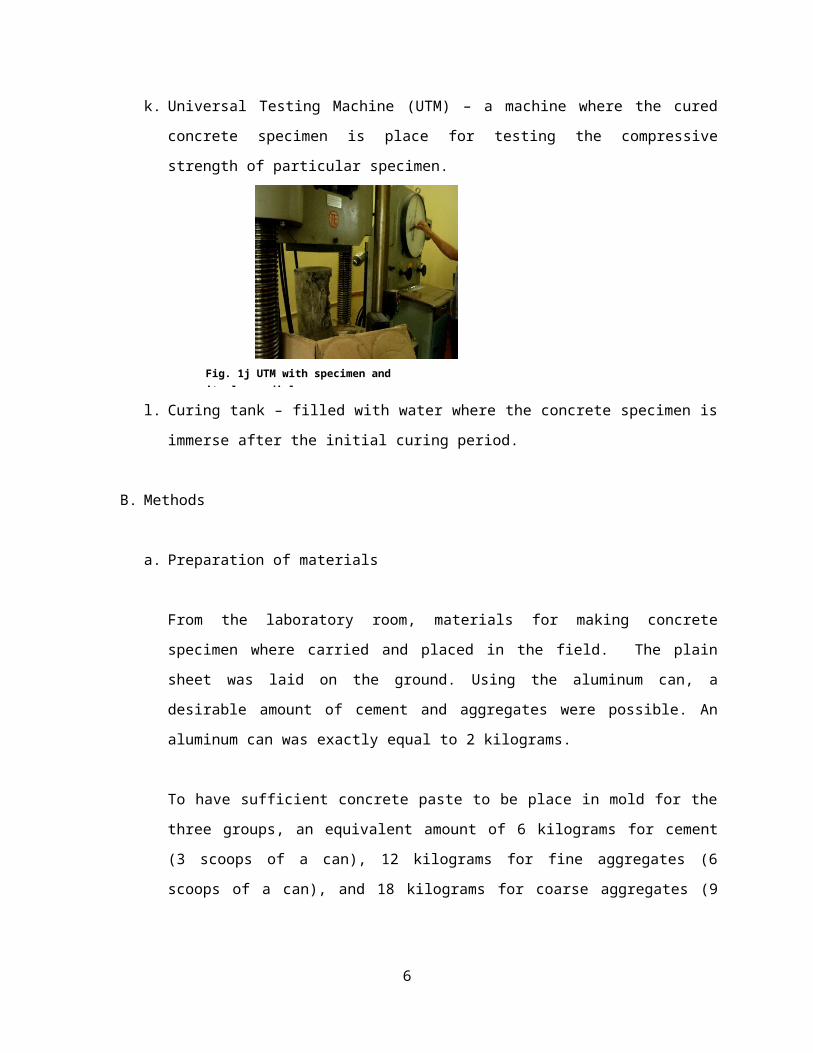
i. Plain sheet – a steel made sheet use where the preparation of
the concrete specimen is possible to prevent the concrete
paste from wasting.
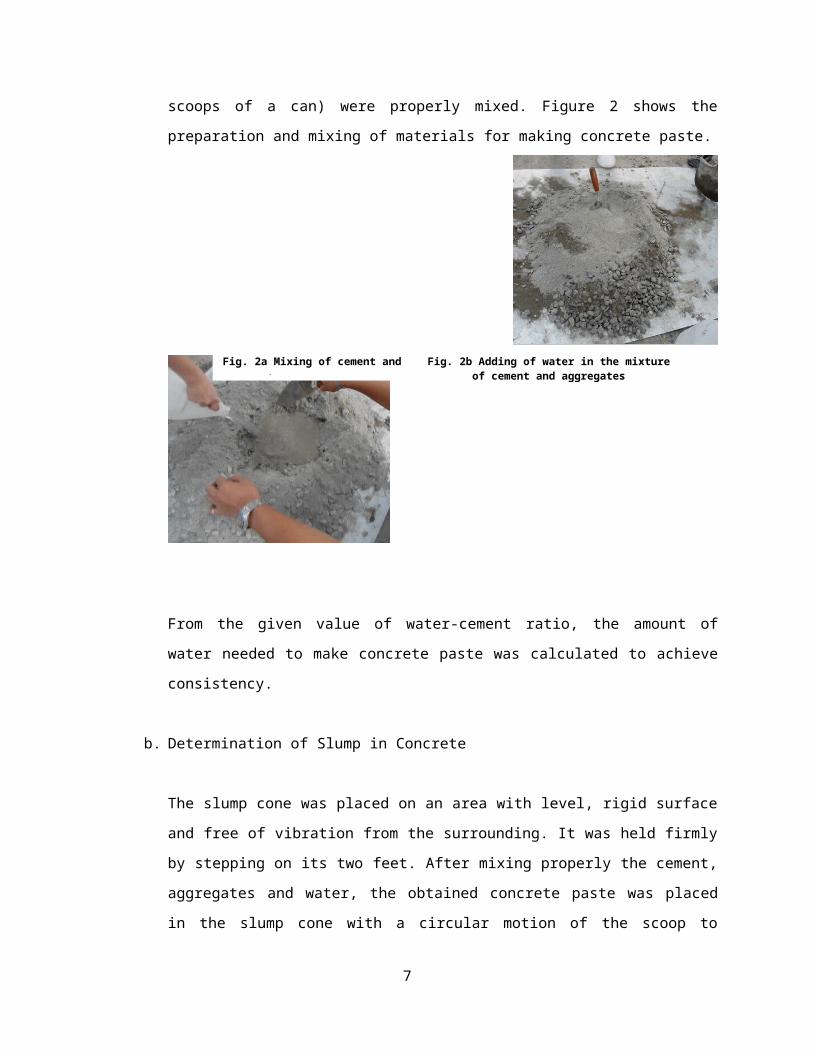
j. Shovel – made possible the mixing of the concrete components
for making cylindrical concrete specimen.
5
Fig. 1g Trowel
Fig. 1h Steel Plain Sheet
Fig. 1i Shovel
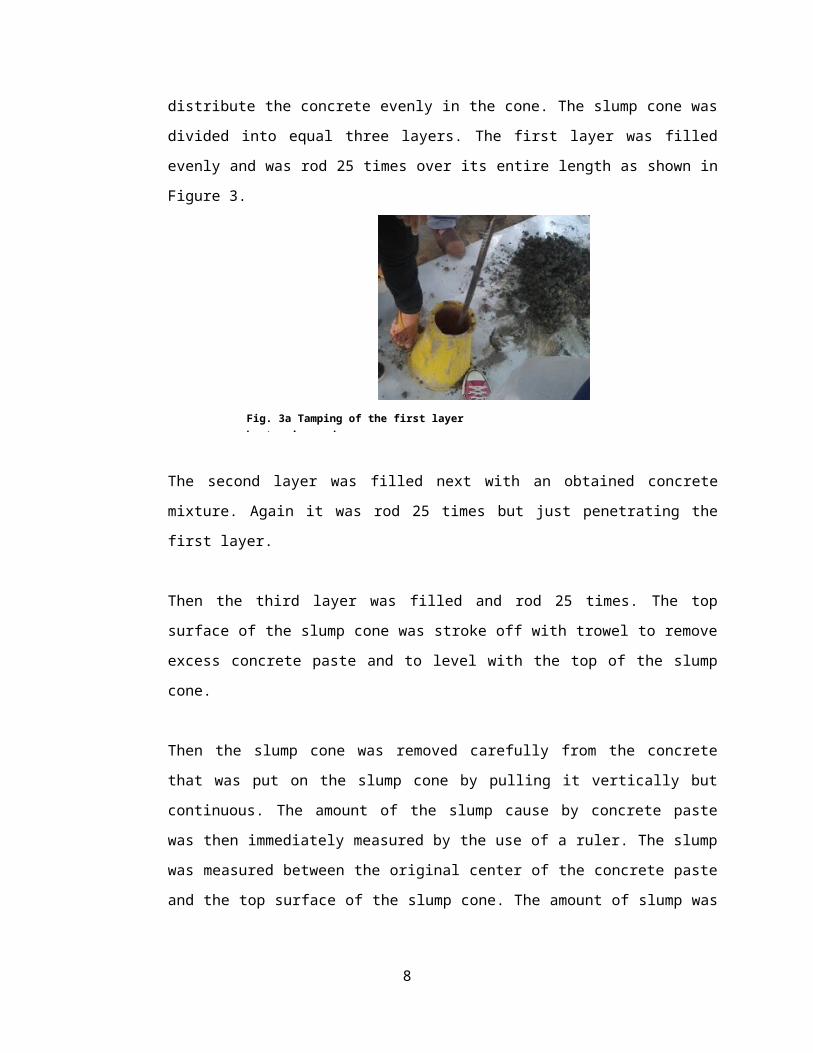
k. Universal Testing Machine (UTM) – a machine where the cured
concrete specimen is place for testing the compressive
strength of particular specimen.
l. Curing tank – filled with water where the concrete specimen is
immerse after the initial curing period.
B. Methods
a. Preparation of materials
From the laboratory room, materials for making concrete
specimen where carried and placed in the field. The plain
sheet was laid on the ground. Using the aluminum can, a
desirable amount of cement and aggregates were possible. An
aluminum can was exactly equal to 2 kilograms.
To have sufficient concrete paste to be place in mold for the
three groups, an equivalent amount of 6 kilograms for cement
(3 scoops of a can), 12 kilograms for fine aggregates (6
scoops of a can), and 18 kilograms for coarse aggregates (9
6
Fig. 1j UTM with specimen and its large dial
scoops of a can) were properly mixed. Figure 2 shows the
preparation and mixing of materials for making concrete paste.
From the given value of water-cement ratio, the amount of
water needed to make concrete paste was calculated to achieve
consistency.
b. Determination of Slump in Concrete
The slump cone was placed on an area with level, rigid surface
and free of vibration from the surrounding. It was held firmly
by stepping on its two feet. After mixing properly the cement,
aggregates and water, the obtained concrete paste was placed
in the slump cone with a circular motion of the scoop to
7
Fig. 2a Mixing of cement and aggregates
Fig. 2b Adding of water in the mixtureof cement and aggregates
distribute the concrete evenly in the cone. The slump cone was
divided into equal three layers. The first layer was filled
evenly and was rod 25 times over its entire length as shown in
Figure 3.
The second layer was filled next with an obtained concrete
mixture. Again it was rod 25 times but just penetrating the
first layer.
Then the third layer was filled and rod 25 times. The top
surface of the slump cone was stroke off with trowel to remove
excess concrete paste and to level with the top of the slump
cone.
Then the slump cone was removed carefully from the concrete
that was put on the slump cone by pulling it vertically but
continuous. The amount of the slump cause by concrete paste
was then immediately measured by the use of a ruler. The slump
was measured between the original center of the concrete paste
and the top surface of the slump cone. The amount of slump was
8
Fig. 3a Tamping of the first layerby tamping rod
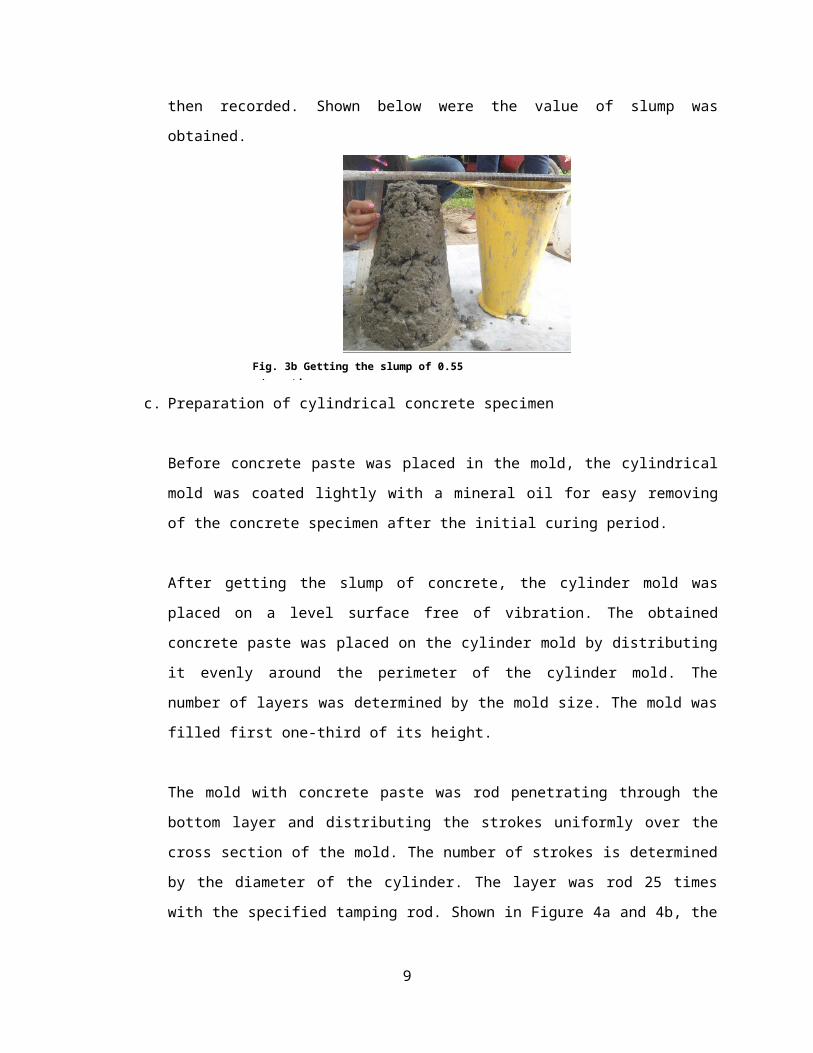
then recorded. Shown below were the value of slump was
obtained.
c. Preparation of cylindrical concrete specimen
Before concrete paste was placed in the mold, the cylindrical
mold was coated lightly with a mineral oil for easy removing
of the concrete specimen after the initial curing period.
After getting the slump of concrete, the cylinder mold was
placed on a level surface free of vibration. The obtained
concrete paste was placed on the cylinder mold by distributing
it evenly around the perimeter of the cylinder mold. The
number of layers was determined by the mold size. The mold was
filled first one-third of its height.
The mold with concrete paste was rod penetrating through the
bottom layer and distributing the strokes uniformly over the
cross section of the mold. The number of strokes is determined
by the diameter of the cylinder. The layer was rod 25 times
with the specified tamping rod. Shown in Figure 4a and 4b, the
9
Fig. 3b Getting the slump of 0.55 w/c ratio
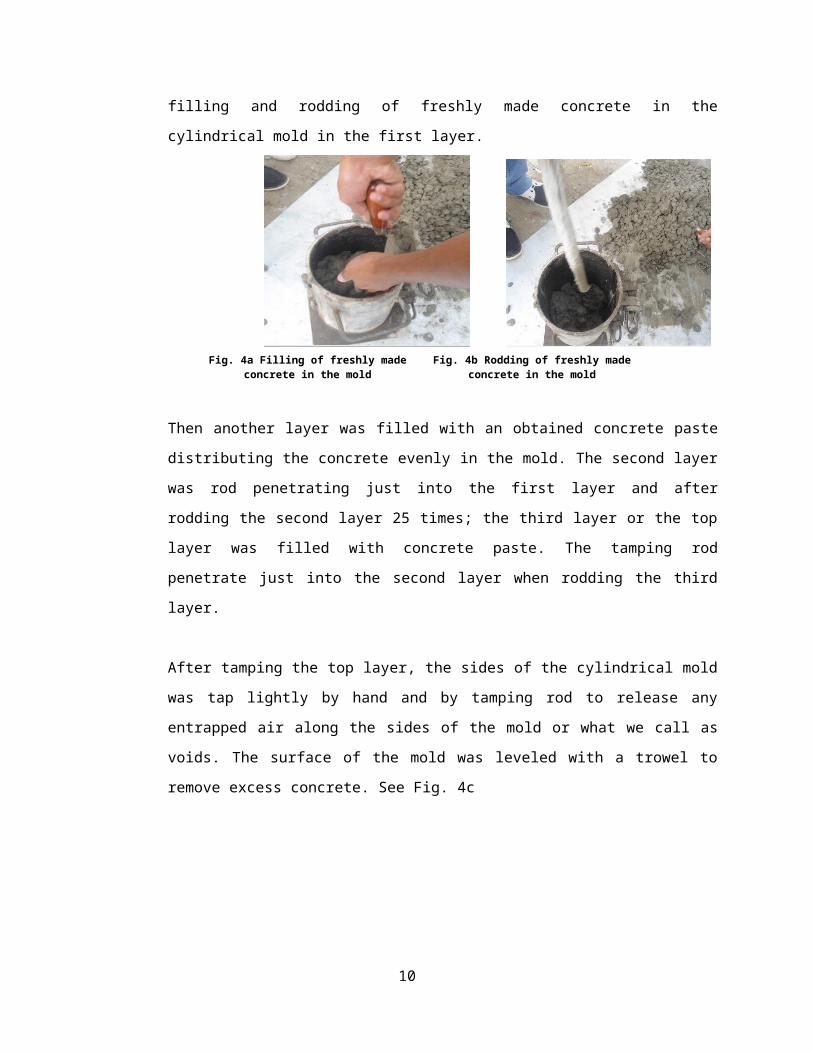
filling and rodding of freshly made concrete in the
cylindrical mold in the first layer.
Then another layer was filled with an obtained concrete paste
distributing the concrete evenly in the mold. The second layer
was rod penetrating just into the first layer and after
rodding the second layer 25 times; the third layer or the top
layer was filled with concrete paste. The tamping rod
penetrate just into the second layer when rodding the third
layer.
After tamping the top layer, the sides of the cylindrical mold
was tap lightly by hand and by tamping rod to release any
entrapped air along the sides of the mold or what we call as
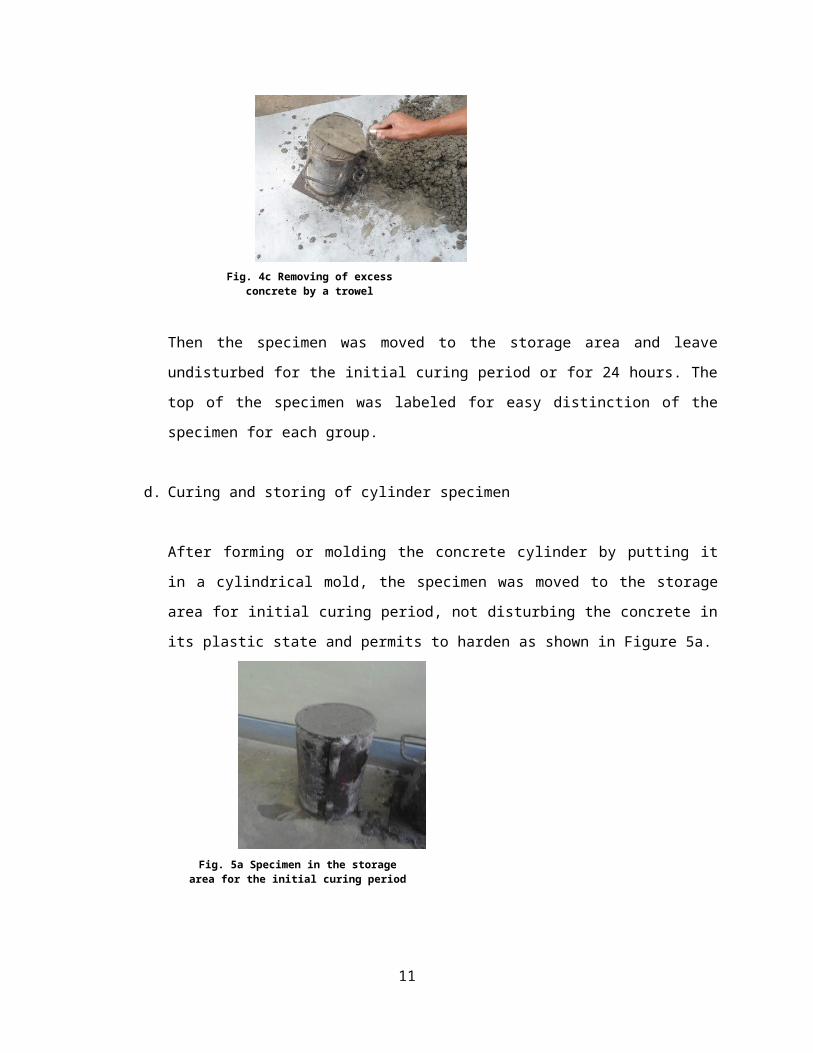
voids. The surface of the mold was leveled with a trowel to
remove excess concrete. See Fig. 4c
10
Fig. 4a Filling of freshly madeconcrete in the mold
Fig. 4b Rodding of freshly made concrete in the mold
Then the specimen was moved to the storage area and leave
undisturbed for the initial curing period or for 24 hours. The
top of the specimen was labeled for easy distinction of the
specimen for each group.
d. Curing and storing of cylinder specimen
After forming or molding the concrete cylinder by putting it
in a cylindrical mold, the specimen was moved to the storage
area for initial curing period, not disturbing the concrete in
its plastic state and permits to harden as shown in Figure 5a.
11
Fig. 4c Removing of excessconcrete by a trowel
Fig. 5a Specimen in the storagearea for the initial curing period
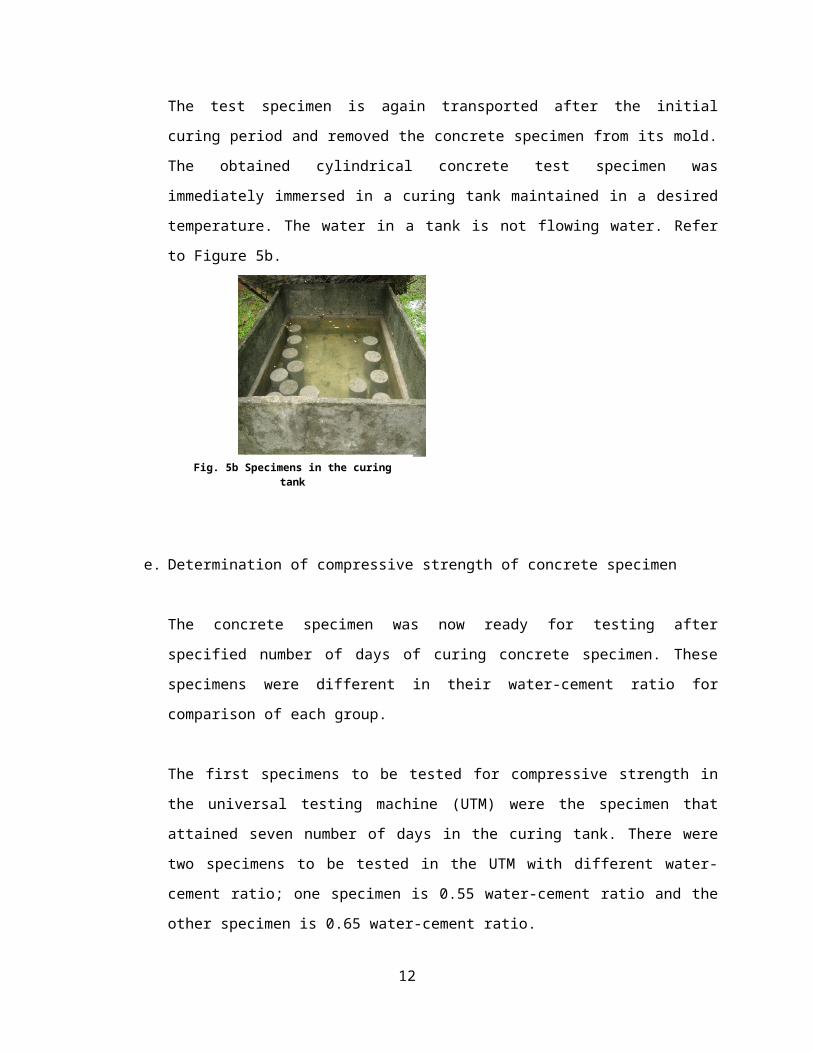
The test specimen is again transported after the initial
curing period and removed the concrete specimen from its mold.
The obtained cylindrical concrete test specimen was
immediately immersed in a curing tank maintained in a desired
temperature. The water in a tank is not flowing water. Refer
to Figure 5b.
e. Determination of compressive strength of concrete specimen
The concrete specimen was now ready for testing after
specified number of days of curing concrete specimen. These
specimens were different in their water-cement ratio for
comparison of each group.
The first specimens to be tested for compressive strength in
the universal testing machine (UTM) were the specimen that
attained seven number of days in the curing tank. There were
two specimens to be tested in the UTM with different water-
cement ratio; one specimen is 0.55 water-cement ratio and the
other specimen is 0.65 water-cement ratio.
12
Fig. 5b Specimens in the curingtank
Then another two specimen with different water-cement ratio
(0.55 and 0.65 w/c ratio) were tested in the UTM. These
specimens were tested after 14 number of days in the curing
tank.
The last two specimens were tested in the UTM. These specimens
reached the maximum number of days of curing. This time the
specimen were tested with 28 number of days cured in the
curing tank.
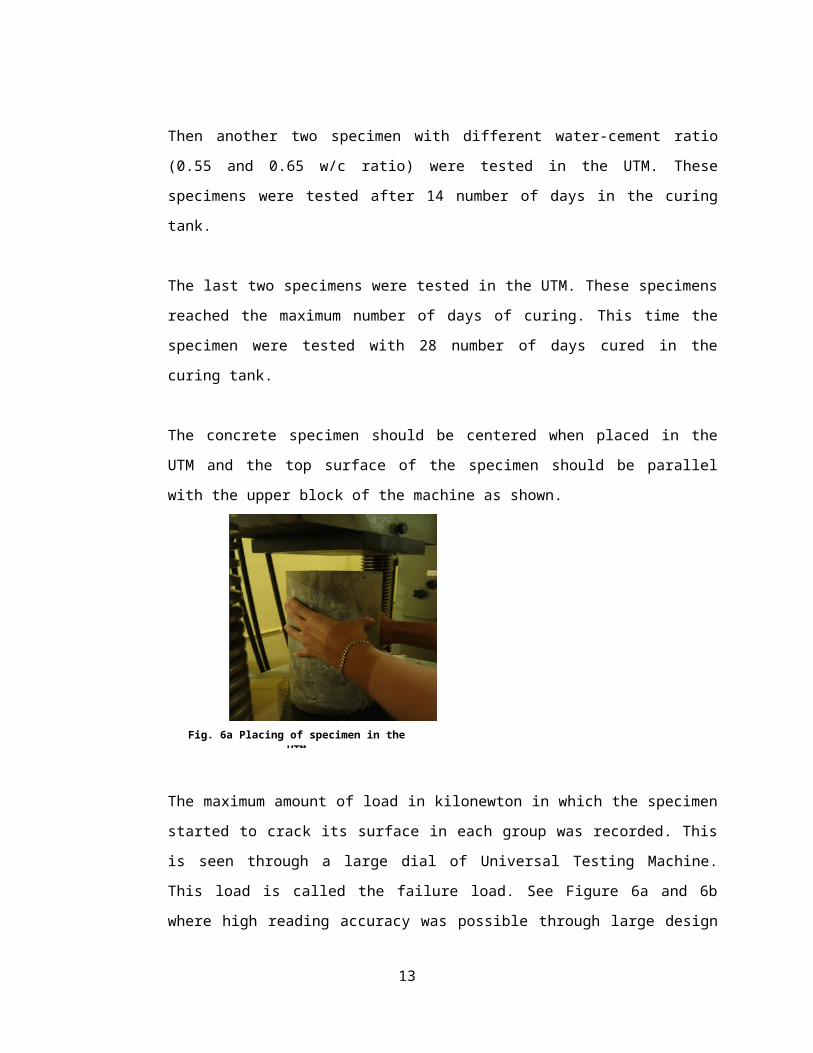
The concrete specimen should be centered when placed in the
UTM and the top surface of the specimen should be parallel
with the upper block of the machine as shown.
The maximum amount of load in kilonewton in which the specimen
started to crack its surface in each group was recorded. This
is seen through a large dial of Universal Testing Machine.
This load is called the failure load. See Figure 6a and 6b
where high reading accuracy was possible through large design
13
Fig. 6a Placing of specimen in theUTM
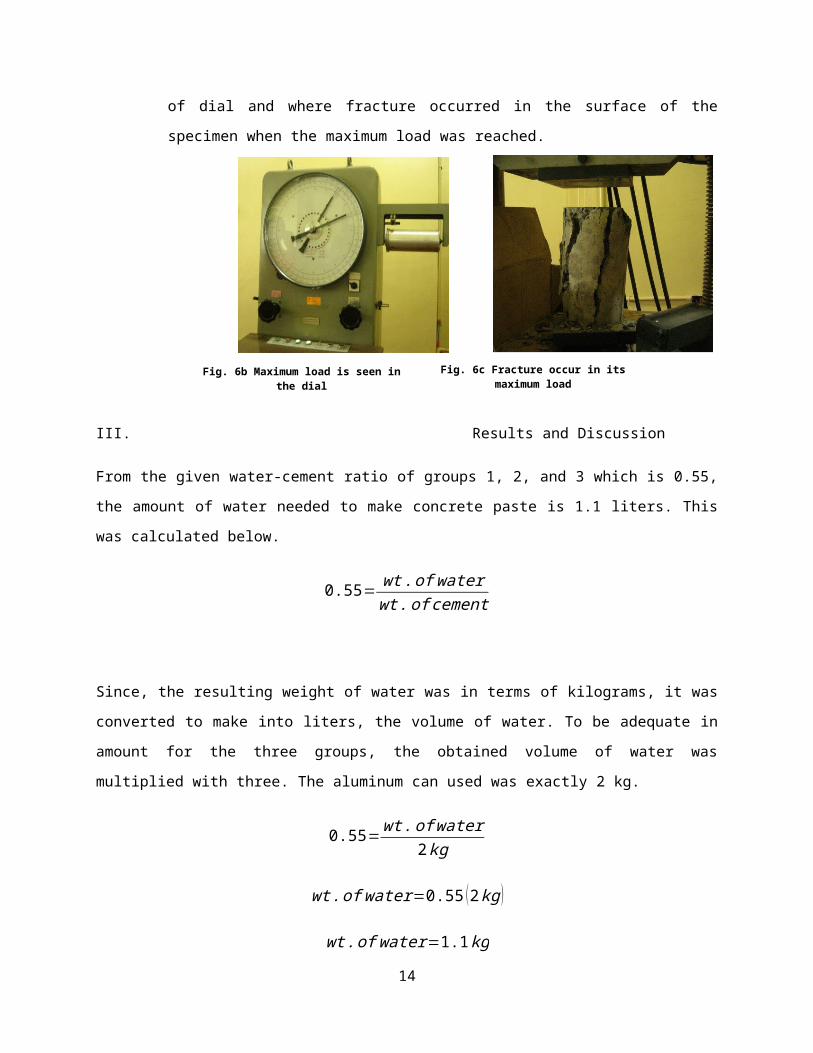
of dial and where fracture occurred in the surface of the
specimen when the maximum load was reached.
III. Results and Discussion
From the given water-cement ratio of groups 1, 2, and 3 which is 0.55,
the amount of water needed to make concrete paste is 1.1 liters. This
was calculated below.
0.55=wt.of waterwt.ofcement
Since, the resulting weight of water was in terms of kilograms, it was
converted to make into liters, the volume of water. To be adequate in
amount for the three groups, the obtained volume of water was
multiplied with three. The aluminum can used was exactly 2 kg.
0.55=wt.ofwater
2kg
wt.of water=0.55 (2kg )
wt.of water=1.1kg
14
Fig. 6b Maximum load is seen inthe dial
Fig. 6c Fracture occur in itsmaximum load
This is also equivalent to 1.1 liters. Multiplied with three for the
three groups we got 3.3 liters of water needed. The other group
(groups 4-6) has water-cement ratio of 0.65 and they got 3.9 liters of
water. Of course, the water use for mixing is of good quality. It was
clean and free from injurious quantities of alkalis, acid, oils and
other substances that may have adverse effect on concrete strength.
Before making the cylindrical concrete specimen for testing in the
UTM, the slump of different water-cement ratio were measured first.
For the 0.55 water-cement ratio, the slump is 0.8 centimeter. This is
much lower compared to 0.65 water-cement ratio which is 8.8
centimeters. The slump measures consistency in concrete and quality
control.
The cylinder mold was coated inside with a mineral oil first before
concrete paste was filled in because mineral oil makes the concrete
when it hardened easy to remove from the mold.
In tamping the concrete paste in the mold, the strokes should be
uniformly distributed over the cross section of the mold. The number
of strokes is determined by the mold diameter. So for 6 inches
diameter, the number of strokes for each layer is 25 strokes. While
the number of layers to be filled with concrete is determined by the
mold size, so for a 12 inches mold size, the number of layers is 3
equal layers.
The side of the mold should be tap to close the voids in it. The voids
are the spaces of air in the concrete. These voids have something to
do with the strength of the concrete.
15
The compressive strength is measured by breaking cylindrical concrete
specimens in a compression-testing machine.
Cylinders should be centered in the compression testing machine and
loaded to complete failure. The specimen was placed on the lower
bearing block, the upper block was almost in contact with the specimen
and it was parallel with the specimen top surface. The spherical head
was carefully and slowly brought into contact with the specimen. The
test load was applied continuously and without shock so that an
accurate maximum load is obtained.
The normal norm when testing concrete specimen and according to
research, the lesser the water-cement ratio or the lesser the amount
of water mixed to make concrete cylinder, the stronger the concrete.
However, the reverse happened when the specimen was tested in the UTM.
The 0.55 water-cement ratio when tested has lower failure load which
has 94 kN compared to 0.65 water-cement ratio of the other group which
has 114 kN. This is base on 8 day curing period.
This was repeated when the 15 day curing period specimen was tested.
The failure load was greater in 0.65 water-cement ratio specimen than
0.55 water-cement ratio specimen. 0.55 w/c ratio has 121 kN and 0.65
w/c ratio has 165 kN.
The compressive strength of each concrete specimen was calculated by
dividing the maximum load at failure by the average cross-sectional
area of the specimen.
CompressiveStrength (MPa )= MaximumLoad(N)
Cross−sectionalAreaofSpecimen(mm2)
16
f'c=PA
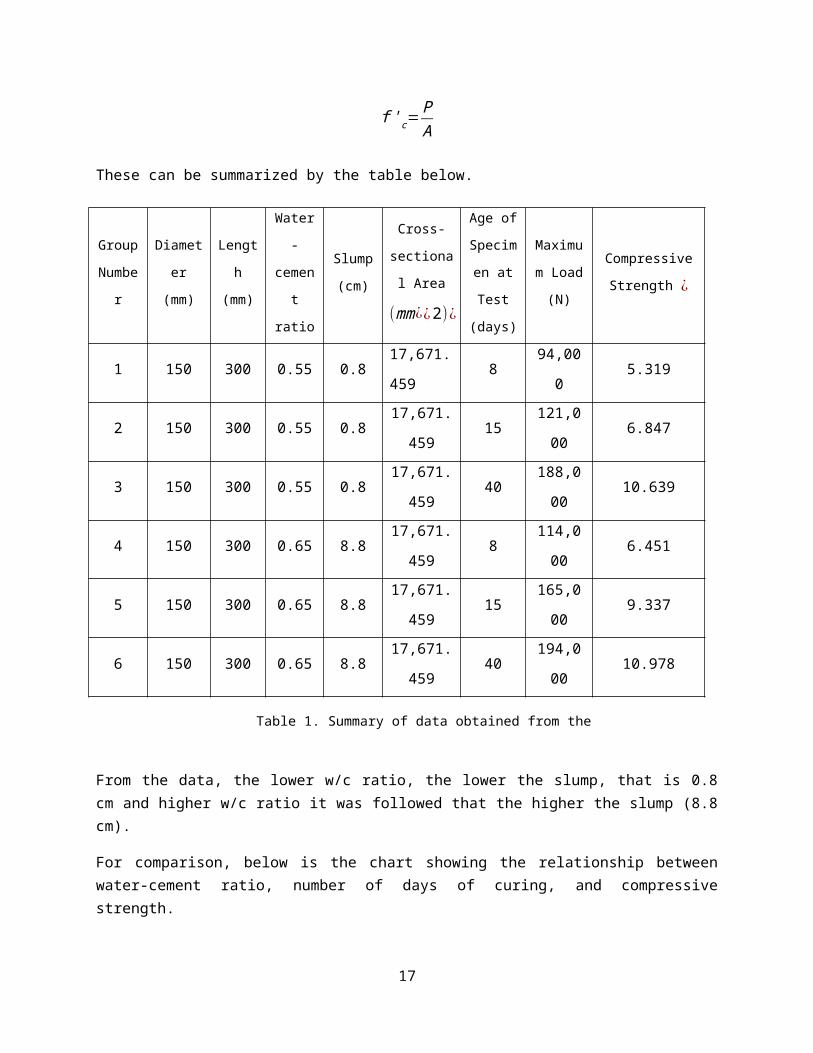
These can be summarized by the table below.
Group
Numbe
r
Diamet
er
(mm)
Lengt
h
(mm)
Water
-
cemen
t
ratio
Slump
(cm)
Cross-
sectiona
l Area
(mm¿¿2)¿
Age of
Specim
en at
Test
(days)
Maximu
m Load
(N)
Compressive
Strength ¿
1 150 300 0.55 0.817,671.
4598
94,00
05.319
2 150 300 0.55 0.817,671.
45915
121,0
006.847
3 150 300 0.55 0.817,671.
45940
188,0
0010.639
4 150 300 0.65 8.817,671.
4598
114,0
006.451
5 150 300 0.65 8.817,671.
45915
165,0
009.337
6 150 300 0.65 8.817,671.
45940
194,0
0010.978
From the data, the lower w/c ratio, the lower the slump, that is 0.8cm and higher w/c ratio it was followed that the higher the slump (8.8cm).
For comparison, below is the chart showing the relationship betweenwater-cement ratio, number of days of curing, and compressivestrength.
17
Table 1. Summary of data obtained from the activity
0 5 10 15 20 25 30 35 40 450
2
4
6
8
10
12
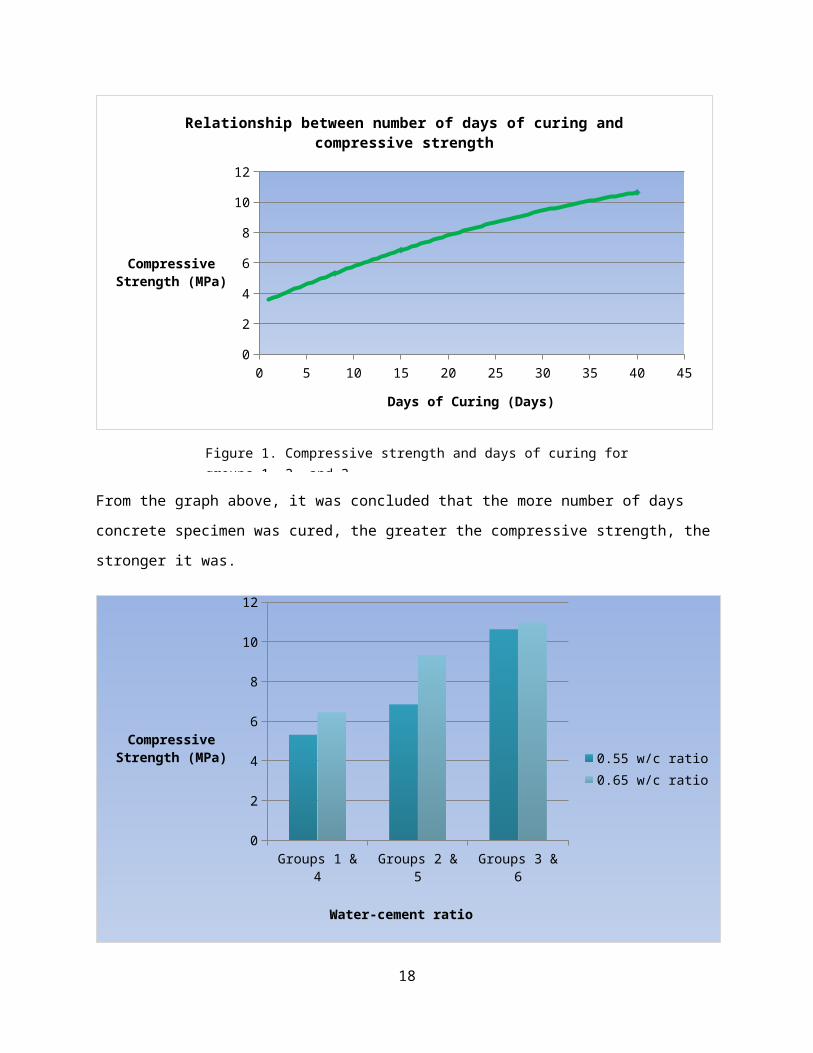
Relationship between number of days of curing and compressive strength
Days of Curing (Days)
Compressive Strength (MPa)
From the graph above, it was concluded that the more number of days
concrete specimen was cured, the greater the compressive strength, the
stronger it was.
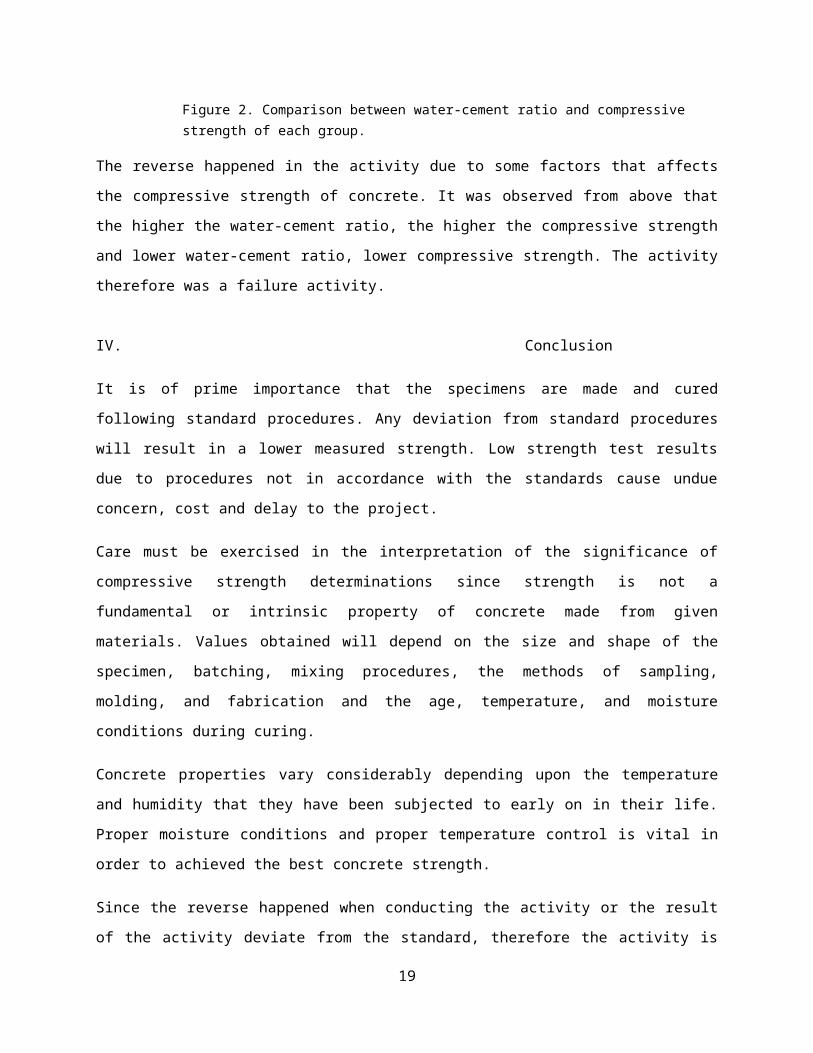
Groups 1 & 4
Groups 2 & 5
Groups 3 & 6
0
2
4
6
8
10
12
0.55 w/c ratio0.65 w/c ratio
Water-cement ratio
Compressive Strength (MPa)
18
Figure 1. Compressive strength and days of curing for groups 1, 2, and 3.
The reverse happened in the activity due to some factors that affects
the compressive strength of concrete. It was observed from above that
the higher the water-cement ratio, the higher the compressive strength
and lower water-cement ratio, lower compressive strength. The activity
therefore was a failure activity.
IV. Conclusion
It is of prime importance that the specimens are made and cured
following standard procedures. Any deviation from standard procedures
will result in a lower measured strength. Low strength test results
due to procedures not in accordance with the standards cause undue
concern, cost and delay to the project.
Care must be exercised in the interpretation of the significance of
compressive strength determinations since strength is not a
fundamental or intrinsic property of concrete made from given
materials. Values obtained will depend on the size and shape of the
specimen, batching, mixing procedures, the methods of sampling,
molding, and fabrication and the age, temperature, and moisture
conditions during curing.
Concrete properties vary considerably depending upon the temperature
and humidity that they have been subjected to early on in their life.
Proper moisture conditions and proper temperature control is vital in
order to achieved the best concrete strength.
Since the reverse happened when conducting the activity or the result
of the activity deviate from the standard, therefore the activity is
19
Figure 2. Comparison between water-cement ratio and compressive strength of each group.
not good activity. In the activity, lower water-cement ratio, the
lower the compressive strength and higher the water-cement ratio, the
higher the compressive strength. This is due to some factors that
affect the compressive strength of concrete mentioned above.
References:
How Producers can Correct Improper Test-Cylinder Curing, Ward R. Malisch, TheConcrete Producer, Nov 1997, pp 782-805.
NRMCA/ASCC Checklist for Checklist for Concrete Pre-Construction Conference, NRMCA,Silver Spring, MD
Concrete in Practice Series, NRCMA, Silver Spring, MD
www.worldofconcrete.com
www.nrmca.org
www.astm.org
20


