Embed Size (px)
Citation preview

PLEASE SCROLL DOWN FOR ARTICLE
This article was downloaded by: [Intl Food Policy Research Institute]On: 5 November 2010Access details: Access Details: [subscription number 920025251]Publisher RoutledgeInforma Ltd Registered in England and Wales Registered Number: 1072954 Registered office: Mortimer House, 37-41 Mortimer Street, London W1T 3JH, UK
Water InternationalPublication details, including instructions for authors and subscription information:http://www.informaworld.com/smpp/title~content=t792815876
Yellow River basin: living with scarcityClaudia Ringlera; Ximing Caib; Jinxia Wangc; Akhter Ahmeda; Yunpeng Xued; Zongxue Xue; EthanYangb; Zhao Jianshif; Tingju Zhua; Lei Chenge; Fu Yongfengd; Fu Xinfengd; Gu Xiaoweic; Liangzhi Youa
a International Food Policy Research Institute, Washington, DC, USA b Ven Te Chow HydrosystemsLaboratory, Department of Civil and Environmental Engineering, University of Illinois at Urbana-Champaign, Urbana, Illinois, USA c Center for Chinese Agricultural Policy, Institute of GeographicSciences and Natural Resources Research, Chinese Academy of Sciences, Beijing, China d Yellow RiverConservancy Commission, Zhengzhou, China e Beijing Normal University, Beijing, China f TsinghuaUniversity, Beijing, China
Online publication date: 05 November 2010
To cite this Article Ringler, Claudia , Cai, Ximing , Wang, Jinxia , Ahmed, Akhter , Xue, Yunpeng , Xu, Zongxue , Yang,Ethan , Jianshi, Zhao , Zhu, Tingju , Cheng, Lei , Yongfeng, Fu , Xinfeng, Fu , Xiaowei, Gu and You, Liangzhi(2010)'Yellow River basin: living with scarcity', Water International, 35: 5, 681 — 701To link to this Article: DOI: 10.1080/02508060.2010.509857URL: http://dx.doi.org/10.1080/02508060.2010.509857
Full terms and conditions of use: http://www.informaworld.com/terms-and-conditions-of-access.pdf
This article may be used for research, teaching and private study purposes. Any substantial orsystematic reproduction, re-distribution, re-selling, loan or sub-licensing, systematic supply ordistribution in any form to anyone is expressly forbidden.
The publisher does not give any warranty express or implied or make any representation that the contentswill be complete or accurate or up to date. The accuracy of any instructions, formulae and drug dosesshould be independently verified with primary sources. The publisher shall not be liable for any loss,actions, claims, proceedings, demand or costs or damages whatsoever or howsoever caused arising directlyor indirectly in connection with or arising out of the use of this material.

Water InternationalVol. 35, No. 5, September 2010, 681–701
Yellow River basin: living with scarcity
Claudia Ringlera*, Ximing Caib, Jinxia Wangc, Akhter Ahmeda, Yunpeng Xued,Zongxue Xue, Ethan Yangb, Zhao Jianshif, Tingju Zhua, Lei Chenge , Fu Yongfengd ,Fu Xinfengd , Gu Xiaoweic and Liangzhi Youa
aInternational Food Policy Research Institute, Washington DC, USA; bVen Te Chow HydrosystemsLaboratory, Department of Civil and Environmental Engineering, University of Illinois at Urbana-Champaign, Urbana, Illinois, USA; cCenter for Chinese Agricultural Policy, Institute of GeographicSciences and Natural Resources Research, Chinese Academy of Sciences, Beijing, China; dYellowRiver Conservancy Commission, Zhengzhou, China; eBeijing Normal University, Beijing, China;fTsinghua University, Beijing, China
The Yellow River basin is a key food production centre of global importance fac-ing rapidly growing water scarcity. Water availability for agriculture in the basin isthreatened by rapid growth in the demand for industrial and urban water, the needto flush sediment from the river’s lower reaches, environmental demands and grow-ing water pollution. Climate change is already evident in the basin with long-termdeclines in river runoff, higher temperatures, and increasing frequency and intensityof drought. The Chinese government has exhausted most options for improving watersupply. The challenge will be to switch to improved water demand management, whichis hampered by existing governance structures, and lack of integrated agriculture andwater resource policies.
Keywords: Yellow River basin; water scarcity; climate change; water trading
Introduction
China is facing growing water scarcity in many river basins due to its rapid economicdevelopment, an expanding population, growing urbanization and limited scope to developnew supplies. Water overdrafts, both from surface and sub-surface sources, are causingserious environmental problems ranging from the degradation of ecosystems in the deltasof major rivers to aquifer depletion in northern China. The Yellow River basin (YRB)is symptomatic of the challenges facing China’s water economy. The YRB, which is thesecond largest basin in China, is a key agricultural and industrial region in the country andalso considered the “cradle of Chinese civilization”. However, the basin faces severe watershortages. The particular climatological and hydrologic conditions together with very rapidindustrial and urban development are making sustainable water supply for all users and usesa complex and difficult task. Given the extreme water shortages in the basin, how can waterresources be managed to continue to support agricultural and economic development whilealso improving outcomes for the environment?
∗Corresponding author. Email: [email protected]
ISSN 0250-8060 print/ISSN 1941-1707 online
© 2010 International Water Resources Association
DOI: 10.1080/02508060.2010.509857
http://www.informaworld.com
Downloaded By: [Intl Food Policy Research Institute] At: 16:08 5 November 2010

682 C. Ringler et al.
In this paper we report results of a two-year study on biophysical and socioeconomicaspects of the water and related resources in the YRB; the relation of water develop-ment and agricultural and economic growth; and options for enhancing water availabilityand access for sustained agricultural and economic development, while maintainingenvironmental sustainability.
Background on the Yellow River basin
Water resources in the Yellow River basin
The Yellow River (or “Huanghe” in Chinese) is the second longest river in China. It rises inthe Bayangela Mountains in western China, dropping a total of 4500 m as it loops north intothe Gobi Desert before turning south through the Loess Plateau and then east to its mouthin the Bohai Sea (Figure 1). The river flows 5464 km and passes through nine provincesand autonomous regions, with a basin area of 795,000 km2, which includes 42,000 km2 ofinland river catchments in the northwest of the basin. Rainfall averages 450 mm and annualaverage natural runoff is 53.5 km3, which is less than runoff estimates of 58 km3 duringthe 1960s to the 1980s. Total annual water resources, including groundwater, are 64.7 km3
(YRCC 2006).The basin faces severe pressures on available water resources. With an estimated 150
million people benefiting from Yellow River water resources, both inside and outside thebasin area, per capita water availability today is already only 430 m3, less than half the1000 m3 threshold for chronic water scarcity (Falkenmark and Widstrand 1992). Other
Figure 1. Map of the Yellow River basin.
Downloaded By: [Intl Food Policy Research Institute] At: 16:08 5 November 2010

Water International 683
indicators of water scarcity include the ratio of annual water withdrawal to renewable waterresources, which exceeds 75% in the basin (Ministry of Water Resources 2001), and thehigh fraction of consumptive water use (ratio of consumption to withdrawal), estimated tobe 75%, which is far higher than the global average of 43%. This is due to the compara-tively high share of water use by agriculture, almost full use of return flow in downstreamirrigation districts through conjunctive use of canals and wells, as well as considerablenon-beneficial water losses (Rosegrant and Cai 2003, Cai and Rosegrant 2004).
In 2000, the basin produced 14% of Chinese grain harvest and 14% of the country’sGDP using only 2% of national water resources. Total agricultural area is approximately13 million ha of which 7 million ha are irrigated. To address past flooding problems andsupport agricultural and economic development, the Yellow River has been heavily engi-neered, with 15 large reservoirs that store 566 km3 with an installed hydropower capacityof 10,380 MW.
The basin is typically divided into an upstream, midstream and downstream area.The mountainous upstream area generates most of the river flow, has a relatively low popu-lation density, limited agricultural and industrial development, and concentrates most of thepoverty in the basin. The midstream area includes both the fragile Loess Plateau and semi-arid and arid agricultural areas that heavily depend on irrigation. Over the last decade, therehas been important industrial development in several of the mid-stream provinces, compet-ing with irrigation for limited water resources. The downstream area contains most of theurban-industrial development, a combination of ground- and surface-water irrigation, andfragile wetland ecosystems at the river mouth.
Key challenges for YRB water and food security
In addition to the low per capita water availability, other unique challenges of wateravailability and access in the YRB include the world’s highest sediment loads, whichrequire large flushing flows; the important role of multipurpose reservoirs for hydropowerand flood control; large flooding events, and, more recently, significant droughts; rapidincreases in water demand from industries, cities and the environment; high levels of degra-dation of water quality in the middle and downstream main channel and tributaries; largepotential impact of climate change and variability; and continued poor management ofthe water resource. These developments have led to sharp competition between upstreamand downstream users, between irrigators and industry in the midstream area and rapidlygrowing water degradation.
The Yellow River has the highest sediment concentration in the world, at 37.6 kg/m3
(Shi and Shao 2000, Xue et al. 2010). Therefore, since 2002 the YRB annually flushes sed-iments that accumulate in the lower reaches of the river through targeted reservoir releases,using an estimated 15 km3 of water resources during the rainy season. While the policywas successful at removing sediment, several irrigation intakes are now too high above thewater level in the river to access water.
Both floods and droughts damage the YRB economy. For example, from 1950 to1990, the total direct damage of floods and droughts was estimated at 116.4 billion RMB(1 RMB = US$0.146), with floods accounting for 45% of total damage (Ma 1996).
Agriculture, which is the major water user in the basin, faces increasing competitionfor water resources as a result of rapid urban and industrial development. In 50 years, theirrigated area in the YRB increased more than 350% and agricultural water use by morethan 250% (YRCC 2006). Water demand from industry and domestic use increased evenmore steeply, but from a very low base. The largest adverse impacts on the availability of
Downloaded By: [Intl Food Policy Research Institute] At: 16:08 5 November 2010

684 C. Ringler et al.
Table 1. Water Allocation Agreement of 1987 and actual withdrawals, 1998 and 2008 (km3).
2008 1998
Total Surface Ground Total Surface GroundUWFR withdrawals water Water withdrawals water water
Qinghai 1.41 1.86 1.47 0.39 1.92 1.63 0.29Sichuan 0.04 0.03 0.03 – 0.02 0.01 0.01Gansu 3.04 4.44 3.80 0.64 4.15 3.53 0.62Ningxia 4.00 7.63 7.12 0.51 9.68 9.14 0.54Inner Mongolia 5.86 9.37 6.97 2.40 9.26 7.30 1.96Shaanxi 3.8 6.27 3.22 3.05 5.51 2.42 3.09Shanxi 4.31 4.14 1.70 2.44 3.64 1.18 2.46Henan 5.54 6.63 4.20 2.43 5.77 3.34 2.43Shandong 7.00 7.99 7.07 0.92 9.77 8.46 1.32Heibei/Tianjin 2.00 0.73 0.73 n/a n/a n/a n/aTotal 37.00 49.10 36.31 12.78 49.71 37.00 12.71
Note: UWFR = Unified Water Flow Regulation (enforced since 1999).Source: YRCC (2005).
irrigation water came in 1998 from the decision by the government of China to stop theincreasing flow cutoff periods to the downstream river reaches, which had attracted interna-tional attention. Flow stoppages in the YRB were the most striking evidence of excess waterwithdrawal and consumption in the basin with increasing cutoff periods from 1972–98.In 1997, there was no discharge from the basin to the sea for 226 days, and the river driedup to Kaifeng, 600 km inland from its mouth (Cai and Rosegrant 2004, Ke and Zhou2007). Flow cutoffs were eliminated through unified water flow regulation (UWFR), whichwas implemented by the YRCC in 1999 as enforcement of the 1987 cross-provincial waterallocation agreement (Table 1). Implementation of the UWFR contributed to a decline intotal irrigation water use in the mid- and downstream areas by 4.8 km3 from 1988–92to 2002–2004 (Chen 2002, YRCC 1998–2006), while urban-industrial uses continued togrow (Table 2). The enforcement of the UWFR has not led to any compensation of irriga-tion water users. Moreover, declines in surface-water use for irrigation directly contributedto increased groundwater withdrawals, particularly in the downstream areas. Despite themaintenance of year-round flows since 1999, flows remain insufficient to prevent seawaterintrusion and wetland recession.
Water quality problems have grown in the YRB, both as a result of the reduced capac-ity of the river to dilute waste and growing domestic, industrial and agricultural effluents.Their combined effect has reduced the Yellow River’s service functions for decades tocome. According to Li et al. (2003), in 1998 water pollution cost the YRB a total of 14.97billion RMB or 2.6% of its GDP. In early 2010, the government of China, for the first time,released national-level estimates of pollution that also included agriculture. According tothe study, agriculture is responsible for 43.7% of the nation’s chemical oxygen demand (themain measure of organic compounds in water), 67% of phosphorus and 57% of nitrogendischarges (The Guardian, 9 February 2010). This is not surprising as the country con-sumes more than 30% of the world’s nitrogen fertilizer, which is applied to only 7% ofthe world’s land area. While no basin-level figures are available, the data are likely repre-sentative for water quality in the YRB. This first official recognition by the government ofserious agricultural pollution will likely support a review and revision of the incentives andsubsidies provided for agricultural inputs, particularly fertilizer.
Downloaded By: [Intl Food Policy Research Institute] At: 16:08 5 November 2010

Water International 685
Table 2. Irrigation water use, YRB, 1988–92 and 2002–2004 (km3).
Years Reach Total Agricultural Industrial Domestic
1988–92a Upper 13.11 12.38 0.51 0.22Middle 5.44 4.77 0.38 0.28Lower 12.18 11.24 0.55 0.38Basin 30.72 28.39 1.45 0.89
2002–2004b Upper 17.54 15.71 1.42 0.41Middle 5.71 4.16 0.97 0.58Lower 8.44 7.04 0.82 0.58Basin 31.69 26.91 3.21 1.57
Difference Upper 34% 27% 179% 84%Middle 5% −13% 155% 108%Lower −31% −37% 49% 54%Basin 3% −5% 121% 77%
Sources: aChen (2002); bYRCC (2002–2004), as used in Cai (2006).
To investigate the impact of climate change on future stream flows in the Yellow River,we applied the predictions of the HadCM3 global circulation model using the SRES B2scenario.1 We applied the statistical downscaling model to the Yellow River’s headwatercatchment areas using the SWAT-BNU (Soil and Water Assessment Tool developed atBeijing National university) model. According to the downscaled values, maximum airtemperatures are predicted to increase by 1.3◦C by the 2020s, 2.6◦C by the 2050s, andup to 3.9◦C by the 2080s in the basin; minimum temperatures are expected to increaseby 0.9◦C, 1.5◦C and 2.3◦C, for the same periods. Annual precipitation volumes under thisscenario would be 3.5% higher in the 2020s, 6.4% higher in the 2050s, and 8.7% higher inthe 2080s. The combined impact from higher temperatures and slightly higher precipita-tion levels on Yellow streamflows would be declines of 88 m3/s, 117 m3/s and 152 m3/s,for the three periods, respectively. Thus, even the relatively moderate and precipitation-abundant HadCM3 SRES B2 scenario would severely affect future regional water supplyand water security in the basin, putting further pressure on food security in the country(Xu et al. 2009).
When linking the SWAT-BNU model results with the water simulation model of theYRCC river basin authority, we find that under climate change the annual water budgetdeficit would rise to 4.2 km3. The situation would be even worse in dry years: in one out offour years the water shortage would reach 15.1 km3 and in one out of 20 years, the shortagewould reach 21.0 km3 resulting in basin water deficit ratios of 28% and 37%, respectively.
Food and water in the Yellow River basin
Most of the irrigation water in the YRB, and in China in general, is used for the produc-tion of basic staple crops. In 2005, production of irrigated cereals accounted for 85% oftotal national production, on 82% of the harvested area for cereals, up from 74% of totalproduction on 70% of area in 1995. In comparison, worldwide, irrigated cereal productionaccounted for 52% of total production on only 38% of the global area harvested for cereals.The YRB accounted for 14% of irrigated harvested cereal area and production in China.While agricultural area in China is expected to continue to contract and irrigated area tobarely increase over the next decades, the national share of irrigated area of the YRB isexpected to increase up to 18% due to more rapid declines in irrigated rice area in otherChinese river basins (International Food Policy Research Institute [IFPRI] 2009).
Downloaded By: [Intl Food Policy Research Institute] At: 16:08 5 November 2010

686 C. Ringler et al.
Total demand for cereals in China in 1995 was estimated at 375 million metric tons:69% for direct human consumption, and most of the reminder for animal feed. Ten yearslater, demand had increased to 400 million metric tons and is projected to further increaseto 492 million metric tons by 2050. By then, only 44% will be destined for direct humanconsumption, given the large increase in the use of maize for animal feed (IFPRI 2009).In 2005, China already accounted for a quarter of the world’s total livestock production(FAOSTAT 2010).
In 2007 China was the third largest bioethanol producer in the world after the UnitedStates and Brazil with an annual production of 1.35 million tons. As a result of grow-ing concerns for food security at the national level, the government has since prohibitedbioethanol production using maize and wheat as feedstocks, except for four plants thatwere allowed to maintain their output but not expand (Qiu et al. 2010).
Concerns about food security have been at the heart of much of the policy on agri-cultural development in China for decades. China’s medium- to long-term policy for grainsecurity 2009–20 sets a target of 95% self-sufficiency in grain production, slightly less thanthe 98% for the preceding period. To achieve these levels of production, the governmentfocuses chiefly on investments in science and technology, combined with direct supportto farmers. Key farm support measures include the abolition of the agricultural land taxin 2006 and continued support and subsidies for crop inputs, particularly fertilizers, fueland water, many of which have been gradually decoupled and converted to direct transferpayments to farmers.
Similar to other parts of Asia, overall farm support measures have been growing as aresult of the food price crisis, which peaked in 2007/08. By 2008, Chinese farmers receivedUS$34.4 per acre, comparable to the per-acre level of subsidy (but not per-household sup-port) in the United States (Huang and Rozelle 2009, Rosegrant et al. 2009a, Huang et al.2010). Despite the government’s strong efforts to achieve close to food self-sufficiency inkey crops, it is likely that net food imports will increase from approximately 18 Mt to 50 Mtby 2050 given the growing land and water shortages (IFPRI 2009, Rosegrant et al. 2009a).
The government’s goals and supporting policies on food self-sufficiency have had directnegative impacts on water availability and use in the YRB. For example, the abolition ofthe agricultural land tax, which traditionally was collected together with service fees forirrigation water, has increased the relative cost and difficulty of collecting the latter becausethe collection costs are now spread over a smaller fee base. Moreover, rates of collectionhave fallen because some farmers believe that following the demise of the land tax, theyshould also not have to pay irrigation service charges. Another example is the governmentsupport for nitrogen fertilizer, which has contributed to their over-use, resulting in heavynon-point source pollution in the YRB and elsewhere in China.
At the same time, policies in the water sector have harmed agriculture, such asthe silt-flushing policy and flow-cutoff implementation discussed above. Various policiesimplemented to conserve irrigation water have had other adverse effects, such as reducedmaintenance of the irrigation systems and reduced salaries of irrigation system managers,who are paid according to volume of water delivered, measured at the off-take level, andnot volume of water conserved.
Water legislation and administration
Water legislation
In 2002, the government of China passed a new water law. Key elements include the empha-sis on river basin management; a strong focus on water savings and improved water-use
Downloaded By: [Intl Food Policy Research Institute] At: 16:08 5 November 2010

Water International 687
efficiency; the implementation of water-use quotas, permits and fees for large withdrawals;and the recognition of water for ecological uses as equal in importance to water used forindustry and agriculture. Given the limited water resources of the country, the govern-ment has also widened and deepened legislation on water pricing over the last ten years(Ministry of Water Resources 2003, 2005, Wang 2007, Fu et al. 2008). Several regula-tions released since 2004 support a water rights system as well as water rights transfers,particularly for the YRB. These include the Guidance on water rights transfer demonstra-tion works in Inner Mongolia and Ningxia, the Management and implementation measureson water rights transfer in the Yellow River basin, and Management regulation on water-saving engineering. These regulations have provided the legal foundation for water righttransfers in the YRB.
However, regulations to implement the national laws and national-level regulations inmany cases are still lacking at the provincial level. The slow pace of promulgation of imple-menting regulations at the provincial level is likely due to provincial officials not seeing thelegislation as a priority; a sheer lack of capacity and understanding by provincial officials,and a lack of financial resources to support implementation at lower administrative levelsin the provinces (Wang and Zhang 2009).
Water administration in the YRB
In China, water resources are administered through a nested hierarchical administrativesystem (Wang et al. 2007). The Ministry of Water Resources (MWR) is at the highest cen-tral level directly under the State Council, with Water Resource Bureaus at the provincial,prefecture and county levels, and water management stations in townships at the lowestlevel of administration. Water Resource Bureaus at the provincial, prefecture and countylevels are controlled jointly by the respective government at the same level and the MWR.Irrigation districts administer water resources that span lower-level administrative bound-aries. This system of water administration is supplemented by seven river commissions,including the YRCC, which are administered by the MWR. However, many other agencieshave retained direct or indirect responsibilities for water management such as bureaus oragencies of construction, land resources, environmental protection, energy resources, mete-orology and finance, key among which are the State Environmental Protection Agency andthe Ministry of Energy Resources.
In this environment, local governments tend to focus on maximizing local revenues andeconomic growth subject to given requirements for grain self-sufficiency, rather than focus-ing on conserving scarce water resources. Thus, water administration and managementgenerally see their priorities to achieve these local goals. The often contradictory objectivesof the various water, agriculture and energy agencies continue to hamper integrated waterresources management in China and the YRB. For example, while the YRCC is authorizedby the State Council of China to control Yellow River water resources, some provinces havecontinued to withdraw water in excess of agreed-upon quotas without penalties. The recentYellow River Water Regulation Act (2006) allows for punishment of those provinces thatexceed their water quota, but provides no implementation mechanisms. Furthermore, theYRCC has focused on integrated surface water management on the mainstream, while mosttributaries and groundwater remain without integrated management. Since 2006, YRCChas assumed some control over two key tributaries, the Weihe and Qinhe.
A cross-provincial water allocation agreement was developed in 1987 and has beenenforced by YRCC since 1999 to counteract the downstream flow cutoffs in the basin asdiscussed earlier (see Table 1). The Agreement distributes a total of 37 km3 across the
Downloaded By: [Intl Food Policy Research Institute] At: 16:08 5 November 2010
688 C. Ringler et al.
riparian provinces, including 2 km3 to downstream urban-industrial centres outside thebasin area.
What is the role of water development in the YRB for poverty reductionand agricultural and economic development?
To assess the role of water development for poverty alleviation and agricultural develop-ment in the YRB, we used income data from the 2001 household income and expendituresurvey conducted by the National Bureau of Statistics of China. No later data were avail-able. Because we used the international purchasing power parity (PPP) exchange rate with2005 as the base year, we adjusted per capita income data from the 2001 survey for infla-tion using the consumer price index for China, with the base year 2005 = 100. The dataset used for the analyses represents the rural communities and households in the YRB andincluded 5085 households in nine basin provinces (Ahmed et al. 2009).
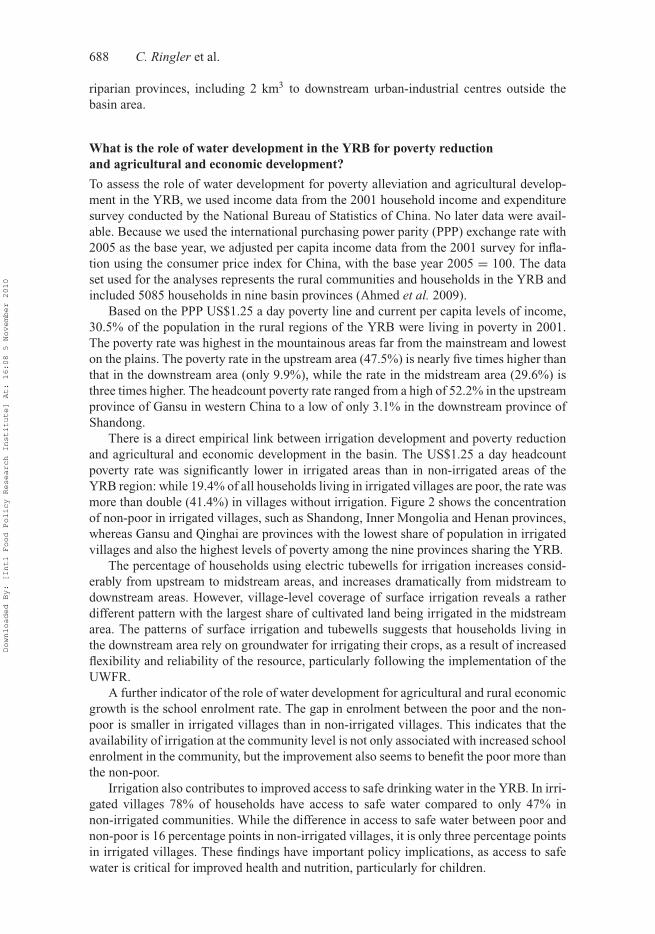
Based on the PPP US$1.25 a day poverty line and current per capita levels of income,30.5% of the population in the rural regions of the YRB were living in poverty in 2001.The poverty rate was highest in the mountainous areas far from the mainstream and loweston the plains. The poverty rate in the upstream area (47.5%) is nearly five times higher thanthat in the downstream area (only 9.9%), while the rate in the midstream area (29.6%) isthree times higher. The headcount poverty rate ranged from a high of 52.2% in the upstreamprovince of Gansu in western China to a low of only 3.1% in the downstream province ofShandong.
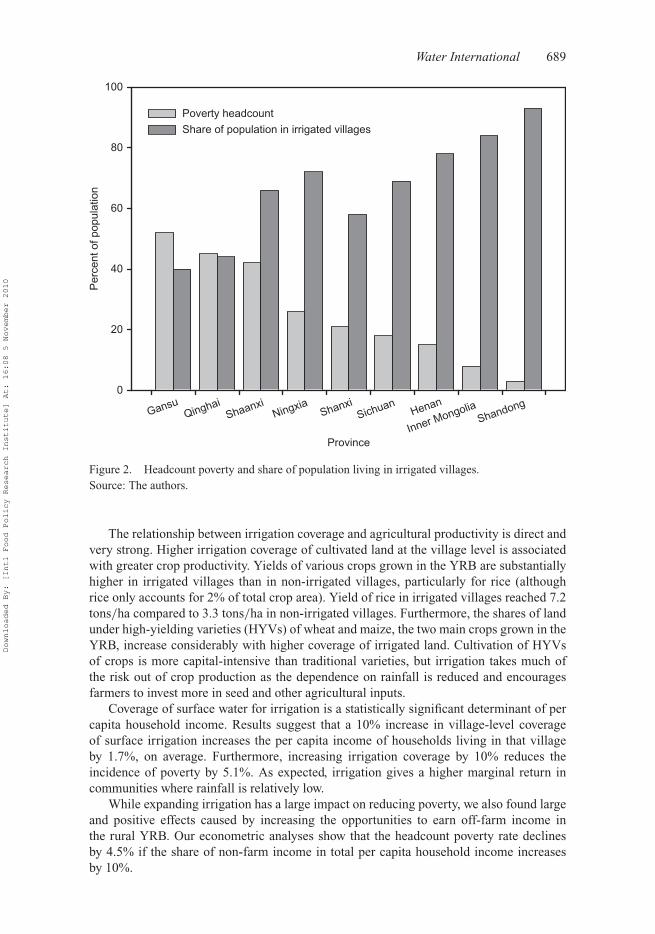
There is a direct empirical link between irrigation development and poverty reductionand agricultural and economic development in the basin. The US$1.25 a day headcountpoverty rate was significantly lower in irrigated areas than in non-irrigated areas of theYRB region: while 19.4% of all households living in irrigated villages are poor, the rate wasmore than double (41.4%) in villages without irrigation. Figure 2 shows the concentrationof non-poor in irrigated villages, such as Shandong, Inner Mongolia and Henan provinces,whereas Gansu and Qinghai are provinces with the lowest share of population in irrigatedvillages and also the highest levels of poverty among the nine provinces sharing the YRB.
The percentage of households using electric tubewells for irrigation increases consid-erably from upstream to midstream areas, and increases dramatically from midstream todownstream areas. However, village-level coverage of surface irrigation reveals a ratherdifferent pattern with the largest share of cultivated land being irrigated in the midstreamarea. The patterns of surface irrigation and tubewells suggests that households living inthe downstream area rely on groundwater for irrigating their crops, as a result of increasedflexibility and reliability of the resource, particularly following the implementation of theUWFR.
A further indicator of the role of water development for agricultural and rural economicgrowth is the school enrolment rate. The gap in enrolment between the poor and the non-poor is smaller in irrigated villages than in non-irrigated villages. This indicates that theavailability of irrigation at the community level is not only associated with increased schoolenrolment in the community, but the improvement also seems to benefit the poor more thanthe non-poor.
Irrigation also contributes to improved access to safe drinking water in the YRB. In irri-gated villages 78% of households have access to safe water compared to only 47% innon-irrigated communities. While the difference in access to safe water between poor andnon-poor is 16 percentage points in non-irrigated villages, it is only three percentage pointsin irrigated villages. These findings have important policy implications, as access to safewater is critical for improved health and nutrition, particularly for children.
Downloaded By: [Intl Food Policy Research Institute] At: 16:08 5 November 2010
Water International 689
Province
GansuQinghai
ShaanxiNingxia
Shanxi
SichuanHenan
Inner Mongolia
Shandong
Pe
rce
nt
of
po
pu
latio
n
0
20
40
60
80
100
Poverty headcount
Share of population in irrigated villages
Figure 2. Headcount poverty and share of population living in irrigated villages.Source: The authors.
The relationship between irrigation coverage and agricultural productivity is direct andvery strong. Higher irrigation coverage of cultivated land at the village level is associatedwith greater crop productivity. Yields of various crops grown in the YRB are substantiallyhigher in irrigated villages than in non-irrigated villages, particularly for rice (althoughrice only accounts for 2% of total crop area). Yield of rice in irrigated villages reached 7.2tons/ha compared to 3.3 tons/ha in non-irrigated villages. Furthermore, the shares of landunder high-yielding varieties (HYVs) of wheat and maize, the two main crops grown in theYRB, increase considerably with higher coverage of irrigated land. Cultivation of HYVsof crops is more capital-intensive than traditional varieties, but irrigation takes much ofthe risk out of crop production as the dependence on rainfall is reduced and encouragesfarmers to invest more in seed and other agricultural inputs.
Coverage of surface water for irrigation is a statistically significant determinant of percapita household income. Results suggest that a 10% increase in village-level coverageof surface irrigation increases the per capita income of households living in that villageby 1.7%, on average. Furthermore, increasing irrigation coverage by 10% reduces theincidence of poverty by 5.1%. As expected, irrigation gives a higher marginal return incommunities where rainfall is relatively low.
While expanding irrigation has a large impact on reducing poverty, we also found largeand positive effects caused by increasing the opportunities to earn off-farm income inthe rural YRB. Our econometric analyses show that the headcount poverty rate declinesby 4.5% if the share of non-farm income in total per capita household income increasesby 10%.
Downloaded By: [Intl Food Policy Research Institute] At: 16:08 5 November 2010

690 C. Ringler et al.
Addressing water scarcity in the YRB: options and investment needs
Improved water use efficiency, particularly in irrigated agriculture, but also for domesticand industrial uses, is key to meeting future growth in the demand for water for sustainedagricultural and economic development. Water-use efficiency can be increased throughengineering, agronomic, institutional and economic measures. More recently, economicand institutional means have become more important. When implemented appropriately,economic incentives for water management (prices, taxes, subsidies, quotas and use orownership rights) can affect the decisions made by water users and motivate them to con-serve and use water more efficiently. Efficiency pricing works well in the domestic andindustrial sectors, but it is much more challenging for irrigation as price increases areoften punitive to farmers because water is a large input to generally low-value produc-tion. This is particularly so in China where much of the irrigated area produces basicgrains.
In the past, increasing the supply of water through new water development has beena common strategy to address water shortages. However, in maturing water economies,which are characterized both by increasing scarcity of water (Randall 1981), and byincreasing transfers of water both in scale and amount, managing the demand for waterbecomes more important. The task of demand management is to generate both physicalsavings of water and economic savings by increasing the output per unit of evaporative lossof water, by reducing water pollution, and reducing non-beneficial water uses. This can besupported through a variety of policy measures, including economic incentives to conservewater, for example, through pricing reform and reduced subsidies. Other demand-side mea-sures include regulations on the rights to use water, education campaigns, leak detection,retrofitting, recycling and other technical improvements, enhanced pollution monitoring,and quota and licence systems. While many measures of demand management have tar-geted irrigation as the largest water user, municipal and industrial water use cannot beallowed to grow unchecked. Regulation and economic incentives are needed to reducethe negative ecological, economic, and social impacts of these uses, especially on waterquality.
Given the size of the YRB, no single intervention could possibly do justice to theextreme diversity of water-related challenges found in the basin, which ranges from theupstream mountainous areas dominated by livestock herders, to the hilly/mountainousLoess Plateau with severe erosion challenges, the semi-arid to arid irrigated plains in InnerMongolia/Ningxia with rapidly growing industries, to the key urban-industrial centresinterspersed with highly productive irrigation downstream.
Many interventions have been implemented in the past to increase water supply andenhance flood control. Key among these are the construction of the Xiaolangdi reservoir,completed in 1999, which has increased the designed flood-control period from 60 yearsto over 1000 years (Cai and Rosegrant 2004); the construction of several thousand silt-trap dams across the Loess Plateau (Brismar 1999); and two large watershed rehabilitationprojects implemented by the government of China and the World Bank (World Bank 2003,2007).
Additional interventions in recent years to address growing water shortages and theneed for food include the conversion of hillside production into terraces (this was also doneas part of the watershed rehabilitation project); rainwater harvesting schemes in the westernupland areas; the use of plastic sheeting to contain soil moisture and reduce evaporationin the arid parts of Inner Mongolia and Ningxia; and the resettlement of people out ofextremely dry areas.
Downloaded By: [Intl Food Policy Research Institute] At: 16:08 5 November 2010

Water International 691
Technical solutions: role of engineering measures and enhanced water productivity
The south-to-north water transfer (SNWT) project, if fully implemented, would be thelargest engineering feat to date to address water challenges in northern China and the YRB.The SNWT was planned in the 1950s and officially launched in 2002. Once completed, itcould transfer up to 50 km3 (comparable to total Yellow River runoff) a distance of morethan 1000 km, from the Yangtze River in southern China, to the North China Plain. A west-ern, middle and eastern route have been planned and work is progressing on the technicallyand economically more feasible middle and eastern routes.
The general objective of the project is to sustain economic growth in northern China(Yang and Zehnder 2005, Pietz and Giordano 2009). The objective of the middle and east-ern routes is to provide water for water-short regions in the Haihe and Huaihe River basins,particularly Beijing, Tianjin, Hebei, Henan and Shandong, with limited impact or benefitfor the YRB. Due to the high (and increasing) construction cost, the price of water deliveredthrough the SNWT could easily surpass the estimated “affordable” price of US$0.70/m3.The western route, on the other hand, could transfer 20 km3 to irrigate an additional 1.3million ha and provide water for economic development in Qinghai, Gansu, Shanxi andShanxi provinces, as well as Ningxia and Inner Mongolia, all in the YRB. However, eco-nomic, engineering and ecological side effects prevent this route from development in theforeseeable future.
Even without the SNWT, engineers at YRCC still see some potential for water savingsin the basin, amounting to 5.7 km3 by 2020 and 7.6 km3 by 2030, mostly in the agriculturesector. According to their calculations, water savings in agriculture of 4.0 km3 by 2020and 5.4 km3 by 2030 can be achieved through adjustments in planting dates and cropspecies, crop yield improvements and lining of canals. These calculations take into accountcontinued agricultural and economic growth and allow for small increases in irrigated area.Furthermore, the industrial sector is expected to reduce its water use by 1.5 km3 by 2020and by 2.1 km3 by 2030 through increased water reuse and recycling. In the domesticsector, potential water savings have been estimated at 0.12 km3 by 2020 and 0.17 km3 by2030 for the YRB, chiefly through increased leak detection and other efficiency-enhancingprogrammes and disconnection of illegal users.
As the simulations for climate change presented earlier show, these savings will notbe sufficient to turn around trends of growing water deficits in the basin, particularlyin dry years. Thus, even more investment in agricultural research and development willbe needed to achieve even more rapid improvements in crop yields without use of moreirrigation water; this is the current focus of the Chinese government as we discussedabove.
To assess water productivity (WP) further across the YRB for key rainfed (WPR)and irrigated (WPI) crops, we used data from 60 counties from the upstream, midstreamand downstream basin areas (including downstream areas irrigated outside the hydrologicboundaries), and extrapolated the results to the entire basin. We then assessed the spatialvariability of water productivity as well as associated water and energy factors with regardto climate, land cover and agricultural practices (Cai et al. 2010).
All crops of rice and wheat receive some form of irrigation in the YRB.2 Wheat growsduring the winter–spring season, during which precipitation is less than 30% of the cropwater requirement. In contrast, about 11% of maize and 17% of soybean area are rainfed.Table 3 presents average values of irrigated and rainfed area and yield by basin area. Whileirrigated maize yields are, on average, 77% higher than rainfed yields, basin-wide averagesoybean yields are similar for both rainfed and irrigated areas.
Downloaded By: [Intl Food Policy Research Institute] At: 16:08 5 November 2010

692 C. Ringler et al.
Table 3. Irrigated and rainfed area and yield of key crops by sub-basin in the YRB.
Crops Basinwide Midstream Downstream
Irrigated area (000 ha) Rice 25.3 13.0 12.3Maize 540.2 254.3 284.9Wheat 1141.0 536.4 597.7Soybean 149.6 80.6 69.0
Rainfed area (000 ha) Rice 0.0 0.0 0.0Maize 68.8 30.3 37.9Wheat 0.0 0.0 0.0Soybean 30.1 14.3 15.8
Irrigated yields (ton/ha) Rice 5.4 5.5 5.3Maize 5.3 5.0 5.7Wheat 3.7 2.8 4.4Soybean 1.4 1.2 1.7
Rainfed yields (ton/ha) Rice n/a n/a n/aMaize 3.0 1.9 4.0Wheat n/a n/a n/aSoybean 1.4 1.0 1.9
Source: Authors.
Table 4. Area-weighted WPI and WPR for different regions in YRB.
WPI (kg/m3) WPR (kg/m3)
Region/Crops Rice Maize Wheat Soybean Rice Maize Wheat Soybean
Basin-wide average 0.50 0.97 1.39 0.26 – 1.09 – 0.41Standard deviation 0.25 0.32 0.51 0.13 – 0.36 – 0.16Midstream 0.49 0.94 1.16 0.26 – 0.68 – 0.28Standard deviation 0.22 0.33 0.49 0.13 – 0.35 – 0.15Downstream 0.51 0.99 1.57 0.27 – 1.41 – 0.52Standard deviation 0.26 0.30 0.34 0.12 – 0.33 – 0.12
Source: Authors.
Using the cropped area as a weighting factor, we interpolated irrigated and rainfedwater productivity to the entire YRB. Table 4 presents the results for upstream, midstreamand downstream areas. Results fit the range of values previously published by Zwart andBastiaanssen (2004), who reported water productivity values of 0.6–1.6 kg/m3 for rice,1.1–2.7 kg/m3 for maize, and 0.6–1.7 kg/m3 for wheat. While values of water productivityfor rainfed and irrigated crops are quite different in the midstream basin, they are similarlyhigh in the downstream area.
It is interesting to note that WPR for maize and soybean is slightly higher than WPI inthe downstream area and also for soybean in the midstream basin. This implies that in partsof the basin, irrigated maize and soybean may not be as water-efficient as rainfed crops.This is likely a result of inefficient water use (i.e. the divisor in the equation is higher thanit should be). The standard deviation of the WPR data is higher than that of the WPI data.Thus, irrigation stabilizes crop yield and production, which is important under increasingclimate variability and climate change.
While there is still scope for increased water-use efficiency in irrigated agriculture inthe YRB (National Bureau of Statistics of China 2003, Yang et al. 2003), the scope is lim-ited and further declines in allocation of water to irrigation will eventually result in reduced
Downloaded By: [Intl Food Policy Research Institute] At: 16:08 5 November 2010

Water International 693
Figure 3. Irrigation requirement in the Yellow River basin.Source: The authors.
food production with serious implications for local food security and farmer incomes, aswell as potential impacts on global food prices and trade.
Figure 3 is a map of annual requirements for irrigation water for the YRB, computed asreference evapotranspiration minus precipitation, summed over the crop season. The spa-tial pattern of irrigation water requirements mirrors the location of irrigated areas in thebasin. The highest requirement for irrigation water in the northwestern part of the mid-stream basin is close to one metre. The map clearly demonstrates that irrigation is and willcontinue to remain a major factor for agricultural production if the goals of food productionare to be achieved.
Institutional solutions: irrigation management reform
Despite high levels of water scarcity in the country and in the YRB, integrated watermanagement in China remains elusive as a result of fragmented management and con-flicts among water users at the national, provincial and local levels. Key challenges inChinese water legislation and administration relate to the lack of regulations supportingimplementation of the 2002 water law, and poor incentives for water conservation at thelevel of the irrigation system. To address growing water scarcity, in addition to watersupply/engineering measures, the government has started to support reform of irrigationmanagement.
At the level of the irrigation system, reform since the early 1990s has successivelyestablished water-user associations (WUAs) and contractors (hired technical experts) in
Downloaded By: [Intl Food Policy Research Institute] At: 16:08 5 November 2010

694 C. Ringler et al.
place of collective management (water allocation through village leadership) to enhanceirrigation management. A survey of irrigation districts in Ningxia and Henan provincesin 2001 and 2005 showed that by 2004, 30% of villages managed their water under con-tract and 21% through WUAs. However, 85% of WUAs still used the village leadership asgoverning board, at least in their initial set-up.
The key difference for water conservation outcomes was not the type of administra-tion but the type of incentives. Our econometric analysis showed that regardless of thewater management institution, managers who faced positive incentives – typically receiv-ing direct compensation for reducing water applications below estimated targets – wereable to reduce water use per hectare of wheat by nearly 1,000 m3, or 20%, in the sam-pled irrigation districts, but wheat yields also declined by approximately 4%. Resultswere statistically inconclusive for maize and rice. While changes in institutions and incen-tives have successfully reduced water applications in the YRB, the sustainability of thesemeasures remains doubtful. This is because the savings provide limited benefits to localgovernments and farmers when the water is transferred to other provinces without com-pensation. One way to address compensation is through a system of transfer of water rightsas discussed below (Wang and Zhang 2009).
Economic solutions: role of water pricing and water markets
Water pricing
China has gradually moved toward efficiency-oriented policies of water pricing as a methodto help rationalize water allocation and alleviate water scarcity for both the urban and irri-gation sectors. Generally, water pricing is instituted to (1) create incentives for efficientwater use; (2) recover costs of water service provision; and (3) ensure financial sustain-ability for water supply systems and irrigation, including the ability to raise capital forexpansion of services to meet future demand. In water-scarce economies, such as the YRB,the efficient allocation of water across sectors is also an important consideration.
Although water prices have been steadily raised over the past several decades in China,and particularly since the latest round of water-pricing reforms started in 1997, agricul-tural water is still thought to be much under-priced. As a result, water charges remain alimited instrument to increase water use efficiency and productivity further (Wang andZhang 2009). Moreover, given the growing rural–urban income divide, it is unlikely thatthe government will raise irrigation fees to levels high enough to reduce irrigation wateruse seriously (Rosegrant and Cai 2003). Furthermore, in the YRB, the UWFR has led toincome shortfalls of districts in parts of the basin where irrigation water supplies were cutconsiderably, particularly in midstream provinces. To make up for water shortfalls, theseprovinces were allowed to increase irrigation service fees. For example, Ningxia doubledthe price of the service charge for irrigation to 0.012 RMB/m3 (US$0.002/m3) in 2000(Wang et al. 2003). Downstream provinces, on the other hand, have generally maintainedlower and simpler area-based fee structures.
Water rights, markets and transfers
Clearly defined and legally enforceable water rights and responsibilities for water operatorsand users in an irrigation system are the foundation underlying the incentives for conserv-ing water and improving irrigation efficiency (Bruns and Meinzen-Dick 2000, Yang et al.2003). The establishment of systems of water-use rights could empower water users in allsectors, as it establishes both rights and responsibilities to specified water use. If water is
Downloaded By: [Intl Food Policy Research Institute] At: 16:08 5 November 2010

Water International 695
allocated to other sectors, typically urban and industrial, irrigators and other users wouldneed to be compensated. Moreover, establishing water rights can serve as an incentive toinvest in productive water uses, as they convey security to use water for a prolonged period.Furthermore, water-use rights provide incentives for all sectors to invest in water-savingtechnologies, as water outside of the existing water use right would have to be bought andpaid for (Rosegrant and Binswanger 1994, Rosegrant et al. 2009b).
China does not currently have formal water markets that are supported by transparent anduniversal water property rights. There are, however, non-market mechanisms for assigningwater-use rights and allocating water in China. Usufructuary rights to water use have evolvedeither explicitly through laws and regulations or implicitly through conventions (Ma et al.2007). These rights are generally assigned based on one of three systems: first-come first-served allocation (prior appropriation rights); allocation based on proximity to water bodies(“riparian” rights); and public allocation (Heaney et al. 2006). Moreover, as discussed above,the government of China has released several regulations supporting water trading.
Since 2000, YRCC has promoted the establishment of water-right systems by con-ducting demonstration projects aimed at reducing water competition among sectors.The purpose of these demonstration sites is to reallocate water from agriculture to industrythrough increasing irrigation efficiency, generally through engineering measures, such ascanal lining (Wang et al. 2006, Chen et al. 2007, Li 2007, Liu et al. 2007, Wang 2007).One transfer pilot project operates in Ningxia Province and 16 projects signed transfer con-tracts in Inner Mongolia, with a value of US$100 million. Under these projects, irrigationdistricts transfer part of their water use rights to industrial enterprises for a period of 25years. However, analyses showed that water users in the irrigation districts are generally notaware of the water rights transfer; transfers are determined by the administration, not mar-kets, and there are no adjustments based on market signals or economic measures. Thus,major challenges remain until a true market for water rights can be established.
The intra-provincial irrigation-to-agriculture transfers in the YRB provide importantinputs for the potential development of inter-provincial water trading, which has been dis-cussed by both policy makers and water allocation managers at the MWR and YRCC forseveral years. Such a reallocation could increase the water allocation efficiency of the 1987cross-provincial water allocation agreement. Upstream provinces have a strong interest inmaintaining the status quo in water allocation, however, and thus avoid the political costsof changing the current allocation. Moreover, given the large share of return flows in theYRB, changes in provincial permits from upstream to downstream might be inconsequen-tial. It is therefore important to assess the full costs and benefits of changing the currentsystem of water quotas.
Heaney et al. (2006) assess the benefits of water reallocation across YRB waterresource regions using a production-function approach without accounting for the riverhydrology (flow routing or return flows). They estimate economic benefits throughincreased value of agricultural production at 1 billion RMB per year, with reallocationchiefly occurring from the midstream to the downstream area. The authors caution, how-ever, that for the benefits to be reaped, in addition to administrative challenges, newagricultural areas and labour would need to be made available downstream.
The most successful administrative water transfer to date in the YRB was the enforce-ment of the UWFR that ensured that flow to the Yellow River mouth was not cut off after1999. This policy was in line with the refocus, over the last decade, on sustainable water useand keeping the Yellow River “healthy” promoted by the government of China. However,as we pointed out above, no compensation was paid to those provinces and water users thathad to give up water as a result of the enforcement of the 1987 agreement.
Downloaded By: [Intl Food Policy Research Institute] At: 16:08 5 November 2010

696 C. Ringler et al.
Given the key importance of compensating irrigators for giving up water for both flowsat the river mouth and rapid urban–industrial development downstream, we analyse thepotential impact on basin GDP of water rights trading using a multi-agent system (MAS)modelling framework developed for the YRB (Yang et al. 2009). The model is populatedwith aggregated data from the YRCC water simulation model. A total of 52 water-useagents are defined, nine for the provinces sharing Yellow River flows, three to reflectdownstream ecological needs, five to represent key reservoirs, and the reminder to representkey tributaries and inflows. The model is calibrated to 2000 data. Using the MAS model, wecompared two scenarios to evaluate the consequences of changes from the current schemeof water allocation (business-as-usual of the current UWFR based on the 1987 allocationagreement): (1) water allocation across provinces without quotas; and (2) a market-basedapproach of water allocation for irrigation.
Under the UWFR, YRCC determines targets of monthly water releases for each of themajor reservoirs on the main channel, based on the current reservoir storage, the futureweather forecast, and the downstream water demand. The scenario without regulationassumes no administrative allocation mechanisms; agents are free to maximize water usesubject to available resources. Thus, upstream water users will maximize off-takes, leav-ing less water available for downstream users; similarly, reservoir agents will maximizehydropower generation. The water rights trading scenario uses the UWFR as an initialwater entitlement, based on which water can be traded among agents. To avoid adverseimpacts on the downstream ecosystem, minimum downstream flows achieved under theUWFR scenario are set as constraints.
Figure 4 compares business-as-usual with the second scenario without any alloca-tion rules for both water consumption and gross domestic product (GDP). Overall annualwater consumption under the scenario without regulation is 38.3 km3, 11% higher thanthe 34.5 km3 under the UWFR scenario. The system-wide GDP is 1123.26 billion RMBunder the scenario without regulation, 10% less than the 1246.68 billion RMB from theUWFR scenario. As expected, impacts on downstream ecosystem agents from unmanagedflows are considerable. For the most downstream ecosystem agent, flow stoppages start inFebruary and continue through December, reflecting reality from 1972 to 1998 before theUWFR was enforced (Zhao et al. 2009). On the other hand, water consumption declinesand GDP increases under the UWFR. For example, upstream GDP declines by 2.5 billionRMB annually, without compensation.
Month
Mo
nth
ly G
DP
, b
illio
n R
MB
0
20
40
60
80
100
120
140UWFR
Unmanaged
Month
Jan Feb Mar Apr May Jun Jul Aug Sep Oct Nov DecJan Feb Mar Apr May Jun Jul Aug Sep Oct Nov Dec
Mo
nth
ly w
ate
r co
nsu
mp
tio
n,
km
3
0
2
4
6
8
10UFWR
Unmanaged
(a) (b)
Figure 4. System-wide comparisons between UWFR scenario (baseline) and unmanaged scenarioin (a) monthly water consumption; (b) monthly GDP.Source: The authors.
Downloaded By: [Intl Food Policy Research Institute] At: 16:08 5 November 2010
Water International 697
Province
QinghaiSichuan
GansuNingxia
Inner Mongolia
ShanxiShaanxi
Henan
Shandong
Wa
ter
co
nsu
mp
tio
n,
km
3
0
1
2
3
4
5
6
7
8
9
UWFR
WT
Unmanaged
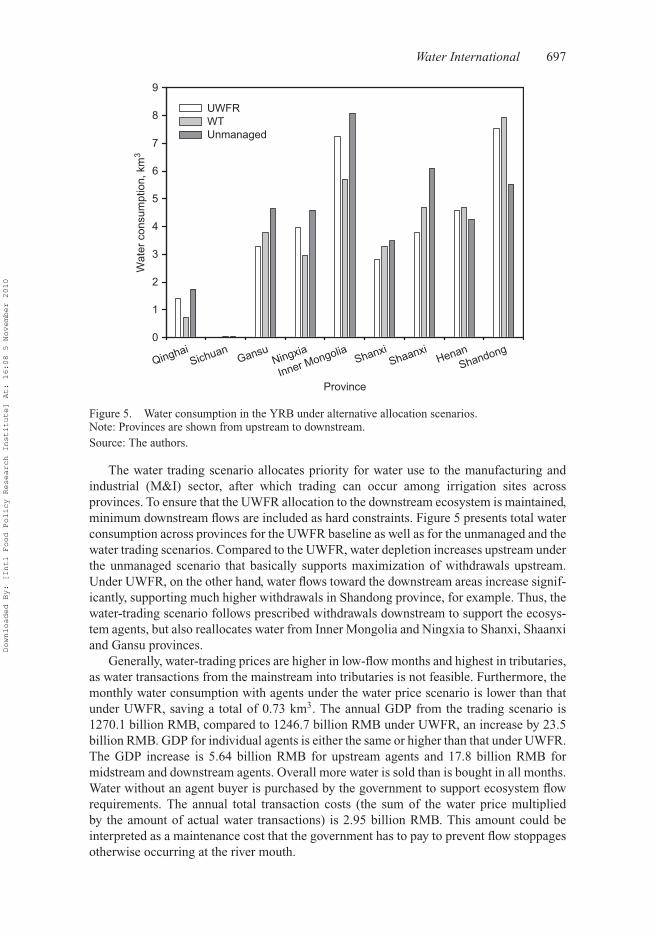
Figure 5. Water consumption in the YRB under alternative allocation scenarios.Note: Provinces are shown from upstream to downstream.Source: The authors.
The water trading scenario allocates priority for water use to the manufacturing andindustrial (M&I) sector, after which trading can occur among irrigation sites acrossprovinces. To ensure that the UWFR allocation to the downstream ecosystem is maintained,minimum downstream flows are included as hard constraints. Figure 5 presents total waterconsumption across provinces for the UWFR baseline as well as for the unmanaged and thewater trading scenarios. Compared to the UWFR, water depletion increases upstream underthe unmanaged scenario that basically supports maximization of withdrawals upstream.Under UWFR, on the other hand, water flows toward the downstream areas increase signif-icantly, supporting much higher withdrawals in Shandong province, for example. Thus, thewater-trading scenario follows prescribed withdrawals downstream to support the ecosys-tem agents, but also reallocates water from Inner Mongolia and Ningxia to Shanxi, Shaanxiand Gansu provinces.
Generally, water-trading prices are higher in low-flow months and highest in tributaries,as water transactions from the mainstream into tributaries is not feasible. Furthermore, themonthly water consumption with agents under the water price scenario is lower than thatunder UWFR, saving a total of 0.73 km3. The annual GDP from the trading scenario is1270.1 billion RMB, compared to 1246.7 billion RMB under UWFR, an increase by 23.5billion RMB. GDP for individual agents is either the same or higher than that under UWFR.The GDP increase is 5.64 billion RMB for upstream agents and 17.8 billion RMB formidstream and downstream agents. Overall more water is sold than is bought in all months.Water without an agent buyer is purchased by the government to support ecosystem flowrequirements. The annual total transaction costs (the sum of the water price multipliedby the amount of actual water transactions) is 2.95 billion RMB. This amount could beinterpreted as a maintenance cost that the government has to pay to prevent flow stoppagesotherwise occurring at the river mouth.
Downloaded By: [Intl Food Policy Research Institute] At: 16:08 5 November 2010

698 C. Ringler et al.
In summary, compared to the baseline scenario with UWFR, the scenario without reg-ulation results in higher water consumption and lower GDP, and significant flow cutoffs atthe river mouth. The water-trading scenario, on the other hand, results in a small declinein water consumption, combined with a significant increase in GDP. GDP, basically foragriculture, increases by 1.9%, which compares well with results of Heaney et al. (2006),even though they did not model the basin hydrology. GDP increases would be much higherif M&I would not receive first priority and thus would become an active water-tradingsector.
Conclusions
The government of China has recognized the severe water constraints in the YRB.To address growing water scarcity, the government has started to change its approachesfrom management of water supply toward improved management of water demand. Signsof the new approaches are the 2002 water law, the increased number of regulations onwater prices and a series of water trading pilots implemented in the YRB. However, mostorganizations concerned with water management are still headed and staffed by engineers,and traditional water-engineering measures, as exemplified by the SNWT, still dominateinterventions in terms of funding.
There is no panacea for addressing the severe water scarcity challenges in the YRB.Based on an assessment of options available, we believe that the government should con-tinue to reform the institutions responsible for irrigation management and water pricingacross all water-using sectors, but current users need to be compensated for ceding waterresources to users with higher-valued uses. Projects that transfer enhanced water rightsthat follow market mechanisms, and include the establishment of water rights and relatedresponsibilities would be a first step in that direction. Reform is also required at all theadministrative levels from the central to the local government to support fully integratedland and water management at the basin level and to avoid large inefficiencies caused byconflicting objectives of the various agencies involved in water supply and food productionin the YRB.
Expanding irrigation in the YRB will help boost crop yields, which in turn will increaseincomes of the poor and reduce poverty. However, the potential for expanding irrigation islimited, and labour productivity is known to be lowest in agriculture. Therefore, acceler-ating a shift of the rural labour force out of agriculture by creating off-farm employmentopportunities in higher-productivity sectors in rural areas is arguably even more importantfor future rural economic development.
Other ancillary measures that need to be continued include further adoption of water-saving technologies, and continued support to agricultural research and development toincrease crop productivity for both irrigated and rainfed crops. Continued productiveinvestment is needed, rather than subsidies, in the rural non-farm sector to ensure that theurban-rural poverty gap does not widen even further. There is still scope for savings of agri-cultural water through improved water productivity. But continued transfers of water outof agriculture will eventually result in declining production, with implications for nationalfood production as well as global food prices and trade.
AcknowledgementThis study forms part of the Consultative Group on International Agricultural Research ChallengeProgram on Water and Food.
Downloaded By: [Intl Food Policy Research Institute] At: 16:08 5 November 2010

Water International 699
Notes1. HadCM3 stands for United Kingdom Meteorological Office Hadley Centre’s Coupled Model,
version 3. The B2 storyline and scenario family characterizes a world in which the emphasis ison local solutions to economic, social, and environmental sustainability, with slowly increasingpopulation and intermediate economic development. It is considered a very moderate scenario.
2. While in government statistics some wheat areas are shown as rainfed, these areas generallyhave access to water harvesting facilities, ponds or groundwater. Based on our methodology, weclassified them as irrigated.
ReferencesAhmed, A., et al., 2009. Water and poverty in China’s Yellow River Basin. Mimeo. Report pre-
pared for the Challenge Program on Water and Food Yellow River Basin Focal Project. Availablefrom: http://www.ccapwater.com/river/Ahmed%20et%20al%20_Water%20and%20Poverty%20in%20China_FINAL_Dec%2016,%202009.pdf
Brismar, A., 1999. Environmental challenges and impacts of land use conversion in the YellowRiver basin. Interim Report IR-99-016. Laxenburg, Austria: International Institute for AppliedSystems Analysis.
Bruns, B.R. and Meinzen-Dick, R.S., eds. 2000. Negotiating water rights. London: ITDG Publishing.Cai, X., 2006. Water stress, water transfer and social equity in Northern China: implications for pol-
icy reforms. Human Development Report Office. Occasional Paper. New York: United NationsDevelopment Programme.
Cai, X. and Rosegrant, M., 2004. Optional water development strategies for the Yellow River basin:Balancing agricultural and ecological water demands. Water Resources Research, 40, W08S04,doi:10.1029/2003WR002488.
Cai, X., et al., 2010. Water productivity assessment for the Yellow River Basin. Mimeo. Report pre-pared for the Challenge Program on Water and Food Yellow River Basin Focal Project. Availablefrom: http://www.ccapwater.com/river/YellowBasinWaterProductivityAssessment.pdf
Chen, J., Zhang W., and He, H., 2007. Implementation effects of water rights transfer in the YellowRiver basin. China Water Resources, 19, 49–50 [in Chinese].
Chen, Z.K., 2002. Impact of the successive drought on the North China Plain ecological environment.Working paper of the China Institute of Water and Hydropower Research [in Chinese].
Falkenmark, M. and Widstrand, C., 1992. Population and water resources: a delicate balance.Population Bulletin. Washington: Population Reference Bureau.
FAOSTAT 2010. Food and Agriculture Organization statistical databases. Available from:http://faostat.fao.org/ [Accessed February 2010].
Fu, T., Chang, M., and Zhong, L., 2008. Reform of China’s urban water sector. London: IWAPublishing.
Heaney, A., et al., 2006. Water reallocation in northern China: towards more formal markets forwater. In: I.R. Willett and Z. Gao, eds. Agricultural water management in China. Canberra:Australian Center for International Agricultural Research, 130–141.
Huang, J. and Rozelle, S., 2009. Agriculture, food security, and poverty in China: past perfor-mance, future prospects, and implications for agricultural R&D policy. International Food PolicyResearch Institute – Australian Centre for International Agricultural Research Policy Brief.Washington DC: IFPRI.
Huang, J., et al., 2010. Subsidies and distortions in China’s agriculture: evidence from producer-leveldata. Mimeo. Beijing: Center for Chinese Agricultural Policy.
IFPRI, 2009. IFPRI IMPACT Simulations. Mimeo.Ke, S. and Zhou, K., 2007. Integrated water resources management in the Yellow River basin.
People’s Yellow River, 29 (1), 5–7 [in Chinese].Li, G., 2007. Exploring and practice of water rights transfer in the Yellow River Basin. China Water
Resources, 19, 30–31 [in Chinese].Li, J., et al., 2003. Estimation of the economic loss of water pollution in China. China Water
Resources, 11, 63–66 [in Chinese].Liu, X., Wu, L., and Wan, Z., 2007. Research on water rights transfer in the Inner Mongolia in the
Yellow River basin. People’s Yellow River, 29 (10), 16–17 [in Chinese].Ma, X., 1996. Flood and drought disasters of the Yellow River basin. Zhengzhou: Yellow River Press.
Downloaded By: [Intl Food Policy Research Institute] At: 16:08 5 November 2010

700 C. Ringler et al.
Ma, X., Han, J., and Chang, Y., 2007. Research on evolution of water rights transfer in the YellowRiver Basin. Research of China’s Economic History, 1, 41–47.
Ministry of Water Resources, 2001. Water resource bulletin of China 2000 [online]. Beijing: Ministryof Water Resources. Available from http://www.chinawater.net.cn [Accessed 2002].
Ministry of Water Resources, 2003. Water resources yearbook. Beijing: Ministry of Water Resources.Ministry of Water Resources, 2005. Water resources yearbook. Beijing: Ministry of Water Resources.National Bureau of Statistics of China, 2003. Available from http://www.stats.gov.cn/tjsj/qtsj/
hjtjzl/hjtjsj2003/t20050706_402261014.htm. [Accessed 2002].Pietz, D. and Giordano, M., 2009. Managing the Yellow River: continuity and change. In: F. Molle and
P. Wester, eds. River basin trajectories: societies, environments and development. Wallingford:CAB International, 99–122.
Qiu, H., et al., 2010. Bioethanol development in China and the potential impacts on its agriculturaleconomy. Applied Energy, 87 (1), 76–83.
Randall, A., 1981. Property entitlements and pricing policies for a maturing water economy.Australian Journal of Agricultural Economics, 25 (3), 195–212.
Rosegrant, M.W. and Cai, X., 2003. Rice and water: an examination from China to the world. In: T.W.Mew, et al., eds. Rice science: innovations and impact for livelihoods. Manila: International RiceResearch Institute, 847–867.
Rosegrant, M.W. and Binswanger, H.P., 1994. Markets in tradable water rights: potential for effi-ciency gains in developing country water resource allocation. World Development, 22 (11),1613–25.
Rosegrant, M.W., Ringler, C., and Zhu, T., 2009a. Water for agriculture: maintaining food secu-rity under growing scarcity. Annual Review of Environment and Resources, 34, 205–223. doi:10.1146/annurev.environ.030308.090351.
Rosegrant, M.W., Fernandez, M., and Sinha, A., 2009b. Looking into the future for agriculture andAKST. In: B.D. McIntyre, et al., eds. International assessment of agricultural knowledge, sci-ence and technology for development (IAASTD): Global report. Washington DC: Island Press,307–376.
Shi H. and Shao M., 2000. Soil and water loss from the Loess Plateau in China. Journal of AridEnvironments, 45 (1), 9–20.
Wang, J. and Zhang, L., 2009. Water policy, management and institutions: role in pro-poor waterallocation in the Yellow River Basin. Mimeo. Report prepared for the Challenge Program onWater and Food Yellow River Basin Focal Project. Available from: http://www.ccapwater.com/river/Report/Policiesandinstitutionsfinal.pdf
Wang, J., et al., 2003. Pro-poor intervention strategies in irrigated agriculture in China. Report.Colombo: International Water Management Institute and Manila: Asian Development Bank.Available from: http://www.ccapwater.com/river/index.html
Wang, J., et al., 2007. Agriculture and groundwater development in Northern China: trends,institutional responses, and policy options. Water Policy, 9 (S1), 61–74.
Wang, S., et al., 2006. Transfer water rights to optimize water allocation in the southern irrigationdistricts of Inner Mongolia in the Yellow River. Water Conservancy in Inner Mongolia, 2, 56–59.
Wang, Y., 2007. Comments on the reform of water price, water rights and water markets in China.China’s population, resources and environment, 5: 153–158 [in Chinese].
World Bank, 2003. Implementation completion report for loess plateau watershed rehabilitationproject. Report No. 25701. Washington, D.C.: The World Bank.
World Bank, 2007. Project performance assessment report for second loess plateau watershed reha-bilitation project and Xiaolangdi multipurpose project I & II and Tarim Basin II project. ReportNo. 41122. Washington, D.C.: The World Bank.
Xu, Z.X., Zhao, F.F., and Li, J.Y., 2009. Response of streamflow to climate change in the headwatercatchment of the Yellow River basin. Quaternary International, 208 (1–2), 62–75.
Xue, Y., Sun, Y., and Ringler, C., 2010. A review of governance, laws and water interventions in theYellow River Basin over the last 60 years. Report prepared for the Challenge Program on Waterand Food Yellow River Basin Focal Project. Mimeo. Available from: http://www.ccapwater.com/river/Report/WP5a_final.pdf
Yang, H., Zhang, X., and Zehnder, A.J.B., 2003. Water scarcity, pricing mechanism and institutionalreform in northern China irrigated agriculture. Agricultural Water Management, 61 (2), 143–161.
Yang, H. and Zehnder, A.J.B., 2005. The South-North Water Transfer Project in China. WaterInternational, 30 (3), 339–349.
Downloaded By: [Intl Food Policy Research Institute] At: 16:08 5 November 2010

Water International 701
Yang, Y.-C.E., Cai, X., and Stipanovic, D.M., 2009. A decentralized optimization algorithm formultiagent system–based watershed management. Water Resources Research, 45, W08430,doi:10.1029/2008WR007634.
YRCC, 1998–2006. Yellow River water resources bulletins [online]. Yellow River ConservancyCommission. Available from: http://www.yrcc.gov.cn/ [in Chinese]. [Accessed 2006].
Zhao, J., et al., 2009. Evaluation of economic and hydrologic impact of unified water flow regulationin the Yellow River Basin. Water Resources Management, 23 (7), 1381–1401.
Zwart, S.J. and Bastiaanssen, G.M., 2004. Review of measured crop water productivity values forirrigated wheat, rice cotton and maize. Agricultural Water Management, 69 (2), 115–133.
Downloaded By: [Intl Food Policy Research Institute] At: 16:08 5 November 2010


