Embed Size (px)
Citation preview


MIXPaper from
responsible sources
FSC® C003609
© All rights reserved
Copyright of material published is to be retained by Zero Carbon Building Limited and the respective contributors.
No part of the Zero Carbon Building Journal, written or pictorial, may be reproduced, stored in retrieval system or transmitted,
in any form or by any means, electronic, mechanical photocopying, recording or otherwise,
without the permission in writing of the copyright holder.
Zero Carbon Building Journal isDesign and Published by
Edge Media Limitedwww.edgemedia.com.hk
Printed in Hong Kong
Zero Carbon Building JournalThis journal is available online, visit http://zcb.hkcic.org/eng/informationcentre/publications.aspx
Chief EditorDr Christopher To
Editorial CommitteeDr Benny Chow
Dr T.T. ChowProfessor Christopher Gorse
Dr Lin HaoMr M.K. Leung
Professor Irene LoMr Emilio Miguel Mitre
Professor Thomas NgDr Wei Pan
Professor Deo PrasadProfessor Shengwei Wang
Dr Raymond Yau
Journal CoordinatorDr Margaret Kam
Email: [email protected]
Submission of PapersPaper submission guidelines can be obtained online at http://[email protected]
Contact DetailsZCB
8 Sheung Yuet Road, Kowloon Bay,Kowloon, Hong KongTel: +852 2100 9800Fax: +852 2100 9890Email: [email protected]
Website: http://zcb.hkcic.orgISSN 2311-7400

Volume 4 December 2015
EditorialChristopher To05
Net-Zero Carbon Buildings: A US PerspectiveChimay J. Anumba, Yewande Abraham and David Kaneda
06 Design, Construction, Operation and Monitoring of Zero Carbon Green HomeDong Woo Cho, Jung Yeon Yu, Jin Woo Jeong and Jong Hee Paik
22
Understanding Building Performance: Implications of heat loss and air permiability on building controlChristopher Gorse, Felix Thomas, Dominic Miles-Shenton, David Farmer, David Glew and David Johnston
First Bioaerosol Characterization of the Zero Carbon Building in Hong KongJimmy C.K. Tong, Marcus H.Y. Leung and Patrick K.H. Lee
36
30
Kai Tak Cruise Terminal Building – A Low Energy and Sustainable Terminal BuildingJames Marshall, Jacky Wong, Muthukaruppan Ramanathan, Gary Chan and Felix Wong50
Trade and Industry Tower, Kai Tak (TITKT) – An Exemplar in Sustainability Design for Government Buildings in Hong KongMark Cameron
58
Zero Carbon Building Journal
4
The need to reduce energy consumption and carbon emissions from
buildings is critical. While zero energy and zero carbon buildings
are recognised concepts to address these problems, how they can
be achieved remain elusive for the majority of practitioners in the
construction industry. There is no one standardized definition,
calculation methodologies are often implicit and strategies adopted
need to be climate specific. Furthermore, there is a lack of accessible
measured performance data to support decision-making. However
this is gradually changing as shown by Dr. Dong Woo Cho, Jung
Yeon Yu, Jin Woo Jeong and Jong Hee Paik in their Zero Carbon
Green Home project in Korea where an 85% reduction in electricity
consumption and 91% saving in electricity cost have been achieved.
Supported by the Korea government’s ambition to create a market
for zero energy and zero carbon projects, the project is an excellent
benchmark for future developments.
The United States is also making considerable progress to meet
set goals to reduce building energy demand. Stringent building
assessment methods such as the Living Building Challenge for
example are setting higher performance benchmarks and stimulating
the growth of net zero energy and net plus buildings. In their
paper, Prof. Chimay Anumba, Yewande Abraham and David Kaneda
provide a comprehensive overview of the US experience in building
assessment methods, various policies and guidelines that promote
net zero energy and zero carbon buildings and recent case studies.
Integral to net zero energy and zero carbon buildings is good
indoor air quality. In Hong Kong’s high-density urban environment,
this poses a significant challenge for designers, particularly when
natural ventilation is used as a cooling strategy to reduce energy
consumption. In their research, Dr. Jimmy Tong, Dr. Marcus Leung
ZCB Journal 2015 • Volume 4
Editorial
ZCB Journal 2015 • Volume 4 5
and Dr. Patrick Lee share their insights from an assessment of the
airborne microbiology in ZCB during summer and winter months. In
identifying and understanding the relationships between zero carbon
design strategies and microbial community compositions, their study
can inform practitioners on how to enhance air quality in zero energy
and zero carbon buildings.
Another critical issue affecting industry adoption of zero energy
and zero carbon buildings is the performance gap. This gap can be
reduced through effective design of the building fabric but often
the building fabric does not perform to design intent. Through
their air tightness studies for existing and retrofit properties in the
United Kingdom, Prof. Christopher Gorse and his team at the Leeds
Sustainability Institute present their results and insights into how
energy efficient, thermally resistant building enclosures can be built
to achieve nearly zero energy buildings.
Closer to home, progress towards low energy design is shown in
case studies of the Cruise Terminal Building and the Trade and
Industry Tower at Kai Tak. The Cruise Terminal Building showcases
how an integrated design process, high performance building
envelope, energy efficient building services systems and use of
renewable energy can create a sustainable low rise building with a
high level of amenity. One the other hand, the Trade and Industry
Tower Kai Tak reveals how low energy and carbon design strategies
can be effectively integrated into a high-rise building. Both cases
demonstrate the use of innovative technologies to enhance
energy and carbon performance which can hopefully inspire green
innovation in the Hong Kong construction industry.
Ir Dr. TO Wing, Christopher
Chief Editor

Dong Woo Cho is a senior research fellow at the Building and Urban Research Institute of Korea Institute of Civil Engineering and Building Technology (KICT). Dr. Cho obtained his PhD degree in 1995 at Dongguk University. He has been involved in numerous R&D projects, such as the building energy rating system and retrofit window system in Korea. Dr. Cho is the vice president of the Korea Green Building Council. He has published over 100 academic papers, and his research interests include zero carbon/energy buildings, passive houses, and the green building certification system (G-SEED).
Jung Yeon Yu is a researcher at the Building and Urban Research Inst i tute of Korea Institute of Civil Engineering and Building Technology (KICT). Ms. Yu is a PhD student in the Department of Architectural Engineering at Graduate School of Hanyang University in Seoul. Her research interests include zero carbon/energy buildings, passive houses, and stack effect in high-rise buildings.
Jing Woo Jeong is a researcher at the Building and Urban Research Institute of Korea Institute of Civil Engineering and Building Technology (KICT). Mr. Jeong obtained his Master’s degree in In ha University in 2010. His research interests include zero carbon/energy buildings, passive houses, and high performance building materials.
Jong Hee Paik is a researcher at the Building and Urban Research Institute of Korea Institute of Civil Engineering and Building Technology (KICT). Ms. Paik obtained her bachelor’s degree at the University of Nottingham in 2013. For her bachelor’s degree, she did a study on renewable integration into the University Park campus in Nottingham. Her research interests include zero carbon/energy buildings, passive houses, sustainable built environment, and renewable energy.
Design, Construction, Operation and Monitoring of Zero Carbon Green Home
Zero Carbon Green Home (ZCGH) is one of the zero energy building pilot projects in Korea. With the integration of passive and active design, ZCGH was able to achieve its goal of 87% reduction in heating energy consumption and 85% reduction in electricity consumption, which resulted in 82% savings in annual heating costs and 91% savings in electricity costs. The indoor thermal environment analysis was carried out in summer and winter. With the use of automated external venetian blinds in summer, direct solar heat gains were avoided; and in addition to the highly insulated building envelope, the indoor air temperature was reduced through cross ventilation. In winter, high performance windows and highly insulated walls minimized heat loss, which allowed the indoor air and floor temperature to be maintained around 20 oC; moreover the heat recovery ventilation system and individual room control further reduced energy consumption of the building. The energy consumption and electricity production of ZCGH were monitored. This project will serve as a prototype of future zero energy building projects promoting the distribution of zero carbon homes for a sustainable residential building environment in the near future.
Keywords: Zero Carbon Green Home, Nearly Zero Energy Building, passive house, passive design, integrated design
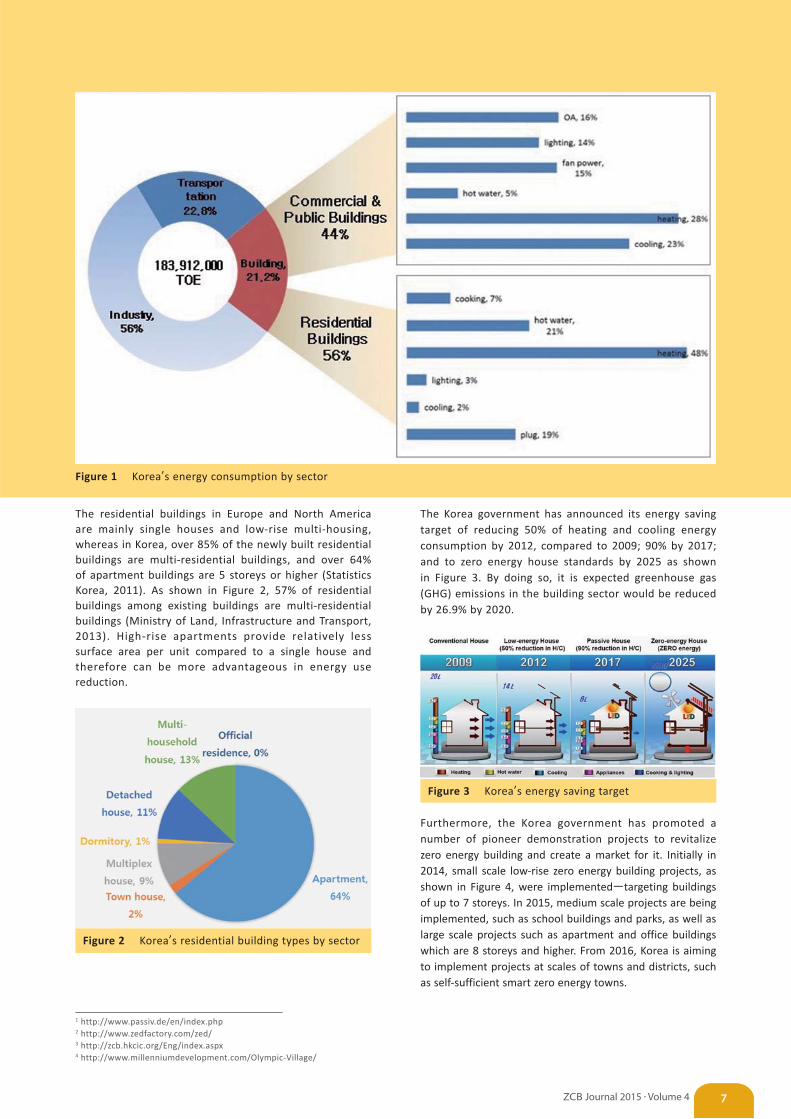
IntroductionIn Korea, about 300,000 house units are newly built per year, and the building sector accounts for approximately 21.2% of the total energy consumption (Korea Energy Economics, 2011). As shown in Figure 1, residential buildings take up 56% of the total energy consumption from the building sector.
Dong Woo Cho1*, PhD
Jung Yeon Yu2, MSc
Jin Woo Jeong3, MSc
Jong Hee Paik4, BEng1 Builidng and Urban Research Institute, Korea Institute of Civil Engineering and
Building Technology (KICT), Republic of Korea, *Corresponding author; email: [email protected]
2 Graduate School of Architectural Engineering, Hanyang University, Republic of Korea, email: [email protected]
3 Builidng and Urban Research Institute, Korea Institute of Civil Engineering and Building Technology (KICT), Republic of Korea, email: [email protected]
4 Builidng and Urban Research Institute, Korea Institute of Civil Engineering and Building Technology (KICT), Republic of Korea, email: [email protected]
Zero Carbon Building Journal
ZCB Journal 2015 • Volume 46
1 http://www.passiv.de/en/index.php2 http://www.zedfactory.com/zed/3 http://zcb.hkcic.org/Eng/index.aspx4 http://www.millenniumdevelopment.com/Olympic-Village/
The residential buildings in Europe and North America are mainly single houses and low-rise multi-housing, whereas in Korea, over 85% of the newly built residential buildings are multi-residential buildings, and over 64% of apartment buildings are 5 storeys or higher (Statistics Korea, 2011). As shown in Figure 2, 57% of residential buildings among existing buildings are multi-residential buildings (Ministry of Land, Infrastructure and Transport, 2013). High-rise apartments provide relatively less surface area per unit compared to a single house and therefore can be more advantageous in energy use reduction.
Figure 2 Korea’s residential building types by sector
The Korea government has announced its energy saving target of reducing 50% of heating and cooling energy consumption by 2012, compared to 2009; 90% by 2017; and to zero energy house standards by 2025 as shown in Figure 3. By doing so, it is expected greenhouse gas (GHG) emissions in the building sector would be reduced by 26.9% by 2020.
Figure 3 Korea’s energy saving target
Furthermore, the Korea government has promoted a number of pioneer demonstration projects to revitalize zero energy building and create a market for it. Initially in 2014, small scale low-rise zero energy building projects, as shown in Figure 4, were implemented―targeting buildings of up to 7 storeys. In 2015, medium scale projects are being implemented, such as school buildings and parks, as well as large scale projects such as apartment and office buildings which are 8 storeys and higher. From 2016, Korea is aiming to implement projects at scales of towns and districts, such as self-sufficient smart zero energy towns.
Figure 1 Korea’s energy consumption by sector
7ZCB Journal 2015 • Volume 4
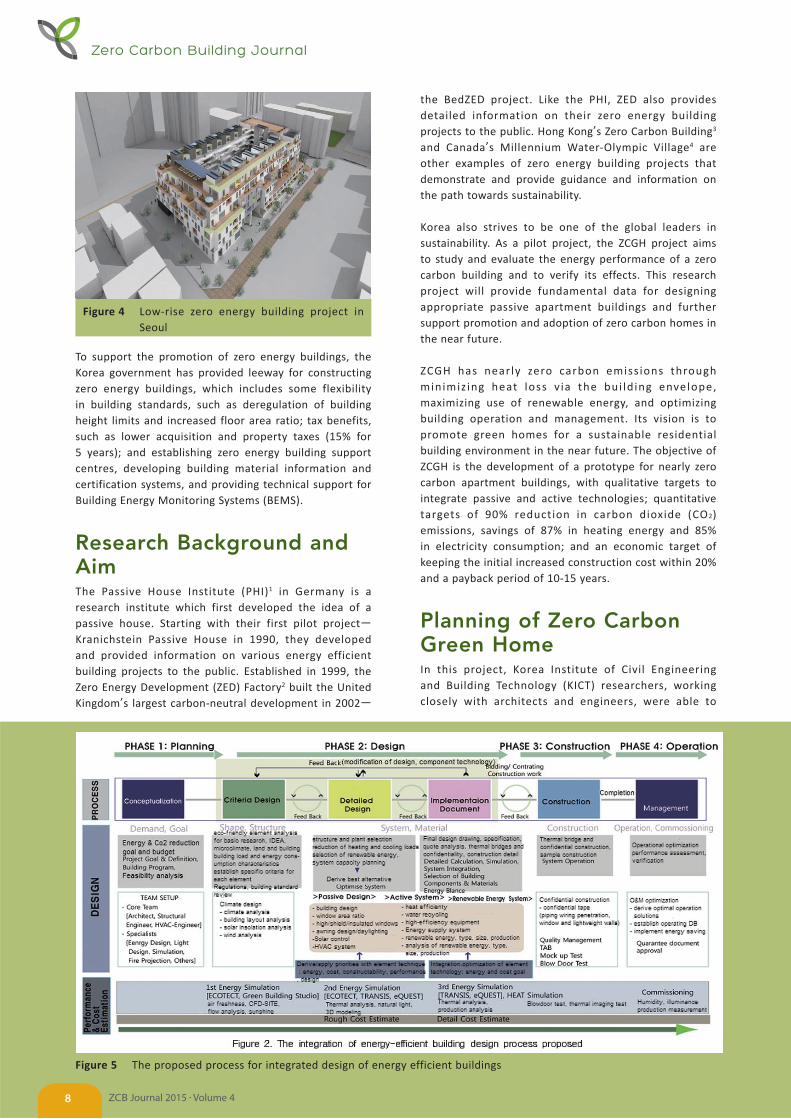
Figure 4 Low-rise zero energy building project in Seoul
To support the promotion of zero energy buildings, the Korea government has provided leeway for constructing zero energy buildings, which includes some flexibility in building standards, such as deregulation of building height limits and increased floor area ratio; tax benefits, such as lower acquisition and property taxes (15% for 5 years); and establishing zero energy building support centres, developing building material information and certification systems, and providing technical support for Building Energy Monitoring Systems (BEMS).
Research Background and AimThe Passive House Institute (PHI)1 in Germany is a research institute which first developed the idea of a passive house. Starting with their first pilot project―Kranichstein Passive House in 1990, they developed and provided information on various energy efficient building projects to the public. Established in 1999, the Zero Energy Development (ZED) Factory2 built the United Kingdom’s largest carbon-neutral development in 2002―
the BedZED project. Like the PHI, ZED also provides detailed information on their zero energy building projects to the public. Hong Kong’s Zero Carbon Building3 and Canada’s Millennium Water-Olympic Village4 are other examples of zero energy building projects that demonstrate and provide guidance and information on the path towards sustainability.
Korea also strives to be one of the global leaders in sustainability. As a pilot project, the ZCGH project aims to study and evaluate the energy performance of a zero carbon building and to verify its effects. This research project will provide fundamental data for designing appropriate passive apartment buildings and further support promotion and adoption of zero carbon homes in the near future.
ZCGH has nearly zero carbon emiss ions through minimiz ing heat loss v ia the bui ld ing envelope, maximizing use of renewable energy, and optimizing building operation and management. Its vision is to promote green homes for a sustainable residential building environment in the near future. The objective of ZCGH is the development of a prototype for nearly zero carbon apartment buildings, with qualitative targets to integrate passive and active technologies; quantitative targets of 90% reduction in carbon dioxide (CO2)emissions, savings of 87% in heating energy and 85% in electricity consumption; and an economic target of keeping the initial increased construction cost within 20% and a payback period of 10-15 years.
Planning of Zero Carbon Green HomeIn this project, Korea Institute of Civil Engineering and Building Technology (KICT) researchers, working closely with architects and engineers, were able to
Figure 5 The proposed process for integrated design of energy efficient buildings
Zero Carbon Building Journal
ZCB Journal 2015 • Volume 48
conduct an integrated design process which considered the performance and costs for each phase―planning, design, construction and operation. The environment, and application of passive and active strategies, were considered for each phase.
The KICT researchers were involved in the initial phase of the design process, in order to integrate passive and active technologies into the building. Aside from the main integrated design team, a number of experts in various fields participated in the feedback process as members of the design team. Figure 5 shows an overview of the integrated design process for energy efficient buildings based on domestic and international trend analysis of integrated design.
Consequently, energy simulations were carried out
with a number of softwares to verify the adequacy
and feasibility of different systems designed for the
building. For energy simulations, DOE-2 software was
used to evaluate energy consumption of the building.
Simulations of the effects of solar radiation on the
building’s orientation were carried out with Ecotect
software. Ventilation simulations were carried out using
STAR-CD program―a computational fluid dynamics
software. The photovoltaic (PV) system was evaluated
with PV-Pro program. Moreover, energy efficient design
including orientation, window area ratio, overhangs,
cross ventilation, thermal bridges, building form and so
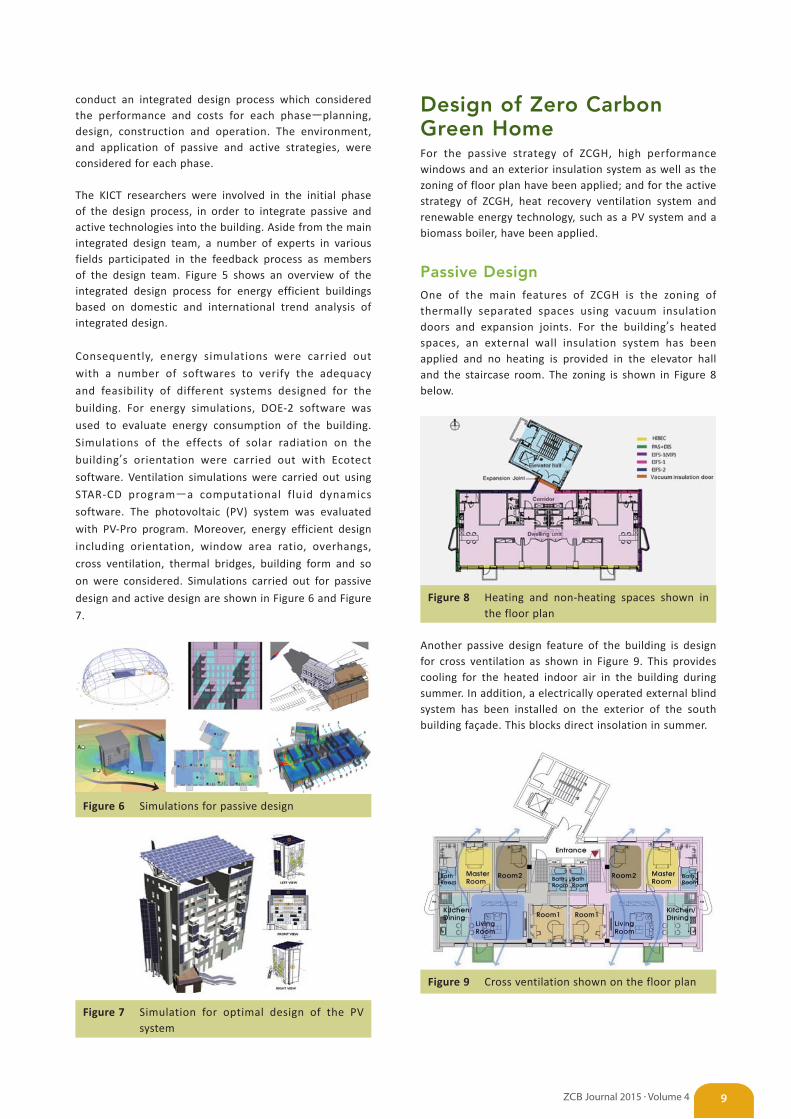
on were considered. Simulations carried out for passive
design and active design are shown in Figure 6 and Figure
7.
Figure 6 Simulations for passive design
Figure 7 Simulation for optimal design of the PV system
Design of Zero Carbon Green HomeFor the passive strategy of ZCGH, high performance windows and an exterior insulation system as well as the zoning of floor plan have been applied; and for the active strategy of ZCGH, heat recovery ventilation system and renewable energy technology, such as a PV system and a biomass boiler, have been applied.
Passive DesignOne of the main features of ZCGH is the zoning of thermally separated spaces using vacuum insulation doors and expansion joints. For the building’s heated spaces, an external wall insulation system has been applied and no heating is provided in the elevator hall and the staircase room. The zoning is shown in Figure 8 below.
Figure 8 Heating and non-heating spaces shown in the floor plan
Another passive design feature of the building is design for cross ventilation as shown in Figure 9. This provides cooling for the heated indoor air in the building during summer. In addition, a electrically operated external blind system has been installed on the exterior of the south building façade. This blocks direct insolation in summer.
Figure 9 Cross ventilation shown on the floor plan
9ZCB Journal 2015 • Volume 4
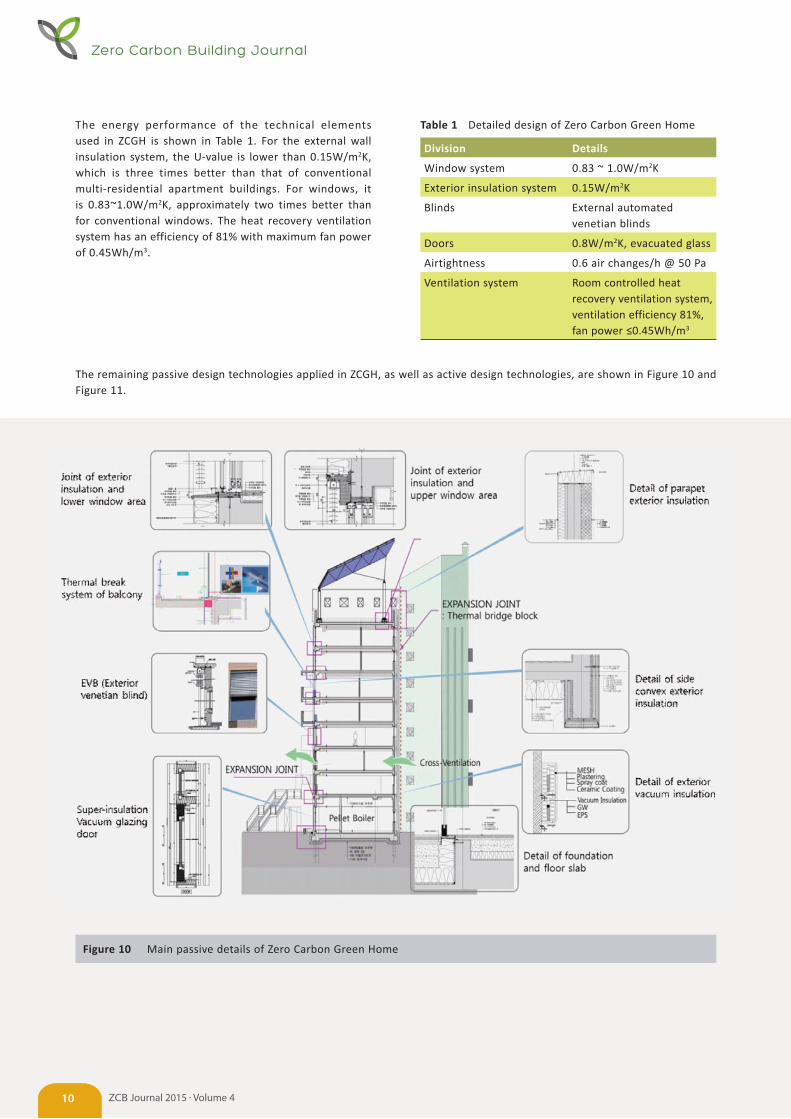
The energy performance of the technical elements used in ZCGH is shown in Table 1. For the external wall insulation system, the U-value is lower than 0.15W/m2K, which is three times better than that of conventional multi-residential apartment buildings. For windows, it is 0.83~1.0W/m2K, approximately two times better than for conventional windows. The heat recovery ventilation system has an efficiency of 81% with maximum fan power of 0.45Wh/m3.
Figure 10 Main passive details of Zero Carbon Green Home
Table 1 Detailed design of Zero Carbon Green Home
Division Details
Window system 0.83 ~ 1.0W/m2K
Exterior insulation system 0.15W/m2K
Blinds External automated venetian blinds
Doors 0.8W/m2K, evacuated glass
Airtightness 0.6 air changes/h @ 50 Pa
Ventilation system Room controlled heat recovery ventilation system, ventilation efficiency 81%, fan power ≤0.45Wh/m3
The remaining passive design technologies applied in ZCGH, as well as active design technologies, are shown in Figure 10 and Figure 11.
Zero Carbon Building Journal
ZCB Journal 2015 • Volume 410
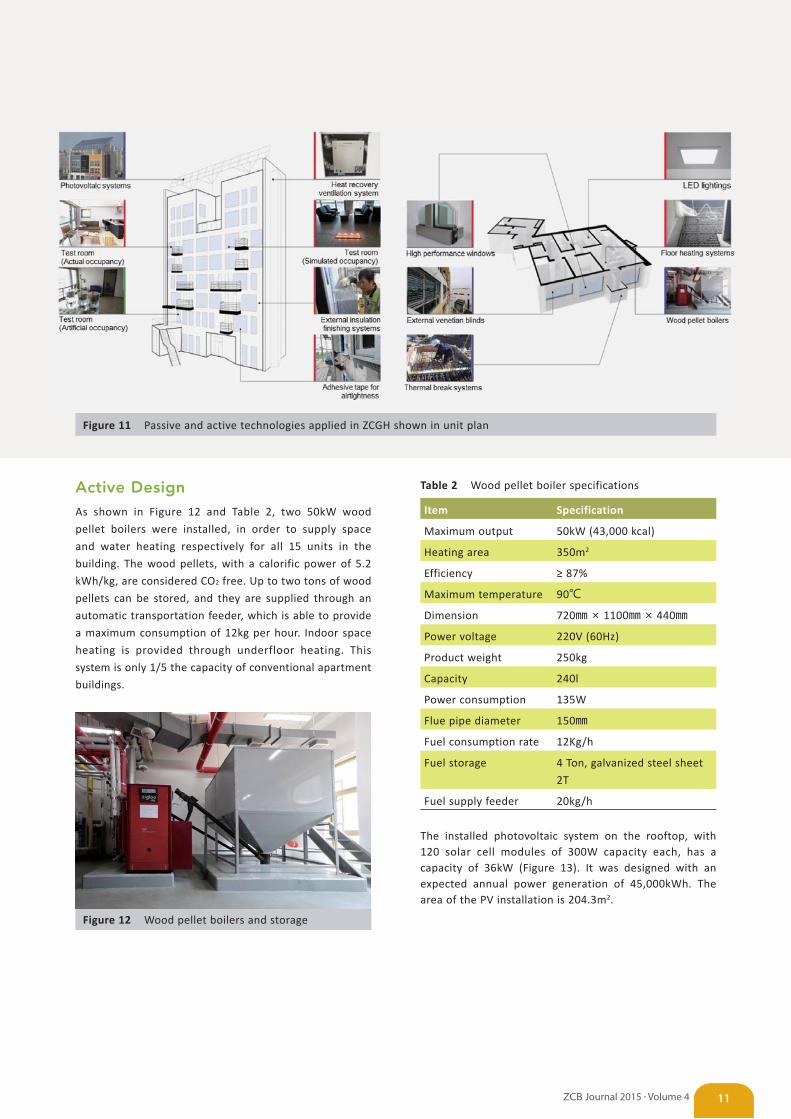
Figure 11 Passive and active technologies applied in ZCGH shown in unit plan
Active DesignAs shown in Figure 12 and Table 2, two 50kW wood
pellet boilers were installed, in order to supply space
and water heating respectively for all 15 units in the
building. The wood pellets, with a calorific power of 5.2
kWh/kg, are considered CO2 free. Up to two tons of wood
pellets can be stored, and they are supplied through an
automatic transportation feeder, which is able to provide
a maximum consumption of 12kg per hour. Indoor space
heating is provided through underfloor heating. This
system is only 1/5 the capacity of conventional apartment
buildings.
Figure 12 Wood pellet boilers and storage
Table 2 Wood pellet boiler specifications
Item Specification
Maximum output 50kW (43,000 kcal)
Heating area 350m2
Efficiency ≥ 87%
Maximum temperature 90℃
Dimension 720㎜ × 1100㎜ × 440㎜
Power voltage 220V (60Hz)
Product weight 250kg
Capacity 240l
Power consumption 135W
Flue pipe diameter 150㎜
Fuel consumption rate 12Kg/h
Fuel storage 4 Ton, galvanized steel sheet
2T
Fuel supply feeder 20kg/h
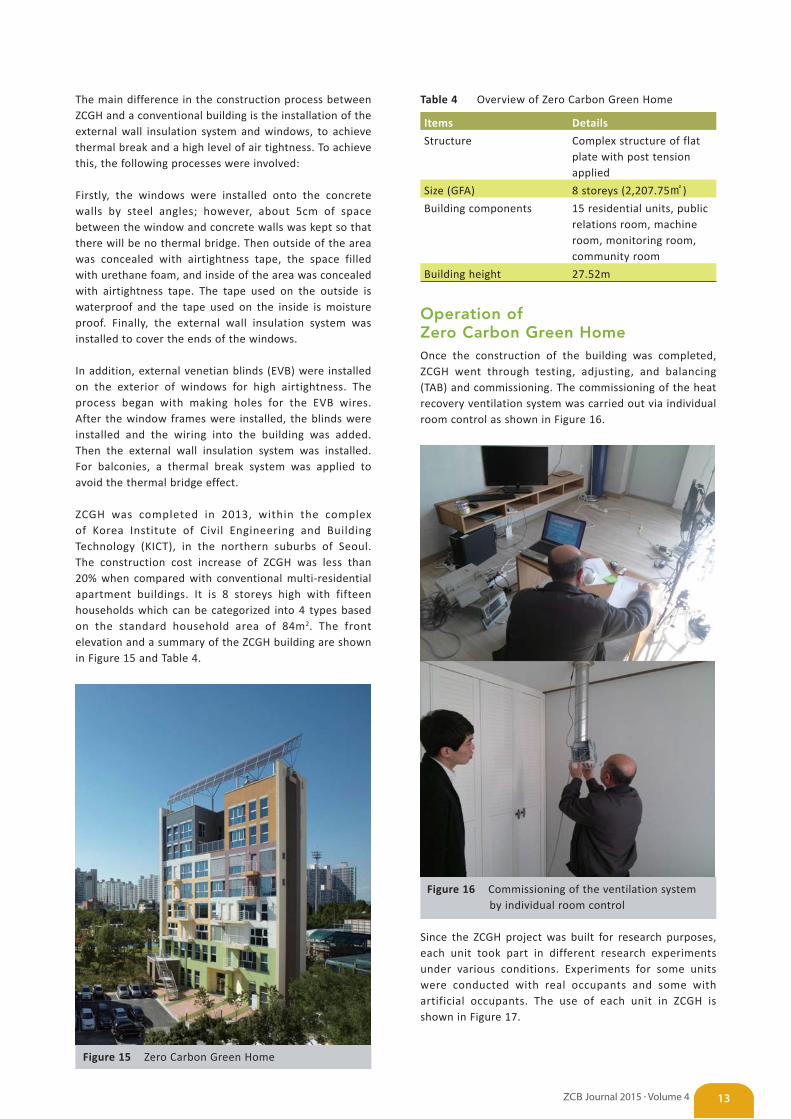
The installed photovoltaic system on the rooftop, with 120 solar cell modules of 300W capacity each, has a capacity of 36kW (Figure 13). It was designed with an expected annual power generation of 45,000kWh. The area of the PV installation is 204.3m2.
11ZCB Journal 2015 • Volume 4
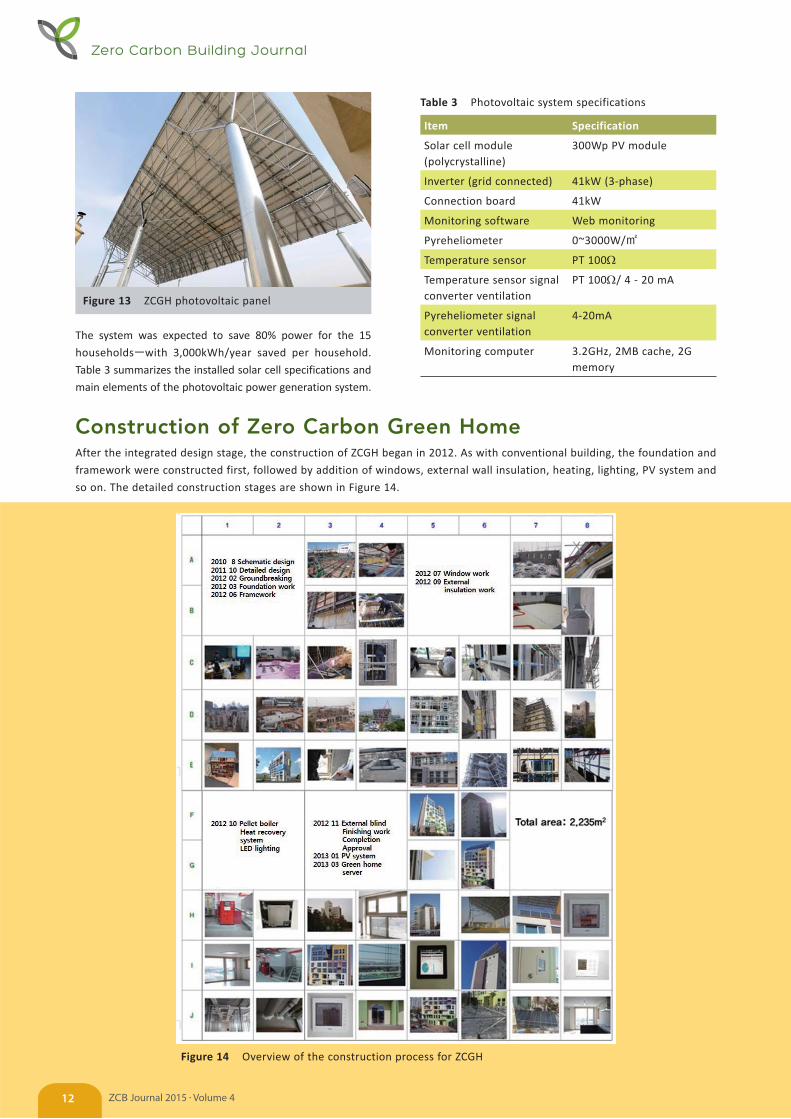
Figure 13 ZCGH photovoltaic panel
The system was expected to save 80% power for the 15
households―with 3,000kWh/year saved per household.
Table 3 summarizes the installed solar cell specifications and
main elements of the photovoltaic power generation system.
Table 3 Photovoltaic system specifications
Item Specification
Solar cell module (polycrystalline)
300Wp PV module
Inverter (grid connected) 41kW (3-phase)
Connection board 41kW
Monitoring software Web monitoring
Pyreheliometer 0~3000W/㎡
Temperature sensor PT 100
Temperature sensor signal converter ventilation
PT 100/ 4 - 20 mA
Pyreheliometer signal converter ventilation
4-20mA
Monitoring computer 3.2GHz, 2MB cache, 2G memory
Construction of Zero Carbon Green HomeAfter the integrated design stage, the construction of ZCGH began in 2012. As with conventional building, the foundation and
framework were constructed first, followed by addition of windows, external wall insulation, heating, lighting, PV system and
so on. The detailed construction stages are shown in Figure 14.
Figure 14 Overview of the construction process for ZCGH
Zero Carbon Building Journal
ZCB Journal 2015 • Volume 412
The main difference in the construction process between ZCGH and a conventional building is the installation of the external wall insulation system and windows, to achieve thermal break and a high level of air tightness. To achieve this, the following processes were involved:
Firstly, the windows were installed onto the concrete walls by steel angles; however, about 5cm of space between the window and concrete walls was kept so that there will be no thermal bridge. Then outside of the area was concealed with airtightness tape, the space filled with urethane foam, and inside of the area was concealed with airtightness tape. The tape used on the outside is waterproof and the tape used on the inside is moisture proof. Finally, the external wall insulation system was installed to cover the ends of the windows.
In addition, external venetian blinds (EVB) were installed on the exterior of windows for high airtightness. The process began with making holes for the EVB wires. After the window frames were installed, the blinds were installed and the wiring into the building was added. Then the external wall insulation system was installed. For balconies, a thermal break system was applied to avoid the thermal bridge effect.
ZCGH was completed in 2013, within the complex of Korea Institute of Civil Engineering and Building Technology (KICT), in the northern suburbs of Seoul. The construction cost increase of ZCGH was less than 20% when compared with conventional multi-residential apartment buildings. It is 8 storeys high with fifteen households which can be categorized into 4 types based on the standard household area of 84m2. The front elevation and a summary of the ZCGH building are shown in Figure 15 and Table 4.
Figure 15 Zero Carbon Green Home
13ZCB Journal 2015 • Volume 4
Table 4 Overview of Zero Carbon Green Home
Items Details
Structure Complex structure of flat plate with post tension applied
Size (GFA) 8 storeys (2,207.75㎡)
Building components 15 residential units, public relations room, machine room, monitoring room, community room
Building height 27.52m
Operation of Zero Carbon Green HomeOnce the construction of the building was completed, ZCGH went through testing, adjusting, and balancing (TAB) and commissioning. The commissioning of the heat recovery ventilation system was carried out via individual room control as shown in Figure 16.
Figure 16 Commissioning of the ventilation system by individual room control
Since the ZCGH project was built for research purposes, each unit took part in different research experiments under various conditions. Experiments for some units were conducted with real occupants and some with artificial occupants. The use of each unit in ZCGH is shown in Figure 17.
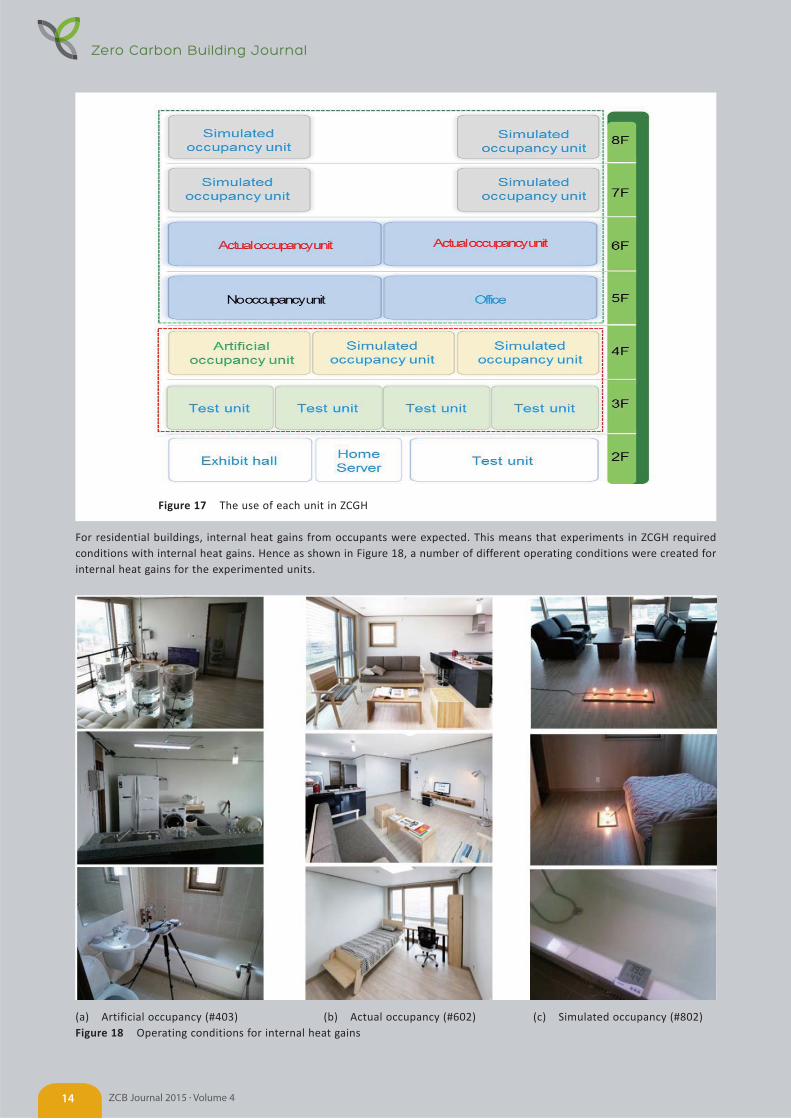
Figure 17 The use of each unit in ZCGH
For residential buildings, internal heat gains from occupants were expected. This means that experiments in ZCGH required conditions with internal heat gains. Hence as shown in Figure 18, a number of different operating conditions were created for internal heat gains for the experimented units.
(a) Artificial occupancy (#403) (b) Actual occupancy (#602) (c) Simulated occupancy (#802)Figure 18 Operating conditions for internal heat gains
Zero Carbon Building Journal
ZCB Journal 2015 • Volume 414
The energy consumption can also be gauged from the amount of wood pellets consumed by the two 50kW biomass boilers installed in the building for water and space heating. This shows the amount of energy consumed from space heating in winter, and water heating throughout the year. The energy consumption for space heating in winter can also be gauged from the amount of hot water supplied through the pipes for underfloor heating in each unit.
In addition to energy consumption, the amount of energy produced from the PV system was also monitored. Energy production from the PV can be assessed through real time data as well as daily, monthly and yearly data.
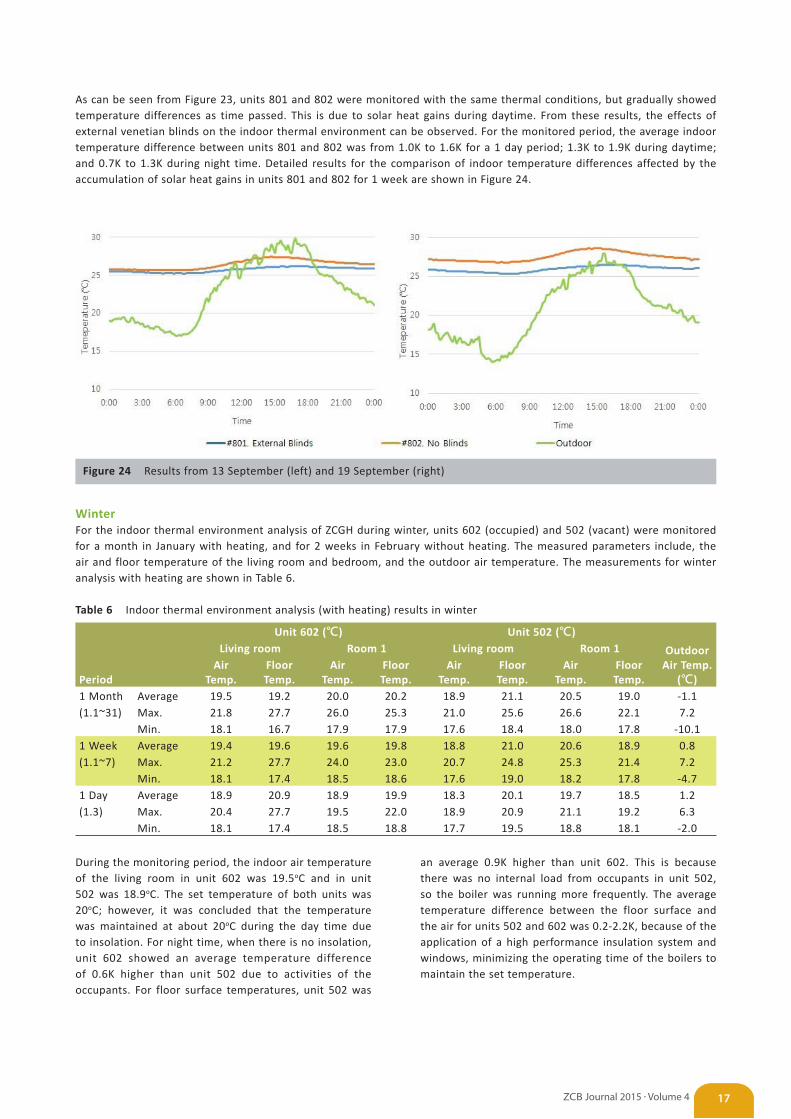
Moreover, the indoor thermal environment of units in ZCGH were monitored in both summer and winter. A number of temperature sensors and data loggers were installed to measure and record indoor and outdoor air temperatures, surface temperatures of floor, walls and ceiling, supply and return air temperature, etc. Figure 21 shows some of the temperature measurement points.
15ZCB Journal 2015 • Volume 4
Figure 21 Temperature measurement points
Since Korea has very distinct summer and winter seasons, it is crucial to adopt energy saving techniques suitable for this climate. The high performance external wall
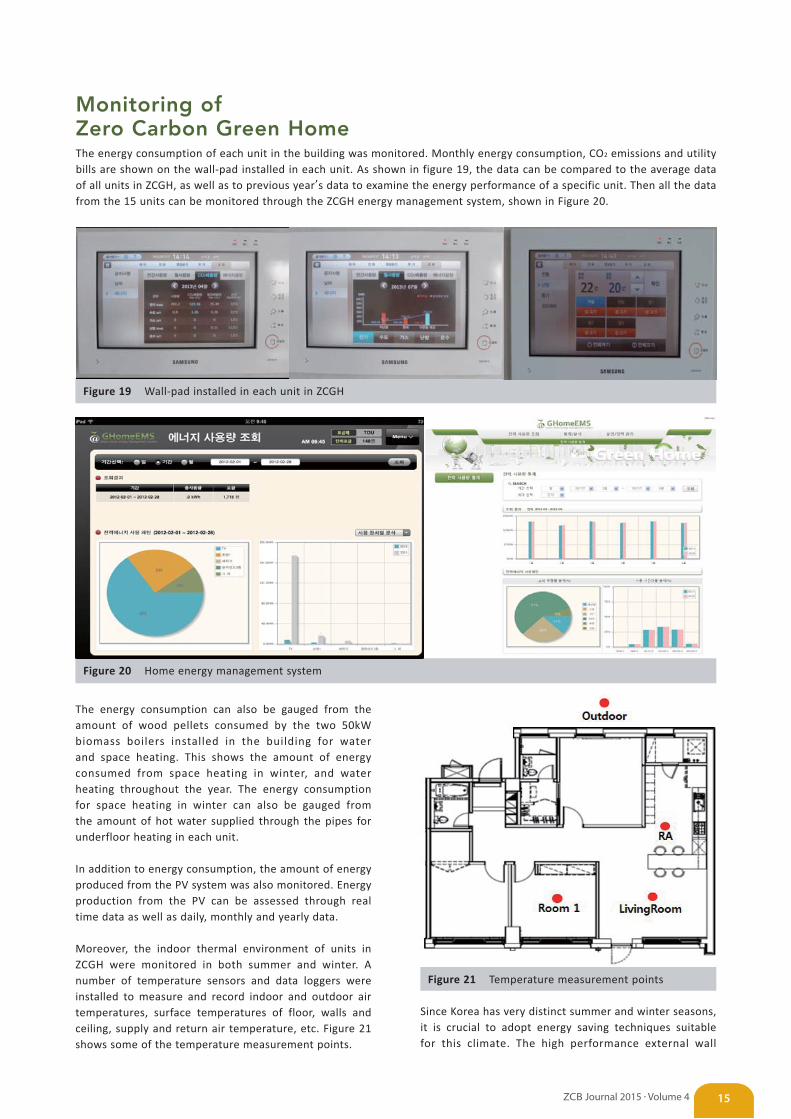
Monitoring of Zero Carbon Green HomeThe energy consumption of each unit in the building was monitored. Monthly energy consumption, CO2 emissions and utility bills are shown on the wall-pad installed in each unit. As shown in figure 19, the data can be compared to the average data of all units in ZCGH, as well as to previous year’s data to examine the energy performance of a specific unit. Then all the data from the 15 units can be monitored through the ZCGH energy management system, shown in Figure 20.
Figure 19 Wall-pad installed in each unit in ZCGH
Figure 20 Home energy management system
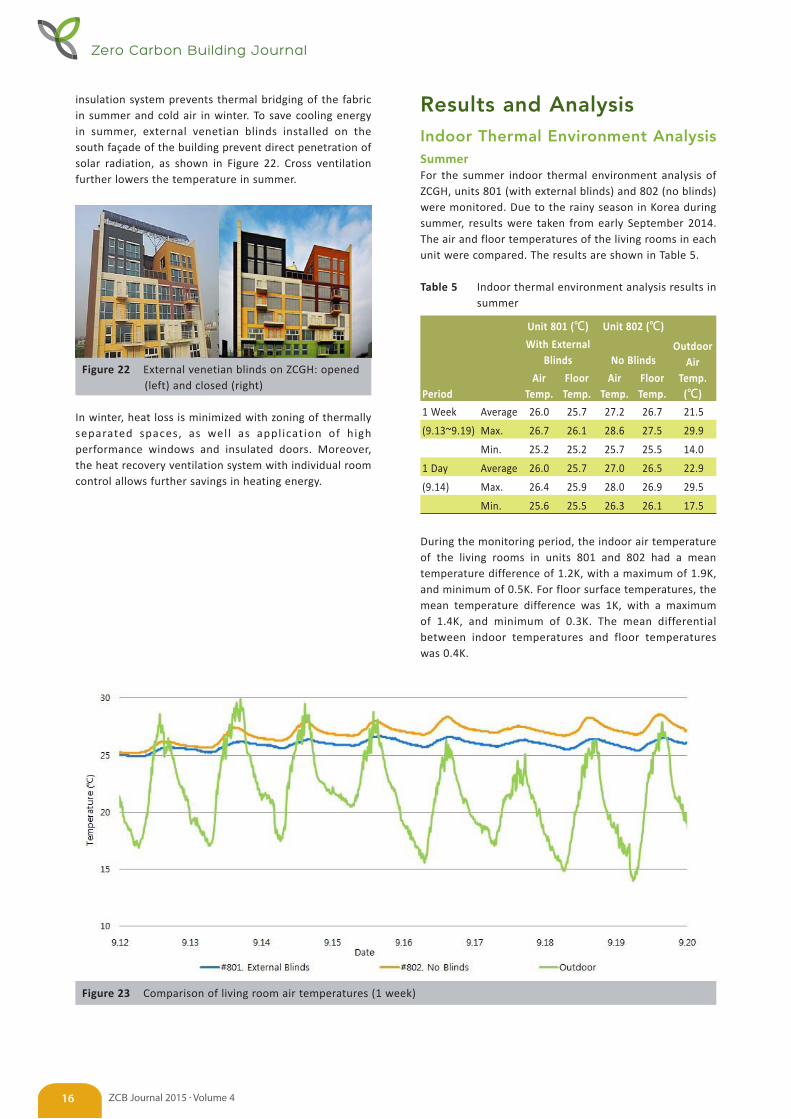
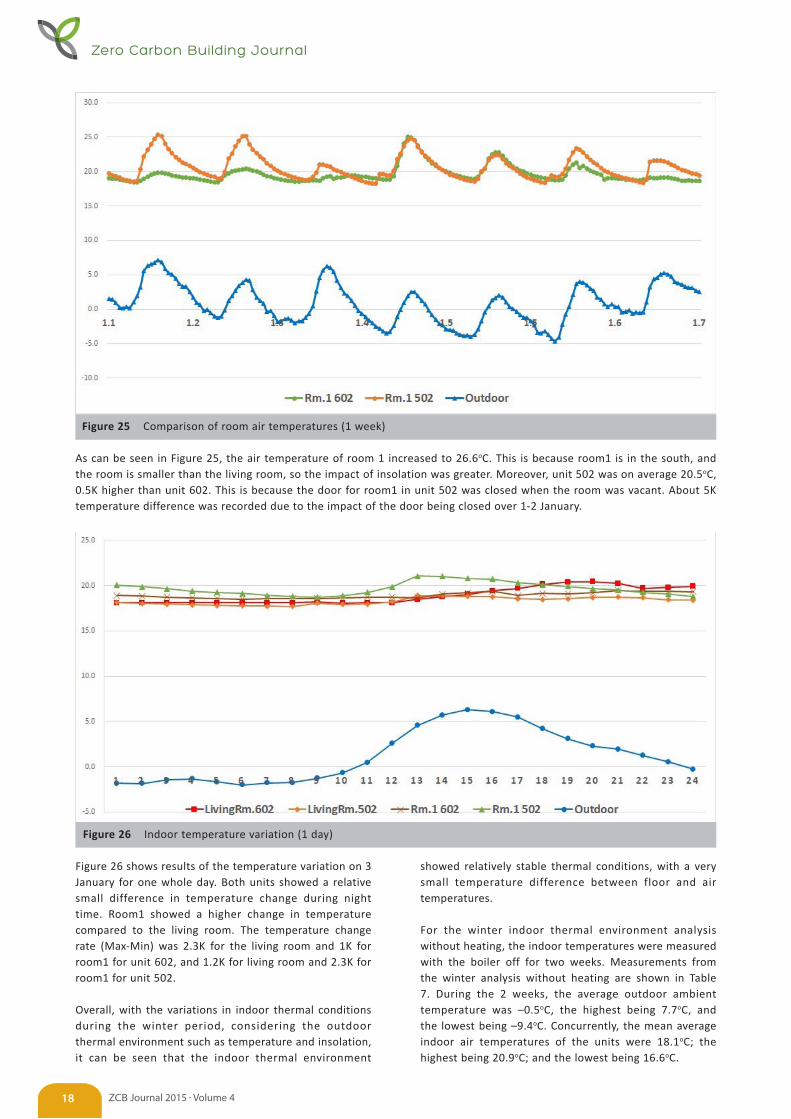
Figure 23 Comparison of living room air temperatures (1 week)
insulation system prevents thermal bridging of the fabric in summer and cold air in winter. To save cooling energy in summer, external venetian blinds installed on the south façade of the building prevent direct penetration of solar radiation, as shown in Figure 22. Cross ventilation further lowers the temperature in summer.
Figure 22 External venetian blinds on ZCGH: opened (left) and closed (right)
In winter, heat loss is minimized with zoning of thermally separated spaces, as wel l as appl ication of high performance windows and insulated doors. Moreover, the heat recovery ventilation system with individual room control allows further savings in heating energy.
Results and AnalysisIndoor Thermal Environment AnalysisSummer For the summer indoor thermal environment analysis of ZCGH, units 801 (with external blinds) and 802 (no blinds) were monitored. Due to the rainy season in Korea during summer, results were taken from early September 2014. The air and floor temperatures of the living rooms in each unit were compared. The results are shown in Table 5.
Table 5 Indoor thermal environment analysis results in summer
Period
Unit 801 (℃) Unit 802 (℃)
Outdoor Air
Temp. (℃)
With External Blinds No Blinds
Air Temp.
Floor Temp.
Air Temp.
Floor Temp.
1 Week Average 26.0 25.7 27.2 26.7 21.5
(9.13~9.19) Max. 26.7 26.1 28.6 27.5 29.9
Min. 25.2 25.2 25.7 25.5 14.0
1 Day Average 26.0 25.7 27.0 26.5 22.9
(9.14) Max. 26.4 25.9 28.0 26.9 29.5
Min. 25.6 25.5 26.3 26.1 17.5
During the monitoring period, the indoor air temperature of the living rooms in units 801 and 802 had a mean temperature difference of 1.2K, with a maximum of 1.9K, and minimum of 0.5K. For floor surface temperatures, the mean temperature difference was 1K, with a maximum of 1.4K, and minimum of 0.3K. The mean differential between indoor temperatures and floor temperatures was 0.4K.
Zero Carbon Building Journal
ZCB Journal 2015 • Volume 416
As can be seen from Figure 23, units 801 and 802 were monitored with the same thermal conditions, but gradually showed temperature differences as time passed. This is due to solar heat gains during daytime. From these results, the effects of external venetian blinds on the indoor thermal environment can be observed. For the monitored period, the average indoor temperature difference between units 801 and 802 was from 1.0K to 1.6K for a 1 day period; 1.3K to 1.9K during daytime; and 0.7K to 1.3K during night time. Detailed results for the comparison of indoor temperature differences affected by the accumulation of solar heat gains in units 801 and 802 for 1 week are shown in Figure 24.
Figure 24 Results from 13 September (left) and 19 September (right)
17ZCB Journal 2015 • Volume 4
WinterFor the indoor thermal environment analysis of ZCGH during winter, units 602 (occupied) and 502 (vacant) were monitored for a month in January with heating, and for 2 weeks in February without heating. The measured parameters include, the air and floor temperature of the living room and bedroom, and the outdoor air temperature. The measurements for winter analysis with heating are shown in Table 6.
Table 6 Indoor thermal environment analysis (with heating) results in winter
Unit 602 (℃) Unit 502 (℃)
Outdoor Air Temp.
(℃)
Living room Room 1 Living room Room 1
PeriodAir
Temp.Floor Temp.
Air Temp.
Floor Temp.
Air Temp.
Floor Temp.
Air Temp.
Floor Temp.
1 Month Average 19.5 19.2 20.0 20.2 18.9 21.1 20.5 19.0 -1.1(1.1~31) Max. 21.8 27.7 26.0 25.3 21.0 25.6 26.6 22.1 7.2
Min. 18.1 16.7 17.9 17.9 17.6 18.4 18.0 17.8 -10.11 Week Average 19.4 19.6 19.6 19.8 18.8 21.0 20.6 18.9 0.8(1.1~7) Max. 21.2 27.7 24.0 23.0 20.7 24.8 25.3 21.4 7.2
Min. 18.1 17.4 18.5 18.6 17.6 19.0 18.2 17.8 -4.71 Day Average 18.9 20.9 18.9 19.9 18.3 20.1 19.7 18.5 1.2(1.3) Max. 20.4 27.7 19.5 22.0 18.9 20.9 21.1 19.2 6.3
Min. 18.1 17.4 18.5 18.8 17.7 19.5 18.8 18.1 -2.0
During the monitoring period, the indoor air temperature of the living room in unit 602 was 19.5oC and in unit 502 was 18.9oC. The set temperature of both units was 20oC; however, it was concluded that the temperature was maintained at about 20oC during the day time due to insolation. For night time, when there is no insolation, unit 602 showed an average temperature difference of 0.6K higher than unit 502 due to activities of the occupants. For floor surface temperatures, unit 502 was
an average 0.9K higher than unit 602. This is because there was no internal load from occupants in unit 502, so the boiler was running more frequently. The average temperature difference between the floor surface and the air for units 502 and 602 was 0.2-2.2K, because of the application of a high performance insulation system and windows, minimizing the operating time of the boilers to maintain the set temperature.
Zero Carbon Building Journal
ZCB Journal 2015 • Volume 418
Figure 25 Comparison of room air temperatures (1 week)
As can be seen in Figure 25, the air temperature of room 1 increased to 26.6oC. This is because room1 is in the south, and the room is smaller than the living room, so the impact of insolation was greater. Moreover, unit 502 was on average 20.5oC, 0.5K higher than unit 602. This is because the door for room1 in unit 502 was closed when the room was vacant. About 5K temperature difference was recorded due to the impact of the door being closed over 1-2 January.
Figure 26 Indoor temperature variation (1 day)
Figure 26 shows results of the temperature variation on 3 January for one whole day. Both units showed a relative small difference in temperature change during night time. Room1 showed a higher change in temperature compared to the living room. The temperature change rate (Max-Min) was 2.3K for the living room and 1K for room1 for unit 602, and 1.2K for living room and 2.3K for room1 for unit 502.
Overall, with the variations in indoor thermal conditions during the winter period, considering the outdoor thermal environment such as temperature and insolation, it can be seen that the indoor thermal environment
showed relatively stable thermal conditions, with a very small temperature difference between floor and air temperatures.
For the winter indoor thermal environment analysis without heating, the indoor temperatures were measured with the boiler off for two weeks. Measurements from the winter analysis without heating are shown in Table 7. During the 2 weeks, the average outdoor ambient temperature was –0.5oC, the highest being 7.7oC, and the lowest being –9.4oC. Concurrently, the mean average indoor air temperatures of the units were 18.1oC; the highest being 20.9oC; and the lowest being 16.6oC.
19ZCB Journal 2015 • Volume 4
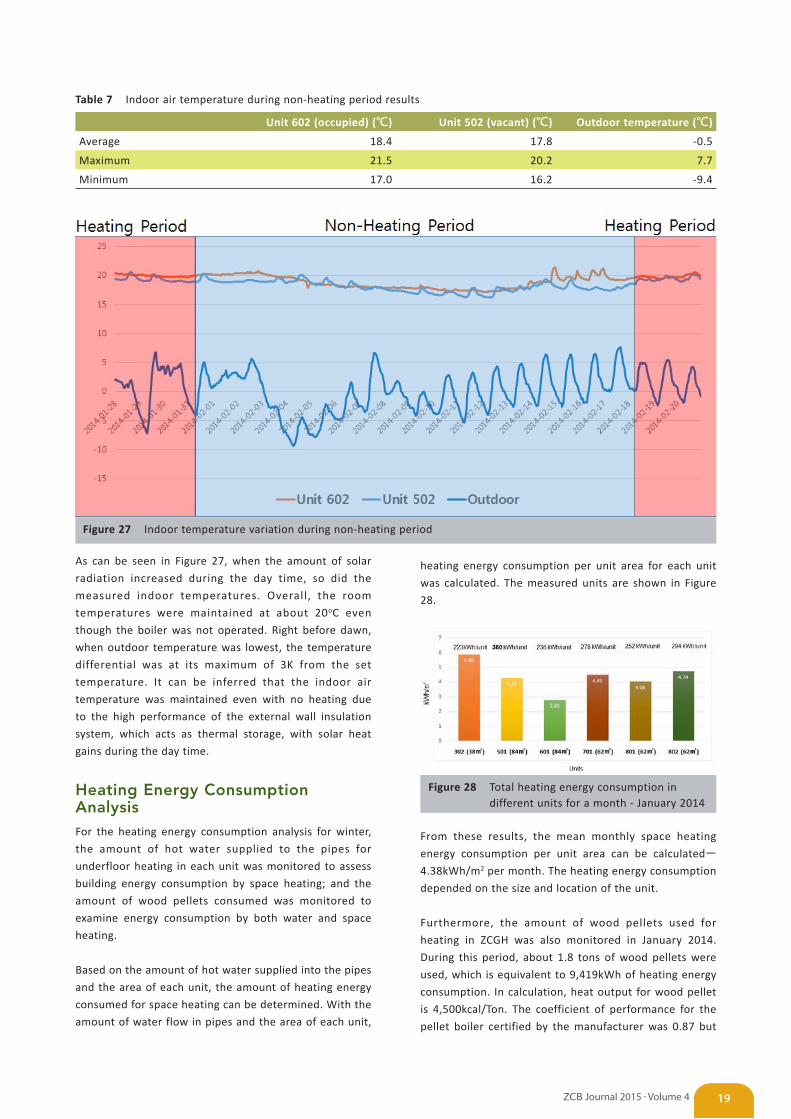
Table 7 Indoor air temperature during non-heating period results
Unit 602 (occupied) (℃) Unit 502 (vacant) (℃) Outdoor temperature (℃)
Average 18.4 17.8 -0.5
Maximum 21.5 20.2 7.7
Minimum 17.0 16.2 -9.4
Figure 27 Indoor temperature variation during non-heating period
As can be seen in Figure 27, when the amount of solar
radiation increased during the day time, so did the
measured indoor temperatures. Overall, the room
temperatures were maintained at about 20oC even
though the boiler was not operated. Right before dawn,
when outdoor temperature was lowest, the temperature
differential was at its maximum of 3K from the set
temperature. It can be inferred that the indoor air
temperature was maintained even with no heating due
to the high performance of the external wall insulation
system, which acts as thermal storage, with solar heat
gains during the day time.
Heating Energy Consumption AnalysisFor the heating energy consumption analysis for winter,
the amount of hot water supplied to the pipes for
underfloor heating in each unit was monitored to assess
building energy consumption by space heating; and the
amount of wood pellets consumed was monitored to
examine energy consumption by both water and space
heating.
Based on the amount of hot water supplied into the pipes
and the area of each unit, the amount of heating energy
consumed for space heating can be determined. With the
amount of water flow in pipes and the area of each unit,
heating energy consumption per unit area for each unit
was calculated. The measured units are shown in Figure
28.
Figure 28 Total heating energy consumption in different units for a month - January 2014
From these results, the mean monthly space heating
energy consumption per unit area can be calculated―
4.38kWh/m2 per month. The heating energy consumption
depended on the size and location of the unit.
Furthermore, the amount of wood pellets used for
heating in ZCGH was also monitored in January 2014.
During this period, about 1.8 tons of wood pellets were
used, which is equivalent to 9,419kWh of heating energy
consumption. In calculation, heat output for wood pellet
is 4,500kcal/Ton. The coefficient of performance for the
pellet boiler certified by the manufacturer was 0.87 but
Zero Carbon Building Journal
ZCB Journal 2015 • Volume 420
0.8 was used. The loss rate for distribution in pipes was
assumed to be 10%. This equates to mean heating energy
consumption of 10.4kWh/m2 per month for the 15 units.
This means that during the winter heating period from
December through February, each unit consumed about
1,689kWh per annum―equivalent to 320kg of wood
pellets per year. This is only about 20% of the annual
energy consumption of a comparable conventional
apartment. A comparison of the amount of heating
energy consumption in ZCGH with that of conventional
apartments is shown in Table 8.
Table 8 Heating energy consumption comparison with conventional apartment buildings
Energy Consumption
(kWh/unit∙year) Notes
Conventional apartments
9,088 Gas (LNG) boiler
Zero Carbon Green Home
1,689 Pellet boiler (Dec.-Feb.)
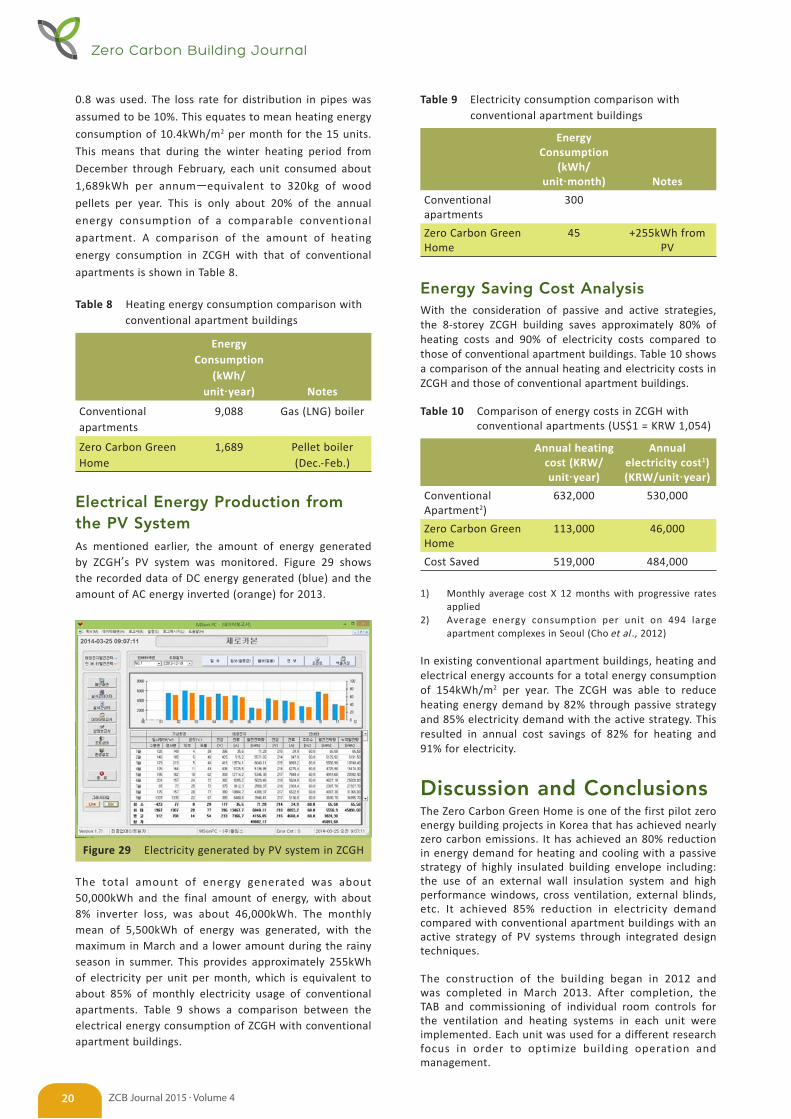
Electrical Energy Production from the PV SystemAs mentioned earlier, the amount of energy generated by ZCGH’s PV system was monitored. Figure 29 shows the recorded data of DC energy generated (blue) and the amount of AC energy inverted (orange) for 2013.
Figure 29 Electricity generated by PV system in ZCGH
The total amount of energy generated was about 50,000kWh and the final amount of energy, with about 8% inverter loss, was about 46,000kWh. The monthly mean of 5,500kWh of energy was generated, with the maximum in March and a lower amount during the rainy season in summer. This provides approximately 255kWh of electricity per unit per month, which is equivalent to about 85% of monthly electricity usage of conventional apartments. Table 9 shows a comparison between the electrical energy consumption of ZCGH with conventional apartment buildings.
Table 9 Electricity consumption comparison with conventional apartment buildings
Energy Consumption
(kWh/unit∙month) Notes
Conventional apartments
300
Zero Carbon Green Home
45 +255kWh from PV
Energy Saving Cost AnalysisWith the consideration of passive and active strategies, the 8-storey ZCGH building saves approximately 80% of heating costs and 90% of electricity costs compared to those of conventional apartment buildings. Table 10 shows a comparison of the annual heating and electricity costs in ZCGH and those of conventional apartment buildings.
Table 10 Comparison of energy costs in ZCGH with conventional apartments (US$1 = KRW 1,054)
Annual heating cost (KRW/unit∙year)
Annual electricity cost1) (KRW/unit∙year)
Conventional Apartment2)
632,000 530,000
Zero Carbon Green Home
113,000 46,000
Cost Saved 519,000 484,000
1) Monthly average cost X 12 months with progressive rates applied
2) Average energy consumption per unit on 494 large apartment complexes in Seoul (Cho et al ., 2012)
In existing conventional apartment buildings, heating and electrical energy accounts for a total energy consumption of 154kWh/m2 per year. The ZCGH was able to reduce heating energy demand by 82% through passive strategy and 85% electricity demand with the active strategy. This resulted in annual cost savings of 82% for heating and 91% for electricity.
Discussion and ConclusionsThe Zero Carbon Green Home is one of the first pilot zero energy building projects in Korea that has achieved nearly zero carbon emissions. It has achieved an 80% reduction in energy demand for heating and cooling with a passive strategy of highly insulated building envelope including: the use of an external wall insulation system and high performance windows, cross ventilation, external blinds, etc. It achieved 85% reduction in electricity demand compared with conventional apartment buildings with an active strategy of PV systems through integrated design techniques.
The construction of the building began in 2012 and was completed in March 2013. After completion, the TAB and commissioning of individual room controls for the ventilation and heating systems in each unit were implemented. Each unit was used for a different research focus in order to optimize building operation and management.
21ZCB Journal 2015 • Volume 4
The indoor thermal environment of ZCGH was monitored and evaluated in both summer and winter. In summer, the effect of direct solar heat gains was evaluated through the application of automated external venetian blinds installed on the building’s south façade. The mean temperature difference of 1.2K was calculated from indoor air temperatures in the units with and without external blinds; and the average indoor temperature difference between units varied from 1.0K to 1.6K for 1 day period; 1.3K to 1.9K during day time; and 0.7K to 1.3K during night time. In winter, the indoor thermal environment was monitored for two conditions: with and without heating. With heating, the mean indoor air temperature was 19.2oC, with a maximum of 21.8oC, and a minimum of 17.6oC. With no heating, the mean average indoor air temperature was 18.1oC; with a maximum of 20.9oC; and a minimum of 16.6oC. It is concluded that the indoor air temperature was maintained due to the highly insulated building envelope acting as a thermal storage, and with solar heat gains during the day.
Heating energy consumption of ZCGH was monitored through the volume of hot water flow in pipes for underfloor heating and the amount of wood pellets used for the biomass boilers. From the hot water flow in underfloor heating pipes, a mean monthly heating energy consumption per unit area of 4.38kWh/m2 per month was calculated. From the amount of wood pellets used in winter, a mean heating energy consumption of 10.4kWh/m2 per month was calculated, which is equivalent to about 1,689kWh per annum for all 15 units. This equates to 20% of the annual energy consumption of a conventional apartment. In other words, an 80% reduction in heating energy consumption for ZCGH was achieved.
For energy production, the amount of electricity generated from the PV system has been monitored through the PV control system. The total amount of energy generated, after 8% inverter loss, was about 46,000kWh. This provides approximately 255kWh of electricity per unit per month, which is equivalent to about 85% of monthly electricity usage of conventional apartments. Hence the target to reduce electricity consumption was achieved.
Finally, an economic analysis of the annual heating and electricity costs saved was conducted. With the integration of passive and active design strategies, ZCGH achieved the goal of an 80% reduction in heating energy consumption and 85% in electricity consumption. This resulted in annual cost savings of 82% in heating and 91% in electricity.
In conclusion, this project serves as a prototype for future zero energy building projects on high-rise buildings, and provides fundamental data for design appropriate for passive apartment buildings. This further aids in promoting the adoption of zero carbon homes in Korea for a more sustainable residential building environment in the near future.
AcknowledgementsThis study was part of “Establishment and Technology Realization of Zero Carbon Green Home,” one of many KICT’s projects funded by the Korea government.
ReferencesAIA (2007) Integrated Project Delivery: A Guide, Version 1 .
The American institute of Architects, California, (available at : http://www.aia.org /groups/aia/documents/pdf/aiab083423.pdf).
Cho, D.W. (2012) The Study on the Operation for the Energy Consumption Certificate , Korea Institute of Construction Technology, Korea.
Cho, D.W., Yu, J.Y., and Shin, S.E. (2012) Annual Report of Zero Carbon Green Home Development (3rd year) , Industrial Technology Research Group, Korea.
Cho, D.W., Yu, J.Y., Jung, J.W. and Paik, J.H (2014) Infrastructure establishment & practical application for Zero Carbon Green Home , Korea Institute of Construction Technology, Korea.
IEA & UNEP (2013) Modernising building energy codes . I nte r n at i o n a l E n e rg y A ge n c y a n d U n i te d N at i o n s Environment Programs, Paris, (avai lable at: http://www.iea.org/publications/freepublications/publication/PolicyPathwaysModernisingBuildingEnergyCodes.pdf).
iiSBE (2003) The Integrated Design Process . International Initiative for a Sustainable Built Environment, Ontario, Canada, (available at: http://www.iisbe.org/down/gbc2005/Other_presentations/IDP_overview.pdf).
Korea Energy Economics Institute (2011) Energy Consumption Survey , Ulsan, Korea, (available at: http://www.keei.re.kr/main.nsf/index_en.html).
Ministry of Land, Infrastructure and Transport (2012) National Building Energy Integration Management System Statistics Data , Sejong-si, Korea, (available at: http://www.molit.go.kr/portal.do).
Min i st ry o f Land, Inf rast ructure and Transport (2013) Infrastructure and Transport, Land & Transport Report , Sejong-si, Korea, (available at: http://www.molit.go.kr/portal.do).
Statistics Korea (2010) Population and Housing Census , Daejeon, Korea, (available at: http://kostat.go.kr/portal/eng /surveyOutline/8/5/index.static).
The Pres ident ia l Committee on Green Growth (2009) Revitalization of Green City Buildings , Sejong-si, Korea, (available at: http://www.greengrowth.go.kr/main/search.do).
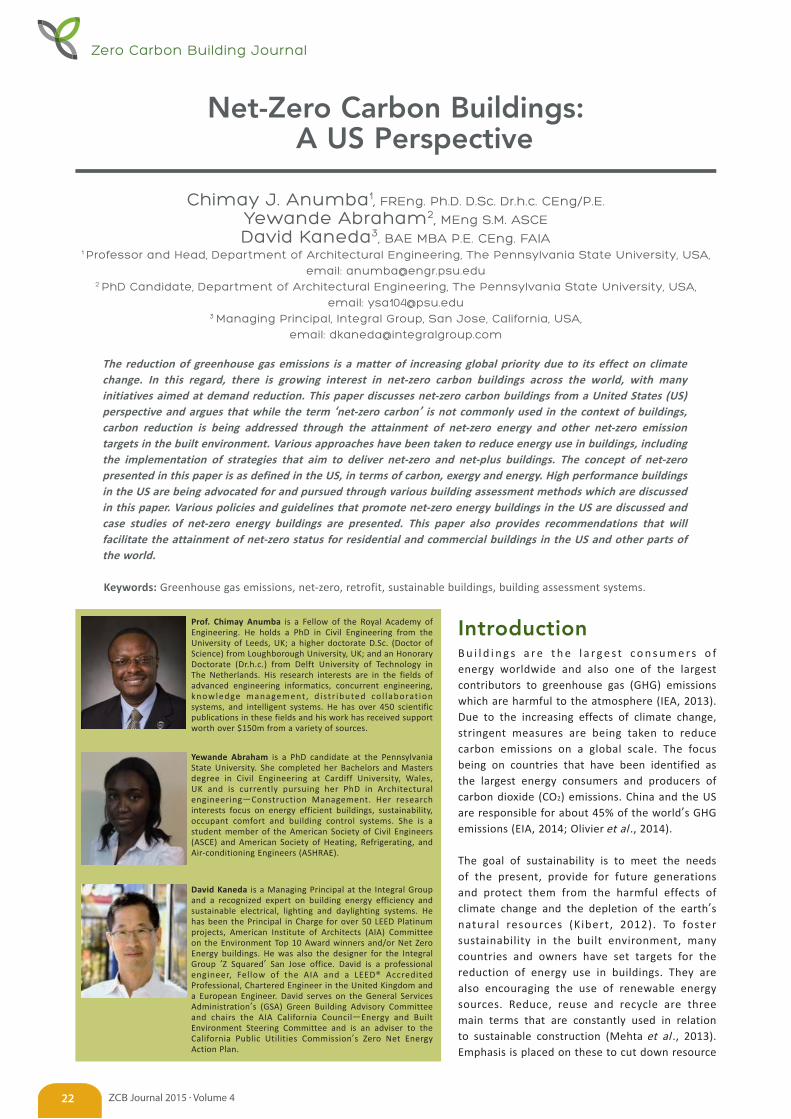
Prof. Chimay Anumba is a Fellow of the Royal Academy of Engineering. He holds a PhD in Civil Engineering from the University of Leeds, UK; a higher doctorate D.Sc. (Doctor of Science) from Loughborough University, UK; and an Honorary Doctorate (Dr.h.c.) from Delft University of Technology in The Netherlands. His research interests are in the fields of advanced engineering informatics, concurrent engineering, knowledge management , d ist r ibuted co l laborat ion systems, and intelligent systems. He has over 450 scientific publications in these fields and his work has received support worth over $150m from a variety of sources.
Yewande Abraham is a PhD candidate at the Pennsylvania State University. She completed her Bachelors and Masters degree in Civil Engineering at Cardiff University, Wales, UK and is currently pursuing her PhD in Architectural engineering―Construction Management. Her research interests focus on energy efficient buildings, sustainability, occupant comfort and building control systems. She is a student member of the American Society of Civil Engineers (ASCE) and American Society of Heating, Refrigerating, and Air-conditioning Engineers (ASHRAE).
David Kaneda is a Managing Principal at the Integral Group and a recognized expert on building energy efficiency and sustainable electrical, lighting and daylighting systems. He has been the Principal in Charge for over 50 LEED Platinum projects, American Institute of Architects (AIA) Committee on the Environment Top 10 Award winners and/or Net Zero Energy buildings. He was also the designer for the Integral Group ‘Z Squared’ San Jose office. David is a professional engineer, Fellow of the AIA and a LEED® Accredited Professional, Chartered Engineer in the United Kingdom and a European Engineer. David serves on the General Services Administration’s (GSA) Green Building Advisory Committee and chairs the AIA California Council―Energy and Built Environment Steering Committee and is an adviser to the California Public Utilities Commission’s Zero Net Energy Action Plan.
Net-Zero Carbon Buildings: A US Perspective
The reduction of greenhouse gas emissions is a matter of increasing global priority due to its effect on climate change. In this regard, there is growing interest in net-zero carbon buildings across the world, with many initiatives aimed at demand reduction. This paper discusses net-zero carbon buildings from a United States (US) perspective and argues that while the term ‘net-zero carbon’ is not commonly used in the context of buildings, carbon reduction is being addressed through the attainment of net-zero energy and other net-zero emission targets in the built environment. Various approaches have been taken to reduce energy use in buildings, including the implementation of strategies that aim to deliver net-zero and net-plus buildings. The concept of net-zero presented in this paper is as defined in the US, in terms of carbon, exergy and energy. High performance buildings in the US are being advocated for and pursued through various building assessment methods which are discussed in this paper. Various policies and guidelines that promote net-zero energy buildings in the US are discussed and case studies of net-zero energy buildings are presented. This paper also provides recommendations that will facilitate the attainment of net-zero status for residential and commercial buildings in the US and other parts of the world.
Keywords: Greenhouse gas emissions, net-zero, retrofit, sustainable buildings, building assessment systems.
IntroductionB u i l d i n g s a r e t h e l a r g e s t c o n s u m e r s o f energy worldwide and also one of the largest contributors to greenhouse gas (GHG) emissions which are harmful to the atmosphere (IEA, 2013). Due to the increasing effects of climate change, stringent measures are being taken to reduce carbon emissions on a global scale. The focus being on countries that have been identified as the largest energy consumers and producers of carbon dioxide (CO2) emissions. China and the US are responsible for about 45% of the world’s GHG emissions (EIA, 2014; Olivier et al ., 2014).
The goal of sustainability is to meet the needs of the present, provide for future generations and protect them from the harmful effects of climate change and the depletion of the earth’s natural resources (Kibert, 2012). To foster sustainability in the built environment, many countries and owners have set targets for the reduction of energy use in buildings. They are also encouraging the use of renewable energy sources. Reduce, reuse and recycle are three main terms that are constantly used in relation to sustainable construction (Mehta et al ., 2013). Emphasis is placed on these to cut down resource
Chimay J. Anumba1, FREng. Ph.D. D.Sc. Dr.h.c. CEng/P.E.
Yewande Abraham2, MEng S.M. ASCE
David Kaneda3, BAE MBA P.E. CEng. FAIA1 Professor and Head, Department of Architectural Engineering, The Pennsylvania State University, USA,
email: [email protected] 2 PhD Candidate, Department of Architectural Engineering, The Pennsylvania State University, USA,
email: [email protected] Managing Principal, Integral Group, San Jose, California, USA,
email: [email protected]
Zero Carbon Building Journal
ZCB Journal 2015 • Volume 422
use and lower building energy consumption, reduce the associated carbon emissions, and minimize resource wastage through sustainable design and construction (Mehta et al ., 2013).
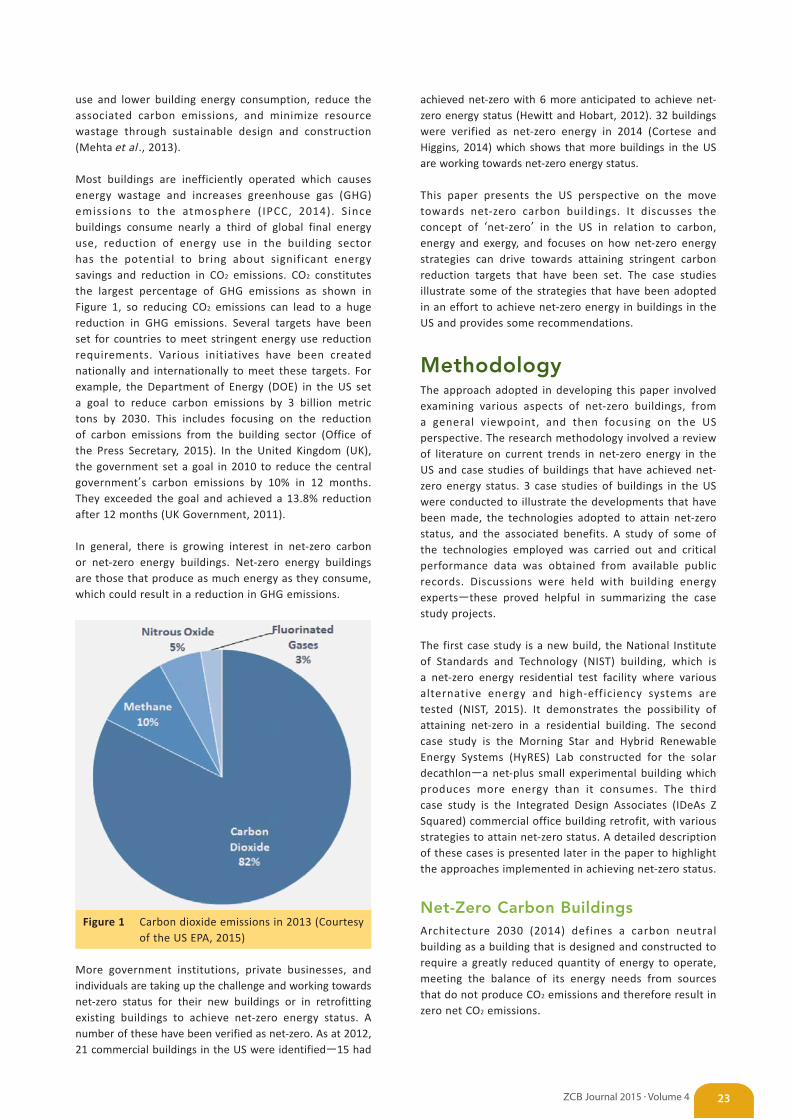
Most buildings are inefficiently operated which causes energy wastage and increases greenhouse gas (GHG) emissions to the atmosphere ( IPCC, 2014). Since buildings consume nearly a third of global final energy use, reduction of energy use in the building sector has the potential to bring about significant energy savings and reduction in CO2 emissions. CO2 constitutes the largest percentage of GHG emissions as shown in Figure 1, so reducing CO2 emissions can lead to a huge reduction in GHG emissions. Several targets have been set for countries to meet stringent energy use reduction requirements. Various initiatives have been created nationally and internationally to meet these targets. For example, the Department of Energy (DOE) in the US set a goal to reduce carbon emissions by 3 billion metric tons by 2030. This includes focusing on the reduction of carbon emissions from the building sector (Office of the Press Secretary, 2015). In the United Kingdom (UK), the government set a goal in 2010 to reduce the central government’s carbon emissions by 10% in 12 months. They exceeded the goal and achieved a 13.8% reduction after 12 months (UK Government, 2011).
In general, there is growing interest in net-zero carbon or net-zero energy buildings. Net-zero energy buildings are those that produce as much energy as they consume, which could result in a reduction in GHG emissions.
Figure 1 Carbon dioxide emissions in 2013 (Courtesy of the US EPA, 2015)
More government institutions, private businesses, and individuals are taking up the challenge and working towards net-zero status for their new buildings or in retrofitting existing buildings to achieve net-zero energy status. A number of these have been verified as net-zero. As at 2012, 21 commercial buildings in the US were identified―15 had
achieved net-zero with 6 more anticipated to achieve net-zero energy status (Hewitt and Hobart, 2012). 32 buildings were verified as net-zero energy in 2014 (Cortese and Higgins, 2014) which shows that more buildings in the US are working towards net-zero energy status.
This paper presents the US perspective on the move towards net-zero carbon buildings. It discusses the concept of ‘net-zero’ in the US in relation to carbon, energy and exergy, and focuses on how net-zero energy strategies can drive towards attaining stringent carbon reduction targets that have been set. The case studies illustrate some of the strategies that have been adopted in an effort to achieve net-zero energy in buildings in the US and provides some recommendations.
MethodologyThe approach adopted in developing this paper involved examining various aspects of net-zero buildings, from a general viewpoint, and then focusing on the US perspective. The research methodology involved a review of literature on current trends in net-zero energy in the US and case studies of buildings that have achieved net-zero energy status. 3 case studies of buildings in the US were conducted to illustrate the developments that have been made, the technologies adopted to attain net-zero status, and the associated benefits. A study of some of the technologies employed was carried out and critical performance data was obtained from available public records. Discussions were held with building energy experts―these proved helpful in summarizing the case study projects.
The first case study is a new build, the National Institute of Standards and Technology (NIST) building, which is a net-zero energy residential test facility where various alternative energy and high-efficiency systems are tested (NIST, 2015). It demonstrates the possibility of attaining net-zero in a residential building. The second case study is the Morning Star and Hybrid Renewable Energy Systems (HyRES) Lab constructed for the solar decathlon―a net-plus small experimental building which produces more energy than it consumes. The third case study is the Integrated Design Associates (IDeAs Z Squared) commercial office building retrofit, with various strategies to attain net-zero status. A detailed description of these cases is presented later in the paper to highlight the approaches implemented in achieving net-zero status.
Net-Zero Carbon BuildingsArchitecture 2030 (2014) defines a carbon neutral building as a building that is designed and constructed to require a greatly reduced quantity of energy to operate, meeting the balance of its energy needs from sources that do not produce CO2 emissions and therefore result in zero net CO2 emissions.
23ZCB Journal 2015 • Volume 4
One of the foremost proponents for carbon neutral buildings in the US is Architecture 2030―a US based environmental advocacy group. They created the 2030 challenge in 2006 for the reduction of GHG (mainly carbon) emissions. The 2030 challenge focuses on new buildings and major renovations to existing buildings in order to reduce their fossil fuel and GHG-emitting energy. For example, they recommend that new buildings should be designed to reduce site energy use intensity to 70% by 2016, 80% by 2020, 90% by 2025 and to be carbon neutral by 2030 (Architecture 2030, 2014). Although these targets seem ambitious, they are increasingly adopted by individuals, and organizations in the local, state and federal government sectors of the US (Architecture 2030, 2014).
While the US does not typically consider net-zero carbon emissions in isolation, there has been increasing use of this terminology, and net-zero carbon may be incorporated in efforts to reduce GHG emissions in the US (Cushman Jr, 2015). The approach widely adopted in the US focuses more on net-zero energy buildings―a term which is defined in the following section.
Net-Zero Energy BuildingsNet-zero energy buildings can be defined in several ways. Generally, they are defined as buildings that use renewable energy onsite, and which generates as much energy as is used by the building (IPCC, 2014; Torcellini et al ., 2006). The Energy Independence and Security Act (EISA) (2007) defines a net-zero energy commercial building as one that is ‘designed, constructed and operated to require greatly reduced quantity of energy to operate; meet the balance of energy needs from sources of energy that do not produce greenhouse gases; therefore result in no net emissions of greenhouse gases and be economically viable’ (EISA, 2007).
Other definitions of net-zero energy buildings based on energy use are presented according to Torcellini et al . (2006). Net-zero site energy is defined as a situation where the building produces as much energy as it uses in a year accounted for at the site. Net-zero source energy is where the building produces as much energy as it uses in a year when accounted for at the source. In the case of net-zero energy costs, the utility pays the building owner for the energy the building exports to the grid, and that cost is equal to what the owner would pay the utility. A net-zero energy emissions building produces as much emissions free renewable energy as it uses from emissions producing energy sources. Torcellini et al . (2006) stated that the applicable net-zero energy definition will be determined by what the energy source is doing.
In reducing building energy use to attain net-zero, transportation/commuting energy use during and after construction should be minimized (Kibert, 2012). This factor is considered in most high performance green building assessment systems. Another important
consideration in the reduction of building energy consumption is embodied energy. Embodied energy is the energy used for producing building materials and products in construction (Mehta et al ., 2013). It is the amount of energy used to obtain raw materials and convert them to finished products.
Hernandez and Kenny (2010) proposed a definition of life cycle net-zero energy buildings, which includes the embodied energy, and annual energy use of the building. From previous definitions, a net zero energy building is defined as having an energy balance in building connection to the grid with the energy generated from renewable sources. They define a life cycle net-zero energy building as one where the energy used in operating the building plus the embodied energy accrued over the life cycle of the building is equal to or less than the energy produced from the use of renewable energy (Hernandez and Kenny, 2010).
Marszal et al . (2011) listed some other factors that should be taken into consideration in the definition of net-zero energy buildings such as the metric of the energy balance, the balancing period, the type of energy balance, and connection to the energy infrastructure.
In the US, the EISA report outlines the goal for the net-zero energy commercial buildings initiative which states that technologies, practices and policies should be created for the development of zero net-energy commercial buildings. These should be disseminated for all newly constructed commercial buildings by 2030, 50% of the commercial building stock by 2040, and all commercial buildings in the United States by 2050 (EISA, 2007).
The Federal government in the US has some laws in place for new federal buildings to achieve net-zero energy by 2020 (Executive Order #13514). The Department of Energy (DOE) Building Technologies Program has the goal of making commercial net-zero energy buildings marketable by 2025. In addition to these, there are other policies, laws and strategies that have been put in place in the US for net-zero energy buildings. These will be further discussed in the following sections.
Net-Zero Exergy BuildingsExergy is defined as the quality of energy or the ‘work potential of energy with respect to environmental conditions’ (De Meester et al. , 2009). Exergy to energy ratio is given by the Carnot factor. A net-zero exergy building is one that has a yearly zero exergy transfer across a building district boundary in a district energy system while energy transfer is taking place at a certain time (Kilkis, 2007). Kilkis (2007) further explained that a net-zero exergy building includes the complete impact of buildings on the environment and considers the quality of energy savings and energy use reduction. Studies show that using a simple net-zero energy building concept is inadequate and exergy should be considered to show the extent of the problem and create solutions for energy efficiency.
Zero Carbon Building Journal
ZCB Journal 2015 • Volume 424
Comparative Analysis of Net-Zero Energy and Net-Zero CarbonAlthough these two concepts drive towards reducing the harmful effects of increasing energy consumption and carbon emissions from buildings, they may not be used interchangeably as seen from the definitions. Net-zero energy is concerned with the balance of building energy use, which may also have an impact on emissions. Net-zero carbon is more concerned with the balance in carbon/CO2 emissions from a building. Net-zero carbon can be achieved through some of the net-zero energy strategies.
The following sections demonstrate how net-zero energy and net-zero carbon buildings are achieved in the US through various building assessment methods and case study examples.
Building Assessment Methods in the USBuilding assessment systems evaluate the performance of bui ldings according to some def ined metr ics. The metr ics, which are sometimes broken down into checklists or made more flexible and open to interpretation, are required to meet established criteria to attain certification. A ranking is awarded to a building according to how well it performs in comparison with the listed criteria. Some of the tools assess buildings holistically based on environmental, social and economic requirements (Kibert, 2012). These building assessment systems are instrumental in the design and construction of high performance buildings (Kibert, 2012).
A number of assessment systems exist in different countries. In the US, the main building assessment systems are Leadership in Energy and Environmental Design (LEED), Green Globes, and Living Building Challenge (LBC). Of these three, the most rigorous, stringent and challenging is the Living Building Challenge.
The LBC provides certification that covers all the petals and imperatives that provide guidance for meeting the petal requirements (Kibert, 2012). The petals are performance categories that are used to assess the building. Seven petals are used which include Place, Water, Energy, Health & Happiness, Materials, Equity and Beauty (LBC, 2015). The LBC allows partial certification in some petals. To achieve full certification, the building is required (amongst other things) to be net-zero energy and net-zero water with tracking of embodied energy, and material reuse (LBC, 2015). Although demanding, the LBC is achievable and pushes the boundaries for higher performance green buildings. In addition to minimizing environmental impacts and reducing energy use, the LBC encourages the creation of an environment and building that is educative and inspiring to visitors and users of the buildings. The LBC specifically recognizes and certifies buildings for net-zero energy achievement.
LEED was initiated by the US Green Building Council (USGBC) which was established in 1993 (Mehta et al ., 2013). LEED was formed in 1998 and has undergone several revisions and additions with the most recent version being LEED Version 4 (USGBC, 2015). It is the most widely used green building assessment system in the US. It awards certification at different levels with the base level being ‘LEED Certified’ and the highest level being ‘LEED Platinum’. While LEED is not as challenging as LBC and does not provide net-zero certification, it could provide a good starting point for achieving net-zero energy as a number of verified net-zero energy buildings have LEED Gold or Platunum certification (Cortese and Higgins, 2014).
Green Globes is an alternative building assessment system to LEED. It is more interactive and flexible than LEED (Kibert, 2012). Green Globes is also a more affordable green building certification. It differs from LEED in that it awards points for life-cycle assessment of building assemblies during the design process. It is increasingly adopted by industry. The rating system range from one globe to four globes (the highest certification).
LEED and Green Globes do not require a building to be net-zero energy to achieve the highest certification. As such, they are not as challenging as the LBC. While both recognize reduction in GHG emissions, they do not specifically require buildings to be net-zero carbon. These rating systems are applicable to new construction, retrofits, and different facilities including schools, offices, healthcare, and residential. Building assessment certifications should focus not only on initial recognition and short term energy savings but on energy efficiency and high performance throughout the lifecycle of the building.
Case StudiesA few case studies have been selected to demonstrate how net-zero energy has been achieved in new and retrofit projects in the US. New buildings provide a good opportunity to create energy efficient designs, taking into consideration various pertinent factors, to attain high performance buildings. There are also opportunities to select the most energy efficient technologies in the design phase that could lead to net-zero energy and net-zero carbon for new buildings. Deep retrofits also have the potential to deliver significant energy savings (IPCC, 2014) and could result in net-zero buildings. The case studies presented are based on published materials on the buildings, and in some cases, unstructured interviews with energy experts associated with the buildings.
25ZCB Journal 2015 • Volume 4
New Build: NIST Net-Zero Energy Residential Test Facility (NZERTF)The National Institute of Standards and Technology (NIST) had a 252m² test house built in 2013. The building is located in Gaithersburg, Maryland―a humid subtropical climate zone exhibiting four distinct seasons (Kottek et al ., 2006). It is a 4 bedroom, 3 bathroom residential test facility built to net-zero energy requirements (Figure 2). The all electric test house serves as a living space for a computer simulated virtual family of four and acts as a living laboratory. In addition to being air tight, nearly eliminating unintended air infiltration, the building has very low levels of volatile organic compounds in comparison with other new buildings (Bello, 2015). It also has excellent indoor air quality. The air tightness decreases energy consumption and reduces entry of contaminants into the house. The facility is equipped with a solar photovoltaic (PV) system and solar water heating (Bello, 2014).
Figure 2 NIST Net-Zero Energy Residential Test Facility (Courtesy of Hunter Fanney)
The NZERTF is highly energy efficient and has exceeded its goal, with excess energy to power an electric vehicle, and export to the local utility grid. The energy use intensity is about 70% more efficient than the average house in that location (Bello, 2014). Being a research facility, various technologies have been installed for further studies. The house has 3 different ground geothermal loops installed in different forms: a solar thermal system and air heat pump for domestic hot water; conventional and high-pressure air duct systems; and in-floor radiant heat loops (Healthy Indoors, 2015). The building is both net-zero energy and certified LEED Platinum―the highest USGBC certification for green buildings.
The technologies used in this facility can be adopted in different parts of the world, particularly for locations with a similar climate.
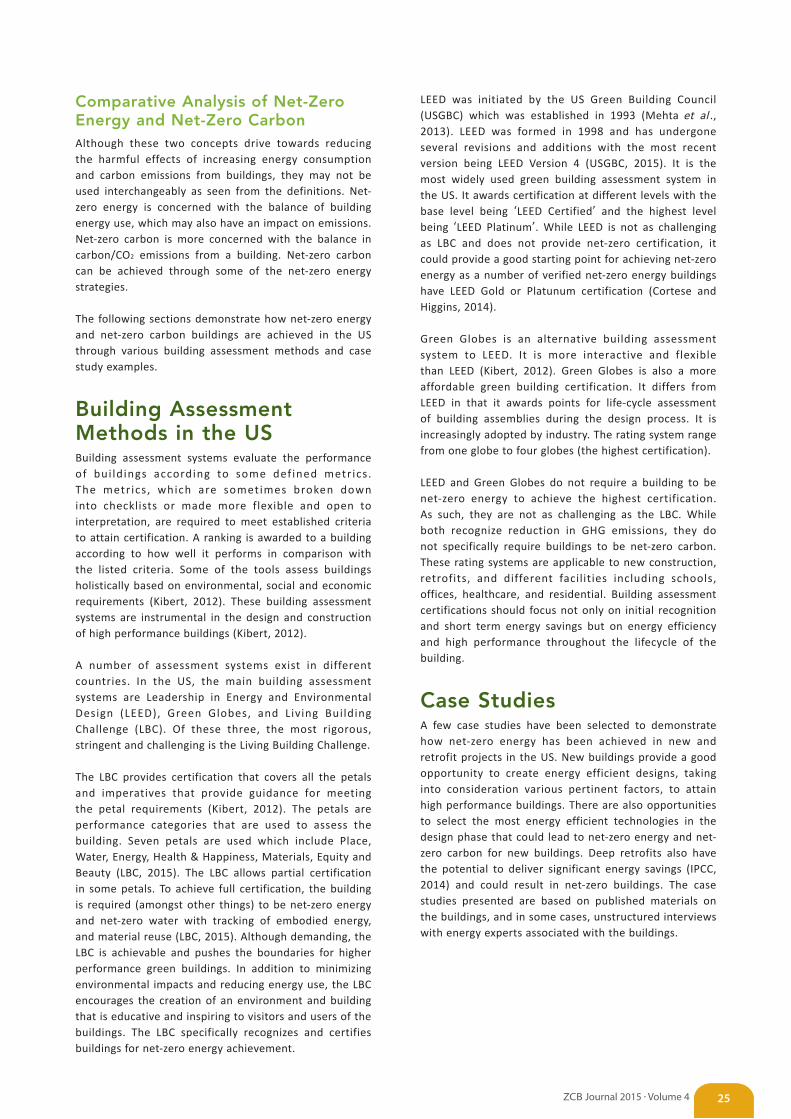
New Build: Morning Star and Hybrid Renewable Energy Systems (HyRES) LabThe HyRES Lab includes a 74m² (800 square feet) net-zero energy house. It comprises: an energy research laboratory;a 10kW wind turbine (Figure 3); electric vehicle charging station (Figure 4); 6 independent solar arrays; 6 geothermal loops; and 2 energy storage systems (Riley, 2008).
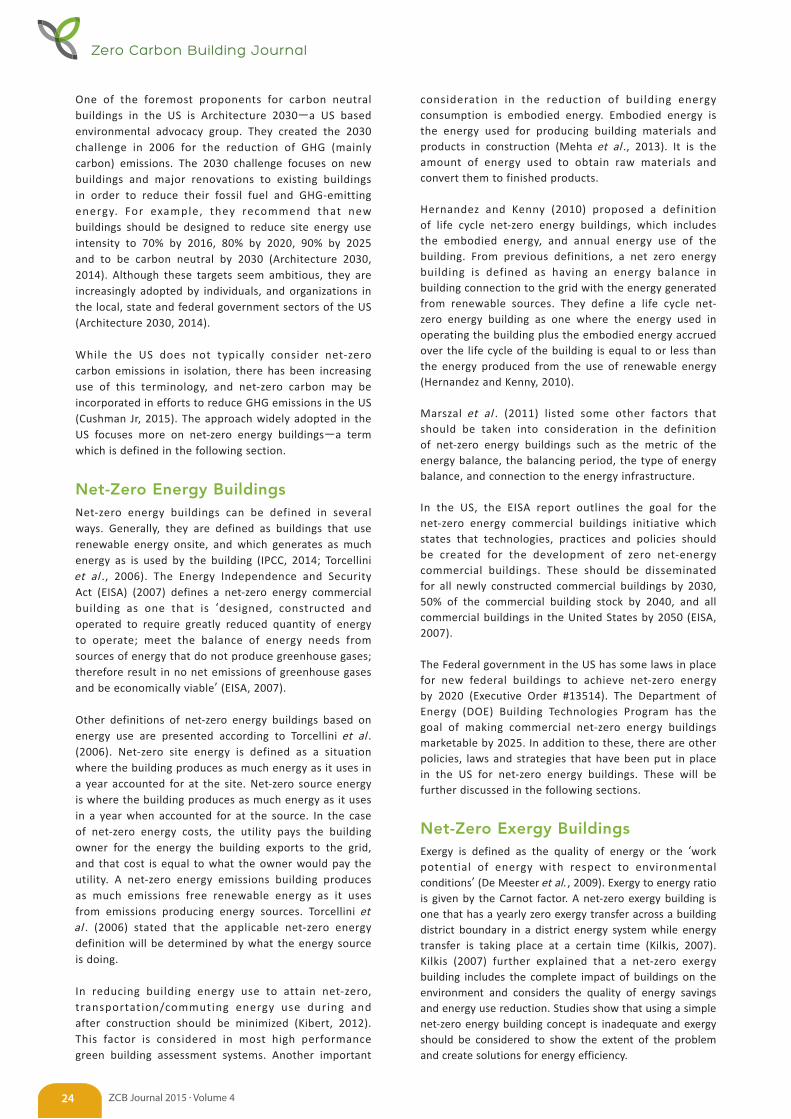
Figure 3 Morning Star Solar Home at its permanent location, Penn State’s University Park Campus
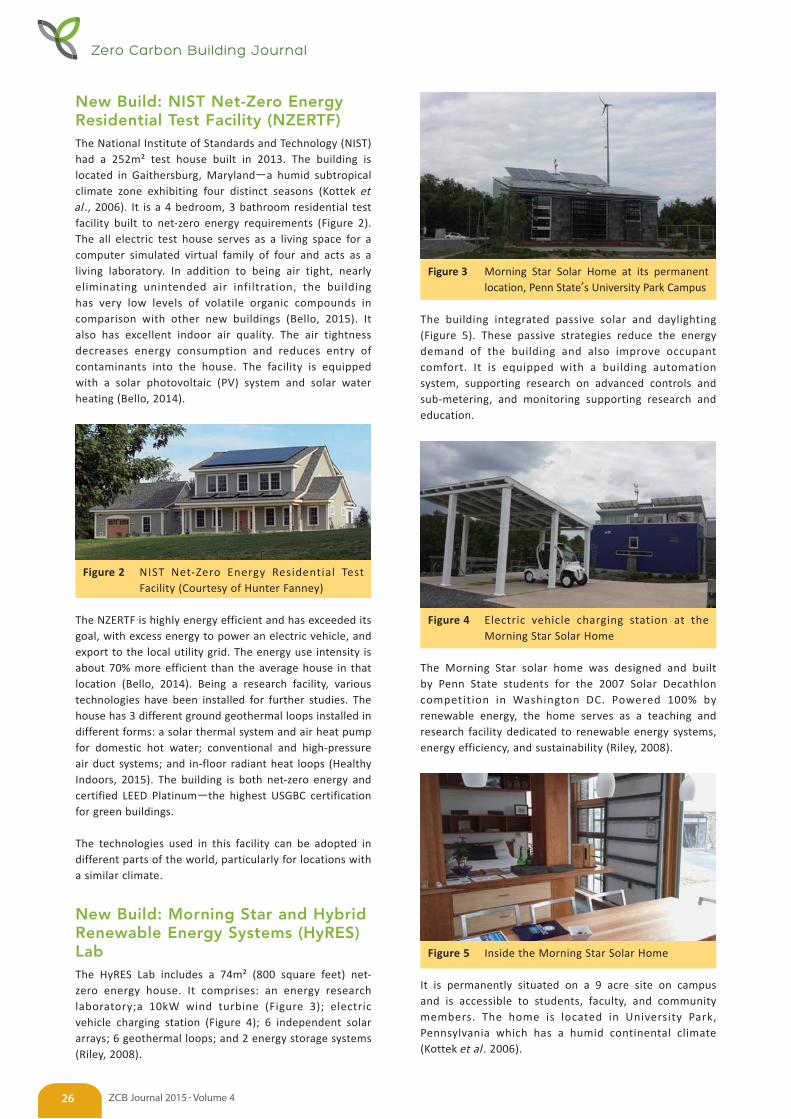
The building integrated passive solar and daylighting (Figure 5). These passive strategies reduce the energy demand of the building and also improve occupant comfort. It is equipped with a building automation system, supporting research on advanced controls and sub-metering, and monitoring supporting research and education.
Figure 4 Electric vehicle charging station at the Morning Star Solar Home
The Morning Star solar home was designed and built by Penn State students for the 2007 Solar Decathlon competition in Washington DC. Powered 100% by renewable energy, the home serves as a teaching and research facility dedicated to renewable energy systems, energy efficiency, and sustainability (Riley, 2008).
Figure 5 Inside the Morning Star Solar Home
It is permanently situated on a 9 acre site on campus and is accessible to students, faculty, and community members. The home is located in University Park, Pennsylvania which has a humid continental climate (Kottek et al . 2006).
Zero Carbon Building Journal
ZCB Journal 2015 • Volume 426
Most of the sustainable building practices adopted in the home could be replicated in other locations based on the energy requirements of the facility, the climate of the region, technological expertise, and financial constraints (as some of the technologies may be expensive to install and operate elsewhere).
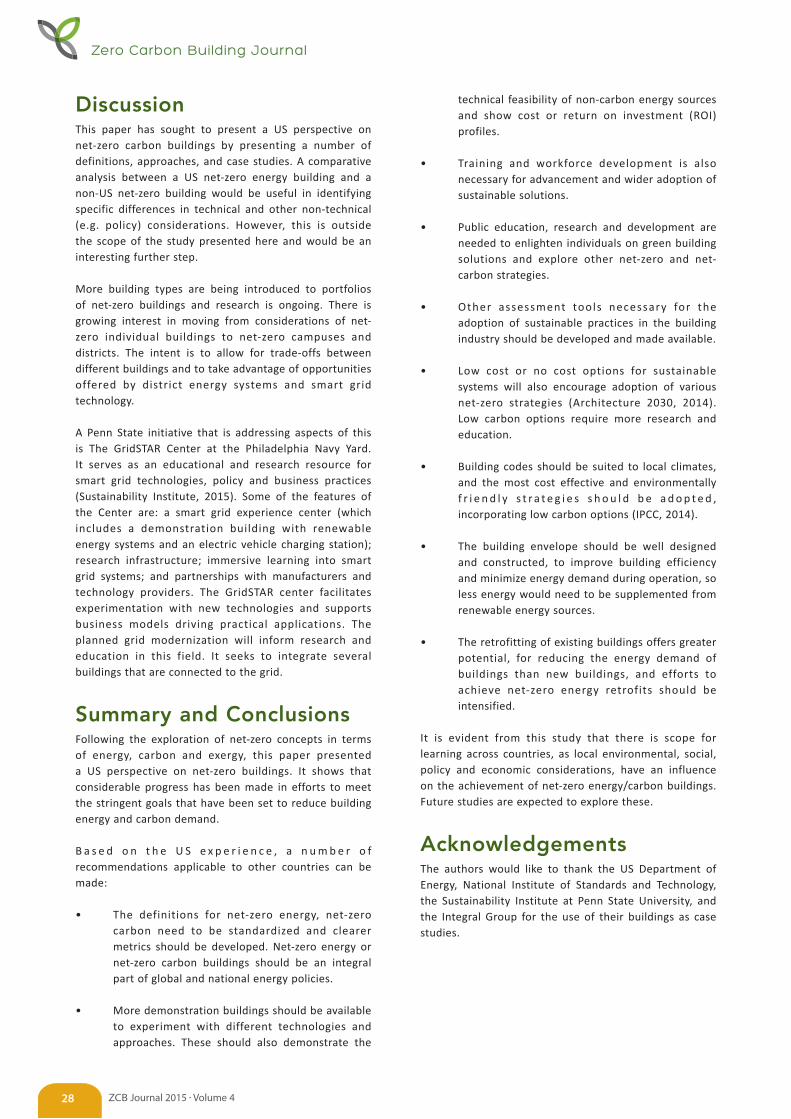
Commercial Retrofit: IDeAs Z Squared OfficeThe Integrated Design Associates (IDeAs) Z Squared building is the first certified net-zero energy, zero carbon commercial building in the US (Integral Group, 2015). Opened in 2007, the building was transformed from a windowless concrete bank built in the 1960s (Figure 6) to a modern office building (see Figures 7 and 8). The building is about 669m² (7,200 square feet) and located in San Jose, California. It has won several awards including the USGBC’s North California Chapter Flex Your Power Award for energy efficiency and the American Society of Heating, Refrigeration and Air-Conditioning Engineers (ASHRAE) Technology Award for effective energy management and indoor air quality. It is also net-zero energy certified by the International Living Future Institute.
Figure 6 Before retrofit, old bank building built in 1960
Different from the two previous case studies, San Jose is located in a subtropical Mediterranean climate (Kottek et al . 2006) characterized as sunny most of the year (about 300 days of sunshine). The design decisions and technologies used in this facility are applicable to regions with sunny climates.
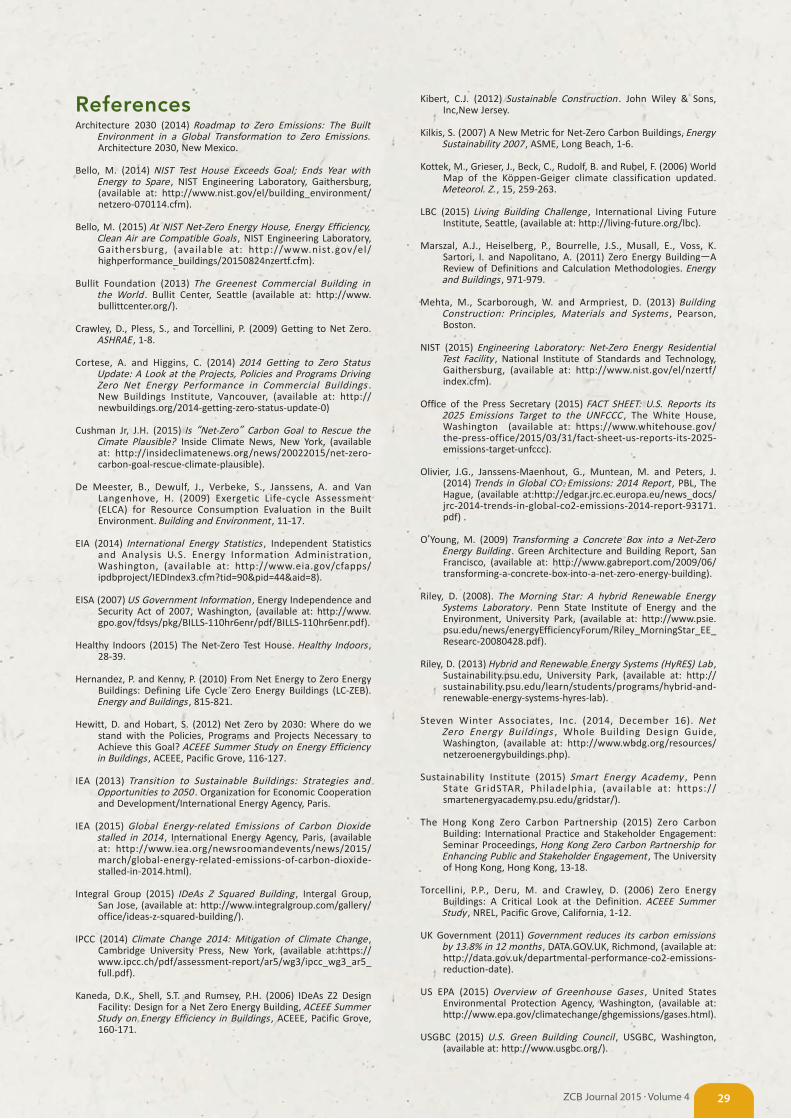
Figure 7 IDeAs Z Squared Office- after retrofit
The key green features of the building are:the use of a tight thermal envelope; control of solar heat gain through shading devices and spectrally selective glass; a ground source heat pump system; radiant heating and cooling; and natural and displacement ventilation for space conditioning (Integral Group, 2015; Kaneda et al ., 2006).
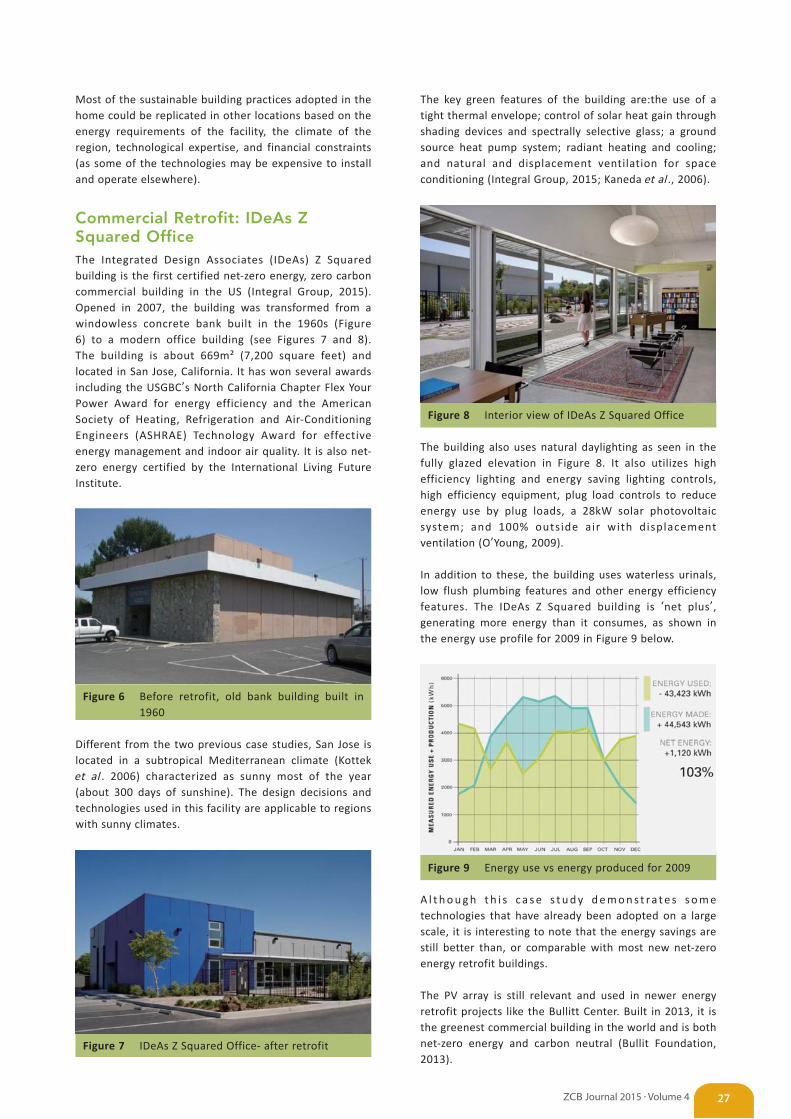
Figure 8 Interior view of IDeAs Z Squared Office
The building also uses natural daylighting as seen in the fully glazed elevation in Figure 8. It also utilizes high efficiency lighting and energy saving lighting controls, high efficiency equipment, plug load controls to reduce energy use by plug loads, a 28kW solar photovoltaic system; and 100% outside air with displacement ventilation (O’Young, 2009).
In addition to these, the building uses waterless urinals, low flush plumbing features and other energy efficiency features. The IDeAs Z Squared building is ‘net plus’, generating more energy than it consumes, as shown in the energy use profile for 2009 in Figure 9 below.
Figure 9 Energy use vs energy produced for 2009
A l t h o u g h t h i s c a s e s t u d y d e m o n s t r a t e s s o m e technologies that have already been adopted on a large scale, it is interesting to note that the energy savings are still better than, or comparable with most new net-zero energy retrofit buildings.
The PV array is still relevant and used in newer energy retrofit projects like the Bullitt Center. Built in 2013, it is the greenest commercial building in the world and is both net-zero energy and carbon neutral (Bullit Foundation, 2013).
27ZCB Journal 2015 • Volume 4
DiscussionThis paper has sought to present a US perspective on net-zero carbon buildings by presenting a number of definitions, approaches, and case studies. A comparative analysis between a US net-zero energy building and a non-US net-zero building would be useful in identifying specific differences in technical and other non-technical (e.g. policy) considerations. However, this is outside the scope of the study presented here and would be an interesting further step.
More building types are being introduced to portfolios of net-zero buildings and research is ongoing. There is growing interest in moving from considerations of net-zero individual buildings to net-zero campuses and districts. The intent is to allow for trade-offs between different buildings and to take advantage of opportunities offered by district energy systems and smart grid technology.
A Penn State initiative that is addressing aspects of this is The GridSTAR Center at the Philadelphia Navy Yard. It serves as an educational and research resource for smart grid technologies, policy and business practices (Sustainability Institute, 2015). Some of the features of the Center are: a smart grid experience center (which includes a demonstration building with renewable energy systems and an electric vehicle charging station); research infrastructure; immersive learning into smart grid systems; and partnerships with manufacturers and technology providers. The GridSTAR center facilitates experimentation with new technologies and supports business models driving practical applications. The planned grid modernization will inform research and education in this field. It seeks to integrate several buildings that are connected to the grid.
Summary and ConclusionsFollowing the exploration of net-zero concepts in terms of energy, carbon and exergy, this paper presented a US perspective on net-zero buildings. It shows that considerable progress has been made in efforts to meet the stringent goals that have been set to reduce building energy and carbon demand.
B a s e d o n t h e U S e x p e r i e n c e , a n u m b e r o f recommendations applicable to other countries can be made:
• The definitions for net-zero energy, net-zero carbon need to be standardized and clearer metrics should be developed. Net-zero energy or net-zero carbon buildings should be an integral part of global and national energy policies.
• More demonstration buildings should be available to experiment with different technologies and approaches. These should also demonstrate the
technical feasibility of non-carbon energy sources and show cost or return on investment (ROI) profiles.
• Training and workforce development is also necessary for advancement and wider adoption of sustainable solutions.
• Public education, research and development are needed to enlighten individuals on green building solutions and explore other net-zero and net-carbon strategies.
• Other assessment tools necessary for the adoption of sustainable practices in the building industry should be developed and made available.
• Low cost or no cost options for sustainable systems will also encourage adoption of various net-zero strategies (Architecture 2030, 2014). Low carbon options require more research and education.
• Building codes should be suited to local climates, and the most cost effective and environmentally f r i e n d l y s t r a t e g i e s s h o u l d b e a d o p t e d , incorporating low carbon options (IPCC, 2014).
• The building envelope should be well designed and constructed, to improve building efficiency and minimize energy demand during operation, so less energy would need to be supplemented from renewable energy sources.
• The retrofitting of existing buildings offers greater potential, for reducing the energy demand of buildings than new buildings, and efforts to achieve net-zero energy retrofits should be intensified.
It is evident from this study that there is scope for learning across countries, as local environmental, social, policy and economic considerations, have an influence on the achievement of net-zero energy/carbon buildings. Future studies are expected to explore these.
AcknowledgementsThe authors would like to thank the US Department of Energy, National Institute of Standards and Technology, the Sustainability Institute at Penn State University, and the Integral Group for the use of their buildings as case studies.
Zero Carbon Building Journal
ZCB Journal 2015 • Volume 428
ReferencesArchitecture 2030 (2014) Roadmap to Zero Emissions: The Built
Environment in a Global Transformation to Zero Emissions. Architecture 2030, New Mexico.
Bello, M. (2014) NIST Test House Exceeds Goal; Ends Year with Energy to Spare , NIST Engineering Laboratory, Gaithersburg, (available at: http://www.nist.gov/el/building_environment/netzero-070114.cfm).
Bello, M. (2015) At NIST Net-Zero Energy House, Energy Efficiency, Clean Air are Compatible Goals , NIST Engineering Laboratory, Gaithersburg, (available at: http://www.nist.gov/el/highperformance_buildings/20150824nzertf.cfm).
Bullit Foundation (2013) The Greenest Commercial Building in the World . Bullit Center, Seattle (available at: http://www.bullittcenter.org/).
Crawley, D., Pless, S., and Torcellini, P. (2009) Getting to Net Zero. ASHRAE, 1-8.
Cortese, A. and Higgins, C. (2014) 2014 Getting to Zero Status Update: A Look at the Projects, Policies and Programs Driving Zero Net Energy Performance in Commercial Buildings . New Buildings Institute, Vancouver, (available at: http://newbuildings.org/2014-getting-zero-status-update-0)
Cushman Jr, J.H. (2015) Is “Net-Zero” Carbon Goal to Rescue the Cimate Plausible? Inside Climate News, New York, (available at: http://insideclimatenews.org/news/20022015/net-zero-carbon-goal-rescue-climate-plausible).
De Meester, B., Dewulf, J., Verbeke, S., Janssens, A. and Van Langenhove, H. (2009) Exergetic Life-cycle Assessment (ELCA) for Resource Consumption Evaluation in the Built Environment. Building and Environment , 11-17.
EIA (2014) International Energy Statistics , Independent Statistics and Analysis U.S. Energy Information Administration, Washington, (available at: http://www.eia.gov/cfapps/ipdbproject/IEDIndex3.cfm?tid=90&pid=44&aid=8).
EISA (2007) US Government Information, Energy Independence and Security Act of 2007, Washington, (available at: http://www.gpo.gov/fdsys/pkg/BILLS-110hr6enr/pdf/BILLS-110hr6enr.pdf).
Healthy Indoors (2015) The Net-Zero Test House. Healthy Indoors , 28-39.
Hernandez, P. and Kenny, P. (2010) From Net Energy to Zero Energy Buildings: Defining Life Cycle Zero Energy Buildings (LC-ZEB). Energy and Buildings , 815-821.
Hewitt, D. and Hobart, S. (2012) Net Zero by 2030: Where do we stand with the Policies, Programs and Projects Necessary to Achieve this Goal? ACEEE Summer Study on Energy Efficiency in Buildings , ACEEE, Pacific Grove, 116-127.
IEA (2013) Transition to Sustainable Buildings: Strategies and Opportunities to 2050. Organization for Economic Cooperation and Development/International Energy Agency, Paris.
IEA (2015) Global Energy-related Emissions of Carbon Dioxide stalled in 2014, International Energy Agency, Paris, (available at: http://www.iea.org/newsroomandevents/news/2015/march/global-energy-related-emissions-of-carbon-dioxide-stalled-in-2014.html).
Integral Group (2015) IDeAs Z Squared Building , Intergal Group, San Jose, (available at: http://www.integralgroup.com/gallery/office/ideas-z-squared-building/).
IPCC (2014) Climate Change 2014: Mitigation of Climate Change, Cambridge University Press, New York, (available at:https://www.ipcc.ch/pdf/assessment-report/ar5/wg3/ipcc_wg3_ar5_full.pdf).
Kaneda, D.K., Shell, S.T. and Rumsey, P.H. (2006) IDeAs Z2 Design Facility: Design for a Net Zero Energy Building, ACEEE Summer Study on Energy Efficiency in Buildings , ACEEE, Pacific Grove, 160-171.
29ZCB Journal 2015 • Volume 4
Kibert, C.J. (2012) Sustainable Construction . John Wiley & Sons, Inc,New Jersey.
Kilkis, S. (2007) A New Metric for Net-Zero Carbon Buildings, Energy Sustainability 2007, ASME, Long Beach, 1-6.
Kottek, M., Grieser, J., Beck, C., Rudolf, B. and Rubel, F. (2006) World Map of the Köppen-Geiger climate classification updated. Meteorol. Z. , 15, 259-263.
LBC (2015) Living Building Challenge , International Living Future Institute, Seattle, (available at: http://living-future.org/lbc).
Marszal, A.J., Heiselberg, P., Bourrelle, J.S., Musall, E., Voss, K. Sartori, I. and Napolitano, A. (2011) Zero Energy Building―A Review of Definitions and Calculation Methodologies. Energy and Buildings , 971-979.
Mehta, M., Scarborough, W. and Armpriest, D. (2013) Building Construction: Principles, Materials and Systems , Pearson, Boston.
NIST (2015) Engineering Laboratory: Net-Zero Energy Residential Test Facility , National Institute of Standards and Technology, Gaithersburg, (available at: http://www.nist.gov/el/nzertf/index.cfm).
Office of the Press Secretary (2015) FACT SHEET: U.S. Reports its 2025 Emissions Target to the UNFCCC , The White House, Washington (available at: https://www.whitehouse.gov/the-press-office/2015/03/31/fact-sheet-us-reports-its-2025-emissions-target-unfccc).
Olivier, J.G., Janssens-Maenhout, G., Muntean, M. and Peters, J. (2014) Trends in Global CO2 Emissions: 2014 Report , PBL, The Hague, (available at:http://edgar.jrc.ec.europa.eu/news_docs/jrc-2014-trends-in-global-co2-emissions-2014-report-93171.pdf) .
O’Young, M. (2009) Transforming a Concrete Box into a Net-Zero Energy Building . Green Architecture and Building Report, San Francisco, (available at: http://www.gabreport.com/2009/06/transforming-a-concrete-box-into-a-net-zero-energy-building).
Riley, D. (2008). The Morning Star: A hybrid Renewable Energy Systems Laboratory . Penn State Institute of Energy and the Environment, University Park, (available at: http://www.psie.psu.edu/news/energyEfficiencyForum/Riley_MorningStar_EE_Researc-20080428.pdf).
Riley, D. (2013) Hybrid and Renewable Energy Systems (HyRES) Lab, Sustainability.psu.edu, University Park, (available at: http://sustainability.psu.edu/learn/students/programs/hybrid-and-renewable-energy-systems-hyres-lab).
Steven Winter Associates, Inc. (2014, December 16). Net Zero Energy Buildings , Whole Building Design Guide, Washington, (available at: http://www.wbdg.org/resources/netzeroenergybuildings.php).
Sustainability Institute (2015) Smart Energy Academy , Penn State GridSTAR, Philadelphia, (available at: https://smartenergyacademy.psu.edu/gridstar/).
The Hong Kong Zero Carbon Partnership (2015) Zero Carbon Building: International Practice and Stakeholder Engagement: Seminar Proceedings, Hong Kong Zero Carbon Partnership for Enhancing Public and Stakeholder Engagement , The University of Hong Kong, Hong Kong, 13-18.
Torcellini, P.P., Deru, M. and Crawley, D. (2006) Zero Energy Buildings: A Critical Look at the Definition. ACEEE Summer Study , NREL, Pacific Grove, California, 1-12.
UK Government (2011) Government reduces its carbon emissions by 13.8% in 12 months , DATA.GOV.UK, Richmond, (available at: http://data.gov.uk/departmental-performance-co2-emissions-reduction-date).
US EPA (2015) Overview of Greenhouse Gases , United States Environmental Protection Agency, Washington, (available at: http://www.epa.gov/climatechange/ghgemissions/gases.html).
USGBC (2015) U.S. Green Building Council , USGBC, Washington, (available at: http://www.usgbc.org/).
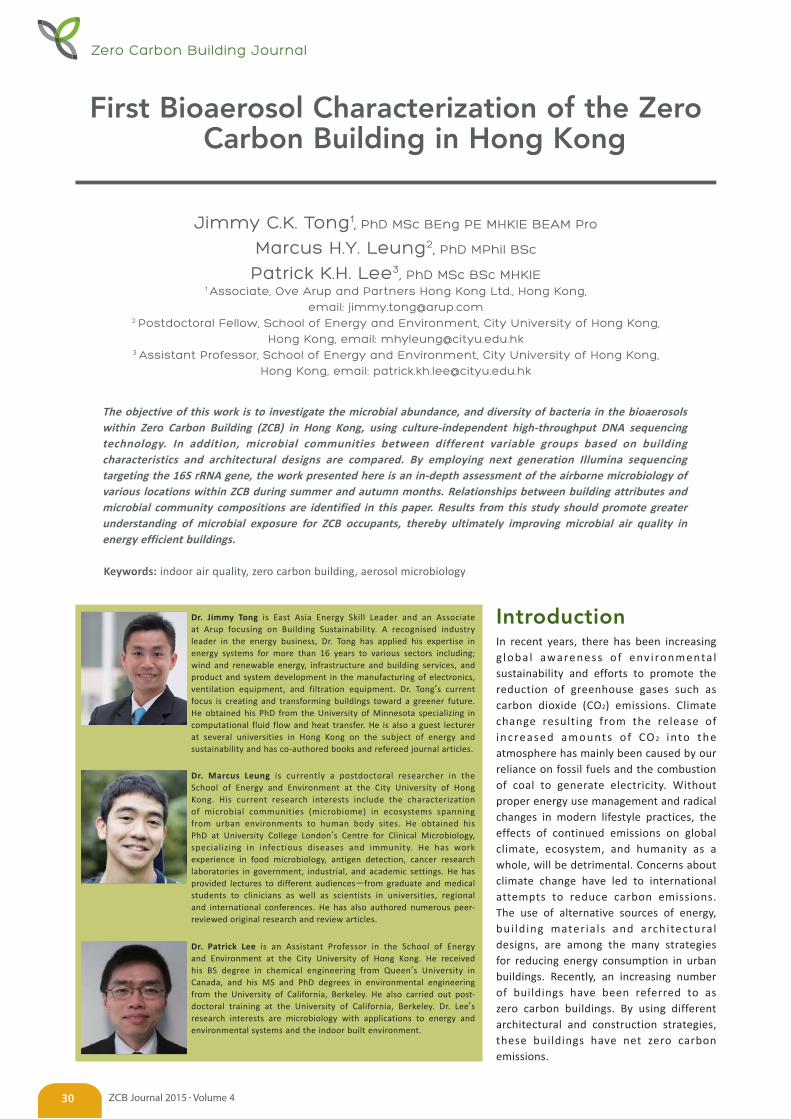
Dr. Jimmy Tong is East Asia Energy Skill Leader and an Associate at Arup focusing on Building Sustainability. A recognised industry leader in the energy business, Dr. Tong has applied his expertise in energy systems for more than 16 years to various sectors including; wind and renewable energy, infrastructure and building services, and product and system development in the manufacturing of electronics, ventilation equipment, and filtration equipment. Dr. Tong’s current focus is creating and transforming buildings toward a greener future. He obtained his PhD from the University of Minnesota specializing in computational fluid flow and heat transfer. He is also a guest lecturer at several universities in Hong Kong on the subject of energy and sustainability and has co-authored books and refereed journal articles.
Dr. Marcus Leung is currently a postdoctoral researcher in the School of Energy and Environment at the City University of Hong Kong. His current research interests include the characterization of microbial communities (microbiome) in ecosystems spanning from urban environments to human body sites. He obtained his PhD at University College London’s Centre for Clinical Microbiology, specializing in infectious diseases and immunity. He has work experience in food microbiology, antigen detection, cancer research laboratories in government, industrial, and academic settings. He has provided lectures to different audiences―from graduate and medical students to clinicians as well as scientists in universities, regional and international conferences. He has also authored numerous peer-reviewed original research and review articles.
Dr. Patrick Lee is an Assistant Professor in the School of Energy and Environment at the City University of Hong Kong. He received his BS degree in chemical engineering from Queen’s University in Canada, and his MS and PhD degrees in environmental engineering from the University of California, Berkeley. He also carried out post-doctoral training at the University of California, Berkeley. Dr. Lee’s research interests are microbiology with applications to energy and environmental systems and the indoor built environment.
First Bioaerosol Characterization of the Zero Carbon Building in Hong Kong
The objective of this work is to investigate the microbial abundance, and diversity of bacteria in the bioaerosols within Zero Carbon Building (ZCB) in Hong Kong, using culture-independent high-throughput DNA sequencing technology. In addition, microbial communities between different variable groups based on building characteristics and architectural designs are compared. By employing next generation Illumina sequencing targeting the 16S rRNA gene, the work presented here is an in-depth assessment of the airborne microbiology of various locations within ZCB during summer and autumn months. Relationships between building attributes and microbial community compositions are identified in this paper. Results from this study should promote greater understanding of microbial exposure for ZCB occupants, thereby ultimately improving microbial air quality in energy efficient buildings.
Keywords: indoor air quality, zero carbon building, aerosol microbiology
IntroductionIn recent years, there has been increasing g loba l awareness o f env i ronmenta l sustainability and efforts to promote the reduction of greenhouse gases such as carbon dioxide (CO2) emissions. Climate change resulting from the release of increased amounts o f CO 2 into the atmosphere has mainly been caused by our reliance on fossil fuels and the combustion of coal to generate electricity. Without proper energy use management and radical changes in modern lifestyle practices, the effects of continued emissions on global climate, ecosystem, and humanity as a whole, will be detrimental. Concerns about climate change have led to international attempts to reduce carbon emissions. The use of alternative sources of energy, bui ld ing mater ia ls and architectural designs, are among the many strategies for reducing energy consumption in urban buildings. Recently, an increasing number of buildings have been referred to as zero carbon buildings. By using different architectural and construction strategies, these buildings have net zero carbon emissions.
Jimmy C.K. Tong1, PhD MSc BEng PE MHKIE BEAM Pro
Marcus H.Y. Leung2, PhD MPhil BSc
Patrick K.H. Lee3, PhD MSc BSc MHKIE1 Associate, Ove Arup and Partners Hong Kong Ltd., Hong Kong,
email: [email protected] Postdoctoral Fellow, School of Energy and Environment, City University of Hong Kong,
Hong Kong, email: [email protected] Assistant Professor, School of Energy and Environment, City University of Hong Kong,
Hong Kong, email: [email protected]
Zero Carbon Building Journal
ZCB Journal 2015 • Volume 430
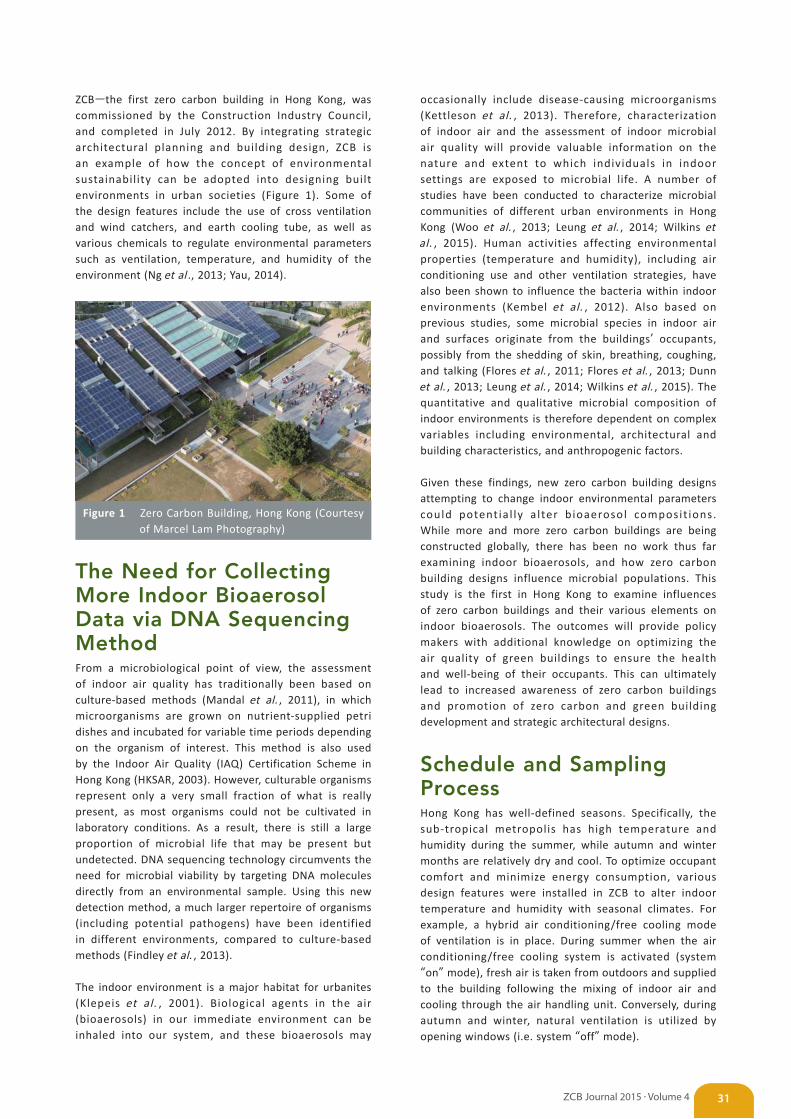
ZCB―the first zero carbon building in Hong Kong, was commissioned by the Construction Industry Council, and completed in July 2012. By integrating strategic architectural planning and building design, ZCB is an example of how the concept of environmental sustainability can be adopted into designing built environments in urban societies (Figure 1). Some of the design features include the use of cross ventilation and wind catchers, and earth cooling tube, as well as various chemicals to regulate environmental parameters such as ventilation, temperature, and humidity of the environment (Ng et al ., 2013; Yau, 2014).
Figure 1 Zero Carbon Building, Hong Kong (Courtesy of Marcel Lam Photography)
The Need for Collecting More Indoor Bioaerosol Data via DNA Sequencing MethodFrom a microbiological point of view, the assessment of indoor air quality has traditionally been based on culture-based methods (Mandal et al. , 2011), in which microorganisms are grown on nutrient-supplied petri dishes and incubated for variable time periods depending on the organism of interest. This method is also used by the Indoor Air Quality (IAQ) Certification Scheme in Hong Kong (HKSAR, 2003). However, culturable organisms represent only a very small fraction of what is really present, as most organisms could not be cultivated in laboratory conditions. As a result, there is still a large proportion of microbial life that may be present but undetected. DNA sequencing technology circumvents the need for microbial viability by targeting DNA molecules directly from an environmental sample. Using this new detection method, a much larger repertoire of organisms (including potential pathogens) have been identified in different environments, compared to culture-based methods (Findley et al. , 2013).
The indoor environment is a major habitat for urbanites (Klepeis et al. , 2001). Biological agents in the air (bioaerosols) in our immediate environment can be inhaled into our system, and these bioaerosols may
occasionally include disease-causing microorganisms (Kettleson et al. , 2013). Therefore, characterization of indoor air and the assessment of indoor microbial air quality will provide valuable information on the nature and extent to which individuals in indoor settings are exposed to microbial life. A number of studies have been conducted to characterize microbial communities of different urban environments in Hong Kong (Woo et al. , 2013; Leung et al. , 2014; Wilkins et al. , 2015). Human activities affecting environmental properties (temperature and humidity), including air conditioning use and other ventilation strategies, have also been shown to influence the bacteria within indoor environments (Kembel et al. , 2012). Also based on previous studies, some microbial species in indoor air and surfaces originate from the buildings’ occupants, possibly from the shedding of skin, breathing, coughing, and talking (Flores et al. , 2011; Flores et al. , 2013; Dunn et al. , 2013; Leung et al. , 2014; Wilkins et al. , 2015). The quantitative and qualitative microbial composition of indoor environments is therefore dependent on complex variables including environmental, architectural and building characteristics, and anthropogenic factors.
Given these findings, new zero carbon building designs attempting to change indoor environmental parameters could potent ia l ly a l ter b ioaerosol composit ions. While more and more zero carbon buildings are being constructed globally, there has been no work thus far examining indoor bioaerosols, and how zero carbon building designs influence microbial populations. This study is the first in Hong Kong to examine influences of zero carbon buildings and their various elements on indoor bioaerosols. The outcomes will provide policy makers with additional knowledge on optimizing the air quality of green buildings to ensure the health and well-being of their occupants. This can ultimately lead to increased awareness of zero carbon buildings and promotion of zero carbon and green building development and strategic architectural designs.
Schedule and Sampling ProcessHong Kong has well-defined seasons. Specifically, the sub-tropical metropolis has high temperature and humidity during the summer, while autumn and winter months are relatively dry and cool. To optimize occupant comfort and minimize energy consumption, various design features were installed in ZCB to alter indoor temperature and humidity with seasonal climates. For example, a hybrid air conditioning/free cooling mode of ventilation is in place. During summer when the air conditioning/free cooling system is activated (system “on” mode), fresh air is taken from outdoors and supplied to the building following the mixing of indoor air and cooling through the air handling unit. Conversely, during autumn and winter, natural ventilation is utilized by opening windows (i.e. system “off” mode).
31ZCB Journal 2015 • Volume 4
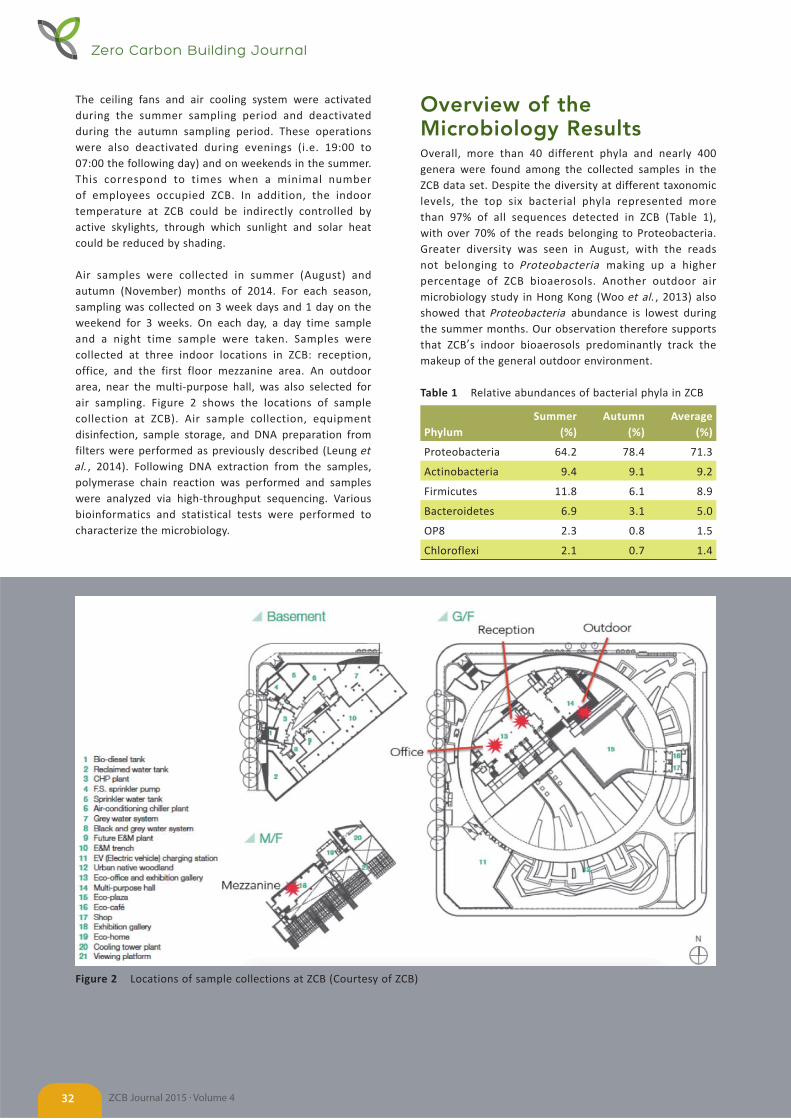
The ceiling fans and air cooling system were activated during the summer sampling period and deactivated during the autumn sampling period. These operations were also deactivated during evenings (i.e. 19:00 to 07:00 the following day) and on weekends in the summer. This correspond to times when a minimal number of employees occupied ZCB. In addition, the indoor temperature at ZCB could be indirectly controlled by active skylights, through which sunlight and solar heat could be reduced by shading.
Air samples were collected in summer (August) and autumn (November) months of 2014. For each season, sampling was collected on 3 week days and 1 day on the weekend for 3 weeks. On each day, a day time sample and a night time sample were taken. Samples were collected at three indoor locations in ZCB: reception, office, and the first floor mezzanine area. An outdoor area, near the multi-purpose hall, was also selected for air sampling. Figure 2 shows the locations of sample collection at ZCB). Air sample collection, equipment disinfection, sample storage, and DNA preparation from filters were performed as previously described (Leung et al. , 2014). Following DNA extraction from the samples, polymerase chain reaction was performed and samples were analyzed via high-throughput sequencing. Various bioinformatics and statistical tests were performed to characterize the microbiology.
Overview of the Microbiology ResultsOverall, more than 40 different phyla and nearly 400 genera were found among the collected samples in the ZCB data set. Despite the diversity at different taxonomic levels, the top six bacterial phyla represented more than 97% of all sequences detected in ZCB (Table 1), with over 70% of the reads belonging to Proteobacteria. Greater diversity was seen in August, with the reads not belonging to Proteobacteria making up a higher percentage of ZCB bioaerosols. Another outdoor air microbiology study in Hong Kong (Woo et al. , 2013) also showed that Proteobacteria abundance is lowest during the summer months. Our observation therefore supports that ZCB’s indoor bioaerosols predominantly track the makeup of the general outdoor environment.
Table 1 Relative abundances of bacterial phyla in ZCB
PhylumSummer
(%)Autumn
(%)Average
(%)
Proteobacteria 64.2 78.4 71.3
Actinobacteria 9.4 9.1 9.2
Firmicutes 11.8 6.1 8.9
Bacteroidetes 6.9 3.1 5.0
OP8 2.3 0.8 1.5
Chloroflexi 2.1 0.7 1.4
Figure 2 Locations of sample collections at ZCB (Courtesy of ZCB)
Zero Carbon Building Journal
ZCB Journal 2015 • Volume 432
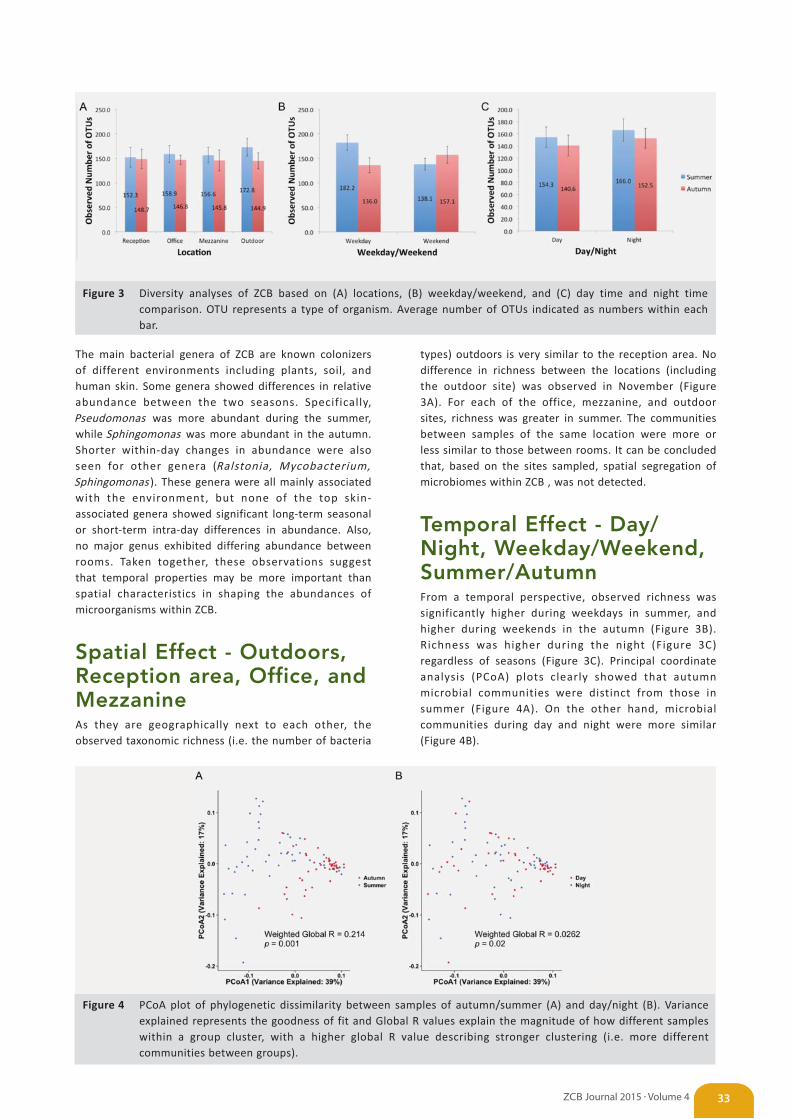
The main bacterial genera of ZCB are known colonizers of different environments including plants, soil, and human skin. Some genera showed differences in relative abundance between the two seasons. Specifically, Pseudomonas was more abundant during the summer, while Sphingomonas was more abundant in the autumn. Shorter within-day changes in abundance were also seen for other genera (Ralstonia, Mycobacterium, Sphingomonas ). These genera were all mainly associated with the environment, but none of the top skin-associated genera showed significant long-term seasonal or short-term intra-day differences in abundance. Also, no major genus exhibited differing abundance between rooms. Taken together, these observations suggest that temporal properties may be more important than spatial characteristics in shaping the abundances of microorganisms within ZCB.
Spatial Effect - Outdoors, Reception area, Office, and MezzanineAs they are geographically next to each other, the observed taxonomic richness (i.e. the number of bacteria
Figure 4 PCoA plot of phylogenetic dissimilarity between samples of autumn/summer (A) and day/night (B). Variance explained represents the goodness of fit and Global R values explain the magnitude of how different samples within a group cluster, with a higher global R value describing stronger clustering (i.e. more different communities between groups).
Figure 3 Diversity analyses of ZCB based on (A) locations, (B) weekday/weekend, and (C) day time and night time comparison. OTU represents a type of organism. Average number of OTUs indicated as numbers within each bar.
types) outdoors is very similar to the reception area. No difference in richness between the locations (including the outdoor site) was observed in November (Figure 3A). For each of the office, mezzanine, and outdoor sites, richness was greater in summer. The communities between samples of the same location were more or less similar to those between rooms. It can be concluded that, based on the sites sampled, spatial segregation of microbiomes within ZCB , was not detected.
Temporal Effect - Day/Night, Weekday/Weekend, Summer/AutumnFrom a temporal perspective, observed richness was significantly higher during weekdays in summer, and higher during weekends in the autumn (Figure 3B). Richness was higher during the night (Figure 3C) regardless of seasons (Figure 3C). Principal coordinate analysis (PCoA) plots clearly showed that autumn microbial communities were distinct from those in summer (Figure 4A). On the other hand, microbial communities during day and night were more similar (Figure 4B).
33ZCB Journal 2015 • Volume 4
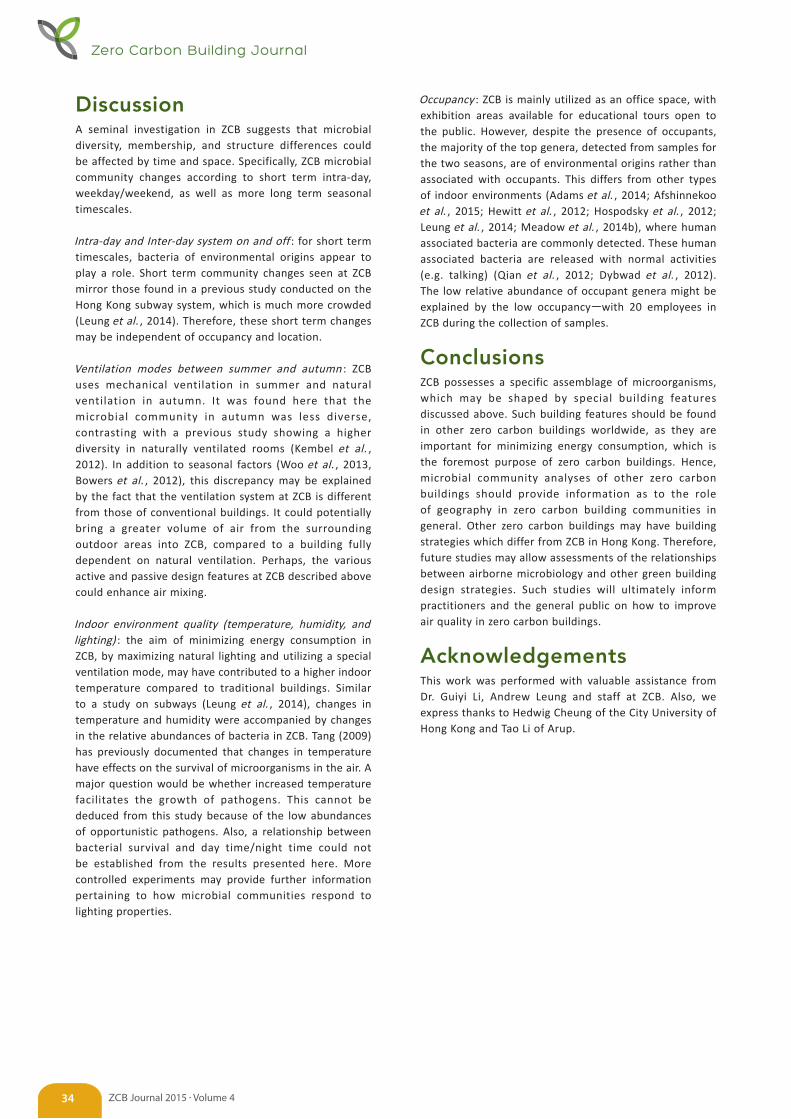
DiscussionA seminal investigation in ZCB suggests that microbial diversity, membership, and structure differences could be affected by time and space. Specifically, ZCB microbial community changes according to short term intra-day, weekday/weekend, as well as more long term seasonal timescales.
Intra-day and Inter-day system on and off : for short term timescales, bacteria of environmental origins appear to play a role. Short term community changes seen at ZCB mirror those found in a previous study conducted on the Hong Kong subway system, which is much more crowded (Leung et al. , 2014). Therefore, these short term changes may be independent of occupancy and location.
Ventilation modes between summer and autumn : ZCB uses mechanical ventilation in summer and natural ventilation in autumn. It was found here that the microbial community in autumn was less diverse, contrasting with a previous study showing a higher diversity in naturally ventilated rooms (Kembel et al. , 2012). In addition to seasonal factors (Woo et al. , 2013, Bowers et al. , 2012), this discrepancy may be explained by the fact that the ventilation system at ZCB is different from those of conventional buildings. It could potentially bring a greater volume of air from the surrounding outdoor areas into ZCB, compared to a building fully dependent on natural ventilation. Perhaps, the various active and passive design features at ZCB described above could enhance air mixing.
Indoor environment quality (temperature, humidity, and lighting) : the aim of minimizing energy consumption in ZCB, by maximizing natural lighting and utilizing a special ventilation mode, may have contributed to a higher indoor temperature compared to traditional buildings. Similar to a study on subways (Leung et al. , 2014), changes in temperature and humidity were accompanied by changes in the relative abundances of bacteria in ZCB. Tang (2009) has previously documented that changes in temperature have effects on the survival of microorganisms in the air. A major question would be whether increased temperature facilitates the growth of pathogens. This cannot be deduced from this study because of the low abundances of opportunistic pathogens. Also, a relationship between bacterial survival and day time/night time could not be established from the results presented here. More controlled experiments may provide further information pertaining to how microbial communities respond to lighting properties.
Occupancy : ZCB is mainly utilized as an office space, with exhibition areas available for educational tours open to the public. However, despite the presence of occupants, the majority of the top genera, detected from samples for the two seasons, are of environmental origins rather than associated with occupants. This differs from other types of indoor environments (Adams et al. , 2014; Afshinnekoo et al. , 2015; Hewitt et al. , 2012; Hospodsky et al. , 2012; Leung et al. , 2014; Meadow et al. , 2014b), where human associated bacteria are commonly detected. These human associated bacteria are released with normal activities (e.g. talking) (Qian et al. , 2012; Dybwad et al. , 2012). The low relative abundance of occupant genera might be explained by the low occupancy―with 20 employees in ZCB during the collection of samples.
ConclusionsZCB possesses a specific assemblage of microorganisms, which may be shaped by special building features discussed above. Such building features should be found in other zero carbon buildings worldwide, as they are important for minimizing energy consumption, which is the foremost purpose of zero carbon buildings. Hence, microbial community analyses of other zero carbon buildings should provide information as to the role of geography in zero carbon building communities in general. Other zero carbon buildings may have building strategies which differ from ZCB in Hong Kong. Therefore, future studies may allow assessments of the relationships between airborne microbiology and other green building design strategies. Such studies will ultimately inform practitioners and the general public on how to improve air quality in zero carbon buildings.
AcknowledgementsThis work was performed with valuable assistance from Dr. Guiyi Li, Andrew Leung and staff at ZCB. Also, we express thanks to Hedwig Cheung of the City University of Hong Kong and Tao Li of Arup.
Zero Carbon Building Journal
ZCB Journal 2015 • Volume 434
ReferenceAdams, R.I., Miletto, M., Lindow, S.E., Taylor, J.W. and Bruns,
T.D. (2014) Airborne bacterial communities in residences: similarities and differences with Fungi. PLoS ONE , 9, e91283.
Afshinnekoo, E., Meydan, C., Chowdhury, S., Jaroudi, D., Boyer, C., Bernstein, N., Maritz, J.M., Reeves, D. and Mason, C.E. (2015) Geospatial resolution of human and bacterial diversity with city-scale metagenomics . CELS, (available at: http://dx.doi.org/10.1016/j.cels.2015.01.001).
Bowers, R.M., McCubbin, I.B., Hallar, A.G. and Fierer, N. (2012) Seasonal variability in airborne bacterial communities at a high-elevation site. Atmos Environ , 50, 41–49.
Dunn, R.R., Fierer, N., Henley, J.B., Leff, J.W. and Menninger, H.L. (2013) Home life: factors structuring the bacterial diversity found within and between homes. PLoS ONE , 8, e64133.
Dybwad, M., Granum, P.E., Bruheim, P. and Blatny, J.M. (2012) Characterization of airborne bacteria at an underground subway station. Appl Environ Microbiol , 78, 1917–1929.
Findley, K., Oh, J., Yang, J., Conlan, S., Deming, C., Meyer, J. A., Schoenfeld, D., Nomicos, E., Park, M. Kong, H.H. and Segre, J.A. (2013) Topographic diversity of fungal and bacterial communities in human skin. Nature , 498, 367-370.
Flores, G., Bates, S., Knights, D., Lauber, C., Stombaugh, J. and Knight, R. (2011) Microbial biogeography of public restroom surfaces. PLoS ONE , 6, e28132.
Flores, G., Bates, S., Caporaso, J., Lauber, C., Leff, J. and Knight, R. (2013) Diversity, distribution and sources of bacteria in residential kitchens. Environ Microbiol , 15, 588–596.
Hewitt, K.M., Gerba, C.P., Maxwell, S.L. and Kelley, S.T. (2012) Bacterial abundance and diversity in three metropolitan areas. PLoS ONE, 7, e37849.
HKSAR (2003) A Guide on Indoor Air Quality Certification Scheme for Offices and Public Places , The Government of the Hong Kong Special Administrative Region, Hong Kong, (avai lable at: http://www.iaq.gov.hk/second.asp?page=pub&sub=booklet).
Hospodsky, D., Qian, J., Nazaroff, W.W., Yamamoto, N., Bibby, K., Rismani-Yazdi, H. and Peccia, J. (2012) Human occupancy as a source of indoor airborne bacteria. PLoS ONE , 7, e34867.
Kembel, S.W., Jones, E., Kline, J., Northcutt, D., Stenson, J., Womack, A.M., Bohannan, B.J., Brown, G.Z. and Green, J.L. (2012) Architectural design influences the diversity and structure of the built environment microbiome. ISME J , 6, 1469–1479.
Kettleson, E., Kumar, S., Reponen, T., Vesper, S., Méheust, D. and Grinshpun, S.A. (2013) Stenotrophomonas, Mycobacterium, and Streptomyces in home dust and air: associations with moldiness and other home/family characteristics. Indoor Air , 23, 387–396.
Klepeis, N.E., Nelson, W.C., Ott, W.R., Robinson, J.P., Tsang, A.M. and Switzer, P. (2001) The National Human Activity Pattern Survey (NHAPS): a resource for assessing exposure to environmental pollutants. J Expo Anal EnvEpidemiol , 11, 231–252.
Leung, M.H.Y., Wilkins, D., Li, E.K.T., Kong, F.K.F. and Lee, P.K.H. (2014) Indoor-air microbiome in an urban subway network: diversity and dynamics. Appl Environ Microbiol , 80, 6760–6770.
Mandal, J. and Brandl, H. (2011) Bioaerosols in indoor environment – a review with special reference to residential and occupational locations. Open Environ Biol , 1–14.
Meadow, J.F., Altrichter, A.E., Kembel, S.W., Moriyama, M., O’Connor, T.K., Womack, A.M., Brown, G.Z., Green, J.L. and Bohannan, B.J.M. (2014) Bacterial communities on classroom surfaces vary with human contact. Microbiome , 2, 7.
Ng, T.S., Yau, R.M., Lam, T.N. and Cheng, V.S. (2013) Design and commission a zero-carbon building for hot and humid climate. International Journal of Low-Carbon Technologies , 0, 1–13.
Qian, J., Hospodsky, D., Yamamoto, N., Nazaroff, W.W. and Peccia, J. (2012) Size-resolved emission rates of airborne bacteria and fungi in an occupied classroom. Indoor Air , 22, 339–351.
Salter, S.J., Cox, M.J., Turek, E.M., Calus, S.T., Cookson, W.O., Moffatt, M.F., Turner, P., Parkhill, J., Loman, N.J. and Walker, A.W. (2014) Reagent and laboratory contamination can critically impact sequence-based microbiome analyses. BMC Biol , 12, 87.
Tang, J.W. (2009) The effect of environmental parameters on the survival of airborne infectious agents. JR Soc Interface , 6 (6), S737–S746.
Woo, A.C., Brar, M.S., Chan, Y., Lau, M.C.Y., Leung, F.C.C., Scott, J.A., Vrijmoed, L.L.P., Zawar-Reza, P. and Pointing, S.B. (2013) Temporal variation in airborne microbial populations and microbially-derived allergens in a tropical urban landscape. Atmos Environ , 74, 291–300.
Wilkins, D., Leung, M.H.Y. and Lee, P.K.H. (2015) Indoor air bacterial communities in Hong Kong households assemble independently of occupant skin microbiomes. Environ Microbiol , (doi: 10.1111/1462-2920.12889).
Yau, R.M. (2014) The ZCB – Hong Kong’s First Zero Carbon Building and Its Key Carbon Neutrality Strategies. Zero Carbon Building Journal , 1, 25–29.
35ZCB Journal 2015 • Volume 4
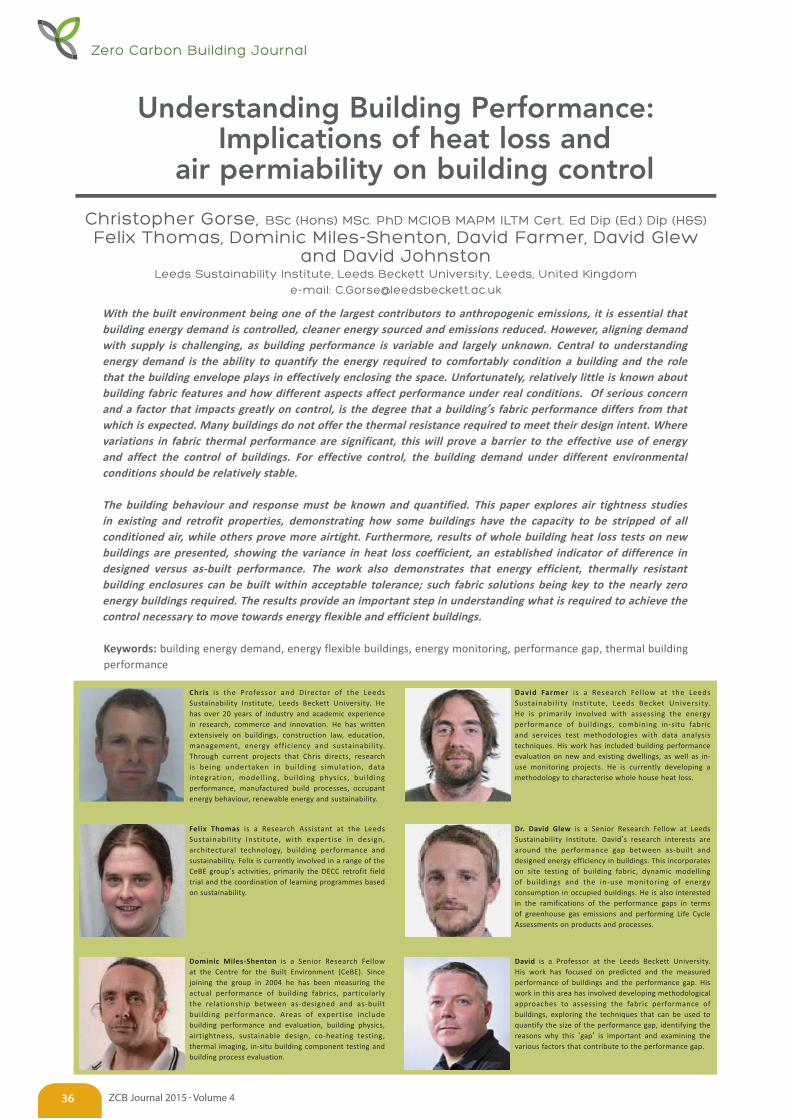
Chris is the Professor and Director of the Leeds Sustainability Institute, Leeds Beckett University. He has over 20 years of industry and academic experience in research, commerce and innovation. He has written extensively on buildings, construction law, education, management, energy efficiency and sustainability. Through current projects that Chris directs, research is being undertaken in building simulation, data integration, modell ing, building physics, building performance, manufactured build processes, occupant energy behaviour, renewable energy and sustainability.
David Farmer is a Research Fellow at the Leeds Sustainabi l i ty Inst itute, Leeds Becket University. He is primarily involved with assessing the energy performance of buildings, combining in-situ fabric and services test methodologies with data analysis techniques. His work has included building performance evaluation on new and existing dwellings, as well as in-use monitoring projects. He is currently developing a methodology to characterise whole house heat loss.
Felix Thomas is a Research Assistant at the Leeds Sustainabil ity Institute, with expertise in design, architectural technology, building performance and sustainability. Felix is currently involved in a range of the CeBE group’s activities, primarily the DECC retrofit field trial and the coordination of learning programmes based on sustainability.
Dr. David Glew is a Senior Research Fellow at Leeds Sustainability Institute. David’s research interests are around the performance gap between as-built and designed energy efficiency in buildings. This incorporates on site testing of building fabric, dynamic modelling of buildings and the in-use monitoring of energy consumption in occupied buildings. He is also interested in the ramifications of the performance gaps in terms of greenhouse gas emissions and performing Life Cycle Assessments on products and processes.
Dominic Miles-Shenton is a Senior Research Fellow at the Centre for the Built Environment (CeBE). Since joining the group in 2004 he has been measuring the actual performance of building fabrics, particularly the relationship between as-designed and as-built building performance. Areas of expertise include building performance and evaluation, building physics, airtightness, sustainable design, co-heating testing, thermal imaging, in-situ building component testing and building process evaluation.
David is a Professor at the Leeds Beckett University. His work has focused on predicted and the measured performance of buildings and the performance gap. His work in this area has involved developing methodological approaches to assessing the fabric performance of buildings, exploring the techniques that can be used to quantify the size of the performance gap, identifying the reasons why this ‘gap’ is important and examining the various factors that contribute to the performance gap.
Understanding Building Performance: Implications of heat loss and
air permiability on building control
With the built environment being one of the largest contributors to anthropogenic emissions, it is essential that building energy demand is controlled, cleaner energy sourced and emissions reduced. However, aligning demand with supply is challenging, as building performance is variable and largely unknown. Central to understanding energy demand is the ability to quantify the energy required to comfortably condition a building and the role that the building envelope plays in effectively enclosing the space. Unfortunately, relatively little is known about building fabric features and how different aspects affect performance under real conditions. Of serious concern and a factor that impacts greatly on control, is the degree that a building’s fabric performance differs from that which is expected. Many buildings do not offer the thermal resistance required to meet their design intent. Where variations in fabric thermal performance are significant, this will prove a barrier to the effective use of energy and affect the control of buildings. For effective control, the building demand under different environmental conditions should be relatively stable.
The building behaviour and response must be known and quantified. This paper explores air tightness studies in existing and retrofit properties, demonstrating how some buildings have the capacity to be stripped of all conditioned air, while others prove more airtight. Furthermore, results of whole building heat loss tests on new buildings are presented, showing the variance in heat loss coefficient, an established indicator of difference in designed versus as-built performance. The work also demonstrates that energy efficient, thermally resistant building enclosures can be built within acceptable tolerance; such fabric solutions being key to the nearly zero energy buildings required. The results provide an important step in understanding what is required to achieve the control necessary to move towards energy flexible and efficient buildings.
Keywords: building energy demand, energy flexible buildings, energy monitoring, performance gap, thermal building performance
Christopher Gorse, BSc (Hons) MSc. PhD MCIOB MAPM ILTM Cert. Ed Dip (Ed.) Dip (H&S)
Felix Thomas, Dominic Miles-Shenton, David Farmer, David Glew and David Johnston
Leeds Sustainability Institute, Leeds Beckett University, Leeds, United Kingdom
e-mail: [email protected]
Zero Carbon Building Journal
ZCB Journal 2015 • Volume 436
Introduction: Buildings and the EnvironmentThe Intergovernmental Panel on Climate Change (IPCC) has confirmed that the world’s climate is changing due to anthropogenic carbon dioxide (CO2) emissions (IPCC, 2014). Approximately 34% of man-made CO2 emissions come from the built environment (United Nations Environment Program, 2007), representing 45% of the United Kingdom (UK)’s total carbon footprint (The Carbon Trust, 2009), with space heating loads accounting for the greatest proportion of emissions (Palmer and Cooper, 2013; Pérez-Lombard, 2008). Heating loads make up 62% of the total energy used in homes (Palmer and Cooper, 2013; DECC, 2013; DECC, 2014). Thus, the construction industry carries a significant burden, being responsible for the largest share of emissions by some way (EC report by Prism Environment, 2012).
Regulations and European Directives are driving changes for new buildings, and retrofit of the existing stock will follow (CLG, 2009; EPBD, 2010). As it is estimated that 87% of existing buildings will remain operational by the year 2050 (Kelly, 2009), the thermal upgrading of buildings will have a significant role in reducing overall CO2 emissions. The value of such change is already recognised and the housing stock is legislated to become more energy efficient (EPBD, 2010; Vadera et al ., 2008). Despite this, the understanding of the measures that are required to be undertaken is relatively limited and still developmental.
Reducing the energy use associated with buildings has been identified as a key, relatively easy and cost-effective strategy within existing policy. Conversely, if buildings do not deliver the required energy savings, then CO2 reductions will become very difficult to achieve (Oreszczyn and Lowe, 2010). In order to meet the aspirational target of nearly zero energy buildings in the UK by 2016 for domestic buildings, ahead of the Energy Performance of Buildings Directive 2020 target (EPBD, 2010), a better understanding of real building performance is required. The thermal characteristics of buildings need to be measured and tested in the field, to understand their responses to changes in their internal and external environments, and the energy demanded to achieve a stable and comfortable internal environment.
When bui lding fabrics provide suff ic ient thermal resistance, the capability to control building spaces and move towards more efficient energy exchanges becomes possible, and the balancing of supply and demand more achievable. While nearly or net zero carbon is the target (EPBD, 2010), high performing fabrics that result in buildings with controllable low energy demand are required, as a neutral energy balance is almost impossible to achieve without energy efficiency (Hermelink et al ., 2013).
Control of Energy DemandThere is a need to control building energy demand so that the energy required for space heating can be better aligned with a decarbonised supply. It has been recognised that the concepts of low energy buildings, with passive fabric measures, such as Passivhaus type buildings, together with renewable energy offer one of the more common approaches to achieving net zero energy buildings (Hermelink et al ., 2013). Cleaner energy needs to be sourced to reduce emissions and meet the 80% reduction by 2050, based on 1990 levels (Climate Change Act, 2008). However, to use decarbonised energy sources, better control of demand will be required.
The methods of capturing and transferring energy, often referred to as ‘energy generation’, are changing. Energy providers are reducing their reliance on fossil fuels, moving to more variable renewable energy or nuclear sources that cannot be easily switched on and off. Methods of controlling demand are important for energy efficiency and carbon reduction; there needs to be effective and efficient use of energy available. Ensuring that supply meets demand has become a challenging proposition. However, attempts to balance this situation will become significantly easier, if building energy demand can be controlled. The notion of energy flexible buildings is desirable. Furthermore, where building energy demand is controllable it has the potential to relieve stress on the energy generation infrastructure (Bley, 2014; Cioffi et al ., 2012; Østergaard Jensen, 2015). The first step is to ensure that the fabric is effective at maintaining a controllable and condonable environment with low or zero energy demand.
MethodologyA key step to net zero energy buildings is to establish the energy required to comfortably condition a building and to ensure the building is performing as expected. For economical and energy efficient use, factors such as thermal resistance, heat capacity and the ability of the building to draw energy when available play an important role in the economics of net zero and energy flexible buildings. The reliable measurement and assessment of buildings is fundamental for predicting demand. The energy required to condition the building must be known and the role that the building envelope plays in effectively enclosing the space and thermally separating the internal and external environment must be understood. Unfortunately, relatively little is known about fabric performance under real conditions. The degree that heat energy flows through the fabric’s plane elements, junctions and thermal bridges, as well as accounting for the volume of air that bypasses insulation, must be understood if demand is to be accurately predicted.
37ZCB Journal 2015 • Volume 4
Importantly, the building fabric should be of a sufficient quality and level of performance; providing a thermally resistant, sufficiently airtight and sealed enclosure so that users can control their environment and accommodate optimal energy behaviour. Users need the ability to stabilise and control their internal environment, if they are to make the most effective use of the energy available to them.
In this paper, a review of research programmes undertaken by Leeds Beckett University is provided. In particular the review draws on the research of a party wall study to demonstrate the variability in element performance that takes place when voids connect and the insulation properties are bypassed. Further to this, air permeability studies of whole buildings are discussed, to explore the differences enclosures and retrofits achieve in reducing undesirable leakage. Finally, the heat loss coefficients for 30 new buildings are presented. The work is used to demonstrate the differences in predicted and measured performance. The predictions are produced from a combination of specified and design performance values (notional design requirements), compared with the actual performance measured in the field when built. The review of heat loss coefficients provides an overview of the differences found.
Research MethodsThe research reported here spans a period of over 10 years. During this period a number of research methods were used for performance measurements. Those most pertinent to the work reported are highlighted below. Further information on the methods is available at the Leeds Sustainability Institute (http://www.leedsbeckett.ac.uk/as/cebe/).
Steady-state Thermal Performance MeasurementsThe measurement of in situ U-value and whole house heat loss requires a steady-state test environment where internal temperatures can be controlled and variations in external conditions monitored. The whole building heat loss tests (Johnston et al ., 2013) provide ideal conditions for monitoring heat flux through the fabric and elements of the building envelope. The thermal transmittance of a building element (U-value) is defined in ISO 7345 as the “Heat flow rate in the steady-state divided by area and by the temperature difference between the surroundings on each side of a system” (ISO, 1987, p.3). U-values are expressed in W/m2K. In situ U-value measurements were undertaken in accordance with ISO 9869 (ISO, 1994). In situ measurements of heat flux density, using heat flux plates (HFPs) from which in situ U-values were derived, were taken at different locations depending on the nature of the thermal elements under investigation. It would be usual to use an array of five or more heat flux sensors
to ensure the average heat transfer for an element could be established. Generally, measurements of heat flux density were taken from locations considered not to be significantly influenced by the thermal bridging at junctions (typically readings are taken at distances greater than 1000mm from the junctions and thermal bridges).
The predicted U-values were calculated in accordance with BS EN ISO 6946 (BSI, 2007a), SAP or the RdSAP assumed U-value (BRE, 2012).
Steady-state Whole House Heat Loss Measurements (Heat Loss Coefficient)The heat loss coefficient (HLC) is the rate of heat loss (fabric and ventilation) in watts (W) from the entire thermal envelope of a building per kelvin (K) of the temperature differential between the internal and external environments. The HLC is expressed in W/K. A modified version of Leeds Beckett University’s Whole House Heat Loss Test Method (Johnston et al ., 2013) is used to obtain HLC measurements during steady-state measurement period, normally this is 7-14 days, where internal temperatures are maintained at a constant temperature (the constant being fixed at a temperature between 22oC and 25oC depending on the nature of the building and external conditions). The HLC represents the aggregate of the plane element, thermal bridging, and ventilation heat losses.
Relative HumidityWhere possible relative humidity (RH) is monitored within the test buildings. RH is monitored to establish whether the air moisture content changes during test periods. Changes in moisture content can have a significant impact upon the thermal conductivity of the building fabric.
Airtightness Testing and Building Pressurisation TestsBuilding pressurisation tests using a blower door in accordance with ATTMA L1 (ATTMA, 2010) are performed to establish the airtightness. An estimation of the background ventilation rate is derived from the air leakage rate at 50 Pascals. The airtightness value is used to isolate the ventilation heat loss components of the HLC using the n/20 rule1 (Sherman, 1987). The conditions present during the pressurisation tests provide the opportunity for leakage and air infiltration identification. During pressurisation, leakage detection can be performed using a smoke puffer stick. Occasionally, where building owners allow, a whole
1 n/19.2 was used for background ventilation, this includes corrections for storey height and sheltering factor.
Zero Carbon Building Journal
ZCB Journal 2015 • Volume 438
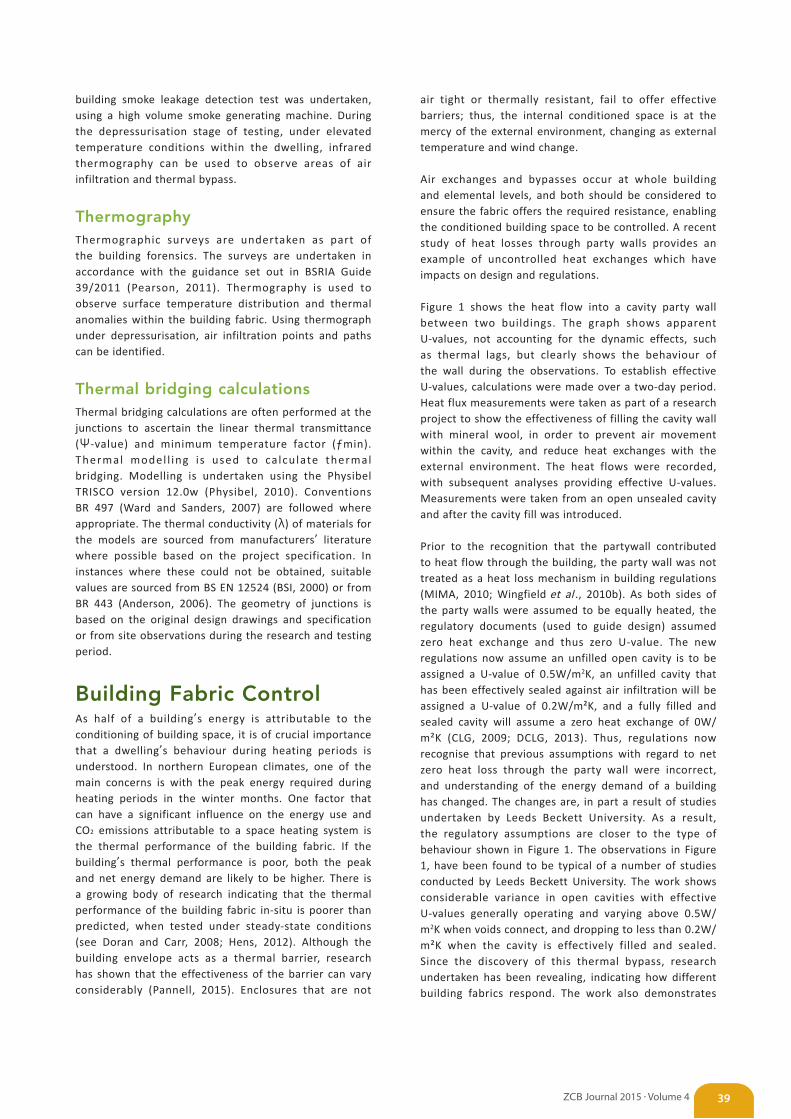
building smoke leakage detection test was undertaken, using a high volume smoke generating machine. During the depressurisation stage of testing, under elevated temperature conditions within the dwelling, infrared thermography can be used to observe areas of air infiltration and thermal bypass.
ThermographyThermographic surveys are undertaken as part of the building forensics. The surveys are undertaken in accordance with the guidance set out in BSRIA Guide 39/2011 (Pearson, 2011). Thermography is used to observe surface temperature distribution and thermal anomalies within the building fabric. Using thermograph under depressurisation, air infiltration points and paths can be identified.
Thermal bridging calculationsThermal bridging calculations are often performed at the junctions to ascertain the linear thermal transmittance (Ψ-value) and minimum temperature factor (ƒmin). Thermal model l ing i s used to ca lculate thermal bridging. Modelling is undertaken using the Physibel TRISCO version 12.0w (Physibel, 2010). Conventions BR 497 (Ward and Sanders, 2007) are followed where appropriate. The thermal conductivity (λ) of materials for the models are sourced from manufacturers’ literature where possible based on the project specification. In instances where these could not be obtained, suitable values are sourced from BS EN 12524 (BSI, 2000) or from BR 443 (Anderson, 2006). The geometry of junctions is based on the original design drawings and specification or from site observations during the research and testing period.
Building Fabric ControlAs half of a building’s energy is attributable to the conditioning of building space, it is of crucial importance that a dwelling’s behaviour during heating periods is understood. In northern European climates, one of the main concerns is with the peak energy required during heating periods in the winter months. One factor that can have a significant influence on the energy use and CO2 emissions attributable to a space heating system is the thermal performance of the building fabric. If the building’s thermal performance is poor, both the peak and net energy demand are likely to be higher. There is a growing body of research indicating that the thermal performance of the building fabric in-situ is poorer than predicted, when tested under steady-state conditions (see Doran and Carr, 2008; Hens, 2012). Although the building envelope acts as a thermal barrier, research has shown that the effectiveness of the barrier can vary considerably (Pannell, 2015). Enclosures that are not
air tight or thermally resistant, fail to offer effective barriers; thus, the internal conditioned space is at the mercy of the external environment, changing as external temperature and wind change.
Air exchanges and bypasses occur at whole building and elemental levels, and both should be considered to ensure the fabric offers the required resistance, enabling the conditioned building space to be controlled. A recent study of heat losses through party walls provides an example of uncontrolled heat exchanges which have impacts on design and regulations.
Figure 1 shows the heat flow into a cavity party wall between two buildings. The graph shows apparent U-values, not accounting for the dynamic effects, such as thermal lags, but clearly shows the behaviour of the wall during the observations. To establish effective U-values, calculations were made over a two-day period. Heat flux measurements were taken as part of a research project to show the effectiveness of filling the cavity wall with mineral wool, in order to prevent air movement within the cavity, and reduce heat exchanges with the external environment. The heat flows were recorded, with subsequent analyses providing effective U-values. Measurements were taken from an open unsealed cavity and after the cavity fill was introduced.
Prior to the recognition that the partywall contributed to heat flow through the building, the party wall was not treated as a heat loss mechanism in building regulations (MIMA, 2010; Wingfield et al ., 2010b). As both sides of the party walls were assumed to be equally heated, the regulatory documents (used to guide design) assumed zero heat exchange and thus zero U-value. The new regulations now assume an unfilled open cavity is to be assigned a U-value of 0.5W/m2K, an unfilled cavity that has been effectively sealed against air infiltration will be assigned a U-value of 0.2W/m²K, and a fully filled and sealed cavity will assume a zero heat exchange of 0W/m²K (CLG, 2009; DCLG, 2013). Thus, regulations now recognise that previous assumptions with regard to net zero heat loss through the party wall were incorrect, and understanding of the energy demand of a building has changed. The changes are, in part a result of studies undertaken by Leeds Beckett University. As a result, the regulatory assumptions are closer to the type of behaviour shown in Figure 1. The observations in Figure 1, have been found to be typical of a number of studies conducted by Leeds Beckett University. The work shows considerable variance in open cavities with effective U-values generally operating and varying above 0.5W/m2K when voids connect, and dropping to less than 0.2W/m²K when the cavity is effectively filled and sealed. Since the discovery of this thermal bypass, research undertaken has been revealing, indicating how different building fabrics respond. The work also demonstrates
39ZCB Journal 2015 • Volume 4
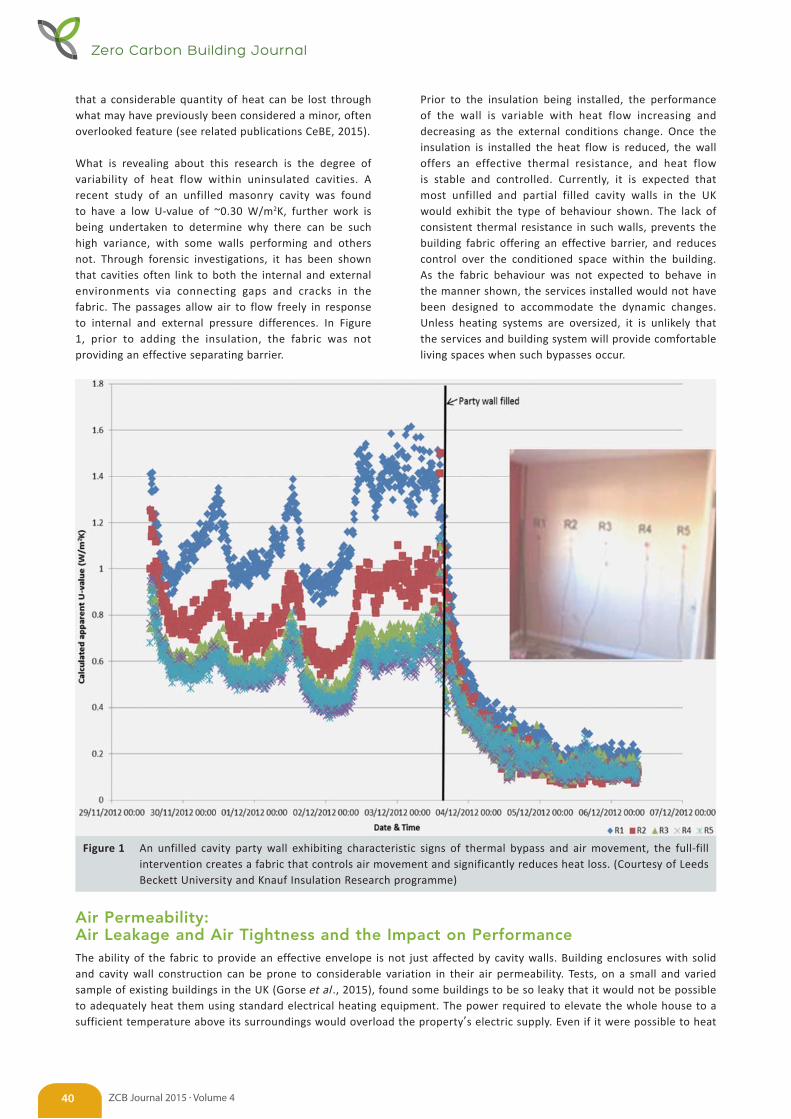
that a considerable quantity of heat can be lost through what may have previously been considered a minor, often overlooked feature (see related publications CeBE, 2015).
What is revealing about this research is the degree of variability of heat flow within uninsulated cavities. A recent study of an unfilled masonry cavity was found to have a low U-value of ~0.30 W/m2K, further work is being undertaken to determine why there can be such high variance, with some walls performing and others not. Through forensic investigations, it has been shown that cavities often link to both the internal and external environments via connecting gaps and cracks in the fabric. The passages allow air to flow freely in response to internal and external pressure differences. In Figure 1, prior to adding the insulation, the fabric was not providing an effective separating barrier.
Figure 1 An unfilled cavity party wall exhibiting characteristic signs of thermal bypass and air movement, the full-fill intervention creates a fabric that controls air movement and significantly reduces heat loss. (Courtesy of Leeds Beckett University and Knauf Insulation Research programme)
Air Permeability: Air Leakage and Air Tightness and the Impact on PerformanceThe ability of the fabric to provide an effective envelope is not just affected by cavity walls. Building enclosures with solid and cavity wall construction can be prone to considerable variation in their air permeability. Tests, on a small and varied sample of existing buildings in the UK (Gorse et al ., 2015), found some buildings to be so leaky that it would not be possible to adequately heat them using standard electrical heating equipment. The power required to elevate the whole house to a sufficient temperature above its surroundings would overload the property’s electric supply. Even if it were possible to heat
Prior to the insulation being installed, the performance of the wall is variable with heat flow increasing and decreasing as the external conditions change. Once the insulation is installed the heat flow is reduced, the wall offers an effective thermal resistance, and heat flow is stable and controlled. Currently, it is expected that most unfilled and partial filled cavity walls in the UK would exhibit the type of behaviour shown. The lack of consistent thermal resistance in such walls, prevents the building fabric offering an effective barrier, and reduces control over the conditioned space within the building. As the fabric behaviour was not expected to behave in the manner shown, the services installed would not have been designed to accommodate the dynamic changes. Unless heating systems are oversized, it is unlikely that the services and building system will provide comfortable living spaces when such bypasses occur.
Zero Carbon Building Journal
ZCB Journal 2015 • Volume 440
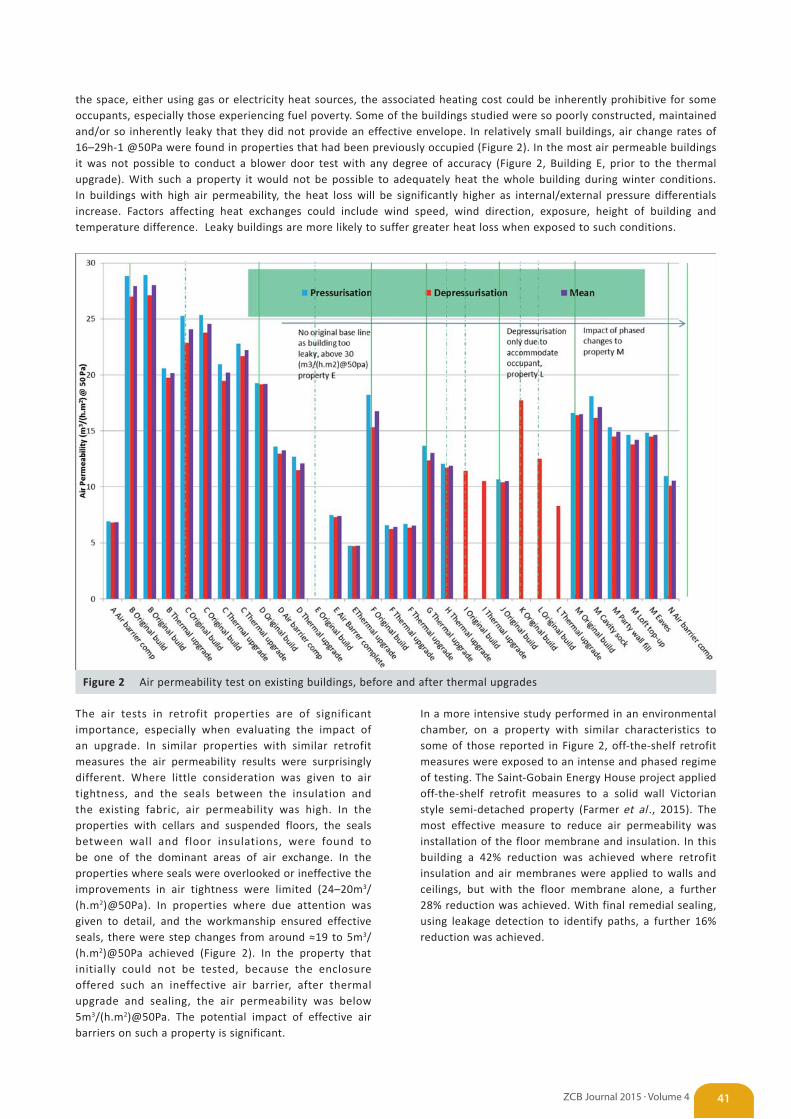
the space, either using gas or electricity heat sources, the associated heating cost could be inherently prohibitive for some occupants, especially those experiencing fuel poverty. Some of the buildings studied were so poorly constructed, maintained and/or so inherently leaky that they did not provide an effective envelope. In relatively small buildings, air change rates of 16–29h-1 @50Pa were found in properties that had been previously occupied (Figure 2). In the most air permeable buildings it was not possible to conduct a blower door test with any degree of accuracy (Figure 2, Building E, prior to the thermal upgrade). With such a property it would not be possible to adequately heat the whole building during winter conditions. In buildings with high air permeability, the heat loss will be significantly higher as internal/external pressure differentials increase. Factors affecting heat exchanges could include wind speed, wind direction, exposure, height of building and temperature difference. Leaky buildings are more likely to suffer greater heat loss when exposed to such conditions.
Figure 2 Air permeability test on existing buildings, before and after thermal upgrades
The air tests in retrofit properties are of significant importance, especially when evaluating the impact of an upgrade. In similar properties with similar retrofit measures the air permeability results were surprisingly different. Where little consideration was given to air tightness, and the seals between the insulation and the existing fabric, air permeability was high. In the properties with cellars and suspended floors, the seals between wall and floor insulations, were found to be one of the dominant areas of air exchange. In the properties where seals were overlooked or ineffective the improvements in air tightness were limited (24–20m3/(h.m2)@50Pa). In properties where due attention was given to detail, and the workmanship ensured effective seals, there were step changes from around ≈19 to 5m3/(h.m2)@50Pa achieved (Figure 2). In the property that initially could not be tested, because the enclosure offered such an ineffective air barrier, after thermal upgrade and sealing, the air permeability was below 5m3/(h.m2)@50Pa. The potential impact of effective air barriers on such a property is significant.
In a more intensive study performed in an environmental chamber, on a property with similar characteristics to some of those reported in Figure 2, off-the-shelf retrofit measures were exposed to an intense and phased regime of testing. The Saint-Gobain Energy House project applied off-the-shelf retrofit measures to a solid wall Victorian style semi-detached property (Farmer et al ., 2015). The most effective measure to reduce air permeability was installation of the floor membrane and insulation. In this building a 42% reduction was achieved where retrofit insulation and air membranes were applied to walls and ceilings, but with the floor membrane alone, a further 28% reduction was achieved. With final remedial sealing, using leakage detection to identify paths, a further 16% reduction was achieved.
41ZCB Journal 2015 • Volume 4
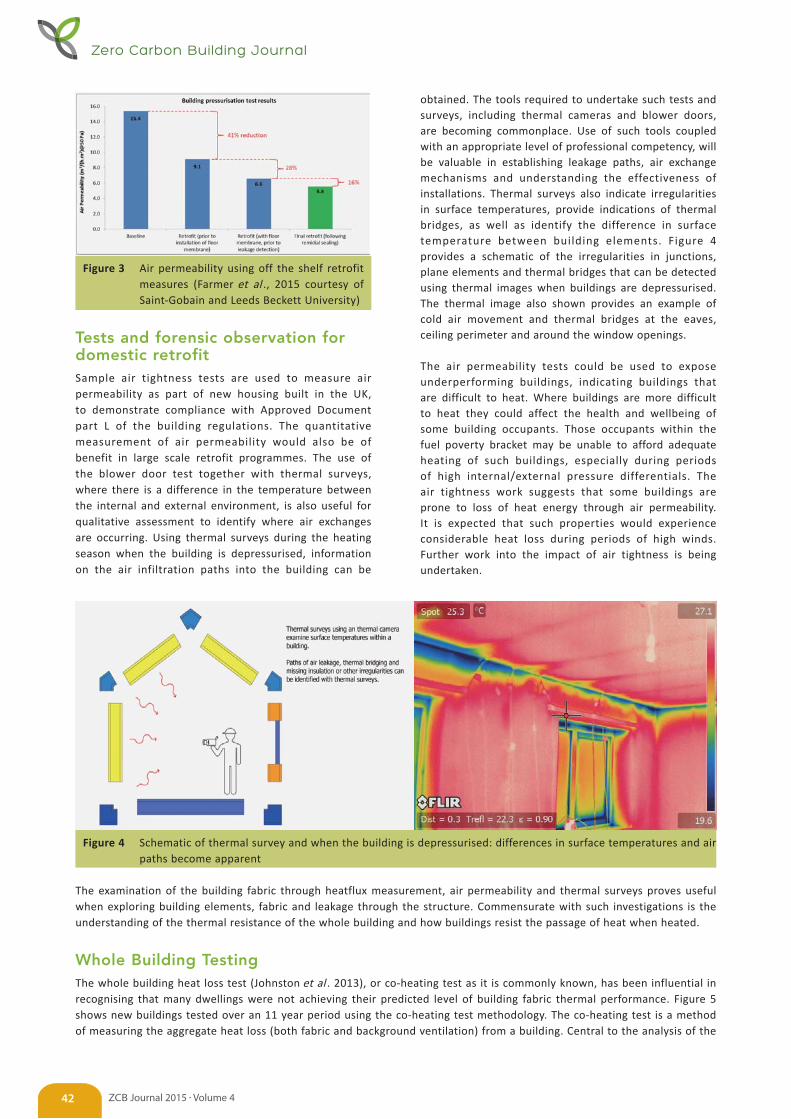
Figure 3 Air permeability using off the shelf retrofit measures (Farmer et al ., 2015 courtesy of Saint-Gobain and Leeds Beckett University)
Tests and forensic observation for domestic retrofitSample air tightness tests are used to measure air permeability as part of new housing built in the UK, to demonstrate compliance with Approved Document part L of the building regulations. The quantitative measurement of air permeability would also be of benefit in large scale retrofit programmes. The use of the blower door test together with thermal surveys, where there is a difference in the temperature between the internal and external environment, is also useful for qualitative assessment to identify where air exchanges are occurring. Using thermal surveys during the heating season when the building is depressurised, information on the air infiltration paths into the building can be
obtained. The tools required to undertake such tests and surveys, including thermal cameras and blower doors, are becoming commonplace. Use of such tools coupled with an appropriate level of professional competency, will be valuable in establishing leakage paths, air exchange mechanisms and understanding the effectiveness of installations. Thermal surveys also indicate irregularities in surface temperatures, provide indications of thermal bridges, as well as identify the difference in surface temperature between building elements. Figure 4 provides a schematic of the irregularities in junctions, plane elements and thermal bridges that can be detected using thermal images when buildings are depressurised. The thermal image also shown provides an example of cold air movement and thermal bridges at the eaves, ceiling perimeter and around the window openings.
The air permeability tests could be used to expose underperforming buildings, indicating buildings that are difficult to heat. Where buildings are more difficult to heat they could affect the health and wellbeing of some building occupants. Those occupants within the fuel poverty bracket may be unable to afford adequate heating of such buildings, especially during periods of high internal/external pressure differentials. The air tightness work suggests that some buildings are prone to loss of heat energy through air permeability. It is expected that such properties would experience considerable heat loss during periods of high winds. Further work into the impact of air tightness is being undertaken.
Figure 4 Schematic of thermal survey and when the building is depressurised: differences in surface temperatures and air paths become apparent
The examination of the building fabric through heatflux measurement, air permeability and thermal surveys proves useful when exploring building elements, fabric and leakage through the structure. Commensurate with such investigations is the understanding of the thermal resistance of the whole building and how buildings resist the passage of heat when heated.
Whole Building TestingThe whole building heat loss test (Johnston et al . 2013), or co-heating test as it is commonly known, has been influential in recognising that many dwellings were not achieving their predicted level of building fabric thermal performance. Figure 5 shows new buildings tested over an 11 year period using the co-heating test methodology. The co-heating test is a method of measuring the aggregate heat loss (both fabric and background ventilation) from a building. Central to the analysis of the
Zero Carbon Building Journal
ZCB Journal 2015 • Volume 442
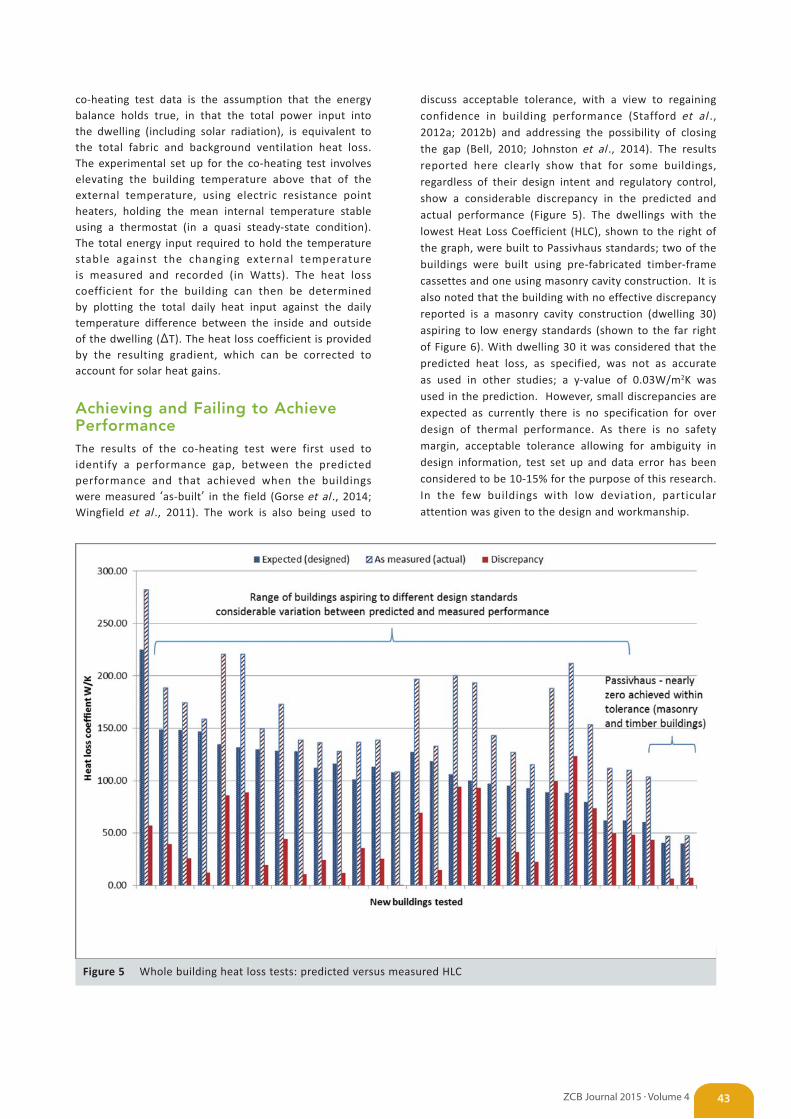
co-heating test data is the assumption that the energy balance holds true, in that the total power input into the dwelling (including solar radiation), is equivalent to the total fabric and background ventilation heat loss. The experimental set up for the co-heating test involves elevating the building temperature above that of the external temperature, using electric resistance point heaters, holding the mean internal temperature stable using a thermostat (in a quasi steady-state condition). The total energy input required to hold the temperature stable against the changing external temperature is measured and recorded (in Watts). The heat loss coefficient for the building can then be determined by plotting the total daily heat input against the daily temperature difference between the inside and outside of the dwelling (ΔT). The heat loss coefficient is provided by the resulting gradient, which can be corrected to account for solar heat gains.
Achieving and Failing to Achieve PerformanceThe results of the co-heating test were first used to identify a performance gap, between the predicted performance and that achieved when the buildings were measured ‘as-built’ in the field (Gorse et al ., 2014; Wingfield et al ., 2011). The work is also being used to
43ZCB Journal 2015 • Volume 4
discuss acceptable tolerance, with a view to regaining confidence in building performance (Stafford et al ., 2012a; 2012b) and addressing the possibility of closing the gap (Bell, 2010; Johnston et al ., 2014). The results reported here clearly show that for some buildings, regardless of their design intent and regulatory control, show a considerable discrepancy in the predicted and actual performance (Figure 5). The dwellings with the lowest Heat Loss Coefficient (HLC), shown to the right of the graph, were built to Passivhaus standards; two of the buildings were built using pre-fabricated timber-frame cassettes and one using masonry cavity construction. It is also noted that the building with no effective discrepancy reported is a masonry cavity construction (dwelling 30) aspiring to low energy standards (shown to the far right of Figure 6). With dwelling 30 it was considered that the predicted heat loss, as specified, was not as accurate as used in other studies; a y-value of 0.03W/m2K was used in the prediction. However, small discrepancies are expected as currently there is no specification for over design of thermal performance. As there is no safety margin, acceptable tolerance allowing for ambiguity in design information, test set up and data error has been considered to be 10-15% for the purpose of this research. In the few buildings with low deviation, particular attention was given to the design and workmanship.
Figure 5 Whole building heat loss tests: predicted versus measured HLC
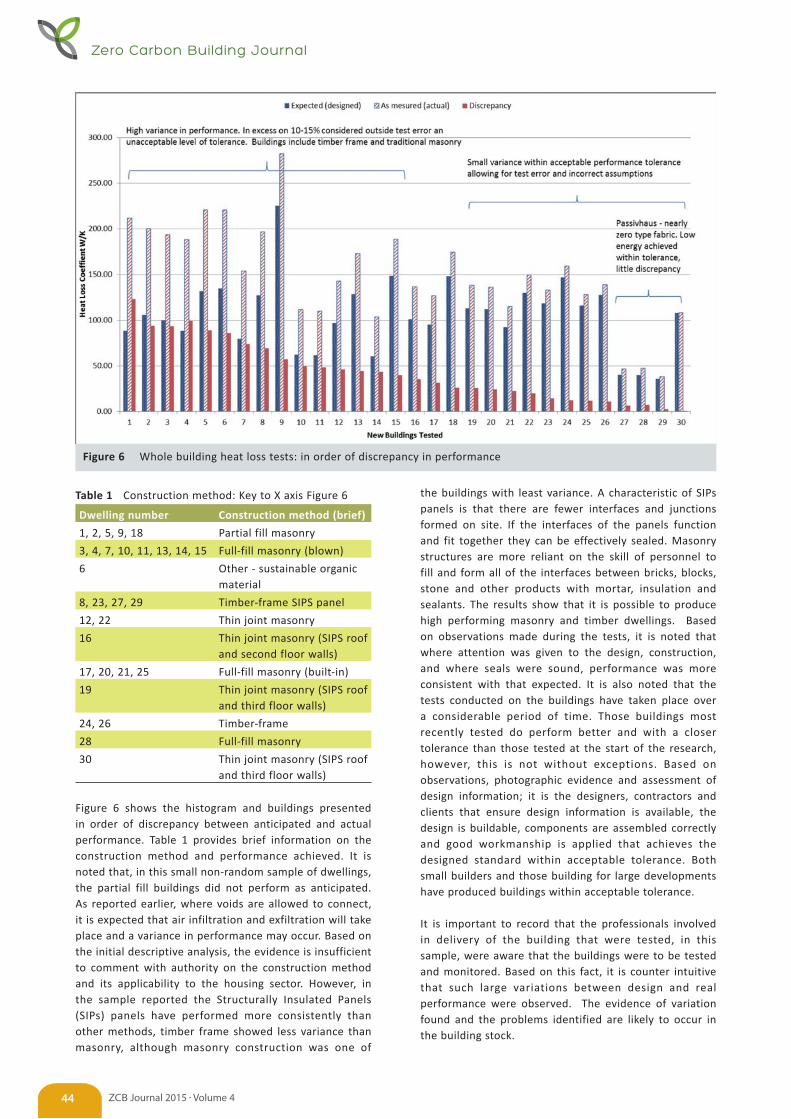
Figure 6 Whole building heat loss tests: in order of discrepancy in performance
Table 1 Construction method: Key to X axis Figure 6
Dwelling number Construction method (brief)
1, 2, 5, 9, 18 Partial fill masonry
3, 4, 7, 10, 11, 13, 14, 15 Full-fill masonry (blown)
6 Other - sustainable organic material
8, 23, 27, 29 Timber-frame SIPS panel
12, 22 Thin joint masonry
16 Thin joint masonry (SIPS roof and second floor walls)
17, 20, 21, 25 Full-fill masonry (built-in)
19 Thin joint masonry (SIPS roof and third floor walls)
24, 26 Timber-frame
28 Full-fill masonry
30 Thin joint masonry (SIPS roof and third floor walls)
Figure 6 shows the histogram and buildings presented in order of discrepancy between anticipated and actual performance. Table 1 provides brief information on the construction method and performance achieved. It is noted that, in this small non-random sample of dwellings, the partial fill buildings did not perform as anticipated. As reported earlier, where voids are allowed to connect, it is expected that air infiltration and exfiltration will take place and a variance in performance may occur. Based on the initial descriptive analysis, the evidence is insufficient to comment with authority on the construction method and its applicability to the housing sector. However, in the sample reported the Structurally Insulated Panels (SIPs) panels have performed more consistently than other methods, timber frame showed less variance than masonry, although masonry construction was one of
the buildings with least variance. A characteristic of SIPs panels is that there are fewer interfaces and junctions formed on site. If the interfaces of the panels function and fit together they can be effectively sealed. Masonry structures are more reliant on the skill of personnel to fill and form all of the interfaces between bricks, blocks, stone and other products with mortar, insulation and sealants. The results show that it is possible to produce high performing masonry and timber dwellings. Based on observations made during the tests, it is noted that where attention was given to the design, construction, and where seals were sound, performance was more consistent with that expected. It is also noted that the tests conducted on the buildings have taken place over a considerable period of time. Those buildings most recently tested do perform better and with a closer tolerance than those tested at the start of the research, however, this is not without exceptions. Based on observations, photographic evidence and assessment of design information; it is the designers, contractors and clients that ensure design information is available, the design is buildable, components are assembled correctly and good workmanship is applied that achieves the designed standard within acceptable tolerance. Both small builders and those building for large developments have produced buildings within acceptable tolerance.
It is important to record that the professionals involved in delivery of the building that were tested, in this sample, were aware that the buildings were to be tested and monitored. Based on this fact, it is counter intuitive that such large variations between design and real performance were observed. The evidence of variation found and the problems identified are likely to occur in the building stock.
Zero Carbon Building Journal
ZCB Journal 2015 • Volume 444
Where the buildings perform as expected, such as those shown on the right hand side of Figure 6, there is greater potential for the thermal comfort and energy levels to be more consistent and predictable throughout a full session of heating. It is also expected that greater variation in energy demand will be experienced with buildings that have high air permeability and low thermal resistance. Co-heating tests are only valid if conducted under a certain set of environmental conditions, in more extreme conditions the tests becomes unreliable. The tests are generally conducted when wind speeds are low and relatively stable to reduce uncertainty in the results. In more extreme conditions the test may become unreliable, especially with buildings of high air permeability. Thus, the results reported are those collected during stable winter (heating) conditions. It is likely that the results for the high air permeable buildings would be more variable during extreme conditions, though this requires further research.
Reliability of the Whole Building TestsTests have been conducted to explore the repeatability of the co-heating test. In January 2010, a research team from Leeds Metropolitan University (now Leeds Beckett University) undertook a co-heating test on a 2½ storey detached dwelling using the Whole House Heat Loss Test Method (Miles-Shenton et al ., 2010). The test was undertaken as part of a project designed to test the thermal performance of prototype dwellings in-situ for an energy efficient housing development. The Heat Loss Coefficient (HLC) resulting from the 2010 co-heating test, conducted in January, was 132.9 (± 1.5) W/K. In December 2012, a different research team from the same University undertook a co-heating test on the same dwelling in accordance with the 2012 iteration of the Co-heating Test Method (Farmer et al ., 2013; 2014; Johnston et al ., 2012). The HLC resulting from the December 2012 co-heating test was 133.8 (± 1.9) W/K. The two co-heating test results, obtained 35 months apart and with different research teams, differed by <1%. An independent sample T-test of the 24 hour solar corrected HLCs obtained showed no statist ical ly s ignif icant difference (P = 0.432) between the HLCs obtained in each test. This suggests a reasonable level of precision (repeatability) in the co-heating test in this instance.
Cross Checking Heat Loss Tests: Reliability and ValidityIn addition to checking the repeatability of the co-heating method on the same dwelling in the field, an opportunity also presented itself to cross check alternative testing methods through the Saint-Gobain Energy House project (Farmer et al ., 2014; Weaver and Gibson, 2014). At each of the six stages of the retrofit project, blind tests were independently undertaken by the Leeds Beckett University team (at Leeds Sustainability Institute), and
Saint-Gobain Recherché. The Saint-Gobain team used the Quick U-value of Buildings (QUB) method (Pandraud et al ., 2014) and the Leeds team used the co-heating test.
The unique facility offered by the environmental chamber meant it was possible to perform each test separately and sequentially, under the same controlled external conditions, something which is not possible to achieve in the field. QUB is a diagnostic method that enables the heat loss coefficient to be calculated over one or two nights. The Quick U-value method measures the temperature response during a heating and free cooling period. The level of uncertainty is estimated to be ± 15% when performed on a single night, and declines as the test period is extended (Pandraud, et al ., 2014). However, the cross checking of the methods at the energy house showed a much closer fit than was expected (Farmer et al . 2014). The tests and the work reported have proved reliable.
Standards and Build QualityAs well as having to design buildings to a high standard in order to meet a nearly zero energy predicted performance target, the buildings themselves must be constructed to a high standard in order for that performance to be realised. High thermal performance targets can be met where construction is carried out carefully and sufficient quality control is exercised in order to ensure that design targets are reached. The work reported here confirms this and supports earlier assumptions made on smaller sample (see initial work by Stafford et al . 2012a, 2012b). One of the main findings of the forensic analysis undertaken is that the most common faults occur where the integrity of the air and thermal barriers are breached or discontinued (Gorse et al ., 2013). Thus, the connection and continuity of the thermal envelope and the air barrier must be maintained in design and when built. The work of Johnston et al . (2014) highlights buildings that have achieved high standards of energy performance in design and construction. The work reported here used thermal surveys and whole building heat loss tests to understand the fabric performance. Those buildings that met their design standard showed limited evidence of unintended bypass, air leakage and thermal bridging. However, test results still show a considerable discrepancy between design intentions and ‘as built’ performance, which are seldom accounted for by margin of error alone. It is evident that buildings that offer effective thermal barriers will provide more consistent and reliable behaviour. Through further research, it will become evident how much heat energy is required to achieve thermal comfort, then understanding the thermal inertial and capacity will help address the potential for energy storage.
45ZCB Journal 2015 • Volume 4
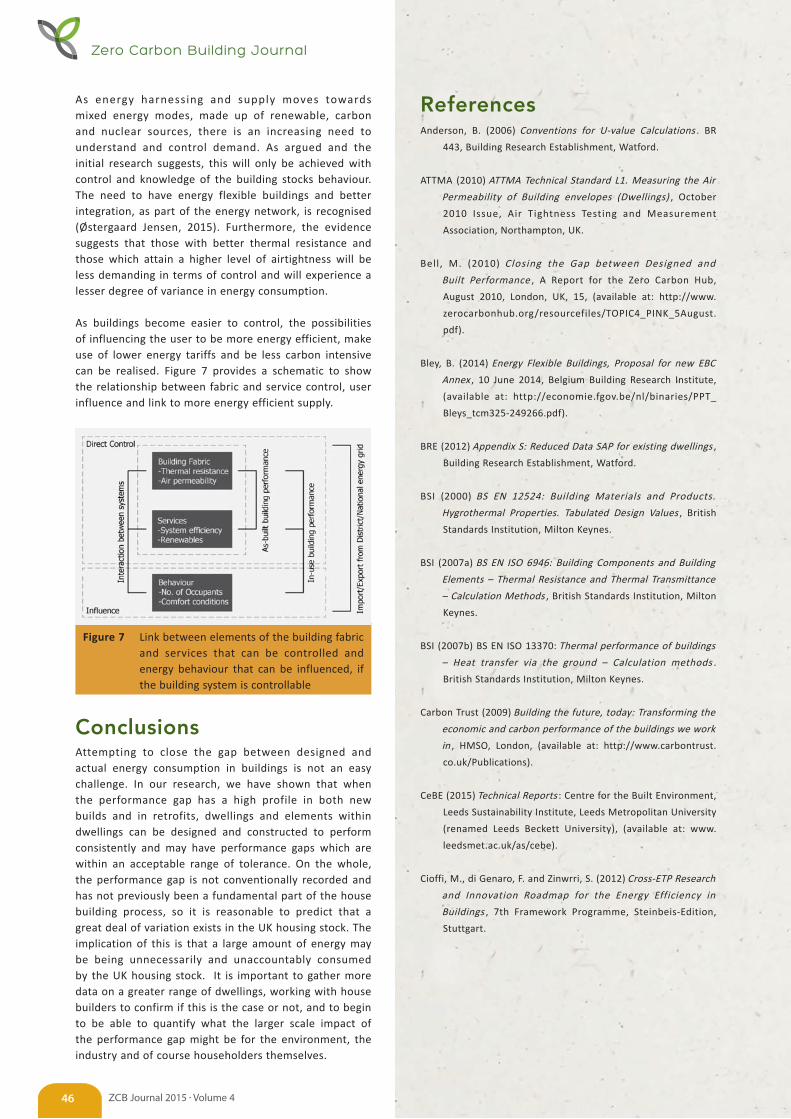
As energy harnessing and supply moves towards mixed energy modes, made up of renewable, carbon and nuclear sources, there is an increasing need to understand and control demand. As argued and the initial research suggests, this will only be achieved with control and knowledge of the building stocks behaviour. The need to have energy flexible buildings and better integration, as part of the energy network, is recognised (Østergaard Jensen, 2015). Furthermore, the evidence suggests that those with better thermal resistance and those which attain a higher level of airtightness will be less demanding in terms of control and will experience a lesser degree of variance in energy consumption.
As buildings become easier to control, the possibilities of influencing the user to be more energy efficient, make use of lower energy tariffs and be less carbon intensive can be realised. Figure 7 provides a schematic to show the relationship between fabric and service control, user influence and link to more energy efficient supply.
Figure 7 Link between elements of the building fabric and services that can be controlled and energy behaviour that can be influenced, if the building system is controllable
ConclusionsAttempting to close the gap between designed and actual energy consumption in buildings is not an easy challenge. In our research, we have shown that when the performance gap has a high profile in both new builds and in retrofits, dwellings and elements within dwellings can be designed and constructed to perform consistently and may have performance gaps which are within an acceptable range of tolerance. On the whole, the performance gap is not conventionally recorded and has not previously been a fundamental part of the house building process, so it is reasonable to predict that a great deal of variation exists in the UK housing stock. The implication of this is that a large amount of energy may be being unnecessarily and unaccountably consumed by the UK housing stock. It is important to gather more data on a greater range of dwellings, working with house builders to confirm if this is the case or not, and to begin to be able to quantify what the larger scale impact of the performance gap might be for the environment, the industry and of course householders themselves.
ReferencesAnderson, B. (2006) Conventions for U-value Calculations . BR
443, Building Research Establishment, Watford.
ATTMA (2010) ATTMA Technical Standard L1. Measuring the Air
Permeability of Building envelopes (Dwellings) , October
2010 Issue, Air Tightness Testing and Measurement
Association, Northampton, UK.
Bell , M. (2010) Closing the Gap between Designed and
Built Performance , A Report for the Zero Carbon Hub,
August 2010, London, UK, 15, (available at: http://www.
zerocarbonhub.org/resourcefiles/TOPIC4_PINK_5August.
pdf).
Bley, B. (2014) Energy Flexible Buildings, Proposal for new EBC
Annex , 10 June 2014, Belgium Building Research Institute,
(available at: http://economie.fgov.be/nl/binaries/PPT_
Bleys_tcm325-249266.pdf).
BRE (2012) Appendix S: Reduced Data SAP for existing dwellings ,
Building Research Establishment, Watford.
BSI (2000) BS EN 12524: Building Materials and Products.
Hygrothermal Properties. Tabulated Design Values , British
Standards Institution, Milton Keynes.
BSI (2007a) BS EN ISO 6946: Building Components and Building
Elements – Thermal Resistance and Thermal Transmittance
– Calculation Methods , British Standards Institution, Milton
Keynes.
BSI (2007b) BS EN ISO 13370: Thermal performance of buildings
– Heat transfer via the ground – Calculation methods .
British Standards Institution, Milton Keynes.
Carbon Trust (2009) Building the future, today: Transforming the
economic and carbon performance of the buildings we work
in , HMSO, London, (available at: http://www.carbontrust.
co.uk/Publications).
CeBE (2015) Technical Reports : Centre for the Built Environment,
Leeds Sustainability Institute, Leeds Metropolitan University
(renamed Leeds Beckett University), (available at: www.
leedsmet.ac.uk/as/cebe).
Cioffi, M., di Genaro, F. and Zinwrri, S. (2012) Cross-ETP Research
and Innovation Roadmap for the Energy Efficiency in
Buildings , 7th Framework Programme, Steinbeis-Edition,
Stuttgart.
Zero Carbon Building Journal
ZCB Journal 2015 • Volume 446
CLG (2009) Planning, building and the environment, Proposed
Changes to Part L and Part F of the Building Regulations: A
consultation Paper, Communities and Local Government ,
18 J u n e 2009, ( ava i l a b l e at : htt p : / / we b a rc h i ve .
nationalarchives.gov.uk/20120919132719/http://www.
communities.gov.uk/publications/planningandbuilding/
partlf2010consultation).
DCLG (2013) The Building Regulations 2010, Conservation of Fuel
and power . Approved Document L1a, Conservation of fuel
and power in new dwellings, Department for Communities
and Local Government.
Climate Change Act 2008 (c.27) The Stationery Office, London.
DECC (2013) 2012 UK Greenhouse Gas Emissions, Provisional
Figures and 2011 UK Greenhouse Gas Emissions, Final
Figures by Fuel Type and End-User , Department of Energy
and Climate Change, (available at: https://www.gov.
uk/government/publications/provisional-uk-emissions-
estimates).
DECC (2014) Digest of United Kingdom Energy Statistics (DUKES)
2014, Department of Energy and Climate Change, (available
at: https://www.gov.uk/government/uploads/system/
uploads/attachment_data/f i le/338750/DUKES_2014_
printed.pdf).
Doran, S. and Carr, B. (2008) Thermal Transmittance of Walls
of Dwellings Before and After Application of Cavity Wall
Insulation , A report to the Energy Saving Trust by the
BRE, Glasgow, (available at: http://www.decc.gov.uk/
assets/decc/11/about-us/economics-social-research/3146-
thermal-transmittance.pdf).
EPBD (2010) Energy Performance Building Directive, 2010/31/
EU , Directive 2010/3/EU of the European Parliament and of
the Council, 19 May 2010, Official Journal of the European
Union, (available at: http://eur-lex.europa.eu).
Farmer, D. Johnston, D. Miles-Shenton D. and Peat, M.
(2013) Post Construction and Early Occupation Study,
Derwenthorpe – Heat Flux Measurement Report , A report
to the Technology Strategy Board as part of the Technology
Strategy Board’s Bui ld ing Performance Eva luat ion
Programme, July 2013, Centre for the Built Environment
(CeBE), Leeds Metropolitan University, Leeds, UK.
Farmer, D., Brooke-Peat, M., Miles-Shenton., D, Cuttle, C. and
Gorse, C. (2014) Saint-Gobain Energy House Thermal
Upgrade Testing , Technical Report, Leeds Sustainability
Institute, Leeds Beckett University, Leeds, UK, Unpublished.
47ZCB Journal 2015 • Volume 4
Farmer, D., Brooke-Peat, M., Miles-Shenton., D. and Gorse,
C. (2015) Saint-Gobain Energy House Thermal Upgrade
Testing , Technical Report, Leeds Sustainability Institute,
Leeds Beckett University, Leeds, UK, Unpublished.
Gorse, C.A., Glew, D., Miles-Shenton, D., Farmer, D. and
Fletcher M. (2013) Building Performance: Fabric, impact
and implications , Sustainable Building 2013 Hong Kong
Regional Conference, Urban Density and Sustainability,
12-13 September 2013, Hong Kong, (available at: http://
sbconferences.org/sb13hongkong).
Gorse, C.A., Miles Shenton, D., Farmer, D., Fletcher, M., Glew,
D., Stafford, A. and Parker, J. (2014) The gap between
calculated and real performances: Experiences from
laboratory and field and the measures to address the
difference , Real Building Energy Performance Assessment,
Universiteit Gent and BBRI Belgium DYNASTEE Seminar
www.dynastee.info, 16 April 2014.
Gorse, C.A., Glew, D., Stafford, A., Fylan., F, Miles-Shenton, D.,
Farmer, D., Fletcher, M., Smith, M., Throup, G., Brooke-
Peat, M., Parker, J. and Johnston, D. (2015) DECC Core
Cities Monitoring and Evaluation Project - Green Deal
Trial , Reports 1 - 4, Department of Energy and Climate
Change, Leeds Sustainability Institute, Leeds Metropolitan
University, Unpublished.
Hens, H. (2012) Applied Building Physics: Boundary Conditions,
Building Performance and Material Properties , Ernst &
Sohn, Berlin.
Hermelink, A., Schimschar, S., Boermans, T., Pagliano, L.,
Zangheri, P., Armani, R., Voss, K. and Musall, E. (2013)
Towards nearly zero-energy buildings: Definition of common
principles under EPBD: Final Report , BESDE10788, prepared
for the European Commission, 14 Feb 2013, Ecofys,
(available at: https://ec.europa.eu/energy/sites/ener/files/
documents/nzeb_full_report.pdf).
ISO (1987) ISO 7345: 1987 Thermal Insulation: Physical
quantities and definitions , ISO TC 163 Thermal performance
and energy use in the built environment. Milton Keynes,
British Standards Institution.
ISO (1994) ISO 9869: 1994 Thermal insulation, Building
elements, Insitu measurement of thermal resistance and
thermal transmittance , TC 163 Thermal performance and
energy use in the built environment. Milton Keynes, British
Standards Institution.
Zero Carbon Building Journal
ZCB Journal 2015 • Volume 448
IPCC (2014) Climate change 2013: The physical science basis ,
Intergovernmental Panel on Climate Change, (available at:
http://www.ipcc.ch/).
Johnston, D., Miles-Shenton, D., Farmer, D., and Wingfield, J.
(2012) Whole House Heat Loss Test Method (Coheating) ,
March 2012, Centre for the Built Environment, Leeds
M et ro p o l i ta n U n i ve rs i t y ( re n a m e d L e e d s B e c kett
University), (available at: www.leedsmet.ac.uk/as/cebe/
projects).
Johnston, D., Miles-Shenton, D., Farmer, D., and Wingfield, J.
(2013) Whole House Heat Loss Test Method (Coheating) ,
June 2013, Centre for the Built Environment, Leeds
M et ro p o l i ta n U n i ve rs i t y ( re n a m e d L e e d s B e c kett
University), Leeds, UK, (available at: www.leedsmet.ac.uk/
as/cebe/projects).
Johnston, D., and Farmer, D. and Brooke-Peat, M., and Miles-
Shenton, D. (2014) Bridging the domestic building fabric
performance gap. Building Research and Information , ISSN
0961-3218 (In Press).
Kelly, J.M. (2009) Retrofitting the existing UK building stock.
Building Research and Information , 37, 196-200.
Miles-Shenton, D., Wingfield, J., Sutton, R. and Bell, M. (2010)
Temple Avenue Project Part 1 – Evaluation of Design
and Construction Process and Measurement of Fabric
Performance of New Build Dwellings , Report to Joseph
Rowntree Foundation, Leeds Metropolitan University,
Leeds, UK, (available at: http://www.leedsbeckett.ac.uk/as/
cebe/projects/tap/tap_part1.pdf).
MIMA (2010) Preventing Thermal Bypasses in Party Separating
Walls , Design Guide, 2010 Building Regulations Issue,
Mineral Wool Manufacturers Association, L7315, November
2010, (available at: http://www.mima.info/pdf/MIMA-Party-
Walll-Bypass-Guide.pdf).
Oreszczyn, T. and Lowe, R. (2010) Challenges for energy and
buildings research: objectives, methods and funding
mechanisms. Building Research & Information , 38(1), 107-
122.
Østergaard Jensen, S. (2015) Energy in Buildings Community
Programme, EBC Annex 67 Energy Flexible Buildings ,
International Energy Agency, (available at: http://www.iea-
ebc.org/projects/ongoing-projects/ebc-annex-67/).
Palmer, J. and Cooper, I. (2013) United Kingdom Housing Energy
Fact File 2013, Cambridge Architectural Research , Eclipse
Research Consultants and Cambridge Energy, Cambridge,
UK, Report prepared under contract to Department of
Energy and Climate Change, London, UK.
Pandraud, G., Gossard, D. and Alzetto, F. (2014) Experimental
optimization of the QUB method, IEA EBC Annex 58 , 6th
Expert meeting, 14-16 April 2014, Ghent, Belgium.
Pannell, R. (2015) The Delivery of Zero Carbon Housing in the UK.
Zero Carbon Building Journal , January, 3, 33-39.
Pearson, C. (2011) Thermal Imaging of Building Fabric . BG
39/2011. Bracknell, BSRIA.
Pérez-Lombard, L., Ortiz, J. and Pout, C. (2008) A review on
buildings energy consumption information. Energy and
Buildings , 40(3), 394-398.
Physibel (2010) TRISCO . Version 12.0w [Software]. Maldegem,
Physibel.
Prism Environmental (2012) Construction Sector Overview in
the UK , report for the European Commission, (available
at: http://www.prismenvironment.eu/reports_prism/UK_
PRISM_Environment_Report_EN.pdf).
Sherman, M. (1987) Estimation of Infiltration for Leakage and
Climate Indicators. Energy and Buildings , 10 (81).
Stafford, A., Gorse, C. and Shao, L. (2012a) The Retrofit
Challenge: Delivering Low Carbon Buildings , Report no. 4,
Energy Saving Trust and Low Carbon Futures, (available at:
www.lowcarbonfutures.org).
Stafford, A., Bell, M. and Gorse, C. (2012b) Building Confidence:
A Working Paper , Report no. 8, Energy Saving Trust and Low
Carbon Futures, (available at: www.lowcarbonfutures.org).
United Nations Environment Program (2007) Buildings and
climate change: Status, challenges and opportunities ,
(available at: http://www.unep.org).
Vadera, S., Wools, P., Flint, C., Pearson, I., Hodge, M., Jordon, W.
and Davies, M. (2008) Strategy for Sustainable Construction ,
HM Government, (avai lable at : http://webarchive.
nationalarchives.gov.uk/+/http:/www.bis.gov.uk/files/
file46535.pdf).
49ZCB Journal 2015 • Volume 4
Ward, T. and Sanders, C. (2007) Conventions for Calculating
Linear Thermal Transmittance and Temperature Factors . BR
497, Building Research Establishment, Watford.
Weaver, M and Gibson, S. (2014) Energy House - Saint-Gobain ,
(available at: http://media.saint-gobain.co.uk/App_Media/
Saint-Gobain/pdfs/V9477_Saint-Gobain_Energy_House_
Leaflet_HIGH_RES_V8.pdf).
Wingfield, J. Johnston, D. Miles-Shenton, D. and Bell, M. (2010)
Whole House Heat Loss Test Method (Coheating) , Centre
for the Built Environment, Leeds Metropolitan University
(renamed Leeds Beckett University), Leeds, UK, (available
at: www.leedsmet.ac.uk/as/cebe/projects).
Wingfield, J., Miles-Shenton, D. and Bell, M. (2010) Investigations
of the Party Wall Thermal Bypass in Timber Frame
Dwell ings , Report to EURISOL, Leeds Metropol itan
University, Leeds, UK, (available at: http://www.leedsmet.
ac.uk/as/cebe/projects/eurisol/eurisol_timber_frame_
report.pdf).
Wingfield, J., Bell, M., Miles-Shenton, D., South, T. and Lowe,
B. (2011) Evaluating the impact of an enhanced energy
performance standard on load-bearing masonry domestic
construction, Understanding the gap between designed
and real performance: Lessons from Stamford Brook ,
Department for Communities and Local Government,
London.
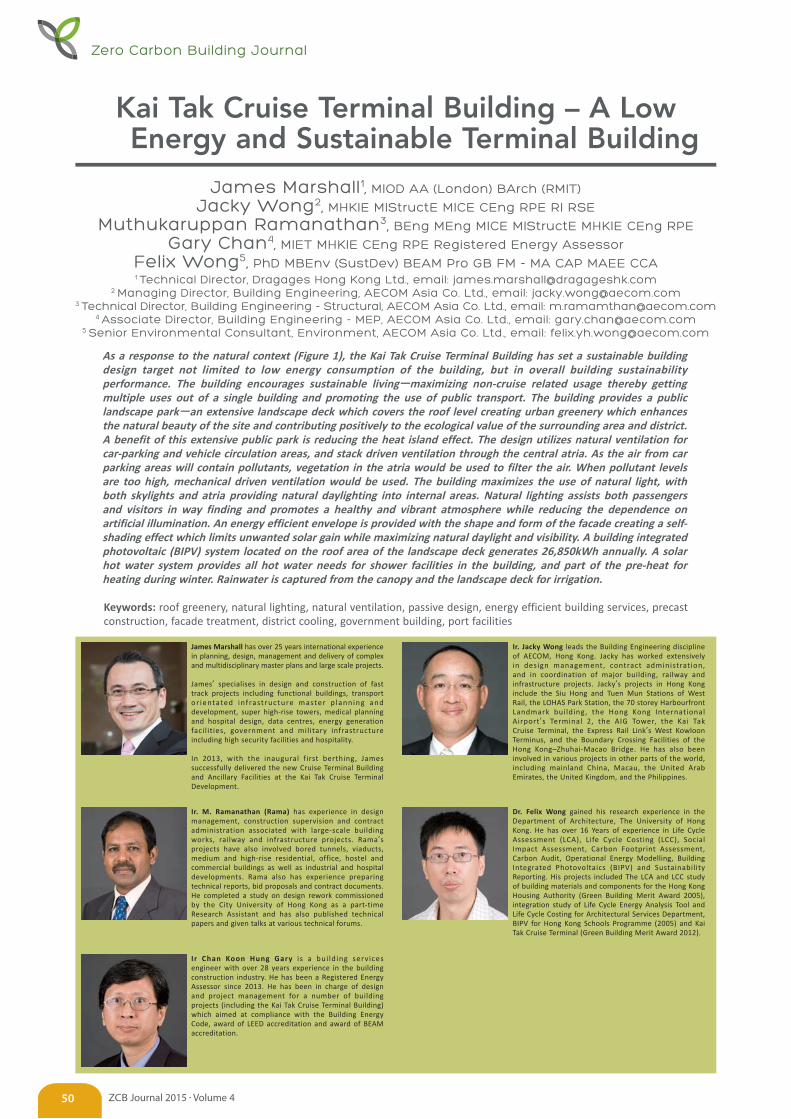
Dr. Felix Wong gained his research experience in the Department of Architecture, The University of Hong Kong. He has over 16 Years of experience in Life Cycle Assessment (LCA), Life Cycle Costing (LCC), Social Impact Assessment, Carbon Footprint Assessment, Carbon Audit, Operational Energy Modelling, Building Integrated Photovoltaics (BIPV) and Sustainability Reporting. His projects included The LCA and LCC study of building materials and components for the Hong Kong Housing Authority (Green Building Merit Award 2005), integration study of Life Cycle Energy Analysis Tool and Life Cycle Costing for Architectural Services Department, BIPV for Hong Kong Schools Programme (2005) and Kai Tak Cruise Terminal (Green Building Merit Award 2012).
Ir Chan Koon Hung Gary is a bui lding services engineer with over 28 years experience in the building construction industry. He has been a Registered Energy Assessor since 2013. He has been in charge of design and project management for a number of building projects (including the Kai Tak Cruise Terminal Building) which aimed at compliance with the Building Energy Code, award of LEED accreditation and award of BEAM accreditation.
James Marshall has over 25 years international experience in planning, design, management and delivery of complex and multidisciplinary master plans and large scale projects.
James’ specialises in design and construction of fast track projects including functional buildings, transport or ientated inf rastructure master p lanning and development, super high-rise towers, medical planning and hospital design, data centres, energy generation facilities, government and military infrastructure including high security facilities and hospitality.
In 2013, with the inaugural first berthing, James successfully delivered the new Cruise Terminal Building and Ancillary Facilities at the Kai Tak Cruise Terminal Development.
Ir. Jacky Wong leads the Building Engineering discipline of AECOM, Hong Kong. Jacky has worked extensively in design management, contract administration, and in coordination of major building, railway and infrastructure projects. Jacky’s projects in Hong Kong include the Siu Hong and Tuen Mun Stations of West Rail, the LOHAS Park Station, the 70 storey Harbourfront Landmark building, the Hong Kong International Airport’s Terminal 2, the AIG Tower, the Kai Tak Cruise Terminal, the Express Rail Link’s West Kowloon Terminus, and the Boundary Crossing Facilities of the Hong Kong–Zhuhai-Macao Bridge. He has also been involved in various projects in other parts of the world, including mainland China, Macau, the United Arab Emirates, the United Kingdom, and the Philippines.
Ir. M. Ramanathan (Rama) has experience in design management, construction supervision and contract administration associated with large-scale building works, railway and infrastructure projects. Rama’s projects have also involved bored tunnels, viaducts, medium and high-rise residential, office, hostel and commercial buildings as well as industrial and hospital developments. Rama also has experience preparing technical reports, bid proposals and contract documents. He completed a study on design rework commissioned by the City University of Hong Kong as a part-time Research Assistant and has also published technical papers and given talks at various technical forums.
Kai Tak Cruise Terminal Building – A Low Energy and Sustainable Terminal Building
As a response to the natural context (Figure 1), the Kai Tak Cruise Terminal Building has set a sustainable building design target not limited to low energy consumption of the building, but in overall building sustainability performance. The building encourages sustainable living―maximizing non-cruise related usage thereby getting multiple uses out of a single building and promoting the use of public transport. The building provides a public landscape park―an extensive landscape deck which covers the roof level creating urban greenery which enhances the natural beauty of the site and contributing positively to the ecological value of the surrounding area and district. A benefit of this extensive public park is reducing the heat island effect. The design utilizes natural ventilation for car-parking and vehicle circulation areas, and stack driven ventilation through the central atria. As the air from car parking areas will contain pollutants, vegetation in the atria would be used to filter the air. When pollutant levels are too high, mechanical driven ventilation would be used. The building maximizes the use of natural light, with both skylights and atria providing natural daylighting into internal areas. Natural lighting assists both passengers and visitors in way finding and promotes a healthy and vibrant atmosphere while reducing the dependence on artificial illumination. An energy efficient envelope is provided with the shape and form of the facade creating a self-shading effect which limits unwanted solar gain while maximizing natural daylight and visibility. A building integrated photovoltaic (BIPV) system located on the roof area of the landscape deck generates 26,850kWh annually. A solar hot water system provides all hot water needs for shower facilities in the building, and part of the pre-heat for heating during winter. Rainwater is captured from the canopy and the landscape deck for irrigation.
Keywords: roof greenery, natural lighting, natural ventilation, passive design, energy efficient building services, precast construction, facade treatment, district cooling, government building, port facilities
James Marshall1, MIOD AA (London) BArch (RMIT)
Jacky Wong2, MHKIE MIStructE MICE CEng RPE RI RSE
Muthukaruppan Ramanathan3, BEng MEng MICE MIStructE MHKIE CEng RPE
Gary Chan4, MIET MHKIE CEng RPE Registered Energy Assessor
Felix Wong5, PhD MBEnv (SustDev) BEAM Pro GB FM - MA CAP MAEE CCA1 Technical Director, Dragages Hong Kong Ltd., email: [email protected]
2 Managing Director, Building Engineering, AECOM Asia Co. Ltd., email: [email protected] Technical Director, Building Engineering - Structural, AECOM Asia Co. Ltd., email: [email protected]
4 Associate Director, Building Engineering - MEP, AECOM Asia Co. Ltd., email: [email protected] Senior Environmental Consultant, Environment, AECOM Asia Co. Ltd., email: [email protected]
Zero Carbon Building Journal
ZCB Journal 2015 • Volume 450
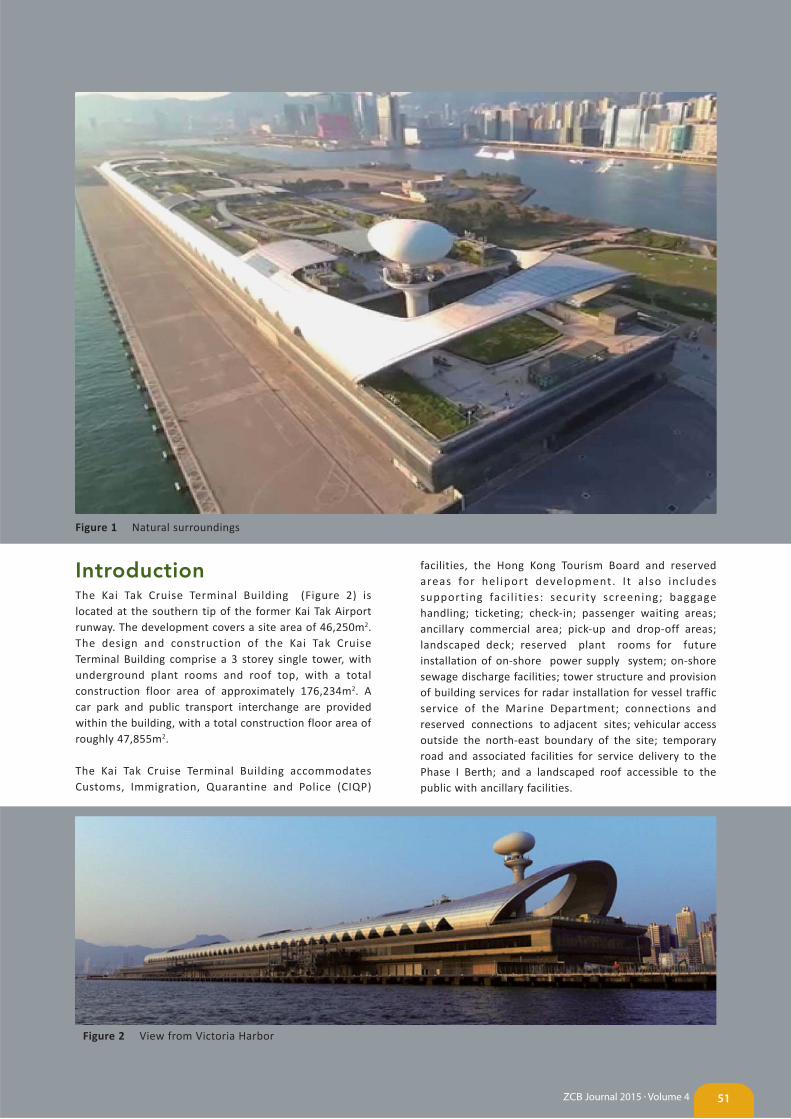
IntroductionThe Kai Tak Cruise Terminal Building (Figure 2) is located at the southern tip of the former Kai Tak Airport runway. The development covers a site area of 46,250m2. The design and construction of the Kai Tak Cruise Terminal Building comprise a 3 storey single tower, with underground plant rooms and roof top, with a total construction floor area of approximately 176,234m2. A car park and public transport interchange are provided within the building, with a total construction floor area of roughly 47,855m2.
The Kai Tak Cruise Terminal Building accommodates Customs, Immigration, Quarantine and Police (CIQP)
facilities, the Hong Kong Tourism Board and reserved areas for hel iport development. I t a lso includes supporting faci l it ies: security screening; baggage handling; ticketing; check-in; passenger waiting areas; ancillary commercial area; pick-up and drop-off areas; landscaped deck; reserved plant rooms for future installation of on-shore power supply system; on-shore sewage discharge facilities; tower structure and provision of building services for radar installation for vessel traffic service of the Marine Department; connections and reserved connections to adjacent sites; vehicular access outside the north-east boundary of the site; temporary road and associated facilities for service delivery to the Phase I Berth; and a landscaped roof accessible to the public with ancillary facilities.
Figure 1 Natural surroundings
Figure 2 View from Victoria Harbor
51ZCB Journal 2015 • Volume 4
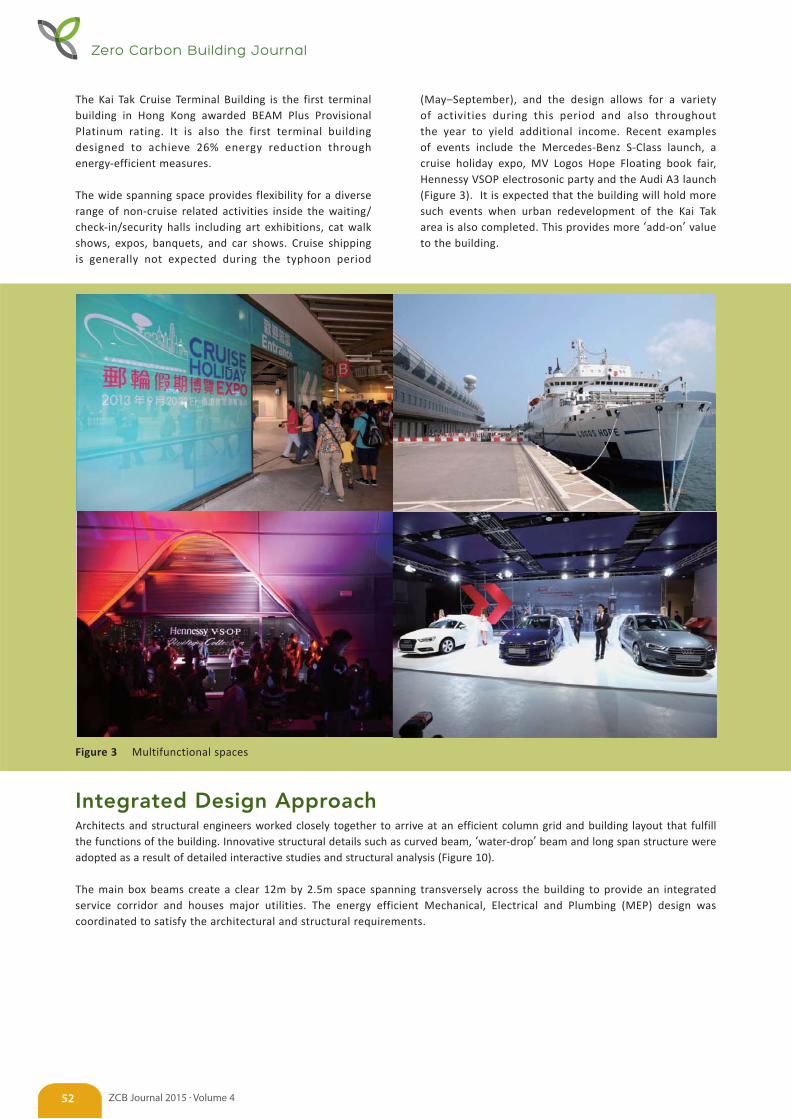
The Kai Tak Cruise Terminal Building is the first terminal building in Hong Kong awarded BEAM Plus Provisional Platinum rating. It is also the first terminal building designed to achieve 26% energy reduction through energy-efficient measures.
The wide spanning space provides flexibility for a diverse range of non-cruise related activities inside the waiting/check-in/security halls including art exhibitions, cat walk shows, expos, banquets, and car shows. Cruise shipping is generally not expected during the typhoon period
Figure 3 Multifunctional spaces
Integrated Design ApproachArchitects and structural engineers worked closely together to arrive at an efficient column grid and building layout that fulfill the functions of the building. Innovative structural details such as curved beam, ‘water-drop’ beam and long span structure were adopted as a result of detailed interactive studies and structural analysis (Figure 10).
The main box beams create a clear 12m by 2.5m space spanning transversely across the building to provide an integrated service corridor and houses major utilities. The energy efficient Mechanical, Electrical and Plumbing (MEP) design was coordinated to satisfy the architectural and structural requirements.
(May–September), and the design allows for a variety of activities during this period and also throughout the year to yield additional income. Recent examples of events include the Mercedes-Benz S-Class launch, a cruise holiday expo, MV Logos Hope Floating book fair, Hennessy VSOP electrosonic party and the Audi A3 launch (Figure 3). It is expected that the building will hold more such events when urban redevelopment of the Kai Tak area is also completed. This provides more ‘add-on’ value to the building.
Zero Carbon Building Journal
ZCB Journal 2015 • Volume 452
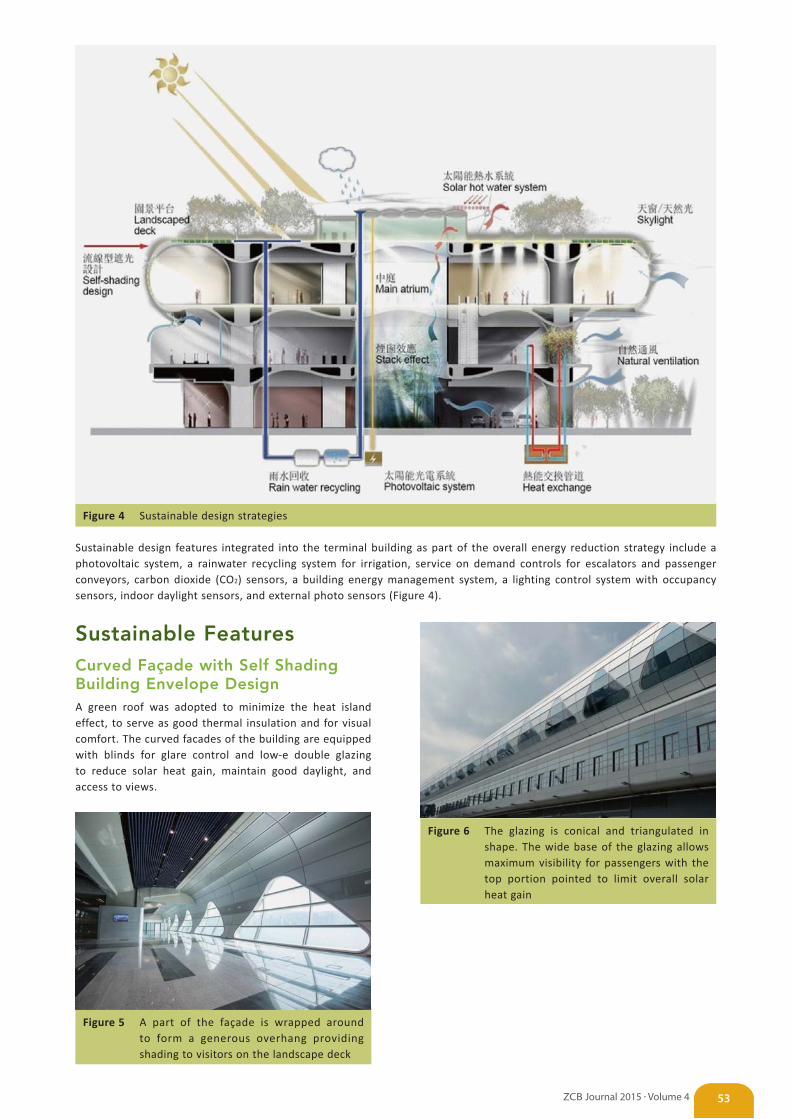
Figure 4 Sustainable design strategies
Sustainable design features integrated into the terminal building as part of the overall energy reduction strategy include a photovoltaic system, a rainwater recycling system for irrigation, service on demand controls for escalators and passenger conveyors, carbon dioxide (CO2) sensors, a building energy management system, a lighting control system with occupancy sensors, indoor daylight sensors, and external photo sensors (Figure 4).
Sustainable FeaturesCurved Façade with Self Shading Building Envelope DesignA green roof was adopted to minimize the heat island effect, to serve as good thermal insulation and for visual comfort. The curved facades of the building are equipped with blinds for glare control and low-e double glazing to reduce solar heat gain, maintain good daylight, and access to views.
Figure 5 A part of the façade is wrapped around to form a generous overhang providing shading to visitors on the landscape deck
53ZCB Journal 2015 • Volume 4
Figure 6 The glazing is conical and triangulated in shape. The wide base of the glazing allows maximum visibility for passengers with the top portion pointed to limit overall solar heat gain
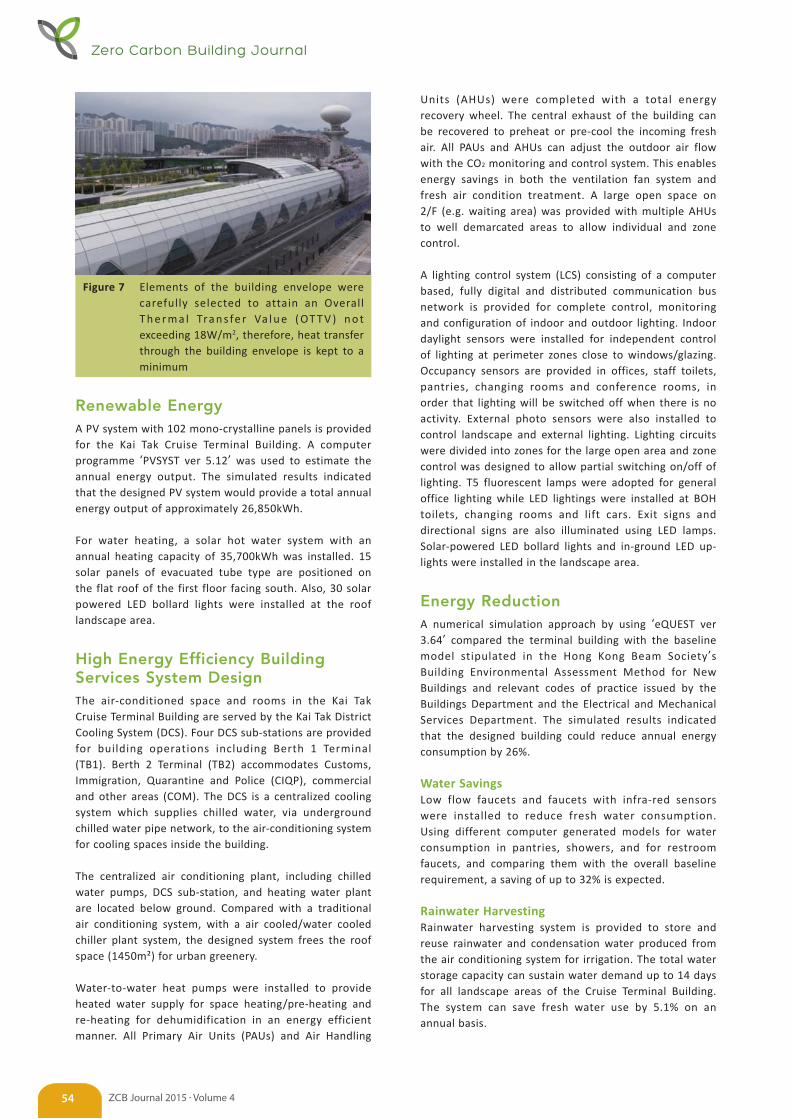
Figure 7 Elements of the building envelope were carefully selected to attain an Overall T h e r m a l Tra n s fe r Va l u e ( OT T V ) n o t exceeding 18W/m2, therefore, heat transfer through the building envelope is kept to a minimum
Renewable EnergyA PV system with 102 mono-crystalline panels is provided for the Kai Tak Cruise Terminal Building. A computer programme ‘PVSYST ver 5.12’ was used to estimate the annual energy output. The simulated results indicated that the designed PV system would provide a total annual energy output of approximately 26,850kWh.
For water heating, a solar hot water system with an annual heating capacity of 35,700kWh was installed. 15 solar panels of evacuated tube type are positioned on the flat roof of the first floor facing south. Also, 30 solar powered LED bollard lights were installed at the roof landscape area.
High Energy Efficiency Building Services System DesignThe air-conditioned space and rooms in the Kai Tak Cruise Terminal Building are served by the Kai Tak District Cooling System (DCS). Four DCS sub-stations are provided for building operations including Berth 1 Terminal (TB1). Berth 2 Terminal (TB2) accommodates Customs, Immigration, Quarantine and Police (CIQP), commercial and other areas (COM). The DCS is a centralized cooling system which supplies chilled water, via underground chilled water pipe network, to the air-conditioning system for cooling spaces inside the building.
The centralized air conditioning plant, including chilled water pumps, DCS sub-station, and heating water plant are located below ground. Compared with a traditional air conditioning system, with a air cooled/water cooled chiller plant system, the designed system frees the roof space (1450m²) for urban greenery.
Water-to-water heat pumps were installed to provide heated water supply for space heating/pre-heating and re-heating for dehumidification in an energy efficient manner. All Primary Air Units (PAUs) and Air Handling
Units (AHUs) were completed with a total energy recovery wheel. The central exhaust of the building can be recovered to preheat or pre-cool the incoming fresh air. All PAUs and AHUs can adjust the outdoor air flow with the CO2 monitoring and control system. This enables energy savings in both the ventilation fan system and fresh air condition treatment. A large open space on 2/F (e.g. waiting area) was provided with multiple AHUs to well demarcated areas to allow individual and zone control.
A lighting control system (LCS) consisting of a computer based, fully digital and distributed communication bus network is provided for complete control, monitoring and configuration of indoor and outdoor lighting. Indoor daylight sensors were installed for independent control of lighting at perimeter zones close to windows/glazing. Occupancy sensors are provided in offices, staff toilets, pantries, changing rooms and conference rooms, in order that lighting will be switched off when there is no activity. External photo sensors were also installed to control landscape and external lighting. Lighting circuits were divided into zones for the large open area and zone control was designed to allow partial switching on/off of lighting. T5 fluorescent lamps were adopted for general office lighting while LED lightings were installed at BOH toilets, changing rooms and lift cars. Exit signs and directional signs are also illuminated using LED lamps. Solar-powered LED bollard lights and in-ground LED up-lights were installed in the landscape area.
Energy ReductionA numerical simulation approach by using ‘eQUEST ver 3.64’ compared the terminal building with the baseline model stipulated in the Hong Kong Beam Society’s Building Environmental Assessment Method for New Buildings and relevant codes of practice issued by the Buildings Department and the Electrical and Mechanical Services Department. The simulated results indicated that the designed building could reduce annual energy consumption by 26%.
Water SavingsLow flow faucets and faucets with infra-red sensors were installed to reduce fresh water consumption. Using different computer generated models for water consumption in pantries, showers, and for restroom faucets, and comparing them with the overall baseline requirement, a saving of up to 32% is expected.
Rainwater HarvestingRainwater harvesting system is provided to store and reuse rainwater and condensation water produced from the air conditioning system for irrigation. The total water storage capacity can sustain water demand up to 14 days for all landscape areas of the Cruise Terminal Building. The system can save fresh water use by 5.1% on an annual basis.
Zero Carbon Building Journal
ZCB Journal 2015 • Volume 454
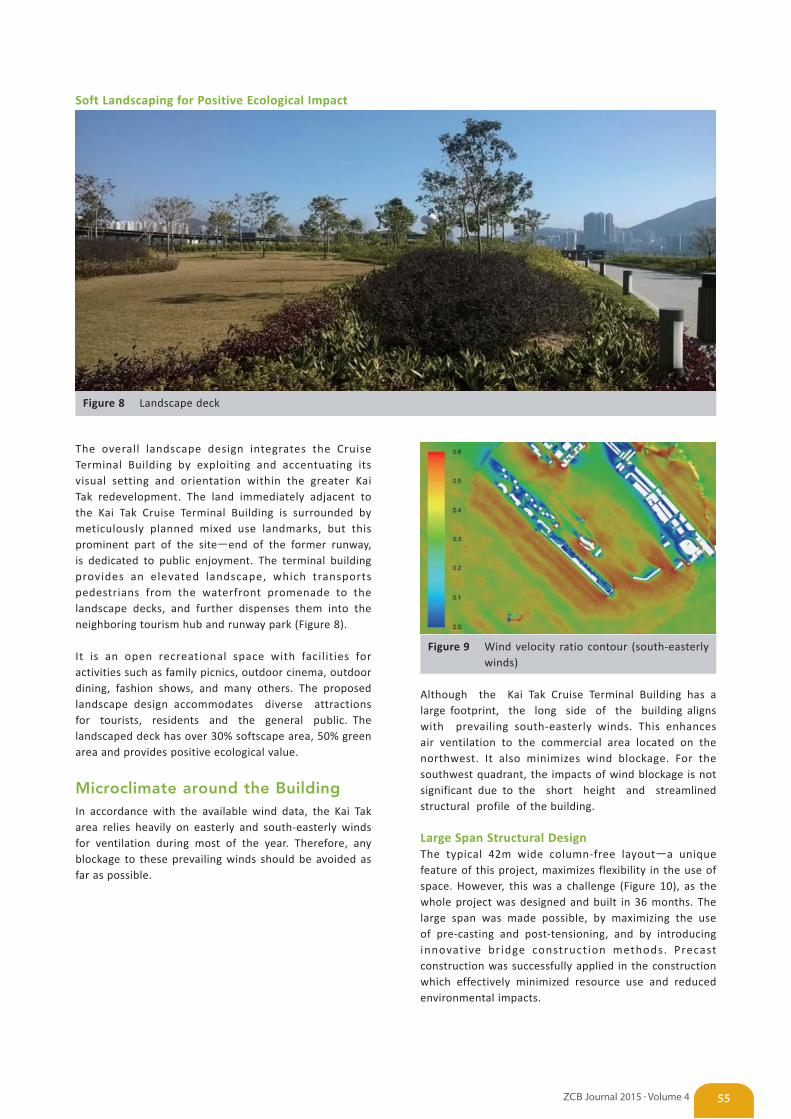
The overall landscape design integrates the Cruise Terminal Building by exploiting and accentuating its visual setting and orientation within the greater Kai Tak redevelopment. The land immediately adjacent to the Kai Tak Cruise Terminal Building is surrounded by meticulously planned mixed use landmarks, but this prominent part of the site―end of the former runway, is dedicated to public enjoyment. The terminal building provides an elevated landscape, which transports pedestrians from the waterfront promenade to the landscape decks, and further dispenses them into the neighboring tourism hub and runway park (Figure 8).
It is an open recreational space with facilities for activities such as family picnics, outdoor cinema, outdoor dining, fashion shows, and many others. The proposed landscape design accommodates diverse attractions for tourists, residents and the general public. The landscaped deck has over 30% softscape area, 50% green area and provides positive ecological value.
Microclimate around the BuildingIn accordance with the available wind data, the Kai Tak area relies heavily on easterly and south-easterly winds for ventilation during most of the year. Therefore, any blockage to these prevailing winds should be avoided as far as possible.
Soft Landscaping for Positive Ecological Impact
Figure 8 Landscape deck
55ZCB Journal 2015 • Volume 4
Figure 9 Wind velocity ratio contour (south-easterly winds)
Although the Kai Tak Cruise Terminal Building has a large footprint, the long side of the building aligns with prevailing south-easterly winds. This enhances air ventilation to the commercial area located on the northwest. It also minimizes wind blockage. For the southwest quadrant, the impacts of wind blockage is not significant due to the short height and streamlined structural profile of the building.
Large Span Structural DesignThe typical 42m wide column-free layout―a unique feature of this project, maximizes flexibility in the use of space. However, this was a challenge (Figure 10), as the whole project was designed and built in 36 months. The large span was made possible, by maximizing the use of pre-casting and post-tensioning, and by introducing innovative br idge construct ion methods. Precast construction was successfully applied in the construction which effectively minimized resource use and reduced environmental impacts.
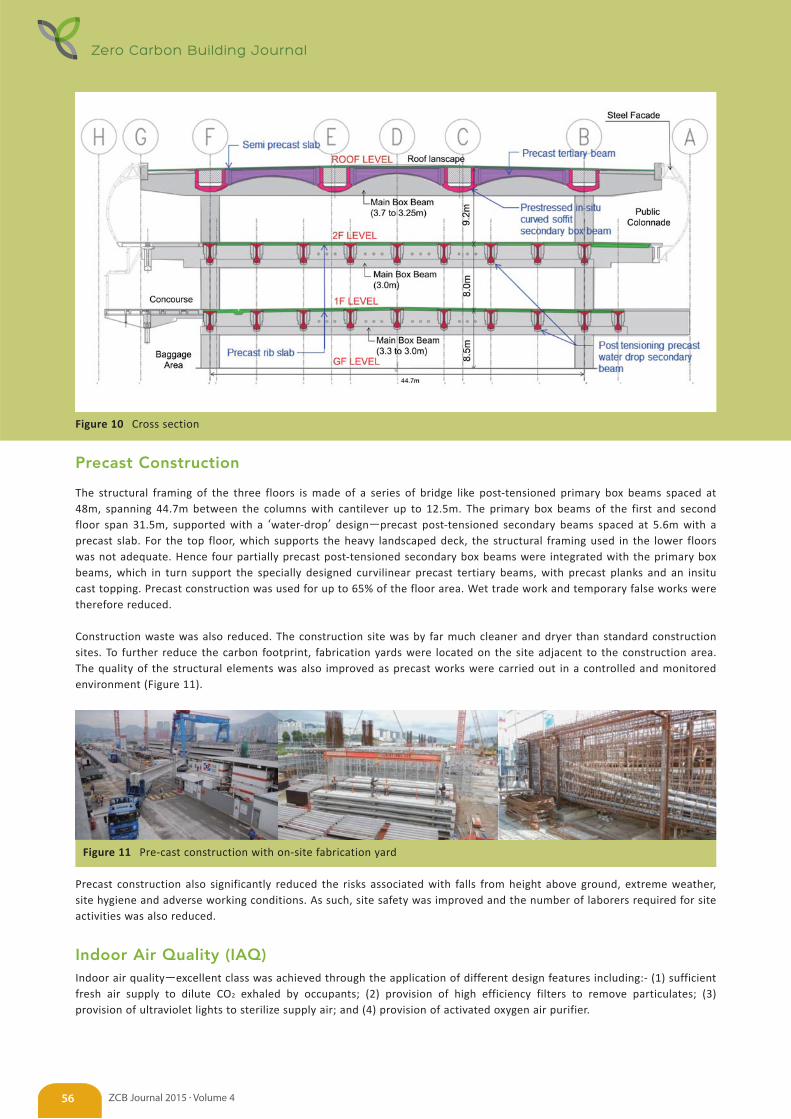
Figure 10 Cross section
Precast Construction
The structural framing of the three floors is made of a series of bridge like post-tensioned primary box beams spaced at 48m, spanning 44.7m between the columns with cantilever up to 12.5m. The primary box beams of the first and second floor span 31.5m, supported with a ‘water-drop’ design―precast post-tensioned secondary beams spaced at 5.6m with a precast slab. For the top floor, which supports the heavy landscaped deck, the structural framing used in the lower floors was not adequate. Hence four partially precast post-tensioned secondary box beams were integrated with the primary box beams, which in turn support the specially designed curvilinear precast tertiary beams, with precast planks and an insitu cast topping. Precast construction was used for up to 65% of the floor area. Wet trade work and temporary false works were therefore reduced.
Construction waste was also reduced. The construction site was by far much cleaner and dryer than standard construction sites. To further reduce the carbon footprint, fabrication yards were located on the site adjacent to the construction area. The quality of the structural elements was also improved as precast works were carried out in a controlled and monitored environment (Figure 11).
Figure 11 Pre-cast construction with on-site fabrication yard
Precast construction also significantly reduced the risks associated with falls from height above ground, extreme weather, site hygiene and adverse working conditions. As such, site safety was improved and the number of laborers required for site activities was also reduced.
Indoor Air Quality (IAQ)Indoor air quality―excellent class was achieved through the application of different design features including:- (1) sufficient fresh air supply to dilute CO2 exhaled by occupants; (2) provision of high efficiency filters to remove particulates; (3) provision of ultraviolet lights to sterilize supply air; and (4) provision of activated oxygen air purifier.
Zero Carbon Building Journal
ZCB Journal 2015 • Volume 456

Skylights with AtriaThe roof was designed with elevated skylights with atria to allow penetration of natural sunlight to all floors (Figure 12). Together with the curved façade with large windows, the interiors are open to views of the sky. These features reduce the need for artificial lighting and save energy. The atria also facilitates the stack effect―bringing in cool air from the surroundings and forcing the hot air out through the skylight at the roof. This reduces the energy required for air conditioning.
Figure 12 Skylight with atria
Making Full Use of the Existing RunwayThe Kai Tak Cruise Terminal Building was built on top of the old runway hence minimal reclamation was required. This preserved the beauty of the harbor in its existing condition. With only a slight revision to the existing seawall and an extended deck, the berth for two world class vessels to park was formed (Figure 13).
Figure 13 Berths for two world class vessels
ConclusionThe Kai Tak Cruise Terminal Building achieves the following:
• Greenery coverage of 36.7% of the site area with landscape areas contributing to the ecological value of the area;
• Provision of visual access to external views and outdoor green spaces and visual privacy from the exterior;
• No light pollution from exterior lighting;
• An energy reduction estimated at 26% better than the Building Energy Code 2007
• Use of AHUs and PAUs with direct fresh air intake and equipped with heat wheels for reclamation of heat energy from exhaust air;
• Minimizing energy consumption through the use of LED type exit signs and feature lights;
• Service-on-demand control for escalators (on-off control);
• Energy savings and reduction in greenhouse gas emissions through the use of renewable energy, including PV and solar heating;
• Minimizing impact to the heritage of the site and building and reuse of the existing runway;
• Reduced reliance on electrical l ighting and maximal use of daylight for ambient lighting requirements;
• High performance building envelope through consideration of sun shading, insulation, glazing, acoustics and automatic solar blinds;
• Use of a District Cooling System;
• Energy efficiency measures with a payback period of less than 9 years;
• Excellent Class IAQ for all office areas and public assembly spaces;
• B E A M P l u s P l a t i n u m g r a d e ( p r o v i s i o n a l assessment);
• 32% annual savings in water consumption using water saving devices; and
• Construction waste minimization, and wet trade work and temporary false-works reduced, through the use of both on-site and off-site precasting and post-tensioning, with more than 65% of the floor area constructed with precast elements.
ReferencesEMSD (2012) Code of Practice for Energy Efficiency of Building
Services Installations , Electrical and Mechanical Services Department, HKSAR Government.
CEDD (2010) Kaitak on the Move , Issue 2, 9, Civil Engineering and Development Department, HKSAR Government.
HK-BS (2004) Hong Kong Building Environmental Method―New Buildings, Version 4/04, Hong Kong Beam Society, Hong Kong.
57ZCB Journal 2015 • Volume 4
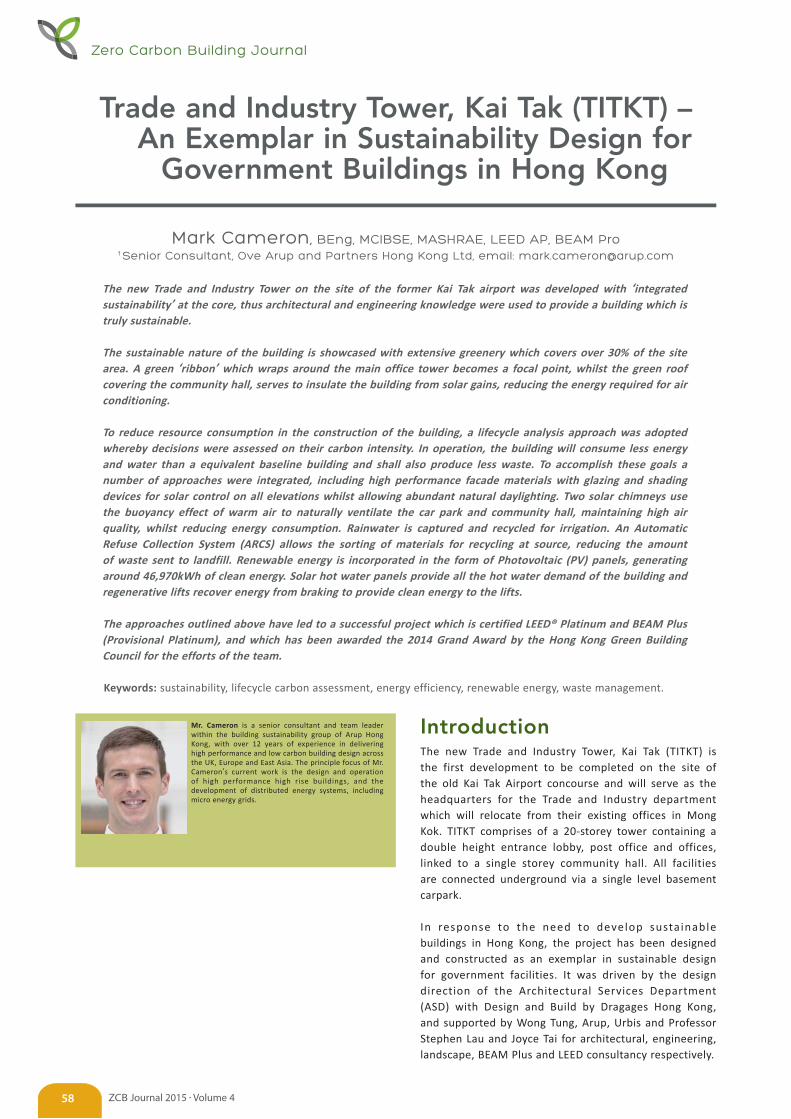
Trade and Industry Tower, Kai Tak (TITKT) – An Exemplar in Sustainability Design for
Government Buildings in Hong Kong
The new Trade and Industry Tower on the site of the former Kai Tak airport was developed with ‘integrated sustainability’ at the core, thus architectural and engineering knowledge were used to provide a building which is truly sustainable.
The sustainable nature of the building is showcased with extensive greenery which covers over 30% of the site area. A green ‘ribbon’ which wraps around the main office tower becomes a focal point, whilst the green roof covering the community hall, serves to insulate the building from solar gains, reducing the energy required for air conditioning.
To reduce resource consumption in the construction of the building, a lifecycle analysis approach was adopted whereby decisions were assessed on their carbon intensity. In operation, the building will consume less energy and water than a equivalent baseline building and shall also produce less waste. To accomplish these goals a number of approaches were integrated, including high performance facade materials with glazing and shading devices for solar control on all elevations whilst allowing abundant natural daylighting. Two solar chimneys use the buoyancy effect of warm air to naturally ventilate the car park and community hall, maintaining high air quality, whilst reducing energy consumption. Rainwater is captured and recycled for irrigation. An Automatic Refuse Collection System (ARCS) allows the sorting of materials for recycling at source, reducing the amount of waste sent to landfill. Renewable energy is incorporated in the form of Photovoltaic (PV) panels, generating around 46,970kWh of clean energy. Solar hot water panels provide all the hot water demand of the building and regenerative lifts recover energy from braking to provide clean energy to the lifts.
The approaches outlined above have led to a successful project which is certified LEED® Platinum and BEAM Plus (Provisional Platinum), and which has been awarded the 2014 Grand Award by the Hong Kong Green Building Council for the efforts of the team.
Keywords: sustainability, lifecycle carbon assessment, energy efficiency, renewable energy, waste management.
IntroductionThe new Trade and Industry Tower, Kai Tak (TITKT) is the first development to be completed on the site of the old Kai Tak Airport concourse and will serve as the headquarters for the Trade and Industry department which will relocate from their existing offices in Mong Kok. TITKT comprises of a 20-storey tower containing a double height entrance lobby, post office and offices, linked to a single storey community hall. All facilities are connected underground via a single level basement carpark.
In response to the need to develop sustainable buildings in Hong Kong, the project has been designed and constructed as an exemplar in sustainable design for government facilities. It was driven by the design direction of the Architectural Services Department (ASD) with Design and Build by Dragages Hong Kong, and supported by Wong Tung, Arup, Urbis and Professor Stephen Lau and Joyce Tai for architectural, engineering, landscape, BEAM Plus and LEED consultancy respectively.
Mark Cameron, BEng, MCIBSE, MASHRAE, LEED AP, BEAM Pro1 Senior Consultant, Ove Arup and Partners Hong Kong Ltd, email: [email protected]
Mr. Cameron is a senior consultant and team leader within the building sustainability group of Arup Hong Kong, with over 12 years of experience in delivering high performance and low carbon building design across the UK, Europe and East Asia. The principle focus of Mr. Cameron’s current work is the design and operation of high performance high rise buildings, and the development of distributed energy systems, including micro energy grids.
Zero Carbon Building Journal
ZCB Journal 2015 • Volume 458
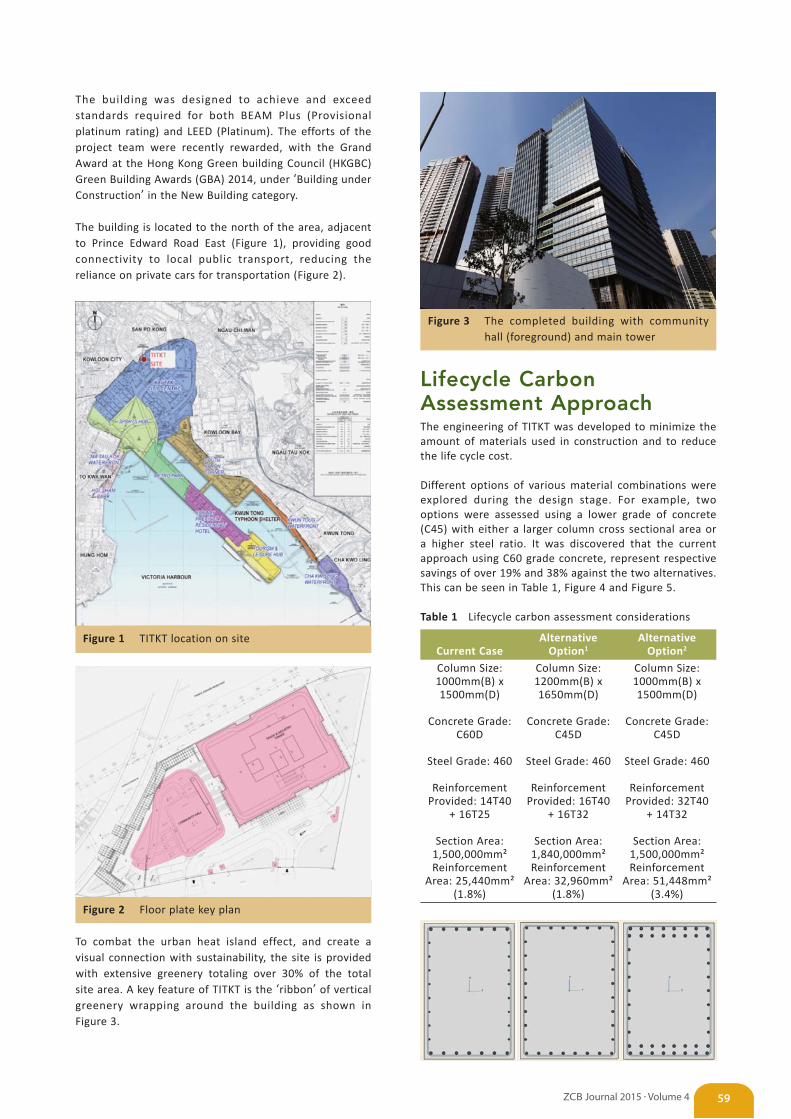
The building was designed to achieve and exceed standards required for both BEAM Plus (Provisional platinum rating) and LEED (Platinum). The efforts of the project team were recently rewarded, with the Grand Award at the Hong Kong Green building Council (HKGBC) Green Building Awards (GBA) 2014, under ‘Building under Construction’ in the New Building category.
The building is located to the north of the area, adjacent to Prince Edward Road East (Figure 1), providing good connectivity to local public transport, reducing the reliance on private cars for transportation (Figure 2).
Figure 1 TITKT location on site
Figure 2 Floor plate key plan
To combat the urban heat island effect, and create a visual connection with sustainability, the site is provided with extensive greenery totaling over 30% of the total site area. A key feature of TITKT is the ‘ribbon’ of vertical greenery wrapping around the building as shown in Figure 3.
Figure 3 The completed building with community hall (foreground) and main tower
Lifecycle Carbon Assessment ApproachThe engineering of TITKT was developed to minimize the amount of materials used in construction and to reduce the life cycle cost.
Different options of various material combinations were explored during the design stage. For example, two options were assessed using a lower grade of concrete (C45) with either a larger column cross sectional area or a higher steel ratio. It was discovered that the current approach using C60 grade concrete, represent respective savings of over 19% and 38% against the two alternatives. This can be seen in Table 1, Figure 4 and Figure 5.
Table 1 Lifecycle carbon assessment considerations
Current CaseAlternative
Option1Alternative
Option2
Column Size: 1000mm(B) x 1500mm(D)
Concrete Grade: C60D
Steel Grade: 460
Reinforcement Provided: 14T40
+ 16T25
Section Area: 1,500,000mm²Reinforcement
Area: 25,440mm² (1.8%)
Column Size: 1200mm(B) x 1650mm(D)
Concrete Grade: C45D
Steel Grade: 460
Reinforcement Provided: 16T40
+ 16T32
Section Area: 1,840,000mm²Reinforcement
Area: 32,960mm² (1.8%)
Column Size: 1000mm(B) x 1500mm(D)
Concrete Grade: C45D
Steel Grade: 460
Reinforcement Provided: 32T40
+ 14T32
Section Area: 1,500,000mm²Reinforcement
Area: 51,448mm² (3.4%)
59ZCB Journal 2015 • Volume 4
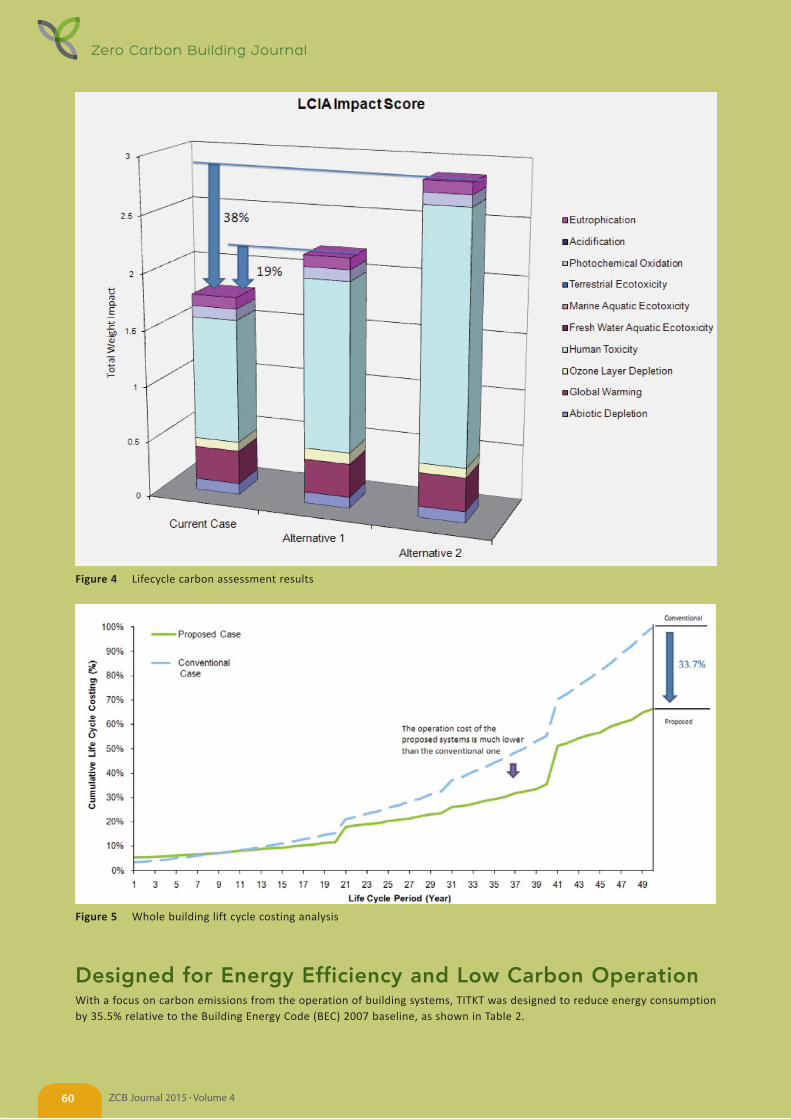
Figure 4 Lifecycle carbon assessment results
Figure 5 Whole building lift cycle costing analysis
Designed for Energy Efficiency and Low Carbon OperationWith a focus on carbon emissions from the operation of building systems, TITKT was designed to reduce energy consumption by 35.5% relative to the Building Energy Code (BEC) 2007 baseline, as shown in Table 2.
Zero Carbon Building Journal
ZCB Journal 2015 • Volume 460
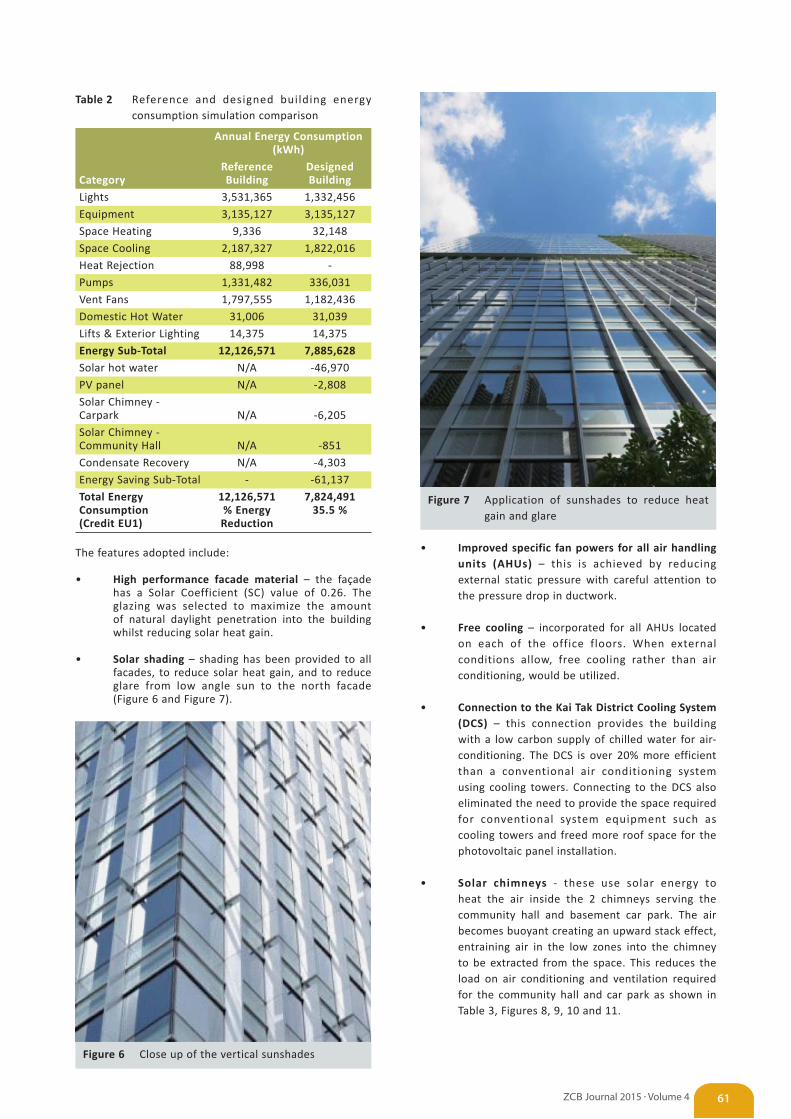
Table 2 Reference and designed building energy consumption simulation comparison
Annual Energy Consumption (kWh)
CategoryReference Building
Designed Building
Lights 3,531,365 1,332,456Equipment 3,135,127 3,135,127Space Heating 9,336 32,148Space Cooling 2,187,327 1,822,016Heat Rejection 88,998 -Pumps 1,331,482 336,031Vent Fans 1,797,555 1,182,436Domestic Hot Water 31,006 31,039Lifts & Exterior Lighting 14,375 14,375Energy Sub-Total 12,126,571 7,885,628Solar hot water N/A -46,970PV panel N/A -2,808Solar Chimney - Carpark N/A -6,205Solar Chimney - Community Hall N/A -851Condensate Recovery N/A -4,303Energy Saving Sub-Total - -61,137Total Energy Consumption (Credit EU1)
12,126,571% Energy Reduction
7,824,49135.5 %
The features adopted include:
• High performance facade material – the façade has a Solar Coefficient (SC) value of 0.26. The glazing was selected to maximize the amount of natural daylight penetration into the building whilst reducing solar heat gain.
• Solar shading – shading has been provided to all facades, to reduce solar heat gain, and to reduce glare from low angle sun to the north facade (Figure 6 and Figure 7).
Figure 6 Close up of the vertical sunshades
Figure 7 Application of sunshades to reduce heat gain and glare
• Improved specific fan powers for all air handling units (AHUs) – this is achieved by reducing external static pressure with careful attention to the pressure drop in ductwork.
• Free cooling – incorporated for all AHUs located on each of the office floors. When external conditions allow, free cooling rather than air conditioning, would be utilized.
• Connection to the Kai Tak District Cooling System (DCS) – this connection provides the building with a low carbon supply of chilled water for air-conditioning. The DCS is over 20% more efficient than a conventional air conditioning system using cooling towers. Connecting to the DCS also eliminated the need to provide the space required for conventional system equipment such as cooling towers and freed more roof space for the photovoltaic panel installation.
• Solar chimneys - these use solar energy to heat the air inside the 2 chimneys serving the community hall and basement car park. The air becomes buoyant creating an upward stack effect, entraining air in the low zones into the chimney to be extracted from the space. This reduces the load on air conditioning and ventilation required for the community hall and car park as shown in Table 3, Figures 8, 9, 10 and 11.
61ZCB Journal 2015 • Volume 4
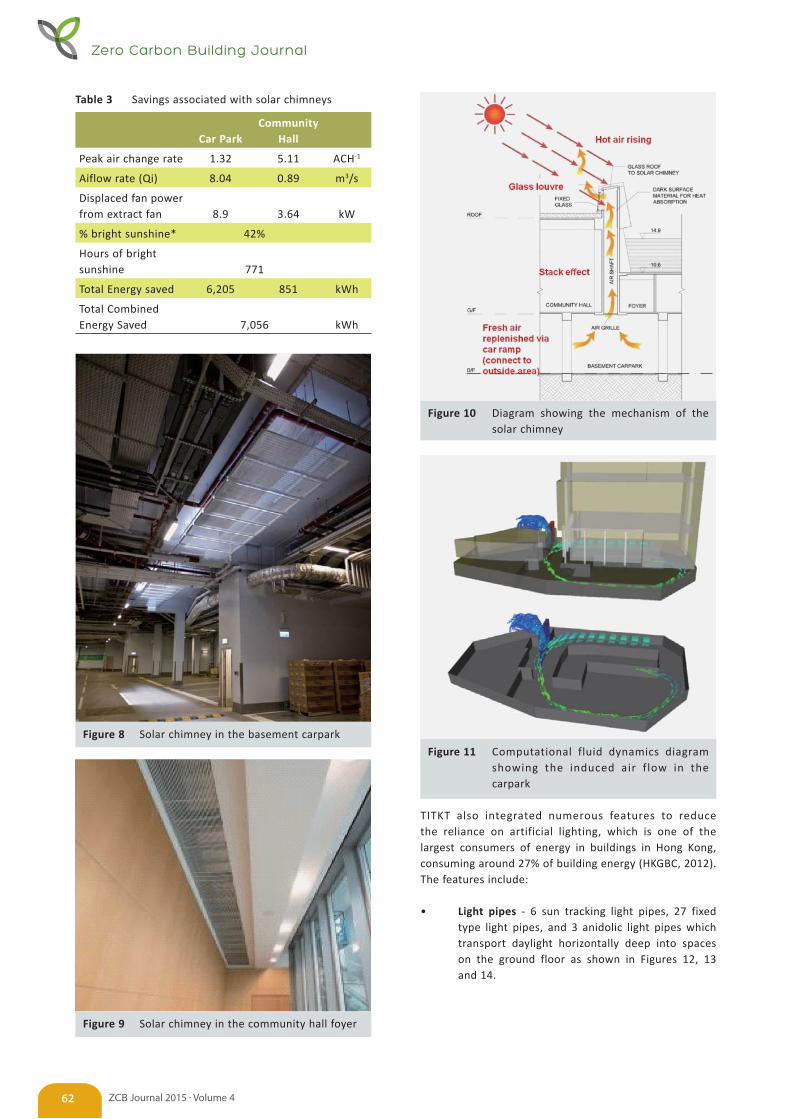
Table 3 Savings associated with solar chimneys
Car ParkCommunity
Hall
Peak air change rate 1.32 5.11 ACH-1
Aiflow rate (Qi) 8.04 0.89 m3/s
Displaced fan power from extract fan 8.9 3.64 kW
% bright sunshine* 42%
Hours of bright sunshine 771
Total Energy saved 6,205 851 kWh
Total Combined Energy Saved 7,056 kWh
Figure 8 Solar chimney in the basement carpark
Figure 9 Solar chimney in the community hall foyer
Figure 10 Diagram showing the mechanism of the solar chimney
Figure 11 Computational fluid dynamics diagram showing the induced air flow in the carpark
TITKT also integrated numerous features to reduce the reliance on artificial lighting, which is one of the largest consumers of energy in buildings in Hong Kong, consuming around 27% of building energy (HKGBC, 2012). The features include:
• Light pipes - 6 sun tracking light pipes, 27 fixed type light pipes, and 3 anidolic light pipes which transport daylight horizontally deep into spaces on the ground floor as shown in Figures 12, 13 and 14.
Zero Carbon Building Journal
ZCB Journal 2015 • Volume 462
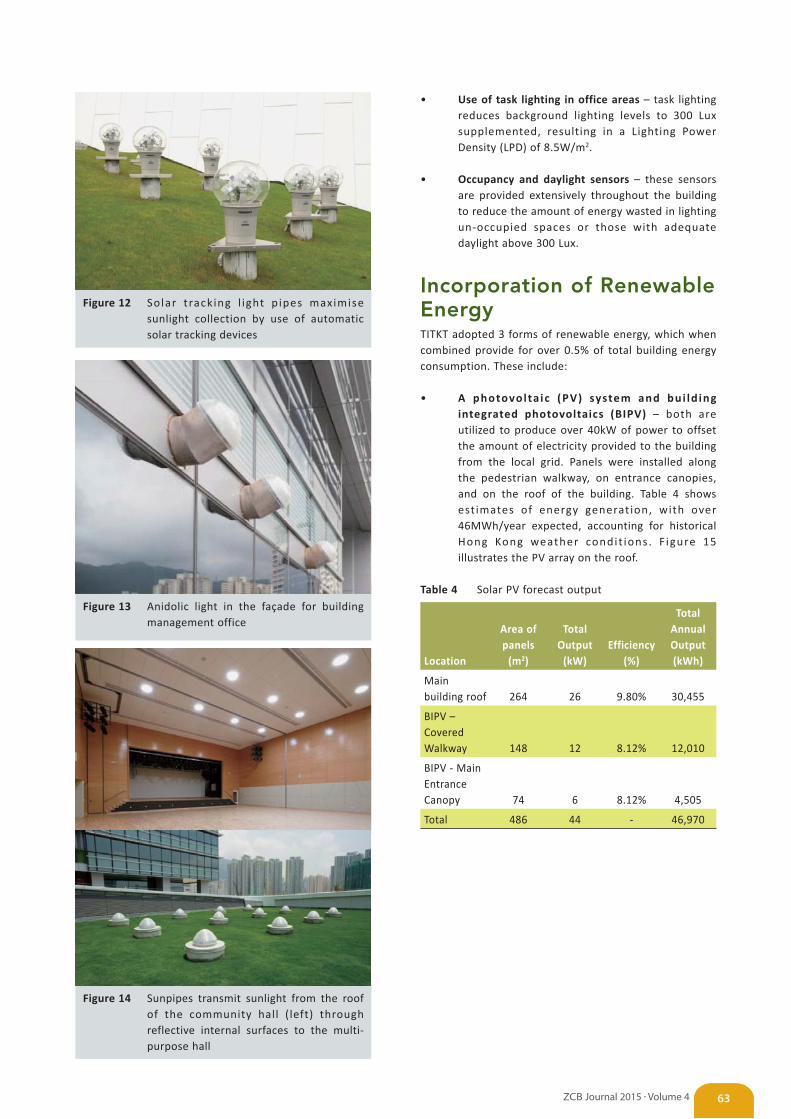
Figure 12 Solar tracking l ight p ipes maximise sunlight collection by use of automatic solar tracking devices
Figure 13 Anidolic light in the façade for building management office
Figure 14 Sunpipes transmit sunlight from the roof of the community hall (left) through reflective internal surfaces to the multi-purpose hall
63ZCB Journal 2015 • Volume 4
• Use of task lighting in office areas – task lighting reduces background lighting levels to 300 Lux supplemented, resulting in a Lighting Power Density (LPD) of 8.5W/m2.
• Occupancy and daylight sensors – these sensors are provided extensively throughout the building to reduce the amount of energy wasted in lighting un-occupied spaces or those with adequate daylight above 300 Lux.
Incorporation of Renewable Energy TITKT adopted 3 forms of renewable energy, which when combined provide for over 0.5% of total building energy consumption. These include:
• A photovolta ic (PV) system and bui ld ing integrated photovoltaics (BIPV) – both are utilized to produce over 40kW of power to offset the amount of electricity provided to the building from the local grid. Panels were installed along the pedestrian walkway, on entrance canopies, and on the roof of the building. Table 4 shows est imates of energy generation, with over 46MWh/year expected, accounting for historical Hong Kong weather condit ions. F igure 15 illustrates the PV array on the roof.
Table 4 Solar PV forecast output
Location
Area of panels
(m2)
Total Output
(kW)Efficiency
(%)
Total Annual Output (kWh)
Main building roof 264 26 9.80% 30,455
BIPV – Covered Walkway 148 12 8.12% 12,010
BIPV - Main Entrance Canopy 74 6 8.12% 4,505
Total 486 44 - 46,970
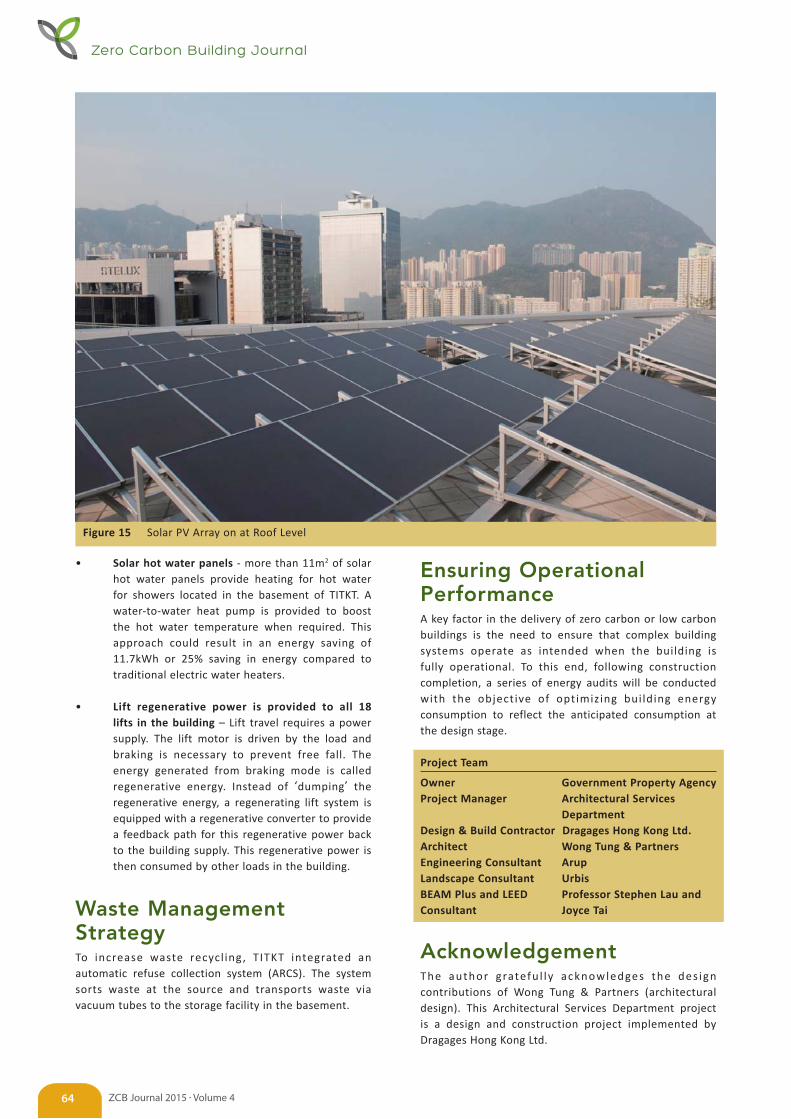
Zero Carbon Building Journal
ZCB Journal 2015 • Volume 464
Figure 15 Solar PV Array on at Roof Level
• Solar hot water panels - more than 11m2 of solar hot water panels provide heating for hot water for showers located in the basement of TITKT. A water-to-water heat pump is provided to boost the hot water temperature when required. This approach could result in an energy saving of 11.7kWh or 25% saving in energy compared to traditional electric water heaters.
• Lift regenerative power is provided to all 18 lifts in the building – Lift travel requires a power supply. The lift motor is driven by the load and braking is necessary to prevent free fall. The energy generated from braking mode is called regenerative energy. Instead of ‘dumping’ the regenerative energy, a regenerating lift system is equipped with a regenerative converter to provide a feedback path for this regenerative power back to the building supply. This regenerative power is then consumed by other loads in the building.
Waste Management Strategy To increase waste recycl ing, TITKT integrated an automatic refuse collection system (ARCS). The system sorts waste at the source and transports waste via vacuum tubes to the storage facility in the basement.
Ensuring Operational PerformanceA key factor in the delivery of zero carbon or low carbon buildings is the need to ensure that complex building systems operate as intended when the building is fully operational. To this end, following construction completion, a series of energy audits will be conducted with the objective of optimizing bui lding energy consumption to reflect the anticipated consumption at the design stage.
Project Team
Owner Government Property AgencyProject Manager Architectural Services
DepartmentDesign & Build Contractor Dragages Hong Kong Ltd.Architect Wong Tung & PartnersEngineering Consultant ArupLandscape Consultant UrbisBEAM Plus and LEED Consultant
Professor Stephen Lau and Joyce Tai
AcknowledgementThe author gratefu l ly acknowledges the des ign contributions of Wong Tung & Partners (architectural design). This Architectural Services Department project is a design and construction project implemented by Dragages Hong Kong Ltd.

65ZCB Journal 2015 • Volume 4
ReferencesHKGBC (2012) “HK3030” A Vision for a Low Carbon Sustainable
Built Environment in Hong Kong by 3030 , Hong Kong Green
Building Council, Hong Kong.
Fax: (852) 2100 9090 E-mail: [email protected]
Tel: (852) 2100 9038
Congratulations to the CIC Innovation Award 2015 Winners!The awardees of the CIC Innovation Award 2015 were announced at the Award Presentation Ceremony at the Government House on 15 December 2015.
Details are available on:
www.cic.hk/cicinnovationaward2015
20152100 9038
Young Innovator for Local Academiai-Core: Giving Construction a "Heart"NIU Yuhan, PhD Student, The University of Hong KongLIU Diandian, Mphil Student, The University of Hong KongCHEN Ke, PhD Student, The University of Hong KongYE Meng, PhD Student, The University of Hong KongOwner: LU Weisheng, Assistant Professor, The University of Hong Kong
Local Grand PrizeAnti-heat Stress Clothing for Construction Workers in Hot and Humid WeatherAlbert CHAN, Head of Department & Chair Professor, Department of Building and Real Estate, The Hong Kong Polytechnic UniversityFrancis WONG, Academic Discipline Leader, Research Centre Director, The Hong Kong Polytechnic UniversityLI Yi, Professor and Director of Textile Bioengineering Research Center, The Hong Kong Polytechnic UniversityDel P. WONG, Associate Professor & Program Leader, Technological and Higher Education Institute of Hong Kong
First Prize of Local AcademiaZ-Panel System - Lightweight PrefabricationLAU Hing-ching, Research Assistant, School of Architecture, The Chinese University of Hong KongZHU Jingxiang, Associate Professor, School of Architecture, The Chinese University of Hong KongXIA Heng, Research Assistant, School of Architecture, The Chinese University of Hong Kong
Second Prize of Local AcademiaCarbon Neutral Construction Products Manufactured with Cement and Concrete WastesPOON Chi-sun, Chair Professor, The Hong Kong Polytechnic UniversityHerbert ZHENG, General Manager, Concrete Services, Gammon Construction Ltd.XUAN Dongxing, Research Fellow, The Hong Kong Polytechnic UniversityZHAN Baojian, Research Associate, The Hong Kong Polytechnic University
International Grand Prize Bendable ConcreteVictor LI, E.B. Wylie Collegiate Chair Professor of Civil and Environmental Engineering Professor of Materials Science and Engineering, University of Michigan, Ann Arbor, USA
First Prize of Local Industry PractitionersMechanized ConstructionJames Edward Ted LAWTON, Engineering Development Manager, Gammon Construction Ltd.Alex FUNG, Principle Engineer, Gammon Construction Ltd.
Second Prize of Local Industry PractitionersDevelopment of City Air Purification SystemDavid NG, Director, Sino Green in Hong Kong LimitedDaryl NG, Director, Sino Green in Hong Kong LimitedVincent CHENG, Director, Ove Arup & Partners HK Ltd.Jimmy TONG, Associate, Ove Arup & Partners HK Ltd.
Young Innovator for Local Industry PractitionersInnovative Use of Polymer Solutions for the Construction of Diaphragm WallsCarlos LAM, Geotechnical Engineer, Civil Engineeing and Development Department, HKSAR

C
M
Y
CM
MY
CY
CMY
K
84_out.pdf 1 4/2/2015 12:27:14

ZCB04_01_Title - 複製.indd 1 8/1/2016 15:27:04