Embed Size (px)
Citation preview
© 2013 - Zomato Media Private Limited (India)
Zomato: Investor Deck September 2013
Executive Summary (1 of 2)
2
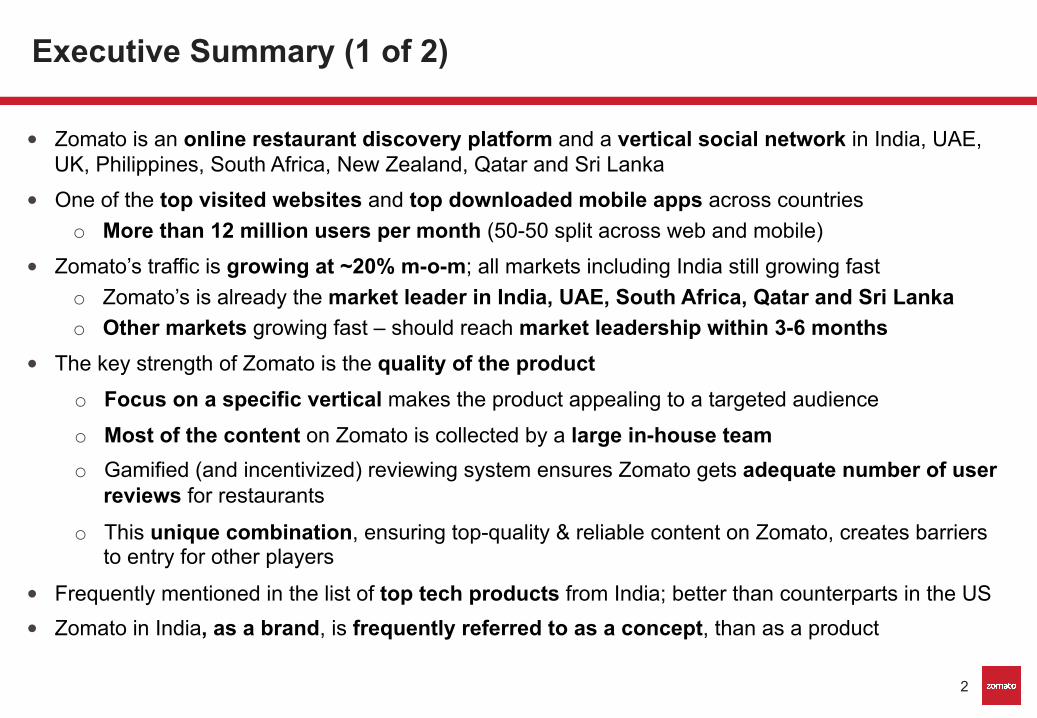
• Zomato is an online restaurant discovery platform and a vertical social network in India, UAE, UK, Philippines, South Africa, New Zealand, Qatar and Sri Lanka
• One of the top visited websites and top downloaded mobile apps across countries o More than 12 million users per month (50-50 split across web and mobile)
• Zomato’s traffic is growing at ~20% m-o-m; all markets including India still growing fast o Zomato’s is already the market leader in India, UAE, South Africa, Qatar and Sri Lanka o Other markets growing fast – should reach market leadership within 3-6 months
• The key strength of Zomato is the quality of the product o Focus on a specific vertical makes the product appealing to a targeted audience
o Most of the content on Zomato is collected by a large in-house team o Gamified (and incentivized) reviewing system ensures Zomato gets adequate number of user
reviews for restaurants
o This unique combination, ensuring top-quality & reliable content on Zomato, creates barriers to entry for other players
• Frequently mentioned in the list of top tech products from India; better than counterparts in the US • Zomato in India, as a brand, is frequently referred to as a concept, than as a product

Executive Summary (2 of 2)
3
• Zomato monetizes its traffic through hyper-local display ads on the website and mobile o Current revenue at INR ~22M ($400K) per month; expected to reach $600K by Jan’14 o Zomato’s client base consists of restaurants who want to reach out to a targeted audience o On an average Zomato makes ~$200 per advertiser per month o Zomato has a proven and scalable revenue model; currently, Zomato has hit net profitability in
India, gross profitability in UAE, and is on road to healthy revenue in all its other markets • Over time, Zomato aims to sign up 15% of the industry base as paid advertisers
o 15% benchmark has already been hit in some key markets as proof of concept o In 2016, Zomato should have ~400k restaurants (currently ~110k) in its database o With ~60k advertisers, at current monetization levels, this means total revenue potential of ~$150M/
year o This needs large feet-on-street for sales; unit economics are profitable in all locations
• Zomato aims to replicate its business model in more countries o Zomato is aiming to raise $40M of capital to support entry into other markets primarily in Asia,
Latin America and Europe (Expansion into Brazil, Turkey and Indonesia already underway) o Each country will take $2-5M of investment (depending on size of market) to quickly reach market
leadership position and hit profitability o A large consumer presence enables the business to integrate backwards for significant further
monetization – e.g. table reservations, online orders, etc.

DEEP DIVE

5
Zomato was started with the vision of helping people discover more places to eat around them.
Started in 2008; currently one of the fastest-growing products in this space.
Why was Zomato created?

Zomato has been made available for all platforms – web, mobile as well as print
6
Web
Mobile

Zomato is currently present in 27 cities across 8 countries
7
0
10
20
30
40
50
60
70
80
2008 2009 2010 2011 2012 2013 2015
2
18
9 5 3
30
70
No. of cities Projected
27
Plans to add ~40 more cities over the next 2-3 years
Launching Sao Paulo, Istanbul and Jakarta by
the end of 2013

So, why does Zomato work? Two things – focus and depth.
8
Focus
Zomato is a rich content platform accentuated by user generated content
Web 1.0 – Content platform built around restaurant listings (>100k listings) with
rich information including menus, photos
Web 2.0 – User reviews & ratings, personal profiles and picture uploads;
creating a vertical social network
• Zomato only focuses on one vertical - restaurants
• Due to this focus, we are able to build the
product experience just around restaurant and food discovery
Focus on a vertical makes the product appealing to a targeted audience
Depth A B

Focus: Zomato is centered around restaurant and food discovery
9
The home page is an entry point for a user to start exploring eating out options, and search by preference (by locations, cuisines or by dish names); users can also search by dining channels – take-away / dine-in / nightlife etc.
The search page allows the user to see restaurant listings as per his choice and filter them further
A
Each restaurant page has information like address, phone numbers, typical cost for two, attributes, menus, pictures & map co-ordinates

Depth (1 of 3): we have a large in-house team focused on keeping our information fresh and relevant
10
• 100,000 listings across cities – all information updated every three months • Managed by ~100 people (local content teams across all our various
locations) • 30,000 data points modified every day • ~500 incoming requests per day, from restaurant businesses to update
data about their listings • 1,000 menus collected on-field, scanned and updated every day
The content operation is very similar to a mapping (cartography) operation. We are the only local search company in the world with very real-time and
updated data
B
Web 1.0

0
5,000
10,000
15,000
20,000
Yelp Zomato
Number of restaurants listed
OpenTable
~2,500
12,500
TripAdvisor
18,000
Depth (2 of 3): we have comprehensive and updated data in each of the cities we are present in (London case study)
11
B
Web 1.0
~25% of listings have outdated data
• Zomato lists ~18000 restaurant businesses in London with information like menus, pictures and map co-ordinates
• 80% listings have menus which are refreshed every 3 months
• 98% listings have accurate co-ordinates
~40% of listings have closed operations
Rich web1.0 content (menus, pics) ✔ ✗ ✗ ✔
10,000 – 12,000
Note: Yelp doesn’t display the number of listings it has but classifies as nightlife/ restaurants/ pubs/ etc. Since there is an overlap within these classifications, we have indicated a range.

Depth (3 of 3): Zomato has an active user base generating additional content on the platform
12
B
Users can write reviews, create wishlists, mark favorites and recommend restaurants to their social networks. Each city has a Foodie leaderboard with different levels of foodies – Foodie, Big Foodie, Super Foodie & Connoisseurs
• More than 1 million user registrations
• More than 2 million mobile app downloads
• More than 300K user reviews
• More than 1 million user ratings for restaurants
Web 2.0

Overall, the quality of the product along with the depth of information makes a killer winning formula
13
Frequently featured by Apple, Microsoft, Blackberry on their App Stores
Won the NDTV Gadget Guru “App of the Year” award in 2013
Upstart digital start-up Zomato blitzes London's ultra competitive restaurant listings sector.
- Huffington Post

Zomato on the web is growing very fast; the content on the website is consumed by 6 million people every month
14
Note: As of August 2013, web traffic is expected to cross ~6 million visitors per month. Including mobile apps traffic as well, the total visitors on Zomato are approximately 12 million per month
2,000,000
4,000,000
6,000,000 Monthly Visitors
Jan-12 Apr-12 Jul-12 Oct-12 Jan-13 Apr-13 Jul-13
* Spurt in traffic for New Year’s eve
Zomato on mobile is also growing very fast – we see ~6 million visits per month
from our mobile apps
~ 9% growth m-o-m

How do we drive traffic to our product?
15
Customer trial happens through all these mechanisms;
Customer retention happens due to content and product quality
SEM
Search Engine Optimization
PR activities
Word of Mouth
OEM/Telco tie-ups
Social Media
BTL marketing
Note: BTL advertising includes outdoor branding initiatives, such as stickers, restaurant tent cards, public place hoardings, etc.

Direct traffic is a very healthy portion of our overall web traffic
16
0%
10%
20%
30%
40%
50%
60%
70%
80%
90%
Aug/12 Sep/12 Oct/12 Nov/12 Dec/12 Jan/13 Feb/13 Mar/13 Apr/13 May/13 Jun/13 Jul/13
WebDtrafficDbyDsources
DirectDTraffic Non/paidDSearchDTraffic PaidDSearchDTraffic ReferralDTraffic
Non/paidDsearch:D68%
Direct:D21%
Paid search:D8%
Non/paidDsearch:D77%
Direct:D16%
PaidDsearch:D3%

We bring it all together and translate all this into real business value
17
When we have critical mass of traffic in a city
…we have a feet-on-street sales team and
When do we generate revenue?
What do we sell?
Display Ads
Hyper-local search
Display ads on hyper-local search pages

50
100
150
200
Jun '12 Sep '12 Dec '12 Mar '13 Jun '13
Average number of monthly visitors per restaurant
So what do the economics of a city look like? Let’s deep dive into Bangalore as a case study (1 of 5)
18
Critical mass of traffic
Monetization value chain
Increasing Feet on Street
Client acquisitions
Revenue generation
Efficiency/Productivity
Bangalore dissected
Web only

2
4
6
8
10
Number of Sales Employees
Jun '12 Sep '12 Dec '12 Mar '13 Jun '13
So what do the economics of a city look like? (2/5)
19
Critical mass of traffic
Monetization value chain
Increasing Feet on Street
Client acquisitions
Revenue generation
Efficiency/Productivity
Bangalore dissected
Two senior people pulled out to scale Dubai sales team
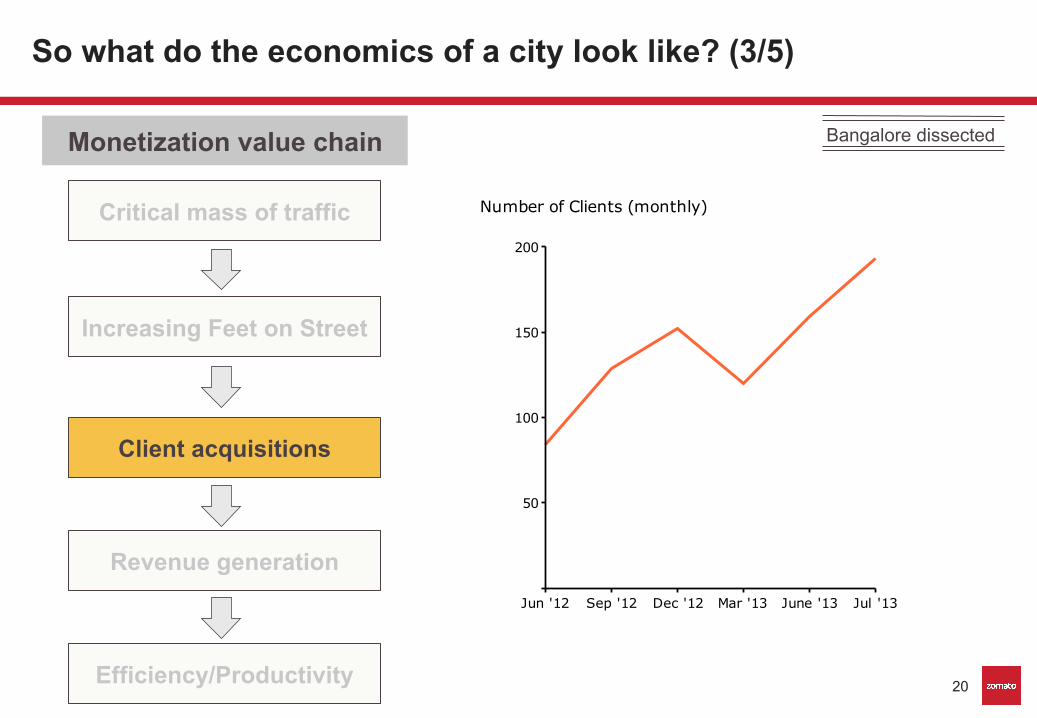
50
100
150
200
Number of Clients (monthly)
Jun '12 Sep '12 Dec '12 Mar '13 June '13 Jul '13
So what do the economics of a city look like? (3/5)
20
Critical mass of traffic
Monetization value chain
Increasing Feet on Street
Client acquisitions
Revenue generation
Efficiency/Productivity
Bangalore dissected
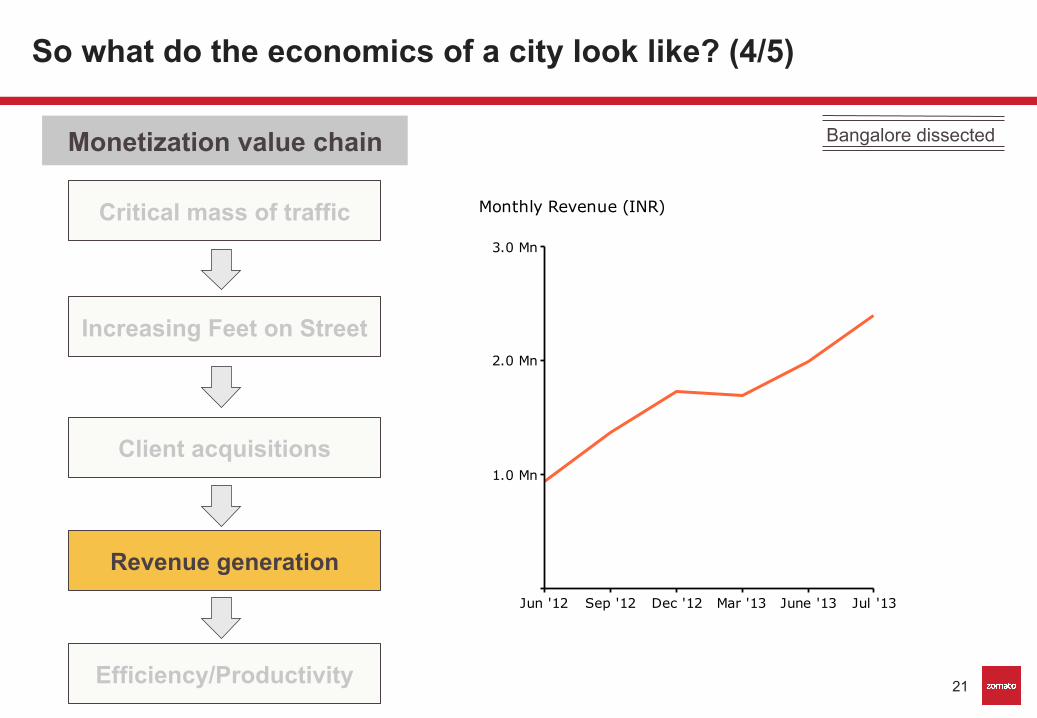
1.0 Mn
2.0 Mn
3.0 Mn
Monthly Revenue (INR)
Jun '12 Sep '12 Dec '12 Mar '13 June '13 Jul '13
So what do the economics of a city look like? (4/5)
21
Critical mass of traffic
Monetization value chain
Increasing Feet on Street
Client acquisitions
Revenue generation
Efficiency/Productivity
Bangalore dissected

So what do the economics of a city look like? (5/5)
22
Critical mass of traffic
Monetization value chain
Increasing Feet on Street
Client acquisitions
Revenue generation
Efficiency/Productivity
Bangalore dissected
1.0
2.0
3.0
4.0
Jun '13
Revenue/Cost
Multiplier
3.7
Revenue multiplier per sales person

Bringing it all together, everything depends and follows our ability to generate traffic on the website
23
Bangalore dissected
100
200
300
Revenues
Restaurants
Traffic
June '12 Sep-12 Dec-12 Mar-13 Jun-13
No. of Sales persons
Clients
Monetization value chain: How it all comes together
Note: All data points indexed to 100 for June 2012

We have demonstrated repeatability of this model in new markets as well (case study for Dubai)
24
Dubai
500
1,000
1,500
No. of Sales personsClients
Restaurants
Traffic
Dec-12 Mar-13 Jun-13
Revenues
Dubai 11 Sales people 106 Clients in 9 months
Monetization value chain: Coming together in a new market
Note: All data points indexed to 100 for December 2012

Our traffic has been growing across all markets, old and new…
25
0
2,000,000
4,000,000
6,000,000
Jan-13
Delhi
Mumbai
Bangalore
Hyderabad
Others
3,030,958
Jul-13
Delhi
Mumbai
Bangalore
Dubai
Manila
Pune
Others
5,653,554
Dubai
Pune
Hyderabad
London
Note: This is the monthly traffic (web visitors) from each of the given locations

…followed by our revenue which is on an equally exciting trajectory
26
0
100
200
300
400
Annual Revenues (INR Mn)
2010-11
3
2011-12
21
2012-13
122
2013-14(P)
320
0
500
1,000
1,500
Number of Clients (Monthly)
July 2011
140
July 2012
410
July 2013
1,500
Current monthly run rate of INR 22 Mn
(August 2013)

International locations are adding to traffic as well as revenue very rapidly
27
-
4,000,000
8,000,000
12,000,000
16,000,000
20,000,000
24,000,000
28,000,000
Revenues: India & International
International IndiaAmounts in INR
-
1,000,000
2,000,000
3,000,000
4,000,000
5,000,000
6,000,000
7,000,000
Traffic: India & International
International IndiaMonthly visitors

Sales team economics have consistently gotten better in all our markets
28
2
4
6
Delhi
5.5
Bangalore
3.5
Mumbai
2.6
Pune
3.7
Kolkata
3.1
Hyderabad
3.1
Chandigarh
1.7
Chennai
1.3
Dubai
1.5
Ahmedabad
0.9
Each column shows the multiplier of: Revenue per sales person in the city
vis-à-vis Cost (salaries) per sales person in that city
> 12 months < 12 months
Time period since
Zomato’s launch
in the city

Also, we have maintained a fairly stable ARPU over time
29
INR
Note: Dubai is at an ARPU of Dhs 2,100 at the moment
-
2,000
4,000
6,000
8,000
10,000
12,000
14,000
16,000
Bangalore Delhi NCR Mumbai

Our advertisers see great value in what they buy from us
30
Mass Reach ~15 M visitors every month
Accessibility
Available on web and all mobile platforms
Targeted Advertising
Hyper-local, relevant search results
Value for Money More economical than traditional medium
Call Tracking Zomato user calls routed through an internal system with recording feature
Analytics
Easy to track traffic, visits, and return on investment
Why do our advertisers pay us? Why do they keep paying us?
“We find that Zomato is a great way to showcase the wide variety of cuisines and ambience on offer to our potential audience.”
- JW Marriott

Zomato is the only content/ media platform which tracks ROI on ad-spend; we do this using call-masking
31
Zomato Telephone numbers displayed on our platforms for
client restaurants are masked numbers
ACD (Automated Call Distribution) Each masked number is mapped and forwarded to
the corresponding restaurant
• Call logs for incoming calls
• Calls recorded for later reference, and for client’s internal system checks
• Incoming phone numbers stored and shared with restaurants to keep log of frequent visitors
Restaurants get calls on their usual phones
Calls are recorded, and call analytics are used by Zomato to generate regular call reports
(Shared with client restaurants to demonstrate ROI on their advertising spend)
Key Features of Call Masking

Calls per paying restaurant have increased over all our cities; proves the strength of the underlying business model
32
0"
20"
40"
60"
80"
100"
120"
140"
Jul+12" Aug+12" Sep+12" Oct+12" Nov+12" Dec+12" Jan+13" Feb+13" Mar+13" Apr+13" May+13" Jun+13" Jul+13"
Bangalore" Delhi"NCR" Dubai" Mumbai"

We want to take Zomato to 40 more cities across 18 more countries
33
Present in 8 countries
Target for Nov 2013
Vision 2015

List of under-served and low competition countries Zomato aims to go to
34
• Latin America (potential topline in $M) o Brazil (~$50M)
o Argentina (~$20M) o Chile (~$8M)
o Colombia (~$4M) o Mexico (~$20M)
• Europe o Turkey (~$15M)
o Russia (~$20M) o Germany (~$20M)
o France (~$10M)
o Spain (~$10M) o Italy (~$10M)
o Eastern Europe (~$10M) o Scandinavian countries (~$20M)
• ANZ o Australia (~$30M)
• Asia o Indonesia (~$15M)
o Malaysia (~$10M) o Vietnam (~$4M)
o Thailand (~$4M) o Korea (~$10M)
o China? • Middle East
o Egypt (~$5M)
o Saudi Arabia (~$2M) o Kuwait (~$2M)
o Jordan (~$2M) o Oman (~$2M)
• Current presence o India (~$20M)
o UAE (~$15M) o United Kingdom (~$40M)
o South Africa (~$10M) o Philippines (~$8M)
o New Zealand (~$4M) o Qatar (~$4M)
o Sri Lanka (~$2M)
Potential topline: ~$350M+

TEAM

Who are the people behind Zomato?
36
Name Role Credentials
Deepinder Goyal Founder & CEO IIT Delhi, Ex-Bain & Company
Pankaj Chaddah Co-founder & COO IIT Delhi, Ex-Bain & Company
Gunjan Patidar CTO IIT Delhi
Albinder Dhindsa VP, International Operations IIT Delhi & Columbia University
Surobhi Das VP, Content IIM Ahmedabad, Ex-Bain & Company
Upasana Nath VP, Recruitment Ex-Google
Saurabh Sengupta VP, Business Development IIT Delhi & IIM Indore, Ex-Aon Hewitt
Puneet Singh Arora VP, Finance & Operations IIM Calcutta, Ex-E&Y, Ex-MakeMyTrip
Pramod Rao Head of Europe Operations IIT Kharagpur, Ex-Bain & Company
Rohin Thampi Head of Middle East Operations IIM Ahmedabad
Mridul Anand AVP, Content IIM Calcutta & IIT Delhi
+ 400 more

BACK UP

This business model is highly repeatable in terms of traffic and revenue
38
0
50
100
150
200
0
50
100
150
200
Jun-12
100
Sep-12
139
Dec-12
156
Mar-13
148
Jun-13
171Delhi Mumbai
Pune Hyderabad
0
100
200
300
0
100
200
300
Jun-12
100
Sep-12
147
Dec-12
185
Mar-13
181
Jun-13
213
Bangalore
0
100
200
300
0
100
200
300
Jun-12
100
Sep-12
113
Dec-12
166
Mar-13
204
Jun-13
196
0
50
100
150
200
0
100
200
300
Jun-12
100
Sep-12
153
Dec-12
131
Mar-13
150
Jun-13
171
0
100
200
300
400
500
0
100
200
300
Jun-12
100
Sep-12
156
Dec-12
219
Mar-13
238
Jun-13
454
Monthly Revenue Index
Monthly Traffic Index Note: All data points for each city indexed to 100 for June 2012

Content and user engagement – listings; reviews and ratings per listing
39
City% #%of%lis+ngs% Ra+ngs%per%lis+ng% Reviews%per%lis+ng%Mumbai" 10766" "17.4"" "4.1""
Delhi"NCR" 10355" "28.5"" "6.8""
Bangalore" 4872" "28.0"" "8.4""
Pune" 3770" "19.5"" "5.8""
Chennai" 3455" "13.1"" "3.0""
Hyderabad" 2708" "19.5"" "5.2""
Kolkata" 2615" "23.9"" "8.1""
Ahmedabad" 1965" "11.6"" "2.9""
Jaipur" 1525" "6.9"" "1.4""
Chandigarh" 1163" "16.6"" "3.7""
Indore" 1007" "4.4"" "0.8""
GuwahaR" 666" "4.9"" "0.3""
Lucknow" 664" "10.9"" "2.8""
Ludhiana" 494" "7.9"" "2.1""
London" 17974" "2.2"" "0.3""
Metro"Manila" 11576" "5.5"" "0.4""
Dubai" 5147" "9.4"" "1.6""
Johannesburg" 2318" "7.9"" "1.6""
Abu"Dhabi" 1666" "6.0"" "0.5""
India"
Major"Int’l"

Cap table as of 30 August 2013
40
Deepinder Goyal, 24.30%
Pankaj Chaddah, 8.10%
Gunjan Patidar, 1.70%
Friends & Family, 0.70%
Info Edge, 57.80%
ESOPs, 7.40%
Current Shareholding Structure


