Embed Size (px)
Citation preview

Pacific Science (1990), vol. 44, no. 3: 297-310© 1990 by University of Hawaii Press. All rights reserved
Zooplankton of the Gulf of California after the 1982-1983 EI Nino Event:Biomass Distribution and Abundance!
BERTHA E. LAVANIEGOs-EsPEJO AND J. RUBEN LARA-LARA2
ABSTRACT: From 23 March to 7 April 1984, we studied the responses ofzooplankton populations to the 1982-1983 El Nino event in the Gulf ofCalifornia. Twenty six stations were sampled for zooplankton distribution andabundance. Mean displacement volume was 388 cm3/lOOO m3
, a value higherthan biomass values reported for the California Current and the eastern tropicalPacific. Maximum values (up to 60 mg/m3 of dry weight) were registered on theeastern shore of the gulf. At other stations biomass values ranged from 11.2 to39.2 mg/m3
. No significant differences were observed in the mean biomass of thecentral gulf between spring 1983 and spring 1984. However, biomass increasedin the southern gulf during spring 1984. Mean total abundance of zooplanktonwas 13% higher than in 1983. Coastal stations registered up to 31 % of the totalabundance. Copepods and cladocerans represented over 65% of mean totalabundance and community structure differed from that in 1983: there weremore copepods, euphausiids, tunicates, and siphonophores in 1984, and fewercladocerans, ostracods, and red crabs (Pleuroncodes planipes). Similarity analysisshowed two main assemblages: one in the central gulf (temperate zone), the othernear the mouth (tropical zone). These two regions correspond to zones withdifferent physical and primary production characteristics. The different responses seen in the central and southern gulf may reflect phytoplankton biomassand primary productivity dynamics. The El Nino event reduced the biomass inthe southern part of the gulf, although the entire gulf in 1983 and 1984 showedhigher biomass values than other eastern Pacific systems. Year-to-year differences may be less important than seasonal changes. The EI Nino phenomenonmainly affected the relative abundances of different taxa.
1 This study was supported through project PCECBNA021265. Ship time was awarded by the National Councilof Science and Technology of Mexico (CONACYT).Manuscript accepted October 1989.
2Centro de Investigaci6n Cientifica y Educaci6n Superior de Ensenada, B.C., Ave. Espinoza No. 843, Ensenada, B.c., Mexico.
1985). The complex dynamics result in variability in production cycles and permanentinstability in the distributional ranges ofplanktonic species (Gilbert and Allen 1943,Round 1967, Zeitszchel 1969, Brinton et al.1986, Valdez-Holguin and Lara-Lara 1987,Jimenez-Perez and Lara-Lara 1988).
The pelagic ecosystem of the Gulf of Cali-fornia is affected by El Nino/southern oscillation events (Baumgartner and Christensen1985, Robles-Pacheco and Marinone 1987,Valdez-Holguin and Lara Lara 1987, JimenezPerez and Lara-Lara 1988, Lara-Lara andValdez-Holguin 1988, Lavaniegos-Espejo etal. 1989). During El Nino periods, tropicaland subtropical diatoms in the laminatedsediments increase (Baumgartner et al. 1985).This enhancement of phytoplankton micro-
297
THE GULF OF CALIFORNIA is a large evaporative basin, with surface salinity about> 35%0.It freely connects with the Pacific Ocean. Themouth of the gulf is located in a transitionalzone influenced by two large circulation systems: the equatorial system and the anticyclonic gyre of the North Pacific, with intensities varying seasonally and interannuallyin response to the dominant wind regimes(Wyrtki 1966, Baumgartner and Christensen

298 PACIFIC SCIENCE, Volume 44, July 1990
FIGURE 1. Sampling stations in the Gulf of California:0, day and ., nIght tows.
MATERIALS AND METHODS
Twenty-six stations were sampled from themouth to the central gulf (Figure 1), from 23March to 7 April 1984, aboard the RjV ElPuma. At each station an oblique tow with aBongo net (60 cm diam., 0.333-mm mesh size)from 200 m to the surface was performed.Water volume filtered was measured witha TKS flowmeter. Samples were collectedat noon and midnight, preserved in 4% formaldehyde, and neutralized with sodiumborate.
0'
.J/O
.JO
•129
o~,
"
MAR 23-APR 7/984
"So
fossils in the central gulf may correspond toperiods ofincreased primary productivity andchlorophyll a content such as were measuredduring the 1982-1983 El Nino event (ValdezHolguin and Lara-Lara 1987). High zooplankton volumes have also been reportedduring the El Nino event (Jimenez-Perez andLara-Lara 1988). This contrasts with lowerphytoplankton productivity rates (Dandonneau and Donguy 1983, McGowan 1983,Chavez et al. 1984) and diminished zooplankton volumes observed in other eastern Pacificsystems during El Nino events (McGowan1984, Barber and Chavez 1986).
Our objective was to study the effects of theEl Nino phenomenon on zooplankton biomass and abundance, and compare biomassdistribution and abundance in spring 1984 (ElNino relaxation period) with the biomass andabundance reported in spring 1983 (at thepeak of the El Nino event) for the Gulf ofCalifornia.
Study area
The only evaporative basin in the PacificOcean is the Gulf of California (Roden 1964).It is located in an arid environment betweenthe Baja California Peninsula and mainlandMexico (Figure 1). The gulf is about 1000 kmlong and about 150 km in average width. Thetipper gulf is separated from the lower gulf bytwo large midriff islands. The lower gulfcomprises a series of basins (2000-3000 mdeep). Strong, semicontinuous tidal mixingand seasonal upwelling occur in the centralgulf, near the northern islands; northwesterlywinds cause upwelling on the eastern shoreduring winter-spring, and southerly windscause upwelling on the western shore in summer (Roden and Groves 1959, Badan-Dangonet al. 1985). These processes result in exceptionally high phytoplankton productivity inthe gulf (Zeitzschel 1969), in contrast to productivity in the other large marginal seas ofthe world, the Mediterranean and the Redseas. The physicochemical environment andprimary productivity are reported by AlvarezBorrego (1983) and Alvarez-Borrego andLara-Lara (in press).

Zooplankton Distribution after El Nino-LAVANIEGOs-EsPEJo AND LARA-LARA 299
b
n·
,"",. "..
. .. ,
.' :
. .
/
IMAR 23- APR 71984
lI
MAR 23-APR 7/984
<'.10o \~"
FIGURE 2. Surface temperature (0C) (a) and salinity (%0) (b) distributions during March-April 1984 in the Gulf ofCalifornia.
Samples were size fractionated to 1/4 witha Folsom splitter. Zooplankton displacementvolumes were estimated following Kramer etal. (1972). Biomass expressed as dry and wetweight, and ash-free dry weight were measured following Beers (1976). Biomass differences between day and night tows were testedusing the Mann-Whitney test (Siegel 1980).
Kendall's correlation coefficient was usedto correlate surface temperature, salinity(measured with a Bissett-Berman CTD), andzooplankton biomass.
Organisms were counted in 1/32 aliquotsfractionated by means of a Folsom splitter.The following keys were used to identifythe organisms: Gurney (1942), Williamson(1957), Boyd (1960), Hardy (1965), Smith(1977), and Yamaji (1977). To estimate possible combined effects of vertical migrationand net avoidance, day abundances were compared with night abundances by means of theMann-Whitney test (Siegel 1980).
Faunistic associations were assessed by estimating the similarity between stations with

300 PACIFIC SCIENCE, Volume 44, July 1990
b
N/D =1.38~ 4- 16
'.16 - 64
.64-256
MAR 23-APR 7/984
N/D= 1.07~ 64- 256<'so. 256-1024
FIGURE 3. Zooplankton biomass in the Gulf of California during March-April 1984: a, displacement volume(cm3/1000 m3
); b, ash-free dry weight (mg/m3). N/D denotes the ratio between the medians of results of night and
day tows.
Kendall's correlation coefficient, followed bya grouping technique, as described by Davis(1973).
RESULTS
Surface salinity values of > 35.2%0 wererecorded for more than 50% of the sampling
stations (Figure 2b). Only in the southern gulfand the northernmost stations was salinityequal to or less than 35.0%0.
Minimum surface temperature (15.9°C)was registered south of Ballenas channel (29°N, 113.5° W), and temperatures increasedprogressively to the south, reaching 23°C atthe mouth of the gulf (Figure 2a). In thecentral gulf, lower temperatures were found at

Zooplankton Distribution after EI Nino-LAVANIEGOs-EsPEJo AND LARA-LARA 301
TABLE 1
ZOOPLANKTON BIOMASS IN THE GULF OF CALIFORNIA DURING MARCH-ApRIL 1984
DISPLACEMENT ASH-FREEVOLUME WET WEIGHT DRY WEIGHT DRY WEIGHT
STATION (cm 3 j1000 m 3 ) (gjlOOO m 3 ) (mgjm3 ) (mgjm3 )
Central 41 154 141 11 845 201 199 24 2249 607 583 32 1954 887 919 132 11866 421 409 36 3261 458 444 30 2065 491 512 3174 150 156 11 985 819 811 62 5877 166 168 14 12
x 435 434 38 30South 83 604 611 39 24
102 261 259 25 2291 239 240 16 1397 260 259 22 1894 304 311 25 22
112 603 654 62 57105 271 269 15 13109 294 298 20 16116 507 508 34 28124 350 362 20 17117 622 648 35 26120 382 393 17 14
x 391 401 28 23Mouth 125 335 319 31 26
(south of 24° N Jat.) 129 322 326 22 19132 213 219 13 12134 186 209 15 13
Total x 389 393 31 25SD 198 203 24 23
NOTE: Stations are divided at 27° Nlat. for central and south areas.
the western shore, while in the southern gulfthe lowest temperatures were registered at theeastern shore.
Biomass Distribution
Zooplankton displacement volume averaged 389 cm3/1000 m 3 (150-887 cm3/1000m3
), and the distribution was homogeneousthroughout the gulf (Figure 3a). Values forstations on the eastern continental shelf averaged 585 cm3/lOOO m3, 60% higher than thosefrom the other stations (Table 1). Wet weightwas distributed as the displacement volume,
averaging 393 g/lOOO m 3 (Table 1). Mean dryweight was 31 mg/m 3; 88% of the values wereless than 40 mg/m3
, and only two shallow( < 100 m) stations on the eastern continentalshelf showed values higher than 60 mg/m3
(Table 1). Ash-free dry weight also showedthese maxima (>55 mg/m 3
). With the exception of two stations at the mouth of the gulf,where biomass was low (Figure 3b), the rangeof biomass was from 16 to 32 mg/m 3
• Therewere no significant differences (P> .05) inresults from day and night tows. No significant correlations were found between biomassand surface temperature or salinity.

302
/
N/O: 1.20 .~256-1024'
"'so. 1024-4016
MAR23-APR71984
FIGURE 4. Total zooplankton abundance (ind/m3).
N/D indicates the night-to-day median ratio of results ofnight and day tows.
Abundance
Mean total zooplankton abundance was1087 individuals (ind)jm3
• Maximum abundance (3321 indjm3) was registered in a coastal station south of 28° N (Figure 4). Otherstations in the southern gulf showed lowerdensities « 1000 indjm3
) than those in thecentral area (Figure 4).
The zooplankton populations were dividedinto 29 taxonomic groups (Table 2). Holoplankton species represented 97.4%, and meroplankton 2.6% of mean abundance. Cope-
PACIFIC SCIENCE, Volume 44, July 1990
pods reached the highest densities (560 indjm3
), followed by cladocerans (161 indjm3).
These two groups represented 66.3% of totalzooplankton abundance by numbers (Table3). The following eight groups: euphausiids,chaetognaths, radiolarians, siphonophores,apendicularians, veliger larvae, ostracods,and polychaetes, averaged from 10 to 79indjm3 and were responsible for 29.4% of thetotal abundance (Table 3). Densities of theremaining groups were below 10 indjm3 . Nostatistical differences (P> .05) were found between abundances in day and night tows.Affinity among stations was high (Table 4).Ninety-four percent of the correlation coefficients were highly significant (P < .001), andthe remaining very significant (.001 < P <.01).
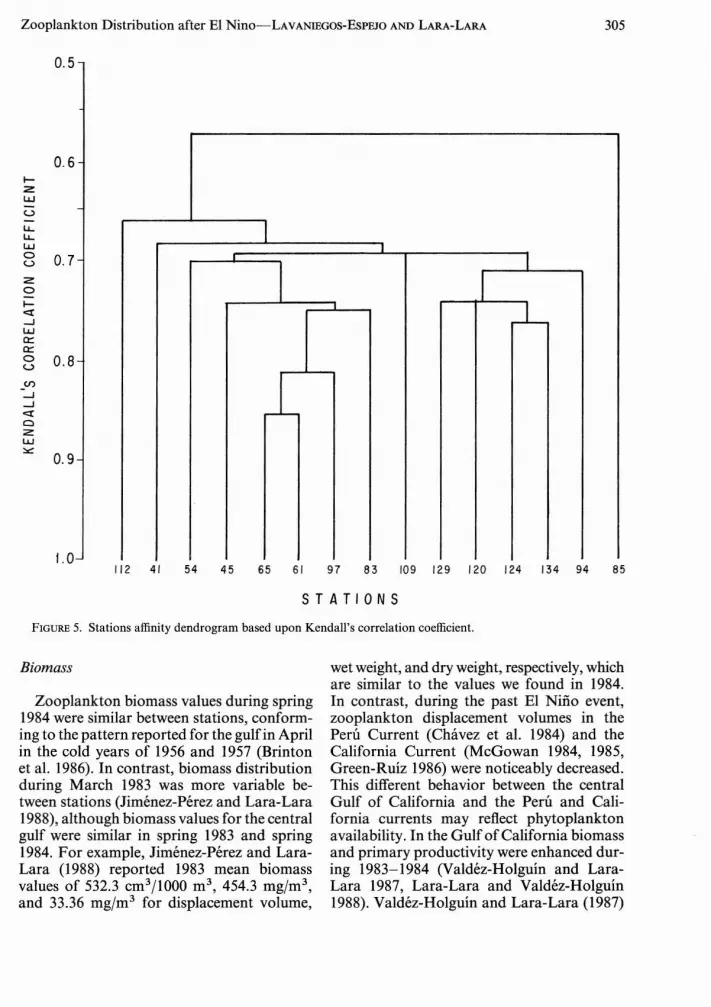
The affinity dendrogram (Figure 5) showstwo main zooplankton assemblages (Figure6), one in the central gulf and the other atthe mouth. Comparisons between the abundances of these two assemblages showed significant (P < .05) differences for several zooplankton taxa: copepods, siphonophores,ctenophores, and invertebrate larvae weremore abundant in the central gulf; and veligerlarvae, heteropods, amphipods, and stomatopod larvae reached higher densities inthe southern assemblage.
DISCUSSION
Environmental conditions in the Gulf ofCalifornia in March 1983 showed climaticanomalies resulting from the El Nino eventthat affected the eastern Pacific Ocean between fall 1982 (Cane 1983, Rasmusson andWallace 1983) and fall 1983. Surface salinitydecreased « 34.9%0) while surface temperature increased up to 3°C, and sea level rose toits maximum in the last 20 yr (Robles-Pachecoand Marinone 1987). During spring 1984,values for surface salinity reverted toward themore usual values reported by Roden andGroves (1959), Roden (1964), and AlvarezBorrego and Schwartzlose (1979). Surfacetemperatures were 1° to 2°C lower during thespring of 1984, showing that the El Ninoevent had weakened.

TABLE 2 N0
ABUNDANCES (IND/M3) OF THE MAIN ZooPLANKTONIC GROUPS0
"0Pi::l
SAMPLING STATIONS ~....0::l
GROUPS 41 45 54 61 65 85 83 97 94 112 109 124 120 129 134 Q~
COPEPODA (Sc) 124 741 475 425 535 1093 439 329 436 2382 165 264 351 379 261 ::l.0-
CLADOCERA 1 4 4 466 812 0 256 275 31 222 268 26 2 44 1 s::EUPHAUSIACEA 151 46 490 36 68 136 27 4 58 152 <1 4 4 10 3
::t.0
CHAETOGNATA (Ph) 4 36 25 57 69 194 102 70 34 126 24 25 43 63 24 ::lpo
RADIOLARIA (C) 4 2 3 96 45 3 103 57 25 9 8 24 134 108 135 ;:;.>SIPHONOPHORA 6 72 12 52 200 27 44 19 16 222 10 8 8 5 6 0..,APPENDICULARIA 2 2 3 191 116 5 15 61 15 112 33 27 39 31 16 t!lVeliger larvae <1 <1 1 5 2 3 1 3 9 15 1 41 6 105 23 ~OSTRACODA (Sc) 11 25 9 16 10 6 32 13 17 8 13 8 9 16 6 ::lPOLYCHAETA(C) 1 4 3 23 24 2 38 14 11 0 9 5 4 10 7 0
IDOLIOLIDAE <I 2 <1 2 12 1 3 6 3 3 5 22 38 1 28 t"'"Fish eggs and larvae <1 <1 1 5 10 1 26 9 25 5 I 3 2 11 4 ><:FORAMINIFERA 1 <1 <1 15 22 1 17 6 1 9 <1 2 1 4 3 >THECOSOMATA <1 1 1 7 8 4 6 7 7 15 2 2 9 7 2 z;;Echinodermata larvae 1 2 3 13 7 0 17 15 1 4 4 <1 <1 2 0 8HYDROMEDUSAE (C) <1 2 <1 2 8 2 1 1 3 12 1 1 2 2 <1 'fDECAPODA <1 3 3 1 2 2 1 2 6 9 2 2 1 2 1 tIl
'"HETEROPODA (Sf) <1 <1 <1 1 1 3 1 2 2 1 <1 3 4 11 1 "Ilt:l
AMPHIPODA 0 <1 1 1 <1 1 1 2 5 5 3 3 4 2 2 0SALPIDAE 0 0 2 0 0 1 2 1 8 0 2 1 <1 <1 2 >GYMNOSOMATA <1 <1 <1 2 3 0 5 1 1 1 <1 1 <1 1 <1 z
0Other invertebrate larvae 0 0 0 2 1 0 6 7 0 1 0 0 0 0 0 t"'"Cyphonautes larvae 0 1 1 <1 2 3 3 1 1 3 0 <1 <1 0 0 >
'"CTENOPHORA (Ph) 1 0 <1 0 <1 7 <1 <1 0 0 0 0 0 0 0 >ICirripedia larvae 0 <1 0 0 1 0 0 <1 <1 1 <1 0 0 0 0 t"'"
ISOPODA 0 0 0 0 0 0 <1 1 <1 0 <1 <1 <1 <1 <1 ~CEPHALOPODA <1 0 <1 0 0 0 0 0 <1 0 0 1 0 <1 <1SCYPHOMEDUSAE (C) 0 0 0 0 0 0 0 <1 0 0 0 0 <1 <1 0Stomatopoda larvae 0 0 0 0 0 0 0 0 <1 <1 0 <1 <1 0 <1Not identified 0 0 0 1 0 1 4 3 1 4 0 0 1 1 2
Total 307 943 1,037 1,419 1,958 1,496 1,150 909 716 3,321 551 473 662 815 527% 1.9 5.8 6.4 8.7 12 9.2 7.1 5.6 4.4 20.4 3.4 2.9 4.1 5 3.2Number of groups 21 22 24 22 24 20 25 27 26 23 23 25 25 24 23
NOTE: Names in capital letters indicate holoplankton, lower-case letters indicate groups belonging to the meroplankton. Ph denotes phylum; C, class; Sc, subclass; Sf, superfamily; others <.U0are Orders. <.U

TABLE 3
RELATIVE (%) AND MEAN ABUNDANCE (IND/M3 ) OF THE GROUPS OF ZOOPLANKTON
GROUPS X % % CUMULATIVE
COPEPODA (Sc) 560 51.6 51.6CLADOCERA 161 14.8 66.4EUPHAUSIACEA 79 7.3 73.7CHAETOGNATA (Ph) 60 5.5 79.2RADIOLARIA (C) 50 4.6 83.8SIPHONOPHORA 47 4.3 88.1APPENDICULARIA 45 4.1 92.2Veliger larvae 14 1.3 93.6OSTRACODA (Sc) 13 1.2 94.8POLYCHAETA (C) 10 1.0 95.7DOLIOLIDAE 8 0.8 96.5Fish eggs and larvae 7 0.6 97.1FORAMINIFERA 5 0.5 97.6THECOSOMATA 5 0.5 98.1Echinodermata larvae 5 0.4 98.6HYDROMEDUSAE (C) 2 0.2 98.8DECAPODA 2 0.2 99.0HETEROPODA (Sf) 2 0.2 99.2AMPHIPODA 2 0.2 99.4SALPIDAE I 0.1 99.5GYMNOSOMATA I 0.1 99.6Other invertebrate larvae I 0.1 99.7Cyphonautes larvae I 0.1 99.8CTENOPHORA (Ph) I 0.0 99.8Cirripedia larvae 0 0.0 99.8ISOPODA 0 0.0 99.8CEPHALOPODA 0 0.0 99.9SCYPHOMEDUSAE (C) 0 0.0 99.9Stomatopoda larvae 0 0.0 99.9Not identified I 0.1 100.0
Total 1,086 100.0 100.0
NOTE: See footnote of Table 2 for explanation of abbreviations.
TABLE 4
KENDALL'S CORRELATION COEFFICIENTS MATRIX BETWEEN SAMPLING STATIONS
STATION 45 54 61 65 85 83 97 94 112 109 124 120 129 134
41 .680 .619 .677 .644 .559 .519 .542 .570 .563 .505 .483 .505 .552 .46445 .700 .675 .743 .495 .556 .604 .650 .640 .631 .541 .579 .504 .44254 .591 .511 .484 .514 .521 .680 .549 .610 .529 .478 .493 .43761 .850 .413 .746 .812 .632 .664 .657 .639 .621 .644 .53765 .418 .693 .716 .613 .670 .605 .589 .561 .539 .48385 .010 .010 .347 .353 .509 .498 .357 .458 .570 .436 .47083 .010 .720 .545 .480 .520 .509 .488 .501 .46397 .010 .586 .563 .694 .628 .620 .645 .53394 .596 .663 .713 .627 .673 .634
112 .473 .526 .528 .535 .391109 .010 .688 .637 .604 .564124 .742 .740 .762120 .720 .694129 .658134 .010
NOTE: P < .00I, or as otherwise indicated.
Zooplankton Distribution after EI Nino-LAVANIEGOs-EsPEJo AND LARA-LARA
0.5
305
0.6I-ZI.LJ
U-LL.LL.I.LJ0 0.7<...>
z0I-ex...JI.LJa:::a:::0 0.8<...>
_en...J...Jex0zI.LJ:><:::
0.9
II
I
1
1.0112 41 54 45 65 61 97 83 109 129 120 124 134 94 85
STATIONS
FIGURE 5. Stations affinity dendrogram based upon Kendall's correlation coefficient.
Biomass
Zooplankton biomass values during spring1984 were similar between stations, conforming to the pattern reported for the gulf in Aprilin the cold years of 1956 and 1957 (Brintonet al. 1986). In contrast, biomass distributionduring March 1983 was more variable between stations (Jimenez-Perez and Lara-Lara1988), although biomass values for the centralgulf were similar in spring 1983 and spring1984. For example, Jimenez-Perez and LaraLara (1988) reported 1983 mean biomassvalues of 532.3 cm3/lOOO m 3
, 454.3 mg/m3,and 33.36 mg/m3 for displacement volume,
wet weight, and dry weight, respectively, whichare similar to the values we found in 1984.In contrast, during the past El Nino event,zooplankton displacement volumes in thePeru Current (Chavez et al. 1984) and theCalifornia Current (McGowan 1984, 1985,Green-Ruiz 1986) were noticeably decreased.This different behavior between the centralGulf of California and the Peru and California currents may reflect phytoplanktonavailability. In the Gulf of California biomassand primary productivity were enhanced during 1983-1984 (Valdez-Holguin and LaraLara 1987, Lara-Lara and Valdez-Holguin1988). Valdez-Holguin and Lara-Lara (1987)

306 PACIFIC SCIENCE, Volume 44, July 1990
FIGURE 6. Zooplankton assemblages in spring 1984 inthe Gulf ofCalifornia. Isolines indicate Kendall's correlation coefficient.
have hypothesized that the enhanced productivity was the result of an elevated phytoplankton biomass due to suppression of zooplankton grazing, indicated by the scarcity oftypical calanoids during spring 1983. Oithonasp. and Penilia avirostris were the dominantspecies in 1983 (Jimenez-Perez and Lara-Lara1988). In the southern gulf, Jimenez-Perez andLara-Lara (1988) reported mean biomassvalues of 209.6 cm3/IOOO m3
, 148.7 mg/m3,
and 18.95 mg/m3 for displacement volume,wet weight, and dry weight, respectively. Thesevalues are about 40% lower than the ones for
Numerical Abundance
Zooplankton abundances in spring 1984were up to 13% higher than the densitiesreported by Jimenez-Perez and Lara-Lara(1988) for spring 1983. In comparison with theCalifornia Current, mean zooplankton abundance for the Gulf of California during thesprings of 1983 and 1984 was an order ofmagnitude higher (Table 6). This may be theresult of the high primary productivity andchlorophyll a concentrations measured dur-
1984. This different response between thecentral and southern portions of the gulf mayreflect the stronger influence ofoceanic watersin the southern gulf. In consequence, thezooplankton biomass decreased in 1983 in thesouthern gulf, as reported for the Peruvianwaters and the California Current. Our resultsindicate that the southern and central gulf aremore than mere geographic limits: that thestructure and function of the plankton ecosystem is indeed different in the two sections,the central gulf being more temperate and thesouthern more tropical-oceanic. These differences have been noted previously (Brintonel al. 1986, Valdez-Holguin and Lara-Lara1987, Jimenez-Perez and Lara-Lara 1988).Biomass values (Griffiths 1968; Farfan 1973,Cummings 1977) previously reported for theGulf of California have been in areas notcomparable with our study.
There are no long-term zooplankton biomass series in the gulf that can be comparedwith other ecosystems to evaluate interannualvariability. If we average the values forthe whole gulf, interannual variability ofthe zooplankton biomass becomes negligible,and El Nino events seem to affect mainlythe relative abundances of the zooplanktongroups. However, if we average by zones(central versus south), then differences between years appear in the southern portion ofthe gulf. Our results show that although thesouthern gulf behaves as does the CaliforniaCurrent (Thrailkill 1961, McGowan 1984,1985, Green-Ruiz 1986) and other areas in theeastern Pacific (Flores-Zepeda 1985) duringEl Nino events, average zooplankton biomassin the gulf is always higher (Table 5).
o
~"
<.JQo.:::-"
MAR 23-APR 7/984/
0'\.
'"<9
.1/0
0
.:::-"
<J'
/<SO
.:::-
<So

Zooplankton Distribution after El Nino-LAVANIEGOs-EsPEJo AND LARA-LARA 307
TABLE 5
COMPARISONS OF ZooPLANKTON DISPLACEMENT VOLUMES (cm3/IOOO m 3)
VOLUME DEPTH MESH WIDTHGEOGRAPIDC AREA (cm3 /IOOO m3
) DATE (m) (mm) REFERENCES
Gulf of California29°-24° N 405 Mar. 1983 200 0.333 Jimenez-Perez and Lara-
Lara (1988)29°-24° N 445 Mar.-Apr. 1984 200 0.333 This study24°-23° N 254 Mar.-Apr. 1984 200 0.333 This study
California Current30°-25°40' N 255 Mar. 1951-1957 140 0.600 Staff, SPFI (1952-1956),
Thrailkill (1957, 1959)30°-25°40' N 310 Apr. 1951-1957 140 0.600 Thrailkill (1957, 1959)30°-25°40' N 73 Mar. 1958 140 0.600 Thrailkill (1961)30°-25°40' N 88 Apr. 1958 140 0.600 Thrailkill (1961)25°35'-23°26' N 65 Dec. 1982 200 0.505 Green-Ruiz (1986)25°35'-23°26' N 86 Feb. 1983 200 0.505 Green-Ruiz (1986)25°35'-23°26' N 20 May 1983 200 0.505 Green-Ruiz (1986)
North Equatorial Current (20°-10° N)Oceanic zone 75 Oct. 1955 300 0.600 Holmes et al. (1957)Dome of Costa Rica 272 Dec. 1955 300 0.600 Holmes et al. (1957)Dome of Costa Rica 161 Nov. 1982 200 0.333 Flores-Zepeda (1985)Dome of Costa Rica 181 Nov. 1982 200 0.505 Flores-Zepeda (1985)
North Equatorial Countercurrent (10°-4° N)Oceanic zone 113 Oct. 1955 300 0.600 Holmes et al. (1957)Dome of Costa Rica 165 Nov. 1955 300 0.600 Holmes et al. (1957)Dome of Costa Rica 143 Nov. 1982 200 0.333 Flores-Zepeda (1985)Dome of Costa Rica 135 Nov. 1982 200 0.505 Flores-Zepeda (1985)
South Equatorial Current (4° N-4° S)Oceanic zone 1,215 Nov.-Dec. 1955 300 0.600 Holmes et al. (1957)Coastal zone 323 Nov. 1955 300 0.600 Holmes et al. (1957)
NOTE: We estimated the averages, using only data from night tows. All tows were oblique.
ing this period as previously discussed. Thezooplankton populations were dominated bycopepods, but they only represented about
'51 % of the total abundance in 1984 and 44%in 1983. In the California Current system,copepods have been reported to representup to 70% of total zooplankton abundance(Table 6). This is the result of the considerablecontribution by the cladocerans to the totalabundance in the gulf, 14% in 1984 and 30%in 1983. The most abundant cladoceran, Penilia avirostris, which is characteristic of tropical coastal waters, inhabits temperate centralgulf waters (Jimenez-Perez and Lara-Lara1988). Abundance of these two groups, copepods and cladocerans, showed an inversebehavior from 1983 to 1984; abundance ofcopepods increased and that of cladoceransdecreased. Other differences in abundancebetween the springs of 1983 and 1984 were
shown by the other groups (abundances inthe range of 10-100 indjm3
): abundance ofeuphausiids, tunicates, and siphonophores increased in 1984, and that of ostracod andred crab (Pleuroncodes planipes) decreased in1984 (Table 6).
Total numerical abundance distributionand the station affinity analysis showed thepresence of two large assemblages: (1) thewarm temperate in the central gulf, wheretidal mixing and upwelling are common andcause the cool water in this area (BadanDang6n e1 al. 1985); and (2) the tropical onein the southern gulf (stations south of 27°N) with more equatorial influence. In spring1983, these two main asemblages were alsoshown for copepod species (Jimenez-Perezand Lara-Lara 1988).
We have presented here more evidence thatshows that the sernienclosed ecosystem of the

308
TABLE 6
PACIFIC SCIENCE, Volume 44, July 1990
COMPARISONS OF MEAN ABUNDANCES (IND/M3) OF THE MAIN TAXONOMIC GROUPS IN THE GULF OF CALIFORNIA
WITH THOSE OF THE CALIFORNIA CURRENT
Gulf of California California Current(24°_29° N) (26°-30° N)
Bongo net, oblique tow, Calif. Coop. Oceanic Fish Invest.SAMPLING 0-200 m, 0.60 m diam., net, oblique tow, 0-140 m, I-m diam.,
CHARACTERISTICS 0.333-mm mesh width 0.600-mm mesh width
DATE Mar. 1983 Mar.-Apr. 1984" Feb. 1959
NUMBER OF SAMPLES 5 5 5
COPEPODA 321 468 18CLADOCERA 257 106EUPHAUSIACEA II 127 2CHAETOGNATA 58 35 2RADIOLARIA 30TUNICATA 12 56 <ISIPHONOPHORA 15 32 <IGASTROPODA 17 IIOSTRACODA 62 15 <IFish eggs and larvae 2 7 <IFORAMINIFERA 4HYDROMEDUSAE 2 2 <IPleuroncodes larvae 25 2 2AMPHIPODA 4 2 <IOthers 21 17 <ITotal Mean Abundance 790 920 35
REFERENCES Jimenez-Perez (1987) This study Ahlstrom and Thrailkill (1963)
NOTE: We esIimaIed the averages, using only data from night tows. All tows were oblique. See footnote of Table 2 for explanationof capital letters.
a Coastal stations were excluded.
Gulf of California responds differently thanthe typical upwelling ecosystems (Californiaand Peru currents) to the El Nino/southernoscillation phenomenon.
ACKNOWLEDGMENTS
We thank L. C. Jimenez-Perez for his support during collection of the samples.
LITERATURE CITED
AHLSTROM, E. H., and J. R. THRAILKILL. 1963.Plankton volume loss with time ofpreservation. Calif. Coop. Oceanic Fish Invest. Rep.9: 57-73.
ALVAREZ-BORREGO, S. 1983. Gulf of California. Pages 427-449 in B. H. Ketchum,ed. Estuaries and enclosed seas. Elsevier,Amsterdam.
ALVAREZ-BoRREGO, S., and J. R. LARA-LARA.In press. The physical environment andprimary productivity of the Gulf of California. in J. P. Dauphin and P. Simmonei,eds. Monogr. Am. Assoc. Pet. Geol.
ALVAREZ-BoRREGO, S., and R. A. SCHWARTZLOSE. 1979. Masas de agua del Golfo deCalifornia. Cienc. Mar. 6:43-63.
BADAN-DANGON, A., C. J. KOBLINSKY, and T.BAUMGARTNER. 1985. Spring and summerin the Gulf of California: Observations ofsurface thermal patterns. Oceanol. Acta8: 13-22.
BARBER, R. T., and F. CHAVEZ. 1986. Ocean
Zooplankton Distribution after El Nino-LAVANIEGOs-EsPEJo AND LARA-LARA 309
variability in relation to living resourcesduring the 1982-1983 El Nino. Nature(London) 319:279-285.
BAUMGARTNER, T., and N. CHRISTENSEN, Jr.1985. Coupling of the Gulf of California tolarge-scale interannual climatic variability.J. Mar. Res. 43: 825-848.
BAUMGARTNER, T., V. FERREIRA-BARTRINA,H. SCHRADER, and A. SOUTAR. 1985. A20-year varve record of siliceous phytoplankton variability in the central Gulf ofCalifornia. Mar. Geol. 64: 113-129.
BEERS, J. R. 1976. Determination of zooplankton biomass. Pages 37-84 in H. S.Steedman, ed. Zooplankton fixation andpreservation. Monogr. Oceanogr. Method01. 4. UNESCO Press, Paris.
BoYD, C. M. 1960. The larval stages of Pleuroncodes planipes Stimpson (Crustacea, Decapoda, Galatheidae). BioI. Bull. (WoodsHole, Mass.) 118: 17-30.
BRINTON, E., A. FLEMINGER, and D. SIEGELCAUSEY. 1986. The temperate and tropicalplanktonic biotas of the Gulf of California.Calif. Coop. Oceanic Fish Invest. Rep.27: 228-266.
CANE, M. A. 1983. Oceanographic eventsduring El Nino. Science 222: 1189-1194.
CHAVEZ, F., R. T. BARBER, J. E. KOGELSCHATZ, V. G. THAYER, and C. BINn. 1984.El Nino and primary productivity: Potential effects on atmospheric carbon dioxide and fish production. Trop. OceanAtmos. Newsl. 28: 1-2.
CuMMINGS, J. A. 1977. Seasonal and areal distribution of zooplankton standingstocks in the northern Gulf of California. M.S. thesis, University of Arizona,Tucson.
DANDONNEAU, Y. and R. J. DONGUY. 1983.Changes in surface chlorophyll concentrations related to the 1982 El Nino. Trop.Ocean Atmos. Newsl. 21: 14-15.
DAVIS, E. C. 1973. Statistics and data analysisin geology. John Wiley and Sons, NewYork.
FARFAN, B. C. 1973. Estimacion de biomasade zooplancton en la zona norte del Golfode California. Pages 339-364 in Estudioquimico sobre la contaminacion por insecticidas en la desembocadura del Rio
Colorado. Reporte final a la Direccion deAcuacultura de la Sria. de Recursos Hidniulicos, 2da. etapa. Unidad de CienciasMarinas, U.A.B.C., Mexico. Torno II.
FLORES-ZEPEDA, M. 1985. Determinacion ycomparacion de las biomasas totales y parciales del zooplancton obtenido durante elcrucero Domo III en la region del Domo deCosta Rica. B. S. thesis, Autonomous National University of Mexico (U.N.A.M.).
GILBERT, J. Y., and W. E. ALLEN. 1943. Thephytoplankton of the Gulf of Californiaobtained by the E. W. Scripps in 1939 and1940. J. Mar. Res. 5(2): 89-110.
GREEN-Ruiz, J. 1986. Variacion cualitativa ycuantitativa de los eufimsidos (Crustacea,Malacostraca) en un ciclo estacional en elPacifico Oriental de Baja California Sur.B.S. thesis, Autonomous National University of Mexico (U.N.A.M.).
GRIFFITHS, R. C. 1968. Physical, chemical andbiological oceanography at the entrance tothe Gulf of California, spring of 1960. U.S.Fish Wildl. Servo Spec. Sci. Rep. Fish. 573.
GURNEY, R. 1942. Larvae of decapod Crustacea. Ray Society, London. 306 p.
HARDY, A. 1965. The open sea: Its natural history. Houghton Mifflin Co., GreatBritain.
HOLMES, R. W., M. B. SCHAEFER, and B. M.SHIMADA. 1957. Primary production, chlorophyll and zooplankton volumes in theeastern Tropical Pacific Ocean. Inter-AmTrop. Tuna Comm. Bull. 2(4): 127-169.
JIMENEZ-PEREz, C. 1987. Caracteristicas estructurales del zooplancton del Golfo de California durante el fenomeno de El Nino(1982-1983). M.S. thesis, Center of Scientific Research and Higher Education ofEnsenada (CICESE), Ensenada, Mexico.
JIMENEZ-PEREZ, L. C., and J. R. LARA-LARA.1988. Zooplankton biomass and copepodcommunity structure in the Gulf of California during the 1982-1983 El Nino event.Calif. Coop. Oceanic Fish, Invest. Rep.29: 122-128.
KRAMER, D., M. J. KALIN, E. G. STEVENS, J.R. THRAILKILL, and J. R. ZWEIFEL. 1972.Collecting and processing data on fish eggsand larvae in the California Current region.NOAA Tech. Rep. NMFS C. 370.

310
LARA-LARA, J. R., and J. E. VALDEZ-HoLGuiN. 1988. Size fraction biomass and primary productivity in the Gulf of Californiaduring spring 1984. Cienc. Mar. 14: 1-14.
LAVANIEGOs-EsPEJO, B. E., J. R. LARA-LARA,and E. BRINTON. 1989. Effects of"El Nino"1982-1983 event upon the euphausiid populations of the Gulf of California. Calif.Coop. Oceanic Fish Invest. Rep. 30: 73-87.
MCGOWAN, J. A. 1983. E1 Nino and biological production in the California Current. Trop. Ocean Atmos. Newsi. 21: 23.
---. 1984. The Californian El Nino.Oceanus 27: 48-51.
--. 1985. El Nino 1983 in the SouthernCalifornia Bight. Pages 166-184 in W. S.Wooster and D. L. Fluharty, eds. El NinoNorth. - Nino effects in the eastern Subarctic Pacific Ocean. Washington Sea GrantProgram, University of Washington, Seattle.
RASMUSSON, E. M., andJ. M. WALLACE. 1983.Meteorological aspects of the El Ninosouthern oscillation. Science 222: 11951202.
ROBLES-PACHECO, J. M., and G. MARINONE.1987. Seasonal and interannual thermohaline variability in the Guaymas Basin ofthe Gulf of California. Cont. Shelf Res.7:715-733.
RODEN, G. 1. 1964. Oceanographic aspects ofthe GulfofCalifornia. Pages 30-58 in T. H.van Andel and G. G. Shor, Jr., eds. Marinegeology of the Gulf of California. Mem.Am. Assoc. Pet. Geoi. 3.
RODEN, G. 1., and G. W. GROVES. 1959.Recent oceanographic investigations in theGulfofCalifornia. J. Mar. Res. 18: 10-35.
ROUND, F. E. 1967. The phytoplankton oftheGulf of California. Part 1. Its composition,distribution and contribution to the sediment. J. Exp. Mar. BioI. Ecoi. 1: 76-97.
SIEGEL, S. 1980. Estadistica no parametrica,2d ed. Trillas, Mexico, D.F.
SMITH, D. L. 1977. A guide to marine coastal
PACIFIC SCIENCE, Volume 44, July 1990
plankton and marine invertebrate larvae.Kendall-Hunt Publ. Co., Dubuque, Iowa.
STAFF, SOUTH PACIFIC FISHERY INVESTIGATIONS. 1952. Zooplankton volumes off thePacific coast, 1951. U.S. Fish Wildi. ServoSpec. Sci. Rep. Fish. 73.
---. 1953. Zooplankton volumes off thePacific coast, 1952. U.S. Fish Wildi. ServoSpec. Sci. Rep. Fish. 100.
---. 1954. Zooplankton volumes off thePacific coast, 1953. U.S. Fish Wildi. ServoSpec. Sci. Rep. Fish. 132.
---. 1955. Zooplankton volumes off thePacific coast, 1954. U.S. Fish Wildl. ServoSpec. Sci. Rep. Fish. 161.
---. 1956. Zooplankton volumes off thePacific coast, 1955. U.S. Fish Wildi. ServoSpec. Sci. Rep. Fish. 177.
THRAILKILL, J. R. 1957. Zooplankton volumes off the Pacific coast, 1956. U.S. FishWildi. Servo Spec. Sci. Rep. Fish. 232.
---. 1959. Zooplankton volumes off thePacific coast, 1957. U.S. Fish. Wi1dI. ServoSpec. Sci. Rep. Fish. 326.
---. 1961. Zooplankton volumes off thePacific coast. U.S. Fish Wildi. Servo Spec.Sci. Rep. Fish. 581.
VALDEZ-HOLGUiN, E., and J. R. LARA-LARA.1987. Primary productivity in the Gulf ofCalifornia: Effects of El Nino 1982-1983event. Cienc. Mar. 13(2): 34-50.
WILLIAMSON, D. 1. 1957. Crustacea, Decapoda: Larvae. 1. General. Cons. Perm. Int.Explor. Mer. Fiches Ident. Zooplankton112.
WYRTKI, K. 1966. Oceanography of easternEquatorial Pacific Ocean. Oceanogr. Mar.BioI. Annu. Rev. 4: 33-68.
YAMAJI, 1. 1977. Illustration of the marineplankton of Japan. Hoikusha Pubi. Co.,Osaka.
ZEITSZCHEL, B. 1969. Primary productivity inthe Gulf of California. Mar. BioI. 3: 201207.