Embed Size (px)
Citation preview

« »
–
, , ,
XVIII -
( . , 16–17 2015 .)
I
2015
63:001.89:005.71(063)(571.1/.5) 4 (253) 1 431
25
:. . , , ;. . , « », ;. , - , ;. . , , - .- . , .
:. . , - . , ; . . , . . ,
. . , . . , . .- . , . . , . - .
25 - , ,, : . . . VIII . .- . .( -, 16-17 2015 ) : 2 . .1./ .: . . [ ] ; .:
. . [ .]; . . ., . - . , . .. , . .- . . .- , 2015.- .
ISBN 978-5-906143-66-2 ( .1)ISBN 978-5-906143-65-5
VIII -- , , ,
: , ; ;; ; -
; ; , ;; ; -
., -
, .
63:001.89:005.71(063)(571.1/.5) 4 (253) 1 431
ISBN 978-5-906143-66-2 ( .1)ISBN 978-5-906143-65-5 © , 2015
25
3
,
UDC 635.26:526.32
EVALUATION OF ONION ACCESSIONS IN STORAGE
AMIROV B.M., AMIROVA Z.S., MANABAEVA U.A., ZHASYBAEVA K.R.Kazakh Research Institute of Potato and Vegetable Growing, Kazakhstan
e-mail: [email protected]
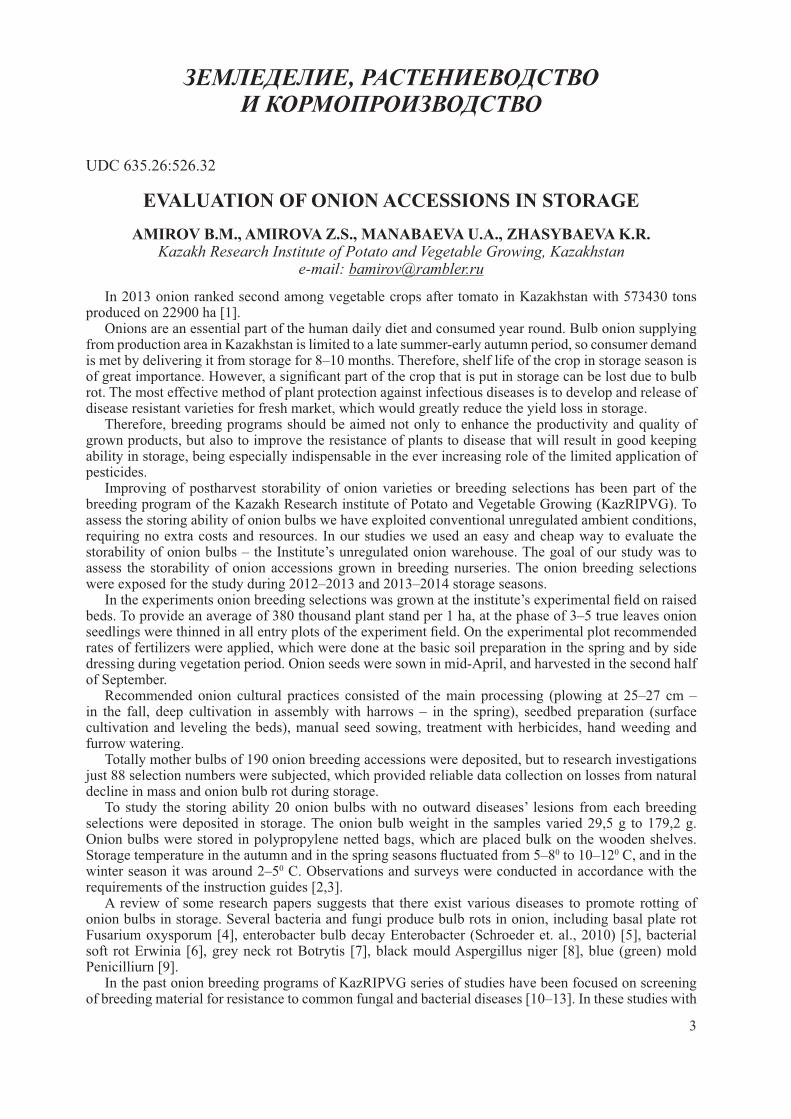
In 2013 onion ranked second among vegetable crops after tomato in Kazakhstan with 573430 tons produced on 22900 ha [1].
Onions are an essential part of the human daily diet and consumed year round. Bulb onion supplying from production area in Kazakhstan is limited to a late summer-early autumn period, so consumer demand is met by delivering it from storage for 8–10 months. Therefore, shelf life of the crop in storage season is of great importance. However, a signifi cant part of the crop that is put in storage can be lost due to bulb rot. The most effective method of plant protection against infectious diseases is to develop and release of disease resistant varieties for fresh market, which would greatly reduce the yield loss in storage.
Therefore, breeding programs should be aimed not only to enhance the productivity and quality of grown products, but also to improve the resistance of plants to disease that will result in good keeping ability in storage, being especially indispensable in the ever increasing role of the limited application of pesticides.
Improving of postharvest storability of onion varieties or breeding selections has been part of the breeding program of the Kazakh Research institute of Potato and Vegetable Growing (KazRIPVG). To assess the storing ability of onion bulbs we have exploited conventional unregulated ambient conditions, requiring no extra costs and resources. In our studies we used an easy and cheap way to evaluate the storability of onion bulbs – the Institute’s unregulated onion warehouse. The goal of our study was to assess the storability of onion accessions grown in breeding nurseries. The onion breeding selections were exposed for the study during 2012–2013 and 2013–2014 storage seasons.
In the experiments onion breeding selections was grown at the institute’s experimental fi eld on raised beds. To provide an average of 380 thousand plant stand per 1 ha, at the phase of 3–5 true leaves onion seedlings were thinned in all entry plots of the experiment fi eld. On the experimental plot recommended rates of fertilizers were applied, which were done at the basic soil preparation in the spring and by side dressing during vegetation period. Onion seeds were sown in mid-April, and harvested in the second half of September.
Recommended onion cultural practices consisted of the main processing (plowing at 25–27 cm – in the fall, deep cultivation in assembly with harrows – in the spring), seedbed preparation (surface cultivation and leveling the beds), manual seed sowing, treatment with herbicides, hand weeding and furrow watering.
Totally mother bulbs of 190 onion breeding accessions were deposited, but to research investigations just 88 selection numbers were subjected, which provided reliable data collection on losses from natural decline in mass and onion bulb rot during storage.
To study the storing ability 20 onion bulbs with no outward diseases’ lesions from each breeding selections were deposited in storage. The onion bulb weight in the samples varied 29,5 g to 179,2 g. Onion bulbs were stored in polypropylene netted bags, which are placed bulk on the wooden shelves. Storage temperature in the autumn and in the spring seasons fl uctuated from 5–80 to 10–120 C, and in the winter season it was around 2–50 C. Observations and surveys were conducted in accordance with the requirements of the instruction guides [2,3].
A review of some research papers suggests that there exist various diseases to promote rotting of onion bulbs in storage. Several bacteria and fungi produce bulb rots in onion, including basal plate rot Fusarium oxysporum [4], enterobacter bulb decay Enterobacter (Schroeder et. al., 2010) [5], bacterial soft rot Erwinia [6], grey neck rot Botrytis [7], black mould Aspergillus niger [8], blue (green) mold Penicilliurn [9].
In the past onion breeding programs of KazRIPVG series of studies have been focused on screening of breeding material for resistance to common fungal and bacterial diseases [10–13]. In these studies with

4
local onion varieties during storage were identifi ed some bacterial pathogens like Pseudomonas cepacia, P. varidifl ova, Erwinia cypripedii and E. caratovora. In a series of laboratory tests pathogens of the genus Fusarium were found: F.oxysporum, F. oxysporum var. cepa, F. javanicum, F. javanicum var. radicicola, F. solani var. reolens, F. moniliforme var. lacticolor, F. bulbigenum ske.et Mass and F. Meristomides. The local onion varieties in storage have shown to be selectively affected by pathogen of fungal or bacterial origin, depending on the onion genotype by 2–11 %.
In the present experiments in prolonged storage (October to April) contribution of the listed diseases to onion bulb infection varied depending on the genotype of the onion breeding selections. There were some complications in clear identifi cation of particular pathogens on onion bulbs of breeding selections studied. Because of the presence of pathogens of multiple diseases’ symptoms or their mixture on the onion bulbs simultaneously, in this paper are presented the results for the total loss from the diseases.
It should be noted that in this study under the category of a storable onion bulbs were recognized only those samples that are suitable for planting for seed reproduction, i.e. all of the healthy bulbs regardless of sprouting ones were taken into account.
The surveys showed that the magnitude of losses in stored onion bulbs varied considerably depending on the genotype of the onion breeding selection material studied.
By the percentage of natural decline in weight the onion breeding selection material were grouped as: 1 – high (>10,0 %), 2 – medium (6,0–10,0 %) and 3 – low (<6,0 %). Categories accepted on losses from diseases during storage were: 1 – high (>7,0 %), 2 – medium (3,0–7,0 %) and 3 – low (<3,0 %). The storability of onion entries were grouped as: 1 – high (>90,0 %), 2 – medium (80,0–90,0 %) and 3 – low (<80,0 %).
As the results have shown, high natural decline in mass (>10,0 %) was observed in 18 breeding selections of onion, in 35 selection numbers it was at a level of 6,0–10,0 %, low natural decline in mass (<6,0 %) were noted in 35 onion accessions. The lowest natural decline in mass were observed for onion breeding selections ON268 – 3,3 % and ON208 – 2,3 %. The maximum natural decline in onion mass were recorded for selection numbers ON136 – 19,0 % and ON174 – 18,3 %. Out of the 88 onion breeding selections investigated 25 accessions have no visible infection signs on onion bulbs. The maximum loss from diseases were observed in onion breeding selections ON282 – 22,4 % and ON202 – 22,0 %.
In order to identify if there is any relationship between storability and yield-weight characteristics of the onion breeding selections pair correlation analysis was carried out (Table.). The analysis showed that there were weak relationship between onions productivity and storability indices (R = -0,045–0,355). Total losses were conditioned in a greater extent by the losses from diseases than from natural decline in weight.
Correlation between indices of storability of onion breeding selections
Total losses, %Natural decline in weight, %
Losses from disease, %
Storability of mother bulbs, %
Mean onion bulb weight, g -0,045 -0,355 0,224 0,045
Total losses, % 0,737 0,835 -1,000
Natural decline in weight, % 0,244 -0,738
Losses from disease, % -0,835
Ultimately, the economic value of studied onion breeding selections was integrated into indices to include mean onion bulb weight at 100g, natural decline in mass at <6 % and the loss from diseases at <10 % during prolonged storage and storability rate at >90 %. The best distinguished integrated indices of onion bulb storability were documented for onion breeding selections ON208, ON275, ON272, ON180, ON185, ON248 and ON278.
Despite the fact that the conditions for onion bulb storage in this study signifi cantly deviated from the accepted standard conditions, yet still there was an opportunity to assess the onion breeding selection material to obtain relatively conclusive results for onion bulb storability at prolonged storage.
The results of the studies showed that the natural decline in mass, losses from diseases and storability of onion bulbs varied considerably depending on the genotype of the studied breeding selection material of onion.
References:
1. Statistical Agency of the Republic of Kazakhstan. 3 Series. Agriculture, forestry and fisheries. Gross harvest of crops in the Republic of Kazakhstan. 2012.

5
2. Dospehov B.A. Methods of field experience. Moscow, 1985. – 415 p.3. Kazakov A.A. Onions. 1970. – 360 p.4. Holz G., Knox-Davies P.S., Resistance of onion selections to Fusarium oxysporum f. sp. cepae. //Phytophylactica.
1974. 6: 153–156. 5. Schroeder B.K., Waters T. D., and L. J. du Toit. Evaluation of Onion Cultivars for Resistance to Enterobacter
cloacae in Storage. // Plant Disease,- 2010, Volume 94, 2: 236–243.6. Omveer Singe, A., Roy N. and R.P. Gupta. Storage rot in bulbs of onion (Allium cepa L.) and its control.
Pesticides, 1987, 21 6: 43–47.7. Kandoba A.B. Grey neck rot dangerous disease of onion//Potatoes and vegetables, 1997. 4: 31. 8. Swee-Suak Ko, Jenn-Wen Huang, Jaw-Fen Wang, Subramanvam Shannnigasundaram, Woo-Nang Chang.
Evaluation of Onion Cultivars for Resistance to Aspergillus niger, the Causal Agent of Black Mold//J. Amer. Soc. Hort. Sci. 2002, 127(4):697–702.
9. Lazarev A.M. Diseases of onion and garlic in storage // Plant Protection and Quarantine, 2005, 8: 42.10. Alpysbaeva V.O., Ibragimova G.M., Vodyanova O.S. Onion breeding for immunity in Kazakhstan. Proc.
Collection of scientific works of the International scientific and practical conference dedicated to the 85th anniversary of Bobrov L.G. – Almaty, 2013.- P. 59–61.
11. Vodyanova O.S.. Susceptibility of varieties and breeding accessions onion Botrytis alli and screening of new biotypes stability. Proc. Modern problems of plant protection and quarantine. Almaty, 2005 – P. 303–307.
12. Vodyanova O.S., Oleinikova E. Bacterial diseases of onion and the possibility of screening for resistant forms. Proc. Current research trends on potato and vegetable growing. Almaty, 2008. – P. 111–115.
13. Vodyanova O.S., Alpysbaeva V.O., Oleinikova E., Galimbaeva R.Sh... Study of susceptibility of varieties of onions during storage to Fusarium rot. Proc. Current research trends on potato and vegetable growing. Almaty, 2008- P. 115 -220.
SEQUENCE RESEARCH OF SAPOSHNIKOVIA DIVARICATA IN MONGOLIA
GUNDEGMAA TS1, CHOIJAMTS G2., BATMUNKH L3.MNUMS1.2 , LSUM3
AbstractAim: Determining some properties of nucleus dezoxyribonucleic of Saposhnikovia divaricata Materials and methods: We picked up the roots of Saposhnikovia divaricata from the area named Takhilt Davaa, Tuv
Province and Sumber soum, Dornod province after the parts on the surface were dried and withered. The dezoxyribonucleic was classifi ed using GeneAll kit. It was carried out in accordance with the term for determining PCR. PCR products were sequenced at Genotec, Inc molecule biology laboratory in Republic of Korea. We established the FASTA fi le using total 16 sequences, including 3 sequences regarding to 7 species of Saposhnikovia divaricata. Also, we compared it and drew phylogenies tree using 6 softwares, including the Chroma 210, Clustral W, CLC Sequence Viewer 6, BLAST (nBLAST, tBLAST) BioEdit, Clustral X2, MEGA5 and CLC Workbench.
Results:5.8S part of root cell nucleus of Saposhnikovia divaricata has 788 coupe nucleotide lengths. The
cutting ferment is 2, EcoRV, SmaI in sequence of Saposhnikovia divaricata. Clearly read scope is 1. Saposhnikovia divaricata in Mongolia is different from other species in other countries with some nucleotides in the ITS part sequence. 23 different species of Apiaceae in Mongolia are concerned to Apiodeae and Saniculoideae.
IntroductionSaposhnikovia divaricata in Mongolia is the perennial plant which included in Apiaceae, registered as
a rare plant and is signifi cant to the productions and uses. The plant is dropped off due to its wrong raw material preparation technology and export because its root is used in Asia and Eastern countries. For this, planting the plant with tissue culture method is signifi cant to the environment and economy with purpose of protecting the gene and supplying to the market.
Classifi cation:– Phylum: Viridiplantae– Class: Magnoliidaehttp://www.tropicos.org/Name/43000013Takht.– Order: Apialeshttp://www.tropicos.org/Name/43000070Nakai– Family: Apiaceaehttp://www.tropicos.org/Name/42000273Lindl.

6
– Genus: Saposhnikoviahttp://www.tropicos.org/Name/40029485Schischk.– Species: Saposhnikoviahttp://www.tropicos.org/Name/40029485divaricata (Turcz).
Purpose:Determining some properties of nucleus deoxyribonucleic of Saposhnikovia divaricataObjectives:1. Determining nucleotide sequence of nucleus deoxyribonucleic of Saposhnikovia divaricata2. Making comparative analysis in nucleotide sequence3. Drawing phylogenies tree of Saposhnikovia divaricata4. Comparing with the studied species of Saposhnikovia divaricata in Mongolia Methodology:We picked up the roots of Saposhnikovia divaricata from the area named Takhilt Davaa, Tuv Province
and Sumbersoum, Dornod province after the parts on the surface were dried and withered. We removed the sample’s soils, earths and plant wastes and dried in cold and dry conditions.
1. Classifying deoxyribonucleic: Crush and powder the plant samples after freezing it in liquid nitrogen. The deoxyribonucleic was classifi ed from the plant using GeneAll, (General bio system, Seoul, Korea) kit. PCR, sequence: It was made in term determining PCR.
2. Primer sequence: ITS parts of copying oligo nucleotide primer were synthesized by Genotec, Inc (Daejeon, South Korea). Universal primer and ending is ITSp-1(5I – TAC CGA TTG AAT GRT CCG – 3I)
3. 2 L PCR product was added to 1.0 % agarose gel (Bioshop Canada, Inc., Burlington, ON, Canada) to each bottle using electrophoresis (Mupid – exU, Advance-Bio, Tokyo, Japan).
4. The sequence was made by Genotic, Inc (Daejeon, South Korea) after cleaning all products with GENE ALL kit.
5. Drawing phylogenies tree: We established the FASTA fi le using total 16 sequences, including 3 sequences regarding to 7 species of Saposhnikovia divaricata. Also, we compared it and drew phylogenies tree using 6 softwares, including the Chroma 210, Clustral W, CLC Sequence Viewer 6, BLAST (nBLAST, tBLAST) BioEdit, Clustral X2, MEGA5 and CLC Workbench.
Results:5.8S part of root cell nucleus of Saposhnikovia divaricata has 788 coupe nucleotide lengths. It includes
178 Adenine, 210 Cytosine, 224 Guanine and 175 Timine. Adenine+ Timine 0.448 % and Guanine +Cytosine 0.551 %. Single catena weight is 240.974 kDa and double catena weight is 481 and 312 kDa. If ORF is in all beginning coding versions, its open read range is negative -1, its beginning code if TGG and it is began from 180th nucleotide and ended on 485th nucleotide. Total length of this range is 306 double nucleotide. The cutting ferments-2(EcoRV, SmaI) in sequence of Saposhnikovia divaricata is the ferments cutting nucleotide sequence in a part. There are not any double and multi-cutter ferment.
Conclusion:Saposhnikovia divaricata in Mongolia is different from other species in other countries with some
nucleotides in the ITS part sequence. 23 different species of Apiaceae in Mongolia are concerned to Apiodeae and Saniculoideae.
References:
1. APG III Angiosperm Phylogeny Group III. 2009. An update of the AngoispermPhylogeny Group classiflcation for the orders and families of flowering plants; APG III. Botanical Journal of the Linnean Society 161;105–121
2. Soltis D.E, Gitzendanner M.A and Solitis P.S 2007. A 567-taxon data set for angiosperms; The challenges posed by Bayesian analyses of large data sets. International Journal of Plant Sciences 168; 137–157
3. Pimenov M.G, Leonov M.V (1993) The general of the Umbelliferae. Royal Botanic Gardens, Kew4. BaigalmaaJigden, Hongtao Wang, Yeon-Ju Kim, Jong-Hun Noh, ChoijamtsGotov, Jong-II Lee, Deok-Chun
Yang ‘Development of a Multiplex Polymerase Chain Reaction Method for Simultaneous Detection of Four Cimicifuga Species’’ Crop Science, vol. 50.jily-august 2010.
5. VolodiyaTs., Tserenbaljir D and Lamjav Ts. “Using Mongolian medicinal herbs in Eastern and Western medical science”, 2005. 180.

7
EFFECT OF DRIP IRRIGATION ON THE PRODUCTION OF GREEN MASS OF CORN
MUNKHTUYA KH. , ERDENEZORIG T.School of Agro-Ecology, Mongolian University of Life Sciences, Ulaanbaatar, Mongolia
INTRODUCTIONLivestock husbandry is main sector to supply food and materials to the people for our country which
still have nomadic civilization and herders have aspired to prepare enough grassland in connection with adverse climate conditions in recent years, especially experiencing severe weather conditions in winter. However natural meadow and grassland are getting deteriorated year by year due to low precipitation, drought and desertifi cation in our country. Therefore, we are facing challenge appropriately to use grown grassland for production of fodder and to enhance pastureland condition, as well as to grow forage annual plant because we wouldn’t have relied on only natural grassland due to above mentioned reasons.
The purpose of the Research is to study irrigation effect for the plant growth and development which was grown in drip irrigation system in order to prepare fodder which has high protein content using the corn with improvement of deteriorated pastureland in Mongolian Gobi zone. We tried to make study the irrigation effect for stages of corn development, determine the green mass crop of corn and calculate the water consumption for growing corn
MATERIALS AND METHODSIn the research, four corn hybrids which are origin from Russia, such as Anutka, Kabardinskya,
Krasnodarsky and Victoria were selected, and these were planted by consistent technique on total of 1728 m2 fi eld with drip irrigation method. Cultivation was done by techniques, NPK(13–22–11) fertilization with 46 % effecting substance was used as a background.
For research, Tif.Drin, fl exible duct of Taifun-20 drip irrigation system which thickness was 1–1.15 mm and spacing between drips was 30 centimeters and which had 1.39 liter per hour water consumption was installed in the 5 centimeters of depth, and water compressor made in China which had a capacity to pump 24 m3 of water per hour was used for irrigation.
The research had been conducted in Derensoum, DundgobiAimag during the plant growing period in 2012, which locates in downhill of SantMountain ,210 kilometers south from Ulaanbaatar at edge of dry steppe and desertifi ed steppe elevated around 1560 meters above sea level.
Many factors which are clustered with each other such as geographic location, heat and projection of the Sun, moisture turn-off, atmosphere and air motion, land surface are infl uencing to form local micro climate. Derensoum, Dundgobiaimag is in the Dry Steppe Zone.
During the plant growing period (April-September) in 2012, average temperature was 12.8–19.4 degree, average soil temperature was 12.8–28.8 degree, amount of the precipitation was 217.8 mm and 122.3 mm precipitation in July was 88.3–103.5 mm more than the precipitation during the period of 2009–2011 or 82.2–156.8 mm more than long standing annual average.
Figure 1. Corn planting (August 26, 2012)

8
Big harvest for planting corn can be gotten if it is planted in the weedless,sparse and clean soil with high moisture and productivity and with thick humifi cated layer which density of ploughing layer is 1.3–1.35 gram per centimeter 3 and which has =6–7.5 reaction medium. [1]. As seen as the soil analysis before planting the corn, the thickness of humifi cated layer in 0–40 centimeters of seam is variety, averag conttent of vegetable soil is 1.2 %, soil reaction medium is -7.3 or weak alkalinity, among changeable elements, average nitrogen amount for each 100 grams of soil is 2.79 mg, average phosphorus amount each 100 grams of soil is 1.8 mg and interchanging potassium each 100 grams of soil is 11.5 mg.
RESULTSFour different hybrids of corn were planted in the 5 centimetters of depth, with 40 centimeters of
spacing between lines and 30 centimeters of spacing between plants, estimating 35 kilograms of seed for each hectare on June 25, 2012 or when soil temperature was above 10°
The following results were come out in accordance with Incident Observation by Veidman method which were conducted by stages such Germinating of corn brand for maturity of plant (when the young shoot pushes through the soil surface), tasseling (emerging the tassel on the stalk), silking (tassel produces pollen grain) kerneling (emergence of seed maturity from below silking ).
Irrigation effect for Corn Development As seen as the corn development from above Table, duration for planting to germinating was 8
days for all hybrids, durations between planting to tasseling was 60 days for Krasnodarsky, 62 days for Kabardinskaya, 64 days for Victoria, 58 days for Anutka depending on the hybrid. Hybrid, Kabardinskaya was tasseled for the shortest period or within 12 days tasseling became normal.
Diagram 1. Duration for each stage of development (days for each brand)
As seen as the result of study the occurrence feature for corn hybrids, difference of period between germinating to tasseling was 2–6 days, difference of period between tasseling to silking is 3–5 days, and total difference of period between planting to silking was 1–5 days. This depends on morphological feature for each hybrid.
Drip water effect to crop mass and kernel weight of the cornBiometrical measurement for one plant weight, number of leaves, length of the weight, root weight
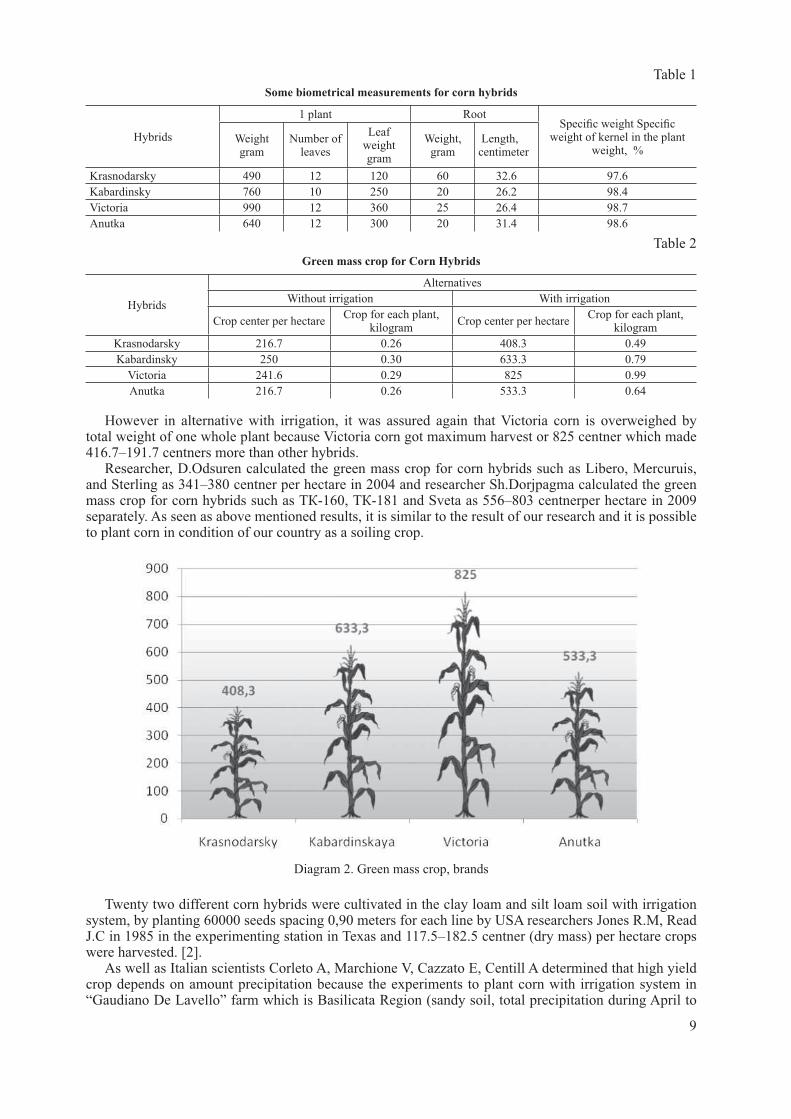
and root length had been done for each hybrid, four times on September 12, 2012. Therefore the following results were shown (Table 1).
It is determined that is possible to get big harvest because average weight for each Victoria corn is 990 gram which has 500–230 grams of more weight and number of leaves and average leaf weight is more 240–60 grams than other hybrids and specifi c weight of productive limb for plant weight is maximal or 98.7 %.
Effect of the irrigation method to the green mass crop of corn In accordance with our research, hybrid, Kabardinsky got maximum harvest or 250 centner green
mass crops which was harvested 33.3–8.4 centner more crop than other hybrids, in alternative without irrigation. (Table 2)
9
Table 1
Some biometrical measurements for corn hybrids
Hybrids
1 plant RootSpecifi c weight Specifi c
weight of kernel in the plant weight, %
Weight gram
Number of leaves
Leafweightgram
Weight, gram
Length, centimeter
Krasnodarsky 490 12 120 60 32.6 97.6
Kabardinsky 760 10 250 20 26.2 98.4
Victoria 990 12 360 25 26.4 98.7
Anutka 640 12 300 20 31.4 98.6
Table 2
Green mass crop for Corn Hybrids
Hybrids
Alternatives
Without irrigation With irrigation
Crop center per hectareCrop for each plant,
kilogramCrop center per hectare
Crop for each plant, kilogram
Krasnodarsky 216.7 0.26 408.3 0.49
Kabardinsky 250 0.30 633.3 0.79
Victoria 241.6 0.29 825 0.99
Anutka 216.7 0.26 533.3 0.64
However in alternative with irrigation, it was assured again that Victoria corn is overweighed by total weight of one whole plant because Victoria corn got maximum harvest or 825 centner which made 416.7–191.7 centners more than other hybrids.
Researcher, D.Odsuren calculated the green mass crop for corn hybrids such as Libero, Mercuruis, and Sterling as 341–380 centner per hectare in 2004 and researcher Sh.Dorjpagma calculated the green mass crop for corn hybrids such as -160, -181 and Sveta as 556–803 centnerper hectare in 2009 separately. As seen as above mentioned results, it is similar to the result of our research and it is possible to plant corn in condition of our country as a soiling crop.
Diagram 2. Green mass crop, brands
Twenty two different corn hybrids were cultivated in the clay loam and silt loam soil with irrigation system, by planting 60000 seeds spacing 0,90 meters for each line by USA researchers Jones R.M, Read J.C in 1985 in the experimenting station in Texas and 117.5–182.5 centner (dry mass) per hectare crops were harvested. [2].
As well as Italian scientists Corleto A, Marchione V, Cazzato E, Centill A determined that high yield crop depends on amount precipitation because the experiments to plant corn with irrigation system in “Gaudiano De Lavello” farm which is Basilicata Region (sandy soil, total precipitation during April to

10
September is 261–270 mm) were conducted and 118–130 centner per hectare of crop was harvested (dry mass) [3].
Total precipitation during April to September in Derensoum which we conducted our experiment was 217.8 mm and average green mass crop for all four corn hybrids was 416.6 centners.
Irrigation procedure for CornIrrigation frequency and standard for corn depends on not only climatic factors, also it is closely
related to the soil moisture movement and stages of the corn development [4].When we irrigated the plant keeping 70 % of soil moisture during the plant growing stages, water
consumption of drip irrigation per day was 48 m3 or total 432 m3 of water was consumed when irrigation had been done 9 times during the stage between germinating to tasseling (Table 3).
However it was determined that daily water consumption for sweet corn which was grown in the Dry Steppe zone, Bottom Volga Region, Ukraine was 34.8 m3 per hectare when soil moisture content was kept up to 70–80 %, but daily water consumption was 32.9–36,6 m3 per hectare if soil moisture content was kept at 80 % constantly [5].
Table 3
Allocation of water consumption (by stages of development) grow
Irrigation
Irrigation frequency and standard for stages of corn development
Irri
gat
ion s
tandar
d,
m3 p
er h
ecta
re
Tota
l num
ber
of
irri
gat
ion t
imes
Irri
gat
ion S
tandar
d,
m3 p
er h
ecta
re
Planting-germinating Germinating-Tasseling Tasseling- Silking
num
ber
stan
dar
d
num
ber
stan
dar
d
num
ber
stan
dar
d
DripIrrigation
1 48 9 432 4 192 48 14 672
Coeffi cient for total water consumption of CornTotal water consumption of Corn is not same for each zone; it always changes depending on moisture
supply. Specially it was determined that irrigation standard was around 550–600 m3 per hectare for forest steppe and central zone with 500–600 mm of precipitation irrigating 2–3 times, for Dry Steppe zone with 300–400 mm of precipitation irrigating 4–6 times, for semi-desert zone with 250–300 mm of precipitation irrigating 6–8 times. (V.I.Chirkov 1964, I.S.Kostin, A.S.Simonov, D.A Shtoiko, D.C. Filev, A.L. Zaporojchenko, V.I.Ostapov 1971, I.A. Kozin 1977) [1].
It was determined that total 3537.9 m3 of water was consumed to form 408.3–825 centners of corn green mass crop and coeffi cient of water consumption was 52.1–82.6 m3per ton. (See Table 6).
When total water consumption of corn (evotranspiration) was estimated in accordance with result of multiyear study, irrigation standard was used 18–25 % water consumption during the plant growing stage when 7–8 leaves were emerged, and daily average water consumption was 38–43 m3 per hectare. So it looks similar with result of our research.
It was determined that 60.9 % of total water consumption of plant was recovered by precipitation and 22.3 % of water consumption was compensated from soil moisture as 16.8 % of total consumed water for plant was water by irrigation in drip irrigation system.
SUMMARY
1. Hybrid “Victoria” got the maximum harvest or 825centner per hectare which made 191.7–416.7 centners per hectare of crop more than other hybrids. Therefore this hybrid can be used for ensilage as reserve forage when food is getting insuufficent during the winter and spring time.
2. It was approved that is possible to plant corn as a forage in climate condition in Mongolia as all four hybrids of corn were grown up to silking stage, 408.3–825 centner per hectare of green mass crop was harvested when irrigation was made keeping soil moisture content at 70 % in drip irrigation system.
3. It was determined that 48 m3 of water was consumed for one time irrigation of the corn planted in irrigated field during the stage between planting to germinating and 432 m3 of water was consumed for 9 times of irrigation during the stage between germinating to tasseling, 192 m3 of water was consumed for 4 times of irrigation during the stage between tasseling to silking.
4. 3537.9 m3 of water was consumed to get harvested 408.3–825 centners of corn green mass crop in Dry Steppe Zone.

11
REFERENCES
1. V.I.Ostapov, N. .Dudari “Corn on the Irrigated Field” Kiev. 1979 year. page-9, pages-50–512. Referring journal “Corn and its brand” 1988 year. 1. 00263. “Drip irrigation of a sweet corn in Dry Steppe Zone, Bottom Volga region” Ukrain, 2011 year. 4. D.V.Yarmizin “Meliorative Agriculture” Moskow. 1966 year, page-2835. Sh.Dorjpagma”Test result which studied planting time for corn brand and hybrid in the Central
Agricultural” dissertation for Master’s Degree for Agronomics. UB 2009 year.6. D.Odsuren “Biomass crop of Corn Hybrid Brand depends on bio fertilzation” dissertation for Master’s
Degree for Agronomics UB 2004 year7. A.Choijamts “Plant Fertilization Management” UB. 2010 year
ENERGY AND PROTEIN NUTRITION OF GRAIN OF TWO COMMON WHEAT FOR PIGS AND POULTRY
STOYANOVA A.K., GANCHEV G.G., STOYANOVA S.S. Trakia University, Faculty of Agriculture, Stara Zagora, Bulgaria
The cultivation of crops and varieties with high quality and productivity, has always been a priority. The infl uence of soil and climatic conditions of the different agro-technical factors of climate anomalies and their impact on the productivity of crops and varieties, although their genetic traits (1.3, 4). Research work on the quality of wheat occurred against a fi eld study of the impact of agrarian techniques, fertilization, weed control, etc. Continued testing of ecologically plastic varieties suitable for different regions (1, 2).
This study aims to explore the impact of treatment with certain herbicides on grain quality as well as its energy and protein nutrition for non-ruminants.
Material and methodsThe experiment was conducted with two common wheat in 2011–2014. Object of fi eld study varieties
Apolon and Indzhenio treated with herbicides and their mixtures: Control; Axial one (da); Lintur + Traksos (15g/da + 120ml/da-tank mixture); Logran + Traksos (3,75g/da + 120ml/da – tank mixture); Lintur + Axial (15g/da + 90ml/da- tank mixture); Logran + Axial (3,75g/da + 90 ml/da- tank mixture).
It is made qualitative analysis of grain is made by a Weende-method. It is content of crude protein, crude fat, crude fi ber, nitrogen-lacking extract substances. Based on these results, it is calculated the nutritional value of the grain varieties and variants.
For calculation of the content of digestible nutrients in wheat we used data for the digestibility coeffi cients for ruminants, pigs and poultry ( odorov et al, 2007).
D pga = 0,0242 DPb + 0,0394 DEEc +0,0184 D F + 0,0170 DNFEd
M pge = 0,0210 DP + 0,0374 DEE +0,0144 D F + 0,0171 DNFED pf = 0,0239 DP + 0,0398 DEE +0,0177 D F + 0,0177 DNFE M pg = 0,0178 DP + 0,0397 DEE +0,0177 D F + 0,0177 DNFE D pg – digestible energy for pigs, MJ/kg DM
DP – digestible protein DEE – digestible ether extract DNFE – digestible nitrogen free extract M pg – metabolizable energy for pigs, MJ/kg DM D p – digestible energy for poultry, MJ/kg DM M p – metabolizable energy for poultry, MJ/kg DMResults and discussion
For animals important in plant nutrition have feed and they occupy an important place cereal feed. These feeds are used to balance the energy in animal rations. Have established relationships that enable to calculate the energy and protein value of common wheat varieties studied.
The data for the chemical analysis, varieties and variants presented in Table 1, make it possible to determined the nutritional value of the grain and the effects of herbicide and mixtures thereof.
The results of the qualitative analysis of grain are recalculated to 100 % dry matter (Table. 1). The analysis of performance in years, varieties and options show higher crude protein content in grain in the fi rst

12
year of study. Although genetically transmitted content quality traits affected by growing conditions. In the fi rst year due to the favorable combination of average daily air temperature and the humidity
better form grain with high crude protein content. The trend observed in both varieties studied. It is noted that the treatment with the herbicide has no effect on the chemical composition.
Table 1
Chemical composition of the grain of common wheat, g/kg DM
Variety Year Variant CP CFAT CF DEE
2011–2012
1 151,30 12,00 23,50 794,40
2 153,20 12,50 30,90 784,80
3 155,10 12,90 19,70 793,70
4 165,20 13,10 24,50 778,30
5 161,90 11,40 19,00 788,60
6 162,20 8,80 15,20 795,20
2013–2014
1 109,90 13,40 9,50 851,70
2 105,90 17,00 11,30 848,70
3 131,60 7,20 7,10 838,00
4 129,20 18,60 17,90 819,30
5 130,20 15,80 18,80 821,80
6 118,60 11,20 16,90 839,30
2011–2012
1 167,40 12,40 22,60 778,20
2 167,60 12,90 23,50 775,50
3 168,30 12,50 21,70 777,50
4 168,00 13,00 18,90 779,50
5 168,80 13,70 21,40 776,90
6 162,00 13,40 14,50 790,50
2013–2014
1 132,40 13,90 20,50 818,80
2 122,60 14,30 21,30 827,20
3 122,80 7,10 6,20 849,20
4 103,80 31,70 4,30 846,10
5 131,30 19,50 21,00 814,70
6 142,30 15,40 25,20 802,50
Table 2
Energy and protein value of wheat for pigs and poultry in 1 g DM, 2011–2012
Variety Variant D pg M pg D p M p
Apolon
1 16,34 15,99 15,74 15,00
2 16,27 15,91 15,66 14,91
3 16,41 16,05 15,82 15,06
4 16,40 16,01 15,78 14,98
5 16,43 16,05 15,83 15,04
6 16,45 16,08 15,87 15,08
Indzhenio
1 16,41 16,02 15,80 14,99
2 16,39 15,99 15,78 14,96
3 16,42 16,02 15,81 14,99
4 16,45 16,05 15,84 15,02
5 16,45 16,05 15,84 15,01
6 16,49 16,11 15,90 15,11

13
In Tables 2 and 3 summarize the results obtained for the content of digestible nutrients in pigs and poultry. Calculated is digestible and metabolizable energy in non-ruminants in 1 kg of dry matter (DM). When pigs are evaluating the content of D pg, which is measured in MJ/kg feed. Birds in assessing the content of M p as faeces and urine are separated mixed. The unit is the same as for pigs – MJ/kg. For the fi rst business year digestible energy in pigs moving within the 16,27 to 16,49 MJ/kg DM. In birds values ranged from 15,66 to 15,90 MJ/kg DM. The results show tight limits in varying values of digestible energy for both species. The results for the variation of metabolizable energy running again minor differences.
In pigs metabolizable energy in the range of 15, 91–16, 11 MJ/kg DM and poultry respectively 15,66–15,90 MJ/kg DM. In the second year the trends are maintained. Swine values for digestible and metabolizable energy have a small margin. Values range from D p 16, 34 to 16, 67 MJ/kg DM and M pfrom 16,07 to 16,42 MJ/kg DM period of study. The values obtained are minor differences.
Table 3
Energy and protein value of wheat for pigs and poultry in 1 g DM, 2013–2014
Variety Variant D pg M pg D p M p
Apolon
1 16,40 16,17 15,86 15,32
2 16,38 16,15 15,82 15,31
3 16,44 16,15 15,90 15,26
4 16,45 16,15 15,86 15,23
5 16,44 16,14 15,85 15,22
6 16,35 16,09 15,79 15,21
Indzhenio
1 16,39 16,09 15,81 15,16
2 16,34 16,07 15,76 15,16
3 16,43 16,17 15,91 15,31
4 16,67 16,42 16,08 15,57
5 16,46 16,15 15,85 15,21
6 16,39 16,06 15,78 15,09
When the results in birds again registered minor differences in the content of digestible and metabolizable energy. Results for D p are within normal limits and move from 15, 76 to 16,08 MJ/kg DM. Metabolizable energy for poultry also varies in a narrow range 15,09–15,57 MJ/kg DM. The differences in the values of digestible energy for birds in years and variants are negligible and are within the margin of error.
After detailed analysis of the data digest and metabolizable energy was found for the entire period of study digestible energy in pigs calculated in variety shows Indzhenio was only 0,2 % higher than the same variety in Apolon. Averages for metabolizable energy in pigs and poultry with minor differences.
ConclusionsIt was found that application of herbicides tested in two varieties of common wheat, no signifi cant
infl uence on the content of qualitative traits.The values of digestible and metabolizable energy vary in a narrow range, which indicates that the
products for the treatment of crops and varieties not infl uence energy nutrition of wheat for pigs and poultry.
References
1. Delchev G. G. Inflience of some herbicide tank-mix combinations on grain yield and grain quality of durum wheat. “Science & Technologies”, 2009. Agricultural science, 6, Plant studies: 345–349.
2. Delibaltova C., Moskova T., Kirchev H., Mateev A., Yanchev I. Study on grain quality of common wheat varieties grown in Southeast Bulgaria. Proceedings of the Penal Code, 2014, UF, Sofia, 46–55.
3. Sabeva M., Kuneva V., Angelova S. Evaluation of samples peas (Pisum sativum) from the collection of IPGR – Sadovo based on cluster analysis, Scientific Works of USB-Plovdiv, series C. Engineering and Technology, 2015, Volume XII, 294–297.
4. Todorov, N. et al. Guide for Animal Nutrition. 2007. Matkom Sofia

14
ENERGY AND PROTEIN NUTRITION OF GRAIN OF TWO COMMON WHEAT FOR RUMINANTS
STOYANOVA A. K., GANCHEV G.G., STOYANOVA S.S.Trakia University, Faculty of Agriculture, Stara Zagora, Bulgaria
Numerous studies have demonstrated the infl uence of agro-technical measures on productivity and quality of grain of wheat. The content of nutrients, although genetically determined varies depending on the level of agrotechnics. Therefore still continue studies on the various components of the technology of cultivation of common wheat (1,2,3,4,5). Weed control is an important element of the complex events. Continued demand for environmentally plastic varieties with high productivity and quality of grain.
The purpose of this study was to analyze the effect of treatment with certain herbicides and herbicidal mixtures of two common wheat on the nutritional value of the grain.
Material and methodsStudy was conducted of two varieties of common wheat -Apolon and Indzhenio, treated with some
herbicide.F ield experience is displayed in the fi eld of Agricultural Faculty, Trakia University-Stara Zagora. Treatment options: 1.Kontrola; 2.Axial one (100ml/da); 3.Lintur+Traksos (15g/da + 120ml/da – tank mixture); 4.Logran+Traksos (3,75g/da + 120ml/da – tank mixture); 5.Lintur+Axial (15g/da + 90ml/da- tank mixture); 6.Logran+Axial (3,75g/da + 90 ml/da- tank mixture).
For calculation of the content of digestible nutrients in wheat we used data for the digestibility coeffi cients for ruminants ( odorov et al, 2007). FU h, FUGi and PDI values for ruminant were calculated using the equations ( odorov et al, 2004).
G j = 0,0242 Pk + 0,0366 EEl + 0,0209 Fm + 0,017 NFE M = 0,0152 DPn + 0,0342 DEEo + 0,0128 D F + 0,0159 DNFEp
FUM = M (0,075 + 0,039q)FUG = M (0,04 + 0,1q)PDI = 1,11 P (1 – Degq) Dsi + 0,093 FOMFOMr = DOMs – DEE – FP – P (1 – )FPt = 250 – 0,5 DM
FUM – feed unit for milk (= 6 MJ net energy for lactation) FUG – feed unit for growth (= 6 MJ net energy for growth) GE – gross energy CP – crude protein EE – Ether extract CF – crude fi bre DP – digestible protein DEE – digestible ether extract DNFE – digestible nitrogen free extract Deg– degradability of dietary protein in the rumen FOM – fermentable organic matter DOM – digestible organic matter FP – silage fermentable products dry meterResults and discussionMost important in animal nutrition have plant feed, and they occupy an important place cereal feed.
Assess the nutritional value of feed is made on the basis of assessment of the content of individual organic compounds and especially the energy and protein value. Record the water content and dry matter, crude protein and crude fi ber, the presence of the defi cient mineral substances, vitamins and essential amino acids. Qualitative composition of two varieties of common wheat, adjusted to 100 % dry matter (DM). The results are given varieties and embodiments of the treatment with the herbicides and years.
The data show higher crude protein content in grain in the fi rst experimental year. In variety Apolon crude protein content of moves within 151,3 to 165,20 g/kg DM in the fi rst year and from 162,2 to 168,8 g/kg DM iz variety Indzhenio. In the second year are stated at lower values. It has been shown that qualitative traits are genetically determined. However, a partial infl uence of agroecological conditions and specifi c climatic factors during the growing season of the crop.

15
Table 1.
Chemical composition of the grain of common wheat, g/kg DMu
Variant Variety CP CFAT CF DEE
2011–2012
1
Apolon
151,30 12,00 23,50 794,40
2 153,20 12,50 30,90 784,80
3 155,10 12,90 19,70 793,70
4 165,20 13,10 24,50 778,30
5 161,90 11,40 19,00 788,60
6 162,20 8,80 15,20 795,20
1
Indzhenio
167,40 12,40 22,60 778,20
2 167,60 12,90 23,50 775,50
3 168,30 12,50 21,70 777,50
4 168,00 13,00 18,90 779,50
5 168,80 13,70 21,40 776,90
6 162,00 13,40 14,50 790,50
2013–2014
1
Apolon
109,90 13,40 9,50 851,70
2 105,90 17,00 11,30 848,70
3 131,60 7,20 7,10 838,00
4 129,20 18,60 17,90 819,30
5 130,20 15,80 18,80 821,80
6 118,60 11,20 16,90 839,30
1
Indzhenio
132,40 13,90 20,50 818,80
2 122,60 14,30 21,30 827,20
3 122,80 7,10 6,20 849,20
4 103,80 31,70 4,30 846,10
5 131,30 19,50 21,00 814,70
6 142,30 15,40 25,20 802,50
Major infl uence on the accumulation of crude protein in the grain have values of climatic elements during the forming and pouring the grain. In the fi rst year’s daily average temperatures are higher than the climate norm precisely during this period. Unlike temperature factor, the amount of rainfall affects the protein content of the grain, but it is shown that at higher values of precipitation is formed grain with lower crude protein content (Delibaltova et al. 2014).
Table 2
Energy and protein value of wheat for ruminants in 1 g DM
Variant Variety2011–2012 2013–2014
FUM FUG PDI FUM FUG PDI
Apolon
1 1,44 1,60 105,53 1,49 1,68 99,98
2 1,43 1,58 105,58 1,50 1,68 98,88
3 1,44 1,60 106,15 1,47 1,65 103,74
4 1,43 1,58 107,46 1,48 1,65 102,18
5 1,43 1,59 107,26 1,47 1,64 102,69
6 1,44 1,59 107,68 1,48 1,66 101,37
Indzhenio
1 1,43 1,58 107,86 1,47 1,64 103,04
2 1,42 1,57 107,72 1,47 1,65 101,52
3 1,43 1,57 107,96 1,48 1,66 102,60
4 1,43 1,58 107,90 1,52 1,72 97,76
5 1,43 1,58 108,00 1,47 1,64 102,46
6 1,44 1,60 107,19 1,45 1,62 104,22

16
In different animal species shall evaluate the contents of a different kind of energy in the feed. The most accurate, but the most diffi cult is the assessment of net energy. It is calculated in the evaluation of the energy value of feed for ruminants and horses, using different units. In ruminant fodder units used for milk (FUM) and fodder units for growth (FUG) and the horse fodder units for horses (PDI). FUM used in lactating female animals (cows, buffaloes, sheep, goats) and FUG and fattened in growing ruminants. Using two units of energy is required because of the different energy recovery feed lactating and growing animals.
The results presented in Table 2 indicate movement in a narrow range of content in a variety of FUM Apolon. In the two years of FUM content in 1kg of dry matter in the grain of wheat ranged from 1,43 to 1,49 1 kg DM. In variety Inzhenio variation is again in a narrow range – from 1,43 to 1,52 in 1 gDM. Analysis of fodder units of growth shows little impact on the treatment of varieties with herbicide mixtures. Values at Apolon vary within the 1,58 to 1,68 and from 1,57 to 1,72 in Indzhenio variety for both experienced years. The values obtained are minor differences. The content of the PDI is normal 99,98 to 108,0 in 1 g DM. The results show a very weak infl uence of the applied herbicides and herbicide mixtures in crop production. The second year has seen the same trend in both varieties.
ConclusionsStudy herbicides do not affect the chemical composition of the grain. The crude protein content in
variety Indzhenio is higher by 5.0 % compared to the variety Apolon, average for the period of study.Applied products for the treatment of crops and varieties do not affect the content of FUM and FUG
in wheat.The results for the content of protein digestible in the intestine (PDI) showed that the applied products
for the treatment of crops do not affect the levels of both PDI and wheat varieties.
References
1. Delchev G. G. Inflience of some herbicide tank-mix combinations on grain yield and grain quality of durum wheat. “Science & Technologies”, 2009. Agricultural science, 6, Plant studies: 345–349.
2. Gerdgikova, M., M. Videva, M. Georgiev. Influence of the species of the leguminous predecessor upon the chemical composition of common wheat grain, International scientific on-line journal “Science & Technologies”, 2011, I, 6, Plant studies: 150–153, http:// journal.sustz.com (in Bg).
3. Delibaltova, C., Moskova, T., Kirchev, H., Mateev, A., Yanchev, I. Study on grain quality of common wheat varieties grown in Southeast Bulgaria. Proceedings of the Penal Code, 2014, UF, Sofia, 46–55.
4. Dotchev, C. Dependence of the vitreous, the extraction of wet gluten and crude protein content of the grain size in common wheat varieties. Agrarian Sciences, 2011, Sofia – Ruse, 7–11.
5. Todorov N.I. et all. Animal nutrition, Textbook, 2004. Sofia.6. Todorov, N. et al. Guide for Animal Nutrition. 2007. Matkom Sofia
631.527
. ., . ., « - -
», . . , e-mail:jenisagro@gmail.
-, . 68 %
[1]. 84 % -
, ,- ; , - - -
. - : -- -
: . 13 % - - -
- . 3 % – - - -- .

17
– 61 % –
- . 93 % -
,
- . -
, - 6,1 % -
.
57 %
, - . 33 % - -
, - -
- , - -
9 %.
9063 . , 7289,6 . , 75 %.
– 1975,3 . – - .
- , , -
- .
- .
-
.
. -
, .
-
. 1,4 . ,
0,001 % .
- : ,
.
900 . , 9 % .
– , -
. , , , .
.
– ,
(
10–15 20–25 ). -
3,5 / 9 / – .
2145 . , 22 % .
, ,
, , .
(
) 3 / 7,2 / – . - -
– 3,3 5,2 / .
2–4,4 / .
. – 6,6 , 69 % – -
. , , ,
, , , , , , ,
. , – , - -
. -
.
, , - - .
– 1,5–2,5 / . , -
. – 2–2,5 / .
.
73,8 %, – 85,6 %, -
– 70,8 % - – 66,8 %.
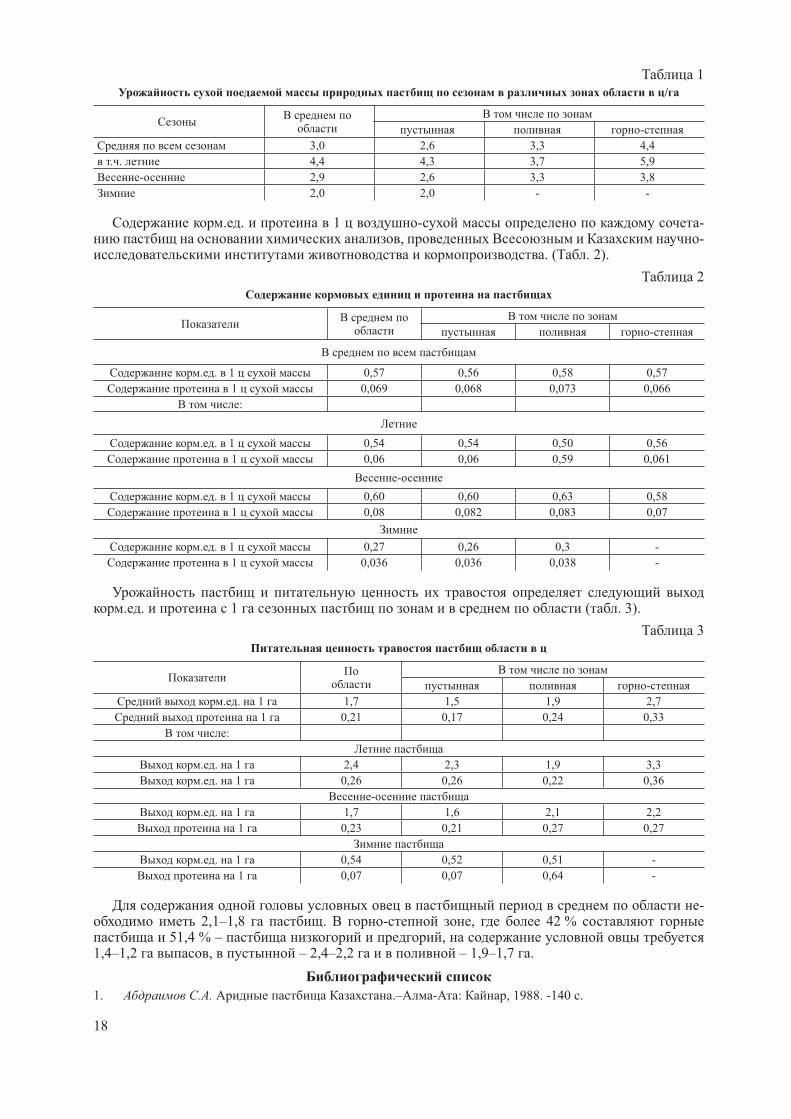
, -
. ( . 1).
18
1
/
-
3,0 2,6 3,3 4,4
. . 4,4 4,3 3,7 5,9
- 2,9 2,6 3,3 3,8
2,0 2,0 - -
. . 1 - -, -
. ( . 2).
2
-
. . 1 0,57 0,56 0,58 0,57
1 0,069 0,068 0,073 0,066
:
. . 1 0,54 0,54 0,50 0,56
1 0,06 0,06 0,59 0,061
-
. . 1 0,60 0,60 0,63 0,58
1 0,08 0,082 0,083 0,07
. . 1 0,27 0,26 0,3 -
1 0,036 0,036 0,038 -
. . 1 ( . 3).
3
-
. . 1 1,7 1,5 1,9 2,7
1 0,21 0,17 0,24 0,33
:
. . 1 2,4 2,3 1,9 3,3
. . 1 0,26 0,26 0,22 0,36
-
. . 1 1,7 1,6 2,1 2,2
1 0,23 0,21 0,27 0,27
. . 1 0,54 0,52 0,51 -
1 0,07 0,07 0,64 -
- 2,1–1,8 . - , 42 %
51,4 % – ,1,4–1,2 , – 2,4–2,2 – 1,9–1,7 .
1. . . .– - : , 1988. -140 .

19
636:633
- 2012–2014
. .,
« - -», . , , e-mail: [email protected]
,,
- .-
: , , , ,- , 91,2
, .- -
. , 2012–2014 : (4100
.); (1544 .); (1260
.); (1648 .); - - (2168
.);(2029 .), I- 85–90 %.
( 75 . ), 4,0–4,5 42–45
, .
: 1- – ,(318 ), 2- – , (305 ).
6 « - 41» (72 ), « - » (75 ), « 29» (68 ), « 7» (65 ), « » (85 ), « » (62 ).
-- .
- -, 3- – 14,2 , 6- – 23,9 ,
15- - 4,8 . -
370 , 924 23735 .
( « », « » / « »),
15 % , 110–120 2–3 .
, - « » - -
(320 , – 150 170 ); , , -
. « », « », « », «SunBeeUgam» -, -
- .

20
- -, -
20–30 % - 38,2 %, - 22,5 % - -
22,4 %.-
. - (30–40 % )
( , , ,, – 20–25 1 10–15 ),
- 3–5 .
- -- - .
(12049 ) (1000 ).-
-29–2 -4 , -33–5 -3 , -10–1 . 4 , -22–8 -2 , Yr 15, -9–4 -1 , -10–1 -5 , -9–4 -7 , -47–9 -8 .; -
: Bhuntar, Tanori 70, . . 163 wour, 476 / , , , Gabo 54, 41377, 59695, 307, 308, .;
: 816 SA, 829 SA, -09–03, F6
76–4 , 857 SA, F5
-2–3 47 42, 808 SA, 875 IR, .
- - 1073 . -
, 1000 . 617 194 .
– . . .
, ,- , , -- , 400 ,
– 205 , – 195. 330 . 11749 -
. : – 5353 , – 1804, – 3994 – 598.
950 , – 450 ( – 200 ,
– 100, - – 50, – 100), – 100 ( ), - – 300 ( – 150 , – 50, – 100) – 100
154 - - – 45 ( – 16, – 10, – 10, -
– 9), – 35 ( ), – 57 ( – 32, – 10, – 15), – 17.
,- -
1112 , – 570 ( ), – 92 ( – 50, – 30) –
200 ( ), – 75 ( ), – 75 ( , ) – 100 .
« », « » 562 - 60
- : 7 , 14 – , 3 – , 15 – ,4 – , 2 – , 1 – , 1 – , 3 – , 5 – , 2 – ,1 – 2 .
120 - (1,50 1,59) .
, , 6

21
, 348,0 523,0 ., , , -
23–26 %.- -
, , , , , , ,, , 65,3 82,5 .
, , .-
- -: – 680 (142,8 / ), -704
(101,0 / ); , , -14–1; – (41,7 / ), (40,7 / ); - – 21 (34,4 / ), -1677 (20,2 / ); « » (12,73 / ), « » (10,53 /); – (211 / ), (214 / ), (196 / ); –
(463 / ), (479 / ); – - (354 / ), (357 / ); - – 11–1 (571 / ), (529 / ).
- -, , ,
- 38,4; 34,7; 46,8 . / .-
30N
50/ « » -
, – 1370,6 - – 201,0 %.
568,8 203,2 .
-, – « » « »; 4 -
: « -47», « -20», « » « -74».
« ». , , « -
» «Seed» - «KazINNO IT» -
, .. -
, . « »
: «Plemuchet -»; «Plemuchet
»; «Plemuchet -» « ».
« » - (900 ), -
, (2257 ), - (300
) , -, .- . , . 95 -
2290 .,
-: 1197 ; 18 ; 90 ;
104 , , ; 16 ; 183 ; 116 ; 23 , -
200 .

22
633.1
. ., . ., . ., « - -
», . , , e-mail: [email protected]
– . -
2–3 ,.
-- -
- .- . 6- -
.25 2, 4- .
24 7 . – -
. 22 . ,6–8 70 . – . – 20–25 / . – 60 . / . 120 / . .
., -
1–3. - PR31D, PR32W86/X1140R, PR31P41/X4F687 5–10 .
121–125 , – 129–131 ,.
.
206–230 212–235 . PR31D, PR32W86/X1140R, PR31P41/X4F687 ( ) -
. - ,: « 75 » (230 ), -2501 (229 ), -2395,
-2540 (226 ) -2449, -2313 (224 ); : PR31P41/X4F687 (235 ), PR32W86/X1140R (231 ), PR31D (228 ).
-2477 (206 ), -2580 -2396 (208 ) P1758/X7F738 (212 ) PR34N24/X4K585 (215 ).
-: – 1,4–1,7 . 65,8–86,4 , – 1,2–1,7
. 62,8–90,2 ., - -
(14 %) - 63,0–129,0 / 100,9–184,8 / .
3 «587 » (75,1 / ) 1,54–90,1 % - : -2319 (66,0 / ), -2345 (73,1 / ),
-2396 (68,3 / ) -2501 (71,7 / ) 12,1 %, 2,7 %, 9,1 % 4,5 %.,
- :– PR34N24/
X4K585 (470,3 ) P1574/X18A634 (438,9 );– -2396
(162,3 ), -2319 (177,9 ), -2345 (177,2 ), -2432 (185,4 ) 587 (183,6 );

23
– - « 587 » (76,5 %), -2432 (75,8 %), -2345 (75,7 %), -2413 (75,4 %) -2449
(75,0 %);– 1000 P1574/X18A634 (432,6 ),
– -2501 (218,8 ).-704 (100,9 / )
587 37,7 %; 69,7–152,1 % -704 23,3–83,2 %. PR34N24/X4K585 (184,8 / ).
, ( %) 14,8 15,0; – 7,2–10,9; – 3,08–3,88; – 52,27–
56,86; – 1,29–3,55. 2,76–
4,93 %. - – -2499 (4,93 %), -2482 (4,51 %), -2580 (4,18 %) (4,15 %). -
– PR31P41/X4F687 (4,28 %), PR32W86/X1140R (4,15 %).,
.
633. 289.1
. ., « »,
. , e-mail: [email protected]
– . -. ,
. 270 (2012 . . « »,
, ), -, 120 , 56, – 46, -
– 32, -16. 4–9 , – 14–18 . .
,.
22 , 11,6–29,5 %. ( g ron pectinatum) 10 1,26–1, 9 / 2,
12,5–24,1 %. -, , , , , , .
63±3,2 67±1,9 ( . 1).
1
, , ,, / 2
%
1 2 3 4 5
( .) 62±1,4 1,12 100,0
-47346, .
64±2,3 1,29 115,2
-27790,.
. . 65±1,8 1,31 116,9
- 564869, DJ-4000 66±2,1 1,34 119,6

24
1 2 3 4 5
- 494617, R-115 63±3,2 1,26 112,5
-415799, . 66±2,8 1,37 122,3
- 536010, . 65±3,4 1,33 118,7
-547351, -3696 65±1,6 1,30 116,0
- 516482, R-591 66±3,1 1,35 120,5
- 578519, RUFF , 67±1,9 1,39 124,1
-531538 , 66±3,3 1,36 121,4
-494616,R-127 63±3,7 1,27 113,4
- 531537, -26864 65±2,6 1,32 117,8
- 401079, -1084 64±3,4 1,25 111,6
- 325182, S-261 67±1,8 1,38 123,2
-27968, -259 .64±3,8 1,28 114,3
-314603, 558 71±2,6 1,41 125,9
-5023, . 66±1,9 1,32 117,8
-401039, -261 73±1,8 1,43 127,7
-383536, 217 68±1,5 1,37 122,3
- 547301, AJC-050 73±2,3 1,45 129,5
- 440088 72± 1,6 1,42 126,8
-33833 . . 71±2,1 1,40 125,0
05 0,07
4 , , , - 11,6–23,2 %.
. 1,28- 1,4I / 2, -
14,3–25,9 %. 64+3,8 71+2,6 . 2 : -261 217 , -
22,3–27,7 %. (71±2,1–73±2, ), (1,40,-
1,45 / 2), 25–29,5 % . 22 -
(5 ) (5 ) , .
. 1

25
633. 174/581.192
–
. ., « », . ,
e-mail: [email protected]
(Sorghum sudanens Piper) – , ,. ,
. -, . ,
, . ..
, , 2,5 ., - [1].. -
8–100 . 20 – 300 ., , -
, .
45 -75 . 25 – 30 , - 10 – 15 1 .
3 -5 , 6–8 [2].-
, . 170 300 1 . -
450- 600 1 . 50 100 , - 6 18 , 23 1
,. ,
, -, .
; , – . 2005 « »
. , , . - 1,0 – 1,7 %. 350
, 240 . 10 .
-. . ,
.- , -
...
, . -: 16 %, 28 %, 2,9 %, -
43 %. -
. 4,2 % -, 2,2 -3,4 %.
-,
.

26
1. . . , . . . – . 2005 – 74.2. . . . – . , 1982. – 197.
631.21:635.1/8
,
. ., . .,,
, e-mail: [email protected]
,, , -
., 1 100 , –
120 , – 26 . .- -
, ,, .
2013 , 184,8 / , – 3,344 16,6 / .
133,1 . , 3,241 , – 24,4 / . : -
82,3 . , – 1,248 , – 15,2 / ., -
. ,, ,
, . -. -.
. ( ) -
. ( ) ,
., , -
. -, ( ) -
., -
, , ,, , .
- - 25 : , , , , (
), , , , , ( -), , , , , , ,
, , .
, ,, ,
, .-

27
. 2012–2014 ..
2012–2014 , - 212 « -
2012–2014 » « -, -
». -- 10 : ,
. . , ,, - , -
, ,, , . . .
. --
..
11000 157 97 . 3 (2012–2014 ) 2029 ,
67 . 864 -. : : 2012 – 3500 ., 2013 – 4592 ., 2014 – 5097
.; – 2150 ., – 1284 ., – 6857 . – 223 . 3
1000 . 7 . 3 500 2000 35 . : -
60 .; – 223; – 55; – 40;
- – 22 , .. 2 .
-.
2 -. (2012–2014 ) 80
Erwinia carotovor (Pectobacterium phytophtorum, Pect. arotovorum), 40 . 40
, 4 . - 200 .
( , Y , S ). -
20 . 10 -, :
4, 3, 3 . 2012–2014 4 . -
7352 -, . . 3907 ; 450 -
, 6018 1761 , – 153453 ., - 4160 ; 2536 , -
- 827 ; 149 ;13 , . . – 5, – 3, – 3,
– 3, – 1, . . – 1, – 1, – 1. 7 .
. 2012–2014 - 1753
, , ( , ), . . 889 – , 161 – , 446 – , 285 – ; 829 -
; 202 , 294 - , 37 – , 17 – ; 434 , -
330 , . . 5 , ,; 184 .
-

28
1626 , . . 1202 – , 424 – ; 464 -
; 475 – 16500 , 23 – ; 781 , - 353 ; -
60 . ( ) , 163 . -
2 - – Fusarium oxisporum Alternaria alternat .
3 ( ) (2012–2014 ) ( ) 25 .
2 – , .2012–2014 . . . -
20 . 2012–2014 :
. - 622 372 – . 152
, 394 , -210 ; 27 . 5
, . . 4 – 1 – .
2012–2014 10 , - 302 , 154. 3
5 , - 190 , .
13 , . .9 – , 2 – , 1 – , 1 – .
2012–2014 56 , . .22 – , 26 – 8 – . 56 38 (10 – , 25 – , 3 – ). 64 , 32 .57 . 2012–2014 33 -
. 2010 (3420 2),
.-
: F1, , F
1 ( ). 2011 2013 -
2 F1
- ( ) 2 - ( ). 2012 2
( , 2015 ) ), 2013 – , 2014 – 56. 2012–2014 3
. F1
( ), 2 .
, 8 18 : , , , -
, , , , , , , -, , , , , , .
. 1991 12 -
, 1991–1995 – 8 , 1996–2000 – 11 , 2001–2005 – 16 , 2006–2010 – 31 . 5 (2011–2015 )
61 . 2015 140 ( 28
).
, , , --
, , 20 100 % « ,
».

29
, -.
–
. 2012–2014
56 , . . 22 – , 26 – 8 – . 56 38 - (10 – , 25 – , 3 – ). 64 , 32 -
. 57 . 2012–2014 33 -
. 2015 140 -, . . 127 – .
, --
.
631.521.633.11.631.559.574.53
. ., . ., . ., ., « - -
», . , , e-mail: [email protected]
-. , ,
. -
, , , -,
.-
160–190 . 80–90 %. . , -
, (2003) (2007)., -
,.
, -, , -
-. ,
, -.
(2012–2014 .) ( ) 94 .
32 ,0,2–6,8 / , 0,5–17,1 %.
, -.
-
.

30
– . 2012 182 187 / ,
0–4 . 2013 175 . 10 -
– 1504, 91/491, 18212–10, 3677 165 – 174 . 2014 ,
169–170 , 8 158 – 167 – 18212–7, 1504, 91/491, 20987, 3677 .
2012 (37,0 ) 0,2–5,9 / , 0,5–15,9 %, 6 – , / ,3677, -5 590, , -15.
2013 . 14 - 0,3–4,0 / ,2,9–11,4 %, (35,2 / ) 2,0–6,0 / , 6,1–18,1 %, (33,2 / ).
91/491 (39,2 / ), 18212–10 (38,5), 68 (38,3), (37,4), 1 -15.. (37,3) .
2014 . 12 - 0,2–6,8 / , 0,5–17,1 %, (39,8 / )
0,5–6,6 / , 1,2–16,5 %, (40,0 / ).20988(46,6 / ), 1 -15.. (44,3), 3677 (44,3), 20987 (43,8), 91/491 (43,3) . (
7–8 %).,
1000 . 2012 . 1000 3 - – (43,4 ), -15 (41,9 ) (41,1 ), (41,1 ). 2013 . 6 –
(45,4 ), 1 -15.. (43,0), 68 (42,7) . (40,4 )(39,2 ). 2014 . 1000 -
-15 (41,9 ), (41,1 ), 70 (39,3 ). 2012–2014 -
– 20988, 1 -15.., 91/491, 3677 37,3–46,6 / 3,2–17,1 %, -
. – 1 -15104–4. 2014 .
631.527
. ., . ., « », . , , [email protected]
.-
, . ,, 2014 2,3 ( 2011 . – 1,8 ),
127,3 . ( 2011 . – 99,6 . ), – 3,3 ( 2011 . – 2,6 ) . , -
. , ,20–30 %. .
- « », «», 2013–2020 ., , -
. 2006–2012

31
(11,1 / ) 1976–1980 (10,8 / ), -.
- « » - 2020 :
, , -, ;
; - -,
; -. , -
. « « -2050» – », -, -
, .,
, , -, -
. . . – .- , - -
, , ..
. 2020 11,5 ; -
, , 4,3 ; - 2020 13,2 / , – 21,1 .
- - – -
- , - ,, , ,
. 2012–2014 . “
” « » - 189 / ; 194
. – 42 , 22
2014 ., – 25 (22 2014 ), – 22 (13). -
( , , -), .
, . «» ( )
35,1 / – 28,8 / – . – 8,7 / , – 3,5 / .
( « ») -, ,
. ,.
. ,(II ), (I ), (III ), (0 -
, ), 39,2 42,9 / , 37,9 43,2 %, 18,5 22,5 %.
. 2014 119,1 . .
-, -
. . 300 / , 10 % .

32
2020 , 1,0–1,3 / .
, -. ( ) 2
( 95, ) 3 ( , , ) , -, , , .
, 95 ( « ») – 33,4 / , 52,5 %, 23,0 %, 87–89 . -
; 3,5 / ; ,, 3 14,0 / ; ( ), 90–95 .,
28–32 / , 48 %, 24 %. . 3 14,4 / ; ( ) – -
30,1 / , 23 %, 54 %, 85–90 .,
. , . 3 , ( ) (
). 8,3 27,6 / , 28,8 – 37,5 %. , ,
- – 264,7 . 2013 303,3 . 2014 . . -
. 2014 .,, 2 17 ,
( ). - ( « - . . –
). , 100–120 .,25,5 / , 49,5 %.
, , ..
2008–2012 . 4,8 / , 12 / . -
: – 2012, 125–127 ., - 20,7 / , 90–95 %; -150 80,0 / , -2017 5 % ( ).
: 4 : 47,8 / , 9 %;
51,0 / , 20 %; -2020 67,9 / ; -2017.
: -, ,
, .-
, ,.
« – « » - 22 . . , -
400 / 200–250 / ., -
.. , 2012 / -
, , « »,, , , , ( – «
).-
. 225 / , 2 . ,
3 – 4 .-
. 157 8 . -

33
Sr2 Sr22. - – Lr9, Lr24 Lr19 Lr23, Lr25.
96 - , - 7 .
. -- .
180 18 . 1080 - . In vitro
151,2 . . - , 403 . . . 553,68 , 8,38 -
( -1), 75,3 - , 120,0 350,0 .- .
5 10 -
..
2012–2013 . , -, 109 / . , 55 % -
. . -,
. 2014 -
50 12 .
, . -. , , -
. . . , 10–12 , .
--
. -,
, .,
. - « »: ,
. « » 5 -
(Extension). 11 -
. .,
« », – -- -
. ,- . -
520 2, 5 000 2. – 2 .
-, .
2014 . , - 47,9 % 7,3 . , / 6
4, 2 ( ). , 2 2012 1 664 . (2014 .–1420,3), . .
.-
, , 3 000 / , 4,9 .. . . .
130 - 6 , -

34
/ .
, « , «», « »,
« ». ( ) 2014 . 446 072 .
14 – 12 . 2014 -
85,2 . ( 2007 – 72,3 . ), 9,2 . ( 2007 . – 6,9 . ), -
– 7,0 . , – 4,9 . . 17,7 . ( 2007 . – 14,2 . ), – 10,5 . ( 2007 . – 6,9 . ).
( -80,-4003, -2010) 113 . ; – 11,3 . ;
30 ., , , ,
, ,2014 . 1000 ( 2007 500 ). -
,.
., ,
,. -
. --
.
., ., .- ,
e-mail:[email protected]
- -. , -
, , , : -,
. 1985–2013 .
. . 3 : -
, . 29 8 ,( ) 1,74 ( 1.5–2), 12 , - 1,2
( 1.05–1.4), 9 (31.0 % ), - 0.91 (0.57–1.16).
8 20300 670 ,( ), 12 -2272,30 175,3 0 -
, 9 , 23280 2310 , ., , -
.

35
352,2–275.6 , 161–39.6 . 212.4 ,
23.6 (10 %) ( 1). 13–18.60 , 15.50 ,
1.60 - (13.90 ), ( . 1).
1
--
0 0
1985–2013 2222,8 125,8 277,1 41,1 15,5 1,6
2030 -67.0 352 161 14,8 0,9
2272 175.0 275.6 39,6 15,5 1,6
2328 231.0 212.4 -23,6 16,1 2,2
1838–2854.20 , 2222.8 0 , (20970 ) 125.8 0 .
- -, , .
10–25 %, 14.0 % (X±t=14.0±0.44).
(14.7–14.5 %), (13.6–13.8 %),
(14.6 %). ( . 2). 21.0–43 %, 29.9 % (X±t=29.9±0.26).
(31.9–32.5 %), (27.3–28.0 %), . -
1.5–4.5 %, .
-1 - 13–80 , 30.9 . 30.4 , -
30.8 .
2
1985–2013
% %. .
( )
14,7 13,6 14,16 32,5 29,9 28,0 29,4 28,3 39,4
14,5 13,8 13,7 32,3 30,0 27,6 29,7 28,9 35,7
- 13,4 13,7 13,5 31,9 30,4 27,3 28,6 28,6 37,0
2001, 2003–2005, 2007 , 5 (33.1–27.8), .
11 100 %, 57,1 %(X±t=57.1±0.25) 53.1 %, 58.2 %, 57.2 %.
,.

36
1000 23 53 , 36.6 (X±t=36.6±0.35), 35.2 , , 36.7 . -
1000 , . 1000 -
37.4–37.8 , . 18 90 , 44.02
±0.75 . , 40.5–43.3 . -, 45.4–46.3 , 46.3–47.0 ,
(0.6–0.7 ). 656–804 / , 767,8 / , -
762 / , 656–824 / , 769,3 / ,- 678–834 / , 769 / . 1986, 1998, 2005 ,
1989, 1992, 2004 785–799 / , -.
- 1985, 1987–1988, 1991 1996, 2009, 2010 743–758 / , 2007 ,
(716 / ), . 684 , 53–83 %, 68.3 ±0.4 %), -
68.3 %, 69.0 %, 68.6 %, , .
-- (0.7–1.2 %),
2.4–2.7 % , 100 310 660 3, -
493.1 3, (493.1±4 3), 18–28.4 3,
12.4–13.5 3, . 2000, 2001 558–605
3, . 1995, 1989 , , 369–377 3, (2 ).
- 2000- .
2000- 8.2 / , 1000 1.6 , 7.8 / , 7,8 % .
1.5 %, 0.4 , 49 3, 0.14 .
2000 1.60 , 125,80 .
1.5 %, 49.1 3, 1,4 , - 8.2 / , 1000 1.6 , 7.8 / , 7.8 %.
( ) , (r= -0.574**-0.512**), (r= -559**-0.462*),
(r= -0.417–0.324) , (r=0.642**-0.512**), (r=0.318–0.308), (r=0.399–0.355) . -
(r=0.601**), ,(r= -0.373–0.327) .

37
631.854:633.5
,
. .,« - - »
- .- , , -
. - ,.
, , +100
3400–35000 ..
- . ,, -
« » . 3/1 .
, [1]..
,.
: , ,, .
2010–2012 –.
- . -, ,
.,
, .,
.-
.
.-
,, ,
., , , ,
, , . ..
, ,. ,
., -
, .,
.- ,
- , [2,3].

38
-, 1,0–2,0 % .
-, ,
.,
.,
., -
, ., -
: , , .( . ) , – ( ,
, , . ), - ( , ) .-
.:
2 % ( =0,02) ,=0,15...0,17.
,.
, -, , ,
, (1 ).
1-
( / )2010–2012
5,7 2,6 8,3 1,33
4,8 2,9 7,7 1,46
5,1 3,1 8,2 1,52
3,3 1,8 5,1 1,21
6,6 3,3 9,9 1,78
5,1–9,9 /. , -
. 50,5-58,0 % .
,. , -
. 1,21–1,78 / ,. , -
.
, - . - 6 0–30
2,9 / , - . , -- , ,
, 20–30 / .

39
- ,,
, .
:
1. . ., . ., . ., . -,2012,346 .
2. . . . - , 1968, 180 .3. . . // -
, 4, 1967, 10–14
: 631.11.327:631.527
,
. ., ., « -
» , . -mail – [email protected]
. -.
-, . -
-
, . , -
. , -
, . [1].
: . 42- -, , -
. 12–15 % -. ,
, « ». -
-
, . .[2].
. . -, - .
--
. -, -
. ,, ,
. -, , [3,4].

40
. 1. 2012–2014
, , , ,, . -
, , .-
, F2.
– - – . -
. , , 1000 ,.
,. [5].
-, ,
, ( -
2010 )., -
, -. ,
,.
-
- ..
, .-
« – » . - -.
4 - – , , -14, 2010
. 35
. 3 -

41
. -
3- (05
=1,9 / ) - 14 -78/92–2, 22/90–2–2, 15/92–2-2,82/92–3, 78/00–4, 52/91–1–
4,78/00–3, 15/92–2-2, 947–6–2–1,14/90–4,16/90–6, 16/90–2–1, 82/91–3,84/90–1–4, 8,3 13,4 / . 2 -
., ,
, ,: 3,0 5,0 .
2,8 3,8 . -.
, 51 58 ., 1000 48,0 – 56,2 .
– 82//92–3, 84/90–1–4, 78/92–2-2,14/90–4,, – -
, , -, 30,1 34,0 %, -
15- 17 %, 89–95 %, 4,3–4,5 . 3
.
– 82/91–3, 16/90–6, 78/92–2-2, 16/90–2–1, 52/91–1–4, 15/92–2-2. 3- -,
, , .( , « »)
1. . . // ; -
, , . – : « », 2004. – . 3172. . ., . . / . ., 1987. .44–53.3. . ., . ., . ., . . -
// . – 2000. – 3. – . 2–4. 4. . .
// -. – 1988. – . 45–49.
5. ., ., . , . - // -
1- - . – , 2003.- . 13–14.
A ., .,, - . Email: mbadamzaya@yahoo. om
. - -
. , -
., .
, -. -
:

42
1.2.
“” .
, , ,, -
- .
-, , , , , . -
, - , 1.
1 , -
(5.9 10–2) , – (2.5 10–2 ) . - -
., -
-
.-
, ,-
. -.
.
2 , -, -
--(5.8 10–3), – - (1.4 1013). -
, -
.-
, ( ,
. ),.
, , -, . ,
.
3 , -
(4.4 10–1), – (1.4 10–1).,
.

43
1
/ /--
,/ // % / / % / / /
1 0–30 10.8 26.8 51.9 21.3
2 0–30 7.7 60 22 18
3 0–30 13.9 40.3 28 31.7
4 0–30 13.9 40.3 28.8 30.9
5 0–30 10.7 24.3 54.2 21.5
6 0–30 10.8 54.6 20.4 25
7 0–30 6.3 39.7 22.2 38.1
-1 - (13.9 ), 24–60 % ( - -
), 20.4–54.2 % ( - ), 18.0–38.1 % ( - ). -,
, - , - ..
, , ., 4.
- (7.1 10–6), (1.5 10–6 ). -
.
1. , , -.
2..
3. -, .
633.11. 633.526
. ., . ., . ., . ., « - »,
, , . , .E-mail: baimagambetovakk@ mail.ru
-.
, , - [1].
,-
, .-
, -, .
,
44
[2]. ,
. , -
, - ,.
, -, 10 6 -
, . . . ,- -
, . « : -
», ,, , -
,, . . [3].
, --
..
, , , , -, ,
( , , ,).
, -,
- ., . ,
, -,
. , ., -
. , [4–6].
.
F3-F
10-
, .. -
, ,.
- ( ). -
,;
, . . . , -- . -
, 1992–2012 , -
, :, -10, -15, -17, -19, -
32, 90, , , , , . 2010 2012
.-
, .
(263,6 . ), 32 (180,1 . ), 10 (80,25 . ), 15

45
(48,0 . ) 17 (66,7 . ), -- ,
. 3 , -
( . 1).
1
, ( )
2013 . 2014 .
11,000 12,550
6,100 6,300
, 2,800 3,000
, , - 198,500 263,600
4 12,210 12,210
10 , 65,800 80,250
15 , - 45,500 48,000
19 , 49,800 50,300
17 - , - 54,400 66,700
25 65,180 66,000
32 160,000 180,100
90 - 21,970 23,200
50 0,420 0,620
0,500 1,400
700,180 821,400
-: 53, 75, , , ,
i -2014 58. -
; -- , - -
;;
(Lr,Yr,Sr.Bt ); -. -
, , , ,- , , , ,
. 2011–2013 -
., /
2011–2013 75 - 17,0 / « 30» 3,2 / –
. 75 38 (13,0 / ) 2,5 / ,
– +3,7 / 38–12,9 / . 20,3 / 19
2,5 / . « »
2012–2014 -
, 2 3. -, , -
-. -
, .

46
, , « -»
– , .
2
.:
, /
3
,/
- +
-
2014
2012 2013 2014,
1000 ,
-,
, %
9.3 18.2 16.2 14.6 + -0 90 41.7 98.1 0
8.7 18.8 22.3 16.6 +2.0 90 45.5 93.4 0
10.1 21.8 21.7 17.9 +3.3 90 42.4 91.0 0
- - 20.5 20.5 +4.3 84 43.2 93.0 0
,, ,
.
3
, - .
, / 2014
2012 2013 2014- -
-, 1000
,,
, %
27,6 19,0 38,6 28,4 . 94 41,9 114 0,0
24,8 22,2 42,5 29,8 +1,4 91 37,8 116 0,8
29,5 15,3 42,0 28,9 +0,5 96 40,7 121 2,0
43,0 43,0 +4,4 90 42,1 113 15,0
, , , -
,.-
, -, .
-–
- .
1. , - « » [ ]. – club.xronika.az/
analitika/126-sovremennoe-sostoyanie-i-investicionnaya.html2. . .: . [ ].-www.carnivorousplant.
info/.../7536-nazarbaev-kazaxstan-soberet-mil3. // -
.-2013.- 10.-.1–6.
4. . . . . – : - .- 1998. – 312 .5. . ., . ., . . . – .- 2000. – 124 .6. . . -
: . … - .- . : 06.05.06.- .-2011.- 54 .

47
635.657
-
. .,- ,
. , e-mail: [email protected]
,-
., – -
, -,, , , -
., -
. -. -
, -, .
., , -
. -, .
, 3–5 .
, . – . -
, - [1].
- ,, , , -
. ,.
, [2]. 1971 .
: . . , . . ( , - 1, ), , ,
. 4 , 3 . . 2012 -
., ,
( ), . 2014 2 – -80, - -
. 2013 – -1255 2014 – -1, .
-, , , -
, ., ,
( - , , , ,, - , ).
.. 2012–2014 . « ». . -

48
. 20–25 ,-
. .. 25
. -.
(14 %) .. -
, - -: (55,0–61,0 ) F05–74, F05–93, F03–41, F06–47, F05-50, F06–111, F02–55, F97–52, F92–52, 13-
, -71, -29, -1222, -1238, -583, F02–55, -1221; :(30,0–37,0) F05–93, F02–55, F92–52, 13- , -71, 27748517–4, -1238, -7 ;
: (4,0–6,3 .) F05–33, F05-50, F04–22, F06–78, F02–55, F97–147, F00–25, F97–130, F103, -71, -29, -1182, -1238, -583, -2197, -2616, 34- ,
-35, -1221, -7 ; : (35,0–42,0) F06–47, F05-50, F06–78, F00–25, F97–63, F03–153, -29, -1182, -1231, 34- , -7 ; -
: (33–42 .) -1221, F06–47, F00–25, -29, -1231, -7 , F03–153, 34- , F97–63; ( 31,5–46 .) F97–60, F05–88,F06–37, F05–99, F05–93,
F97–147, -2197, 97–24, -7 , 27748517–4, -29, -1238, F05–22, 28- , F97–130, F103, F97–121, -1222, -118, -1182, -1221, 34- , -1231, F97–121, F06–47, F00–25, F97–52, -583,F05–33, -8 , F03–153, -35, F97–52, F97–63, -2616, F06–78; ( 1000
371–400 .) -118, F97–121, F97–63, -8 , -35, 45/1–04, F06–111, F06–78, F97–130, -1222, -583, -1231, 34- , -1182, F97–52, -2616, F00–25, F05–33 ( . 1).
,, , -
, .
1. . . : . – :« », 2009. – . 192.
2. 2013–2020 « – 2020»
631.413.3
. ., . ., . .,- ,
. , , e-mail: [email protected]
, -, .
. - 15–20 .
. -.
, ,. -
10 20 ., .
.

49
, ,, - , -
. 8–10 , ,, .
, - ( . 1). 5–7 .
, 1 .,
(15–16 ).. -
, [1].
75–80 % .
1
, 3/
,
6–8 40–50 400–600 500–700 600–800
50–70 500–700 600–800 700–900
- -70–100 700–800 800–1000 1000–1200
, , .. , -
, ,.
. , -. 0,001–0,003.
, ., . -
-. ,
.. .
, . [2].
. - 45-50 % .
, .-
( 1). -, 1,5 [3].
20–25 %., -
, -
.. , -
, . -.
. ,, , .

50
. 1.
-. 0
1 / .. ( 15…20
) . 1…3 . , -
.. -
.. .
( 2). ,.
. -, -
.. -
- ( 2).
.
. 2.
, -, ,
, .
.
1. – , 1976. – 38 .2. – - , , 1972. – 239 .3. . . . , -
- – , 2004. – 18 .
51
., ., .,,
.
80- 11,2 . , 46,2 .. 2000 – 3,3 / , 0,9 /
59,8 25,5 , . -, , .
29,7 % ., , .
-, . -
.-
.-
.:
1. .2. .
“ “.
. -250 , 190 ,
-470 , +420 . 200 . - 1860–23000 .
86–79 , 64–74 105–115 . 280 , 200 . -
. 2001 2004 .
75–99 , 90–115 . 27,40 ,
130 -180 . 15950 -18500 . - 2000–231,3: 2001–352,4: 2003–65 .
,: 2.73 %, ph 7,9, 0,29 %, -
-11,7 , 2,3 , -27 100 .. . -
.
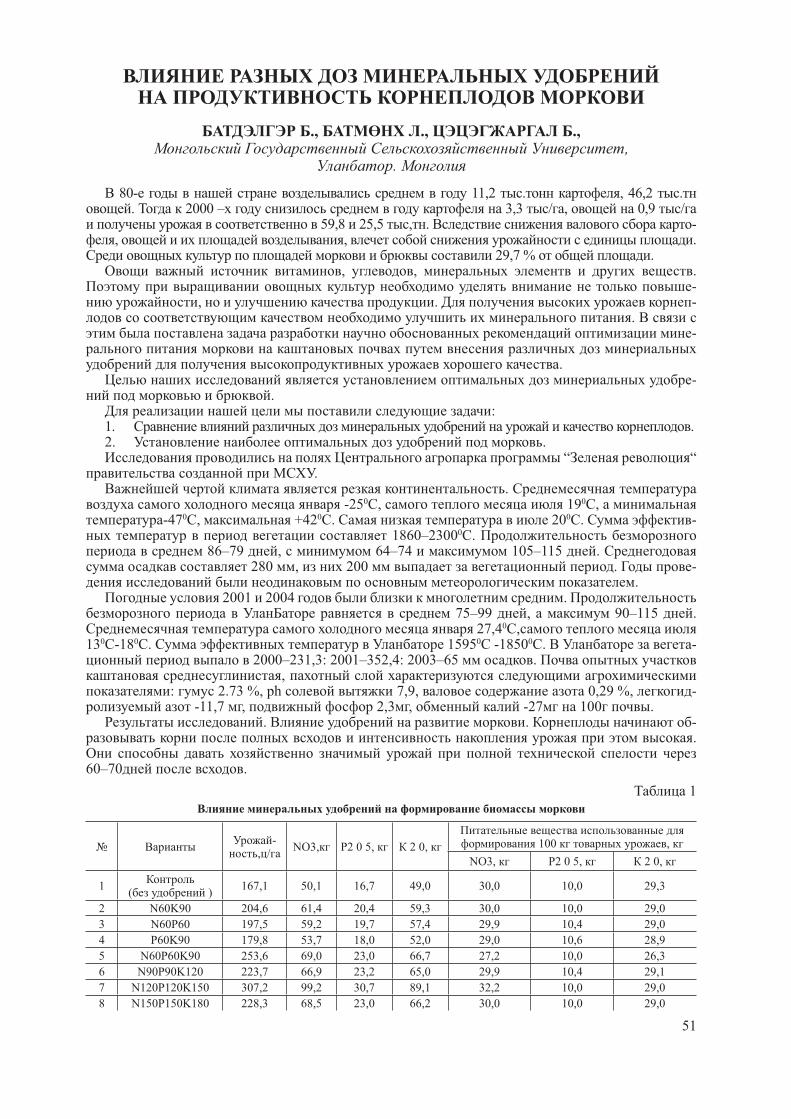
60–70 .
1
-, /
NO3, P2 0 5, 2 0, 100 ,
NO3, P2 0 5, 2 0,
1( )
167,1 50,1 16,7 49,0 30,0 10,0 29,3
2 N60K90 204,6 61,4 20,4 59,3 30,0 10,0 29,0
3 N60P60 197,5 59,2 19,7 57,4 29,9 10,4 29,0
4 P60K90 179,8 53,7 18,0 52,0 29,0 10,6 28,9
5 N60P60K90 253,6 69,0 23,0 66,7 27,2 10,0 26,3
6 N90P90K120 223,7 66,9 23,2 65,0 29,9 10,4 29,1
7 N120P120K150 307,2 99,2 30,7 89,1 32,2 10,0 29,0
8 N150P150K180 228,3 68,5 23,0 66,2 30,0 10,0 29,0
52
- 23–30 .
,, .
-.
89–99 . NO
3., P
2 5 2 100
32,2, 10, 29,0 N120
P120
K150
/ ., -
..
-. 167,1 / ,
N60
K90
/ 204,6 / N120
P120
K150
/ 307,2 / .
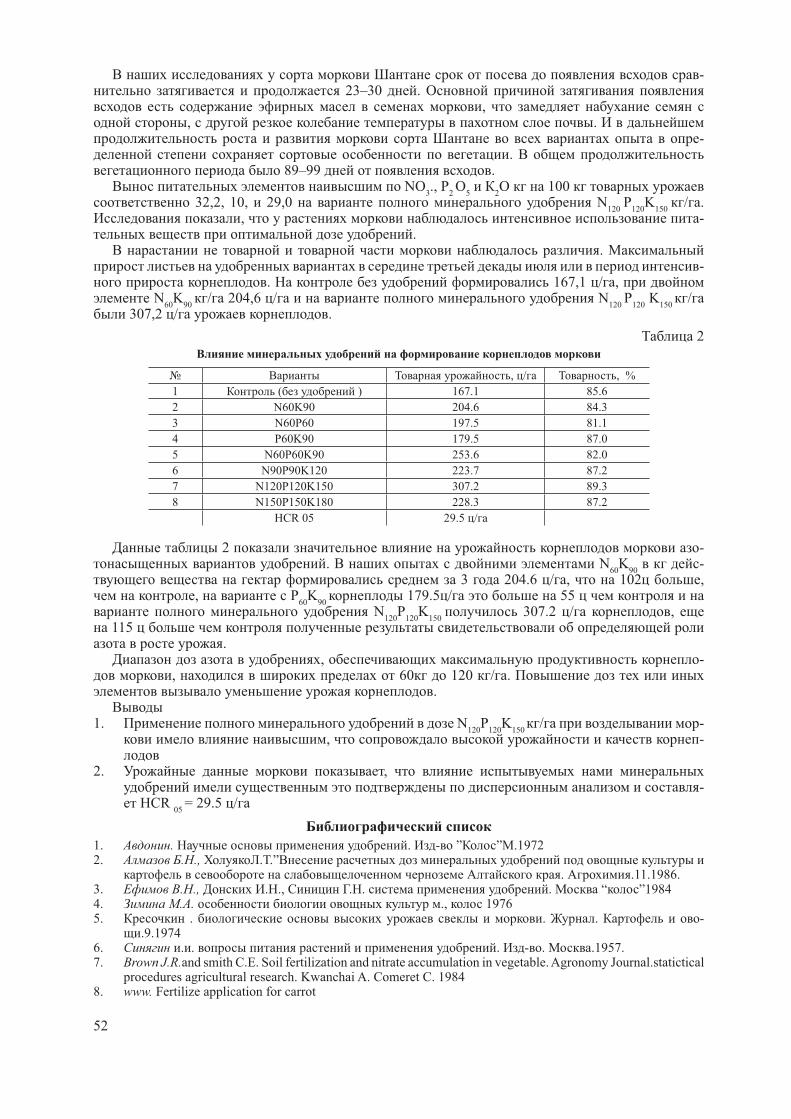
2
, / , %
1 ( ) 167.1 85.6
2 N60K90 204.6 84.3
3 N60P60 197.5 81.1
4 P60K90 179.5 87.0
5 N60P60K90 253.6 82.0
6 N90P90K120 223.7 87.2
7 N120P120K150 307.2 89.3
8 N150P150K180 228.3 87.2
HCR 05 29.5 /
2 -. N
60K
90-
3 204.6 / , 102 ,, P
60K
90 179.5 / 55
N120
P120
K150
307.2 / , 115
., -
, 60 120 / ..
1. N120
P120
K150
/ -, -
2. ,-
HCR 05
= 29.5 /
1. . . - ” ” .19722. . ., . .”
. .11.1986.3. . ., . ., . . . “ ”19844. . . ., 19765. . . . -
.9.19746. . . . - . .1957.7. Brown J.R.and smith C.E. Soil fertilization and nitrate accumulation in vegetable. Agronomy Journal.statictical
procedures agricultural research. Kwanchai A. Comeret C. 19848. www. Fertilize application for carrot

53
SAUSSUREA INVOLUCRATE -
, , .
Saussurea involucrate - -.
., , , -
( , . , ) 1800–3000 .- .
. -
-.
:1.2.3.4.5.
. -, .
1800–2000 -.
100 2 20 2..
10 . 1999 . - -
..
. , 1999 -.
. 2000–2005 . 2006–2007 .
. -.
.
1
( 6 )
/ /
- -
1 4.25–30 60 20 30 25 20
2 4.20–25 50 20 25 25 20
3 4.15–20 50 20 20 20 30
, - 155 140 .
, ,.
100 65–70 % - (88–96 %).

54
. 20–25 20–30 .
. -.-
.. -
24 , 13 .
2
,,
, ,-
,
-
,
-
,
25.7 19.5 11.1 14.9 4.92 11 28
26.3 17.0 8.75 17.4 4.42 24 27
10 3- .-
2.5 3.5 .. 64.8 2
. ,.
1–2 - 15 . -
6 100 786 .--
.
1. 20–30 .2. -
27 .3. 145–155
140 .4. 3 .5. .
1. . . . 1982
2. . . . . . 1980.
3. . . - .
2003.
4. . - . 1987.
5. ., ., . . - .
1975.
6. . - . 1995.
7. Snow lotus (saussurea laniceps and saussurea involucrate ) itmonline.org.http:/www.itmonline.org/jintu/
snow lotus.htm/2005

55
631.16:658.155
. ., . .,, . , .
* ,. , , [email protected]
-, - -
. 2014 -
2001 10 , 3 .-
. -;
- -, .
-. ,
125 , , -, , .
2001 31, 2012 – 42 , .
91,4 .,
, ,, . 80-
2,4 . , 2012 .51,8 %. , -
. , 2008–2012 . - – 86 %. 20 %
, 70 % – 4 % – . -
: , , , , -.
, ,, 2008–2012 .
1976–1980 . – 6,5 . , 1987–2010 .
1:5 1:9 2 . ..
,. , -
37,7 %, 20,4, 11,5, 4,3 %. , -
:- ,
( , , ). , -,
[2]..
, -, ,
, .
56
, -.
, . -
, ., , , -
.-
, . -. -
,.
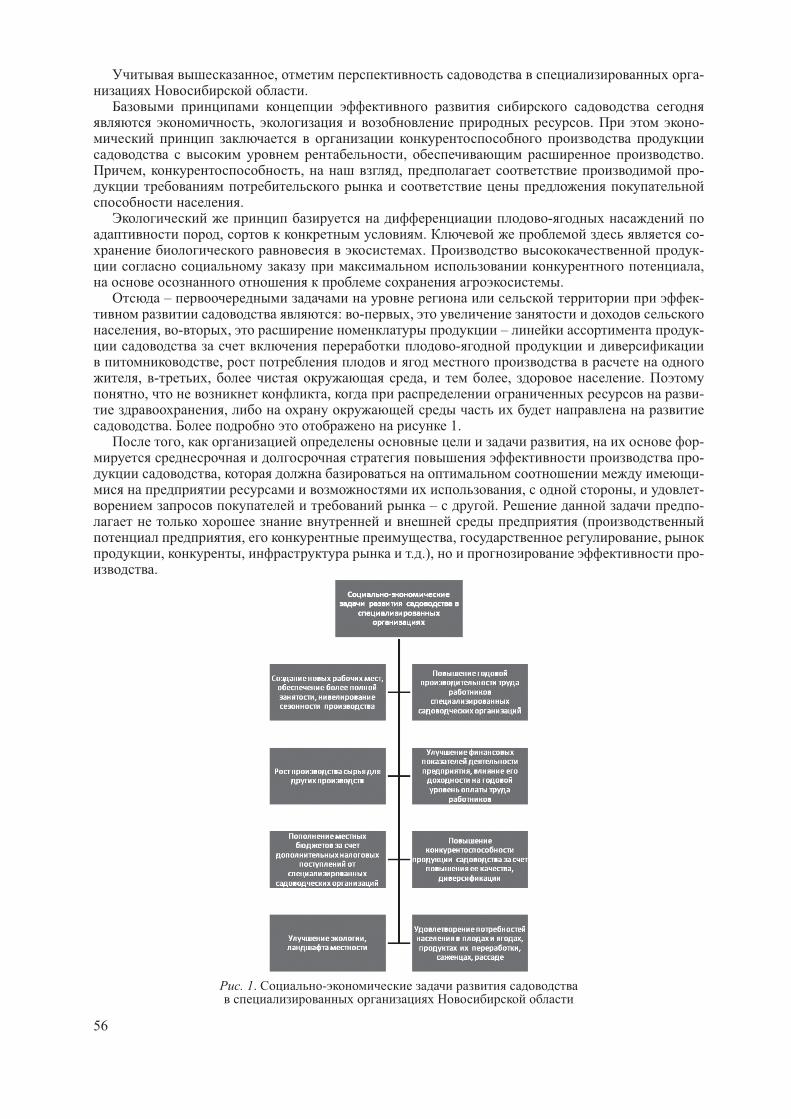
– -: - ,
, - , – --
,, - , , , ., , -
,. 1.
, , --
, -, , -
– . - (
, , ,, , . .), -
.
. 1. -

57
, ,: ; -
; - -. , ,
,-
.,
. , -. ,
.-
, [3,4]. - .
, , .- , -
7 , 24 , 17 – , 20 – ,6 – , 11 – . 1.
2006–2012 . -, , , , .
1
, %
2006 . 2007 . 2008 . 2009 . 2010 . 2011 . 2012 22006–2012.
272 114,2 113,1 170,6 104,3 71,5 118,8 137,7
109 107,1 114,1 111,7 109,4 42,7 106,1 100,1
111,7 102,2 129,6 157,0 157,8 76,0 108,7 120,4
108,6 123,8 114,5 129,7 102,2 98,5 103,7 111,5
107,5 102,5 114,2 116,5 100,7 85,3 103,2 104,3
, 2006–2012 . ( . 2,3).
. 2. - , 2006 .
. 3. - , 2012 .

58
, , 2006 . - – 50 %, –
32 %, – 8 %, – 5 %. 2012 . ,. 35 %,
3 .,
, , ., -
.
1. . . . / , – 2012.- 1.- .200–210.
2. . ., ..- . . – , 2013. – . 154–158.
3 . . . . . -2020 . – , 2010. – 28 .
4. . ., . ., . . – , 2009. – 110 .
-
., .,, ( ),
,
- , - 1200 . - ,
, , , 1500000 2
. “ - ”.-
, 50 ( ), 100 ( ) . 150 ,
. , -- .
.- , , -
. , -. 150–200 , 110–120 . ( 3000 )
, -. -
, , 30 / , ( , ) 60–70 / .
, 10 / ,-15–20 / . 10 %
. -.
, ,. - -
, 70 % , “ -” , ,80 %
, , ,. , 18–25
, 2.5–3.2 %.
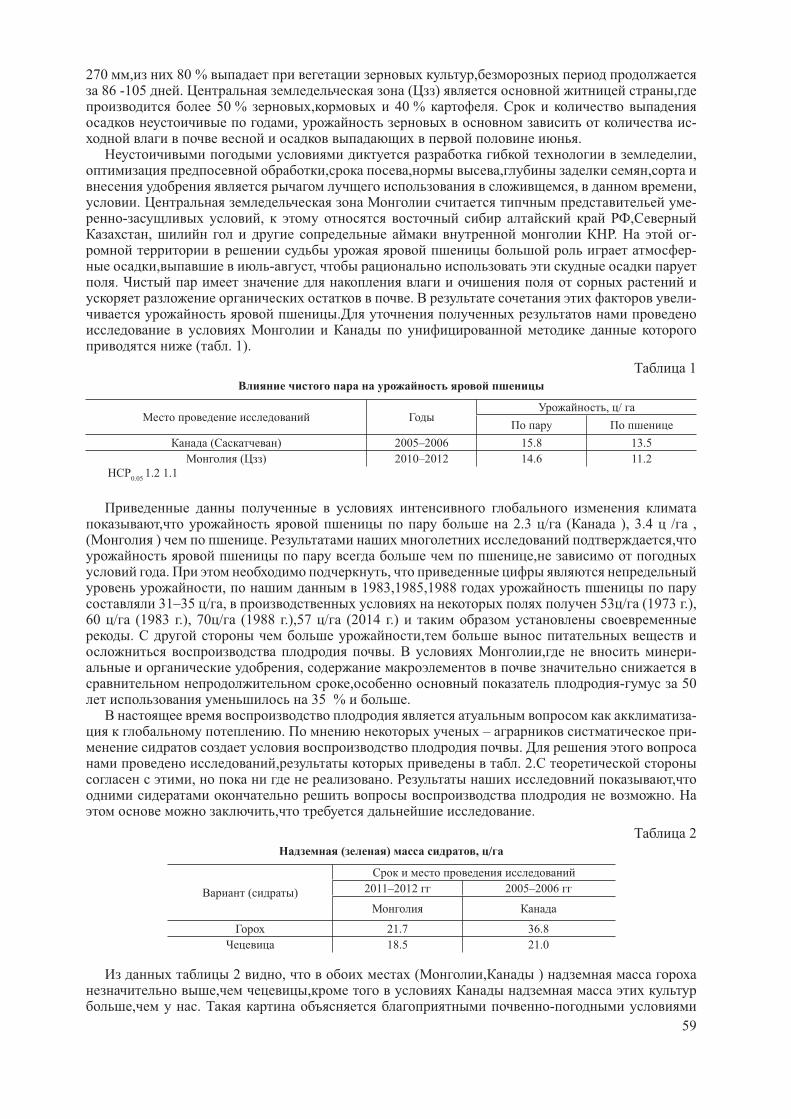
59
270 , 80 % , 86 -105 . ( ) ,
50 % , 40 % ., -
.,
, , , ,, ,
. -- , ,
, . --
, - ,.
. -.
( . 1).
1
, /
( ) 2005–2006 15.8 13.5
( ) 2010–2012 14.6 11.2
0.051.2 1.1
, 2.3 / ( ), 3.4 / , ( ) . ,
,. ,
, 1983,1985,1988 31–35 / , 53 / (1973 .),
60 / (1983 .), 70 / (1988 .),57 / (2014 .). ,
. , -,
, - 50 35 % .
-. – -
., . 2.
, . ,.
, .
2
( ) , /
( ) 2011–2012 2005–2006
21.7 36.8
18.5 21.0
2 , ( , ) , ,
, . -
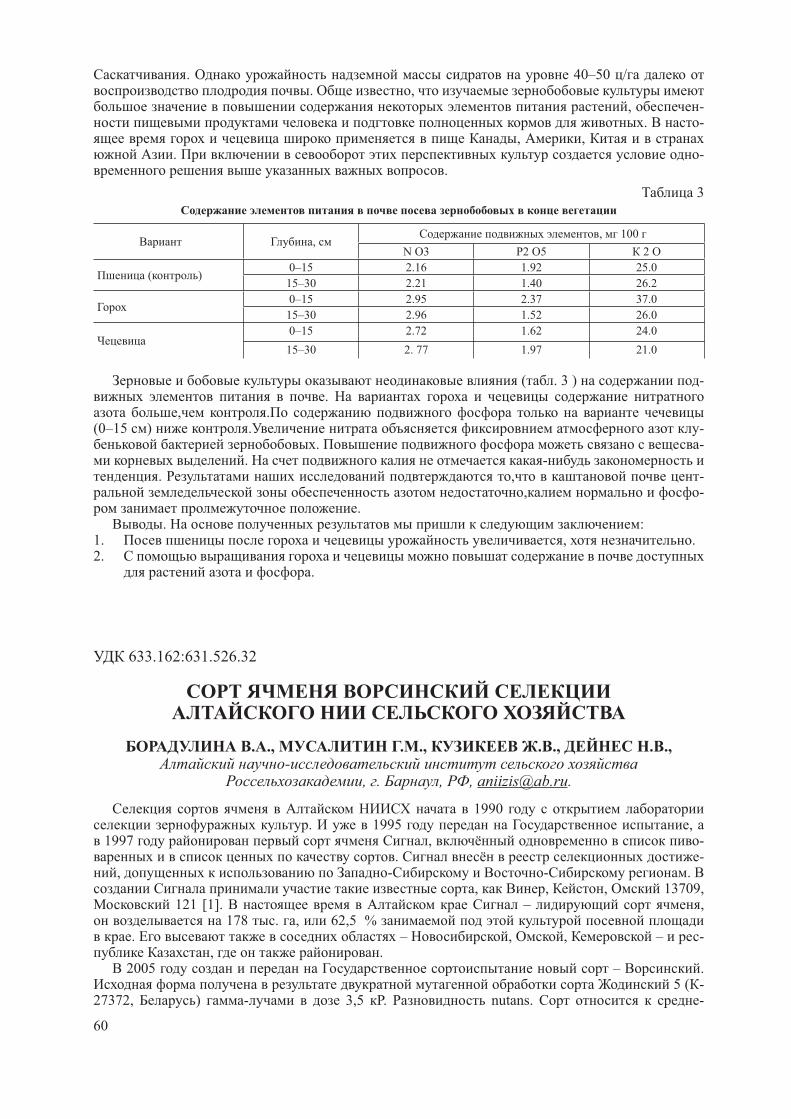
60
. 40–50 /. ,
, -. -
, ,. -
.
3
,, 100
N O3 P2 O5 2
( )0–15 2.16 1.92 25.0
15–30 2.21 1.40 26.2
0–15 2.95 2.37 37.0
15–30 2.96 1.52 26.0
0–15 2.72 1.62 24.0
15–30 2. 77 1.97 21.0
( . 3 ) -.
, .(0–15 ) . -
. -. -
. , -, -
.. :
1. , .2.
.
633.162:631.526.32
. ., . ., . ., . .,-
, . , , [email protected].
1990 . 1995 ,
1997 , -. -
, - - ., , , 13709,
121 [1]. – , 178 . , 62,5 %
. – , , – -, .
2005 – . 5 ( -
27372, ) - 3,5 . nutans. -

61
, 90, , 99 1–2 .
( .1). 8 39,0 / , 4,8 / , (14,0 %).
1
, , /
2006 2007 2008 2009 2010 2011 2012 2013.
/ ±
37,1* 48,2* 45,5* 62,1 43,5* 26,0 9,4* 40,2 39,0 +4,8
, . 27,9 37,8 40,2 61,9 38,2 24,1 7,3 36,4 34,2 -
0,5 3,1 3,2 3,7 5,8 3,2 6,1 1,6 3,9
,, , , , ( . 2).
2008 - .
2
, .2006–2007 ., /
,
20,5 +3,0
27,4 +1,8
24,7 +1,7
21,3 +3,1
29,1 +1,5
25,2 +3,1
32,9 +2,7
-. , 2006 -
42,0 / .-
– 11,8 / , 2,6 / ., , -
, ..
,.
, - ( ). -
, ,, ,
, . ( . 3).
3
, . 2009–2011 .
,
4,39 3,99 4,14
, 76 78 77
, / 719 682 703
1000 , 45,0 45,0 43,3
, % 12,0 11,7 12,9
, % 59,0 59,0 58,0
, % 77,1 77,4 75,5
, 21 18 20
, 2,1 2,4 1,6
, % 10,0 15,6 0,0

62
, 2013 75,2 . .
2007–2009 . « -2» -
-. . -
. . [2]. (N30).
4
- ( « -2», . 2007–2009 .)
N30
23,1 25,5
25,8 28,9
28,8 33,1
1,1 1,5
4 , 5,7 / , – 3,0 / . -
: 7,6 4,2 / .
. , , -,
5 ( - ) 13 ( -) 2011 .
1. . ., . ., . . //. – , 2012. –
. 228–2392. . . -
// ….. . .- . ., , 2010. – 146 .
633.1
-
. .,- , . , . E-mail: [email protected]
- -.
,.
- -- -
.. 2014
« . .» « » « ». -16. II
. - 15 . 4- , 17 2 « » -
, « . .» « . .» .

63
. . (1985) « » . . (1989).
2014 ( - 338 ) -
, ( - 94 ). 1142,30 . 27 -20 .
. ( , 1992; .,2005; , 2006), - -
1600–18000 . (+10 )1561 , 2014 11420 . ,
, ,.
. 7–8 6 .
- , - 3- . 3–4 -
. 30 30 -50 « », « », « », « »
« » ( . 1). « 1» - 26 33 , – 3 ( 41 ).
« - » « -1» 42 , -
17–21 . « - » « » - 95 , – 27 . 55–75- -
.
1
-
,
-
,
-
-
-
-,
,
- 1
17.06 24.06 7 33 3.08 41 10.08 60
. 13.06 21.06 8 36 5.08 43 12.08 63
16.06 20.06 6 3.08 42 6.08 55
17.06 24.06 7 56 3.09 72 75
. 13.06 21.06 8 55 30.08 71
16.06 20.06 6 25.08 64 29.08 72
17.06 24.06 7 56 4.09 73 75
. 13.06 21.06 8 55 30.08 71
16.06 20.06 6 20.08 59 25.08 68
17.06 24.06 7 69 - - - 70
. 13.06 21.06 8 68 - - - 70
16.06 20.06 6 25.09 95 30.08 85
17.06 24.06 7 28.08 66 3.09 70
. 13.06 21.06 8 29.08 69 70
16.06 20.06 6 24.08 63 28.08 70
17.06 24.06 7 72 3.09 - - 72
. 13.06 21.06 8 72 29.08 - - 72
16.06 20.06 6 22.08 61 25.08 75
, « 1», « », « » - « », -
« », II - III – I .
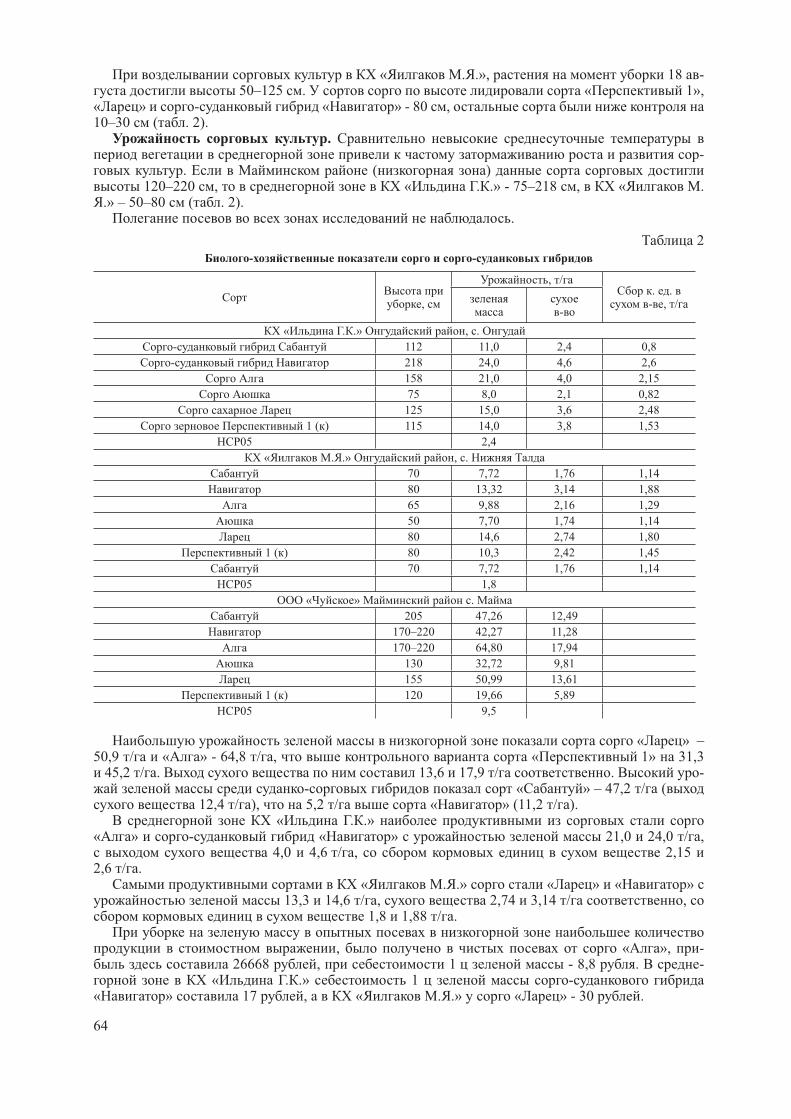
64
« . .», 18 - 50–125 . « 1»,
« » - « » - 80 ,10–30 ( . 2).
.-
. ( ) 120–220 , « . .» - 75–218 , « .
.» – 50–80 ( . 2). .
2
- -
,
, /. .
- , /-
« . .» , .
- 112 11,0 2,4 0,8
- 218 24,0 4,6 2,6
158 21,0 4,0 2,15
75 8,0 2,1 0,82
125 15,0 3,6 2,48
1 ( ) 115 14,0 3,8 1,53
05 2,4
« . .» , .
70 7,72 1,76 1,14
80 13,32 3,14 1,88
65 9,88 2,16 1,29
50 7,70 1,74 1,14
80 14,6 2,74 1,80
1 ( ) 80 10,3 2,42 1,45
70 7,72 1,76 1,14
05 1,8
« » .
205 47,26 12,49
170–220 42,27 11,28
170–220 64,80 17,94
130 32,72 9,81
155 50,99 13,61
1 ( ) 120 19,66 5,89
05 9,5
« » – 50,9 / « » - 64,8 / , « 1» 31,3
45,2 / . 13,6 17,9 / . -- « » – 47,2 / (
12,4 / ), 5,2 / « » (11,2 / ). « . .»
« » - « » 21,0 24,0 / , 4,0 4,6 / , 2,15
2,6 / . « . .» « » « »
13,3 14,6 / , 2,74 3,14 / , 1,8 1,88 / .
, « », - 26668 , 1 - 8,8 . -
« . .» 1 -« » 17 , « . .» « » - 30 .

65
, - , , -, . :
- « », « » « »; - « » « », - « ».
633.11(574.2)(471)
-
. ., « - . . . »,
, , e-mail: [email protected]
,, .
. . (1932) [1] ,
. . . . (2009) [2] -.
. ., . . (1957), Asana R.D. et. al., (1958) , , ,
, 1000 [3,4]. . . (1965) . . (1968) [5,6]
1000 , . . (1969) , . . (2006) , . . (2010), . . (2011) [7,8,9,10] -
.. . (1982), . . (1982) -
[11,12], .
. . (1981) , -,
, [13].. ., . . . (1982) -
. , 1000 r = 0,52, r = 0,42, r = 0,35 [14].
. . (1969) -, -
. , , ,,
[15].
. . (2002), . . (2005), . . (2007), . . (2010) . [16,17,18,19]. -
. . (2005), . . (2006), . . (2011) [20,21,22].. . (1968), . . (1987, 2004) ,
[23,24,25].. . (1970) ,
( -, , .) [26].

66
- -. , -
, – 2012 2014 -.
8 -, , , , - -
, , . ..
9,6 / 27,4 / . ,
, , . - r = 0,55–0,78,
. -- -
, -. 24–62 % 2012 58–87 % 2014.
. . . (1977), . . (1998), . . (2007), . . (2009) ,
[27,28,29,30]. ,
- . - r = -0,61, r = -0,60
r = -0,73 . 2012 ( ).
- (2012, 2014 .)
- - -
-
0,55*0,78**
-
0,190,39
-0,10-0,03
-
-0,170,11
-0,48-0,19
0,85**0,20
-
0,33-0,49
-0,37-0,61*
0,74*0,53
0,74*0,07
-
0,09-0,52
-0,13-0,73**
0,85**0,22
0,68*0,21
0,69*0,68*
-
-0,42-0,67*
0,08-0,73**
0,300,14
0,250,01
0,170,68*
0,55*0,68*
-
-0,19-0,22
-0,41-0,60*
0,78**0,41
0,91**0,74**
0,79**0,54
0,74*0,64*
0,540,62*
: * 5 % , ** 1 % , * , – 2012 , – 2014
46 88 2012 62 110 2014.
, , - (r = 0,85, r = 0,74, r = 0,85 r = 0,78, ). 2014
.-
. – . -
(r = 0,74 – 0,91), , . , 2012
r = 0,68 r = 0,74.

67
. ,.
6 10 . (r = 0,68 – 0,69), r = 0,68 2014
2012 r = 0,79.
– ,, .
28 38 . -. -
. - (r = 0,55–0,68),
. (r = 0,64–0,74),
.
r = 0,62, 2012 .
, :1. ,
- (r = 0,55–0,78) .
2. , , (r = 0,74), (r = 0,64)
(r = 0,62), – (r = -0,60).
3. ,, (r = 0,91), (r = 0,79), (r =
0,78) (r = 0,74).
631.112:633.19:633.11
. ., . ., . ., « . . . », -1,
, e-mail: [email protected]
.24.2 12 150 . 50 % .
--
.-
.
,.
, --
. . . . -. , -
.

68
2 . NO
3 0–40
39 49 ( . 1). – 39 / ,
– 49 / . NO3
--
.
1
, ( / )
NO3 0–40 2O5 0–20
2013 2014 2013 2014
29 50 39 21 32 26
50 35 42 18 20 19
59 40 49 21 13 17
(0–20 ) 39 49 / -
. – 17 / . – 26 / .
2014 121,1– 136,3 60–70 % -
( . 2).
2
, 2014 ,
136,3 116,8 42,7 73,2
121,1 108,9 38,8 66,3
128,6 111.6 39,9 68,5
– 121,1 , – 136,3 .
12 –19 , 136,3 116,8 .
121,1 108,9 128,6 111,6 .,
25 %., , -
74,1 ,70,1 71,7 42,7, 38,8 39,9 . -
63,4 % 64,6 % 64,3 %
., , -
66,3 – 73,2 . – 50,9 . -
– 73,2 . 14 % 100 % , 15,2 / 10,2 / ( . 3)
3
, 2014 , /
15,2
12,9
11,1

69
4,1 /
2,3 / 27 % 15 %
.
, ,
15,2 / , -
11,1 / , -
. -
0–40 – 50 / , -
32 /
.
2014 – 13 / .
631.52
. ., . .,
- ,. , , [email protected]
,
.
. -
.
. 2012–2014 . -
. , ,
1,1–1,2 %, 2 5
– 135–150 / , – 6,8–7,0. – .
, 2012 -
, 2013
, ,
, 2014
, -
,
.
. 10 16 -
. -
,
. , , ,
- . , -
[1].
. . -
61 – 65 %. (83,9 %),
(83,8 %) (82,6 %).
-
. , 97, , 84, ,
, 3,
91–94 , 3–5 . -
2, – 95–96 , – 120 .
3 156–175 , -
166–176 .
(35,9–42,2 %).

70
2 71,2 19,4 / .
3 -
84 (+7,2; 2,8 / ), (+7,1; 2,7 / ), (+5,2; 1,4 / ),
97 (+3,9; 1,2 / ). .
- -
,
97, , 84, .
« » -
. ,
85–90 , – 45-50 .
, .
76,4 / , 20,8 / , – 6,0 / . 2014
.
2014
10185 , 43,8 % .
. 3 ,
60,7–68,3 %.
2008
(85,5 %), (88,9 %), (88,6 %).
« - », « - -
» . « – »
, , 89 – 32–35 .
, .
, -
, , , .
, 3 – 124 ,
– 109 .
. –
,
.
, 34,2–
46,3 %. – 34,2 %.
1000 – 7,1–7,7 .
89 79,0 / ; 17,1 / .
(83,7 / ; 21,2 / ), (81,8 / ; 21,2 / ), (80,7 / ; 19,2 / ).
89
.
:
1.
84 (78,4 / ), (78,3 / )
(76,4 / ). 84 (6,3 / ),
(6,1 / ), 97 (6,2 / ).
2. -
. (83,7 / ),
(81,8 / ), (80,7 / ).
(5,7 / ), 10 (5,7 / ), 2008 (5,6 / ).
1. . 1. 1985,
267 .

71
633:631.5
. ., . .,- . . . ,
-1, , e-mail: [email protected]
- , -, – -
[2].-
, – - [1].
. - 20 , .
(30–35 ) [1,3].
, - 30 .
. ,, , [1,4].
2012–2014 « . . . » 100 2
. 3,6–4,1 %. –
.: 20–25 ; 25–30 30–35 .
. 50 (30–35 ) .
. 2011 - 44,7 73,4 . -
13,8 0, – 4,7 0 -11,4 0. 2011 2012 17,3 , 31,2 .
. 26,1 . 2012 2013 , , -
9,4 29,5 .. -24,5 0, – -14,1 0
– -11,1 0. 2013 (73,6 ),. 2013 2014 119,7
48,5 . -12,8 0, – -18,7 0 – -18,4 0. 29,1 -
– -4,7 0.-
30–35 ( . 1). 2011 2012 , - 2
. -, 30–35 20 %. 2012 74,9 , 39 %
25–30 92 % 20–25 ( . 1). -
. 2013
20–25 25–30 . 30–35 (183,2 ).

72
. 1. (2012–2014 .)
1
,
,2012 . 2013 . 2014 .
20 – 25 38,6 151,8 127,2 105,9
25 – 30 53,5 147,2 131,7 110,8
30 – 35 74,9 183,2 140,8 133,0
05 10,8 15,9 F <F05
2,5 ,.
- 30–35 .
. 2. ,
, -, . 2012–2014 .
20–25 119,8 , 25–30 – 121,9 , 30–35 – 128,3 ( . 2). -

73
. 2012 20–25 46,1 , 25–30 –44,0 , 30–
35 – 41,6 . 2013 (47,3–55,4 ) 2014 (65,4–71,6 ). -
(2011–2012 .). 20–25 56,3 , 7,7 ,
25–30 22,2 30–35 .. 2013 78,9–82,8 ,
2014 58,8–60,4 ., , 25–30 30–35
38–94 %, . , 30–35
20 %.
1. . . / . . . – - , 1975. – 136 .2. . ., . ., . . -
// . – 2013. – 1(9). – . 23–27.
3. ShannonChant. Increasestubbleheightstotrapmoresnow // Crops. – September, 2013. – . 7.4. CutforthH., McConkeyB., Angadi S., Judiesch D. Extra-tall stubble can increase crop yield in the semiarid
Canadian prairie // anadian journal of plant science. – March 30, 2011. – 91. – . 783–785.
632:934:633.11”321”(1–925.116)
« »
. ., . .,
« »,. , , e-mail: [email protected]
-,-
.
« » 2012–2014 . - « »
36., ( . .
+ ) ( . . ), , -
. 390, ( . . -) , ( . . – ) -
- – , ., -
( , ) ( , , ,, , , , , , , , )
( , , , ).,
, . 2012 .. 2013 . :
364 ( 132 ). - -

74
. 2014 . 37 , 1 , 2–3
., , ,
(Bipolaris sorokiniana . Fusarium) 2012 . – 8 %, 2013 . – 0, 2014 . – 25 %.
2012 .,. -
58 %, - – 40 %. 73 53 %,
. -.
. 2012 ., 2013
, 2014 . 2–4 ,.
8 , 1- 2- – 6,5–4 ,.
, , -, . 2012 . -
1,4–2,2 , 2013–2014 . – 20–25 %. 1,2–5,3 ,
– 1,6–2,8 .-
. 2012 . (39 %), . 2013 . (45 %) (29 %), (11 %). 2014 . (15–35 %), (12–17 %).
390 67–96 %, 53–92 %, ( 2013 .) – 74–75 %.
(64–99 %) , (50 ./ ).
- (10–15 ./ 2), , 2014 .
, (23 ./ 2). - 93 ./ 2 240–298 ./ 2
. , , ,.
( -, ). 70–
97 %, – 92–99 %. 60-, 96–
98 %. , -+ ,
+ .,
2012 . 0,53 1,74 / .2013 . 0,7 / ( 2,6 3,3 / ),
, -. 2014 . 2,9 3,9 / .
, -
, -. ,
, ,, , -
,, .

75
631.82:633.853.493
. .,
« . . . », , . , [email protected]
( 1559/ 2) 2013–2014 . -
, . . . .
: , , , .
«TRAPPER» 4 / ,
. , -
50 %
{1}. «
» 2,0–2,5 / . , -
, «Amazone»
. – 2–3 .
« » – 1 /
« » – 1 / « » – 0,2 / . 168 2, -
4- .
1.
2. 20
3. N 20
4. 20 +N20
5. 20 +N40
6. 20N20
7. 20N20 +N20
: ( ),
2 5– 48 %; ( ), N – 23 %,
2 5– 23 %; ( ), N – 34 %,
.
-
107,1 110,3 .
, (36,8 35,3 ), . .
, ,
.
0–40
11,5 / ( . 1).
, ,
0,3–3,7 / .
-
. -
.
, .
17,3 /
. -
4,5–8,7 / ,
.
, – .
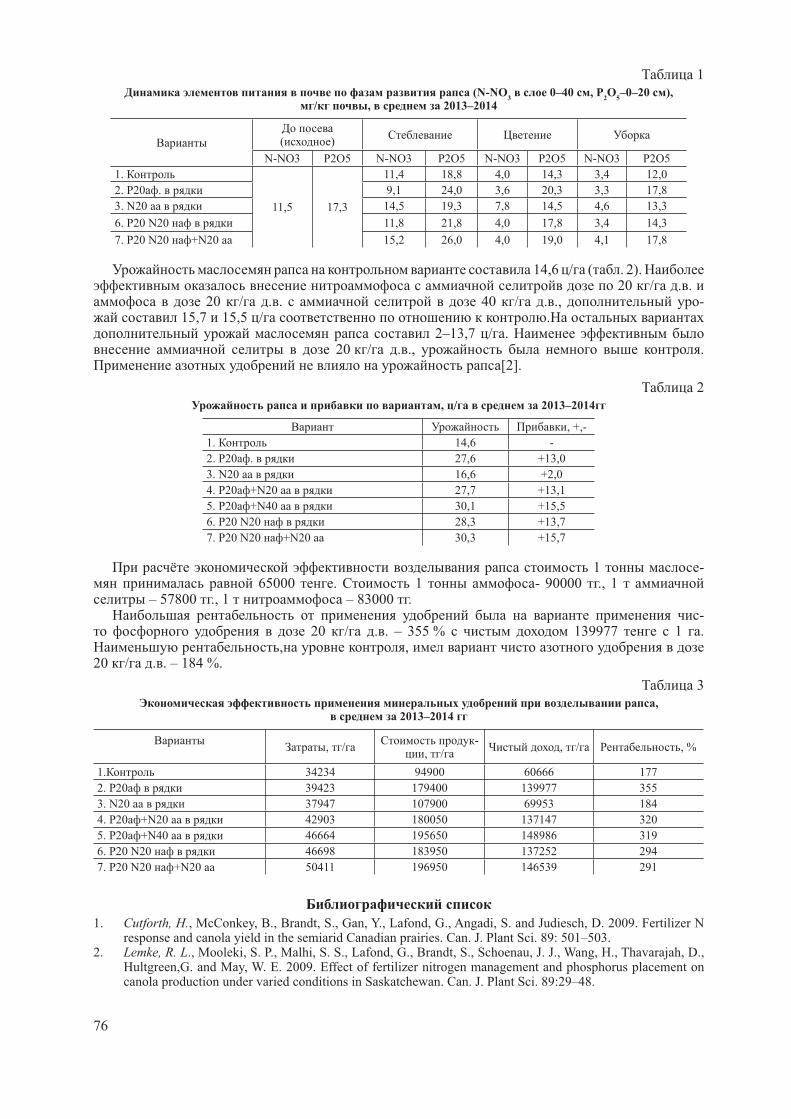
76
1
(N-NO3
0–40 , P2O
5–0–20 ),
/ , 2013–2014
( )
N-NO3 P2O5 N-NO3 P2O5 N-NO3 P2O5 N-NO3 P2O5
1.
11,5 17,3
11,4 18,8 4,0 14,3 3,4 12,0
2. 20 . 9,1 24,0 3,6 20,3 3,3 17,8
3. N20 14,5 19,3 7,8 14,5 4,6 13,3
6. 20 N20 11,8 21,8 4,0 17,8 3,4 14,3
7. 20 N20 +N20 15,2 26,0 4,0 19,0 4,1 17,8
14,6 / ( . 2). 20 / . .
20 / . . 40 / . ., - 15,7 15,5 / .
2–13,7 / . 20 / . ., .
[2].
2
, / 2013–2014
, +,-
1. 14,6 -
2. 20 . 27,6 +13,0
3. N20 16,6 +2,0
4. 20 +N20 27,7 +13,1
5. 20 +N40 30,1 +15,5
6. 20 N20 28,3 +13,7
7. 20 N20 +N20 30,3 +15,7
1 - 65000 . 1 - 90000 ., 1
– 57800 ., 1 – 83000 .-
20 / . . – 355 % 139977 1 ., ,
20 / . . – 184 %.
3
, 2013–2014
, /-
, /, / , %
1. 34234 94900 60666 177
2. 20 39423 179400 139977 355
3. N20 37947 107900 69953 184
4. 20 +N20 42903 180050 137147 320
5. 20 +N40 46664 195650 148986 319
6. 20 N20 46698 183950 137252 294
7. 20 N20 +N20 50411 196950 146539 291
1. Cutforth, H., McConkey, B., Brandt, S., Gan, Y., Lafond, G., Angadi, S. and Judiesch, D. 2009. Fertilizer N response and canola yield in the semiarid Canadian prairies. Can. J. Plant Sci. 89: 501–503.
2. Lemke, R. L., Mooleki, S. P., Malhi, S. S., Lafond, G., Brandt, S., Schoenau, J. J., Wang, H., Thavarajah, D., Hultgreen,G. and May, W. E. 2009. Effect of fertilizer nitrogen management and phosphorus placement on canola production under varied conditions in Saskatchewan. Can. J. Plant Sci. 89:29–48.

77
631.8:631.4
. .,,
, . E-mail: [email protected]
-. -
, -,
, , - –
[1–5]. - , -
, - 26–36 / [6–8].
. . [9] . . . [10] ( 40–50 / ).
[11] ,1 .
. , 1971–1975 .
500 . ., -
[2–5, 8], .
- 1800–1900 , -
– 250- 350 – 70–95 .-
( . 1). , - ( , .) -
18–25 / , – 12–16 /. 1,5–2 .
( - , ,- - ),
( , ).
1
, /
, - - - - -
30–50 30–45 15–30 8–15 10–22 25–45
40–60 10–25 10–20 5–12 8–16 15–25
- ( . 2).
, , 35–40 / . , -

78
. , -,
. -, , ( )
..
2
, /
N-NO3, / 60 60 N30 60 60
76 23,1 24,5 25,2
52 21,0 23,0 23,6
46 21,5 22,8 24,2
66 22,4 23,5 24,8
, , - -.
, ,(20–30 /
2) (30–60 / ).
(40–60 /2
)., , ,
30–50 / -.
- , -- 1,5 . -
15–25 / ,- (30–40 /
N, 20–30 /2
). ( , , ,
, .) ( , ,.)
, , -, . ,
-,
.
:
1. . . : -. . . , 1973. 26 .
2. . .: . . . . 1995. 19 .
3. . ., . ., . . . - ( ). . . - , . , 1999. 36 .
4. . . -: . . . , 2001. 32 .
5. . .: . . , 2009. 19 .
6. . ., . ., . . . .: , 1980 184 .7. . ., . ., . .
// :. , 2000. . 82–87.
8. . ., . . , :« ». 2008. 180 .
9. . . – : - « », 2006. 220 .
10. . ., . ., . . / . : . 20. 151 .
11. . ., . ., . . ., / . . . . : ,1978. 429 .
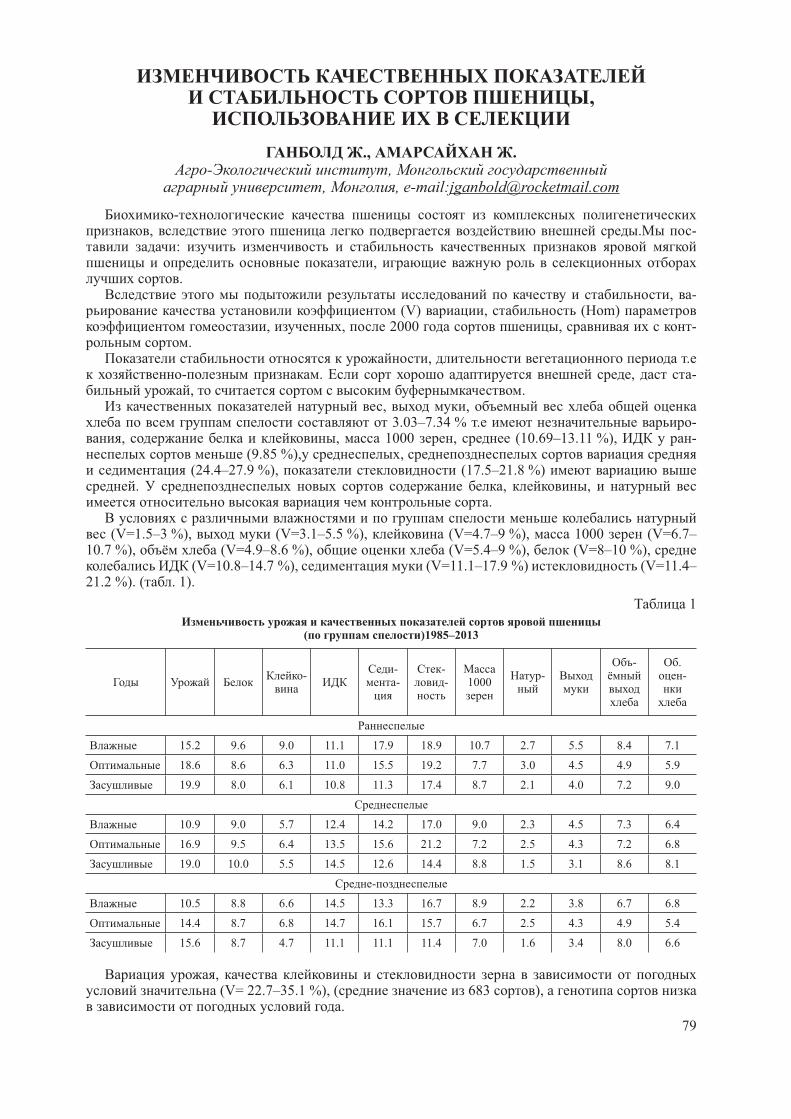
79
,
., .- ,
, , e-mail:[email protected]
-, . -
:,
., -
(V) , (Hom) , , 2000 , -
., .
- . , -, .
, , 3.03–7.34 % . -
, , 1000 , (10.69–13.11 %), - (9.85 %), ,
(24.4–27.9 %), (17.5–21.8 %) . , ,
.
(V=1.5–3 %), (V=3.1–5.5 %), (V=4.7–9 %), 1000 (V=6.7–10.7 %), (V=4.9–8.6 %), (V=5.4–9 %), (V=8–10 %),
(V=10.8–14.7 %), (V=11.1–17.9 %) (V=11.4–21.2 %). ( . 1).
1
( )1985–2013
---
-- 1000
-- .
-
15.2 9.6 9.0 11.1 17.9 18.9 10.7 2.7 5.5 8.4 7.1
18.6 8.6 6.3 11.0 15.5 19.2 7.7 3.0 4.5 4.9 5.9
19.9 8.0 6.1 10.8 11.3 17.4 8.7 2.1 4.0 7.2 9.0
10.9 9.0 5.7 12.4 14.2 17.0 9.0 2.3 4.5 7.3 6.4
16.9 9.5 6.4 13.5 15.6 21.2 7.2 2.5 4.3 7.2 6.8
19.0 10.0 5.5 14.5 12.6 14.4 8.8 1.5 3.1 8.6 8.1
-
10.5 8.8 6.6 14.5 13.3 16.7 8.9 2.2 3.8 6.7 6.8
14.4 8.7 6.8 14.7 16.1 15.7 6.7 2.5 4.3 4.9 5.4
15.6 8.7 4.7 11.1 11.1 11.4 7.0 1.6 3.4 8.0 6.6
, (V= 22.7–35.1 %), ( 683 ),
.

80
:-167 , , 1000 , , ,
,. -160 , , 1000 , ,
, , ( -). 187 , , ,, .
-74 , , , , ,, , -170 , , , -
, , ,. -151 , , ,
, 1000 , , -156 , , 1000 , , -155 , 1000 , , ,
-29, -34, .
-1 , , , 1000 , .
, 1000 , ,, .
- : F
4–5, I
,(r=0.694**), , (r=0.458*-0.572**), -
, , ,. II ,
, , 1000 , .- ( -
) 1000 , ,.
., , , , . -
, ., , -
-167, -168, -160, -187, --141, -182, -74, -170, -175, - -
151, -156, -144.
.:
--
---
.,
-, .
.
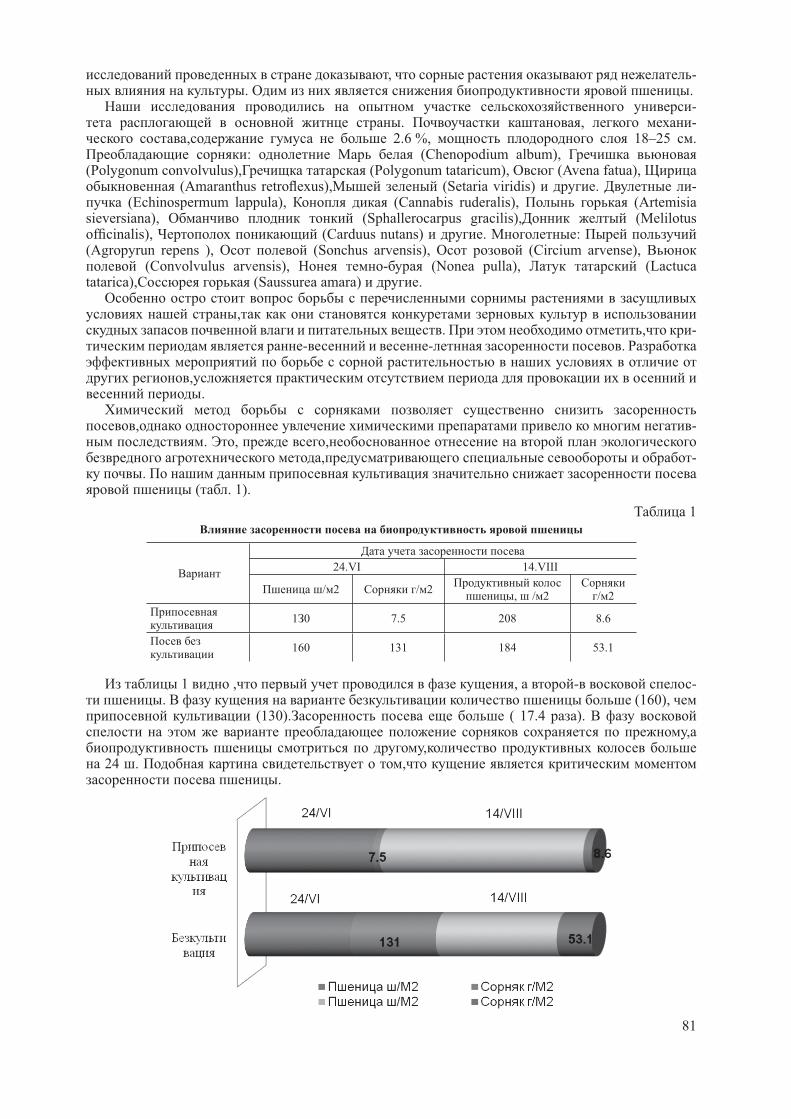
81
, -. .
-. , -
, 2.6 %, 18–25 .: (Chenopodium album),
(Polygonum convolvulus), (Polygonum tataricum), (Avena fatua), (Amaranthus retrofl exus), (Setaria viridis) . -
(Echinospermum lappula), (Cannabis ruderalis), (Artemisia sieversiana), (Sphallerocarpus gracilis), (Melilotus offi cinalis), (Carduus nutans) . :(Agropyrun repens ), (Sonchus arvensis), (Circium arvense),
(Convolvulus arvensis), - (Nonea pulla), (Lactuca tatarica), (Saussurea amara) .
,. , -
- - .
,.
, -. , ,
, -.
( . 1).
1
24.VI 14.VIII
/ 2 / 2, / 2 / 2
1 0 7.5 208 8.6
160 131 184 53.1
1 , , - -. (160),
(130). ( 17.4 ).,
, 24 . ,
.

82
-.
, ., -
– , .
.
632.4.01/08:535.37
. ., « - »,
. , , [email protected]
- -
,.
, : - ( ) « », « -7»;
« -6»; --
- ; « ».-
« -4», « -5».
, .-
( ) . , -,-
., -
,.
-.
Bipolaris sorokiniana Schoem., , -,
,. , -
,.
36 --
– 0,86.
- [1, 2].
- « ».

83
, , , -, -
, , . -, ,
, . « » -, -
, ( ), ( %) [3].
, - (Puccinia Rob. et Desm), (Septoria nodorum
Berkley, S.tritici Rob.et Desm, S.graminis Desm), (Erysiphe graminis (DC) Speer). « » -
:, – ,
– [4].-
,.
,,
.-
-,
. r=0,82…0,98. « »
,.
( ) . , -,
, . -
. 11 -
- (
, , ). - = 0,85…0,99 0,01.
. - 4,2 ,
– 1,2–3,1 [5]. , , -
, , ,. ,
-
250 %. .
-, . .
( ,). -
, . ( - ) -
: -, ,

84
( , ), ( 2,0 – 6,0 ) .
12 3 -.
, -,
[6]. [7].
, ,- , -
.
, , -, [8, 9].
, : -
; ; -.
, -,-
.
1. . ., . . -. – 2166245, 2001.
2. . ., . . -. – 2188538, 2002.
3. / . ., . .,. . . // . . .; , . - . .– ,
2008.– . 190–195.4. . ., . . -
.– , 2006, 11.5. ./ . . .– .- ,
1998.6. . ., . .
. // , 2009, 3.7. . .,. . ., . . -
. – 2446671, 2012. 8. : - -
/ . ., . ., . ., . .,. ., . .// . .– , 2010.
9. . ., . ., . . - // -
. – 2013 .– 5. – . 100–105.
633.321.04.30.48.
. ., . ., . ., . .,, , , [email protected]
– . , – - , , -
. , .

85
-.
, , . ( ). -
, - .. -
. – ( 15 ), , -
. 20–22 . -
..
6–8 [1]. .,
. 1 3 .,
. – 15 30 ., ,
. 10 -
30 .. 60
.-
– 80–100 400–500 1 2. 2,0–2,5 1 ,
4,0–5,5 6,5–8,0 / [2–4]. 10
(1991–1994 .) 2,0 3,0 / -. -
– 2,5 / ., -
, ,. , , -
. , 18–20 / , [5].
, – ., -
. - 30 % . -
.
..
, , -
. 0,64–0,79 / 10,4–12,8 % [6].
..
..
, , ,.
-, .
50 % [7]. 10–15 %. – -
. -, .

86
5–7 , 75–80 % .
- – .
, 2–4 , ., 10,
: 3,4–4,5, 1,6–2,1 / , -.
3,05–3,47 / 0,75–0,88 / - 1,5–2,5 / [8].
. -.
,-
18–20 / . 30 %.
( ). – 2,0–2,5 / . -
.
.. -
.
1. . . – / . ,. . // – 1979. – 4 – . 46–48.
2. . ./ . . , . . // :
. . .– .: 1991. – . 46. – . 18–25.3. . .
/ . . // : . . .– .: 1991. – . 46. – . 26–29.
4. . . / . . -, . . , . . , . . // :
. . . – ., , 1987. – . 35. – . 116–123.5. . . ./ . . – , 1970. – 146 .6. . .
: . . … . .- . . / . . . – , 2005. – 23 .7. . . -
/ . . , . . , . . // -: . . . – , 1987. – . 35. – . 142–145.
8. . . . / . . - – , , , 2002. – 268 .
631.52:633.11 (574.2)
. ., . ., . ., . .,- . . . ,
-

87
. -.
( , , , ). , ,,
..
. , , [1,2].
, ,, .
400 -, ,
( . .), -.
- : , 1000 -, , – 1 ,
[3,4,5,6] . .( 55–30), , , - Juliano, - Falling Number
1700 ( ICC 107/ 1–95) [7,8,9,10,11,12] - 1046 – 2008 [13].
ICC -121–92 [14] ( . .),
p/L, - [15].
. -, - .
: 45,6 % - 1 , 41,8 %- , 12,6 % - 4 5- ( . 1).
1
2011–2013 ., %
1 2 3 4 5
7,9 16,3 11,3 52,0 1,1 11,4
16,1 64,6 7,4 11,9 - -
- 13,4 26,7 43,3 13,3 3,3
21,9 29,6 9,7 30,5 4,4 3,9
17,6 28,0 11,1 30,7 3,8 8,8
- 672 / 39 %, ( 105 . )
( . 2).
(12,59– 18,02 %) : – 14,87 %, - – 15,23 %, – 14,72 %, - 14,82 %.
, -. P/L
0,17; 0,32; 0,37 ( -).
( , -), 3,6
, , , 200, 242, 257 . .
(47,8 %) - (45,7 %) ( . 3).
66 .: 530 (81), SDDO43 (80), Sokrates (78), 3 (75).

88
-.
1- (83), -18404 (81), AZ -2 (80).
2
, 2011–2013 .
SKCS 4100, %
(66–120) 45,7
(53–65) 47,8
(48–52) 3,9
(36–47) 0,7
(0–35) 1,9
53,27–55,84 ( . 4) - – 48,34–59,66 %.
: Glenlea (65,20 %), 1542 (62,93 %), 1945 (62,22 %), 2021 (60,78 %).
, -. –
.
4
, 2011–2013 .
, % , %
44–48 15,0
49–50 12,2
51–53 27,6
54–56 31,3
57–59 10,9
60–62 3,0
3,57–3,78. ,: 3 (4,46), 26
(4,68), (4,68), 88 (4,75), (4,98).
2
, , , 2011–2013 .
, ,
,/
1000
,
-, %
, %
-,
,
, %
, %
, %
-
-,
,.
.
p/L
,
,
732–814
20,2–42,5
40–76
26,4–44,0
61–105
285–488
51,69–60,30
10–22
12,59–18,02
3,03–4,68
29–80
49–389
0,17–0,7
470–860
3,1–4,8
782 33,8 58 33,8 85 388 53,27 17 14,87 3,77 61 200 0,29 693 4,1
-758–805
32,6-39,2
44–77
26,6–35,4
50–89
330–429
51,28–60,58
12–18
14,32–15,92
3,46–3,91
46–68
227–422
0,28–1,06
710–970
3,9–4,5
765 35,7 60 31,3 72 386 56,52 14 15,23 3,72 60 326 0,53 828 4,2
--
672–768
28,4–39,9
39–52
21,2–44,0
55–95
281–461
48,34–59,66
8–16
13,30–16,02
3,24–4,51
50–70
153–297
0,24–0,71
630–970
3,4–4,8
732 36,8 46 32,1 73 377 55,27 12 14,72 3,78 63 242 0,32 819 4,2
- 728–800
27,6–37,1
46–74
25,0–38,6
54–97
297–436
49,61–57,96
7–20
13,48–16,94
3,18–4,23
41–74
109–408
0,22–0,67
580–933
2,96–4,36
775 32,6 64 31,2 76 370 54,82 10 14,82 3,70 62 257 0,37 754 3,63

89
1. Anne Van Der Borght Fractionation of wheat and wheat flour into starch and gluten overview of the main processes and the factors involved. – Journal Cereal Science. -2005 .
2. Wen – yang Li Comparison of Starch granule Size Distribution between Hard and Soft Wheat Cultivars Eastern China. – Agricultural Science in China.-2008 .
3. 7971–2–2002.4. 10842–89. 1000 5. 10987–76.6. 1054–2002. -
7. 55–30. 8. 10846–91 . .9. 1564–2006 -
10. 10845–98 . .11. Juliano B.O. (1985). Criteria and test for rice grain quality. In: Juliano BO (ed) Rice chemistry and technology.
American Association of Cereal Chemists, Inc., St. Paul, Minnesota, pp 443–513.12. ICC 107 / 1–95. - – 13. 1046–2008 .14. ICC -121 -92 .15. (
, , ).- .,1988.- .70.
:631.52.633.289.1
. ., . ., « »,
. , , e.mail: [email protected]
,, -
, . ,
.-
., , -
, . ., ,
, . -, , . -
3,0–7,2 % - -8,0–12,2, -1–4,7, -8,9–16,1, -14,2–21,6, -2,2–3,1. , ,
.,
.--
., - ,
( , , , ).
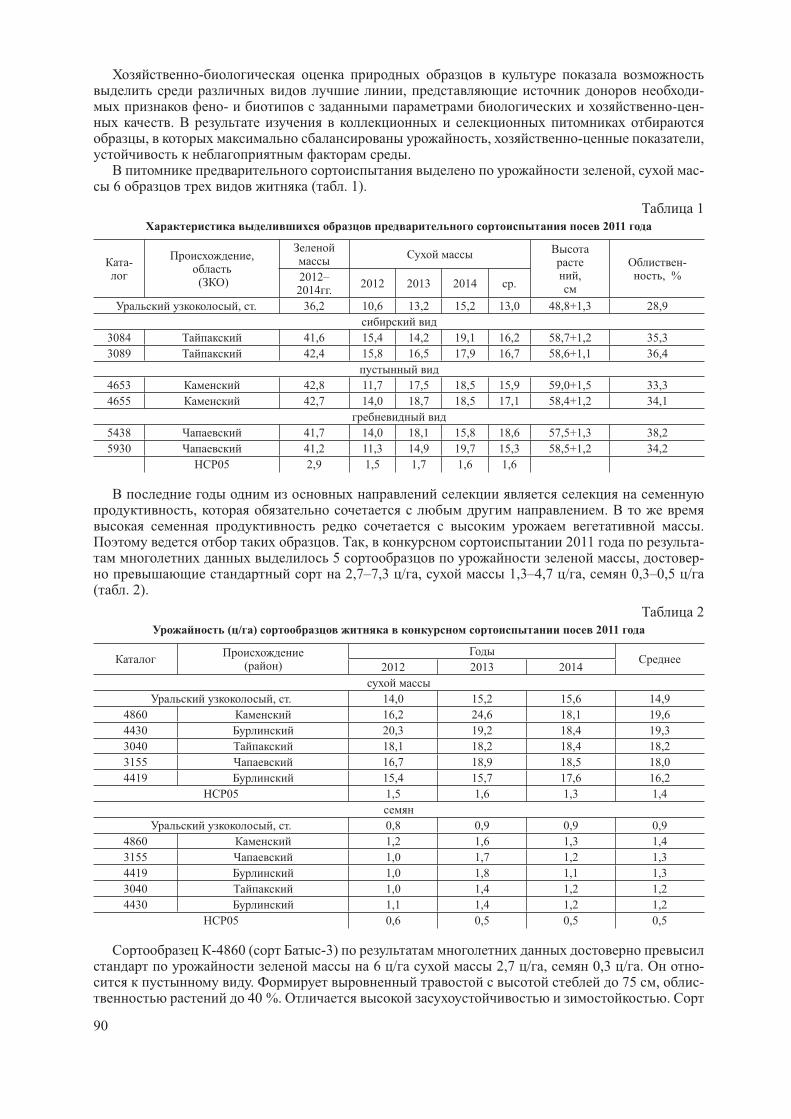
90
-, -
- - -.
, , - ,.
, - 6 ( . 1).
1
2011
-,
( ),
-, %2012–
2014 .2012 2013 2014 .
, . 36,2 10,6 13,2 15,2 13,0 48,8+1,3 28,9
3084 41,6 15,4 14,2 19,1 16,2 58,7+1,2 35,3
3089 42,4 15,8 16,5 17,9 16,7 58,6+1,1 36,4
4653 42,8 11,7 17,5 18,5 15,9 59,0+1,5 33,3
4655 42,7 14,0 18,7 18,5 17,1 58,4+1,2 34,1
5438 41,7 14,0 18,1 15,8 18,6 57,5+1,3 38,2
5930 41,2 11,3 14,9 19,7 15,3 58,5+1,2 34,2
05 2,9 1,5 1,7 1,6 1,6
, ..
. , 2011 - 5 , -
2,7–7,3 / , 1,3–4,7 / , 0,3–0,5 /( . 2).
2
( / ) 2011
( ) 2012 2013 2014
, . 14,0 15,2 15,6 14,9
4860 16,2 24,6 18,1 19,6
4430 20,3 19,2 18,4 19,3
3040 18,1 18,2 18,4 18,2
3155 16,7 18,9 18,5 18,0
4419 15,4 15,7 17,6 16,2
05 1,5 1,6 1,3 1,4
, . 0,8 0,9 0,9 0,9
4860 1,2 1,6 1,3 1,4
3155 1,0 1,7 1,2 1,3
4419 1,0 1,8 1,1 1,3
3040 1,0 1,4 1,2 1,2
4430 1,1 1,4 1,2 1,2
05 0,6 0,5 0,5 0,5
-4860 ( -3) 6 / 2,7 / , 0,3 / . -
. 75 , - 40 %. .

91
14 %, 16 %, 29 %. 10,2 . , 25,9 . . -
. 2014 -3 ( -4860) .
635.655.581.5
-
. ., . ., . ., « - »,
., . -
, , 39–43 / ,39–40 % , 19–23 % .
2014 110 . ., -
, -, - ,
, . 40 . 20
, 10 .-
. [1].
- [2], [3,4,5], [6],
[7]. , [8, 9].
« »« », « », « -
», « » [10,11,12]..
« » 2012, 2013 2014 . ( . ., 1973;
. ., 1986) [13], , 600 ./ 4–5 . ,
30 , 10 2. -. ( ) 357
( ), 125–130 105–110 ..
( . ., . , 2004) [14]. Fehr Cavines (1979) [15]. -
– , , , ,, , . – . .
( . ., . ., . ., 1968) [16]. – ,
, , , , 1000 .

92
9 21 ( , , , ,, )( . 1).
1
,
, , , , , , 8/2–2, ,
9
Santana, Safrana, , Shama 4
, , , , 5
, , 3
, , , , 2, 302 6
1
1
Gem 1
30
- « » ( . 2).
2
- « » 2012–2014 .
, 0 ,
-- -
-- -
2012
+16,1 +10,4 +5,7 45,2 56,5 -11,3
+18,6 +16,4 +2,2 68,9 61,6 +7,3
+21,0 +21,2 -0,2 130,3 53,9 +76,4
+25,9 +24,1 +1,8 8,6 26,6 -18,0
+24,7 +22,1 +2,6 0,0 21,2 -21,2
+16,0 +16,0 0,0 0,6 15,9 -15,3
2013
+12,3 10,4 +1,9 164,0 56,5 +102,4
+16,9 16,4 +0,5 80,7 61,6 +19,1
+21,3 21,2 +0,1 82,0 53,9 +28,1
+24,9 24,1 +0,8 42,4 26,6 +15,8
+ 23,6 22,1 +1,5 85,2 21,2 +64,0
+19,9 16,0 +3,9 7,2 15,9 -8,7
2014
+10,1 +10,4 -0,3 106,7 56,5 +50,2
+18,6 +16,4 +2,2 58,8 61,6 -2,8
+23,0 +21,2 +1,8 35,3 53,9 -18,6
+25,9 +24,1 +1,8 8,6 26,6 -18,0
+24,1 +21,2 +2,9 0,0 22,1 -22,1
+18,0 +16,0 +2,0 10,8 15,9 -5,1
, , 2012 2014 , .
.(100–110 ), (111–121 ) (122–135 ) .
38,0 – 41,6 %. ,
41,6 %. 21,5 – 22,5 %.

93
39,8 / .28,8 / ( . 3).
3
, 2012–2014 .
, .-
,-
, /, % , %
1 109 34,8 38,0 22,5
3 106 26,8 41,6 21,8
3 115 33,4 40,2 21,5
9 114 36,5 39,0 22,0
7 125 36,1 38,7 21,8
9 123 39,8 38,8 22,3
34,8 / . – 42,1–43,0 % .
(39,0–38,4 / ), – (42,1 / ) 35,6 / . -
8/22 ( ) – 40,5–41,2 2 – 41,8 %.
42,9 / , 2030- 40,3 / .
( ) – 40,4–41,2 %, ( ) – 40,6 %.
1. . . // . -2011.- 6. – . 38–39.2. . ., . . - //
. -2011.- 1. – . 106–109.3. . ., . . -
// . -2011.- 2. – . 19–23.4. . .
// .5 . . « ».- -, 2009.- . 313.
5. . ., . ., . . // . . . – 2012. – .17–19.
6. . ., . ., . ., . . // . . –2012. – 3. – .4–6.
7. - . ., . . - - // . . . – 2012. – 1.- .113–116.
8. Bandeira Barros Helio, SediyamaTuneo, Teixeira Rita de Cassia, Ribeiro Fidelis Rodrigo, Cruz CosmeDamiao, Reis Mucio Silva.
// Rev.ceres. Univ.fed. Vicosa. – 2010. – 3 – .359–366.9. AlbrechtL. P., deLucca B. A., RizzattiA. M., ScapimC. A., Barbosa . C.Sementesdesojaproduzidas mepoca
sdesafrinhan regiaooestedoEstadodoParana // Actasci. Agro . -2009. – 31. 2 (1).-P. 121–127. 10. . ., . . // 16 -
« - , , -», , 28.05.2013, 1.- . 73–74.
11. . ., . ., . . - // .- 2013, 5. – . 7–11.
12. . ., . . - // - « -
21 », 100 . . , , 2013.- . 191–193.
13. . . , , 1973.14. . ., . . . , ,2004.15. Fehr W.R., Cavines C.E. Stages of soybean development. Cooperative Extention Service. Iowa State University.
Ames, Iowa, 1979.16. . ., . ., . . ,
, 1968.

94
633.113.9”321”:631.547(571.1)
. ., . .,
- ,. , , ,[email protected]
., , -
. - 78 .
. 78 : 33 , 3 , 2
, 1 , , 2 ,2 , 4 , 6 , 3
, 8 , 1 , , 8 3 , .
. 2014 . 18 : 16.05.2015 .
2.06.2015 . : , , , ,, . .
. I - 31–49 , II – 30–52 ( . 1).
( ), Presto//2*Tesmo 1…, POP-WG ( ), k-688 (?), 31–33- . 502 ( )
57/3 ( ), 46- 49- .
. 1. 78 I ( ; 16.05.2014) II
( ; 2.06.2014) ( , . , – 2014 .)
31 42 , 37–40 . - (37–40 ), (37, 38 ),
(39 ), (36–39 ), (37–39 ). – 34- .
(41 ), (43 ) (40, 43 ). 34–39 ,
, (36- ). (35–46 ) (31, 33, 37, 42 )
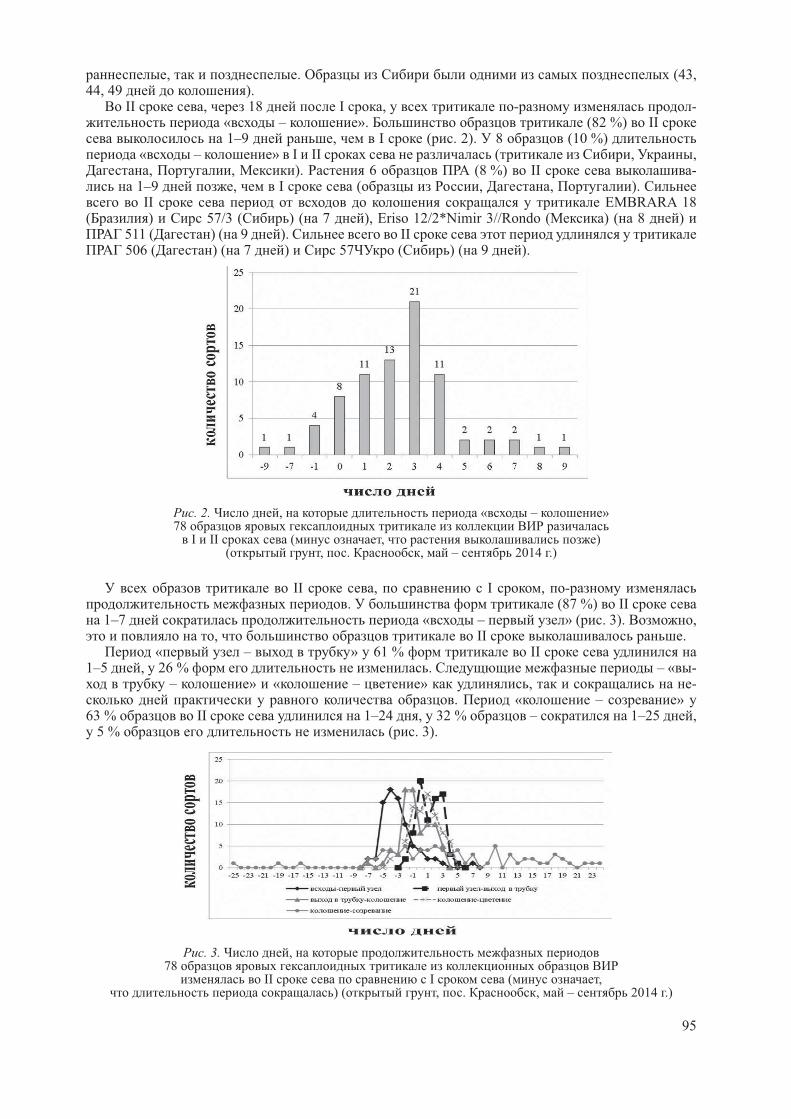
95
, . (43, 44, 49 ).
II , 18 I , - - « – ». (82 %) II 1–9 , I ( . 2). 8 (10 %)
« – » I II ( , ,, , ). 6 (8 %) II -
1–9 , I ( , , ). II EMBRARA 18
( ) 57/3 ( ) ( 7 ), Eriso 12/2*Nimir 3//Rondo ( ) ( 8 ) 511 ( ) ( 9 ). II 506 ( ) ( 7 ) 57 ( ) ( 9 ).
. 2. , « – »78
I II ( , )( , . , – 2014 .)
II , I , -. (87 %) II
1–7 « – » ( . 3). ,, II .
« – » 61 % II 1–5 , 26 % . – « -
– » « – » , -. « – »
63 % II 1–24 , 32 % – 1–25 , 5 % ( . 3).
. 3. ,78
II I ( ,) ( , . , – 2014 .)

96
, - (II ) [1, 2, 3], -
, « – », [3, 4]. « -
– » ( ) -, , « – -
», « – » « – »« – » . , « – » I 3–5 , II – 3–6 ; « – » I 8–12 , II – 7–17 ; « – » I
5–8 , II – 3–8 . « – » « -
– » , [3, 4], : I , , « – »
49 79 , II , 57 , - 61 72 .
(« – »)« – » , , [1, 3], -
: I , , 84 121 , II – 93 115 .
1. . ., . ., . . . . – .:. , 1982. – 343 .
2. . ., . . Vrn1–3 // .- . . . – 1985. – 1 (55). – . 19–23.
3. Ko ner J., P nkov K. Chromosome substitutions with dominant loci Vrn-1 and their effect on developmental stages of wheat // Czech J. Genet. Plant Breed. – 2004. – V. 40. – 2. – P. 37–44.
4. . ., . ., . ., . . -
. [ ]. – http://agromage.com/stat_id.php?id=409.
631.4:551.3
., . .,« . . - »
, . E-mail: [email protected]:[email protected]
.
.
-- , , ,
., 21 ,
, -
, .:
(5–6 ) ,

97
,, . [1]
, . [2] 2–3 -
( . ., 2007). [3] 1–2 10–12.
( , , , ,).
, ( ),.
-. , ,
( , -, , ,
; , ), () , .
-.
- ..
., , ,
.- : - 2,5 , -5,9
-31,3 , 24,4; 28,7 15,5 ..
22,0 , 24,0 . 100 , 20–25 :- .
-35˚ , 50 . e 1,0
. ,. - 20 %-
. 1 6,0–7,0 . - -
. . -. 80–90 %
, 10–20 % .
, .35 . -
. ,.
,. 2010 ,
- 12–16 . 2–
4 . , .- .
.
:
1. . . : , // -: : .
. . . – , 2004. – . 67–74.2. Chepil W.S., 1943, Relation of wind erosion to the dry aggregate structure of soil. Soil Sci. 21: 488–507; 3. . . 2007. .
. 83–136.

98
,
, ,
. .,- ,
, , kasniizr @ mail. Ru
, -,
, , , ,
.. – . -
35–40 % 18–25 % .; .
- ., ,
, -. ,
.[1]., -, ,
.[2,3,4,5, 6]. , , -
- -.
..
- -- .
: – .. 100 / . –
. , -. 50 2, 40 2.
:- – 150 + 2 . 7–10 ;- – 300 + 2 . 7–10 ;- - – 200 + 400 .
;- – 200 + .
;- – ( );- (
) .-
. ,
7–10 , - .- -
,.
, -.
--
- .

99
.
, -. ,
- -- . -
, .,
. , 40,1 / . 7,9 / .
, -., ,
, ,. -
,, ,
.. -
– , -. 1.
1
« ».
« »
1. , / 32,2 40,1 38,8 39,3 35,2
2. , / - 7,9 6,6 7,1 3,0
3. . 60.000 60.000 60.000 60.000 60.000
4. , / . 193 200 240600 232800 235800 211200
5. , / 48077 58077 50577 50577 50277
6. 1 , . 1493,0 1448,3 1303,5 1286,9 1428,3
7. , / . 145122 182523 182223 185223 160923
8. , %. 301 314 360 366 320
-, . ,
1 , 3,0 7,9 , 182223 185223 . ./ .
, -- , . ,
- , 5 , .
., -
. ,,
.
1. . ., . .– , 2007. – 183 .
2. . ., . . . . -. , 2014, 16 .
3. . . « – » – , 2013, – 4 .4. . . « – » – , 2013, – 4 .5. . ., . . // -
3 . . . .. , 2003. – .25. – 4. – 129 .
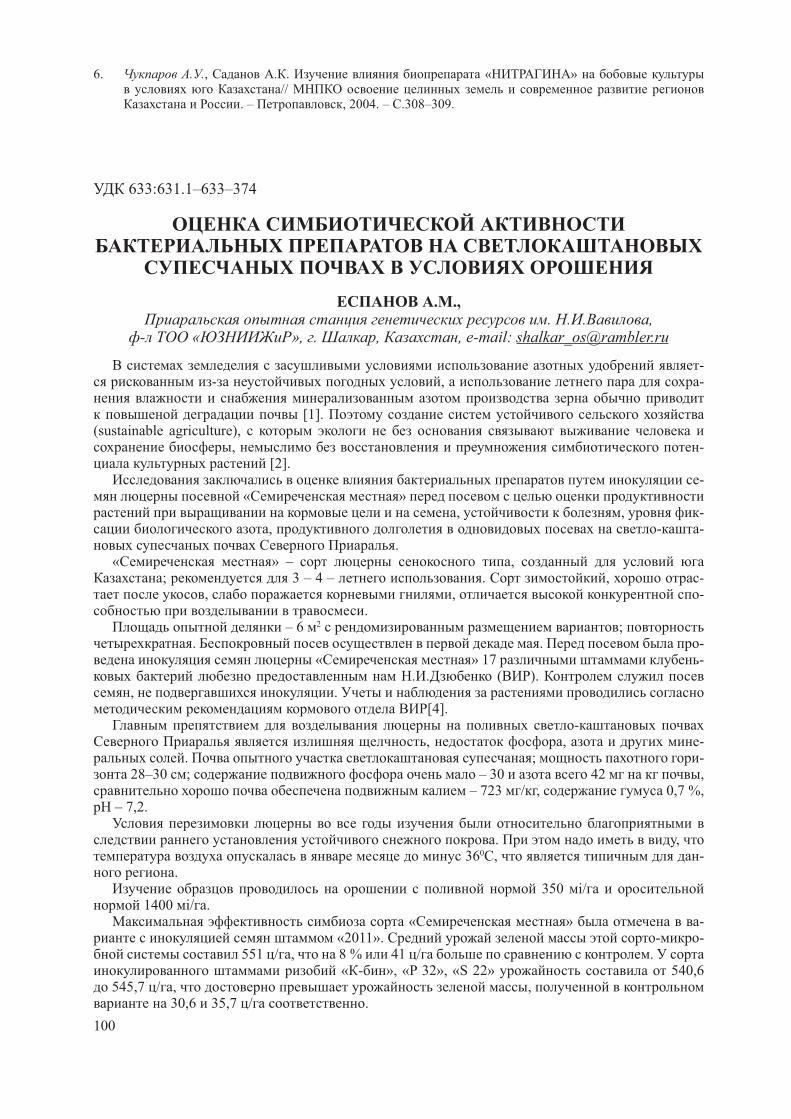
100
6. . ., . . « »//
. – , 2004. – .308–309.
633:631.1–633–374
. .,. . . ,
- « », . , , -mail: [email protected]
-- , -
[1]. (sustainable agriculture),
, - [2].
- « »
, , -, - -
.« » – ,
; 3 – 4 – . , -, , -
. – 6 2 ;
. . - « » 17 -
. . ( )., .
[4].-
, , -. ; -
28–30 ; – 30 42 , – 723 / , 0,7 %,
– 7,2.
. , 360 , -
. 350 /
1400 / . « » -
«2011». - - 551 / , 8 % 41 / .
« - », «P 32», «S 22» 540,6 545,7 / , ,
30,6 35,7 / .

101
-, . -
.« »
: « -29», « -23», «P 32», «G-68», « 17», « - »« -92». ,
, – «S 22» « -29», , -. -
, ,.
0,10 0,41 / , 23 /.
, -, -
.
«S 22» « -29».
1. Biederbeck V.O., Bouman O.T., Cambell C.A. et al. Nitrogen benefits from four green-manure legumes in dryland cropping systems// Canadian Journal of Plant Science.- 1996.-Vol.76.- P. 307–315.
2. - / . ., . . , . . , . . // : -
: . . . – 2007. – . 357–364.
633.2/.4: 633.289.1 (574.2)
. ., . ., « - . . . »,
. , [email protected].
. – .
[1]., -
.
.
, .,
[2]. – ., [3].
,.
,, -
, , .

102
-. . . ( .), “ ” - -
, ., .
. . [4]. -, , , , -, , , , , - -
. – 202 (1949 .) (1992 ).
. . [5] «AGROS-2001». 2012–2014 . , -
, ,, .
, -.
2012–2014 . 140,5 , 158,3 11,2 % ( 1).
. 1. (2012–2014 .)
2012 2014 , 2013 . - 2012 – 80,3 , 2013 – 2014 – , -
186,5 203,3 , 109,9 . 2012 .
, 2011 . 13 ,, ( ). 2012 -
( – ) 105 , 2013 110 , 2014 107 . (2012–2014 .) – 107 .
46 81 , 202 – 80 , – 83 . .
2012 : 2, 9, - 202 (48,6 / ) 22,0–55,5 %, (58,7 / ) 1,7–28,7 %. -
5 202 (20,9 / )28,7 %, (26,5 / ) 1,5 %. 2013 2,
202(105,6 / ) 5,2 %, (98,1 / ) 13,2 %. - 2013 . 2014 -
: 2,9,12, 202 (43,1 / ) 9,5 – 28,0 %, (45,8 / ) 3,0 – 20,5 %.

103
2, 5, 9, 202 (15,1 / ) 22,5 – 35,7 %, (16,0 /) 15,6 – 28,1 % ( . 1).
1
, 2012
-,
, / , /
-
% st
-
% st
2012 2013 2014
--
202
2012 2013 2014
--
202
- 202, st
48,6 105,6 43,1 65,8 100 - 20,9 38,0 15,1 24,7 100 -
,st 58,7 98,1 45,8 67,5 - 100 26,5 42,2 16,0 28,2 - 100
2 75,6 111,1 47,2 77,9 118,4 115,4 25,4 40,0 20,5 28,6 115,7 101,4
5 55,5 83,3 45,8 61,5 93,4 91,1 26,9 39,6 19,0 28,5 115,3 101,0
9 59,7 86,1 52,8 66,2 100,6 98,0 25,7 22,1 18,5 22,1 89,6 78,3
12 45,9 105,6 55,2 68,2 103,6 101,0 14,9 37,0 14,1 22,0 89,2 77,9
05 13,5 17,6 16,6 5,6 5,5 5,8
(2012–2014 .) ( . 2).
-, 13, .
2
, 2011 .
,
, / , %
% st
2012 2013 2014-
2022012 2013 2014
202, st1,3 2,4 0,8 1,5 100 - 36,3 28,6 37,1 34,0
,st 1,0 2,3 0,8 1,4 - 100 36,2 28,7 38,5 34,4
2 1,5 2,4 0,6 1,5 100,0 100,0 39,8 31,9 31,5 34,4
12 1,0 2,5 1,0 1,5 100,0 100,0 39,5 28 43,5 37
13 1,2 2,6 1,1 1,6 106,6 114,2 40,5 35,5 42,5 39,5
05 0,5 0,6 0,4
. 95 % 100 %, ,
. 13 -
- 5 : 2, 5, 9, 12, 13. .
, -- 2.
.
1. . . / .. : .: . . ., . . ., . . ., . . ., .. .,- ,2010.-3 .
2. . . // . . .-. . « -
» 8–9 2010 . – , 2010. – . 3. – . 124–128. 3. . . . « ».: - « »,1981.– 22 .4. -
/ . . . . ., . . ., . . .- .,1985.- 188 .5.. . . « ». – .: , 1985.-351 .

104
631.52:633.16
. .- . . .
. , . [email protected]
– ,, -
, -.
– ., -
, - [1].
, . – -
,. -
.-
[2]. , -. ,
. « . . . »
: , , - 1 2 , , 1 2–3 ,
..
33 -: « . . . » 2005, 2007,
, ; « » , , , , ; « » 5, 6 7, 8; «
» 16, 40, 42, 43; : 90, 91, 95, 96, , ; : , , , , ,
; : , , , . 2013 2014 .
. 2000.
2013–2014 . -.
,, ,
, , , ..
170,8 , - 166,1 .
,- (71–80 ), : 6 –
87 , 5 – 86 , 8 – 83 ; – 86 .: , , 16 – 64 , , 43 – 66
; – 64 , – 66 .- ,
.
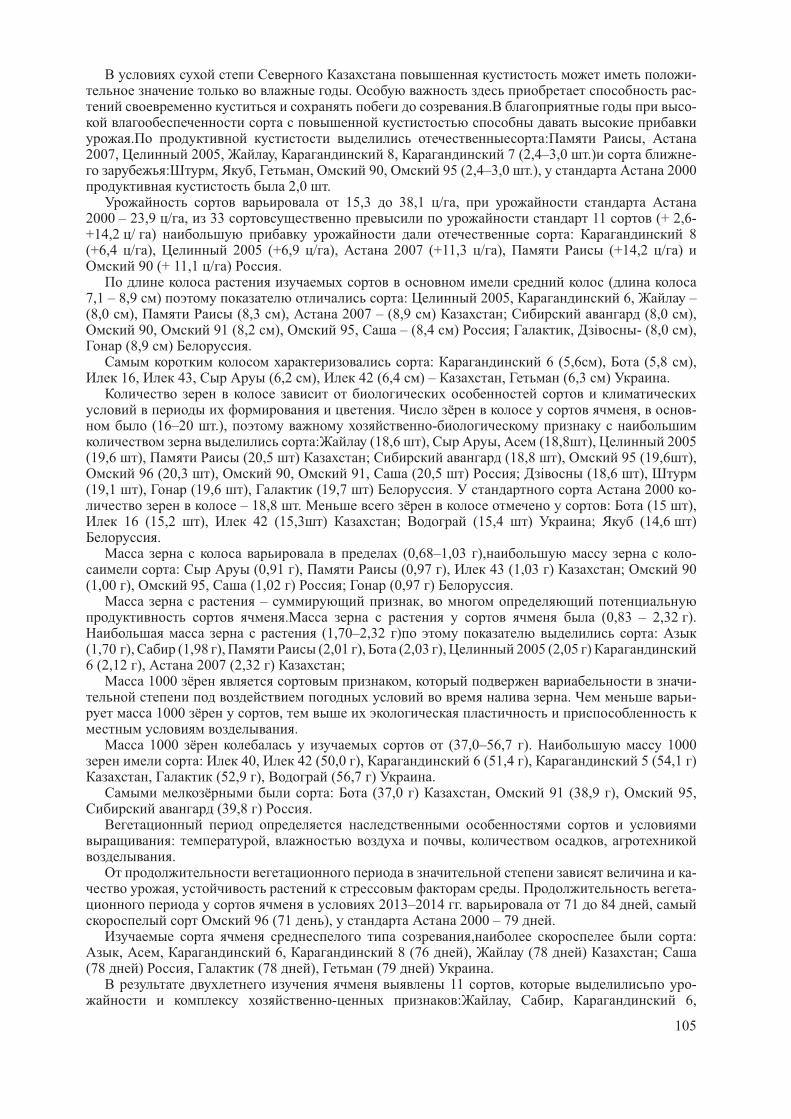
105
-. -
. -
. : ,2007, 2005, , 8, 7 (2,4–3,0 .) -
: , , , 90, 95 (2,4–3,0 .), 2000 2,0 .
15,3 38,1 / ,2000 – 23,9 / , 33 11 (+ 2,6- +14,2 / ) : 8 (+6,4 / ), 2005 (+6,9 / ), 2007 (+11,3 / ), (+14,2 / )
90 (+ 11,1 / ) . (
7,1 – 8,9 ) : 2005, 6, – (8,0 ), (8,3 ), 2007 – (8,9 ) ; (8,0 ),
90, 91 (8,2 ), 95, – (8,4 ) ; , - (8,0 ), (8,9 ) .
: 6 (5,6 ), (5,8 ), 16, 43, (6,2 ), 42 (6,4 ) – , (6,3 ) .
. , - (16–20 .), -
: (18,6 ), , (18,8 ), 2005 (19,6 ), (20,5 ) ; (18,8 ), 95 (19,6 ),
96 (20,3 ), 90, 91, (20,5 ) ; (18,6 ),(19,1 ), (19,6 ), (19,7 ) . 2000 -
– 18,8 . : (15 ), 16 (15,2 ), 42 (15,3 ) ; (15,4 ) ; (14,6 )
. (0,68–1,03 ), -
: (0,91 ), (0,97 ), 43 (1,03 ) ; 90 (1,00 ), 95, (1,02 ) ; (0,97 ) .
– ,. (0,83 – 2,32 ).
(1,70–2,32 ) :(1,70 ), (1,98 ), (2,01 ), (2,03 ), 2005 (2,05 )6 (2,12 ), 2007 (2,32 ) ;
1000 , -. -
1000 ,.
1000 (37,0–56,7 ). 1000 : 40, 42 (50,0 ), 6 (51,4 ), 5 (54,1 )
, (52,9 ), (56,7 ) .: (37,0 ) , 91 (38,9 ), 95,
(39,8 ) .
: , , ,.
-, . -
2013–2014 . 71 84 , 96 (71 ), 2000 – 79 .
, :, , 6, 8 (76 ), (78 ) ;
(78 ) , (78 ), (79 ) . 11 , -
- : , , 6,

106
8, 2005, 2007, ; 90 ;; .
1. . . / . ., . . – , 1993. – 292 .2. . ., . . : , 2008.-
138 .
631.51: 631.43
. ., . ., « - . . . »,
, , e-mail: [email protected]
, , -, .
.,
319,3 , 20 %, 42 % – 40 %, - -
. , , ,. - .
, ,( - )
. – 134,7 ,
,(162,3 – 2011 ) , -
(49,0 – 2010 ). -, -
.,
., . , -, 62 % ,, . -
- ( ,
, , ),, - .
, . . . 2014–2015 -, -
, -.
2014–2015 , ,,
( . 1).
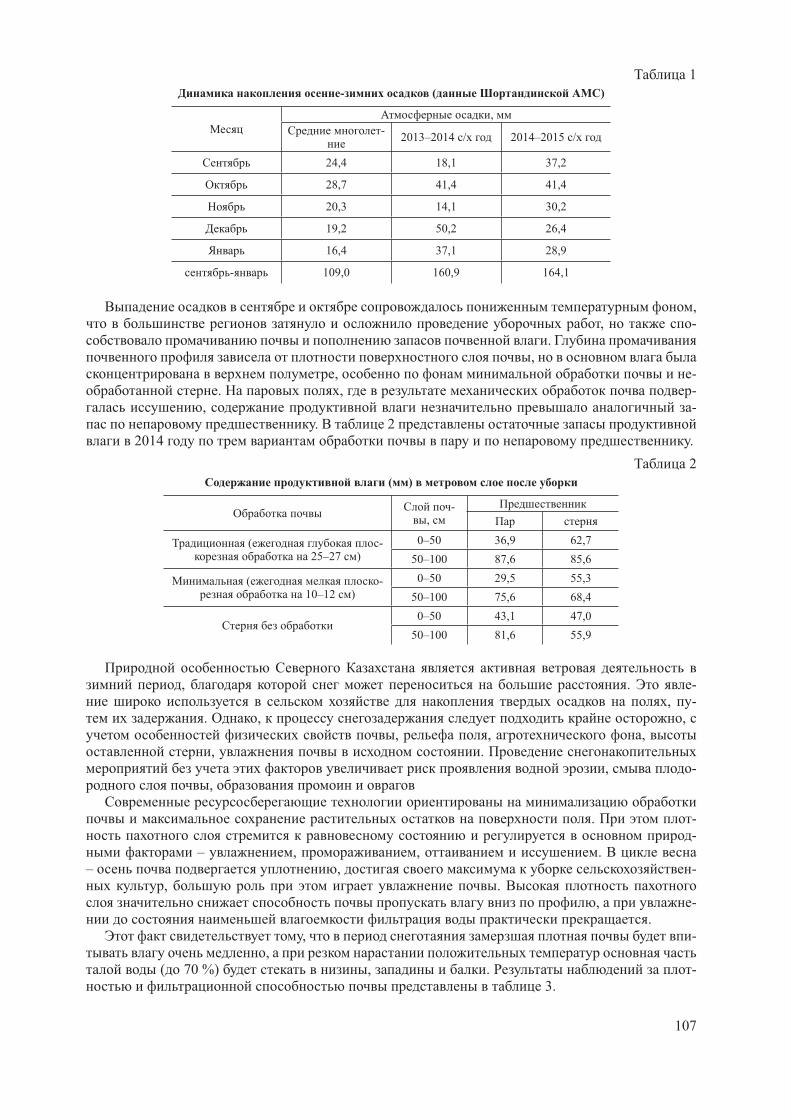
107
1
- ( )
,
-2013–2014 / 2014–2015 /
24,4 18,1 37,2
28,7 41,4 41,4
20,3 14,1 30,2
19,2 50,2 26,4
16,4 37,1 28,9
- 109,0 160,9 164,1
,
, -
.
,
, -
. , -
, -
. 2
2014 .
2
( )
-,
( - 25–27 )
0–50 36,9 62,7
50–100 87,6 85,6
( - 10–12 )
0–50 29,5 55,3
50–100 75,6 68,4
0–50 43,1 47,0
50–100 81,6 55,9
, . -
, -
. , ,
, , ,
, .
, -
,
. -
-
– , , .
– , -
, .
, -
.
, -
,
( 70 %) , . -
3.

108
3
2014
-,
,/ 3
--,
/
( - 25–27 )
0–10 1,00 2,0
0–30 1,15 0,7
( - 10–12 )
0–10 1,07 1,3
0–30 1,22 0,4
0–10 1,12 0,9
0–30 1,24 0,4
-. -
, ( -, , ).
, .-
– 25–35 . 30–40 , .
, ,, -
. 2015 ,
35–37 , 85–93 , 95–103 ( . 4). , -
, , 30–50 % , ( , 28,6–51,4 )
. ( ),
, .
4
, . – 2015
,,
/ 3 ,
* ** * ** * **
( - 25–27 )
15,4 24,8 0,27 0,27 41,6 67,0
( - 10–12 )
15,6 25,1 0,26 0,25 40,6 62,7
29,3 30,8 0,26 0,26 76,2 80,1
( - 25–27 )
37,4 38,0 0,24 0,27 89,8 102,6
( - 10–12 )
35,6 36,7 0,24 0,26 85,4 95,4
37,2 39,5 0,25 0,26 93,0 102,7
*- 21.01.2015 , ** 17.03.15 .
, , - , - – 116–137 ; -
– 97–116 – 87–107 . -, ( ) ,
, ,.

109
, , -, .
: 633.31.16
. .,« » – . .
, ,e-mail: shalkar [email protected]
, [1]
., -
.,
. ,
., - , ,
50 . 10 . -
[2]. :
69 – 87 . 10 5 – 7 , - . 69 – 72
- ( . .-67771, 53370, 51745, 64486, . .-915, 942), ( -551742), ( . .-901) . 10 –
- 78 . ( – )
30 – 35 , ( – ) 25 – 35 .
., . ,
[3]
(5 – 7 ). ( , ) - 45 – 75 . ( 173193–1, ,
415) ( 24, 447) 50 – 55 , 70 – 75 . 10
50 – 70 . .1000 .
. 1000 , -
. 1000 ,.
-, - , , .
.

110
23,0 – 36,0 (5 – 7 ) ( . .-922, 921), ( .-905, 902) -
. 1000 22,9 , – 7 . ( . .-939, -2647), ( . .-911, 921, . .-
51744, 64515, 51745, 59832, 64510), ( -61926) -. 1000 36,0 – 42,0 . – 7 .
10 35,6 , – 7 ..
. , -
. ( . .-64356, 63378, 67771,
0118963, 30595, 64486, , . .-921, 929, 935), ( . .-2647, . .-902,905, 939, 916, 944, 941), ( -61926), - ( -552508) .
8,6 – 18,0 . 8,1- 11,8 .
:
1. . . “ - -
” 8 – 2007 . 17–18 .
2. . . . . . . ( ) .
1985. 26 .
3. . . . . . . . “ ” -
7 – 2003 . 21–22 .
633.3:631.529
., ., ., . .,
« - -», . , ,e-mail: [email protected]
- -
.
- -.
, -.
Astragalus, Fabacea. - 309 .
: . , , -. .
, - . 2010 ,
, 2 , -. . . .
. ,. 7–13 .
, 8–12 . -
.

111
. , , -
12–17 .
, , ,
.
. -
, .
15–18 . .
.
, – . , -
58–63 .
,
51,0±3,0 , 3,0±0,4 ./ ,
39,5±2,0 , 3,9±0,2 ., 4,3±0,6 .
. -
. 340 / ,
434 / , - , 112 143 / .
.
, -
.
( , - ).
67–72 %.
, -
14,4 19,0 %, – 29,9–33,2 %.
, -
,
. -
,
.
631.52:633.16
. .,
« . . . »,
-1, , e-mail: [email protected]
, -
– .
,
,
. [1].
,
, -
.
.
. . . , -
, ,
, .

112
, , -
. 1000 ,
. -
1000 , -
– . , -
, , .
1000 , -
[2].
(2012–2014 .) 1000 -
36,4 60,2 , 23,5 58,1 .
1000 -
, , . 1.
1
( / 2)
-,
--
,,
,
, 1000 ,
-,
2012 0,55** 0,24 0,79** 0,66** 0,81** 0,29 0,52** 0,32
2013 0,36** 0,53** 0,06 -0,13 0,30** -0,18** 0,00 -0,26**
2014 0,39** 0,15* 0,15* -0,10 0,24** 0,02 0,26** -0,25**
1000 -
.
, 1000 : Antiago,
(44,3–50,6 ); Beatrix, (45,2–54,2 ); Thorgall, (47,0–57,6 ); ,
(47,2–56,2 ); , (49,1–58,7 ); , (48,6–60,2 ); ,
(46,9–54,3 ); -7763, (45,4–60 ); 5300, (50,6–59,8 ); - ,
(45,8–58 ) .
. -
,
. -
( - )
(10–33 .). 20 . 17,2 % . -
11 47 . 20
30 % . 20 :
-23875, (28–47 .); -20855, (28–43 .); -29026, (21–42 .); -433614,
(20–23 .); , (21–30 .); , (32–33 .).
, , -
. .
.
,
1000 :Antiago ( ), i ( ), -23875 ( ),
-3476( ), -433614 ( ), -30605( ), - ( ), ,
, ( ).
-
.
.
1. . . . – . – .: , 1966. – 559 .
2 . . : . – .: ,
1978. – 431 .

113
579.66:631.461.5
« »
1 . ., 2 . ., 1 . ., 2 . .1,1 « » . , , e-mail: [email protected]
2 « » ,. , , e-mail: [email protected]
– , -
. -.
. -, -
, ., -
., 80 %, -
Rhizobium, Mesorhizobium, Sinorhizobium, Bradyrhizobium[1–2].,
,, .
- « – » , -
, - .
.,
,.
-, ,
[3, 4].-
« » .
– Bradyrhizobium japonicum -17.
24 28° . -, / : – 6,0;
K2HPO
4– 0,5; MgSO
4 – 0,2; -1,5; ZnSO
4 – 0,005; FeCl
3– 0,01; -
– 2,0; 7,0. 750 200 48 180–200 /
28±1° . 1:4. « »
- - - – 200 / + 400
(n 109 / ). – .. -
. . [5]..
« – » 1. ,
, « - »

114
n 109, 92,6–97,2 , ( ) 89,3 . -
– 8,8 %.,
« » n 109. , 14,8 ,
– 35,8 , – 53,4 , - – 9, 0 ; 20,6 ; 31,0 , .
1
« – »
( )
,, .
-,
C-
,
89,3 9,0 20,6 31,0
n 109 92,6 12,8 33,8 50,4
+ 97,2 14,8 35,8 53,4
-.
: 64,4 %, 73,8 %, 72,3 %.
« – » n 109 , -
( . 2). : 2 , 2,4 .
2
« – » ( )
, , ,
1,4 0,8 150,0
n 109 2,5 2,4 314,8
+ 2,8 2,9 355,0
« » - ( . 3). ,
,, . , 19,6 , -
– 8,1 , – 2,4 . 1000 190,1 , – 149,9 , 26,8 %. -
53,9 / , 11,2 / (26,2 %) ,42,7 / .
3
« »
,
-
,
-
-,
-
-,
1000,
-
/
-
- %
81,2 0,6 23,8 53,8 8,10 149,9 42,7 0,0
n 10992,3 0,2 23,0 48,2 7,08 160,9 49,9 16,9
+ 100,8 0,8 46,0 109,4 19,67 190,1 53,9 26,2

115
, - « »
, , -.
1. . ., . . . – .: ,1973. -180 .
2. . ., . . – // . . – 2005. – . 106–107.
3. . . // , – 2000. – 6. – . 71–78.
4. . ., . ., . . - // . – 2008. – 1(19). –
11–14.5. . . : . – .:
, 1991. – 140 .
631.58
,
. ., . ., « »,
- -,
, ,,
.- -
, -. ,
, [4–5]. ,
, -.
, , -:
–
1 – 18 St ( )
2 – ( )
3 – ( )
4 – i 7 ( )
5– i 97 St ( )
6 – ( )
7– 1 ( )
–
1 – 27
2 – 5
3– 12

116
4 – 19
5– 26
6 – 2
–
1 – 2,0 .
2 – 2,5 .
3 – 3,0 .
, , – ., ( + =
24+16=40 ) , , -1,41 %. , -
, , ,. (2012–2014 .)
. -.
2012 , 44,0 17,3 . -
, 4,20 , ., -
– . 2011 – 2012 - 246,0 , 174,0 . -
, , 37,011,5 . 2012–2013 ,
82,0 . ( - ) 122,8 , 24,8 . 2013–2014 -
218,0 ., -
, ,.
, -
,. -
.- .
, 13 20 , 15 22 .13–14 12–150 -
13–150 , - -, – . 19–22 9–100 6–80 .
, -, . ,
, ,
. – – . -
37 39 , 39 43 . (27 , 5 12 ) -
38 ( 97) 39 ( ), 41 ( 7) 43 ( ).
, , ,. -
. , 27 -
, 2,0 ./ 95,5 %, , 2,5 3,0 86,8 78,0 %

117
. 18 94,0; 83,2 76,6 %. -
, 2,5 3,0 . -
(19 26 ) 2,5 3,0 ./69,5 71,0; 66,4 69,0 %, 2,0 ./ 62,0 %.
. -,
.
1
, /( 2012–2014 . .)
/ 2012 2013 2014
1
27 5,1 9,5 3,5 6,0
5 2,0 7,4 3,4 4,3
12 3,3 8,9 3,8 5,3
19 3,7 9,3 4,4 5,8
26 3,2 7,4 4,5 5,0
2 1,5 12,1 4,8 6,1
2i 7
27 2,1 7,3 2,7 4,0
5 3,7 7,0 2,4 4,4
12 3,5 9,6 2,8 5,2
19 4,6 6,4 4,1 5,0
26 4,3 11,5 4,3 6,7
2 1,9 9,5 4,5 5,3
3 18
27 – 8,3 2,3 5,3
5 – 7,1 2,6 4,8
12 – 7,6 2,5 5,0
19 – 10,0 3,7 6,8
26 – 9,6 4,7 7,1
2 – 8,4 4,6 6,5
4
27 1,8 7,0 2,8 3,9
5 3,7 8,3 2,4 4,8
12 5,6 9,6 2,6 5,1
19 3,5 10,5 3,5 5,8
26 3,5 8,5 3,6 5,2
2 2,7 8,1 4,0 4,9
5 97
27 – 7,9 3,0 5,4
5 – 6,2 3,0 4,6
12 – 8,8 2,9 5,8
19 – 7,0 4,2 5,6
26 – 6,4 4,3 5,3
2 – 13,7 4,5 9,1
6
27 5,0 7,2 2,7 5,0
5 4,7 9,4 2,7 5,6
12 4,5 6,4 2,9 4,6
19 5,1 9,8 4,2 6,4
26 5,3 11,3 4,3 7,0
2 3,7 11,2 4,7 6,5
: , -, , .
9 13 ./ . ., -
. 2 , 97, ,
6,1 – 9,1 / . 18 7 26 , .

118
, , -. -
2013 , - , -,
.:
1.
, .;
2. 2 , 97, , 6,1 – 9,1 / . 18 7 26 ,
.
1. . . // 2- . ,« », 1967, .2, .7–260.
2. . 1, ., 1985, 269 .
: 634.13
. ., . .,- ,
. , , e-mail: [email protected], [email protected]
,, -
1 , , ,.
.. ,
, – .
,- « -
», , -10 ( . . , . . . );
– GF, GF, -29, ; – 21, 1, 4, 8, 10, 12, 14 ( -. . ); – –R
4, 3/42, 4/4 6, 7/7 3, 248/5 ( . . );
– -13 ( . . ), ( . . ).-
6 3 . - - 4- 10 40 .
, ,.
, ,. -
., 4–5 , -
. 11–12- ,- – -13 23–48 % ,
. , 21, - – , -10, -13 ( . 1).
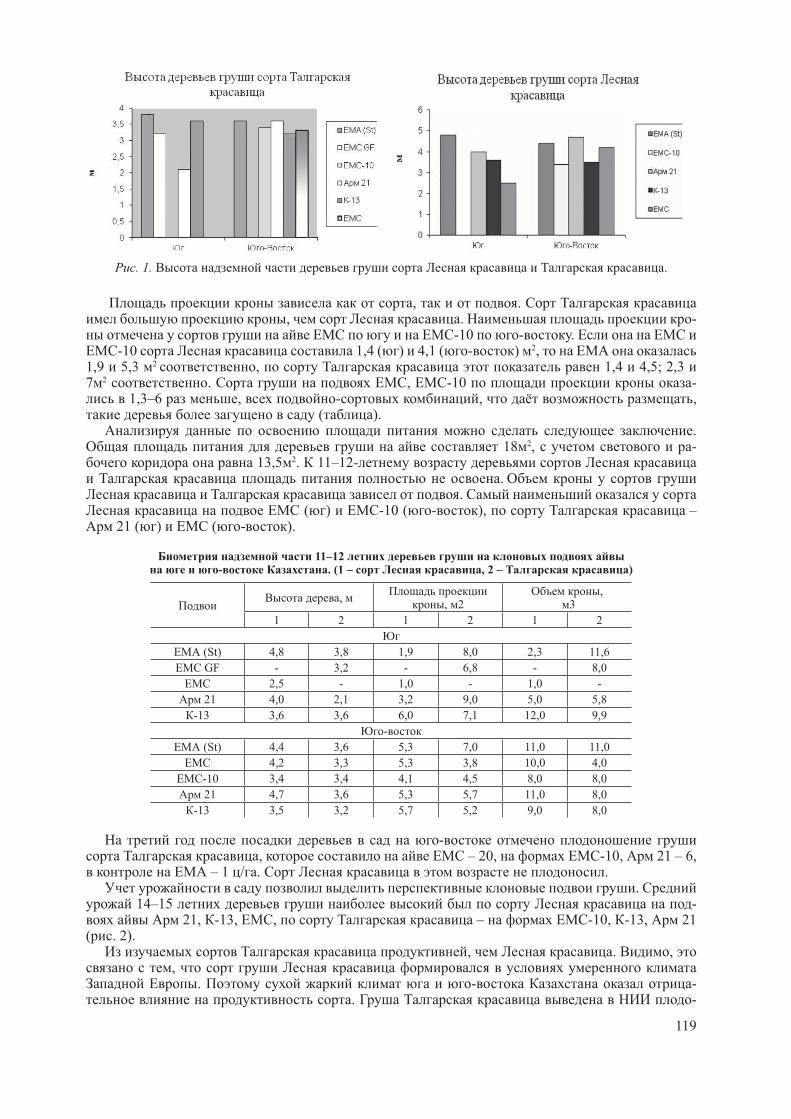
119
. 1. .
, ., . -
-10 - .-10 1,4 ( ) 4,1 ( - ) 2,
1,9 5,3 2 , 1,4 4,5; 2,3 7 2 . , -10 -
1,3–6 , - , , ( ).
. 18 2, -
13,5 2. 11–12-.
. ( ) -10 ( - ), –
21 ( ) ( - ).
11–12 - . (1 – , 2 – )
,, 2
,3
1 2 1 2 1 2
(St) 4,8 3,8 1,9 8,0 2,3 11,6
EMC GF - 3,2 - 6,8 - 8,0
2,5 - 1,0 - 1,0 -
21 4,0 2,1 3,2 9,0 5,0 5,8
-13 3,6 3,6 6,0 7,1 12,0 9,9
-
(St) 4,4 3,6 5,3 7,0 11,0 11,0
4,2 3,3 5,3 3,8 10,0 4,0
-10 3,4 3,4 4,1 4,5 8,0 8,0
21 4,7 3,6 5,3 5,7 11,0 8,0
-13 3,5 3,2 5,7 5,2 9,0 8,0
-, – 20, -10, 21 – 6,
– 1 / . ..
14–15 - 21, -13, , – -10, -13, 21
( . 2). , . ,
,. - -
. -
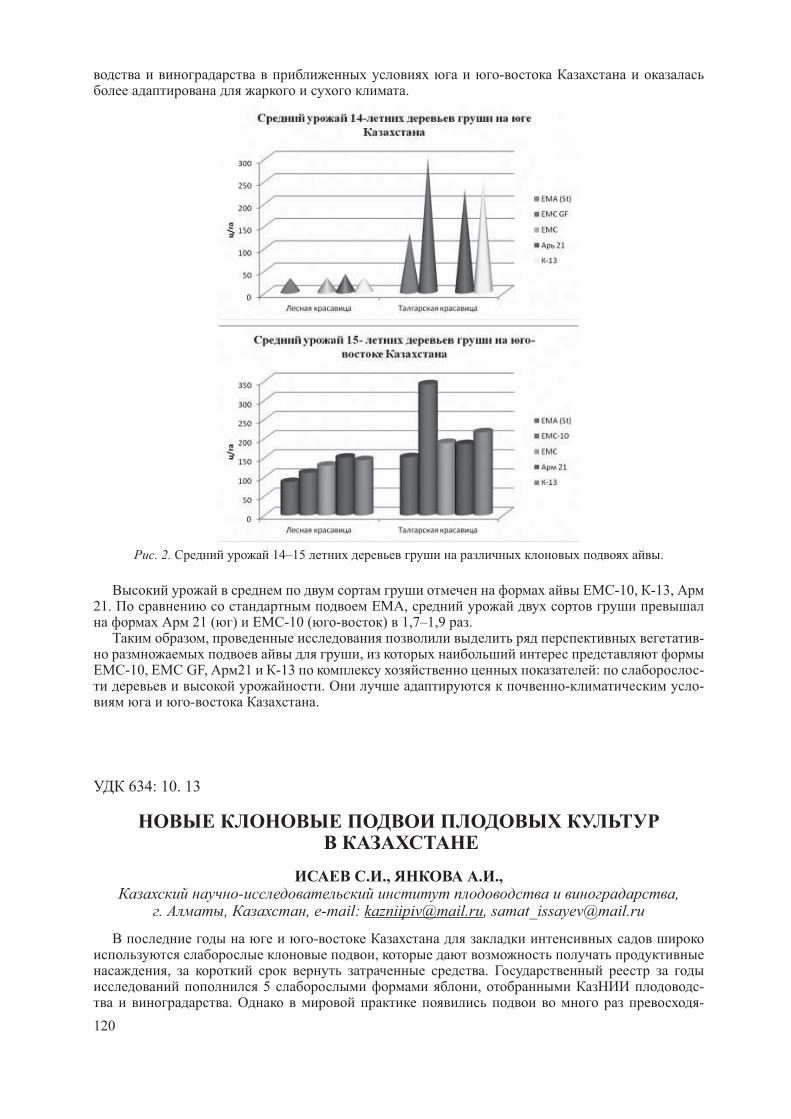
120
-.
. 2. 14–15 .
-10, -13,21. ,
21 ( ) -10 ( - ) 1,7–1,9 ., -
,-10, GF, 21 -13 : -
. - -- .
634: 10. 13
. ., . .,- ,
. , , e-mail: [email protected], [email protected]
-,
, . 5 , -
. -

121
- ,. , -
, ,.
, -.
,. . 19 5 « » « -
», 3 , 6 « », 3 « » .
: , , , .-
, ,, , ,
, , . ,-
. , -.
3 . « 5» (10- ./ ), « 6» (10 ./ ) -
70–6–8 (5 ./ ), 6–4–8 (8 ./ ). - 5–4–11 (2 ./ ), 3 (2 ./ ).
2,8 – 3,5 . 3 ( 4,3 ). 18, 16–20,
6–4–8, 5, 64–143, 6–20–1, 71–3–15, 104 (36–42 ). MARK.
, -. ,
70–6–8, 103, 104, 3, 2 9. 71–3–150, 4, 5
106, . 70–6–8, 103, 104, 3, 2, .
,. (
) 103 9. 2,5 -3,0 .
70–6–8, 5 (4,5-5,0 ) ( . 1).
,9 5 305,8 ./ .
2 3,8 . 4, 2, 64–143, 71–3–150, –
104, 105. 5 , ,
. 7 -
4 (317 . ./ ), 64–143 (306 . ./ ), 5 (308 . ./ ),104 (389 . ./ ).
3,7–4.8 , 9 (81 . ./ ) 1,1–1,4 106 (287,0 . ./ ).,
, -.
98–100 % . ( ) ,
. -- :
, , , (87–100 % ). – 85–90 %.
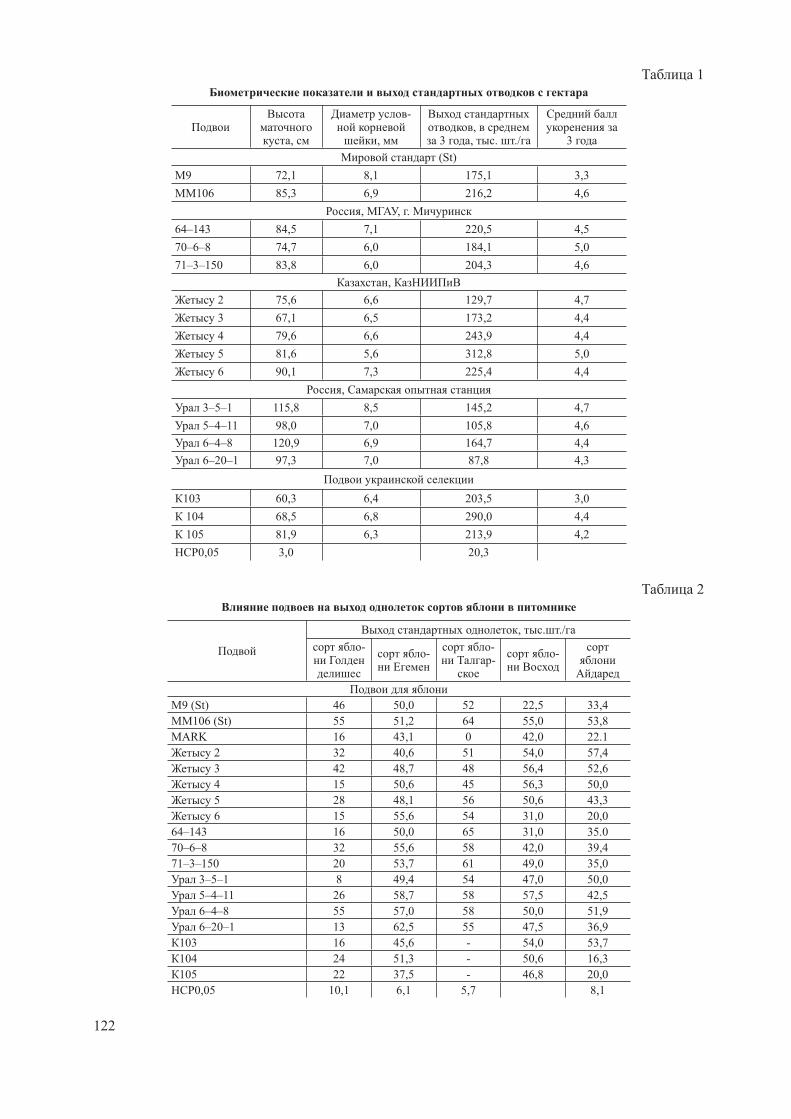
122
1
,
-
,,
3 , . ./ 3
(St)
9 72,1 8,1 175,1 3,3
106 85,3 6,9 216,2 4,6
, , .
64–143 84,5 7,1 220,5 4,5
70–6–8 74,7 6,0 184,1 5,0
71–3–150 83,8 6,0 204,3 4,6
,
2 75,6 6,6 129,7 4,7
3 67,1 6,5 173,2 4,4
4 79,6 6,6 243,9 4,4
5 81,6 5,6 312,8 5,0
6 90,1 7,3 225,4 4,4
,
3–5–1 115,8 8,5 145,2 4,7
5–4–11 98,0 7,0 105,8 4,6
6–4–8 120,9 6,9 164,7 4,4
6–20–1 97,3 7,0 87,8 4,3
103 60,3 6,4 203,5 3,0
104 68,5 6,8 290,0 4,4
105 81,9 6,3 213,9 4,2
0,05 3,0 20,3
2
, . ./
--
--
-
9 (St) 46 50,0 52 22,5 33,4
106 (St) 55 51,2 64 55,0 53,8
MARK 16 43,1 0 42,0 22.1
2 32 40,6 51 54,0 57,4
3 42 48,7 48 56,4 52,6
4 15 50,6 45 56,3 50,0
5 28 48,1 56 50,6 43,3
6 15 55,6 54 31,0 20,0
64–143 16 50,0 65 31,0 35.0
70–6–8 32 55,6 58 42,0 39,4
71–3–150 20 53,7 61 49,0 35,0
3–5–1 8 49,4 54 47,0 50,0
5–4–11 26 58,7 58 57,5 42,5
6–4–8 55 57,0 58 50,0 51,9
6–20–1 13 62,5 55 47,5 36,9
103 16 45,6 - 54,0 53,7
104 24 51,3 - 50,6 16,3
105 22 37,5 - 46,8 20,0
0,05 10,1 6,1 5,7 8,1

123
. -. ,
90–140 8–12 ..
98–174 10–13 . - 104 105.
.,
. (37 –
62 . ./ ) (31 -58 . ./ ). (16 – 57 . ./ ).
., ,
.
633. 11:631.52 (574. 2)
2-
. .,« - . . . »,
« -2050» [1].
- -. -
– .
. - -
– .
[2,3]. 30- XX
, - . . . -
. -
. ., -
2014 . 2014 -
. -. 1, 2 , 2, 3
, 3 1

124
, . , - 1 2 -
3 5,5 0 (!). . 4,4 0
. 1,4 1,7 . - 1, 2- 3 .
23,6 ., -
, 7–10 . 2- 2014 1721 ,
822 ,47,5 %.
158/09, 237/10, 93/10, 7,5; 9,0 12,5 / ( . 1). 170/08, 386/08, 200/10, 129/10 -
2 5,0–10 / ( . 1). : 337/09, 158/10, 139/08, R2(251/2), 351/07
2,5–10,0 / ( . 1). 100 104 , – 100, 2
– 101, – 103 .
1
2- , 2014 .
, , , / +
100 25,0 -
158/09 100 37,5 +12,5
237/10 100 34,0 +9,0
93/10 100 32,5 +7,5
2 101 30,0 -
170/08 101 40,0 +10,0
386/08 101 35,0 +5,0
200/10 101 35,0 +5,0
129/10 101 35,0 +5,0
103 30,0 -
337/09 103 40,0 +10,0
158/10 103 40,0 +10,0
139/08 103 35,0 +5,0
R2(251/2) 103 32,5 +2,5
351/07 103 32,5 +2,5
.
1. – -
. « « -2050»: ». 14.10.2012.
2. . ., . . -
. – , 2009. –182 .
3. . ., . ., . . : -
, // . – 2008. – 12. – . 8–10.

125
631.347.4
.
. ., . ., « - »,
. , , [email protected]
, -, , , -
, ( ,).
:- , -
;- ;- ,
;- , -
;- ;- , .
- , -, ,
, ,.
-.
.: -
, ., « » -
– , [1].
-.
. 1. .

126
-, .
(2 )., -
, 1 5 ..
..-
. . : R=0,42 +1000d, .,,
, :
R= /0,4+0,00025( /d), . (1)
:
R= /0,6+0,00035( /d), . (2)
- , ., d – , .
, « », -
(I=60q ).
, 2- .
I=60q/3,14(R1
2+R2
2)n, / ( 3 ) R
1 – , R
2 –
, ., n – ,-1, n=0,44, I – , / . , q – , / .
-:
q = 2� , / ( 4 ) 7 – ( 0,76 ), – , 2., –
, . ( )
.
1
( ).
,
0,15 0,20 0,25 0,15 0,20 0,25
, / 0,0082 0,0096 0,107 0,0814 0,094 0,105
-,
6,3 6,9 7,1 6,59 6,89 7,092
4,55 4,75 4,99 4,65 4,88 5,025
, / 0,055 0,058 0,065 0,0546 0,0575 0,060
,2,0
-, , -
, .

127
1. . ., . . – « 05.01.03.05.03. --
».
636.085.1
-
. ., . ., . ., « - -
, . , , e-mail: [email protected]
– -. -
, . -.
[1, 2]. -, ,
, ,, . -
, -
.-
, .-
.
, , , -, , . .
, , -[3, 4].
--
.
, ,.
. – -
.,
1 299 412 , ( , ,
. .) – 270–271 . - 2,74–4,20, 2,60–4,71 2,30–4,22 / ,
– 2,55–3,41, 2,85–3,88 2,54–3,53 / ,. ,
2014 2 2012, - 2012 2013 2014
( 1).

128
. 1. , /
– 0,19–0,30 0,20–0,23 , , -. 0,019–0,030 , -
2014 2,22 , 2012 – 2,81 .
, -, , -
.,
. -: , ,.
830–874 , – 0,45–0,55 , – 0,057–0,100 ,
0,120–0,250 ( 2).
. 2. ,
6,80–11,7, 7,70–13,28 6,80–11,87 / , ,

129
2012 , 2013–2014 , (8,2–9,2).
,, 2013 2014 , -
, .
1. . . : , ,// , 2009. – 9. –
. 6–10.2. . . – -
// . – 2009. – 6. – . 3–5.3. . . // . – 2008. –
8. – . 2–10.4. . ., . ., . . –
. . – .: -, 2009. – 200 .
633.15
. ., . ., . ., « - -
», . , , e-mail: [email protected]
– -, 10–11 15–20 %
. -, ,
.-
. –
., -
. I 2012 185 , 2014 –
130–135 . - 2012 + 20 +232014 +10 31 °C, 0–20 +10–15 °C.
2012 12–13 , 2013 2014 13–15 . 2012 84–91 ,
2013 2014 103–106 . - 2012 +26–33 , 2013 2014 +14–26 °C, 2012
8–9 , 10–12 .,
2014 2012. – 2012 69–75, 2013–2014 72–76 %, – 78–81 74–75 % -
, – 73–97 81–96 %. 5/87 – 2012 – 73–74, 2013–2014 – 81–85 %,
237 , 170 – 2012 – 74–83 2013–2014 – 84–88 %, 188, 200 – 93–96 %. -
90–96 %.
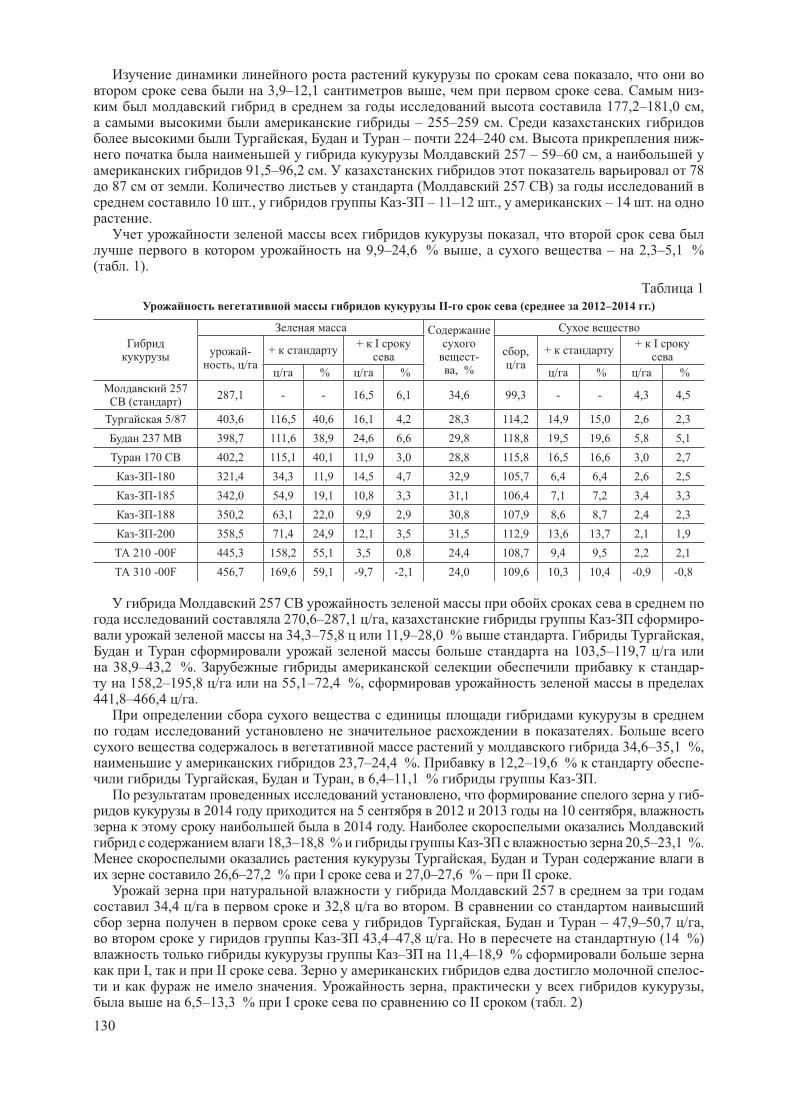
130
, 3,9–12,1 , . -
177,2–181,0 , – 255–259 .
, – 224–240 . - 257 – 59–60 ,
91,5–96,2 . 78 87 . ( 257 )
10 ., - – 11–12 ., – 14 ..
, 9,9–24,6 % , – 2,3–5,1 %
( . 1).
1
II- ( 2012–2014 .)
-, %
-, /
++ I
,/
++ I
/ % / % / % / %
257 ( )
287,1 - - 16,5 6,1 34,6 99,3 - - 4,3 4,5
5/87 403,6 116,5 40,6 16,1 4,2 28,3 114,2 14,9 15,0 2,6 2,3
237 398,7 111,6 38,9 24,6 6,6 29,8 118,8 19,5 19,6 5,8 5,1
170 402,2 115,1 40,1 11,9 3,0 28,8 115,8 16,5 16,6 3,0 2,7
- -180 321,4 34,3 11,9 14,5 4,7 32,9 105,7 6,4 6,4 2,6 2,5
- -185 342,0 54,9 19,1 10,8 3,3 31,1 106,4 7,1 7,2 3,4 3,3
- -188 350,2 63,1 22,0 9,9 2,9 30,8 107,9 8,6 8,7 2,4 2,3
- -200 358,5 71,4 24,9 12,1 3,5 31,5 112,9 13,6 13,7 2,1 1,9
210 -00F 445,3 158,2 55,1 3,5 0,8 24,4 108,7 9,4 9,5 2,2 2,1
310 -00F 456,7 169,6 59,1 -9,7 -2,1 24,0 109,6 10,3 10,4 -0,9 -0,8
257 270,6–287,1 / , - - 34,3–75,8 11,9–28,0 % . ,
103,5–119,7 / 38,9–43,2 %. -
158,2–195,8 / 55,1–72,4 %, 441,8–466,4 / .
. 34,6–35,1 %,
23,7–24,4 %. 12,2–19,6 % -, , 6,4–11,1 % - .
, - 2014 5 2012 2013 10 ,
2014 . 18,3–18,8 % - 20,5–23,1 %.
, 26,6–27,2 % I 27,0–27,6 % – II .
257 34,4 / 32,8 / .
, – 47,9–50,7 / ,- 43,4–47,8 / . (14 %)
– 11,4–18,9 % I, II . -
. , , 6,5–13,3 % I II ( . 2)

131
2
(14 %)
I III
,/
± ,/
± ± II
/ % / % / %
257 ( )
26,3 - - 24,4 - - 1,9 7,8
5/87 24,8 -1,5 -6,0 22,2 -2,2 -9,9 2,6 11,7
237 26,1 -0,2 -0,8 22,7 -1,7 -7,5 3,4 15,0
170 25,6 -0,7 -2,7 22,6 -1,8 -8,0 3,0 13,3
- -180 30,3 4,0 15,2 28,5 4,1 16,8 1,8 6,3
- -185 29,5 3,2 12,2 27,7 3,3 13,5 1,8 6,5
- -188 29,5 3,2 12,2 27,8 3,4 13,9 1,7 6,1
- -200 29,3 3,0 11,4 29,0 4,6 18,9 0,3 1,0
210–00F 9,4 -16,9 - 8,0 -16,4 - 1,4 17,5
310–00F 7,7 -18,6 - 6,9 -17,5 - 0,8 11,6
, – 130740 / , 100 %, -
102,4–103,9 % 106–116 . / ,- 103,5–105,1 %.
631.675:631.86/.87
. ., . ., . ., . ., « - »,
. , . -mail – [email protected]
- , -, , , -
. -
- ( ), -
, , [1, 2].
[3, 4]. , ,, -
, , -.
, .,
., , , -
, , - 14,6–36,3 %
( . 1).

132
– -
. ,, ( 70 %
), , , , , -, [5].
.
1
(1995–1997 . .)
,, /
/ %
3600 18,2 21,5 3,3 18,1
850 17,6 21,2 3,6 20,5
60 28,2 34,4 6,2 22,0
120 46,4 57,3 10,4 23,5
35 12,1 14,8 2,7 22,3
280 148,0 164,7 16,7 36,3
12 332,0 380,4 48,4 14,6
- , -
15–40 %, 20–25 %.
[6].- , -
,- , -
2003–2005 . . .
- - – ( 1 2).
-, . -
.: - -704 -
, « » – .. – 3, 5 10 / , – 100, 200 300 -
. – , – , – .
. 1. . 2.

133
, -
, .
2 .
2
/-
( ) ( ) , 3/ .,
3/1 2 3 4 5 6 7 8
820.05200
24.05250
7.06300
18.06300
3.07350
20.07350
5.08400
29.08400
2550
47.07700
18.07800
5.05850
24.08900
- - - - 3250
( . 3).
3
, /
1 , ,
0 3 5 10 0 100 200 300
605 633 686 733 418 450 486 529
-
. , -
26,5 %.
21,1 % – 10 / .
« »,
« » [7] , , -
. ,
, , , ,
, .
« » .
1. ( ) / . . – , 1997, – 26 .
2. / . – - , 2000 , 9.- . 9.
3. . . . -
.- , ,
2001 . – 27 .
4. . . : . –
, 4–2004 . .10–12.
5. . . – – . – , 4–2004 . .2–3.
6. . ., . ., . . -
. – ,
2000 . 12. . 13–14.
7. « »
/ ., ., . – :
« », 2003. -50 .

134
631.581/.6 (574.51)
. ., . ., . ., . .,- ,
, . E-mail: [email protected]
- .,
220–280 , - – 280–400 – 400 . -
0,48; 0,78 1,12..
, -. -
, -: . -
– -.
0–100 140 .
0–30 – (0–10 ) ., 1, -
0–30 .
, 0–30 15,7–16,2 , – 33–35
20,1 .
1
( ) 0–30
,,--
20–22 20–22
20–22 20–22
0–10 6,8 9,2 9,8 7,0 7,1
10–20 6,6 12,2 12,9 4,2 4,3
20–30 6,7 11,6 12,3 4,5 4,8
0–30 20,1 33,0 35,0 15,7 16,2
, -.
. . . ( )
1961–1991 . 17,7 / , – .
( . 1).,
, , . --
30,3 / , – 22,0 / ( . 2). – -
, , - –

135
.. (
350–400 ) . --
. -. .
. 1.
. 2.
« – » « – -» , 6,7 / ,
1,4 , « – » ( . 3)., -
-, . , -
, ,. ,
30 / -.

136
10–12 5,8 / , 36,7 %. 1993
12,7–12,9 / .-
2,6 / ( . 4).
. 3. “ – ” “ – ” - .
. 4. ,
- 10–12
25–27 , 2,2 / . -,
2,5 / ( . 5). 6,6 / .

137
. 5.
-: -
( ) 32,4 / 3,8 / , 11,7 %. .
, ,,
.
.
633.11. “
324” : 631.582
-
. ., . ., . ., . .,- ,
, . E-mail: [email protected]
- .-
( , 17–200 ) 300–400 [1].
- , 80 % . ,
, . 50- 500–600 . ,
4–5 14–15 / . 1991 1202 . ,
100–150 . , – - 20 80 . [2].

138
-. , 2003
259,1 . , 2009 58,8 . , – 2 ( 263,2 . 113,6 . ).
2006–2012 - 162,2 . , 154,9 . .
- ,.
. -, :
2002–2014 15,3 / , - 7,0 / , . , 2007
10,0 / , 2009- 13,0 / ., -
, 2,8 .,
220 300 ( 1,8 , 64 % ); - 280–400 (0,7 , 27 %) –
400 (0,3 , 11 %). , – . -
15–25 % , 20 % -.
., . ( - ) 1000 - -
1300–1600 , 4–5 .-
. 200–400 600–700 . -
. 600–700 900–1000 .
1100 . . - (15–20 )
0,9–1,3 %.
- 1,9–2,3 %. ,
- .- ,
, ,.
,, 243 , -
.: -
,.
-. , ,
..
, 0–100 120–130 .
. 1,5–2,0 , ,
, – .

139
400 , ( .1).
. 1. ( . 2012–2014 .)
28,8 / , ( ) – 4,9 / .
2 .
. 2. ( / , . 2012–2014 .)
,, 5,0–5,2 / .
, 30,5 / ..
6,8 / . ,, -
, -. ,
.

140
, , 400 ,
, , .
1. . ., . . . // .: « », 1988. – 303 .2. . ., . ., . . // , , 1996. – 172 .
633.172:631.874 (574.2)
. ., « - . . . »,
, , E-mail: [email protected]
, . . -
.,
-.
-
. ( )
,,
.
. 2008–2011 .
. 3,6 %. - – . . – 600 2.
, .-
. , ,.
(5–6 ) .. 6–8 / . 5–6 .
, -1,4 30–35 , . -
. , ,, .
( -) 1.
( 2008–2011 .) , -, 20,4 .
0–100 , 4 123,0 ( . 1). 95,7 ,
27,3 .

141
,, .
1
( 2008–2011 .)
( )
, 12,3 20,4
0–100 , , 123,0 54,4
0–100 , , 95,7 98,5
(N 3) 0–40 , ,/
74,0 60,0
(P2O5) 0–20 , ,/
32,0 23,0
( ), ./ 2 19,6 16,6
( ), ./ 2 4,1 3,9
, / - 135,6
1 ( ), / 16,5 16,8
1 9100 8100
1 , . 1 , 32500 19324
1 , . 1 8870 18900
54,4 , - 98,5 44,1
., -
.-
. - 135,6 / .
-.
, - 0–40 60,0 , 0–20
23,0 1 . 74,0 , 0–20 – 32,0 1
.-
, ,.
, -, ,
(4,1 ./ 2) .
(3,9 ./ 2),.
,.
( ) . 1 ,
16,5–16,8 / . 1 (8100 ), -
(9100 ). 1 -: 4- 10–12 , -
, 12–14 25–27 .
. , -, -
, .

142
, -, -
, -
( ).-
, ,.
,-
, - ,.
631.81.095.337
, ,
. ., . ., . ., . .,
. ., . .,
,, . E-mail: [email protected]
– 600 .( , , ) 50 -
[1]., -
, [1]. – -, , .
, -[2,3]. ,
[3].,
,, .
, [4].
- 2011–2014 .
: – – – - – ., 3,9–5,2 %,N-NO
3 + NH
4 – 7,6- 11,9 /
;2 5
– 16,1 /100 ;2
– 10,4 /100 , - ( , , , )[5].
, : 200 / , 5 9 2 / .
9 , 2 . 3 .
, ,.
3,4–5,6 %, – 1,3–1,6 % ( . 1).

143
1
,
, %
,, %
,, %
24,4 11,8
+ 27,8 13,3
+ -5 28,0 13,1
+ -9 30,0 13,4
, , 2,0–5,4, – 2,3–4,6 .
, ,, . 9 200 /
1000 1,9 , – 3,4 .
N45
, ,.
9,4–18,9 %, – 24,0–28,6 %, - – 6,8–13,4 %. , -
9 2 / ( .2).
2
, ,
, / , % , / , %
1,80 - 2,71 -
+ 1,97 +9,4 3,36 +24,0
+ -5 2,08 +15,6 3,32 +22,5
+ -9 2,14 +18,9 3,43 +28,6
05 0,11 0,52
,,
. 9 2 / , – 200 / 9 2 / .
0,3 0,6–0,7 / . - 24 27–30 %, – 1,5 %.
1. [ ]. – http:// gkultura.ru›files/
others/VOLSKI_BIOHIM.
2. . . : -
. : , 2001. 352
3. . . -
: . . . . .
. .- . . ., 2011. 116 .
4. / . . . . i : « i », 2007. 100 .
5. . . - -
: . . : - , 1987. 60 .

144
-
. ., . .,, ,
. , . -mail: [email protected]
-. , -
, , -.
,, .
, ,, , -
. , ,, 75 % -
, 0,5–0,7 , 25 % 0,8–0,9.
-, ,
.-
, . --
, .-
.
. 1. .

145
, 1, , . -
, ,,
.,
. -.
. ,, -
, ,. ,
, 60–70 , - , .
NaCl, Na2SO
4, 85–135 , 0,2 %, -
1,45 %. 135–165 Na2CO3 11 . ,
, .- ,
. 100–140 , -
. - -, ,
., -
., , ,
. , ,. – , -
,.
, . -.
,0–25 . , ,
, -. , , -
, , 2.
. 2. ,

146
,, , -
, ,.
, , 3. , , ,
, ( 4). 60 1 -
, ., -
, ,. .
. 3.
.4.

147
-
, ,
. -
. , ,
, .
, -
, -
.
636.1,2,3,4, 575.11
. .,
« -», . , , [email protected]
. ,
.
2011
« » -
« -
2020».
-
.
:
1. ( );
2. ,
.
, -
. , , ,
.
, , .
, , -
.
, -
, ( -
):
1) ;
2) ;
3) ;
4) ;
5) ;
6) 2–3
.
.
;
1.
;
2. ;

148
3. , ;
4. ;
5. -
, ,
, , , ,
;
6. -
;
7. .
-
,
, -
, .
, -
, , ,
.
– .
: 635.21
. ., . ., . ., . .,
« » ,, [email protected]
,
( ). (950 . . . .) .
– - - , ,
. , ,
, , .
- , + 22 – +
240 C, – (- 100C -150C). -
– .
250–300 . .
5 (2010–2014)
7 .
(3–01–5) – , , , -
, ,
,
. 7 . -
, , , .
, . . , .
, , . , -
. , , . - -
, , , . , ,
- , .
2014 .
(8–02–5) – , , -
, , ,

149
. 7 ,
. , .
, . . , ,
, , , . ,
, . , , .
, . , , -
. 2014 .
(6–02–15) – , , , ,
. 7 -
,
. , , , .
, . . ,
, . , .
, . , -
, . , , , -
. , . , -
. .
(8–98–5) – , , , -
, ,
,
. 7 . -
, . , . . ,
, , , , .
, , , . -
- . , , . -
, . , - , ,
. .
(8–04–9) – , , , ,
. 7
,
. , , , , -
. . , , . ,
, . , -
, , . , .
, . .
(10–02–02) – , , , -
, ,
,
. 7 . -
, . , , -
. . , , , -
, , , .
, , . - . -
, , . , , -
, . , - , , .
.
(84–91–3) – , , -
, , ,
. 7 ,
. , , -
. , , ,
, . - -
. , , . . , -
- , , . ,
. . .

150
635.65:631.527(02)
-
. ., . ., . ., « - »,
, 1, e-mail: [email protected]
– . , -, – 1,5–2,0 ,
. 1 . . 170 115–120 .
[1]. 1 50 , 2 , 50 , 250 , 10 ,
3,41, 1,9
2, 26 .
. , . [2].
– , , , . 2010 74 %.
2014 100 . .- , -
[3,4,5]. 1980 -
. ., . ., . ., . . ( , 871), , ,
.: , -
, ; ; -; , .
. 2014 - ( ).
, 740 , 43°15 . ., 76°54 . .
., . - . . . 10
. 2 . 4 , 30 . -, .
( . ., 1973) [6]. – . . ( . ., . .,
. ., 1968) [7]. -: , , , .
– ,, , , -
, 1000 . 2014 -
. , . - – 0,3 0 -
50,2 ( . 1). ,, 2012 2014
.. -
: 30,0 25,0 / ; -
-28 -94 42,0–33,0 / ;-76, -84, -87 (32,0–29,5 / );

151
-259 -18636,5–34,0 / ; –186, –408, –150,
–367, –567, –118 45,0–29,0 / ; ( . 2).
1
2014
, 00
..
..
..
..
106,7 56,5 +50,2 +10,1 +10,4 -0,3
58,8 61,6 -2,8 +18,6 +16,4 +2,2
35,3 53,9 -18,6 +23,0 +21,2 +1,8
8,6 26,6 -18,0 +25,9 +24,1 +1,8
0 22,1 -22,1 +24,1 +21,2 +2,9
2
,. , , /
St 66 19,5
71 30,0
71 25,0
2 – 28 66 33,0
– 94 66 42,0
– 87 66 29,5
– 84 65 30,0
– 76 65 32,0
– 259 66 36,5
– 186 66 34,0
– 567 67 33,5
– 150 65 38,0
– 186 66 45,0
– 367 65 34,5
– 408 66 39,5
– 118 66 29,0
, - : - – – 384, -558, – 150, – 111, – 542, , – 134, – 374,
– 408, – 186, – 118, , – 577, – 259, – 186, – 173, – 60, , , – 567, , – 55, 90,25 – 116,0 ; (10,0–13,0 ) : – 186, – 44, – 173, – 170, – 134; -
(18,0- 77,6 ): – 39, , , , – 367, , – 111, – 374; (7,2–10,4 ): – 367, , – 111, – 39, , – 118,
; ( 39,6–78,0 .) – – 39, , , – 118, – 373, – 367, – 111, – 197, – 285, – 189.
, 2014 . « »
2015–2017 , -
.
1. . ., . ., . ., . . // -. 2013. 3. . 15–17.

152
2. . ., . . // -
. 2012. 9. . 21–23.
3. Vandenberg A., Slinkard A.E. CDC Mozart field pea // Can. J. Plant Sci. – 2002. – 82, 2. – . 429–431.
4. . . // . . . - , , 2002. – 46 .
5. Vandenberg A., Slinkard A.E. CDC Verdi field pea // Can. J. Plant Sci. – 2002. -82, 2. – . 433–434.
6. . . , , 1973.
7. . ., . ., . . ,
, 1968.
635.657
. ., . ., . ., . .,- ,
, . . E-mail: [email protected]
,.
, ( , , ,), , ( , , ), -
( , , ).,
20 55 % 16–27 %. 1,0 50 % , 3,0 60 % . . .
( ) 50 . , , .
-.
2012 . ,2014 , , -
, ., 25 10 -
.--
. 7 , 6 , 2 .
3 , 2 , 1 .-
. -: . . ( , - ),
. . ( , ), ( , ), -
( , ), ( , ), « » ( ), ( ,
), ( , ), ( ) ( , ) . . .
,, , -
.

153
: 635.1/8 : 631.531 (083.131)
. ., . ., . .,, . , .
-mail: [email protected]
, , -, , -
..
-.
,, -
.-
, , -.
2012 – 2014 ..
, ,. F
1 «
» ( ). «Bokyng greenhouses
ltd» .- .
, , -.
, -. -
, – ..
. . , , .. , , -
- .-
., , -
: 1. ( ); 2. ; 3. ; 4. ; 5. -; 6. .
, 4–5 ,
. F
1
., -
, – 94,7 , – (81,7 )., , (105,1 ),
.,
. – 2232 2, – (2404 2).
, , – , – .

154
, -
, , -
– 191,7 , – (189,0 2).
, , -
– 5523 2, – (5375 2).
.
, ,
– 5,5 %, – (5,2 %).
,
– 5,8 %;
.
, , -
– 3,22 %, – .
-
– 2,97 %,
, , 2,78 2,77 %.
, -
, – 14,44 %, –
(16,27 %).
– 51,49 %, -
– (16,55 %).
,
, – 0,50 %, –
(0,60 %).
,
(0,52 %), -
– (0,54 %).
, -42–123–4619–88
4.01.71.03 – 300 / . , -
,
– 32,6 / ; (33,4 / ).
, -
– 31,2 / , – (32,7 / ).
, ,
9–9,6 ( ).
– 1,08 / , – (0,98 / ). -
, – 1,24 /
, – (0,91 / ).
,
, – 0,67 / , –
(0,76 / ). -
– 0,70 / , – (0,81 / ).
-
, , .
, , .
, ,
– 4,8 / 2, –
(4,5 / 2).
, ,
(19,2 / 2), –
(22,7 / 2). -
( . 1). ,
(
159 , – 121 ). -
, – .

155
1
F1
(2012–2014 .)
1 2,
/ 2,
3 - -
% %
( )4,3 100 16,0 100 - - 139 108
4,8 111,6 19,2 1200 0,5 33 159 121
2,9 67,4 15,9 99 - - 108 88
4,5 104,6 22,7 141,9 0,2 6,7 143 102
4,0 93,0 16,9 105,6 - 0,9 124 94
3,4 79,0 11,8 73,8 - - 111 89
0,5 0,06–0,76 0,17–0,76
S , % 1,4–5,1 1,6–3,9
,
– 2729 / 2; -
– 1845 / 2. , . .
, ( . 2).
2
F1
(2012–2014 .)
/ 2,
/ 2,
/ 2
-, / 2
- 1 ,
-, %
( )16,0 5867 5882 5 366,4 -
19,2 7017 4288 2729 223,3 63,6
15,9 5617 4383 1234 275,7 28,2
22,7 8207 8662 - 381,6 -
16,9 6133 4288 1845 253,7 43,0
11,8 4393 4288 105 363,4 2,4
:
1.
.
(5,8 %) ; –
(3,22 %) (3,10 %); – (16,27 %)
(16,55 %).
(0,50 %).
(31,2 / ), 9,6 –
( ).
2. , , –
19,2 / 2, – – 22,7 / 2.
, , – 121 , -
– (102 ).
3. (2729 / 2)
(1845 / 2); .
-
.
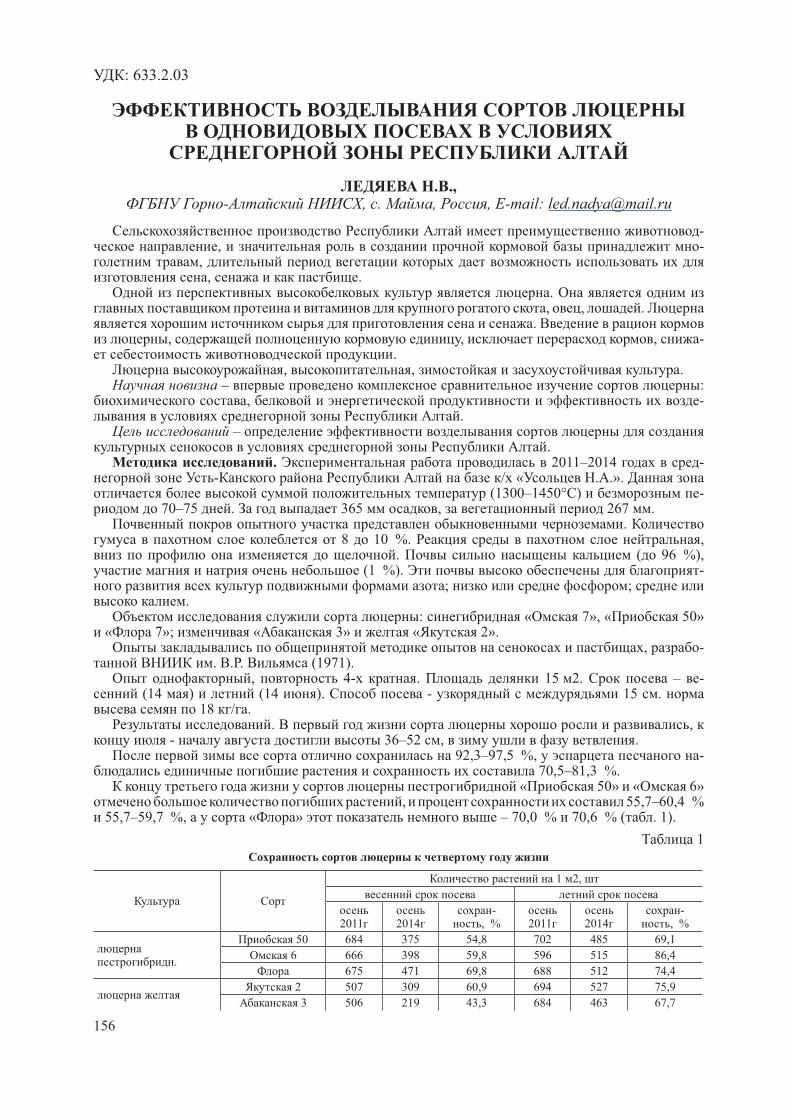
156
: 633.2.03
. .,- , . , , E-mail: [email protected]
-, -
,, .
., , .
., , , -
., , .
– :, -
. –
.. 2011–2014 -
- / « . .». (1300–1450° ) -
70–75 . 365 , 267 ..
8 10 %. ,. ( 96 %),
(1 %). -; ;
.: « 7», « 50»
« 7»; « 3» « 2»., -
. . . (1971). , 4- . 15 2. – -
(14 ) (14 ). - 15 . 18 / .
. , - 36–52 , .
92,3–97,5 %, - 70,5–81,3 %.
« 50» « 6» , 55,7–60,4 %
55,7–59,7 %, « » – 70,0 % 70,6 % ( . 1).
1
1 2,
2011 2014-
, % 2011 2014-
, %
.
50 684 375 54,8 702 485 69,1
6 666 398 59,8 596 515 86,4
675 471 69,8 688 512 74,4
2 507 309 60,9 694 527 75,9
3 506 219 43,3 684 463 67,7

157
- 54,8–69,8 % 69,1–86,4 % ,
« 2» - 60,9 75,9 % ., , -
, ,1,5–2 , 30–40 / .
-, , 34,0–48,4 39,8–53,2 / – .
: « 6» – 58,5 65,3 / , 4,9–11,5 %, « 50» – 50,1 56,1 /
« » – 41,9 45,6 / , 2,3–12,2 %. : « 2» – 50,8 58,3 / , 2,9–8,9 %,
« 3» – 31,5 32,8 / , 8,5–8,9 % ( . 2).
2
, ( / )
50 48,4 48,8 50,1
6 36,8 65,2 58,5
26,5 38,2 41,9
2 34,0 55,3 50,8
3 35,8 28,9 31,5
05 1,49 1,19
50 53,2 53,2 56,1
6 45,5 68,6 65,3
28,0 40,0 45,6
2 39,8 60,0 58,3
3 42,2 30,0 32,8
05 1,02 1,09
, - - , , , .
, , ( . 3).
3
( 2011–2014 )
,/
* 1 ,
, /. .,/
,1 . .,
**
.
50 48,8 76 37,1 31,2 8,9 119
7 65,2 75 48,9 43,7 9,1 112
7 38,2 75 28,7 25,6 9,1 112
3 28,9 72 20,8 21,7 9,6 96
2 55,3 78 43,1 42,0 9,7 103
.
50 53,2 79 42,0 35,1 9,0 120
7 68,6 78 53,5 46,0 9,1 116
7 40,0 78 31,2 25,6 8,9 122
3 30,0 74 22,2 22,8 9,7 97
2 60,0 80 48,0 42,0 9,6 114
: * - ; 1 . ., ** - 1 ,

158
- « 7», « 2» « 3» – 16,2–19,0 %. « 50»
« 7» 15,1–15,5 % .. -
. -: 29,1–30,5 %,
24,5–25,8 %. -
« 7»: 48,9 53,5 / , . « 2» - 31,2 48,0 / .
« 3». (4820–5710 . – 6320–7070 . –
) « 6» « 2». (960 1220 . )
« 3» ( . 4).
4
,/
.,
.
,.
.1 ,
.,
.
--
, %
50 50,1
5990
10020 119,6 4030 67
6 58,5 11700 102,4 5710 95
41,9 8380 142,9 2390 40
2 50,85340
10160 105,1 4820 90
3 31,5 6300 169,5 960 18
- 50 56,1
5990
11220 106,8 5230 87
6 65,3 13060 91,7 7070 118
45,6 9120 131,4 3130 52
2 58,35340
11660 91,6 6320 118
3 32,8 6560 162,8 1220 23
-, « 6» « 2».
« 50». .
: « 7» « 2» – 60,0–68,6 / , . . 52,0–71,4 % .
: 631.52:635.61.
. ., . ., . .,-
, , e-mail: [email protected]
., ,
, .: , , , , , , .
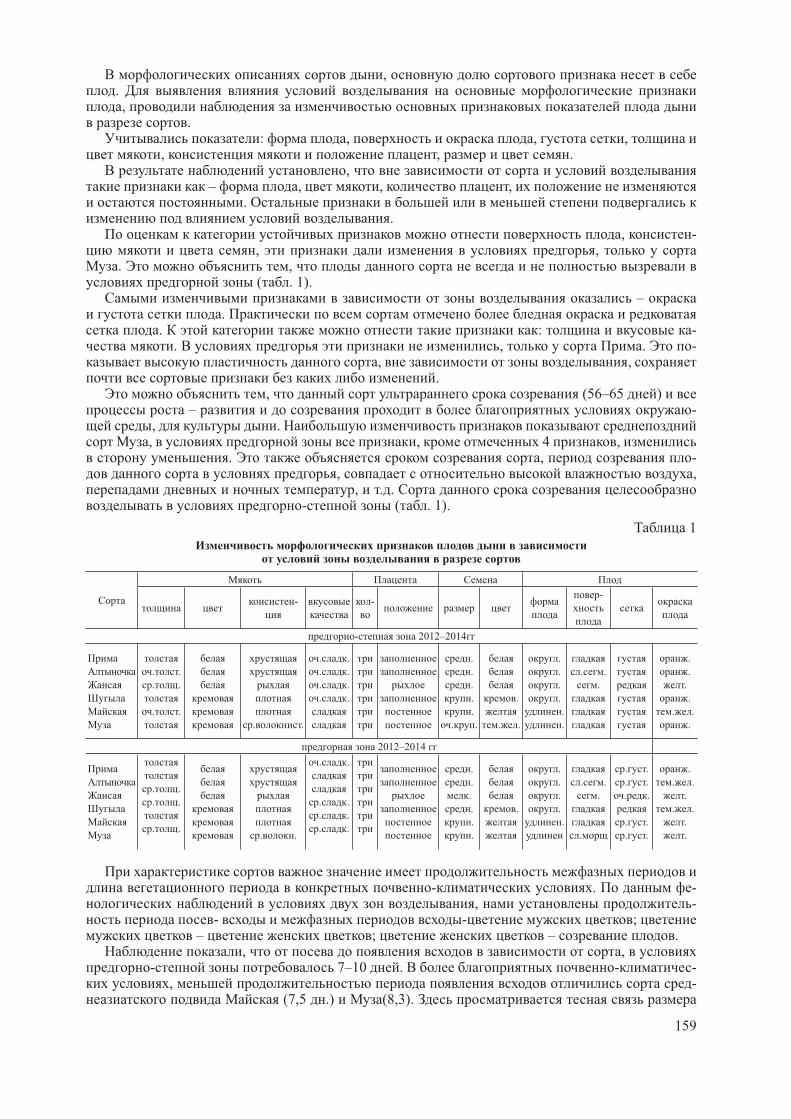
159
,.,
.: , , ,
, , .,
– , , ,.
., -
, ,. ,
( . 1). –
.. : -
. , . -, ,
., (56–65 )
– -, ., , 4 ,
. , -, ,
, . .- ( . 1).
1
- --
- 2012–2014
. .
. .
. .
. .
. .
. .
. .
. .
.
.
.
.
.
. .
.
. .
.
.
.
.
.
.
. .
.
.
.
.
.
. .
.
2012–2014
. .
. .
. .. .
. .
. .
. .
. .
.
.
.
.
.
.
.
.
.
.
.
.
. .
.
.
. .
. .
. .
. .
. .
.
. .
.
. .
.
.
- . -, -
- - ; – ; – .
, ,- 7–10 . - -
, - (7,5 .) (8,3).

160
. - – 9–11 ( . 2).
2
, -
.-
.-
- ..
- .
- 20012–2014
9,39,69,3
10,07,58,3
27,330,328,632,333,340,6
4,65,35,05,66,33,6
27,139,438,448,149,458,8
5975728689
103
2012–2014
14,314,615,014,619,019,3
30,332,632,635,337,745,3
5,06,36,06,77,37,3
29,739,138,148,049,059,4
6578779094112
, – 19–20 , 2–2,5
, - . ,
4–6 , .
.
– , -
– 27,3 40,6 , – 30,3 45,3 . -
, – .
- –
– 3,6 6,3 ., , -
– . -7,3
2 , (5,0 .) .
, -
– , -
. 27,1
58,8 29,7 59,4 .
( . 2) -
.
1 , –
10–12 .
: – 59–65, – 75–78, -72–77, – 86–
90, – 89–94 – 103–112 .
3 9 .
. , :
– – ,
, , ;
– –
, ;
– – , -
;
–
– ;
– -
3 9 .

161
1. . ., . . : , / « » , . –
2012. – .1592. . . . – : « », 1998. – . 1573. . . , . . /
, -: 5 « », 23–26 - 2008 . – .46–54
633.361:631.53
- . ., «
», e-mail: [email protected]
– , , -, , .
,, . ,
, , , ,, , , . -
..
. – , .
« » -: , , , , , .
,.
[1].,
( ) ., -
, .
. – ,. . -
« » , , , -, [2].
« » , . . -. « »
, ,
., [3,4]
« » . - 8–10 , ,
10 .- 2
(2010–2013), ( ),, .
162
2013 , - 300 .
100 3 ., , , -
« » . 12
« » . « » , 2012 8 100 , -
2011 – 3 . 2013 , « » -
1 4 2, 1, 9 .
[5–8] , , -,
, , -. , ,
, 35,5 %, - 16,5 % ( , 1940) [9]. - ,
, – ,- . -
« » .
1. . . : . . . – : -, 1989.
2. . . : . ,2007. – 22 .
3. . ., . . - // . . 2007. – 12. – . 439–441.
4. . . (Trifoliumambiguum M.B.) // . .- . ., . 125 . . . . – , 2012. – .77–78.
5. . . - . – : ,1976. – 216 .
6. . . . – .: , 1976. – 156 .7. . ., . . // . .-
. . / . – 1980. – .27. – .35–40.8. . ., . ., . . //
. – 1987. – 2. – .38–40.9. shedriydar.ru/nashi-stati/ontogenez-espartseta.html
631.52:633.11 (574.2)
. ., « -
. . » , , .-mail: [email protected]
-. -
, ,.

163
10–14 . -
[2].
, -
, ,
.
, , -
, ,
85 %. -
, .
–
[1].
: ,
10–15 %, 14 % .
, .
-
« . . . » -
3 . 4- , 25 2.
-7 III
.
2. «Wintersteiger».
-142 10846–91
« ». -
AGROS 2.11 [3].
. 2012
13,6 / .
11,4 16,0 / , 16,08 17,76 % -
2- 12,1 / 16,81 % .
150/05–2 474/02–1, 150/05–2 -
– 17,04 %,
16,91 %. , ,
0,19 0,35 %: 365/02–3, 11/02–1 .
2013 , 2012 , 1,6
9,1 / .
21,1 / 14,33 %. ,
(13,83 %). 55/02–5 – 25,0 /
14,53 %, – 13,83 %.
2014 17,5 27,2 /
19,5 / . 4 : 150/05–2, 336/06–2,
11/02–1, 365/02–3 , , 3,8; 4,7; 5,2; 7,7 / ,
2. -
( 2 – 16,03 %),
22,3 / , 2013 . 1,2 %.
2
1,1 4,3 / , 15,22 16,56 %. 316/99 -
2 4,3 / .
2 1 : 321/03–5. 321/03–5
( 321/03–5 –
16,6 / , 16,8 / ).
, 2012–2014 ., 316/99,
2 4,3 / ;
336/06–2,
(15,79 %). : 336/06–2, 365/02–3, 150/05–2, 189/99 -
.
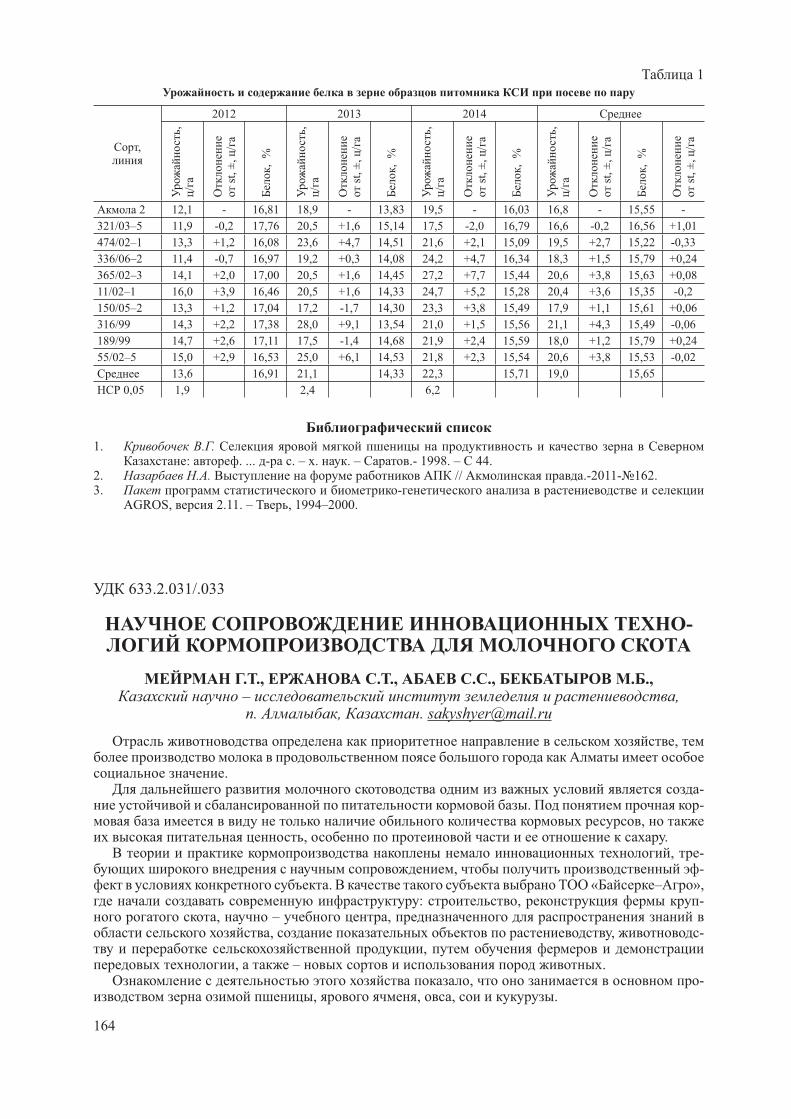
164
1
,
2012 2013 2014
,/ s
t, ±
, /
, %
,/ s
t, ±
, /
, %
,/ s
t, ±
, /
, %
,/ s
t, ±
, /
, %
st,
±,
/
2 12,1 - 16,81 18,9 - 13,83 19,5 - 16,03 16,8 - 15,55 -
321/03–5 11,9 -0,2 17,76 20,5 +1,6 15,14 17,5 -2,0 16,79 16,6 -0,2 16,56 +1,01
474/02–1 13,3 +1,2 16,08 23,6 +4,7 14,51 21,6 +2,1 15,09 19,5 +2,7 15,22 -0,33
336/06–2 11,4 -0,7 16,97 19,2 +0,3 14,08 24,2 +4,7 16,34 18,3 +1,5 15,79 +0,24
365/02–3 14,1 +2,0 17,00 20,5 +1,6 14,45 27,2 +7,7 15,44 20,6 +3,8 15,63 +0,08
11/02–1 16,0 +3,9 16,46 20,5 +1,6 14,33 24,7 +5,2 15,28 20,4 +3,6 15,35 -0,2
150/05–2 13,3 +1,2 17,04 17,2 -1,7 14,30 23,3 +3,8 15,49 17,9 +1,1 15,61 +0,06
316/99 14,3 +2,2 17,38 28,0 +9,1 13,54 21,0 +1,5 15,56 21,1 +4,3 15,49 -0,06
189/99 14,7 +2,6 17,11 17,5 -1,4 14,68 21,9 +2,4 15,59 18,0 +1,2 15,79 +0,24
55/02–5 15,0 +2,9 16,53 25,0 +6,1 14,53 21,8 +2,3 15,54 20,6 +3,8 15,53 -0,02
13,6 16,91 21,1 14,33 22,3 15,71 19,0 15,65
0,05 1,9 2,4 6,2
1. . .: . ... - . – . . – .- 1998. – 44.
2. . . // .-2011- 162.3. -
AGROS, 2.11. – , 1994–2000.
633.2.031/.033
-
. ., . ., . ., . ., – ,
. , . [email protected]
,
.-
. -,
, ., -
, -. « – »,
: , -, – ,
, , -,
, – ., -
, , , .

165
-
13–18 / , – 8–12 / , - – 18–22, 13–14 /
. , ,
( )
.
-
-
, ( ) ( .,
2014) 6,0 . + -
– 70 .
-
20 / – 85 / .
+ (
), – 20 10 / (70 ). -
( ),
. .
-
, « – ».
, 287,3 206,7 .
(25–35 / ) (
., 2014).
-
, -
. -
.
17,2 18,4 / .
33,6–34,6 / .
-
12,5–13,6 19,8–21,1 / .
5–7 60 / . ., -
11–15 %.
-
. 680 / ,
555 / , 125 / 90 / . -
134,5 / 1120 / ( . 1).
1
278 135
1 492 40
( ) 378 48
3,6
/ 555 125
/ 134,5
/ 1120,1
, -
800 / , 380
/ 330 / , 90 / . ,
(262 , 380 / ), (260 ,
330 / ), (127 , 90 / ) ( . 2).

166
2
-, .
.
,2
-,
--
, / 2, /
+ 262 9390 408 6,57 380
+ 127 2182 32 3,79 90
260 9120 395 5,85 330
- - - - 800
– : ,
100 . .,
5 : – 80 / , – 260 / ;
– 100 / , – – 53 / , – 173 / , – 66,6 / (
, 2014). .
-
.
, : 1 – 191
, 114,6 (60 %), – 76,4 (40 %),
– 300,0 , – 174,6 (58,2 %), – 125,4 (41,8 %), 3 – 320,0 ,
– 198,4 (62 %), – 121,6 (38 %). 3-
77,6 82,56 / ,
.
.
.
« - » 400 . -
( 5 ), , -
. 2014
. 2014 400 -
. -
, – .
. -
.
,
. . -
, 1,5 ,
.
, -
, 15 % -
. ,
( ). – 23–25 %., – 14–16 %.
( ) 20
. 20 28 150
250 / ,
( ., ., 2014). -
20 .
, .
( ) , -
, , -
.

167
633.2/.3
. ., . ., « - - ,
», . , ,e-mail: [email protected]
. -.
. -, . ,, 30–35 %,
30–40 %. , --
. , -, [1].
, --
. [2].
,.
.. -
, - [3, 4].
2012 -. 2012 .
– .. ,
, 14,6–15,8 / , 3,2–3,8 / , 25,1–25,2 / ,
13,7–11,0 / , 2,4–1,8 / 21,8–16,9 / . - (16,4–25,4 / ). -
, ,
, ,.
( . 1).
1
2 ,( 2012–2014 )
,/
--
, /, / ,
/
--
, /, /
1 2 3 4 5 6 7
( ) 9,4 2,0 15,6 12,5 2,7 21,6
10,9 2,2 17,2 14,6 3,2 25,2
11,3 2,4 18,9 13,0 2,9 22,5
2 ( ) 8,2 2,0 13,2 13,1 3,2 21,0

168
1 2 3 4 5 6 7
8,4 3,0 13,5 7,2 3,2 21,5
9,0 2,2 14,5 14,7 3,6 23,6
11,3 2,7 18,1 15,8 3,8 25,2
87 ( ) 7,2 1,7 11,5 10,6 2,5 17,5
7,9 1,9 12,9 11,6 2,8 18,7
9,2 2,2 14,7 12,3 3,0 20,0
( ) 7,4 1,7 12,2 12,0 2,7 19,9
8,7 2,0 14,4 13,8 3,2 22,9
– 83 8,4 1,9 13,9 11,6 2,7 19,9
-189 ( ) 6,8 1,0 12,2 11,6 1,4 20,8
91 7,2 0,9 12,8 12,2 1,4 21,8
8,3 1,0 14,9 12,4 1,5 23,1
+ 8,5 1,5 13,4 13,7 2,4 21,8
+ 8,6 1,4 13,1 11,0 1,8 16,9
+ 7,8 1,3 12,0 10,6 1,8 16,4
+ 6,1 0,4 9,3 9,3 1,5 14,3
, -, -
..
1. . ., . ., . . .// « - ». – . -
, 2011. – 59 .2. . . 2011–2015 . // -
. – 2011. – 10. – . 14–17. 3. . ., . .
// . – , 2010. – 9. – . 11–13.4. . ., . ., . . -
// . – 2005. – 11. – . 12–14.
631.531
. ., . ., . ., « - -
», . , , e-mail: [email protected]
--
. -. , , , ,
. ( ).
. 1

169
-, ,
, . 30–70 %,
. -,
. ,. : , -
, , -- -
.-
. – , - . -
- -, .
, -
[1]., . -
– .
, -.
, ,- .
, [2].-
26600 , – 1500 , 15 % -.
, - [3].
, , , , , , , , [4].
,, , -
1- ,, .
-, , 20 % .
-, .
, -. – .
1. . ., . . - -// . – 2011. – 9. – . 5–8.
2. . ., . ., . . .// « - ». – .
, 2011. – 59 .3. . . // -
: . . .- . . – , 2003. – . 1. – . 387–392.
4. . ., . .// . – 2013. – 6. – . 27–28.
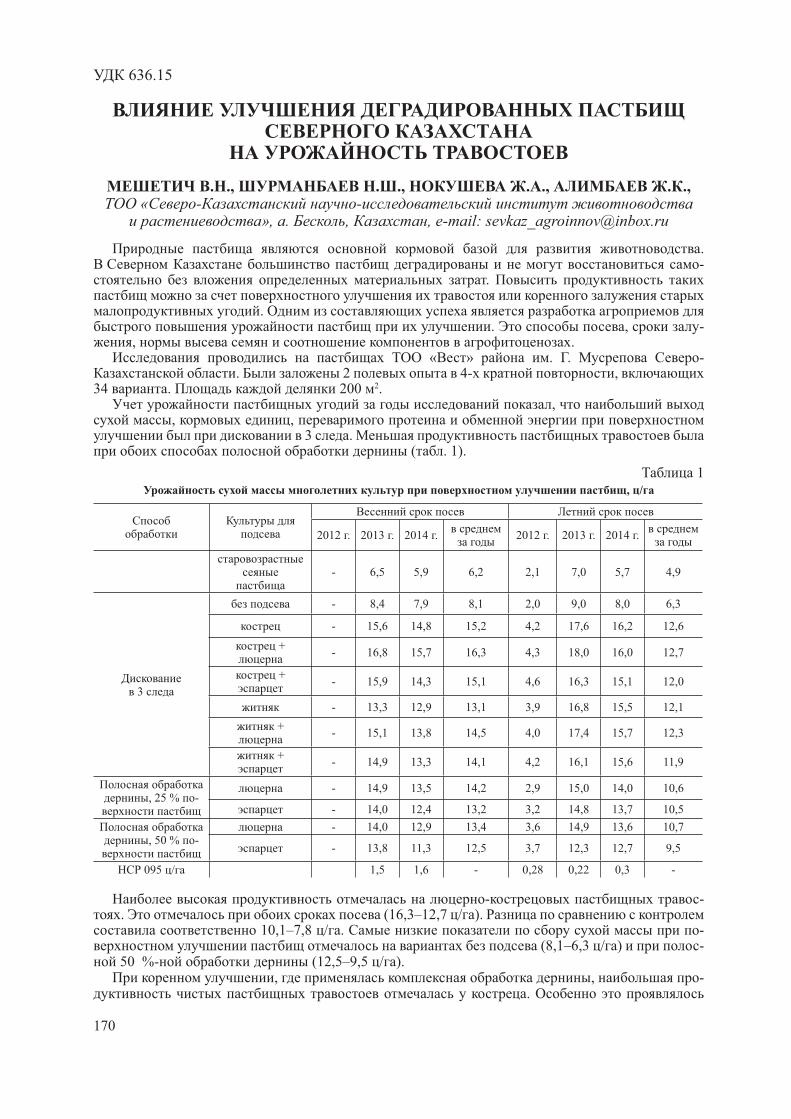
170
636.15
. ., . ., . ., . ., « - -
», . , , -mail: [email protected]
.-
.
.. , -
, . « » . . -
. 2 4- ,34 . 200 2.
,, ,
3 . ( . 1).
1
, /
2012 . 2013 . 2014 . 2012 . 2013 . 2014 .
- 6,5 5,9 6,2 2,1 7,0 5,7 4,9
3
- 8,4 7,9 8,1 2,0 9,0 8,0 6,3
- 15,6 14,8 15,2 4,2 17,6 16,2 12,6
+- 16,8 15,7 16,3 4,3 18,0 16,0 12,7
+- 15,9 14,3 15,1 4,6 16,3 15,1 12,0
- 13,3 12,9 13,1 3,9 16,8 15,5 12,1
+- 15,1 13,8 14,5 4,0 17,4 15,7 12,3
+- 14,9 13,3 14,1 4,2 16,1 15,6 11,9
, 25 % -- 14,9 13,5 14,2 2,9 15,0 14,0 10,6
- 14,0 12,4 13,2 3,2 14,8 13,7 10,5
, 50 % -- 14,0 12,9 13,4 3,6 14,9 13,6 10,7
- 13,8 11,3 12,5 3,7 12,3 12,7 9,5
095 / 1,5 1,6 - 0,28 0,22 0,3 -
- -. (16,3–12,7 / ).
10,1–7,8 / . - (8,1–6,3 / ) -
50 %- (12,5–9,5 / )., , -
.

171
. 2,1 / . -, -
- ,- .
10–9,7 / , 6,6, 9,3 ( . 2).
2
, /
2012 2013 2014-
2012 2013 2014-
( )- 7,5 7,1 7,3 2,1 7,0 5,6 4,9
- 17,3 15,8 16,6 5,2 19,6 18,4 14,4
+ - 17,3 15,7 16,5 5,8 21,3 19,9 15,6
+ - 15,1 13,8 14,5 5,9 18,4 16,7 13,6
- 15,6 14,8 16,2 4,1 17,2 15,8 12,3
+ - 17,8 16,9 17,3 4,9 20,1 19,0 14,6
+ - 16,1 15,2 15,6 5,4 18,2 16,8 13,4
+ - 16,0 14,5 15,2 5,1 19,1 17,8 14,0
095 / 2,16 1,8 0,34 0,26 2,9 -
, , -
( ) 7,2–14,3 %.
636.32
. ., . ., . ., . ., « - -
», . , , e-mail: [email protected]
, -, – -
. -
.
. --
. , ,., 2012–2014 -
.-
« » . . - .- - . -
, 34 . 200 2 .

172
14 . , 15 , – 13, 17 , – 15 . 12 .
I – 93–99 ./ 2, – 67–76, – 84–86 – 89–93 . 1 2
( . 1).
1./ 2
I II
3
93 - 150 -
+ 96 86 158 121
+ 99 89 162 137
70 121
+ 76 84 132 117
+ 69 93 141 131
+ 165 - 279 -
25 %
- 88 - 143
- 97 - 147
50 %
- 89 - 149
- 93 - 150
88–97 ./ 2
( . 2).
2, ./ 2
I II
106 - 168 -
+ 98 96 163 135
+ 101 98 163 150
79 - 139
+ 79 98 136 128
+ 76 99 133 142
+ 182 - 292 -
3
, ./ 2
2013 2014 2013 2014
– ( )
51 87 83 82
3
58 45 60 62
69 64 73 50
+ 115 101 118 109
+ 101 60 108 73
61 55 65 58
+ 93 92 96 94
+ 84 80 90 85
+ 97 90 100 94
25 %
71 67 75 70
69 65 73 71
50 %
94 92 98 96
91 88 95 92

173
1 2 - 69–99 . 76–107 . .
(45–118 ./ 2), - (45–115 ./ 2). -
(115–118 ./ 2) ( . 3).
-- (109–120 / 2), - -
(105–114 / 2). (50–55 . 2) (69–80 ./ 2) (77–82 ./ 2) ( . 4).
4
, ./ 2
2013 2014 2013 2014
–( )
55 50 53 51
-
76 69 80 73
+ 117 114 120 109
+ 110 105 114 106
79 77 82 80
+ 101 98 105 100
+ 88 85 96 93
+ 100 93 108 103
,, -
.
631.674.6
. .,- ( ),. , , e-mail: [email protected]
,, -
.-
, -, .
,
, .,
,.
, , , -
« » 1 .

174
, – , =0,20–0,30 [1]. -
, , , , . +6,9 – +9,50 . -
100 3300–34000 . - 250–330 , (IV-IX) 128–172 .
150–180 . -, -
.- , –
1,22 / 3 21–22 % ,=1,9–2,4 . .
1,288 / 7,73 / , 0,28.
- ( , , , NPK, -
.) [2].
. 1 2.
1
2 5,/100
2 ,/100
, %N - -
, /100,/
2,46 14,52 1,85 4,48 8,07 0,30
( = 0,30) ,.
– , - – .
2
- , - /100
3 Cl 2+ Mg2+ Na+ + SO42- , %
1,16 0,23 0,91 0,693 0,005 0,218 0,12
- , -- , (0,8 - /100
). . , 0,12 %, .
, -:
4. , ;5. ;6. ;7. ;8. , ;9. .
[3]. -
– . F1 («Nunhems Zaden»), .
-, -
., – 1,2 / (5 / )
(2–2,5 ).

175
, 2 0,75 .
.. .
2 , , -, -
, ..
, [4–6].,
, 0–30 . , -
. , -.
– -.
, - 3–4 , .
. , -,
.-
70–80 % ., -
. , ,- -
.
. -, 15–20
.,
. 3
, .
3
-, % , * , 3/
- 85 30–35 65–100
- 70 35–40 110–155
75 35–40 110–130
, -,
.
, ,
,:
– 40 – 50 %, -;
– ;– .– 35–40 %.

176
– 1,5–2 ;– .– , , .
,.
1 . . ( ). – - : -, 1970. – 240 .
2. . . . – : « », 1972. – 368 .3. / . . . . – - , , 1966. – 524 .4. : . – : , 2006. –
456 .5. / . . . . - . - - : , 1972.-
240 .6. . ., . ., . . .
( ). – : , 2012. – 44 .
635.649:631.544.43
. ., . ., . ., « »,
, 213407, ., . , . 5, [email protected]
-.
F1
., ,
, .:
1. .2. - .3. , -
. 2012–2014 . -
. 3- . 70 30 . N
60 (
2 5)
120 (
2)
120.
. -.
I O. Kempthorne Genstat. -
12 – .-
0,01 .,
.

177
0,05 .,
-. -
,.
- . (Xi) , 6,1 8,9 / 2.
( ) : , -, .
1. ( ) 260–09 - . -
(Sgi) -- 260–09,
.-
. 1 – ,
, , . - 1 ,
, 260–09, ., - .
260–09 . -
, – :, 260–09, . -
(Sgi), . (bi = 1,69–5,66)
, , ,, . -123,6
( ) 94,3 ( ).:
-..
, :260–09, , . , -
, --
2015 .
631.58
. ., . ., . ., . ., « »
,, -
, .-
.

178
-. -
. , 38–40 , 20–22 , 12–13 13 , -
800 [1].- .
( , -. . .) .
-.
, , 9 , 7 , 2 . , ,
, ,
[2].,
. -- , -
. ., , , , , -
. – 0,22 % – 0,19 %, -1.1 %. .
« »- 40062030292–001–2011, 12,20–17,42 %.
:1. ( ) 2. N
40P
20. 3. 1,5 / . 4.
3,0 / . 5. 5,0 / . 6. 7,0 / . 7. 9,0 / . – , -
– . ( . 1), -
. 1,5 /
3,10 / . 3 / - 4,58 /
1,48 / 1,5 / .5 / 5,82 /
1,24 /3 / . 12,86–13,38 /
7–9 / . 1,5–3,0 / , 5–9 / . 1 /
1,60 / ., -
.
1
0–40
N-NO3 /
( )
2012 2013 2014
6,34 5,61 6,81 6,25
N40P20 9,61 7,29 8,54 8,48
1,5 / 10,70 8,02 9,33 9,35
3,0 / 12,42 9,41 10,67 10,83
5,0 / 14,38 10,63 11,20 12.07
7,0 / 16,01 10,91 11,67 12,86
9,0 / 16,04 11,84 12,26 13,38

179
,-
8,7–25,7 / 1,5 5 / .7–9 / 34,1–35,4 / . 1 /
4,7 /( . 2).
2
0–40
P2O5 /
( )
2012 2013 2014
105,4 109,8 107,0 107,4
N40P20 109,3 105,5 111,1 108,6
1,5 / 110,4 121,3 116,6 116,1
3,0 / 126,8 130,3 119,1 125,4
5,0 / 132,5 139,6 127,3 133,1
7,0 / 138,4 148,9 137,4 141,5
9,0 / 140,2 148,3 140,0 142,8
1 3–5 40,2 – 67 , 180 – 300 . 3–4 . , -
-.
1. . // . – 2008. – 4. – . 7–10.
2. . ., . ., . . // -
« ». , 2011. – .2. – C. 160–163.
631.58
. ., . ., ., ., « »,
, , -. -
, .
10 – , 20 – -, 20–40 – , 100–150 – -
80–90 ( . . , 1989; . . , 2005)
, , ( , , ), -
, ( . 1).

180
« » : - 95–97 %, 200–250 . ,
,. 1,
,.
4,6 7,1 , 3 10,4 3,9 4,7 .
, - ( -
) . ( -)
. -,
(10 ) 14–21 , (25 )(30 -2 ).
1
,
2012 2013 2014
0–20 0–100 0–20 0–100 0–20 0–100 0–20 0–100
( – )
( )16,7 73,5 13,4 65,1 8,8 45,3
12,9 61,3
N40P20 15,8 73,5 15,2 66,1 9,2 46,2 13,4 61,9
1,5 / 20,4 75,9 21,3 76,4 10,9 50,6 17,5 67,6
3,0 / 20,2 79,9 24,2 79,4 11,7 52,8 18,7 70,7
5,0 / 20,5 75,9 24,3 79,6 12,8 61,2 19,2 72,2
7,0 / 21,4 76,6 24,5 79,1 12,8 58,4 19,5 71,3
9,0 / 23,2 79,0 23,9 79,1 13,1 59,3 20,0 72,4
( )
( )14,2 69,1 12,9 64,2 7,4 37,5 11,5 56,9
N40P20 14,0 68,2 13,4 65,1 7,6 38,2 11,6 57,1
1,5 / 19,4 78,1 17,8 79,3 9,2 41,3 15,4 66,2
3,0 / 18,9 78,3 19,2 79,3 9,5 43,4 15,8 67,0
5,0 / 18,6 77,4 19,3 78,9 10,3 42,8 16,0 66,3
7,0 / 17,2 78,2 20,1 79,4 9,6 41,5 15,6 66,3
9,0 / 19,1 79,1 18,9 79,3 10,7 42,4 16,2 66,9
( )
( )18,6 78,1 16,4 74,5 11,6 71,4 15,5 74.6
N40P20 19,1 78,2 16,9 72,6 11,2 75,6 15,7 75,4
1,5 / 22,6 90,4 19,9 85,7 13,2 72,3 18,5 82,8
3,0 / 24,2 91,3 25,2 98,3 14,4 74,7 21,2 88,1
5,0 / 26,2 100,1 23,4 103,7 14,3 70,2 21,3 91,3
7,0 / 30,2 100,0 28,9 104,5 14,7 67,8 24,6 90,7
9,0 / 33,4 101,2 29,4 101,2 5,0 71,3 25,9 91,2
( ) 0–20 1,3 ,
1,1 0,8 . ,-
,.

181
633.2.03:571.61
. ., . .,
- , , .
-mail: [email protected]
,
,
, [1, 2].
, -
[3].
-
[4, 5].
– -
, ,
.
2004–2010 .
, .
- . 37–42 %.
– 75,8 %, -
– 22 %, – 2 %. -
. 0–20 2–3 %.
, , -
25 52 2.
, , ,
, , -
[6–8].
-1,5
-80. 45 60 , -
– 40–55 . -
. – , , – 2–3
.
, -
-
.
, « » -
20–30 .
- -
.
, -
- -
.
.
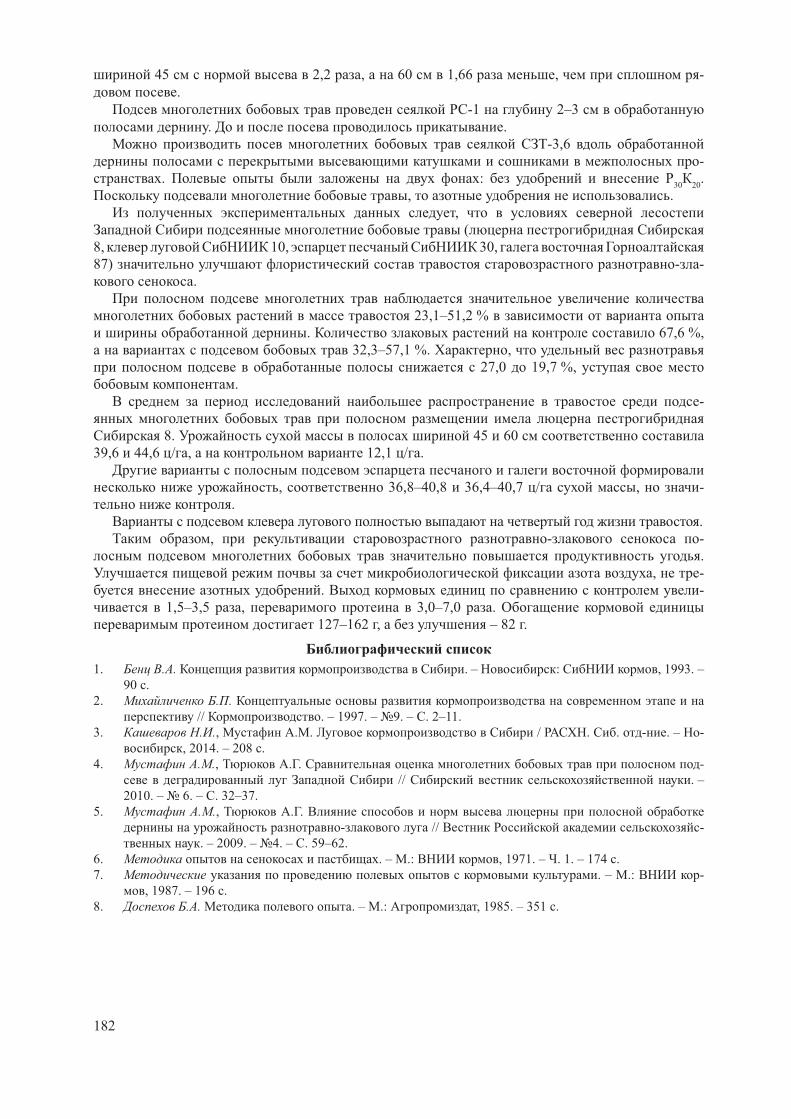
182
45 2,2 , 60 1,66 , -
.
-1 2–3
. .
-3,6
-
. :30 20
.
, .
,
(
8, 10, 30,
87) - -
.
23,1–51,2 %
. 67,6 %,
32,3–57,1 %. ,
27,0 19,7 %,
.
-
8. 45 60
39,6 44,6 / , 12,1 / .
, 36,8–40,8 36,4–40,7 / , -
.
.
, - -
.
, -
. -
1,5–3,5 , 3,0–7,0 .
127–162 , – 82 .
1. . . . – : , 1993. –
90 .
2. . .
// . – 1997. – 9. – . 2–11.
3. . ., . . / . . - . – -
, 2014. – 208 .
4. . ., . . -
// . –
2010. – 6. – . 32–37.
5. . ., . .
- // -
. – 2009. – 4. – . 59–62.
6. . – .: , 1971. – . 1. – 174 .
7. . – .: -
, 1987. – 196 .
8. . . . – .: , 1985. – 351 .

183
635.656:631.82:6311.11
. ., . ., . ., « - . . . »,
, , -mai: [email protected]
– , [1]. ,
, (No-Till). No-Till
, - [2]. [3] , -
, ,
, -, .
, . « . . . » 2012–2014 .
0–20 ( ): – 19–21 – 31–32 / . ( ) -
, , , . « » 2,0 / .
200 , 3–4 . - – 2,1 .
« » 1,5 / + « » 0,7 / . - 2.
– , -. ( + ) – 47 .
0–20 : – 3,5 %, – 0,25 %, – 0,15 %, – 5 %, . ( = 7,6).
– ( 0–40 ), – (0–20 ). , -
. (134,7 ) -
2012 . (100,7 ), , – 2013 2014 . (139,8 148,0 ). .
2012 2013 . – 67,7 90,0 , 2014 . – 63,6 . ( )
2012 . (0,5), 2013 2014 . – = 0,8. -
2 5, 2012–2014 . -
136 , – 131 .-
9 / , – 20 / , – 11 31 / ( . 1).
– – -.
., .
N20–40 / 3–5 / .

184
, –
. N-N3
5–6 / -.
.,
. 20 / - 2–3 / .
1
(0–40 ) (0–20 ), /
N-N 3 2 5 N-N 3 N-N 3 N-N 3
9 20
9 5 5
20 10 5 5
N20 12 7 5
20N20 13 6 5
20N20 +N20 15 7 5
11 31
9 4 5
20 9 5 5
N20 12 5 6
20N20 12 6 6
20N20 +N20 14 7 5
,-
.
7,9 / ( . 2). 20 3,3 / 42 %. -
3,9–4,5 /. N20
.
2
, / %
2012 . 2013 . 2014 .
1. 3,7 10,1 10,5 7,9 - -
2. 20 6,4 13,1 15,0 11,2 3,3 42
3. N20 4,0 10,2 12,4 8,7 0,8 10
4. 20 N20 6,6 13,7 15,9 11,8 3,9 49
5. 20 N40 6,5 13,4 17,1 12,0 4,1 52
6. 20 N20 6,8 14,0 17,1 12,2 4,3 54
7. 20N20 N20 7,2 13,3 17,8 12,4 4,5 57
0,95 / 1,2 2,7 2,7 1,5 -
1. 6,3 15,6 14,4 11,8 - -
2. 20 6,4 17,2 16,5 13,4 1,6 14
3. N20 7,7 19,9 20,0 15,7 3,9 33
4. 20 N20 7,9 20,1 19,8 15,9 4,1 35
5. 20 N40 8,5 19,7 20,7 15,8 4,0 34
6. 20 N20 8,0 20,4 20,0 16,0 4,2 36
7. 20N20 N20 8,5 19,7 20,1 15,6 3,8 32
0,95 / 1,3 1,6 3,3 1,6 -

185
- 11,8 / , 3,9 / .
N20 – 15,7 / , 33 % ., -
., (3,9–4,5 / ) N20.
,.
. 20 /
3,3 / . . - 31 / -
– 3,9 / . 1452/ -2 .
1. . ., – -.// - -
23–24 2011. - , – 16–26.2. . No-Till // . – 2011. – 2. – . 59–62.3. . ., . .
.// .. 4, 2013, . – 5–9.
: 633.854. 631.527
. ., . ., . .,.- . , ,
-. ,
.
.- , -
, -.
-. -
.-
2012–2014 - -.
0,4–0,6. 10° 2600–2700° , - 127–157 . 297 .
- . - 2011–2012 .- .
. 2012–2013 2013–2014 .- . -.

186
30 .-
« », « » ( ) ( ), « » ( ),« », « » ( ), « », ( ),
« ». « ».
,. -
– 2012 100 120 . 2013 113
124 , 2014 114 125 .114–119 .
3- , - « »: , , NK , NK ;
« » XF 2800, « »: 5525, Coldsun. - 92, 52, SK 2594, .
-.
,.
4- - 21,4 – 41,9 . 84,8–103,4 .
113,0 ., .
« » 3 98,8 -111,2 . - 99,7 -105,6 ,
SK 2594. XF 3004 80,2 .
,,
. 7,65–13,51 %.
8 % 8,2 – 17,8 / ( . 1).
3 12,1 / . 5 .
« » NK . NK 15,2 / (+3,1 / ),
13,5 / (+1,4 / ). - « » XF 9004 15,3 / (+3,2 / )
« » 5543 2,9 / . « » 52, -
3 14,3 / (+2,2 / )., NK , XF 3822, XF3021, 5658, Goldsun, -
.0,8–6,5 / .
. -.
46,07–50,47 %, 47,03 %. , -
. (50,47 %), 95 49,5 % -
. (+2,64 % ) NK (+ 1,87 %).
1 « »NK 699,0 , . -
« » XF 9004 (669,3 )« » Goldsun, (676,6 ). 3 -
533,1 / .

187
1
( 2012–2014 .)
-, /
+,- -, /
-, % . . 1 ,
, « », 12,1 - 47,03 533,1
« », 13,5 +1,4 49,67 640,3
NK « », 11,6 -0,5 46,63 539,8
« », 13,0 +0,9 46,07 550,3
NK « », 15,2 +3,1 48,9 699,0
, « » 11,6 -0,5 50,47 552,8
, « » 11,6 -0,5 48,9 534,6
52 , « » 14,3 +2,2 49,0 662,7
SK 2594 , « » 10,9 -1,2 48,0 483,2
92 , « » 10,5 -1,6 48,67 478,3
XF 90.04 « », 15,3 +3,2 46,47 669,3
XF 3822 « », 12,5 +0,4 46,87 548,5
XF 2800 « », 10,1 -2,1 46,63 443,5
XF 3021 « », 13,0 +0,9 47,57 577,2
« », 9,4 -2,8 46,90 416,2
« » 9,5 -2,6 47,13 409,8
« » 11,1 -1,0 46,77 472,9
« », 8,2 -3,9 46,8 408,4
95 , « » 12,3 -2,5 49,5 556,8
5543 « » 17,8 +3,0 47,9 773,1
5542 « » 11,1 -3,7 46,5 468,6
5525 « » 8,6 -6,2 46,9 373,6
5658 « » 14,6 -0,2 48,1 640,3
F 4418 « », 10,0 -4,8 46,9 425,5
F 3004 « », 12,1 -2,70 47,1 520,4
Goldsun « » 15,2 +0,4 48,3 676,6
05 0,4–0,8 /
« » 52 -662,7 / .
,.
. « » ( ) XF 9004 52
« ».
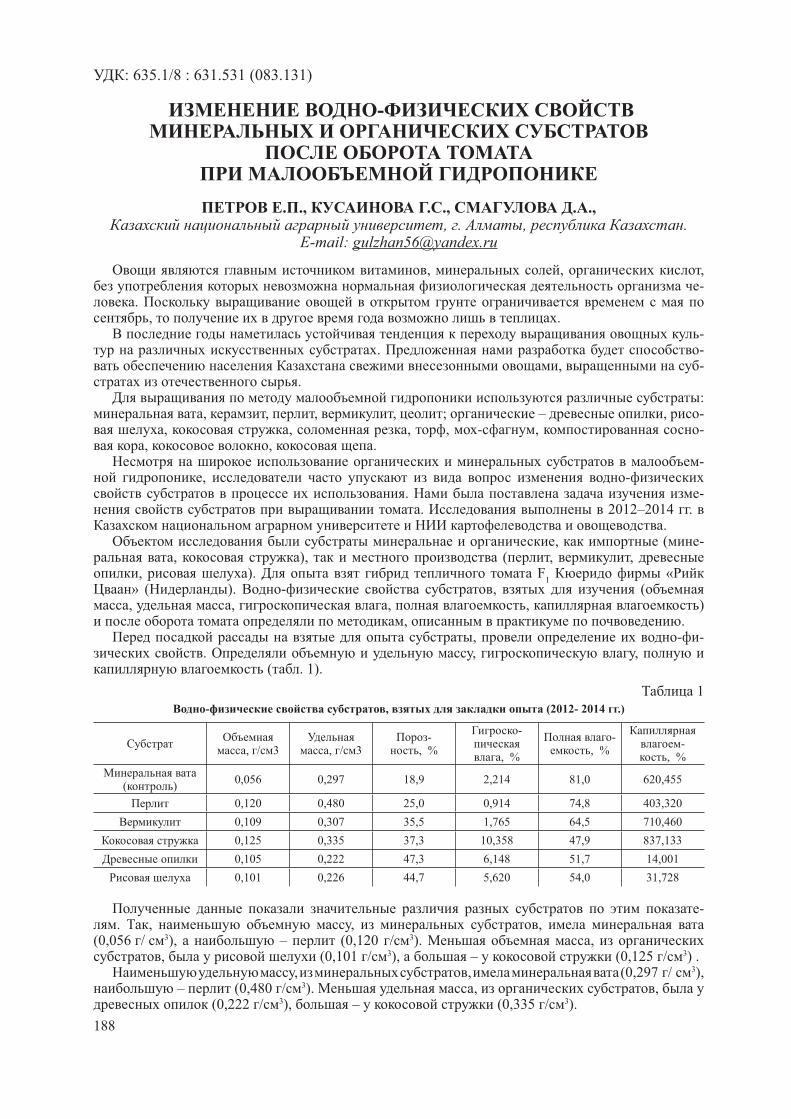
188
: 635.1/8 : 631.531 (083.131)
-
. ., . ., . .,, . , .
-mail: [email protected]
, , ,-
., .
-. -
, -.
:, , , , ; – , -
, , , , - , -, , .
-, -
. -. 2012–2014 .
., ( -
, ), ( , ,, ). F
1 «
» ( ). - , (, , , , )
, ., - -
. , , ( . 1).
1
- , (2012- 2014 .)
, / 3 , / 3-
, %
-
, %
-, %
-, %
( )0,056 0,297 18,9 2,214 81,0 620,455
0,120 0,480 25,0 0,914 74,8 403,320
0,109 0,307 35,5 1,765 64,5 710,460
0,125 0,335 37,3 10,358 47,9 837,133
0,105 0,222 47,3 6,148 51,7 14,001
0,101 0,226 44,7 5,620 54,0 31,728
-. , , ,
(0,056 / 3), – (0,120 / 3). ,, (0,101 / 3), – (0,125 / 3) .
, , (0,297 / 3), – (0,480 / 3). , ,
(0,222 / 3), – (0,335 / 3).

189
, - (2,214 %), – (0,914 %).
, ,(10,358 %), – (5,620 %).
, ,(81,0 %), – (64,5 %). -
(54,0 %), – (47,9 %)., ,
(710,460 %), – (403,320 %). - (837,133 %), –
(14,001 %). - -, ( . 2).
2
- , F1
(2012–2014 .)
, / 3 , / 3-
, %
-
, %
-,
%-
, %
( )0,063 0,279 22,6 0,221 77,5 521,483
0,078 0,512 15,2 0,988 84,8 227,096
0,162 0,196 82,7 4,775 17,0 390,397
0,135 0,160 84,4 5,655 15,8 730,552
0,154 0,201 76,6 4,022 23,6 25,231
0,083 0,155 53,5 3,712 46,0 52,372
, ,(0,063 / 3), – (0,162 / 3). , -
, (0,083 / 3), – (0,154 / 3)., , (0,155 / 3),
– (0,201 / 3)., , -
(4,775 %), – (0,221 %). -, , (5,655 %), – (3,712 %).
, , (84,8 %), - – (17,0 %).
( 46,6 %), – (15,8 %)., , -
(521,483 %), – (227,096 %). - (730,552 %), – -
(25,231 %).- ,
( . 3).
3
- F1
(2012–2014 .)
, / 3 , / 3-
, %
-
, %
-,
%-
, %
( )+0,007 -0,018 +3,7 -1,993 -3,6 -98,972
-0,042 +0,032 -9,8 +0,074 +10,0 -176,224
- +0,053 -0,111 +47,2 +3,010 -47,5 -320,063
+0,010 -0,175 +47,1 -4,703 -32,1 -106,581
+0,049 -0,021 +29,3 -2,126 -28,1 +11,230
-0,018 -0,071 +8,8 -1,908 -7,4 +20,644

190
, – -; . -
, – ; .
, – ..
, – . -
..-
, – .:
1. , , - . (0,056 / 3), -
– (0,105 / 3). , - (0,297 / 3), – (0,222 / 3).
, ,(2,214 %), – (10,358 %). ,
, (81,0 %); – (54,0 %). , , -
(710,460 %), – (837,133 %). 2. - -
. , - ( , ). -
. , -, .
633.18:631.527.56
. ., « - ,
. . », . , , [email protected]
-. ,
, [1], [2], [3], - [4].
( , ),
.-
, -. -
., , , 1390, -
V20A ( – WA, Wield Abortive; - – Oriza sativa f.spontanea, sin.Oryza rufi pogon). -
5 2.

191
15 15 30 30 .. 3–5
(15 15 ) 2–3- 10 7 -.
. . [5]. [6].
,( ., 1390 ). , ,
,
( . 1).
1
,, .
,, .
-, ./
15 15 30 30 15 15 30 30 15 15 30 30 15 15 30 30 15 15 30 30
114 109 4,5 7,7 18,7 20,5 138 196 7,4 9,6
116 105 5,8 14,7 19,0 20,9 142 217 7,5 10,4
101 98 3,8 12,0 14,8 15,8 122 197 8,2 12,4
96 96 4,7 14,7 14,7 16,2 129 207 8,7 12,8
91 85 5,8 11,6 13,9 15,5 127 214 9,2 13,9
84 83 5,8 10,5 14,1 16,4 131 221 9,3 13,5
1390 90 81 4,3 10,8 14,5 15,3 175 249 12,0 16,3
1390 87 80 4,3 16,0 15,9 16,8 193 257 12,1 15,4
056,5 1,3 0,8 17,6 1,0
: – ( ) ; –
( ) -
,
.
, , 1390
,
1390
. ,
, WA , , -
.
,
,
.
1390 , , -
; – . - -
.
-
.
1000 ( , ,
), . , -
.
1390
( . 2).
30 30
,
.

192
2
1000 , , % , %
15 15 30 30 15 15 30 30 15 15 30 30
29,9 30,1 18,4 18,2 85 80
29,5 29,0 18,5 18,0 70 56
34,2 33,7 17,3 16,7 86 91
33,9 33,2 17,0 16,7 88 81
29,6 29,0 17,2 17,4 83 81
28,2 27,9 17,8 18,2 83 71
1390 28,3 28,5 17,8 17,7 75 68
1390 29,8 30,1 17,2 17,3 61 48
05 0,5 0,7 4,7
-- .
1390. : - 1390 ; – ; –
..
, -.
-, , ( ), -
( ); ( , ); ( , -
1390 ); - -.
,.. -
, , -, - .
, -.
2. . ., . ., . .// . – 1985. – 2. – . 33–34.
3. Akbar M., Yabuno T. Breeding for salin-resistant varieties of rice// Japan. Journ. Breed. – 1975. – Vol. 25, 4. – P. 215–220.
4. Ratho S.N., Pradhan S.B. Cytoplasmic inheritance of low temperature tolerance in rice// RBQ. – 1994. – 20. – P. 26.
5. Chen Y.F., Li C.G. Epigenetic control of tolerance for transient low light stress in rice// Intern. Rice Res. Notes. – 1996. – Vol. 21, 1. – P. 39–40.
6. // -. – .: , 1984. – . 12.
7. . . (5- .). – .: , 1985. – 351 .

193
633.31
-
. ., « - -
», . - , . E-mail: vkniish@mail. ru.
, , , -.
– . , -, , -
. ., .
,. ,
. ,, 4- . 2–3
. . 16 :
« », « », « », « », « », « », «», « 50», « 8893», « », « 18», « », « »,
« - 8», « 7», « 1068».- -
. . – , - (Ph – 70), – 3,5 %, – 22,6 , -
– 18,5 / – 400 100 .- 490 .
: 2012 – 454 , 2013 – 479 , 2014 – 493 ., ,
., , .
,. , - -
, ., . -
-. ( . 1 2)
« ».
1
, %
1/101/2
57,356,655,853,249,433,3
42,743,444,246,850,666,7
, ..

194
2
( % )
32,9028,4024,60
12,5013,2013,90
19,5013,6011,0
30,9042,9046,50
-. , . . (
) , -.
, , , -, ,
. - ( 50 50 %),
.,
, , ,.
. -, , 2/3
1/3 . ,.
. 3. ,, .
3
/
, /
2012 2013 2014 .
1.2.3.4.5.6.7.8.9.
10.
St « »
- - 8
1068 7
50
166,4189,0174,6169,6187,2175,3183,7191,2180,0186,5
194,3216,8199,4189,7212,7196,3195,3217,8199,6211,6
182,2200,0185,2188,9203,7191,5193,6193,3186,5192,9
181,0201,8186,4182,7201,2187,7190,9200,8188,7197,0
, 3 , « » – 201,8 / , « » – 201,2 / , « 1068» – 200,8 / ,
« 50» – 197,0 / . 10
56,3 61,6 / . « », « »,« 1068», « 55», « » 5,3–7,0 / , 9,7–12,8 %
47,9 49,3 %. – 49,3 % « » « 1068».
« 1068» – 17,2 « » – 17,3 %.
, 16 -- « », «
1068», « », « 50», - , -
.

195
4
/, /
2012 2013 2014 .-
, %-
1.2.3.4.5.6.7.8.9.
10.
St « »
- 8 1068
7 50
0,5
50,157,753,652,455,853,354,257,055,156,52,5
58,367,561,659,063,858,959,266,059,765,62,7
55,459,856,558,260,156,757,960,356,757,52,7
54,661,657,256,559,956,357,161,157,259,9
-
47,649,347,948,249,148,448,549,347,948,9
-
16,617,016,216,817,316,816,417,216,016,9
-
., -
, -.
7. . . . ( ). ., « », 1987. – 240 . .8. . .
- : ( ). – 2014. – 32 .
631.527:633.2
. ., . ., . .,
, , -, , ,
., ,
, ,.
, , , - – , ,
. 11 . 7
- : , , , 1251, 30, 41, ; 5 – - : ,
5, 10, 1251, 3. 1251 . 5 .
, 30. -
3274, 12, 2048. - 264, 64.1, 8.1 / .
16.1 %, 34.6 %. .

196
5 10 5–3 10–1,
- . 5 - 187–442, – 43,4–102,9; – 5,4–16,5 / . -
15,7 %. 10–1 1996–1997 ., -47…-53 0 , 5–7 . 10
(11,7) 4,1 / , - 156 % (73,0) 17,6 / , 135 % .
. -.
. , ,, , -
.-
. ,.
10 80 . sangvineum. , . -
, , , . ,- . , ,
.,
38,4 / . – 21 / , 2010–2012 . 3,9 / .
(12,8 %) (11,3 %), , -
.-
2015 ., -
.
631:633.854.78
. ., . .,- . . . ,
-1, , e-mail: [email protected]
, , . 2300,4 . .
.,
,. -
. , -[1].
. ., . ., . . (1998 ), -, -
25 / , . . (2003 ) -

197
40 . / . . ., . . (2009 ) , ,
, 40–50 .. ., . ., . . (2008), . . (2008 ) ,
40 . / . . (2012 ) , - 40–50 ./ . .
-.
,, ,
7 (10, 20, 30, 40, 50, 60 70 ). 2012–2014 . - -
. . .. – 3,6 -4,1 %,
– 0,20–0,26 %, – 0,10–0,15 %, 0–40 – 3,8–4,1 /100 , 0–20 – 2,19–2,83 82–116 /100 . 10–14 5–6
. - (2,0–2,5 / ). 5–8
. – .. 2012
. 38,5 71,1 . 3
63,1 , – 67,6 , 13,2 . 14,9 0 , -
2,5 0 , 2,2 0 , 2,5 0 , 1,1, 0 .
2013 ,. 3,50 , ,
– 0,70 , 0,80 0,50 . 31,0 ,
28,7 ., 35,6 .
– 38,2 . 2014 -
,. 46,7 -
71,7 . 6,0 23,6 -.
13,1 0 , 0,7 0 ,1,6 0 . 1,8 0 , 4,4 0 .
(10–14 )115,4 . 35,4–82,8 -
. ( . 1). 32,6
80,0 . 30 50 ..
10 (208,9 ).. 30 . – 173,6 , 50 . – 142,1 70 . – 105,6 .
, , 70 . (7,4 / ), 50 . 0,3 / ,
30 . 2,2 / , 10 . 5,3 / .- 30 70
( 2). -, 30
, 20,0 / – - 50,0 /.

198
. 1.,
. 2., /
, -, - 30
.. – 40–50 / .
1. . . / . . . – .: , 1990. – 174 .2. .
// . – 2012. – 2. – . 24–26.3. . . // . – 2003. – 3. – . 10–11.4. . . -
/ . . // . . ... . .- . . – , 2008. – 23 .
5. . . . . - // . – 2008. – 3.–
. 31–39.6. . ., . ., . . // -
. – 1998. – 3. – . 45.7. . ., . .
// .- . . . . – 2009. – 1. – . 57–64.

199
631.527.1
. ., . ., . .,- - ,
. , , e-mail: [email protected]
, .,
.. -
, , ,.
,
(40/50 / 100 / ) - (17–19 %), (3–4 / ) [1].
, -, , -
[2].- 1992–2014 .
..
. - , - (Medicago varia Martyn). : . ., . .,
. ., . .- -
. , , 45 % 19 %, 15 %.
. , - (Medicago varia Martyn). - . . ., . .,
. ., . .-
, , 7. 2 270–300 / ,
73 / . 14–15,8 %. (98 %) - (4 ).- 8. - 8 -
(Medicago varia Martyn).- . : . .,
. ., . ., . .- 8 - , -
-, , 7, 4 .
– 119,2 / , – 46,9 / , – 1,3 / ., . .
. - . :. ., . ., . ., . .
- , --
, , 7, 4, - 8.

200
- (Medicago varia Martyn). (200–2011 .)
: – 110,6 / , – 33,7 / , – 1,78 / , - – 16,6 %.
14. - , - - (Medicago varia Martyn). : . .,
. ., . ., . ., . . - -, -
, , 7, 4, , - 8 .
36 %, - – 56 %, – 170 %.
. - , (Melilotus offi cinales). : . ., . ., . ., . .,
. .- -
, , ..
25 %, 36 %. – 16–18 %.- 7. - -
. : . ., . ., . ., . .- 7 (Melilotus albus Medik).
- , -, , .
– 228,4 / , – 66,4 / 5,9 / . 10. - .
: . ., . ., . ., . . - -,
, , , 2. -, , , , -
. (Melilotus offi cinales). 14. - . :
. ., . ., . ., . ., . . - -,
, , , 2. ,
, , ,.
(Melilotus offi cinales). 14 - ,
-- , 38, , ,
88, , , 99, .- . : . ., . ., . .,
. ., . ., . . . 2- -
108 / , – 22,4 / – 2,3 / . – 25,6 %, – 35,7 %
– 43,7 %.. - ,
Galega orientalis. : . ., . ., . ., . .,. ., . .
, -, , , , -
, . . ., 8–10 , – 3–4 .
, – , ,

201
. .: 100 20–24 , –
57–78, – 25 .- 9. -
.: . ., . ., . ., . .
: - , , -, 150 , , 1- 49,8 %
2- – 48,6 %., , - ,
14 18, 12. -, - 5,5–13 , 1,5–3,0 , -
, . – , 18,5–27,0 - .- 9 ( )
– 27 %, – 6,3 , 4,8 %., (1992–2012 .)
.
8. . – .: . – 1978. – 307 .9. . . . – . –
1999. – 168 .
633.15
. .,-
- -. , , -,
. ,. .
,, .
, -- .
, , -. ,
, , 10–120 .-
, . . 0–20 ., , -
. , -,
( ).
. -, -
,.
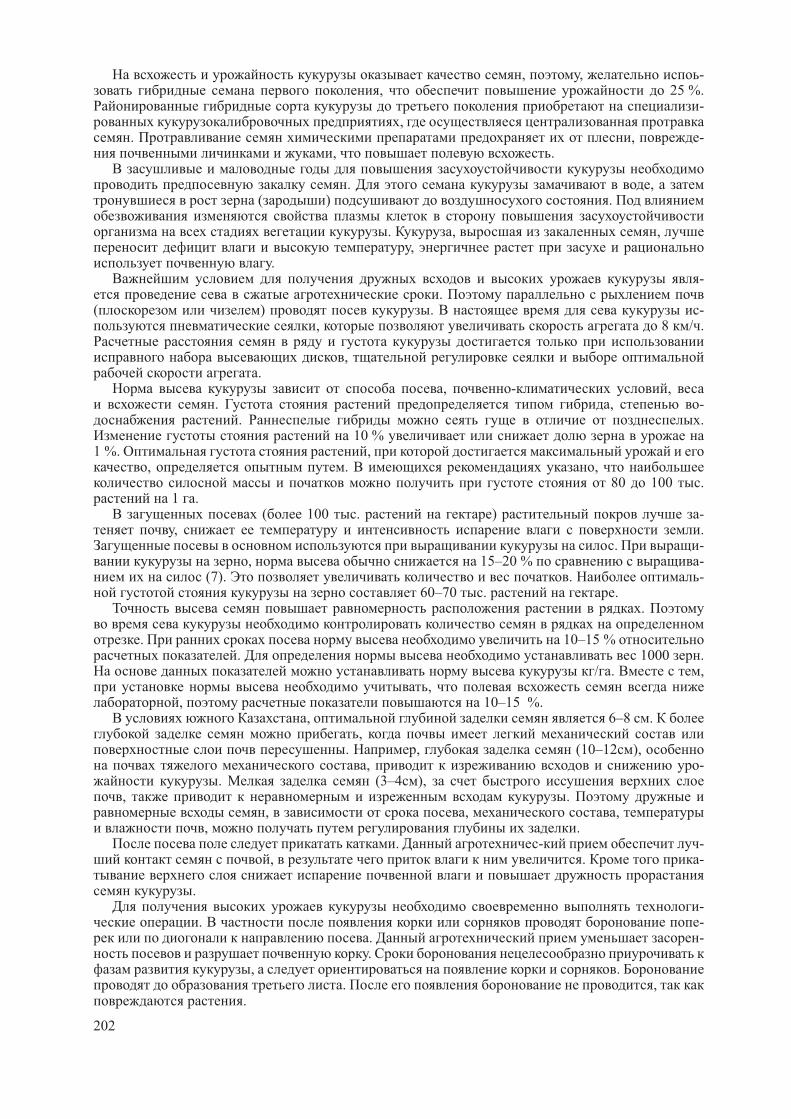
202
, , -, 25 %.
-,
. , -, .
. , ( ) .
. , ,,
.-
.( ) . -
, 8 / .
,.
, - ,. , -
. . 10 %
1 %. ,, . ,
80 100 . 1 .
( 100 . ) -, .
. -, 15–20 % -
(7). . - 60–70 . .
.
. 10–15 % . 1000 .
/ . ,,
, 10–15 %. , 6–8 .
,. , (10–12 ),
, -. (3–4c ),
, ., , ,
, .. - -
, . -
.-
. -. -.
, .. ,
.

203
, .-
. ,.
.
. -. 3- .
, 7–8 . ,
., – -
. 2,4- . 2,4-
: ( , , ,, , ); ( , , , , , -
); ( ); ( , ,). 2,4- .
., , . -
() .
, .
, , . .-
. , (
). : ,, -
. – .
3. . . . – .: 1963. -157 .4. . . . – .: , 1974. – 136 .
634.72:631.527
. ., . .,
« - » ( « »),. , , , -mail: [email protected]
(Ribes aureum Pursh) . -
, , ,. , -
.. (
, , , , , ),

204
, -. – . -
– , , , ,, ( ). , -
, , ., , , ,
.. . 1962
. -. . . ,
. , -.
. -. . (1975–
1980) . . (1981–1986). .
- . 1985 . . . 1996 .
. . « ». ,, ( -
, ).,
, , - 1294/2 ( )
– ..
, , -,
, - . 9
. 2006 . -, , , , 2007 . ,
. . . , . . , . . . 2011 . 10 2014 . – . . . ,
. . .. -
-41,0° ., +35° .
. , -,
, ,, , -
., , , ,
.. (3,5–4,0 ), 4–8 . (1,4–
3,2 ), - , , , ., , . , -
. : – 18,2 %, – 13,1 %, – 1,0 %, – 1,2 %, – 31,7 /100 , – 12,0 /100 . – 6,0,
– 8,0 / (20,0–26,6 / ).. (5–6 ), 8–12 .
(1,2–2,6 ), , , , . , . – , . :
– 16,4 %, – 12,0 %, – 0,6 %, – 1,7 %, – 29,1 /100 , – 8,2 /100 . – 5,3, – 7,0 / (17,7–23,3 / ).
. (5–6 ), 6–9 . (1,0–1,6 ), , , , . - ,

205
. , . : – 16,5 %, – 11,9 %, – 1,0 %, – 1,1 %, – 29,1 /100 , – 11,1 /100 . – 5,0, – 6,0 / (16,6–20,0 / ).
. (4–5 ), 5–10 . - (1,0–1,7 ), , , , .
, . : – 17,7 %, - – 13,9 %, – 0,8 %, – 0,7 %, – 23,2 /100 , – 9,2 /100 .
- , , . – 3,7, – 4,5 / (12,2–15,0 / ).
. (5–7 ), 5–9 . (1,4–2,4 ), -, , , , . - , ,
. ( ), . : – 15,2 %, – 13,3 %, – 1,9 %, – 1,3 %;
– 47,8 /100 , – 9,6 /100 . – 4,3, - – 5,0 / (14,5–16,7 / ).
. (3–4 ), 5–7 . (1,4–3,1 ), -, , , . - , , -
. , ( – ).: – 13,4 %, – 10,2 %, –
2,4 %, – 1,2 %, – 44,1 /100 , – 5,2 /100 . - – 4,3, – 5,8 / (14,2–19,3 / ).
. (3–4 ), 4–6 . (1,0–2,0 ), -, , , . - , , -
. , ( – ).: – 17,2 %, – 12,3 %, – 2,7 %,
– 1,3 %, – 47,4 /100 , – 6,4 /100 . – 4,3, – 4,5 / (14,4–15,0 / ).
(4–7 ), 7–12 . - (1,2–1,9 ), , - , , -
. - , , . , - ( – ).
: – 16,5 %, – 10,9 %, – 1,7 %, – 1,0 %, – 42,6 /100 , – 3,0 /100 . – 4,0,
– 6,0 / (13,3–20,0 / ). ( 82,0 %) -.
. 4–6 , 6–10 . (1,3–2,4 ), , , , , .- , , . , (
).: – 16,5 %, –11,3 %, – 1,6 %,
– 1,3 %, – 30,9 /100 , – 7,6 /100 . – 3,7, – 5,0 / (12,3–16,6 / ).
. 4,2–4,6 ,
4,3–4,6, – 4,5–4,7 .-
, .-
, .:
, . – :- , 1999. – . 351–373.
. ., . . . ., // . IV. . / . . . . – : , 2009. – . 294–310.
. ., . . // : .- . ., . 80- -
( , 20–22 2013 .) / . . - .. . . . : - « », 2013. . 294–296.

206
631:633.853.493
. ., « - . . »,
. -1, , [email protected]
-,
. Rapool -
– - [1]. No-Till
15 20 [2]. (Brassicanapus) -
,, .
2012–2014 . ,- . . . , -
.100–120 2, .
2012–2014 :Trapper, SalsaCL, Mobil CL Osorno, . –
.AmazoneDMC. (36 %) 2,5 / . 1,5–2,5 , , -
0,7–2,0 ./ .2011–2012 , -
35 % . - 109,9 , 33 % , 65
27 , , ,.
2013 97,5 , 62,7 . ,
,.
2013 29 % . - 36 . -
+20,80 -, .
2014 -,
. 46,7 - 71,7 . 6,0 23,6
. 2012 Osorno Trapper.
Kaliber (96,7 %) Mobil CL (95,7 %). 2013 -
Trapper – 87,4 %, MobilCL 77,4 %.2014 SalsaCL (95,2 %) Trapper (88,1 %).
, – - [3]. , -, .
.
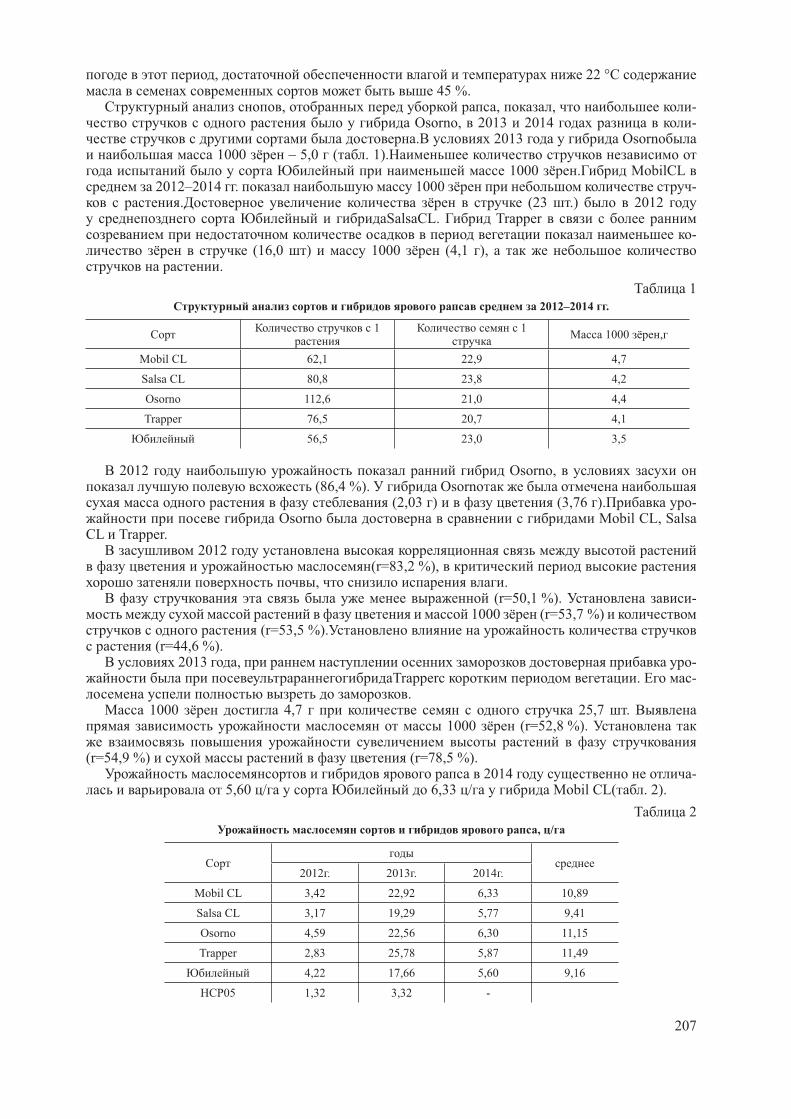
207
, 22 ° 45 %.
, , , - Osorno, 2013 2014 -. 2013 Osorno
1000 – 5,0 ( . 1). 1000 . MobilCL
2012–2014 . 1000 -. (23 .) 2012
SalsaCL. Trapper -
(16,0 ) 1000 (4,1 ),.
1
2012–2014 .
1 1 1000 ,
Mobil CL 62,1 22,9 4,7
Salsa CL 80,8 23,8 4,2
Osorno 112,6 21,0 4,4
Trapper 76,5 20,7 4,1
56,5 23,0 3,5
2012 Osorno, (86,4 %). Osorno
(2,03 ) (3,76 ). - Osorno Mobil CL, Salsa
CL Trapper. 2012
(r=83,2 %), , .
(r=50,1 %). - 1000 (r=53,7 %)
(r=53,5 %). (r=44,6 %).
2013 , -Trapper . -
. 1000 4,7 25,7 .
1000 (r=52,8 %).
(r=54,9 %) (r=78,5 %). 2014 -
5,60 / 6,33 / Mobil CL( . 2).
2
, /
2012 . 2013 . 2014 .
Mobil CL 3,42 22,92 6,33 10,89
Salsa CL 3,17 19,29 5,77 9,41
Osorno 4,59 22,56 6,30 11,15
Trapper 2,83 25,78 5,87 11,49
4,22 17,66 5,60 9,16
05 1,32 3,32 -

208
2012–2014 . -Osorno (11,15 / ),
, Trapper (11,49 / ). 2012
(43,75…46,09 %). 2014 -.
2013 45,12 50,06 %.
3 Trapper – 43,79 %. 2012
Osorno – 46,09 %. 2013 2014 .Salsa CL 50,06 % 45,44 %.
1. Ludger Alpmann. GuteErfahrungenmitHybridraps. [ ]http://archiv.saaten-union.de
2. R.E. Blackshaw et al. Canola Response to ESN and Urea in a Four-Year No-Till Cropping System.
AgronomyJournal. Vol. 103 No. 1.Jan, 2011, p. 92–99.
3. . . ( , , )/
. . – .: “DLV ”,2013 – 320 .
631.32:633.2/3
., .,« - - »
, ., , e-mail: [email protected]
- , ,.
.,
..
300- . 25–30 .
., ,
. -.
- ,.
30–40 80-
.
..
, - , ,-
.

209
.
- .
.-
36 -. , ,
, - ., , , ,
- , , , , - , ,, , - ,
., , .
,.
25 , 17 .
-,
. ,, , , . ,
. , -.
. -.
. « » 15 « » - 110 -
.
.
631.4
-
. . 1,2
1. ,630501 . ,
2. ,. . E-mail: [email protected]
, -, ,
, -. -
[1]. . . [2] -:
1. ,, .
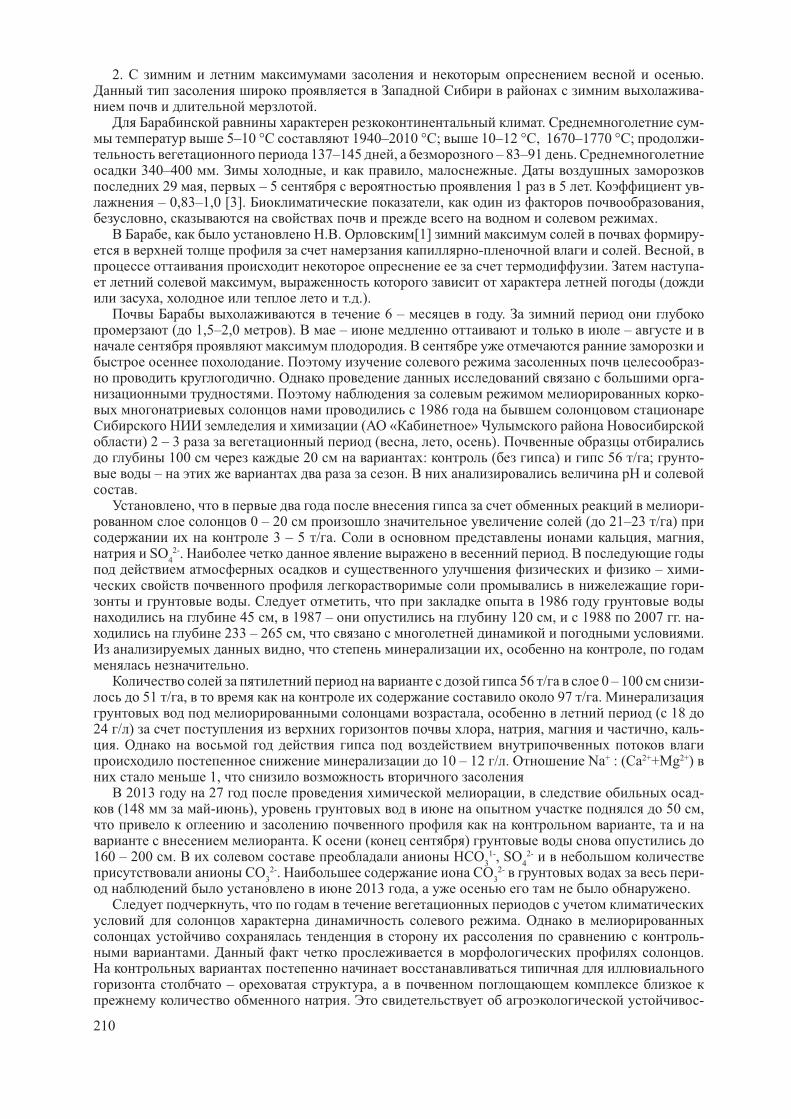
210
2. .-
.. -
5–10 ° 1940–2010 ° ; 10–12 ° , 1670–1770 ° ; - 137–145 , – 83–91 .
340–400 . , , . 29 , – 5 1 5 . -
– 0,83–1,0 [3]. , ,, ., . . [1] -
- . ,. -
, (, . .).
6 – . ( 1,5–2,0 ). – –
.. -
. -. -
1986 ( « »
) 2 – 3 ( , , ). 100 20 : ( ) 56 / ; -
– ..
, - 0 – 20 ( 21–23 / )
3 – 5 / . , , SO
4
2-. . – -
-. , 1986
45 , 1987 – 120 , 1988 2007 . - 233 – 265 , .
, , ,.
56 / 0 – 100 - 51 / , 97 / .
, ( 18 24 / ) , , , -
. 10 – 12 / . Na+ : (Ca2++Mg2+)
1, 2013 27 , -
(148 - ), 50 ,,
. ( )160 – 200 . HCO
3
1-, SO4
2-
CO3
2-. CO3
2- - 2013 , .
,.
-. .
– ,. -

211
, -.
1. . . //, - « » . - , , 1979, . 263 – 274.
2. . . // ., - , 1946 .3. - / . . . -
// , – 2002, -388 .
634.75:631.527
. ., « -
. . . », , . E-mail:[email protected]
. -, 20 ,
, . -1,1°, -3,3° – [1].
« -, » [2].
., – -
. , ., .
50 84 % .
, . -0,5 -10,2° , -1,0 14,5° . .
5,0° . 16, – 42 % . 14 (2000–2014) -
2005 2010 . 2010 ., -, .
(-0,5…-2,7° )1–3 10 % , (-0,3…-8.5° ) 1–4 ,72 % , . 1997 . -
-2,0…-3,5° , - -5,0…-8,5° . .
– (78,5 %), (55,9 %). 20,0–50,1 %.
( , , ) – 2,7–8,6 %. 2007 . -2,0° .
44,9 %, – 23,4 % .,
21,5–26,3 % 12,3–14,8 % . 2010 . -3,5° ,
-5,0° . 4,9–40,9 %, – 6,4–45,2 %.
2009, 2011, 2012 .. 2013 . , -
, 10–14 . 26–27 (-0,5° )
.

212
, 6,0 % , -0,5 1,0° , – -0,5 -3,5° – 14 % . (15–17 )
4 % , . 1989 . ( 6 7 ) -4,0°
., , ( ,
) .: – 61,4 %, – 43,1, – 43,0, – 37,8,
– 34,0, – 28,0, – 29,1, – 29,6, – 18,1 %. - – -
– 1,1 %, – 1,6, – 2,5 %. 2014 . 0,9° , 18 %. -
10 (6–9 , 11–12, 15, 18–20 )-0,5 -6,0° , 11–12 -1,0…-1,2° ,
0,3…7,5° . (3, 5–6 9 ) -0,5…-2,0° .
. . ,46,7 % 3,0–5,9 . .
. 50
84 % , – 72 % .- ( -
, , ), 1,1–2,5 % ( , , ) – 2,7–8,6 %. -
– , , (54,7–78,5 %).
1. . / . . – .: , 1974. – 96 .2. , . – , 1999. –
.417–444.
633.11 «324»: 631.61
. ., . ., . ., « - ».
. , . E-mail: [email protected]
,,
. : -, , , , -
. , : ,, , , ,
, , -,
.- -
, . -, -
, -. ,
, -

213
.,
, ,.
,, , , .
,, - . -
, ,.
. -, , ,
.. , - -
, , ;
; (80 % ) ;
(70 % ) ,, ,
. 15
10 , 20 20 , 4–5 / - 1, ( ,
, , - , ) 3–4 / ., -
(2–4) 1. ,
., ,
( , . .), - ( – ) -
., -
. ,. -
, 1,0–1,5 ./ .
, -- , ,
( ). -, ( -
, , , . .).,
, -, , -
,. -
, - -.
-N
30, , ,
. – N
30,
, . . .

214
N30
( ),, -
, . -.
N30
, -.
, ,, N
60-
, ,, . N
30
.
,. . . -
, -, ,
, . . 80 / .,
. , , , , --
, ,.
, , .,
., ,
, , , -, . .
. , ., , ,
, . -,
., , ,
-, ,
.
633.3.35
. 1., . .2
1 ,. , , e-mail: [email protected]
2 « - », . ,, , e-mail: [email protected]
-.
- -. 2000- ., , FAO, CIMMYT, ICARDA -

215
., 2001 -
, 0 , 2007 - 500 000 . 2008 1 200 000
, -.
. 2011 -
1 600 000 10 ,[1].
. 2012 - - 12,4 , 76,5 % . -
2011 7 % [2]. , -
. , 2012–2014 .
, , - -,
. 1. .
,,
. ( , , -
, .) , ( , . .): -
. , -,
.. 1.
1
.
, / 2
-
(« », 3 / )
( ) - 3,8 1,1 10,5
- 2,8 0,9 11,8
+ 0,5 0,6 7,8
- 5,7 3,4 17,7
+ 3,9 1,3 11,6
- 8,4 5,2 20,3
+ 12,2 6,7 24,4
1, . -
(0,5 / 2 - 0,6 / 2 )
2. .
,
.-
, [3].

216
.
[4]., -
- ( . 2).
2
-
,/ 2
-, %
-
/ 2
- -, %
-, %
20.05; 2,8 226 81 161 71 58
20.05; 3,0 232 77 172 74 57
20.05; 3,2 245 77 179 73 56
25.05; 2,8 218 78 164 75 59
25.05; 3,0 217 72 176 81 59
25.05; 3,2 246 77 182 74 57
30.05; 2,8 232 83 172 74 61
30.05; 3,0 238 79 181 76 60
30.05; 3,2 249 78 192 77 60
, 30 2,8; 3,0; 3,2 . / : 83;79;78 %.
74;76;77 %. , - (8,1–8,6 / )
(30 ).,
- , - ( . 3).
3
( 3 )
,. / , / 2 , .
1000 , .
-/
20.05.
2,8 161 11 31,3 5,5
3,0 172 10 31,2 5,4
3,2 179 11 30,4 6,0
25.05.
2,8 164 12 30,6 6,1
3,0 ( - ) 176 13 30,4 6,9
3,2 182 12 30,8 6,7
30.05.
2,8 172 15 31,4 8,1
3,0 181 15 31,5 8,6
3,2 192 14 31,2 8,4
05 1,23
, (217–232 / 2)., -
.,
(232–249 / 2). - -, . ,
2012–2014 30 ,: 3,0 3,2
8,6; 8,4 / .
1. R.Derpsch & T.Friedrich. , 2008 .,2. 2012
2013 .

217
3. . . ., . . ., . . .: – , 2009. -71 .
4. . . . – - 2011 . 5–6.
:633.28:581.4
. ., . .,« - - »
– . . , ,
, e-mail: [email protected]
– .
: , .- – ,
, , ,
.-
, (Psathyrastachys juncea Nevski) , .
. - – , , .
, -.
1986 , 2009 90 , 3- .
« » ( ), -37439 ( ) -, -37279 ( ) -37437 ( ), 1 2 (1989 – 1990 . .) 686,4 – 814,0
, – – 489 / . . 3- -
. 7 . ( -44471) ( -39544) ,
7 1 47,5 – 54,5 ..
-44471 ( ),-37489 ( ) 23 - ,
., , , -
90 , , 10 1992 –
2000 ,
. (1992 – 2000 . .)
( . . – 46749, 46750, 46828, 46755), ( – 37189) –

218
557,0 – 620,0 ., ( . . – 36809, 36808, 36818, 36117, 37705, 44985, . . – 068074), ( – 46835) – 1 . . – 428,0 – 592,0 .
, 1 . . – 411,0 .
, . - 45 – 57 % , -
– 39 – 48 %. ( . . – 46749, 46828, 46750) , ( – 46835), ( – 37484),
( . . – 36818, 37701, 37702, 44984, . . – 068062), ( – 40177), ( – 39239) – 43 – 48 %.
. ( – 46828), ( . . – 46179, 47952), ( – 40397) -
, ( – 47248) - 29,0 – 38,0 . , ( – 45312),
( . . – 36812, 36814, 44988, 46752, . . – 068092), ( . . – 40019, 40020) - 11,0 – 23,0 % , –
– 1 . . – 24,0 ., , -
.
:
1. . . – . , , « », 1981. -3 .2. . . .// .
- . – . 3. – . – « ». – 1979. – . 126.
3. . . // . . -- . – . 3. – . –
« ». – 1979. – . 10.
631.52/.53:57
. ., . .,- ,
. , , [email protected]
– , -
. , :; , , ; -
.,
., ( , ,
1000 , , , ), - -. . .
,, , .
, [1,2].
-, , ,
, –

219
,.
, , -, -
,.
, , ., -
3 1 . [3]. , - -
, , -.
--
.,
- ( . 1).
1
-, %
24 65,0 3,0 10,5 3,5 48,0
60 67,0 2,0 19,0 4,5 42,5
72,5 2,0 16,0 2,0 52,5
66,0 2,5 16,5 2,0 45,5
65,0 3,5 16,5 4,5 41,5
70,0 2,5 22,5 1,5 44,0
10 69,5 3,0 15,5 3,0 48,0
69,0 3,0 20,0 2,0 44,0
71,0 2,5 18,0 6,0 44,5
70,0 3,5 19,0 4,0 49,5
80,5 5,5 21,0 1,5 52,5
78,5 4,0 24,5 1,5 50,5
72,0 5,0 20,0 2,0 45,0
71,5 4,5 20,0 1,0 48,0
, ,, . -
. -, ,
, . -. ,
– . ,, .
11,5 % . -
3,5 %, 5,5 %, ., -
, ., , ,
, .

220
.-
. . – 75 %. -
,, .
., . -
,.
, .,
, -.
. -, , :
., , 1 .
-.
637.5.03
. ., « - . . »,
« » . ,
, ., .
– Kochia Prostrata (L) Schrad [1]. . [2] 6
, -.
-,
, - [3].
-: -
– , – 15 , – .,
[4]. ,
.,
. ,.
-.

221
3- : - 2- , -
+150 – +350 ; +40
2- +150 – +350 .: -
50 % -12,1 %. , - 6 , -
1,5 .,
2 5
76 %, 6 40 % 7,4 %., , -
6 6 ,
.
1. . . // . – , 1970. – 127 .
2 . . . – : , 1988. – 139 .3 . . // . - .: , 1982. -119 .4 . . // . – .: , 1982.-130 .
636.295/296
.- . 20–30 %
. .,
. ., « -
. . », « »,. ,
20 , 5 , , ,
3–7 / , ..
- 0,60 . ,
: 56 %, – 37 %, – 38 %, – 9 %,
– 37 % [1].-
, . -, , -
,, -
, ,. -
. -, [3,4] [5] ,

222
( , , , , ) - 10–12 % 18–26 %, 40–60 %.
,-
( ), 20–30 % -
.--
( , , , ). 1–2 . 1,5 ,
, , , ., , , , , -
, , 5–7 % [6–9].
,- , .
-, , , -
,,
. --
[10].-
,, , 10–15 ,
159 , – 220 , – 500 .
, - ( .1,2), , -
5 000 2 / - 1 000 . 15 000
185 000 - 200 .
15 .
1. -. / I 16.11.99. . . – 2000. – .38–46.
2..- . . / . . 4–7 . – . –
2007. – . 505-506. 3. // - – 1982. – 1 – . 69–72.4. -
. II .:. – . – 1995. – . 81–88
5., . // .: -
. – . – 1995. – . 57–58.6. . // . –
1977. – 6. – . 69–71.7. . // .:
. – . – 1995. – . 52–53.8.
// . . . -. – ,- 1990.- . 84–85.
9. Gudman.1989.10. Applicationof Electromagnetic RadiationofLowFrequencyforIncreasingoftheCropcapisityoftheAgriculturalSe
eds. /EurasiaNuclearBulletin, Turkey. – N.3. – 2004. – . 60–65.

223
633.16:631.527
. ., ., . ., . ., « - ,
. . », . , , [email protected]
-. -
,, , ,
. -, -
, . ,
, -- . ,
, , -.
-, – 70,
10. : – -, , 5 1
( 180 / , 150 / , 160 / ), – .: - «
. . »., , -
. 9,8° . -. – 129 .
40–70 . – - ,. 1 %,
0,68–0,71 %. - . 1–2 , 2 5 / ,
– 1,6–2,5 / .
. , 3 : ( 75 ); ( 76 82); ( 83 89).
- 72 75 , .
- 23–25 , -.
(82 ),- 16 ,
, 12–14 . 70 10
95 90 , ,- – 22 .
. ,, ,
, . -,
7 10 .
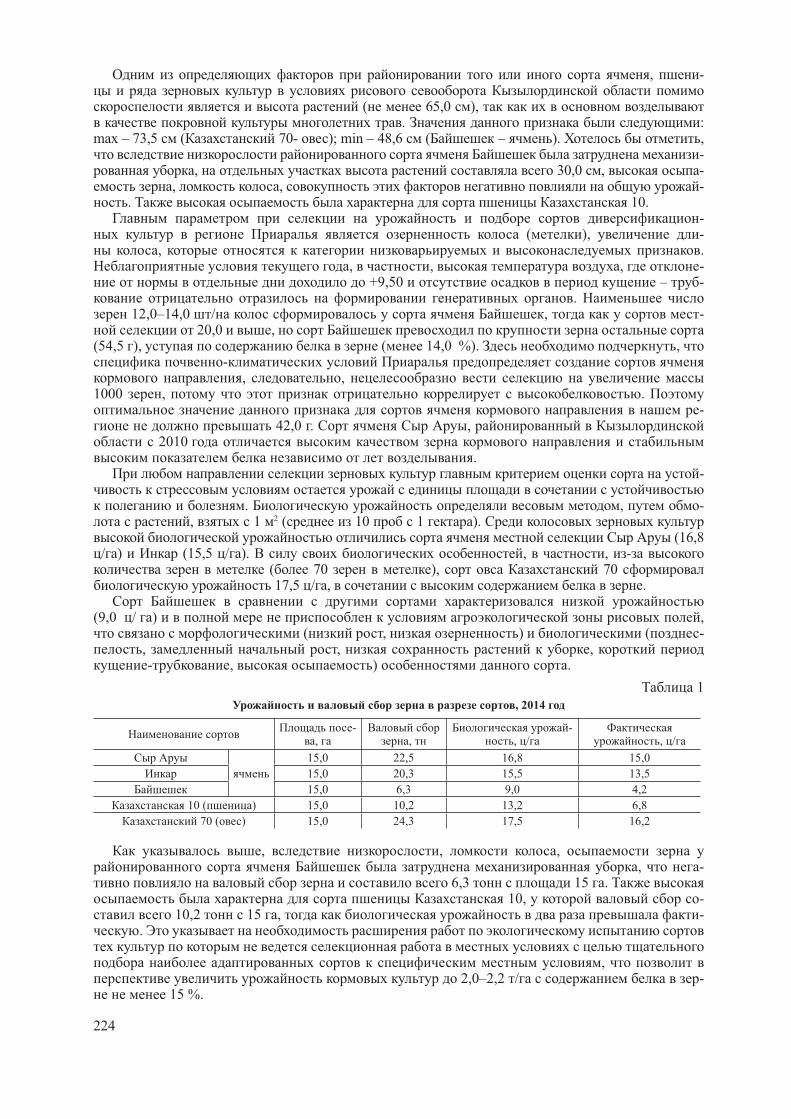
224
, -
( 65,0 ),. :
max – 73,5 ( 70- ); min – 48,6 ( – ). ,-
, 30,0 , -, , -
. 10.-
( ), -, .
, , , - +9,50 – -
. 12,0–14,0 / , -
20,0 ,(54,5 ), ( 14,0 %). ,
-, ,
1000 , .-
42,0 . , 2010
.-
. , -, 1 2 ( 10 1 ).
(16,8 / ) (15,5 / ). , , -
( 70 ), 70 17,5 / , .
(9,0 / ) , ( , ) ( -
, , ,- , ) .
1
, 2014
-, ,
-, / , /
15,0 22,5 16,8 15,0
15,0 20,3 15,5 13,5
15,0 6,3 9,0 4,2
10 ( ) 15,0 10,2 13,2 6,8
70 ( ) 15,0 24,3 17,5 16,2
, , ,, -
6,3 15 . 10, -
10,2 15 , -.
, 2,0–2,2 / -
15 %.

225
633.112 «342» : 631.52/53
C -
. .,, . ,
- -, .
[1, 2, 3] .
( ) - 60- , . . .
, -, . -
[4]. -
, [5].-
,[6]. 411, -
[7, 8]. - 411 2009–2011 . , ,
( 86 ), ( ,, .) [9].
1 2 , 411. .
5 1 . 5 2 , –
10 2 . 4.
, 411, , . -
.
1
, 2011–2013 .
, /,
, , ,
3,18 4,6 2,4 132 1,14
19/06 3,78 4,2 3,4 128 1,70
15/11 3,78 4,2 3,5 125 1,58
16/10 3,40 4,4 3,2 122 1,73
,( 19/06, 15/11, 16/10, 13/04, 19/07) .
- 1000 .
2
, 2011–2013 .
, /,
,,
,
3,55 4,2 2,6 135 1,44
4 3,53 4,2 3,2 116 1,53
13/04 3,84 3,9 3,8 118 1,85
19/07 3,57 3,9 3,3 123 2,03
12/04 3,27 4,0 3,3 124 1,81
17/06 3,02 4,0 3,6 116 1,93

226
-
411.-
.,
[10]. ( . 3). – -
.- .
- , .,
.,
. -, , 411.
3
– –
–
2006 - 0,367 - 0,036* 0,656
2007 - - 0,340
2008 - 0,180 0,533 0,052*
2009 - 0,021* - 0,135* - 0,038*
2010 - 0,290 0,289 - 0,400
2011 - 0,564 0,252 - 0,154*
2012 - 0,714 - 0,563 0,662
2013 - 0,290 0,526 0,025** –
1. . . // . – 2. – 1982. – .13–14
2. . ., . . - // . . . / . .- . . – 1981. – . 73. – . 44–49.
3. . . // . .. , / , . – 1985. – . 98. –
. 99–104.4. . .
: … . .- . : 06.01.05. – , 1994. – 170 .5. . ., . .
- // - - / . . . . – .,
1982. – .107–1146. . ., . .
// . 3 / . – , 1997. – 2 .7. . . // -
. 34 / . – , 2000. – 2 .8. . ., . . 411 // . -
52 / . – , 2007. – 2 .9. . .
: … . .- . : 06.01.05. – , 2013. – 18 .10. . ., . . -
// .- . . / . – 1980. – . 36 (2). – . 28–31

227
633.262:631.55 (571.1/5)
. ., . .,- ,, . -mail: [email protected]
-. ,
, , - [1–4].
-- .
(Bromopsis inermis (Leyss.) Holub.) - -.
- 189 (2n=56 ). [5].
. . [6]. - :
( , ) (1994–1996 ., 1995–1997 .), ( - ) (1992–1994 .) ( ) (2011–2013 .).
-. , 1994 1997 ( =0,83;
0,84), 1995 1996 – ( =1,24; 1,86). 1992 1994 ( =1,63; 1,92).
2013 .,
, [7]. -
.. ,
, , – .
(1,6 / ) (1,0 / ) .. ,
. 15–20 .-
7,21 7,40 /( ).
-, -
, 4- .
(0,65 / ) (0,46 / ) .
.-
, . 8–10
2013 . -.

228
- , /
± ± ±
7,21 - 6,32 - 0,42 -
7,40 +0,19 5,21 - 1,11 1,6 +1,18
3,82 -3,39 5,47 - 0,85 1,0 +0,58
05 1,10 0,76 0,51
0,65 - 0,46 -
0,32 -0,33 0,41 -0,05
0,22 -0,43 0,28 -0,18
05 0,06 0,04
- -.
-
, -, .
.- -
,.
.. ,
, ,.
, ,.
6,14 / , – 5,67 / , – 2,51 / .
(0,65 / ) (0,46 / ) . -
..

229
1. . ., . . . – .: , 1988. – 184 .2. . . : - . – -
: - . - , 1992. – 264 .3. . . ( ) / . .
- . – , 2006. – 228 .4. . . :
. . … . .- . . – , 2002. – 16 .5. . – .: -
, 1987. – 196 .6. . . . – .: , 1985. – 351 .7. Kashevarov N.I., Osipova G.M., Tyuryukov A.G., and Filippova N.I. Investigation of the characteristics of
smooth bromegrass (Bromopsis inermis Leys) biological traits for cultivation under extreme environmental conditions // Russian Agricultural Sciences. – 2015. – Vol. 41, 1. – P. 14–17.
633.511
., ., ., « - », . ,
, e-mail: [email protected]
-, -
., -
,- ,
. , ,, , -
- -.
, -.
.-
. ,, ,
III-V ., -
, ,. ,
, -,
., ,
, .–
,.
-.
- -, -

230
, - .,
- , - ,.
., , -
. ,. .
-. , ,
- -. , , , -
, ,,
III-V . , -, -
, , , --
.-
III-IV ,( , , ), .
- -, -
, .,
. ,
, , , F1
. ( ) F
1-
, . ( ), , -
, , -, .
- --
, , , ,, .
631.52 : 631.452.
., . ., . ., « - »,
, , e-mail: [email protected]
-. ,
., -
, , - , .

231
-.
: , -, -
. ,.
--
- ,, .
, -, , . -
, ., .
, -, . -
– , , [1].
4,0–4,5 - 1,2 2,5 . (
69 % ) (30 %) ( 1 %). , 3- , 4-
. 2012–2014 ( , 1981 ., . . . ) [2] -
. -: , ,
– 4011. .
, - 1
80–90 . / . 13,6–14,4 , ,
– 3,5–5,6 . - –12,2 ,
2,7 . 1 -
: 80–90 . / . 52,8–55,6 , -
12,4–13,6 . – 49,8 ,
9,5 ..
1 . 1 .
, 95,9–97,8 .
(2012–2014 .)
,01.0
6
- , 0
1.0
6 ,01.0
7
-,
. 01.0
7
-,
01.0
8
-,
. 01.0
8
-,
. 01.0
8 -,
.01.0
9
-,
01.0
9
– -120 . ./
12,2 2,7 49,8 9,5 91,3 11,7 8,6 10,5 1,2
, 70 . ./ 12,9 3,1 51,6 10,8 93,6 8,4 9,5 11,2 1,5
, 80 . ./ 13,6 3,5 52,8 12,4 95,9 13,8 10,4 13,4 2,1
, 90 . ./ 14,4 5,6 55,6 13,6 97,8 14,5 11,7 17,2 2,8

232
8,4 . , - –13,8 , –14,5 . ,
2,1–2,8 . , ., -
– 91,3 , – 11,7 ., – 8,6 .
1 , 90 . ./
.17,2 . , 6,7 . .
2- , 70 . ./ , - 11,2 . , 3- – 13,4 .
, - 10,5 .
,90 . ./ , 2,3–3,4 ,
1,2 -2,3 ., 5,5–6,7 . ,.
, , ,,
-, ,
.
1. ., ., ., .,, ,
. – . – 2010. – . 35–42.2. . . –
. . – 1981. – . 18–27.
: 631.52:632.61
., . ., . ., « - »,
, , e-mail: [email protected]
,, -
, , – , ,
( ), , ( -) . .
, -, . -
, ., , -
, . ,
( . 1).
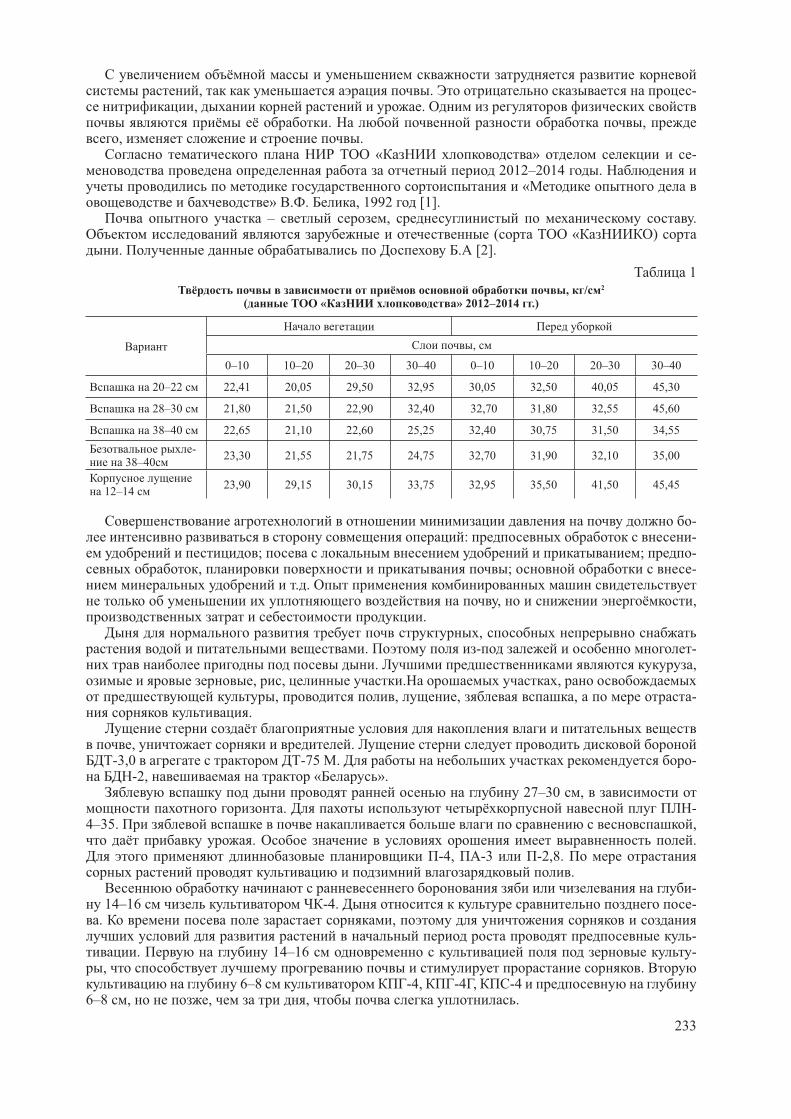
233
, . -, .
. ,, .
« » - 2012–2014 .
«» . . , 1992 [1].
– , . ( « )
. . [2].
1
, / 2
( « » 2012–2014 .)
,
0–10 10–20 20–30 30–40 0–10 10–20 20–30 30–40
20–22 22,41 20,05 29,50 32,95 30,05 32,50 40,05 45,30
28–30 21,80 21,50 22,90 32,40 32,70 31,80 32,55 45,60
38–40 22,65 21,10 22,60 25,25 32,40 30,75 31,50 34,55
- 38–40
23,30 21,55 21,75 24,75 32,70 31,90 32,10 35,00
12–14 23,90 29,15 30,15 33,75 32,95 35,50 41,50 45,45
-: -
; ; -, ; -
. ., ,
.,
. - -. ,
, , . ,, , , , -
.
, .-3,0 -75 . -
-2, « ». 27–30 ,
. -4–35. ,
. .-4, -3 -2,8.
.-
14–16 -4. -. ,
-. 14–16 -
, . 6–8 -4, -4 , -4
6–8 , , , .

234
,. ,
. ( ) , -
50 % . : -, .
-, . -
10 %. , -
– . - 30–40 / . , ,
., ,
( . 2).
2
, /( « », 2012–2014 .)
, /
N60P90 N120 P120 N120 P140 N120P160 N120P180
31,2 31,1 34,0 41,3 31,5 38,7
35,5 35,7 36,2 26,7 30,8 29,4
30,0 34,1 39,9 39,3 30,9 31,9
26,6 38,5 43,0 20,8 23,4 27,6
12 36,0 40,1 32,7 20,4 37,8 33,8
31,0 40,1 35,7 33,2 34,0 26,9
N120 180
- N
60P
90.
1,1–1,5 -.
, -. , , -
, 41,3 / N120
P140.
,, N
120 P
120 36,2 / , 39,9 / ,
43,0 / . 12, , N60
P90
-, 40,1 / .
1. . . . - « -». – 1992. – .64–228.
2. . . . .: « ». – 1968. – .169.
633.511:631.527
., ., ., ., « - »,
, . -mail: [email protected]
– .

235
-, -
.-
, ., , , -
.-
( , .). - – (F
1)
..
- .- -
. ,,
, ,. -
., -
25 % ,.
- , -.
--
( , ),, .
, ,, , ,
( ), , - F
1-
,.
-. ,
,. -
, , -
. , -
., -
. , - ( )
, . . . -, -
, .
, , -, III-V , -
., , - -
. , -

236
– ,.
- , - 2012–2014 . ( ), ( . . -
),, - – ,
., - , 45 ( ), -
, ,, ( ) -
. , 45 , - 116–120 19 , -4005
50 % 123 , 19 3–7 . 19 1–2 , 7 ,
-4005, 50 % 123–124 .
- ( ) , ,
. 15 5,9–6,0 , -
17 39,0–40,8 / , 18 , 37,0–38,9 / -4005 -
36,9 / 5,9 . 4 40,0–40,8 / , -4016, -4017, -4027 -4035,
3,1–3,9 / ..
., , 45
. , . . 30 --4005 37,5–38,1 %
33 – 32,8–33,3 .0,1–0,7 % 0,1–0,6 . ,
, 9 : -4003, -4006, -4010, -4013, -4015, -4016,-4035, -4036, -4045 38,0–38,1 % 17
33,0–33,3 , 37,4 % 32,7 . , - – 0,6–0,7 % 0,3–0,6 .
., , , -
.
631.52 : 631. 452.
., ., ., ., « - »
, . -mail: [email protected]
--
- , -, ,

237
.-
-.
– , .
. , , -.
, – -, , -
..
2012–2014 , 0–20, 20–40, 40–60 ,
( / ).
, / (2012–2014 .)
, -
,3/ (0–1–1)
,
, /
2012 . 2013 . 2014 . 3
07.05 02.10 07.05 02.10 08.04 02.10 07.05 02.10
– -
-120 . /800–1200
0–2020–4040–60
5,84,92,8
3,92,92,0
6,25,33,6
4,73,72,8
6,75,83,8
3,94,13,2
6,25,33,4
4,13,52,6
70 . /-
800–12000–2020–4040–60
8,17,33,6
5,94,42,8
9,68,85,2
6,84,73,4
10,54,73,8
7,65,43,9
9,46,94,2
6,74,83,3
80 . /-
800–12000–20
20–4040–60
9,67,24,0
7,45,33,3
10,28,64,2
7,65,83,6
10,88,54,3
7,86,24,1
10,28,14,1
7,65,73,6
90 . /-
800–12000–20
20–4040–60
9,88,24,7
8,95,83,2
10,69,25,5
9,57,54,2
12,29,86,9
10,37,84,8
10,89,05,7
9,57,04,0
-.
2012 , -. ( )
0–20 5,8 / , 3,9 / , 20–40 4,9 / 2,9 / 40–60 2,8; 2,0 / .
-.
( / ) , -, 0–20 9,8 / ,
20–40 – 8,2 / , 40–60 – 4,7 / . ,,
..
2013 , , 0–20 9,6 – 10,2 / , 6,8 –7,6 / , 40–60 8,8 –8,6 / ,
4,7–5,8 / ., 2013 , -
90 . / ( - – 4). , 0–20 10,6 / , 20–
40 – 9,2 / 40–60 – 5,5 / .

238
.-
0–20 , 9,5 / , 20–40 – 7,5 / , - 4,2 /
2013 , 0 – 20 6,2 / , 4,7 / ,
20–40 5,3 / , 3,1 / , 40–60 3,6 / , 2,8 / .
2014 , – 4, 90 . / .
– 4, 90 . / -
. , – 12,2 / ,10,3 / , 20–40 9,8 / 7,8 /40–60 6,9 / 4,8 / .
, ,, -
.,
( ). , 0–20 -
–6,2 / , -4,1 / . 20–40 - – 5,3 / , -3,5 / 40–60 – 3,4 / , -2,6 /
. 3 ,
, 90 . /, 0–20 – 10,8 / 9,5 / . 20–40
9,0 , 7,0 / 40–60 5,7- 4,0 / .
, -.
, ,, -
.
1. ., ., ., .,, ,
. – . -2010. – . 35–42.2. . . –
. . – 1981. – . 18–27.
: 633.51
., ., ., ., « - »
, , e-mail: [email protected]
. -.

239
– -, , , ,
. ,, , -
, -. ,
, , , .,, , -
., « » 2012–2014 .
, .: - , -
– 0,8 %. 2,5–3,0 . -
« -4005», 23 / 90 ., ,
.. -
,, , ( . 1).
, -
, .
10/VII 15/VII .
– ( 100 2 , )
. 1.
12–13 , ,
,.
. -.
, -, . -
-
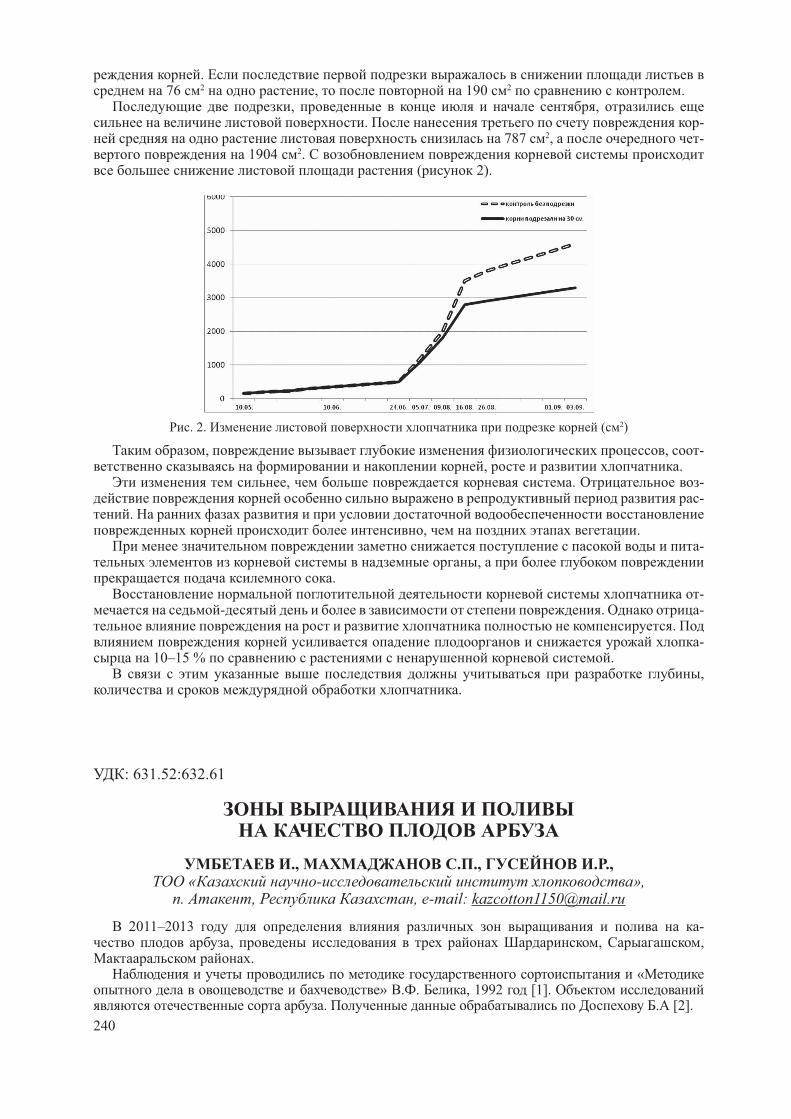
240
. 76 2 , 190 2 .
, ,. -
787 2, - 1904 2.
( 2).
. 2. ( 2)
, , -, .
, . --
., .
-,
.-
- . -.
- 10–15 % .
,.
: 631.52:632.61
., . ., . ., « - »,. , , e-mail: [email protected]
2011–2013 -, , ,
. «
» . . , 1992 [1]. . . [2].

241
-, 80–85 % . -
3–4 -,
. -. -
1–3 5–8 . - – 8–10 .
2–3 300 3/ , – – 1–2 350 3/ . -
3–4 400–500 3/ , 4–5 4–5 350–400 3/ .
. ( . 1).
1
( 2011–2013 .)
, % , % /
75 75 7575 80 7585 85 85
9,419,778,28
298,0217,0244,0
, 75 80 75 9,77 %. 85 85 85 -
8,28 %. - 75 75 75 298 / .
,. ,
-.
, -, 65 65 65 % -
..
, -.
3600–4050 , 24,9–25,4 ,.
, 36,2 / -.
92,8 %, 83,2 %, 7,9 %. .
, , ,, ,
., ,
, . - 1,8–2,5 ,
( . 2).
2
-10 ( 2012–2014 .)
, / , % , %, /
28,4 11,14 8,89 223
30,7 11,55 10,05 156
36,5 13,94 11,86 87
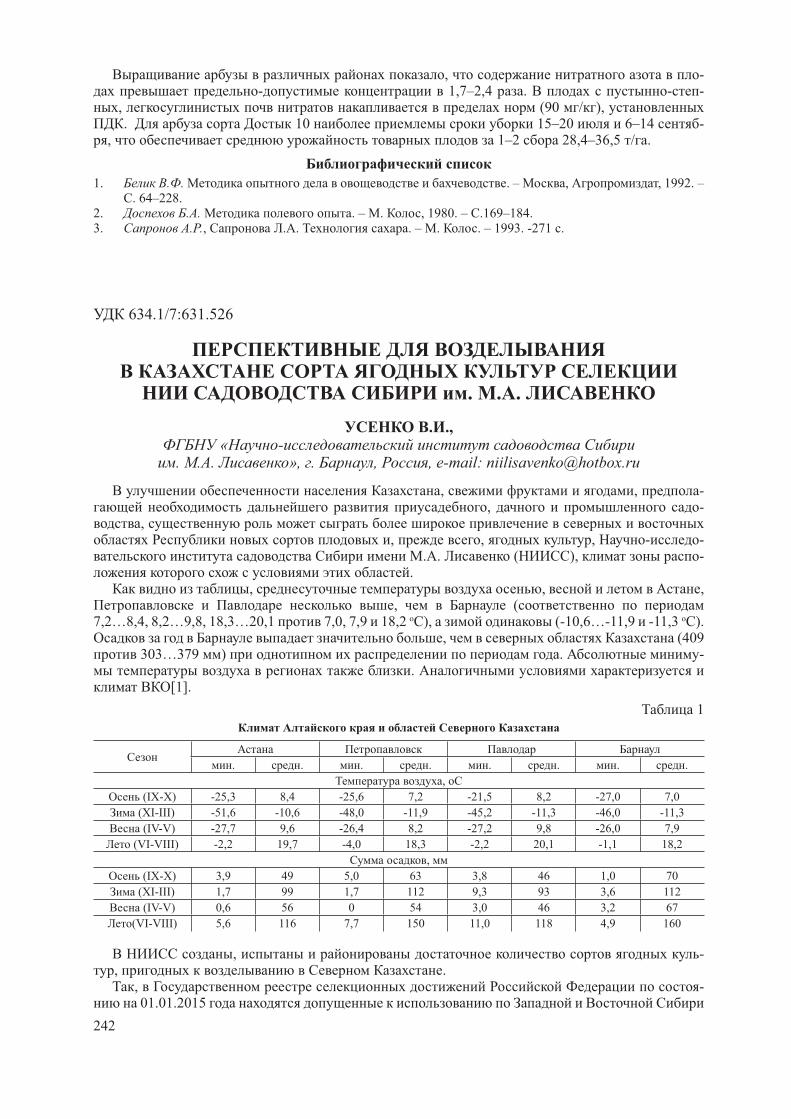
242
, -- 1,7–2,4 . - -
, (90 / ),. 10 15–20 6–14 -
, 1–2 28,4–36,5 / .
1. . . . – , , 1992. – . 64–228.
2. . . . – . , 1980. – .169–184.3. . ., . . . – . . – 1993. -271 .
634.1/7:631.526
. . .
. ., « -
. . . », . , , e-mail: [email protected]
, , -, -
,, , , - -
. . ( ), -.
, , ,, (
7,2…8,4, 8,2…9,8, 18,3…20,1 7,0, 7,9 18,2 ), (-10,6…-11,9 -11,3 )., (409
303…379 ) . -.
[1].
1
. . . . . . . .
,
(IX-X) -25,3 8,4 -25,6 7,2 -21,5 8,2 -27,0 7,0
(XI-III) -51,6 -10,6 -48,0 -11,9 -45,2 -11,3 -46,0 -11,3
(IV-V) -27,7 9,6 -26,4 8,2 -27,2 9,8 -26,0 7,9
(VI-VIII) -2,2 19,7 -4,0 18,3 -2,2 20,1 -1,1 18,2
,
(IX-X) 3,9 49 5,0 63 3,8 46 1,0 70
(XI-III) 1,7 99 1,7 112 9,3 93 3,6 112
(IV-V) 0,6 56 0 54 3,0 46 3,2 67
(VI-VIII) 5,6 116 7,7 150 11,0 118 4,9 160
, -, .
, - 01.01.2015

243
22 , 7 – , 13 – , 22 – , 31 – ,9 – , 1 – ( « - ») ( « ») [2].
« ». 1987 .
( . , .) .11 ( , , , , ,
, , , , , ), 9 (, , , , , , , ,
) 2 ( , ). ( . - )
( , , ,, ) ( , , )
..
1995 ( , , ), 1997 ( ,) 2000 ( , ) .
, ( , , , ), ( , , ), -
( , , , , ) ( ).
- ( , ) 20 ( , , , , , ,
, , , , , , , , ,, , , , ) , ,
, .-
. 31 ( , , ,, ), ( , , , , ,
, , , , , , , ,, , , , , , ),
( , ) ( , , , ).
- – 2006 2014
( , ) – ( , ) ( , , , )( ). , -
, ,.
. ,, , , , , ,
, , , , , , ; – ; – , , , ; -
– , , , , , , – , , , , [3].
. , -,
, , -, - .
-
.

244
1. . / . .- . . . . -, . .- . . . . . – - , 2014. – 524 .
2. , . 1. . – .: « . », 2015.
3. , -, . . // 30.07.2009 . 434
( 26.04.2010 291, 31.03.2011 06–2/153, 18.01.2012 06–2/20, 06.06.2012 4–1/301, 11.04.2013 4–2/164).
630*232.43
. ., . .,- «
», ,030006, . , . 169, e-mail: [email protected]
, -. -
-, ,
.[1–3]-
.-
, -.
, , -, .
2009 1- ., , 3,0 1,0
2,0 1,0
,10 . 3,0 ,
1,0 . 2,0 10 %
, - 3,0 1,1 .
2,0 10,0 %.1,1 .
2 –
5,0 30,0 .-
3,0 1,0 , 10 %, 2,0 1,0
1. . . -. – .: . . ,
. 22. , 1984, . 112–118 2. . . . .: , 1952. – 218 .

245
3. . . . – .: --
. . - . - , 1983, . 12–13
630*232.43
. ., . ., – «
», ,030006, . , . 169, e-mail: [email protected]
. -
. , ,. , ,
, -.
, -. , -
,. ,
.[1–3]
. ., -
. -.
.
. – - 2–3 100 2010 – 2011 -
. 4 – 25–27 ,
25–27 , 1- 25–27 2- 25–27 .
9,0 12,0 . 2 3. 3,0 1,0 .
3–4 -
- 25–27 74,9 76,8 %.
, 1- 2-.
4–5- 25–27 82,2 84,8 %.
25–27 , 1- 25–27 2- 25–27
.

246
1. . . -. .:
. - , 1983, . 38–40 2. . ., . . -
. . - , , 1971, 12, . 75–77
3. . ., . ., . .. .
. - . 2, -, 2003. – . 121 – 125
630*232.43
. ., . ., – «
», ,030006, . , . 169, e-mail: [email protected]
.
, -,
., , -
, . [1–3] 1985 – 1988 .
-.
2012 – 2014 – « » - 26 – 27 .
, -.
3 – - 75,0 - 1,54 , 50,0
4,5 %. 2- -
1,55 50,0 , 75,0 - 2,6 %.
4 – , -
. 2- -
50,0 , 3- 75,0 .
2009 2,0 .
, -, .

247
3- - 125,1 ,
. 4- 136,9 5- – 141,7 . 2014 10,8, 11,6 12,5 %
1. . . . – .:. . I (78), -
,1983, . 68–75 2. . . .
- . - -. , 1984
3. . . -. - «
, », -, 2011, . 218–222
633.112 (571.1)
. ., «
- » ( « »),, 644012, . -12, , 26. -mail: [email protected]
, -.
– .
. - – -
.
-,
[1].. .
. . . .,. . [2, 3, 4]. , ,
., …
2006–2008 . (1,14…1,15 / . 1000 );
, ( .1).
.… - ( = 0,80…0,87).
:. -
( = 0,69…0,89). ( = 0,84).

248
( = 0,85 = 0,68, ). -:
… – ( = 0,77…0,84 = 0,77…0,91,)., -
….
1
, / . 1000
-
_Lim.
_Lim.
_Lim.
1,02 0,68–1,31 1,27 0,90–1,94 1,15 0,85–1,63
1,08 0,67–1,35 1,00 0,73–1,40 1,02 0,71–1,31
1,14 0,73–1,35 1,16 1,11–1,20 1,14 0,99–1,25
-,
. 1000
- 1000 , , , .
,. , , -
, , ( .2).
. . [6]. , ,
., -
.
2
1000 , % 1000
_Lim.
_Lim.
36,8 31,6–40,3 63,2 61,6–68,4
34,6 27,1–43,4 65,4 65,4–72,9
33,8 28,9–37,1 66,2 64,6–71,1
, - ( .3). -
.
20,3…40,5 % 14,8…58,3 %, . , -, 2008
(79,7…83,4 %). ,, 2006 2007 .
. , 2006–2008 .
3,7…5,1 %.-
(r = 0,73…0,76).

249
(r = -0,60…-0,76). , -, . -
.
3
, %
( ) « »
_Lim.
_Lim.
_Lim.
_Lim.
73,4 66,9–79,7 26,6 20,3–33,1 29,6 17,8–40,0 3,7 3,1–4,5
69,7 61,6–83,4 33,8 26,6–38,4 35,7 14,8–53,6 5,1 3,4–7,4
70,0 59,5–81,6 33,4 28,4–40,5 39,0 21,6–58,3 4,5 1,2–7,9
, :-
., -
, …( = 0,68…0,92).
… , ( = 0,77…0,84 = 0,77…0,91, )..
- (r = 0,73…0,76).
, (r = -0,60…-0,76). -
.
1. - - / . . // . – 1992. – 7–12. – . 96–102.
2. . . , // . . . – 1951. – .7. – .51–139.
3. . . . – ., 1981. – 175 .4. . . :
. . … . .- . . – , 1971. – 20 .5. . . , -
: … . .- . . – , 1968. – 282 .
: 635.939.73: 631.527
. .,
« . . . »,. , , e-mail: [email protected]
,- , - -
. -

250
. - ,,
[7]. , . -
– - .
.,
, , ( ), -
. [2, 4, 6, 8]. . . .
, 92–100 % - [5].
. . -: (96,2 %), -.
, , ,.
(87,3–97,5 %) [1]. – -
-.
, . 2011–2013 .« ». , : L. kamtschaticaPojark.- , , ; L. altaica Pall. – , , ; L. turczaninowii Pojark. – , ; L. kamtschatica Pojark. L. altaica Pall. – ; L. turczaninowii Pojark. L. kamtschatica Pojark.–
, L. emphyllocalyx Maxim. – -6–36.,
[3]. 2011 . 2–3 , – 4–7 .
. ( - 00 , +10+120 ) .
10 -9,0 0 . ..
2012 . . 3–4 , – 7–9 . -
– 29–30 , 4–6 . 9–10 -, -1,3…2,50 .
. ,.
2013 . . - 11–13 , – 13–15 . -
, -6–36 29 ., .
+ 5,0…+10,00 , 11 ..
..
, , –75,0; 82,8; 92,4 % ( .)., , , -
– 71,0 ( 2011 .) 70,5 % 2013 ., L. altaica Pall.,
, .. 2011 .
23,0 %, – 53 %. 2013 . 43,5 %.
« » 62,0–88,6 %, .

251
,, %
2011 2012 . 2013 .
L. kamtschatica Pojark.
75,0 - -
- 82,8 80,6
92,4 - 90,8
L. altaica Pall.
71,0 - 70,5
89,3 - 91,7
- 91,2 86,6
L. kamtschatica Pojark. L. altaica Pall.
53,0 48,0 43,5
L. turczaninowii Pojark.
62,0 - -
- 86,9 88,6
L. turczaninowii Pojark. L. kamtschatica Pojark
- 76,0 74,8
L. emphyllocalyx Maxim.
-6–36 98,6 - 98,7
2013 .74,8 %, . . 2012 .
-6–36 . 98,6–98,7 %.
. , – 43,5 53,0 %. -
– 62,0–98,7 %, ,.
- ( )- .
1. . . - //
: - , . – : -, 2003. – . 88–93.
2. . . -. ... . - . – . , 2002. – 23 .
3. . . . – .: , 1988. – 287 .4. . . -
// . . – 1982. – . 126. – . 53–58.5. . Caeruleae Rehd /
. . , . . // . . . . , , . – 1986. – . 99. – .111–115.
6. . . . – - , 1998. – 68 .7. , . – : - -
, 1999. – . 444–448.8. . . -
. ... . - . – - , 2002. – 18 .

252
631.41
. .,- ,
. ,
- ,, -
,.
, ., .
– 9–14, 27–36, 13–19, %, – 3–4, 1,3–1,8 %. ,
– 8–15. , -. : ( ), -
, , . – 10,0–13,3 /
, -. . , -
, . 2,0–2,5 / ,
. , -
.22 / – 4,0 / . -
, ,, .
-20–0–54,0 / . - 65–70 / . -
, .0,15–0,52 / .
, ,. , -
. -. 436 1445 / .
444 1445 / , 380–444 / . -
(126–240 / ),. -
. 646, 234 / ,
617 325, 427 106 / , 457 80 / .
, . 3,2 8,0 / , -
– 4,2 10,2 / , 0,5–2,0 / ., , 2,5 / , -
. -, .
, -
.: – 0,4–1,7 / , 0,03–0,10 / . -
. -

253
..
0,3 3,2 / , -.
1. . ., . .. . « » , 1963
. 435–400 2. . ., . . -
. « ». - , . « » 1984 .157–160.
3. . . . . « ,» . . . . 1975 . 64–70.
4. . . .. . 1992 1 .70–71.
5. . . . . - «» - .
2015 .166–172.
: 653.21.152
. ., . ., . ., . ., « »,
. , , ucxoc @mail. ru
-. , -
, -, , .
( , ,) ,
..
-
. -,
, ..
., , -
. , ,, .
,.
, - « » ,
, , -. , ,
, , , ,, , -

254
. . , ,- ( . 1).
1
2012–2014 .
2012 2013 2014
- - - -
0,3 0,16.
0,25.
0,41
0,32 0,63 0,51 0,58
0,45 0,36 0,3 0,51
0,37 0,45 0,45 0,39
, , -,
.
2008 . 2008 210–320 3/ , 2009 - 380 – 420 3/
; 2010 - 420–440 3/ ; 2011 - 360- 380 3/ .. -
. , ,, , + 650
. ,, .
. -, , -
, , « »,. . ,
( ),, -
, ,.
, -, .
,, .
2012–2014 , 1, . -
35–420 . -, ,
- . -, ,
– .
( .2). 3 25- 46 / . -
.-
( ). ,.
, , - ( . .,1976).
-.

255
2
( / ), . 2012–2014 .
.
2012 2013 2014
, . 28,6 34,4 27 30,3
47,5 45,3 39 44,0
43,8 43,9 31 39,7
27,8 41,3 29 32,9
-19 29,4 41,1 31 33,9
38,3 40,6 33 37,4
41,6 39,5 37 39,4
46,9 39,4 38 41,4
26,6 37,4 28 30,8
37,9 32,1 29 33,1
22,5 28,2 25 25,3
05 - - - 3,2
, ,, .
., - -
,.
: 633.11.631.52.
. ., . ., . ., « », . , ,
-mail: ucxoc @ mail. Ru
, ,. ,
, -, .
., -
. « »
2012 2014 43 .- .
(2012–2014 .)- . -
. 60,7 85,2 .
– 2012 -5,0 , 2013 – 1,2 ,2014 – 15,4 19,00, 20,00, 21,40
– 14,2 ,42,1 , 33,1 21,60,21,30, 20,50 - -34,6 , 41,9 , 11,8 25,20,23,30, 21,90 ( . 1).

256
1
2012–2014 . .
-- - -
2012,
, °18,314,3
5,019,0
14,221,6
34,625,2
72,122,1
2013,
,°0,1
21,21,2
20,042,121,3
41,923,3
85,221,5
2014,
,°0,4
22,215,421,4
33,120,5
11,821,9
60,721,5
3 61 ,
70 .
56–72 . , -
, .
, .
, -
. , - -
.
3 1,6 2,0.
-
, -
. .
.
3 5,5–6,3 ( . 2).
2
3 (2012–2014 .)
-- ,
-,- ,
., .
42, . 58 1,8 1,7 5,5 11,0 18,2
( ) 56 1,8 1,7 6,3 12,8 23,5
33/8/98 65 1,9 1,7 6,3 12,5 22,1
62 1,8 1,6 6,0 12,7 20,7
44 8/90 64 1,9 1,6 5,9 12,6 22,2
316/99 59 1,7 1,6 5,8 12,7 21,3
246/86–89 60 1,8 1,7 6,1 12,7 21,2
783 61 1,6 1,6 5,9 11,6 21,8
10 69/93 60 1,8 1,7 6,2 11,9 18,8
36 16/01 59 1,7 1,5 6,3 11,5 18,4
26/97 56 1,7 1,6 6,2 12,0 19,2
188/97 72 1,9 1,7 5,9 12,0 19,9
, -
. 3
8,2–9,1 / 7,2 / . 3
11 1,2 1,9 / , 18
( . 3).

257
3
, / 3 (2012–2014 .)
- +2012 2013 2014
42, . 2,9 9,5 9,3 7,2 -
( ) 3,6 12,3 11,7 9,1 1,9
33/8/98 3,6 11,9 11,7 9,1 1,9
3,4 10,0 11,3 8,9 1,7
44 8/90 3,7 11,4 11,5 8,9 1,7
316/99 3,5 11,3 11,2 8,7 1,5
246/86–89 3,2 11,4 11,2 8,6 1,4
783 3,4 11,0 11,1 8,5 1,3
10 69/93 3,6 10,8 10,8 8,4 1,2
36 16/01 3,7 10,4 10,5 8,2 1,2
26/97 3,4 10,6 10,5 8,2 1,2
188/97 3,2 11,4 10,4 8,2 1,2
05 0,3 0,8 0,7 - 0,6
, ,, .
- ,: ( ), 33/8/98, , 448/90.
633.11:631.52(574.2)
. ., « - . . . »,
. , . -
, -, ,
. , ,, , – , -
., , , -
, ( ,1962; , 1972; ,1975; , 1997; , 2005).
, ,-
..
. -, [1].
-.
, , , .

258
.
, , .. « . . . »,
.. , ,
, , ,[2].
2013, 2014 -, ( = 0,8).
. - – 7, – 25 2 -
3,5 . – , . -
, -. , -
(2010) [3]. -
«Agros – 2.11».-
. – 24 , .
- -, , ,
.
[4]. ,,
, ( . 1). -
. , , -. . .(1965) ,
, [5]. , -
-286/06; 19/07; 195/06. . 371/06 -
, .
1
, 2013 – 2014 .
,
, , /
St ±2013 20142
2013 20142
, St 104 100 102 14,2 24,4 19,3
286/06 104 101 102 26,0 27,4 26,7 +7,4
19/07 104 99 101 23,5 26,2 24,8 + 5,5
195/06 103 99 101 17,7 21,8 20,2 + 0,9
34/04 102 99 100 12,2 21,2 16,7 - 2,6
-, St
106 107 107 21,9 27,2 24,5
371/06 109 108 108 17,3 26,2 21,7 - 2,8
104 102 103 18,9 24,9 21,9
– . ( -, ), ( . . ,
2000).

259
. . (1965), . . (1979), . . (1984) - – 60 – 90 . -
2013 64 89 72 , 2014 60 75 67 .
2013–2014 4–5 ( . 2). , -
, , ( . . , 1971; . , 1980; . . ,
1995). : 286/06, 19/07, 195/06 . – -
., , .
- 5 80 % ( . . , 1968; . . , 1977)..
, , ., : -
, , ,( . . , 1978; . . ,1985).
2014 , -, .
, -: 286/06, 19/07, 195/06
, , . - 371/06 34/04,
, . - , ( . .),
, . 2 2
69 , . - 5 , ,
5 : 286/06, 19/07, 195/06, 371/06.
2
, 2013 – 2014 .
,
,
% St
,
% St2013 2014
2 2013 2014
2
, St 80 73 76 100 4 4 4 100
286/06 67 65 66 87 5 5 5 125
19/07 70 69 69 91 5 5 5 125
195/06 67 65 66 87 5 5 5 125
34/04 67 66 66 87 4 4 4 100
, St89 75 82 100 4 4 4 100
371/06 64 60 62 75 5 5 5 125
72 68 69 4,5 4,5 4,5
, ,, : 286/06; 19/07; 195/06.
1. . . . . – – , 2008. – . 218–225.
2. . ., . . -. – , 2009. – .38–42.
3. . – 2010 – 179 .4. . ., . .
// . – ,1985. – .43 – 47.5. . . . – – -
: , 1965. – 197 .

260
631.52:633.11
. .,- . . .
. , , e-mail: [email protected]
,. -
(80 %), , . . -
,.
, ,
., -
, ,. , ,
, . . , -. . . : « -
, ».
, .-
8 ( , , , , , , , ). 3 : , ( -
). , -,
. – , -
.. , ,
, . [1].
- .. ,
, [2].
--
, .-
. 81 84 .
87–90, – 90–93 ., -
(222 / 2) (220 / 2) . (205 / 2), (206 / 2) (206 / 2). -
(161 / 2), (175 / 2) (173 / 2) -. -
: – 99 / 2, -203 / 2 , 294 / 2 . -
: -31,8 %, – 26,8 % – 22,8 %.

261
, 1000 , , : – 0,92 36,3 ; -1,13 37,5 ; – 1,44 41,0 -
. (1,05 ) 1000 (36,2 ) ( . 1).
, -;
, – .
, 1000 ,
. 1. ( ) 1000 ( )
(18,0–19,1 %), ,, .
(42,7 %) (37,8 %) (35,9 32,5 % ) , .
. 2. , %
, .,
: 3 , 98 ( ),

262
3, 97, , ( ), RescuexRegent, ( ), A 939 2S-11 ( ), Breughton ( ), SV 73417, WW 16151 ( ), Hurmantla ( ), Kolibri, Shenklutinfl atum ( ) .
, , ,, ; 14,6–14,7 %
, .-
: 93 ( ), ,134 ( ), AC ora, Pasgua, Laura ( ), AC Majestic, PI 506350 Spillman, PI 590576 Kulm ( ), Nadodores 63, SieteCeros ( ).
:, -
- .
1. , ,// . – ., 1999. – 61 .
2. . ., H.A. / ,1988. – 129 .
631.87:631.82:631.445
,
. ., . .,- ,
. , , [email protected]
. -
, [1, 2].
,
1989 . -: – –
– – . - – .
– -, .
[3, 4]. 3 : ( ),
( ), ( – ) 0–20 .. – :
0–
( );1 – N30P54K18. N150P270K90 . ./
. – :0 – ,
1 – ( -
,). – :
0– ,
1–
( Agrobacterium radiobacter 204). – .

263
2014 , - 135 (68 % ), =0,68.
- 120 77 %
0 1, -
83 16 % ( . 1). -
. -, .
1
,, 0–20 , 2014 .
,/
,/
,. /
,. /
1* 2 3 1 2 3 1 2 3 1 2 3
0 0 0 19 33 25 26 58 97 305 153 0,61 1,19 1,92 1,24 30 25 38 31
0 1 0 18 39 14 24 92 151 318 187 0,39 1,25 2,32 1,32 37 31 29 32
0 0 1 15 42 18 25 94 124 344 187 0,24 1,14 3,28 1,55 22 34 42 32
0 1 1 18 40 17 25 77 216 186 160 0,4 1,78 2,64 1,61 24 19 45 29
1 0 0 20 30 33 28 120 120 494 245 1,1 0,8 4,26 2,05 52 20 48 40
1 1 0 17 35 19 24 109 120 323 184 0,58 1,61 2,49 1,56 48 63 59 56
1 0 1 20 38 30 29 83 138 406 209 0,49 1,18 4,77 2,15 49 53 50 51
1 1 1 18 30 31 26 81 78 439 199 0,44 0,85 4,7 2 41 37 55 44
05 F <F05 F <F05 F <F05 7,84
* 1 – 1 ( ), 2 – 2 ( ), 3 – 3 ( )
23–34 % . -
,, , - ,
( . 2). 2014
9 %, ( . 2). .
2
0–20 , , 1 , 2014 .
, NH3 /
,. /
,02 ( . / .)/
0 0 0 0,490 14,1 1,617
0 0 1 0,475 14,5 1,545
0 1 0 0,475 14,6 1,422
0 1 1 0,453 14,1 1,378
0 0,473 14,3 1,491
1 0 0 0,582 16,2 1,306
1 0 1 0,510 14,8 1,173
1 1 0 0,417 15,6 1,289
1 1 1 0,462 15,7 1,194
1 0,493 15,6 1,241
05
F < F05 0,48
0,060,05F < F05
F < F05 0,96 F < F05
F < F05 0,09
- 7 %.
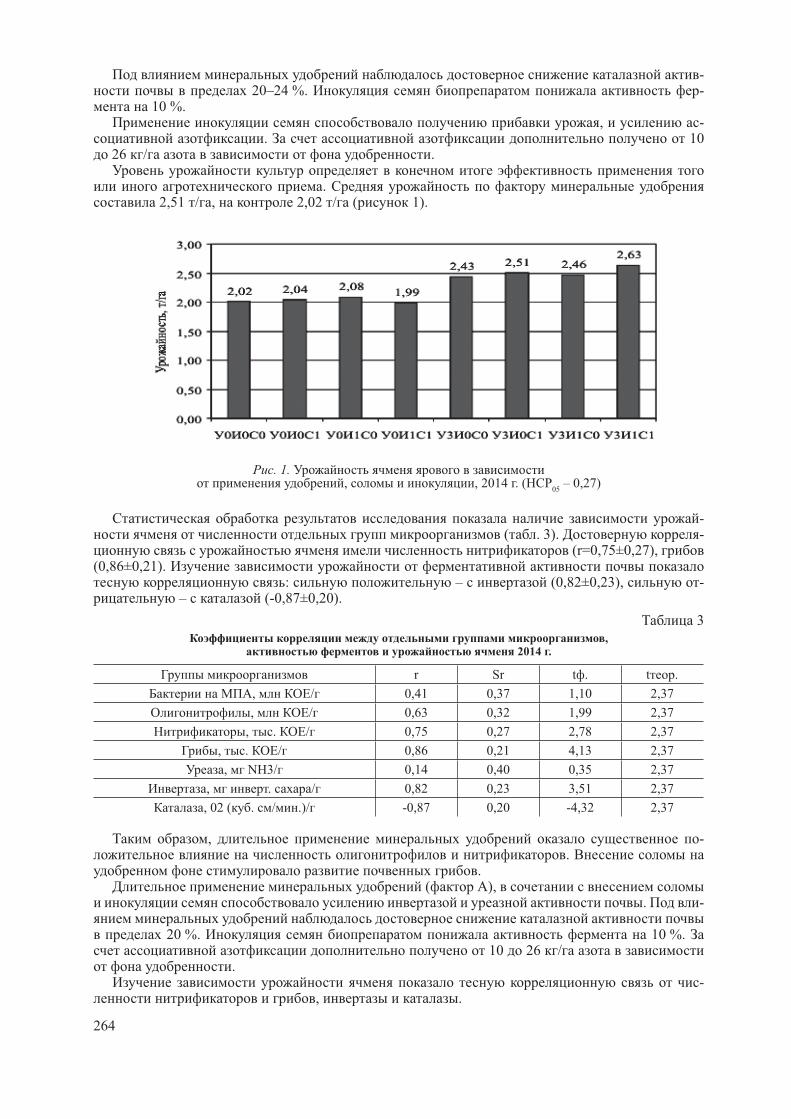
264
- 20–24 %. -
10 %. , -
. 10 26 / .
. 2,51 / , 2,02 / ( 1).
. 1., , 2014 . (
05 – 0,27)
- ( . 3). -
(r=0,75±0,27), (0,86±0,21).
: – (0,82±0,23), - – (-0,87±0,20).
3
, 2014 .
r Sr t . t .
, / 0,41 0,37 1,10 2,37
, / 0,63 0,32 1,99 2,37
, . / 0,75 0,27 2,78 2,37
, . / 0,86 0,21 4,13 2,37
, NH3/ 0,14 0,40 0,35 2,37
, . / 0,82 0,23 3,51 2,37
, 02 ( . / .)/ -0,87 0,20 -4,32 2,37
, -.
. ( ),
. -
20 %. 10 %. 10 26 /
.-
, .

265
1. . . , / . . . – . : - , 2005. – 302 .
2. . . / . . , . . ,
. . // . – : ,
2001. – . 3. – 203 .
3. . . . – . : , 1970. – 325 .
4. : . . / . . . . – . : .
« », 2005. – 608 .
633.853.494.
. ., . ., . .,
« - -», e-mail: [email protected]
, -
, -
.
-
, -
.
, -
[1].
– -
.
– . 3- -
. 60 ,
4- .
. . -
– 5,8 %. – 0,12–0,20 %, – 0,45 %.
.
[2].
.
6- .
12 35 . 50–69 , 22–23 %
.
-18,5–19,1 ,
+19,0–19,5° . , ,
+41,0° , -30,0–35,0° , 40,0–45,0° .
. -
. -
, , :
, 254,5 / , III -
245 / .
176,0 / .
I + +
167,5 / . 128,8 / ( . 1).

266
1
, /
2012 . 2013 . 2014 .
I
+ + 176,1 181,3 145,1 167,5
2- - 108,7 88,0 98,3
- 134,7 123 128,8
94,2 98,5 81,75 91,4
095 / 0,6
II
+ + 142,3 158,5 126,8 142,5
88,2 95,7 80,38 88,0
263,4 271,5 228,7 254,5
183,4 189,1 155,6 176,0
095 / 1,4
III
+ 162,5 171,4 137,12 157,0
2- - 98,7 82,90 90,8
94,0 101,3 82,05 92,4
259,2 265,7 209,9 245
095 / 1,1
- 220,3 / .
2014 -. -
., -
( , ).
.,
, [3]., ,
.
1. . ., . ., . . -
// .– 2013 . – 1. – . 23–24.
2. . . . – .: , 1985. – 175 .
3. . ., . . -
// .– 2010 . – 12. – .10–12.
633.853.494.
. ., . ., . .
« - -», e-mail: [email protected]
– . , - 30 % [1].

267
– -.
, ,, , , , ,
. : -, , .
, , -, -
, ., , ,
. 1 100 3–4 . ,. -
- (, ,
. .) - ( ,. .). -
. -, , -
50–60 % [2]. ,. ,
-, .
[3].
– . , -
[4]. – -
. – . 2012–2014 -
3-« ». – 300 2, – .
– . -.
-, . : -
- . -2,1 .
.
.. ,
, -. ,
, , -, , , , – -
, , , .. -
III + 13,6 / 2, – 12,9 / 2, -
I + + 10,3 / 2 ( . 1)., -
, -.
, , – -
– 5,6 / 2, – 6,2 / 2, -.

268
., -
. I – 5,1 / 2, - – 7,9 / 2, III 2 – 6,5 / 2.
- 12,2 / 2.
1
3 ( ) / 2
2012 . 2013 . 2014 . 3
I
1
+
10,3 9,8 7,6 9,2 +
( )
2 2 - 7,2 3,1 5,1
8,1 - - -
3- 7,9 5,6 6,7
9,0 8,6 6,2 7,9
II
1
+
11,1 10,9 7,9 9,9 +
8,6 8,3 6,8 7,9
2 13,1 11,8 9,7 11,5
3 12,7 11,6 8,9 11,0
III
1 + ( ) 13,6 12,3 10,8 12,2
2 2 - 7,5 5,6 6,5
9,2 8,8 6,3 8,1
3 12,9 11,8 9,3 11,3
. , -
,
, ,
. -
.
,
. -
: , , , , .
1. , . . / . . ,
. . , . . . – .: - , 2004. – 228 .
2. , . . -
/ . . , . . , . . , . . // , , :
: - .
I / : , 2011. – . 14–16.
3. . ., . ., . . -
// . – 2014. – 7. – . 13.
4. . ., . ., . . -
// . – 2013. – 2. – , 30.

269
664.6/.7:633.13:1–925.116
. ., . ., . ., . .,
« - », 644012, . -12, , 26. E-mail: [email protected]
, -- . ,
, , -[1].
, , [2]. 2008 . -
, 2009 . – 22. 2014 .-
2015 . – . 2014 . ( : mutica-
aristata). :.
, . -- .
, 2013 . . 90 A.byzantina,
albomutica. . Sativa, nudisativa, inermis. . Sativa, mutica, . 1.
13, 21, ,. 23 . -.
1
,
,
1 2
13 . . Harmon. . Sativa. mutica. , -
. 1000 37,6–42,6 .
15 . . - 82
. . Sativa. mutica. . 1000 38,0–40,0 .
( 943 II)
. . Sativa. mutica. , - -. . 1000 31,4–39,0 .
90 . .New Nortex ( ,-9988)
. A.byzantina. albomutica. . -, - . 1000 36,5–42,0 .
( - 1 ), st.
. . Sativa. mutica. , -. 1000 37,6–40,0 .
(Frazer Panter). . Sativa. mutica. . -
. 1000 37,8 .
( 3 559)
. . Sativa. mutica. .. 1000 37,3–38,6 .
2 ( 290 474) -
12914
. . Sativa. mutica. , .. 1000 45,5-54,0 .
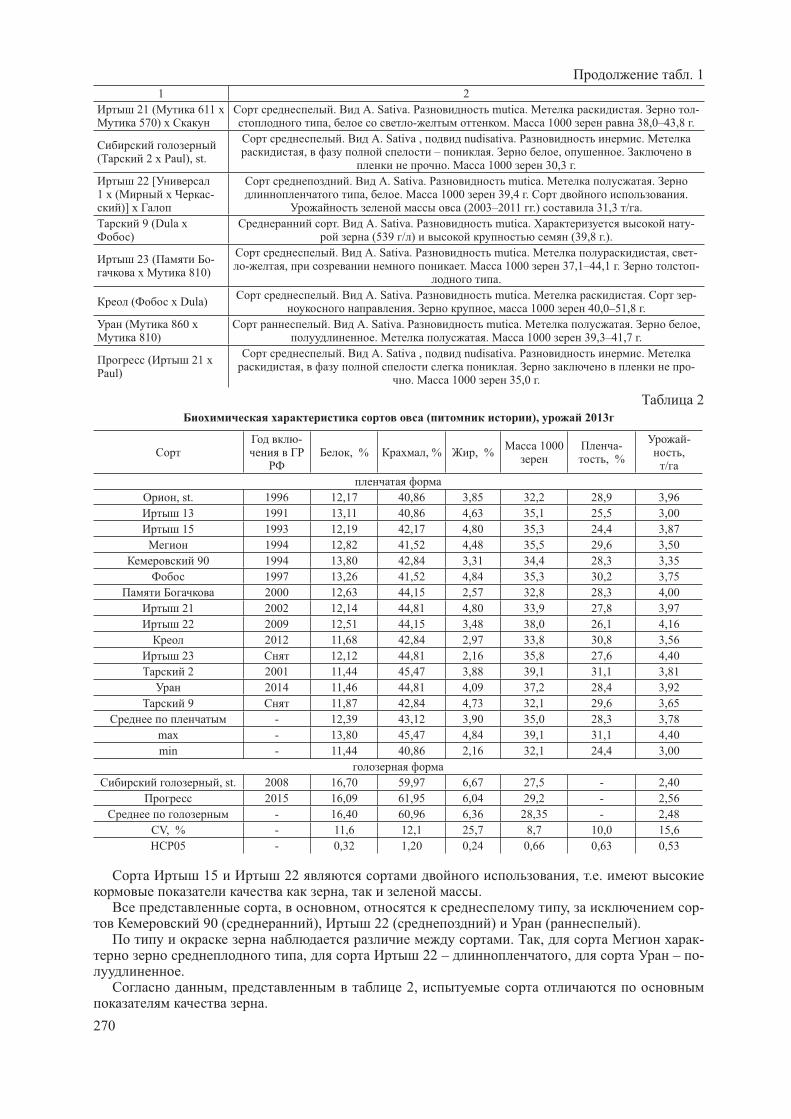
270
1 2
21 ( 611 570)
. . Sativa. mutica. . -, - . 1000 38,0–43,8 .
( 2 Paul), st.
. . Sativa , nudisativa. ., – . , .
. 1000 30,3 .
22 [1 ( -
)]
. . Sativa. mutica. ., . 1000 39,4 . .
(2003–2011 .) 31,3 / .
9 (Dula )
. . Sativa. mutica. - (539 / ) (39,8 .).
23 ( - 810)
. . Sativa. mutica. , -- , . 1000 37,1–44,1 . -
.
( Dula). . Sativa. mutica. . -
. , 1000 40,0–51,8 .
( 860 810)
. . Sativa. mutica. . ,. . 1000 39,3–41,7 .
( 21 Paul)
. . Sativa , nudisativa. ., . -
. 1000 35,0 .
2
( ), 2013
-, % , % , %
1000 -, %
-,
/
, st. 1996 12,17 40,86 3,85 32,2 28,9 3,96
13 1991 13,11 40,86 4,63 35,1 25,5 3,00
15 1993 12,19 42,17 4,80 35,3 24,4 3,87
1994 12,82 41,52 4,48 35,5 29,6 3,50
90 1994 13,80 42,84 3,31 34,4 28,3 3,35
1997 13,26 41,52 4,84 35,3 30,2 3,75
2000 12,63 44,15 2,57 32,8 28,3 4,00
21 2002 12,14 44,81 4,80 33,9 27,8 3,97
22 2009 12,51 44,15 3,48 38,0 26,1 4,16
2012 11,68 42,84 2,97 33,8 30,8 3,56
23 12,12 44,81 2,16 35,8 27,6 4,40
2 2001 11,44 45,47 3,88 39,1 31,1 3,81
2014 11,46 44,81 4,09 37,2 28,4 3,92
9 11,87 42,84 4,73 32,1 29,6 3,65
- 12,39 43,12 3,90 35,0 28,3 3,78
max - 13,80 45,47 4,84 39,1 31,1 4,40
min - 11,44 40,86 2,16 32,1 24,4 3,00
, st. 2008 16,70 59,97 6,67 27,5 - 2,40
2015 16,09 61,95 6,04 29,2 - 2,56
- 16,40 60,96 6,36 28,35 - 2,48
CV, % - 11,6 12,1 25,7 8,7 10,0 15,6
05 - 0,32 1,20 0,24 0,66 0,63 0,53
15 22 , . ., .
, , , - 90 ( ), 22 ( ) ( ).
. , -, 22 – , – -
., 2,
.
. 1
271
2013 . 13, 90 ( 0,63–1,09 %).
13 (+ 0,78 %), 1000 (+2,9 ), (- 3,4 %), ,
(-0,96 / ). 0,99 %, 2,99 , 1000 (3,75 / ).
(+3,29 +4,21 %) , 21, 22, 2 . 21
(+0,95 %), (3,97 / ). 22 1000 (+5,0 +5,80 ),
(3,92 4,16 / ). 21 9 (+0,88 +0,95 %).
(3,97 3,65 / ). 1000 (+1,7 ) -
(-0,61 %). ., , 2013 .,
:1. 2000 . ( 13, 15, , 90
) (12–13,8 %), ,, , , (3,0–3,8 / );
2. , 2000 . – , 22, 23 ( ), (11–12 %), -
(4,0–4,4 / );3. – 21, 9 2000 .
(4,73–4,80 %) ( 21) 2013 . .
1. , . . (Avena L.). , , :
/ . . ; , .- ., 2007.- .274–275.
2. , . . -
( , , ) / . . ; . .- . - . - . – -
, 2011. – . 504.
581.17:631.524.84:633.11”321”(1–925–116)
. ., . ., . .,
« - »( « »), , 644012, . -12, , 26.
E-mail: [email protected]
,, . 2013 2014 .
, - 14–15 .
2013 . ( = 0,99). 2014 . ( = 0,77).

272
: - 14–15
, . [1] -
( ) [2]. ( ).
. . Ex el [3]. ( . 1),
4,70–5,11 2 26,88–29,31 2 , -. -
.-
. , 2013 . (+1,70 71 % ), -
12,66–18,14 2. 2014 . (27,7 % ) ,
(28,3–30,2 2), (95 % ).
. , - (r = +0,585 +0,917). (r =
+0,424) (r = -0,636) . (
– , , 0,5–3,0 2).. , 21,8–28,7 %
30,1–34,4 % . 20,5–23,3 %).
2
14–15
14 (2013 .) 15 (2014 .)_
,2
, %,
2
, %,
2
, %
- - - - -
4,84 29,4 - 4,74 15,8 - 4,70 22,6 -
12,66 28,9 - 15,63 31,2 - 14,66 30,1 -
20,80 10,8 51,3 32,59 30,2 44,9 26,70 20,5 48,1
5,04 24,7 - 4,68 18,8 - 4,80 21,8 -
13,87 36,7 - 16,48 32,0 - 15,38 34,4 -
23,60 16,7 44,8 34,06 28,8 44,9 28,83 22,8 44,9
5,36 27,1 - 4,86 30,2 - 5,11 28,7 -
18,14 33,3 - 17,04 28,8 - 17,59 31,1 -
25,64 18,2 43,2 32,97 28,3 50,1 29,31 23,3 46,7
. 15,64 24,55 46,43 19,78 28,54 46,63 17,80 26,59 46,57
-. -
, , . 2. (22,56–
26,17 2× ./ .)., -

273
– 250,72–284,67 2× ./ .
- , -, ,
[4]. , 1, 44,9–46,1 %.
, ,- .
( = 60,8 %). - 57,1 %.
2
2013 2014 ., 2× ./ .
-- - – -
22,56 140,88 166,12 250,72 593,63
23,49 141,80 182,81 284,67 650,17
26,17 131,61 177,11 265,20 625,01
(r = +0,302 +0,361) - -
.
3
14–15
, 2,
2× ./ .,
,/
36, st. 57,42 503,89 2,96 2,88
50,69 559,51 3,80 2,27
1414 63,33 627,81 3,64 2,65
33, st. 51,01 631,95 2,91 3,02
71,29 1013,53 3,59 3,09
141/03–2 66,81 881,59 2,11 3,65
35,st. 61,27 683,37 3,61 2,74
220/03–83 66,32 701,65 3,98 2,76
17 72,00 714,31 3,67 3,07
05 5,01 50,60 0,51 0,57
14–15 -, 3.
( ) - 36 , -
0,84 . 1414 ( ) - 0,68 .
( ) -
33. 141/03–2, 33 0,63 / ,
2 2014 . . -:
15,8 2 249,64 2× ./ . 220/03–83 ( " ") 17
( ) ( - 5–10 2 18–31 2× ./ .) 35.

274
.1. 4,70–5,11 2
26,88–29,31 2 . - 21,8–34,4 %, – 44,9–46,1 %.
2. , -..
3. -- (r = +0,302 +0,361).
4. - 14–15 : – 1414;
– 141/03–2 ( 2); – 220/03–83 17.
1. . . / . . ,. . // . 1961 .8, .3.
2. . . / . . .- .: -, 1965. – 170 .
3. . . / . . . – “ ”, 1973.4. . // -
. - ., 1983.- . 224–230.