Embed Size (px)
Citation preview

© 2007 Population Reference Bureau
Association Between Average Annual World Population Growth Rates and GDP per Capita Growth Rates, 1975-2004
-1
0
1
2
3
4
5
6
7
8
-6 -4 -2 0 2 4 6 8
Growth Rates in Population
Source: Population Reference Bureau, Population & Economic Development Linkages 2007 Data Sheet.
Growth Rate in GDP per Capita
Growing population
Growing economyDeclining population
Declining economy
China
SingaporeCongo, Dem. Rep.
Saudi Arabia

© 2007 Population Reference Bureau
• Globally, a higher rate of population growth is associated with a lower rate of economic growth, but the association varies across regions and income levels.
Notes on Association Between Average Annual World Population Growth Rates and GDP per Capita Growth Rates
© 2007 Population Reference Bureau
Association Between Average Annual Growth Rates in Population and GDP per Capita, Africa, 1975-2004
-1
0
1
2
3
4
5
6
7
8
-10 -5 0 5 10 15
Population Growth Rate
Source: Population Reference Bureau, Population & Economic Development Linkages 2007 Data Sheet.
GDP per Capita Growth Rate
Growing population
Growing economyDeclining populationDeclining economy
Botswana
Lesotho
Sierra Leone

© 2007 Population Reference Bureau
Association Between Average Annual Growth Rates in Population and GDP per Capita, Asia, 1975-2004
-1
0
1
2
3
4
5
6
7
8
-10 -5 0 5 10 15
Population Growth Rate
Source: Population Reference Bureau, Population & Economic Development Linkages 2007 Data Sheet.
GDP per Capita Growth Rate
Growing population
Growing economyDeclining populationDeclining economy
China
Kuwait Malaysia

© 2007 Population Reference Bureau
Association Between Average Annual Growth Rates in Population and GDP per Capita, Europe, 1975-2004
-1
0
1
2
3
4
5
6
7
8
-10 -5 0 5 10 15
Population Growth Rate
Source: Population Reference Bureau, Population & Economic Development Linkages 2007 Data Sheet.
GDP per Capita Growth Rate
Growing population
Growing economyDeclining populationDeclining economy
AlbaniaMoldova Slovenia

© 2007 Population Reference Bureau
Association Between Average Annual Growth Rates in Population and GDP per Capita, Latin America, 1975-2004
-1
0
1
2
3
4
5
6
7
8
-10 -5 0 5 10 15
Population Growth Rate
Source: Population Reference Bureau, Population & Economic Development Linkages 2007 Data Sheet.
GDP per Capita Growth Rate
Growing population
Growing economyDeclining populationDeclining economy
Nicaragua
Dominican Republic
Trinidad and Tobago

© 2007 Population Reference Bureau
Use of Modern Contraception by Wealth
25
45
4
12
48
6
25
47
7
4547
27
60
50
Burkina Faso 2003 Guatemala 1999 Bangladesh 2004
Poorest Quintile 2nd 3rd 4th Richest Quintile
Married Women Ages 15-49 Using Modern Contraception
Percent
Source: Population Reference Bureau, Population & Economic Development Linkages 2007 Data Sheet.

© 2007 Population Reference Bureau
• Across the world, poor women use contraceptives at lower rates than wealthier women. However, strong family planning efforts can increase use of contraceptives in all wealth groups, even in low-income countries such as Bangladesh.
Notes on Use of Modern Contraception by Wealth

© 2007 Population Reference Bureau
Use of Modern Contraception by Education
57
15
1
68
24
11
69
49
25
Colombia 2005 Mozambique 2003 Cameroon 2004
No Education Primary Secondary or Higher
Source: ORC Macro, Demographic and Health Surveys.
Married Women Ages 15-49 Using Modern Contraception
Percent

© 2007 Population Reference Bureau
Use of Modern Contraception by Place of Residence
52
40
1510
46
29
36
Bangladesh 2004 Kenya 2003 Mali 2001 Benin 2001
Urban Rural
Source: ORC Macro, Demographic and Health Surveys.
Married Women Ages 15-49 Using Modern Contraception
Percent
© 2007 Population Reference Bureau
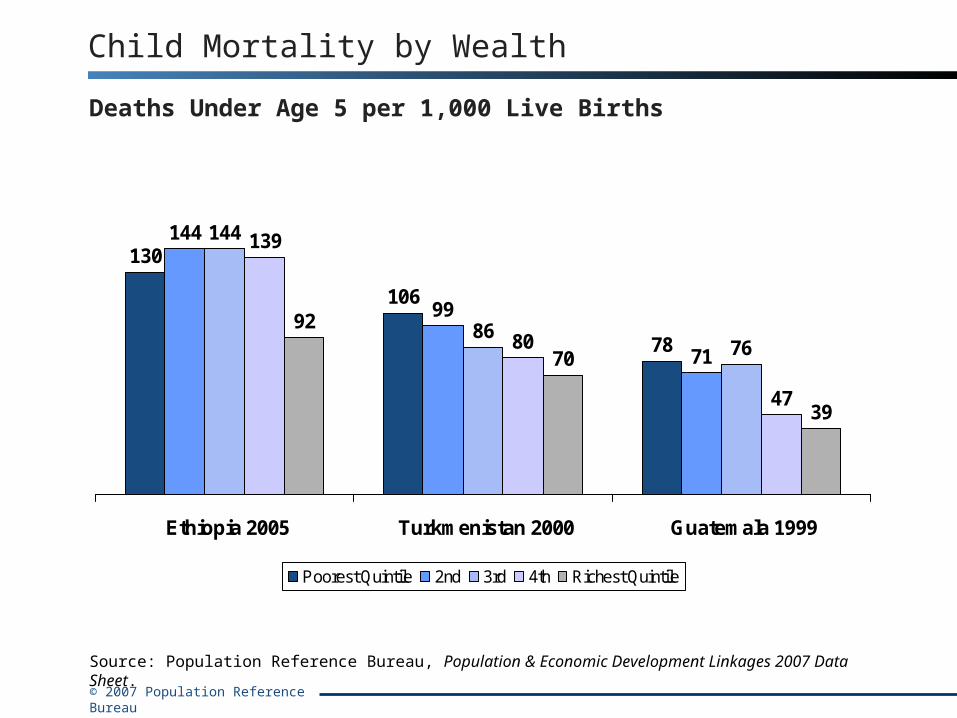
Child Mortality by Wealth
130
106
78
144
99
71
144
8676
139
80
47
92
70
39
Ethiopia 2005 Turkmenistan 2000 Guatemala 1999
Poorest Quintile 2nd 3rd 4th Richest Quintile
Deaths Under Age 5 per 1,000 Live Births
Source: Population Reference Bureau, Population & Economic Development Linkages 2007 Data Sheet.
© 2007 Population Reference Bureau
• The mortality rate of children under age 5 varies between the wealthy and the poor in a country. People in lower wealth groups face more risk of their children dying than those in wealthier groups.
Notes on Child Mortality by Wealth

© 2007 Population Reference Bureau
Child Mortality by Place of Residence
185
136
94
4130
253
202
117
47 52
Mali 2001 Burkina Faso2003
Kenya 2003 DominicanRepublic 2002
Philippines2003
Urban Rural
Source: ORC Macro, Demographic and Health Surveys.
Deaths Under Age 5 per 1,000 Live Births

© 2007 Population Reference Bureau
Infant Mortality by Wealth
78
101109
77
109100
80
98 95
58
7889
4534
66
Haiti 2005-2006 Cambodia 2005 Malawi 2004
Poorest Quintile 2nd 3rd 4th Richest Quintile
Source: ORC Macro, Demographic and Health Surveys.
Deaths Under Age 1 per 1,000 Live Births

© 2007 Population Reference Bureau
Association Between Fertility and Education
0
20
40
60
80
100
120
0 1 2 3 4 5 6 7 8
Percent of Girls Enrolled in Secondary School
Source: Population Reference Bureau, Population & Economic Development Linkages 2007 Data Sheet.
Total Fertility Rate
Palestinian Territory
Uruguay
Morocco
© 2007 Population Reference Bureau
• The share of secondary school age girls who are enrolled in school tends to be higher in countries with lower fertility rates.
Notes on Association Between Fertility and Education

© 2007 Population Reference Bureau
Total Fertility Rate by Wealth
6.4
4.9
4.1
4.9
3.2
2.42.8
2.4
1.4
Ghana 2003 Cambodia 2005 Colombia 2005
Poorest Quintile Middle Quintile Richest Quintile
Average Number of Children Born to a Woman During Her Lifetime
Source: ORC Macro, Demographic and Health Surveys.

© 2007 Population Reference Bureau
Total Fertility Rate by Education
7.1
6.0
2.6
6.6
5.3
2.0
4.1
3.2
1.7
Mali 2001 Ghana 2003 Vietnam 2002
No Education Primary Secondary or Higher
Source: ORC Macro, Demographic and Health Surveys.
Average Number of Children Born to a Woman During Her Lifetime

© 2007 Population Reference Bureau
Association Between Fertility and Poverty
0
20
40
60
80
100
0 1 2 3 4 5 6 7 8
Percent of Population Living on <$2 per Day
Source: Population Reference Bureau, Population & Economic Development Linkages 2007 Data Sheet.
Total Fertility Rate
Niger
Jordan
Mongolia

© 2007 Population Reference Bureau
• Countries with a higher percentage of people living in poverty often have higher fertility rates.
Notes on Association Between Fertility and Poverty
© 2007 Population Reference Bureau
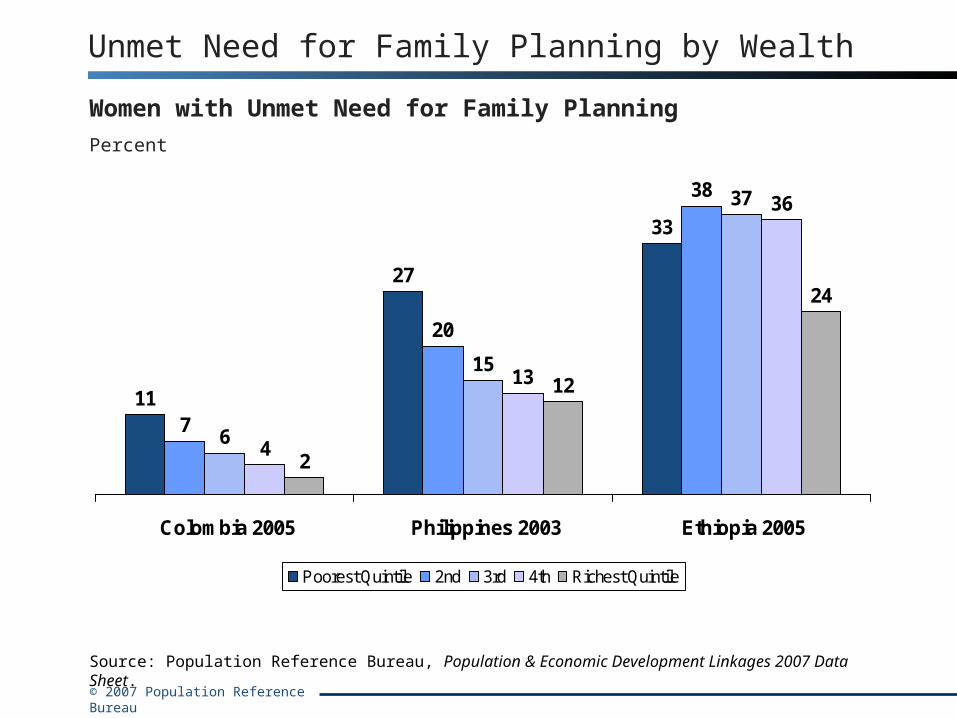
Unmet Need for Family Planning by Wealth
11
27
33
7
20
38
6
15
37
4
13
36
2
12
24
Colombia 2005 Philippines 2003 Ethiopia 2005
Poorest Quintile 2nd 3rd 4th Richest Quintile
Source: Population Reference Bureau, Population & Economic Development Linkages 2007 Data Sheet.
Women with Unmet Need for Family Planning
Percent

© 2007 Population Reference Bureau
• The poorest people often have the highest unmet need for family planning services. However, in some countries, such as Ethiopia, the poorest may have low unmet need because they desire large families. In countries with strong family planning programs, such as Colombia, unmet need for family planning is relatively low, especially when compared to neighboring countries.
• Women have an unmet need for family planning if they are married women of reproductive age (ages 15 to 49) who say they do not want more children or want to wait two or more years to have another child, yet are not using contraception.
Notes on Unmet Need for Family Planning By Wealth

© 2007 Population Reference Bureau
Period of Potential Demographic Bonus
Source: Population Reference Bureau, Population & Economic Development Linkages 2007 Data Sheet.
1989 2011
1980 2008
1986 2050
1964 2024
1974 2047
1965 2014
1969 2037
1965 2013
2005 2050
1985 2048
2014 2050
1950 1975 2000 2025 2050
Chad
Ghana
Malawi
China
India
South Korea
Bolivia
Brazil
Guatemala
Czech Republic
Poland

© 2007 Population Reference Bureau
• Countries with increasing numbers of working-age adults relative to dependent elderly and children have an opportunity to increase employment, investment, and savings. This potential economic advantage in growth and well-being is called a demographic bonus.
• This graph shows the time period in which selected countries can realize this bonus. Whether or not the demographic bonus is realized depends on economic policies and the creation of economic opportunities.
Notes on Period of Potential Demographic Bonus

© 2007 Population Reference Bureau
Trends in Number of Working-Age Adults per Dependent
0
1
2
3
1980 1990 2000 2010 2020 2030 2040 2050
Eastern Europe
South-eastern Asia
South-central Asia
Latin America andthe Caribbean
Sub-Saharan Africa
Number of Working-Age Adults (Ages 15-64) per Dependent (Under Age 15 and Ages 65 and Over)
Source: United Nations, World Population Prospects: The 2004 Revision, 2005.

© 2007 Population Reference Bureau
Association Between Fertility and Female Labor Force Participation
0
20
40
60
80
100
0 1 2 3 4 5 6 7 8
Female Labor Force Participation Rate 2004
Source: United Nations, World Population Prospects: The 2004 Revision, 2005; International Labor Organization, Yearbook of Labor Statistics 2006.
Total Fertility Rate 2000-2004
Turkey
DjiboutiPhilippines

© 2007 Population Reference Bureau
• Female labor force participation tends to be higher in countries with lower fertility rates.
Notes on Association Between Fertility and Female Labor Force Participation

© 2007 Population Reference Bureau
Adolescent Pregnancy and Motherhood by Wealth
46
32
24
29 29
20
1316
8
Philippines 2003 Tanzania 2004 Ethiopia 2005
Poorest Quintile Middle Quintile Richest Quintile
Source: ORC Macro, Demographic and Health Surveys.
Women Ages 15-19 Who Are Mothers or Pregnant with Their First Child
Percent

© 2007 Population Reference Bureau
Adolescent Pregnancy and Motherhood by Education
57
43
14
39
25
1210
4 4
Madagascar 2003-2004 Tanzania 2004 Jordan 2002
No Education Primary Secondary or Higher
Source: ORC Macro, Demographic and Health Surveys.
Women Ages 15-19 Who Are Mothers or Pregnant with Their First Child
Percent
© 2007 Population Reference Bureau
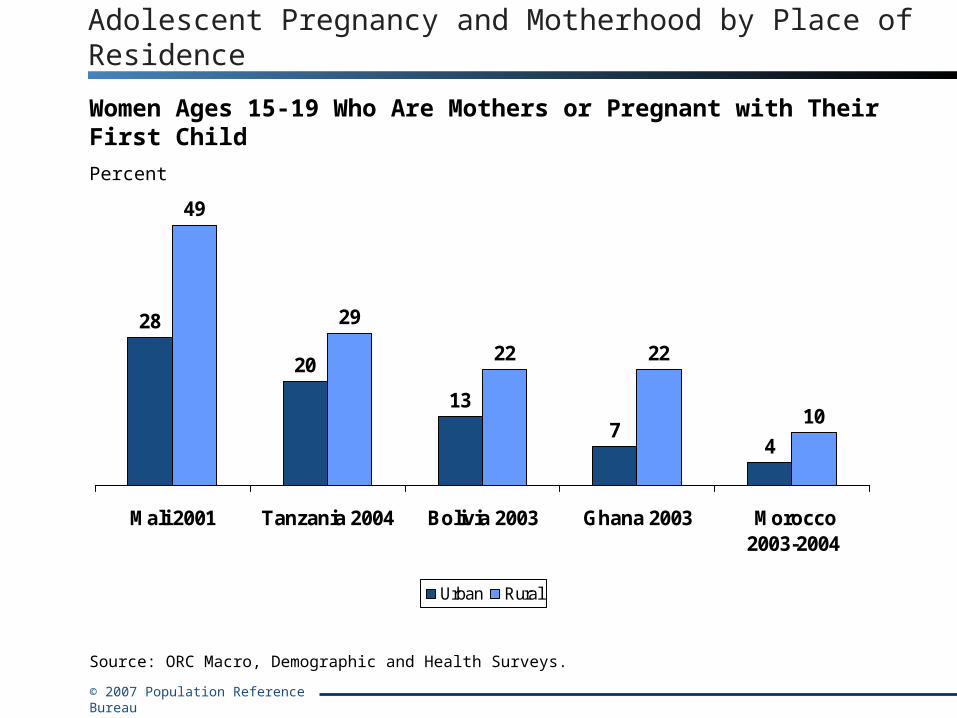
Adolescent Pregnancy and Motherhood by Place of Residence
28
20
13
74
49
29
22 22
10
Mali 2001 Tanzania 2004 Bolivia 2003 Ghana 2003 Morocco 2003-2004
Urban Rural
Source: ORC Macro, Demographic and Health Surveys.
Women Ages 15-19 Who Are Mothers or Pregnant with Their First Child
Percent

© 2007 Population Reference Bureau
Delivery Assistance by Place of Residence
98
84 81 80
56
7971
57
30
8
Colombia 2005 Benin 2001 Indonesia2002/2003
Ghana 2003 Chad 2004
Urban Rural
Source: ORC Macro, Demographic and Health Surveys.
Births Attended by a Doctor or Other Health Professional
Percent

© 2007 Population Reference Bureau
Inequalities in Health Status
2.2
1.9
3.2
Under-5 Mortality Rate Women Malnourished* Children Stunted **
Latest Surveys 1990-2002Average ratio of the rate in poorest quintile to rate in richest quintile
Note: Averages are not weighted for population size.* BMI<18.5, defined as weight in kilograms divided by the square of height in meters.** Low height for age in relation to an international reference population of well-nourished children.
Source: D.R. Gwatkin, S. Rutstein, K. Johnson, E.A. Suliman, and A. Wagstaff, Initial Country-Level Information about Socioeconomic Differences in Health, Nutrition, and Population, Volumes I and II (Washington, DC: The World Bank, November 2003).
56 countries 45 countries 50 countries

© 2007 Population Reference Bureau
Life Expectancy at Birth
65.4
75.6
63.4
51.0
World More DevelopedRegions
Less DevelopedCountries
Least DevelopedCountries
Note: More developed regions, according to the UN Population Division, include Australia, New Zealand, Europe, North America, and Japan. Less developed regions include Africa, Asia (excluding Japan), and Latin America and the Caribbean; 50 countries within these regions are classified as least developed.
Source: United Nations Population Division, World Population Prospects: The 2004 Revision, 2005.
2000-2005
Years

© 2007 Population Reference Bureau
Childhood Mortality Among the Poor
66
105
114
121
128
149
183
189
206
257
Philippines 2003
Bolivia 2003
Lesotho 2004
Bangladesh 2004
Ghana 2003
Kenya 2003
Malawi 2004
Cameroon 2004
Burkina Faso 2003
Nigeria 2003
Poorest Economic QuintileDeaths under age 5 per 1,000 births
Source: ORC Macro, Demographic and Health Surveys.

© 2007 Population Reference Bureau
Adolescent Fertility Rate
271
168
81
215
126
63
206
100
65
141
6856
78
27 28
Madagascar Bolivia Turkey
Poorest Quintile 2nd Quintile 3rd Quintile 4th Quintile Richest Quintile
Births per 1,000 Women Ages 15-19
Source: D.R. Gwatkin, S. Rutstein, K. Johnson, E.A. Suliman, and A. Wagstaff, Initial Country-Level Information about Socioeconomic Differences in Health, Nutrition, and Population, Volumes I and II (Washington, DC: The World Bank, November 2003).

© 2007 Population Reference Bureau
Fertility Among Poorer and Wealthier Women
7.4 7.3
5.2
4.44.4
3.6
1.7 1.8
Zambia 1996 Zambia 2001 Colombia 1995 Colombia 2000
Poorest Quintile Richest Quintile
Total Fertility Rate
Source: D.R. Gwatkin, S. Rutstein, K. Johnson, E.A. Suliman, and A. Wagstaff, Initial Country-Level Information about Socioeconomic Differences in Health, Nutrition, and Population, Volumes I and II (Washington, DC: The World Bank, November 2003).

© 2007 Population Reference Bureau
Spousal Violence
5
21
31
40
10
1418
35
South Africa Haiti Peru Zambia
Poorest Quintile Richest Quintile
Women Who Have Ever Experienced Spousal ViolencePercent
Source: D.R. Gwatkin, S. Rutstein, K. Johnson, E.A. Suliman, and A. Wagstaff, Initial Country-Level Information about Socioeconomic Differences in Health, Nutrition, and Population, Volumes I and II (Washington, DC: The World Bank, November 2003).
© 2007 Population Reference Bureau
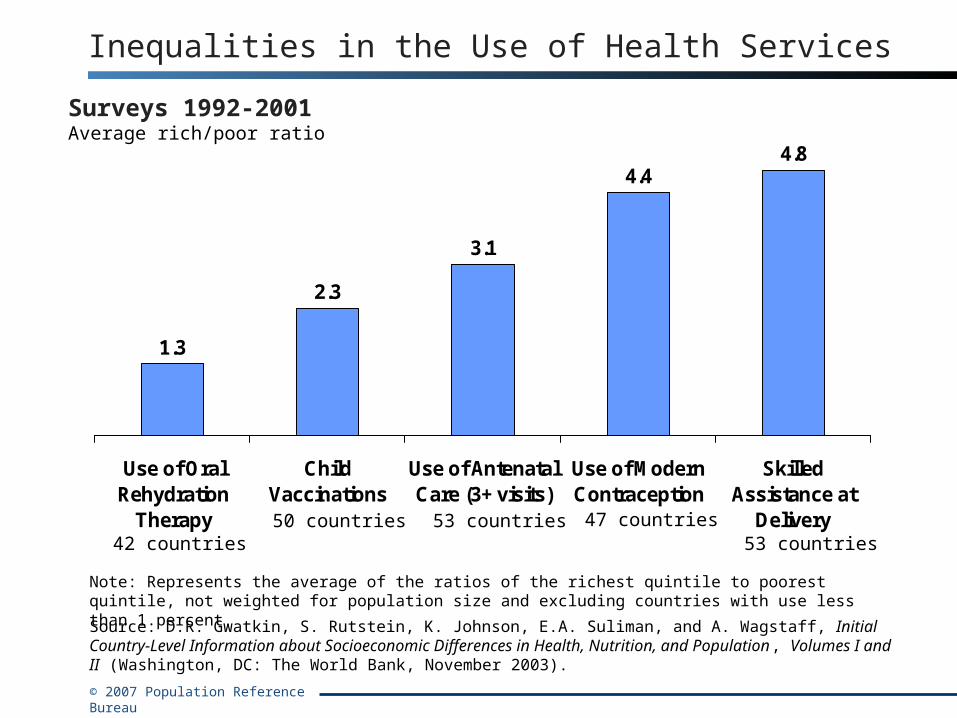
Inequalities in the Use of Health Services
1.3
2.3
3.1
4.44.8
Use of OralRehydration
Therapy
ChildVaccinations
Use of AntenatalCare (3+ visits)
Use of ModernContraception
SkilledAssistance at
Delivery
Surveys 1992-2001Average rich/poor ratio
Note: Represents the average of the ratios of the richest quintile to poorest quintile, not weighted for population size and excluding countries with use less than 1 percent.
42 countries50 countries 53 countries 47 countries
53 countries
Source: D.R. Gwatkin, S. Rutstein, K. Johnson, E.A. Suliman, and A. Wagstaff, Initial Country-Level Information about Socioeconomic Differences in Health, Nutrition, and Population, Volumes I and II (Washington, DC: The World Bank, November 2003).

© 2007 Population Reference Bureau
Childhood Vaccination Coverage
3
56
85
4
69
88
9
78
90
11
72
90
40
8391
Nigeria 2003 Philippines 2003 Egypt 2005
Poorest Quintile 2nd Quintile 3rd Quintile 4th Quintile Richest Quintile
Children 12-23 Months Receiving Full Basic CoveragePercent
Source: ORC Macro, Demographic and Health Surveys.

© 2007 Population Reference Bureau
Contraceptive Users Who Obtain Supplies and Services From a Public Sector Program
9287
7568
64
52
67
52
28 31
India Vietnam Kenya Bolivia Egypt
Poorest Quintile Richest Quintile
Married Women UsersPercent
Source: D.R. Gwatkin, S. Rutstein, K. Johnson, E.A. Suliman, and A. Wagstaff, Initial Country-Level Information about Socioeconomic Differences in Health, Nutrition, and Population, Volumes I and II (Washington, DC: The World Bank, November 2003).

© 2007 Population Reference Bureau
Delivery Assistance Among Women
72
51
46
39
34
31
30
25
21
4
Columbia 2005
Egypt 2005
Malawi 2004
Burkina Faso 2003
Lesotho 2004
Tanzania 2004/2005
Madagascar 2003/2004
Philippines 2003
Ghana 2003
Chad 2004
Poorest Economic QuintilePercent of births attended by skilled personnel
Source: ORC Macro, Demographic and Health Surveys.

© 2007 Population Reference Bureau
Births Attended by Skilled Personnel: Progress Mixed
33
78
23 20
9399
7077
Nicaragua 1997-1998
Nicaragua 2001 Uganda 1995 Uganda 2000-2001
Poorest Quintile Richest Quintile
Percent
Source: D.R. Gwatkin, S. Rutstein, K. Johnson, E.A. Suliman, and A. Wagstaff, Initial Country-Level Information about Socioeconomic Differences in Health, Nutrition, and Population, Volumes I and II (Washington, DC: The World Bank, November 2003).
© 2007 Population Reference Bureau
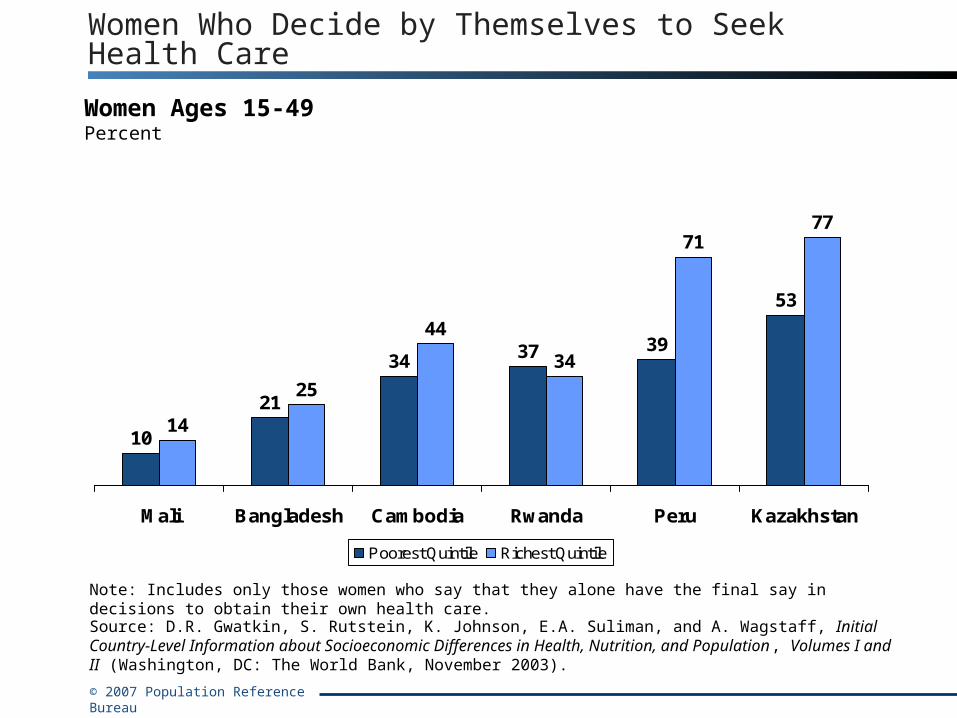
Women Who Decide by Themselves to Seek Health Care
10
21
34 37 39
53
14
25
44
34
7177
Mali Bangladesh Cambodia Rwanda Peru Kazakhstan
Poorest Quintile Richest Quintile
Women Ages 15-49Percent
Note: Includes only those women who say that they alone have the final say in decisions to obtain their own health care.Source: D.R. Gwatkin, S. Rutstein, K. Johnson, E.A. Suliman, and A. Wagstaff, Initial Country-Level Information about Socioeconomic Differences in Health, Nutrition, and Population, Volumes I and II (Washington, DC: The World Bank, November 2003).

© 2007 Population Reference Bureau
Outliers: Vietnam, Egypt, and Kazakhstan
58
9199
58
9299
58
9299
58
9499
52
9299
Vietnam: ModernContraceptive Use
Egypt: Child Immunizations Kazakhstan: SkilledDelivery Assistance
Poorest Quintile 2nd Quintile 3rd Quintile 4th Quintile Richest Quintile
Percent
Source: D.R. Gwatkin, S. Rutstein, K. Johnson, E.A. Suliman, and A. Wagstaff, Initial Country-Level Information about Socioeconomic Differences in Health, Nutrition, and Population, Volumes I and II (Washington, DC: The World Bank, November 2003).
© 2007 Population Reference Bureau
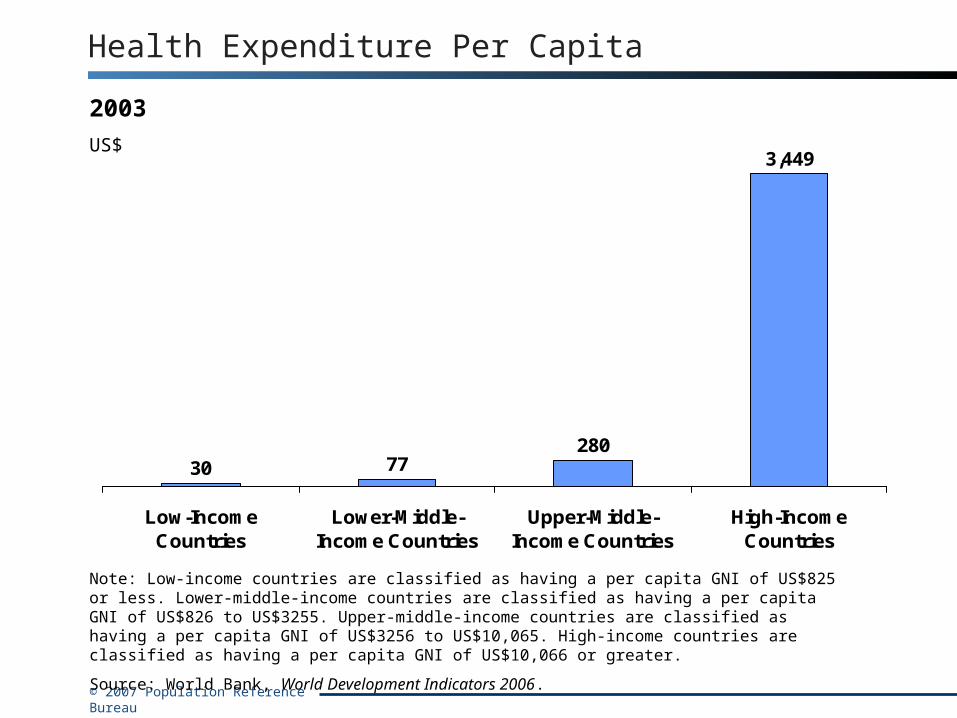
Health Expenditure Per Capita
30 77280
3,449
Low-IncomeCountries
Lower-Middle-Income Countries
Upper-Middle-Income Countries
High-IncomeCountries
Note: Low-income countries are classified as having a per capita GNI of US$825 or less. Lower-middle-income countries are classified as having a per capita GNI of US$826 to US$3255. Upper-middle-income countries are classified as having a per capita GNI of US$3256 to US$10,065. High-income countries are classified as having a per capita GNI of US$10,066 or greater.
Source: World Bank, World Development Indicators 2006.
2003
US$

© 2007 Population Reference Bureau
Population Living on Less Than US$2 per Day
2002Percent
50
7875
41
23 20
World South Asia Sub-SaharanAfrica
East Asia and thePacific
Latin Americaand the
Caribbean
Middle Eastand North
Africa
Source: World Bank, World Development Indicators 2006.