Embed Size (px)
Citation preview
2011 Calf-ETERIA StudyBenchmarking Ontario dairy calf raising practices & Opportunities
for Improvement
Central Ontario Agriculture Conference 2012Georgian College, Barrie

Presentation Outline
What is Calf-ETERIA? About the project
Calf and Heifer Management Survey Results Opportunities for improvement
Next Steps
Calf-ETERIA
Using CALF health and productivity as a template for an Evaluation of Translation and Extension of Research Information for Agriculture

What is Calf-ETERIA ? A University of Guelph-OMAFRA Knowledge Translation and
Transfer funded project.
Team Members:
Ken Leslie – Project Coordinator
Tom Wright – Project Co-Coordinator
Vivianne Bielmann – Project Manager Trevor DeVries Mario Mongeon Brian Lang Bill Grexton
Harold House Betty Summerhayes Ian Rumbles
Project Objectives Benchmark current dairy calf and heifer management practices
Develop approaches to undertaking KTT initiatives to improve awareness and encourage adoption of, known optimal management techniques to increase economic performance and health
Evaluate and quantify both the animal health and economic performance subsequent to their initial benchmark
Disseminate case-study based benefits of optimal management systems to demonstrate both financial and animal health improvements to all Ontario dairy producers through producer meetings and web-based media
3 KTT Approaches
Calf and Heifer management clubs Including interaction with veterinarians
Web-based KTT for BMP’s for calves & heifers
Control Group
Benefits Ontario dairy producers from two key perspectives:
Economically – through reduced costs attributed to death losses, animal morbidity and associated treatment costs and reduction in compromised lifetime milk production losses, as a result of health problems encountered as a calf
Improved welfare of dairy calves and heifers - through increased survival rates and improved health-status
Expected Benefits and Impacts
Expected Benefits and Impacts
IMPACTS To change and improve specific aspects about
the management of calves and heifers on Ontario dairy farms
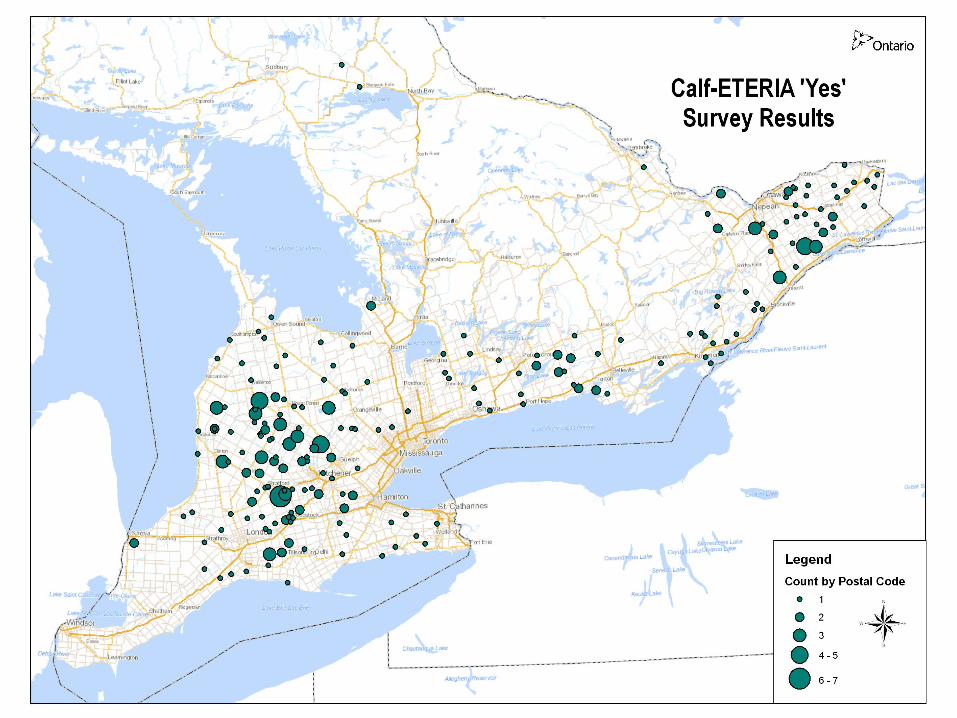
Ontario Calf and Heifer Management Survey
3,145 surveys were mailed out to dairy producers on DHI The survey was also available online
921 surveys were completed and returned by mail
43 surveys were completed online
30% response
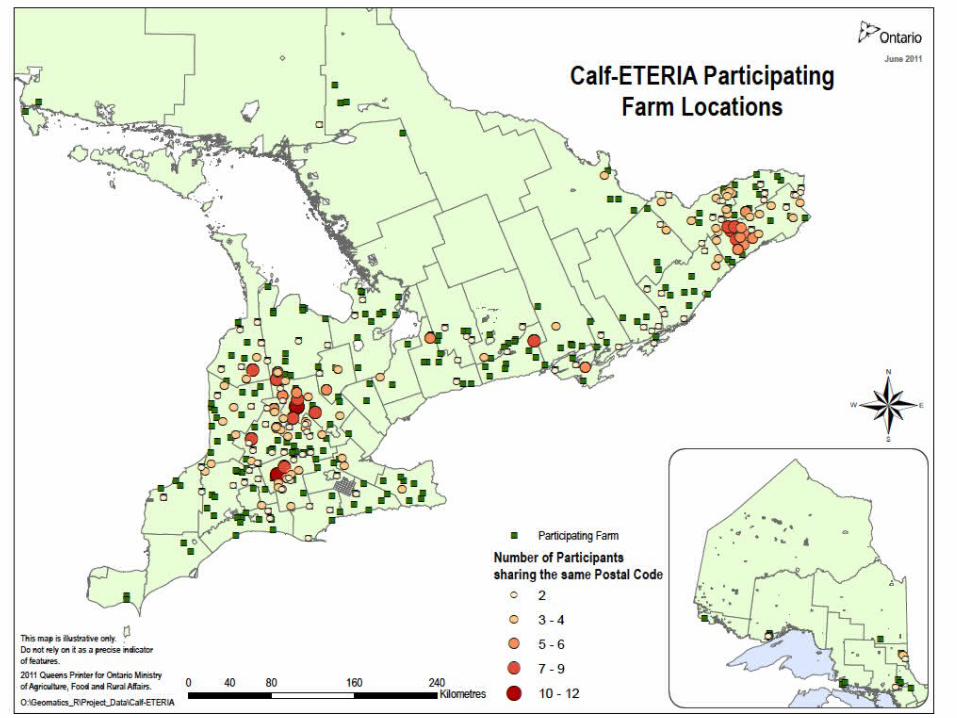
Status of Survey

Distribution of Herd Size
Herd Size Number of Farms0 – 50 cows 44551 – 100 cows 319101 – 150 cows 89151 – 200 cows 27201 – 250 cows 19251 – 350 cows 14400+ cows 7
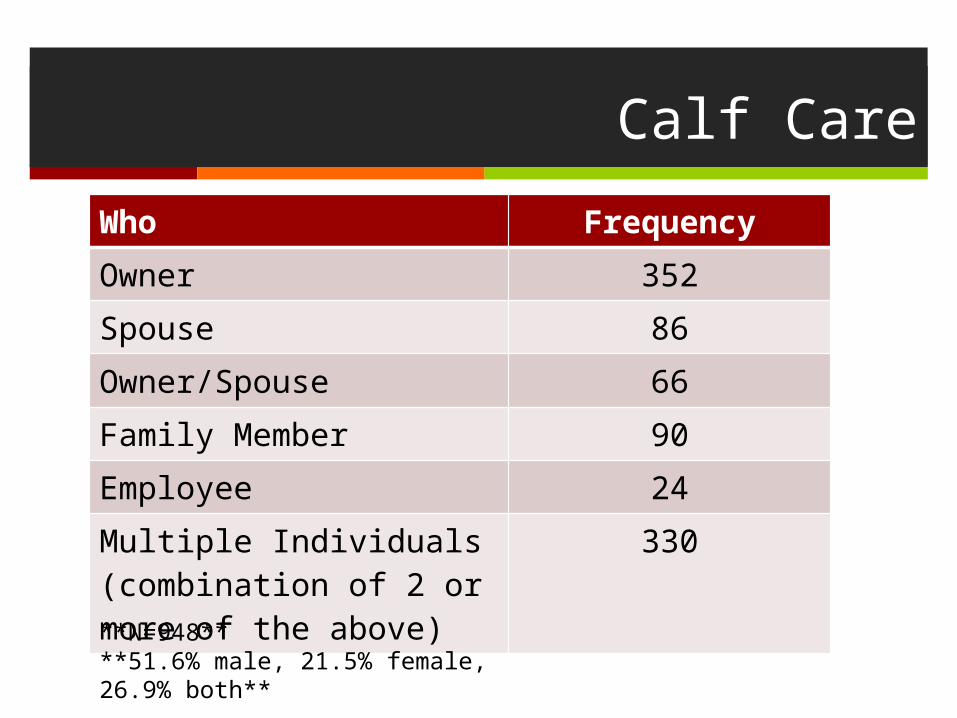
Calf Care
Who FrequencyOwner 352Spouse 86Owner/Spouse 66Family Member 90Employee 24Multiple Individuals (combination of 2 or more of the above)
330
**N=948****51.6% male, 21.5% female, 26.9% both**
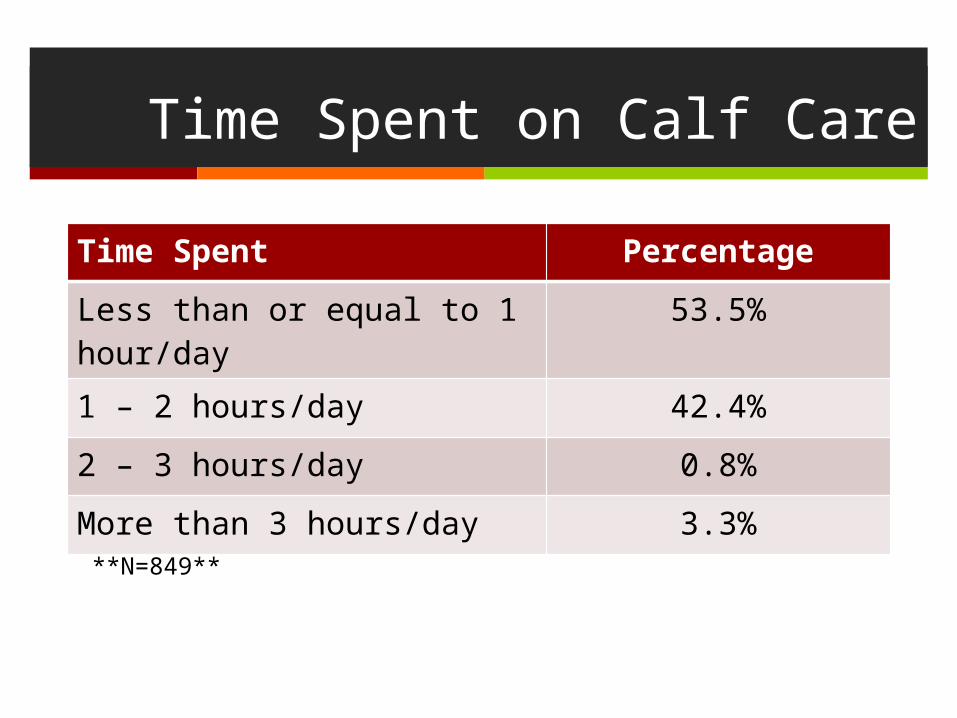
Time Spent on Calf Care
Time Spent Percentage
Less than or equal to 1 hour/day 53.5%
1 – 2 hours/day 42.4%
2 – 3 hours/day 0.8%
More than 3 hours/day 3.3%
**N=849**

Cost of Labour
Employee wages, for calf care, ranged from $5 /hour up to $25 /hour, depending on the farm

Where are Calves normally Born?
Location PercentageIndividual Calving Pen 31%Group Maternity Pen 11.6%Dry Cow Pen 7.8%Tie Stall/Free Stall 7.9%Pasture (when applicable) 29.6%Combination of 2 or more of the above 40.2%
Video Surveillance Use
75 / 930 producers indicated that video surveillance is currently used to monitor cows in the calving area
Herd sizes of these 75 ranged from 28 cows up to 550 cows
Separation of Calf from Dam
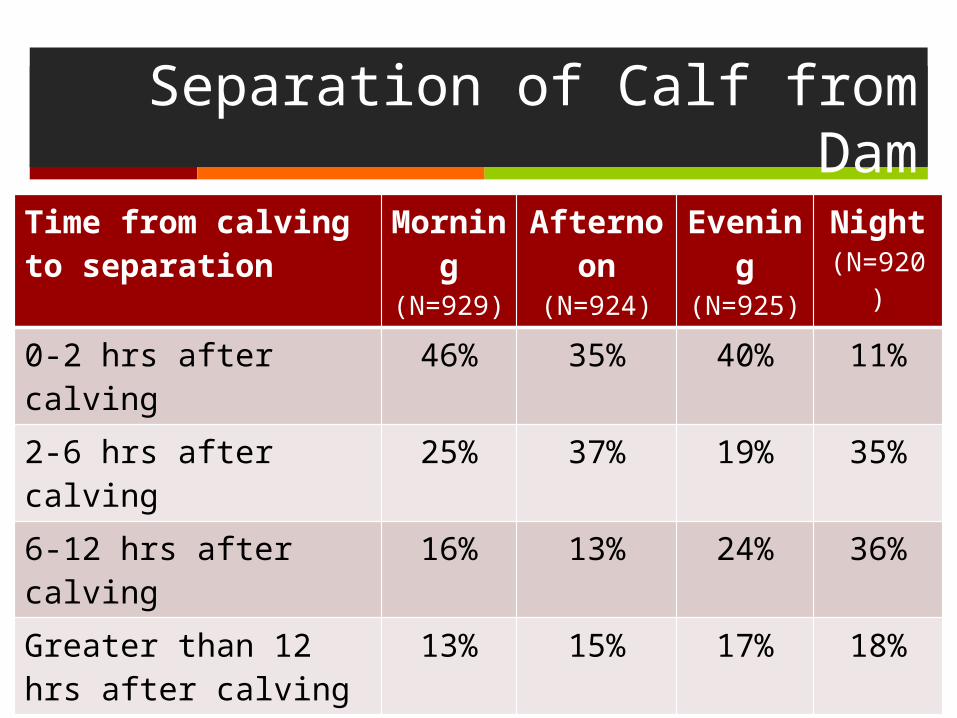
Time from calving to separation
Morning(N=929)
Afternoon(N=924)
Evening(N=925)
Night(N=920)
0-2 hrs after calving 46% 35% 40% 11%
2-6 hrs after calving 25% 37% 19% 35%
6-12 hrs after calving 16% 13% 24% 36%
Greater than 12 hrs after calving
13% 15% 17% 18%

Separation Technique
Total Separation to Calf Housing 758 (81%)
Partial Separation using a tub or gate 98 (10%)
Other + Partial or Total separation 17 (2%)
Other 67 (7%) Methods Used:
Moved to box stall/calf pens Tied to corner of calving pen Cow is removed from pen Tied up alongside cows Calf stays with cow for hours/until licked dry/up to 3 days

Calving Assistance
On average, how often was assistance required during a calving, in the past year? Never 0.4%
Less than 10% 27%
10 – 20% 41%
More than 20% of calvings 23.6%
Exact percentage 7.4% Range: 1% - 98%
Disinfecting Navels
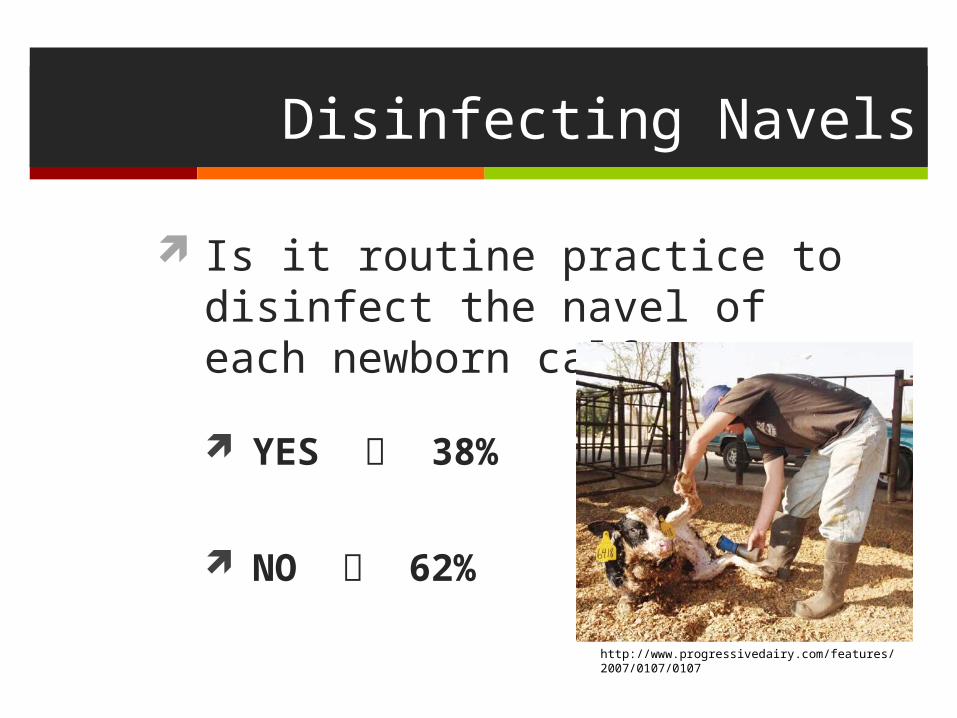
Is it routine practice to disinfect the navel of each newborn calf?
YES 38%
NO 62%
http://www.progressivedairy.com/features/2007/0107/0107
Disinfecting Navels
Why do it? Prevent infections – stop pathogens from going up
the cord into the calf’s body Navel infections can lead to other health problems Some studies show decreased growth associated
with navel infections
An easy, cost-effective method to help prevent disease

Products administered shortly after Birth
TreatmentNone 490 (51.5%)Vitamin E/Selenium 218 (23%)Vitamins A, D and E 97 (10%)Oral Antibody or vaccine 277 (29%)Iron 26 (3%)Intranasal Viral Vaccine 3 (0.3%)More than one of the above 152 (16%)
**N=950N.B. – Percentages do not add up to 100%
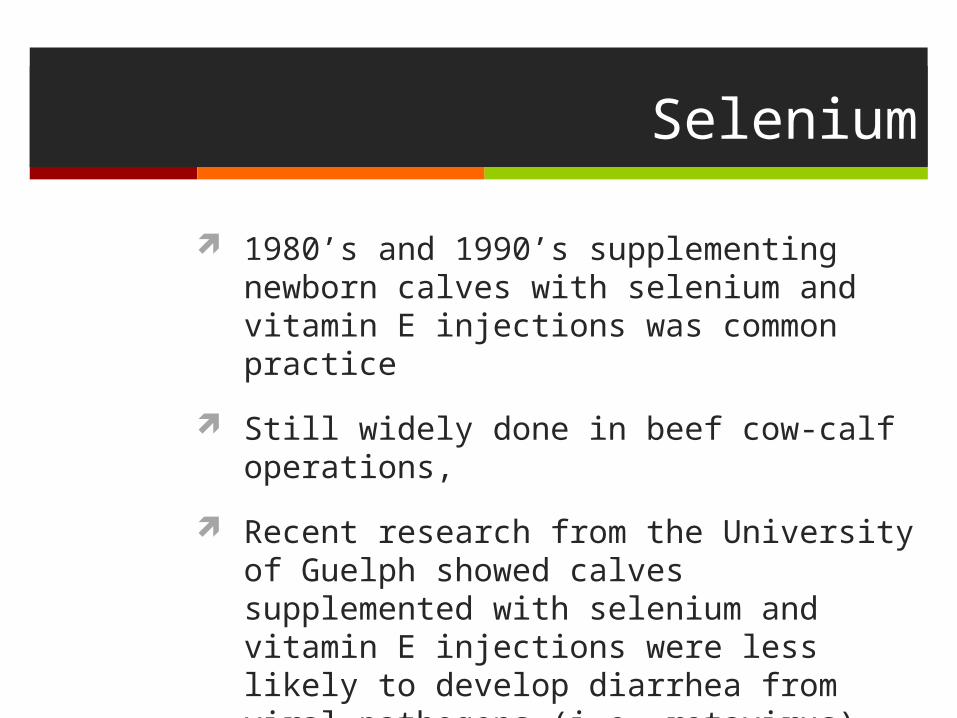
Selenium
1980’s and 1990’s supplementing newborn calves with selenium and vitamin E injections was common practice
Still widely done in beef cow-calf operations,
Recent research from the University of Guelph showed calves supplemented with selenium and vitamin E injections were less likely to develop diarrhea from viral pathogens (i.e. rotavirus)

Colostrum Feeding
What percentage of calves nurse the dam? 0% 429 1-10% 189 11-30% 83 31-50% 49 60-90% 30 91-100% 18
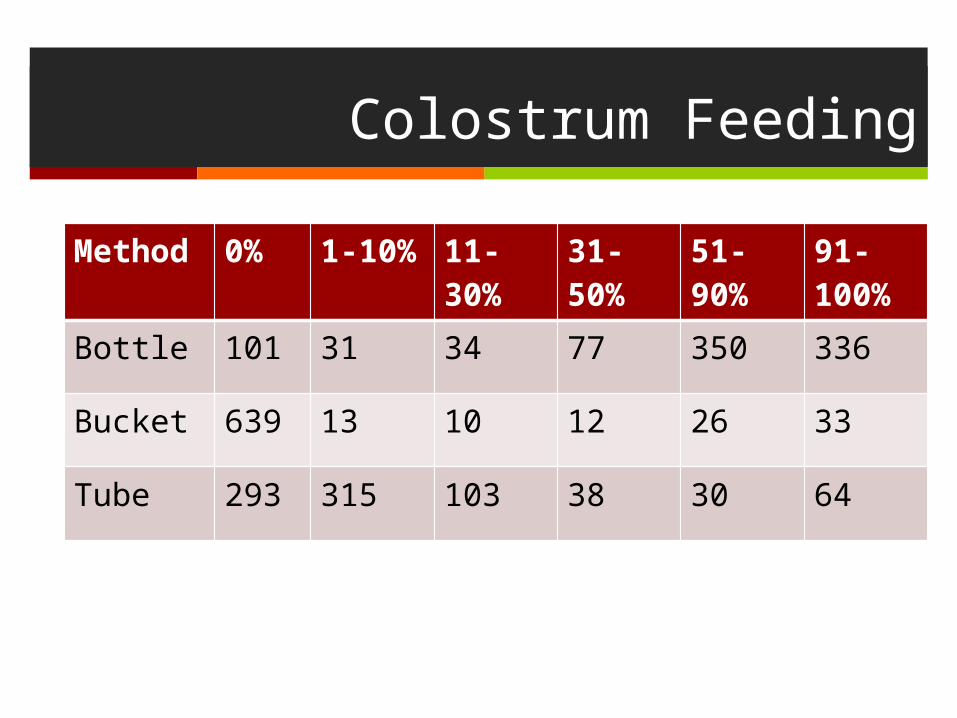
Colostrum Feeding
Method 0% 1-10% 11-30% 31-50% 51-90% 91-100%
Bottle 101 31 34 77 350 336
Bucket 639 13 10 12 26 33
Tube 293 315 103 38 30 64
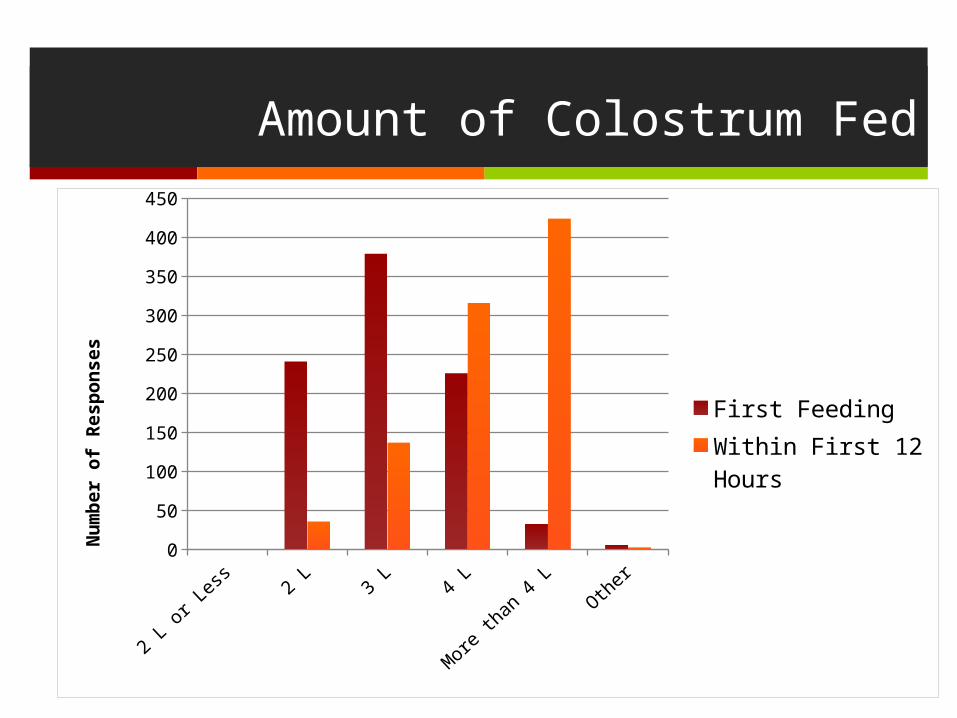
Amount of Colostrum Fed
2 L or L
ess 2 L 3 L 4 L
More than 4 L
Other0
50
100
150
200
250
300
350
400
450
First FeedingWithin First 12 Hours
Num
ber o
f Res
pons
es
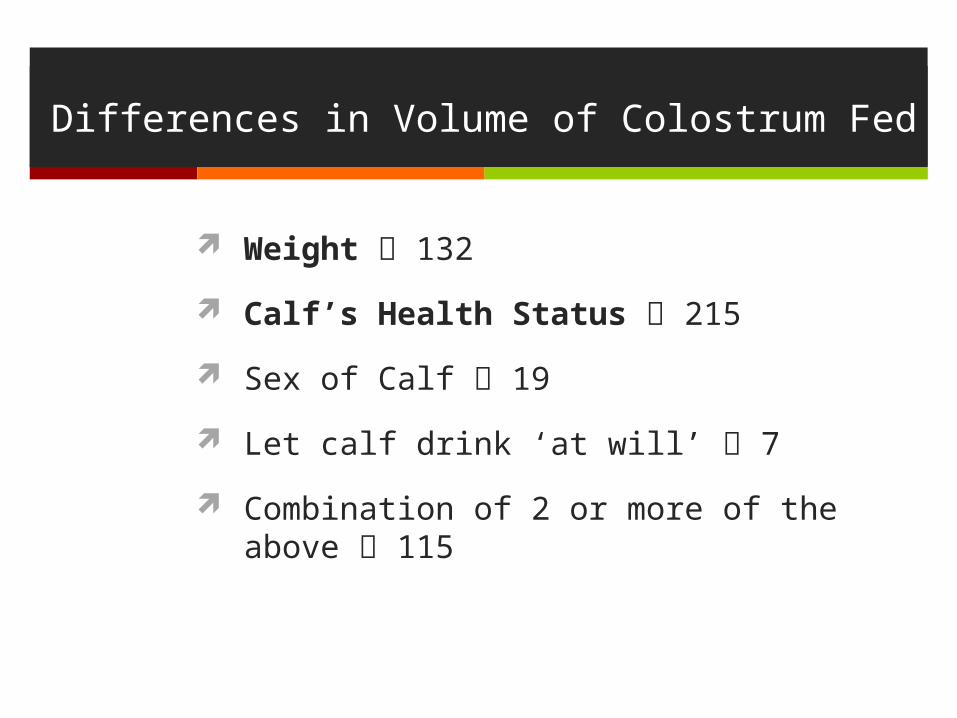
Differences in Volume of Colostrum Fed
Weight 132
Calf’s Health Status 215
Sex of Calf 19
Let calf drink ‘at will’ 7
Combination of 2 or more of the above 115

Colostrum Quality
How many producers are checking colostrum quality? 281/931 30%
How are they checking it? Colour and/or consistency 72% (265/370) Volume 19% (70/370) Colostrometer 6% (23/370) Refractometer 0.2% (1/370) Laboratory 3% (11/370)
Colostrum Quality
Importance of colostrum qualityQuality decreases quickly after calving.
Collection should occur within 1 to 2 hours, max of 6 hrs.
The relationship between IgG concentrations and volume of colostrum is unpredictable
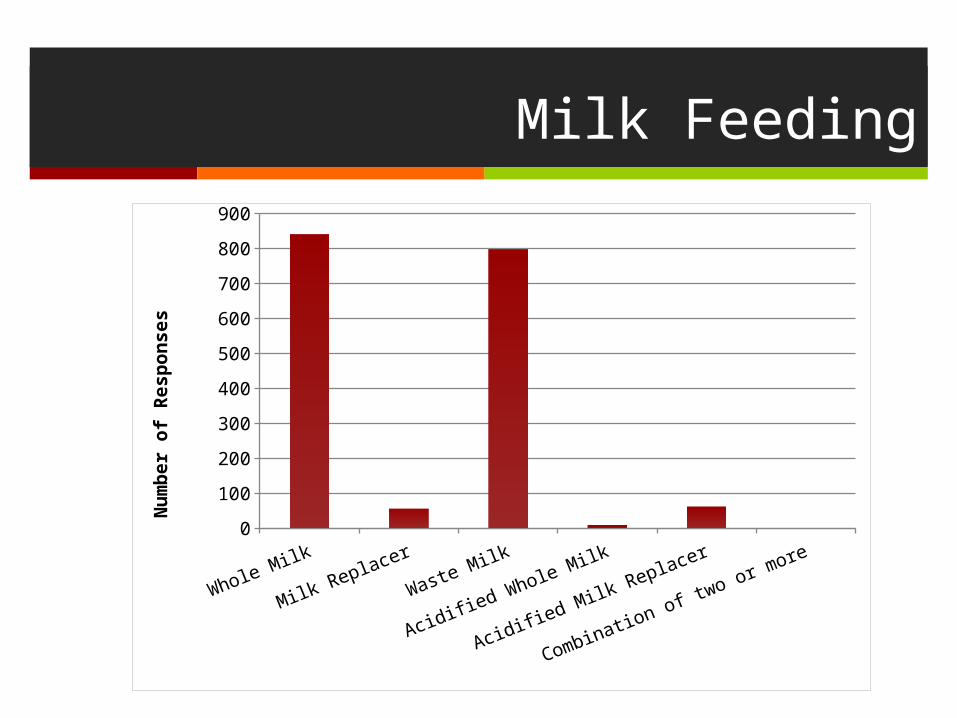
Milk Feeding
Whole Milk
Milk Replacer
Waste Milk
Acidified Whole Milk
Acidified Milk Replacer
Combination of two or more0
100
200
300
400
500
600
700
800
900
Num
ber o
f Res
pons
es
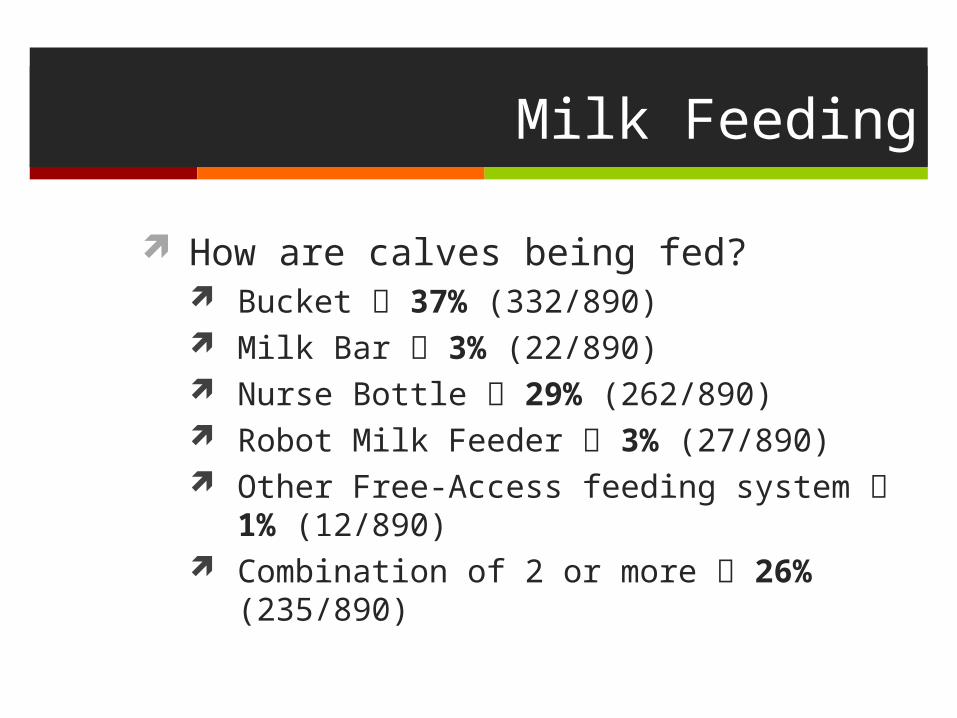
Milk Feeding
How are calves being fed? Bucket 37% (332/890) Milk Bar 3% (22/890) Nurse Bottle 29% (262/890) Robot Milk Feeder 3% (27/890) Other Free-Access feeding system 1% (12/890) Combination of 2 or more 26% (235/890)
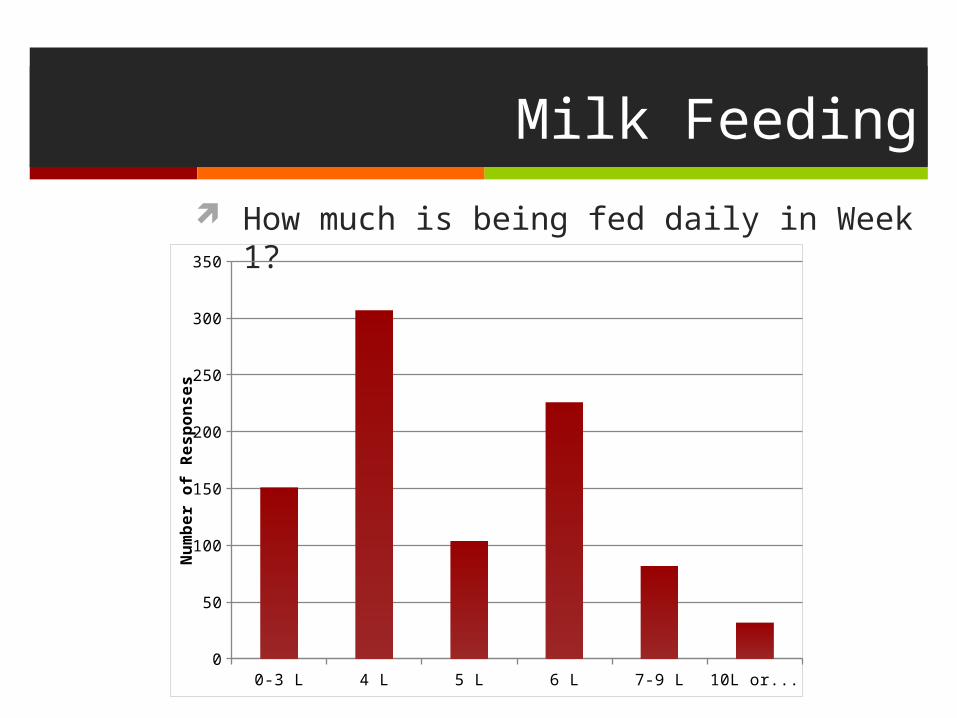
Milk Feeding
How much is being fed daily in Week 1?
0-3 L 4 L 5 L 6 L 7-9 L 10L or more0
50
100
150
200
250
300
350
Num
ber
of R
espo
nses
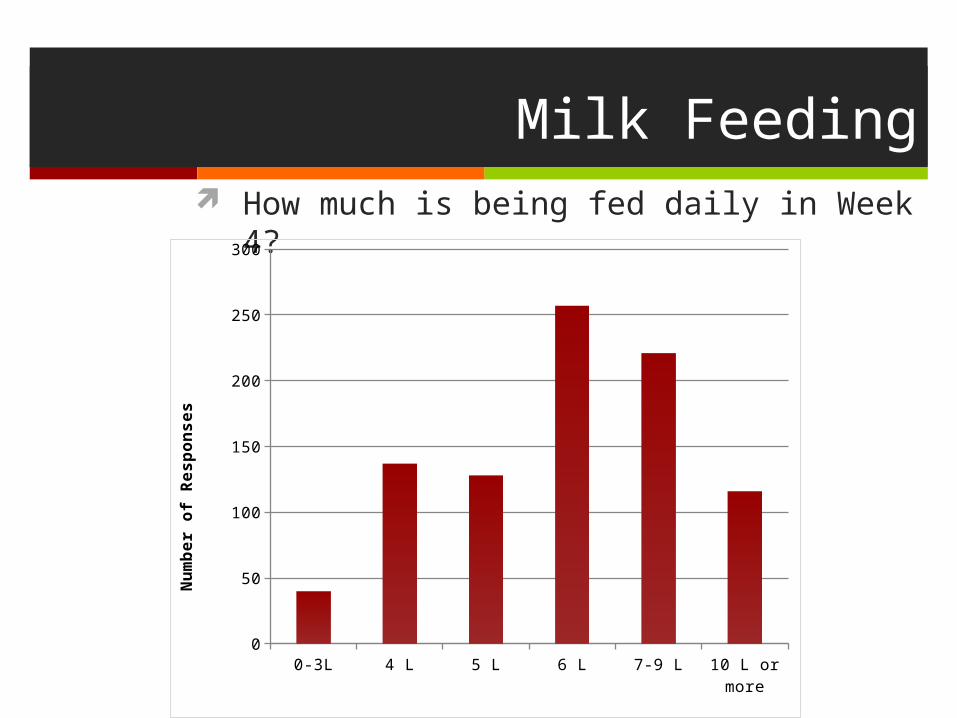
Milk Feeding How much is being fed daily in Week 4?
0-3L 4 L 5 L 6 L 7-9 L 10 L or more0
50
100
150
200
250
300
Num
ber
of R
espo
nses
Feeding programs based on feeding 500 g of milk (4L) or milk replacer DM day puts the calf at serious risk for limited or no growth during the first 2 - 3 weeks of life unless environmental conditions of temperature and moisture are optimal
Traditional milk feeding levels
(Courtesy of Trevor DeVries)

Increased milk feeding levels for accelerated growth
Recommendation now is to feed calves more milk – increase rate of frame growth (not fattening per se) Feed whole milk ad libitum (free access) or at other
high levels (8-10+ L/day) Feed more milk replacer
1 to 1.5 kg of powder/day26-28% CP, 15-20% fat
Achieve gains of 1 to 1.5 kg/d of growth pre-weaning
(Courtesy of Trevor DeVries)
0
2
4
6
8
10
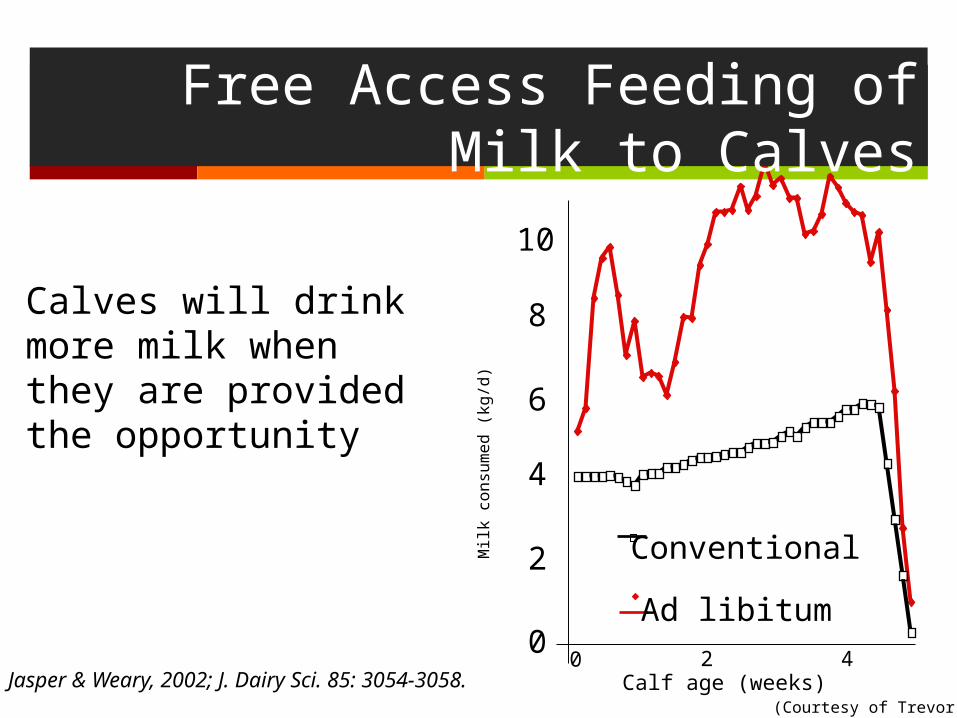
0 2 4Calf age (weeks)
Milk
consu
med (
kg/d
)
Calves will drink more milk when they are provided the opportunity
Ad libitum
Conventional
Jasper & Weary, 2002; J. Dairy Sci. 85: 3054-3058.
Free Access Feeding of Milk to Calves
(Courtesy of Trevor DeVries)
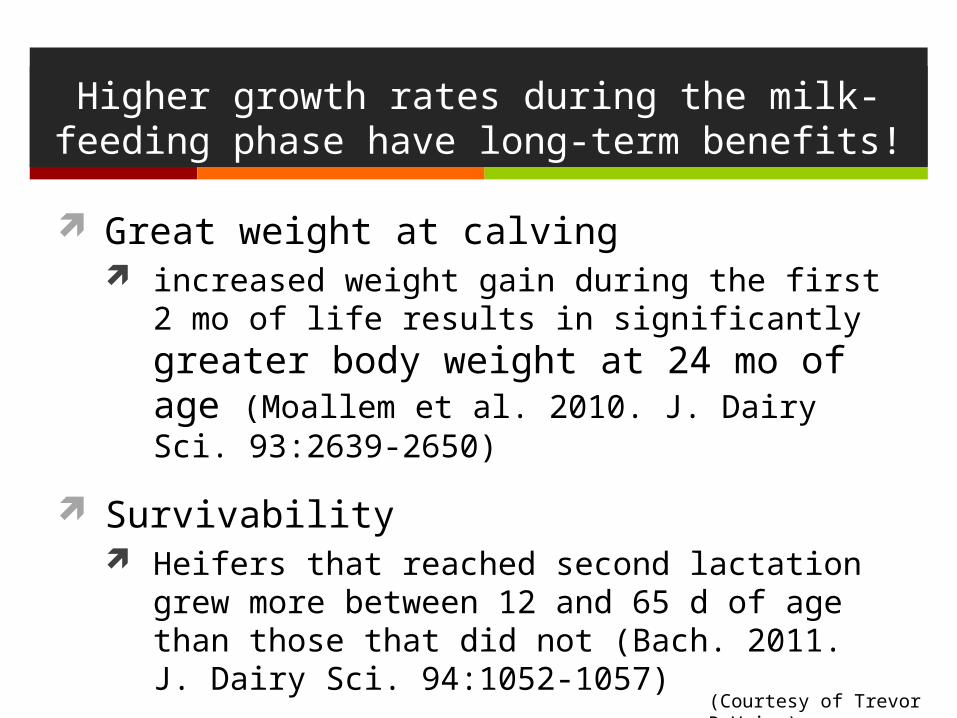
Higher growth rates during the milk-feeding phase have long-term benefits!
Great weight at calving increased weight gain during the first 2 mo of life results
in significantly greater body weight at 24 mo of age (Moallem et al. 2010. J. Dairy Sci. 93:2639-2650)
Survivability Heifers that reached second lactation grew more
between 12 and 65 d of age than those that did not (Bach. 2011. J. Dairy Sci. 94:1052-1057)
(Courtesy of Trevor DeVries)
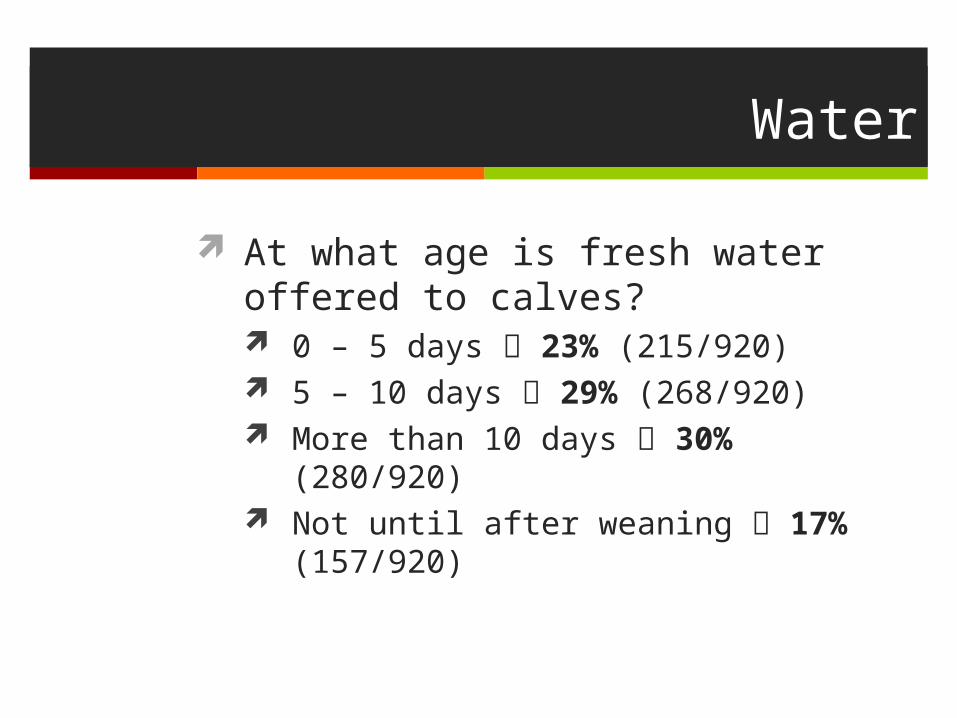
Water
At what age is fresh water offered to calves? 0 – 5 days 23% (215/920) 5 – 10 days 29% (268/920) More than 10 days 30% (280/920) Not until after weaning 17% (157/920)

Importance of Water
Most essential nutrient, represents 70% of body weight
Water is lost from respiration and manure
Water intake is positively correlated with dry matter intake
(Courtesy of Tom Wright)
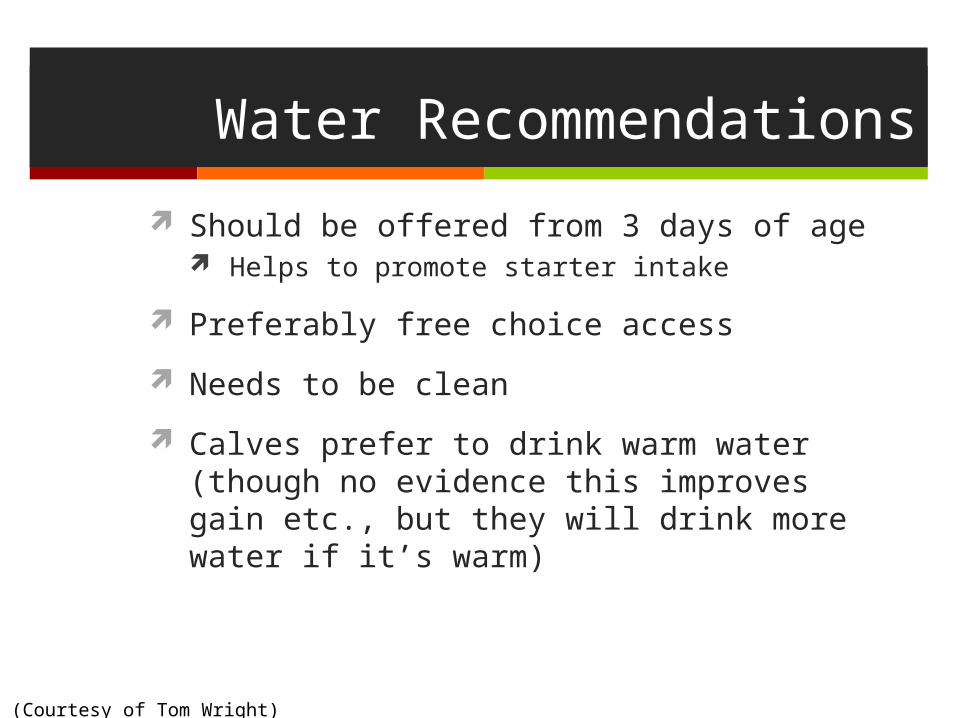
Water Recommendations
Should be offered from 3 days of age Helps to promote starter intake
Preferably free choice access
Needs to be clean
Calves prefer to drink warm water (though no evidence this improves gain etc., but they will drink more water if it’s warm)
(Courtesy of Tom Wright)
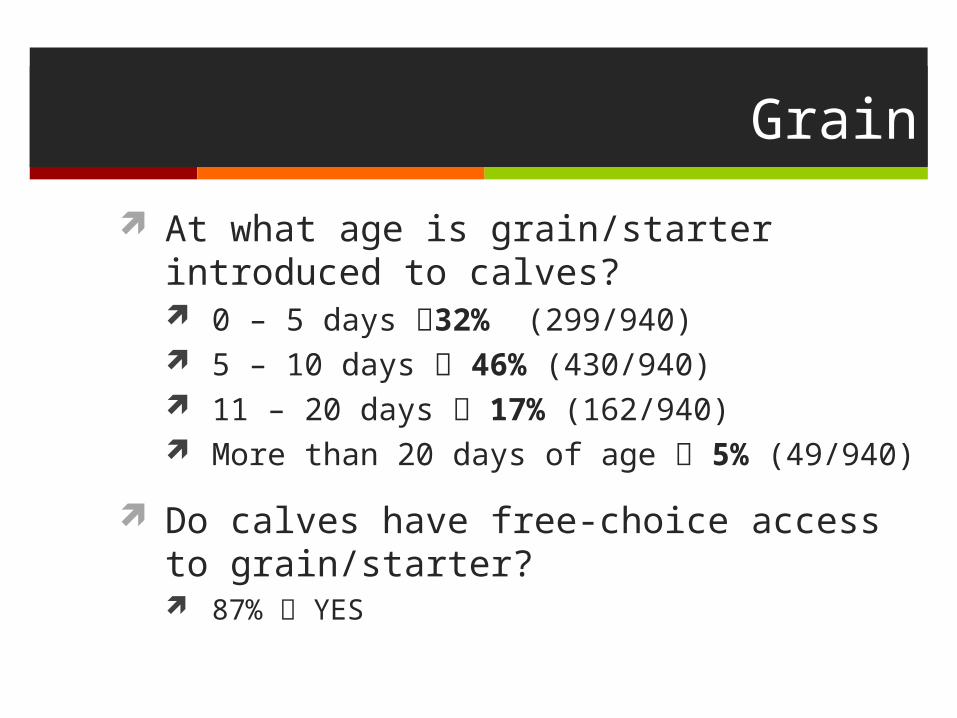
Grain
At what age is grain/starter introduced to calves? 0 – 5 days 32% (299/940) 5 – 10 days 46% (430/940) 11 – 20 days 17% (162/940) More than 20 days of age 5% (49/940)
Do calves have free-choice access to grain/starter? 87% YES
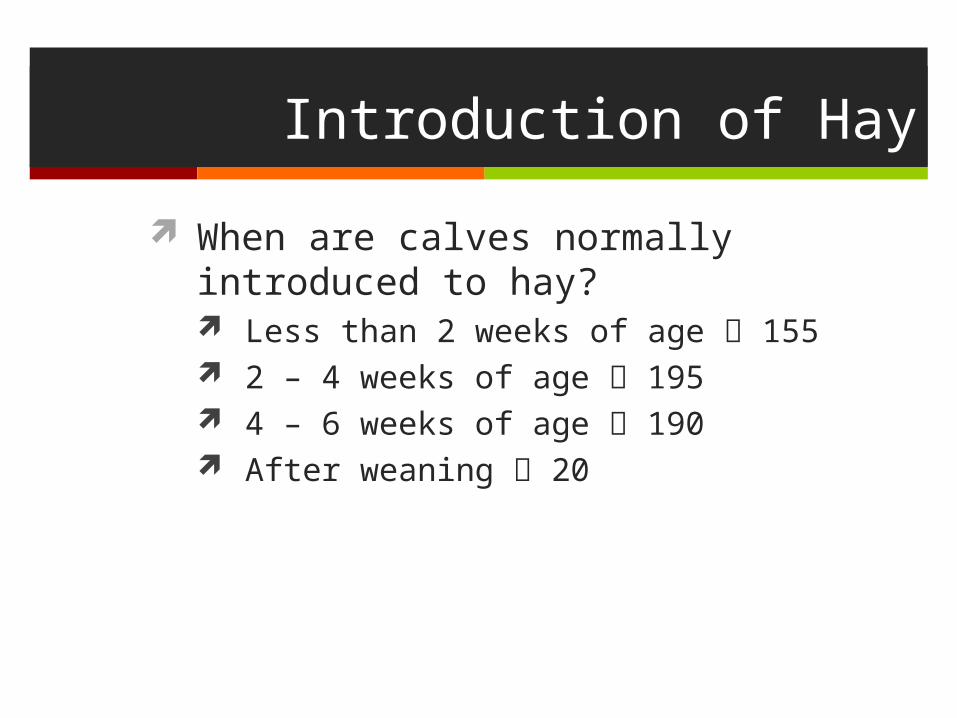
Introduction of Hay
When are calves normally introduced to hay? Less than 2 weeks of age 155 2 – 4 weeks of age 195 4 – 6 weeks of age 190 After weaning 20

Recording Information
What information is recorded on individual calves? Nothing 60 ID info 911 Calving ease info 796 Stillbirth 806 Routine procedures 262 Calf disease events 371 Calf health treatments 463 Growth 62 Death after 24 hours 602 Weaning date 105
Standard Operating Procedures
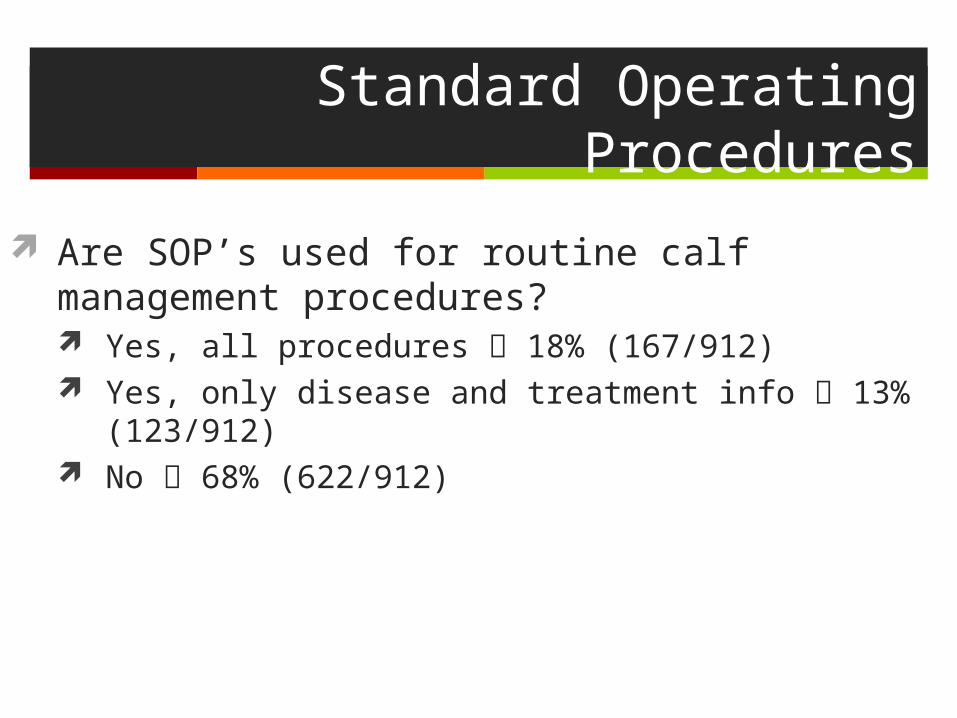
Are SOP’s used for routine calf management procedures? Yes, all procedures 18% (167/912) Yes, only disease and treatment info 13% (123/912) No 68% (622/912)
Health Problems – Pre-weaning
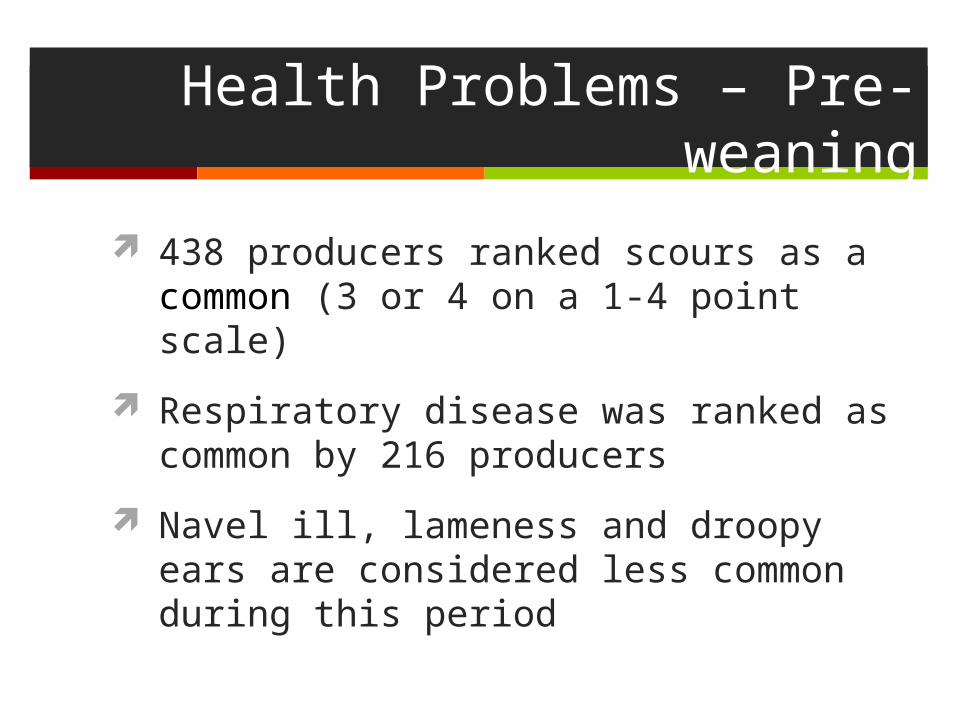
438 producers ranked scours as a common (3 or 4 on a 1-4 point scale)
Respiratory disease was ranked as common by 216 producers
Navel ill, lameness and droopy ears are considered less common during this period

Weaning
How are calves weaned off milk? Abruptly stop feeding 191 Decrease volume 249 Dilution of milk 311 Intermittent feeding 98 Combination of methods 93
How is the time of weaning decided? Calf age 812 Calf weight 293 Starter/grain intake 454*often this is a combination*

Weaning Age
5 weeks or less 2.4% (21/863)
6 weeks 12% (101/863)
7 weeks 9% (77/863)
8 weeks 36% (311/863)
9 weeks 10% (86/863)
10 weeks or more 31% (267/863)
Health Problems – Post-weaning
175 producers considered respiratory disease to be a common or very common health problem in post-weaned calves
Vaccination
Are calves vaccinated for respiratory disease? 47 % are vaccinating calves against respiratory
disease

56-98 98-180 180-270 270-3810.5
0.6
0.7
0.8
0.9
1
1.1 BRD+
BRD-
Effect of BRD on ADGAv
erag
e D
aily
Gai
n (k
g/da
y)
Time Period of Measurement (days)
**
*
(Courtesy of Amy Stanton)
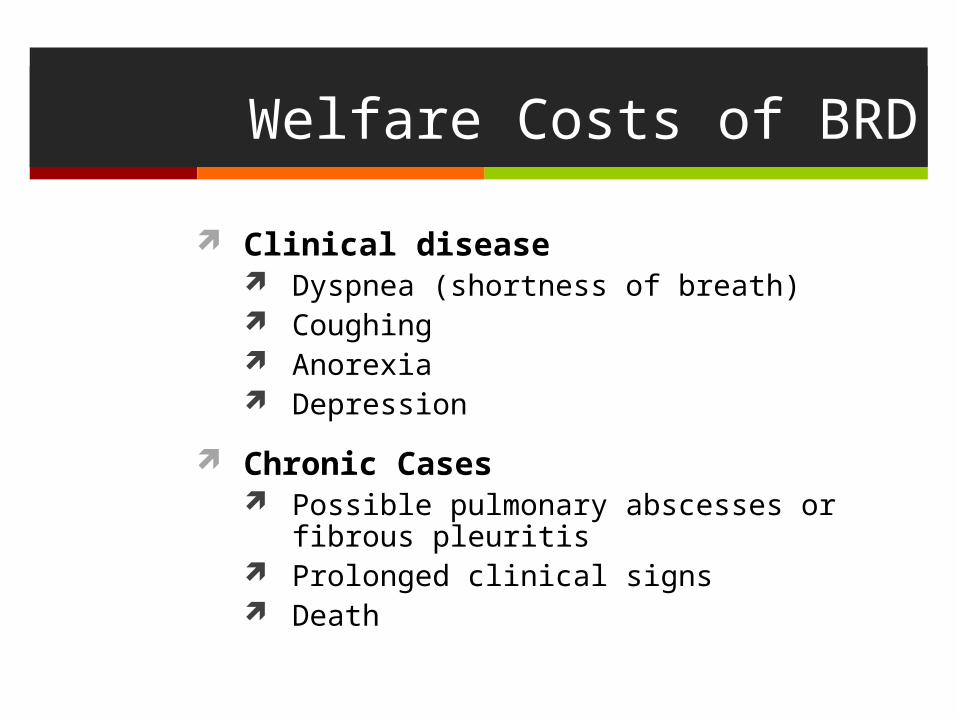
Welfare Costs of BRD
Clinical disease Dyspnea (shortness of breath) Coughing Anorexia Depression
Chronic Cases Possible pulmonary abscesses or fibrous pleuritis Prolonged clinical signs Death
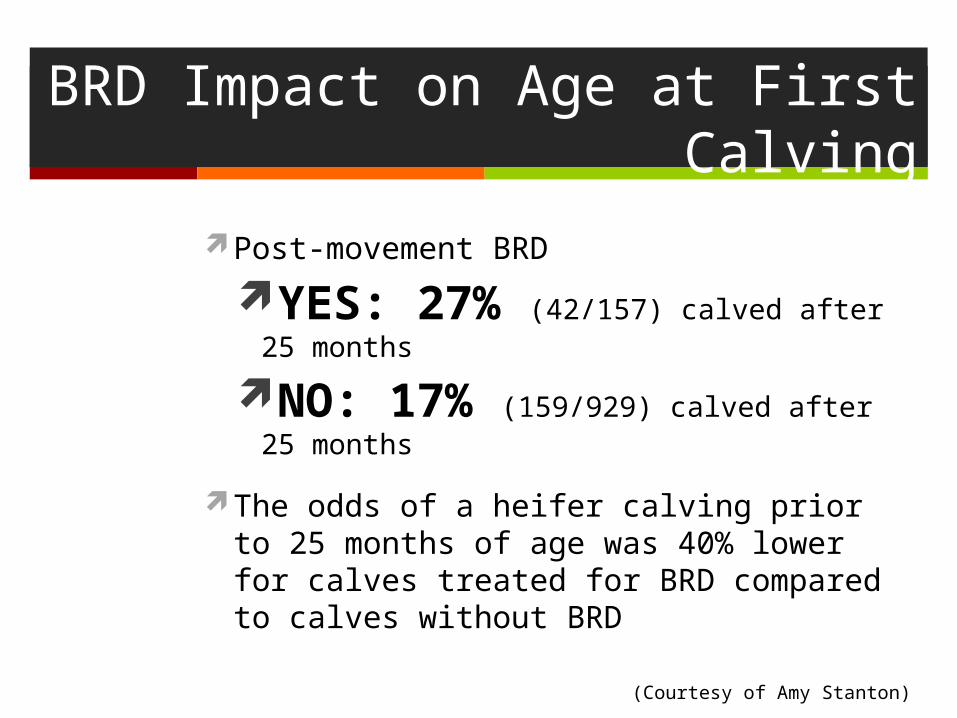
BRD Impact on Age at First Calving
Post-movement BRD
YES: 27% (42/157) calved after 25 months
NO: 17% (159/929) calved after 25 months
The odds of a heifer calving prior to 25 months of age was 40% lower for calves treated for BRD compared to calves without BRD
(Courtesy of Amy Stanton)
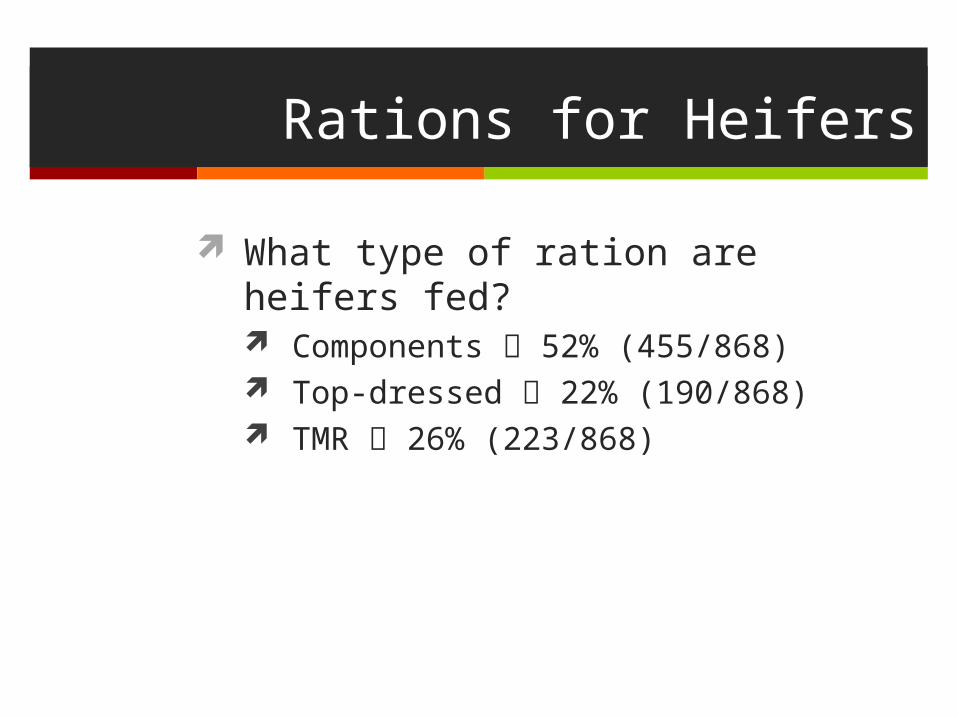
Rations for Heifers
What type of ration are heifers fed? Components 52% (455/868) Top-dressed 22% (190/868) TMR 26% (223/868)
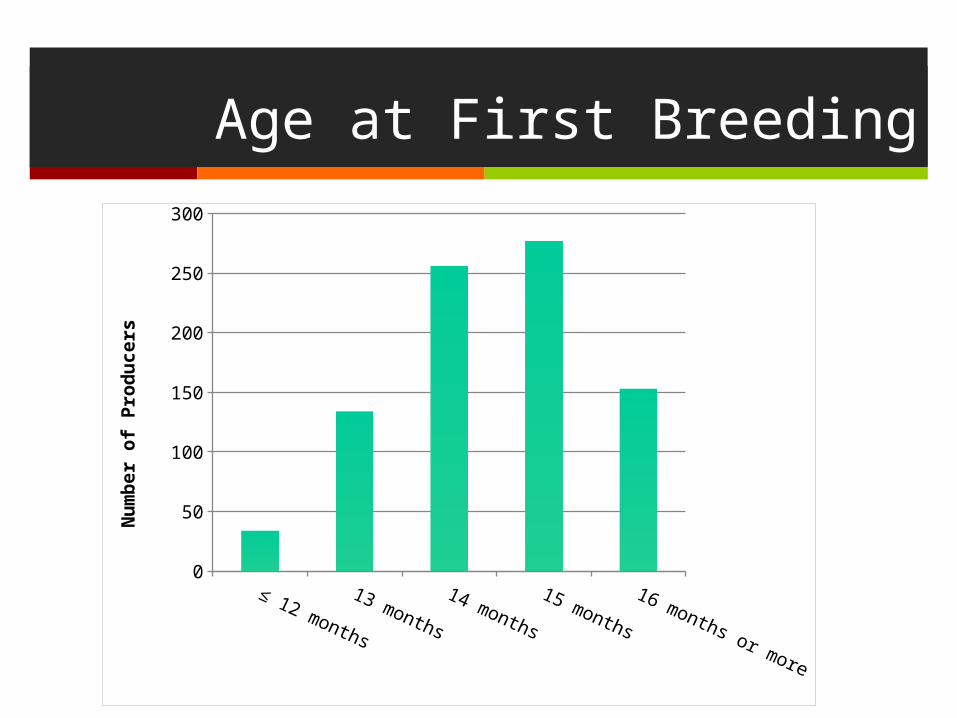
Age at First Breeding
≤ 12 months
13 months
14 months
15 months
16 months or more
0
50
100
150
200
250
300
Num
ber o
f Pro
duce
rs

Comparison of Age at First Calving and Productive Life
32.1
32.833.1
33.7 33.633.3 33.1 33.0
32.6 32.632.0 32.2
31.0
30.1 29.9
25
27
29
31
33
35
37
22 23 24 25 26 27 28 29 30 31 32 33 34 35 36
Age at First Calving (months)
Tim
e S
pe
nt
in H
erd
(m
o)
Heifers calving at 25-26 months have the longest herd life
CanWest DHI 2008-09
Productive life in a dairy herd is similar across all ages with a range of less than 4 months
(Courtesy of Brian Lang and Bill Grexton)

Age at First Calving and Lifetime Milk Production
20,000
22,000
24,000
26,000
28,000
22 23 24 25 26 27 28 29 30 31 32 33 34 35 36Age at First Calving
Lifeti
me p
rod
uct
ion
kg
Highest lifetime
production is from heifers calving at 23 to 25 months
of age
CanWest DHI 2008-09(Courtesy of Brian Lang and Bill Grexton)
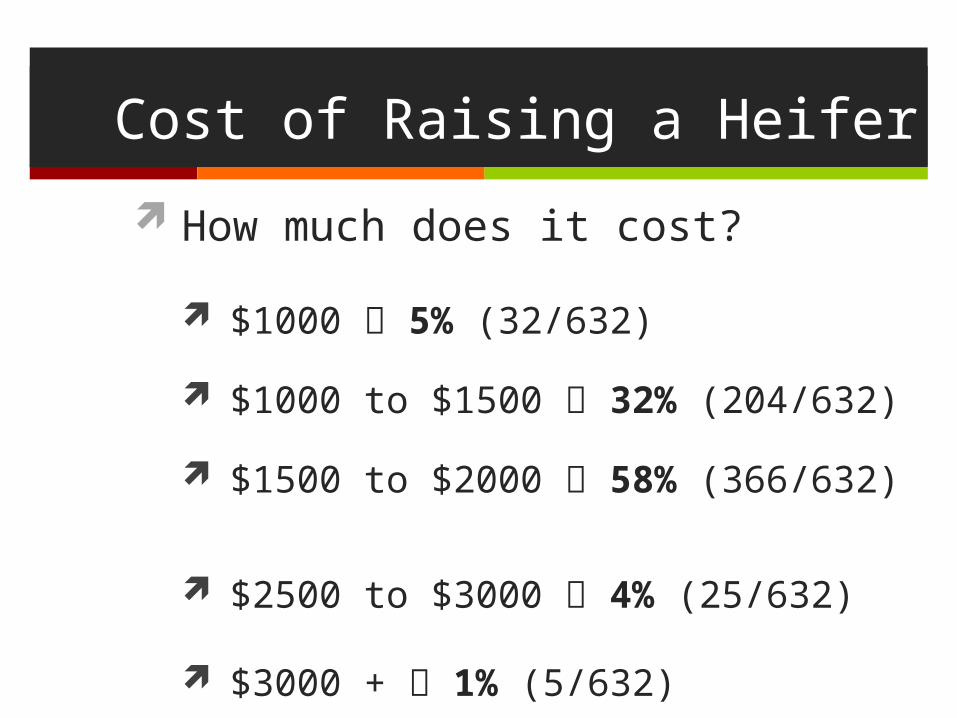
Cost of Raising a Heifer
How much does it cost?
$1000 5% (32/632)
$1000 to $1500 32% (204/632)
$1500 to $2000 58% (366/632)
$2500 to $3000 4% (25/632)
$3000 + 1% (5/632)
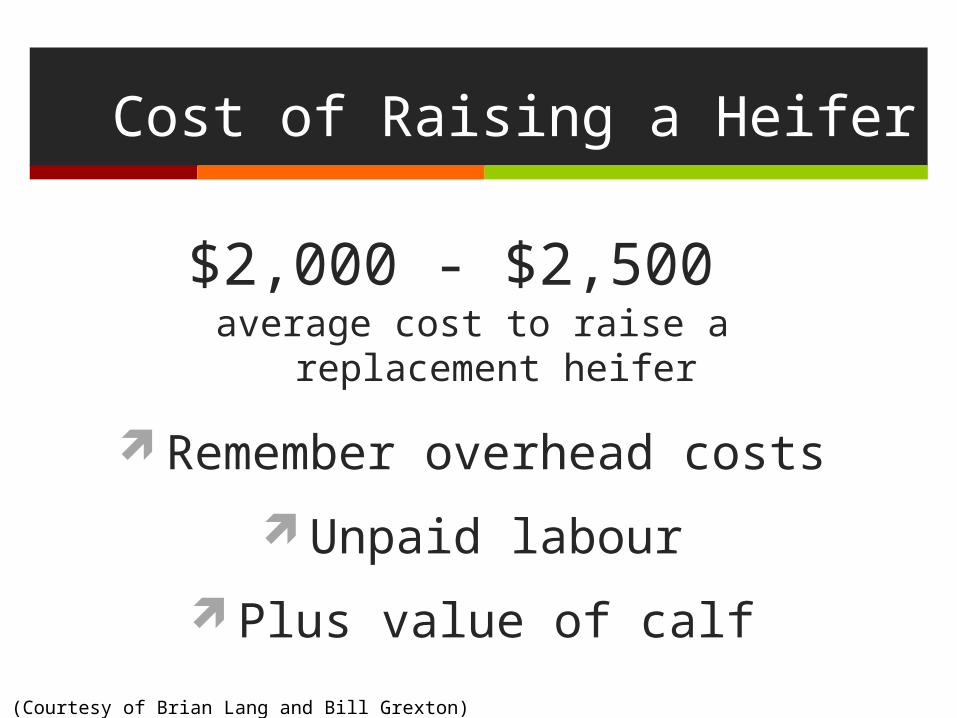
Cost of Raising a Heifer
$2,000 - $2,500 average cost to raise a replacement heifer
Remember overhead costs
Unpaid labour
Plus value of calf
(Courtesy of Brian Lang and Bill Grexton)
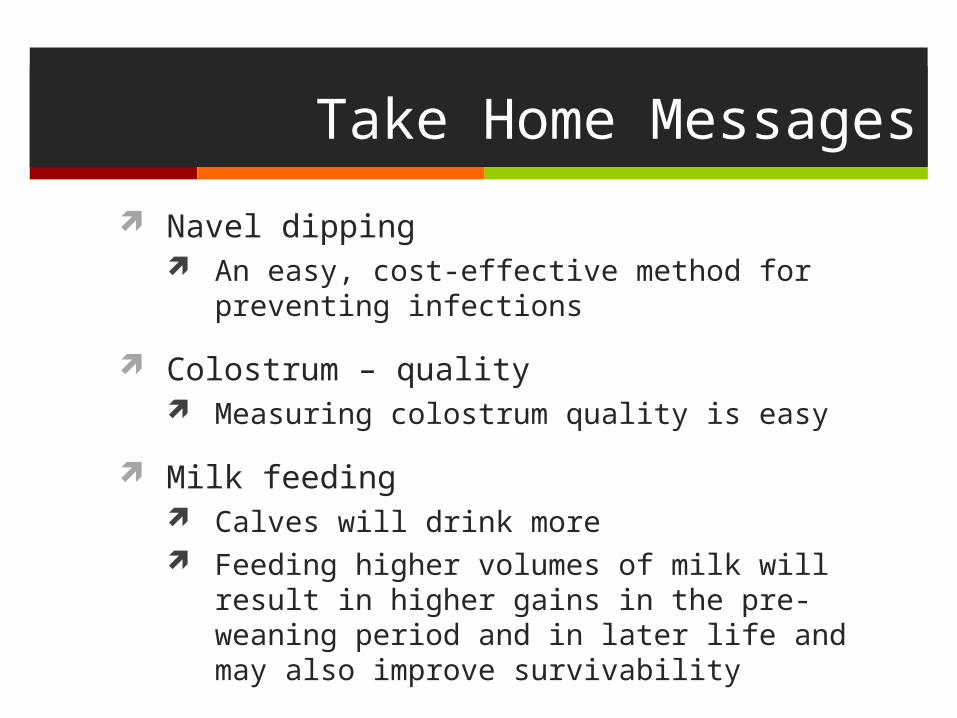
Take Home Messages
Navel dipping An easy, cost-effective method for preventing infections
Colostrum – quality Measuring colostrum quality is easy
Milk feeding Calves will drink more Feeding higher volumes of milk will result in higher gains
in the pre-weaning period and in later life and may also improve survivability

Take Home Messages
Water intake An important nutrient Should be offered by 3 days of age Promotes starter intake
Disease Respiratory disease has long term impacts on the
production and survivability
Age at first breeding Can be improved Heifers calving at 23-25 months have the highest lifetime
production

Next Steps of the Project
January to March implement the KTT methods (management clubs and web-based modules)
Continue to collect data

Thank You