Embed Size (px)
Citation preview
© 2013 IBM CorporationOctober 4, 2013
IT Analytics and Big Data Making Your Life Easier
Paul Smith (Smitty) Service Management Architect
© 2013 IBM Corporation2
Agenda
Data Overload Search, Predict, Optimize How can IT Analytics help?
© 2013 IBM Corporation3
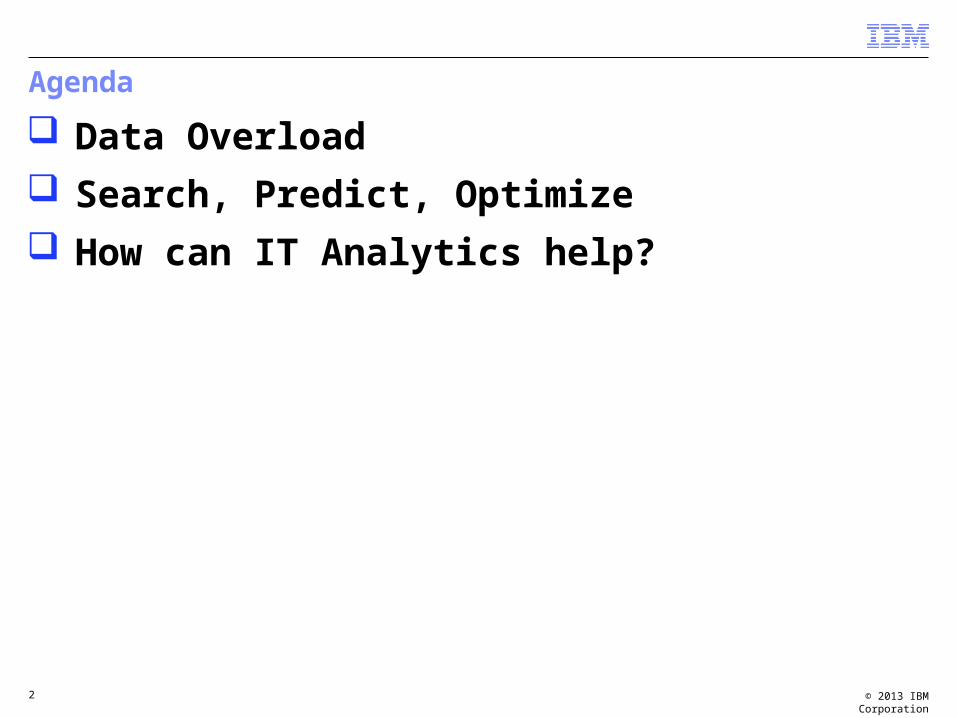
Software problem led to two days of downtime at the largest bank in Europe has tarnished their image as the most reliable banking website.
3
The Bottom Line: In Today’s World, the App can never go DOWN!!!
Trading halted for half a day on the
biggest US exchange for financial
options following an outage caused by
software problems.
Not surprisingly, many angry customers poured out their wrath via social networking after the largest video streaming company had a software outage for more than 20 hours
Airline canceled more than 700
flights and another 765 flights
are delayed due to a software
outage – Blamed ticketing
partner while the real problem
was on their end
Every business has 5-10 critical business process and applications. Slowdown or outage have a direct impact on their profits, revenue, customers and brand equity
A leading freight company lost $120 million in revenue because IT was unaware that critical warning messages were associated with their key freight delivery application. They were unable to deliver packages for an entire day due to downtime.
© 2013 IBM Corporation4
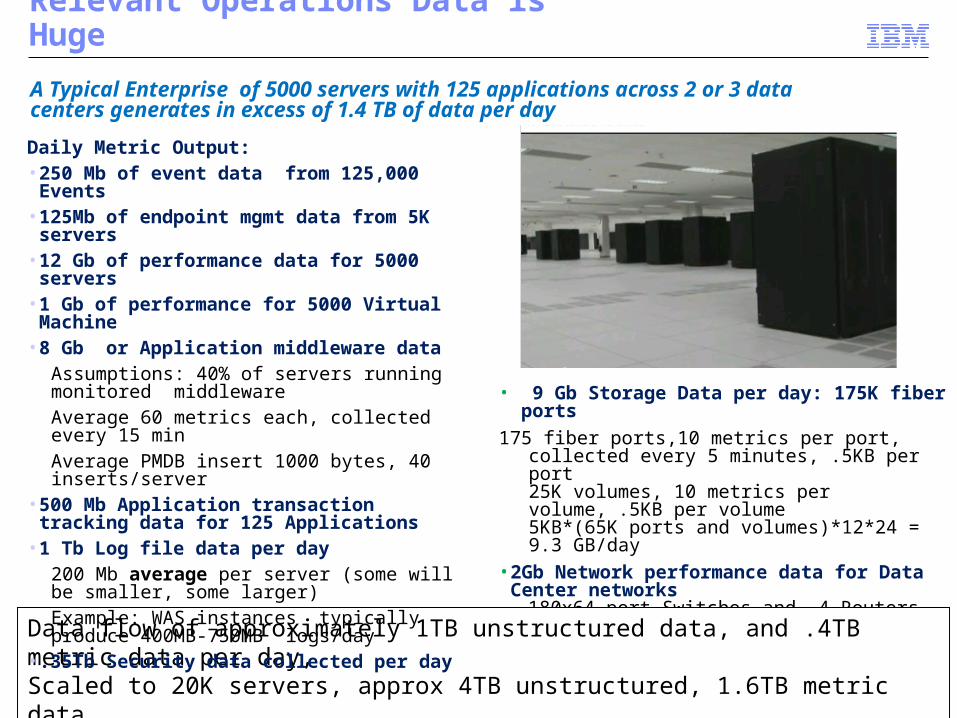
Relevant Operations Data is Huge
A Typical Enterprise of 5000 servers with 125 applications across 2 or 3 data centers generates in excess of 1.4 TB of data per day
• 9 Gb Storage Data per day: 175K fiber ports
175 fiber ports,10 metrics per port, collected every 5 minutes, .5KB per port25K volumes, 10 metrics per volume, .5KB per volume5KB*(65K ports and volumes)*12*24 = 9.3 GB/day
• 2Gb Network performance data for Data Center networks
180x64 port Switches and 4 Routers to manage physical network.
Data flow of approximately 1TB unstructured data, and .4TB metric data per day,Scaled to 20K servers, approx 4TB unstructured, 1.6TB metric data
Daily Metric Output:• 250 Mb of event data from 125,000 Events • 125Mb of endpoint mgmt data from 5K servers• 12 Gb of performance data for 5000 servers• 1 Gb of performance for 5000 Virtual Machine • 8 Gb or Application middleware data
Assumptions: 40% of servers running monitored middlewareAverage 60 metrics each, collected every 15 minAverage PMDB insert 1000 bytes, 40 inserts/server
• 500 Mb Application transaction tracking data for 125 Applications
• 1 Tb Log file data per day 200 Mb average per server (some will be smaller, some larger)Example: WAS instances typically produce 400MB-750MB logs/day
• .35Tb Security data collected per day
© 2013 IBM Corporation5
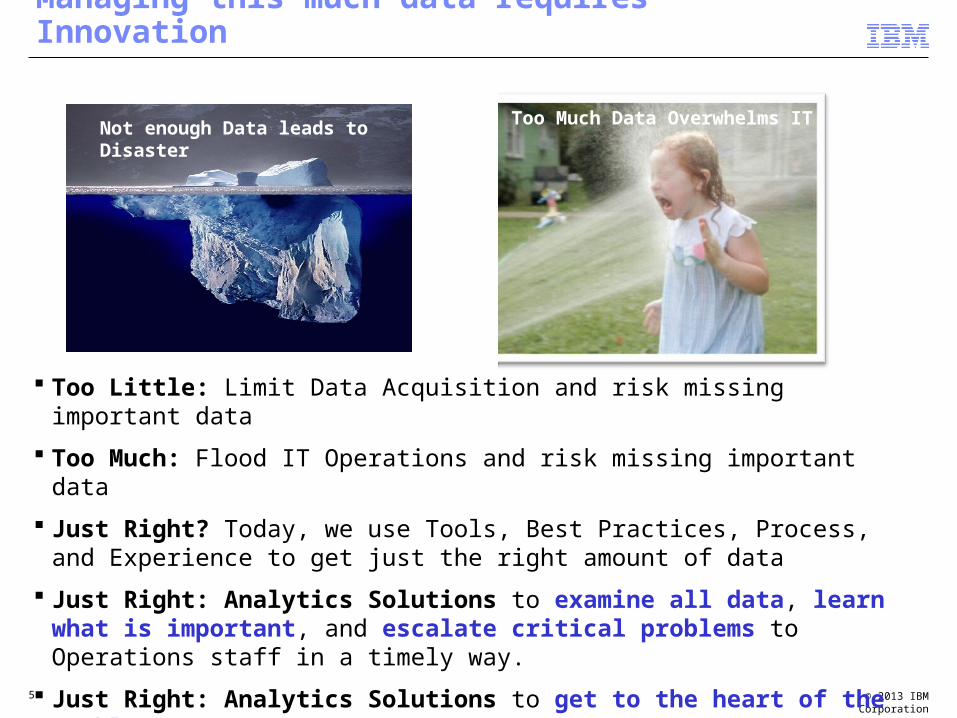
Too Much Data Overwhelms IT
Managing this much data requires Innovation
Too Little: Limit Data Acquisition and risk missing important data
Too Much: Flood IT Operations and risk missing important data
Just Right? Today, we use Tools, Best Practices, Process, and Experience to get just the right amount of data
Just Right: Analytics Solutions to examine all data, learn what is important, and escalate critical problems to Operations staff in a timely way.
Just Right: Analytics Solutions to get to the heart of the problem.
Just Right: Analytics Solutions to provide actionable insights.
Not enough Data leads to Disaster
© 2013 IBM Corporation6
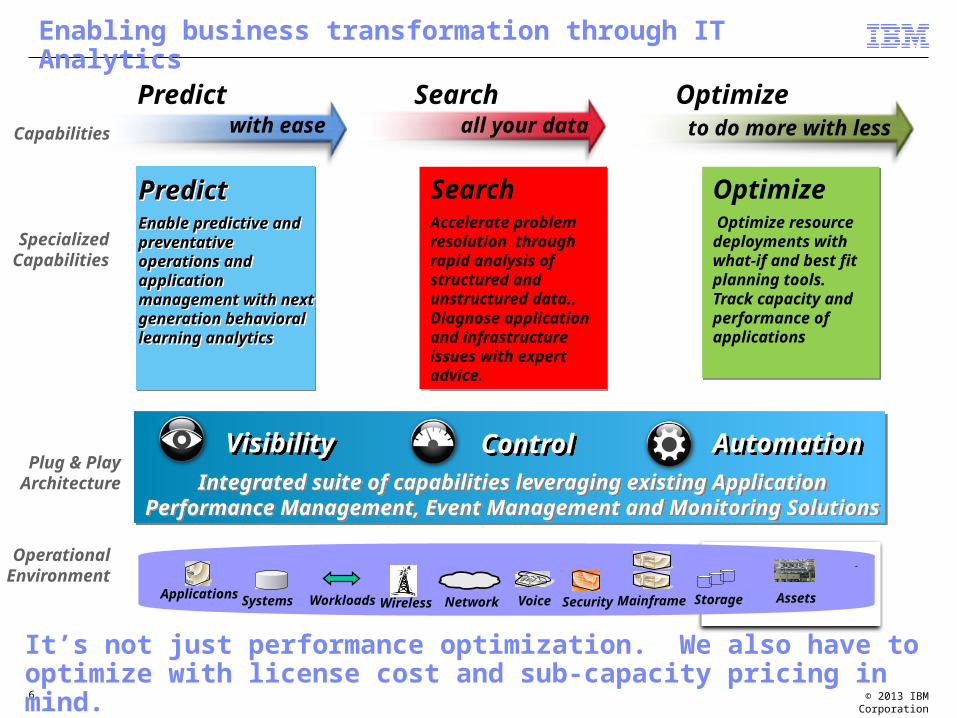
PredictEnable predictive and preventative operations and application management with next generation behavioral learning analytics
PredictEnable predictive and preventative operations and application management with next generation behavioral learning analytics
Specialized Capabilities
VisibilityVisibility
ControlControl
AutomationAutomationPlug & Play
Architecture Integrated suite of capabilities leveraging existing Application Performance Management, Event Management and Monitoring Solutions
Integrated suite of capabilities leveraging existing Application Performance Management, Event Management and Monitoring Solutions
SearchAccelerate problem resolution through rapid analysis of structured and unstructured data.. Diagnose application and infrastructure issues with expert advice.
SearchAccelerate problem resolution through rapid analysis of structured and unstructured data.. Diagnose application and infrastructure issues with expert advice.
Optimize Optimize resource deployments with what-if and best fit planning tools. Track capacity and performance of applications
Optimize Optimize resource deployments with what-if and best fit planning tools. Track capacity and performance of applications
Enabling business transformation through IT Analytics
Capabilities all your datawith easeSearchPredict
to do more with less
Optimize
Operational Environment
NetworkSystems SecurityApplications Voice Mainframe StorageWirelessWorkloads Assets
It’s not just performance optimization. We also have to optimize with license cost and sub-capacity pricing in mind.
© 2013 IBM Corporation7
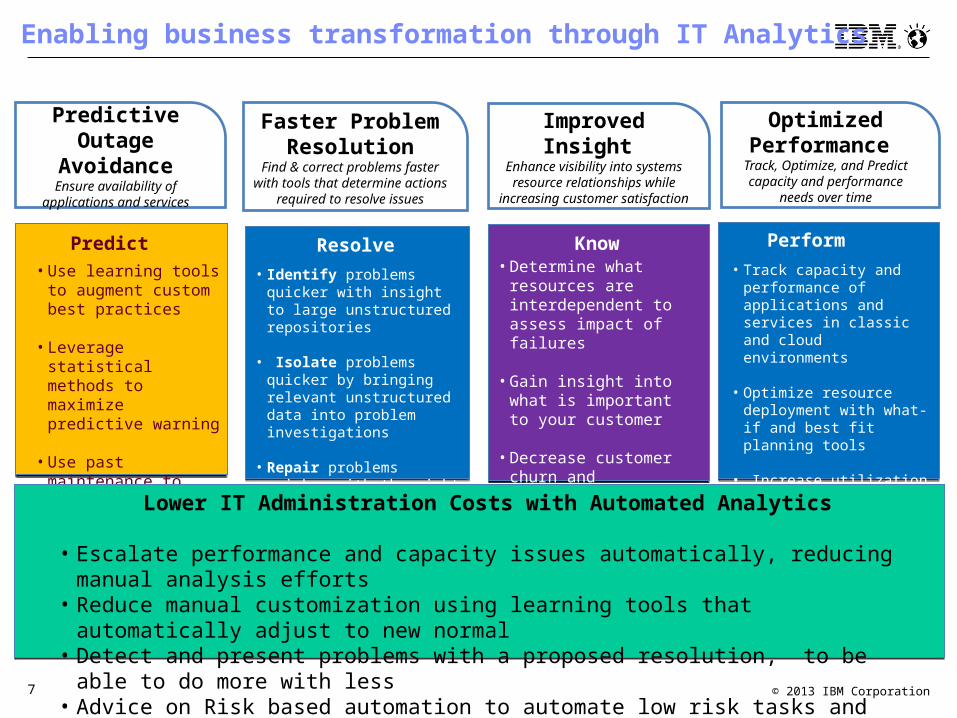
Enabling business transformation through IT Analytics
Predictive Outage Avoidance
Ensure availability of applications and services
• Use learning tools to augment custom best practices
• Leverage statistical
methods to maximize predictive warning
• Use past maintenance to predict part failures
Predict
Faster Problem Resolution
Find & correct problems faster with tools that determine actions
required to resolve issues
• Identify problems quicker with insight to large unstructured repositories
• Isolate problems quicker by bringing relevant unstructured data into problem investigations
• Repair problems quicker with the right details quickly to hand.
Resolve
Optimized Performance
Track, Optimize, and Predict capacity and performance needs
over time
• Track capacity and performance of applications and services in classic and cloud environments
• Optimize resource deployment with what-if and best fit planning tools
• Increase utilization of existing assets
Perform
Improved Insight Enhance visibility into systems resource relationships while
increasing customer satisfaction
• Determine what resources are interdependent to assess impact of failures
• Gain insight into what is important to your customer
• Decrease customer churn and acquisition costs while increasing customer retention and satisfaction
Know
Lower IT Administration Costs with Automated Analytics
• Escalate performance and capacity issues automatically, reducing manual analysis efforts• Reduce manual customization using learning tools that automatically adjust to new normal• Detect and present problems with a proposed resolution, to be able to do more with less• Advice on Risk based automation to automate low risk tasks and escalate high risk fixes.
© 2013 IBM Corporation8
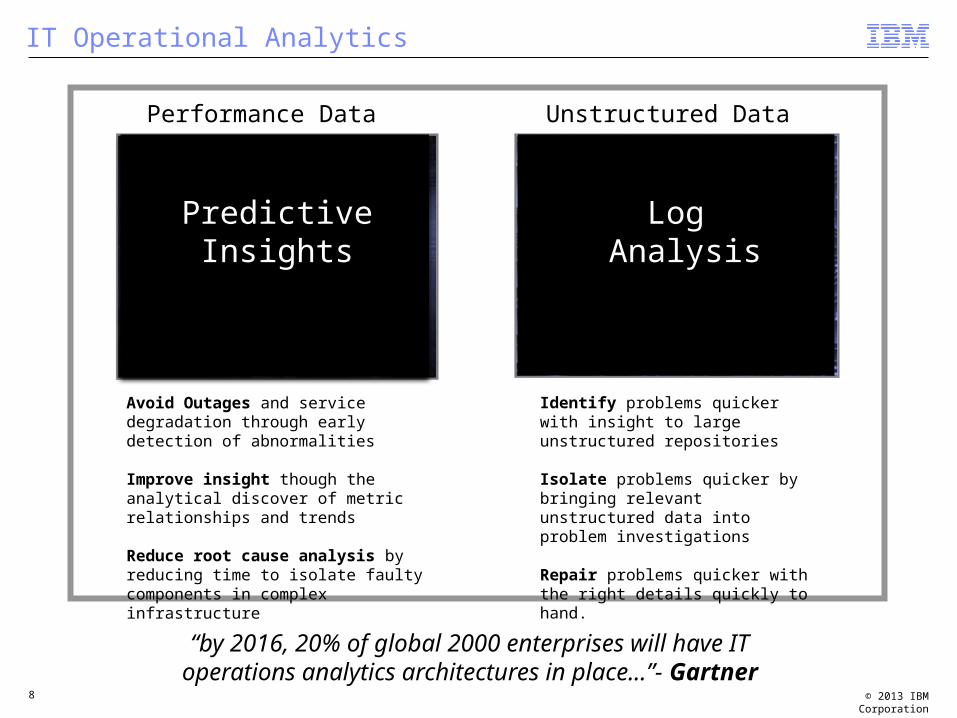
IT Operational Analytics
PredictiveInsights
Log Analysis
Performance Data Unstructured Data
Identify problems quicker with insight to large unstructured repositories
Isolate problems quicker by bringing relevant unstructured data into problem investigations
Repair problems quicker with the right details quickly to hand.
Avoid Outages and service degradation through early detection of abnormalities
Improve insight though the analytical discover of metric relationships and trends
Reduce root cause analysis by reducing time to isolate faulty components in complex infrastructure
“by 2016, 20% of global 2000 enterprises will have IT operations analytics architectures in place...”- Gartner
© 2013 IBM Corporation9
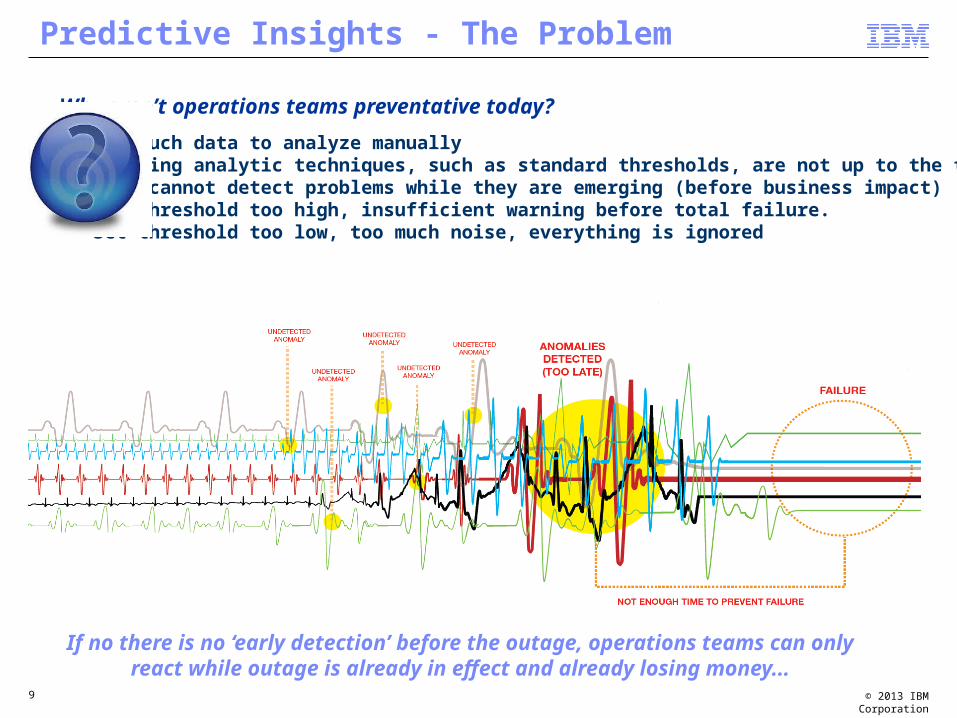
Predictive Insights - The Problem
If no there is no ‘early detection’ before the outage, operations teams can only react while outage is already in effect and already losing money...
Why aren’t operations teams preventative today?
- Too much data to analyze manually- Existing analytic techniques, such as standard thresholds, are not up to the task- They cannot detect problems while they are emerging (before business impact)- Set threshold too high, insufficient warning before total failure.- Set threshold too low, too much noise, everything is ignored
© 2013 IBM Corporation10
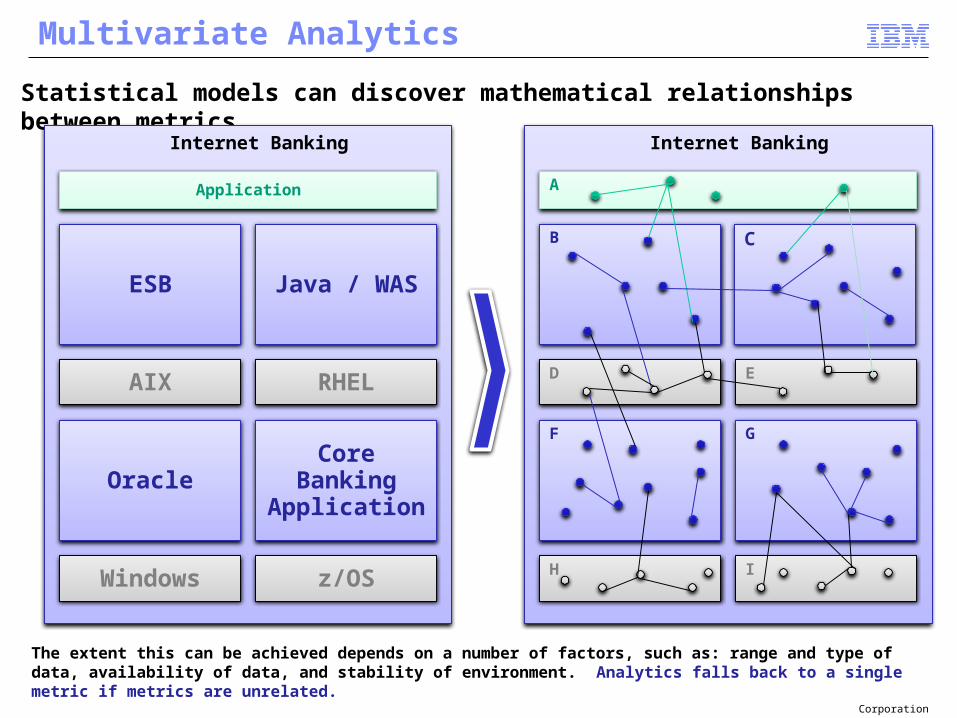
Multivariate Analytics
Statistical models can discover mathematical relationships between metrics
The extent this can be achieved depends on a number of factors, such as: range and type of data, availability of data, and stability of environment. Analytics falls back to a single metric if metrics are unrelated.
Core BankingApplication
z/OS
ESB
AIX
Java / WAS
RHEL
Oracle
Windows
Application
Internet Banking
G
I
B
D
C
E
F
H
A
Internet Banking
© 2013 IBM Corporation11
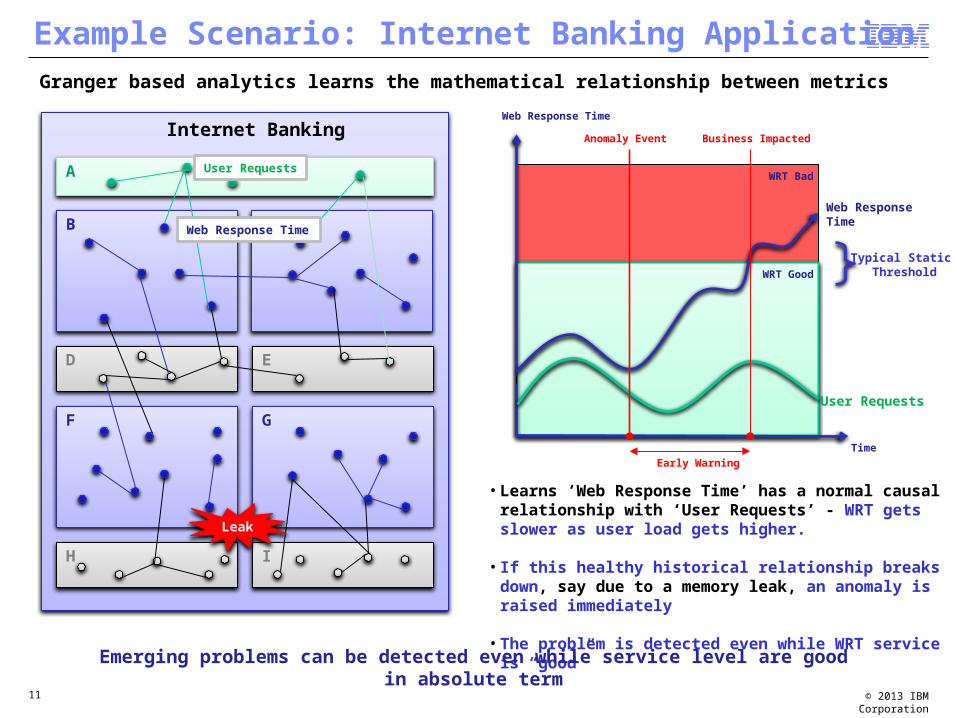
Example Scenario: Internet Banking ApplicationGranger based analytics learns the mathematical relationship between metrics
Web Response Time
WRT Bad
WRT Good
User Requests
Time
Web Response Time
Anomaly Event Business Impacted
Early Warning
• Learns ‘Web Response Time’ has a normal causal relationship with ‘User Requests’ - WRT gets slower as user load gets higher.
• If this healthy historical relationship breaks down, say due to a memory leak, an anomaly is raised immediately
• The problem is detected even while WRT service is “good”
Emerging problems can be detected even while service level are good in absolute term
G
I
B
D
C
E
F
H
A
Internet Banking
Web Response Time
User Requests
Leak
Typical Static Threshold
© 2013 IBM Corporation12
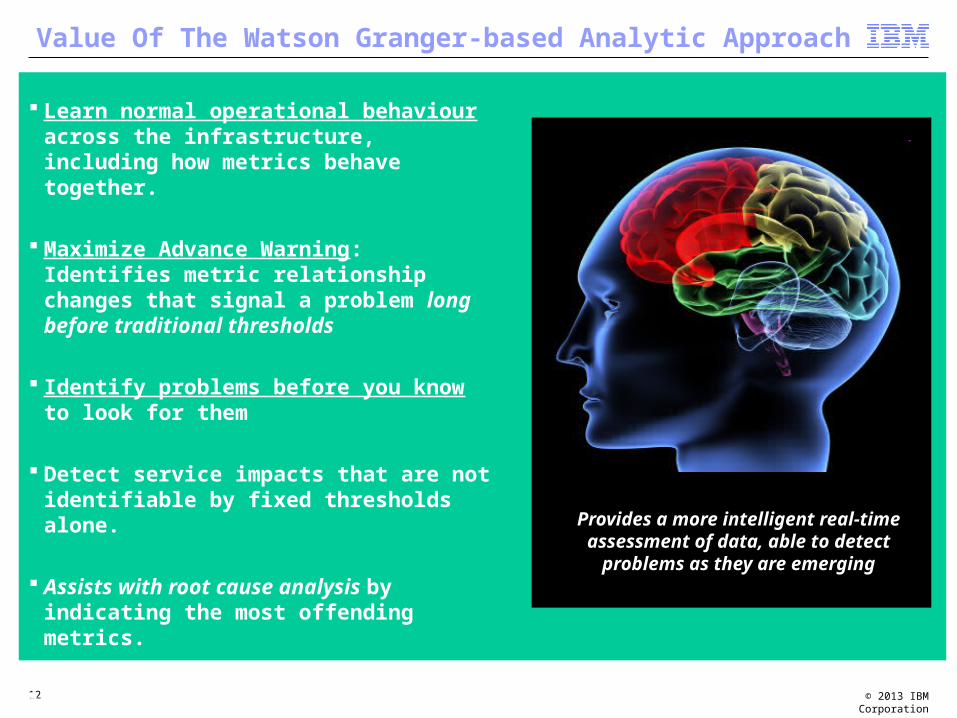
Value Of The Watson Granger-based Analytic Approach
Learn normal operational behaviour across the infrastructure, including how metrics behave together.
Maximize Advance Warning: Identifies metric relationship changes that signal a problem long before traditional thresholds
Identify problems before you know to look for them
Detect service impacts that are not identifiable by fixed thresholds alone.
Assists with root cause analysis by indicating the most offending metrics.
Reduces expensive and time consuming false alerts.
Provides a more intelligent real-time assessment of data, able to detect
problems as they are emerging
© 2013 IBM Corporation13
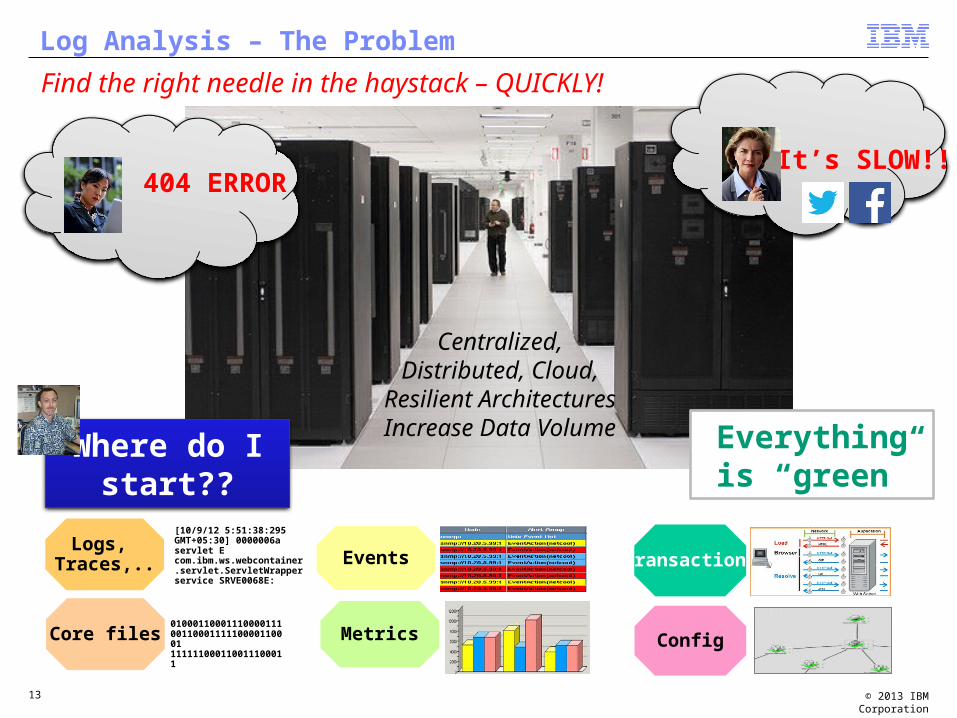
Centralized, Distributed, Cloud,
Resilient Architectures
Increase Data Volume
Log Analysis – The Problem
Where do I start??
Everything is “green”
It’s SLOW!! 404 ERROR
Logs, Traces,.. Events
Metrics
Transactions
Config
[10/9/12 5:51:38:295 GMT+05:30] 0000006a servlet E com.ibm.ws.webcontainer.servlet.ServletWrapper service SRVE0068E:
Core files010001100011100001110011000111110000110001111111000110011100011
Find the right needle in the haystack – QUICKLY!
© 2013 IBM Corporation
1414
Advanced search and text analytics across large volumes of data
Index, search and analyze application, middleware, and infrastructure data
Quickly search and visualize application errors across thousands of log records
Cross index search across logs and documentation
Integrate log search with existing service management tooling to gain multiple perspectives on a specific instance of a problem
Log Analysis – Key Capabilities
Accelerate problem isolation, identification and repair
Log Analysis
14
© 2013 IBM Corporation
Analytics in IT - Capacity Management
Definition from ITIL V3– ITIL Capacity Management aims to ensure that the capacity of IT
services and the IT infrastructure is able to deliver the agreed service level targets in a cost effective and timely manner.
– Capacity Management considers all resources required to deliver the IT service, and plans for short, medium and long term business requirements.
Sub Processes– Component Capacity Management – Service Capacity Management – Business Capacity Management – Capacity Management Reporting
15
© 2013 IBM Corporation
Helps consolidate and reduce costs– Reduces HW and labor costs– Reduces number of physical servers required to run workloads– Reduce number of required licenses
Helps ensure application availability– Are any resources overloaded? When will physical resources reach their limits?– Have there been any significant changes in my environment between two weeks?– Ensure supply can meet demand– Ensure business policies are met
Helps optimize resource utilization– Right size virtual machines– Identify trends for workload balancing
Why Capacity Management is important
16
© 2013 IBM Corporation
Use Analytics to Forecast
You already have the data! Use analytics to:
• Forecast resource bottlenecks• Estimate impact of planned business change• Estimate impact of planned outage (ie maintenance)• Discover risky components• Discover hidden limits and potential unstable components• Give input to performance test decisions• Experiment with placement of workloads (cost, license,
performance, etc)
17

© 2013 IBM Corporation
Thank You!
18