Embed Size (px)
Citation preview

© 2013 John Wiley & Sons, Ltd, Accounting for Managers, 1Ce, Ch 13 1

CHAPTER 13
Performance Evaluation of
Business Units
© 2013 John Wiley & Sons, Ltd, Accounting for Managers, 1Ce, Ch 13 2

Learning Objectives How has the change to multidivisional organizations
impacted the way performance is evaluated within organizations?
How can return on investment, residual income, and economic value added be used to assess the performance of company divisions?
Should corporate-level costs be included in the evaluation of a business unit’s performance?
Why is it important to use more than just financial measures of performance?
How can transfer pricing be used to help motivate managers of divisionalized organizations to work cost-effectively and competitively?
© 2013 John Wiley & Sons, Ltd, Accounting for Managers, 1Ce, Ch 13 3

Structure of Business Organizations
Three types of Organizations
1. Private sector Businesses whose prime goal is profit.
2. Public sector Government funded and provides services for
the public
3. Not-for-profit sector Provides a range of charitable or social
services
© 2013 John Wiley & Sons, Ltd, Accounting for Managers, 1Ce, Ch 13 4

Structure of Business Organizations
© 2013 John Wiley & Sons, Ltd, Accounting for Managers, 1Ce, Ch 13 5
Functional Organization Chart
Divisional Organization Chart

Responsibility Centres Cost centre
No income generation responsibility Managed by ability to operate within cost budget
Profit centre Responsible for ‘bottom line’ profits Evaluated on their performance compared to budget in
achieving or exceeding their profit target Investment centre
Have profit responsibility Evaluated based on a measure of the return on
investment made by the investment centre
© 2013 John Wiley & Sons, Ltd, Accounting for Managers, 1Ce, Ch 13 6

© 2013 John Wiley & Sons, Ltd, Accounting for Managers, 1Ce, Ch 13 7
The Decentralized Organization andDivisional Performance Measurement Decentralization
Devolution of authority to make decisions
Divisionalization Include both financial and non-financial performance
measures Divisional performance can be assessed through
budgets and performance against budgets Can also be assessed in terms of their ability to
manage and earn income relative to their strategic investments

Methods of Divisional Performance Measurement
Return on investment (ROI) Residual income, Economic value added
© 2013 John Wiley & Sons, Ltd, Accounting for Managers, 1Ce, Ch 13 8

© 2013 John Wiley & Sons, Ltd, Accounting for Managers, 1Ce, Ch 13 9
Return on Investment (ROI) Rate of return achieved on the capital
employedROI
DDiivviissiioonn AA DDiivviissiioonn BB
TToottaall AAsssseettss $$11,,000000,,000000 $$22,,000000,,000000
OOppeerraattiinngg pprrooffiitt $$220000,,000000 $$330000,,000000
RReettuurrnn oonn iinnvveessttmmeenntt 2200%% 1155%%
Operating profit
Total assets =

Example2 Divisions Division A Division B
Investment $4,000,000 $20,000,000Profit $1,000,000 $2,000,000
Absolute profit is higher
$1,000,000 is available for investment 2 competing projects Cost of capital 15%
Anticipated profit Division A Division B Profit $200,000 $130,000
© 2013 John Wiley & Sons, Ltd, Accounting for Managers, 1Ce, Ch 13 10

Example - ROIDivision A Division B
Original Investment $4,000,000 $20,000,000Profit $1,000,000 $2,000,000ROI 25% 10%
Additional investment $1,000,000 $ 1,000,000Profit $200,000 $130,000ROI on additional investment 20% 13%
Total investment $5,000,000 $21,000,000Profit $1.200,000 $2,130,000ROI 24% 10.1%
© 2013 John Wiley & Sons, Ltd, Accounting for Managers, 1Ce, Ch 13 11

Example - ROI
Division A may not want its project to be approved as its overall ROI will fall from 25% to 24%
Division B may want its project to be approved as its overall ROI will increase from 10% to 10.1%
Corporate view is to prefer Division A investment as it earns a higher ROI
© 2013 John Wiley & Sons, Ltd, Accounting for Managers, 1Ce, Ch 13 12

© 2013 John Wiley & Sons, Ltd, Accounting for Managers, 1Ce, Ch 13 13
Residual Income (RI) Profit remaining after deducting a portion of the capital
invested that represents the cost of capital from the investment in the division
Residual income = Operating profit before tax - Capital charge
DDiivviissiioonn AA DDiivviissiioonn BB
CCaappiittaall iinnvveesstteedd $$11,,000000,,000000 $$22,,000000,,000000
OOppeerraattiinngg pprrooffiitt $$220000,,000000 $$330000,,000000
LLeessss ccoosstt ooff ccaappiittaall aatt 1177..55%% $$117755,,000000 $$335500,,000000
RReessiidduuaall iinnccoommee $$2255,,000000 --$$5500,,000000

Example – Residual IncomeDivision A Division B
Original Investment $4,000,000 $20,000,000
Profit $1,000,000 $2,000,000
Cost of capital 15% $600,000 $3,000,000
Residual income $400,000 -$1,000,000
Additional investment $1,000,000 $ 1,000,000
Profit $200,000 $130,000
Cost of capital 15% $150,000 $150,000
Residual income $50,000 -$20,000
© 2013 John Wiley & Sons, Ltd, Accounting for Managers, 1Ce, Ch 13 14

Example – Residual Income
Under the residual income method, Division A’s project would be approved as it contributes to shareholder value, whereas Division B’s project erodes shareholder value Compare the cost of capital of 15% to Division
B’s ROI (13% on new investment)
© 2013 John Wiley & Sons, Ltd, Accounting for Managers, 1Ce, Ch 13 15

Comparison of Techniques Residual income is considered a stronger
measure than ROI because managers do not feel constrained to meet a percentage target
Managers will make investments that have a return in excess of a firm’s cost of capital, whereas if they used only ROI as a basis for evaluation, they might reject an investment if it lowers the division’s overall ROI
© 2013 John Wiley & Sons, Ltd, Accounting for Managers, 1Ce, Ch 13 16

Economic Value Added
It deducts a percentage of the invested capital from income to determine the true earnings of a division It is calculated using after-tax earnings It deducts the current liabilities from total
assets when determining the total invested capital for the division
© 2013 John Wiley & Sons, Ltd, Accounting for Managers, 1Ce, Ch 13 17

Economic Value Added
© 2013 John Wiley & Sons, Ltd, Accounting for Managers, 1Ce, Ch 13 18
Whered is the cost of debt for the firme is the cost of equity for the firmMVd is the market value of the firm’s debtMVe is the market value of the firm’s equity

Example Long-term debt market value = $12 million Equity market value = $15 million Cost of debit = 10% Cost of equity = 15%. Total assets = $10,500,000 After-tax profit = $1,525,000 Current liabilities end of period = $500,000
© 2013 John Wiley & Sons, Ltd, Accounting for Managers, 1Ce, Ch 13 19
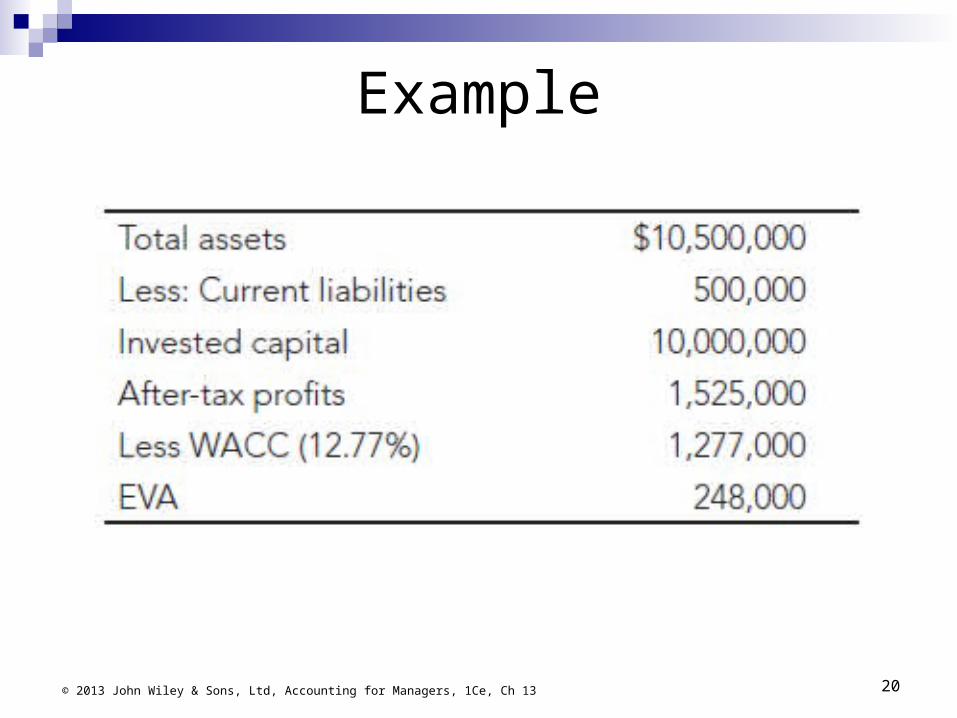
Example
© 2013 John Wiley & Sons, Ltd, Accounting for Managers, 1Ce, Ch 13 20

Controllability One of the limitations of operating profit as a measure of
divisional performance is the inclusion of costs over which the divisional manager has no control
Allocating corporate charges to a division may be necessary for financial reporting but is not always desirable for performance evaluation purposes
Performance evaluation of managers can be carried out based only on the controllable profit. The controllable profit is the profit after deducting expenses that
can be controlled by the divisional manager, but it ignores those expenses that are outside the divisional manager’s control
© 2013 John Wiley & Sons, Ltd, Accounting for Managers, 1Ce, Ch 13 21
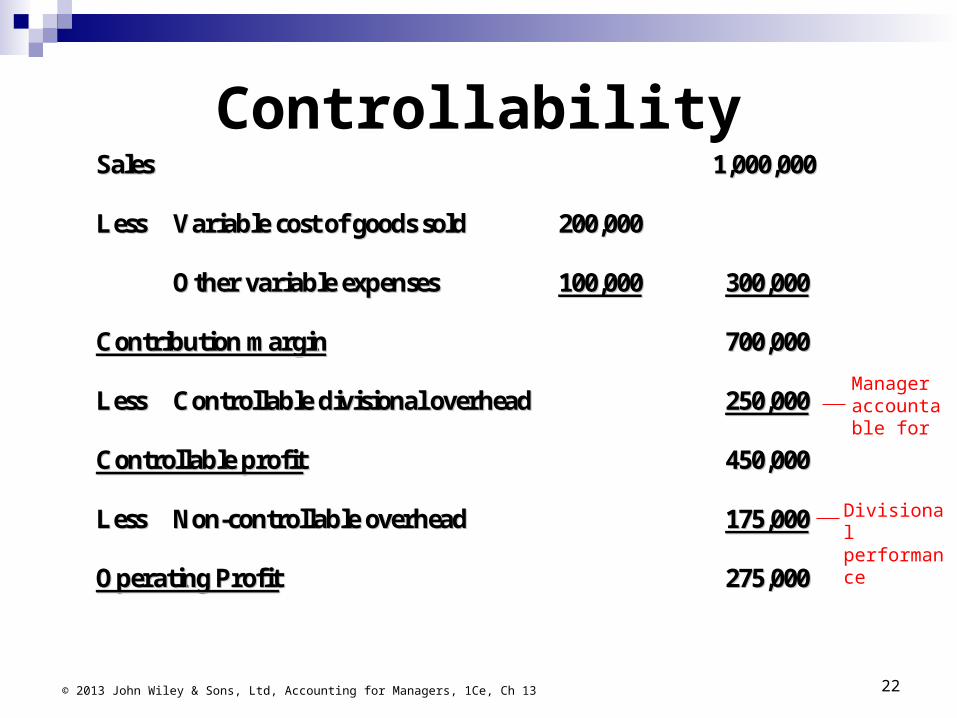
ControllabilitySSaalleess 11,,000000,,000000
LLeessss VVaarriiaabbllee ccoosstt ooff ggooooddss ssoolldd 220000,,000000
OOtthheerr vvaarriiaabbllee eexxppeennsseess 110000,,000000 330000,,000000
CCoonnttrriibbuuttiioonn mmaarrggiinn 770000,,000000
LLeessss CCoonnttrroollllaabbllee ddiivviissiioonnaall oovveerrhheeaadd 225500,,000000
CCoonnttrroollllaabbllee pprrooffiitt 445500,,000000
LLeessss NNoonn--ccoonnttrroollllaabbllee oovveerrhheeaadd 117755,,000000
OOppeerraattiinngg PPrrooffiitt 227755,,000000
Manager accountable for
Divisional performance
© 2013 John Wiley & Sons, Ltd, Accounting for Managers, 1Ce, Ch 13 22

Non-Financial Performance Evaluation
© 2013 John Wiley & Sons, Ltd, Accounting for Managers, 1Ce, Ch 13 23
Balanced Scorecard

Transfer Pricing
Intention of transfer pricing is to create an environment where managers are encouraged act competitively by controlling costs and managing capacity efficiently
By using transfer prices between divisions, managers of the supplying division are encouraged to make a profit and, thus, to work efficiently and cost-effectively
© 2013 John Wiley & Sons, Ltd, Accounting for Managers, 1Ce, Ch 13 24

Transfer Pricing Transfer prices between divisions can be
established using several methods Market transfer price Marginal cost-based transfer price . Full-cost transfer price. Cost-plus transfer price Negotiated transfer price
© 2013 John Wiley & Sons, Ltd, Accounting for Managers, 1Ce, Ch 13 25

Transfer Pricing ExampleDivision A produces 10,000 units at a cost of $100,000, with additional production costs at $5 per unit
Division A sells its output to Division B at $13.
Division B carries out further processing which costs $300,000 with additional costs of $13 per unit for units over 10,000.
Selling Price depends on quantity:
10,000 units $50/unit
12,000 units $46/unit
15,000 units $39/unit
© 2013 John Wiley & Sons, Ltd, Accounting for Managers, 1Ce, Ch 13 26
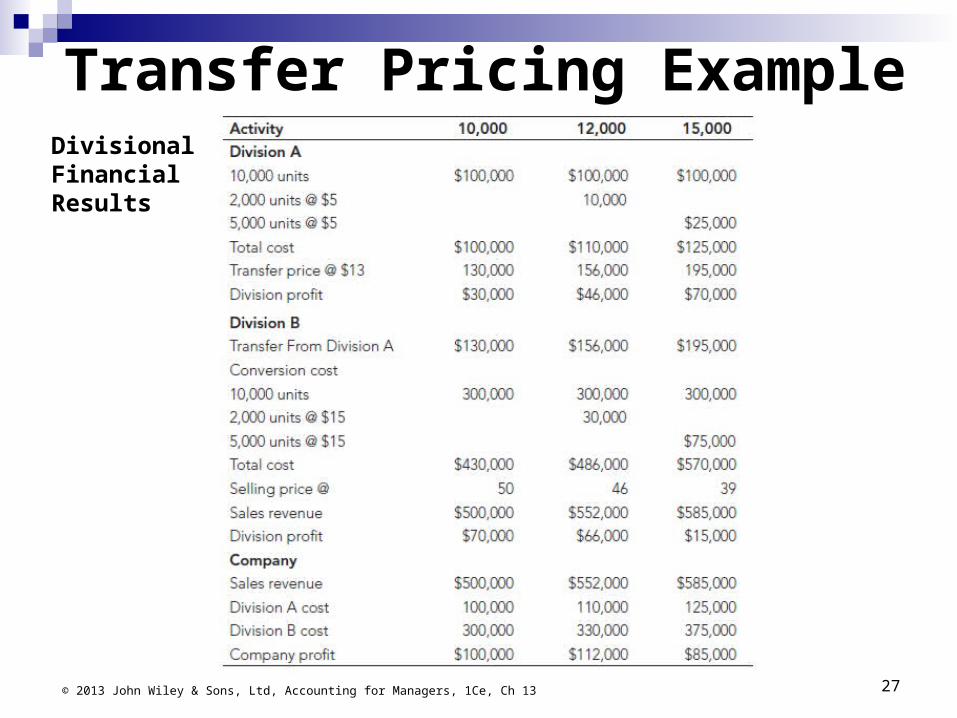
Transfer Pricing Example
© 2013 John Wiley & Sons, Ltd, Accounting for Managers, 1Ce, Ch 13 27
Divisional Financial Results
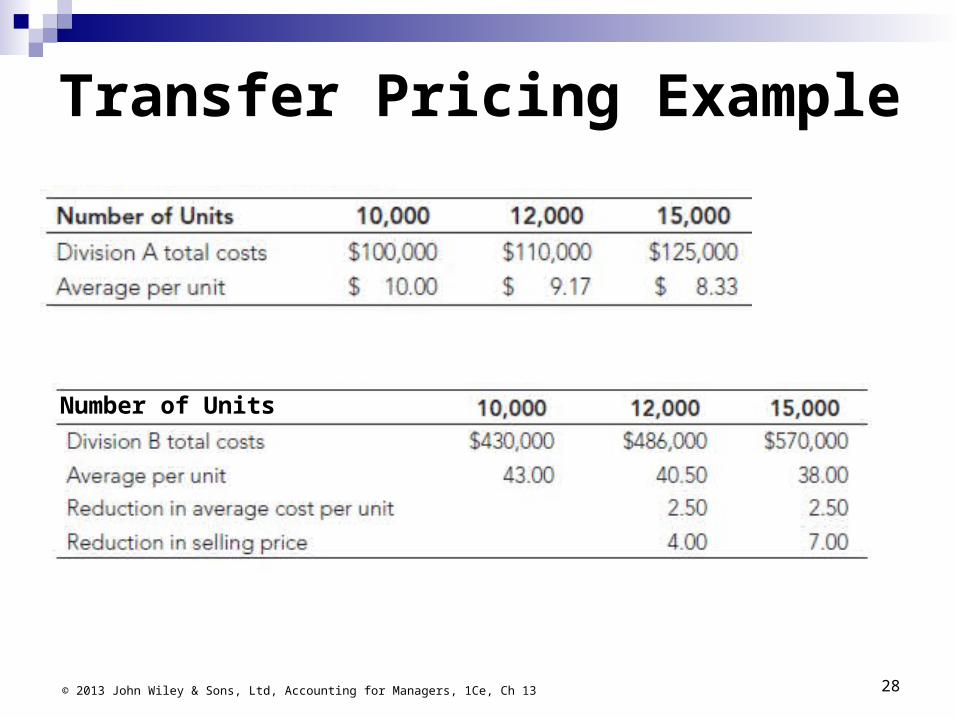
Transfer Pricing Example
© 2013 John Wiley & Sons, Ltd, Accounting for Managers, 1Ce, Ch 13 28
Number of Units

Conclusions Responsibility centres
Cost, profit & investment centres Divisional performance measurement
Return on Investment, Residual Income, Economic Value Added
Controllability Non-Financial Performance Evaluation Transfer pricing
© 2013 John Wiley & Sons, Ltd, Accounting for Managers, 1Ce, Ch 13 29