Embed Size (px)
Citation preview
Equity research│October 25, 2016
Asia Pacific Daily - 25 October 2016
Equity Research Reports…
▌IDEA OF THE DAY | Taiwan Technology Components (NEUTRAL) - What has gone wrong with the TFT LCD industry? | P2 Despite expectations of higher 2H16 earnings, AUO and INX are trading at trough valuations. Taiwan’s panel makers are marginalised in the global display arena. Domestic investors are avoiding a short-term trade on panel stocks, while regional investors appear to be embracing the OLED supply chain, in our view. The supply shortage is due to capacity cuts/seasonality, while end-demand has not increased too much. Panel makers’ profitability may stay negative in the mid-term. We keep AUO’s TP at NT$13.7 (implying 0.97x EV/CE), while we lower INX’s TP from NT$12.9 to NT$$12.0, (implying 0.66x EV/CE). Maintain Neutral sector rating. ——————————————————————————————————————————————————————————————————————————————————————— ▌Australia National Australia Bank (HOLD, tp:A$26.70) - CP release may assist result | P3 Industria REIT (HOLD, tp:A$2.15▼) - Industrial boost | P4 Orica (HOLD, tp:A$16.00▲) - FY16 result preview | P5 Redbubble (ADD, tp:A$1.62) - Forecast reaffirmed | P6 Santos (HOLD, tp:A$4.55▲) - PNG LNG supports result | P7 ——————————————————————————————————————————————————————————————————————————————————————— ▌China/Hong Kong Longfor Properties (ADD, tp:HK$16.40) - Management: confident of achieving double-digit… | P8 ——————————————————————————————————————————————————————————————————————————————————————— ▌India Mindtree Ltd (REDUCE, tp:Rs420.00▼) - Deteriorating earnings visibility | P9 ——————————————————————————————————————————————————————————————————————————————————————— ▌Indonesia Bank Tabungan Negara (ADD, tp:Rp2,400.00) - 3Q16 results: another strong quarter | P10 ——————————————————————————————————————————————————————————————————————————————————————— ▌Malaysia British American Tobacco (REDUCE, tp:RM50.00) - Contraband cigarettes a thorn for BAT | P11 Bursa Malaysia (HOLD, tp:RM9.00▲) - Lower 9M16 earnings due to weaker equity income | P12 Telekom Malaysia (HOLD, tp:RM6.70) - Manoeuvring Budget 2017 | P13 ——————————————————————————————————————————————————————————————————————————————————————— ▌Singapore Raffles Medical Group (REDUCE, tp:S$1.41) - Results first take: slowing topline growth… | P14 Raffles Medical Group (REDUCE, tp:S$1.46▲) - 3Q16’s post briefing notes | P15 ——————————————————————————————————————————————————————————————————————————————————————— ▌Thailand Delta Electronics (Thailand) (REDUCE, tp:THB61.50) - 3Q16 earnings was in line | P16 Krung Thai Bank (HOLD, tp:THB18.00) - Higher non-interest income drives 3Q16 upside | P17 Krungthai Card (HOLD, tp:THB139.00▲) - Good earnings with healthy asset quality | P18 ——————————————————————————————————————————————————————————————————————————————————————— ▌Vietnam Ha Tien 1 Cement JSC (ADD, tp:VND31,869.00▼) - Comments about HT1’s recent share… | P19 PetroVietnam Gas (REDUCE, tp:VND45,600.00) - Weak 9M16 results reinforce our Reduce… | P20
Showcasing CIMB Research Ideas
MAL: Economic Update 23/10 Budget 2017: A tight balancing act >PDF
———————————————————————————————————————————————————————————————————————————————————
MAL: Strategy Note 21/10 2017 Budget – more winners than losers but... >PDF
———————————————————————————————————————————————————————————————————————————————————
HKG: Q Technology (Group) Company Ltd 20/10 Dual engines to drive growth >PDF
———————————————————————————————————————————————————————————————————————————————————
IND: United Tractors 19/10 A stronger turnaround in 2017 >PDF
———————————————————————————————————————————————————————————————————————————————————
MAL: MRCB-Quill REIT 18/10 Expanding footprint in the ‘Sentral’ heart of KL >PDF
Regional Equity Research Contacts
Michael GREENALL, CFP Regional Head of Research T: (60) 3 2261 9088 E: [email protected]
———————————————————————————————————————————————————————————————————————————————————
Show Style "View Doc Map"
CIMB Conference / Events |
CIMB 9th Annual Malaysia Corporate Day 05 January 2017 – Malaysia – Kuala Lumpur
IMPORTANT DISCLOSURES, INCLUDING ANY REQUIRED RESEARCH CERTIFICATIONS, ARE PROVIDED AT THE END OF THIS REPORT. IF THIS REPORT IS DISTRIBUTED IN THE UNITED STATES IT IS DISTRIBUTED BY CIMB SECURITIES (USA), INC. AND IS CONSIDERED THIRD-PARTY AFFILIATED RESEARCH.
Powered by the EFA Platform
Technology│Taiwan│Equity research│October 24, 2016
Sector Note
IMPORTANT DISCLOSURES, INCLUDING ANY REQUIRED RESEARCH CERTIFICATIONS, ARE PROVIDED AT THE END OF THIS REPORT. IF THIS REPORT IS DISTRIBUTED IN THE UNITED STATES IT IS DISTRIBUTED BY CIMB SECURITIES (USA), INC. AND IS CONSIDERED THIRD-PARTY AFFILIATED RESEARCH.
Powered by the EFA Platform
Technology Components What has gone wrong with the TFT LCD industry?
Despite expectations of higher 2H16 earnings, AUO and INX are trading at trough ■valuations. Taiwan’s panel makers are marginalised in the global display arena.
Domestic investors are avoiding a short-term trade on panel stocks, while regional ■investors appear to be embracing the OLED supply chain, in our view.
The supply shortage is due to capacity cuts/seasonality, while end-demand has not ■increased too much. Panel makers’ profitability may stay negative in the mid-term.
We keep AUO’s TP at NT$13.7 (implying 0.97x EV/CE), while we lower INX’s TP ■from NT$12.9 to NT$$12.0, (implying 0.66x EV/CE). Maintain Neutral sector rating.
Share prices have diverged from panel price movements Despite market expectations of substantially increasing earnings in 2H16, AUO and INX are trading at a 6-year trough range. The divergence and de-rating are mainly caused by a lack of investor participation and change in investment appetite, in our view. We believe domestic investors appear to be avoiding short-term trades, while regional investors are shifting their focus from legacy TFT LCD technology to the OLED supply chain.
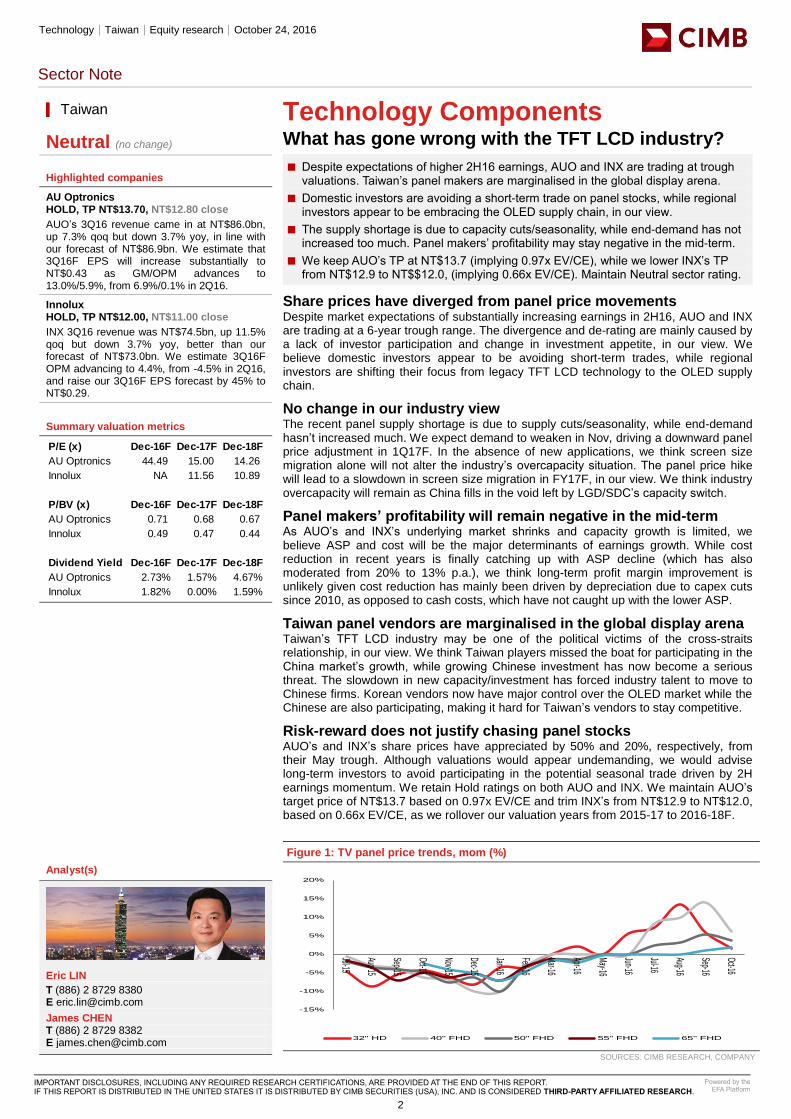
No change in our industry view The recent panel supply shortage is due to supply cuts/seasonality, while end-demand hasn’t increased much. We expect demand to weaken in Nov, driving a downward panel price adjustment in 1Q17F. In the absence of new applications, we think screen size migration alone will not alter the industry’s overcapacity situation. The panel price hike will lead to a slowdown in screen size migration in FY17F, in our view. We think industry overcapacity will remain as China fills in the void left by LGD/SDC’s capacity switch.
Panel makers’ profitability will remain negative in the mid-term As AUO’s and INX’s underlying market shrinks and capacity growth is limited, we believe ASP and cost will be the major determinants of earnings growth. While cost reduction in recent years is finally catching up with ASP decline (which has also moderated from 20% to 13% p.a.), we think long-term profit margin improvement is unlikely given cost reduction has mainly been driven by depreciation due to capex cuts since 2010, as opposed to cash costs, which have not caught up with the lower ASP.
Taiwan panel vendors are marginalised in the global display arena Taiwan’s TFT LCD industry may be one of the political victims of the cross-straits relationship, in our view. We think Taiwan players missed the boat for participating in the China market’s growth, while growing Chinese investment has now become a serious threat. The slowdown in new capacity/investment has forced industry talent to move to Chinese firms. Korean vendors now have major control over the OLED market while the Chinese are also participating, making it hard for Taiwan’s vendors to stay competitive.
Risk-reward does not justify chasing panel stocks AUO’s and INX’s share prices have appreciated by 50% and 20%, respectively, from their May trough. Although valuations would appear undemanding, we would advise long-term investors to avoid participating in the potential seasonal trade driven by 2H earnings momentum. We retain Hold ratings on both AUO and INX. We maintain AUO’s target price of NT$13.7 based on 0.97x EV/CE and trim INX’s from NT$12.9 to NT$12.0, based on 0.66x EV/CE, as we rollover our valuation years from 2015-17 to 2016-18F.
[ X ]
Figure 1: TV panel price trends, mom (%)
SOURCES: CIMB RESEARCH, COMPANY
▎Taiwan
Neutral (no change)
Highlighted companies
AU Optronics HOLD, TP NT$13.70, NT$12.80 close
AUO’s 3Q16 revenue came in at NT$86.0bn, up 7.3% qoq but down 3.7% yoy, in line with our forecast of NT$86.9bn. We estimate that 3Q16F EPS will increase substantially to NT$0.43 as GM/OPM advances to 13.0%/5.9%, from 6.9%/0.1% in 2Q16.
Innolux HOLD, TP NT$12.00, NT$11.00 close
INX 3Q16 revenue was NT$74.5bn, up 11.5% qoq but down 3.7% yoy, better than our forecast of NT$73.0bn. We estimate 3Q16F OPM advancing to 4.4%, from -4.5% in 2Q16, and raise our 3Q16F EPS forecast by 45% to NT$0.29.
Summary valuation metrics
Analyst(s)
Eric LIN
T (886) 2 8729 8380 E [email protected]
James CHEN T (886) 2 8729 8382 E [email protected]
-15%
-10%
-5%
0%
5%
10%
15%
20%
Jul-15
Aug-15
Sep-15
Oct-15
Nov-15
Dec-15
Jan-16
Feb-16
Mar-16
Apr-16
May-16
Jun-16
Jul-16
Aug-16
Sep-16
Oct-16
32" HD 40" FHD 50" FHD 55" FHD 65" FHD
P/E (x) Dec-16F Dec-17F Dec-18F
AU Optronics 44.49 15.00 14.26
Innolux NA 11.56 10.89
P/BV (x) Dec-16F Dec-17F Dec-18F
AU Optronics 0.71 0.68 0.67
Innolux 0.49 0.47 0.44
Dividend Yield Dec-16F Dec-17F Dec-18F
AU Optronics 2.73% 1.57% 4.67%
Innolux 1.82% 0.00% 1.59%
2
Banks│Australia│Equity research│October 24, 2016
IMPORTANT DISCLOSURES REGARDING COMPANIES THAT ARE THE SUBJECT OF THIS REPORT AND AN EXPLANATION OF RECOMMENDATIONS CAN BE FOUND AT THE END OF THIS DOCUMENT. MORGANS FINANCIAL LIMITED (ABN 49 010 669 726) AFSL 235410 - A PARTICIPANT OF ASX GROUP
Powered by EFA
National Australia Bank
CP release may assist result
NAB is scheduled to report its FY16 result on 27 October. We are forecasting ■FY16 cash earnings of $6,368m on our revised cash earnings basis which excludes earnings from the life insurance operations.
We are forecasting a final dividend of 99 cps fully franked. ■
We will be particularly looking to see if the 2H16 result benefits from a collective ■provision (CP) release despite asset quality deterioration.
Revised FY16 cash earnings basis NAB’s FY16 result will be presented with the life insurance operations being classified as ‘discontinued operations’. We have consequently revised our FY16 cash earnings basis to match NAB’s revised basis by removing life insurance earnings. We are now forecasting FY16 cash earnings of $6,368m. On the dividend front, our base case remains that the final dividend will be unchanged at 99 cps fully franked and we continue to expect the dividend to be cut next year. However, there is the risk that the dividend may be cut this year.
Revenue We are forecasting 1% revenue growth from 1H16 to 2H16, and 3% growth from FY15 to FY16. Subdued revenue growth largely stems from our forecast of net interest margin contraction coupled with no growth in non-interest income.
Expenses We expect costs to have been controlled tightly in 2H16 in light of subdued revenue growth. We forecast costs to be broadly flat from 1H16 to 2H16 and to increase by 3% from FY15 to FY16. We suspect that project investment spend in particular has continued to be tightly managed in 2H16. NAB’s total project investment spend (opex and capex) was $476m in 1H16, down ~20% from 2H15 and down ~1% from 1H15. This is in contrast to CBA’s experience, which has successively increased investment spend over each of the last six half-years. The decrease in NAB’s investment spend may hurt its pre-provision profit growth going forward.
Asset quality We are forecasting a credit impairment charge of $488m in 2H16, compared with $375m in 1H16. NAB reported a 3Q16 credit impairment charge of $228m, meaning that we are forecasting a 4Q16 charge of $260m. It appears to us that the 3Q16 charge benefitted from a CP release despite asset quality deterioration. We will be looking to see whether the 2H16 result benefits from a CP release.
Investment view and changes to forecasts We have reduced our cash EPS forecast by 1.1% in FY17 due to a slight reduction to our income forecast. We have made no material changes to our cash EPS forecast in FY18. We maintain our HOLD recommendation. Our price target, based on our dividend discount model, is $26.70. Key downside risks to our price target include: increased funding costs; and greater-than-expected asset quality deterioration.
SOURCE: MORGANS, COMPANY REPORTS
▎Australia
HOLD (no change) Current price: A$27.74
Target price: A$26.70
Previous target: A$26.70
Up/downside: -3.7%
Reuters: NAB.AX
Bloomberg: NAB AU
Market cap: US$56,060m
A$73,705m
Average daily turnover: US$125.9m
A$165.7m
Current shares o/s 2,626m
Free float: 95.0%
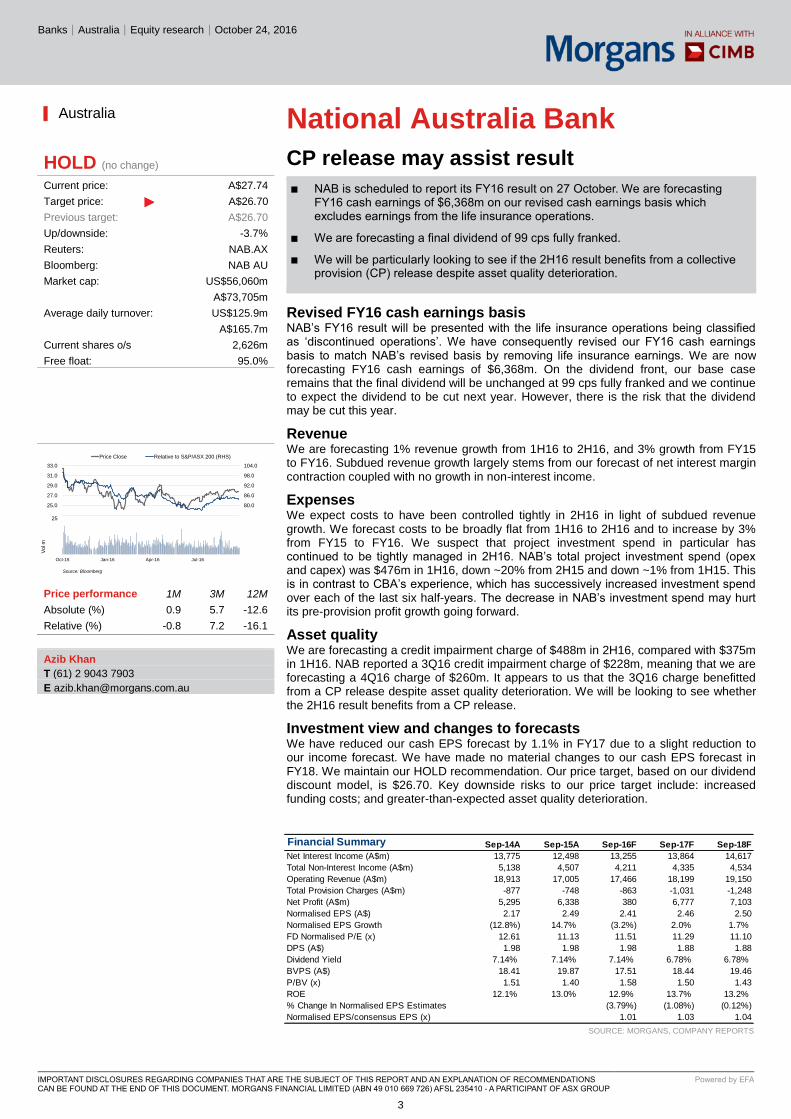
Price performance 1M 3M 12M
Absolute (%) 0.9 5.7 -12.6
Relative (%) -0.8 7.2 -16.1
Azib Khan
T (61) 2 9043 7903
Financial Summary Sep-14A Sep-15A Sep-16F Sep-17F Sep-18F
Net Interest Income (A$m) 13,775 12,498 13,255 13,864 14,617
Total Non-Interest Income (A$m) 5,138 4,507 4,211 4,335 4,534
Operating Revenue (A$m) 18,913 17,005 17,466 18,199 19,150
Total Provision Charges (A$m) -877 -748 -863 -1,031 -1,248
Net Profit (A$m) 5,295 6,338 380 6,777 7,103
Normalised EPS (A$) 2.17 2.49 2.41 2.46 2.50
Normalised EPS Growth (12.8%) 14.7% (3.2%) 2.0% 1.7%
FD Normalised P/E (x) 12.61 11.13 11.51 11.29 11.10
DPS (A$) 1.98 1.98 1.98 1.88 1.88
Dividend Yield 7.14% 7.14% 7.14% 6.78% 6.78%
BVPS (A$) 18.41 19.87 17.51 18.44 19.46
P/BV (x) 1.51 1.40 1.58 1.50 1.43
ROE 12.1% 13.0% 12.9% 13.7% 13.2%
% Change In Normalised EPS Estimates (3.79%) (1.08%) (0.12%)
Normalised EPS/consensus EPS (x) 1.01 1.03 1.04
74.0
80.0
86.0
92.0
98.0
104.0
23.0
25.0
27.0
29.0
31.0
33.0
Price Close Relative to S&P/ASX 200 (RHS)
Source: Bloomberg
5
10
15
20
25
Oct-15 Jan-16 Apr-16 Jul-16
Vol m
3
REIT│Australia│Equity research│October 24, 2016
IMPORTANT DISCLOSURES REGARDING COMPANIES THAT ARE THE SUBJECT OF THIS REPORT AND AN EXPLANATION OF RECOMMENDATIONS CAN BE FOUND AT THE END OF THIS DOCUMENT. MORGANS FINANCIAL LIMITED (ABN 49 010 669 726) AFSL 235410 - A PARTICIPANT OF ASX GROUP
Powered by EFA
Industria REIT
Industrial boost
In August, IDR announced the acquisition of WesTrac Newcastle for A$158.6m. ■The asset was acquired on an initial yield of 7.25% with rent growing at 3% on an 18-year triple net lease.
The acquisition was funded via a A$19.8m placement and A$65.2m non-■renounceable entitlement offer at A$2.12 as well as bank debt of A$85.4m. Gearing sits at 35%.
Post the transaction, there was a small upgrade to FY17 guidance with DPS of ■16c (up from 15.6c) and FFO of 17.9-18.1c (up from 17.5-17.7c).
We retain our Hold rating with our revised price target set at A$2.15. ■
Income underpinned by 18-year triple net lease IDR has acquired WesTrac Newcastle for A$158.6m with settlement completed on 27 September 2016. The asset was finished in 2012 and is the NSW/ACT headquarters for WesTrac (Australia), which is now IDR’s largest tenant (23% of income). It was acquired on an initial yield of 7.25% with rent growing at the greater of 3% or CPI. The 18-year triple net lease has two x five-year options. The acquisition was funded by a A$19.8m placement and A$65.2m 1:4 non-renounceable entitlement offer at A$2.12 as well as additional debt of A$85.4m. The placement and rights issue stock was not entitled to the September distribution. Gearing is now 35% with IDR’s total debt facility limit increased by A$50m.
Portfolio WALE lifts to around 8 years; shift to industrial Post the new acquisition and recent asset sales, IDR’s portfolio is currently valued at A$544.7m with a WACR of 7.5% and WALE of 7.9 years (up from 5 years at June). Exposure to industrial assets has increased to 48% (from 24%) and occupancy has increased to 97% (from 96%). IDR’s top 10 tenants account for 53% of rental income with most of the rental income underpinned by ≥3% rent increases. FY17 lease expiries were at 8.0% in August 2016 (representing around 8,000sqm) so we expect the pressure on vacancy will continue in the near term despite recent leasing successes. Positively, IDR’s exposure to the Brisbane Technology Park (BTP) has reduced from 41% at June 2016 to 26% post the WesTrac acquisition and recent asset sales.
Small uplift to FY17 DPS guidance Post the transaction, there has been a small upgrade to FY17 guidance with DPS of 16c (up from 15.6c) and FFO of 17.9-18.1c (up from 17.5-17.7c). Guidance was reiterated at its AGM on 19 October 2016. NTA sits at A$2.05 (down from A$2.12 in June 2016 largely due to the impact of stamp duty costs).
Investment view Incorporating the acquisition and capital raising, our DCF/NAV valuation has moved to A$2.15 (from A$2.18), which is also our revised price target. Near-term catalysts include corporate activity, asset sales and positive news flow on leasing deals. Key risks to our forecasts relate to lease vacancy/non-renewal. We retain our Hold rating.
SOURCE: MORGANS, COMPANY REPORTS
▎Australia
HOLD (no change) Current price: A$2.09
Target price: A$2.15
Previous target: A$2.18
Up/downside: 3.1%
Reuters: IDR.AX
Bloomberg: IDR AU
Market cap: US$259.3m
A$340.9m
Average daily turnover: US$0.28m
A$0.37m
Current shares o/s 163.1m
Free float: 100.0%
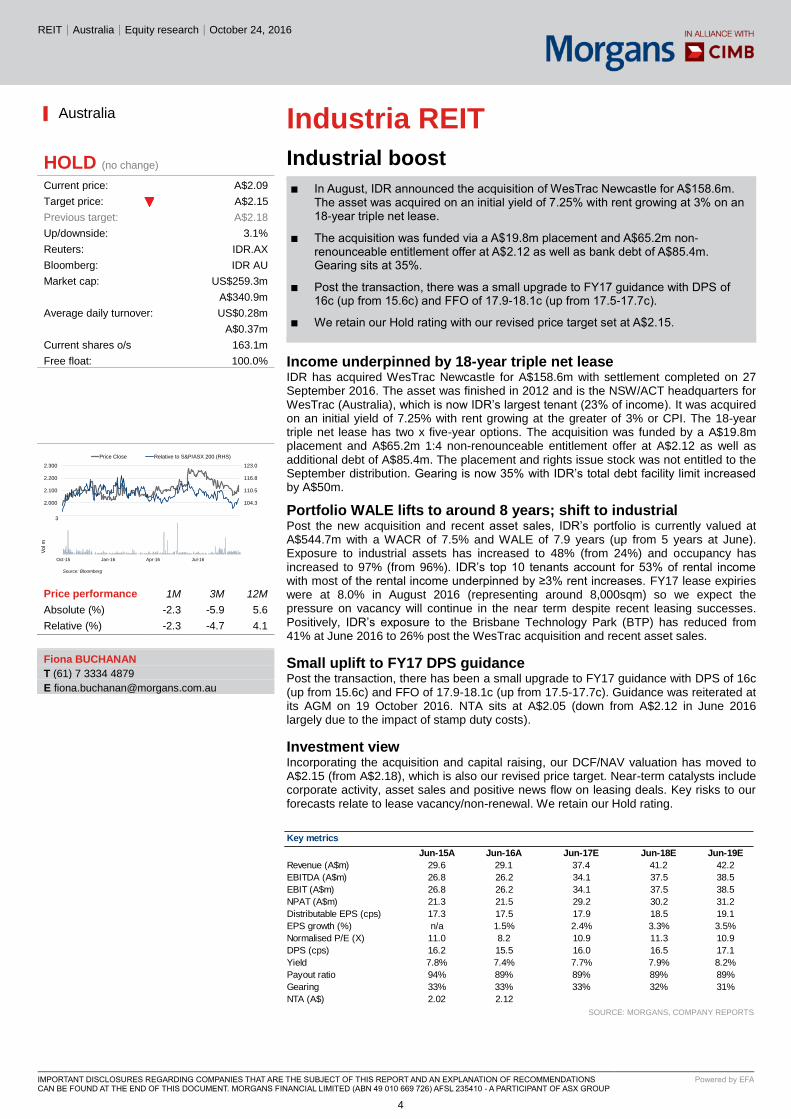
Price performance 1M 3M 12M
Absolute (%) -2.3 -5.9 5.6
Relative (%) -2.3 -4.7 4.1
Fiona BUCHANAN
T (61) 7 3334 4879
Key metrics
Jun-15A Jun-16A Jun-17E Jun-18E Jun-19E
Revenue (A$m) 29.6 29.1 37.4 41.2 42.2
EBITDA (A$m) 26.8 26.2 34.1 37.5 38.5
EBIT (A$m) 26.8 26.2 34.1 37.5 38.5
NPAT (A$m) 21.3 21.5 29.2 30.2 31.2
Distributable EPS (cps) 17.3 17.5 17.9 18.5 19.1
EPS growth (%) n/a 1.5% 2.4% 3.3% 3.5%
Normalised P/E (X) 11.0 8.2 10.9 11.3 10.9
DPS (cps) 16.2 15.5 16.0 16.5 17.1
Yield 7.8% 7.4% 7.7% 7.9% 8.2%
Payout ratio 94% 89% 89% 89% 89%
Gearing 33% 33% 33% 32% 31%
NTA (A$) 2.02 2.12
98.0
104.3
110.5
116.8
123.0
1.900
2.000
2.100
2.200
2.300
Price Close Relative to S&P/ASX 200 (RHS)
Source: Bloomberg
1
2
3
Oct-15 Jan-16 Apr-16 Jul-16
Vo
l m
4
Chemicals - Others│Australia│Equity research│October 24, 2016
IMPORTANT DISCLOSURES REGARDING COMPANIES THAT ARE THE SUBJECT OF THIS REPORT AND AN EXPLANATION OF RECOMMENDATIONS CAN BE FOUND AT THE END OF THIS DOCUMENT. MORGANS FINANCIAL LIMITED (ABN 49 010 669 726) AFSL 235410 - A PARTICIPANT OF ASX GROUP
Powered by EFA
Orica
FY16 result preview
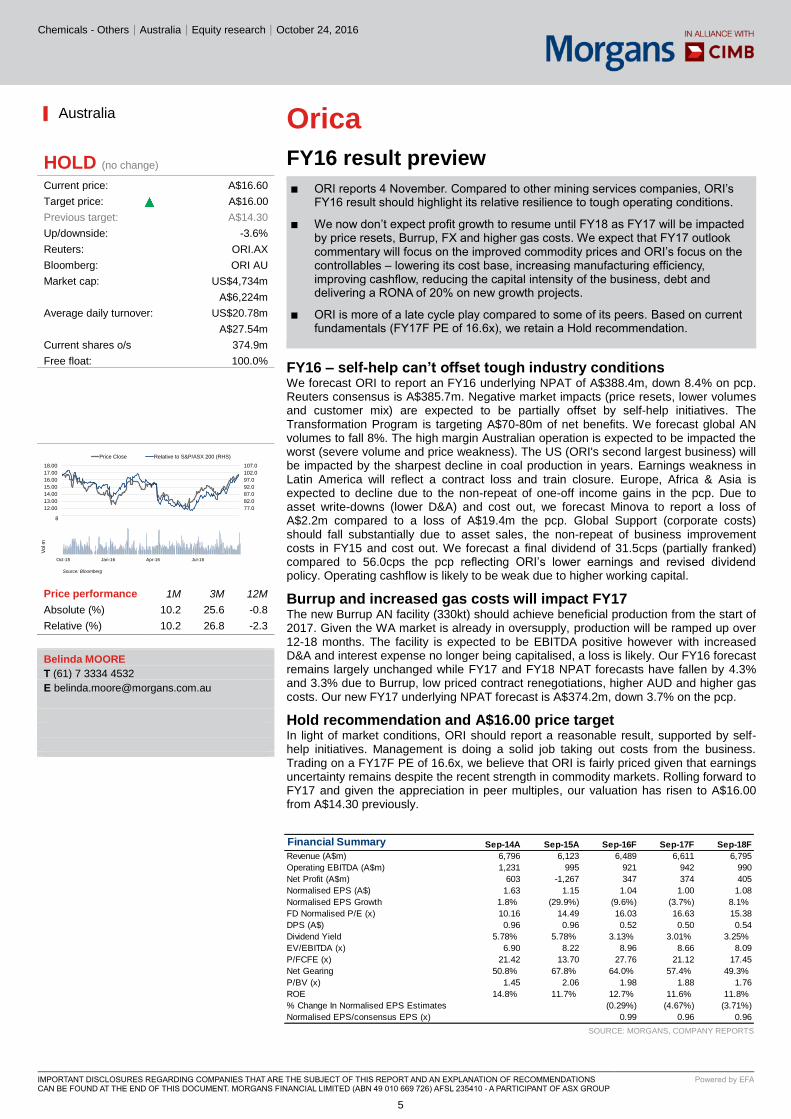
ORI reports 4 November. Compared to other mining services companies, ORI’s ■FY16 result should highlight its relative resilience to tough operating conditions.
We now don’t expect profit growth to resume until FY18 as FY17 will be impacted ■by price resets, Burrup, FX and higher gas costs. We expect that FY17 outlook commentary will focus on the improved commodity prices and ORI’s focus on the controllables – lowering its cost base, increasing manufacturing efficiency, improving cashflow, reducing the capital intensity of the business, debt and delivering a RONA of 20% on new growth projects.
ORI is more of a late cycle play compared to some of its peers. Based on current ■fundamentals (FY17F PE of 16.6x), we retain a Hold recommendation.
FY16 – self-help can’t offset tough industry conditions We forecast ORI to report an FY16 underlying NPAT of A$388.4m, down 8.4% on pcp. Reuters consensus is A$385.7m. Negative market impacts (price resets, lower volumes and customer mix) are expected to be partially offset by self-help initiatives. The Transformation Program is targeting A$70-80m of net benefits. We forecast global AN volumes to fall 8%. The high margin Australian operation is expected to be impacted the worst (severe volume and price weakness). The US (ORI's second largest business) will be impacted by the sharpest decline in coal production in years. Earnings weakness in Latin America will reflect a contract loss and train closure. Europe, Africa & Asia is expected to decline due to the non-repeat of one-off income gains in the pcp. Due to asset write-downs (lower D&A) and cost out, we forecast Minova to report a loss of A$2.2m compared to a loss of A$19.4m the pcp. Global Support (corporate costs) should fall substantially due to asset sales, the non-repeat of business improvement costs in FY15 and cost out. We forecast a final dividend of 31.5cps (partially franked) compared to 56.0cps the pcp reflecting ORI’s lower earnings and revised dividend policy. Operating cashflow is likely to be weak due to higher working capital.
Burrup and increased gas costs will impact FY17 The new Burrup AN facility (330kt) should achieve beneficial production from the start of 2017. Given the WA market is already in oversupply, production will be ramped up over 12-18 months. The facility is expected to be EBITDA positive however with increased D&A and interest expense no longer being capitalised, a loss is likely. Our FY16 forecast remains largely unchanged while FY17 and FY18 NPAT forecasts have fallen by 4.3% and 3.3% due to Burrup, low priced contract renegotiations, higher AUD and higher gas costs. Our new FY17 underlying NPAT forecast is A$374.2m, down 3.7% on the pcp.
Hold recommendation and A$16.00 price target In light of market conditions, ORI should report a reasonable result, supported by self-help initiatives. Management is doing a solid job taking out costs from the business. Trading on a FY17F PE of 16.6x, we believe that ORI is fairly priced given that earnings uncertainty remains despite the recent strength in commodity markets. Rolling forward to FY17 and given the appreciation in peer multiples, our valuation has risen to A$16.00 from A$14.30 previously.
SOURCE: MORGANS, COMPANY REPORTS
▎Australia
HOLD (no change) Current price: A$16.60
Target price: A$16.00
Previous target: A$14.30
Up/downside: -3.6%
Reuters: ORI.AX
Bloomberg: ORI AU
Market cap: US$4,734m
A$6,224m
Average daily turnover: US$20.78m
A$27.54m
Current shares o/s 374.9m
Free float: 100.0%
Price performance 1M 3M 12M
Absolute (%) 10.2 25.6 -0.8
Relative (%) 10.2 26.8 -2.3
Belinda MOORE
T (61) 7 3334 4532
Financial Summary Sep-14A Sep-15A Sep-16F Sep-17F Sep-18F
Revenue (A$m) 6,796 6,123 6,489 6,611 6,795
Operating EBITDA (A$m) 1,231 995 921 942 990
Net Profit (A$m) 603 -1,267 347 374 405
Normalised EPS (A$) 1.63 1.15 1.04 1.00 1.08
Normalised EPS Growth 1.8% (29.9%) (9.6%) (3.7%) 8.1%
FD Normalised P/E (x) 10.16 14.49 16.03 16.63 15.38
DPS (A$) 0.96 0.96 0.52 0.50 0.54
Dividend Yield 5.78% 5.78% 3.13% 3.01% 3.25%
EV/EBITDA (x) 6.90 8.22 8.96 8.66 8.09
P/FCFE (x) 21.42 13.70 27.76 21.12 17.45
Net Gearing 50.8% 67.8% 64.0% 57.4% 49.3%
P/BV (x) 1.45 2.06 1.98 1.88 1.76
ROE 14.8% 11.7% 12.7% 11.6% 11.8%
% Change In Normalised EPS Estimates (0.29%) (4.67%) (3.71%)
Normalised EPS/consensus EPS (x) 0.99 0.96 0.96
72.0
77.0
82.0
87.0
92.0
97.0
102.0
107.0
11.00
12.00
13.00
14.00
15.00
16.00
17.00
18.00
Price Close Relative to S&P/ASX 200 (RHS)
Source: Bloomberg
2
4
6
8
Oct-15 Jan-16 Apr-16 Jul-16
Vol m
5
Media - Integrated│Australia│Equity research│October 24, 2016
IMPORTANT DISCLOSURES REGARDING COMPANIES THAT ARE THE SUBJECT OF THIS REPORT AND AN EXPLANATION OF RECOMMENDATIONS CAN BE FOUND AT THE END OF THIS DOCUMENT. MORGANS FINANCIAL LIMITED (ABN 49 010 669 726) AFSL 235410 - A PARTICIPANT OF ASX GROUP
Powered by EFA
Redbubble
Forecast reaffirmed
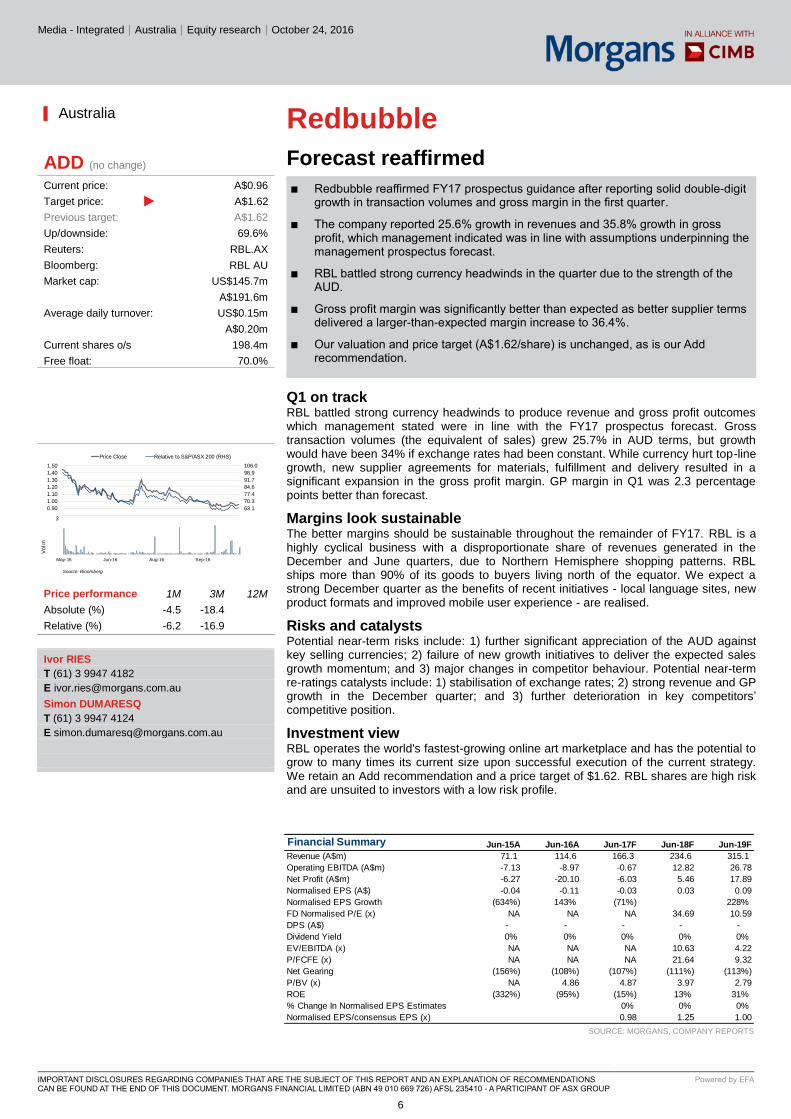
Redbubble reaffirmed FY17 prospectus guidance after reporting solid double-digit ■growth in transaction volumes and gross margin in the first quarter.
The company reported 25.6% growth in revenues and 35.8% growth in gross ■profit, which management indicated was in line with assumptions underpinning the management prospectus forecast.
RBL battled strong currency headwinds in the quarter due to the strength of the ■AUD.
Gross profit margin was significantly better than expected as better supplier terms ■delivered a larger-than-expected margin increase to 36.4%.
Our valuation and price target (A$1.62/share) is unchanged, as is our Add ■recommendation.
Q1 on track RBL battled strong currency headwinds to produce revenue and gross profit outcomes which management stated were in line with the FY17 prospectus forecast. Gross transaction volumes (the equivalent of sales) grew 25.7% in AUD terms, but growth would have been 34% if exchange rates had been constant. While currency hurt top-line growth, new supplier agreements for materials, fulfillment and delivery resulted in a significant expansion in the gross profit margin. GP margin in Q1 was 2.3 percentage points better than forecast.
Margins look sustainable The better margins should be sustainable throughout the remainder of FY17. RBL is a highly cyclical business with a disproportionate share of revenues generated in the December and June quarters, due to Northern Hemisphere shopping patterns. RBL ships more than 90% of its goods to buyers living north of the equator. We expect a strong December quarter as the benefits of recent initiatives - local language sites, new product formats and improved mobile user experience - are realised.
Risks and catalysts Potential near-term risks include: 1) further significant appreciation of the AUD against key selling currencies; 2) failure of new growth initiatives to deliver the expected sales growth momentum; and 3) major changes in competitor behaviour. Potential near-term re-ratings catalysts include: 1) stabilisation of exchange rates; 2) strong revenue and GP growth in the December quarter; and 3) further deterioration in key competitors’ competitive position.
Investment view RBL operates the world's fastest-growing online art marketplace and has the potential to grow to many times its current size upon successful execution of the current strategy. We retain an Add recommendation and a price target of $1.62. RBL shares are high risk and are unsuited to investors with a low risk profile.
SOURCE: MORGANS, COMPANY REPORTS
▎Australia
ADD (no change) Current price: A$0.96
Target price: A$1.62
Previous target: A$1.62
Up/downside: 69.6%
Reuters: RBL.AX
Bloomberg: RBL AU
Market cap: US$145.7m
A$191.6m
Average daily turnover: US$0.15m
A$0.20m
Current shares o/s 198.4m
Free float: 70.0%
Price performance 1M 3M 12M
Absolute (%) -4.5 -18.4
Relative (%) -6.2 -16.9
Ivor RIES
T (61) 3 9947 4182
Simon DUMARESQ
T (61) 3 9947 4124
Financial Summary Jun-15A Jun-16A Jun-17F Jun-18F Jun-19F
Revenue (A$m) 71.1 114.6 166.3 234.6 315.1
Operating EBITDA (A$m) -7.13 -8.97 -0.67 12.82 26.78
Net Profit (A$m) -6.27 -20.10 -6.03 5.46 17.89
Normalised EPS (A$) -0.04 -0.11 -0.03 0.03 0.09
Normalised EPS Growth (634%) 143% (71%) 228%
FD Normalised P/E (x) NA NA NA 34.69 10.59
DPS (A$) - - - - -
Dividend Yield 0% 0% 0% 0% 0%
EV/EBITDA (x) NA NA NA 10.63 4.22
P/FCFE (x) NA NA NA 21.64 9.32
Net Gearing (156%) (108%) (107%) (111%) (113%)
P/BV (x) NA 4.86 4.87 3.97 2.79
ROE (332%) (95%) (15%) 13% 31%
% Change In Normalised EPS Estimates 0% 0% 0%
Normalised EPS/consensus EPS (x) 0.98 1.25 1.00
56.0
63.1
70.3
77.4
84.6
91.7
98.9
106.0
0.80
0.90
1.00
1.10
1.20
1.30
1.40
1.50
Price Close Relative to S&P/ASX 200 (RHS)
Source: Bloomberg
1
2
3
May-16 Jun-16 Aug-16 Sep-16
Vo
l m
6
Oil & Gas Exp & Prodn│Australia│Equity research│October 23, 2016
IMPORTANT DISCLOSURES REGARDING COMPANIES THAT ARE THE SUBJECT OF THIS REPORT AND AN EXPLANATION OF RECOMMENDATIONS CAN BE FOUND AT THE END OF THIS DOCUMENT. MORGANS FINANCIAL LIMITED (ABN 49 010 669 726) AFSL 235410 - A PARTICIPANT OF ASX GROUP
Powered by EFA
Santos
PNG LNG supports result
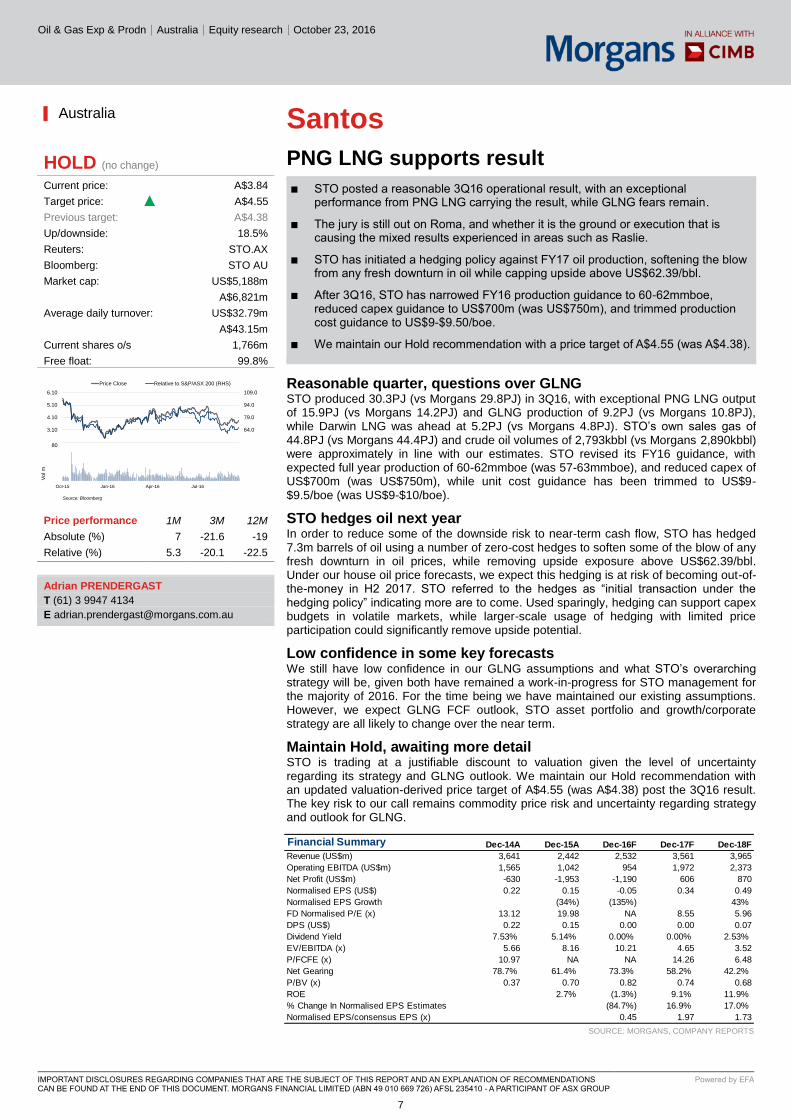
STO posted a reasonable 3Q16 operational result, with an exceptional ■performance from PNG LNG carrying the result, while GLNG fears remain.
The jury is still out on Roma, and whether it is the ground or execution that is ■causing the mixed results experienced in areas such as Raslie.
STO has initiated a hedging policy against FY17 oil production, softening the blow ■from any fresh downturn in oil while capping upside above US$62.39/bbl.
After 3Q16, STO has narrowed FY16 production guidance to 60-62mmboe, ■reduced capex guidance to US$700m (was US$750m), and trimmed production cost guidance to US$9-$9.50/boe.
We maintain our Hold recommendation with a price target of A$4.55 (was A$4.38). ■
Reasonable quarter, questions over GLNG STO produced 30.3PJ (vs Morgans 29.8PJ) in 3Q16, with exceptional PNG LNG output of 15.9PJ (vs Morgans 14.2PJ) and GLNG production of 9.2PJ (vs Morgans 10.8PJ), while Darwin LNG was ahead at 5.2PJ (vs Morgans 4.8PJ). STO’s own sales gas of 44.8PJ (vs Morgans 44.4PJ) and crude oil volumes of 2,793kbbl (vs Morgans 2,890kbbl) were approximately in line with our estimates. STO revised its FY16 guidance, with expected full year production of 60-62mmboe (was 57-63mmboe), and reduced capex of US$700m (was US$750m), while unit cost guidance has been trimmed to US$9-$9.5/boe (was US$9-$10/boe).
STO hedges oil next year In order to reduce some of the downside risk to near-term cash flow, STO has hedged 7.3m barrels of oil using a number of zero-cost hedges to soften some of the blow of any fresh downturn in oil prices, while removing upside exposure above US$62.39/bbl. Under our house oil price forecasts, we expect this hedging is at risk of becoming out-of-the-money in H2 2017. STO referred to the hedges as “initial transaction under the hedging policy” indicating more are to come. Used sparingly, hedging can support capex budgets in volatile markets, while larger-scale usage of hedging with limited price participation could significantly remove upside potential.
Low confidence in some key forecasts We still have low confidence in our GLNG assumptions and what STO’s overarching strategy will be, given both have remained a work-in-progress for STO management for the majority of 2016. For the time being we have maintained our existing assumptions. However, we expect GLNG FCF outlook, STO asset portfolio and growth/corporate strategy are all likely to change over the near term.
Maintain Hold, awaiting more detail STO is trading at a justifiable discount to valuation given the level of uncertainty regarding its strategy and GLNG outlook. We maintain our Hold recommendation with an updated valuation-derived price target of A$4.55 (was A$4.38) post the 3Q16 result. The key risk to our call remains commodity price risk and uncertainty regarding strategy and outlook for GLNG.
SOURCE: MORGANS, COMPANY REPORTS
▎Australia
HOLD (no change) Current price: A$3.84
Target price: A$4.55
Previous target: A$4.38
Up/downside: 18.5%
Reuters: STO.AX
Bloomberg: STO AU
Market cap: US$5,188m
A$6,821m
Average daily turnover: US$32.79m
A$43.15m
Current shares o/s 1,766m
Free float: 99.8%
Price performance 1M 3M 12M
Absolute (%) 7 -21.6 -19
Relative (%) 5.3 -20.1 -22.5
Adrian PRENDERGAST
T (61) 3 9947 4134
Financial Summary Dec-14A Dec-15A Dec-16F Dec-17F Dec-18F
Revenue (US$m) 3,641 2,442 2,532 3,561 3,965
Operating EBITDA (US$m) 1,565 1,042 954 1,972 2,373
Net Profit (US$m) -630 -1,953 -1,190 606 870
Normalised EPS (US$) 0.22 0.15 -0.05 0.34 0.49
Normalised EPS Growth (34%) (135%) 43%
FD Normalised P/E (x) 13.12 19.98 NA 8.55 5.96
DPS (US$) 0.22 0.15 0.00 0.00 0.07
Dividend Yield 7.53% 5.14% 0.00% 0.00% 2.53%
EV/EBITDA (x) 5.66 8.16 10.21 4.65 3.52
P/FCFE (x) 10.97 NA NA 14.26 6.48
Net Gearing 78.7% 61.4% 73.3% 58.2% 42.2%
P/BV (x) 0.37 0.70 0.82 0.74 0.68
ROE 2.7% (1.3%) 9.1% 11.9%
% Change In Normalised EPS Estimates (84.7%) 16.9% 17.0%
Normalised EPS/consensus EPS (x) 0.45 1.97 1.73
49.0
64.0
79.0
94.0
109.0
2.10
3.10
4.10
5.10
6.10
Price Close Relative to S&P/ASX 200 (RHS)
Source: Bloomberg
20
40
60
80
Oct-15 Jan-16 Apr-16 Jul-16
Vol m
7
Property Devt & Invt│Hong Kong│Equity research│October 24, 2016
Company Note
IMPORTANT DISCLOSURES, INCLUDING ANY REQUIRED RESEARCH CERTIFICATIONS, ARE PROVIDED AT THE END OF THIS REPORT. IF THIS REPORT IS DISTRIBUTED IN THE UNITED STATES IT IS DISTRIBUTED BY CIMB SECURITIES (USA), INC. AND IS CONSIDERED THIRD-PARTY AFFILIATED RESEARCH.
Powered by the
EFA Platform
Longfor Properties Management: confident of achieving double-digit earnings growth in FY16-18
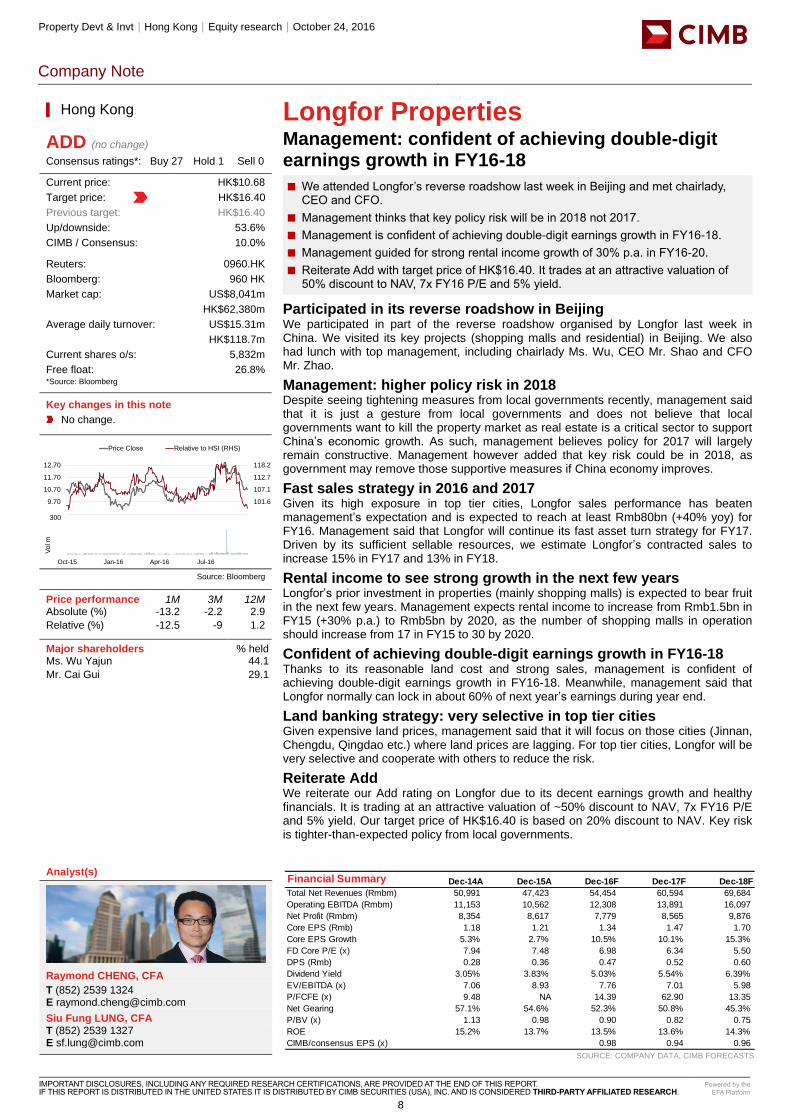
We attended Longfor’s reverse roadshow last week in Beijing and met chairlady, ■CEO and CFO.
Management thinks that key policy risk will be in 2018 not 2017. ■ Management is confident of achieving double-digit earnings growth in FY16-18. ■ Management guided for strong rental income growth of 30% p.a. in FY16-20. ■ Reiterate Add with target price of HK$16.40. It trades at an attractive valuation of ■50% discount to NAV, 7x FY16 P/E and 5% yield.
Participated in its reverse roadshow in Beijing We participated in part of the reverse roadshow organised by Longfor last week in China. We visited its key projects (shopping malls and residential) in Beijing. We also had lunch with top management, including chairlady Ms. Wu, CEO Mr. Shao and CFO Mr. Zhao.
Management: higher policy risk in 2018 Despite seeing tightening measures from local governments recently, management said that it is just a gesture from local governments and does not believe that local governments want to kill the property market as real estate is a critical sector to support China’s economic growth. As such, management believes policy for 2017 will largely remain constructive. Management however added that key risk could be in 2018, as government may remove those supportive measures if China economy improves.
Fast sales strategy in 2016 and 2017 Given its high exposure in top tier cities, Longfor sales performance has beaten management’s expectation and is expected to reach at least Rmb80bn (+40% yoy) for FY16. Management said that Longfor will continue its fast asset turn strategy for FY17. Driven by its sufficient sellable resources, we estimate Longfor’s contracted sales to increase 15% in FY17 and 13% in FY18.
Rental income to see strong growth in the next few years Longfor’s prior investment in properties (mainly shopping malls) is expected to bear fruit in the next few years. Management expects rental income to increase from Rmb1.5bn in FY15 (+30% p.a.) to Rmb5bn by 2020, as the number of shopping malls in operation should increase from 17 in FY15 to 30 by 2020.
Confident of achieving double-digit earnings growth in FY16-18 Thanks to its reasonable land cost and strong sales, management is confident of achieving double-digit earnings growth in FY16-18. Meanwhile, management said that Longfor normally can lock in about 60% of next year’s earnings during year end.
Land banking strategy: very selective in top tier cities Given expensive land prices, management said that it will focus on those cities (Jinnan, Chengdu, Qingdao etc.) where land prices are lagging. For top tier cities, Longfor will be very selective and cooperate with others to reduce the risk.
Reiterate Add We reiterate our Add rating on Longfor due to its decent earnings growth and healthy financials. It is trading at an attractive valuation of ~50% discount to NAV, 7x FY16 P/E and 5% yield. Our target price of HK$16.40 is based on 20% discount to NAV. Key risk is tighter-than-expected policy from local governments.
▎Hong Kong
ADD (no change) Consensus ratings*: Buy 27 Hold 1 Sell 0
Current price: HK$10.68
Target price: HK$16.40
Previous target: HK$16.40
Up/downside: 53.6%
CIMB / Consensus: 10.0%
Reuters: 0960.HK
Bloomberg: 960 HK
Market cap: US$8,041m
HK$62,380m
Average daily turnover: US$15.31m
HK$118.7m
Current shares o/s: 5,832m
Free float: 26.8% *Source: Bloomberg
Key changes in this note
No change.
Source: Bloomberg
Price performance 1M 3M 12M Absolute (%) -13.2 -2.2 2.9
Relative (%) -12.5 -9 1.2
Major shareholders % held Ms. Wu Yajun 44.1
Mr. Cai Gui 29.1
Analyst(s)
Raymond CHENG, CFA
T (852) 2539 1324 E [email protected]
Siu Fung LUNG, CFA T (852) 2539 1327 E [email protected]
SOURCE: COMPANY DATA, CIMB FORECASTS
Financial Summary Dec-14A Dec-15A Dec-16F Dec-17F Dec-18F
Total Net Revenues (Rmbm) 50,991 47,423 54,454 60,594 69,684
Operating EBITDA (Rmbm) 11,153 10,562 12,308 13,891 16,097
Net Profit (Rmbm) 8,354 8,617 7,779 8,565 9,876
Core EPS (Rmb) 1.18 1.21 1.34 1.47 1.70
Core EPS Growth 5.3% 2.7% 10.5% 10.1% 15.3%
FD Core P/E (x) 7.94 7.48 6.98 6.34 5.50
DPS (Rmb) 0.28 0.36 0.47 0.52 0.60
Dividend Yield 3.05% 3.83% 5.03% 5.54% 6.39%
EV/EBITDA (x) 7.06 8.93 7.76 7.01 5.98
P/FCFE (x) 9.48 NA 14.39 62.90 13.35
Net Gearing 57.1% 54.6% 52.3% 50.8% 45.3%
P/BV (x) 1.13 0.98 0.90 0.82 0.75
ROE 15.2% 13.7% 13.5% 13.6% 14.3%
CIMB/consensus EPS (x) 0.98 0.94 0.96
96.0
101.6
107.1
112.7
118.2
8.70
9.70
10.70
11.70
12.70
Price Close Relative to HSI (RHS)
100
200
300
Oct-15 Jan-16 Apr-16 Jul-16
Vol m
8
IT Services│India│Equity research│October 24, 2016
Company Note
IMPORTANT DISCLOSURES, INCLUDING ANY REQUIRED RESEARCH CERTIFICATIONS, ARE PROVIDED AT THE END OF THIS REPORT. IF THIS REPORT IS DISTRIBUTED IN THE UNITED STATES IT IS DISTRIBUTED BY CIMB SECURITIES (USA), INC. AND IS CONSIDERED THIRD-PARTY AFFILIATED RESEARCH.
Powered by the
EFA Platform
Mindtree Ltd Deteriorating earnings visibility
Mindtree reported a 1.7% constant currency (CC) qoq decline in US$ sales in ■2QFY17 vs. our estimate of a 0.9% qoq growth.
Margin performance continued to deteriorate with an EBIT margin dip of 638bp yoy. ■ 1HFY17 PAT was 40% of our FY17F forecast, much below our (and consensus) ■expectations, on the back of lower-than-expected revenues and margins.
We cut FY17-FY19F EPS estimates (which were materially below consensus post ■1QFY17) by 13-20% to reflect deteriorating earnings visibility. Maintain Reduce.
Disappointing sales performance in 2QFY17… Mindtree’s 1.7% qoq US$ sales decline in 2QFY17 came in below our expectation of a 0.9% qoq growth. This was largely due to client-specific issues at many of its large clients, resulting in a 4.5% qoq decline in reported US$ sales from its top 2-9 clients. All industry segments registered declines in reported terms, which resulted in a 1.8% qoq dip in volume (despite seasonal strength). Mindtree has been witnessing slower ramp-ups and cautious spend from its clients owing to macro issues, as per management.
…with EBIT margin continuing to slide and now at the single-digits EBIT margin declined qoq by 223bp to 8.9% vs. our expectation of a 79bp qoq decline. This was due to headwinds from wage inflation, continuing losses in Bluefin and muted sales growth with onsite pricing pressure. Tailwinds from the absence of visa cost qoq (~100bp) did not help to stem the decline. Sluggish sales growth resulted in a higher SG&A cost ratio by 62bp qoq despite the minimal 0.7% qoq increase in cost.
Turning around sales growth not an easy task In our view, turning around sales growth (US$ sales growth, excl. last three acquisitions, likely to fall to c.7% in FY17F from c.15% in FY16) materially is not an easy task as: i) recent issues affecting many large clients have not only been due to sluggish volumes but also pricing pressure, ii) there are growth challenges in Bluefin post Brexit, with its large presence in the UK, iii) order book is declining (down qoq/yoy by 17%/5%), and iv) attrition rate of senior sales employees (incl. digital head), has increased.
While margins appear to have bottomed, strong recovery not easy We believe a strong recovery in EBIT margins from the current levels is also not easy considering i) the lack of strong sales growth catalysts in the near term, ii) Mindtree’s lacklustre track record in dealing with ongoing pricing pressure, in our view, iii) high sales & marketing investment required to drive sales growth given dependence on relatively small-sized orders (esp. in digital), and iv) ongoing cost-cutting initiatives will only result in margin gains over the medium term, according to Mindtree.
Valuations still unattractive with declining margins/return ratios Despite major share price declines over the past 3-12 months, we believe its current P/E valuation is still not attractive and does not adequately reflect declining earnings visibility. We cut our TP to Rs420, reflecting a 1-year forward P/E of 12x, down from 13x, due to declining sales/earnings growth. This is a c.15-20% discount to its 5-year average reflecting declining sales growth, margins and return ratios. Any faster-than-expected recovery in sales growth/margins and/or corporate events, such as M&A, are key risks.
▎India
REDUCE (no change) Consensus ratings*: Buy 12 Hold 13 Sell 12
Current price: Rs479.0
Target price: Rs420.0
Previous target: Rs510.0
Up/downside: -12.3%
CIMB / Consensus: -22.6%
Reuters: MINT.BO
Bloomberg: MTCL IN
Market cap: US$1,202m
Rs80,391m
Average daily turnover: US$5.05m
Rs337.3m
Current shares o/s: 168.0m
Free float: 86.3% *Source: Bloomberg
Key changes in this note
FY17F ROE down to 17.2% from 21.1%.
FY17-19F US$ sales decreased by 5.6%/8.7%/8.2%.
FY17-19F wgt. dil. EPS decreased by 19.7%/14.1%./12.9%.
Source: Bloomberg
Price performance 1M 3M 12M Absolute (%) -6.1 -15.4 -35
Relative (%) -4.6 -16.7 -37.9
Major shareholders % held Founders and related parties 13.7
Coffee Day Enterprises P Ltd and Coffee Day Trading Ltd. 16.7
Nalanda India Fund and related entities 11.1
Analyst(s)
Sandeep SHAH
T (91) 22 6602 5159 E [email protected]
SOURCE: COMPANY DATA, CIMB FORECASTS
Financial Summary Mar-15A Mar-16A Mar-17F Mar-18F Mar-19F
Revenue (Rsm) 35,619 46,730 52,524 58,160 65,279
Net Profit (Rsm) 5,363 5,525 4,390 5,408 6,248
Core EPS (Rs) 31.92 32.86 26.11 32.17 37.17
Core EPS Growth 18.7% 2.9% (20.5%) 23.2% 15.5%
FD Core P/E (x) 15.00 14.58 18.35 14.89 12.89
Price To Sales (x) 2.26 1.72 1.53 1.38 1.23
DPS (Rs) 8.50 9.61 7.84 9.98 11.90
Dividend Yield 1.78% 2.01% 1.64% 2.08% 2.48%
EV/EBITDA (x) 10.09 9.35 10.21 8.22 6.98
P/FCFE (x) 20.4 115.8 37.7 34.3 28.2
Net Gearing (44.3%) (15.6%) (25.3%) (32.9%) (40.6%)
P/BV (x) 3.99 3.33 2.98 2.65 2.35
ROE 29.4% 25.0% 17.2% 18.9% 19.3%
% Change In Core EPS Estimates (19.7%) (14.1%) (12.9%)
CIMB/consensus EPS (x) 0.83 0.84 0.83
54.0
71.5
89.0
106.5
124.0
440
540
640
740
840
Price Close Relative to SENSEX (RHS)
2
4
6
Oct-15 Jan-16 Apr-16 Jul-16
Vo
l m
9
Banks│Indonesia│Equity research│October 24, 2016
Company Note
IMPORTANT DISCLOSURES, INCLUDING ANY REQUIRED RESEARCH CERTIFICATIONS, ARE PROVIDED AT THE END OF THIS REPORT. IF THIS REPORT IS DISTRIBUTED IN THE UNITED STATES IT IS DISTRIBUTED BY CIMB SECURITIES (USA), INC. AND IS CONSIDERED THIRD-PARTY AFFILIATED RESEARCH.
Powered by the
EFA Platform
Bank Tabungan Negara 3Q16 results: another strong quarter
BBTN’s 9M16 net profit came broadly in line with expectations at Rp1.6tr (+33% ■yoy/+5% qoq), forming 67%/70% of our/consensus FY16 forecasts.
Strong profit growth was driven by robust income growth (+13% yoy/+3% qoq) and ■benign provisioning (-27% yoy/+2% qoq).
NPL deteriorated slightly to 3.6% in 3Q16 from 3.4% in 2Q16, while SML improved ■to 12.2% in 3Q16 from 12.5% in 2Q16.
Maintain Add with an unchanged GGM-based target price. Key risk is adverse ■change in the subsidised housing scheme.
Robust profit growth BBTN’s 9M16 net profit came in line with expectations at Rp1.6tr (+33% yoy/+5% qoq), forming 67%/70% of our/consensus FY16 forecasts. Robust profit growth was driven by strong overall income growth (+13% yoy/+3% qoq) and benign provisioning (-27% yoy/+2% qoq) – this resulted in relatively benign credit costs at 0.4% in 9M16 (unchanged from 1H16). At the same time, its LDR improved significantly on a qoq basis to 104% in 3Q16 from 111% in 2Q16.
Relatively stable margin Net interest margin (NIM) dropped slightly to 4.6% in 9M16 from 4.7% in 1H16 (4.5% in 9M15) as cost of funds (CoF) rose to 6.1% in 9M16 from 6% in 1H16 (6.4% in 9M15). A pick-up in CoF was attributed to strong time deposit growth of 21% yoy/11% qoq vs. CASA growth of 16% yoy/+9% qoq. CASA ratio stood at 46% in 3Q16, relatively unchanged on a qoq basis. Loan yield was at 10.5% in 9M16, unchanged from 1H16.
Strong mortgage growth Overall loan growth remained robust at 17% yoy/3% qoq, driven by strong subsidised mortgage growth of 30% yoy/5% qoq (34% of total loans), followed by non-subsidised mortgages growth of 14% yoy/3% qoq (38% of total loans) and construction loan growth of +18% yoy/3% qoq (13% of total loans). On the other hand, commercial loans shrank (-5% yoy/+1% qoq) as BBTN continues to scale down its exposure to the commercial loan portfolio amid asset quality issues.
Asset quality remained in check NPL deteriorated slightly to 3.6% in 3Q16 from 3.4% in 2Q16, mainly due to the rise in construction loan NPL to 4.4% in 3Q16 from 3.9% in 2Q16 and commercial loan NPL to 13.2% in 3Q16 from 11.3% in 2Q16. On the other hand, NPL from subsidised mortgage improved slightly to 2.1% in 3Q16 from 2.2% in 2Q16. Special mention loans (SML) also improved to 12.2% in 3Q16 from 12.5% in 2Q16. It remains confident about gradually improving its asset quality and expects its NPL to fall below 3% in Dec 16.
Maintain Add Robust loan growth, benign provisioning amid improvement in asset quality, and attractive valuations underpin our Add call. Despite rallying by 52% YTD and outperforming JCI and JAKFIN by 34-35% during the same period, BBTN still trades at 1.0x FY17 P/B, below its 10-year average of 1.2x P/B. Key risk will be changes in the subsidised housing programme such as lower budget allocation for FLPP and lower government funding proportion which would negatively impact BBTN’s interest margins.
▎Indonesia
ADD (no change) Consensus ratings*: Buy 20 Hold 5 Sell 1
Current price: Rp1,940
Target price: Rp2,400
Previous target: Rp2,400
Up/downside: 23.7%
CIMB / Consensus: 8.0%
Reuters: BBTN.JK
Bloomberg: BBTN IJ
Market cap: US$1,579m
Rp20,544,600m
Average daily turnover: US$2.84m
Rp37,301m
Current shares o/s: 10,565m
Free float: 40.0% *Source: Bloomberg
Key changes in this note
No change.
Source: Bloomberg
Price performance 1M 3M 12M Absolute (%) -2.8 4.6 63.7
Relative (%) -3.4 0.3 47.2
Major shareholders % held Government of Indonesia 60.0
Analyst(s)
Jovent GIOVANNY
T (62) 21 3006 1727 E [email protected]
Timothy HANDERSON T (62) 21 3006 1724 E [email protected]
SOURCE: COMPANY DATA, CIMB FORECASTS
Financial Summary Dec-14A Dec-15A Dec-16F Dec-17F Dec-18F
Net Interest Income (Rpb) 5,465 6,811 7,855 9,160 10,671
Total Non-Interest Income (Rpb) 895 1,106 1,237 1,369 1,555
Operating Revenue (Rpb) 6,359 7,917 9,092 10,529 12,226
Total Provision Charges (Rpb) (772) (894) (913) (1,086) (1,293)
Net Profit (Rpb) 1,116 1,851 2,309 2,743 3,168
Core EPS (Rp) 106.5 174.4 217.7 258.6 298.6
Core EPS Growth (33.2%) 63.8% 24.8% 18.8% 15.5%
FD Core P/E (x) 18.22 11.12 8.91 7.50 6.50
DPS (Rp) 44.36 21.12 43.80 54.65 64.91
Dividend Yield 2.29% 1.09% 2.26% 2.82% 3.35%
BVPS (Rp) 1,155 1,312 1,790 1,995 2,230
P/BV (x) 1.68 1.48 1.08 0.97 0.87
ROE 9.4% 14.1% 14.0% 13.7% 14.1%
CIMB/consensus EPS (x) 1.01 1.01 0.99
91
124
158
1,000
1,500
2,000
Price Close Relative to JCI (RHS)
50
100
150
Oct-15 Jan-16 Apr-16 Jul-16
Vo
l m
10
Tobacco│Malaysia│Equity research│October 24, 2016
Company Note
IMPORTANT DISCLOSURES, INCLUDING ANY REQUIRED RESEARCH CERTIFICATIONS, ARE PROVIDED AT THE END OF THIS REPORT. IF THIS REPORT IS DISTRIBUTED IN THE UNITED STATES IT IS DISTRIBUTED BY CIMB SECURITIES (USA), INC. AND IS CONSIDERED THIRD-PARTY AFFILIATED RESEARCH.
Powered by the
EFA Platform
British American Tobacco Contraband cigarettes a thorn for BAT
■ 9MFY16 core net profit to RM518m within expectations, at 74% of our full-year estimate. Dividend of 45 sen/share declared, in line with expectations.
■ The 27.6% decline in 9M16 core net profit mainly due to: i) decline in sales volume, ii) lower market share, and iii) easy availability of illicit cigarettes.
■ Management expects special dividend of RM0.49/share from BAT's land sale proceeds to be announced by Feb 2017.
■ Maintain Reduce and DDM-based target price of RM50.00.
Disappointing 9M16 from weak sales volume 9MFY16 results continued to be disappointing. After adding back one-off expenses of RM85.7m incurred in 2QFY16, core net profit declined 27.6% yoy to RM518m while EBIT margins declined 3.8% pts to 23.5%. This was on the back of a 17.3% yoy revenue decline, affected by i) weak sales volume (-32.3% yoy), and ii) decline in legal market share by 2.7% pts to 58.1% (end-Aug 2016 vs. end-2015). Nevertheless, 9M16 core net profit was in line, achieving 74% our full-year estimate.
3Q16 earnings aided by low tax rate In 3Q16, BAT recorded 56% yoy growth in core net profit to RM208.6m. Although sales volume was flattish (0.2% qoq), net profit were boosted by: i) lower tax rate of 14.6% (-44.3% pts qoq) due to provision excess in 2QFY16, ii) better EBIT margins from higher utilisation rates, and iii) one-off expenses of RM86m in 2QFY16. In line with the winding down of all factory operations by 2H17, BAT's contract manufacturing volume declined 34.1% qoq, which in turn led to a 3.2% qoq decline in 3Q16 revenue to RM932.2m.
Contraband cigarettes still a thorn While Royal Malaysian Customs has increased efforts to reduce illicit trade, contraband cigarettes had risen to 49.9% of total Malaysia cigarette volume at end-May 16. This is the highest in the world and a stark increase vs. 36.9% in 2015. We believe this led to a sharp yoy decline of 28.6% in legal market volumes in 9M16 as smokers leaned towards contraband products for the cheap prices. BAT's volume decline during the period was even wider at 32.3% yoy; we attribute this to its premium product portfolio.
Special dividend of RM0.49/share to be announced by Feb 2017 Management highlighted that the group will announce a special dividend from the RM218m proceeds from its land sale by Feb 2017 (4QFY16 results). We estimate that after accounting for one-off expenses of RM78.1m for its restructuring exercise, the group can declare a special dividend of RM0.49/share, assuming a 100% payout ratio. This would raise our yields for FY16F to 6.0% from 4.6%.
Maintain Reduce We make no changes to our estimates and our DDM-based TP of RM50.00. We maintain our Reduce call on the stock due to concerns of declining sales volume and downtrend in the group’s legal market share. Although yields are attractive at 4.6-5.0 for FY16-18F, we advocate that clients switch to brewers for better earnings visibility and higher dividend appeal. Upside risks to our view are a spike in sales volume and no increase in excise duty in the near term.
▎Malaysia
REDUCE (no change) Consensus ratings*: Buy 2 Hold 3 Sell 12
Current price: RM50.24
Target price: RM50.00
Previous target: RM50.00
Up/downside: -0.5%
CIMB / Consensus: 1.2%
Reuters: BATO.KL
Bloomberg: ROTH MK
Market cap: US$3,437m
RM14,345m
Average daily turnover: US$2.46m
RM10.04m
Current shares o/s: 285.5m
Free float: 50.0% *Source: Bloomberg
Key changes in this note
No change.
Source: Bloomberg
Price performance 1M 3M 12M Absolute (%) 1.5 -7.8 -20.2
Relative (%) 1.1 -9 -18.3
Major shareholders % held BAT BV 50.0
PNB 6.1
Aberdeen Asset Management 5.3
Analyst(s)
Walter AW
T (60) 3 2261 9093 E [email protected]
SOURCE: COMPANY DATA, CIMB FORECASTS
Financial Summary Dec-14A Dec-15A Dec-16F Dec-17F Dec-18F
Revenue (RMm) 4,796 4,582 2,668 2,675 2,646
Operating EBITDA (RMm) 1,281 1,279 1,014 991 1,052
Net Profit (RMm) 902.0 912.6 700.0 713.0 760.9
Core EPS (RM) 3.16 3.20 2.45 2.50 2.67
Core EPS Growth 17.6% 1.2% (23.3%) 1.9% 6.7%
FD Core P/E (x) 15.90 15.72 20.49 20.12 18.85
DPS (RM) 3.09 3.12 2.33 2.37 2.53
Dividend Yield 6.15% 6.21% 4.64% 4.72% 5.04%
EV/EBITDA (x) 11.47 11.43 14.48 14.76 13.72
P/FCFE (x) 19.33 16.95 20.08 20.67 16.35
Net Gearing 65.6% 50.6% 59.7% 45.4% 14.7%
P/BV (x) 27.24 26.26 24.68 23.25 21.90
ROE 174% 170% 124% 119% 120%
CIMB/consensus EPS (x) 0.99 0.94 0.97
68.0
81.3
94.7
108.0
40.0
50.0
60.0
70.0
Price Close Relative to FBMKLCI (RHS)
1
1
2
2
Oct-15 Jan-16 Apr-16 Jul-16
Vol m
11
Stockbroking & Exchanges│Malaysia│Equity research│October 24, 2016
Company Note
IMPORTANT DISCLOSURES, INCLUDING ANY REQUIRED RESEARCH CERTIFICATIONS, ARE PROVIDED AT THE END OF THIS REPORT. IF THIS REPORT IS DISTRIBUTED IN THE UNITED STATES IT IS DISTRIBUTED BY CIMB SECURITIES (USA), INC. AND IS CONSIDERED THIRD-PARTY AFFILIATED RESEARCH.
Powered by the
EFA Platform
Bursa Malaysia Lower 9M16 earnings due to weaker equity income
At 67% of our full-year forecast and 71% of Bloomberg consensus estimates, ■Bursa’s 9M16 net profit was below expectations.
9M16 equity income fell by 5.4% yoy due to lower market trading value. ■ Derivative income rose by 4.4% yoy in 9M16. ■ We cut our EPS FY16-18 EPS forecasts by 5-8% due to reduction in projected ■revenue. However, our target price is raised to RM9.00 due to rollover to end-2017.
Maintain Hold on Bursa given the uncertainty surrounding its equity market income. ■
Below expectations Bursa’s 9M16 net profit (-3% yoy) was below expectations, accounting for 67% of our full-year forecast and 71% of consensus. This was mainly due to weaker-than-expected revenue, arising from lower equity market income. The average daily trading value (ADTV) for the equity market actually fell by 9.8% yoy to only RM1.74bn in 3Q16 (US$417m), the lowest since 4Q13. As per norm, no dividend was declared in 3Q16.
Lower equity income in 9M16 The company’s equity income dipped by 5.4% yoy to RM163.9m (US$39m) in 9M16, dragged down by the 6.1% yoy decline in ADTV to RM1.85n (US$445m). The lower ADTV in 9M16 resulted from the drop in the market velocity from 29% in 9M15 to 27% in 9M16, which more than offset the 5.6% yoy rise in market capitalisation of the equity market to RM1.65tr (US$396bn) in Sep 16.
Stronger performance by derivative business On the flip side, its derivative income rose by 4.4% yoy to RM66.8m (US$16m) in 9M16, supported by the 2% yoy increase in volume of average daily contracts (ADC) in the derivative market to 58.686 in 9M16. By type of contract, CPO futures contracts expanded by 4.7% yoy in 9M16 but BMKLCI futures contracts dwindled by 7.9% yoy.
Equity income is still the biggest contributor to revenue In 9M16, equity income contributed the biggest share of Bursa’s revenue (45.5%), although this was lower than the 47.8% contribution in 9M15. This was followed by the 18.5% revenue contribution from derivative income in 9M16, which rose from 17.7% a year ago. Other contributors were listing fees (11% of Bursa’s 9M16 revenue), depository services (8.1%) and market data (7.4%),
Cutting EPS forecasts but raising target price We cut our projected EPS forecasts by 8.4% for FY16F and 5-6% for FY17-18F as we lower our assumed ADTV by 6-10%. EPS cuts notwithstanding, we raise our target price (TP) from RM8.86 to RM9.00 due to rollover in TP to end-2017. Our target P/E remains 20x, which is at a 5% discount to the five-year average P/E of 21.4x.
Maintain Hold In spite of the uncertainty surrounding equity market income, Bursa remains a Hold. We are positive on the prospects for derivative income as Bursa’s derivative products are trading on the Globex platform, which gives it access to international investors. The upside/downside risks to our TP are a spike/dip in equity market trading value. We prefer BIMB Holdings for exposure to the financial services sector in Malaysia.
▎Malaysia
HOLD (no change) Consensus ratings*: Buy 4 Hold 11 Sell 0
Current price: RM9.03
Target price: RM9.00
Previous target: RM8.86
Up/downside: -0.3%
CIMB / Consensus: -0.8%
Reuters: BMYS.KL
Bloomberg: BURSA MK
Market cap: US$1,159m
RM4,843m
Average daily turnover: US$1.02m
RM4.15m
Current shares o/s: 531.9m
Free float: 65.3% *Source: Bloomberg
Key changes in this note
FY16F EPS cut by 8.4%.
FY17-18F EPS cut by 5-6%.
Source: Bloomberg
Price performance 1M 3M 12M Absolute (%) 2.7 1.6 8.1
Relative (%) 2 0.8 10.3
Major shareholders % held Capital Market Development Fund 18.6
Minister of Finance Inc 16.2
EPF 8.6
Analyst(s)
Winson NG, CFA
T (60) 3 2261 9071 E [email protected]
SOURCE: COMPANY DATA, CIMB FORECASTS
Financial Summary Dec-14A Dec-15A Dec-16F Dec-17F Dec-18F
Revenue (RMm) 471.3 487.7 495.0 537.3 574.7
Operating EBITDA (RMm) 297.1 302.5 295.2 325.0 349.1
Net Profit (RMm) 198.2 198.6 195.1 216.4 232.4
Core EPS (RM) 0.37 0.37 0.37 0.41 0.44
Core EPS Growth 14.5% 0.2% (1.8%) 10.9% 7.4%
FD Core P/E (x) 24.23 24.18 24.62 22.20 20.67
DPS (RM) 0.54 0.35 0.35 0.39 0.42
Dividend Yield 5.98% 3.82% 3.86% 4.28% 4.60%
EV/EBITDA (x) 12.65 11.02 11.48 10.58 9.98
P/FCFE (x) 14.70 20.07 33.72 11.61 16.02
Net Gearing (139%) (181%) (171%) (162%) (154%)
P/BV (x) 6.42 5.98 5.87 5.75 5.63
ROE 25.4% 25.6% 24.1% 26.2% 27.5%
% Change In Core EPS Estimates (8.38%) (5.63%) (5.66%)
CIMB/consensus EPS (x) 0.96 0.98 0.99
97.0
102.0
107.0
8.00
8.50
9.00
Price Close Relative to FBMKLCI (RHS)
1
2
3
Oct-15 Jan-16 Apr-16 Jul-16
Vo
l m
12
Telco - Integrated│Malaysia│Equity research
Shariah Compliant
Company Flash Note
IMPORTANT DISCLOSURES, INCLUDING ANY REQUIRED RESEARCH CERTIFICATIONS, ARE PROVIDED AT THE END OF THIS REPORT. IF THIS REPORT IS DISTRIBUTED IN THE UNITED STATES IT IS DISTRIBUTED BY CIMB SECURITIES (USA), INC. AND IS CONSIDERED THIRD-PARTY AFFILIATED RESEARCH.
Powered by the EFA Platform
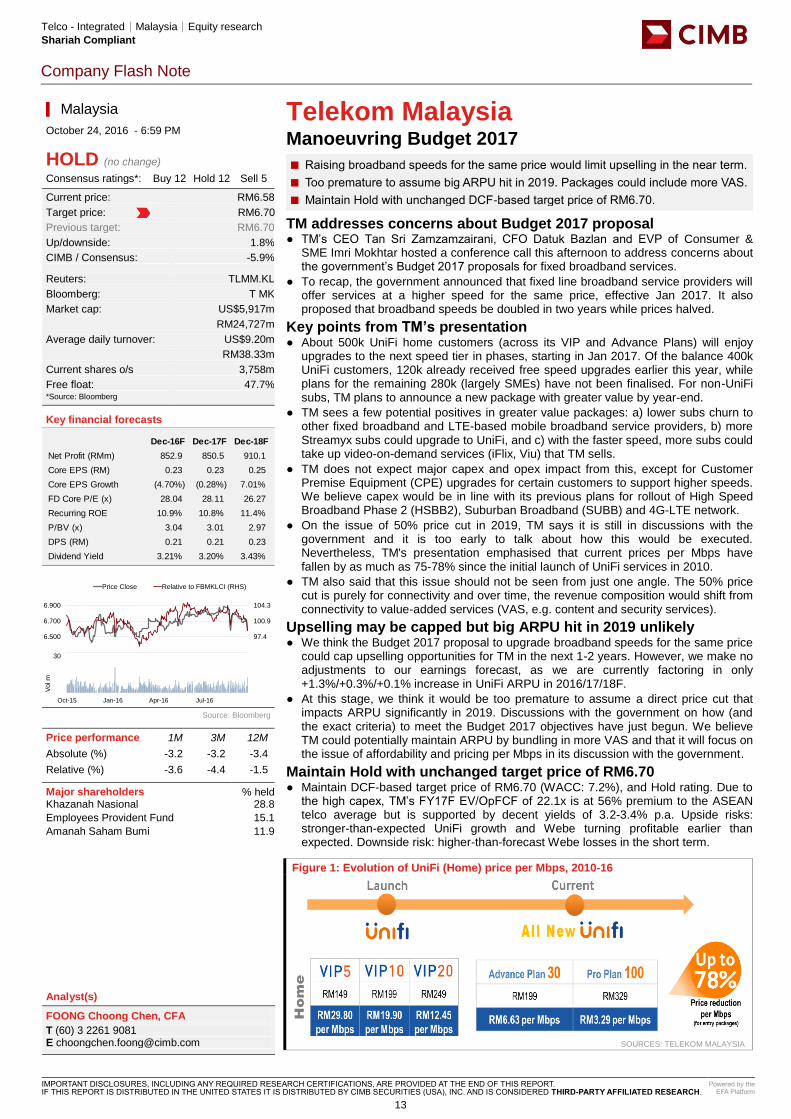
Telekom Malaysia Manoeuvring Budget 2017
Raising broadband speeds for the same price would limit upselling in the near term. ■ Too premature to assume big ARPU hit in 2019. Packages could include more VAS. ■ Maintain Hold with unchanged DCF-based target price of RM6.70. ■
TM addresses concerns about Budget 2017 proposal ● TM’s CEO Tan Sri Zamzamzairani, CFO Datuk Bazlan and EVP of Consumer &
SME Imri Mokhtar hosted a conference call this afternoon to address concerns about the government’s Budget 2017 proposals for fixed broadband services.
● To recap, the government announced that fixed line broadband service providers will offer services at a higher speed for the same price, effective Jan 2017. It also proposed that broadband speeds be doubled in two years while prices halved.
Key points from TM’s presentation ● About 500k UniFi home customers (across its VIP and Advance Plans) will enjoy
upgrades to the next speed tier in phases, starting in Jan 2017. Of the balance 400k UniFi customers, 120k already received free speed upgrades earlier this year, while plans for the remaining 280k (largely SMEs) have not been finalised. For non-UniFi subs, TM plans to announce a new package with greater value by year-end.
● TM sees a few potential positives in greater value packages: a) lower subs churn to other fixed broadband and LTE-based mobile broadband service providers, b) more Streamyx subs could upgrade to UniFi, and c) with the faster speed, more subs could take up video-on-demand services (iFlix, Viu) that TM sells.
● TM does not expect major capex and opex impact from this, except for Customer Premise Equipment (CPE) upgrades for certain customers to support higher speeds. We believe capex would be in line with its previous plans for rollout of High Speed Broadband Phase 2 (HSBB2), Suburban Broadband (SUBB) and 4G-LTE network.
● On the issue of 50% price cut in 2019, TM says it is still in discussions with the government and it is too early to talk about how this would be executed. Nevertheless, TM's presentation emphasised that current prices per Mbps have fallen by as much as 75-78% since the initial launch of UniFi services in 2010.
● TM also said that this issue should not be seen from just one angle. The 50% price cut is purely for connectivity and over time, the revenue composition would shift from connectivity to value-added services (VAS, e.g. content and security services).
Upselling may be capped but big ARPU hit in 2019 unlikely ● We think the Budget 2017 proposal to upgrade broadband speeds for the same price
could cap upselling opportunities for TM in the next 1-2 years. However, we make no adjustments to our earnings forecast, as we are currently factoring in only +1.3%/+0.3%/+0.1% increase in UniFi ARPU in 2016/17/18F.
● At this stage, we think it would be too premature to assume a direct price cut that impacts ARPU significantly in 2019. Discussions with the government on how (and the exact criteria) to meet the Budget 2017 objectives have just begun. We believe TM could potentially maintain ARPU by bundling in more VAS and that it will focus on the issue of affordability and pricing per Mbps in its discussion with the government.
Maintain Hold with unchanged target price of RM6.70 ● Maintain DCF-based target price of RM6.70 (WACC: 7.2%), and Hold rating. Due to
the high capex, TM’s FY17F EV/OpFCF of 22.1x is at 56% premium to the ASEAN telco average but is supported by decent yields of 3.2-3.4% p.a. Upside risks: stronger-than-expected UniFi growth and Webe turning profitable earlier than expected. Downside risk: higher-than-forecast Webe losses in the short term.
Figure 1: Evolution of UniFi (Home) price per Mbps, 2010-16
SOURCES: TELEKOM MALAYSIA
▎Malaysia
October 24, 2016 - 6:59 PM
HOLD (no change) Consensus ratings*: Buy 12 Hold 12 Sell 5
Current price: RM6.58
Target price: RM6.70
Previous target: RM6.70
Up/downside: 1.8%
CIMB / Consensus: -5.9%
Reuters: TLMM.KL
Bloomberg: T MK
Market cap: US$5,917m
RM24,727m
Average daily turnover: US$9.20m
RM38.33m
Current shares o/s 3,758m
Free float: 47.7% *Source: Bloomberg
Key financial forecasts
Source: Bloomberg
Price performance 1M 3M 12M
Absolute (%) -3.2 -3.2 -3.4
Relative (%) -3.6 -4.4 -1.5
Major shareholders % held Khazanah Nasional 28.8
Employees Provident Fund 15.1
Amanah Saham Bumi 11.9
Analyst(s)
FOONG Choong Chen, CFA
T (60) 3 2261 9081 E [email protected]
Dec-16F Dec-17F Dec-18F
Net Profit (RMm) 852.9 850.5 910.1
Core EPS (RM) 0.23 0.23 0.25
Core EPS Growth (4.70%) (0.28%) 7.01%
FD Core P/E (x) 28.04 28.11 26.27
Recurring ROE 10.9% 10.8% 11.4%
P/BV (x) 3.04 3.01 2.97
DPS (RM) 0.21 0.21 0.23
Dividend Yield 3.21% 3.20% 3.43%
94.0
97.4
100.9
104.3
6.300
6.500
6.700
6.900
Price Close Relative to FBMKLCI (RHS)
10
20
30
Oct-15 Jan-16 Apr-16 Jul-16
Vo
l m
13
Hospitals│Singapore│Equity research
Company Flash Note
IMPORTANT DISCLOSURES, INCLUDING ANY REQUIRED RESEARCH CERTIFICATIONS, ARE PROVIDED AT THE END OF THIS REPORT. IF THIS REPORT IS DISTRIBUTED IN THE UNITED STATES IT IS DISTRIBUTED BY CIMB SECURITIES (USA), INC. AND IS CONSIDERED THIRD-PARTY AFFILIATED RESEARCH.
Powered by the EFA Platform
Raffles Medical Group Results first take: slowing topline growth hints at weakening demand
3Q/9M16 net profit (+4% yoy) largely in line, forming 96%/95% of our 3Q/9M ■forecasts. 9M16 formed 66% of our FY16F (below historical average of 69%).
Profitability is still dragged down by new expansion projects with ramp-up slower ■than expected. 3Q OPM (15.6%) down qoq and yoy (2Q16: 16.8%, 3Q15: 18.2%).
We maintain our forecasts and target price pending this morning’s analyst briefing. ■
Slowing revenue growth YTD hints at weak demand ● 3Q16’s revenue growth of 17.5% yoy was still mostly lifted by ISOS. Ex-ISOS, group
revenue was +7.9%. We note that core revenue growth (i.e. ex-ISOS) has been on a downward trend YTD (1Q16: +11.6%, 2Q: +8.7%). Given the context of big expansion projects (Shaw Centre/Holland V opened in Jun 15 and Jun 16 respectively), topline growth has been lacklustre.
● By segment, hospital services grew 6.0% yoy and primary healthcare services grew 39.7%. Both were fairly in line with our expectations. We read the mid-single digit hospital growth as broadly in line with industry growth and our concern is whether demand would improve when its hospital extension is completed in CY17. Healthcare services growth was mostly lifted by ISOS.
OP margins (15.6%) down qoq and yoy (2Q16: 16.8%; 3Q15: 18.2%) ● On the cost front, margins were weaker due to new expansion projects (recruitment of
more staff and training expenses). ISOS is still a drag on profitability and ramp-up has been slower than expected. 3Q16’s operating profit growth therefore lagged revenue growth and was a mere +0.3% yoy.
● Excluding ISOS, operating profit growth would have been better at +4.5% yoy. However, core operating profit (i.e. ex-ISOS) downward growth trend YTD still paints a bleak outlook (1Q16: +7.8%, 2Q: +6.5%).
Holland V committed occupancy improved to 95% ● Raffles Holland V first opened in Jun 16. The positive is that committed occupancy is
currently 95% (up from 60% in 3Q16). We understand rental rates were at the lower end of S$10-15 psf. We note that full rental contribution is not yet reflected in 3Q’s numbers.
Maintain Reduce pending analyst briefing ● We keep our SOP-based target price, and Reduce rating pending this morning’s
analyst briefing.
Figure 1: Results Comparison
SOURCES: CIMB, COMPANY REPORTS
FYE Dec (S$ m) 3Q
FY16
3Q
FY15
yoy %
chg
qoq %
chg
3QFY16
cum
3QFY15
cum
yoy %
chg
Prev.
FY16F Comments
Revenue 119.3 101.5 17.5 0.3 355.1 295.8 20.0 495.2 Healthcare +39.7% yoy; Hospital +6.0% yoy
Operating costs (96.9) (79.8) 21.5 1.7 (286.8) (231.2) 24.0 (394.2) ex-ISOS, group rev +7.9%
EBITDA 22.3 21.7 2.7 (5.3) 68.3 64.6 5.7 101.0
EBITDA margin (%) 18.7 21.4 -2.7%pt -1.1%pt 19.2 21.8 -2.6%pt 20.4 3Q margin contraction mostly due to higher staff costs
Depn & amort. (3.8) (3.2) 16.6 3.7 (11.0) (9.2) 19.5 (14.2)
EBIT 18.6 18.5 0.3 (7.0) 57.2 55.3 3.4 86.8
Interest expense (0.0) (0.0) 56.0 5.4 (0.1) (0.1) 73.4 (0.1)
Interest & invt inc 0.3 0.3 1.3 (6.5) 0.9 0.9 (0.2) 1.0
Associates' contrib - - nm nm - - nm -
Exceptionals 0.0 0.0 nm nm 0.0 0.0 nm 0.0
Pretax profit 18.8 18.8 0.2 (7.0) 58.0 56.2 3.3 87.7 Barely in line, 3Q forming 21% of our FY
Tax (3.1) (3.1) (2.5) (25.7) (10.9) (9.4) 15.6 (14.0)
Tax rate (%) 16.3 16.7 nm nm 18.8 16.8 nm 16.0
Minority interests 0.5 (0.0) nm nm 1.3 (0.2) nm 0.0 MI still loss making
Net profit 16.2 15.6 4.0 (2.6) 48.4 46.5 4.1 73.7 Barely in line; 3Q/9M forming 22/66% of our FY16F
Core net profit 16.2 15.6 4.0 (2.6) 48.4 46.5 4.1 73.7 (4Q is seasonally stronger)
EPS (S cts) 0.93 0.91 2.5 (3.5) 2.79 2.73 2.4 4.22
Core EPS (S cts) 0.93 0.91 2.5 (3.5) 2.79 2.73 2.4 4.22
▎Singapore
October 24, 2016 - 9:12 AM
REDUCE (no change) Consensus ratings*: Buy 6 Hold 5 Sell 2
Current price: S$1.51
Target price: S$1.41
Previous target: S$1.41
Up/downside: -6.6%
CIMB / Consensus: -12.1%
Reuters: RAFG.SI
Bloomberg: RFMD SP
Market cap: US$1,890m
S$2,638m
Average daily turnover: US$1.42m
S$1.93m
Current shares o/s 1,746m
Free float: 48.0% *Source: Bloomberg
Key financial forecasts
Source: Bloomberg
Price performance 1M 3M 12M
Absolute (%) -1 -5.6 4.1
Relative (%) -0.3 -1.9 10.5
Major shareholders % held Loo Choon Yong 48.1
FIL 4.9
Aberdeen 4.8
Analyst(s)
Jonathan SEOW
T (65) 6210 8671 E [email protected]
Dec-16F Dec-17F Dec-18F
Net Profit (S$m) 73.65 81.50 90.68
Core EPS (S$) 0.042 0.047 0.052
Core EPS Growth 6.4% 10.6% 11.3%
FD Core P/E (x) 35.59 32.36 29.08
Recurring ROE 11.8% 12.3% 12.7%
P/BV (x) 4.11 3.83 3.54
DPS (S$) 0.020 0.020 0.020
Dividend Yield 1.32% 1.32% 1.32%
97.0
103.0
109.0
115.0
121.0
127.0
1.200
1.300
1.400
1.500
1.600
1.700
Price Close Relative to FSSTI (RHS)
5
10
Oct-15 Jan-16 Apr-16 Jul-16
Vol m
14
Hospitals│Singapore│Equity research│October 24, 2016
Company Note
IMPORTANT DISCLOSURES, INCLUDING ANY REQUIRED RESEARCH CERTIFICATIONS, ARE PROVIDED AT THE END OF THIS REPORT. IF THIS REPORT IS DISTRIBUTED IN THE UNITED STATES IT IS DISTRIBUTED BY CIMB SECURITIES (USA), INC. AND IS CONSIDERED THIRD-PARTY AFFILIATED RESEARCH.
Powered by the
EFA Platform
Raffles Medical Group 3Q16’s post briefing notes
■ ISOS’s quarterly losses are expanding and turnaround is taking longer than expected. Shaw continues to be loss-making.
■ Staff costs (increased recruitment for Holland V and higher cost structure at ISOS) accounted for the majority of 3Q’s 2.6%pt yoy OPM decline. We cut EPS on this.
■ Medical tourism was flat and hospital growth was driven by domestic patients.
■ Guidance for the hospital extension’s initial lease out lowered to 30-40% (from c.75%).
■ Our SOP-based target price rises as we roll forward our valuation. Maintain Reduce.
ISOS quarterly loss run-rate worsening While ISOS has clearly lifted the group's topline growth (reported 9M16 +20% yoy; ex-ISOS +9% yoy), it continues to be a drag on profitability and its quarterly run-rate has worsened (3Q16 operating profit: -S$0.8m, 2Q: -S$0.5m, 1Q: -S$0.3m). Management attributed the losses to rebranding and transition costs, coupled with higher staff costs (staff cost/sales is 60+% for ISOS vs. RFMD's existing c.50%). Guidance is for a better FY17 for ISOS as it grows its corporate client base and improves staff productivity.
Staff cost pressure still prevalent, made worse by ISOS Staff cost continues to be under pressure due to recruitment for Holland V, made worse by the higher cost structure at ISOS. 3Q’s staff cost/revenue was 51.5% (vs. 48-50% historically). Taking a 3-year view, we think the staff/cost revenue ratio should remain at an elevated level as the larger magnitude of the hospital extension further adds to cost pressure, mitigated by a maturing Holland V and improved efficiency at ISOS. This accounted for the majority of our FY16F-18F EPS cuts.
Medical tourism still weak Medical tourism is no longer a growth driver and management highlighted that absolute medical tourism has remained largely flat. Management blamed weak macro conditions, rising healthcare costs in Singapore and a strong S$ as factors for the lack of growth.
Hospital extension update RFMD now intends to lease out 30-40% of the Raffles Hospital extension (vs. 75% initially). We are generally positive on the longer term prospects of utilising more space for own use as returns are better. However, this also translates to higher depreciation as leased-out space is recognised as investment property and not depreciated. Management updated that the hospital extension is due for completion by end-CY17.
Management sounding more positive on Holland V relative to Shaw Shaw medical centre (17.5k sf, opened Jun 15) is still loss-making but management expects it to break even by end-FY16. When asked about the breakeven timeline for its own Holland V medical centre (9k sf, opened Jun 16), management sounded more positive and expected breakeven within a year. We attribute the better performance at Holland V to the smaller floor space (i.e. lower costs) and better location.
Maintain Reduce Valuations are rich at 25.5x CY17F EV/EBITDA with a 6% 3-year EPS (FY16F-18F) CAGR. Regional peers are trading at a cheaper 22x CY17F with a higher 16% EPS growth. The stock is also trading above its historical mean of 21x. At the same time, margins continue to decline on cost pressures which could worsen nearing the completion of the Raffles Hospital extension. Our SOP-based TP only rises as we roll forward our valuation. Maintain Reduce.
▎Singapore
REDUCE (no change) Consensus ratings*: Buy 6 Hold 5 Sell 2
Current price: S$1.51
Target price: S$1.46
Previous target: S$1.41
Up/downside: -2.8%
CIMB / Consensus: -8.9%
Reuters: RAFG.SI
Bloomberg: RFMD SP
Market cap: US$1,884m
S$2,630m
Average daily turnover: US$1.38m
S$1.86m
Current shares o/s: 1,746m
Free float: 48.0% *Source: Bloomberg
Key changes in this note
FY16F EPS decreased by 3%.
FY17F EPS decreased by 4%.
FY18F EPS decreased by 8%.
Source: Bloomberg
Price performance 1M 3M 12M Absolute (%) -1.3 -7.1 2.8
Relative (%) -1.3 -4.1 9.7
Major shareholders % held Loo Choon Yong 48.1
FIL 4.9
Aberdeen 4.8
Analyst(s)
Jonathan SEOW
T (65) 6210 8671 E [email protected]
SOURCE: COMPANY DATA, CIMB FORECASTS
Financial Summary Dec-14A Dec-15A Dec-16F Dec-17F Dec-18F
Revenue (S$m) 374.6 410.5 495.2 540.0 603.6
Operating EBITDA (S$m) 85.7 89.7 98.1 106.9 118.3
Net Profit (S$m) 67.64 69.29 71.16 77.87 83.58
Core EPS (S$) 0.039 0.040 0.041 0.045 0.048
Core EPS Growth 4.89% 2.91% 2.80% 9.43% 7.34%
FD Core P/E (x) 39.05 37.93 36.71 33.76 31.45
DPS (S$) 0.018 0.020 0.020 0.020 0.020
Dividend Yield 1.22% 1.33% 1.33% 1.33% 1.33%
EV/EBITDA (x) 27.80 28.31 26.85 25.47 23.16
P/FCFE (x) NA NA 404.7 39.1 63.2
Net Gearing (26.6%) (8.6%) (3.8%) 7.7% 6.2%
P/BV (x) 4.73 4.30 4.11 3.85 3.60
ROE 12.8% 11.9% 11.5% 11.8% 11.8%
% Change In Core EPS Estimates (3.39%) (4.45%) (7.83%)
CIMB/consensus EPS (x) 0.97 0.93 0.87
97.0
103.0
109.0
115.0
121.0
127.0
1.200
1.300
1.400
1.500
1.600
1.700
Price Close Relative to FSSTI (RHS)
5
10
Oct-15 Jan-16 Apr-16 Jul-16
Vol m
15
Technology Components│Thailand│Equity research│October 24, 2016
Company Note
IMPORTANT DISCLOSURES, INCLUDING ANY REQUIRED RESEARCH CERTIFICATIONS, ARE PROVIDED AT THE END OF THIS REPORT. IF THIS REPORT IS DISTRIBUTED IN THE UNITED STATES IT IS DISTRIBUTED BY CIMB SECURITIES (USA), INC. AND IS CONSIDERED THIRD-PARTY AFFILIATED RESEARCH.
Powered by the
EFA Platform
Delta Electronics (Thailand) 3Q16 earnings was in line
DELTA reported 3Q16 core net profit of THB1,373m (US$39m; +5.8% qoq, but -■11.5% yoy), in line with our forecast and consensus.
DELTA posted 3Q16 revenue of THB11.6bn (US$333m; +3% qoq, but -4% yoy). ■ The appreciation of the baht was responsible for lower GPM and R&D expense. ■ The soonest that we can expect to witness GPM expansion is FY19. ■ Reiterate Reduce call with target price of THB61.50, based on 12.5x FY17 P/E. ■
3Q16 core net profit was in line with our estimate and consensus DELTA reported 3Q16 core net profit of THB1,373m (US$39m; +5.8% qoq, but -11.5% yoy) which was 5% above our forecast and 3% above Bloomberg consensus. The company performed poorly in 9M16, delivering negative earnings growth of 17% compare to the same period last year. 9M16 core net profit of THB3,882m (US$111m) represented 71% of our FY16 forecast, which we deem broadly in line.
DC fan and IABG backed topline growth 3Q16 revenue increased 3% qoq to THB11.6bn (US$333m; +3% qoq, but -4% yoy). The negative yoy growth was a result of the significant growth of 22% of FMBG (Fan and Thermal Management) products, especially the electric fan product, together with the 26% growth in sales of IABG product (Industrial Automation Business Group). This was partly offset the shrinkage of telecom power system in India and MENA (Middle East and North Africa).
Stronger baht resulted in lower margin and R&D expense The stronger baht vs. the US dollar pressured GPM in 3Q16 to 26.5% (vs. 26.1% in 3Q15 and 27.2% in 2Q16). Meanwhile, the SG&A-to-Sales ratio fell more than 150bp lower from 16.4% in 2Q16 to 14.9% (vs. 13.7% in 3Q15). This was due to the appreciation of the baht against euro that lowered the R&D expense by more than THB100m to THB545m.
Outlook We expect DELTA to deliver topline growth of 3.8% CAGR FY15–18. However, we project growing revenue from the automotive segment and regional business in India to pressure the GPM to below 27%. This would lead to lower bottomline growth of 1.9% CAGR FY15–18. We estimate the soonest significant expansion of margin will be in FY19 due to the: 1) growing margin in India, and 2) decline in data centre product sales stabilising.
Maintain Reduce Considering the uninspiring earnings outlook and expectation of no margin expansion until FY19F, we maintain our Reduce call with an unchanged target price of THB61.50, based on 12.5x FY17 P/E (+0.25 s.d. above its 5-year average). Key upside risks to our call are margin expansion and positive sales growth for data centre product.
▎Thailand
REDUCE (no change) Consensus ratings*: Buy 3 Hold 3 Sell 7
Current price: THB77.75
Target price: THB61.50
Previous target: THB61.50
Up/downside: -20.9%
CIMB / Consensus: -17.2%
Reuters: DELT.BK
Bloomberg: DELTA TB
Market cap: US$2,758m
THB96,984m
Average daily turnover: US$3.48m
THB121.5m
Current shares o/s: 1,247m
Free float: 36.9% *Source: Bloomberg
Key changes in this note
No change.
Source: Bloomberg
Price performance 1M 3M 12M Absolute (%) 3.3 6.5 -15.5
Relative (%) 2.4 6.7 -21.5
Major shareholders % held Deltron Holding Ltd 27.7
Delta Electronics Taiwan 20.0
Analyst(s)
Kitichan SIRISUKARCHA, CFP
T (66) 2 657 9232 E [email protected]
SOURCE: COMPANY DATA, CIMB FORECASTS
Financial Summary Dec-14A Dec-15A Dec-16F Dec-17F Dec-18F
Revenue (THBm) 44,121 46,938 45,996 49,733 52,458
Net Profit (THBm) 5,535 6,302 5,507 6,134 6,668
Core EPS (THB) 4.51 5.05 4.41 4.92 5.35
Core EPS Growth 13.2% 12.0% (12.6%) 11.4% 8.7%
FD Core P/E (x) 17.24 15.39 17.61 15.81 14.55
Price To Sales (x) 2.20 2.07 2.11 1.95 1.85
DPS (THB) 2.97 3.07 3.06 3.17 3.44
Dividend Yield 3.82% 3.95% 3.94% 4.07% 4.43%
EV/EBITDA (x) 12.49 10.81 12.43 10.96 9.65
P/FCFE (x) 14.85 17.38 19.98 18.22 13.67
Net Gearing (65.1%) (66.4%) (62.8%) (64.9%) (70.4%)
P/BV (x) 3.57 3.17 3.21 2.98 2.76
ROE 21.4% 21.8% 18.1% 19.6% 19.7%
% Change In Core EPS Estimates 0% 0% 0%
CIMB/consensus EPS (x) 0.91 0.93 0.97
68.0
79.4
90.9
102.3
58.0
68.0
78.0
88.0
Price Close Relative to SET (RHS)
5
10
15
Oct-15 Jan-16 Apr-16 Jul-16
Vo
l m
16
Banks│Thailand│Equity research│October 24, 2016
Company Note
IMPORTANT DISCLOSURES, INCLUDING ANY REQUIRED RESEARCH CERTIFICATIONS, ARE PROVIDED AT THE END OF THIS REPORT. IF THIS REPORT IS DISTRIBUTED IN THE UNITED STATES IT IS DISTRIBUTED BY CIMB SECURITIES (USA), INC. AND IS CONSIDERED THIRD-PARTY AFFILIATED RESEARCH.
Powered by the
EFA Platform
Krung Thai Bank Higher non-interest income drives 3Q16 upside
3Q16 net profit of THB8.6bn (US$246m) was up 61.2% yoy, but flat qoq. ■ Continued loan contraction and sharp rise in NPLs in 3Q16. ■ Non-interest income regained momentum with stable credit cost in 3Q16. ■ We revise up our FY16-17F EPS forecasts but cut our FY18F EPS forecast. ■ We reiterate our Hold rating and target price of THB18 (based on 0.9x FY17F P/BV). ■
3Q16 net profit of THB8.6bn (US$246m) exceeds our forecast KTB’s 3Q16 net profit (+61.2% yoy, flat qoq) came in above our and consensus forecasts by 12% and 11%, respectively. This was due to higher-than-expected non-interest income. Subsequently, 9M16 net profit was above at 74% of our FY16F estimate. 3Q16’s pre-provision operating profit growth was +8.0% yoy but was down by a marginal 1.7% qoq.
Continued loan contraction and sharp rise in NPLs Loans in 3Q16 contracted by 4.6% qoq and by 7.3% from end-FY15, primarily as a result of the repayment of government-related and large corporate loans. On top of that, KTB’s net NPL ratio rose to 4.2% in 3Q16 from 3.8% in 2Q16, a larger increase than the qoq rise in 2Q16. The deterioration in asset quality was across the board, led by large corporate and SME loans. Although KTB did not provide figures on special mention loans, we believe they are still on an uptrend.
Non-interest income regains momentum with stable credit cost Non-interest income growth was 12.1% yoy and 16.6% qoq in 3Q16, resulting from net fee income growth (+0.1% yoy, +4.9% qoq), profit sharing from its insurance unit, gain on trading and forex transactions, and other income. Meanwhile, 3Q16 credit cost came in flat qoq at 160bp while its loan loss reserve coverage was 105%, still the lowest among the big four banks. KTB’s cost-to-income ratio was 41.7% in 3Q16, up from 39% in 2Q16.
Higher FY16-17F EPS forecasts but lower FY18F EPS forecast We raise our FY16-17F EPS forecasts by 7-10.2% as we assume higher net interest margin and lower cost-to-income ratio. However, we cut our FY18F EPS forecast by 12.8% due to a higher credit cost assumption of 140bp vs. 90bp, previously. We forecast KTB’s pre-provision operating profit growth at +11.4%/+3.3%/+5.2% for FY16F/17F/18F.
Reiterate our Hold rating and target price of THB18 We maintain our Hold rating and TP of THB18 which is based on 0.9x FY17F P/BV (our GGM assumes LT ROE of 11% and CoE of 12%) vs. Thai banks’ 1.0x. We think this set of positive 3Q16 results will not excite the market given that it was driven by non-recurring income. We believe investors will remain concerned about asset quality in view of the large qoq jump in NPLs. Upside risk to our call is stronger-than-expected loan growth and non-interest income growth, while downside risk is a sharp increase in NPLs.
▎Thailand
HOLD (no change) Consensus ratings*: Buy 13 Hold 11 Sell 5
Current price: THB17.70
Target price: THB18.00
Previous target: THB18.00
Up/downside: 1.7%
CIMB / Consensus: -8.0%
Reuters: KTB.BK
Bloomberg: KTB TB
Market cap: US$7,035m
THB247,376m
Average daily turnover: US$35.76m
THB1,245m
Current shares o/s: 13,982m
Free float: 40.0% *Source: Bloomberg
Key changes in this note
FY16F EPS increased by 10.2%.
FY17F EPS increased by 7.0%.
FY18F EPS decreased by 12.8%.
Source: Bloomberg
Price performance 1M 3M 12M Absolute (%) -2.2 4.7 0.6
Relative (%) -3.1 4.9 -5.4
Major shareholders % held FIDF 55.0
Vayupak Fund I 3.7
Analyst(s)
Weerapat WONK-URAI
T (66) 2 657 9224 E [email protected]
SOURCE: COMPANY DATA, CIMB FORECASTS
Financial Summary Dec-14A Dec-15A Dec-16F Dec-17F Dec-18F
Net Interest Income (THBm) 77,158 80,868 87,066 82,994 86,666
Total Non-Interest Income (THBm) 30,892 35,741 38,445 41,279 44,739
Operating Revenue (THBm) 108,050 116,609 125,511 124,273 131,405
Total Provision Charges (THBm) (18,643) (30,542) (31,300) (31,566) (27,699)
Net Profit (THBm) 33,191 28,492 33,394 31,246 37,276
Core EPS (THB) 2.37 2.04 2.39 2.24 2.67
Core EPS Growth (11.0%) (14.2%) 17.2% (6.4%) 19.3%
FD Core P/E (x) 7.45 8.68 7.41 7.92 6.64
DPS (THB) 0.90 0.76 0.96 0.89 1.07
Dividend Yield 5.08% 4.29% 5.40% 5.05% 6.03%
BVPS (THB) 16.61 17.59 19.04 20.40 22.02
P/BV (x) 1.07 1.01 0.93 0.87 0.80
ROE 15.1% 11.9% 13.0% 11.3% 12.6%
% Change In Core EPS Estimates 10.2% 7.0% (12.8%)
CIMB/consensus EPS (x) 1.09 0.94 0.96
89.0
97.3
105.7
114.0
14.00
16.00
18.00
20.00
Price Close Relative to SET (RHS)
100
200
300
Oct-15 Jan-16 Apr-16 Jul-16
Vo
l m
17
Finance Companies│Thailand│Equity research│October 24, 2016
Company Note
IMPORTANT DISCLOSURES, INCLUDING ANY REQUIRED RESEARCH CERTIFICATIONS, ARE PROVIDED AT THE END OF THIS REPORT. IF THIS REPORT IS DISTRIBUTED IN THE UNITED STATES IT IS DISTRIBUTED BY CIMB SECURITIES (USA), INC. AND IS CONSIDERED THIRD-PARTY AFFILIATED RESEARCH.
Powered by the
EFA Platform
Krungthai Card Good earnings with healthy asset quality
3Q16 net profit came in at THB640m (US$18.3m), +28% yoy and +10.3% qoq. ■ Intact loan growth and strong card spending growth. ■ Solid non-interest income growth with well-controlled opex in 3Q16. ■ We raise our FY16-18F EPS forecasts by 3.5-6.0%. ■ Maintain Hold but raise target price to THB139 (based on 3.0x FY17F P/BV). ■
3Q16 net profit of THB640m (US$18.3m) KTC's 3Q16 net profit rose 28% yoy and 10.3% qoq, and was 5% better than our expectation but in line with Bloomberg consensus. Subsequently, 9M16 net profit was above at 73% of our FY16F estimate. Its pre-provision operating profit rose 19% yoy and 5% qoq.
Intact loan growth and strong card spending growth Loan growth was decent at 11.8% yoy and 2% qoq, in our view. Card spending growth was 11% yoy in 3Q16, down from 15.4% yoy in 2Q16; however, this was still higher than the industry’s 4% yoy. Sequentially weaker card spending growth was due to the low season in 3Q16. While 9M16 card spending growth was strong at 14% yoy, it was slightly below KTC’s target of 15% for FY16F. Meanwhile, its NPL ratio was stable qoq at 1.9% in 3Q16 while its credit cost stayed high at 10.6% (flat qoq).
Solid non-interest income growth with well-controlled opex Non-interest income growth for 3Q16 was strong at 13% yoy and 2.3% qoq. Bad-debt recovery in 3Q16 was up marginally qoq. Fee income growth was 13% yoy and 2% qoq. 3Q16 cost-to-income ratio declined to 42.7% from 43.6% in 2Q16. Meanwhile, cost-to-income ratio for 9M16 was 43.4%, lower than our previous FY16F assumption of 47.7%. Also, its funding cost of 3.1% was lower than our expectation for 3Q16 (3.4% in 2Q16).
Raise FY16-18F EPS by 3.5-6.0% We raise our FY16-18F EPS forecasts on stronger non-interest income growth, higher net-interest margin and lower cost-to-income ratio. KTC’s debt collection process led to solid numbers in bad-debt recovery for the quarter. On top of that, KTC’s management said it would continue to focus on operating cost efficiency, which led to the well-controlled opex ratio in 3Q16. We forecast its pre-provision profit growth will be decent at 16.3%/7.7%/7.4% in FY16/17/18F.
Maintain Hold but raise target price to THB139 We maintain our Hold rating on KTC but raise our target price from THB123 to THB139, which is based on 3.0x FY17F P/BV (our GGM assumes LT ROE of 23% and COE of 10.3%) vs. Thai consumer finance peers’ 6.8x. We believe that its current valuation fairly reflects its solid earnings growth outlook in FY16-18F. Upside risk to our call is stronger-than-expected loan growth while downside risks could come from a spike in NPLs and more intense competition in the credit card industry.
▎Thailand
HOLD (no change) Consensus ratings*: Buy 8 Hold 5 Sell 1
Current price: THB152.0
Target price: THB139.0
Previous target: THB123.0
Up/downside: -8.6%
CIMB / Consensus: -6.0%
Reuters: KTC.BK
Bloomberg: KTC TB
Market cap: US$1,114m
THB39,191m
Average daily turnover: US$4.41m
THB153.5m
Current shares o/s: 257.8m
Free float: 35.0% *Source: Bloomberg
Key changes in this note
FY16F EPS increased by 6%.
FY17F EPS increased by 5%.
FY18F EPS increased by 3.5%.
Source: Bloomberg
Price performance 1M 3M 12M Absolute (%) 14.3 33.3 54.3
Relative (%) 13.4 33.5 48.3
Major shareholders % held Krung Thai Bank 49.5
Analyst(s)
Weerapat WONK-URAI
T (66) 2 657 9224 E [email protected]
SOURCE: COMPANY DATA, CIMB FORECASTS
Financial Summary Dec-14A Dec-15A Dec-16F Dec-17F Dec-18F
Net Interest Income (THBm) 7,272 8,012 9,396 10,330 11,207
Total Non-Interest Income (THBm) 5,228 5,848 6,578 7,000 7,575
Operating Revenue (THBm) 12,499 13,860 15,974 17,330 18,783
Total Provision Charges (THBm) (4,989) (5,183) (5,860) (6,316) (6,697)
Net Profit (THBm) 1,755 2,073 2,555 2,746 3,017
Core EPS (THB) 6.81 8.04 9.91 10.65 11.70
Core EPS Growth 68.4% 18.1% 23.3% 7.5% 9.9%
FD Core P/E (x) 22.33 18.91 15.34 14.27 12.99
DPS (THB) 2.75 3.25 4.00 4.30 4.73
Dividend Yield 1.81% 2.14% 2.63% 2.83% 3.11%
BVPS (THB) 28.58 33.87 39.77 46.12 53.10
P/BV (x) 5.32 4.49 3.82 3.30 2.86
ROE 26.0% 25.7% 26.9% 24.8% 23.6%
% Change In Core EPS Estimates 5.97% 4.93% 3.49%
CIMB/consensus EPS (x) 1.06 0.99 0.95
75
93
111
128
146
71
91
111
131
151
Price Close Relative to SET (RHS)
2
4
6
Oct-15 Jan-16 Apr-16 Jul-16
Vol m
18
Cement│Vietnam│Equity research│October 24, 2016
Company Note
THIS REPORT IS PREPARED IN ASSOCIATION WITH VNDIRECT SECURITIES CORPORATION. PLEASE SEE DISCLAIMER AND IMPORTANT NOTICES APPEARING AT THE END OF THIS DOCUMENT. IMPORTANT DISCLOSURES, INCLUDING ANY REQUIRED RESEARCH CERTIFICATIONS, ARE ALSO PROVIDED AT THE END OF THIS REPORT. IF THIS REPORT IS DISTRIBUTED IN THE UNITED STATES IT IS DISTRIBUTED BY CIMB SECURITIES (USA), INC. AND IS CONSIDERED THIRD-PARTY AFFILIATED RESEARCH.
Powered by the
EFA Platform
Ha Tien 1 Cement JSC Comments about HT1’s recent share price volatility
HT1’s share price surged by as much as 30% in the two weeks after the Brexit vote, ■but has been under pressure since the middle of July.
In the past, HT1’s stock price benefitted from a weak EUR/VND rate because the ■company borrows in EUR; but the EUR has been stronger than the market expected
Company-specific factors and high coal prices have also weighed on the stock. ■ We cut our FY16-18F EPS by 14-18% due to flat cement prices in Vietnam and ■margin pressure stemming from the outsourcing of some of HT1’s production.
We cut our target price, which is now based on 9x FY17F P/E, by 6%. ■
HT1’s share price surged after the Brexit vote… In early July, we believe local retail investors pushed up HT1’s share price on hopes that the Euro would weaken significantly in the wake of the Brexit vote, and on optimism that the company would realise a windfall gain from the sale of suburban land that was previously the site of an HT1 cement factory.
…but HT1 has been under pressure since mid-July HT1’s share price promptly retraced all of its post-Brexit gains as the EUR remained stronger than expected, while hopes of a windfall gain from the sale of land subsided. The company is likely to complete the sale of this land in FY16F, but the magnitude of the windfall gain could be less than what local investors are hoping for, in our view.
Some new factors have also put pressure on the share price HT1 was quite volatile last week, and sold off again today, which we believe is because: 1) foreign investors have been selling the stock, 2) investors are concerned HT1 will be encouraged by its SOE parent, VICEM, to acquire its new expensive cement factory, and 3) the significant rise in world coal prices over the past month dashed hopes that HT1 would be able to cut costs by importing coal at (previously low) world prices.
Production outsourcing raises multiple concerns We believe HT1 is likely to outsource more of its production to VICEM’s Ha Long cement factory this year, which is likely to depress its gross margin – we estimate that the company’s gross margin on outsourced cement is less than 1/3 of that for the cement it produces itself. Also, there are concerns that such an outsourcing agreement could be a precursor to a takeover of the Ha Long factory by HT1. The cost of building the Ha Long factory, which is only a few years old, over-ran its budget by nearly 70%.
We cut our earnings forecasts The likely impact of HT1’s outsourcing on its gross margins, together with a tempered forecast for cement prices has prompted us to cut our FY16-18F earnings forecasts by 14-18%. We previously expected a modest increase in cement prices this year, but we now expect unchanged cement prices, despite robust industry-wide volume sales (HT1’s volume sales are likely to grow by 19% in FY16F).
Maintain Add rating We maintain our Add rating, but lower our target price by 6% to VND 31,869, as we switched our valuation methodology from DCF to one based on 9x FY17F P/E (9% premium to HT1’s less efficient peers). Uncertainty about the possibility that HT1 may take over the Ha Long factory (which is the main downside risk to our Add rating) prompted us to change our valuation basis.
▎Vietnam
ADD (no change) Consensus ratings*: Buy 2 Hold 2 Sell 0
Current price: VND25,250
Target price: VND31,869
Previous target: VND33,900
Up/downside: 26.2%
CIMB / Consensus: -1.3%
Reuters: HT1.HM
Bloomberg: HT1 VN
Market cap: US$359.8m
VND8,028,288m
Average daily turnover: US$0.17m
VND3,835m
Current shares o/s: 318.0m
Free float: 20.3% *Source: Bloomberg
Key changes in this note
FY16-18F EPS reduced by 18%/13%/14%.
FY16-18F revenues reduced by 7%/13%/18%.
Source: Bloomberg
Price performance 1M 3M 12M Absolute (%) -8.9 -19.9 -2.9
Relative (%) -10.5 -25.3 -16.7
Major shareholders % held VICEM 79.7
Ha Tien Transport JSC 0.3
Vietin Bank 0.3
Analyst(s)
NGUYEN Xuan Huy
T (84) 90 912 3880 E [email protected]
SOURCE: COMPANY DATA, CIMB FORECASTS
Financial Summary Dec-14A Dec-15F Dec-16F Dec-17F Dec-18F
Revenue (VNDb) 6,758 7,608 8,650 8,836 9,034
Operating EBITDA (VNDb) 1,488 1,925 2,074 2,253 2,341
Net Profit (VNDb) 309 739 917 1,126 1,270
Core EPS (VND) 971 2,323 2,886 3,541 3,994
Core EPS Growth 9964% 139% 24% 23% 13%
FD Core P/E (x) 26.01 10.87 8.75 7.13 6.32
DPS (VND) - - - - -
Dividend Yield 0% 0% 0% 0% 0%
EV/EBITDA (x) 10.03 7.06 5.94 4.83 3.96
P/FCFE (x) 474.1 63.4 87.4 21.7 13.1
Net Gearing 187% 127% 81% 45% 17%
P/BV (x) 2.16 1.81 1.50 1.24 1.04
ROE 8.9% 18.1% 18.8% 19.1% 17.9%
% Change In Core EPS Estimates 0.0% (18.2%) (13.5%) (13.7%)
CIMB/consensus EPS (x) 0.99 1.04 1.00
71.0
89.8
108.5
127.3
22,000
27,000
32,000
37,000
Price Close Relative to VNINDEX (RHS)
200
400
600
800
Oct-15 Jan-16 Apr-16 Jul-16
Vo
l th
19
Gas Transmission & Dist│Vietnam│Equity research│October 24, 2016
Company Note
THIS REPORT IS PREPARED IN ASSOCIATION WITH VNDIRECT SECURITIES CORPORATION. PLEASE SEE DISCLAIMER AND IMPORTANT NOTICES APPEARING AT THE END OF THIS DOCUMENT. IMPORTANT DISCLOSURES, INCLUDING ANY REQUIRED RESEARCH CERTIFICATIONS, ARE ALSO PROVIDED AT THE END OF THIS REPORT. THIRD-PARTY AFFILIATED RESEARCH..
Powered by the
EFA Platform
PetroVietnam Gas Weak 9M16 results reinforce our Reduce call
GAS’s revenues fell 7.5% yoy in 9M16, while net profits fell 46.5% yoy. Note that ■GAS released unaudited results, which lacks some detailed information.
The company’s results deteriorated from 1H16, when net profits fell by 42% yoy and ■were also below consensus expectations for a circa 35% fall in PAT.
We estimate that regularly scheduled maintenance of GAS’s Nam Con Son pipeline ■caused maintenance expenses to double from 9M15 to 9M16.
Selling expenses surged, driven by GAS’s LPG business. ■ We maintain our Reduce rating on GAS, and our target price, which is based on ■FCFE (15% cost of equity). Potential de-rating catalysts include lower oil prices.
Nam Con Son maintenance continues to weigh on GAS’s earnings The expenses involved in the regularly scheduled, periodic maintenance of GAS’s Nam Con Son pipeline, helps to explain why the gross margins that the company earned in its dry gas business (60% of overall revenues) fell from ~29% in 9M15 to ~12% in 9M16. However, the maintenance, which is done every five years, resulted in the pipeline being inoperable for five days, so the growth in the volume of natural gas that GAS transported fell from 6% in 1H16 to 2% in 9M16.
Dry gas gross margins also depressed by low oil prices Although the gross margins in GAS’s dry gas business were depressed by the maintenance expenses discussed above, low oil prices were the main factor that depressed the gross margins in this business. GAS earns a spread between the price it pays for 80% of the natural gas it transports and sells to end users and the actual selling price to those users. However, ASP fell 13% yoy because selling prices are linked to oil prices, while input prices increased 2% yoy as per a pre-agreed schedule.
LPG business also depressed by higher oil price The revenues in GAS’s LPG business (31% of overall revenues) fell 14% yoy in 9M16 despite a ~7% increase in LPG volume sales because GAS’s LPG ASP fell ~18% yoy, driven by lower oil prices – although we note that world LPG prices fell by about 24% yoy. We estimate that gross margins in the LPG business increased slightly from 12% in 9M15 to 12.5% in 9M16 despite the fall in LPG prices owing to the company’s strong competency in trading LPG (GAS has one of the largest LPG storage facilities in Asia).
Higher selling expenses driven by LPG subsidiaries GAS’s SG&A/revenues ratio increased from 4.2% in 9M15 to 5% in 9M16, driven by a 25% yoy increase in the company’s overall selling expenses, which was in turn driven by a ~50% surge in the selling expenses of GAS’s two LPG subsidiaries, PGS and PVG. The surge in the selling expenses of those two subsidiaries reflects GAS’s ongoing efforts to build its retail LPG business, given its strong competency in trading LPG.
GAS’s 9M16 earnings fell short of consensus expectations We believe that most analysts were expecting a circa 35% yoy fall in earnings, and that higher maintenance expenses (which the company does not disclose), and higher SG&A were the main culprits for the shortfall.
We continue to rate GAS a Reduce GAS is trading at a lofty 22x FY16 P/E valuation versus an expected 31% yoy fall in FY16 earnings so we maintain our Reduce rating and our target price, which is based on FCFE. Upside risks include higher crude oil prices as the price that GAS sells most of its natural gas is linked to MFO prices (which move in tandem with oil prices).
▎Vietnam
REDUCE (no change) Consensus ratings*: Buy 1 Hold 3 Sell 3
Current price: VND68,100
Target price: VND45,600
Previous target: VND45,600
Up/downside: -33.0%
CIMB / Consensus: -14.4%
Reuters: GAS.HM
Bloomberg: GAS VN
Market cap: US$5,840m
VND130,299,000m
Average daily turnover: US$0.76m
VND16,910m
Current shares o/s: 1,895m
Free float: 3.2% *Source: Bloomberg
Key changes in this note
No change.
Source: Bloomberg
Price performance 1M 3M 12M Absolute (%) -0.7 10.7 44.6
Relative (%) -1.3 6.4 31.9
Major shareholders % held PetroVietnam Group 95.8
Analyst(s)
Hang VU
T (84) 98 881 2015 E [email protected]
SOURCE: COMPANY DATA, CIMB FORECASTS
Financial Summary Dec-14A Dec-15A Dec-16F Dec-17F Dec-18F
Revenue (VNDb) 73,375 64,300 57,266 63,747 72,237
Operating EBITDA (VNDb) 20,846 13,764 10,227 11,512 15,150
Net Profit (VNDb) 14,114 8,534 5,920 6,924 7,893
Core EPS (VND) 7,448 4,503 3,093 3,618 4,124
Core EPS Growth 14.9% (39.5%) (31.3%) 17.0% 14.0%
FD Core P/E (x) 9.14 15.12 21.80 18.64 16.35
DPS (VND) 4,000 3,500 3,000 3,000 3,000
Dividend Yield 5.87% 5.14% 4.41% 4.41% 4.41%
EV/EBITDA (x) 5.39 8.20 11.39 10.58 8.30
P/FCFE (x) 8.43 34.25 33.68 44.65 28.15
Net Gearing (48.3%) (41.4%) (35.4%) (22.6%) (13.1%)
P/BV (x) 3.59 3.14 3.15 3.06 2.91
ROE 40.7% 22.2% 14.4% 16.5% 18.1%
CIMB/consensus EPS (x) 0.92 0.90 0.93
70
97
123
150
25,000
45,000
65,000
85,000
Price Close Relative to VNINDEX (RHS)
1
2
3
Oct-15 Jan-16 Apr-16 Jul-16
Vol m
20
Asia Pacific Daily│Equity research│October 25, 2016
REGIONAL HEAD
Michael William GREENALL Regional Head of Research +60 (3) 2261 9088 [email protected]
COUNTRY HEADS OF RESEARCH
Ivy NG, CFA Siew Khee. LIM Erwan TEGUH Kasem PRUNRATANAMALA, CFA Michael KOKALARI, CFA Malaysia Singapore Indonesia Thailand Vietnam +60 (3) 2261 9073 +65 6210 8664 +62 (21) 3006 1720 +66 (2) 657 9221 +84 907 974408 [email protected] [email protected] [email protected] [email protected] [email protected] Bertram LAI Dohoon LEE Eric LIN Pramod AMTHE Joyce Anne, RAMOS Hong Kong/China South Korea Taiwan India Philippines +852 2532 1111 +82 (2) 6730 6121 +886 (2) 8729 8380 +91 (22) 6602-5167 +63 (2) 888 7293 [email protected] [email protected] [email protected] [email protected] [email protected] Coverage via partnership arrangement with Yolan SEIMON SB Equities Sri Lanka +94 (11) 2306273 [email protected] Coverage via partnership arrangement with John Keells Stock Brokers
REGIONAL SECTOR HEADS
KJ KWANG Ivy NG, CFA Raymond YAP, CFA Offshore & Marine Plantations Transportation +82 (2) 6730 6123 +60 (3) 2261 9073 +60 (3) 2261 9072 [email protected] [email protected] [email protected]
7
21
Asia Pacific Daily│Equity research│October 25, 2016
DISCLAIMER WJV#05 The content of this report (including the views and opinions expressed therein, and the information comprised therein) has been prepared by and belongs to CIMB save that (i) if it is a report written by the analyst(s) of John Keells Stock Brokers (“John Keells”), it belongs to John Keells; (ii) if it is a report written by the analyst(s) of SB Equities Inc (“SBE”), it belongs to SBE; and (iii) if it is a report written by the analyst(s) of Morgans Financial Limited (“Morgans”), it belongs to Morgans. This report is distributed by CIMB and in respect of sections of the report relating to (i), (ii) and/or (iii) aforesaid, it is distributed pursuant to an arrangement between John Keells, SBE and Morgans respectively and none of the aforesaid parties is an affiliate of CIMB. This report is not directed to, or intended for distribution to or use by, any person or entity who is a citizen or resident of or located in any locality, state, country or other jurisdiction where such distribution, publication, availability or use would be contrary to law or regulation. By accepting this report, the recipient hereof represents and warrants that he is entitled to receive such report in accordance with the restrictions set forth below and agrees to be bound by the limitations contained herein (including the “Restrictions on Distributions” set out below). Any failure to comply with these limitations may constitute a violation of law. This publication is being supplied to you strictly on the basis that it will remain confidential. No part of this report may be (i) copied, photocopied, duplicated, stored or reproduced in any form by any means or (ii) redistributed or passed on, directly or indirectly, to any other person in whole or in part, for any purpose without the prior written consent of CIMB. The information contained in this research report is prepared from data believed to be correct and reliable at the time of issue of this report. CIMB, John Keells, SBE and/or Morgans, as the case may be, may or may not issue regular reports on the subject matter of this report at any frequency and may cease to do so or change the periodicity of reports at any time. None of CIMB, John Keells, SBE or Morgans is under any obligation to update this report in the event of a material change to the information contained in this report. None of CIMB, John Keells, SBE or Morgans has any and none of them will accept any, obligation to (i) check or ensure that the contents of this report remain current, reliable or relevant, (ii) ensure that the content of this report constitutes all the information a prospective investor may require, (iii) ensure the adequacy, accuracy, completeness, reliability or fairness of any views, opinions and information, and accordingly, CIMB, John Keells, SBE and Morgans and their respective affiliates and related persons (and their respective directors, associates, connected persons and/or employees) shall not be liable in any manner whatsoever for any consequences (including but not limited to any direct, indirect or consequential losses, loss of profits and damages) of any reliance thereon or usage thereof. In particular, CIMB, John Keells, SBE and Morgans disclaim all responsibility and liability for the views and opinions set out in this report. Unless otherwise specified, this report is based upon reasonable sources. Such sources will, unless otherwise specified, for market data, be market data and prices available from the main stock exchange or market where the relevant security is listed, or, where appropriate, any other market. Information on the accounts and business of company(ies) will generally be based on published statements of the company(ies), information disseminated by regulatory information services, other publicly available information and information resulting from our research. Whilst every effort is made to ensure that statements of facts made in this report are accurate, all estimates, projections, forecasts, expressions of opinion and other subjective judgments contained in this report are based on assumptions considered to be reasonable as of the date of the document in which they are contained and must not be construed as a representation that the matters referred to therein will occur. Past performance is not a reliable indicator of future performance. The value of investments may go down as well as up and those investing may, depending on the investments in question, lose more than the initial investment. No report shall constitute an offer or an invitation by or on behalf of CIMB, John Keells, SBE or Morgans or their respective affiliates to any person to buy or sell any investments. CIMB, John Keells, SBE and/or Morgans and/or their respective affiliates and related companies, their directors, associates, connected parties and/or employees may own or have positions in securities of the company(ies) covered in this research report or any securities related thereto and may from time to time add to or dispose of, or may be materially interested in, any such securities. Further, CIMB, John Keells, SBE and/or Morgans and/or their respective affiliates and related companies do and seek to do business with the company(ies) covered in this research report and may from time to time act as market maker or have assumed an underwriting commitment in securities of such company(ies), may sell them to or buy them from customers on a principal basis and may also perform or seek to perform significant investment banking, advisory, underwriting or placement services for or relating to such company(ies) as well as solicit such investment, advisory or other services from any entity mentioned in this report. CIMB, John Keells, SBE and/or Morgans and/or their respective affiliates may enter into an agreement with the company(ies) covered in this report relating to the production of research reports. CIMB, John Keells, SBE and/or Morgans may disclose the contents of this report to the company(ies) covered by it and may have amended the contents of this report following such disclosure. The analyst responsible for the production of this report hereby certifies that the views expressed herein accurately and exclusively reflect his or her personal views and opinions about any and all of the issuers or securities analysed in this report and were prepared independently and autonomously. No part of the compensation of the analyst(s) was, is, or will be directly or indirectly related to the inclusion of specific recommendations(s) or view(s) in this report. The analyst(s) who prepared this research report are prohibited from receiving any compensation, incentive or bonus based on specific investment banking transactions or for providing a specific recommendation for, or view of, a particular company. Information barriers and other arrangements may be established where necessary to prevent conflicts of interests arising. However, the analyst(s) may receive compensation that is based on his/their coverage of company(ies) in the performance of his/their duties or the performance of his/their recommendations and the research personnel involved in the preparation of this report may also participate in the solicitation of the businesses as described above. In reviewing this research report, an investor should be aware that any or all of the foregoing, among other things, may give rise to real or potential conflicts of interest. Additional information is, subject to the duties of confidentiality, available on request. The term “John Keells Stock Brokers” shall, unless the context otherwise requires, mean each of John Keells Stock Brokers and its affiliates, subsidiaries and related companies. The term “SB Equities Inc.” shall, unless the context otherwise requires, mean each of SB Equities Inc. and its affiliates, subsidiaries and related companies. The term “Morgans Financial Limited” shall, unless the context otherwise requires, mean each of Morgans Financial Limited and its affiliates, subsidiaries and related companies. The term “CIMB” shall denote, where appropriate, the relevant entity distributing or disseminating the report in the particular jurisdiction referenced below, or, in every other case, CIMB Group Holdings Berhad ("CIMBGH") and its affiliates, subsidiaries and related companies.
8
22
Asia Pacific Daily│Equity research│October 25, 2016
Country CIMB Entity Regulated by Hong Kong CIMB Securities Limited Securities and Futures Commission Hong Kong India CIMB Securities (India) Private Limited Securities and Exchange Board of India (SEBI) Indonesia PT CIMB Securities Indonesia Financial Services Authority of Indonesia Malaysia CIMB Investment Bank Berhad Securities Commission Malaysia Singapore CIMB Research Pte. Ltd. Monetary Authority of Singapore South Korea CIMB Securities Limited, Korea Branch Financial Services Commission and Financial Supervisory Service Taiwan CIMB Securities Limited, Taiwan Branch Financial Supervisory Commission Thailand CIMB Securities (Thailand) Co. Ltd. Securities and Exchange Commission Thailand
Information in this report is a summary derived from individual research reports. As such, readers are directed to the individual research report or note to review the individual Research Analyst’s full analysis of the subject company. Important disclosures relating to the companies that are the subject of research reports published by CIMB, John Keells, SBE or Morgans, as the case may be, and the proprietary position by each of them and shareholdings of its Research Analysts’ who prepared the report in the securities of the company(s) are available in the individual research report. This report does not purport to contain all the information that a prospective investor may require. CIMB, John Keells, SBE and Morgans and their respective affiliates do not make any guarantee, representation or warranty, express or implied, as to the adequacy, accuracy, completeness, reliability or fairness of any such information and opinion contained in this report. None of CIMB, John Keells, SBE, Morgans and their respective affiliates and related persons shall be liable in any manner whatsoever for any consequences (including but not limited to any direct, indirect or consequential losses, loss of profits and damages) of any reliance thereon or usage thereof. This report is general in nature and has been prepared for information purposes only. It is intended for circulation amongst CIMB and its affiliates’ clients generally and does not have regard to the specific investment objectives, financial situation and the particular needs of any specific person who may receive this report. The information and opinions in this report are not and should not be construed or considered as an offer, recommendation or solicitation to buy or sell the subject securities, related investments or other financial instruments or any derivative instrument, or any rights pertaining thereto. Investors are advised to make their own independent evaluation of the information contained in this research report, consider their own individual investment objectives, financial situation and particular needs and consult their own professional and financial advisers as to the legal, business, financial, tax and other aspects before participating in any transaction in respect of the securities of company(ies) covered in this research report. The securities of such company(ies) may not be eligible for sale in all jurisdictions or to all categories of investors.
Australia : The distribution of this report is not an offer to buy or sell to any person within or outside Australia or a solicitation to any person within or outside of Australia to buy or sell any instrument described herein. This report is being issued outside Australia to a limited number of institutional investors and may not be provided to any person other than the original recipient and may not be reproduced or used for any other purposes. Canada: This research report has not been prepared in accordance with the disclosure requirements of Dealer Member Rule 3400 – Research Restrictions and Disclosure Requirements of the Investment Industry Regulatory Organization of Canada. For any research report distributed by CIBC, further disclosures related to CIBC conflicts of interest can be found at https://researchcentral.cibcwm.com . China: For the purpose of this report, the People’s Republic of China (“PRC”) does not include the Hong Kong Special Administrative Region, the Macau Special Administrative Region or Taiwan. The distributor of this report has not been approved or licensed by the China Securities Regulatory Commission or any other relevant regulatory authority or governmental agency in the PRC. This report contains only marketing information. The distribution of this report is not an offer to buy or sell to any person within or outside PRC or a solicitation to any person within or outside of PRC to buy or sell any instruments described herein. This report is being issued outside the PRC to a limited number of institutional investors and may not be provided to any person other than the original recipient and may not be reproduced or used for any other purpose. France: Only qualified investors within the meaning of French law shall have access to this report. This report shall not be considered as an offer to subscribe to, or used in connection with, any offer for subscription or sale or marketing or direct or indirect distribution of financial instruments and it is not intended as a solicitation for the purchase of any financial instrument. Germany: This report is only directed at persons who are professional investors as defined in sec 31a(2) of the German Securities Trading Act (WpHG). This publication constitutes research of a non-binding nature on the market situation and the investment instruments cited here at the time of the publication of the information. The current prices/yields in this issue are based upon closing prices from Bloomberg as of the day preceding publication. Please note that neither the German Federal Financial Supervisory Agency (BaFin), nor any other supervisory authority exercises any control over the content of this report. Hong Kong: This report is issued and distributed in Hong Kong by CIMB Securities Limited (“CHK”) which is licensed in Hong Kong by the Securities and Futures Commission for Type 1 (dealing in securities), Type 4 (advising on securities) and Type 6 (advising on corporate finance) activities. Any investors wishing to purchase or otherwise deal in the securities covered in this report should contact the Head of Sales at CIMB Securities Limited. The views and opinions in this research report are of CIMB, John Keells, SBE or Morgans, as the case may be, as of the date hereof and are subject to change. If the Financial Services and Markets Act of the United Kingdom or the rules of the Financial Conduct Authority apply to a recipient, our obligations owed to such recipient therein are unaffected. CHK has no obligation to update its opinion or the information in this research report. This publication is strictly confidential and is for private circulation only to clients of CHK. India: This report is issued and distributed in India by CIMB Securities (India) Private Limited (”CIMB India") which is registered with SEBI as a stock-broker under the Securities and Exchange Board of India (Stock Brokers and Sub-Brokers) Regulations, 1992, the Securities and Exchange Board of India (Research Analyst) Regulations, 2014 (SEBI Registration Number INH000000669) and in accordance with the provisions of Regulation 4 (g) of the Securities and Exchange Board of India (Investment Advisers) Regulations, 2013, CIMB India is not required
9
23
Asia Pacific Daily│Equity research│October 25, 2016
to seek registration with SEBI as an Investment Adviser. The research analysts, strategists or economists principally responsible for the preparation of this research report are segregated from equity stock broking and merchant banking of CIMB India and they have received compensation based upon various factors, including quality, accuracy and value of research, firm profitability or revenues, client feedback and competitive factors. Research analysts', strategists' or economists' compensation is not linked to investment banking or capital markets transactions performed or proposed to be performed by CIMB India or its affiliates.” Indonesia: This report is issued and distributed by PT CIMB Securities Indonesia (“CIMBI”). The views and opinions in this research report are our own as of the date hereof and are subject to change. If the Financial Services and Markets Act of the United Kingdom or the rules of the Financial Conduct Authority apply to a recipient, our obligations owed to such recipient therein are unaffected. CIMBI has no obligation to update its opinion or the information in this research report. Neither this report nor any copy hereof may be distributed in Indonesia or to any Indonesian citizens wherever they are domiciled or to Indonesian residents except in compliance with applicable Indonesian capital market laws and regulations. This research report is not an offer of securities in Indonesia. The securities referred to in this research report have not been registered with the Financial Services Authority (Otoritas Jasa Keuangan) pursuant to relevant capital market laws and regulations, and may not be offered or sold within the territory of the Republic of Indonesia or to Indonesian citizens through a public offering or in circumstances which constitute an offer within the meaning of the Indonesian capital market law and regulations. Ireland: CIMB is not an investment firm authorised in the Republic of Ireland and no part of this document should be construed as CIMB acting as, or otherwise claiming or representing to be, an investment firm authorised in the Republic of Ireland. Malaysia: This report is issued and distributed by CIMB Investment Bank Berhad (“CIMB”) solely for the benefit of and for the exclusive use of our clients. If the Financial Services and Markets Act of the United Kingdom or the rules of the Financial Conduct Authority apply to a recipient, our obligations owed to such recipient therein are unaffected. CIMB has no obligation to update, revise or reaffirm its opinion or the information in this research reports after the date of this report. New Zealand: In New Zealand, this report is for distribution only to persons who are wholesale clients pursuant to section 5C of the Financial Advisers Act 2008. Singapore: This report is issued and distributed by CIMB Research Pte Ltd (“CIMBR”). CIMBR is a financial adviser licensed under the Financial Advisers Act, Cap 110 (“FAA”) for advising on investment products, by issuing or promulgating research analyses or research reports, whether in electronic, print or other form. Accordingly CIMBR is a subject to the applicable rules under the FAA unless it is able to avail itself to any prescribed exemptions. Recipients of this report are to contact CIMB Research Pte Ltd, 50 Raffles Place, #19-00 Singapore Land Tower, Singapore in respect of any matters arising from, or in connection with this report. CIMBR has no obligation to update its opinion or the information in this research report. This publication is strictly confidential and is for private circulation only. If you have not been sent this report by CIMBR directly, you may not rely, use or disclose to anyone else this report or its contents. If the recipient of this research report is not an accredited investor, expert investor or institutional investor, CIMBR accepts legal responsibility for the contents of the report without any disclaimer limiting or otherwise curtailing such legal responsibility. If the recipient is an accredited investor, expert investor or institutional investor, the recipient is deemed to acknowledge that CIMBR is exempt from certain requirements under the FAA and its attendant regulations, and as such, is exempt from complying with the following : (a) Section 25 of the FAA (obligation to disclose product information); (b) Section 27 (duty not to make recommendation with respect to any investment product without having a reasonable basis where you may be reasonably expected to rely on the recommendation) of the FAA; (c) MAS Notice on Information to Clients and Product Information Disclosure [Notice No. FAA-N03]; (d) MAS Notice on Recommendation on Investment Products [Notice No. FAA-N16]; (e) Section 36 (obligation on disclosure of interest in securities), and (f) any other laws, regulations, notices, directive, guidelines, circulars and practice notes which are relates to the above, to the extent permitted by applicable laws, as may be amended from time to time, and any other laws, regulations, notices, directive, guidelines, circulars, and practice notes as we may notify you from time to time. In addition, the recipient who is an accredited investor, expert investor or institutional investor acknowledges that a CIMBR is exempt from Section 27 of the FAA, the recipient will also not be able to file a civil claim against CIMBR for any loss or damage arising from the recipient’s reliance on any recommendation made by CIMBR which would otherwise be a right that is available to the recipient under Section 27 of the FAA, the recipient will also not be able to file a civil claim against CIMBR for any loss or damage arising from the recipient’s reliance on any recommendation made by CIMBR which would otherwise be a right that is available to the recipient under Section 27 of the FAA. South Korea: This report is issued and distributed in South Korea by CIMB Securities Limited, Korea Branch (“CIMB Korea”) which is licensed as a cash equity broker, and regulated by the Financial Services Commission and Financial Supervisory Service of Korea. In South Korea, this report is for distribution only to professional investors under Article 9(5) of the Financial Investment Services and Capital Market Act of Korea (“FSCMA”). Spain: This document is a research report and it is addressed to institutional investors only. The research report is of a general nature and not personalised and does not constitute investment advice so, as the case may be, the recipient must seek proper advice before adopting any investment decision. This document does not constitute a public offering of securities. CIMB is not registered with the Spanish Comision Nacional del Mercado de Valores to provide investment services. Sweden: This report contains only marketing information and has not been approved by the Swedish Financial Supervisory Authority. The distribution of this report is not an offer to sell to any person in Sweden or a solicitation to any person in Sweden to buy any instruments described herein and may not be forwarded to the public in Sweden. Switzerland: This report has not been prepared in accordance with the recognized self-regulatory minimal standards for research reports of banks issued by the Swiss Bankers’ Association (Directives on the Independence of Financial Research).
10
24
Asia Pacific Daily│Equity research│October 25, 2016
Taiwan: This research report is not an offer or marketing of foreign securities in Taiwan. The securities as referred to in this research report have not been and will not be registered with the Financial Supervisory Commission of the Republic of China pursuant to relevant securities laws and regulations and may not be offered or sold within the Republic of China through a public offering or in circumstances which constitutes an offer or a placement within the meaning of the Securities and Exchange Law of the Republic of China that requires a registration or approval of the Financial Supervisory Commission of the Republic of China. Thailand: This report is issued and distributed by CIMB Securities (Thailand) Company Limited (“CIMBS”) based upon sources believed to be reliable (but their accuracy, completeness or correctness is not guaranteed). The statements or expressions of opinion herein were arrived at after due and careful consideration for use as information for investment. Such opinions are subject to change without notice and CIMBS has no obligation to update its opinion or the information in this research report. If the Financial Services and Markets Act of the United Kingdom or the rules of the Financial Conduct Authority apply to a recipient, our obligations owed to such recipient are unaffected. CIMB Securities (Thailand) Co., Ltd. may act or acts as Market Maker, and issuer and offerer of Derivative Warrants and Structured Note which may have the following securities as its underlying securities. Investors should carefully read and study the details of the derivative warrants in the prospectus before making investment decisions. AAV, ADVANC, AMATA, ANAN, AOT, AP, BA, BANPU, BBL, BCP, BDMS, BEAUTY, BEC, BEM, BH, BJCHI, BLA, BLAND, BTS, CBG, CENTEL, CHG, CK, CKP, CPALL, CPF, CPN, DELTA, DTAC, EARTH, EGCO, EPG, GL, GLOW, GPSC, GUNKUL, HANA, HMPRO, ICHI, INTUCH, IRPC, ITD, IVL, JAS, KBANK, KCE, KKP, KTB, KTC, LH, LHBANK, LPN, M, MAJOR, MINT, PLANB, PLAT, PS, PTG, PTT, PTTEP, PTTGC, QH, ROBINS, RS, S, SAMART, SAMTEL, SAWAD, SCB, SCC, SCCC, SCN, SGP, SIRI, SPALI, SPCG, STEC, STPI, SVI, TASCO, TCAP, THAI, THCOM, TICON, TISCO, TMB, TOP, TPIPL, TRUE, TTA, TTCL, TTW, TU, UNIQ, UV, VGI, VNG, WHA, WORK. Corporate Governance Report: The disclosure of the survey result of the Thai Institute of Directors Association (“IOD”) regarding corporate governance is made pursuant to the policy of the Office of the Securities and Exchange Commission. The survey of the IOD is based on the information of a company listed on the Stock Exchange of Thailand and the Market for Alternative Investment disclosed to the public and able to be accessed by a general public investor. The result, therefore, is from the perspective of a third party. It is not an evaluation of operation and is not based on inside information. The survey result is as of the date appearing in the Corporate Governance Report of Thai Listed Companies. As a result, the survey result may be changed after that date. CIMBS does not confirm nor certify the accuracy of such survey result.
Score Range: 90 - 100 80 - 89 70 - 79 Below 70 or No Survey Result Description: Excellent Very Good Good N/A
United Arab Emirates: The distributor of this report has not been approved or licensed by the UAE Central Bank or any other relevant licensing authorities or governmental agencies in the United Arab Emirates. This report is strictly private and confidential and has not been reviewed by, deposited or registered with UAE Central Bank or any other licensing authority or governmental agencies in the United Arab Emirates. This report is being issued outside the United Arab Emirates to a limited number of institutional investors and must not be provided to any person other than the original recipient and may not be reproduced or used for any other purpose. Further, the information contained in this report is not intended to lead to the sale of investments under any subscription agreement or the conclusion of any other contract of whatsoever nature within the territory of the United Arab Emirates. United Kingdom: In the United Kingdom and European Economic Area, this report is being disseminated by CIMB Securities (UK) Limited (“CIMB UK”). CIMB UK is authorized and regulated by the Financial Conduct Authority and its registered office is at 27 Knightsbridge, London, SW1X7YB. Unless specified to the contrary, this report has been issued and approved for distribution in the U.K. and the EEA by CIMB UK. Investment research issued by CIMB UK has been prepared in accordance with CIMB Group’s policies for managing conflicts of interest arising as a result of publication and distribution of investment research. This report is for distribution only to, and is solely directed at, selected persons on the basis that those persons: (a) are eligible counterparties and professional clients of CIMB UK; (b) have professional experience in matters relating to investments falling within Article 19(5) of the Financial Services and Markets Act 2000 (Financial Promotion) Order 2005 (as amended, the “Order”), (c) fall within Article 49(2)(a) to (d) (“high net worth companies, unincorporated associations etc”) of the Order; (d) are outside the United Kingdom subject to relevant regulation in each jurisdiction, or (e) are persons to whom an invitation or inducement to engage in investment activity (within the meaning of section 21 of the Financial Services and Markets Act 2000) in connection with any investments to which this report relates may otherwise lawfully be communicated or caused to be communicated (all such persons together being referred to as “relevant persons”). This report is directed only at relevant persons and must not be acted on or relied on by persons who are not relevant persons. Any investment or investment activity to which this report relates is available only to relevant persons and will be engaged in only with relevant persons. Where this report is labelled as non-independent, it does not provide an impartial or objective assessment of the subject matter and does not constitute independent “investment research” under the applicable rules of the Financial Conduct Authority in the UK. Consequently, any such non-independent report will not have been prepared in accordance with legal requirements designed to promote the independence of investment research and will not subject to any prohibition on dealing ahead of the dissemination of investment research. Any such non-independent report must be considered as a marketing communication. United States: This research report is distributed in the United States of America by CIMB Securities (USA) Inc, a U.S. registered broker-dealer and a related company of CIMB Research Pte Ltd, CIMB Investment Bank Berhad, PT CIMB Securities Indonesia, CIMB Securities (Thailand) Co. Ltd, CIMB Securities Limited, CIMB Securities (India) Private Limited, and is distributed solely to persons who qualify as “U.S. Institutional Investors” as defined in Rule 15a-6 under the Securities and Exchange Act of 1934. This communication is only for Institutional Investors whose ordinary business activities involve investing in shares, bonds, and associated securities and/or derivative securities and who have professional experience in such investments. Any person who is not a U.S. Institutional Investor or Major Institutional Investor must not rely on this communication. The delivery of this research report to any person in the United States of America is not a recommendation to effect any transactions in the securities discussed herein, or an endorsement of any opinion expressed herein. CIMB Securities (USA) Inc, is a FINRA/SIPC
11
25
Asia Pacific Daily│Equity research│October 25, 2016
member and takes responsibility for the content of this report. For further information or to place an order in any of the above-mentioned securities please contact a registered representative of CIMB Securities (USA) Inc. Other jurisdictions: In any other jurisdictions, except if otherwise restricted by laws or regulations, this report is only for distribution to professional, institutional or sophisticated investors as defined in the laws and regulations of such jurisdictions.
Corporate Governance Report of Thai Listed Companies (CGR). CG Rating by the Thai Institute of Directors Association (Thai IOD) in 2015, Anti-Corruption Progress Indicator 2015. AAV – Very Good, 3B, ADVANC – Excellent, 3A, AEONTS – Good, 1, AMATA – Very Good, 2, ANAN – Very Good, 3A, AOT – Very Good, 2, AP - Good, 3A, ASK – Very Good, 3B, ASP – Very Good, 4, BANPU – Very Good, 4, BAY – Very Good, 4, BBL – Very Good, 4, BCH – not available, no progress, BCP - Excellent, 5, BEM – not available, no progress, BDMS – Very Good, 3B, BEAUTY – Good, 2, BEC - Good, 3B, BH - Good, 2, BIGC - Excellent, 3A, BJC – Good, 1, BLA – Very Good, 4, 1, BTS - Excellent, 3A, CBG – Good, 1, CCET – not available, 1, CENTEL – Very Good, 3A, CHG – Good, 3B, CK – Excellent, 3B, COL – Very Good, 3A, CPALL – Good, 3A, CPF – Very Good, 3A, CPN - Excellent, 5, DELTA - Very Good, 3A, DEMCO – Very Good, 3A, DTAC – Excellent, 3A, EA – not available, 3A, ECL – Good, 4, EGCO - Excellent, 4, EPG – not available, 3B, GFPT - Very Good, 3A, GLOBAL – Very Good, 2, GLOW - Good, 3A, GPSC – not available, 3B, GRAMMY - Excellent, 3B, GUNKUL – Very Good, 1, HANA - Excellent, 4, HMPRO - Excellent, 3A, ICHI – Very Good, 3A, INTUCH - Excellent, 4, ITD – Good, 1, IVL - Excellent, 4, JAS – not available, 3A, JASIF – not available, no progress, JUBILE – Good, 3A, KAMART – not available, no progress, KBANK - Excellent, 4, KCE - Excellent, 4, KGI – Good, 4, KKP – Excellent, 4, KSL – Very Good, 2, KTB - Excellent, 4, KTC – Very Good, 3A, LH - Very Good, 3B, LPN – Excellent, 3A, M - Good, 2, MAJOR - Good, 1, MAKRO – Good, 3A, MALEE – not available, 2, MBKET – Good, 2, MC – Very Good, 3A, MCOT – Excellent, 3A, MEGA – Very Good, 2, MINT - Excellent, 3A, MTLS – Good, 2, NYT – Good, no progress, OISHI – Very Good, 3B, PLANB – Good, 3B, PS – Excellent, 3A, PSL - Excellent, 4, PTT - Excellent, 5, PTTEP - Excellent, 4, PTTGC - Excellent, 5, QH – Very Good, 2, RATCH – Excellent, 3A, ROBINS – Excellent, 3A, RS – Very Good, 1, SAMART - Excellent, 3B, SAPPE - Good, 3B, SAT – Excellent, 5, SAWAD – Good, 1, SC – Excellent, 3B, SCB - Excellent, 4, SCBLIF – not available, no progress, SCC – Excellent, 5, SCN – Good, 1, SCCC - Good, 3A, SIM - Excellent, 3B, SIRI - Good, 1, SPALI - Excellent, 3A, SPRC – not available, no progress, STA – Very Good, 1, STEC – Very Good, 3B, SVI – Very Good, 3A, TASCO – Very Good, 3A, TCAP – Very Good, 4, THAI – Very Good, 3A, THANI – Very Good, 5, THCOM – Excellent, 4, THRE – Very Good, 3A, THREL – Very Good, 3A, TICON – Very Good, 3A, TISCO - Excellent, 4, TK – Very Good, 3B, TKN – not available, no progress, TMB - Excellent, 4, TPCH – Good, 3B, TOP - Excellent, 5, TRUE – Very Good, 2, TTW – Very Good, 2, TU – Very Good, 3A, UNIQ – not available, 2, VGI – Excellent, 3A, WHA – Good, 3A, WORK – not available, no progress.
Comprises level 1 to 5 as follows: Level 1: Committed Level 2: Declared Level 3: Established (3A: Established by Declaration of Intent, 3B: Established by Internal Commitment and Policy) Level 4: Certified Level 5: Extended.
CIMB Recommendation Framework Stock Ratings Definition: Add The stock’s total return is expected to exceed 10% over the next 12 months. Hold The stock’s total return is expected to be between 0% and positive 10% over the next 12 months. Reduce The stock’s total return is expected to fall below 0% or more over the next 12 months. The total expected return of a stock is defined as the sum of the: (i) percentage difference between the target price and the current price and (ii) the forward net dividend yields of the stock. Stock price targets have an investment horizon of 12 months.
Sector Ratings Definition: Overweight An Overweight rating means stocks in the sector have, on a market cap-weighted basis, a positive absolute
recommendation. Neutral A Neutral rating means stocks in the sector have, on a market cap-weighted basis, a neutral absolute
recommendation. Underweight An Underweight rating means stocks in the sector have, on a market cap-weighted basis, a negative absolute
recommendation.
Country Ratings Definition: Overweight An Overweight rating means investors should be positioned with an above-market weight in this country relative to
benchmark. Neutral A Neutral rating means investors should be positioned with a neutral weight in this country relative to benchmark. Underweight An Underweight rating means investors should be positioned with a below-market weight in this country relative to
benchmark.
12
26