Embed Size (px)
Citation preview
Sector Note | Alpha series Financial Services │ Indonesia │ October 5, 2018
IMPORTANT DISCLOSURES, INCLUDING ANY REQUIRED RESEARCH CERTIFICATIONS, ARE PROVIDED AT THE END OF THIS REPORT. IF THIS REPORT IS DISTRIBUTED IN THE UNITED STATES IT IS DISTRIBUTED BY CGS-CIMB SECURITIES (USA), INC. AND IS CONSIDERED THIRD-PARTY AFFILIATED RESEARCH.
Powered by the EFA Platform
Banks Deep dive into corporate loans: positive takeaways from pricing and fundamentals
■ Based on our sample (51 companies), new loans since 2016 have been driven by SOE debtors. Surprisingly, most were funded by non-SOE lenders.
■ Most of the loans’ pricing has been adjusted up (c.55bp qoq/65bp YTD) following the rate hike in May; companies’ fundamentals remain robust.
■ We believe loans will be driven by the corporate segment going forward, benefitting banks with corporate exposure. Maintain Overweight.
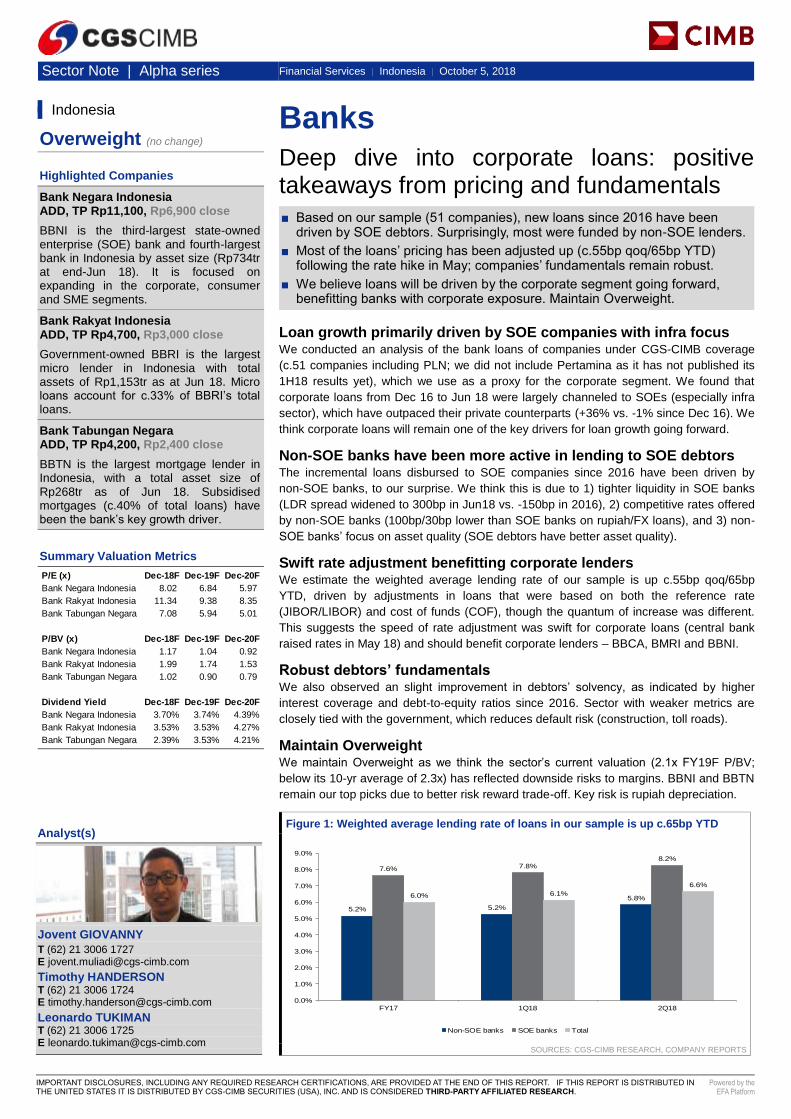
Loan growth primarily driven by SOE companies with infra focus We conducted an analysis of the bank loans of companies under CGS-CIMB coverage
(c.51 companies including PLN; we did not include Pertamina as it has not published its
1H18 results yet), which we use as a proxy for the corporate segment. We found that
corporate loans from Dec 16 to Jun 18 were largely channeled to SOEs (especially infra
sector), which have outpaced their private counterparts (+36% vs. -1% since Dec 16). We
think corporate loans will remain one of the key drivers for loan growth going forward.
Non-SOE banks have been more active in lending to SOE debtors The incremental loans disbursed to SOE companies since 2016 have been driven by
non-SOE banks, to our surprise. We think this is due to 1) tighter liquidity in SOE banks
(LDR spread widened to 300bp in Jun18 vs. -150bp in 2016), 2) competitive rates offered
by non-SOE banks (100bp/30bp lower than SOE banks on rupiah/FX loans), and 3) non-
SOE banks’ focus on asset quality (SOE debtors have better asset quality).
Swift rate adjustment benefitting corporate lenders We estimate the weighted average lending rate of our sample is up c.55bp qoq/65bp
YTD, driven by adjustments in loans that were based on both the reference rate
(JIBOR/LIBOR) and cost of funds (COF), though the quantum of increase was different.
This suggests the speed of rate adjustment was swift for corporate loans (central bank
raised rates in May 18) and should benefit corporate lenders – BBCA, BMRI and BBNI.
Robust debtors’ fundamentals We also observed an slight improvement in debtors’ solvency, as indicated by higher
interest coverage and debt-to-equity ratios since 2016. Sector with weaker metrics are
closely tied with the government, which reduces default risk (construction, toll roads).
Maintain Overweight We maintain Overweight as we think the sector’s current valuation (2.1x FY19F P/BV;
below its 10-yr average of 2.3x) has reflected downside risks to margins. BBNI and BBTN
remain our top picks due to better risk reward trade-off. Key risk is rupiah depreciation.
Figure 1: Weighted average lending rate of loans in our sample is up c.65bp YTD
SOURCES: CGS-CIMB RESEARCH, COMPANY REPORTS
Indonesia
Overweight (no change)
Highlighted Companies
Bank Negara Indonesia ADD, TP Rp11,100, Rp6,900 close
BBNI is the third-largest state-owned enterprise (SOE) bank and fourth-largest bank in Indonesia by asset size (Rp734tr at end-Jun 18). It is focused on expanding in the corporate, consumer and SME segments.
Bank Rakyat Indonesia ADD, TP Rp4,700, Rp3,000 close
Government-owned BBRI is the largest micro lender in Indonesia with total assets of Rp1,153tr as at Jun 18. Micro loans account for c.33% of BBRI’s total loans.
Bank Tabungan Negara ADD, TP Rp4,200, Rp2,400 close
BBTN is the largest mortgage lender in Indonesia, with a total asset size of Rp268tr as of Jun 18. Subsidised mortgages (c.40% of total loans) have been the bank’s key growth driver.
Summary Valuation Metrics
Insert
Analyst(s)
Jovent GIOVANNY
T (62) 21 3006 1727 E [email protected]
Timothy HANDERSON T (62) 21 3006 1724 E [email protected]
Leonardo TUKIMAN T (62) 21 3006 1725 E [email protected]
P/E (x) Dec-18F Dec-19F Dec-20F
Bank Negara Indonesia 8.02 6.84 5.97
Bank Rakyat Indonesia 11.34 9.38 8.35
Bank Tabungan Negara 7.08 5.94 5.01
P/BV (x) Dec-18F Dec-19F Dec-20F
Bank Negara Indonesia 1.17 1.04 0.92
Bank Rakyat Indonesia 1.99 1.74 1.53
Bank Tabungan Negara 1.02 0.90 0.79
Dividend Yield Dec-18F Dec-19F Dec-20F
Bank Negara Indonesia 3.70% 3.74% 4.39%
Bank Rakyat Indonesia 3.53% 3.53% 4.27%
Bank Tabungan Negara 2.39% 3.53% 4.21%
Title:
Source:
Please fill in the values above to have them entered in your report
5.2% 5.2%
5.8%
7.6% 7.8%8.2%
6.0% 6.1%
6.6%
0.0%
1.0%
2.0%
3.0%
4.0%
5.0%
6.0%
7.0%
8.0%
9.0%
FY17 1Q18 2Q18
Non-SOE banks SOE banks Total
Financial Services │ Indonesia
Banks │ October 5, 2018
2
Loan growth primarily driven by SOE companies with infra focus
We conducted an analysis on the bank loans of companies under our coverage,
which we view as a proxy to Indonesia’s corporate segment. For the purpose of
this report, we gathered the bank loan data for 51 debtors (50 listed companies
under our coverage + PLN; we did not include Pertamina (the National Oil and
Gas company) as it has yet to publish its 1H18 financial statements), which
represents c.23% of the big 4 banks’ corporate loans in aggregate (c.10% of
system loans).
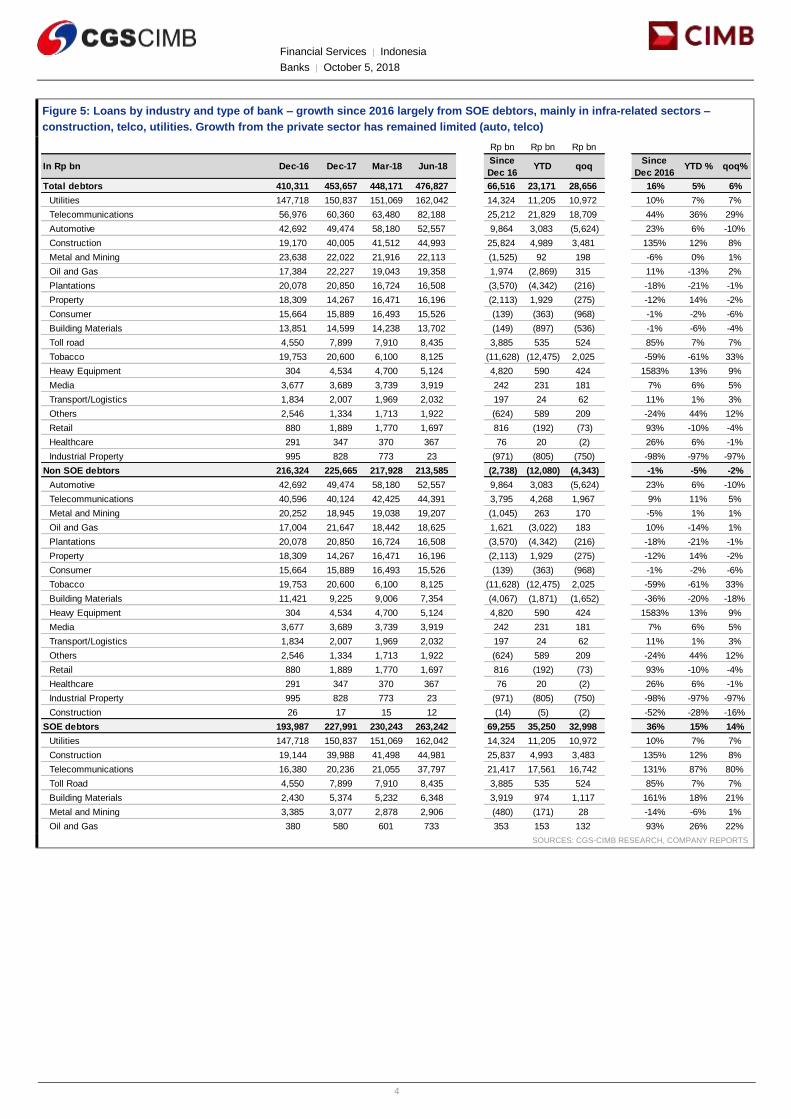
We found that corporate loans between Dec 16 to Jun 18 were largely
channeled to SOE companies (especially in the infra sector), which outpaced its
private counterparts, in line with the overall economy. Within our sample, we
found that the loan disbursement was strongest towards 1) infra-related sectors
(i.e. SOE contractors), 2) telco companies and 3) utilities (i.e. the national
electricity company – PLN). On the private sector side, however, growth has
been limited based on our checks, with auto, telco, retail, and heavy equipment
the only notable sectors that posted growth YTD.
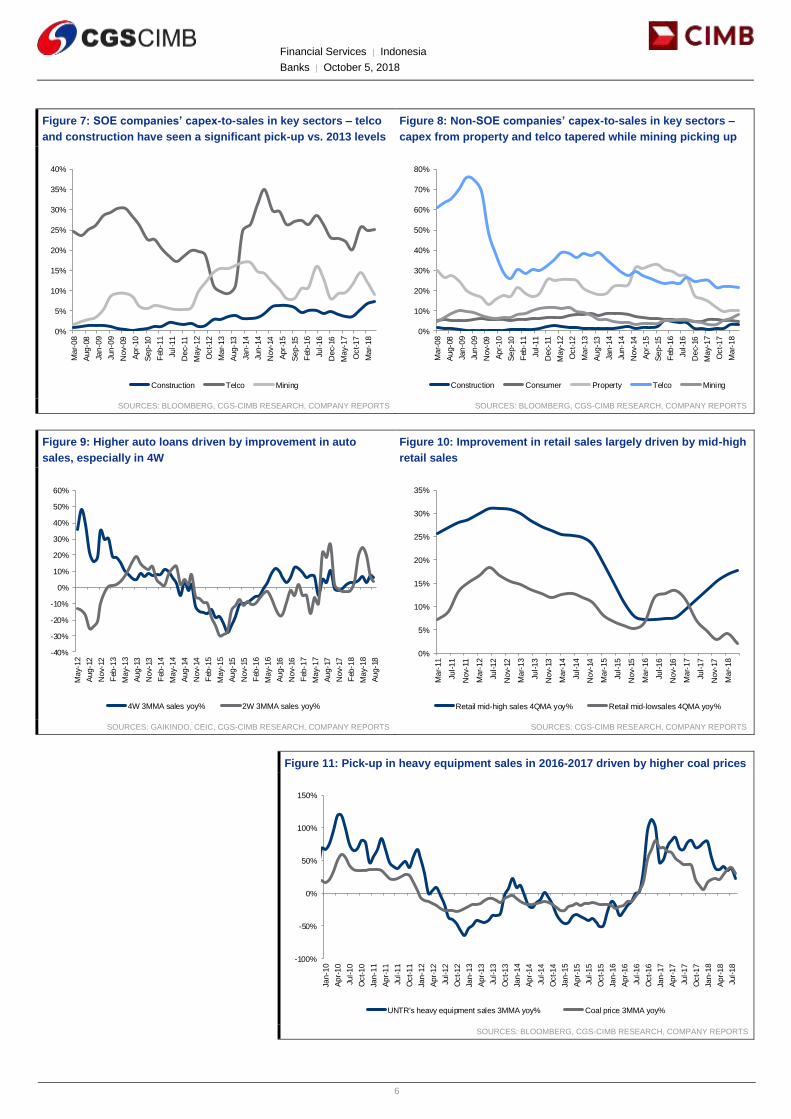
We believe that growth from these sectors is in line with improving fundamentals
related to the respective sectors (e.g. aggregate 4W and 2W unit sales grew by
9% yoy in 8M18; the retail segment – especially mid-high – posted robust growth
while heavy equipment sales grew by 34% yoy, in line with improving conditions
in the mining sector).
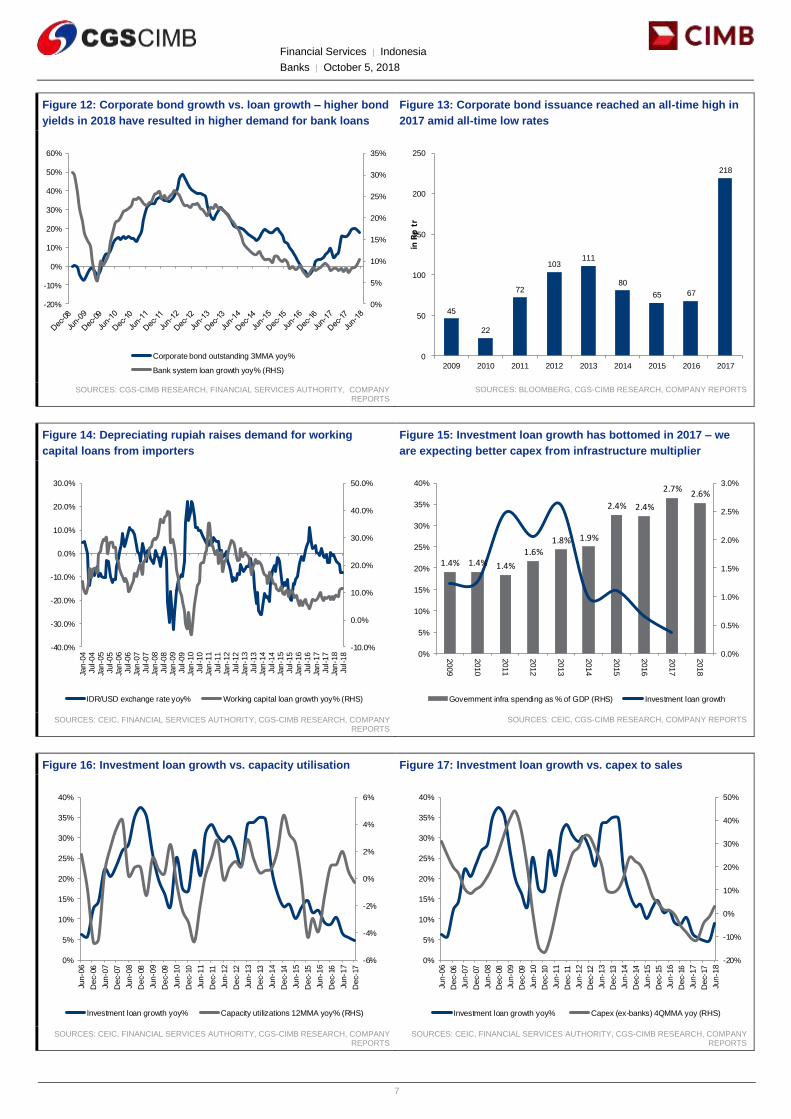
Going forward, we think corporate loans could remain one of the key drivers for
overall loan growth amid: 1) rising bond yield (which made large corporate
debtors unable to issue bonds), 2) rupiah depreciation which also increases
working capital demand for importers, and 3) new capex cycle from
infrastructure multiplier. Thus, we believe that banks with a better liquidity profile
are set to be the main beneficiaries.
Figure 2: Corporate loans – our sample accounts for c.23% of the big 4’s corporate
loan
SOURCES: CGS-CIMB RESEARCH, COMPANY REPORTS
Figure 3: Big 4 corporate loan growth yoy vs. Indonesia’s 10-year bond yield
SOURCES: CGS-CIMB RESEARCH, COMPANY REPORTS
2Q18 (Rp bn) Sample Total corp loan as % of total corporate loan
BMRI 74,031 296,800 25%
BBRI 49,536 192,000 26%
BBNI 41,786 225,369 19%
BBCA 38,796 191,433 20%
Total 204,149 905,602 23%
Title:
Source:
Please fill in the values above to have them entered in your report
5.0%
5.5%
6.0%
6.5%
7.0%
7.5%
8.0%
8.5%
9.0%
9.5%
10.0%
0.0%
5.0%
10.0%
15.0%
20.0%
25.0%
30.0%
35.0%
40.0%
Big 4 corporate loan growth yoy% Indo 10-year bond yield (RHS)
Financial Services │ Indonesia
Banks │ October 5, 2018
3
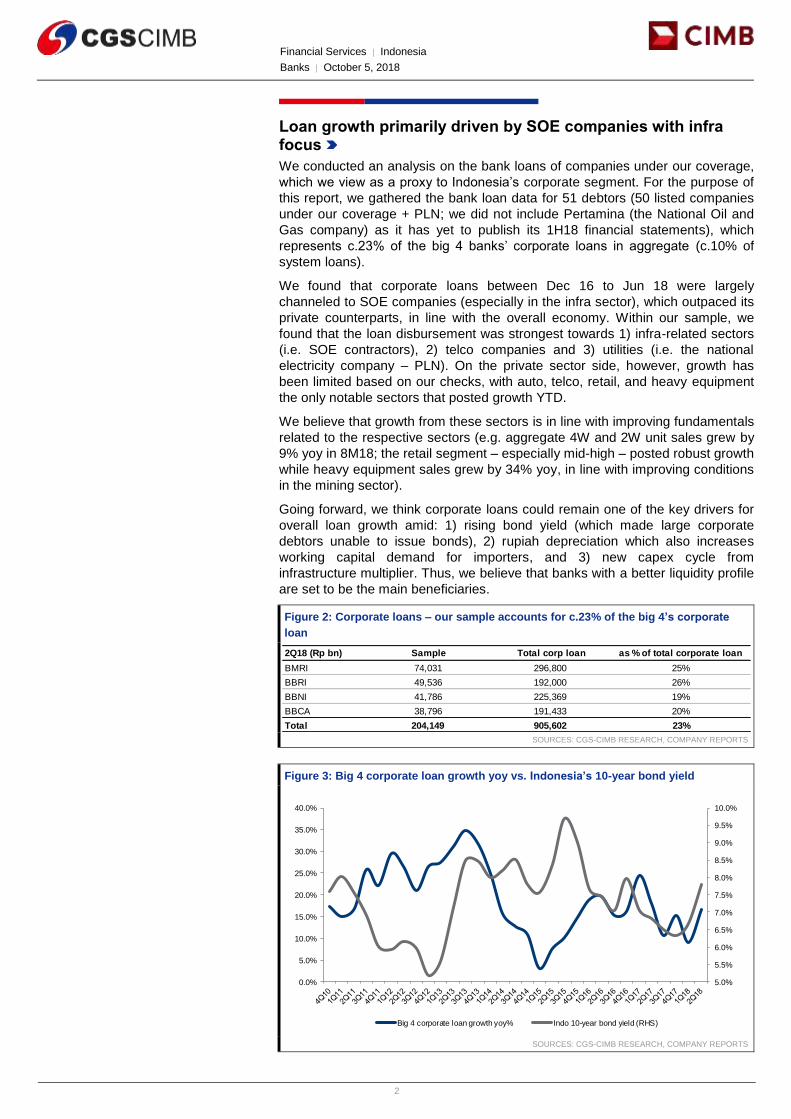
Figure 4: List of debtor and creditors in our sample
SOURCES: CGS-CIMB RESEARCH, COMPANY REPORTS
NoList of debtors under our sample
(sorted by exposure as of 2Q18)No
List of banks under our sample
(sorted by exposure as of 2Q18)
1 PLN
2 Astra International (ASII) 1 Mandiri
3 Telkom Indonesia (TLKM) 2 BRI
4 Waskita Karya (WSKT) 3 BNI
5 Medco Energi Internasional (MEDC) 4 BTN
6 Adaro Energy (ADRO)
7 Tower Bersama Infrastructure (TOWR) 1 BCA
8 XL Axiata (EXCL) 2 Sumitomo Mitsui Banking Corporation
9 Sarana Menara Nusantara (TOWR) 3 MUFG
10 Jasa Marga (JSMR) 4 DBS
11 Solusi Tunas Pratama (SUPR) 5 OCBC
12 Wijaya Karya (WIKA) 6 Mizuho
13 Holcim Indonesia (SMCB) 7 CIMB Niaga
14 Semen Indonesia (SMGR) 8 Export Import Bank of China
15 Perusahaan Gas Negara (PGAS) 9 Japan Bank for International Cooperation
16 Gudang Garam (GGRM) 10 Bank of China
17 Eagle High Plantations (BWPT) 11 Maybank
18 Ciputra Development (CTRA) 12 China Development Bank
19 Salim Ivomas Pratama (SIMP) 13 Asian Development Bank
20 Astra Agro Lestari (AALI) 14 Sarulla Lenders Consortium (JBIC, ADB, etc)
21 Summarecon Agung (SMRA) 15 Export Development Canada
22 Unilever Indoensia (UNVR) 16 Others (70 other non-SOE banks/institutions)
23 Charoen Pokphand Indonesia (CPIN)
24 Mayora Indah (MYOR)
25 Media Nusantara Citra Tbk (MNCN)
26 Bumi Serpong Damai (BSDE)
27 United Tractors (UNTR)
28 Aneka Tambang (ANTM)
29 Adi Sarana Armada (ASSA)
30 AKR Corporindo (AKRA)
31 Pakuwon Jati (PWON)
32 Malindo Feedmill (MAIN)
33 Indofood CBP Sukses Makmur (ICBP)
34 Indosat (ISAT)
35 Delta Dunia Makmur (DOID)
36 Adhi Karya (ADHI)
37 Mitra Adi Perkasa (MAPI)
38 Elnusa (ELSA)
39 Vale Indonesia (VALE)
40 Sarimelati Kencana (PZZA)
41 Kalbe Farma (KLBF)
42 Arwana Citramulia (ARNA)
43 Bukit Asam (PTBA)
44 Jaya Real Property (JRPT)
45 Surya Semesta Internusa (SSIA)
46 Mitra Keluarga Karyasehat (MIKA)
47 Total Bangunan Persada (TOTL)
48 Surya Citra Media (SCMA)
49 Siloam International Hospitals (SILO)
50 Supra Boga Lestari (RANC)
51 Link Net (LINK)
SOE banks
Non-SOE banks
Financial Services │ Indonesia
Banks │ October 5, 2018
4
Figure 5: Loans by industry and type of bank – growth since 2016 largely from SOE debtors, mainly in infra-related sectors –
construction, telco, utilities. Growth from the private sector has remained limited (auto, telco)
SOURCES: CGS-CIMB RESEARCH, COMPANY REPORTS
Rp bn Rp bn Rp bn
In Rp bn Dec-16 Dec-17 Mar-18 Jun-18Since
Dec 16YTD qoq
Since
Dec 2016YTD % qoq%
Total debtors 410,311 453,657 448,171 476,827 66,516 23,171 28,656 16% 5% 6%
Utilities 147,718 150,837 151,069 162,042 14,324 11,205 10,972 10% 7% 7%
Telecommunications 56,976 60,360 63,480 82,188 25,212 21,829 18,709 44% 36% 29%
Automotive 42,692 49,474 58,180 52,557 9,864 3,083 (5,624) 23% 6% -10%
Construction 19,170 40,005 41,512 44,993 25,824 4,989 3,481 135% 12% 8%
Metal and Mining 23,638 22,022 21,916 22,113 (1,525) 92 198 -6% 0% 1%
Oil and Gas 17,384 22,227 19,043 19,358 1,974 (2,869) 315 11% -13% 2%
Plantations 20,078 20,850 16,724 16,508 (3,570) (4,342) (216) -18% -21% -1%
Property 18,309 14,267 16,471 16,196 (2,113) 1,929 (275) -12% 14% -2%
Consumer 15,664 15,889 16,493 15,526 (139) (363) (968) -1% -2% -6%
Building Materials 13,851 14,599 14,238 13,702 (149) (897) (536) -1% -6% -4%
Toll road 4,550 7,899 7,910 8,435 3,885 535 524 85% 7% 7%
Tobacco 19,753 20,600 6,100 8,125 (11,628) (12,475) 2,025 -59% -61% 33%
Heavy Equipment 304 4,534 4,700 5,124 4,820 590 424 1583% 13% 9%
Media 3,677 3,689 3,739 3,919 242 231 181 7% 6% 5%
Transport/Logistics 1,834 2,007 1,969 2,032 197 24 62 11% 1% 3%
Others 2,546 1,334 1,713 1,922 (624) 589 209 -24% 44% 12%
Retail 880 1,889 1,770 1,697 816 (192) (73) 93% -10% -4%
Healthcare 291 347 370 367 76 20 (2) 26% 6% -1%
Industrial Property 995 828 773 23 (971) (805) (750) -98% -97% -97%
Non SOE debtors 216,324 225,665 217,928 213,585 (2,738) (12,080) (4,343) -1% -5% -2%
Automotive 42,692 49,474 58,180 52,557 9,864 3,083 (5,624) 23% 6% -10%
Telecommunications 40,596 40,124 42,425 44,391 3,795 4,268 1,967 9% 11% 5%
Metal and Mining 20,252 18,945 19,038 19,207 (1,045) 263 170 -5% 1% 1%
Oil and Gas 17,004 21,647 18,442 18,625 1,621 (3,022) 183 10% -14% 1%
Plantations 20,078 20,850 16,724 16,508 (3,570) (4,342) (216) -18% -21% -1%
Property 18,309 14,267 16,471 16,196 (2,113) 1,929 (275) -12% 14% -2%
Consumer 15,664 15,889 16,493 15,526 (139) (363) (968) -1% -2% -6%
Tobacco 19,753 20,600 6,100 8,125 (11,628) (12,475) 2,025 -59% -61% 33%
Building Materials 11,421 9,225 9,006 7,354 (4,067) (1,871) (1,652) -36% -20% -18%
Heavy Equipment 304 4,534 4,700 5,124 4,820 590 424 1583% 13% 9%
Media 3,677 3,689 3,739 3,919 242 231 181 7% 6% 5%
Transport/Logistics 1,834 2,007 1,969 2,032 197 24 62 11% 1% 3%
Others 2,546 1,334 1,713 1,922 (624) 589 209 -24% 44% 12%
Retail 880 1,889 1,770 1,697 816 (192) (73) 93% -10% -4%
Healthcare 291 347 370 367 76 20 (2) 26% 6% -1%
Industrial Property 995 828 773 23 (971) (805) (750) -98% -97% -97%
Construction 26 17 15 12 (14) (5) (2) -52% -28% -16%
SOE debtors 193,987 227,991 230,243 263,242 69,255 35,250 32,998 36% 15% 14%
Utilities 147,718 150,837 151,069 162,042 14,324 11,205 10,972 10% 7% 7%
Construction 19,144 39,988 41,498 44,981 25,837 4,993 3,483 135% 12% 8%
Telecommunications 16,380 20,236 21,055 37,797 21,417 17,561 16,742 131% 87% 80%
Toll Road 4,550 7,899 7,910 8,435 3,885 535 524 85% 7% 7%
Building Materials 2,430 5,374 5,232 6,348 3,919 974 1,117 161% 18% 21%
Metal and Mining 3,385 3,077 2,878 2,906 (480) (171) 28 -14% -6% 1%
Oil and Gas 380 580 601 733 353 153 132 93% 26% 22%
Financial Services │ Indonesia
Banks │ October 5, 2018
5
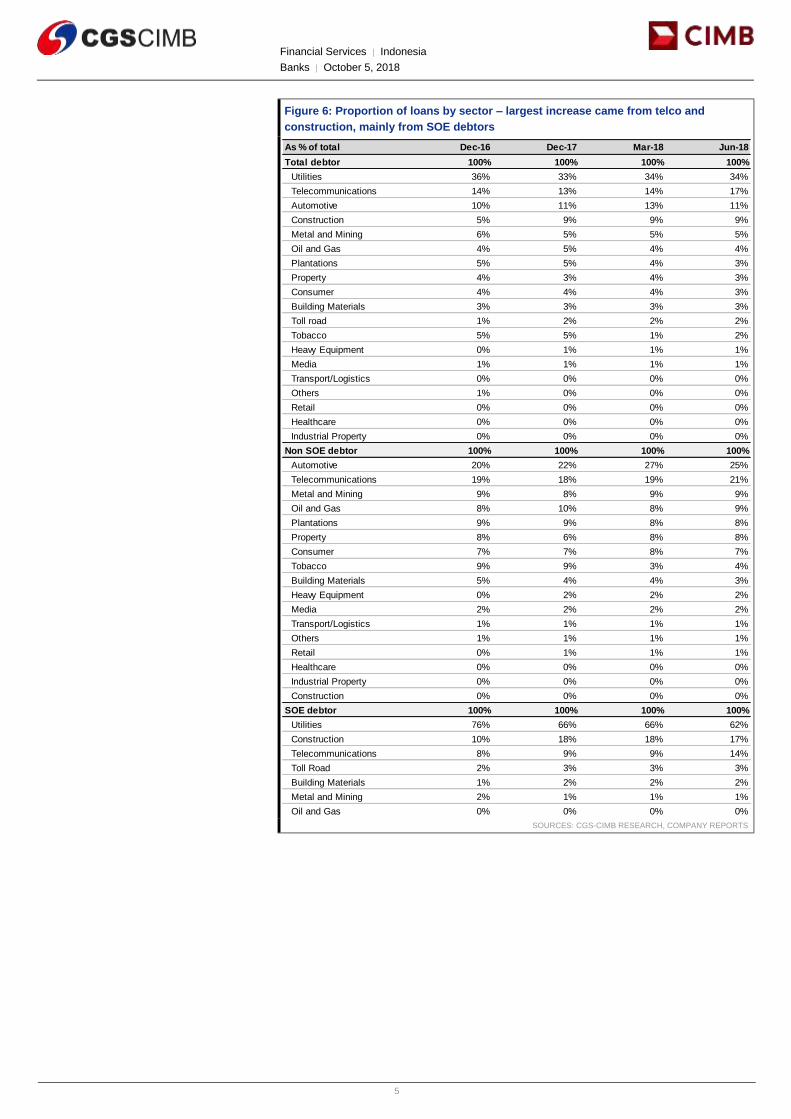
Figure 6: Proportion of loans by sector – largest increase came from telco and
construction, mainly from SOE debtors
SOURCES: CGS-CIMB RESEARCH, COMPANY REPORTS
As % of total Dec-16 Dec-17 Mar-18 Jun-18
Total debtor 100% 100% 100% 100%
Utilities 36% 33% 34% 34%
Telecommunications 14% 13% 14% 17%
Automotive 10% 11% 13% 11%
Construction 5% 9% 9% 9%
Metal and Mining 6% 5% 5% 5%
Oil and Gas 4% 5% 4% 4%
Plantations 5% 5% 4% 3%
Property 4% 3% 4% 3%
Consumer 4% 4% 4% 3%
Building Materials 3% 3% 3% 3%
Toll road 1% 2% 2% 2%
Tobacco 5% 5% 1% 2%
Heavy Equipment 0% 1% 1% 1%
Media 1% 1% 1% 1%
Transport/Logistics 0% 0% 0% 0%
Others 1% 0% 0% 0%
Retail 0% 0% 0% 0%
Healthcare 0% 0% 0% 0%
Industrial Property 0% 0% 0% 0%
Non SOE debtor 100% 100% 100% 100%
Automotive 20% 22% 27% 25%
Telecommunications 19% 18% 19% 21%
Metal and Mining 9% 8% 9% 9%
Oil and Gas 8% 10% 8% 9%
Plantations 9% 9% 8% 8%
Property 8% 6% 8% 8%
Consumer 7% 7% 8% 7%
Tobacco 9% 9% 3% 4%
Building Materials 5% 4% 4% 3%
Heavy Equipment 0% 2% 2% 2%
Media 2% 2% 2% 2%
Transport/Logistics 1% 1% 1% 1%
Others 1% 1% 1% 1%
Retail 0% 1% 1% 1%
Healthcare 0% 0% 0% 0%
Industrial Property 0% 0% 0% 0%
Construction 0% 0% 0% 0%
SOE debtor 100% 100% 100% 100%
Utilities 76% 66% 66% 62%
Construction 10% 18% 18% 17%
Telecommunications 8% 9% 9% 14%
Toll Road 2% 3% 3% 3%
Building Materials 1% 2% 2% 2%
Metal and Mining 2% 1% 1% 1%
Oil and Gas 0% 0% 0% 0%
Financial Services │ Indonesia
Banks │ October 5, 2018
6
Figure 7: SOE companies’ capex-to-sales in key sectors – telco
and construction have seen a significant pick-up vs. 2013 levels
Figure 8: Non-SOE companies’ capex-to-sales in key sectors –
capex from property and telco tapered while mining picking up
SOURCES: BLOOMBERG, CGS-CIMB RESEARCH, COMPANY REPORTS SOURCES: BLOOMBERG, CGS-CIMB RESEARCH, COMPANY REPORTS
Figure 9: Higher auto loans driven by improvement in auto
sales, especially in 4W
Figure 10: Improvement in retail sales largely driven by mid-high
retail sales
SOURCES: GAIKINDO, CEIC, CGS-CIMB RESEARCH, COMPANY REPORTS SOURCES: CGS-CIMB RESEARCH, COMPANY REPORTS
Figure 11: Pick-up in heavy equipment sales in 2016-2017 driven by higher coal prices
SOURCES: BLOOMBERG, CGS-CIMB RESEARCH, COMPANY REPORTS
Title:
Source:
Please fill in the values above to have them entered in your report
0%
5%
10%
15%
20%
25%
30%
35%
40%
Mar-
08
Aug-0
8
Jan-0
9
Jun-0
9
Nov-
09
Apr-
10
Sep-1
0
Feb
-11
Jul-11
Dec-
11
May-
12
Oct-12
Mar-
13
Aug-1
3
Jan-1
4
Jun-1
4
Nov-
14
Apr-
15
Sep-1
5
Feb
-16
Jul-16
Dec-
16
May-
17
Oct-17
Mar-
18
Construction Telco Mining
Title:
Source:
Please fill in the values above to have them entered in your report
0%
10%
20%
30%
40%
50%
60%
70%
80%
Mar-
08
Aug-0
8
Jan-0
9
Jun-0
9
Nov-
09
Apr-
10
Sep-1
0
Feb
-11
Jul-11
Dec-
11
May-
12
Oct-12
Mar-
13
Aug-1
3
Jan-1
4
Jun-1
4
Nov-
14
Apr-
15
Sep-1
5
Feb
-16
Jul-16
Dec-
16
May-
17
Oct-17
Mar-
18
Construction Consumer Property Telco Mining
Title:
Source:
Please fill in the values above to have them entered in your report
-40%
-30%
-20%
-10%
0%
10%
20%
30%
40%
50%
60%
May-
12
Aug-1
2
Nov-
12
Feb
-13
May-
13
Aug-1
3
Nov-
13
Feb
-14
May-
14
Aug-1
4
Nov-
14
Feb
-15
May-
15
Aug-1
5
Nov-
15
Feb
-16
May-
16
Aug-1
6
Nov-
16
Feb
-17
May-
17
Aug-1
7
Nov-
17
Feb
-18
May-
18
Aug-1
8
4W 3MMA sales yoy% 2W 3MMA sales yoy%
Title:
Source:
Please fill in the values above to have them entered in your report
0%
5%
10%
15%
20%
25%
30%
35%
Mar-
11
Jul-11
Nov-
11
Mar-
12
Jul-12
Nov-
12
Mar-
13
Jul-13
Nov-
13
Mar-
14
Jul-14
Nov-
14
Mar-
15
Jul-15
Nov-
15
Mar-
16
Jul-16
Nov-
16
Mar-
17
Jul-17
Nov-
17
Mar-
18
Retail mid-high sales 4QMA yoy% Retail mid-lowsales 4QMA yoy%
Title:
Source:
Please fill in the values above to have them entered in your report
-100%
-50%
0%
50%
100%
150%
Jan-1
0
Apr-
10
Jul-10
Oct-10
Jan-1
1
Apr-
11
Jul-11
Oct-11
Jan-1
2
Apr-
12
Jul-12
Oct-12
Jan-1
3
Apr-
13
Jul-13
Oct-13
Jan-1
4
Apr-
14
Jul-14
Oct-14
Jan-1
5
Apr-
15
Jul-15
Oct-15
Jan-1
6
Apr-
16
Jul-16
Oct-16
Jan-1
7
Apr-
17
Jul-17
Oct-17
Jan-1
8
Apr-
18
Jul-18
UNTR's heavy equipment sales 3MMA yoy% Coal price 3MMA yoy%
Financial Services │ Indonesia
Banks │ October 5, 2018
7
Figure 12: Corporate bond growth vs. loan growth – higher bond
yields in 2018 have resulted in higher demand for bank loans
Figure 13: Corporate bond issuance reached an all-time high in
2017 amid all-time low rates
SOURCES: CGS-CIMB RESEARCH, FINANCIAL SERVICES AUTHORITY, COMPANY
REPORTS SOURCES: BLOOMBERG, CGS-CIMB RESEARCH, COMPANY REPORTS
Figure 14: Depreciating rupiah raises demand for working
capital loans from importers
Figure 15: Investment loan growth has bottomed in 2017 – we
are expecting better capex from infrastructure multiplier
SOURCES: CEIC, FINANCIAL SERVICES AUTHORITY, CGS-CIMB RESEARCH, COMPANY
REPORTS SOURCES: CEIC, CGS-CIMB RESEARCH, COMPANY REPORTS
Figure 16: Investment loan growth vs. capacity utilisation Figure 17: Investment loan growth vs. capex to sales
SOURCES: CEIC, FINANCIAL SERVICES AUTHORITY, CGS-CIMB RESEARCH, COMPANY
REPORTS SOURCES: CEIC, FINANCIAL SERVICES AUTHORITY, CGS-CIMB RESEARCH, COMPANY
REPORTS
Title:
Source:
Please fill in the values above to have them entered in your report
0%
5%
10%
15%
20%
25%
30%
35%
-20%
-10%
0%
10%
20%
30%
40%
50%
60%
Corporate bond outstanding 3MMA yoy%
Bank system loan growth yoy% (RHS)
Title:
Source:
Please fill in the values above to have them entered in your report
45
22
72
103 111
80
65 67
218
0
50
100
150
200
250
2009 2010 2011 2012 2013 2014 2015 2016 2017
in R
p t
r
Title:
Source:
Please fill in the values above to have them entered in your report
-10.0%
0.0%
10.0%
20.0%
30.0%
40.0%
50.0%
-40.0%
-30.0%
-20.0%
-10.0%
0.0%
10.0%
20.0%
30.0%
Jan-0
4Ju
l-04
Jan-0
5Ju
l-05
Jan-0
6Ju
l-06
Jan-0
7Ju
l-07
Jan-0
8Ju
l-08
Jan-0
9Ju
l-09
Jan-1
0Ju
l-10
Jan-1
1Ju
l-11
Jan-1
2Ju
l-12
Jan-1
3Ju
l-13
Jan-1
4Ju
l-14
Jan-1
5Ju
l-15
Jan-1
6Ju
l-16
Jan-1
7Ju
l-17
Jan-1
8Ju
l-18
IDR/USD exchange rate yoy% Working capital loan growth yoy% (RHS)
Title:
Source:
Please fill in the values above to have them entered in your report
1.4% 1.4% 1.4%
1.6%1.8% 1.9%
2.4% 2.4%
2.7%2.6%
0.0%
0.5%
1.0%
1.5%
2.0%
2.5%
3.0%
0%
5%
10%
15%
20%
25%
30%
35%
40%
2009
2010
2011
2012
2013
2014
2015
2016
2017
2018
Government infra spending as % of GDP (RHS) Investment loan growth
Title:
Source:
Please fill in the values above to have them entered in your report
-6%
-4%
-2%
0%
2%
4%
6%
0%
5%
10%
15%
20%
25%
30%
35%
40%
Jun-0
6
Dec-
06
Jun-0
7
Dec-
07
Jun-0
8
Dec-
08
Jun-0
9
Dec-
09
Jun-1
0
Dec-
10
Jun-1
1
Dec-
11
Jun-1
2
Dec-
12
Jun-1
3
Dec-
13
Jun-1
4
Dec-
14
Jun-1
5
Dec-
15
Jun-1
6
Dec-
16
Jun-1
7
Dec-
17
Investment loan growth yoy% Capacity utilizations 12MMA yoy% (RHS)
Title:
Source:
Please fill in the values above to have them entered in your report
-20%
-10%
0%
10%
20%
30%
40%
50%
0%
5%
10%
15%
20%
25%
30%
35%
40%
Jun-0
6
Dec-
06
Jun-0
7
Dec-
07
Jun-0
8
Dec-
08
Jun-0
9
Dec-
09
Jun-1
0
Dec-
10
Jun-1
1
Dec-
11
Jun-1
2
Dec-
12
Jun-1
3
Dec-
13
Jun-1
4
Dec-
14
Jun-1
5
Dec-
15
Jun-1
6
Dec-
16
Jun-1
7
Dec-
17
Jun-1
8
Investment loan growth yoy% Capex (ex-banks) 4QMMA yoy (RHS)
Financial Services │ Indonesia
Banks │ October 5, 2018
8
Non-SOE banks have been more active in lending to SOE debtors
To our surprise, incremental loans disbursed to SOE companies since 2016
have been driven by non-SOE banks. Within our sample, foreign-related banks
(MUFG, CIMB Niaga, SMBC) have been some of the most aggressive in
disbursing new loans to SOE corporations.
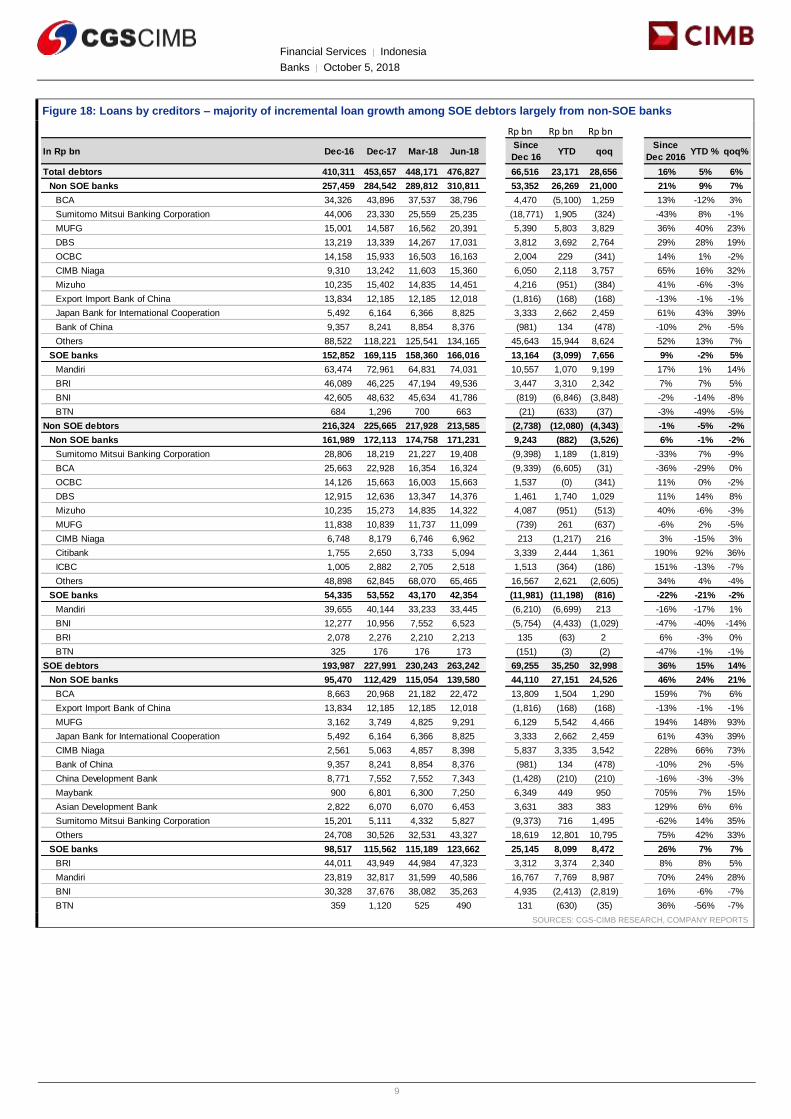
Among SOE banks, BMRI stands out as the largest creditor (largest exposure to
the telco sector), followed by BBRI (utilities) and BBNI (construction) to SOE
sectors. Overall, banks’ exposure to SOE debtors rose 15% YTD, largely driven
by non-SOE banks (+24% YTD), while SOE banks’ exposure rose 7% YTD.
On the other hand, banks’ appetite towards non-SOE companies seems to be
much lower. Outstanding loans to non-SOE companies in our coverage were
down 5% YTD, largely due to a significant reduction in loans from SOE banks (-
21% YTD), while non-SOE banks were more benign (-1% YTD).
These findings lead us to believe that private banks are seeing an improvement
in their loan growth outlook and are positioned to leverage up, though the focus
is still on asset quality (as indicated by focusing disbursements on SOE
companies) – this could provide further upside to loan growth, in our view.
An interesting observation to note is that non-SOE banks are actually more
aggressive in disbursing loans to SOE companies compared to SOE bank
counterparts. We believe that this is due to a few reasons:
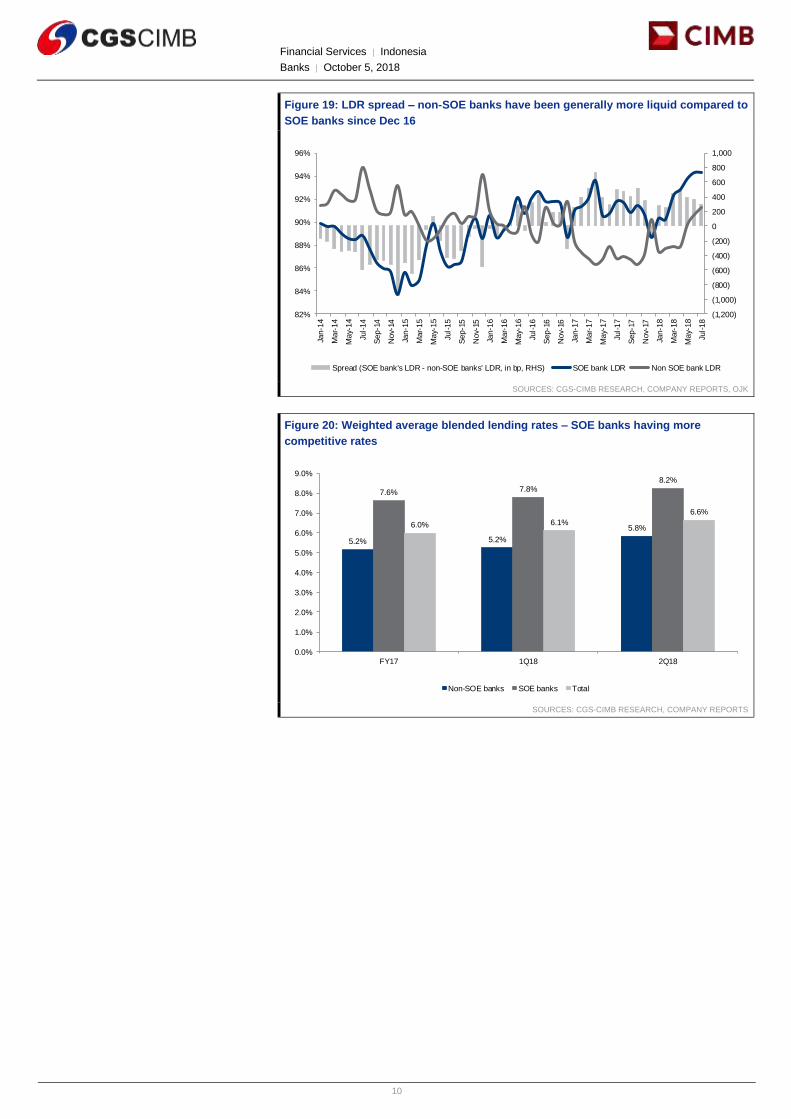
1) Tighter liquidity for SOE banks - the LDR spread between SOE and
non-SOE banks (i.e. SOE banks’ LDR - non-SOE banks’ LDR) widened
to +300bp in Jul 18 (meaning SOE banks have a higher LDR) vs. -
300bp in Dec 16 and -160bp in Dec 17 (meaning SOE banks had lower
LDRs in both cases).
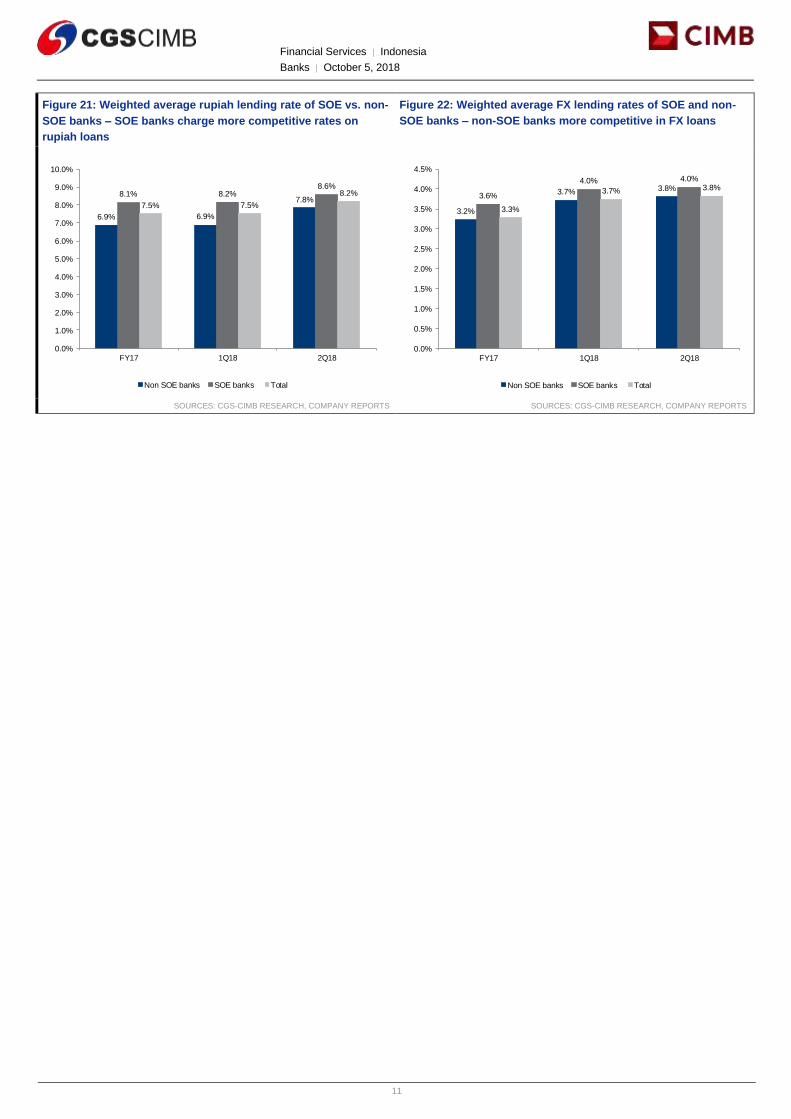
2) More competitive rates by non-SOE banks – our analysis suggests
that the average rupiah/FX loan pricing on non-SOE banks is
c.100bp/30bp lower than their SOE counterparts – which we attribute to
better liquidity.
3) Non-SOE banks focusing on asset quality – non-SOE banks are
keen on giving loans to SOE companies which bear sovereign risk; and
hence less risk of default. This also partly explains non-SOE banks’
willingness to have lower yields on their loans as they are still very
selective in loan disbursement post asset quality consolidation in 2016-
2017.
Financial Services │ Indonesia
Banks │ October 5, 2018
9
Figure 18: Loans by creditors – majority of incremental loan growth among SOE debtors largely from non-SOE banks
SOURCES: CGS-CIMB RESEARCH, COMPANY REPORTS
Rp bn Rp bn Rp bn
In Rp bn Dec-16 Dec-17 Mar-18 Jun-18Since
Dec 16YTD qoq
Since
Dec 2016YTD % qoq%
Total debtors 410,311 453,657 448,171 476,827 66,516 23,171 28,656 16% 5% 6%
Non SOE banks 257,459 284,542 289,812 310,811 53,352 26,269 21,000 21% 9% 7%
BCA 34,326 43,896 37,537 38,796 4,470 (5,100) 1,259 13% -12% 3%
Sumitomo Mitsui Banking Corporation 44,006 23,330 25,559 25,235 (18,771) 1,905 (324) -43% 8% -1%
MUFG 15,001 14,587 16,562 20,391 5,390 5,803 3,829 36% 40% 23%
DBS 13,219 13,339 14,267 17,031 3,812 3,692 2,764 29% 28% 19%
OCBC 14,158 15,933 16,503 16,163 2,004 229 (341) 14% 1% -2%
CIMB Niaga 9,310 13,242 11,603 15,360 6,050 2,118 3,757 65% 16% 32%
Mizuho 10,235 15,402 14,835 14,451 4,216 (951) (384) 41% -6% -3%
Export Import Bank of China 13,834 12,185 12,185 12,018 (1,816) (168) (168) -13% -1% -1%
Japan Bank for International Cooperation 5,492 6,164 6,366 8,825 3,333 2,662 2,459 61% 43% 39%
Bank of China 9,357 8,241 8,854 8,376 (981) 134 (478) -10% 2% -5%
Others 88,522 118,221 125,541 134,165 45,643 15,944 8,624 52% 13% 7%
SOE banks 152,852 169,115 158,360 166,016 13,164 (3,099) 7,656 9% -2% 5%
Mandiri 63,474 72,961 64,831 74,031 10,557 1,070 9,199 17% 1% 14%
BRI 46,089 46,225 47,194 49,536 3,447 3,310 2,342 7% 7% 5%
BNI 42,605 48,632 45,634 41,786 (819) (6,846) (3,848) -2% -14% -8%
BTN 684 1,296 700 663 (21) (633) (37) -3% -49% -5%
Non SOE debtors 216,324 225,665 217,928 213,585 (2,738) (12,080) (4,343) -1% -5% -2%
Non SOE banks 161,989 172,113 174,758 171,231 9,243 (882) (3,526) 6% -1% -2%
Sumitomo Mitsui Banking Corporation 28,806 18,219 21,227 19,408 (9,398) 1,189 (1,819) -33% 7% -9%
BCA 25,663 22,928 16,354 16,324 (9,339) (6,605) (31) -36% -29% 0%
OCBC 14,126 15,663 16,003 15,663 1,537 (0) (341) 11% 0% -2%
DBS 12,915 12,636 13,347 14,376 1,461 1,740 1,029 11% 14% 8%
Mizuho 10,235 15,273 14,835 14,322 4,087 (951) (513) 40% -6% -3%
MUFG 11,838 10,839 11,737 11,099 (739) 261 (637) -6% 2% -5%
CIMB Niaga 6,748 8,179 6,746 6,962 213 (1,217) 216 3% -15% 3%
Citibank 1,755 2,650 3,733 5,094 3,339 2,444 1,361 190% 92% 36%
ICBC 1,005 2,882 2,705 2,518 1,513 (364) (186) 151% -13% -7%
Others 48,898 62,845 68,070 65,465 16,567 2,621 (2,605) 34% 4% -4%
SOE banks 54,335 53,552 43,170 42,354 (11,981) (11,198) (816) -22% -21% -2%
Mandiri 39,655 40,144 33,233 33,445 (6,210) (6,699) 213 -16% -17% 1%
BNI 12,277 10,956 7,552 6,523 (5,754) (4,433) (1,029) -47% -40% -14%
BRI 2,078 2,276 2,210 2,213 135 (63) 2 6% -3% 0%
BTN 325 176 176 173 (151) (3) (2) -47% -1% -1%
SOE debtors 193,987 227,991 230,243 263,242 69,255 35,250 32,998 36% 15% 14%
Non SOE banks 95,470 112,429 115,054 139,580 44,110 27,151 24,526 46% 24% 21%
BCA 8,663 20,968 21,182 22,472 13,809 1,504 1,290 159% 7% 6%
Export Import Bank of China 13,834 12,185 12,185 12,018 (1,816) (168) (168) -13% -1% -1%
MUFG 3,162 3,749 4,825 9,291 6,129 5,542 4,466 194% 148% 93%
Japan Bank for International Cooperation 5,492 6,164 6,366 8,825 3,333 2,662 2,459 61% 43% 39%
CIMB Niaga 2,561 5,063 4,857 8,398 5,837 3,335 3,542 228% 66% 73%
Bank of China 9,357 8,241 8,854 8,376 (981) 134 (478) -10% 2% -5%
China Development Bank 8,771 7,552 7,552 7,343 (1,428) (210) (210) -16% -3% -3%
Maybank 900 6,801 6,300 7,250 6,349 449 950 705% 7% 15%
Asian Development Bank 2,822 6,070 6,070 6,453 3,631 383 383 129% 6% 6%
Sumitomo Mitsui Banking Corporation 15,201 5,111 4,332 5,827 (9,373) 716 1,495 -62% 14% 35%
Others 24,708 30,526 32,531 43,327 18,619 12,801 10,795 75% 42% 33%
SOE banks 98,517 115,562 115,189 123,662 25,145 8,099 8,472 26% 7% 7%
BRI 44,011 43,949 44,984 47,323 3,312 3,374 2,340 8% 8% 5%
Mandiri 23,819 32,817 31,599 40,586 16,767 7,769 8,987 70% 24% 28%
BNI 30,328 37,676 38,082 35,263 4,935 (2,413) (2,819) 16% -6% -7%
BTN 359 1,120 525 490 131 (630) (35) 36% -56% -7%
Financial Services │ Indonesia
Banks │ October 5, 2018
10
Figure 19: LDR spread – non-SOE banks have been generally more liquid compared to
SOE banks since Dec 16
SOURCES: CGS-CIMB RESEARCH, COMPANY REPORTS, OJK
Figure 20: Weighted average blended lending rates – SOE banks having more
competitive rates
SOURCES: CGS-CIMB RESEARCH, COMPANY REPORTS
Title:
Source:
Please fill in the values above to have them entered in your report
(1,200)
(1,000)
(800)
(600)
(400)
(200)
0
200
400
600
800
1,000
82%
84%
86%
88%
90%
92%
94%
96%
Jan-1
4
Mar-
14
May-
14
Jul-14
Sep-1
4
Nov-
14
Jan-1
5
Mar-
15
May-
15
Jul-15
Sep-1
5
Nov-
15
Jan-1
6
Mar-
16
May-
16
Jul-16
Sep-1
6
Nov-
16
Jan-1
7
Mar-
17
May-
17
Jul-17
Sep-1
7
Nov-
17
Jan-1
8
Mar-
18
May-
18
Jul-18
Spread (SOE bank's LDR - non-SOE banks' LDR, in bp, RHS) SOE bank LDR Non SOE bank LDR
Title:
Source:
Please fill in the values above to have them entered in your report
5.2% 5.2%
5.8%
7.6% 7.8%8.2%
6.0% 6.1%
6.6%
0.0%
1.0%
2.0%
3.0%
4.0%
5.0%
6.0%
7.0%
8.0%
9.0%
FY17 1Q18 2Q18
Non-SOE banks SOE banks Total
Financial Services │ Indonesia
Banks │ October 5, 2018
11
Figure 21: Weighted average rupiah lending rate of SOE vs. non-
SOE banks – SOE banks charge more competitive rates on
rupiah loans
Figure 22: Weighted average FX lending rates of SOE and non-
SOE banks – non-SOE banks more competitive in FX loans
SOURCES: CGS-CIMB RESEARCH, COMPANY REPORTS SOURCES: CGS-CIMB RESEARCH, COMPANY REPORTS
Title:
Source:
Please fill in the values above to have them entered in your report6.9% 6.9%
7.8%8.1% 8.2%
8.6%
7.5% 7.5%
8.2%
0.0%
1.0%
2.0%
3.0%
4.0%
5.0%
6.0%
7.0%
8.0%
9.0%
10.0%
FY17 1Q18 2Q18
Non SOE banks SOE banks Total
Title:
Source:
Please fill in the values above to have them entered in your report3.2%
3.7% 3.8%3.6%
4.0% 4.0%
3.3%
3.7% 3.8%
0.0%
0.5%
1.0%
1.5%
2.0%
2.5%
3.0%
3.5%
4.0%
4.5%
FY17 1Q18 2Q18
Non SOE banks SOE banks Total
Financial Services │ Indonesia
Banks │ October 5, 2018
12
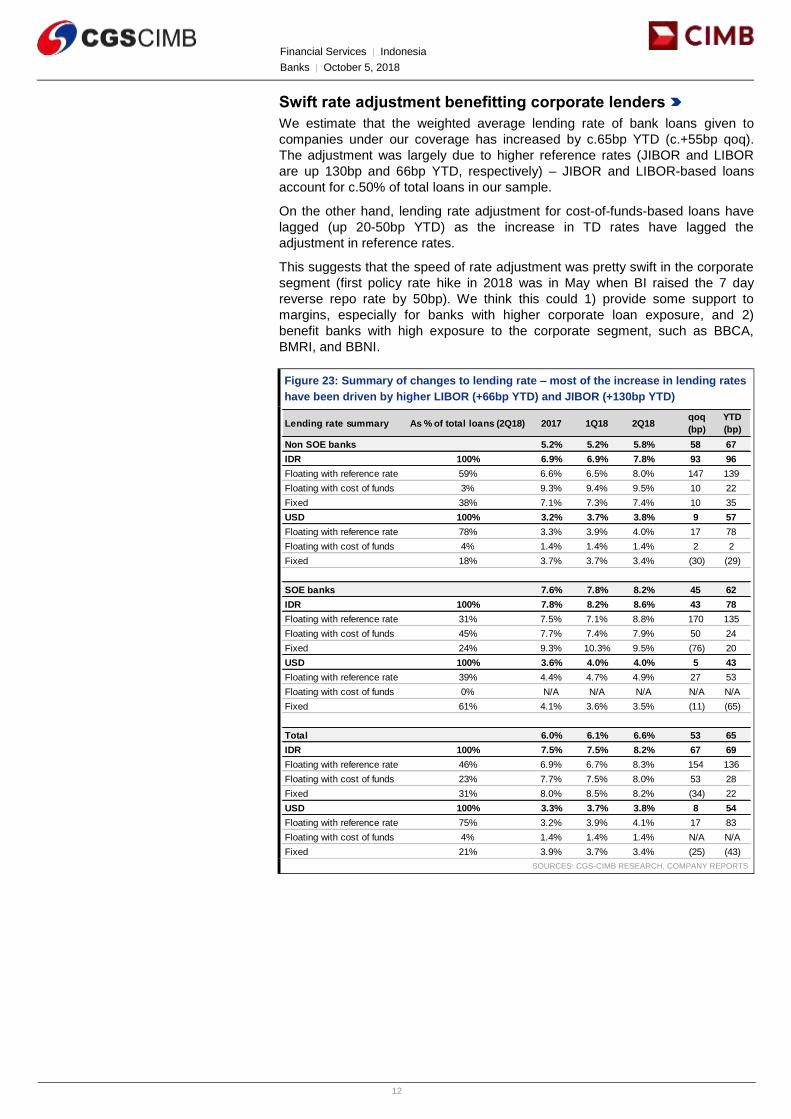
Swift rate adjustment benefitting corporate lenders
We estimate that the weighted average lending rate of bank loans given to
companies under our coverage has increased by c.65bp YTD (c.+55bp qoq).
The adjustment was largely due to higher reference rates (JIBOR and LIBOR
are up 130bp and 66bp YTD, respectively) – JIBOR and LIBOR-based loans
account for c.50% of total loans in our sample.
On the other hand, lending rate adjustment for cost-of-funds-based loans have
lagged (up 20-50bp YTD) as the increase in TD rates have lagged the
adjustment in reference rates.
This suggests that the speed of rate adjustment was pretty swift in the corporate
segment (first policy rate hike in 2018 was in May when BI raised the 7 day
reverse repo rate by 50bp). We think this could 1) provide some support to
margins, especially for banks with higher corporate loan exposure, and 2)
benefit banks with high exposure to the corporate segment, such as BBCA,
BMRI, and BBNI.
Figure 23: Summary of changes to lending rate – most of the increase in lending rates
have been driven by higher LIBOR (+66bp YTD) and JIBOR (+130bp YTD)
SOURCES: CGS-CIMB RESEARCH, COMPANY REPORTS
Lending rate summary As % of total loans (2Q18) 2017 1Q18 2Q18 qoq
(bp)
YTD
(bp)
Non SOE banks 5.2% 5.2% 5.8% 58 67
IDR 100% 6.9% 6.9% 7.8% 93 96
Floating with reference rate 59% 6.6% 6.5% 8.0% 147 139
Floating with cost of funds 3% 9.3% 9.4% 9.5% 10 22
Fixed 38% 7.1% 7.3% 7.4% 10 35
USD 100% 3.2% 3.7% 3.8% 9 57
Floating with reference rate 78% 3.3% 3.9% 4.0% 17 78
Floating with cost of funds 4% 1.4% 1.4% 1.4% 2 2
Fixed 18% 3.7% 3.7% 3.4% (30) (29)
SOE banks 7.6% 7.8% 8.2% 45 62
IDR 100% 7.8% 8.2% 8.6% 43 78
Floating with reference rate 31% 7.5% 7.1% 8.8% 170 135
Floating with cost of funds 45% 7.7% 7.4% 7.9% 50 24
Fixed 24% 9.3% 10.3% 9.5% (76) 20
USD 100% 3.6% 4.0% 4.0% 5 43
Floating with reference rate 39% 4.4% 4.7% 4.9% 27 53
Floating with cost of funds 0% N/A N/A N/A N/A N/A
Fixed 61% 4.1% 3.6% 3.5% (11) (65)
Total 6.0% 6.1% 6.6% 53 65
IDR 100% 7.5% 7.5% 8.2% 67 69
Floating with reference rate 46% 6.9% 6.7% 8.3% 154 136
Floating with cost of funds 23% 7.7% 7.5% 8.0% 53 28
Fixed 31% 8.0% 8.5% 8.2% (34) 22
USD 100% 3.3% 3.7% 3.8% 8 54
Floating with reference rate 75% 3.2% 3.9% 4.1% 17 83
Floating with cost of funds 4% 1.4% 1.4% 1.4% N/A N/A
Fixed 21% 3.9% 3.7% 3.4% (25) (43)
Financial Services │ Indonesia
Banks │ October 5, 2018
13
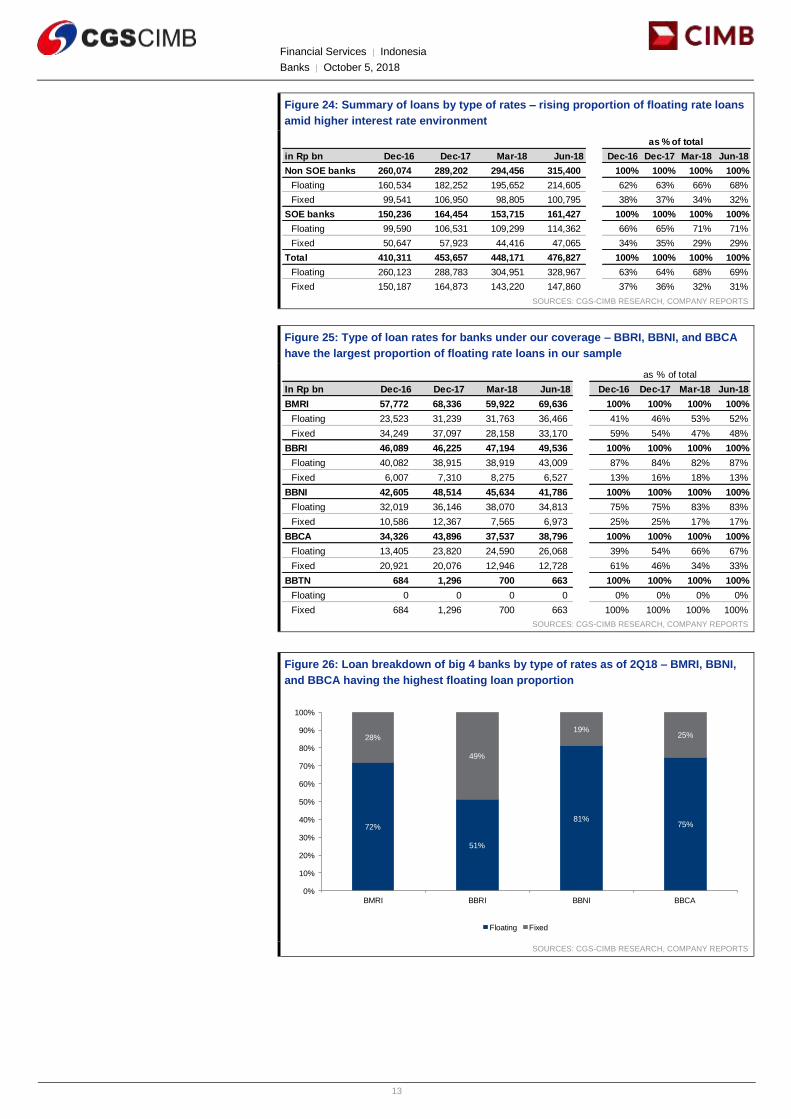
Figure 24: Summary of loans by type of rates – rising proportion of floating rate loans
amid higher interest rate environment
SOURCES: CGS-CIMB RESEARCH, COMPANY REPORTS
Figure 25: Type of loan rates for banks under our coverage – BBRI, BBNI, and BBCA
have the largest proportion of floating rate loans in our sample
SOURCES: CGS-CIMB RESEARCH, COMPANY REPORTS
Figure 26: Loan breakdown of big 4 banks by type of rates as of 2Q18 – BMRI, BBNI,
and BBCA having the highest floating loan proportion
SOURCES: CGS-CIMB RESEARCH, COMPANY REPORTS
in Rp bn Dec-16 Dec-17 Mar-18 Jun-18 Dec-16 Dec-17 Mar-18 Jun-18
Non SOE banks 260,074 289,202 294,456 315,400 100% 100% 100% 100%
Floating 160,534 182,252 195,652 214,605 62% 63% 66% 68%
Fixed 99,541 106,950 98,805 100,795 38% 37% 34% 32%
SOE banks 150,236 164,454 153,715 161,427 100% 100% 100% 100%
Floating 99,590 106,531 109,299 114,362 66% 65% 71% 71%
Fixed 50,647 57,923 44,416 47,065 34% 35% 29% 29%
Total 410,311 453,657 448,171 476,827 100% 100% 100% 100%
Floating 260,123 288,783 304,951 328,967 63% 64% 68% 69%
Fixed 150,187 164,873 143,220 147,860 37% 36% 32% 31%
as % of total
In Rp bn Dec-16 Dec-17 Mar-18 Jun-18 Dec-16 Dec-17 Mar-18 Jun-18
BMRI 57,772 68,336 59,922 69,636 100% 100% 100% 100%
Floating 23,523 31,239 31,763 36,466 41% 46% 53% 52%
Fixed 34,249 37,097 28,158 33,170 59% 54% 47% 48%
BBRI 46,089 46,225 47,194 49,536 100% 100% 100% 100%
Floating 40,082 38,915 38,919 43,009 87% 84% 82% 87%
Fixed 6,007 7,310 8,275 6,527 13% 16% 18% 13%
BBNI 42,605 48,514 45,634 41,786 100% 100% 100% 100%
Floating 32,019 36,146 38,070 34,813 75% 75% 83% 83%
Fixed 10,586 12,367 7,565 6,973 25% 25% 17% 17%
BBCA 34,326 43,896 37,537 38,796 100% 100% 100% 100%
Floating 13,405 23,820 24,590 26,068 39% 54% 66% 67%
Fixed 20,921 20,076 12,946 12,728 61% 46% 34% 33%
BBTN 684 1,296 700 663 100% 100% 100% 100%
Floating 0 0 0 0 0% 0% 0% 0%
Fixed 684 1,296 700 663 100% 100% 100% 100%
as % of total
Title:
Source:
Please fill in the values above to have them entered in your report
72%
51%
81%75%
28%
49%
19%25%
0%
10%
20%
30%
40%
50%
60%
70%
80%
90%
100%
BMRI BBRI BBNI BBCA
Floating Fixed
Financial Services │ Indonesia
Banks │ October 5, 2018
14
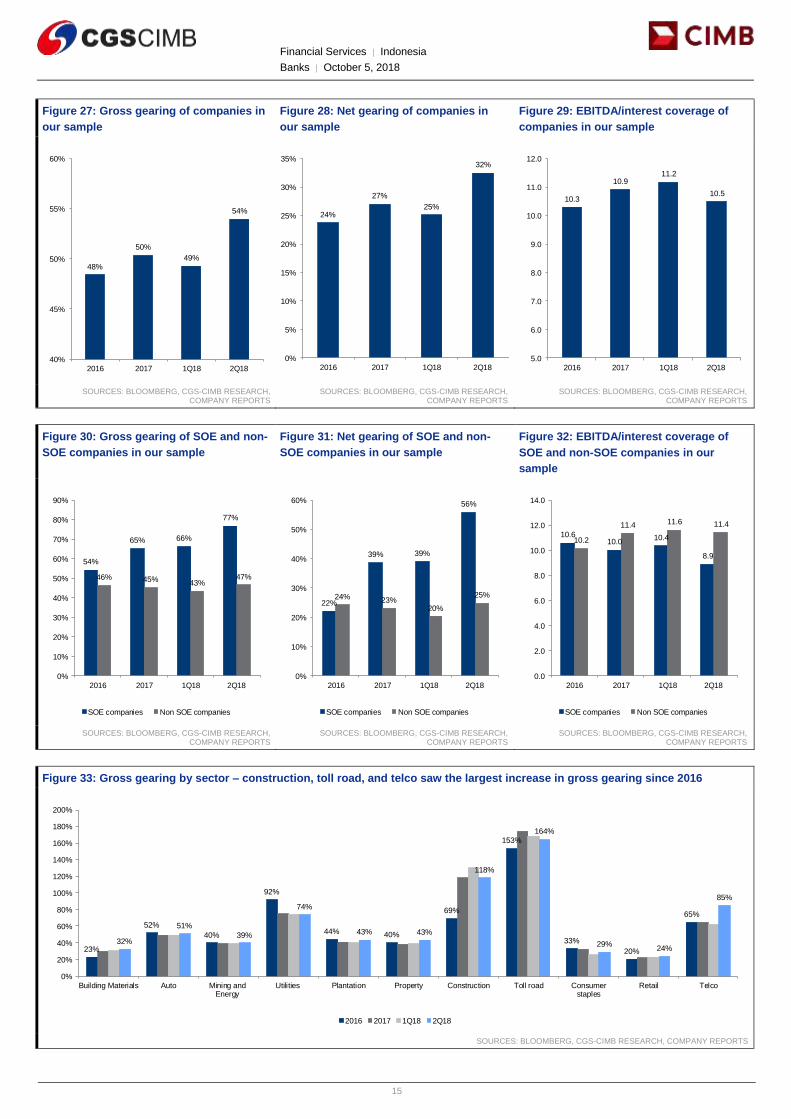
Robust debtors’ fundamentals
We have also noticed a slight improvement in most of the debtors’ solvency
compared to 2016 levels. We looked at the companies’ interest coverage ratios
(EBITDA/interest expense), which improved slightly from c.10x in 2016 to c.11x
as of 1H18 (annualised numbers). Debt-to-equity ratio (i.e. gross gearing), which
is another common measure used by banks in loan covenants, only rose slightly
to 54% in 2Q18 compared to 48% in 2016, while net gearing seems manageable
at 32% in 2Q18 vs. 24% in 2016.
While the impact of higher rates has yet to be fully reflected, we remain
confident that the banks’ asset quality should remain manageable as most
debtors are maintaining ratios well above those required by the covenant (i.e. 1-
2x minimum interest coverage ratio, 2-3x maximum debt-to-equity ratio, among
others).
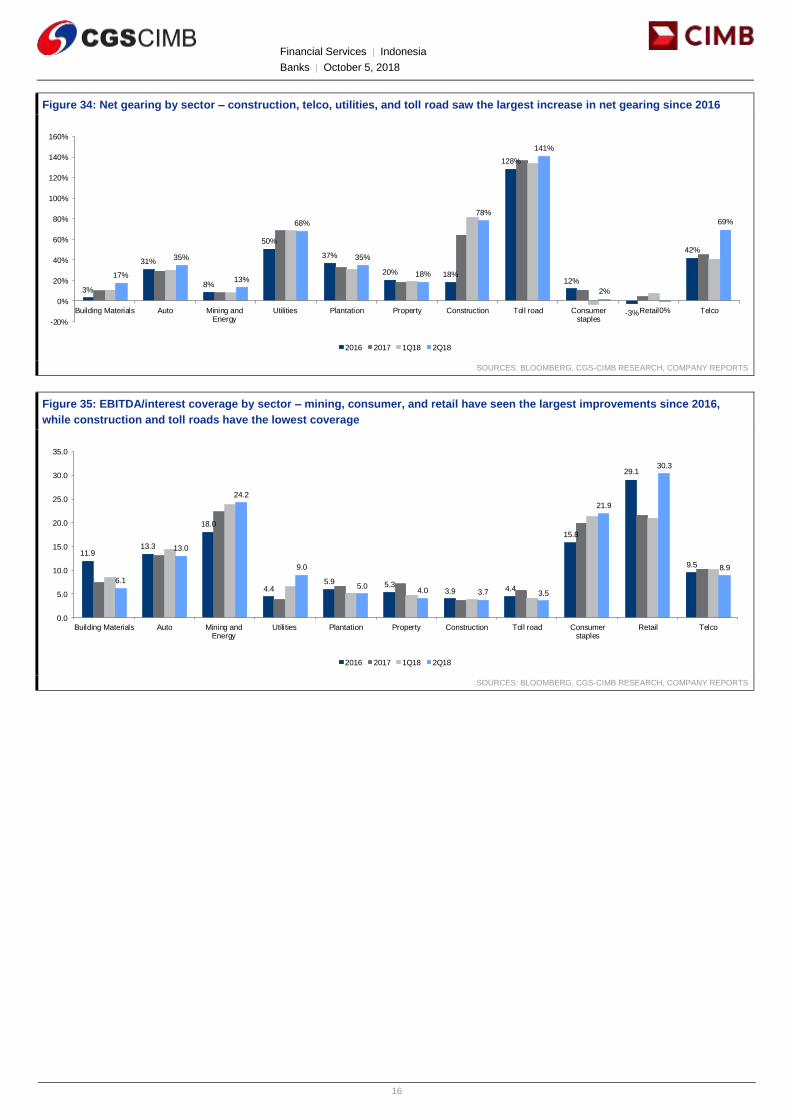
As a further analysis, we also looked at each of the sectors’ financial metrics to
determine the sectors with potential asset quality issues. We found that among
the companies in our sample, construction, toll road and property sectors’
metrics seem to be the weakest (interest coverage ratio of 3-4x, debt-to-equity of
40-160%).
Moreover, in relative terms, SOE debtors’ metrics fare worse compared to its
private counterparts – interest coverage ratio for SOE debtors was at 9x in 2Q18
vs. 11x for private, while the debt-to-equity ratio was 77% for SOE debtors in
2Q18 vs. 47% in private (net gearing of 56% vs. 25% in 2Q18, respectively).
Nonetheless, despite weaker metrics for SOE companies, the sovereign risk
embedded in these companies effectively reduces the risk of default and
provides another layer of defense for creditors. We believe this spurred the
appetite from banks amid the flight to quality (especially for private banks which
are still somewhat struggling with asset quality) during the asset quality
downturn. This is particularly true for the construction and toll road sectors
(which had below-average solvency in our sample) as most loans to these
sectors are being given to SOE contractors and JSMR.
Furthermore, the ratios of SOE companies and construction/property/toll road
companies are still significantly better than the average terms required by banks
on its loan covenants, which indicates minimal default risk, in our view.
Financial Services │ Indonesia
Banks │ October 5, 2018
15
Figure 27: Gross gearing of companies in
our sample
Figure 28: Net gearing of companies in
our sample
Figure 29: EBITDA/interest coverage of
companies in our sample
SOURCES: BLOOMBERG, CGS-CIMB RESEARCH,
COMPANY REPORTS SOURCES: BLOOMBERG, CGS-CIMB RESEARCH,
COMPANY REPORTS SOURCES: BLOOMBERG, CGS-CIMB RESEARCH,
COMPANY REPORTS
Figure 30: Gross gearing of SOE and non-
SOE companies in our sample
Figure 31: Net gearing of SOE and non-
SOE companies in our sample
Figure 32: EBITDA/interest coverage of
SOE and non-SOE companies in our
sample
SOURCES: BLOOMBERG, CGS-CIMB RESEARCH,
COMPANY REPORTS SOURCES: BLOOMBERG, CGS-CIMB RESEARCH,
COMPANY REPORTS SOURCES: BLOOMBERG, CGS-CIMB RESEARCH,
COMPANY REPORTS
Figure 33: Gross gearing by sector – construction, toll road, and telco saw the largest increase in gross gearing since 2016
SOURCES: BLOOMBERG, CGS-CIMB RESEARCH, COMPANY REPORTS
Title:
Source:
Please fill in the values above to have them entered in your report
48%
50%
49%
54%
40%
45%
50%
55%
60%
2016 2017 1Q18 2Q18
Title:
Source:
Please fill in the values above to have them entered in your report24%
27%
25%
32%
0%
5%
10%
15%
20%
25%
30%
35%
2016 2017 1Q18 2Q18
Title:
Source:
Please fill in the values above to have them entered in your report10.3
10.911.2
10.5
5.0
6.0
7.0
8.0
9.0
10.0
11.0
12.0
2016 2017 1Q18 2Q18
Title:
Source:
Please fill in the values above to have them entered in your report
54%
65% 66%
77%
46% 45% 43%47%
0%
10%
20%
30%
40%
50%
60%
70%
80%
90%
2016 2017 1Q18 2Q18
SOE companies Non SOE companies
Title:
Source:
Please fill in the values above to have them entered in your report
22%
39% 39%
56%
24% 23%20%
25%
0%
10%
20%
30%
40%
50%
60%
2016 2017 1Q18 2Q18
SOE companies Non SOE companies
Title:
Source:
Please fill in the values above to have them entered in your report10.6
10.010.4
8.9
10.2
11.4 11.6 11.4
0.0
2.0
4.0
6.0
8.0
10.0
12.0
14.0
2016 2017 1Q18 2Q18
SOE companies Non SOE companies
Title:
Source:
Please fill in the values above to have them entered in your report
23%
52%
40%
92%
44% 40%
69%
153%
33%
20%
65%
32%
51%
39%
74%
43% 43%
118%
164%
29%24%
85%
0%
20%
40%
60%
80%
100%
120%
140%
160%
180%
200%
Building Materials Auto Mining andEnergy
Utilities Plantation Property Construction Toll road Consumerstaples
Retail Telco
2016 2017 1Q18 2Q18
Financial Services │ Indonesia
Banks │ October 5, 2018
16
Figure 34: Net gearing by sector – construction, telco, utilities, and toll road saw the largest increase in net gearing since 2016
SOURCES: BLOOMBERG, CGS-CIMB RESEARCH, COMPANY REPORTS
Figure 35: EBITDA/interest coverage by sector – mining, consumer, and retail have seen the largest improvements since 2016,
while construction and toll roads have the lowest coverage
SOURCES: BLOOMBERG, CGS-CIMB RESEARCH, COMPANY REPORTS
Title:
Source:
Please fill in the values above to have them entered in your report
17%
35%
13%
68%
35%
18%
78%
141%
2%
0%
69%
3%
31%
8%
50%
37%
20% 18%
128%
12%
-3%
42%
-20%
0%
20%
40%
60%
80%
100%
120%
140%
160%
Building Materials Auto Mining andEnergy
Utilities Plantation Property Construction Toll road Consumerstaples
Retail Telco
2016 2017 1Q18 2Q18
Title:
Source:
Please fill in the values above to have them entered in your report
11.913.3
18.0
4.45.9 5.3
3.9 4.4
15.8
29.1
9.5
6.1
13.0
24.2
9.0
5.04.0 3.7 3.5
21.9
30.3
8.9
0.0
5.0
10.0
15.0
20.0
25.0
30.0
35.0
Building Materials Auto Mining andEnergy
Utilities Plantation Property Construction Toll road Consumerstaples
Retail Telco
2016 2017 1Q18 2Q18
Financial Services │ Indonesia
Banks │ October 5, 2018
17
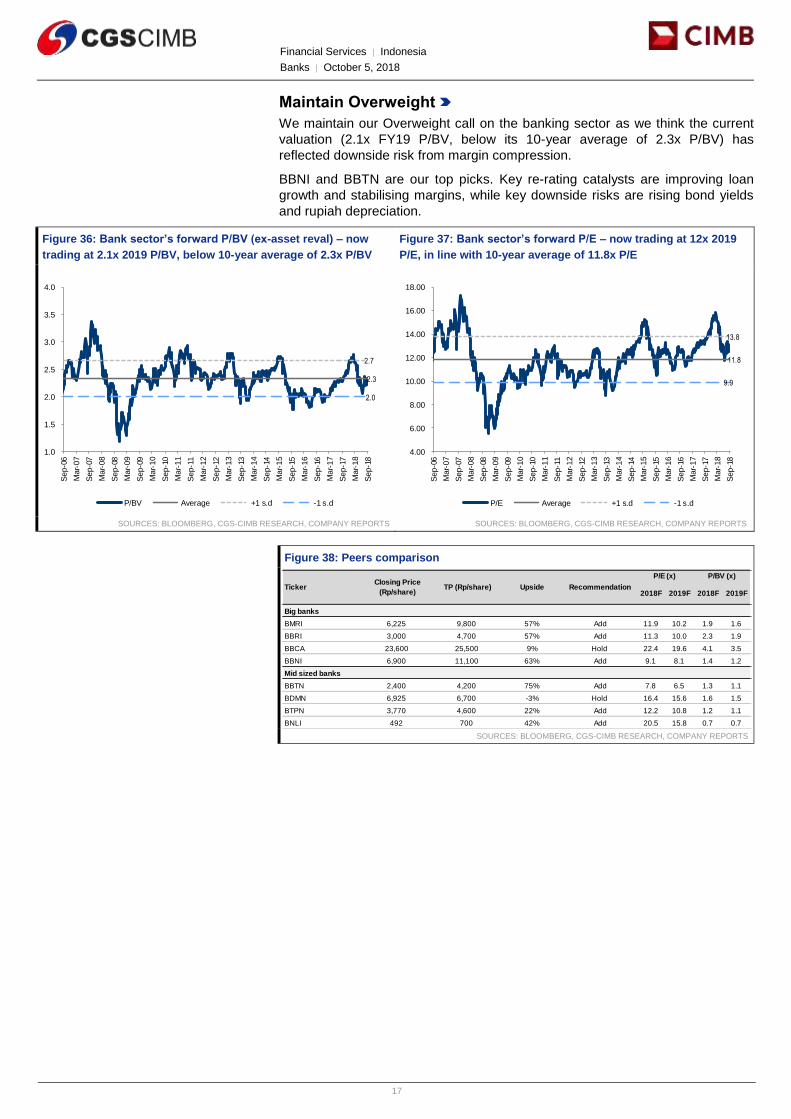
Maintain Overweight
We maintain our Overweight call on the banking sector as we think the current
valuation (2.1x FY19 P/BV, below its 10-year average of 2.3x P/BV) has
reflected downside risk from margin compression.
BBNI and BBTN are our top picks. Key re-rating catalysts are improving loan
growth and stabilising margins, while key downside risks are rising bond yields
and rupiah depreciation.
Figure 36: Bank sector’s forward P/BV (ex-asset reval) – now
trading at 2.1x 2019 P/BV, below 10-year average of 2.3x P/BV
Figure 37: Bank sector’s forward P/E – now trading at 12x 2019
P/E, in line with 10-year average of 11.8x P/E
SOURCES: BLOOMBERG, CGS-CIMB RESEARCH, COMPANY REPORTS SOURCES: BLOOMBERG, CGS-CIMB RESEARCH, COMPANY REPORTS
Figure 38: Peers comparison
SOURCES: BLOOMBERG, CGS-CIMB RESEARCH, COMPANY REPORTS
Title:
Source:
Please fill in the values above to have them entered in your report
2.3
2.7
2.0
1.0
1.5
2.0
2.5
3.0
3.5
4.0
Sep-0
6
Mar-
07
Sep-0
7
Mar-
08
Sep-0
8
Mar-
09
Sep-0
9
Mar-
10
Sep-1
0
Mar-
11
Sep-1
1
Mar-
12
Sep-1
2
Mar-
13
Sep-1
3
Mar-
14
Sep-1
4
Mar-
15
Sep-1
5
Mar-
16
Sep-1
6
Mar-
17
Sep-1
7
Mar-
18
Sep-1
8
P/BV Average +1 s.d -1 s.d
Title:
Source:
Please fill in the values above to have them entered in your report
11.8
13.8
9.9
4.00
6.00
8.00
10.00
12.00
14.00
16.00
18.00
Sep-0
6
Mar-
07
Sep-0
7
Mar-
08
Sep-0
8
Mar-
09
Sep-0
9
Mar-
10
Sep-1
0
Mar-
11
Sep-1
1
Mar-
12
Sep-1
2
Mar-
13
Sep-1
3
Mar-
14
Sep-1
4
Mar-
15
Sep-1
5
Mar-
16
Sep-1
6
Mar-
17
Sep-1
7
Mar-
18
Sep-1
8
P/E Average +1 s.d -1 s.d
2018F 2019F 2018F 2019F
Big banks
BMRI 6,225 9,800 57% Add 11.9 10.2 1.9 1.6
BBRI 3,000 4,700 57% Add 11.3 10.0 2.3 1.9
BBCA 23,600 25,500 9% Hold 22.4 19.6 4.1 3.5
BBNI 6,900 11,100 63% Add 9.1 8.1 1.4 1.2
Mid sized banks
BBTN 2,400 4,200 75% Add 7.8 6.5 1.3 1.1
BDMN 6,925 6,700 -3% Hold 16.4 15.6 1.6 1.5
BTPN 3,770 4,600 22% Add 12.2 10.8 1.2 1.1
BNLI 492 700 42% Add 20.5 15.8 0.7 0.7
P/E (x) P/BV (x)
Ticker Closing Price
(Rp/share)TP (Rp/share) RecommendationUpside
Financial Services │ Indonesia
Banks │ October 5, 2018
18
DISCLAIMER The content of this report (including the views and opinions expressed therein, and the information comprised therein) has been prepared by and belongs to CGS-CIMB or CIMB Investment Bank Berhad (“CIMB”), as the case may. Reports relating to a specific geographical area are produced and distributed by the corresponding CGS-CIMB entity as listed in the table below. Reports relating to Malaysia are produced and distributed by CIMB.
This report is not directed to, or intended for distribution to or use by, any person or entity who is a citizen or resident of or located in any locality, state, country or other jurisdiction where such distribution, publication, availability or use would be contrary to law or regulation.
By accepting this report, the recipient hereof represents and warrants that he is entitled to receive such report in accordance with the restrictions set forth below and agrees to be bound by the limitations contained herein (including the “Restrictions on Distributions” set out below). Any failure to comply with these limitations may constitute a violation of law. This publication is being supplied to you strictly on the basis that it will remain confidential. No part of this report may be (i) copied, photocopied, duplicated, stored or reproduced in any form by any means or (ii) redistributed or passed on, directly or indirectly, to any other person in whole or in part, for any purpose without the prior written consent of CGS-CIMB or CIMB, as the case may be.
The information contained in this research report is prepared from data believed to be correct and reliable at the time of issue of this report. CGS-CIMB or CIMB, as the case may be, may or may not issue regular reports on the subject matter of this report at any frequency and may cease to do so or change the periodicity of reports at any time. Neither CGS-CIMB nor CIMB has an obligation to update this report in the event of a material change to the information contained in this report. Neither CGS-CIMB nor CIMB accepts any, obligation to (i) check or ensure that the contents of this report remain current, reliable or relevant, (ii) ensure that the content of this report constitutes all the information a prospective investor may require, (iii) ensure the adequacy, accuracy, completeness, reliability or fairness of any views, opinions and information, and accordingly, CGS-CIMB and CIMB, their respective affiliates and related persons including China Galaxy International Financial Holdings Limited (“CGIFHL”) and CIMB Group Sdn. Bhd. (“CIMBG”) and their respective related corporations (and their respective directors, associates, connected persons and/or employees) shall not be liable in any manner whatsoever for any consequences (including but not limited to any direct, indirect or consequential losses, loss of profits and damages) of any reliance thereon or usage thereof. In particular, CGS-CIMB and CIMB disclaim all responsibility and liability for the views and opinions set out in this report.
Unless otherwise specified, this report is based upon sources which CGS-CIMB or CIMB, as the case may be, considers to be reasonable. Such sources will, unless otherwise specified, for market data, be market data and prices available from the main stock exchange or market where the relevant security is listed, or, where appropriate, any other market. Information on the accounts and business of company(ies) will generally be based on published statements of the company(ies), information disseminated by regulatory information services, other publicly available information and information resulting from our research.
Whilst every effort is made to ensure that statements of facts made in this report are accurate, all estimates, projections, forecasts, expressions of opinion and other subjective judgments contained in this report are based on assumptions considered to be reasonable as of the date of the document in which they are contained and must not be construed as a representation that the matters referred to therein will occur. Past performance is not a reliable indicator of future performance. The value of investments may go down as well as up and those investing may, depending on the investments in question, lose more than the initial investment. No report shall constitute an offer or an invitation by or on behalf of CGS-CIMB or CIMB, as the case may be, or any of their respective affiliates (including CGIFHL, CIMBG and their respective related corporations) to any person to buy or sell any investments.
CGS-CIMB, CIMB, their respective affiliates and related corporations (including CGIFHL, CIMBG and their respective related corporations) and/or their respective directors, associates, connected parties and/or employees may own or have positions in securities of the company(ies) covered in this research report or any securities related thereto and may from time to time add to or dispose of, or may be materially interested in, any such securities. Further, CGS-CIMB, CIMB, their respective affiliates and their respective related corporations (including CGIFHL, CIMBG and their respective related corporations) do and seek to do business with the company(ies) covered in this research report and may from time to time act as market maker or have assumed an underwriting commitment in securities of such company(ies), may sell them to or buy them from customers on a principal basis and may also perform or seek to perform significant investment banking, advisory, underwriting or placement services for or relating to such company(ies) as well as solicit such investment, advisory or other services from any entity mentioned in this report.
CGS-CIMB, CIMB or their respective affiliates (including CGIFHL, CIMBG and their respective related corporations) may enter into an agreement with the company(ies) covered in this report relating to the production of research reports. CGS-CIMB or CIMB, as the case may be, may disclose the contents of this report to the company(ies) covered by it and may have amended the contents of this report following such disclosure.
The analyst responsible for the production of this report hereby certifies that the views expressed herein accurately and exclusively reflect his or her personal views and opinions about any and all of the issuers or securities analysed in this report and were prepared independently and autonomously. No part of the compensation of the analyst(s) was, is, or will be directly or indirectly related to the inclusion of specific recommendations(s) or view(s) in this report. The analyst(s) who prepared this research report is prohibited from receiving any compensation, incentive or bonus based on specific investment banking transactions or for providing a specific recommendation for, or view of, a particular company. Information barriers and other arrangements may be established where necessary to prevent conflicts of interests arising. However, the analyst(s) may receive compensation that is based on his/their coverage of company(ies) in the performance of his/their duties or the performance of his/their recommendations and the research personnel involved in the preparation of this report may also participate in the solicitation of the businesses as described above. In reviewing this research report, an investor should be aware that any or all of the foregoing, among other things, may give rise to real or potential conflicts of interest. Additional information is, subject to the duties of confidentiality, available on request.
Reports relating to a specific geographical area are produced by the corresponding CGS-CIMB entity as listed in the table below. The term “CGS-CIMB” shall denote, where appropriate, the relevant entity distributing or disseminating the report in the particular jurisdiction referenced below, or, in every other case except as otherwise stated herein, CGS-CIMB Securities International Pte. Ltd. and its affiliates, subsidiaries and related corporations.
Financial Services │ Indonesia
Banks │ October 5, 2018
19
Country CGS-CIMB Entity Regulated by
Hong Kong CGS-CIMB Securities (Hong Kong) Limited Securities and Futures Commission Hong Kong
India CGS-CIMB Securities (India) Private Limited Securities and Exchange Board of India (SEBI)
Indonesia PT CGS-CIMB Sekuritas Indonesia Financial Services Authority of Indonesia
Singapore CGS-CIMB Research Pte. Ltd. Monetary Authority of Singapore
South Korea CGS-CIMB Securities (Hong Kong) Limited, Korea Branch Financial Services Commission and Financial Supervisory Service
Thailand CGS-CIMB Securities (Thailand) Co. Ltd. Securities and Exchange Commission Thailand
Reports relating to Malaysia are produced by CIMB as listed in the table below:
Country CIMB Entity Regulated by
Malaysia CIMB Investment Bank Berhad Securities Commission Malaysia
Other Significant Financial Interests:
(i) As of October 4, 2018 CGS-CIMB / CIMB has a proprietary position in the securities (which may include but not limited to shares, warrants, call warrants and/or any other derivatives) in the following company or companies covered or recommended in this report:
(a) Bank Central Asia, Bank Danamon, Bank Mandiri, Bank Rakyat Indonesia
(ii) Analyst Disclosure: As of October 5, 2018, the analyst(s) who prepared this report, and the associate(s), has / have an interest in the securities (which may include but not limited to shares, warrants, call warrants and/or any other derivatives) in the following company or companies covered or recommended in this report:
(a) -
This report does not purport to contain all the information that a prospective investor may require. Neither CGS-CIMB or CIMB, as the case may be, nor any of their respective affiliates (including CGIFHL, CIMBG and their related corporations) make any guarantee, representation or warranty, express or implied, as to the adequacy, accuracy, completeness, reliability or fairness of any such information and opinion contained in this report. Neither CGS-CIMB or CIMB, as the case may be, nor any of their respective affiliates nor their related persons (including CGIFHL, CIMBG and their related corporations) shall be liable in any manner whatsoever for any consequences (including but not limited to any direct, indirect or consequential losses, loss of profits and damages) of any reliance thereon or usage thereof.
This report is general in nature and has been prepared for information purposes only. It is intended for circulation amongst CGS-CIMB’s or CIMB’s (as the case may be) clients generally and does not have regard to the specific investment objectives, financial situation and the particular needs of any specific person who may receive this report. The information and opinions in this report are not and should not be construed or considered as an offer, recommendation or solicitation to buy or sell the subject securities, related investments or other financial instruments or any derivative instrument, or any rights pertaining thereto.
Investors are advised to make their own independent evaluation of the information contained in this research report, consider their own individual investment objectives, financial situation and particular needs and consult their own professional and financial advisers as to the legal, business, financial, tax and other aspects before participating in any transaction in respect of the securities of company(ies) covered in this research report.
The securities of such company(ies) may not be eligible for sale in all jurisdictions or to all categories of investors.
Australia: Despite anything in this report to the contrary, this research is provided in Australia by CGS-CIMB Securities (Singapore) Pte. Ltd. and CGS-CIMB Securities (Hong Kong) Limited. This research is only available in Australia to persons who are “wholesale clients” (within the meaning of the Corporations Act 2001 (Cth) and is supplied solely for the use of such wholesale clients and shall not be distributed or passed on to any other person. You represent and warrant that if you are in Australia, you are a “wholesale client”. This research is of a general nature only and has been prepared without taking into account the objectives, financial situation or needs of the individual recipient. CGS-CIMB Securities (Singapore) Pte. Ltd. and CGS-CIMB Securities (Hong Kong) Limited do not hold, and are not required to hold an Australian financial services license. CGS-CIMB Securities (Singapore) Pte. Ltd. and CGS-CIMB Securities (Hong Kong) Limited rely on “passporting” exemptions for entities appropriately licensed by the Monetary Authority of Singapore (under ASIC Class Order 03/1102) and the Securities and Futures Commission in Hong Kong (under ASIC Class Order 03/1103).
Canada: This research report has not been prepared in accordance with the disclosure requirements of Dealer Member Rule 3400 – Research Restrictions and Disclosure Requirements of the Investment Industry Regulatory Organization of Canada. For any research report distributed by CIBC, further disclosures related to CIBC conflicts of interest can be found at https://researchcentral.cibcwm.com .
China: For the purpose of this report, the People’s Republic of China (“PRC”) does not include the Hong Kong Special Administrative Region, the Macau Special Administrative Region or Taiwan. The distributor of this report has not been approved or licensed by the China Securities Regulatory Commission or any other relevant regulatory authority or governmental agency in the PRC. This report contains only marketing information. The distribution of this report is not an offer to buy or sell to any person within or outside PRC or a solicitation to any person within or outside of PRC to buy or sell any instruments described herein. This report is being issued outside the PRC to a limited number of institutional investors and may not be provided to any person other than the original recipient and may not be reproduced or used for any other purpose.
France: Only qualified investors within the meaning of French law shall have access to this report. This report shall not be considered as an offer to subscribe to, or used in connection with, any offer for subscription or sale or marketing or direct or indirect distribution of financial instruments and it is not intended as a solicitation for the purchase of any financial instrument.
Germany: This report is only directed at persons who are professional investors as defined in sec 31a(2) of the German Securities Trading Act (WpHG). This publication constitutes research of a non-binding nature on the market situation and the investment instruments cited here at the time of the publication of the information.
The current prices/yields in this issue are based upon closing prices from Bloomberg as of the day preceding publication. Please note that neither the German Federal Financial Supervisory Agency (BaFin), nor any other supervisory authority exercises any control over the content of this report.
Hong Kong: This report is issued and distributed in Hong Kong by CGS-CIMB Securities (Hong Kong) Limited (“CHK”) which is licensed in Hong Kong by the Securities and Futures Commission for Type 1 (dealing in securities), Type 4 (advising on securities) and Type 6 (advising on corporate
Financial Services │ Indonesia
Banks │ October 5, 2018
20
finance) activities. Any investors wishing to purchase or otherwise deal in the securities covered in this report should contact the Head of Sales at CGS-CIMB Securities (Hong Kong) Limited. The views and opinions in this research report are our own as of the date hereof and are subject to change. If the Financial Services and Markets Act of the United Kingdom or the rules of the Financial Conduct Authority apply to a recipient, our obligations owed to such recipient therein are unaffected. CHK has no obligation to update its opinion or the information in this research report.
This publication is strictly confidential and is for private circulation only to clients of CHK.
CHK does not make a market on other securities mentioned in the report.
India: This report is issued and distributed in India by CGS-CIMB Securities (India) Private Limited (“CGS-CIMB India”) which is registered with the National Stock Exchange of India Limited and BSE Limited as a trading and clearing member under the Securities and Exchange Board of India (Stock Brokers and Sub-Brokers) Regulations, 1992. In accordance with the provisions of Regulation 4(g) of the Securities and Exchange Board of India (Investment Advisers) Regulations, 2013, CGS-CIMB India is not required to seek registration with the Securities and Exchange Board of India (“SEBI”) as an Investment Adviser. CGS-CIMB India is registered with SEBI as a Research Analyst pursuant to the SEBI (Research Analysts) Regulations, 2014 ("Regulations").
This report does not take into account the particular investment objectives, financial situations, or needs of the recipients. It is not intended for and does not deal with prohibitions on investment due to law/jurisdiction issues etc. which may exist for certain persons/entities. Recipients should rely on their own investigations and take their own professional advice before investment.
The report is not a “prospectus” as defined under Indian Law, including the Companies Act, 2013, and is not, and shall not be, approved by, or filed or registered with, any Indian regulator, including any Registrar of Companies in India, SEBI, any Indian stock exchange, or the Reserve Bank of India. No offer, or invitation to offer, or solicitation of subscription with respect to any such securities listed or proposed to be listed in India is being made, or intended to be made, to the public, or to any member or section of the public in India, through or pursuant to this report.
The research analysts, strategists or economists principally responsible for the preparation of this research report are segregated from the other activities of CGS-CIMB India and they have received compensation based upon various factors, including quality, accuracy and value of research, firm profitability or revenues, client feedback and competitive factors. Research analysts', strategists' or economists' compensation is not linked to investment banking or capital markets transactions performed or proposed to be performed by CGS-CIMB India or its affiliates.
CCGS-CIMB India has not received any investment banking related compensation from the companies mentioned in the report in the past 12 months.
CGS-CIMB India has not received any compensation from the companies mentioned in the report in the past 12 months.
Indonesia: This report is issued and distributed by PT CGS-CIMB Sekuritas Indonesia (“CGS-CIMB Indonesia”). The views and opinions in this research report are our own as of the date hereof and are subject to change. CGS-CIMB Indonesia has no obligation to update its opinion or the information in this research report. Neither this report nor any copy hereof may be distributed in Indonesia or to any Indonesian citizens wherever they are domiciled or to Indonesian residents except in compliance with applicable Indonesian capital market laws and regulations.
This research report is not an offer of securities in Indonesia. The securities referred to in this research report have not been registered with the Financial Services Authority (Otoritas Jasa Keuangan) pursuant to relevant capital market laws and regulations, and may not be offered or sold within the territory of the Republic of Indonesia or to Indonesian citizens through a public offering or in circumstances which constitute an offer within the meaning of the Indonesian capital market law and regulations.
Ireland: CGS-CIMB is not an investment firm authorised in the Republic of Ireland and no part of this document should be construed as CGS-CIMB acting as, or otherwise claiming or representing to be, an investment firm authorised in the Republic of Ireland.
Malaysia: This report is distributed in Malaysia by CIMB solely for the benefit of and for the exclusive use of our clients. Recipients of this report are to contact CIMB, at 17th Floor Menara CIMB No. 1 Jalan Stesen Sentral 2, Kuala Lumpur Sentral 50470 Kuala Lumpur, Malaysia, in respect of any matters arising from or in connection with this report. CIMB has no obligation to update, revise or reaffirm its opinion or the information in this research reports after the date of this report.
New Zealand: In New Zealand, this report is for distribution only to persons who are wholesale clients pursuant to section 5C of the Financial Advisers Act 2008.
Singapore: This report is issued and distributed by CGS-CIMB Research Pte Ltd (“CGS-CIMBR”). CGS-CIMBR is a financial adviser licensed under the Financial Advisers Act, Cap 110 (“FAA”) for advising on investment products, by issuing or promulgating research analyses or research reports, whether in electronic, print or other form. Accordingly CGS-CIMBR is a subject to the applicable rules under the FAA unless it is able to avail itself to any prescribed exemptions.
Recipients of this report are to contact CGS-CIMB Research Pte Ltd, 50 Raffles Place, #16-02 Singapore Land Tower, Singapore in respect of any matters arising from, or in connection with this report. CGS-CIMBR has no obligation to update its opinion or the information in this research report. This publication is strictly confidential and is for private circulation only. If you have not been sent this report by CGS-CIMBR directly, you may not rely, use or disclose to anyone else this report or its contents.
If the recipient of this research report is not an accredited investor, expert investor or institutional investor, CGS-CIMBR accepts legal responsibility for the contents of the report without any disclaimer limiting or otherwise curtailing such legal responsibility. If the recipient is an accredited investor, expert investor or institutional investor, the recipient is deemed to acknowledge that CGS-CIMBR is exempt from certain requirements under the FAA and its attendant regulations, and as such, is exempt from complying with the following : (a) Section 25 of the FAA (obligation to disclose product information); (b) Section 27 (duty not to make recommendation with respect to any investment product without having a reasonable basis where you may be reasonably expected to rely on the recommendation) of the FAA; (c) MAS Notice on Information to Clients and Product Information Disclosure [Notice No. FAA-N03]; (d) MAS Notice on Recommendation on Investment Products [Notice No. FAA-N16]; (e) Section 36 (obligation on disclosure of interest in securities), and (f) any other laws, regulations, notices, directive, guidelines, circulars and practice notes which are relates to the above, to the extent permitted by applicable laws, as may be amended from time to time, and any other laws, regulations, notices, directive, guidelines, circulars, and practice notes as we may notify you from time to time. In addition, the recipient who is an accredited investor, expert investor or institutional investor acknowledges
Financial Services │ Indonesia
Banks │ October 5, 2018
21
that a CGS-CIMBR is exempt from Section 27 of the FAA, the recipient will also not be able to file a civil claim against CGS-CIMBR for any loss or damage arising from the recipient’s reliance on any recommendation made by CGS-CIMBR which would otherwise be a right that is available to the recipient under Section 27 of the FAA, the recipient will also not be able to file a civil claim against CGS-CIMBR for any loss or damage arising from the recipient’s reliance on any recommendation made by CGS-CIMBR which would otherwise be a right that is available to the recipient under Section 27 of the FAA.
CGS-CIMBR, its affiliates and related corporations, their directors, associates, connected parties and/or employees may own or have positions in securities of the company(ies) covered in this research report or any securities related thereto and may from time to time add to or dispose of, or may be materially interested in, any such securities. Further, CGS-CIMBR, its affiliates and its related corporations do and seek to do business with the company(ies) covered in this research report and may from time to time act as market maker or have assumed an underwriting commitment in securities of such company(ies), may sell them to or buy them from customers on a principal basis and may also perform or seek to perform significant investment banking, advisory, underwriting or placement services for or relating to such company(ies) as well as solicit such investment, advisory or other services from any entity mentioned in this report.
As of October 4, 2018, CGS-CIMBR does not have a proprietary position in the recommended securities in this report.
CGS-CIMBR does not make a market on the securities mentioned in the report.
South Korea: This report is issued and distributed in South Korea by CGS-CIMB Securities (Hong Kong) Limited, Korea Branch (“CGS-CIMB Korea”) which is licensed as a cash equity broker, and regulated by the Financial Services Commission and Financial Supervisory Service of Korea. In South Korea, this report is for distribution only to professional investors under Article 9(5) of the Financial Investment Services and Capital Market Act of Korea (“FSCMA”).
Spain: This document is a research report and it is addressed to institutional investors only. The research report is of a general nature and not personalised and does not constitute investment advice so, as the case may be, the recipient must seek proper advice before adopting any investment decision. This document does not constitute a public offering of securities.
CGS-CIMB is not registered with the Spanish Comision Nacional del Mercado de Valores to provide investment services.
Sweden: This report contains only marketing information and has not been approved by the Swedish Financial Supervisory Authority. The distribution of this report is not an offer to sell to any person in Sweden or a solicitation to any person in Sweden to buy any instruments described herein and may not be forwarded to the public in Sweden.
Switzerland: This report has not been prepared in accordance with the recognized self-regulatory minimal standards for research reports of banks issued by the Swiss Bankers’ Association (Directives on the Independence of Financial Research).
Thailand: This report is issued and distributed by CGS-CIMB Securities (Thailand) Co. Ltd. (“CGS-CIMB Thailand”) based upon sources believed to be reliable (but their accuracy, completeness or correctness is not guaranteed). The statements or expressions of opinion herein were arrived at after due and careful consideration for use as information for investment. Such opinions are subject to change without notice and CGS-CIMB Thailand has no obligation to update its opinion or the information in this research report.
CGS-CIMB Thailand may act or acts as Market Maker, and issuer and offerer of Derivative Warrants and Structured Note which may have the following securities as its underlying securities. Investors should carefully read and study the details of the derivative warrants in the prospectus before making investment decisions.
AAV, ADVANC, AMATA, AOT, AP, BANPU, BBL, BCH, BCP, BCPG, BDMS, BEAUTY, BEM, BGRIM, BJC, BH, BLA, BLAND, BPP, BTS, CBG, CENTEL, CHG, CK, CKP, COM7, CPALL, CPF, CPN, DELTA, DTAC, EA, EGCO, EPG, ERW, ESSO, GGC, GFPT, GLOBAL, GLOW, GPSC, GUNKUL, HANA, HMPRO, INTUCH, IRPC, ITD, IVL, KBANK, KCE, KKP, KTB, KTC, LH, LPN, MAJOR, MEGA, MINT, MTLS, ORI, PRM, PSH, PSL, PTG, PTT, PTTEP, PTTGC, QH, RATCH, ROBINS, RS, SAWAD, SCB, SCC, SGP, SIRI, SPALI, SPRC, STA, STEC, SUPER, TASCO, TCAP, THAI, THANI, TISCO, TKN, TMB, TOA, TOP, TPIPL, TPIPP, TRUE, TTW, TU, TVO, UV, WHA, WHAUP, WORK.
Corporate Governance Report:
The disclosure of the survey result of the Thai Institute of Directors Association (“IOD”) regarding corporate governance is made pursuant to the policy of the Office of the Securities and Exchange Commission. The survey of the IOD is based on the information of a company listed on the Stock Exchange of Thailand and the Market for Alternative Investment disclosed to the public and able to be accessed by a general public investor. The result, therefore, is from the perspective of a third party. It is not an evaluation of operation and is not based on inside information.
The survey result is as of the date appearing in the Corporate Governance Report of Thai Listed Companies. As a result, the survey result may be changed after that date. CGS-CIMB Thailand does not confirm nor certify the accuracy of such survey result.
Score Range: 90 - 100 80 – 89 70 - 79 Below 70 or No Survey Result
Description: Excellent Very Good Good N/A
United Arab Emirates: The distributor of this report has not been approved or licensed by the UAE Central Bank or any other relevant licensing authorities or governmental agencies in the United Arab Emirates. This report is strictly private and confidential and has not been reviewed by, deposited or registered with UAE Central Bank or any other licensing authority or governmental agencies in the United Arab Emirates. This report is being issued outside the United Arab Emirates to a limited number of institutional investors and must not be provided to any person other than the original recipient and may not be reproduced or used for any other purpose. Further, the information contained in this report is not intended to lead to the sale of investments under any subscription agreement or the conclusion of any other contract of whatsoever nature within the territory of the United Arab Emirates.
United Kingdom and European Economic Area (EEA): In the United Kingdom and European Economic Area, this material is also being distributed by CGS-CIMB Securities (UK) Limited (“CGS-CIMB UK”). CGS-CIMB UK is authorized and regulated by the Financial Conduct Authority and its registered office is at 27 Knightsbridge, London, SW1X7YB. The material distributed by CGS-CIMB UK has been prepared in accordance with CGS-CIMB’s policies for managing conflicts of interest arising as a result of publication and distribution of this material. This material is for distribution only to, and is solely directed at, selected persons on the basis that those persons: (a) are eligible counterparties and professional clients of CGS-CIMB UK; (b) have professional experience in matters relating to investments falling within Article 19(5) of the Financial Services and Markets Act 2000 (Financial Promotion) Order 2005 (as amended, the “Order”), (c) fall within Article 49(2)(a) to (d) (“high net worth companies,
Financial Services │ Indonesia
Banks │ October 5, 2018
22
unincorporated associations etc”) of the Order; (d) are outside the United Kingdom subject to relevant regulation in each jurisdiction, material(all such persons together being referred to as “relevant persons”). This material is directed only at relevant persons and must not be acted on or relied on by persons who are not relevant persons. Any investment or investment activity to which this material relates is available only to relevant persons and will be engaged in only with relevant persons.
Where this material is labelled as non-independent, it does not provide an impartial or objective assessment of the subject matter and does not constitute independent “research” (cannot remove research from here under the applicable rules of the Financial Conduct Authority in the UK. Consequently, any such non-independent material will not have been prepared in accordance with legal requirements designed to promote the independence of research (cannot remove research from here) and will not subject to any prohibition on dealing ahead of the dissemination of research. Any such non-independent material must be considered as a marketing communication.
United States: This research report is distributed in the United States of America by CGS-CIMB Securities (USA) Inc, a U.S. registered broker-dealer and a related company of CGS-CIMB Research Pte Ltd, PT CGS-CIMB Sekuritas Indonesia, CGS-CIMB Securities (Thailand) Co. Ltd, CGS-CIMB Securities (Hong Kong) Limited, CGS-CIMB Securities (India) Private Limited, and is distributed solely to persons who qualify as “U.S. Institutional Investors” as defined in Rule 15a-6 under the Securities and Exchange Act of 1934. This communication is only for Institutional Investors whose ordinary business activities involve investing in shares, bonds, and associated securities and/or derivative securities and who have professional experience in such investments. Any person who is not a U.S. Institutional Investor or Major Institutional Investor must not rely on this communication. The delivery of this research report to any person in the United States of America is not a recommendation to effect any transactions in the securities discussed herein, or an endorsement of any opinion expressed herein. CGS-CIMB Securities (USA) Inc, is a FINRA/SIPC member and takes responsibility for the content of this report. For further information or to place an order in any of the above-mentioned securities please contact a registered representative of CGS-CIMB Securities (USA) Inc.
CGS-CIMB Securities (USA) Inc. does not make a market on other securities mentioned in the report.
CGS-CIMB Securities (USA) Inc. has not managed or co-managed a public offering of any of the securities mentioned in the past 12 months.
CGS-CIMB Securities (USA) Inc. has not received compensation for investment banking services from any of the company mentioned in the past 12 months.
CGS-CIMB Securities (USA) Inc. neither expects to receive nor intends to seek compensation for investment banking services from any of the company mentioned within the next 3 months.
Other jurisdictions: In any other jurisdictions, except if otherwise restricted by laws or regulations, this report is only for distribution to professional, institutional or sophisticated investors as defined in the laws and regulations of such jurisdictions.
Corporate Governance Report of Thai Listed Companies (CGR). CG Rating by the Thai Institute of Directors Association (Thai IOD) in 2017, Anti-Corruption 2017
AAV – Very Good, n/a, ADVANC – Excellent, Certified, AEONTS – Good, n/a, AMATA – Very Good, n/a, ANAN – Excellent, n/a, AOT – Excellent, Declared, AP – Excellent, Declared, ASK – Very Good, Declared, ASP – Very Good, Certified, BANPU – Excellent, Certified, BAY – Excellent, Certified, BBL – Very Good, Certified, BCH – Good, Declared, BCP - Excellent, Certified, BCPG – Very Good, n/a, BEM – Very Good, n/a, BDMS – Very Good, n/a, BEAUTY – Good, n/a, BEC – Very Good, n/a, , BGRIM – not available, n/a, BH - Good, n/a, BJC – Very Good, Declared, BJCHI – Very Good, Declared, BLA – Very Good, Certified, BPP – Good, n/a, BR - Good, Declared, BTS - Excellent, Certified, CBG – Good, n/a, CCET – Good, n/a, CENTEL – Very Good, Certified, CHG – Very Good, Declared, CK – Excellent, n/a, COL – Very Good, Declared, CPALL – not available, Declared, CPF – Excellent, Declared, CPN - Excellent, Certified, DELTA - Excellent, n/a, DEMCO – Excellent, Certified, DIF – not available, n/a, DTAC – Excellent, Certified, EA – Very Good, n/a, ECL – Very Good, Certified, EGCO - Excellent, Certified, EPG – Very Good, n/a, GFPT - Excellent, Declared, GGC – not available, Declared, GLOBAL – Very Good, Declared, GLOW – Very Good, Certified, GPSC – Excellent, Declared, GRAMMY - Excellent, n/a, GUNKUL – Excellent, Declared, HANA - Excellent, Certified, HMPRO - Excellent, Certified, ICHI – Excellent, n/a, III – not available, n/a, INTUCH - Excellent, Certified, IRPC – Excellent, Certified, ITD – Very Good, n/a, IVL - Excellent, Certified, JAS – not available, Declared, JASIF – not available, n/a, JUBILE – Good, Declared, KAMART – not available, n/a, KBANK - Excellent, Certified, KCE - Excellent, Certified, KGI – Very Good, Certified, KKP – Excellent, Certified, KSL – Very Good, Certified, KTB - Excellent, Certified, KTC – Excellent, Certified, LH - Very Good, n/a, LPN – Excellent, Certified, M – Very Good, n/a, MACO – Very Good, n/a, MAJOR – Very Good, n/a, MAKRO – Very Good, Declared, MALEE – Very Good, n/a, MBKET – Very Good, Certified, MC – Very Good, Declared, MCOT – Excellent, Certified, MEGA – Very Good, n/a, MINT - Excellent, Certified, MTLS – Very Good, Declared, NYT – Excellent, n/a, OISHI – Very Good, n/a, PLANB – Excellent, Declared, PLAT – Very Good, Certified, PSH – Excellent, Certified, PSL - Excellent, Certified, PTT - Excellent, Certified, PTTEP - Excellent, Certified, PTTGC - Excellent, Certified, QH – Excellent, Certified, RATCH – Excellent, Certified, ROBINS – Excellent, Certified, RS – Very Good, n/a, SAMART - Excellent, n/a, SAPPE - Good, n/a, SAT – Excellent, Certified, SAWAD – Very Good, n/a, SC – Excellent, Declared, SCB - Excellent, Certified, SCBLIF – not available, n/a, SCC – Excellent, Certified, SCN – Very Good, Declared, SCCC - Excellent, Declared, SIM - Excellent, n/a, SIRI – Very Good, Declared, SPA - Good, n/a, SPALI - Excellent, n/a, SPRC – Excellent, Declared, STA – Very Good, Declared, STEC – Excellent, n/a, SVI – Excellent, Certified, TASCO – Very Good, n/a, TCAP – Excellent, Certified, THAI – Very Good, n/a, THANI – Very Good, Certified, THCOM – Excellent, Certified, THRE – Very Good, Certified, THREL – Excellent, Certified, TICON – Very Good, Declared, TIPCO – Very Good, Certified, TISCO - Excellent, Certified, TK – Very Good, n/a, TKN – Very Good, Declared, TMB - Excellent, Certified, TNR – Good, n/a, TOP - Excellent, Certified, TPCH – Good, n/a, TPIPP – not available, n/a, TRUE – Excellent, Declared, TTW – Very Good, n/a, TU – Excellent, Declared, TVO – Excellent, Declared, UNIQ – not available, Declared, VGI – Excellent, Declared, WHA – not available, Declared, WHART – not available, n/a,
Rating Distribution (%) Inv estment Banking clients (%)
Add 62.3% 4.5%
Hold 26.2% 2.5%
Reduce 9.3% 0.8%
Distribution of stock ratings and inv estment banking clients for quarter ended on 30 June 2018
1203 companies under cov erage for quarter ended on 30 June 2018
Financial Services │ Indonesia
Banks │ October 5, 2018
23
WORK – not available, n/a.
Companies participating in Thailand’s Private Sector Collective Action Coalition Against Corruption programme (Thai CAC) under Thai Institute of Directors (as of October 28, 2016) are categorized into:
- Companies that have declared their intention to join CAC, and
- Companies certified by CAC
Recommendation Framework
Stock Ratings Definition:
Add The stock’s total return is expected to exceed 10% over the next 12 months.
Hold The stock’s total return is expected to be between 0% and positive 10% over the next 12 months.
Reduce The stock’s total return is expected to fall below 0% or more over the next 12 months.
The total expected return of a stock is defined as the sum of the: (i) percentage difference between the target price and the current price and (ii) the forward net dividend yields of the stock. Stock price targets have an investment horizon of 12 months.
Sector Ratings Definition:
Overweight An Overweight rating means stocks in the sector have, on a market cap-weighted basis, a positive absolute recommendation.
Neutral A Neutral rating means stocks in the sector have, on a market cap-weighted basis, a neutral absolute recommendation.
Underweight An Underweight rating means stocks in the sector have, on a market cap-weighted basis, a negative absolute recommendation.
Country Ratings Definition:
Overweight An Overweight rating means investors should be positioned with an above-market weight in this country relative to benchmark.
Neutral A Neutral rating means investors should be positioned with a neutral weight in this country relative to benchmark.
Underweight An Underweight rating means investors should be positioned with a below-market weight in this country relative to benchmark.
#03