Embed Size (px)
Citation preview
AN ABSTRACT OF THE THESIS OF
Kirk W. Pomper for the Degree of Doctor of Philosophy in Horticulture presented on December 19. 1995. Title: Expansion. Apoplastic Solutes, and Sugar Uptake in Developing Strawberry Fruit.
Abstract approved: Patrick J. Breen
Identification of factors that affect water and sugar transport in strawberry could aid
in attempts to influence fruit size and quality. Apoplastic water potential (v|/aw) gradients
within the strawberry plant, that could influence water and assimilate transport, were
identified. Fruit expansion was very sensitive to water stress and occurred when the \yaw
of leaves was higher than that of fruit. Green-white fruit underwent osmotic adjustment in
drought stressed plants, but not to levels to where expansion could be maintained during
daytime.
Solutes in the apoplast of developing strawberry fruit may contribute significantly to
a i|/aw gradient within in the plant. We utilized four techniques to determine fruit apoplastic
solute potential (Vas). First, y^ was estimated from the difference between ij/aw (measured
via psychrometry) and the xylem water potential (vj/jj (measured with a pressure chamber);
secondly, xylem exudate was collected via a pressure chamber; thirdly, liquid was
recovered by centrifugation of plugs of fruit tissue; and finally, apoplastic solution was
collected on paper disks by a novel method developed to sample the open pith cavity of
ripening strawberry fruit with little or no cell damage. All methods, except the xylem

exudate method, suggested moderate levels of apoplastic solutes (more negative vi/^) in
ripening fruit, including concentrations of sucrose and glucose each near 50 mM.
Turgor-sensitive sugar uptake from the apopiast of sink tissues may represent a
point of regulation in translocation of sucrose by influencing the rate of uptake of sucrose
from the sink apopiast. To determine whether Y|/aw of bathing solutions (and thereby cell
turgor) influenced sugar uptake by fruit cortex tissue from the apopiast, disks were cut from
green-white fruit and placed into incubation solutions at various osmolarities. Lowering
cell turgor decreased in vitro uptake of C -sucrose and C -glucose by tissue disks.
Strawberry fruit cells apparently do not possess a sugar uptake system that is stimulated by
a reduction in turgor, as found in some plants.

Expansion, Apoplastic Solutes, and Sugar Uptake in Developing
Strawberry Fruit.
by
Kirk W. Pomper
A Thesis
submitted to
Oregon State University
in partial fulfillment of the requirements for the
degree of
Doctor of Philosophy
Completed December 19, 1995 Commencement June 1996

©Copyright by Kirk W. Pomper December 19,1995 All Rights Reserved

Doctor of Philosophy thesis of Kirk W. Pomper presented on December 19.1995
APPROVED:
Major Professor, representing Horticulture
Head of Department of Horticulture
Dean of GraduaM School uateS
I understand that my thesis will become part of the permanent collection of Oregon State University libraries. My signature below authorizes release of my thesis to any reader upon request.
^ Kirk W. Pomper, Author

ACKNOWLEDGEMENTS
When I began thinking about writing this section, I realized that I have been here in
this department a long time and that many people have had a significant influence on me
during this period. However, no one has had a greater influence on me than Pat Breen and I
want to thank him for his comments and beer; I don't think I could have made it through the
former without the later. Really, Pat gave me a chance to develop as a scientist and as a
person and I can not speak highly enough of him professionally and personally. I want to
thank Tony Chen, Fred Rickson, Stephen Griffith, and especially Anita Azarenko, as well
as lab group members for assisting my research efforts. There are friendships I have made
here that I will always treasure—Robin, Ted, Glen, Neil, Brenadine, Angela, Kais, Yerko,
Carmo, Habib, Cheryl, Mike, Anne, Guiwen, and Joel—and I want to say that you all mean
a lot to me. I sure enjoyed those pool nights with the gang, pizza and beer at the Dream
with the group on Friday, and sipping coffee at the Beanery. The Bearded One (Steve),
Hal, and others at Grace Lutheran Church, as well as my first roommates here in Corvallis
(Marc, Scotty, and Susan) also helped me grow personally. I especially enjoyed being
Glen's roommate during part of my stay here. He introduced me to Tofu Classics, hot oil
spaghetti, and we had great discussions about Star Trek. I want to thank my parents and
sister for their love and phone calls; and of course, I want to thank Colleen for her love and
support through this degree; I realize I was not always the easiest to be around. I really
enjoyed spending time with Colleen's family also. I don't know what the future holds for
science in this country, but I will go forth bravely and with hope. Let the future begin!

CONTRIBUTION OF AUTHORS
Dr. Patrick Breen was involved in the experimental design, discussion and editing
of successive drafts of each manuscript.

TABLE OF CONTENTS
Page
CHAPTER 1: INTRODUCTION 1
CHAPTER 2: LITERATURE REVIEW 4
2.1 Strawberry fruit morphology and growth 4
2.2 Fruit expansion and plant water potential 5
2.3 Osmotic adjustment 6
2.4 Measurement of water potential 7
2.5 Phloem loading and unloading 9
2.6 Phloem transport to fruit 14
2.7 Apoplastic solutes and phloem transport 15
2.8 Sugar uptake from the apoplast 17
CHAPTER 3: EXPANSION AND OSMOTIC ADJUSTMENT OF STRAWBERRY FRUIT DURING WATER STRESS 20
3.1 Abstract 21
3.2 Introduction 22
3.3 Materials and methods 26
3.4 Results 31
3.5 Discussion 40
3.6 Literature cited 47
CHAPTER 4: LEVELS OF APOPLASTIC SOLUTES IN DEVELOPING STRAWBERRY FRUIT 51

TABLE OF CONTENTS (Continued)
Page
4.1 Abstract 52
4.2 Introduction 53
4.3 Materials and methods 56
4.4 Results 61
4.5 Discussion 72
4.6 Literature cited 80
CHAPTER 5: THE EFFECT OF CELL TURGOR ON SUGAR UPTAKE IN STRAWBERRY FRUIT CORTEX TISSUE 83
5.1 Abstract 84
5.2 Introduction 85
5.3 Materials and methods 87
5.4 Results 92
5.5 Discussion 100
5.6 Literature cited 109
CHAPTER 6: EPILOGUE 112
BIBLIOGRAPHY 116
APPENDICES 128

LIST OF FIGURES
Figure Page
3-1. Expansion of green-white and red 'Brighton' fruit in well watered control ( ) and water-stressed ( ) plants recorded with pressure transducers in the greenhouse 32
3-2. (A) Expansion of green-white 'Brighton' fruit in watered ( ) and water- stressed ( ) plants recorded with pressure transducers in the greenhouse on two separate occasions 34
3-3. The difference between leaf and fruit apoplastic water potential (Yaw) (e.g. A ij/aw = vj/leaf - n/fnjjj) for watered (| I) and water-stressed ([S3) 'Brighton' strawberry plants 36
3-4. (A) The relationship between solute potential (vj/s) and relative water content (RWC) during rapid drying for green-white fruit from watered (O) and water-stressed (•) plants 39
4-1. Photograph of a half red' Brighton' strawberry fruit which a paper filter disk, 6 mm in diameter, was placed on the surface of the fruits' central cavity 61
4-2. Mid-afternoon xylem pressure potential (vi/x^^s, O) determined with a pressure chamber, and apoplastic water potential (i|/aw, •) measured with in situ hygrometers, for a greenhouse grown primary strawberry fruit at four times during fruit development 62
4-3. Solute potential of xylem exudate (vj/^xyi,.,,,) collected from green, green- white, and red primary strawberry fruit in relation to pressure applied with a pressure chamber 65
4-4. Concentrations of sucrose (•) and glucose (O) in exudate collected from strawberry fruit placed in a pressure bomb 68

LIST OF FIGURES (Continued)
Figure Page
4-5. Solute potential of solution (vj/s<ent) removed sequentially after centrifugation of strawberry fruit cylinders (1 cm diameter) and measured with a vapor pressure osmometer 70
5-1. A, Percent change in fresh weight of tissue disks from green-white strawberry fruit after 1 h of incubation in solutions at various osmolarities containing mannitol (O; y = 27.846 - 0.067x, r2 = 0.76) or ethylene glycol (•) 94
5-2. Uptake of [14C]-sucrose (•) by strawberry fruit tissue disks (A) in incubation solutions at various osmolarities containing mannitol (y = 0.4810 - O.OOlOx - .OOOlx2; r2 = -0.61) and (B) at the calculated cell turgor of the tissue (y = 0.221 + O.OOlx, r2 = 0.59) 96
5-3. Concentration dependence of (A) [ C]-sucrose, (B) Cj-mannitol, (C) [14C]-glucose, and (D) 0-methyl-[ C]-glucose uptake by strawberry fruit disks at high (O) and low (▼) turgor 99
5-4. Concentration dependence of [ C]-sucrose uptake by strawberry fruit disks, pretreatment with 2 mM PCMBS (T) and without pretreatment (O) in mannitol containing incubation solutions at (A) high and (B) low turgor 101
5-5. Time course reduction in the total C remaining in fruit tissue disks at high (•) or low (O) turgor conditions with continued rinsing 102

LIST OF TABLES
Table Page
3-1. Leaf temperature, stomatal conductance, and quantum flux during fruit and leaf water potential (v|/aw) and fruit expansion experiments 35
3-2. Osmotic adjustment in terms of solute potential (\j/s ; of 'Brighton' strawberry leaves and red fruit in stressed and non-stressed plants 38
4-1. Comparison of xylem exudate components to water relations of developing strawberry fruit 64
4-2. Glucose and sucrose in xylem exudate collected on disks described in Table 4-1 67
4-3. Solute potential and sugar concentrations of solution collected on paper filter disks from the strawberry fruit cavity and cut surface 73
4-4. Summary of apoplastic solute potential (x^^) determined by four methods and the ratio of x]/^ to solute potential (\j/s.buik) in strawberry fruit at two developmental stages 74
5 -1. Summary of kinetics constants for uptake of sugar in strawberry fruit disks 98

LIST OF APPENDICES
Page
APPENDIX A: IDENTIFICATION OF BOTH ACID AND ALKALINE INVERTASE ACTIVITY IN DEVELOPING STRAWBERRY FRUIT 129
A.1 Abstract 129
A.2 Introduction 129
A.3 Materials and methods 130
A.4 Results and discussion 132
A.5 Literature cited 136
APPENDIX B: FRUIT WATER LOSS AND ITS INFLUENCE ON WATER POTENTIAL 140
B.l Introduction 140
B.2 Materials and methods 140
B.3 Results 141
B.4 Conclusions 142
B.5 Literature cited 142
APPENDIX C: THE BASIS OF THERMOCOUPLE PSYCHROMETRY AND HYGROMETRY 146
APPENDIX D: ADDITIONAL GROWTH INFORMATION FOR SOLITARY ^BRIGHTON' FRUIT 149
APPENDIX E: SCANNING ELECTRON MICROSCOPY (SEM) EXAMINATION OF FRUIT STOMATA 150
APPENDIX F: ANALYSIS OF VARIANCE FOR DATA PRESENTED IN CHAPTER 3 154

LIST OF APPENDIX FIGURES
Figure Page
A1. The activity-pH response of soluble invertase at three stages of strawberry fruit development 139
Bl. Restriction of transpiration of fruit and leaves 144
B2. The apoplastic water potential (vj/aw) of green-white (A) and red (B) 'Brighton' strawberry fruit 145
Dl. Growth data for developing solitary 'Brighton' fruit where competing flowers were removed at pollination 149
El. Scanning electron microscopy (SEM) photograph (100X) of a 'Brighton' strawberry fruit and achene surface at the green stage of development 151
E2. Scanning electron microscopy (SEM) photograph (100X) of a 'Brighton' fruit and achene surface at the green-white stage of development 152
E3. Scanning electron microscopy (SEM) photograph (100X) of the fruit and achene surface of a red 'Brighton' strawberry fruit 153

LIST OF APPENDIX TABLES
Table Page
Al. Acid and alkaline invertase activities during fruit development in 'Brighton' strawberry 137
A2. Acid and neutral-alkalme invertase activities separate during acetone precipitation 138
B1. Water loss from 'Brighton' strawberry fruit in terms of weight loss after harvesting2 143
Fl. One way ANOVA for Randomized Complete Blocks (days) 154
F2. Two Way Repeated Measures ANOVA on Two Factors 155
F3. Two Way ANOVA Split Plot 156

EXPANSION, APOPLASTIC SOLUTES, AND SUGAR UPTAKE IN DEVELOPING STRAWBERRY FRUIT
CHAPTER 1
INTRODUCTION
About 90% of the total weight of a ripe strawberry {Fragaria x ananassa Duch.)
fruit is water (Darrow, 1966), so the transport of water and assimilate is an important
component in achieving optimum growth and development of the strawberry fruit. Major
gains in agricultural crop yields have come through increased partitioning of assimilate
from leaves (sources) to the harvestable storage organs (sinks) (Gifford et al., 1984).
Identification of the pathways by which water and sugar are transported to strawberry
fruit may allow their manipulation via breeding or biotechnological methods, increasing
both yields and possibly fruit sugar levels. The water status of a plant organ can be
represented by its water potential. Water moves in the xylem along gradients within the
plant toward lower water potentials, with gradients created between organs and tissues
due to differences in evaporational losses, solute accumulation, and the water demand
needed for cell expansion (Nonami and Boyer, 1993). However, xylem is not the only
pathway by which water is transported within the plant, water is in fact the major
substance translocated in the phloem. Because of physical disruption of the xylem, the
phloem is often the dominant pathway of water transport into developing fruit (Lee,
1991). Diurnal fluctuation in expansion has been reported in many fruit (Berger and

Selles, 1993) and is related to the water potential gradient between the stem and fruit
(Johnson et. al, 1992).
Even mild levels of drought stress can greatly reduce overall strawberry fruit
expansion (Renquist and Breen, 1982; Dwyer et al., 1987). Since water potential =
turgor potential + solute potential, when turgor potential is unchanged, a decrease in
solute potential lowers the water potential of a plant organ. Osmotic adjustment (the
active accumulation of solutes by cells) can decrease solute potential and thereby
maintain positive turgor under drought stress, allowing continued cell expansion and
metabolic functions that require positive turgor (Morgan, 1984). Larger water potential
differences between tissues enhances water and assimilate transport toward the tissue
with lower water potential. Strawberry leaves undergo osmotic adjustment with drought
stress (CNeil, 1983). The reductions in fruit expansion under drought stress may indicate
that these tissues fail to osmotically adjust to levels to achieve sufficient turgor for cell
expansion.
The rate of transport of assimilate via the phloem into sink regions such as
strawberry fruit may be influenced by solutes in the extracellular space or apoplast (the
whole continuity outside the plasma membrane). High levels of apoplastic solutes would
be expected to promote the removal of water from the phloem, reducing its turgor, and
presumably that of sink cells, and increase the efflux of translocated solutes into the
apoplast for subsequent uptake by sink cells (Lang and Thorpe, 1986). Phloem transport
to a sink organ has been enhanced by lowering its water potential through incubation in a
non-permeating osmoticum, demonstrating that high levels of apoplastic solutes can

influence translocation (Lang and Thorpe, 1986). Continued transport of sugars and other
solutes to sink regions containing high apoplastic solutes could be maintained if declining
turgor stimulates solute uptake by sink cells. Turgor-sensitive uptake has been observed
in many sink tissues, where cell turgor of tissue disks is reduced in incubation solutions
containing non-permeating osmoticum, resulting in increased uptake of exogenously
supplied sugar (Wyse et al., 1986; Oparka and Wright, 1988a and 1988b). Apoplastic
water would move into sink cells as they accumulated solutes, allowing continued water
and assimilate import in to the region. Neither the levels of solutes in the fruit apoplast,
nor turgor-sensitive uptake by strawberry fruit cells has been examined.
Sucrose, the major sugar translocated in strawberry (Forney and Breen, 1985a),
could be unloaded via a symplastic route (via plasmodesmata) as well as into the apoplast
prior to its uptake into fruit cells (Forney and Breen, 1986). An improved understanding
of the mechanisms of water and sugar transport could help identify strategies to increase
transport to the fruit and increase its expansion and sugar accumulation under water-
stress. The objectives of this thesis research were to: a) relate plant water relations to
fruit expansion during water-stress, b) to assess the contribution of apoplastic solutes to
fruit water potential, and c) determine whether the uptake of sugars by fruit cells from the
apoplast was turgor-sensitive.

CHAPTER 2
LITERATURE REVIEW
2.1 Strawberry fruit morphology and growth
The strawberry fruit is an aggregate fruit with achenes (these small, dry one-
seeded organs are the true botanical fruit) on the surface of a fleshy receptacle. The
receptacle is composed of: a) an epidermis, made up of polygonal cells, b) a hypodermis,
consisting of meristematic cells, c) a cortex composed of rounded parenchyma cells,
comprising most of the fleshy portion of the fruit, d) a bundle zone, the ring of vascular
tissue with individual branches leading to each achene, and e) pith, consisting of thin-
walled cells which often separate during fruit growth leaving large cavities (Winton and
Winton, 1935).
The strawberry fruit is borne on a type of inflorescence known as a cyme which
gives rise to a hierarchy of fruit; the largest is in the primary (1°) position, with
succeeding smaller fruit at lower ranks designated as secondary (2°), tertiary (3°),
quaternary (4°), etc. In addition to position within an inflorescence, fruit size is also
dependent upon the number of developed achenes (Janick and Eggert, 1968), the number
of cells (Cheng and Breen, 1992), fruit competition, and plant vigor (Darrow, 1966;
Janick and Eggert, 1968). The growth of the strawberry fruit, as measured by an increase
in weight or volume, often shows a sigmoidal pattern (Knee et al., 1977, Woodward,
1972), although a double sigmoidal growth curve has also been reported (Perkins-Veazie

and Huber, 1987; Miura et al., 1990). In a study of three cultivars that vary in final fruit
size, Cheng and Breen (1992) found that the relative difference in cell number per fruit is
established by anthesis, cell division continued until about 12 days after anthesis (DAA),
and mean cell size of mature fruit cells was similar in all cultivars.
Strawberry fruit expansion is very sensitive to drought, with even mild water
stress greatly reducing yields (Renquist, 1982; Dwyer et al., 1987). Even under favorable
environmental conditions few strawberry fruit expand to their fullest potential (Abbott et
al., 1970). Water deprivation limits cell expansion and fruit growth, and Webb (1973)
suggested that limitations in the water supply capacity of the strawberry peduncle/pedicel
may prevent most fruit on a single inflorescence from attaining full size.
2.2 Fruit expansion and plant water potential
i[/w is the chemical potential of water expressed in units of pressure (usually MPa)
(Nobel, 1983). The water status of a plant organ can be described by its water potential
(i|/w), which is considered the sum of the solute potential (\(/s) and the turgor potential
(vj/p), when the gravitational component is ignored. Water moves within the plant along
decreasing gradients in v|/w. These gradients are created between plant organs and tissues
by differences in evaporation rates, solute content, and cell expansion (Nonami and
Boyer, 1993). Diurnal fluctuation of expansion has been reported in many fruit and is
related to the difference in ij/w between the stem and fruit (Johnson, 1992; Tromp, 1984;
Berger and Selles, 1993). Lee (1989a) proposed that unidirectional water flux into

tomato fruit is driven by fruit growth and transpirational losses, creating a ij/w gradient
between the stem and fruit. Johnson et al. (1992) showed that there is a strong correlation
between tomato fruit expansion and the i|/w difference between the fruit and stem, with a
i|/w gradient favoring solution flow into fruit coinciding with a rapid increase in fruit
diameter, whereas inverting the v|/w gradient caused fruit shrinkage. Fruit shrinkage can
result from a reversal in water flow, and water fluxes from apple fruit toward the trunk
during water stress have been measured using a heat-pulse method (Yamamoto, 1983).
Evaporational loss from fruit likely plays only a limited role in influencing fruit
v)/w and expansion. Lee (1990) suggested that fruit transpiration in tomato may exceed
the delivery capacity of the conducting tissues in the pedicel causing fruit shrinkage.
However, Johnson (1992) found that only a small fraction (10.5 %) of the water imported
into tomato fruit is lost to transpiration. Wrapping of apple fruit in foil to restrict
transpiration only reduces diurnal fruit shrinkage by 20-35% and had little influence on
fruit v|/w (Tromp, 1984).
2.3 Osmotic adjustment
Osmotic adjustment, the maintenance of positive cell turgor through the
accumulation of solutes within cells, is often a strategy by which plants tolerate salt or
water stress (Morgan, 1984; Kramer and Boyer, 1995). Positive cell turgor is required for
plant growth (Meyer and Boyer, 1981), opening of stomata, photosynthesis, and nitrogen
metabolism (Kramer, 1983; Turner and Jones, 1980). Cell turgor is equal to v)/w minus

the i|/s (i.e. v|/p = vj/w - VJ/S). The accumulation of solutes in cells can lower \\is, thereby
increasing \\ip, allowing turgor dependant processes to continue at progressively lower
leaf v)/w. If v|/p and cell wall yield (the minimum turgor below which no expansion occurs)
remain steady, reductions in v|/s reduce \|/w of cells (i.e. vj/w = \\ip + \\is), and may increase
water and assimilate transport toward tissues with reduced VJ/W (Cosgrove, 1993). Jones et
al. (1985) have suggested that osmotic adjustment likely occurs in fruit tissues, but this
has not been reported in the literature.
Osmotic adjustment occurs in the leaves ofFragaria x ananassa Duch. (Renquist
et al., 1982), F. chiloensis (Archbold and Zhang, 1991), and F. virginiana (O'Neill, 1983)
in response to drought stress. Archbold and Zhang (1991) have suggested that the greater
degree of osmotic adjustment shown in F. chiloensis than in F. virginiana could
contribute to better growth and survival of F. chiloensis under drought. It has not been
determined whether the fruit of strawberry under drought are capable of osmotic
adjustment as a means to maintain growth and influence plant v}/w gradients so as to effect
water transport.
2.4 Measurement of water potential
The v}/w of a plant organ is usually measured either via psychrometry or a pressure
chamber. With the pressure chamber method, a plant organ is severed and placed into a
chamber where the pressure is increased until fluid, presumably from the xylem, is
pushed from the cut end. This pressure, although opposite in sign, is considered to be

8
numerically equivlant to the i|/w of the organ; assuming solute levels in the xylem are very
low (i.e. vj/w = i|/p). Obviously one major drawback of the pressure chamber method is
that the destructive sampling prevents repeated measurements of the same organ.
The validity of v|/w measurements made with a pressure chamber to represent the
total water potential of a tissue has been called into question. Xylem tension measured
with a pressure probe is much lower than that determined with a pressure chamber
(Balling and Zimmermann, 1990; Zimmermann et al., 1993; Zimmermann et al., 1994;
Benkert et al., 1995). Using NMR-microscopy, Zimmermann et al. (1993) reported that
drought stressed leaves show large amounts of air in the tissue and they suggest that air-
filled spaces interfere with the propagation of pressure across the tissue in the pressure
chamber, leading to overly negative n/w measurements. High resolution H-NMR-
imaging of tissue a few millimeters from the cut ends of excised tobacco leaves also
indicate that xylem water does not recede from the cut end as has been assumed for many
years (Zimmermann et al., 1993).
In psychrometry, either plant tissue is placed in a chamber containing a
thermocouple or the chamber apparatus is place on an organ while still attached to a
plant. After a period of time, the water vapor in the chamber comes into equilibrium with
the v|/w of the tissue. There is a thermocouple junction inside psychrometer chamber
which is then cooled to a temperature below the dew point of the air of the chamber by
passage of an electrical current that causes water to condense on the junction, then the
current is discontinued. Water on the junction evaporates, cooling it, with the magnitude
of the temperature depression dependant on the humidity (water vapor pressure) of the

surrounding air. The temperature difference before and after evaporative cooling of the
junction is directly related to the relative humidity and hence v|/w (see Appendix B for
further information of the theory and operation of a psychrometer). Measurement of the
i|/w of a given leaf with psychometric and pressure chamber methods yield similar values.
Since measurement of v)/w of plant tissue with a pressure chamber may not represent the
true iyw, it causes one to wonder whether psychrometers also yield accurate measurements
of \|/w of organs.
2.5 Phloem loading and unloading
Sucrose and other components of the phloem sieve elements are translocated by
means of a passive bulk flow down a gradient of hydrostatic pressure (Giaquinta, 1983).
Sink regions (areas where carbon is utilized) apparently influence the direction and
magnitude of translocation by locally removing water and solutes from the sieve tubes,
thus steepening the osmotic and chemical gradient between source leaves and sink tissues
(Thome, 1986). The bulk flow of solutes in the phloem also results in the transport of
significant amounts of water to sink regions.
Excellent reviews of carbon partitioning and phloem loading can be found in
Frommer and Sonnewald (1995) and Wardlaw (1990). The path of transfer of sucrose
from its site of synthesis to the leaf phloem depends on the plant species, but can consist
of an apoplastic (the whole continuity outside the plasma membrane) (e.g. sugar beet,
potato, etc.) or a symplastic (via plasmodesmata) route (e.g. cucumber) (Wardlaw, 1992).

10
Significant advances have been made recently in understanding phloem loading which
deserve mention. Molecular approaches have led to the cloning of a sucrose transporter
that is thought to be located in the sieve element plasma membrane, and is involved in
phloem loading from the apoplast in potato (see the review of Bush, 1993). Yeast are
able to use sucrose as a sole carbon source by secreting invertase (which hydrolyses
sucrose to its hexose meioties) and subsequently transporting the released hexoses into
the cell. Some strains are also able transport sucrose through a maltose transporter.
Riesmeier et al. (1992) isolated a yeast mutant deficient in both invertase activity and
maltose transport. After confirming that cells of this strain could not grow on sucrose,
they re-introduced cytosolic invertase or sucrose synthase (neither are secreted) to allow
these mutants to metabolize sucrose, but only after it enters the cell. These yeast mutants
were transformed with a cDNA library from spinach leaves, which presumably contained
the gene for the sucrose transporter, constructed in a yeast expression vector and then
screened for transformants that restore growth on sucrose. Growth on sucrose would
indicate that either the mutant yeast had acquired sucrose transport or secreted invertase
activity. Riesmeier et al. (1992) identified a clone that encoded for a sucrose transporter.
This group went on to show that this sucrose transporter plays an essential role in
phloem loading and assimilate partitioning in potato using antisense technology
(Riesmeier et al., 1994). H+ATPase genes have also been cloned from potato (Harms et
al., 1994) and could be important in phloem loading since sucrose transporters are
sucrose-H+ symporters. Gahrtz et al. (1994) have also cloned a phloem-specific sucrose
transporter from Plantago major L. supporting the model of apoplastic phloem loading.

11
Several reviews on phloem unloading have been published recently, so it will only
be outlined briefly here along with some recent significant contributions in this area (see
Oparka, 1990; Patrick, 1990; Wardlaw, 1990; Wolswinkle, 1990; Thome, 1986). Several
processes may serve to promote continued unloading from the phloem into sink regions:
1) chemical alteration of the unloaded assimilates (e.g. hydrolysis of sucrose to glucose
and fructose, or formation of starch), 2) compartmentation within apoplastic or
symplastic pools, or, 3) utilization of assimilates for growth (Thome, 1985).
Unloading of sugars from the phloem may occur through the symplast or
apoplast or a combination of both (Oparka, 1990; Patrick, 1990). The unloading of
solutes from the phloem may involve an active transport step (Gifford and Thome, 1986),
but evidence that unloading is passive mechanism has also been reported (Porter, 1985).
It is not currently known whether the sucrose transporter recently cloned from the phloem
is involved in unloading, such as backflow through the sucrose transporter (Riesmeier et
al., 1992; Frommer and Sonnewald, 1995). Extensive plasmodesmata connections from
between the phloem and surrounding tissues, as demonstrated in ultrastructural studies
and by the movement of fluorescent probes, have been used as evidence for a symplastic
route. This route is the major pathway of unloading in expanding leaves (Turgeon,
1989), root apices (Giaquinta et al., 1983) maternal tissues of developing seeds (Thome,
1985), and potato tubers (Oparka 1986; Oparka and Prior, 1987, 1988).
Common features of sinks in which phloem is unloaded symplastically are
metabolism of imported photosynthate that is based on polymer formation (e.g. starch)
and sink cells with turgor less than that of the sieve elements (Patrick, 1990). Apoplastic

12
pathways of unloading are thought to occur in sugar cane stems (Glasziou and Gayler,
1972), sugar beet tap roots (Wyse, 1972), and citrus (Koch et al., 1986) and tomato
(Damon et al., 1988) fruits. These sinks tend to accumulate osmotically active solutes to
high concentrations (Patrick, 1990). A symplastic unloading route may be important
early in the development of some fruit (e.g. tomato), with apoplastic unloading becoming
the major route later in development (Patrick, 1990).
A great deal of our knowledge of phloem unloading is based on solute release
from the maternal tissues of legumes using the "empty seed coat" system (Thome, 1985;
Wolswinkle, 1990,1992; Bradford, 1994). Recently, Wang and Fisher (1993, 1994) have
elegantly examined the symplastic and apoplastic steps of phloem transport into
developing wheat grains using fluorescent probes (e.g. Lucifer yellow). These authors
also used microautoradiographic analysis of kernel sections and collected phloem exudate
via aphid stylets after pulse labeling the plant with CO2 to examine transport and
unloading of 14C-sucrose.
Recent work by Lucas et al. (1993) have changed the view of plasmodesmata as
passive cytoplasmic bridges between neighboring cells to that of a supramolecular
complexes consisting of membranes and proteins. They provide evidence that the
plasmodesmata complex controls the size exclusion limit for intercellular diffusion of
metabolites and small molecules as well as regulates the intercellular trafficking of
macromolecules, including proteins and nucleic acids. Plasmodesmata may act as turgor
regulated valves, controlling the outward movement of solutes from the sieve elements
(Oparka and Prior, 1992).

13
The general inaccessibility and fragility of the phloem has hampered experiments
concerning the unloading of solutes. A significant recent advance in examining phloem
unloading has been the use of confocal laser scanning microscopy in the laboratory of
K.J. Oparka, enabling real-time imaging of phloem unloading in the root tip of
Arabidopsis seedlings (Oparka et al., 1994). The fluorescent probe 5(6)
carboxyfluorescein (which is restricted to the symplast upon entry into phloem sieve
elements due to its charged nature) was loaded into a single cotyledon and the entire
seedling placed in a chamber for observation under the microscope. The probe was
observed to be translocated rapidly to the root tip and unloaded from the phloem into
discrete concentric files of cells. This unloading site corresponded to the position of two
protophloem files of sieve elements, demonstrating a functional role of these cells in
symplastic sieve element unloading. Oparka's group has shown that phloem transport
processes can be imaged in real time and non-invasively within a intact plant, providing
that the phloem is relatively close to the plant surface.
Molecular biological approaches to understanding phloem unloading have thus far
been basically limited to alterations of sink cell metabolism. Mtiller-Rober et al. (1992)
inhibited starch synthesis in transgenic potato by expressing a chimeric gene encoding
antisense RNA for ADP-glucose pyrophosphorylase, which is thought to regulate starch
synthesis. This reduced the activity of this enzyme and lowered starch contents to 2 to 5%
of wild-type levels. In addition to inhibition of starch synthesis, the number of tubers and
both fresh and dry tuber weight were reduced per plant, suggesting a reduction in sink
strength. Stark et al. (1991) created transgenic potato plants in which ADP-glucose
14
pyrophosphorylase was over expressed only in the tuber, compared to wild type plants,
and reported increased starch and higher dry matter content in tubers.
The function of phloem proteins (P-proteins) are incompletely understood but
appear to be involved in plugging damaged phloem. Several cDNAs have been isolated
that encode the expression of these proteins within companion cells in the vascular
bundles of pumpkin (Bostwick et al., 1992). Phloem specific promoters have been
identified (Martin et al., 1993) and will hopefully allow future manipulation of unloading
pathways and alteration of metabolism within sieve elements.
2.6 Phloem transport to fruit
The phloem is a major pathway for water and solute movement into fruits. Water
is also delivered via the xylem, but a break or discontinuity of the xylem has been
reported late in fruit development in grape (Findlay et al., 1987), tomato (Lee, 1989), and
apple (Lang and Ryan, 1994). The physical disruption of the xylem presumably limits its
ability to transport water, and Lee (1989b) estimated that approximately 77% of the flow
of water into a tomato fruit late in development takes place via the phloem.
Sucrose is the major sugar translocated in strawberry (Forney and Breen, 1985a)
and may be unloaded into the fruit apoplast prior to uptake by fruit cells (Forney and
Breen, 1986). Although a fruit-pedicel abscision zone does not form in strawberry, in
many cultivars ripe fruit can be easily detached at the calyx, possibly reflecting a
weakening in the vasculature in this region.

15
2.7 Apoplastic solutes and phloem transport
Solutes can be present at high levels in the apoplast of some sink tissues such as
mature sugarcane stalks (Welbaum and Meinzer, 1990), developing seeds (Wolswinkle,
1990), tomato pericarp (Ruan et al., 1995), and ripening grape berries (Lang and During,
1991). The apoplast can serve as a storage area for sugar. Sucrose in the apoplast of
stems of mature sugarcane may reach concentrations of 700 mM and account for up to
20% of the stored sugar (Welbaum and Meinzer, 1990). Apoplastic water potential (v|/aw),
which is considered to represent v|/w of a tissue (Nobel, 1983), can be measured via
psychrometry (Dixon and Tyree, 1984). High concentrations of apoplastic solutes in sink
tissues may augment v[/aw gradients within plants and influence water and assimilate flow
from source to sink organs.
Lang and Thorpe (1986) have hypothesized that high levels of apoplastic solutes
promote removal of water from the phloem, by reducing its turgor, causing increased
efflux of translocated solutes into the apoplast for subsequent active uptake by sink cells.
Apoplastic water would move into these cells due to increased solute content (i.e.
reduced \j/s), allowing continued water and assimilate transport to the region. These
authors showed that steepening the v|/aw gradient between the shoot and root of Phaseolus
vulgahs L., by bathing the root in a solution containing a non-permeating osmoticum
(mannitol), increased assimilate transport to the root. Solute levels in the apoplast of
grape berries are relatively high and this may be the result of leakage from cells as fruit
mature and senesce (Lang and During, 1991). High concentrations of apoplastic solutes
16
may be maintained because fruit transpiration is low, which results in reduced xylem flow
to fruit which would increase dilution. The fruit pedicel of grape may essentially isolate
apoplastic solutes from the dilute xylem solution in the stem due to its long diffusional
path. Extreme swelling of cell walls and degeneration of plastids have been noted in
ripening strawberry fruit (Knee et al., 1977), suggesting that a loss in cell membrane
integrity could also result in a rise in apoplastic solute levels.
Direct quantification of solutes in the apoplast of plant tissues is technically very
difficult. Washing-out (Glasziou and Gayler, 1972) or centrifiigation of tissue segments
(Terry and Bonner, 1980) have been used to obtain solute directly from the apoplast.
However, a serious problem with these techniques is contamination of samples by the
contents of cells damaged during the process (Ehwald et al., 1980). The pressure
chamber has been used in attempts to sample the apoplast of leaves by collecting the
xylem fluid pushed from the pedicel (Jachetta et al., 1986). Physical, semi-permeable
barriers surrounding vascular bundles have been reported that could interfere with the
free movement of apoplastic solutes, both in storage organs, such as sugarcane stalks
(Welbaum, et al., 1992) and leaves (Canny, 1993), possibly preventing the retrieval of
authentic apoplastic solution via the pressure chamber. Ruan et al. (1995) have
successfully retrieved apoplastic solution under pressure through a syringe needle
inserted into a tomato fruit using a pressure chamber method. The indirect estimation of
apoplastic solutes levels can be calculated by assuming that the apoplastic solute potential
(Was) equals the difference between ij/aw and vj/x_press (xylem pressure potential or tension)
(i.e., vj/^ = i|/aw - vivpress).

17
2.8 Sugar uptake from the apoplast
Plant cells possess the capacity to accumulate solute supplied exogenously to the
apoplast (see Oparka, 1990). Sugar uptake from the apoplast by sink cells may represent
the final step of apoplastic unloading from the phloem. However, Maynard and Lucas
(1982) have suggested that uptake of sugars from the apoplast by cells may represent a
general mechanism by which cells retrieve leaked sugars.
Turgor-sensitive uptake has been observed in many sink tissues. Increasing the
concentration of a non-permeating osmoticum bathing plant tissues, thus lowering cell
turgor, increases uptake of exogenously supplied sucrose by tissues of sugar beet taproot
(Wyse et al., 1986), potato tuber (Oparka and Wright, 1988a and 1988b), leaves (Daie
and Wyse, 1985) and developing cotyledons of Phaseolus (Patrick, 1994a). Increased
uptake of sucrose from the apoplast by sink cells triggered by reduced turgor could be a
strategy by which sink regions promote continued import of assimilates. However, this
tactic may not be used by all tissues, for reducing turgor failed to enhance sucrose uptake
in disks of Citrus sinensis leaves (Martinez-Cortina and Sanz, 1994) and carrot root tissue
(Hole and Dearman, 1994).
The uptake of sugars in vitro often yields biphasic uptake kinetics with a saturable
(carrier mediated) component and a linear (diffusional) component (see Oparka, 1990;
Bush, 1993). The saturable component of in vitro sucrose uptake is obstructed by
p-chloromercuibenzenesulfonic acid (PCMBS), a potent inhibitor of the plasma
membrane sucrose transporter in plants (Giaquinta, 1976; Riesmeier et al., 1992). The
observed biphasic kinetic patterns for sugar uptake by plant tissues may result from

18
combined carrier and diffusional mechanisms, different cell types in tissue with
dissimilar uptake rates, or reflect metabolism of sugars within cells in addition to
transport across the plasma membrane. In sink potato tuber tissue, biphasic kinetics of
glucose and fructose uptake represents a linear component of sugar transport across the
plasma membrane superimposed on a second saturable component representing starch
synthesis within cells (Wright and Oparka, 1990).
Forney and Breen (1986) reported that uptake of sucrose by tissue disks from
green-white strawberry fruit displays biphasic kinetics, with a saturable component
predominant at low concentrations (< 25 mM) and a linear component at higher
concentrations. Uptake of glucose was more rapid and its kinetics revealed only the first
component, which saturates near 200 mM. Fructose uptake showed a pattern similar to
that of sucrose. The influence of the osmolarity of the incubation solution on (i.e. cell
turgor) the role and kinetics of sugar uptake by strawberry fruit tissues has not been
investigated.
Sugar carriers and transporters are likely present in the plasma membrane of cells
in sink tissues where sugar is unloaded into the apoplast or in cells in which leaked sugars
are retrieved (Oparka, 1990; Riesmeier et al., 1994). Molecular approaches have led to
the cloning of sucrose and hexose transporters from plants using yeast complimentation
techniques discussed earlier in this literature review (Bush, 1993). A glucose transporter
has been cloned from Arabidopsis by Sauer et al. (1990). Identification of the cellular
location and the molecular structure of sugar transporters is now possible, and such

19
information will enable significant strides to be made in our understanding of sugar
uptake mechanisms and their role in sink activity.

20
CHAPTERS
EXPANSION AND OSMOTIC ADJUSTMENT OF STRAWBERRY FRUIT DURING WATER STRESS
Kirk W. Pomper and Patrick J. Breen Dept. of Horticulture, Oregon State University, Corvallis, OR 97331
For submission to Journal of the American Society for Horticultural Science

21
3.1 Abstract
Expansion of green-white and red fruit in watered (control) and water-stressed
greenhouse-grown strawberry (Fragaria x ananassa Duch. cv. Brighton) plants was
monitored with pressure transducers. Green-white fruit expansion in control plants was
rapid, showing little diurnal variation, whereas in water-stressed plants it occurred only
during dark periods and fruit shrinkage occurred during the day. Red fruit were mature
and failed to show net expansion. The apoplastic water potential (v|/aw), measured with in
situ psychrometers, in control plants was always higher in leaves than in green-white
fruit. In stressed plants, vi/aw of leaves was higher than that of green-white fruit only in
pre-dawn measurements, corresponding to the period when these fruit expanded. To
determine their ability to osmotically adjust, fruit were removed from control and water
stressed plants and hydrated in water for 12 h at 40C or 20oC and then solute potential at
full turgor (v|/s ) was measured. Hydration at 40C reduced enlargement of water-stressed
green-white fruit by one-third compared to that at 20oC. Water-stressed fruit hydrated at
either temperature showed osmotic adjustment with a i|/s that was 0.28 MPa lower than
that of control fruit. Mature leaves of water-stressed plants showed a similar level of
osmotic adjustment, whereas water stress did not have a significant effect on the v)/s of
red fruit. Using a rapid dehydration methodology, solute potential (i|/s) of green-white
fruit was measured and plotted against its relative water content (RWC = [fresh weight -
dry weight/fully turgid weight - dry weight] x 100). Water-stressed green-white fruit had
a lower VJ/S for a given RWC than control fruit further, confirming the occurrence of
22
osmotic adjustment in stressed fruit tissue. The lack of a linear relationship between
turgor pressure and RWC prevented the calculation of cell elasticity or volumetric elastic
modulus (e = Avj/p/ARWC x 100). Osmotic adjustment resulted in about a 2.5-fold
increase in the levels of both glucose and sucrose in stressed fruit, contributing to about
17% of the decrease in total vj/s. Even though green-white fruit showed osmotic
adjustment in water-stressed plants, it was not sufficient to maintain fruit expansion
during the day.
3.2 Introduction
Expansion of fruit requires, among other factors, an adequate flow of water to the
organ and sufficient turgor to drive cell enlargement. The water status of fruit or other
plant organs may be characterized by their water potential (v|/w), which is frequently
considered the sum of turgor potential (\|/p) and solute potential (i|/s), when the
gravitational component is ignored (i.e. i|/w = \\ip + vj/s) (Nobel, 1983; Kramer and Boyer,
1995). Water moves along a gradient toward lower Y)/w, created between organs and
tissues by differences in evaporational losses, solute accumulation, and water demand
caused by cell expansion (Nonami and Boyer, 1993). Diurnal fluctuation of expansion
has been reported in many fruit, including apple (Trump, 1984) and peach (Berger and
Selles, 1993) and is related to the difference in Y|/W between the stem and fruit. Johnson et
al. (1992) showed the establishment of a v|/w gradient favoring solution flow into tomato

23
fruit coincides with a rapid increase in fruit diameter; inverting the gradient caused the
fruit to shrink.
Positive cell turgor is required for plant growth (Meyer and Boyer, 1981; Kramer,
1988). Since \\fp is equal to Y|/W minus \\is, the accumulation of solutes in cells and
lowering of v|/s increases i|/p, allowing turgor dependant processes to continue at
progressively lower \j/w. Increased elasticity of cell walls is a passive mechanism which
allows decreases in cell volume with dehydration, slowing the rate of loss of turgor with
decreasing v|/w. Osmotic adjustment, which is the maintenance of positive cell turgor
through the active accumulation of solutes within cells, is often a strategy by which plants
tolerate water or salt stress (Morgan, 1984). Osmotic and elastic adjustment together can
maintain symplastic volume and positive cell turgor in plants diumally and during soil
drying (Saliendra and Meinzer, 1991). Jones et al. (1985) suggested that osmotic
adjustment likely occurs in fruit tissues, but this has not been reported in the literature.
Water accounts for about 90% of the total weight of a ripe strawberry fruit
(Darrow, 1966) and, therefore, it is not surprising that even mild drought stress can
greatly reduce fruit yield (Renquist, 1982a; Dwyer et al., 1987). Osmotic adjustment has
been reported in leaves of the cultivated strawberry (Fragaria x ananassa Duch.)
(Renquist et al., 1982a; Save et al, 1993), as well as in its progenitor species, F.
chiloensis Duch. (Archbold and Zhang, 1991) and F. virginiana Duch. (O'Neill, 1983).
Archbold and Zhang (1991) suggested that the greater degree of osmotic adjustment
shown in F. chiloensis than F. virginiana contributes to continued growth and survival of

24
F. chiloensis during drought. No information is available on whether strawberry fruit on
water-stressed plants undergo osmotic adjustment as a means to continue expansion.
In order to distinguish between osmotic adjustment and passive changes in cell
solute contents, such as by accumulation of solutes through dehydration, i|/s should be
measured at a particular vj/w or water content. For convenience and purposes of
comparison, the level of osmotic adjustment is usually determined by contrasting the v)/s
of excised tissues from water-stressed and watered plants after a hydration step to bring
the tissue to full turgor (i.e. vj/w = 0) (Jones and Turner, 1978; Turner, 1988).
The degree of osmotic adjustment that occurs in plants in response to a water
deficit can be assessed by rehydration of control and water-stressed plants, followed by
rapid dehydration and measurement of tissue n/s and relative water content (RWC = [fresh
weight - dry weight/turgid weight - dry weight] x 100) (Turner and Jones, 1978; Morgan,
1984). A change in RWC of a plant tissue represents the change in cellular volume
(Morgan, 1984). When the vj/s of tissue is plotted against its RWC, a more negative v|/s for
a given RWC (i.e. cell volume) of stressed compared to unstressed plants is interpreted as
osmotic adjustment in stressed tissues (Turner and Jones, 1978). Plotting the change in
calculated turgor pressure (i.e. i)/p = v|/aw - i|/s) versus RWC allows an estimate of cell
elasticity or volumetric elastic modulus (e = Ai|/p/ARWC x 100).
The measurement of osmotic adjustment in growing plant tissues adds an
additional complication. In expanding organs, such as growing fruit, cell walls yield
under relatively low pressure so that cell volume may increase during the rise to full
turgor in the hydration step. If at harvest, cells of water-stressed growing tissue have a

25
higher concentration of solutes than comparable non-stressed cells, they may take up
more water osmotically during hydration and expand to a larger voliune, thereby diluting
the accumulated solutes, increasing \\rs, and masking evidence of osmotic adjustment.
Milad and Shackel (1992) found that expanding fruit from prune trees before irrigation
showed a greater increase in both volume and v|/s upon hydration as compared to fruit
hydrated 24 h after irrigation. Turner and Jones (1978) reported that after a hydration
period that would have lead to dilution of solutes in stressed tissue, the \\is was still lower
in expanding leaves of water-stressed sunflower plants at a given RWC than that of
control plants, indicating that osmotic adjustment occurred in stressed leaves. If cell
expansion is metabolically dependant, lowering temperature of tissue during the
hydration step might reduce dilution of \\is. Decreased temperatures during fruit
hydration would also reduced respiration rates and utilization of solutes that contribute to
\\is of the tissue.
Understanding the relationship between \\fw and fruit expansion and the role of
osmotic adjustment in growth maintenance could contribute to genetic or cultural
manipulations to optimize fruit growth and yield. The objectives of this study were to
determine whether fruit expansion in strawberry was related to the difference between
leaf and fruit i|/w, and if fruit undergo osmotic adjustment during water-stress.

26
3.3 Materials and methods
Plant material and stress imposition - Plants of the day-neutral strawberry {Fragaria x
ananassa Duch.) 'Brighton', were grown during winter and early spring months in 3.8-
liter plastic pots in 1 soil: 1 coarse sand: 1 peat (by volume) in a shaded greenhouse
maintained at 30/180C (day/night) in which high-pressure sodium lamps (HPS) provided
2 1 supplemental light (175 ± 25 mmol m" s") and a 14-h photoperiod, from 0730 to 2130
HR. The single primary flower on each inflorescence was pollinated with a small paint
brush, tagged, and all competing flowers or buds at lower orders removed. Plants were
watered daily and fertilized with 20N-8.6P-16.6K with N at 400mg liter" twice weekly.
At the start of each experiment, water was withheld from a portion of the plants to
produce water-stress, whereas control plants continued to be watered daily.
Fruit expansion - Fruit expansion at green-white (15-20 days after anthesis (DAA)) and
red (25-35 DAA) stages was monitored using linear variable differential transformers
(LVDT) (model LD400-2.5, Omega Engineering, Stamford, Conn.) in conjunction with a
micrologger (model 21X, Campbell Scientific, Logan, Utah). Each LVDT was secured in
a custom-built U-shaped plexiglass platform which was placed over a single attached fruit
positioned horizontally on a small stand. The plunger of the LVDT rested on the fruit
from above, at about fruit midlength, and its weight was sufficient to maintain contact
without damaging the fruit surface. An excitation voltage of lOvdc was maintained using
an in-line voltage regulator. Expansion measurements were recorded diumally every 10
min. Day measurements were corrected for a slight, but consistent, sensitivity of LVDTs
to the HPS lamps.

27
Water relation components - Apoplastic water potential (v|/aw), which is considered to
represent i|/w of a tissue (Nobel, 1983), was measured in fruit as described by Pomper and
Breen (1995; see Chapter 4) using temperature-corrected in situ psychrometers (Dixon
and Tyree, 1984) that were calibrated according to the manufacture's specifications (Plant
Water Status Instruments, Guelph, Ontario, Canada) and used in conjunction with a
microvoltmeter (model HR-33T, Wescor Inc. Logan, Utah). Psychrometers were
attached with silicone grease to a site on a fruit where achenes had been removed with a
forceps or to leaves where the cuticle was removed with fine sandpaper (600 grit), the
surface was rinsed with distilled water and wiped dry. Plants had 10 to 15 leaves, of
which one fully expanded, mature leaf was randomly chosen for \|/aw measurement. A
period of 3 h was found to be adequate for fruit tissue to reach equilibrium with the air in
the psychrometer chamber (data not shown).
To monitor the diurnal fluctuation in v}/aw, psychrometers were attached to a leaf and
a green-white fruit on the same plant under water-stressed or control conditions at least 5
h prior to the first measurement taken in the evening (2100 HR); subsequent
measurements were at predawn (0600 HR) and in the mid afternoon (1500 HR). Water
was withheld from stressed plants for 5 to 7 days prior to attachment of psychrometers
and they displayed a slight wilting during afternoon measurements. HPS lamps did not
create an electrical interference with psychrometer measurements. Diurnal leaf and fruit
i|/aw measurements were replicated on four separate, cloudy days over a several week
period. Leaf and fruit v)/aw data were subjected to analysis of variance using a repeated
measures design blocked by day. Leaf stomatal conductance and quantum flux were

28
measured with a steady state porometer (model LI-1600, LI-COR Inc., Lincoln, Neb.)
using a broadleaf chamber (aperture set at 2 cm ) as specified by the manufacturer.
Fruit solute potential (i|/s) was determined after \j/aw of fruit was measured at 1500
HR. Portions of fruit were place in liquid nitrogen for 15 min, then thawed for 20 min at
room temperature, and cell sap obtained by centrifugation (3000x g for 5 min) at 40C.
After 3 min at room temperature, a portion of the cell sap was put on a 0.32 cm filter
paper disk (Wescor Inc.) which was inserted into a sample holder, provided by the
manufacturer, and ys determined psychometrically. The average cell v}/p of a fruit was
calculated (i.e. v|/p = vj/aw - \\fs).
Osmotic adjustment - Two different methods were employed to determine whether
stressed fruit underwent osmotic adjustment in plants subjected to water stress. First, to
determine whether osmotic adjustment occurred in water-stressed fruit and leaves, control
and slightly wilted stressed plants used in i|/aw measurements were watered at 1500 HR
and allowed to recover for 3 h in black plastic bags away from light (at which point
leaves of stressed plants appeared fully turgid). Red and green-white fruit and fully
expanded mature leaves (usually two per plant) were severed, still in plastic bags, and
taken to the laboratory. The pedicel of red fruit and leaf petioles were re-cut under water
and placed in beakers with distilled water. Water-saturated paper towels were placed
around the beakers which were then covered with a black plastic bag to maintain a water
saturated atmosphere. Red fruit were weighed at 0, 1, 3, 8, 10, and 12 h after the start of
hydration. After 12 h, a leaflet or portion of a fruit was put in a microfuge tube (1.5 ml)
which was then placed in liquid nitrogen for 30 min, thawed for 20 min at room

29
temperature, cell sap obtained by centrifugation, and solute potential at full turgor (ys100)
determined psychometrically (Jones and Turner, 1978). The i|/s of mature leaves (15
leaves per treatment) and red fruit (four fruit per treatment) was determined on three
separate occasions and subjected to an analysis of variance in a randomized block design,
blocked by day.
In a preliminary experiment, green-white fruit were found to take up appreciable
amounts of water (gain fresh weight) upon hydration, raising concerns about a possible
differential increase in cell volume between stressed and control fruit. From fruit weight
and water displacement data (not shown), fruit volume in 'Brighton' was found to
increase linearly with increasing fresh weight (y = -0.264 +1.225x, r = 0.98) from small
green to red stages.
The effectiveness of low temperature in reducing fruit expansion during
hydration was examined. Hydration at low temperatures would also reduce respiration
rates and utilization of solutes that contribute to tissue \\is. For hydration, green-white
fruit were cut in half lengthwise with a razor blade and half of each pair placed in distilled
water in a petri dish at 40C or 20oC. Fruit halves were weighed prior to hydration and
after 1,3,8, 10 and 12 h. At the end of 12 h, a portion of the fruit was frozen in liquid
nitrogen and \\fsl determined psychometrically as described above. Data for volume
change and vj/s100 were subjected to analysis of variance using a split-plot design. Four
half-fruit were used for water-stressed and hydration treatment combinations.
A second method, basically that described by Turner and Jones (1978) except that
fruit v|/aw was determined psychometrically, was also used to determine whether tissues
30
underwent osmotic adjustment. Briefly, water-stressed and control plants with green-
white fruit were watered in early evening, taken to the laboratory, and allowed to recover
for 6 h, by which time wilted leaves of stressed plants became turgid. Psychrometers
were attached to fruit as described above and measurements started after a 3 h recovery
period. After an additional 3 h fruit, which were securely clamped to psychrometers,
were severed from plants. The vj/aw of detached fruit was measured every 6 h, after which
one previously water-stressed and control fruit was sacrificed for v|/s and RWC
measurements. v|/s was determined psychometrically with one portion of a fruit, a second
portion (II) was weighed and then dried, and a third portion (III) placed in distilled H2O
for 3 h at 40C and then weighed and dried. RWC was calculated as = [(FWn - DW,,)/
(TWin - DWin)] x 100> where FWn was initial fresh weight of the second portion, TW,,,
turgid weight of portion III after 3 h hydration, and DW the dry weight of oven dried
portions of the fruit. Volumetric elastic modulus (e = Avj/p/ARWC x 100) was determined
by plotting the calculated turgor pressure for each green-white fruit from water-stressed
and watered plants versus its RWC.
Sugar analysis - Hexoses and amino acids often are accumulated in plant tissues that
osmotically adjust (Meyer and Boyer, 1981; Zhang and Archbold, 1993; Wang et al.,
1995). Glucose and sucrose content was measured in control and water-stressed green-
white strawberry fruit. In an effort to avoid cell damage that could induce hydrolysis of
sucrose, fruit were not sectioned and re-hydrated in distilled water as previously
described. Green-white fruit were harvested 6 h after water-stressed and control plants
were re-watered and placed in black plastic bags. One portion of fruit was used to
31
determine i|/s as described above and another portion was placed in boiling 70% ethanol
for 5 min. The ethanol extract was taken to dryness, reconstituted in distilled H2O, and
glucose and sucrose levels determined as described by Pomper and Breen (1995; Chapter
4).
3.4 Results
Fruit expansion - In well watered plants, green-white fruit continually expanded,
increasing at a rate of approximately 2.4 mm d" over the 3 days of the experiment,
whereas control red fruit expanded slightly at first, but showed shrinkage by the last day
(Fig. 3-1). As water-stress progressed it greatly diminished the growth of green-white
fruit, and they showed increasingly conspicuous diurnal fluctuations in expansion.
Although the nighttime expansion rate of green-white fruit was similar for water-stressed
and control fruit, growth of stressed fruit ceased during daylight hours and shrinkage was
often recorded. Shrinkage in green-white fruit was especially marked on the third day of
measurement when stressed plants were first observed to wilt. Red fruit on water-
stressed plants failed to show net expansion, but did exhibit a slight diurnal pattern of
expansion and contraction.
Water relations - In another study, the expansion of two green-white fruit each on control
and water-stressed plants was monitored over a 24 h period starting 4 days after
withholding water from stressed plants. As before, fruit on well watered control plants
showed rapid growth both during day and night, whereas expansion of water-stressed

32
'en c D CL X
UJ
8
6 -
4 -
2 -
0
- control stressed
,»'"' green —white fruit
1900 0700 1900 0700 1900 0700 1900
Time
Figure 3-1. Expansion of green-white and red 'Brighton' fruit in well watered control ( ) and water-stressed ( ) plants recorded with pressure transducers in the green- house. Water was withheld for 4 days prior the start of monitoring expansion. Data is from one representative experiment. Bars on x-axis indicate dark periods. Arrow indicates the beginning of wilting of leaves on stressed plant.
fruit occurred only at night and shrinkage was generally observed during daylight hours
(Fig. 3-2A).
Fruit and leaf i|/aw of these and two similar plants were determined over the same
24 h period. Leaf temperatures and light levels (quantum flux) were fairly consistent day
to day during measurement periods in this study (Table 3-1). Their values, as well those
of stomatal conductance, were highest at the mid-afternoon (1500 HR) sampling time.

33
As expected, stomatal conductance during daylight was much lower in stressed than
control plants. Diurnal fluctuation in v|/aw was greater in leaves than fruit (Fig. 3-2B).
The vj/aw of water-stressed leaves was significantly more negative than leaves of control
plants. The v|/aw of both control and water-stressed leaves significantly increased at 0600
HR and declined by 1500 HR. There was not a statistically significant interaction
between treatment and time of day (see Appendix F). Water stress also lowered fruit v|/aw,
but the effect was not significant. Fruit vj/aw did decline significantly from 0600 HR to
1500 HR in both control and stressed plants. Water-stressed plants showed wilting by
1500 HR, and green-white expanded little during light periods, indeed shrinkage was
observed.
Water flow to, and expansion of, strawberry fruit may be associated with the
differences in v|/aw between leaves and fruit, therefore, these differences in control and
water-stressed plants at the three sampling times are presented in Figure 3-3. The
difference in vi/aw between leaves and fruit was influenced significantly by water-stress
and the time of day. In watered control plants the differences were always positive
(i.e., vi/aw of the leaf was higher, less negative, than that of fruit), with the smallest
difference occurring in mid-afternoon. This positive difference corresponded with the
relatively rapid expansion of green-white fruit on control plants (Fig. 3-2A).
In stressed plants, the difference in v|/aw between the leaf and fruit was negative
(i.e., \|/aw of the leaf was less than that of fruit) at the two daylight measurements (2100
HR and 1500 HR), representing periods when fruit shrinkage predominated. However,
the difference was positive at predawn (0600 HR), when expansion of fruit on stressed

34
E E
o (n c D CL X
LU
2.5
2.0
control stressed
-0.5 D
n 0.0
>. -0.5
D -1.0 ■+->
C (D -1.5
-I-'
O O -2.0
i_ (D -2.5 D
-' A
-3.0 1500 2100 0300 0900 1500
Time
Figure 3-2. (A) Expansion of green-white 'Brighton' fruit in watered ( ) and water- stressed( ) plants recorded with pressure transducers in the greenhouse on two separate occasions. (B) The apoplastic water potential (v)/aw) of leaves and green-white fruit in watered and water-stressed plants. Stars indicate means are significantly different at P=0.05 according to Student -Neuman-Keuls test. ±SE of four separate daily means.

Table 3-1 Leaf temperature, stomatai conductance, and quantum flux during fruit and leaf water potential (i}/aw) and fruit expansion experiments.
Stomatai conductance (cm sec"1)
Time (HR)
Leaf temperature (C°)
Quantum flux (mmol m'V1) Control Water-stress
2100 21.1 ±0.3* 137.0 ±10.5 0.16 ±0.02 0.02 ± 0.01
0600 16.2 ±0.3 0.0 ± 0.0 0.00 ± 0.00 0.00 ± 0.00
1500 24.1 ±0.8 228.0 ±58.3 0.53 ± 0.05 0.13 ±0.02
Note: mean derived from four separate experiments. ±SE
36
"O c D
O
c <D
JD
CD O C <D L_ (D
Q
C CD
O CL
i_ CD
-t-J D
0.5
D 0.0 CL
-0.5
-1.0
_L
I I control K\l stressed
X ^q
2100 0600 1500
Time (HR)
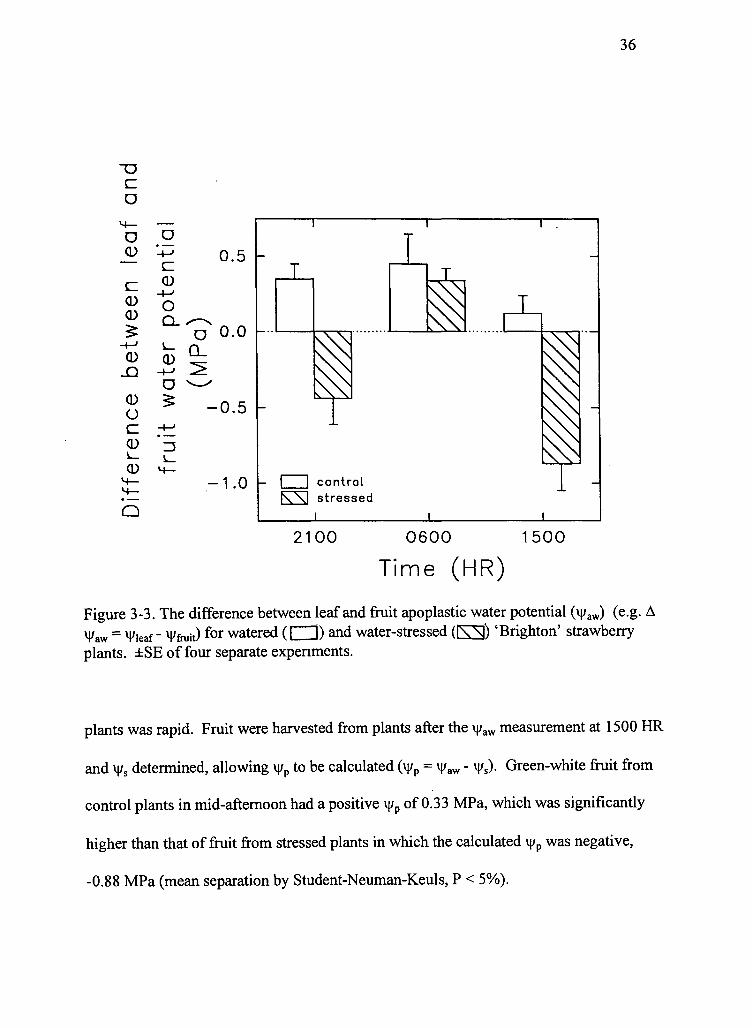
Figure 3-3. The difference between leaf and fruit apoplastic water potential (v|/aw) (e.g. A Vaw = Vieaf - y&uit) f°r watered (CH) and water-stressed (KS) 'Brighton' strawberry plants. ±SE of four separate expenments.
plants was rapid. Fruit were harvested from plants after the \j/aw measurement at 1500 HR
and i|/s determined, allowing v|/p to be calculated (v|/p = v|/aw - \\is). Green-white fruit from
control plants in mid-afternoon had a positive v|/p of 0.33 MPa, which was significantly
higher than that of fruit from stressed plants in which the calculated ij/p was negative,
-0.88 MPa (mean separation by Student-Neuman-Keuls, P < 5%).

37
Osmotic adjustment - Fruit halves from both control and stressed green-white fruit
increased in volume during hydration at either 20oC and 40C, reaching maximum volume
by 10 h (data not shown). The volume increase in control fruit was significantly less at
the lower hydration temperature, with mean values of 0.14 and 0.09 ml ml"1 for 20oC and
40C, respectively (mean separation by Student-Neuman-Keuls, P < 5%). Similarly, the
volume of stressed fruit upon hydration increased to 0.26 ml ml" at 20oC, but only 0.18
ml ml"1 at 40C. Since the increase in fruit volume was about 30% less at a hydration
temperature of 40C than 20oC, strawberry fruit expansion during hydration may be
partially metabolically dependant. Both treatments (control or water-stress) and
hydration temperature had significant effects on volume change of green-white fruit upon
hydration, however, they did not show a significant interaction (see Appendix F).
Osmotic adjustment occurred in mature leaves of stressed plants, shown by a
significantly lower \\is (0.27 MPa) than control leaves (Table 3-2). Water-stress did not
cause significant osmotic adjustment in red fruit, although \\is was lower in stressed
than control fruit (Table 3-2). The volume increased in red fruit during hydration was
slight (0.001 ml ml"1) in both treatments. Hydration temperature (20oC or 40C) did not
significantly effect the \|/s100 of green-white fruit, so the data were combined for statistical
analysis (see Appendix F). Green-white fruit from water-stressed plants showed evidence
of osmotic adjustment, demonstrated by a significantly lower v|/s (0.28 MPa) than fruit
from control plants (Table 3-2).

38
Table 3-2. Solute potential at full turgor (v|/s100) of leaves and red fruit, hydrated
at 20oC and green-white fruit hydrated at 4° and 20oC, from 'Brighton' strawberry under water-stressed or watered (control) conditions.
Solute potential at full turgor
Treatment Leaf Red fruit Green- white fruit
MPa
Control -1.30 a2 -0.94 a -1.00 a
Water- -1.57b -1.07 a -0.72 b stressed
Difference 0.27 0.13 0.28
'After hydration of tissue from control or stressed plants, portions of the material were frozen in liquid nitrogen, thawed and VJ/S measured from the cell sap via psychrometry.
Separation of means by Student-Neuman-Keuls separation of means at a level of significance of 5%, n = 3.
The v)/s did not decrease with a reduction in RWC with green-white fruit of control
or water-stressed plants using the method of Turner and Jones (1978) (Fig. 3-4A).
However, i|/s of water-stressed green-white fruit was usually below -1.4 MPa and more
negative than that of control fruit at a given RWC, indicating that osmotic adjustment
occurred in water-stressed fruit. The lack of a linear relationship between turgor pressure
and RWC prevented the calculation of cell elasticity or s (Fig. 3-4B). Calculated \yv was
negative for most control and water-stressed fruit after dehydration.

39
C 0)
-M ^-^ O D CL Q_
"o CO
CD -I-'
o Q.
o en
o CL
0.0
-0.5
-1.0
-1.5
-2.0
-2.5
1.0
0.0
-1.0 h
-2.0
-3.0
O
1 1 O control # stressed
0 o o qpo o .o •
o
A
o •8 O ^o o o
o o » GO o
_1_
o
B 60 70 80 90 100
Relative water content
Figure 3-4. (A) The relationship between solute potential (Y(/S) and relative water content (RWC) during rapid drying for green-white fruit from watered (O) and water-stressed (•) plants. (B) The relationship between turgor potential (i|/p) and RWC during rapid drying for green-white fruit from watered (O) and water-stressed (•) plants. The dashed line emphasizes that a majority of fruit from water-stressed plants display \\is below -1.4 MPa.

40
Sugar analysis - The \|/s of green-white fruit from water-stressed plants was -1.41 MPa,
which was significantly more negative than that of control plants at -0.82 MPa (P-value<
0.05 mean separation using independent t-test; n = 5). Both glucose and sucrose levels
were several fold higher in stressed than control green-white fruit. Control fruit had
levels of glucose at 2.7 ±0.2 mmol gFW"1 and sucrose at 4.3 ±0.4 mmol gFW1, whereas
water-stressed fruit had glucose at 12.7 ±2.7 mmol gFW"1 and sucrose at 12.1 ±1.3 mmol
gFW"1 (each individual sugar was significantly higher in stressed fruit with a P-value<
0.05 mean separation using independent t-test; n = 5). The ratio of glucose to sucrose
was 1:1.5 in control and 1:1 in stressed fruit, indicating that some hydrolysis of stored
sucrose may have occurred. Sugar concentrations in green-white fruit wer calculated by
assuming that the water content of fruit was 90% (based on fruit growth data in Appendix
D in Fig. D-l) at full turgor. The concentration of glucose was 3.0 mM (e.g. 2.7 x 10"3
mmol / 9.0 x lO"4 liter) and that of sucrose 4.6 mM in fruit of control plants, whereas
values were several fold higher in fruit from water-stressed plants at 13.9 mM and 13.4
mM for glucose and sucrose respectively.
3.5 Discussion
Strawberry fruit expansion was very sensitive to changes in plant water status.
Even 3 days prior to leaf wilting, fruit expansion on water-stressed plants was inhibited in
daylight conditions. Diurnal expansion of green-white fruit on these plants likely
reflected increased water demand by leaves (even with reduced opening of stomata) and
limited soil moisture. In a laboratory study, Antoszewski (1974) reported that

41
illumination of strawberry leaves caused contraction in green-white and red fruit,
coinciding with opening of leaf stomata; the water status of plants used was not defined.
In the present study, red fruit were not expanding and showed little diurnal expansion or
contraction (Fig. 3-1).
The observed shrinkage of green-white fruit may reflect movement of water back
into the plant crown or limited water transport to the fruit with continued water loss from
its surface. Fruit shrinkage has been reported in other species and has been taken to
represent back flow of water into the stem (Trump, 1984; Johnson, 1992; Berger and
Selles, 1993). Water flux from apple fruit toward the trunk during plant water stress has
been measured using a heat-pulse method (Yamamoto, 1983). Grange and Andrews
(1995) reported that tomato fruit show diurnal fluctuation in expansion, growing during
the night and shrinking during the day, even in well watered plants.
Strawberry fruit expansion occurred when leaf v}/aw was higher than that of fruit,
supporting the idea that water flows to regions of lower vj/avv in the plant. The greater
diurnal variation in v|/aw in strawberry leaves than fruit reported here (Fig. 3-3) is similar
to what Johnson (1993) described for tomato, where fruit expansion and shrinkage was
correlated with diurnal fluctuations in stem vj/aw. Interestingly, strawberry fruit v|/aw was
significantly higher than that of leaves in stressed plants in the afternoon, suggesting that
fruit were somehow buffered or isolated from extreme changes in vj/aw of the xylem
stream.
Water is expected to flow to regions of lower v|/aw in a plant, but this assumes an
unrestricted path of water movement. There is evidence that this is not always the case,

42
and therefore, that v|/aw may not a good predictor of water transport in plants (Passioura,
1988). Clearly there are mechanisms that either isolate organs from the xylem stream or
somehow provide preferential water transport to certain regions. Trolinder et al. (1993)
reported that petals of cotton flowers continue to expand when leaf expansion is inhibited
by water stress, with i|/w of petal tissue being consistently higher that of subtending leaves
and bracts. In some manner, water needed for petal expansion is independent of the vj/w
gradient within the cotton plant. In wheat and barley, grain \|/w remains about 1 MPa
higher than that of associated bracts during water stress (Barlow et al., 1980; Brooks et
al., 1982). Barlow et al. (1980) reported that the deposition of lipids and suberin in the
chalazal end of the wheat kernel was enhanced by water stress and may serve to isolate
the grain hydraulically from the mother plant, preventing a fall in VJ/W in this organ under
water stress. They also suggested that the phloem may be the major path of delivery of
water to the isolated grain.
Phloem appears to be an important vascular component for water delivery into
fleshy fruits (Findlay et al., 1987; Lee, 1990b). The ability of strawberry fruit to maintain
a steady \|/aw under water stress could be related to the development of a hydraulic barrier
to the xylem stream or some other isolation mechanism. Pomper and Breen (1995) found
evidence of an apoplastic barrier to solute movement in strawberry fruit when, using a
pressure chamber, they were unable to retrieve a xylem mobile dye from the pedicel after
it was injected into the body of the fruit. Antoszewski (1974) reported that cavitation
greatly increases in the strawberry fruit pedicle upon illumination of leaves, such a
process could effectively isolate the fruit from the xylem stream of the rest of the plant.

43
It was not unexpected that turgor was low in green-white from water-stressed
plants. However, the negative turgor value (-0.88 MPa) calculated for such fruit in mid-
afternoon, when turgor of control fruit was positive, probably resulted from an
overestimation of fruit \\is and or an underestimation of \j/aw. The calculated turgor of fruit
subjected to rapid drying was also negative (Fig. 3-4B). In tissues with low turgor, such
as those under water stress, negative \]ip values may result (Wenkert, 1980). The freeze-
thaw step used to disrupt cells prior to measuring \\is permits dilution of cell solutes with
apoplastic water raising i|/s, making it less negative, and lowering calculated v|/p values.
Since we were unable to estimate the extent of dilution of cell solutes by solution in the
apoplast in strawberry fruit, we did not attempt to mathematically adjust \\is values.
Additionally, there may be n/w gradients within severely water-stressed strawberry fruit,
and the v|/aw of the outer region of the fruit measured with in situ psychrometers may have
been more negative than internal values, thereby lowering calculated turgor values of
stressed fruit. Milad and Shackel (1992) found differences in vj/s of cell sap measured
between the stem and stylar ends of prune fruit. Differences in i|/s of cells within the
strawberry fruit could also cause negative calculated turgor values for whole fruit.
Whatever the reason for the negative turgor calculation for green-white strawberry fruit
on water-stressed plants, these values indicate that fruit cells were likely at very low
turgor.
Increases in cell volume during growth need to be carefully distinguished from
reversible elastic effects of cell walls, so plant growth is defined as an irreversible
increase in size to separate it from the reversible changes (Kramer and Boyer, 1995). In

44
mature tissues, elastic changes are the only ones that occur in cell walls and are easily
detected; they are reported in terms of 6 (Kramer and Boyer, 1995). Cell growth is often
analyzed according to the equation formulated by Lockhart (1965): r = m (\\ip - Y), where
r is the rate of increase in cell volume, m is the extensibility of the cell wall (irreversible
extension), \\fp is the turgor, and Y is the minimum turgor below which no expansion
occurs (see Passioura, 1994a). This equation is most useful for short-term responses of
several minutes, with m and Y adjusting to changes in v|/p. The effects of increased turgor
on cell expansion are transient, with continued expansion dependant on new cell wall
synthesis (Shackel, 1987; Passioura, 1994b). Cell expansion is likely dependant on cell
wall enzymes that cleave load-bearing hemi-cellulose molecules, reducing wall stress,
and allowing growth (Cosgrove, 1993; Passioura, 1994b). If turgor falls to zero, no cell
expansion will occur.
Osmotic and elastic adjustment together may be important in maintaining
symplastic volume and positive cell turgor in mature tissues of droughted plants (Bressan,
1990; Saliendra and Meinzer, 1991). However, the elasticity of cell walls in tissues that
osmotically adjust with drought often show decreases in elasticity, such as in mature
strawberry leaves (Save et al., 1993), while in other plants, tissue elasticity increases
(Saliendra and Meinzer, 1991) or stays the same (Jones and Turner, 1980). Elasticity of
growing tissue is difficult to measure, since even small increases in the cell v|/p cause
extension of the cell walls. Several groups have reported that changes in elasticity of cell
walls in young expanding leaves that have undergone osmotic adjustment (Jones and
Turner, 1980; Grima and Krieg, 1992). Since there was no clear relationship between

45
turgor pressure and RWC in green-white strawberry fruit (Fig. 3-4A), we were unable to
determine whether there were differences in 8 of watered and water-stressed green-white
fruit. Growth of green-white fruit during hydration, even at low temperature, likely
caused unreliable measurements of RWC.
This laboratory continues to be interested in the uptake of glucose and sucrose by
fruit tissues (Pomper and Breen, 1995; Pomper and Breen, 1996). Sucrose is the major
sugar translocated in strawberry (Forney and Breen, 1985) and glucose, fructose, and
sucrose accumulate to about equal levels (1% FW) in green-white 'Brighton' strawberry
fruit (Forney and Breen, 1986). Using the van't Hoff equation (e.g. \|/s = -Cone. RT at
250C) and a total concentration of glucose and sucrose of 7.0 mM in control fruit and 25
mM in water-stressed fruit, the total VJ/S of glucose and sucrose in the fruit can account for
about -0.018 MPa and -0.067 MPa in control and water-stressed fruit, respectively. Only
about 2% of the i|/s of control fruit (-0.82 MPa) and about 5% of the total \j/s of water-
stressed fruit (-1.41 MPa) was accounted for by glucose and sucrose in the fruit. Osmotic
adjustment resulted in about 2.5-fold increase in the levels of these sugars in stressed
green-white fruit but this contributed only about 17% of the decrease in i|/s in stressed
fruit. Intracellular invertase activity, which hydrolyses sucrose into glucose and fructose,
is present in green-white fruit of 'Brighton' (data not shown) and developing fruit of
other cultivars (Hubbard, et al., 1991). The increase in glucose compared to sucrose in
water-stressed green-white strawberry fruit may have resulted from the hydrolysis of
stored sucrose or reduced sucrose transport.

46
In conclusion, strawberry fruit expansion was very sensitive to water stress and
occurred when leaf i|/aw was higher than that of fruit. Although, green-white fruit
underwent osmotic adjustment when plants were subjected to water-stress, this was not
sufficient to maintain fruit expansion during daylight hours when stress was greatest.
Growth of green-white fruit during hydration, even at low temperature, caused unreliable
measurements of RWC which did not allow calculation of s. Osmotic adjustment
resulted in a 2.5-fold increase in the levels glucose and sucrose in stressed green-white
fruit, but this contributed only about 17% of the decrease in VJ/S in stressed fruit.

47
3.6 Literature cited
Archbold, D.D. and B. Zhang. 1991. Drought stress resistance in Fragaria species, p. 138-144. In: A. Dale and J.J. Luby (eds.). The Strawberry into the 21 st Century. Timber Press, Portland, Ore.
Antoszewski, R. 1974. Accumulation of nutrients in the strawberry as related to water transport and to growth pattern of the strawberry receptacle. Proceedings 19th Inter. Hort. Cong., Warsaw 2:167-176.
Barlow, E.W.R., J.W. Lee, R. Munns and M.G. Smart. 1980. Water relations of developing wheat grain. Aust. J. Plant Physiol. 7:519-525.
Berger, A. and G. Selles. 1993. Diurnal fruit shrinkage: a model, pp. 261-269. In: M. Borghetti, J. Grace, and A. Raschi (eds.). Water Transport in Plants Under Climatic Stress. Cambridge University Press, Cambridge.
Boyer, J.S. 1989. Water potential and plant metabolism: comments regarding Dr. P.J. Kramer's article 'Changing concepts regarding plant water relations'. Volume 11, Number 7, p. 565-568. and Dr. J.B Passioura's response, p. 569-571. Plant Cell Environ. 12:213-216.
Bressan, R.A., D.E. Nelson, N.M. Iraki, P.C. LaRosa, N.K. Singh, P.M. Hasegawa and N.C. Carpita. 1990. Reduced cell expansion and changes in cell walls of plant cells adapted to NaCl. pp. 137. In: Katterman (ed.) Environmental Injury to Plants. Academic Press, San Diego.
Brooks, A., C.F. Jenner and D. Aspinall. 1982. Effects of water deficit on endosperm starch granules and on grain physiology of wheat and barley. Aust. J. Plant Physiol. 9:423-436.
Darrow, G.M. 1966. The Strawberry: History, breeding, and physiology. Holt, Rinehart, and Winston, New York.
Dixon, M.A. and M.T. Tyree. 1984. A new stem hygrometer, corrected for temperature gradients and calibrated against the pressure bomb. Plant Cell Environ. 7:693- 697.
Dwyer, L.M., D.W. Stewart, L. Houwing and D. Balchin. 1987. Response of strawberries to irrigation scheduling. HortScience 22:42-44.
Findlay, N., K.F. Oliver, N. Nii and B.G. Coombe. 1987. Solute accumulation by grape pericarp cells. IV. Perfusion of pericarp apoplast via the pedicel and evidence for xylem malfunction in ripening berries. J. Expt. Bot. 38:668-79.

48
Forney, C.F. and Breen, P.J. 1985. Collection and characterization of phloem exudate from strawberry pedicels. HortScience 20: 413-414.
Forney, C.F. and Breen, P.J. 1986. Sugar content and uptake in strawberry fruit. J. Am. Soc. Hortic. Sci. Ill: 241-247.
Grima, F.S. and D.R. Krieg. 1991. Osmotic adjustment in sorghum. Plant Physiol. 99:577-582.
Hubbard, N.L., D.M. Pharr, and S.C. Huber. 1991. Sucrose phosphate synthase and other sucrose metabolizing enzymes in fruits of various species. Physiol. Plant. 82:191-196.
Johnson, R.W., M.A. Dixon and D.R. Lee. 1992. Water relations of the tomato during fruit growth. Plant Cell Environ. 15:947-953.
Jones, H.G., A.N. Lakso and J.P. Syvertsen. 1985. Physiological control of water status in temperate and subtropical fruit trees. Hort. Reviews 7:301-344.
Jones, M.M. and N.C. Turner. 1978. Osmotic adjustment in leaves of sorghum in response to water deficits. Plant Physiol. 61:122-126.
Jones, M.M. and N.C. Turner. 1980. Osmotic adjustment in expanding and fully expanded leaves of sunflower in response to water deficits. Aust. J. Plant Physiol. 7:181-192.
Kramer, P.J. 1983. Water deficit and plant growth, p. 342-415. In: P.J. Kramer (ed.). Water Relations in Plants. Academic Press, New York.
Kramer, P.J. 1988. Changing concepts regarding plant water relations. Plant Cell Environ. 11:565-568.
Kramer, P.J. and J.S. Boyer. 1995. Water Relations of Plants and Soils. Academic Press, New York.
Lee, D.R. 1989a. A unidirectional water flux model of fruit growth. Can. J. Bot. 68:1286-1290.
Lee, D.R. 1989b. Vasculature of the abscission zone of tomato fruit: implications for transport. Can. J. Bot. 67:1889-1902.
Lockhart, J.A. 1965. An analysis of irreversible plant cell elongation. J. Theor. Biol. 8:264-275.

49
Meyer, R.F. and J.S. Boyer. 1981. Osmoregulation, solute distribution, and growth in soybean seedlings having low water potentials. Planta. 151:482-489.
Milan, R.E. and K. A. Shackel. 1992. Water relations of fruit end cracking in french prune (Prunus domestica L. cv. French). J. Amer. Soc. Hort. Sci. 117:824- 828.
Morgan, J.M. 1984. Osmoregulation and water stress in higher plants. Annu. Rev. Plant Physiol. 35:299-319.
Nobel, P.S. 1983. Biophysical plant physiology and ecology. W. H. Freeman and Co., San Fancisco.
Nonami H., and J.S. Boyer. 1993. Direct demonstration of a growth-induced water potential gradient. Plant Physiol. 102:13-19.
O'Neill, S.D. 1983. Role of osmotic potential gradients during water stress and leaf senescence in Fragaria virginiana. Plant Physiol. 72:931-937.
Passioura, J.B. 1988. Response to Dr. P.J. Kramer's article 'Changing concepts regarding plant water relations'. Volume 11, Number 7, p. 565-568. Plant Cell Environ. 11:569-571.
Passioura, J.B. 1994a. The yield of crops in relation to drought, pp. 343-359. In: K.J. Boote, J.M. Bennett, T.R. Sinclair, and G.M. Paulsen (eds.). Physiology and Determination of Crop Yield. Madison, Wisconsin.
Passioura, J.B. 1994b. The physical chemistry of the primary cell wall: implications for the control of expansion rate. J. Expt. Bot. 45:1675-1682.
Pomper, K.W. and P.J. Breen. 1995. Levels of apoplastic solutes in developing strawberry fruit. J. Expt. Bot. 46:743-752 (also see Chapter 4).
Pomper, K.W. and P.J. Breen. 1996. The effect of cell turgor on sugar uptake in developing strawberry fruit. Physiol. Plant. (In press) (also see Chapter 5).
Renquist, A.R., P.J. Breen and L.W. Martin. 1982a. Effects of black polyethylene mulch on strawberry leaf elongation and diurnal leaf water potential. J. Amer. Soc. Hort. Sci. 107:640-643.
Renquist, A.R., P.J. Breen and L.W. Martin. 1982b. Influences of water status and temperature on leaf elongation in strawberry. Scientia Hort. 18:77-85.
Saliendra N.Z. and F.C. Meinzer. 1991. Symplastic volume, turgor, stomatal conductance and growth in relation to osmotic and elastic adjustment in droughted sugarcane. J. Expt. Bot. 42:1251-1259.

50
Save, R., J. Penuelas, O. Marfa, and L. Serrano. 1993. Changes in leaf osmotic and elastic properties and canopy structure of strawberries under mild water stress. HortScience 28:925-927.
Shackel, K.A., M.A. Matthews, J.C. Morrison. 1987. Dynamic relation between expansion and cellular turgor in growing grape (Vitis vinifera L.) leaves. Plant Physiol. 84:1166-1171.
Trolinder, N.L., B.L. McMichael and D.R. Upchurch. 1993. Water relations of cotton flower petals and fruit. Plant Cell Environ. 16:755-760.
Trump, J. 1984. Diurnal fruit shrinkage in apple as affected by leaf water potential and vapour pressure deficit of the air. Scientia Hort. 22:81-87.
Turner, N.C. 1988. Measurement of plant water status by the pressure chamber technique. Irr. Sci. 9:289-308.
Wang, Z., B. Quebedeaux, and G.W Stutte. 1995. Osmotic adjustment: Effect of water stress on carbohydrates in leaves, stems and roots of apple. Aust. J. Plant Physiol. 22:747-754.
Wenkert, W. 1980. Measurement of tissue osmotic pressure. Plant Physiol. 65:614- 617.
Zhang B. and D.D. Archbold. 1993. Solute accumulation in leaves oiaFragaria chiloensis and a F. Virginiana selection responds to water deficit stress. J. Amer. Soc. Hort. Sci. 118:280-285.
Zhang B. and D.D. Archbold. 1993. Water relations ofFragaria chiloensis and a F. virginiana during and after water deficit. J. Amer. Soc. Hort. Sci. 118:280-285.

51
CHAPTER 4
LEVELS OF APOPLASTIC SOLUTES IN DEVELOPING STRAWBERRY FRUIT
Kirk W. Pomper and Patrick J. Breen Dept. of Horticulture, Oregon State University, Corvallis, OR 97331
Written in the style of the Journal of the American Society for Horticultural Science

52
4.1 Abstract
Solutes in the apoplast of sink organs can contribute to apoplastic water potential
(\j/aw) gradients that influence transport of water and assimilates. However, sampling the
apoplast solution is often technically difficult. Three methods were used to collect
apoplastic solution from developing strawberry fruit for determining apoplastic solute
potential i}]/^) and sucrose and glucose concentrations. In addition, vj/aj. was estimated
from the difference between i|/aw (measured via hygrometry) and fruit xylem pressure
potential (yx.press) (measured with a pressure chamber). As strawberry fruit developed,
\|/aw decreased linearly whereas v|/x_press declined slightly then increased, therefore the
estimated vi/^ also decreased. Liquid was recovered from tissue plugs of ripening fruit
using centrifugation. The solute potential (\\is) of these samples from pink and red fruit
varied from -0.9 to -1.1 MPa and was similar to that of the bulk fruit solute potential
(Vs-buik)- A novel method was developed to sample the apoplastic solution, with little or
no cell damage, by collecting liquid on filter paper disks inserted into the hollow cavity
naturally formed in ripening fruit. Here the \\is was about -1.0 MPa, again similar to
Vs-buik* anci sucrose and glucose concentrations were each near 50 mM. Solution
recovered from ripening fruit by centrifugation and paper disks from the fruit cavity was
red, suggesting leakage of anthocyanins into the apoplast. Liquid collected from the
pedicel xylem of detached fruit using a pressure chamber was colorless, had a high ij/s
(about -0.3 MPa), and low sugar concentrations (< 1 mM) throughout fruit development,

53
suggesting that this method is not effective for sampling the fruit apoplast. Sugars
accounted for only about 35% of the \\ts of the apoplast of ripening strawberry fruit.
4.2 Introduction
Solutes are present at high levels in the apoplast (the whole continuum outside the
plasma membrane) of sink tissues such as mature sugarcane stalks (Welbaum and
Meinzer, 1990), developing seeds (Wolswinkle, 1990), and ripening grape berries (Lang
and During, 1991). The apoplast can serve as a storage area for sugar; twenty percent of
the sucrose in mature sugarcane tissue is held in the apoplast, reaching concentrations of
700 mM (Welbaum and Meinzer, 1990). High concentrations of solutes in the apoplast
may create apoplastic water potential (n/aw) gradients within plants, influencing water and
assimilate flow from source to sink organs.
Sugar and other solutes are translocated in the phloem by a passive bulk flow
down a gradient of hydrostatic pressure from source to sink regions. Lang and Thorpe
(1986) have hypothesized that high levels of solutes in the apoplast could promote
removal of water from the phloem, reducing its turgor, and increasing the efflux of
translocated solutes into the apoplast for subsequent uptake by sink cells. Apoplastic
water would then move into cells due to their increased solute content, allowing
continued water and assimilate import to the region. These authors found that steepening
the \|/aw gradient between the shoot and root of Phaseolus vulgar is L., by bathing the root
in a solution containing a non-permeating osmoticum, increased assimilate flow to the

54
root. A vj/aw gradient between the stem and grape berry has been identified that is created
by high levels of apoplastic solutes in developing berries, this at a period when reduced
xylem conductivity prevents backflow of solutes in the fruit apoplast to the stem (Lang
and During, 1992). High levels of solutes could be maintained in the fruit apoplast due to
low rates of fruit transpiration, such as in tomato (Johnson et al., 1992), reducing xylem
flow to fruit. The long dififusional path of the fruit pedicel would essentially isolate
apoplastic solutes from the dilute xylem solution in the stem.
Solutes may leak from cells into the apoplast in sink tissue as they mature and
senesce, as postulated by Lang and During (1991) for ripening grape berries. Ripening
fruit of strawberry {Fragaria x ananassa Duch.) display extreme swelling of cell walls
and degeneration of plastids (Knee et al., 1977), suggesting that a loss in cell membrane
integrity with maturation could lead to an increase in apoplastic solute levels. It is
possible to estimate, indirectly, the level of apoplastic solutes by assuming that the
apoplastic solute potential {y^ equals the difference between v)/aw and v|Vpress (xylem
pressure potential or tension) (i.e., y^ = i|/aw - v)/x.press)- Preliminary work in our
laboratory shows that the calculated values of v)/^ become more negative as strawberry
fruit ripen, indicating increased accumulation of solutes in the apoplast. Direct,
unambiguous quantification of solutes in the apoplast of plant tissues is technically
difficult. This is especially so with fragile tissues such as those from strawberry fruit
which are easily damaged. Washing-out (Glasziou and Gayler, 1972) or centrifugation of
tissue segments (Terry and Bonner, 1980) have been used to obtain samples of the
apoplast. However, a serious problem with these techniques is unforeseen cell damage

55
and release of cell constituents which contaminate the apoplast solution (Ehwald et al.,
1980).
Collection of xylem exudate using a pressure chamber has also been used to
sample the apoplastic solution (Jachetta et al., 1986). This approach may not always be
suitable, for xylem discontinuity, such as occurs in grape (Findlay et al, 1987) and tomato
(Lee, 1989) fruits, may restrict the movement of solutes between the apoplast and
vascular system of the stem. However, Lang and During (1991) were able to collect
xylem exudate that appeared to represent the fruit apoplast from ripening 'Riesling'
grapes. Physical semi-permeable barriers surrounding vascular bundles may also
interfere with the free movement of apoplastic solutes in storage organs, such as in
sugarcane stalks (Welbaum, et al., 1992) and leaves of many plants (Canny, 1993),
thereby preventing sampling of the apoplast via the pressure chamber technique.
Sucrose is the major sugar translocated in strawberry (Forney and Breen, 1985a)
and may be apoplastically unloaded in the fruit (Forney and Breen, 1986), thereby
contributing to solute levels in the apoplast. The subsequent uptake of sucrose from the
apoplast by fruit cells could promote continued translocation to the fruit. Uptake of
sucrose by strawberry fruit tissue in vitro displays biphasic kinetics, with a saturable
(carrier mediated) component predominant at low sugar concentrations (< 25 mM) and a
linear (diffusional) component at higher concentrations (Forney and Breen, 1986).
Fructose uptake shows a similar pattern. However, uptake of glucose is more rapid and
its kinetics reveal only the first component, which saturates near 200 mM. Determination
of the in vivo composition and concentrations of sugars in the apoplast of strawberry fruit

56
would be helpful in ascertaining the contribution of saturable and linear uptake
components in sugar uptake or retrieval by fruit cells.
Identification of mechanisms and pathways by which water and sugar are
transported to strawberry fruit may allow manipulation of water and dry matter
partitioning within the plant. The objectives of this study were to sample the apoplast of
the developing strawberry fruit, to assess the contribution of solutes toward y^, and
quantify apoplastic sucrose and glucose levels. Several techniques were used to sample
the apoplastic solution of the strawberry fruit and a novel method was developed to
obtain a sample of the solution with little or no cell damage.
4.3 Materials and methods
Plant material - Plants of 'Brighton', a day-neutral strawberry, were grown in 3.8 liter
plastic pots in 1 soil: 1 coarse sand: 1 peat (by volume) in a greenhouse maintained at
30/180C (day/night) in which high-pressure sodium lamps (175 ± 25 mmol m" s" )
provided a 16-h photoperiod. The single primary flower on each inflorescence was
pollinated with a small paint brush, tagged, and all competing flowers or flower buds at
lower orders removed.
Apoplastic water potential - The vj/aw was determined using temperature-corrected in situ
hygrometers (Dixon and Tyree, 1984) that were calibrated according to the manufactures
specifications (Plant Water Status Instruments, Guelph, Ontario, Canada) and used in
conjunction with a micro voltmeter (model HR-33T, Wescor Inc. Logan, UT) as described

57
by Lee et al. (1988). Briefly, hygrometers were attached to the fruit surface where several
achenes had been removed with a fine forceps, the fruit surface rinsed with distilled
water, and wiped dry. Hygrometers were attached to green, green-white, pink, and red
primary fruit, at 7,15,20, and 25 days after anthesis (DAA), respectively, using silicone
grease at the instrument-fruit junction to ensure a vapor seal. The entire installation was
covered with glass wool and pieces of styrofoam to minimize temperature shifts, and
allowed to equilibrate overnight (10-12 h). Measurements of v}/aw were made during the
following afternoon in the greenhouse.
Fruit xylem water potential - The v|/x.press (or xylem tension) was determined for each fruit
immediately after completion of vj/aw measurements. The fruit was severed with a razor
blade at the pedicel (with a 3 cm stub) and quickly placed in a pressure chamber (PMS
Instruments, Corvallis, OR). A cut plastic pipet tip (200 ml) was temporarily inserted
into one side of the rubber septum of the pressure chamber to minimize damage to the
fruit pedicel inserted from the other side. Pressure was slowly increased (approximately
0.006 MPa s" ; Brown and Tanner, 1981) until bubbles were evident from the pedicel
xylem. The pressure at that moment was recorded as the fruit v)/x.press. Preliminary
studies showed that hygrometer attachment did not influence fruit v|/x.preSs- Apoplastic
solute potential was calculated for each fruit as v)/^ = v}/aw - v|/x.press.
Fruit solute potential - To determine bulk solute potential (ys.buik)> portions of the same
fruit used to determine \|/aw and v|/x.press were frozen at -80oC for 1 h, thawed for 20 min at
room temperature, cell sap obtained by centrifugation at 40C (3000x g for 5 min), and sap
osmolarity measured with a vapor pressure depression osmometer (Wescor 5100 C,

58
Wescor Inc.) (Li and Delrot, 1987). Throughout this work, osmolarity was converted to
solute potential (250C) by using 2.48 MPa per Osmkg"1 (e.g. v/s.bulk = -Conc.RT at 250C
= Osmol x 2.48). Cell turgor was calculated according to v|/turgor = v|/s_bu|k - v)/aw.
Xylem exudate collection - Xylem exudate was collected by a method developed for
sunflower leaves (Jachetta et al., 1986). Fruit were excised during the afternoon, placed
in a pressure chamber (with about 1 cm of pedicel protruding outside) and the cut pedicel
end blotted dry. After an initial balance pressure was determined (\|/x.press)5 pressure was
increased in increments of 0.02 to 0.04 MPa. A period of 3 to 5 min was sufficient for
collecting a suitable sample of sap, after which pressure was increased again to a new
balance pressure to continue the efflux of xylem sap. The sap was absorbed on a filter
paper disk (6 mm diameter) placed on the cut surface. It was determined that when a
paper disk took on a distinctive glistening appearance it held approximately 7ml. To
reduce evaporation from the paper disk, water saturated tissue paper was placed in the
recessed area of the pressure chamber head, which was then covered with plastic wrap.
Upon saturation, the disk was transferred immediately to the sample chamber of the vapor
pressure osmometer and the measurement of osmolarity converted to the solute potential
of xylem exudate (v|/s.xy|em) as described above. The total xylem water potential (v|/XWp)
was calculated as the sum of vj/s_xy|em and M/X.press. Disks were then stored at -80oC for later
glucose and sucrose analysis.
The terms M/X.press or v|/s.xyiem specifying the xylem pressure or solute potential are
used as a convenience, since these measured parameters may also represent non-xylem
apoplastic compartments within the fruit. When chamber pressure is increased to reach

59
or surpass the Vx-press of the fruit (when fluid is pushed from the cut pedicel), water may
be forced through cell membranes, diluting the solution in the fruit apoplast (see
Passioura, 1980; Jachetta et al., 1986, Canny, 1993).
A dye was injected into strawberry fruit to test whether a xylem discontinuity or a
physical barrier surrounding the xylem could interfere with the sampling of apoplastic
solution. A xylem mobile dye, 1% (W/V) aqueous azosulfamide solution (Ashworth,
1982), was injected (20 or 200 ml) with a fine needled syringe into the cortex of three
green fruit and the cortex and cavity of three green-white or red fruit. The fruit was then
detached, placed in a pressure chamber, exudate collected as described previously, and
the presence of dye noted.
Centrifugation of tissue - A solution from strawberry fruit tissue was collected by
centrifugation using a method described by Welbaum and Meinzer (1990) with sugarcane
stems. Fruit was harvested in mid-afternoon and immediately cut with a 1 cm-diameter
cork borer and a 1 cm-long cylinder from the cortex placed in a microfilter centrifuge
tube (1.2 cm diameter) equipped with a 0.8 mm cellulose acetate filter and a 3 ml receiver
tube (Fisher Scientific, Pittsburgh, Perm.). Tubes were centrifuged for 10 min each at 30,
160, 300, 500, 750, 1000, 1200, 1600, 2800, and 4000xg (the limit of the microfilter
centrifuge tubes), unless otherwise noted. Solution collected in the receiver tube was
completely removed after each centrifugation, the osmolarity measured with the vapor
pressure depression osmometer, and converted to the solute potential of the solution
collected (v|/s<ent). At the conclusion of the centrifugation series, the tissue cylinder was
frozen at -80oC for 1 h, thawed for 20 min at room temperature, centrifuged at 40C

60
(3000x g for 5 min), osmolarity obtained with the vapor pressure depression osmometer,
and solute potential of the cell sap (vj/^buik) calculated.
Collection from the fruit cavity - The anatomy of the strawberry fruit provides an
opportunity to directly retrieve a sample of apoplastic solution from the fruit while
attached to the plant. Vascular traces of the strawberry fruit radiate out to each achene
from a central vascular cylinder surrounding the pith, which in some cultivars, including
'Brighton', develops a hollow cavity as the fruit enlarges. By carefully cutting the
attached fruit along its longitudinal axis and partially separating the halves, with the fruit
hinged near the calyx, it is possible to insert a filter paper disk (6 mm diameter) into the
cavity in contact with undamaged pith cells to collect an un-contaminated sample of the
apoplastic solution by capillary action (Fig. 4-1). This technique was used successfully to
collect solution from the hollow cavity of use of this method. Filter paper disks were
also used to collect solution from the cut surface of the fruit cortex. Four disks were
collected from both the cavity and cut surface of each fruit. Filter paper disks placed in
the fruit cavity were removed when they appeared to saturate (usually 15 to 30 minutes).
The vapor pressure depression osmometer was used to determine solute potential for the
fruit cavity (Vs^avity) and surface (v|/s.surface)- The disks were then stored at -80oC for later
glucose and sucrose analysis.
Glucose and sucrose analysis - Sugars were eluted from the filter paper disks into 500 ml
of distilled water. One aliquot was assayed for glucose using the glucose oxidase,
peroxidase and o-dianisidine system from Sigma Chemical, St.Louis Mo. (Sigma
Technical Bulletin No. 510). To determine sucrose levels, an aliquot of disk eluent was
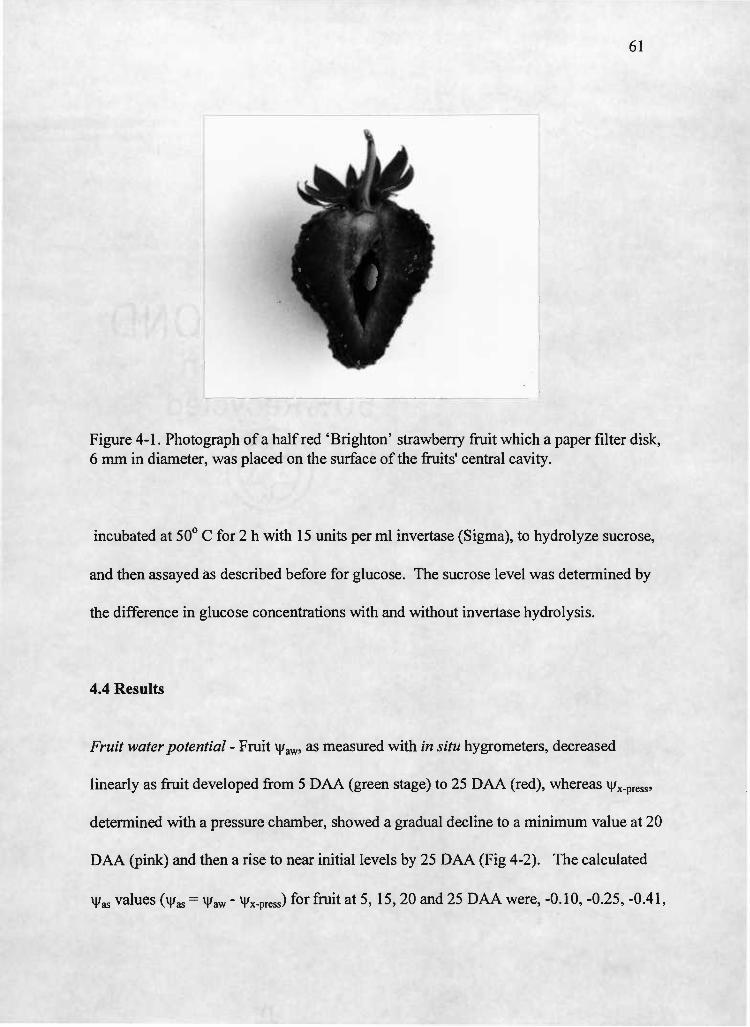
61
Figure 4-1. Photograph of a half red 'Brighton' strawberry fruit which a paper filter disk, 6 mm in diameter, was placed on the surface of the fruits' central cavity.
incubated at 50° C for 2 h with 15 units per ml invertase (Sigma), to hydrolyze sucrose,
and then assayed as described before for glucose. The sucrose level was determined by
the difference in glucose concentrations with and without invertase hydrolysis.
4.4 Results
Fruit water potential - Fruit vj/aw, as measured with in situ hygrometers, decreased
linearly as fruit developed from 5 DAA (green stage) to 25 DAA (red), whereas v|/x.press,
determined with a pressure chamber, showed a gradual decline to a minimum value at 20
DAA (pink) and then a rise to near initial levels by 25 DAA (Fig 4-2). The calculated
vj/gs values (vi/^ = \i/aw - v|/x.press) for fruit at 5,15, 20 and 25 DAA were, -0.10, -0.25, -0.41,

62
-0.2
D CL
v_
CO (0 <D i_
Q_ -1.0
-1.2 -
0 10 15 20 25
Days after anthesis
Figure 4-2. Mid-afternoon xylem pressure potential (M/X.press, O) determined with a pressure chamber, and apoplastic water potential (v|/aw, •) measured with in situ hygrometers, for a greenhouse grown primary strawberry fruit at four times during fruit development. Portions of the fruit were frozen, thawed and solute potential (v|/s.bulk, V) was determined from the cell sap using a vapor pressure osmometer. Each symbol represents the mean of five fruit. Error bars represent standard error.

63
and -0.74 MPa, respectively. The more negative n/^ values for pink and red fruit may
reflect higher levels of apoplastic solutes in ripening fruit. The v|/s.buik also tended to
decrease with fruit development and values were similar to those of i|/aw in pink and red
fruit (Fig. 4-2). The calculated cell turgor decreased to near zero (yturgor= Vaw - MVbuik)
in pink and red fruit (data not shown).
Xylem exudate collection - Results from a separate xylem exudate study were similar to
those described above, and are presented in Table 4-1. Compared to green and green-
white fruit, red ripe fruit again showed the lowest, most negative, values of v|/aw, vj;^, and
Vs-buiio t»ut not Vx-press- The solute potential of exudate (v|/s.Xyiem) collected in this study is
shown in Figure 4-3. Ten sequentially collected 7 ml samples were obtained from three
fruit each at three stages of development by increasing chamber pressure. The v|/s.xy|em of
green fruit increased quickly to a plateau of about -0.25 MPa over an applied pressure
range of 0.4 to 0.5 MPa (Fig. 4-3 A). Pressure as high as 1.2 MPa was required to collect
ten samples of exudate from green-white and red fruit and the v)/s.xylem in both stabilized at
about -0.30 MPa with increasing pressure (Fig. 4-3B and 4-3C). The lack of a marked
decline in the solute potential of xylem exudate as strawberry fruit matured (Table 4-1
and Fig. 4-3) is in contrast to the observed decrease in the calculated vi;^ (Table 4-1). The
calculated vj/xwp (where v)/XWp = vj/s.xyiem + vj/x.press) was similar in green-white and red fruit
and higher in green fruit. The v|/XWp was lower than v|/aw in green and green-white stages,
and much higher in red fruit.
The first exudate sample collected from the fruit likely contained solutes released
from damaged cells at the cut surface of the fruit pedicel. The level of sugars in this
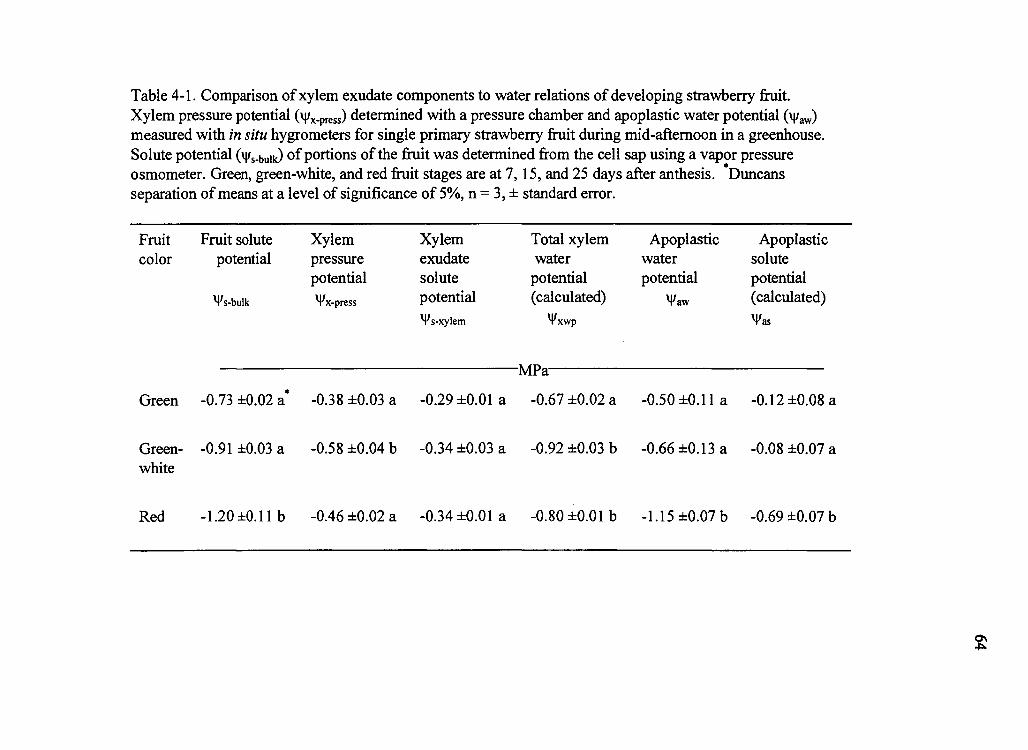
Table 4-1. Comparison of xylem exudate components to water relations of developing strawberry fruit. Xylem pressure potential (vj/x_press) determined with a pressure chamber and apoplastic water potential (vj/aw) measured with in situ hygrometers for single primary strawberry fruit during mid-afternoon in a greenhouse. Solute potential (v)/s.bu|k) of portions of the fruit was determined from the cell sap using a vapor pressvire osmometer. Green, green-white, and red fruit stages are at 7,15, and 25 days after anthesis. Duncans separation of means at a level of significance of 5%, n = 3, ± standard error.
Fruit Fruit solute Xylem Xylem Total xylem Apoplastic Apoplastic color potential pressure exudate water water solute
potential solute potential potential potential Vs-bulk MVpress potential
Vs-xylem
(calculated) Vxwp
ik rn
M>aw (calculated) Vas
Green -0.73 ±0.02 a -0.38 ±0.03 a -0.29 ±0.01 a -0.67 ±0.02 a -0.50 ±0.1 la -0.12 ±0.08 a
Green- -0.91 ±0.03 a -0.58 ±0.04 b -0.34 ±0.03 a -0.92 ±0.03 b -0.66 ±0.13 a -0.08 ±0.07 a white
Red -1.20 ±0.1 lb -0.46 ±0.02 a -0.34 ±0.01 a -0.80 ±0.01 b -1.15 ±0.07 b -0.69 ±0.07 b
ON

65
D CL
O
c -t-"
O CL
0)
"o in
-o.i
-0.2
-0.3
o XJ =3 X 0)
E o
X
-0.4
-0.1
-0.3
-0.4
-0.1
-0.2
-0.3
-0.4
1 1 1 1 r- A green
oo
B ■4 1 h
green —white
c
v¥S^-
red
vw
-0.5 0.2 0.4 0.6 0.8 1.0 1.2
Pressure applied (MPa)
Figvire 4-3. Solute potential of xylem exudate (M/s.xyiem) collected from green, green-white, and red primary strawberry fruit in relation to pressure applied with a pressure chamber. Ten exudate samples were collected from three fruit at each developmental stage. Each symbol represents an exudate sample, with some symbols directly overlapping. Polynomial regression lines were fit for, A) green (y = -1.62 + 4.50x - 3.67x , r = 0.66), B) green-white (y = 0.81 - 5.02x + 6.44x2 - 2.51x3, r2 = 0.50), and red developmental stages (y = -0.78 + 0.94x - 0.46x2, r2 = 0.57).

66
sample was many fold higher than in subsequent samples (Fig. 4-4). However, vj/s_xylem
was unchanged after the second disk of exudate was collected (Fig. 4-3). Based on these
considerations, the second exudate sample was selected as most appropriate in attempting
to characterize the apoplastic solution of the fruit. The v|/s_xy|em value of this sample was
essentially the same (about -0.3 MPa) for the three developmental stages (Table 4-1).
The v|/s.xylem was more negative than the calculated y^ for fruit at the green and green-
white stages, but less negative in red fruit (Table 4-1). At all fruit developmental stages
the concentrations of glucose and sucrose in the second sample collected were each less
than 1.0 mM.
The concentration of sucrose in the xylem exudate from fruit at all three
developmental stages was relatively high in the initial sample, many times higher than
that of glucose, and was sharply lower in subsequent samples (Table 4-2; Fig. 4-4).
Glucose showed a similar, but less dramatic, pattern. The high sucrose to glucose ratio
(about 5:1) in the initial sample suggests that it was not derived from strawberry fruit
(receptacle) symplast, since Forney and Breen (1986) found a sucrose and glucose
concentration ratio of about 1:1 in red fruit of the cultivar used here. Similarly, we found
pedicels from red strawberry fruit had a sucrose:glucose ratio of 1:1 (both 1.15 mmol
gFW"1). The relatively high level of sucrose in the first sample of xylem exudate may
reflect compartments or cell types within the pedicel, such as the phloem, which are
enriched in sucrose.
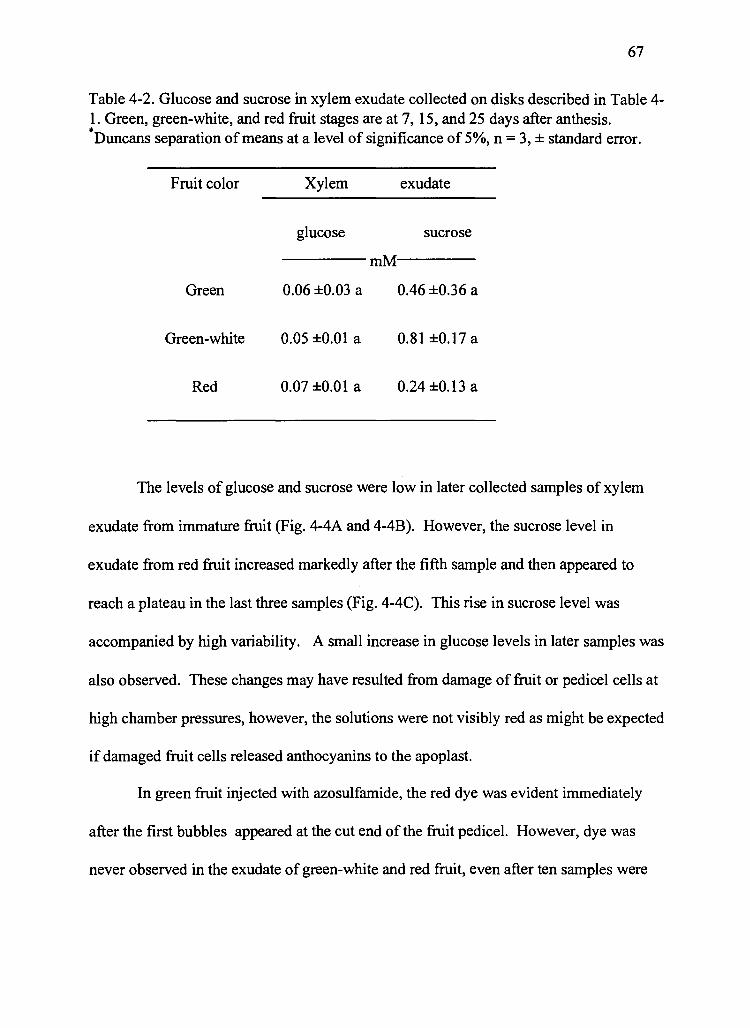
67
Table 4-2. Glucose and sucrose in xylem exudate collected on disks described in Table 4- 1. Green, green-white, and red fruit stages are at 7,15, and 25 days after anthesis. Duncans separation of means at a level of significance of 5%, n = 3, ± standard error.
Fruit color Xylem exudate
glucose sucrose
mM
Green 0.06 ±0.03 a 0.46 ±0.36 a
Green-white 0.05 ±0.01 a 0.81 ±0.17 a
Red 0.07 ±0.01 a 0.24 ±0.13 a
The levels of glucose and sucrose were low in later collected samples of xylem
exudate from immature fruit (Fig. 4-4A and 4-4B). However, the sucrose level in
exudate from red fruit increased markedly after the fifth sample and then appeared to
reach a plateau in the last three samples (Fig. 4-4C). This rise in sucrose level was
accompanied by high variability. A small increase in glucose levels in later samples was
also observed. These changes may have resulted from damage of fruit or pedicel cells at
high chamber pressures, however, the solutions were not visibly red as might be expected
if damaged fruit cells released anthocyanins to the apoplast.
In green fruit injected with azosulfamide, the red dye was evident immediately
after the first bubbles appeared at the cut end of the fruit pedicel. However, dye was
never observed in the exudate of green-white and red fruit, even after ten samples were

68
cn 13
If)
7
6
5
4
3
2
1
0
6
5
4
3
2
1
0
6
5
4
3
2
1
0
1 r green
~\ 1 r-
A • sucrose O glucose
green —white B -
V-Q-^^^-^" » f ft f red c
Figure 4-4. Concentrations of sucrose (•) and glucose (O) in exudate collected from strawberry fruit placed in a pressure bomb. Each symbol represents the mean of disks collected from three fruit at green (A) and green-white (B) and six different fruit at red (C) developmental stages. Error bars represent standard error.

69
collected and chamber pressures reached 1.2 MPa (data not shown), suggesting the
development of a barrier to solute movement between the main body of the ripening fruit
and pedicel xylem.
Centrifiigation of tissue - No liquid was recovered from cortex tissue plugs of either
green or green-white fruit when centrifuged at 30 to 4000x g in ten sequential steps. The
result was the same whether fruit was picked in the afternoon or prior to dawn, when fruit
vj/as is highest (data not shown). Similarly, no liquid was recovered when receptacle
tissue from pink fruit was centrifuged at a force of less than 750x g. However,
centrifiigation at six steps between 750 to 4000x g yielded 10-20 ml of solution after each
spin. Each sample collected was pink, implying cell damage and release of anthocyanins.
The solute potential of the liquid recovered by centrifiigation (\|/s<ent) was similar to the
Vs-buik (Fig- 4-5 A), indicating that either solute potential of the apoplastic solution is
similar to that of the fruit symplast or that this procedure is destructive to strawberry fruit
tissue and that much of the recovered solution was derived from damaged cells.
Centrifiigation of cortex tissue from red fruit yielded 10-20 ml of red liquid at
each of the seven steps from 300 to 4000x g. No liquid was recovered at lower centrifical
forces. Again the y^nt was similar to that of the bulk vj/s.bulk of the fruit (Fig. 4-5B).
Fruit cavity collection - Filter paper disks were reddish in appearance when removed
from the cavity or when touched to the cut surface of fruit at pink and red stages.
Infrequently, very small clumps of fruit cells adhered to the paper disk. The cavity in
green-white fruit was not large enough to yield reliable samples because material from
cut cells could easily contaminate the paper disks during their insertion or retrieval.

70
D CL
O -t-j
c (D
-4-'
o CL
(D
"o
-0.6
-0.8
-1.0
-0.6
-0.8
1.0
-1.2
-1.4
pink T 1 TTV T; /L.
A
1000 2000 3000 4000
Centrifugation (g)
Figure 4-5. Solute potential of solution (v)/s.cent) removed sequentially after centrifugation of strawberry fruit cylinders (1 cm diameter) and measure with a vapor pressure osmometer. The fruit cylinder was frozen at the completion of centrifugation, thawed and solute potential (v|/s.bullc) was determined from the cell sap using a vapor pressure osmometer. Each symbol represents the mean of three fruit. Error bars represent standard error.

71
A disk usually displayed a wet sheen after 15 or 30 min in the fruit cavity.
Occasionally, however, a disk placed in a cavity of a red fruit accumulated very little
liquid and was discarded. The cause of poor uptake of solution by a disk is unknown, but
it may indicate that the quantity of apoplastic solution in a strawberry fruit fluctuates in
response to environment or physiological factors. Based on a comparison of collected
disks with a standard curve of disk weight vs. volume of added water, disks retrieved
from a fruit cavity after 15 or 30 min usually contained about 5 ml of solution, whereas
those placed on the cut fruit surface held approximately 7 ml. There was no difference in
the measured osmolarity of 5 or 7 ml aliquots of salt solution standard using the vapor
pressure osmometer, indicating that osmolarities measured with volumes collected from
the fruit cavity and cut surface are directly comparable.
The solute potential of the solution from the cavity (v|/s_cavity) of red fruit was
significantly higher than that recovered from the surface of cut receptacle tissue
(MVsurfaceX but not significantly different from the bulk v|/s_bulk (Table 4-3). In pink fruit
there were no significant difference in the values of these parameters, although ij/s_caVjty
was again highest. Stage of fruit ripeness did not have a significant effect on solute
potential. Similar concentrations of glucose and sucrose were recovered from the cavity
of pink and red fruiv, ranging from 47 to 62 mM (Table 4-3). These concentrations were
comparable or somewhat lower than the levels of glucose and sucrose in the liquid
collected from the cut surface of the fruit.
Results of the four methods used in this study to determine solute potential of the
apoplastic solution of strawberry fruit, by either attempting to obtain samples of the

72
solution or indirectly by measuring associated parameters, are summarized in Table 4-4.
These values of solute potential may not be directly comparable since v[/s_fhji, was not
constant for a given fruit developmental stage. The solute potential of the apoplast may
be linked with that of the bulk fruit, therefore, to correct for the variation in vj/s.blI|k,
apoplastic solute potential obtained by the various methods is also expressed as a ratio to
the measured x|/s.bUik- Based on the data shown in Table 4-3, the apoplast of ripening
strawberry fruit contained high levels of solutes which could enhance phloem transport
by the steepening v|/aw gradient between the leaves and fruit. The low apoplastic solute
levels in young fruit (see Table 4-1 and Fig. 4-1) indicate that they do not play a role in
the establishment of a \|/aw gradient to influence transport to developing fruit.
4.5 Discussion
The estimation of y^ from the difference between v}/aw and vj/x.press, a relatively fast
and easy method, indicated increasing levels of solute in the apoplast as fruit ripened.
Based on solute potential values, the concentration of apoplastic solute in red fruit, as
estimated by this method, is over twice that found in the xylem exudate, but about 67% of
that determined from directly sampling the fruit cavity or by centrifugation (Table 4-4).
The validity of v|/x.press measurements made with a pressure chamber to represent the total
water potential of a tissue has been called into question. Recently, Zimmermann's group

73
Table 4-3. Solute potential and sugar concentrations of solution collected on paper filter disks from the strawberry fruit cavity and cut surface. Solute potential of solution collected from the cavity (v|/s_cavity) or cut surface (v)/s.surface) or from cell sap collected from portions of the fruit (M/S_buik) were determined using a vapor pressure osmometer. Glucose and sucrose concentrations were determined colormetrically from liquots of solution collected. Duncans separation of means at a level of significance of 5%, n = 10. Calculated based on 7 and 5 ml collected from the cut surface and cavity of fruit, respectively. ± standard error.
**
Site Solute Potential Glucose Sucrose (MPa) (mM) (mM)
Pink fruit stage
Cavity -1.01 ±0.03 a* 49.8** ±7.3 a 54.4 ±13.7 a
Ws-cavity)
Cut -1.12 ±0.05 abc 67.2 ±14.2 ab 52.8 ±8.4 a surface
(MVsurface)
Fruit -1.13 ±0.03 abc - -
bulk
(Vs-bulk)
Red fruit stage
Cavity -1.05 ±0.06 ab 62.1 ±9.3 ab 46.8 ±15.8 a
(Vs-cavity)
Cut -1.21 ±0.06 c 85.7 ±8.9 b 77.6 ±18.9 a surface
Ws-surfaceJ
Fruit -1.19 ±0.04 be _ .
bulk
(M>s-bulk)

74
Table 4-4. Summary of apoplastic solute potential i^^) determined by four methods and the ratio of VJ/^ to solute potential (viVbuik) in strawberry fruit at two developmental stages. Methods used: Calculation based on vj/gs = i|/aw - v)/x.press from Fig. 2, yxylem exudate from second disk collected via pressure bomb from Table 1, "solution collected via centrifiigation of tissue cylinder from Fig. 5, and wsolution collected from the fruit cavity from Table 2. vxylem exudate from second disk and ratio for green-white fruit. Color of solution was the same in either pink or red stage when noted.
Method
Fruit Calculation2 Xylem Centrifugation" Cavityw
Stage M>as exudatey Vs-xylem 1
Vs-cent
Vs-cavity
H fTt MPa
Pink -0.42 -0.34v -0.89 -1.01
Red -0.74 -0.34 -1.00 -1.05
Color of - not colored pink to red pink to red solution
Ratio
(Vas/Vs-bulk) (Vs-xylem/Vs-bulk) (M>s-cenA>s-bulk) (Vs-cavity/ys-bulk)
Pink 0.39 0.37v 0.95 0.89
Red 0.59 0.29 0.86 0.88
(Balling and Zimmermann, 1990; Zimmermann et al., 1993) found that xylem tension
measured with a pressure probe was much lower than that determined with a pressure
chamber, and concluded that the use of a pressure chamber often leads to overly negative
Vx-press measurements. If \|/x.press was underestimated (i.e., more negative) in ripening
strawberry fruit in this present study, VJ/^ may be more negative than that calculated and
closer to values from the centrifugation and cavity methods. Since vyx.press is a component

75
in the calculation of \\ixwp, its underestimation would make v|/xwp similar to v|/aw values in
less mature fruit.
The exudate collected from the xylem of red fruit had the highest solute potential
compared to samples collected directly from the fruit cavity and by centrifugation, with
the apparent concentration of solutes in xylem exudate only a third that in solutions
collected via these other methods (Table 4-4). For exudate to be pushed from the cut
surface of the pedicel, the chamber pressure must surpass the fruit v(/x.press and water must
move into the xylem from other tissues. Jachetta et al. (1986) suggested that exudate
collected from the cut petiole of a leaf by incremental rises in overpressure would be
increasingly diluted by water forced through membranes of parenchyma cells of leaf
veins some distance from the cut surface. Canny (1993), on the other hand, has suggested
that overpressure could instead immediately force water from parenchyma cells near the
cut surface causing a several fold dilution of even the initial exudate sample collected.
In the case of the strawberry fruit, even the first exudate sample collected may be diluted
by water derived from cells proximal to the cut surface of the pedicel.
The recovery of injected dye from the green fruit and the inability to collect it
from the xylem of green-white and red fruit is consistent with the development of a
barrier to solute movement between the main body of the ripening strawberry fruit and
the xylem. Possibly, the higher chamber pressures needed to obtain ten samples of
xylem exudate from green-white and red fruit, compared to green fruit (see Fig. 4-3), are
a consequence of an anatomical barrier to solute movement developing as strawberry fruit
mature. Similarly, the extremely low levels of sucrose and glucose, generally many

76
orders of magnitude less than that recovered from the fruit cavity, and the lack of any red
pigment in the xylem exudate indicates that apoplastic solutes in ripening strawberry fruit
are somehow isolated from the pedicel xylem and can not be retrieved by the pressure
chamber method.
Several types of anatomical barriers have been described that prevent the back
flow of solutes into the xylem from the sink apoplast. Xylem discontinuity in grape
(Findlay et al., 1987) and tomato (Lee, 1989) pedicels isolate these fruit from the rest of
the plant, thereby preventing the movement of solutes back into the xylem. Although a
fruit-pedicel abscision zone does not form in strawberry, ripe fruit of this cultivar are
easily detached at the calyx, possibly reflecting a weakening in the vasculature in this
region. Suberized and lignified bundle sheath cell walls have been reported by Welbaum
et al. (1992) that obstructed solute diffusion from the sugar storage region in sugarcane to
the vascular bundles which prevented the backflow of sucrose into the xylem. Canny
(1993) has also identified the presence of semi-permeable barriers to solute movement in
the xylem of leaves. Similar barriers to solute movement may be present in ripening
strawberry fruit.
The similarity in solute potential values of the liquid recovered by centrifugation
of tissue from pink and red fruit (v|/s.cent) to that of i(/s.bulk indicates that the apoplastic
concentration of solutes is relatively high in ripening fruit, and/or that this procedure
damaged cells and their released solutes were recovered in the solution collected. The
inability to collect liquid by centrifugation from green or green-white fruit tissue may
represent the increased ability of these tissues to hold water prior to the events that

77
accompany fruit softening. Extreme hydration of the middle lamella and wall matrix
material has been reported in ripening strawberry fruit (Knee et al., 1977). Some solutes
were likely released from cut and damaged cells of the cylinder of fruit tissue placed in
the centrifuge tube. Fruit tissue plugs were not rinsed prior to centrifugation due to
concern for diluting the apoplast solution (Welbaum and Meinzer, 1990). It is presumed
that substances released from damaged pink or red strawberry fruit cells were reabsorbed
by the tissue or recovered in the initial quantities of liquid collected. Since the liquid
obtained by centrifugation was red, this method may have been too harsh for fragile
strawberry fruit tissue, causing cell damage and leakage of vacuole-stored anthocyanins
and other solutes to the apoplast. Conversely, the release of anthocyanins and solutes
into the apoplast may be an inherent consequence of ripening in strawberry fruit. Lang
and During (1991) obtained red exudate from the xylem of a grape berry with pigmented
flesh and concluded that this resulted from a loss of compartmentation in the fruit at the
onset of ripening.
Due to the pith cavity that forms in the center of ripening fruit, the strawberry
offers an opportunity for sampling the apoplastic solution of an attached organ. The
relatively low solute potential (n/s.cavjty) and the red color of the disks retrieved from the
cavity of pink and red fruit strongly suggest that fruit cortex cells had released symplastic
solutes, including sugars and anthocyanins, to the apoplast. Although disks retrieved
from a cavity occasionally contained clumps of red cells, these were not responsible for
the general red color of the disks.

78
Both sucrose and glucose were present at concentrations of about 50 mM in the
solution collected from the cavity of pink and red fruit (Table 4-3). Fructose, which we
did not measure, is likely present in the apoplast at levels similar to that of glucose, since
these hexoses are near a 1:1 ratio in ripening 'Brighton' fruit (Forney and Breen, 1986).
John and Yamaki (1994) recently used compartmental analysis to estimate sugar pools in
the vacuole, cytoplasm, and free space in tissue plugs from ripening strawberry fruit.
Using this indirect method, they calculated the total sugar concentration in the apoplast of
light green and slightly red fruit as 167 and 217 mM, respectively. The latter value is in
rough agreement with our estimated total concentration of 150 mM for sucrose and
hexoses in the apoplast of red strawberry fruit. John and Yamaki (1994) calculated that
the apoplastic region in strawberry fruit accounts for only 13% of the total sugar in the
fruit. Using the van't Hoff equation (e.g. v|/s = -Conc.RT at 20oC) and a concentration of
150 mM, the total i|/s of sucrose, glucose, and fructose in the apoplast of a red fruit can
account for about -0.37 MPa, or about 35%, of the v|/s<aviiy of-1.05 MPa (from Table 4-3).
Sucrose in the apoplast of ripening strawberry fruit, as recovered in the cavity
method, may have been unloaded from the phloem into the apoplast. Since neither
glucose nor fructose are transported in the phloem of strawberry (Forney and Breen,
1986), glucose detected in the recovered solution could have resulted from sucrose
hydrolysis in the apoplast. Poovaiah and Veluthambi (1985) have reported the presence
of invertase activity in a cell wall fraction from developing strawberry fruit.
Additionally, both glucose and sucrose may have leaked from fruit cells into the apoplast.
All three sugars are likely retrieved from the apoplast by surrounding cells. Based on

79
uptake kinetics with tissue from green-white strawberry fruit (Forney and Breen, 1986),
both saturable and linear uptake systems may be involved in the uptake of sucrose from
the apoplast, with the linear system predominating at the sucrose concentration detected
in red fruit. If apoplastic glucose and sucrose are each at 50 mM, the rate of glucose
uptake by its saturable uptake system would be over two fold greater than the uptake of
sucrose. However, if membrane integrity decreases greatly in a strawberry fruit as it
develops beyond the green-white stage, the rate of net uptake of sucrose and hexose from
the apoplast by fruit cells may be appreciably different than that described for less mature
fruit tissue.
In conclusion, xylem exudate from strawberry fruit did not allow sampling of the
apoplast, while other methods yielded more reliable and comparable estimates of xy^-
The apoplast of ripening fruit contained high levels of solutes, most of which were not
sugars, possibly enhancing phloem delivery of water and assimilate to the fruit. The
relatively low level of apoplastic solutes in young fruit suggests that they do not play an
important role in transport early in development. The linear, and to a lesser extent the
saturable, component of sucrose uptake may be functioning in the ripening fruit apoplast
at the sucrose concentration (50 mM) measured.

80
4.6 Literature cited
Ashworth, E.N. 1982. Properties of peach flower buds which facilitate supercooling. Plant Physiol. 70:1475-9.
Balling, A. and U. Zimmermann. 1990. Comparative measurements of the xylem pressure ofNicotiana plants by means of the pressure bomb and pressure probe. Planta 182:325-38.
Brown, P.W. and C.B. Tanner. 1981. Alfalfa water potential measurement: a comparison of the pressure chamber and leaf dew-point hygrometer. Crop Sci. 21:240-4.
Canny, M.J. 1993. The transpiration stream in the leaf apoplast: water and solutes. Philo. Trans.s of the Royal Soc. of London Bio. Sci. 341:87-100.
Dixon, M.A. and M.T. Tyree. 1984. A new stem hygrometer, corrected for temperature gradients and calibrated against the pressure bomb. Plant Cell Environ. 7:693-7.
Ehwald, R.5 D. Kowallock, A.B. Meshcheryakov and V.P. Kholodova. 1980. Sucrose leakage from isolated parenchyma of sugar beet roots. J. Exp. Bot. 31:607-20.
Findlay, N., K.F. Oliver, N. Nii and B.G. Coombe. 1987. Solute accumulation by grape pericarp cells. IV. Perfusion of pericarp apoplast via the pedicel and evidence for xylem malfunction in ripening berries. J. Exp. Bot. 38:668-79.
Forney, C.F. and P.J. Breen. 1985a. Collection and characterization of phloem exudate from strawberry pedicels. HortScience 20:55-62.
Forney, C.F. and P.J. Breen. 1985b. Growth of strawberry fruit and sugar uptake of fruit discs at different inflorescence positions. Scientia Hort. 27:55-62.
Forney, C.F. and P.J. Breen. 1986. Sugar content and uptake in the strawberry fruit. J. Amer. Soc. Hort. Sci. 111:241-7.
Glasziou, K.T. and K.R. Gayler. 1972. Storage of sugar in stalks of sugarcane. Bot. Rev. 38:471-90.
Jachetta, J.J., A.P. Appleby and L. Boersma. 1986. Use of the pressure vessel to measure concentrations of solutes in apoplastic and membrane-filtered symplastic sap in sunflower leaves. Plant Physiol. 82:995-9.

81
John, O. and S. Yamaki. 1994. Sugar content, compartmentation, and efflux in strawberry tissue. J. Amer. Soc. Hort. Sci. 119:1024-8.
Johnson, R.W., M.A. Dixon and R. Lee. 1992. Water relations of the tomato during fruit growth. Plant Cell Environ. 15:947-53.
Knee, M., J.A. Sargent and D.J. Osbome. 1977. Cell wall metabolism in developing strawberry fruits. J. Exp. Bot. 28:377-96.
Lang, A. and H. During. 1991. Partitioning control by water potential gradient: evidence for compartmentation breakdown in grape berries. J. Exp. Bot. 42:1117-22.
Lang, A. and W.R.N. Edwards. 1986. Plant water potential and translocation. In: Eds. J. Cronshaw, W.J. Lucas, and R.T. Giaquinta. Phloem Transport. Proceedings of an international conference on phloem transport. Alan R. Liss, Inc., New York pp. 193-4.
Lang, A. and M.R. Thorpe. 1986. Water potential, translocation and assimilate partitioning. J. Exp. Bot. 37:495-503.
Lee, D.R. 1989. Vasculature of the abscission zone in tomato fruit: implications for transport. Canad. J. Bot. 67:1898-1902.
Lee, D.R., M.A. Dixon and R.W. Johnson. 1988. Simultaneous measurements of tomato fruit and stem water potentials using in situ stem hygrometers. Canad. J. Bot. 67:2352-5.
Li, Z. and S. Delrot. 1987. Osmotic dependence of the transmembrane potential difference of broadbean mesocarp cells. Plant Physiol. 84:895-9.
Passioura, J.B. 1980. The meaning of matric potential. J. Exp. Bot. 31:1161-9.
Poovaiah, B.W. and K. Veluthambi. 1985. Auxin-regulated invertase activity in strawberry fruits. J. Amer. Soc. Hort. Sci. 110:258-61.
Terry, M.E. and B.A. Bonner. 1980. An examination of centrifiigation as a method of extracting an extracellular solution from peas, and its use for the study of indoleacetic-acid induced growth. Plant Physiol. 66:321-6.
Welbaum, G.E. and F.C. Meinzer. 1990. Compartmentation of solutes and water in developing sugarcane stalk tissue. Plant Physiol. 93:1147-53.

82
Welbaum, G.E., F.C. Meinzer, R.L. Grayson and K.T. Thomham. 1992. Evidence for and consequences of a barrier to solute diffusion between the apoplast and vascular bundles in sugarcane stalk tissue. Aust. J. Plant Physiol. 19:611-23.
Wolswinkle, P. 1990. Recent progress in research on the role of turgor sensitive transport in seed development. Plant Physiol. Biochem. 28:399-410.
Zimmermann, U., A. Hasse, D. Langbein and F. Meinzer. 1993. Mechanisms of long- distance water transport in plants: a re-examination of some paradigms in the light of new evidence. Philosoph. Trans. Royal Soc. London Bio. Sci. 341:19-31.

83
CHAPTER 5
THE EFFECT OF CELL TURGOR ON SUGAR UPTAKE IN STRAWBERRY FRUIT CORTEX TISSUE
Kirk W. Pomper and Patrick J. Breen Dept. of Horticulture, Oregon State University, Corvallis, Or 97331
In the format for the Journal of the American Society of Horticultural Science

84
5.1 Abstract
A reduction in cell turgor has been shown to stimulate sugar uptake in several
plant sink tissues and it may regulate the import of assimilate into the sink apoplast, as
well as maintain cell turgor. To determine whether cell turgor influences sugar uptake by
strawberry (Fragaria x ananassa Duch. cv. Brighton) fruit cortex tissue, disks were cut
from greenhouse-grown primary fruit at the green-white stage of development and placed
in buffered incubation solutions containing either mannitol or ethylene glycol as an
osmoticum. Cell turgor of fruit disks was calculated from the difference between the
water potential of bathing solution and tissue solute potential after incubation at various
osmolarities. Cell turgor increased when tissue disks were placed into mannitol
incubation solutions more dilute than the water potential of fresh tissue (about 415
mOsmol kg"1). The rate of uptake of [ C]-sucrose or [ C]-glucose decreased as
osmolarity of the incubation solution increased, i.e. as cell turgor declined. Cell turgor
and the rate of [14C]-sucrose uptake were unaffected when rapidly permeating ethylene
glycol was used as an osmoticum. A decrease in cell turgor reduced both the Vmax of the
saturable (carrier mediated) kinetic component of sucrose uptake and the slope of the
linear (diffusional) component. The sulfhydryl binding reagent
p-chloromercuibenzenesulfonic acid, an inhibitor of the plasma membrane sucrose
carrier, strongly inhibited only the saturable component of sucrose uptake. Increased
uptake of the nonmetabolizable sugar, O-methyl-glucose, at high turgor was similar to
that of glucose, indicating that carrier activity was influenced by cell turgor, not cell
metabolism. Turgor did not influence efflux of [14C]-sucrose from disks and had no
85
effect on cell viability. Strawberry fruit cells do not possess a sugar uptake system that is
stimulated by a reduction in turgor.
5.2 Introduction
How sink regions in plants regulate the unloading of solutes from the phloem is
poorly understood. Sugar and other solutes are translocated in the phloem by a passive
bulk flow down a gradient of hydrostatic pressure from source to sink regions. In sink
tissues, solutes may be unloaded from the phloem into the apoplast (the whole continuity
outside the plasma membrane) where they are taken up by sink cells, or they may be
unloaded symplastically (cell to cell via plasmodesmatal connections), or by a
combination of these two systems (Oparka, 1990; Patrick, 1990). Removal of solutes
from sites of unloading could steepen the hydrostatic gradient between source leaves and
sink tissues (Wolswinkle, 1990; Patrick, 1994a, b).
The rate of transport of assimilate to sink regions may be influenced by turgor-
sensitive uptake of solutes from the sink apoplast. Lang and Thorpe (1986) have
postulated that high levels of apoplastic solutes promote the removal of water from the
phloem, reducing its turgor, and presumably that of sink cells, and increasing the efflux
of translocated solutes into the apoplast for subsequent uptake by sink cells. They
demonstrated that steepening the water potential gradient between the shoot and root of
Phaseolus vulgaris L., by bathing the root in a solution containing a non-permeating
osmoticum, increased assimilate flow to the root. One way by which transport of sugars
and other solutes to a sink region with high apoplastic solutes could be maintained is

86
through a mechanism in which declining turgor stimulates solute uptake by sink cells.
Apoplastic water would move into these cells as they accumulated solutes, allowing
continued water and assimilate import to the region. A reduction in cell turgor, by
increasing the concentration of a nonpermeating osmoticum in a bathing solution, was
shown to increase apoplastic sucrose uptake in tissues of sugar beet taproot (Wyse et al.,
1986) and potato tuber (Oparka and Wright, 1988a, b), as well as in leaves (Daie and
Wyse, 1985) and young cotyledons of Phaseolus (Patrick, 1994a).
Turgor-sensitive sugar uptake from the apoplast of sink tissues may also represent
a point of regulation in maintaining cell turgor. Maintenance of cell turgor through the
accumulation of solutes within cells, or osmoregulation, is often a strategy by which
plants tolerate salt or water stress (Morgan, 1984). Positive cell turgor is also required for
plant growth (Meyer and Boyer, 1981).
Sucrose, the major sugar translocated in strawberry (Forney and Breen, 1985a),
may be unloaded into the apoplast of the fruit (Forney and Breen, 1986). Levels of
apoplastic solutes increase during strawberry fruit development, with red fruit having
apoplastic solute potentials as low as -1.0 MPa and sucrose and glucose concentrations at
approximately 50 mM each (Chapter 5; Pomper and Breen, 1995). Forney and Breen
(1986) reported that uptake of sucrose in vitro by tissue from strawberry fruit at the
white-pink stage displays biphasic kinetics, with a saturable component predominant at
low concentrations (< 25 mM) and a linear component at higher concentrations. Fructose
uptake showed a similar pattern. Uptake of glucose was more rapid and its kinetics
revealed only the first component, which saturates near 200 mM. The influence of

87
incubation solution osmolarity (thereby cell turgor) on sugar uptake by strawberry fruit
tissues has not been examined.
Our longterm goal is to understand the mechanism of sugar transport and
accumulation in strawberry fruit. The objective of the present study was to determine
whether the rate and kinetics of uptake of sucrose and glucose in vitro are influenced by
turgor in fruit tissue disks.
5.3 Materials and methods
Plant material - Plants of the culitvar Brighton, a day-neutral strawberry (Fragaria x
ananassa Duch.), were grown in 3.8-1 pots in a mixture of equal parts of soil, coarse sand,
peat (v/v/v) in a greenhouse that was maintained at 30/180C (day/night), and where high-
pressure sodium lamps (400 watt, Energy Techtonics Horticulture Lighting, York, Perm.,
2 1 USA) (175 ±25 mmolm" s") provided a 16-hphotoperiod. Primary flowers were
pollinated with a small paint brush, tagged, and all competing flowers or flower buds
were removed from an inflorescence.
Fruit tissue water relations - Disks of fruit tissue were prepared as described by Forney
and Breen (1986). Briefly, disks (1.3 x 7.0 mm) were cut from the cortex of primary fruit
at the green-white stage of development (15-20 days after anthesis), pooled and
preincubated for 1 h in 10 ml of buffer solution at selected osmolarities. Disks were then
distributed into 50-ml Erlenmeyer flasks containing 5 ml of buffer solution at the
treatment osmolarity. Fruit disks from pink and red fruit disintegrated during incubation
and were not used in this study. The buffer solutions consisted of 50 mM CaCl2, 20 mM

88
citric acid (pH 5.0), and either mannitol or ethylene glycol as an osmoticum unless
otherwise noted. The buffer solution was approximately 180 to 190 mOsmol at
preparation, prior to the addition osmoticum. Using strawberry fruit disks, Forney and
Breen (1986) found that 50 mM CaClz maintained the maximum respiration rate and a
pH optimum of 5.0 with this buffer yielded the highest uptake of [ C]-sucrose.
Mannitol, which permeates slowly, was used to alter cell turgor, whereas rapidly
permeating ethylene glycol was used to change cell osmolarity without modifying cell
turgor (but see Cram, 1984). Inclusion of 100 mM manmtol in buffer solutions increased
osmolarity by about 100 mOsmol. During preincubation and uptake studies, flasks
containing disks were placed in a gyratory water bath shaker (80 rpm) at 250C for
1 or 4 h.
After incubation, tissues were frozen for 1 h at -80oC, thawed, and the cell sap
was obtained by centrifugation at 40C (3,000 g for 5 min). After 5 additional min at room
temperature, sap and incubation solution osmolarity were determined with a vapor
pressure depression osmometer (Wescor 5100 C, Wescor Inc., Logan, UT). The solute
potential can be calculated using the vant'Hoff equation: solute potential = -CRT, where
C is the molality of the solution or osmolarity (moles of solute kg H2O"), R is the gas
constant (0.00831 kgMPa mol"1 K"1), and T is the absolute temperature (K) (Salisbury and
Ross, 1992). The measured osmolarity of cell sap and incubation solution was
transformed to tissue solute potential and solution water potential respectively by
multiplying mOsmol kg"' with -2.48 MPa (Welbaum and Meinzer, 1990). The average

89
turgor was calculated as the difference between tissue solute potential and incubation
solution water potential (Li and Delrot, 1987).
Water potential of fresh unincubated fruit tissue was determined by two methods:
First, disks (1.3 x 7.0 mm) were cut from fruit, rinsed for 3 s with distilled water, blotted
dry, weighed, placed into incubation solutions at various mannitol osmolarities for 1 h,
and reweighed. The solution osmolarity where there was no change in tissue weight was
considered equivalent to the tissue water potential (Oparka and Wright, 1988b). Second,
disks (4x1 mm) were cut from fruit cortex tissue and placed directly into the vapor
pressure depression osmometer chamber, osmolarity was measured and converted to
tissue water potential. Additional unincubated cortex tissue was frozen for 1 h at -80oC,
thawed, cell sap obtained by centrifugation, and osmolarity was measured and converted
to tissue solute potential as described above.
Sugar uptake - The uptake of [ C]-sugars by tissue disks from buffer solutions
containing [14C]-sucrose, [14C]-glucose, [ C]-mannitol (Amershine Co., Arlington
Heights, IL), or 3-0-methyl-[l C]-glucose (O-methyl-glucose; Sigma) at 3.33 MBq ml"1
was examined at various osmolarities. As described by Forney and Breen (1986), disks
(1.3 x 7.0 mm) were cut, weighed and preincubated for 1 h in buffer solutions containing
mannitol, sorbitol or ethylene glycol at a selected treatment osmolarity. Disks were then
placed into buffer solutions that included a [ C]-labeled sugar (10 mM) and incubated
for 2.5 h. Sugar uptake into strawberry fruit tissue disks is nearly constant for up to 4 h
(Forney and Breen, 1986).

90
After incubation, disks were rinsed (3x10 min) with ice-cold incubation solution
to remove [ C]-sugars from the cell apoplast, extracted overnight with 80% ethanol at
60oC, and then taken to dryness in an oven. The dry radioactive extract was resuspended
in 1 ml of water, 10 ml of aqueous counting fluor (ReadyGel, Beckman, Palo Alto, CA)
was added, and the amount of C was determined with a Beckman LS 7000 scintillation
counter. Only the ethanol soluble fraction is routinely reported, since less than 20% of
radioactivity was contained in the ethanol insoluble portion and total C accumulation
was found to follow the same pattern as in the ethanol-soluble fraction (unpublished data
of Pomper and Breen).
The effect of turgor on uptake kinetics for sugars was also studied using a range
of [14C]-sugar concentrations (1, 5,10, 25, 50, 75,100 mM) at high (455 mOsmol kg"1)
and low (265 mOsmol kg') solution osmolarities. Mannitol levels were adjusted so that
a given osmolarity was maintained at all [ C]-sugar concentrations. Incubation solutions
at 265 mOsmol kg" maintained disks at a positive turgor (based on disk turgor data in
Fig. 5-1), whereas tissues were near zero turgor in solutions at 455 mOsmol kg" . Kinetic
analysis was preformed using Lineweaver-Burk plots. Where two kinetic components
were present, the first order rate coefficient k was calculated as the slope of the linear
regression equation for the total sugar uptake above about 25 mM substrate
concentrations. The contribution of the linear component to total sugar uptake was
estimated as k multiplied by the substrate concentration. The linear component was
subtracted from the total uptake to give rates for the saturable component.

91
Addition of inhibitor - The sulfhydryl binding reagent p-chloromercuribenzenesulfonic
acid (PCMBS) is an inhibitor of the plasma membrane sucrose carrier (Giaquinta, 1976).
In some experiments, disks were preincubated for 45 min in buffer containing 2 mM
PCMBS (Sigma) but lacking sucrose (Wyse et al., 1986; Wright and Oparka, 1989), at
the selected treatment osmolarities. Disks were then rinsed with PCMBS-free buffer (3 x
10 min) and uptake of [14C]-sucrose (3.33 MBq ml") was studied using a range of 14C-
sucrose concentrations at high (455 mOsmol kg") and low (265 mOsmol kg"1)
osmolarities.
Sucrose efflux - Efflux (or exchange) of' C from disks preloaded with [l4C]-sucrose was
examined at high and low cell turgor by incubation in 265 and 455 mOsmol kg"1
solutions, respectively. The half-life for exchange of sugar from the vacuole and
cytoplasm was estimated by the compartmentation method (Macklon, 1976; Wyse et al.,
1986). Disks were preloaded with [ C]-sucrose as described in the uptake experiment
and then rinsed (2x4 min) at 250C with nonradioactive buffer solutions at treatment
osmolarity. Efflux of 14C from 10 disks was monitored for 150 min by collecting rinses,
drying the liquid down, resuspending in 1 ml of water, adding 10 ml of aqueous counting
fluor, and then measuring radioactivity with a scintillation counter. At the end of 150
min, disks were extracted overnight with 80% ethanol and radioactivity of the extract was
determined. The contribution of efflux from the vacuole, determined from the regression
analysis, was subtracted from the data to determine the contribution of efflux from the
cytoplasm. Regression analysis was completed using the highest r regression fit for each
compartment.

92
Cell viability - Phenolic efflux (based on Redmann et al., 1986) was examined by rinsing
disks for 5 s, then placing them into buffer solutions containing mannitol at osmolarities
of 150,310 and 610 mOsmol kg' . Solution absorbance at 280 nm was measured after 3
h of incubation. Solutions containing disks were then frozen at -80oC for 1 h, thawed,
and absorbance was measured to determine the total phenolics within disks in order to
calculate the percentages that leaked out during incubation.
Disks were also incubated in mannitol solutions of 150, 310 and 610 mOsmol kg"1
for 2 h, then the solution was spiked with Neutral Red (0.1% w/v), and after 30 min disks
were placed into 0.05 M NaOH for 1 min and then put on slides under coverslips
(Stadalman and Kinzel, 1972). Disks were evaluated using a blind draw of randomly
numbered slides. An area (50 mm ) of parenchyma cells on each disk was picked
randomly in the first cell layer underneath cells damaged from cutting the disks. Neutral
Red accumulation in the cell vacuole indicates a living cell. Viability of tissue was
reported as the percentage of cells in the outermost intact cell layer that stained red.
5.4 Results
Fruit tisssue water relations - Water potential of fresh tissue disks was equivalent to
about 415 mOsmol kg" (or -1030 kPa); this is shown by the gain or loss of fresh weight,
respectively, in mannitol solutions below and above this osmolarity (Fig. 5-1 A).
Increasing solution osmolarity with ethylene glycol did not cause a decrease in disk fresh
weight, indicating that this osmoticum, in contrast to mannitol, freely permeated fruit cell
membranes (Fig 5-1 A).

93
Using the vapor pressure osmometer method, water potential of fresh fruit was
calculated at -1007 kPa (±86 SE, n = 10) or approximately 430 mOsmol kg'1, and was
thus similar to the water potential determined from the change in fresh weight. Tissue
solute potential of fresh fruit was measured at -1065 kPa (±126 SE, n = 10). Therefore,
the mean turgor of cells in green-white fruit was 58 kPa (water potential - solute potential
= turgor) [-1007 kPa - (-1065 kPa) = 58 kPa] with a range of 0 to 100 kPa.
Cell turgor increased when tissue disks were incubated in mannitol solutions at
osmolarities below 400 mOsmol kg"1, which is equivalent to the water potential of fresh
fruit tissue (Fig. 5-IB). Disks reached equilibrium with the incubation solution within 1
h; therefore, incubation for 4 h showed little change in turgor (Fig. 5-IB). The calculated
turgor of disks increased and showed great variability in solutions from 400 to 700
mOsmol kg"1. Gelling of the cell sap was observed after disks incubated in this
osmolarity range were frozen and thawed; this probably caused unreliable osmolarity
readings. Since tissue disks lost fresh weight at osmolarities greater than about 400
mOsmol kg"1 (Fig. 5-1 A), the tissue would have experienced a loss of turgor rather than
an increase (Fig. 5-1B).
When disks were incubated in solutions containing ethylene glycol from 165 to
665 mOsmol kg"1, cell osmolarity increased but cell turgor remained at approximately
100 kPa after 1 h of incubation (data not shown). No gelling of cell sap was observed
with a high osmolarity of ethylene glycol.
Sugar uptake - The rate of uptake of [ C]-sucrose at 10 mM decreased with increasing
osmolarity of the incubation solution (r2= -0.61; Fig. 5-2A), showing a linear relationship

94
CO.
0)
c o
JO O
D CL _*:
<D L_
=3
(/) <D i_
Q_
50 -A 1 1 1 II i |
• ethylene glycol"
40 - o O mann tol
30 ^ • 1 • • •
20 A O • • •
10 o - o ̂ o o -
0
-10
Q^ *■-
o T3
8 "^^ ■Is - o
-20 | 1 1 | 1
B 1 1 1 1 1
V 1' h
T T 4 h 150 \
W 100 — 1 wC7
-
50
0
i- V
1
1 ?*■
T T V ? v^ -
▼ V ▼ ' T '
100 200 300 400 500 600
Solution (mOsmol/kg)
Figure 5-1. A, Percent change in fresh weight of tissue disks from green-white strawberry fruit after 1 h of incubation in solutions at various osmolarities containing mannitol (O; y = 27.846 - 0.067x, r2 - 0.76) or ethylene glycol (•). Each symbol represents a tissue disk. Disks from five fruit were used in this experiment. B, Turgor pressure in disks, calculated by using the data in Fig. 2A, after 1 h (V; y = 329.370 - 1.570x + 0.002x2, r2 = 0.71) and 4 h (▼; y = 417.273 - 2.089x + 0.002x2, r2 = 0.77) in incubation solutions at various osmolarities containing mannitol. The variable and high values of turgor pressure at osmolarities greater than 400 mOsmol kg" were considered artifacts due to gelling of the cell sap. Data presented is from three experiments, with each symbol the mean of five disks or a sample of incubation solution.

95
with the calculated cell turgor (r2= 0.59; Fig 5-2B). Similar results were obtained for
uptake of [ C]-sucrose with sorbitol or polyethylene glycol 400 instead of mannitol as
the osmoticum (data not shown). Uptake of [14C]-glucose (10 mM) showed a negative
linear relationship with incubation solution osmolarity (r = -0.74) and a positive, albeit
less strongly, linear relationship with cell turgor (r = 0.49; Fig. 5-2A, 5-2B). The rate of
uptake of [ C]-sucrose at 100 mM showed a similar decrease with increasing osmolarity
of the incubation solution (data not shown). The observed decrease in uptake of both
glucose and sucrose with a decline in turgor indicates that turgor effects on sugar uptake
were of a general character and not sugar specific. When ethylene glycol was used as an
osmoticum, sucrose uptake was maintained at approximately 0.45 mmol [g fresh weight]"
1 h"1 for the range of 165 to 665 mOsmol kg"1 (data not shown). The inhibitory effect of
low cell turgor on sucrose uptake was more evident at higher sucrose concentrations,
suggesting that turgor altered uptake kinetics. As previously reported by Forney and
Breen (1986), a saturable component following Michaelis-Menten kinetics was
predominant at low sucrose concentrations, whereas above 25 mM a linear component
following first order kinetics dominated. Sucrose uptake can be described by the the
equation v = Vmax S/(S + Km) + kS , where v is the rate of sucrose uptake, S is the
sucrose concentration in the incubation solution, Vmax and Km are Michaelis-Menten
constants, and k is the first order rate coefficient (see Maynard and Lucas, 1982). Sucrose
uptake kinetics showed a steeper linear component at high (k = 0.015 mmol g [fresh
weight]"1 h"1) than at low (k = 0.011 mmol g [fresh weight]" h"1) turgor (Fig. 5-3A).

96
100 200 300 400 500 600 700 0 20 40 60 80 100
Solution (mOsmol/kg) Cell turgor (kPa)
Figure 5-2. Uptake of [14C]-sucrose (•) by strawberry fruit tissue disks (A) in incubation solutions at various osmolarities containing mannitol (y = 0.4810 - O.OOlOx - .OOOlx ; r = -0.61) and (B) at the calculated cell turgor of the tissue (y = 0.221 + O.OOlx, r2 = 0.59). The arrow indicates the initial water potential of fruit tissue. Data presented are from four experiments, with each symbol the mean often disks or the incubation solution. Turgor was assumed to equal zero when solution osmolarity was > 450 mOsmol kg" . Uptake of [l4C]-glucose ( □) by fruit tissue disks (C) in incubation solutions at various osmolarities containing mannitol (y = 0.794 - O.OOlx, r2 = -0.74) and (D) at the calculated cell turgor of the tissue (y = 0.449 - 0.002x, r2 = 0.49). All regression coefficients were statistically significant from zero, P<0.05. Data presented are from two experiments, with each symbol the mean often disks or the incubation solution.
97
The higher turgor produced by the 265 mOsmol kg" solution also enhanced the saturable
component of sucrose uptake, indicated by an increase in Vmax (Table 5-1). The value of
k , Vmax and Km for the uptake of sucrose at high turgor were similar to those previously
reported by Forney and Breen (1986) who used buffer solutions that were not balanced
osmotically (Table 5-1).
The saturable kinetics of glucose uptake were enhanced at the higher cell turgor
(Fig. 5-3C, Table 5-1). In a separated experiment, O-methyl-glucose, a nonmetabolizable
glucose analog, also exhibited enhanced saturable uptake at higher turgor (Fig. 5-3D). O-
methyl-glucose saturable uptake curves were indistinguishable from glucose uptake
curves when run simultaneously at respective turgors (data not shown).
[' C]-mannitol, with sorbitol used as an osmoticum, was found to permeate the
disk cells, but mannitol was still suitable as an osmoticum for altering disk cell turgor.
Uptake of [14C]-mannitol displayed only a linear uptake component that was steeper at
high (k = 0.027 mmol [g fresh weight]"1 h"1) than at low (k = 0.024 mmol [g fresh
weight]"1 h"1) turgor (Fig. 5-3B).
Addition of inhibitor - The saturable component of sucrose uptake was strongly inhibited
by preincubation of disks in 2 mM PCMBS (Fig. 5-4A and 5-4B); this is shown by a 80%
reduction in Vmax and a quadrupling in the K,,, value (Table 5-1). The linear component
of sucrose uptake was again steeper at high than low turgor and was not inhibited at either
turgor level by PCMBS (Fig. 5-4A, 5-4B; Table 5-1).
Sucrose efflux - The rate of efflux of C from the cytoplasm and vacuole after disks were
preloaded was not significantly affected by turgor, indicating that turgor had little effect

98
Table 5-1. Summary of kinetics constants for uptake of sugar in strawberry fruit disks. Sugar uptake can be described by the equation v = Vmax S/(S + Km) + kS , where v is the rate of sugar uptake, S is the sucrose concentration in the incubation solution, Vmax and Km are Michaelis-Menten constants, and k is the first order rate coefficient. Fruit tissue was at high turgor in incubation solutions at 265 mOsmol kg" , whereas tissue was at low or zero turgor in solutions at 455 mOsmol kg".
Sugar k Km
V vmax
(mmol gFWV) (mM)
(mmol gFW1 h"1)
Sucrose
High turgor 0.015 2.3 0.242
Low turgor 0.011 3.1 0.164
Glucose
High turgor 0.000 68.0 8.6
Low turgor 0.000 160.0 5.3
Sucrose
High turgor 0.016 2.1 0.132
With 0.015 5.3 0.029 PCMBS
Low turgor 0.012 1.0 0.118
With 0.010 5.4 0.028 PCMBS

99
en
~6 E 3 Q)
D -M Q.
i_ D D^ 13 I/)
I o
0 20 40 60 80 100 0 20 40 60 80 100
Sugar (mM) Sugar (mM)
Figure 5-3. Concentration dependence of (A) [14C]-sucrose, (B) [' C]-mannitol, (C) [14C]-glucose, and (D) O-methyl-f1 C]-glucose uptake by strawberry fruit disks at high (O) and low (T) turgor. Incubation solutions were adjusted with mannitol so that the total osmolarity was maintained at all sugar concentrations. Symbols represent means of four replicates for [14C]-sucrose and two replicates for all other sugars ± SE.

100
on the integrity of cell membranes or cell viability. There was a trend for low turgor
disks to display shorter [ Cj-efflux half-life times. Figure 5-5 shows the time course
reduction in the total C remaining in fruit tissue disks at high or low turgor with
continued rinsing used in determining [' C]-efflux half-life times. The half-life for 14C
efflux from the vacuole was 407.0 min (±34.2 SE, n = 4) at high and 321.7 min (±29.6
SE, n=4) at low turgor (P-value > 0.2 using an independent t-test). For the cytoplasm,
half-life for 14C efflux was 18.5 (±3.9 SE, n - 4) at high turgor and 12.6 min (±5.5 SE, n
= 4) at low turgor (P-value > 0.23 using an independent t-test).
Cell viability - Turgor effects were not the result of differential cell injury or death since
estimates of cell viability in disks was unaffected by the osmolarity of buffer solutions.
The efflux of phenolics from disks, a measure of cell injury, was similar (approximately
45% of total phenolics) at all solution osmolanties. Tissue viability was also assessed by
measuring the percentage of cells in the outermost intact cell layer of disks which stained
with Neutral Red. After 2 h incubation of ten disks in 150, 310 or 610 mOsmol kg"1
solutions, 39 to 48% of cells were stained. Regression analysis showed no difference
between the staining of cells with increasing osmolarity. Only 16% of cells took up stain
in disks incubated in distilled water for 2 h. Cells in disks that were frozen at -80oC or
heated at 60oC for 1 h prior to incubation took up no stain.
5.5 Discussion
The effect of incubation solution osmolarity on uptake of sugars by tissue disks of
strawberry fruit was due to differences in cell turgor, not cell osmotic potential. This was

101
2.0
en
"o E 3.
D ■+-> CL
(D (0 O i_ O
CO I o
1 1
O control T 2mM PCMBS
1.5 -
A ■ high turgor
1 1 1
20 40 60 80 100
Sucrose (mM)
i-M, Figure 5-4. Concentration dependence of [ C]-sucrose uptake by strawberry fruit disks, pretreatment with 2 mM PCMBS (T) and without pretreatment (O) in mannitol containing incubation solutions at (A) high and (B) low turgor. Incubation solutions were adjusted so that the total osmolarity was maintained at all sucrose concentrations. Symbols represent means of two replicates ± SE.

102
(D icr
H- Q_ (D Q
(D -M 0) > Z3 1 J <n 10 o CO D -M
O
U D rr
"i 1 1—i—r • high turgor i Q O low turgor
T T
1 I I I cytoplasmic
compartment
0 10 20 30 40 50 60 70
Vacuolar compartment
0 25 50 75 100 125
Efflux time (min)
150
Figure 5-5. Time course reduction in the total 14C remaining in fruit tissue disks at high (•) or low (O) turgor conditions with continued rinsing. Regression lines used to determine (A) vacuolar 14C efflux and (B) cytoplasmic efflux, after subtraction of vacuolar contribution at high and low turgor. Symbols represent means of four replicates ±SE.

103
demonstrated by the response of uptake to the turgor-altering osmoticum, mannitol and
the absence of a response with ethylene glycol, which modified cell osmotic potential but
not cell turgor. Osmolarity of the incubation solutions did not affect cell injury or
mortality.
The average turgor of the green-white strawberry fruit cortex (which is
predominately parenchyma cells with some vascular tissue) prior to incubation was only
58 kPa, supporting the possibility of high apoplast solute levels. Lang and Thorpe
(1986) have suggested that high concentrations of solutes in the apoplast of sink tissue
reduce cell turgor and augment the phloem pressure gradient from the source to sink
region. In potato tuber (sink) tissue, where sugar is thought to be unloaded from the
phloem symplastically (Oparka and Prior, 1987), cell turgor has been calculated to be 320
kPa. In contrast, Shackel et al. (1991) used a pressure probe and found cell turgor in
ripening tomato fruit to be less than 20 kPa; an apoplastic unloading pathway is thought
to predominate at this developmental stage (Damon et al., 1988). Using in situ
psychometric methodology, Pomper and Breen (1995, see chapter 4) calculated turgor of
green-white and slightly pink strawberry fruit as 250 kPa and 50 kPa, respectively. They
also found that solute levels in the apoplast increased as fruit developed from green-white
to pink, as evidenced by apoplastic solute potentials decreasing from -0.25 and -0.41
MPa. The accumulation of solutes in the apoplast and the decrease in cell turgor in
strawberry fruit after the green-white stage is consistent with, but not limited to,
apoplastic phloem unloading. Maynard and Lucas (1982) pointed out that apoplastic
uptake may represent a general retrieval system for sugars leaking from sink cells rather

104
than an integral component of apoplastic unloading. From studies on the uptake of [14C]-
sucrose and label redistribution of its hexose components, Forney and Breen (1986)
suggested that both apoplastic and symplastic unloading are operating in strawberry fruit.
The uptake of both sucrose and glucose by strawberry fruit tissue decreased with a
decrease in cell turgor (i.e. with an increase in osmolarity of the incubation solution). In
contrast, tissues from potato tuber (Oparka and Wright, 1988a, b), sugar beet (Wyse et al.,
1986), as well as Phaseolus leaves (Daie and Wyse, 1985) and young cotyledons (Patrick,
1994a, b) show an opposite response; a decline in turgor stimulates sugar uptake. To
check our technique, we examined uptake of [* C]-sucrose by (sink) potato tuber disks
using our buffer solutions and sugar uptake protocol. We confirmed the results of Oparka
and Wright (1988a, b) that uptake of [ C]-sucrose increases with increasing osmolarity
of mannitol incubation solutions (data not shown). Our observation of the opposite effect
of reduced cell turgor on sugar uptake in green-white strawberry fruit disks suggests that
a decline in cell turgor does not increase sugar accumulation in this tissue and the
possibility that strawberry fruit cells at this stage are unable to osmoregulate.
Declining turgor also failed to enhance sucrose uptake in disks of Citrus sinensis
leaves (Martinez-Cortina and Sanz, 1994) and carrot root tissue (Hole and Dearman,
1994). Hole and Dearman (1994) concluded that transmembrane exchange of sucrose is
not involved in regulating solute potential in the apoplast of carrot root or in controlling
turgor gradients between source and sink. However, these authors suggested that other
osmotically active compounds in the sink apoplast, such as potassium (Enoch and Glinka.
1981), could still be involved in creating turgor gradients between source and sink.

105
Sucrose and hexoses in the apoplast of red ripe strawberry fruit make up only 35% of the
total apoplastic solute potential of-1.0 MPa (Pomper and Breen, 1995, chapter 4).
Therefore non-sugar solutes in the apoplast of strawberry fruit may play a more important
role in regulating the apoplastic water potential (or turgor) gradient between the fruit and
leaves.
In addition to the rate of uptake, turgor affected the kinetics of sugar uptake in
strawberry fruit tissue in a manner different from that in sugar beet (Wyse et al., 1986),
potato (Oparka and Wright, 1988b), and bean leaf disks (Daie and Wyse, 1985).
Saturable (carrier mediated) uptake of glucose by strawberry fruit tissue was augmented
at high turgor. The biphasic characteristic of sucrose uptake by fruit tissue was also more
pronounced at high turgor, displaying an enhanced saturable component and an increased
slope of the linear (diffusional) component. Conversely, higher cell turgor in sugar beet
root (Wyse et al., 1986) and bean leaf (Daie and Wyse, 1985) disks reduced the saturable
component of sucrose uptake by these tissues, but it did not affect the linear phase.
Energy for carrier mediated (saturable) sucrose uptake is indirectly supplied via ATP
(Bush, 1993) and inhibition of a plasma membrane H+-ATPase by high turgor was
suggested as the cause of the decline in the saturable component in sugar beet (Wyse et
al., 1986). In tissue of young (sink) potato tubers, higher turgor decreased the slope of
linear uptake, whereas the saturable component was unchanged (Oparka and Wright,
1988a, b). Inhibitor studies suggest that a turgor-sensitive H+-ATPase is active in sugar
importing (sink) tubers but not in sprouting (source) tubers (Wright and Oparka, 1989).

106
The saturable component of sucrose uptake in strawberry fruit was inhibited by
PCMBS as has been demonstrated in many plant tissues (Giaquinta, 1976; Oparka and
Wright, 1988a, b). The limited effect of PCMBS at sucrose concentrations greater than
25 mM suggests that carrier mediated uptake of sucrose contributes little to total uptake
at high sucrose concentrations. PCMBS has been reported not to penetrate the plasma
membrane (Giaquinta, 1976) and since sucrose uptake in untreated tissue was so similar
overall to PCMBS-treated tissue, it seems likely that PCMBS did not penetrate into the
cytoplasm where cellular metabolism and storage functions would have been significantly
affected. Very little is known concerning the source of the linear (diffusional) component
of sucrose uptake; it may represent a channel system, or even another carrier system not
sensitive to PCMBS (see Bush, 1993; Lin, 1985). The uptake of [14C]-sugars by the
strawberry fruit tissue is a function of the combined effects of turgor on both plasma
membrane and tonoplast transport arranged in series, so it is difficult to identify the
regulatory influence of changes in cell turgor.
The kinetics of sugar uptake may reflect metabolism within cells in addition to
transport across the plasma membrane. In sink potato tuber tissue, the biphasic kinetic
pattern of glucose and fructose uptake represents a linear component of sugar transport
across the plasma membrane superimposed on a second saturable component representing
starch synthesis within cells (Wright and Oparka, 1990). In strawberry, only 20% of the
14C of labeled sucrose is incorporated into an ethanol insoluble component representing
starch and cell wall components during a 4 h uptake period (Forney and Breen, 1986).
We confirmed this and found that changes in turgor did not alter the proportion of C

107
incorporated into the insoluble component (data not shown). Increased uptake of the
nonmetabolizable sugar O-methyl-glucose at high turgor also indicated that only carrier
activity was influenced by cell turgor, not accumulation due to changes in cell
metabolism.
Efflux rates from the cytoplasm and vacuole of strawberry fruit cells indicate that
high turgor did not significantly increase leakage of 14C from cell membranes. Half-life
times for [ 4C]-effIux from vacuoles of sugar beet taproot tissue disks were shorter at high
(522 min) than at low (1363 min) cell turgor (Wyse et al., 1986) whereas comparable
values for strawberry fruit tissue were similar, 407 and 321 min respectively. The half-
life times for the efflux of C from the cytoplasm were similar in sugar beet taproot
(Wyse et al., 1986) and strawberry fruit tissue at high or low turgor. The shorter vacuole
efflux times in strawberry fruit tissue, as compared to those of sugar beet taproot tissue,
suggests that the fruit tissue is more prone to leakage of sugars stored in the vacuole.
Retrieval of sugars that leak into the apoplast may be a higher priority in strawberry fruit
tissue than in the less permeable sugar beet taproot tissue.
Cram (1984) has pointed out that mannitol may be suitable as an osmoticum in
incubation solutions only in short term experiments of several hours, since in some
species or tissues this sugar alcohol is taken up and utilized, possibly affecting the
metabolism of the cell. Mannitol was found to permeate strawberry cells in this study,
but was still suitable as an osmoticum for altering disk cell turgor. Since mannitol uptake
increased at higher turgor and a saturable carrier uptake was not present, this can be taken
as evidence of increase membrane permeability with increased turgor. However, not only

108
does the [ C]-efflux data at high turgor not support this, we also found that shocking
strawberry tissue disks in dilute buffer solutions and then placing them at low turgor
conditions did not significantly increase [ C]-sucrose uptake compared to that of
unshocked tissue, indicating that high turgor conditions did not cause significant
membrane damage (data not shown).
In conclusion, cells of strawberry fruit at the green-white stage do not possess
sucrose and glucose uptake systems that are stimulated by a reduction in turgor nor does
turgor significantly modify sucrose efflux. If the results of the in vitro sugar transport
experiments of the present study reflect in vivo transport mechanism, it would seem
unlikely that strawberry fruit cells are able to respond to, or regulate, the levels of
apoplastic solutes through sugar transport. However, since sucrose and hexoses account
for only about 35% of the osmotic potential of the apoplastic solution in strawberry fruit
(Pomper and Breen, 1995, chapter 4), the cellular response to apoplastic solutes could be
mediated by non-sugar components.

109
5.6 Literature cited
Bush, D. 1993. Proton-coupled sugar and amino acid transporters in plants. Annu. Rev. Plant Physiol. 44:513-542.
Cram, W.J. 1984. Mannitol transport and suitability as an osmoticum in root cells. Physiol. Plant. 61:396-404.
Daie, J. and R.E. Wyse. 1985. Evidence on the mechanism of enhanced sucrose uptake at low cell turgor in leaf discs ofPhaseolus coccinius. Physiol. Plant. 64:547-552.
Damon, S., J. Hewitt, M. Neider and A.B. Bennett. 1988. Sink metabolism in tomato II. Phloem unloading and sugar uptake. Plant Physiol. 87:731-736.
Enoch, S. and Z. Glinka. 1981. Changes in potassium fluxes in cells of carrot storage tissue related to turgor pressure. Physiol. Plant. 53:548-552.
Forney, C.F. and P.J. Breen. 1985a. Collection and characterization of phloem exudate from strawberry pedicels. HortScience 20:413-414.
Forney, C.F. and P.J. Breen. 1985b. Growth of strawberry fruit and sugar uptake of fruit discs at different inflorescence positions. Scientia Hort. 27:55-62.
Forney, C.F. and P.J. Breen. 1986. Sugar content and uptake in strawberry fruit. J. Amer. Soc. Hort. Sci. 111:241-247.
Giaquinta, R.T. 1976. Evidence for phloem loading from the apoplast. Chemical modifications of membrane sulfhydryl groups. Plant Physiol. 57:872-875.
Hole, C.C. and J. Dearman. 1994. Sucrose uptake by the phloem parenchyma of carrot storage root. J. Exp. Bot. 45:7-15.
Lang, A. and M.R. Thorpe. 1986. Water potential, translocation and assimilate partitioning. J. Exp. Bot. 37:495-503.
Li, Z. and S. Delrot. 1987. Osmotic dependence of the transmembrane potential difference of broadbean mesocarp cells. Plant Physiol. 84:895-899.
Lin, W. 1985. Linear sucrose transport in protoplasts from developing soybean cotyledons. Plant Physiol. 78:894-897.
Macklon, A.E.S. 1976. An examination, by compartmental flux analysis, of the development of sodium and chloride absorption capacities in beet root discs. J. Exp. Bot. 27:651-657.

110
Maynard, J.W. and J.W. Lucas. 1982. Sucrose and glucose uptake into Beta vulgaris leaf tissue: a case for general (apoplastic) retrieval systems. Plant Physiol. 70:1436-1443.
Martinez-Cortina, C. and A. Sanz. 1994. Effect of hormones on sucrose uptake and on ATPase activity of Citrus sinensis L. Osbeck leaves. Ann. Bot. 73:331- 335.
Meyer, R.E. and J.S. Boyer. 1981. Osmoregulation, solute distribution and growth in soybean seedlings having low water potentials. Planta 151:482-489.
Morgan, J.M. 1984. Osmoregulation and water stress in higher plants. Annu. Rev. Plant Physiol. 35:299-319.
Oparka, K.J. and D.A.M. Prior. 1987. 14C-sucrose efflux from the perimedulla of growing potato tubers. Plant Cell Environ. 10:667-675.
Oparka, K.J. and K.M. Wright. 1988a. Osmotic regulation of starch synthesis in potato tubers? Planta 174:123-126.
Oparka, K.J. and K.M. Wright. 1988b. Influence of cell turgor on sucrose partitioning in potato tuber storage tissues. Planta 175:529-526.
Oparka, K.J. 1990. What is phloem unloading. Plant Physiol. 94:393-396.
Patrick, J.W. 1990. Sieve element unloading: cellular pathway, mechanism and control. Physiol. Plant. 78:298-308.
Patrick, J.W. 1994a. Turgor-dependant unloading of photosynthates from coats of developing seed ofPhaseolus vulgaris and Viciafaba. Turgor homeostasis and set points. Physiol. Plant. 90:367-377.
Patrick, J.W. 1994b. Turgor-dependant unloading assimilates from coats of developing legume seed. Assessment of the significance of the whole plant. Physiol. Plant. 90:645-654.
Pomper, K.W. and P.J. Breen. 1995. Levels of apoplastic solutes in developing strawberry fruit. J. Exp. Bot. 293:(In Press).
Redmann, R.E., J. Haraldson and L.V. Gusta. 1986. Leakage of UV-absorbing substances as a measure of salt injury in leaf tissue of woody species. Physiol. Plant. 67:87-91.
Salisbury, F.B. and C.W. Ross. 1992. Plant Physiology 4th ed. Wadsworth Publishing Company, Inc. Belmont, Calif.

Ill
Shackel, K.A., C. Greve, J.M. Labavitch and H. Ahmadi. 1991. Cell turgor changes associated with ripening in tomato pericarp tissue. Plant Physiol. 97:814-816.
Stadalman, E.J. and H. Kinzel. 1972. Vital staining of plant cells. Chap. 10, pp. 326- 364. Methods in Cell Physiology, Vol.V. Academic Press, Inc. New York.
Welbaum, G.E. & Meinzer, F.C. 1990. Compartmentation of solutes and water in developing sugarcane stalk tissue. Plant Physiol. 93:1147-1153.
Wolswinkle, P. 1990. Recent progress in research on the role of turgor sensitive transport in seed development. Plant Physiol. Biochem. 28:399-410.
Wright, K.M. and K.J. Oparka. 1989. Sucrose uptake and partitioning in discs derived from source versus sink potato tubers. Planta 177:237-244.
Wright, K.M. and K.J. Oparka. 1990. Hexose accumulation and turgor-sensitive starch synthesis in discs derived from source versus sink potato tubers. J. Exp. Bot. 41:1355-1360.
Wyse, R.E., E. Zamski and A.D. Tomos. 1986. Turgor regulation of sucrose transport in sugar beet taproot tissue. Plant Physiol. 81:478-481.

112
CHAPTER 6
EPILOGUE
An improved understanding of the mechanisms of water and sugar transport in
strawberry could help identify strategies to increase transport to the fruit and influence its
expansion. The objectives of this thesis research were to: 1) relate plant water relations to
fruit expansion during water-stress, 2) to assess the contribution of apoplastic solutes
toward fruit v|/aw, and 3) determine whether the uptake of sugars by fruit cells form the
apoplast was turgor-sensitive. The major conclusions of this research were that: 1) green-
white fruit expansion was very sensitive to water stress, occurring when leaf iyw was
higher than that of fruit, and that fruit underwent osmotic adjustment when plants were
subjected to water-stress, but not to levels that allowed continued expansion, 2)
apoplastic solutes (mainly non-sugar components) contributed significantly to the fruit
\j/aw late in development, and 3) sugar uptake from the apoplast by fruit cells was not
stimulated by reductions in turgor as in tissues of many other plants. In this epilogue,
I will comment on some of the methods used in this research and explore some of the
potential avenues to further our understanding of water and sugar transport to the
developing strawberry fruit.
Is the v|/w of plant tissues and organs meaningful as an indicator of water status or
predictor of water transport? After several decades of emphasis on plant \j/w as a good
indicator of plant water status, some investigators claim that physiological processes are

113
better related to RWC than to vj/w (Sinclair and Ludlow, 1985). Rates of cell enlargement,
photosynthesis, and respiration are highly correlated with RWC (Kramer and Boyer,
1995). The main advantage of using v}/w is that it is based on a physically defined
reference rather than a biological one (e.g. pure free water at atmospheric pressure and a
defined gravitational position, at the same temperature as the system of interest), allowing
an experiment to be repeated and compared to a defined reference (Boyer, 1988).
Comparisons of plant water status based on water content are based on a biological
reference that varies, although RWC is an improvement because it uses the water content
of cells at full turgor as a reference. There is also the question of whether a growing
organ or tissue, such as a green-white strawberry fruit can attain full turgor. The vj/w, as
well as RWC, both provide useful information on tissue water status under stress, but vi/w
may be more reliably measured than RWC in growing tissue.
There is continuing evidence to reject the belief that water movement within a
plant can be predicted solely on differences in VJ/W (Passioura, 1988). However, in this
present study, green-white strawberry fruit expansion (indicating water flow to the fruit)
did occur when leaf \(/w was higher than that of fruit, as would be predicted by the
difference in viv A direct measure of water movement through the xylem to the fruit
would still be more desirable. Methods that would seem to allow the examination of
xylem water movement in the plant that at first seem attractive, such as dye movement in
the apoplast, often do not represent the flow of water because of barriers in the apoplast
restricting movement of dye molecules but not to water (see Canny, 1993). Nuclear
resonce imaging (NRI) has been used to examine the amount of bound and free water in

114
plant tissues, including the vascular system. Maas and Line (1995) have completed
studies of developing strawberry fruit using this technique and identified higher levels of
free water in vascular traces as compared to parenchyma tissue. The NRI apparatus is
very expansive and requires excellent technical expertise. However, it seems possible
that NRI could be used in examining changes in water status of fruit with water-stress and
diurnal changes in water transport.
What proportion of water transported into developing strawberry fruit is delivered
by the phloem? The contribution of phloem delivered water to developing strawberry
fruit could be determined by girdling the pedicel and examining the change in the rate of
expansion. 'Brighton' strawberry fruit offer a unique opportunity to examine the
influence of cell turgor on phloem unloading of assimilate into the fruit. Fruit of this
cultivar form a large hollow cavity as it ripens. This cavity could be filled with solutions
of non-permeating osmotica in an effort to alter fruit turgor and influence phloem
unloading of radioactively labeled sucrose into the cavity and fruit tissues.
The active accumulation of compatible solutes in plant tissue with osmotic
adjustment, such as sugars and amino acids, is generally thought to be a mechanism by
which positive turgor is maintained in cells during water-stress. However, Passioura
(1988b) has argued that accumulation of these solutes, such as glucose and sucrose, could
also just be a by-product of the slow down in use of solutes by tissues during water-stress
and this view should be considered when interpreting osmotic adjustment studies. The
observed relative increase in glucose compared to sucrose in water-stressed green-white
strawberry fruit tissue suggests that part of the osmotic adjustment mechanism in stressed

115
fruit could be hydrolysis of stored sucrose by either invertase or sucrose synthase or
combination of the two. It would be interesting to examine the activities of these two
enzymes in control and water-stressed strawberry fruit. Tarczynski et al. (1993)
increased the salt tolerance of tobacco plants by introducing a bacterial gene that
increased the production of mannitol in the plant tissues. Could increased water-stress
tolerance be introduced into strawberry without disturbing normal metabolic pathways?
Sugar uptake from the apoplast of green-white fruit tissue was not stimulated by reduced
cell turgor, suggesting this process is not involved in osmotic adjustment in fruit tissues.
Does reduced turgor in fruit cells increase apoplastic uptake of solutes other than sugars
or does it increase phloem transport of solute to the fruit leading to a decrease in fruit VJ/S?
There are many questions that remain to be answered.
Let's step back for a minute and look at the whole plant. Longer-term adaption of
the strawberry plant to drought was not examined in this study. In addition to the
occurrence of leaf osmotic adjustment, Save et al. (1993) reported morphological
adaptions with long-term drought stress of the cultivated strawberry in the field. They
found that drought stress reduced total leaf area and altered the plant architecture into a
polylayer canopy with leaves oriented more toward the north. Drought stress did not
increase root biomass (g dry weight plant"1). Gains in drought resistance resulting in
increase fruit yield in strawberry will likely require consideration of the mechanisms
plant adaption at the whole-plant and cellular levels.

116
BIBLIOGRAPHY
Abbott, A.J., G.R. Best and R.A. Webb. 1970. The relation of achene to berry weight in strawberry fruit. J. Hort. Sci. 45:215-222.
Antoszewski, R. 1974. Accumulation of nutrients in the strawberry as related to water transport and to growth pattern of the strawberry receptacle. Proceed. 19th Inter. Hort. Cong., Warsaw 2:167-176.
Archbold, D.D. and B. Zhang. 1991. Drought stress resistance in Fragaria species, p. 138-144. In: A. Dale and J.J. Luby (eds.). The Strawberry into the 21 st Century. Timber Press, Portland, Ore.
Ashworth, E.N. 1982. Properties of peach flower buds which facilitate supercooling. Plant Physiol. 70:1475-1479.
Balling, A. and U. Zimmermann. 1990. Comparative measurements of the xylem pressure ofNicotiana plants by means of the pressure bomb and pressure probe. Planta 182:325-338.
Barlow, E.W.R., J.W. Lee, R. Munns and M.G. Smart. 1980. Water relations of developing wheat grain. Aust. J. Plant Physiol. 7:519-525.
Benkert, R., J. Zhu, G. Zimmermann, R. Turk, F. Bentrup, and U. Zimmermann. 1995. Long-term xylem pressure measurments in the liana Tetrastigma voinerianum by means of the xylem pressure probe. Planta 196:804 -813.
Berger, A. and G. Selles. 1993. Diurnal fruit shrinkage: a model, p. 261-269. In: M. Borghetti, J. Grace, and A. Raschi (eds.). Water Transport in Plants Under Climatic Stress. Cambridge University Press, Cambridge.
Bostwick, D.E., J.M. Dannenhoffer, M.I. Skaggs, R.M. Lister, B.A. Larkin and G.A. Thompson. 1994. Pumpkin phloem lectin genes are specifically expressed in companion cells. Plant Cell 4:1539-1548.
Boyer, J.S. 1989. Water potential and plant metabolism: comments on Dr. P.J. Kramer's article 'Changing concepts regarding plant water relations,' Volume 11, Number 7, pp. 565-568, and Dr. J.B. Passioura's Response, pp. 569-571. Plant, Cell and Env. 12:213-216.
Bradford, K.J. 1994. Water stress and the water relations of seed develpment: a critical review. Crop Sci. 34:1-11.

117
Bressan, R.A., D.E. Nelson, N.M. Iraki, P.C. LaRosa, N.K. Singh, P.M. Hasegawa and N.C. Carpita. 1990. Reduced cell expansion and changes in cell walls of plant cells adapted to NaCl. p. 137. In: Katterman (ed.) Environmental Injury to Plants. Academic Press, San Diego.
Brooks, A., C.F. Jenner and D. Aspinall. 1982. Effects of water deficit on endosperm starch granules and on grain physiology of wheat and barley. Aust. J. Plant Physiol. 9:423-436.
Brown, P.W. and C.B. Tanner. 1981. Alfalfa water potential measurement: A comparison of the pressure chamber and leaf dew-point hygrometer. Crop Sci. 21:240-244.
Bush, D. 1993. Proton-coupled sugar and amino acid transporters in plants. Annu. Rev. Plant Physiol. 44:513-542.
Canny, M.J. 1993. The transpiration stream in the leaf apoplast: water and solutes. Philo. Trans. Royal Soc. London Bio. Sci. 341:87-100.
Canny, M.J. 1995. Apoplastic water and solute movement: New rules for an old space. Ann. Rev. Plant Physiol. Plant Mol. Biol. 46:215-36.
Cheng, G.W. and P.J. Breen. 1992. Cell count and size in relation to fruit size among strawberry cultivars. J. Amer. Soc. Hort. Sci. 117:946-950.
Cosgrove D.J. 1993. How do plant cell walls extend? Plant Physiol. 102:1-6.
Cosgrove, D.J. 1993. Water uptake by growing cells: An assessment of the controlling roles of wall relaxation, solute uptake, and hydraulic conductance. Int. J. Plant Sci. 154(1): 10-21.
Cram, W.J. 1984. Mannitol transport and suitability as an osmoticum in root cells. Physiol. Plant. 61:396-404.
Daie, J. and R.E. Wyse. 1985. Evidence on the mechanism of enhanced sucrose uptake at low cell turgor in leaf discs ofPhaseolus coccinius. Physiol. Plant. 64:547-552.
Damon, S., J. Hewitt, M. Neider and A.B. Bennett. 1988. Sink metabolism in tomato II. Phloem unloading and sugar uptake. Plant Physiol. 87:731-736.
Darrow, G.M. 1966. The Strawberry: History, breeding, and physiology. Holt, Rinehart, and Winston, New York.

118
Dixon, M.A. and M.T. Tyree. 1984. A new stem hygrometer, corrected for temperature gradients and calibrated against the pressure bomb. Plant Cell Environ. 7:693-697.
Dwyer, L.M., D.W. Stewart, L. Houwing and D. Balchin. 1987. Responce of strawberries to irrigation scheduling. HortScience 22:42-44.
Ehwald, R., D. Kowallock, A.B. Meshcheryakov and V.P. Kholodova. 1980. Sucrose leakage from isolated parenchyma of sugar beet roots. J. Exp. Bot. 31:607-620.
Enoch, S. and Z. Glinka. 1981. Changes in potassium fluxes in cells of carrot storage tissue related to turgor pressure. Physiol. Plant. 53:548-552.
Findlay, N., K.F. Oliver, N. Nii and B.G. Coombe. 1987. Solute accumulation by grape pericarp cells. IV. Perfusion of pericarp apoplast via the pedicel and evidence for xylem malfunction in ripening berries. J. Exp. Bot. 38:668-679.
Forney, C.F. and P.J. Breen. 1985a. Collection and characterization of phloem exudate from strawberry pedicels. HortScience 20:55-62.
Forney, C.F. and P.J. Breen. 1985b. Growth of strawberry fruit and sugar uptake of fruit discs at different inflorescence positions. Scientia Hort. 27:55-62.
Forney, C.F. and P.J. Breen. 1986. Sugar content and uptake in the strawberry fruit. J. Amer. Soc. Hort. Sci. 111:241-247.
Frommer, W.B. and U. Sonnewald. 1995. Molecular analysis of carbon partitioning in solanaceous species. J. Expt. Bot. 46(287):587-607.
Gahrtz, M, J. Stolz and N. Sauer. 1994. Phloem-specific sucrose-H+ symporter from Plantago major L. supports the model of apoplastic phloem loading. Plant J. 6:697-706.
Galletta, G.J. and R.S. Bringhurst. 1991. Strawberry management. In: Small fruit crop managment. G.J. Galletta and D.G. Himelrick (eds.) Prentice Hall, Englewood Cliffs, N.J.
Giaquinta, R.T. 1976. Evidence for phloem loading from the apoplast. Chemical modifications of membrane sulfhydryl groups. Plant Physiol. 57:872-875.
Giaquinta, R.T., W. Lin, N.L. Sadler and V.R. Franceschi. 1983. Pathway of phloem unloading of sucrose in com roots. Plant Physiol. 72:362-367.

119
Gifford, R.M., J.H. Thome, W.D. Hitz and R.T. Giaquinta. 1984. Crop productivity and photoassimilate partitioning. Science 225:801-808.
Girma, F.S. and D.R. Krieg. 1991. Osmotic adjustment in sorghum. Plant Physiol. 99:577-582.
Glasziou, K.T. and K.R. Gayler. 1972. Storage of sugar in stalks of sugarcane. Bot. Rev. 38:471-490.
Grange, R.I. and J. Andrews. Respiration and growth of tomato fruit. Plant, Cell and Environ. 18:925-930.
Greenspan, M.D., K.A. Shackel, and M.A. Matthews. 1994. Developmental changes in the diurnal water budget of the grape berry exposed to water deficits. Plant, Cell and Environ. 17:811-820.
Harms, K., R.V. Woehner, B. Schulz and W.B. Frommer. Isolation and characterization of P-type H+-ATPase genes from potato. Plant Mole. Bio. 26:979-988.
Hole, C.C. and J. Dearman. 1994. Sucrose uptake by the phloem parenchyma of carrot storage root. J. Exp. Bot. 45:7-15.
Hubbard, N.L., D.M. Pharr, and S.C. Huber. 1991. Sucrose phosphate synthase and other sucrose metabolizing enzymes in fruits of various species. Physiol. Plant. 82:191-196.
Jachetta, J.J., A.P. Appleby and L. Boersma. 1986. Use of the pressure vessel to measure concentrations of solutes in apoplastic and membrane-filtered symplastic sap in sunflower leaves. Plant Physiol. 82:995-999.
Janick J. and D.A. Eggert. 1968. Factors affecting fruit size in the strawberry. Proceed. Amer. Soc. Hort. Sci. 93:311-316.
John, O. and S. Yamaki. 1994. Sugar content, compartmentation, and efflux in strawberry tissue. J. Amer. Soc. Hort. Sci. 119:1024-1028.
Johnson, R.W., M.A. Dixon and R. Lee. 1992. Water relations of the tomato during fruit growth. Plant Cell Environ. 15:947-953.
Jones, H.G., A.N. Lakso and J.P. Syvertsen. 1985. Physiological control of water staus in temperate and subtropical fruit trees. Hort. Reviews 7:301-344.

120
Jones, M.M. and N.C. Turner. 1978. Osmotic adjustment in leaves of sorghum in responce to water deficits. Plant Physiol. 61:122-126.
Jones, M.M. and N.C. Turner. 1980. Osmotic adjustment in expanding and fully expanded leaves of sunflower in response to water deficits. Aust. J. Plant Physiol. 7:181-192.
Knee, M., J.A. Sargent and D.J. Osbome. 1977. Cell wall metabolism in developing strawberry fruits. J. Exp. Bot. 28:377-396.
Kramer, P.J. 1983. Water deficit and plant growth, p. 342-415. In: P.J. Kramer (ed.). Water Relations in Plants. Academic Press, New York.
Kramer, P.J. 1988. Changing concepts regarding plant water relations. Plant Cell Environ. 11:565-568.
Kramer, P.J. and J.S. Boyer. 1995. Water Relations of Plants and Soils. Academic Press, New York.
Lang, A. and M.R. Thorpe. 1986. Water potential, translocation and assimilate partitioning. J. Exp. Bot. 37:495-503.
Lang, A. and W.R.N. Edwards. 1986. Plant water potential and translocation. p. 193-194 In: J. Cronshaw, W.J. Lucas, and R.T. Giaquinta. (eds.) Phloem Transport. Proceedings of an international conference on phloem transport. Alan R. Liss, Inc., New York.
Lang, A. and H. During. 1991. Partitioning control by water potential gradient: Evidence for compartmentation breakdown in grape berries. J. Exp. Bot. 42:1117-1122.
Lang, A. and K.G. Ryan. 1994. Vascular development and sap flow in apple pedicels. Ann. Bot. 74:381-388.
Lee, D.R., M.A. Dixon and R.W. Johnson. 1988. Simultaneous measurements of tomato fruit and stem water potentials using in situ stem hygrometers. Canad. J. Bot. 67:2352-2355.
Lee, D.R. 1989. Vasculature of the abscission zone in tomato fruit: implications for transport. Canad. J. Bot. 67:1898-1902.
Li, Z. and S. Delrot. 1987. Osmotic dependence of the transmembrane potential difference of broadbean mesocarp cells. Plant Physiol. 84:895-899.
Lin, W. 1985. Linear sucrose transport in protoplasts from developing soybean cotyledons. Plant Physiol. 78:894-897.
121
Lucas, W.J., B. Ding and C. van der School. 1993. Plasmodesmata and the spracellular nature of plants. New Phytol. 125:435-476.
Macklon, A.E.S. 1976. An examination, by compartmental flux analysis, of the development of sodium and chloride absorption capacities in beet root discs. J. Exp. Bot. 27:651-657.
Martinez-Cortina, C. and A. Sanz. 1994. Effect of hormones on sucrose uptake and on ATPase activity of Citrus sinensis L. Osbeck leaves. Ann. Bot. 73:331-335.
Mass, J.L. and M.J. Line. 1995. Nuclear magnatic resonance microimaging of strawberry flower buds and fruit. HortScience 30:1090-1096.
Maynard, J.W. and J.W. Lucas. 1982. Sucrose and glucose uptake into Beta vulgaris leaf tissue: a case for general (apoplastic) retrieval systems. Plant Physiol. 70:1436-1443.
Meyer, R.F. and J.S. Boyer. 1981. Osmoregulation, solute distribution, and growth in soybean seedlings having low water potentials. Planta. 151:482-489.
Miura, H., S. Imada and S. Yabuuchi. 1990. Double sigmoid growth curve of strawberry fruit. J. Jpn. Soc. Hort. Sci. 59:527-531.
Moore, P.H. and D.J. Cosgrove. 1991. Developmental changes in cell and tissue water relations parameters in storage parenchyma of sugarcane. Plant Physiol. 96:794- 801.
Morgan, J.M. 1984. Osmoregulation and water stress in higher plants. Annu. Rev. Plant Physiol. 35:299-319.
Muller-Rober, B., U. Sonnewald and L. Willmitzer. 1992. Inhibition of ADP-glucose pyrophosphorylase in transgenic potatoes leads to sugar-storing tubers and influences tuber formation and expression of tuber storage proteins. EMBO J. 11:1229-1238.
Munns, R. 1988. Why measure osmotic adjustment? Aust. J. Plant Physiol. 15:717-726.
Nobel, P.S. 1983. Biophysical plant physiology and ecology. W. H. Freeman and Co., San Fancisco.
Nonami H. and J.S. Boyer. 1993. Direct demonstration of a growth-induced water potential gradient. Plant Physiol. 102:13-19.
O'Neill, S.D. 1983. Role of osmotic potential gradients during water stress and leaf senescence in Fragaria virginiana. Plant Physiol. 72:931-937.

122
Oparka, K.J. and D.A.M. Prior. 1987.14C-sucrose efflux from the perimedulla of growing potato tubers. Plant Cell Environ. 10:667-675.
Oparka, K.J. and K.M. Wright. 1988a. Osmotic regulation of starch synthesis in potato tubers? Planta 174:123-126.
Oparka, K.J. and K.M. Wright. 1988b. Influence of cell turgor on sucrose partitioning in potato tuber storage tissues. Planta 175:529-526.
Oparka, K.J. 1990. What is phloem unloading? Plant Physiol. 94:393-396.
Oparka, K.J. and D.A.M. Prior. 1992. Direct evidence for the generated closure of plasmodesmata. Plant J. 2:741-750.
Oparka, K.J., CM. Duckett, D.A.M. Prior and D.B. Fisher. 1994. Real-time imaging of phloem unloading in the root tip of Arabidopsis. Plant J. 6:759-766.
Passioura, J.B. 1980. The meaning of matric potential. J. Exp. Bot. 31:1161-9.
Passioura, J.B. 1988. Response to Dr. P.J. Kramer's article, "Changing concepts regarding plant water relations,' Volume 11, Number 7, pp. 565-568. Plant, Cell and Environ. 11:569-571.
Passioura, J.B. 1994a. The yield of crops in relation to drought, p. 343-359. In: K.J. Boote, J.M. Bennett, T.R. Sinclair, and G.M. Paulsen (eds.). Physiology and Determination of Crop Yield. Amer. Soc. Agronomy. Madison, Wisconsin.
Passioura, J.B. 1994b. The physical chemistry of the primary cell wall: implications for the control of expansion rate. J. Exp. Bot. 45:1675-1682.
Patrick, J.W. 1990. Sieve element unloading: cellular pathway, mechanism and control. Physiol. Plant. 78:298-308.
Patrick, J.W. 1994a. Turgor-dependant unloading of photosynthates from coats of developing seed ofPhaseolus vulgaris and Viciafaba. Turgor homeostasis and set points. Physiol. Plant. 90:367-377.
Patrick, J.W. 1994b. Turgor-dependant unloading assimilates from coats of developing legume seed. Assessment of the significance of the whole plant. Physiol. Plant. 90:645-654.
Perkins-veazie and D.J. Huber. 1987. Growth and ripening of strawberry fruit under field conditions. Proc. Fla. State Hort. Soc. 100:253-256.

123
Pomper, K.W. and P.J. Breen. 1995. Levels of apoplastic solutes in developing strawberry fruit. J. Expt. Bot. 46:743-752.
Pomper, K.W. and P.J. Breen. 1996. The effect of cell turgor on sugar uptake in developing strawberry fruit. Physiol. Plant. (In press).
Poovaiah, B.W. and K. Veluthambi. 1985. Auxin-regulated invertase activity in strawberry fruits. J. Amer. Soc. Hort. Sci. 110:258-261.
Porter, G.A., D.P. Knievel and J.C. Shannon. 1985. Sugar efflux from maize (Zea mays L.) pedicel tissue. Plant Physiol. 77:524-531.
Redmann, R.E., J. Haraldson and L.V. Gusta. 1986. Leakage of UV-absorbing substances as a measure of salt injury in leaf tissue of woody species. Physiol. Plant. 67:87-91.
Renquist, A.R., P.J. Breen and L.W. Martin. 1982a. Effects of black polyethylene mulch on strawberry leaf elongation and diurnal leaf water potential. J. Amer. Soc. Hort. Sci. 107:640-643.
Renquist, A.R., P.J. Breen and L.W. Martin. 1982b. Influences of water status and temperature on leaf elongation in strawberry. Scientia Hort. 18:77-85.
Riesmeier J.W., L. Willmitzer and W.B. Frommer 1992. Isolation and characterization of a sucrose carrier cDNA from spinach by functional expression in yeast. EMBO J. 11:4705-4713.
Riesmeier, J.W., L. Willimitzer and W.B. Frommer. 1994. Evidence for an essential role of the sucrose transporter in pholem loading and assimilate partitioning. EMBO J. 13:1-7.
Ruan, Y.-L., C. Mate, J.W. Patrick, and C.J. Brady. 1995. Non-destructive collection of apoplast fluid from developing tomato fruit using a pressure dehydration procedure. Aust. J. Plant Physiol. 22:761-769.
Salisbury, F.B. and C.W. Ross. 1992. Plant Physiology 4th ed. Wadsworth Publishing Company, Inc. Belmont, Calf.
Saliendra N.Z. and F.C. Meinzer. 1991. Symplastic volume, turgor, stomatal conductance and growth in relation to osmotic and elastic adjustment in droughted sugarcane. J. Expt. Bot. 42:1251-1259.
Santakumari, M. and G. A. Berkowitz. 1990. Correlation between the maintenance of photosynthesis and in situ protoplast volume at low water potentials in droughted wheat. Plant Physiol. 92:733-739.

124
Sauer, N., K. Friedlander and U. Graml-Wicke. 1990. Primary structure, genomic organization and heterologus expression of a glucose transpoerter from Arabidopsis thaliana. EMBO J. 9:3045-3050.
Save, R., J. Penuelas, 0. Marfa, and L. Serrano. 1993. Changes in leaf osmotic and elastic properties and canopy structure of strawberries under mild water stress. HortScience 28:925-927.
Schmalstig, J.G. and D.J. Cosgrove. 1990. Coupling of solute transport and cell expansion in pea stems. Plant Physiol. 94:1625-1633.
Shackel, K.A., M.A. Matthews and J.C. Morrison. 1987. Dynamic relation between expansion and cellular turgor in growing grape (Vitis vinifera L.) leaves. Plant Physiol. 84:1166-1171.
Shackel, K.A., C. Greve, J.M. Labavitch and H. Ahmadi. 1991. Cell turgor changes associated with ripening in tomato pericarp tissue. Plant Physiol. 97:814-816.
Shaw, D.V. 1988. Genotypic variation and genotypic correlations for sugars and organic acids in strawberries. J. Amer. Soc. Hort. Sci. 113:770-774.
Sinclair, T.R. and M.M. Ludlow. 1985. Who taught plants thermodynamics? The unfilled potential of plant water potential. Aust. J. Plant Physiol. 12:213-217.
Stadalman, E.J. and H. Kinzel. 1972. Vital staining of plant cells. Chap.10, p. 326-364. Methods in Cell Physiology, Vol.V. Academic Press, Inc. New York.
Suramsiri, P. and F. Lenz. 1986. Photosynthesis and stomatal behaviour of strawberries. V. Effect of water deficiency. Gartenbua. 51:84-92.
Stadler, R. J. Brandner, A. Schulz, M. Gahrtz, and N. Sauer. 1995. Phloem loading by the PmSUC2 sucrose carrier from Plantago major occurs into companion cells. Plant Cell. 7:1545-1554.
Stark, D.M., G.F. Berry, Y.M. Muskopf, K.P. Timmmerman and G.M. Kishore. 1991. Increased starch and dry matter deposition in trasgenic russet burbank potato tubers. Poster Abstract: Third International Congress of Plant Molecular Biology- Molecluar Biology of Plant Growth and Development; 6-11 October 1991; Tucson, AZ.
Tarczynski, M.C., R.G. Jensen and H.J. Bohnert. 1993. Stress protection of transgenic tobacco by production of the osmolyte mannitol. Science 259:508-510.

125
Terry, M.E. and B.A. Bonner. 1980. An examination of centrifugation as a method of extracting an extracellular solution from peas, and its use for the study of indoleacetic-acid induced growth. Plant Physiol. 66:321-326.
Thome, J.H. and R.M. Rainbird. 1983. An in vivo technique for the study of phloem unloading in seed coats of developing soybean seeds. Plant Physiol. 72:268- 271.
Thome, J.H. 1985. Phloem unloading of C and N assimilates in developing seeds. Ann. Rev. Plant Physiol. 36:317-343.
Thome, J.H. 1986. Sieve tube unloading, Phloem Transport ed. Alan R. Liss, line. p. 211-224.
Trolinder, N.L., B.L. McMichael and D.R. Upchurch. 1993. Water relations of cotton flower petals and fruit. Plant Cell Environ. 16:755-760.
Trump, J. 1984. Diumal fruit shrinkage in apple as affected by leaf water potential and vapour pressure deficit of the air. Scientia Hort. 22:81-87.
Turgeon, R. 1989. The sink-soure transition in leaves. Ann. Rev. Plant Physiol. Plant Mol.Biol. 40:119-138.
van lersel, M.W. and D.M. Oosterhuis. 1995. Diumal water relations of expanding and full-sized cotton fruits and subtending leaves. Plant, Cell and Environ. 18:807- 812.
Wang, N. and D.B. Fisher. 1994. The use efflorescent tracers to characterise the post- phloem trasnport pathway in maternal tissues of developing wheat grains. Plant Physiol. 104:17-27.
Wang, N. and D.B. Fisher. 1994. Monitor phloem unloading and post-phloem transport by microperfusion of attached wheat grains. Plant Physiol. 104:7-16.
Wang, Z., B. Quebedeaux, and G.W Stutte. 1995. Osmotic adjustment: Effect of water stress on carbohydrates in leaves, stems and roots of apple. Aust. J. Plant Physiol. 22:747-754.
Wardlaw, I.F. 1990. The control of carbon partitioning in plants. Tansely review no.27. NewPhytol. 116:341-381.
Webb R.A. 1973. A possible influence of pedicle dimensions on fruit size and yieldin strawberry. Scientia Hort. 1:321-330.

126
Welbaum, G.E. and F.C. Meinzer. 1990. Compartmentation of solutes and water in developing sugarcane stalk tissue. Plant Physiol. 93:1147-1153.
Welbaum, G.E., F.C. Meinzer, R.L. Grayson and K.T. Thomham. 1992. Evidence for and consequences of a barrier to solute diffusion between the apoplast and vascular bundles in sugarcane stalk tissue. Aust. J. Plant Physiol. 19:611-623.
Wenkert, W. 1980. Measurment of tissue osmotic pressure. Plant Physiol. 65:614-617.
Winton A.L. and K.B. Winton. 1935. The structure and composition of foods, vol. II p. 608. John Wiley and Sons, New York.
Wols winkle, P. 1990. Recent progress in research on the role of turgor sensitive transport in seed development. Plant Physiol. Biochem. 28:399-410.
Woodward, J.R. 1972. Physical and chemical changes in developing strawberry fruits. J. Sci. Food Agric. 23:465-473.
Wright, K.M. and K.J. Oparka. 1989. Sucrose uptake and partitioning in discs derived from source versus sink potato tubers. Planta 177:237-244.
Wright, K.M. and K.J. Oparka. 1990. Hexose accumulation and turgor-sensitive starch synthesis in discs derived from source versus sink potato tubers. J. Exp. Bot. 41:1355-1360.
Wyse, R.E., E. Zamski and A.D. Tomos. 1986. Turgor regulation of sucrose transport in sugar beet taproot tissue. Plant Physiol. 81:478-481.
Yamada, S., M. Katsuhara, W.B. Kelly, C.B. Michalowski, and H.J. Bohnert. 1995. A family of transcripts encoding water channel proteins: Tissue-specific expression in the common ice plant. 1995. Plant Cell. 7:1129-1142.
Yamamoto, T. 1983. Models of water competition between fruits and leaves on spurs of 'Bartlett' pear trees and its measurment by heat-pulse method. Scientia Hort. 20:241-250.
Zhang B. and D.D. Archbold. 1993. Solute accumulation in leaves ofaFragaria chiloensis and a F. virginiana selection responds to water deficit stress. J. Amer. Soc. Hort. Sci. 118:280-285.
Zhang B. and D.D. Archbold. 1993. Water relations ofFragaria chiloensis and a F. virginiana during and after water deficit. J. Amer. Soc. Hort. Sci. 118:280-285.

127
Zimmermann, U., A. Hasse, D. Langbein and F. Meinzer. 1993. Mechanisms of long- distance water transport in plants: a re-examination of some paradigms in the light of new evidence. Philosoph. Trans. Royal Soc. London Bio. Sci. 341:19-31.
Zimmermann, U., F. Meinzer, A., R. Benkert, J.J. Zhu, H. Schneider, G. Goldstein, E. Kuchembrod and D. Hasse. 1993. Xylem water transport: is the available evidence consistent with the cohesion theory? Plant Cell Environ. 17:1169- 1181.

128
APPENDICES

129
APPENDIX A
IDENTIFICATION OF BOTH ACID AND ALKALINE INVERTASE ACTIVITY IN DEVELOPING STRAWBERRY FRUIT
A.1 Abstract
Invertase may influence sugar levels and assimilate transport in strawberry fruit.
Several groups, including our own, only detected acid invertase activity (optimum pH
4.6) in strawberry fruit, however, recently Hubbard et al. (Physiol. Plant. 82:191-196,
1991) reported the presence of alkaline invertase activity (pH 7.5). Since dissimilar
isolation protocols and cultivars may have contributed to the different findings, we re-
examined our work with developing 'Brighton' strawberry fruit using the extraction
procedure of Hubbard et al. Alkaline invertase was detected and its activity increased
many fold as fruit developed from green to the red stage, whereas, acid invertase activity
decreased markedly. In addition, when fruit extracts were precipitated with cold acetone,
a precipitate contained 60% of the acid invertase activity and the protein coagulated at the
surface contained 60% of the alkaline invertase activity. This allowed easy separation of
these two enzymes.
A.2 Introduction
Sugar concentrations of strawberry fruit have been widely studied as a component
of fruit flavor (Shaw, 1988). This laboratory continues to be interested in the

130
involvement of invertase (which degrades sucrose to hexoses) in sucrose transport and
sugar accumulation in strawberry fruit. Poovaiah and Veluthambi (1985) reported the
presence of only acid invertase activity (optimum activity at pH 4.6) in the soluble and
cell wall extracts of developing 'Ozark Beauty' strawberry fruit. Soluble acid invertase
activity was highest at anthesis after which it receded rapidly with fruit development.
Ranwala et al. (1992) also reported the presence of soluble acid invertase in 'Hokowase'
strawberry fruit, however, the activity (on a fresh weight basis) was higher in ripe than
unripe fruit. Recently, Hubbard et al. (1991) reported the presence of both soluble acid
and alkaline invertase in 'Chandler' strawberry fruit, with highest acid activity in unripe
fruit and maximum alkaline activity in ripening fruit.
In our laboratory, using the extraction protocol of Poovaiah and Veluthambi
(1985), Scott (1989) reported that 'Brighton' fruit contained only soluble acid invertase
activity (pH 4.6) with highest early in fruit development. Different cultivars were used in
the above studies and we wished to determine if this, or different extraction protocols
influenced the ability to detect alkaline invertase activity. Therefore we re-examined
invertase activity in developing 'Brighton' strawberry fruit using the protocol of Hubbard
et al. to determine if alkaline invertase was present.
A.3 Materials and methods
Plant material - Plants of 'Brighton', a day-neutral strawberry were grown in 3.8-liter
pots in 1 soil: 1 coarse sand: 1 peat (by volume), in a greenhouse that was maintained at
30/180C (day/night), and where high-pressure sodium lamps (175 ±25 mmol m" s"1)

131
provided a 14-h photoperiod. Primary flowers were pollinated with a small paint brush,
tagged, and all competing flowers or flower buds removed from an inflorescence. Fruit
were harvested at small green, green-white, and red-ripe stages of development,
representing 7,15, and 25 days after anthesis (DAA).
Extraction protocol - Protein extraction of alkaline and acid invertase were performed as
described by Hubbard et al. (1991). Briefly, fruit samples were powdered in a chilled
mortar and pestle with liquid nitrogen. The fruit powder was then combined with a
homogenizing buffer (8 ml/gFW) containing 100 mM 3(N-morpholino) propanesulfonic
acid (MOPS) (pH 7.5), 5 mM MgCl2, 0.5 mg ml'1 bovine serum albumin (BSA), 2.5 mM
dithiothreitol (DTT), 0.05% (v/v) Triton x-100, 10 mM ascorbic acid, 2% (v/v) glycerol,
1 mM ethylenediaminetetraacetic acid (EDTA) and 2% (W/V) polyvinylpyrrolidone.
Tissue homoginates were centrifuged for 30 sec at 10,000xg, and the supemate desalted
by centrifugal column filtration (Helmerhorst and Stokes, 1980). All operations were
conducted at 40C.
In separate experiments, tissue homoginates from green-white fruit (15 DAA)
were desalted by precipitating the protein overnight at -20oC using 5 volumes of cold
cetone:! per volume of fruit extract instead of the centrifugal column filtration method
used by above.
Acid and alkaline invertase activity assays - Reaction mixtures (100 ml) containing
buffers at 100 mM citrate-phosphate (pH 3.5-5.0), 2(N-morpholino) ethanesulfonic acid
(MES, pH 6.0), MOPS (pH 7.5), and N-2-hydroxyethylpiperazine N'-2-ethanesulfoic acid
(HEPES, pH 8.0-8.2), with 120 mM sucrose and desalted extract (40 ml) were used to
132
determine the pH optimum of invertase activity in the fruit extract. Reaction mixtures
were terminated by placing tubes in boiling water at 0 and 30 min after initiation with
enzyme extract. Reaction mixtures were assayed for glucose using the glucose oxidase,
peroxidase and o-dianisidine system from Sigma Chemical, St.Louis, Mo. (Sigma
Technical Bulletin No. 510).
Protein precipitates or flocculent from cold acetone were, centrifuged for 30 min
at 40C at 3000xg, decanted, and the protein re-suspended on ice with 1 ml of buffer (10
mM MOPS at pH 7.5), and 40 ml of extract assayed for invertase activity as above.
A.4 Results and discussion
Using the protein extraction method of Hubbard et al. (1991) we were able to
recover both acid (pH 4.0) and alkaline (pH 8.0) invertase activities from 'Brighton'
strawberry fruit. Essentially only acid invertase activity was isolated from small green
fruit, activity was highest at pH 4.0 and declined steadily as pH increased (Fig. Al).
Both acid and alkaline invertase activity were isolated from green-white fruit, with
alkaline activity highest at pH 8.0. In red fruit, high alkaline invertase activity was
isolated and acid invertase activity was reduced from earlier developmental stages.
When the maximum activities (g fresh weight") from Figure Al are compared in
Table Al, acid invertase activity (pH 4.0) decreased by nearly 50% from the green-white
to red fruit stage. Alkaline invertase activity (pH 8.0) was extremely low in small green
fruit, but increased several fold with further fruit development.

133
The high acid invertase activity in small green fruit of 'Brighton' and its decline
with further development is consistent with earlier findings (Scott, 1989). The rise in
alkaline invertase activity in this cultivar with fruit development is similar to that reported
by Hubbard et al. (1991) in 'Chandler' fruit. Although the role of alkaline invertase is
unclear, the rise in its activity during strawberry berry fruit ripening presumably
influences the levels to which sucrose and hexose accumulate in ripe fruit.
The previous failure of Scott (1989) to recover alkaline invertase activity from
'Brighton' fruit presumably was due to the use of the isolation protocol of Poovaiah and
Veluthambi (1985). This protocol differs in many ways from the method of Hubbard et
al. (1991), and therefore it is difficult to identify those aspects which allowed the
extraction of alkaline invertase activity. However, in the methodology of Poovaiah and
Veluthambi (1985), no protease inhibitors or BSA were included in the extraction buffer
and that extract was dialyzed overnight. In contrast, the protocol of Hubbard et al.
(1991) uses a large quantity of BSA in the extraction buffer and this may protect
invertase from protease activity. Additionally, fruit homoginates are desalted
immediately after extraction and invertase activity measured. Ranwala et al. (1992), with
a protocol similar to Poovaiah and Veluthambi, also did not identify alkaline invertase
activity and they also dialyzed fruit extracts overnight.
In a separate series of experiments, acid and alkaline invertase activities were
found to separate when precipitated with cold acetone (Table A2). A protein flocculent
formed in the acetone and upon centrifugation the resulting pellet contained 66% of the
acid invertase activity, whereas protein that coagulated at the surface, when decanted and
134
centrifuged into a pellet, contained 61% of the alkaline activity. Lipids and proteins with
associated lipids, would be expected to accumulate at the top of the acetone layer during
protein precipitation. The accumulation of alkaline invertase activity in this region may
be an indication that this enzyme is a membrane-bound protein in strawberry fruit.
However, the literature does not contain any support for or against alkaline invertase
being membrane bound. This method of separating the two invertase activities in the
fruit would be useful in further efforts in characterizing of the enzymes.
In an attempt to further separate the acid and alkaline invertase activities, protein
samples obtained through acetone precipitation were separated using non-denaturing
polyacrylamide gel electrophoresis (PAGE) or native PAGE and gels stained for
invertase activity (25 or 50 mg per lane) (von Schaewen et al., 1990). Unfortunately, we
were unable to identify invertase activity in the strawberry fruit protein extracts on native
gels assayed at pH 5.0 or 8.0, but yeast invertase used as a control was well stained (data
not shown). The large amount of BSA added during the extraction may not have
allowed enough fruit protein (including invertase) to be loaded onto the gels to allow
detection of invertase activity. Based on this work, fruit protein extract obtained using
the protocol of Hubbard et al. is not suitable for use with native PAGE methodologies as
a method to further characterize strawberry invertase activity.
Hubbard et al. (1991) found that activities of the sucrose degrading enzymes,
sucrose synthase, and alkaline invertase increased in activity along with a rise in sucrose
content during ripening of strawberry fruit. The activity of the sucrose synthesizing
enzyme, sucrose phosphate synthase, also increases during ripening. Increasing activities

135
sucrose synthesizing and degrading enzymes suggest that sucrose turnover occurs in
strawberry fruit (Hubbard et al., 1991). It is interesting, that Ranwala et al. (1992)
reported acid invertase activity was higher in ripe than unripe strawberry fruit, while
Hubbard et al. (1991) reported the opposite. These groups used different cultivars,
suggesting that there is variation in invertase activity amongst strawberry genotypes.
Although Poovaiah and Veluthambi (1985) reported the presence of cell wall bound acid
invertase activity in strawberry fruit, we did not measure its activity in the course of this
present study.
Shaw (1988) found a highly positive genotypic correlation (1.00) between
glucose and fructose in fruit, and a highly negative genotypic correlation (-0.66) between
sucrose and glucose-fructose in a specific strawberry population. Sucrose, is the major
sugar translocated in strawberry (Forney and Breen, 1985) and based on 14C-sugar
uptake, sucrose is hydrolyzed and re-synthesized upon uptake by strawberry fruit (Forney
and Breen, 1986). Shaw (1988) suggests that glucose and fructose content in strawberry
fruit is dependent on hydrolysis of translocated sucrose and that a single gene controls the
level of sucrose in the fruit. This gene could very well be an absence of the sucrose
synthesizing enzyme such as sucrose phosphate synthase, or high levels of alkaline or
acid invertase activity in ripening fruit. Examination the germplasm of Shaw (1988) with
the protocol of Hubbard et al. (1991) could identify whether high alkaline invertase
activity in ripening strawberry influences sucrose levels in the fruit.
In conclusion, alkaline invertase activity was essentially absent in young green
'Brighton' fruit, but relatively high in green-white and red fruit. Alkaline and acid
136
invertase activities were partially separated when fruit protein was precipitated with cold
acetone.
A.5 Literature cited
Forney, C.F. and P.J. Breen. 1985. Collection and characterization of phloem exudate from strawberry pedicels. HortScience 20:55-62.
Forney, C.F. and P.J. Breen. 1986. Sugar content and uptake in the strawberry fruit. J. Amer. Soc. Hort. Sci. 111:241-247.
Hubbard, N.L., D.M. Pharr and S.C. Huber. 1991. Sucrose phosphate synthase and other sucrose metabolizing enzymes in fruits of various species. Physiol. Plant. 82:191-196.
Poovaiah, B.W. and K. Veluthambi. 1985. Auxin-regulated invertase activity in strawberry fruits. J. Amer. Soc. Hort. Sci. 110:258-261.
Ranwala, A.P., C. Suematsu and H. Masuda. 1992. Soluble and wall-bound invertases in strawberry fruit. Plant Sci. 84:59-64.
von Schaewen, A., M. Stitt, R. Schmidt, U. Sonnewald and L. Willmitzer. 1990. Expression of a yeast-derived invertase in the cell wall of tobacco and Arabidopsis plants leads to accumulation of carbohydrate and inhibition of photosynthesis and strongly influences growth and phenotype of transgenic tobacco plants. EMBO J. 9:3033-3044.
Scott, J.D. 1989. Sugar transport in strawberry fruit: Uptake competition, and developmental changes in invertase levels. Ph.D. thesis, Oregon State University.
Shaw, D.V. 1988. Genotypic variation and genotypic correlations for sugars and organic acids in strawberries. J. Amer. Soc. Hort. Sci. 113:770-774.

137
Table Al. Acid and alkaline invertase activities during fruit development in 'Brighton' strawberry.
Invertase activity (mmol gFWV)
Fruit stage Days after anthesis(DAA)
pH4.0 pH8.0
Small green (7 DAA)
11.6 ±2.5 a* 0.2 ±0.1 a
Green-white (15 DAA)
7.8 ±1.4 a 6.4 ±1.7 b
Red (25 DAA)
4.2 ±1.0 b 9.2 ±1.3 c
Separation of means by Duncans separation of means at a level of significance of 5%, means of 3 separate experiments with 3 replicates each, ±S.E.

138
Table A2. Acid and neutral-alkaline invertase activities separate during acetone precipitation.
Invertase activity (mmol glucose gFWV)
Protein acetone position pH4.0 pH8.0
Top
Bottom
2.8 ±0.1*
5.5 ±0.6
4.2 ±0.4
2.7 ±0.2
Note: mean of 2 separate experiments with 3 replicates each; ±S.E.

139
>
o <
CD (f) D k_
CD >
Li- en
~o E
PH
Figure Al. The activity-pH response of soluble invertase at three stages of strawberry fruit development. (A) Small green fruit showed only acid invertase activity (highest at pH 4.0). (B) Green-white fruit showed both alkaline invertase activity (highest at pH 8.0) and acid invertase activity. (C) Red fruit showed alkaline invertase activity and low acid invertase activity (pH 4.0).

140
APPENDIX B
FRUIT WATER LOSS AND ITS INFLUENCE ON WATER POTENTIAL
B.l Introduction
Gradients in apoplastic water potential (v|/aw) between plant organs due to
differences in water loss, solute content and cell expansion can influence the transport of
water and assimilate. The objectives of this study were to determine: 1) the rate of water
loss from developing strawberry fruit, 2) if restricting fruit or leaf transpiration increased
fruit v|/aw while attached to the plant, and 3) relationship of the rate of change of fruit vj/aw
loss of water from a fruit being severed from the plant.
B.2 Materials and methods
1) Loss of water from attached strawberry fruit was estimated by measuring the decrease
of fresh weight of detached fruit. Solitary primary fruit at small green, green-white, and
red stages were harvested in the mid-aftemoon by cutting the pedicel at a length of about
2 cm, the cut end was sealed with silicon grease, and the fruit placed on a greenhouse
bench, out of direct sun light. Fruit were weighed at 0, 3, and 24 h after picking.
2) v|/aw of green-white and red fruit and leaves was measured via in situ psychrometry in
the greenhouse as described in Chapter 3). Weight loss and vj/aw of red and green-white
fruit were monitored over 10 h after fruit were severed from plants.

141
B.3 Results
1) Red fruit were about lOx and green-white fruit 6x larger than in terms of fresh weight
and small green fruit (Table Bl). Weight loss per unit fruit fresh weight was about 2x
higher for small green fruit than fruit ant the other stages. Webb (1973) had reported that
red fruit lost weight faster than immature fruit, depriving developing fruit within the
inflorescence. However, the immature fruit used in that study were larger that the small
green fruit used in this present study. This work suggest small 'Brighton' fruit lose water
at a faster rate (g fresh weight ~l) than red fruit.
2) Reducing the transpiration of a green fruit by enclosing it in a clear plastic bag in mid-
afternoon did not influence its n/aw (Fig. Bl). The v)/aw of the bagged fruit was similar to
that of a comparable fruit in untreated plants. Bagging the entire plant increased leaf i|/aw,
but did not change the iyaw of green fruit. Bagging red fruit also did not affect fruit \\iav/
(Fig. B2). Again enclosing the entire plant increased leaf \|/aw, while not changing red-
fruit V|/aw.
3) Upon severing fruit from the plant, the mean rate of weight loss per unit fresh weight
was similar in green-white and red fruit, with fruit losing approximately 5% of their
initial fresh weight after 12 h (Fig. B2). Severed green-white fruit showed a steady
decline in \|/aw (-1.00 MPa after 10 h), whereas v|/aw of severed red fruit dropped much less
(-0.35 MPa).

142
B.4 Conclusions
1) Small green strawberry fruit of the cultivar Brighton lose water at a faster rate (g fresh
weight"1) than red fruit.
2) Restricting water loss of fruit attached to the plant did not influence its v}/aw.
3) Maintenance of v|/aw of green-white fruit depended on constant delivery of water from
the plant. However, v|/aw red fruit was little influenced by removal from pedicel delivery
of water.
B.5 Literature cited
Webb, R.A. 1973. A possible influence of pedicle dimensions on fruit size and yield in strawberry. Sci. Hort. 1:321-330.
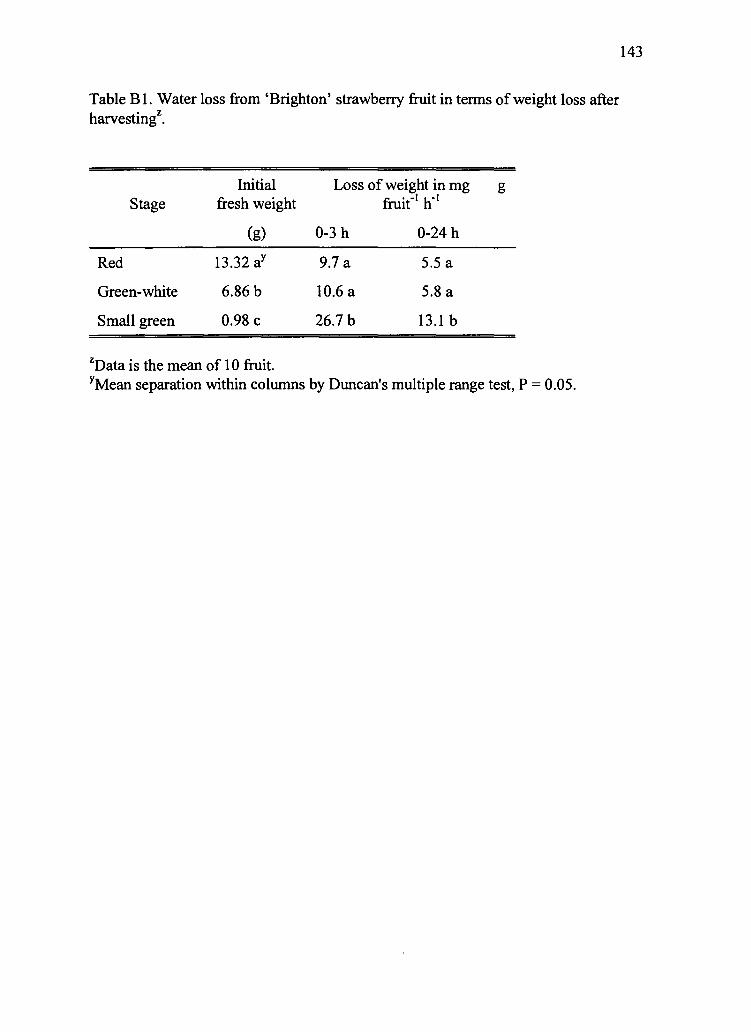
143
Table Bl. Water loss from 'Brighton' strawberry fruit in terms of weight loss after harvesting2.
Stage Initial
fresh weight Loss of weight in mg g
fruit"1 h"1
(g) 0-3 h 0-24 h
Red 13.32 ay 9.7 a 5.5 a
Green-white 6.86 b 10.6 a 5.8 a
Small green 0.98 c 26.7 b 13.1b
EData is the mean of 10 fruit. yMean separation within columns by Duncan's multiple range test, P = 0.05.

144
c (D
-I-' O Q_
-t-1
o
o -4-' (0
_D CL O CL <
0.0
-0.5 -
-1.0
D Q_
-1.5
0.0
-0.5
-1.0
-1.5
control A
leaf
hGW
on
enclosure _J i
on ioff
r-CH
Off
leaf
T T
R
-r rv T T T T
B
C
.leaf
R
on off on
1000 1200 1400 16001000 1200 1400 1600
Time
Figure B1. Restriction of transpiration of fruit and leaves. The apoplastic water potential (i|/aw) of (A) control green-white (GW) fruit and leaves and (C) treated plant, and (B) control red (R) fruit and leaves and (D) treated plant. Arrows on treated plants indicate where plastic bags with moist paper towels were place either over the fruit or plant and then removed. ±SE. n = 3.

145
'0
D -M cn
o
O
100
95
90
85
80 100
95
90
85
80
green ^^w/ ^%^
t**^ J 1_
0 2 4 6 8 10 12 14
Time (h)
0.0
-0.5
-1.0
-1.5
-2.0
-2.5
-0.5
-1.0
-1.5
-2.0
-2.5
Q
> "O o
a
o'
Q r-t- CD —S
"D O r-t- CD Z5 r-t-
5'
Figure B2. The apoplastic water potential (v}/aw) of green-white (A) and red (B) 'Brighton' strawberry fruit. Arrow marks where fruit were severed from the plant. ±SE. n = 3.

146
APPENDIX C
THE BASIS OF THERMOCOUPLE PSYCHROMETRY AND HYGROMETRY
The water potential of a plant tissue can be determined by measuring the vapor
pressure of the air that is in equilibrium with the tissue in a chamber at a known
temperature, conveniently measured with a thermocouple. A thermocouple operates on
the principle of the thermoelectric effect: such that when a circuit consisting of two wires
made of different metals (e.g. copper and the alloy constantan) are joined at two junctions
at different temperatures, a current flows around the circuit. When one junction is at a
known temperature and the current is measured, the temperature of the other junction can
be calculated. In psychrometry, organs can be severed, placed in an enclosed chamber
and the water vapor of the air allowed to reach an equilibrium with the tissue. Inside the
psychrometer chamber is a thermocouple whose junction is cooled to a temperature
below the dew point of the chamber by the passage of an electrical current thus causing
water to condense on the junction. (This cooling phenomenon, which is the opposite of
the thermoelectric effect, is called the Peltier Effect: when a current is passed through a
circuit of the two different metals one will heat and one will cool depending on the
direction of the current.) The cooling current is then discontinued, and the condensed
water allowed to evaporate from the junction into the surrounding atmosphere. The
evaporating water draws heat from the junction (the heat of vaporization), depressing the
temperature of the junction from that of the surrounding air temperature. The magnitude

147
of the temperature depression depends on the humidity of the surrounding air; the drier
(and warmer) the air, the faster the evaporation rate and the greater the depression. The
temperature of the junction is measured by electrical means prior to the cooling and
during evaporation. The differential temperature of the junction is directly related to the
relative humidity and hence the water potential measured (Wescor HR33T Dew Point
Microvolt instruction and service manual). The \|/w of a plant tissue can be determined
with the equation: ij/w (in MPa) = -1.06 T log10(100/RH) where T is the temperature (in
Kelvins) and RH is the relative humidity (Salisbury and Ross, 1992).
The dewpoint or hygrometric method can theoretically yield more accurate
estimate of v)/w than the psychometric method. With psychrometry measurements, the wet
junction will always be below the temperature of its surroundings and heat will also tend
to flow from the surroundings to the junction. After an initial cooling of the junction, a
dewpoint mode uses Peltier cooling to counter the inflow of heat electronically through
pulses of current for cooling that exactly balance the heat inflow for a net energy transfer
of zero. When this balance is set up on a dry thermocouple to account for all heat transfer
mechanisms other than condensing or evaporation water, the temperature of a wet
junction will be influenced only by the water and not the surrounding environment. This
method requires that specific cooling coefficients be determined in advance of \j/w
measurements for each thermocouple for all temperatures at which it is used.
Psychrometers (using the psychometric mode) or hygrometers (using the dewpoint mode)
can be attached in situ on a plant so that the i|/w of a plant organ can be used continuously
to measure under various conditions over time. The same thermocouple apparatus can be

148
used with either the psychometric or dew point mode, the choice of mode is dependant on
whether the microvoltmeter used for measurements contains the necessary electronics for
the dew point procedure.
Literature cited
Salisbury, F.B. and C.W. Ross. 1992. Plant Physiology, 4th ed. Wadsworth Publishing Company, Inc^ Belmont, CA.

149
APPENDIX D
ADDITIONAL GROWTH INFORMATION FOR SOLITARY 'BRIGHTON' FRUIT
D>
(0
TJ
s- O I
c o
a
o o <
D
^-» *-» D E
100
o o
<D
^ a>
a
Q r-t-
Q. Q
> o o c
c a"
o* 3
0 10 20 30 40
Days after anthesis
Figure Dl. Growth data for developing solitary 'Brighton' fruit where competing flowers were removed at pollination. (A) fresh weight ( ; y = -6.8 + 0.7x +0.02x2, r2 = 0.87, n = 40) and water content (V; y = 71.25 +1.43x -0.03x2, r2 = 0.91) during fruit development. (B) Absolute growth rates in terms of dry matter accumulation (O; y = 0.2170 -0.0580x +0.0050x2 =0.0009x3.
.3 2 r = 0.83) and accumulation water (•; y = 1.2903 -0.3893x
+0.0359x -0.0007xJ, r = 0.83) during fruit development.

150
APPENDIX E
SCANNING ELECTRON MICROSCOPY (SEM) EXAMINATION OF FRUIT STOMATA.
Objective: Developing strawberry fruit were examined for the presence of stomata.
Protocol. Portions of green, green-white, and red 'Brighton' fruit were fixed under a
vacuum of 15 inches of Hg in FAA for 3 h, then moved through a 50%, 70%, and
100%/trichlorotifluroethane series at 30 min changes. The samples were put in a Balsers
CPD 020 dryer and critical point dried, mounted on aluminum mounts with DUCO
cement (Devcon Corp., Woodale, IL.) then coated with 20 nm of 60:40 wt% Au/Pd alloy
in Varian VE vacuum evaporator operating at 1 x 10" Torr. Examination was made at 10
KV in an AmRay 1000A scanning electron microscope. Images were recorded on
Polaroid Type 55 P/N film.
Conclusion: We failed to identify stomata on the achenes or fruit surface at green, green-
white, or red stages of fruit development (see Figs. El, E2, and E3).

151
Figure El. Scanning electron microscopy (SEM) photograph (100X) of a 'Brighton' strawberry fruit and achene surface at the green stage of development.

152
Figure E2. Scanning electron microscopy (SEM) photograph (100X) of a 'Brighton' fruit and achene surface at the green-white stage of development. Trichomes can also be seen on the fruit surface.

153
Figure E3. Scanning electron microscopy (SEM) photograph (100X) of the fruit and achene surface of a red 'Brighton' strawberry fruit. Trichomes are evident on the fruit surface.

154
APPENDIX F
ANALYSIS OF VARIANCE FOR DATA PRESENTED IN CHAPTER 3
Table Fl. One way ANOVA for Randomized Complete Blocks (days). Variable: Solute potential
leaf red fruit
Source df Mean square
Day 2 0.008NS 0.017NS
Main effect stress 1 0.112* 0.026NS
Error 2 0.002 0.004
Total 5
♦significance at p = 0.05; NS = not significant

Table F2. Two Way Repeated Measures ANOVA on Two Factors.
155
Leaf Fruit Difference water potential water potential between
Source df Mean square
Day 3 0.521 0.410 0.058
Stress 1 6.848* 1.515NS 2.375*
Stress x Day 3 0.054 0.371 0.177
Time 2 5.287* 1.450* 1.215
Time x day 6 0.211 0.135 0.103
Stress x time 2 0.177NS 0.098NS 0.425*
Residual 6 0.107 0.138 0.057
Total 23
* significance at p = 0.05: ; NS = not significant

Table F3. Two Way ANOVA Split Plot
156
df —
Solute Potential
Mean Square
Volume change
Source
Block 2 0.021 0.0006
Stress 1 0.232* 0.0300*
Main plot error ?.
0.001 0.0010
Temperature 1 0.005NS 0.014>*
Temp x stress 1 0.002 0.0001NS
Error 4 0.010 0.0005
Total 11
* significance at P = 0.05 ;NS = not significant