Embed Size (px)
Citation preview
How the Budget is Approved After the Budget Committee approves a budget, it must be adopted by the School Board no later than June 30, the last day of the old fiscal year. But first, the School Board publishes a summary of the approved budget in the newspaper and allows one final round of citizen comment at a public hearing. The public hearing is advertised twice in the local newspaper. The School Board may change the budget before it is adopted. The Board cannot increase expenditures in any one fund by more than 10% or increase the tax amount approved by the Budget Committee without a revised budget summary and hearing notice and holding another public hearing. Supplemental Budgets If the School District receives unanticipated revenues, then it is possible to use a supplemental budget to authorize expenditure of these revenues in the current fiscal year. However, a supplemental budget cannot be used to authorize a tax levy. The School Board may adopt a supplemental budget at a regular public meeting if the expenditures in the supplemental budget are less than 10% of the annual budget for the fund being adjusted. If the expenditures are more, the School Board must first publish the supplemental budget and hold a public hearing.
BUDGETING PROCESS Page 5
Budgeting Process (Continued)
SUPERINTENDENT’S BUDGET MESSAGE (Continued)
SUPERINTENDENT’S BUDGET MESSAGE Page 7
Each year brings renewed excitement for the students served by Springfield Public Schools, and we will continue to offer outstanding educational opportunities, despite ongoing funding challenges in the State of Oregon. Our staff and community remain committed to working on behalf of all students and ensuring they are equipped for the future. We appreciate the support of the Budget Committee, School Board and community. As Superintendent, I respectfully offer this 2017–2018 Proposed Budget for your consideration.
Warmly, Dr. Susan Rieke-Smith Superintendent Springfield Public Schools
MENSAJE PRESUPUESTO DEL SUPERINTENDENTE EN ESPAÑOL (Continuado)
MENSAJE PRESUPUESTO DEL SUPERINTENDENTE Página 9
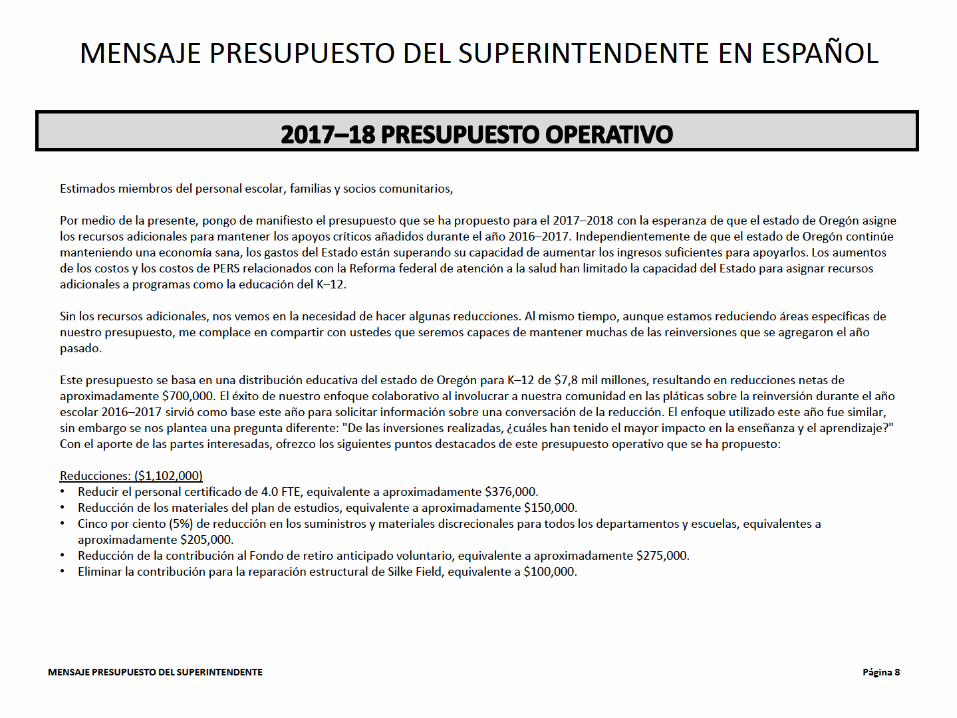
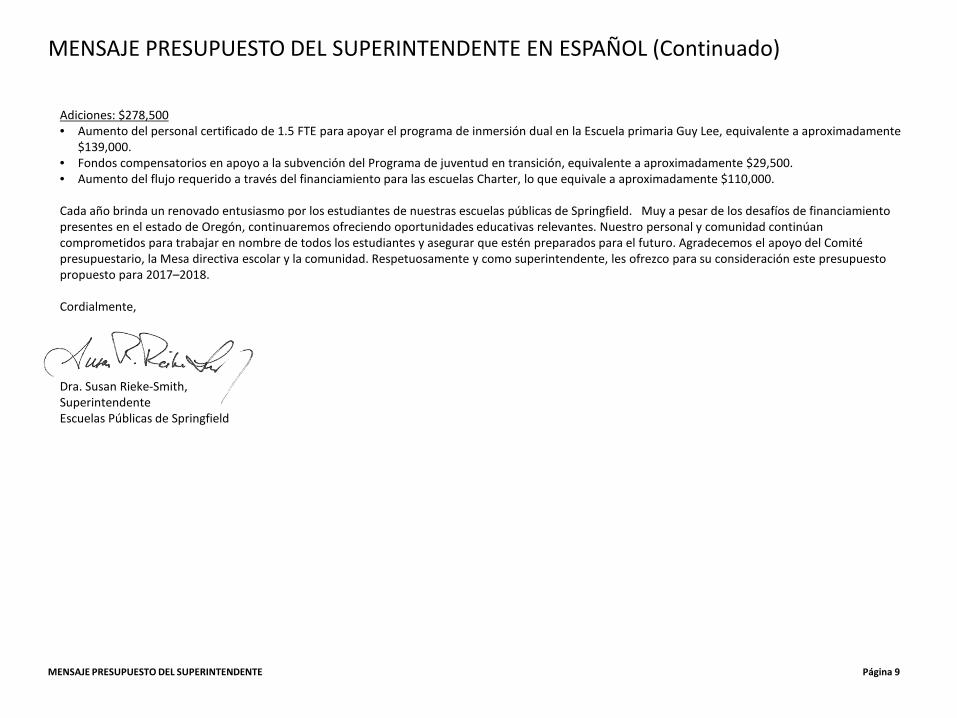
Adiciones: $278,500 • Aumento del personal certificado de 1.5 FTE para apoyar el programa de inmersión dual en la Escuela primaria Guy Lee, equivalente a aproximadamente
$139,000. • Fondos compensatorios en apoyo a la subvención del Programa de juventud en transición, equivalente a aproximadamente $29,500. • Aumento del flujo requerido a través del financiamiento para las escuelas Charter, lo que equivale a aproximadamente $110,000.
Cada año brinda un renovado entusiasmo por los estudiantes de nuestras escuelas públicas de Springfield. Muy a pesar de los desafíos de financiamiento presentes en el estado de Oregón, continuaremos ofreciendo oportunidades educativas relevantes. Nuestro personal y comunidad continúan comprometidos para trabajar en nombre de todos los estudiantes y asegurar que estén preparados para el futuro. Agradecemos el apoyo del Comité presupuestario, la Mesa directiva escolar y la comunidad. Respetuosamente y como superintendente, les ofrezco para su consideración este presupuesto propuesto para 2017–2018. Cordialmente, Dra. Susan Rieke-Smith, Superintendente Escuelas Públicas de Springfield

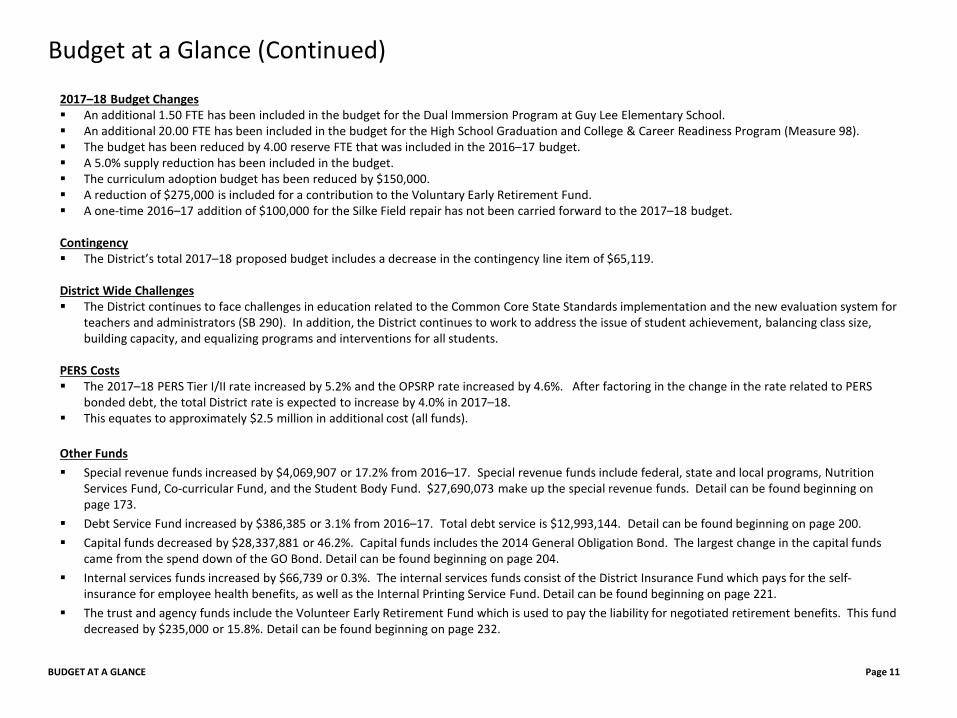
2017–18 Budget Changes An additional 1.50 FTE has been included in the budget for the Dual Immersion Program at Guy Lee Elementary School. An additional 20.00 FTE has been included in the budget for the High School Graduation and College & Career Readiness Program (Measure 98). The budget has been reduced by 4.00 reserve FTE that was included in the 2016–17 budget. A 5.0% supply reduction has been included in the budget. The curriculum adoption budget has been reduced by $150,000. A reduction of $275,000 is included for a contribution to the Voluntary Early Retirement Fund. A one-time 2016–17 addition of $100,000 for the Silke Field repair has not been carried forward to the 2017–18 budget.
Contingency The District’s total 2017–18 proposed budget includes a decrease in the contingency line item of $65,119. District Wide Challenges The District continues to face challenges in education related to the Common Core State Standards implementation and the new evaluation system for
teachers and administrators (SB 290). In addition, the District continues to work to address the issue of student achievement, balancing class size, building capacity, and equalizing programs and interventions for all students.
PERS Costs The 2017–18 PERS Tier I/II rate increased by 5.2% and the OPSRP rate increased by 4.6%. After factoring in the change in the rate related to PERS
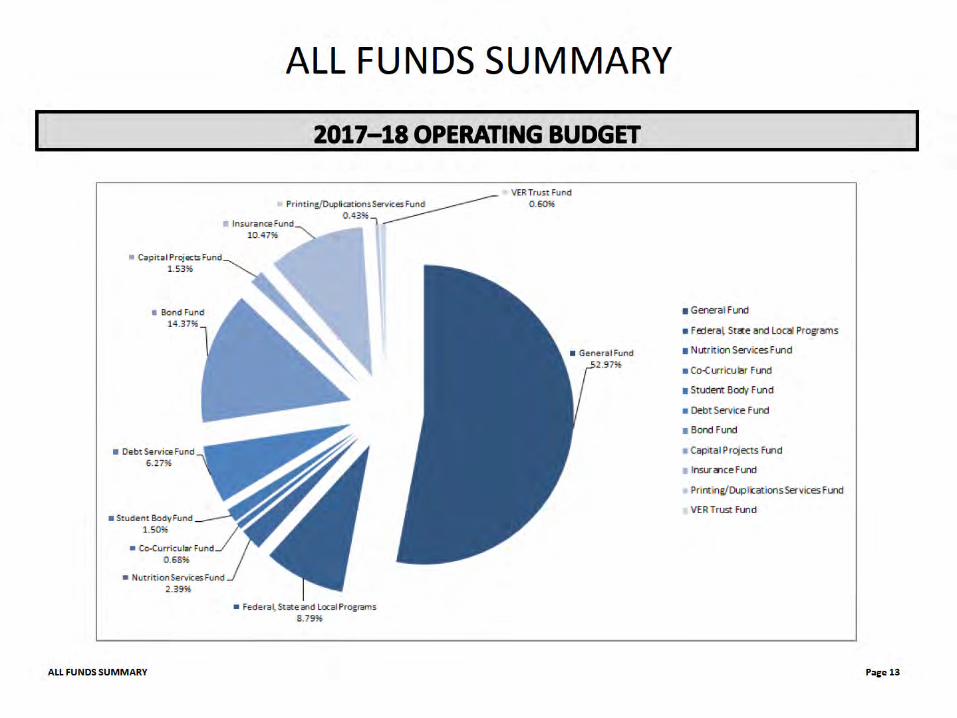
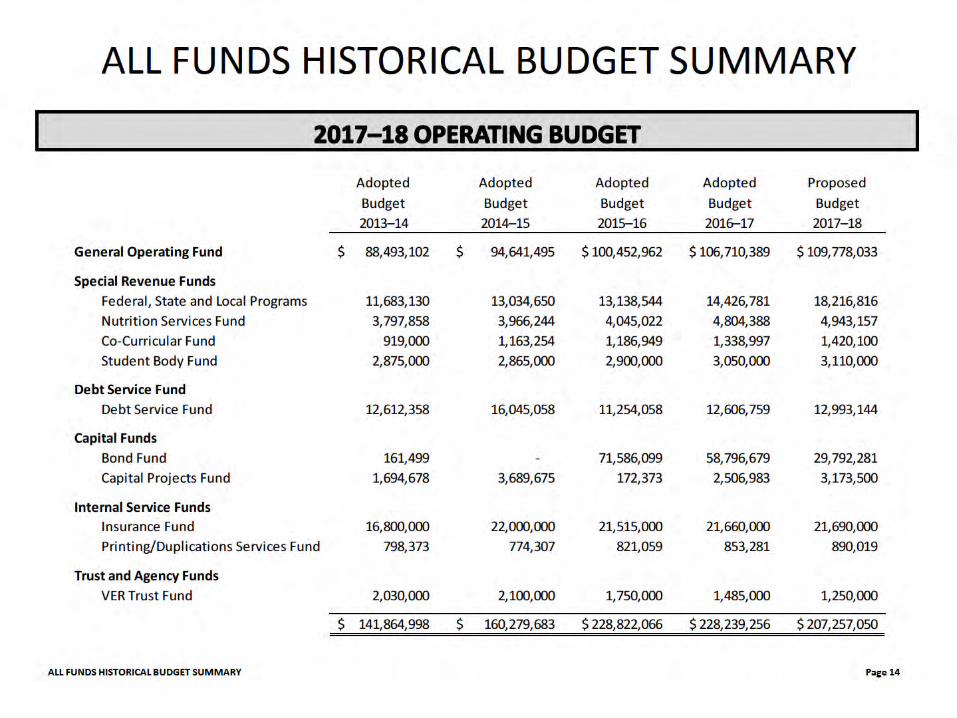
bonded debt, the total District rate is expected to increase by 4.0% in 2017–18. This equates to approximately $2.5 million in additional cost (all funds). Other Funds Special revenue funds increased by $4,069,907 or 17.2% from 2016–17. Special revenue funds include federal, state and local programs, Nutrition
Services Fund, Co-curricular Fund, and the Student Body Fund. $27,690,073 make up the special revenue funds. Detail can be found beginning on page 173.
Debt Service Fund increased by $386,385 or 3.1% from 2016–17. Total debt service is $12,993,144. Detail can be found beginning on page 200. Capital funds decreased by $28,337,881 or 46.2%. Capital funds includes the 2014 General Obligation Bond. The largest change in the capital funds
came from the spend down of the GO Bond. Detail can be found beginning on page 204. Internal services funds increased by $66,739 or 0.3%. The internal services funds consist of the District Insurance Fund which pays for the self-
insurance for employee health benefits, as well as the Internal Printing Service Fund. Detail can be found beginning on page 221. The trust and agency funds include the Volunteer Early Retirement Fund which is used to pay the liability for negotiated retirement benefits. This fund
decreased by $235,000 or 15.8%. Detail can be found beginning on page 232.
BUDGET AT A GLANCE Page 11
Budget at a Glance (Continued)
Economic Summary (Continued)
ECONOMIC SUMMARY Page 21
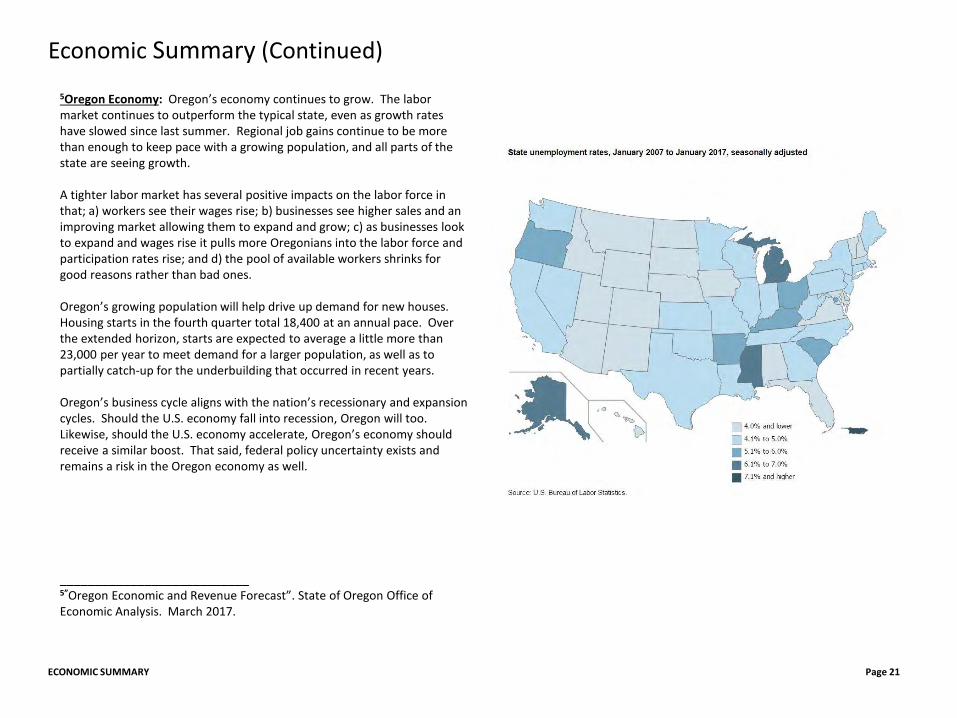
5Oregon Economy: Oregon’s economy continues to grow. The labor market continues to outperform the typical state, even as growth rates have slowed since last summer. Regional job gains continue to be more than enough to keep pace with a growing population, and all parts of the state are seeing growth. A tighter labor market has several positive impacts on the labor force in that; a) workers see their wages rise; b) businesses see higher sales and an improving market allowing them to expand and grow; c) as businesses look to expand and wages rise it pulls more Oregonians into the labor force and participation rates rise; and d) the pool of available workers shrinks for good reasons rather than bad ones. Oregon’s growing population will help drive up demand for new houses. Housing starts in the fourth quarter total 18,400 at an annual pace. Over the extended horizon, starts are expected to average a little more than 23,000 per year to meet demand for a larger population, as well as to partially catch-up for the underbuilding that occurred in recent years. Oregon’s business cycle aligns with the nation’s recessionary and expansion cycles. Should the U.S. economy fall into recession, Oregon will too. Likewise, should the U.S. economy accelerate, Oregon’s economy should receive a similar boost. That said, federal policy uncertainty exists and remains a risk in the Oregon economy as well. ___________________________ 5”Oregon Economic and Revenue Forecast”. State of Oregon Office of Economic Analysis. March 2017.
Economic Summary (Continued)
ECONOMIC SUMMARY Page 22
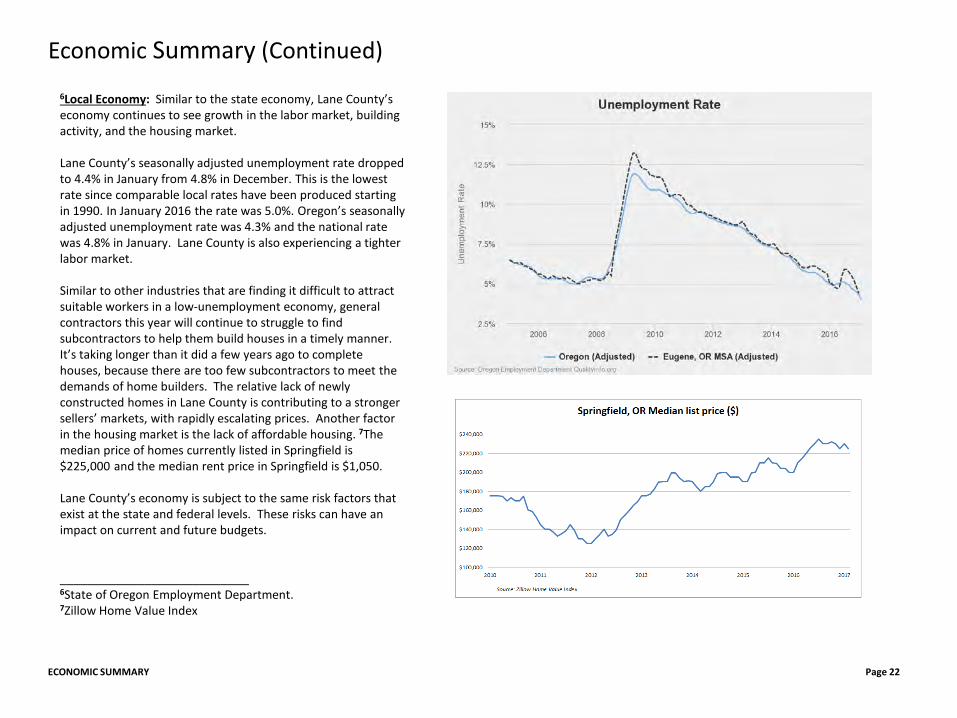
6Local Economy: Similar to the state economy, Lane County’s economy continues to see growth in the labor market, building activity, and the housing market. Lane County’s seasonally adjusted unemployment rate dropped to 4.4% in January from 4.8% in December. This is the lowest rate since comparable local rates have been produced starting in 1990. In January 2016 the rate was 5.0%. Oregon’s seasonally adjusted unemployment rate was 4.3% and the national rate was 4.8% in January. Lane County is also experiencing a tighter labor market. Similar to other industries that are finding it difficult to attract suitable workers in a low-unemployment economy, general contractors this year will continue to struggle to find subcontractors to help them build houses in a timely manner. It’s taking longer than it did a few years ago to complete houses, because there are too few subcontractors to meet the demands of home builders. The relative lack of newly constructed homes in Lane County is contributing to a stronger sellers’ markets, with rapidly escalating prices. Another factor in the housing market is the lack of affordable housing. 7The median price of homes currently listed in Springfield is $225,000 and the median rent price in Springfield is $1,050. Lane County’s economy is subject to the same risk factors that exist at the state and federal levels. These risks can have an impact on current and future budgets. ___________________________ 6State of Oregon Employment Department. 7Zillow Home Value Index
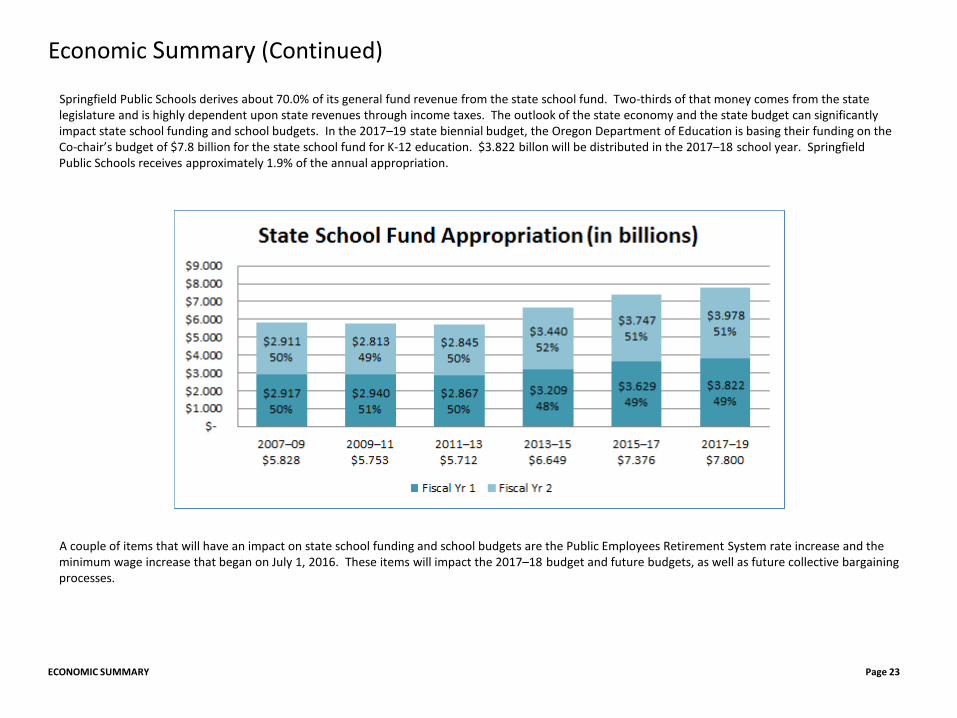
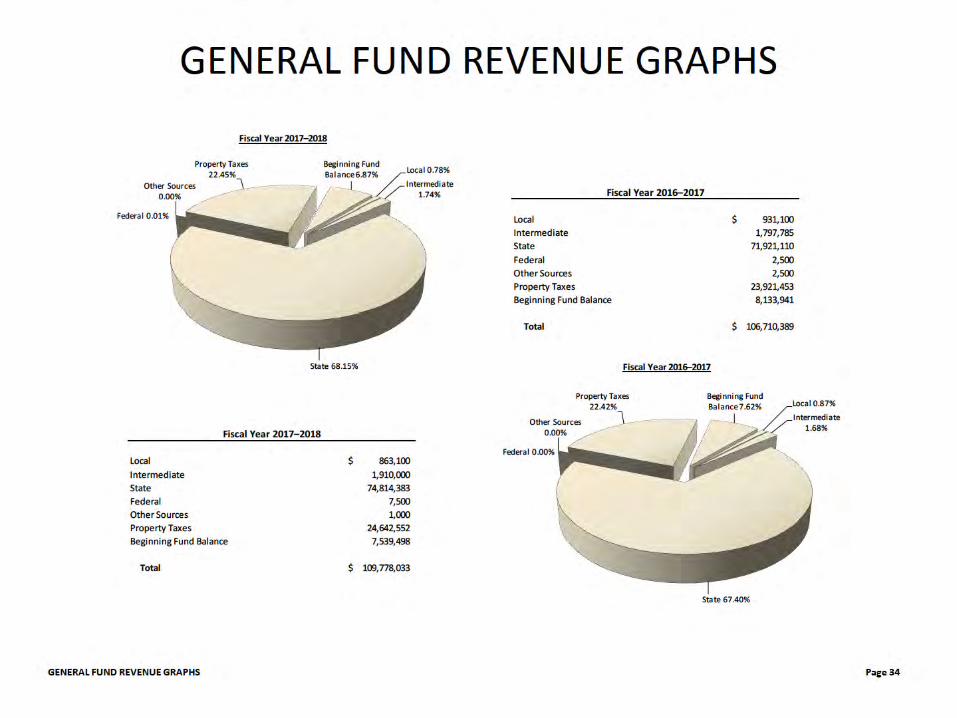
Springfield Public Schools derives about 70.0% of its general fund revenue from the state school fund. Two-thirds of that money comes from the state legislature and is highly dependent upon state revenues through income taxes. The outlook of the state economy and the state budget can significantly impact state school funding and school budgets. In the 2017–19 state biennial budget, the Oregon Department of Education is basing their funding on the Co-chair’s budget of $7.8 billion for the state school fund for K-12 education. $3.822 billon will be distributed in the 2017–18 school year. Springfield Public Schools receives approximately 1.9% of the annual appropriation. A couple of items that will have an impact on state school funding and school budgets are the Public Employees Retirement System rate increase and the minimum wage increase that began on July 1, 2016. These items will impact the 2017–18 budget and future budgets, as well as future collective bargaining processes.
ECONOMIC SUMMARY Page 23
Economic Summary (Continued)
Economic Summary (Continued) 8Oregon Supreme Court Decision on 2013 Legislation Impacting the Public Employees Retirement System (PERS): In 2013, two provisions in the legislative session resulted in changes to the PERS annual cost-of-living adjustment (COLA) and the elimination of the tax remedy for those individuals who do not pay Oregon state income tax because they do not reside in Oregon. These changes were challenged in the Oregon Supreme Court. On April 30, 2015, the Oregon Supreme Court announced a decision that upheld the elimination of the tax remedy payments to non-residents. The COLA reductions were declared unconstitutional as applied to benefits earned prior to those bills’ respective effective dates. However, it was determined that the reduced COLA could be applied to the benefits earned after the bills became effective. Senate Bill 822 (2013) and Senate Bill 861 (2013 Special Session) reduced the annual COLA to be applied to benefit payments. Previously, the COLA was capped at 2.0% annually and tied to changes in the Portland Consumer Price Index. These bills reduced the maximum COLA to, eventually, 1.25% on the first $60,000 of benefits annually and 0.15% for amounts over $60,000. Additionally, SB 861 provided an annual supplementary payment to benefit recipients over six years, starting in 2014. Benefit recipients whose benefits are based on an effective retirement date of May 1, 2013, or earlier are entitled to restoration of their COLA under the prior rules: 2.0% annual cap tied to the Portland Consumer Price Index (CPI). Index adjustments above and below the 2.0% cap are “banked” for future years. Benefit recipients whose benefits are based on an effective retirement date of June 1, 2013, or later may have a blended COLA rate based on when their benefit was earned in relation to the effective dates of Senate Bill 822 and Senate Bill 861. The impact of these decisions on the total pension liability and employer’s net pension liability (asset) has not been fully determined. However, based on PERS’ third-party actuaries calculations, the impact on the District would be approximately a 5.0% rate increase. This rate increase will take effect in the 2017–18 budget year. This projected increase does not take into account the District’s side account. ___________________________ 8Court Decision 5-29-15, <http://www.oregon.gov/PERS/pages/index.aspx>
ECONOMIC SUMMARY Page 24
Economic Summary (Continued)
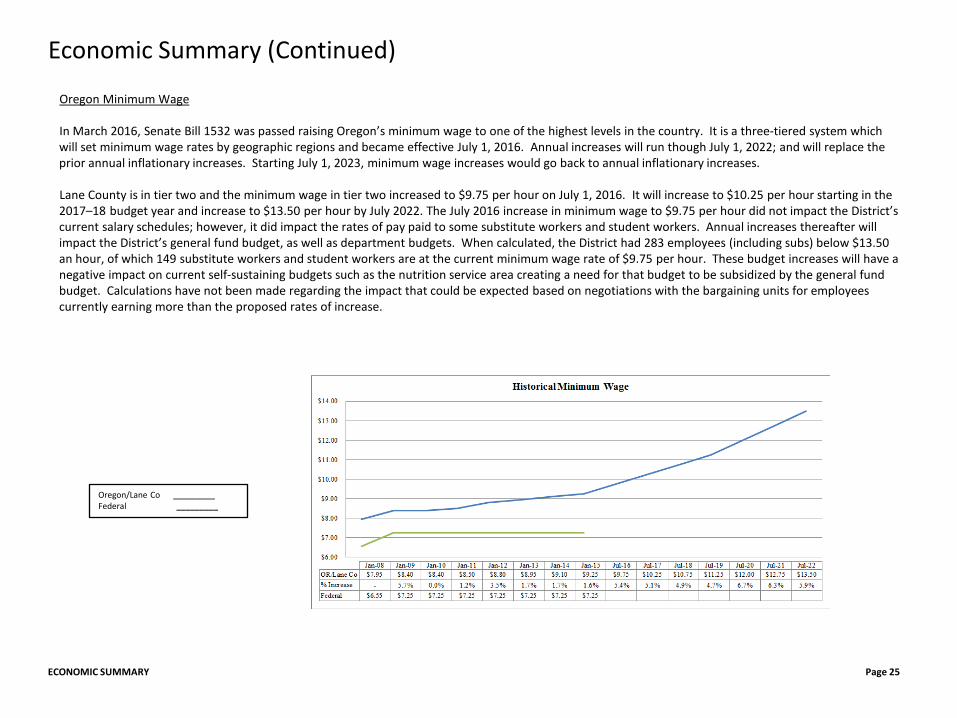
Oregon Minimum Wage In March 2016, Senate Bill 1532 was passed raising Oregon’s minimum wage to one of the highest levels in the country. It is a three-tiered system which will set minimum wage rates by geographic regions and became effective July 1, 2016. Annual increases will run though July 1, 2022; and will replace the prior annual inflationary increases. Starting July 1, 2023, minimum wage increases would go back to annual inflationary increases. Lane County is in tier two and the minimum wage in tier two increased to $9.75 per hour on July 1, 2016. It will increase to $10.25 per hour starting in the 2017–18 budget year and increase to $13.50 per hour by July 2022. The July 2016 increase in minimum wage to $9.75 per hour did not impact the District’s current salary schedules; however, it did impact the rates of pay paid to some substitute workers and student workers. Annual increases thereafter will impact the District’s general fund budget, as well as department budgets. When calculated, the District had 283 employees (including subs) below $13.50 an hour, of which 149 substitute workers and student workers are at the current minimum wage rate of $9.75 per hour. These budget increases will have a negative impact on current self-sustaining budgets such as the nutrition service area creating a need for that budget to be subsidized by the general fund budget. Calculations have not been made regarding the impact that could be expected based on negotiations with the bargaining units for employees currently earning more than the proposed rates of increase.
ECONOMIC SUMMARY Page 25
Oregon/Lane Co _________ Federal _________
ENROLLMENT PROJECTIONS Page 27
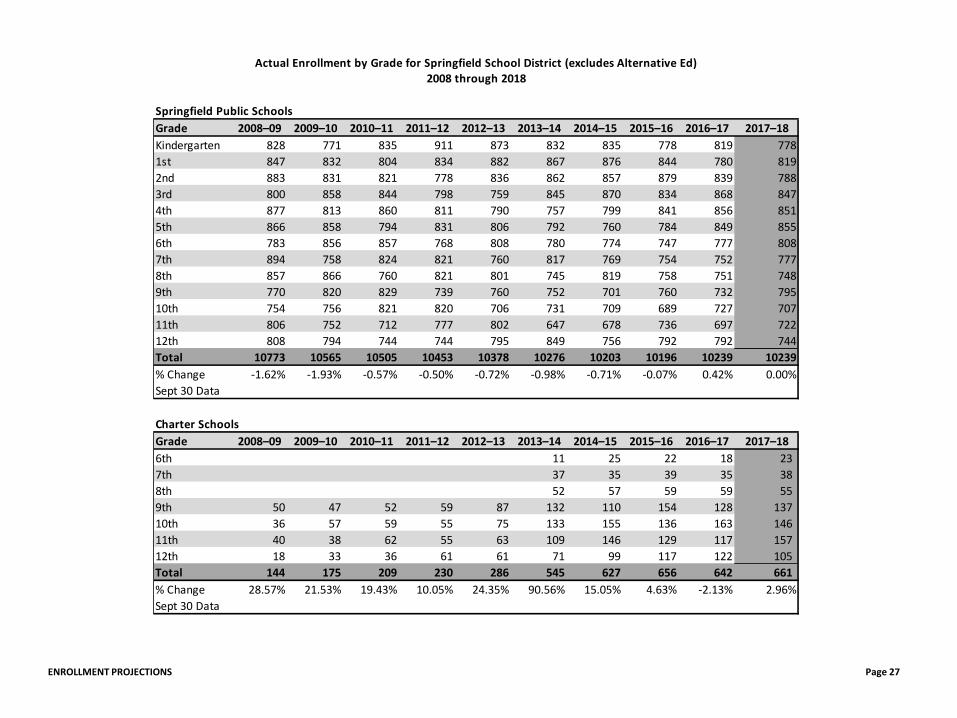
Springfield Public SchoolsGrade 2008–09 2009–10 2010–11 2011–12 2012–13 2013–14 2014–15 2015–16 2016–17 2017–18Kindergarten 828 771 835 911 873 832 835 778 819 7781st 847 832 804 834 882 867 876 844 780 8192nd 883 831 821 778 836 862 857 879 839 7883rd 800 858 844 798 759 845 870 834 868 8474th 877 813 860 811 790 757 799 841 856 8515th 866 858 794 831 806 792 760 784 849 8556th 783 856 857 768 808 780 774 747 777 8087th 894 758 824 821 760 817 769 754 752 7778th 857 866 760 821 801 745 819 758 751 7489th 770 820 829 739 760 752 701 760 732 79510th 754 756 821 820 706 731 709 689 727 70711th 806 752 712 777 802 647 678 736 697 72212th 808 794 744 744 795 849 756 792 792 744Total 10773 10565 10505 10453 10378 10276 10203 10196 10239 10239% Change -1.62% -1.93% -0.57% -0.50% -0.72% -0.98% -0.71% -0.07% 0.42% 0.00%Sept 30 Data
Charter SchoolsGrade 2008–09 2009–10 2010–11 2011–12 2012–13 2013–14 2014–15 2015–16 2016–17 2017–186th 11 25 22 18 23 7th 37 35 39 35 38 8th 52 57 59 59 55 9th 50 47 52 59 87 132 110 154 128 137 10th 36 57 59 55 75 133 155 136 163 146 11th 40 38 62 55 63 109 146 129 117 157 12th 18 33 36 61 61 71 99 117 122 105 Total 144 175 209 230 286 545 627 656 642 661 % Change 28.57% 21.53% 19.43% 10.05% 24.35% 90.56% 15.05% 4.63% -2.13% 2.96%Sept 30 Data
Actual Enrollment by Grade for Springfield School District (excludes Alternative Ed)2008 through 2018
GENERAL FUND RESOURCES Page 29
GENERAL FUND RESOURCES (Continued)
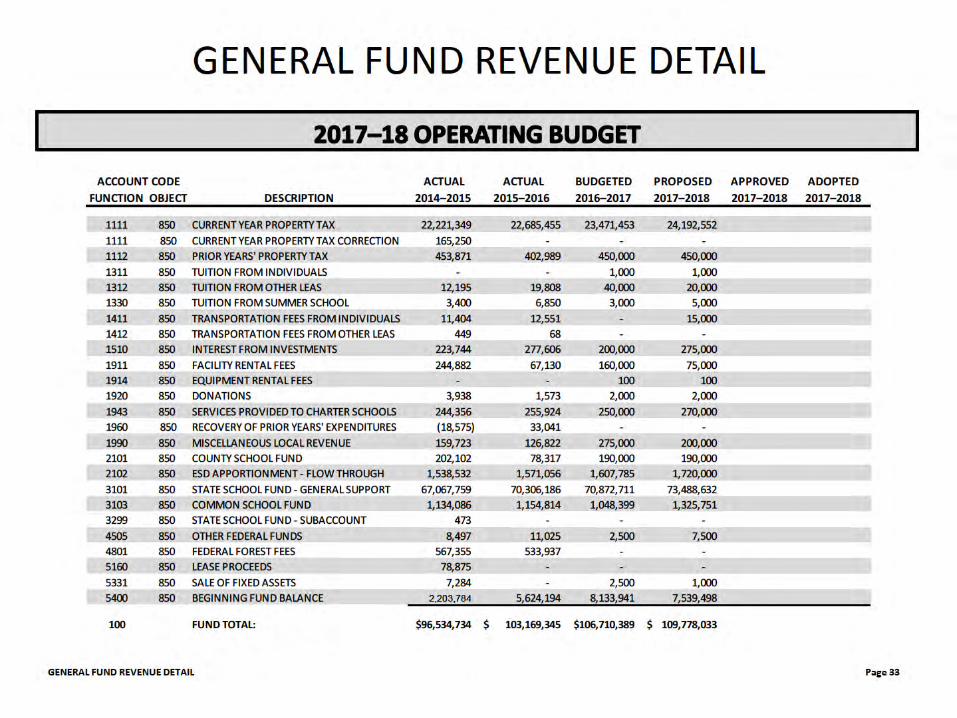
1510 Interest from Investments: Earnings on funds invested by the District. Investments must be in compliance with the provisions of ORS 294.035 and 294.046, as well as follow the Springfield School District Board investment policy. 1911 Facility Rental Fees: Money that is received by the District as payment for rent from groups that utilize District facilities. 1914 Equipment Rental Fees: Money that is received by the District as payment for rent from groups that utilize District equipment. 1920 Donations: Money received by the District from private individuals or organizations for which no repayment or special service to the contributor is expected. 1943 Services Provided to Charter Schools: Money received by the District for services provided to a District charter school. These services could be, but are not limited to, personnel, financial services, facility services, and technology services. 1960 Recovery of Prior Years’ Expenditures: Refunds of expenditures made in prior fiscal years. 1990 Miscellaneous Local Revenue: Money realized through receipts from a variety of sources including jury duty, copier fees, etc.
2000 COUNTY SOURCES
These sources are revenue collected by an intermediate administrative unit and distributed to LEAs in amounts that differ in proportion to those which
were collected within such systems. 2101 County School Fund: Money received from the allocation of resources from the County School Fund through a levy on all taxable property in Lane County. The County School Fund includes the additional school revenue Congress granted states as federal timber replacement revenue in the Secure Rural Schools and Community Self-Determination Act of 2000. 2102 Education Service District Flow-through: Money received in-lieu of services from the Lane Education Service District. In previous years the District has received services through its allocation of “flex funds”. For the 2017–2018 fiscal year the District is opting to receive approximately 50.0% of this in the form of money and provide the services in district.
3000 STATE SOURCES Revenue from funds collected by the state and distributed to school districts. The largest source of state revenue is the State School Fund. 3101 State School Fund General Support: Revenue from this source is from a long-standing state fund within the budget of the Oregon Department of Education (ODE). ODE holds the funds and distributes eleven payments per year to districts according to a legislatively adopted formula (also known as the equalization formula). Funding is based upon a per pupil allocation with additional allocations for students with special needs, seniority of staff, and transportation costs included in the formula. For additional information please refer to ORS 327.006 to ORS 327.157. 3103 Common School Fund: Money from the sale of land to the state for common school purposes as stipulated in Oregon Revised Statutes. The Common School Fund revenue estimate is based on the continuation of State Land Board distribution policy adopted in early 2005. To avoid substantial variations in distribution from year to year, the Board decided to calculate the growth rate using a three-year rolling average of fund values. This rate then will determine what percent of the fund value is to be distributed. The distribution percentage has varied from year to year, but has historically averaged around 4.0%. 3299 Restricted Grants-in-aid: Money received by the District from state funds which must be used for a categorical or specific purpose.
4000 FEDERAL SOURCES Revenue generated from funds collected by the Federal Government and distributed to local school districts. Such funds can be distributed on a direct or a flow-through basis. 4505 Other Federal Funds: Revenue from sources that are not designated from a specific source, other than the Federal Government. 4801 Federal Forest Fees: Money received from the County Fund as a result of the apportionment of Federal Forest Fees.
GENERAL FUND RESOURCES Page 30
GENERAL FUND RESOURCES (Continued)
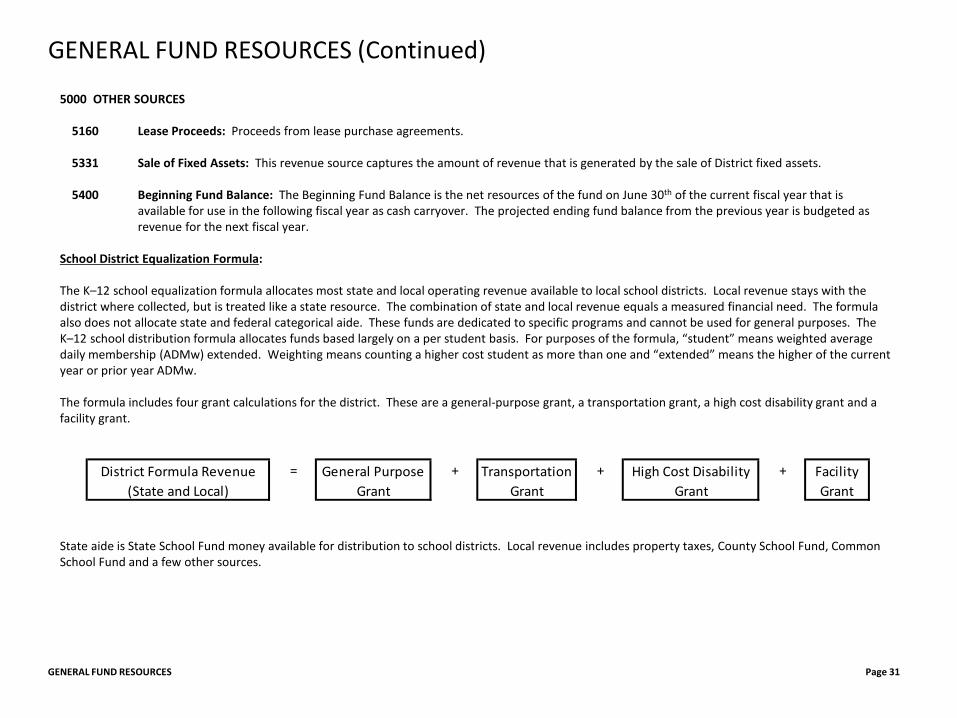
5000 OTHER SOURCES 5160 Lease Proceeds: Proceeds from lease purchase agreements. 5331 Sale of Fixed Assets: This revenue source captures the amount of revenue that is generated by the sale of District fixed assets. 5400 Beginning Fund Balance: The Beginning Fund Balance is the net resources of the fund on June 30th of the current fiscal year that is available for use in the following fiscal year as cash carryover. The projected ending fund balance from the previous year is budgeted as
revenue for the next fiscal year. School District Equalization Formula: The K–12 school equalization formula allocates most state and local operating revenue available to local school districts. Local revenue stays with the district where collected, but is treated like a state resource. The combination of state and local revenue equals a measured financial need. The formula also does not allocate state and federal categorical aide. These funds are dedicated to specific programs and cannot be used for general purposes. The K–12 school distribution formula allocates funds based largely on a per student basis. For purposes of the formula, “student” means weighted average daily membership (ADMw) extended. Weighting means counting a higher cost student as more than one and “extended” means the higher of the current year or prior year ADMw. The formula includes four grant calculations for the district. These are a general-purpose grant, a transportation grant, a high cost disability grant and a facility grant. State aide is State School Fund money available for distribution to school districts. Local revenue includes property taxes, County School Fund, Common School Fund and a few other sources.
GENERAL FUND RESOURCES Page 31
GENERAL FUND RESOURCES (Continued)
= + + +District Formula Revenue (State and Local)
General Purpose Grant
Transportation Grant
High Cost Disability Grant
Facility Grant
The general-purpose grant starts at $4,500 target per weighted student. Applying the teacher experience factor increases or decreases the $4,500 per student target by $25 for each year the district average experience is more or less than the statewide average teacher experience. A calculated percentage adjustment factor (currently about 150.0%) modifies the adjusted target amount to allocate the full state and local funds available. The grant accounts for approximately 95.0% of the formula revenue. Thus the number of students and their associated weights are a very important determinate of the district formula revenue. There are no constraints on how this money can be expended. The transportation grant is a 70.0% to 90.0% reimbursement of approved student transportation costs. These costs are primarily school bus costs for transporting between home and school and class field trips. Districts are ranked by costs per student. Districts ranked in the top 10.0% have 90.0% grants. Districts ranked in the next lower 10.0% have 80.0% grants and the bottom 80.0% of districts have 70.0% grants. The District receives a 70% reimbursement transportation grant. Transportation grants are about 4.0% of the equalization formula revenue. The high cost disability grant is initially the sum of the costs above $30,000 for each student with disabilities. ESD costs for each student can be included in the total. The total grants for all districts cannot exceed $18 million per year. If eligible costs exceed $18 million, grants are prorated down to sum up to $18 million. The facility grant is up to 8.0% of the construction costs for new classrooms, but is subject to a biennial limit of $25 million (statewide). The grant is for classroom equipment that cannot be included in bonded debt. If eligible facility grants exceed the biennial limit, grants are prorated down to be less than 8.0% of construction costs.
GENERAL FUND RESOURCES Page 32
GENERAL FUND RESOURCES (Continued)
INSTRUCTION SERVICES (Continued)
INSTRUCTION SERVICES Page 40
In terms of professional development for 2017–18, our work will continue to focus on a) quality instruction and the development of The Skillful Teacher; b) implementation of Response to Intervention (RtI) and Positive Behavior Interventions & Support (PBIS) systems of support; c) student learning goals and effective assessment strategies; d) effective teaming strategies; and e) Common Core State Standard implementation with a focus on a guaranteed and viable curriculum. This work will be supported through various grants to include Title IA, Title IIA, and other resources that support our efforts. Implementation of MTSS (RtI and PBIS) - While we have engaged in implementation efforts specific to the Common Core State Standards, we will continue to invest time and energy in the area of multi-tiered approach to core instruction and intervention in the coming year. This focus requires us to refine our implementation of RtI and PBIS as these efforts are designed to provide additional instructional support for all students. In these efforts, we will focus on implementing systems and structures at the building level. We strongly believe that teams of teachers using data for decision-making and planning instruction/intervention is a highly effective practice. By implementing these systems for academic and behavioral interventions, we believe we will realize increased student achievement and a more positive school culture at all levels. Implement the Four CLASS Blueprints - The CLASS blueprints were developed in 2010–11 and provide a roadmap for student success through shared, collaborative leadership in four areas: professional development, career pathways for teachers, performance evaluation, and creative compensation. Our professional development blueprint utilized the National Staff Development Council’s standards (Learning Forward, 2011) for professional growth as a guide. SPS is committed to embedding opportunities for professional development within a teacher’s or educational assistant’s work day that is a) in depth; b) sustained over time; c) differentiated to meet the varied needs of our diverse staff; d) built upon collaboration; and e) linked to both our evaluation system and future, creative compensation model. Finally, with the anticipation of newly adopted K–8 math curriculum, efforts will include professional development focused on supporting teachers with its successful implementation. Our career pathway blueprint has generated more opportunities for staff to engage in leadership and to support others through the delivery of professional development activities. We have over 50 teachers engaging in District level leadership activities including the Superintendent’s Teacher Advisory Team, future innovations teams (STEM/STEAM, Literacy Leadership, Equity, PBIS Leadership, Dual Immersion), and other building level leadership teams.
INSTRUCTION SERVICES (Continued)
INSTRUCTION SERVICES Page 41
For the past four years, we have been building capacity in high leverage instructional practices by providing ‘best practice’ professional development and improving our ability to deliver quality feedback through the observation process. Additionally, we have moved forward with linking our feedback specifically to our Evaluation and Growth model. Embedded in this model are the key tenets of The Skillful Teacher and The Skillful Leader. Complementing this work will be Inter Rater Reliability (IRR) training for administrators who will be engaged in a series of Learning Walks designed to hone their skills and align observational practices. Specifically, our focus will center on creating consistency across evaluators as they engage in classroom observations and assess educator performance using a common tool. Our work will further result in the alignment of evaluators’ agreements regarding levels of performance. IRR will be directly tied to our evaluation model and incorporated into the TalentEd tool. Quality instruction will continue to be our focus for 2017–2018 in the area of performance evaluation. Guaranteed and Viable Curriculum - Access to a guaranteed and viable curriculum will ensure that every student in the Springfield School District has the opportunity to learn. A guaranteed and viable curriculum consists of all content standards that outline the concepts and skills that are essential within an academic discipline at each grade level. We are continually engaged in the process of creating and updating curriculum anchor documents at all grade levels, K–12 throughout the district. The anchor documents identify the student learning targets and accompanying formative and summative assessments necessary to implement sound instructional practices. Additionally, these documents provide a level of support and focus so that the needs of all students can be adequately addressed within the amount of instructional time available to teachers. In order to improve overall student achievement, clear and measurable academic goals are established and data are analyzed, interpreted, and used to regularly monitor student progress towards those goals. Our current and future work toward ensuring a guaranteed and viable curriculum will result in a clearer horizontally and vertically aligned K–12 curriculum. The Instruction Services Department believes that this work will systematically improve academic achievement and graduation rates for all of our students.
OFFICE OF SUPERINTENDENT & BOARD OF EDUCATION (Continued)
OFFICE OF SUPERINTENDENT & BOARD OF EDUCATION Page 43
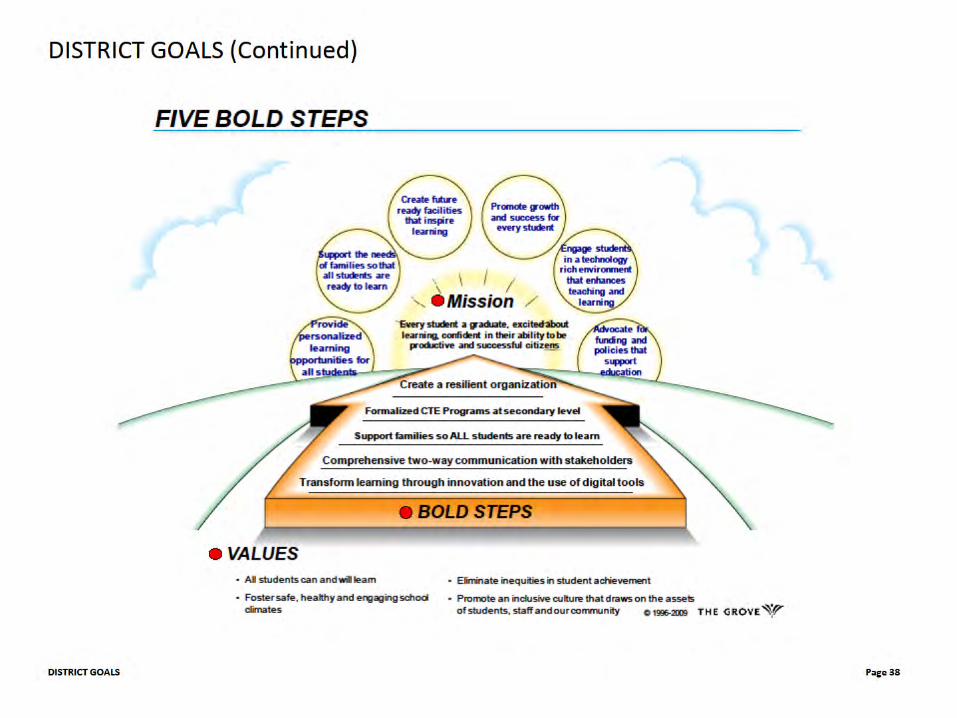
District Goal 1: Provide Personalized Learning Opportunities for All Students - The Board and Superintendent are committed to expanding instruction that reflects an integrated STEAM/project based learning framework, expanding curricular options that engage all students, encourages them to engage their talents that result in all students reaching their full potential. District Goal 2: Support the Needs of All Families so that All Students are Ready to Learn - The Board and Superintendent are committed to expanding community partnerships with social, medical, city and county services that support families and result in full time student attendance and readiness to learn. District Goal 3: Create Future Ready Facilities that Inspire Learning - The Board and Superintendent are committed to maintenance, renovation and expansion of current facilities that are focused to 21st Century instruction and support personalized student learning opportunities. District Goal 4: Promote Growth and Success in Every Student - The Board and Superintendent are committed to allocating District resources in a manner that supports a multi-tiered instructional approach to ensure equity of educational outcomes for all students, regardless of circumstance. District Goal 5: Engage Students in a Technology Rich Environment that Enhances Teaching and Learning - The Board and Superintendent are committed to ensuring teachers have the necessary technological tools to instruct students and ensure they develop 21st Century technology skills that allow them to fully participate in a global society. District Goal 6: Advocate for Stable Funding and Policies that Support Student Growth and Achievement - The Board and Superintendent understand it is our moral obligation to ensure every student receives the best education possible. They are committed to working collaboratively with local, state and federal elected officials and policy makers to ensure policies and funding, support sustainable funding to ensure personalized learning and achievement from one biennium to the next.
BUSINESS OPERATIONS Page 45
BUSINESS OPERATIONS (Continued)
Focus Area 1: Support the needs of families so that all students are ready to learn Budgeting Process - The budgeting process for this spending plan requires a different approach than the 2016–17 school year. While the economy of Oregon is strong and State revenues are increasing, the State is facing a large budget deficit from an ongoing PERS liability and Federal Medicare deficits. During the 2016–17 budget process, Springfield School District developed strategies for the District that are shared and committed by all District staff, Board members and the Budget Committee. These strategies support student achievement at all levels and reflect our community’s shared values. These strategies reflect our explicit efforts to eliminate the existing opportunity/achievement gaps for all students. For the 2017–18 fiscal year those commitments and efforts continue, however resources are not increasing as originally anticipated. The District has invested significant time and effort to communicate with all stakeholders. The process for this year focuses on our decisions during the 2016–17 year and verifies that those efforts should/could continue. Reinvestment - As we move toward the future of education we must continue the important conversations of reinvestment. While the “Great Recession” yielded significant reductions, we are choosing to turn our attention to growth and reinvestment. During this conversation we choose not to focus on what was lost, but rather where the investment of valuable resources for the future should be made. As a link to the budgeting process, reinvestment priorities identified during the 2016–17 budget process are tested and verified. The District is asking the important question of whether resources are aligned in the most effective way. While we understand the reality that we will not be able to afford all desired investments, the process is valuable for staff to assist in providing input. Through this collaborative open process, investments will continue to support student achievement at all levels and reflect our community’s shared values. Focus Area 2: Create future ready facilities that inspire learning The Business Operations Department is integrally involved in leading and supporting the successful bond measure. With the passage in 2014 of a $71.5 million General Obligation Bond Measure, the stewardship of ensuring that the District is meeting its obligation to the community is critical. In an effort to maintain transparency, the School Board appointed a Bond Oversight Committee, which meets twice annually and receives quarterly updates. This oversight committee reviews the financial details of the bond resource implementation, as well as tours completed (and in-progress) projects. The 2017–18 school year will welcome the opening of the replacement to Hamlin Middle School.
A focus for the District is continuing to expand Career and Technical Education (CTE) offerings to students. In an effort to support CTE, District facilities are being updated to ensure flexibility. Applied learning requires that there is adequate space for students to listen to instruction and apply those instructions through “hands-on” learning. The new Hamlin Middle School will serve as a model for spaces that meet these needs. With the flexibility between collaboration spaces and maker spaces and a STEM lab, students will be engaged in applied learning opportunities.
BUSINESS OPERATIONS Page 46
BUSINESS OPERATIONS (Continued)
Focus Area 3: Risk Management With the elimination of a full time Risk Manager several years ago, the District has begun to utilize an Executive Risk Management Team approach. This team is responsible for all issues related to safety, security, injuries, injury prevention and reducing District liability. The team is comprised of key administrators that oversee various functions (custodial, facilities, transportation, nutrition services, and worker’s compensation) of the District. With a shared responsibility and focus on risk management, it is the goal of the District to lower our exposure and costs. The District’s Safety Committee continues to develop strategies for reducing liability and ensuring safety for our students, staff and community. The Risk Management Fund will provide limited opportunities for the District Safety Committee to invest in preventative methods for employee health and wellness. Other, Significant Organizational and Operational Tasks: 2017–2018 Print Services: I. As a function of the Business Operations Department, Print Services continues to provide affordable options for development and reproduction of
printed materials for our schools and departments. In support of the educational process for students, Print Services has updated its Strategic Business Plan (Phase II). Continuing to focus on the future is critical to Print Services success. This plan focuses on expanded use of online ordering and digital technologies among internal customers in strong alignment with the curriculum department while sustaining successful performance in the outside customer base. The plan supports Springfield Public Schools’ mission to provide youth education/welfare and prepare youth for a bright and successful future.
Nutrition Services: I. The overall goal of the District Nutrition Services Department is to provide attractive and nutritious meals that support the student learning process.
The department is constantly working to increase participation in the breakfast and lunch program. In order to accomplish this, a concerted effort needs to be focused on increasing the awareness and participation in the free and reduced meal program. Additionally the department will continue to develop a professional, service-oriented environment and provide appropriate professional development for staff, focusing on safety for all students and staff.
II. As the program continues to operate in a self-sustaining manner, replacing aging and outdated equipment is a priority. Managing this over a reasonable time period is a more economical way to ensure equipment is in good working order and problems are addressed proactively not reactively. In order to accomplish this, management staff developed a comprehensive list of kitchen equipment (including cafeteria tables), year manufactured and specific details about production capabilities. This results in a comprehensive replacement schedule accompanied by a funding strategy for the District. For the 2017–18 school year, the program will be investing in equipment for routine upgrades, which will include ovens, ranges, etc. at elementary schools.
FACILITIES MANAGEMENT Page 48
FACILITIES MANAGEMENT (Continued)
Care and Upkeep of Buildings Services (Fund 100, Function 2542) supports utilities for all District buildings, as well as all custodial activities in each of the schools, including the materials, equipment and supplies necessary to do daily cleaning of schools and perform deep cleaning during non-school periods. They provide setup for breakfast and lunch programs, support for after-hour facilities use, cleaning of buildings, and perform minor repairs. Custodians also play an important role as the first line of defense for buildings. For the 2017–18 fiscal year, staff levels for this area include 54.50 FTE custodial staff. Care and Upkeep of Grounds Services (Fund 100, Function 2543) has responsibility for maintaining all exterior landscaping, irrigation systems and maintenance and repair of playground equipment. The mandated Integrated Pest Management program is also included in the responsibilities for this function. Staffing levels for this area include 6.00 FTE classified staff. Maintenance - Minor Capital Projects Fund (Fund 100, Function 2544) is used for construction and/or remodeling of facilities in response to priorities established through District policies. This fund is judiciously managed to ensure the availability of funds to deal with ongoing improvements and emergencies. Only projects of a significant nature are within this fund. Normal maintenance and minor remodeling activities are included in the individual department funds.
Vehicle Maintenance Services (Fund 100, Function 2545) supports activities concerned with the maintenance, servicing, fueling, and repair of off-road District vehicles other than buses. This includes dump trucks and all motor driven equipment for grounds and off-road services. Staffing levels for this area include 0.50 FTE classified staff. Security Services (Fund 100, Function 2546) supports activities concerned with security of our school campuses and other facilities, as well as maintenance and repair of building security systems, fire alarm systems, security camera systems, and locks, card keys and keys, as well as repairs related to building vandalism. In addition, the contracts for security monitoring and afterhours security response are included. Staffing levels for this area include 1.00 FTE classified staff. Electrical/Plumbing/HVAC Services (Fund 100, Function 2547) has responsibilities for maintaining and installing all electrical, plumbing, heating, ventilating and air conditioning systems. This area installs all network data to support Technology Services. Staffing levels for this area include 1.00 FTE supervisory staff and 5.00 FTE classified staff. Painting/Furniture Services (Fund 100, Function 2548) has responsibilities for painting and graffiti removal from District buildings. This area also provides repair and restoration of school tables, desks, and chairs; and makes all signs and notices for school facilities. Staffing levels for this area include 3.00 FTE classified staff.
FACILITIES MANAGEMENT Page 49
FACILITIES MANAGEMENT (Continued)
Metals Services (Fund 100, Function 2549) supports facility and department activities in the following areas: welding, fabrication, and sheet metal of all equipment including athletic, security, building and other assigned work; all small engine-driven equipment; and maintenance and repair of all secondary education metal shop, wood shop, automotive, and custodial equipment. Staffing levels for this area include 2.00 FTE classified staff. Capital Projects Fund (401) is managed for special projects including buildings and property acquisition, major construction or remodeling of facilities. The projects planned are in alignment with the priorities established by the School Board and recommended by the Sites and Facilities Committee. The fund has served as contingency for major emergency facility repairs, such as emergency roof replacement, boiler replacement and all projects too large to be absorbed in the General Fund. The Capital Projects Fund primarily obtains revenues from outside funding sources such as property sales or facility grants. The Facilities Advisory Committees have recommended that funds generated from the sale of land, buildings and other real property be used for other District related land and capital purchases as well as capital repairs and improvements at District facilities.
TRANSPORTATION SERVICES Page 51
TRANSPORTATION SERVICES (Continued)
Equipment Replacement Fund - The Equipment Replacement Fund receives revenue from the State of Oregon as the result of a ten-year depreciation cycle for District-owned buses that are regularly used for home-to-school transportation. Over a ten-year period, the District receives 70.0% of the original cost of each bus through this program. Use of the money in this fund is restricted to purchasing new buses and specific bus equipment, such as digital recording devices and radios. It is important to note that the State does not reimburse the District if a bus is not used the majority of the time for home-to-school transportation. Currently, this would include several of the Type-20 “activity” buses used primarily by the high schools. Over the past several years, we have worked to establish a bus replacement schedule that will provide for the regular replacement of our fleet. What we have found is that our practice of purchasing buses, even with the 70.0% reimbursement from the State, makes it difficult to establish a workable schedule. For the past four acquisitions, we have elected to use a lease purchase agreement. We believe that leasing will allow us to establish a regular replacement schedule, giving us the ability to operate a newer, and more energy efficient, environmentally friendlier fleet with little to no increase in annual costs. Even using leases, it is impossible to establish even a fifteen-year replacement fund without the infusion of General Fund dollars at some point. As part of our fleet analysis, we looked at our routes and transportation requirements to determine the most cost effective style of buses to purchase. Initially, the plan called for purchasing a mix of 84 passenger buses and Type-A SPED buses. Based on our experience, we have moved to Type-C 48 passenger front engine propane powered buses for our SPED routes and Type-C 78 passenger buses for our standard route bus. In 2017–18, we will be purchasing six buses. These buses will be front engine propane-powered SPED buses to replace three of our oldest buses in the fleet (approaching 20 years old). One will replace a bus destroyed by a fire in October 2016, and two will be used to support new SPED routes for 2017–18. Looking Towards 2017–2018: The District goal setting process resulted in five major transportation goals as part of the Significant Organizational and Operational Tasks. Goal 1: Focuses on putting together a strategic plan for the management of the District non-bus fleet. Goal 2: Is centered on the Transportation Facility located on 42nd Street in terms of updates in drainage and paving. Goal 3: Focuses on reviewing compliance with OARs, ORSs, and District policies and procedures. This work includes a review of District policies and ARs, a review of department procedures and the alignment of our routes with the Board approved Transportation Supplemental Plan. Goal 4: Looks at a continued evaluation of department efficiencies that takes into account the continued refinement of our bus routes, reducing the number of preventable accidents, and other efficiencies that can be achieved within the department.
TRANSPORTATION SERVICES Page 52
TRANSPORTATION SERVICES (Continued)
Goal 5: Addresses student safety with the primary focus on the Safe Routes to School initiative. This work encourages students to walk and ride bicycles to school while addressing student safety concerns through safety education and working with local agencies to improve walking and bicycling routes. 2017–18 Staffing: One instructional initiative that continues to impact the Transportation Department was the implementation of full-day kindergarten. Prior to 2016–17, we had mid-day routes taking the morning kindergarten students from school to home. With full-day kindergarten, eligible kindergarten students ride the regular morning and afternoon routes. The result has been the reduction in hours for many of our drivers, in some cases below the 20 hours per week guaranteed in the Oregon School Employee Association (OSEA) contract. While we have been able to continue to address this using other work within the department, in 2017–18 we are looking at some operational changes that will address this issue as well as create efficiencies within the department. We are currently looking at the possibility of adding three additional SPED routes next year to reduce ride times of students. Even with these changes, we are moving into 2017–18 with no added department FTE from the 2016–17 FTE allotment. For 2017–18, we are proposing that bus driver staffing in the Transportation Department remain at the same levels as 2016–17. Even by adding three special needs routes, the department FTE allocation should remain flat. This will be accomplished by reducing the other 21 special needs routes, some that currently approach 40 hours per week. The department FTE will include 0.50 FTE director, 1.00 FTE supervisory staff, 1.00 FTE assistant supervisory staff, and 60.23 FTE classified staff, for a total of 62.73 FTE. Other Budget Considerations: The overall 2017–18 transportation budget will remain flat from 2016–17 budget levels; with little to no expected increases other than diesel, which will be offset by the increased use of propane. One area where we are anticipating additional costs is in the area of athletic transportation. While we are budgeting for no increase, we believe that we will continue to see an upward expense due to longer trips to southern Oregon for both high schools.
HUMAN RESOURCES Page 54
HUMAN RESOURCES (Continued)
Teacher and Administrator Evaluation System - Springfield School District’s teacher and administrator evaluation system complies with the requirements as outlined in Senate Bill 290 and the Oregon Framework for Teacher and Administrator Evaluation. Teachers and administrators are evaluated on a regular cycle of continuous improvement that includes self-reflection, goal setting, observation, formative assessment and summative evaluation. Multiple sources of data are used to measure teacher and administrator performance on the standards of professional practice. In addition, Human Resources is working to implement the state mandated matrix system of teacher evaluation, which integrates teacher self-reflection scores and evaluator scores. Training on the matrix system will continue throughout the 2017–2018 school year. The Human Resources Department works collaboratively with the Instruction Department in the areas of a) implementing the net-based TalentEd management system and the Skillful Teacher framework; b) developing and implementing a process for the development of quality Student Learning Goals (SLGs) for both teachers and administrators; c) developing and implementing embedded processes to support a high level of Inter Rater Reliability (IRR) across administrators, specific to performance evaluation at each level; d) providing relevant professional learning opportunities to improve professional practice and impact on student learning; and e) aligning those practices to the teacher and administrator’s evaluation and her/his need for professional growth. District Goal 2: Communication The Human Resources Department will collaborate with the Communications Department to develop a diversity and equity policy to ensure that all Springfield schools are welcoming places for students, staff and community members. 2017–2018 - The District goal setting process resulted in three major Human Resources (HR) Department goals as identified in the Significant Organizational and Operational Tasks. Task 1: Support staff in continuing to implement online processes and to create efficiencies within the HR systems. As we evaluate current processes and align them with best practice, we identify structures, strategies, and processes that improve our communication with employees and create efficiencies at both the work site and District office. HR utilizes several online technology programs, including SafeSchools, AESOP Teacher Absence System, Criminal Information Services (CRIS), TalentEd Recruit and Hire, Perform and Records, and the WorkKeys skill assessment systems. All District employees complete annual training to comply with state and federal mandates, thereby ensuring a safe and effective learning and working environment for all.
HUMAN RESOURCES Page 55
HUMAN RESOURCES (Continued)
Task 2: Successfully negotiate successive collective bargaining agreements with employee associations that are a) fair to employees; b) affordable to the District; c) reflective of District values; d) attractive to potential employee candidates; and e) align with or support District strategic reinvestment strategies. Springfield School District has approximately 698 teachers, 614 classified employees, and 62 administrative, supervisory and confidential employees. The District’s strong relationship with our collective bargaining associations allows us to continue to focus on the educational progress and attainment of our students while addressing the needs, concerns, and compensation levels of our employees. We meet monthly with both classified and licensed labor management teams to address concerns and problem-solve issues together. In addition, we work together to provide support to employees in the areas of professional development, performance evaluations, investigations, discipline, staffing decisions, and ensuring that both employees and the District adhere to our collective bargaining agreements. Task 3: Continuing to implement the revised Classified Performance Evaluation System. Classified staff is evaluated annually. The revision includes the alignment of the performance evaluation tool to the new job description/employee job title/classification. The purpose is to have performance evaluation standards that align to job specific requirements and expectations.
COMMUNICATIONS DEPARTMENT Page 57
COMMUNICATIONS DEPARTMENT (Continued)
Key priorities for the Communications Department include community outreach; public relations and working with local news media; staff communication; crisis communication; maintenance of Board policy and administrative rules; serving as liaison with community, government and other agencies; providing support to the Springfield Education Foundation; translation of District-wide and other important documents; planning and coordinating special events; leading appreciation efforts to recognize staff and students; organizing community literacy programs. A 1.00 FTE Community Engagement Officer oversees all functions within this department, including: The Public Information (Fund 100, Function 2633) function is responsible for internal and external communications, public relations, District website content and oversight, social media, advertising, and working with news media. The department also organizes and supports special events, provides oversight of Board policy and direct support to the Board, serves as a liaison to community groups (such as Key Communicators, Springfield Education Foundation, Culture and Education Alliance, etc.), and communicates with parents regarding state report cards and other ongoing issues, such as the continuing effects of low education funding levels. It also leads the District’s legislative and government relations efforts, works closely with TEAM Springfield members, and helps create and distribute the semi-annual TEAM Springfield newsletter. For the 2017–18 fiscal year, the staff level for this area is 0.75 FTE classified staff. The District Reception (Fund 100, Function 2577) function supports activities associated with the District’s reception area and greeting patrons in person and by telephone. The customer service specialist in this area also directs the public and staff to the appropriate District departments or services, coordinates translation services for District-wide and high priority documents, and provides key assistance related to planning special events and staff/student recognition, including: Teacher Appreciation Week and Classified Appreciation Week, the annual retirement event, the ACE Awards, Outstanding Volunteer Reception, the Student Achievement Reception, and several other events. The Gift of Literacy (GOL) has become a large part of this position’s duties—including assisting with staff/committee communication, planning and other coordination duties for GOL’s year-round program and planning efforts. In addition to supporting other initiatives of the Communications Department, this area is also responsible for the dissemination of community information to the schools and managing public meeting space for staff and community groups. For the 2017–18 fiscal year, the staff level for this area is 1.00 FTE classified staff.
TECHNOLOGY SERVICES Page 59
TECHNOLOGY SERVICES (Continued)
Data Security - This area focuses on insuring that District data is secure and used in accordance with federal law, state law, and District policies and procedures. Looking toward 2017–18: The 2014 General Obligation Bond allocated $13.6 million for the purchase of new and replacement computer equipment. The passing of the bond was good news for the District and Technology Services, providing much needed funding to replace outdated computer equipment district-wide. Spend down of the technology bond funds is a six-year plan divided into twelve different projects. While the bond funds will allow us to update District technology, bond funds cannot be used for many of the expenses currently funded by the General Fund. For example, hardware and software maintenance contracts, training, payroll, and benefit costs cannot be bond funded. As a result, the availability of bond funds does not replace the need for a Technology Department General Fund budget. Instructional Technology - While budget responsibility for the dedicated instructional technology staff is moving to the Instruction Department, a great deal of our work in 2017–18 will be in direct support of instructional initiatives. This work includes responding to school proposals with new computer hardware and coordinating support for new curriculum adoptions. We continue to focus on technology strategies identified in the strategic plan related to the Game Plan: “Transform Learning Through Innovation and the Use of Digital Tools”. A large part of this work for 2017–18 will include creating the next iteration of a Technology Plan developed in conjunction with the Instruction Department. Other areas of focus include addressing targets from the plan such as “Current, reliable, secure and supportable technology”, and “Data is available for decision making”. In the area of data availability, we developed the R.A.D.A.R. system in 2016–17 that addresses the need to identify and display student achievement data. In 2017–18, we will be looking at the best way to make additional data available to instruction staff. Student and Staff Computer Devices - The bond funds will allow us to address, over the next four years, the need to update staff and student computers. We will continue to use the school proposal process to prioritize the deployment of student computers. We continue to replace staff computers based primarily on age of the existing staff computers. The adoption and purchase of new math software will also drive device placement in 2017–18. Early indications suggest that a number of computer devices will be needed to fully implement the digital components of the new math curriculum. The cost of the devices will be funded from the 2014 General Obligation Bond. We continue to focus on getting the right device for the application. As a result, student computer devices will include a combination of Ipads, Chrome devices, laptops and desktop computers.
TECHNOLOGY SERVICES (Continued)
TECHNOLOGY SERVICES Page 60
Computer Network - The bond supports the replacement of virtually all of the network equipment in the District. During the first year of the bond, we updated networks at six schools, which included access to wireless Internet in every learning space. In year two of the bond (2016–17), we plan to complete upgrades to an additional six school networks. The remaining networks will be upgraded in the 2017–18 school year. We are also focusing on upgrading network equipment at the District level to provide for greater Internet bandwidth, reliability, and where possible, redundancy. Telecommunication Systems - The first bond funded telephone system was placed at the administration building this year followed by a deployment at Maple Elementary School. We are anticipating the completion of at least four additional systems in 2016–17. In 2017–18, we are targeting 6-7 additional schools as part of year two of the three-year project. General Fund related telephone system expenses for 2017–18 will be used to support the old systems in the district. Application Systems - Work in this area for 2017–18 will focus on the continued implementation of the Synergy student information system, records management, student achievement reporting, and integration of new curriculum adoptions. This work will include the ongoing implementation of Synergy LessonVue and AssessmentVue tools, expansion of our ability make student achievement data available through Synergy and the R.A.D.A.R. system, and records management through the Oregon Records Management System (ORMS). Changes in the local Synergy consortium will result in increased costs associated with running and operating the Synergy software. Bend-LaPine School District has elected to withdraw from the consortium which will increase our costs by as much as 30.0%. We continue to work with Eugene 4J, Three Rivers, and Eagle Point as part of the consortium. Computer User Support - We continue to look for efficiencies to better support computer users in the District. In 2016–17, we expanded the number of computers managed through the Casper software and will continue that work into 2017–18. Data Security - In 2017–18, we are looking to do a comprehensive review of all District policies and procedures related to data security to insure alignment with recent changes in federal and state laws. 2017–18 Staffing: General Fund staffing for 2017–18 includes 0.50 FTE director, 1.00 FTE supervisory staff, 4.00 FTE exempt staff, and 5.50 FTE classified staff. This represents a reduction of 1.00 FTE – the Instructional Technology position is moving to Instruction. Two additional technical positions are currently funded through the bond.
TECHNOLOGY SERVICES (Continued)
TECHNOLOGY SERVICES Page 61
Technology Fund: The Technology Fund receives revenue from annual E-rate refunds associated with General Fund expenditures. Changes in the E-rate program have resulted in drastic reductions in E-rate reimbursements specifically in the area of telecommunications. This year represents the last year of telecommunications reimbursements with an anticipated payout of around $60,000. For the 2017–18 budget, we are allocating $96,000 in the Technology Fund, primarily to support the use of technology to deliver instruction. Based on the 2016–17 ending fund balance, reduction in E-rate reimbursements, and an annual allocation of $96,000, the Technology Fund will be depleted within the next 2-3 years.
GENERAL FUND
GENERAL FUND Page 64
The General Fund is utilized to account for all the revenues and expenditures necessary for the day-to-day operation of the District except those funds that are assigned to a special purpose fund. Revenues in the General Fund can be received from federal, state and county government sources. The largest revenue source in the General Fund is received from the State School Fund, and the second largest source of revenue comes from property tax assessments at the local level. Tuitions and fees for some programs are collected to partially offset costs of those programs. Expenditures are tracked by cost center (each central office and each school), function, and object code (description of the expense). The General Fund is considered a major governmental fund and in some cases, transfers are made from the General Fund to support other funds. Annually, transfers are made from the General Fund to the following funds for the following purpose: Co-Curricular Fund for the support of athletic and activity programs; Instructional Materials Fund for the purchase of textbooks; and Debt Service Fund for the principal payment on the Qualified Zone Academy Bonds and payment of non-general obligation bonded debt.
GENERAL FUND – OVERVIEW Page 65
GENERAL FUND - OVERVIEW
GENERAL FUND FUNCTION DETAIL Page 66
GENERAL FUND FUNCTION DETAIL
Function Description Actual
2014–15 Actual
2015–16 FTE
2016–17 Adopted 2016–17
FTE 2017–18
Proposed 2017–18
Approved 2017–18
Adopted 2017–18
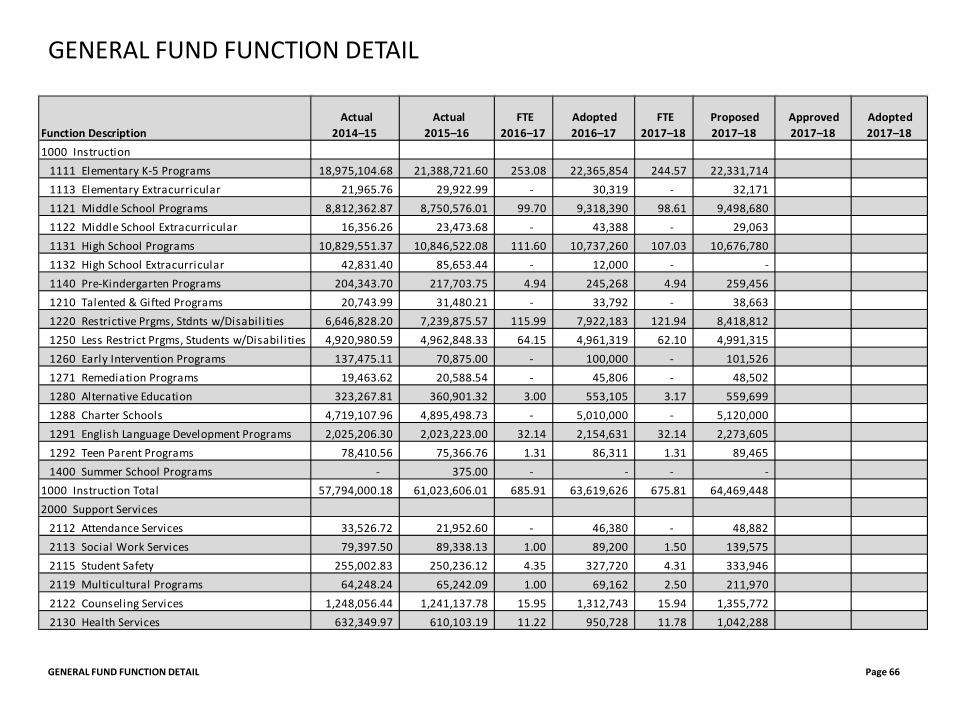
1000 Instruction1111 Elementary K-5 Programs 18,975,104.68 21,388,721.60 253.08 22,365,854 244.57 22,331,714 1113 Elementary Extracurricular 21,965.76 29,922.99 - 30,319 - 32,171 1121 Middle School Programs 8,812,362.87 8,750,576.01 99.70 9,318,390 98.61 9,498,680 1122 Middle School Extracurricular 16,356.26 23,473.68 - 43,388 - 29,063 1131 High School Programs 10,829,551.37 10,846,522.08 111.60 10,737,260 107.03 10,676,780 1132 High School Extracurricular 42,831.40 85,653.44 - 12,000 - - 1140 Pre-Kindergarten Programs 204,343.70 217,703.75 4.94 245,268 4.94 259,456 1210 Talented & Gifted Programs 20,743.99 31,480.21 - 33,792 - 38,663 1220 Restrictive Prgms, Stdnts w/Disabil ities 6,646,828.20 7,239,875.57 115.99 7,922,183 121.94 8,418,812 1250 Less Restrict Prgms, Students w/Disabil ities 4,920,980.59 4,962,848.33 64.15 4,961,319 62.10 4,991,315 1260 Early Intervention Programs 137,475.11 70,875.00 - 100,000 - 101,526 1271 Remediation Programs 19,463.62 20,588.54 - 45,806 - 48,502 1280 Alternative Education 323,267.81 360,901.32 3.00 553,105 3.17 559,699 1288 Charter Schools 4,719,107.96 4,895,498.73 - 5,010,000 - 5,120,000 1291 English Language Development Programs 2,025,206.30 2,023,223.00 32.14 2,154,631 32.14 2,273,605 1292 Teen Parent Programs 78,410.56 75,366.76 1.31 86,311 1.31 89,465 1400 Summer School Programs - 375.00 - - - -
1000 Instruction Total 57,794,000.18 61,023,606.01 685.91 63,619,626 675.81 64,469,448 2000 Support Services
2112 Attendance Services 33,526.72 21,952.60 - 46,380 - 48,882 2113 Social Work Services 79,397.50 89,338.13 1.00 89,200 1.50 139,575 2115 Student Safety 255,002.83 250,236.12 4.35 327,720 4.31 333,946 2119 Multicultural Programs 64,248.24 65,242.09 1.00 69,162 2.50 211,970 2122 Counseling Services 1,248,056.44 1,241,137.78 15.95 1,312,743 15.94 1,355,772 2130 Health Services 632,349.97 610,103.19 11.22 950,728 11.78 1,042,288
GENERAL FUND FUNCTION DETAIL Page 67
GENERAL FUND FUNCTION DETAIL
Function Description Actual
2014–15 Actual
2015–16 FTE
2016–17 Adopted 2016–17
FTE 2017–18
Proposed 2017–18
Approved 2017–18
Adopted 2017–18
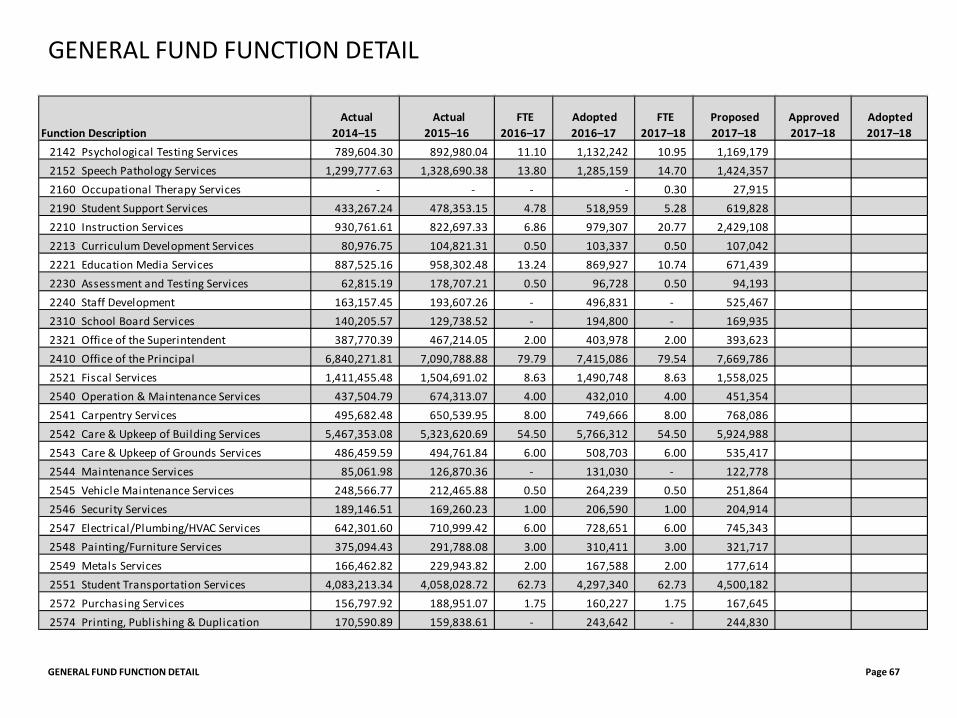
2142 Psychological Testing Services 789,604.30 892,980.04 11.10 1,132,242 10.95 1,169,179 2152 Speech Pathology Services 1,299,777.63 1,328,690.38 13.80 1,285,159 14.70 1,424,357 2160 Occupational Therapy Services - - - - 0.30 27,915 2190 Student Support Services 433,267.24 478,353.15 4.78 518,959 5.28 619,828 2210 Instruction Services 930,761.61 822,697.33 6.86 979,307 20.77 2,429,108 2213 Curriculum Development Services 80,976.75 104,821.31 0.50 103,337 0.50 107,042 2221 Education Media Services 887,525.16 958,302.48 13.24 869,927 10.74 671,439 2230 Assessment and Testing Services 62,815.19 178,707.21 0.50 96,728 0.50 94,193 2240 Staff Development 163,157.45 193,607.26 - 496,831 - 525,467 2310 School Board Services 140,205.57 129,738.52 - 194,800 - 169,935 2321 Office of the Superintendent 387,770.39 467,214.05 2.00 403,978 2.00 393,623 2410 Office of the Principal 6,840,271.81 7,090,788.88 79.79 7,415,086 79.54 7,669,786 2521 Fiscal Services 1,411,455.48 1,504,691.02 8.63 1,490,748 8.63 1,558,025 2540 Operation & Maintenance Services 437,504.79 674,313.07 4.00 432,010 4.00 451,354 2541 Carpentry Services 495,682.48 650,539.95 8.00 749,666 8.00 768,086 2542 Care & Upkeep of Building Services 5,467,353.08 5,323,620.69 54.50 5,766,312 54.50 5,924,988 2543 Care & Upkeep of Grounds Services 486,459.59 494,761.84 6.00 508,703 6.00 535,417 2544 Maintenance Services 85,061.98 126,870.36 - 131,030 - 122,778 2545 Vehicle Maintenance Services 248,566.77 212,465.88 0.50 264,239 0.50 251,864 2546 Security Services 189,146.51 169,260.23 1.00 206,590 1.00 204,914 2547 Electrical/Plumbing/HVAC Services 642,301.60 710,999.42 6.00 728,651 6.00 745,343 2548 Painting/Furniture Services 375,094.43 291,788.08 3.00 310,411 3.00 321,717 2549 Metals Services 166,462.82 229,943.82 2.00 167,588 2.00 177,614 2551 Student Transportation Services 4,083,213.34 4,058,028.72 62.73 4,297,340 62.73 4,500,182 2572 Purchasing Services 156,797.92 188,951.07 1.75 160,227 1.75 167,645 2574 Printing, Publishing & Duplication 170,590.89 159,838.61 - 243,642 - 244,830
GENERAL FUND FUNCTION DETAIL Page 68
GENERAL FUND FUNCTION DETAIL
Function Description Actual
2014–15 Actual
2015–16 FTE
2016–17 Adopted 2016–17
FTE 2017–18
Proposed 2017–18
Approved 2017–18
Adopted 2017–18
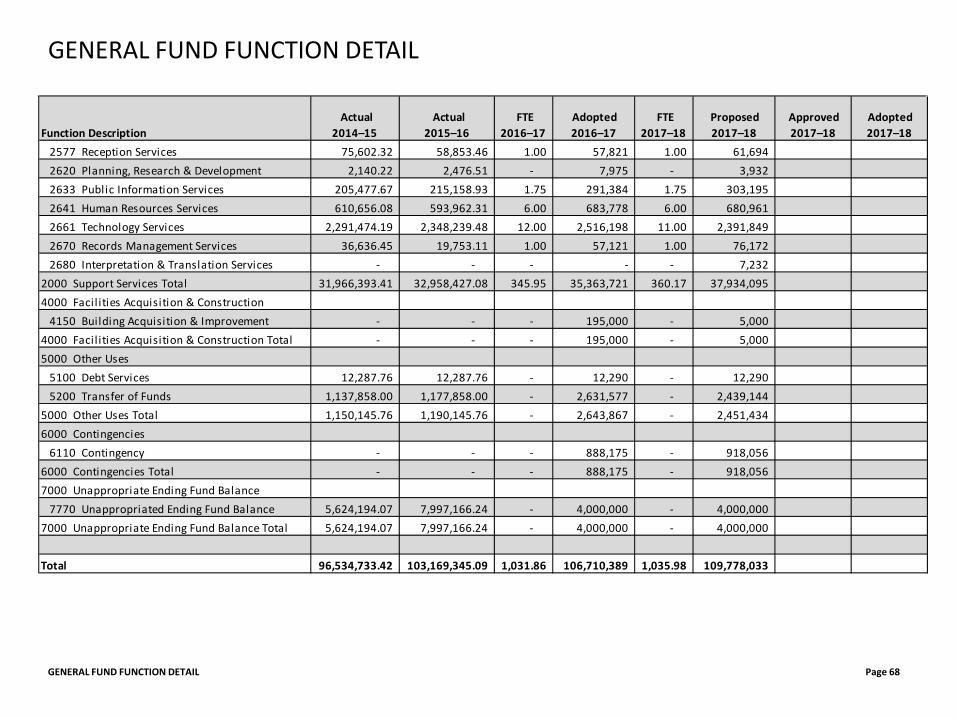
2577 Reception Services 75,602.32 58,853.46 1.00 57,821 1.00 61,694 2620 Planning, Research & Development 2,140.22 2,476.51 - 7,975 - 3,932 2633 Public Information Services 205,477.67 215,158.93 1.75 291,384 1.75 303,195 2641 Human Resources Services 610,656.08 593,962.31 6.00 683,778 6.00 680,961 2661 Technology Services 2,291,474.19 2,348,239.48 12.00 2,516,198 11.00 2,391,849 2670 Records Management Services 36,636.45 19,753.11 1.00 57,121 1.00 76,172 2680 Interpretation & Translation Services - - - - - 7,232
2000 Support Services Total 31,966,393.41 32,958,427.08 345.95 35,363,721 360.17 37,934,095 4000 Facil ities Acquisition & Construction
4150 Building Acquisition & Improvement - - - 195,000 - 5,000 4000 Facil ities Acquisition & Construction Total - - - 195,000 - 5,000 5000 Other Uses
5100 Debt Services 12,287.76 12,287.76 - 12,290 - 12,290 5200 Transfer of Funds 1,137,858.00 1,177,858.00 - 2,631,577 - 2,439,144
5000 Other Uses Total 1,150,145.76 1,190,145.76 - 2,643,867 - 2,451,434 6000 Contingencies
6110 Contingency - - - 888,175 - 918,056 6000 Contingencies Total - - - 888,175 - 918,056 7000 Unappropriate Ending Fund Balance
7770 Unappropriated Ending Fund Balance 5,624,194.07 7,997,166.24 - 4,000,000 - 4,000,000 7000 Unappropriate Ending Fund Balance Total 5,624,194.07 7,997,166.24 - 4,000,000 - 4,000,000
Total 96,534,733.42 103,169,345.09 1,031.86 106,710,389 1,035.98 109,778,033
GENERAL FUND OBJECT DETAIL Page 69
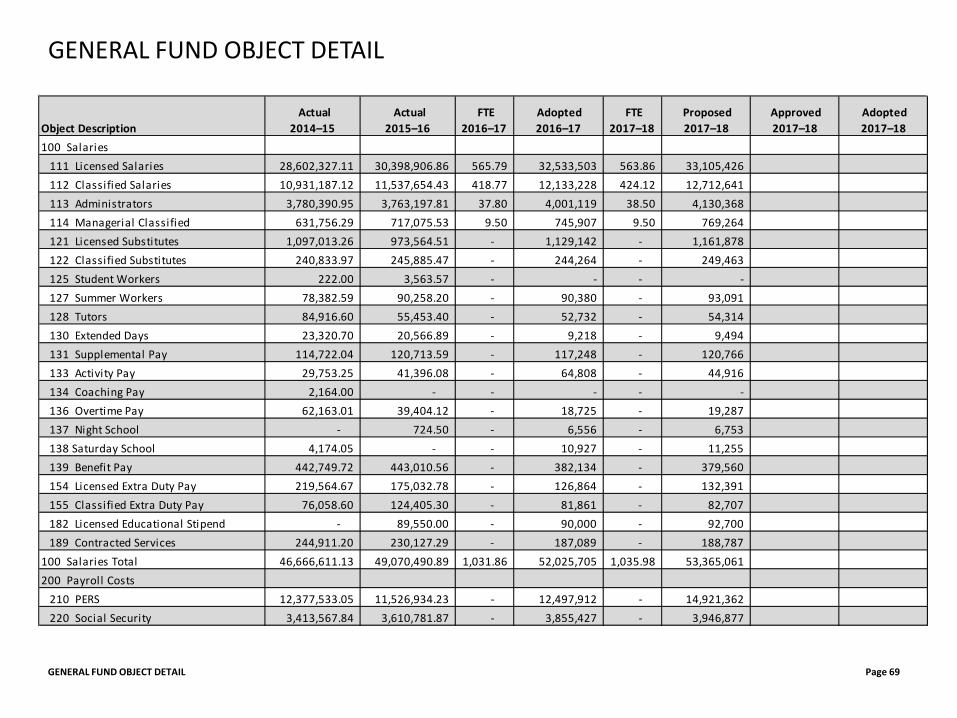
GENERAL FUND OBJECT DETAIL
Object Description Actual
2014–15 Actual
2015–16 FTE
2016–17 Adopted 2016–17
FTE 2017–18
Proposed 2017–18
Approved 2017–18
Adopted 2017–18
100 Salaries111 Licensed Salaries 28,602,327.11 30,398,906.86 565.79 32,533,503 563.86 33,105,426 112 Classified Salaries 10,931,187.12 11,537,654.43 418.77 12,133,228 424.12 12,712,641 113 Administrators 3,780,390.95 3,763,197.81 37.80 4,001,119 38.50 4,130,368 114 Managerial Classified 631,756.29 717,075.53 9.50 745,907 9.50 769,264 121 Licensed Substitutes 1,097,013.26 973,564.51 - 1,129,142 - 1,161,878 122 Classified Substitutes 240,833.97 245,885.47 - 244,264 - 249,463 125 Student Workers 222.00 3,563.57 - - - - 127 Summer Workers 78,382.59 90,258.20 - 90,380 - 93,091 128 Tutors 84,916.60 55,453.40 - 52,732 - 54,314 130 Extended Days 23,320.70 20,566.89 - 9,218 - 9,494 131 Supplemental Pay 114,722.04 120,713.59 - 117,248 - 120,766 133 Activity Pay 29,753.25 41,396.08 - 64,808 - 44,916 134 Coaching Pay 2,164.00 - - - - - 136 Overtime Pay 62,163.01 39,404.12 - 18,725 - 19,287 137 Night School - 724.50 - 6,556 - 6,753 138 Saturday School 4,174.05 - - 10,927 - 11,255 139 Benefit Pay 442,749.72 443,010.56 - 382,134 - 379,560 154 Licensed Extra Duty Pay 219,564.67 175,032.78 - 126,864 - 132,391 155 Classified Extra Duty Pay 76,058.60 124,405.30 - 81,861 - 82,707 182 Licensed Educational Stipend - 89,550.00 - 90,000 - 92,700 189 Contracted Services 244,911.20 230,127.29 - 187,089 - 188,787
100 Salaries Total 46,666,611.13 49,070,490.89 1,031.86 52,025,705 1,035.98 53,365,061 200 Payroll Costs
210 PERS 12,377,533.05 11,526,934.23 - 12,497,912 - 14,921,362 220 Social Security 3,413,567.84 3,610,781.87 - 3,855,427 - 3,946,877
GENERAL FUND OBJECT DETAIL Page 70
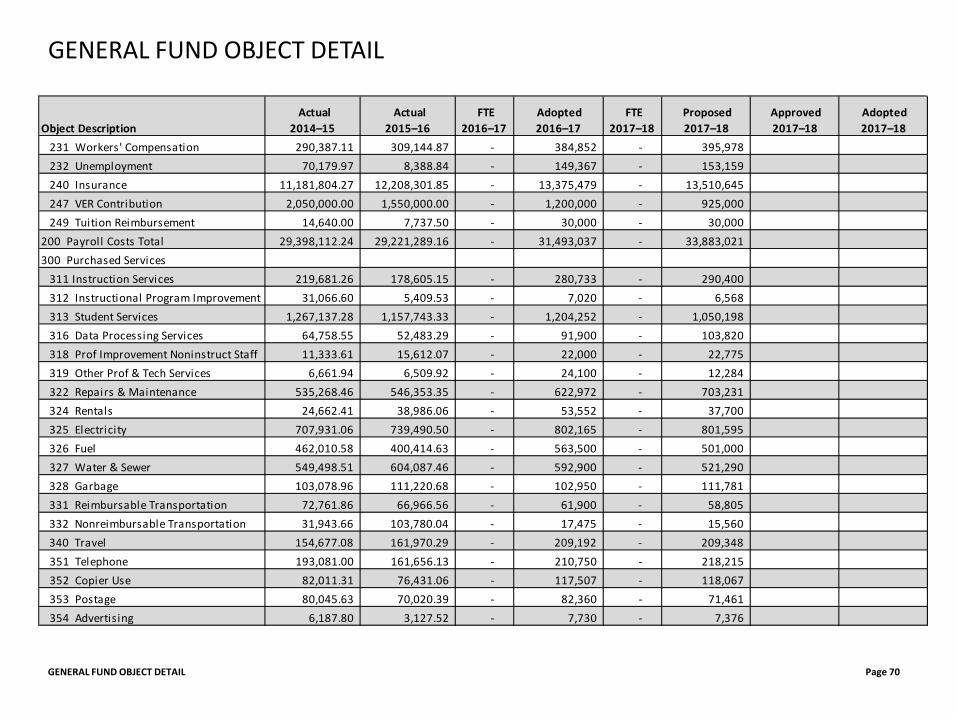
GENERAL FUND OBJECT DETAIL
Object Description Actual
2014–15 Actual
2015–16 FTE
2016–17 Adopted 2016–17
FTE 2017–18
Proposed 2017–18
Approved 2017–18
Adopted 2017–18
231 Workers' Compensation 290,387.11 309,144.87 - 384,852 - 395,978 232 Unemployment 70,179.97 8,388.84 - 149,367 - 153,159 240 Insurance 11,181,804.27 12,208,301.85 - 13,375,479 - 13,510,645 247 VER Contribution 2,050,000.00 1,550,000.00 - 1,200,000 - 925,000 249 Tuition Reimbursement 14,640.00 7,737.50 - 30,000 - 30,000
200 Payroll Costs Total 29,398,112.24 29,221,289.16 - 31,493,037 - 33,883,021 300 Purchased Services
311 Instruction Services 219,681.26 178,605.15 - 280,733 - 290,400 312 Instructional Program Improvement 31,066.60 5,409.53 - 7,020 - 6,568 313 Student Services 1,267,137.28 1,157,743.33 - 1,204,252 - 1,050,198 316 Data Processing Services 64,758.55 52,483.29 - 91,900 - 103,820 318 Prof Improvement Noninstruct Staff 11,333.61 15,612.07 - 22,000 - 22,775 319 Other Prof & Tech Services 6,661.94 6,509.92 - 24,100 - 12,284 322 Repairs & Maintenance 535,268.46 546,353.35 - 622,972 - 703,231 324 Rentals 24,662.41 38,986.06 - 53,552 - 37,700 325 Electricity 707,931.06 739,490.50 - 802,165 - 801,595 326 Fuel 462,010.58 400,414.63 - 563,500 - 501,000 327 Water & Sewer 549,498.51 604,087.46 - 592,900 - 521,290 328 Garbage 103,078.96 111,220.68 - 102,950 - 111,781 331 Reimbursable Transportation 72,761.86 66,966.56 - 61,900 - 58,805 332 Nonreimbursable Transportation 31,943.66 103,780.04 - 17,475 - 15,560 340 Travel 154,677.08 161,970.29 - 209,192 - 209,348 351 Telephone 193,081.00 161,656.13 - 210,750 - 218,215 352 Copier Use 82,011.31 76,431.06 - 117,507 - 118,067 353 Postage 80,045.63 70,020.39 - 82,360 - 71,461 354 Advertising 6,187.80 3,127.52 - 7,730 - 7,376
GENERAL FUND OBJECT DETAIL Page 71
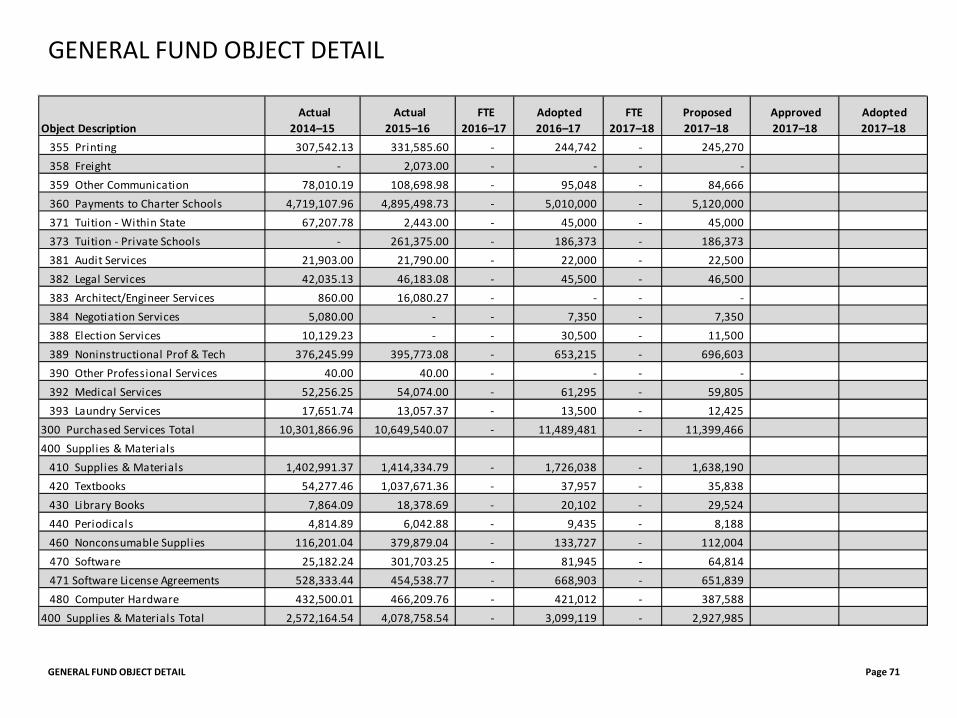
GENERAL FUND OBJECT DETAIL
Object Description Actual
2014–15 Actual
2015–16 FTE
2016–17 Adopted 2016–17
FTE 2017–18
Proposed 2017–18
Approved 2017–18
Adopted 2017–18
355 Printing 307,542.13 331,585.60 - 244,742 - 245,270 358 Freight - 2,073.00 - - - - 359 Other Communication 78,010.19 108,698.98 - 95,048 - 84,666 360 Payments to Charter Schools 4,719,107.96 4,895,498.73 - 5,010,000 - 5,120,000 371 Tuition - Within State 67,207.78 2,443.00 - 45,000 - 45,000 373 Tuition - Private Schools - 261,375.00 - 186,373 - 186,373 381 Audit Services 21,903.00 21,790.00 - 22,000 - 22,500 382 Legal Services 42,035.13 46,183.08 - 45,500 - 46,500 383 Architect/Engineer Services 860.00 16,080.27 - - - - 384 Negotiation Services 5,080.00 - - 7,350 - 7,350 388 Election Services 10,129.23 - - 30,500 - 11,500 389 Noninstructional Prof & Tech 376,245.99 395,773.08 - 653,215 - 696,603 390 Other Professional Services 40.00 40.00 - - - - 392 Medical Services 52,256.25 54,074.00 - 61,295 - 59,805 393 Laundry Services 17,651.74 13,057.37 - 13,500 - 12,425
300 Purchased Services Total 10,301,866.96 10,649,540.07 - 11,489,481 - 11,399,466 400 Supplies & Materials
410 Supplies & Materials 1,402,991.37 1,414,334.79 - 1,726,038 - 1,638,190 420 Textbooks 54,277.46 1,037,671.36 - 37,957 - 35,838 430 Library Books 7,864.09 18,378.69 - 20,102 - 29,524 440 Periodicals 4,814.89 6,042.88 - 9,435 - 8,188 460 Nonconsumable Supplies 116,201.04 379,879.04 - 133,727 - 112,004 470 Software 25,182.24 301,703.25 - 81,945 - 64,814 471 Software License Agreements 528,333.44 454,538.77 - 668,903 - 651,839 480 Computer Hardware 432,500.01 466,209.76 - 421,012 - 387,588
400 Supplies & Materials Total 2,572,164.54 4,078,758.54 - 3,099,119 - 2,927,985
GENERAL FUND OBJECT DETAIL Page 72
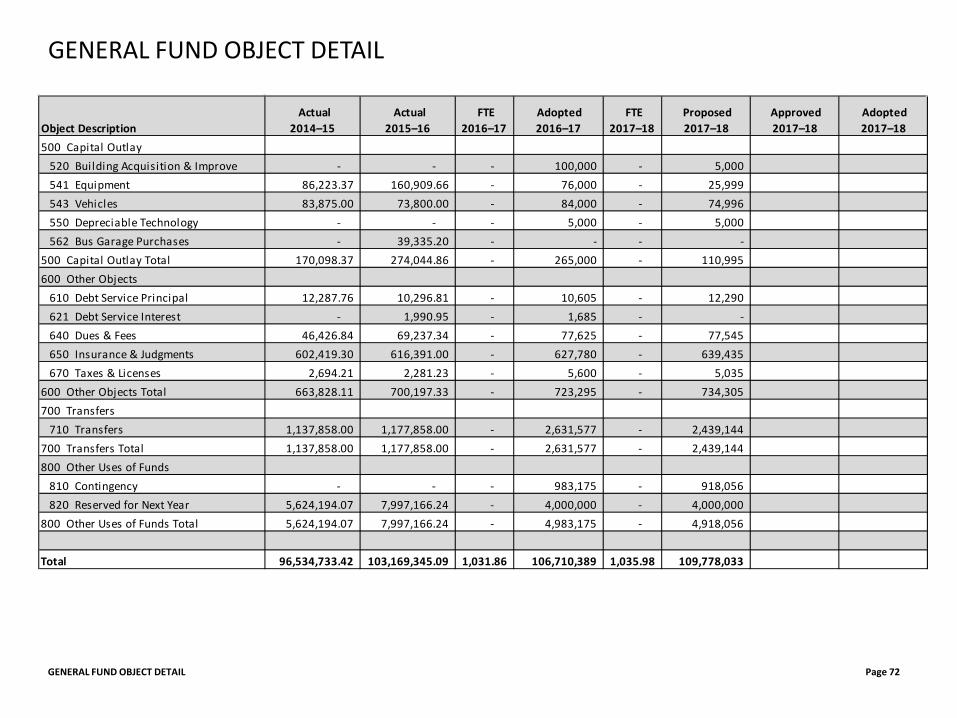
GENERAL FUND OBJECT DETAIL
Object Description Actual
2014–15 Actual
2015–16 FTE
2016–17 Adopted 2016–17
FTE 2017–18
Proposed 2017–18
Approved 2017–18
Adopted 2017–18
500 Capital Outlay520 Building Acquisition & Improve - - - 100,000 - 5,000 541 Equipment 86,223.37 160,909.66 - 76,000 - 25,999 543 Vehicles 83,875.00 73,800.00 - 84,000 - 74,996 550 Depreciable Technology - - - 5,000 - 5,000 562 Bus Garage Purchases - 39,335.20 - - - -
500 Capital Outlay Total 170,098.37 274,044.86 - 265,000 - 110,995 600 Other Objects
610 Debt Service Principal 12,287.76 10,296.81 - 10,605 - 12,290 621 Debt Service Interest - 1,990.95 - 1,685 - - 640 Dues & Fees 46,426.84 69,237.34 - 77,625 - 77,545 650 Insurance & Judgments 602,419.30 616,391.00 - 627,780 - 639,435 670 Taxes & Licenses 2,694.21 2,281.23 - 5,600 - 5,035
600 Other Objects Total 663,828.11 700,197.33 - 723,295 - 734,305 700 Transfers
710 Transfers 1,137,858.00 1,177,858.00 - 2,631,577 - 2,439,144 700 Transfers Total 1,137,858.00 1,177,858.00 - 2,631,577 - 2,439,144 800 Other Uses of Funds
810 Contingency - - - 983,175 - 918,056 820 Reserved for Next Year 5,624,194.07 7,997,166.24 - 4,000,000 - 4,000,000
800 Other Uses of Funds Total 5,624,194.07 7,997,166.24 - 4,983,175 - 4,918,056
Total 96,534,733.42 103,169,345.09 1,031.86 106,710,389 1,035.98 109,778,033
GENERAL FUND OBJECT SUMMARY Page 73
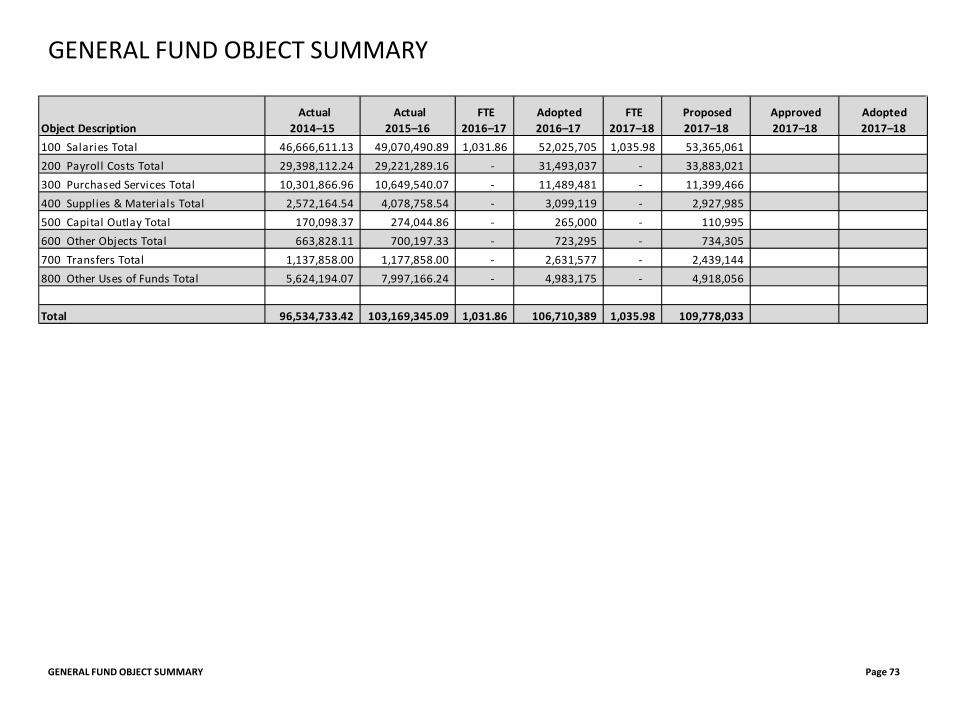
GENERAL FUND OBJECT SUMMARY
Object Description Actual
2014–15 Actual
2015–16 FTE
2016–17 Adopted 2016–17
FTE 2017–18
Proposed 2017–18
Approved 2017–18
Adopted 2017–18
100 Salaries Total 46,666,611.13 49,070,490.89 1,031.86 52,025,705 1,035.98 53,365,061 200 Payroll Costs Total 29,398,112.24 29,221,289.16 - 31,493,037 - 33,883,021 300 Purchased Services Total 10,301,866.96 10,649,540.07 - 11,489,481 - 11,399,466 400 Supplies & Materials Total 2,572,164.54 4,078,758.54 - 3,099,119 - 2,927,985 500 Capital Outlay Total 170,098.37 274,044.86 - 265,000 - 110,995 600 Other Objects Total 663,828.11 700,197.33 - 723,295 - 734,305 700 Transfers Total 1,137,858.00 1,177,858.00 - 2,631,577 - 2,439,144 800 Other Uses of Funds Total 5,624,194.07 7,997,166.24 - 4,983,175 - 4,918,056
Total 96,534,733.42 103,169,345.09 1,031.86 106,710,389 1,035.98 109,778,033
GENERAL FUND OBJECT DETAIL BY FUNCTION Page 74
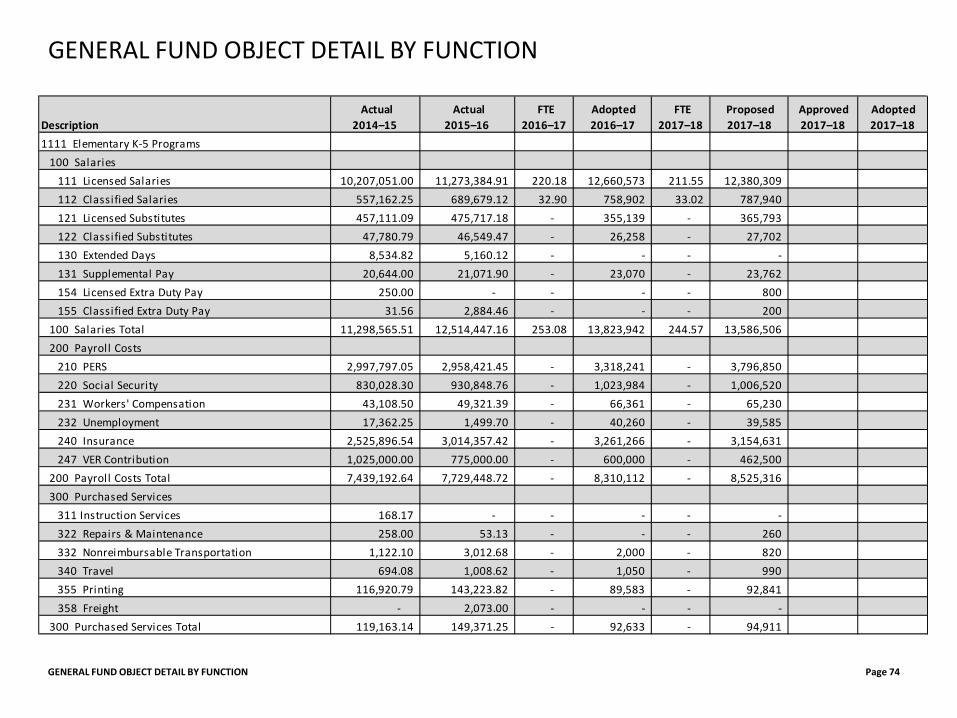
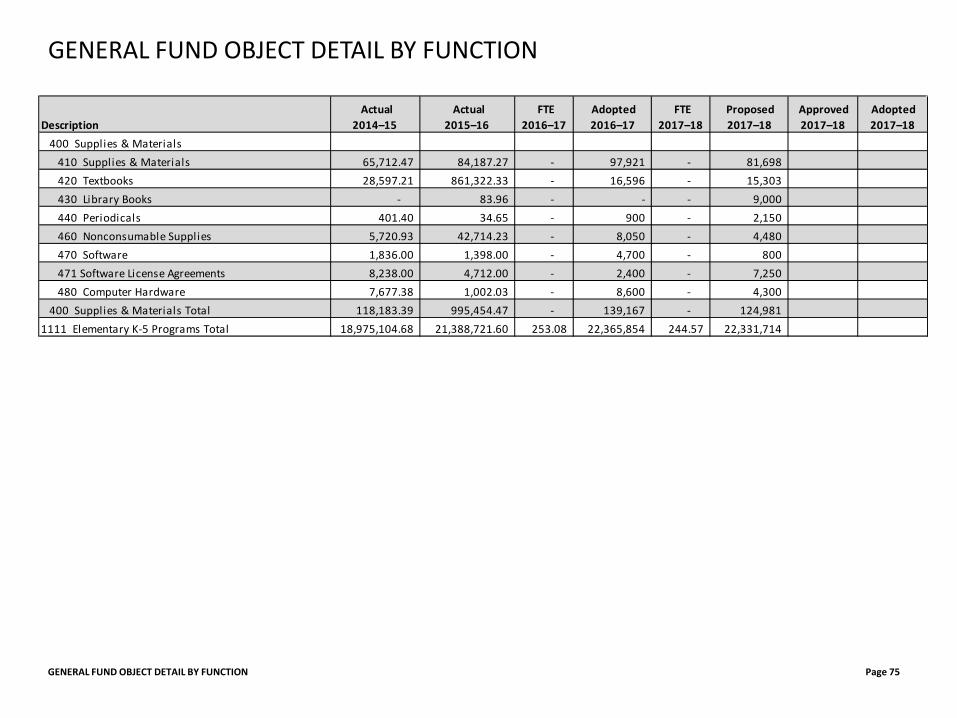
GENERAL FUND OBJECT DETAIL BY FUNCTION
Description Actual
2014–15 Actual
2015–16 FTE
2016–17 Adopted 2016–17
FTE 2017–18
Proposed 2017–18
Approved 2017–18
Adopted 2017–18
1111 Elementary K-5 Programs100 Salaries
111 Licensed Salaries 10,207,051.00 11,273,384.91 220.18 12,660,573 211.55 12,380,309 112 Classified Salaries 557,162.25 689,679.12 32.90 758,902 33.02 787,940 121 Licensed Substitutes 457,111.09 475,717.18 - 355,139 - 365,793 122 Classified Substitutes 47,780.79 46,549.47 - 26,258 - 27,702 130 Extended Days 8,534.82 5,160.12 - - - - 131 Supplemental Pay 20,644.00 21,071.90 - 23,070 - 23,762 154 Licensed Extra Duty Pay 250.00 - - - - 800 155 Classified Extra Duty Pay 31.56 2,884.46 - - - 200
100 Salaries Total 11,298,565.51 12,514,447.16 253.08 13,823,942 244.57 13,586,506 200 Payroll Costs
210 PERS 2,997,797.05 2,958,421.45 - 3,318,241 - 3,796,850 220 Social Security 830,028.30 930,848.76 - 1,023,984 - 1,006,520 231 Workers' Compensation 43,108.50 49,321.39 - 66,361 - 65,230 232 Unemployment 17,362.25 1,499.70 - 40,260 - 39,585 240 Insurance 2,525,896.54 3,014,357.42 - 3,261,266 - 3,154,631 247 VER Contribution 1,025,000.00 775,000.00 - 600,000 - 462,500
200 Payroll Costs Total 7,439,192.64 7,729,448.72 - 8,310,112 - 8,525,316 300 Purchased Services
311 Instruction Services 168.17 - - - - - 322 Repairs & Maintenance 258.00 53.13 - - - 260 332 Nonreimbursable Transportation 1,122.10 3,012.68 - 2,000 - 820 340 Travel 694.08 1,008.62 - 1,050 - 990 355 Printing 116,920.79 143,223.82 - 89,583 - 92,841 358 Freight - 2,073.00 - - - -
300 Purchased Services Total 119,163.14 149,371.25 - 92,633 - 94,911
GENERAL FUND OBJECT DETAIL BY FUNCTION Page 75
GENERAL FUND OBJECT DETAIL BY FUNCTION
Description Actual
2014–15 Actual
2015–16 FTE
2016–17 Adopted 2016–17
FTE 2017–18
Proposed 2017–18
Approved 2017–18
Adopted 2017–18
400 Supplies & Materials410 Supplies & Materials 65,712.47 84,187.27 - 97,921 - 81,698 420 Textbooks 28,597.21 861,322.33 - 16,596 - 15,303 430 Library Books - 83.96 - - - 9,000 440 Periodicals 401.40 34.65 - 900 - 2,150 460 Nonconsumable Supplies 5,720.93 42,714.23 - 8,050 - 4,480 470 Software 1,836.00 1,398.00 - 4,700 - 800 471 Software License Agreements 8,238.00 4,712.00 - 2,400 - 7,250 480 Computer Hardware 7,677.38 1,002.03 - 8,600 - 4,300
400 Supplies & Materials Total 118,183.39 995,454.47 - 139,167 - 124,981 1111 Elementary K-5 Programs Total 18,975,104.68 21,388,721.60 253.08 22,365,854 244.57 22,331,714
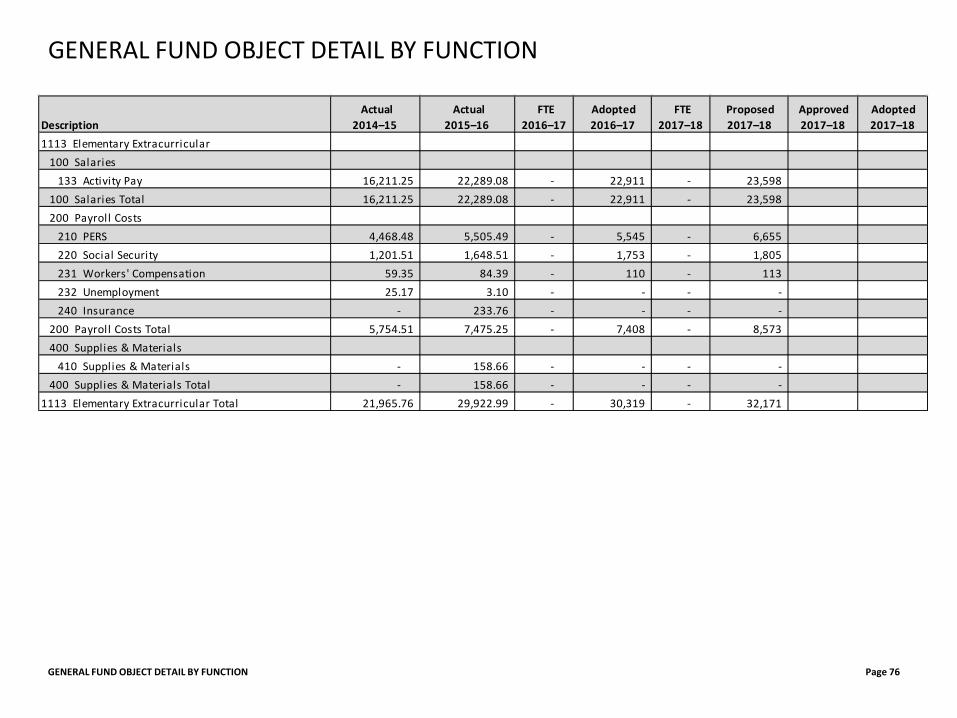
GENERAL FUND OBJECT DETAIL BY FUNCTION Page 76
GENERAL FUND OBJECT DETAIL BY FUNCTION
Description Actual
2014–15 Actual
2015–16 FTE
2016–17 Adopted 2016–17
FTE 2017–18
Proposed 2017–18
Approved 2017–18
Adopted 2017–18
1113 Elementary Extracurricular100 Salaries
133 Activity Pay 16,211.25 22,289.08 - 22,911 - 23,598 100 Salaries Total 16,211.25 22,289.08 - 22,911 - 23,598 200 Payroll Costs
210 PERS 4,468.48 5,505.49 - 5,545 - 6,655 220 Social Security 1,201.51 1,648.51 - 1,753 - 1,805 231 Workers' Compensation 59.35 84.39 - 110 - 113 232 Unemployment 25.17 3.10 - - - - 240 Insurance - 233.76 - - - -
200 Payroll Costs Total 5,754.51 7,475.25 - 7,408 - 8,573 400 Supplies & Materials
410 Supplies & Materials - 158.66 - - - - 400 Supplies & Materials Total - 158.66 - - - -
1113 Elementary Extracurricular Total 21,965.76 29,922.99 - 30,319 - 32,171
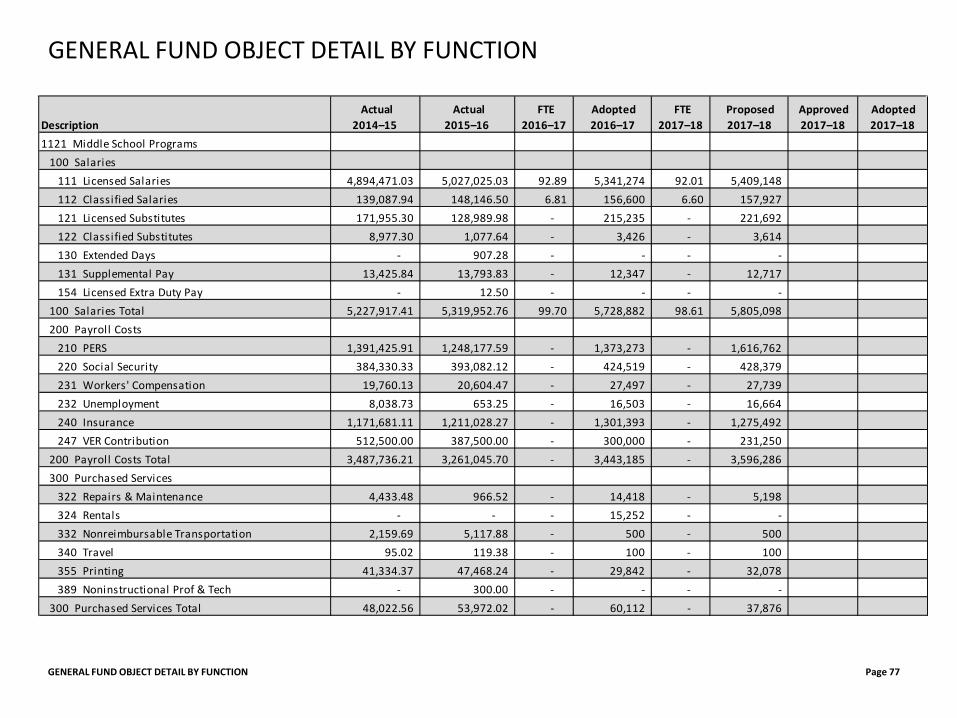
GENERAL FUND OBJECT DETAIL BY FUNCTION Page 77
GENERAL FUND OBJECT DETAIL BY FUNCTION
Description Actual
2014–15 Actual
2015–16 FTE
2016–17 Adopted 2016–17
FTE 2017–18
Proposed 2017–18
Approved 2017–18
Adopted 2017–18
1121 Middle School Programs100 Salaries
111 Licensed Salaries 4,894,471.03 5,027,025.03 92.89 5,341,274 92.01 5,409,148 112 Classified Salaries 139,087.94 148,146.50 6.81 156,600 6.60 157,927 121 Licensed Substitutes 171,955.30 128,989.98 - 215,235 - 221,692 122 Classified Substitutes 8,977.30 1,077.64 - 3,426 - 3,614 130 Extended Days - 907.28 - - - - 131 Supplemental Pay 13,425.84 13,793.83 - 12,347 - 12,717 154 Licensed Extra Duty Pay - 12.50 - - - -
100 Salaries Total 5,227,917.41 5,319,952.76 99.70 5,728,882 98.61 5,805,098 200 Payroll Costs
210 PERS 1,391,425.91 1,248,177.59 - 1,373,273 - 1,616,762 220 Social Security 384,330.33 393,082.12 - 424,519 - 428,379 231 Workers' Compensation 19,760.13 20,604.47 - 27,497 - 27,739 232 Unemployment 8,038.73 653.25 - 16,503 - 16,664 240 Insurance 1,171,681.11 1,211,028.27 - 1,301,393 - 1,275,492 247 VER Contribution 512,500.00 387,500.00 - 300,000 - 231,250
200 Payroll Costs Total 3,487,736.21 3,261,045.70 - 3,443,185 - 3,596,286 300 Purchased Services
322 Repairs & Maintenance 4,433.48 966.52 - 14,418 - 5,198 324 Rentals - - - 15,252 - - 332 Nonreimbursable Transportation 2,159.69 5,117.88 - 500 - 500 340 Travel 95.02 119.38 - 100 - 100 355 Printing 41,334.37 47,468.24 - 29,842 - 32,078 389 Noninstructional Prof & Tech - 300.00 - - - -
300 Purchased Services Total 48,022.56 53,972.02 - 60,112 - 37,876
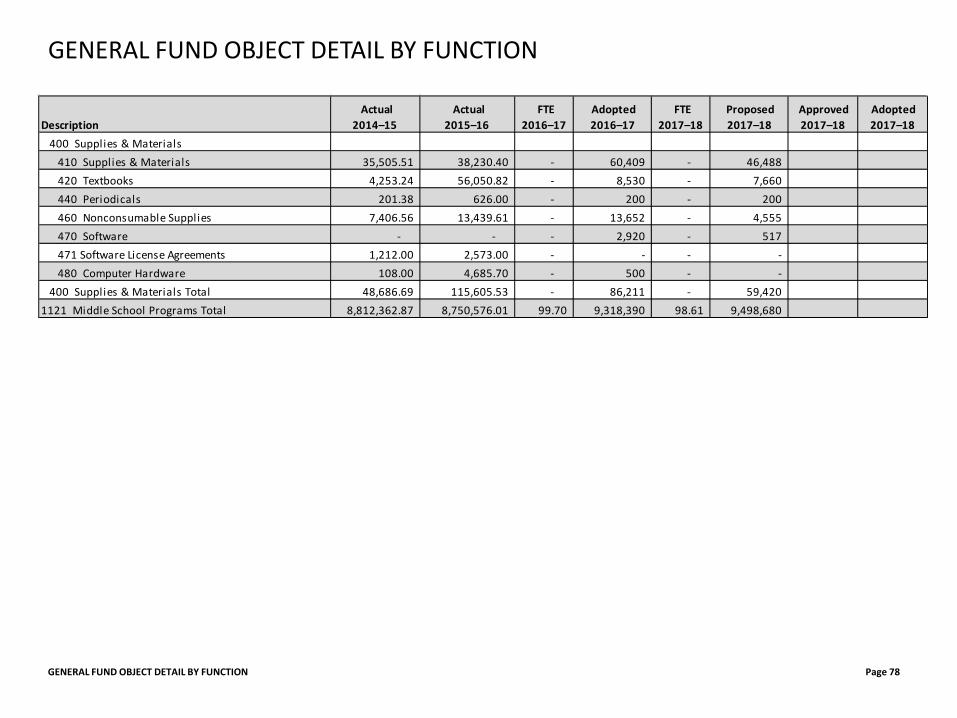
GENERAL FUND OBJECT DETAIL BY FUNCTION Page 78
GENERAL FUND OBJECT DETAIL BY FUNCTION
Description Actual
2014–15 Actual
2015–16 FTE
2016–17 Adopted 2016–17
FTE 2017–18
Proposed 2017–18
Approved 2017–18
Adopted 2017–18
400 Supplies & Materials410 Supplies & Materials 35,505.51 38,230.40 - 60,409 - 46,488 420 Textbooks 4,253.24 56,050.82 - 8,530 - 7,660 440 Periodicals 201.38 626.00 - 200 - 200 460 Nonconsumable Supplies 7,406.56 13,439.61 - 13,652 - 4,555 470 Software - - - 2,920 - 517 471 Software License Agreements 1,212.00 2,573.00 - - - - 480 Computer Hardware 108.00 4,685.70 - 500 - -
400 Supplies & Materials Total 48,686.69 115,605.53 - 86,211 - 59,420 1121 Middle School Programs Total 8,812,362.87 8,750,576.01 99.70 9,318,390 98.61 9,498,680
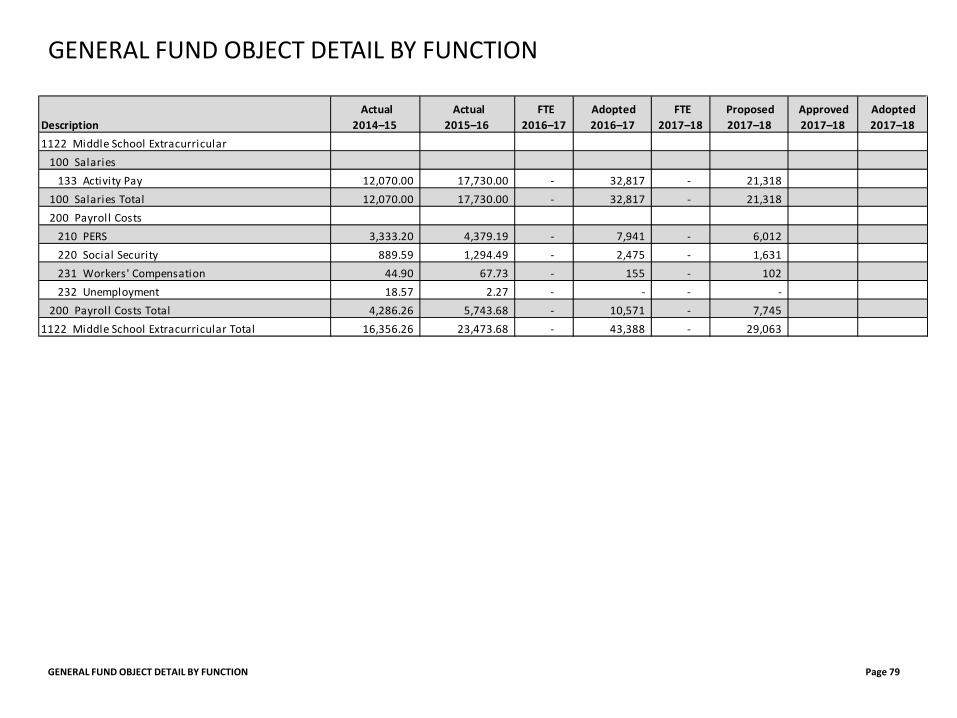
GENERAL FUND OBJECT DETAIL BY FUNCTION Page 79
GENERAL FUND OBJECT DETAIL BY FUNCTION
Description Actual
2014–15 Actual
2015–16 FTE
2016–17 Adopted 2016–17
FTE 2017–18
Proposed 2017–18
Approved 2017–18
Adopted 2017–18
1122 Middle School Extracurricular100 Salaries
133 Activity Pay 12,070.00 17,730.00 - 32,817 - 21,318 100 Salaries Total 12,070.00 17,730.00 - 32,817 - 21,318 200 Payroll Costs
210 PERS 3,333.20 4,379.19 - 7,941 - 6,012 220 Social Security 889.59 1,294.49 - 2,475 - 1,631 231 Workers' Compensation 44.90 67.73 - 155 - 102 232 Unemployment 18.57 2.27 - - - -
200 Payroll Costs Total 4,286.26 5,743.68 - 10,571 - 7,745 1122 Middle School Extracurricular Total 16,356.26 23,473.68 - 43,388 - 29,063
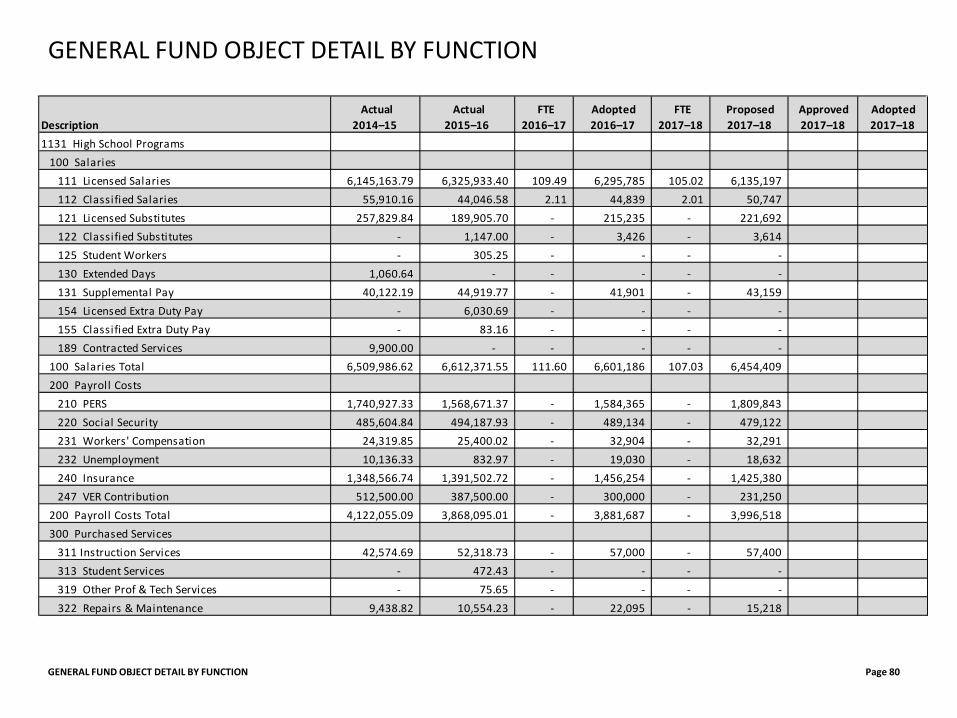
GENERAL FUND OBJECT DETAIL BY FUNCTION Page 80
GENERAL FUND OBJECT DETAIL BY FUNCTION
Description Actual
2014–15 Actual
2015–16 FTE
2016–17 Adopted 2016–17
FTE 2017–18
Proposed 2017–18
Approved 2017–18
Adopted 2017–18
1131 High School Programs100 Salaries
111 Licensed Salaries 6,145,163.79 6,325,933.40 109.49 6,295,785 105.02 6,135,197 112 Classified Salaries 55,910.16 44,046.58 2.11 44,839 2.01 50,747 121 Licensed Substitutes 257,829.84 189,905.70 - 215,235 - 221,692 122 Classified Substitutes - 1,147.00 - 3,426 - 3,614 125 Student Workers - 305.25 - - - - 130 Extended Days 1,060.64 - - - - - 131 Supplemental Pay 40,122.19 44,919.77 - 41,901 - 43,159 154 Licensed Extra Duty Pay - 6,030.69 - - - - 155 Classified Extra Duty Pay - 83.16 - - - - 189 Contracted Services 9,900.00 - - - - -
100 Salaries Total 6,509,986.62 6,612,371.55 111.60 6,601,186 107.03 6,454,409 200 Payroll Costs
210 PERS 1,740,927.33 1,568,671.37 - 1,584,365 - 1,809,843 220 Social Security 485,604.84 494,187.93 - 489,134 - 479,122 231 Workers' Compensation 24,319.85 25,400.02 - 32,904 - 32,291 232 Unemployment 10,136.33 832.97 - 19,030 - 18,632 240 Insurance 1,348,566.74 1,391,502.72 - 1,456,254 - 1,425,380 247 VER Contribution 512,500.00 387,500.00 - 300,000 - 231,250
200 Payroll Costs Total 4,122,055.09 3,868,095.01 - 3,881,687 - 3,996,518 300 Purchased Services
311 Instruction Services 42,574.69 52,318.73 - 57,000 - 57,400 313 Student Services - 472.43 - - - - 319 Other Prof & Tech Services - 75.65 - - - - 322 Repairs & Maintenance 9,438.82 10,554.23 - 22,095 - 15,218
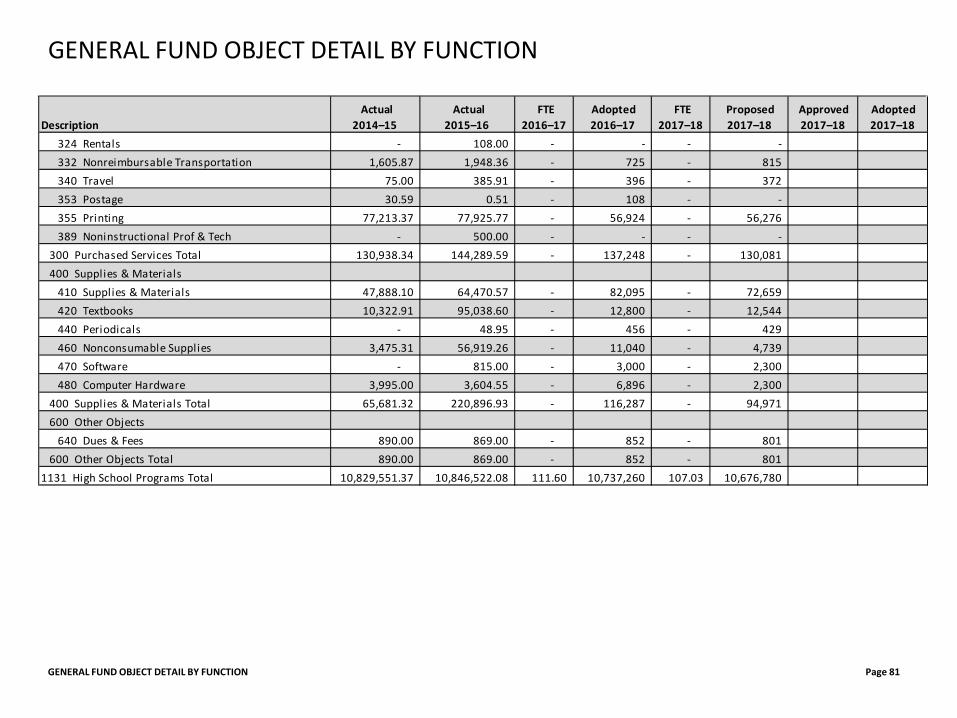
GENERAL FUND OBJECT DETAIL BY FUNCTION Page 81
GENERAL FUND OBJECT DETAIL BY FUNCTION
Description Actual
2014–15 Actual
2015–16 FTE
2016–17 Adopted 2016–17
FTE 2017–18
Proposed 2017–18
Approved 2017–18
Adopted 2017–18
324 Rentals - 108.00 - - - - 332 Nonreimbursable Transportation 1,605.87 1,948.36 - 725 - 815 340 Travel 75.00 385.91 - 396 - 372 353 Postage 30.59 0.51 - 108 - - 355 Printing 77,213.37 77,925.77 - 56,924 - 56,276 389 Noninstructional Prof & Tech - 500.00 - - - -
300 Purchased Services Total 130,938.34 144,289.59 - 137,248 - 130,081 400 Supplies & Materials
410 Supplies & Materials 47,888.10 64,470.57 - 82,095 - 72,659 420 Textbooks 10,322.91 95,038.60 - 12,800 - 12,544 440 Periodicals - 48.95 - 456 - 429 460 Nonconsumable Supplies 3,475.31 56,919.26 - 11,040 - 4,739 470 Software - 815.00 - 3,000 - 2,300 480 Computer Hardware 3,995.00 3,604.55 - 6,896 - 2,300
400 Supplies & Materials Total 65,681.32 220,896.93 - 116,287 - 94,971 600 Other Objects
640 Dues & Fees 890.00 869.00 - 852 - 801 600 Other Objects Total 890.00 869.00 - 852 - 801
1131 High School Programs Total 10,829,551.37 10,846,522.08 111.60 10,737,260 107.03 10,676,780
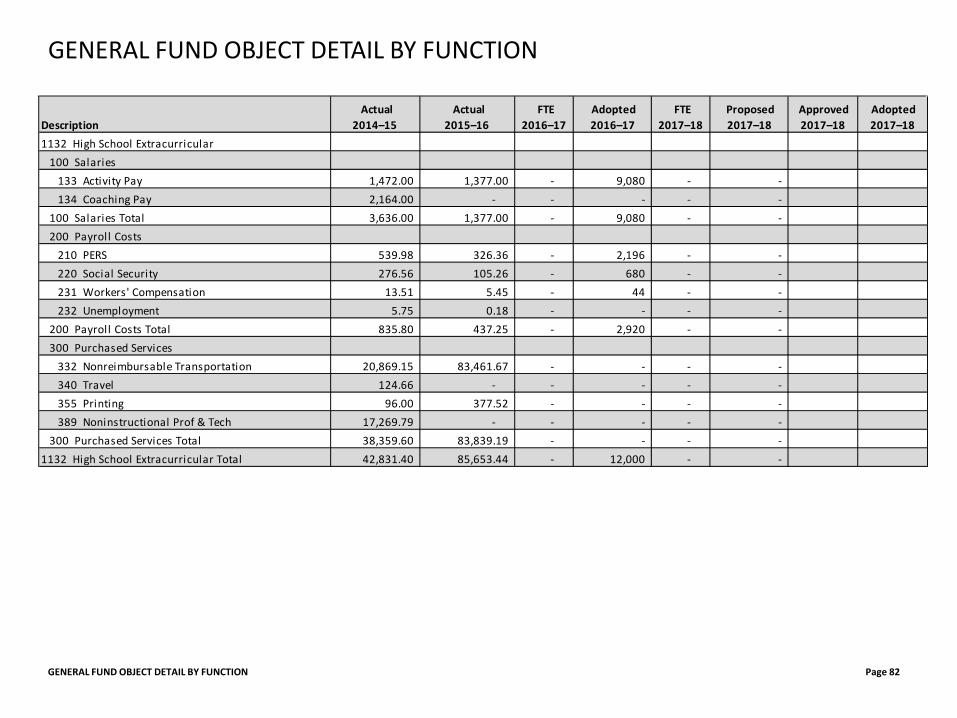
GENERAL FUND OBJECT DETAIL BY FUNCTION Page 82
GENERAL FUND OBJECT DETAIL BY FUNCTION
Description Actual
2014–15 Actual
2015–16 FTE
2016–17 Adopted 2016–17
FTE 2017–18
Proposed 2017–18
Approved 2017–18
Adopted 2017–18
1132 High School Extracurricular100 Salaries
133 Activity Pay 1,472.00 1,377.00 - 9,080 - - 134 Coaching Pay 2,164.00 - - - - -
100 Salaries Total 3,636.00 1,377.00 - 9,080 - - 200 Payroll Costs
210 PERS 539.98 326.36 - 2,196 - - 220 Social Security 276.56 105.26 - 680 - - 231 Workers' Compensation 13.51 5.45 - 44 - - 232 Unemployment 5.75 0.18 - - - -
200 Payroll Costs Total 835.80 437.25 - 2,920 - - 300 Purchased Services
332 Nonreimbursable Transportation 20,869.15 83,461.67 - - - - 340 Travel 124.66 - - - - - 355 Printing 96.00 377.52 - - - - 389 Noninstructional Prof & Tech 17,269.79 - - - - -
300 Purchased Services Total 38,359.60 83,839.19 - - - - 1132 High School Extracurricular Total 42,831.40 85,653.44 - 12,000 - -
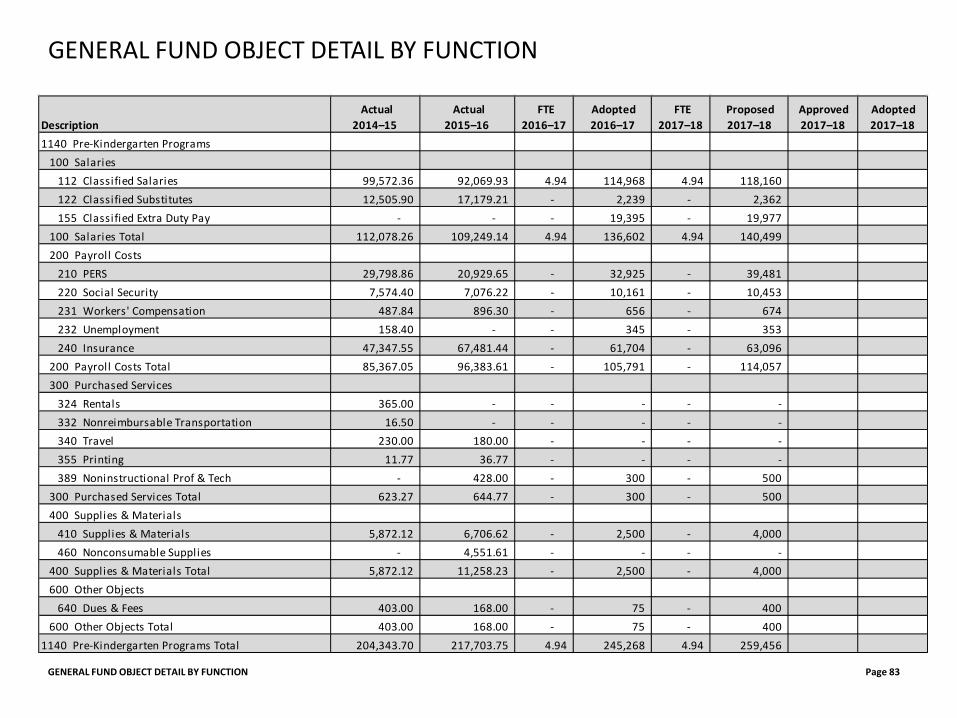
GENERAL FUND OBJECT DETAIL BY FUNCTION Page 83
GENERAL FUND OBJECT DETAIL BY FUNCTION
Description Actual
2014–15 Actual
2015–16 FTE
2016–17 Adopted 2016–17
FTE 2017–18
Proposed 2017–18
Approved 2017–18
Adopted 2017–18
1140 Pre-Kindergarten Programs100 Salaries
112 Classified Salaries 99,572.36 92,069.93 4.94 114,968 4.94 118,160 122 Classified Substitutes 12,505.90 17,179.21 - 2,239 - 2,362 155 Classified Extra Duty Pay - - - 19,395 - 19,977
100 Salaries Total 112,078.26 109,249.14 4.94 136,602 4.94 140,499 200 Payroll Costs
210 PERS 29,798.86 20,929.65 - 32,925 - 39,481 220 Social Security 7,574.40 7,076.22 - 10,161 - 10,453 231 Workers' Compensation 487.84 896.30 - 656 - 674 232 Unemployment 158.40 - - 345 - 353 240 Insurance 47,347.55 67,481.44 - 61,704 - 63,096
200 Payroll Costs Total 85,367.05 96,383.61 - 105,791 - 114,057 300 Purchased Services
324 Rentals 365.00 - - - - - 332 Nonreimbursable Transportation 16.50 - - - - - 340 Travel 230.00 180.00 - - - - 355 Printing 11.77 36.77 - - - - 389 Noninstructional Prof & Tech - 428.00 - 300 - 500
300 Purchased Services Total 623.27 644.77 - 300 - 500 400 Supplies & Materials
410 Supplies & Materials 5,872.12 6,706.62 - 2,500 - 4,000 460 Nonconsumable Supplies - 4,551.61 - - - -
400 Supplies & Materials Total 5,872.12 11,258.23 - 2,500 - 4,000 600 Other Objects
640 Dues & Fees 403.00 168.00 - 75 - 400 600 Other Objects Total 403.00 168.00 - 75 - 400
1140 Pre-Kindergarten Programs Total 204,343.70 217,703.75 4.94 245,268 4.94 259,456
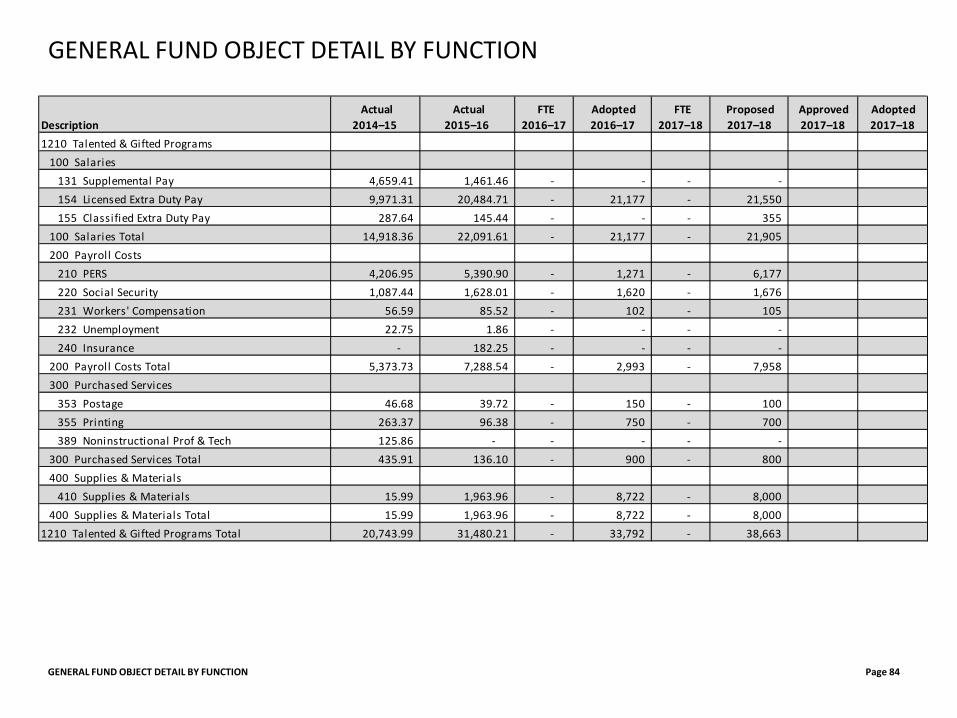
GENERAL FUND OBJECT DETAIL BY FUNCTION Page 84
GENERAL FUND OBJECT DETAIL BY FUNCTION
Description Actual
2014–15 Actual
2015–16 FTE
2016–17 Adopted 2016–17
FTE 2017–18
Proposed 2017–18
Approved 2017–18
Adopted 2017–18
1210 Talented & Gifted Programs100 Salaries
131 Supplemental Pay 4,659.41 1,461.46 - - - - 154 Licensed Extra Duty Pay 9,971.31 20,484.71 - 21,177 - 21,550 155 Classified Extra Duty Pay 287.64 145.44 - - - 355
100 Salaries Total 14,918.36 22,091.61 - 21,177 - 21,905 200 Payroll Costs
210 PERS 4,206.95 5,390.90 - 1,271 - 6,177 220 Social Security 1,087.44 1,628.01 - 1,620 - 1,676 231 Workers' Compensation 56.59 85.52 - 102 - 105 232 Unemployment 22.75 1.86 - - - - 240 Insurance - 182.25 - - - -
200 Payroll Costs Total 5,373.73 7,288.54 - 2,993 - 7,958 300 Purchased Services
353 Postage 46.68 39.72 - 150 - 100 355 Printing 263.37 96.38 - 750 - 700 389 Noninstructional Prof & Tech 125.86 - - - - -
300 Purchased Services Total 435.91 136.10 - 900 - 800 400 Supplies & Materials
410 Supplies & Materials 15.99 1,963.96 - 8,722 - 8,000 400 Supplies & Materials Total 15.99 1,963.96 - 8,722 - 8,000
1210 Talented & Gifted Programs Total 20,743.99 31,480.21 - 33,792 - 38,663
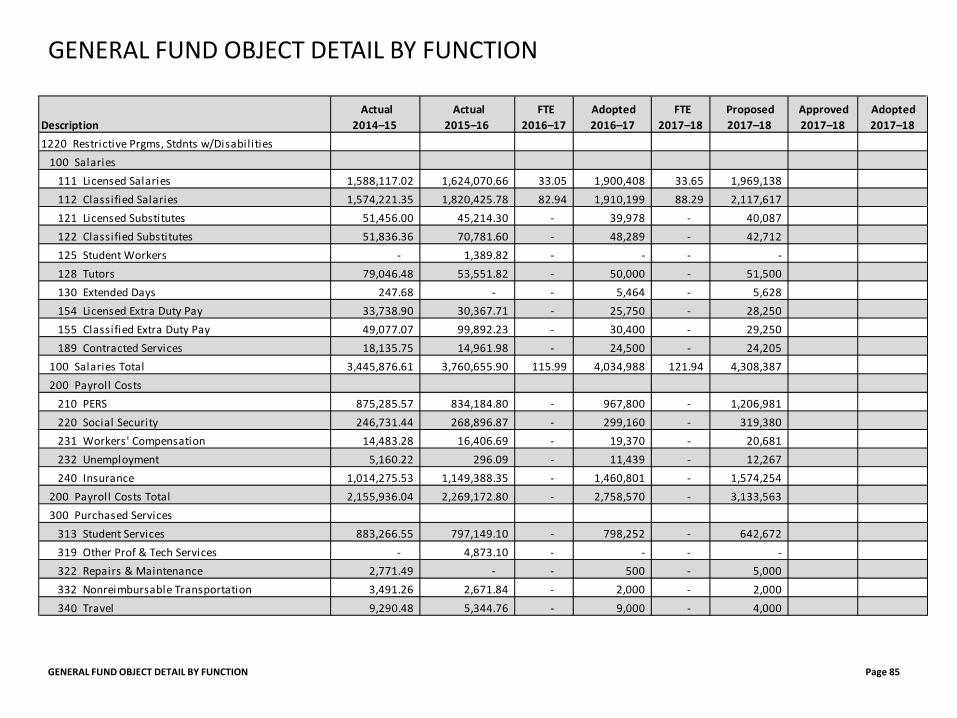
GENERAL FUND OBJECT DETAIL BY FUNCTION Page 85
GENERAL FUND OBJECT DETAIL BY FUNCTION
Description Actual
2014–15 Actual
2015–16 FTE
2016–17 Adopted 2016–17
FTE 2017–18
Proposed 2017–18
Approved 2017–18
Adopted 2017–18
1220 Restrictive Prgms, Stdnts w/Disabil ities100 Salaries
111 Licensed Salaries 1,588,117.02 1,624,070.66 33.05 1,900,408 33.65 1,969,138 112 Classified Salaries 1,574,221.35 1,820,425.78 82.94 1,910,199 88.29 2,117,617 121 Licensed Substitutes 51,456.00 45,214.30 - 39,978 - 40,087 122 Classified Substitutes 51,836.36 70,781.60 - 48,289 - 42,712 125 Student Workers - 1,389.82 - - - - 128 Tutors 79,046.48 53,551.82 - 50,000 - 51,500 130 Extended Days 247.68 - - 5,464 - 5,628 154 Licensed Extra Duty Pay 33,738.90 30,367.71 - 25,750 - 28,250 155 Classified Extra Duty Pay 49,077.07 99,892.23 - 30,400 - 29,250 189 Contracted Services 18,135.75 14,961.98 - 24,500 - 24,205
100 Salaries Total 3,445,876.61 3,760,655.90 115.99 4,034,988 121.94 4,308,387 200 Payroll Costs
210 PERS 875,285.57 834,184.80 - 967,800 - 1,206,981 220 Social Security 246,731.44 268,896.87 - 299,160 - 319,380 231 Workers' Compensation 14,483.28 16,406.69 - 19,370 - 20,681 232 Unemployment 5,160.22 296.09 - 11,439 - 12,267 240 Insurance 1,014,275.53 1,149,388.35 - 1,460,801 - 1,574,254
200 Payroll Costs Total 2,155,936.04 2,269,172.80 - 2,758,570 - 3,133,563 300 Purchased Services
313 Student Services 883,266.55 797,149.10 - 798,252 - 642,672 319 Other Prof & Tech Services - 4,873.10 - - - - 322 Repairs & Maintenance 2,771.49 - - 500 - 5,000 332 Nonreimbursable Transportation 3,491.26 2,671.84 - 2,000 - 2,000 340 Travel 9,290.48 5,344.76 - 9,000 - 4,000
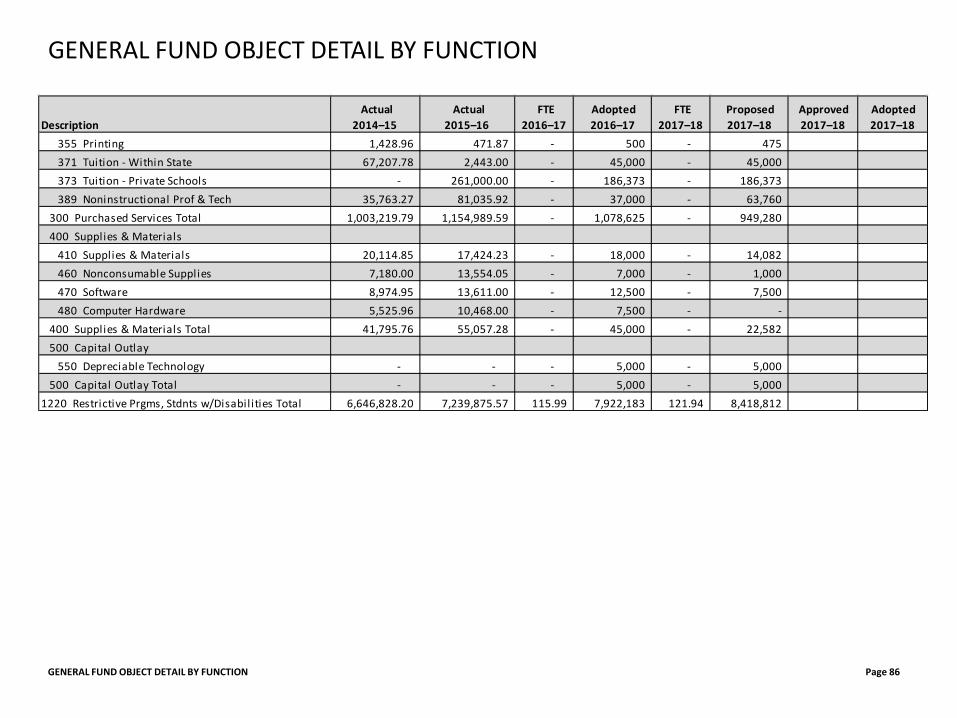
GENERAL FUND OBJECT DETAIL BY FUNCTION Page 86
GENERAL FUND OBJECT DETAIL BY FUNCTION
Description Actual
2014–15 Actual
2015–16 FTE
2016–17 Adopted 2016–17
FTE 2017–18
Proposed 2017–18
Approved 2017–18
Adopted 2017–18
355 Printing 1,428.96 471.87 - 500 - 475 371 Tuition - Within State 67,207.78 2,443.00 - 45,000 - 45,000 373 Tuition - Private Schools - 261,000.00 - 186,373 - 186,373 389 Noninstructional Prof & Tech 35,763.27 81,035.92 - 37,000 - 63,760
300 Purchased Services Total 1,003,219.79 1,154,989.59 - 1,078,625 - 949,280 400 Supplies & Materials
410 Supplies & Materials 20,114.85 17,424.23 - 18,000 - 14,082 460 Nonconsumable Supplies 7,180.00 13,554.05 - 7,000 - 1,000 470 Software 8,974.95 13,611.00 - 12,500 - 7,500 480 Computer Hardware 5,525.96 10,468.00 - 7,500 - -
400 Supplies & Materials Total 41,795.76 55,057.28 - 45,000 - 22,582 500 Capital Outlay
550 Depreciable Technology - - - 5,000 - 5,000 500 Capital Outlay Total - - - 5,000 - 5,000
1220 Restrictive Prgms, Stdnts w/Disabil ities Total 6,646,828.20 7,239,875.57 115.99 7,922,183 121.94 8,418,812
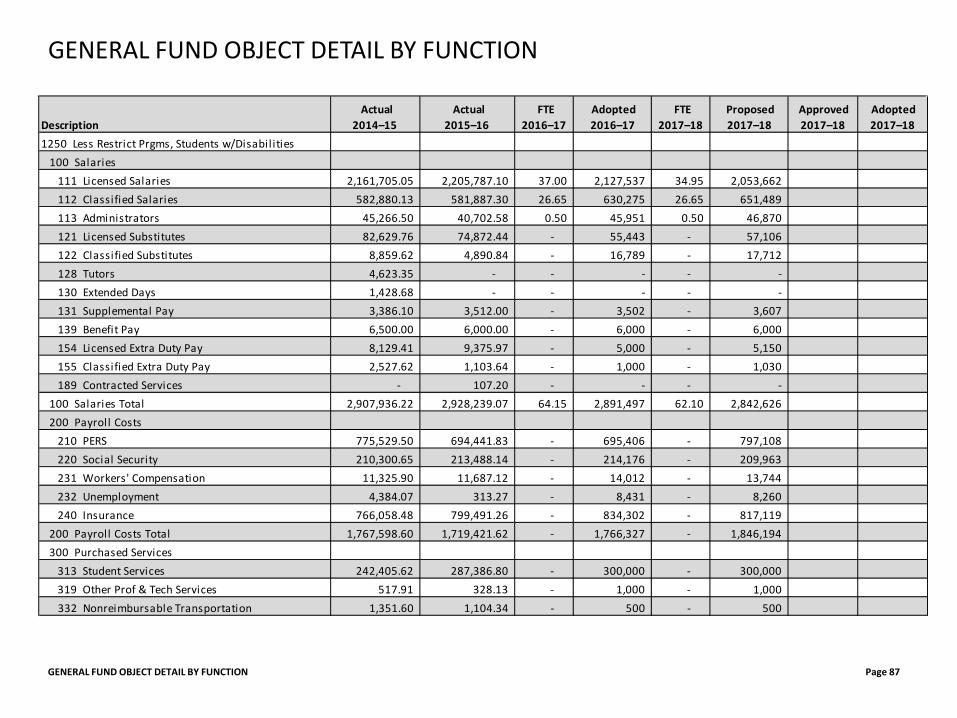
GENERAL FUND OBJECT DETAIL BY FUNCTION Page 87
GENERAL FUND OBJECT DETAIL BY FUNCTION
Description Actual
2014–15 Actual
2015–16 FTE
2016–17 Adopted 2016–17
FTE 2017–18
Proposed 2017–18
Approved 2017–18
Adopted 2017–18
1250 Less Restrict Prgms, Students w/Disabil ities100 Salaries
111 Licensed Salaries 2,161,705.05 2,205,787.10 37.00 2,127,537 34.95 2,053,662 112 Classified Salaries 582,880.13 581,887.30 26.65 630,275 26.65 651,489 113 Administrators 45,266.50 40,702.58 0.50 45,951 0.50 46,870 121 Licensed Substitutes 82,629.76 74,872.44 - 55,443 - 57,106 122 Classified Substitutes 8,859.62 4,890.84 - 16,789 - 17,712 128 Tutors 4,623.35 - - - - - 130 Extended Days 1,428.68 - - - - - 131 Supplemental Pay 3,386.10 3,512.00 - 3,502 - 3,607 139 Benefit Pay 6,500.00 6,000.00 - 6,000 - 6,000 154 Licensed Extra Duty Pay 8,129.41 9,375.97 - 5,000 - 5,150 155 Classified Extra Duty Pay 2,527.62 1,103.64 - 1,000 - 1,030 189 Contracted Services - 107.20 - - - -
100 Salaries Total 2,907,936.22 2,928,239.07 64.15 2,891,497 62.10 2,842,626 200 Payroll Costs
210 PERS 775,529.50 694,441.83 - 695,406 - 797,108 220 Social Security 210,300.65 213,488.14 - 214,176 - 209,963 231 Workers' Compensation 11,325.90 11,687.12 - 14,012 - 13,744 232 Unemployment 4,384.07 313.27 - 8,431 - 8,260 240 Insurance 766,058.48 799,491.26 - 834,302 - 817,119
200 Payroll Costs Total 1,767,598.60 1,719,421.62 - 1,766,327 - 1,846,194 300 Purchased Services
313 Student Services 242,405.62 287,386.80 - 300,000 - 300,000 319 Other Prof & Tech Services 517.91 328.13 - 1,000 - 1,000 332 Nonreimbursable Transportation 1,351.60 1,104.34 - 500 - 500
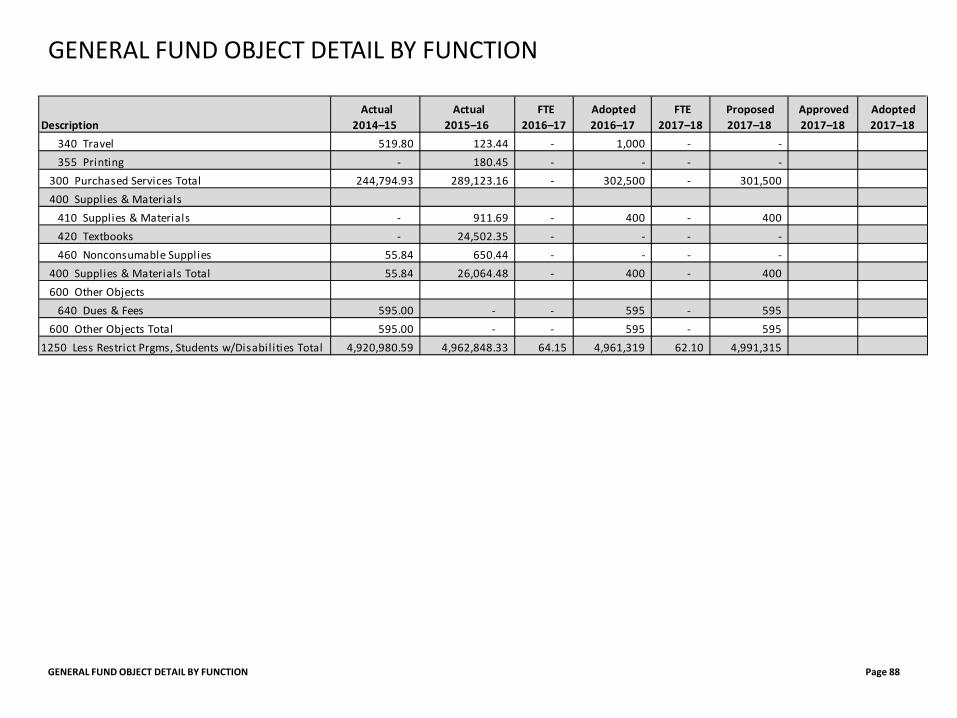
GENERAL FUND OBJECT DETAIL BY FUNCTION Page 88
GENERAL FUND OBJECT DETAIL BY FUNCTION
Description Actual
2014–15 Actual
2015–16 FTE
2016–17 Adopted 2016–17
FTE 2017–18
Proposed 2017–18
Approved 2017–18
Adopted 2017–18
340 Travel 519.80 123.44 - 1,000 - - 355 Printing - 180.45 - - - -
300 Purchased Services Total 244,794.93 289,123.16 - 302,500 - 301,500 400 Supplies & Materials
410 Supplies & Materials - 911.69 - 400 - 400 420 Textbooks - 24,502.35 - - - - 460 Nonconsumable Supplies 55.84 650.44 - - - -
400 Supplies & Materials Total 55.84 26,064.48 - 400 - 400 600 Other Objects
640 Dues & Fees 595.00 - - 595 - 595 600 Other Objects Total 595.00 - - 595 - 595
1250 Less Restrict Prgms, Students w/Disabil ities Total 4,920,980.59 4,962,848.33 64.15 4,961,319 62.10 4,991,315
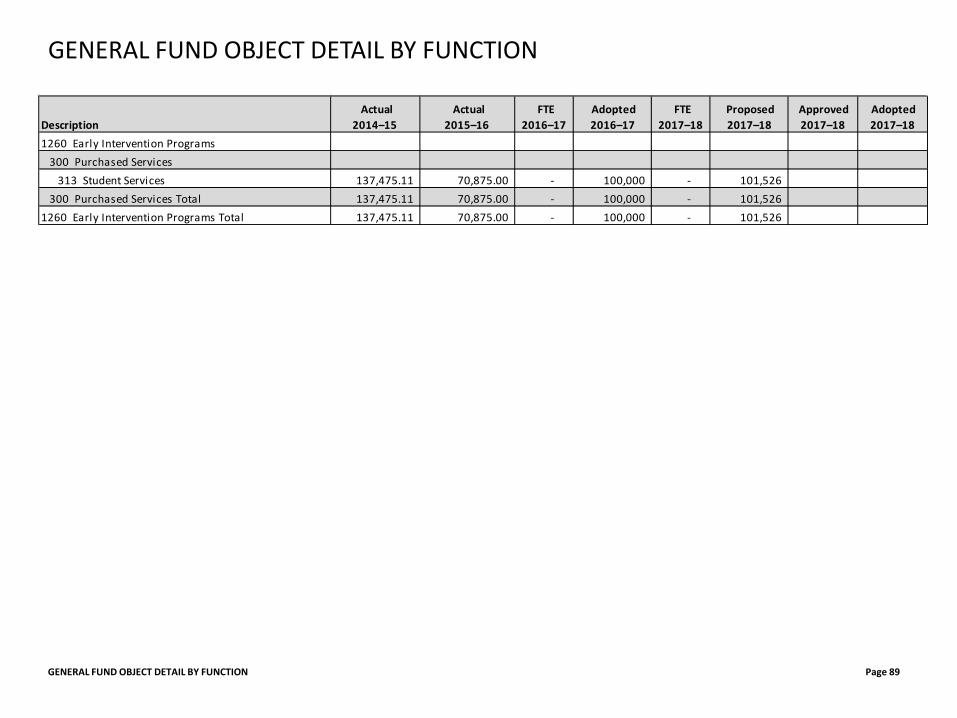
GENERAL FUND OBJECT DETAIL BY FUNCTION Page 89
GENERAL FUND OBJECT DETAIL BY FUNCTION
Description Actual
2014–15 Actual
2015–16 FTE
2016–17 Adopted 2016–17
FTE 2017–18
Proposed 2017–18
Approved 2017–18
Adopted 2017–18
1260 Early Intervention Programs300 Purchased Services
313 Student Services 137,475.11 70,875.00 - 100,000 - 101,526 300 Purchased Services Total 137,475.11 70,875.00 - 100,000 - 101,526
1260 Early Intervention Programs Total 137,475.11 70,875.00 - 100,000 - 101,526
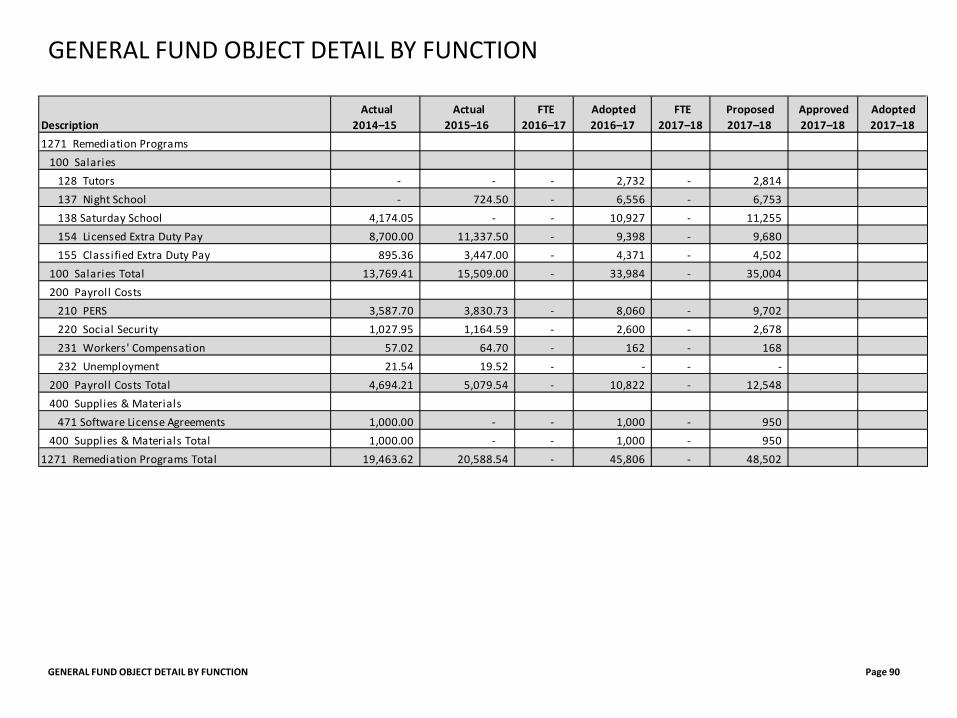
GENERAL FUND OBJECT DETAIL BY FUNCTION Page 90
GENERAL FUND OBJECT DETAIL BY FUNCTION
Description Actual
2014–15 Actual
2015–16 FTE
2016–17 Adopted 2016–17
FTE 2017–18
Proposed 2017–18
Approved 2017–18
Adopted 2017–18
1271 Remediation Programs100 Salaries
128 Tutors - - - 2,732 - 2,814 137 Night School - 724.50 - 6,556 - 6,753 138 Saturday School 4,174.05 - - 10,927 - 11,255 154 Licensed Extra Duty Pay 8,700.00 11,337.50 - 9,398 - 9,680 155 Classified Extra Duty Pay 895.36 3,447.00 - 4,371 - 4,502
100 Salaries Total 13,769.41 15,509.00 - 33,984 - 35,004 200 Payroll Costs
210 PERS 3,587.70 3,830.73 - 8,060 - 9,702 220 Social Security 1,027.95 1,164.59 - 2,600 - 2,678 231 Workers' Compensation 57.02 64.70 - 162 - 168 232 Unemployment 21.54 19.52 - - - -
200 Payroll Costs Total 4,694.21 5,079.54 - 10,822 - 12,548 400 Supplies & Materials
471 Software License Agreements 1,000.00 - - 1,000 - 950 400 Supplies & Materials Total 1,000.00 - - 1,000 - 950
1271 Remediation Programs Total 19,463.62 20,588.54 - 45,806 - 48,502
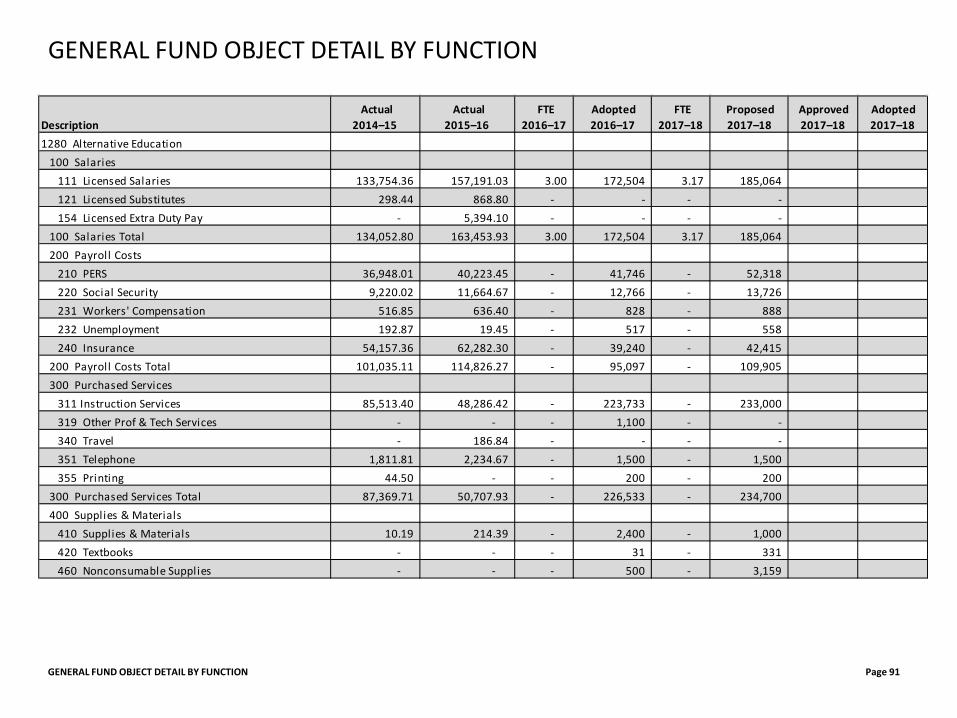
GENERAL FUND OBJECT DETAIL BY FUNCTION Page 91
GENERAL FUND OBJECT DETAIL BY FUNCTION
Description Actual
2014–15 Actual
2015–16 FTE
2016–17 Adopted 2016–17
FTE 2017–18
Proposed 2017–18
Approved 2017–18
Adopted 2017–18
1280 Alternative Education100 Salaries
111 Licensed Salaries 133,754.36 157,191.03 3.00 172,504 3.17 185,064 121 Licensed Substitutes 298.44 868.80 - - - - 154 Licensed Extra Duty Pay - 5,394.10 - - - -
100 Salaries Total 134,052.80 163,453.93 3.00 172,504 3.17 185,064 200 Payroll Costs
210 PERS 36,948.01 40,223.45 - 41,746 - 52,318 220 Social Security 9,220.02 11,664.67 - 12,766 - 13,726 231 Workers' Compensation 516.85 636.40 - 828 - 888 232 Unemployment 192.87 19.45 - 517 - 558 240 Insurance 54,157.36 62,282.30 - 39,240 - 42,415
200 Payroll Costs Total 101,035.11 114,826.27 - 95,097 - 109,905 300 Purchased Services
311 Instruction Services 85,513.40 48,286.42 - 223,733 - 233,000 319 Other Prof & Tech Services - - - 1,100 - - 340 Travel - 186.84 - - - - 351 Telephone 1,811.81 2,234.67 - 1,500 - 1,500 355 Printing 44.50 - - 200 - 200
300 Purchased Services Total 87,369.71 50,707.93 - 226,533 - 234,700 400 Supplies & Materials
410 Supplies & Materials 10.19 214.39 - 2,400 - 1,000 420 Textbooks - - - 31 - 331 460 Nonconsumable Supplies - - - 500 - 3,159
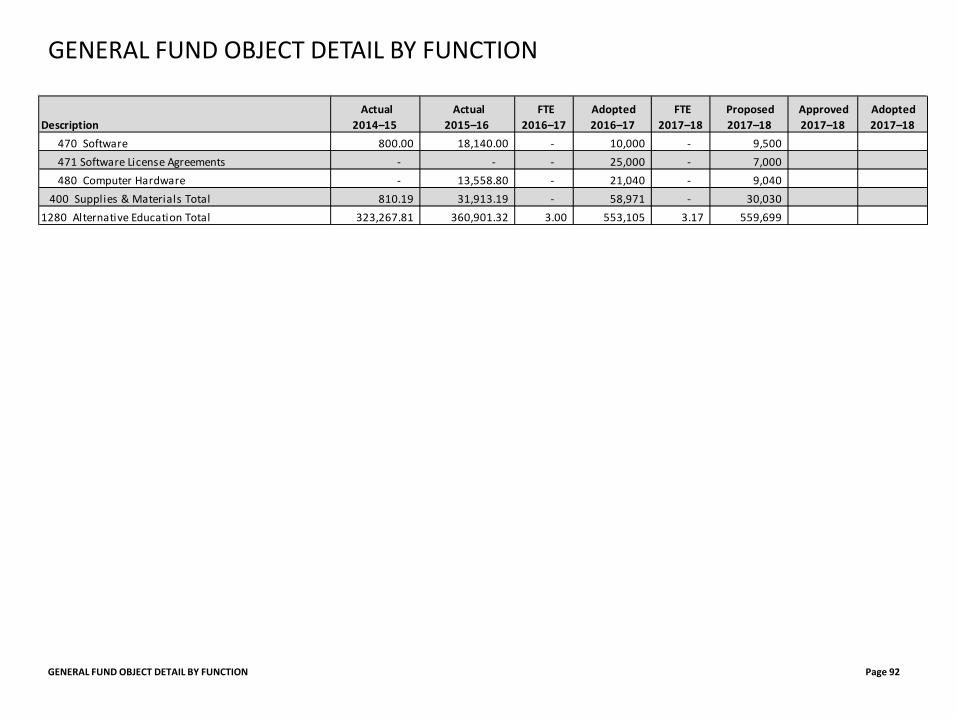
GENERAL FUND OBJECT DETAIL BY FUNCTION Page 92
GENERAL FUND OBJECT DETAIL BY FUNCTION
Description Actual
2014–15 Actual
2015–16 FTE
2016–17 Adopted 2016–17
FTE 2017–18
Proposed 2017–18
Approved 2017–18
Adopted 2017–18
470 Software 800.00 18,140.00 - 10,000 - 9,500 471 Software License Agreements - - - 25,000 - 7,000 480 Computer Hardware - 13,558.80 - 21,040 - 9,040
400 Supplies & Materials Total 810.19 31,913.19 - 58,971 - 30,030 1280 Alternative Education Total 323,267.81 360,901.32 3.00 553,105 3.17 559,699
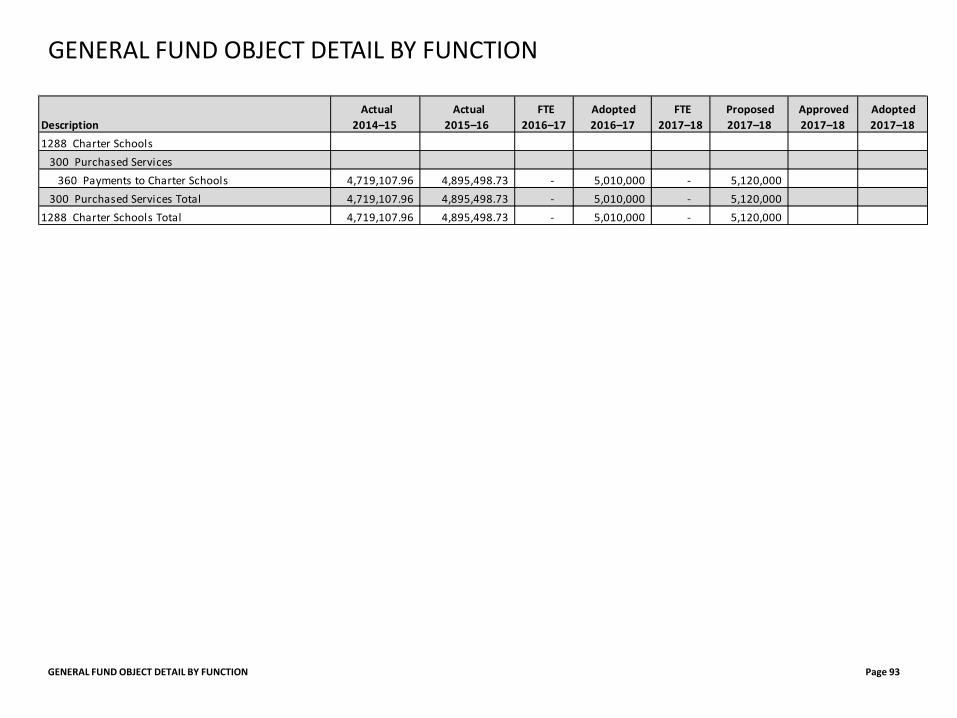
GENERAL FUND OBJECT DETAIL BY FUNCTION Page 93
GENERAL FUND OBJECT DETAIL BY FUNCTION
Description Actual
2014–15 Actual
2015–16 FTE
2016–17 Adopted 2016–17
FTE 2017–18
Proposed 2017–18
Approved 2017–18
Adopted 2017–18
1288 Charter Schools300 Purchased Services
360 Payments to Charter Schools 4,719,107.96 4,895,498.73 - 5,010,000 - 5,120,000 300 Purchased Services Total 4,719,107.96 4,895,498.73 - 5,010,000 - 5,120,000
1288 Charter Schools Total 4,719,107.96 4,895,498.73 - 5,010,000 - 5,120,000
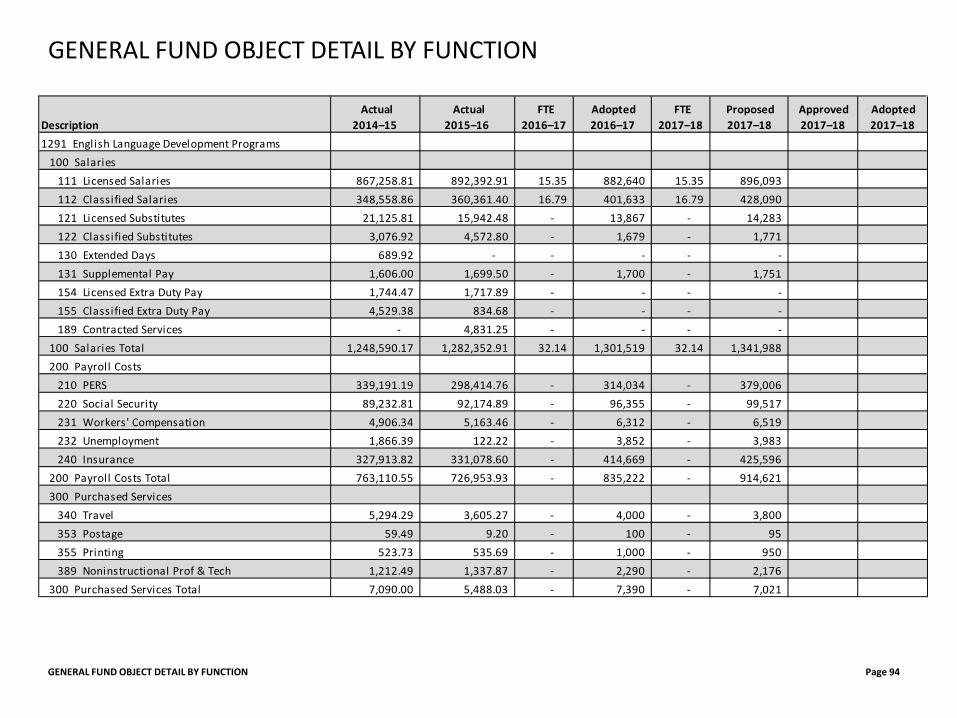
GENERAL FUND OBJECT DETAIL BY FUNCTION Page 94
GENERAL FUND OBJECT DETAIL BY FUNCTION
Description Actual
2014–15 Actual
2015–16 FTE
2016–17 Adopted 2016–17
FTE 2017–18
Proposed 2017–18
Approved 2017–18
Adopted 2017–18
1291 English Language Development Programs100 Salaries
111 Licensed Salaries 867,258.81 892,392.91 15.35 882,640 15.35 896,093 112 Classified Salaries 348,558.86 360,361.40 16.79 401,633 16.79 428,090 121 Licensed Substitutes 21,125.81 15,942.48 - 13,867 - 14,283 122 Classified Substitutes 3,076.92 4,572.80 - 1,679 - 1,771 130 Extended Days 689.92 - - - - - 131 Supplemental Pay 1,606.00 1,699.50 - 1,700 - 1,751 154 Licensed Extra Duty Pay 1,744.47 1,717.89 - - - - 155 Classified Extra Duty Pay 4,529.38 834.68 - - - - 189 Contracted Services - 4,831.25 - - - -
100 Salaries Total 1,248,590.17 1,282,352.91 32.14 1,301,519 32.14 1,341,988 200 Payroll Costs
210 PERS 339,191.19 298,414.76 - 314,034 - 379,006 220 Social Security 89,232.81 92,174.89 - 96,355 - 99,517 231 Workers' Compensation 4,906.34 5,163.46 - 6,312 - 6,519 232 Unemployment 1,866.39 122.22 - 3,852 - 3,983 240 Insurance 327,913.82 331,078.60 - 414,669 - 425,596
200 Payroll Costs Total 763,110.55 726,953.93 - 835,222 - 914,621 300 Purchased Services
340 Travel 5,294.29 3,605.27 - 4,000 - 3,800 353 Postage 59.49 9.20 - 100 - 95 355 Printing 523.73 535.69 - 1,000 - 950 389 Noninstructional Prof & Tech 1,212.49 1,337.87 - 2,290 - 2,176
300 Purchased Services Total 7,090.00 5,488.03 - 7,390 - 7,021
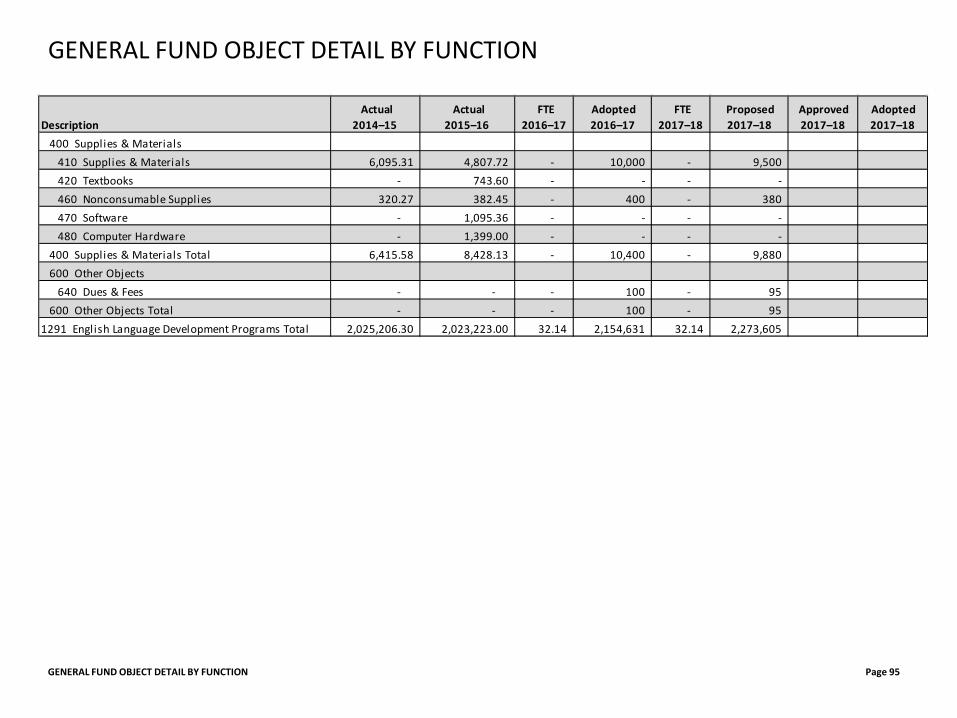
GENERAL FUND OBJECT DETAIL BY FUNCTION Page 95
GENERAL FUND OBJECT DETAIL BY FUNCTION
Description Actual
2014–15 Actual
2015–16 FTE
2016–17 Adopted 2016–17
FTE 2017–18
Proposed 2017–18
Approved 2017–18
Adopted 2017–18
400 Supplies & Materials410 Supplies & Materials 6,095.31 4,807.72 - 10,000 - 9,500 420 Textbooks - 743.60 - - - - 460 Nonconsumable Supplies 320.27 382.45 - 400 - 380 470 Software - 1,095.36 - - - - 480 Computer Hardware - 1,399.00 - - - -
400 Supplies & Materials Total 6,415.58 8,428.13 - 10,400 - 9,880 600 Other Objects
640 Dues & Fees - - - 100 - 95 600 Other Objects Total - - - 100 - 95
1291 English Language Development Programs Total 2,025,206.30 2,023,223.00 32.14 2,154,631 32.14 2,273,605
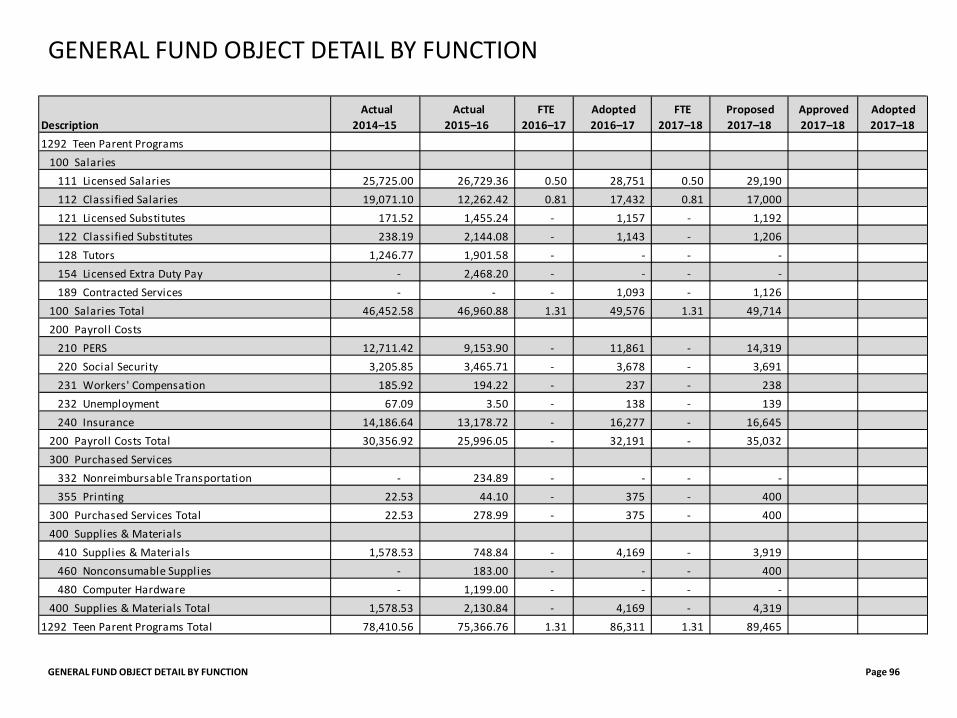
GENERAL FUND OBJECT DETAIL BY FUNCTION Page 96
GENERAL FUND OBJECT DETAIL BY FUNCTION
Description Actual
2014–15 Actual
2015–16 FTE
2016–17 Adopted 2016–17
FTE 2017–18
Proposed 2017–18
Approved 2017–18
Adopted 2017–18
1292 Teen Parent Programs100 Salaries
111 Licensed Salaries 25,725.00 26,729.36 0.50 28,751 0.50 29,190 112 Classified Salaries 19,071.10 12,262.42 0.81 17,432 0.81 17,000 121 Licensed Substitutes 171.52 1,455.24 - 1,157 - 1,192 122 Classified Substitutes 238.19 2,144.08 - 1,143 - 1,206 128 Tutors 1,246.77 1,901.58 - - - - 154 Licensed Extra Duty Pay - 2,468.20 - - - - 189 Contracted Services - - - 1,093 - 1,126
100 Salaries Total 46,452.58 46,960.88 1.31 49,576 1.31 49,714 200 Payroll Costs
210 PERS 12,711.42 9,153.90 - 11,861 - 14,319 220 Social Security 3,205.85 3,465.71 - 3,678 - 3,691 231 Workers' Compensation 185.92 194.22 - 237 - 238 232 Unemployment 67.09 3.50 - 138 - 139 240 Insurance 14,186.64 13,178.72 - 16,277 - 16,645
200 Payroll Costs Total 30,356.92 25,996.05 - 32,191 - 35,032 300 Purchased Services
332 Nonreimbursable Transportation - 234.89 - - - - 355 Printing 22.53 44.10 - 375 - 400
300 Purchased Services Total 22.53 278.99 - 375 - 400 400 Supplies & Materials
410 Supplies & Materials 1,578.53 748.84 - 4,169 - 3,919 460 Nonconsumable Supplies - 183.00 - - - 400 480 Computer Hardware - 1,199.00 - - - -
400 Supplies & Materials Total 1,578.53 2,130.84 - 4,169 - 4,319 1292 Teen Parent Programs Total 78,410.56 75,366.76 1.31 86,311 1.31 89,465
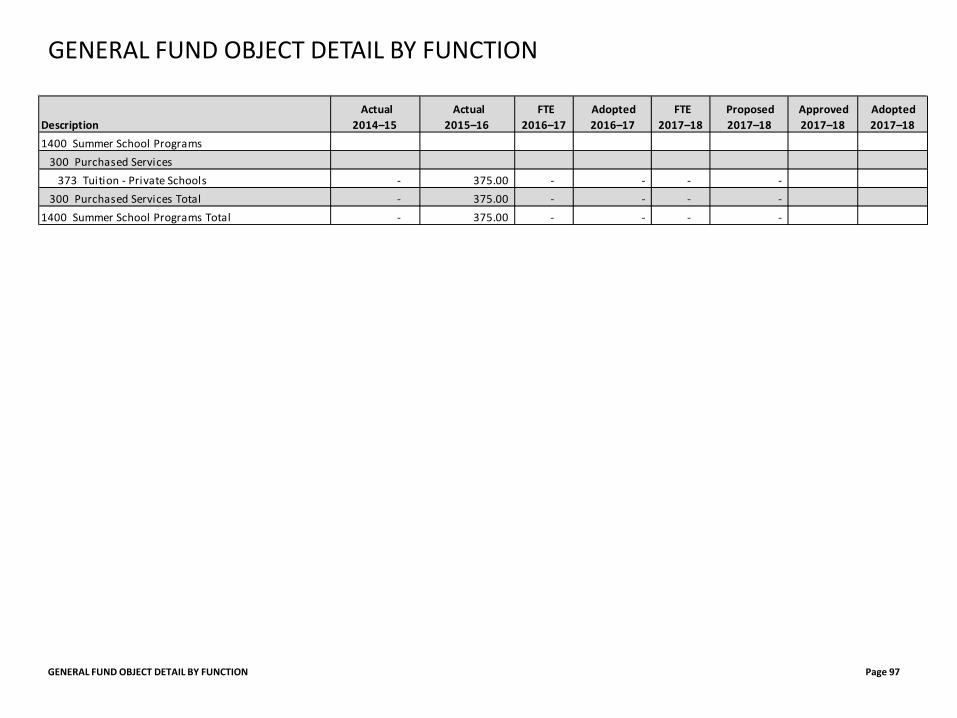
GENERAL FUND OBJECT DETAIL BY FUNCTION Page 97
GENERAL FUND OBJECT DETAIL BY FUNCTION
Description Actual
2014–15 Actual
2015–16 FTE
2016–17 Adopted 2016–17
FTE 2017–18
Proposed 2017–18
Approved 2017–18
Adopted 2017–18
1400 Summer School Programs300 Purchased Services
373 Tuition - Private Schools - 375.00 - - - - 300 Purchased Services Total - 375.00 - - - -
1400 Summer School Programs Total - 375.00 - - - -
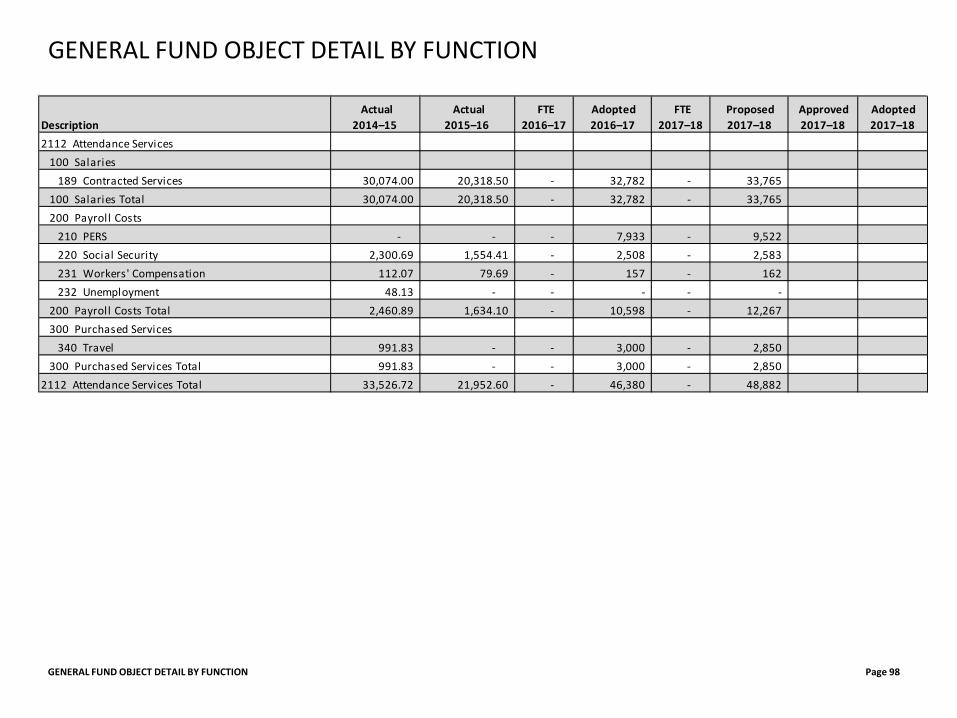
GENERAL FUND OBJECT DETAIL BY FUNCTION Page 98
GENERAL FUND OBJECT DETAIL BY FUNCTION
Description Actual
2014–15 Actual
2015–16 FTE
2016–17 Adopted 2016–17
FTE 2017–18
Proposed 2017–18
Approved 2017–18
Adopted 2017–18
2112 Attendance Services100 Salaries
189 Contracted Services 30,074.00 20,318.50 - 32,782 - 33,765 100 Salaries Total 30,074.00 20,318.50 - 32,782 - 33,765 200 Payroll Costs
210 PERS - - - 7,933 - 9,522 220 Social Security 2,300.69 1,554.41 - 2,508 - 2,583 231 Workers' Compensation 112.07 79.69 - 157 - 162 232 Unemployment 48.13 - - - - -
200 Payroll Costs Total 2,460.89 1,634.10 - 10,598 - 12,267 300 Purchased Services
340 Travel 991.83 - - 3,000 - 2,850 300 Purchased Services Total 991.83 - - 3,000 - 2,850
2112 Attendance Services Total 33,526.72 21,952.60 - 46,380 - 48,882
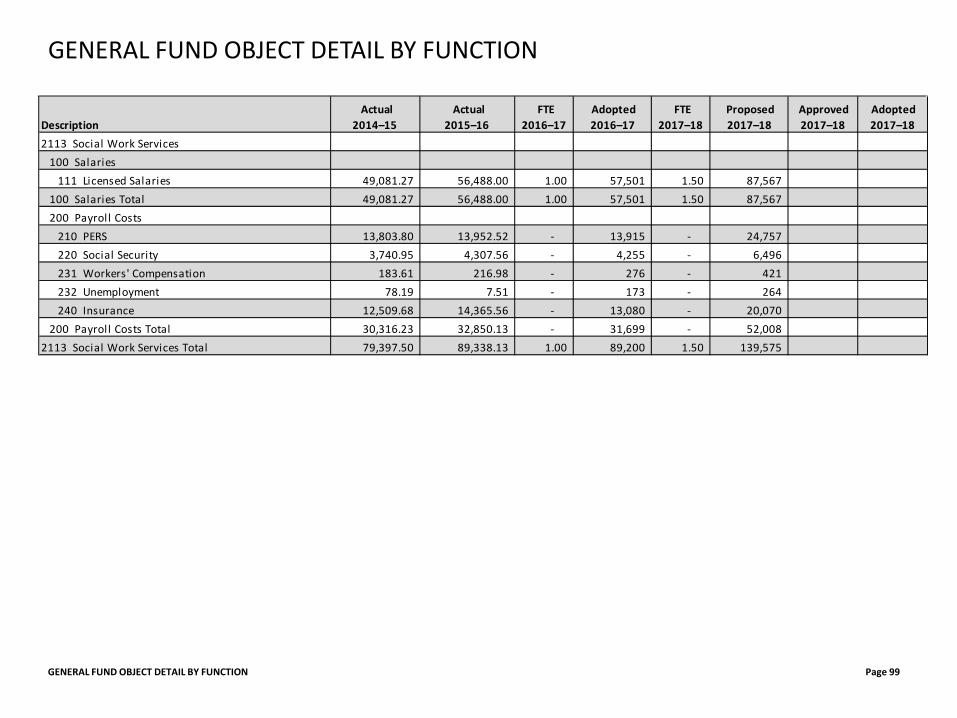
GENERAL FUND OBJECT DETAIL BY FUNCTION Page 99
GENERAL FUND OBJECT DETAIL BY FUNCTION
Description Actual
2014–15 Actual
2015–16 FTE
2016–17 Adopted 2016–17
FTE 2017–18
Proposed 2017–18
Approved 2017–18
Adopted 2017–18
2113 Social Work Services100 Salaries
111 Licensed Salaries 49,081.27 56,488.00 1.00 57,501 1.50 87,567 100 Salaries Total 49,081.27 56,488.00 1.00 57,501 1.50 87,567 200 Payroll Costs
210 PERS 13,803.80 13,952.52 - 13,915 - 24,757 220 Social Security 3,740.95 4,307.56 - 4,255 - 6,496 231 Workers' Compensation 183.61 216.98 - 276 - 421 232 Unemployment 78.19 7.51 - 173 - 264 240 Insurance 12,509.68 14,365.56 - 13,080 - 20,070
200 Payroll Costs Total 30,316.23 32,850.13 - 31,699 - 52,008 2113 Social Work Services Total 79,397.50 89,338.13 1.00 89,200 1.50 139,575
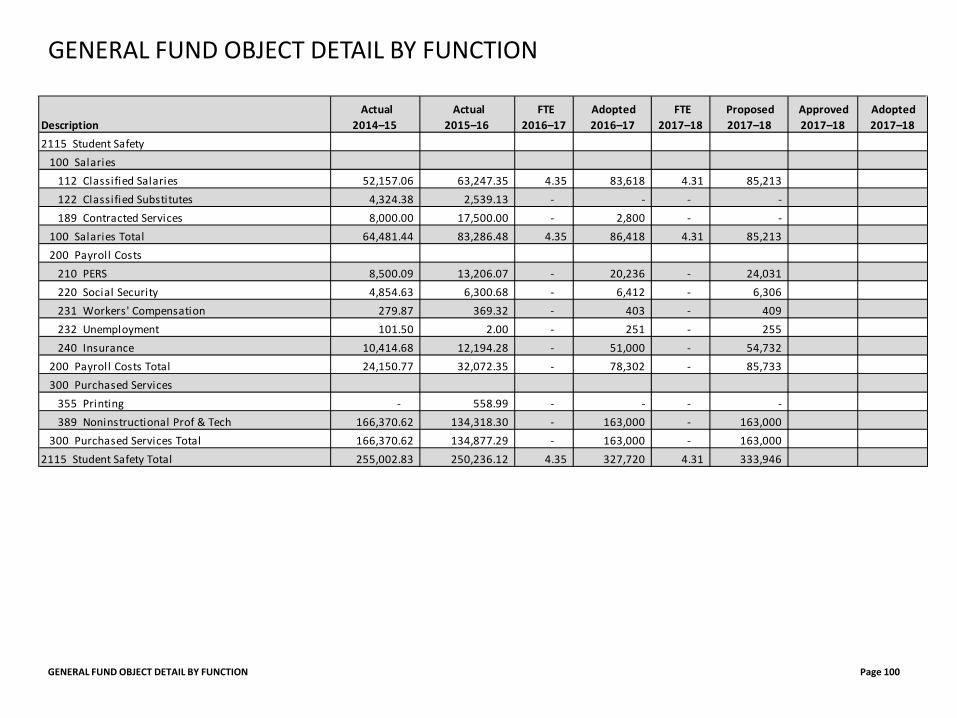
GENERAL FUND OBJECT DETAIL BY FUNCTION Page 100
GENERAL FUND OBJECT DETAIL BY FUNCTION
Description Actual
2014–15 Actual
2015–16 FTE
2016–17 Adopted 2016–17
FTE 2017–18
Proposed 2017–18
Approved 2017–18
Adopted 2017–18
2115 Student Safety100 Salaries
112 Classified Salaries 52,157.06 63,247.35 4.35 83,618 4.31 85,213 122 Classified Substitutes 4,324.38 2,539.13 - - - - 189 Contracted Services 8,000.00 17,500.00 - 2,800 - -
100 Salaries Total 64,481.44 83,286.48 4.35 86,418 4.31 85,213 200 Payroll Costs
210 PERS 8,500.09 13,206.07 - 20,236 - 24,031 220 Social Security 4,854.63 6,300.68 - 6,412 - 6,306 231 Workers' Compensation 279.87 369.32 - 403 - 409 232 Unemployment 101.50 2.00 - 251 - 255 240 Insurance 10,414.68 12,194.28 - 51,000 - 54,732
200 Payroll Costs Total 24,150.77 32,072.35 - 78,302 - 85,733 300 Purchased Services
355 Printing - 558.99 - - - - 389 Noninstructional Prof & Tech 166,370.62 134,318.30 - 163,000 - 163,000
300 Purchased Services Total 166,370.62 134,877.29 - 163,000 - 163,000 2115 Student Safety Total 255,002.83 250,236.12 4.35 327,720 4.31 333,946
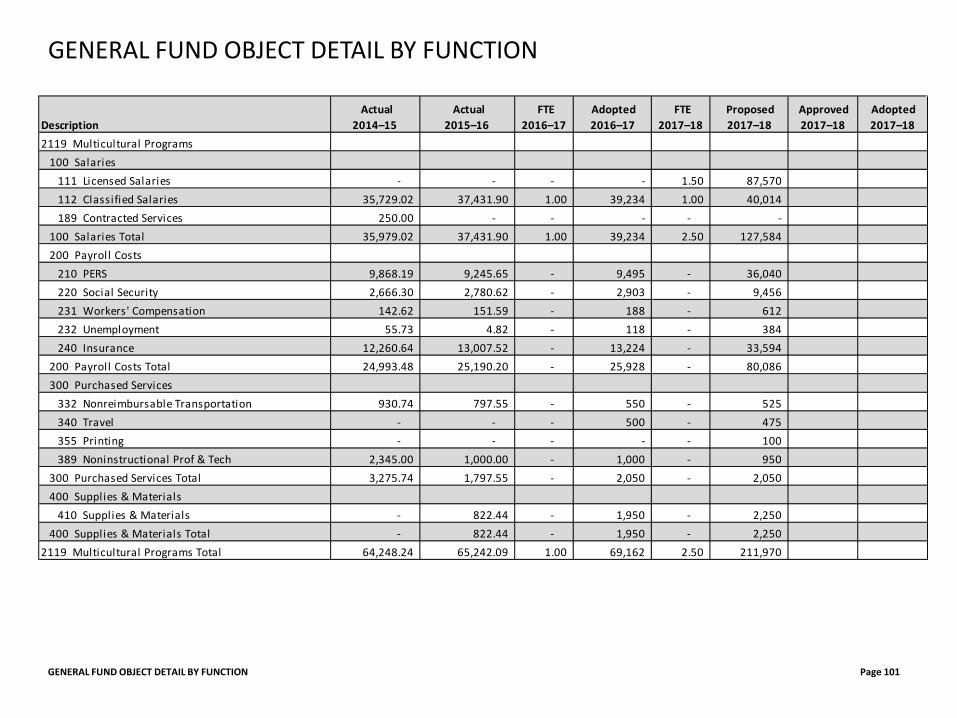
GENERAL FUND OBJECT DETAIL BY FUNCTION Page 101
GENERAL FUND OBJECT DETAIL BY FUNCTION
Description Actual
2014–15 Actual
2015–16 FTE
2016–17 Adopted 2016–17
FTE 2017–18
Proposed 2017–18
Approved 2017–18
Adopted 2017–18
2119 Multicultural Programs100 Salaries
111 Licensed Salaries - - - - 1.50 87,570 112 Classified Salaries 35,729.02 37,431.90 1.00 39,234 1.00 40,014 189 Contracted Services 250.00 - - - - -
100 Salaries Total 35,979.02 37,431.90 1.00 39,234 2.50 127,584 200 Payroll Costs
210 PERS 9,868.19 9,245.65 - 9,495 - 36,040 220 Social Security 2,666.30 2,780.62 - 2,903 - 9,456 231 Workers' Compensation 142.62 151.59 - 188 - 612 232 Unemployment 55.73 4.82 - 118 - 384 240 Insurance 12,260.64 13,007.52 - 13,224 - 33,594
200 Payroll Costs Total 24,993.48 25,190.20 - 25,928 - 80,086 300 Purchased Services
332 Nonreimbursable Transportation 930.74 797.55 - 550 - 525 340 Travel - - - 500 - 475 355 Printing - - - - - 100 389 Noninstructional Prof & Tech 2,345.00 1,000.00 - 1,000 - 950
300 Purchased Services Total 3,275.74 1,797.55 - 2,050 - 2,050 400 Supplies & Materials
410 Supplies & Materials - 822.44 - 1,950 - 2,250 400 Supplies & Materials Total - 822.44 - 1,950 - 2,250
2119 Multicultural Programs Total 64,248.24 65,242.09 1.00 69,162 2.50 211,970
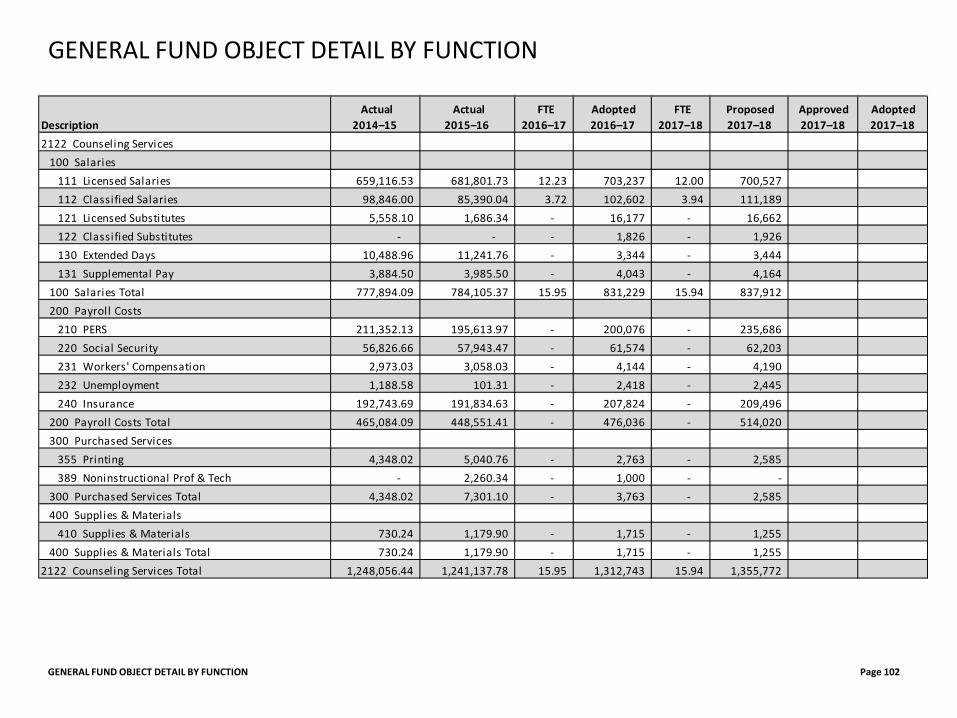
GENERAL FUND OBJECT DETAIL BY FUNCTION Page 102
GENERAL FUND OBJECT DETAIL BY FUNCTION
Description Actual
2014–15 Actual
2015–16 FTE
2016–17 Adopted 2016–17
FTE 2017–18
Proposed 2017–18
Approved 2017–18
Adopted 2017–18
2122 Counseling Services100 Salaries
111 Licensed Salaries 659,116.53 681,801.73 12.23 703,237 12.00 700,527 112 Classified Salaries 98,846.00 85,390.04 3.72 102,602 3.94 111,189 121 Licensed Substitutes 5,558.10 1,686.34 - 16,177 - 16,662 122 Classified Substitutes - - - 1,826 - 1,926 130 Extended Days 10,488.96 11,241.76 - 3,344 - 3,444 131 Supplemental Pay 3,884.50 3,985.50 - 4,043 - 4,164
100 Salaries Total 777,894.09 784,105.37 15.95 831,229 15.94 837,912 200 Payroll Costs
210 PERS 211,352.13 195,613.97 - 200,076 - 235,686 220 Social Security 56,826.66 57,943.47 - 61,574 - 62,203 231 Workers' Compensation 2,973.03 3,058.03 - 4,144 - 4,190 232 Unemployment 1,188.58 101.31 - 2,418 - 2,445 240 Insurance 192,743.69 191,834.63 - 207,824 - 209,496
200 Payroll Costs Total 465,084.09 448,551.41 - 476,036 - 514,020 300 Purchased Services
355 Printing 4,348.02 5,040.76 - 2,763 - 2,585 389 Noninstructional Prof & Tech - 2,260.34 - 1,000 - -
300 Purchased Services Total 4,348.02 7,301.10 - 3,763 - 2,585 400 Supplies & Materials
410 Supplies & Materials 730.24 1,179.90 - 1,715 - 1,255 400 Supplies & Materials Total 730.24 1,179.90 - 1,715 - 1,255
2122 Counseling Services Total 1,248,056.44 1,241,137.78 15.95 1,312,743 15.94 1,355,772

GENERAL FUND OBJECT DETAIL BY FUNCTION Page 103
GENERAL FUND OBJECT DETAIL BY FUNCTION
Description Actual
2014–15 Actual
2015–16 FTE
2016–17 Adopted 2016–17
FTE 2017–18
Proposed 2017–18
Approved 2017–18
Adopted 2017–18
2130 Health Services100 Salaries
111 Licensed Salaries 163,304.94 170,509.96 4.00 230,004 4.50 262,698 112 Classified Salaries 160,158.72 155,430.92 7.22 165,395 7.28 183,249 122 Classified Substitutes 3,947.26 358.45 - - - - 139 Benefit Pay 1,440.00 1,412.44 - - - - 154 Licensed Extra Duty Pay 9,636.04 11,943.97 - 2,000 - 2,060 189 Contracted Services 30,779.00 27,546.00 - 14,214 - 14,640
100 Salaries Total 369,265.96 367,201.74 11.22 411,613 11.78 462,647 200 Payroll Costs
210 PERS 76,928.92 81,841.26 - 99,609 - 130,657 220 Social Security 26,254.91 26,273.73 - 30,499 - 34,326 231 Workers' Compensation 1,508.56 1,554.30 - 1,976 - 2,223 232 Unemployment 549.10 39.44 - 1,186 - 1,341 240 Insurance 133,725.71 117,552.35 - 142,099 - 151,383
200 Payroll Costs Total 238,967.20 227,261.08 - 275,369 - 319,930 300 Purchased Services
313 Student Services 3,990.00 1,860.00 - 6,000 - 6,000 318 Prof Improvement Noninstruct Staff - 100.00 - - - - 319 Other Prof & Tech Services 3,944.32 - - 4,000 - 3,800 340 Travel 5,812.34 6,291.61 - 6,000 - 5,700 353 Postage 282.23 293.80 - 500 - 475 355 Printing 674.37 146.01 - 1,016 - 960 389 Noninstructional Prof & Tech 6,167.50 - - 220,000 - 218,000
300 Purchased Services Total 20,870.76 8,691.42 - 237,516 - 234,935
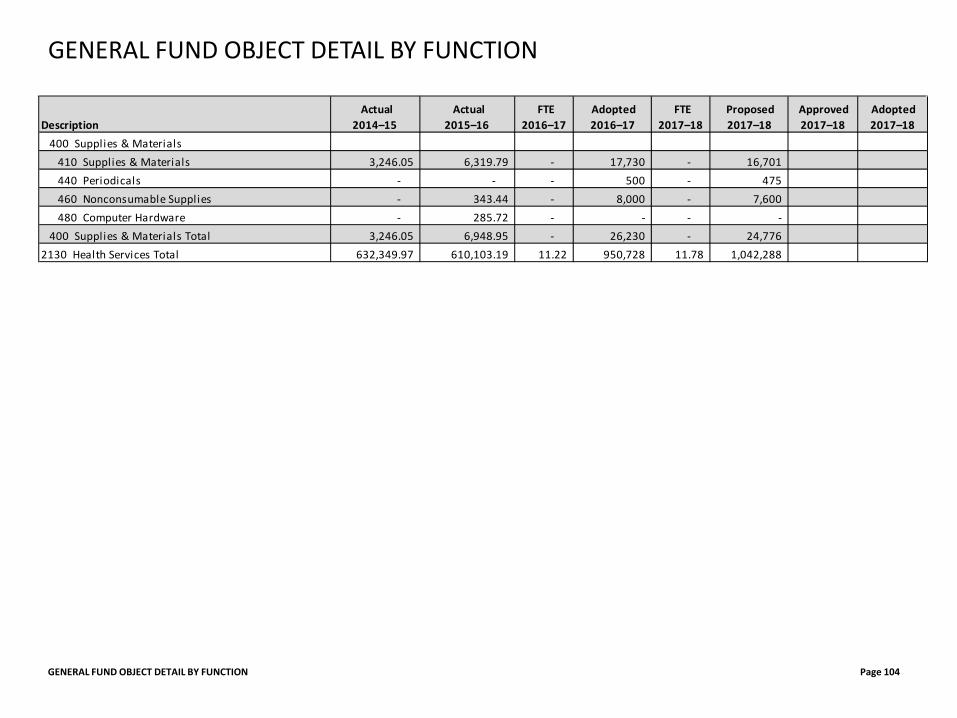
GENERAL FUND OBJECT DETAIL BY FUNCTION Page 104
GENERAL FUND OBJECT DETAIL BY FUNCTION
Description Actual
2014–15 Actual
2015–16 FTE
2016–17 Adopted 2016–17
FTE 2017–18
Proposed 2017–18
Approved 2017–18
Adopted 2017–18
400 Supplies & Materials410 Supplies & Materials 3,246.05 6,319.79 - 17,730 - 16,701 440 Periodicals - - - 500 - 475 460 Nonconsumable Supplies - 343.44 - 8,000 - 7,600 480 Computer Hardware - 285.72 - - - -
400 Supplies & Materials Total 3,246.05 6,948.95 - 26,230 - 24,776 2130 Health Services Total 632,349.97 610,103.19 11.22 950,728 11.78 1,042,288
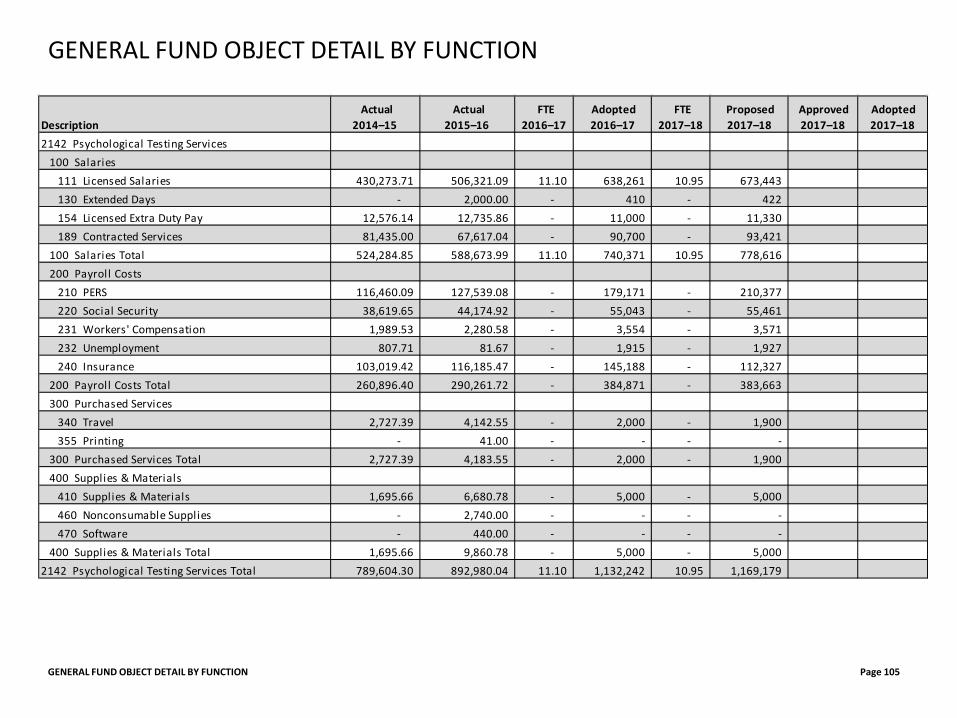
GENERAL FUND OBJECT DETAIL BY FUNCTION Page 105
GENERAL FUND OBJECT DETAIL BY FUNCTION
Description Actual
2014–15 Actual
2015–16 FTE
2016–17 Adopted 2016–17
FTE 2017–18
Proposed 2017–18
Approved 2017–18
Adopted 2017–18
2142 Psychological Testing Services100 Salaries
111 Licensed Salaries 430,273.71 506,321.09 11.10 638,261 10.95 673,443 130 Extended Days - 2,000.00 - 410 - 422 154 Licensed Extra Duty Pay 12,576.14 12,735.86 - 11,000 - 11,330 189 Contracted Services 81,435.00 67,617.04 - 90,700 - 93,421
100 Salaries Total 524,284.85 588,673.99 11.10 740,371 10.95 778,616 200 Payroll Costs
210 PERS 116,460.09 127,539.08 - 179,171 - 210,377 220 Social Security 38,619.65 44,174.92 - 55,043 - 55,461 231 Workers' Compensation 1,989.53 2,280.58 - 3,554 - 3,571 232 Unemployment 807.71 81.67 - 1,915 - 1,927 240 Insurance 103,019.42 116,185.47 - 145,188 - 112,327
200 Payroll Costs Total 260,896.40 290,261.72 - 384,871 - 383,663 300 Purchased Services
340 Travel 2,727.39 4,142.55 - 2,000 - 1,900 355 Printing - 41.00 - - - -
300 Purchased Services Total 2,727.39 4,183.55 - 2,000 - 1,900 400 Supplies & Materials
410 Supplies & Materials 1,695.66 6,680.78 - 5,000 - 5,000 460 Nonconsumable Supplies - 2,740.00 - - - - 470 Software - 440.00 - - - -
400 Supplies & Materials Total 1,695.66 9,860.78 - 5,000 - 5,000 2142 Psychological Testing Services Total 789,604.30 892,980.04 11.10 1,132,242 10.95 1,169,179
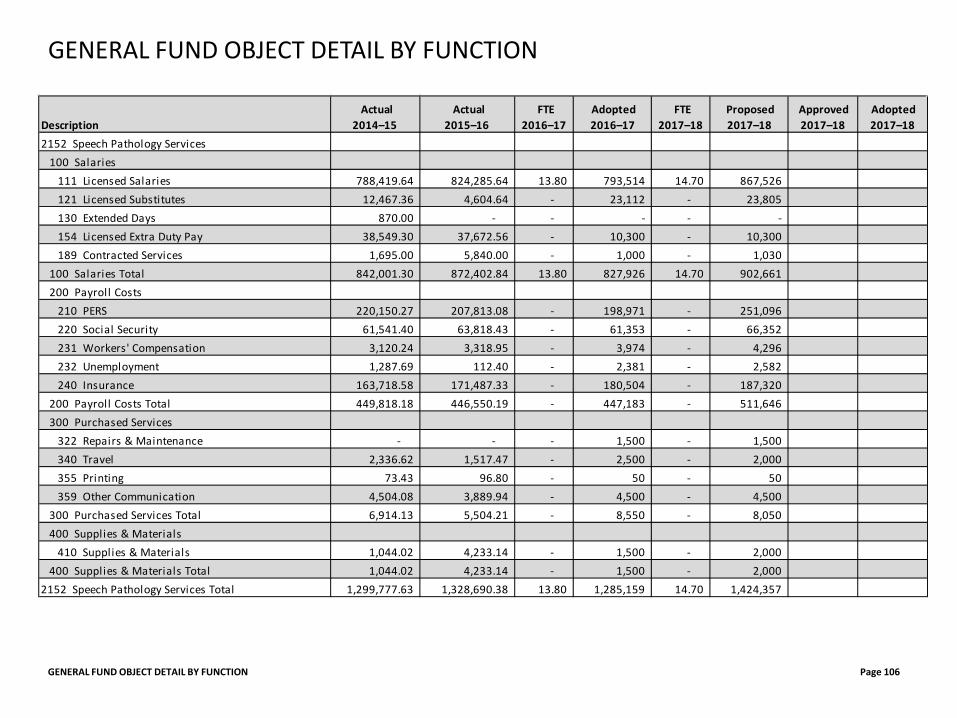
GENERAL FUND OBJECT DETAIL BY FUNCTION Page 106
GENERAL FUND OBJECT DETAIL BY FUNCTION
Description Actual
2014–15 Actual
2015–16 FTE
2016–17 Adopted 2016–17
FTE 2017–18
Proposed 2017–18
Approved 2017–18
Adopted 2017–18
2152 Speech Pathology Services100 Salaries
111 Licensed Salaries 788,419.64 824,285.64 13.80 793,514 14.70 867,526 121 Licensed Substitutes 12,467.36 4,604.64 - 23,112 - 23,805 130 Extended Days 870.00 - - - - - 154 Licensed Extra Duty Pay 38,549.30 37,672.56 - 10,300 - 10,300 189 Contracted Services 1,695.00 5,840.00 - 1,000 - 1,030
100 Salaries Total 842,001.30 872,402.84 13.80 827,926 14.70 902,661 200 Payroll Costs
210 PERS 220,150.27 207,813.08 - 198,971 - 251,096 220 Social Security 61,541.40 63,818.43 - 61,353 - 66,352 231 Workers' Compensation 3,120.24 3,318.95 - 3,974 - 4,296 232 Unemployment 1,287.69 112.40 - 2,381 - 2,582 240 Insurance 163,718.58 171,487.33 - 180,504 - 187,320
200 Payroll Costs Total 449,818.18 446,550.19 - 447,183 - 511,646 300 Purchased Services
322 Repairs & Maintenance - - - 1,500 - 1,500 340 Travel 2,336.62 1,517.47 - 2,500 - 2,000 355 Printing 73.43 96.80 - 50 - 50 359 Other Communication 4,504.08 3,889.94 - 4,500 - 4,500
300 Purchased Services Total 6,914.13 5,504.21 - 8,550 - 8,050 400 Supplies & Materials
410 Supplies & Materials 1,044.02 4,233.14 - 1,500 - 2,000 400 Supplies & Materials Total 1,044.02 4,233.14 - 1,500 - 2,000
2152 Speech Pathology Services Total 1,299,777.63 1,328,690.38 13.80 1,285,159 14.70 1,424,357
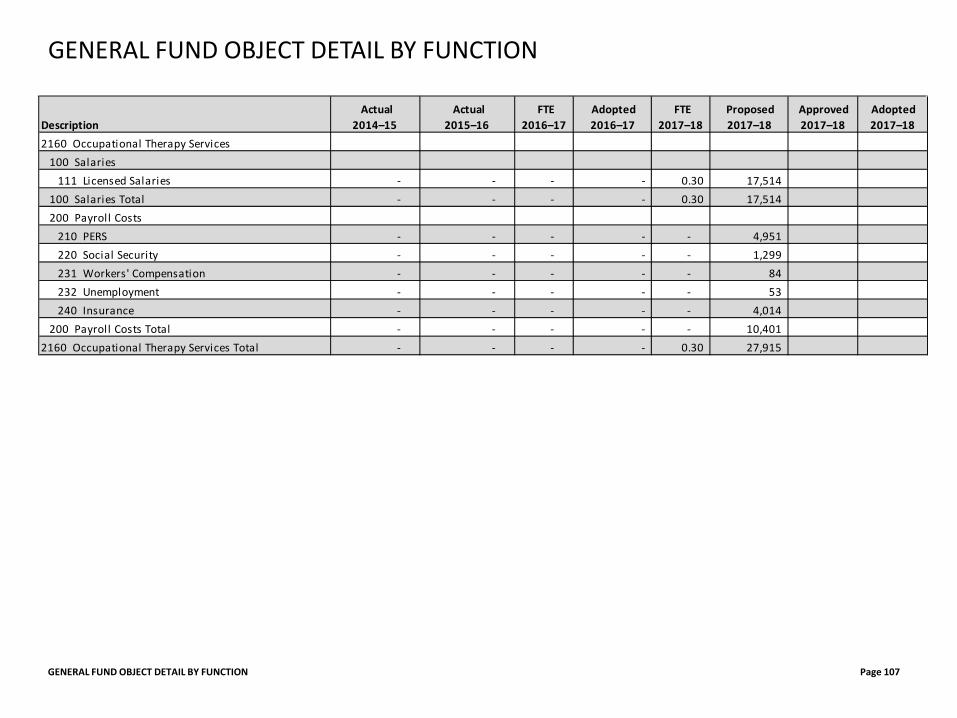
GENERAL FUND OBJECT DETAIL BY FUNCTION Page 107
GENERAL FUND OBJECT DETAIL BY FUNCTION
Description Actual
2014–15 Actual
2015–16 FTE
2016–17 Adopted 2016–17
FTE 2017–18
Proposed 2017–18
Approved 2017–18
Adopted 2017–18
2160 Occupational Therapy Services100 Salaries
111 Licensed Salaries - - - - 0.30 17,514 100 Salaries Total - - - - 0.30 17,514 200 Payroll Costs
210 PERS - - - - - 4,951 220 Social Security - - - - - 1,299 231 Workers' Compensation - - - - - 84 232 Unemployment - - - - - 53 240 Insurance - - - - - 4,014
200 Payroll Costs Total - - - - - 10,401 2160 Occupational Therapy Services Total - - - - 0.30 27,915
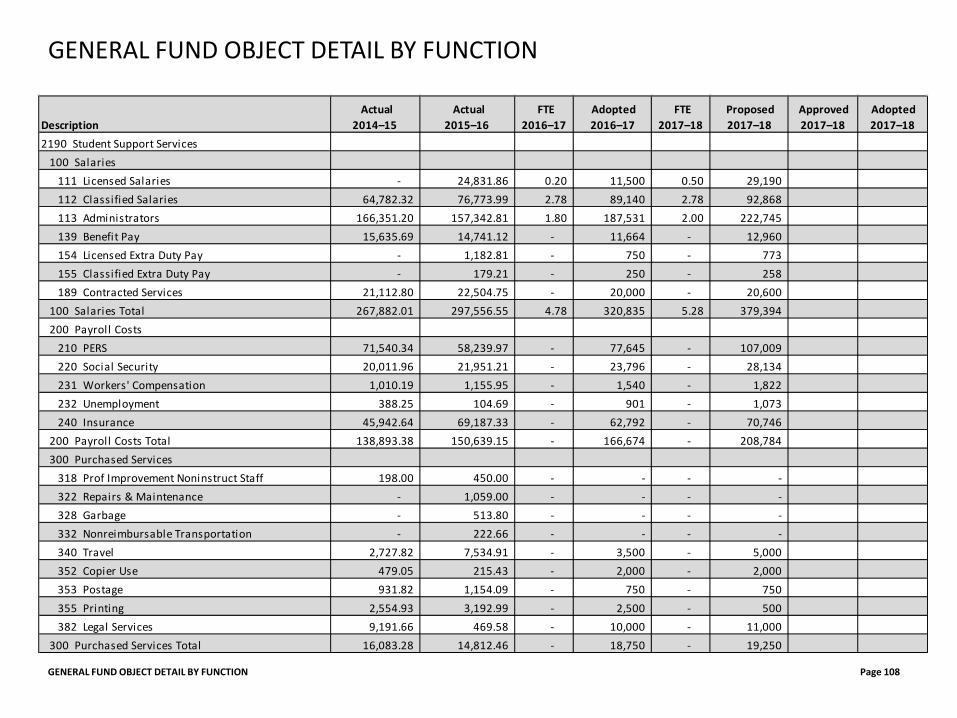
GENERAL FUND OBJECT DETAIL BY FUNCTION Page 108
GENERAL FUND OBJECT DETAIL BY FUNCTION
Description Actual
2014–15 Actual
2015–16 FTE
2016–17 Adopted 2016–17
FTE 2017–18
Proposed 2017–18
Approved 2017–18
Adopted 2017–18
2190 Student Support Services100 Salaries
111 Licensed Salaries - 24,831.86 0.20 11,500 0.50 29,190 112 Classified Salaries 64,782.32 76,773.99 2.78 89,140 2.78 92,868 113 Administrators 166,351.20 157,342.81 1.80 187,531 2.00 222,745 139 Benefit Pay 15,635.69 14,741.12 - 11,664 - 12,960 154 Licensed Extra Duty Pay - 1,182.81 - 750 - 773 155 Classified Extra Duty Pay - 179.21 - 250 - 258 189 Contracted Services 21,112.80 22,504.75 - 20,000 - 20,600
100 Salaries Total 267,882.01 297,556.55 4.78 320,835 5.28 379,394 200 Payroll Costs
210 PERS 71,540.34 58,239.97 - 77,645 - 107,009 220 Social Security 20,011.96 21,951.21 - 23,796 - 28,134 231 Workers' Compensation 1,010.19 1,155.95 - 1,540 - 1,822 232 Unemployment 388.25 104.69 - 901 - 1,073 240 Insurance 45,942.64 69,187.33 - 62,792 - 70,746
200 Payroll Costs Total 138,893.38 150,639.15 - 166,674 - 208,784 300 Purchased Services
318 Prof Improvement Noninstruct Staff 198.00 450.00 - - - - 322 Repairs & Maintenance - 1,059.00 - - - - 328 Garbage - 513.80 - - - - 332 Nonreimbursable Transportation - 222.66 - - - - 340 Travel 2,727.82 7,534.91 - 3,500 - 5,000 352 Copier Use 479.05 215.43 - 2,000 - 2,000 353 Postage 931.82 1,154.09 - 750 - 750 355 Printing 2,554.93 3,192.99 - 2,500 - 500 382 Legal Services 9,191.66 469.58 - 10,000 - 11,000
300 Purchased Services Total 16,083.28 14,812.46 - 18,750 - 19,250

GENERAL FUND OBJECT DETAIL BY FUNCTION Page 109
GENERAL FUND OBJECT DETAIL BY FUNCTION
Description Actual
2014–15 Actual
2015–16 FTE
2016–17 Adopted 2016–17
FTE 2017–18
Proposed 2017–18
Approved 2017–18
Adopted 2017–18
400 Supplies & Materials410 Supplies & Materials 3,153.23 5,642.92 - 4,000 - 4,000 440 Periodicals 325.00 330.00 - 500 - 500 460 Nonconsumable Supplies 78.00 179.99 - 1,000 - 1,000 470 Software 90.35 315.08 - 1,000 - 500 471 Software License Agreements - 3,131.00 - - - 200 480 Computer Hardware 6,166.99 4,556.00 - 5,000 - 5,000
400 Supplies & Materials Total 9,813.57 14,154.99 - 11,500 - 11,200 600 Other Objects
640 Dues & Fees 595.00 1,190.00 - 1,200 - 1,200 600 Other Objects Total 595.00 1,190.00 - 1,200 - 1,200
2190 Student Support Services Total 433,267.24 478,353.15 4.78 518,959 5.28 619,828
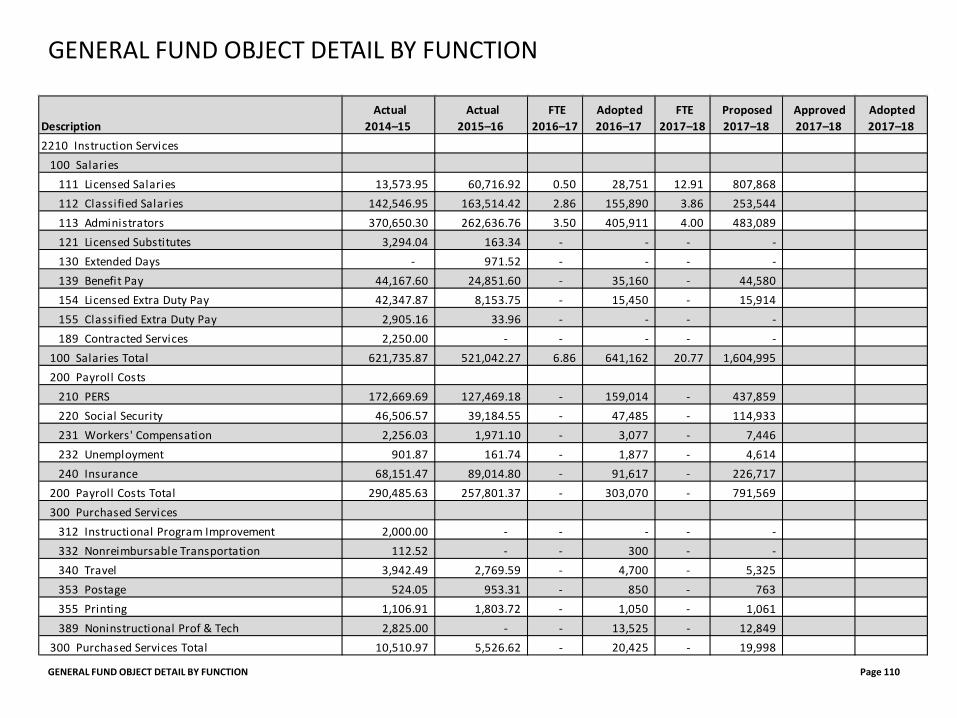
GENERAL FUND OBJECT DETAIL BY FUNCTION Page 110
GENERAL FUND OBJECT DETAIL BY FUNCTION
Description Actual
2014–15 Actual
2015–16 FTE
2016–17 Adopted 2016–17
FTE 2017–18
Proposed 2017–18
Approved 2017–18
Adopted 2017–18
2210 Instruction Services100 Salaries
111 Licensed Salaries 13,573.95 60,716.92 0.50 28,751 12.91 807,868 112 Classified Salaries 142,546.95 163,514.42 2.86 155,890 3.86 253,544 113 Administrators 370,650.30 262,636.76 3.50 405,911 4.00 483,089 121 Licensed Substitutes 3,294.04 163.34 - - - - 130 Extended Days - 971.52 - - - - 139 Benefit Pay 44,167.60 24,851.60 - 35,160 - 44,580 154 Licensed Extra Duty Pay 42,347.87 8,153.75 - 15,450 - 15,914 155 Classified Extra Duty Pay 2,905.16 33.96 - - - - 189 Contracted Services 2,250.00 - - - - -
100 Salaries Total 621,735.87 521,042.27 6.86 641,162 20.77 1,604,995 200 Payroll Costs
210 PERS 172,669.69 127,469.18 - 159,014 - 437,859 220 Social Security 46,506.57 39,184.55 - 47,485 - 114,933 231 Workers' Compensation 2,256.03 1,971.10 - 3,077 - 7,446 232 Unemployment 901.87 161.74 - 1,877 - 4,614 240 Insurance 68,151.47 89,014.80 - 91,617 - 226,717
200 Payroll Costs Total 290,485.63 257,801.37 - 303,070 - 791,569 300 Purchased Services
312 Instructional Program Improvement 2,000.00 - - - - - 332 Nonreimbursable Transportation 112.52 - - 300 - - 340 Travel 3,942.49 2,769.59 - 4,700 - 5,325 353 Postage 524.05 953.31 - 850 - 763 355 Printing 1,106.91 1,803.72 - 1,050 - 1,061 389 Noninstructional Prof & Tech 2,825.00 - - 13,525 - 12,849
300 Purchased Services Total 10,510.97 5,526.62 - 20,425 - 19,998
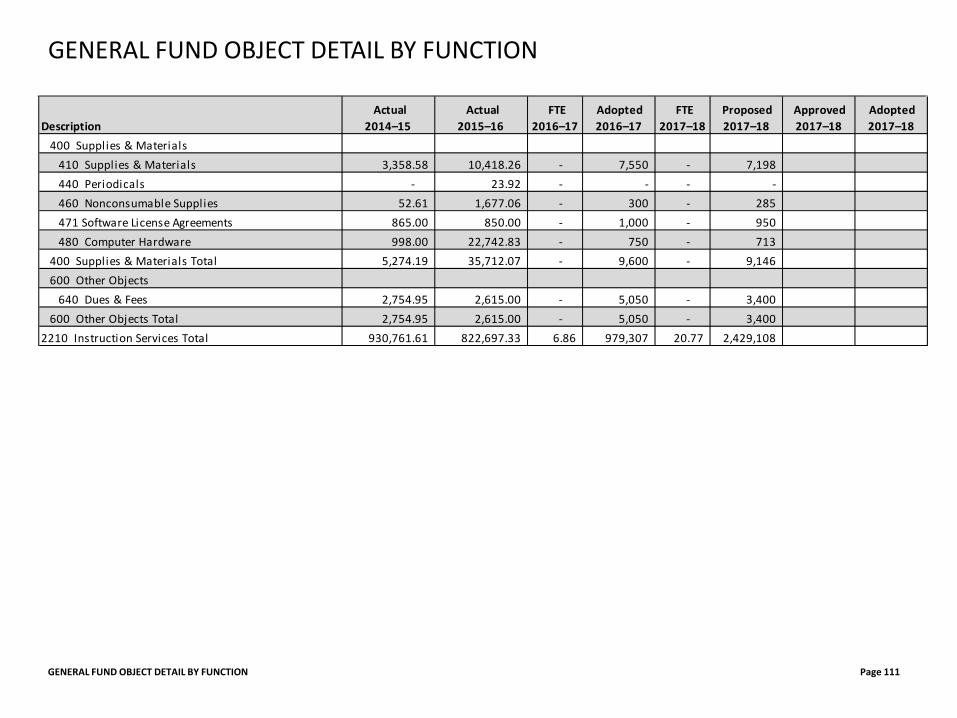
GENERAL FUND OBJECT DETAIL BY FUNCTION Page 111
GENERAL FUND OBJECT DETAIL BY FUNCTION
Description Actual
2014–15 Actual
2015–16 FTE
2016–17 Adopted 2016–17
FTE 2017–18
Proposed 2017–18
Approved 2017–18
Adopted 2017–18
400 Supplies & Materials410 Supplies & Materials 3,358.58 10,418.26 - 7,550 - 7,198 440 Periodicals - 23.92 - - - - 460 Nonconsumable Supplies 52.61 1,677.06 - 300 - 285 471 Software License Agreements 865.00 850.00 - 1,000 - 950 480 Computer Hardware 998.00 22,742.83 - 750 - 713
400 Supplies & Materials Total 5,274.19 35,712.07 - 9,600 - 9,146 600 Other Objects
640 Dues & Fees 2,754.95 2,615.00 - 5,050 - 3,400 600 Other Objects Total 2,754.95 2,615.00 - 5,050 - 3,400
2210 Instruction Services Total 930,761.61 822,697.33 6.86 979,307 20.77 2,429,108
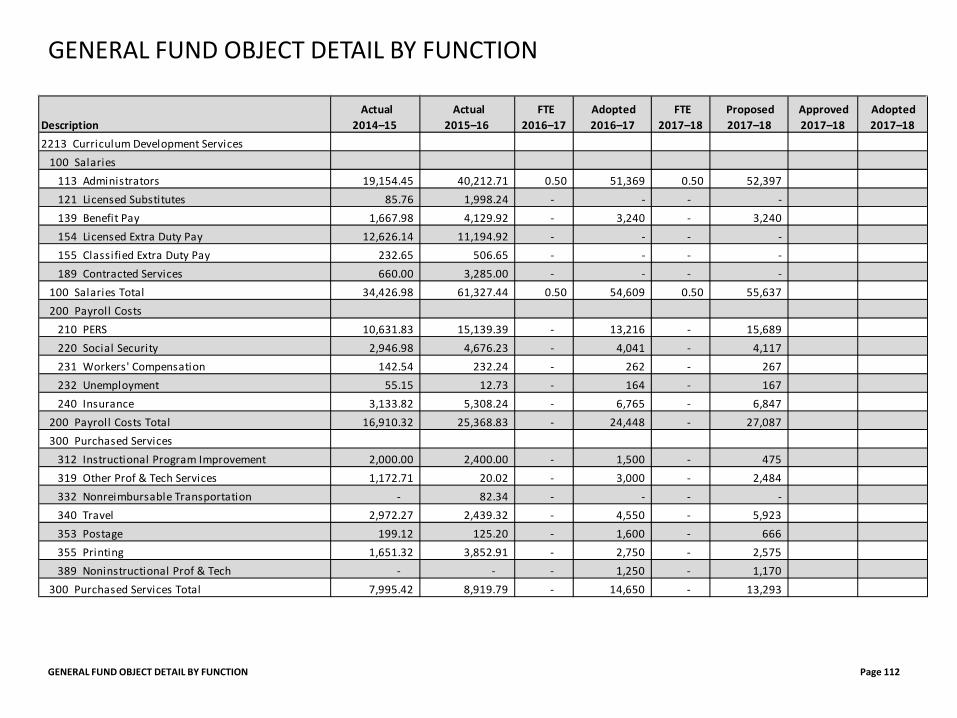
GENERAL FUND OBJECT DETAIL BY FUNCTION Page 112
GENERAL FUND OBJECT DETAIL BY FUNCTION
Description Actual
2014–15 Actual
2015–16 FTE
2016–17 Adopted 2016–17
FTE 2017–18
Proposed 2017–18
Approved 2017–18
Adopted 2017–18
2213 Curriculum Development Services100 Salaries
113 Administrators 19,154.45 40,212.71 0.50 51,369 0.50 52,397 121 Licensed Substitutes 85.76 1,998.24 - - - - 139 Benefit Pay 1,667.98 4,129.92 - 3,240 - 3,240 154 Licensed Extra Duty Pay 12,626.14 11,194.92 - - - - 155 Classified Extra Duty Pay 232.65 506.65 - - - - 189 Contracted Services 660.00 3,285.00 - - - -
100 Salaries Total 34,426.98 61,327.44 0.50 54,609 0.50 55,637 200 Payroll Costs
210 PERS 10,631.83 15,139.39 - 13,216 - 15,689 220 Social Security 2,946.98 4,676.23 - 4,041 - 4,117 231 Workers' Compensation 142.54 232.24 - 262 - 267 232 Unemployment 55.15 12.73 - 164 - 167 240 Insurance 3,133.82 5,308.24 - 6,765 - 6,847
200 Payroll Costs Total 16,910.32 25,368.83 - 24,448 - 27,087 300 Purchased Services
312 Instructional Program Improvement 2,000.00 2,400.00 - 1,500 - 475 319 Other Prof & Tech Services 1,172.71 20.02 - 3,000 - 2,484 332 Nonreimbursable Transportation - 82.34 - - - - 340 Travel 2,972.27 2,439.32 - 4,550 - 5,923 353 Postage 199.12 125.20 - 1,600 - 666 355 Printing 1,651.32 3,852.91 - 2,750 - 2,575 389 Noninstructional Prof & Tech - - - 1,250 - 1,170
300 Purchased Services Total 7,995.42 8,919.79 - 14,650 - 13,293
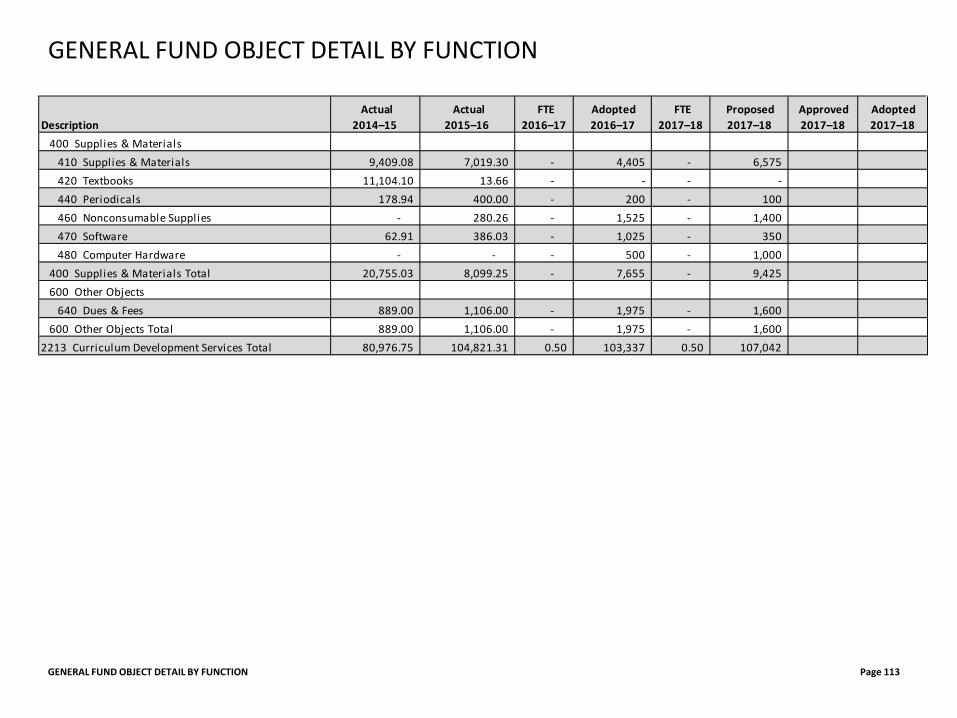
GENERAL FUND OBJECT DETAIL BY FUNCTION Page 113
GENERAL FUND OBJECT DETAIL BY FUNCTION
Description Actual
2014–15 Actual
2015–16 FTE
2016–17 Adopted 2016–17
FTE 2017–18
Proposed 2017–18
Approved 2017–18
Adopted 2017–18
400 Supplies & Materials410 Supplies & Materials 9,409.08 7,019.30 - 4,405 - 6,575 420 Textbooks 11,104.10 13.66 - - - - 440 Periodicals 178.94 400.00 - 200 - 100 460 Nonconsumable Supplies - 280.26 - 1,525 - 1,400 470 Software 62.91 386.03 - 1,025 - 350 480 Computer Hardware - - - 500 - 1,000
400 Supplies & Materials Total 20,755.03 8,099.25 - 7,655 - 9,425 600 Other Objects
640 Dues & Fees 889.00 1,106.00 - 1,975 - 1,600 600 Other Objects Total 889.00 1,106.00 - 1,975 - 1,600
2213 Curriculum Development Services Total 80,976.75 104,821.31 0.50 103,337 0.50 107,042
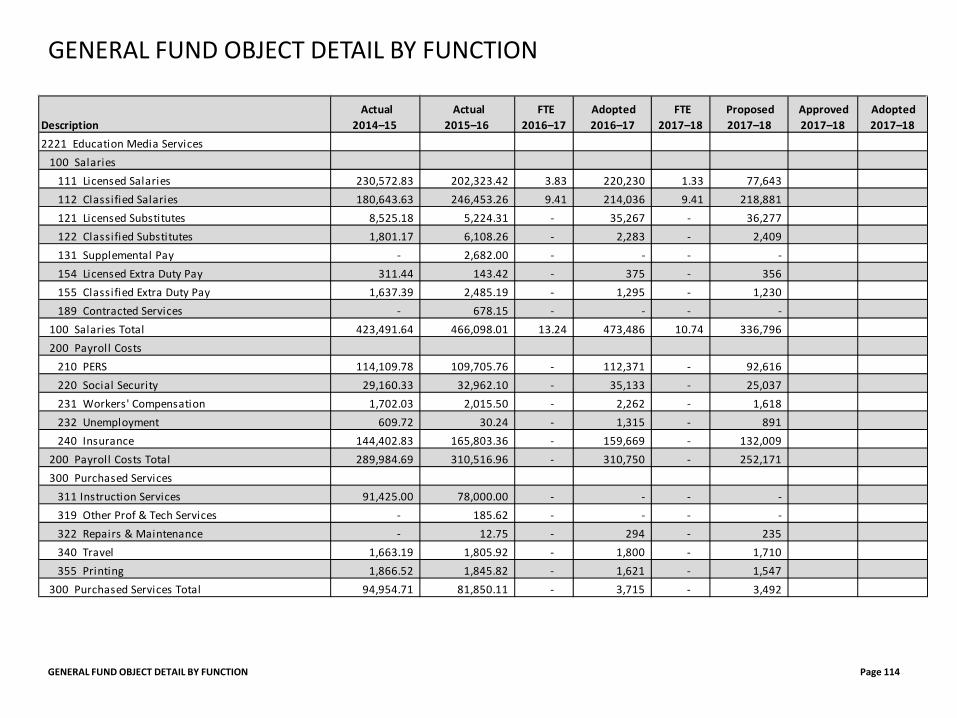
GENERAL FUND OBJECT DETAIL BY FUNCTION Page 114
GENERAL FUND OBJECT DETAIL BY FUNCTION
Description Actual
2014–15 Actual
2015–16 FTE
2016–17 Adopted 2016–17
FTE 2017–18
Proposed 2017–18
Approved 2017–18
Adopted 2017–18
2221 Education Media Services100 Salaries
111 Licensed Salaries 230,572.83 202,323.42 3.83 220,230 1.33 77,643 112 Classified Salaries 180,643.63 246,453.26 9.41 214,036 9.41 218,881 121 Licensed Substitutes 8,525.18 5,224.31 - 35,267 - 36,277 122 Classified Substitutes 1,801.17 6,108.26 - 2,283 - 2,409 131 Supplemental Pay - 2,682.00 - - - - 154 Licensed Extra Duty Pay 311.44 143.42 - 375 - 356 155 Classified Extra Duty Pay 1,637.39 2,485.19 - 1,295 - 1,230 189 Contracted Services - 678.15 - - - -
100 Salaries Total 423,491.64 466,098.01 13.24 473,486 10.74 336,796 200 Payroll Costs
210 PERS 114,109.78 109,705.76 - 112,371 - 92,616 220 Social Security 29,160.33 32,962.10 - 35,133 - 25,037 231 Workers' Compensation 1,702.03 2,015.50 - 2,262 - 1,618 232 Unemployment 609.72 30.24 - 1,315 - 891 240 Insurance 144,402.83 165,803.36 - 159,669 - 132,009
200 Payroll Costs Total 289,984.69 310,516.96 - 310,750 - 252,171 300 Purchased Services
311 Instruction Services 91,425.00 78,000.00 - - - - 319 Other Prof & Tech Services - 185.62 - - - - 322 Repairs & Maintenance - 12.75 - 294 - 235 340 Travel 1,663.19 1,805.92 - 1,800 - 1,710 355 Printing 1,866.52 1,845.82 - 1,621 - 1,547
300 Purchased Services Total 94,954.71 81,850.11 - 3,715 - 3,492
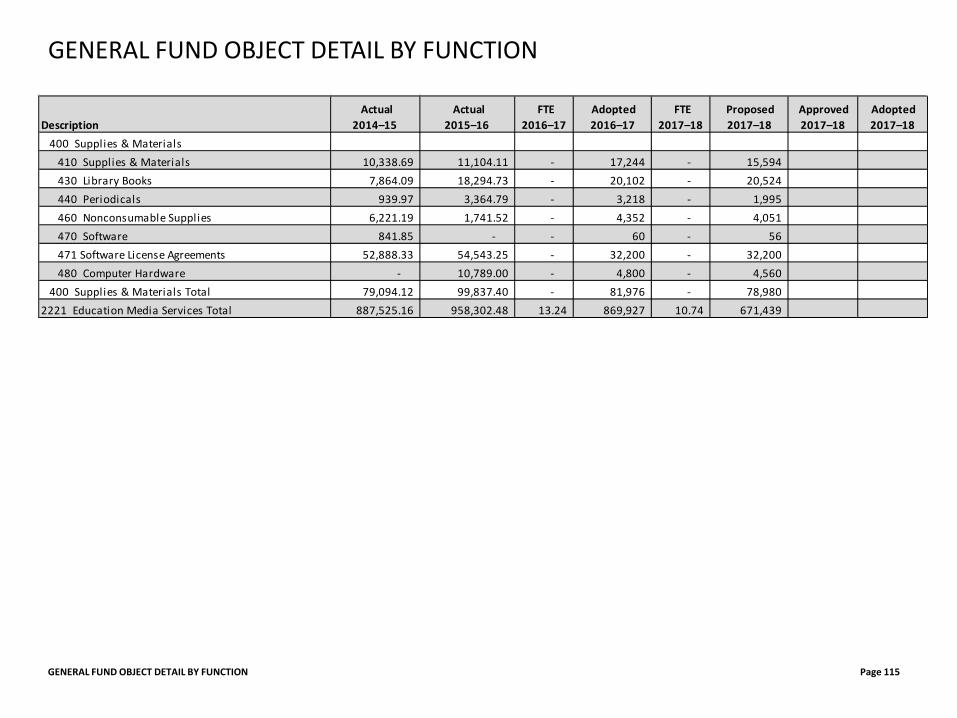
GENERAL FUND OBJECT DETAIL BY FUNCTION Page 115
GENERAL FUND OBJECT DETAIL BY FUNCTION
Description Actual
2014–15 Actual
2015–16 FTE
2016–17 Adopted 2016–17
FTE 2017–18
Proposed 2017–18
Approved 2017–18
Adopted 2017–18
400 Supplies & Materials410 Supplies & Materials 10,338.69 11,104.11 - 17,244 - 15,594 430 Library Books 7,864.09 18,294.73 - 20,102 - 20,524 440 Periodicals 939.97 3,364.79 - 3,218 - 1,995 460 Nonconsumable Supplies 6,221.19 1,741.52 - 4,352 - 4,051 470 Software 841.85 - - 60 - 56 471 Software License Agreements 52,888.33 54,543.25 - 32,200 - 32,200 480 Computer Hardware - 10,789.00 - 4,800 - 4,560
400 Supplies & Materials Total 79,094.12 99,837.40 - 81,976 - 78,980 2221 Education Media Services Total 887,525.16 958,302.48 13.24 869,927 10.74 671,439
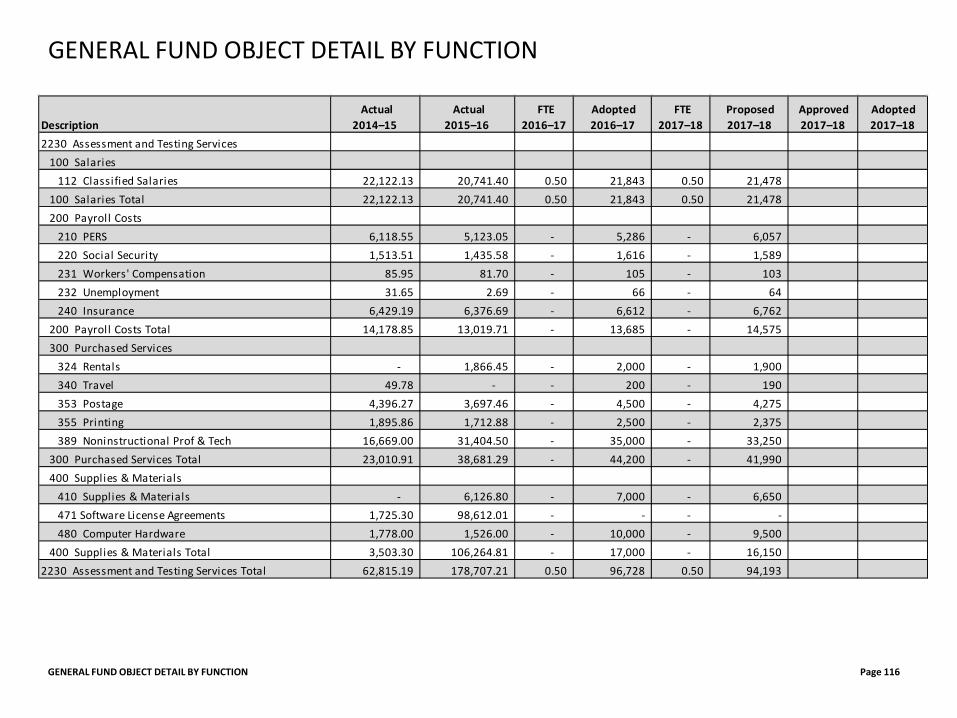
GENERAL FUND OBJECT DETAIL BY FUNCTION Page 116
GENERAL FUND OBJECT DETAIL BY FUNCTION
Description Actual
2014–15 Actual
2015–16 FTE
2016–17 Adopted 2016–17
FTE 2017–18
Proposed 2017–18
Approved 2017–18
Adopted 2017–18
2230 Assessment and Testing Services100 Salaries
112 Classified Salaries 22,122.13 20,741.40 0.50 21,843 0.50 21,478 100 Salaries Total 22,122.13 20,741.40 0.50 21,843 0.50 21,478 200 Payroll Costs
210 PERS 6,118.55 5,123.05 - 5,286 - 6,057 220 Social Security 1,513.51 1,435.58 - 1,616 - 1,589 231 Workers' Compensation 85.95 81.70 - 105 - 103 232 Unemployment 31.65 2.69 - 66 - 64 240 Insurance 6,429.19 6,376.69 - 6,612 - 6,762
200 Payroll Costs Total 14,178.85 13,019.71 - 13,685 - 14,575 300 Purchased Services
324 Rentals - 1,866.45 - 2,000 - 1,900 340 Travel 49.78 - - 200 - 190 353 Postage 4,396.27 3,697.46 - 4,500 - 4,275 355 Printing 1,895.86 1,712.88 - 2,500 - 2,375 389 Noninstructional Prof & Tech 16,669.00 31,404.50 - 35,000 - 33,250
300 Purchased Services Total 23,010.91 38,681.29 - 44,200 - 41,990 400 Supplies & Materials
410 Supplies & Materials - 6,126.80 - 7,000 - 6,650 471 Software License Agreements 1,725.30 98,612.01 - - - - 480 Computer Hardware 1,778.00 1,526.00 - 10,000 - 9,500
400 Supplies & Materials Total 3,503.30 106,264.81 - 17,000 - 16,150 2230 Assessment and Testing Services Total 62,815.19 178,707.21 0.50 96,728 0.50 94,193
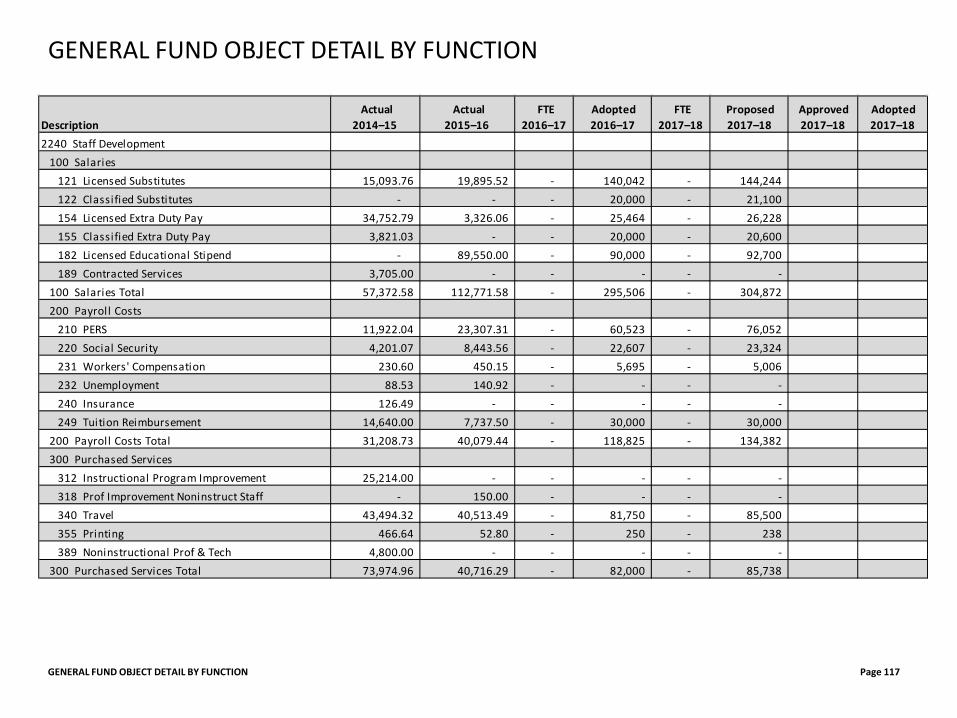
GENERAL FUND OBJECT DETAIL BY FUNCTION Page 117
GENERAL FUND OBJECT DETAIL BY FUNCTION
Description Actual
2014–15 Actual
2015–16 FTE
2016–17 Adopted 2016–17
FTE 2017–18
Proposed 2017–18
Approved 2017–18
Adopted 2017–18
2240 Staff Development100 Salaries
121 Licensed Substitutes 15,093.76 19,895.52 - 140,042 - 144,244 122 Classified Substitutes - - - 20,000 - 21,100 154 Licensed Extra Duty Pay 34,752.79 3,326.06 - 25,464 - 26,228 155 Classified Extra Duty Pay 3,821.03 - - 20,000 - 20,600 182 Licensed Educational Stipend - 89,550.00 - 90,000 - 92,700 189 Contracted Services 3,705.00 - - - - -
100 Salaries Total 57,372.58 112,771.58 - 295,506 - 304,872 200 Payroll Costs
210 PERS 11,922.04 23,307.31 - 60,523 - 76,052 220 Social Security 4,201.07 8,443.56 - 22,607 - 23,324 231 Workers' Compensation 230.60 450.15 - 5,695 - 5,006 232 Unemployment 88.53 140.92 - - - - 240 Insurance 126.49 - - - - - 249 Tuition Reimbursement 14,640.00 7,737.50 - 30,000 - 30,000
200 Payroll Costs Total 31,208.73 40,079.44 - 118,825 - 134,382 300 Purchased Services
312 Instructional Program Improvement 25,214.00 - - - - - 318 Prof Improvement Noninstruct Staff - 150.00 - - - - 340 Travel 43,494.32 40,513.49 - 81,750 - 85,500 355 Printing 466.64 52.80 - 250 - 238 389 Noninstructional Prof & Tech 4,800.00 - - - - -
300 Purchased Services Total 73,974.96 40,716.29 - 82,000 - 85,738
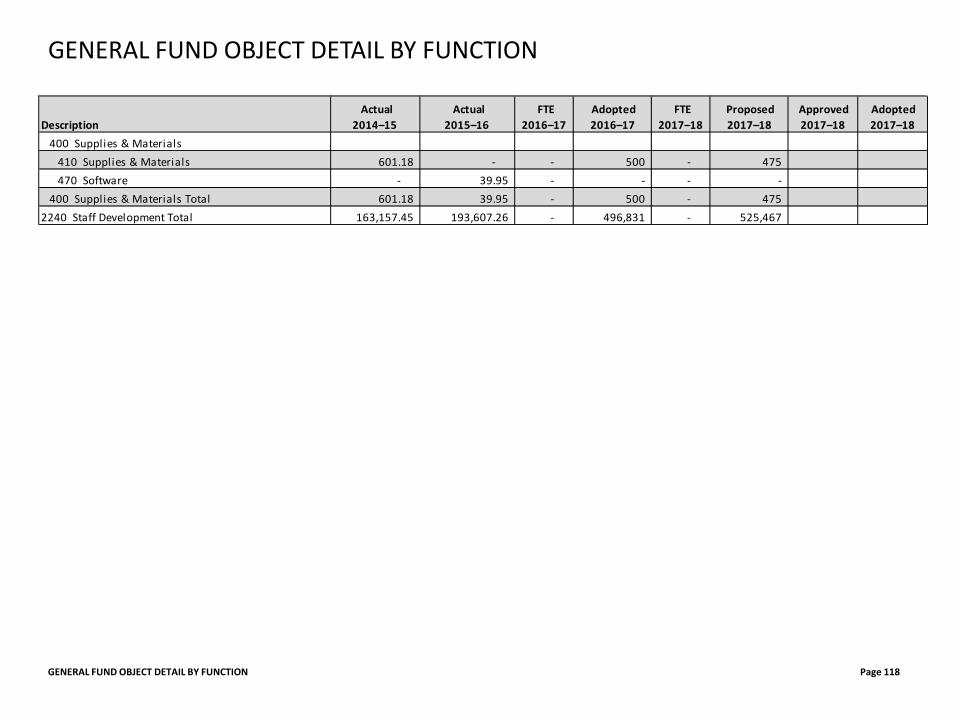
GENERAL FUND OBJECT DETAIL BY FUNCTION Page 118
GENERAL FUND OBJECT DETAIL BY FUNCTION
Description Actual
2014–15 Actual
2015–16 FTE
2016–17 Adopted 2016–17
FTE 2017–18
Proposed 2017–18
Approved 2017–18
Adopted 2017–18
400 Supplies & Materials410 Supplies & Materials 601.18 - - 500 - 475 470 Software - 39.95 - - - -
400 Supplies & Materials Total 601.18 39.95 - 500 - 475 2240 Staff Development Total 163,157.45 193,607.26 - 496,831 - 525,467
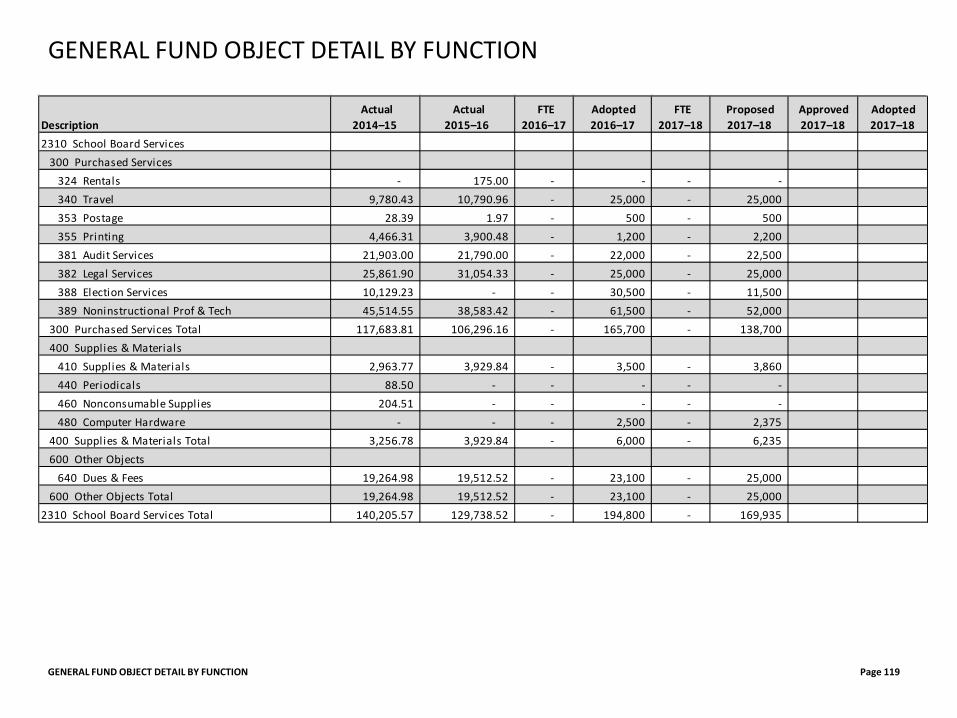
GENERAL FUND OBJECT DETAIL BY FUNCTION Page 119
GENERAL FUND OBJECT DETAIL BY FUNCTION
Description Actual
2014–15 Actual
2015–16 FTE
2016–17 Adopted 2016–17
FTE 2017–18
Proposed 2017–18
Approved 2017–18
Adopted 2017–18
2310 School Board Services300 Purchased Services
324 Rentals - 175.00 - - - - 340 Travel 9,780.43 10,790.96 - 25,000 - 25,000 353 Postage 28.39 1.97 - 500 - 500 355 Printing 4,466.31 3,900.48 - 1,200 - 2,200 381 Audit Services 21,903.00 21,790.00 - 22,000 - 22,500 382 Legal Services 25,861.90 31,054.33 - 25,000 - 25,000 388 Election Services 10,129.23 - - 30,500 - 11,500 389 Noninstructional Prof & Tech 45,514.55 38,583.42 - 61,500 - 52,000
300 Purchased Services Total 117,683.81 106,296.16 - 165,700 - 138,700 400 Supplies & Materials
410 Supplies & Materials 2,963.77 3,929.84 - 3,500 - 3,860 440 Periodicals 88.50 - - - - - 460 Nonconsumable Supplies 204.51 - - - - - 480 Computer Hardware - - - 2,500 - 2,375
400 Supplies & Materials Total 3,256.78 3,929.84 - 6,000 - 6,235 600 Other Objects
640 Dues & Fees 19,264.98 19,512.52 - 23,100 - 25,000 600 Other Objects Total 19,264.98 19,512.52 - 23,100 - 25,000
2310 School Board Services Total 140,205.57 129,738.52 - 194,800 - 169,935
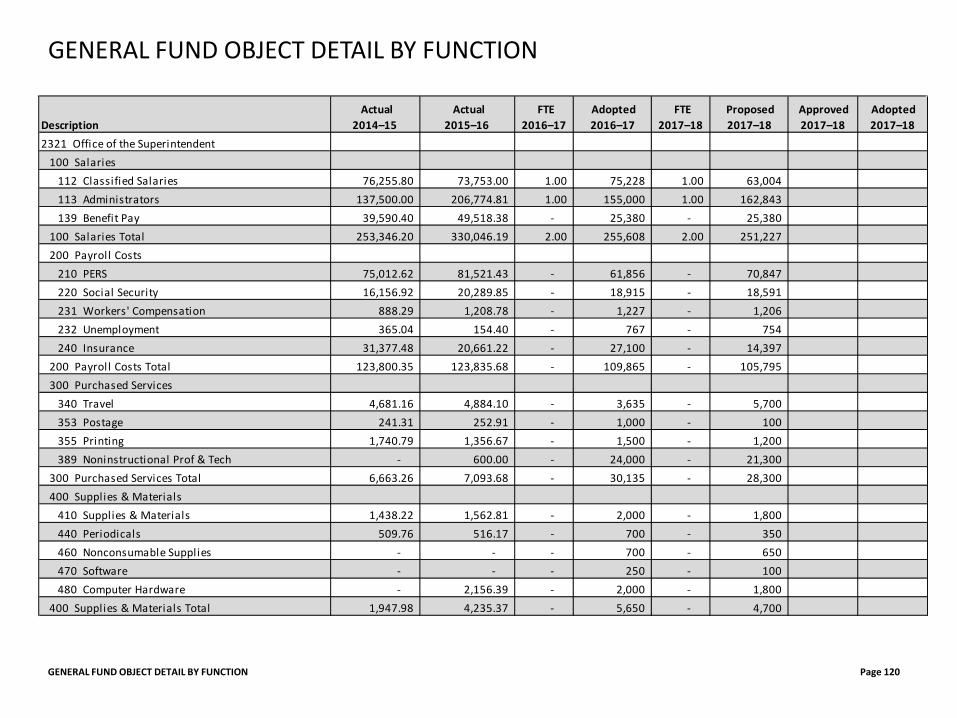
GENERAL FUND OBJECT DETAIL BY FUNCTION Page 120
GENERAL FUND OBJECT DETAIL BY FUNCTION
Description Actual
2014–15 Actual
2015–16 FTE
2016–17 Adopted 2016–17
FTE 2017–18
Proposed 2017–18
Approved 2017–18
Adopted 2017–18
2321 Office of the Superintendent100 Salaries
112 Classified Salaries 76,255.80 73,753.00 1.00 75,228 1.00 63,004 113 Administrators 137,500.00 206,774.81 1.00 155,000 1.00 162,843 139 Benefit Pay 39,590.40 49,518.38 - 25,380 - 25,380
100 Salaries Total 253,346.20 330,046.19 2.00 255,608 2.00 251,227 200 Payroll Costs
210 PERS 75,012.62 81,521.43 - 61,856 - 70,847 220 Social Security 16,156.92 20,289.85 - 18,915 - 18,591 231 Workers' Compensation 888.29 1,208.78 - 1,227 - 1,206 232 Unemployment 365.04 154.40 - 767 - 754 240 Insurance 31,377.48 20,661.22 - 27,100 - 14,397
200 Payroll Costs Total 123,800.35 123,835.68 - 109,865 - 105,795 300 Purchased Services
340 Travel 4,681.16 4,884.10 - 3,635 - 5,700 353 Postage 241.31 252.91 - 1,000 - 100 355 Printing 1,740.79 1,356.67 - 1,500 - 1,200 389 Noninstructional Prof & Tech - 600.00 - 24,000 - 21,300
300 Purchased Services Total 6,663.26 7,093.68 - 30,135 - 28,300 400 Supplies & Materials
410 Supplies & Materials 1,438.22 1,562.81 - 2,000 - 1,800 440 Periodicals 509.76 516.17 - 700 - 350 460 Nonconsumable Supplies - - - 700 - 650 470 Software - - - 250 - 100 480 Computer Hardware - 2,156.39 - 2,000 - 1,800
400 Supplies & Materials Total 1,947.98 4,235.37 - 5,650 - 4,700
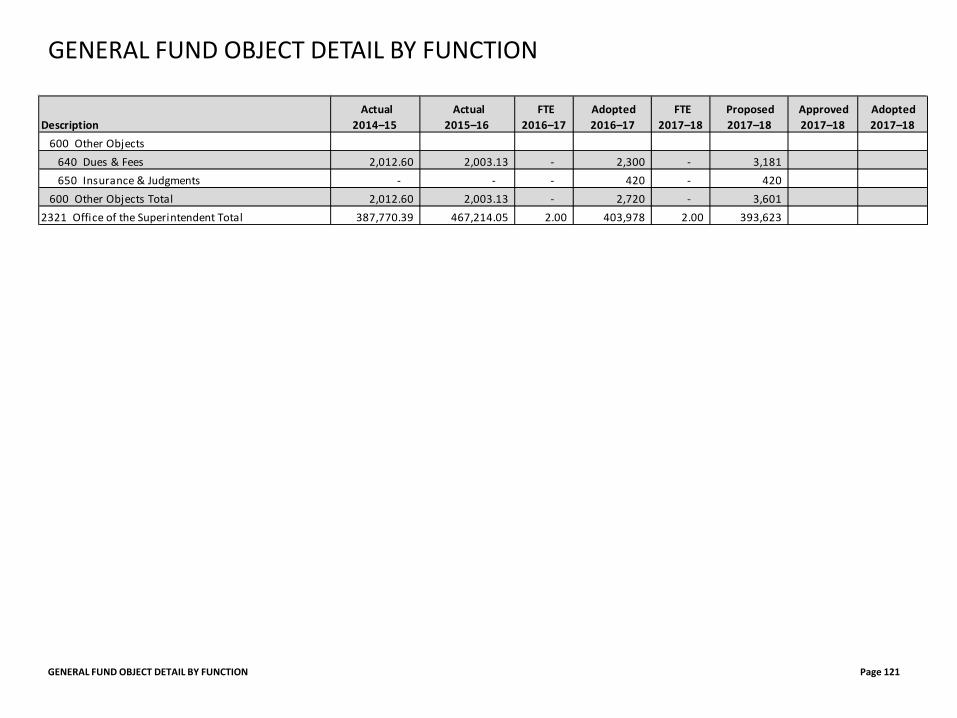
GENERAL FUND OBJECT DETAIL BY FUNCTION Page 121
GENERAL FUND OBJECT DETAIL BY FUNCTION
Description Actual
2014–15 Actual
2015–16 FTE
2016–17 Adopted 2016–17
FTE 2017–18
Proposed 2017–18
Approved 2017–18
Adopted 2017–18
600 Other Objects640 Dues & Fees 2,012.60 2,003.13 - 2,300 - 3,181 650 Insurance & Judgments - - - 420 - 420
600 Other Objects Total 2,012.60 2,003.13 - 2,720 - 3,601 2321 Office of the Superintendent Total 387,770.39 467,214.05 2.00 403,978 2.00 393,623
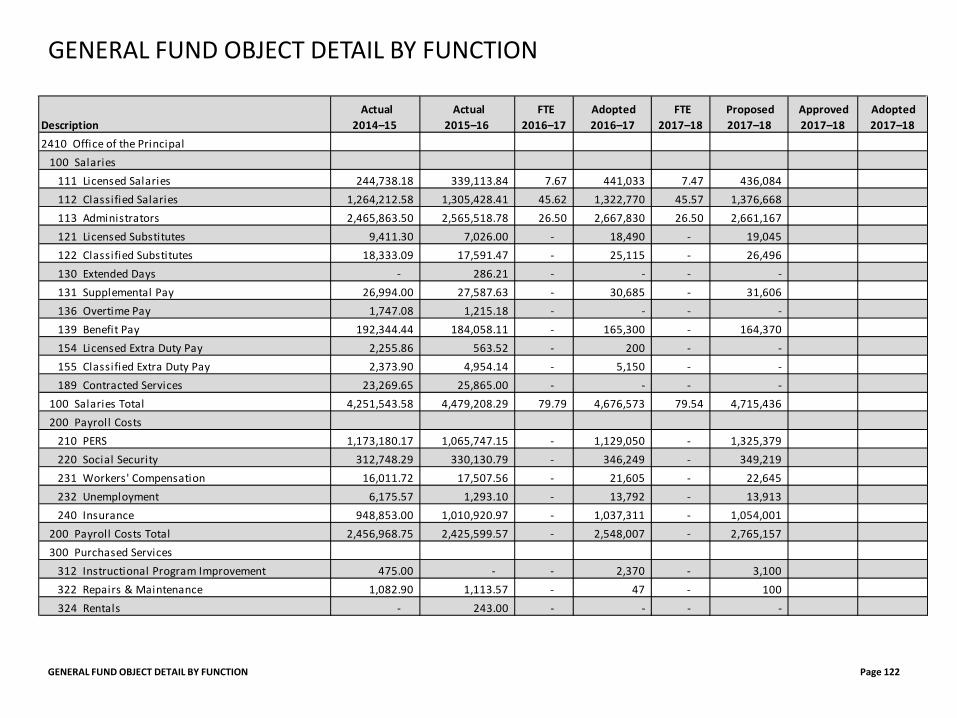
GENERAL FUND OBJECT DETAIL BY FUNCTION Page 122
GENERAL FUND OBJECT DETAIL BY FUNCTION
Description Actual
2014–15 Actual
2015–16 FTE
2016–17 Adopted 2016–17
FTE 2017–18
Proposed 2017–18
Approved 2017–18
Adopted 2017–18
2410 Office of the Principal100 Salaries
111 Licensed Salaries 244,738.18 339,113.84 7.67 441,033 7.47 436,084 112 Classified Salaries 1,264,212.58 1,305,428.41 45.62 1,322,770 45.57 1,376,668 113 Administrators 2,465,863.50 2,565,518.78 26.50 2,667,830 26.50 2,661,167 121 Licensed Substitutes 9,411.30 7,026.00 - 18,490 - 19,045 122 Classified Substitutes 18,333.09 17,591.47 - 25,115 - 26,496 130 Extended Days - 286.21 - - - - 131 Supplemental Pay 26,994.00 27,587.63 - 30,685 - 31,606 136 Overtime Pay 1,747.08 1,215.18 - - - - 139 Benefit Pay 192,344.44 184,058.11 - 165,300 - 164,370 154 Licensed Extra Duty Pay 2,255.86 563.52 - 200 - - 155 Classified Extra Duty Pay 2,373.90 4,954.14 - 5,150 - - 189 Contracted Services 23,269.65 25,865.00 - - - -
100 Salaries Total 4,251,543.58 4,479,208.29 79.79 4,676,573 79.54 4,715,436 200 Payroll Costs
210 PERS 1,173,180.17 1,065,747.15 - 1,129,050 - 1,325,379 220 Social Security 312,748.29 330,130.79 - 346,249 - 349,219 231 Workers' Compensation 16,011.72 17,507.56 - 21,605 - 22,645 232 Unemployment 6,175.57 1,293.10 - 13,792 - 13,913 240 Insurance 948,853.00 1,010,920.97 - 1,037,311 - 1,054,001
200 Payroll Costs Total 2,456,968.75 2,425,599.57 - 2,548,007 - 2,765,157 300 Purchased Services
312 Instructional Program Improvement 475.00 - - 2,370 - 3,100 322 Repairs & Maintenance 1,082.90 1,113.57 - 47 - 100 324 Rentals - 243.00 - - - -
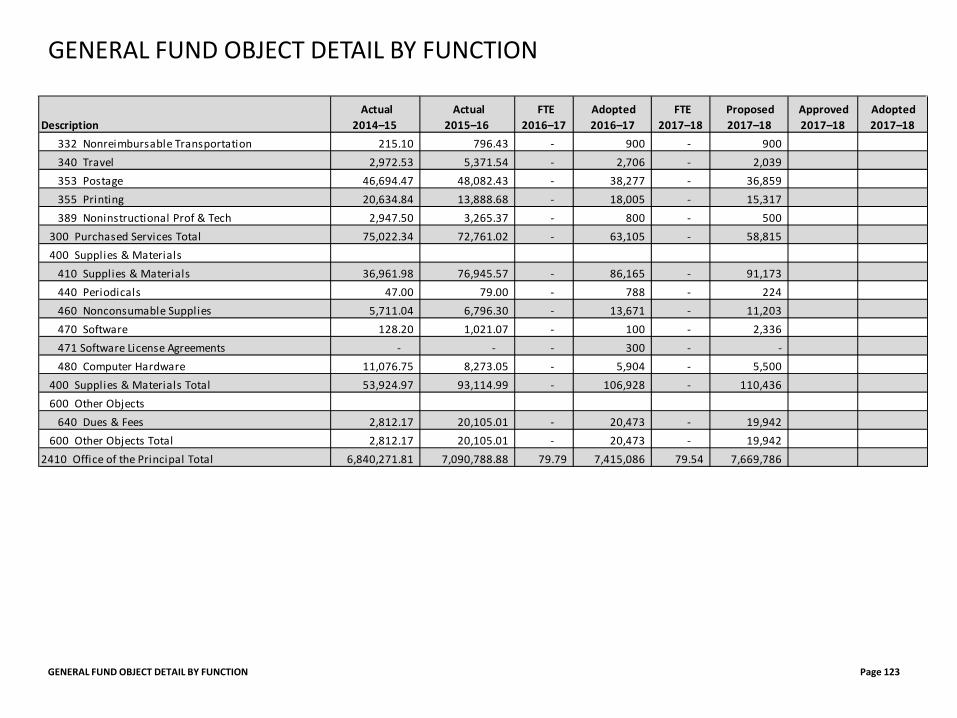
GENERAL FUND OBJECT DETAIL BY FUNCTION Page 123
GENERAL FUND OBJECT DETAIL BY FUNCTION
Description Actual
2014–15 Actual
2015–16 FTE
2016–17 Adopted 2016–17
FTE 2017–18
Proposed 2017–18
Approved 2017–18
Adopted 2017–18
332 Nonreimbursable Transportation 215.10 796.43 - 900 - 900 340 Travel 2,972.53 5,371.54 - 2,706 - 2,039 353 Postage 46,694.47 48,082.43 - 38,277 - 36,859 355 Printing 20,634.84 13,888.68 - 18,005 - 15,317 389 Noninstructional Prof & Tech 2,947.50 3,265.37 - 800 - 500
300 Purchased Services Total 75,022.34 72,761.02 - 63,105 - 58,815 400 Supplies & Materials
410 Supplies & Materials 36,961.98 76,945.57 - 86,165 - 91,173 440 Periodicals 47.00 79.00 - 788 - 224 460 Nonconsumable Supplies 5,711.04 6,796.30 - 13,671 - 11,203 470 Software 128.20 1,021.07 - 100 - 2,336 471 Software License Agreements - - - 300 - - 480 Computer Hardware 11,076.75 8,273.05 - 5,904 - 5,500
400 Supplies & Materials Total 53,924.97 93,114.99 - 106,928 - 110,436 600 Other Objects
640 Dues & Fees 2,812.17 20,105.01 - 20,473 - 19,942 600 Other Objects Total 2,812.17 20,105.01 - 20,473 - 19,942
2410 Office of the Principal Total 6,840,271.81 7,090,788.88 79.79 7,415,086 79.54 7,669,786
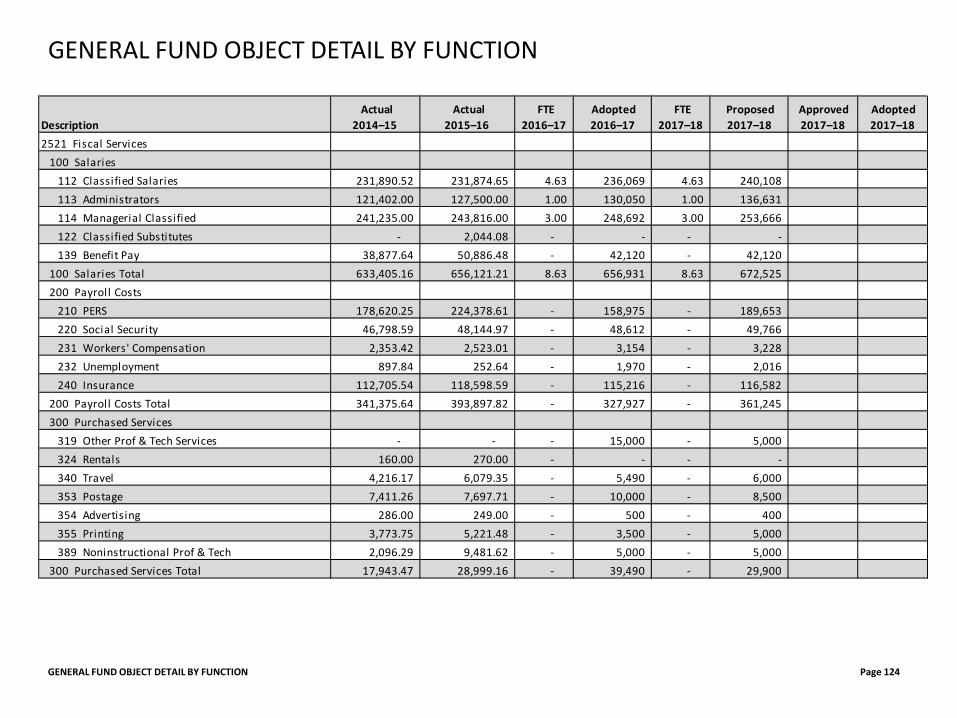
GENERAL FUND OBJECT DETAIL BY FUNCTION Page 124
GENERAL FUND OBJECT DETAIL BY FUNCTION
Description Actual
2014–15 Actual
2015–16 FTE
2016–17 Adopted 2016–17
FTE 2017–18
Proposed 2017–18
Approved 2017–18
Adopted 2017–18
2521 Fiscal Services100 Salaries
112 Classified Salaries 231,890.52 231,874.65 4.63 236,069 4.63 240,108 113 Administrators 121,402.00 127,500.00 1.00 130,050 1.00 136,631 114 Managerial Classified 241,235.00 243,816.00 3.00 248,692 3.00 253,666 122 Classified Substitutes - 2,044.08 - - - - 139 Benefit Pay 38,877.64 50,886.48 - 42,120 - 42,120
100 Salaries Total 633,405.16 656,121.21 8.63 656,931 8.63 672,525 200 Payroll Costs
210 PERS 178,620.25 224,378.61 - 158,975 - 189,653 220 Social Security 46,798.59 48,144.97 - 48,612 - 49,766 231 Workers' Compensation 2,353.42 2,523.01 - 3,154 - 3,228 232 Unemployment 897.84 252.64 - 1,970 - 2,016 240 Insurance 112,705.54 118,598.59 - 115,216 - 116,582
200 Payroll Costs Total 341,375.64 393,897.82 - 327,927 - 361,245 300 Purchased Services
319 Other Prof & Tech Services - - - 15,000 - 5,000 324 Rentals 160.00 270.00 - - - - 340 Travel 4,216.17 6,079.35 - 5,490 - 6,000 353 Postage 7,411.26 7,697.71 - 10,000 - 8,500 354 Advertising 286.00 249.00 - 500 - 400 355 Printing 3,773.75 5,221.48 - 3,500 - 5,000 389 Noninstructional Prof & Tech 2,096.29 9,481.62 - 5,000 - 5,000
300 Purchased Services Total 17,943.47 28,999.16 - 39,490 - 29,900
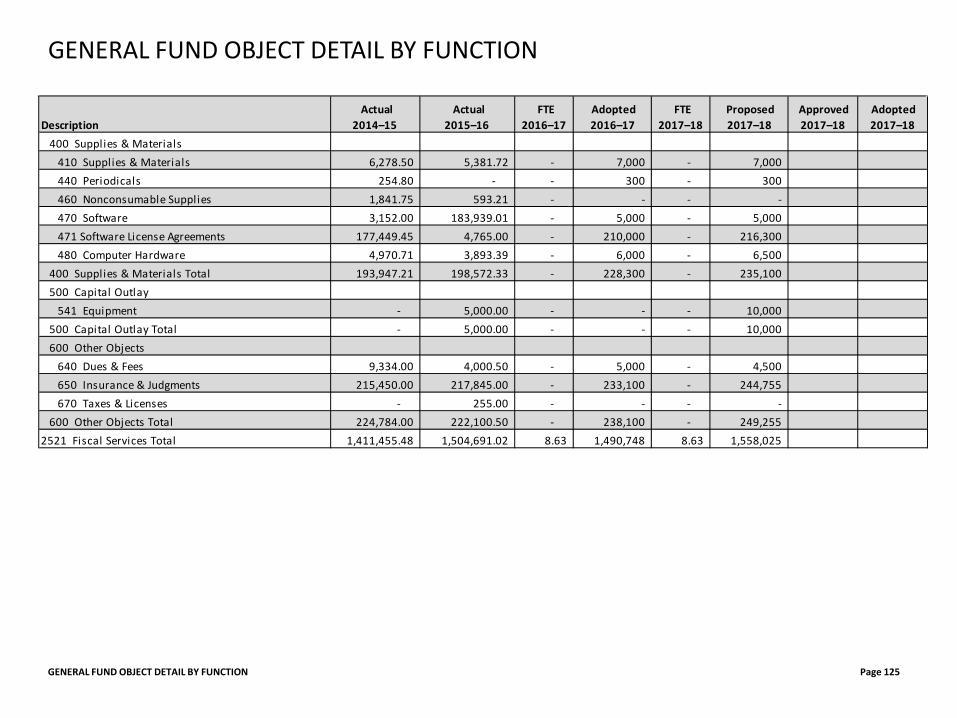
GENERAL FUND OBJECT DETAIL BY FUNCTION Page 125
GENERAL FUND OBJECT DETAIL BY FUNCTION
Description Actual
2014–15 Actual
2015–16 FTE
2016–17 Adopted 2016–17
FTE 2017–18
Proposed 2017–18
Approved 2017–18
Adopted 2017–18
400 Supplies & Materials410 Supplies & Materials 6,278.50 5,381.72 - 7,000 - 7,000 440 Periodicals 254.80 - - 300 - 300 460 Nonconsumable Supplies 1,841.75 593.21 - - - - 470 Software 3,152.00 183,939.01 - 5,000 - 5,000 471 Software License Agreements 177,449.45 4,765.00 - 210,000 - 216,300 480 Computer Hardware 4,970.71 3,893.39 - 6,000 - 6,500
400 Supplies & Materials Total 193,947.21 198,572.33 - 228,300 - 235,100 500 Capital Outlay
541 Equipment - 5,000.00 - - - 10,000 500 Capital Outlay Total - 5,000.00 - - - 10,000 600 Other Objects
640 Dues & Fees 9,334.00 4,000.50 - 5,000 - 4,500 650 Insurance & Judgments 215,450.00 217,845.00 - 233,100 - 244,755 670 Taxes & Licenses - 255.00 - - - -
600 Other Objects Total 224,784.00 222,100.50 - 238,100 - 249,255 2521 Fiscal Services Total 1,411,455.48 1,504,691.02 8.63 1,490,748 8.63 1,558,025
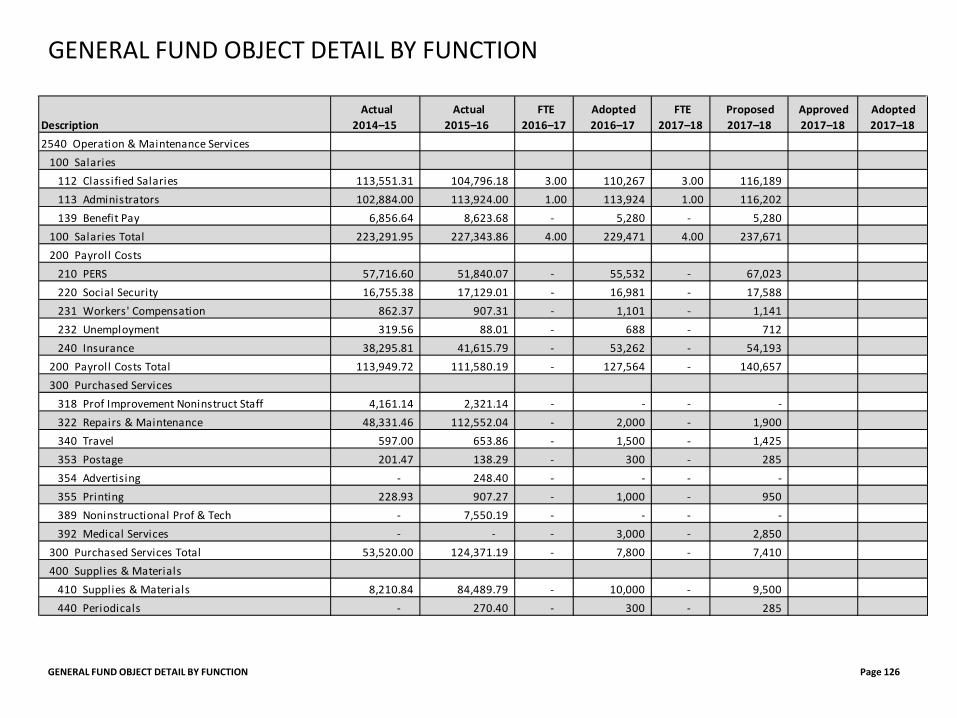
GENERAL FUND OBJECT DETAIL BY FUNCTION Page 126
GENERAL FUND OBJECT DETAIL BY FUNCTION
Description Actual
2014–15 Actual
2015–16 FTE
2016–17 Adopted 2016–17
FTE 2017–18
Proposed 2017–18
Approved 2017–18
Adopted 2017–18
2540 Operation & Maintenance Services100 Salaries
112 Classified Salaries 113,551.31 104,796.18 3.00 110,267 3.00 116,189 113 Administrators 102,884.00 113,924.00 1.00 113,924 1.00 116,202 139 Benefit Pay 6,856.64 8,623.68 - 5,280 - 5,280
100 Salaries Total 223,291.95 227,343.86 4.00 229,471 4.00 237,671 200 Payroll Costs
210 PERS 57,716.60 51,840.07 - 55,532 - 67,023 220 Social Security 16,755.38 17,129.01 - 16,981 - 17,588 231 Workers' Compensation 862.37 907.31 - 1,101 - 1,141 232 Unemployment 319.56 88.01 - 688 - 712 240 Insurance 38,295.81 41,615.79 - 53,262 - 54,193
200 Payroll Costs Total 113,949.72 111,580.19 - 127,564 - 140,657 300 Purchased Services
318 Prof Improvement Noninstruct Staff 4,161.14 2,321.14 - - - - 322 Repairs & Maintenance 48,331.46 112,552.04 - 2,000 - 1,900 340 Travel 597.00 653.86 - 1,500 - 1,425 353 Postage 201.47 138.29 - 300 - 285 354 Advertising - 248.40 - - - - 355 Printing 228.93 907.27 - 1,000 - 950 389 Noninstructional Prof & Tech - 7,550.19 - - - - 392 Medical Services - - - 3,000 - 2,850
300 Purchased Services Total 53,520.00 124,371.19 - 7,800 - 7,410 400 Supplies & Materials
410 Supplies & Materials 8,210.84 84,489.79 - 10,000 - 9,500 440 Periodicals - 270.40 - 300 - 285
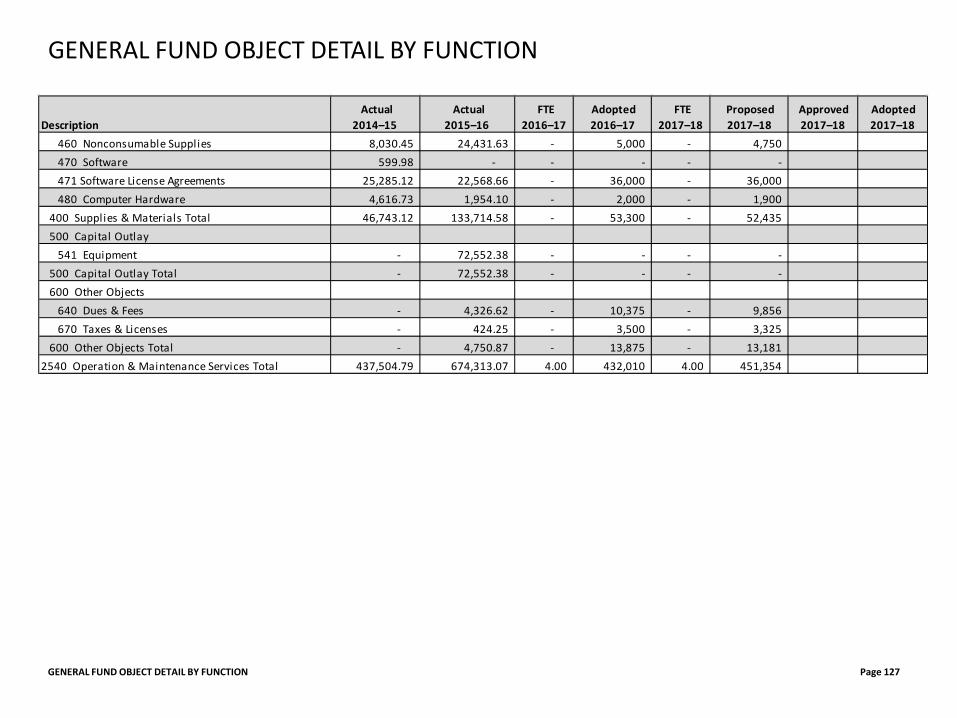
GENERAL FUND OBJECT DETAIL BY FUNCTION Page 127
GENERAL FUND OBJECT DETAIL BY FUNCTION
Description Actual
2014–15 Actual
2015–16 FTE
2016–17 Adopted 2016–17
FTE 2017–18
Proposed 2017–18
Approved 2017–18
Adopted 2017–18
460 Nonconsumable Supplies 8,030.45 24,431.63 - 5,000 - 4,750 470 Software 599.98 - - - - - 471 Software License Agreements 25,285.12 22,568.66 - 36,000 - 36,000 480 Computer Hardware 4,616.73 1,954.10 - 2,000 - 1,900
400 Supplies & Materials Total 46,743.12 133,714.58 - 53,300 - 52,435 500 Capital Outlay
541 Equipment - 72,552.38 - - - - 500 Capital Outlay Total - 72,552.38 - - - - 600 Other Objects
640 Dues & Fees - 4,326.62 - 10,375 - 9,856 670 Taxes & Licenses - 424.25 - 3,500 - 3,325
600 Other Objects Total - 4,750.87 - 13,875 - 13,181 2540 Operation & Maintenance Services Total 437,504.79 674,313.07 4.00 432,010 4.00 451,354
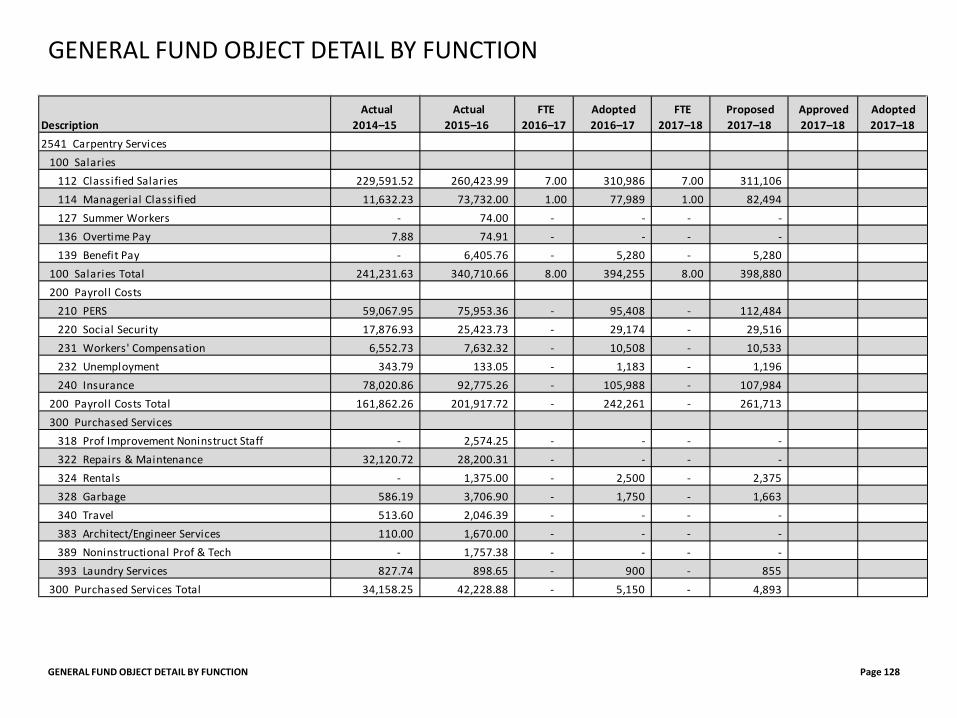
GENERAL FUND OBJECT DETAIL BY FUNCTION Page 128
GENERAL FUND OBJECT DETAIL BY FUNCTION
Description Actual
2014–15 Actual
2015–16 FTE
2016–17 Adopted 2016–17
FTE 2017–18
Proposed 2017–18
Approved 2017–18
Adopted 2017–18
2541 Carpentry Services100 Salaries
112 Classified Salaries 229,591.52 260,423.99 7.00 310,986 7.00 311,106 114 Managerial Classified 11,632.23 73,732.00 1.00 77,989 1.00 82,494 127 Summer Workers - 74.00 - - - - 136 Overtime Pay 7.88 74.91 - - - - 139 Benefit Pay - 6,405.76 - 5,280 - 5,280
100 Salaries Total 241,231.63 340,710.66 8.00 394,255 8.00 398,880 200 Payroll Costs
210 PERS 59,067.95 75,953.36 - 95,408 - 112,484 220 Social Security 17,876.93 25,423.73 - 29,174 - 29,516 231 Workers' Compensation 6,552.73 7,632.32 - 10,508 - 10,533 232 Unemployment 343.79 133.05 - 1,183 - 1,196 240 Insurance 78,020.86 92,775.26 - 105,988 - 107,984
200 Payroll Costs Total 161,862.26 201,917.72 - 242,261 - 261,713 300 Purchased Services
318 Prof Improvement Noninstruct Staff - 2,574.25 - - - - 322 Repairs & Maintenance 32,120.72 28,200.31 - - - - 324 Rentals - 1,375.00 - 2,500 - 2,375 328 Garbage 586.19 3,706.90 - 1,750 - 1,663 340 Travel 513.60 2,046.39 - - - - 383 Architect/Engineer Services 110.00 1,670.00 - - - - 389 Noninstructional Prof & Tech - 1,757.38 - - - - 393 Laundry Services 827.74 898.65 - 900 - 855
300 Purchased Services Total 34,158.25 42,228.88 - 5,150 - 4,893
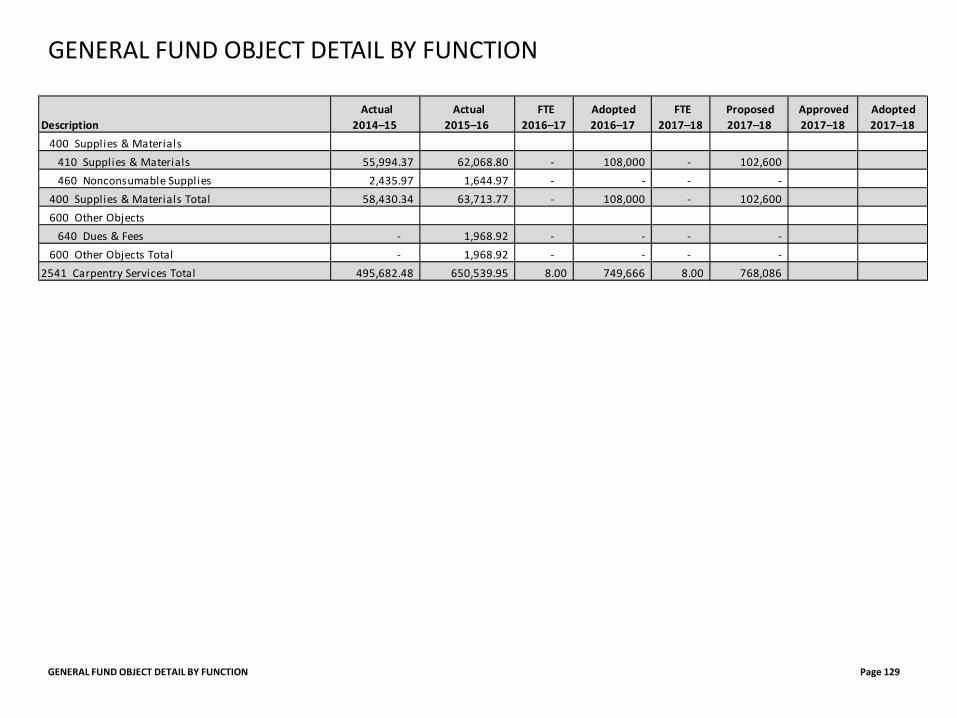
GENERAL FUND OBJECT DETAIL BY FUNCTION Page 129
GENERAL FUND OBJECT DETAIL BY FUNCTION
Description Actual
2014–15 Actual
2015–16 FTE
2016–17 Adopted 2016–17
FTE 2017–18
Proposed 2017–18
Approved 2017–18
Adopted 2017–18
400 Supplies & Materials410 Supplies & Materials 55,994.37 62,068.80 - 108,000 - 102,600 460 Nonconsumable Supplies 2,435.97 1,644.97 - - - -
400 Supplies & Materials Total 58,430.34 63,713.77 - 108,000 - 102,600 600 Other Objects
640 Dues & Fees - 1,968.92 - - - - 600 Other Objects Total - 1,968.92 - - - -
2541 Carpentry Services Total 495,682.48 650,539.95 8.00 749,666 8.00 768,086
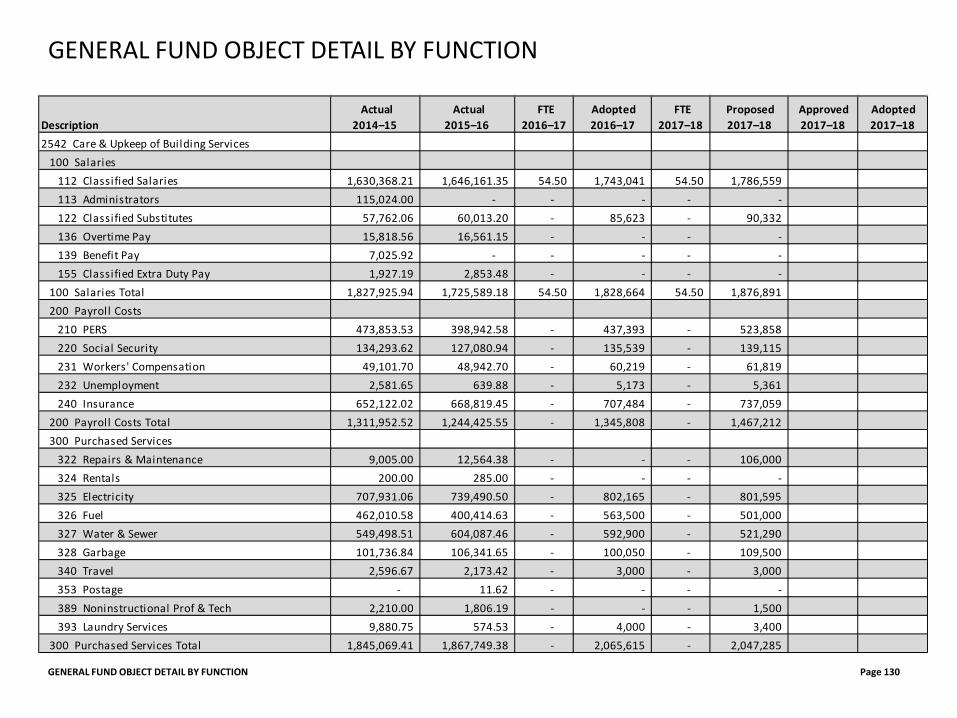
GENERAL FUND OBJECT DETAIL BY FUNCTION Page 130
GENERAL FUND OBJECT DETAIL BY FUNCTION
Description Actual
2014–15 Actual
2015–16 FTE
2016–17 Adopted 2016–17
FTE 2017–18
Proposed 2017–18
Approved 2017–18
Adopted 2017–18
2542 Care & Upkeep of Building Services100 Salaries
112 Classified Salaries 1,630,368.21 1,646,161.35 54.50 1,743,041 54.50 1,786,559 113 Administrators 115,024.00 - - - - - 122 Classified Substitutes 57,762.06 60,013.20 - 85,623 - 90,332 136 Overtime Pay 15,818.56 16,561.15 - - - - 139 Benefit Pay 7,025.92 - - - - - 155 Classified Extra Duty Pay 1,927.19 2,853.48 - - - -
100 Salaries Total 1,827,925.94 1,725,589.18 54.50 1,828,664 54.50 1,876,891 200 Payroll Costs
210 PERS 473,853.53 398,942.58 - 437,393 - 523,858 220 Social Security 134,293.62 127,080.94 - 135,539 - 139,115 231 Workers' Compensation 49,101.70 48,942.70 - 60,219 - 61,819 232 Unemployment 2,581.65 639.88 - 5,173 - 5,361 240 Insurance 652,122.02 668,819.45 - 707,484 - 737,059
200 Payroll Costs Total 1,311,952.52 1,244,425.55 - 1,345,808 - 1,467,212 300 Purchased Services
322 Repairs & Maintenance 9,005.00 12,564.38 - - - 106,000 324 Rentals 200.00 285.00 - - - - 325 Electricity 707,931.06 739,490.50 - 802,165 - 801,595 326 Fuel 462,010.58 400,414.63 - 563,500 - 501,000 327 Water & Sewer 549,498.51 604,087.46 - 592,900 - 521,290 328 Garbage 101,736.84 106,341.65 - 100,050 - 109,500 340 Travel 2,596.67 2,173.42 - 3,000 - 3,000 353 Postage - 11.62 - - - - 389 Noninstructional Prof & Tech 2,210.00 1,806.19 - - - 1,500 393 Laundry Services 9,880.75 574.53 - 4,000 - 3,400
300 Purchased Services Total 1,845,069.41 1,867,749.38 - 2,065,615 - 2,047,285
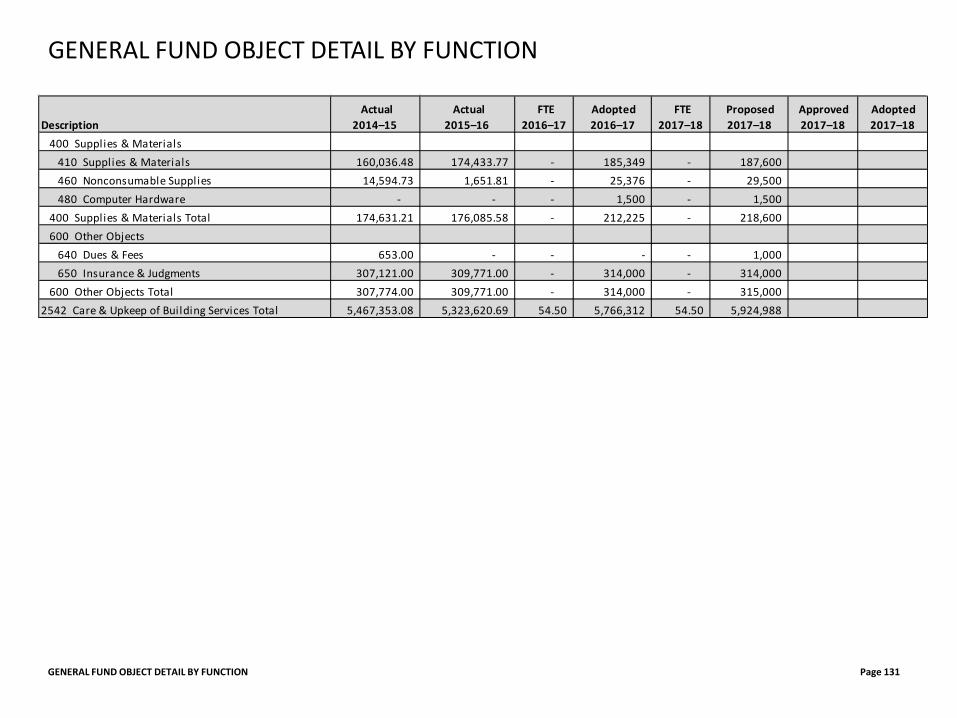
GENERAL FUND OBJECT DETAIL BY FUNCTION Page 131
GENERAL FUND OBJECT DETAIL BY FUNCTION
Description Actual
2014–15 Actual
2015–16 FTE
2016–17 Adopted 2016–17
FTE 2017–18
Proposed 2017–18
Approved 2017–18
Adopted 2017–18
400 Supplies & Materials410 Supplies & Materials 160,036.48 174,433.77 - 185,349 - 187,600 460 Nonconsumable Supplies 14,594.73 1,651.81 - 25,376 - 29,500 480 Computer Hardware - - - 1,500 - 1,500
400 Supplies & Materials Total 174,631.21 176,085.58 - 212,225 - 218,600 600 Other Objects
640 Dues & Fees 653.00 - - - - 1,000 650 Insurance & Judgments 307,121.00 309,771.00 - 314,000 - 314,000
600 Other Objects Total 307,774.00 309,771.00 - 314,000 - 315,000 2542 Care & Upkeep of Building Services Total 5,467,353.08 5,323,620.69 54.50 5,766,312 54.50 5,924,988
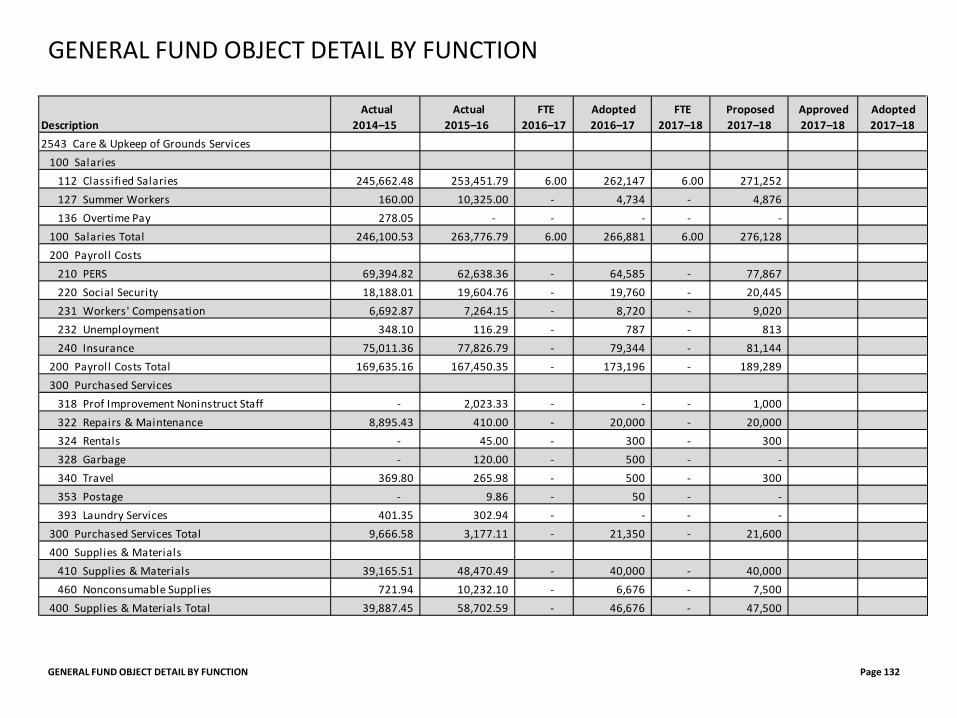
GENERAL FUND OBJECT DETAIL BY FUNCTION Page 132
GENERAL FUND OBJECT DETAIL BY FUNCTION
Description Actual
2014–15 Actual
2015–16 FTE
2016–17 Adopted 2016–17
FTE 2017–18
Proposed 2017–18
Approved 2017–18
Adopted 2017–18
2543 Care & Upkeep of Grounds Services100 Salaries
112 Classified Salaries 245,662.48 253,451.79 6.00 262,147 6.00 271,252 127 Summer Workers 160.00 10,325.00 - 4,734 - 4,876 136 Overtime Pay 278.05 - - - - -
100 Salaries Total 246,100.53 263,776.79 6.00 266,881 6.00 276,128 200 Payroll Costs
210 PERS 69,394.82 62,638.36 - 64,585 - 77,867 220 Social Security 18,188.01 19,604.76 - 19,760 - 20,445 231 Workers' Compensation 6,692.87 7,264.15 - 8,720 - 9,020 232 Unemployment 348.10 116.29 - 787 - 813 240 Insurance 75,011.36 77,826.79 - 79,344 - 81,144
200 Payroll Costs Total 169,635.16 167,450.35 - 173,196 - 189,289 300 Purchased Services
318 Prof Improvement Noninstruct Staff - 2,023.33 - - - 1,000 322 Repairs & Maintenance 8,895.43 410.00 - 20,000 - 20,000 324 Rentals - 45.00 - 300 - 300 328 Garbage - 120.00 - 500 - - 340 Travel 369.80 265.98 - 500 - 300 353 Postage - 9.86 - 50 - - 393 Laundry Services 401.35 302.94 - - - -
300 Purchased Services Total 9,666.58 3,177.11 - 21,350 - 21,600 400 Supplies & Materials
410 Supplies & Materials 39,165.51 48,470.49 - 40,000 - 40,000 460 Nonconsumable Supplies 721.94 10,232.10 - 6,676 - 7,500
400 Supplies & Materials Total 39,887.45 58,702.59 - 46,676 - 47,500
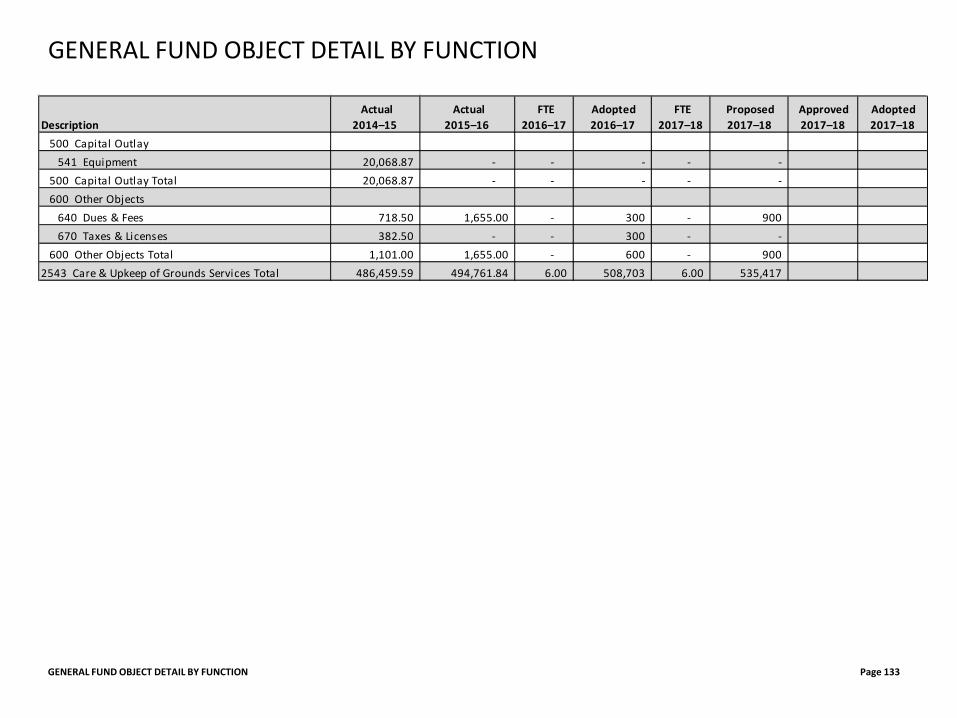
GENERAL FUND OBJECT DETAIL BY FUNCTION Page 133
GENERAL FUND OBJECT DETAIL BY FUNCTION
Description Actual
2014–15 Actual
2015–16 FTE
2016–17 Adopted 2016–17
FTE 2017–18
Proposed 2017–18
Approved 2017–18
Adopted 2017–18
500 Capital Outlay541 Equipment 20,068.87 - - - - -
500 Capital Outlay Total 20,068.87 - - - - - 600 Other Objects
640 Dues & Fees 718.50 1,655.00 - 300 - 900 670 Taxes & Licenses 382.50 - - 300 - -
600 Other Objects Total 1,101.00 1,655.00 - 600 - 900 2543 Care & Upkeep of Grounds Services Total 486,459.59 494,761.84 6.00 508,703 6.00 535,417
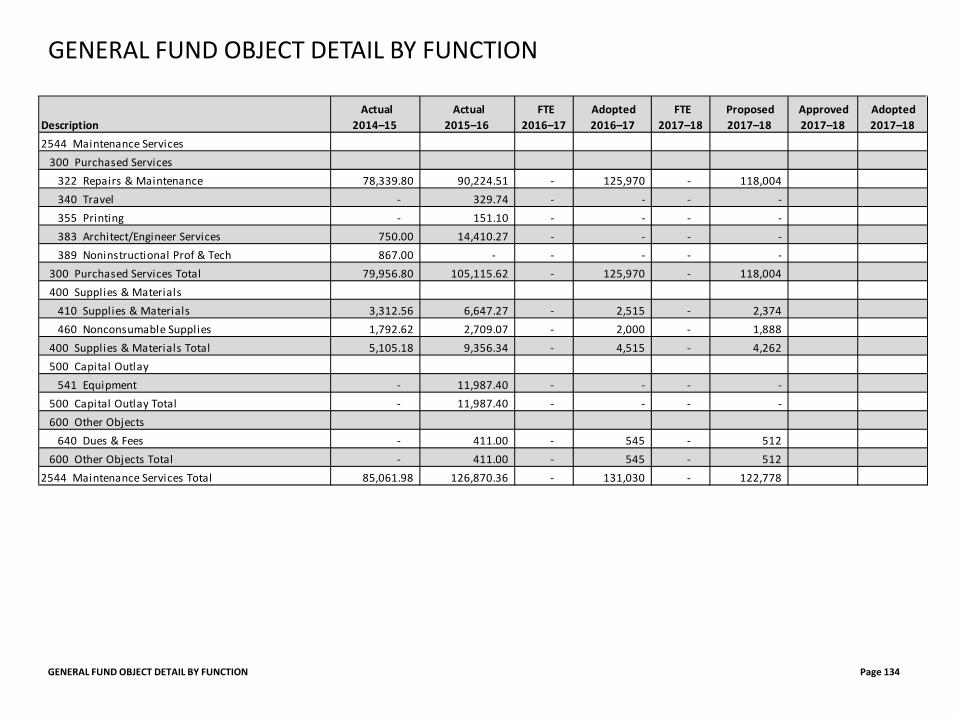
GENERAL FUND OBJECT DETAIL BY FUNCTION Page 134
GENERAL FUND OBJECT DETAIL BY FUNCTION
Description Actual
2014–15 Actual
2015–16 FTE
2016–17 Adopted 2016–17
FTE 2017–18
Proposed 2017–18
Approved 2017–18
Adopted 2017–18
2544 Maintenance Services300 Purchased Services
322 Repairs & Maintenance 78,339.80 90,224.51 - 125,970 - 118,004 340 Travel - 329.74 - - - - 355 Printing - 151.10 - - - - 383 Architect/Engineer Services 750.00 14,410.27 - - - - 389 Noninstructional Prof & Tech 867.00 - - - - -
300 Purchased Services Total 79,956.80 105,115.62 - 125,970 - 118,004 400 Supplies & Materials
410 Supplies & Materials 3,312.56 6,647.27 - 2,515 - 2,374 460 Nonconsumable Supplies 1,792.62 2,709.07 - 2,000 - 1,888
400 Supplies & Materials Total 5,105.18 9,356.34 - 4,515 - 4,262 500 Capital Outlay
541 Equipment - 11,987.40 - - - - 500 Capital Outlay Total - 11,987.40 - - - - 600 Other Objects
640 Dues & Fees - 411.00 - 545 - 512 600 Other Objects Total - 411.00 - 545 - 512
2544 Maintenance Services Total 85,061.98 126,870.36 - 131,030 - 122,778
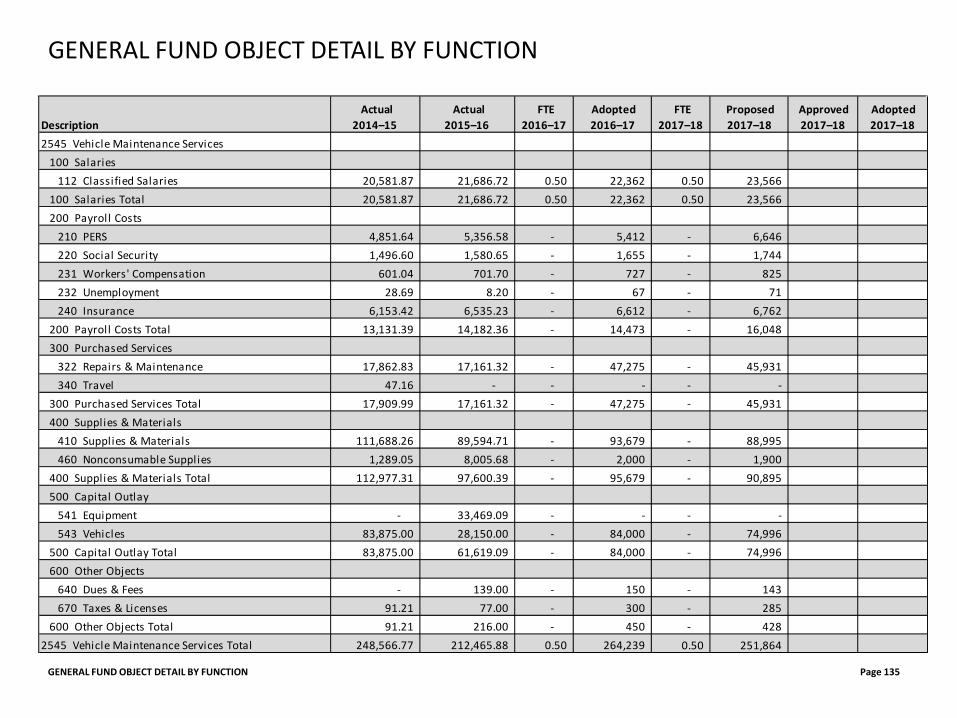
GENERAL FUND OBJECT DETAIL BY FUNCTION Page 135
GENERAL FUND OBJECT DETAIL BY FUNCTION
Description Actual
2014–15 Actual
2015–16 FTE
2016–17 Adopted 2016–17
FTE 2017–18
Proposed 2017–18
Approved 2017–18
Adopted 2017–18
2545 Vehicle Maintenance Services100 Salaries
112 Classified Salaries 20,581.87 21,686.72 0.50 22,362 0.50 23,566 100 Salaries Total 20,581.87 21,686.72 0.50 22,362 0.50 23,566 200 Payroll Costs
210 PERS 4,851.64 5,356.58 - 5,412 - 6,646 220 Social Security 1,496.60 1,580.65 - 1,655 - 1,744 231 Workers' Compensation 601.04 701.70 - 727 - 825 232 Unemployment 28.69 8.20 - 67 - 71 240 Insurance 6,153.42 6,535.23 - 6,612 - 6,762
200 Payroll Costs Total 13,131.39 14,182.36 - 14,473 - 16,048 300 Purchased Services
322 Repairs & Maintenance 17,862.83 17,161.32 - 47,275 - 45,931 340 Travel 47.16 - - - - -
300 Purchased Services Total 17,909.99 17,161.32 - 47,275 - 45,931 400 Supplies & Materials
410 Supplies & Materials 111,688.26 89,594.71 - 93,679 - 88,995 460 Nonconsumable Supplies 1,289.05 8,005.68 - 2,000 - 1,900
400 Supplies & Materials Total 112,977.31 97,600.39 - 95,679 - 90,895 500 Capital Outlay
541 Equipment - 33,469.09 - - - - 543 Vehicles 83,875.00 28,150.00 - 84,000 - 74,996
500 Capital Outlay Total 83,875.00 61,619.09 - 84,000 - 74,996 600 Other Objects
640 Dues & Fees - 139.00 - 150 - 143 670 Taxes & Licenses 91.21 77.00 - 300 - 285
600 Other Objects Total 91.21 216.00 - 450 - 428 2545 Vehicle Maintenance Services Total 248,566.77 212,465.88 0.50 264,239 0.50 251,864
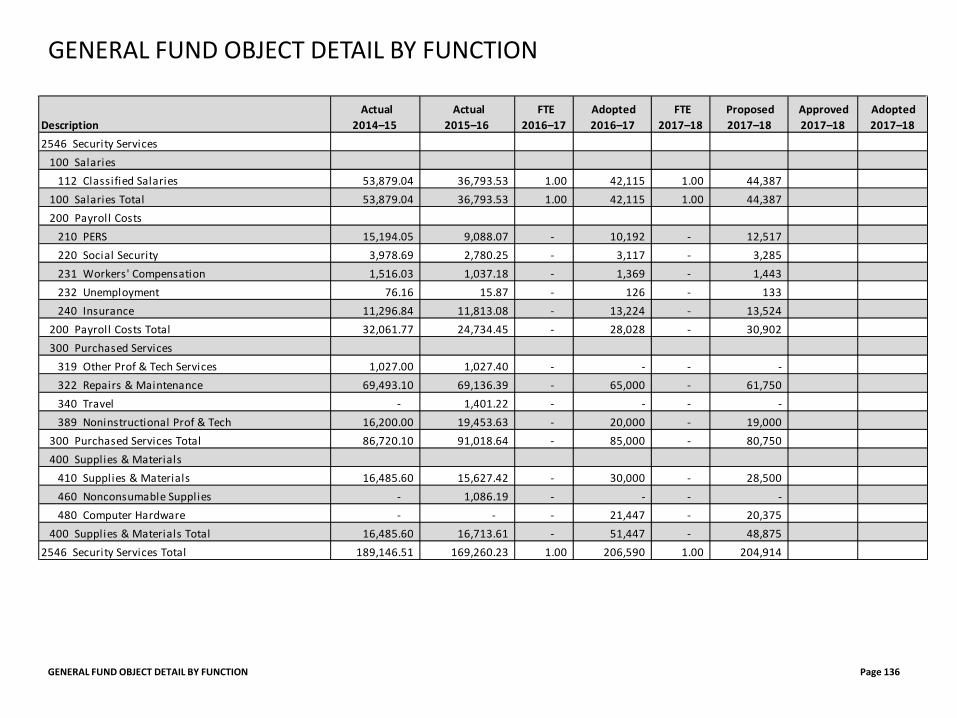
GENERAL FUND OBJECT DETAIL BY FUNCTION Page 136
GENERAL FUND OBJECT DETAIL BY FUNCTION
Description Actual
2014–15 Actual
2015–16 FTE
2016–17 Adopted 2016–17
FTE 2017–18
Proposed 2017–18
Approved 2017–18
Adopted 2017–18
2546 Security Services100 Salaries
112 Classified Salaries 53,879.04 36,793.53 1.00 42,115 1.00 44,387 100 Salaries Total 53,879.04 36,793.53 1.00 42,115 1.00 44,387 200 Payroll Costs
210 PERS 15,194.05 9,088.07 - 10,192 - 12,517 220 Social Security 3,978.69 2,780.25 - 3,117 - 3,285 231 Workers' Compensation 1,516.03 1,037.18 - 1,369 - 1,443 232 Unemployment 76.16 15.87 - 126 - 133 240 Insurance 11,296.84 11,813.08 - 13,224 - 13,524
200 Payroll Costs Total 32,061.77 24,734.45 - 28,028 - 30,902 300 Purchased Services
319 Other Prof & Tech Services 1,027.00 1,027.40 - - - - 322 Repairs & Maintenance 69,493.10 69,136.39 - 65,000 - 61,750 340 Travel - 1,401.22 - - - - 389 Noninstructional Prof & Tech 16,200.00 19,453.63 - 20,000 - 19,000
300 Purchased Services Total 86,720.10 91,018.64 - 85,000 - 80,750 400 Supplies & Materials
410 Supplies & Materials 16,485.60 15,627.42 - 30,000 - 28,500 460 Nonconsumable Supplies - 1,086.19 - - - - 480 Computer Hardware - - - 21,447 - 20,375
400 Supplies & Materials Total 16,485.60 16,713.61 - 51,447 - 48,875 2546 Security Services Total 189,146.51 169,260.23 1.00 206,590 1.00 204,914
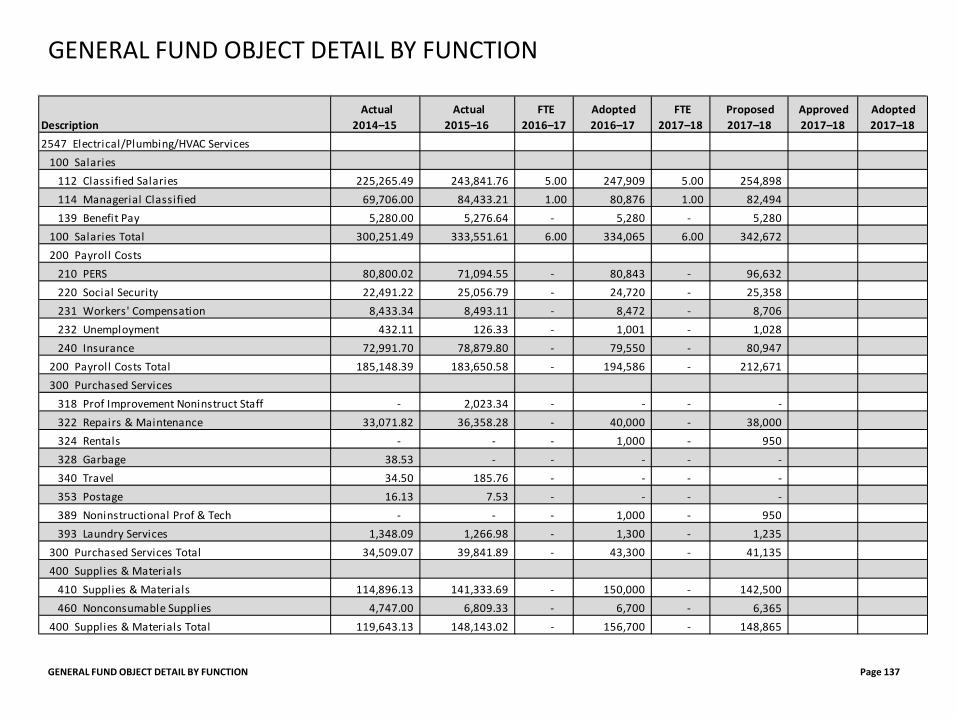
GENERAL FUND OBJECT DETAIL BY FUNCTION Page 137
GENERAL FUND OBJECT DETAIL BY FUNCTION
Description Actual
2014–15 Actual
2015–16 FTE
2016–17 Adopted 2016–17
FTE 2017–18
Proposed 2017–18
Approved 2017–18
Adopted 2017–18
2547 Electrical/Plumbing/HVAC Services100 Salaries
112 Classified Salaries 225,265.49 243,841.76 5.00 247,909 5.00 254,898 114 Managerial Classified 69,706.00 84,433.21 1.00 80,876 1.00 82,494 139 Benefit Pay 5,280.00 5,276.64 - 5,280 - 5,280
100 Salaries Total 300,251.49 333,551.61 6.00 334,065 6.00 342,672 200 Payroll Costs
210 PERS 80,800.02 71,094.55 - 80,843 - 96,632 220 Social Security 22,491.22 25,056.79 - 24,720 - 25,358 231 Workers' Compensation 8,433.34 8,493.11 - 8,472 - 8,706 232 Unemployment 432.11 126.33 - 1,001 - 1,028 240 Insurance 72,991.70 78,879.80 - 79,550 - 80,947
200 Payroll Costs Total 185,148.39 183,650.58 - 194,586 - 212,671 300 Purchased Services
318 Prof Improvement Noninstruct Staff - 2,023.34 - - - - 322 Repairs & Maintenance 33,071.82 36,358.28 - 40,000 - 38,000 324 Rentals - - - 1,000 - 950 328 Garbage 38.53 - - - - - 340 Travel 34.50 185.76 - - - - 353 Postage 16.13 7.53 - - - - 389 Noninstructional Prof & Tech - - - 1,000 - 950 393 Laundry Services 1,348.09 1,266.98 - 1,300 - 1,235
300 Purchased Services Total 34,509.07 39,841.89 - 43,300 - 41,135 400 Supplies & Materials
410 Supplies & Materials 114,896.13 141,333.69 - 150,000 - 142,500 460 Nonconsumable Supplies 4,747.00 6,809.33 - 6,700 - 6,365
400 Supplies & Materials Total 119,643.13 148,143.02 - 156,700 - 148,865
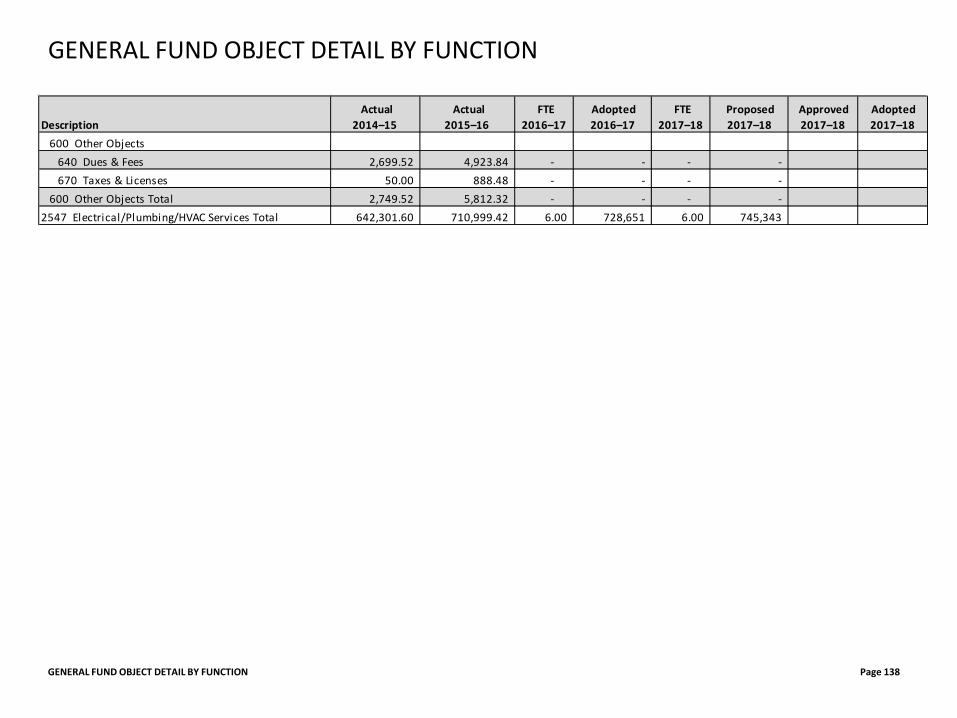
GENERAL FUND OBJECT DETAIL BY FUNCTION Page 138
GENERAL FUND OBJECT DETAIL BY FUNCTION
Description Actual
2014–15 Actual
2015–16 FTE
2016–17 Adopted 2016–17
FTE 2017–18
Proposed 2017–18
Approved 2017–18
Adopted 2017–18
600 Other Objects640 Dues & Fees 2,699.52 4,923.84 - - - - 670 Taxes & Licenses 50.00 888.48 - - - -
600 Other Objects Total 2,749.52 5,812.32 - - - - 2547 Electrical/Plumbing/HVAC Services Total 642,301.60 710,999.42 6.00 728,651 6.00 745,343
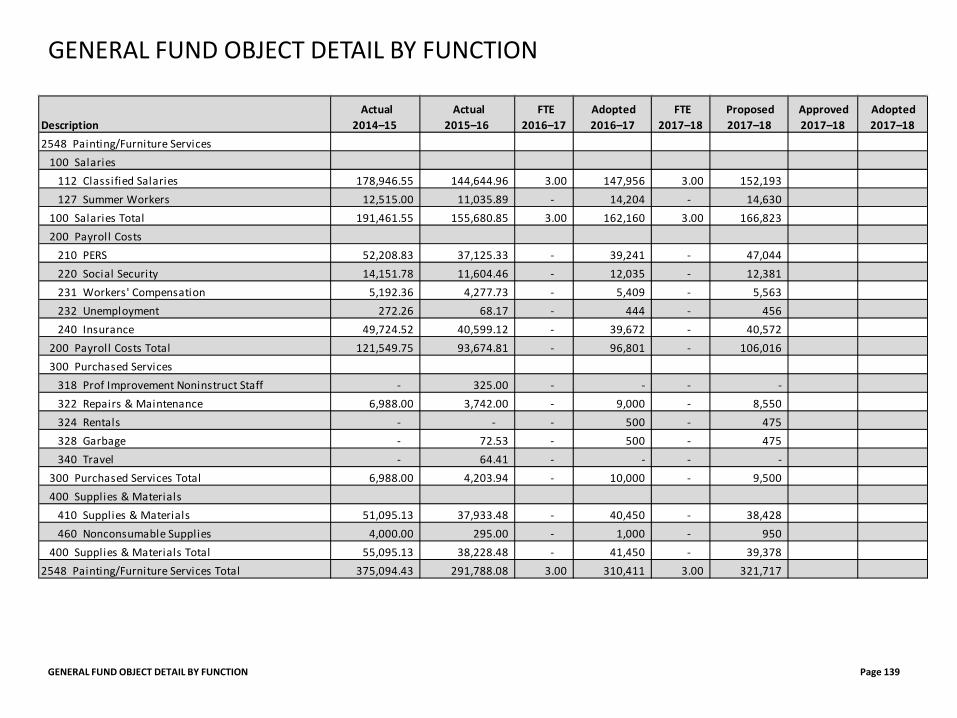
GENERAL FUND OBJECT DETAIL BY FUNCTION Page 139
GENERAL FUND OBJECT DETAIL BY FUNCTION
Description Actual
2014–15 Actual
2015–16 FTE
2016–17 Adopted 2016–17
FTE 2017–18
Proposed 2017–18
Approved 2017–18
Adopted 2017–18
2548 Painting/Furniture Services100 Salaries
112 Classified Salaries 178,946.55 144,644.96 3.00 147,956 3.00 152,193 127 Summer Workers 12,515.00 11,035.89 - 14,204 - 14,630
100 Salaries Total 191,461.55 155,680.85 3.00 162,160 3.00 166,823 200 Payroll Costs
210 PERS 52,208.83 37,125.33 - 39,241 - 47,044 220 Social Security 14,151.78 11,604.46 - 12,035 - 12,381 231 Workers' Compensation 5,192.36 4,277.73 - 5,409 - 5,563 232 Unemployment 272.26 68.17 - 444 - 456 240 Insurance 49,724.52 40,599.12 - 39,672 - 40,572
200 Payroll Costs Total 121,549.75 93,674.81 - 96,801 - 106,016 300 Purchased Services
318 Prof Improvement Noninstruct Staff - 325.00 - - - - 322 Repairs & Maintenance 6,988.00 3,742.00 - 9,000 - 8,550 324 Rentals - - - 500 - 475 328 Garbage - 72.53 - 500 - 475 340 Travel - 64.41 - - - -
300 Purchased Services Total 6,988.00 4,203.94 - 10,000 - 9,500 400 Supplies & Materials
410 Supplies & Materials 51,095.13 37,933.48 - 40,450 - 38,428 460 Nonconsumable Supplies 4,000.00 295.00 - 1,000 - 950
400 Supplies & Materials Total 55,095.13 38,228.48 - 41,450 - 39,378 2548 Painting/Furniture Services Total 375,094.43 291,788.08 3.00 310,411 3.00 321,717
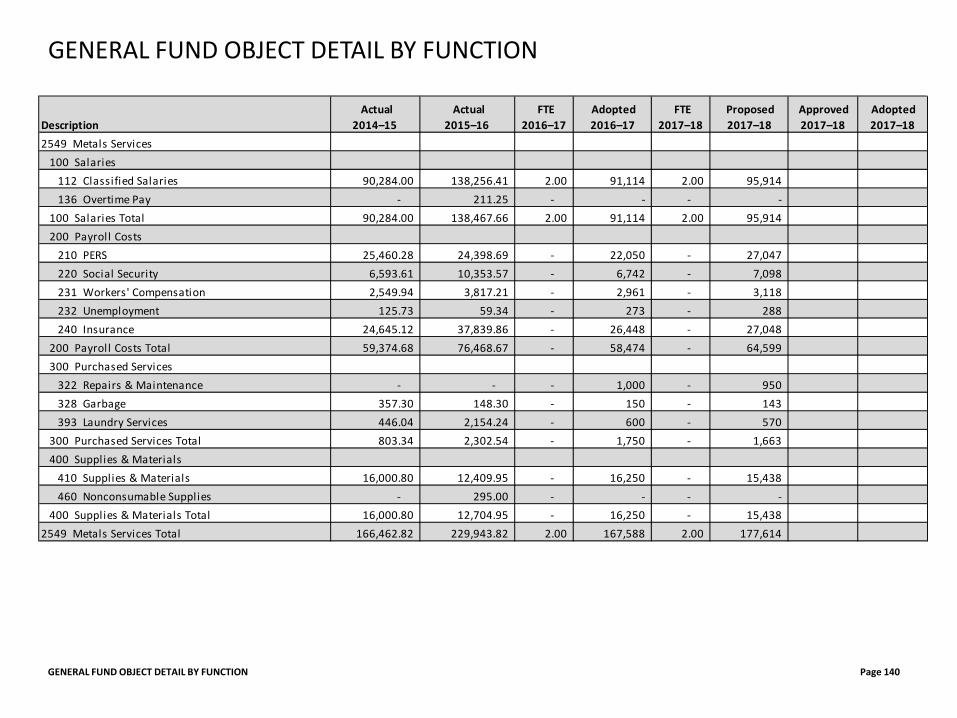
GENERAL FUND OBJECT DETAIL BY FUNCTION Page 140
GENERAL FUND OBJECT DETAIL BY FUNCTION
Description Actual
2014–15 Actual
2015–16 FTE
2016–17 Adopted 2016–17
FTE 2017–18
Proposed 2017–18
Approved 2017–18
Adopted 2017–18
2549 Metals Services100 Salaries
112 Classified Salaries 90,284.00 138,256.41 2.00 91,114 2.00 95,914 136 Overtime Pay - 211.25 - - - -
100 Salaries Total 90,284.00 138,467.66 2.00 91,114 2.00 95,914 200 Payroll Costs
210 PERS 25,460.28 24,398.69 - 22,050 - 27,047 220 Social Security 6,593.61 10,353.57 - 6,742 - 7,098 231 Workers' Compensation 2,549.94 3,817.21 - 2,961 - 3,118 232 Unemployment 125.73 59.34 - 273 - 288 240 Insurance 24,645.12 37,839.86 - 26,448 - 27,048
200 Payroll Costs Total 59,374.68 76,468.67 - 58,474 - 64,599 300 Purchased Services
322 Repairs & Maintenance - - - 1,000 - 950 328 Garbage 357.30 148.30 - 150 - 143 393 Laundry Services 446.04 2,154.24 - 600 - 570
300 Purchased Services Total 803.34 2,302.54 - 1,750 - 1,663 400 Supplies & Materials
410 Supplies & Materials 16,000.80 12,409.95 - 16,250 - 15,438 460 Nonconsumable Supplies - 295.00 - - - -
400 Supplies & Materials Total 16,000.80 12,704.95 - 16,250 - 15,438 2549 Metals Services Total 166,462.82 229,943.82 2.00 167,588 2.00 177,614
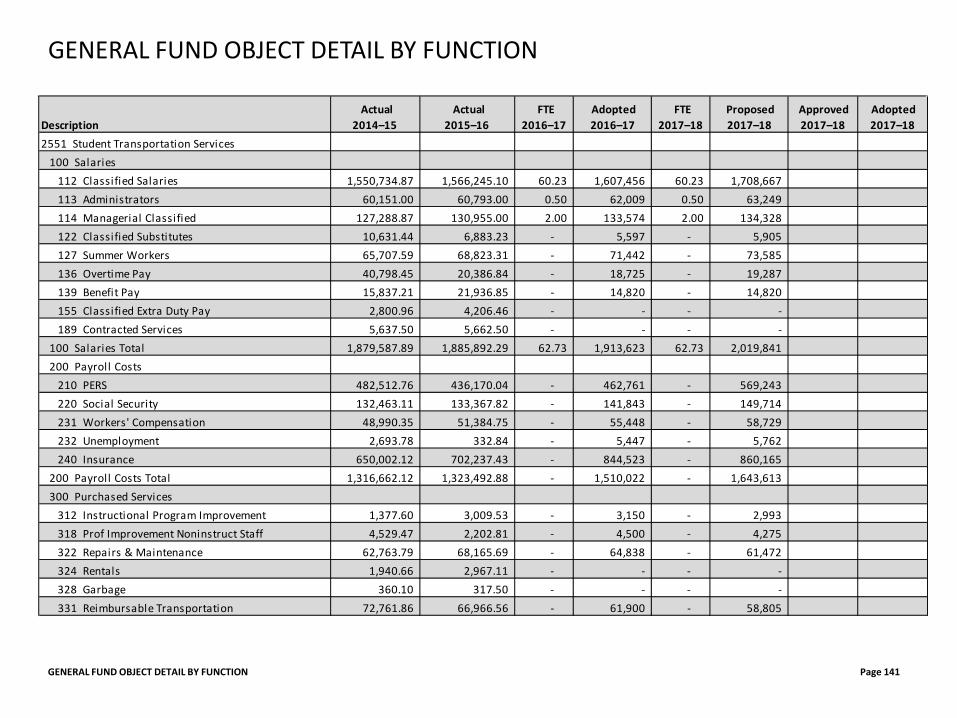
GENERAL FUND OBJECT DETAIL BY FUNCTION Page 141
GENERAL FUND OBJECT DETAIL BY FUNCTION
Description Actual
2014–15 Actual
2015–16 FTE
2016–17 Adopted 2016–17
FTE 2017–18
Proposed 2017–18
Approved 2017–18
Adopted 2017–18
2551 Student Transportation Services100 Salaries
112 Classified Salaries 1,550,734.87 1,566,245.10 60.23 1,607,456 60.23 1,708,667 113 Administrators 60,151.00 60,793.00 0.50 62,009 0.50 63,249 114 Managerial Classified 127,288.87 130,955.00 2.00 133,574 2.00 134,328 122 Classified Substitutes 10,631.44 6,883.23 - 5,597 - 5,905 127 Summer Workers 65,707.59 68,823.31 - 71,442 - 73,585 136 Overtime Pay 40,798.45 20,386.84 - 18,725 - 19,287 139 Benefit Pay 15,837.21 21,936.85 - 14,820 - 14,820 155 Classified Extra Duty Pay 2,800.96 4,206.46 - - - - 189 Contracted Services 5,637.50 5,662.50 - - - -
100 Salaries Total 1,879,587.89 1,885,892.29 62.73 1,913,623 62.73 2,019,841 200 Payroll Costs
210 PERS 482,512.76 436,170.04 - 462,761 - 569,243 220 Social Security 132,463.11 133,367.82 - 141,843 - 149,714 231 Workers' Compensation 48,990.35 51,384.75 - 55,448 - 58,729 232 Unemployment 2,693.78 332.84 - 5,447 - 5,762 240 Insurance 650,002.12 702,237.43 - 844,523 - 860,165
200 Payroll Costs Total 1,316,662.12 1,323,492.88 - 1,510,022 - 1,643,613 300 Purchased Services
312 Instructional Program Improvement 1,377.60 3,009.53 - 3,150 - 2,993 318 Prof Improvement Noninstruct Staff 4,529.47 2,202.81 - 4,500 - 4,275 322 Repairs & Maintenance 62,763.79 68,165.69 - 64,838 - 61,472 324 Rentals 1,940.66 2,967.11 - - - - 328 Garbage 360.10 317.50 - - - - 331 Reimbursable Transportation 72,761.86 66,966.56 - 61,900 - 58,805
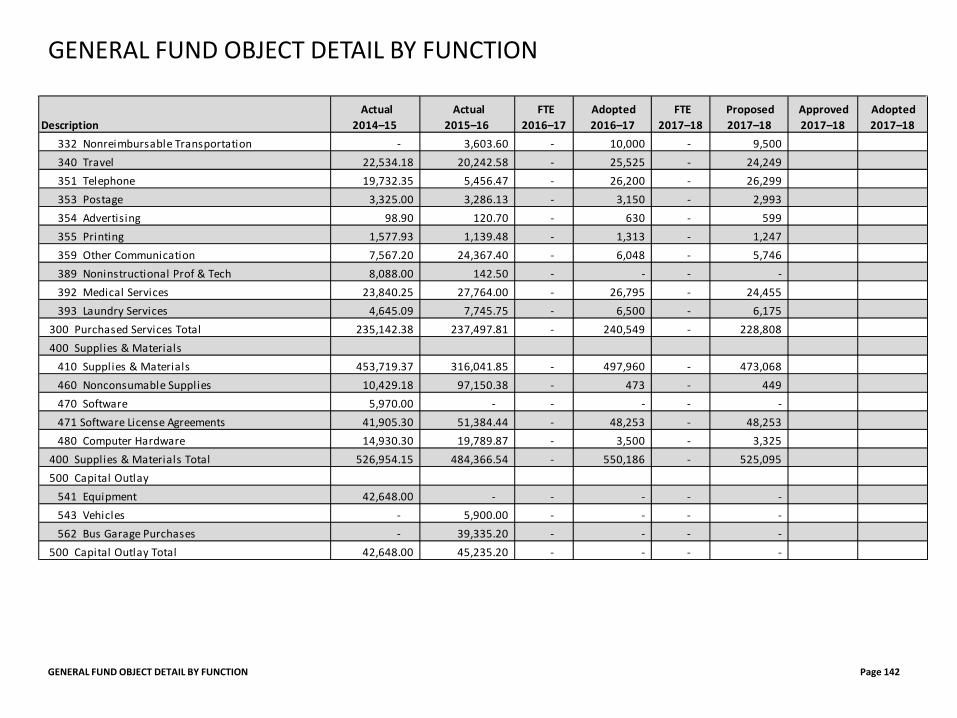
GENERAL FUND OBJECT DETAIL BY FUNCTION Page 142
GENERAL FUND OBJECT DETAIL BY FUNCTION
Description Actual
2014–15 Actual
2015–16 FTE
2016–17 Adopted 2016–17
FTE 2017–18
Proposed 2017–18
Approved 2017–18
Adopted 2017–18
332 Nonreimbursable Transportation - 3,603.60 - 10,000 - 9,500 340 Travel 22,534.18 20,242.58 - 25,525 - 24,249 351 Telephone 19,732.35 5,456.47 - 26,200 - 26,299 353 Postage 3,325.00 3,286.13 - 3,150 - 2,993 354 Advertising 98.90 120.70 - 630 - 599 355 Printing 1,577.93 1,139.48 - 1,313 - 1,247 359 Other Communication 7,567.20 24,367.40 - 6,048 - 5,746 389 Noninstructional Prof & Tech 8,088.00 142.50 - - - - 392 Medical Services 23,840.25 27,764.00 - 26,795 - 24,455 393 Laundry Services 4,645.09 7,745.75 - 6,500 - 6,175
300 Purchased Services Total 235,142.38 237,497.81 - 240,549 - 228,808 400 Supplies & Materials
410 Supplies & Materials 453,719.37 316,041.85 - 497,960 - 473,068 460 Nonconsumable Supplies 10,429.18 97,150.38 - 473 - 449 470 Software 5,970.00 - - - - - 471 Software License Agreements 41,905.30 51,384.44 - 48,253 - 48,253 480 Computer Hardware 14,930.30 19,789.87 - 3,500 - 3,325
400 Supplies & Materials Total 526,954.15 484,366.54 - 550,186 - 525,095 500 Capital Outlay
541 Equipment 42,648.00 - - - - - 543 Vehicles - 5,900.00 - - - - 562 Bus Garage Purchases - 39,335.20 - - - -
500 Capital Outlay Total 42,648.00 45,235.20 - - - -
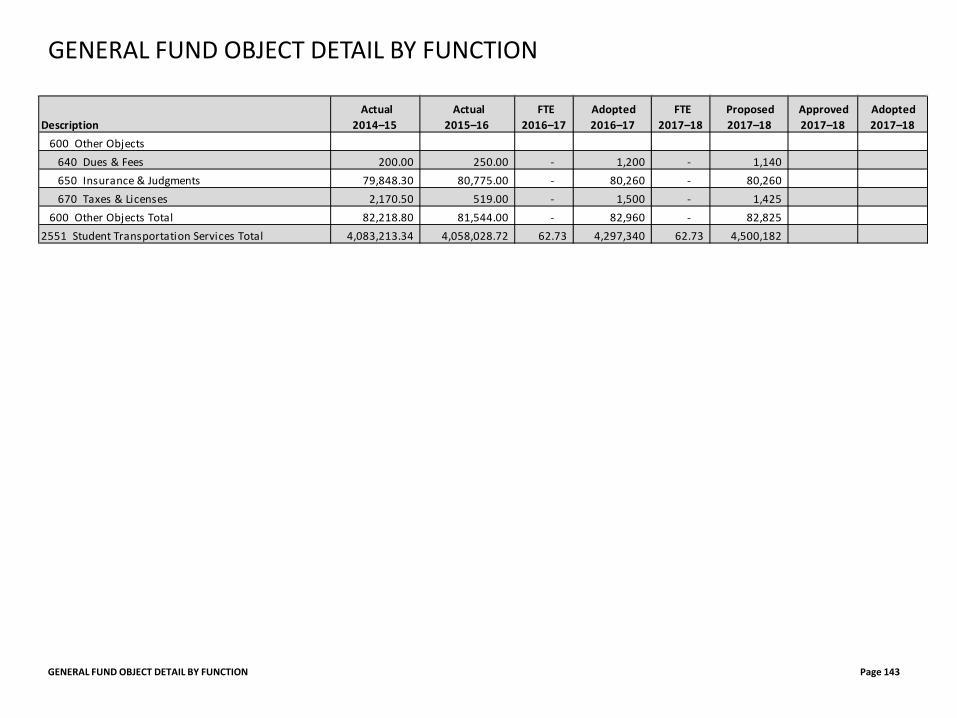
GENERAL FUND OBJECT DETAIL BY FUNCTION Page 143
GENERAL FUND OBJECT DETAIL BY FUNCTION
Description Actual
2014–15 Actual
2015–16 FTE
2016–17 Adopted 2016–17
FTE 2017–18
Proposed 2017–18
Approved 2017–18
Adopted 2017–18
600 Other Objects640 Dues & Fees 200.00 250.00 - 1,200 - 1,140 650 Insurance & Judgments 79,848.30 80,775.00 - 80,260 - 80,260 670 Taxes & Licenses 2,170.50 519.00 - 1,500 - 1,425
600 Other Objects Total 82,218.80 81,544.00 - 82,960 - 82,825 2551 Student Transportation Services Total 4,083,213.34 4,058,028.72 62.73 4,297,340 62.73 4,500,182
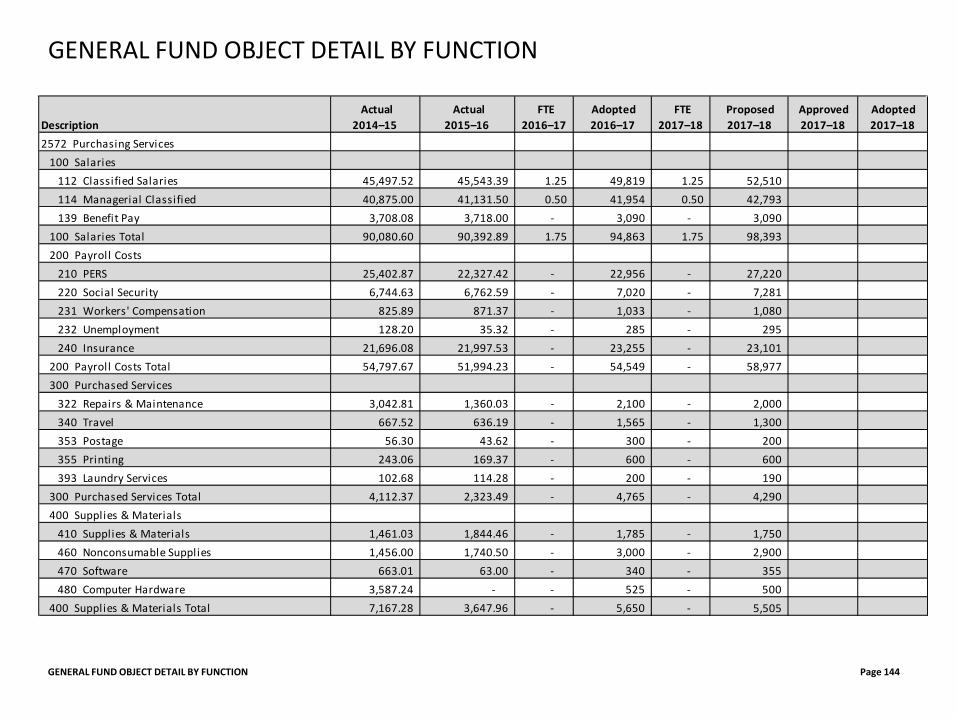
GENERAL FUND OBJECT DETAIL BY FUNCTION Page 144
GENERAL FUND OBJECT DETAIL BY FUNCTION
Description Actual
2014–15 Actual
2015–16 FTE
2016–17 Adopted 2016–17
FTE 2017–18
Proposed 2017–18
Approved 2017–18
Adopted 2017–18
2572 Purchasing Services100 Salaries
112 Classified Salaries 45,497.52 45,543.39 1.25 49,819 1.25 52,510 114 Managerial Classified 40,875.00 41,131.50 0.50 41,954 0.50 42,793 139 Benefit Pay 3,708.08 3,718.00 - 3,090 - 3,090
100 Salaries Total 90,080.60 90,392.89 1.75 94,863 1.75 98,393 200 Payroll Costs
210 PERS 25,402.87 22,327.42 - 22,956 - 27,220 220 Social Security 6,744.63 6,762.59 - 7,020 - 7,281 231 Workers' Compensation 825.89 871.37 - 1,033 - 1,080 232 Unemployment 128.20 35.32 - 285 - 295 240 Insurance 21,696.08 21,997.53 - 23,255 - 23,101
200 Payroll Costs Total 54,797.67 51,994.23 - 54,549 - 58,977 300 Purchased Services
322 Repairs & Maintenance 3,042.81 1,360.03 - 2,100 - 2,000 340 Travel 667.52 636.19 - 1,565 - 1,300 353 Postage 56.30 43.62 - 300 - 200 355 Printing 243.06 169.37 - 600 - 600 393 Laundry Services 102.68 114.28 - 200 - 190
300 Purchased Services Total 4,112.37 2,323.49 - 4,765 - 4,290 400 Supplies & Materials
410 Supplies & Materials 1,461.03 1,844.46 - 1,785 - 1,750 460 Nonconsumable Supplies 1,456.00 1,740.50 - 3,000 - 2,900 470 Software 663.01 63.00 - 340 - 355 480 Computer Hardware 3,587.24 - - 525 - 500
400 Supplies & Materials Total 7,167.28 3,647.96 - 5,650 - 5,505
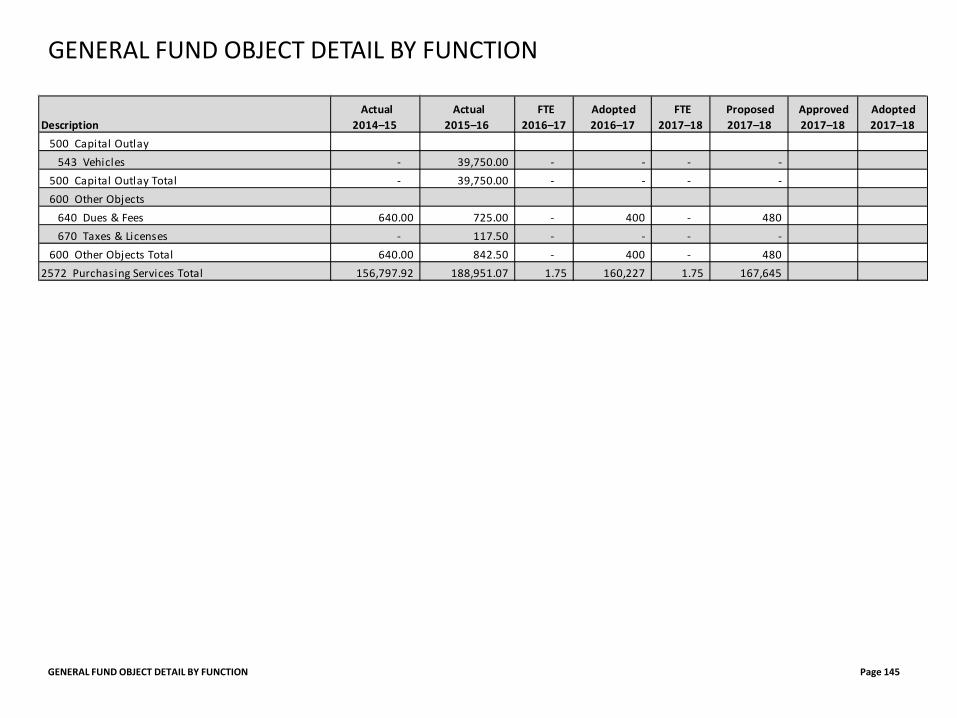
GENERAL FUND OBJECT DETAIL BY FUNCTION Page 145
GENERAL FUND OBJECT DETAIL BY FUNCTION
Description Actual
2014–15 Actual
2015–16 FTE
2016–17 Adopted 2016–17
FTE 2017–18
Proposed 2017–18
Approved 2017–18
Adopted 2017–18
500 Capital Outlay543 Vehicles - 39,750.00 - - - -
500 Capital Outlay Total - 39,750.00 - - - - 600 Other Objects
640 Dues & Fees 640.00 725.00 - 400 - 480 670 Taxes & Licenses - 117.50 - - - -
600 Other Objects Total 640.00 842.50 - 400 - 480 2572 Purchasing Services Total 156,797.92 188,951.07 1.75 160,227 1.75 167,645
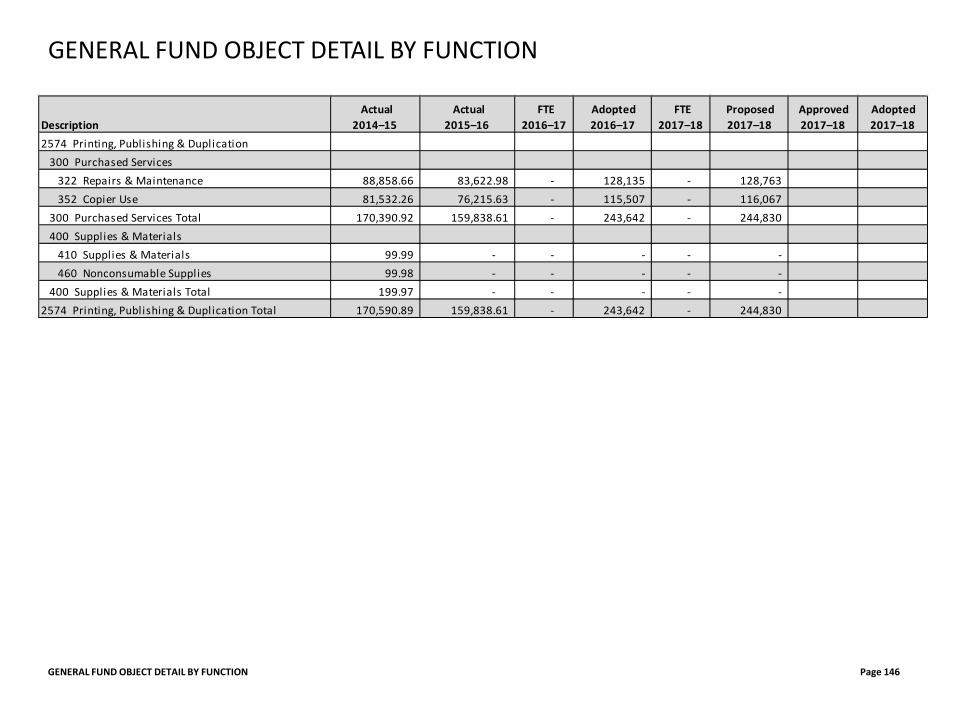
GENERAL FUND OBJECT DETAIL BY FUNCTION Page 146
GENERAL FUND OBJECT DETAIL BY FUNCTION
Description Actual
2014–15 Actual
2015–16 FTE
2016–17 Adopted 2016–17
FTE 2017–18
Proposed 2017–18
Approved 2017–18
Adopted 2017–18
2574 Printing, Publishing & Duplication300 Purchased Services
322 Repairs & Maintenance 88,858.66 83,622.98 - 128,135 - 128,763 352 Copier Use 81,532.26 76,215.63 - 115,507 - 116,067
300 Purchased Services Total 170,390.92 159,838.61 - 243,642 - 244,830 400 Supplies & Materials
410 Supplies & Materials 99.99 - - - - - 460 Nonconsumable Supplies 99.98 - - - - -
400 Supplies & Materials Total 199.97 - - - - - 2574 Printing, Publishing & Duplication Total 170,590.89 159,838.61 - 243,642 - 244,830
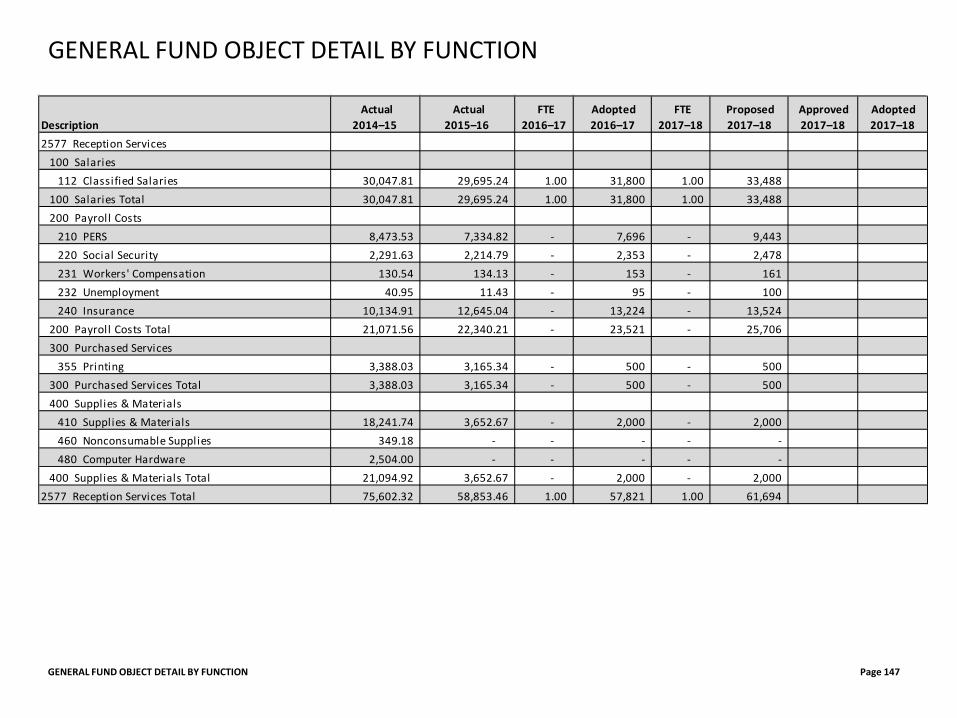
GENERAL FUND OBJECT DETAIL BY FUNCTION Page 147
GENERAL FUND OBJECT DETAIL BY FUNCTION
Description Actual
2014–15 Actual
2015–16 FTE
2016–17 Adopted 2016–17
FTE 2017–18
Proposed 2017–18
Approved 2017–18
Adopted 2017–18
2577 Reception Services100 Salaries
112 Classified Salaries 30,047.81 29,695.24 1.00 31,800 1.00 33,488 100 Salaries Total 30,047.81 29,695.24 1.00 31,800 1.00 33,488 200 Payroll Costs
210 PERS 8,473.53 7,334.82 - 7,696 - 9,443 220 Social Security 2,291.63 2,214.79 - 2,353 - 2,478 231 Workers' Compensation 130.54 134.13 - 153 - 161 232 Unemployment 40.95 11.43 - 95 - 100 240 Insurance 10,134.91 12,645.04 - 13,224 - 13,524
200 Payroll Costs Total 21,071.56 22,340.21 - 23,521 - 25,706 300 Purchased Services
355 Printing 3,388.03 3,165.34 - 500 - 500 300 Purchased Services Total 3,388.03 3,165.34 - 500 - 500 400 Supplies & Materials
410 Supplies & Materials 18,241.74 3,652.67 - 2,000 - 2,000 460 Nonconsumable Supplies 349.18 - - - - - 480 Computer Hardware 2,504.00 - - - - -
400 Supplies & Materials Total 21,094.92 3,652.67 - 2,000 - 2,000 2577 Reception Services Total 75,602.32 58,853.46 1.00 57,821 1.00 61,694
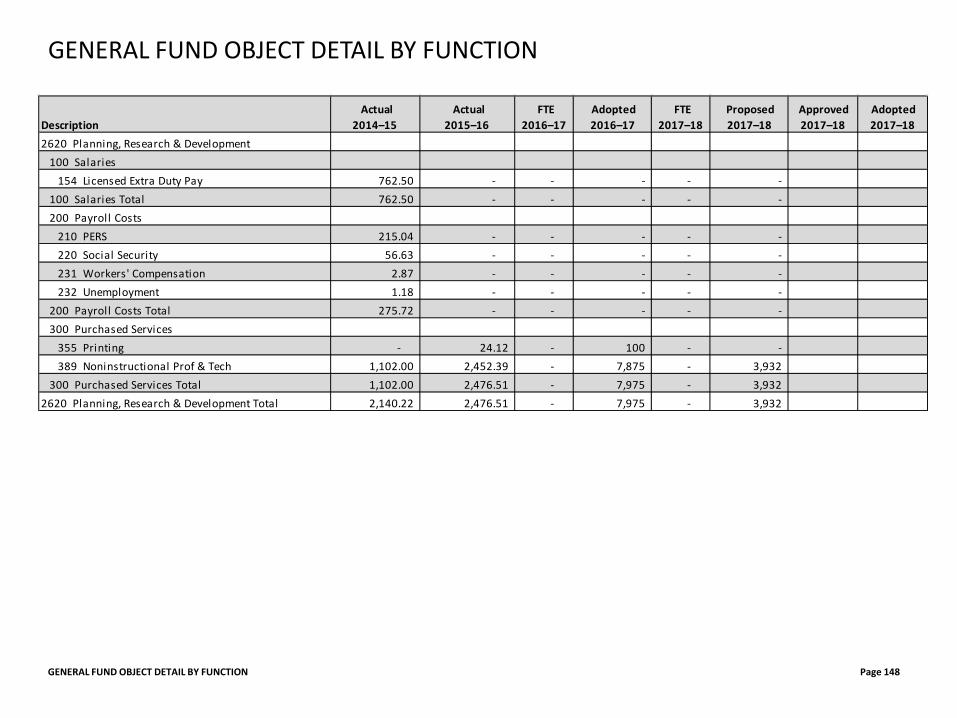
GENERAL FUND OBJECT DETAIL BY FUNCTION Page 148
GENERAL FUND OBJECT DETAIL BY FUNCTION
Description Actual
2014–15 Actual
2015–16 FTE
2016–17 Adopted 2016–17
FTE 2017–18
Proposed 2017–18
Approved 2017–18
Adopted 2017–18
2620 Planning, Research & Development100 Salaries
154 Licensed Extra Duty Pay 762.50 - - - - - 100 Salaries Total 762.50 - - - - - 200 Payroll Costs
210 PERS 215.04 - - - - - 220 Social Security 56.63 - - - - - 231 Workers' Compensation 2.87 - - - - - 232 Unemployment 1.18 - - - - -
200 Payroll Costs Total 275.72 - - - - - 300 Purchased Services
355 Printing - 24.12 - 100 - - 389 Noninstructional Prof & Tech 1,102.00 2,452.39 - 7,875 - 3,932
300 Purchased Services Total 1,102.00 2,476.51 - 7,975 - 3,932 2620 Planning, Research & Development Total 2,140.22 2,476.51 - 7,975 - 3,932
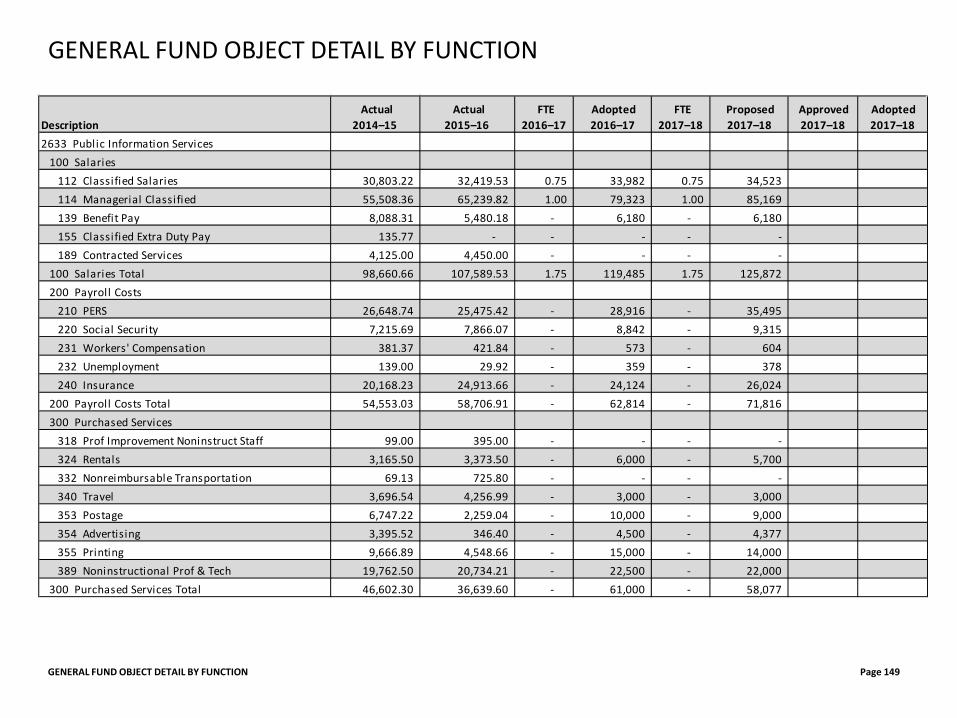
GENERAL FUND OBJECT DETAIL BY FUNCTION Page 149
GENERAL FUND OBJECT DETAIL BY FUNCTION
Description Actual
2014–15 Actual
2015–16 FTE
2016–17 Adopted 2016–17
FTE 2017–18
Proposed 2017–18
Approved 2017–18
Adopted 2017–18
2633 Public Information Services100 Salaries
112 Classified Salaries 30,803.22 32,419.53 0.75 33,982 0.75 34,523 114 Managerial Classified 55,508.36 65,239.82 1.00 79,323 1.00 85,169 139 Benefit Pay 8,088.31 5,480.18 - 6,180 - 6,180 155 Classified Extra Duty Pay 135.77 - - - - - 189 Contracted Services 4,125.00 4,450.00 - - - -
100 Salaries Total 98,660.66 107,589.53 1.75 119,485 1.75 125,872 200 Payroll Costs
210 PERS 26,648.74 25,475.42 - 28,916 - 35,495 220 Social Security 7,215.69 7,866.07 - 8,842 - 9,315 231 Workers' Compensation 381.37 421.84 - 573 - 604 232 Unemployment 139.00 29.92 - 359 - 378 240 Insurance 20,168.23 24,913.66 - 24,124 - 26,024
200 Payroll Costs Total 54,553.03 58,706.91 - 62,814 - 71,816 300 Purchased Services
318 Prof Improvement Noninstruct Staff 99.00 395.00 - - - - 324 Rentals 3,165.50 3,373.50 - 6,000 - 5,700 332 Nonreimbursable Transportation 69.13 725.80 - - - - 340 Travel 3,696.54 4,256.99 - 3,000 - 3,000 353 Postage 6,747.22 2,259.04 - 10,000 - 9,000 354 Advertising 3,395.52 346.40 - 4,500 - 4,377 355 Printing 9,666.89 4,548.66 - 15,000 - 14,000 389 Noninstructional Prof & Tech 19,762.50 20,734.21 - 22,500 - 22,000
300 Purchased Services Total 46,602.30 36,639.60 - 61,000 - 58,077
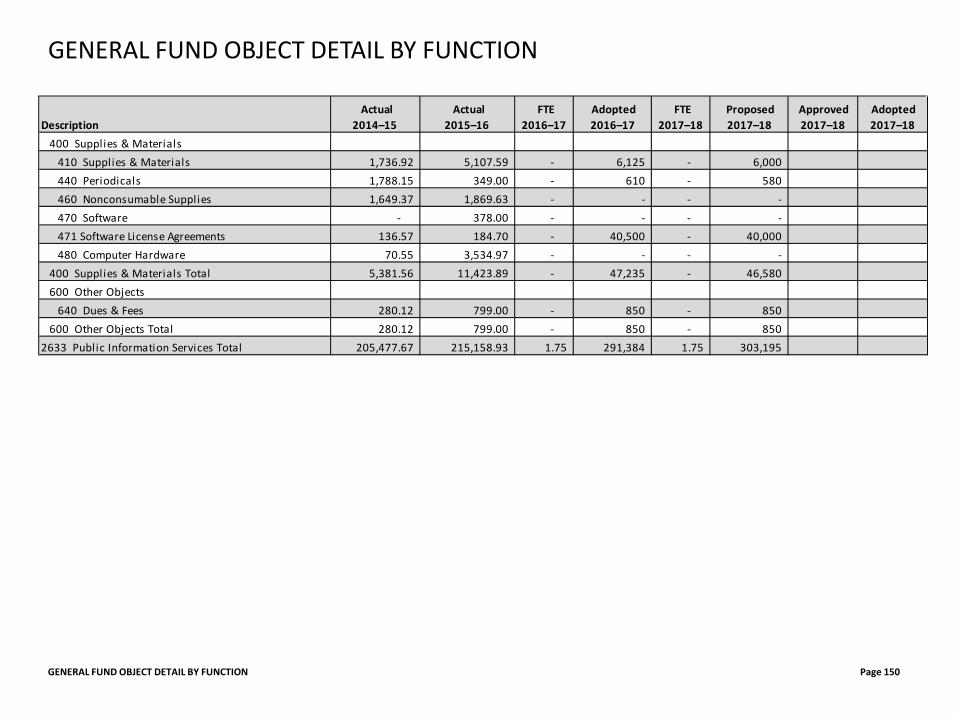
GENERAL FUND OBJECT DETAIL BY FUNCTION Page 150
GENERAL FUND OBJECT DETAIL BY FUNCTION
Description Actual
2014–15 Actual
2015–16 FTE
2016–17 Adopted 2016–17
FTE 2017–18
Proposed 2017–18
Approved 2017–18
Adopted 2017–18
400 Supplies & Materials410 Supplies & Materials 1,736.92 5,107.59 - 6,125 - 6,000 440 Periodicals 1,788.15 349.00 - 610 - 580 460 Nonconsumable Supplies 1,649.37 1,869.63 - - - - 470 Software - 378.00 - - - - 471 Software License Agreements 136.57 184.70 - 40,500 - 40,000 480 Computer Hardware 70.55 3,534.97 - - - -
400 Supplies & Materials Total 5,381.56 11,423.89 - 47,235 - 46,580 600 Other Objects
640 Dues & Fees 280.12 799.00 - 850 - 850 600 Other Objects Total 280.12 799.00 - 850 - 850
2633 Public Information Services Total 205,477.67 215,158.93 1.75 291,384 1.75 303,195
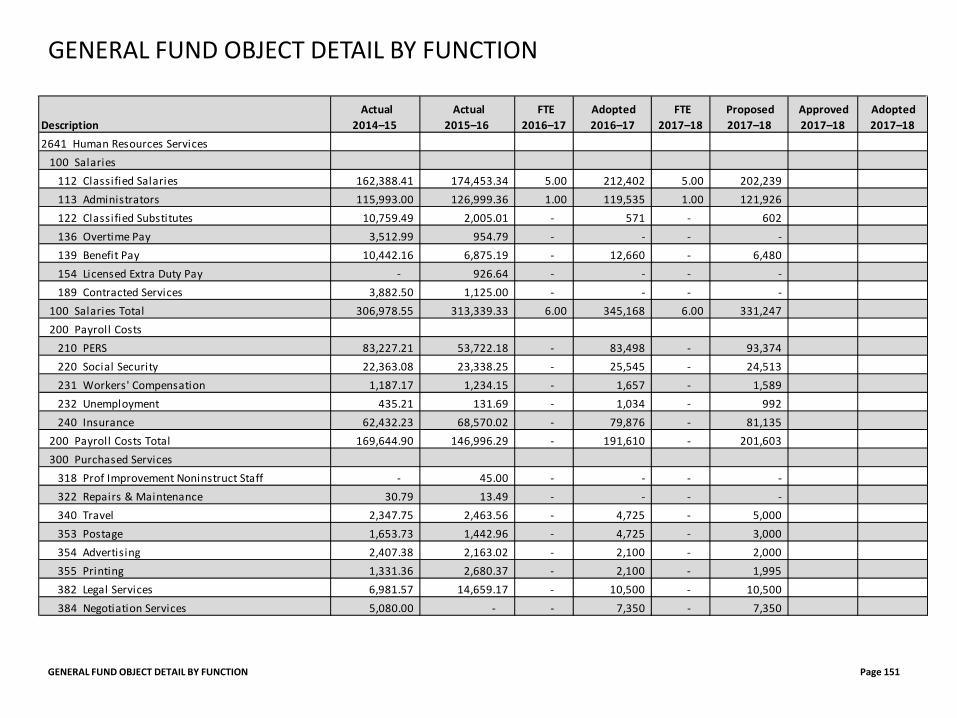
GENERAL FUND OBJECT DETAIL BY FUNCTION Page 151
GENERAL FUND OBJECT DETAIL BY FUNCTION
Description Actual
2014–15 Actual
2015–16 FTE
2016–17 Adopted 2016–17
FTE 2017–18
Proposed 2017–18
Approved 2017–18
Adopted 2017–18
2641 Human Resources Services100 Salaries
112 Classified Salaries 162,388.41 174,453.34 5.00 212,402 5.00 202,239 113 Administrators 115,993.00 126,999.36 1.00 119,535 1.00 121,926 122 Classified Substitutes 10,759.49 2,005.01 - 571 - 602 136 Overtime Pay 3,512.99 954.79 - - - - 139 Benefit Pay 10,442.16 6,875.19 - 12,660 - 6,480 154 Licensed Extra Duty Pay - 926.64 - - - - 189 Contracted Services 3,882.50 1,125.00 - - - -
100 Salaries Total 306,978.55 313,339.33 6.00 345,168 6.00 331,247 200 Payroll Costs
210 PERS 83,227.21 53,722.18 - 83,498 - 93,374 220 Social Security 22,363.08 23,338.25 - 25,545 - 24,513 231 Workers' Compensation 1,187.17 1,234.15 - 1,657 - 1,589 232 Unemployment 435.21 131.69 - 1,034 - 992 240 Insurance 62,432.23 68,570.02 - 79,876 - 81,135
200 Payroll Costs Total 169,644.90 146,996.29 - 191,610 - 201,603 300 Purchased Services
318 Prof Improvement Noninstruct Staff - 45.00 - - - - 322 Repairs & Maintenance 30.79 13.49 - - - - 340 Travel 2,347.75 2,463.56 - 4,725 - 5,000 353 Postage 1,653.73 1,442.96 - 4,725 - 3,000 354 Advertising 2,407.38 2,163.02 - 2,100 - 2,000 355 Printing 1,331.36 2,680.37 - 2,100 - 1,995 382 Legal Services 6,981.57 14,659.17 - 10,500 - 10,500 384 Negotiation Services 5,080.00 - - 7,350 - 7,350
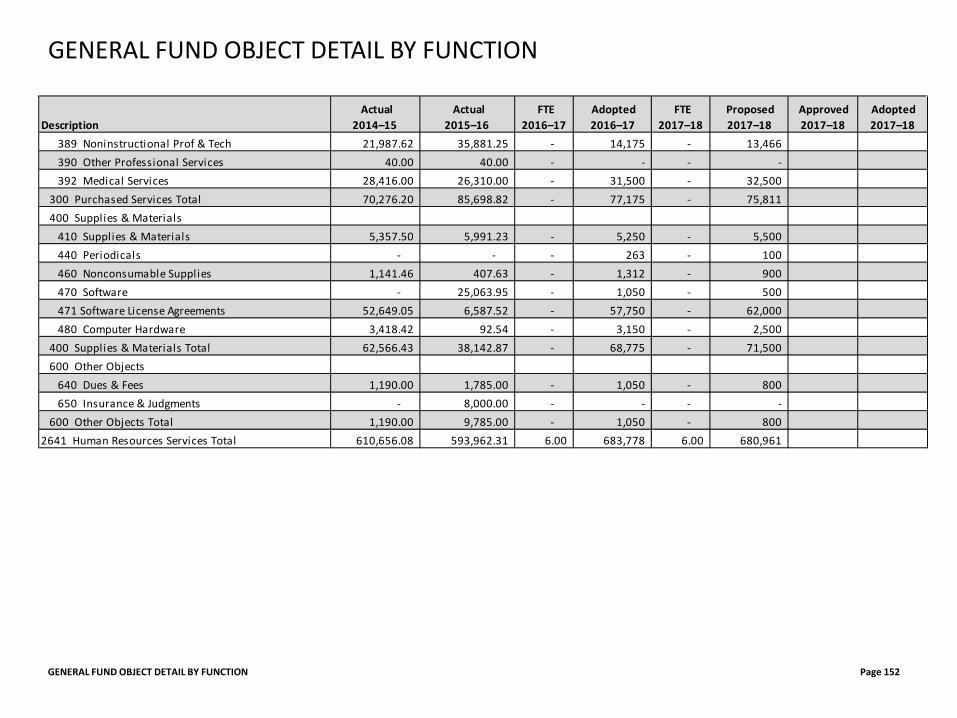
GENERAL FUND OBJECT DETAIL BY FUNCTION Page 152
GENERAL FUND OBJECT DETAIL BY FUNCTION
Description Actual
2014–15 Actual
2015–16 FTE
2016–17 Adopted 2016–17
FTE 2017–18
Proposed 2017–18
Approved 2017–18
Adopted 2017–18
389 Noninstructional Prof & Tech 21,987.62 35,881.25 - 14,175 - 13,466 390 Other Professional Services 40.00 40.00 - - - - 392 Medical Services 28,416.00 26,310.00 - 31,500 - 32,500
300 Purchased Services Total 70,276.20 85,698.82 - 77,175 - 75,811 400 Supplies & Materials
410 Supplies & Materials 5,357.50 5,991.23 - 5,250 - 5,500 440 Periodicals - - - 263 - 100 460 Nonconsumable Supplies 1,141.46 407.63 - 1,312 - 900 470 Software - 25,063.95 - 1,050 - 500 471 Software License Agreements 52,649.05 6,587.52 - 57,750 - 62,000 480 Computer Hardware 3,418.42 92.54 - 3,150 - 2,500
400 Supplies & Materials Total 62,566.43 38,142.87 - 68,775 - 71,500 600 Other Objects
640 Dues & Fees 1,190.00 1,785.00 - 1,050 - 800 650 Insurance & Judgments - 8,000.00 - - - -
600 Other Objects Total 1,190.00 9,785.00 - 1,050 - 800 2641 Human Resources Services Total 610,656.08 593,962.31 6.00 683,778 6.00 680,961
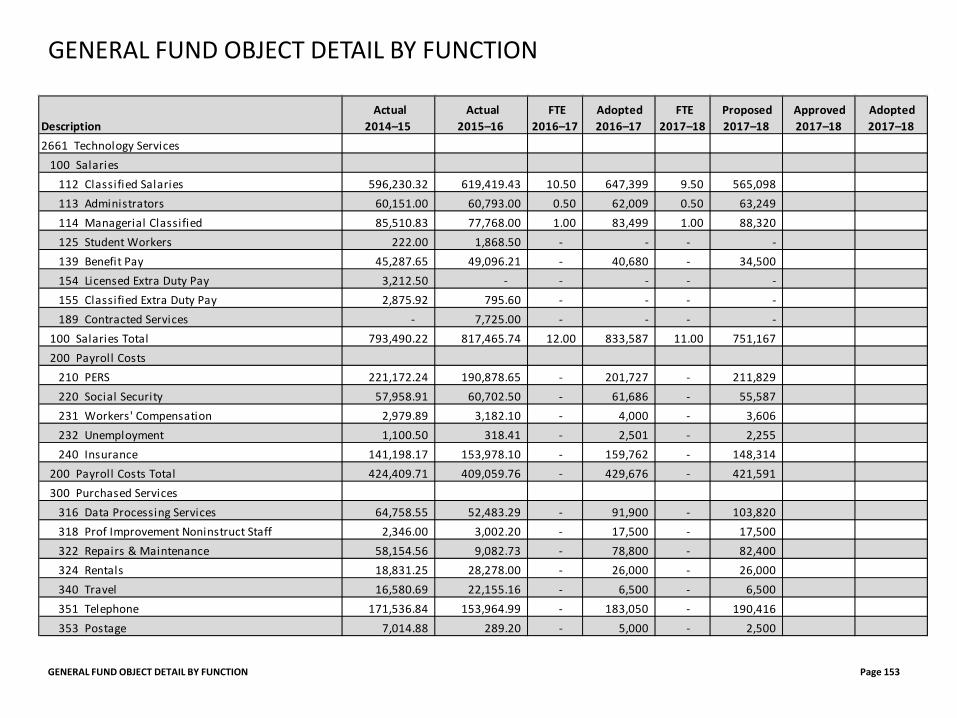
GENERAL FUND OBJECT DETAIL BY FUNCTION Page 153
GENERAL FUND OBJECT DETAIL BY FUNCTION
Description Actual
2014–15 Actual
2015–16 FTE
2016–17 Adopted 2016–17
FTE 2017–18
Proposed 2017–18
Approved 2017–18
Adopted 2017–18
2661 Technology Services100 Salaries
112 Classified Salaries 596,230.32 619,419.43 10.50 647,399 9.50 565,098 113 Administrators 60,151.00 60,793.00 0.50 62,009 0.50 63,249 114 Managerial Classified 85,510.83 77,768.00 1.00 83,499 1.00 88,320 125 Student Workers 222.00 1,868.50 - - - - 139 Benefit Pay 45,287.65 49,096.21 - 40,680 - 34,500 154 Licensed Extra Duty Pay 3,212.50 - - - - - 155 Classified Extra Duty Pay 2,875.92 795.60 - - - - 189 Contracted Services - 7,725.00 - - - -
100 Salaries Total 793,490.22 817,465.74 12.00 833,587 11.00 751,167 200 Payroll Costs
210 PERS 221,172.24 190,878.65 - 201,727 - 211,829 220 Social Security 57,958.91 60,702.50 - 61,686 - 55,587 231 Workers' Compensation 2,979.89 3,182.10 - 4,000 - 3,606 232 Unemployment 1,100.50 318.41 - 2,501 - 2,255 240 Insurance 141,198.17 153,978.10 - 159,762 - 148,314
200 Payroll Costs Total 424,409.71 409,059.76 - 429,676 - 421,591 300 Purchased Services
316 Data Processing Services 64,758.55 52,483.29 - 91,900 - 103,820 318 Prof Improvement Noninstruct Staff 2,346.00 3,002.20 - 17,500 - 17,500 322 Repairs & Maintenance 58,154.56 9,082.73 - 78,800 - 82,400 324 Rentals 18,831.25 28,278.00 - 26,000 - 26,000 340 Travel 16,580.69 22,155.16 - 6,500 - 6,500 351 Telephone 171,536.84 153,964.99 - 183,050 - 190,416 353 Postage 7,014.88 289.20 - 5,000 - 2,500
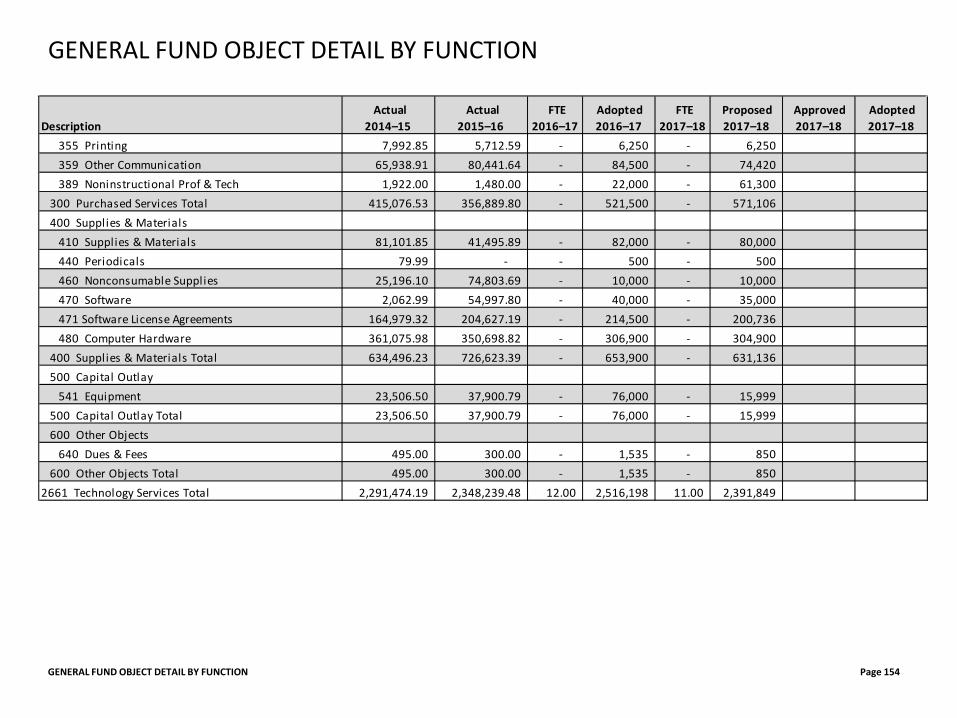
GENERAL FUND OBJECT DETAIL BY FUNCTION Page 154
GENERAL FUND OBJECT DETAIL BY FUNCTION
Description Actual
2014–15 Actual
2015–16 FTE
2016–17 Adopted 2016–17
FTE 2017–18
Proposed 2017–18
Approved 2017–18
Adopted 2017–18
355 Printing 7,992.85 5,712.59 - 6,250 - 6,250 359 Other Communication 65,938.91 80,441.64 - 84,500 - 74,420 389 Noninstructional Prof & Tech 1,922.00 1,480.00 - 22,000 - 61,300
300 Purchased Services Total 415,076.53 356,889.80 - 521,500 - 571,106 400 Supplies & Materials
410 Supplies & Materials 81,101.85 41,495.89 - 82,000 - 80,000 440 Periodicals 79.99 - - 500 - 500 460 Nonconsumable Supplies 25,196.10 74,803.69 - 10,000 - 10,000 470 Software 2,062.99 54,997.80 - 40,000 - 35,000 471 Software License Agreements 164,979.32 204,627.19 - 214,500 - 200,736 480 Computer Hardware 361,075.98 350,698.82 - 306,900 - 304,900
400 Supplies & Materials Total 634,496.23 726,623.39 - 653,900 - 631,136 500 Capital Outlay
541 Equipment 23,506.50 37,900.79 - 76,000 - 15,999 500 Capital Outlay Total 23,506.50 37,900.79 - 76,000 - 15,999 600 Other Objects
640 Dues & Fees 495.00 300.00 - 1,535 - 850 600 Other Objects Total 495.00 300.00 - 1,535 - 850
2661 Technology Services Total 2,291,474.19 2,348,239.48 12.00 2,516,198 11.00 2,391,849
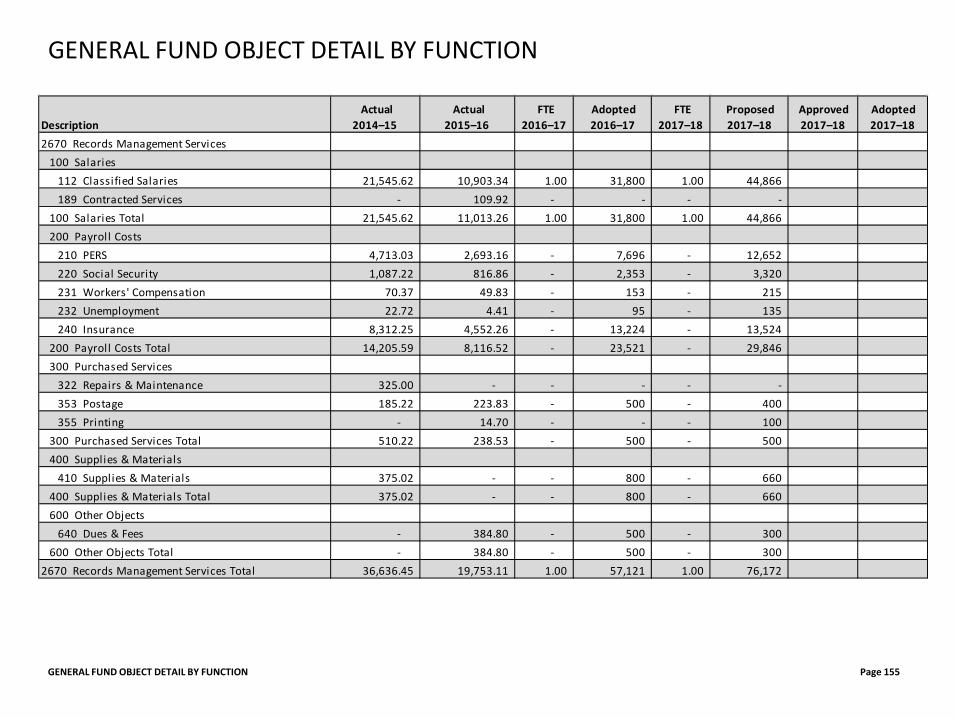
GENERAL FUND OBJECT DETAIL BY FUNCTION Page 155
GENERAL FUND OBJECT DETAIL BY FUNCTION
Description Actual
2014–15 Actual
2015–16 FTE
2016–17 Adopted 2016–17
FTE 2017–18
Proposed 2017–18
Approved 2017–18
Adopted 2017–18
2670 Records Management Services100 Salaries
112 Classified Salaries 21,545.62 10,903.34 1.00 31,800 1.00 44,866 189 Contracted Services - 109.92 - - - -
100 Salaries Total 21,545.62 11,013.26 1.00 31,800 1.00 44,866 200 Payroll Costs
210 PERS 4,713.03 2,693.16 - 7,696 - 12,652 220 Social Security 1,087.22 816.86 - 2,353 - 3,320 231 Workers' Compensation 70.37 49.83 - 153 - 215 232 Unemployment 22.72 4.41 - 95 - 135 240 Insurance 8,312.25 4,552.26 - 13,224 - 13,524
200 Payroll Costs Total 14,205.59 8,116.52 - 23,521 - 29,846 300 Purchased Services
322 Repairs & Maintenance 325.00 - - - - - 353 Postage 185.22 223.83 - 500 - 400 355 Printing - 14.70 - - - 100
300 Purchased Services Total 510.22 238.53 - 500 - 500 400 Supplies & Materials
410 Supplies & Materials 375.02 - - 800 - 660 400 Supplies & Materials Total 375.02 - - 800 - 660 600 Other Objects
640 Dues & Fees - 384.80 - 500 - 300 600 Other Objects Total - 384.80 - 500 - 300
2670 Records Management Services Total 36,636.45 19,753.11 1.00 57,121 1.00 76,172
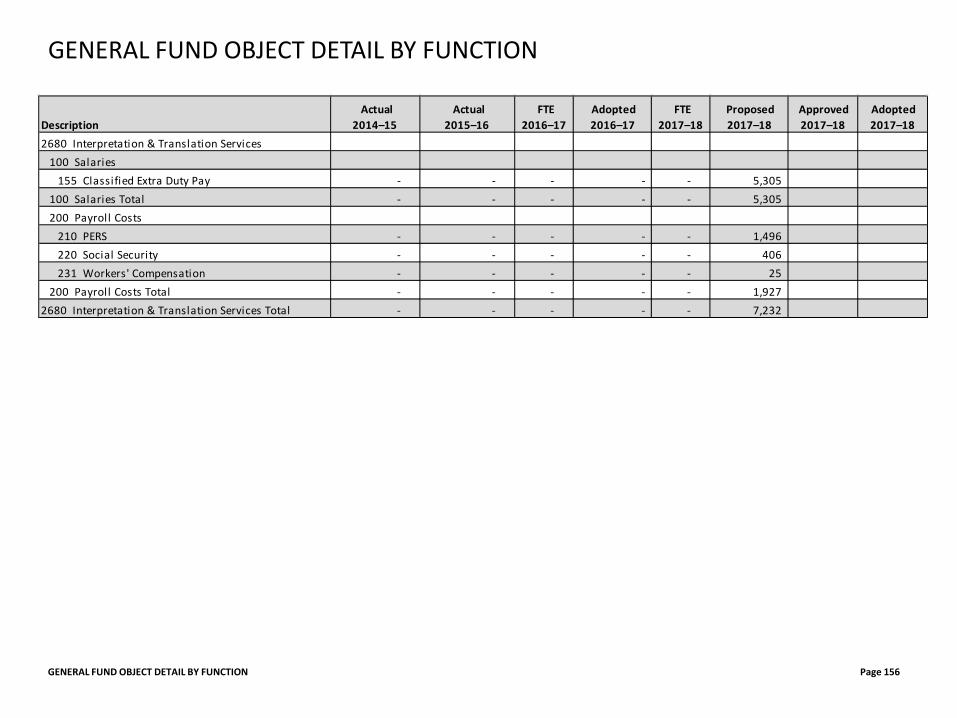
GENERAL FUND OBJECT DETAIL BY FUNCTION Page 156
GENERAL FUND OBJECT DETAIL BY FUNCTION
Description Actual
2014–15 Actual
2015–16 FTE
2016–17 Adopted 2016–17
FTE 2017–18
Proposed 2017–18
Approved 2017–18
Adopted 2017–18
2680 Interpretation & Translation Services100 Salaries
155 Classified Extra Duty Pay - - - - - 5,305 100 Salaries Total - - - - - 5,305 200 Payroll Costs
210 PERS - - - - - 1,496 220 Social Security - - - - - 406 231 Workers' Compensation - - - - - 25
200 Payroll Costs Total - - - - - 1,927 2680 Interpretation & Translation Services Total - - - - - 7,232
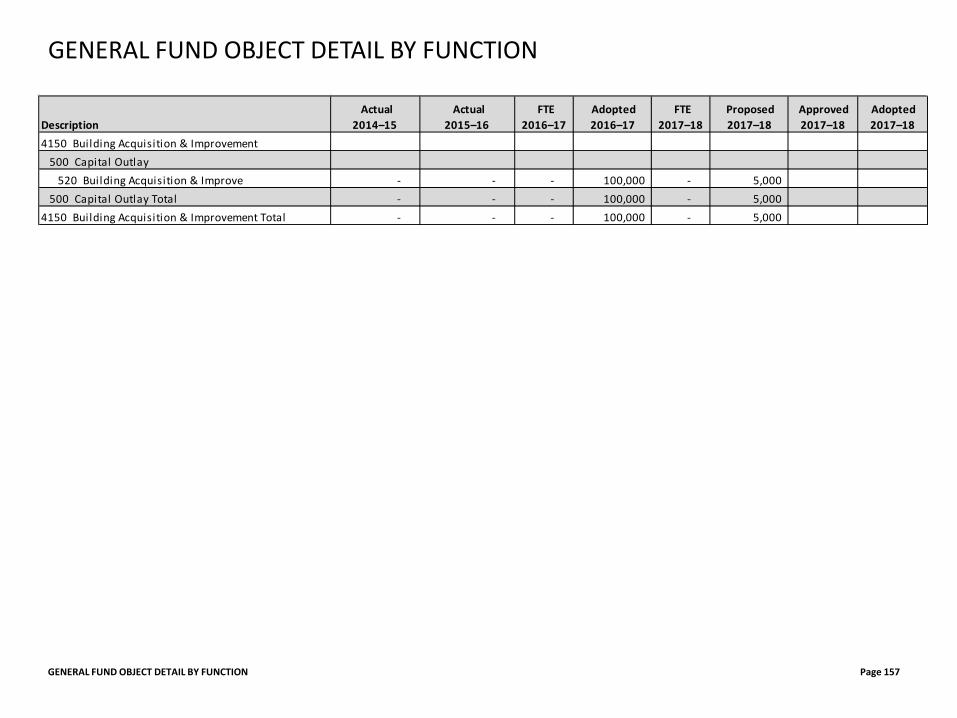
GENERAL FUND OBJECT DETAIL BY FUNCTION Page 157
GENERAL FUND OBJECT DETAIL BY FUNCTION
Description Actual
2014–15 Actual
2015–16 FTE
2016–17 Adopted 2016–17
FTE 2017–18
Proposed 2017–18
Approved 2017–18
Adopted 2017–18
4150 Building Acquisition & Improvement500 Capital Outlay
520 Building Acquisition & Improve - - - 100,000 - 5,000 500 Capital Outlay Total - - - 100,000 - 5,000
4150 Building Acquisition & Improvement Total - - - 100,000 - 5,000
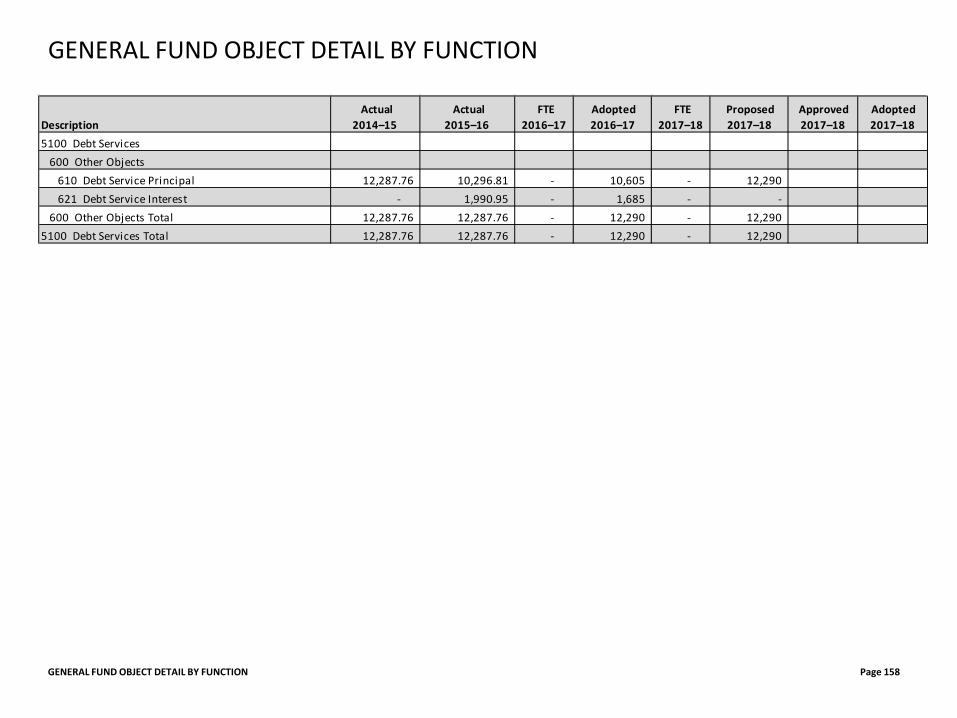
GENERAL FUND OBJECT DETAIL BY FUNCTION Page 158
GENERAL FUND OBJECT DETAIL BY FUNCTION
Description Actual
2014–15 Actual
2015–16 FTE
2016–17 Adopted 2016–17
FTE 2017–18
Proposed 2017–18
Approved 2017–18
Adopted 2017–18
5100 Debt Services600 Other Objects
610 Debt Service Principal 12,287.76 10,296.81 - 10,605 - 12,290 621 Debt Service Interest - 1,990.95 - 1,685 - -
600 Other Objects Total 12,287.76 12,287.76 - 12,290 - 12,290 5100 Debt Services Total 12,287.76 12,287.76 - 12,290 - 12,290
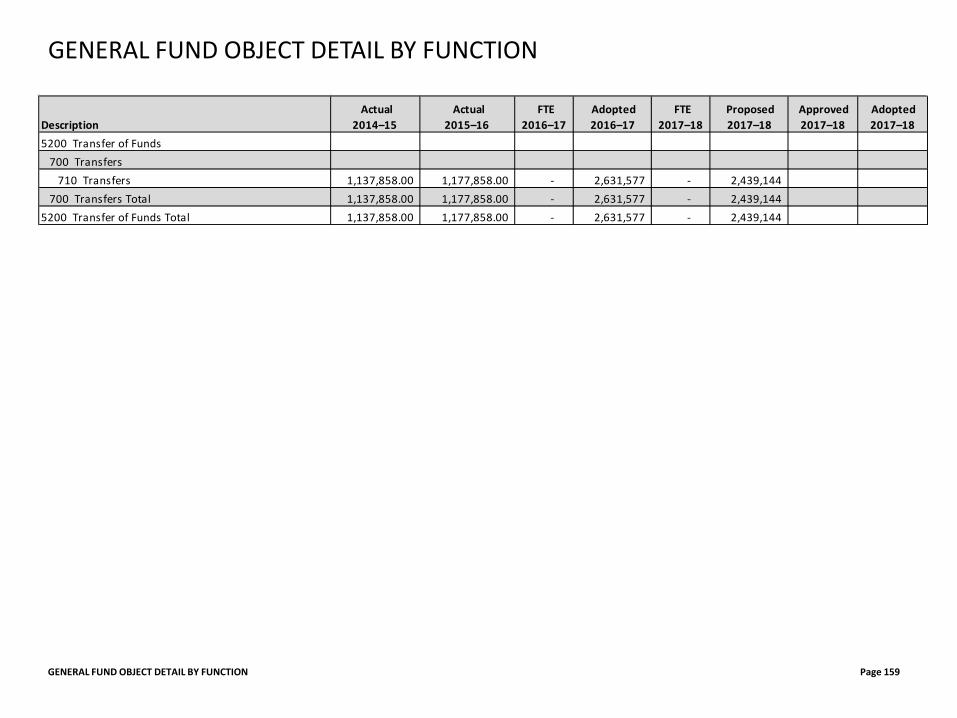
GENERAL FUND OBJECT DETAIL BY FUNCTION Page 159
GENERAL FUND OBJECT DETAIL BY FUNCTION
Description Actual
2014–15 Actual
2015–16 FTE
2016–17 Adopted 2016–17
FTE 2017–18
Proposed 2017–18
Approved 2017–18
Adopted 2017–18
5200 Transfer of Funds700 Transfers
710 Transfers 1,137,858.00 1,177,858.00 - 2,631,577 - 2,439,144 700 Transfers Total 1,137,858.00 1,177,858.00 - 2,631,577 - 2,439,144
5200 Transfer of Funds Total 1,137,858.00 1,177,858.00 - 2,631,577 - 2,439,144
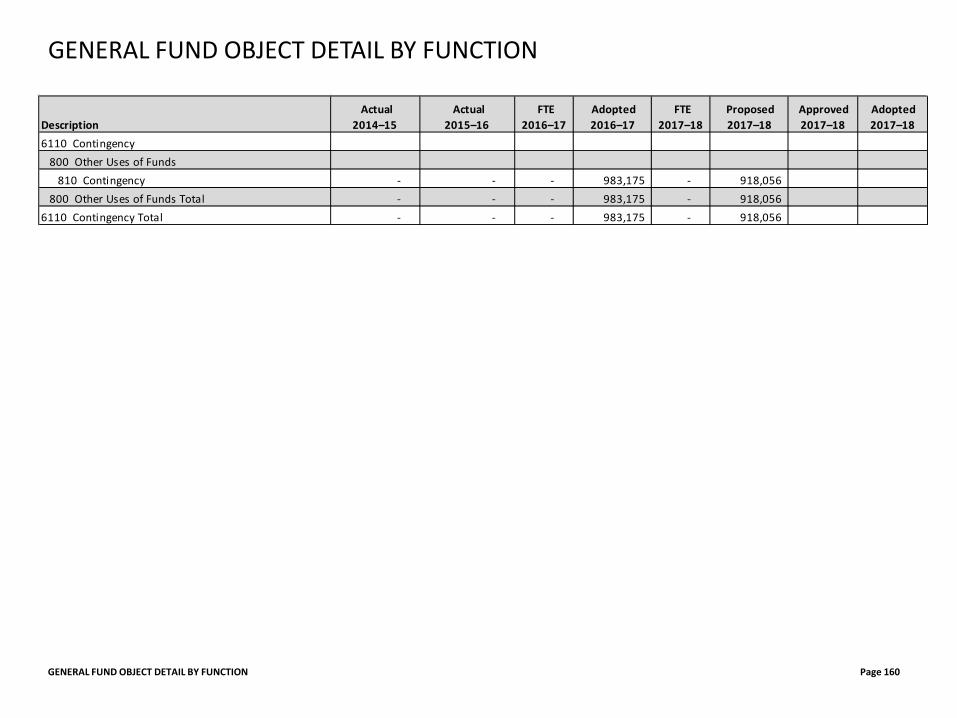
GENERAL FUND OBJECT DETAIL BY FUNCTION Page 160
GENERAL FUND OBJECT DETAIL BY FUNCTION
Description Actual
2014–15 Actual
2015–16 FTE
2016–17 Adopted 2016–17
FTE 2017–18
Proposed 2017–18
Approved 2017–18
Adopted 2017–18
6110 Contingency800 Other Uses of Funds
810 Contingency - - - 983,175 - 918,056 800 Other Uses of Funds Total - - - 983,175 - 918,056
6110 Contingency Total - - - 983,175 - 918,056
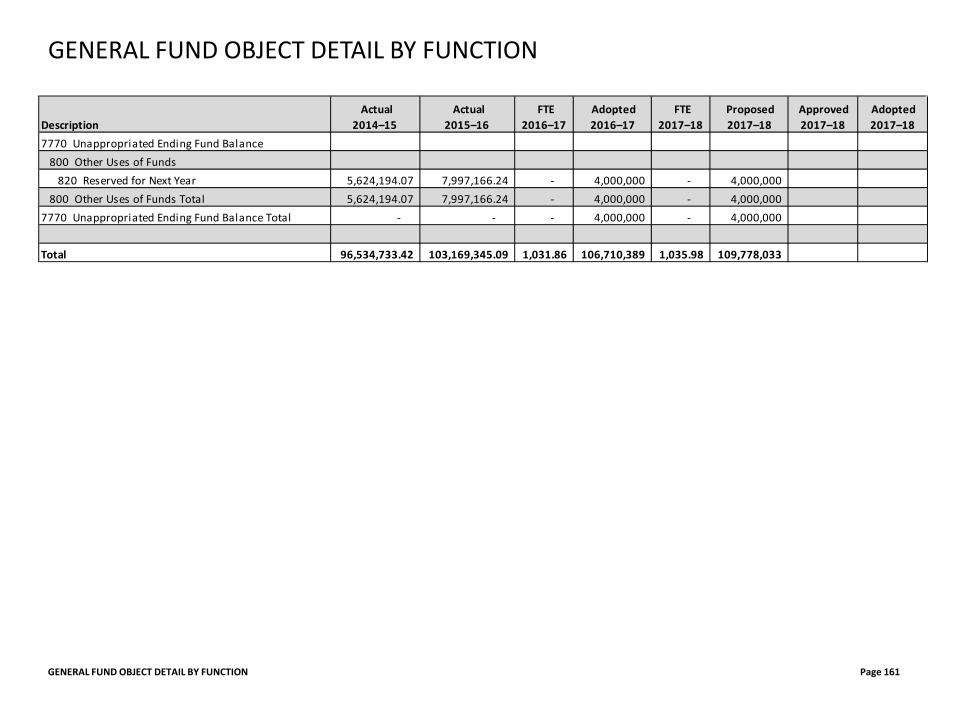
GENERAL FUND OBJECT DETAIL BY FUNCTION Page 161
GENERAL FUND OBJECT DETAIL BY FUNCTION
Description Actual
2014–15 Actual
2015–16 FTE
2016–17 Adopted 2016–17
FTE 2017–18
Proposed 2017–18
Approved 2017–18
Adopted 2017–18
7770 Unappropriated Ending Fund Balance800 Other Uses of Funds
820 Reserved for Next Year 5,624,194.07 7,997,166.24 - 4,000,000 - 4,000,000 800 Other Uses of Funds Total 5,624,194.07 7,997,166.24 - 4,000,000 - 4,000,000
7770 Unappropriated Ending Fund Balance Total - - - 4,000,000 - 4,000,000
Total 96,534,733.42 103,169,345.09 1,031.86 106,710,389 1,035.98 109,778,033
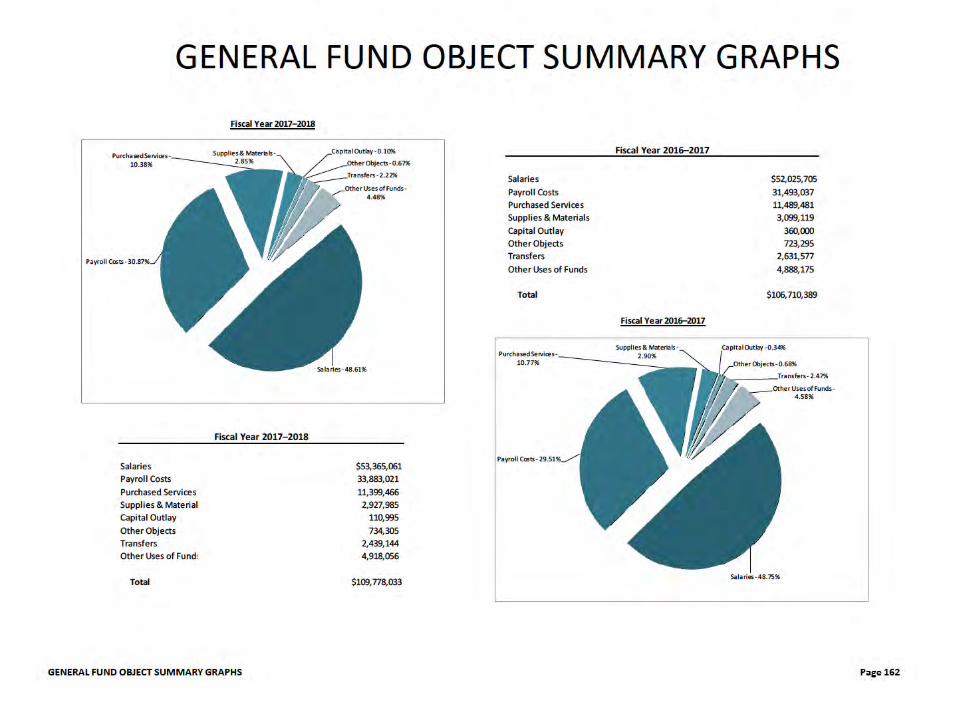
FEDERAL, STATE & LOCAL GRANTS
FEDERAL, STATE & LOCAL GRANTS Page 163
Grants are funds received for federal, state, local, and private grants. Also included are gifts and grants from the Springfield Education Foundation, a local non-profit foundation established to support Springfield Public Schools. Grants are used for the purpose of expanding educational offerings and opportunities. The legal authority establishing the fund specifies the use and limitations of such funds, and generally, the funds cannot be diverted or used for other purposes. In some instances, the District may be required to provide “matching funds” to support program activities. This often takes the form of “in-kind” contributions such as provisions of classroom or office space, or matching effort from allocation of existing resources, such as District employees. The use of the resources in these funds are restricted by the provision of each individual grant, statute, administrative rule, and policy. Some of the grants received include: 21st- Century – Afterschool Programs is a grant used for the Miller Afterschool Program, better know as MAP, which serves Springfield High School
and several schools that feed into the high school (Guy Lee Elementary, Two Rivers-Dos Rios Elementary, and Hamlin Middle School). This afterschool program creates enrichment opportunities for students by partnering with organizations such as Willamalane Park and Recreation District and the University of Oregon.
ArtCore is a 4-year model development and research initiative that joins community creatives and middle school teachers to develop arts-based
teaching and learning customized to meet the needs and goals of the school. Teaching artists from the community participate to generate unique arts integration learning modules, driven by standards and guided by expertise in music, dance, theater, and visual arts disciplines. In our District, Hamlin Middle School sixth grade language arts teachers are co-creating writing, improv, and performance curriculum with Nate Beard.
Battle of the Books is a statewide program sponsored by the Oregon Association of School Libraries in conjunction with a Library Services and Technology Act grant. Students in third through twelfth grade, regardless of ability, are exposed to quality literature representing a variety of literacy styles and viewpoints. The mission is to encourage and recognize students who enjoy reading, to broaden reading interest, to increase reading comprehension, to promote academic excellence, and to promote cooperative learning and teamwork among students.
English Language Learners Transformation and Target Evaluation is a state funded program focused on improving the ELL student experience. These funds are a critical step toward ensuring English language learner students are receiving the resources and support they need while helping combat Oregon’s achievement gap.
EWEB Wet Grant is a locally EWEB-funded educational program (Watersheds, Energy and Teamwork) that provides students an opportunity to go to a local fish hatchery to learn about the life cycle of spawning salmon.
FEDERAL, STATE & LOCAL GRANTS – OVERVIEW Page 164
FEDERAL, STATE & LOCAL GRANTS - OVERVIEW
High School Graduation and College & Career Readiness Act (Measure 98) provides direct funding to school districts to increase high school graduation rates by focusing on three specific areas: a) Establish or expand career and technical education programs in high school; b) Establish or expand college-level educational opportunities for students in high schools; and c) Establish or expand dropout-prevention strategies in high schools.
IDEA – Individuals with Learning Disabilities Act is a grant under Public Law 108-446 (2004 IDEA reauthorization), which superseded Public Law 94-
142. Through this grant, the District is allocated funds, based on the number of identified and served students with disabilities, to help meet the excess costs for services to these students. Grant funds are used only for the excess costs of providing special education and related services to students with disabilities. Funds ensure that these students have access to a free, appropriate public education to meet each child’s unique needs and prepare each child for further education, employment, and independent living.
Kids in Transition to School (KITS) Program is a short-term, targeted, evidence-based Oregon Social Learning Center (OSLC) intervention that helps children at high risk for school difficulties to be better prepared for school both socially and academically.
This program is offered to families in the Maple Elementary School, Two Rivers-Dos Rios Elementary School, and Riverbend Elementary School
communities. This program has been very successful in helping kids learn the skills they need to be successful in the classroom. LTCT - Long-Term Care & Treatment is an intergovernmental contract between the Oregon Department of Education and the District. The District
provides approved educational programs for students in sponsored long-term care or treatment facilities. The funds provide for special education instructional staff for the students in this program.
Oregon Outdoor School Lottery Fund (Measure 99) is a program funded with lottery funds to provide outdoor education to Oregon students. This fund was designed to provide Oregon 5th and 6th grade students with a week-long outdoor school program.
Preschool Promise is a local program in conjunction with United Way and the Early Learning Alliance that provides preschool opportunities for low income children. Using available classroom space at Maple Elementary School, the District's first preschool opened in September 2016, with a class of 16 students. The students learn a variety of basic skills, both social and academic, in the course of a 5-1/2 hour day, helping them be better prepared to start kindergarten the following year.
FEDERAL, STATE & LOCAL GRANTS – OVERVIEW Page 165
FEDERAL, STATE & LOCAL GRANTS - OVERVIEW
Project Soars - Student Ownership, Accountability, and Responsibility for School Safety is a federally funded grant through IRIS Educational Media. This program will develop, field-test, and evaluate a comprehensive, student-centered, and technology-based school safety framework for high schools designed to increase students’ resilience to victimization. SOAR will inform theory about how to reduce student victimization within a restorative framework. SOAR consists of:
a) Web-based school safety and behavioral assessments; b) A student-driven social capital building and safety awareness campaign; c) A web-based student tip line with embedded training; and d) Student and school personnel web-based training in team-based restorative problem solving.
Safe Routes to School is a grant funded program through Lane Transit District that advocates and promotes the practice of safe bicycling and walking
to and from schools. Each year the program coordinators work with various focus schools to develop a safe routes plan.
SUB-Well Grant is a project that monitors water quality in the local area while teaching middle and high school students about scientific methods. This grant supports hands-on instruction in the areas of water and energy science. Support comes in the form of teacher training workshops, development and implementation of new curriculum materials, assist with classroom instruction, organizing and providing instructional support for fieldtrips, funding for materials and equipment for science projects, and recruitment, training and supervision of the middle school and high school advanced water teams. The program focuses on improving the delivery of science education in our District and offering students the opportunity to conduct field research and monitoring of local watersheds. This project is possible through a variety of cooperative partnerships with local and state agencies, including Springfield Utility Board, Eugene Water & Electric Board, the City of Springfield, the McKenzie Watershed Council and the Federal Bureau of Land Management.
Title IA is a federally funded academic program that counteracts the effects of poverty on students’ success. Springfield Title I distributes funds to schools based on the number of impoverished children that attend rather than on achievement scores. This distribution ensures that successful schools will not be penalized by losing funds and that Tile I funds will not be spread too thinly. Title I is based on the premise that all children can learn to high standards when they are provided with equal, open access to educational opportunities.
Title I schools in Springfield include Centennial, Douglas Gardens, Guy Lee, Maple, Mt. Vernon, Page, Riverbend, and Two Rivers-Dos Rios elementary schools; Hamlin Middle School; and Gateways High School.
FEDERAL, STATE & LOCAL GRANTS – OVERVIEW Page 166
FEDERAL, STATE & LOCAL GRANTS - OVERVIEW
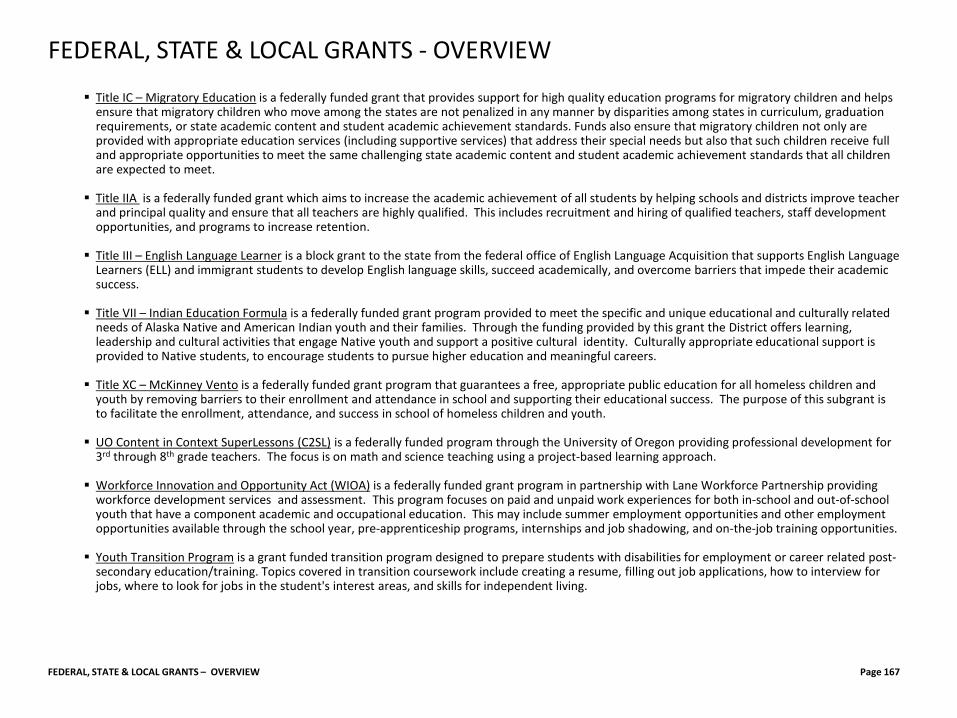
Title IC – Migratory Education is a federally funded grant that provides support for high quality education programs for migratory children and helps ensure that migratory children who move among the states are not penalized in any manner by disparities among states in curriculum, graduation requirements, or state academic content and student academic achievement standards. Funds also ensure that migratory children not only are provided with appropriate education services (including supportive services) that address their special needs but also that such children receive full and appropriate opportunities to meet the same challenging state academic content and student academic achievement standards that all children are expected to meet.
Title IIA is a federally funded grant which aims to increase the academic achievement of all students by helping schools and districts improve teacher and principal quality and ensure that all teachers are highly qualified. This includes recruitment and hiring of qualified teachers, staff development opportunities, and programs to increase retention.
Title III – English Language Learner is a block grant to the state from the federal office of English Language Acquisition that supports English Language Learners (ELL) and immigrant students to develop English language skills, succeed academically, and overcome barriers that impede their academic success.
Title VII – Indian Education Formula is a federally funded grant program provided to meet the specific and unique educational and culturally related needs of Alaska Native and American Indian youth and their families. Through the funding provided by this grant the District offers learning, leadership and cultural activities that engage Native youth and support a positive cultural identity. Culturally appropriate educational support is provided to Native students, to encourage students to pursue higher education and meaningful careers.
Title XC – McKinney Vento is a federally funded grant program that guarantees a free, appropriate public education for all homeless children and youth by removing barriers to their enrollment and attendance in school and supporting their educational success. The purpose of this subgrant is to facilitate the enrollment, attendance, and success in school of homeless children and youth.
UO Content in Context SuperLessons (C2SL) is a federally funded program through the University of Oregon providing professional development for 3rd through 8th grade teachers. The focus is on math and science teaching using a project-based learning approach.
Workforce Innovation and Opportunity Act (WIOA) is a federally funded grant program in partnership with Lane Workforce Partnership providing workforce development services and assessment. This program focuses on paid and unpaid work experiences for both in-school and out-of-school youth that have a component academic and occupational education. This may include summer employment opportunities and other employment opportunities available through the school year, pre-apprenticeship programs, internships and job shadowing, and on-the-job training opportunities.
Youth Transition Program is a grant funded transition program designed to prepare students with disabilities for employment or career related post-secondary education/training. Topics covered in transition coursework include creating a resume, filling out job applications, how to interview for jobs, where to look for jobs in the student's interest areas, and skills for independent living.
FEDERAL, STATE & LOCAL GRANTS – OVERVIEW Page 167
FEDERAL, STATE & LOCAL GRANTS - OVERVIEW
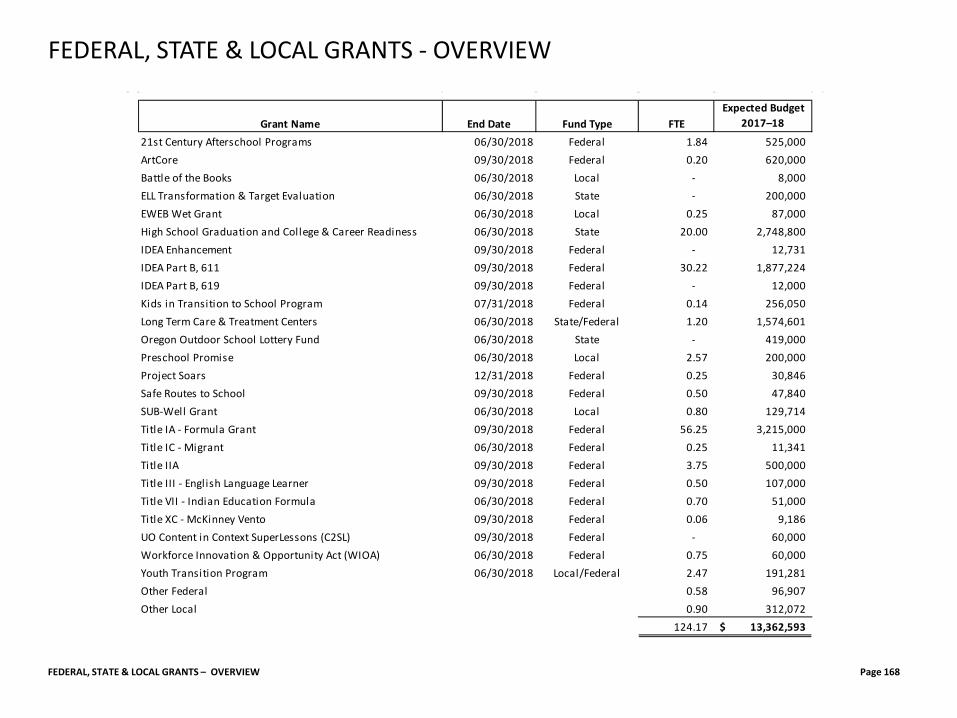
FEDERAL, STATE & LOCAL GRANTS – OVERVIEW Page 168
FEDERAL, STATE & LOCAL GRANTS - OVERVIEW
Grant Name End Date Fund Type FTE Expected Budget
2017–18
21st Century Afterschool Programs 06/30/2018 Federal 1.84 525,000 ArtCore 09/30/2018 Federal 0.20 620,000 Battle of the Books 06/30/2018 Local - 8,000 ELL Transformation & Target Evaluation 06/30/2018 State - 200,000 EWEB Wet Grant 06/30/2018 Local 0.25 87,000 High School Graduation and College & Career Readiness 06/30/2018 State 20.00 2,748,800 IDEA Enhancement 09/30/2018 Federal - 12,731 IDEA Part B, 611 09/30/2018 Federal 30.22 1,877,224 IDEA Part B, 619 09/30/2018 Federal - 12,000 Kids in Transition to School Program 07/31/2018 Federal 0.14 256,050 Long Term Care & Treatment Centers 06/30/2018 State/Federal 1.20 1,574,601 Oregon Outdoor School Lottery Fund 06/30/2018 State - 419,000 Preschool Promise 06/30/2018 Local 2.57 200,000 Project Soars 12/31/2018 Federal 0.25 30,846 Safe Routes to School 09/30/2018 Federal 0.50 47,840 SUB-Well Grant 06/30/2018 Local 0.80 129,714 Title IA - Formula Grant 09/30/2018 Federal 56.25 3,215,000 Title IC - Migrant 06/30/2018 Federal 0.25 11,341 Title IIA 09/30/2018 Federal 3.75 500,000 Title III - English Language Learner 09/30/2018 Federal 0.50 107,000 Title VII - Indian Education Formula 06/30/2018 Federal 0.70 51,000 Title XC - McKinney Vento 09/30/2018 Federal 0.06 9,186 UO Content in Context SuperLessons (C2SL) 09/30/2018 Federal - 60,000 Workforce Innovation & Opportunity Act (WIOA) 06/30/2018 Federal 0.75 60,000 Youth Transition Program 06/30/2018 Local/Federal 2.47 191,281 Other Federal 0.58 96,907 Other Local 0.90 312,072
124.17 13,362,593$
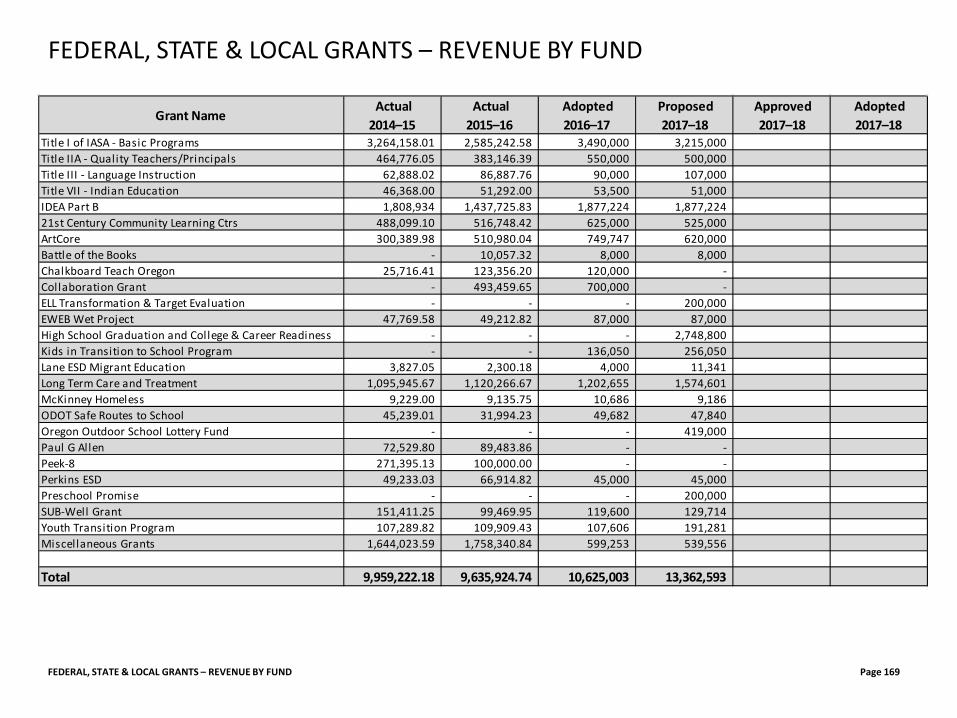
FEDERAL, STATE & LOCAL GRANTS – REVENUE BY FUND Page 169
FEDERAL, STATE & LOCAL GRANTS – REVENUE BY FUND
Grant Name Actual
2014–15 Actual
2015–16 Adopted 2016–17
Proposed 2017–18
Approved 2017–18
Adopted 2017–18
Title I of IASA - Basic Programs 3,264,158.01 2,585,242.58 3,490,000 3,215,000 Title IIA - Quality Teachers/Principals 464,776.05 383,146.39 550,000 500,000 Title III - Language Instruction 62,888.02 86,887.76 90,000 107,000 Title VII - Indian Education 46,368.00 51,292.00 53,500 51,000 IDEA Part B 1,808,934 1,437,725.83 1,877,224 1,877,224 21st Century Community Learning Ctrs 488,099.10 516,748.42 625,000 525,000 ArtCore 300,389.98 510,980.04 749,747 620,000 Battle of the Books - 10,057.32 8,000 8,000 Chalkboard Teach Oregon 25,716.41 123,356.20 120,000 - Collaboration Grant - 493,459.65 700,000 - ELL Transformation & Target Evaluation - - - 200,000 EWEB Wet Project 47,769.58 49,212.82 87,000 87,000 High School Graduation and College & Career Readiness - - - 2,748,800 Kids in Transition to School Program - - 136,050 256,050 Lane ESD Migrant Education 3,827.05 2,300.18 4,000 11,341 Long Term Care and Treatment 1,095,945.67 1,120,266.67 1,202,655 1,574,601 McKinney Homeless 9,229.00 9,135.75 10,686 9,186 ODOT Safe Routes to School 45,239.01 31,994.23 49,682 47,840 Oregon Outdoor School Lottery Fund - - - 419,000 Paul G Allen 72,529.80 89,483.86 - - Peek-8 271,395.13 100,000.00 - - Perkins ESD 49,233.03 66,914.82 45,000 45,000 Preschool Promise - - - 200,000 SUB-Well Grant 151,411.25 99,469.95 119,600 129,714 Youth Transition Program 107,289.82 109,909.43 107,606 191,281 Miscellaneous Grants 1,644,023.59 1,758,340.84 599,253 539,556
Total 9,959,222.18 9,635,924.74 10,625,003 13,362,593
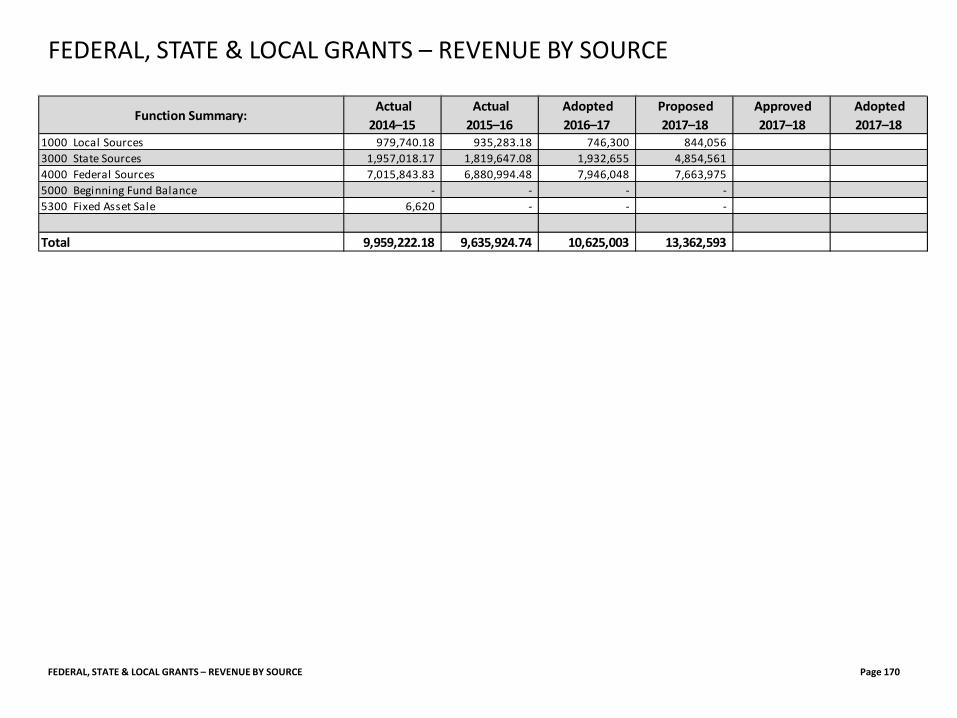
FEDERAL, STATE & LOCAL GRANTS – REVENUE BY SOURCE Page 170
FEDERAL, STATE & LOCAL GRANTS – REVENUE BY SOURCE
Function Summary: Actual
2014–15 Actual
2015–16 Adopted 2016–17
Proposed 2017–18
Approved 2017–18
Adopted 2017–18
1000 Local Sources 979,740.18 935,283.18 746,300 844,056 3000 State Sources 1,957,018.17 1,819,647.08 1,932,655 4,854,561 4000 Federal Sources 7,015,843.83 6,880,994.48 7,946,048 7,663,975 5000 Beginning Fund Balance - - - - 5300 Fixed Asset Sale 6,620 - - -
Total 9,959,222.18 9,635,924.74 10,625,003 13,362,593
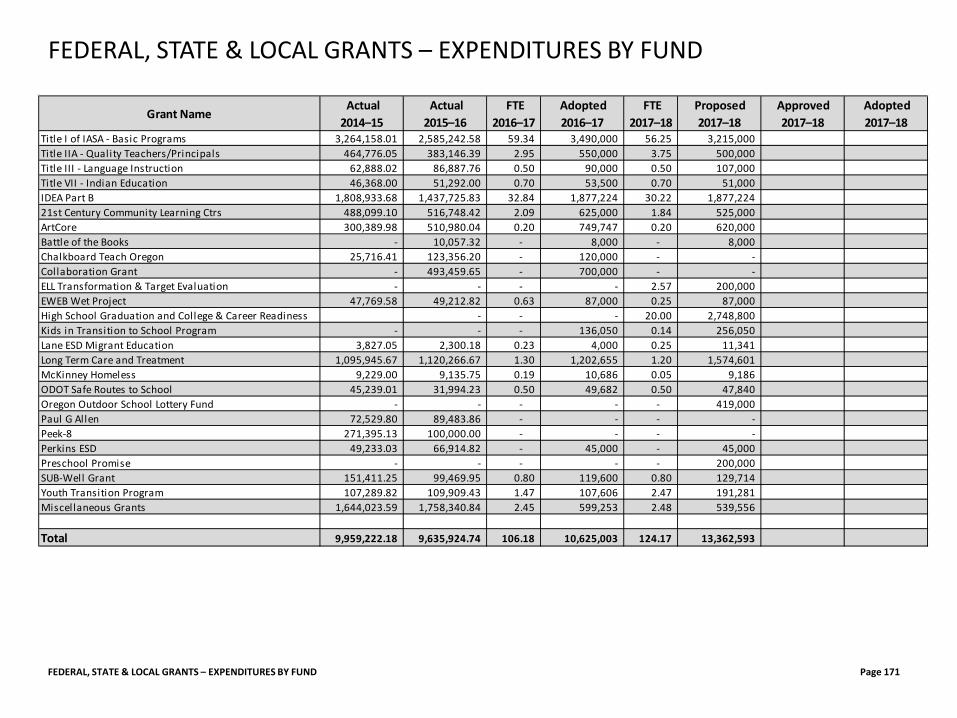
FEDERAL, STATE & LOCAL GRANTS – EXPENDITURES BY FUND Page 171
FEDERAL, STATE & LOCAL GRANTS – EXPENDITURES BY FUND
Grant Name Actual
2014–15 Actual
2015–16 FTE
2016–17 Adopted 2016–17
FTE 2017–18
Proposed 2017–18
Approved 2017–18
Adopted 2017–18
Title I of IASA - Basic Programs 3,264,158.01 2,585,242.58 59.34 3,490,000 56.25 3,215,000 Title IIA - Quality Teachers/Principals 464,776.05 383,146.39 2.95 550,000 3.75 500,000 Title III - Language Instruction 62,888.02 86,887.76 0.50 90,000 0.50 107,000 Title VII - Indian Education 46,368.00 51,292.00 0.70 53,500 0.70 51,000 IDEA Part B 1,808,933.68 1,437,725.83 32.84 1,877,224 30.22 1,877,224 21st Century Community Learning Ctrs 488,099.10 516,748.42 2.09 625,000 1.84 525,000 ArtCore 300,389.98 510,980.04 0.20 749,747 0.20 620,000 Battle of the Books - 10,057.32 - 8,000 - 8,000 Chalkboard Teach Oregon 25,716.41 123,356.20 - 120,000 - - Collaboration Grant - 493,459.65 - 700,000 - - ELL Transformation & Target Evaluation - - - - 2.57 200,000 EWEB Wet Project 47,769.58 49,212.82 0.63 87,000 0.25 87,000 High School Graduation and College & Career Readiness - - - 20.00 2,748,800 Kids in Transition to School Program - - - 136,050 0.14 256,050 Lane ESD Migrant Education 3,827.05 2,300.18 0.23 4,000 0.25 11,341 Long Term Care and Treatment 1,095,945.67 1,120,266.67 1.30 1,202,655 1.20 1,574,601 McKinney Homeless 9,229.00 9,135.75 0.19 10,686 0.05 9,186 ODOT Safe Routes to School 45,239.01 31,994.23 0.50 49,682 0.50 47,840 Oregon Outdoor School Lottery Fund - - - - - 419,000 Paul G Allen 72,529.80 89,483.86 - - - - Peek-8 271,395.13 100,000.00 - - - - Perkins ESD 49,233.03 66,914.82 - 45,000 - 45,000 Preschool Promise - - - - - 200,000 SUB-Well Grant 151,411.25 99,469.95 0.80 119,600 0.80 129,714 Youth Transition Program 107,289.82 109,909.43 1.47 107,606 2.47 191,281 Miscellaneous Grants 1,644,023.59 1,758,340.84 2.45 599,253 2.48 539,556
0.01 Total 9,959,222.18 9,635,924.74 106.18 10,625,003 124.17 13,362,593
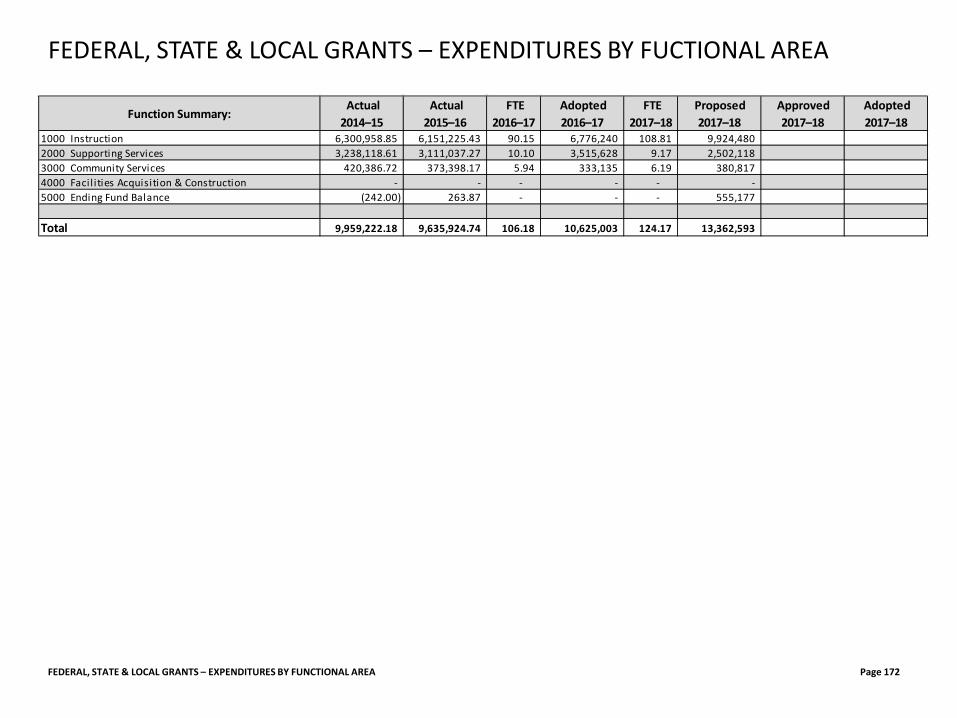
FEDERAL, STATE & LOCAL GRANTS – EXPENDITURES BY FUNCTIONAL AREA Page 172
FEDERAL, STATE & LOCAL GRANTS – EXPENDITURES BY FUCTIONAL AREA
Function Summary: Actual
2014–15 Actual
2015–16 FTE
2016–17 Adopted 2016–17
FTE 2017–18
Proposed 2017–18
Approved 2017–18
Adopted 2017–18
1000 Instruction 6,300,958.85 6,151,225.43 90.15 6,776,240 108.81 9,924,480 2000 Supporting Services 3,238,118.61 3,111,037.27 10.10 3,515,628 9.17 2,502,118 3000 Community Services 420,386.72 373,398.17 5.94 333,135 6.19 380,817 4000 Facil ities Acquisition & Construction - - - - - - 5000 Ending Fund Balance (242.00) 263.87 - - - 555,177
Total 9,959,222.18 9,635,924.74 106.18 10,625,003 124.17 13,362,593
SPECIAL REVENUE FUNDS Page 173
SPECIAL REVENUE FUNDS
Special Revenue Funds account for the proceeds of specific revenue sources (other than expendable trusts or major capital projects) that are legally restricted to expenditure for specified purposes. Some examples of special revenue funds might include: restricted state or federal grants-in aid; restricted tax levies. A separate fund may be used for each restricted source or one fund may be used. Special Revenue Program Funds consist of the following funds which roll up into one for budgetary reporting purposes: Grant Funds (see prior section Federal, State & Local Grants)
Indirect Fund (Fund 200) is used for the assessment of indirect costs that are not readily identified with the activities funded by the federal grant or
contract but are never the less incurred for the joint benefit of all activities of the District. Indirect costs recovered are used for items such as paying for the administration of grants.
Technology Fund (Fund 294) receives revenue through the E-rate program administered by the Universal Service Administrative Company (USAC)
under the direction of the Federal Communications Commission (FCC). The program provides discounts to assist schools in obtaining affordable telecommunications and internet access. Funding is requested under four categories of service: telecommunications services, internet services, internal connections, and basic maintenance of internal connections. Discounts for support depend on the level of poverty and the urban/rural status of the population served and range from 20% to 90% of the costs of eligible services. Instructional Material Fund (Fund 296) receives funds through an inter-fund transfer from the General Fund (Fund 100). These funds are used for the
purchase of instructional material adoptions. Instructional material adoptions can be supplemental adoptions, renewal adoptions, or full adoptions of instructional materials. Vehicle Replacement Fund (Fund 297) receives the depreciation reimbursement from the state for District school buses. This revenue is used to
purchase new student transportation equipment. Fully depreciated buses are replaced on a rotating replacement plan schedule. Following the Oregon Department of Education’s guiding principles, the District uses this fund to provide safe and economical school bus vehicles and equipment.
• Risk Management Fund (Fund 298) is used to provide coverage for the District for exposures to various risks of loss related to torts; theft of, damage to, and destruction of assets; errors and omissions; and natural disasters. Payments of judgments awarded against the District and not covered by insurance would also be paid from the Risk Management Fund. All of the District’s work involves possible risk of loss through acts of nature, the economy, society, as well as normal business concerns arising from acts or non-acts of employees and the operational abilities of the District’s facilities and equipment.
SPECIAL REVENUE FUNDS – OVERVIEW Page 174
SPECIAL REVENUE FUNDS - OVERVIEW
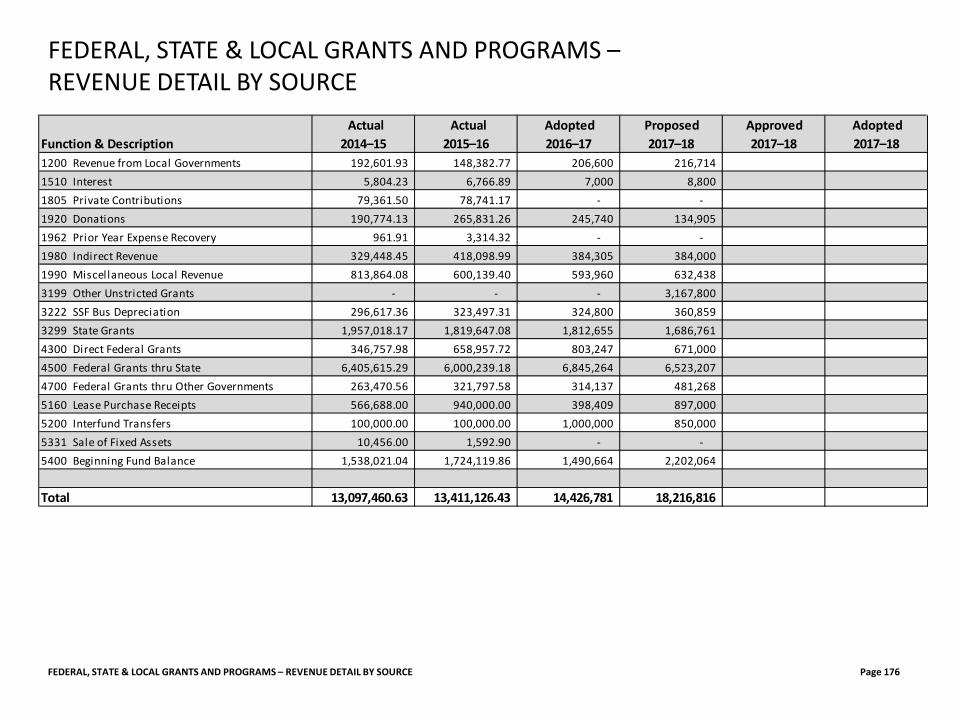
FEDERAL, STATE & LOCAL GRANTS AND PROGRAMS – REVENUE DETAIL BY SOURCE Page 176
FEDERAL, STATE & LOCAL GRANTS AND PROGRAMS – REVENUE DETAIL BY SOURCE
Function & Description Actual 2014–15
Actual 2015–16
Adopted 2016–17
Proposed 2017–18
Approved 2017–18
Adopted 2017–18
1200 Revenue from Local Governments 192,601.93 148,382.77 206,600 216,714 1510 Interest 5,804.23 6,766.89 7,000 8,800 1805 Private Contributions 79,361.50 78,741.17 - - 1920 Donations 190,774.13 265,831.26 245,740 134,905 1962 Prior Year Expense Recovery 961.91 3,314.32 - - 1980 Indirect Revenue 329,448.45 418,098.99 384,305 384,000 1990 Miscellaneous Local Revenue 813,864.08 600,139.40 593,960 632,438 3199 Other Unstricted Grants - - - 3,167,800 3222 SSF Bus Depreciation 296,617.36 323,497.31 324,800 360,859 3299 State Grants 1,957,018.17 1,819,647.08 1,812,655 1,686,761 4300 Direct Federal Grants 346,757.98 658,957.72 803,247 671,000 4500 Federal Grants thru State 6,405,615.29 6,000,239.18 6,845,264 6,523,207 4700 Federal Grants thru Other Governments 263,470.56 321,797.58 314,137 481,268 5160 Lease Purchase Receipts 566,688.00 940,000.00 398,409 897,000 5200 Interfund Transfers 100,000.00 100,000.00 1,000,000 850,000 5331 Sale of Fixed Assets 10,456.00 1,592.90 - - 5400 Beginning Fund Balance 1,538,021.04 1,724,119.86 1,490,664 2,202,064
Total 13,097,460.63 13,411,126.43 14,426,781 18,216,816
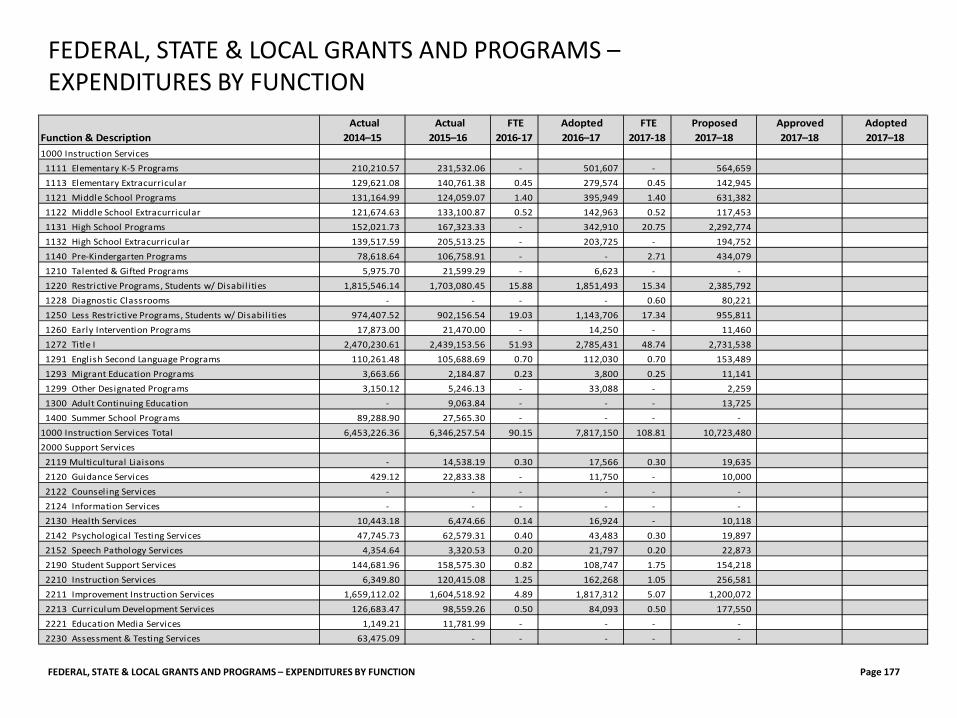
FEDERAL, STATE & LOCAL GRANTS AND PROGRAMS – EXPENDITURES BY FUNCTION
FEDERAL, STATE & LOCAL GRANTS AND PROGRAMS – EXPENDITURES BY FUNCTION Page 177
Function & Description Actual 2014–15
Actual 2015–16
FTE 2016-17
Adopted 2016–17
FTE 2017-18
Proposed 2017–18
Approved 2017–18
Adopted 2017–18
1000 Instruction Services 1111 Elementary K-5 Programs 210,210.57 231,532.06 - 501,607 - 564,659 1113 Elementary Extracurricular 129,621.08 140,761.38 0.45 279,574 0.45 142,945 1121 Middle School Programs 131,164.99 124,059.07 1.40 395,949 1.40 631,382 1122 Middle School Extracurricular 121,674.63 133,100.87 0.52 142,963 0.52 117,453 1131 High School Programs 152,021.73 167,323.33 - 342,910 20.75 2,292,774 1132 High School Extracurricular 139,517.59 205,513.25 - 203,725 - 194,752 1140 Pre-Kindergarten Programs 78,618.64 106,758.91 - - 2.71 434,079 1210 Talented & Gifted Programs 5,975.70 21,599.29 - 6,623 - - 1220 Restrictive Programs, Students w/ Disabil ities 1,815,546.14 1,703,080.45 15.88 1,851,493 15.34 2,385,792 1228 Diagnostic Classrooms - - - - 0.60 80,221 1250 Less Restrictive Programs, Students w/ Disabil ities 974,407.52 902,156.54 19.03 1,143,706 17.34 955,811 1260 Early Intervention Programs 17,873.00 21,470.00 - 14,250 - 11,460 1272 Title I 2,470,230.61 2,439,153.56 51.93 2,785,431 48.74 2,731,538 1291 English Second Language Programs 110,261.48 105,688.69 0.70 112,030 0.70 153,489 1293 Migrant Education Programs 3,663.66 2,184.87 0.23 3,800 0.25 11,141 1299 Other Designated Programs 3,150.12 5,246.13 - 33,088 - 2,259 1300 Adult Continuing Education - 9,063.84 - - - 13,725 1400 Summer School Programs 89,288.90 27,565.30 - - - - 1000 Instruction Services Total 6,453,226.36 6,346,257.54 90.15 7,817,150 108.81 10,723,480 2000 Support Services 2119 Multicultural Liaisons - 14,538.19 0.30 17,566 0.30 19,635 2120 Guidance Services 429.12 22,833.38 - 11,750 - 10,000 2122 Counseling Services - - - - - - 2124 Information Services - - - - - - 2130 Health Services 10,443.18 6,474.66 0.14 16,924 - 10,118 2142 Psychological Testing Services 47,745.73 62,579.31 0.40 43,483 0.30 19,897 2152 Speech Pathology Services 4,354.64 3,320.53 0.20 21,797 0.20 22,873 2190 Student Support Services 144,681.96 158,575.30 0.82 108,747 1.75 154,218 2210 Instruction Services 6,349.80 120,415.08 1.25 162,268 1.05 256,581 2211 Improvement Instruction Services 1,659,112.02 1,604,518.92 4.89 1,817,312 5.07 1,200,072 2213 Curriculum Development Services 126,683.47 98,559.26 0.50 84,093 0.50 177,550 2221 Education Media Services 1,149.21 11,781.99 - - - - 2230 Assessment & Testing Services 63,475.09 - - - - -
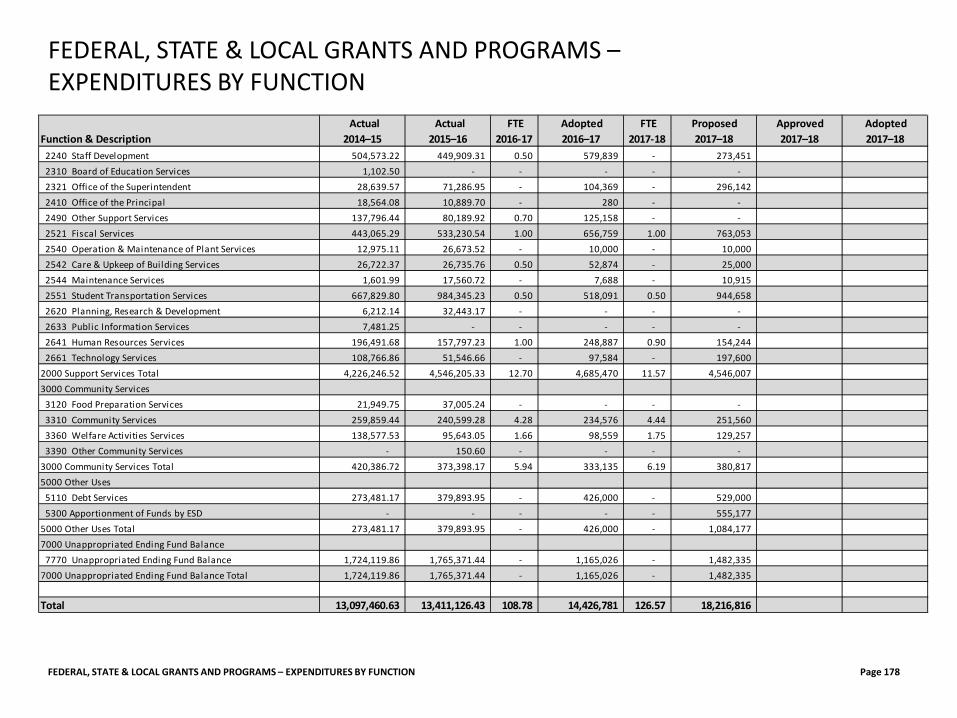
FEDERAL, STATE & LOCAL GRANTS AND PROGRAMS – EXPENDITURES BY FUNCTION
FEDERAL, STATE & LOCAL GRANTS AND PROGRAMS – EXPENDITURES BY FUNCTION Page 178
Function & Description Actual 2014–15
Actual 2015–16
FTE 2016-17
Adopted 2016–17
FTE 2017-18
Proposed 2017–18
Approved 2017–18
Adopted 2017–18
2240 Staff Development 504,573.22 449,909.31 0.50 579,839 - 273,451 2310 Board of Education Services 1,102.50 - - - - - 2321 Office of the Superintendent 28,639.57 71,286.95 - 104,369 - 296,142 2410 Office of the Principal 18,564.08 10,889.70 - 280 - - 2490 Other Support Services 137,796.44 80,189.92 0.70 125,158 - - 2521 Fiscal Services 443,065.29 533,230.54 1.00 656,759 1.00 763,053 2540 Operation & Maintenance of Plant Services 12,975.11 26,673.52 - 10,000 - 10,000 2542 Care & Upkeep of Building Services 26,722.37 26,735.76 0.50 52,874 - 25,000 2544 Maintenance Services 1,601.99 17,560.72 - 7,688 - 10,915 2551 Student Transportation Services 667,829.80 984,345.23 0.50 518,091 0.50 944,658 2620 Planning, Research & Development 6,212.14 32,443.17 - - - - 2633 Public Information Services 7,481.25 - - - - - 2641 Human Resources Services 196,491.68 157,797.23 1.00 248,887 0.90 154,244 2661 Technology Services 108,766.86 51,546.66 - 97,584 - 197,600 2000 Support Services Total 4,226,246.52 4,546,205.33 12.70 4,685,470 11.57 4,546,007 3000 Community Services 3120 Food Preparation Services 21,949.75 37,005.24 - - - - 3310 Community Services 259,859.44 240,599.28 4.28 234,576 4.44 251,560 3360 Welfare Activities Services 138,577.53 95,643.05 1.66 98,559 1.75 129,257 3390 Other Community Services - 150.60 - - - - 3000 Community Services Total 420,386.72 373,398.17 5.94 333,135 6.19 380,817 5000 Other Uses 5110 Debt Services 273,481.17 379,893.95 - 426,000 - 529,000 5300 Apportionment of Funds by ESD - - - - - 555,177 5000 Other Uses Total 273,481.17 379,893.95 - 426,000 - 1,084,177 7000 Unappropriated Ending Fund Balance 7770 Unappropriated Ending Fund Balance 1,724,119.86 1,765,371.44 - 1,165,026 - 1,482,335 7000 Unappropriated Ending Fund Balance Total 1,724,119.86 1,765,371.44 - 1,165,026 - 1,482,335
Total 13,097,460.63 13,411,126.43 108.78 14,426,781 126.57 18,216,816
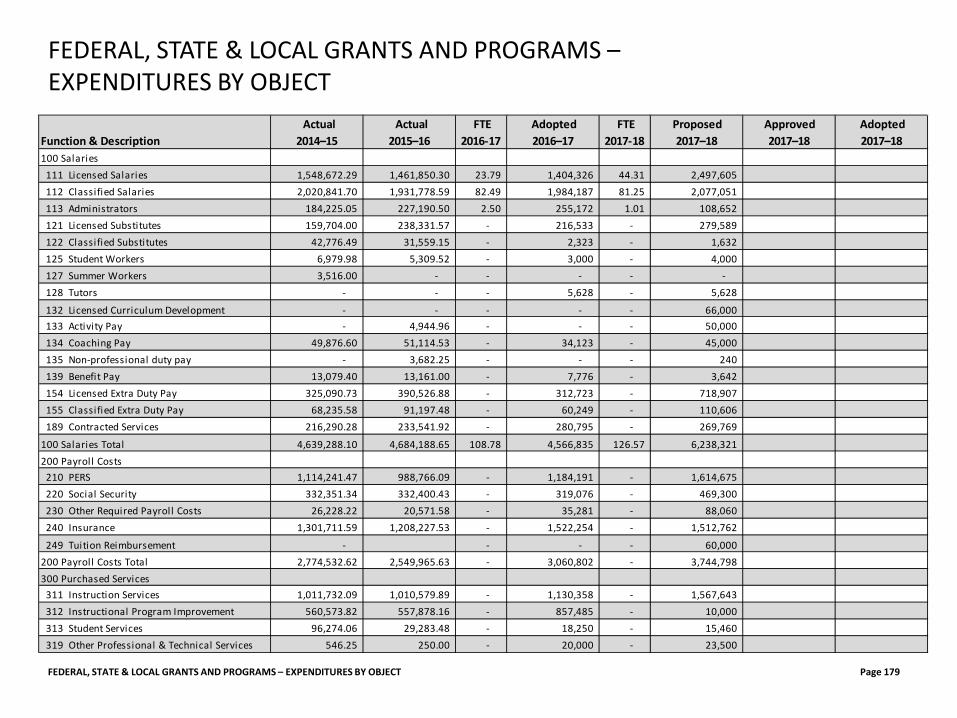
FEDERAL, STATE & LOCAL GRANTS AND PROGRAMS – EXPENDITURES BY OBJECT Page 179
FEDERAL, STATE & LOCAL GRANTS AND PROGRAMS – EXPENDITURES BY OBJECT
Function & Description Actual 2014–15
Actual 2015–16
FTE 2016-17
Adopted 2016–17
FTE 2017-18
Proposed 2017–18
Approved 2017–18
Adopted 2017–18
100 Salaries 111 Licensed Salaries 1,548,672.29 1,461,850.30 23.79 1,404,326 44.31 2,497,605 112 Classified Salaries 2,020,841.70 1,931,778.59 82.49 1,984,187 81.25 2,077,051 113 Administrators 184,225.05 227,190.50 2.50 255,172 1.01 108,652 121 Licensed Substitutes 159,704.00 238,331.57 - 216,533 - 279,589 122 Classified Substitutes 42,776.49 31,559.15 - 2,323 - 1,632 125 Student Workers 6,979.98 5,309.52 - 3,000 - 4,000 127 Summer Workers 3,516.00 - - - - - 128 Tutors - - - 5,628 - 5,628
132 Licensed Curriculum Development - - - - - 66,000 133 Activity Pay - 4,944.96 - - - 50,000 134 Coaching Pay 49,876.60 51,114.53 - 34,123 - 45,000 135 Non-professional duty pay - 3,682.25 - - - 240 139 Benefit Pay 13,079.40 13,161.00 - 7,776 - 3,642 154 Licensed Extra Duty Pay 325,090.73 390,526.88 - 312,723 - 718,907 155 Classified Extra Duty Pay 68,235.58 91,197.48 - 60,249 - 110,606 189 Contracted Services 216,290.28 233,541.92 - 280,795 - 269,769
100 Salaries Total 4,639,288.10 4,684,188.65 108.78 4,566,835 126.57 6,238,321 200 Payroll Costs 210 PERS 1,114,241.47 988,766.09 - 1,184,191 - 1,614,675 220 Social Security 332,351.34 332,400.43 - 319,076 - 469,300 230 Other Required Payroll Costs 26,228.22 20,571.58 - 35,281 - 88,060 240 Insurance 1,301,711.59 1,208,227.53 - 1,522,254 - 1,512,762
249 Tuition Reimbursement - - - - 60,000 200 Payroll Costs Total 2,774,532.62 2,549,965.63 - 3,060,802 - 3,744,798 300 Purchased Services 311 Instruction Services 1,011,732.09 1,010,579.89 - 1,130,358 - 1,567,643 312 Instructional Program Improvement 560,573.82 557,878.16 - 857,485 - 10,000 313 Student Services 96,274.06 29,283.48 - 18,250 - 15,460 319 Other Professional & Technical Services 546.25 250.00 - 20,000 - 23,500
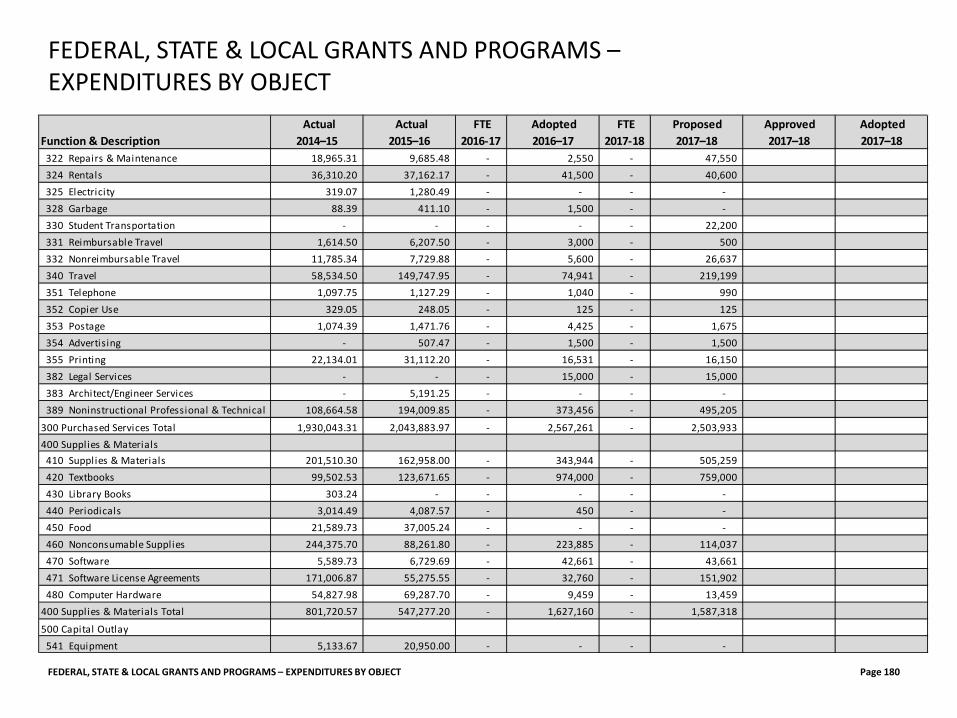
FEDERAL, STATE & LOCAL GRANTS AND PROGRAMS – EXPENDITURES BY OBJECT Page 180
FEDERAL, STATE & LOCAL GRANTS AND PROGRAMS – EXPENDITURES BY OBJECT
Function & Description Actual 2014–15
Actual 2015–16
FTE 2016-17
Adopted 2016–17
FTE 2017-18
Proposed 2017–18
Approved 2017–18
Adopted 2017–18
322 Repairs & Maintenance 18,965.31 9,685.48 - 2,550 - 47,550 324 Rentals 36,310.20 37,162.17 - 41,500 - 40,600 325 Electricity 319.07 1,280.49 - - - - 328 Garbage 88.39 411.10 - 1,500 - - 330 Student Transportation - - - - - 22,200 331 Reimbursable Travel 1,614.50 6,207.50 - 3,000 - 500 332 Nonreimbursable Travel 11,785.34 7,729.88 - 5,600 - 26,637 340 Travel 58,534.50 149,747.95 - 74,941 - 219,199 351 Telephone 1,097.75 1,127.29 - 1,040 - 990 352 Copier Use 329.05 248.05 - 125 - 125 353 Postage 1,074.39 1,471.76 - 4,425 - 1,675 354 Advertising - 507.47 - 1,500 - 1,500 355 Printing 22,134.01 31,112.20 - 16,531 - 16,150 382 Legal Services - - - 15,000 - 15,000 383 Architect/Engineer Services - 5,191.25 - - - - 389 Noninstructional Professional & Technical 108,664.58 194,009.85 - 373,456 - 495,205
300 Purchased Services Total 1,930,043.31 2,043,883.97 - 2,567,261 - 2,503,933 400 Supplies & Materials 410 Supplies & Materials 201,510.30 162,958.00 - 343,944 - 505,259 420 Textbooks 99,502.53 123,671.65 - 974,000 - 759,000 430 Library Books 303.24 - - - - - 440 Periodicals 3,014.49 4,087.57 - 450 - - 450 Food 21,589.73 37,005.24 - - - - 460 Nonconsumable Supplies 244,375.70 88,261.80 - 223,885 - 114,037 470 Software 5,589.73 6,729.69 - 42,661 - 43,661 471 Software License Agreements 171,006.87 55,275.55 - 32,760 - 151,902 480 Computer Hardware 54,827.98 69,287.70 - 9,459 - 13,459 400 Supplies & Materials Total 801,720.57 547,277.20 - 1,627,160 - 1,587,318
500 Capital Outlay 541 Equipment 5,133.67 20,950.00 - - - -
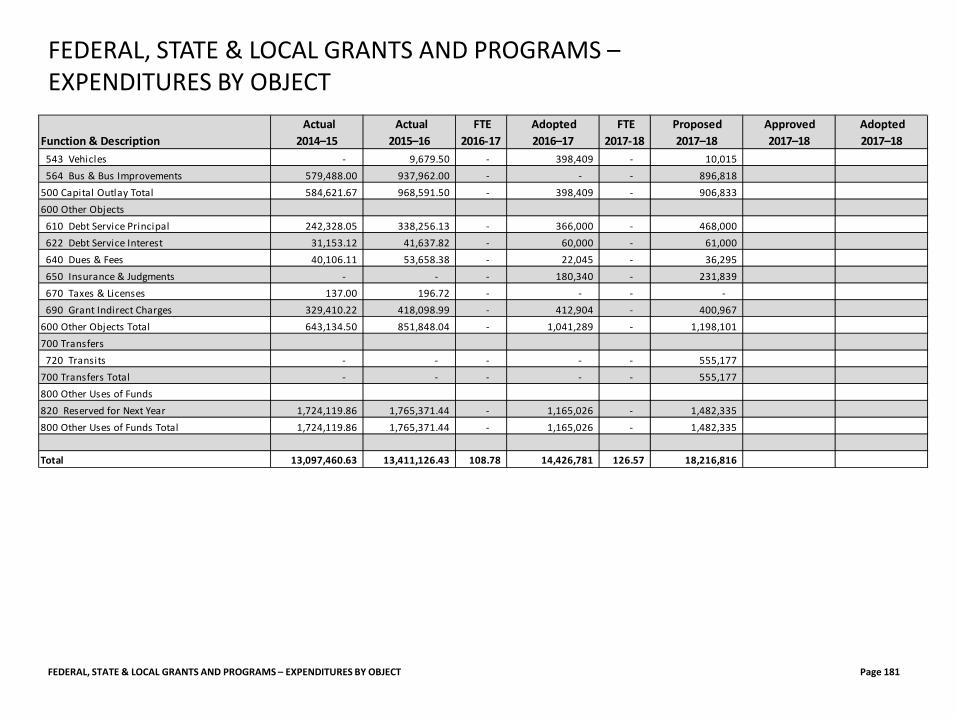
FEDERAL, STATE & LOCAL GRANTS AND PROGRAMS – EXPENDITURES BY OBJECT Page 181
FEDERAL, STATE & LOCAL GRANTS AND PROGRAMS – EXPENDITURES BY OBJECT
Function & Description Actual 2014–15
Actual 2015–16
FTE 2016-17
Adopted 2016–17
FTE 2017-18
Proposed 2017–18
Approved 2017–18
Adopted 2017–18
543 Vehicles - 9,679.50 - 398,409 - 10,015 564 Bus & Bus Improvements 579,488.00 937,962.00 - - - 896,818 500 Capital Outlay Total 584,621.67 968,591.50 - 398,409 - 906,833 600 Other Objects 610 Debt Service Principal 242,328.05 338,256.13 - 366,000 - 468,000 622 Debt Service Interest 31,153.12 41,637.82 - 60,000 - 61,000 640 Dues & Fees 40,106.11 53,658.38 - 22,045 - 36,295 650 Insurance & Judgments - - - 180,340 - 231,839 670 Taxes & Licenses 137.00 196.72 - - - - 690 Grant Indirect Charges 329,410.22 418,098.99 - 412,904 - 400,967 600 Other Objects Total 643,134.50 851,848.04 - 1,041,289 - 1,198,101 700 Transfers 720 Transits - - - - - 555,177 700 Transfers Total - - - - - 555,177 800 Other Uses of Funds820 Reserved for Next Year 1,724,119.86 1,765,371.44 - 1,165,026 - 1,482,335 800 Other Uses of Funds Total 1,724,119.86 1,765,371.44 - 1,165,026 - 1,482,335
Total 13,097,460.63 13,411,126.43 108.78 14,426,781 126.57 18,216,816
NUTRITION SERVICES FUND
NUTRITION SERVICES FUND Page 182
It is the mission of the Nutrition Services program, in conjunction with the District Wellness committee, to create a school environment that promotes and protects children’s health, well-being, and ability to learn by supporting healthy eating, in the community and in life. It is our desire to provide nutritionally balanced meals to all of the students in the District. The District participates in the National School Lunch and Breakfast Programs, as well as the Child and Adult Care Food Program (CACFP). Under the Federal Free and Reduced Meal Program, those students whose family income meets certain federal guidelines may qualify to receive free or reduced priced meals. Beginning in the 2015–16 school year, the District had seven schools qualify for the Community Eligibility Provision (CEP). To qualify for the CEP, schools must meet certain federal criteria. Through the CEP, the qualifying schools are now able to provide free breakfast and lunch to ALL students without requiring applications to the Free and Reduced Lunch Program. This means that all students at Douglas Gardens Elementary, Guy Lee Elementary, Maple Elementary, Page Elementary, Riverbend Elementary, Two Rivers-Dos Rios Elementary, and Hamlin Middle School will receive free breakfast and lunch. With the implementation of the CEP program, we have seen an increase in participation of 15% for breakfast and 18% for lunch within the first three months. Students at non-CEP schools who qualify for reduced meals will now get their lunch for free (they already received breakfast for free). Students at these schools will still be required to go through the application process. Currently meals are prepared on-site in 12 elementary schools, 4 middle schools, 2 high schools, Willamette Leadership Academy charter middle and high schools, and the memorial building which prepares meals for Gateways High School, Academy of Arts and Academics charter high school and the Community Transition Program. The Nutrition Services program supports and transports, through the distribution warehouse, food products for all District schools. More than 7,356 meals are served daily and over 420 students receive after school meals everyday. Other services available include ala carte selections and catering for special events at all locations within the School District. The Nutrition Services staff prepares menus each month based on federal FDA guidelines for nutrition, and purchases ingredients that are as local, healthful, and natural as possible. The District has partnered with the Willamette Farm and Food Coalition on a Harvest of the Month program. Each month one locally grown item is highlighted and served weekly in all cafeterias. Harvest of the Month gives students the chance to taste and learn about the importance of eating fruits and vegetables. The District has also partnered with the Willamette Farm and Food Coalition, FOOD for Lane County’s Youth Farm and Emerald Fruit and Produce to implement the Farm to School Program. Farm to School educational activities have been implemented at Guy Lee Elementary. The goals of the program are to educate children about where their food comes from, how to grow their own food, and the value of fresh fruits and vegetables in their diet. The program includes farm field trips to FOOD for Lane County’s Youth Farm, tasting tables in the cafeteria, a “harvest meal” in which students prepare a meal using produce they harvested at the farm, garden sessions at the Youth Farm and nutrition lessons. The Nutrition Services program operates under the philosophy that the program will be financially self-supporting. This minimizes the chance of any additional subsidizing from the General Fund. The Nutrition Services program continually strives to work within their budgetary constraints, provide quality meals and keep lunch and breakfast prices as low as possible for students.
NUTRITION SERVICES FUND – FUND 291 – OVERVIEW Page 183
NUTRITION SERVICES FUND – FUND 291 - OVERVIEW
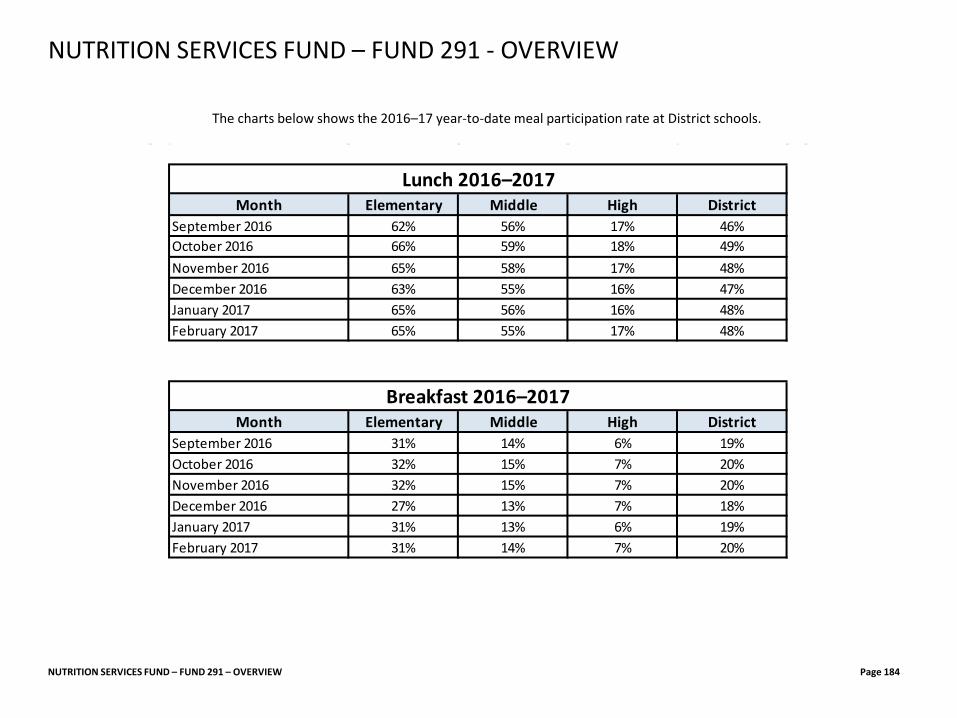
NUTRITION SERVICES FUND – FUND 291 – OVERVIEW Page 184
NUTRITION SERVICES FUND – FUND 291 - OVERVIEW
The charts below shows the 2016–17 year-to-date meal participation rate at District schools. Month Elementary Middle High District
September 2016 62% 56% 17% 46%October 2016 66% 59% 18% 49%November 2016 65% 58% 17% 48%December 2016 63% 55% 16% 47%January 2017 65% 56% 16% 48%February 2017 65% 55% 17% 48%
Month Elementary Middle High DistrictSeptember 2016 31% 14% 6% 19%October 2016 32% 15% 7% 20%November 2016 32% 15% 7% 20%December 2016 27% 13% 7% 18%January 2017 31% 13% 6% 19%February 2017 31% 14% 7% 20%
Lunch 2016–2017
Breakfast 2016–2017
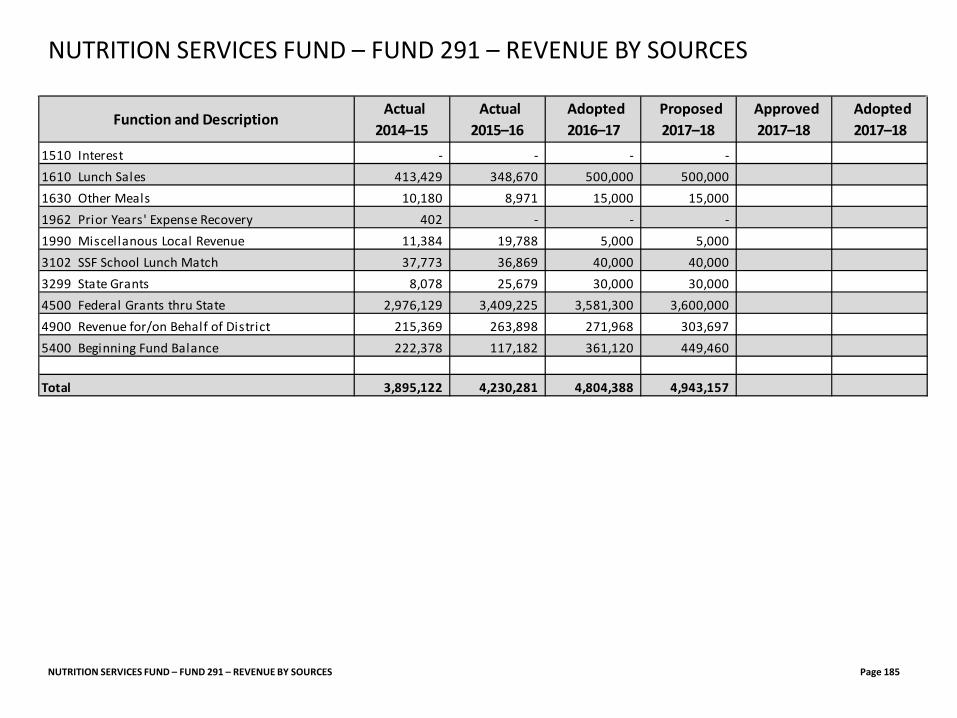
NUTRITION SERVICES FUND – FUND 291 – REVENUE BY SOURCES Page 185
NUTRITION SERVICES FUND – FUND 291 – REVENUE BY SOURCES
Function and Description Actual 2014–15
Actual 2015–16
Adopted 2016–17
Proposed 2017–18
Approved 2017–18
Adopted 2017–18
1510 Interest - - - - 1610 Lunch Sales 413,429 348,670 500,000 500,000 1630 Other Meals 10,180 8,971 15,000 15,000 1962 Prior Years' Expense Recovery 402 - - - 1990 Miscellanous Local Revenue 11,384 19,788 5,000 5,000 3102 SSF School Lunch Match 37,773 36,869 40,000 40,000 3299 State Grants 8,078 25,679 30,000 30,000 4500 Federal Grants thru State 2,976,129 3,409,225 3,581,300 3,600,000 4900 Revenue for/on Behalf of District 215,369 263,898 271,968 303,697 5400 Beginning Fund Balance 222,378 117,182 361,120 449,460
Total 3,895,122 4,230,281 4,804,388 4,943,157
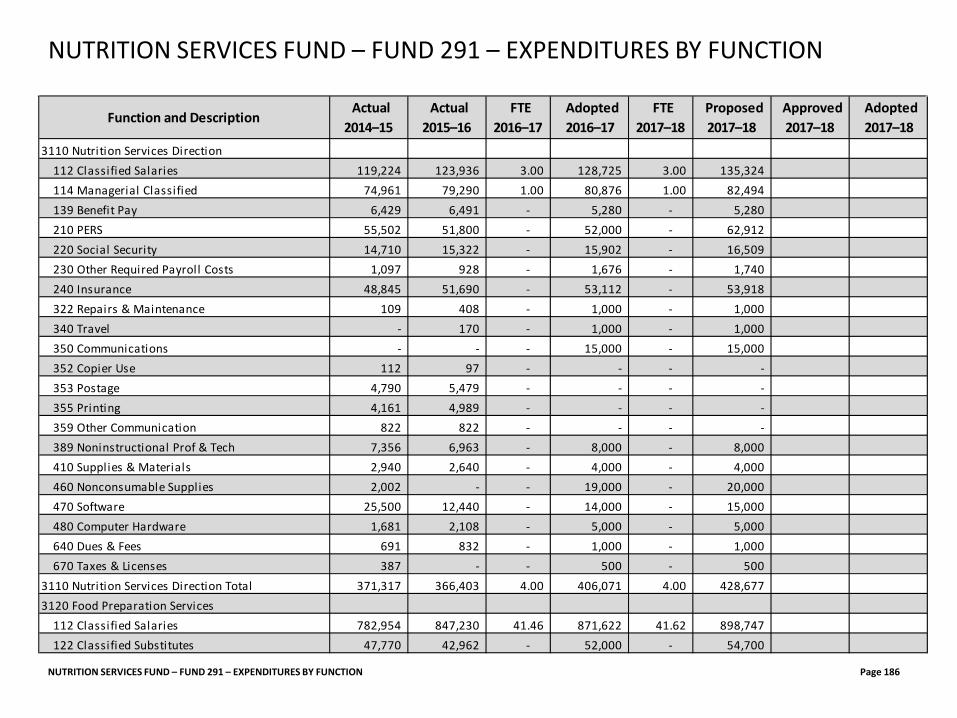
NUTRITION SERVICES FUND – FUND 291 – EXPENDITURES BY FUNCTION Page 186
NUTRITION SERVICES FUND – FUND 291 – EXPENDITURES BY FUNCTION
Function and Description Actual 2014–15
Actual 2015–16
FTE 2016–17
Adopted 2016–17
FTE 2017–18
Proposed 2017–18
Approved 2017–18
Adopted 2017–18
3110 Nutrition Services Direction112 Classified Salaries 119,224 123,936 3.00 128,725 3.00 135,324 114 Managerial Classified 74,961 79,290 1.00 80,876 1.00 82,494 139 Benefit Pay 6,429 6,491 - 5,280 - 5,280 210 PERS 55,502 51,800 - 52,000 - 62,912 220 Social Security 14,710 15,322 - 15,902 - 16,509 230 Other Required Payroll Costs 1,097 928 - 1,676 - 1,740 240 Insurance 48,845 51,690 - 53,112 - 53,918 322 Repairs & Maintenance 109 408 - 1,000 - 1,000 340 Travel - 170 - 1,000 - 1,000 350 Communications - - - 15,000 - 15,000 352 Copier Use 112 97 - - - - 353 Postage 4,790 5,479 - - - - 355 Printing 4,161 4,989 - - - - 359 Other Communication 822 822 - - - - 389 Noninstructional Prof & Tech 7,356 6,963 - 8,000 - 8,000 410 Supplies & Materials 2,940 2,640 - 4,000 - 4,000 460 Nonconsumable Supplies 2,002 - - 19,000 - 20,000 470 Software 25,500 12,440 - 14,000 - 15,000 480 Computer Hardware 1,681 2,108 - 5,000 - 5,000 640 Dues & Fees 691 832 - 1,000 - 1,000 670 Taxes & Licenses 387 - - 500 - 500
3110 Nutrition Services Direction Total 371,317 366,403 4.00 406,071 4.00 428,677 3120 Food Preparation Services
112 Classified Salaries 782,954 847,230 41.46 871,622 41.62 898,747 122 Classified Substitutes 47,770 42,962 - 52,000 - 54,700
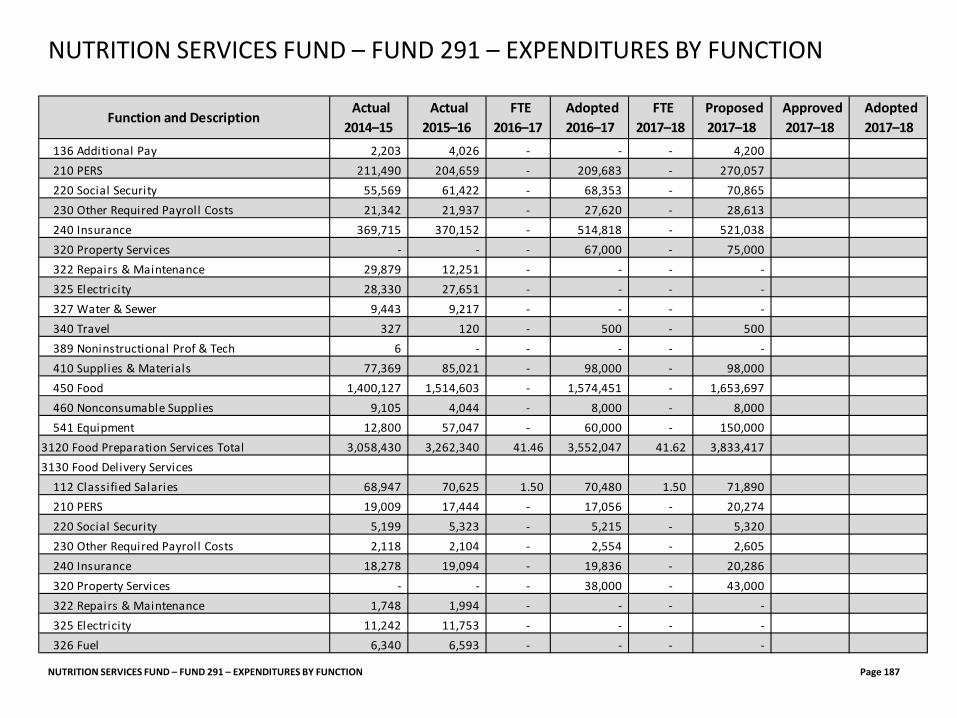
NUTRITION SERVICES FUND – FUND 291 – EXPENDITURES BY FUNCTION Page 187
NUTRITION SERVICES FUND – FUND 291 – EXPENDITURES BY FUNCTION
Function and Description Actual 2014–15
Actual 2015–16
FTE 2016–17
Adopted 2016–17
FTE 2017–18
Proposed 2017–18
Approved 2017–18
Adopted 2017–18
136 Additional Pay 2,203 4,026 - - - 4,200 210 PERS 211,490 204,659 - 209,683 - 270,057 220 Social Security 55,569 61,422 - 68,353 - 70,865 230 Other Required Payroll Costs 21,342 21,937 - 27,620 - 28,613 240 Insurance 369,715 370,152 - 514,818 - 521,038 320 Property Services - - - 67,000 - 75,000 322 Repairs & Maintenance 29,879 12,251 - - - - 325 Electricity 28,330 27,651 - - - - 327 Water & Sewer 9,443 9,217 - - - - 340 Travel 327 120 - 500 - 500 389 Noninstructional Prof & Tech 6 - - - - - 410 Supplies & Materials 77,369 85,021 - 98,000 - 98,000 450 Food 1,400,127 1,514,603 - 1,574,451 - 1,653,697 460 Nonconsumable Supplies 9,105 4,044 - 8,000 - 8,000 541 Equipment 12,800 57,047 - 60,000 - 150,000
3120 Food Preparation Services Total 3,058,430 3,262,340 41.46 3,552,047 41.62 3,833,417 3130 Food Delivery Services
112 Classified Salaries 68,947 70,625 1.50 70,480 1.50 71,890 210 PERS 19,009 17,444 - 17,056 - 20,274 220 Social Security 5,199 5,323 - 5,215 - 5,320 230 Other Required Payroll Costs 2,118 2,104 - 2,554 - 2,605 240 Insurance 18,278 19,094 - 19,836 - 20,286 320 Property Services - - - 38,000 - 43,000 322 Repairs & Maintenance 1,748 1,994 - - - - 325 Electricity 11,242 11,753 - - - - 326 Fuel 6,340 6,593 - - - -
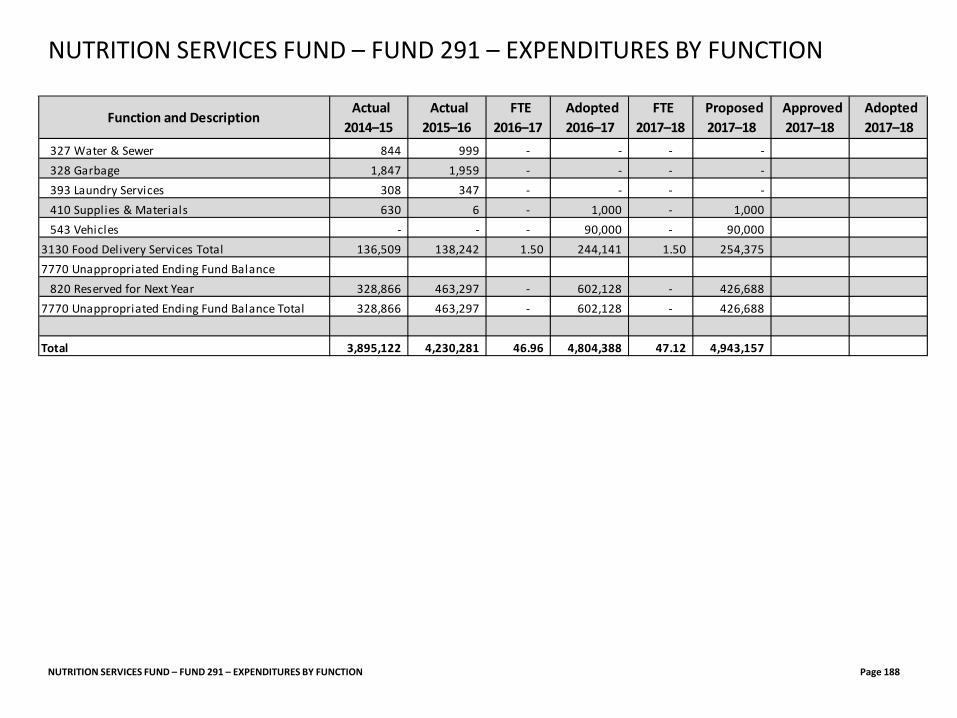
NUTRITION SERVICES FUND – FUND 291 – EXPENDITURES BY FUNCTION Page 188
NUTRITION SERVICES FUND – FUND 291 – EXPENDITURES BY FUNCTION
Function and Description Actual 2014–15
Actual 2015–16
FTE 2016–17
Adopted 2016–17
FTE 2017–18
Proposed 2017–18
Approved 2017–18
Adopted 2017–18
327 Water & Sewer 844 999 - - - - 328 Garbage 1,847 1,959 - - - - 393 Laundry Services 308 347 - - - - 410 Supplies & Materials 630 6 - 1,000 - 1,000 543 Vehicles - - - 90,000 - 90,000
3130 Food Delivery Services Total 136,509 138,242 1.50 244,141 1.50 254,375 7770 Unappropriated Ending Fund Balance
820 Reserved for Next Year 328,866 463,297 - 602,128 - 426,688 7770 Unappropriated Ending Fund Balance Total 328,866 463,297 - 602,128 - 426,688
Total 3,895,122 4,230,281 46.96 4,804,388 47.12 4,943,157
CO-CURRICULAR FUND
CO-CURRICULAR FUND Page 189
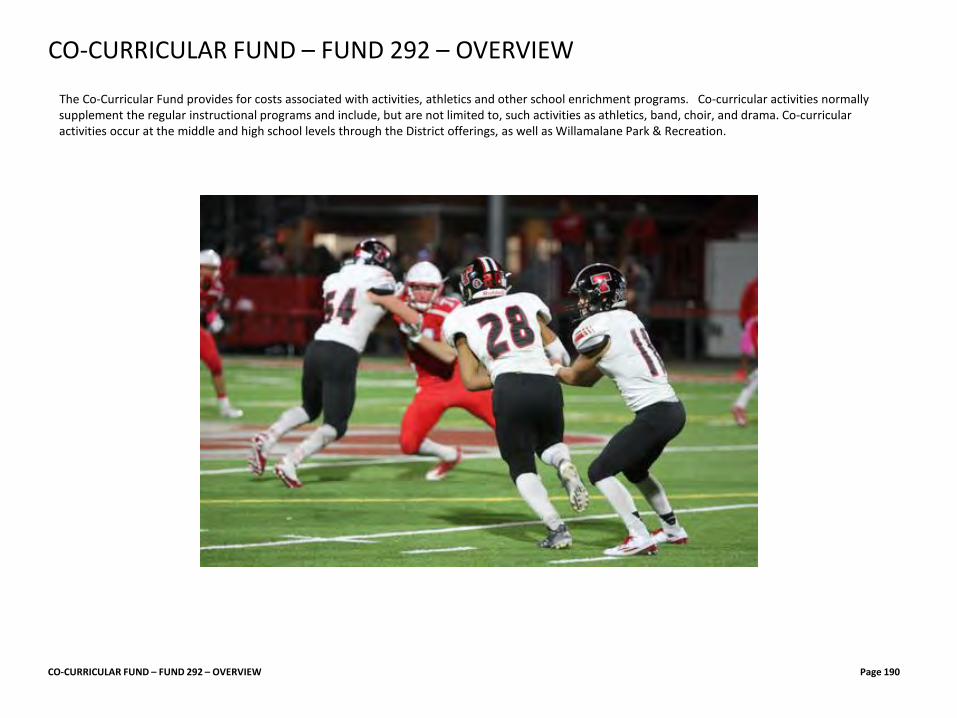
The Co-Curricular Fund provides for costs associated with activities, athletics and other school enrichment programs. Co-curricular activities normally supplement the regular instructional programs and include, but are not limited to, such activities as athletics, band, choir, and drama. Co-curricular activities occur at the middle and high school levels through the District offerings, as well as Willamalane Park & Recreation.
CO-CURRICULAR FUND – FUND 292 – OVERVIEW Page 190
CO-CURRICULAR FUND – FUND 292 – OVERVIEW
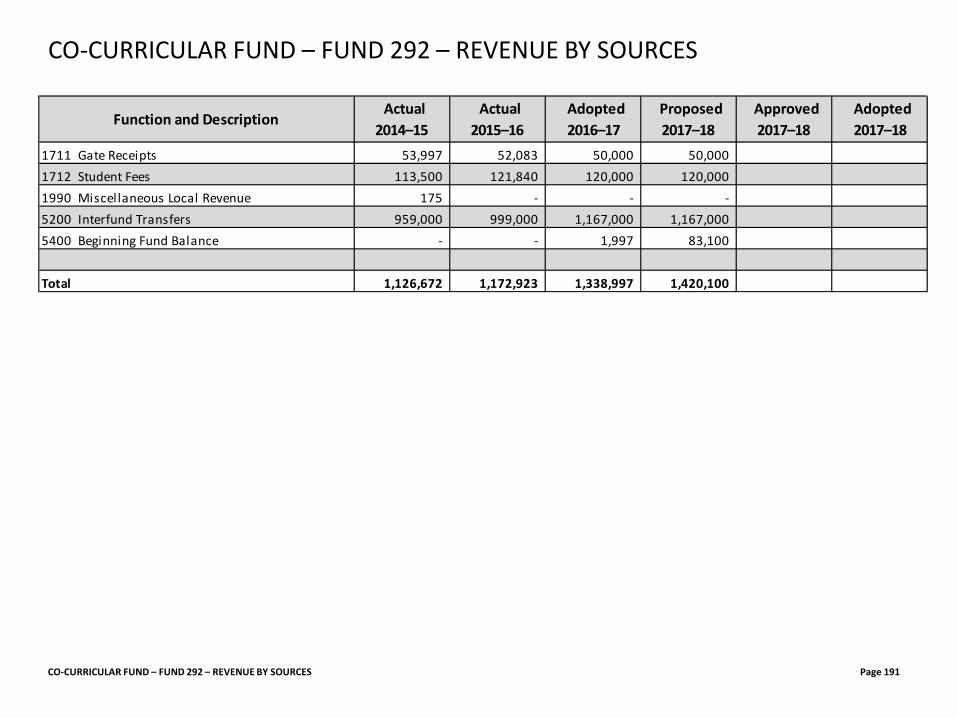
CO-CURRICULAR FUND – FUND 292 – REVENUE BY SOURCES
CO-CURRICULAR FUND – FUND 292 – REVENUE BY SOURCES Page 191
Function and Description Actual 2014–15
Actual 2015–16
Adopted 2016–17
Proposed 2017–18
Approved 2017–18
Adopted 2017–18
1711 Gate Receipts 53,997 52,083 50,000 50,000 1712 Student Fees 113,500 121,840 120,000 120,000 1990 Miscellaneous Local Revenue 175 - - - 5200 Interfund Transfers 959,000 999,000 1,167,000 1,167,000 5400 Beginning Fund Balance - - 1,997 83,100
Total 1,126,672 1,172,923 1,338,997 1,420,100
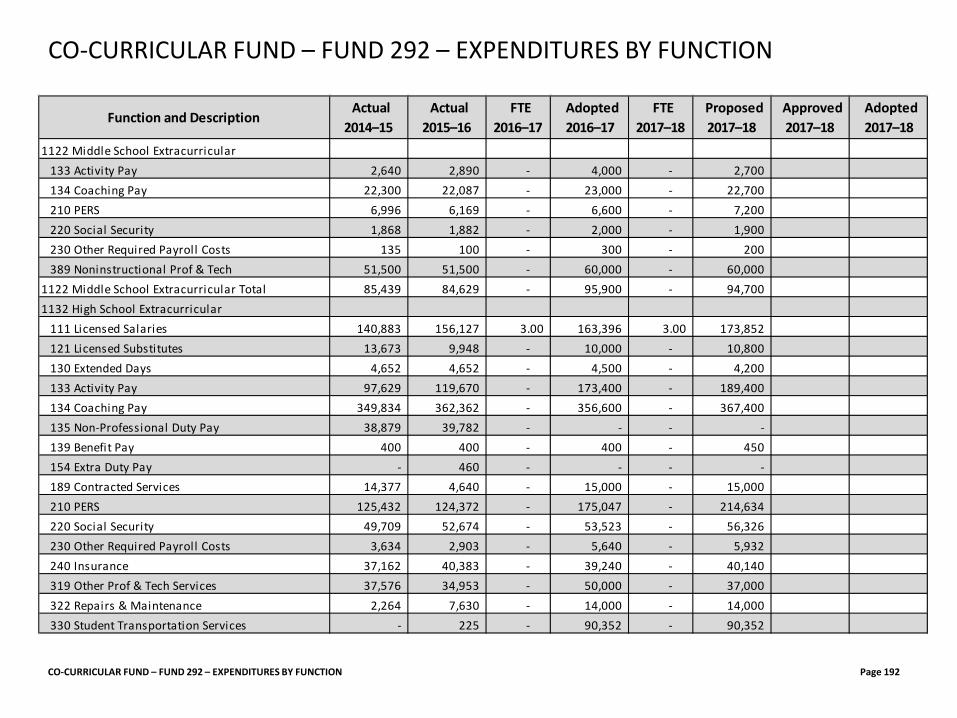
CO-CURRICULAR FUND – FUND 292 – EXPENDITURES BY FUNCTION
CO-CURRICULAR FUND – FUND 292 – EXPENDITURES BY FUNCTION Page 192
Function and Description Actual 2014–15
Actual 2015–16
FTE 2016–17
Adopted 2016–17
FTE 2017–18
Proposed 2017–18
Approved 2017–18
Adopted 2017–18
1122 Middle School Extracurricular133 Activity Pay 2,640 2,890 - 4,000 - 2,700 134 Coaching Pay 22,300 22,087 - 23,000 - 22,700 210 PERS 6,996 6,169 - 6,600 - 7,200 220 Social Security 1,868 1,882 - 2,000 - 1,900 230 Other Required Payroll Costs 135 100 - 300 - 200 389 Noninstructional Prof & Tech 51,500 51,500 - 60,000 - 60,000
1122 Middle School Extracurricular Total 85,439 84,629 - 95,900 - 94,700 1132 High School Extracurricular
111 Licensed Salaries 140,883 156,127 3.00 163,396 3.00 173,852 121 Licensed Substitutes 13,673 9,948 - 10,000 - 10,800 130 Extended Days 4,652 4,652 - 4,500 - 4,200 133 Activity Pay 97,629 119,670 - 173,400 - 189,400 134 Coaching Pay 349,834 362,362 - 356,600 - 367,400 135 Non-Professional Duty Pay 38,879 39,782 - - - - 139 Benefit Pay 400 400 - 400 - 450 154 Extra Duty Pay - 460 - - - - 189 Contracted Services 14,377 4,640 - 15,000 - 15,000 210 PERS 125,432 124,372 - 175,047 - 214,634 220 Social Security 49,709 52,674 - 53,523 - 56,326 230 Other Required Payroll Costs 3,634 2,903 - 5,640 - 5,932 240 Insurance 37,162 40,383 - 39,240 - 40,140 319 Other Prof & Tech Services 37,576 34,953 - 50,000 - 37,000 322 Repairs & Maintenance 2,264 7,630 - 14,000 - 14,000 330 Student Transportation Services - 225 - 90,352 - 90,352
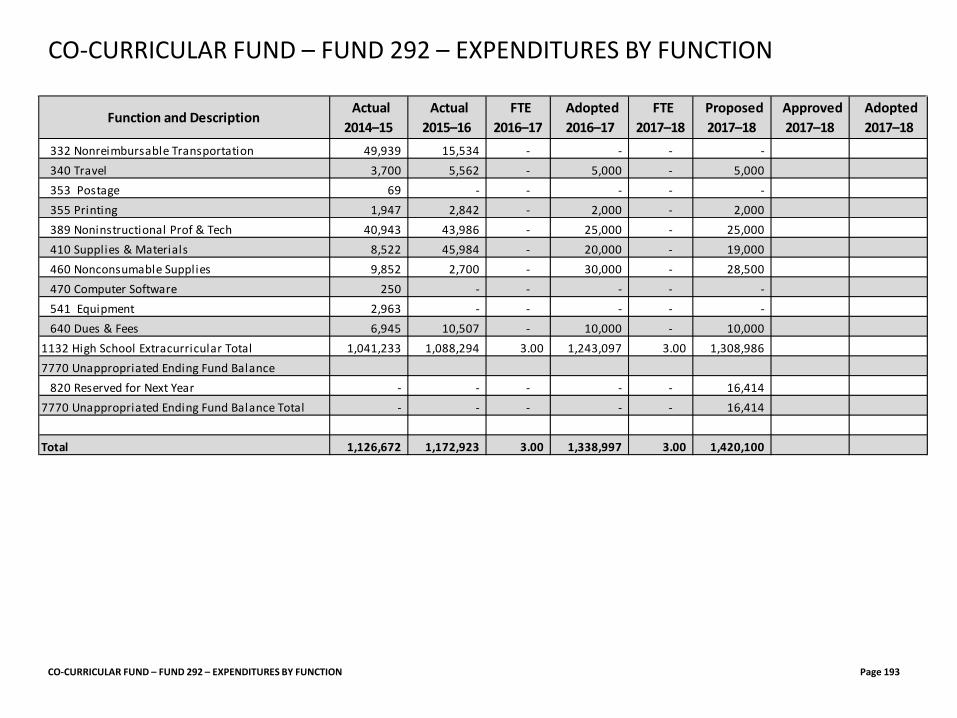
CO-CURRICULAR FUND – FUND 292 – EXPENDITURES BY FUNCTION
CO-CURRICULAR FUND – FUND 292 – EXPENDITURES BY FUNCTION Page 193
Function and Description Actual 2014–15
Actual 2015–16
FTE 2016–17
Adopted 2016–17
FTE 2017–18
Proposed 2017–18
Approved 2017–18
Adopted 2017–18
332 Nonreimbursable Transportation 49,939 15,534 - - - - 340 Travel 3,700 5,562 - 5,000 - 5,000 353 Postage 69 - - - - - 355 Printing 1,947 2,842 - 2,000 - 2,000 389 Noninstructional Prof & Tech 40,943 43,986 - 25,000 - 25,000 410 Supplies & Materials 8,522 45,984 - 20,000 - 19,000 460 Nonconsumable Supplies 9,852 2,700 - 30,000 - 28,500 470 Computer Software 250 - - - - - 541 Equipment 2,963 - - - - - 640 Dues & Fees 6,945 10,507 - 10,000 - 10,000
1132 High School Extracurricular Total 1,041,233 1,088,294 3.00 1,243,097 3.00 1,308,986 7770 Unappropriated Ending Fund Balance
820 Reserved for Next Year - - - - - 16,414 7770 Unappropriated Ending Fund Balance Total - - - - - 16,414
Total 1,126,672 1,172,923 3.00 1,338,997 3.00 1,420,100
STUDENT BODY ACTIVITIES
STUDENT BODY ACTIVITIES Page 194
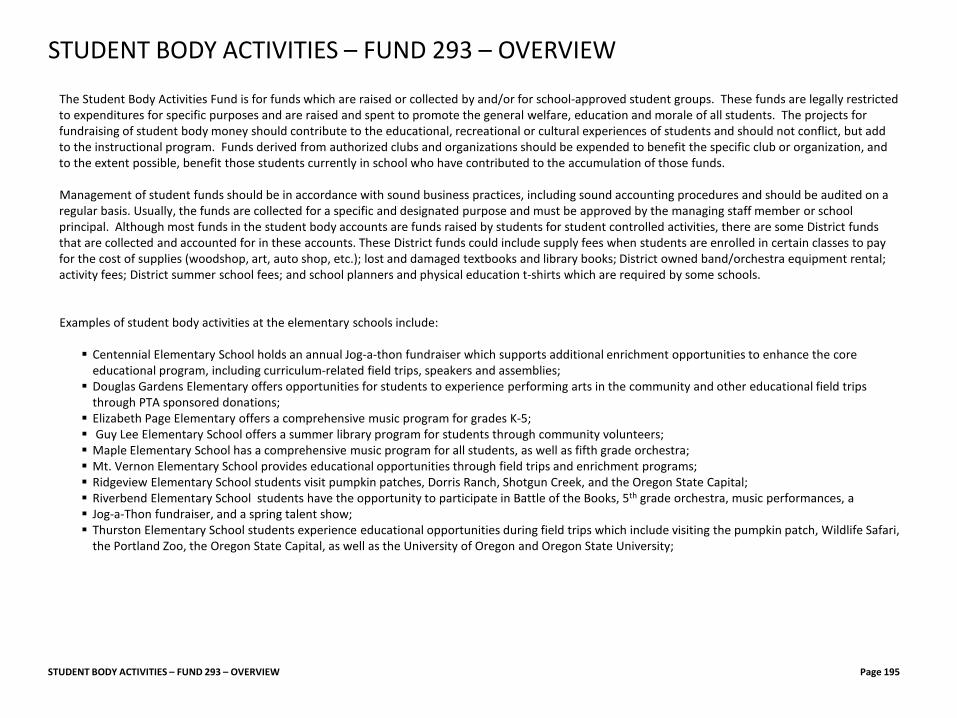
The Student Body Activities Fund is for funds which are raised or collected by and/or for school-approved student groups. These funds are legally restricted to expenditures for specific purposes and are raised and spent to promote the general welfare, education and morale of all students. The projects for fundraising of student body money should contribute to the educational, recreational or cultural experiences of students and should not conflict, but add to the instructional program. Funds derived from authorized clubs and organizations should be expended to benefit the specific club or organization, and to the extent possible, benefit those students currently in school who have contributed to the accumulation of those funds. Management of student funds should be in accordance with sound business practices, including sound accounting procedures and should be audited on a regular basis. Usually, the funds are collected for a specific and designated purpose and must be approved by the managing staff member or school principal. Although most funds in the student body accounts are funds raised by students for student controlled activities, there are some District funds that are collected and accounted for in these accounts. These District funds could include supply fees when students are enrolled in certain classes to pay for the cost of supplies (woodshop, art, auto shop, etc.); lost and damaged textbooks and library books; District owned band/orchestra equipment rental; activity fees; District summer school fees; and school planners and physical education t-shirts which are required by some schools. Examples of student body activities at the elementary schools include: Centennial Elementary School holds an annual Jog-a-thon fundraiser which supports additional enrichment opportunities to enhance the core
educational program, including curriculum-related field trips, speakers and assemblies; Douglas Gardens Elementary offers opportunities for students to experience performing arts in the community and other educational field trips
through PTA sponsored donations; Elizabeth Page Elementary offers a comprehensive music program for grades K-5; Guy Lee Elementary School offers a summer library program for students through community volunteers; Maple Elementary School has a comprehensive music program for all students, as well as fifth grade orchestra; Mt. Vernon Elementary School provides educational opportunities through field trips and enrichment programs; Ridgeview Elementary School students visit pumpkin patches, Dorris Ranch, Shotgun Creek, and the Oregon State Capital; Riverbend Elementary School students have the opportunity to participate in Battle of the Books, 5th grade orchestra, music performances, a Jog-a-Thon fundraiser, and a spring talent show; Thurston Elementary School students experience educational opportunities during field trips which include visiting the pumpkin patch, Wildlife Safari,
the Portland Zoo, the Oregon State Capital, as well as the University of Oregon and Oregon State University;
STUDENT BODY ACTIVITIES – FUND 293 – OVERVIEW Page 195
STUDENT BODY ACTIVITIES – FUND 293 – OVERVIEW
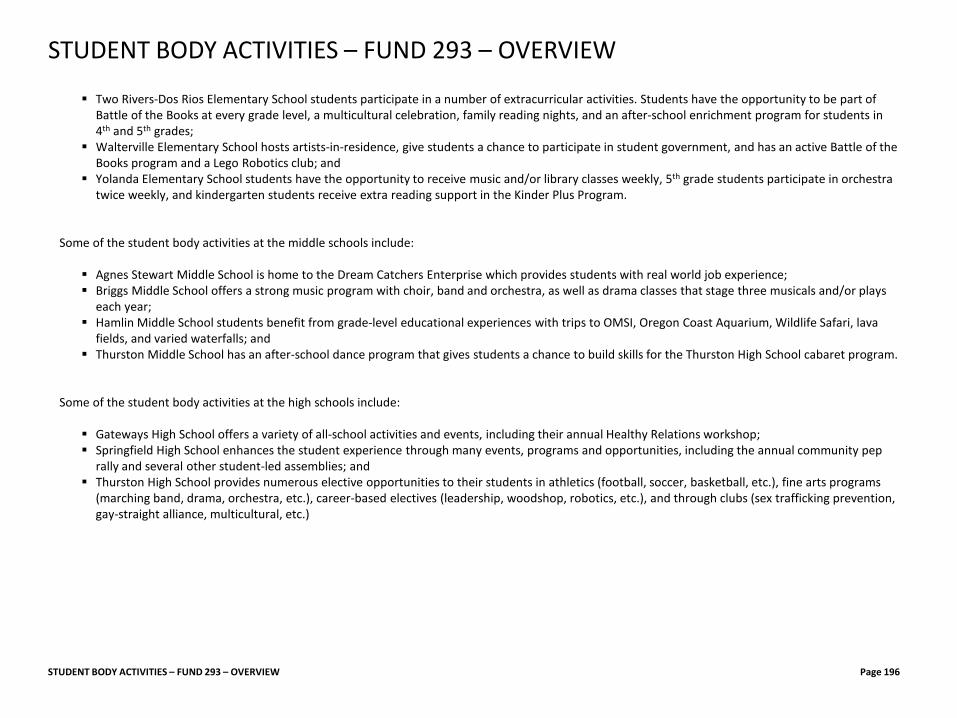
Two Rivers-Dos Rios Elementary School students participate in a number of extracurricular activities. Students have the opportunity to be part of Battle of the Books at every grade level, a multicultural celebration, family reading nights, and an after-school enrichment program for students in 4th and 5th grades;
Walterville Elementary School hosts artists-in-residence, give students a chance to participate in student government, and has an active Battle of the Books program and a Lego Robotics club; and
Yolanda Elementary School students have the opportunity to receive music and/or library classes weekly, 5th grade students participate in orchestra twice weekly, and kindergarten students receive extra reading support in the Kinder Plus Program.
Some of the student body activities at the middle schools include: Agnes Stewart Middle School is home to the Dream Catchers Enterprise which provides students with real world job experience; Briggs Middle School offers a strong music program with choir, band and orchestra, as well as drama classes that stage three musicals and/or plays each year; Hamlin Middle School students benefit from grade-level educational experiences with trips to OMSI, Oregon Coast Aquarium, Wildlife Safari, lava
fields, and varied waterfalls; and Thurston Middle School has an after-school dance program that gives students a chance to build skills for the Thurston High School cabaret program.
Some of the student body activities at the high schools include: Gateways High School offers a variety of all-school activities and events, including their annual Healthy Relations workshop; Springfield High School enhances the student experience through many events, programs and opportunities, including the annual community pep
rally and several other student-led assemblies; and Thurston High School provides numerous elective opportunities to their students in athletics (football, soccer, basketball, etc.), fine arts programs
(marching band, drama, orchestra, etc.), career-based electives (leadership, woodshop, robotics, etc.), and through clubs (sex trafficking prevention, gay-straight alliance, multicultural, etc.)
STUDENT BODY ACTIVITIES – FUND 293 – OVERVIEW Page 196
STUDENT BODY ACTIVITIES – FUND 293 – OVERVIEW
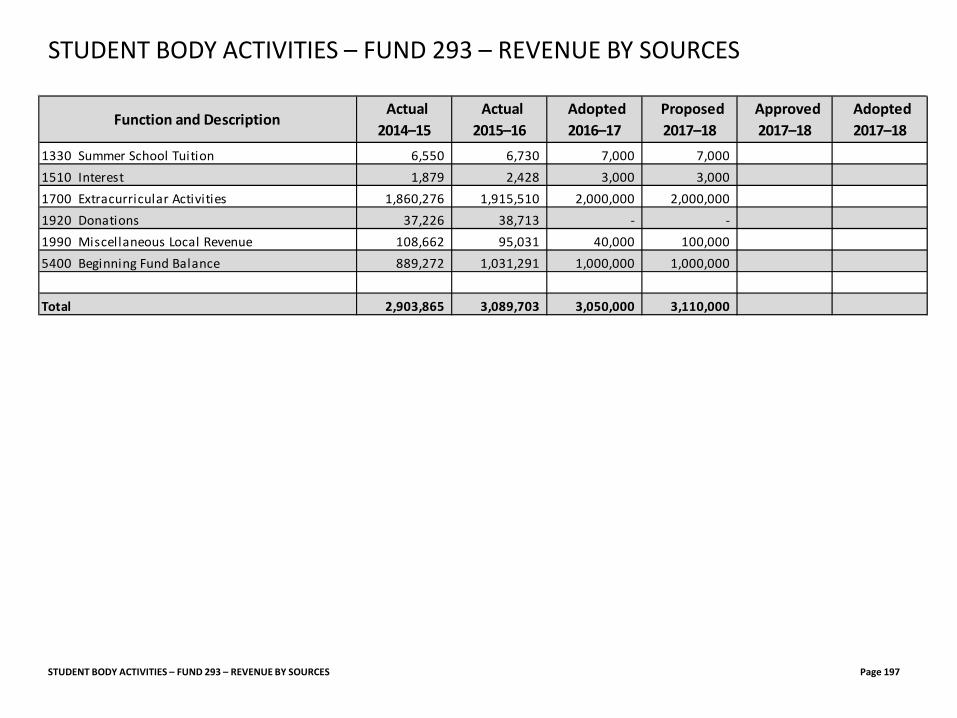
STUDENT BODY ACTIVITIES – FUND 293 – REVENUE BY SOURCES Page 197
STUDENT BODY ACTIVITIES – FUND 293 – REVENUE BY SOURCES
Function and Description Actual 2014–15
Actual 2015–16
Adopted 2016–17
Proposed 2017–18
Approved 2017–18
Adopted 2017–18
1330 Summer School Tuition 6,550 6,730 7,000 7,000 1510 Interest 1,879 2,428 3,000 3,000 1700 Extracurricular Activities 1,860,276 1,915,510 2,000,000 2,000,000 1920 Donations 37,226 38,713 - - 1990 Miscellaneous Local Revenue 108,662 95,031 40,000 100,000 5400 Beginning Fund Balance 889,272 1,031,291 1,000,000 1,000,000
Total 2,903,865 3,089,703 3,050,000 3,110,000
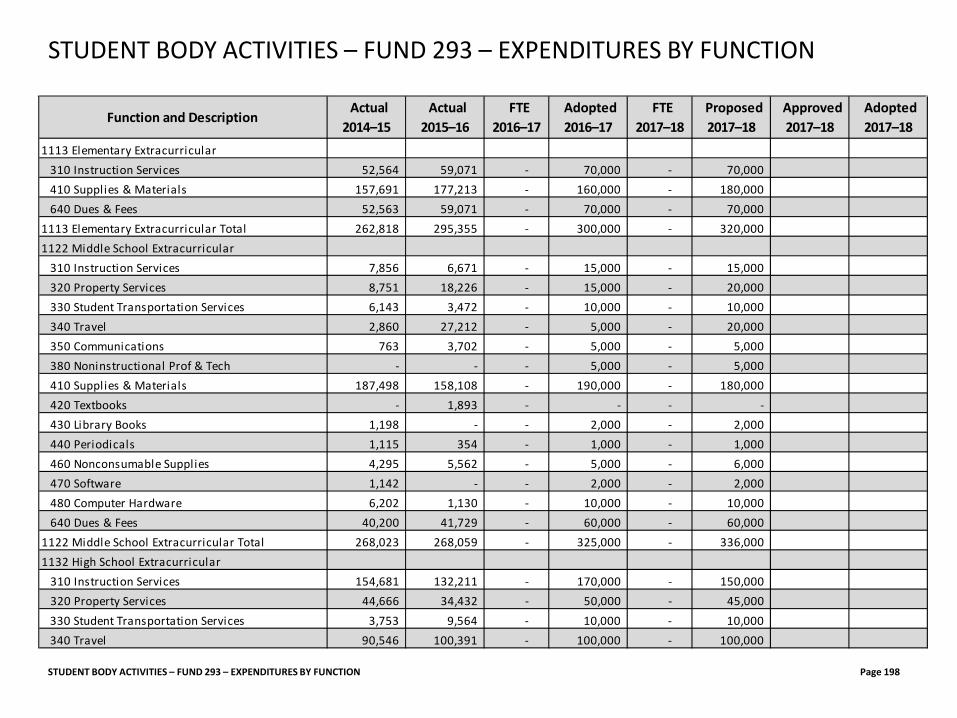
STUDENT BODY ACTIVITIES – FUND 293 – EXPENDITURES BY FUNCTION Page 198
STUDENT BODY ACTIVITIES – FUND 293 – EXPENDITURES BY FUNCTION
Function and Description Actual 2014–15
Actual 2015–16
FTE 2016–17
Adopted 2016–17
FTE 2017–18
Proposed 2017–18
Approved 2017–18
Adopted 2017–18
1113 Elementary Extracurricular310 Instruction Services 52,564 59,071 - 70,000 - 70,000 410 Supplies & Materials 157,691 177,213 - 160,000 - 180,000 640 Dues & Fees 52,563 59,071 - 70,000 - 70,000
1113 Elementary Extracurricular Total 262,818 295,355 - 300,000 - 320,000 1122 Middle School Extracurricular
310 Instruction Services 7,856 6,671 - 15,000 - 15,000 320 Property Services 8,751 18,226 - 15,000 - 20,000 330 Student Transportation Services 6,143 3,472 - 10,000 - 10,000 340 Travel 2,860 27,212 - 5,000 - 20,000 350 Communications 763 3,702 - 5,000 - 5,000 380 Noninstructional Prof & Tech - - - 5,000 - 5,000 410 Supplies & Materials 187,498 158,108 - 190,000 - 180,000 420 Textbooks - 1,893 - - - - 430 Library Books 1,198 - - 2,000 - 2,000 440 Periodicals 1,115 354 - 1,000 - 1,000 460 Nonconsumable Supplies 4,295 5,562 - 5,000 - 6,000 470 Software 1,142 - - 2,000 - 2,000 480 Computer Hardware 6,202 1,130 - 10,000 - 10,000 640 Dues & Fees 40,200 41,729 - 60,000 - 60,000
1122 Middle School Extracurricular Total 268,023 268,059 - 325,000 - 336,000 1132 High School Extracurricular
310 Instruction Services 154,681 132,211 - 170,000 - 150,000 320 Property Services 44,666 34,432 - 50,000 - 45,000 330 Student Transportation Services 3,753 9,564 - 10,000 - 10,000 340 Travel 90,546 100,391 - 100,000 - 100,000
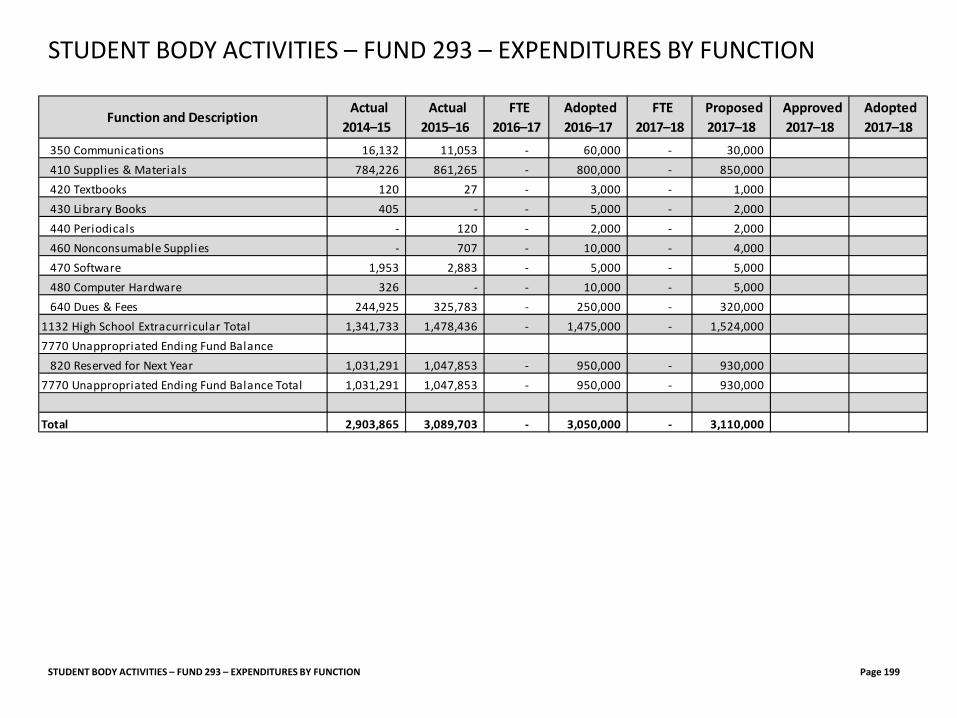
STUDENT BODY ACTIVITIES – FUND 293 – EXPENDITURES BY FUNCTION Page 199
STUDENT BODY ACTIVITIES – FUND 293 – EXPENDITURES BY FUNCTION
Function and Description Actual 2014–15
Actual 2015–16
FTE 2016–17
Adopted 2016–17
FTE 2017–18
Proposed 2017–18
Approved 2017–18
Adopted 2017–18
350 Communications 16,132 11,053 - 60,000 - 30,000 410 Supplies & Materials 784,226 861,265 - 800,000 - 850,000 420 Textbooks 120 27 - 3,000 - 1,000 430 Library Books 405 - - 5,000 - 2,000 440 Periodicals - 120 - 2,000 - 2,000 460 Nonconsumable Supplies - 707 - 10,000 - 4,000 470 Software 1,953 2,883 - 5,000 - 5,000 480 Computer Hardware 326 - - 10,000 - 5,000 640 Dues & Fees 244,925 325,783 - 250,000 - 320,000
1132 High School Extracurricular Total 1,341,733 1,478,436 - 1,475,000 - 1,524,000 7770 Unappropriated Ending Fund Balance
820 Reserved for Next Year 1,031,291 1,047,853 - 950,000 - 930,000 7770 Unappropriated Ending Fund Balance Total 1,031,291 1,047,853 - 950,000 - 930,000
Total 2,903,865 3,089,703 - 3,050,000 - 3,110,000
DEBT SERVICES FUND
DEBT SERVICES FUND Page 200
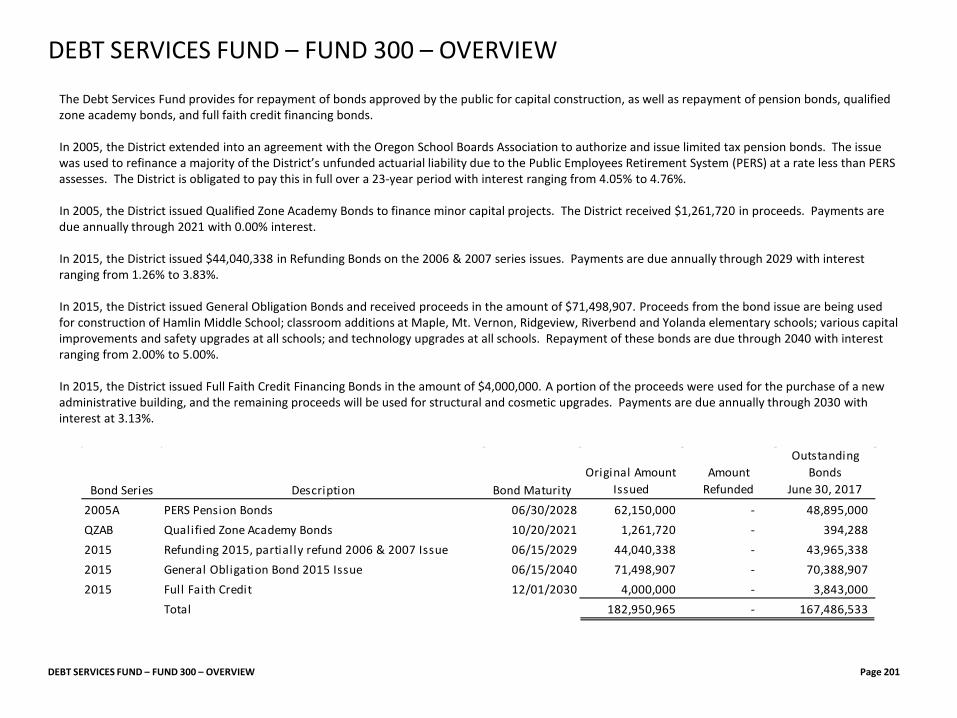
Bond Series Description Bond MaturityOriginal Amount
IssuedAmount
Refunded
Outstanding Bonds
June 30, 2017
2005A PERS Pension Bonds 06/30/2028 62,150,000 - 48,895,000 QZAB Qualified Zone Academy Bonds 10/20/2021 1,261,720 - 394,288 2015 Refunding 2015, partially refund 2006 & 2007 Issue 06/15/2029 44,040,338 - 43,965,338 2015 General Obligation Bond 2015 Issue 06/15/2040 71,498,907 - 70,388,907 2015 Full Faith Credit 12/01/2030 4,000,000 - 3,843,000
Total 182,950,965 - 167,486,533
The Debt Services Fund provides for repayment of bonds approved by the public for capital construction, as well as repayment of pension bonds, qualified zone academy bonds, and full faith credit financing bonds. In 2005, the District extended into an agreement with the Oregon School Boards Association to authorize and issue limited tax pension bonds. The issue was used to refinance a majority of the District’s unfunded actuarial liability due to the Public Employees Retirement System (PERS) at a rate less than PERS assesses. The District is obligated to pay this in full over a 23-year period with interest ranging from 4.05% to 4.76%. In 2005, the District issued Qualified Zone Academy Bonds to finance minor capital projects. The District received $1,261,720 in proceeds. Payments are due annually through 2021 with 0.00% interest. In 2015, the District issued $44,040,338 in Refunding Bonds on the 2006 & 2007 series issues. Payments are due annually through 2029 with interest ranging from 1.26% to 3.83%. In 2015, the District issued General Obligation Bonds and received proceeds in the amount of $71,498,907. Proceeds from the bond issue are being used for construction of Hamlin Middle School; classroom additions at Maple, Mt. Vernon, Ridgeview, Riverbend and Yolanda elementary schools; various capital improvements and safety upgrades at all schools; and technology upgrades at all schools. Repayment of these bonds are due through 2040 with interest ranging from 2.00% to 5.00%. In 2015, the District issued Full Faith Credit Financing Bonds in the amount of $4,000,000. A portion of the proceeds were used for the purchase of a new administrative building, and the remaining proceeds will be used for structural and cosmetic upgrades. Payments are due annually through 2030 with interest at 3.13%.
DEBT SERVICES FUND – FUND 300 – OVERVIEW Page 201
DEBT SERVICES FUND – FUND 300 – OVERVIEW
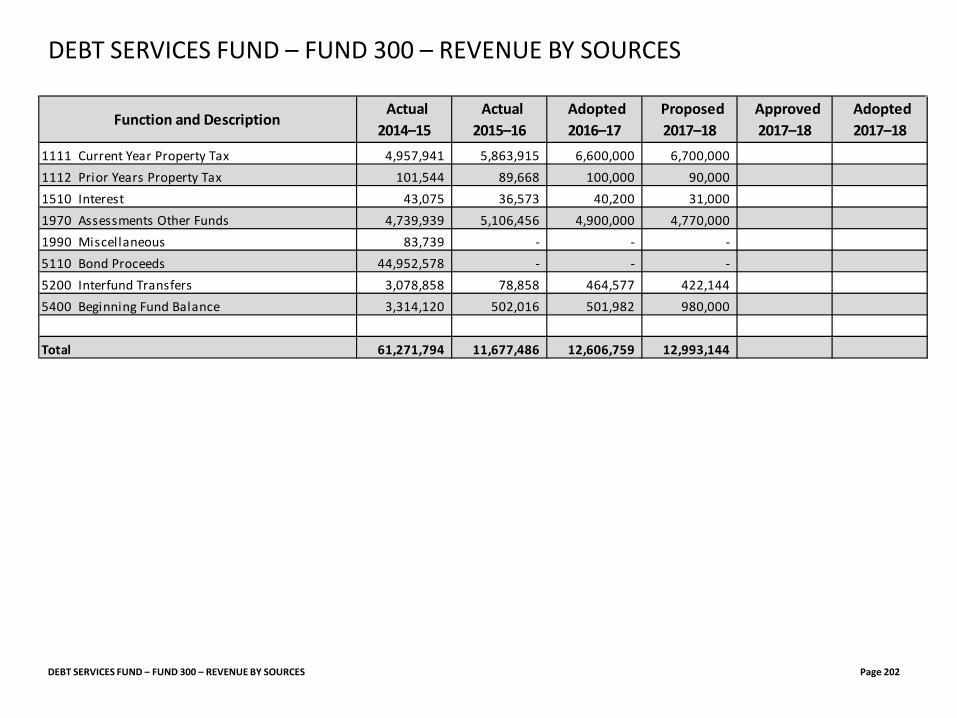
DEBT SERVICES FUND – FUND 300 – REVENUE BY SOURCES Page 202
DEBT SERVICES FUND – FUND 300 – REVENUE BY SOURCES
Function and Description Actual 2014–15
Actual 2015–16
Adopted 2016–17
Proposed 2017–18
Approved 2017–18
Adopted 2017–18
1111 Current Year Property Tax 4,957,941 5,863,915 6,600,000 6,700,000 1112 Prior Years Property Tax 101,544 89,668 100,000 90,000 1510 Interest 43,075 36,573 40,200 31,000 1970 Assessments Other Funds 4,739,939 5,106,456 4,900,000 4,770,000 1990 Miscellaneous 83,739 - - - 5110 Bond Proceeds 44,952,578 - - - 5200 Interfund Transfers 3,078,858 78,858 464,577 422,144 5400 Beginning Fund Balance 3,314,120 502,016 501,982 980,000
Total 61,271,794 11,677,486 12,606,759 12,993,144
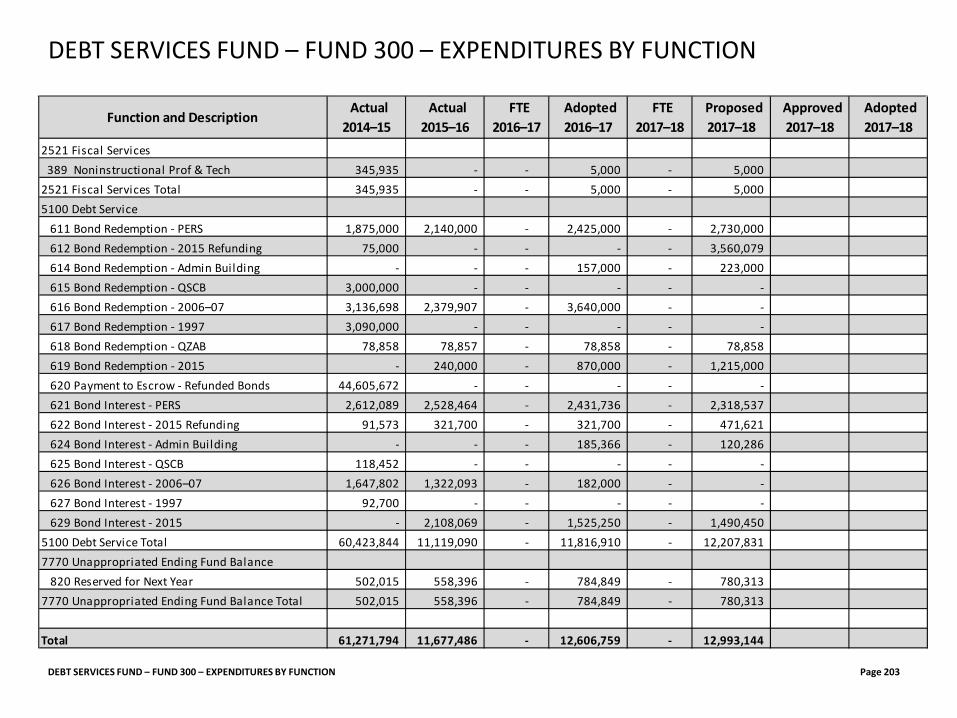
DEBT SERVICES FUND – FUND 300 – EXPENDITURES BY FUNCTION Page 203
DEBT SERVICES FUND – FUND 300 – EXPENDITURES BY FUNCTION
Function and Description Actual 2014–15
Actual 2015–16
FTE 2016–17
Adopted 2016–17
FTE 2017–18
Proposed 2017–18
Approved 2017–18
Adopted 2017–18
2521 Fiscal Services 389 Noninstructional Prof & Tech 345,935 - - 5,000 - 5,000 2521 Fiscal Services Total 345,935 - - 5,000 - 5,000 5100 Debt Service
611 Bond Redemption - PERS 1,875,000 2,140,000 - 2,425,000 - 2,730,000 612 Bond Redemption - 2015 Refunding 75,000 - - - - 3,560,079 614 Bond Redemption - Admin Building - - - 157,000 - 223,000 615 Bond Redemption - QSCB 3,000,000 - - - - - 616 Bond Redemption - 2006–07 3,136,698 2,379,907 - 3,640,000 - - 617 Bond Redemption - 1997 3,090,000 - - - - - 618 Bond Redemption - QZAB 78,858 78,857 - 78,858 - 78,858 619 Bond Redemption - 2015 - 240,000 - 870,000 - 1,215,000 620 Payment to Escrow - Refunded Bonds 44,605,672 - - - - - 621 Bond Interest - PERS 2,612,089 2,528,464 - 2,431,736 - 2,318,537 622 Bond Interest - 2015 Refunding 91,573 321,700 - 321,700 - 471,621 624 Bond Interest - Admin Building - - - 185,366 - 120,286 625 Bond Interest - QSCB 118,452 - - - - - 626 Bond Interest - 2006–07 1,647,802 1,322,093 - 182,000 - - 627 Bond Interest - 1997 92,700 - - - - - 629 Bond Interest - 2015 - 2,108,069 - 1,525,250 - 1,490,450
5100 Debt Service Total 60,423,844 11,119,090 - 11,816,910 - 12,207,831 7770 Unappropriated Ending Fund Balance
820 Reserved for Next Year 502,015 558,396 - 784,849 - 780,313 7770 Unappropriated Ending Fund Balance Total 502,015 558,396 - 784,849 - 780,313
Total 61,271,794 11,677,486 - 12,606,759 - 12,993,144
CAPITAL PROJECTS FUND
CAPITAL PROJECTS FUND Page 204
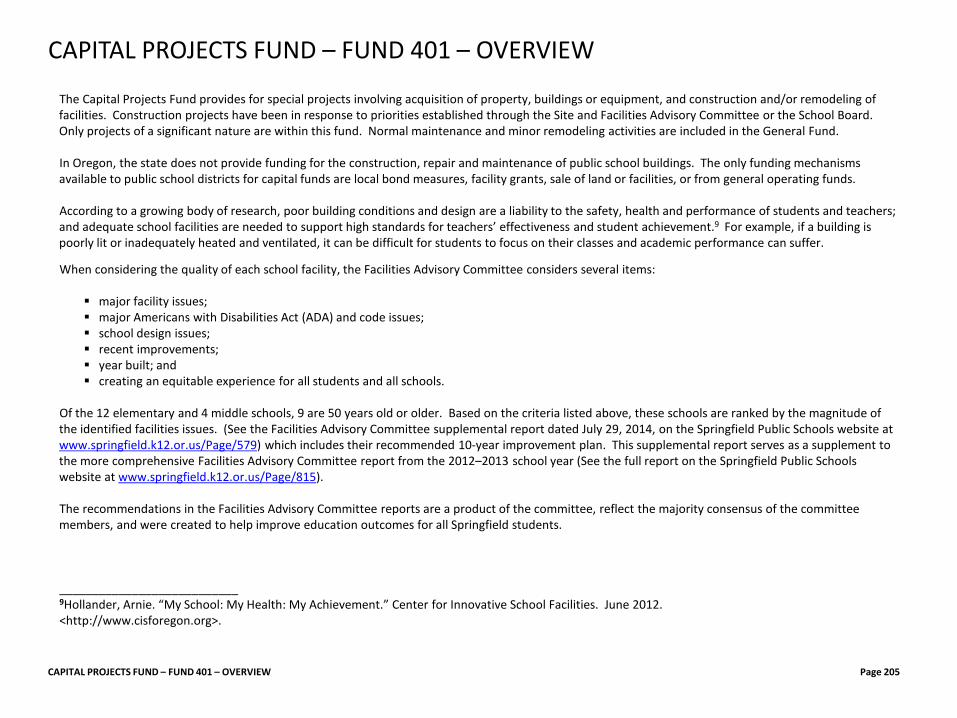
The Capital Projects Fund provides for special projects involving acquisition of property, buildings or equipment, and construction and/or remodeling of facilities. Construction projects have been in response to priorities established through the Site and Facilities Advisory Committee or the School Board. Only projects of a significant nature are within this fund. Normal maintenance and minor remodeling activities are included in the General Fund. In Oregon, the state does not provide funding for the construction, repair and maintenance of public school buildings. The only funding mechanisms available to public school districts for capital funds are local bond measures, facility grants, sale of land or facilities, or from general operating funds. According to a growing body of research, poor building conditions and design are a liability to the safety, health and performance of students and teachers; and adequate school facilities are needed to support high standards for teachers’ effectiveness and student achievement.9 For example, if a building is poorly lit or inadequately heated and ventilated, it can be difficult for students to focus on their classes and academic performance can suffer.
When considering the quality of each school facility, the Facilities Advisory Committee considers several items:
major facility issues; major Americans with Disabilities Act (ADA) and code issues; school design issues; recent improvements; year built; and creating an equitable experience for all students and all schools.
Of the 12 elementary and 4 middle schools, 9 are 50 years old or older. Based on the criteria listed above, these schools are ranked by the magnitude of the identified facilities issues. (See the Facilities Advisory Committee supplemental report dated July 29, 2014, on the Springfield Public Schools website at www.springfield.k12.or.us/Page/579) which includes their recommended 10-year improvement plan. This supplemental report serves as a supplement to the more comprehensive Facilities Advisory Committee report from the 2012–2013 school year (See the full report on the Springfield Public Schools website at www.springfield.k12.or.us/Page/815). The recommendations in the Facilities Advisory Committee reports are a product of the committee, reflect the majority consensus of the committee members, and were created to help improve education outcomes for all Springfield students. ___________________________ 9Hollander, Arnie. “My School: My Health: My Achievement.” Center for Innovative School Facilities. June 2012. <http://www.cisforegon.org>.
CAPITAL PROJECTS FUND – FUND 401 – OVERVIEW Page 205
CAPITAL PROJECTS FUND – FUND 401 – OVERVIEW
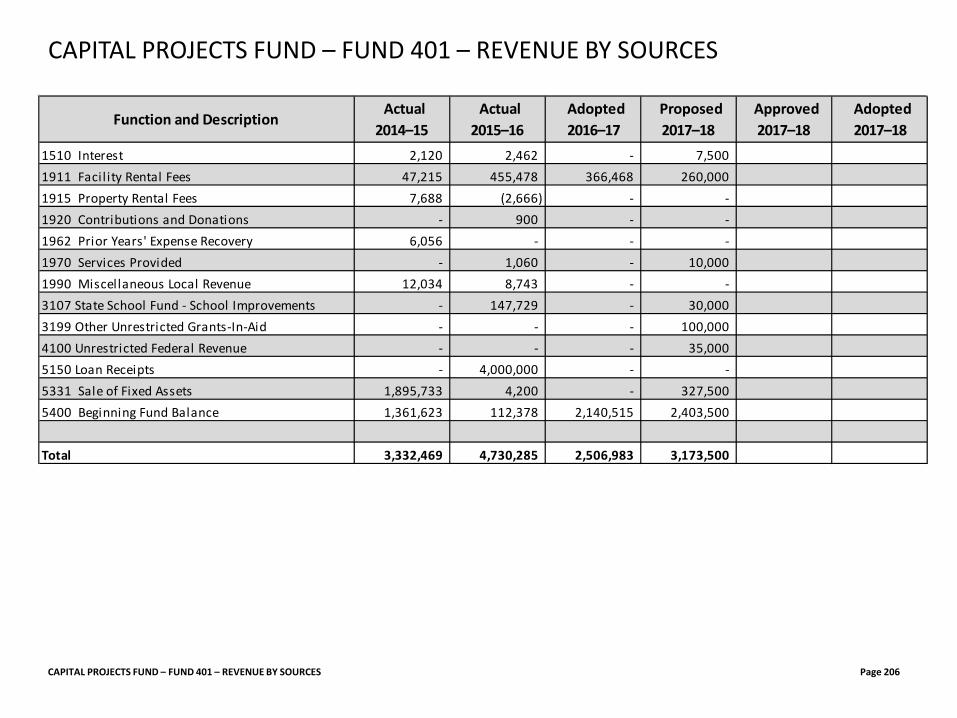
CAPITAL PROJECTS FUND – FUND 401 – REVENUE BY SOURCES Page 206
CAPITAL PROJECTS FUND – FUND 401 – REVENUE BY SOURCES
Function and Description Actual 2014–15
Actual 2015–16
Adopted 2016–17
Proposed 2017–18
Approved 2017–18
Adopted 2017–18
1510 Interest 2,120 2,462 - 7,500 1911 Facil ity Rental Fees 47,215 455,478 366,468 260,000 1915 Property Rental Fees 7,688 (2,666) - - 1920 Contributions and Donations - 900 - - 1962 Prior Years' Expense Recovery 6,056 - - - 1970 Services Provided - 1,060 - 10,000 1990 Miscellaneous Local Revenue 12,034 8,743 - - 3107 State School Fund - School Improvements - 147,729 - 30,000 3199 Other Unrestricted Grants-In-Aid - - - 100,000 4100 Unrestricted Federal Revenue - - - 35,000 5150 Loan Receipts - 4,000,000 - - 5331 Sale of Fixed Assets 1,895,733 4,200 - 327,500 5400 Beginning Fund Balance 1,361,623 112,378 2,140,515 2,403,500
Total 3,332,469 4,730,285 2,506,983 3,173,500
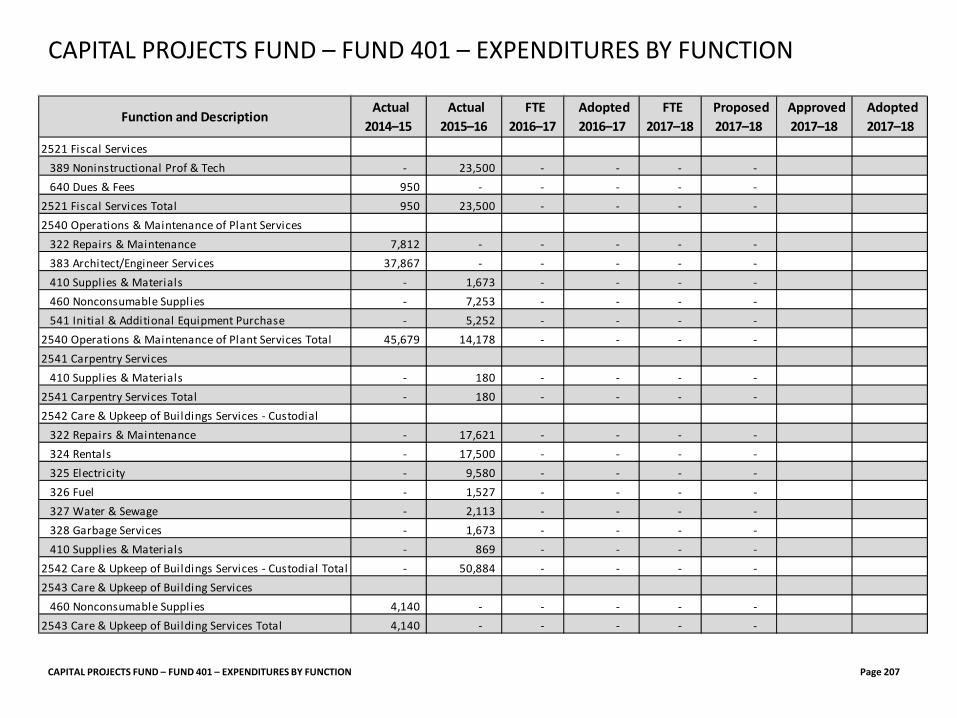
CAPITAL PROJECTS FUND – FUND 401 – EXPENDITURES BY FUNCTION Page 207
CAPITAL PROJECTS FUND – FUND 401 – EXPENDITURES BY FUNCTION
Function and Description Actual 2014–15
Actual 2015–16
FTE 2016–17
Adopted 2016–17
FTE 2017–18
Proposed 2017–18
Approved 2017–18
Adopted 2017–18
2521 Fiscal Services389 Noninstructional Prof & Tech - 23,500 - - - - 640 Dues & Fees 950 - - - - -
2521 Fiscal Services Total 950 23,500 - - - - 2540 Operations & Maintenance of Plant Services
322 Repairs & Maintenance 7,812 - - - - - 383 Architect/Engineer Services 37,867 - - - - - 410 Supplies & Materials - 1,673 - - - - 460 Nonconsumable Supplies - 7,253 - - - - 541 Initial & Additional Equipment Purchase - 5,252 - - - -
2540 Operations & Maintenance of Plant Services Total 45,679 14,178 - - - - 2541 Carpentry Services
410 Supplies & Materials - 180 - - - - 2541 Carpentry Services Total - 180 - - - - 2542 Care & Upkeep of Buildings Services - Custodial
322 Repairs & Maintenance - 17,621 - - - - 324 Rentals - 17,500 - - - - 325 Electricity - 9,580 - - - - 326 Fuel - 1,527 - - - - 327 Water & Sewage - 2,113 - - - - 328 Garbage Services - 1,673 - - - - 410 Supplies & Materials - 869 - - - -
2542 Care & Upkeep of Buildings Services - Custodial Total - 50,884 - - - - 2543 Care & Upkeep of Building Services
460 Nonconsumable Supplies 4,140 - - - - - 2543 Care & Upkeep of Building Services Total 4,140 - - - - -
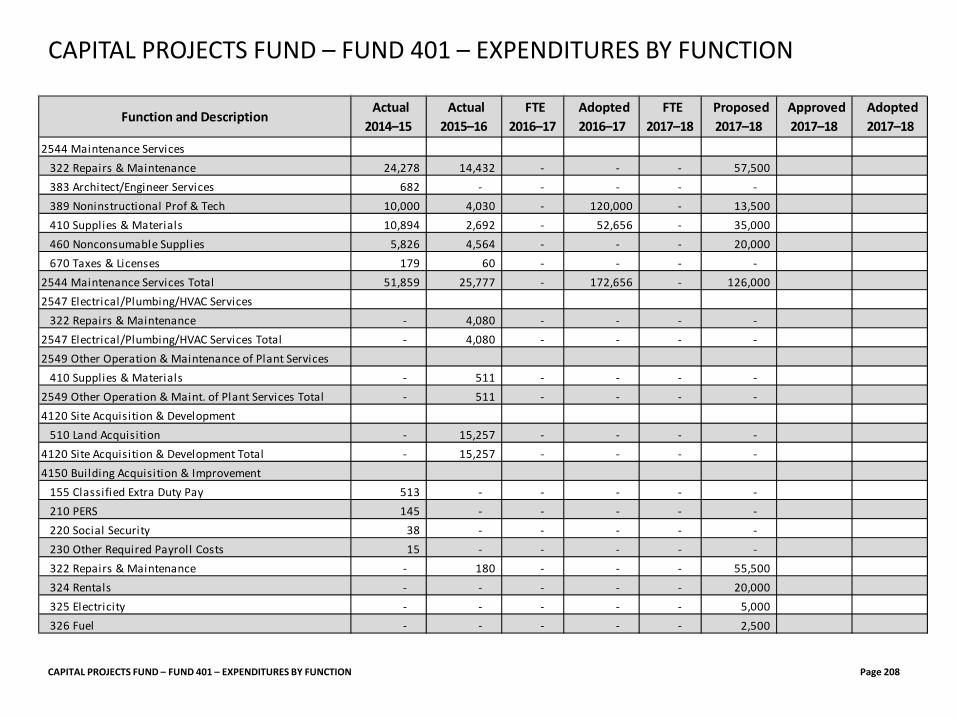
CAPITAL PROJECTS FUND – FUND 401 – EXPENDITURES BY FUNCTION Page 208
CAPITAL PROJECTS FUND – FUND 401 – EXPENDITURES BY FUNCTION
Function and Description Actual 2014–15
Actual 2015–16
FTE 2016–17
Adopted 2016–17
FTE 2017–18
Proposed 2017–18
Approved 2017–18
Adopted 2017–18
2544 Maintenance Services322 Repairs & Maintenance 24,278 14,432 - - - 57,500 383 Architect/Engineer Services 682 - - - - - 389 Noninstructional Prof & Tech 10,000 4,030 - 120,000 - 13,500 410 Supplies & Materials 10,894 2,692 - 52,656 - 35,000 460 Nonconsumable Supplies 5,826 4,564 - - - 20,000 670 Taxes & Licenses 179 60 - - - -
2544 Maintenance Services Total 51,859 25,777 - 172,656 - 126,000 2547 Electrical/Plumbing/HVAC Services
322 Repairs & Maintenance - 4,080 - - - - 2547 Electrical/Plumbing/HVAC Services Total - 4,080 - - - - 2549 Other Operation & Maintenance of Plant Services
410 Supplies & Materials - 511 - - - - 2549 Other Operation & Maint. of Plant Services Total - 511 - - - - 4120 Site Acquisition & Development
510 Land Acquisition - 15,257 - - - - 4120 Site Acquisition & Development Total - 15,257 - - - - 4150 Building Acquisition & Improvement
155 Classified Extra Duty Pay 513 - - - - - 210 PERS 145 - - - - - 220 Social Security 38 - - - - - 230 Other Required Payroll Costs 15 - - - - - 322 Repairs & Maintenance - 180 - - - 55,500 324 Rentals - - - - - 20,000 325 Electricity - - - - - 5,000 326 Fuel - - - - - 2,500
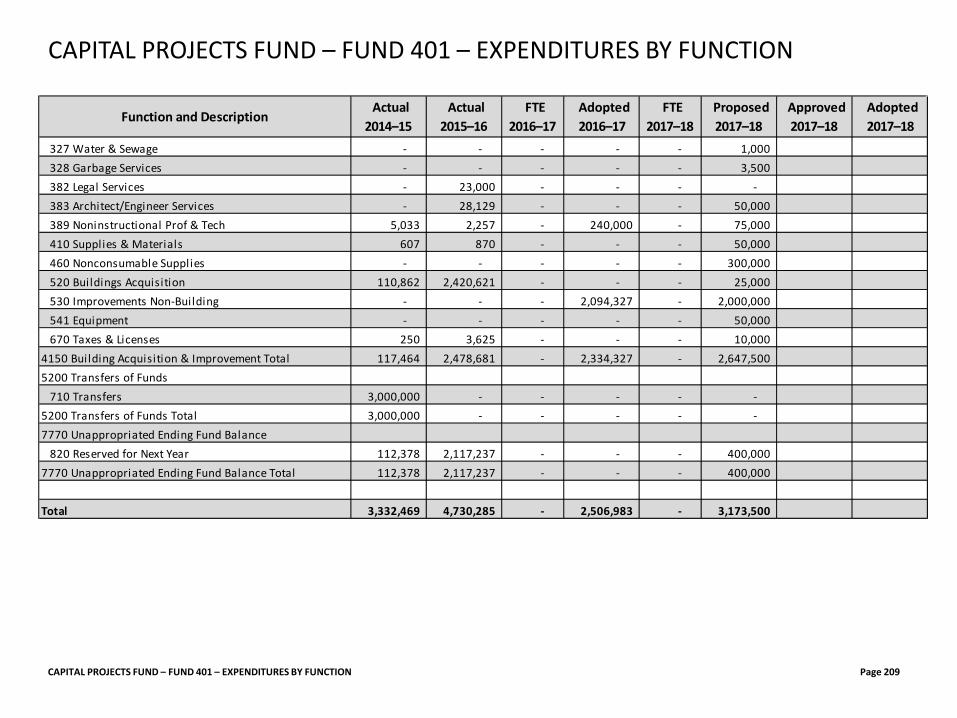
CAPITAL PROJECTS FUND – FUND 401 – EXPENDITURES BY FUNCTION Page 209
CAPITAL PROJECTS FUND – FUND 401 – EXPENDITURES BY FUNCTION
Function and Description Actual 2014–15
Actual 2015–16
FTE 2016–17
Adopted 2016–17
FTE 2017–18
Proposed 2017–18
Approved 2017–18
Adopted 2017–18
327 Water & Sewage - - - - - 1,000 328 Garbage Services - - - - - 3,500 382 Legal Services - 23,000 - - - - 383 Architect/Engineer Services - 28,129 - - - 50,000 389 Noninstructional Prof & Tech 5,033 2,257 - 240,000 - 75,000 410 Supplies & Materials 607 870 - - - 50,000 460 Nonconsumable Supplies - - - - - 300,000 520 Buildings Acquisition 110,862 2,420,621 - - - 25,000 530 Improvements Non-Building - - - 2,094,327 - 2,000,000 541 Equipment - - - - - 50,000 670 Taxes & Licenses 250 3,625 - - - 10,000
4150 Building Acquisition & Improvement Total 117,464 2,478,681 - 2,334,327 - 2,647,500 5200 Transfers of Funds
710 Transfers 3,000,000 - - - - - 5200 Transfers of Funds Total 3,000,000 - - - - - 7770 Unappropriated Ending Fund Balance
820 Reserved for Next Year 112,378 2,117,237 - - - 400,000 7770 Unappropriated Ending Fund Balance Total 112,378 2,117,237 - - - 400,000
Total 3,332,469 4,730,285 - 2,506,983 - 3,173,500
BOND FUND – FUND 415
BOND FUND – FUND 415 Page 210
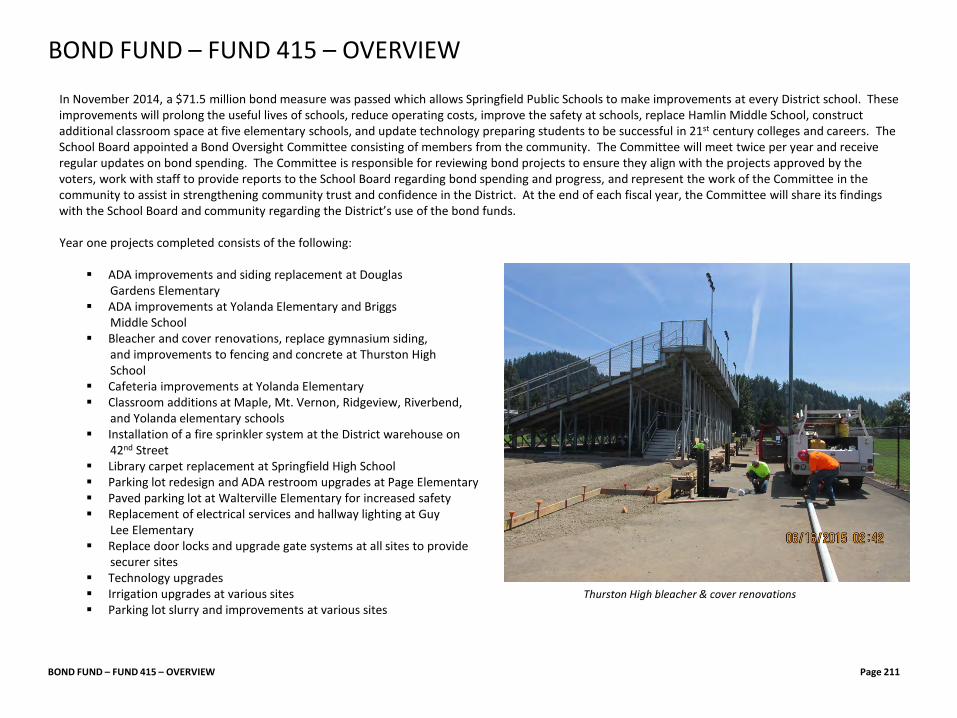
In November 2014, a $71.5 million bond measure was passed which allows Springfield Public Schools to make improvements at every District school. These improvements will prolong the useful lives of schools, reduce operating costs, improve the safety at schools, replace Hamlin Middle School, construct additional classroom space at five elementary schools, and update technology preparing students to be successful in 21st century colleges and careers. The School Board appointed a Bond Oversight Committee consisting of members from the community. The Committee will meet twice per year and receive regular updates on bond spending. The Committee is responsible for reviewing bond projects to ensure they align with the projects approved by the voters, work with staff to provide reports to the School Board regarding bond spending and progress, and represent the work of the Committee in the community to assist in strengthening community trust and confidence in the District. At the end of each fiscal year, the Committee will share its findings with the School Board and community regarding the District’s use of the bond funds. Year one projects completed consists of the following:
ADA improvements and siding replacement at Douglas Gardens Elementary ADA improvements at Yolanda Elementary and Briggs Middle School Bleacher and cover renovations, replace gymnasium siding, and improvements to fencing and concrete at Thurston High School Cafeteria improvements at Yolanda Elementary Classroom additions at Maple, Mt. Vernon, Ridgeview, Riverbend, and Yolanda elementary schools Installation of a fire sprinkler system at the District warehouse on 42nd Street Library carpet replacement at Springfield High School Parking lot redesign and ADA restroom upgrades at Page Elementary Paved parking lot at Walterville Elementary for increased safety Replacement of electrical services and hallway lighting at Guy Lee Elementary Replace door locks and upgrade gate systems at all sites to provide securer sites Technology upgrades Irrigation upgrades at various sites Thurston High bleacher & cover renovations Parking lot slurry and improvements at various sites
BOND FUND – FUND 415 – OVERVIEW Page 211
BOND FUND – FUND 415 – OVERVIEW
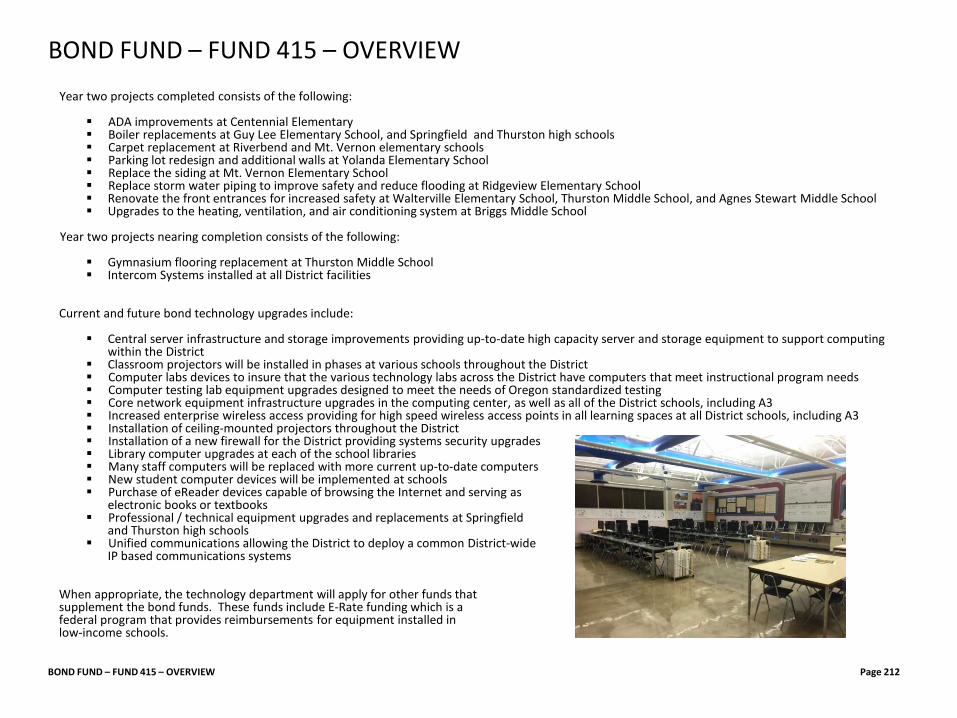
Year two projects completed consists of the following: ADA improvements at Centennial Elementary Boiler replacements at Guy Lee Elementary School, and Springfield and Thurston high schools Carpet replacement at Riverbend and Mt. Vernon elementary schools Parking lot redesign and additional walls at Yolanda Elementary School Replace the siding at Mt. Vernon Elementary School Replace storm water piping to improve safety and reduce flooding at Ridgeview Elementary School Renovate the front entrances for increased safety at Walterville Elementary School, Thurston Middle School, and Agnes Stewart Middle School Upgrades to the heating, ventilation, and air conditioning system at Briggs Middle School
Year two projects nearing completion consists of the following:
Gymnasium flooring replacement at Thurston Middle School Intercom Systems installed at all District facilities
Current and future bond technology upgrades include:
Central server infrastructure and storage improvements providing up-to-date high capacity server and storage equipment to support computing within the District
Classroom projectors will be installed in phases at various schools throughout the District Computer labs devices to insure that the various technology labs across the District have computers that meet instructional program needs Computer testing lab equipment upgrades designed to meet the needs of Oregon standardized testing Core network equipment infrastructure upgrades in the computing center, as well as all of the District schools, including A3 Increased enterprise wireless access providing for high speed wireless access points in all learning spaces at all District schools, including A3 Installation of ceiling-mounted projectors throughout the District Installation of a new firewall for the District providing systems security upgrades Library computer upgrades at each of the school libraries Many staff computers will be replaced with more current up-to-date computers New student computer devices will be implemented at schools Purchase of eReader devices capable of browsing the Internet and serving as electronic books or textbooks Professional / technical equipment upgrades and replacements at Springfield and Thurston high schools Unified communications allowing the District to deploy a common District-wide IP based communications systems
When appropriate, the technology department will apply for other funds that supplement the bond funds. These funds include E-Rate funding which is a federal program that provides reimbursements for equipment installed in low-income schools.
BOND FUND – FUND 415 – OVERVIEW Page 212
BOND FUND – FUND 415 – OVERVIEW
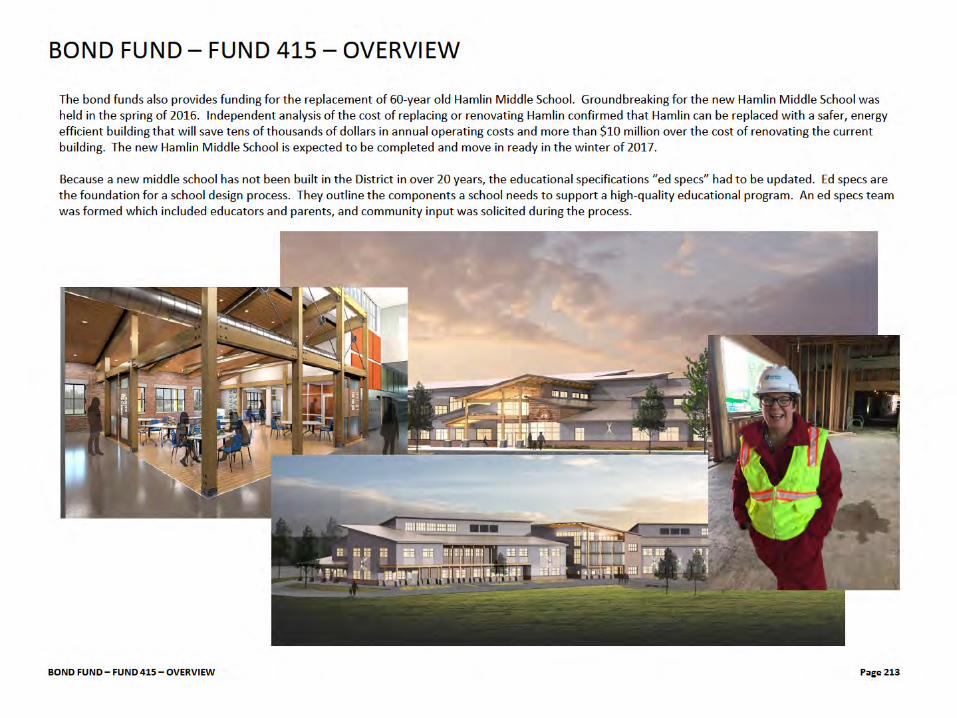
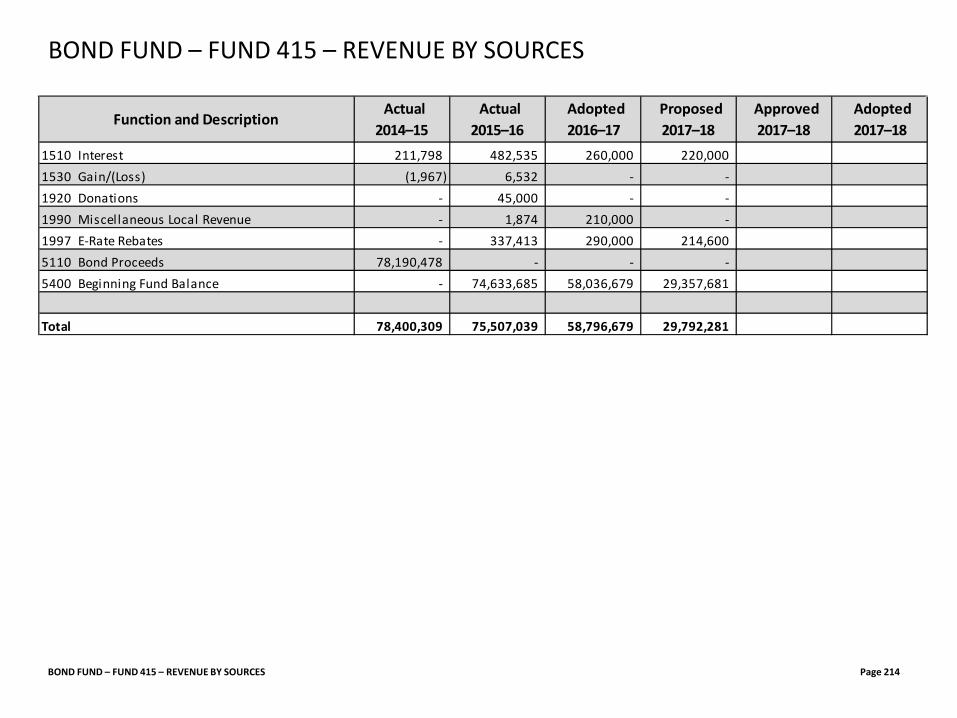
BOND FUND – FUND 415 – REVENUE BY SOURCES Page 214
BOND FUND – FUND 415 – REVENUE BY SOURCES
Function and Description Actual 2014–15
Actual 2015–16
Adopted 2016–17
Proposed 2017–18
Approved 2017–18
Adopted 2017–18
1510 Interest 211,798 482,535 260,000 220,000 1530 Gain/(Loss) (1,967) 6,532 - - 1920 Donations - 45,000 - - 1990 Miscellaneous Local Revenue - 1,874 210,000 - 1997 E-Rate Rebates - 337,413 290,000 214,600 5110 Bond Proceeds 78,190,478 - - - 5400 Beginning Fund Balance - 74,633,685 58,036,679 29,357,681
Total 78,400,309 75,507,039 58,796,679 29,792,281
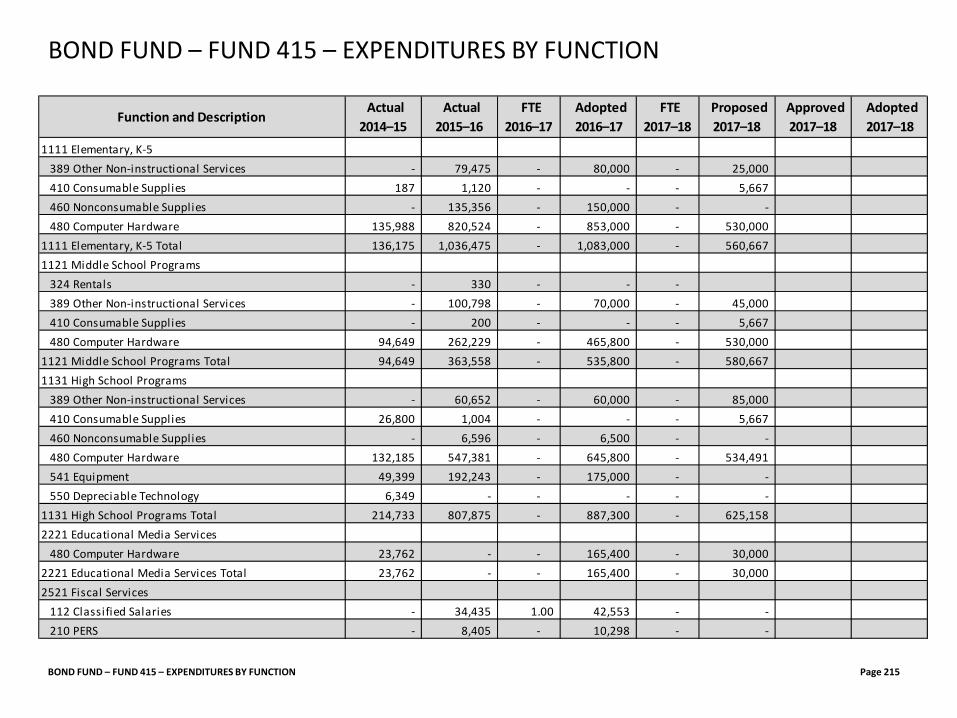
BOND FUND – FUND 415 – EXPENDITURES BY FUNCTION Page 215
BOND FUND – FUND 415 – EXPENDITURES BY FUNCTION
Function and Description Actual 2014–15
Actual 2015–16
FTE 2016–17
Adopted 2016–17
FTE 2017–18
Proposed 2017–18
Approved 2017–18
Adopted 2017–18
1111 Elementary, K-5389 Other Non-instructional Services - 79,475 - 80,000 - 25,000 410 Consumable Supplies 187 1,120 - - - 5,667 460 Nonconsumable Supplies - 135,356 - 150,000 - - 480 Computer Hardware 135,988 820,524 - 853,000 - 530,000
1111 Elementary, K-5 Total 136,175 1,036,475 - 1,083,000 - 560,667 1121 Middle School Programs 324 Rentals - 330 - - -
389 Other Non-instructional Services - 100,798 - 70,000 - 45,000 410 Consumable Supplies - 200 - - - 5,667 480 Computer Hardware 94,649 262,229 - 465,800 - 530,000
1121 Middle School Programs Total 94,649 363,558 - 535,800 - 580,667 1131 High School Programs
389 Other Non-instructional Services - 60,652 - 60,000 - 85,000 410 Consumable Supplies 26,800 1,004 - - - 5,667 460 Nonconsumable Supplies - 6,596 - 6,500 - - 480 Computer Hardware 132,185 547,381 - 645,800 - 534,491 541 Equipment 49,399 192,243 - 175,000 - - 550 Depreciable Technology 6,349 - - - - -
1131 High School Programs Total 214,733 807,875 - 887,300 - 625,158 2221 Educational Media Services
480 Computer Hardware 23,762 - - 165,400 - 30,000 2221 Educational Media Services Total 23,762 - - 165,400 - 30,000 2521 Fiscal Services
112 Classified Salaries - 34,435 1.00 42,553 - - 210 PERS - 8,405 - 10,298 - -
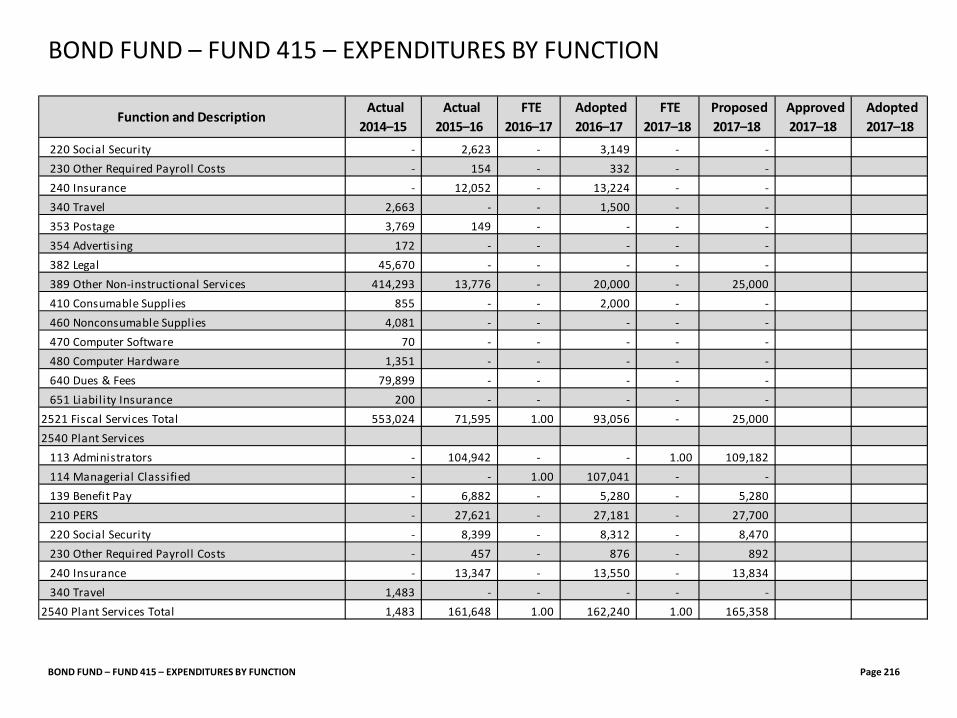
BOND FUND – FUND 415 – EXPENDITURES BY FUNCTION Page 216
BOND FUND – FUND 415 – EXPENDITURES BY FUNCTION
Function and Description Actual 2014–15
Actual 2015–16
FTE 2016–17
Adopted 2016–17
FTE 2017–18
Proposed 2017–18
Approved 2017–18
Adopted 2017–18
220 Social Security - 2,623 - 3,149 - - 230 Other Required Payroll Costs - 154 - 332 - - 240 Insurance - 12,052 - 13,224 - - 340 Travel 2,663 - - 1,500 - - 353 Postage 3,769 149 - - - - 354 Advertising 172 - - - - - 382 Legal 45,670 - - - - - 389 Other Non-instructional Services 414,293 13,776 - 20,000 - 25,000 410 Consumable Supplies 855 - - 2,000 - - 460 Nonconsumable Supplies 4,081 - - - - - 470 Computer Software 70 - - - - - 480 Computer Hardware 1,351 - - - - - 640 Dues & Fees 79,899 - - - - - 651 Liabil ity Insurance 200 - - - - -
2521 Fiscal Services Total 553,024 71,595 1.00 93,056 - 25,000 2540 Plant Services 113 Administrators - 104,942 - - 1.00 109,182 114 Managerial Classified - - 1.00 107,041 - - 139 Benefit Pay - 6,882 - 5,280 - 5,280 210 PERS - 27,621 - 27,181 - 27,700 220 Social Security - 8,399 - 8,312 - 8,470 230 Other Required Payroll Costs - 457 - 876 - 892 240 Insurance - 13,347 - 13,550 - 13,834
340 Travel 1,483 - - - - - 2540 Plant Services Total 1,483 161,648 1.00 162,240 1.00 165,358
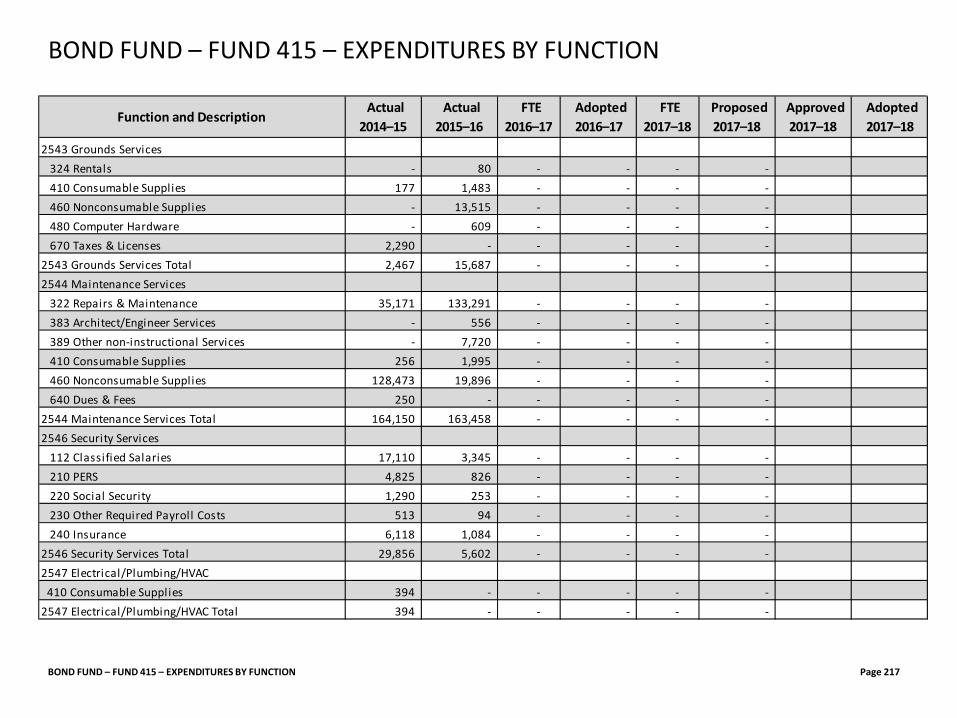
BOND FUND – FUND 415 – EXPENDITURES BY FUNCTION Page 217
BOND FUND – FUND 415 – EXPENDITURES BY FUNCTION
Function and Description Actual 2014–15
Actual 2015–16
FTE 2016–17
Adopted 2016–17
FTE 2017–18
Proposed 2017–18
Approved 2017–18
Adopted 2017–18
2543 Grounds Services 324 Rentals - 80 - - - - 410 Consumable Supplies 177 1,483 - - - -
460 Nonconsumable Supplies - 13,515 - - - - 480 Computer Hardware - 609 - - - - 670 Taxes & Licenses 2,290 - - - - -
2543 Grounds Services Total 2,467 15,687 - - - - 2544 Maintenance Services
322 Repairs & Maintenance 35,171 133,291 - - - - 383 Architect/Engineer Services - 556 - - - - 389 Other non-instructional Services - 7,720 - - - -
410 Consumable Supplies 256 1,995 - - - - 460 Nonconsumable Supplies 128,473 19,896 - - - - 640 Dues & Fees 250 - - - - -
2544 Maintenance Services Total 164,150 163,458 - - - - 2546 Security Services
112 Classified Salaries 17,110 3,345 - - - - 210 PERS 4,825 826 - - - - 220 Social Security 1,290 253 - - - - 230 Other Required Payroll Costs 513 94 - - - - 240 Insurance 6,118 1,084 - - - -
2546 Security Services Total 29,856 5,602 - - - - 2547 Electrical/Plumbing/HVAC 410 Consumable Supplies 394 - - - - - 2547 Electrical/Plumbing/HVAC Total 394 - - - - -
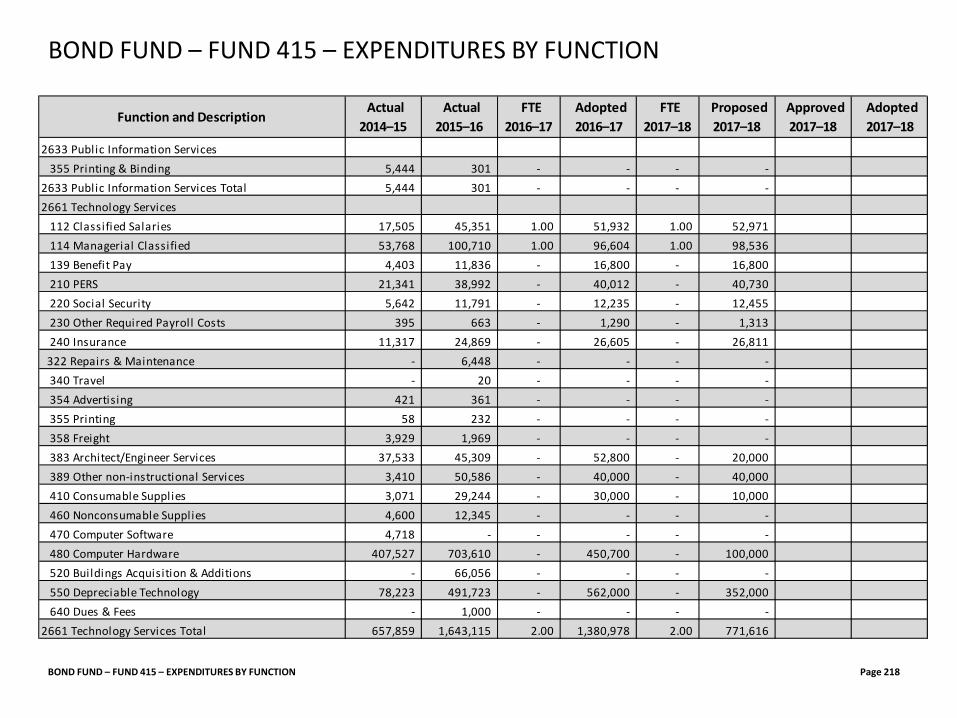
BOND FUND – FUND 415 – EXPENDITURES BY FUNCTION Page 218
BOND FUND – FUND 415 – EXPENDITURES BY FUNCTION
Function and Description Actual 2014–15
Actual 2015–16
FTE 2016–17
Adopted 2016–17
FTE 2017–18
Proposed 2017–18
Approved 2017–18
Adopted 2017–18
2633 Public Information Services355 Printing & Binding 5,444 301 - - - -
2633 Public Information Services Total 5,444 301 - - - - 2661 Technology Services
112 Classified Salaries 17,505 45,351 1.00 51,932 1.00 52,971 114 Managerial Classified 53,768 100,710 1.00 96,604 1.00 98,536 139 Benefit Pay 4,403 11,836 - 16,800 - 16,800 210 PERS 21,341 38,992 - 40,012 - 40,730 220 Social Security 5,642 11,791 - 12,235 - 12,455 230 Other Required Payroll Costs 395 663 - 1,290 - 1,313 240 Insurance 11,317 24,869 - 26,605 - 26,811
322 Repairs & Maintenance - 6,448 - - - - 340 Travel - 20 - - - - 354 Advertising 421 361 - - - - 355 Printing 58 232 - - - - 358 Freight 3,929 1,969 - - - - 383 Architect/Engineer Services 37,533 45,309 - 52,800 - 20,000 389 Other non-instructional Services 3,410 50,586 - 40,000 - 40,000 410 Consumable Supplies 3,071 29,244 - 30,000 - 10,000 460 Nonconsumable Supplies 4,600 12,345 - - - - 470 Computer Software 4,718 - - - - - 480 Computer Hardware 407,527 703,610 - 450,700 - 100,000 520 Buildings Acquisition & Additions - 66,056 - - - - 550 Depreciable Technology 78,223 491,723 - 562,000 - 352,000 640 Dues & Fees - 1,000 - - - -
2661 Technology Services Total 657,859 1,643,115 2.00 1,380,978 2.00 771,616
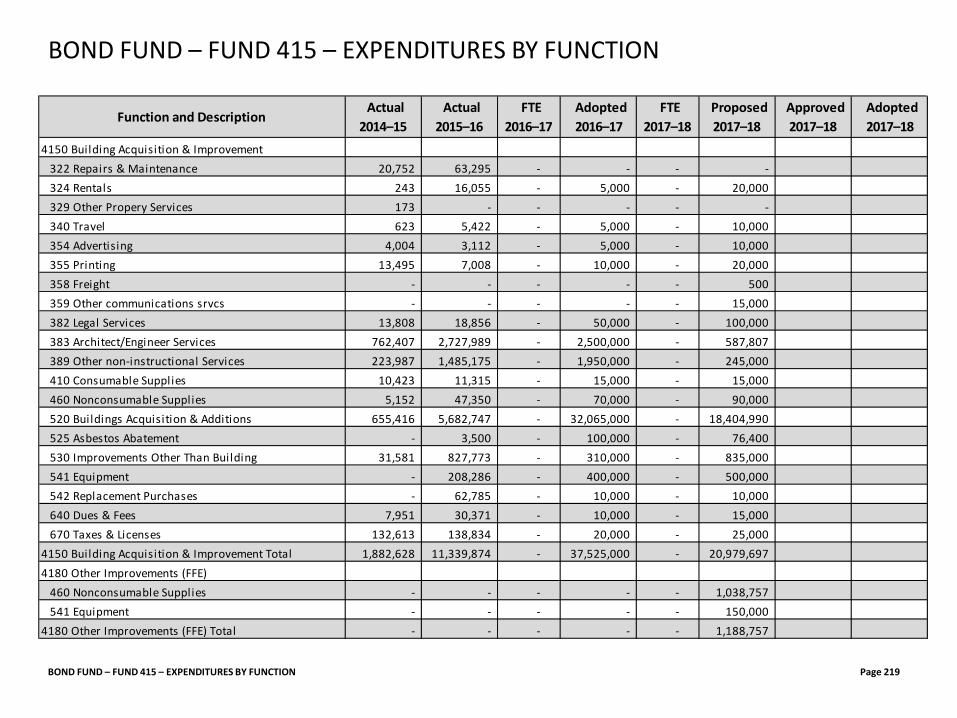
BOND FUND – FUND 415 – EXPENDITURES BY FUNCTION Page 219
BOND FUND – FUND 415 – EXPENDITURES BY FUNCTION
Function and Description Actual 2014–15
Actual 2015–16
FTE 2016–17
Adopted 2016–17
FTE 2017–18
Proposed 2017–18
Approved 2017–18
Adopted 2017–18
4150 Building Acquisition & Improvement 322 Repairs & Maintenance 20,752 63,295 - - - - 324 Rentals 243 16,055 - 5,000 - 20,000 329 Other Propery Services 173 - - - - -
340 Travel 623 5,422 - 5,000 - 10,000 354 Advertising 4,004 3,112 - 5,000 - 10,000 355 Printing 13,495 7,008 - 10,000 - 20,000 358 Freight - - - - - 500 359 Other communications srvcs - - - - - 15,000 382 Legal Services 13,808 18,856 - 50,000 - 100,000 383 Architect/Engineer Services 762,407 2,727,989 - 2,500,000 - 587,807 389 Other non-instructional Services 223,987 1,485,175 - 1,950,000 - 245,000 410 Consumable Supplies 10,423 11,315 - 15,000 - 15,000 460 Nonconsumable Supplies 5,152 47,350 - 70,000 - 90,000 520 Buildings Acquisition & Additions 655,416 5,682,747 - 32,065,000 - 18,404,990 525 Asbestos Abatement - 3,500 - 100,000 - 76,400 530 Improvements Other Than Building 31,581 827,773 - 310,000 - 835,000 541 Equipment - 208,286 - 400,000 - 500,000 542 Replacement Purchases - 62,785 - 10,000 - 10,000 640 Dues & Fees 7,951 30,371 - 10,000 - 15,000 670 Taxes & Licenses 132,613 138,834 - 20,000 - 25,000
4150 Building Acquisition & Improvement Total 1,882,628 11,339,874 - 37,525,000 - 20,979,697 4180 Other Improvements (FFE)
460 Nonconsumable Supplies - - - - - 1,038,757 541 Equipment - - - - - 150,000
4180 Other Improvements (FFE) Total - - - - - 1,188,757
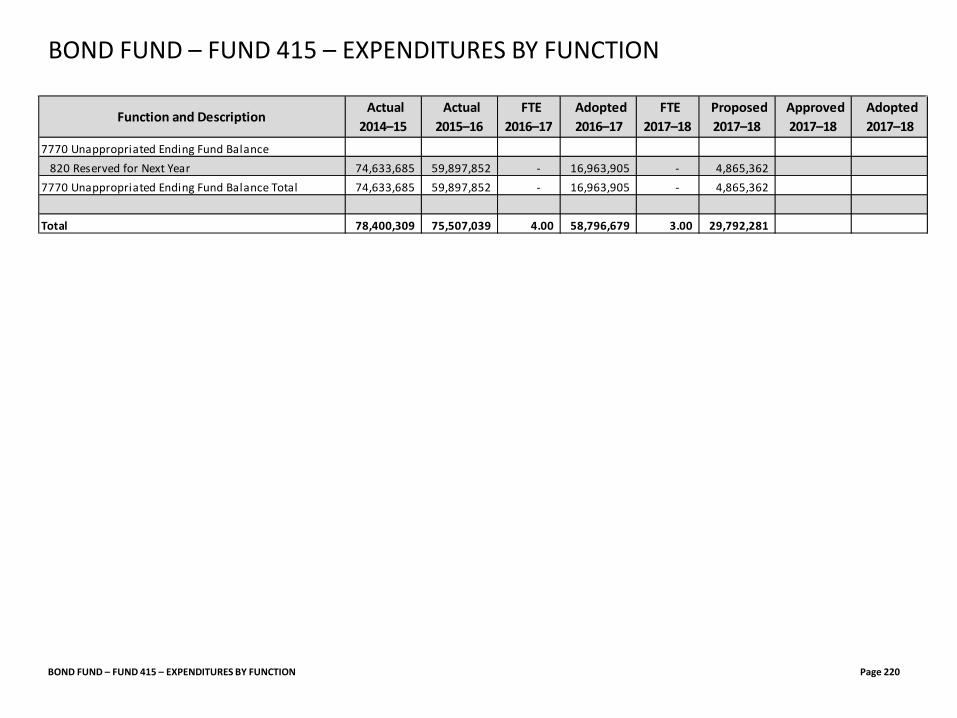
BOND FUND – FUND 415 – EXPENDITURES BY FUNCTION Page 220
BOND FUND – FUND 415 – EXPENDITURES BY FUNCTION
Function and Description Actual 2014–15
Actual 2015–16
FTE 2016–17
Adopted 2016–17
FTE 2017–18
Proposed 2017–18
Approved 2017–18
Adopted 2017–18
7770 Unappropriated Ending Fund Balance820 Reserved for Next Year 74,633,685 59,897,852 - 16,963,905 - 4,865,362
7770 Unappropriated Ending Fund Balance Total 74,633,685 59,897,852 - 16,963,905 - 4,865,362
Total 78,400,309 75,507,039 4.00 58,796,679 3.00 29,792,281
INSURANCE FUND
INSURANCE FUND Page 221
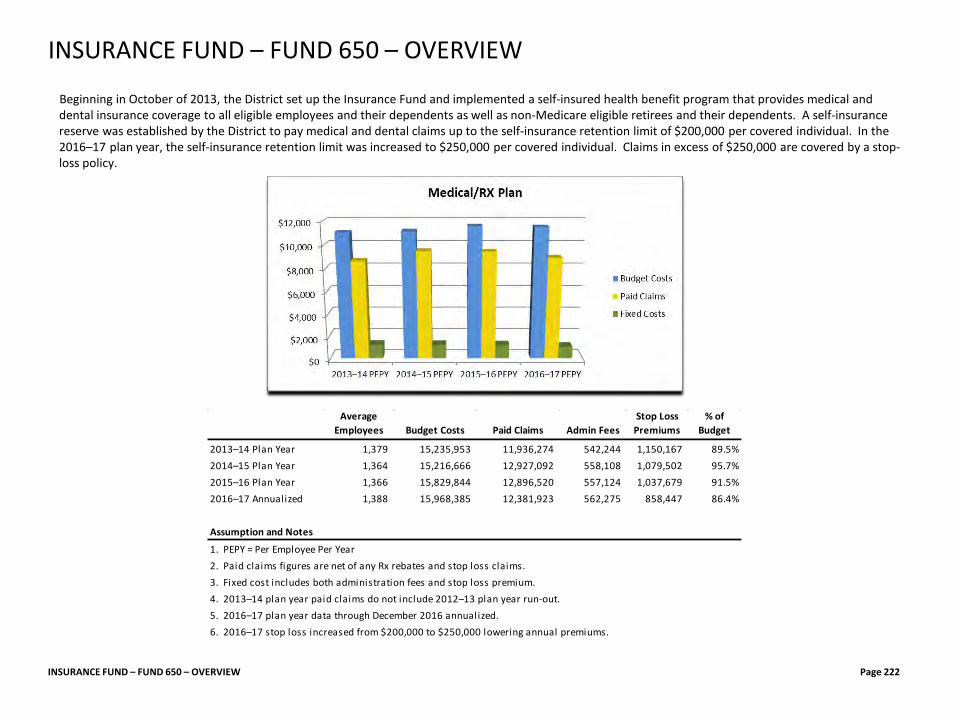
Beginning in October of 2013, the District set up the Insurance Fund and implemented a self-insured health benefit program that provides medical and dental insurance coverage to all eligible employees and their dependents as well as non-Medicare eligible retirees and their dependents. A self-insurance reserve was established by the District to pay medical and dental claims up to the self-insurance retention limit of $200,000 per covered individual. In the 2016–17 plan year, the self-insurance retention limit was increased to $250,000 per covered individual. Claims in excess of $250,000 are covered by a stop-loss policy.
INSURANCE FUND – FUND 650 – OVERVIEW Page 222
INSURANCE FUND – FUND 650 – OVERVIEW
Average Employees Budget Costs Paid Claims Admin Fees
Stop Loss Premiums
% of Budget
2013–14 Plan Year 1,379 15,235,953 11,936,274 542,244 1,150,167 89.5%2014–15 Plan Year 1,364 15,216,666 12,927,092 558,108 1,079,502 95.7%2015–16 Plan Year 1,366 15,829,844 12,896,520 557,124 1,037,679 91.5%2016–17 Annualized 1,388 15,968,385 12,381,923 562,275 858,447 86.4%
Assumption and Notes
1. PEPY = Per Employee Per Year2. Paid claims figures are net of any Rx rebates and stop loss claims.3. Fixed cost includes both administration fees and stop loss premium.4. 2013–14 plan year paid claims do not include 2012–13 plan year run-out.5. 2016–17 plan year data through December 2016 annualized.6. 2016–17 stop loss increased from $200,000 to $250,000 lowering annual premiums.
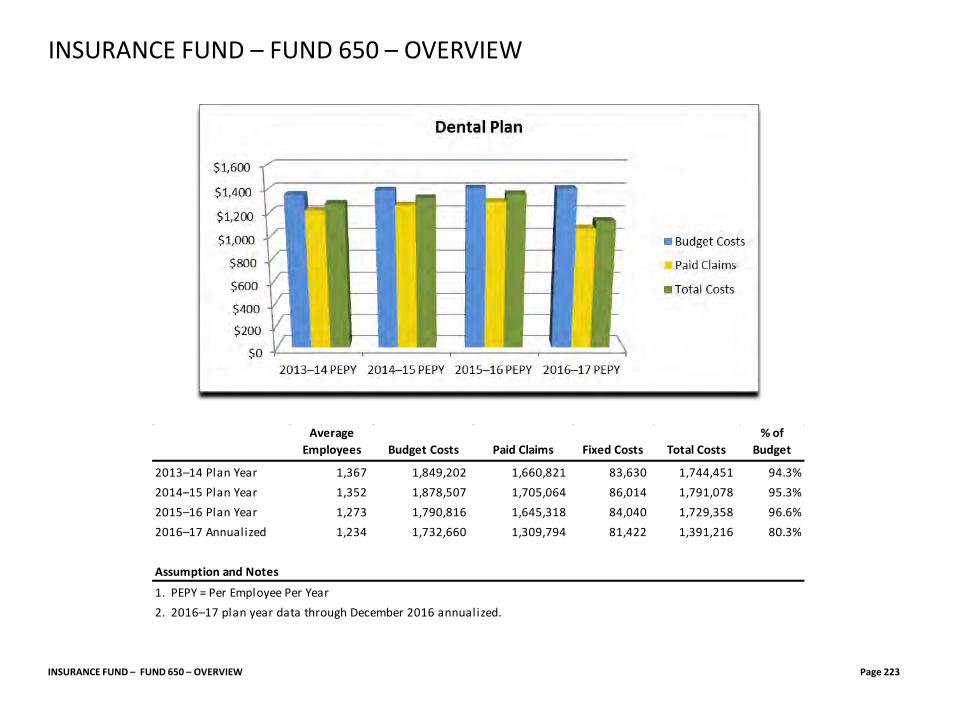
INSURANCE FUND – FUND 650 – OVERVIEW Page 223
INSURANCE FUND – FUND 650 – OVERVIEW
Average Employees Budget Costs Paid Claims Fixed Costs Total Costs
% of Budget
2013–14 Plan Year 1,367 1,849,202 1,660,821 83,630 1,744,451 94.3%2014–15 Plan Year 1,352 1,878,507 1,705,064 86,014 1,791,078 95.3%2015–16 Plan Year 1,273 1,790,816 1,645,318 84,040 1,729,358 96.6%2016–17 Annualized 1,234 1,732,660 1,309,794 81,422 1,391,216 80.3%
Assumption and Notes
1. PEPY = Per Employee Per Year2. 2016–17 plan year data through December 2016 annualized.
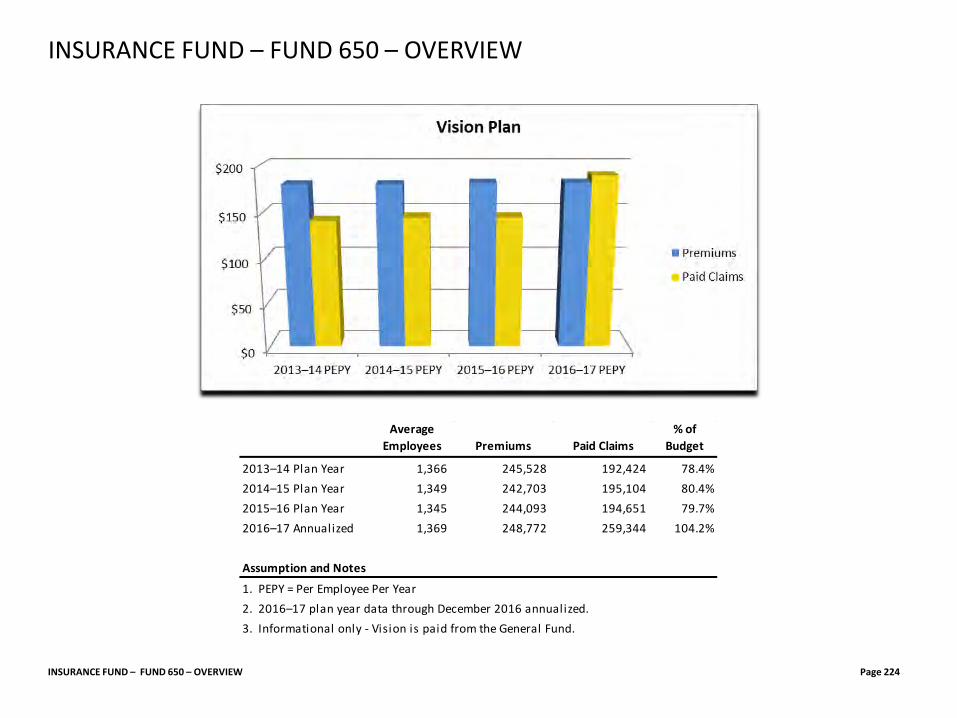
INSURANCE FUND – FUND 650 – OVERVIEW Page 224
INSURANCE FUND – FUND 650 – OVERVIEW
Average Employees Premiums Paid Claims
% of Budget
2013–14 Plan Year 1,366 245,528 192,424 78.4%2014–15 Plan Year 1,349 242,703 195,104 80.4%2015–16 Plan Year 1,345 244,093 194,651 79.7%2016–17 Annualized 1,369 248,772 259,344 104.2%
Assumption and Notes
1. PEPY = Per Employee Per Year2. 2016–17 plan year data through December 2016 annualized.3. Informational only - Vision is paid from the General Fund.
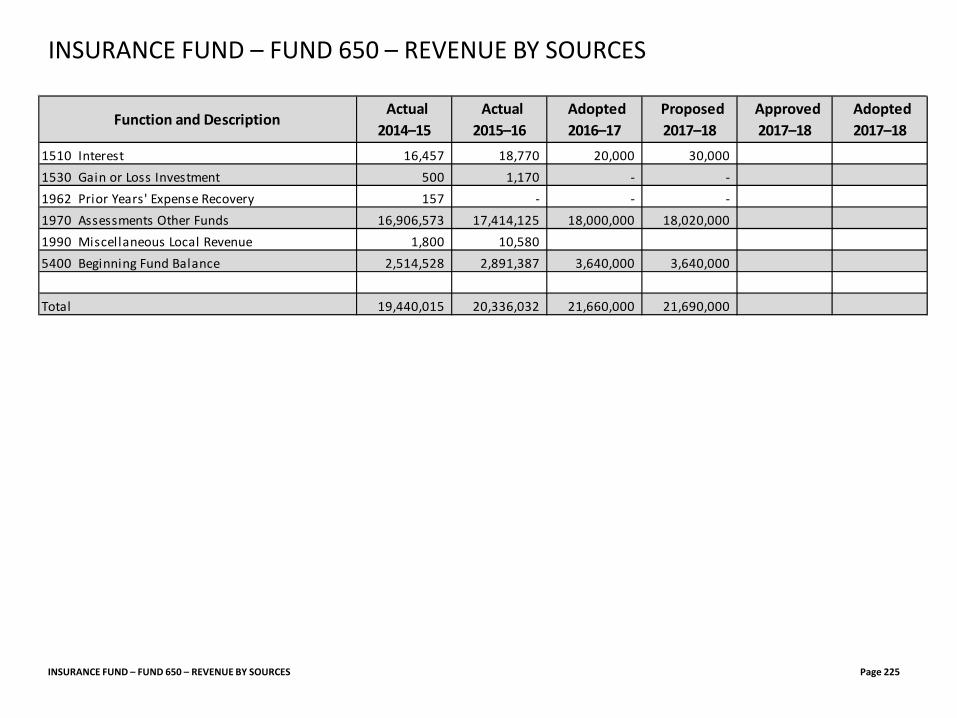
INSURANCE FUND – FUND 650 – REVENUE BY SOURCES Page 225
INSURANCE FUND – FUND 650 – REVENUE BY SOURCES
Function and Description Actual 2014–15
Actual 2015–16
Adopted 2016–17
Proposed 2017–18
Approved 2017–18
Adopted 2017–18
1510 Interest 16,457 18,770 20,000 30,000 1530 Gain or Loss Investment 500 1,170 - - 1962 Prior Years' Expense Recovery 157 - - - 1970 Assessments Other Funds 16,906,573 17,414,125 18,000,000 18,020,000 1990 Miscellaneous Local Revenue 1,800 10,580 5400 Beginning Fund Balance 2,514,528 2,891,387 3,640,000 3,640,000
Total 19,440,015 20,336,032 21,660,000 21,690,000
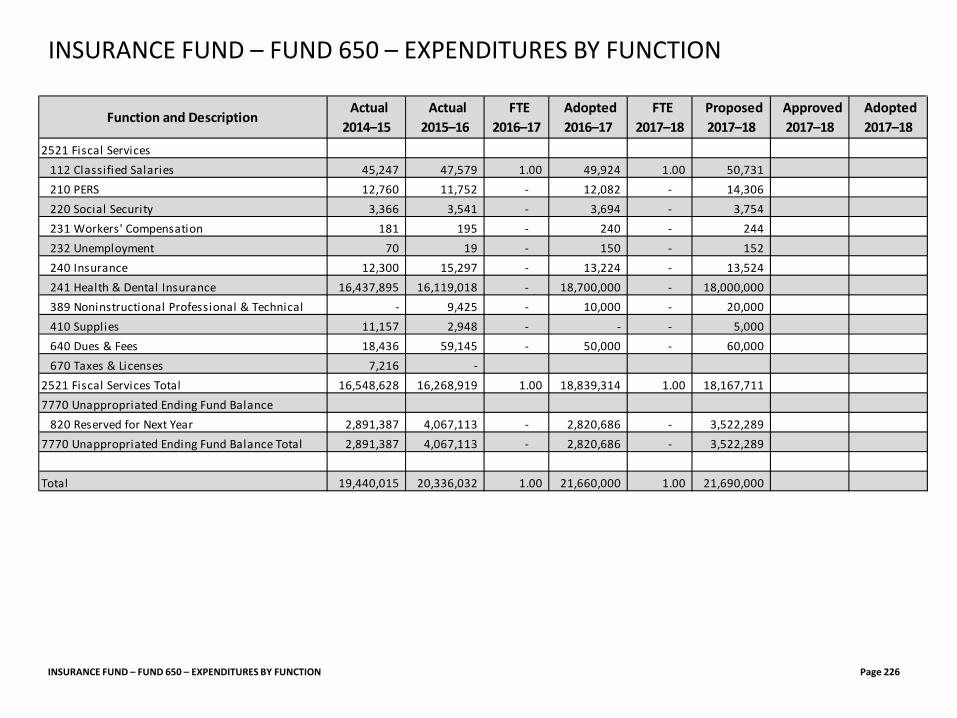
INSURANCE FUND – FUND 650 – EXPENDITURES BY FUNCTION Page 226
INSURANCE FUND – FUND 650 – EXPENDITURES BY FUNCTION
Function and Description Actual 2014–15
Actual 2015–16
FTE 2016–17
Adopted 2016–17
FTE 2017–18
Proposed 2017–18
Approved 2017–18
Adopted 2017–18
2521 Fiscal Services112 Classified Salaries 45,247 47,579 1.00 49,924 1.00 50,731 210 PERS 12,760 11,752 - 12,082 - 14,306 220 Social Security 3,366 3,541 - 3,694 - 3,754 231 Workers' Compensation 181 195 - 240 - 244 232 Unemployment 70 19 - 150 - 152 240 Insurance 12,300 15,297 - 13,224 - 13,524 241 Health & Dental Insurance 16,437,895 16,119,018 - 18,700,000 - 18,000,000 389 Noninstructional Professional & Technical - 9,425 - 10,000 - 20,000 410 Supplies 11,157 2,948 - - - 5,000 640 Dues & Fees 18,436 59,145 - 50,000 - 60,000 670 Taxes & Licenses 7,216 -
2521 Fiscal Services Total 16,548,628 16,268,919 1.00 18,839,314 1.00 18,167,711 7770 Unappropriated Ending Fund Balance
820 Reserved for Next Year 2,891,387 4,067,113 - 2,820,686 - 3,522,289 7770 Unappropriated Ending Fund Balance Total 2,891,387 4,067,113 - 2,820,686 - 3,522,289
Total 19,440,015 20,336,032 1.00 21,660,000 1.00 21,690,000

INTERNAL PRINTING SERVICES
INTERNAL PRINTING SERVICES Page 227
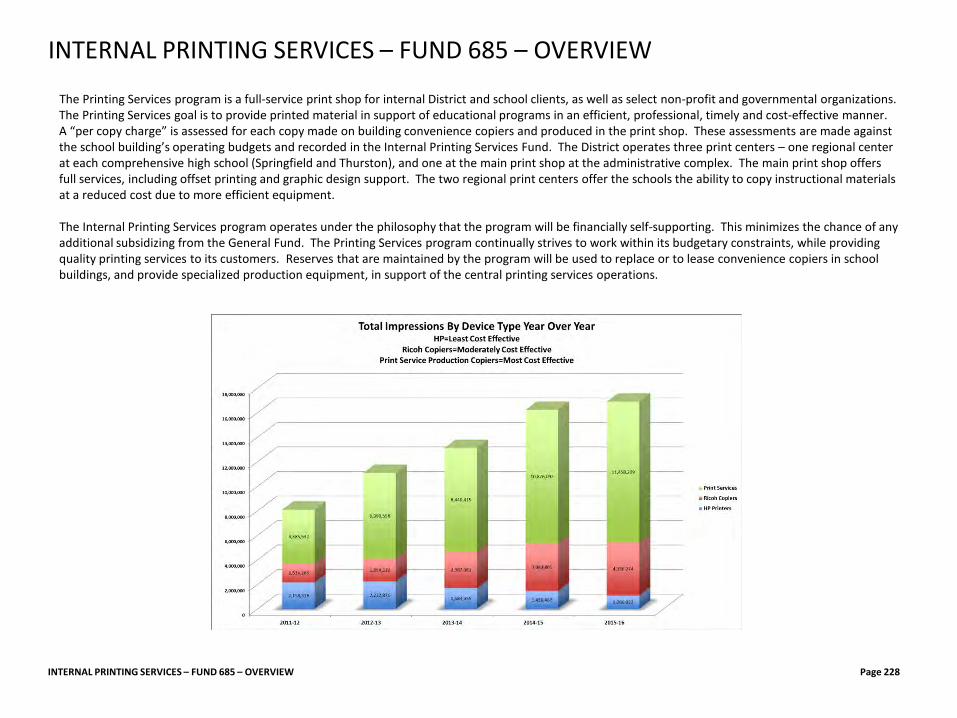
The Printing Services program is a full-service print shop for internal District and school clients, as well as select non-profit and governmental organizations. The Printing Services goal is to provide printed material in support of educational programs in an efficient, professional, timely and cost-effective manner. A “per copy charge” is assessed for each copy made on building convenience copiers and produced in the print shop. These assessments are made against the school building’s operating budgets and recorded in the Internal Printing Services Fund. The District operates three print centers – one regional center at each comprehensive high school (Springfield and Thurston), and one at the main print shop at the administrative complex. The main print shop offers full services, including offset printing and graphic design support. The two regional print centers offer the schools the ability to copy instructional materials at a reduced cost due to more efficient equipment. The Internal Printing Services program operates under the philosophy that the program will be financially self-supporting. This minimizes the chance of any additional subsidizing from the General Fund. The Printing Services program continually strives to work within its budgetary constraints, while providing quality printing services to its customers. Reserves that are maintained by the program will be used to replace or to lease convenience copiers in school buildings, and provide specialized production equipment, in support of the central printing services operations.
INTERNAL PRINTING SERVICES – FUND 685 – OVERVIEW Page 228
INTERNAL PRINTING SERVICES – FUND 685 – OVERVIEW
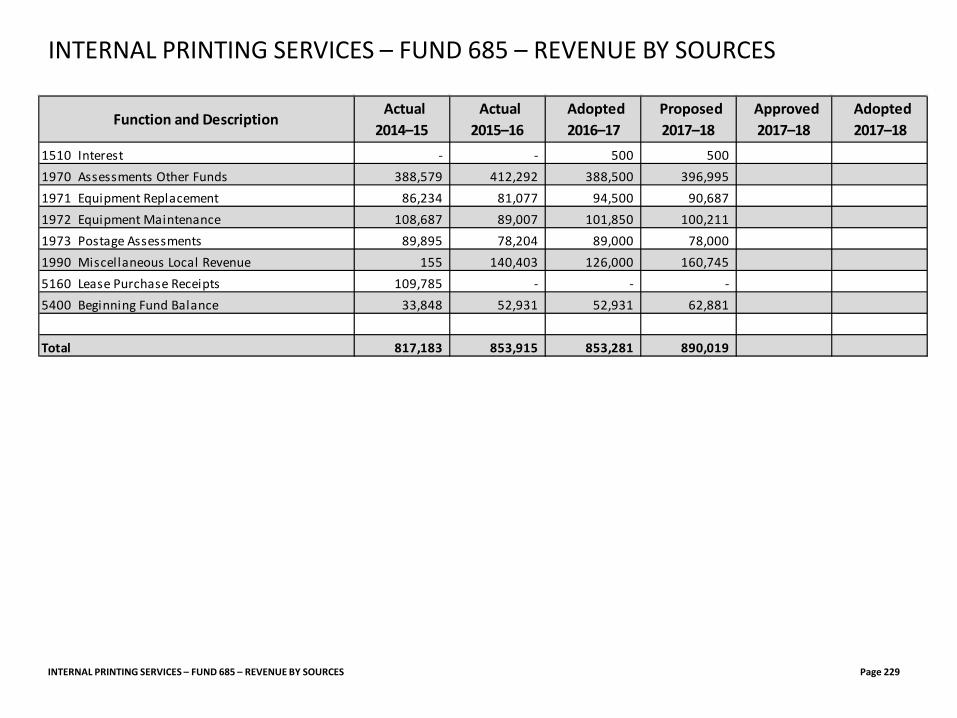
INTERNAL PRINTING SERVICES – FUND 685 – REVENUE BY SOURCES Page 229
INTERNAL PRINTING SERVICES – FUND 685 – REVENUE BY SOURCES
Function and Description Actual 2014–15
Actual 2015–16
Adopted 2016–17
Proposed 2017–18
Approved 2017–18
Adopted 2017–18
1510 Interest - - 500 500 1970 Assessments Other Funds 388,579 412,292 388,500 396,995 1971 Equipment Replacement 86,234 81,077 94,500 90,687 1972 Equipment Maintenance 108,687 89,007 101,850 100,211 1973 Postage Assessments 89,895 78,204 89,000 78,000 1990 Miscellaneous Local Revenue 155 140,403 126,000 160,745 5160 Lease Purchase Receipts 109,785 - - - 5400 Beginning Fund Balance 33,848 52,931 52,931 62,881
Total 817,183 853,915 853,281 890,019
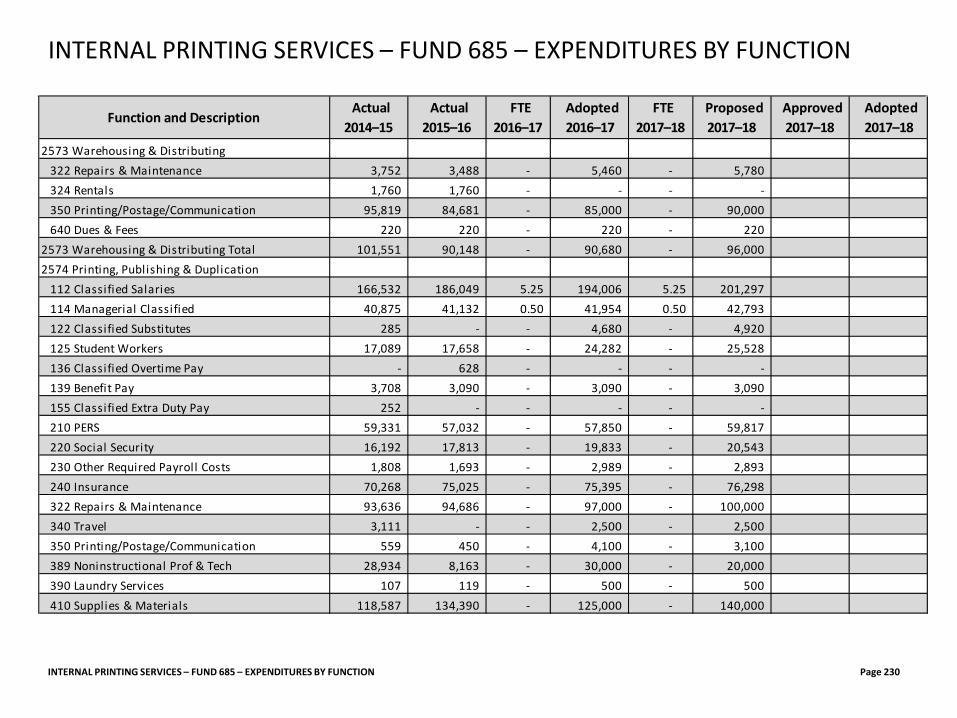
INTERNAL PRINTING SERVICES – FUND 685 – EXPENDITURES BY FUNCTION Page 230
INTERNAL PRINTING SERVICES – FUND 685 – EXPENDITURES BY FUNCTION
Function and Description Actual 2014–15
Actual 2015–16
FTE 2016–17
Adopted 2016–17
FTE 2017–18
Proposed 2017–18
Approved 2017–18
Adopted 2017–18
2573 Warehousing & Distributing322 Repairs & Maintenance 3,752 3,488 - 5,460 - 5,780 324 Rentals 1,760 1,760 - - - - 350 Printing/Postage/Communication 95,819 84,681 - 85,000 - 90,000 640 Dues & Fees 220 220 - 220 - 220
2573 Warehousing & Distributing Total 101,551 90,148 - 90,680 - 96,000 2574 Printing, Publishing & Duplication
112 Classified Salaries 166,532 186,049 5.25 194,006 5.25 201,297 114 Managerial Classified 40,875 41,132 0.50 41,954 0.50 42,793 122 Classified Substitutes 285 - - 4,680 - 4,920 125 Student Workers 17,089 17,658 - 24,282 - 25,528 136 Classified Overtime Pay - 628 - - - - 139 Benefit Pay 3,708 3,090 - 3,090 - 3,090 155 Classified Extra Duty Pay 252 - - - - - 210 PERS 59,331 57,032 - 57,850 - 59,817 220 Social Security 16,192 17,813 - 19,833 - 20,543 230 Other Required Payroll Costs 1,808 1,693 - 2,989 - 2,893 240 Insurance 70,268 75,025 - 75,395 - 76,298 322 Repairs & Maintenance 93,636 94,686 - 97,000 - 100,000 340 Travel 3,111 - - 2,500 - 2,500 350 Printing/Postage/Communication 559 450 - 4,100 - 3,100 389 Noninstructional Prof & Tech 28,934 8,163 - 30,000 - 20,000 390 Laundry Services 107 119 - 500 - 500 410 Supplies & Materials 118,587 134,390 - 125,000 - 140,000
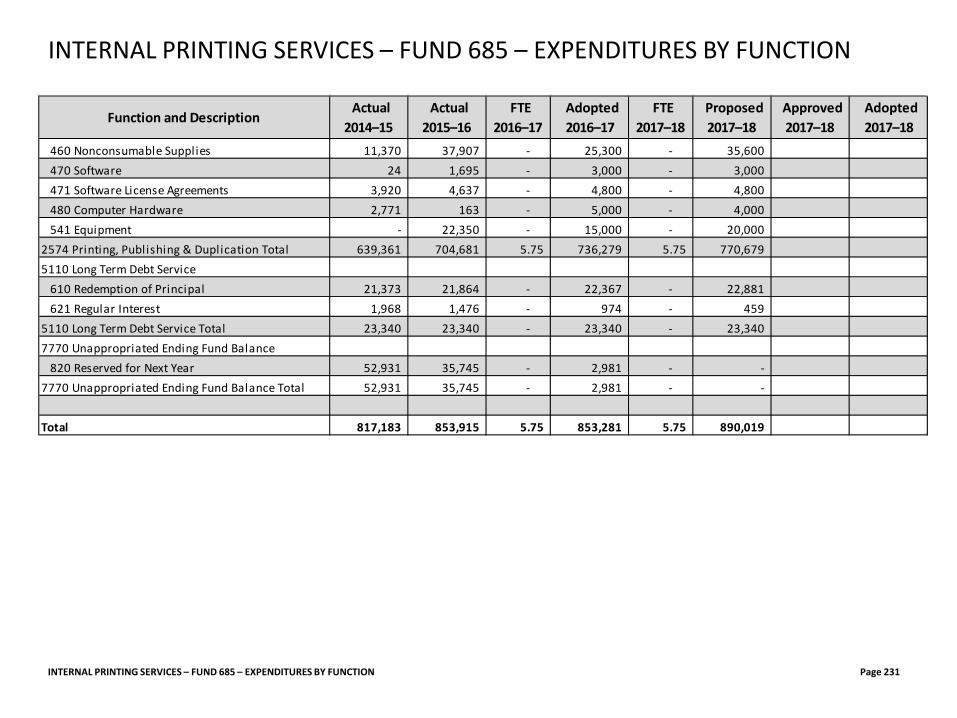
INTERNAL PRINTING SERVICES – FUND 685 – EXPENDITURES BY FUNCTION Page 231
INTERNAL PRINTING SERVICES – FUND 685 – EXPENDITURES BY FUNCTION
Function and Description Actual 2014–15
Actual 2015–16
FTE 2016–17
Adopted 2016–17
FTE 2017–18
Proposed 2017–18
Approved 2017–18
Adopted 2017–18
460 Nonconsumable Supplies 11,370 37,907 - 25,300 - 35,600 470 Software 24 1,695 - 3,000 - 3,000 471 Software License Agreements 3,920 4,637 - 4,800 - 4,800 480 Computer Hardware 2,771 163 - 5,000 - 4,000 541 Equipment - 22,350 - 15,000 - 20,000
2574 Printing, Publishing & Duplication Total 639,361 704,681 5.75 736,279 5.75 770,679 5110 Long Term Debt Service
610 Redemption of Principal 21,373 21,864 - 22,367 - 22,881 621 Regular Interest 1,968 1,476 - 974 - 459
5110 Long Term Debt Service Total 23,340 23,340 - 23,340 - 23,340 7770 Unappropriated Ending Fund Balance
820 Reserved for Next Year 52,931 35,745 - 2,981 - - 7770 Unappropriated Ending Fund Balance Total 52,931 35,745 - 2,981 - -
Total 817,183 853,915 5.75 853,281 5.75 890,019

VOLUNTARY EARLY RETIREMENT
VOLUNTARY EARLY RETIREMENT Page 232
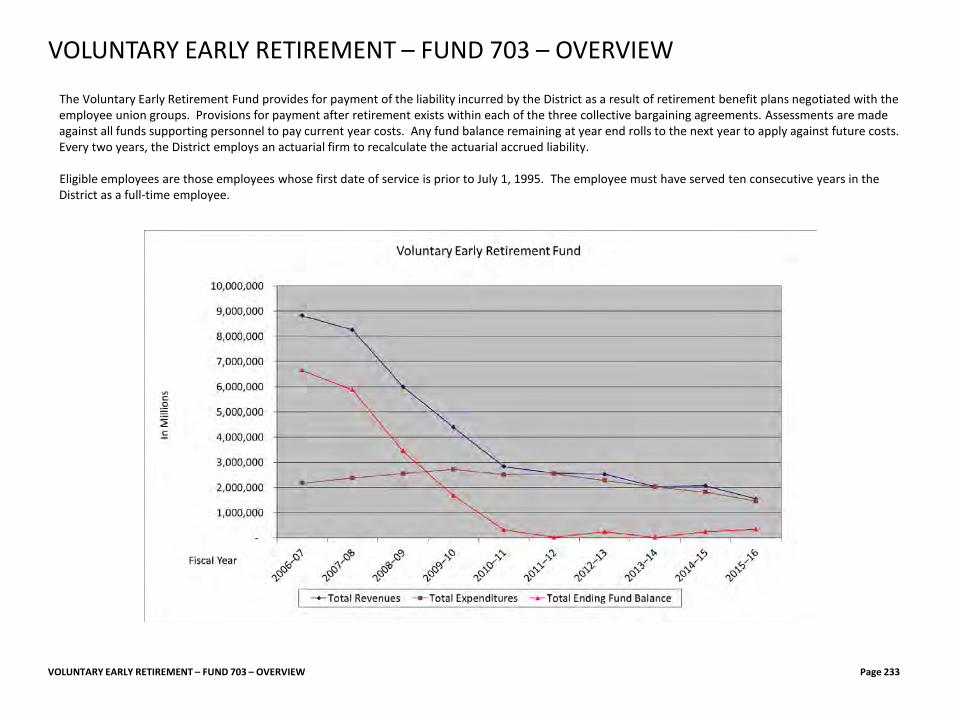
The Voluntary Early Retirement Fund provides for payment of the liability incurred by the District as a result of retirement benefit plans negotiated with the employee union groups. Provisions for payment after retirement exists within each of the three collective bargaining agreements. Assessments are made against all funds supporting personnel to pay current year costs. Any fund balance remaining at year end rolls to the next year to apply against future costs. Every two years, the District employs an actuarial firm to recalculate the actuarial accrued liability. Eligible employees are those employees whose first date of service is prior to July 1, 1995. The employee must have served ten consecutive years in the District as a full-time employee.
VOLUNTARY EARLY RETIREMENT – FUND 703 – OVERVIEW Page 233
VOLUNTARY EARLY RETIREMENT – FUND 703 – OVERVIEW
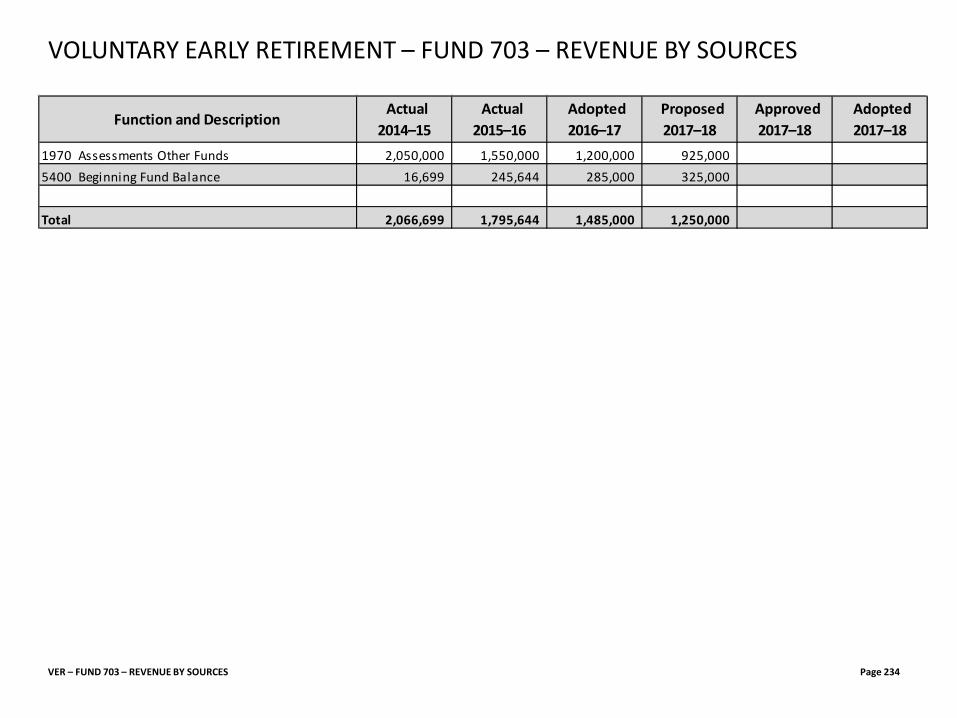
VOLUNTARY EARLY RETIREMENT – FUND 703 – REVENUE BY SOURCES
VER – FUND 703 – REVENUE BY SOURCES Page 234
Function and Description Actual 2014–15
Actual 2015–16
Adopted 2016–17
Proposed 2017–18
Approved 2017–18
Adopted 2017–18
1970 Assessments Other Funds 2,050,000 1,550,000 1,200,000 925,000 5400 Beginning Fund Balance 16,699 245,644 285,000 325,000
Total 2,066,699 1,795,644 1,485,000 1,250,000
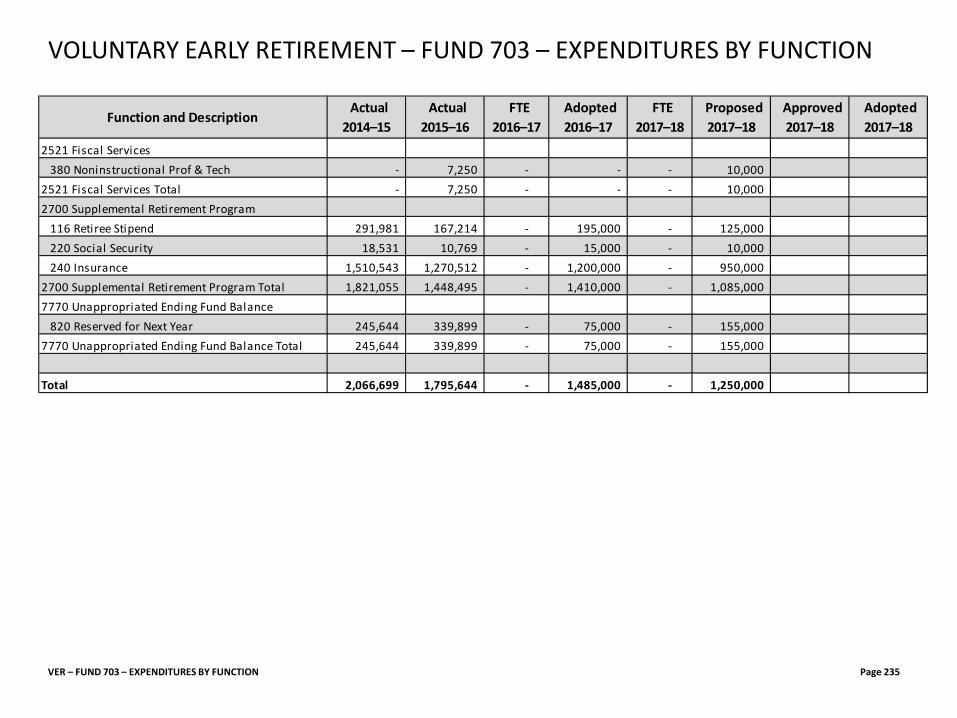
VOLUNTARY EARLY RETIREMENT – FUND 703 – EXPENDITURES BY FUNCTION
VER – FUND 703 – EXPENDITURES BY FUNCTION Page 235
Function and Description Actual 2014–15
Actual 2015–16
FTE 2016–17
Adopted 2016–17
FTE 2017–18
Proposed 2017–18
Approved 2017–18
Adopted 2017–18
2521 Fiscal Services380 Noninstructional Prof & Tech - 7,250 - - - 10,000
2521 Fiscal Services Total - 7,250 - - - 10,000 2700 Supplemental Retirement Program
116 Retiree Stipend 291,981 167,214 - 195,000 - 125,000 220 Social Security 18,531 10,769 - 15,000 - 10,000 240 Insurance 1,510,543 1,270,512 - 1,200,000 - 950,000
2700 Supplemental Retirement Program Total 1,821,055 1,448,495 - 1,410,000 - 1,085,000 7770 Unappropriated Ending Fund Balance
820 Reserved for Next Year 245,644 339,899 - 75,000 - 155,000 7770 Unappropriated Ending Fund Balance Total 245,644 339,899 - 75,000 - 155,000
Total 2,066,699 1,795,644 - 1,485,000 - 1,250,000
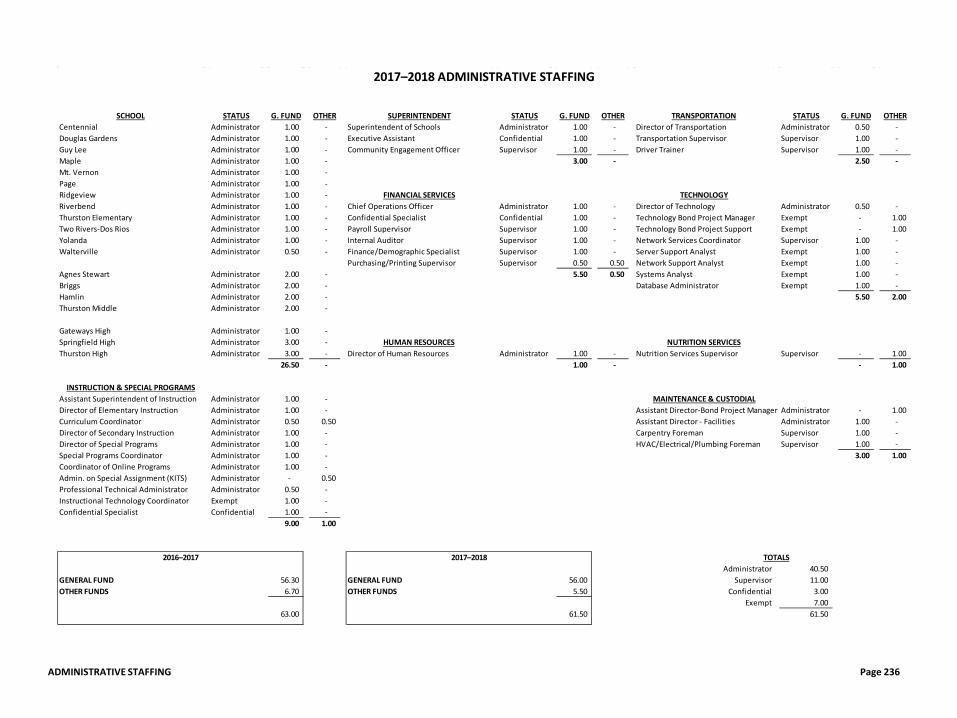
ADMINISTRATIVE STAFFING Page 236
SCHOOL STATUS G. FUND OTHER SUPERINTENDENT STATUS G. FUND OTHER TRANSPORTATION STATUS G. FUND OTHERCentennial Administrator 1.00 - Superintendent of Schools Administrator 1.00 - Director of Transportation Administrator 0.50 - Douglas Gardens Administrator 1.00 - Executive Assistant Confidential 1.00 - Transportation Supervisor Supervisor 1.00 - Guy Lee Administrator 1.00 - Community Engagement Officer Supervisor 1.00 - Driver Trainer Supervisor 1.00 - Maple Administrator 1.00 - 3.00 - 2.50 - Mt. Vernon Administrator 1.00 - Page Administrator 1.00 - Ridgeview Administrator 1.00 - FINANCIAL SERVICES TECHNOLOGYRiverbend Administrator 1.00 - Chief Operations Officer Administrator 1.00 - Director of Technology Administrator 0.50 - Thurston Elementary Administrator 1.00 - Confidential Specialist Confidential 1.00 - Technology Bond Project Manager Exempt - 1.00 Two Rivers-Dos Rios Administrator 1.00 - Payroll Supervisor Supervisor 1.00 - Technology Bond Project Support Exempt - 1.00 Yolanda Administrator 1.00 - Internal Auditor Supervisor 1.00 - Network Services Coordinator Supervisor 1.00 - Walterville Administrator 0.50 - Finance/Demographic Specialist Supervisor 1.00 - Server Support Analyst Exempt 1.00 -
Purchasing/Printing Supervisor Supervisor 0.50 0.50 Network Support Analyst Exempt 1.00 - Agnes Stewart Administrator 2.00 - 5.50 0.50 Systems Analyst Exempt 1.00 - Briggs Administrator 2.00 - Database Administrator Exempt 1.00 - Hamlin Administrator 2.00 - 5.50 2.00 Thurston Middle Administrator 2.00 -
Gateways High Administrator 1.00 - Springfield High Administrator 3.00 - HUMAN RESOURCES NUTRITION SERVICESThurston High Administrator 3.00 - Director of Human Resources Administrator 1.00 - Nutrition Services Supervisor Supervisor - 1.00
26.50 - 1.00 - - 1.00
INSTRUCTION & SPECIAL PROGRAMSAssistant Superintendent of Instruction Administrator 1.00 - MAINTENANCE & CUSTODIALDirector of Elementary Instruction Administrator 1.00 - Assistant Director-Bond Project Manager Administrator - 1.00 Curriculum Coordinator Administrator 0.50 0.50 Assistant Director - Facilities Administrator 1.00 - Director of Secondary Instruction Administrator 1.00 - Carpentry Foreman Supervisor 1.00 - Director of Special Programs Administrator 1.00 - HVAC/Electrical/Plumbing Foreman Supervisor 1.00 - Special Programs Coordinator Administrator 1.00 - 3.00 1.00 Coordinator of Online Programs Administrator 1.00 - Admin. on Special Assignment (KITS) Administrator - 0.50 Professional Technical Administrator Administrator 0.50 - Instructional Technology Coordinator Exempt 1.00 - Confidential Specialist Confidential 1.00 -
9.00 1.00
TOTALSAdministrator 40.50
GENERAL FUND 56.30 GENERAL FUND 56.00 Supervisor 11.00 OTHER FUNDS 6.70 OTHER FUNDS 5.50 Confidential 3.00
Exempt 7.00 63.00 61.50 61.50
2017–2018 ADMINISTRATIVE STAFFING
2016–2017 2017–2018
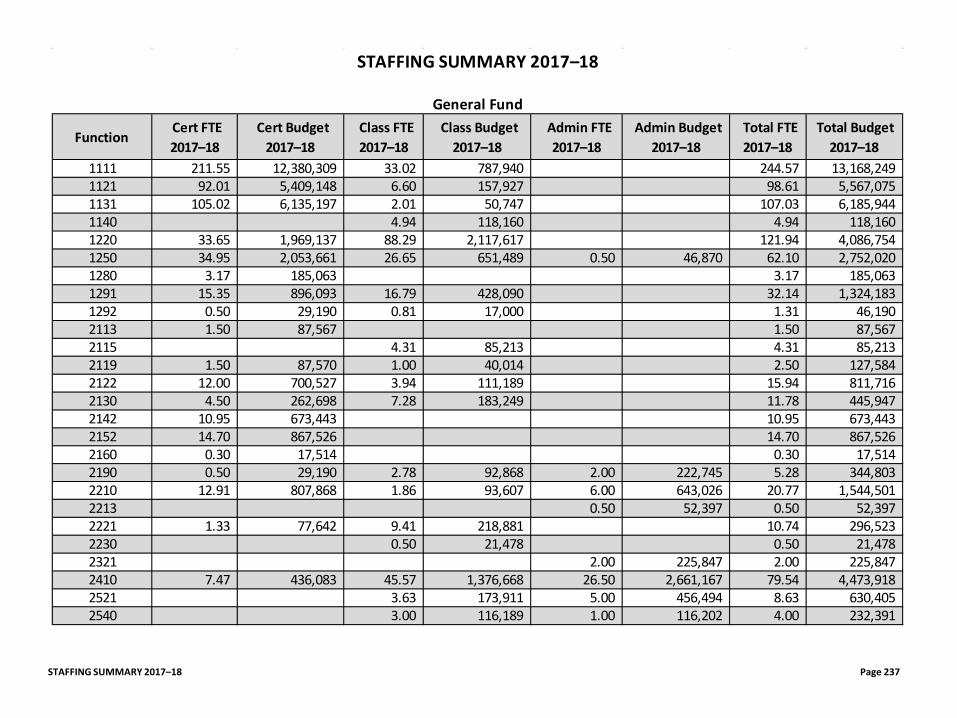
STAFFING SUMMARY 2017–18 Page 237
STAFFING SUMMARY 2017–18
General Fund
Function Cert FTE 2017–18
Cert Budget 2017–18
Class FTE 2017–18
Class Budget 2017–18
Admin FTE 2017–18
Admin Budget 2017–18
Total FTE 2017–18
Total Budget 2017–18
1111 211.55 12,380,309 33.02 787,940 244.57 13,168,249 1121 92.01 5,409,148 6.60 157,927 98.61 5,567,075 1131 105.02 6,135,197 2.01 50,747 107.03 6,185,944 1140 4.94 118,160 4.94 118,160 1220 33.65 1,969,137 88.29 2,117,617 121.94 4,086,754 1250 34.95 2,053,661 26.65 651,489 0.50 46,870 62.10 2,752,020 1280 3.17 185,063 3.17 185,063 1291 15.35 896,093 16.79 428,090 32.14 1,324,183 1292 0.50 29,190 0.81 17,000 1.31 46,190 2113 1.50 87,567 1.50 87,567 2115 4.31 85,213 4.31 85,213 2119 1.50 87,570 1.00 40,014 2.50 127,584 2122 12.00 700,527 3.94 111,189 15.94 811,716 2130 4.50 262,698 7.28 183,249 11.78 445,947 2142 10.95 673,443 10.95 673,443 2152 14.70 867,526 14.70 867,526 2160 0.30 17,514 0.30 17,514 2190 0.50 29,190 2.78 92,868 2.00 222,745 5.28 344,803 2210 12.91 807,868 1.86 93,607 6.00 643,026 20.77 1,544,501 2213 0.50 52,397 0.50 52,397 2221 1.33 77,642 9.41 218,881 10.74 296,523 2230 0.50 21,478 0.50 21,478 2321 2.00 225,847 2.00 225,847 2410 7.47 436,083 45.57 1,376,668 26.50 2,661,167 79.54 4,473,918 2521 3.63 173,911 5.00 456,494 8.63 630,405 2540 3.00 116,189 1.00 116,202 4.00 232,391
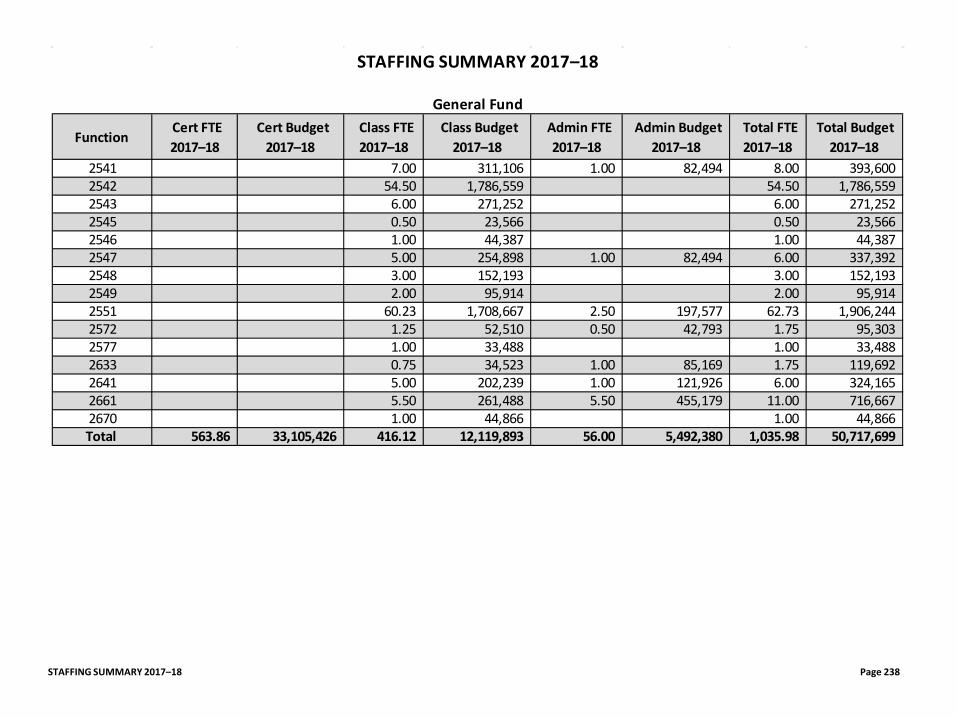
STAFFING SUMMARY 2017–18 Page 238
STAFFING SUMMARY 2017–18
General Fund
Function Cert FTE 2017–18
Cert Budget 2017–18
Class FTE 2017–18
Class Budget 2017–18
Admin FTE 2017–18
Admin Budget 2017–18
Total FTE 2017–18
Total Budget 2017–18
2541 7.00 311,106 1.00 82,494 8.00 393,600 2542 54.50 1,786,559 54.50 1,786,559 2543 6.00 271,252 6.00 271,252 2545 0.50 23,566 0.50 23,566 2546 1.00 44,387 1.00 44,387 2547 5.00 254,898 1.00 82,494 6.00 337,392 2548 3.00 152,193 3.00 152,193 2549 2.00 95,914 2.00 95,914 2551 60.23 1,708,667 2.50 197,577 62.73 1,906,244 2572 1.25 52,510 0.50 42,793 1.75 95,303 2577 1.00 33,488 1.00 33,488 2633 0.75 34,523 1.00 85,169 1.75 119,692 2641 5.00 202,239 1.00 121,926 6.00 324,165 2661 5.50 261,488 5.50 455,179 11.00 716,667 2670 1.00 44,866 1.00 44,866 Total 563.86 33,105,426 416.12 12,119,893 56.00 5,492,380 1,035.98 50,717,699
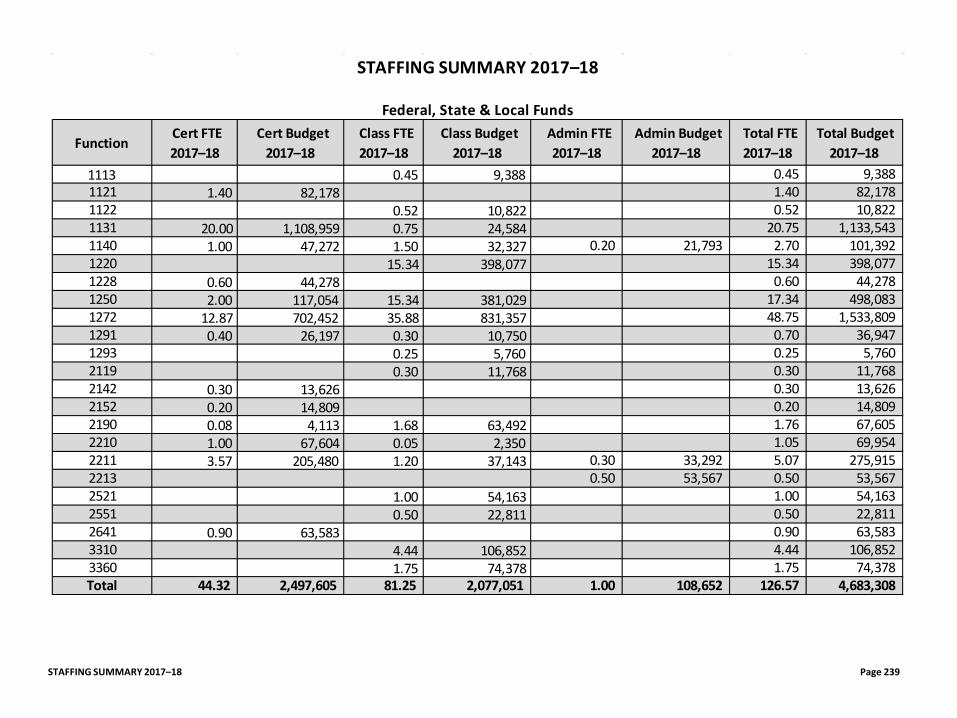
STAFFING SUMMARY 2017–18 Page 239
STAFFING SUMMARY 2017–18
Federal, State & Local Funds
Function Cert FTE 2017–18
Cert Budget 2017–18
Class FTE 2017–18
Class Budget 2017–18
Admin FTE 2017–18
Admin Budget 2017–18
Total FTE 2017–18
Total Budget 2017–18
1113 0.45 9,388 0.45 9,388 1121 1.40 82,178 1.40 82,178 1122 0.52 10,822 0.52 10,822 1131 20.00 1,108,959 0.75 24,584 20.75 1,133,543 1140 1.00 47,272 1.50 32,327 0.20 21,793 2.70 101,392 1220 15.34 398,077 15.34 398,077 1228 0.60 44,278 0.60 44,278 1250 2.00 117,054 15.34 381,029 17.34 498,083 1272 12.87 702,452 35.88 831,357 48.75 1,533,809 1291 0.40 26,197 0.30 10,750 0.70 36,947 1293 0.25 5,760 0.25 5,760 2119 0.30 11,768 0.30 11,768 2142 0.30 13,626 0.30 13,626 2152 0.20 14,809 0.20 14,809 2190 0.08 4,113 1.68 63,492 1.76 67,605 2210 1.00 67,604 0.05 2,350 1.05 69,954 2211 3.57 205,480 1.20 37,143 0.30 33,292 5.07 275,915 2213 0.50 53,567 0.50 53,567 2521 1.00 54,163 1.00 54,163 2551 0.50 22,811 0.50 22,811 2641 0.90 63,583 0.90 63,583 3310 4.44 106,852 4.44 106,852 3360 1.75 74,378 1.75 74,378 Total 44.32 2,497,605 81.25 2,077,051 1.00 108,652 126.57 4,683,308
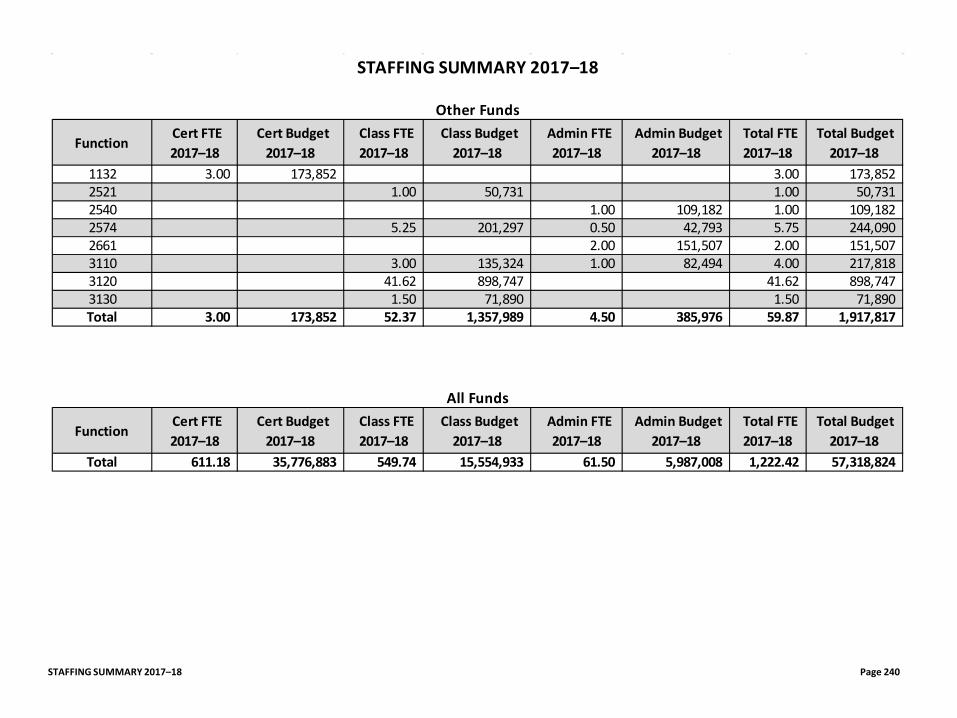
STAFFING SUMMARY 2017–18 Page 240
STAFFING SUMMARY 2017–18
Other Funds
Function Cert FTE 2017–18
Cert Budget 2017–18
Class FTE 2017–18
Class Budget 2017–18
Admin FTE 2017–18
Admin Budget 2017–18
Total FTE 2017–18
Total Budget 2017–18
1132 3.00 173,852 3.00 173,852 2521 1.00 50,731 1.00 50,731 2540 1.00 109,182 1.00 109,182 2574 5.25 201,297 0.50 42,793 5.75 244,090 2661 2.00 151,507 2.00 151,507 3110 3.00 135,324 1.00 82,494 4.00 217,818 3120 41.62 898,747 41.62 898,747 3130 1.50 71,890 1.50 71,890 Total 3.00 173,852 52.37 1,357,989 4.50 385,976 59.87 1,917,817
All Funds
Function Cert FTE 2017–18
Cert Budget 2017–18
Class FTE 2017–18
Class Budget 2017–18
Admin FTE 2017–18
Admin Budget 2017–18
Total FTE 2017–18
Total Budget 2017–18
Total 611.18 35,776,883 549.74 15,554,933 61.50 5,987,008 1,222.42 57,318,824
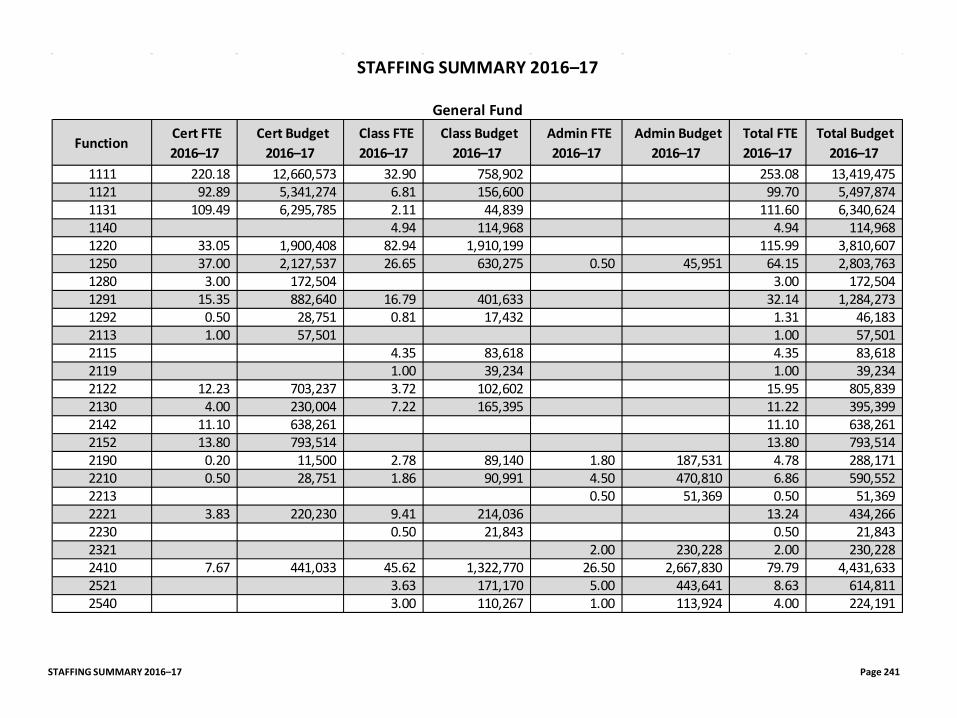
STAFFING SUMMARY 2016–17 Page 241
STAFFING SUMMARY 2016–17
General Fund
Function Cert FTE 2016–17
Cert Budget 2016–17
Class FTE 2016–17
Class Budget 2016–17
Admin FTE 2016–17
Admin Budget 2016–17
Total FTE 2016–17
Total Budget 2016–17
1111 220.18 12,660,573 32.90 758,902 253.08 13,419,475 1121 92.89 5,341,274 6.81 156,600 99.70 5,497,874 1131 109.49 6,295,785 2.11 44,839 111.60 6,340,624 1140 4.94 114,968 4.94 114,968 1220 33.05 1,900,408 82.94 1,910,199 115.99 3,810,607 1250 37.00 2,127,537 26.65 630,275 0.50 45,951 64.15 2,803,763 1280 3.00 172,504 3.00 172,504 1291 15.35 882,640 16.79 401,633 32.14 1,284,273 1292 0.50 28,751 0.81 17,432 1.31 46,183 2113 1.00 57,501 1.00 57,501 2115 4.35 83,618 4.35 83,618 2119 1.00 39,234 1.00 39,234 2122 12.23 703,237 3.72 102,602 15.95 805,839 2130 4.00 230,004 7.22 165,395 11.22 395,399 2142 11.10 638,261 11.10 638,261 2152 13.80 793,514 13.80 793,514 2190 0.20 11,500 2.78 89,140 1.80 187,531 4.78 288,171 2210 0.50 28,751 1.86 90,991 4.50 470,810 6.86 590,552 2213 0.50 51,369 0.50 51,369 2221 3.83 220,230 9.41 214,036 13.24 434,266 2230 0.50 21,843 0.50 21,843 2321 2.00 230,228 2.00 230,228 2410 7.67 441,033 45.62 1,322,770 26.50 2,667,830 79.79 4,431,633 2521 3.63 171,170 5.00 443,641 8.63 614,811 2540 3.00 110,267 1.00 113,924 4.00 224,191
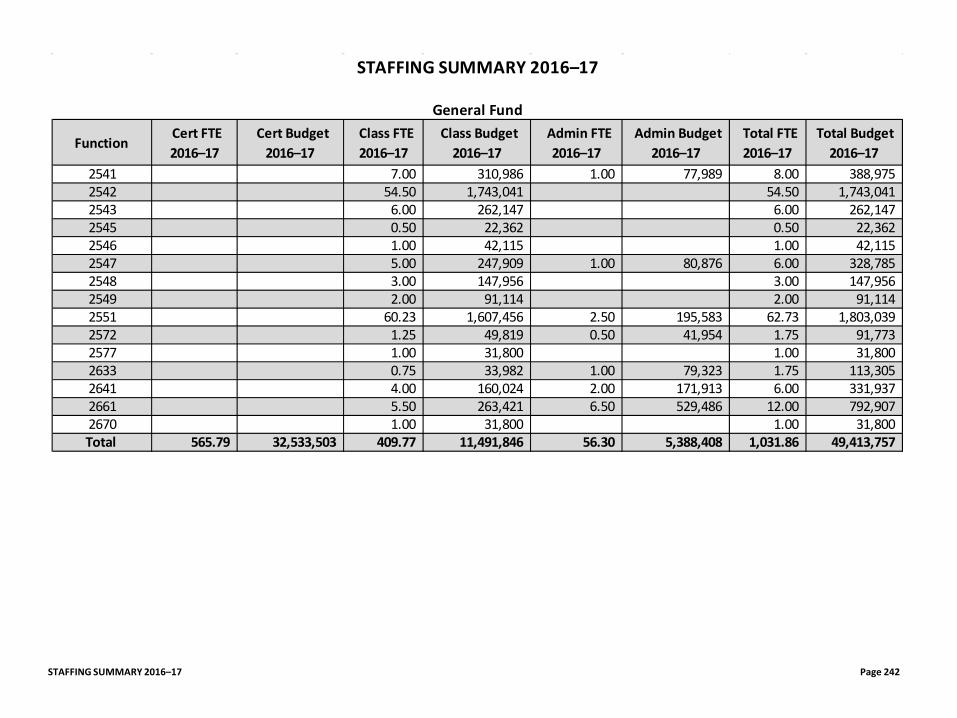
STAFFING SUMMARY 2016–17 Page 242
STAFFING SUMMARY 2016–17
General Fund
Function Cert FTE 2016–17
Cert Budget 2016–17
Class FTE 2016–17
Class Budget 2016–17
Admin FTE 2016–17
Admin Budget 2016–17
Total FTE 2016–17
Total Budget 2016–17
2541 7.00 310,986 1.00 77,989 8.00 388,975 2542 54.50 1,743,041 54.50 1,743,041 2543 6.00 262,147 6.00 262,147 2545 0.50 22,362 0.50 22,362 2546 1.00 42,115 1.00 42,115 2547 5.00 247,909 1.00 80,876 6.00 328,785 2548 3.00 147,956 3.00 147,956 2549 2.00 91,114 2.00 91,114 2551 60.23 1,607,456 2.50 195,583 62.73 1,803,039 2572 1.25 49,819 0.50 41,954 1.75 91,773 2577 1.00 31,800 1.00 31,800 2633 0.75 33,982 1.00 79,323 1.75 113,305 2641 4.00 160,024 2.00 171,913 6.00 331,937 2661 5.50 263,421 6.50 529,486 12.00 792,907 2670 1.00 31,800 1.00 31,800 Total 565.79 32,533,503 409.77 11,491,846 56.30 5,388,408 1,031.86 49,413,757
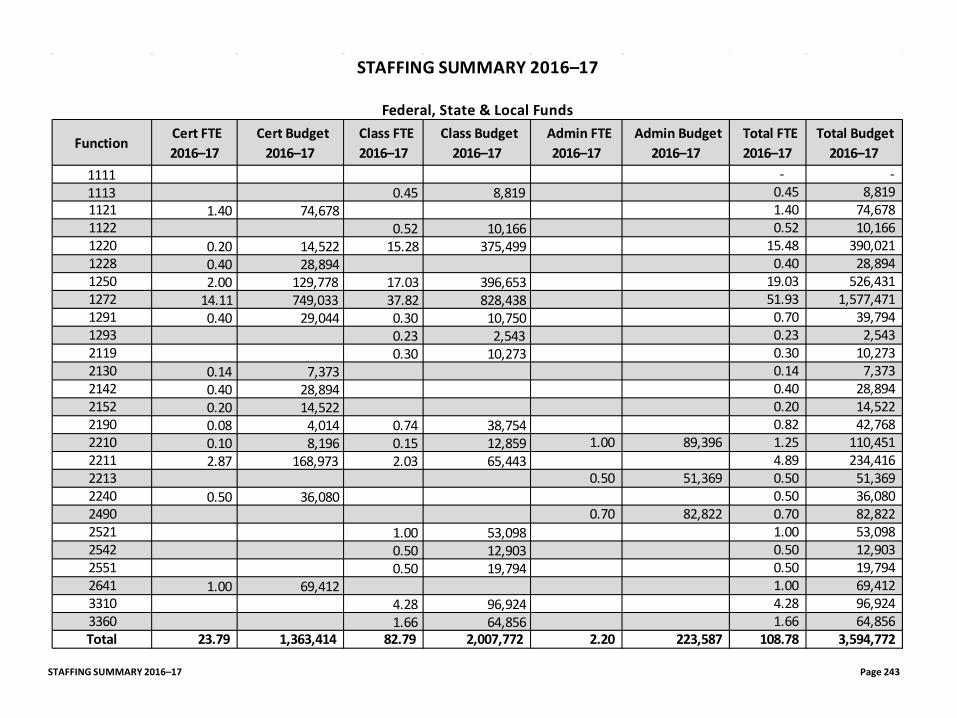
STAFFING SUMMARY 2016–17 Page 243
STAFFING SUMMARY 2016–17
Federal, State & Local Funds
Function Cert FTE 2016–17
Cert Budget 2016–17
Class FTE 2016–17
Class Budget 2016–17
Admin FTE 2016–17
Admin Budget 2016–17
Total FTE 2016–17
Total Budget 2016–17
1111 - - 1113 0.45 8,819 0.45 8,819 1121 1.40 74,678 1.40 74,678 1122 0.52 10,166 0.52 10,166 1220 0.20 14,522 15.28 375,499 15.48 390,021 1228 0.40 28,894 0.40 28,894 1250 2.00 129,778 17.03 396,653 19.03 526,431 1272 14.11 749,033 37.82 828,438 51.93 1,577,471 1291 0.40 29,044 0.30 10,750 0.70 39,794 1293 0.23 2,543 0.23 2,543 2119 0.30 10,273 0.30 10,273 2130 0.14 7,373 0.14 7,373 2142 0.40 28,894 0.40 28,894 2152 0.20 14,522 0.20 14,522 2190 0.08 4,014 0.74 38,754 0.82 42,768 2210 0.10 8,196 0.15 12,859 1.00 89,396 1.25 110,451 2211 2.87 168,973 2.03 65,443 4.89 234,416 2213 0.50 51,369 0.50 51,369 2240 0.50 36,080 0.50 36,080 2490 0.70 82,822 0.70 82,822 2521 1.00 53,098 1.00 53,098 2542 0.50 12,903 0.50 12,903 2551 0.50 19,794 0.50 19,794 2641 1.00 69,412 1.00 69,412 3310 4.28 96,924 4.28 96,924 3360 1.66 64,856 1.66 64,856 Total 23.79 1,363,414 82.79 2,007,772 2.20 223,587 108.78 3,594,772
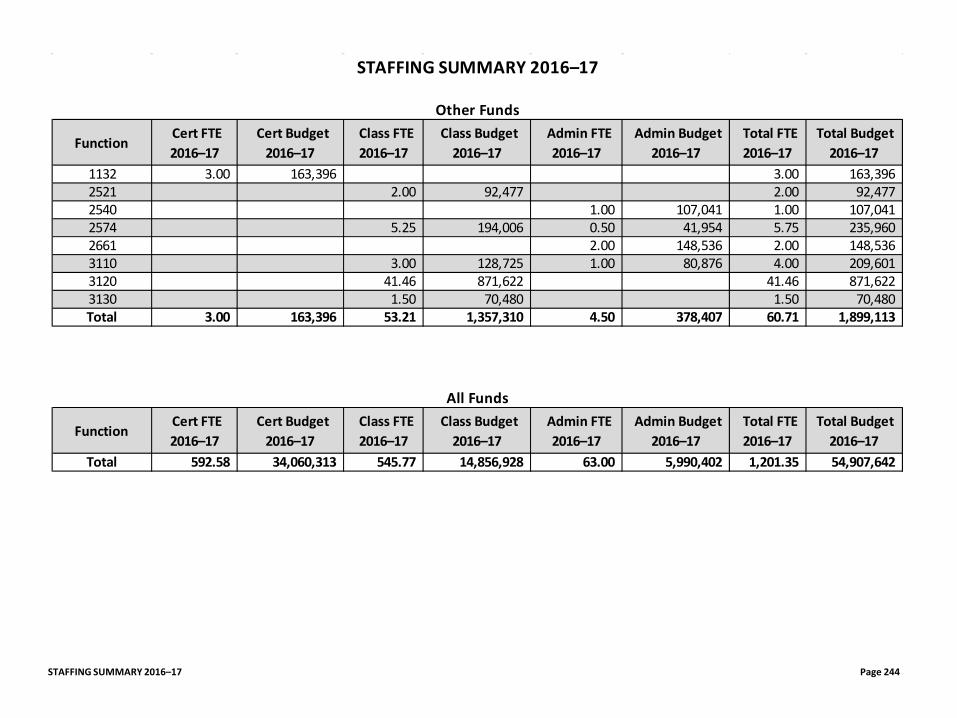
STAFFING SUMMARY 2016–17 Page 244
STAFFING SUMMARY 2016–17
Other Funds
Function Cert FTE 2016–17
Cert Budget 2016–17
Class FTE 2016–17
Class Budget 2016–17
Admin FTE 2016–17
Admin Budget 2016–17
Total FTE 2016–17
Total Budget 2016–17
1132 3.00 163,396 3.00 163,396 2521 2.00 92,477 2.00 92,477 2540 1.00 107,041 1.00 107,041 2574 5.25 194,006 0.50 41,954 5.75 235,960 2661 2.00 148,536 2.00 148,536 3110 3.00 128,725 1.00 80,876 4.00 209,601 3120 41.46 871,622 41.46 871,622 3130 1.50 70,480 1.50 70,480 Total 3.00 163,396 53.21 1,357,310 4.50 378,407 60.71 1,899,113
All Funds
Function Cert FTE 2016–17
Cert Budget 2016–17
Class FTE 2016–17
Class Budget 2016–17
Admin FTE 2016–17
Admin Budget 2016–17
Total FTE 2016–17
Total Budget 2016–17
Total 592.58 34,060,313 545.77 14,856,928 63.00 5,990,402 1,201.35 54,907,642
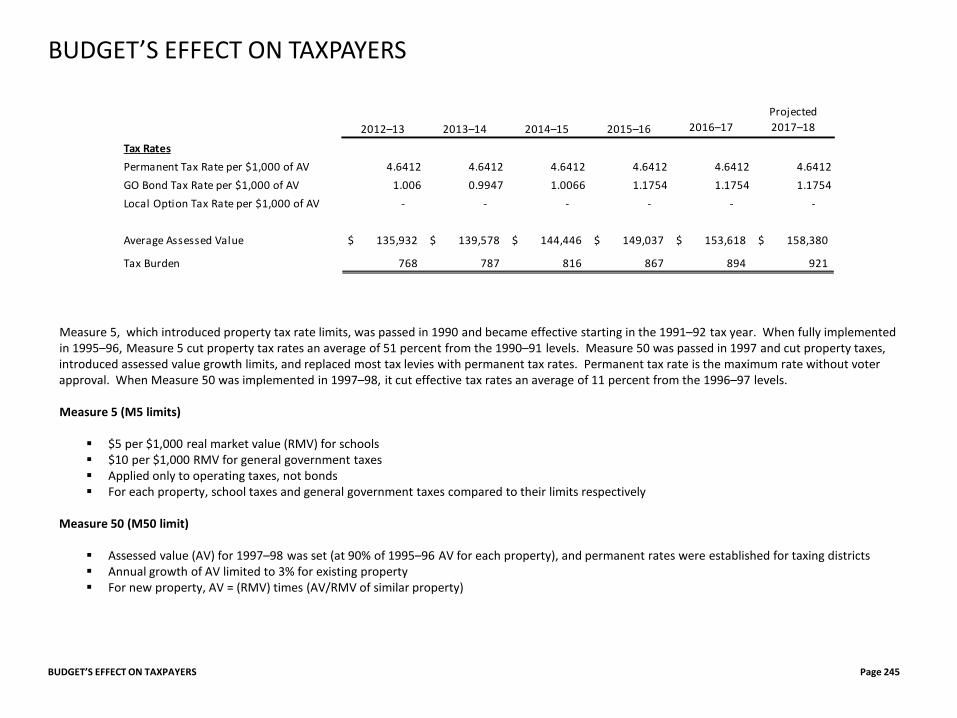
BUDGET’S EFFECT ON TAXPAYERS Page 245
BUDGET’S EFFECT ON TAXPAYERS
Measure 5, which introduced property tax rate limits, was passed in 1990 and became effective starting in the 1991–92 tax year. When fully implemented in 1995–96, Measure 5 cut property tax rates an average of 51 percent from the 1990–91 levels. Measure 50 was passed in 1997 and cut property taxes, introduced assessed value growth limits, and replaced most tax levies with permanent tax rates. Permanent tax rate is the maximum rate without voter approval. When Measure 50 was implemented in 1997–98, it cut effective tax rates an average of 11 percent from the 1996–97 levels. Measure 5 (M5 limits)
$5 per $1,000 real market value (RMV) for schools $10 per $1,000 RMV for general government taxes Applied only to operating taxes, not bonds For each property, school taxes and general government taxes compared to their limits respectively
Measure 50 (M50 limit)
Assessed value (AV) for 1997–98 was set (at 90% of 1995–96 AV for each property), and permanent rates were established for taxing districts Annual growth of AV limited to 3% for existing property For new property, AV = (RMV) times (AV/RMV of similar property)
2012–13 2013–14 2014–15 2015–16 2016–17Projected 2017–18
Tax RatesPermanent Tax Rate per $1,000 of AV 4.6412 4.6412 4.6412 4.6412 4.6412 4.6412GO Bond Tax Rate per $1,000 of AV 1.006 0.9947 1.0066 1.1754 1.1754 1.1754Local Option Tax Rate per $1,000 of AV - - - - - -
Average Assessed Value 135,932$ 139,578$ 144,446$ 149,037$ 153,618$ 158,380$
Tax Burden 768 787 816 867 894 921
ACCOUNT CODES: Account codes identify the funding source and nature of a budgeted expenditure. ACCOUNTING SYSTEM: The total structure of records and procedures which discover, record, classify, summarize, and report information on the financial position and results of operations of a government of any of its funds, fund types, balanced account groups, or organization components. ACCRUAL BASIS: The basis of accounting under which transactions are recognized when they occur regardless of the timing of related cash flows. ACCRUE: To record revenues when earned or when levies are made and to record expenditures as soon as they result in liabilities, regardless of when the revenue is actually received or the payment is actually made. ACCRUED LIABILITIES: Amounts owed but not yet due; for example, accrued interest on bonds or notes. ACCRUED REVENUES: Levies made or revenue earned and not collected regardless of whether due or not. ACHIEVEMENT GAP: A persistent and significant disparity in educational achievement and attainment among groups of students as determined by a standardized measure. ACTUARIAL: Relating to the compiling and analyzing statistical calculations, especially of life expectancy. AD VALOREM: A tax whose amount is based on the value of a transaction or of property. ADMINISTRATORS, LICENSED: Persons assigned to administrative or supervisory positions who meet standards of eligibility established and who have training or licensure relevant to specific positions within the District. This includes positions such as the Superintendent, Assistant Superintendent, Directors of Instruction, Administrators, School Principals, etc. ADMINISTRATORS, NON-LICENSED: Administrative or supervisory positions not requiring any type of licensure but who meet eligibility and or needs set forth by the District. This category is primarily made up of managers or supervisors that support the business operations of the District. ADOPTED BUDGET: The financial plan adopted by the School Board which forms a basis for expenditure appropriations. ALLOCATIONS: To divide an appropriation into amounts for specific purposes.
GLOSSARY Page 246
GLOSSARY
APPROPRIATION: An authorization, usually limited in amount and time, granted by a legislative body to make expenditures and to incur obligations for specific purchases. ASSESSED VALUE (AV): The portion of value of real or personal property that is taxable; the lesser of the property’s real value or the constitutional value limit. The value limit may increase 3% annually unless qualifying improvements or changes are made to the property. ASSESSMENT: A method to measure what students are learning (i.e., testing). ASSET: An economic benefit obtained or controlled by the District as a result of a past transaction or event. ASSIGNED FUNDS: Funding designated at the District level for a specific purpose. AVERAGE DAILY MEMBERSHIP (ADM): The measure that indicates the average number of students in membership on any given day during the reporting period. AVERAGE DAILY MEMBERSHIP RESIDENT (ADMr): The ADM of the students who live in the District, regardless of where they attend. AVERAGE DAILY MEMBERSHIP WEIGHTED (ADMw): The average daily membership of daily student enrollment increased by a variety of weighting factors. For example, each student qualifying for special education services is given an additional weight and counted as 2.0 full-time equivalents (FTE) for funding purposes. BALANCED BUDGET: The District considers the budget balanced when total expenditures are equal to total revenues. However, there are instances when revenues exceed expenditures, or when expenditures exceed revenues but residual fund balances are used to make up the difference. BEGINNING FUND BALANCE: Funds carried forward from the current fiscal year into the next budgeted fiscal year that become a resource to support the appropriations for the next budgeted fiscal year. The beginning fund balance is the same amount as the previous year’s ending fund balance. BIENNIUM: A two-year period. BOND OR BOND ISSUED: A certificate of debt guaranteeing payment of the original investment plus interest on specific dates.
GLOSSARY Page 247
GLOSSARY (Continued)
BUDGET: A plan of financial operation embodying an estimate of proposed expenditures and means of financing them for a single fiscal year. BUDGET COMMITTEE: Consists of five community members and our five board members. Committee members must live in the District, must not be an officer or employee of the District, and must be a registered voter of the District. Budget committee positions are appointed by the Board of Education for three-year terms. BUDGET DOCUMENT: The instrument used by the budget-making authority to present a comprehensive financial plan to the School Board, which is the appropriating body. The budget document contains a message from the Superintendent, together with a summary of the proposed expenditures, means of financing them, and the schedules supporting the summary. These schedules show in detail the information as to past years’ actual revenues, expenditures, and other data used in making the estimates. BUDGET INITIATIVES: Short-term goals or objectives the District intends to accomplish in the near future. Initiatives should support the District’s missions and long-term goals. BUDGETARY CONTROL: The management of the District, in accordance with an approved budget, for the purpose of keeping expenditures within the limitations of available appropriations and available revenues. CAPITAL BUDGET: A plan of proposed capital projects for the coming year and the means for financing them. CAPITAL EXPENDITURES: Tangible property of a more or less permanent nature with a useful life of at least three years, and costing at least $5,000. Examples of capital expenditures include buildings, copy machines, buses, and computer/information technology equipment. CARRY OVER FUND BALANCE: Represents the amount of the prior year’s ending fund balance that is budgeted as a resource in the next year. CERTIFIED TAX RATE: A tax “ceiling” set by state law to protect taxpayers from unchecked tax increases. If the proposed tax rate is above the certified rate, an agency must advertise the proposed increase and hold public hearings before their rate can be approved. CHARTER SCHOOL: A public school operated by a group of parents, teachers and/or community members as a semi-autonomous school of choice within a school district. It is given the authority to operate under a contract or "charter" between the members of the charter school community and the local board of education (sponsor). Under Oregon law, a charter school is a separate legal entity operating under a binding agreement with a sponsor.
GLOSSARY Page 248
GLOSSARY (Continued)
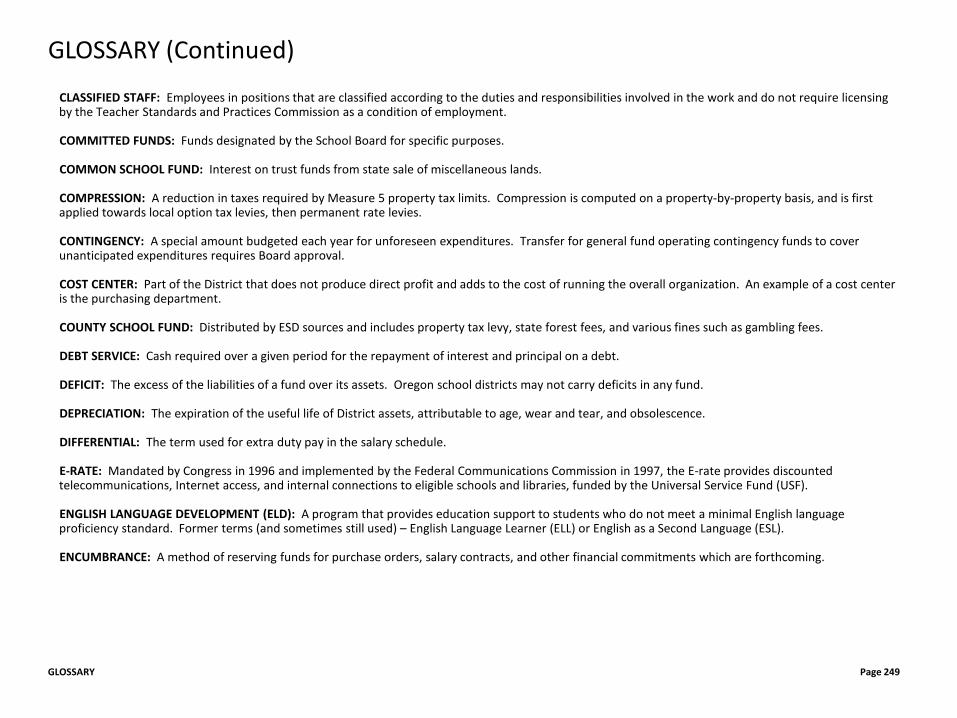
CLASSIFIED STAFF: Employees in positions that are classified according to the duties and responsibilities involved in the work and do not require licensing by the Teacher Standards and Practices Commission as a condition of employment. COMMITTED FUNDS: Funds designated by the School Board for specific purposes. COMMON SCHOOL FUND: Interest on trust funds from state sale of miscellaneous lands. COMPRESSION: A reduction in taxes required by Measure 5 property tax limits. Compression is computed on a property-by-property basis, and is first applied towards local option tax levies, then permanent rate levies. CONTINGENCY: A special amount budgeted each year for unforeseen expenditures. Transfer for general fund operating contingency funds to cover unanticipated expenditures requires Board approval. COST CENTER: Part of the District that does not produce direct profit and adds to the cost of running the overall organization. An example of a cost center is the purchasing department. COUNTY SCHOOL FUND: Distributed by ESD sources and includes property tax levy, state forest fees, and various fines such as gambling fees. DEBT SERVICE: Cash required over a given period for the repayment of interest and principal on a debt. DEFICIT: The excess of the liabilities of a fund over its assets. Oregon school districts may not carry deficits in any fund. DEPRECIATION: The expiration of the useful life of District assets, attributable to age, wear and tear, and obsolescence. DIFFERENTIAL: The term used for extra duty pay in the salary schedule. E-RATE: Mandated by Congress in 1996 and implemented by the Federal Communications Commission in 1997, the E-rate provides discounted telecommunications, Internet access, and internal connections to eligible schools and libraries, funded by the Universal Service Fund (USF). ENGLISH LANGUAGE DEVELOPMENT (ELD): A program that provides education support to students who do not meet a minimal English language proficiency standard. Former terms (and sometimes still used) – English Language Learner (ELL) or English as a Second Language (ESL). ENCUMBRANCE: A method of reserving funds for purchase orders, salary contracts, and other financial commitments which are forthcoming.
GLOSSARY Page 249
GLOSSARY (Continued)
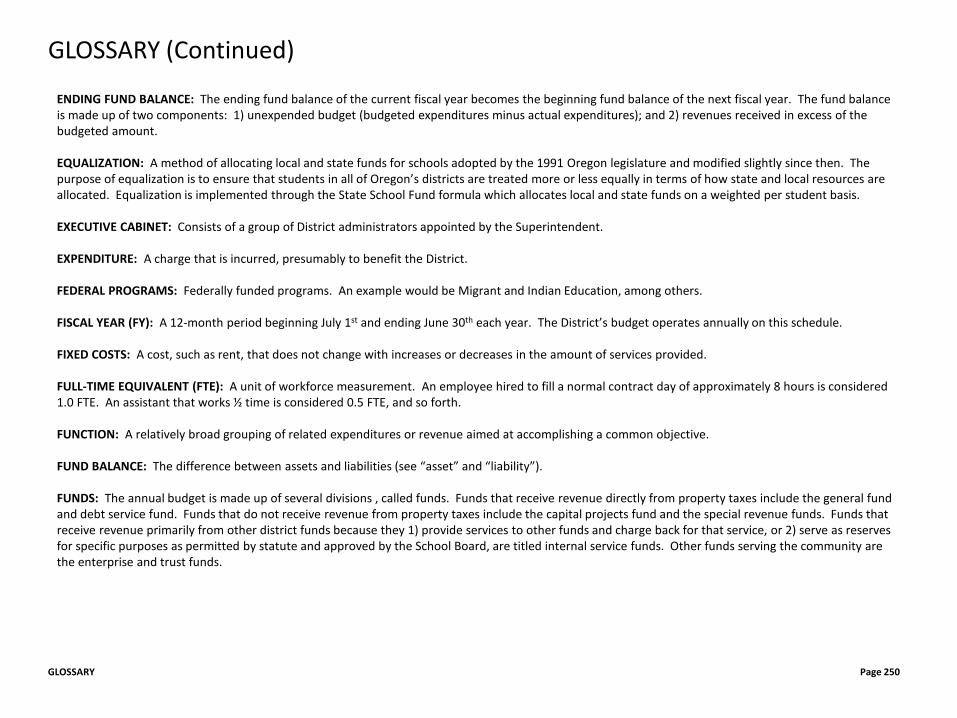
ENDING FUND BALANCE: The ending fund balance of the current fiscal year becomes the beginning fund balance of the next fiscal year. The fund balance is made up of two components: 1) unexpended budget (budgeted expenditures minus actual expenditures); and 2) revenues received in excess of the budgeted amount. EQUALIZATION: A method of allocating local and state funds for schools adopted by the 1991 Oregon legislature and modified slightly since then. The purpose of equalization is to ensure that students in all of Oregon’s districts are treated more or less equally in terms of how state and local resources are allocated. Equalization is implemented through the State School Fund formula which allocates local and state funds on a weighted per student basis. EXECUTIVE CABINET: Consists of a group of District administrators appointed by the Superintendent. EXPENDITURE: A charge that is incurred, presumably to benefit the District. FEDERAL PROGRAMS: Federally funded programs. An example would be Migrant and Indian Education, among others. FISCAL YEAR (FY): A 12-month period beginning July 1st and ending June 30th each year. The District’s budget operates annually on this schedule. FIXED COSTS: A cost, such as rent, that does not change with increases or decreases in the amount of services provided. FULL-TIME EQUIVALENT (FTE): A unit of workforce measurement. An employee hired to fill a normal contract day of approximately 8 hours is considered 1.0 FTE. An assistant that works ½ time is considered 0.5 FTE, and so forth. FUNCTION: A relatively broad grouping of related expenditures or revenue aimed at accomplishing a common objective. FUND BALANCE: The difference between assets and liabilities (see “asset” and “liability”). FUNDS: The annual budget is made up of several divisions , called funds. Funds that receive revenue directly from property taxes include the general fund and debt service fund. Funds that do not receive revenue from property taxes include the capital projects fund and the special revenue funds. Funds that receive revenue primarily from other district funds because they 1) provide services to other funds and charge back for that service, or 2) serve as reserves for specific purposes as permitted by statute and approved by the School Board, are titled internal service funds. Other funds serving the community are the enterprise and trust funds.
GLOSSARY Page 250
GLOSSARY (Continued)
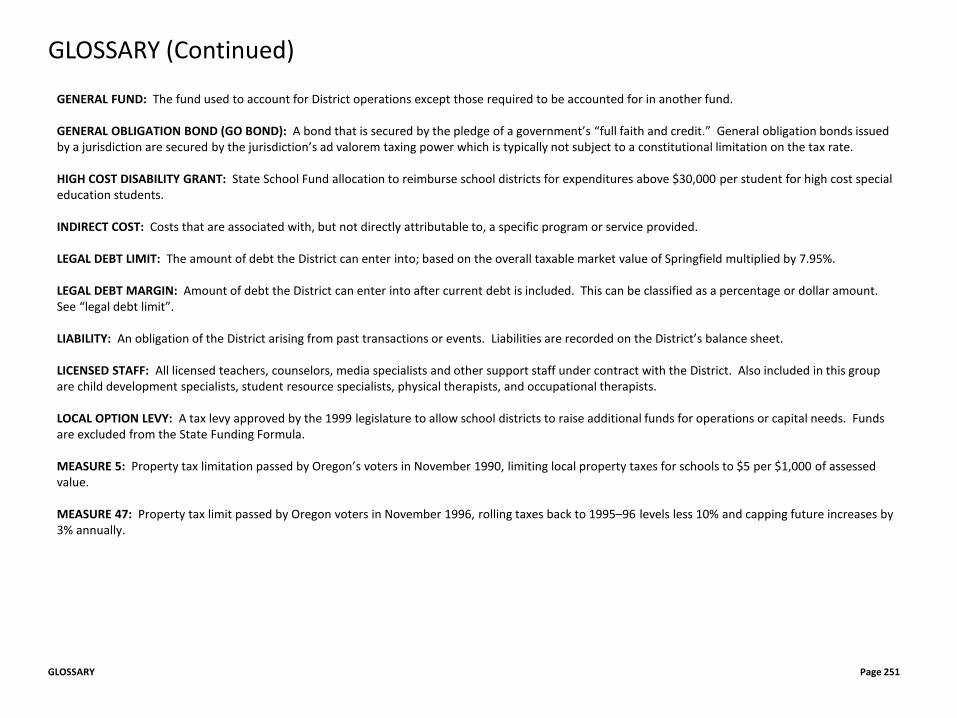
GENERAL FUND: The fund used to account for District operations except those required to be accounted for in another fund. GENERAL OBLIGATION BOND (GO BOND): A bond that is secured by the pledge of a government’s “full faith and credit.” General obligation bonds issued by a jurisdiction are secured by the jurisdiction’s ad valorem taxing power which is typically not subject to a constitutional limitation on the tax rate. HIGH COST DISABILITY GRANT: State School Fund allocation to reimburse school districts for expenditures above $30,000 per student for high cost special education students. INDIRECT COST: Costs that are associated with, but not directly attributable to, a specific program or service provided. LEGAL DEBT LIMIT: The amount of debt the District can enter into; based on the overall taxable market value of Springfield multiplied by 7.95%. LEGAL DEBT MARGIN: Amount of debt the District can enter into after current debt is included. This can be classified as a percentage or dollar amount. See “legal debt limit”. LIABILITY: An obligation of the District arising from past transactions or events. Liabilities are recorded on the District’s balance sheet. LICENSED STAFF: All licensed teachers, counselors, media specialists and other support staff under contract with the District. Also included in this group are child development specialists, student resource specialists, physical therapists, and occupational therapists. LOCAL OPTION LEVY: A tax levy approved by the 1999 legislature to allow school districts to raise additional funds for operations or capital needs. Funds are excluded from the State Funding Formula. MEASURE 5: Property tax limitation passed by Oregon’s voters in November 1990, limiting local property taxes for schools to $5 per $1,000 of assessed value. MEASURE 47: Property tax limit passed by Oregon voters in November 1996, rolling taxes back to 1995–96 levels less 10% and capping future increases by 3% annually.
GLOSSARY Page 251
GLOSSARY (Continued)
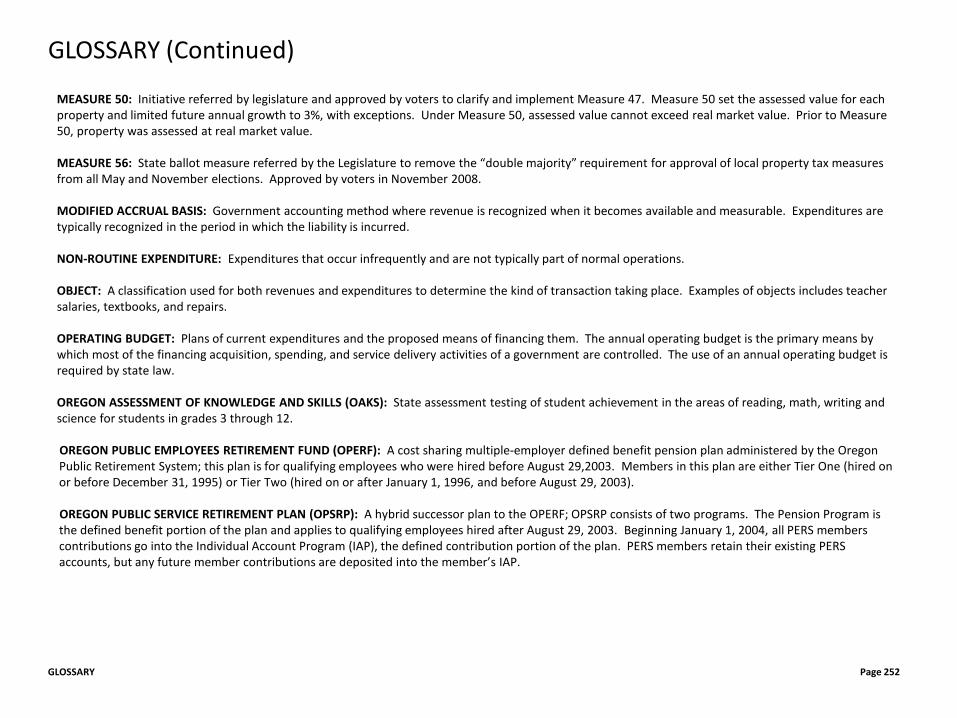
MEASURE 50: Initiative referred by legislature and approved by voters to clarify and implement Measure 47. Measure 50 set the assessed value for each property and limited future annual growth to 3%, with exceptions. Under Measure 50, assessed value cannot exceed real market value. Prior to Measure 50, property was assessed at real market value. MEASURE 56: State ballot measure referred by the Legislature to remove the “double majority” requirement for approval of local property tax measures from all May and November elections. Approved by voters in November 2008. MODIFIED ACCRUAL BASIS: Government accounting method where revenue is recognized when it becomes available and measurable. Expenditures are typically recognized in the period in which the liability is incurred. NON-ROUTINE EXPENDITURE: Expenditures that occur infrequently and are not typically part of normal operations. OBJECT: A classification used for both revenues and expenditures to determine the kind of transaction taking place. Examples of objects includes teacher salaries, textbooks, and repairs. OPERATING BUDGET: Plans of current expenditures and the proposed means of financing them. The annual operating budget is the primary means by which most of the financing acquisition, spending, and service delivery activities of a government are controlled. The use of an annual operating budget is required by state law. OREGON ASSESSMENT OF KNOWLEDGE AND SKILLS (OAKS): State assessment testing of student achievement in the areas of reading, math, writing and science for students in grades 3 through 12. OREGON PUBLIC EMPLOYEES RETIREMENT FUND (OPERF): A cost sharing multiple-employer defined benefit pension plan administered by the Oregon Public Retirement System; this plan is for qualifying employees who were hired before August 29,2003. Members in this plan are either Tier One (hired on or before December 31, 1995) or Tier Two (hired on or after January 1, 1996, and before August 29, 2003). OREGON PUBLIC SERVICE RETIREMENT PLAN (OPSRP): A hybrid successor plan to the OPERF; OPSRP consists of two programs. The Pension Program is the defined benefit portion of the plan and applies to qualifying employees hired after August 29, 2003. Beginning January 1, 2004, all PERS members contributions go into the Individual Account Program (IAP), the defined contribution portion of the plan. PERS members retain their existing PERS accounts, but any future member contributions are deposited into the member’s IAP.
GLOSSARY Page 252
GLOSSARY (Continued)
OREGON REVISED STATUTES (ORS): Oregon laws established by the legislature. OREGON SCHOOL EMPLOYEES ASSOCIATION (OSEA): The employee group representing classified staff. OTHER FINANCING SOURCE: Transactions that cannot be clearly classified as either a revenue or expenditures. An example is the transfer of fund balances from one fund to another. PAYROLL COSTS: Amounts paid by the District on behalf of employees, in addition to gross salary. Examples are group health insurance, contributions to Public Employees Retirement System (PERS), social security (FICA), workers’ compensation, and unemployment insurance. PERMANENT TAX RATE: The maximum rate of ad valorem property taxes that a local government can impose. Taxes generated from the permanent rate limit can be used for any purpose. A district can levy any rate or amount up to their permanent rate authority each year. The District’s permanent tax rate is $4.6412. PROGRAM: Revenues and expenditures that are tracked as a particular project. An example of a program is “Title I”, which is referenced in the book as a federal grant the District received. The District operates approximately 100 such programs. PROGRAM REVIEWS: Part of the internal review process for the general fund budget. These reviews are conducted as a means of maintaining budget integrity and transparency, and assessing budget needs for the next year. PROPERTY TAX LEVY: Individual components of property taxes the District receives each year. The District may receive tax revenue from up to three different levies, and when combined they form the overall property tax rate. PROPERTY TAX RATE: The tax rate at which homes and businesses are charged annually. PROPOSED BUDGET: Financial and operating plan for the District that the Superintendent is recommending to the public and budget committee. PUBLIC EMPLOYEES RETIREMENT SYSTEM (PERS): System that administers public employee benefits in Oregon. The District contributes to two pension plans administered by PERS: The Oregon Public Employees Retirement Fund (OPERF) and the Oregon Public Service Retirement Plan (OPSRP).
GLOSSARY Page 253
GLOSSARY (Continued)
QUALITY EDUCATION MODEL (QEM): A model, developed by the Legislative Council on the Quality Education Model and refined by the Oregon Quality Education Commission, specifies what constitutes adequate funding and services for elementary, middle and high school students. REAL MARKET VALUE: Defined under Measure 50 to be the amount of cash that could reasonably be expected to be paid by an informed buyer to an informed seller as of the assessment date of the tax year. REGRESSION ANALYSIS: A statistical method that can be used for predicting future numerical values. The District uses a form of regression analysis when projecting future enrollment, revenues, and other figures. REQUIREMENT: An expenditure or net decrease to fund resources. RESOURCES: Estimated beginning fund balance on hand at the beginning of the fiscal year, plus all anticipated revenues. REVENUES: Actual income the District receives from external sources. Donated items of value are not counted as revenue. Types of revenue include: Unrestricted: Revenues received by the District that can be used for any legal purpose desired by the District, without restriction. Restricted: Revenues received by the District that must be used for a categorical or specific purpose. If such money is not completely used, it must be
returned. Revenues from intermediate sources: Revenues that come to the District from other local governments, such as the Safe Routes to School. Revenues from state sources: Revenues that come to the District from, or through, the Oregon Department of Education. Unrestricted grants-in-aid: Revenues received as grants by the District, which can be used for any legal purpose desired by the District without
restriction. This category represents a significant portion of the District’s general fund total resources. Restricted grants-in-aid: Revenues received as grants by the District from state funds that must be used for a categorical or specific purpose. Revenue from federal sources: Revenue received from the federal government.
SPRINGFIELD ASSOCIATION OF ADMINISTRATORS & CONFIDENTIAL EMPLOYEES (SAAC): The employee group representing all licensed and non-licensed administrators. SPRINGFIELD EDUCATION ASSOCIATION (SEA): The employee group representing all licensed teachers, including licensed nursing and health care staff. SPRINGFIELD EDUCATION FOUNDATION (SEF): The Springfield Education Foundation is a non-profit, 501(c)3 organization, dedicated to creating bright and successful futures for students attending Springfield Public Schools.
GLOSSARY Page 254
GLOSSARY (Continued)
STAFFING RATIO: The licensed staffing ratio is the ratio of students to licensed staff. STAKEHOLDER: Any person or group that has a vested interest in the District. Examples include the public, local businesses, employees, Board of Education, and legislature. SUPPLEMENTAL BUDGET: Prepared to meet unexpected needs or to spend revenues not anticipated at the time the regular budget was adopted. A supplemental budget cannot be used to increase a tax levy. SURVIVAL RATES: A method used by the District to project future enrollment. Factors included in the method can include birth rates, inter- and intra-city mobility patterns, previous enrollment figures, rental vs. homeownership figures, etc. TAXABLE MARKET VALUE: See “Assessed Value”. TAXES: Compulsory charges levied by the District for the purpose of financing the operation of schools. TITLE I: Title I of the Elementary and Secondary Education Act is federal funding aimed at students who are behind academically or at risk of falling behind. Funding provides assistance to students who are economically disadvantaged. TRANSFERS: Amounts distributed from one fund to finance activities in another fund. TRUST AND AGENCY FUNDS: Also referred to as fiduciary funds. Assets held by the District in trustee capacity for organizations related, but independent, of the District. The District does not have the authority to expend these funds and cannot use these accounts without authorization from the approving club or organization. UNAPPROPRIATED ENDING FUND BALANCE: Amount budgeted to carry over to the next year’s budget to provide the District with needed cash flow until other money is received and to provide financial stability. This amount cannot be transferred by resolution or used through a supplemental budget during the fiscal year. UNDISTRIBUTED RESERVE: Part of the District’s fund balance that is not specifically reserved for a particular purpose. WORKING CAPITAL: Financial term for the liquidity of an organization’s financial condition. Sometimes refers to beginning or ending fund balances.
GLOSSARY Page 255
GLOSSARY (Continued)
ADM Average Daily Membership ADMr Average Daily Resident Membership ADMw Average Daily Weighted Membership ASB Associated Student Body AV Assessed Property Value BFB Beginning Fund Balance CACFP Child and Adult Care Food Program CDC Child Development Center CEP Community Eligibility Provision COLA Cost of Living Adjustment CRIS Criminal Information Services CTP Community Transition Program EA Educational Assistant DOL Department of Labor EEOC Equal Employment Opportunity Commission EFB Ending Fund Balance
ACRONYMS Page 256
ACRONYMS
ELL English Language Learners ESD Education Service District ESL English as a Second Language FDA Food and Drug Administration FTE Full-Time Equivalency GAAP Generally Accepted Accounting Principles GDP Gross Domestic Product GO Bond General Obligation Bond GOL Gift of Literacy HR Human Resources IAP Individual Account Program IDEA Individuals with Disabilities Education Act IEP Individualized Education Program LEA Local Education Agency LTCT Long-Term Care and Treatment MAPS Managers, Administrators, Professionals & Supervisors
PERS Public Employees Retirement System OAKS Oregon Assessment of Knowledge and Skills OAR Oregon Administrative Rules ODE Oregon Department of Education OPERF Oregon Public Employees Retirement Fund OPSRP Oregon Public Service Retirement Plan ORS Oregon Revised Statutes OSBA Oregon School Boards Association OSEA Oregon School Employees Association OSHA Occupational Safety and Health Administration PBIS Positive Behavior Interventions and Supports PTA Parent Teacher Association PTO Parent Teacher Organization QEM Quality Education Model RMV Real Market Value
ACRONYMS Page 257
ACRONYMS (Continued)
SAAC Springfield Association of Administrators & Confidential Employees SAIF State Accident Insurance Fund SEA Springfield Education Association SEF Springfield Education Foundation SPED Special Education SPS Springfield Public Schools SSF State School Fund STEM Science, Technology, Engineering & Mathematics curriculum STEAM Science, Technology, Engineering, Arts & Mathematics curriculum TAG Talented and Gifted TOSA Teacher on Special Assignment UEFB Unappropriated Ending Fund Balance USDE United States Department of Education VER Voluntary Early Retirement YTP Youth Transition Program