Embed Size (px)
Citation preview


i APPROVED FOR PUBLIC RELEASE
ECBC Strategic Mission and Vision The U.S. Army Edgewood Chemical Biological Center (ECBC) functions as the nation’s principal research, development, and engineering resource for non-medical chemical and biological warfare (CBW) defense applications. ECBC’s mission is to integrate life-cycle science, engineering, and operations solutions to counter CBRNE threats to U.S. forces and the nation. This mission recognizes that ECBC’s range of influence has grown to include military and homeland defense as well as expanding research, development, and engineering needs beyond CB defense to include comparable technical solutions for radiological, nuclear and explosives (RNE) hazards. ECBC’s vision is to be the premier resource for CBRNE solutions, uniting and informing the defense community. As such, ECBC is charged with understanding the comprehensive threat to the warfighter and providing the scientific knowledge, technology, and materiel required to protect and enable the warfighter to effectively operate and implement strategic decisions while in the presence of CBW contamination. ECBC’s mission and vision are supported by the Center’s core capabilities of research and technology, engineering, and program integration. The Research and Technology (R&T) capability provides integrated science and technology solutions that address CB Defense knowledge gaps and vulnerabilities. The Center’s R&T capability areas include Biosciences, CB Detection, CB Protection and Decontamination, Chemical Sciences, Physics, Computational Sciences, and Toxicology and Obscurants. Basic science research at ECBC contributes valuable information to the fundamental science knowledgebase, enabling the development of technologies that directly benefit the warfighter and further strengthen the Army’s Science and Technology mission. ECBC’s unique set of core research and technology capabilities position it to be the Army’s fundamental source of research in chemistry and biology.

ii APPROVED FOR PUBLIC RELEASE
ECBC ILIR Proposal Process The In-House Laboratory Independent Research (ILIR) program is specifically designed to foster increased innovation within the ECBC Basic Research portfolio. The purpose of the ILIR program is to fund innovative basic research projects that are high risk and have high potential payoff for fulfilling Army needs. The DoD defines basic research as “the systematic study directed toward greater knowledge or understanding of the fundamental aspects of phenomena and of observable facts without specific applications toward processes or products in mind.” ECBC views the ILIR as a critical part of its efforts at ensuring a high level of basic science, to foster innovation in the areas of chemistry and biology, and to mentor junior investigators in the art and practice of new technological innovations and new phenomenology at the boundaries of chemistry, biology, mathematics, or physics that will gain additional insight and advances in support of CBRNE defense missions. The ILIR program solicits innovative proposals from the center’s principal investigators that correspond to ECBC’s critical core capability areas: Inhalation Toxicology, Filtration Science, Threat Agent Chemistry and Bioscience, Aerosol Physics, and Agent Spectroscopy/Algorithm Development. Proposals are first reviewed internally by the Branch and Division Chiefs for their technical innovation, alignment to Army/ECBC S&T topic areas, and programmatic completeness. The proposals are then reviewed and critiqued by a panel comprised of resident and external Department of the Army Senior Technologists (STs), Senior Scientists from other DoD organizations, and civilian and military faculty members at the U.S. Military Academy. Some of these same reviewers also serve on a Technical Advisory Board (TAB), which is convened in the fourth quarter of the program to assess the year-to-date performance of the basic science research projects. The review panels evaluate each proposal on its scientific objective, the scientific methods proposed, the qualifications of the investigator, and the budget, with the scientific objective and method weighted as the most important criteria. The proposals are then ranked according to merit. Only proposals deemed by the panel as basic research are considered for funding. Quality comments from the reviewers are compiled and used, with the numerical score, as a critical assessment of the proposal. This written feedback is essential for ECBC’s mentoring of researchers and for justifying the elimination of research programs that are not competitive. Quarterly reviews of project performance and the end-of-the-year TAB review provide additional guidance to the program’s participants, ensuring projects meet significant milestones, and substantive new knowledge is produced and transferred to the ECBC and broader scientific community. This cyclical review and assessment process was used to select and monitor the progress of three new ILIR projects and three projects already in existence. Internal funds were also used to support two directed basic research projects, under the Surface Science Initiative (SSI) program, and seven “Seedling” projects, which are smaller-scale projects of high risk, high reward basic research. This Annual Review contains the technical reports from all fifteen ECBC produced, ILIR/SSI/Seedling-funded projects.

iii APPROVED FOR PUBLIC RELEASE
FY12 ILIR Technical Report Executive Summary The ECBC ILIR Program funded six projects in FY12, the SSI Program divided funding between two projects, and internal “seedling” funding was distributed to seven projects. Together, the ILIR, SSI, and Seedling projects covered multiple areas of interest across the chemical, biological, and physical sciences, including molecular toxicology, abiotic systems design, computational method development, human stem cell research, aerosol sciences, and rational material design. The projects are briefly summarized below: In-House Laboratory Independent Research (ILIR) Projects “Effect of Genetic Database Comprehensiveness on Fractional Proteomics of Escherichia coli O157:H7” (PI: Bevilacqua). In a continuation of last year’s study, E. coli O157:H7 protein fractions were analyzed using mass spectrometry-based proteomics. Using a new database, a higher percentage of sample proteins were identified. Although three penicillin binding proteins (PBPs) were identified in the secretome fraction, these proteins were not found play a role in antibiotic resistance. Overall, this research is expected to provide fundamental knowledge regarding extracellular proteins produced by Gram-negative bacteria, specifically those components important for bacterial survival and antibiotic resistance. “Molecular Toxicology of TICs in Human Embryonic Stem Cells” (PI: Madren-Whalley). Undifferentiated WA09 human embryonic stem cells (hESC) exposed to the widely-used organophosphate insecticide, methyl parathion (MP), and its active metabolite, methyl paraoxon (MPO), were studied using LC-MS and real time-polymerase chain reaction (RT-PCR). In this follow-on study, additional confirmatory metabolomics data (via LC-MS-MS) and new high content image analysis (HCA) data from exposed and control pluripotent WA09 hESC was collected. The results suggest that MP and MPO significantly and differentially impact the metabolism of hESC and that MP affects the expression of key genes involved in the differentiation and pluripotency of hESC. “Tuning the Optical Properties of Multi-Layered Nanoparticles Using Plasmon-Exciton Coupling” (PI: DeLacy). An optimization-based approach was used to tailor the optical response of silver/silica multilayer nanospheres over the visible region. Mie theory and the Transfer Matrix Method were used to describe the optical response of multilayered nanospheres. Silver coated silica spheres provided the largest cross-section per volume/mass. Computational and experimental results indicate that the absorption wavelength of the J-aggregate form of the dye is dependent on both the distance of the dye layer from the silver core and the degree of dye aggregation. “Highly Ordered Nanowire Arrays based on Polydiacetylene for Sensing Applications” (PI: Killops). Stable diacetylene (DA) structures with hierarchical, long range order were constructed by appending DA-containing molecules to the backbone of homopolymers, random copolymers, and block copolymers via a reactive monomer post-modification approach. The self-assembling properties of the various polymer architectures were evaluated with respect to their colorimetric properties using UV-vis absorbance spectroscopy. The materials polymerized within several

iv APPROVED FOR PUBLIC RELEASE
seconds of irradiation, revealing that annealing may help to increase susceptibility to polymerization. “Secretome Biomarkers for the Identification and Differentiation of Enterohemorrhagic and Enteropathogenic Escherichia coli (EHEC and EPEC) Strains” (PI: Jabbour). A metaproteomic approach was used to identify the secreted proteins associated with EHEC and EPEC strain pathogenicity. The taxonomic results showed strain level classification for the studied strains and distinctive separation among the strains. Comparative proteomic calculations showed separation between EHEC O157:H7 and O104:H4 in replicate samples using cluster analysis. “A Platform Approach to Produce Polymer Nanoparticles with Modular Functionality from Block Copolymer Surfactants” (PI: Killops). Hairy polystyrene latexes with tunable functionality were synthesized from a polystyrene-b-poly(ethylene oxide-co-allyl glycidyl ether) amphiphilic diblock copolymer. The incorporation of an allyl-functional monomer into the hydrophilic portion of the BCP enabled the use of thiol-ene “click” chemistry to decorate the polymer backbone with a diverse range of commercially available thiol-functional groups to create a library of particles with functional corona. Analysis from XPS and zeta potential measurements indicates that that the functional corona resides at the periphery of the particles, extending into solution. Surface Science Initiative (SSI) Projects “Preparation and Properties of Luminescent Lanthanide/Graphene Materials” (PI: Karwacki). Luminescent graphene/lanthanide complexes were made from the reaction of the graphene carboxylate with europium and terbium in a methanol solution under basic conditions. Coordination of the graphene carboxylate with the lanthanide was verified by laser induced fluorescence. Surface morphology and physical properties of the graphene/lanthanide materials were investigated by scanning electron microscope (SEM) and transmission electron microscope (TEM) measurements. Molecular modeling of the systems was conducted to better understand the binding of lanthanide to graphene and to provide direction on further enhancements of the system by organic ligands. “Understanding the Role of Physical and Chemical Adsorption on the Raman Enhancement from Metallic Nanoparticles and Nanostructured Surfaces” (PI: Guicheteau). Experimental and theoretical methods using small molecules were used to improve understanding of the physical phenomena that govern the adsorption and interaction of analytes with metallic nanoparticles and nanostructured metallic surfaces. The theoretical effort sought to find the underlying physics that determine the vibrational modes that are chemically enhanced when an analyte molecule chemically binds to the SERS substrate. The effect of molecular orientation relative to the SERS surface and the effect of movement of electronic density in response to nuclear motion along the normal vibrational coordinate on the Raman signal were examined. Seedling Projects “In Vitro Investigation of Monoclonal Antibodies to Neutralize Botulinum Toxin Entry into Cells” (PI: Buckley). In this study, M17 neuroblastoma cells were exposed to a monoclonal

v APPROVED FOR PUBLIC RELEASE
antibody, Bot IgG, and pre-incubated with BOT toxin complexes to determine if the antibody could neutralize the entry of BOT toxin into the cells. At the concentrations tested, the Bot IgG antibody did not inhibit the function of BOT A toxin complex. “Relieving Mipafox Inhibition in Organophosphorus Acid Anhydrolyase by Rational Design” (PI: Shah and Henderson). The insecticide mipafox [N,N’-diisopropyldiamidofluorophosphate] reversibly inhibits the hydrolysis activity of the enzyme organophosphate acid anhydrolyase (OPAA). The crystal structure of the OPAA-DDP complex suggests that disruption of the Asp244 and Glu381 bonds could potentially release DDP from the OPAA active site to give the enzyme hydrolysis activity. To test this hypothesis, three mutant OPAA enzymes, one with an Asp244 to alanine mutation, a second with a Glu381 to alanine mutation, and a third with both, were developed to remove the corresponding hydrogen bonds between these amino acids and the bound DDP. In all cases, the mutant enzymes were not found to have mipafox hydrolysis activity but retained their high hydrolysis rates against Soman, indicating that the remaining OPAA-DDP interactions are adequate to stabilize their complex and keep DPP bound to the enzyme. “Science of Decision Making: A Data Modeling Approach” (PI: Jabbour). A parallel data analysis algorithm for peptide classification, based on data generated from commercially available algorithms, namely SEQUEST and OMSSA, were developed. The outputs from those algorithms were analyzed to determine the probability score of the identified peptides and their associated proteins. The statistical analyses and data interpretation using our proposed approach showed that we can lower the false discovery rate (FDR) by using common proteins from both algorithms. This approach showed that the identification accuracy and reliable classification of microbes were improved without increasing the data analysis time. “A Computational Study of the Effect of Graphene on Nucleophilicity” (PI: Banks). The objective of this research was to obtain sufficient data to justify that pristine graphene can catalyze key reactions in organic chemistry. A computational study of modifying reaction rates was performed using density functional theory (DFT) methodology. Exploratory reactions for synthetically important cycloaddition and electrocyclic chemistry were also calculated to have stabilized transition states relative to the gas phase reactions. “Piezoelectric Microcantilevers for Real-Time Detection of Agent Bound to AChE in Blood” (PI: Kyro). In this study, a high sensitivity, high Quality Factor multilayered microcantilever (MCL) for sensing small molecules bound to acetylcholinesterase (AChE) was developed. Computer simulation results indicated that this device is capable of zeptogram sensitivity. Theoretical analyses were performed using computer simulation (MATLAB) and the results verified using commercial software tools (Coventor) along with published data from the literature. In the best simulation, a sensitivity of 22.7 zg/Hz for a frequency shift of 8.8 MHz and a 0.2 pg attached mass was obtained. “DNA Origami Bio-Platforms” (PI: Chue). The primary goal of this effort was to understand the fundamental limits in design and fabrication of nanostructures using DNA origami methods. The inSēquio software suite was used to facilitate the design of DNA scaffolds to hold protein ligands and to design of nanoscale, sequence optimized, molecular capture units that can be evaluated for charge distribution, hydrophilicity/hydrophobicity and steric flexibility.

vi APPROVED FOR PUBLIC RELEASE
“Designing Strongly Repellant Surfaces via Molecular Dynamics Simulations” (PI: Cabalo). This study used atomistic simulations to examine the role of nanostructures in minimizing the interaction energy between particles and a surface. Using molecular mechanics and molecular dynamics simulations, we calculated the interaction of a 26 nm rigid protein particle with nanostructured silicon surfaces of various sizes consisting of arrays of cones to mimic sharp, rough surface features. Protein particles bound strongest to the flat, smooth surface and weakest to the roughest surfaces, suggesting the importance of contact area and supporting the design of a wide range of size features to repel various particle sizes.

vii APPROVED FOR PUBLIC RELEASE
Table of Contents In-House Laboratory Independent Research Projects
Effect of Genetic Database Comprehensiveness on Fractional Proteomics of Escherichia coli O157:H7 Vicky Bevilacqua, Samir Deshpande Rabih Jabbour, Patrick McCubbin, Mary Wade ......................1
Molecular Toxicology of TICs in Human Embryonic Stem Cells Janna S. Madren-Whalley, Robert E. Burrier, Alan M. Smith, Jessica A. Palmer, Kevin R. Conard, Paul R. West, Vicky L. H. Bevilacqua, and Jennifer W. Sekowski .......................................................7
Tuning the Optical Properties of Multi-Layered Nanoparticles Using Plasmon-Exciton Coupling Brendan DeLacy, Wenjun Qiu, Marin Soljačić, Steven Johnson, John Joannopoulos ....................18
Highly Ordered Nanowire Arrays based on Polydiacetylene for Sensing Applications Kato L. Killops, Luis M. Campos ..........................................................................................................31
Secretome Biomarkers for the Identification and Differentiation of Enterohemorrhagic and Enteropathogenic Escherichia coli (EHEC and EPEC) Strains Rabih Jabbour, James Wright, Samir Deshpande, Mary Wade, Patrick McCubbin, Vicky Bevilacqua .............................................................................................................................................38
A Platform Approach to Produce Polymer Nanoparticles with Modular Functionality from Block Copolymer Surfactants Kato Killops, Christina Rodriguez, Nathaniel Lynd ............................................................................49
Surface Science Initiative (SSI) Projects
Preparation and Properties of Luminescent Lanthanide/Graphene Materials Amanda Jenkins, Alex Balboa, Margaret Hurley, David Ziegler, Christopher Karwacki ...............55
Understanding the Role of Physical and Chemical Adsorption on the Raman Enhancement from Metallic Nanoparticles and Nanostructured Surfaces Jason Guicheteau, Ashish Tripathi, Erik Emmons, Jerry Cabalo, Craig Knox, Brandon Scott, Keith Carron, and Steven Christesen .............................................................................................................69
Seedling Projects
In Vitro Investigation of Monoclonal Antibodies to Neutralize Botulinum Toxin Entry into Cells Patricia Buckley, Janna Madren-Whalley ...........................................................................................83
Relieving Mipafox Inhibition in Organophosphorus Acid Anhydrolyase by Rational Design Terry Henderson, Steven Harvey, and Saumil Shah ...........................................................................88
Science of Decision Making: A Data Modeling Approach Samir Deshpande, Rabih Jabbour .......................................................................................................93
A Computational Study of the Effect of Graphene on Nucleophilicity Harold Banks ........................................................................................................................................99
Piezoelectric Microcantilevers for Real-Time Detection of Agent Bound to AChE in Blood Kelly Kyroa, Hasan Goktasb, Mona Zaghloul ...................................................................................105
DNA Origami Bio-Platforms Calvin Chue, Janet Jensen, James Jensen ........................................................................................112
Designing Strongly Repellant Surfaces via Molecular Dynamics Simulations Craig Knox, Jerry Cabalo, Stephanie Ihejirika, Gary Kilper ............................................................116

viii APPROVED FOR PUBLIC RELEASE


1 APPROVED FOR PUBLIC RELEASE
Effect of Genetic Database Comprehensiveness on Fractional Proteomics of Escherichia coli O157:H7
Vicky L. H. Bevilacqua,a Samir V. Deshpande,b Rabih E. Jabbour,a Patrick E. McCubbin,c
Mary M. Wade a a Edgewood Chemical Biological Center, Research & Technology Directorate, 5183 Blackhawk
Road, Aberdeen Proving Ground, MD 21010 b Science and Technology Corporation, Edgewood, MD
c Optimetrics, Inc., Abingdon, MD
ABSTRACT Our hypothesis is that the binding of extracellular proteins (membrane vesicle (MV) or secreted) could contribute toward mechanisms of antibiotic resistance. To address this possibility, we are characterizing the extracellular, fimbriae, and whole cell proteins produced by the pathogenic Gram-negative bacterium Escherichia coli (E. coli) O157:H7 in terms of proteomics and binding of antibiotics using mass spectrometry based proteomics. Here we report on a study of the effect of the comprehensive nature of the database used for proteomics on the fractional analysis of secreted, whole cell lysate, and fimbriae protein fractions. We found that analysis using a more restricted database chosen based on sample knowledge will result in the identification of a higher percentage of sample proteins than a database that is more comprehensive. For E. coli O157:H7, we identified proteins that were specific to certain cellular fractions. Of these, four penicillin binding proteins were identified solely in the secretome fraction. Although the three penicillin binding proteins (PBPs) whose functions have been determined are antibiotic targets for penicillin and they therefore do not play an antibiotic resistance role, the identification of PBPs solely in the secretome does agree with our hypothesis that antibiotic proteins would be observed in the extracellular fraction.
INTRODUCTION 1. The objective of this project is to investigate the role of MVs and extracellular proteins in defining the mechanism(s) of antibiotic resistance and virulence. Certain extracellular proteins of pathogenic bacteria have been shown to function in survival mechanisms such as host immune system modulation [1] and biofilm formation.[2] Additionally, Gram-negative bacteria release a subset of extracellular proteins as MV components. Gram-negative bacteria form MVs by pinching off of the outer membrane to form liposomes. Bacteria form MVs at an energy loss and MVs contain periplasmic space components including enzymes, which suggest a functional role for MVs. Pathogenic Gram-negative bacteria produce more MVs than their non-pathogenic counterparts. Not surprisingly, several studies have provided evidence for a number of roles for MVs,[3] such as transfer of antibiotic-resistance enzymes to other bacteria [4] and directed intercellular transport of virulence factors.[5] In addition, work by Schooling and Beveridge [6] indicates that MVs shed by Gram-negative bacteria are a ubiquitous component in the biofilms of these bacteria. Levin and Rozen cite biofilm formation as one of three means by which bacterial populations can attain non-inherited antibiotic resistance.[7]

2 APPROVED FOR PUBLIC RELEASE
Our hypothesis is that the binding of extracellular proteins (MV or secreted) could contribute toward mechanisms of antibiotic resistance. To address this possibility, we are characterizing the extracellular, fimbriae, and whole cell proteins produced by the pathogenic Gram-negative bacterium E. coli O157:H7 in terms of proteomics and binding of antibiotics. We are using a mass spectrometry (MS) based proteomics approach to classify the proteins. MS proteomics experiments generate a vast amount of information in the form of spectra. The interpretation of the spectra depends on peptide mass fingerprinting (PMF) algorithms such as SEQUEST [8] and MASCOT.[9] The PMF algorithm compares the experimental spectra with theoretical spectra of the protein sequences stored in FASTA format. The number of available protein sequences has increased dramatically since 2003. It is thus expected that the comprehensive nature of the database used for analysis will affect the outcome of the results. Here we report on a study of the effect of the comprehensive nature of the database used for proteomics on the fractional analysis of secreted, whole cell lysate, and fimbriae protein fractions.
METHODS 2.
Escherichia coli O157:H7 Growth and Protein Fraction Preparation 2.1 E. coli O157:H7 (substrain Sakai) was grown in trypticase soy broth (TSB) to the late exponential phase (~108 cfu/mL) in an orbital shaker (125 rpm) at 37°C. The cell culture was stored at 4°C until fractionation. For isolation of the whole cell lysate and secreted protein fractions, 30 mL of culture was centrifuged at 11,300 x g/hr using a Beckman J2-MC centrifuge. The supernatant was decanted to separate it from the pellet. This supernatant containing the secreted proteins is referred to as the secreted fraction. The pellet was re-suspended in ~3.5 mL of 100 mM ammonium bicarbonate (ABC). This suspension was divided into three aliquots of approximately equal volume. The cell pellet suspension samples were thawed and lysed by ultrasonication (25 s on, 5 s off, 4 min total) using a Branson Digital Sonifier® (Danbury, CT). The lysate was centrifuged at 14,000 rpm for 20 min at 10°C using a Beckman GS-15R centrifuge. This fraction is referred to as the whole cell lysate fraction. A microwave lysis procedure was also attempted in which the sample was subject to microwaves using a Discover™ System (CEM Corporation, Matthews, NC) was performed at 55°C for time periods of 5, 10, and 15 minutes rather than being subjected to sonication. For isolation of fimbriae, cell culture aliquots (3 x 30 mL) were centrifuged at 15,000 x g/30 using a Beckman J2-MC centrifuge. Each pellet was re-suspended in 7 mL of ABC. These solutions were sheared through a 2 in, 22 gauge needle, 10 times each. Samples were divided into 1.5 mL centrifuge tubes and centrifuged at 15,000 x g/15 min using a Beckman GS-15R centrifuge. The supernatants were combined and filtered through a 0.45 µm acetate syringe filter. The filtrate was then heated at 60°C/hr in a block heater. These samples are referred to as the fimbriae fraction. Samples were frozen at -25°C for up to four days.
Liquid-Chromatography/Mass Spectrometry Sample Preparation 2.2 Samples were prepared for liquid-chromatography tandem mass spectrometry (LC-MS/MS) in a similar manner to that previously reported.[10] Briefly, proteins were extracted from the whole cell lysate and secreted fractions by transferring each sample to a separate Microcon® YM-3

3 APPROVED FOR PUBLIC RELEASE
filter unit (Millipore, Billerica, MA) and centrifuging at 14,100 x g/20-30 min. The filter membrane was washed with ABC and centrifuged at 14,100 x g/20 min. For the fimbriae fraction, the frozen samples were thawed and pipetted into Microcon® YM-3 filter units (Millipore, Billerica, MA) for purification. The filters were each centrifuged at 14,000 x g/25 min three times with a 200 µL ABC wash in between centrifugations. Generally, the proteins in the retentate were denatured at 40°C for 1 hr with 300 µL of 7.2 M urea and 3 µg/mL dithiothreitol in ABC. The urea was removed by centrifugation (14,100 x g/30-40 min) and the retentate was washed three times with ABC (150 µL ABC followed by centrifugation at 14,100 x g/30-40 min using an Eppendorf centrifuge 5415C or 5415D, Eppendorf North America, Westbury, NY). The filter unit was then transferred to a new receptor tube, and the proteins in the retentate were digested overnight at 37°C with 5 µL sequencing grade trypsin (Product # 511A, Promega, Madison, WI) in 10 µL acetonitrile and 240 µL ABC. The tryptic peptides were isolated by centrifuging at 14,100 x g/20-30 min. Alternative digestion protocols involved adjusting trypsin concentration, incubation time, and temperature.
Liquid-Chromatography/Mass Spectrometry Experiments 2.3 The tryptic peptides were separated in a similar manner to that previously described [10] on a capillary column using the Dionex UltiMate 3000 (Sunnyvale, CA) and the resolved peptides were electrosprayed into a linear ion trap mass spectrometer (LTQ XL; Thermo Scientific, San Jose, CA). Product ion mass spectra were obtained in the data-dependent acquisition mode, with a survey scan followed by MS/MS of the top five most intense precursor ions.
Proteomics Analysis 2.4 A protein database was constructed as previously described [10] in a FASTA format using the annotated proteome sequences derived from the genomes in the National Center for Biotechnology Information (NCBI, http://www.ncbi.nlm.nih.gov, accessed November 16, 2010). For this task, an in-house PERL (http://www.activatestate.com/ActivePerl, accessed November 16, 2010) program was used to automatically download proteome sequences from the NCBI. The database was constructed by translating putative protein-encoding genes and contains amino acid sequences of potential tryptic peptides obtained by the in silico digestion of all proteins, assuming up to two missed cleavages. The acquired mass spectra were searched against this database with the SEQUEST algorithm (Thermo Scientific). The SEQUEST thresholds for searching the product ion mass spectra were Xcorr, deltaCn, Sp, RSp, and deltaMpep. These parameters provide a uniform matching score for all candidate peptides. The files containing candidate peptides generated by SEQUEST were validated using the PeptideProphet™ algorithm.[11] Peptide sequences with probability scores of 95% and higher were retained and used to generate a binary matrix of sequence-to-bacterium (STB) assignments. The binary matrix was populated by matching the peptides with corresponding proteins in the database and assigning a score of one. A score of zero was assigned for a non-match. The column in the binary matrix represents the proteome of a given bacterium, and each row represents a tryptic peptide sequence from an LC product ion mass spectral analysis. A sample microorganism was matched with a database bacterium by the number of unique peptides that remained after filtering of degenerate peptides from the binary matrix. Verification of the classification and identification

4 APPROVED FOR PUBLIC RELEASE
of candidate microorganisms is performed through hierarchical clustering analysis and taxonomic classification using the in-house developed software package ABOid™.[12]
Biochemical Pathway Mapping 2.5 An algorithm was developed in-house for automated comparison of proteins observed in samples from a given fraction (whole cell, secreted, fimbriae). This algorithm was used to compare the proteins observed by LC-MS/MS in the three fractions and to determine which proteins were common between two or three fractions and which proteins were specific to a given fraction (fraction-specific proteins). Fraction-specific proteins were mapped to E. coli metabolic pathways using the Kyoto Encyclopedia of Genes and Genomes (KEGG) database (www.genome.jp/kegg/, accessed 16 Nov 2011, Copyright 1995-2011 Kanehisa Laboratories).
RESULTS AND DISCUSSION 3. Three whole cell, three fimbriae, and five secreted fraction peptide samples were prepared for LC-MS/MS experiments and proteomics analysis. For PMF, we constructed three different databases, named “EC_Sakai”, “Escherichia”, and “WholeDB” with protein sequences from 5x101, 4x10² and 2x10³ microorganisms, respectively. The WholeDB, Escherichia and EC_Sakai databases were constructed from the genomes of all sequenced bacteria, all bacteria genomes of the E. coli genus, and only the E. coli O157:H7 substrain Sakai genome, respectively. In addition, a decoy database was constructed in which the theoretical peptide sequences were determined by reversing the protein sequences. Table 1 provides the number of proteins and peptides for each database.
Table 1: Number of Protein and Peptide Sequences in Databases Used. Database # of Microorganisms # of Proteins # of Peptides # of Unique Peptides
WholeDB 2 x 10³ 6,376,733 419,145,721 2.21E+08 Escherichia 4 x 10² 298,264 17,716,320 1.26E+06 EC_Sakai 5 x 101 5,433 323,872 3.04E+05
Decoy 5 x 101 5,433 325,303 3.05E+05 After database searching using SEQUEST, followed by ABOid™ analysis with the standard PeptideProphet cutoff of 95%, different numbers of proteins were observed for a given cellular fraction for each database (Figure 1). These results show that, if information is known about the sample, a higher percentage of proteins will be identified using a database based on prior sample knowledge rather than a more comprehensive database. There may be loss of protein information resulting from the strict probability cutoff of 95%.

5 APPROVED FOR PUBLIC RELEASE
Figure 1: Proteins identified per cellular fraction for each database.
We analyzed the data for the cellular fractions by preparing Receivers Operating Characteristic (ROC) curves. ROC curves were plotted for each replicate sample for a fraction. We used a binary classifier to determine the optimum cutoff by calculating the areas under the ROC curves (AUC) for that fraction. The statistical software "R" (www.r-project.org, accessed 15 Oct 2012) and the package "ROCR" (www.cran.R-project.org, accessed 15 Oct 2012) were used for computing the optimum cutoff values. The optimum cutoff values were not identical for the different cellular fractions (~95% for whole cell fraction, ~90% for fimbriae fraction, and 90-95% for secretome), indicating that samples from different fractions and/or bacteria require separate ROC analysis to determine the peptide confidence cutoff for optimum results. However, final choice of cutoff involves a compromise between use of the optimum cutoff and the increasing analysis time required for ROC analysis with increasing number of samples. From the samples analyzed using the 95% cutoff, 200 E. coli proteins were identified. Of these proteins, 15% were common to all fractions. In addition, proteins specific to the secreted (3%), fimbriae (5%), and whole cell (29%) fractions were observed. Biochemical pathway mapping using KEGG was carried out and the fimbriae-specific subset included a glucose-specific phosphotransferase system (G-PTS) component protein, inositol monophosphatase (IMP), and a DNA-binding transcription dual regulator. IMP has a role in streptomycin synthesis, and G-PTS is involved in environmental processing. Sequence alignment of the DNA-binding transcription dual regulator protein showed that it is homologous with a hydrogen peroxide-inducible genes activator. Furthermore, a putative stress protein and four penicillin binding proteins (PBPs) were identified solely in the secretome. Three of the PBPs are part of the peptidoglycan biosythesis complex involved in bacteria cell wall synthesis and targeted by penicillin in its antibiotic role. We have yet to determine the function of the fourth PBP. Each of these proteins (PBPs, IMP, G-PTS, putative stress protein) was also identified in the analysis of samples from smaller initial culture volumes, less than 10 mL as compared to 30 mL for the previous samples, from a new batch of E. coli O157:H7. Although a limit of detection was not determined, each of these proteins was identified in all replicate samples from the larger culture volume, but some were not identified in all replicate samples prepared from the smaller culture volumes, which implies that the concentrations of some of the proteins may be near the limit of detection in the smaller-volume samples. Only penicillin binding proteins were identifiable by searching the identified protein names for the word "penicillin". It is possible that there are extracellular or other proteins

6 APPROVED FOR PUBLIC RELEASE
that bind to antibiotics other than penicillin. To address this consideration, we attempted coupling of ampicillin to magnetic beads having three different functional groups linked to the beads through differing chain lengths. Two types of groups resulted in successful coupling, one with a tosyl activation group having a 6-carbon chain (coupled through an ampicillin amine), the other with an amine terminal group having an 18-carbon chain (coupled through an ampicillin carboxyl). We incubated secretome proteins with these two ampicillin-bead complexes and with control beads (no ampicillin) and are currently carrying out the LC-MS/MS analysis on any proteins that may have bound to the beads to ascertain if any secretome proteins selectively bind to ampicillin. Details of the magnetic bead work will be reported separately upon completion of the LC-MS/MS analysis.
CONCLUSIONS 4. We analyzed E. coli O157:H7 whole cell, fimbriae, and secreted protein fractions by LC-MS/MS using protein databases of increasing comprehensiveness. We found that a more restricted database chosen based on sample knowledge will result in the identification of a higher percentage of sample proteins than a database that is more comprehensive. However, if strain-unique proteins are of interest, care must be taken to ensure that a protein that has been identified with a more restrictive database is truly unique when compared to the proteomes of organisms that were not included in the database. For E. coli O157:H7, we identified proteins that were specific to certain cellular fractions. Based on the functions noted above, the fimbriae-associated proteins IMP, G-PTS and the fimbriae-associated putative stress protein would be expected to be part of survival mechanisms. The DNA-binding dual regulator also found in the fimbriae functions as a hydrogen peroxide-inducible genes activator, which has a positive regulatory effect on production of surface proteins that control colony morphology and auto-aggregation, indicating that this protein is a virulence factor. Finally, although the PBPs whose functions were determined are antibiotic targets for penicillin and they therefore do not play an antibiotic resistance role, the identification of PBPs solely in the secretome does agree with our hypothesis that antibiotic proteins would be observed in the extracellular fraction.
REFERENCES [1] Vranakis, I.; et al. Journal of Proteome Research 2011, 10 (9), p4241-4251. [2] Ostrowski, A.; et al. Journal of Bacteriology 2011, 193 (18), p4821-4831. [3] Kuehn, M.J.; Kesty, N.C. Genes & Development 2005, 19 (22), p2645-2655. [4] Ciofu, O.; et al. Journal of Antimicrobial Chemotherapy 2000, 45, p9-13. [5] Sidhu, V.K.; et al. BMC Microbiology 2008, 8 (87). [6] Schooling, S.R.; Beveridge, T.J. Journal of Bacteriology 2006, 188 (16), p5945-5957. [7] Levin B.R.; Rozen, D.E. Nature Reviews Microbiology 2006, 4 (7), p556-562. [8] Eng, J.K.; et al. Journal of the American Society for Mass Spectrometry 1994, 5 (11) p976-
989. [9] Perkins, D.N.; et al. Electrophoresis 1999, 20 (18), p3551-3567. [10] Jabbour, R.E.; et al. Applied Environmental Microbiology 2010, 76 (11), p3637-3644. [11] Keller, A.; et al. Analytical Chemistry 2002, 74 (20), p5383-5392. [12] Deshpande, S.E.; et al. Journal of Chromatography and Separation Techniques 2011,
S5:001.

7 APPROVED FOR PUBLIC RELEASE
Molecular Toxicology of TICs in Human Embryonic Stem Cells
Janna S. Madren-Whalley,a Robert E. Burrier,b Alan M. Smith,b Jessica A. Palmer,b Kevin R. Conard,b Paul R. West,b Vicky L. H. Bevilacqua,a and Jennifer W. Sekowski a
a Edgewood Chemical Biological Center, Research & Technology Directorate, 5183 Blackhawk Road, Aberdeen Proving Ground, MD, USA 21010
b Stemina Biomarker Discovery, Inc., Madison, WI, USA 53719
ABSTRACT Given their wide spread use, lack of barriers for procurement, and potential for serious health consequences if deployed by a terrorist, toxic industrial chemicals (TICs) represent a real threat to warfighters and civilians at home and abroad. Unfortunately, for a vast number of TICs, including the widely-used organophosphate insecticide, methyl parathion (MP), used in crop spraying, mosquito control, etc., there is incomplete knowledge regarding the basic molecular toxicological consequences of exposure in humans.[1,2,3,4] While the literature suggests diverse toxicological consequences for MP exposure, those data are based on human epidemiological studies, in vivo animal studies, or in vitro studies using immortal cell lines. Thus, there remains no definitive connection to the molecular events that occur during MP exposure in “normal” human cells. Here we have studied the effects of MP and its active metabolite, methyl paraoxon (MPO), on undifferentiated WA09 human embryonic stem cells (hESC). We have utilized LC-MS-MS to positively identify mass features (putatively identified in FY11) and High Content Image Analysis (HCA) to examine the effect of reactive oxygen species (ROS) on MP exposed hESC. Identifying molecular endpoints in hESC after exposure to MP and MPO by LC-MS-MS and HCA will aid in the understanding of the impact these TIC exposures have on very early human development.
INTRODUCTION 1. Chemicals that have certain known effects in adults can have dramatically different toxic effects during embryonic and prenatal development. For example, the successful adult anti-epileptic drug, valproate, has a dramatic toxic effect on embryonic development, leading to neural tube deficits, autism, and cognitive dysfunction.[5] In their 2007 study, Cezar et al used LC-MS-MS to examine the metabolites in spent medium from pluripotent human embryonic stem cells exposed to valproate and found a blockage of the serotonin production pathway. Therefore, an important part of any complete toxicological evaluation must include examination of the compound’s effect on human embryonic development. The use of hESC to explore human embryonic molecular toxicological endpoints is a promising development in the field of toxicology. Since pluripotent hESC contain the ability to differentiate into any somatic cell in the body, they provide a unique window into the influence of toxicants on the entire early human development process. In year two of this study (FY12), we have performed LC-MS-MS based confirmation of chemical structures for a subset of mass features putatively annotated in FY11, focusing on the arginine-proline pathway and human reactive oxygen species. Our previous study, using non-targeted LC-MS based metabolomic analysis on hESC dosed with MP and MPO, identified human metabolites and metabolic pathways that may be subject to chemically induced alterations. Here we collected additional confirmatory (via LC-MS-MS) metabolomics data and new HCA data

8 APPROVED FOR PUBLIC RELEASE
from exposed and control pluripotent WA09 hESC. The results of these studies will help to completely and accurately define the functional consequences of exposure to operationally relevant levels of MP and MPO during early human development.
METHODS 2.
Metabolomics Experimental Overview 2.1
Cell Culture for Metabolomic Analysis 2.1.1 For metabolomic analysis, hESC were dosed at three concentrations for each chemical compound based on the cell viability data (FY11 data, not shown). Media controls (no cells), dosed media controls (no cells with dosed media), and controls (cells with undosed media) were also included in the experimental design. Additionally, a positive and negative control was included on the culture plate. For both the viability and metabolomics experiments, 96-well plates were seeded with 250,000 cells/well of WA09 hESC. These cells were exposed to MP or MPO for three days. Each day, the spent media was removed and replaced with mTeSR™1 media containing MP or MPO. Chemical stock solutions were made in DMSO and each final solution used to dose hESC contained 0.1% DMSO. Spent media samples were collected on the fourth day and quenched with 40% acetonitrile. Quenched samples were stored at -80 °C until they were prepared for metabolomic analysis. Cell viability was measured after sample collection using the MultiTox-Fluor viability assay (Promega).
Sample Preparation 2.1.2 To isolate the small molecular weight compounds (<10 KDa) from samples for metabolomics experimentation, Millipore Multiscreen Ultracel-10 molecular weight cut-off plates were used. These plates were first washed with a 0.1% sodium hydroxide solution and then twice with water to remove contaminant polymer product. The quenched samples were added to the washed filter which was centrifuged at 2000 x g for approximately 200 minutes at 4 °C; the flow-through was collected, and then dried overnight in a SpeedVac. Lastly, the dried samples were reconstituted in 70 µL of 1:1 0.1% formic acid in water: 0.1% formic acid in acetonitrile and transferred to a 96-well plate compatible with the Agilent LC-QTOF-MS system.
LC-MS Experimental 2.1.3 Samples were analyzed in both ESI positive and ESI negative modes on the Agilent QTOF Model G6530A, serial number US10162003, operated in high resolution, extended dynamic range mode. A Phenomenex Luna HILIC column; 100 x 3mm; P/N 00D-4449-Y0, 512587-1 was used for the analysis.
Data Processing 2.2
Data Preprocessing 2.2.1

9 APPROVED FOR PUBLIC RELEASE
This section outlines how the raw LC-MS data files were handled and evaluated during the data analysis process prior to statistical analysis for differential feature identification.
mzData File Creation 2.2.2 Agilent raw data files were converted to the open source mzData file format using Agilent MassHunter Qual software version 3.0. During the conversion process, de-isotoping (+1 charge state only) was performed on the centroid data and peaks with an absolute height more than 400 (approximately double the typical average instrument background level). The resulting mzData files contain centroid data of de-isotoped (+1 charge state only) peaks that have an absolute height greater than 400 counts.
Mass Feature Creation and Integration 2.2.3 Peak picking and feature creation were performed using the open source software library XCMS. Mass features (peaks) were detected using the centWave algorithm. Following peak picking deviations in retention times were corrected using the obiwarp algorithm that is based on a non-linear clustering approach to align LC-MS samples. Mass feature bins or groups were generated using a density based grouping algorithm. After the data had been grouped into mass features, missing features were integrated based on retention time and mass range of a feature bin using the iterative peak filling. Feature intensity is based on the Mexican hat integration values of the feature extracted ion chromatograms.
Adduct and Higher Charge State Isotope Filter 2.2.4 This algorithm evaluates feature groups and calculates the probability that related features are due to common adducts or isotopes using a correlation based method. The abundance levels for the related features are summed and the redundant features are removed from the XCMS dataset. Features that are the result of the combining isotopes and adducts contain an "_A" or "_I" in the feature ID.
Mass Defect Filter 2.2.5 The filter combines both linear and polygon based filters to exclude or include mass features. The filter was trained using all of the chemical formulas in the Stemina MetDB (metabolite database, Stemina Biomarker Discovery, Madison, WI) and creates a conservative filter that allows many endogenous metabolites, peptides, drugs, and drug metabolites through while removing features of unlikely biological origin.
Solvent/Extraction Blank Filter 2.2.6 The extraction blank filter removes ions associated with the sample extraction process and background ions present in the LC-MS system. Features were removed from the metabolomics dataset if the average in the experimental samples was less than five times the average abundance in the extraction blanks.

10 APPROVED FOR PUBLIC RELEASE
Contamination DB Filter 2.2.7 The contamination DB filter removes features with a mass match within 20 ppm to entries in Stemina's MetDB which contains a number of contaminants such as plasticizers and PEG compounds identified in previous studies. Features are removed without respect to retention time if they match a contaminant or a common charge specific adduct of a contaminant.
Statistical Analysis and Identification of Differential Features 2.3
Abundance and Reproducibility Filter 2.3.1 Prior to statistical analysis, features were filtered by factor (e.g. MP or MPO) to remove features that did not exhibit abundance greater than 20,000 in 65% of the LC-MS runs for at least one dose level (L, M, H) of at least one experimental compound (e.g. MP or MPO). This filter selects against spurious low abundance features at the level of detection that are not reproducibly measured, and features that may not have peak shapes amenable to reproducible detection and/or integration. This filter typically removes a large portion of the metabolomics dataset, and focuses the analysis on the most reliable and valuable features. For example a feature with abundance values greater than 20,000 in 70% of the negative mode LC-MS samples in one dose level of one experimental compound and abundance values greater than 20,000 in none of the other experimental compound by dose combinations would pass the filter because at least one experimental compound by dose factor satisfies the filter criteria.
Data Transformation and Normalization 2.3.2 All data was log base two transformed. Normalization for each factor level was performed by subtracting the column (sample) mean and dividing by the row (feature) standard deviation for each value.
Differential Analysis of Mass Features (Univariate) 2.3.3 Mass features were evaluated under the null hypothesis that no difference is present between the means of experimental classes and the alternative hypothesis that there is a difference between experimental classes. Welch two sample T-tests were performed as a parametric method that does not assume equal variances of the experimental classes. False discovery rates were controlled for multiple testing using the Benjamin–Hochberg (1995) method of p-value correction of the ANOVA and Welch T-tests.
Analysis of Mass Features (Multivariate) 2.3.4 Multivariate (or chemometric) analysis is the application of statistical/machine learning procedures to identify a group of features that have valuable experimental information. These methods differ from univariate methods in that they consider the importance of a given feature with respect to all of the mass features present in the experimental comparison. This information is typically displayed graphically by separation of groups, but the measure of a given features importance to the separation of the experimental classes in multivariate space is evaluated by

11 APPROVED FOR PUBLIC RELEASE
ranking a features contribution. Two different multivariate methods were applied to the data to evaluate the importance of features, a supervised method and an unsupervised method by dose and experimental compound. Principal component analysis (NIPALS PCA) was the unsupervised method used to evaluate the contribution of a feature by ranking the loadings values of features over three principle components. The supervised linear classifier method partial least squares-discriminant analysis (PLS-DA) was used to rank the importance of features based on their ability to discern experimental classes. The PLS-DA scored mass features based on the variable importance in projection (VIP) scores.
Initial Identification of Mass Features 2.3.5 Annotation of mass features was carried out by comparing the m/z mass values of the mass features to Stemina's MetDB containing records from multiple public databases such as HMDB, KEGG, PubChem Compound, and METLIN and company-specific metabolite data. The features were annotated with respect to the appropriate adducts for each ESI mode.
Selection of Interesting Features 2.3.6 Feature selection was performed on a compound by dose basis using Welch T-tests and fold changes. Features were selected for further evaluation if they had a Welch FDR<.05 with at least a 75% fold change. If a feature was selected as interesting in a drug or dose level comparison it was then evaluated experiment wide for fold changes. Following feature selection only significant features putatively annotated as human in origin and present on KEGG pathway diagrams were further evaluated. Pathway enrichment analysis was then performed on the selected features and features in pathways exhibiting a statistically significant enrichment were further evaluated for fold changes. These selection criteria focused the analysis on biochemical pathways.
Mass Features Selected for LC-MS-MS Confirmation 2.3.7 The set of mass features putatively annotated from experiments performed in FY11 and which passed several analytical criteria to be considered good candidates for LC-MS-MS structure confirmation are listed below. Table 1: Commercially available metabolites chosen for MS-MS structural confirmation and their pathways.
Metabolite Pathway Asymmetric Dimethylarginine (ADMA) NOS inhibitor
Arginine and Proline metabolism
Ornithine L-Proline Trans-4-Hydroxy-L-Proline 4-Acetamidobutamic acid cis-4-Hydroxy-D-proline Ornithine D-Arginine and D-Ornithine metabolism L-Cystathionine
Gly, Ser and Thr metabolism Choline 5-Aminolevulinic acid Choline Glycerophospholipid metabolism Ornithine Glutathione metabolism L-Cystathionine Cys and Met metabolism

12 APPROVED FOR PUBLIC RELEASE
LC-MS data acquisition 2.3.8
Samples were analyzed using electrospray ionization (ESI) in either positive or negative polarity (depending on the feature of interest), on an Agilent 6520 or 6540 QTOF instrument, operated in high resolution, extended dynamic range mode. The same MS source conditions and LC method and gradient were used as was employed in FY11. LC-MS and LC-MS-MS data were acquired using Agilent MassHunter QTOF Acquisition software B.04.0. MS-MS spectra were acquired in a targeted fashion by inputting the desired precursor ion for the feature of interest into the software. A narrow precursor quadrupole isolation window (1.3 Da) setting was used and MS-MS was performed across the entire chromatographic run, acquiring MS spectra every 5 sec to regain mass axis calibration using the internal reference ions. Data was acquired for three types of samples as shown in Table 2.
LC-MS Data analysis and confirmation criteria 2.3.9 Data analysis was performed using Agilent MassHunter Qualitative Analysis v B.04 software. The chemical structure of a mass feature of interest in a FY11 Study sample was considered a match with a reference standard if three criteria were satisfied: 1) The relative mass difference between the observed reference standard compound molecular ion and the molecular ion for the mass feature of interest are less than 20 ppm; 2) if the MS-MS spectral peaks resulting from the collision induced dissociation of the same precursor ion for both the reference standard compound and molecular ion for the mass feature of interest are similar in mass (within 40 ppm) and abundance; and 3) the retention time for the peak corresponding to the mass feature of interest and reference standard as shown in the extracted ion chromatogram (EIC) are within 30 seconds and the elution profile is similar for both the reference compound and mass feature of interest.
Table 2: MS-MS sample types and solvents. Sample type Sample solvent/matrix
1 Spent media from Phase 1 paraoxon or parathion dosed cells containing feature of interest mTeSR™1 cell media dosed with paraoxon or parathion
2 Reference standard - compound of interest Dissolved in mTeSR™1 cell media at 3 different concentrations
3 Reference standard - compound of interest Dissolved in 50-50 CAN:water with 0.1% formic acid
Preparation of LC-MS-MS Samples 2.3.10
LC-MS-MS acquisition was performed on stored samples from the FY11 Study that originally showed the greatest MS signal strength for the features of interest. Those samples were compared to reference standards for confirmation of identity. Sample Type 1: Prior to this analysis, samples from the FY11 Study had been stored at 4C sealed in the original injection vials (containing the solvent originally used for dissolution (1:1 0.1% formic acid in water: 0.1% formic acid in acetonitrile). Note: None of the features appeared to

13 APPROVED FOR PUBLIC RELEASE
show significant signal loss as after storage. Retention time shifts from the original FY11 study from a minimum of 0% to a maximum of 10% were observed. Sample Type 2: Reference standards were purchased for the mass features of interest and LC-MS-MS data was acquired for the reference standards at 3 different concentrations (0.001 mM, 0.01 mM and 0.1 mM) dissolved in mTeSR™1 cell media under the same LC gradient conditions as those originally used in the FY11 Study. Samples are dissolved in this media because the mTeSR™1 can affect the chromatography and the retention times of the features of interest. Three concentrations can be useful to help to distinguish which extracted ion chromatographic peaks correspond to the reference standard in cases where multiple peaks are present, for example those caused by isobaric compounds. Sample Type 3: LC-MS-MS data was acquired for the same reference standards, in this case at a concentration of 0.1 mM dissolved in 50:50 ACN:water with 0.1% formic acid. Data acquired under these conditions may show a different retention time, but a cleaner reference MS-MS spectrum can sometimes be obtained. For the reference standard samples dissolved in 50:50 ACN:water with 0.1% formic acid (sample type 3), data was acquired at three different collision energies (industry standard 10, 20 and 40V), then an optimal collision energy was determined from that data by examining the quality of the spectra, including matching the spectra to public databases when available. This optimal energy was then employed in the MS-MS of the reference standards dissolved in mTeSR™1 (sample type 2), and the original study samples (sample type 1).
Pathways Analysis 2.3.11 Pathways enrichment analysis was performed by mapping annotated mass features for each experimental compound to human metabolic pathways using KEGG compound IDs. Hypergeometric p-values and false discovery rates (FDR) were used to assign a quantitative measure of statistical significance to each pathway. Features derived from ESI negative and positive mode for each experimental compound were pooled for this analysis. False positive results can be generated by isobaric compounds that generate multiple "hits" in a pathway from the same mass, so unique masses instead of unique compound IDs were used for these calculations. The relevant parameters used to calculate hypergeometric p-values for each pathway were: the number of unique mass "hits", the number of unique masses in the pathway, and the total number of unique masses in all of the human pathways in the KEGG database. For each experimental compound, the p-values for the derived pathways were converted to FDR using the Benjamini and Hochberg (1995) correction.
High Content Image Analysis (HCA) 2.4
Cell Culture 2.4.1 WA09 hESC were purchased from the WiCell Institute, Madison, WI and were grown in mTeSR™1 medium (STEMCELL Technologies, Inc., BC, Canada) according to WiCell protocols.

14 APPROVED FOR PUBLIC RELEASE
Exposure 2.4.2 Undifferentiated hESC were seeded into 96 well plates and grown to small sized colonies. Colonies were exposed for either 4 or 24 hrs to mTeSR™1 (medium control), 0.1% DMSO (vehicle control), Rotenone (200 nM, 100 nM, 30nM, 10 nM, positive control), and MP (100 µ M, 50 µ M, 25 µ M, 10 µM, experimental compound) on day five after seeding. Final concentrations of MP and rotenone selected were those that would cause minimal or no cell death (FY11 results)
Imaging 2.4.3 In order to quantitate the ROS response of hESC following exposure to MPO and the positive control, rotenone, the Cellomics Oxidative Stress Kit Assay was used. Cells were stained live and fixed prior to imaging according to kit protocol. Slight modifications were made so that the assay was suitable for use with hESC. This assay allows visualization and quantitation of the incorporation of fluorescent ethidium in DNA resulting from ROS-induced oxidation of non-fluorescent dihydroethidium (DHE). The nuclear co-stain, Hoechst dye, was used to permit location of the nuclei. The assay was read on the Thermo Scientific Cellomics® ArrayScan® HCA Imager and quantitation software used calculate the relative ratios of fluorescent ethidium per cell nucleus.
RESULTS 3.
Metabolomics 3.1 Overall, the MS-MS spectra for the confirmed compounds in samples were high quality matches with the spectra for the reference standards.
Table 3: Summary of targeted compounds and their structure confirmation results. Some features showed different retention time from when first run in the FY11 Study (FY11) to Phase II (FY12), however those that were confirmed showed consistent retention times for the reference standards and the confirmed compounds
within the Phase II experiments. 2-oxo-5-aminovalerate was unavailable for purchase.
Targeted Compound Polarity Precursor Ion Exact
Mass
Phase I Feature
RT* (sec)
Ref Std [1] RT in mTeSR™
(sec)
Collision Energy
Confirmed by LC-MS-MS
Asymmetric Dimethylarginine Positive 203.1503 425 400 20 Yes
Ornithine Positive 133.0972 514 465 10 Yes L-Proline Positive 116.0706 511 465 20 Yes
**Trans-4-Hydroxy-L-Proline Negative 130.0505 83
405 20 No **Cis-4-hydroxy-D-proline 405 20 No
**5-Aminolevulinic acid 60-270 10 No 4-Acetamidobutanoic acid Positive 146.081 101 100 20 No (plausible)
L-Cystathionine Negative 221.0591 607 607 16 Yes Choline Positive 104.1075 50 55 20 Yes
* RT = Retention Time ** Isomers

15 APPROVED FOR PUBLIC RELEASE
4-Acetamidobutanoic acid was not confirmed, however is still plausible. The retention time and elution profile are similar to those of the reference standards, but the MS-MS spectra were only a partial match to the reference standard, showing additional peaks to those of the reference standard that could not be subtracted out. These additional peaks may be contributed by other isomer or interferent ions that are within the 1.3 Da precursor window.
Figure 1: This diagram is a portion of the Arginine and Proline KEGG pathway showing the location of three
of the five definitively identified metabolites in Phase II (FY12), asymmetric dimethylarginine (ADMA), L-proline, and ornithine. This pathway is involved with the response of cells to reactive oxygen species.

16 APPROVED FOR PUBLIC RELEASE
High Content Image Analysis 3.2
Hoechst stain (nuclei) DHE stain (ROS in DNA) Composite overlay
Figure 2: hESC grown in mTeSR™1 medium (Day 5, exposed for 24 hrs) and stained live using Cellomics’ Oxidative Stress Kit dyes. Exposure conditions for images: (Row A) mTeSR™1 medium (negative control),
(Row B) 0.1% DMSO (vehicle control), (Row C) 200nM Rotenone (positive control), and (Row D) 10uM MP (test compound).
Images on the left show cells stained with Hoechst stain, a nuclear stain which allows visualization of the nuclei for cell identification. Images in the middle show cells stained with dihydroethidium (DHE) which in the presence of ROS-induced oxidation converts to fluorescent ethidium and intercalates into the DNA allowing for visualization and quantitation of the presence of ROS. Images on the right are an overlay of the previous two images. The assay was visualized on the Thermo Scientific Cellomics® ArrayScan® HCA Imager and quantitation software used to calculate the relative ratios of fluorescent ethidium per cell nucleus. Red arrows point to the few cells exhibiting fluorescent ethidium. The results of this assay indicate that there is no significant difference in the level of ROS activity in the nuclei between the negative controls and either the positive control or the MP exposed cells.

17 APPROVED FOR PUBLIC RELEASE
CONCLUSIONS 4. Our results indicate that exposure to MP and MPO significantly and differentially impact the metabolism of hESC. The LC-MS-MS spectra were consistent with data for chemical reference standards and MS-MS spectra in public databases for five metabolites of interest including asymmetric dimethylarginine, L-proline, ornithine, choline and L-cystathionine. These metabolites were chosen due to their presence in metabolic pathways that involve human cells' response to oxidative stress. The Arginine and Proline metabolism pathway (Figure 1) showed the most perturbation with the most metabolites that passed the criteria for confirmation. One of the several metabolites that we confirmed as greater than two fold increased in this pathway in the secretome of MP and MPO exposed hESC was asymmetric dimethylarginine (ADMA). It is known that ADMA decreases all forms of nitric oxide synthase (NOS), and that a decrease in NOS leads to impaired neural tube development.[10] Our HCA experiments indicated that the cells did not change structurally, nor did they undergo senescence or programmed cell death in response to the MP exposures we examined. However, the cells’ ROS response to MP exposure was very different than anticipated. Much less fluorescence than predicted was observed and was scattered and punctuate throughout the cells (Figure 2). Pluripotent embryonic stem cells have been reported to be more resistant to damage by ROS than differentiated and immortalized adult cells.[11] However, the question remains as to how the reduction in the redundant systems for ROS protection (and stress defense in general) may play an increasing role in the toxicity pathway of MP and MPO in stem cells as those cells differentiate. These results have opened a new avenue toward a better understanding of how exposure to toxic industrial chemicals (such as MP and MPO) may interfere with early human embryonic growth and development.
ACKNOWLEDGEMENTS The authors would like to thank the In-house Laboratory Independent Research (ILIR) program for funding and Dr. A. Way Fountain, Dr. Laura Borland and Mr. Roy Thompson for administrative support.
REFERENCES [1] Slotkin, T.A.; et al. Environmental Health Perspectives 2007, 115 (1), p93-101. [2] Edwards, F.L.; et al. International Journal of Environmental Public Health 2005, 2 (3-4),
p430-441. [3] Galloway, T.; Handy, R. Ecotoxicology 2003, 12 (1-4), 345-363. [4] Johnson, F.O.; et al. Toxicological Sciences 2009, 109 (1), p132-142. [5] Cezar, G.; et al. Stem Cells and Development 2007, 16 (6), p869-892. [6] Isoda H.; et al. Environmental Science 2005, 12 (1), p9-19. [7] Calaf, G.M.; Roy, D. Molecular Medicine 2007, 13 (5-6), p255-265. [8] Hreljac, I.; et al. Environmental and Molecular Mutagenesis 2008, 49, p360-367. [9] Guizzetti, M.; et al. Toxicology 2005, 215, p182-190. [10] Nachmany, A.; et al. Journal of Neurochemistry 2006, 96 (1), p247-253 (2006). [11] Saretzki, G.; et al. Stem Cells 2008, 26, p455-464.

18 APPROVED FOR PUBLIC RELEASE
Tuning the Optical Properties of Multi-Layered Nanoparticles Using Plasmon-Exciton Coupling
Brendan G. DeLacy,a Wenjun Qiu,b Marin Soljačić,b Steven G. Johnson,c John D. Joannopoulosb a Edgewood Chemical Biological Center, Research & Technology Directorate, 5183 Blackhawk
Road, Aberdeen Proving Ground, MD 21010 b Department of Physics, Massachusetts Institute of Technology, Cambridge, MA 02139
c Department of Mathematics, Massachusetts Institute of Technology, Cambridge, MA 02139
ABSTRACT We detail the use of Mie theory and the Transfer Matrix Method to provide an analytical expression for describing the optical response of multilayered nanospheres. An optimization-based approach was then used to tailor the optical response of silver/silica multilayer nanospheres over the visible region. We show that the structure which provides the largest cross-section per volume/mass, averaged over a wide frequency range, is the silver coated silica sphere. Additionally, FY12 efforts in the fabrication and optical characterization of unique spherical double-shell structures are summarized. These efforts included the synthesis of particles containing a plasmonic silver core, an inner polyelectrolyte shell, and an outer excitonic shell of J-aggregate dye. Silver nanoparticles (NPs) were first coated via the layer-by-layer self-assembly of oppositely charged polyelectrolytes, with alternating layers of poly(diallyldimethyl ammonium chloride) (PDADMAC) and poly(styrene sulfonate) (PSS) consecutively adsorbed onto the particles. A cationic cyanine dye, 1,1-diethyl-2,2-cyanine iodide (PIC), was then self-assembled onto the outermost anionic PSS layer. Computational and experimental results indicate that the absorption wavelength of the J-aggregate form of the dye is dependent on both the distance of the dye layer from the silver core and the degree of dye aggregation.
INTRODUCTION 1. Nanoparticles with strong optical response, characterized by scattering, absorption and total cross-sections, have wide applications in biomedical imaging, photothermal therapy, and optical obscuration.[1-3] Different applications require different optical response properties. For instance, real-time biomedical imaging is based on large scattering cross-sections, while photothermal therapy requires nanoparticles with large absorption cross-sections and small scattering cross-sections. For obscuration applications,[4,5] the ideal nanoparticle should typically have large total cross-sections over the whole visible spectrum while keeping the volume or mass of nanoparticles as small as possible. The diversity and complexity of these requirements necessitate an engineering approach of nanoparticle design. Previous studies on the optical response of nanoparticles are mainly based on parametric approaches,[6-8] which works well for simple structures. However, when the structure becomes complicated and the number of design parameters increases, optimization becomes the preferable approach because it can efficiently explore the whole parameter space. Furthermore, because the optimization objective function can be an arbitrary transformation of the frequency-dependent cross-sections, this approach is very powerful in tailoring the broadband optical response of nanoparticles. For example, some applications may require that the optical resonance has both a

19 APPROVED FOR PUBLIC RELEASE
strong peak value and a wide bandwidth. This can be achieved by maximizing the average cross-section over the bandwidth of interest. For obscuration applications, we want the total cross-section to be consistently large over the whole visible spectrum. This is equivalent to maximizing the minimal cross-section over this spectrum. In this paper, we will use an optimization tool to tailor the optical response of multilayer nanospheres over wide frequency range of interest. Before we start, we need to select the material system. Nanoparticles composed of metal and dielectric materials support surface plasmons on the metal/dielectric interfaces and can strongly interact with light in the visible range.[9-13] At resonance, the cross-sections of these nanoparticles are much larger than their physical cross-sections, which make them superscatterers and superabsorbers.[9-12] Furthermore, the plasmon resonance frequency can be tuned by varying the physical structure of the nanoparticles. In order to be able to tailor the optical response of nanoparticles over a wide frequency range, we choose the metal/dielectric material system. For concreteness, we will focus on the silver/silica material system.
EXPERIMENTAL 2.
Calculation of Optical Response via Transfer Matrix Method 2.1
Figure 1: Schematic of an n layer nanosphere embedded in infinite dielectric medium. The outer radius and
dielectric function of individual layers are (Ri , εi ), i = 1, 2, ..., n. The dielectric function of the medium is εm. The solid lines represent an incident plane wave which contains incoming and outgoing waves. The dashed
line represents the scattered wave which only contains outgoing wave. In order to calculate the optical response of multilayered nanospheres, we generalize Mie theory and apply the Transfer Matrix Method.[13-15] For multilayer nanospheres, the electric field can be decomposed into orthogonal channels labeled by (𝜎, 𝑙), where 𝜎 takes TE or TM, and 𝑙 =1,2,3,…, n.[9-12] The scattering and absorption cross-sections are the sum of contributions from each channel, and the extinction cross-section is the sum of scattering and absorption cross-sections: 𝜎!"# =
!!
!!!!!!! 2𝑙 + 1 1− 𝑟!,!
! (1)
𝜎!"# =
!!
!!!!!!! 2𝑙 + 1 1− 𝑟!,!
! (2)
𝜎!"# = 𝜎!"# + 𝜎!"# (3)

20 APPROVED FOR PUBLIC RELEASE
In order to determine 𝑟!,!, the reflection coefficient, we decompose the electric field inside each shell into incoming and outgoing spherical waves with coefficients (𝐴!,𝐵!). The coefficients of adjacent shells are connected by the transfer matrix of that interface, whose elements are determined by the boundary condition of TE or TM modes:
𝐴!!!𝐵!!!
= 𝑀!!!,!𝐴!𝐵!
(4)
The transfer matrix of the whole system can be calculated by combining the transfer matrices of individual interfaces:
𝐴!!!𝐵!!!
= 𝑀!!!,𝑀!,!!!…𝑀!,!,𝑀!,!𝐴!𝐵!
= 𝑀 𝐴!𝐵!
(5)
Since the second kind of spherical Bessel function is singular at the origin, we can set 𝐴! = 𝐵! =1. Therefore: 𝑟! =
!!!!!!!!
= !!"!!!!!!!!!!"
(6)
Optical Response of Silver/Sililca Bilayer Nanospeheres 2.2 In this section, we analyze the optical response of silver/silica bilayer nanospheres as the building elements of multilayer structures. For silver, the complex dielectric function as a function of frequency is generated by linearly interpolating the experimental data.[16] For simplicity, the size dependence of Ag’s dielectric function is not taken into account. For silica, the dielectric function is taken as a constant ε = 2.1. There are two configurations of silver/silica bilayer nanoparticles, depending on the core material. First, we consider silica coated silver spheres. Colloidal suspensions of such nanoparticles were obtained from Nanocomposix (Nanocomposix Inc., San Diego, CA). Figure 2 shows the measured and calculated total cross-sections of the fabricated nanoparticles.
Figure 2: The total cross-section of silica coated silver spheres suspended in ethanol. The cross-section is normalized by volume (the left axis) and mass (the right axis). The insert is a TEM mage of the fabricated nanoparticles. The red line is the measured total cross-section. The black bar represents the standard deviations from eight transmission measurement on eight samples. The blue line is the transfer matrix calculation of the total cross-section with the radius of the silver core
sampled from the measured distribution and the thickness of the silica shell fixed at 25.3nm. The dielectric function of ethanol is taken as εm = 1.85.

21 APPROVED FOR PUBLIC RELEASE
The radius of the silver core has a distribution with mean 26.3nm and standard deviation 9.3nm. The thickness of the silica shell is around 25.3nm. The calculation agrees quite well with the measurement. The total cross-section peaks around 455nm. This peak comes from the l = 1 surface plasmon mode at the silver/silica boundary. The peak wavelength only varies slightly when the inner and outer radius change. For instance, consider a silica coated silver sphere suspended in air. Fixing the outer radius at 50nm, the peak wavelength varies from 410nm to 415nm when the inner radius varies from 5nm to 45nm. Fixing the aspect ratio 𝑅! 𝑅! at 0.8, the peak wavelength varies from 390nm to 480nm when the outer radius varies from 25nm to 75nm. In contrast, the surface plasmon resonance of the reverse configuration has great tunability over the visible range.[17–21] Consider a silver coated silica sphere suspended in air. Fixing the outer radius at 50nm, the peak wavelength varies from 405nm to 720nm when the inner radius varies from 5nm to 45nm. Besides the peak wavelength, the relative strength of scattering and absorption cross-sections in the total cross-section also vary. For [R1, R2] = [5nm, 50nm], the absorption cross-section accounts for 25% of the total cross-section at resonance. For [R1, R2] = [45nm, 50nm], this percentage rises to 60%. The tunability of the resonance wavelength and the tunability of the total cross-section composition make silver coated silica sphere a good candidate for achieving broadband optical response.
Optimization of Average Cross-Sections Over Wide Frequency Range 2.3 The optical response of silver/silica bilayer nanospheres indicates that increasing the number of metal/dielectric interfaces can provide additional tunability in the optical response. Using this insight, we aim to design silver/silica multilayer nanosphere with a large average cross-section over wide frequency range. The figure of merit (FOM) is the scattering, absorption, and total cross-section averaged over the target frequency range, normalized by volume or mass. 𝐹𝑂𝑀 = !
!!"#!!!"#𝜎!"#$%&'()*
!!"#!!"#
𝑑𝜔 (7) For concreteness, we take 400-600nm and 600-800nm as the target frequency range of interest. The structure under consideration is a multilayer nanosphere with alternating silver and silica layers (six layers in total). The design parameters are the thicknesses of individual layers. The lower bounds of the thicknesses are set to be zero. The upper bound of the allowed thickness is set to be a large value (1µm). Therefore, this general structure includes structures with fewer layers (one through five layers) as boundary points. We performed the optimization using numerical optimization package NLOPT.[22] Since this problem is non-convex, there are many local optima. To find the global optima in the design parameter space, we used the Multi-Level-Single-Linkage (MLSL) algorithm. This algorithm performs a sequence of local optimization from random points by a clustering heuristic that helps it to avoid repeated searches of the same optima.[23] The local optimization algorithm used here is BOBYQA.[24] This algorithm performs derivative-free bound-constrained optimization using an iteratively constructed quadratic approximation of the objective function. Figure 3 summarizes the optimization results.

22 APPROVED FOR PUBLIC RELEASE
Figure 3: Optimization of average cross-sections over wide frequency range. The structure under consideration is a
silver/silica multilayer nanosphere. The optimal structure found by the optimization engine is always silver coated silica sphere. For all subfigures, blue (red) lines show the optimized average cross-sections over the blue (red) shaded frequency range. (a, b, c) correspond to scattering, absorption and total cross-sections per volume respectively. (d, e, f) correspond
to scattering, absorption and total cross-sections per mass, respectively. The radius of the silica cores and the thickness of silver shells exhibiting the cross-sections shown above are given in Table 1.
In all cases, the optimal structure returned by the optimization engine is always a silver coated silica sphere. Although multilayer structures can offer greater tunability of the optical response, bilayer structures already maximize the average cross-section over wide frequency range. From Table 1, we can see that nanospheres with an outer radius around 70nm have the largest normalized average scattering cross-section. The wavelength of the scattering peak can be further tuned by varying the aspect ratio. For absorption cross-sections, our optimization engine found many local optima with approximately equal FOM’s. These local optima have the same aspect ratio, and the thickness of the silver layer varies from zero to several nanometers. This can be explained by the quasi-static approximation. The absorption cross-section of a nanoparticle can be written as σabs (ω )= ω Im[α (ω )], where α (ω ) is the polarizability.[25–27] When the nanoparticle diameter is much smaller than the wavelength, the quasi-static approximation is valid, under which the polarizability is proportional to the volume of the nanoparticle with the proportionality coefficient dependent on frequency and aspect ratio.[24] Therefore, the normalized absorption cross-section averaged over a frequency range is only determined by the aspect ratio and independent of the nanoparticle diameter as long as the nanoparticle diameter is much smaller than the wavelength. In Table 1, the thickness of the silver layer is set to be ≥ 2nm. Nanospheres with thinner silver layers have approximately the same normalized average absorption cross-section but are difficult to fabricate. The structures that give the largest average scattering and absorption cross- sections are quite different. Since the FOM of the absorption cross-section is about twice as large as the FOM of the scattering cross-section, the structure that gives the largest average total cross-section is essentially identical to the structure providing the largest average absorption cross-section. The structures given in Table 1 are superscatters and superabsorbers. For instance, the structure with [R, T] = [60.40nm, 8.68nm] has an average scattering cross-section of 8.65m2/g over 600-800nm, while its physical cross-section is only

23 APPROVED FOR PUBLIC RELEASE
2.07m2/g. The structure with [R, T ] = [18.09nm, 2.00nm] provides an average total cross-section of 17.52m2/g over 600-800nm, which means that only 1g of such nanoparticles, when fully dispersed, can obscure an area as large as 17.52m2 .
Table 1: Optimization of Average Cross-sections (Normalized by Volume)
cross-section range (nm) silica (nm) silver (nm) FOM (1/nm)
Σsca 400-600 600-800
31.25 60.32
26.65 9.65
0.0486 0.0464
Σabs 400-600 600-800
6.07 14.80
2.00 2.00
0.0767 0.0817
Σtot 400-600 600-800
6.09 16.12
2.00 2.00
0.0773 0.0846
(Normalized by Mass) cross-section range (nm) silica (nm) silver (nm) FOM (m2 /g)
σsca 400-600 600-800
38.53 60.40
17.88 8.68
5.64 8.65
σabs 400-600 600-800
6.54 17.89
2.00 2.00
10.87 16.71
σtot 400-600 600-800
8.71 18.09
2.00 2.00
10.93 17.52
Fabrication of Double-Shell Nanospheres 2.4
Multi-layered nanoparticles, composed of both a noble metal and a J-aggregate dye, provide a unique framework for studying plasmon-exciton interactions. In this study, we report the formation of double-shell nanostructures in which a cyanine dye, 1,1’-diethyl-2,2’-cyanine iodide (PIC), was adsorbed onto an Ag core/polyelectrolyte shell structure. A central aim of this study was to first determine the impact of the polyelectrolyte shell chemistry on the degree of J-aggregate formation. A second goal was to determine the impact of the polyelectrolyte layer thickness on plasmon-exciton coupling exhibited by the double shell structures. To achieve this, alternating layers of poly(diallyldimethyl ammonium chloride) (PDADMAC) and poly(styrene sulfonate) (PSS) were self-assembled onto silver nanoparticles. The layer-by-layer self-assembly of a polyelectrolytes has been used extensively as a means of coating and functionalizing colloidal particles.[28-29] The thickness of the polyelectrolyte spacer layer was controlled by varying the number of PDADMAC/PSS layers that were adsorbed. Subsequently, a cationic form of PIC was adsorbed onto the outermost anionic PSS layer. A schematic of the double-shell structure is provided in Figure 4A. Figure 4B provides a schematic of the electrostatic adsorption of 1,1’-diethyl-2,2-cyanine (PIC) J-aggregates at the surface of a PDADMAC/PSS coated silver nanoparticle.

24 APPROVED FOR PUBLIC RELEASE
Figure 4: Schematic of (A) a double-shell structure composed of a silver metallic core, a spacer layer
consisting of alternating layers PDADMAC/PSS polyelectrolytes, and a 1,1’-diethyl-2,2’-cyanine iodide (PIC) exterior layer. The outer radius and dielectric function of individual layers are (Ri, εi, i = 1,2,…, n). The
dielectric function of the medium is εm. (B) The electrostatic adsorption of 1,1’-diethyl-2,2-cyanine (PIC) J-aggregates onto a silver core/polyelectrolyte spacer. Na+, Cl-, and I- ions are not drawn for clarity. Figures are
not drawn to scale.
Instrumentation and Measurements 2.4.1 UV/Vis transmission spectra of the colloidal suspensions were measured in a quartz cuvette (10 mm optical path length) using a V-670 spectrophotometer (JASCO Co.). Spectra were measured from 190 nm to 800 nm. Transmission electron microscopy (TEM) images were observed in a FEI (Hillsboro, OR) Tecnai 12 TWIN TEM operating at 100kV. Samples were prepared by placing 5.0 µL of the particle solution onto a freshly ionized 300 copper mesh carbon coated/formvar grid. The samples were allowed to dry completely. Images were collected using an Olympus Soft Imaging System (Lakeland, CO) Megaview III digital camera. Figures were assembled in Adobe Photoshop using only linear adjustments in brightness and contrast. For the determination of zeta-potential, a Zetasizer Nano ZS (Malvern Instruments) was used to measure the electrophoretic mobilities of colloidal particles. The mobility µ was converted into a ζ -potential using the Smoluchowski relation (ζ = µη/ε), where η is the viscosity of the solvent and ε is the permittivity of the solvent). The hydrodynamic radius was also determined using the Zetasizer Nano ZS instrument. This measurement is a dynamic light scattering technique that measures the diffusion of particles moving under Brownian motion. Size and size distribution are determined from the Stokes-Einstein relationship.
Synthesis of Double-Shell Structures 2.4.2 Silver core nanoparticles: Silver nanoparticles were prepared using a modified procedure by Lee and Meisel in which Ag+ ions are chemically reduced in aqueous solution.[30] Approximately 110 mg of AgNO3 were dissolved in 400 mL deionized H2O (18MΩ) and placed in a 1L 3-neck flask. A condenser tube (250 mm jacket length) was placed on the center neck of the flask to minimize evaporation losses. An addition funnel, containing 10 mL of 1% (wt/wt) trisodium citrate solution, was attached to a second neck of the flask. The solution was magnetically stirred
r1
r2
r3
Metallic Core
Polyelectrolyte Spacer Layer
(varying thickness)
PIC J-aggregate
Shell
A B N
N CH3
H3C
Ag Core
N
N
CH3
CH3
N
NCH3
CH3
N
N CH3
CH3
N
N
H3C
H3C
N
NH3C
H3C
N
NH3C
H3C
N
NH3C
CH3
Cyanine Dye
NCH3
H3C
NH3C
H3C
NH3C
H3C
NH3CCH3
SO3-
SO3-
SO3-
SO3-
Polystyrene Sulfonate (PSS)PolydiallylDimethylAmmoniumChloride(PDADMAC)
ε1ε2ε3
εm

25 APPROVED FOR PUBLIC RELEASE
and heated to 100°C using a heating jacket and temperature controller (Glass-Col, Terre Haute, IN) while refluxing. Once the boiling point was reached, the trisodium citrate solution was slowly added drop-wise. The mixture was heated and stirred for an additional hour at 100°C. The solution was then cooled to room temperature and stirring continued for an additional hour. Assuming a 100% yield, the silver colloid had an approximate concentration of 0.3 mg/mL. Figure 5 (on left) displays a TEM image of silver nanoparticles that were fabricated using the citrate reduction method. Most of the particles have a spherical shape with a relatively narrow size distribution, although a small amount of non-spherical particles are observed. Particle size measurements of the colloidal silver yielded an average particle size of 54.5 nm with a standard deviation of 9.8 nm.
Figure 5: (Left) TEM images of silver nanoparticles fabricated using the citrate reduction method. (Right)
Transmission spectra of solutions containing 0.022 mg/mL silver sol (solid line) and 0.023 mg/mL PIC (broken line). λmax = 442 nm for the silver sol. λmax = 523 nm for the PIC solution.
(PIC) Standard Solution: 25 mg PIC standard were placed in a 100 mL volumetric flask, and diluted to ~75% volume with phosphate buffer (pH = 6.0) followed by sonication and vigorous mixing. The flask was subsequently diluted to 100 mL with phosphate buffer. Figure 5 displays the transmission spectra of the PIC standard. For spectral comparison, the transmission spectrum of colloidal silver standard (0.022 mg/mL) is also displayed in Figure 5 (on right). An absorption maximum at λmax = 523 nm is observed for the monomer form of the dye. Of particular note is the absence of the PIC J-aggregate peak, which is commonly observed at or near 575 nm. This observation is consistent with published data, as the concentration of the PIC standard in this solution is too low for the formation of the J-aggregate. Silver Core – Polyelectrolyte Shell Nanoparticle Preparation: The adsorption of multiple polyelectrolyte layers was achieved by exposing the silver sol to supersaturated concentrations of polyelectrolytes. First, 10 mL Ag sol were transferred to a 50 mL polypropylene centrifuge tube. The sample was centrifuged at 4000 RPM for 15 minutes and the supernatant containing excess citrate was removed. 5 mL H2O were then added to the tube followed by sonication. Next, 5 mL PDADMAC (1 mg/mL, 0.01 M NaCl) were added, and the suspension was vigorously mixed for 1 minute. The solution was allowed to stand for 30 minutes. Centrifugation (4000 RPM, 15 minutes) was used to remove the supernatant and excess polymer. Two cycles of a 10 mL water addition, followed by sonication, centrifugation, and supernatant removal were performed to ensure the removal of excess polymer. The same solution concentration and procedures used for the adsorption of PDADMAC were used for adsorption of additional polyelectrolyte layers (i.e.

26 APPROVED FOR PUBLIC RELEASE
PSS, 1 mg/mL, 0.01 M NaCl). Combinations of 2, 4, and 6 polyelectrolyte layers, i.e. (PDADMAC/PSS)1,2,3, were adsorbed onto the silver particles. The Ag core – polyelectrolyte shell nanoparticles were resuspended in 5 mL water with sonication. Ag/polyelectrolyte/PIC Composite Nanoparticles 5 mL of Ag Core: Polyelectrolyte shell nanoparticles in water were placed in a 50 mL polypropylene centrifuge tube. 5 mL of PIC standard were added followed by vigorous mixing and sonication. The samples sat for 24 hours to ensure adequate adsorption and aggregation of the dye onto the surface of the particles. The following day, the colloidal suspensions were centrifuged at 4000 RPM for 15 minutes, and the supernatant discarded for removal of excess PIC standard. The solid nanoparticles were washed with 10 mL water followed by sonication, centrifugation, and supernatant removal to ensure the removal of excess PIC. The particles were then resuspended in 5 mL water and sonicated. Finally, excessively large NPs were removed using a 0.22 µm Millex GP syringe filter. This procedure was repeated for each of the Ag/polyelectrolyte/PIC NP combinations.
Double-Shell Nanosphere Results 2.5 Insertion of a polyelectrolyte layer between the Ag core and the cyanine dye was a central theme in this study. Specifically, our goal was to demonstrate the formation of the PIC J-aggregate on a silver core – polyelectrolyte shell composite nanoparticle. It is well known that the layer-by-layer self-assembly of polyelectrolytes on colloidal particles is an established technique for building stable and functionalized multilayers on nanoparticles. The irreversible electrostatic interaction between cationic and anionic polyelectrolyte layers is widely thought to be responsible for the stabilization of these films. In our study, the sequential addition of PDADMAC and PSS, with PSS forming the outermost polyelectrolyte layer, was used to control the thickness of the polyelectrolyte layer and to render the outer surface of the particles with a negative charge. Such a scenario would promote the dispersion of these particles in aqueous solution and the adsorption and J-aggregation of the cationic PIC dye onto the surface of the particles. Colloidal suspensions of Ag core – polyelectrolyte shell nanoparticles were exposed to PIC dye for 24 hours. The impact of polyelectrolyte layer thickness was explored by adsorbing PIC to Ag/polyelectrolyte composite nanoparticles composed of 1 PDADMAC/PSS bi-layer, 2 PDADMAC/PSS bi-layers, and 3 PDADMAC/PSS bi-layers. Figure 6 displays the transmission spectra of these experiments. The spectra is characterized by the formation of a red-shifted J-aggregate peak at 581 nm, 581 nm, and 579 nm for Ag particles coated with 1 (PDADMAC/PSS), 2 (PDADMAC/PSS), and 3 (PDADMAC/PSS) shells, respectively.

27 APPROVED FOR PUBLIC RELEASE
Figure 6: Transmission spectra of PIC coated Ag core-polyelectrolyte shell nanoparticles, with varying
polyelectrolyte layer thickness. 1 (PDADMAC/PSS), 2 (PDADMAC/PSS), and 3 (PDADMAC/PSS) correspond to 2, 4, and 6 alternating layers of PDADMAC and PSS, respectively. Formation of the red-
shifted J-aggregate peak was observed at 581 nm, 581 nm, and 579 nm for the Ag/1(PDADMAC/PSS)/PIC, Ag/2(PDADMAC/PSS)/PIC, and Ag/3(PDADMAC/PSS)/PIC nanoparticles, respectively.
These results suggest that PIC is fully aggregated, since the J-aggregate peak is observed at wavelengths greater than 575 nm. 575 nm is the wavelength at which the fully J-aggregated form of PIC is commonly observed, while it is also the wavelength that is theoretically predicted.[31-32]
Furthermore, the results suggest that plasmon-exciton interactions between the silver particles and the J-aggregate shell play a role in the additional red-shift in the J-aggregate absorption peak. This assumption is based on the observation that the J-aggregate peak for Ag/1(PDADMAC/PSS) and Ag/2(PDADMAC/PSS) was red-shifted to a greater extent than for Ag/3(PDADMAC/PSS). This observation corresponds to the fact that plasmon-exciton interactions are enhanced as the distance between the J-aggregate shell and the Ag core particles is diminished. Scattering and absorption cross-sections of Ag/(PDADMAC/PSS)/PIC nanoparticle composites were calculated in order to explain the main absorption features of the experimental data obtained in Figure 6. The method described in Section 2 was used to calculate these cross-sections. The dielectric constants of the PDADMAC and PSS layers were based on literature results and assumed to be 2.25 and 2.56, respectively.[33] Assuming a silver core of 54.5 nm (with SD = 9.8 nm) and a J-aggregate dye outer layer thickness of 5 nm, the calculated extinction of the silver/polyelectrolyte/PIC double shell nanostructures were calculated for a range of spacer layer thicknesses. Using Equation 8, the dielectric constant of the J-aggregate layer was calculated.[31] 𝜀 = 𝜀! − 2𝑉𝑐𝑜𝑠
!!!!!
(8)
An oscillator strength (f) of 0.35 and a relaxation rate (γ) of 0.015 were assumed in the calculations. Results of these calculations are provided in Figure 7 and demonstrate the
0
10
20
30
40
50
60
70
80
90
100
200 300 400 500 600 700 800
% Transmittance
Wavelength [nm]
Ag/1(PDADMAC/PSS)/PIC (~0.018 mg/mL Ag)
Ag/2(PDADMAC/PSS)/PIC (~0.011 mg/mL Ag)
Ag/3(PDADMAC/PSS)/PIC (~0.007 mg/mL Ag)

28 APPROVED FOR PUBLIC RELEASE
dependence of coupling strength and shift of the exciton frequency on spacer layer thickness. The red-shifted energy of the J-aggregate peak increases as the spacer layer thickness is minimized, i.e. the plasmon-exciton interaction is maximized. The theoretical absorption wavelength of the J-aggregate peak had the strongest correlation with experimental results when a PDADMAC/PSS bi-layer thickness of 1 nm was assumed, i.e. polyelectrolyte layer thicknesses of 1 nm, 2 nm, and 3 nm were used for particles containing 1, 2, and 3 (PDADMAC/PSS) bi-layers, respectively. This calculation is consistent for similar structures, in which the thickness of the polyelectrolyte bi-layers was determined to be 1.7 to 3.0 nm.[28,34]
Figure 7: Extinction cross-section results for the impact of spacer layer thickness on the absorption
wavelength of the J-aggregate peak. An oscillation strength (f) of 0.35 and a relaxation rate (γ) of 0.015 were assumed in the calculations.
CONCLUSIONS 3.
Computationally, we report the use of optimization tools to tailor the optical response of silver/silica multilayer spheres. We show that the structure that gives the largest average cross- section over wide frequency range is the bilayer structure with a silver shell. Because the FOM can be an arbitrary function of the frequency dependent cross-sections, the optimization approach described here can be used to design nanoparticles with more complicated optical response. Experimentally, novel composite nanoparticles composed of an Ag core, a polyelectrolyte spacer layer, and a PIC exterior have been synthesized. The optical properties of the composite nanoparticles in aqueous solution were measured in the UV/Visible regions. Transmission spectra of the colloidal nanoparticles indicated that PDADMAC/PSS spacer layers promote the J-aggregation of PIC. A 24 hour exposure of PIC to a colloidal suspension of silver core – polyelectrolyte shell nanoparticles yielded the full aggregation of PIC. The observed wavelength of absorption for the J-aggregate in these composites was observed at 579-581 nm, indicating the formation of a fully aggregated dye on the surface of the composites. The additional red-shift in energy that was observed may be explained by the plasmon-exciton interaction between the silver core and the J-aggregate exterior. Based on theoretical calculations of the absorption and scattering cross-sections of these composite nanoparticles along with the experimental observations, it is concluded that the J-aggregate absorption wavelength in these composites is a

29 APPROVED FOR PUBLIC RELEASE
function of 1) the degree of dye aggregation and 2) the thickness of the polyelectrolyte spacer layer. These observations provide a foundation for future research which involves tuning the optical properties of Ag-PIC composites through the use of polyelectrolyte or other spacer layers.
ACKNOWLEDGEMENTS This research was funded by the Department of the Army Basic Research Program and sponsored by the Edgewood Chemical Biological Center. Support was also provided by the U.S. Army Research Office under contract W911NF-07-D-0004.
REFERENCES [1] Pu, Y.; et al. Physical Review Letters 2010, 104, p207402. [2] Huang, X.; et al. Advanced Materials 2009, 21, p4880-4910. [3] Noguez, C. Journal of Physical Chemistry C 2007, 111, p3806-3819. [4] Alyones, S.; et al. IEEE Transactions on Antennas and Propagation 2007, 55, p1856-1861. [5] Bruce, C.W.; Alyones, S. Applied Optics 2009, 48, p5095-5098. [6] Jain, P.K.; et al. Journal of Physical Chemistry B 2006, 110, p7238-7248. [7] Zhu, J.; et al. Applied Physics Letters 2011, 99, p101901. [8] Roma´n-Vela´zquez, C.E.; Noguez, C. Journal of Chemical Physics 2011, 134, p044116. [9] Hamam, R.E.; et al. Physics Review A 2007, 75, p053801. [10] Ruan, Z.; Fan, S. Physics Review Letters 2010, 105, p013901. [11] Ruan, Z.; Fan, S. Journal of Physical Chemistry C 2010, 114, p7324-7329. [12] Ruan, Z.; Fan, S. Applied Physics Letters 2011, 98, p043101. [13] Qiu, W.; et al. Optics Express 2012, 20 (16), p18494. [14] Hulst, Van de. H.C. Light Scattering by Small Particles; Dover Publications Inc.: New
York, 1981. [15] Bohren, C.; Huffman, D. Absorption and Scattering of Light by Small Particles; John
Wiley & Sons: Germany, 1983. [16] Palik, E.D. Handbook of Optical Constants of Solids; Academic Press: New York, 1985. [17] Oldenburg, S.; et al. Chemical Physics Letters 1998, 288, p243-247. [18] Prodan, E.; Nordlander, P. Nano Letters 2003, 3, p543-547. [19] Prodan, E.; et al. Science 2003, 302, p419-422. [20] Bardhan, R.; et al. ACS Nano 2010, 4, p6169-6179. [21] Bardhan, R.; et al. Journal of Physical Chemistry C 2010, 114, p7378-7383. [22] Johnson, S.G. The nlopt nonlinear optimization package. [http://ab-initio.mit.edu/nlopt] [23] Kucherenko, S.; Sytsko, Y. Computational Optimization and Applications 2005, 30, p297-
318. [24] Powell, M.J.D. The bobyqa algorithm for bound constrained optimization without
derivatives; Technical Report; Department of Applied Mathematics and Theoretical Physics: Cambridge, England, 2009.
[25] Fofang, N.T.; et al. Nano Letters 2008, 8, p3481-3487. [26] Yoshida, A.; Kometani, N. Journal of Chemical Physics C 2010, 114, p2867-2872. [27] Lebedev, V.S.; et al. Quantum Electronics 2010, 40, p246-248. [28] Sukhorukov, G.B.; et al. Colloids and Surfaces A: Physicochemical and Engineering
Aspects 1998, 137, p253.

30 APPROVED FOR PUBLIC RELEASE
[29] Sukhorukov, G.B.; et al. Polymers for Advanced Technologies 1998, 9, p759. [30] Lee, P.C.; Meisel, D. Journal of Physical Chemistry 1982, 86, p3391. [31] Kobayashi, T. J-Aggregates; World Scientific Publishing Co. Pte. Ltd.: Singapore, 1996. [32] Dixon, A.; et al. American Journal of Undergraduate Research 2005, 3 (4), p29. [33] Zong, Y.; et al. Analytical Chemistry 2008, 80, p5246. [34] Bradley, M.S.; et al. Advanced Materials 2005, 17, p1881.

31 APPROVED FOR PUBLIC RELEASE
Highly Ordered Nanowire Arrays based on Polydiacetylene for Sensing Applications
Kato L. Killops,a Luis M. Camposb
a Edgewood Chemical Biological Center, Research & Technology Directorate, 5183 Blackhawk Road, Aberdeen Proving Ground, MD 21010
b Department of Chemistry, Columbia University, New York, NY 10027
INTRODUCTION 1. The Warfighter in the field is exposed to a diverse range of hazards such as, explosives, toxic chemicals, biological pathogens and fatigue, which can significantly compromise their health and cognitive abilities to perform complex operations. This high risk environment places heavy demand on the development of robust abiotic sensing materials that display the sensitivity, required for detecting threats at low concentrations, and selectivity, in order to distinguish harmful substances from their less toxic analogues. To address this need, recent advances in nanotechnology and self-assembling materials, specifically in the area of conjugated polymers,[1] have led to miniaturization and signal amplification for sensing applications. There has been a wealth of research dedicated to the study of polydiacetylene (PDA) for use as a colorimetric sensing material.[2,3] The conjugated backbone of PDA is responsible for a blue to red shift in light absorption upon exposure to external stimuli such as temperature,[4] pH,[5] mechanical stress,[6] electric current,[7] and binding of analytes.[8,9] This colorimetric response can be detected using standard UV-visible absorption spectroscopy techniques. While this stimulus sensitivity is highly desirable in sensing applications, it also precludes the use of PDA for rugged conditions where it is critical to avoid false positives due to environmental exposure. Furthermore, it is known that PDA additionally possesses luminescent and conductive properties, however, these attributes have not been previously combined to further increase the utility of PDA as a sensing platform.
Figure 1: Schematic representation of diacetylene polymer self-assembled in a thin film.
To circumvent these issues and capitalize on the multifaceted response of PDA, we’ve developed a block copolymer (BCP) based approach where diacetylene (DA) units are incorporated in a comb configuration along the backbone. We anticipate that by incorporating DA into a phase separating BCP, we can achieve long-range order coupled with enhanced stability derived from the DA being attached to a polymer backbone. Furthermore, employing a macromolecule provides the opportunity for adding diverse functionality via a post-polymerization modification

32 APPROVED FOR PUBLIC RELEASE
strategy. Herein, we present the synthesis, characterization, and preliminary self-assembly results for DA-containing block copolymers and random copolymers.
EXPERIMENTAL 2.
Materials 2.1 Reagents and solvents were purchased from Sigma-Aldrich and used without further purification, unless otherwise noted. 10,12-pentacosadiynoic acid (PCDA) was purchased from GFS Chemicals. N-hydroxysuccinimide was purchased from Acros Organics. Styrene and methyl methacrylate were purified over a column of neutral alumina.
Instrumentation 2.2 NMR (1H, 13C) spectra were recorded on a Bruker DMX-300 MHz spectrometer at room temperature. Chemical shifts are reported in parts per million (δ) relative to CHCl3 (7.24 ppm for 1H), DMSO (2.50 ppm for 1H), or DMF (8.03 ppm for 1H) as internal reference. Gel permeation chromatography was performed in CHCl3 on a Malvern Viscotek 270max equipped with a refractive index detector, UV-photodiode array, viscometer, and low-angle and right-angle light scattering detectors. Fourier transformed infrared (FT-IR) spectroscopy was performed using a Bruker Tensor 27 FT-IR spectrometer equipped with a Bruker Platinum ATR accessory. Spectra are the sum of 16 scans acquired at a resolution of 4 cm-1. Atomic force microscopy was conducted on Bruker Icon system in tapping mode. AFM data was processed using the Nanoscope Analysis software. Ultraviolet (UV) light irradiation of the samples was carried out with a 15 W UVP Black Ray UV bench lamp XX-15 L, fitted with 254 nm bulbs.
Synthesis 2.3 N-methacryloxysuccinamide (NMAOS) was synthesized according to published procedures.[10] The synthesis of 2,2’-(ethylene dioxy)-bis-ethylamine-functional PCDA (PCDA-EDEA) and ethylene diamine-functional PCDA (EDA-PCDA) were synthesized according to literature methods.[11] All DA-functional molecules and macromolecules were stored in amber vials away from light to prevent premature polymerization.
15k Polystyrene Macroinitiator 2.3.1 To a round bottomed flask were added 8.507g (81.7mmol) styrene, 90 mg (0.46 mmol) ethyl 2-bromoisobutyrate, and 189 mg (1.09 mmol) PMDETA. The solution was sealed and degassed by three freeze-pump-thaw cycles, frozen, and CuBr (66 mg, 0.46 mmol) was added under positive N2 pressure. The mixture was heated to 90°C for 4 hours with stirring, after which, the solution was diluted with THF and run over a plug of neutral alumina before precipitating twice into methanol. Dried in vacuo; recovered 3.59 g white powder; MWNMR=14580.
5k Polystyrene Macroinitiator 2.3.2 This was synthesized analogously to 15k PS. MWNMR=6950; MWGPC=5200, PDI=1.14.

33 APPROVED FOR PUBLIC RELEASE
PS-b-P(MMA-co-NMAOS) 2.3.3
To a round bottomed flask were added 5k PS macroinitiator (1.04g, 0.208 mmol), NMAOS (686 mg, 3.74 mmol), MMA (384 mg, 3.83 mmol), PMDETA (37 mg, 0.21 mmol), and 1 mL of anisole. The mixture was sealed, stirred to dissolve solids, and degassed by three freeze-pump-thaw cycles. The CuBr (44 mg, 0.31 mmol) was added under positive N2 pressure, and the mixture was heated to 90°C for 30 min. The mixture was diluted with dichloromethane and run over an alumina plug, followed by concentration and two precipitations into methanol. Recovered 1.51 g off-white powder. MWNMR=8950; MWGPC=8090, PDI=1.27.
PS-b-P(NMAOS) (large block) 2.3.4 To a round bottomed flask were added 15k PS macroinitiator (890 mg, 5.93x10⁻² mmol), NMAOS (476 mg, 2.60 mmol), PMDETA (39 mg, 0.23 mmol), and 2 mL of anisole. The mixture was sealed, stirred to dissolve solids, and degassed by three freeze-pump-thaw cycles. The CuBr (16 mg, 0.11 mmol) was added under positive N2 pressure, and the mixture was heated to 110°C overnight. The mixture was diluted with dichloromethane and run over an alumina plug, followed by concentration and two precipitations into methanol. Recovered 970 mg off-white powder. MWNMR=17330.
PS-b-P(NMAOS) (small block) 2.3.5 Prepared analogously to large block. MWNMR=15900.
Functionalization of NMAOS Groups with Amine-Functional DA 2.3.6 The polymer was dissolved in THF and 1 eq. (to NMAOS) triethylamine was added. A solution of DA-amine (2-3 eq. to NMAOS) in THF was added slowly to the polymer solution. NHS precipitated out of solution as the reaction progressed. The solution was heated at 60°C for 3 hours, before cooling, filtering NHS solid, concentrating, and precipitating into methanol. Conversions were approximated from the disappearance of the peak at 2.8 ppm from the methylene protons on NMAOS in 1H NMR.
RESULTS AND DISCUSSION 3. With the goals of enhanced stability and hierarchical, long-range self-assembly in mind, commercially available PCDA was appended to a BCP backbone. Initial efforts focused on a chain-end functional BCP system well-known to phase separate, polystyrene-b-polylactic acid. In this strategy, an alkyne-functional diacetylene [12] was attached to the chain end of the azide-functional BCP [13] using copper-catalyzed alkyne-azide cycloaddition, or click reaction. It was ultimately determined that the volume fraction of DA was too low to promote ordered phase separation at the chain end, and an alternate strategy was employed. In order to increase the volume fraction of the DA component, and keep the DA molecules in a preferred orientation for topochemical polymerization, a comb-coil architecture was devised. In

34 APPROVED FOR PUBLIC RELEASE
this strategy, DA units are grafted directly to the backbone of a homopolymer, random copolymer, or block copolymer. A reactive monomer, N-methacryloxysuccinimide (NMAOS), is easily homo- or copolymerized using standard atom transfer radical polymerization (ATRP) techniques.[10] The NMAOS monomer was made in one step from commercially available starting materials in multigram quantities. There have been numerous efforts, both experimental and theoretical, focusing on the comb-coil architecture and self-assembly behavior. Most of these studies have dealt with liquid crystalline side chains,[14,15] but analogies can be drawn to our DA-side chain system in terms of volume fraction, backbone rigidity, and to some extent, phase behavior. In this effort, several different architectures were explored in parallel in order to elucidate the most promising structure to promote phase separation and long range order (Figure 2).
Figure 2: Chemical structures and schematic representations of diacetylene polymer architectures.
ATRP was used to synthesize PS macroinitiators and grow the NMAOS and PMMA-co-NMAOS blocks. Two amine-functional PCDA molecules [11] were synthesized: one with a bis(ethylene oxide) spacer, and one ethylene diamine (shown in Figure 2). The NMAOS groups on the polymer backbone were easily modified via nucleophilic substitution by the primary DA amines, with conversions ca. 90%, as steric hindrance prevented all succinimidic esters from being displaced. The DA-substituted polymers are denoted poly(amido diacetylene methacrylate) (PADA). The self-assembly properties of the DA-containing macromolecules were evaluated by spin-coating thin films from solution. Films ranging in thickness from 40 to 70 nm were cast from 1 wt./wt.% solutions. Solvents tested include THF, CHCl3, toluene, and chlorobenzene. THF, CHCl3, and toluene were found to preferentially solvate the styrene block, leading to DA crystal formation in the as-cast films. Furthermore, the spin-coating process was found to be very sensitive to relative humidity levels, with humidity above ca. 40% resulting in rough films with macrophase-separated domains. Chlorobenzene was found to solvate both blocks and suppress crystal formation and macrophase separation; smooth films resulted. Since many block copolymers that are prone to phase separation do not form ordered structures directly from spin coating, additional treatments are often needed to promote chain mobility to achieve ordered arrays.[16] Although thermal annealing at a temperature greater than the glass transition temperature of the BCP is a common and effective technique to promote microphase

35 APPROVED FOR PUBLIC RELEASE
separation, the polymers currently under investigation degraded at temperatures exceeding 100°C. Alternatively, solvent annealing provides chain mobility by swelling the polymer film without the possibility of thermal degradation. Polymer films in this study have been annealed in a variety of solvent vapors including THF, CHCl3, and toluene.
Figure 3: Atomic Force Microscopy images of DA polymer thin films: (a, c) PMMA-co-PADA and (b, d) PS-
b-PADA (small block). Top shows height, bottom shows phase, and all scale bars 1µm. Atomic force microscopy (AFM) provides a means to image the microstructure of thin films without the need for additional sample preparation. Tapping mode AFM can elucidate differences in elastic modulus, thus can image nanoscale phase separation for BCP materials having distinct moduli. Since the DA component is expected to be crystalline, with the styrene block and methacrylate backbones being amorphous, a contrast in phase from AFM was expected. In the case of the PMMA-co-PADA random copolymer, long, fiber-like structures were formed in the as cast films (Figures 3a and 3c). These features have a width of 40-50 nm and a height of 5-6nm, which agrees well with the predicted end-to-end length of two PCDA molecules from literature.[17] More remarkably, these structures span up to several microns in length, which is a promising result for their potential use as resistance-sensing elements. However, these films displayed a disordered morphology overall, and a more predictable microstructure is desirable for precision applications. The second set of AFM images (Figures 3b and 3d) results from PS-b-PADA (short block) after spin casting from toluene and annealing in toluene vapor. Both the height and phase images show spherical features that have sizes ranging from 30-50 nm. In the phase image, there is clear contrast between the spheres (light) and the matrix (dark), indicating phase separation and the existence of materials with distinct moduli. Of particular note is the uniformity of the pattern over the entire imaging area. This promising result has led to work on increasing the volume fraction of the DA block to achieve cylindrical or
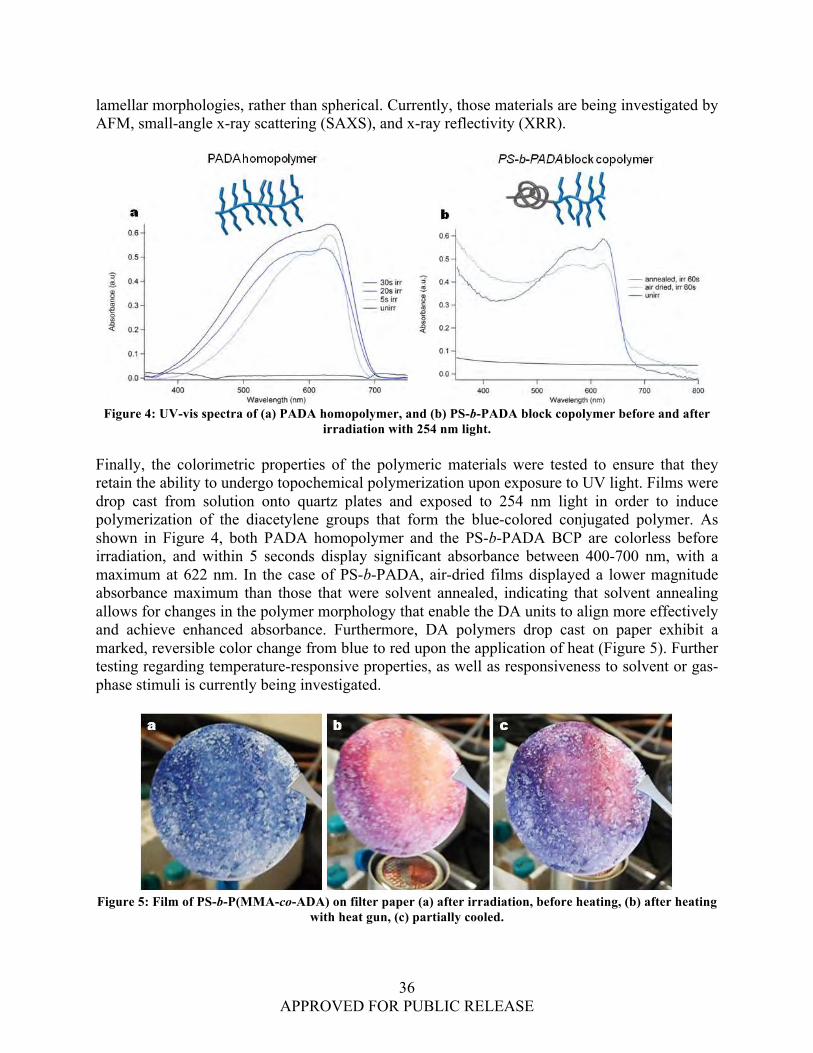
36 APPROVED FOR PUBLIC RELEASE
lamellar morphologies, rather than spherical. Currently, those materials are being investigated by AFM, small-angle x-ray scattering (SAXS), and x-ray reflectivity (XRR).
Figure 4: UV-vis spectra of (a) PADA homopolymer, and (b) PS-b-PADA block copolymer before and after
irradiation with 254 nm light. Finally, the colorimetric properties of the polymeric materials were tested to ensure that they retain the ability to undergo topochemical polymerization upon exposure to UV light. Films were drop cast from solution onto quartz plates and exposed to 254 nm light in order to induce polymerization of the diacetylene groups that form the blue-colored conjugated polymer. As shown in Figure 4, both PADA homopolymer and the PS-b-PADA BCP are colorless before irradiation, and within 5 seconds display significant absorbance between 400-700 nm, with a maximum at 622 nm. In the case of PS-b-PADA, air-dried films displayed a lower magnitude absorbance maximum than those that were solvent annealed, indicating that solvent annealing allows for changes in the polymer morphology that enable the DA units to align more effectively and achieve enhanced absorbance. Furthermore, DA polymers drop cast on paper exhibit a marked, reversible color change from blue to red upon the application of heat (Figure 5). Further testing regarding temperature-responsive properties, as well as responsiveness to solvent or gas-phase stimuli is currently being investigated.
Figure 5: Film of PS-b-P(MMA-co-ADA) on filter paper (a) after irradiation, before heating, (b) after heating
with heat gun, (c) partially cooled.

37 APPROVED FOR PUBLIC RELEASE
CONCLUSION 4. With the aim of producing stable DA structures with hierarchical, long range order, DA-containing molecules were appended to the backbone of homopolymers, random copolymers, and block copolymers via a reactive monomer post-modification approach. The NMAOS monomer was easily incorporated by homopolymerization, copolymerization with MMA, or by chain extension from a PS macroinitiator using ATRP. The NHS group was easily displaced by nucleophilic substitution of the primary DA-amine, with conversions of >90% confirmed by 1H NMR. The self-assembly properties of the various polymer architectures were evaluated through the formation of thin films by solution spin casting. The films have been evaluated preliminarily by AFM, although more detailed studies by SAXS and XRR are forthcoming. The films were also evaluated with respect to their colorimetric properties by UV-vis absorbance spectroscopy. It was found that the materials polymerize within several seconds of irradiation, and that annealing may help to increase susceptibility to polymerization.
REFERENCES [1] McQuade, D.T.; et al. Chemical Reviews 2000, 100, p2537. [2] Sun, X.; et al. Chemical Society Review 2010, 39, p4244. [3] Reppy, M.A.; Pindzola, B.A. Chemical Communications 2007, 2007 (42), p4317. [4] Peng, H.; et al. Journal of the American Chemical Society 2005, 127, p12782. [5] Dautel, O.J.; et al. Journal of the American Chemical Society 2006, 128, p16213. [6] Caruso, M.M.; et al. Chemical Reviews 2009, 109, p5755. [7] Peng, H.; et al. Nature Nanotechnology 2009, 4, p738. [8] Charych, D.H.; et al. Science 1993, 261, p585. [9] Lee, J.; et al. Advanced Functional Materials 2012, 22, p1632. [10] Shunmugam, R.; Tew, G.N. Journal of Polymer Science Part A: Polymer Chemistry 2005,
43, p5831. [11] Jung, Y.K.; et al. Advanced Functional Materials 2008, 18, p701. [12] Leal, M.P.; et al. Chemistry - A European Journal 2011, 17, p1828. [13] Campos, L.M.; et al. Macromolecules 2008, 41, p7063. [14] Potemkin, I.I.; Bodrova, A.S. Macromolecules 2009, 42 (7), p2817-2825. [15] Shah, M.; et al. Macromolecules 2008, 41, p218. [16] Albert, J.N.L.; Epps, T.H. Materials Today 2010, 13, p24. [17] Tieke, B.; et al. Angewandte Chemie International Edition 1976, 15, p764.

38 APPROVED FOR PUBLIC RELEASE
Secretome Biomarkers for the Identification and Differentiation of Enterohemorrhagic and Enteropathogenic Escherichia coli
(EHEC and EPEC) Strains
Rabih E. Jabbour,a James D. Wright,a Samir V. Deshpande,b Mary Wade,a Patrick McCubbin,c
Vicky Bevilacquaa
a Edgewood Chemical Biological Center, Research & Technology Directorate, 5183 Blackhawk Road, Aberdeen Proving Ground, MD 21010
b Science and Technology Corporation, Edgewood, MD 21040; c Optimetrics Inc., Abingdon, MD 21009
ABSTRACT
The secreted proteins of the enterohemorrhagic and enteropathogenic Escherichia coli (EHEC and EPEC) are the most common cause of hemorrhagic colitis, a bloody diarrhea with EHEC infection, which often can lead to life threatening hemolytic-uremic syndrome (HUS).We are employing a metaproteomic approach as a complimentary technique to the current genomic-based approaches. This metaproteomic approach evaluates the secreted proteins associated with pathogenicity and utilizes their signatures as differentiation biomarkers between EHEC and EPEC strains. The result showed that the identified tryptic peptides of the secreted proteins extracted from different EHEC and EPEC growths have differences in their amino acid sequences and could be potentially utilized as biomarkers for the studied Escherichia coli (E. coli) strains. Analysis of extracts from EHEC O104:H4 resulted in the identification of a multidrug efflux protein, which belongs to the family of fusion proteins that are responsible for cell transportation. Experimental peptides identified lie in the region of the HlyD haemolysin secretion protein-D that is responsible for transporting the haemolysin A toxin. Moreover, the taxonomic classification of EHEC O104:H4 showed a closest match with E. coli E55989, which is in agreement with genomic sequencing studies that were done extensively on the mentioned strain. The taxonomic results showed strain level classification for the studied strains and distinctive separation among the strains. Comparative proteomic calculations showed separation between EHEC O157:H7 and O104:H4 in replicate samples using cluster analysis. There are no reported studies addressing the characterization of secreted proteins in various enhanced growth media and utilizing them as biomarkers for strain differentiation. The results of FY12 are promising to pursue further experimentation to statistically validate the results and to further explore the impact of environmental conditions on the nature of the secreted biomarkers in various E. coli strains that are of public health concerns in various sectors.
INTRODUCTION 1. The US Government has initiated extensive efforts in the detection and identification of biological threat species in their Defense Advanced Research Projects Agency (DARPA) programs that explore the “detect to protect” and “detect to treat” paradigms.[1-2] Those initiatives cover areas of general health risk, bio-terrorism utility, Homeland Security, agricultural monitoring, food safety, environmental monitoring, and biological warfare agents in battlefield situations.[3] Some of the health concerns include food contamination outbreak for military and civilian population and also the transmission of outbreaks from abroad to US soil, such as the

39 APPROVED FOR PUBLIC RELEASE
fatal E. coli O104:H4 outbreak that occurred in Germany in 2011. E. coli O104:H4 infected citizens from 16 different industrial nations including the US.[4-7] The recent use of mass spectrometry (MS) based proteomic analysis has proven useful in characterizing and identifying biological agents without prior knowledge of the samples.[8] Therefore, the present study sought to determine whether MS proteomics could be used to distinguish between enterohemorrhagic and enteropathogenic E. coli (EHEC and EPEC) strains. More specifically, discrimination between EHEC and EPEC strains based on their secreted proteins composition, as determined by MS, was investigated. EHEC and EPEC are the major cause of various diseases in humans through their presence in food and water matrices. Their infection in host cells is through attachment and effacement mechanisms in which the pathogen secretes various proteins that compromise the integrity of the cytoskeleton of the host cell.[9] EHEC and EPEC pathogens showed different responses to antibiotics. Their pathogenicity in humans is enhanced with an antibiotic regimen as the case with EHEC strains. Moreover, there are studies that reported the difference in the number and nature of the secreted proteins between EHEC and EPEC.[10] Thus, development of techniques capable of distinguishing between EHEC and EPEC is imperative to provide effective medical counter measure with respect to an outbreak in food or water supplies. High-throughput tandem MS-based proteomics was applied as a means for characterizing cellular proteins and producing amino acid sequence information for peptides derived from these proteins for Burkholderia and Yersinia species and strains. Whole cell proteins and secreted proteins from various bacterial strains were compared and contrasted with the in-house ABOID™ algorithm for species and strain level discrimination.[11] Therefore the objective is to establish the sequence-based identity of secreted proteins isolated from the aforementioned E. coli strains. To achieve this goal, we are utilizing a high-throughput proteomic analytical system to provide a rapid means of characterizing virulence proteins and producing amino acid sequence information to be used as differentiation biomarkers of EHEC and EPEC strains in various biological matrices. This is essential to enhance the safety of food and water supplies to the US soldiers and provide health personnel with reliable strain level discrimination for effective medical countermeasures.
EXPERIMENTAL SECTION 2.
EHEC and EPEC Strain Preparations 2.1 In the present study the pathogenic E. coli strains were E. coli O157:H7, E. coli O104:H4, and E. coli O11:H2 working cultures. Cultures were prepared by streaking cells from cryopreserved stocks onto tryptic soy broth (TSB) and incubated at 37 oC until the stationary growth phase. After incubation, cells were harvested and the colony counts were performed using optical density measurements.
Isolation of the Secreted Proteins 2.2
40 APPROVED FOR PUBLIC RELEASE
The harvested cells were pelleted by centrifugation at 2,300 RCF for 30 minutes and the supernatant was immediately separated into various 30 mL aliquots. The supernatants were then filtered using 0.22 um hollow fiber dialysis filters to ensure no large particulates or cellular debris were present in the samples. Pelleted and supernatant samples were frozen at -70 oC until further processing.
Processing of Secreted and Whole Cells Proteins 2.3 The whole cell samples were lysed using a bead beating technique (30s-on, 10s-off for min. duration). The lysates were centrifuged at 14,100 x g for 30 min to remove cellular debris and large particulates. The supernatant from the whole cell lysates and the filtered secretome samples were loaded separately on PALL MW-3 kDa filter units (Ann Arbor, MI) and centrifuged at 14,100 x g for 30 min. The effluents were discarded and the filter membranes were washed with 100 mM avidin-biotin-peroxidase complex (ABC) solution and centrifuged for 20 min at 14,100 x g. Proteins from the whole cells and secretome fractions were denatured by adding 8 M urea and 30 mg/mL DTT to the filter and incubation for an hour at 40 oC. The tubes were then centrifuged at 14,100 x g for 40 min and washed three times using 150 mL of 100 mM ABC solution. On the last wash, ABC was allowed to sit on the membrane for 20 min while shaking, followed by centrifugation at 14,100 x g for 40 min. The filter units were then transferred to new receptor tubes and the proteins were digested with 5 µL trypsin in 240 µL of ABC solution + 5 µL ACN. Proteins were digested overnight at 37 oC on an orbital shaker set to 90 rpm. Sixty microliters of 5% ACN/0.5% formic acid (FA) was added to each filter to quench the trypsin digestion followed by two minutes of vortexing for sample mixing. The tubes were centrifuged for 10 min at 14,100 x g. An additional 60 mL 5% ACN/0.5% FA mixture was added to the filter and centrifuged. The effluents were then analyzed using LC-ESI- tandem MS (MS/MS).
Protein Database and Database Search Engine 2.4 A protein database was constructed in a FASTA format using the annotated bacterial proteome sequences derived from fully sequenced chromosomes of all available E. coli strains, 54strains, (as of September 2012). A PERL program (http://www.activestate.com/Products/ActivePerl; accessed April 2011) was written to download these sequences automatically from the National Institutes of Health National Center for Biotechnology (NCBI) site (http://www.ncbi.nlm.nih.gov; accessed September 2012). Each database protein sequence was supplemented with information about the source organism and the genomic position of the respective ORF embedded into a header line. The database of E. coli bacterial proteome was constructed by translating putative protein-coding genes and consists of few millions of amino acid sequences of potential tryptic peptides obtained by the in silico digestion of all proteins (allowing up to two missed cleavages). The experimental MS/MS spectral data of bacterial peptides were searched using SEQUEST algorithm against a constructed proteome database of microorganisms. The SEQUEST thresholds for searching the product ion mass spectra of peptides were Xcorr, deltaCn, Sp, RSp, and deltaMpep. These parameters provided a uniform matching score for all candidate peptides. The generated out files of these candidate peptides were then validated using the PeptideProphet algorithm. Peptide sequences with a probability score of 95% and higher were retained in the

41 APPROVED FOR PUBLIC RELEASE
dataset and used to generate a binary matrix of sequence-to-bacterium assignments. The binary matrix assignment was populated by matching the peptides with corresponding proteins in the database and assigned a score of 1. A score of 0 was assigned for a non-match. The column in the binary matrix represents the proteome of a given E. coli strain, and each row represents a tryptic peptide sequence from the LC-MS/MS analysis. Analyzed samples were matched with the E. coli strains based on the number of unique peptides that remained after further filtering of degenerate peptides from the binary matrix. Verification of the classification and identification of candidate microorganisms was performed through hierarchical clustering analysis and taxonomic classification. The in-house developed software called “ABOID™” transformed results of searching MS/MS spectra of peptide ions against a custom protein database, which was downloaded from NCBI with commercial software SEQUEST into a taxonomically meaningful and easy to interpret output. It calculated probabilities that peptide sequence assignment to a MS/MS spectrum was correct and used accepted spectrum–to-sequence matches to generate a sequence-to-bacterium (STB) binary matrix of assignments. Validated peptide sequences, differentially present or absent in various strains (STB matrices), were visualized as assignment bitmaps and analyzed by an ABOID™ module that used phylogenetic relationships among E. coli strains as a part of the decision tree process. The bacterial classification and identification algorithm used assignments of organisms to taxonomic groups (phylogenetic classification) based on an organized scheme that begins at the phylum level and follows through classes, orders, families, and genus down to the strain level. ABOIDTM was developed in-house using PERL, MATLAB, and Microsoft Visual Basic.
RESULTS AND DISCUSSION 3.
ABOID™ Algorithm Output 3.1 The ABOID™ algorithm provides results in different formats and this can be tailored to the appropriate factors addressed. For example, Figure 1 serves as an example to illustrate the typical output generated for the LC-MS/MS analyses of bacterial protein digests using bioinformatics tools to process the peptide sequence information for bacterial differentiation and classification. The top window lists the identified unique proteins and their corresponding bacterium match. The middle window represents the binary matrix of the sequence-to-bacterium search matching. The middle window represents the total number of unique proteins identified for a given bacterium. The lower section represents the histogram output of bacterial identification. Figure 2 shows another output of the ABOID™, in this case an identification output represented in histogram format. This graph is generated by plotting the number of unique proteins versus the E. coli strain matching in the database. The Y-axis represents the percentage of unique peptides matched with 95% confidence level for all the strains on the x-axis. The identified E. coli strain, i.e. E. coli O157:H7 matches with the analyzed bacterial sample. The horizontal redline is the threshold cutoff under which common degenerate peptides among various bacteria within the constructed proteome database are shown. These degenerate peptides are removed from the total number of unique peptides of the identified species.

42 APPROVED FOR PUBLIC RELEASE
Figure 1: MS-based proteomic approach output. The upper section represents the matching algorithm results
of the identified tryptic peptides resulting from the LC-MS/MS analysis. The middle section represents the binary matrix of STB scoring. Presence of a unique peptide corresponding with a protein in the given
proteome of a bacterium is scored 1, and a no match is scored 0.The lower section represents the histogram output of bacterial identification.
Figure 2: Histogram representing the output of the binary matrix of the unique peptides identified for E. coli O157:H7 analyzed and processed using ABOID™. All identified peptides were extracted at 95% confidence
level.

43 APPROVED FOR PUBLIC RELEASE
Determination of Common Proteins using Secretome Lysates for EHEC 3.2and EPEC Strains
EHEC and EPEC strains O157:H7, O104:H4 and O111:H2 respectively, were analyzed by proteomic MS to determine the common proteins from replicate analyses generated from their secretome lysates. Tables 1-2 show the list of common proteins obtained from three analyses of E. coli O157:H7 and O104:H4 respectively. The matching of most common proteins were done using uniprotKB database.[12] The uniprotKB is a non-redundant database that includes all sequenced microbes and provides biological ontologies, classifications and cross-references, cellular processes, and biochemical functions for each protein. In Table 1 the data showed that most of the common proteins identified had highest hit/identification with O157:H7 and cellular functionality related to the flagella proteins. Table 1: Common strain-unique proteins from replicate analysis of the secretome fraction of E. coli O157:H7.
Accession # Protein Name Highest Hit Process Function Component
AP_002538.1 Flagellar filament structural protein
EC O157:H7/ EC K12
Ciliary or Flagellar motility
ND Bacterial-type
flagellum hook
AP_003849.1 DNA-binding
transcriptional dual regulator
EC O157:H7 Binding Transcription ND
NP_288384.1 Flagellin EC O157:H7 Ciliary or Flagellar motility
Structural molecule activity
Bacterial-type flagellum filament
YP_001882351.1 Hypothetical protein SbBS512_E4084
Shigella Byodii /EC
NC101 ND ND ND
The dominant flagellar functions are often observed with EHEC bacteria as the responsible pathogenic factors in the attaching and effacing mechanism.[9] This agreement between the genomics and proteomics studies showed that this approach could be used as a complementary technique to the genomic based techniques. On the other hand, the data showed that the common proteins identified were strain-unique regardless of the database used. For example when we utilized our database that includes only E. coli strains, the identification was the same as that of uniprotKB that includes all sequenced bacteria. Table 2 represents the output of uniprotKB analyses for the common proteins identified in the secretome fraction of E. coli O104:H4 strain. The common proteins were first identified using the ABOID™ algorithm and then uniprotKB was utilized to determine the non-redundant matching as well as cellular functions and processes. It is noteworthy to mention that the E. coli O104:H4 is not fully sequenced and is not included in either database. The highest hit in Table 2 represents the closest match between the studied strain and that of bacterial strains in the uniprotKB database. Most of the matches were with E. coli strains that were considered to have more of enteroaggregative E. coli (EAEC) and/or EPEC strains. None of the matches were with the E. coli O157:H7 which indicates that the O104:H7 is not closely related to EHEC strains. Also, the common proteins identified for O104:H4 were diverse in cellular functions contrary to those of O157:H7, which were mainly flagellar ones.

44 APPROVED FOR PUBLIC RELEASE
Table 2: Common strain-unique proteins from replicate analysis of the secretome fraction of E. coli O104:H4.
Accession # Protein Name Highest Hit Process Function Component
YP_003223560.1 Secreted
Autotrans-porter serine protease
EC O103:H2 Proteolysis serine-type
endopeptidase activity
peptidase activity
YP_001463426.1 Multidrug efflux system subunit
MdtA EC O139:H28 Transport transporter
activity Plasma
Membrane
YP_002292692.1 conserved
hypothetical protein
EC SE11 ND ND ND
YP_003229309.1 Putative DNA primase EC O26:H11 ND ND ND
YP_541664.1 DNA-Binding protein
EC UTI89_C2667
Nitrogen utilization DNA Binding ND
NP_286019.1 Hypothetical protein EC O157:H7
Lipoprotein metabolic process
Lipase/hydrolase activities Lipid particle
Further examination of the cellular functions of the common proteins for O104:H4 strain, using uniprotKB utilities, reveals the potential cellular functionality of the tryptic peptides identified from the LC-MS/MS analyses. The uniprotKB cellular function tools utilize various solid thick colored lines to represent the different cellular functions for each active site in a given protein. For example the tryptic peptides that correspond to the identified secreted autotrans-porter serine protease were located in the region of the protein that has a virulence function as shown in Figure 3. The dotted circle represents the region of the identified peptides for the secreted autotransporter serine protease proteins that was common among the replicate LC-MS/MS analyses of the secreted fraction of O104:H4 strain.

45 APPROVED FOR PUBLIC RELEASE
Figure 3: UniprotKB cellular functions identification tool, InterProScan, for a common protein identified in
the secreted fractions of E. coli O104:H4. The dotted oval represents the cellular function of the peptides identified from LC-MS/MS analyses.
Effect of Cellular Fraction on the Differentiation of EHEC O157:H7 3.3
Strain Whole cell and secreted fractions, from E. coli O157:H7 strain, were analyzed by LC-MS/MS followed by data processing using the ABOID™ algorithm. The identification of the samples was correctly established to the E. coli O157:H7 strain but with more ambiguity using the whole cell fraction vs. secreted one. The near neighbor analysis, using Euclidean distance linkage approach showed that the identified unique set of proteins from the secreted fraction had the closest match with the used E. coli O157:H7, Figure 4a than that of the identified proteins from the whole cell fraction, Figure 4b. The similarity between the analyzed secretome and closest neighbor in the database showed 100% matching with E. coli O157:H7, Figure 4a, while there was only around 35% similarity between the whole cell fraction and the E. coli O157:H7 from the database. This similarity difference between whole cell and secretome fractions could be attributed to the presence of more strain-unique proteins from the secretome fraction than that of the whole cell where there common proteins present across all E. coli strains and in higher concentration than the secreted ones. The identified proteins in the whole cell fraction showed a large number of ribosomal proteins, which are commonly found in other strains and species of E. coli and other bacteria. Such types of proteins would result in less differentiation than that of the secretome proteins, which they did not have ribosomal or other highly expressed and conserved proteins. This difference in types of proteins from the two studied fractions was reflected in the taxonomic classification as shown in Figures 4a-b.

46 APPROVED FOR PUBLIC RELEASE
Figure 4: Single linkage Euclidean distancing for the near-neighbor classification of EHEC E. coli O157:H7
strains from secretome (a) and whole cell (b) fractions.
Differentiation of E. coli O157:H7 and E. coli O104:H4 Strains Using 3.4Secretome Lysates
Pathogenic E. coli O157:H7 and E. coli O104:H4 were analyzed by proteomic MS for strain identification and differentiation using secretome fractions for each strain. The identification of the samples was correctly established and those results were observed in the output of the STB binary matrix, with the number of unique peptides on the y-axis and bacterium proteome on the x-axis. The near neighbor analysis, using the Euclidean distance linkage approach, for these E. coli strains showed that the identified unique set of proteins had the closest match with the experimental E. coli O157:H7 and E. coli O104:H4 strains, with the exception that the database does not contain the O104:H4 strain due to its absence from the list of fully sequenced E. coli strains in the public repository. The near neighbor analysis, using Euclidean distance linkage approach, for these E. coli O104:H4 showed a closest match with the E. coli 55989 strain, Figure 5. The E. coli strain 55989 is an enteroaggregative strain (EAEC) originally isolated from the diarrheagenic stools of an HIV-positive adult suffering from persistent watery diarrhea in the Central African Republic in 2002. The EAEC strains form aggregates as their name suggests, and are an emerging cause of gastroenteritis.[13] This taxonomic classification of E. coli O104:H4 agrees with the genomic sequencing efforts that are extensively done on the O104:H4 strain due to its implication in the deadly outbreak of E. coli in Germany in 2011.[14] The genomic sequencing of the E. coli O104:H4 showed that this strain is 95% genomically similar to the EAEC 55989 and suggests that this strain is more of a hybrid clone between E. coli 55989 and ancestor E. coli O104:H4. This new strain from genomic classifications has been shown to be distant from EHEC strains including O157:H7, the culprit in food contamination outbreak.[7] Such genomic studies provide strong support to our findings in terms of proteomic identification of the strains and in the agreement of the phylogenetic classification. The utilization of

47 APPROVED FOR PUBLIC RELEASE
proteomics-based identification and phylogenetic classification of the E. coli strains from their secretome fractions showed that this approach is an effective and reliable complementary approach to those of the whole genome sequencing and optical genetic mapping techniques. Moreover, a recent study on the pathogenicity mechanism of the E. coli O104:H4 showed that this strain behaves as EAEC in its verotoxicity to the host cells which is a characteristic of EAEC strains.[15]
Figure 5: Euclidean distance single linkage of the nearest neighbor classification of pathogenic E. coli
O157:H7 (a) and E. coli O104:H4 using secretome proteins. Although proteomics showed strain level classification for the studied E. coli strains, each strain did not show any close relation to the others. This observation is important to support the findings reported in genomic studies that those strains are different in their protein expression as concluded from pathogenesis and sequencing studies.[14-15]
CONCLUSIONS 4. The results of FY12 revealed that using secretome proteins as biomarkers for differentiation of EHEC and EPEC strains is useful when utilizing metaproteomic analyses. The strain level differentiation among EHEC strains was improved using secreted proteins as biomarkers. Secretome proteins provide a unique source of cellular variability that was not observed when compared to whole cell lysates. The extensive genomic studies on the studied strains showed strong agreement in the classification of a non-database strain, i.e. E. coli O104:H4, determined using the MS-based proteomics approach. Such agreement needs to be further examined through a larger sample set and under various environmental conditions to verify the effectiveness of the approach. In addition, such studies once validated could increase confidence in identifying microbes at early stages of outbreaks at the strain level using protein biomarkers and enhance medical countermeasures and diagnostics.

48 APPROVED FOR PUBLIC RELEASE
Overall, MS/MS-based proteomics and bioinformatics were shown to have utility in the comparative proteomics study for the differentiation of EHEC strains. This resulted in different degrees of separation between the correctly determined database organism and the next nearest neighbor organism(s). Moreover, this approach relies on taxonomic correlation within the constructed proteome database. It is possible to infer the identification of an organism not present in the genome database. This capability is supported by the fact that prokaryotic organisms, as they are arranged in hierarchal order, have increasingly common proteins from strain to phyla and vice versa. Such properties will allow the utilization of the MS-based proteomic approach to infer taxonomic classification based on the depth of available genomic sequence information for such microbes.
ACKNOWLEDGEMENT The authors wish to thank Mrs. Cynthia Swim for her administrative assistance of this research project and for Dr. Augustus Fountain for his support and management of the In-house Laboratory Independent Research program at ECBC.
REFERENCES [1] National Research Council, Sensor Systems for Biological Agent Attacks; National
Academy Press: Washington, DC, 2005. [2] Demirev, P.A.; et al. Johns Hopkins APL Technical Digest 2005, 26, p321-333. [3] Demirev, P.A.; Fenselau, C. Annual Review of Analytical Chemistry 2008, 1, p71-93. [4] http://www.euro.who.int/en/what-we-do/health-topics/emergencies/international-health-
regulations/news/news/2011/07/outbreaks-of-e.-coli-o104h4-infection-update-30. [5] Perna N.T.; et al. Nature 2001, 409, p529–533. [6] European Food Safety Authority (EFSA) Joint EFSA/ECDC technical report: “Shiga
toxin/verotoxin-producing Escherichia coli in humans, food, and animals in the EU/EEA, with special reference to the German outbreak strain STEC O104”, 2011, Available: http://www.efsa.europa.eu/en/supporting/pub/166e.htm.
[7] Mellmann, A.; et al. PLoS ONE 2011, 6 (7), e22751. [8] Jabbour, R.E.; et al. Applied Environtal Microbiology 2010, 76 (11), p3637-3644. [9] Frankel, G.; et al. Molecular Microbiology 1998, 30, p911-921. [10] Deng, W.; et al. Molecular and Cellular Proteomics 2012. [11] Jabbour, R.E.; et al. Journal of Proteome Research 2010, 9, p3647-3655. [12] http://www.uniprot.org/help/uniprotKB. [13] http://hamap.expasy.org/proteomes/ECO55.html. [14] Kupferschmidt, K.; Science 2011, 332 (6035) p1249-1250. [15] Al-Safadi, R.; et al. PLoS ONE 2012, 7, e41628.

49 APPROVED FOR PUBLIC RELEASE
A Platform Approach to Produce Polymer Nanoparticles with Modular Functionality from Block Copolymer Surfactants
Kato L. Killops,a Christina Rodriguez,b Nathaniel A. Lynd b
a Edgewood Chemical Biological Center, Research & Technology Directorate, 5183 Blackhawk Road, Aberdeen Proving Ground, MD 21010
b Materials Research Laboratory, University of California, Santa Barbara, CA 93106
INTRODUCTION 1. The ability to synthesize colloidal polymer particles in the nanoscale size regime with tunable peripheral functionality has attracted much attention in recent years. Often, emulsion or dispersion polymerization techniques are employed to achieve spherical particles. Emulsion polymerization techniques are highly amenable to industrial processes due to ease of scalability and the use of water as the solvent. The possibility to tailor the particles’ functionality lies at the nexus of advanced purification strategies,[1,2] as well as expanding opportunities for phonic materials,[3] smart coatings,[4,5] and abiotic-biological interfaces.[6,7] Currently, there are many strategies for achieving functional polymer colloids. Mixing a range of monomers in desired proportions can lead to particles with diverse functionality via precipitation polymerization.[7,8] Statistically, these monomers should present themselves on the particle surface, especially if charged or hydrophilic monomers are used.[9] However, it is difficult to control how many of each group is available at the particle interface beyond a statistical distribution. Within the realm of emulsion polymerization, common approaches include incorporation of reactive surfactants or surfmers (surfactant monomers) [10] to achieve peripheral functionality. An alternative approach is to use amphiphilic block copolymers (BCPs) as surfactants to stabilize emulsion particles,[11] resulting in hairy latexes. Although a number of different BCPs have been used, polystyrene-b-poly(ethylene oxide) has been widely studied in emulsion polymerizations.[12] The use of BCP surfactants confers a number of advantages over their small molecule counterparts including low critical micelle concentrations and low diffusion coefficients, which aid in anchoring the macromolecules to the particle interface.[13] Our approach capitalizes on the opportunity for macromolecules to provide multiple modular functional groups on a single surfactant molecule. Furthermore, the advantage of using a BCP platform is that a single precursor polymer can be modified with a variety of moieties in order to create a library of functional particles. Starting from a polystyrene-b-poly(ethylene oxide-co-allyl glycidyl ether) amphiphilic diblock copolymer,[14,15] we demonstrate the synthesis of hairy polystyrene latexes with tunable functionality. The incorporation of an allyl-functional monomer into the hydrophilic portion of the BCP enables the use of thiol-ene “click” chemistry [16] to decorate the polymer backbone with a diverse range of commercially available thiol-functional groups (examples are shown in Figure 1). This modification strategy enables the pre- or post-polymerization modification of allyl groups with a variety of moieties that are charged or neutral, pH sensitive, zwitterionic, etc.

50 APPROVED FOR PUBLIC RELEASE
Figure 1: Schematic representation of using emulsion polymerization with modular block copolymer
surfactants to produce latexes with functional corona, and their colloidal assembly structures.
EXPERIMENTAL 2.
Chemicals 2.1 All chemicals were purchased from Sigma Aldrich and used without further purification, unless otherwise stated. Allyl glycidyl ether were purchased from TCI America. Styrene was degassed by three freeze-pump-thaw cycles and purified by stirring over dibutylmagnesium at 0°C and distilling into receiving flasks. Ethylene oxide and allyl glycidyl ether were degassed by three freeze-pump-thaw cycles and purified by stirring over butylmagnesium chloride at 0°C and distilling into receiving flasks. Deuterated solvents for NMR were purchased from Cambridge Isotope Laboratories.
Instrumentation 2.2 NMR (1H, 13C) spectra were recorded on a Bruker DMX-300 MHz spectrometer at room temperature. Chemical shifts are reported in parts per million (δ) relative to CHCl3 (7.24 ppm for 1H), DMSO (2.50 ppm for 1H), or DMF (8.03 ppm for 1H) as internal reference. Gel permeation chromatography was performed in N,N-dimethylformamide (DMF) on a Waters 2695 Separation Module equipped with a Waters 2414 Refractive Index Detector and a Waters 2996 Photodiode Array Detector. X-ray photoelectron spectroscopy (XPS) measurements were performed using a Kratos Axis Ultra Spectrometer (Kratos Analytical, Manchester, UK) with a monochromatic Al Kα X-ray source (1486.6 eV) operating at 225 W under a vacuum of 1.0 × 10⁻⁸ Torr. Charge compensation was carried out by injection of low-energy electrons into the magnetic lens of the electron spectrometer. The pass energy of the analyzer was set at 80 eV for survey scans with an energy resolution of 0.5 eV. The spectra were analyzed using CasaXPS v.2.3.14 software. The C–C peak at 285 eV was used as the reference for binding energy calibration. Scanning electron microscopy was performed on a FEI XL30 Sirion FEG Digital Electron Scanning Microscope at

51 APPROVED FOR PUBLIC RELEASE
3.0 to 5.0 keV. Dynamic light scattering and zeta potential measurements were performed on a Wyatt Mobius instrument at ambient temperature.
Synthesis 2.3
Polystyrene-b-Poly(Ethylene Oxide-co-Allyl Glycidyl Ether) 2.3.1 The synthesis for polystyrene-b-poly(ethylene oxide-co-allyl glycidyl ether) (PS-b-P(EO-co-AGE)) was performed according to procedures found in Killops, et al:[17] MN,GPC = 59200, PDI=1.23; Mw, NMR = 11k PS, 44k P(EO-co-AGE).
Functionalization of PS-b-P(EO-co-AGE) via Thiol-ene Chemistry 2.3.2 Generally, polymer was dissolved in a minimal amount of solvent (typically DMF or THF) in a vial fitted with a septum, and ca. 10 eq. (relative to ene) of thiol, and 0.2 eq. (relative to ene) 2,2-dimethoxy-2-phenylacetophenone (DMPA) were added. The mixture was sparged with nitrogen for 5 minutes before the vial was irradiated with 365 nm light for 30 minutes. Conversion of the ene groups was verified by 1H NMR. Functionalized polymers were typically purified by dialysis against Milli-Q water for 24h to remove unreacted thiol, and lyophilized to dry.
Particle Synthesis 2.3.3 A general recipe was used and scaled accordingly: 10 wt. % styrene in water, 5-20 wt. % block copolymer (BCP) (relative to styrene), and 0.8 wt. % (relative to styrene) potassium persulfate. Reactions were typically conducted in 25 to 100 mL of water. First, styrene was suspended with vigorous stirring in half of the total volume of water in a three-neck flask fitted with a condenser. The BCP was dissolved in the other half of water. The BCP micelle solution was added dropwise to the stirring styrene suspension. The mixture was sparged with N2 for 30 minutes at RT, then heated to 80°C under N2 flow. In a separate vial fitted with a septum, potassium persulfate was dissolved in a small amount of water and sparged with N2 for 10 minutes. The solution was transferred via cannula to the reaction mixture. The emulsion polymerization was stirred at 80°C for 6-16 hours.
RESULTS AND DISCUSSION 3. In order to create a platform to synthesize polymer nanoparticles with diverse peripheral functionality, an amphiphilic block copolymer (BCP) scaffold was devised to serve as an emulsion polymerization stabilizer. The PS-b-P(EO-co-AGE) BCP contains a short PS block to anchor the BCP to the particle, as well as a hydrophilic EO-based corona to stabilize the styrene droplets. Within the EO corona, allyl groups are dispersed along the backbone, which permits pre- or post-polymerization functionalization with a diverse range of thiol groups. The PS-b-P(EO-co-AGE) BCP was synthesized via standard anionic polymerization in large (>10g) quantities. Pre-polymerization functionalization of the allyl groups was achieved using thiol-ene chemistry.[18] Commercially available thiols including thioglycolic acid, thioglycerol, and cysteamine were appended to the BCP using the photochemically-initiated thiol-ene reaction,

52 APPROVED FOR PUBLIC RELEASE
and full conversion of the allyl groups was confirmed by 1H NMR. The acid and amine groups impart a pH switchability to the particles (vide infra), while the thioglycerol adds additional hydrophilic character, potentially adding to the overall stabilizing power of the BCP.
Table 1: Average diameters of particles with varying BCP content. BCP content
(wt. %) DSEM (nm)
DDLS (nm) Functionality
0 % 204 ± 5 201 ± 1 none 5 % 291 ± 17 398 ± 10 carboxylic acid 5 % 165 ± 17 223 ± 30 amine 5 % -- 300 ± 3 alkene
10 % 111 ± 6 -- alkene 15 % 83 ± 9 -- alkene 20 % 80 ± 3 -- alkene
Latex particles with average diameters less than 400 nm were prepared via batch emulsion polymerization using the amphiphilic BCP as a stabilizer. Alkene functional particles with average diameters ranging from 300 nm (in solution) to 80 nm (dried) were prepared. It appears that the amount of BCP stabilizer has a dramatic effect on the final diameter of the particles. A substantial decrease in diameter was observed upon increasing the BCP content from 5 wt. % to 15 wt. %. However, upon increasing the BCP content further, from 15 to 20 wt. %, a saturation point is reached, where steric crowding of the chains prevents additional stabilization of smaller particles. The particles have low polydispersity, and have a propensity to form iridescent colloidal crystal arrays (Figure 2).
Figure 2: SEM images of (a) 10 wt %, (b) 15 wt %, and (c) 20 wt % PS-b-P(EO-co-AGE)-containing particles. An attractive feature of this approach is the ability to produce a range of particles with controlled size and diverse functionality from a single polymer scaffold. The functionalized particles were prepared analogously to the alkene functional particles. Particles with pH switchability were prepared from thioglycolic acid and cysteamine-functional BCPs, while particles with enhanced hydrophilicity were prepared from thioglycerol having two vicinal hydroxyl groups. Expanding the set of functional particles to include amino acids, sulfates, guanidines, etc. will be conducted in the second year of the project.

53 APPROVED FOR PUBLIC RELEASE
Figure 3: XPS spectra of particles containing BCP (left) and bare PS latex (right).
In order to capitalize on the potentially beneficial aspects of particles with a functional corona, verification of the presence of BCP on the periphery of the particles was required. Initially, particles with and without BCP were analyzed by x-ray photoelectron spectroscopy (XPS), which elucidates the presence of elements as well as information about their bonding order within 1-10 nm of the surface. XPS analysis (Figure 3) indicates the presence of BCP within the first 10 nm of the surface, as evidenced by the C-O bond peak at 287 eV, which is absent in the bare PS latex. Angle-resolved XPS allows for probing different depths within the material, and higher angle indicates shallower penetration of the x-ray beam. It is clear that there is no enrichment of ether-containing material within the first few nanometers (75° angle) over the larger depth profiled at 0°. Therefore, from XPS, we can conclude that the BCP is present within the particles, and most likely resides on the surface. For further confirmation of BCP anchoring to the surface of the particles, their electrophoretic mobility and zeta potential (ζ) were determined. Particles having a surface charge will migrate in solution according to the direction of an applied voltage potential. Particles having amine or carboxylic acid functional groups within their corona are well-suited for electrophoretic mobility measurements, as they can become positively or negatively charged, respectively. As shown in Figure 4, the electrophoretic mobility and zeta potential were measured for neutral PS-b-P(EO-co-AGE) particles, carboxylate particles at pH 8, and ammonium particles at pH 3. In the case of neutral, alkene functional particles, the electrophoretic mobility does not follow a clear trend, and the data appears scattered with a random fit. In the case of both negatively charged particles containing carboxylate groups at the periphery and positively charged ammonium functional particles, the particles move substantially within the applied electric field. The carboxylate particles have a negative ζ of -29.9 mV, while the ammonium particles display ζ of 30.3 mV. The zeta potentials correspond directly to the predicted charges of the particles, and have nearly identical magnitudes with opposite charges. Because the same polymer scaffold, containing the same average number of functional groups along the backbone, is used to synthesize each of the functionalized polymers used in the particle synthesis, there should be approximately the same number of charged groups for each set of particles. Furthermore, information from zeta potential measurement supports our hypothesis that that polymer chains indeed extend into solution to stabilize the particles.

54 APPROVED FOR PUBLIC RELEASE
Figure 4: Electrophoretic mobility and zeta potential of (a) allyl functional (pH 7), (b) carboxylate functional
(pH 8), and (c) ammonium functional particles.
CONCLUSION 4. A functional amphiphilic block copolymer, polystyrene-b-poly(ethylene oxide-co-allyl glycidyl ether), has been successfully employed as a stabilizer in emulsion polymerization. We have demonstrated control over the size of the particles by varying the amount of BCP incorporated into the particles, to give particles with low polydispersity. The inclusion of allyl groups within the hydrophilic portion of the BCP allows for modification of a single polymer scaffold to create a library of particles with functional corona. Analysis from XPS and zeta potential measurements indicates that that the functional corona does reside at the periphery of the particles, extending into solution. We predict that the type of functionality at the corona will have important implications for the self-assembly of the particles into colloidal crystal assemblies, and for advanced applications, which will be explored in the second year of the project.
REFERENCES [1] Wei, B.C.; et al. Journal of the American Chemical Society 2012, 134, p10780. [2] Daniele, M.A.; et al. Small 2012, 8, p2083. [3] Kim, S.H.; et al. NPG Asia Materials 2011, 3, p25. [4] Munoz-Bonilla, A.; et al. Macromolecules 2010, 43, p2721. [5] Munoz-Bonilla, A.; et al. Polymer Chemistry 2010, 1, p624. [6] Fakhrullin, R.F.; Lvov, Y.M. ACS Nano 2012, 6, p4557. [7] Lee, S.-H.; et al. Journal of the American Chemical Society 2012, (publication to be
released). [8] Zakrevskyy, Y.; et al. Adv. Funct. Mater. 2012, (publication to be released). [9] Zhang, Q.; et al. Langmuir 2012, 28, p5940. [10] Pargen, S.; et al. Macromolecules 2012, 45, p1230. [11] Riess, G. Colloids and Surfaces A: Physiochemical and Engineering Aspects 1999, 153,
p99. [12] Mura, J.L.; Riess, G. Polymers for Advanced Technologies 1995, 6, p497. [13] Riess, G.; Labbe, C. Macromolecular Rapid Communications 2004, 25, p401. [14] Dimitriou, M.D.; et al. Langmuir 2011, 27, p13762. [15] Lee, B.F.; et al. Journal of Polymer Science Part A: Polymer Chemistry 2011, 49, p4498. [16] Killops, K.L.; et al. Journal of the American Chemical Society 2008, 130, p5062. [17] Killops, K.L.; et al. ACS Macro Letters 2012, 1, p758. [18] Campos, L.M.; et al. Macromolecules 2008, 41, p7063.


55 APPROVED FOR PUBLIC RELEASE
Preparation and Properties of Luminescent Lanthanide/Graphene Materials
Amanda L. Jenkins,a Alex Balboa,b Margaret M. Hurley,c David P. Ziegler,d
and Christopher J. Karwacki b a ASK Incorporated, Hebron, MD 21830
b Edgewood Chemical Biological Center, Research & Technology Directorate, 5183 Blackhawk Road, Aberdeen Proving Ground, MD 21010
c US Army Research Laboratory, Deer Creek Loop, Aberdeen Proving Ground, MD 21005 d US Army Natick RDE Center, Natick, MA 01760
ABSTRACT
Interest in graphene-based materials is growing because of their unique mechanical and electrical properties. These properties can be tuned or modified to create many interesting materials and give rise to many possible applications ranging from field emission displays,[1-3] sensors,[4-6] thin film transistors,[7-9] touch panels,[9,10] and electrodes for optoelectronic devices.[11] Luminescence of graphene oxide has been studied, however its success has been limited by a lack of uniformity in treatment techniques and the inability to make materials that are strongly luminescent.[10] In an effort to better understand the binding sites, as well as add chemical selectivity and detection capabilities, luminescent lanthanides have been complexed with graphene oxide. The ability of graphene to quench the luminescence fluorescent dyes by graphene has also been reported.[12,13] In an effort to make highly luminescent graphene, luminescent graphene/lanthanide complexes were made from the reaction of the graphene carboxylate[14] with europium and terbium in a methanol solution under basic conditions.[15,16] The coordination of the graphene carboxylate with the lanthanide was verified by laser induced fluorescence. The surface morphology and physical properties of the graphene/lanthanide materials have been investigated by scanning electron microscope (SEM) and transmission electron microscope (TEM) measurements. Molecular modeling of the systems was conducted to better understand the binding of lanthanide to graphene and to provide direction on further enhancements of the system by organic ligands.
INTRODUCTION 1. Lanthanides comprise the largest naturally occurring group in the periodic table, comprised of elements 57-71.[17] The similarities in the lanthanides arise from a resemblance in the electronic configurations of the elements which consists of the xenon levels, filled 6s sublevel, and a varying amount of electrons occupying the 4f sublevel. Generally, the optical absorption and emission spectra of the ions formed by the triply charged free lanthanide ions consist of very narrow lines (0.1-0.01 nm). Quantum mechanical calculations have indicated that the energies and the radial extensions of the 4f eigen functions dramatically drop at the beginning of the lanthanide series so that the maxima of the 4f eigen functions no longer exceed those of the 5s and 5p eigen functions. The 4f orbitals are therefore not the outermost shell, but are largely shielded from the external environment by the filled 5s and 5p shells. Since these 4f orbitals are shielded, the electrostatic field induced by coordinating ligands causes only small perturbations in the 4f electrons energy levels, and as a result, they retain their semi “atomic” nature responsible for the narrow bands observed in lanthanide emission and excitation spectra.[18,19]

56 APPROVED FOR PUBLIC RELEASE
These narrow features result in analyses which are both selective and sensitive. The spectral position and intensity of these features are dependent on the environmental symmetry of the lanthanide complex.[20]
When a lanthanide ion is placed in a molecular environment, it is subject to a number of influences that are absent in the free ion. Although, as previously mentioned, the 4f levels are shielded from the outside influences by the 5s and 5p levels, aspects of the external environment can cause small shifts and splittings in the free ion states. Since the external environment produces an electric field, the free ion levels can be split into Stark components. The exact nature and degree of these splittings are due not only to the magnitude of the electric field but also to symmetry considerations. Since the magnitude of the external field can cause shifts in line position, it follows that line positions can be affected by the identity of any external ions. This behavior has been observed in crystals that have been doped with a lanthanide ion and some analytes as well as in a number of rare earth chelate complexes.[21, 22] The magnitude of the splittings of the Stark components associated with lanthanide compounds is much greater than the magnitude of these same splittings in the case of transition metal compounds. This is because, in the case of the lanthanides, the contribution to the energy of the orbital made by the spin-orbit interaction is of the same order of magnitude as the coulomb interaction (electron-electron repulsion). The exact character and degree of these spectral changes are a function of the complexing species, the major factors being the coordination number, symmetry, geometry, and the type of coordinating molecule. Although the ligand field is sufficient to produce these shifts, splits, and intensity changes, the ligand to f electron coupling doesn't result in broadening of the lines. Detailed descriptions and the theoretical foundations of lanthanide spectroscopy are described by Deike, Hufner, and Wybourne.[23-25] As a result of this unique chemistry, lanthanides have been used for a variety of purposes such as catalysts, optical components, alternatives to radioisotopes, and as scientific probes for a wide variety of phenomenon including temperature probes [26,27] and structure [28,29] often at parts per trillion (ppt) levels or lower.[30,31] Trace analysis techniques based on lanthanide spectroscopy have also found application for detection of pharmaceuticals, biological molecules, toxic chemicals, and many others.[32-36] The ability of the luminescent lanthanides to accurately and sensitively indicate events in their coordination sphere is being combined with the excellent electrical and mechanical properties of graphene to create a material with a wide range of uses.
EXPERIMENTAL 2.
Reagents 2.1 Unless otherwise indicated, materials were obtained from commercial suppliers and used without further purification. Analytical reagent grade chemicals were used along with deionized water to prepare solutions. The lanthanides were obtained from Aldrich (Aldrich, Milwaukee, WI). The graphene oxide was prepared by Teresa Bandosz at the City College of New York (CUNY) and used as received.[14] Eu(NO3)3 · 5H2O was prepared by taking Eu2O3 and dissolving it in water with heat and just enough nitric acid to produce a clear solution. The resulting solution was dried and evaluated spectroscopically to confirm the conversion.

57 APPROVED FOR PUBLIC RELEASE
Instrumentation 2.2
Luminescence was excited using a model 35-LAP-321-120 argon ion laser (Melles Griot, Carlsbad, CA). A 488 nm holographic filter (Kaiser Optical Systems, Ann Arbor, MI, USA) turned to pass the 465.8nm line, was used to exclude all other laser lines. Spectra were collected using an f/4, 0.5-m monochromator (Chromex, Albuquerque, NM) equipped with a model ST-6 CCD (Santa Barbara Instruments Group, Santa Barbara, CA) using Kestrel Spec Software (K&M Co., Torrance, CA). Spectra were also obtained with a StellarNet Blue wave miniature fiber optic spectrometer (StellarNet, Tampa, FL) with a range 500-700nm equipped with a 2400g/mm ruled grating, a 2048 element detector array, integrated order sorting filter, 16-bit digitizer, and a 25µm slit and running SpectraWiz software. The excitation and emission light was carried to and from the sample using a 400µm bifurcated multimode fiber. (Thor Labs, Newton, NJ). SEM micrographs were obtained using a JEOL 6300F Field Emission SEM (JEOL, Ltd., Tokyo). TEM micrographs were obtained by placing small amount of powder into a vial of methanol and ultrasonicating them using a Branson B-12 80 watt ultrasonic cleaner for 5 minutes. Once the particles were suspended in the methanol, a small amount of liquid was drawn off using a pipette and placed drop-wise onto a holey carbon film copper TEM grid purchased through SPI Supplies and allowed to dry on clean filter paper. Prior to use, the holey carbon film TEM grids were pre-cleaned with de-ionized water to remove as much adsorbed silicon and other detritus from SPI Supplies manufacturing process. The particle samples were then imaged using a JEOL FasTEM 2010 TEM at 200kv using a Gatan Corp. Gatan Image Filter (GIF 2000) digital camera and the energy dispersive (EDS) X-ray spectrometry was recorded using an EDAX Corp. Genesis Si(Li) 30mm2 EDS detector system with the TEM operated in S (TEM) mode.
Compound Preparation 2.3 Graphene carboxylic acid was prepared by Teresa Bandosz, (City College New York) and used as obtained. Graphene/europium materials were first prepared by the following the procedure outlined by Jang Yong Kim et al.[16] The graphene carboxylic acid (0.5 g), water (20 mL) and NaOH (1 M aqueous solution, 1 mL) were sonicated for 30 minutes in a Cole-Parmer sonicator at 200 W. Europium nitrate, Eu(NO3)3 · 5H2O (0.428 g, 1 mmol) was added and stirred overnight. The solids were centrifuged, washed with water and acetone. The graphene/europium solids were dried on a watch glass overnight. This procedure was repeated with increasing amounts of europium nitrate (1.0g, 1.25g, 1.5g and 2.0g). The same procedure was repeated for the terbium graphene oxide compound. Terbium nitrate was used as purchased and 0.5, 1.0, 1.5, and 2.0g respectively were reacted with the graphene oxide as described above. The resulting europium samples were then reacted with α-pyridion in an attempt to recreate the results presented in the Jang Yong Kim paper.[16] The europium graphene oxide samples prepared with 0.5g (as done in the paper) and samples made with 1.0 and 1.g grams of europium were selected for this study. Graphene/europium/picolinate materials were prepared by dissolving (0.420 g, 2 mmol) α -pyridoin in methanol (20 mL), with 2mL of 1.0M NaOH. The graphene/europium solids and methanol (20 mL) were sonicated for 30 minutes followed by the addition of the α-pyridoin anion methanol solution. The reaction mixture was stirred overnight

58 APPROVED FOR PUBLIC RELEASE
and the resulting solids were washed with methanol several times and then water to remove any residual α-pyridoin and/or europium compounds detached from the graphene. This process was repeated with varying amounts of α-pyridoin in methanol (0.25g, 0.75g, and 1.0g).
Compound Evaluation 2.4 The graphene oxide, europium oxide, europium nitrate, terbium nitrate and the resulting europium graphene oxide and terbium graphene oxide samples as well as the samples with the α-pyridoin were evaluated using the laser induced fluorescence system described above. Excitation wavelengths of 465.8nm, 488nm, 496nm, and 514nm were evaluated with 465.8nm selected as optimal for the europium complexes and 514nm selected for the terbium samples. The compounds with the highest luminescent intensity were selected for further study. The resulting europium and terbium graphene oxide samples were analyzed by SEM and TEM methods.
Molecular Modeling 2.5 The lanthanide graphene oxide system was primarily studied using europium in a variety of different charge and multiplicity states. The most probable wave function for each of these charge and multiplicity was determined by allowing the wave function to break symmetry in order to converge to a stable solution (through STABLE = OPT keyword of GAUSSIAN09).[37] By comparing single point energies and analyzing the stability of the wave functions, the most probable lanthanide cation was further studied with a variety of model graphene oxide systems such as naphthalene carboxylate, phenalene carboxylate, 2-oxo-2H-Pyran-3-carboxylate (ca), and coumarin-3-carboxylic acid (cca). In addition, some studies were undertaken of the starting material Eu(NO3)3 · 5H2O and CO ligating to an europium central atom to further understand the energetics. Previous work indicated that density functional theory may be adequate to determine the energetics and structure for lanthanide-ligand systems.[38] Most of the studied systems were run as unrestricted open-shell wavefunctions.[39] Single point energies and geometry optimization of these systems were carried out with the Gaussian 09 computational chemistry package [40] using the (U)BP86 functional.[41,42] In order to reduce the computational cost with an adequate description of the lanthanide-ligand complex, we used the Stuttgart-Dresden SDD small-core (MWB28) ECP pseudo-relativistic basis set (Gaussian (14s13p10d8f6g)/[10s8p5d4f3g] and large-core (MWB52) ECP pseudo-relativistic basis set (Gaussian (7s6p5d)/[5s4p3d] valence basis using a segmented contraction scheme) [43] was employed for metal atoms and standard all-electron Pople 6-31G(d) double valence basis set – for other atoms.[44] The default settings were used with the exception of Integral(Grid=UltraFineGrid).
RESULTS AND DISCUSSION 3.
Compound Preparation 3.1 The conversion from europium oxide to europium nitrate was relatively easy and confirmed spectroscopically by a comparison with the spectra published by Buenzli et al.[45] Europium

59 APPROVED FOR PUBLIC RELEASE
samples were evaluated using excitation wavelengths of 465.8nm, 472nm, 488nm, and 514nm. As previously published, excitation at 465.8 was determined to have the best luminescence intensity and give the best peak resolution.[30] Complexation between the lanthanide and the graphene was determined by spectral changes and increased luminescence from the lanthanide. The europium graphene samples with the best luminescent intensity were those prepared with 1.5g of europium nitrate; data shown in Figure 1. The sample prepared with 0.5 grams showed no spectral difference from the graphene oxide sample itself. In comparing the spectra of graphene oxide, europium nitrate and the optimized europium graphene oxide, the 5D0→ 7F1 transition of the europium from about 590-595nm was evaluated. In this region, a 1nm shift is seen the europium peak of the nitrate at 592nm and the graphene oxide at 591nm. Additionally, the two peaks in the 595nm region are better resolved in the graphene oxide complex. The Eu(GO) peak at 595nm is also higher in intensity, however this could be due to the fact that the graphene oxide itself has a fluorescence peak at that wavelength.
Figure 1: Results of the europium study. Excitation wavelength was 465.8nm.
The hypersensitive 5D0→ 7F2 europium transition was also used to determine binding. The europium nitrate peak at 615nm was not only shifted one nanometer to the blue (614nm) in the Eu(GO) but also reduced in intensity relative to the peak at 617.5nm. The peak at 617nm was shifted 0.1nm to the blue in the nitrate complex. Comparing these splitting patterns with the calculations done by Stump et al.[20] (and taking into account no peaks were seen in the 5D0→ 7F1 transition) the site symmetry for both molecules is likely D2 or D2d with either a tetragonal or rhombic crystal system. For this study, all samples were excited using 488nm. The terbium samples performed in a similar manner with sampled prepared with 0.5g terbium showing no spectral response and the sample prepared with 1.5g of terbium showing the optimal luminescence. Graphene oxide, terbium nitrate, and Tb(GO) were all excited at 465.8, 488, 496 and 514nm. The best wavelength for the terbium was 514nm and was used for comparison of the terbium complexes and the graphene oxide, as shown in Figure 2. The first transition 5D4→ 7F5 had the strongest luminescence. In this spectral region, three peaks were seen for the terbium nitrate (541.5, 543.25, and 545.75) while only two peaks were noted for the Tb(GO) complex (544.5 and 547.0nm). The intensity of the largest peak also shifted from the left (nitrate) to the right (Tb(GO)). In the 5D4→ 7F4 transition, the terbium nitrate has 2 unresolved peaks (581 and

60 APPROVED FOR PUBLIC RELEASE
585.25nm) while the Tb(GO) complex has only one (585.0nm). The 5D4→ 7F3 transition has one peak at 621.5nm for the nitrate and two unresolved peaks at 621.25 and 622.75nm in the Tb(GO) complex. The graphene oxide and Tb(GO) both had weak peaks at 536.75 and 593.75nm which were not seen in the terbium nitrate spectrum.
Figure 2: Results of the terbium study. Excitation wavelength was 514.0nm.
Scanning Electron Microscope Analysis 3.2
The SEM analysis of the graphene oxide showed the nice sheet like structure as expected (Figure 3). The elemental analysis showed traces of sulfur, oxygen, magnesium and potassium left over from preparation by the Humer method. In the europium graphene oxide (Figure 4) as well as the terbium graphene oxide (Figure 5) SEM images the lanthanide can be seen on the surface of the graphene oxide. The sheets are a bit less visible and the large lanthanides are covering the surface. The SEM elemental analysis shows the europium and terbium respectively as expected but also shows a large amount of sodium and oxygen. This is residual from the NaOH washes, and shows that more extensive washing steps will be needed to completely remove it. Results from the TEM study are forthcoming.
Figure 4: SEM image of the graphene oxide taken at 10KV.

61 APPROVED FOR PUBLIC RELEASE
Figure 5: SEM image of the europium graphene oxide taken at 5KV.
Figure 6: SEM image of the terbium graphene oxide taken at 10KV.
Transmission Electron Microscope Analysis 3.3
TEM images of the europium graphene oxide particles are shown in Figure 6, which presents a lower magnification, and a higher magnification image of the particles respectively. The lower magnification TEM image indicates that these particles dispersed better in the methanol and sonication treatment but the sonicator unit was not powerful enough to properly suspend the particles into the methanol. An interesting feature to note in the higher magnification image is the mottled appearance of the particle surface, which may be due to a volatile component off-gassing or evaporating in the TEM vacuum and electron beam exposure. There did not seem to be any distinct graphene crystallinity present in this sample. Elemental data on the sample is shown in the EDS spectra of Figure 7. In addition to the expected europium, oxygen, and carbon, there are strong EDS spectra of the elements sulfur and silicon. The X-ray maps shown as Figure 8 illustrate the strong correlation of the sulfur and silicon X-ray EDS data to being bound to the europium graphene oxide particles.

62 APPROVED FOR PUBLIC RELEASE
Figure 6: Low magnification (a) and (b) high magnification image of a europium graphene oxide particle.
Figure 7: The EDS spectra of the europium graphene oxide sample.
Figure 8: The X-ray map of the europium graphene oxide components: (a) carbon and oxygen, (b) europium,
(c) sulfur, and (d) silicon.

63 APPROVED FOR PUBLIC RELEASE
The TEM images for the Terbium graphene oxide particles sample showed that the graphene was present mostly as planar flakes as seen in the lower magnification of Figure 9a. The high magnification TEM image shown in Figure 9b exhibits good crystallinity of the graphene as the atomic lattice features of the graphene particles are clearly visible. The slightly mottled appearance of the graphene is not as profound as that seen in the europium graphene oxide sample. The EDS spectra of Figure 10 shows a lack of additional elements which might explain the difference. Figure 11 shows the X-ray maps of the terbium graphene oxide particles near the edge of a hole in the holey carbon TEM grid.
Figure 9: Low magnification (a) and high magnification (b) image of the terbium graphene oxide particle.
Figure 10: The EDS spectrum of the terbium graphene oxide.

64 APPROVED FOR PUBLIC RELEASE
Figure 11: The carbon/oxygen (a) and terbium (b) X-ray map of terbium graphene oxide.
Molecular Modeling 3.4
Single point energies for europium cations were compiled in Table 1. As one may note, the following Eu cations appear to be possibly the most stable in the gas phase: (charge of +1, multiplicity of 9, electronic state of 9-A2U) and (charge of +3, multiplicity of 1, electronic state is 1-A1G). Subsequently, europium, with a formal charge of +3, multiplicity of 1, was used as the central cation for a number of complexes studied.
Table 1: Single point energies values (hartrees) for europium cation. Cation Multiplicity Energy (hartrees)
Eu+1 1 - Eu+1 3 -710.292201282 Eu+1 5 -710.349394542 Eu+1 7 -710.443344405 Eu+1 9 -710.455388793 Eu+1 11 - Eu+3 1 -708.936118739 Eu+3 3 -708.944898527 Eu+3 5 - Eu+3 7 - Eu+3 9 -708.502404593 Eu+3 11 - Eu+2 2 -709.862777144 Eu+2 4 -709.875869818 Eu+2 6 -709.933746608 Eu+2 8 -710.030010048 Eu+2 10 -709.271795700 Eu+2 12 - Eu+4 2 -707.323434869 Eu+4 4 -707.356395090 Eu+4 6 -707.420752371 Eu+4 8 -707.018265130 Eu+4 10 -706.525061673 Eu+4 12 -705.695083864

65 APPROVED FOR PUBLIC RELEASE
A compilation of a variety of Eu−O bond lengths and O−Eu−O bond angles obtained with BP86 DFT functional are given in Table 2 and Table 3 for some of the europium complexes. As shown previously, lanthanide and ligands containing carbonylic and carboxylic functional groups can form specific complexes, depending on the central atom.[39] Previous work with carbonate anions and water indicated that lanthanide(s) can form stable complexes.[46] The formation of a bidentate with ligand containing solely a carboxylic functional group, such as naphthalene carboxylate and phenalene carboxylate anions, seems energetically unfavorable. Steric factors and an unfavorable bond distance between the anionic carboxylic oxygens seem to be contributing to the lack of favorable binding.
Table 2: Geometry Parameters of a variety of Eu-graphene oxide model complexes Calculated at (U)BP86 Level of Theory (Bond Lengths in Å and Bond Angles in deg).
Complex C−Os* C−Ol** Eu−Os* Eu−Ol** Os* −Eu−Ol** Os*−Ol** Ca 1.22 1.26 - - - 3.11 Cca 1.22 1.27 - - - 3.19
Eu(cca)3(H2O)2 1.24 1.31 2.27 2.47 70.9-72.7 2.77-2.81 Eu(ca)3(H2O)2 1.24 1.31 2.27 2.47 70.9-73.0 2.78-2.83 s* = short l** = long
Table 3: Geometry Parameters of a variety of Eu-nitrate model complexes Calculated at (U)BP86 Level of
Theory (Bond Lengths in Å and Bond Angles in deg). Complex N−Os* N−Ol** Eu−Os* Eu−Ol** Os* −Eu−Ol** Os*−Ol** Os*−N-Ol**
NO3 1.28 1.28 - - - 2.22 120.0 Eu(NO3)3(H2O)4 1.29 1.31 2.43 2.49 52.9-53.5 2.20-2.24 114.5-114.7 Eu(ca)3(H2O)2 1.24 1.31 2.27 2.47 70.9-73.0 2.78-2.83
s* = short l** = long
Previous preliminary results indicated that the europium-oxygen bond lengths of these graphene oxide model compounds are comparable to europium-fluoride bond lengths [47] and somewhat shorter than other europium-oxygen non-graphene ligands.[48] In addition, qualitatively, the bidentate ligand attachment of the carbonlyic and carboxylate oxygen to europium is longer than the europium-oxygen bond length found in europium oxide [42] and europium-oxygen bond length of europium-water complexes.[42,43,49-51] The C-O bond distance results compare favorably with some of the previous published work.[46] Some of the interactions of europium and oxygen has also been explained previously with Pearson’s Hard–Soft-Acid–Base (HSAB) principle and the frontier orbital theory of chemical reactivity as proposed by Fukui.[52]

66 APPROVED FOR PUBLIC RELEASE
Figure 12: Molecular electrostatic potential of Eu(cca)3(H2O)3
CONCLUSIONS 4.
The ability to label graphene oxide with luminescent lanthanides has been validated. Europium and terbium were both successfully complexed with graphene; the resulting spectra were collected and verified. Based on this work, the addition of other luminescent lathanides (samarium, dysprosium, etc.) to graphene oxide should be relatively straightforward. Molecular modeling of some of these model species was undertaken to understand complexation with a luminescent central. However, once the modeling data is available, it will be used to help optimize the ratio of lanthanide to graphene. Modeling will also be used to direct complexation of the newly prepared lanthanide graphene species with organic ligands to further enhance the luminescence of complex as well as add specificity and functionality to the materials for future applications, such as sensors or electronic devices. Ongoing work on terbium cations and complexes will be detailed in future publications.
REFERENCES [1] Tien, H.; et al. Carbon 2011, 49, p1550-1560. [2] Vadukumpully, S.; et al. Carbon 2009, 47, p3288-3294. [3] Yoon, B.; et al. Journal of the American Chemical Society 2005, 127, p8234-8235. [4] Shao, Y.; et al. Electroanalysis 2010, 22, p1027-1036. [5] Liu, Y.; et al. Chemical Society Reviews 2012, 41, p2283-2307. [6] Pumera, M.; et al. TrAC Trends in Analytical Chemistry 2010, 29, p954-965. [7] Sun, Q.; et al. Applied Physics Letters 2010, 96, p103301.

67 APPROVED FOR PUBLIC RELEASE
[8] Yan, C.; et al. Nanoscale 2012, 4, p4870-4882. [9] Lee, S.; et al. Nano Letters 2012, 12, p3472-3476. [10] Soldano, C.; et al. Carbon 2010, 48, p2127-2150. [11] Hellstrom, S.L.; et al. ACS Nano 2009, 3, p1423-1430. [12] Kim, J.; et al. Journal of the American Chemical Society 2010, 132, p260-267. [13] Dantham, V.R.; et al. Chemical Physics Letters 2012, 521, p130-133. [14] Seredych, M.; Bandosz, T.J. The Journal of Physical Chemistry C 2007, 111, p15596-
15604. [15] Gupta, B.K.; et al. Nano Letters 2011, 11, p5227-5233. [16] Kim, J.; et al. Bulletin of the Korean Chemical Society 2010, 31, p1485. [17] Bünzli, J.-C.G.; Choppin, G.R. Lanthanide Probes in Life, Chemical, and Earth Sciences:
Theory and Practice; Elsevier: The University of Michigan, 1989. [18] Cotton, S. In Lanthanides and Actinides; Oxford University Press: New York, 1991. [19] Murray, G.M.; et al. Inorganic Chemistry 1989, 28, p1994-1998. [20] Stump, N.A. A study of Lanthanide Fluorescence Shifts Caused by Near Neighbor
Perturbation; University of Tennessee: Blount Hall, 1991. [21] Wright, J.C.; Wehry, E.L. In Modern Luminescence Spectroscopy, Vol. 4; Pleniun Press:
New York, 1981; p51-109. [22] Murray, G.M. Rare Earth Containing Complex Compounds for the Determination of
Inorganic Ions; University of Tennessee: Blount Hall, 1988. [23] Deike, G.H. In Spectra and Energy Levels of Rare Earth Ions in Crystals; Interscience
Publishers: New York, 1968. [24] Hufner, S. In Optical Spectra of Transparent Rare Earth Compounds; Academic Press:
New York, 1978. [25] Wybourne, B.G. In Spectroscopic Properties of the Rare Earths; Interscience Publishers:
New York, 1965. [26] Gualtieri, D.M.; et al. Journal of Applied Physics 1991, 69, p5978-5980. [27] Klakamp, S.L.; Horrocks Jr., W.D. Journal of Inorganic Biochemistry 1992, 46, p175-192. [28] Bünzli, J.-C.G.; et al. Journal of Physical Chemistry 1989, 93, p980-984. [29] Thomason, J.W.; et al. Applied Spectroscopy 1996, 50, p401-408. [30] Jenkins, A.L.; et al. Analytical Chemistry 1999, 71, p373-378. [31] Jenkins, A.L.; et al. Analyst 2001, 126, p798-802. [32] Hurskainen, P.; et al. Nucleic Acids Research 1991, 19, p1057-1061. [33] Parker, D. Coordination Chemistry Reviews 2000, 205, p109-130. [34] Orcutt, K.M.; et al. Sensors 2010, 10, p1326-1337. [35] Ai, K.; et al. Angewandte Chemie International Edition 2009, 48, p304-308. [36] Gao, F.; et al. Talanta 2009, 80, p202-206. [37] Bauernschmitt, R.; Ahlrichs, R. Journal of Chemical Physics 1996, 104, p9047-9052. [38] Byrne, O. Spectroscopy and Photochemistry of Europium Atoms in Low Temperature
Solids - An Experimental and Theoretical Study. Ph.D. Thesis, National University of Ireland – Maynooth, Kildare, Ireland, 2010.
[39] Mihaylov, T.; et al. Chemical Physics 2006, 327, p209-219. [40] Frisch, M.J.; et al. Gaussian~09 Revision A.1. [41] Perdew, J.P. Physics Review B 1986, 33, p8822-8824. [42] Becke, A.D. Journal of Chemical Physics 1993, 98, 5648-5652. [43] Cao, X.; Dolg, M. Journal of Molecular Structure: THEOCHEM 2002, 581, p139-147.

68 APPROVED FOR PUBLIC RELEASE
[44] Francl, M.M.; et al. Journal of Chemical Physics 1982, 77, p3654-3665. [45] Bünzli, J.-C.G.; Yersin, J.R. Inorganic Chemistry 1979, 18, p605-607. [46] Janicki, R.; et al. European Journal of Inorganic Chemistry 2011, 2011, p3601-3616. [47] Chaumont, A.; Wipff, G. Physical Chemistry Chemical Physics 2005, 7, p1926-1932. [48] Katia, N.N.; et al. Inorganic Chemistry 2011, 50, p1689-1697. [49] Ricca, A.; Bauschlicher Jr., C.W. Chemical Physics Letters 2002, 366, p623-627. [50] Schmidt, M.W.; et al. Journal of Computational Chemistry 1993, 14, p1347-1363. [51] Gordon, M.S.; Schmidt, M.W. In Advances in Electronic Structure Theory: GAMESS A
Decade Later; Dykstra, C.E.; et al., Eds.; Elsevier: Amsterdam, 2005; p1167-1189. [52] Manna, D.; Ghanty, T.K. Physical Chemistry Chemical Physics 2012, 14, p11060-11069.

69 APPROVED FOR PUBLIC RELEASE
Understanding the Role of Physical and Chemical Adsorption on the Raman Enhancement from Metallic Nanoparticles and
Nanostructured Surfaces Jason Guicheteau,a Ashish Tripathi,b Erik Emmons,b Jerry Cabalo,a Craig Knox,b Brandon Scott,c
Keith Carron,c and Steven Christesen a a Edgewood Chemical Biological Center, Research & Technology Directorate, 5183 Blackhawk
Road, Aberdeen Proving Ground, MD 21010 b Science Applications International Corporation, Gunpowder Branch, Aberdeen Proving
Ground, MD 21010 c University of Wyoming, Laramie, Wyoming 82072
ABSTRACT
The enhancement of the Raman signal resulting from analyte adsorption onto nano-structured metallic surfaces was first discovered in 1977. Since then, surface-enhanced Raman spectroscopy (SERS) has developed into an exceptionally fertile area of scientific investigation producing hundreds of refereed publications yearly. This research, however has not yet transformed SERS into a tool for routine chemical analysis. Much of the reason for this has to do with lack of substrate reproducibility and the highly analyte specific enhancement factors. While most of the SERS enhancement can be explained by the enhanced electric field produced by the metallic nanostructures, the role of physical and chemical adsorption is less well understood. Because the enhanced electric field drops off sharply with distance, the adsorption is critical to observing enhanced Raman spectra. This research is aimed at a quantitative understanding of the effects of both physical and chemical adsorption on the SERS enhancement. We investigated simple molecules with varying degrees of polarity to provide an improved experimental and theoretical understanding of the physical phenomena that govern the adsorption and interaction of analytes with metallic nanoparticles and nanostructured metallic surfaces.
INTRODUCTION 1. Since the discovery and following proof of surface-enhanced Raman scattering (SERS) in the late 1970s,[1-3] the technique has grown into a wide field of study in both academia and more recently, industry. Over 1000 papers per year are published detailing various SERS research accomplishments ranging from single molecule SERS (SMSERS), medical and cellular interactions, chemical detections, hazard detection and probably the most prevalent; the manufacture of nanometallic substrate surfaces and colloidal nanoparticles. Captured in these studies and others is a heavy focus on the fundamental understanding of what drives the SERS effect. Throughout the literature, much attention is and has been focused on two mechanisms that are understood to control the enhancement of the Raman scattering, relating to the electromagnetic fields generated at or near nanoparticle surfaces and the physical (chemical) adsorption of a target analyte to a surface.[4-5] The electromagnetic enhancement (EM) is typically believed to be the stronger effect contributing to approximately 104 or greater enhancement, while the chemical enhancement (CE) is believed to only contribute at most a factor of 102.[6] When one examines the notable reviews of this work,[7-8] it is clear the basic

70 APPROVED FOR PUBLIC RELEASE
knowledge and understanding of the SERS phenomenon is fairly mature. However, with that stated, there are still significant gaps in why some molecules are SERS active and others are not. As stated above, the EM and CE are known to be the driving forces behind SERS. The EM enhancement is dependent on the nanoscale surface roughness features or the particle size and shape in a colloidal suspension.[9-10] Since the intensity of the Raman scattering from an adsorbed analyte molecule is proportional to the square of the local electromagnetic field (EMF), the increase in the magnitude of the EMF at the metal surface increases the number of photons that are Raman scattered. If the correct wavelength of light strikes a metallic roughness feature, the plasma of conduction electrons will oscillate collectively and is known as a localized surface plasmon.[11] This, combined with the free-electron property of a SERS active metal (ε is negative), leads to a large polarization field in the particle and allows the resonant wavelength to be absorbed and scattered, creating large electromagnetic fields around the roughness feature. The net effect is that a molecule localized within these large electromagnetic fields produces an enhanced Raman signal. Unlike the EM effect, the CE is related to specific interactions between the metal and the formation of a molecule-metal complex creating a charge-transfer state between the two species that can resonantly enhance the Raman scattering signal from analyte molecules. Differing from the EM, the molecule must be directly adsorbed to the roughened metal surface in order to experience the CE enhancement and is believed to only contribute to the enhancement effect at most 102. Sites of atomic scale roughness, such as metal clusters or adatom defects, are thought to act as chemical active sites that facilitate the creation of charge transfer complexes, but the nature and identity of these sites has not been conclusively determined. Part of our work in this program is to further understand these active sites. Even without the formation of a strict charge-transfer complex, the analyte molecule must adsorb onto the metal to take advantage of the EM which falls off rapidly with distance. Chemicals that don’t adsorb to the metal nanoparticle will not be enhanced. This is why most SERS studies are performed with analytes that bind strongly to the metal particles or nanostructures. The nanoparticle surface charge plays a critical role in the determining the adsorptivity of the analyte as well as the stability of the colloidal suspension. This surface charge on the nanoparticle results in a relative increase in the concentration of counter-ions close to the surface and the formation of an electrical double layer. The potential difference between the stationary layer of solvent and the mobile layer or slipping plane is referred to as the zeta potential and provides information about the charge on the nanoparticle which in turn affects the stability of the colloid and the binding of the analyte molecule. To describe both these physical and chemical adsorption effects, the Langmuir isotherm can be used to characterize the binding of the analyte to the substrate:[12] 𝜃 = !"
!"!! (1)
In this equation, the analyte concentration is given by c, the fractional surface coverage by θ, and the adsorption equilibrium constant by K. The fractional coverage is calculated as the ratio of the SERS peak intensity divided by the intensity at full surface coverage (I/Imax). K can be

71 APPROVED FOR PUBLIC RELEASE
determined from experimental data by fitting K and Imax using a nonlinear regression technique. While the plot of SERS intensity vs. concentration yields the adsorption equilibrium constant, the rate constant for adsorption can be extracted from the time dependence of the SERS signal via the time-dependent Langmuir equation:[13] 𝜃 = 1− 𝑒!!" (2) where k is the rate constant and t the time delay between exposure of the SERS substrate to the analyte solution and data collection. Figure 1b shows the results for BPE adsorbed onto KlariteTM (not the same substrate as in Figure 1a) and the fit of the data to Equation 2.
Figure 1: Dependence of SERS signal with fits to Langmuir isotherm and time-dependent Langmuir equation
on (a) concentration and (b) time. In utilizing Langmuir isotherms, size measurement characteristics, zeta potential, and both colloidal solutions and commercial and in-house manufactured 2-D nonmetallic planar arrays, we investigated molecules with varying degrees of polarity in order to seek an improved experimental and theoretical understanding of the physical phenomena that govern the adsorption and interaction of analytes with SERS active surfaces as well as a better understanding of the interparticle characteristic nature behind SERS. The next section provides a detailed summary of last year’s effort, which is a follow on of previously funded under the ILIR program. Please refer to the ILIR Annual Reports from 2010 and 2011 for full accounts of the previous year’s work.[14-15]
RESULTS 2.
Previous Year Summary 2.1 In previous year of this project we demonstrated the fabrication of 2-dimensional SERS substrates based on tethering gold & silver nanoparticles to quartz & glass slides. We utilized Langmuir isotherms (kinetic measurements), and zeta potential experiments to demonstrate our prepared surfaces could be used to analyze molecules that form charge transfer complexes, (e.g. benzenethiol), and molecules that do not have strong charge transfer characteristics (e.g. aminoethanol). Rate constants for 2-mercaptoethanol were determined to be 0.0619 ± 0.00076 s-1 at the 95% confidence interval for 1 mM and 0.0238 ± 0.0075 s-1 at the 95% confidence interval for 5 mM. Additional experimental work carried out this year details enhancements to the planar
0.00
2.00
4.00
6.00
8.00
10.00
12.00
1.0E-09 1.0E-08 1.0E-07 1.0E-06 1.0E-05
Concentration (M)
Rel
ativ
e SE
RS
Inte
nsity
0
0.2
0.4
0.6
0.8
1
1.2
1.4
0 10 20 30 40 50 60 70
Time (min)
Rel
ativ
e SE
RS
Inte
nsity
a) b)0.00
2.00
4.00
6.00
8.00
10.00
12.00
1.0E-09 1.0E-08 1.0E-07 1.0E-06 1.0E-05
Concentration (M)
Rel
ativ
e SE
RS
Inte
nsity
0
0.2
0.4
0.6
0.8
1
1.2
1.4
0 10 20 30 40 50 60 70
Time (min)
Rel
ativ
e SE
RS
Inte
nsity
0.00
2.00
4.00
6.00
8.00
10.00
12.00
1.0E-09 1.0E-08 1.0E-07 1.0E-06 1.0E-05
Concentration (M)
Rel
ativ
e SE
RS
Inte
nsity
0
0.2
0.4
0.6
0.8
1
1.2
1.4
0 10 20 30 40 50 60 70
Time (min)
Rel
ativ
e SE
RS
Inte
nsity
a) b)

72 APPROVED FOR PUBLIC RELEASE
array construction, kinetic measurements for new chemicals, and beginning construction on a temperature controlled cell for activation energy measurements. Complementing the experimental research in this project, computational modeling has been used to understand how the interaction between an analyte molecule and the SERS substrate controls signal enhancement. Hybrid Density functional theory (DFT) and Amsterdam Density Functional theory was employed to simulate the interaction between several similar analytes and a various cluster of silver and gold atoms.
Experimental Measurements of Aromatic Thiols on Gold and Silver 2.2 The overall goal of the series of experiments was to measure the rate constants for binding of different analytes to gold and silver substrates by measuring the SERS signal intensity as a function of time. The analytes are chosen to be similar in structure but differ in polarity due to the structure of the molecules. Originally the plan was to study a series of alkanethiol molecules. Molecules containing thiol groups are known to chemisorb on silver and gold by forming a bond between the sulfur atom and the metallic surface, losing a proton in the process. Therefore thiols are commonly used in SERS experiments. Due to the smaller cross sections observed for alkanethiols, it was decided to instead switch to aromatic thiols, which have inherently stronger signal levels in both normal Raman scattering and SERS. This greatly increased the level of signal observed. The two aromatic thiols focused on here are benezenethiol (thiophenol) and 4-mercaptophenol. These differ only in the presence of the –OH group at the para position in mercaptophenol, leading to a difference in the polarity. Both of these molecules were seen to have large signal levels on both silver and gold SERS substrates. The molecular structure of these molecules and their surface-enhanced Raman spectra are shown below in Figure 2. Overall the spectra are similar, due to the similar molecular structures, but there are enough differences in band frequencies and relative intensities to differentiate between the two molecules.
Figure 2: SERS spectra of benzenethiol and 4-mercaptophenol in colloidal solution.
A series of kinetic experiments were performed to determine the relative binding properties of these molecules to gold and silver SERS substrates. The SERS substrates were prepared by tethering colloidal silver or gold particles to GAPS slides (Sigma-Aldrich). GAPS slides are aminopropyl trimethylsilane functionalized glass slides. The colloidal silver and gold particles

73 APPROVED FOR PUBLIC RELEASE
have an affinity for the amine groups and become “tethered” to the glass substrate when they are deposited on top of them. This fixes the positions of the nanoparticles in a constant configuration so that a stable substrate is obtained. In the experiments described here, the following procedure was used. Aliquots of 5 µL of colloidal solution were deposited on the GAPS slides and allowed to dry, forming the SERS substrates. After the SERS substrate had dried, the slide was thoroughly rinsed in a jet of ultrapure water to remove loosely bound nanoparticles, and then allowed to dry again. A relatively small amount of colloid was used for slide preparation to ensure the numbers of available active sites are much smaller than the number of analyte molecules – reasons for this will be discussed later. The substrate was then placed in a Petri dish and immersed in 7 mL of a 20% ethanol/80% ultrapure water solution containing the desired concentration of the analyte at time t=0. The ethanol provided an internal intensity standard for the measurements. The kinetic series measurement was begun within one minute of adding the analyte. In each case the kinetic study was run for at least two hours. The measurements on the silver substrates were performed with 532 nm excitation using a ChemImage FALCON II Raman chemical imaging system with a 10× objective. For the gold substrates, 785 nm excitation was used on a JASCO Raman microscope with a 5× microscope objective. The reaction kinetic data was analyzed using the fundamental reaction rate equations. In general the rate law for a chemical reaction such as chemisorption of a thiol to silver or gold is of the following form: !"
!"= 𝑘 𝐶!!𝐶!"#! (3)
where I is the intensity of a band of the analyte in the SERS spectrum, t is time, k is the rate constant, Ca is the concentration of the analyte, Csub is the concentration of analyte occupied sites on the substrate, and n and m are the reaction orders with respect to the analyte and the substrate, respectively. A simplification of this equation occurs if the number of analyte molecules in the solution is much larger than the number of active sites on the substrate. In that case Ca is approximately constant during the entire reaction time and the rate equation can be rewritten as: !"
!"= 𝑘!"𝐶!"#! (4)
where kps = k Ca
n is a ‘pseudo’ rate constant. The value of kps can be obtained by measuring the SERS intensity as a function of time for different analyte concentrations. This is achieved by assuming m=1 and maintaining constant temperature conditions, which allows the use of the Langmuir isotherm. Taking the logarithm of the equation kps = k Ca
n above gives: ln 𝑘!" = ln 𝑘 + 𝑛 ln (𝐶!) (5) Therefore, if a plot of ln(kps) versus ln(Ca) is plotted the values of ln(k) and n with respect to the analyte can be obtained as the y-intercept and the slope, respectively.

74 APPROVED FOR PUBLIC RELEASE
The experimental results for thiophenol and 4-mercaptophenol on silver and gold SERS substrates are shown below in Figures 3-6; each figure contains two panels. The left hand panel shows the ratio of an analyte band integrated intensity to that of an internal standard ethanol band. The ratio technique was used to reduce variation in the measurements. The solid lines in the left hand figures show the Langmuir isotherm fits. From these fits the value of kps can be obtained for each concentration. The right hand panel in each figure shows the values of ln(kps) versus ln(Ca), which were obtained from the time-dependent measurements. As mentioned previously, a linear fit to the values of ln(kps) versus ln(Ca) allows the rate constant k and the order of the reaction with respect to the analyte to be obtained. These values were obtained for the two analytes on both the silver and gold SERS substrates. Figure 7 shows the fits in Figures 32-35 all overlaid on one plot for comparison purposes. The tabulated values of kps and the reaction order with respect to the analyte are shown in Table 1.
Figure 3: (a) Time-resolved Raman intensity measurements for thiophenol on Ag substrates using 532 nm
excitation for a range of different concentrations. (b) Fit of ln(kps) versus ln(Ca) used to determine the reaction order and k values.
Figure 4: (a) Time-resolved Raman intensity measurements for thiophenol on Au substrates using 785 nm
excitation for a range of different concentrations. (b) Fit of ln(kps) versus ln(Ca) used to determine the reaction order and k values.

75 APPROVED FOR PUBLIC RELEASE
Figure 5: (a) Time-resolved Raman intensity measurements for 4-mercaptophenol on Ag substrates using 532
nm excitation for a range of different concentrations. (b) Fit of ln(kps) versus ln(Ca) used to determine the reaction order and k values.
Figure 6: (a) Time-resolved Raman intensity measurements for 4-mercaptophenol on Au substrates using 785
nm excitation for a range of different concentrations. (b) Fit of ln(kps) versus ln(Ca) used to determine the reaction order and k values.
Figure 7: Fit of ln(kps) versus ln(Ca) used to determine the reaction order with respect to the analyte and k
values for both thiophenol and 4-mercaptophenol on silver and gold substrates. These curves are present in Figures 3-6 but are overlaid here for comparison purposes.

76 APPROVED FOR PUBLIC RELEASE
Table 1: Values of the reaction order with respect to the analyte and rate constants for thiophenol and 4-mercaptophenol on silver and gold substrates.
Chemical Substrate Reaction order with respect to analyte Rate constant (1/s)
Thiophenol silver 0.625 7.97 gold 0.432 0.109
4-mercaptophenol silver 0.189 0.032 gold 0.422 1.16
Interparticle Characteristics 2.3
Following experimental work at ECBC, the University of Wyoming has joined the effort and is concentrating their focus on nano-interparticle characteristics. To date, they have demonstrated two significant benefits of what they are calling dynamic SERS (DSERS) measurements: removal of instrumental and normal Raman interferences in SERS spectroscopy; and site selective spectroscopy of adsorbate populations on SERS active particles. Their first example of shelled nanoparticles at very low concentrations confirmed the benefit of DSERS for removal of an overwhelmingly strong solvent spectral interference. The second benefit, site selection, was demonstrated with 4-mercaptopyridine on bare Au nanoparticles to observe a small population of molecules that were spectroscopically unique from the large population of molecules on the particles. The DSERS spectrum originated from excess variance between a small population of adsorbates on the ensemble of nanoparticles; this is illustrated in Figure 8.
Figure 8: Experimental results for 4MP on Au nanoparticles at basic and acidic pH. (A) The average
spectrum of 1000-100 ms acquisitions at pH 9; (B) The average spectrum of 1000-100 ms acquisitions at pH 5; (C) DSERS spectrum from data set used to produce (A); (D) DSERS spectrum from data set used to produce (B); (E) Two individual acquisitions spectra; (F) Intensity vs. time subset of the 1000 acquisition at 1091 cm-1.
Gaussian Calculations 2.4 The objective of this computational study was to determine how individual vibrational modes experience the chemical enhancement component of SERS. Specifically, how molecular orientation to the substrate surface affects the relative chemical enhancement. A number of studies on thiobenzene and similar systems have been done with the same objectives.[16-18] The study by Saikin focused on resonant enhancement through the mixed metal-molecular states of thiobenzene on silver. Although the models used in this study are similar to those in the Saikin

77 APPROVED FOR PUBLIC RELEASE
study, the focus of this study was on the change in the polarizability tensor along the normal coordinates and the molecular orientation, as well as the change in electron density, and how these changes contributed to the chemical enhancement of Raman signal. Classical molecular dynamics simulations (MD) were performed to examine the orientation of the thiobenzene and 4-mercaptophenol molecules relative to silver and gold surfaces using the Forcite code with the COMPASS force field. Quantum mechanical calculations were performed using Gaussian 2009 revision C.02 on neat thiobenzene and 4-mercaptophenol, and these molecules on Ag and Au clusters with 1, 3, 5, and 7 atoms. For the 5 and 7 atom metal clusters, the atoms were laid out in a plane to approximate a surface, although these sheet-like clusters were allowed to relax without constraints. These calculations were performed with the hybrid B3LYP functional with the LANL2DZ double zeta basis set with relativity corrected effective core potentials. A number of other calculations were also attempted with hybrid quantum mechanical/classical mechanical (QM:MM) methods, and with larger systems with geometry constraints to capture molecular behavior on a realistic surface. First, a standard frequency analysis including dynamic calculation of the frequency dependent Raman response for 785 nm excitation was performed and used to assign bands in the experimental spectrum. Further analysis was performed by taking the normal mode coordinates and performing single point calculations for dynamic polarizability and electron density along the normal coordinate. In order to investigate the influence of a surface selection rule on the chemical mechanism of SERS, Raman spectra with different orientation averaging schemes were calculated from the derivative of the polarizability tensor with respect to the normal coordinate. The polarizability derivatives could be averaged in the standard way using the isotropic and anisotropic Raman invariants, or the induced polarizability could be determined for a direction assumed to be normal to the cluster “surface”. The movement of the electron density for the total as well as the HOMO and two molecular orbitals immediately below the HOMO (HOMO-1 and HOMO-2) as the molecule moved along the normal vibrational coordinate were a significant focus of this computational study. The movement of density was analyzed with the total RMS of the differences for the electron density (total, HOMO, HOMO-1, and HOMO-2) between the equilibrium geometry and displacements along each normal coordinate were evaluated.
Gaussian Results 2.4.1 The results of single molecule MD simulations of thiobenzene and 4 mercaptophenol show that the preferred orientation of the thiolate molecules on both gold and silver surfaces is with the ring flat on the surface, regardless of the presence of solvent water molecules. For the case of gold substrates, this result is consistent with published results,[19] but is not consistent with results for silver, where the ring makes an angle of 24o relative to the vector normal to the surface. Quantum mechanical calculations that neglect the presence of solvent agree with this result. The discrepancy between the literature values and our results points towards a key assumption in the simulations that the analyte molecules thiobenzene and 4-mercaptophenol surface densities are low, so that there is no interaction between these molecules. In our quantum mechanical calculations of analyte molecules associated with small sheet-like metal clusters, the

78 APPROVED FOR PUBLIC RELEASE
preferred geometry between the sulphur atom and the metal cluster was either association with an edge or a single metal atom. This result is consistent with the result of Payton, et al, where pyridine molecules interacting with an icosahedral silver nanoparticle showed lower energy association with vertices and edges over faces. As a result, crowding around defects in the SERS substrate, such as steps, crystal grain boundaries, etc, would be expected even for submonolayer coverages. A possible explanation for the upright orientation of thiobenzene is that it has a stronger interaction with other thiobenzene molecules rather than the silver surface. Clearly, interaction between analyte molecules on the surface cannot be neglected in the MD simulations. Theoretical and experimental Raman spectra for thiobenzene and 4-mercaptophenol were calculated for 785 nm excitation with the B3LYP/LANL2DZ method. For most frequencies, there were no issues with the LANL2DZ basis set, except for the S-H stretching mode in the free thiobenzene and 4-mercaptophenol. This particular mode appears to be sensitive to the selection of basis set. However, since this mode does not exist when the analyte molecule is contact with the SERS substrate, the selected theoretical method is valid. Some representative results for the analyte molecules are shown in Figure 9. Reasonable agreement with experiment in terms of intensities and frequencies were obtained. For the 1, 3, 5, and 7 member silver and gold clusters, the same relative intensity pattern was obtained. For the 7 member metal clusters, both analyte molecules showed a preference for the ring associating with the metal “surface”.
Figure 9: Comparison of the theoretical and experimental Raman spectra for thiobenzene and 4-
mercaptophenol calculated for 785 nm excitation with the B3LYP/LANL2DZ method. The results from the analyte molecules were used to investigate the influence of molecular orientation on the modes preferentially enhanced by interaction with the metal substrate. First, the presence of a surface selection rule was investigated. Raman scattering intensities were calculated directly from the derivative of the polarizability tensor α with respect to the normal coordinate. Instead of orientation averaging using the isotropic (I) and anisotropic Raman (A) invariants using the expression 45I + 7A, the induced polarization along the direction normal to the surface defined by the planar metal cluster was calculated. The qualitative agreement between the predicted Raman spectra and the experimental data decreased. Because the models used to calculate theoretically predicted spectra neglected plasmonic effects, it was reasoned that a comparison of trends in the relative enhancements between theory and experiment could illuminate the role of molecular orientation on the chemical enhancement effect.

79 APPROVED FOR PUBLIC RELEASE
For a more quantitative analysis, relative enhancements for selected peaks were compared. Table 2 shows the results of the relative intensity analysis. Four modes were common for all systems investigated, and it was found that a ring breathing mode at 1072 cm-1 in thiobenzene on silver and 1073 cm-1 in 4-mercaptophenol on silver were preferentially enhanced. Both relative intensities calculated with standard orientation averaging and with polarization along the normal to the surface replicated the same trends in relative enhancement. The same trends held for relative enhancements calculated from thiobenzene and 4-mercaptophenol molecules associated with single metal atoms. We believe these models are equivalent to systems with the molecule in an upright position, since the ring is not in contact with a surface. As a result, we conclude the orientation cannot be uniquely determined from the relative SERS enhancements. However, the magnitude of absolute enhancement may be useful in deducing the molecular orientation relative to the SERS surface. The effect of the change electron density along the normal mode coordinate was examined. For the total electron density, there were not large differences in the total RMS change in density along the normal coordinate between strongly enhanced modes and weakly enhanced modes. This makes physical sense because the core electrons for all atoms will be closely associated with their respective atoms. The electrons that are able to respond to external electric fields will occupy the higher energy MO’s and will be the most delocalized. These electrons will most likely be involved in the Raman effect. When only considering high energy molecular orbitals, such as the highest occupied molecular orbital (HOMO), there was significant change in electron density. However, the RMS change in electron density of the HOMO was not a perfect predictor of which normal modes experienced enhancement. Qualitative examination of the isosurfaces of other high energy MO’s showed varying degrees of change for different modes, as well as changes in the symmetry of the electron density. Thus, we expect a more complete analysis that includes more of the high energy MO’s as well as symmetry will show better correspondence between changes in electron density and changes in the polarizability.
Table 2: Experimental vs. theoretical relative enhancements.

80 APPROVED FOR PUBLIC RELEASE
Molecular Dynamics 2.5 The objective of this computational study was to determine the activation energies and binding energies of simple organic thiol molecules on Ag and Au nanoparticles, in an effort to understand analyte chemisorption and molecule-surface orientation effects on the chemical enhancement component of SERS as well as to help validate experimental chemisorption kinetic studies. Askerka et al. have studied the mechanism of chemisorption of methanethiol on Au nanoclusters using Density Functional Theory (DFT) as well as multiconfigurational, multireference post-Hartree Fock methods (e.g., Coupled Cluster Theory). Their work suggests the formation of a ‘staple’ motif transition state (2R-S-H + Au -> R-S-Au-H + H-S-R -> R-S-Au-S-R + H2) involving two or more thiol species physisorbed on or near the same metal active site (adatom), in agreement with the proposed striped phase model.[20] These sorbed analytes share their thiol hydrogens with each other and with the metal. This concerted multistep reaction pathway leads to the formation of dihydrogen (H2) and thiolate-metal-thiolate (R-S-Au-S-R) structures. Similar calculations involving hydroxy thiol species and Ag surfaces have not been found in the literature. These systems as well as those with longer alkane thiol chains and thiol ring structures are believed to undergo similar reaction mechanisms on Ag/Au substrates Quantum mechanical calculations were performed using Gaussian09 (Frisch et al.). Two methanethiol or hydroxymethanethiol molecules were placed on one Ag/Au atom to approximate binding to an adatom on top of a metal surface. Askerka et al. compared activation energies and reaction pathways from single adatom calculations with Au20 cluster calculations and found similar results. Geometry optimizations using the Berny eigenvector following method were performed to determine the transition state structures, starting from an initial guess based on the ‘TS5’ methanethiol-Au-methanethiol staple motif structure of Askerka et al. The reactant and product states were also geometry optimized to calculate activation energies (barrier heights) and binding energies (Esystem – Eadatom – 2Eanalyte). The PBE functional and the CEP-121G basis set with relativistic corrections were used. This DFT functional and basis set combination were previously validated and calibrated by Askerka et al. and found to closely reproduce high-level CCSD(T) calculations and to yield negligible basis set superposition error.
Molecular Dynamic Results 2.5.1 Figure 10 shows the optimized transition state structures of both methanethiol and hydroxymethanethiol on Ag. Similar structures on Au were observed. Both of these analyte species form the proposed staple motif structure on either metal, in support of previous studies in the literature of methanethiol on Au and the assumption of similar chemisorption mechanisms for similar species. The reaction mechanism proceeds from the reactant state, involving two physisorbed thiols on the metal adatom, through hydrogen dissociation (thiolate formation) of one thiol by the adatom to this transition state (believed to be the rate-limiting step), involving the now metal hydrogen forming a bond to the other thiol hydrogen in close proximity, through hydrogen dissociation of the other thiol by the metal hydrogen to the final product state, involving free dihydrogen and chemisorbed thiolates on the adatom. This mechanism involves several reaction intermediate states and multiple lower barrier transition states.

81 APPROVED FOR PUBLIC RELEASE
Figure 10: Transition state structures of two methanethiol (left) and two hydroxymethanethiol (right) species on single Ag adatom. Blue, yellow, red, gray, and white represent Ag, S, O, C, and H atoms, respectively.
Table 3 reports the calculated activation energies and binding energies of each of these systems based on the energies of the optimized reactant, transition, and product states. The activation energies of methanethiol are somewhat lower than that of hydroxymethanethiol on either metal, suggesting increased stability and resistance to hydrogen dissociation because of the stronger electronegativity of oxygen. However, binding energies are slightly higher for methanethiol than for hydroxymethanethiol, possibly due to oxygen delocalizing the radical electron of the thiolate sulfur and weakening its interaction with the metal. Au compared to Ag follows a similar trend: lower activation energies and higher binding energies, although the differences in binding energies are much larger and the differences in activation energies are much smaller than in the case of the hydroxyl effect.
Table 3: Calculated activation energies and binding energies (kcal/mol). System Activation Energy Binding Energy 2 methanethiols + 1 Ag 4.0 36.5 2 hydroxymethanethiols + 1 Ag 13.0 35.1 2 methanethiols + 1 Au 3.0 52.2 2 hydroxymethanethiols + 1 Au 10.0 47.8
CONCLUSIONS 3.
There is a relatively large amount of scatter in the experimental data. Future measurements are planned to try to reduce the amount of scatter. There were fluctuations in the temperature of the laboratory, and due to the generally strong dependence of reaction rates on temperature, these could lead to significant scatter in the data. It is planned to implement a temperature controlled cell for future measurements which should reduce the scatter. The temperature cell may also incorporate a flow system to allow larger volumes of solution to be used. This will be helpful to ensure that the analyte does not get depleted during the measurements. Measuring rate constants as a function of temperature will also allow the activation energy to be estimated. Work is also being performed on improving the reproducibility of the SERS substrates. The theoretical effort has been devoted to finding the underlying physics that determine which vibrational modes are chemically enhanced, when an analyte molecule chemically binds to the SERS substrate. First, the effect of molecular orientation relative to the SERS surface has been investigated, and second, the effect of movement of electronic density in response to nuclear motion along the normal vibrational coordinate on the Raman signal have been examined. Both quantum mechanical and molecular dynamics calculations predict that thiobenzene and 4-mercaptophenol will lie flat on a gold or silver surface and that the modes from these models most enhanced involving motion of carbon ring, such as ring breathing modes, C-C stretches,

82 APPROVED FOR PUBLIC RELEASE
and C-C-C bends. However, our calculations do not show that the orientation relative to a surface can be uniquely determined from the trends in relative SERS enhancement. Trends in the absolute enhancements may provide insight into the molecular orientation. However, to successfully reproduce the experimental data for such an analysis, it will be necessary to include the effect of the plasmonic enhancement as well as the chemical enhancement. In the next year we are incorporating new molecules taking advantage of different polarities while continuing to enhance the tethering ability of the silver and gold nanoparticles enabling additional binding kinetic measurements along with additional computational modeling with increasing metallic clusters. Additionally, the University of Wyoming effort will collect Raman spectra from dilute nanoparticle solutions that exhibit signal variations much greater than the (I)1/2 shot noise from the detector. This noise stems from individual particles moving in and out of the laser beam. The rate at which they move is related to their diffusion coefficient, and thus, their size. It is believed that aggregation, to a point, increases the SERS signal. The goal is to ascertain the molecular structure of the hotspot responsible for the enhanced signals
REFERENCES [1] Fleischmann, M.; et al. Chemical Physics Letters 1974, 26 (2), p163-166. [2] Jeanmaire, D.L.; Van Duyne, R.P. Journal of Electroanalytical Chemistry and Interfacial
Electrochemistry 1977, 84 (1), p1-20. [3] Albrecht, M.G.; Creighton, J.A. Journal of the American Chemical Society 1977, 99,
p5215-5217. [4] Premasiri, W.R.; et al. Journal of Physical Chemistry B 2005, 109, p312-320. [5] Schatz, G.C.; et al. In Surface-Enhanced Raman Scattering: Physics and Applications;
Kneipp, K.; et al., Eds.; Springer: New York, 2006; p19-46. [6] Maitani, M.M.; et al. Journal of the American Chemical Society 2009, 131, p6310-6311. [7] Otto, A.; et al. Surface Science 1984, 138, p319-338. [8] Moskovits, M. Reviews of Modern Physics 1985, 57 (3), p783-826. [9] Hulst, Van de. H.C. Light Scattering by Small Particles; Dover Publications Inc.: New
York, 1981. [10] Carey Lea, M. American Journal of Science 1889, 37, p476-491. [11] Rohr, T.E.; et al. Journal of Analytical Biochemistry 1989, 182, p388-398. [12] Adamson, A.W.; Gast, A.P. Physical Chemistry of Surfaces, 6th ed.; Wiley Interscience:
New York, 1997; p599. [13] Biggs, K.B.; et al. Journal Physical Chemistry A 2009, 113 (16), p4581-4586. [14] Edgewood Chemical Biological Center In-House Laboratory Independent Research
Program Annual Report FY10 [15] Edgewood Chemical Biological Center In-House Laboratory Independent Research
Program Annual Report FY11 [16] Cardini, G.; Muniz-Miranda, M. Journal of Physical Chemistry B 2002, 106, p6875-6880. [17] Payton, J.L.; et al. Journal of Chemical Physics 2012, 136 (21), p214103. [18] Saikin, S.K.; et al. Physical Chemistry Chemical Physics 2009, 11 (41), p9401-9411. [19] Love, J.C.; et al. Chemical Reviews 2005, 105 (4), p1103-1169. [20] Askerka, M.; et al. Journal of Physical Chemistry A 2012, 116 (29), p7686-7693.


83 APPROVED FOR PUBLIC RELEASE
In Vitro Investigation of Monoclonal Antibodies to Neutralize Botulinum Toxin Entry into Cells
Patricia E. Buckley and Janna S. Madren-Whalley
Edgewood Chemical Biological Center, Research & Technology Directorate, 5183 Blackhawk Road, Aberdeen Proving Ground, MD 21010
ABSTRACT
Botulinum (BOT) neurotoxin is one of the most toxic substances known to man. While there are naturally occurring cases of botulism, its extreme lethality makes it a concern as a potential bioweapon. There have been many assays designed to detect and identify BOT; however, the current method for neutralizing BOT toxin is to inject human or equine antisera into the affected individual. The side effects associated with these antidotes are often debilitating, and less than therapeutically desired. The objective of this effort is to investigate the ability of recombinant monoclonal antibodies to bind BOT toxin prior to cell entry and prevent the subsequent intracellular catalytic cascade which mediates BOT toxin lethality. In this study, M17 neuroblastoma cells were exposed to a monoclonal antibody, Bot IgG, pre-incubated with BOT toxin complexes in order to determine if the antibody could neutralize the entry of BOT toxin into the cells. At the concentrations tested, the Bot IgG antibody did not inhibit the function of BOT A toxin complex.
INTRODUCTION 1. There are many bacteria that are known to cause disease in humans, but there are few that produce as deadly an effect as Clostridium botulinum. The neurotoxins that are produced by C. botulinum, and some strains of C. butyricum, and C. baratii, have been declared Category A agents on the scale for “Critical biological agent categories for public health preparedness.”[1] The category A agents on this list have the greatest potential for adverse public health impact, and have a moderate to high potential for large-scale dissemination, or the ability to invoke mass fear in the general population due to their heightened recognition to cause death.[1] There have been seven different serotypes of toxin (BOTA-G) produced by these bacteria, documented based upon their immunological properties and amino acid variations.[2] Out of these seven serotypes, there are four toxin types known to cause outbreaks in humans: A, B, E, and F.[3-7] All seven of the Botulinum neurotoxins are zinc metalloproteases that inactivate specific cellular proteins.[5] They are produced as 150-kDa single chain proteins that are comprised of three functional domains: N-terminal catalytic domain (light chain, LC), an internal translocation domain (heavy chain translocation, HCT), and a C-terminal receptor binding domain (heavy chain receptor, HCR).[8] The HCR can then be further subdivided into an N-terminal (HCRN) and C-terminal (HCRC) domains.[8] The LC targets the soluble N-ethylmaleimide-sensitive factor attachment protein receptor, specifically the LC of BOTA, /C, and /E cleave the synaptosome associated 25-kDa protein SNAP-25 whereas, the LC of BOTB, /D, /F, and /G all cleave synaptobrevin 2 (VAMP 2).[5,6,9,10] The HCR is responsible for both the binding and translocation of the toxin in vivo.[8,10] Both chains, bound by a single interchain disulfide bond, are required for toxicity.[7]

84 APPROVED FOR PUBLIC RELEASE
The current method for neutralizing BOT toxin is to inject human or equine antisera into the affected individual. The side effects associated with these antidotes are often debilitating, and less than therapeutically desired. The objective of this effort is to investigate the ability of recombinant monoclonal antibodies to bind BOT toxin prior to cell entry and prevent the subsequent intracellular catalytic cascade which mediates BOT toxin lethality. Previous research has indicated that the hemagglutinin associated protein HA33 mediates the transport of BOT toxin across the cell membrane and the hypothesis is that an antibody specific for HA33 will prevent toxin entry into the cell and prevent the cascade of neurotoxic events.
METHODOLOGY 2.
Neutralization Antibody 2.1 The backbone antibody utilized in this study was produced as part of a joint US Army and Naval Medical Research Institute (NMRI) research grant and described previously.[11] In summary, mice were injected with the Botulinum pentavalent toxoid (BPT) containing types A, B, C, D, and E, produced by the Michigan Department of Public Health. The mice were then primed and immunized with multiple injections of botulinum type B complex (both toxin and toxoid), and sera was collected and screened for a titer to botulinum toxin type A and B complexes. Spleens were collected from the mice showing significant titers. Total RNA was extracted from the spleens and cDNA was produced. This DNA was used to produce a primary λ library. Phage containing the DNA was produced for bio-panning, enriched, and screened for positive clones after three rounds of selection. Colony lift hybridization was performed using 125I-labeled botulinum type B toxin complex. Colonies recognizing the toxin complex were then selected for testing, and induced with IPTG overnight. The supernatants were collected and tested by indirect ELISA. The supernatant producing the strongest reaction was used to determine the Fab clone for further testing (Bot Fab5). The Bot Fab5 was used as the template for cloning into a lentiviral vector system and chineese hamster ovary (CHO) cells to convert the Bot Fab5 into an IgG. This lentivial system allows the genes to be inserted randomly into transcriptionally active regions of the CHO cells, resulting in overproduction of the Bot Fab5. In collaboration with Lentigen Inc. (Gaithersburg, MD), the variable regions of the original Bot Fab5 heavy and light chains were amplified by PCR, cut with AscI and NotI, and directionally cloned into the Lentimax TM-Ig lentiviral expression vectors (Lentigen), which contain the EF-1 alpha promoter. The sequence verified antibody was then transfected into 293FT cells. Cells were cultured in 75mL tissue culture flasks, using ProCho5 medium supplemented with 2mM HT, 2mM GlutaMAX (Invitrogen) and 10mM HEPES (Sigma-Aldrich); with the pH set to 7.3. The cultures were incubated at 37 °C, 5% CO2 and 90% humidity. Stable cell lines, that consistently produce the BOT Fab 5, were selected and counted. Viability and cell sizes were determined by running 0.5 mL suspension samples on a VI-Cell XP cell viability analyzer (Beckman Coulter). The supernatants were collected and purified using affinity chromatography. The resultant antibody, BOT IgG, was tested for neutralization of the BOT A toxin complex (Metabiologics).

85 APPROVED FOR PUBLIC RELEASE
Cell Line for Neutralization Studies 2.2
The human neuroblastoma cell line BE(2)-M17 has been proven to be a preferential model for BOT toxin studies.[12] These cells are susceptible to BOT intoxication, and their dose-dependent release of neurotransmitters can be directly correlated to SNAP-25 or VAMP 2 cleavage.[12] Therefore, M17 cells purchased from ATCC were grown at 37°C in Eagle’s minimum essential medium (EMEM) mixed 1:1 with F12 medium and supplemented with 10% fetal bovine serum (ATCC). Cells were cultured in tissue culture flasks, seeded into six-well tissue culture plates, and grown to 90% confluence for the neutralization experiments.
Antibody Neutralization Test 2.3 M17 cells were seeded into six-well tissue culture plates, and grown with a change of fresh medium. Each well of confluent monolayers was washed three times with 1mL of 37°C DPBS (Invitrogen). To establish cleavage controls, dilutions of BOTA and BOTB toxin complexes were made in EMEM/F12 without serum for cell exposures. Two mL of toxin complex was added to the cells and incubated for 24 hours at 37°C. These exposed cells were washed three times with 1ml ice cold PBS (SIGMA), and 1mL lysis buffer (20mM HEPES, pH 7.4, 1% TritonX-100, 50mM NaCl, and HALT Protease Inhibitor) was then added. Cells were manually scraped, pipetted into tubes, and centrifuged at 10,000 x g for 3 minutes to remove cell debris. Supernatants were run on an 18% Criterion XGT (Bio-Rad) SDS PAGE gel, and electrophoretically transferred to a nitrocellulose filter for Western blotting using standard procedures. Blots were probed with 1:2500 dilutions of Rabbit anti-SNAP 25 (SIGMA) and Rabbit anti-VAMP2 (SIGMA) in 1X milk diluent blocking buffer (KPL). The blots were then developed using GE Amersham’s Western Development Kit according to the manufacturer’s instructions, and read on a Bio-Rad Gel Doc system. The procedure for the antibody neutralization tests were the same as the procedure for the controls with one modification. BOTA and BOTB toxin complexes were incubated with 300µg/mL, 150µg/mL, 30µg/mL, and 15µg/mL of the Bot IgG antibody (Lentigen) in 2 mL EMEM/F12 (ATCC) medium without serum. This antibody/toxin complex was then added to the confluent monolayer of cells and incubated for 24 hours at 37°C.
RESULTS 3. Initial experiments were performed to determine the amount of toxin needed to cleave the M17 cell proteins. It was determined that 50nM of BOTA toxin complex produced adequate cleavage of SNAP-25 for visualization (Figure 1). After running the experiment several times, at increasing concentrations of BOTB toxin complex, it was determined that exposure to BOTB toxin complex failed to produce discernible cleavage detection with the Rabbit anti-VAMP 2 (SIGMA) antibody (data not shown). Therefore, the neutralization tests were only performed with BOTA toxin complex.

86 APPROVED FOR PUBLIC RELEASE
Figure 1: Western blot of SNAP-25 from M17 cells exposed to BOTA toxin complex. Each well has the
amount of BOTA toxin complex indicated above in nM quantities. 50nM was chosen as the ideal concentration to produce SNAP25 cleavage.
Once the optimal concentration of BOTA toxin complex was determined, the antibody neutralization experiment was performed. M17 cells were exposed to 50nM BOTA toxin complex pre-incubated with various dilutions of Bot IgG. While cleavage of the SNAP-25 was not as clear as in the control experiment, it appeared that the Bot IgG was not able to neutralize the BOTA toxin complex (Figure 2).
Figure 2: Western blot of SNAP-25 from M17 cells exposed to BOTA toxin complex pre-incubated with Bot IgG antibody. The amount of BOTA toxin complex in nM quantities and the amount of antibody in µg/mL quantities the used to expose M17 cells is indicated above each well. None of the concentrations of antibody
tested appeared to inhibit SNAP25 cleavage.
CONCLUSIONS 4. The majority of the testing for this project involved developing appropriate protocols to visualize the M17 protein cleavage of BOT toxin complex. To date, the concentrations of Bot IgG antibody tested were unable to neutralize the BOTA toxin complex. Additional testing will be performed using different anti-VAMP 2 antibody for the visualization of BOTB toxin complex cleavage. Furthermore, future experiments will also include testing other anti-Bot toxin antibodies to determine if they have any neutralization capacity.
REFERENCES [1] Rotz, L.D.; et al. Emerging Infectious Diseases 2002, 8 (2), p225-230. [2] Smith, T.J.; et al. PLoS One 2007, 2 (12), e1271. [3] Arnon, S.S.; et al. Journal of the American Medical Association 2001, 285 (8), p1059-
1070. [4] Baldwin, M.R.; et al. Infection and Immunity 2008, 76 (3), p1314-1318. [5] Barr, J.R.; et al. Emerging Infectious Diseases 2005, 11 (10), p1578-1583. [6] Evans, E.R.; et al. Journal of Applied Microbiology 2009, 107 (4), p1384-1391.

87 APPROVED FOR PUBLIC RELEASE
[7] Montecucco, C.; Schiavo, G. Molecluar Microbioloy 1994, 13 (1), p1-8. [8] Baldwin, M.R.; et al. Infection and Immunity 2005, 73 (10), p6998-7005. [9] Cheng, L.W.; et al. Infection and Immunity 2009, 77 (10), p4305-4313. [10] Kalb, S.R.; et al. PLoS One 2009, 4 (4), e5355. [11] Emanuel, P.; et al. Journal of Immunological Methods 1996, 193 (2), p189-197. [12] Lee, J.-O.; et al. The Botulinum Journal 2008, 1 (1), p135-152.

88 APPROVED FOR PUBLIC RELEASE
Relieving Mipafox Inhibition in Organophosphorus Acid Anhydrolyase by Rational Design
Terry J. Henderson, Steven P. Harvey, and Saumil S. Shah
Edgewood Chemical Biological Center, Research & Technology Directorate, 5183 Blackhawk Road, Aberdeen Proving Ground, MD 21010-5424
ABSTRACT
Organophosphate acid anhydrolyase (OPAA) is a bimetalloenzyme that hydrolyzes acetylcholinesterase-inhibiting organophosphorus compounds, including fluorine-containing nerve agents such as Soman [pinacolyl methylphosphonoflouridate]. The insecticide mipafox [N,N’-diisopropyldiamidofluorophosphate], a close analog of the nerve agent substrate diisopropyl fluorophosphonate, is a special case for OPAA, as it reversibly inhibits the enzyme’s hydrolysis activity. It is believed that OPAA hydrolyzes mipafox to DDP [N,N’-diisopropyldiamidophosphate], which becomes bound to the OPAA active site through a hydrogen bond network. The crystal structure of the OPAA-DDP complex [1] suggests that disruption of two of these bonds, one involving Asp244 and the other involving Glu381, could potentially release DDP from the OPAA active site to give the enzyme catalytic mipafox hydrolysis activity. To test this hypothesis, we produced three mutant OPAA enzymes, one with an Asp244 to alanine mutation, a second with a Glu381 to alanine mutation, and a third with both, to remove the corresponding hydrogen bonds between these amino acids and the bound DDP. In all cases, the mutant enzymes were not found to have mipafox hydrolysis activity but retained their high hydrolysis rates against Soman, indicating that the remaining OPAA-DDP interactions are adequate to stabilize their complex and keep DPP bound to the enzyme.
INTRODUCTION 1. Some 28 years ago, two enzymes were identified [2] that detoxify fluorine-containing nerve agents such as diisopropyl fluorophosphonate (DFP) and Soman (GD), shown in Figure 1. These enzymes are generally referred to as organophosphate/organophosphorus hydrolyases. Seven years later, an organophosphate acid anhydrolyase (OPAA, EC 3.1.8.2) was purified from halophilic Alteromonas sp. bacteria and displayed hydrolysis activity against several highly toxic organophosphorus compounds, including the fluorine-containing nerve agents Tabun (GA), Sarin (GB), and Soman.[3] OPAA has high hydrolysis activity against phosphorus-fluorine bonds in organophosphorus compounds, but very minimal activity for phosphorus-oxygen and phosphorus-carbon bonds in the compounds. Mipafox, an organophosphorus insecticide containing a phosphorus-fluorine bond, however, is not an OPAA substrate under normal assay conditions but a competitive inhibitor with a Ki=0.49 mM for DFP substrate hydrolysis.[3, 4] The OPAA enzyme is active at pH~8.5 and requires divalent cations.[3-5] A recent crystal structure of OPAA co-crystallized with mipafox [1] suggests that the enzyme hydrolyzes the insecticide to N,N’-diisopropyldiamidophosphate (DDP), also shown in Figure 1, and it is this hydrolysis product rather than mipafox that becomes bound to the OPAA active site to inhibit DFP substrate hydrolysis. The DDP is reversibly held in the enzyme’s active site by an intricate network of hydrogen bonds involving both divalent cations and three amino

89 APPROVED FOR PUBLIC RELEASE
acids. There is no evidence in the crystal structure for a covalent bond between the enzyme and DDP.
Figure 1: OPAA substrates mipafox, DFP, and Soman along with the DDP reaction product.
Structural data derived from OPAA co-crystallized with the mipafox substrate [1] reveals that besides coordinating the two metal cations, the DDP product interacts with the enzyme’s amino acids via electrostatic interactions through its two nitrogen atoms and one of its carboxyl oxygen atoms. This is illustrated in Figure 2, where one DDP nitrogen atom donates a hydrogen bond to a carboxyl oxygen atom of Asp244, and the other DDP nitrogen atom donates a hydrogen bond to a Glu381 carboxyl oxygen atom. Additionally, a DDP oxygen atom accepts a hydrogen bond from the His343 nitrogen atom, and the two DDP isopropyl groups participate in hydrophobic interactions with several OPAA amino acids. In an effort to investigate the forces stabilizing the OPAA-DDP complex, we have chosen to systematically eliminate hydrogen bonds between the enzyme and DDP for its release from the OPAA active site, giving rise to catalytic mipafox hydrolysis activity. Our initial effort focused on the DDP-Asp224 and DDP-Glu381 hydrogen bonds. We produced three mutant OPAA enzymes, one with an Asp244 to alanine mutation, a second with a Glu381 to alanine mutation, and a third with both mutations, for removing their corresponding hydrogen bonds in the OPAA-DPP complex and creating an OPAA variant with catalytic mipafox activity. Herein, we report our preliminary results for the three mutants.
Figure 2: Ligplot schematic [6] representation of the interactions between DDP (circumscribed by a yellow
boundary), the two Mn++ cations in the OPAA active site (MnA and MnB), and OPAA amino acids via hydrogen bonds (dashed green lines) and non-polar interactions (residues demarcated by a spoked arc).
EXPERIMENTAL PROCEDURES 2.
Coding regions for each of three OPAA variants, an Asp244 to alanine mutant (D244A), a Glu381 to alanine mutant (E381A), and a variant with both (D244A-E381A), were separately ligated into the promotor region of pSE420 plasmids between their RcaI and EcoRI restriction sites for expressing the variant proteins. For each, an Escherichia coli DH5α culture containing one of the plasmids was
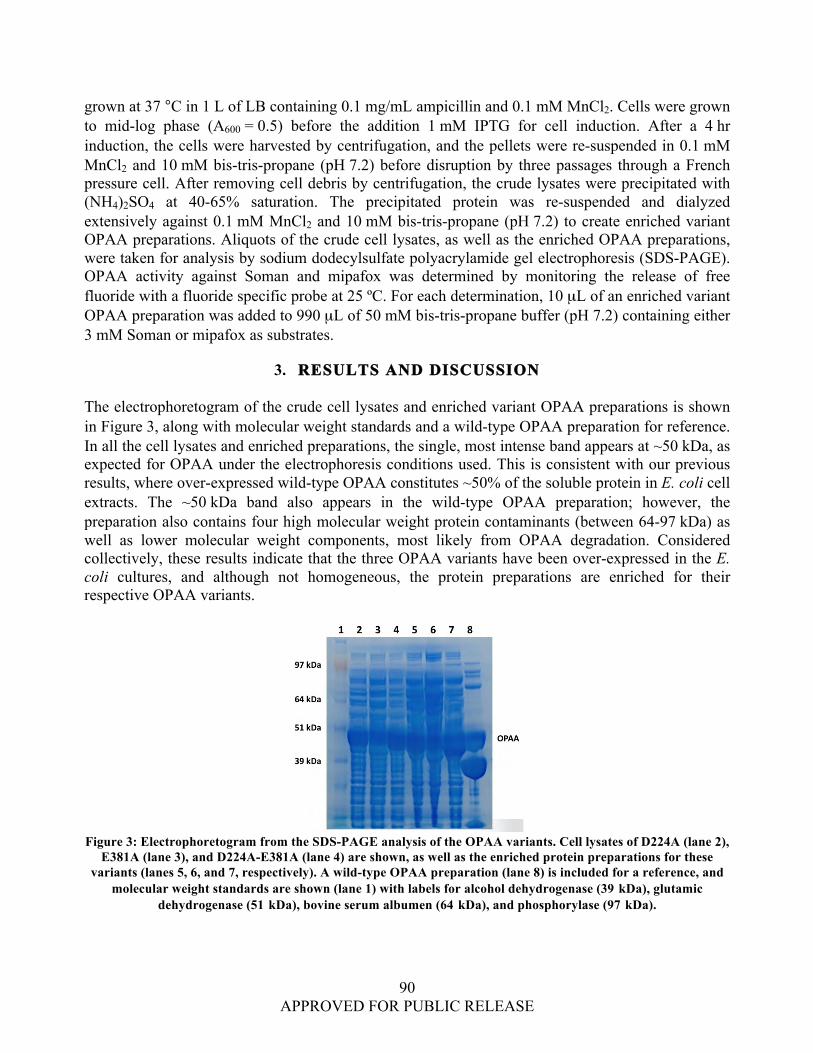
90 APPROVED FOR PUBLIC RELEASE
grown at 37 °C in 1 L of LB containing 0.1 mg/mL ampicillin and 0.1 mM MnCl2. Cells were grown to mid-log phase (A600 = 0.5) before the addition 1 mM IPTG for cell induction. After a 4 hr induction, the cells were harvested by centrifugation, and the pellets were re-suspended in 0.1 mM MnCl2 and 10 mM bis-tris-propane (pH 7.2) before disruption by three passages through a French pressure cell. After removing cell debris by centrifugation, the crude lysates were precipitated with (NH4)2SO4 at 40-65% saturation. The precipitated protein was re-suspended and dialyzed extensively against 0.1 mM MnCl2 and 10 mM bis-tris-propane (pH 7.2) to create enriched variant OPAA preparations. Aliquots of the crude cell lysates, as well as the enriched OPAA preparations, were taken for analysis by sodium dodecylsulfate polyacrylamide gel electrophoresis (SDS-PAGE). OPAA activity against Soman and mipafox was determined by monitoring the release of free fluoride with a fluoride specific probe at 25 ºC. For each determination, 10 µL of an enriched variant OPAA preparation was added to 990 µL of 50 mM bis-tris-propane buffer (pH 7.2) containing either 3 mM Soman or mipafox as substrates.
RESULTS AND DISCUSSION 3. The electrophoretogram of the crude cell lysates and enriched variant OPAA preparations is shown in Figure 3, along with molecular weight standards and a wild-type OPAA preparation for reference. In all the cell lysates and enriched preparations, the single, most intense band appears at ~50 kDa, as expected for OPAA under the electrophoresis conditions used. This is consistent with our previous results, where over-expressed wild-type OPAA constitutes ~50% of the soluble protein in E. coli cell extracts. The ~50 kDa band also appears in the wild-type OPAA preparation; however, the preparation also contains four high molecular weight protein contaminants (between 64-97 kDa) as well as lower molecular weight components, most likely from OPAA degradation. Considered collectively, these results indicate that the three OPAA variants have been over-expressed in the E. coli cultures, and although not homogeneous, the protein preparations are enriched for their respective OPAA variants.
Figure 3: Electrophoretogram from the SDS-PAGE analysis of the OPAA variants. Cell lysates of D224A (lane 2),
E381A (lane 3), and D224A-E381A (lane 4) are shown, as well as the enriched protein preparations for these variants (lanes 5, 6, and 7, respectively). A wild-type OPAA preparation (lane 8) is included for a reference, and
molecular weight standards are shown (lane 1) with labels for alcohol dehydrogenase (39 kDa), glutamic dehydrogenase (51 kDa), bovine serum albumen (64 kDa), and phosphorylase (97 kDa).

91 APPROVED FOR PUBLIC RELEASE
As illustrated in Figure 4, each of the three OPAA variants has catalytic hydrolysis activity against Soman that is substantially above the rate for Soman alone in aqueous solution. This confirms the conclusion above that the variants have been over-expressed in the E. coli cultures. Because the mutant OPAA concentrations in the enriched preparations are not known, the activity of each of the variants relative to each other cannot be established. It is likely that much of the relative differences observed in Soman hydrolysis between the three variants represent different variant concentrations in the enriched variant preparations rather than differences in specific activities. Finally, the figure reveals that all three OPAA variants do not have mipafox hydrolysis activity significantly different than the spontaneous rate for the insecticide alone in aqueous solution. Data for all three variants are superimposed over one another in the figure, as well as those for spontaneous mipafox hydrolysis. Clearly, neither the D244A nor the E381A mutations, or both used together, are able to release the DDP from the enzyme active site and create mipafox hydrolysis activity.
Figure 4: Kinetic results of the OPAA variants D244A, D244A-E381A, and E381A against Soman and mipafox. Results for the spontaneous hydrolysis of Soman (Soman alone) and mipafox (Mipafox alone) are also included.
We have chosen to investigate two hydrogen bonds in the OPAA-DDP complex and determine their contributions to stabilizing this complex. For both bonds, DDP nitrogen atoms (N1 and N2 in Figure 2) donate hydrogen bonds to carboxyl group oxygen atoms of the native Asp244 and Glu381 amino acids.[1] The removal of these hydrogen bonds, either individually with an Asp244 to alanine mutation or a Glu381 to alanine mutation, or both mutations together, does not create catalytic hydrolysis activity against the mipafox insecticide. Because the creation of catalytic hydrolysis activity requires the release of DDP from the enzyme, and because it is known that the OPAA-DPP complex is a consequence of numerous stabilizing forces between the enzyme and DDP hydrolysis product, it is reasonable to assume that removal of these hydrogen bonds does not release DPP from the enzyme. The reasons for this cannot be determined without further investigation; however, the removal of these two hydrogen bonds leaves three more in place (one involving His343 and two involving each of the Mn++ cations; see Figure 2) as well as at least two hydrophobic interactions between DDP and OPAA amino acids (involving Tyr212, His332, Val342, and Arg418) to stabilize the OPAA-DDP complex.[1] It is reasonable to assume, therefore, that these remaining hydrogen bonds and hydrophobic interactions provide adequate stabilization of the enzyme-hydrolysis product complex to keep it undisrupted. It is possible that the two point mutations to alanine residues contributed to the existing hydrophobic interactions between OPAA and DDP, or created new

92 APPROVED FOR PUBLIC RELEASE
hydrophobic interactions, or obliterated the enzyme’s hydrolysis activity. We believe that the latter case is unlikely, given that all three OPAA variants retain high hydrolysis rates against Soman.
CONCLUSIONS 4. We have demonstrated conclusively that the removal of the Asp244-DDP and Glu331-DPP hydrogen bonds in the OPAA-DDP complex does not create catalytic mipafox hydrolysis activity. We attribute this to the fact that removal of these hydrogen bonds leaves three more in place between OPAA and DDP, as well as at least two hydrophobic interactions, to provide sufficient stabilizing forces to the complex, prohibiting the release of DPP from the enzyme active site.
REFERENCES [1] Vyas, N.K.; et al. Biochemistry 2010, 49, p547-559. [2] Hoskins, F.C.G.; et al. Fundamental Applied Toxicology 1984, 4, p165-172. [3] DeFrank, J.J.; Cheng, T.-C. Journal of Bacteriology 1991, 173, p1938-1943. [4] Cheng, T.-C.; et al. Applied Environmental Microbiology 1993, 59, p3138-3140. [5] Cheng, T.-C.; et al. Journal of Industrial Microbiology and Biotechnology 1997, 18, p49-55. [6] Wallace, A.C.; et al. Protein Engineering 1996, 8, p127-134.

93 APPROVED FOR PUBLIC RELEASE
Science of Decision Making: A Data Modeling Approach
Samir V. Deshpande,a Rabih E. Jabbour b a Science & Technology Corporation, Edgewood, MD 21040
b Edgewood Chemical Biological Center, Research & Technology Directorate, 5183 Blackhawk Road, Aberdeen Proving Ground, MD 21010
ABSTRACT
We have developed a parallel data analysis algorithm for peptide classification, used for microbial identification, based on data generated from commercially available algorithms, namely SEQUEST and OMSSA. The outputs from those algorithms were analyzed to determine the probability score of the identified peptides and their associated proteins. The statistical analyses and data interpretation using our proposed approach showed that we can lower the false discovery rate (FDR) by using common proteins from both algorithms. This approach showed that the identification accuracy and reliable classification of microbes were improved without increasing the data analysis time. In summary, we have a higher confidence in the identification and lower bottleneck in data analysis process.
INTRODUCTION 1. Peptide mass fingerprinting (PMF) based identification algorithms using mass spectrometry (MS) data were developed in the early 1990s. One of the early PMF algorithms, SEQUEST, was widely used by the scientific community, to decipher the sequence information of peptides generated from tandem MS analysis. This software is commercially available and solely distributed by Thermo fisher company.[1-2] Later on other PMF algorithms were developed and report in literature such as MASCOT,[3] open source software OMSSA [4] and X!Tandem.[5] These algorithms assign a peptide sequence along with a matching score of the experimental ion product mass spectrum to a theoretical ion product mass derived from the protein sequences in a given proteome database. The resulting peptide-spectrum matches (PSM) score is computed by either “descriptive”, “interpretative”, “stochastic” or “probabilistic” modeling methods and are used to provide discrimination between true positive (TP) and false positive (FP) peptide identification.[6] The mentioned PMF algorithms have an inherent extensive computational time requirement that becomes cumbersome for high throughput proteomic analysis. Hence, there is a need to overcome such obstacle in data analysis procedure through development of relatively rapid tools capable of identification and classification of microbes in near real-time settings. The PMF algorithms create overlap between TP and FP peptide identifications,[7] where by the identified FP peptides lower the overall confidence for the identified TP peptides. Keller at. el., developed PSM scoring algorithm based on machine learning methods such as linear discriminant analysis.[8] This algorithm provides a higher confidence level in peptide identification as each spectrum is discriminated by weighing each vector feature and provide a relative weight to that peptide MS spectrum. Many researchers use a decoy database which contains the reversed protein sequences to score the FP peptide identification and thereby compute a FDR score.[9] This “Decoy” database has two limitations namely; (1) the database search time is doubled and (2) a suitable decoy

94 APPROVED FOR PUBLIC RELEASE
database cannot be generated for all applications, especially when the researcher is not doing targeted database search.[10] Gupta et.al, 2011 stated “that target-decoy approach (TDA) is not needed when accurate p-values of individual peptide-spectrum matches are available.” [11] Moreover when using decoy database it is difficult to maintain the mass and amino acid composition of target peptide and decoy peptide. To overcome the issues of over fitting a vector feature of spectrum,” decoy” database, and to lower dynamically the FDR score we have developed a parallel data analysis algorithm ”Merlin”, that can analyze PSM results from SEQUEST and OMSSA and potentially other PMF algorithms. Merlin uses multiple scores like cross correlation (XCorr), preliminary score (Sp) and mass differences coefficient (ΔCn) for SEQUEST, probability value (p-value) from PeptideProphet, and e-value from OMSSA to compute the most probable PSM for identification and classification of the organism in the analyzed experimental sample. In future we plan to incorporate other open and closed source PMF algorithms to provide a robust and an automated PMF algorithm, Merlin, capable of improving confidence score of identified peptides during the proteomics data processing and integrated within in-house developed microbial identification tools, ABOID™.[12]
METHODOLOGY 2.
Escherichia coli O157:H7 Sample Preparation 2.1 Escherichia coli O157:H7 were grown in trypticase soy broth (TSB) to the late exponential phase (~108 cfu/mL) in an orbital shaker (125 rpm) at 37 oC. The cell culture was stored at 4 oC until fractionation. For isolation of the secreted protein fractions, 30 mL of culture was centrifuged at 11,300 x g/1 hr using a Beckman J2-MC centrifuge (Indianapolis, IN). The supernatant was decanted to separate it from the pellet. This supernatant containing the secreted proteins is referred to as the secreted fraction. The pellet was re-suspended in ~3.5 mL of 100 mM ammonium bicarbonate (ABC). This extracellular was divided into three aliquots of approximately equal volume. The cell pellet extracellular samples were thawed and lysed by ultrasonication (25 s on, 5 s off, 4 min total) using a Branson Digital Sonifier® (Danbury, CT). The lysate was centrifuged at 14,000 rpm for 20 min at 10 ºC using a Beckman GS-15R centrifuge. Samples were frozen at -25oC for up to four days.
Bacterial Sample Processing 2.2 Samples were prepared for liquid-chromatography tandem mass spectrometry (LC-MS/MS) in a similar manner to that previously reported.[13] Briefly, proteins were extracted from the secreted fractions by transferring each sample to a separate Microcon® YM-3 filter unit (Millipore, Billerica, MA) and centrifuging at 14,100 x g/20-30 min. The filters were each centrifuged at 14,000 x g/25 min three times with a 200 µL ABC wash in between centrifugations. Generally, the proteins in the retentate were denatured at 40ºC for 1 hr with 270 µL of 7.2 M urea and 30 µg/mL dithiothreitol in ABC. The urea was removed by centrifugation (14,100 x g/30-40

95 APPROVED FOR PUBLIC RELEASE
min) and the retentate was washed three times with ABC (150 µL ABC followed by centrifugation at 14,100 x g/30-40 min using an Eppendorf centrifuge 5415C or 5415D, Eppendorf North America, Westbury, NY). The filter unit was then transferred to a new receptor tube, and the proteins in the retentate were digested overnight at 37 ºC with 5 µL sequencing grade trypsin (Product # 511A, Promega, Madison, WI) in 10 µL acetonitrile and 240 µL ABC. The tryptic peptides were isolated by centrifuging at 14,100 x g/20-30 min.
Liquid-Chromatography/Mass Spectrometry Experiments 2.3 The tryptic peptides were separated in a similar manner to that previously described [13] on a capillary column using the Dionex UltiMate 3000 (Sunnyvale, CA) and the resolved peptides were sprayed into a linear ion trap mass spectrometer (LTQ XL; Thermo Scientific, San Jose, CA). Product ion mass spectra were obtained in the data-dependent acquisition mode, with a survey scan followed by MS/MS on the top five most intense precursor ions.
RESULTS 3.
Database Search & Data Analysis 3.1 A proteome database was constructed in a FASTA format derived from the Escherichia coli O157:H7 str. Sakai genome obtained from the National Center for Biotechnology Information (NCBI, http://www.ncbi.nlm.nih.gov, accessed August 14, 2012) genomic database repository. Also, the constructed proteome database included 115 contaminants protein sequences of all potential laboratory contaminants. The constructed proteome database consists of 5433 proteins were used in this study. The proteome database was in silico digested using trypsin for enzymatic cleavage and in order to obtain theoretical product ion spectra of all potential peptides. Then, the proteome database was indexed in FASTA format for compatibility with the examined algorithms, SEQUEST and OMSSA, as listed in Table 1.
Table 1: Protein Sequence in-silico digestion parameters. Parameter Value
Fasta Database EC_Sakai.fasta Fasta Index EC_Sakai.fasta.idx Fasta Digest EC_Sakai.fasta.dgt
Enzyme name Trypsin (KR) Mass Range 600-3500
Sequence Length 5-35 Mass Type Monoisotopic
Missed Cleavage Sites 2 The experimental product ion spectra in *.RAW file format were obtained from the LTQ XL mass spectrometer and processed using file conversion tool developed by Seattle Proteome Center (SPC)/ Institute of System Biology (Seattle, WA) into mass to charge extensible mark-up language, mzXML format.[14] Three replicate suspension samples having 43501 MS/MS were searched against the constructed proteome database according to the parameters mentioned in Table 1 and with

96 APPROVED FOR PUBLIC RELEASE
inclusion of extra parameters namely (a) Mass tolerance of 2.50000 amu, (b) fragment ion tolerance of 1.00000 amu. The MS files (RAW files) were submitted to SEQUEST and the same files converted into mzXML files were submitted to OMSSA for database searching. The output of SEQUEST without any threshold cutoff were submitted to in-house developed software ABOID™ to derive the probability score of peptides production ion spectra and then converted into comma separated file format (csv) to concatenate spectral files into one file. Also the PSM results from OMSSA were exported into a comma separated (CSV) file format. The .csv file generated from SEQUEST contains information like, scan number, peptide, XCorr, Sp, ΔCn, RSp, M+H, protein name and accession number. The .csv file generated from OMSSA contains information like scan number, peptide sequence, peptide mass, protein name and mass, accession number, e-value and p-value. The two algorithms csv files, for the same analyzed sample, were submitted to “Merlin” to extract the common proteins identified by the mentioned searching algorithms. The common proteins and its weighing factors and database parameters were submitted again to ABOID™ for identification and computation of the probability score. Peptide sequences with probability scores of 95% and higher were retained and used to generate a binary matrix of sequence-to-bacterium (STB) assignments. The binary matrix was populated by matching the peptides with corresponding proteins in the constructed proteome database and assigning a score of one for match and zero for non-match. The columns in the binary matrix represent the proteome of bacteria and contaminant in the database, the rows represent identified tryptic peptide sequences obtained from tandem MSS spectral processing. A sample microorganism is matched with a database bacterium by the number of unique peptides that remained after filtering of degenerate peptides from the binary matrix. Verification of the classification and identification of candidate microorganisms is performed through hierarchical clustering analysis and taxonomic classification as shown by the in-house developed software ABOID™. The flowchart of the Merlin’s process is shown in Figure 1.
Figure 1: Flow chart for Merlin algorithm.

97 APPROVED FOR PUBLIC RELEASE
Table 2 shows the total number of unique proteins observed from the two database searching algorithms, and the common proteins identified by Merlin. Although the number of identified common proteins in Merlin is relatively lower than that of the other algorithms, the identification score of the bacteria was higher using Merlin protein list than that of the other algorithms.
Table 2: Database searching comparison and number of unique proteins observed. Sample ID Spectra SEQUEST OMSSA Merlin
2011-02-10-02 13265 103 107 80 2011-02-10-03 14728 82 92 68 2011-02-10-05 15508 119 140 101
Figure 2 shows a venn diagram of the analyzed bacterial samples and the number of candidate proteins identified by Merlin. The results showed that an increase of common proteins in replicate analyses which was lower using the other algorithms individually.
Figure 2: Venn diagram for Merlin results obtained from the replicate bacterial samples.
CONCLUSION 4.
This study showed that utilization of single PMF algorithm could result in higher FDR value as compared to a combinatorial approach that concurrently retains spectral information from diverse individual algorithms based on statistical confidence using Bayesian and Gaussian PMF algorithms to lower the FP rate and eliminate the data analysis bottleneck. Additional studies to incorporate the de novo analysis to identify the best fitting peptides without using database searching tools and then to use Poisson distribution to match de novo output with peptides identified by database searching tools. Also, incorporation of receiver operating characteristics curve (ROC) will enable the computation of the probability cut off value for analysis. Such studies will expand the algorithms to provide enhanced selectivity.
REFERENCES [1] Eng, J.; et al. Journal of The American Society for Mass Spectrometry 1994, 5 (11), p976-989. [2] http://www.thermoscientific.com. [accessed on 10/09/12]

98 APPROVED FOR PUBLIC RELEASE
[3] Perkins, D.N.; et al. Electrophoresis 1999, 20, p3551-3567. [4] Geer, L.Y.; et al. Journal of Proteome Research 2004, 3 (5), p958-964. [5] Craig, R.; Beavis, R.C. Bioinformatics 2004, 20 (9), p1466-1467. [6] Sadygov, R.G.; et al. Nature Methods 2004, 1 (3), p195-202. [7] MacCoss, M.J.; et al. Analytical Chemistry 2002, 74, p5593-5599. [8] Keller, A. et al. Analytical Chemistry 2002, 74 (20), p5383-5392. [9] Elias, J.E.; et al. Nature Biotechnology 2004, 22, p214-219. [10] Kim, S. et al. Journal of Proteome Research 2008, 7 (8), p3354-3363. [11] Gupta, N.; et al. Journal of the American Society for Mass Spectrometry 2011, 22 (7), p1111-
1120. [12] Deshpande, S.V.; et al. Journal of Chromatograph Separation Techniques 2011, S5:001. [13] Jabbour, R.E.; et al. Applied and Environmental Microbiology 2010, 76 (11), p3637-3644. [14] Pedrioli, P.G.A.; et al. Nature Biotechnology 2004, 22 (11), p1459-1466.
99 APPROVED FOR PUBLIC RELEASE
A Computational Study of the Effect of Graphene on Nucleophilicity
Harold D. Banks
Edgewood Chemical Biological Center, Research & Technology Directorate, 5183 Blackhawk Road, Aberdeen Proving Ground, MD 21010
ABSTRACT
The laboratory preparation of graphene has led to the discovery of many of its unique properties. Vigorous research efforts are underway to develop useful applications. A useful realization is that when graphene is stripped away from graphite, a sea of π-electrons circulate above and below the plane described by the sp2 carbons. This project was an initial entry into a computational exploration of organic chemistry reactions that could potentially be accelerated in close proximity to such an environment. The initial reactions investigated were SN1 and SN2 reactions. It was posited that aromatic compounds and aromatic transition states would undergo favorable interactions due to π-stacking between the graphene surface and substrate. If the energy of the transition state were lowered more than that of the ground state, the reaction would be accelerated. A computational study of reaction rates was performed using density functional theory (DFT) methodology. Our results indicate that the hypothesis, that adsorption of reactants on graphene can modify reaction rates, is valid and should be confirmed with a more extensive study.
INTRODUCTION 1. Nature has provided exquisite examples of supramolecular [1] catalysis in the form of enzymes. These extremely specialized molecules allow reactions to occur under the mild temperature and pressure conditions necessary for life. Lessons can be learned from the mechanisms by which these compounds tremendously accelerate vital reactions. In particular, one can focus on non-covalent interactions; i.e., H-bonding, electrostatic effects, hydrophobic properties, van der Waals forces and π – π stacking interactions.[2] These stabilizing energies are the essential components of supramolecular chemistry, an area that studies the assembly of molecules. There are many examples of catalysis by graphite, one of the allotropes of carbon, in the literature. Oxidation, reduction, cleavage of carbon-heteroatom bonds, and the Friedel-Crafts reaction were areas that provide the largest number of examples.[3] It was of interest to test the hypothesis that graphene, (Figure 1) a recently discovered allotrope of carbon, arising from exfoliating a layer from the surface of graphite producing a one-atom-thick, planar structure,[4] would have useful catalytic properties by taking advantage of its sea of (mobile) π-electrons above and below its plane.[5]
Figure 1: Layer of Graphene.

100 APPROVED FOR PUBLIC RELEASE
The electron density would be expected to perturb the frontier molecular orbitals of appropriate reactions, changing the activation energy relative to the gas phase reaction.[6] Those transition states (TS) that could be stabilized by π – π stacking due have aromatic character could hypothetically result in accelerated rates. Our approach to investigate this hypothesis is computational chemistry. This methodology allows one to select in a relatively short period of time reactions that are recommended for verification in the laboratory. As such, it is often less expensive and unquestionably safer than laboratory work. This endeavor was a Seedling Project to establish if this hypothesis has sufficient theoretical support to be more rigorously explored in a larger ILIR study. As will be evident, this introductory computational investigation has brought this important question to the brink of satisfactory resolution. In addition to nucleophilic substitution the scope of the reaction was expanded to include the Diels-Alder reaction and the electrocyclic rearrangement of benzene oxide to oxepine.
COMPUTATIONAL METHODS 2. Graphene is a huge molecule. Performing calculations on it are impractical at present. It is therefore essential to utilize a surrogate that captures the essential structural elements of graphene while remaining within the realm of computational cost. If the model chosen is too small, however, and the dimensions of the substrate and the model are comparable, the calculated results undoubtedly will incorporate edge effects. For this reason, it was determined that pyrene and coronene, while computationally quite accessible, were unsuitable for most reactions. The 6x6x1 H-terminated supercell (661) (vide infra) was deemed to be a reasonable model compound.[7] For initial geometries, molecules could be aligned over the supercell centroid. Given the reasonable results obtained by means of density functional calculations (DFT).[8] These methods which incorporate electron correlation were selected instead of the more laborious ab initio method (MP2).[9] To further expedite the calculations the Dmol3 program, Version 6.0, was employed.[10,11] This method employs numerical orbitals for the basis sets. In a typical calculation the functional used was LDA/PWC. The integration accuracy and SCF tolerance were both set to coarse, and an all electron core treatment was used with a DN basis set, basis file 3.5, with an octupole multipolar expansion and smearing set to 0.005 hartrees. The nudged elastic band method that tends to decrease the time required to examine the minimum energy path was used. To obtain transition states, reactant and product structures were optimized, followed by identification of the TS input structure using linear synchronous transit and quadratic synchronous transit techniques. This structure could be animated to determine if it was a reasonable approximation to the desired TS. A transition search was then performed. Only one imaginary frequency was found in the vibrational analysis for acceptable transition states. Ideally, with unlimited computational resources, the effect of the graphene model on the TS energy of a given reaction would be handled by performing a TS calculation on the entire system. This becomes a daunting task since the calculation would involve systems containing a large number of atoms. For example, with the computational tools at hand, the transition search for nucleophilic displacement of bromide ion by Cl- from CH3Br on 661 required determination of 128 frequencies

101 APPROVED FOR PUBLIC RELEASE
and almost 72 h of computations. When the complex of the supercell and the TS identified, it was found to have one imaginary frequency at -406 cm-1. The structure of the 661 moiety in the complex was that of a shallow dish that departed from planarity by an average of 2o. It is possible to obtain solely the 661 energy by copying its structure from the TS-661 results into a new file. Since the total energy of the system remains constant, and, the energy change of 661 should be exactly offset by that of the TS. In this case, the calculated stabilization energy of the transition state found to be 17.6 kcal/mol.
RESULTS AND DISCUSSION 3. The objective of this seedling project was to determine if there was sufficient theoretical evidence to support our hypothesis that pristine [12] graphene could be utilized as a catalyst for certain types of organic reactions, particularly nucleophilic substitution that plays a prominent role in military applications. The reaction of chloride ion with methyl bromide (Equation 1), an example of nucleophilic substitution second-order (SN2), was chosen as the starting point since the linear orientation of nucleophile, reaction center and leaving group simplify the calculations. Cl- + CH3Br → CH3Cl + Br- (1) Even with this simplication, the calculation could only be performed in the time available for this project at a moderate level of theory. The geometry for this reaction along with the TS distances are given in Figure 2.
Figure 2: Complex of the transition state for CH3Br + Cl- SN2 reaction and 6x6x1. (The Br – C and C – Cl
distances are given in Å; the distance between centroids is 3.165 Å.) As stated above, stabilization energy of 17.6 kcal/mol was calculated with a separation of the centroids of the TS and 661 of 3.165 Å. A recent study of benzene-substituted benzene distances found an average distance of 3.7 Å,[13] suggesting that nonbonded interactions occur in the TS for this SN2 reaction are comparable to π – π interactions. This calculation, given the assumptions described above, produces a result that should differ from the exact value. The utility of the calculation is to provide an indication that this is a reaction that is likely to result in reaction acceleration when more rigorous calculations using a higher order method and basis set can be supported. The results for additional SN2 reactions with the versatile nucleophile, ammonia, are given in Table 1.

102 APPROVED FOR PUBLIC RELEASE
Table 1: Stabilization Energies of SN2 TS for Reaction with NH3 on the 6x6x1 Supercell (298.15 K, 1.00 atm.) Substrate Nucleophile ∆H (kcal/mol)
2-Phenylchloroethane NH3 -4.5 Fluoroethane NH3 -5.2
Thiirane NH3 -42.3 Chloromethane NH3 -26.2
The modest stabilization of the TS for 2-phenylchloroethane suggests that comparable quantities of stabilization are obtained for both the ground and TS by means of π – π interactions. Frontier molecular orbital theory [14] states that when the energy difference of the highest occupied molecular orbital (HOMO) and the lowest unoccupied orbital (LUMO) decreases, the rate of the reaction increases. A possible reason for the TS stabilization energies provided above is that the electron cloud on the graphene surrogate is destabilizing the energy of the HOMO. As an example of nucleophilic substitution for a reaction that is borderline SN1/SN2, the identity reaction of displacement of chloride ion from benzyl chloride was studied (Equation 2). Cl- + BzCl → ClBz + Cl- (2) This reaction, possessing carbocationic character, has added interest in that the aromatic ring has the opportunity to participate in favorable π – π stacking interactions with 661. These interactions may occur in sandwich, parallel displaced, T-shape and edge-to-face orientations.[15] Two orientations were optimized to provide the structures of Figure 3. The sandwich structure was calculated to have stabilization energy of 30.2 kcal/mol relative to the gas phase structure, while the T-shape structure is 35.2 kcal/mol more stable than the gas phase structure. This relative stability is consistent with the fact that repulsions between the chloride ion that is relatively close to the mobile π-electrons of 661 should destabilize this structure, whereas the T-shaped structure benefits from larger Cl- distances and proximity of the positively charged benzylic carbon, leading to decreased repulsive and increased attractive energies respectively.
Figure 3: Possible orientations of the transition state for the displacement reaction of benzyl chloride. The
distances are given in Å. In addition to nucleophilic substitution, reactions that have aromatic transition states were investigated. Aromatic transition states are those that have (4n+2) π electrons in a ring. Two examples of these reactions were studied: the Diels Alder reaction of 1,3-butadiene and ethylene, a cycloaddition, and the electrocyclic transformation of benzene oxide to oxepine. For the Diels-Alder

103 APPROVED FOR PUBLIC RELEASE
reaction, a stabilization energy of 30.8 kcal/mol was calculated for its adsorbed TS as opposed to the gas phase reaction.
Figure 4: Transition state for the Diels-Alder Reaction of 1,3-Butadiene and Ethene. The distance between the
transition state and 661centroids is 3.776 Å. The forming C – C bond distances are 2.31and 2.377 Å. The transition state is colored for clarity.
A stabilization energy of 25.1 kcal/mole was determined for the electrocyclic reaction relative to the gas phase reaction (Figure 5).
Figure 5: Transistion state for the Electrocyclic Reaction of Benzene Oxide. The distance between the best plane
drawn through the transition state [16] and 661 is 4.961 Å. The normal to the best plane is drawn in green. The graphene model has a slightly convex shape.
CONCLUSIONS 4.
The objective of this Seedling Project was to obtain sufficient data to justify more extensive research investment in the idea that pristine graphene can catalyze key reactions in organic chemistry. Due to the military applications of nucleophilic substitution reactions, these reactions were given considerable attention. At the level of sophistication demanded by this investigation it was determined that the transition states in SN2 reactions are stabilized relative the gas phase, using the 661 supercell as a model for graphene. When the reaction proceeds by a borderline mechanism as is the case for the identity reaction of benzyl chloride, the parallel orientation of the rings is less stable than the T-shape. Exploratory reactions for synthetically important cycloaddition and electrocyclic chemistry were also calculated to have stabilized transition states relative to the gas phase reactions. These findings clearly indicate that additional work is justified to increase the accuracy of the calculations, and to expand the range of reactions.
REFERENCES [1] Gale, P.A.; Ed.; Chemical Society Reviews 2007, p125-440. [2] Rybtchinski, B. ACS Nano 2011, 5, p6791; See for recent applications to nanomaterials.

104 APPROVED FOR PUBLIC RELEASE
[3] (a) Schaetz, A., et al. ACS Catalysis 2012, 2, p1267. (b) Dreyer, D.R.; Bielawski, C.W. Chemical Science 2011, 2, p1233. (c) Liu, M.; et al. ACS Nano 2012, 6, p3142. (d) Machado, B.F.; Serp, P. Catalysis Science and Technology 2012, 2, p54-75; See all sources for examples.
[4] Novoselov, K.S.; et al. Science 2004, 30, p666-669. [5] (a) Allen, M.J.; et al. Chemical Review 2010, 110, p132. (b) Boehm, H.-P. Angewandte Chemie
International Edition 2010, 49, p9332-9335; See all sources for reviews on graphene. [6] Cramer, C. J. Essentials of Computational Chemistry, 2nd Ed.; John Wiley & Sons: Chichester ,
England, 2004, p249-300. [7] Banks, H.D. 243rd National American Chemical Society Meeting, San Diego, CA; oral
presentation [March 2012]. [8] (a) Granatier, J.; et al. Journal of Physical Chemistry C 2012, 116, p14151. (b) Wang, R., et al.
Chemistry – A European Journal 2012, 18, p7443. (c) Jacobson, P.; et al. ACS Nano 2012, 6, p3564. (d) Lim, D.-H.; Wilcox, N. Journal of Physical Chemistry C 2011, 115, p22742. (e) Granatier, J.; et al. Journal of Chemical Theory and Computations 2011, 7, p3743. (f) Zhou, M.; et al. Nanotechnology 2011, 22, p385502; See all sources for recent examples of DFT calculations on graphene supported metals.
[9] Inada, Y.; Orita, H. Journal of Computational Chemistry 2008, 29, p225-32; See source and references cited therein.
[10] DMol3: Accelrys Software Inc., 10188 Telesis Court, Suite 100, San Diego, CA 92121. [11] Delley, B. Journal of Chemical Physics 2000, 113, p7756-7764. [12] (a) Huang, X.; et al. Chemical Society Review 2012, 41, p666-686; Se source for graphene
oxide and references cited therein. (b) Scheuermann, G.M.; et al. Journal of the American Chemical Society 2009, 131, p8262-8270; See source for metal catalysts on graphene and references cited therein.
[13] Watt, M.; et al. Journal of the American Chemical Society 2011, 133, p3854. [14] Fukui, K. Angewandte Chemie International Edition 1982, 21, p801-809. [15] (a) Wheeler, S.E.; et al. Journal of the American Chemical Society 2010, 132, p3304-3311. (b)
Martinez, C.R.; Iverson, B.L. Chemical Science 2012, 3, p2191-2201. (c) Hohenstein, E.G.; et al. Journal of the American Chemical Society 2011, 133, p13244-13247. (d) Wheeler, S.E. Journal of the American Chemical Society 2011, 133, p10262-10274.
[16] Galabov, B.; et al. Journal of the American Chemical Society 2008, 130, p9887-9896.

105 APPROVED FOR PUBLIC RELEASE
Piezoelectric Microcantilevers for Real-Time Detection of Agent Bound to AChE in Blood
Kelly Kyroa, Hasan Goktasb, Mona Zaghloulb
a Edgewood Chemical Biological Center, Research & Technology Directorate, 5183 Blackhawk Road, Aberdeen Proving Ground, MD 21010
b The George Washington University, Department of Electrical and Computer Engineering, N.W., Washington, DC 20052
ABSTRACT
We developed a high sensitivity, high Quality Factor multilayered microcantilever (MCL) for sensing small molecules bound to acetylcholinesterase (AChE), an enzyme involved in neurotransmission. The evaluation of agent bound to AChE in blood has been a challenge due to the membrane-embedded nature of the enzyme. As yet, there is not a portable, real-time blood monitoring system for the evaluation of nerve agent exposure. The design of a field-ready device that is capable of sensing small mass shifts in viscous fluid poses real challenges and requires unique approaches. The MCL offers attributes such as determination of exposure, nature of agent bound, and kinetic evaluation of the binding. Computer simulation results indicate that our device is capable of zeptogram sensitivity. The sensitivity is obtained by measuring the resonance frequency shift upon attachment of a small molecular mass to the antibody-functionalized surface of the cantilever. The cantilever was built using piezoelectric material (PZT) so that it would be self-actuated and output read as a function of frequency shift. Theoretical analyses were done using computer simulation (MATLAB) and the results verified using commercial software tools (Coventor) along with published data from the literature. In our best simulation we obtained a sensitivity of 22.7 zg/Hz for a frequency shift of 8.8 MHz and a 0.2 pg attached mass.
INTRODUCTION 1. Neurotransmission is accomplished by the enzyme acetylcholinesterase (AChE) which hydrolyzes the neurotransmitter acetylcholine at cholinergic synapses.[1,2] Poisoning by organophosphorus compounds such as pesticides and nerve agents inactivates AChE and can result in paralysis and/or death.[2,3] In this project we developed a high sensitivity microcantilever (MCL) for sensing small molecules bound to AChE in blood. Upon attachment of a small mass the resonance frequency shift of the device is detected. The resonant frequency shift is driven by biomolecular interactions and originates from surface stress on the microcantilever.[4]
The MCL surface is functionalized with anti-AChE antibodies to make the assay specific for AchE (Figure 1). By measuring the resonant frequency shift of the MCL upon binding of healthy, unexposed AChE and its natural substrate acetylcholine (ACh) versus the resonant frequency shift when a non-natural inhibitor (agent) competes for and attaches to the active site of the enzyme a comparison can be made. The natural ACh substrate has a rapid kinetic profile due to its high turnover rate but the alternative binding of competitive, unnatural substrates such as nerve agents may either be slow or covalent, allowing for additional kinetic information. It is expected that the resonant frequency shift induced by the binding of the natural substrate (acetylcholine) to AChE

106 APPROVED FOR PUBLIC RELEASE
would be different than that of an inhibitor compound both because of the mass difference and because of the nature of the binding. A device with a smart reader can be prepared for compounds with known masses and binding kinetics; in the event of an exposure, the device will inform the user of their status and instruct them on the steps they need to take. This system may be effective for the testing and investigation of binding kinetics of non-traditional agents, many of which have not been well-characterized. If the exposure is due to an unknown, the device will be useful for characterization (using NMR, MS-MS or other methods) as the MCL system will allow for sequestration of agent bound to AChE (via the antigen-antibody interaction) facilitating analysis due to retention of the adsorbed compound present within the MCL system.
Figure 1: Schematic of a dynamic-mode cantilever. The antibody-antigen interaction between anti-AChE and AChE is illustrated. Antibody functionalization of the MCL surface allows for detection of a natural (ACh) vs. unnatural (agent) substrate due to either a mass difference and/or an alternative kinetic binding profile. Image
adapted from reference.[5]
METHODOLOGY 2.
Cantilever Design 2.1
Our objective was to build an array of cantilever devices in order to test each design and compare real results with computer-generated, theoretical models. We designed our cantilever using piezoelectric material (PZT) so that it might be self-actuated, allowing the user to read output as a function of frequency shift. Internal actuation also permits the device to be packaged for portability. Mounting the microcantilever in a microfluidic chamber (Figure 2) allows blood (containing AChE) to be injected and the resonant frequency shift of the native binding of the neurotransmitter acetylcholine (ACh) to acetylcholinesterase (AChE) to be evaluated in real time. Figure 2 (left) illustrates a device designed by GWU for use in AChE exposure sensing. Figure 2 (right) shows an actual device built for AIDS virus detection also designed in Prof. Zaghloul’s lab (Bowei Zhang). A microfluidic capillary for fluid delivery is seen entering and exiting through the top right corner.

107 APPROVED FOR PUBLIC RELEASE
Figure 2: (Left) Schematic of the experimental design of the MCL biosensor system. (Right) Microfluidic device
for use in AIDS virus detection designed by one of Prof. Zaghloul’s graduate students, Bowei Zhang. Microfabrication of the device was performed by designing a wafer in a clean room. This wafer was coated with SiO2, deposited with piezoelectric (PZT) material and other materials that have been incorporated for the optimal resonance frequency shift. The surface was coated with gold for antibody functionalization. The wafer was apportioned into five sections and in each section were 100 cantilevers. Four potential positions for mass (Figure 3) were evaluated (locations 5, 6, 7 and 8 in Figure 3 are the same as locations 4, 3, 2 and 1) because location of the mass on the body of the cantilever is very important to its sensitivity.
Figure 3: Diagram of a multilayer cantilever and beam indicating eight different locations where a mass may
potentially be evaluated. In reality, a particle can attach at any location on the surface and sensitivity (frequency shift) changes with respect to location of attached mass. If the mass attaches on the end of a cantilever fixed at only one end then the frequency shift is high. The sensitivity is very small if the mass attaches to a location closest to the fixed support. A cantilever fixed at both ends, as shown in Figure 3, maximizes the sensitivity; sensitivity is the greatest when the mass locates within the mid-region (positions 3-6). A distribution scheme with cantilevers arrayed at varying lengths was also incorporated for each type of design. Theoretical analyses have been ongoing and simulations using commercial software tools have verified our preliminary results. So far, the best design in our layout achieves zeptogram sensitivity.

108 APPROVED FOR PUBLIC RELEASE
Antibody Functionalization 2.2 6 mm2 gold-coated test slides (EMF Corp.) were used to simulate the gold (Au) surface of the cantilever. Immobilization of anti-AChE antibodies on the Au surface was tested with the purpose of determining the best method to provide optimum surface coverage, as more surface coverage translates to increased sensitivity. Antibody (anti-AChE) immobilization on the Au surface was accomplished with equal success using both calixcrown self-assembled monolayers (SAMs) (Proteogen) [6,7] and cystamine/glutaraldehyde (Sigma).[8] The cystamine/glutaraldehyde method was performed stepwise with cystamine applied first to form a self-assembled monolayer followed by incubation in the bifunctional linker glutaraldehyde introducing an aldehyde group for antibody binding. Two different primary antibodies against AChE were tested to evaluate which would afford better surface coverage. Anti-AChE antibody, A-11 (Santa Cruz), which binds to the C-terminal region of human AChE and N-19 (Santa Cruz) which binds to the N-terminal region [2] were tested using manufacturer recommended dilutions for immunofluorescence (IF) (1:50). Visualization of antibody attachment was accomplished using fluorescent FITC-conjugated (495/521 nm ex/em) secondary antibodies against the respective anti-AChE primaries (Santa Cruz, 1:200). Both surface functionalization methods (calixcrown and cystamine/glutaraldehyde) were found to be effective along with the attachment of both C- and N-terminal antibodies, as indicated by the punctuate FITC fluorescence seen both by naked eye through the lens of an inverted microscope (Olympus IX71, San Jose, CA) equipped with an iXon+ EMCCD camera (Andor, South Windsor, CT) at 20X magnification. It remains to be determined which antibody yields the better surface coverage as each provided similar results.
Fluorescent Labeling of AChE using TAMRA-FP 2.3 Following confirmation of antibody attachment, a fluorescent, fluorophosphonate (FP) test probe, TAMRA-FP (Thermo Scientific), was then used with the intent that it would mimic a more potent (nerve agent) type of compound. TAMRA-FP is a small fluorescent (552/575 nm ex/em) probe that irreversibly binds to and labels the active site serine of metabolic serine hydrolases, a class of enzymes of which AChE is a member.[9-11] Affirmation of both anti-AChE:AChE binding as well as FP-labeling of the enzyme was accomplished via TAMRA fluorescence imaging. A small amount (57 uL) of blood was diluted in PBS to 2 mg/mL blood protein. Slides functionalized as described above (with either antibody A-11 or N-19 bound to calixcrown SAMs or cystamine/glutaraldehyde) were incubated in the 2 mg/mL blood protein solution as a control to eliminate the possibility of blood (background) autofluorescence. Another set of four slides functionalized the same way were incubated in a solution of PBS containing 2 uM TAMRA-FP. This second control was performed to eliminate the possibility of nonspecific background binding of TAMRA-FP to the antibody-functionalized surface. A third set of four identically functionalized slides were incubated in the 2 mg/mL blood solution also treated with 2 uM TAMRA-FP (manufacturer’s recommended dilution) with the intent of simulating an (agent) exposure situation. All experiments were incubated for 1 h at room temperature followed by fluorescence visualization using an EMCCD camera and inverted microscope at 100X magnification. Incubations in TAMRA-FP were protected from light to prevent photobleaching of the TAMRA fluorophore.

109 APPROVED FOR PUBLIC RELEASE
RESULTS AND DISCUSSION 3. 1.1. Cantilever Design We verified the sensitivity (frequency [f] shift) for a multilayer cantilever and beam by comparing the Coventor simulation results with our calculated (MATLAB) results (Table 1). We also compared our maximum frequency shift with reference literature.[12] According to Park, the minimum detectable mass is 35 pg/Hz. Sensitivity is calculated by dividing the attached mass by the frequency shift – i.e. a 1102 Hz frequency shift with a 0.2 pg mass attached on the tip of the cantilever has a sensitivity of 181 attogram/Hz. This means that according to our calculations the minimum detectable mass is actually 0.2 pg/1102 Hz = 181E-18 g/Hz = 181 ag/Hz. As illustrated below in Table 1, our calculations for frequency shift (f_shift) at varying cantilever lengths and Coventor-generated simulations are very similar, lending support to the accuracy of our approach.
Table 1: Comparison of coventor simulation frequency shifts with calculated data shifts for a cantilever of varying lengths.
COVENTOR CALCULATION
Length (um)
f_without mass (Hz)
f_with 0.2pg (Hz)
f_shift (Hz)
f_without mass (Hz)
f_with 0.2pg (Hz)
f_shift (Hz)
120 5.360749E05 5.350317E05 1043 4.8385E005 4.8275E005 1102 170 2.671201E05 2.667587E05 361.4 2.4109E005 2.4070E005 388.18 220 1.594598E05 1.592875E05 172.3 1.4395E005 1.4378E005 179.21
We also verified the sensitivity (frequency shift) for multilayer cantilever and beam with respect to location of mass by comparing the Coventor simulation result with our calculation results (Table 2). Table 2: Comparison of Coventor simulation frequency shift with calculated data for a mass at various locations
on the cantilever. (Coventor Simulation Results)
Mass Location Displacement (um) f_without mass (Hz) f_With 0.2pg (Hz) f_shift (Hz) 1 & 8 6.074021E-10 2.493852E07 2.400151E07 937010 2 & 7 7.816939E-10 2.493852E07 2.043238E07 4506140 3 & 6 9.514572E-10 2.493852E07 1.744231E07 7496210 4 & 5 1.070951E-09 2.493852E07 1.64798E07 8458720
(Calculation Results)
Mass Location % Difference
(between Coventor and Calculation)
f_without mass (Hz) f_With 0.2pg (Hz) f_shift (Hz)
1 & 8 38 2.6456E007 2.5162E007 1.2941E006 2 & 7 12.7 2.6456E007 2.1378E007 5.0782E006 3 & 6 5.71 2.6456E007 1.8532E007 7.9246E006 4 & 5 4.71 2.6456E007 1.7599E007 8.8573E006
Calculated results for frequency shift were most similar to Coventor for a mass located in the region of positions 3-6 on the cantilever (Figure 3), with a discrepancy of only 4.7-5.7%. Positions 3-6 also indicate the regions of greatest sensitivity with frequency shifts of 7.9-8.8 MHz. In our best

110 APPROVED FOR PUBLIC RELEASE
simulation we obtained a sensitivity of 22.7 zg/Hz for a frequency shift of 8.8 MHz and a 0.2 pg attached mass. We also confirmed the Quality factor (frequency shift) for a multilayer cantilever by comparing experimental results from several publications [13-17] with our calculated results. Results from our Quality factor calculations were found to closely resemble experimentally-acquired Quality factor results, adding experimental credibility to our approach.
Antibody Functionalization 3.1 Initial experiments using fluorescent secondary antibodies confirmed attachment of anti-AChE to the gold surface. This was confirmed by visualization of FITC fluorescence, present when secondary antibody was applied in conjunction with primary anti-AChE but not seen in the absence of primary antibody, nor was it seen when anti-AChE was visualized in the absence of the fluorescent secondary. These control experiments also indicated that both methods of surface functionalization appear to be sufficiently operative and that the surface monolayer was binding anti-AChE. SAMs bound to the Au surface followed by application of anti-AChE and incubation in a blood solution containing the fluorescent, fluorophosphonate (FP) test probe, TAMRA-FP, were visualized and imaged for TAMRA fluorescence (552/575 nm ex/em) (Figure 4). Bright punctuate fluorescent clusters of surface-bound FP-labeled AchE were indicated. Only when the FP-probe was in the presence of blood (which contains AChE) was fluorescence visualized, indicating that the labeling was specific for AchE and not due to background binding of antibodies or to the SAMs on the surface.
Figure 4: Gold surface functionalized with anti-AChE and incubated 1 hour in a blood solution containing 2 uM
TAMRA-FP probe. TAMRA fluorescence was imaged using an EMCCD camera and inverted microscope at 100X magnification. Bright reddish-pink fluorescent clusters indicate probe-labeled AChE bound to anti-AChE
antibodies.
CONCLUSIONS 4. The combination of a microcantilever (MCL) system and protein immobilization process provides for a simple, portable real-time diagnostic system. The device operates on the principle that a

111 APPROVED FOR PUBLIC RELEASE
resonance frequency shift corresponds to a change in mass. As yet, there is not a portable, real-time blood monitoring system to evaluate acetylcholinesterase (AchE) toxicity. The design of a field-ready MCL device that is capable of sensing small mass shifts in viscous fluid offers attributes such as determination of exposure, nature of agent bound, and kinetic evaluation of the binding. Computer simulation results thus far indicate our design is capable of zeptogram sensitivity. In our best design we obtained a sensitivity of 22.7 zg/Hz for a frequency shift of 8.8 MHz and a 0.2 pg attached mass. Future plans include biological functionalization and testing of the PZT devices we have built in the clean room.
ACKNOWLEDGEMENTS The authors would like to thank Professor Zhenyu Li at George Washington University for the use of his laboratory and microscopy equipment.
REFERENCES [1] Johnson, J.L.; et al. Journal of Biological Chemistry 2003, 278 (40), p38948-38955. [2] Garcia-Ayllon, M.-S.; et al. PLoS One 2010, 5 (1), p1-11. [3] Hoogduijn, M.J.; et al. Toxicological Science 2006, 94 (2), p342-350. [4] Hwang, K.S.; et al. Applied Physics Letters 2006, 89 (17), p173905/1-173905/3. [5] Johnson-Blake, N.; Mutharasan, R. Biosensors and Bioelectronics 2012, 32 (1), p1-18. [6] Lee, Y.; et al. Proteomics 2003, 3 (12), p2289-2304. [7] Hwang, K.S.; et al. Lab Chip, 2004, 4 (6), p547-552. [8] Das, J.; Kelley, S.O. Analytical Chemistry 2011, 83 (4), p1167-1172. [9] Nomura, D.K.; et al. Chemical Reseasrch in Toxicology 2006, 19 (9), p1142-1150. [10] Bachovchin, D.A.; Cravatt, B.F. Nature Reviews Drug Discovery 2012, 11 (1), p52-68. [11] Nomura, D.K.; et al. Proceedings of the National Academy of Sciences 2005, 102 (17), p6195-
6200. [12] Park, J.H.; et al. Journal of Electroceramics 2010, 25 (1), p1-10. [13] Gupta, A.; et al. Applied Physics Letters 2004, 84 (11), p1976-1978. [14] Lu, J.; et al. Microsystems Technologies 2007, 13 (11-12), p1517-1522. [15] Naeli, K.; Brand, O. Journal of Applied Physics 2009, 105 (1), p014908/1-014908/10. [16] Lee, J.; et al. Lab Chip 2011, 11 (4), p645-651. [17] Wang, W.-C.; et al. Sensors and Actuators A 2002, A102 (1-2), p165-175.

112 APPROVED FOR PUBLIC RELEASE
DNA Origami Bio-Platforms
Calvin C. Chue, Janet L. Jensen, and James O. Jensen Edgewood Chemical Biological Center, Research & Technology Directorate, 5183 Blackhawk
Road, Aberdeen Proving Ground, MD 21010
INTRODUCTION 1. The primary goal of this effort is to establish a capability at ECBC to design and fabricate nanostructures using DNA origami.[1] The ability to design and build custom molecular structures at the nanoscale will have broad impact across several avenues of defense applications. The methodology will be amenable to the design of numerous architectures for biological sensing and characterization. Specifically this will be a key enabler of sensors having relevance to scientific studies of biological materials, to the detection and identification of biological threats, to medical diagnostics and therapeutics of biological induced diseases, and to the monitoring of commercial consumables for biological contamination. The methodology may enable an ability to “grow” binary storage, solving a fundamental problem in a data-driven genomics age.[2] The fundamental mathematical and computational methods developed in this program will have an impact on nanostructural biological scaffold development. The folding of single- and double-stranded DNA is a chemically well-understood and controllable process. DNA fundamentally represents the storage of genetic information. In many ways, it is also an ideal structural nanomaterial as it is easily synthetically manipulated and bio-compatible. DNA pair bonds dictate primary shape and structure, which can be enhanced with surface charge changes and interaction with proteins such as histones. This allows flexibility in designing complex structures. DNA origami software provides the ability to perform computer aided design at the nanoscale.[3] There is a need in the chemical/biological defense community to develop new and novel bio-structures. In particular DNA self-assembly methods have become useful in the mimicry of biological systems in areas such as molecular capture and therapeutics. We are exploring the use of DNA structures to present antigens in a similar context as traditional protein based ligand display systems as it confers significant benefits in cost, stability, speed and diversity in molecular interactions.
METHODS 2. The primary goal of this effort is to understand the fundamental limits in design and fabrication of nanostructures using DNA origami methods. Specifically we have designed DNA scaffolds that can hold protein ligands, a process facilitated using inSēquio software suite (allows design of nanoscale, sequence optimized, molecular capture units that can be evaluated for charge distribution, hydrophilicity/hydrophobicity and steric flexibility). The Computational Chemistry Group at ECBC has developed expertise in DNA origami design, with the BioSciences Division providing scientific input. This ability augments current capabilities in this area and allows for the design and fabrication of large, complex biologically active moieties. We have focused on three areas using DNA origami methodologies: 1) design of synthetic affinity ligands (similar in function to antibodies), 2) hydrophobic / hydrophilic logic gates, and

113 APPROVED FOR PUBLIC RELEASE
3) charge varied logic gates. The current effort focused only on developing design capabilities specific to ligand display. Synthesis using DNA origami is a straightforward “one-pot” synthesis using a plasmid and appropriate staples. Using an existing PCR apparatus along with an existing AFM imager, we have a preliminary study of internally designed DNA origami structures underway.
RESULTS AND DISCUSSION 3. We obtained a template design from Dr. Michael Norton from Marshall University of a Rectangular Origami with an aperture.[4] The design, also called the Rectangular Fenestrated Origami structure due to the window, has successfully been used by the Norton Group and others as a versatile starting point for new structures. The Fenestrated design uses a single strand of an M13mp18 plasmid and 184 “staples”.
Figure 1: Fenestrated Window DNA Origami design.
The staples consist of single-sided DNA strands with an approximate length of 30-40 bases. During the design process, the plasmid is held in a space-filling configuration and matched up with appropriate staples. The staples use cross-over points to hold the plasmid in place. The output of the inSēquio software package is the sequences of the staples. Once the sequences are known, the staples (approximately 200 different sequences) are synthesized or acquired for the self-assembly process. Many groups use a PCR apparatus for self-assembly as this provides precise control over temperature during the self-assembly process. AFM allows confirmation of proper self-assembly. The goal of our current effort is to modify the rectangular design to act as a platform for biochemical interactions including insertion of synthetic ligands. We are “decorating” the surfaces of the fenestrated window with various biological markers. This is done by attaching the appropriate molecules to the ends of the staples prior to the self-assembly process. The extra material (ligands) that resides on the surface of the design can be anything that can be attached to the end of a small DNA sequence including extra DNA, proteins, or carbohydrates. Work done with Marshall University suggests that direct attachment of a ligand to a directly staple can be

114 APPROVED FOR PUBLIC RELEASE
problematic. The ligand may not be sufficiently accessible to a binding partner. We are designing small DNA origami based tripods to elevate ligands several nanometers from the surface of the rectangle. A preliminary template design for a DNA tripod was obtained from Dr. Hong Zhong of Parabon NanoLabs.
Figure 2: Tripod design.
We are modifying this design to meet our needs. We are also looking at methods to control the charge at various points on the DNA origami structure. Initial work has focused on having small strands of DNA of known composition reside on the surface of the design. CG and AT groups have different charge characteristics.[5,6] Varying the AT/CG ratio provides some control over the physical properties of the surface. We are also looking at using methylated DNA origami bases. Methylation causes a considerable change in the charge and hydrophilic/hydrophobic nature of the DNA construct.
Figure 3: DNA origami tripod.
CONCLUSIONS 4.
We have successfully developed in-house scientific expertise as well as the capability to design DNA origami structures towards understanding the limitations and advantages of this system for new methods in ligand presentation. Our initial work has been to present ligands and other

115 APPROVED FOR PUBLIC RELEASE
entities to biological systems using a rectangular DNA origami design with raised presentation sites. The ability to precisely decorate a surface with biologically active moieties and to control charge and hydrophilic/hydrophobic properties at the nanoscale will provide researchers at ECBC with a powerful platform for biological discovery and control. The current effort has been focused on understanding the scientific principle behind DNA origami designs. Our next phase is to synthesize our designs using an existing PCR apparatus and confirm proper self-assembly using an AFM. This iterative process should lead to direct comparisons with existing protein based ligand display systems within the next 1-2 years.
REFERENCES [1] Rothemund, P.W.K. Nature 2006, 440 (7082), p297-302. [2] Gu, H.; et al. Nature 2010, 465, p202-205. [3] Shen, W.; et al. Journal of the American Chemical Society 2009, 131 (19), p6660–6661. [4] Rajulapati, A. High Resolution Single Molecule Optical Localization of Multiple
Fluorophores on DNA Origami Constructs. M.S. Chemistry Thesis, The Graduate College of Marshall University, Huntington, West Virginia 2009.
[5] Condon, A.; Jabbari, H. Theoretical Computer Science 2009, 410 (4-5), p294-301. [6] Tsui, V.; Case, D.A. Journal of the American Chemical Society 2000, 122 (11), p2489-
2498.
116 APPROVED FOR PUBLIC RELEASE
Designing Strongly Repellant Surfaces via Molecular Dynamics Simulations
Craig Knox,a Jerry Cabalo,a Stephanie Ihejirika,b and Gary Kilper a
a Edgewood Chemical Biological Center, Research & Technology Directorate, 5183 Blackhawk Road, Aberdeen Proving Ground, MD 21010
b MUSIP Student Intern, University of Maryland, College Park, MD 20742
ABSTRACT Contamination of surfaces by deposition of aerosol particles is a process that affects a broad array of application areas, including pharmaceutical and food production, as well as chemical and biological defense. The deposition of particles is driven by particle-surface adhesion. Using atomistic simulations, we examined the role of nanostructures in minimizing the interaction energy between particles and surface. Using molecular mechanics and molecular dynamics simulations, we calculated the interaction of a 26 nm rigid protein particle with nanostructured silicon surfaces of various sizes consisting of arrays of cones to mimic sharp, rough surface features. Liquid water interacting with a similar set of surfaces was used to investigate the interaction for deformable particles. For rigid protein particles, simulations showed that the greatest binding energy was obtained between a particle and a flat, smooth surface. As the nanostructured cones increased in size, this interaction was reduced. The cone tips physically limited the interaction between particle and surface. For cone spacings and/or sizes greater than the size of the particle, it is expected the interaction energy will increase since the particle will “feel” flat surfaces. In the case of liquid water in full contact with similar cone systems, the interaction energy generally increased with cone density, except for cases where the cones were bunched together, which reduced the interaction energy for the same average cone spacing. This small decrease in binding energy is most likely due to the geometry of the cones limiting interaction of water with itself. Since these simulations did not have a water droplet as the initial condition, the existence of a dynamic energy barrier was not fully investigated.
INTRODUCTION 1. Contamination of surfaces by deposition of aerosol particles is a process that affects a broad array of application areas, including clean room processes, such as pharmaceutical or electronics manufacturing; spread of pathogenic organisms in medical facilities and food processing plants; and decontamination of surfaces from chemical and biological agents. A fundamental understanding of the factors that control the probability of particle adhesion to a surface could allow for the design of surfaces that repel particles and prevent deposition and film growth. This study will focus on a natural material with excellent repellant properties: the Lotus leaf.[1,2] The Lotus leaf has knobs ~10 microns wide that are spaced ~30 microns apart. The leaf’s knobs and the flatter surfaces are covered in tiny pillars ~100 nm wide. These features result in a superhydrophobic surface. For the repulsion of water droplets, the hypothesis is that surface tension resists penetration by the knobs and pillars, greatly reducing the effective surface area in contact with water. This contact area is limited to the tips of the knobs and pillars. Water must overcome self-attraction to increase the contact area. As a result, the attraction between the water

117 APPROVED FOR PUBLIC RELEASE
and the leaf surface is minimized. We believe that broadly repellant surfaces may be engineered using specific nanostructure materials, geometries (e.g., cones), topologies (e.g., feature spacings and arrangements), and length-scales to minimize surface adhesion of various aerosol particles.[3,4] This study employs molecular mechanics (MM) and molecular dynamics (MD) simulations to test this hypothesis.
TECHNICAL APPROACH 2. For the study of droplet and particle interactions on surfaces, large length-scales on the order of 100 nm (~1 million atoms) are involved. To reduce the computational cost, a simple description of the interatomic forces has been used. Since these calculations are beyond the practical limits of electronic structure methods such as density functional theory, classical MM/MD is used to describe the interatomic forces. Harmonic springs are used to describe covalent bond stretches, angle bends, and torsions; simple Coulombic and Lennard-Jones potentials are used to describe electrostatic and van der Waals interactions. For MD simulations, atoms are assigned initial velocities from a Boltzmann distribution consistent with a given temperature, and the system evolves over time according to Newton’s equations of motion. These simulations provide values of the interaction (binding) energy as a function of distance to a surface and as a function of the surface nanostructure geometry/topology. For the rigid protein particle studies, three cone array surface models (each ~1 million atoms) were constructed with varying cone heights (26, 13, 6.5 nm), a fixed aspect ratio of 4 (height/radius), and a fixed cone spacing (~1.5 nm). These cones were constructed from diamond cubic crystals of silicon and placed on top of a bare Si (0 0 1) surface sheet (88 nm x 88 nm x 1 nm) in the following square patterns: 6 x 6, 12 x 12, and 24 x 24 for the largest to the smallest cone sizes. An additional flat surface model without cones was used as a control. The protein particle was constructed by replicating the PDB crystal structure of BclA glycoprotein, which is the immunodominant protein in the surface exosporium of Bacillus anthracis, into a 3 nm thick hollow sphere with a 26 nm diameter (~400,000 atoms). MM calculations were performed using LAMMPS with the Lennard-Jones potential (parameters taken from the Dreiding force field) for the van der Waals interactions and a 1 nm cutoff. Figure 1 shows different views of each of the four models with the particle above the surface.

118 APPROVED FOR PUBLIC RELEASE
Figure 1: Models of a 26 nm protein particle interacting with nanostructured surfaces of varying cone size, beginning with a smooth surface (Top) and progressing to large, 26 nm high cones (bottom). Scale bar is 10
nm long. In order to understand the interaction of a liquid with a repellant surface, MD simulations of liquid water were performed in contact with a rigid nanostructured Si surface. The simulation cell was 11 nm x 11 nm x 7.5 nm, and the crystal structure of Si was used to make a surface on the (0 0 1) crystal plane, two atoms thick. To simulate the behavior of nanostructures, sharp cones 40 Å in height and 20 Å in diameter were replicated in patterns ranging from 1 x 1 to 6 x 6, which had the maximum cone density and minimum cone spacing. For the 4 x 4, 3 x 3, and 2 x 2 patterns, the spacing between cones was varied, thus allowing “bunching” to occur, although the same average spacing between cones was maintained. This was due to the method of generating the models. Beginning with the bare surface, systems were built by adding cones on top of the surface with a fixed spacing between cones. The average cone spacing (gap size) was increased for the next system and then the maximum number of cones that fit on the surface in a square pattern with at least this spacing were added. For certain nominal spacings, this procedure resulted in some “extra” bare surface space at the edges and higher actual average spacings as well as cone bunching in the middle of the surface. The remaining void space above the surface was packed with water molecules to a 1.0 g/cm3 density. MD simulations were performed using LAMMPS with the Dreiding force field and the SPC/E water model, the NVT (canonical) ensemble with the Nose-Hoover thermostat, and a 1 fs timestep. The Si atoms were fixed to their initial coordinates. The systems were first energy minimized followed by ~50 ps of relaxation time. Production calculations were performed for 500+ ps of simulation time.
RESULTS 3.
Rigid Protein Particle 3.1 To calculate the particle-surface binding energy for each model, 3D single-point energy scans were performed along the xy-plane (parallel to surface) and along the z-direction (surface

119 APPROVED FOR PUBLIC RELEASE
normal). Figure 2 shows a representative potential energy profile in the z-direction at a given position on the xy-plane. The binding energy at a given x,y point is taken as the negative of the lowest potential energy (bottom of well) along the z-direction. The binding energies at each x,y point were then averaged in 2D over the surface (xy-plane) and statistics were collected. Table 1 shows these values for each of the four models.
Figure 2: Representative potential energy surface along z-axis (surface normal) generated by particle
displacement at a fixed x,y location between cone tips for the small cone size. “0” denotes the position of the xy-plane with the cone tips. Movement in between tips permits values of less than 0.
Table 1: Binding energies (kcal/mol) of models of a 26 nm protein particle interacting with nanostructured surfaces of varying cone size, beginning with a smooth surface (Top) and progressing to large, 26 nm high
cones (bottom). Averages are over 2D (xy-plane).
weakest binding (kcal/mol)
strongest binding (kcal/mol)
average binding (kcal/mol)
std deviation (kcal/mol)
Flat Si Surface 104.483 142.232 125.852 11.148 6.5 nm Cones 0.317 11.969 2.818 1.859 13 nm Cones 0.313 8.928 2.025 1.106 26 nm Cones 0.3395 8.499 1.779 0.984
The weakest binding energies occurred between the bottom of the particle and a cone tip (minimum contact area) and the strongest binding energies occurred in between cones (maximum contact area). The particle interacted with the flat, smooth control surface much more strongly than with any of the cone array surfaces, as expected. This can be understood from the much greater number of atom neighbors within a shorter distance and noting that VDW interactions are relatively short-ranged with a r-6 decay, where r is the spherical radius (distance) between atoms. For all cone sizes up to the size of the particle, binding energy decreased with increasing cone size, resulting from smaller particle-surface contact areas and thus fewer VDW interactions. Although not studied here, it is anticipated that much larger cone sizes compared to the size of the particle will eventually lead to an increase in binding energy due to the particle feeling more flat surfaces on the sides of the large cones. These results demonstrate that particle-surface VDW interactions can be minimized with nanofeature sizes on the order of the particle sizes and that a range of sharp feature sizes (e.g., fractal pattern) may permit broad repellency to a range of particle sizes.

120 APPROVED FOR PUBLIC RELEASE
Liquid Water 3.2 Shown in Figure 3 are representative final frames from the MD simulations of water in contact with the silicon surface. We had hypothesized that the nanostructures would make interaction between the water and the surface less thermodynamically favorable. From this hypothesis, we expected the water to segregate away from the cones and form an interface that minimized contact between the water and the Si surface (i.e., dewetting). Instead, regardless of surface geometry, we found that the liquid water remained in contact with the silicon surface. Additional simulations with an initial water droplet (in contact with air as well as surface) may help further explore this hypothesis. However, a consideration of the binding energy between the water and the silicon is instructive.
Figure 3: Two unit cells showing simulations for water on a Si surface. Representative surfaces simulated
include a flat surface (L) and a surface with cones (R) 40 Angstroms in height in a 6 x 6 pattern. Using the GROUP-GROUP command within LAMMPS, it is possible to exclude the Si-Si and H2O-H2O interactions and only sum the Si-H2O interactions to directly get binding energy between water and the silicon surface from one simulation rather than having to run three separate simulations (mixed system, only Si, and only water) to subtract these terms from the total system energy. Using this approach, the results for the different surface geometries are summarized below (Figure 5). In general, as the number of cones was increased in the simulation cell, the interaction energy increased. Similarly, as the spacing between cones was decreased, the interaction energy increased overall. This can be understood by noting that as the number of cones in the simulation cell increases, the surface area presented to the water increases, thus allowing for more interaction. However, not all of the simulations followed this general trend. For a constant number of cones per cell, as the spacing between cones was made more even, the Si-water binding energy increased. This observation is interesting because, while the Si surface area remains constant for this pattern of cones, bunching of the cones, as shown in Figure 4, reduces the interaction energy. We attribute this to the fact that in regions where the cones are close together (bunched), the interaction energy for water with itself is reduced, without compensation of additional Si surface area. These simulations thus predict that the protrusion of nanostructures into the water does reduce the water-silicon interaction energy somewhat.

121 APPROVED FOR PUBLIC RELEASE
Figure 4: Nine unit cells of the 3 x 3 cone pattern, showing only Si. Pattern showing bunching (left), pattern
showing even spacing (right). Overall, the MD simulations did not show the liquid water pulling away from the Si surface (dewetting) as we expected. Instead, these results suggest that full wetting of the Si surface is still thermodynamically favored, or that there is a kinetic barrier to reforming the water surface. However, because the simulation began with the full wetting of the surface, and not with an initial droplet approaching the surface, kinetic barriers to full wetting of the surface were not considered. We conclude that an understanding of the kinetic barriers to wetting of the surface is critical to fully understanding a repulsive effect. However, the results did show that the energy of interaction between water molecules is also important, and that the effect of the nanostructures on that interaction energy can contribute to the hydrophobicity.
Figure 5: Binding energy as a function of cone spacing (gap sizes). The number of cones per unit cell are
indicated by labels. The above result is critical for understanding how the adhesion of deformable particles could be limited with a nanostructure surface. In the extreme case of a rigid particle interacting with the surface, the particle-surface interactions are limited to the contact points of the nanostructures. The rigidity of the particle prevents penetration of material beyond these points, and the

122 APPROVED FOR PUBLIC RELEASE
interaction area is limited to a localized region surrounding these points. When the attraction between the components within a deformable aerosol particle (intraparticle) is greater than the interaction with the surface material, the interaction between particle and surface can be limited to the tips of the nanostructures.
CONCLUSIONS 4. The protein particle binded strongest to the flat, smooth surface and weakest to the roughest (largest cone size) surfaces, suggesting the importance of contact area and supporting the design of a wide range of size features (e.g., Lotus leaf and fractal patterns) to repel various particle sizes. MD simulations of liquid water interacting with structured Si surfaces did not show any segregation of water from the Si surface. This is most likely due to either thermodynamic unfavorability or a kinetic barrier preventing reformation of a water droplet surface. However, the simulations did show a small reduction in interaction energy between water and silicon when the nanostructures were bunched together. For a fixed Si surface area, the bunching of structures most likely limited the interaction energy between the water molecules themselves, thus making the interaction of water and Si less energetically favored. This suggests that a geometry where the cone height is sufficient to limit interaction with the underlying surface, and a sufficient cone density or a fractal geometry to prevent particles from slipping in between the nanostructures or deformation of particles around the nanostructure tips, should result in a repellant surface.
REFERENCES [1] Zhang, L.; et al. Langmuir 2006, 22 (20), p88576-8580. [2] Neinhuis, C.; Barthlott,W. Annals of Botany 1997, 79 (6), p667. [3] Bhushan, B.; et al. Journal of Interface 2007, 4 (15), p643-648. [4] Lum, K.; et al. Journal of Physical Chemistry B 1999, 103, p4570-4577.