Embed Size (px)
Citation preview
中2
期報告
。
IN I
SHANGRI-LA ASIA LIMITED
香格里拉(亞洲)有限公司
於百慕達註冊成立之有限公司
股份代號: 69
2
1
SHANGRI,LA ASIA LIMITED 咄苓泄
霎(洎莘)
H
范A己
RE
2 。
P 2
E
1
RI
。
SHANGRI-LA ASIA LIMITED
Incorporated in Bermuda with Limited Liability
Stock code: 69
M
RT
.t`
. < 一^ 一·' ·
- i`, F ', ·-,�·�·'· · 7f' ,,,孓
,.,.
. ., ' `' ',
.
茗香格里拉集團
SHANGRl�LA GROUP
以心相待,始於1971
。FsC-
MIX Papar的m國spons;ble sou心,.
泅自負責任的憙林童湄的紙張FSC" C132597
INTERIM REPORT 2021't'IUUIH'r 茗
SHANGRl�LA GROUP
-一,-' -
_ _ 乏.一--;:;;;.一-L ., ··一·-一 I一·,- · _- 一-正一·· `--
這道.,!_�.'U'?'I
尋·•· . . . •'--· . : ; : �...· . ; ;·: .
.丶 . :?::;: .·.· . . ..,.,.. . . ·. ̀ - · , t U;...`
I t..; t�, ·7一 .•·.... --. " ·,·,�-.
`'I ...'```````;.```,;```:; i璽黷
I.
;
`HEARTFELT HOSPITALITY
SINCE 1971

Cover Photos: 1. Island Shangri-La, Hong Kong2. China World Summit Wing, Beijing3. Island Shangri-La, Hong Kong4. Edsa Shangri-La, Manila5. Shangri-La Rasa Sayang, Penang6. Shangri-La Yanuca Island, Fiji7. Shangri-La Singapore8. Shangri-La Hangzhou9. Shangri-La Paris10. Shangri-La Singapore11. China World Summit Wing, Beijing12. Shangri-La Bangkok13. Shangri-La Singapore14. Pudong Shangri-La, Shanghai
1 2 3
4 56
7 8 910
11 12 13 14
CORPORATE INFORMATION
INTERIM REPORT 2021 1
As at 27 August 2021
BOARD OF DIRECTORSExecutive Director(s)Ms KUOK Hui Kwong (Chairman)Mr LIM Beng Chee (Group Chief Executive Officer)
Independent Non-executive Director(s)Professor LI Kwok Cheung ArthurMr YAP Chee KeongMr LI Xiaodong ForrestMr ZHUANG ChenchaoMs KHOO Shulamite N K
EXECUTIVE COMMITTEEMs KUOK Hui Kwong (chairman)Mr LIM Beng Chee
NOMINATION COMMITTEEMs KUOK Hui Kwong (chairman)Professor LI Kwok Cheung ArthurMr LI Xiaodong ForrestMs KHOO Shulamite N K
REMUNERATION & HUMAN CAPITAL COMMITTEEMs KHOO Shulamite N K (chairman)Ms KUOK Hui KwongProfessor LI Kwok Cheung ArthurMr YAP Chee Keong
AUDIT & RISK COMMITTEEMr YAP Chee Keong (chairman)Professor LI Kwok Cheung ArthurMs KHOO Shulamite N K (from 1 August 2021)
COMPANY SECRETARYMr SEOW Chow Loong Iain
SENIOR MANAGEMENTMs KUOK Hui Kwong (Chairman)Mr LIM Beng Chee (Group Chief Executive Officer)Mr TAN Lay Beng (Chief Financial Officer)Mr TAN Chen Kiong George (Chief Human Resources Officer)Mr CHUA Chee Wui (Chief Investment Officer)Mr CHAN Kong Leong (Regional Chief Executive Officer – Southeast Asia & Australasia)Mr LAM Kwok Fung (Chief Technology Officer)Mr PAW Chuen Kee (Deputy Chief Executive Officer and Executive Vice President, Operations – China)
AUDITORPricewaterhouseCoopersCertified Public AccountantsRegistered Public Interest Entity Auditor22/F Prince’s BuildingCentralHong Kong SAR
HEAD OFFICE AND PRINCIPAL PLACE OF BUSINESS28/F Kerry Centre683 King’s RoadQuarry BayHong Kong SAR
REGISTERED ADDRESSVictoria Place5/F, 31 Victoria StreetHamilton HM10Bermuda
PRINCIPAL SHARE REGISTRAR IN BERMUDAMUFG Fund Services (Bermuda) Limited4/F NorthCedar House41 Cedar AvenueHamilton HM12Bermuda
BRANCH SHARE REGISTRAR IN HONG KONGTricor Abacus LimitedLevel 54, Hopewell Centre183 Queen’s Road EastHong Kong SAR
STOCK CODESHong Kong stock exchange – 00069Singapore stock exchange – S07American Depositary Receipt – SHALY
WEBSITESCorporate – www.ir.shangri-la.comBusiness – www.shangri-la.com/group
INVESTOR RELATIONS [email protected]/F Kerry Centre683 King’s RoadQuarry BayHong Kong SAR
KEY DATE(S)Announcement of 2021 final resultsMarch 2022
2 SHANGRI-LA ASIA LIMITED
FINANCIALHIGHLIGHTS
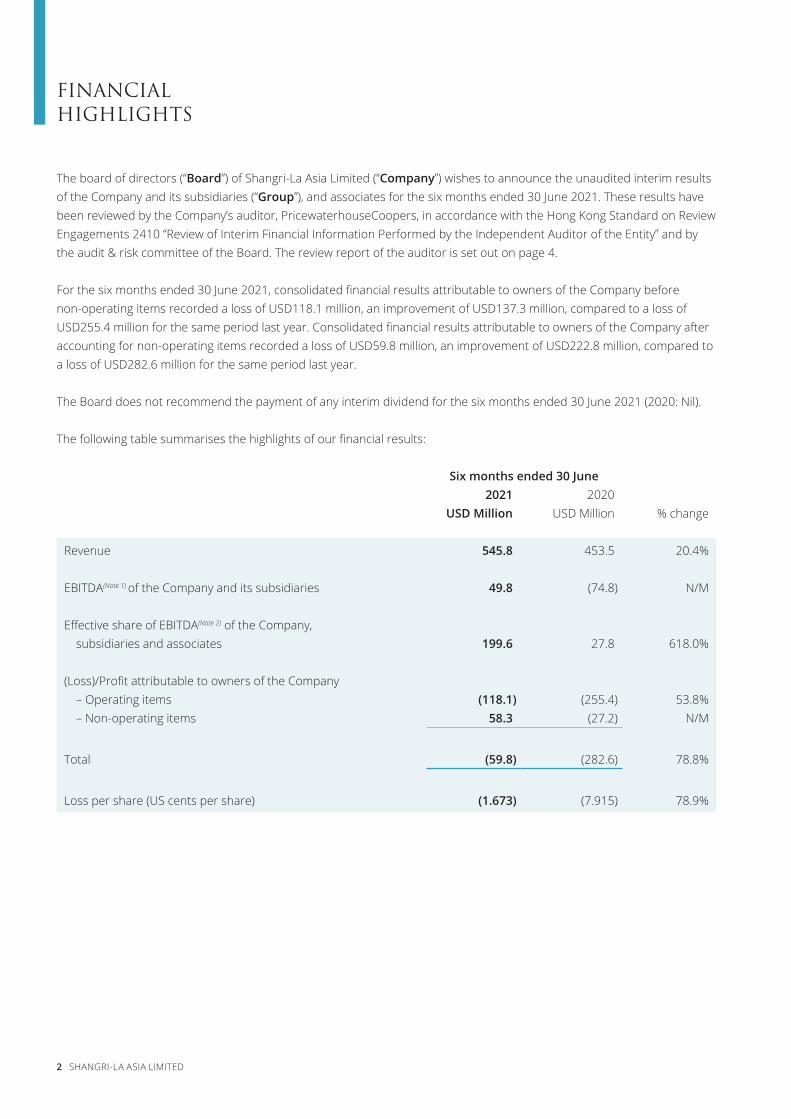
The board of directors (“Board”) of Shangri-La Asia Limited (“Company”) wishes to announce the unaudited interim results of the Company and its subsidiaries (“Group”), and associates for the six months ended 30 June 2021. These results have been reviewed by the Company’s auditor, PricewaterhouseCoopers, in accordance with the Hong Kong Standard on Review Engagements 2410 “Review of Interim Financial Information Performed by the Independent Auditor of the Entity” and by the audit & risk committee of the Board. The review report of the auditor is set out on page 4.
For the six months ended 30 June 2021, consolidated financial results attributable to owners of the Company before non-operating items recorded a loss of USD118.1 million, an improvement of USD137.3 million, compared to a loss of USD255.4 million for the same period last year. Consolidated financial results attributable to owners of the Company after accounting for non-operating items recorded a loss of USD59.8 million, an improvement of USD222.8 million, compared to a loss of USD282.6 million for the same period last year.
The Board does not recommend the payment of any interim dividend for the six months ended 30 June 2021 (2020: Nil).
The following table summarises the highlights of our financial results:
Six months ended 30 June2021 2020
USD Million USD Million % change
Revenue 545.8 453.5 20.4%
EBITDA(Note 1) of the Company and its subsidiaries 49.8 (74.8) N/M
Effective share of EBITDA(Note 2) of the Company, subsidiaries and associates 199.6 27.8 618.0%
(Loss)/Profit attributable to owners of the Company– Operating items (118.1) (255.4) 53.8%– Non-operating items 58.3 (27.2) N/M
Total (59.8) (282.6) 78.8%
Loss per share (US cents per share) (1.673) (7.915) 78.9%
FINANCIALHIGHLIGHTS
INTERIM REPORT 2021 3
As at30 June
202131 December
2020USD Million USD Million % change
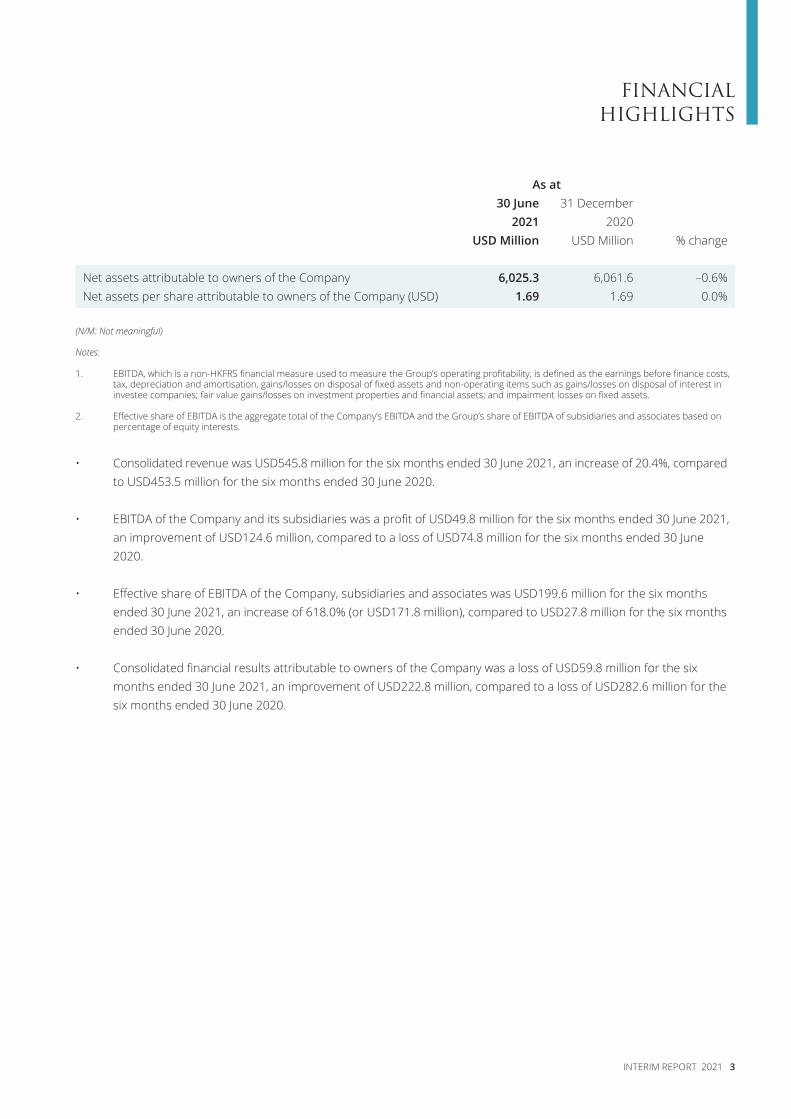
Net assets attributable to owners of the Company 6,025.3 6,061.6 –0.6%Net assets per share attributable to owners of the Company (USD) 1.69 1.69 0.0%
(N/M: Not meaningful)
Notes:
1. EBITDA, which is a non-HKFRS financial measure used to measure the Group’s operating profitability, is defined as the earnings before finance costs, tax, depreciation and amortisation, gains/losses on disposal of fixed assets and non-operating items such as gains/losses on disposal of interest in investee companies; fair value gains/losses on investment properties and financial assets; and impairment losses on fixed assets.
2. Effective share of EBITDA is the aggregate total of the Company’s EBITDA and the Group’s share of EBITDA of subsidiaries and associates based on percentage of equity interests.
• Consolidated revenue was USD545.8 million for the six months ended 30 June 2021, an increase of 20.4%, compared to USD453.5 million for the six months ended 30 June 2020.
• EBITDA of the Company and its subsidiaries was a profit of USD49.8 million for the six months ended 30 June 2021, an improvement of USD124.6 million, compared to a loss of USD74.8 million for the six months ended 30 June 2020.
• Effective share of EBITDA of the Company, subsidiaries and associates was USD199.6 million for the six months ended 30 June 2021, an increase of 618.0% (or USD171.8 million), compared to USD27.8 million for the six months ended 30 June 2020.
• Consolidated financial results attributable to owners of the Company was a loss of USD59.8 million for the six months ended 30 June 2021, an improvement of USD222.8 million, compared to a loss of USD282.6 million for the six months ended 30 June 2020.
4 SHANGRI-LA ASIA LIMITED
REPORT ON REVIEW OF INTERIM FINANCIAL INFORMATION
TO THE BOARD OF DIRECTORS OF SHANGRI-LA ASIA LIMITED(incorporated in Bermuda with limited liability)
Introduction
We have reviewed the interim financial information set out on pages 5 to 38, which comprises the condensed consolidated interim statement of financial position of Shangri-La Asia Limited (the “Company”) and its subsidiaries (together, the “Group”) as at 30 June 2021 and the condensed consolidated interim statement of profit or loss, the condensed consolidated interim statement of comprehensive income, the condensed consolidated interim statement of changes in equity and the condensed consolidated interim statement of cash flows for the six-month period then ended, and a summary of significant accounting policies and other explanatory notes. The Rules Governing the Listing of Securities on The Stock Exchange of Hong Kong Limited require the preparation of a report on interim financial information to be in compliance with the relevant provisions thereof and Hong Kong Accounting Standard 34 “Interim Financial Reporting” issued by the Hong Kong Institute of Certified Public Accountants. The Directors of the Company are responsible for the preparation and presentation of this interim financial information in accordance with Hong Kong Accounting Standard 34 “Interim Financial Reporting”. Our responsibility is to express a conclusion on this interim financial information based on our review and to report our conclusion solely to you, as a body, in accordance with our agreed terms of engagement and for no other purpose. We do not assume responsibility towards or accept liability to any other person for the contents of this report.
Scope of Review
We conducted our review in accordance with Hong Kong Standard on Review Engagements 2410, “Review of Interim Financial Information Performed by the Independent Auditor of the Entity” issued by the Hong Kong Institute of Certified Public Accountants. A review of interim financial information consists of making inquiries, primarily of persons responsible for financial and accounting matters, and applying analytical and other review procedures. A review is substantially less in scope than an audit conducted in accordance with Hong Kong Standards on Auditing and consequently does not enable us to obtain assurance that we would become aware of all significant matters that might be identified in an audit. Accordingly, we do not express an audit opinion.
Conclusion
Based on our review, nothing has come to our attention that causes us to believe that the interim financial information of the Group is not prepared, in all material respects, in accordance with Hong Kong Accounting Standard 34 “Interim Financial Reporting”.
PricewaterhouseCoopersCertified Public Accountants
Hong Kong, 27 August 2021
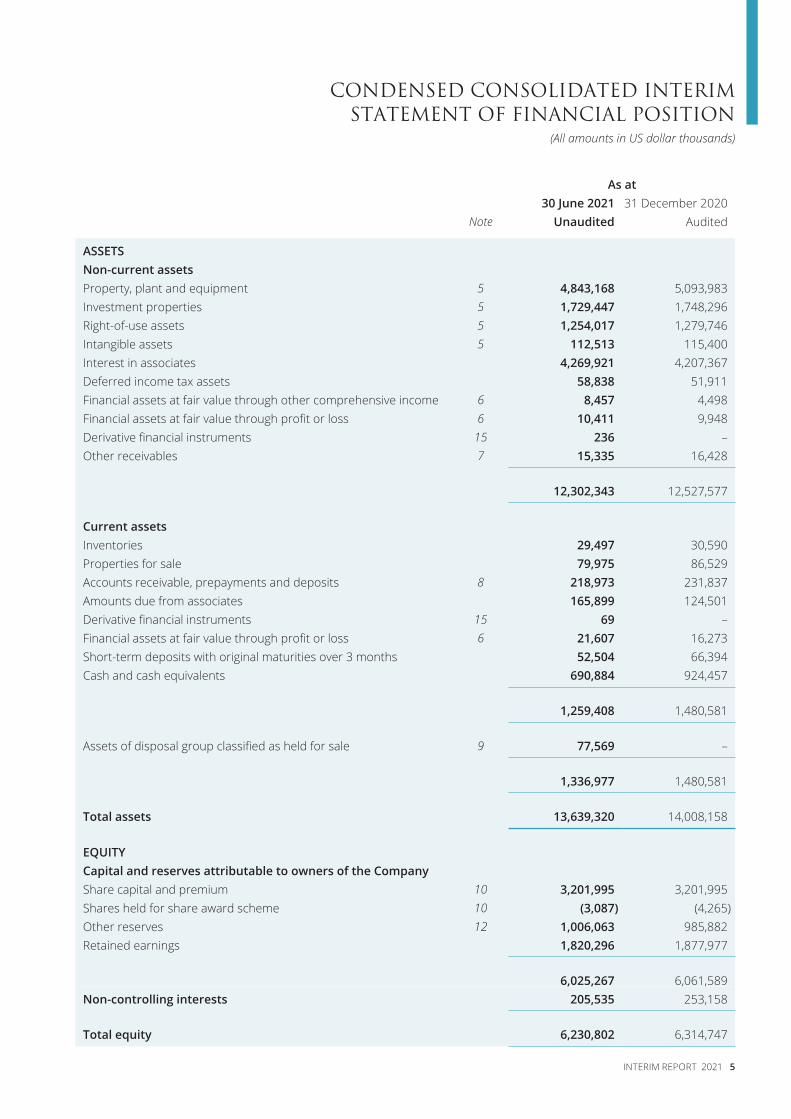
CONDENSED CONSOLIDATED INTERIM STATEMENT OF FINANCIAL POSITION
INTERIM REPORT 2021 5
(All amounts in US dollar thousands)
As at30 June 2021 31 December 2020
Note Unaudited Audited
ASSETSNon-current assetsProperty, plant and equipment 5 4,843,168 5,093,983Investment properties 5 1,729,447 1,748,296Right-of-use assets 5 1,254,017 1,279,746Intangible assets 5 112,513 115,400Interest in associates 4,269,921 4,207,367Deferred income tax assets 58,838 51,911Financial assets at fair value through other comprehensive income 6 8,457 4,498Financial assets at fair value through profit or loss 6 10,411 9,948Derivative financial instruments 15 236 –Other receivables 7 15,335 16,428
12,302,343 12,527,577
Current assetsInventories 29,497 30,590Properties for sale 79,975 86,529Accounts receivable, prepayments and deposits 8 218,973 231,837Amounts due from associates 165,899 124,501Derivative financial instruments 15 69 –Financial assets at fair value through profit or loss 6 21,607 16,273Short-term deposits with original maturities over 3 months 52,504 66,394Cash and cash equivalents 690,884 924,457
1,259,408 1,480,581
Assets of disposal group classified as held for sale 9 77,569 –
1,336,977 1,480,581
Total assets 13,639,320 14,008,158
EQUITYCapital and reserves attributable to owners of the CompanyShare capital and premium 10 3,201,995 3,201,995Shares held for share award scheme 10 (3,087) (4,265)Other reserves 12 1,006,063 985,882Retained earnings 1,820,296 1,877,977
6,025,267 6,061,589Non-controlling interests 205,535 253,158
Total equity 6,230,802 6,314,747
6 SHANGRI-LA ASIA LIMITED
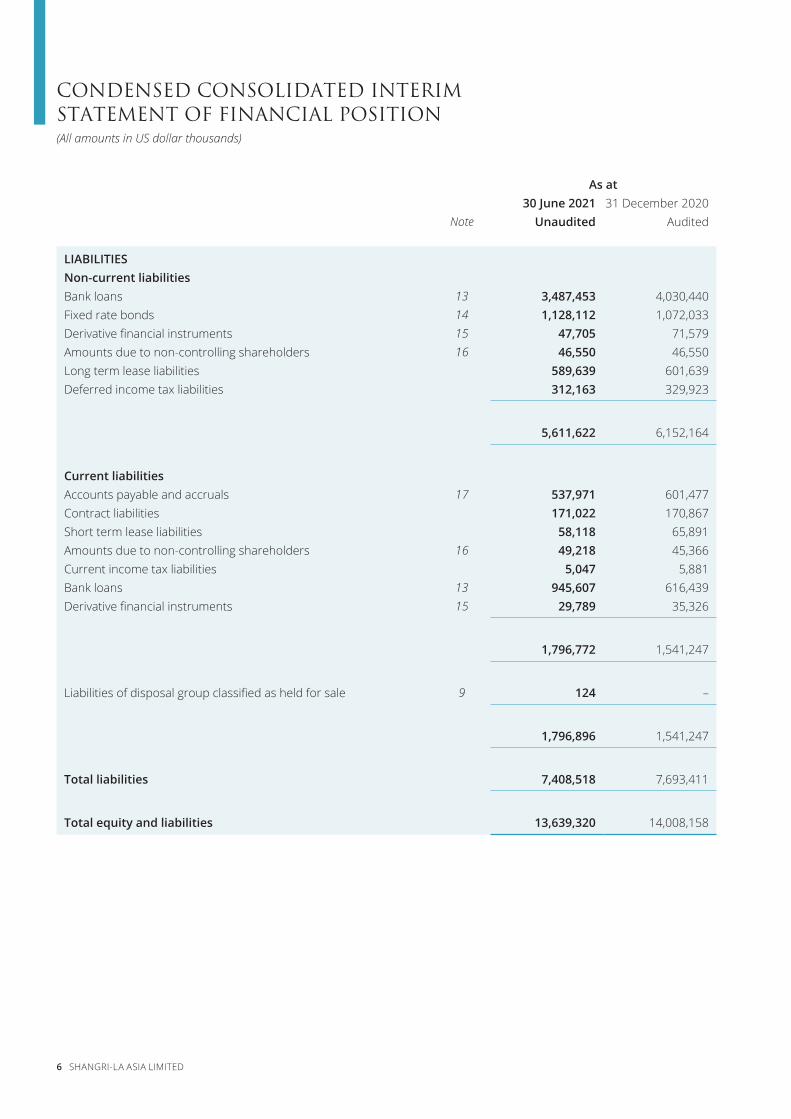
CONDENSED CONSOLIDATED INTERIM STATEMENT OF FINANCIAL POSITION(All amounts in US dollar thousands)
As at30 June 2021 31 December 2020
Note Unaudited Audited
LIABILITIESNon-current liabilitiesBank loans 13 3,487,453 4,030,440Fixed rate bonds 14 1,128,112 1,072,033Derivative financial instruments 15 47,705 71,579Amounts due to non-controlling shareholders 16 46,550 46,550Long term lease liabilities 589,639 601,639Deferred income tax liabilities 312,163 329,923
5,611,622 6,152,164
Current liabilitiesAccounts payable and accruals 17 537,971 601,477Contract liabilities 171,022 170,867Short term lease liabilities 58,118 65,891Amounts due to non-controlling shareholders 16 49,218 45,366Current income tax liabilities 5,047 5,881Bank loans 13 945,607 616,439Derivative financial instruments 15 29,789 35,326
1,796,772 1,541,247
Liabilities of disposal group classified as held for sale 9 124 –
1,796,896 1,541,247
Total liabilities 7,408,518 7,693,411
Total equity and liabilities 13,639,320 14,008,158
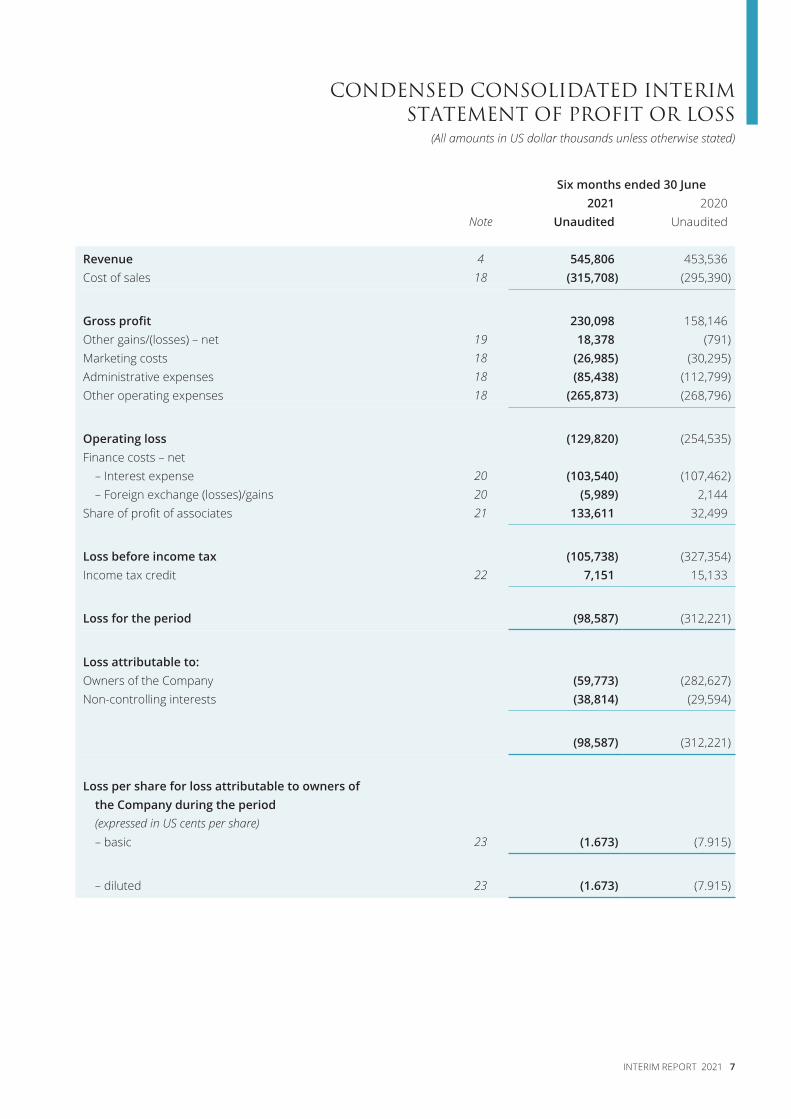
CONDENSED CONSOLIDATED INTERIM STATEMENT OF PROFIT OR LOSS
INTERIM REPORT 2021 7
(All amounts in US dollar thousands unless otherwise stated)
Six months ended 30 June2021 2020
Note Unaudited Unaudited
Revenue 4 545,806 453,536Cost of sales 18 (315,708) (295,390)
Gross profit 230,098 158,146Other gains/(losses) – net 19 18,378 (791)Marketing costs 18 (26,985) (30,295)Administrative expenses 18 (85,438) (112,799)Other operating expenses 18 (265,873) (268,796)
Operating loss (129,820) (254,535)Finance costs – net
– Interest expense 20 (103,540) (107,462)– Foreign exchange (losses)/gains 20 (5,989) 2,144
Share of profit of associates 21 133,611 32,499
Loss before income tax (105,738) (327,354)Income tax credit 22 7,151 15,133
Loss for the period (98,587) (312,221)
Loss attributable to:Owners of the Company (59,773) (282,627)Non-controlling interests (38,814) (29,594)
(98,587) (312,221)
Loss per share for loss attributable to owners of the Company during the period(expressed in US cents per share)– basic 23 (1.673) (7.915)
– diluted 23 (1.673) (7.915)
8 SHANGRI-LA ASIA LIMITED
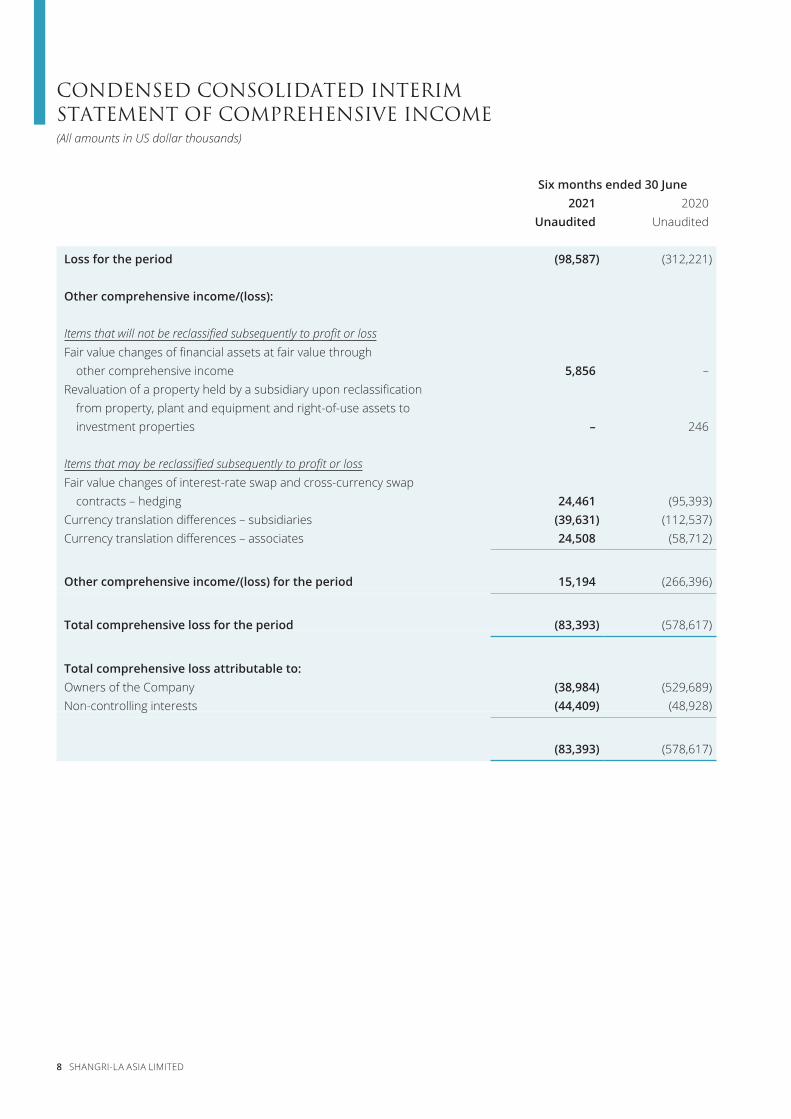
CONDENSED CONSOLIDATED INTERIM STATEMENT OF COMPREHENSIVE INCOME(All amounts in US dollar thousands)
Six months ended 30 June2021 2020
Unaudited Unaudited
Loss for the period (98,587) (312,221)
Other comprehensive income/(loss):
Items that will not be reclassified subsequently to profit or lossFair value changes of financial assets at fair value through
other comprehensive income 5,856 –Revaluation of a property held by a subsidiary upon reclassification
from property, plant and equipment and right-of-use assets to investment properties – 246
Items that may be reclassified subsequently to profit or lossFair value changes of interest-rate swap and cross-currency swap
contracts – hedging 24,461 (95,393)Currency translation differences – subsidiaries (39,631) (112,537)Currency translation differences – associates 24,508 (58,712)
Other comprehensive income/(loss) for the period 15,194 (266,396)
Total comprehensive loss for the period (83,393) (578,617)
Total comprehensive loss attributable to:Owners of the Company (38,984) (529,689)Non-controlling interests (44,409) (48,928)
(83,393) (578,617)
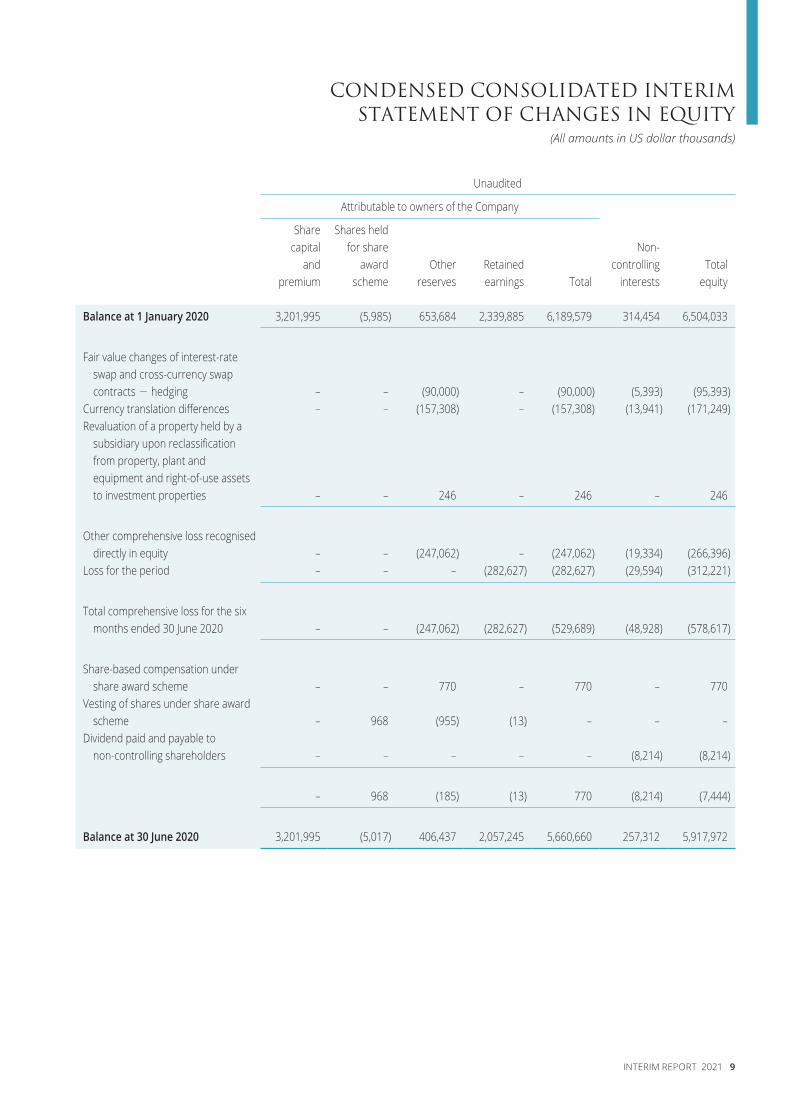
CONDENSED CONSOLIDATED INTERIM STATEMENT OF CHANGES IN EQUITY
INTERIM REPORT 2021 9
(All amounts in US dollar thousands)
Unaudited Attributable to owners of the Company
Share capital
and premium
Shares held for share
award scheme
Other reserves
Retained earnings Total
Non-controlling
interestsTotal
equity
Balance at 1 January 2020 3,201,995 (5,985) 653,684 2,339,885 6,189,579 314,454 6,504,033
Fair value changes of interest-rate swap and cross-currency swap contracts - hedging – – (90,000) – (90,000) (5,393) (95,393)
Currency translation differences – – (157,308) – (157,308) (13,941) (171,249)Revaluation of a property held by a
subsidiary upon reclassification from property, plant and equipment and right-of-use assets to investment properties – – 246 – 246 – 246
Other comprehensive loss recognised directly in equity – – (247,062) – (247,062) (19,334) (266,396)
Loss for the period – – – (282,627) (282,627) (29,594) (312,221)
Total comprehensive loss for the six months ended 30 June 2020 – – (247,062) (282,627) (529,689) (48,928) (578,617)
Share-based compensation under share award scheme – – 770 – 770 – 770
Vesting of shares under share award scheme – 968 (955) (13) – – –
Dividend paid and payable to non-controlling shareholders – – – – – (8,214) (8,214)
– 968 (185) (13) 770 (8,214) (7,444)
Balance at 30 June 2020 3,201,995 (5,017) 406,437 2,057,245 5,660,660 257,312 5,917,972
10 SHANGRI-LA ASIA LIMITED
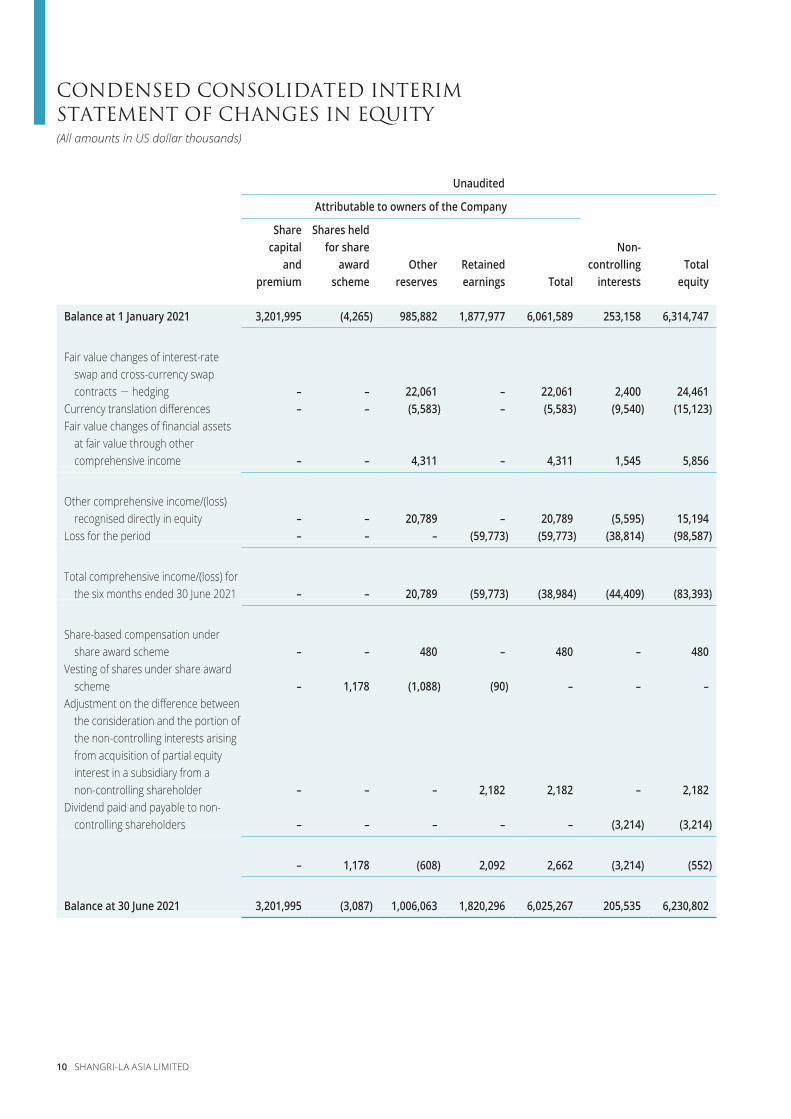
CONDENSED CONSOLIDATED INTERIM STATEMENT OF CHANGES IN EQUITY(All amounts in US dollar thousands)
Unaudited Attributable to owners of the Company
Share capital
and premium
Shares held for share
award scheme
Other reserves
Retained earnings Total
Non-controlling
interestsTotal
equity
Balance at 1 January 2021 3,201,995 (4,265) 985,882 1,877,977 6,061,589 253,158 6,314,747
Fair value changes of interest-rate swap and cross-currency swap contracts - hedging – – 22,061 – 22,061 2,400 24,461
Currency translation differences – – (5,583) – (5,583) (9,540) (15,123)Fair value changes of financial assets
at fair value through other comprehensive income – – 4,311 – 4,311 1,545 5,856
Other comprehensive income/(loss) recognised directly in equity – – 20,789 – 20,789 (5,595) 15,194
Loss for the period – – – (59,773) (59,773) (38,814) (98,587)
Total comprehensive income/(loss) for the six months ended 30 June 2021 – – 20,789 (59,773) (38,984) (44,409) (83,393)
Share-based compensation under share award scheme – – 480 – 480 – 480
Vesting of shares under share award scheme – 1,178 (1,088) (90) – – –
Adjustment on the difference between the consideration and the portion of the non-controlling interests arising from acquisition of partial equity interest in a subsidiary from a non-controlling shareholder – – – 2,182 2,182 – 2,182
Dividend paid and payable to non-controlling shareholders – – – – – (3,214) (3,214)
– 1,178 (608) 2,092 2,662 (3,214) (552)
Balance at 30 June 2021 3,201,995 (3,087) 1,006,063 1,820,296 6,025,267 205,535 6,230,802
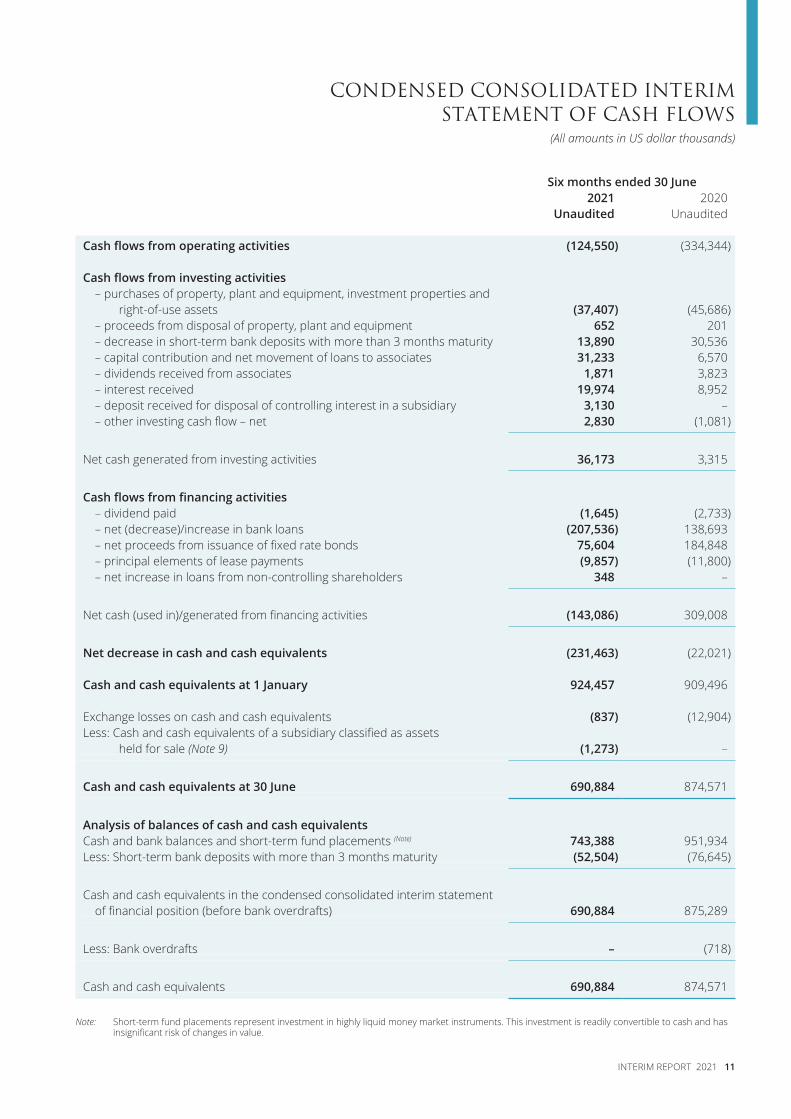
CONDENSED CONSOLIDATED INTERIM STATEMENT OF CASH FLOWS
INTERIM REPORT 2021 11
(All amounts in US dollar thousands)
Six months ended 30 June2021 2020
Unaudited Unaudited
Cash flows from operating activities (124,550) (334,344)
Cash flows from investing activities– purchases of property, plant and equipment, investment properties and
right-of-use assets (37,407) (45,686)– proceeds from disposal of property, plant and equipment 652 201– decrease in short-term bank deposits with more than 3 months maturity 13,890 30,536– capital contribution and net movement of loans to associates 31,233 6,570– dividends received from associates 1,871 3,823– interest received 19,974 8,952– deposit received for disposal of controlling interest in a subsidiary 3,130 –– other investing cash flow – net 2,830 (1,081)
Net cash generated from investing activities 36,173 3,315
Cash flows from financing activities– dividend paid (1,645) (2,733)– net (decrease)/increase in bank loans (207,536) 138,693– net proceeds from issuance of fixed rate bonds 75,604 184,848– principal elements of lease payments (9,857) (11,800)– net increase in loans from non-controlling shareholders 348 –
Net cash (used in)/generated from financing activities (143,086) 309,008
Net decrease in cash and cash equivalents (231,463) (22,021)
Cash and cash equivalents at 1 January 924,457 909,496
Exchange losses on cash and cash equivalents (837) (12,904)Less: Cash and cash equivalents of a subsidiary classified as assets
held for sale (Note 9) (1,273) –
Cash and cash equivalents at 30 June 690,884 874,571
Analysis of balances of cash and cash equivalentsCash and bank balances and short-term fund placements (Note) 743,388 951,934Less: Short-term bank deposits with more than 3 months maturity (52,504) (76,645)
Cash and cash equivalents in the condensed consolidated interim statement of financial position (before bank overdrafts) 690,884 875,289
Less: Bank overdrafts – (718)
Cash and cash equivalents 690,884 874,571
Note: Short-term fund placements represent investment in highly liquid money market instruments. This investment is readily convertible to cash and has insignificant risk of changes in value.
12 SHANGRI-LA ASIA LIMITED
NOTES TO THE CONDENSED CONSOLIDATED INTERIM FINANCIAL STATEMENTS(All amounts in US dollar thousands unless otherwise stated)
1. GENERAL INFORMATIONThe principal activities of the Group are the development, ownership and operation of hotel properties, the provision of hotel management and related services, the development, ownership and operations of investment properties and property development for sale.
The Company is a limited liability company incorporated in Bermuda. The address of its registered office is Victoria Place, 5/F, 31 Victoria Street, Hamilton HM10, Bermuda.
The Company has its primary listing on the Main Board of The Stock Exchange of Hong Kong Limited with secondary listing on the Singapore Exchange Securities Trading Limited.
These condensed consolidated interim financial statements were approved by the Board for issue on 27 August 2021. These condensed consolidated interim financial statements have been reviewed by the Company’s auditor in accordance with the Hong Kong Standard on Review Engagements 2410 “Review of Interim Financial Information Performed by the Independent Auditor of the Entity”.
2. BASIS OF PREPARATION AND ACCOUNTING POLICIESThese unaudited condensed consolidated interim financial statements for the six months ended 30 June 2021 have been prepared in accordance with Hong Kong Accounting Standard (“HKAS”) 34 “Interim Financial Reporting” issued by the Hong Kong Institute of Certified Public Accountants (“HKICPA”). The financial statements have been prepared on a going-concern basis although the Group’s consolidated current liabilities exceeded its consolidated current assets by USD459,919,000 and the Group was running at a cash loss from its operation due to the impact of COVID-19 pandemic during the current reporting period. The future funding requirements can be met through the committed and available bank loan facilities of USD1,564,086,000 which are maturing after 30 June 2022 (of which USD680,000,000 is reserved to be drawn down to replace the existing facility from the same bank). The Group has adequate resources to continue its operation for the foreseeable future. The Group therefore continues to adopt the going concern basis in preparing its condensed consolidated interim financial statements.
These condensed consolidated interim financial statements should be read in conjunction with the annual financial statements for the year ended 31 December 2020, which have been prepared in accordance with Hong Kong Financial Reporting Standards (“HKFRS”). The accounting policies and methods of computation used in the preparation of these condensed consolidated interim financial statements are consistent with those used in the annual financial statements for the year ended 31 December 2020, except for the adoption of the following amendments to accounting standards which are relevant to the Group’s operation and are mandatory for the financial year ending 31 December 2021.
Amendment to HKFRS 16 COVID-19 Related Rent Concessions beyond 30 June 2021Amendments to HKFRS 9, HKAS 39,
HKFRS 7, HKFRS 4 and HKFRS 16Interest Rate Benchmark Reform – Phase 2
Except for the amendment to HKFRS 16 mentioned below, the adoption of other amendments to accounting standards has no material impact on the Group’s financial statements.
NOTES TO THE CONDENSED CONSOLIDATED INTERIM FINANCIAL STATEMENTS
INTERIM REPORT 2021 13
(All amounts in US dollar thousands unless otherwise stated)
2. BASIS OF PREPARATION AND ACCOUNTING POLICIES (CONTINUED)Amendment to HKFRS 16, COVID-19 Related Rent Concessions beyond 30 June 2021 (“2021 amendment”)
The Group previously applied the practical expedient in HKFRS 16 such that a lessee was able to by-pass the need to evaluate whether certain qualifying rent concessions occurring as a direct consequence of the COVID-19 pandemic are lease modifications and, instead, account for those rent concessions as if they were variable lease payments and were not lease modifications. One of these conditions requires the reduction in lease payments affect only payments originally due on or before a specified time limit. The 2021 amendment extends this time limit from the original 30 June 2021 to 30 June 2022.
Following the adoption of the original practical expedient in HKFRS 16 in 2020, the Group has elected to adopt the 2021 amendment and continues to apply the practical expedient to all qualifying COVID-19 related rent concessions granted to the Group during the current reporting period. Consequently, rent concessions received have been accounted for as negative variable lease payments recognised in “Other gains/(losses) – net” in the condensed consolidated interim statement of profit or loss during the period in which the event or condition that triggers those payments occurred. There is no impact on the opening balance of equity at 1 January 2021.
3. ESTIMATESThe preparation of interim financial information requires management to make judgements, estimates and assumptions that affect the application of accounting policies and the reported amounts of assets and liabilities, income and expense. Actual results may differ from these estimates.
In preparing these condensed consolidated interim financial statements, the significant judgements made by management in applying the Group’s accounting policies and the key sources of estimation uncertainty were the same as those that applied to the consolidated financial statements for the year ended 31 December 2020.
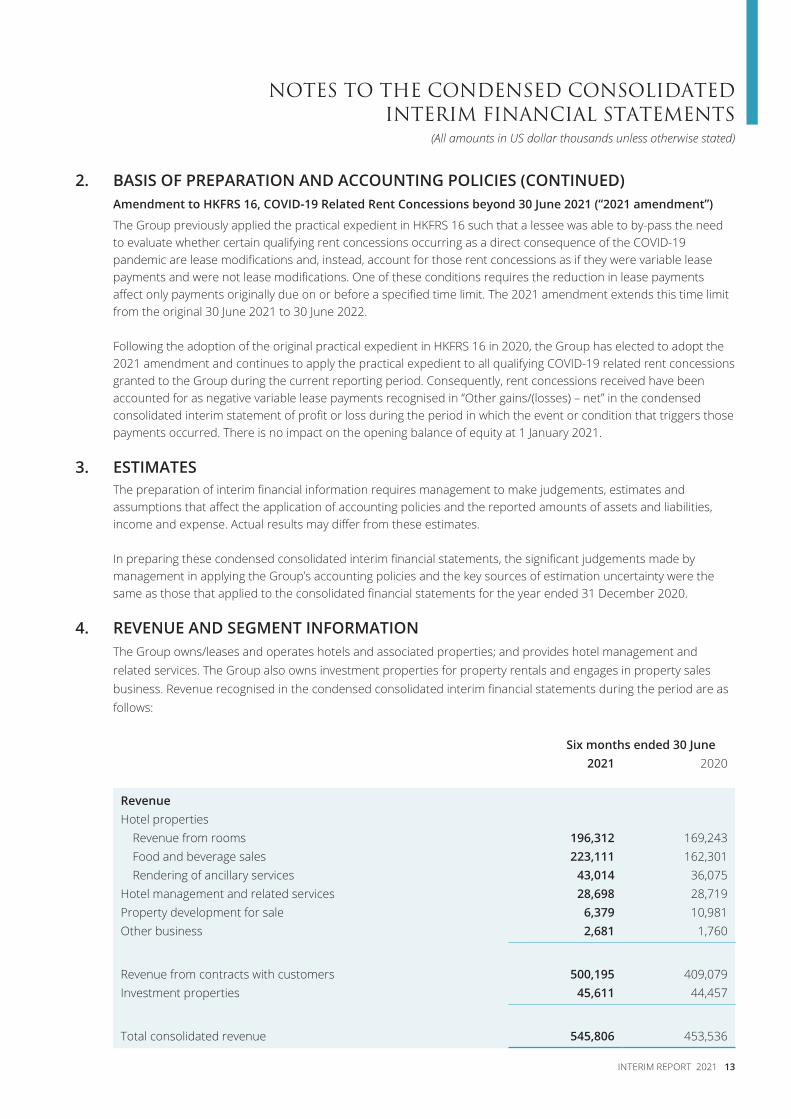
4. REVENUE AND SEGMENT INFORMATIONThe Group owns/leases and operates hotels and associated properties; and provides hotel management and related services. The Group also owns investment properties for property rentals and engages in property sales business. Revenue recognised in the condensed consolidated interim financial statements during the period are as follows:
Six months ended 30 June2021 2020
RevenueHotel properties
Revenue from rooms 196,312 169,243Food and beverage sales 223,111 162,301Rendering of ancillary services 43,014 36,075
Hotel management and related services 28,698 28,719Property development for sale 6,379 10,981Other business 2,681 1,760
Revenue from contracts with customers 500,195 409,079Investment properties 45,611 44,457
Total consolidated revenue 545,806 453,536
14 SHANGRI-LA ASIA LIMITED
NOTES TO THE CONDENSED CONSOLIDATED INTERIM FINANCIAL STATEMENTS(All amounts in US dollar thousands unless otherwise stated)
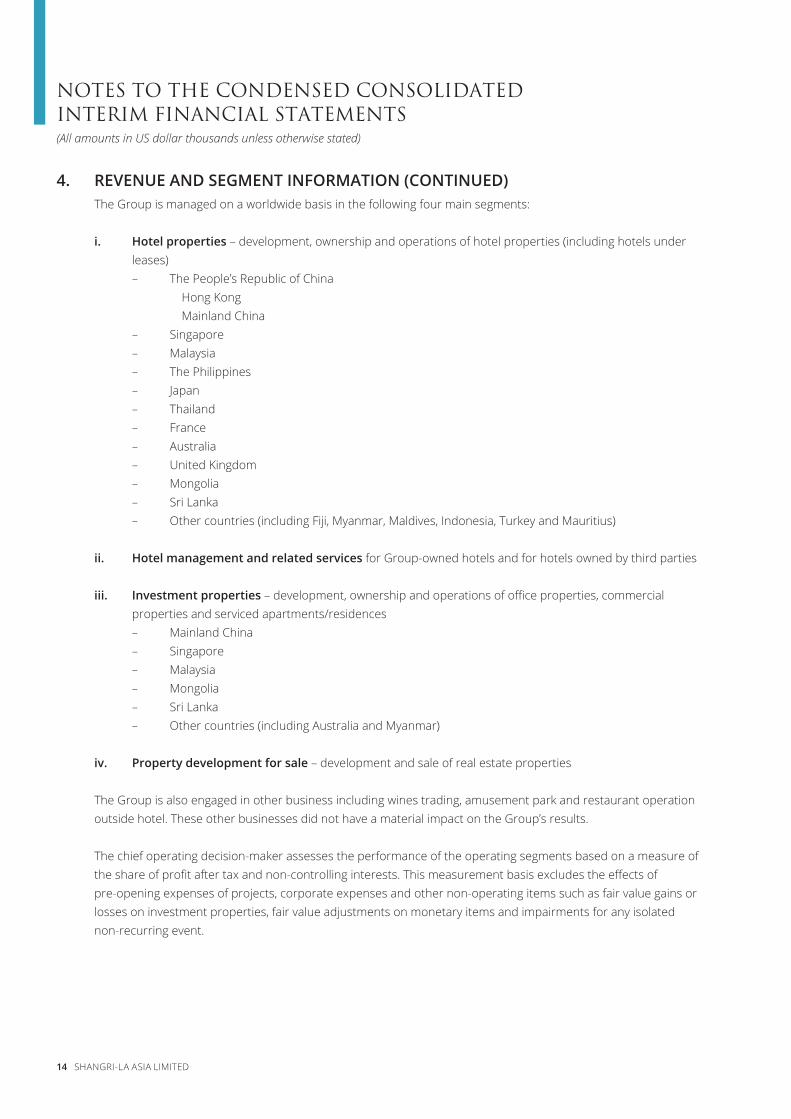
4. REVENUE AND SEGMENT INFORMATION (CONTINUED)The Group is managed on a worldwide basis in the following four main segments:
i. Hotel properties – development, ownership and operations of hotel properties (including hotels under leases)– The People’s Republic of China
Hong Kong Mainland China
– Singapore– Malaysia– The Philippines– Japan– Thailand– France– Australia– United Kingdom– Mongolia– Sri Lanka– Other countries (including Fiji, Myanmar, Maldives, Indonesia, Turkey and Mauritius)
ii. Hotel management and related services for Group-owned hotels and for hotels owned by third parties
iii. Investment properties – development, ownership and operations of office properties, commercial properties and serviced apartments/residences– Mainland China– Singapore– Malaysia– Mongolia– Sri Lanka– Other countries (including Australia and Myanmar)
iv. Property development for sale – development and sale of real estate properties
The Group is also engaged in other business including wines trading, amusement park and restaurant operation outside hotel. These other businesses did not have a material impact on the Group’s results.
The chief operating decision-maker assesses the performance of the operating segments based on a measure of the share of profit after tax and non-controlling interests. This measurement basis excludes the effects of pre-opening expenses of projects, corporate expenses and other non-operating items such as fair value gains or losses on investment properties, fair value adjustments on monetary items and impairments for any isolated non-recurring event.
NOTES TO THE CONDENSED CONSOLIDATED INTERIM FINANCIAL STATEMENTS
INTERIM REPORT 2021 15
(All amounts in US dollar thousands unless otherwise stated)
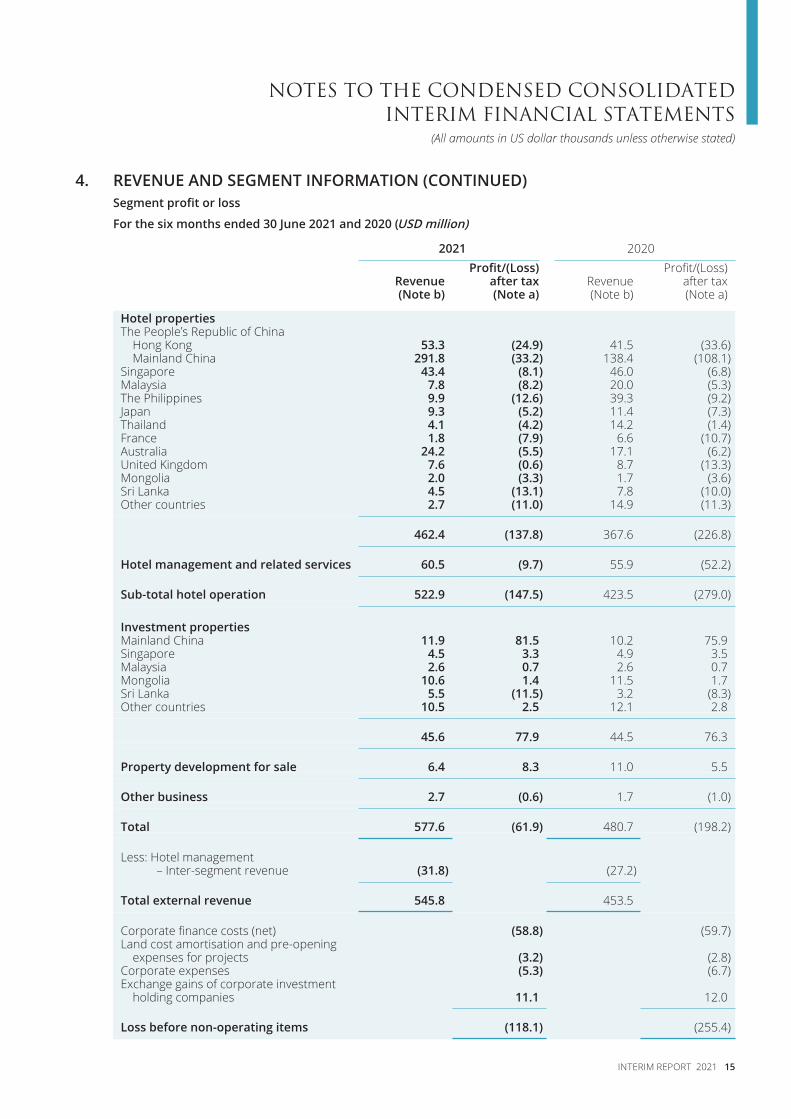
4. REVENUE AND SEGMENT INFORMATION (CONTINUED)Segment profit or loss
For the six months ended 30 June 2021 and 2020 (USD million)
2021 2020
RevenueProfit/(Loss)
after tax RevenueProfit/(Loss)
after tax(Note b) (Note a) (Note b) (Note a)
Hotel propertiesThe People’s Republic of China
Hong Kong 53.3 (24.9) 41.5 (33.6)Mainland China 291.8 (33.2) 138.4 (108.1)
Singapore 43.4 (8.1) 46.0 (6.8)Malaysia 7.8 (8.2) 20.0 (5.3)The Philippines 9.9 (12.6) 39.3 (9.2)Japan 9.3 (5.2) 11.4 (7.3)Thailand 4.1 (4.2) 14.2 (1.4)France 1.8 (7.9) 6.6 (10.7)Australia 24.2 (5.5) 17.1 (6.2)United Kingdom 7.6 (0.6) 8.7 (13.3)Mongolia 2.0 (3.3) 1.7 (3.6)Sri Lanka 4.5 (13.1) 7.8 (10.0)Other countries 2.7 (11.0) 14.9 (11.3)
462.4 (137.8) 367.6 (226.8)
Hotel management and related services 60.5 (9.7) 55.9 (52.2)
Sub-total hotel operation 522.9 (147.5) 423.5 (279.0)
Investment propertiesMainland China 11.9 81.5 10.2 75.9Singapore 4.5 3.3 4.9 3.5Malaysia 2.6 0.7 2.6 0.7Mongolia 10.6 1.4 11.5 1.7Sri Lanka 5.5 (11.5) 3.2 (8.3)Other countries 10.5 2.5 12.1 2.8
45.6 77.9 44.5 76.3
Property development for sale 6.4 8.3 11.0 5.5
Other business 2.7 (0.6) 1.7 (1.0)
Total 577.6 (61.9) 480.7 (198.2)
Less: Hotel management – Inter-segment revenue (31.8) (27.2)
Total external revenue 545.8 453.5
Corporate finance costs (net) (58.8) (59.7)Land cost amortisation and pre-opening
expenses for projects (3.2) (2.8)Corporate expenses (5.3) (6.7)Exchange gains of corporate investment
holding companies 11.1 12.0
Loss before non-operating items (118.1) (255.4)
16 SHANGRI-LA ASIA LIMITED
NOTES TO THE CONDENSED CONSOLIDATED INTERIM FINANCIAL STATEMENTS(All amounts in US dollar thousands unless otherwise stated)
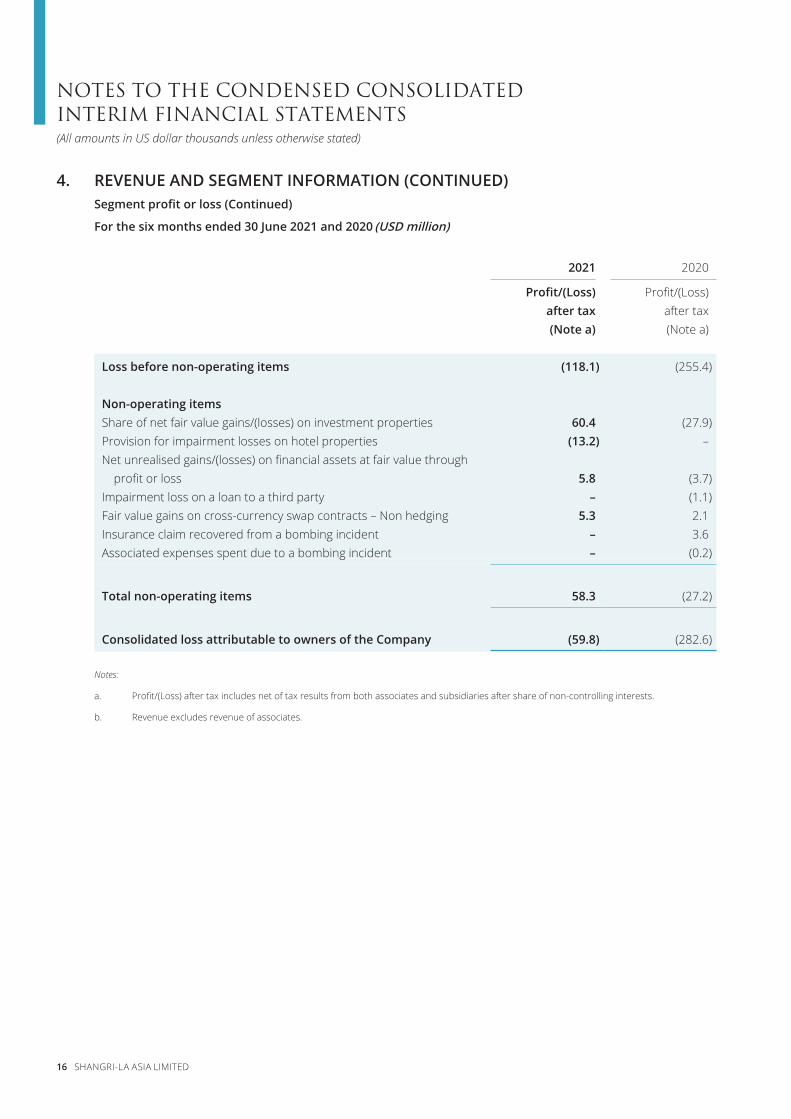
4. REVENUE AND SEGMENT INFORMATION (CONTINUED)Segment profit or loss (Continued)
For the six months ended 30 June 2021 and 2020 (USD million)
2021 2020 Profit/(Loss)
after taxProfit/(Loss)
after tax(Note a) (Note a)
Loss before non-operating items (118.1) (255.4)
Non-operating itemsShare of net fair value gains/(losses) on investment properties 60.4 (27.9)Provision for impairment losses on hotel properties (13.2) –Net unrealised gains/(losses) on financial assets at fair value through
profit or loss 5.8 (3.7)Impairment loss on a loan to a third party – (1.1)Fair value gains on cross-currency swap contracts – Non hedging 5.3 2.1Insurance claim recovered from a bombing incident – 3.6Associated expenses spent due to a bombing incident – (0.2)
Total non-operating items 58.3 (27.2)
Consolidated loss attributable to owners of the Company (59.8) (282.6)
Notes:
a. Profit/(Loss) after tax includes net of tax results from both associates and subsidiaries after share of non-controlling interests.
b. Revenue excludes revenue of associates.
NOTES TO THE CONDENSED CONSOLIDATED INTERIM FINANCIAL STATEMENTS
INTERIM REPORT 2021 17
(All amounts in US dollar thousands unless otherwise stated)
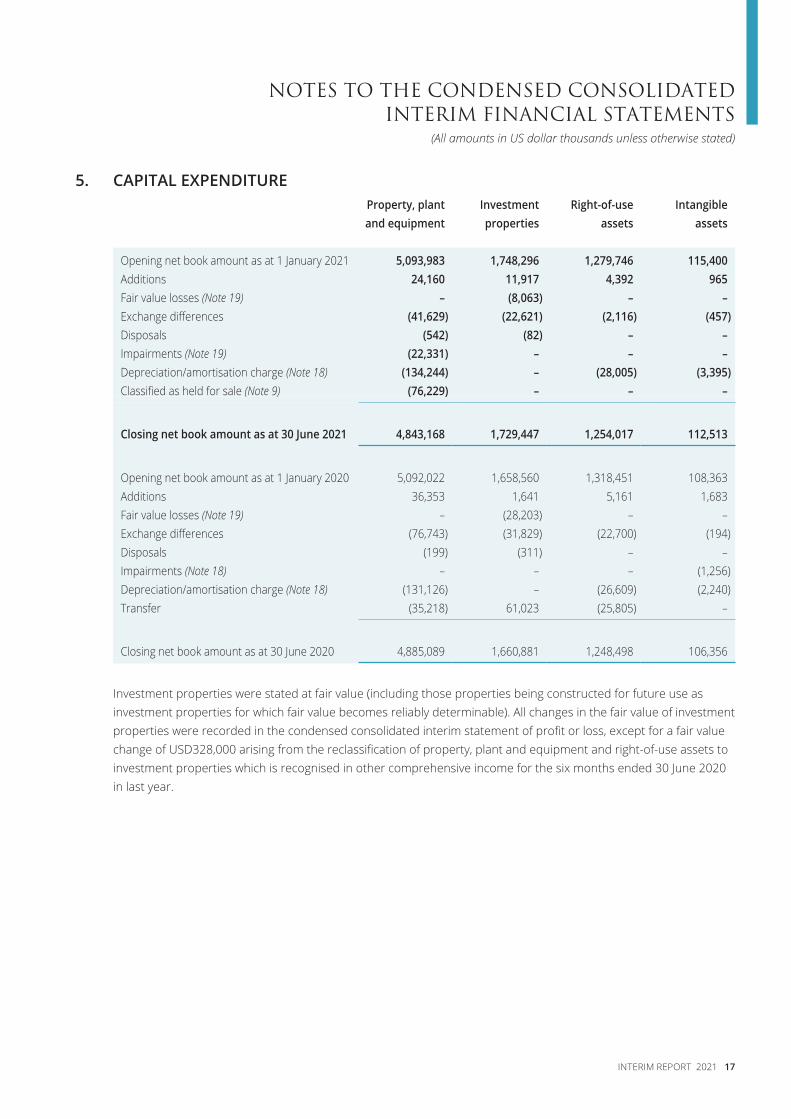
5. CAPITAL EXPENDITUREProperty, plant and equipment
Investment properties
Right-of-use assets
Intangible assets
Opening net book amount as at 1 January 2021 5,093,983 1,748,296 1,279,746 115,400Additions 24,160 11,917 4,392 965Fair value losses (Note 19) – (8,063) – –Exchange differences (41,629) (22,621) (2,116) (457)Disposals (542) (82) – –Impairments (Note 19) (22,331) – – –Depreciation/amortisation charge (Note 18) (134,244) – (28,005) (3,395)Classified as held for sale (Note 9) (76,229) – – –
Closing net book amount as at 30 June 2021 4,843,168 1,729,447 1,254,017 112,513
Opening net book amount as at 1 January 2020 5,092,022 1,658,560 1,318,451 108,363Additions 36,353 1,641 5,161 1,683Fair value losses (Note 19) – (28,203) – –Exchange differences (76,743) (31,829) (22,700) (194)Disposals (199) (311) – –Impairments (Note 18) – – – (1,256)Depreciation/amortisation charge (Note 18) (131,126) – (26,609) (2,240)Transfer (35,218) 61,023 (25,805) –
Closing net book amount as at 30 June 2020 4,885,089 1,660,881 1,248,498 106,356
Investment properties were stated at fair value (including those properties being constructed for future use as investment properties for which fair value becomes reliably determinable). All changes in the fair value of investment properties were recorded in the condensed consolidated interim statement of profit or loss, except for a fair value change of USD328,000 arising from the reclassification of property, plant and equipment and right-of-use assets to investment properties which is recognised in other comprehensive income for the six months ended 30 June 2020 in last year.
18 SHANGRI-LA ASIA LIMITED
NOTES TO THE CONDENSED CONSOLIDATED INTERIM FINANCIAL STATEMENTS(All amounts in US dollar thousands unless otherwise stated)
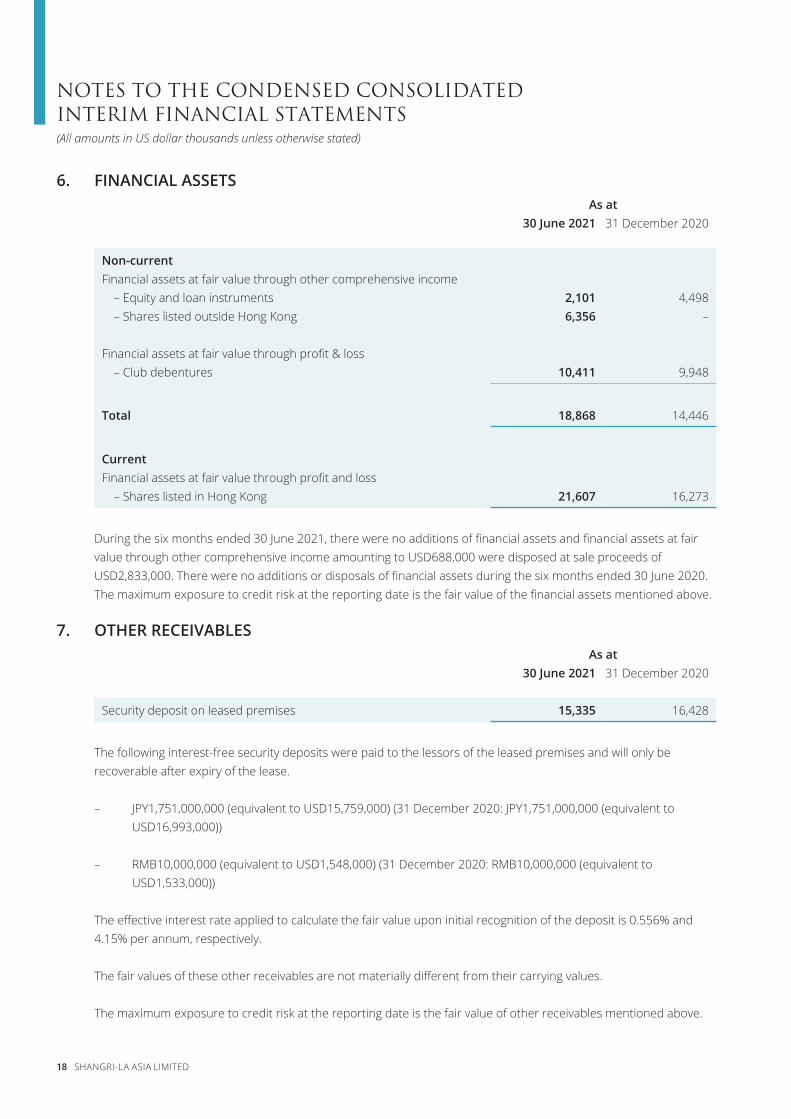
6. FINANCIAL ASSETSAs at
30 June 2021 31 December 2020
Non-currentFinancial assets at fair value through other comprehensive income
– Equity and loan instruments 2,101 4,498– Shares listed outside Hong Kong 6,356 –
Financial assets at fair value through profit & loss– Club debentures 10,411 9,948
Total 18,868 14,446
CurrentFinancial assets at fair value through profit and loss
– Shares listed in Hong Kong 21,607 16,273
During the six months ended 30 June 2021, there were no additions of financial assets and financial assets at fair value through other comprehensive income amounting to USD688,000 were disposed at sale proceeds of USD2,833,000. There were no additions or disposals of financial assets during the six months ended 30 June 2020. The maximum exposure to credit risk at the reporting date is the fair value of the financial assets mentioned above.
7. OTHER RECEIVABLESAs at
30 June 2021 31 December 2020
Security deposit on leased premises 15,335 16,428
The following interest-free security deposits were paid to the lessors of the leased premises and will only be recoverable after expiry of the lease.
– JPY1,751,000,000 (equivalent to USD15,759,000) (31 December 2020: JPY1,751,000,000 (equivalent to USD16,993,000))
– RMB10,000,000 (equivalent to USD1,548,000) (31 December 2020: RMB10,000,000 (equivalent to USD1,533,000))
The effective interest rate applied to calculate the fair value upon initial recognition of the deposit is 0.556% and 4.15% per annum, respectively.
The fair values of these other receivables are not materially different from their carrying values.
The maximum exposure to credit risk at the reporting date is the fair value of other receivables mentioned above.
NOTES TO THE CONDENSED CONSOLIDATED INTERIM FINANCIAL STATEMENTS
INTERIM REPORT 2021 19
(All amounts in US dollar thousands unless otherwise stated)
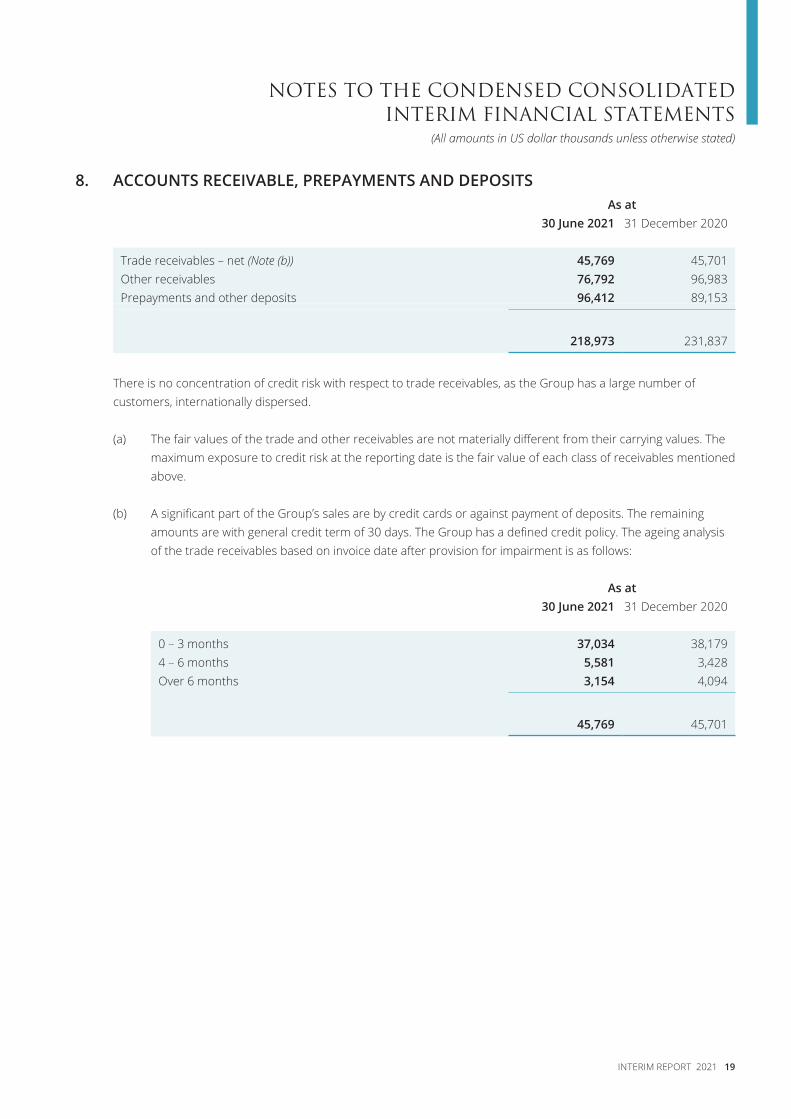
8. ACCOUNTS RECEIVABLE, PREPAYMENTS AND DEPOSITSAs at
30 June 2021 31 December 2020
Trade receivables – net (Note (b)) 45,769 45,701Other receivables 76,792 96,983Prepayments and other deposits 96,412 89,153
218,973 231,837
There is no concentration of credit risk with respect to trade receivables, as the Group has a large number of customers, internationally dispersed.
(a) The fair values of the trade and other receivables are not materially different from their carrying values. The maximum exposure to credit risk at the reporting date is the fair value of each class of receivables mentioned above.
(b) A significant part of the Group’s sales are by credit cards or against payment of deposits. The remaining amounts are with general credit term of 30 days. The Group has a defined credit policy. The ageing analysis of the trade receivables based on invoice date after provision for impairment is as follows:
As at30 June 2021 31 December 2020
0 – 3 months 37,034 38,1794 – 6 months 5,581 3,428Over 6 months 3,154 4,094
45,769 45,701
20 SHANGRI-LA ASIA LIMITED
NOTES TO THE CONDENSED CONSOLIDATED INTERIM FINANCIAL STATEMENTS(All amounts in US dollar thousands unless otherwise stated)
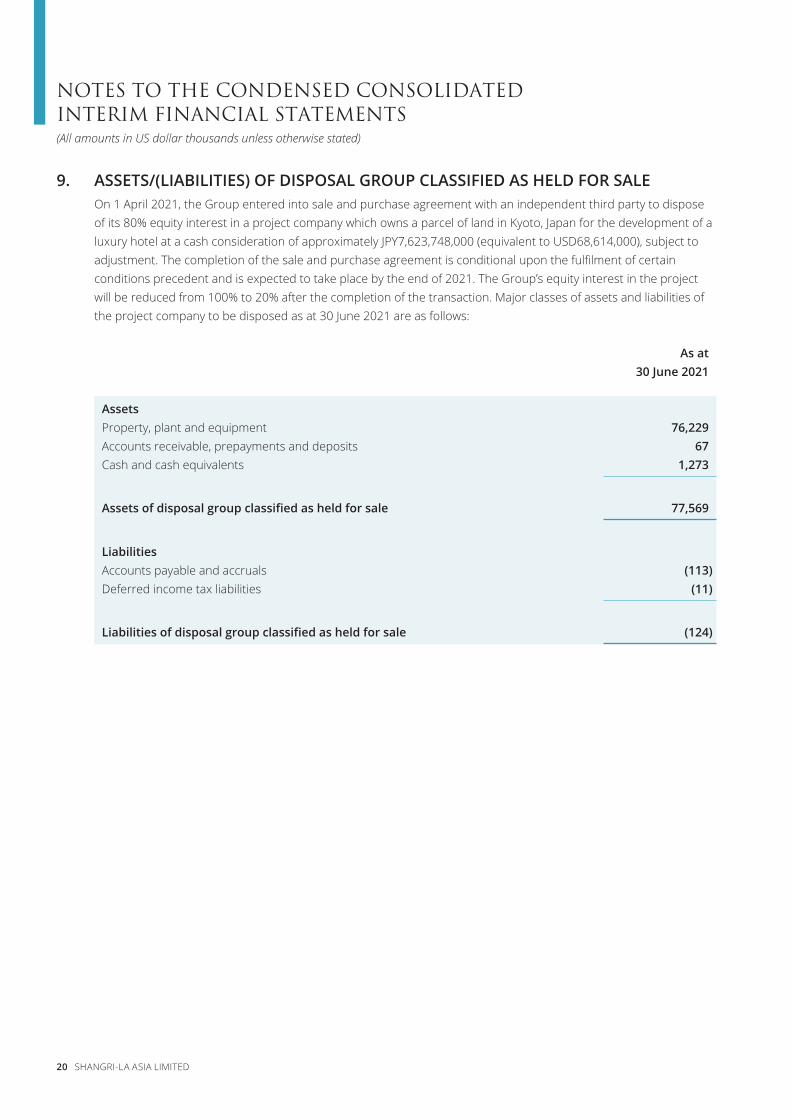
9. ASSETS/(LIABILITIES) OF DISPOSAL GROUP CLASSIFIED AS HELD FOR SALEOn 1 April 2021, the Group entered into sale and purchase agreement with an independent third party to dispose of its 80% equity interest in a project company which owns a parcel of land in Kyoto, Japan for the development of a luxury hotel at a cash consideration of approximately JPY7,623,748,000 (equivalent to USD68,614,000), subject to adjustment. The completion of the sale and purchase agreement is conditional upon the fulfilment of certain conditions precedent and is expected to take place by the end of 2021. The Group’s equity interest in the project will be reduced from 100% to 20% after the completion of the transaction. Major classes of assets and liabilities of the project company to be disposed as at 30 June 2021 are as follows:
As at30 June 2021
AssetsProperty, plant and equipment 76,229Accounts receivable, prepayments and deposits 67Cash and cash equivalents 1,273
Assets of disposal group classified as held for sale 77,569
LiabilitiesAccounts payable and accruals (113)Deferred income tax liabilities (11)
Liabilities of disposal group classified as held for sale (124)
NOTES TO THE CONDENSED CONSOLIDATED INTERIM FINANCIAL STATEMENTS
INTERIM REPORT 2021 21
(All amounts in US dollar thousands unless otherwise stated)
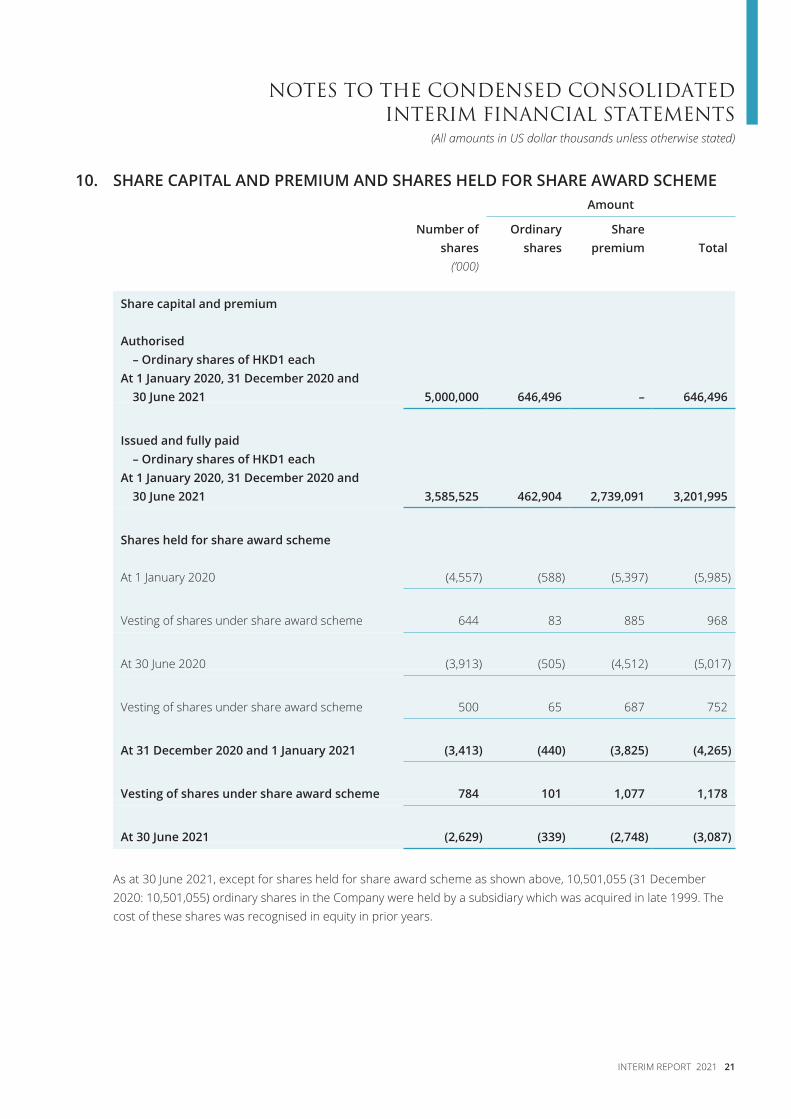
10. SHARE CAPITAL AND PREMIUM AND SHARES HELD FOR SHARE AWARD SCHEMEAmount
Number of shares
Ordinary shares
Share premium Total
(’000)
Share capital and premium
Authorised– Ordinary shares of HKD1 each
At 1 January 2020, 31 December 2020 and 30 June 2021 5,000,000 646,496 – 646,496
Issued and fully paid– Ordinary shares of HKD1 each
At 1 January 2020, 31 December 2020 and 30 June 2021 3,585,525 462,904 2,739,091 3,201,995
Shares held for share award scheme
At 1 January 2020 (4,557) (588) (5,397) (5,985)
Vesting of shares under share award scheme 644 83 885 968
At 30 June 2020 (3,913) (505) (4,512) (5,017)
Vesting of shares under share award scheme 500 65 687 752
At 31 December 2020 and 1 January 2021 (3,413) (440) (3,825) (4,265)
Vesting of shares under share award scheme 784 101 1,077 1,178
At 30 June 2021 (2,629) (339) (2,748) (3,087)
As at 30 June 2021, except for shares held for share award scheme as shown above, 10,501,055 (31 December 2020: 10,501,055) ordinary shares in the Company were held by a subsidiary which was acquired in late 1999. The cost of these shares was recognised in equity in prior years.
22 SHANGRI-LA ASIA LIMITED
NOTES TO THE CONDENSED CONSOLIDATED INTERIM FINANCIAL STATEMENTS(All amounts in US dollar thousands unless otherwise stated)
10. SHARE CAPITAL AND PREMIUM AND SHARES HELD FOR SHARE AWARD SCHEME (CONTINUED)Share awards
During the six months ended 30 June 2021, no shares in the Company were purchased under the share award scheme and 784,000 shares under such scheme were transferred to the awardees upon vesting of the awarded shares. The remaining 2,629,000 shares under the share award scheme were held in trust as at 30 June 2021. Details of the share award scheme were disclosed in Note 11 to the condensed consolidated interim financial statements.
Share options
The shareholders of the Company approved the adoption of a share option scheme on 28 May 2012 (“Share Option Scheme”). The options granted on 23 August 2013 under the Share Option Scheme are immediately exercisable on the grant date and have a contractual option term of ten years with 22 August 2023 being the last exercisable date. The Group has no legal or constructive obligation to repurchase or settle the options in cash.
Details of the Share Option Scheme are set out under the section headed “Share Option Scheme” of the Company’s 2020 annual report.
No share option was exercised during the six months ended 30 June 2021 (year ended 31 December 2020: Nil).
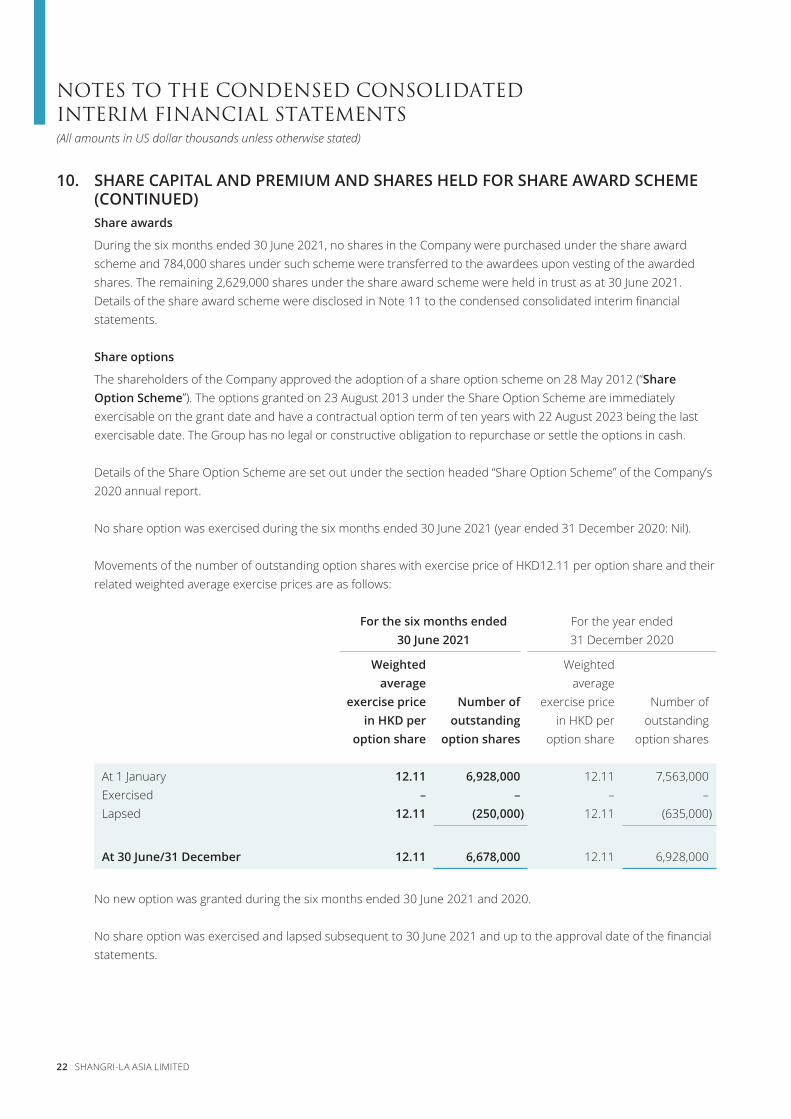
Movements of the number of outstanding option shares with exercise price of HKD12.11 per option share and their related weighted average exercise prices are as follows:
For the six months ended 30 June 2021
For the year ended 31 December 2020
Weighted average
exercise price in HKD per
option share
Number of outstanding
option shares
Weighted average
exercise price in HKD per
option share
Number of outstanding
option shares
At 1 January 12.11 6,928,000 12.11 7,563,000Exercised – – – –Lapsed 12.11 (250,000) 12.11 (635,000)
At 30 June/31 December 12.11 6,678,000 12.11 6,928,000
No new option was granted during the six months ended 30 June 2021 and 2020.
No share option was exercised and lapsed subsequent to 30 June 2021 and up to the approval date of the financial statements.
NOTES TO THE CONDENSED CONSOLIDATED INTERIM FINANCIAL STATEMENTS
INTERIM REPORT 2021 23
(All amounts in US dollar thousands unless otherwise stated)
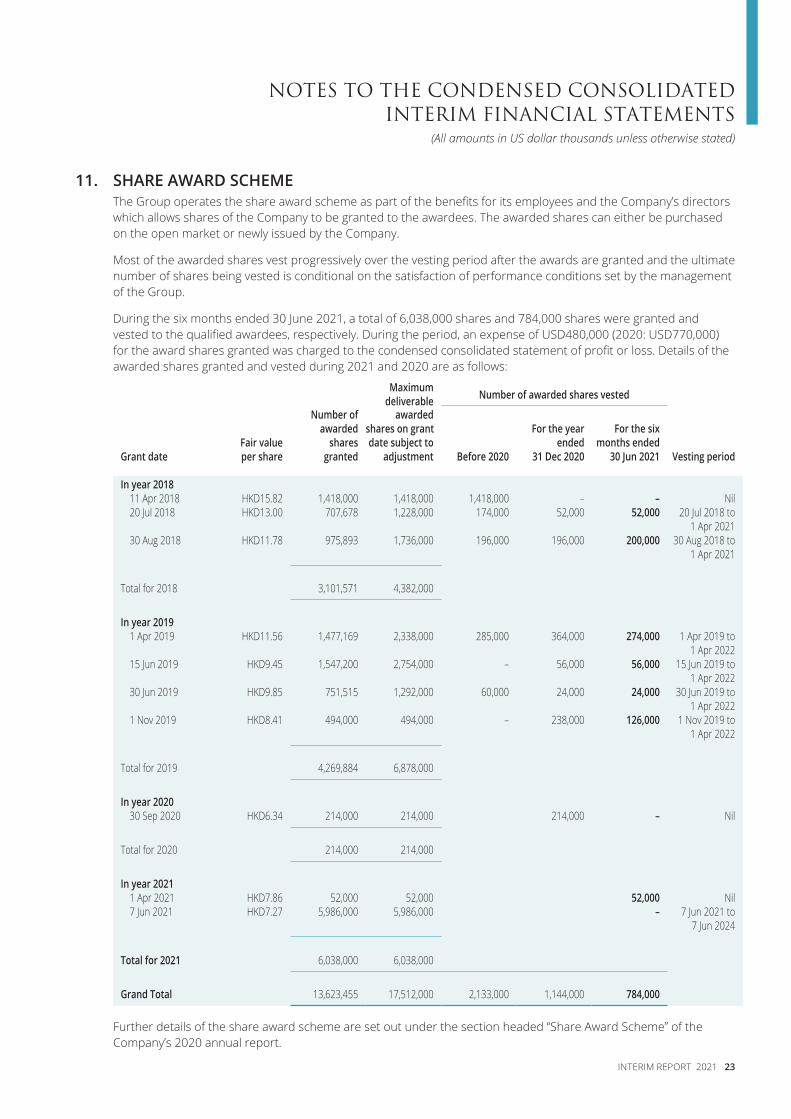
11. SHARE AWARD SCHEMEThe Group operates the share award scheme as part of the benefits for its employees and the Company’s directors which allows shares of the Company to be granted to the awardees. The awarded shares can either be purchased on the open market or newly issued by the Company.
Most of the awarded shares vest progressively over the vesting period after the awards are granted and the ultimate number of shares being vested is conditional on the satisfaction of performance conditions set by the management of the Group.
During the six months ended 30 June 2021, a total of 6,038,000 shares and 784,000 shares were granted and vested to the qualified awardees, respectively. During the period, an expense of USD480,000 (2020: USD770,000) for the award shares granted was charged to the condensed consolidated statement of profit or loss. Details of the awarded shares granted and vested during 2021 and 2020 are as follows:
Maximum deliverable Number of awarded shares vested
Grant dateFair value per share
Number of awarded
sharesgranted
awardedshares on grant date subject to
adjustment Before 2020
For the year ended
31 Dec 2020
For the six months ended
30 Jun 2021 Vesting period
In year 201811 Apr 2018 HKD15.82 1,418,000 1,418,000 1,418,000 – – Nil20 Jul 2018 HKD13.00 707,678 1,228,000 174,000 52,000 52,000 20 Jul 2018 to
1 Apr 202130 Aug 2018 HKD11.78 975,893 1,736,000 196,000 196,000 200,000 30 Aug 2018 to
1 Apr 2021
Total for 2018 3,101,571 4,382,000
In year 20191 Apr 2019 HKD11.56 1,477,169 2,338,000 285,000 364,000 274,000 1 Apr 2019 to
1 Apr 202215 Jun 2019 HKD9.45 1,547,200 2,754,000 – 56,000 56,000 15 Jun 2019 to
1 Apr 202230 Jun 2019 HKD9.85 751,515 1,292,000 60,000 24,000 24,000 30 Jun 2019 to
1 Apr 20221 Nov 2019 HKD8.41 494,000 494,000 – 238,000 126,000 1 Nov 2019 to
1 Apr 2022
Total for 2019 4,269,884 6,878,000
In year 202030 Sep 2020 HKD6.34 214,000 214,000 214,000 – Nil
Total for 2020 214,000 214,000
In year 20211 Apr 2021 HKD7.86 52,000 52,000 52,000 Nil7 Jun 2021 HKD7.27 5,986,000 5,986,000 – 7 Jun 2021 to
7 Jun 2024
Total for 2021 6,038,000 6,038,000
Grand Total 13,623,455 17,512,000 2,133,000 1,144,000 784,000
Further details of the share award scheme are set out under the section headed “Share Award Scheme” of the Company’s 2020 annual report.
24 SHANGRI-LA ASIA LIMITED
NOTES TO THE CONDENSED CONSOLIDATED INTERIM FINANCIAL STATEMENTS(All amounts in US dollar thousands unless otherwise stated)
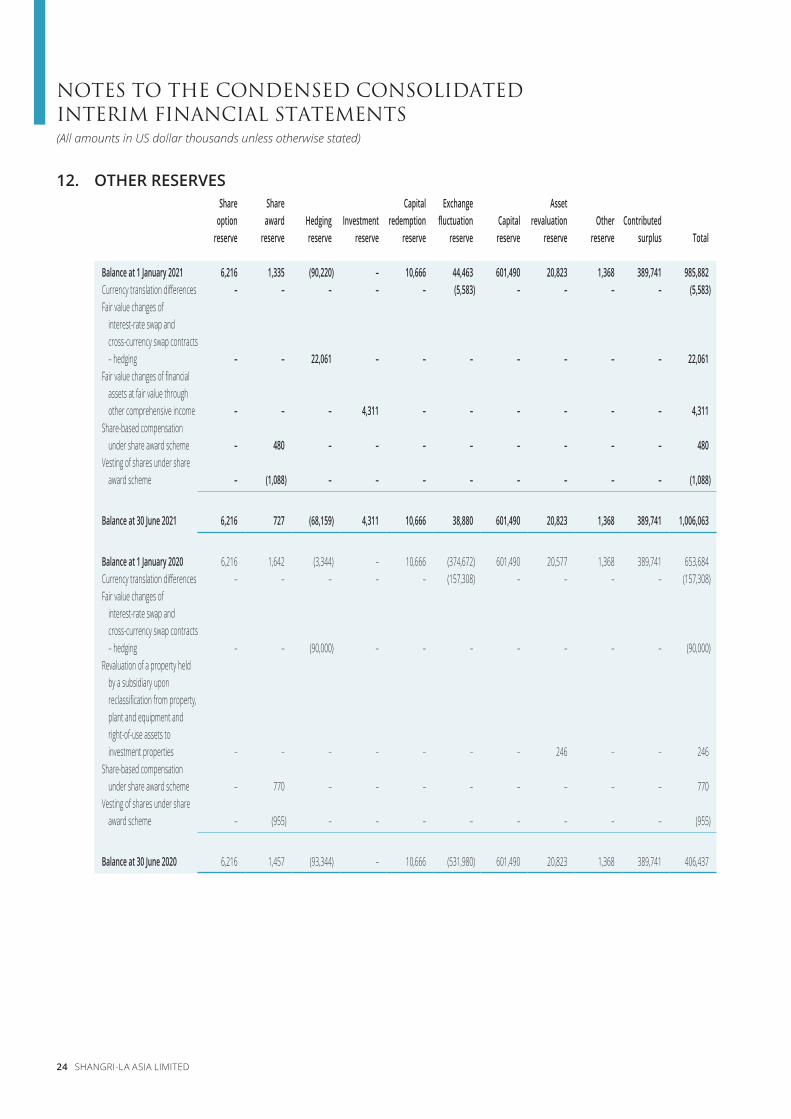
12. OTHER RESERVESShare
option reserve
Share award
reserveHedging reserve
Investment reserve
Capital redemption
reserve
Exchange fluctuation
reserveCapital reserve
Asset revaluation
reserveOther
reserveContributed
surplus Total
Balance at 1 January 2021 6,216 1,335 (90,220) – 10,666 44,463 601,490 20,823 1,368 389,741 985,882Currency translation differences – – – – – (5,583) – – – – (5,583)Fair value changes of
interest-rate swap and cross-currency swap contracts – hedging – – 22,061 – – – – – – – 22,061
Fair value changes of financial assets at fair value through other comprehensive income – – – 4,311 – – – – – – 4,311
Share-based compensation under share award scheme – 480 – – – – – – – – 480
Vesting of shares under share award scheme – (1,088) – – – – – – – – (1,088)
Balance at 30 June 2021 6,216 727 (68,159) 4,311 10,666 38,880 601,490 20,823 1,368 389,741 1,006,063
Balance at 1 January 2020 6,216 1,642 (3,344) – 10,666 (374,672) 601,490 20,577 1,368 389,741 653,684Currency translation differences – – – – – (157,308) – – – – (157,308)Fair value changes of
interest-rate swap and cross-currency swap contracts – hedging – – (90,000) – – – – – – – (90,000)
Revaluation of a property held by a subsidiary upon reclassification from property, plant and equipment and right-of-use assets to investment properties – – – – – – – 246 – – 246
Share-based compensation under share award scheme – 770 – – – – – – – – 770
Vesting of shares under share award scheme – (955) – – – – – – – – (955)
Balance at 30 June 2020 6,216 1,457 (93,344) – 10,666 (531,980) 601,490 20,823 1,368 389,741 406,437
NOTES TO THE CONDENSED CONSOLIDATED INTERIM FINANCIAL STATEMENTS
INTERIM REPORT 2021 25
(All amounts in US dollar thousands unless otherwise stated)
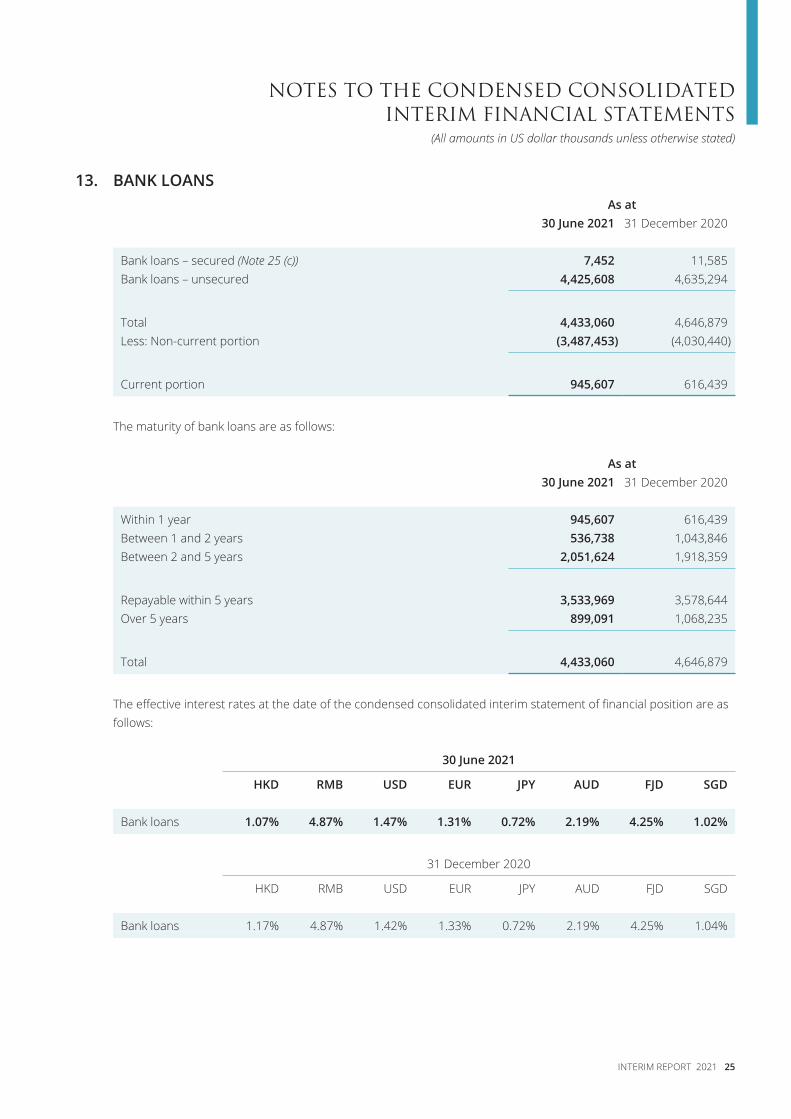
13. BANK LOANSAs at
30 June 2021 31 December 2020
Bank loans – secured (Note 25 (c)) 7,452 11,585Bank loans – unsecured 4,425,608 4,635,294
Total 4,433,060 4,646,879Less: Non-current portion (3,487,453) (4,030,440)
Current portion 945,607 616,439
The maturity of bank loans are as follows:
As at30 June 2021 31 December 2020
Within 1 year 945,607 616,439Between 1 and 2 years 536,738 1,043,846Between 2 and 5 years 2,051,624 1,918,359
Repayable within 5 years 3,533,969 3,578,644Over 5 years 899,091 1,068,235
Total 4,433,060 4,646,879
The effective interest rates at the date of the condensed consolidated interim statement of financial position are as follows:
30 June 2021
HKD RMB USD EUR JPY AUD FJD SGD
Bank loans 1.07% 4.87% 1.47% 1.31% 0.72% 2.19% 4.25% 1.02%
31 December 2020
HKD RMB USD EUR JPY AUD FJD SGD
Bank loans 1.17% 4.87% 1.42% 1.33% 0.72% 2.19% 4.25% 1.04%
26 SHANGRI-LA ASIA LIMITED
NOTES TO THE CONDENSED CONSOLIDATED INTERIM FINANCIAL STATEMENTS(All amounts in US dollar thousands unless otherwise stated)
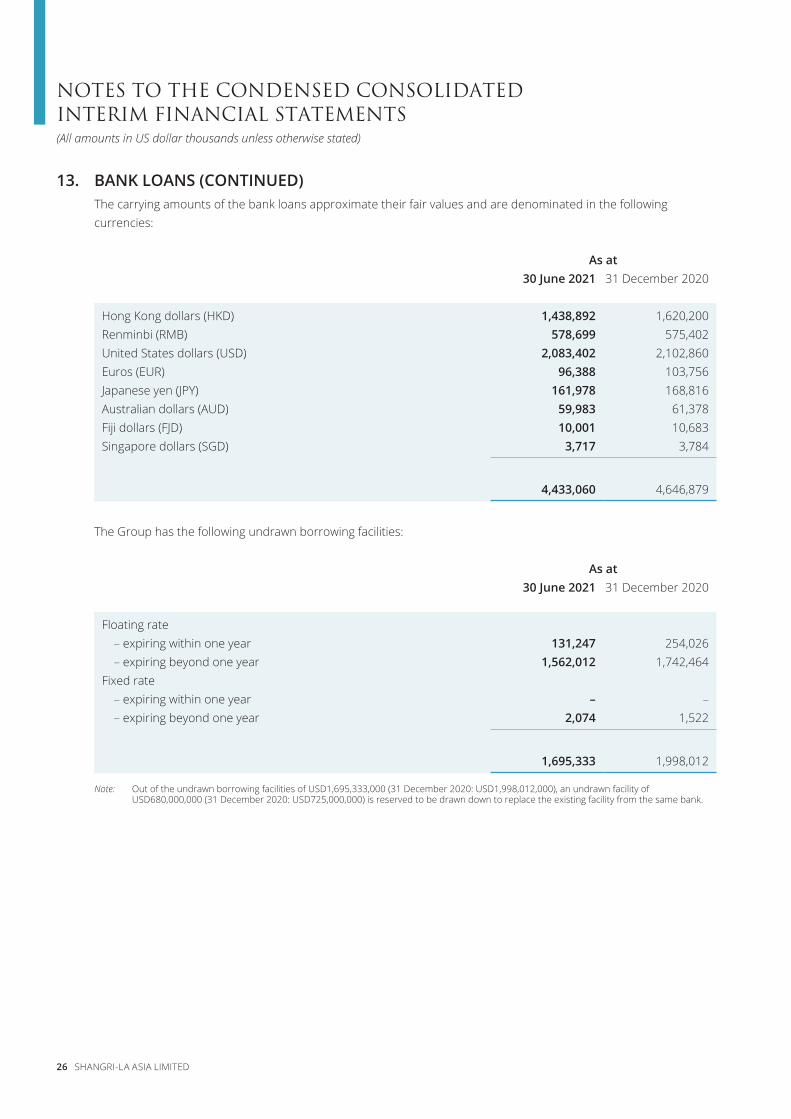
13. BANK LOANS (CONTINUED)The carrying amounts of the bank loans approximate their fair values and are denominated in the following currencies:
As at30 June 2021 31 December 2020
Hong Kong dollars (HKD) 1,438,892 1,620,200Renminbi (RMB) 578,699 575,402United States dollars (USD) 2,083,402 2,102,860Euros (EUR) 96,388 103,756Japanese yen (JPY) 161,978 168,816Australian dollars (AUD) 59,983 61,378Fiji dollars (FJD) 10,001 10,683Singapore dollars (SGD) 3,717 3,784
4,433,060 4,646,879
The Group has the following undrawn borrowing facilities:
As at30 June 2021 31 December 2020
Floating rate– expiring within one year 131,247 254,026– expiring beyond one year 1,562,012 1,742,464
Fixed rate– expiring within one year – –– expiring beyond one year 2,074 1,522
1,695,333 1,998,012
Note: Out of the undrawn borrowing facilities of USD1,695,333,000 (31 December 2020: USD1,998,012,000), an undrawn facility of USD680,000,000 (31 December 2020: USD725,000,000) is reserved to be drawn down to replace the existing facility from the same bank.
NOTES TO THE CONDENSED CONSOLIDATED INTERIM FINANCIAL STATEMENTS
INTERIM REPORT 2021 27
(All amounts in US dollar thousands unless otherwise stated)
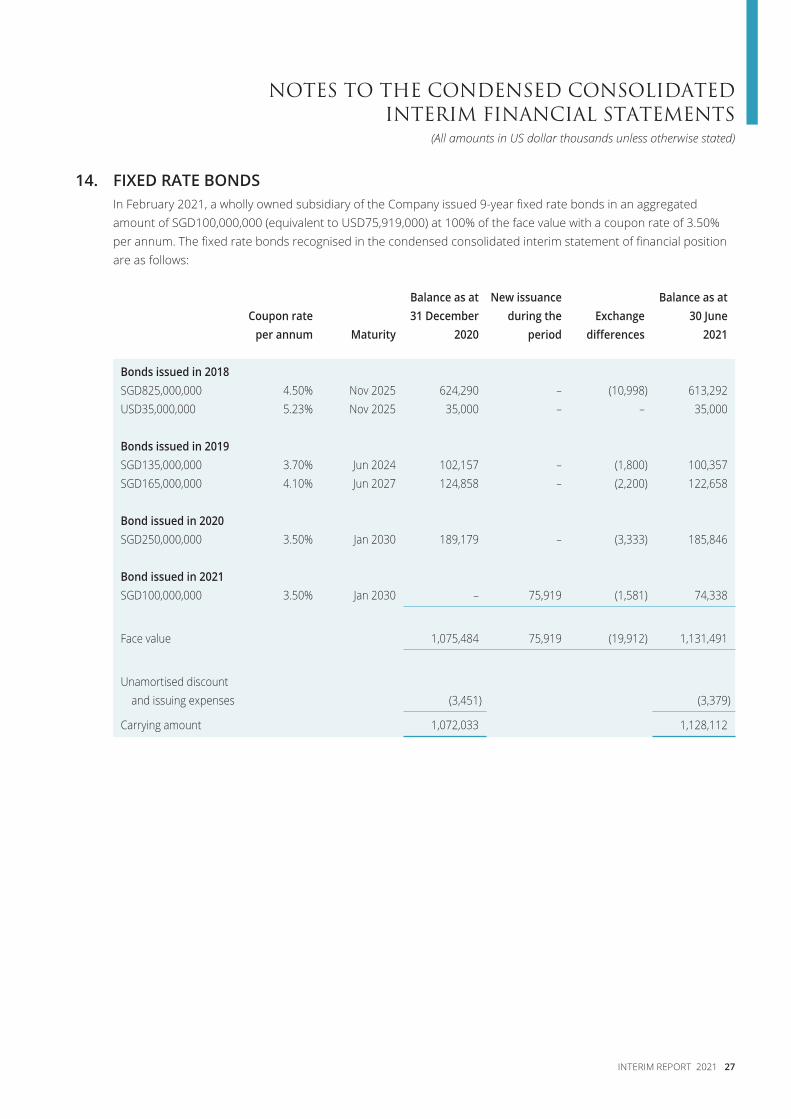
14. FIXED RATE BONDSIn February 2021, a wholly owned subsidiary of the Company issued 9-year fixed rate bonds in an aggregated amount of SGD100,000,000 (equivalent to USD75,919,000) at 100% of the face value with a coupon rate of 3.50% per annum. The fixed rate bonds recognised in the condensed consolidated interim statement of financial position are as follows:
Coupon rate per annum Maturity
Balance as at 31 December
2020
New issuance during the
periodExchange
differences
Balance as at 30 June
2021
Bonds issued in 2018SGD825,000,000 4.50% Nov 2025 624,290 – (10,998) 613,292USD35,000,000 5.23% Nov 2025 35,000 – – 35,000
Bonds issued in 2019SGD135,000,000 3.70% Jun 2024 102,157 – (1,800) 100,357SGD165,000,000 4.10% Jun 2027 124,858 – (2,200) 122,658
Bond issued in 2020SGD250,000,000 3.50% Jan 2030 189,179 – (3,333) 185,846
Bond issued in 2021SGD100,000,000 3.50% Jan 2030 – 75,919 (1,581) 74,338
Face value 1,075,484 75,919 (19,912) 1,131,491
Unamortised discount and issuing expenses (3,451) (3,379)
Carrying amount 1,072,033 1,128,112
28 SHANGRI-LA ASIA LIMITED
NOTES TO THE CONDENSED CONSOLIDATED INTERIM FINANCIAL STATEMENTS(All amounts in US dollar thousands unless otherwise stated)
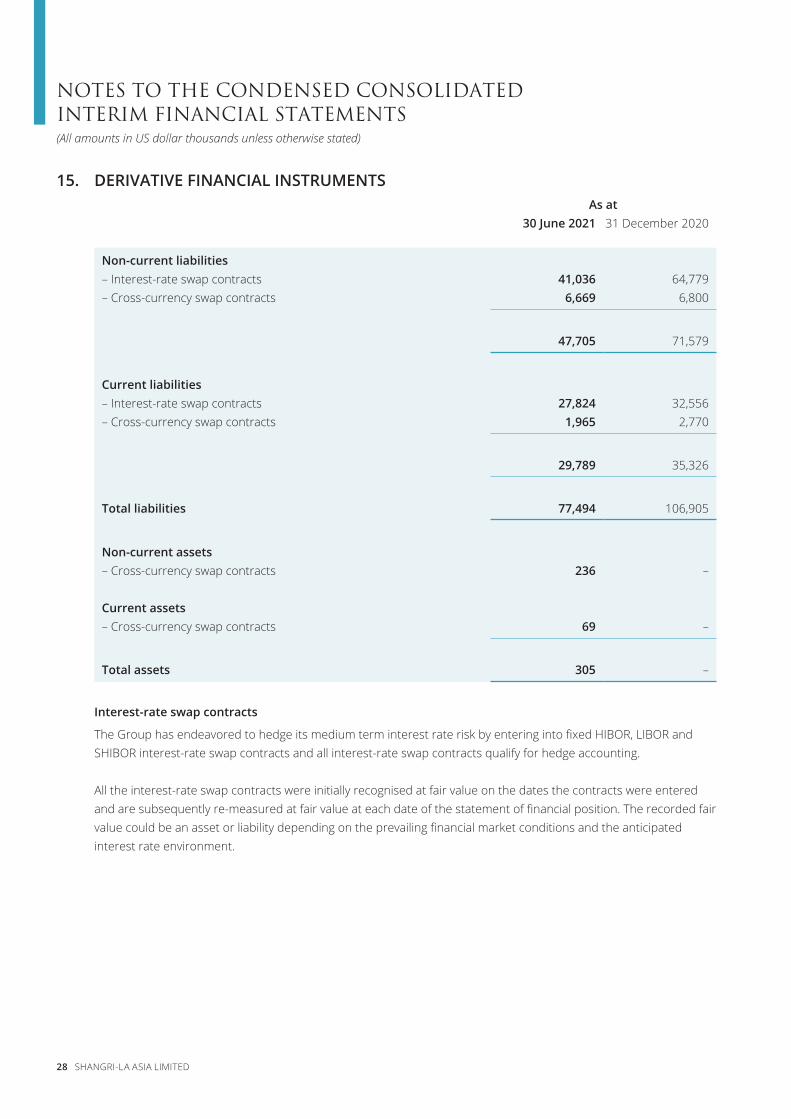
15. DERIVATIVE FINANCIAL INSTRUMENTSAs at
30 June 2021 31 December 2020
Non-current liabilities– Interest-rate swap contracts 41,036 64,779– Cross-currency swap contracts 6,669 6,800
47,705 71,579
Current liabilities– Interest-rate swap contracts 27,824 32,556– Cross-currency swap contracts 1,965 2,770
29,789 35,326
Total liabilities 77,494 106,905
Non-current assets– Cross-currency swap contracts 236 –
Current assets– Cross-currency swap contracts 69 –
Total assets 305 –
Interest-rate swap contracts
The Group has endeavored to hedge its medium term interest rate risk by entering into fixed HIBOR, LIBOR and SHIBOR interest-rate swap contracts and all interest-rate swap contracts qualify for hedge accounting.
All the interest-rate swap contracts were initially recognised at fair value on the dates the contracts were entered and are subsequently re-measured at fair value at each date of the statement of financial position. The recorded fair value could be an asset or liability depending on the prevailing financial market conditions and the anticipated interest rate environment.
NOTES TO THE CONDENSED CONSOLIDATED INTERIM FINANCIAL STATEMENTS
INTERIM REPORT 2021 29
(All amounts in US dollar thousands unless otherwise stated)
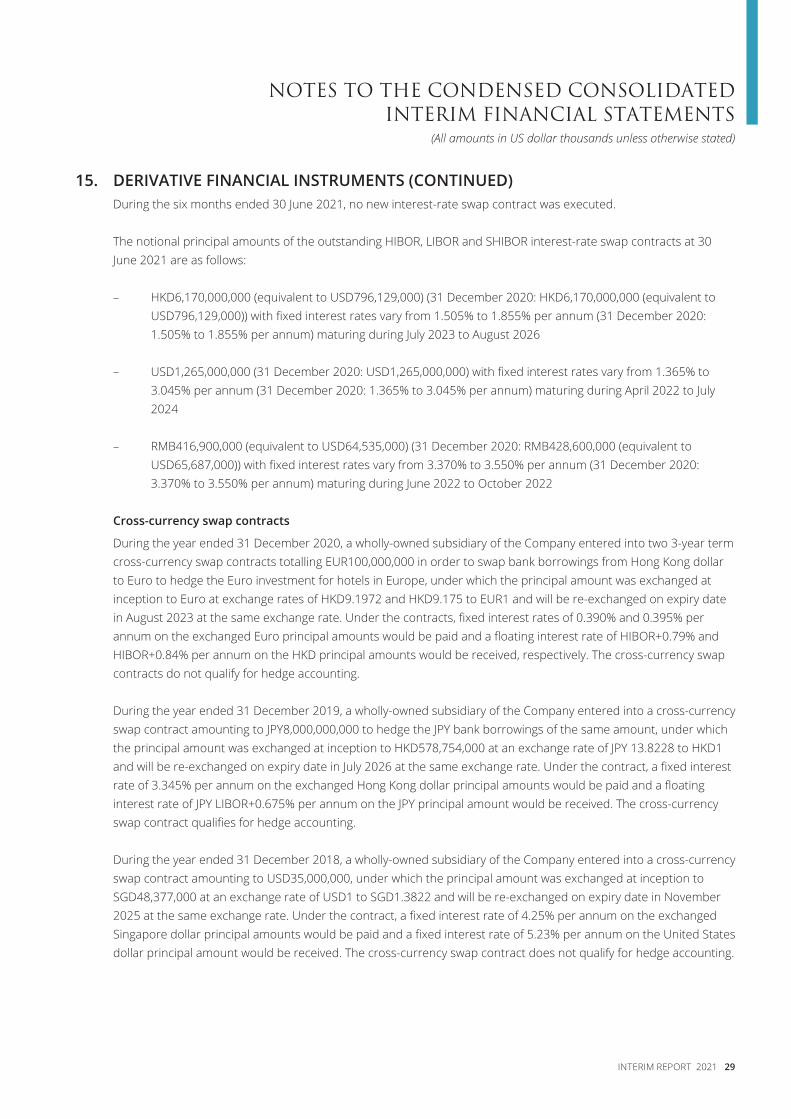
15. DERIVATIVE FINANCIAL INSTRUMENTS (CONTINUED)During the six months ended 30 June 2021, no new interest-rate swap contract was executed.
The notional principal amounts of the outstanding HIBOR, LIBOR and SHIBOR interest-rate swap contracts at 30 June 2021 are as follows:
– HKD6,170,000,000 (equivalent to USD796,129,000) (31 December 2020: HKD6,170,000,000 (equivalent to USD796,129,000)) with fixed interest rates vary from 1.505% to 1.855% per annum (31 December 2020: 1.505% to 1.855% per annum) maturing during July 2023 to August 2026
– USD1,265,000,000 (31 December 2020: USD1,265,000,000) with fixed interest rates vary from 1.365% to 3.045% per annum (31 December 2020: 1.365% to 3.045% per annum) maturing during April 2022 to July 2024
– RMB416,900,000 (equivalent to USD64,535,000) (31 December 2020: RMB428,600,000 (equivalent to USD65,687,000)) with fixed interest rates vary from 3.370% to 3.550% per annum (31 December 2020: 3.370% to 3.550% per annum) maturing during June 2022 to October 2022
Cross-currency swap contracts
During the year ended 31 December 2020, a wholly-owned subsidiary of the Company entered into two 3-year term cross-currency swap contracts totalling EUR100,000,000 in order to swap bank borrowings from Hong Kong dollar to Euro to hedge the Euro investment for hotels in Europe, under which the principal amount was exchanged at inception to Euro at exchange rates of HKD9.1972 and HKD9.175 to EUR1 and will be re-exchanged on expiry date in August 2023 at the same exchange rate. Under the contracts, fixed interest rates of 0.390% and 0.395% per annum on the exchanged Euro principal amounts would be paid and a floating interest rate of HIBOR+0.79% and HIBOR+0.84% per annum on the HKD principal amounts would be received, respectively. The cross-currency swap contracts do not qualify for hedge accounting.
During the year ended 31 December 2019, a wholly-owned subsidiary of the Company entered into a cross-currency swap contract amounting to JPY8,000,000,000 to hedge the JPY bank borrowings of the same amount, under which the principal amount was exchanged at inception to HKD578,754,000 at an exchange rate of JPY 13.8228 to HKD1 and will be re-exchanged on expiry date in July 2026 at the same exchange rate. Under the contract, a fixed interest rate of 3.345% per annum on the exchanged Hong Kong dollar principal amounts would be paid and a floating interest rate of JPY LIBOR+0.675% per annum on the JPY principal amount would be received. The cross-currency swap contract qualifies for hedge accounting.
During the year ended 31 December 2018, a wholly-owned subsidiary of the Company entered into a cross-currency swap contract amounting to USD35,000,000, under which the principal amount was exchanged at inception to SGD48,377,000 at an exchange rate of USD1 to SGD1.3822 and will be re-exchanged on expiry date in November 2025 at the same exchange rate. Under the contract, a fixed interest rate of 4.25% per annum on the exchanged Singapore dollar principal amounts would be paid and a fixed interest rate of 5.23% per annum on the United States dollar principal amount would be received. The cross-currency swap contract does not qualify for hedge accounting.
30 SHANGRI-LA ASIA LIMITED
NOTES TO THE CONDENSED CONSOLIDATED INTERIM FINANCIAL STATEMENTS(All amounts in US dollar thousands unless otherwise stated)
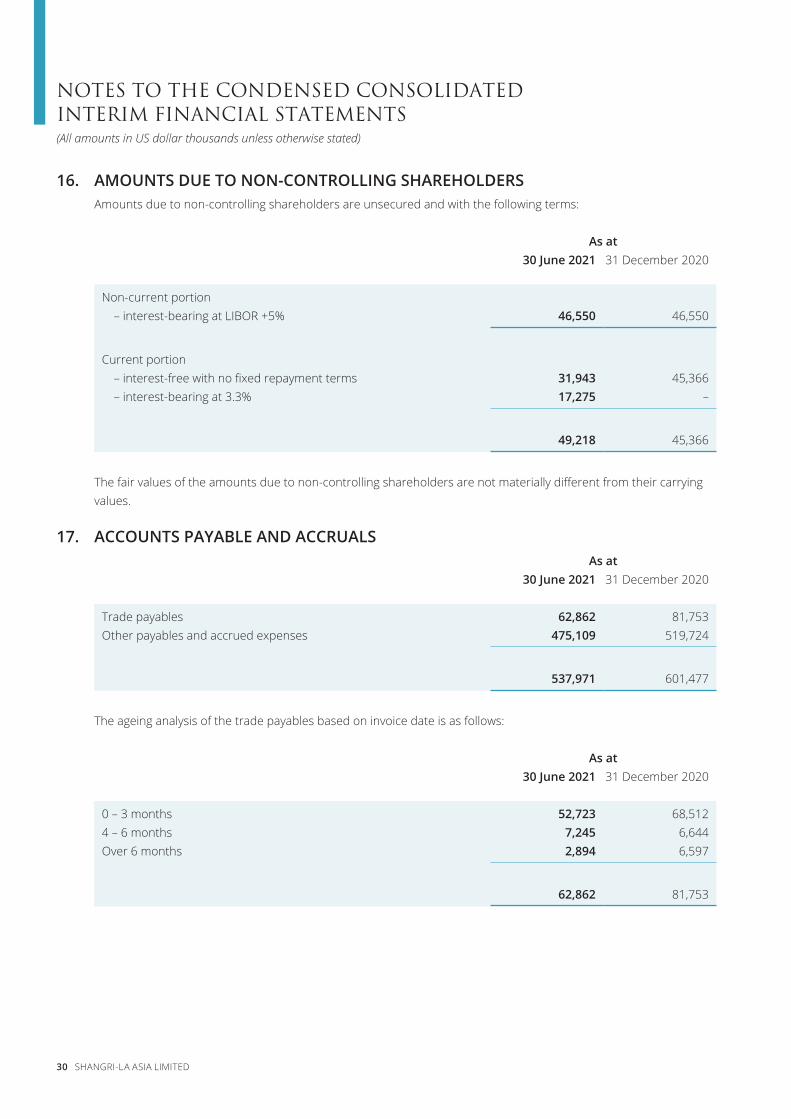
16. AMOUNTS DUE TO NON-CONTROLLING SHAREHOLDERSAmounts due to non-controlling shareholders are unsecured and with the following terms:
As at30 June 2021 31 December 2020
Non-current portion– interest-bearing at LIBOR +5% 46,550 46,550
Current portion– interest-free with no fixed repayment terms 31,943 45,366– interest-bearing at 3.3% 17,275 –
49,218 45,366
The fair values of the amounts due to non-controlling shareholders are not materially different from their carrying values.
17. ACCOUNTS PAYABLE AND ACCRUALSAs at
30 June 2021 31 December 2020
Trade payables 62,862 81,753Other payables and accrued expenses 475,109 519,724
537,971 601,477
The ageing analysis of the trade payables based on invoice date is as follows:
As at30 June 2021 31 December 2020
0 – 3 months 52,723 68,5124 – 6 months 7,245 6,644Over 6 months 2,894 6,597
62,862 81,753
NOTES TO THE CONDENSED CONSOLIDATED INTERIM FINANCIAL STATEMENTS
INTERIM REPORT 2021 31
(All amounts in US dollar thousands unless otherwise stated)
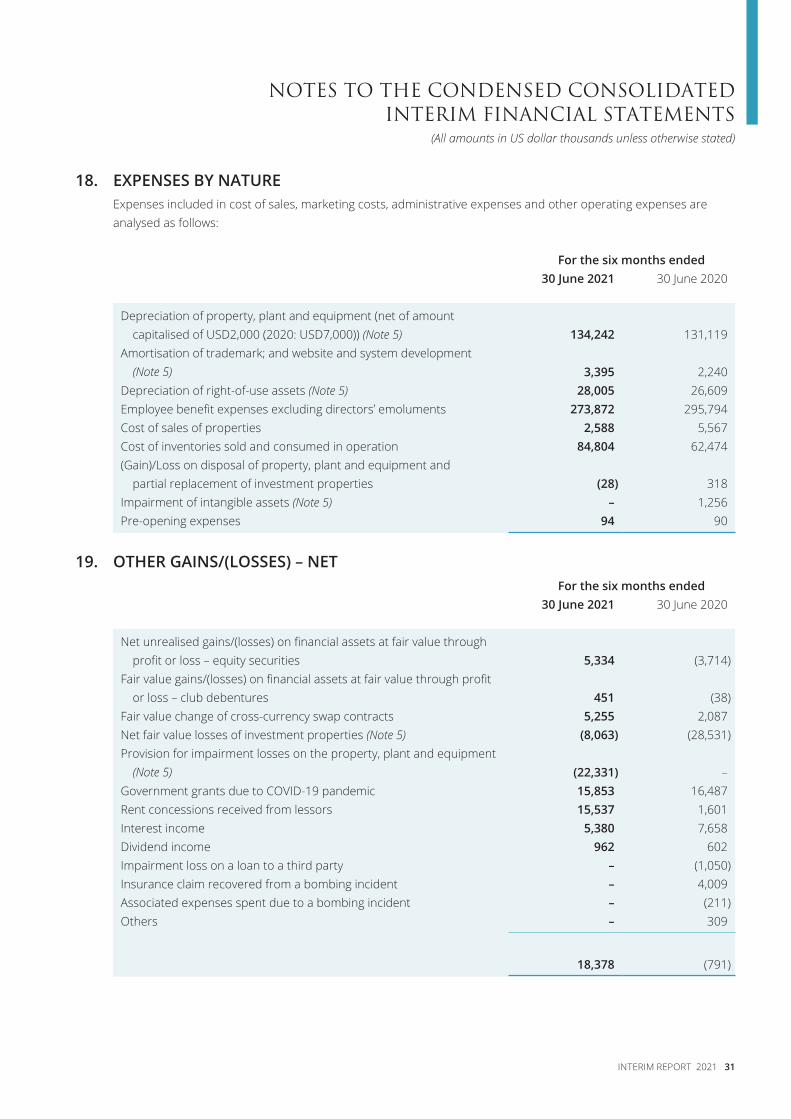
18. EXPENSES BY NATUREExpenses included in cost of sales, marketing costs, administrative expenses and other operating expenses are analysed as follows:
For the six months ended30 June 2021 30 June 2020
Depreciation of property, plant and equipment (net of amount capitalised of USD2,000 (2020: USD7,000)) (Note 5) 134,242 131,119
Amortisation of trademark; and website and system development (Note 5) 3,395 2,240
Depreciation of right-of-use assets (Note 5) 28,005 26,609Employee benefit expenses excluding directors’ emoluments 273,872 295,794Cost of sales of properties 2,588 5,567Cost of inventories sold and consumed in operation 84,804 62,474(Gain)/Loss on disposal of property, plant and equipment and
partial replacement of investment properties (28) 318Impairment of intangible assets (Note 5) – 1,256Pre-opening expenses 94 90
19. OTHER GAINS/(LOSSES) – NETFor the six months ended
30 June 2021 30 June 2020
Net unrealised gains/(losses) on financial assets at fair value through profit or loss – equity securities 5,334 (3,714)
Fair value gains/(losses) on financial assets at fair value through profit or loss – club debentures 451 (38)
Fair value change of cross-currency swap contracts 5,255 2,087Net fair value losses of investment properties (Note 5) (8,063) (28,531)Provision for impairment losses on the property, plant and equipment
(Note 5) (22,331) –Government grants due to COVID-19 pandemic 15,853 16,487Rent concessions received from lessors 15,537 1,601Interest income 5,380 7,658Dividend income 962 602Impairment loss on a loan to a third party – (1,050)Insurance claim recovered from a bombing incident – 4,009Associated expenses spent due to a bombing incident – (211)Others – 309
18,378 (791)
32 SHANGRI-LA ASIA LIMITED
NOTES TO THE CONDENSED CONSOLIDATED INTERIM FINANCIAL STATEMENTS(All amounts in US dollar thousands unless otherwise stated)
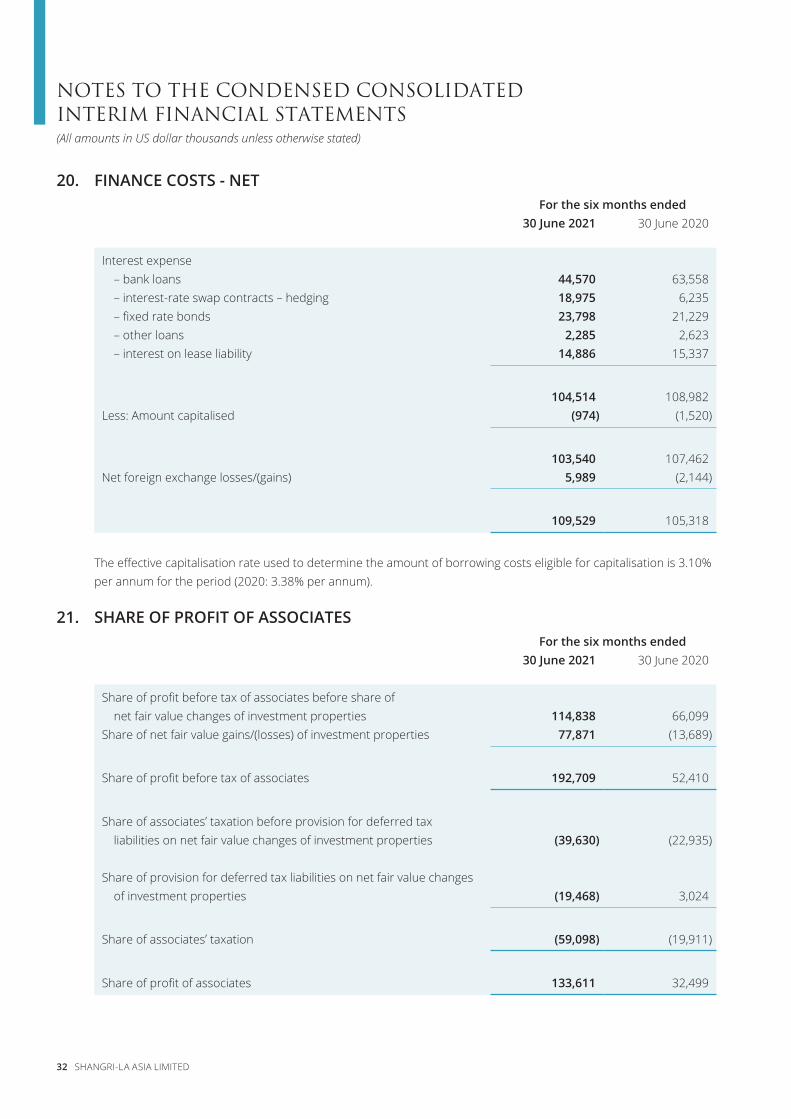
20. FINANCE COSTS - NETFor the six months ended
30 June 2021 30 June 2020
Interest expense– bank loans 44,570 63,558– interest-rate swap contracts – hedging 18,975 6,235– fixed rate bonds 23,798 21,229– other loans 2,285 2,623– interest on lease liability 14,886 15,337
104,514 108,982Less: Amount capitalised (974) (1,520)
103,540 107,462Net foreign exchange losses/(gains) 5,989 (2,144)
109,529 105,318
The effective capitalisation rate used to determine the amount of borrowing costs eligible for capitalisation is 3.10% per annum for the period (2020: 3.38% per annum).
21. SHARE OF PROFIT OF ASSOCIATESFor the six months ended
30 June 2021 30 June 2020
Share of profit before tax of associates before share of net fair value changes of investment properties 114,838 66,099
Share of net fair value gains/(losses) of investment properties 77,871 (13,689)
Share of profit before tax of associates 192,709 52,410
Share of associates’ taxation before provision for deferred tax liabilities on net fair value changes of investment properties (39,630) (22,935)
Share of provision for deferred tax liabilities on net fair value changes of investment properties (19,468) 3,024
Share of associates’ taxation (59,098) (19,911)
Share of profit of associates 133,611 32,499
NOTES TO THE CONDENSED CONSOLIDATED INTERIM FINANCIAL STATEMENTS
INTERIM REPORT 2021 33
(All amounts in US dollar thousands unless otherwise stated)
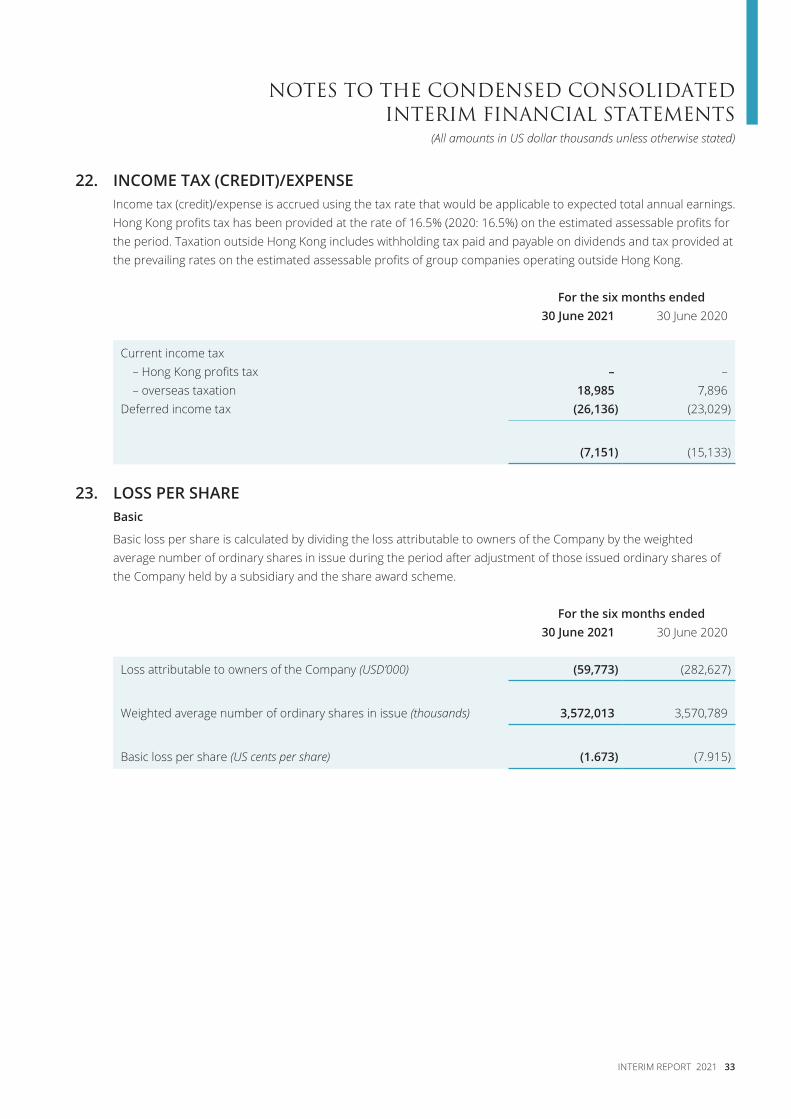
22. INCOME TAX (CREDIT)/EXPENSEIncome tax (credit)/expense is accrued using the tax rate that would be applicable to expected total annual earnings. Hong Kong profits tax has been provided at the rate of 16.5% (2020: 16.5%) on the estimated assessable profits for the period. Taxation outside Hong Kong includes withholding tax paid and payable on dividends and tax provided at the prevailing rates on the estimated assessable profits of group companies operating outside Hong Kong.
For the six months ended30 June 2021 30 June 2020
Current income tax– Hong Kong profits tax – –– overseas taxation 18,985 7,896
Deferred income tax (26,136) (23,029)
(7,151) (15,133)
23. LOSS PER SHAREBasic
Basic loss per share is calculated by dividing the loss attributable to owners of the Company by the weighted average number of ordinary shares in issue during the period after adjustment of those issued ordinary shares of the Company held by a subsidiary and the share award scheme.
For the six months ended30 June 2021 30 June 2020
Loss attributable to owners of the Company (USD’000) (59,773) (282,627)
Weighted average number of ordinary shares in issue (thousands) 3,572,013 3,570,789
Basic loss per share (US cents per share) (1.673) (7.915)
34 SHANGRI-LA ASIA LIMITED
NOTES TO THE CONDENSED CONSOLIDATED INTERIM FINANCIAL STATEMENTS(All amounts in US dollar thousands unless otherwise stated)
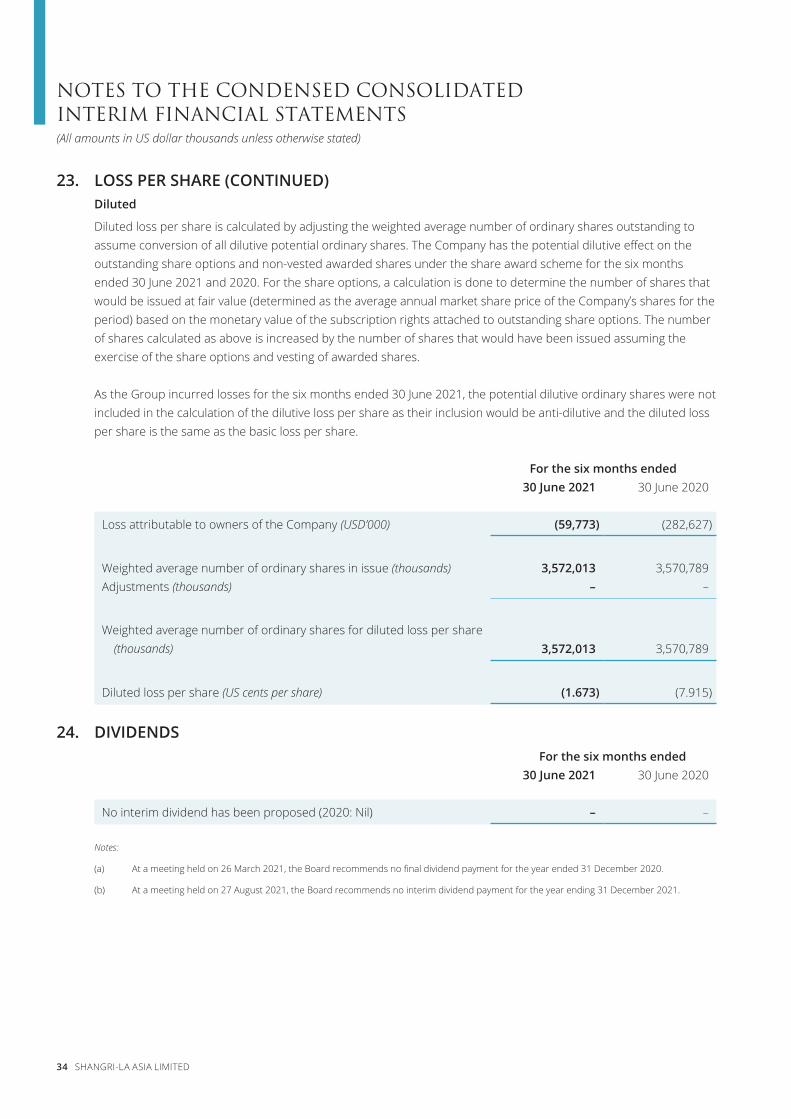
23. LOSS PER SHARE (CONTINUED)Diluted
Diluted loss per share is calculated by adjusting the weighted average number of ordinary shares outstanding to assume conversion of all dilutive potential ordinary shares. The Company has the potential dilutive effect on the outstanding share options and non-vested awarded shares under the share award scheme for the six months ended 30 June 2021 and 2020. For the share options, a calculation is done to determine the number of shares that would be issued at fair value (determined as the average annual market share price of the Company’s shares for the period) based on the monetary value of the subscription rights attached to outstanding share options. The number of shares calculated as above is increased by the number of shares that would have been issued assuming the exercise of the share options and vesting of awarded shares.
As the Group incurred losses for the six months ended 30 June 2021, the potential dilutive ordinary shares were not included in the calculation of the dilutive loss per share as their inclusion would be anti-dilutive and the diluted loss per share is the same as the basic loss per share.
For the six months ended30 June 2021 30 June 2020
Loss attributable to owners of the Company (USD’000) (59,773) (282,627)
Weighted average number of ordinary shares in issue (thousands) 3,572,013 3,570,789Adjustments (thousands) – –
Weighted average number of ordinary shares for diluted loss per share (thousands) 3,572,013 3,570,789
Diluted loss per share (US cents per share) (1.673) (7.915)
24. DIVIDENDSFor the six months ended
30 June 2021 30 June 2020
No interim dividend has been proposed (2020: Nil) – –
Notes:
(a) At a meeting held on 26 March 2021, the Board recommends no final dividend payment for the year ended 31 December 2020.
(b) At a meeting held on 27 August 2021, the Board recommends no interim dividend payment for the year ending 31 December 2021.
NOTES TO THE CONDENSED CONSOLIDATED INTERIM FINANCIAL STATEMENTS
INTERIM REPORT 2021 35
(All amounts in US dollar thousands unless otherwise stated)
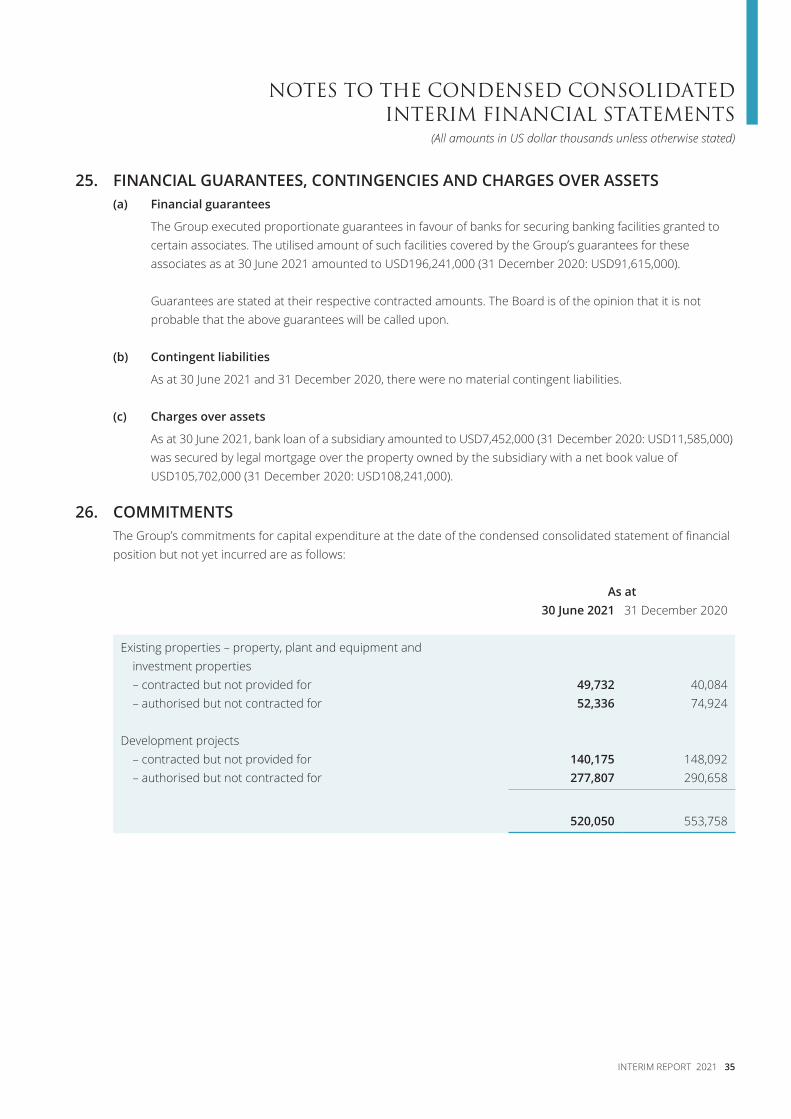
25. FINANCIAL GUARANTEES, CONTINGENCIES AND CHARGES OVER ASSETS(a) Financial guarantees
The Group executed proportionate guarantees in favour of banks for securing banking facilities granted to certain associates. The utilised amount of such facilities covered by the Group’s guarantees for these associates as at 30 June 2021 amounted to USD196,241,000 (31 December 2020: USD91,615,000).
Guarantees are stated at their respective contracted amounts. The Board is of the opinion that it is not probable that the above guarantees will be called upon.
(b) Contingent liabilities
As at 30 June 2021 and 31 December 2020, there were no material contingent liabilities.
(c) Charges over assets
As at 30 June 2021, bank loan of a subsidiary amounted to USD7,452,000 (31 December 2020: USD11,585,000) was secured by legal mortgage over the property owned by the subsidiary with a net book value of USD105,702,000 (31 December 2020: USD108,241,000).
26. COMMITMENTSThe Group’s commitments for capital expenditure at the date of the condensed consolidated statement of financial position but not yet incurred are as follows:
As at30 June 2021 31 December 2020
Existing properties – property, plant and equipment and investment properties– contracted but not provided for 49,732 40,084– authorised but not contracted for 52,336 74,924
Development projects– contracted but not provided for 140,175 148,092– authorised but not contracted for 277,807 290,658
520,050 553,758
36 SHANGRI-LA ASIA LIMITED
NOTES TO THE CONDENSED CONSOLIDATED INTERIM FINANCIAL STATEMENTS(All amounts in US dollar thousands unless otherwise stated)
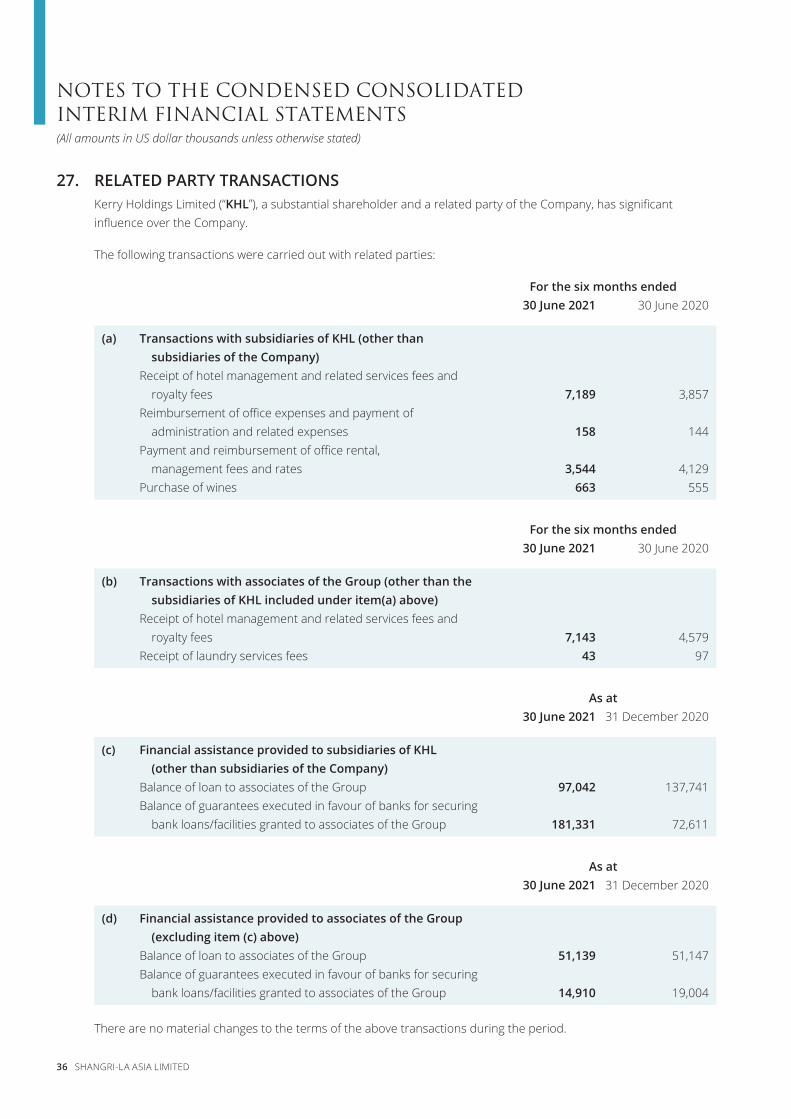
27. RELATED PARTY TRANSACTIONSKerry Holdings Limited (“KHL”), a substantial shareholder and a related party of the Company, has significantinfluence over the Company.
The following transactions were carried out with related parties:
For the six months ended30 June 2021 30 June 2020
(a) Transactions with subsidiaries of KHL (other than subsidiaries of the Company)Receipt of hotel management and related services fees and royalty fees 7,189 3,857Reimbursement of office expenses and payment of administration and related expenses 158 144Payment and reimbursement of office rental, management fees and rates 3,544 4,129Purchase of wines 663 555
For the six months ended30 June 2021 30 June 2020
(b) Transactions with associates of the Group (other than the subsidiaries of KHL included under item(a) above)Receipt of hotel management and related services fees and royalty fees 7,143 4,579Receipt of laundry services fees 43 97
As at30 June 2021 31 December 2020
(c) Financial assistance provided to subsidiaries of KHL (other than subsidiaries of the Company)Balance of loan to associates of the Group 97,042 137,741Balance of guarantees executed in favour of banks for securing bank loans/facilities granted to associates of the Group 181,331 72,611
As at30 June 2021 31 December 2020
(d) Financial assistance provided to associates of the Group (excluding item (c) above)Balance of loan to associates of the Group 51,139 51,147Balance of guarantees executed in favour of banks for securing bank loans/facilities granted to associates of the Group 14,910 19,004
There are no material changes to the terms of the above transactions during the period.
NOTES TO THE CONDENSED CONSOLIDATED INTERIM FINANCIAL STATEMENTS
INTERIM REPORT 2021 37
(All amounts in US dollar thousands unless otherwise stated)
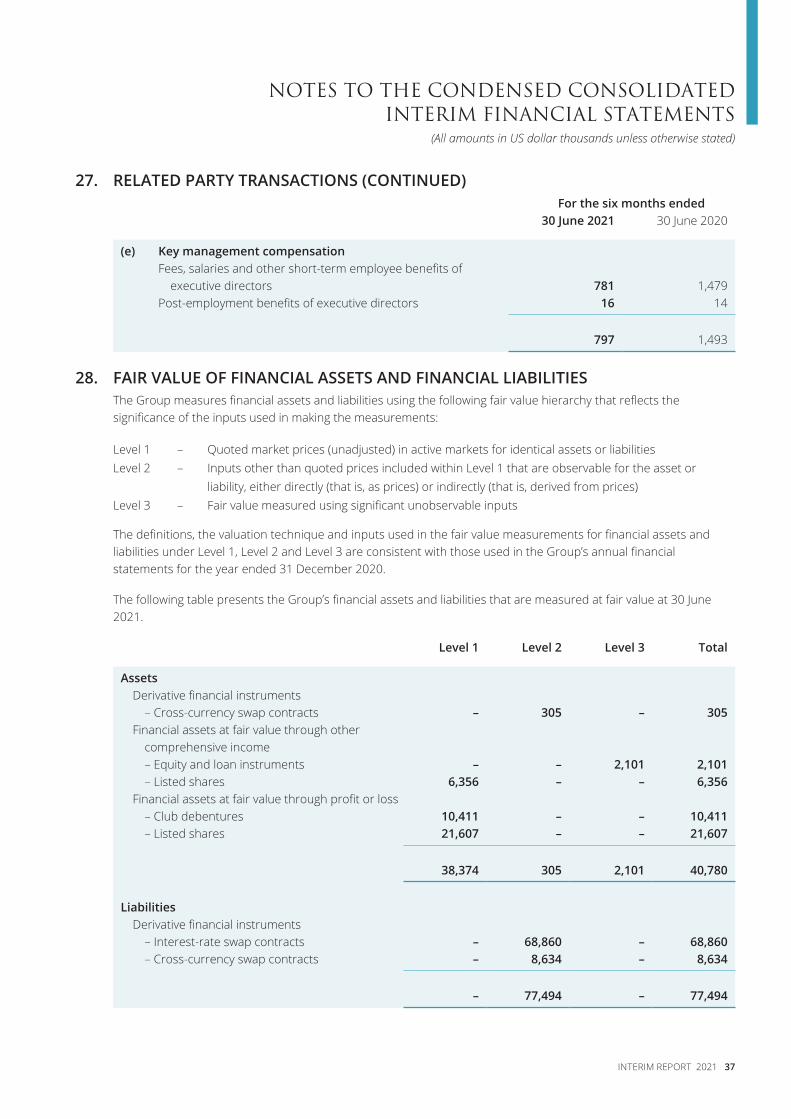
27. RELATED PARTY TRANSACTIONS (CONTINUED)For the six months ended
30 June 2021 30 June 2020
(e) Key management compensationFees, salaries and other short-term employee benefits of executive directors 781 1,479Post-employment benefits of executive directors 16 14
797 1,493
28. FAIR VALUE OF FINANCIAL ASSETS AND FINANCIAL LIABILITIESThe Group measures financial assets and liabilities using the following fair value hierarchy that reflects the significance of the inputs used in making the measurements:
Level 1 – Quoted market prices (unadjusted) in active markets for identical assets or liabilitiesLevel 2 – Inputs other than quoted prices included within Level 1 that are observable for the asset or
liability, either directly (that is, as prices) or indirectly (that is, derived from prices)Level 3 – Fair value measured using significant unobservable inputs
The definitions, the valuation technique and inputs used in the fair value measurements for financial assets and liabilities under Level 1, Level 2 and Level 3 are consistent with those used in the Group’s annual financial statements for the year ended 31 December 2020.
The following table presents the Group’s financial assets and liabilities that are measured at fair value at 30 June 2021.
Level 1 Level 2 Level 3 Total
AssetsDerivative financial instruments
– Cross-currency swap contracts – 305 – 305Financial assets at fair value through other
comprehensive income– Equity and loan instruments – – 2,101 2,101– Listed shares 6,356 – – 6,356
Financial assets at fair value through profit or loss– Club debentures 10,411 – – 10,411– Listed shares 21,607 – – 21,607
38,374 305 2,101 40,780
LiabilitiesDerivative financial instruments
– Interest-rate swap contracts – 68,860 – 68,860– Cross-currency swap contracts – 8,634 – 8,634
– 77,494 – 77,494
38 SHANGRI-LA ASIA LIMITED
NOTES TO THE CONDENSED CONSOLIDATED INTERIM FINANCIAL STATEMENTS(All amounts in US dollar thousands unless otherwise stated)
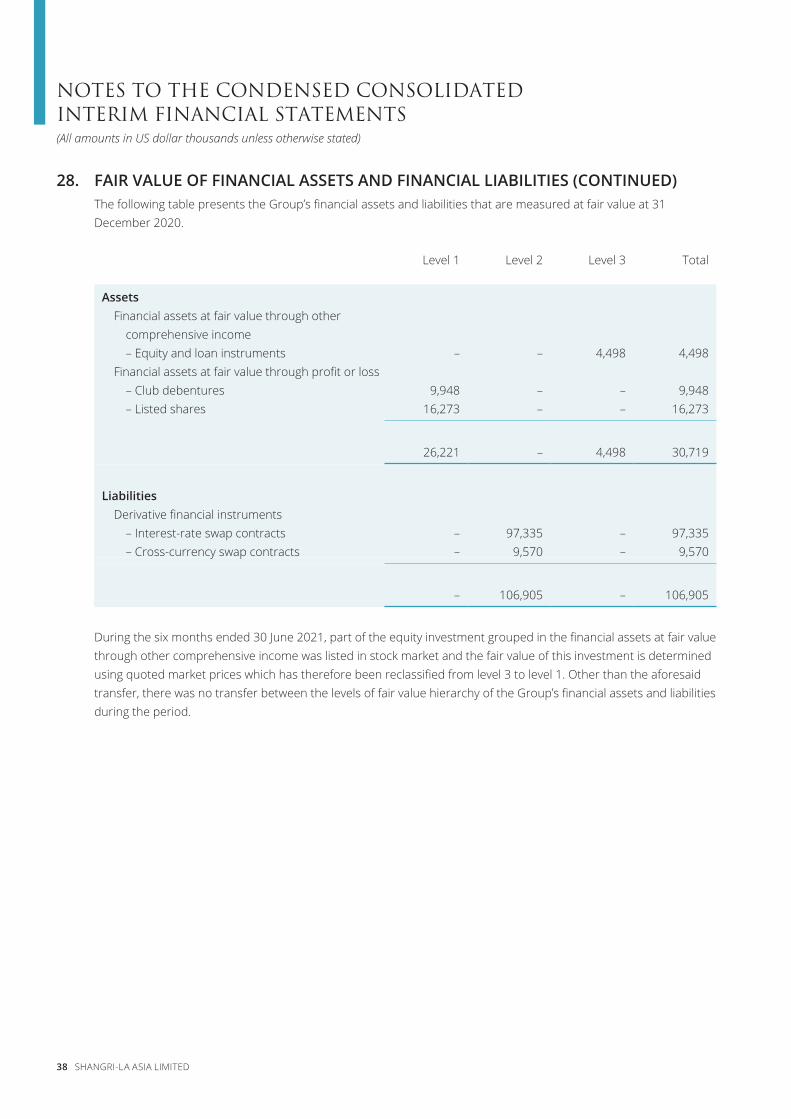
28. FAIR VALUE OF FINANCIAL ASSETS AND FINANCIAL LIABILITIES (CONTINUED)The following table presents the Group’s financial assets and liabilities that are measured at fair value at 31 December 2020.
Level 1 Level 2 Level 3 Total
AssetsFinancial assets at fair value through other
comprehensive income– Equity and loan instruments – – 4,498 4,498
Financial assets at fair value through profit or loss– Club debentures 9,948 – – 9,948– Listed shares 16,273 – – 16,273
26,221 – 4,498 30,719
LiabilitiesDerivative financial instruments
– Interest-rate swap contracts – 97,335 – 97,335– Cross-currency swap contracts – 9,570 – 9,570
– 106,905 – 106,905
During the six months ended 30 June 2021, part of the equity investment grouped in the financial assets at fair value through other comprehensive income was listed in stock market and the fair value of this investment is determined using quoted market prices which has therefore been reclassified from level 3 to level 1. Other than the aforesaid transfer, there was no transfer between the levels of fair value hierarchy of the Group’s financial assets and liabilities during the period.
DISCUSSION AND ANALYSIS
INTERIM REPORT 2021 39
The principal activities of the Group remained the same as in 2020. The Group’s business is organised into four main segments:
• Hotel Properties – development, ownership and operations of hotel properties (including hotels under leases)
• Hotel Management and Related Services for Group-owned hotels and for hotels owned by third parties
• Investment Properties – development, ownership and operations of office properties, commercial properties and serviced apartments/residences for rental purposes
• Property Development for Sale – development and sale of real estate properties
The Group currently owns and/or manages hotels under the following brands:
• Shangri-La Hotels and Resorts• Kerry Hotels• JEN by Shangri-La• Traders
DISCUSSION AND ANALYSIS
40 SHANGRI-LA ASIA LIMITED
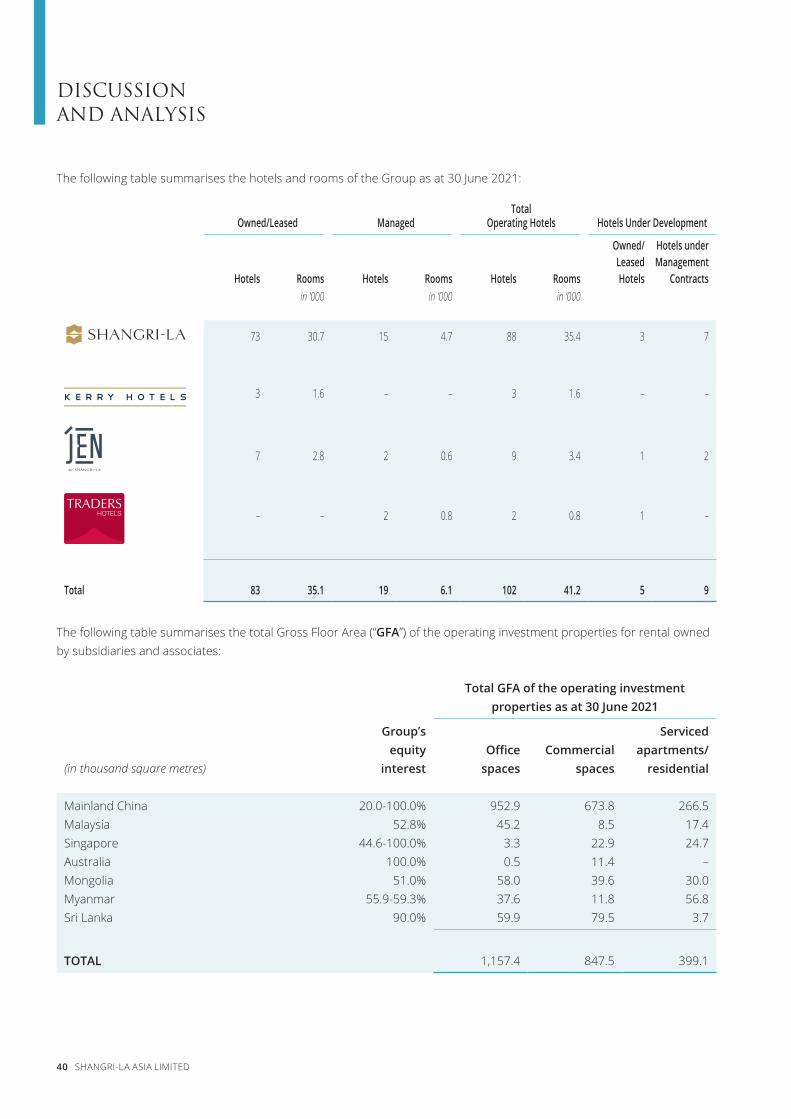
The following table summarises the hotels and rooms of the Group as at 30 June 2021:
Owned/Leased ManagedTotal
Operating Hotels Hotels Under Development
Hotels Rooms Hotels Rooms Hotels Rooms
Owned/LeasedHotels
Hotels under Management
Contractsin ’000 in ’000 in ’000
73 30.7 15 4.7 88 35.4 3 7
3 1.6 – – 3 1.6 – –
7 2.8 2 0.6 9 3.4 1 2
– – 2 0.8 2 0.8 1 –
Total 83 35.1 19 6.1 102 41.2 5 9
The following table summarises the total Gross Floor Area (“GFA”) of the operating investment properties for rental owned by subsidiaries and associates:
Total GFA of the operating investment properties as at 30 June 2021
(in thousand square metres)
Group’s equity
interestOffice
spacesCommercial
spaces
Serviced apartments/
residential
Mainland China 20.0-100.0% 952.9 673.8 266.5Malaysia 52.8% 45.2 8.5 17.4Singapore 44.6-100.0% 3.3 22.9 24.7Australia 100.0% 0.5 11.4 –Mongolia 51.0% 58.0 39.6 30.0Myanmar 55.9-59.3% 37.6 11.8 56.8Sri Lanka 90.0% 59.9 79.5 3.7
58.2 74.7 3.7
TOTAL 1,157.4 847.5 399.1
DISCUSSION AND ANALYSIS
INTERIM REPORT 2021 41
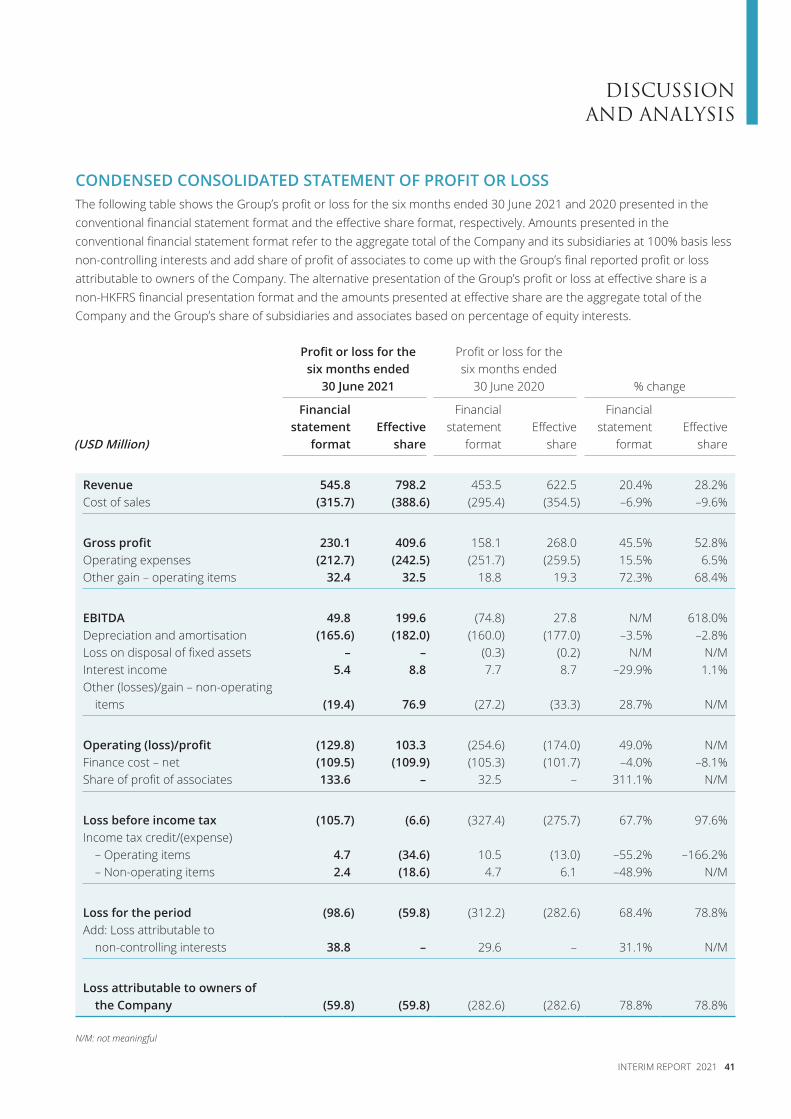
CONDENSED CONSOLIDATED STATEMENT OF PROFIT OR LOSSThe following table shows the Group’s profit or loss for the six months ended 30 June 2021 and 2020 presented in the conventional financial statement format and the effective share format, respectively. Amounts presented in the conventional financial statement format refer to the aggregate total of the Company and its subsidiaries at 100% basis less non-controlling interests and add share of profit of associates to come up with the Group’s final reported profit or loss attributable to owners of the Company. The alternative presentation of the Group’s profit or loss at effective share is a non-HKFRS financial presentation format and the amounts presented at effective share are the aggregate total of the Company and the Group’s share of subsidiaries and associates based on percentage of equity interests.
Profit or loss for the six months ended
30 June 2021
Profit or loss for the six months ended
30 June 2020 % change
(USD Million)
Financial statement
formatEffective
share
Financial statement
formatEffective
share
Financial statement
formatEffective
share
Revenue 545.8 798.2 453.5 622.5 20.4% 28.2%Cost of sales (315.7) (388.6) (295.4) (354.5) –6.9% –9.6%Sri Lanka 90.0% 58.2 74.7 3.7 74.7 3.7
Gross profit 230.1 409.6 158.1 268.0 45.5% 52.8%Operating expenses (212.7) (242.5) (251.7) (259.5) 15.5% 6.5%Other gain – operating items 32.4 32.5 18.8 19.3 72.3% 68.4%Sri Lanka 90.0% 58.2 74.7 3.7 74.7 3.7
EBITDA 49.8 199.6 (74.8) 27.8 N/M 618.0%Depreciation and amortisation (165.6) (182.0) (160.0) (177.0) –3.5% –2.8%Loss on disposal of fixed assets – – (0.3) (0.2) N/M N/MInterest income 5.4 8.8 7.7 8.7 –29.9% 1.1%Other (losses)/gain – non-operating
items (19.4) 76.9 (27.2) (33.3) 28.7% N/MSri Lanka 90.0% 58.2 74.7 3.7 74.7 3.7
Operating (loss)/profit (129.8) 103.3 (254.6) (174.0) 49.0% N/MFinance cost – net (109.5) (109.9) (105.3) (101.7) –4.0% –8.1%Share of profit of associates 133.6 – 32.5 – 311.1% N/MSri Lanka 90.0% 58.2 74.7 3.7 74.7 3.7
Loss before income tax (105.7) (6.6) (327.4) (275.7) 67.7% 97.6%Income tax credit/(expense)
– Operating items 4.7 (34.6) 10.5 (13.0) –55.2% –166.2%– Non-operating items 2.4 (18.6) 4.7 6.1 –48.9% N/M
Sri Lanka 90.0% 58.2 74.7 3.7 74.7 3.7
Loss for the period (98.6) (59.8) (312.2) (282.6) 68.4% 78.8%Add: Loss attributable to
non-controlling interests 38.8 – 29.6 – 31.1% N/MSri Lanka 90.0% 58.2 74.7 3.7 74.7 3.7
Loss attributable to owners of the Company (59.8) (59.8) (282.6) (282.6) 78.8% 78.8%
N/M: not meaningful
DISCUSSION AND ANALYSIS
42 SHANGRI-LA ASIA LIMITED
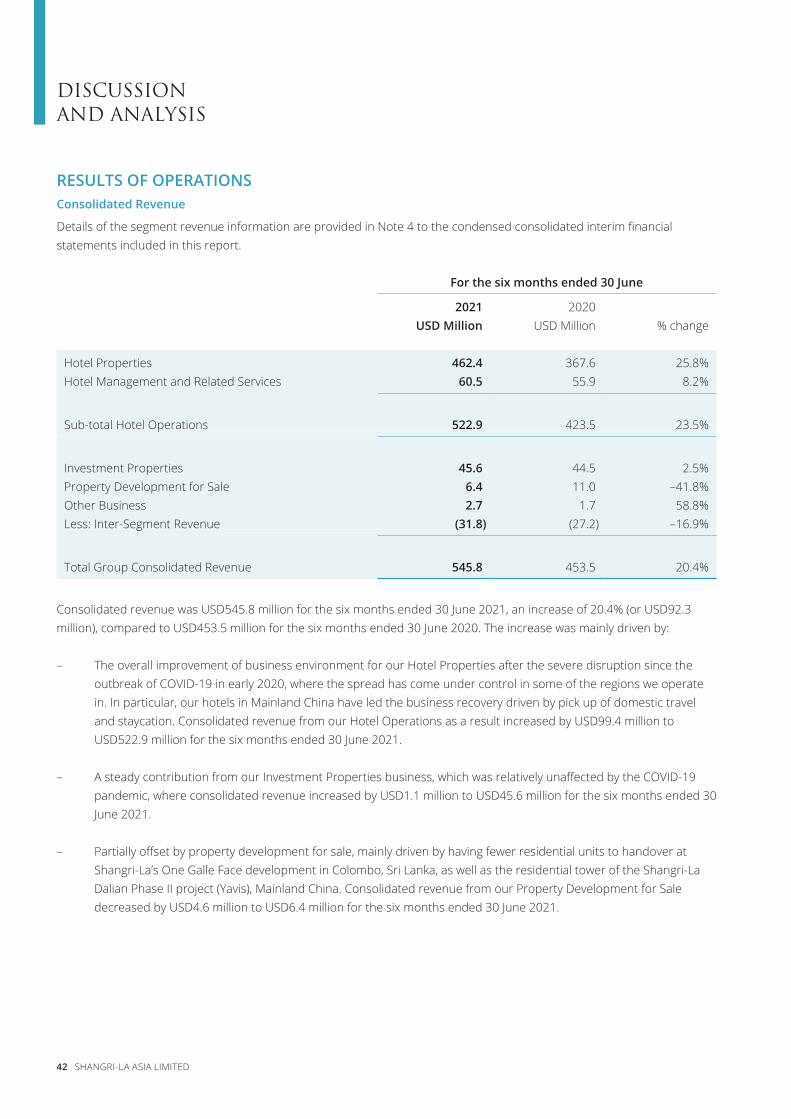
RESULTS OF OPERATIONSConsolidated Revenue
Details of the segment revenue information are provided in Note 4 to the condensed consolidated interim financial statements included in this report.
For the six months ended 30 June 2021 2020
USD Million USD Million % change
Hotel Properties 462.4 367.6 25.8%Hotel Management and Related Services 60.5 55.9 8.2%
Sub-total Hotel Operations 522.9 423.5 23.5%
Investment Properties 45.6 44.5 2.5%Property Development for Sale 6.4 11.0 –41.8%Other Business 2.7 1.7 58.8%Less: Inter-Segment Revenue (31.8) (27.2) –16.9%
Total Group Consolidated Revenue 545.8 453.5 20.4%
Consolidated revenue was USD545.8 million for the six months ended 30 June 2021, an increase of 20.4% (or USD92.3 million), compared to USD453.5 million for the six months ended 30 June 2020. The increase was mainly driven by:
– The overall improvement of business environment for our Hotel Properties after the severe disruption since the outbreak of COVID-19 in early 2020, where the spread has come under control in some of the regions we operate in. In particular, our hotels in Mainland China have led the business recovery driven by pick up of domestic travel and staycation. Consolidated revenue from our Hotel Operations as a result increased by USD99.4 million to USD522.9 million for the six months ended 30 June 2021.
– A steady contribution from our Investment Properties business, which was relatively unaffected by the COVID-19 pandemic, where consolidated revenue increased by USD1.1 million to USD45.6 million for the six months ended 30 June 2021.
– Partially offset by property development for sale, mainly driven by having fewer residential units to handover at Shangri-La’s One Galle Face development in Colombo, Sri Lanka, as well as the residential tower of the Shangri-La Dalian Phase II project (Yavis), Mainland China. Consolidated revenue from our Property Development for Sale decreased by USD4.6 million to USD6.4 million for the six months ended 30 June 2021.
DISCUSSION AND ANALYSIS
INTERIM REPORT 2021 43
RESULTS OF OPERATIONS (CONTINUED)Consolidated Revenue (Continued)
(i) Hotel Properties
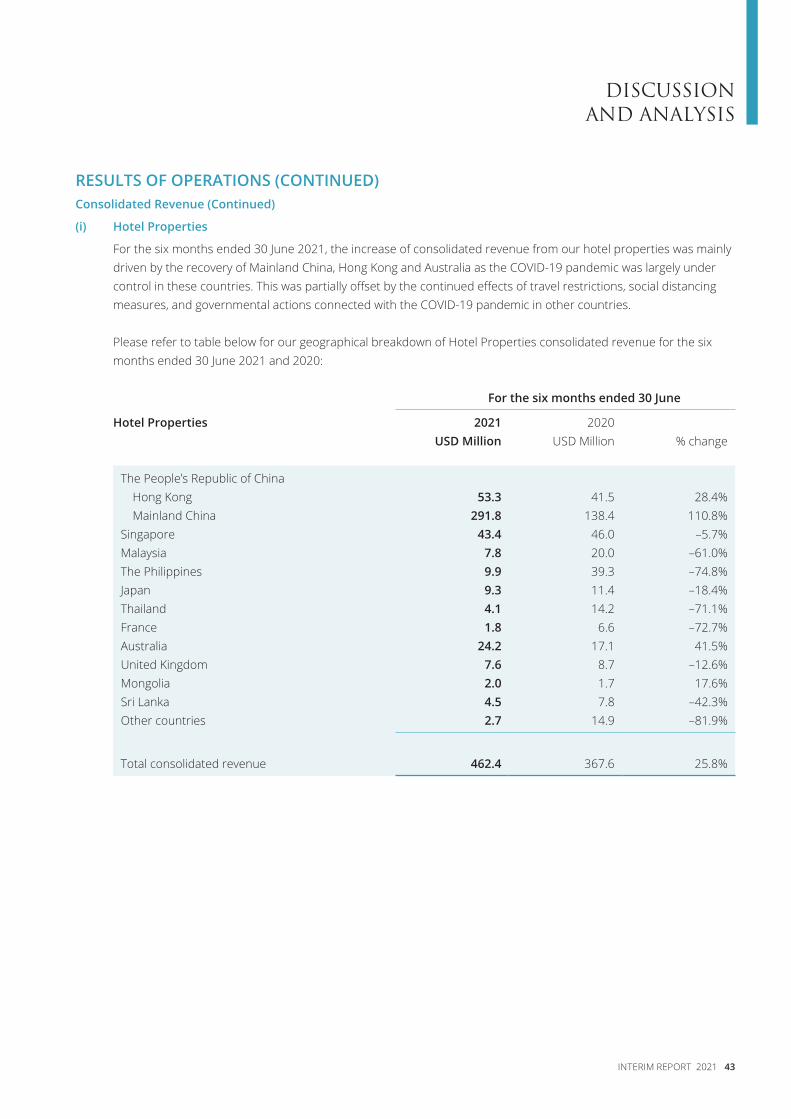
For the six months ended 30 June 2021, the increase of consolidated revenue from our hotel properties was mainly driven by the recovery of Mainland China, Hong Kong and Australia as the COVID-19 pandemic was largely under control in these countries. This was partially offset by the continued effects of travel restrictions, social distancing measures, and governmental actions connected with the COVID-19 pandemic in other countries.
Please refer to table below for our geographical breakdown of Hotel Properties consolidated revenue for the six months ended 30 June 2021 and 2020:
For the six months ended 30 June Hotel Properties 2021 2020
USD Million USD Million % change
The People’s Republic of ChinaHong Kong 53.3 41.5 28.4%Mainland China 291.8 138.4 110.8%
Singapore 43.4 46.0 –5.7%Malaysia 7.8 20.0 –61.0%The Philippines 9.9 39.3 –74.8%Japan 9.3 11.4 –18.4%Thailand 4.1 14.2 –71.1%France 1.8 6.6 –72.7%Australia 24.2 17.1 41.5%United Kingdom 7.6 8.7 –12.6%Mongolia 2.0 1.7 17.6%Sri Lanka 4.5 7.8 –42.3%Other countries 2.7 14.9 –81.9%
Total consolidated revenue 462.4 367.6 25.8%
DISCUSSION AND ANALYSIS
44 SHANGRI-LA ASIA LIMITED
RESULTS OF OPERATIONS (CONTINUED)Consolidated Revenue (Continued)
(i) Hotel Properties (Continued)
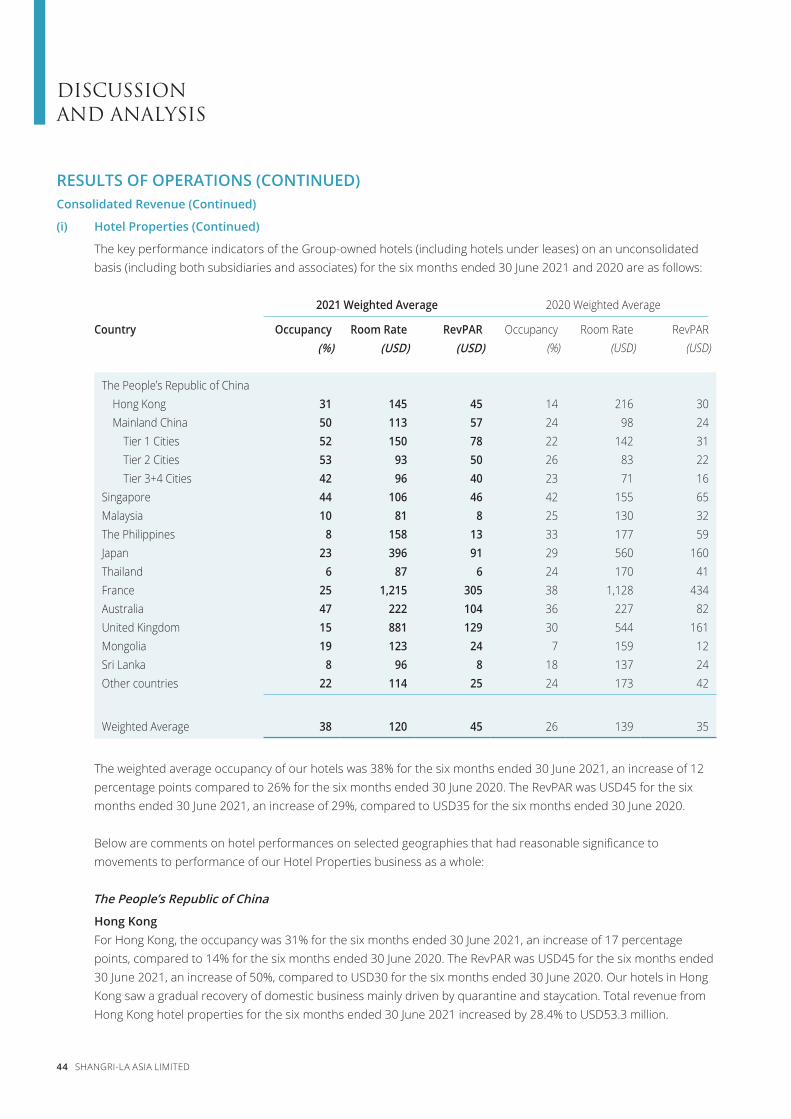
The key performance indicators of the Group-owned hotels (including hotels under leases) on an unconsolidated basis (including both subsidiaries and associates) for the six months ended 30 June 2021 and 2020 are as follows:
2021 Weighted Average 2020 Weighted Average Country Occupancy Room Rate RevPAR Occupancy Room Rate RevPAR
(%) (USD) (USD) (%) (USD) (USD)
The People’s Republic of ChinaHong Kong 31 145 45 14 216 30Mainland China 50 113 57 24 98 24
Tier 1 Cities 52 150 78 22 142 31Tier 2 Cities 53 93 50 26 83 22Tier 3+4 Cities 42 96 40 23 71 16
Singapore 44 106 46 42 155 65Malaysia 10 81 8 25 130 32The Philippines 8 158 13 33 177 59Japan 23 396 91 29 560 160Thailand 6 87 6 24 170 41France 25 1,215 305 38 1,128 434Australia 47 222 104 36 227 82United Kingdom 15 881 129 30 544 161Mongolia 19 123 24 7 159 12Sri Lanka 8 96 8 18 137 24Other countries 22 114 25 24 173 42
Weighted Average 38 120 45 26 139 35
The weighted average occupancy of our hotels was 38% for the six months ended 30 June 2021, an increase of 12 percentage points compared to 26% for the six months ended 30 June 2020. The RevPAR was USD45 for the six months ended 30 June 2021, an increase of 29%, compared to USD35 for the six months ended 30 June 2020.
Below are comments on hotel performances on selected geographies that had reasonable significance to movements to performance of our Hotel Properties business as a whole:
The People’s Republic of China
Hong KongFor Hong Kong, the occupancy was 31% for the six months ended 30 June 2021, an increase of 17 percentage points, compared to 14% for the six months ended 30 June 2020. The RevPAR was USD45 for the six months ended 30 June 2021, an increase of 50%, compared to USD30 for the six months ended 30 June 2020. Our hotels in Hong Kong saw a gradual recovery of domestic business mainly driven by quarantine and staycation. Total revenue from Hong Kong hotel properties for the six months ended 30 June 2021 increased by 28.4% to USD53.3 million.
DISCUSSION AND ANALYSIS
INTERIM REPORT 2021 45
RESULTS OF OPERATIONS (CONTINUED)Consolidated Revenue (Continued)
(i) Hotel Properties (Continued)
The People’s Republic of China (Continued)
Mainland ChinaThe Group had equity interest in 46 operating hotels in Mainland China as at 30 June 2021.
For Mainland China, the occupancy was 50% for the six months ended 30 June 2021, an increase of 26 percentage points, compared to 24% for the six months ended 30 June 2020. The RevPAR was USD57 for the six months ended 30 June 2021, an increase of 138%, compared to USD24 for the six months ended 30 June 2020. In 2021, China hotel market has continued its recovery path in late March after a temporary slowdown in January and February due to combined effects of various local outbreaks of COVID-19 pandemic at the end of 2020, Chinese New Year impact and softened economic activities prior to the Two Sessions meeting held in mid-March. The continued recovery was supported by domestic leisure and corporate travel as well as some government businesses.
Below is the performance of our hotels in different tiered cities:
• In Tier 1 cities, the occupancy was 52% for the six months ended 30 June 2021, an increase of 30 percentage points, compared to 22% for the six months ended 30 June 2020. The RevPAR was USD78 for the six months ended 30 June 2021, an increase of 152%, compared to USD31 for the six months ended 30 June 2020. Recovery of business in Tier 1 cities were helped by a general strong local corporate and leisure demand. Our hotels in Guangzhou and Shenzhen were temporarily impacted in June by the local outbreak of COVID-19 pandemic in the Guangdong province, and business quickly resumed once restrictions were lifted.
• In Tier 2 cities, the occupancy was 53% for the six months ended 30 June 2021, an increase of 27 percentage points, compared to 26% for the six months ended 30 June 2020. The RevPAR was USD50 for the six months ended 30 June 2021, an increase of 127%, compared to USD22 for the six months ended 30 June 2020. The recovery of business in Tier 2 cities were helped by cities such as Hangzhou where it continued to see a strong staycation demand, helping our two hotels in the city reach occupancy of above 60% during the period. Jinan and Nanchang continued to see strong local corporate demand for conferences and business activities, where both their occupancies reached above 80% in April 2021.
• In Tier 3 and Tier 4 cities, the occupancy was 42% for the six months ended 30 June 2021, an increase of 19 percentage points, compared to 23% for the six months ended 30 June 2020. The RevPAR was USD40 for the six months ended 30 June 2021, an increase of 150%, compared to USD16 for the six months ended 30 June 2020. Cities such as Sanya and Lhasa were helped by a strong domestic leisure demand.
Total revenue from Mainland China hotel properties for the six months ended 30 June 2021 increased by 110.8% to USD291.8 million.
DISCUSSION AND ANALYSIS
46 SHANGRI-LA ASIA LIMITED
RESULTS OF OPERATIONS (CONTINUED)Consolidated Revenue (Continued)
(i) Hotel Properties (Continued)
Singapore
For Singapore, the occupancy was 44% for the six months ended 30 June 2021, an increase of 2 percentage points, compared to 42% for the six months ended 30 June 2020. The RevPAR was USD46 for the six months ended 30 June 2021, a decrease of 29%, compared to USD65 for the six months ended 30 June 2020. Although the occupancy was supported by the government’s stay home notice programme for returning residents, the RevPAR saw a decline due to the lower room rate for this business. Total revenue from Singapore hotel properties for the six months ended 30 June 2021 decreased by 5.7% to USD43.4 million.
Malaysia
For Malaysia, the occupancy was 10% for the six months ended 30 June 2021, a decrease of 15 percentage points, compared to 25% for the six months ended 30 June 2020. The RevPAR was USD8 for the six months ended 30 June 2021, a decrease of 75%, compared to USD32 for the six months ended 30 June 2020. Hotels in Malaysia continued to be affected by the negative impact from COVID-19 travel restrictions. Total revenue from Malaysia hotel properties for the six months ended 30 June 2021 decreased by 61.0% to USD7.8 million.
The Philippines
For The Philippines, the occupancy was 8% for the six months ended 30 June 2021, a decrease of 25 percentage points, compared to 33% for the six months ended 30 June 2020. The RevPAR was USD13 for the six months ended 30 June 2021, a decrease of 78%, compared to USD59 for the six months ended 30 June 2020. Operations for our hotels in The Philippines continued to be challenging due to international travel restrictions due to COVID-19. Total revenue from The Philippines hotel properties for the six months ended 30 June 2021 decreased by 74.8% to USD9.9 million.
Japan
For Japan, the occupancy was 23% for the six months ended 30 June 2021, a decrease of 6 percentage points, compared to 29% for the six months ended 30 June 2020. The RevPAR was USD91 for the six months ended 30 June 2021, a decrease of 43%, compared to USD160 for the six months ended 30 June 2020. Our hotel in Tokyo continued to rely on the domestic travel demand, which remained weak due to the pandemic. Total revenue from Japan hotel properties for the six months ended 30 June 2021 decreased by 18.4% to USD9.3 million.
Thailand
For Thailand, the occupancy was 6% for the six months ended 30 June 2021, a decrease of 18 percentage points, compared to 24% for the six months ended 30 June 2020. The RevPAR was USD6 for the six months ended 30 June 2021, a decrease of 85%, compared to USD41 for the six months ended 30 June 2020. Operations for our hotels in Thailand continued to be challenging due to international travel restrictions related to COVID-19. Total revenue from Thailand hotel properties for the six months ended 30 June 2021 decreased by 71.1% to USD4.1 million.
DISCUSSION AND ANALYSIS
INTERIM REPORT 2021 47
RESULTS OF OPERATIONS (CONTINUED)Consolidated Revenue (Continued)
(i) Hotel Properties (Continued)
France
For France, the occupancy was 25% for the six months ended 30 June 2021, a decrease of 13 percentage points, compared to 38% for the six months ended 30 June 2020. The RevPAR was USD305 for the six months ended 30 June 2021, a decrease of 30%, compared to USD434 for the six months ended 30 June 2020. Our hotel in Paris was closed since mid-March 2020 and has only reopened for business in June 2021. Total revenue from France hotel properties for the six months ended 30 June 2021 decreased by 72.7% to USD1.8 million.
Australia
For Australia, the occupancy was 47% for the six months ended 30 June 2021, an increase of 11 percentage points, compared to 36% for the six months ended 30 June 2020. The RevPAR was USD104 for the six months ended 30 June 2021, an increase of 27%, compared to USD82 for the six months ended 30 June 2020. The domestic demand in Australia has recovered steadily as the COVID-19 pandemic had largely been under control in the country with some sporadic local outbreaks. Total revenue from Australia hotel properties for the six months ended 30 June 2021 increased by 41.5% to USD24.2 million.
(ii) Hotel Management & Related Services
As at 30 June 2021, the Group’s wholly owned subsidiary, SLIM International Limited, together with its subsidiaries and certain fellow subsidiaries (“SLIM”) managed a total of 102 hotels and resorts:
– 80 Group-owned hotels– 3 hotels under lease agreements– 19 hotels owned by third parties
The 19 operating hotels (6,124 available rooms) owned by third parties are located in the following destinations:
– Canada: Toronto and Vancouver– The Philippines: Manila– Oman: Muscat (2 hotels)– UAE: Abu Dhabi (2 hotels) and Dubai– Malaysia: Johor and Kuala Lumpur– India: New Delhi and Bengaluru– Taiwan: Taipei and Tainan– Mainland China: Changzhou, Haikou, Suzhou (2 hotels) and Yiwu
The overall weighted average occupancy of the hotels under third-party hotel management agreements was 37% for the six months ended 30 June 2021, an increase of 7 percentage points, compared to 30% for the six months ended 30 June 2020. The RevPAR was USD34 for the six months ended 30 June 2021, a decrease of 11%, compared to USD38 for the six months ended 30 June 2020.
Gross revenues from SLIM was USD60.5 million for the six months ended 30 June 2021, an increase of 8.2% compared to USD55.9 million for the six months ended 30 June 2020.
After eliminating inter-segment sales with subsidiaries, the net revenues from SLIM was USD28.7 million for the six months ended 30 June 2021, flat compared to USD28.7 million for the six months ended 30 June 2020.
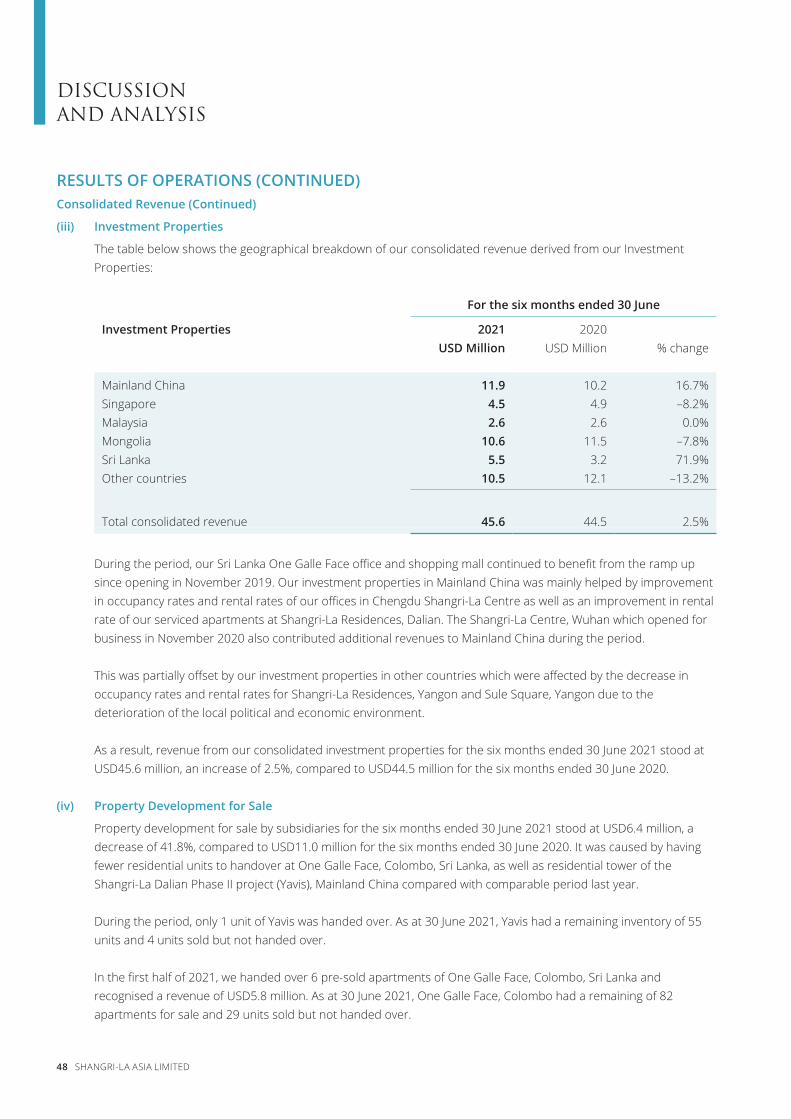
DISCUSSION AND ANALYSIS
48 SHANGRI-LA ASIA LIMITED
RESULTS OF OPERATIONS (CONTINUED)Consolidated Revenue (Continued)
(iii) Investment Properties
The table below shows the geographical breakdown of our consolidated revenue derived from our Investment Properties:
For the six months ended 30 June Investment Properties 2021 2020
USD Million USD Million % change
Mainland China 11.9 10.2 16.7%Singapore 4.5 4.9 –8.2%Malaysia 2.6 2.6 0.0%Mongolia 10.6 11.5 –7.8%Sri Lanka 5.5 3.2 71.9%Other countries 10.5 12.1 –13.2%
Total consolidated revenue 45.6 44.5 2.5%
During the period, our Sri Lanka One Galle Face office and shopping mall continued to benefit from the ramp up since opening in November 2019. Our investment properties in Mainland China was mainly helped by improvement in occupancy rates and rental rates of our offices in Chengdu Shangri-La Centre as well as an improvement in rental rate of our serviced apartments at Shangri-La Residences, Dalian. The Shangri-La Centre, Wuhan which opened for business in November 2020 also contributed additional revenues to Mainland China during the period.
This was partially offset by our investment properties in other countries which were affected by the decrease in occupancy rates and rental rates for Shangri-La Residences, Yangon and Sule Square, Yangon due to the deterioration of the local political and economic environment.
As a result, revenue from our consolidated investment properties for the six months ended 30 June 2021 stood at USD45.6 million, an increase of 2.5%, compared to USD44.5 million for the six months ended 30 June 2020.
(iv) Property Development for Sale
Property development for sale by subsidiaries for the six months ended 30 June 2021 stood at USD6.4 million, a decrease of 41.8%, compared to USD11.0 million for the six months ended 30 June 2020. It was caused by having fewer residential units to handover at One Galle Face, Colombo, Sri Lanka, as well as residential tower of the Shangri-La Dalian Phase II project (Yavis), Mainland China compared with comparable period last year.
During the period, only 1 unit of Yavis was handed over. As at 30 June 2021, Yavis had a remaining inventory of 55 units and 4 units sold but not handed over.
In the first half of 2021, we handed over 6 pre-sold apartments of One Galle Face, Colombo, Sri Lanka and recognised a revenue of USD5.8 million. As at 30 June 2021, One Galle Face, Colombo had a remaining of 82 apartments for sale and 29 units sold but not handed over.
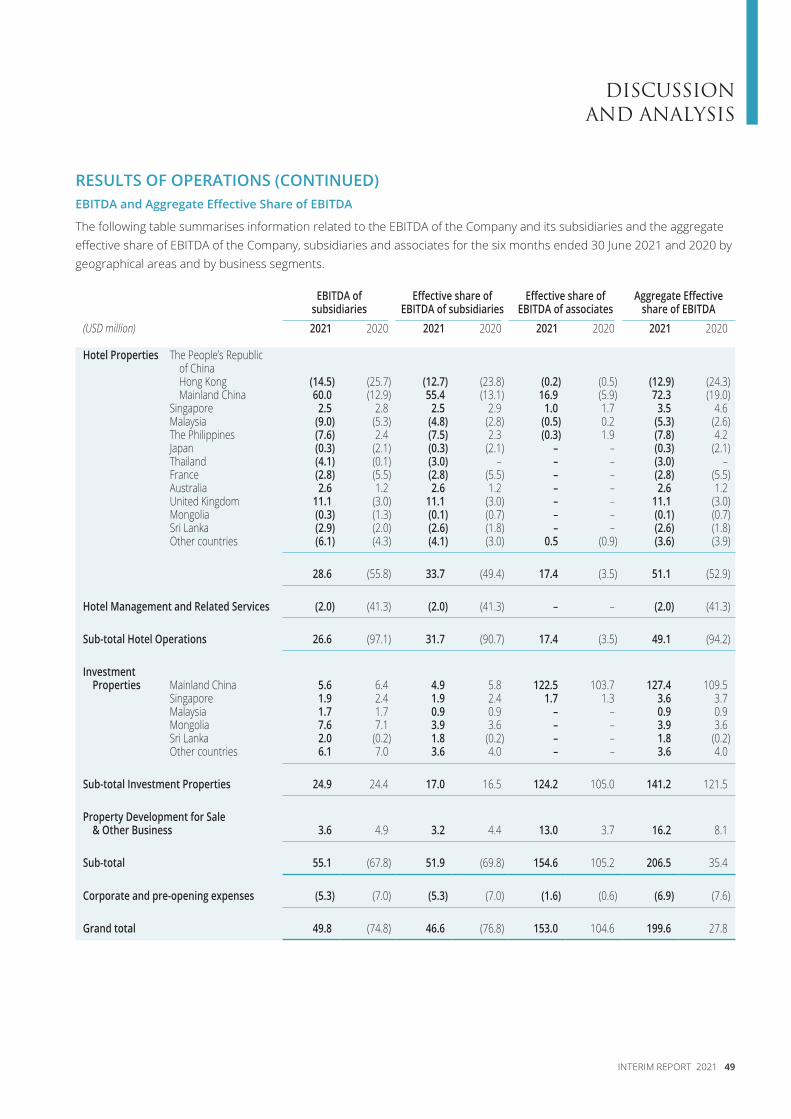
DISCUSSION AND ANALYSIS
INTERIM REPORT 2021 49
RESULTS OF OPERATIONS (CONTINUED)EBITDA and Aggregate Effective Share of EBITDA
The following table summarises information related to the EBITDA of the Company and its subsidiaries and the aggregate effective share of EBITDA of the Company, subsidiaries and associates for the six months ended 30 June 2021 and 2020 by geographical areas and by business segments.
EBITDA of subsidiaries
Effective share of EBITDA of subsidiaries
Effective share of EBITDA of associates
Aggregate Effective share of EBITDA
(USD million) 2021 2020 2021 2020 2021 2020 2021 2020
Hotel Properties The People’s Republic of ChinaHong Kong (14.5) (25.7) (12.7) (23.8) (0.2) (0.5) (12.9) (24.3)Mainland China 60.0 (12.9) 55.4 (13.1) 16.9 (5.9) 72.3 (19.0)
Singapore 2.5 2.8 2.5 2.9 1.0 1.7 3.5 4.6Malaysia (9.0) (5.3) (4.8) (2.8) (0.5) 0.2 (5.3) (2.6)The Philippines (7.6) 2.4 (7.5) 2.3 (0.3) 1.9 (7.8) 4.2Japan (0.3) (2.1) (0.3) (2.1) – – (0.3) (2.1)Thailand (4.1) (0.1) (3.0) – – – (3.0) –France (2.8) (5.5) (2.8) (5.5) – – (2.8) (5.5)Australia 2.6 1.2 2.6 1.2 – – 2.6 1.2United Kingdom 11.1 (3.0) 11.1 (3.0) – – 11.1 (3.0)Mongolia (0.3) (1.3) (0.1) (0.7) – – (0.1) (0.7)Sri Lanka (2.9) (2.0) (2.6) (1.8) – – (2.6) (1.8)Other countries (6.1) (4.3) (4.1) (3.0) 0.5 (0.9) (3.6) (3.9)
28.6 (55.8) 33.7 (49.4) 17.4 (3.5) 51.1 (52.9)
Hotel Management and Related Services (2.0) (41.3) (2.0) (41.3) – – (2.0) (41.3)
Sub-total Hotel Operations 26.6 (97.1) 31.7 (90.7) 17.4 (3.5) 49.1 (94.2)
Investment Properties Mainland China 5.6 6.4 4.9 5.8 122.5 103.7 127.4 109.5
Singapore 1.9 2.4 1.9 2.4 1.7 1.3 3.6 3.7Malaysia 1.7 1.7 0.9 0.9 – – 0.9 0.9Mongolia 7.6 7.1 3.9 3.6 – – 3.9 3.6Sri Lanka 2.0 (0.2) 1.8 (0.2) – – 1.8 (0.2)Other countries 6.1 7.0 3.6 4.0 – – 3.6 4.0
Sub-total Investment Properties 24.9 24.4 17.0 16.5 124.2 105.0 141.2 121.5
Property Development for Sale & Other Business 3.6 4.9 3.2 4.4 13.0 3.7 16.2 8.1
Sub-total 55.1 (67.8) 51.9 (69.8) 154.6 105.2 206.5 35.4
Corporate and pre-opening expenses (5.3) (7.0) (5.3) (7.0) (1.6) (0.6) (6.9) (7.6)
Grand total 49.8 (74.8) 46.6 (76.8) 153.0 104.6 199.6 27.8
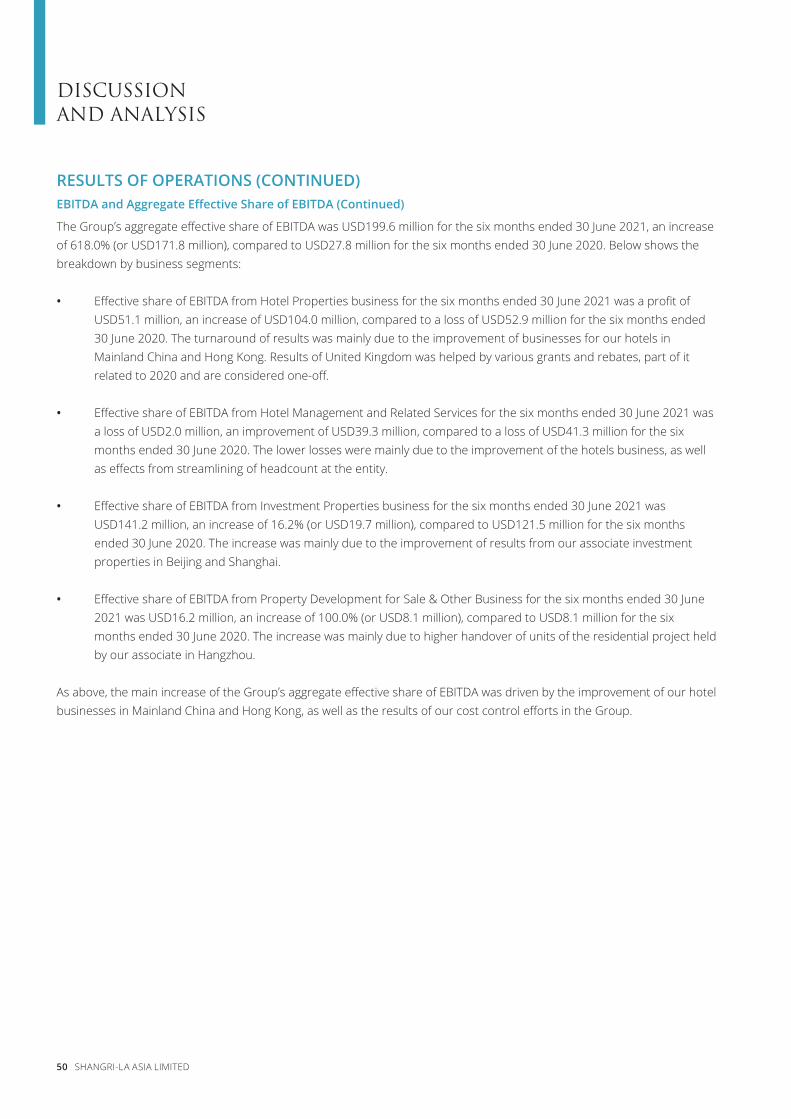
DISCUSSION AND ANALYSIS
50 SHANGRI-LA ASIA LIMITED
RESULTS OF OPERATIONS (CONTINUED)EBITDA and Aggregate Effective Share of EBITDA (Continued)
The Group’s aggregate effective share of EBITDA was USD199.6 million for the six months ended 30 June 2021, an increase of 618.0% (or USD171.8 million), compared to USD27.8 million for the six months ended 30 June 2020. Below shows the breakdown by business segments:
• Effective share of EBITDA from Hotel Properties business for the six months ended 30 June 2021 was a profit of USD51.1 million, an increase of USD104.0 million, compared to a loss of USD52.9 million for the six months ended 30 June 2020. The turnaround of results was mainly due to the improvement of businesses for our hotels in Mainland China and Hong Kong. Results of United Kingdom was helped by various grants and rebates, part of it related to 2020 and are considered one-off.
• Effective share of EBITDA from Hotel Management and Related Services for the six months ended 30 June 2021 was a loss of USD2.0 million, an improvement of USD39.3 million, compared to a loss of USD41.3 million for the six months ended 30 June 2020. The lower losses were mainly due to the improvement of the hotels business, as well as effects from streamlining of headcount at the entity.
• Effective share of EBITDA from Investment Properties business for the six months ended 30 June 2021 was USD141.2 million, an increase of 16.2% (or USD19.7 million), compared to USD121.5 million for the six months ended 30 June 2020. The increase was mainly due to the improvement of results from our associate investment properties in Beijing and Shanghai.
• Effective share of EBITDA from Property Development for Sale & Other Business for the six months ended 30 June 2021 was USD16.2 million, an increase of 100.0% (or USD8.1 million), compared to USD8.1 million for the six months ended 30 June 2020. The increase was mainly due to higher handover of units of the residential project held by our associate in Hangzhou.
As above, the main increase of the Group’s aggregate effective share of EBITDA was driven by the improvement of our hotel businesses in Mainland China and Hong Kong, as well as the results of our cost control efforts in the Group.
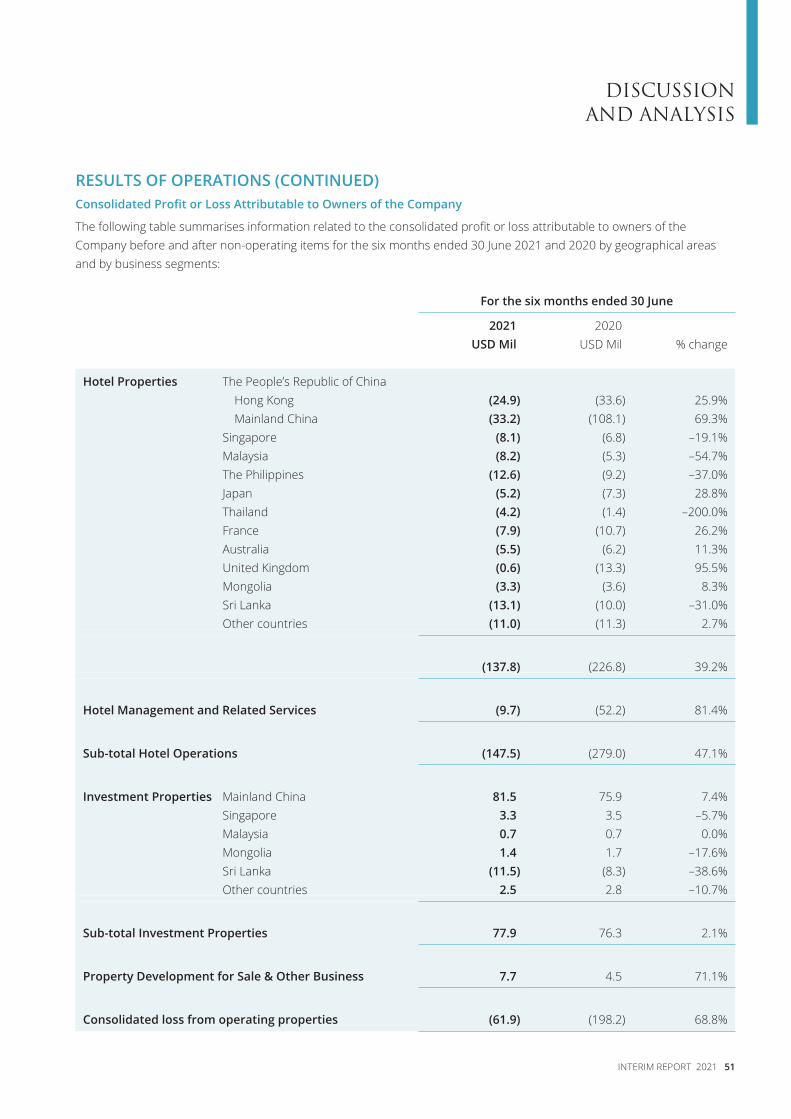
DISCUSSION AND ANALYSIS
INTERIM REPORT 2021 51
RESULTS OF OPERATIONS (CONTINUED)Consolidated Profit or Loss Attributable to Owners of the Company
The following table summarises information related to the consolidated profit or loss attributable to owners of the Company before and after non-operating items for the six months ended 30 June 2021 and 2020 by geographical areas and by business segments:
For the six months ended 30 June 2021 2020
USD Mil USD Mil % change
Hotel Properties The People’s Republic of ChinaHong Kong (24.9) (33.6) 25.9%Mainland China (33.2) (108.1) 69.3%
Singapore (8.1) (6.8) –19.1%Malaysia (8.2) (5.3) –54.7%The Philippines (12.6) (9.2) –37.0%Japan (5.2) (7.3) 28.8%Thailand (4.2) (1.4) –200.0%France (7.9) (10.7) 26.2%Australia (5.5) (6.2) 11.3%United Kingdom (0.6) (13.3) 95.5%Mongolia (3.3) (3.6) 8.3%Sri Lanka (13.1) (10.0) –31.0%Other countries (11.0) (11.3) 2.7%
(137.8) (226.8) 39.2%
Hotel Management and Related Services (9.7) (52.2) 81.4%
Sub-total Hotel Operations (147.5) (279.0) 47.1%
Investment Properties Mainland China 81.5 75.9 7.4%Singapore 3.3 3.5 –5.7%Malaysia 0.7 0.7 0.0%Mongolia 1.4 1.7 –17.6%Sri Lanka (11.5) (8.3) –38.6%Other countries 2.5 2.8 –10.7%
Sub-total Investment Properties 77.9 76.3 2.1%
Property Development for Sale & Other Business 7.7 4.5 71.1%
Consolidated loss from operating properties (61.9) (198.2) 68.8%
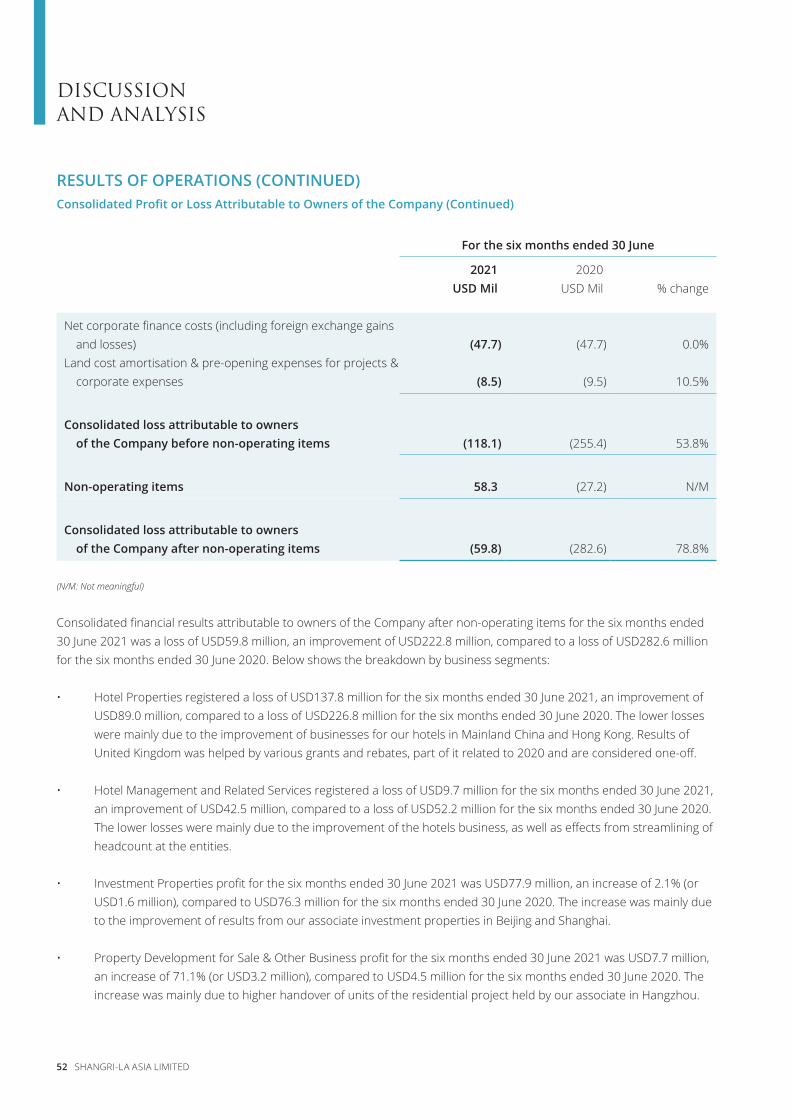
DISCUSSION AND ANALYSIS
52 SHANGRI-LA ASIA LIMITED
For the six months ended 30 June 2021 2020
USD Mil USD Mil % change
Net corporate finance costs (including foreign exchange gains and losses) (47.7) (47.7) 0.0%
Land cost amortisation & pre-opening expenses for projects & corporate expenses (8.5) (9.5) 10.5%
Consolidated loss attributable to owners of the Company before non-operating items (118.1) (255.4) 53.8%
Non-operating items 58.3 (27.2) N/M
Consolidated loss attributable to owners of the Company after non-operating items (59.8) (282.6) 78.8%
(N/M: Not meaningful)
Consolidated financial results attributable to owners of the Company after non-operating items for the six months ended 30 June 2021 was a loss of USD59.8 million, an improvement of USD222.8 million, compared to a loss of USD282.6 million for the six months ended 30 June 2020. Below shows the breakdown by business segments:
• Hotel Properties registered a loss of USD137.8 million for the six months ended 30 June 2021, an improvement of USD89.0 million, compared to a loss of USD226.8 million for the six months ended 30 June 2020. The lower losses were mainly due to the improvement of businesses for our hotels in Mainland China and Hong Kong. Results of United Kingdom was helped by various grants and rebates, part of it related to 2020 and are considered one-off.
• Hotel Management and Related Services registered a loss of USD9.7 million for the six months ended 30 June 2021, an improvement of USD42.5 million, compared to a loss of USD52.2 million for the six months ended 30 June 2020. The lower losses were mainly due to the improvement of the hotels business, as well as effects from streamlining of headcount at the entities.
• Investment Properties profit for the six months ended 30 June 2021 was USD77.9 million, an increase of 2.1% (or USD1.6 million), compared to USD76.3 million for the six months ended 30 June 2020. The increase was mainly due to the improvement of results from our associate investment properties in Beijing and Shanghai.
• Property Development for Sale & Other Business profit for the six months ended 30 June 2021 was USD7.7 million, an increase of 71.1% (or USD3.2 million), compared to USD4.5 million for the six months ended 30 June 2020. The increase was mainly due to higher handover of units of the residential project held by our associate in Hangzhou.
RESULTS OF OPERATIONS (CONTINUED)Consolidated Profit or Loss Attributable to Owners of the Company (Continued)
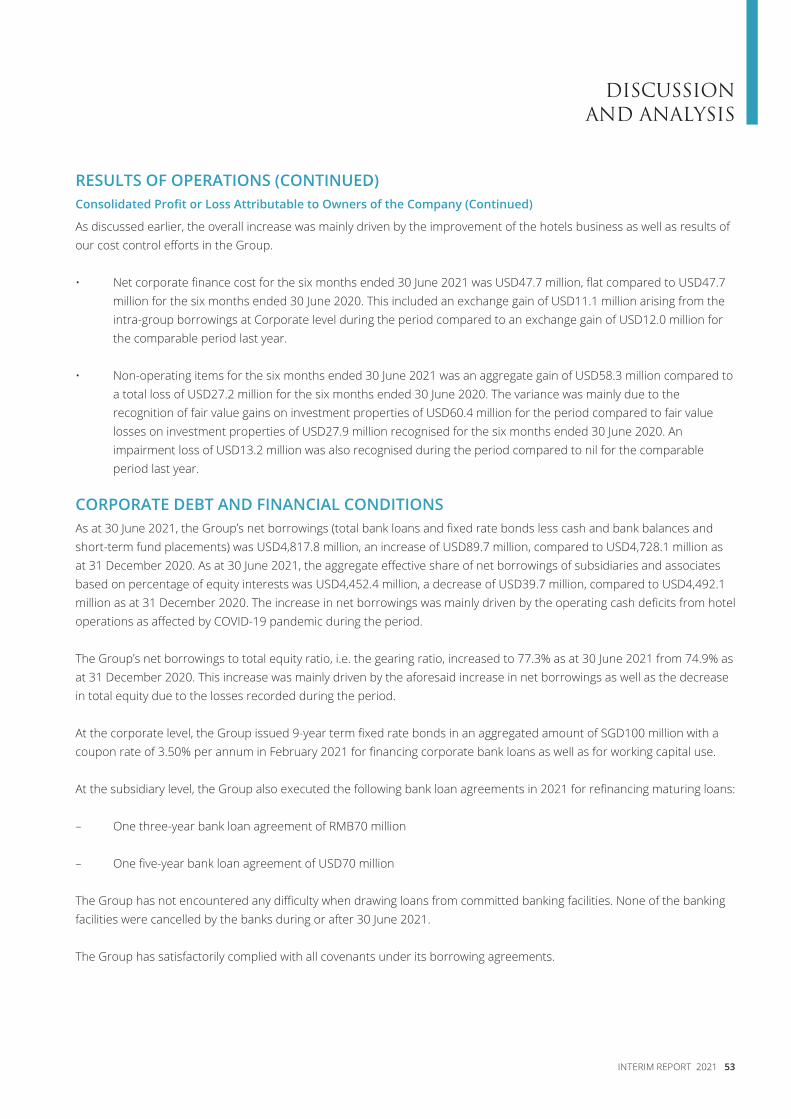
DISCUSSION AND ANALYSIS
INTERIM REPORT 2021 53
RESULTS OF OPERATIONS (CONTINUED)Consolidated Profit or Loss Attributable to Owners of the Company (Continued)
As discussed earlier, the overall increase was mainly driven by the improvement of the hotels business as well as results of our cost control efforts in the Group.
• Net corporate finance cost for the six months ended 30 June 2021 was USD47.7 million, flat compared to USD47.7 million for the six months ended 30 June 2020. This included an exchange gain of USD11.1 million arising from the intra-group borrowings at Corporate level during the period compared to an exchange gain of USD12.0 million for the comparable period last year.
• Non-operating items for the six months ended 30 June 2021 was an aggregate gain of USD58.3 million compared to a total loss of USD27.2 million for the six months ended 30 June 2020. The variance was mainly due to the recognition of fair value gains on investment properties of USD60.4 million for the period compared to fair value losses on investment properties of USD27.9 million recognised for the six months ended 30 June 2020. An impairment loss of USD13.2 million was also recognised during the period compared to nil for the comparable period last year.
CORPORATE DEBT AND FINANCIAL CONDITIONSAs at 30 June 2021, the Group’s net borrowings (total bank loans and fixed rate bonds less cash and bank balances and short-term fund placements) was USD4,817.8 million, an increase of USD89.7 million, compared to USD4,728.1 million as at 31 December 2020. As at 30 June 2021, the aggregate effective share of net borrowings of subsidiaries and associates based on percentage of equity interests was USD4,452.4 million, a decrease of USD39.7 million, compared to USD4,492.1 million as at 31 December 2020. The increase in net borrowings was mainly driven by the operating cash deficits from hotel operations as affected by COVID-19 pandemic during the period.
The Group’s net borrowings to total equity ratio, i.e. the gearing ratio, increased to 77.3% as at 30 June 2021 from 74.9% as at 31 December 2020. This increase was mainly driven by the aforesaid increase in net borrowings as well as the decrease in total equity due to the losses recorded during the period.
At the corporate level, the Group issued 9-year term fixed rate bonds in an aggregated amount of SGD100 million with a coupon rate of 3.50% per annum in February 2021 for financing corporate bank loans as well as for working capital use.
At the subsidiary level, the Group also executed the following bank loan agreements in 2021 for refinancing maturing loans:
– One three-year bank loan agreement of RMB70 million
– One five-year bank loan agreement of USD70 million
The Group has not encountered any difficulty when drawing loans from committed banking facilities. None of the banking facilities were cancelled by the banks during or after 30 June 2021.
The Group has satisfactorily complied with all covenants under its borrowing agreements.
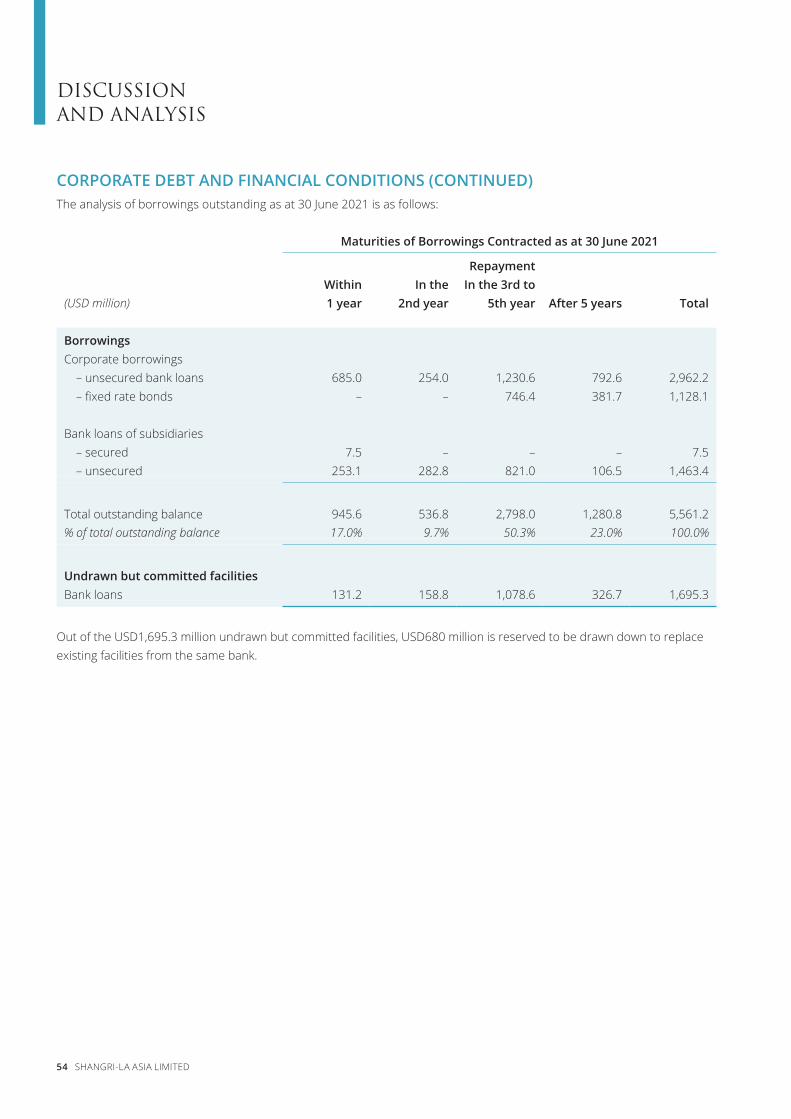
DISCUSSION AND ANALYSIS
54 SHANGRI-LA ASIA LIMITED
CORPORATE DEBT AND FINANCIAL CONDITIONS (CONTINUED)The analysis of borrowings outstanding as at 30 June 2021 is as follows:
Maturities of Borrowings Contracted as at 30 June 2021
(USD million)Within 1 year
In the 2nd year
Repayment In the 3rd to
5th year After 5 years Total
BorrowingsCorporate borrowings
– unsecured bank loans 685.0 254.0 1,230.6 792.6 2,962.2– fixed rate bonds – – 746.4 381.7 1,128.1
Bank loans of subsidiaries– secured 7.5 – – – 7.5– unsecured 253.1 282.8 821.0 106.5 1,463.4
Total outstanding balance 945.6 536.8 2,798.0 1,280.8 5,561.2% of total outstanding balance 17.0% 9.7% 50.3% 23.0% 100.0%
Undrawn but committed facilitiesBank loans 131.2 158.8 1,078.6 326.7 1,695.3
Out of the USD1,695.3 million undrawn but committed facilities, USD680 million is reserved to be drawn down to replace existing facilities from the same bank.
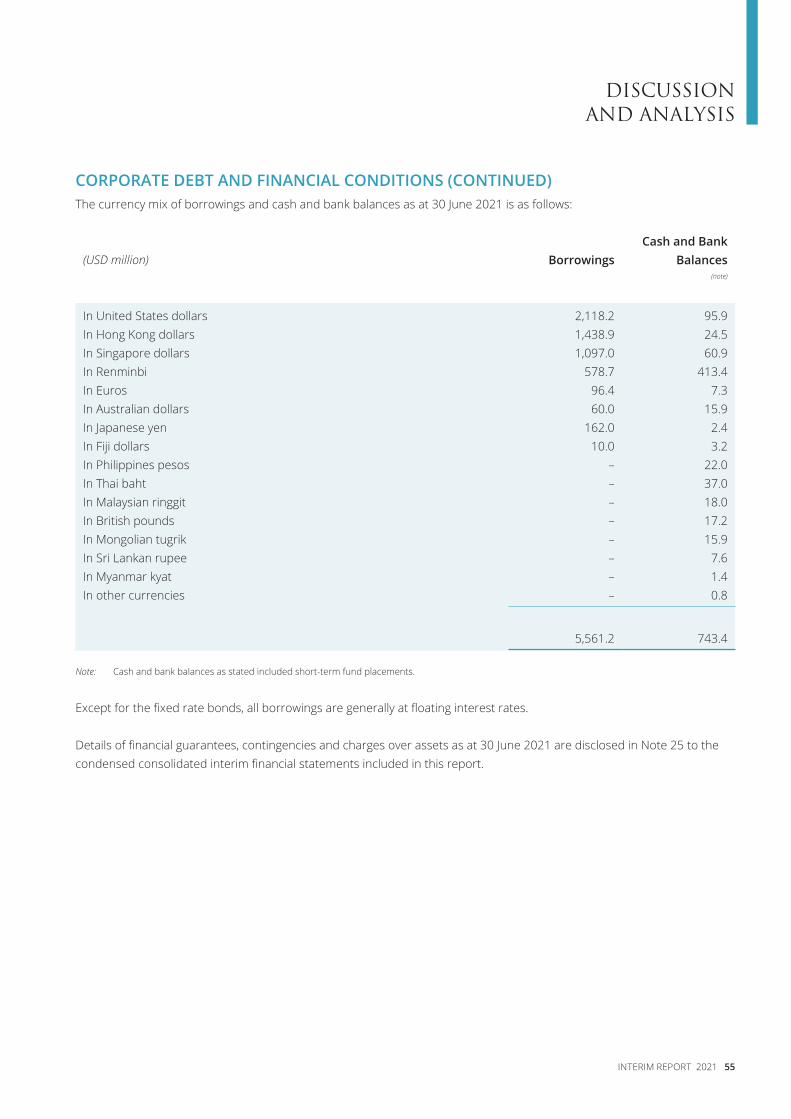
DISCUSSION AND ANALYSIS
INTERIM REPORT 2021 55
CORPORATE DEBT AND FINANCIAL CONDITIONS (CONTINUED)The currency mix of borrowings and cash and bank balances as at 30 June 2021 is as follows:
(USD million) BorrowingsCash and Bank
Balances(note)
In United States dollars 2,118.2 95.9In Hong Kong dollars 1,438.9 24.5In Singapore dollars 1,097.0 60.9In Renminbi 578.7 413.4In Euros 96.4 7.3In Australian dollars 60.0 15.9In Japanese yen 162.0 2.4In Fiji dollars 10.0 3.2In Philippines pesos – 22.0In Thai baht – 37.0In Malaysian ringgit – 18.0In British pounds – 17.2In Mongolian tugrik – 15.9In Sri Lankan rupee – 7.6In Myanmar kyat – 1.4In other currencies – 0.8
5,561.2 743.4
Note: Cash and bank balances as stated included short-term fund placements.
Except for the fixed rate bonds, all borrowings are generally at floating interest rates.
Details of financial guarantees, contingencies and charges over assets as at 30 June 2021 are disclosed in Note 25 to the condensed consolidated interim financial statements included in this report.
DISCUSSION AND ANALYSIS
56 SHANGRI-LA ASIA LIMITED
TREASURY POLICIESThe Group’s treasury policies are aimed at minimising interest and currency risks. The Group assesses the market environment and its financial position and adjusts its tactics from time to time.
(A) Minimising Interest Risks
The majority of the Group’s borrowings are in US dollars, HK dollars and Singapore dollars and arranged at the corporate level. The corporate bonds were issued at fixed rates. The Group has closely monitored the cash flow forecasts of all its subsidiaries and arranged to transfer any surplus cash to the corporate to reduce corporate debts. In order to minimise the overall interest cost, the Group also arranged intra-group loans and implemented RMB cash pooling in Mainland China to utilise the surplus cash of certain subsidiaries to meet the funding requirements of other group companies. The Group reviews the intra-group financing arrangements from time to time in response to changes in currency exchange rates and bank loan interest rates.
The Group has endeavoured to hedge its medium term interest rate risks arising from the Group’s bank loans by entering into fixed HIBOR, LIBOR and SHIBOR interest-rate swap contracts. As at 30 June 2021, the outstanding interest-rate swap contracts are:
– USD1,265.0 million at fixed rates ranging between 1.365% and 3.045% per annum maturing during April 2022 to July 2024.
– HKD6,170.0 million at fixed rates ranging between 1.505% and 1.855% per annum maturing during July 2023 to August 2026
– RMB416.9 million at fixed rates ranging between 3.370% and 3.550% per annum maturing during June 2022 to October 2022.
Taking into account the fixed rate bonds, fixed rate bank loans and the interest-rate swap contracts (including the cross-currency swap contracts that also fix the interest rates of certain bank borrowings), the Group has fixed its interest liability on 62.3% of its outstanding borrowings as at 30 June 2021, compared to 59.6% as at 31 December 2020.
All these interest-rate swap contracts qualify for hedge accounting.
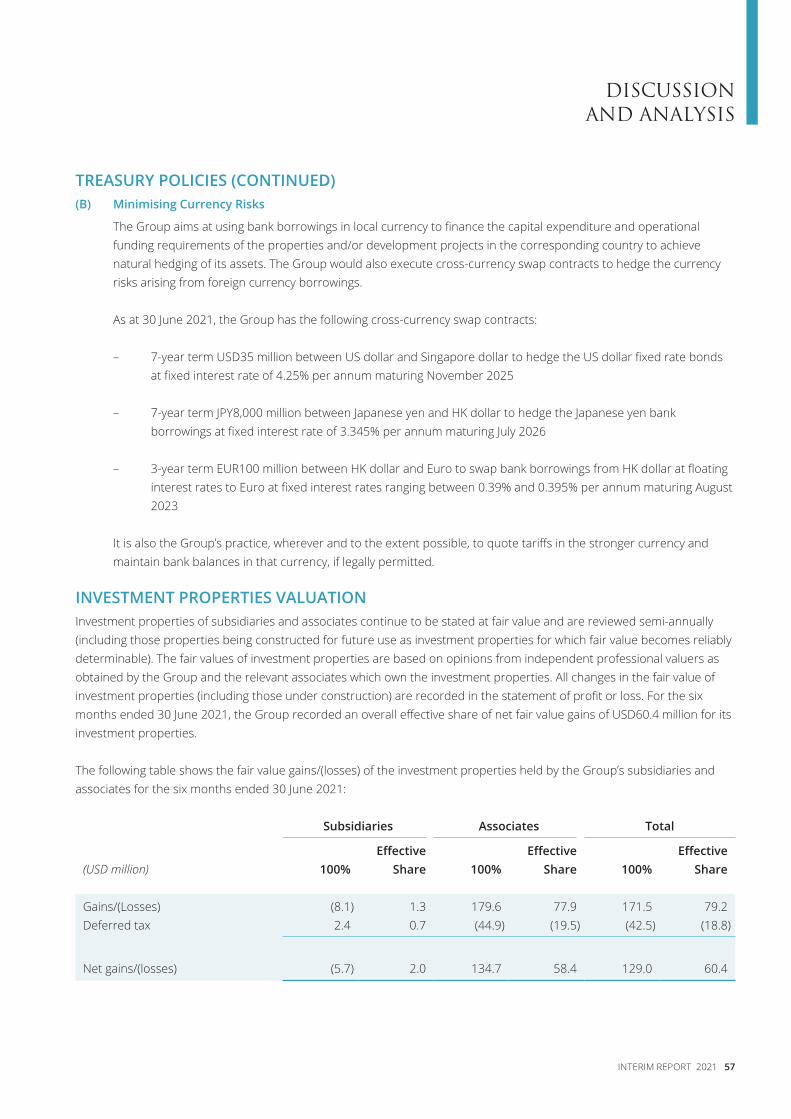
DISCUSSION AND ANALYSIS
INTERIM REPORT 2021 57
TREASURY POLICIES (CONTINUED)(B) Minimising Currency Risks
The Group aims at using bank borrowings in local currency to finance the capital expenditure and operational funding requirements of the properties and/or development projects in the corresponding country to achieve natural hedging of its assets. The Group would also execute cross-currency swap contracts to hedge the currency risks arising from foreign currency borrowings.
As at 30 June 2021, the Group has the following cross-currency swap contracts:
– 7-year term USD35 million between US dollar and Singapore dollar to hedge the US dollar fixed rate bonds at fixed interest rate of 4.25% per annum maturing November 2025
– 7-year term JPY8,000 million between Japanese yen and HK dollar to hedge the Japanese yen bank borrowings at fixed interest rate of 3.345% per annum maturing July 2026
– 3-year term EUR100 million between HK dollar and Euro to swap bank borrowings from HK dollar at floating interest rates to Euro at fixed interest rates ranging between 0.39% and 0.395% per annum maturing August 2023
It is also the Group’s practice, wherever and to the extent possible, to quote tariffs in the stronger currency and maintain bank balances in that currency, if legally permitted.
INVESTMENT PROPERTIES VALUATIONInvestment properties of subsidiaries and associates continue to be stated at fair value and are reviewed semi-annually (including those properties being constructed for future use as investment properties for which fair value becomes reliably determinable). The fair values of investment properties are based on opinions from independent professional valuers as obtained by the Group and the relevant associates which own the investment properties. All changes in the fair value of investment properties (including those under construction) are recorded in the statement of profit or loss. For the six months ended 30 June 2021, the Group recorded an overall effective share of net fair value gains of USD60.4 million for its investment properties.
The following table shows the fair value gains/(losses) of the investment properties held by the Group’s subsidiaries and associates for the six months ended 30 June 2021:
Subsidiaries Associates Total
(USD million) 100%Effective
Share 100%Effective
Share 100%Effective
Share
Gains/(Losses) (8.1) 1.3 179.6 77.9 171.5 79.2Deferred tax 2.4 0.7 (44.9) (19.5) (42.5) (18.8)
Net gains/(losses) (5.7) 2.0 134.7 58.4 129.0 60.4
DISCUSSION AND ANALYSIS
58 SHANGRI-LA ASIA LIMITED
IMPAIRMENT PROVISIONThe Group assesses the carrying value of a group-owned operating hotel when there is any indication that the assets may be impaired. Indicative criteria include continuing adverse changes in the local market conditions in which the hotel operates or will operate, or when the hotel continues to operate at a loss position or materially behind budget. At the end of the period, the Group assesses the carrying value of all group-owned operating hotels and properties under development. Based on the Group’s internal assessment at 30 June 2021, the Group provided impairment losses totalling USD22.3 million on 100% basis (USD13.2 million on effective share basis) for the property, plant and equipment of a hotel in Myanmar during the current period.
FINANCIAL ASSETS – TRADING SECURITIESAs at 30 June 2021, the market value of the Group’s investment portfolio was USD28.0 million, which mainly included 4,483,451 ordinary shares in Kerry Properties Limited amounting to USD14.8 million; 2,241,725 ordinary shares in Kerry Logistics Network Limited amounting to USD6.8 million; and 15,193,700 ordinary shares in Don Muang Tollway PCL amounting to USD6.4 million. The Group recorded effective share of gains of USD5.3 million and USD4.3 million through profit or loss and other comprehensive income, respectively for the six months ended 30 June 2021. Effective share of dividend income of USD0.8 million was recognised during the current period.
DEVELOPMENT PROGRAMMESConstruction work on the following projects is on-going:
(A) Hotel Developments
Group’s Equity
Interest Hotel RoomsProjectedOpening
In Mainland ChinaJEN Kunming by Shangri-La (part of a composite development
project in Kunming City)45% 274 2023
Shangri-La Zhengzhou 45% 314 2024
In JapanShangri-La Kyoto 100%* 80 2024
* Entered into a conditional sale and purchase agreement with an independent third party to dispose 80% of equity interest in April 2021, please refer to the section with heading “Disposal” for more details.
The Shangri-La and Traders Hongqiao Airport which will be operated under operating lease will open for business in 2024.
DISCUSSION AND ANALYSIS
INTERIM REPORT 2021 59
DEVELOPMENT PROGRAMMES (CONTINUED)(B) Composite Developments and Investment Property Developments
Group’sEquity
Interest
Total gross floor area upon completion(excluding hotel component)
(approximate in square metres) ScheduledCompletion
Residential Office Commercial
In Mainland ChinaShenyang Kerry Centre – Phase III 25% 308,985 71,448 74,530 2022 onwards*Kunming City Project 45% 20,917 – – 2023Phase II of Shangri-La Fuzhou 100% – 34,319 50,447 2023Composite development project in
Zhengzhou 45% 94,025 58,946 3,932 2023 onwards*Nanchang City Project – Phase II 20% – 57,630 2,100 2023Tianjin Kerry Centre – Phase II 20% 28,530 92,651 17,490 2025
TOTAL 452,457 314,994 148,499
* Being developed in phases
The Group is currently reviewing the development plans of the following projects:
Hotel development
– Wolong Bay in Dalian, Mainland China (wholly owned by the Group)– Shangri-La Kunming, Mainland China (45% equity interest owned by the Group)– Rome, Italy (wholly owned by the Group)– Lakeside Shangri-La, Yangon, Myanmar (55.86% equity interest owned by the Group)– Bangkok, Thailand (73.61% equity interest owned by the Group)
Composite development
– Accra, the Republic of Ghana (45% equity interest owned by the Group)
The Group continues to review its asset portfolio and may sell assets it considers non-core at an acceptable price and introduce strategic investors for some of its operating assets/development projects. The Group adjusts its development plans and investment strategy from time to time in response to changing market conditions and to improve the financial position of the Group.
DISCUSSION AND ANALYSIS
60 SHANGRI-LA ASIA LIMITED
DISPOSALIn April 2021, the Group entered into a sale and purchase agreement with an independent third party to dispose of its 80% equity interest in a project company which owns a parcel of land in Kyoto, Japan for the development of a luxury hotel at a cash consideration of approximately USD68.6 million, subject to adjustment. The completion of the sale and purchase agreement is conditional upon the fulfilment of certain conditions precedent and is expected to take place by the end of 2021. The Group’s equity interest in the project will be reduced from 100% to 20% after the completion of the transaction.
MANAGEMENT CONTRACTS FOR HOTELS OWNED BY THIRD PARTIESAs at the date of this report, the Group has management agreements for 19 operating hotels owned by third parties. In addition, the Group also has agreements on hand for the development of 9 new hotels currently under development and owned by third parties. The development projects are located in Nanning, Qiantan, Beijing, Shenzhen (2 hotels) and Hangzhou (Mainland China); Jeddah (Saudi Arabia), Phnom Penh (Cambodia) and Melbourne (Australia).
The Group continues to review proposals it receives for management opportunities and intends to secure management agreements for third-party owned hotels that do not require capital commitment in locations/cities which it considers to be of long-term strategic interest.
HUMAN RESOURCESAs at 30 June 2021, the Company and its subsidiaries had approximately 24,100 employees. The number of people employed by Shangri-La Group, including all operating hotels, was 39,100. Remuneration policies, share option scheme, share award scheme and training schemes have been consistently applied by the Group as disclosed in 2020 annual report.
DISCUSSION AND ANALYSIS
INTERIM REPORT 2021 61
PROSPECTSThe reduction of our group’s losses for first half of 2021 continued to be mainly driven by our hotels in Mainland China. Though the recovery in the region momentarily paused during early 2021 due to local outbreaks, the momentum quickly resumed after the Two Sessions meeting in mid-March. We witnessed a strong May performance helped by the pent-up demand, where the month achieved results that were even higher than in May 2019. Hong Kong and Australia also contributed towards the overall recovery as the spread of the virus was largely under control during the period, benefiting from domestic staycation demand, as well as quarantine businesses in Hong Kong.
With the continued restrictions in international travel in the foreseeable future, we remain focused on things we can control. Our top priority will always be the safety and wellbeing of our guests and colleagues, ensured through our “Shangri-La Cares” programme. We also actively encourage and provide support to our colleagues to take the COVID-19 vaccination as our efforts to help stop the spread of the virus in our communities. As at 25 August 2021, close to 90% of all our Group’s colleagues have received at least one dose of the vaccine.
We continue to keep up with innovation to capture the mindshare of today’s fast evolving consumers. As part of Shangri-La’s 50th Anniversary celebrations, we have launched a refreshed logo, presenting a more contemporary look and feel while maintaining the powerful equity of the brand. In May, we have also launched Shangri-La’s family experience brand Fam.ilyTM to target the family leisure market. We piloted immersive summer programs for families at some of our hotel properties, including a summer camp in Hong Kong, surfing program in Sanya, and a theatrical program at Shangri-La Qinhuangdao. On the F&B front, we have received great reception to our new flavours of dumplings during Dragonboat Festival, and we target to see similar results with our upcoming new flavours of mooncakes.
We remain vigilant with our costs and balance sheet. As at 30 June 2021, the Group had cash and cash equivalent of USD743 million and committed undrawn facilities of USD1.7 billion. As the spread of the pandemic has stabilised and pressure on cash needs has lessened, we took the opportunity to pay down some of our debt to help lower our future interest expense burden, reducing our total debt by USD158 million. We continue to conserve our accessible cash reserve by declaring no interim dividend and closely managing our capital expenditure. On 1 April 2021, we have also entered into a sale and purchase agreement with Samty Group, in which they will acquire an indirect 80% interest in our Kyoto project. Upon completion of the agreement at the end of the year, it will further strengthen the Group’s balance sheet.
As we enter the latter half of 2021, we continue to wait for the eventual resumption of normality. The global vaccination rate continues to climb and is building a stronger foundation to protect against COVID-19. As various countries such as UK, France and Turkey begin to relax their restrictions, we are seeing decent summer bookings from their respective local demand, demonstrating human beings’ innate desire of travelling and enjoying new experiences. However, the recent spread of the Delta variant in Mainland China is once again creating uncertainties on the momentum of recovery, where hotel occupancies in early August have already started to see negative impact as the lockdown measures are once again in place in affected provinces. In the remainder of the year, subject to the development of the latest outbreak, there should be opening of four managed hotels in Shougang Park (Beijing, China), Qiantan (China), Nanning (China) and Jeddah (Saudi Arabia). While uncertainties linger, we will continue to remain focused on priorities that are under our control, while keeping our eyes on the horizon for any recovery opportunities.
DISCUSSION AND ANALYSIS
62 SHANGRI-LA ASIA LIMITED
CORPORATE GOVERNANCEThe Company recognises the importance of transparency in governance and accountability to shareholders and that shareholders benefit from good corporate governance. The Company reviews its corporate governance framework on an ongoing basis to ensure compliance with best practices.
Directors Handbook
The Board has adopted a composite handbook (“Directors Handbook”) comprising (amongst other things) a set of principles for securities transactions by directors or any non-directors of the Company (“Securities Principles”) and a set of corporate governance principles of the Company, whose terms align with or are stricter than the requirements set out in the Model Code for Securities Transactions by Directors of Listed Issuers (“Securities Model Code”) as contained in Appendix 10 to the Rules Governing the Listing of Securities (“Listing Rules”) on The Stock Exchange of Hong Kong Limited (“HKSE”) and the code provisions under the Corporate Governance Code and Corporate Governance Report (“CG Model Code”) as contained in Appendix 14 to the Listing Rules, save for the provision in the Directors Handbook that the positions of the chairman and the chief executive officer of the Company may be served by the same person. The Directors Handbook serves as a comprehensive guidebook for all directors of the Company.
Code on Securities Transactions
The Company has made specific enquiry of each of the directors of the Company, and all the directors have confirmed compliance with the Securities Principles throughout the underlying six-month period.
Code on Corporate Governance
The Company has complied with the CG Model Code throughout the underlying six-month period.
Changes in Directors’ Information
There have been changes in the information of some of the directors since the date of the Company’s 2020 annual report. Details of the changes as reported to the Company and as required to be disclosed under Rule 13.51B(1) of the Listing Rules are as follows:
1. Mr YAP Chee Keong was appointed an independent non-executive director of Pacific International Lines (Pte) Limited on 30 March 2021 and ceased to act as an independent non-executive director of Maxeon Solar Technologies, Limited (listed on the Nasdaq) on 7 June 2021. He was appointed an independent non-executive director of Aviva Singlife Holdings Pte Limited on 25 August 2021.
2. Mr LI Xiaodong Forrest was appointed a member of the advisory council of Stanford University’s Graduate School of Business and the board of trustees for the National University of Singapore in September 2020 and April 2021, respectively.
3. On 28 May 2021:
(a) Mr HO Kian Guan retired as a non-executive director of the Company and ceased to act as a member of the Audit & Risk Committee.
(b) Mr HO Chung Tao ceased to act as the alternate director to Mr HO Kian Guan.
(c) Professor LI Kwok Cheung Arthur relinquished the role of the chairman of the Remuneration & Human Capital Committee.
(d) Ms KHOO Shulamite N K was appointed the chairman of the Remuneration & Human Capital Committee.
4. Ms KHOO Shulamite N K was appointed a member of the Audit & Risk Committee on 1 August 2021.
5. Professor LI Kwok Cheung Arthur was appointed a member of the Committee for the Basic Law of the Hong Kong SAR under the Standing Committee of the National People’s Congress on 20 August 2021.
DISCUSSION AND ANALYSIS
INTERIM REPORT 2021 63
AUDIT & RISK COMMITTEEReference is made to the announcement of the Company dated 21 May 2021 regarding the retirement of Mr HO Kian Guan as a Non-executive Director of the Company and member of the Audit & Risk Committee. Upon Mr HO’s retirement on 28 May 2021, the number of members of the Audit & Risk Committee was reduced to two members. Under the Listing Rules, the Audit & Risk Committee must comprise a minimum of three members and the Company is required to appoint members to fill any vacancies within three months if the number of members falls below three. On 1 August 2021, Ms KHOO Shulamite N K was appointed a member of the Audit & Risk Committee and accordingly, the Company has complied with the requirement for the Audit & Risk Committee to comprise a minimum of three members.
SIGNIFICANT SHAREHOLDERS’ INTERESTSAs at 30 June 2021, the interests and short positions of those persons (other than the directors of the Company) in shares and underlying shares in the Company as recorded in the register that is required to be kept by the Company under Section 336 of the Securities and Futures Ordinance (“SFO”) or as ascertained by the Company after reasonable enquiry were as follows:
Name Capacity
Number of ordinary shares
held
Approximate % of total issued
share of the Company
Substantial shareholdersKerry Group Limited (“KGL”)
(Note 1)Interest of controlled corporation(s) 1,799,537,010 50.189
Kerry Holdings Limited (“KHL”) (Notes 1 and 2)
Beneficial ownerInterest of controlled corporation(s)
87,237,0521,538,441,491
2.43342.907
Caninco Investments Limited Beneficial owner 568,568,684 15.857(“Caninco”) (Note 2) Interest of controlled corporation(s) 157,280,233 4.387
Paruni Limited (“Paruni”) Beneficial owner 382,904,547 10.679(Note 2) Interest of controlled corporation(s) 36,667,449 1.023
Other major shareholdersDarmex Holdings Limited
(“Darmex”) (Note 2)Beneficial owner 267,068,070 7.449
Kuok Brothers Sdn Berhad Beneficial owner 84,441,251 2.355Interest of controlled corporation(s) 227,043,761 6.332
Kuok (Singapore) Limited (“KSL”) (Note 3)
Interest of controlled corporation(s) 220,444,907 6.148
Baylite Company Limited (“Baylite”) (Note 3)
Beneficial owner 220,444,907 6.148
Notes:
1. KHL is a wholly owned subsidiary of KGL and accordingly, the shares in which KHL is shown as interested are also included in the shares in which KGL is shown as interested. The number of shares shown were the holdings as at 30 June 2021 and might be different from the latest public record having been filed by the relevant shareholder(s) before 30 June 2021 as required under SFO.
2. Caninco, Paruni and Darmex are wholly owned subsidiaries of KHL and accordingly, the shares in which Caninco, Paruni and Darmex are shown as interested are also included in the shares in which KHL is shown as interested. The number of shares shown were the holdings as at 30 June 2021 and might be different from the latest public record having been filed by the relevant shareholder(s) before 30 June 2021 as required under SFO.
3. Baylite is a wholly owned subsidiary of KSL and accordingly, the shares in which Baylite is shown as interested are also included in the shares in which KSL is shown as interested.
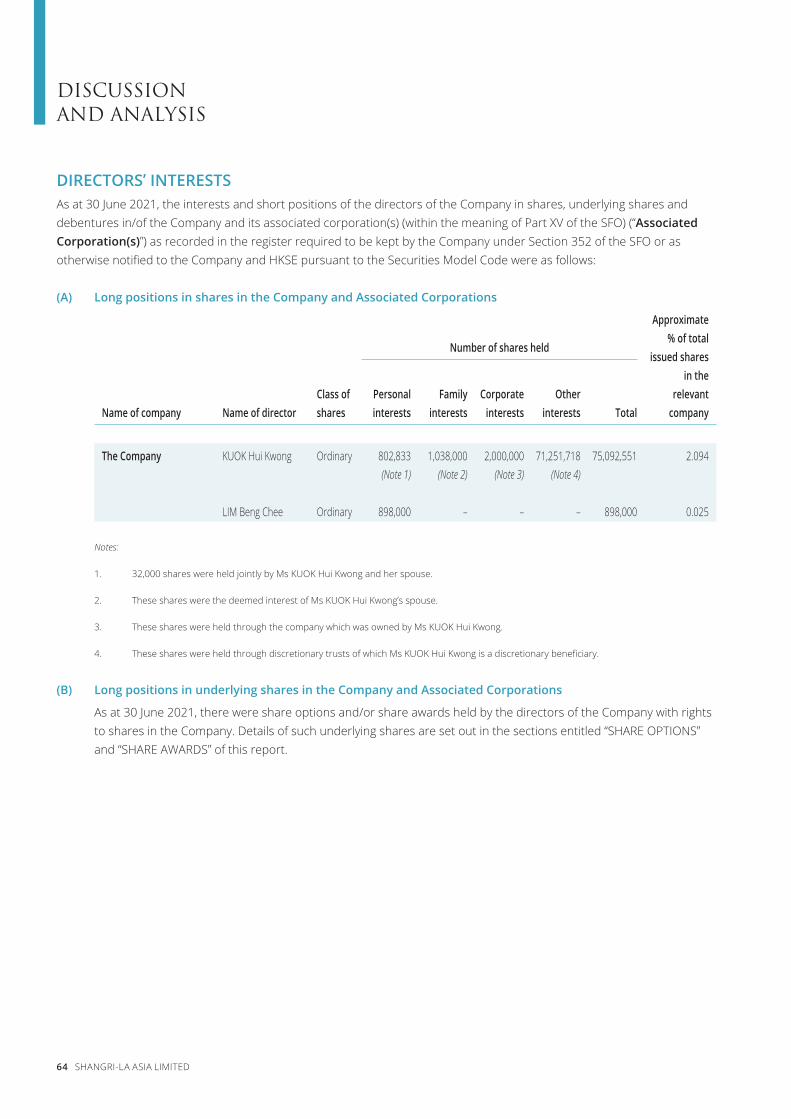
DISCUSSION AND ANALYSIS
64 SHANGRI-LA ASIA LIMITED
DIRECTORS’ INTERESTSAs at 30 June 2021, the interests and short positions of the directors of the Company in shares, underlying shares and debentures in/of the Company and its associated corporation(s) (within the meaning of Part XV of the SFO) (“Associated Corporation(s)”) as recorded in the register required to be kept by the Company under Section 352 of the SFO or as otherwise notified to the Company and HKSE pursuant to the Securities Model Code were as follows:
(A) Long positions in shares in the Company and Associated Corporations
Approximate% of total
issued shares in the
Number of shares held
Name of company Name of directorClass of shares
Personal interests
Family interests
Corporate interests
Other interests Total
relevant company
The Company KUOK Hui Kwong Ordinary 802,833 1,038,000 2,000,000 71,251,718 75,092,551 2.094 (Note 1) (Note 2) (Note 3) (Note 4)
LIM Beng Chee Ordinary 898,000 – – – 898,000 0.025
Notes:
1. 32,000 shares were held jointly by Ms KUOK Hui Kwong and her spouse.
2. These shares were the deemed interest of Ms KUOK Hui Kwong’s spouse.
3. These shares were held through the company which was owned by Ms KUOK Hui Kwong.
4. These shares were held through discretionary trusts of which Ms KUOK Hui Kwong is a discretionary beneficiary.
(B) Long positions in underlying shares in the Company and Associated Corporations
As at 30 June 2021, there were share options and/or share awards held by the directors of the Company with rights to shares in the Company. Details of such underlying shares are set out in the sections entitled “SHARE OPTIONS” and “SHARE AWARDS” of this report.
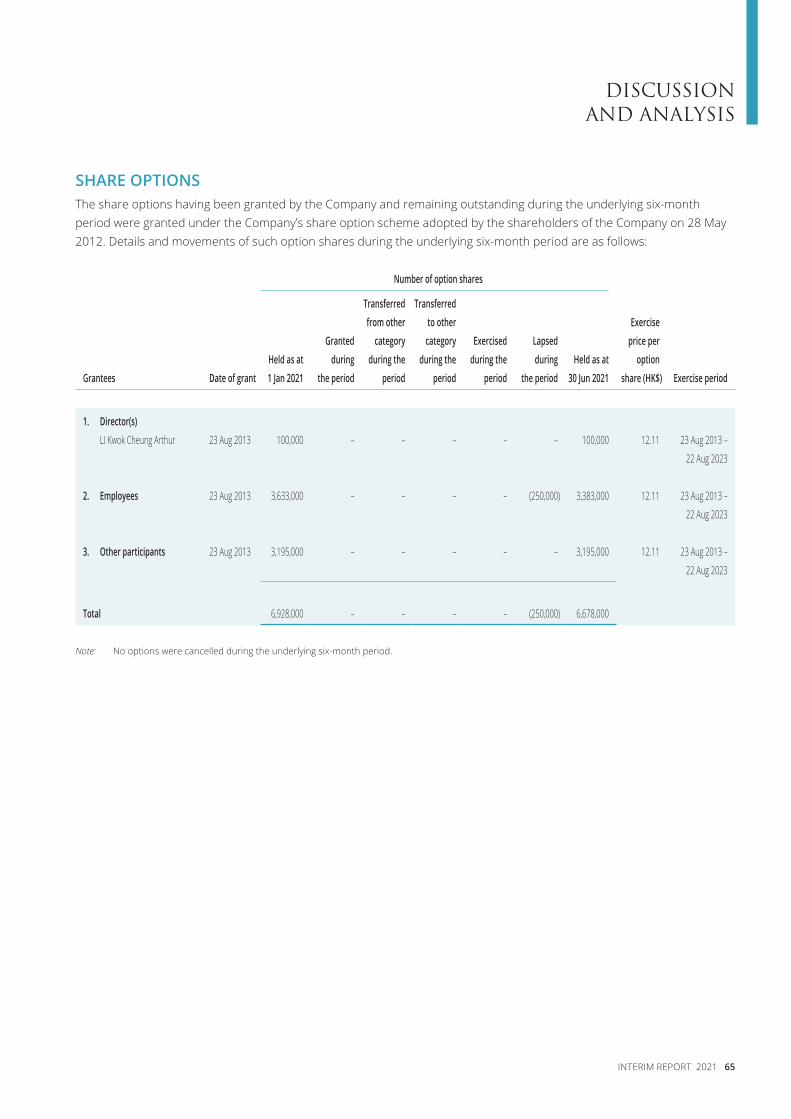
DISCUSSION AND ANALYSIS
INTERIM REPORT 2021 65
SHARE OPTIONSThe share options having been granted by the Company and remaining outstanding during the underlying six-month period were granted under the Company’s share option scheme adopted by the shareholders of the Company on 28 May 2012. Details and movements of such option shares during the underlying six-month period are as follows:
Number of option shares
Grantees Date of grantHeld as at 1 Jan 2021
Granted during
the period
Transferred from other
category during the
period
Transferred to other
category during the
period
Exercised during the
period
Lapsed during
the periodHeld as at
30 Jun 2021
Exercise price per
option share (HK$) Exercise period
1. Director(s)LI Kwok Cheung Arthur 23 Aug 2013 100,000 – – – – – 100,000 12.11 23 Aug 2013 –
22 Aug 2023
2. Employees 23 Aug 2013 3,633,000 – – – – (250,000) 3,383,000 12.11 23 Aug 2013 –
22 Aug 2023
3. Other participants 23 Aug 2013 3,195,000 – – – – – 3,195,000 12.11 23 Aug 2013 –
22 Aug 2023
Total 6,928,000 – – – – (250,000) 6,678,000
Note: No options were cancelled during the underlying six-month period.
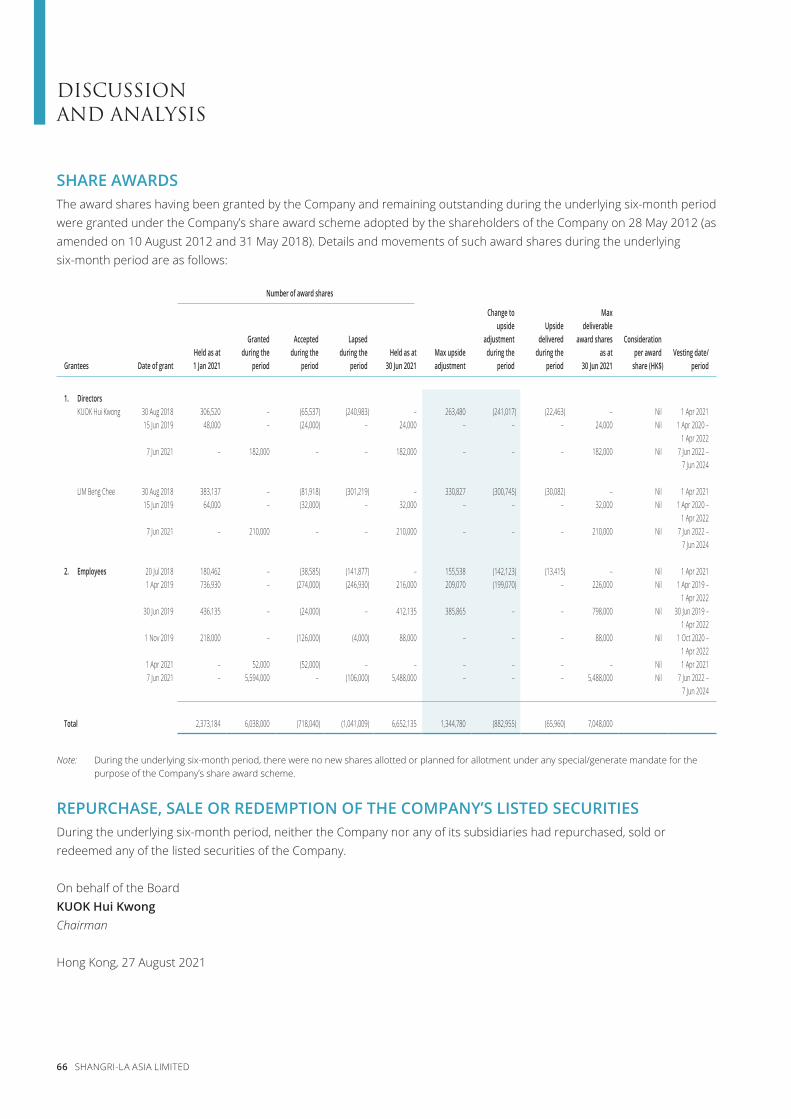
DISCUSSION AND ANALYSIS
66 SHANGRI-LA ASIA LIMITED
SHARE AWARDSThe award shares having been granted by the Company and remaining outstanding during the underlying six-month period were granted under the Company’s share award scheme adopted by the shareholders of the Company on 28 May 2012 (as amended on 10 August 2012 and 31 May 2018). Details and movements of such award shares during the underlying six-month period are as follows:
Number of award shares
Grantees Date of grantHeld as at 1 Jan 2021
Granted during the
period
Accepted during the
period
Lapsed during the
periodHeld as at
30 Jun 2021Max upside adjustment
Change to upside
adjustment during the
period
Upside delivered
during the period
Max deliverable
award shares as at
30 Jun 2021
Consideration per award
share (HK$)Vesting date/
period
1. DirectorsKUOK Hui Kwong 30 Aug 2018 306,520 – (65,537) (240,983) – 263,480 (241,017) (22,463) – Nil 1 Apr 2021
15 Jun 2019 48,000 – (24,000) – 24,000 – – – 24,000 Nil 1 Apr 2020 – 1 Apr 2022
7 Jun 2021 – 182,000 – – 182,000 – – – 182,000 Nil 7 Jun 2022 – 7 Jun 2024
LIM Beng Chee 30 Aug 2018 383,137 – (81,918) (301,219) – 330,827 (300,745) (30,082) – Nil 1 Apr 202115 Jun 2019 64,000 – (32,000) – 32,000 – – – 32,000 Nil 1 Apr 2020 –
1 Apr 20227 Jun 2021 – 210,000 – – 210,000 – – – 210,000 Nil 7 Jun 2022 –
7 Jun 2024
2. Employees 20 Jul 2018 180,462 – (38,585) (141,877) – 155,538 (142,123) (13,415) – Nil 1 Apr 20211 Apr 2019 736,930 – (274,000) (246,930) 216,000 209,070 (199,070) – 226,000 Nil 1 Apr 2019 –
1 Apr 202230 Jun 2019 436,135 – (24,000) – 412,135 385,865 – – 798,000 Nil 30 Jun 2019 –
1 Apr 20221 Nov 2019 218,000 – (126,000) (4,000) 88,000 – – – 88,000 Nil 1 Oct 2020 –
1 Apr 20221 Apr 2021 – 52,000 (52,000) – – – – – – Nil 1 Apr 20217 Jun 2021 – 5,594,000 – (106,000) 5,488,000 – – – 5,488,000 Nil 7 Jun 2022 –
7 Jun 2024
Total 2,373,184 6,038,000 (718,040) (1,041,009) 6,652,135 1,344,780 (882,955) (65,960) 7,048,000
Note: During the underlying six-month period, there were no new shares allotted or planned for allotment under any special/generate mandate for the purpose of the Company’s share award scheme.
REPURCHASE, SALE OR REDEMPTION OF THE COMPANY’S LISTED SECURITIESDuring the underlying six-month period, neither the Company nor any of its subsidiaries had repurchased, sold or redeemed any of the listed securities of the Company.
On behalf of the BoardKUOK Hui KwongChairman
Hong Kong, 27 August 2021