Embed Size (px)
DESCRIPTION
Â
Citation preview
ML Lesson Planning
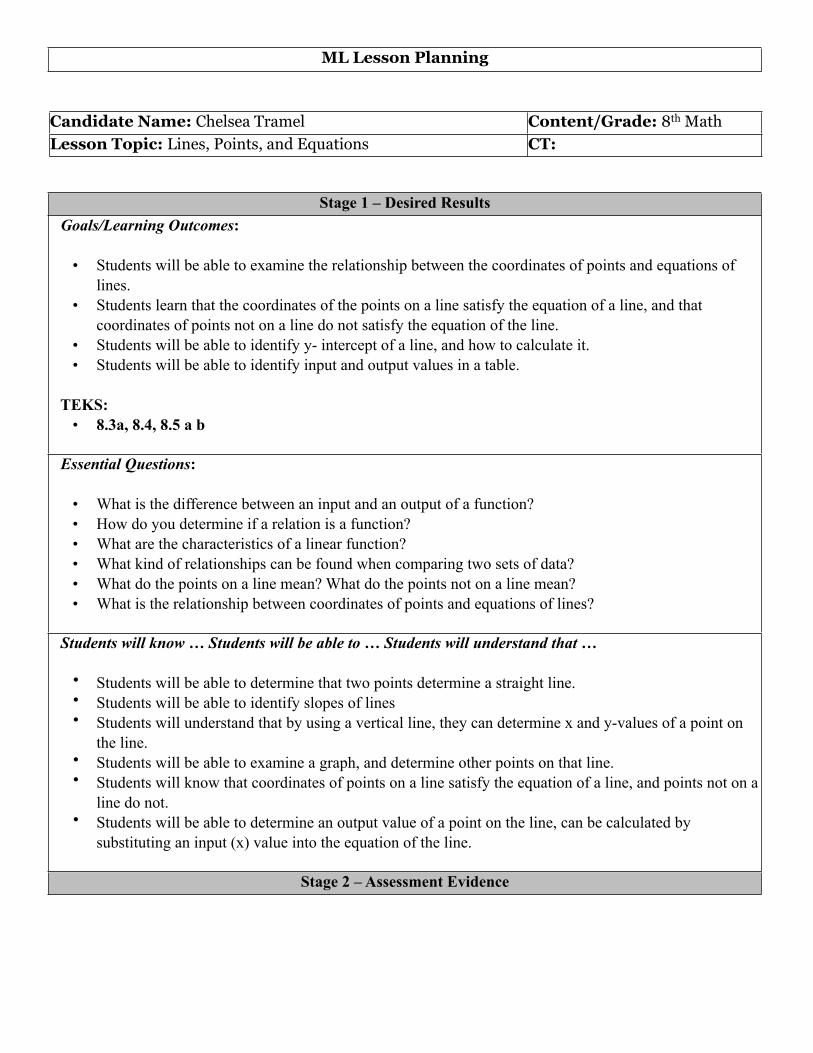
Candidate Name: Chelsea Tramel Content/Grade: 8th Math Lesson Topic: Lines, Points, and Equations CT:
Stage 1 – Desired ResultsStage 1 – Desired Results Goals/Learning Outcomes:
• Students will be able to examine the relationship between the coordinates of points and equations of lines.
• Students learn that the coordinates of the points on a line satisfy the equation of a line, and that coordinates of points not on a line do not satisfy the equation of the line.
• Students will be able to identify y- intercept of a line, and how to calculate it. • Students will be able to identify input and output values in a table.
TEKS: • 8.3a, 8.4, 8.5 a b
Goals/Learning Outcomes:
• Students will be able to examine the relationship between the coordinates of points and equations of lines.
• Students learn that the coordinates of the points on a line satisfy the equation of a line, and that coordinates of points not on a line do not satisfy the equation of the line.
• Students will be able to identify y- intercept of a line, and how to calculate it. • Students will be able to identify input and output values in a table.
TEKS: • 8.3a, 8.4, 8.5 a b
Essential Questions:
• What is the difference between an input and an output of a function? • How do you determine if a relation is a function?• What are the characteristics of a linear function? • What kind of relationships can be found when comparing two sets of data? • What do the points on a line mean? What do the points not on a line mean? • What is the relationship between coordinates of points and equations of lines?
Students will know … Students will be able to … Students will understand that …
• Students will be able to determine that two points determine a straight line.• Students will be able to identify slopes of lines• Students will understand that by using a vertical line, they can determine x and y-values of a point on
the line.• Students will be able to examine a graph, and determine other points on that line. • Students will know that coordinates of points on a line satisfy the equation of a line, and points not on a
line do not. • Students will be able to determine an output value of a point on the line, can be calculated by
substituting an input (x) value into the equation of the line.
Stage 2 – Assessment EvidenceStage 2 – Assessment Evidence
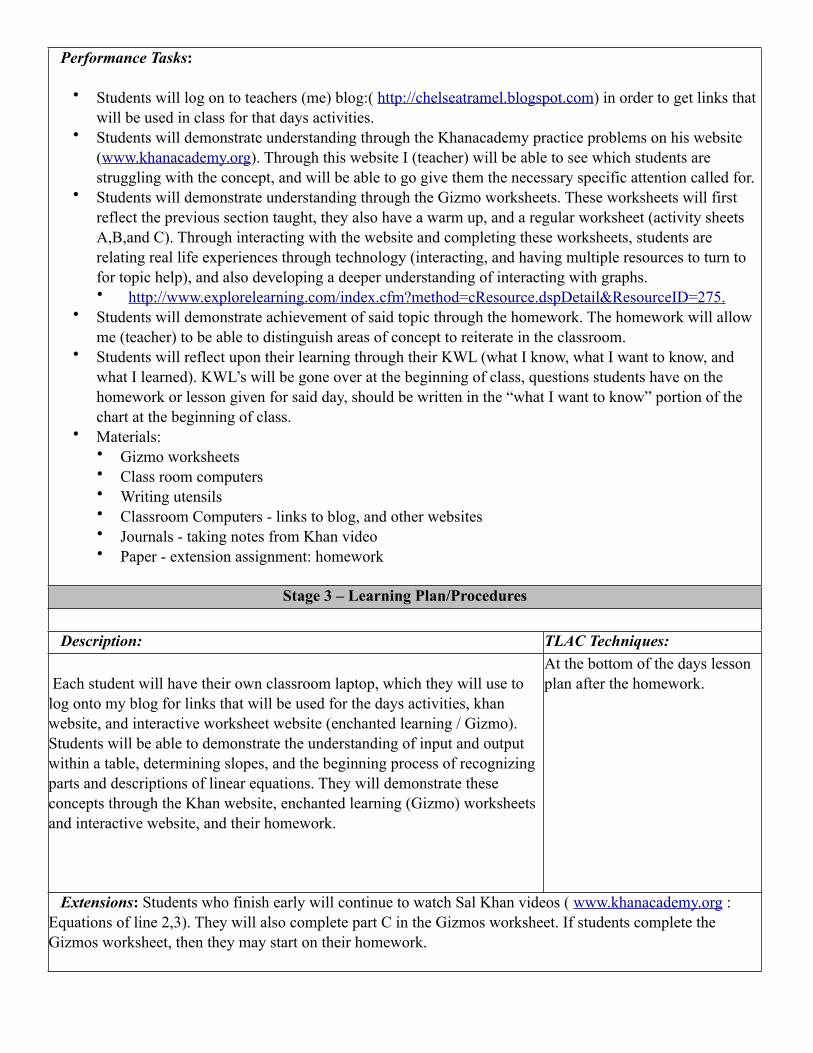
Performance Tasks:
• Students will log on to teachers (me) blog:( http://chelseatramel.blogspot.com) in order to get links that will be used in class for that days activities.
• Students will demonstrate understanding through the Khanacademy practice problems on his website (www.khanacademy.org). Through this website I (teacher) will be able to see which students are struggling with the concept, and will be able to go give them the necessary specific attention called for.
• Students will demonstrate understanding through the Gizmo worksheets. These worksheets will first reflect the previous section taught, they also have a warm up, and a regular worksheet (activity sheets A,B,and C). Through interacting with the website and completing these worksheets, students are relating real life experiences through technology (interacting, and having multiple resources to turn to for topic help), and also developing a deeper understanding of interacting with graphs. • http://www.explorelearning.com/index.cfm?method=cResource.dspDetail&ResourceID=275.
• Students will demonstrate achievement of said topic through the homework. The homework will allow me (teacher) to be able to distinguish areas of concept to reiterate in the classroom.
• Students will reflect upon their learning through their KWL (what I know, what I want to know, and what I learned). KWL’s will be gone over at the beginning of class, questions students have on the homework or lesson given for said day, should be written in the “what I want to know” portion of the chart at the beginning of class.
• Materials: • Gizmo worksheets• Class room computers• Writing utensils • Classroom Computers - links to blog, and other websites• Journals - taking notes from Khan video• Paper - extension assignment: homework
Stage 3 – Learning Plan/ProceduresStage 3 – Learning Plan/Procedures
Description: TLAC Techniques:
Each student will have their own classroom laptop, which they will use to log onto my blog for links that will be used for the days activities, khan website, and interactive worksheet website (enchanted learning / Gizmo). Students will be able to demonstrate the understanding of input and output within a table, determining slopes, and the beginning process of recognizing parts and descriptions of linear equations. They will demonstrate these concepts through the Khan website, enchanted learning (Gizmo) worksheets and interactive website, and their homework.
At the bottom of the days lesson plan after the homework.
Extensions: Students who finish early will continue to watch Sal Khan videos ( www.khanacademy.org : Equations of line 2,3). They will also complete part C in the Gizmos worksheet. If students complete the Gizmos worksheet, then they may start on their homework.
Extensions: Students who finish early will continue to watch Sal Khan videos ( www.khanacademy.org : Equations of line 2,3). They will also complete part C in the Gizmos worksheet. If students complete the Gizmos worksheet, then they may start on their homework.
Modifications: For students with special needs, I will be monitoring their progress with the concept closely, and will help when it is needed; giving the students individual attention necessary for them to master the concept. Based on my judgements of how well they are grasping the outcomes given for the day, I will determine whether or not they need to go to the content mastery lab for further assistance.
Modifications: For students with special needs, I will be monitoring their progress with the concept closely, and will help when it is needed; giving the students individual attention necessary for them to master the concept. Based on my judgements of how well they are grasping the outcomes given for the day, I will determine whether or not they need to go to the content mastery lab for further assistance.
Day 1 1. Upon entering the class, students will know to get their Journals before they take their seat.
2. Folder will be sitting on desk with GIZMOS (explore learning) student exploration sheets for
introduction to points, lines, and equations. Students will also need to take the vocabulary sheet with
definitions to use as a reference during the lesson, and part of their notes. Students will be able to get
the internet links used in class through my blog. Each student will have a classroom laptop already
on their desk upon arriving to class. They will use this laptop to go to the interactive links being used
a. Teachers Blog: http://chelseatramel.blogspot.com
b. Explore Learning:
i. Gizmos: http://www.explorelearning.com/index.cfm?
method=cResource.dspDetail&ResourceID=275
1. Log in: chelsea.tramel
2. Password: bend1218021
3. (10 min ) Warm up - Fill out the KWL, and prior knowledge questions from Gizmo & Gizmo
warm up
a. Gizmos:
i. http://www.explorelearning.com/index.cfm?method=cResource.dspDetail&ResourceID=275
1. Log in: chelsea.tramel
2. Password: bend1218021
4. (5-10 min) go over KWL questions, and GIZMO prior knowledge questions and warm up
5. (45 min) Intro: Show Salman Khan videos
a. Students will use wallwisher.com for parking lot during videos. The link will be given to the
students via my blog.
i. Teacher Blog: http://chelseatramel.blogspot.com
ii.WALL LINK: http://www.wallwisher.com/wall/chelseatramel

b. KHANACADAMY:
i. http://www.khanacademy.org/
ii. Your Coach ID is http://facebookid.khanacademy.org/62007725.
iii. Developmental Math 2 Section: During videos, students will be taking their own notes in
their classroom journals, also during the videos students will post any questions they may
have to wallwisher.com. The teacher (me) will check wallwisher.com after every video for
questions. After watching videos, students will do the practice portion of the equation of a line
1 video, on the website, teacher will be watching students as they do their work, and be able
to recognize which students need individual help.
1. (5.20 min) Application Problem With Graph : http://www.khanacademy.org/video/
application-problem-with-graph?playlist=Developmental+Math+2
a. Check wallwisher.com for questions and answer
2. (4 min) Slope 1 video : http://www.khanacademy.org/video/graphical-slope-of-a-line?
playlist=Developmental+Math+2
a. Check wallwisher.com for questions and answer
3. (7.12 min) Slope 2 video : http://www.khanacademy.org/video/slope-of-a-line-2?
playlist=Developmental+Math+2
a. Check wallwisher.com for questions and answer
4. (5.05 min) Slope 3 video : http://www.khanacademy.org/video/slope-of-a-line-3?
playlist=Developmental+Math+2
a. Check wallwisher.com for questions and answer
5. (3.46 min) Equation of a line: http://www.khanacademy.org/video/equation-of-a-line-1?
playlist=Developmental+Math+2
a. Check wallwisher.com for questions and answer
b. (remainder of time / about 30 min) Practice concept on webpage: http://
www.khanacademy.org/exercises?exid=plugging_in_values
i. Monitor student activity on site, and students that need individual attention, go help
them.
2. (30 min) Students are to start on Gizmos: assessment questions: lines, points, & equations ( students
should get through at least A and B on the worksheets)
3. Homework: Online math book: p. 319 2-16 even & p. 324 2-22 even - remember to use the
homework website & interactive tools in GIZMOS for help if you get stuck!
b. Textbook URL:
ii. Username: cmseast
iii.Password: broncos
iv.Click on Algebra 1 book
2. http://my.hrw.com/
v. http://go.hrw.com/gopages/ma.html
c. Homework help website: (Sections : 5-3 & 5-4)
ii. http://go.hrw.com/hrw.nd/gohrw_rls1/pKeywordResults?keyword=MA7+HWHelp
4. TLAC: Shortest Path, Everybody writes, Do it again
Bibliography
P o i n t s , l i n e s , a n d e q u a t i o n s . ( n . d . ) . R e t r i e v e d f r o m h t t p : / /w w w. e x p l o r e l e a r n i n g . c o m / i n d e x . c f m ?m e t h o d = c R e s o u r c e . d s p D e t a i l & R e s o u r c e I D = 2 7 5
K h a n , S . ( n . d . ) . a p p l i c a t i o n p r o b l e m w i t h g r a p h . R e t r i e v e d f r o m http://www.khanacademy.org/video/application-problem-with-graph?playlist=Developmental+Math+2
K h a n , S . ( n . d . ) . S l o p e 1 v i d e o . R e t r i e v e d f r o m http://www.khanacademy.org/video/graphical-slope-of-a-line?playlist=Developmental+Math+2
K h a n , S . ( n . d . ) . S l o p e 2 v i d e o . R e t r i e v e d f r o m http://www.khanacademy.org/video/slope-of-a-line-2?playlist=Developmental+Math+2
K h a n , S . ( n . d . ) . S l o p e 3 v i d e o . R e t r i e v e d f r o m http://www.khanacademy.org/video/slope-of-a-line-3?playlist=Developmental+Math+2
K h a n , S . ( n . d . ) . E q u a t i o n o f a l i n e . R e t r i e v e d f r o m h t t p : / /w w w. k h a n a c a d e m y. o r g / v i d e o / e q u a t i o n - o f - a - l i n e - 1 ? p l a y l i s t = D e v e l o p m e n t a l M a t h 2
K h a n , S . ( n . d . ) . P l u g g i n g i n v a l u e s . R e t r i e v e d f r o m h t t p : / /w w w. k h a n a c a d e m y. o r g / e x e r c i s e s ? e x i d = p l u g g i n g _ i n _ v a l u e s
B u r g e r , E . , C h a r d , D . , H a l l , E . , K e n n e d y, P. , L e i n w a n t , S . , R e n f r o , F. , S e y m o u r , D . , & Wa i t s , B . ( 2 0 0 7 ) . L i n e a r f u n c t i o n s . ( p p . 2 9 2 - ) . O r l a n d o , A u s t i n , N e w Yo r k , S a n D i e g o , L o n d o n : A H a r c o u r t E d u c a t i o n C o m p a n y R e t r i e v e d f r o m h t t p : / / m y. h r w. c o m / t a b n a v / c o n t r o l l e r . j s p ? i s b n = 0 0 3 0 9 2 1 5 7 0
T r a m e l , C . ( 2 0 1 1 , N o v e m b e r 5 ) . P a r k i n g l o t . R e t r i e v e d f r o m h t t p : / /w w w. w a l l w i s h e r . c o m / w a l l / c h e l s e a t r a m e l
O ' M A L L E Y, M . ( n . d . ) . M r s . o ' m a l l e ' y s w e b s i t e . R e t r i e v e d f r o m h t t p : / /t e a c h e r s . g r e e n v i l l e . k 1 2 . s c . u s / s i t e s / m o m a l l e y / P a g e s / 8 t h G r d M a t h C o u r s e 3 E s s e n t i a l Q u e s t i o n s . a s p x
N a t h e r s o n , M . ( n . d . ) . M i s s . n a t h e r s o n 4 c . R e t r i e v e d f r o m h t t p : / /w w w. c o p p e l l i s d . c o m / 1 5 2 9 2 0 8 1 3 1 0 5 0 5 0 9 9 3 / s i t e / d e f a u l t . a s p
C o l e m a n , K . ( n . d . ) . M i s s c o l e m a n 5 b . R e t r i e v e d f r o m h t t p : / /w w w. c o p p e l l i s d . c o m / 1 5 2 9 2 0 8 1 3 1 0 5 0 3 0 7 9 0 / s i t e / d e f a u l t . a s p
C h a p m a n , G . ( n . d . ) . M r s . c h a p m a n . R e t r i e v e d f r o m h t t p : / / w w w. c o p p e l l i s d . c o m /1 5 2 1 2 0 8 1 9 1 0 3 5 7 5 3 0 / s i t e / d e f a u l t . a s p

Teacher Guide: Points, Lines, and EquationsLearning ObjectivesStudents will…
• Discover that two points determine a straight line.• Use a vertical line (probe) to determine the x- and y-values of a point on the line.• Examine a table of input-output values that list the coordinates of select points on a line.• Examine the graph of a line to identify other points that lie on the line.• Discover that the coordinates of points on a line satisfy the equation of the line, and that
the coordinates of points not on the line do not satisfy the equation of the line. • See how the output (y) value of a point on the line can be calculated by substituting an
input (x) value into the equation of the line.
Vocabularycoordinates, equation, input, ordered pair, output, x-intercept, y-intercept
Lesson OverviewIn the Points, Lines, and Equations Gizmo™, students can plot two points in quadrant I in a coordinate plane and see part of the line determined by the points. Students can use a probe to determine the coordinates of other points on the line and access a table of input-output values of points on the line.
The Student Exploration sheet contains three activities: • Activity A – Students examine the relationship between
the coordinates of points and the equation of a line.• Activity B – Students discover that the coordinates of
points on a line satisfy the equation of the line, and that coordinates of points not on a line do not.
• Activity C – Students use the Gizmo to identify the y-intercept of a line and how to calculate it.
Suggested Lesson Sequence
1. Pre-Gizmo activity ( 10 – 20 minutes)This lesson is about helping students see multiple representations of a line: as an equation, as a graph, and as a set of ordered pairs in a table. You might want to begin this lesson by seeing if students remember how to plot points in the coordinate plane. For example, where would they plot the point (4, 5)?
Display a coordinate grid and demonstrate how to plot the point. Then, ask students to volunteer other ordered pairs and have them plot each point. Include ordered pairs that contain 0 as a coordinate, such as (4, 0) and (0, 6), and ordered pairs that contain negative values, such as (–1, 5), (–3, –3), and (–5, 4). Include non-integer points as well, such as (3.5, 2.8).
2. Prior to using the Gizmo ( 10 – 15 minutes)Before students are at the computers, pass out the Student Exploration sheets and ask students to complete the Prior Knowledge Questions. Discuss student answers as a
class. Afterwards, if possible, use a projector to introduce the Gizmo and demonstrate its basic operations. Show students how to take snapshots in the Gizmo and paste the images into a blank document.
3. Gizmo activities ( 15 – 20 minutes per activity)Assign students to computers, individually or in pairs. Have students work through the Student Exploration (SE) sheet, using the Gizmo. (Or, you can use a projector and do the SE as a teacher-led activity.) Either way, we recommend doing page 1 of the SE (Prior Knowledge Questions and Gizmo Warm-up) plus one of the SE activities.
*ELL Adaptation* - Some students may have difficulty translating equations of lines into ordinary language. Explain that an equation is a mathematical sentence that is a short-cut way to show how two numbers are related. That is, the value of one number called y is based on an expression involving a second number called x. In this Gizmo, the value of y is an expression involving x, numbers, and operations. Emphasize the differences between addition/subtraction signs and positive/negative signs for numbers.
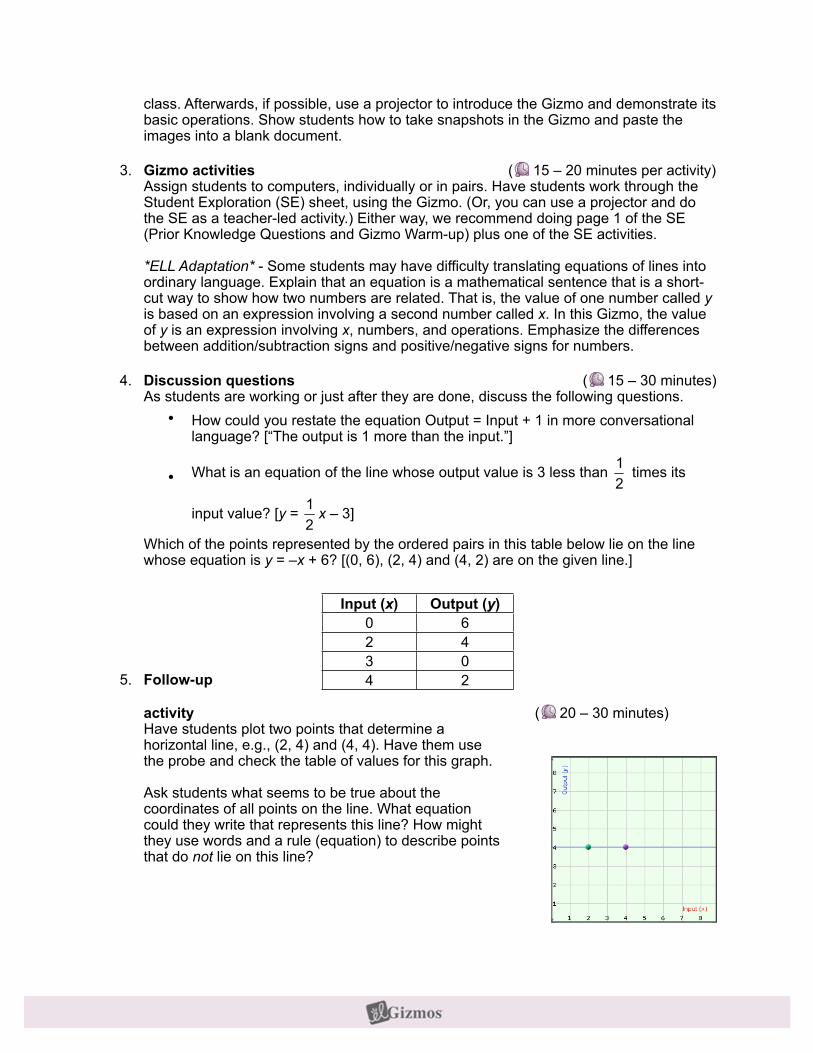
4. Discussion questions ( 15 – 30 minutes)As students are working or just after they are done, discuss the following questions.
• How could you restate the equation Output = Input + 1 in more conversational language? [“The output is 1 more than the input.”]
• What is an equation of the line whose output value is 3 less than times its
input value? [y = x – 3]
Which of the points represented by the ordered pairs in this table below lie on the line whose equation is y = –x + 6? [(0, 6), (2, 4) and (4, 2) are on the given line.]
5. Follow-up
activity ( 20 – 30 minutes)Have students plot two points that determine a horizontal line, e.g., (2, 4) and (4, 4). Have them use the probe and check the table of values for this graph.
Ask students what seems to be true about the coordinates of all points on the line. What equation could they write that represents this line? How might they use words and a rule (equation) to describe points that do not lie on this line?
Input (x) Output (y)0 62 43 04 2
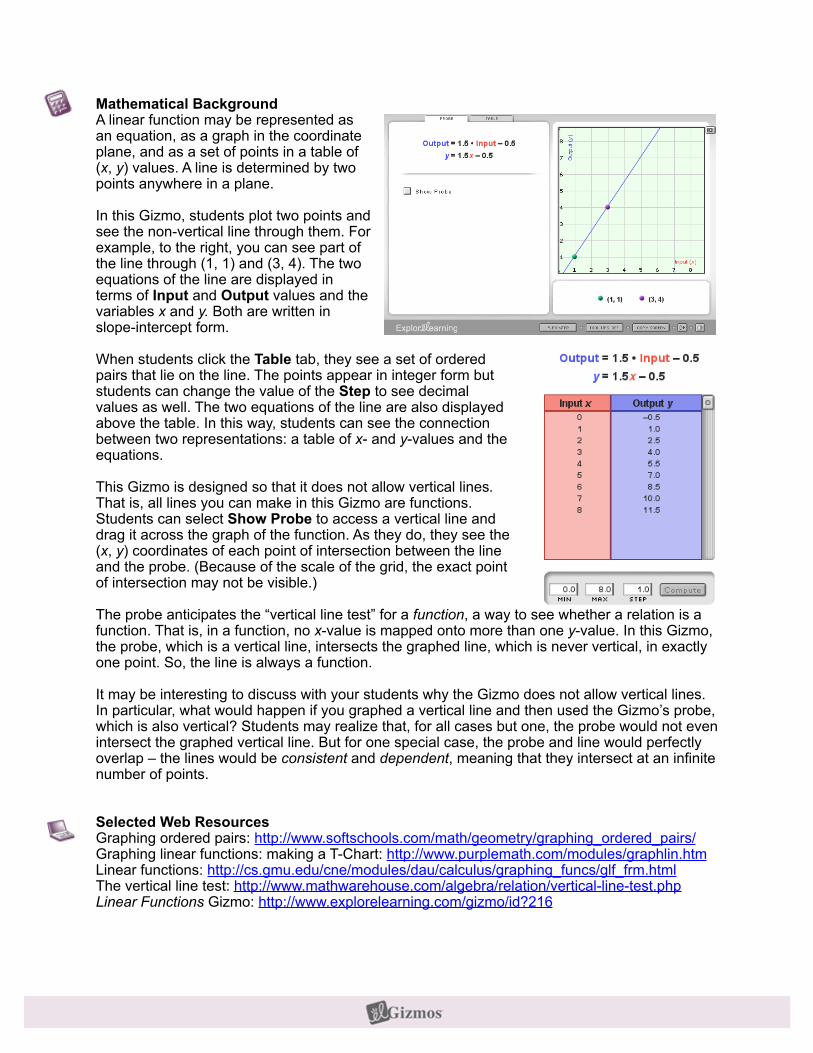
Mathematical BackgroundA linear function may be represented as an equation, as a graph in the coordinate plane, and as a set of points in a table of (x, y) values. A line is determined by two points anywhere in a plane.
In this Gizmo, students plot two points and see the non-vertical line through them. For example, to the right, you can see part of the line through (1, 1) and (3, 4). The two equations of the line are displayed in terms of Input and Output values and the variables x and y. Both are written in slope-intercept form.
When students click the Table tab, they see a set of ordered pairs that lie on the line. The points appear in integer form but students can change the value of the Step to see decimal values as well. The two equations of the line are also displayed above the table. In this way, students can see the connection between two representations: a table of x- and y-values and the equations.
This Gizmo is designed so that it does not allow vertical lines. That is, all lines you can make in this Gizmo are functions. Students can select Show Probe to access a vertical line and drag it across the graph of the function. As they do, they see the (x, y) coordinates of each point of intersection between the line and the probe. (Because of the scale of the grid, the exact point of intersection may not be visible.)
The probe anticipates the “vertical line test” for a function, a way to see whether a relation is a function. That is, in a function, no x-value is mapped onto more than one y-value. In this Gizmo, the probe, which is a vertical line, intersects the graphed line, which is never vertical, in exactly one point. So, the line is always a function.
It may be interesting to discuss with your students why the Gizmo does not allow vertical lines. In particular, what would happen if you graphed a vertical line and then used the Gizmo’s probe, which is also vertical? Students may realize that, for all cases but one, the probe would not even intersect the graphed vertical line. But for one special case, the probe and line would perfectly overlap – the lines would be consistent and dependent, meaning that they intersect at an infinite number of points.
Selected Web ResourcesGraphing ordered pairs: http://www.softschools.com/math/geometry/graphing_ordered_pairs/ Graphing linear functions: making a T-Chart: http://www.purplemath.com/modules/graphlin.htm Linear functions: http://cs.gmu.edu/cne/modules/dau/calculus/graphing_funcs/glf_frm.html The vertical line test: http://www.mathwarehouse.com/algebra/relation/vertical-line-test.phpLinear Functions Gizmo: http://www.explorelearning.com/gizmo/id?216
Vocabulary: Points, Lines, and Equations
Vocabulary
• Coordinates – a set of numbers that names the location of a point.o In the two-dimensional coordinate plane, it takes two numbers (x, y) to specify a
location.o The (x, y) coordinates of a point are called an ordered pair.
• Equation – a mathematical sentence stating that two expressions are equal.o For example, 3 + 4 = 7, 3x + 2 = –5, and y = 5x are equations.
• Input – a value of x that can be substituted into an equation to find the corresponding output or y-value.
o In the equation y = x + 1, if the input is 3, the output is 4.o An input value is the first element in an ordered pair. For example, in the ordered
pair, (3, 4), the number 3 is the input.
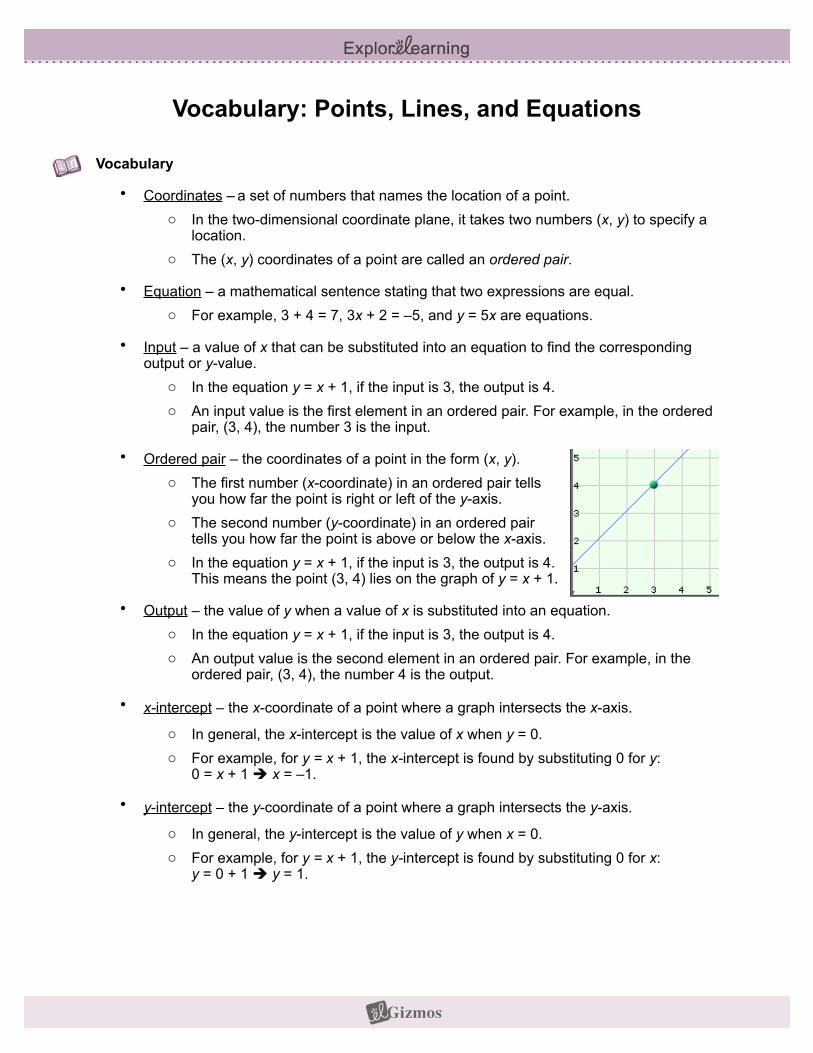
• Ordered pair – the coordinates of a point in the form (x, y).o The first number (x-coordinate) in an ordered pair tells
you how far the point is right or left of the y-axis.o The second number (y-coordinate) in an ordered pair
tells you how far the point is above or below the x-axis.o In the equation y = x + 1, if the input is 3, the output is 4.
This means the point (3, 4) lies on the graph of y = x + 1.
• Output – the value of y when a value of x is substituted into an equation.o In the equation y = x + 1, if the input is 3, the output is 4.o An output value is the second element in an ordered pair. For example, in the
ordered pair, (3, 4), the number 4 is the output.
• x-intercept – the x-coordinate of a point where a graph intersects the x-axis.o In general, the x-intercept is the value of x when y = 0.o For example, for y = x + 1, the x-intercept is found by substituting 0 for y:
0 = x + 1 ! x = –1.
• y-intercept – the y-coordinate of a point where a graph intersects the y-axis.o In general, the y-intercept is the value of y when x = 0.o For example, for y = x + 1, the y-intercept is found by substituting 0 for x:
y = 0 + 1 ! y = 1.

Name: ______________________________________ Date: ________________________
Student Exploration: Points, Lines, and Equations
Vocabulary: coordinates, equation, input, ordered pair, output, x-intercept, y-intercept
Prior Knowledge Questions (Do these BEFORE using the Gizmo.)You can use words or pictures to give directions.
1. On the street map to the right, each square represents one block. To get from place to place, stay on the streets shown.
A. Draw a path on the map to show how you could get from the theater to the library. (Stay on the street grid shown.)
B. Use the compass points (north, south, east, and west) to describe the path you drew along the streets.
___________________________________________________________________
2. Points on a grid are another way to represent locations on a map. The location of a point is given by its coordinates, a pair of numbers written in the form (x, y) or (input, output).
A. What are the coordinates of the theater? ______________
B. What are the coordinates of the library? _______________
Gizmo Warm-upIn the Points, Lines, and Equations Gizmo™, you can plot two points and see the line through them and their coordinates.
1. Drag one of the points in the Gizmo and describe what happens.
____________________________________________________
____________________________________________________
2. Drag the points to (2, 3) and (6, 5). What is the equation of this line? __________________
3. Select Show Probe and drag the red probe. What do the Input (x) and Output (y) mean?
_________________________________________________________________________
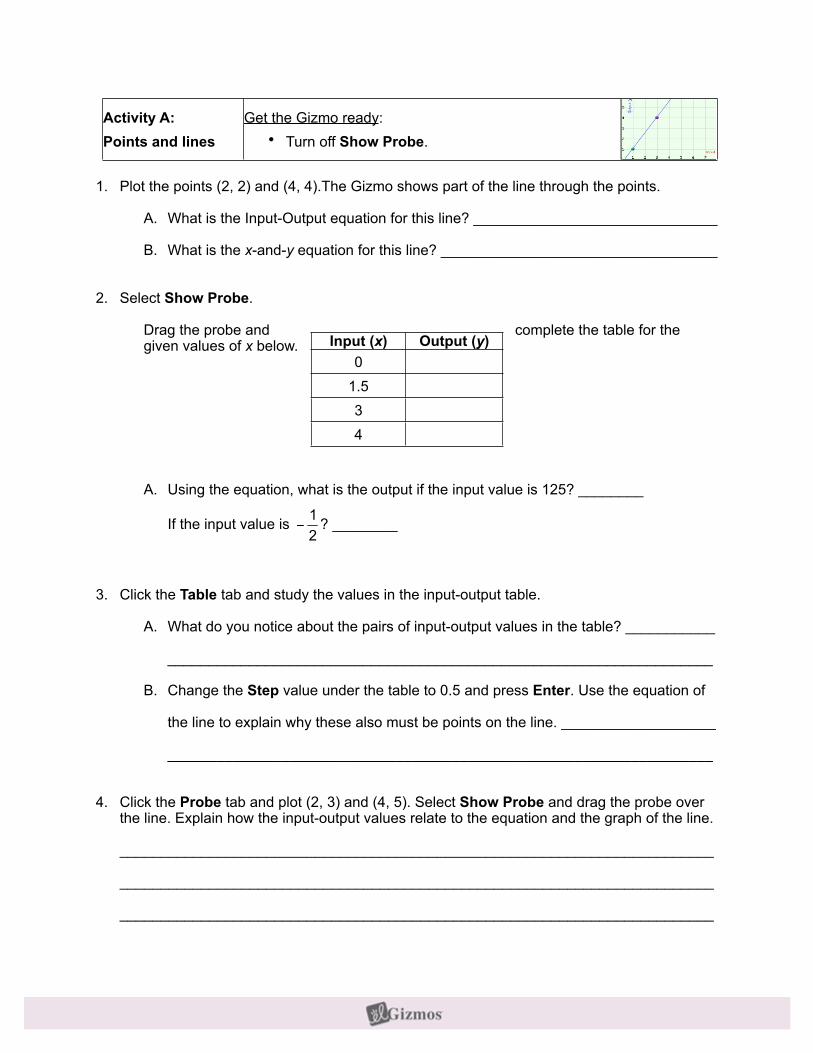
Activity A: Points and lines
Get the Gizmo ready: • Turn off Show Probe.
1. Plot the points (2, 2) and (4, 4).The Gizmo shows part of the line through the points.
A. What is the Input-Output equation for this line? ______________________________
B. What is the x-and-y equation for this line? __________________________________
2. Select Show Probe.
Drag the probe and complete the table for the given values of x below.
A. Using the equation, what is the output if the input value is 125? ________
If the input value is ? ________
3. Click the Table tab and study the values in the input-output table.
A. What do you notice about the pairs of input-output values in the table? ___________
___________________________________________________________________
B. Change the Step value under the table to 0.5 and press Enter. Use the equation of
the line to explain why these also must be points on the line. ___________________
___________________________________________________________________
4. Click the Probe tab and plot (2, 3) and (4, 5). Select Show Probe and drag the probe over the line. Explain how the input-output values relate to the equation and the graph of the line.
_________________________________________________________________________
_________________________________________________________________________
_________________________________________________________________________
Input (x) Output (y)0
1.534
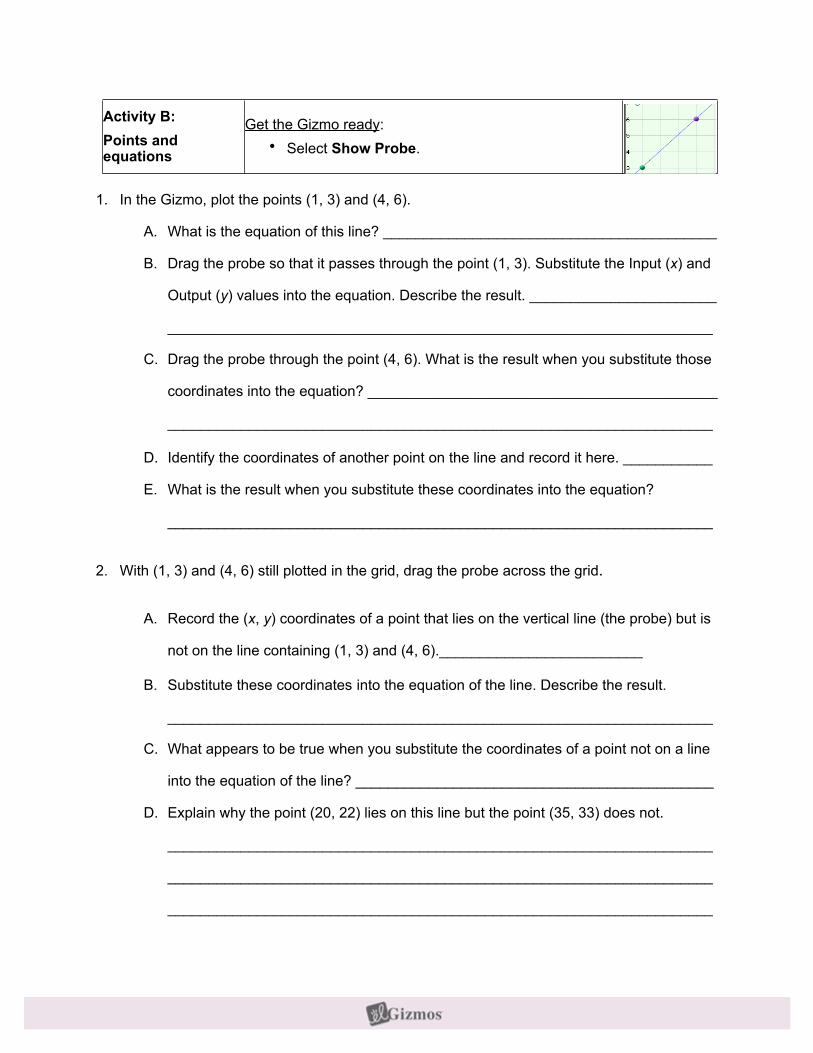
Activity B: Points and equations
Get the Gizmo ready: • Select Show Probe.
1. In the Gizmo, plot the points (1, 3) and (4, 6).
A. What is the equation of this line? _________________________________________
B. Drag the probe so that it passes through the point (1, 3). Substitute the Input (x) and
Output (y) values into the equation. Describe the result. _______________________
___________________________________________________________________
C. Drag the probe through the point (4, 6). What is the result when you substitute those
coordinates into the equation? ___________________________________________
___________________________________________________________________
D. Identify the coordinates of another point on the line and record it here. ___________
E. What is the result when you substitute these coordinates into the equation?
___________________________________________________________________
2. With (1, 3) and (4, 6) still plotted in the grid, drag the probe across the grid.
A. Record the (x, y) coordinates of a point that lies on the vertical line (the probe) but is
not on the line containing (1, 3) and (4, 6)._________________________
B. Substitute these coordinates into the equation of the line. Describe the result.
___________________________________________________________________
C. What appears to be true when you substitute the coordinates of a point not on a line
into the equation of the line? ____________________________________________
D. Explain why the point (20, 22) lies on this line but the point (35, 33) does not.
___________________________________________________________________
___________________________________________________________________
___________________________________________________________________

Activity C:The y-intercept
Get the Gizmo ready: • Select Show Probe.
1. In the Gizmo, plot the points (8, 4) and (6, 2).
A. What is the equation of the line through these points? ________________________
B. Use the equation and complete the table below for each Input (x). Then, click the Table tab and check your answers.
Input (x) Output (y)012345
C. What is the relationship between the x- and y-coordinates in the table?
___________________________________________________________________
D. Select the Probe tab and click Show Probe. Drag the probe to 5.5. What is the
value of y when x = 5.5? __________ Click Show y-value calculation. How is the
value of y calculated? _________________________________________________
2. Turn off Show y-value calculation and plot (3, 5) and (5, 1).
A. The y-intercept is the y-value of the point where the line
crosses the y-axis. What is the y-intercept of this line? ______
Drag the probe to check your answer.
B. The x-intercept of a line is the x-value of the point where the line crosses the x-axis.
Drag the probe to identify the x-intercept of this line. ________
C. Explain how you can use the equation of a line to calculate its x- and y-intercepts.
___________________________________________________________________
___________________________________________________________________