Embed Size (px)
Citation preview

Annex A2 Page 1 o f 2
(average annual growth)
Poland at a dance 3/4/05
POVERTY and SOCIAL
2003 Population, mid-year (millions) GNI per capita (Atlas method, US$) GNI (Atlas method, US$ billions)
Average annual growth, 1997-03
Population (%) Labor force (%)
Most recent estimate (latest year available, 1997-03) Poverty (% of population below national poverty line) Urban population (% of total population) Life expectancy at birth (years) Infant mortality (per 1,000 live births) Child malnutrition (% of children under 5) Access to an improved water source (“A of population) Illiteracy (% ofpopulation age 15+) Gross primary enrollment (% of school-age population)
Male Female
KEY ECONOMIC RATIOS and LONG-TERM TRENDS 1983
GDP (US$ billions) Gross domestic investmenffGDP Exports of goods and services/GDP Gross domestic savingslGDP Gross national savirigs/GDP
Current account balance/GDP Interest payments/GDP Total debffGDP Total debt service/exports Present value of debffGDP Present value of debffexports
1983-93 1993-03 (average annual growth) GDP .. 4.4 GDP per capita 4.4 Exports of goods and services .. 10.9
Poland
38.2 5,170 199.7
-0.1 0.4
18 63 74
8
97 0
100 100 99
1993
85.9 15.6 22.9 16.5 15.6
-5.8 1 .o
52.6
2002
1.4 1.5 4.8
Europe 8. Central
Asia
476 2,160 1,030
0.1 0.4
63 69 25
91 3
102 103 101
2002
191.3 18.9 29.7 15.5 16.3
-2.6 1.2
36.3
2003
3.8 3.9
13.0
Upper- middle- income
331 5,040 1,668
1.2 1.8
75 73 19
90 7
105 106 105
2003
209.6 18.9 33.9 16.3 16.9
-2.0 1.2
32.6
2003-07
4.1 4.2 7.7
I 1 Development diamond’
~
Life expectancy
Gross per primary
~ capita nrollment I
I 1
Access to improved water source
-Poland ~ Upper-middle-income group
Economic ratios.
Trade
- Investment Domestic __ savings
Indebtedness
Poland - ~ Upper-middle-income group
STRUCTURE of the ECONOMY
(“A of GDP) Agriculture 6 6 Industry 40 0 300 304
Manufacturing 174 176 Services 534 669 6
Private consumption 63 0 General government consumption 20 4 190 185 Imports of goods and services 22 0 330 364
1983 4993 2002 2003 Growth of Investment and GDP (x)
GDI ‘ O - G D P -
The diamonds show four key indicators in the country (in bold) compared with its income-group average. If data are missing, the diamond will be incomplete.

Annex A2 Paee 2 o f 2
Poland
IPRICES and GOVERNMENT FINANCE
Domestic prices (% change) Consumer prices Implicit GDP deflator
~ Government finance ~ (% of GDP, includes current grants) Current revenue Current budget balance Overall surplusldeficit
]TRADE
(US$ millions) Total exports (fob)
Food and Live Animals Machinery and Transport Equipment Manufactures
Total imports (cif) Food Fuel and energy Capital goods
Export price index (1995=100) 'Import price index (1995=100) ITerms of trade (1995=100)
BALANCE of PAYMENTS
1 (US$ millions) Exports of goods and services Imports of goods and services
1 Resource balance
Net income ,Net current transfers
1 Current account balance
'Financing items (net) iChanges in net reserves
Memo: Reserves including gold (US$ millions) Conversion rate (DEC, local/US$)
'EXTERNAL DEBT and RESOURCE FLOWS i US$ m///ions) ITotal debt outstanding and disbursed
1 IDA IBRD
'Total debt service 1 IDA IBRD
Composition of net resource flows Official grants Official creditors Private creditors Foreign direct investment Portfolio equity
/World Bank program j Commitments
Disbursements Principal repayments
1983 1993
.. 35.3
.. 30.6
.. 53.3
.. 0.6 ,. -5.0
1983 1993
14,143
.. 18,834
.. 1.838
.. 2,346
.. 157
.. 106
.. 148
1983 1993
.. 15,455
.. 17,561
.. -2,106
.. -3,394
.. 483
.. -5,017
.. 3,879
.. 1.138
.. 4,281
.. 1.8
1983 1993
.. 45,176
.. 1,073 0
.. 1,695 64 0
7
I 1 Development Economics 3/4/05
.. 912
.. 176 44
., 1,715
.. 400
.. 1,046
.. 317 0
.. 317 64
.. 253
2002
1.9 1.2
37.5 -3.9 -6.3
2002
41,019 2,968
34,865 55,109 2,752 5,038 8,187
86
101 a5
2002
56,777 63,177 -6,400
-1,887 3,280
-5,007
5,642 -635
29,794 4.1
2002
69,521
0
13,489 312
0
2,385
0 -1,068 1,774
0 0
15 172 206 -33 106
-140
2003
0.8 0.7
39.2 -3.4 -5.8
2003
53,728 4,084
68,177 39,043
3,155 6,206
10,056
a7 91 95
2003
72,173 77,379 -5,206
-3,112 4,233
-4,085
5,280 -1,195
34,168 3.9
2003
68,275 2,453
0
374 0
112 275
-163 99
-262
Inflation (%) 20 -
-
I
98 99 00 01 02 03
-GDP defiator +CPI
I Export and import levels (US$ mill.)
I80 000 - '70 000 - ,BO 000 - 50 000 -
97 98 99 00 01 02 03 I
I Current account balance to GDP ( O h )
-8 -
' Composition of 2003 debt (US$ mill.)
A - IBRD B - IDA D ~ Other multilateral F - Pnvate C . IMF G -Short-term
E - Bilateral

Annex B2 Page 1 o f 1
Selected Indicators* of Bank Portfolio Performance and Management
As of March 1,2005
Indicator 2002 2003 2004 2005 Portfolio Assessment Number o f Projects Under Implementation a 12 11 10 11 Average Implementation Period (years) Percent of Problem Projects by Number Percent of Problem Projects by Amount Percent o f Projects at Risk by Number Percent of Projects at Risk by Amount Disbursement Ratio (%) e Portfolio Management CPPR during the year (yesho) Supervision Resources (total US$)
b 4.2 a, c 8.3 a, c 14.6
a, d 8.3 a, d 14.6
29.8
no 1,200
5.3 9. I
15.6 9.1
15.6 30.5
no 852
4.4 20.0
6.6 20.0
6.6 40.4
no 740
3.8 0.0 0.0 0.0 0.0
67.0
no 910
Average Supervision (US$/project) 100 77 74 78
Memorandum Item Since FY 80 Last Five FYs
Proj Eval by OED by Amt (US$ millions) 3,275.0 742.8 20.0 10.0 12.7 0.5
Proj Eval by OED by Number 30 10
%of OED Projects Rated U or HU by Number % of OED Projects Rated U or HU by Amt
a. As shown in the Annual Report on Portfolio Performance (except for current FY). b. Average age of projects in the Bank's country portfolio. c. Percent of projects rated U or HU on development objectives (DO) and/or implementation progress (IP). d. As defined under the Portfolio Improvement Program. e. Ratio o f disbursements during the year to the undisbursed balance of the Bank's portfolio at the
beginning of the year: Investment projects only. * Al l indicators are for projects active in the Portfolio, with the exception of Disbursement Ratio,
which includes all active projects as well as projects which exited during the fiscal year.
Annex B3 Page 1 o f 2
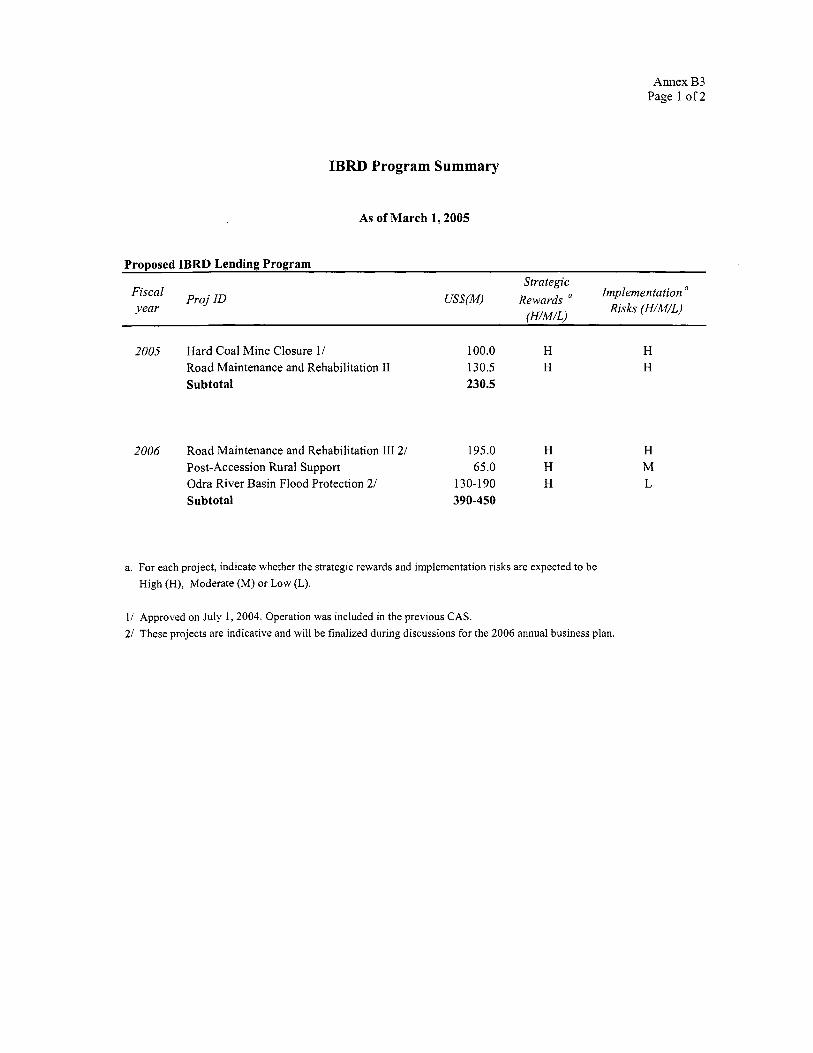
IBRD Program Summary
As of M a r c h 1,2005
Proposed IBRD Lending Program
P r o j ID Fiscal year
Strategic
(H/M/L)
Implementation ‘I Risks (HIM//)
uS$(M) Rewards
2005 Hard Coal Mine Closure 1 / 100.0 H Road Maintenance and Rehabilitation I1 130.5 H Subtotal 230.5
2006 Road Maintenance and Rehabilitation I11 21 195.0 Post-Accession Rural Support 65.0 Odra River Basin Flood Protection 2/ 130-190 Subtotal 390-450
H H H
a. For each project, indicate whether the strategic rewards and implementation risks are expected to be High (H), Moderate (M) or Low (L).
H H
H M L
l / Approved on July 1,2004. Operation was included in the previous CAS. 2/ These projects are indicative and wil l be finalized during discussions for the 2006 annual business plan.

Annex B3 Page 2 o f 2
IFC & MIGA Program, FY2002-2005
2002 2003 2004 2005
IFC approvals (US$m) 0.00 45.82 47.56
Sector (YO) Pulp & Paper Wholesale and Retai Total
Investment instrument(%) Loans Equity Quasi-Equity Other Total
MIGA guarantees (US$m)
0
100
100 100 100
100 100
0 100 100
0.00 0.00 0.00
0
0

Annex B4 Page 1 o f 1
Summary of Nonlending Services
As o f March 1,2005
Product Completion FY Audience Objective
Recent completions Knowledge Economy Assessment Living Standards Assessment Cities o f Change Pensions in Multipillar System Factoring Conference Investment Climate Assessment Anticorruption Policy Dialogue (ESW) Country Financial Accountability Assessment Audit Review TA Regional Policy Review
04 04 04 04 04 04 04 04 04 04
GIP GIP GiP G
GIPD GIP GIP
GIDIB G
GIP
K WPD KITS PS
W PS W PSI PD
WPD WPS
PS WPD
Underway and Planned EU8 Cross-country Public Finance Reform 05-06 G,B K, PS
Health Reform Implementation 05-06 G,B K, PS Railway Reform Implementation policy dial 05-06 G K, PS Public Administration Improvement Program 05-06 G,B K, PS
EU8 Quarterly Economic Reports 05-06 GIDIB WPS
IDF Accounting and Auditing Reform 05-06 GIDIB WPS ROSC Updates (Corporate Governance and Accounting & Auditing Modules) 05 GIDIB WPS Influence o f the Legal System on the Financial Market in Poland 05 GIDIB WPS NDP 2007-13 policy dialogue 05-06 G,B K, PS Financial Savices Policy Notes 05 G,B K, PS Public Environmental Financing 05-06 G P K, PS Energy Efficiency 05 DIPD PS Renewable Energy 06 DIPD PS Energy Policy Dialogue 05-06 DPD PS PPPs for Roads 05-06 GIDIB WPS EU8 Cross-country Labor Market 05-06 GIDIB WPS CGE Model Building 05-06 G,B K, PS
a. Government, donor, Bank, public dissemination. b. Knowledge generation, public debate, problem-solving.

Annex B5 Page 1 o f 1
Poverty and Social Development Indicators
Europe & Upper- Central middle-
Asia income
zoo0
474.9 322.0 0.06 1.22 63.2 74.8
1.6 2.5
Poland 1975 1985 1995 2000 2002
POPULATION Total population, mid year (millions) 34.0 37.2 38.6 38.6 38.2
Urban population (% of total) 55.4 59.3 61.3 61.7 61.8 Fertility rate, total (births per woman) 2.3 2.3 1.6 1.3 1.3
Population growth (annual %) 0.98 0.78 0.11 -0.03 -0.04
POVERTY (% ofpopulation) National headcount index
Urban headcount index Rural headcount index
INCOME GNI per capita, Atlas method (current US$) .. 2,890 4,440 4,670 Consumer price index (1 995 = 100) 0.1 0.3 100.0 182.1 195.7 Food price index (1995 = 100) 0.4 100.0 162.2 168.9
2,030 5,190
INCOME/CONSUMPTION DISTRIBUTION GIN1 index Income share held b y lowest quintile Income share held b y highest quintile
31.6* .. 7.3* ..
42.5* ._
SOCIAL INDICATORS Public expenditure Health (% o f GDP) Education (% o f GDP) Social security and welfare (% o f GDP) Net primary school enrollment rate (% of age group)
Total Male Female
Access to an improved water source (‘3’3 ofpopirlation with access) Total
Urban Rural
Immunization rate (96 of children nges 12-23 months)
Measles DPT
Child malnutrition (% under 5 years) Life expectancy at birth (Years)
Total Male Female
Mortality Infant (per 1,000 live births) under-5 (per 1,000) Adult (15-59)
Male (per 1,000 male adults) Female (per 1,000 female adults)
Maternal mortality ratio (per 100,000 live binhs)
4.20 .. 4.70 4.85 5.05 ..
19.91 17.40 ..
4.25 4.29*
3.53 4.38
96.5 96.5 96.4
99.4 .. 99.7 .. 99.0 ..
97.7 .. 97.6 .. 97.8 ..
93.2 93.0 93.5
91 ._ 96 .. 82 77
92 96 97 98 94 96 98 99
94 93
89 91
71 67 74
71 72 73 74 67 68 69 70 75 76 78 78
68 64 73
73 70 16
14 9 8 15 9 9
32 38
20 23
217 101
254 250 226 .. 105 94 88 ..
13 ..
317 137 58
197 103 67
Births attended by skilled health staff ( X of total)
*) 1999 data
Source: SIMA on-line W D I Database

Annex B6 Page 1 o f 2
Key Economic Indicators
Estimate Projected Indicator 2000 2001 2002 2003 2004 2005 2006 2007
National accounts (as YO of GDP) Gross domestic product”
Agriculture Industry Services
Total Consumption Gross domestic fixed investment
Government investment Private investment
Exports (GNFS)b Imports (GNFS)
Gross domestic savings Gross national savings‘
Memorandum items Gross domestic product (US$ million at current prices) GNF’ per capita (US$, Atlas method)
Real annual growth rates (“A) Gross domestic product at market prices Gross Domestic Income
Gross domestic product at market prices Total consumption Private consumption
Real annual per capita growth rates (“A)
Balance of Payments (US% millions) E X ~ O ~ ~ S (GNFS)~
Merchandise FOB Imports (GNFS)~
Merchandise FOB Resource balance Net current transfers Current account balance
Net private foreign direct investment Long-term loans (net) Official Private
Other capital (net, incl. errors & o d s s i o n s )
Change in reservesd
Memorandum items Resource balance (% of GDP) Real annual growth rates Merchandise exports (FOB)
Primary Manufactures
Merchandise imports (CIF)
100 100 100 100 4 4 3 3
33 31 30 30 63 65 67 67 82 83 84 84 24 21 19 18 3 3 3 3
21 18 16 15
28 28 30 34 34 31 33 36 18 17 16 16 19 18 16 17
166548 185787 191310 209563
4.0 1 .o 1.4 3.7 2.5 1 .o 1.3 3.4
3.9 1.0 2.5 3.8 2.8 1.7 2.7 2.4 3.1 1.8 3.3 3.1
46289 35902 57204 482 10
2380
9358 1379 -456 1835 -121 -618
-10915
-9998
51419 4 1664 58275 49324 -6856 2889
-5357 5624 2263
6393 -2967
437
-4130
56777 46742 63 177 53991
3280
4361 1218
2285 63
-6400
-5007
-1068
-635
72173 6 1007 77379 66732 -5206 4233
-4085
461 1 307 1
-1810 4881
-2402 -1 195
-6.6 -3.7 -3.3 -2.5
100 100 100 100 3 3 3 2
30 30 29 29 67 68 68 68 82 81 81 81 18 19 19 19 3 3 3 3
15 15 15 16
39 40 40 40 41 41 40 41
18 19 19 19 18 19 19 20
242247 294972 321711 349840
5.4 5.0 4.8 5.6 5.4 5.0 4.8 5.6
5.5 5.1 4.9 5.7 2.8 3.3 3.7 4.3 3.2 3.8 4.2 4.9
92475 80337 96708 84352
2300
5633 2014
64 1950 3200
-4233
-362 1
-1208
101 169 88486
107757 93761
2800
6000 -5336 -1210 -4126 2700
-6589
-6784
-540
109550 95935
1 18234 103467
3300
7000 -5964 -2202 -3762 2200
-34
-8684
-965 1
121301 107032 133038 117013
3300
7500
-1 1738
-12594
-4372 -3128 -1245 2200 2120
-1.6 -2.3 -3.0 -3.6

Annex B6 Page 2 o f 2
Key Economic Indicators (Continued)
Estimate Projected Indicator 2000 2001 2002 2003 2004 2005 2006 2007
Public finance (as YO of GDP at market prices)e Current revenues 42.1 42.2 42.3 43.3 42.8 44.1 44.4 43.6 Current expenditures 40.3 43.3 43.1 44.2 44.5 44.2 43.7 42.2 Current account surplus (+) or deficit (-) 1.8 -1.1 -0.7 -0.9 -1.7 -0.1 0.7 1.4 Capital expenditure 2.9 3.1 3.2 3.4 4.1 4.2 4.3 4.0 Foreign financing -1.2 -2.9 0.4 0.7 0.4 -0.3 0.0 -0.5
Monetary indicators M2/GDP Growth o f M2 ("7) Private sector credit growth / total credit growth ("7)
Price indices( yR02 =loo) Merchandise export price index Merchandise import price index Merchandise terms oftrade index Real exchange rate (US$/LCVf
Real interest rates Consumer price index (% change) GDP deflator (% change)
41.5 43.2 41.0 41.4 42.1 42.9 43.6 44.4 11.8 9.2 -2.4 5.5 9.8 9.5 9.3 9.0 73.2 78.2 275.3
121.3 138.0 133.6 120.5 130.0 131.0 132.0 133.0
10.1 5.5 1.9 0.8 3.5 3.0 2.7 2.5 6.7 4.0 1.2 0.7 2.6 2.7 2.5 2.4
a. GDP at factor cost b. "GNFS" denotes "goods and nonfactor services." c. Includes net unrequited transfers excluding official capital grants. d. Includes use o f IMF resources. e. Consolidated General Govemment, ESA95 methodology f. "LCU' denotes "local currency units." An increase in US$/LCU denotes appreciation
Annex B7 Page 1 o f 1
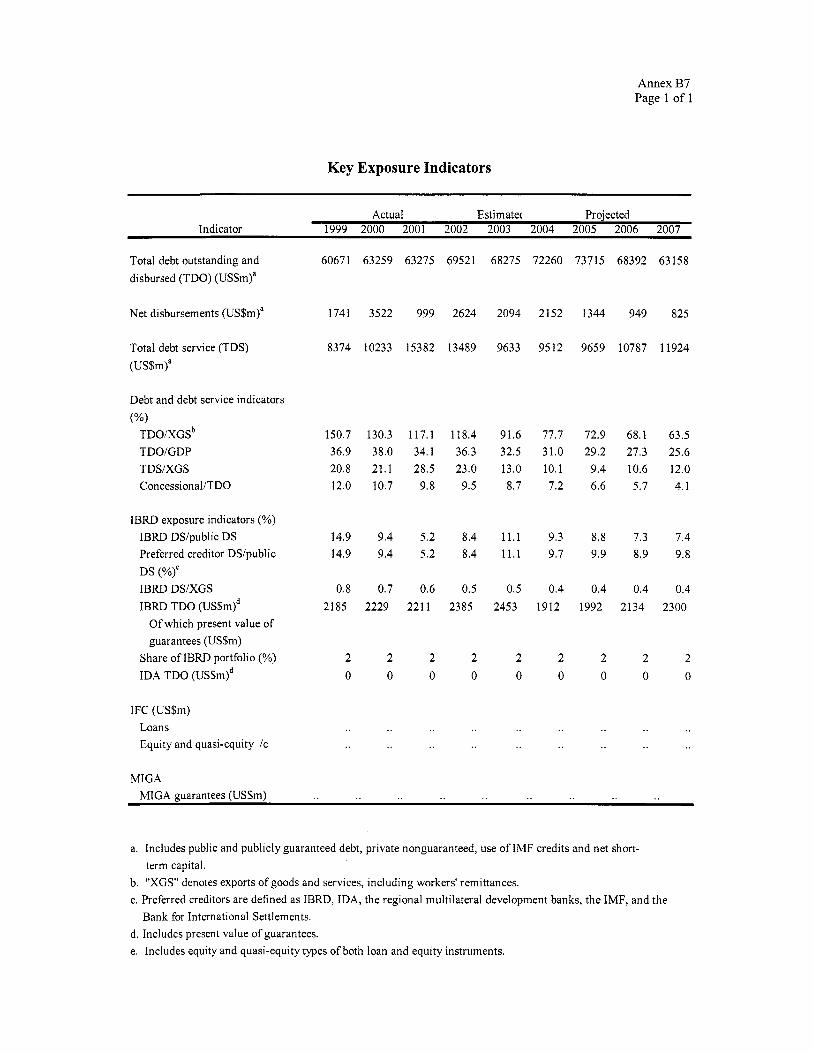
Key Exposure Indicators
Actual Estimate( Projected Indicator 1999 2000 2001 2002 2003 2004 2005 2006 2007
Total debt outstanding and 60671 63259 63275 69521 68275 72260 73715 68392 63158 disbursed (TDO) (US$m)a
Net disbursements (US$m)a 1741 3522 999 2624 2094 2152 1344 949 825
Total debt service (TDS) 8374 10233 15382 13489 9633 9512 9659 10787 11924 (US$mIa
Debt and debt service indicators
(%I TDO~XGS~ 150.7 130.3 117.1 118.4 91.6 77.7 72.9 68.1 63.5 TDOiGDP 36.9 38.0 34.1 36.3 32.5 31.0 29.2 27.3 25.6 TDSiXGS 20.8 21.1 28.5 23.0 13.0 10.1 9.4 10.6 12.0 ConcessionaliTDO 12.0 10.7 9.8 9.5 8.7 7.2 6.6 5.7 4.1
IBRD exposure indicators (%) IBRD DS/public DS 14.9 9.4 5.2 8.4 11.1 9.3 8.8 7.3 7.4 Preferred creditor DSipublic 14.9 9.4 5.2 8.4 11.1 9.7 9.9 8.9 9.8 DS (%)' IBRD DSiXGS 0.8 0.7 0.6 0.5 0.5 0.4 0.4 0.4 0.4 IBRD TDO (US$mld 2185 2229 2211 2385 2453 1912 1992 2134 2300
O f which present value o f guarantees (US$m)
Share o f IBRD portfolio (%) 2 2 2 2 2 2 2 2 2 IDA TDO (USSmld 0 0 0 0 0 0 0 0 0
IFC (US$m) Loans Equity and quasi-equity i c
MIGA MIGA guarantees (USSm)
a. Includes public and publicly guaranteed debt, private nonguaranteed, use o f IMF credits and net short-
b. "XGS" denotes exports o f goods and services, including workers' remittances. c. Preferred creditors are defined as IBRD, IDA, the regional multilateral development banks, the IMF, and the
Bank for Intemational Settlements. d. Includes present value o f guarantees. e. Includes equity and quasi-equity types o f both loan and equity instruments.
term capital.

Annex B8 Page 1 o f2
Operations Portfolio (IBRD & Grants)
As of March 1,2005
Closed Projects 32 IBRD/IDA * Total Disbursed (Active) 1,014.39
108.70 Total Disbursed (Closed) 3,397.63
2,670.13 4,4 12.02 2,778.84
Total Undisbursed (Active) 247.70 Total Undisbursed (Closed) 28.99 Total Undisbursed (Active + Closed) 276.69
o f which has been repaid
of which has been repaid
o f which has been repaid Total Disbursed (Active + Closed)
Difference Between Last PSR Expected and Actual
Project Kame
Bielsko-Biala Water Flood Emergency Roads I1 Rural Development Krakow Energy Efficiency Rail Restructuring Seaway Port Modemization Hard Coal Social Mitigation I Road Maintenance & Rehabilitation Coal Mine Closure Energy Efficiency (GEF) Overall Result
Prqiect ID
PO08595 PO53796 PO08593 PO58202 PO65059 PO40795 PO086 15 PO665 12 PO78 170 PO83093 PO70246
Supervision Original Amount in Rating US% Millions
D O
HS S S S S S S S S S S
- I P
HS S S S S S S S S S S
- FY
1996 1998 1998 2000 2001 2001 200 1 2004 2004 200s 200s
IBRD
21.5 200.0 300.0 120.0 15.0
101.0 38.5
200.0 126.0 100.0
1,222.0
GRANT Undisb.
2.5 16.1 17.2 10.3 12.8 0.2
17.0 51.0 9.0
111.5 11.0 11.0 11.0 258.7
Disbursements
Orig. Frm Rev'd
4.54 1.58 16.14 16.14 9.61 9.61
-1.05 -8.45 7.30
8.88
4.98 0.29 0.10
-0.81
-133.43
-83.46 18.89

Annex B8 Page 2 o f 2
Statement of IFC's Held and Disbursed Portfolio
As of January 31,2005
(In US Dollars Millions)
Held Disbursed
FY Approval Company Loan Equity Quasi Partic Loan Equity Quasi Partic 1996 Baltic Malt 0.00 0.00 1.96 0.00 0.00 0.00 1.87 0.00 1997 CPF 1999 ESCO Polska 1998 Global Hotels
1993 PEF-Poland
1993 Pilkington 2004 Schwarz Group
1995/97/98/00/03/04 Intercell
1994/1996 Peters
Total Portfolio:
0.00 1.60 0.00 0.00 0.00 1.50 0.00 0.00 0.00 0.21 0.00 0.00 0.00 0.21 0.00 0.00 4.35 0.00 5.84 0.00 0.00 0.00 3.64 0.00
54.43 3.69 0.00 0.00 0.00 3.69 0.00 0.00 0.00 1.50 0.00 0.00 0.00 1.50 0.00 0.00 0.40 0.00 0.00 0.00 0.40 0.00 0.00 0.00 2.55 0.00 0.00 0.00 2.55 0.00 0.00 0.00
54.43 0.00 0.00 0.00 54.43 0.00 0.00 0.00 116.16 7.01 7.80 0.00 57.38 6.91 5.51 0.00
ADDrovals Pending commitment Loan Equity Quasi Partic
2003 Intercell-Expan. 0 0 0 0
Total Pending Commitment: 0 0 0 0