Embed Size (px)
Citation preview

Population Genetics in Biological Control: Cryptic Species, Host-associations, and the Geographic Mosaic of Coevolution
By
Jeremy C Andersen
A dissertation submitted in partial satisfaction of the
requirements for the degree of
Doctor of Philosophy
in
Environmental Science Policy and Management
in the
Graduate Division
of the
University of California, Berkeley
Committee in charge:
Professor Nicholas J. Mills, Chair Professor George K. Roderick
Professor Rasmus Nielsen
Spring 2015


1
ABSTRACT
Population Genetics in Biological Control: Cryptic Species, Host-associations, and the Geographic Mosaic of Coevolution
by
Jeremy C Andersen
Doctor of Philosophy in Environmental Science Policy and Management
University of California, Berkeley
Professor Nicholas J Mills, Chair
In this dissertation I expand upon our knowledge in regards to the utility of population genetic approaches to be used for the study of the evolution of introduced biological control agents and their target pests. If biological control methods are to provide sustainable pest management services then more long-term studies will be necessary, and these studies should also include the use of population genetic approaches. For existing biological control programs, post-release population genetic studies could be initiated using museum voucher specimens for baseline data. In Chapter 2, I explored what factors influence our ability to extract usable genomic material from dried museum specimens, and whether we could use non-destructive techniques for parasitic hymenoptera. I found that the age of the specimen was the most important determinant for the amplification of PCR products, with nuclear loci having a higher probability of amplification from older specimens than mitochondrial loci. With these sequence results I was able to differentiate voucher specimens of different strains of the biological control agent Trioxys pallidus and I was able to confirm the identification of an unknown parasitoid reared from the invasive light brown apple moth.
For population genetic surveys to be conducted more frequently in biological control
programs, some of the barriers to developing molecular markers that are variable enough for these types of surveys need to be overcome. One barrier is the time required to develop polymorphic microsatellite markers. Therefore, in Chapter 3, I developed a novel bioinformatics pipeline that searches through next-generation sequence (NGS) data and uses the raw sequencing reads to identify polymorphic loci. Using this approach I was able to rapidly develop microsatellite markers for two of my study species (T. pallidus and Chromaphis juglandicola). For both species more than 60% of the target markers amplified and were found to be polymorphic, compared to previous approaches where the success rates were much lower (published studies often show rates between 1 and 20%).
I then examined evolutionary factors that may affect the sustainability of two classical
biological control programs; 1) the biological control of walnut aphids, and 2) the biological control of invasive knotweeds. The walnut aphid biological control program is a textbook successful biological control program, but has shown recent evidence of localized breakdowns,

2
whereas the biological control program for invasive knotweeds is currently under review in the United States and Canada. In Chapter 4, I explored whether hybridization between introduced “strains” of T. pallidus is responsible for recent breakdowns in this control program. In that study I found low levels of hybridization – thus it is unlikely hybridization is playing an important role in these breakdowns – as well as evidence that two of the strains may actually be cryptic species; one being a specialist and another being a generalist. In Chapter 5, I explored whether the geographic mosaic theory of coevolution might help explain these localized breakdowns. In that chapter I found evidence for a geographic mosaic in the walnut aphid biological control program, and commented on how components of the geographic mosaic theory of coevolution can help us predict what systems we might expect localized breakdowns to occur in. In Chapter 6, I explored whether endosymbionts might play a role in shaping the host-associations of two strains of the candidate biological control agent for invasive knotweeds. I found that while strains of the psyllid Aphalara itadori showed no barriers to hybridization of their nuclear genomes, there were curious patterns of horizontal transmission of their primary endosymbiont. I also found that one haplotype of the secondary endosymbiont Sodalis sp. dramatically changed in frequency during the hybrid crosses reared on giant knotweed. When compared with previous studies of this species, the results I observe suggest that endosymbionts may play an important role in the differing fitness levels of these two strains.
In conclusion, population genetic approaches provide valuable tools for the study of post-
release dynamics in biological control settings. While biological control programs promise to be useful study systems for evolutionary interactions, post-release studies will allow for that promise to come to fruition. In my future research endeavors I would like to continue to monitor the effects of hybridization and the frequency of geographic mosaics of coevolution in biological control settings. In addition, I would like to conduct post-release population genetic studies of both previous successful introductions and programs that resulted in failures. I believe these post-release studies will allow us to better determine what evolutionary factors affect the sustainability of biological control services and will allow for better management practices.

i
Dedication
For Michelle

ii
TABLE OF CONTENTS
LIST OF FIGURES AND TABLES .............................................................................................. v!ACKNOWLEDGEMENTS ........................................................................................................... vi!CHAPTER 1: INTRODUCTION ................................................................................................... 1!
Background ................................................................................................................................. 1!Chapter 1. References ................................................................................................................. 4!
CHAPTER 2: DNA EXTRACTION FROM MUSEUM SPECIMENS OF PARASITIC HYMENOPTERA .......................................................................................................................... 7!
Abstract ....................................................................................................................................... 7!Introduction ................................................................................................................................. 7!Methods and Materials ................................................................................................................ 8!
Species Examined ................................................................................................................... 8!DNA Extraction Protocol ........................................................................................................ 9!Remounting of Specimens ...................................................................................................... 9!DNA Amplification and Sequencing ...................................................................................... 9!Statistical Analysis ................................................................................................................ 10!Phylogenetic Analysis ........................................................................................................... 11!
Results ....................................................................................................................................... 11!DNA Extraction and Sequencing .......................................................................................... 11!Phylogenetic Utility .............................................................................................................. 12!
Discussion ................................................................................................................................. 12!DNA Extraction and Sequencing .......................................................................................... 12!Phylogenetic Utility .............................................................................................................. 13!Damage to Specimens ........................................................................................................... 14!Conclusions ........................................................................................................................... 14!
Acknowledgements ................................................................................................................... 15!Chapter 2. References ............................................................................................................... 16!
CHAPTER 3: iMSAT: A NOVEL APPROACH TO THE DEVELOPMENT OF MICROSATELLITE LOCI USING BARCODED ILLUMINA LIBRARIES .......................... 26!
Abstract ..................................................................................................................................... 26!Introduction ............................................................................................................................... 26!Methods..................................................................................................................................... 27!Results ....................................................................................................................................... 29!
Next-Generation Sequencing Results ................................................................................... 29!Comparison of iMSAT to other methods for identifying STRs ........................................... 29!Amplification of tri-nucleotide STRs in T. pallidus ............................................................. 30!Characteristics of STR markers in T. pallidus ...................................................................... 30!Amplification of tri-nucleotide STRs in C. juglandicola ...................................................... 30!Characteristics of STR markers in C. juglandicola ............................................................... 30!
Discussion ................................................................................................................................. 30!Potential benefits and limitations .......................................................................................... 31!Comparison of results with other species of insects ............................................................. 32!
Conclusions ............................................................................................................................... 32!Acknowledgements ................................................................................................................... 32!

iii
Chapter 3. References ............................................................................................................... 33!CHAPTER 4: MOLECULAR EVIDENCE OF CRYPTIC SPECIES AND HYBRIDIZATION WITHIN THE TRIOXYS PALLIDUS SPECIES COMPLEX ...................................................... 41!
Abstract ..................................................................................................................................... 41!Introduction ............................................................................................................................... 41!Methods..................................................................................................................................... 43!
Sampling Locations and Methods ......................................................................................... 43!DNA Extraction .................................................................................................................... 44!mtDNA Sequencing .............................................................................................................. 44!mtDNA Analyses .................................................................................................................. 44!Microsatellite Genotyping .................................................................................................... 45!Population Structure and Hybridization Analyses ................................................................ 45!
Results ....................................................................................................................................... 46!mtDNA Analysis ................................................................................................................... 46!Population Structure Analysis ............................................................................................... 47!Hybridization Analysis ......................................................................................................... 47!
Discussion ................................................................................................................................. 48!Hybridization and the Sustainability of Biological Control Services ................................... 49!Conclusions ........................................................................................................................... 50!
Acknowledgements ................................................................................................................... 51!Chapter 4. References ............................................................................................................... 52!
CHAPTER 5: POST-RELEASE GENETIC SURVEYS UNCOVER A GEOGRAPHIC MOSAIC OF COEVOLUTION IN THE WALNUT APHID BIOLOGICAL CONTROL PROGRAM. .................................................................................................................................. 73!
Abstract ..................................................................................................................................... 73!Introduction ............................................................................................................................... 73!Methods..................................................................................................................................... 75!
Sampling Locations .............................................................................................................. 75!DNA Extraction and Microsatellite Genotyping .................................................................. 76!Population Genomic Analyses .............................................................................................. 76!Detection of Outlier Loci ...................................................................................................... 77!
Results ....................................................................................................................................... 77!Population Genomic Analyses .............................................................................................. 77!Detection of Outlier Loci ...................................................................................................... 78!
Discussion ................................................................................................................................. 78!Population Structure of T. pallidus and C. juglandicola ....................................................... 80!
Conclusions ............................................................................................................................... 81!Acknowledgments ..................................................................................................................... 81!Chapter 5. References ............................................................................................................... 82!
CHAPTER 6: HYBRIDIZATION BETWEEN TWO HOST-ASSOCIATED STRAINS OF KNOTWEED PSYLLID, APHALARA ITADORI, LEADS TO PATTERNS OF NON-MATERNAL INHERITANCE OF BOTH PRIMARY AND SECONDARY ENDOSYMBIONTS. ................................................................................................................... 92!
Abstract ..................................................................................................................................... 92!Introduction ............................................................................................................................... 92!

iv
Methods..................................................................................................................................... 94!Laboratory Colonies .............................................................................................................. 94!DNA Extractions for Identification of A. itadori Strains ...................................................... 95!Mitochondrial DNA Analyses .............................................................................................. 95!Next-generation Sequencing ................................................................................................. 95!SNP Array Design and Genotyping ...................................................................................... 96!Population Structure and Hybridization Analyses ................................................................ 96!
Results ....................................................................................................................................... 97!Mitochondrial DNA Analyses .............................................................................................. 97!Next-generation Sequencing ................................................................................................. 97!SNP Array Design and Genotyping ...................................................................................... 98!Population Structure and Hybridization Analyses ................................................................ 98!Endosymbiont Haplotypes .................................................................................................... 99!
Discussion ................................................................................................................................. 99!Patterns of endosymbiont horizontal transmission ............................................................. 100!
Conclusion .............................................................................................................................. 101!Acknowledgements ................................................................................................................. 101!Chapter 6. References ............................................................................................................. 102!
CHAPTER 7: CONCLUSIONS ................................................................................................. 109!Dissertation Synthesis ............................................................................................................. 109!Chapter 7. References ............................................................................................................. 112!
APPENDICES ............................................................................................................................ 114!Appendix Figure 1 .................................................................................................................. 114!Appendix Figure 2 .................................................................................................................. 115!Appendix Figure 3 .................................................................................................................. 116!Appendix Table 1 .................................................................................................................... 117!Appendix Table 2 .................................................................................................................... 117!Appendix Tables 3 & 4 ........................................................................................................... 117!

v
LIST OF FIGURES AND TABLES
Figures Chapter 2
Figure 2.1 – Mean DNA concentrations from three braconid species ..................................... 22 Figure 2.2 – Logistic regression results for the amplification of target loci ............................ 23 Figure 2.3 – Maximum parsimony reconstruction of 28S from museum specimens ............... 24 Figure 2.4 – Maximum parsimony reconstruction of COI from museum specimens .............. 25
Chapter 3 Figure 3.1 – iMSAT workflow diagram ................................................................................... 40
Chapter 4 Figure 4.1 – Bayesian majority rule consensus tree for COI ................................................... 67 Figure 4.2 – TCS network diagram showing biogeographic patterns ...................................... 68 Figure 4.3 – TCS network diagram showing host-association patterns ................................... 69 Figure 4.4 – Probability of assignment using STRUCTURE .................................................. 70 Figure 4.5 – Probability of assignment using NewHybrids ..................................................... 71 Figure 4.6 – Comparison of mitochondrial and nuclear results ............................................... 72
Chapter 5 Figure 5.1 – Frequency distributions for pairwise measures of genetic diversity .................... 90 Figure 5.2 – Geographic mosaic of coevolution between T. pallidus & C. juglandicola ........ 91
Chapter 6 Figure 6.1 – Probability of assignment based on the full array .............................................. 107 Figure 6.2 – Probability of assignment based the reduced array ............................................ 108
Tables Chapter 2
Table 2.1 – Parasitoid specimens from the Essig Museum used in analyses ........................... 19 Table 2.2 – GLM model summaries ......................................................................................... 20 Table 2.3 – Model averaged estimates ..................................................................................... 21
Chapter 3 Table 3.1 – STR results for T. pallidus using iMSAT and published programs ...................... 36 Table 3.2 – STR results for C. juglandicola using iMSAT and published programs .............. 37 Table 3.3 – Characteristics for polymorphic STRs for T. pallidus & C. juglandicola ............ 38 Table 3.4 – Collection information for populations of T. pallidus & C. juglandicola ............. 39
Chapter 4 Table 4.1 – Collection information for populations of T. pallidus ........................................... 60
Chapter 5 Table 5.1 – Collection information for populations of T. pallidus & C. juglandicola ............. 87 Table 5.2 – Measures of population differentiation based on FST ............................................ 88 Table 5.3 – Measures of recent migration rates using BA3 ..................................................... 89

vi
ACKNOWLEDGEMENTS
First, I cannot thank my guiding professor Dr. Nicholas J Mills enough for his support throughout my dissertation research. He met every stumbling block – and I know I created more than were necessary – with a smile, a laugh, a smile and a laugh, or a “well, that’s not very good!” I’ll miss coming into the office and knocking on the door, as his heart-felt good mornings provided the perfect start to each workday. When I was looking for graduate programs, a colleague stressed how important having a good relationship with your guiding professor would be. When I heard Nick’s laugh during our first phone conversation I knew that he was the right person to work with – and he was. I’m sure he’ll appreciate a little more free time now that he no longer has to turn my half-broken writing (and thoughts) into sentences, but I’ll forever be grateful for his help, his enthusiasm, and for the opportunities he’s provided.
I cannot imagine how any of this would have been possible without my family and friends. For Michelle; my partner, my biggest supporter, my vocalist critic, my beautiful wife, and the world’s best field assistant – though the fact that you collect twice as many insects at each location is a little embarrassing for me as the “entomologist.” You opened my eyes to the beauty of forests and mountains, to vernal pools and to oak savannahs, and everyday that we spend together I’m struck by how luck I am. From our night walks in the hills, to camping by mountain-rivers, thank you for picking me to share this wonderful journey with. For my parents; thank you for always being a phone call away, for your faith in me, for instilling in me a love of what’s “good and green” in this world, for teaching me to work with my hands and to think with my heart, for Ski Mother Earth and for Earth Day cleanups, I’m very a lucky son. For Ron and Linda and the little doggies; thank you for welcoming me into your family. You’re without a doubt the best in-laws that anyone has ever had. For Myrrha and Christi; my loving sisters, thank you being there at all hours of the day while I walked to campus, I can’t wait to spend more time with you. I am forever grateful for being your brother and for your creativity, support, and guidance. For Adam, Brett, and Joe; my fantastic brother-in-laws, hopefully now that I’ll finally be graduated I can start to give back in kind for all of your generosity and love. For Margot, Isla, and Aria; my beautiful nieces. I’m so happy to be your uncle and I hope that years of entomology themed presents will do the trick in bring you over to the bug world. For Monique; merci pour tout votre amore. I’m sure you were starting to wonder if your oldest grandchild would ever graduate, thank you for never loosing hope! For the extended Andersen and Stillger families, thank you! For Dorothy and the Spruce St neighbors; you’ve made Berkeley our home, thank you for welcoming us into your lives and your families! This work also could not have been possible without the generous support of the Environmental Protection Agency whose STAR fellowship gave me the opportunity to ask questions and the resources to address them, as well as the van den Bosch Memorial Scholarship that supported and encouraged much of this work. I’d also like to thank the University of California Cooperative Extension Specialists who assisted me in my many poorly prepared field collecting endeavors, the individual walnut and filbert growers who allowed me access to their orchards, and one particularly colorful French grower who, though my French is a little rough, I think told me, “there are no aphids here, if there are aphids here you brought them with you from America.” The orchard was hammered with aphids, and I know I didn’t bring them with me. His statement fills me with joy every time I think about it. Finally, thank you to my dissertation committee members. You made working on this project a pleasure, and I hope that this is the start of many more collaborations to come.

1
CHAPTER 1: INTRODUCTION
Background Classical biological control (hereafter referred to simply as biological control), the
reduction in abundance of invasive pestiferous insects and/or weeds through the use of introduced natural enemies (Van Driesche et al. 2010), is often considered a sustainable form of pest management (Bianchi et al. 2006; Bale et al. 2008) due to the fact that it does not rely upon limited natural or synthetic resources. However, too often biological control programs have been initiated and natural enemies introduced without the use of long-term studies to verify their persistence and efficacy as control agents through time (Mills 2000; McCoy & Frank 2010). In many regards this lack of long-term studies is a simple reflection of the fact that biological control is a form of pest control service that is conducted across a landscape, and thus generally not marketable to individual growers (though augmentative biological control programs initiated in greenhouse settings provide fine examples of exceptions [van Lenteren & Woets 1988; Paulitz & Belanger 2001]). As such, these projects are usually funded by governments (e.g. local, regional, and or national governments) or in some instances by crop marketing boards whose needs often necessitate a focus on new and emerging pests rather than on the re-evaluation of previous successes and/or failures. However, research universities may be particularly well situated to provide the ideal location to conduct both post-release and long-term studies of biological control services, and a greater understanding of the factors responsible for both biological control program successes and failures will greatly improve our ability to provide sustainable pest control services.
The necessity for these analyses is all the more vital in the face of increasing levels of
biotic invasions (Mack et al. 2000; Ricciardi 2007; Kumschick et al. 2015). In response, biological control programs – where a non-native and potentially invasive pest is reunited with a natural enemy from its region of origin (Hoddle 2004) – are often used to reduce the ecosystem impacts of the invader. In the nearly 130 years since the successful introduction of the vedalia beetle (Rodolia cardinalis [Mulsant][Coleoptera: Coccinellidae]) to California for the biological control of cottony cushion scale (Icerya purchase Maskell [Hemiptera: Coccoidea]), and with it the beginning of modern biological control (Doutt 1964; Caltagirone & Doutt 1989; Sawyer 2002), the field has been greatly improved. There has been greater emphasis on the use of scientific methods and principles for selecting target pests and candidate natural enemies and conducting risk assessment, particularly pre-release host range testing (e.g. Messing 2001; Sheppard et al. 2005). However, due to a consistent lack of post-release and long-term studies, our understanding of how non-native pests and their introduced natural enemies evolve in their novel habitats and what effect those evolutionary changes have on the efficacy of their associated biological control programs is severely limited.
One commonly used practice that may inadvertently, and unexpectedly, influence the
evolutionary trajectories and the efficacy of introduced natural enemies has been the collection and importation of natural enemies from multiple geographic locations, hosts, and/or climatic regions. These different source populations are often referred to as strains (Hopper et al. 1993; Clarke & Walter 1995) and justifications for releasing a diverse assemblage of genetic lineages

2
of the natural enemy included; 1) that if one strain was more compatible with the novel habitat or more adapted to the target host the probability of establishment would be increased, and 2) that through interbreeding, the established population would be less likely to suffer from genetic bottlenecks.
However, recent molecular work with a number of insect taxa have highlighted the
common occurrence of cryptic species complexes in what were previously thought to be a single species (Campbell et al. 1993; Hebert et al. 2004; Janzen et al. 2005; Smith et al. 2006). In addition, cryptic species are known to have played a nefarious role in either preventing or delaying the implementation of biological control programs (DeBach 1960; Cox & Williams 1981; Room 1990). Therefore, it is likely then that many of the “strains” that were used in classical biological control programs were actually cryptic species complexes. If we are to better understand the factors that influence the establishment of different strains, it is first important to have an accurate delimitation of species boundaries. In addition, even though there may have been a desired goal of genetic mixing between strains, it is unclear what effects hybridization may have on the efficacy of biological control agents. Hybridization, while once considered rare among animal taxa (Mayr 1942), is increasingly being shown to be a common occurrence and an important driver of evolution (Mallet 2005) – particularly in the Insecta (Schwenk et al. 2008) – and rates of hybridization have been increasing due to anthropogenic influences (Allendorf et al. 2001). Interestingly, both increased fitness (i.e. hybrid vigor), and reduced fitness (i.e. hybrid breakdown) are possible following hybridization, and hybridization has been shown to be a concern in conservation settings where the ensuing hybrid swarms (with their reduced fitness) complicate and delay the preservation of target populations (Allendorf et al. 2001). It is unclear what the effects of hybridization have been on the success of biological control introductions and the sustainability of biological control services. However, a previous meta-analysis of biological control programs showed that those which used multiple strains were twice as likely to fail as those that used only a single source population (Clarke & Walter 1995). Being that it is likely that hybridization occurred between the strains (either during collection and shipping, or after release), hybridization may have played a role in these past failures.
For my dissertation I chose to study two classical biological control systems. For the first
part of my dissertation I conducted post-release genetic surveys of both hosts and parasitoids associated with the biological control program for the walnut aphid, Chromaphis juglandicola (Kaltenbach) (Hemiptera: Aphididae). Walnut aphids were once the principle pest in walnut orchards in California (a crop that occupies >113,000 ha and is valued at ~1.8 billion USD in California alone; USDA 2014), where they are active from March through early December (Sluss 1967) and negatively effect tree health as well as the quality and size of the nuts produced (Michelbacher & Ortega 1958). Because of economic concerns, the parasitoid wasp Trioxys pallidus (Haliday) (Hymenoptera: Braconidae) was identified in Europe and introduced to the walnut growing regions of California (Schlinger et al. 1960). However, while this introduction resulted in establishment in the southern and coastal regions of California, T. pallidus failed to establish in the primary walnut growing region of the Central Valley (van den Bosch et al. 1962) leading to a second, and ultimately successful, introduction from Iran (van den Bosch et al. 1979). There have, however, been recent reports of localized breakdowns in this biological control system, and the reasons for these breakdowns are unkown (Hougardy & Mills 2008).

3
For the walnut aphid biological control system I had the following research objectives. First, I wanted to see whether voucher specimens located in the Essig Museum of Entomology can be used in conjunction with non-destructive DNA extraction techniques to examine the level of genetic variability present in the founding populations while preserving the vouchered specimens for future morphological analyses. This study was conducted to determine the feasibility of the approach and the factors (e.g., age or size) that might influence the ability to obtain DNA from museum specimens (Chapter 2). Second, I wanted to examine the population structure and hybridization rates between the different strains of T. pallidus in their native and introduced ranges. To conduct this survey I developed a novel bioinformatic pipeline for identifying polymorphic microsatellite loci from Next-Generation Sequencing datasets to develop microsatellite loci for both T. pallidus and C. juglandicola (Chapter 3). I then used this approach to explore whether the two strains of T. pallidus introduced to California, and a third strain introduced to Oregon for the biological control of filbert aphids, Myzocallis coryli (Goeze)(Hemiptera: Aphididae)(Messing & AliNiazee 1988, 1989), represent cryptic species and to estimate hybridization rates between these strains in their native and introduced ranges (Chapter 4). Third, I wanted to explore whether a geographic mosaic of coevolution (Thompson 1999, 2005) may be occuring in the walnut aphid biological control program (Chapter 5), and whether oscilattions between coevolutionary hotspots and cold spots might have implications for the sustainability of biological control services.
For the second biological control system, I chose the proposed program for invasive
knotweeds, Fallopia spp. (Caryophyllales: Polygonaceae), by the psyllid Aphalara itadori Shinji (Hemiptera: Psyllidae). Knotweeds were first introduced to North America in the mid 1800’s (Beerling et al. 1994), have subsequently become an invasive weed along riverbanks, roadways, wetlands, and other disturbed areas (Maerz et al. 2005; Siemens & Blossey 2007), and are responsible for reductions in native plant and animal species diversity (Gerber et al. 2008; Murrell et al. 2011). Similarly to the walnut aphid biological control program, multiple strains of A. itadori from Japan have been proposed for introduction. Therefore I wanted to develop molecular markers to 1) identify whether these strains represent cryptic species, 2) to create the necessary resources to conduct post-release analyses of hybridization rates between the strains if A. itadori is approved for release, and 3) to explore whether endosymbionts may play an important role in creating reproductive barriers between the strains (Chapter 6).
Finally, in Chapter 7, I conclude by commenting on the need for post-release studies of biological control programs that have resulted in both success and failure. I also comment on the utility of population genetic approaches for studying evolution in biological control systems, and what the results from this study may indicate for sustainable pest management strategies.

4
Chapter 1. References Allendorf FW, Leary RF, Spruell P, Wenburg JK (2001) The problems with hybrids: setting
conservation guidelines. Trends in Ecology & Evolution 16, 613-622. Bale JS, van Lenteren JC, Bigler F (2008) Biological control and sustainable food production.
Philosophical Transactions of the Royal Society B: Biological Sciences 363, 761-776. Beerling DJ, Bailey JP, Conolly AP (1994) Fallopia-japonica (Houtt) Ronse, Decraene
(Reynoutria-japonica Houtt, Polygonum-cuspidatum Sieb and Zucc). Journal of Ecology 82, 959-979.
Bianchi FJJA, Booij CJH, Tscharntke T (2006) Sustainable pest regulation in agricultural landscapes: a review on landscape composition, biodiversity and natural pest control. Proceedings of the Royal Society B: Biological Sciences 273, 1715-1727.
Campbell BC, Steffen-Campbell JD, Werren JH (1993) Phylogeny of the Nasonia species complex (Hymenoptera: Pteromalidae) inferred from an internal transcribed spacer (ITS2) and 28S rDNA sequences. Insect Molecular Biology 2, 225-237.
Caltagirone LE, Doutt RL (1989) The history of the vedalia beetle importation to California and its impact on the development of biological control. Annual Review of Entomology 34, 1-16.
Clarke AR, Walter GH (1995) ''Strains'' and the classical biological control of insect pests. Canadian Journal of Zoology 73, 1777-1790.
Cox JM, Williams DJ (1981) An account of cassava mealybugs (Hemiptera, Pseudococcidae) with a description of a new species. Bulletin of Entomological Research 71, 247-258.
DeBach P (1960) The importance of taxonomy to biological control as illustrated by the cryptic history of Aphytis holoxanthus n. sp. (Hymenoptera: Aphelinidae), a parasite of Chrysomphalus aonidum, and Aphytis coheni n. sp., a parasite of Aonidiella aurantii. Annals of the Entomological Society of America 53, 701-705.
Doutt R (1964) The historical development of biological control. In: Biological Control of Insect Pest and Weeds. DeBach P (ed.). Chapman and Hall, London, UK.
Gerber E, Krebs C, Murrell C, Moretti M, Rocklin R, Schaffner U (2008) Exotic invasive knotweeds (Fallopia spp.) negatively affect native plant and invertebrate assemblages in European riparian habitats. Biological Conservation 141, 646-654.
Hebert PDN, Penton EH, Burns JM, Janzen DH, Hallwachs W (2004) Ten species in one: DNA barcoding reveals cryptic species in the neotropical skipper butterfly Astraptes fulgerator. Proceedings of the National Academy of Sciences of the United States of America 101, 14812-14817.
Hoddle MS (2004) Restoring balance: using exotic species to control invasive exotic species. Conservation Biology 18, 38-49.
Hopper K, Roush R, Powell W (1993) Management of genetics of biological-control introductions. Annual Review of Entomology 38, 27-51.
Hougardy E, Mills NJ (2008) Comparative life history and parasitism of a new color morph of the walnut aphid in California. Agricultural and Forest Entomology 10, 137-146.
Janzen DH, Hajibabaei M, Burns JM, Hallwachs W, Remigio E, et al. (2005) Wedding biodiversity inventory of a large and complex Lepidoptera fauna with DNA barcoding. Philosophical Transactions of the Royal Society B: Biological Sciences 360, 1835-1845.
Kumschick S, Gaertner M, Vila M, Essl F, Jeschke JM, et al. (2015) Ecological impacts of alien species: quantifiction, scope, caveats, recommendations. BioScience 65, 55-63.

5
Mack RN, Simberloff D, Lonsdale WM, Evans H, Clout M, et al. (2000) Biotic invasions: causes, epidemiology, global consequences, and control. Ecological Applications 10, 689-710.
Maerz JC, Blossey B, Nuzzo V (2005) Green frogs show reduced foraging success in habitats invaded by Japanese knotweed. Biodiversity and Conservation 14, 2901-2911.
Mallet J (2005) Hybridization as an invasion of the genome. Trends in Ecology & Evolution 20, 229-237.
Mayr E (1942) Systematics and the Origin of Species from the Viewpoint of a Zoologist Harvard University Press, Cambridge, MA.
McCoy ED, Frank JH (2010) How should the risk associated with the introduction of biological control agents be estimated? Agricultural and Forest Entomology 12, 1-8.
Messing RH (2001) Centrifugal phylogeny as a basis for non-target host testing in biological control: is it relevant for parasitoids? Phytoparasitica 29, 187-190.
Messing RH, AliNiazee MT (1988) Hybridization and host suitability of 2 biotypes of Trioxys-pallidus (Hymenoptera, Aphidiidae). Annals of the Entomological Society of America 81, 6-9.
Messing RH, AliNiazee MT (1989) Introduction and establishment of Trioxys-pallidus Hym, Aphidiidae in Oregon, USA for control of filbert aphid Myzocallis-coryli Hom, Aphididae. Entomophaga 34, 153-163.
Michelbacher AE, Ortega JC (1958) A technical study of insects and related pests attacking walnuts. University of California Bulletin 764, 1-90.
Mills NJ (2000) Biological control: The need for realistic models and experimental approaches to parasitoid introductions. In: Parasitoid Population Biology Hochberg M, Ives A (eds.), pp. 217-234. Princeton University Press, Princeton, NJ, USA.
Murrell C, Gerber E, Krebs C, Parepa M, Schaffner U, et al. (2011) Invasive knotweed affects native plants through allelopathy. American Journal of Botany 98, 38-43.
Paulitz TC, Belanger RR (2001) Biological control in greenhouse systems. Annual Review of Phytopathology 39, 103-133.
Ricciardi A (2007) Are modern biological invasions an unprecedented form of global change? Conservation Biology 21, 329-336.
Room PM (1990) Ecology of a simple plant herbivore system – biological control of Salvinia. Trends in Ecology & Evolution 5, 74-79.
Sawyer R (2002) To Make a Spotless Orange: Biological Control in California. Purdue University Press, West Lafayette, IN.
Schlinger E, Hagen K, van den Bosch R (1960) Imported French parasite of walnut aphid established in California. California Agriculture 14, 3-4.
Schwenk K, Brede N, Streit B (2008) Introduction. Extent, processes and evolutionary impact of interspecific hybridization in animals. Philosophical Transactions of the Royal Society B: Biological Sciences 363, 2805-2811.
Sheppard AW, van Klinken RD, Heard TA (2005) Scientific advances in the analysis of direct risks of weed biological control agents to nontarget plants. Biological Control 35, 215-226.
Siemens TJ, Blossey B (2007) An evaluation of mechanisms preventing the growth and survival of two native species in invasive Bohemian knotweed (Fallopia x bohemica, Polygonaceae). American Journal of Botany 94, 776-783.

6
Sluss RR (1967) Population dynamics of the walnut aphid, Chromaphis juglandicola (Kalt.) in northern California. Ecology 48, 41-58.
Smith MA, Woodley NE, Janzen DH, Hallwachs W, Hebert PDN (2006) DNA barcodes reveal cryptic host-specificity within the presumed polyphagous members of a genus of parasitoid flies (Diptera : Tachinidae). Proceedings of the National Academy of Sciences of the United States of America 103, 3657-3662.
Thompson JN (2005) The Geographic Mosaic of Coevolution. The University of Chicago Press, Chicago, IL.
Thompson JN (1999) Specific hypotheses on the geographic mosaic of coevolution. American Naturalist 153, S1-S14.
USDA (2014) 2014 California Walnut Projective Measurement Report, p. 8, http://www.nass.usda.gov/Statistics_by_State/California/Publications/Fruits_and_Nuts/201409walom.pdf
van den Bosch R, Hom R, Matteson P, Frazer BD, Messenger PS, et al. (1979) Biological control of the walnut aphid in California: impact of the parasite Trioxys pallidus. Hilgardia 47, 1-13.
van den Bosch R, Schlinger EI, Hagen KS (1962) Initial field observations in California on Trioxys pallidus (Haliday) a recently introduced parasite of the walnut aphid. Journal of Economic Entomology 55, 857-862.
Van Driesche RG, Carruthers RI, Center T, Hoddle MS, Hough-Goldstein J, et al. (2010) Classical biological control for the protection of natural ecosystems. Biological Control 54, S2-S33.
van Lenteren JC, Woets J (1988) Biological and integrated pest-control in greenhouses. Annual Review of Entomology 33, 239-269.

7
CHAPTER 2: DNA EXTRACTION FROM MUSEUM SPECIMENS OF PARASITIC HYMENOPTERA
Abstract
At the same time that molecular researchers are improving techniques to extract DNA
from museum specimens, this increased demand for access to museum specimens has created tension between the need to preserve specimens for maintaining collections and morphological research and the desire to conduct molecular analyses. To address these concerns, we examined the suitability of non-invasive DNA extraction techniques on three species of parasitic Hymenoptera (Braconidae), and test the effects of body size (parasitoid species), age (time since collection), and DNA concentration from each extract on the probability of amplifying meaningful fragments of two commonly used genetic loci. We found that age was a significant factor for determining the probability of success for sequencing both 28S and COI fragments. While the size of the braconid parasitoids significantly affected the total amount of extracted DNA, neither size nor DNA concentration were significant factors for the amplification of either gene region. We also tested several primer combinations of various lengths, but were unable to amplify fragments longer than ~150 base pairs. These short fragments of 28S and COI were however sufficient for species identification, and for the discovery of within species genetic variation.
Introduction
Methods for extracting and analyzing DNA sequence data from specimens not immediately preserved for DNA extraction are improving at a rapid rate, as highlighted by the recent sequencing of the Neanderthal genome (Green et al. 2011). Among these methods, several techniques exist which allow DNA to be extracted from a specimen without conferring visible damage (Gilbert et al. 2007; Rohland & Hofreiter 2007; Rowley et al. 2007). These “non-invasive” techniques are of particular interest to natural history museums as they have the potential to contribute to the value of collections, with little to no cost to the museum with regard to the number and quality of specimens held. Insects are a group where these techniques have received increasing attention, and non-invasive techniques have been used for a variety of orders, including Coleoptera, Diptera, Hemiptera, Hymenoptera, Lepidoptera, and Orthoptera, as well as several non-insect arthropods belonging to the Acarina and Aranea (Gilbert et al. 2007; Rowley et al. 2007; Nagy et al. 2010; Bluemel et al. 2011; Lis et al. 2011; Tagliavia et al. 2011). Recent attempts have been able to amplify, through polymerase chain reaction (PCR), useable fragments of mitochondrial DNA from insect specimens collected as early as 1820 (Thomsen et al. 2009). DNA extracted from museum specimens has been a useful source of information for understanding recent shifts in population structure, especially with regard to population declines in native pollinators (Lozier & Cameron 2009; Strange et al. 2009), in addition to having been helpful in the context of molecular based identifications (Rowley et al. 2007), and the short fragments of DNA extracted from museum specimens have recently been used in Next-Generation Sequencing applications (Shokralla et al. 2011). Unfortunately, due in part to the increased demand by researchers for access to museum specimens, tensions exist between the need to preserve specimens for morphological research

8
and the desire to conduct molecular analyses (Mandrioli 2008). Part of this tension is a result of a general lack of knowledge on behalf of both researchers and museum curators as to the likelihood of successfully extracting DNA from dried specimens, the likelihood of generating meaningful sequence data for subsequent analysis, and the post-extraction quality of museum specimens used for non-invasive techniques. One taxon for which DNA information from museum specimens is highly desirable is the parasitic Hymenoptera, in which cryptic variation is common and correct identification is notoriously difficult - even for trained specialists (Noyes 1994). In addition, parasitic Hymenoptera have been the subject of many phylogenetic and evolutionary studies (Dolphin & Quicke 2001), and are important economically, because of their value in the biological control of insect pests in agricultural, urban, and forest environments (Mills 2000; Van Driesche et al. 2008). In this study we examine the suitability of non-invasive DNA extraction techniques for pinned specimens of three species of parasitic Hymenoptera (Braconidae). We test the effects of body size (parasitoid species), and age (time since collection) on the total amount of DNA extracted, and the effect of these three factors on the probability of amplifying meaningful fragments of two commonly used genetic loci. We then test the utility of these amplified fragments in conjunction with previously published sequences for producing phylogenetic trees, one of the primary methods for species identification, and discovery of within-species genetic variation (Goldstein & DeSalle 2010). Finally, we make recommendations regarding the suitability of non-invasive techniques for molecular analysis of less robust museum specimens. Methods and Materials
Species Examined Specimens from three species in the family Braconidae (Atanycolus longifemoralis Shenefelt, Meteorus trachynotus Viereck, and Trioxys pallidus Haliday) were selected from the collection of parasitic Hymenoptera housed in the Essig Museum of Entomology at the University of California, Berkeley. Permission to work with specimens was granted by the Essig Museum, and all specimens were provided on loan. These three species are represented by a large number of specimens collected over a range of years, and by individuals that have been identified by taxonomic specialists. A. longifemoralis is a large (2–8 mg dry weight) ectoparasitoid of wood-boring coleopteran larvae, such as Melanophila drummondi, found on Douglas-fir in the west United States, and British Columbia (Shenefelt 1943; Scott 1974; Deyrup 1975). We examined 15 specimens of A. longifemoralis collected between 1931 and 1981. M. trachynotus is a midsize (0.1-0.3 mg dry weight) endoparasitoid of Choristoneura budworms in North America (Thireau et al. 1990). We examined 6 specimens of M. trachynotus collected either in 1914 or 1980. We also examined three unidentified specimens in the genus Meteorus collected in 2009. T. pallidus is a small (< 0.03 mg dry weight) endoparasitoid that was introduced to California and Oregon for classical biological control programs of walnut (Chromaphis juglandicola) and filbert (Myzocallis coryli) aphids respectively (van den Bosch et al. 1962; van den Bosch et al. 1970; Messing & AliNiazee 1989). We examined 12 specimens of T. pallidus collected between 1959 and 1993. For all specimens, collection information is provided in Table 2.1.
9
DNA Extraction Protocol The general practice for extracting DNA from “ancient” specimens is to use a sterile laboratory – a space where no previous molecular work from the taxon of interest has been performed. However, if DNA extractions are to be routinely performed on insect specimens from museum collections, such as those housed in the Essig Museum, it is unlikely that new sterile laboratories will be available for each extraction event. Therefore, we used procedures we believed would minimize the risk of contamination. In addition to standard laboratory practices, all working spaces and instruments, including pipettes, were cleaned with a 10% bleach solution and allowed to air dry prior to extractions. DNA extraction was performed using the buffers and protocols described by Gilbert et al. (2007) except as noted. Different methods were used to remove the specimens from their mounts. For specimens that were pinned directly, we first warmed the extraction buffer and then pipetted the warmed buffer over the pinned insect. After several minutes, gentle downwards pressure was applied using flamed sterilized forceps. If the parasitoid did not immediately release from the pin, the process was repeated. Some specimens of M. trachynotus, and all of the specimens of T. pallidus were glued to mounting points. For these individuals, warmed extraction buffer was used to loosen the bond between the card and the specimen. If after 30 min the parasitoid was still attached, flame-sterilized scissors were used to cut a small piece of the card with attached specimen from the rest of the mounting point to enable the specimen to be placed into the extraction buffer. For all extractions, the whole specimen was placed in a 1.5 ml eppendorf tube with 500 µl of extraction buffer. For A. longifemoralis, to fully submerge the specimens, multiple washes with the extraction buffer were required. Methods then followed Gilbert et al. (2007). The extracted DNA was suspended in 100 µl of DEPC nuclease free water (BioExpress), and its genomic content was quantified using a ND-1000 NanoDrop® (NanoDrop Technologies, Inc.), before being stored at -20°C.
Remounting of Specimens After specimens had been in 95% ethanol for at least 12 h they were removed and placed dorsally on a microscope cover slip. Enough ethanol was then added to cover the specimen, and the wings and legs were manipulated and spread prior to remounting. The ethanol was then allowed to evaporate, while the specimen was adjusted with forceps. Specimens were allowed to air dry for at least 48 h before being weighed on a Mettler-Toledo AT21 Comparator microgram balance (Mettler-Toledo International, Inc.). After measurement, individuals of A. longifemoralis were re-pinned. For Meteorus spp. and T. pallidus, the insects were re-glued to mounting points. Specimens were then catalogued for return to the collections at the Essig Museum of Entomology.
DNA Amplification and Sequencing The ability to amplify two commonly used DNA fragments, the D2 expansion region of the ribosomal gene 28S, and a fragment of the “barcoding region” of the mitochondrial gene Cytochrome Oxidase I (COI), were evaluated. For the amplification of 28S we used the forward and reverse primers, s3660 (Morse & Normark 2006) and 28Sb (Whiting et al. 1997), respectively, and two novel forward and reverse primers, Essig28SF2 5’ – TTG TCG GCG TGC ACT TCT C – 3’ and Essig28SR2 5’ – gag aag tgc acg ccg aca a – 3’, respectively. For the amplification of COI we used the forward and reverse primers LCO, and HCO (Folmer et al. 1994), respectively, one novel forward primer BracCOIF 5’ – CAT GCW TTT RTW ATR ATT TTT TTT ATR GTW ATR CC – 3’, and three genus specific reverse primers, AtanyCOIR 5’ – CTT AAA ATT AAT AAW ATT AAT GAA GG – 3’, MeteorCOIR 5’ – TTA WAG ATA

10
AWG GRG GRT AMA CWG TTC AHC C – 3’, and TrioxysCOIR 5’ – CAA CCC GTA CCA GCC CCT ACA TTT ATT AAA CCC C – 3’. Novel primers were designed using published sequences from congeners in GenBank as a template, and either using the software PriFi (Fredslund et al. 2005) or by eye. Standard PCR protocols were followed using a BioRad Dyad programmable thermocycler (BioRad Laboratories, Inc.). PCR reactions were carried out using Amplitaq GOLD DNA polymerase and buffers (Life Technologies), with the following conditions; 2.5 µl of 10X PCR Buffer II, 1.5 µM of MgCl2, 0.2 µM of dNTP (Promega Corporation), 0.2 µM of each primer, 0.2 µl of Taq polymerase, 1 µl of DNA template, finally H20 was added to bring the final reaction volume to 25 µl. For the amplification of 28S, all possible primer combinations were tested for all individuals, with an initial denaturing step at 94°C for 4 min was followed by thirty-five cycles of 94°C for 1 min, 52°C for 1 min, and 72°C for 1 min. This was followed by a 5 min extension step at 72°C. For the amplification of COI, genus specific reverse primers as well as the universal reverse primer “HCO” were used in combination with either the forward primer “LCO” or “BracCOIF” following the touchdown protocol presented by Hebert et al. (2003). For all primer combinations, reactions were held at 17°C, and results visualized on a 1.5% agarose gel. Sequencing of both forward and reverse fragments was performed on an Applied BioSystems 3730xl DNA Analyzer (Life Technologies) at the University of California Berkeley DNA Sequencing Facility. Sequence results were edited using Geneious Pro v. 5.5.4 (Drummond et al. 2011), and Nexus files containing both sequence data, parameters for phylogenetic analyses, and tree files for each dataset can be found at TreeBase.org (accession number TB2:S12519).
Statistical Analysis All statistical analyses were performed using the statistical software package R v. 2.14 (R Development Core Team 2011). Differences in DNA concentration (ng/µl) between extracts from parasitoid species were assessed by analysis of covariance (ANCOVA) in the R package STATS (R Development Core Team 2011) with age (in years since collection) included as a covariate. DNA concentration was log transformed to meet assumptions of normality. Backwards, stepwise model simplification was used to examine the significance of interaction terms and main effects, and after simplification, differences in DNA concentration between parasitoid species were assessed using analysis of variance (ANOVA) with Tukey’s Honest-Significance test. To analyze the probability of amplifying meaningful sequences of the two gene fragments, 28S and COI, we performed logistic regression analyses using generalized linear models (GLM), as part of the R package STATS (R Development Core Team 2011), with a Bernoulli distribution (failure/success to amplify either fragment) and a logit-link function, with parasitoid species, age, and log DNA concentration as factors. Multimodel inference was performed based on Akaiki’s Information Criterion corrected for small sample size (AICc) (Burnham et al. 2011; Grueber et al. 2011; Symonds & Moussalli 2011) using the R package AICcmodavg (Mazerolle 2012). Scores were calculated for all model subsets, though the final set of retained models did not include interaction terms due to the extreme differences observed in parameter estimate standard errors (SE) (Agresti & Finlay 2009). Model weights were used to

11
estimate the relative importance of each of the factors included in the models, and model averaging to provide averaged estimates and confidence intervals for each factor (Burnham & Anderson 2002). As age was the most important factor in the models, simplified models that included age only were used to estimate the effect of age on the probability of amplifying meaningful fragments of 28S and COI for specimens between 0 and 96 years old. These simplified models do not account for all of the variability determined by our multimodel analysis, but may be a useful first approximation in the selection of specimens prior to DNA extraction.
Phylogenetic Analysis One of the primary methods of analysis to resolve questions of species identification is the production of phylogenetic trees (Goldstein & DeSalle 2010). To be useful for reconstructing accurate phylogenetic relationships, however, sequence fragments must be sufficiently divergent as to differentiate individuals, whilst not being too divergent that their relationships are clouded by too much “noise.” For short fragments, this presents a particular problem, and thus quantitative analyses have been performed seeking to optimize the location, length and variability of DNA sequences (Martin et al. 1995). To test the utility of short sequence fragments from the two gene regions, to correctly identify known and unknown specimens, as well as to reconstruct meaningful evolutionary relationships between those individuals, we used Maximum Parsimony (MP) to analyze the fragments produced in this study, with sequence data published in GenBank from either the species in question, and/or from congeners. We analyzed both gene regions separately. Alignments were generated using the sequence alignment program MUSCLE (Edgar 2004). For analysis of the COI fragment, due to the high degree of sequence divergence between the three species, individual datatsets for each species (including congeners) were created, again using MUSCLE. Matrices were visualized in MacClade v. 4.08 (Maddison & Maddison 2005), and for all analyses, datasets were truncated to correspond to the sequence fragment generated from our closest primer combinations (Essig28SF2 and Essig28SR2 for 28S; BracCOIF with either AtanyCOIR, MeteorCOIR, or TrioxysCOIR for COI), and primer regions were then excluded. MP analyses were performed using PAUP* v. 4b10 (Swofford 2003) for each matrix using a heuristic search algorithm with a tree-bisection-reconnection branch-swapping algorithm. For the individual analysis of the 28S dataset, gap positions were coded as a 5th character state. Confidence in tree topology was estimated using 1000 bootstrap replicates. Results
DNA Extraction and Sequencing Genomic material was extracted from 15 specimens of A. longifemoralis, 9 specimens in
the genus Meteorus, and 12 specimens of T. pallidus, with specimens ranging in age at time of extraction from 1 to 96 years. Results from the ANCOVA analysis showed that the total amount of genomic material (DNA concentration) differed significantly between parasitoid species (F = 10.19, df = 2,30, p < 0.001), while age had no effect on DNA concentration (F = 1.73, df = 1,30, p = 0.19), and there was no interaction between age and DNA concentration (F = 1.06, df = 2, 30, p = 0.36). Post-hoc analyses found that DNA concentration differed significantly between specimens of the largest parasitoid species, A. longifemoralis, and the smallest parasitoid species, T. pallidus (p < 0.001) (Figure 2.1).

12
Of the examined parameters, based on AIC weights from all models, the model with age
alone had the largest effect on the success/failure of amplifying 28S and COI (Table 2.2). The sum of the Akaike weights for each model in which age appeared were 0.99 for 28S and 1.00 for COI, compared to 0.31 for 28S and 0.23 for COI for models including DNA concentration, and 0.33 for 28S and 0.3 for COI for models including parasitoid species. In addition, after model averaging, and based on weighted parameter and unconditional standard error estimates, for both 28S and COI, age was the only supported parameter based on 95% confidence intervals (Table 2.3). The logistic regression models using age as the only predictor variable for the amplification of 28S had an intercept of 2.564 ± 0.945 (t = 2.714, p = 0.01) and a slope of -0.049 ± 0.02 (t = -2.463, p = 0.019), and for the amplification of COI, an intercept of 2.561 ± 1.125 (t = 2.275, p = 0.023) and a slope of -0.081 ± 0.03 (t = -2.689, p = 0.007), see Figure 2.2.
Phylogenetic Utility For the analysis of the 28S dataset, four MP trees were reconstructed (Figure 2.3).
Sequences from all specimens formed clades with sequences from congeneric species published in GenBank with high bootstrap support (B.P.) for A. longifemoralis (100% B.P.) and T. pallidus (100% B.P.), and medium support for Meteorus (74% B.P.). For the analysis of the COI datasets, 13 MP trees were reconstructed for the A. longifemoralis dataset, 10 MP trees for the Meteorus spp. dataset, and 2 MP trees for the T. pallidus dataset (Figure 2.4). Relationships between A. longifemoralis and its closest included congener A. ulmicola were unsupported. Our unidentified specimens of Meteorus formed a highly supported clade (99% B.P.) with published sequences from M. ictericus, and our specimens of T. pallidus formed a poorly supported clade (65% B.P.) with two published sequences from T. pallidus, as well as two published sequences from unidentified Hymenoptera specimens. Discussion
DNA Extraction and Sequencing Recently, DNA extracted from insect specimens from museum collections has been used
to illuminate questions regarding the population structure and phylogeny of a variety of insect taxa (Gilber et al. 2007; Rohland & Hofreiter 2007; Rowley et al. 2007; Lozier & Cameron 2009; Lees et al. 2010; Nagy et al. 2010; Bluemel et al. 2011; Lis et al. 2011; Shokralla et al. 2011; Tagliavia et al. 2011; Ugelvig et al. 2011). This study is the first to our knowledge to use these techniques with specimens of parasitic Hymenoptera, and the first that attempts to examine the effects of age, size, and DNA concentration of extracts from museum specimens on the probability of successfully sequencing meaningful fragments from those specimens. In general, we found that age had no effect on the amount of total DNA extracted from a braconid parasitoid specimen, but was a significant factor for determining the probability of success for sequencing both fragments of 28S and COI. While specimen size (represented by parasitoid species) significantly affected the total amount of extracted DNA, neither it nor DNA concentration were found to be significant factors for the amplification and sequencing of meaningful fragments of either locus based on 95% confidence intervals.
Some studies (Strange et al. 2009; Thomsen et al. 2009; Bluemel et al. 2011) have
reported being able to amplify fragments of DNA from specimens collected more than 100 years ago. While we were able to successfully amplify and sequence short fragments of both 28S and

13
COI from museum specimens of parasitic Hymenoptera; the oldest specimen from which we obtained 28S was 71 years (collected in 1940), and the oldest specimen from which we obtained COI was 52 years (collected in 1959). In general, we were more successful at amplifying fragments of 28S than fragments of COI, which could be due to a difference in the number of copies of these loci, or even differential rates in which these gene regions are fragmented after an organism’s death, though we did not examine either of these possibilities and can only speculate with regard to their importance. Also, compared to Gilbert et al. (2007) whose methods we followed, we had a slightly lower rate of success for amplifying 28S (61% compared to 78%) and a much lower rate of success for amplifying COI (38% compared to 71%). Based on our regression analysis, we found that these success rates also decreased with age, with success decreasing at a faster rate for COI than for 28S. We should note that we did not consider the effects of a specimen’s temporal history, and assumed that all the specimens in this study were subject to similar storage conditions (temperature, humidity, etc.) while in the Essig Museum. Research has shown that the temporal history of a specimen can affect the success of amplification of DNA from ancient specimens (Smith et al. 2011), and researchers examining specimens from multiple natural history collections should consider the possible effects of storage history on their results.
The size of the fragments amplified in this study are similar to those reported in the
majority of studies using insect specimens from museum collections (Lozier & Cameron 2009; Lees et al. 2010; Bluemel et al. 2011; List et al. 2011; Shokralla et al. 2011; Ugelvig et al. 2011), and in particular to that observed by Rowe et al. (2011), who found that the majority of the total DNA extracted from their specimens was comprised of fragments between 150 and 300 base pairs, and by Ugelvig et al. (2011) who examined the length of microsatellite alleles amplified from museum specimens and found that as specimens increase in age, the length of amplifiable fragments decreases. Conversely, Tagliavia et al. (2011) report being able to amplify fragments of both mitochondrial and nuclear genes of up ~ 800 base pairs from specimens collected 50 years ago, and particularly for phylogenetic studies, their techniques could be of exceptional utility.
While we found no correlation between specimen age and extractable DNA
concentration, and DNA concentration was not a significant factor for fragment amplification and sequencing, we caution that it may play an indirect role in the success of amplification based on the following four concerns; 1) that as a specimen ages, total DNA from the specimen may remain unchanged but become increasingly fragmented, thus rendering it unusable for PCR, 2) that as a specimen ages, total DNA from the specimen itself decreases, but over-all DNA concentrations can remain unchanged as bacteria or fungi growing in or on the specimen increase in abundance, 3) that a Nano-Drop, which cannot distinguish between single and double stranded DNA, is not the correct tool for quantifying DNA fragments from critical specimens and alternative methods which only examine double stranded DNA, or include fragment length may be more appropriate, or 4) that residual phenol from the DNA extraction process can mask the true DNA concentration, and that for older specimens these effects may be more pronounced.
Phylogenetic Utility The phylogenetic analysis of the 28S gene region produced clades that were well supported (Figure 2.3). Our analysis found no difference between specimens of T. pallidus at

14
28S, and a single base pair difference between specimens of A. longifemoralis. There was also a single base pair difference between one specimen of M. trachynotus, and the other specimens of M. trachynotus and Meteorus sp, as well as published sequences for M. ictericus and a published sequence from an unidentified Meteorus. The fragment of 28S, while not as variable as the fragment of COI we amplified, appeared to be useful for resolving both higher level taxonomic relationships, as well as species level differences between most of the species of Meteorus included in this analysis. 28S may not be sufficient however for differentiating between very closely related species (e.g. members of the same species group) as evident from the lack of differentiation between M. ictericus and M. trachynotus. The fragment of COI that we amplified was more variable than the fragment of 28S (as expected), but was amplified from fewer individuals, and in general more recent specimens (Table 2.1). Using the results of our phylogenetic analysis, we suspect that our unidentified specimens of Meteorus sp. are specimens of M. ictericus based on the well-supported clade they formed (100% bootstrap support) with all but one of the published sequence for M. ictericus by Stigenberg & Ronquist (2011). The one published sequence of M. ictericus which was not a member of the clade (HQ264015) was identical to several sequences from M. ruficeps and we expect that this represents a labeling error during the GenBank submission process. We also uncovered multiple haplotypes for T. pallidus within the specimens stored in the Essig Museum.
Damage to Specimens Though we did not quantify damage to specimens, unfortunately visible damage was
observed for several of the specimens used in this study. A. longifemoralis has a long ovipositor, legs, and large wings, and while great care was taken to minimize damage to these structures, the ovipositor sheaths in particular were quite fragile and frequently became dislocated during the DNA extraction process. In all cases, dislocated limbs and ovipositor sheaths were glued to a mounting point on the same pin as the specimen. The major source of damage to specimens was a slight tearing of the wings that resulted from specimens becoming affixed to the glass cover slip during the 48 hr drying period after DNA extraction. All observed damage was done during specimen handling, and was not caused by the DNA extraction process directly. In general, however, specimens did appear to be lighter in color after DNA extraction, and this was most pronounced in the abdomen, though these differences were not quantified. Thus the specific method for DNA extraction used in this study may not be appropriate for specimens for which shades of color is either a distinguishing character or adds to the value of the specimen.
Conclusions Of the variables we examined in this study, the age of a museum specimen appears to be
the most important in determining the probability of amplifying and sequencing meaningful fragments of DNA from parasitic Hymenoptera. We were able to amplify fragments of 28S from older specimens than was the case for fragments of COI. Since 28S exists at a higher copy number than COI, we suspect that as the copy number of a target DNA fragment decreases, the probability of amplifying it successfully from museum specimens will also decrease. Though the DNA fragments produced in this study were relatively short compared to those commonly used for phylogenetic or species identification applications, they were useful both for determining within species variation and for species level identification. For the reconstruction of deeper phylogenetic relationships it may be possible to create “scaffolds” of many short fragments of a

15
target gene region in order to produce sequence data of sufficient length and diversity for analysis, to create a concatenated matrix of short fragments from two or more gene regions, or to use alternative extraction techniques which may be more effective than the methods examined here at preserving longer fragments of DNA from museum specimens (Tagliavia et al. 2011). Acknowledgements
I am extremely grateful to Cheryl Barr, Peter Oboyski, and Bob Zuparko at the Essig Museum of Entomology at UC Berkeley. I would also like to acknowledge Pete Croucher and Brian Ort for their technical assistance, and Linda Bürgi, Sara Emery, Tim Engelkes, Lisa Fernandez, Julie Hopper, Kevi Mace-Hill, Michelle Labbé, and Kip Will for their constructive comments. I would also like to thank Nicholas Mills, George Roderick, and Rasmus Nielsen for their comments on an earlier draft of this chapter.

16
Chapter 2. References Agresti A, Finlay B (2009) 14.1 Model selection procedures. In: Statistical Methods for the
Social Sciences 4th edition. p. 441 - 448. Pearson Prentice Hall, Upper Saddle River, NJ, USA.
Bluemel JK, King RA, Virant-Doberlet M, Symondson WOC (2011) Primers for identification of type and other archived specimens of Aphrodes leafhoppers (Hemiptera, Cicadellidae). Molecular Ecology Resources 11, 770-774.
Burnham KP, Anderson DR (2002) Model Selection and Multimodal Inference: A Practical Information-theoretic Approach. Springer-Verlag, New York, NY, USA.
Burnham KP, Anderson DR, Huyvaert KP (2011) AIC model selection and multimodel inference in behavioral ecology: some background, observations, and comparisons. Behavioral Ecology and Sociobiology 65, 23-35.
Deyrup MA (1975) The Insect Community of Dead and Dying Douglas-Fir: I. The Hymenoptera. University of Washington, Seattle, WA, USA.
Dolphin K, Quicke DLJ (2001) Estimating the global species richness of an incompletely described taxon: an example using parasitoid wasps (Hymenoptera: Braconidae). Biological Journal of the Linnaean Society of London 73, 279-286.
Drummond A, Ashton B, Buxton S, Cheung M, Cooper A, et al. (2011) Geneious v 5.5.4, Available from http://www.geneious.com.
Edgar RC (2004) MUSCLE: multiple sequence alignment with high accuracy and high throughput. Nucleic Acids Research 32, 1792-1797.
Folmer O, Black M, Hoeh W, Lutz R, Vrijenhoek R (1994) DNA primers for amplification of mitochondrial cytochrome c oxidase subunit I from diverse metazoan invertebrates. Molecular Marine Biology and Biotechnology 3, 294-299.
Fredslund J, Schauser L, Madsen L, Sandal N, Stougaard J (2005) PriFi: using a multiple alignment of related sequences to find primers for amplification of homologs. Nucleic Acids Research 33, 16-20.
Green RE, Krause J, Briggs AW, Maricic T, Stenzel U, et al. (2011) A draft sequence of the Neandertal genome. Science 328, 710-722.
Gilbert MTP, Moore W, Melchior L, Worobey M (2007) DNA extraction from dry museum beetles without conferring external morphological damage. PLoS ONE 2, e272.
Goldstein PZ, DeSalle R (2010) Integrating DNA barcode data and taxonomic practice: Determination, discovery, and description. Bioessays 33, 135-147.
Grueber CE, Nakagawa S, Laws RJ, Jamieson IG (2011) Multimodel inference in ecology and evolution: challenges and solutions. Journal of Evolutionary Biology 24, 699-711.
Hebert PDN, Cywinska A, Ball SL, deWaard JR (2003) Biological identifications through DNA barcodes. Proceedings of the Royal Society of London B Biological Sciences 270, 313-321.
Lees DC, Rougerie R, Zeller-Lukashort C, Kristensen NP (2010) DNA mini-barcodes in taxonomic assignment: a morphologically unique new homoneurous moth clade from the Indian Himalayas described in Micropterix (Lepidoptera, Micropterigidae). Zoologica Scripta 39, 642-661.
Lis JA, Ziaja DJ, Lis P (2011) Recovery of mitochondrial DNA for systematic studies of Pentatomoidea (Hemiptera: Heteroptera): successful PCR on early 20(th) century dry museum specimens. Zootaxa 2748, 18-28.

17
Lozier JD, Cameron SA (2009) Comparative genetic analyses of historical and contemporary collections highlight contrasting demographic histories for the bumble bees Bombus pensylvanicus and B. impatiens in Illinois. Molecular Ecology 18, 1875-1886.
Maddison DR, Maddison WP (2005) MacClade. 4.08. Sinauer Associates, Sunderland, MA, USA.
Mandrioli M (2008) Insect collections and DNA analyses: how to manage collections? Museum Management and Curatorship 23, 193-199.
Martin MJ, González-Candelas F, Sobrino F, Dopazo J (1995) A method for determining the position and size of optimal sequence regions for phylogenetic analysis. Journal of Molecular Evolution 41, 1128-1138.
Mazerolle MJ (2012) AICcmodavg: Model Selection and Multimodel Inference Based on (Q)AIC(c). http://cran.r-project.org/web/packages/AICcmodavg/index.html
Messing RH, AliNiazee MT (1989) Introduction and establishment of Trioxys pallidus [Hym.: Aphidiidae] in Oregon, U.S.A. for control of filbert aphid Myzocallis coryli [Hom.: Aphididae]. Entomophaga 34, 153-163.
Mills N (2000) Biological control: the need for realistic models and experimental approaches to parasitoid introductions. In: Hochberg ME, Ives AR (eds.) p. 217-234. Parasitoid Population Biology. Princeton University Press, Princeton, NJ, USA.
Morse GE, Normark BB (2006) A molecular phylogenetic study of armoured scale insects (Hemiptera : Diaspididae). Systematic Entomology 31, 338-349.
Nagy ZT, Breman FC, Dall'Asta U (2010) DNA barcoding of museum specimens of Lymantriidae preserved in the Royal Museum for Central Africa. Entomologica Romanica 15, 11-16.
Noyes JS (1994) The reliability of published host-parasitoid records: a taxonomist's view. Norwegian Journal of Agricultural Sciences S16, 59-69.
R Development Core Team (2011) R: A Language and Environment for Statistical Computing. Vienna, Austria: R Foundation for Statistical Computing.
Rohland N, Hofreiter M (2007) Comparison and optimization of ancient DNA extraction. BioTechniques 42, 343-352.
Rowe KC, Singhal S, Macmanes MD, Ayroles JF, Morelli TL, et al. (2011) Museum genomics: low-cost and high-accuracy genetic data from historical specimens. Molecular Ecology Resources 11, 1082-1092.
Rowley DL, Coddington JA, Gates MW, Norrbom AL, Ochoa RA, et al. (2007) Vouchering DNA-barcoded specimens: test of a nondestructive extraction protocol for terrestrial arthropods. Molecular Ecology Notes 7, 915-924.
Scott DW (1974) Notes on general biology of Flatheaded Fir Borer Melanophila drummondi Kirby reared from Ponderosa Pine (Coleoptera-Buprestidae). Pan-Pac Entomologist 50, 204-205.
Shenefelt RD (1943) The genus Atanycolus Forester in America north of Mexico. Research Studies 11, 51-163.
Shokralla S, Zhou X, Janzen DH, Hallwachs W, Landry J-F, et al. (2011) Pyrosequencing for mini-barcoding of fresh and old museum specimens. PLoS ONE 6, e21252.
Smith CI, Chamberlain AT, Riley MS, Cooper A, Stringer CB, et al. (2001) Not just old, but old and cold. Nature 410, 771-772

18
Stigenberg J, Ronquist F (2011) Revision of the Western Palearctic Meteorini (Hymenoptera, Braconidae), with a molecular characterization of hidden Fennoscandian species diversity. Zootaxa 3084, 1-95.
Strange JP, Knoblett J, Griswold T (2009) DNA amplification from pin-mounted bumble bees (Bombus) in a museum collection: effects of fragment size and specimen age on successful PCR. Apidologie 40, 134-139.
Swofford DL (2003) PAUP*. Phylogenetic Analysis Using Parsimony (*and Other Methods). Sinauer Associates, Sunderland, MA, USA.
Symonds MRE, Moussalli A (2011) A brief guide to model selection, multimodel inference and model averaging in behavioural ecology using Akaike's information criterion. Behavioral Ecology and Sociobiology 65, 13-21.
Tagliavia M, Massa B, Albanese I, La Farina M (2011) DNA extraction from Orthoptera museum specimens. Analytical Letters 44, 1058-1062.
Thireau JC, Régnière J, Cloutier C (1990) Biology and morphology of immature stages of Meteorus trachynotus Vier. (Hymenoptera: Braconidae). Canadian Journal of Zoology 68, 1000-1004.
Thomsen PF, Elias S, Gilbert MTP, Haile J, Munch K, et al. (2009) Non-destructive sampling of ancient insect DNA. PLoS ONE 4, e5048.
Ugelvig LV, Nielsen PS, Boomsma JJ, Nash DR (2011) Reconstructing eight decades of genetic variation in an isolated Danish population of the large blue butterfly Maculinea arion. BMC Evolutionary Biology 11, 201.
Van Driesche RG, Hoddle MS, Center T (2008) Control of Pests and Weeds by Natural Enemies. An Introduction to Biological Control. Malden, MA: Blackwell Publishing.
van den Bosch R, Frazer BD, Davis CS, Messenger PS, Hom R (1970) Trioxys pallidus: an effective new walnut aphid parasite from Iran. California Agriculture 24, 8-10.
van den Bosch R, Schilinger EI, Hagen KS (1962) Initial field observations in California on Trioxys pallidus (Haliday) a recently introduced parasite of the walnut aphid. Journal of Economic Entomology 55, 857-862.
Whiting MF, Carpenter JC, Wheeler QD, Wheeler WC (1997) The Strepsiptera problem: phylogeny of the holometabolous insect orders inferred from 18S and 28S ribosomal DNA sequences and morphology. Systematic Biology 46, 1-68.

19!
Table 2.1 – Parasitoid specimens from the Essig Museum collection used for DNA extraction, indicating age (years), weight (mg), extracted DNA concentration (ng/ul) and the number of base pairs amplified for each of two selected genetic loci
* Specimen weighed on mg scale. † Specimen could not be removed from mounting pin
ID # Location Age
Collection Weight
DNA 28S COI
Atanycolus longifemoralis Shenefelt J0075 Yosemite, CA 79 5.vi.1931 4.013 141.93 J0076 Fallen Leaf Lake, CA 70 5.vii.1940 8.145 55.04 140 J0077 Fallen Leaf Lake, CA 70 5.vii.1940 3.763 44.58 140 J0078 6 mi east of Chester, CA 56 14.vii.1954 5.273 113.53 140 J0079 6 mi east of Chester, CA 56 14.vii.1954 5.011 66.08 J0080 6 mi east of Chester, CA 56 14.vii.1954 6.096 310.10 J0081 Hobart Mills, CA 48 29.vii.1962 5.873 26.08 140 J0082 7 mi N of Truckee, CA 48 29.vii.1962 2.584 63.36 J0083 7 mi N of Truckee, CA 48 29.vii.1962 2.780 115.70 J0084 2 mi W of Brancomb, CA 34 25-27.v.1976 3.225 84.28 140 J0085 2 mi W of Brancomb, CA 34 25-27.v.1976 4.236 506.16 140 J0086 2 mi W of Brancomb, CA 34 25-27.v.1976 2* 74.00 140 103 J0087 Echo Lake, CA 29 24.vi.1981 1.588 70.32 140 103 J0088 Echo Lake, CA 29 24.vi.1981 1.739 113.22 140 103 J0089 Tahoe City, CA 29 30.ix.1981 4.425 28.10 140 103 Meteorus trachynotus Viereck J0103 Orono, ME 96 27.vii.1914 0.161 13.70 J0104 Orono, ME 96 27.vii.1914 0.256 152.82 J0105 Orono, ME 96 26.vii.1914 0.295 5.90 J0106 La Jara Canyon, NM 30 5.vii.1980 0.122 37.59 139 J0107 La Jara Canyon, NM 30 5.vii.1980 0.256 34.21 139 J0108 La Jara Canyon, NM 30 4.vii.1980 0.258 64.50 139 Meteorus undet J0109 Santa Cruz, CA 1 21.5.2009 0.198 78.95 789 658 J0110 San Francisco, CA 1 3.vi.2009 0.274 51.05 789 658 J0111 San Francisco, CA 1 17.vi.2009 0.220 31.40 789 658 Trioxys pallidus Halliday J0090 Rancho Santa Fe, CA 51 18.viii.1959 † 11.10 155 128 J0092 Rancho Santa Fe, CA 51 18.viii.1959 † 9.27 J0093 U.C. Insectary, Albany, CA 47 2.v.1963 † 1.70 155 128 J0094 U.C. Insectary, Albany, CA 47 2.v.1963 † 8.06 155 128 J0095 U.C. Insectary, Albany, CA 47 2.v.1963 † 5.83 J0096 Citrus Exp. Station, Riverside, CA 33 1977 † 1.30 J0097 Citrus Exp. Station, Riverside, CA 33 1977 † 84.41 128 J0098 Citrus Exp. Station, Riverside, CA 33 1977 † 11.80 J0099 U.C. Insectary, Albany, CA 17 13.vii.1993 0.006 4.80 J0100 U.C. Insectary, Albany, CA 17 13.vii.1993 0.008 13.72 155 128 J0101 U.C. Insectary, Albany, CA 17 13.vii.1993 0.014 11.00 155 128 J0102 Berkeley, CA 17 4.viii.1993 0.023 593.84 155 128

20!
Table 2.2 – GLM model summaries for the probability of amplifying meaningful sequences of 28S and COI from three braconid parasitoid species. Model names, descriptions, and AIC summaries for supported models examining factors contributing to the amplification of fragments of 28S and COI. K = the number of fitted parameters in the model, AICc = AIC score corrected for small sample sizes, !i = the difference between the AICc of the current model and that of the model with the lowest AICc score, wi = Akaike weights indicating the probability of the model being the correct model compared to all other tested models. Model Description K AICc !i wi Log-likelihood 28S ~ Age 2 43.83 0 0.43 -19.73 28S ~ Age, Parasitoid species 4 44.85 1.02 0.26 -17.78 28S ~ Age, log(DNA) 3 45.09 1.26 0.23 -19.17 28S ~ Age, log(DNA), Parasitoid species 5 47.47 3.64 0.07 -17.73 28S ~ log(DNA) 2 51.53 7.7 0.01 -23.58 28S ~ Parasitoid species 3 53.94 10.11 0 -23.59 28S ~ log(DNA), Parasitoid species 4 56.19 12.36 0 -23.45 COI ~ Age 2 38.36 0 0.53 -17 COI ~ Age, Parasitoid species 4 39.98 1.62 0.24 -15.34 COI ~ Age, log(DNA) 3 40.64 2.28 0.17 -16.94 COI ~ Age, log(DNA), Parasitoid species 5 42.57 4.21 0.06 -15.29 COI ~ Parasitoid species 3 51.91 13.55 0 -22.58 COI ~ log(DNA) 2 52.45 14.09 0 -24.04 COI ~ log(DNA), Parasitoid species 4 53.16 14.8 0 -21.94

21!
Table 2.3 – Model averaged estimates and uncertainty for the amplification of 28S and COI. Model-averaged parameter estimates were calculated by averaging parameter estimates over all models in which a specific predictor was included. The new averaged parameter estimates are reported with standard errors (SE), as well as 95% confidence intervals (CI). Those parameters whose 95% CI did not include zero are highlighted in bold. Summaries for the categorical parameter Parasitoid species are reported relative to Parasitoid species (Atanycolus). 95% CI
Parameter
Averaged parameter estimate
Weighted unconditional SE Upper Lower
28S Intercept 2.785 1.495 5.699 -0.130 Age -0.054 0.022 -0.011 -0.097 log(DNA) 0.198 0.329 0.840 -0.444 Parasitoid species (Meteorus) 0.186 1.407 2.929 -2.557 Parasitoid species (Trioxys) -1.740 1.035 0.278 -3.757 COI Intercept 2.840 1.470 5.707 -0.026 Age -0.089 0.034 -0.022 -0.156 log(DNA) -0.025 0.344 0.646 -0.695 Parasitoid species (Meteorus) -1.798 1.545 1.214 -4.811 Parasitoid species (Trioxys) 0.756 1.097 2.895 -1.383

22!
Figure 2.1 – Mean DNA concentrations from three braconid species. Mean (± 1 SE) DNA concentrations (ng/µl) extracted from three braconid species, as measured with a NanoDrop. Statistical differences between the species (p < 0.05) are signified by a different letter above each column.

23!
Figure 2.2 – Probability of amplifying fragments of 28S and COI. The probability of successfully amplifying the 28S (left) and COI (right) gene fragments for specimens between 0 and 96 years old were estimated using the results from a logistic regression model with failure/success of amplification of each gene fragment as the response variable and age as the predictor variable. Circles represent the outcome for individual specimens, and the fitted curve from the logistic regression analysis is shown as a solid line, with associated 95% confidence intervals indicated by broken lines. For 28S the intercept equals 2.564 ± 0.945 (t = 2.714, p = 0.01), with a slope of -0.049 ± 0.02 (t = -2.463, p = 0.019), and for COI, the intercept equals 2.561 ± 1.125 (t = 2.275, p = 0.023), with a slope of -0.081 ± 0.03 (t = -2.689, p = 0.007).

24!
Figure 2.3 – One of eight most parsimonious reconstructions of the 28S dataset. Phylogram showing of one of the most parsimonious trees from the analysis of the 28S dataset. Bootstrap support values are shown either above or next to each supported branch. Sequences generated in this study are in bold. A scale bar indicating branch-lengths is shown in the bottom left.

25!
Figure 2.4 – Examples of most parsimonious trees from the analyses of the COI datasets for A) A. longifemoralis (1 of 13 MP trees), B) Meteorus spp., (1 of 10 MP trees) and C) T. pallidus (1 of 2 MP trees). Bootstrap support values are shown either above or next to each supported branch. For each dataset, a scale bar indicating branch-lengths is shown in the bottom left.

26!
CHAPTER 3: iMSAT: A NOVEL APPROACH TO THE DEVELOPMENT OF MICROSATELLITE LOCI USING BARCODED ILLUMINA LIBRARIES !
Abstract
Illumina sequencing with its high number of reads and low per base pair cost is an attractive technology for development of molecular resources for non-model organisms. While many software packages have been developed to identify short tandem repeats (STRs) from next-generation sequencing data, these methods do not inform the investigator as to whether or not candidate loci are polymorphic in their target populations. Here we provide a python program iMSAT that uses the polymorphism data obtained from mapping individual Illumina sequence reads onto a reference genome to identify polymorphic STRs. Using this approach we identified 9,119 candidate polymorphic STRs for use with the parasitoid wasp Trioxys pallidus and 2,378 candidate polymorphic STRs for use with the aphid Chromaphis juglandicola. For both organisms we selected 20 candidate tri-nucleotide STRs for validation. Using fluorescent-labeled oligonucleotide primers we genotyped 91 female T. pallidus collected in nine localities and 46 female C. juglandicola collected in 4 localities and found 15 of the examined markers to be polymorphic for T. pallidus and 12 of the examined markers to be polymorphic for C. juglandicola. Our novel approach uses standard Illumina barcoding primers, and a single Illumina HiSeq run to target polymorphic STR fragments to develop and test STR markers. We validate this approach using the parasitoid wasp T. pallidus and its aphid host C. juglandicola. This approach, which would also be compatible with 454 Sequencing, allowed us to quickly identify markers with known variability and thus presents a significant improvement over existing STR identification software packages. Introduction
Next-Generation Sequencing (NGS) technologies have recently revolutionized the ease and the rate at which genetic resources can be developed (Mardis 2008; Shendure & Ji 2008; Metzker 2010). This revolution has made it possible to now use the genetic tools that were previously only available for model taxa (Ekblom & Galindo 2011). For example, the development of short tandem repeat (STR or microsatellite) markers in non-model organisms is currently undergoing a complete paradigm shift in regards to the techniques and methods used to isolate potential markers, particularly for insect (Bai et al. 2010; Gardner et al. 2011; Cerna et al. 2012; Keller et al. 2012). These new techniques have replaced the laborious steps of DNA cloning with the speed and ease of NGS technologies (López-Uribe et al. 2013) allowing researchers to quickly develop candidate markers for their study organisms.
Perhaps as a result of the increased accessibility to NGS technologies for STR marker
development, there has also been an increased level of activity in the development of associated software for identifying candidate markers. Many highly cited packages (Edgar & Myers 2005; Li & Wan 2005; Thurston & Field 2005; Jewell et al. 2006; Dereeper et al. 2007; Kofler et al. 2007; Faircloth 2008; Kraemer et al. 2009; Castoe et al. 2010; Mayer 2010; Castoe et al. 2012; Du et al. 2013; Miller et al. 2013), but see (Lim et al. 2013) for a more thorough review. Current software packages work by searching through assembled sequence data for tandem-repeat regions and then apply filters to optimize the list of candidate sites based on user specified criteria. Newer programs directly allow for the use of whole genome data (Du et al. 2013) or raw sequence data from paired-end Illumina sequencing (Miller et al. 2013). The most recent software program SSR_pipeline represents a particularly important improvement in the identification of STR data by directly using the quality scores from the sequence reads to aid in the identification of STR markers. Yet, two major obstacles remain for the identification of STR

27!
markers for genetic analyses based on NGS sequence results. First, most existing software packages provide an overwhelming number of candidate loci. Second, they do not inform the investigator as to which loci are fixed and which are polymorphic for the populations under study. For example, a recent study that integrated NGS technologies with existing software packages to develop markers for a species of aphid (Jun et al. 2012) found that only 0.76% of their 342 candidate markers were suitable for use, though whether this was due to failure to amplify target loci with standard PCR protocols or because amplified loci were not polymorphic is unknown to us.
To improve the rate at which polymorphic STR markers can be identified and developed
for use in genetic analyses, we present the use of a novel technique that uses barcoded Illumina sequencing libraries to identify polymorphic STR markers. We test this technique using two insect species from phylogentically distinct orders; the braconid wasp Trioxys pallidus and its aphid host Chromaphis juglandicola. Both insects occur in walnut orchards in California where C. juglandicola is an important invasive pest that was brought under effective biological control by the deliberate introduction of T. pallidus from Iran in 1969 (van den Bosch et al. 1962, 1970, 1979). We then compare the patterns of STR motifs found for each species to other results published from their respective orders to examine the value of this approach for phylogenetically diverse organisms. Methods
To identify and test STR markers, we used an NGS approach. Sequencing libraries for T. pallidus were created by pooling twenty individuals of T. pallidus reared from filbert aphids collected in Bethel, Oregon, United States into a sample labeled “Hazelnut,” and twenty individuals of T. pallidus reared from walnut aphids collected in Tehran, Iran into a sample labeled “Walnut.” DNA was then extracted from each pooled sample using a Qiagen DNeasy Blood & Tissue Kit (Qiagen) with the following modification. To reduce the amount of residual salt in the extract, critical for NGS applications, we performed the AW1 and AW2 washes twice each, followed by an additional spin step to remove any residual AW2 buffer. This was followed by standard elution with the AE buffer. Sequencing libraries for C. juglandicola were created by pooling twenty individuals of C. juglandicola collected in Upper Lake, California, United States, into a sample labeled “US”, and twenty individuals of C. juglandicola collected in Parnac, France into a sample labeled “France”. DNA was then extracted from each pooled sample using the Qiagen Gentra-PureGene DNA Extraction Kit (Qiagen). Concentrations of nucleic acids for all extracts were then quantified with a ND-1000 NanoDrop® (NanoDrop Technologies, Inc.) and concentrations of double stranded DNA were measured using the Qubit® dsDNA HS Assay kit (Life Technologies Corp.). Sequencing libraries for each T. pallidus extract were created using the Nextera™ DNA Sample Prep Kit (Illumina, Inc.) as per Nextera™ instructions, and each library was constructed using a different Illumina barcoding primer. Sequencing libraries for each C. juglandicola extra were created using the PrepX™ ILM DNA Library Kit (Wafergen Biosystems Inc.) at The Functional Genomics Laboratory at the University of California Berkeley, and each library was constructed using a different Illumina barcoding primer. Sequencing libraries were examined for fragment length distribution and concentrations using a 2100 Expert Bioanalyzer (Agiliant Technologies), and a KAPA Biosystems Library Quantification Kit (KAPA Biosystems). Each species’ libraries were then pooled together, and sequenced independently each using a single run of an Illumina HiSeq2000 (Illumina, Inc.) sequencer at the Vincent J. Coates Genomics Sequencing Laboratory at the University of California Berkeley.

28!
Summary statistics representing the sequence results from the Illumina HiSeq2000 run were calculated using the FASTX-Toolkit (Gordon 2009), and this program was then used to filter low quality reads. Individual Illumina sequencing reads were then assembled into contigs using the de novo assembly program Velvet 1.1.06 (Zerbino & Birney 2008) with a kmer length of 65 for T. pallidus and 67 for C. juglandicola. We then used two commonly used programs MSATCOMMANDER (Faircloth 2008) and Phobos (Mayer 2010) to identify di-, tri-, tetra-, and penta-nucleotide repeat patterns. We ran MSATCOMMANDER and Phobos with their default settings. We then compared the results from these programs to those identified with iMSAT, a novel python program that we developed for this study. This software program is freely available for download at SourceForge (https://sourceforge.net/projects/imsat/). Briefly, the program uses the “.vcf” report file of polymorphic sites generated from mapping NGS sequencing reads to a genome assembly using BWA (Li & Durbin 2009) and SAMtools (Li et al. 2009). Both BWA and SAMtools are widely used for the identification and analysis of single nucleotide polymorphism data (McKenna et al. 2010; DePristo et al. 2011; Nielsen et al. 2011).
We have created an interactive command-line interface for the iMSAT program. The program operates as follows (see Figure 3.1 for a graphical representation). The first user prompt asks for the locations of the alignment and “.vcf” files as well as the formatting of the alignment file. iMSAT can process alignment files with both traditional “.fasta” formatted sequence data (i.e. one line beginning with a “>” followed by the sequence name, and a second line with the sequence data) or a tab-delimited format (i.e. one line with both sequence name and sequence data separated by a tab). Our program subsequently filters the “indel” data from the “.vcf” report, and searches for all polymorphic sites that represented di-, tri-, tetra-, and penta-nucleotide STRs that were greater than five repeat units in length. The user is prompted as to whether or not they would like a separate list of polymorphic STR markers that are “fixed” in one of their target populations. The program then produces a “.fasta” formatted file identifying the location of the polymorphic STR in the sequence title and 300 base pairs of both the leading and trailing sequence strands to allow for the production of primers.
For T. pallidus we tested the program as if whole genome assembly was being used. To
do so, we combined the contig sequences generated by Velvet (Zerbino & Birney 2008) into one continuous DNA sequence strand with the union of two contig sequences being differentiated by the addition of 100 “N” base pairs. The addition of these “N” base pairs ensured that when we could exclude any potential STR markers that would be artificially created when we joined the separate consensus sequences. For C. juglandicola we tested the program using the raw output from Velvet (Zerbino & Birney 2008) where all 474,388 contigs were represented in traditional FASTA formatting. For both species we then used the “.vcf” report generated using BWA (Li & Durbin 2009) and SAMtools (Li et al. 2009) to target polymorphic STRs.
To validate this approach we further filtered the data to only include those repeat regions
that were; a) tri-nucleotide repeats, b) were composed of high-quality reads based on the “.vcf” file, and c) had no “N” base calls within 300 base pairs of the repeat region to allow for primer construction. Though the majority of candidate STRs were di-nucleotide repeats, we selected tri-nucleotide repeats because of the known problems associated with scoring di-nucleotide repeats caused by “stutters” (DeWoody et al. 43). For each species we then selected the 20 tri-nucleotide candidate markers with the greatest number of repeat units. Primer pairs for all markers were generated using Primer3 (Rozen & Skaletsky 2000) as implemented in Geneious 5.6.2 (Drummon et al. 2012). To ease multiplexing, primers were designed to be at least 20 base pairs in length and to have an optimal annealing temperature of 57°C.

29!
To test the candidate markers, DNA was extracted from 91 female T. pallidus reared
from three species of aphid (C. juglandicola and Panaphis juglandis on walnut and M. coryli on filbert) from 9 different localities, and from 46 female C. juglandicola from 4 different localities (Table 3.1) using the Qiagen DNeasy Blood & Tissue Kit (Qiagen). Non-labeled oligonucelotide primers were used to test and optimize the conditions of each of the 20 candidate regions for each species through standard PCR protocols and the amplified fragments were sequenced at the DNA Sequencing Facility at the University of California Berkeley. For candidate markers that were consistently amplified, fluorescent-labeled primers compatible with the GeneScan™ 600 LIZ size standard (Life Technologies) were used. PCR conditions were then re-optimized for the fluorescent-labeled primers. For both species markers were amplified using one of two PCR protocols signified by their primary annealing temperature (Ta 57 or Ta 50). For Ta 57 an initial denaturation for 5 minutes at 95°C was followed by 35 cycles of 95°C for 60 seconds, 57°C for 90 seconds, 72°C for 60 seconds, followed by a 10 minute extension period at 72°C. For Ta 50, a touchdown protocol was used with the following profile: an initial denaturation for 5 minutes at 95°C, followed by 14 cycles of 95°C for 60 seconds, 57°C for 90 seconds, and 72°C for 60 seconds where the annealing temperature decreased 0.5°C every cycle, followed by 30 cycles with an annealing temperature of 50°C, and a 10 minute extension period at 72°C.
Fragment lengths were measured in comparison to the GeneScan! LIZ" 600 Size
Standard v. 2.0 (Life technologies) using an Applied Biosystems 3730XL (Life Technologies) at the DNA Sequencing Facility at the University of California Berkeley, and scored using the Microsatellite Plug-in for Geneious 5.6.2 (Drummon et al. 2012). The number of alleles per locus (k), averaged observed (Ho) and expected (He) heterozygosity, deviations from Hardy-Weinberg equilibrium (HWE), and presence of linkage disequilibrium (LD) between loci were examined using GenePop 4.2 (Raymond & Rousset 1995; Rousset 2008).
Results
Next-Generation Sequencing Results Our Illumina sequencing run for T. pallidus resulted in over 99 million 100 base pair
reads and our Illumina sequencing run for C. juglandicola resulted in over 170 million 100 base pair reads. Using the de novo genome assembly program Velvet (Zerbino & Birney 2008) we constructed 65,535 contigs with an average length of 834.2 base pairs and an average coverage of 8.0X for T. pallidus, 474,388 contigs with an average length of 2,573 base pairs and an average coverage of 11.2X for C. juglandicola.
Comparison of iMSAT to other methods for identifying STRs Using MSATCOMMANDER (Faircloth 2008) and Phobos (Mayer 2010) we identified
18,525 and 21,860 STRs for T. pallidus (Table 3.2) and 187,270 and 100,290 STRs for C. juglandicola (Table 3.3). Using our novel python program iMSAT (https://sourceforge.net/projects/imsat/), we found 9,119 candidate polymorphic STRs for T. pallidus (Table 3.2) and 2,378 candidate polymorphic STRs for C. juglandicola (Table 3.3). For T. pallidus di-nucleotide STRs were the most abundant type identified by all three methods in between 55 and 65%, tri-nucleotide STRs represent between 31 and 38% and tetra- and penta-nucleotide STRs between 4 and 6% combined. For C. juglandicola di-nucleotide STRs were again the most abundant type identified by all three methods (82-93%) however for this species, tri-nucleotide STRs were rare (4.6-17%) while tetra- and penta-nucleotide STRs were extremely rare (0-3%).

30!
Amplification of tri-nucleotide STRs in T. pallidus Of the selected 20 STRs from our output of candidate polymorphic tri-nucleotide STRs
we consistently amplified 17 of them with standard PCR protocols. Two of these markers, TpMSAT3 and TpMSAT6 were excluded from the analysis because they displayed repeat patterns not consistent with tri-nucleotide STRs. DNA sequences for the repeat region of each STR marker used in this study were uploaded to GenBank (Accession #’s KC477413-KC477427) and their characteristics were summarized in Table 3.4.
Characteristics of STR markers in T. pallidus Allelic diversity ranged from three alleles per locus for TpMSAT05 to nine for
TpMSAT11 and TpMSAT14 (Table 3.4). Measures of averaged heterozygosity ranged from 0.21 to 0.54 for Ho and 0.33 to 0.54 for He (Table 3.4). One locus, TpMSAT05, exhibited a marginally significant deviation from Hardy-Weinberg Equilibrium (HWE) (#2 = 16.44, DF = 8, P = 0.04), though this deviation was not significant after Bonferroni’s correction for multiple comparisons (corrected $ = 0.013). Another locus, TpMSAT13, exhibited a highly significant deviation from HWE (#2 = 40.23, DF = 8, P = 0.002), which was still significant after Bonferroni’s correction (corrected $ = 0.006). Linkage disequilibrium was not observed between any of the STR markers.
Amplification of tri-nucleotide STRs in C. juglandicola We selected 20 STRs from our output of candidate polymorphic tri-nucleotide STRs and
we were able to consistently amplify 16 of them with standard PCR protocols. Of the 16 markers all but three were found to be polymorphic in our sample populations. One of these markers, CjMSAT12 was excluded from the analysis because it displayed fragment length polymorphisms outside of its expected range. DNA sequences for the repeat region of each STR marker used in this study were uploaded to GenBank (Accession #’s KJ939575-KJ939587) and their characteristics were summarized in Table 3.4.
Characteristics of STR markers in C. juglandicola Allelic diversity for polymorphic loci ranged from two alleles per locus for CjMSAT01,
CjMSAT03, CjMSAT08, CjMSAT09, CjMSAT16, and CjMSAT19 to seven for CjMSAT13. Measures of averaged heterozygosity ranged from 0.08 to 0.15 for Ho and 0.08 to 0.17 for He (Table 3.4). No locus displayed deviations from HWE, and their was no evidence of linkage disequilibrium observed between any of the STR markers. Discussion
The genomic revolution sparked by the advent of NGS is well underway, and its low per base pair cost and high number of sequence reads yields many benefits and tools (Silva et al. 2013), including the rapid development of polymorphic markers for population genetic studies. Our pipeline involving iMSAT identified polymorphic STRs from two simultaneously obtained sequencing reads. The output of iMSAT facilitates the design of primers for population-level studies, reducing the time and expense associated with the production of STRs.

31!
Potential benefits and limitations The iMSAT program presented in this paper represents a significant improvement over
existing techniques of using NGS technologies to identify and develop STR markers. The use of NGS technologies has become a standard for developing STR markers (e.g. Gardner et al. 2011; Zalapa et al. 2012), and has saved the laborious steps associated with plasmid cloning (see Andrés & Bogdanowicz 2011 for detailed steps for traditional and NGS methods). However, a current roadblock in STR development using NGS technologies is that candidate markers must still be tested to identify whether or not they represent polymorphic regions. Given the large numbers of candidate markers identified by existing software packages (Tables 3.2 and 3.3) selecting candidate loci and validating their polymorphism with PCR can be both expensive and time consuming. In two recent studies that make use of NGS technologies and existing STR software programs to identify candidate markers, PCR screening was used to examine 48 (McEwen et al. 2011) and 342 (Jun et al. 2012) candidate markers, but only 11 (23%) and 26 (0.76%) of those markers, respectively, were used in the subsequent studies. Whether these relatively low rates of success in the development of effective markers were due to problems with PCR amplification or to fixation of the markers once amplified is unclear. However, for comparison, our approach resulted in 17 of the 20 candidate polymorphic STRs amplifying, and 15 of the 17 (or 75% of the original 20) proving to be polymorphic for T. pallidus and thus useful for population genetic research. Similarly, 16 out of 20 candidates amplified consistently and 12 of the 16 (or 60% of the original 20) proved to be polymorphic for C. juglandicola.
In addition, our program adds virtually no costs to the overall production of STR
markers, as an additional Illumina Sequencing Library, for example, can be produced by a third party for as little as $200 USD (quote from the Functional Genomics Laboratory at the University of California Berkeley, June 2014). Using freely available and commonly used software in conjunction with the program that we have developed, iMSAT, a list of STR markers that are polymorphic can be generated in a fast and cost-effective manner. While we recovered far fewer potential STR markers using our iMSAT program than found using other existing programs, we feel that the added benefit of knowing that these candidate markers are most likely polymorphic greatly outweighs the reduction in numbers of potential markers. Most studies based on STRs continue to make use of a relatively small number of markers (10-50) and there may not be a need for developing upwards of 12,000 STR markers that is possible using NGS technologies. Finally, although we have only validated this approach using Illumina Sequencing, our software program is also compatible with 454 Sequencing (Roche Diagnostics). The ‘novelty’ of our approach is to use the polymorphism data provided by the raw sequence reads themselves to identify candidate STR markers, and the program takes advantage of the output from existing software tools (Zerbino & Birney 2008; Li & Durbin 2009; Li et al. 2009) which can be applied to both Illumina and 454 Sequencing runs.
A similar approach to screening NGS sequence results for polymorphic regions before
STR development has previously been presented by Hoffman and Nichols (2011). These authors also pooled DNA extracts to create a single sequencing library for 454 sequencing, re-mapped the individual sequence reads to their de novo assembly, and targeted STR repeats that appeared polymorphic. While similar in that both approaches perform in silico polymorphism detection, ours has the advantages that a) the use of Illumina sequencing offers lower cost per base pair and a greater number of total base pairs recovered, and b) by using barcoded libraries we were able to assign sequence reads to both of our populations of T. pallidus and C. juglandicola with only a single run each. This second advantage was particularly valuable, as it allowed us to identify markers that not only were likely to be polymorphic, but whose polymorphism could also be
32!
characterized as either within and/or between populations. This greatly increases the utility of the data in generating useful STR markers, and may in part explain the greater rate of success we observed in isolating polymorphic markers.
Comparison of results with other species of insects Recently, the availability of published genomes from a diversity of insect species has
allowed for comparative genomic analyses, and of interest to this study, examinations into the diversity and distribution of STR motifs. One study conducted by Behura and Severson (2012) compared coding sequences from 25 species of insects representing five different orders, and in contrast to our findings for T. pallidus and C. juglandicola, found that tri-nucleotide repeats were the most common repeat type across the insect taxa. Their results may be inherently biased towards recovery of tri-nucleotide repeats, however, because of their focus on coding regions of DNA where single or double base pair insertions/deletions are unlikely (Li et al. 2002). Another recent study (Pannebakker et al. 2010) examined both coding and non-coding regions, compared published whole genome sequence data from 12 species of insects representing six orders, and found that while most species had predominantly di- or tri-nucleotide repeats, no one type was dominant – even congeners differed in which type of repeats were most abundant. The most dramatic example of this was the difference found between Drosophila simulans and D. melanogaster. While D. simulans had relatively equal proportions of di-, and tri-nucleotides as the most abundant repeat types, penta-nucleotide repeats were the most abundant for D. melanogaster and more than twice as abundant as any other repeat type. Interestingly, these authors found that STRs were more common among the Hymenoptera and represented a higher percentage of the genome than in any of the other orders of insect examined. The Hymenoptera also differed from other orders in that di-nucleotide repeats were the most abundant type of repeat – between 2 and 5 times more frequent than tri-nucleotide repeats. For the one species of aphid, Acyrthosiphon pisum, that was included in their study STRs were about half as abundant as in the species of Hymenoptera examined. Contrary to our results for C. juglandicola, they also found that tri-nucleotide repeats were the most abundant type of repeat unit. Conclusions
We have developed a novel approach for using NGS technologies in conjunction with several popular software packages to identify polymorphic STRs. This approach allowed us to rapidly and cost-effectively develop 15 polymorphic STRs for T. pallidus and 12 polymorphic STRs for C. juglandicola
Acknowledgements
Funding for this study was provided by an EPA-STAR grant. This work could not have been completed without the technical assistance of J Lozier, B Ort, and S Ramirez. N Tsutsui provided access to the Computational Genomics Resource Laboratory at the University of California Berkeley where de novo genome assembly was performed. I would like to thank all of our collaborators who have aided in the collection of T. pallidus and C. juglandicola individuals, N. Mills, G. Roderick, and R. Nielsen as well as two anonymous reviewers whose comments and suggestions greatly improved the manuscript.

33!
Chapter 3. References Andrés JA, Bogdanowicz SM (2011) Isolating microsatellite loci: looking back, looking ahead.
In: Molecular Methods for Evolutionary Genetics. Orgogozo V, Rockman MV (eds.) p. 211-232. Springer, New York, NY, USA.
Bai X, Zhang W, Orantes L, Jun T-H, Mittapalli O, Mian MAR, Michel AP (2010) Combining Next-Generation Sequencing strategies for rapid molecular resource development from an invasive aphid species, Aphis glycines. PLoS One 5, e11370.
Behura SK, Severson DW (2012) Genome-wide comparative analysis of simple sequence coding repeats among 25 insect species. Gene 504, 226-232.
Castoe TA, Poole AW, Gu W, de Koning APJ, Daza M, et al. (2010) Rapid identification of thousands of microsatellite loci for the copperhead snake (Agkistrodon contortrix) from modest amounts of 454 shotgun genome sequence. Molecular Ecology Resources 10, 341-347.
Castoe TA, Poole AW, Koning APJD, Jones KL, Tomback DF, et al. (2012) Rapid microsatellite identification from Illumina paired-end genomic sequencing in two birds and a snake. PLoS ONE 7, e30953.
Cerna K, Straka J (2012) Identification of 37 microsatellite loci for Anthophora plumipes (Hymenoptera: Apidae) using next generation sequencing and their utility in related species. European Journal of Entomology 109, 155-160.
DePristo MA, Banks E, Poplin R, Garimella KV, Maguire JR, et al (2011) A framework for variation discovery and genotyping using next-generation DNA sequencing data. Nature Genetics 43, 491-498.
Dereeper A, Argout X, Billot C, Rami J-F, Ruiz M (2007) SAT, a flexible and optimized Web application for SSR marker development. BMC Bioinformatics 8, 465.
DeWoody JA, Nason JD, Hipkins VD (2006) Mitigating scoring errors in microsatellite data from wild populations. Molecular Ecology Notes 6, 951-957.
Drummond A, Ashton B, Buxton S, Cheung M, Cooper A, et al (2012) Geneious v 5.6.2, Available from http://www.geneious.com
Du L, Li Y, Zhang X, Yue B (2013) MSDB: A user-friendly program for reporting distribution and building databases of microsatellites from genome sequences. Journal of Heredity 104, 154-157.
Edgar RC, Myers EW (2005) PILER: identification and classification of genomic repeats. Bioinformatics 21, I152-I158.
Ekblom R, Galindo J (2011) Applications of next generation sequencing in molecular ecology of non-model organisms. Heredity 107, 1-15.
Faircloth BC (2008) MSATCOMMANDER: detection of microsatellite repeat arrays and automated, locus-specific primer design. Molecular Ecology Resources 8, 92-94.
Gardner MG, Fitch AJ, Bertozzi T, Lowe AJ (2011) Rise of the machines - recommendations for ecologists when using next generation sequencing for microsatellite development. Molecular Ecology Resources 11, 1093-1101.
Gordon A (2009) FASTX-toolkit - FASTA/FASTQ preprocessing tools. Available online at: http://hannonlab.cshl.edu/fastx_toolkit/
Hoffman JI, Nichols HJ (2011) A novel approach for mining polymorphic microsatellite markers in silico. PLoS One 6, e23283.

34!
Jewell E, Robinson A, Savage D, Erwin T, Love CG, et al. (2006) SSRPrimer and SSR Taxonomy Tree: Biome SSR discovery. Nucleic Acids Research 34, W656-W659.
Jun TH, Mian MAR, Freewalt K, Mittapalli O, Michel AP (2012) Development of genic-SSRs markers from soybean aphid sequences generated by high-throughput sequencing of cDNA library. Journal of Applied Entomology 136, 614-625.
Keller D, Jung E, Holderegger R (2012) Development of microsatellite markers for the wetland grasshopper Stethophyma grossum. Conservation Genetics Resources 4, 507-509.
Kofler R, Schloetterer C, Lelley T (2007) SciRoKo: a new tool for whole genome microsatellite search and investigation. Bioinformatics 23, 1683-1685.
Kraemer L, Beszteri B, Gaebler-Schwarz S, Held C, Leese F, Mayer C, Poehlmann K, Frickenhaus S (2009) STAMP: Extensions to the STADEN sequence analysis package for high throughput interactive microsatellite marker design. BMC Bioinformatics 10, 41
Li H, Durbin R (2009) Fast and accurate short read alignment with Burrows-Wheeler Transform. Bioinformatics 25, 1754-1760.
Li H, Handsaker B, Wysoker A, Fennell T, Ruan J, et al. (2009) The Sequence alignment/map (SAM) format and SAMtools. Bioinformatics 25, 2078-2079.
Li Y-C, Korol AB, Fahima T, Beiles A, Nevo E (2002) Microsatellites: genomic distribution, putative functions and mutational mechanisms: a review. Molecular Ecology 11, 2453-2465.
Li Q, Wan J-M (2005) SSRHunter: Development of a local searching software for SSR sites. Yichuan 27, 808-810.
Lim KG, Kwoh CK, Hsu LY, Wirawan A (2013) Review of tandem repeat search tools: a systematic approach to evaluating algorithmic performance. Briefings in Bioinformatics 14, 67-81.
López-Uribe MM, Santiago CK, Bogdanowicz SM, Danforth BN (2013) Discovery and characterization of microsatellites for the solitary bee Colletes inaequalis using Sanger and 454 pyrosequencing. Apidologie 44, 163-172.
Mardis ER (2008) The impact of next-generation sequencing technology on genetics. Trends in Genetics 24,133-141.
Mayer C (2010) Phobos 3.3.11. Available online at: http://www.rub.de/spezzoo/cm/cm_phobos.htm
McEwen JR, Vamosi JC, Rogers SM (2011) Rapid isolation and cross-amplification of microsatellite markers in Plectritis congesta (Valerianaceae) with 454 sequencing. American Journal of Botany 98, e369-e371.
McKenna A, Hanna M, Banks E, Sivachenko A, Cibulskis K, et al. (2010) The Genome Analysis Toolkit: A MapReduce framework for analyzing next-generation DNA sequencing data. Genome Research 20, 1297-1303.
Metzker ML (2010) Applications of next-generation sequencing; sequencing technologies - the next generation. Nature Reviews Genetics 11, 31-46.
Miller MP, Knaus BJ, Mullins TD, Haig SM (2013) SSR_pipeline: A bioinformatic infrastructure for identifying microsatellites from paired-end Illumina high-throughput DNA sequencing data. Journal of Heredity 104, 881-885.
Nielsen R, Paul JS, Albrechtsen A, Song YS (2011) Genotype and SNP calling from next-generation sequencing data. Nature Reviews Genetics 12, 443-451.

35!
Pannebakker BA, Niehuis O, Hedley A, Gadau J, Shuker DM (2010) The distribution of microsatellites in the Nasonia parasitoid wasp genome. Insect Molecular Biology 19, 91-98.
Raymond M, Rousset F (1995) GENEPOP (version 1.2): population genetics software for exact tests and ecumenicism. Journal of Heredity 86, 248-249.
Rousset F (2008) Genepop'007: a complete reimplementation of the Genepop software for Windows and Linux. Molecular Ecology Resources 8, 103-106.
Rozen S, Skaletsky HJ (2000): Primer3 on the WWW for general users and for biologist programmers. In: Bioinformatics Methods and Protocols: Methods in Molecular Biology p. 365-386. Krawetz S, Misener S (eds.) Humana Press, Totowa, NJ, USA.
Shendure J, Ji H (2008) Next-generation DNA sequencing. Nature Biotechnology 26, 1135-1145.
Silva PI, Martins AM, Gouvea EG, Pessoa-Filho M, Ferreira ME (2013) Develoment and validation of microsatellite markers for Brachiaria ruziziensis obtained by partial genome assembly of Illumina single-end reads. BMC Genomics 14, 9.
Thurston MI, Field D (2005) Msatfinder: detection and characterisation of microsatellites. Distributed by the authors at: http://www.genomics.ceh.ac.uk/msatfinder/
van den Bosch R, Hom R, Matteson P, Frazer BD, Messenger PS, et al. (1979) Biological control of the walnut aphid in California: impact of the parasite, Trioxys pallidus. Hilgardia 47, 1-13.
van den Bosch R, Frazer BD, Davis CS, Messenger PS, Hom R (1970) Trioxys pallidus: an effective new walnut aphid parasite from Iran. California Agriculture 24, 8-10.
van den Bosch R, Schilinger EI, Hagen KS (1962) Initial field observations in California on Trioxys pallidus (Haliday) a recently introduced parasite of the walnut aphid. Journal of Economic Entomology 55, 857-862.
Zalapa JE, Cuevas H, Zhu H, Steffan S, Senalik D, et al. (2012) Using Next-Generation Sequencing approaches to isolate simple sequence repeat (SSR) loci in the plant sciences. American Journal of Botany 99, 193-208.
Zerbino DR, Birney E (2008) Velvet: algorithms for de novo short read assembly using de Bruijn graphs. Genome Research 18, 821-829.

36!
Table 3.1. – Source populations of T. pallidus and C. juglandicola used in this study including the number of females genotyped (N), averaged observed (Ho), and expected (He) heterozygosity. Pop Location Host Collector Date N Ho He T. pallidus J0029 Bethel, OR M. coryli J Andersen and
C Hedstrom 24vi2010 6 0.544 0.537
J0030 McMinnville, OR M. coryli J Andersen 24vi2010 6 0.208 0.412 J0001 Durham, CA C. juglandicola N Mills 06vii2006 12 0.311 0.328 J0008 Tulare, CA C. juglandicola N Mills 17ix2006 15 0.271 0.373 J0069 Upper Lake, CA C. juglandicola R Elkins 10ix2010 11 0.312 0.385 J0178 Yuba City, CA P. juglandis J Andersen 27ix2011 7 0.242 0.360 J0179 Escalon, CA C. juglandicola J Andersen and
M Labbé 05vi2012 12 0.344 0.354
J0188 Newark, CA C. juglandicola J Andersen and M Labbé
30viii2012 10 0.347 0.384
J0163 Tehran, Iran C. juglandicola P Star" 24iii2004 12 0.321 0.381 C. juglandicola A0046 Modesto, CA Walnut J Andersen and
K Anderson 7vii2010 9 0.103 0.100
A0052 Linden, CA Walnut J Andersen 10vii2010 8 0.112 0.128 A0073 Upper Lake, CA Walnut J Andersren and
M Labbé 13ix2010 9 0.151 0.165
A0164 Parnac, France Walnut J Andersen and M Labbé
2vi2011 20 0.068 0.082

37!
Table 3.2 – STR results from Trioxys pallidus comparing the total numbers of discovered repeats for each pattern type (di, tri, tetra, or penta) using Phobos, MSATCOMMANDER, and iMSAT. The total numbers of repeats for each pattern are summed, and presented as a percentage of total repeats found using each software program A) Phobos B) MSATCOMMANDER C) iMSAT repeats di tri tetra penta di tri tetra penta di tri tetra penta
5 4132 1612 262 38 5338 3496 657 44 772 500 93 18 6 3737 3317 683 38 2090 1898 218 4 1718 837 145 8 7 1751 1788 229 6 1243 980 59 2 1181 717 80 1 8 1104 958 64 2 762 417 28 1 765 426 29 1 9 616 379 29 1 411 151 10 0 410 178 9 0
10 355 133 12 0 240 46 9 0 228 72 1 0 11 194 43 8 0 134 19 2 0 177 41 2 0 12 105 20 3 0 60 22 0 0 129 17 1 0 13 52 18 0 0 29 4 0 0 92 5 0 0 14 19 5 1 0 13 10 1 0 64 9 0 0 15 15 9 0 0 15 5 6 0 65 5 0 0 16 7 7 8 0 3 3 2 0 46 1 0 0 17 3 4 0 0 1 4 0 0 51 5 0 0 18 1 3 1 0 5 7 0 0 20 0 0 0 19 5 6 0 0 3 16 0 0 39 0 0 0 20 3 17 0 0 1 34 0 0 36 0 0 0
21+ 16 41 0 0 16 7 0 0 124 1 0 0
SUM 12115 8360 1300 85 10363 7119 992 51 5917 281
4 360 28
Percent 55.4 38.2 5.9 0.3 55.9 38.4 5.4 0.3 64.9 30.
9 3.9 0.3

38!
Table 3.3 – STR results from Chromaphis juglandicola comparing the total numbers of discovered repeats for each pattern type (di, tri, tetra, or penta) using Phobos, MSATCOMMANDER, and iMSAT. The total numbers of repeats for each pattern are summed, and presented as a percentage of total repeats found using each software program A) Phobos B) MSATCOMMANDER C) iMSAT repeats di tri tetra penta di tri tetra penta di tri tetra penta 5 21729 7100 347 29 35052 16556 890 33 9 8 3 0 6 12739 4282 123 1 22177 9949 326 4 39 7 14 0 7 8973 2628 37 1 16641 5961 133 3 63 12 13 0 8 7009 1546 12 1 13107 3231 65 2 149 30 11 0 9 5416 848 6 0 9805 1580 38 3 275 25 4 0 10 3860 389 6 1 6850 754 26 0 344 12 10 0 11 2746 193 2 0 4844 382 11 0 260 6 5 0 12 1890 97 2 0 3282 173 4 0 244 2 2 0 13 1283 39 2 0 2403 95 9 0 164 2 4 0 14 937 14 2 0 1875 50 9 0 133 5 0 0 15 793 12 1 0 1518 32 7 0 100 1 0 0 16 709 3 1 0 1433 14 5 0 81 0 0 0 17 608 4 0 0 1205 9 1 0 84 0 0 0 18 577 3 0 0 1283 8 0 0 53 0 0 0 19 626 2 0 0 1228 10 0 0 44 0 0 0 20 604 5 0 0 1211 2 0 0 35 0 0 0 21+ 12028 24 0 0 16100 18 0 0 125 0 0 0 SUM 82527 17189 541 33 146877 38824 1524 45 2202 110 66 0 Percent 82.3 17.1 0.5 0.03 78.4 20.7 0.8 0.02 92.6 4.6 2.8 0

39
Tabl
e 3.
4 – Characteristics of the 15 and 12 polymorphic STRs isolated from T. pallidus and C. juglandicola, respectively, including fluorescent
label, sequence information, repeat motif, fragment lengths of observed alleles, annealing temperature in degrees Celsius (T A), number of observed
alleles (NA), P values from Hardy-Weinberg Equilibrium statistics (PHWE), and GenBank accession numbers. !
Locus
F - Primer sequence
R – Primer sequence
Repeat
motif
Fragment
lengths
T A
NA
PHWE
GenBank
Accession
T. pallidus
TpMSAT01 6FAM - TATCCCCGCCGCGAATAGAA
GTTTGGCGCACGGCTAAAAG
(ATC)14-18
366 – 378 57
5
0.260
KC477413
TpMSAT02 VIC -TGCACCACAATCTGGACCAC
GGTTGCCAACAGACGAGGAA
(ATC)6-20
345 – 387 57
7
0.918
KC477414
TpMSAT04 6FAM - ACATGTGTCGCCTCAGCAAG
ACGAGAGAGACCCAAGCACA
(CGA)4-10
475 – 493 57
7
0.742
KC477415
TpMSAT05 6FAM - AAAGGAGCTCGTTGTCCGTG
AGCTAAAAAGCGCGAAACCA
(TGA)15 - 18 330 – 336 57
3
0.037
KC477416
TpMSAT07 GCTGCTTCGTTCAATGCCAC
VIC - CTGTGGCTTGACTCCGTCTG
(CAG)4-19
322 – 370 57
6
0.324
KC477417
TpMSAT08 NED - TGCTTTGATGCATCCTGGGT
GCCATTCCCCCAAGTGTAGC
(GAC)5-10
305 – 320 57
5
0.808
KC477418
TpMSAT09 TGTGGGTGCTTGTGTCACTG
PET - ACAACAACCCCGCGTTACAA
(TAC)3-9
294 – 312 57
5
0.066
KC477419
TpMSAT10 VIC - GCCTCAAACAAGTTGCCGTG
TCTGCGAGGGGGACATTGAT
(GCT)2-8
396 – 414 57
7
0.093
KC477420
TpMSAT11 PET - ACATCAACGCCGACAAACGA
CGCACAAACCGACGATGATG
(TCA)4-10
300 – 336 50
7
0.480
KC477421
TpMSAT12 PET - AAATGCCGGCCTAGAAACGG
CTTACCTGTCGGTGCTGTCG
(AAC)5-9
255 – 267 57
5
0.478
KC477422
TpMSAT13 NED - CAGCGCATCGTCAGGATCAA
CTCTTCCACCTCCAGCCAGA
(TCA)3-16
422 – 461 57
8
0.002* KC477423
TpMSAT14 6FAM - CCTTGCATACGCTTGCACAC
ATAGCCAAGTCACAGCTGGC
(AAG)3-11
313 – 340 57
9
0.147
KC477424
TpMSAT16 6FAM - ACTGCTCGGCACTTGAACAG
AAACCACCATCGTCGTCGTC
(TGA)12-16
317 – 329 57
5
0.273
KC477425
TpMSAT17 VIC - GCTTGCGTCTCAGCATTCTC
TGCCAATTATCGCCGCATCA
(ATT)6-15
340 – 367 57
6
0.940
KC477426
TpMSAT19 GCTCCCAGAGAAATTGGTGG
VIC - TTGGGAATTAAAAGTGTTGGCT (GAA)4-13
260 – 287 57
6
0.164
KC477427
C. juglandicola
CjMSAT01 6FAM - TTCACGGGAACGCCATGAAG TTGTCCGTGAACCACACGTC
(TAA)10-11
210 – 213 50
2
NA
KJ939575
CjMSAT02 NED - CGTCGTCACCAACAGTTTC
TGAACAGTTTAAATGACGTTGATG
(CAA)9-16
375 – 396 50
5
0.090
KJ939576
CjMSAT03 PET - TTTCCACGTCCCGTAGTCCA
TTGGACATCACACACACGCA
(TAC)11-12
374 – 377 50
2
NA
KJ939577
CjMSAT04 VIC - TGCATTGTGCGTGTGTTTCC
TAACAACACGCCGGTAAGCG
(TAC)18-21
347 – 356 50
4
1
KJ939578
CjMSAT05 6FAM - AGAACTTTACGACCCGTGCC
GTTCAACTCGGACCACTCGG
(ATA)10-12
291 – 297 50
3
1
KJ939579
CjMSAT08 NED - GCGCGCGTCTCTATCTTTCT
CGTCGATCCTGTCAAAGCGT
(TAA)0-15
239 – 284 57
2
NA
KJ939580
CjMSAT09 PET - ACGCGTTTGTCGTCTAGCTC
CGAAACGCGGTGTCTTTGTG
(TAA)9-10
276 – 279 50
2
NA
KJ939581
CjMSAT13 PET - CGCCGCCATGATTAAGTCCA
ACAAGCCGTTCCAGTTGGTC
(CGT)10-18
264 – 288 50
7
NA
KJ939583
CjMSAT14 VIC - TTATGTGCCGGCAGTTACGG
CGCCGTCGTATTACGTGTCA
(ATT)10-13
460 – 469 50
3
0.247
KJ939584
CjMSAT16 6FAM - GGGTACAGCGTTGAGACGTG
TGAACGATTTTCGTCCGCGA
(ATA)7-8
367 – 370 57
2
NA
KJ939585
CjMSAT18 NED - TGTGAACTAGCTGCGGGGTA
CACTCTCTGCGCGTTCCATT
(ATT)10-12
320 – 326 50
3
1
KJ939586
CjMSAT19 PET - ACCAAGTGCATGGGTACAGC
TTCGACCAGCTGACCGTACT
(TAC)14-15
318 - 321
50
2
NA
KJ939587
* indicates a significant deviation from HWE after applying Bonferroni’s correction for multiple-comparison

40!
Figure 3.1 – iMSAT workflow diagram. Before using iMSAT, barcoded NGS sequencing libraries are produced (A) and sequenced (B) and either used to create a de novo assembly or to align an available reference genome (C). Then using SAMtools and BWA the individual sequence reads are used to create a polymorphism report (D) that includs the location of the polymorphic loci, type (SNP or INDEL), and other quality statistics. iMSAT then uses the output and the alignment file to filter the polymorphism data based on a user specified number of base pairs (E), identifies the STR motifs and the number of repeats (F), and outputs separate .fasta files for each candidate locus that can be used with primer design software (G).
!"#$%&'&()*+#"#,(-.(
/))01*-"(%#(232(
4'50'-$*-6(
!"#$%&%("77'1+),#
877'1+),(9%(#':'#'-$'(
48;9%%)7(<(!=8(
>(?'-'#"9'(@7"1("-&(@+"1(A)'7(>(B#%&0$'(@C$:(
#'D%#9(
>(E*)9'#(@C$:(#'D%#9(>(F'1%C'("))(7*9'7(9G"9(G"C'("(D%),1%#DG*71(
HI*-(-(+D(>(F'1%C'("))(4JB7(
>/&'-K:,(4LF(1%K:7((
>(M%0-9(#'D'"9()'-69G7(
>(=#*9'(%09D09(A)'(>(/-$)0&'(NOO(+D(%:()'"&*-6("-&(9#"*)*-6(7'50'-$'(9%("*&(*-(D#*1'#(&'7*6-(
P7'#(&'A-'7(-01+'#(Q-R(%:(+D(:%#(A)9'#*-6(
8R( !R( MR( SR(
TR( ER(
*;48L(
?R(
B#*1'#(&'7*6-(<(6'-'K$("-"),7'7(
E*)9'#(-%-(44F(*-&')7(
U09D09(9"+(&')*1*9'&(A)'7(
@:"79"(A)'7(:%#(*1D%#9(*-9%(D#*1'#(7%VH"#'(D"$W"6'7(
!"#$%&'&()*+#"#,(-X(
!"#$%&'&()*+#"#,(-*(
Y(Z(

41!
CHAPTER 4: MOLECULAR EVIDENCE OF CRYPTIC SPECIES AND HYBRIDIZATION WITHIN THE TRIOXYS PALLIDUS SPECIES COMPLEX
Abstract
Cryptic species complexes have been an important problem in our understanding of biodiversity and the evolution of host ranges. In addition, they have been of particular importance in the use of natural enemies for control of insect pests and weeds because they have delayed implementation and influenced the success of biological control introductions and continue to present safety concerns through potential non-target impacts. In this context, host-associated strains of the parasitoid wasp Trioxys pallidus (Haliday) (Hymenoptera: Braconidae) were successfully introduced to the western United States for the biological control of aphids in walnut and filbert orchard systems. Here we examine whether these host-associated strains represent cryptic species, and whether hybridization between them could be responsible for recent breakdowns in the biological control services present in each system. We collected individuals identified as T. pallidus from their native and introduced ranges and then reconstructed phylogenetic relationships using the mitochondrial locus cytochrome oxidase I and performed genotyping analyses using 15 polymorphic microsatellite loci. We found that T. pallidus is not monophyletic as currently described, and found evidence for the presence of at least two cryptic species. When we compared these results to patterns of host and biogeographic associations we found that one of these cryptic species appeared to be a specialist, while the second species appeared to be a generalist with a broad distribution in the Palearctic region. We found little evidence of hybridization between these cryptic species, and thus, that hybridization is likely not responsible for recent breakdowns of biological control services in the western United States. Introduction
What role diet breadth plays in shaping the evolutionary trajectory of species has been a longstanding question in the study of evolutionary and co-evolutionary biology (Ehrlich & Raven 1964; Jaenike 1990). In particular, it has been well studied among insect herbivores where host plant ranges can drive patterns of biodiversity (Janz et al. 2006; Janz & Nylin 2008). One of the key results from this research is that given the wide diversity of plant life, most insect herbivores appear to be restricted to a relatively narrow subset of host plant species (Bernays & Graham 1988; Futuyma & Moreno 1988; Nosil 2002). A prominent explanation for this diet specialization is the “Jack of all trades, master of none” hypothesis which predicts that a wide host range comes at the cost of reduced efficiency in the use of any particular host (Krasnov et al. 2004; Straub et al. 2011). It is currently unclear, however, whether as a result of these tradeoffs lineages become more (Kelley & Farrell 1998) or less (Stireman 2005) specialized through time as recent work has shown that host range evolution may be a dynamic process (Janz et al. 2001; Nosil 2002; Nosil & Mooers 2005; Winkler & Mitter 2008). As a further complication, it can be difficult to determine whether an organism is a specialist or a generalist because, for many species, ecological factors are often more important in determining host range than evolutionary factors (Hoffmeister 1992; Stireman & Singer 2003; Straub et al. 2011). In addition, evolutionary lineages likely oscillate between transient generalist and longer specialist phases (Nylin et al. 2014), and populations of

42!
generalists may in fact represent locally adapted cryptic species complexes (Condon & Steck 1997; Nason et al. 2002; Moldo et al. 2003; Stireman et al. 2005; Smith et al. 2006).
Cryptic species complexes have often presented problems for the use of natural
enemies in the context of biological pest and weed control, as a failure to detect their presence has resulted in delays in implementing and achieving successful control (DeBach 1960; Cox & Williams 1981; Room 1990; Gibson et al. 2005; Hemachandra et al. 2005) and created safety concerns due to the potential for non-target impacts (Paynter et al. 2008; Mason et al. 2014). Whether generalist or specialist natural enemies are more effective in providing biological control services (Chang & Kareiva 1999; Symondson et al. 2002) has been debated in the literature with compelling arguments for the use of either generalists (e.g. Murdoch et al. 1985) or specialists (e.g. Howarth 2000; Barratt et al. 2010). However, understanding the tradeoffs in using generalist or specialist natural enemies assumes an accurate knowledge of host-associations and species boundaries, and the presence of unidentified cryptic species complexes makes this impossible. Correctly identifying species boundaries may also aid in our understanding of how host range expansions and/or contractions influence the sustainability and non-target risks associated with biological pest control, as the phenotypic plasticity required for a shift in host range has been noted to be a major driver of speciation and diversification (West-Eberhard 2003; Nylin & Janz 2009; Dennis et al. 2011), and may play an important role in the evolution of natural enemies (Henry et al. 2010; Zepeda-Paulo et al. 2013).
Host-associations can also be influenced by hybridization events (Feder et al.
2003), but what role hybridization plays in the sustainability of biological control programs is unclear (Havill et al. 2012). On the one hand, hybridization events between closely related specialist herbivores (Bean et al. 2013) and target weeds (Blair et al. 2008; Williams et al. 2014) have resulted in “hybrid breakdown” (i.e. reduced fitness for the insect herbivores, or increased susceptibility for the target weeds). On the other hand, hybridization between insect herbivores has also been shown to result in “hybrid vigor” through greater offspring fitness compared to parents (Sz!cs et al. 2012). Hybridization can also lead to a dramatic shift in the relative abundance of individuals in a population that possess one of the “parental” genotypes (Yara et al. 2007, 2010; Withers et al. 2011). In the context of classical biological control, where a non-native pest is re-united with a natural enemy from its region of origin, one practice that may have increased the rates of hybridization is the purposeful introduction of individuals from multiple source locations and/or hosts. Individuals from different sources, often referred to as strains (i.e. biotypes or ecotypes; Clarke & Walter 1995), likely represented populations that were either at an early point of incipient speciation (Dres & Mallet 2002), or even cryptic species that were specialized on different hosts (e.g. Smith et al. 2006; Phillips et al. 2008; Desneux et al. 2009; Heraty 2009; Muirhead et al. 2012; Hamback et al. 2013).
The biological control programs for walnut aphid, Chromaphis juglandicola (Kaltenbach) (Hemiptera: Aphididae), in California and for filbert aphid, Myzocallis coryli (Goeze) (Hemiptera: Aphididae), in Oregon provide a valuable study system in which to examine whether host-associated strains of natural enemies are in fact cryptic

43!
species, and to consider the role of host range evolution and effects of hybridization on the sustainability of biological control services. In both nut crop systems (walnuts and filberts) host specific strains of the parasitoid wasp Trioxys pallidus (Haliday) (Hymenoptera: Braconidae) were deliberately introduced and resulted in effective suppression of the abundance of their target aphid species (Frazer & Van Den Bosch 1973; van den Bosch et al. 1979; Messing & AliNiazee 1988, 1989). For the walnut aphid program in California, T. pallidus was originally introduced from southern France and while effective in the southern coastal region (van den Bosch et al. 1962), it was a subsequent introduction from Iran that lead to effective suppression of aphid populations in the interior region of the Central Valley (van den Bosch et al. 1970). Introductions of T. pallidus for filbert aphid in Oregon also originated from France, but included populations from Spain and Italy as well (Messing & AliNiazee 1989). These successful biological control programs have recently shown localized failures in the ability of T. pallidus to provide sufficient pest control services, and the reasons for these failures are unknown (Hougardy & Mills 2009; Walton et al. 2009). An earlier study had shown that individuals of T. pallidus reared from filbert and walnut aphids lacked clear morphological differences and could form viable hybrids in the laboratory, though there were sex ratio differences between the reciprocal crosses (Messing & AliNiazee 1988). Therefore, we suspected that hybridization between individuals of each strain may have played a role in the breakdown of biological control services for these two aphids. Recently, we developed microsatellite markers to examine the population structure of T. pallidus in walnut and filbert orchards (Andersen & Mills 2014). Here we take advantage of the availability of these markers, and use a combination of mitochondrial DNA sequencing and microsatellite genotyping to analyze current populations of T. pallidus from both its native and introduced ranges. Our objectives in this analysis were to determine 1) whether the strains of T. pallidus represent a cryptic species complex, 2) whether different patterns of host association occur among T. pallidus strains, and 3) to what extent hybridization has occurred among strains of T. pallidus. Finally, we comment on how host range evolution and hybridization may influence the sustainability of these and other biological control programs. Methods
Sampling Locations and Methods We sampled walnut and filbert orchards at a series of locations along a transect
from the San Joaquin Valley of California in the south (where we expected populations to be primarily composed of pure Iranian walnut strain of T. pallidus) through to the Willamette Valley of Oregon in the north (where we expected populations to be composed of pure European filbert strain of T. pallidus). Due to the uncertainty as to where, or if, a hybrid zone would exist between these two strains of T. pallidus introduced to western North America, we prioritized our sampling in California and Oregon to include individuals from as many different locations as possible rather than collecting large numbers of individuals from a small number of locations. When possible, however, larger sample sizes were collected. At each sampling location, individuals identified as T. pallidus were collected either by aspirating adults, or by collecting mummified aphids of C. juglandicola, Panaphis juglandis (Goeze) (a second aphid species on walnut), or M. coryli by removing leaves or leaflets and cutting out a

44!
small section of leaf material to allow individual mummified aphids to be placed into glass vials (9.5 mm high, 3 mm diameter) with a foam stopper. These vials were held at room temperature until adults of T. pallidus had emerged from the aphid mummies. Once emerged, or aspirated, all adult T. pallidus were stored in 95% ethanol at -20 °C for molecular analysis.
In addition, we collected individuals identified as T. pallidus from locations
representative of the source populations used for the original introductions into the western United States. These included locations in southern France, northern Italy, and samples provided by Dr. Eshan Rakhshani collected from walnut trees in two locations in Iran. Adults of T. pallidus were similarly stored in 95% ethanol at -20°C for molecular analysis. Collection information for all individuals of T. pallidus from their native and introduced ranges can be found in Table 4.1, and collection locations are shown in Appendix Figure 1.
DNA Extraction DNA extraction was performed for 190 females of T. pallidus using the Qiagen
DNeasy kit (Qiagen Corp.) following the manufacturers protocols, except for as noted below. Individual females were removed from ethanol storage and allowed to air dry for 5 min before being ground using a mortar and pestle and incubated for no less than 12 h in the Cell Lysing Buffer at 55 °C. Following incubation, the extract was centrifuged at 13,300 RPMs for 3 min, or until residual insect remains formed a tight pellet. The extract was then allowed to rest for 5 min before the supernate was transferred to a clean microcentrifuge tube. We then followed the standard Qiagen protocol until the DNA elution step, which was based on 100 µl of buffer AE.
mtDNA Sequencing Standard PCR protocols were used to amplify a portion of the mitochondrial gene
Cytochrome-Oxidase I (COI) with the primer pair LCO and HCO (Folmer et al. 1994). PCR reactions were carried out on a BioRad Dyad programmable thermocycler (BioRad Laboratires, Inc.) following conditions presented by Hebert et al. (2003) using Promega GoTaq DNA polymerase and buffers (Promega) with the following conditions; 5 µl of Promega GoTaq buffer, 0.5 µl of dNTP (Promega), 0.5 µl of both forward and reverse primers, 0.2 µl of Promega GoTaq taq polymerase, 1 µl of DNA, and HPLC purified H20 was then added to bring the final volume to 25 µl. PCR products were held at 17 °C before being visualized on a 1.5% agarose gel. DNA sequencing of both forward and reverse fragments was performed at the University of California Berkeley DNA Sequencing Facility, and sequence results were visualized and edited using Geneious Pro v. 5.6.2 (Drummond et al. 2012). Individual DNA sequences are available on GenBank (accession numbers KM973216 - KM973401 & KR074103 - KR074105).
mtDNA Analyses To examine whether strains of T. pallidus differed based on mitochondrial
sequence diversity, we constructed an alignment of all of our sequenced individuals using
45!
Geneious Pro v. 5.6.2 (Drummond et al. 2012). As there were no insertions or deletions present within the sequence fragments, alignment was trivial. To this alignment we added outgroup sequences for several species of closely related braconid parasitoids obtained from GenBank, including Aphidius funebris (JX507450), A. matricariae (JX507432), Monoctonus cerasi (JX507448), Binodoxys acalephae (JX507441), B. centaureae (JX507447), B. communis (FJ798201), T. curvicaudus (KM973350), and T. complanatus (KJ848479). We also added two ingroup sequences published on GenBank for specimens of T. pallidus collected in southern France from Tuberculatus sp. (JN620695-6) as well as nine sequences (GCNGRF305-12, GSSHH153-14, GSSHH165-14, GSSHH160-14, GHSSHH166-14, JSHYN764-11, NCCC742-11, NGAAD869-14, SMTPJ5260-14) published through the Barcode of Life Database (BOLD) systems and identified as T. pallidus using their BIN algorithm (Ratnasingham and Hebert 2013). The alignment was then visualized and truncated using MacClade v. 4.0.8 (Maddison & Maddison 2005). Phylogenetic analyses were performed using MrBayes v. 3.2.1 x64 (Huelsenbeck 2001) compiled for use with parallel processors, and run through the CIPRES Science Gateway v. 3.1 (Miller et al. 2010). Analyses were performed using two independent runs, each with four chains, with a run time of 20 million generations and a burn-in period of 2 million generations. The alignment was divided into three partitions, one for each codon position, and each codon position was analyzed using the GTR+I+G nucleotide model of evolution. To assess whether the runs had converged, we first compared the standard deviation of the two runs, and then visualized the results with the program TRACER (Rambaut & Drummond 2007).
To further examine biogeographic and host-association patterns we then excluded
outgroup species from the dataset, and used a network analysis as performed through the software program TCS v 1.21 (Clement et al. 2000) with a 95% connection limit. Haplotype groups were then drawn proportional to the number of included sequences using Adobe Illustrator CS2 (Adobe Systems Inc.).
Microsatellite Genotyping Microsatellite genotyping was performed using the polymorphic microsatellite
loci and PCR protocols presented in Andersen and Mills (2014). Briefly, for each individual female, 15 polymorphic microsatellite loci were amplified using PCR. PCR products for up to four loci were pooled, so that no two loci with the same fluorescent label were combined, and the pooled products were genotyped on an Applied Biosystems 3730XL DNA Analyzer at the University of California Berkeley DNA Sequencing Facility. Fragment lengths were then scored using the Microsatellite Plug-in for Geneious Pro v. 5.6.2 (Drummond et al. 2012).
Population Structure and Hybridization Analyses To determine the number of distinct genetic clusters that individuals of T. pallidus collected from its native and introduced range could be assigned to, and the number of individuals of hybrid origin, the genotyping results for the 15 polymorphic microsatellite loci were analyzed using the program STRUCTURE (Pritchard et al. 2000). Four independent runs each of 10 million generations with a burn-in period of 1 million

46!
generations were processed through the online bioinformatics server BioPortal (http://www.bioportal.uio.no) at the University of Oslo, Norway, for potential cluster numbers (K) of one through six. Based on the results from these analyses, we i) determined the optimal K value based on the approach presented by Evanno et al. (2005) using STRUCTURE HARVESTER (Earl & vonHoldt 2012), and ii) determined whether individuals were of hybrid origin based on their probabilities of assignment to genetic clusters (Q). Any individual receiving an assignment of Q > 0.80 to any one cluster was classified as representing a “pure” individual of that cluster, while individuals with Q < 0.80 were classified as being of hybrid origin (Havill et al. 2012). In addition, we directly estimated the probability of assignment (Z) that an individual was of parental or hybrid origin using the software program NewHybrids (Anderson 2008; Anderson & Thompson 2002). NewHybrids can only estimate values for Z when two potential parent populations are examined; therefore we used the results from our STRUCTURE analysis to conduct pairwise comparisons between all recovered population pairs. While NewHybrids directly estimates the probability of assignment to F1, F2, and backcross categories, we summed the probabilities of assignment for each of these hybrid categories into a single combined hybrid group. We constructed datasets for each pairwise comparison that included all individuals with Q > 0.8 for one of the two populations, and all individuals classified as hybrids with 0.8 > Q > 0.25 for both populations being compared. For each pairwise comparison, we used random starting values and allowed NewHybrids to run for 10 million generations with a burn-in period of 1 million generations using a uniform prior for the estimates of both theta and pi. Results
mtDNA Analysis We sequenced a fragment of COI from 189 T. pallidus females collected in California (n =125), Oregon (n=30), Europe (n=22), and Iran (n=12). After the addition of published outgroup and ingroup sequences and the truncation of the dataset, the resulting alignment included 207 sequences and 625 basepairs. GenBank accession numbers and mtDNA haplotype information for each individual are presented in Table 4.1. The results from our MrBayes analysis indicated that after 20 million generations, the two independent runs had converged with an average standard deviation of split frequencies between the runs of 0.0418. The majority-rule consensus tree from the MrBayes analysis (Figure 4.1) reconstructed a clade (Clade A) that included all individuals identified as T. pallidus as well as the single published sequence for T. complanatus with high Bayesian posterior probability support (100% BPP). Based on this reconstruction, T. pallidus is not monophyletic as the sequence from T. complanatus was found with high support (90% BPP) to be sister to another well supported clade (Clade B; 97% BPP) that includes all of the sequences from specimens of T. pallidus reared from filbert aphids in Oregon, all but one of the sequences from specimens of T. pallidus reared from filbert aphids in Europe, and all of the sequences published through BOLD Systems collected in Canada. A separate highly supported clade (Clade C; 90% BPP) included all of the sequences from specimens of T. pallidus collected from walnut and dusky-veined aphids in California, Europe, and Iran, two published sequences from GenBank for T. pallidus reared from Tuberculatus sp. in France, four published

47!
sequences from BOLD Systems collected in Norway, and one sequence from an individual reared from filbert aphid in Italy. The TCS analysis reconstructed two independent networks. One network, labeled “Network 1,” included 22 haplotypes, while the second network, labeled “Network 2,” included eight haplotypes (Figures 4.2 and 4.3). Network 1 included all of the individuals collected from California and Iran, and all of the published sequences from Norway, as well as the majority of individuals from France and Italy (Figure 4.2). This network also included all individuals reared from C. juglandicola and P. juglandis, as well as a single individual (J0138b) reared from M. coryli (Figure 4.3). Network 2 included the majority of individuals collected from Oregon and all of the published sequences from Canada (Figure 4.2), and only included individuals reared from M. coryli or from unknown hosts (Figure 4.3).
Population Structure Analysis We successfully amplified polymorphic microsatellite loci from 190 females of T. pallidus (these represented all of the individuals we sequenced for the mtDNA analysis as well as an additional specimen J0030C from Oregon whose DNA aliquot was exhausted before sequencing of COI was completed). The results from our STRUCTURE analysis indicated that negative log-likelihood values continued to improve with increasing numbers of potential genetic clusters from 2 to 6. However, using STRUCTURE HARVESTER we found that a subdivision that included three clusters was optimal in that it represented the maximal rate of change of the log likelihood scores between STRUCTURE runs of successively increasing K values (i.e. the !K statistic from Evanno et al. [2005]). The probabilities of assignments for each individual to these three clusters are shown graphically in Figure 4.4 and presented as text in Table 4.1. One genetic cluster (Cluster 1; shown in dark grey) included only individuals collected from filbert orchards in Oregon and one individual collected from a filbert aphid on a roadside tree near Bordeaux, France. A second genetic cluster of T. pallidus females (Cluster 2; shown in light grey) included all individuals collected from walnut orchards in California and Iran, as well as one individual collected from a walnut orchard in Oregon. The final genetic cluster (Cluster 3; shown in white) included all individuals collected from walnut aphids in Western Europe, several individuals collected from filbert aphids in Western Europe, two individuals collected from walnut aphids in Berkeley, California, and one individual collected from a walnut orchard in Oregon.
Hybridization Analysis Using Q < 80% for any one genetic cluster as a criterion for identifying hybrids
in STRUCTURE, only three females of T. pallidus were classified as being hybrids. One individual collected in California (J0008c) appears to be a hybrid between individuals from Cluster 2 (Q =77.1%) and Cluster 3 (Q = 20.3%). A second individual collected in Oregon (J0026a) appears to be a hybrid between individuals from Cluster 1 (Q= 20.9%) and Cluster 2 (Q=78.6%). The third individual was collected in Iran (J0161F) and appears to be a hybrid between Cluster 2 (Q = 67.7%) and Cluster 3 (Q=31.1%).

48!
Based on the results from the pair-wise NewHybrids analyses, we confirmed the hybrid status of two of the three females of T. pallidus identified with STRUCTURE (Figure 4.5; Table 4.1). Individual J0026a was classified as being of hybrid origin with high probability (Z = 85.5%) in the Cluster 1 and Cluster 2 comparison, and individual J0008c was classified as being a hybrid, though with low probability of assignment (Z = 58.3%) in the Cluster 2 and Cluster 3 comparison. Individual J0161F that was classified as a hybrid by STRUCTURE was not identified as a hybrid by NewHybrids. Six additional individuals received low probabilities of assignment for being of hybrid origin. Two individuals collected from a walnut orchard in Oregon (J0024a & b) included assignment to hybrid classes in the Cluster 2 and Cluster 3 comparison (Z = 53.1% and Z = 44.6%, respectively); one individual reared from a filbert aphid in Italy (J0137a) included assignment to hybrid classes in the Cluster 1 and Cluster 2 comparison (Z = 23.3%); and two additional individuals also from filbert aphids in Italy (J0138A and J0189A) and one individual collected in Berkeley, CA (J0006a) included assignment to hybrid classes in the Cluster 1 and Cluster 3 comparison (Z = 34.7%, Z = 13.3%, and Z = 15.8%, respectively). Discussion
For insect herbivores, host-associated differentiation is usually represented either by local adaptation (Alstad et al. 1980; Alstad & Edmunds 1983; Glynn & Herms 2004; Ruiz-Montoya & Nunez-Farfan 2013; Stotz et al. 2013) or by expansion onto novel, but phylogenetically related, plant species (Feder et al. 2003; Hamback et al. 2013). In contrast, for insect parasitoids, there are far fewer examples of sequential radiation in which parasitoids diversify in response to the plant-associated diversification of their herbivorous hosts (see Abrahamson & Blair 2008). Many studies of specialized parasitoids have found no evidence of host-associated diversification (Baer et al. 2004; Lopez-Vaamonde et al. 2005; Althoff 2008; Lozier et al. 2008; Dickey & Medina 2010, 2011; Bilodeau et al. 2013), and differentiation appears to have resulted more frequently from shifts to hosts that represent entirely different families or even orders (Yeates & Greathead 1997; Symonds & Elgar 2013; Tachi 2013). Here we find that suspected host-associated strains of the parasitoid wasp Trioxys pallidus that were successfully introduced to the western United States from Europe and Iran for the biological control of walnut and filbert aphids, in their respective crop systems (van den Bosch et al. 1970; Messing & AliNiazee 1989), may in fact represent a cryptic species complex with at least two cryptic species based on general patterns of concordance across mitochondrial and nuclear loci (Figure 4.6).
Without an accurate phylogeny for Trioxys species we can only speculate as to the
direction of evolution of their host-associations. However, we find that one of the two cryptic species in the T. pallidus complex (Clade B in Figure 4.1) appears to be a specialist, while the other (Clade C in Figure 4.1) appears to be a generalist as it includes individuals that were reared from two species of aphids on walnut trees (C. juglandicola and P. juglandis), one individual reared from M. coryli, and published sequences from two individuals reared from a species of Tuberculatus. The aphid hosts of the Trioxys species included in this study are all members of the aphid tribe Panaphidini (Aphididae: Calaphidinae; Kavallieratos et al. 2004; Pons et al. 2006; Fulbright et al. 2007).

49!
Therefore, in contrast to patterns of host-associations seen in many insect parasitoids (e.g. Yeates & Greathead 1997; Symonds & Elgar 2013; Tachi 2013), host-associations in this group are more likely a result of local adaptation rather than shifts to novel hosts. In addition, based on the known host-associations for T. curvicaudus and T. pallidus, both have been recorded from a number of the same species (e.g. Eucallipterus spp., Tuberculatus spp., and Myzcocallis spp. [Kavallieratos et al. 2004; Fulbright et al. 2007]), it seems likely that the ancestor of these two Trioxys species (Clade A) had a wide host range that included, at least, the above aphid species. The apparent specialization of T. complanatus on Therioaphis trifolii and of T. pallidus Clade B on Myzocallis spp., is thus consistent with the specialization as a dead end hypothesis (Kelley and Farrell 1998). However, whether the generalist cryptic species (Clade C) is currently expanding or contracting its host range is unclear.
One curious finding from our analyses was the inclusion in T. pallidus Clade B of
the five published sequences from individuals collected in British Columbia, Saskatchewan, and Ontario, Canada. Four of these sequences were an exact match to sequences we obtained from individuals reared from M. coryli in Oregon and Italy, suggesting that they are descendants from the individuals introduced to the western United States. Native species of Corylus (i.e. hazelnuts or filberts in a commercial setting) can be found throughout Canada and the United States (USDA 2015), and while these species are hosts to a diverse assemblage of aphid species, these aphids are exclusively in the tribe Macrosiphini (Blackman & Eastop 1994). The T. pallidus cryptic species complex appears to be confined to aphids in the tribe Panaphidini (Kavallieratos et al. 2004; Pons et al. 2006; Fulbright et al. 2007). However, C. avellana (i.e. filbert) has been planted as an ornamental in many locations in both Canada and the United States, and it is therefore likely that these sequences belong to individuals that emerged from M. coryli using these ornamental plants. In addition, there are several species of Myzocallis that can be found on oaks (Quercus sp.) and chestnuts (Castanea sp.) in North America. Therefore, while the host associations for the individuals collected in Canada are unknown, it is therefore likely that these individuals emerged from either M. coryli on ornamental plants or another species of Myzocallis on native North American trees.
Hybridization and the Sustainability of Biological Control Services In the context of classical biological control, until recently, natural enemies were
frequently introduced from multiple sources as different “strains” (Clarke & Walter 1995) in the hope that introducing a more diverse pool of individuals would either overcome the genetic bottlenecks associated with founder populations (Hopper et al. 1993) or allow the most fit strain to establish (Phillips et al. 2008). However, the introduction of distinct genetic lineages that were reproductively isolated in their ancestral range raises the question of whether potential hybrids would be more or less fit than their parents. There has also been recent concern about hybridization between introduced and native species of biological control agents (Havill et al. 2012) and that hybridization may facilitiate the the spread of invasive species (Facon et al. 2011; Turgeon et al. 2011). The two ecologically distinct host strains of T. pallidus that we recovered from the western United States in our study had shown evidence of hybrid breakdown in an earlier laboratory study (Messing & AliNiazee 1988). Similarly,

50!
laboratory evidence of hybrid breakdown between Moroccan and European strains of the parasitoid Microctonus aethiopoides lead to rejection of the European strain for introduction into New Zealand for control of the clover root weevil in favor of a parthenogenetic strain from Ireland (Goldson et al. 2003; Gerard et al. 2006). In contrast, intraspecific hybrids of Psyttalia lounsburyi did not show differential fitness with respect to parent populations (Benvenuto et al. 2012a), and hybrid crosses between different species of Trichogramma have shown both hybrid breakdown and hybrid vigor (Benvenuto et al. 2012b). While the potential for negative effects of hybridization currently appear to outweigh the positive effects, the outcome of hybridization among ecologically distinct populations of introduced natural enemies may be either taxon specific or related to the degree of genetic separation between populations. Either way, any generalities about the role of hybridization in the context of biological control introductions await a more extensive set of studies that address both the genetic structure and fitness of hybrids from multiple source populations.
With recent localized failures in both the walnut and filbert aphid biological
control programs in the western United States (Hougardy & Mills 2009; Walton et al. 2009), we expected that hybridization might be a leading cause for the reduction in pest control services. However, based on our analyses, we found that while hybridization between cryptic species of T. pallidus occured in both its native and introduced ranges, the rates were far too low to account for the resumption of in-season insecticide use in the western United States. We will continue to monitor whether other genetic factors that are known to affect biological control programs, including genetic bottlenecks (Hufbauer 2002; Hufbauer & Roderick 2005; de Boer 2012; Omondi et al. 2014; Seabra et al. 2015;) Allee effects (Fauvergue & Hopper 2009; Fauvergue et al. 2012) or restricted geneflow (Vaughn & Antolin 1998) may be playing a role in the observed breakdowns in this textbook classical biological control program.
Conclusions Our study suggests previously identified host-associated strains of the parasitoid wasp T. pallidus represent members of a cryptic species complex. The elevation of these strains to species status has previously been proposed (Caltagirone 1985; Clarke and Walter 1995), but no known morphological characters exist to separate these individuals (Messing & AliNiazee 1988). One of these cryptic species (Clade B) appears to be a specialist on Myzocallis spp., while the second cryptic species (Clade C) appears to be a more generalist parasitoid of tree-dwelling aphids in the Panaphini. While we found evidence of hybridization between individuals from these cryptic species in both their native and introduced ranges, the low levels we observed are not sufficient to account for the recent failures in the biological control programs in the western United States. Lastly, given the widespread use and importance of Trioxys species as biological control agents of aphid species globally (e.g. T. angelicae [Mahmoudi et al. 2010]; T. brevicornis [Star" 1990]; T. complanatus [Milne 1997]; T. curvicaudus [Zuparko 1983]; T. indicus [Singh & Agarwala 1992]; T. monelliopsis [Star" & Marsh 1982]; T. tenuicaudus [Olkowski et al. 1982]), our finding that T. pallidus is not monophyletic, as currently described, strengthens the call for a thorough phylogenetic analysis of this important genus of biological control agents (Rakhshani et al. 2012).

51!
Acknowledgements
Funding for this study was made possible by an EPA-STAR Fellowship and a Robert van den Bosch Memorial Fellowship. I would like to thank P. Star" and E. Rakhshani for providing specimens of T. pallidus, as well as A. Romero and his staff at the Investigación y Technología Agroalimentaria in Tarragona, Spain for their assistance collecting T. pallidus. I would also like to thank R. Messing for sharing his Dissertation collection notes; S. Moraglio for organizing locations for collection in Italy; K. Anderson, R. Elkins, C. Hedstrom, A. Lemieux, K. Mace-Hill, L. Morril, S. Renquist, for collecting specimens in California and Oregon, and M. Labbé for her field assistance on two continents. In addition, I would like to thank the University of California Cooperative Extension Specialists; the East Bay Regional Parks Department; the individual walnut and filbert growers who granted us access to their properties; J. Lozier and B. Ort for their technical assistance in conducting the molecular analyses; and N. Mills, R. Nielsen, and G. Roderick for their comments on an earlier draft of this chapter.

52!
Chapter 4. References Alstad DN, Edmunds GF (1983) Selection, outbreeding depression, and the sex-ratio of
scale insects. Science 220, 93-95. Alstad DN, Edmunds GF, Johnson SC (1980) Host adaptation, sex-ratio, and flight
activity in male black pineleaf scale (Homoptera, Diaspididae). Annals of the Entomological Society of America 73, 665-667.
Althoff DM (2008) A test of host-associated differentiation across the 'parasite continuum' in the tri-trophic interaction among yuccas, bogus yucca moths, and parasitoids. Molecular Ecology 17, 3917-3927.
Andersen JC, Mills NJ (2014) iMSAT: a novel approach to the development of microsatellite loci using barcoded Illumina libraries. BMC Genomics 15, 1-9.
Anderson EC (2008) Bayesian inference of species hybrids using multilocus dominant genetic markers. Philosophical Transactions of the Royal Society B: Biological Sciences 363, 2841-2850.
Anderson EC, Thompson EA (2002) A model-based method for identifying species hybrids using multilocus genetic data. Genetics 160, 1217-1229.
Baer CF, Tripp DW, Bjorksten TA, Antolin MF (2004) Phylogeography of a parasitoid wasp (Diaeretiella rapae): no evidence of host-associated lineages. Molecular Ecology 13, 1859-1869.
Barratt BIP, Howarth FG, Withers TM, Kean JM, Ridley GS (2010) Progress in risk assessment for classical biological control. Biological Control 52, 245-254.
Bean DW, Kazmer DJ, Gardner K, Thompson DC, Reynolds B, Keller JC, Gaskin JF (2013) Molecular genetic and hybridization studies of Diorhabda spp. released for biological control of Tamarix. Invasive Plant Science and Management 6, 1-15.
Benvenuto C, Cheyppe-Buchmann S, Bermond G, Ris N, Fauvergue X (2012) Intraspecific hybridization, life history strategies and potential invasion success in a parasitoid wasp. Evolutionary Ecology 26, 1311-1329.
Benvenuto C, Tabone E, Vercken E, Sorbier N, Colombel E, Warot S, Fauvergue X, Ris N (2012) Intraspecific variability in the parasitoid wasp Trichogramma chilonis: can we predict the outcome of hybridization? Evolutionary Applications 5, 498-510.
Bernays E, Graham M (1988) On the evolution of host specificity in phytophagous arthropods. Ecology 69, 886-892.
Bilodeau E, Guay J-F, Turgeon J, Cloutier C (2013) Survival to parasitoids in an insect hosting defensive symbionts: a multivariate approach to polymorphic traits affecting host use by its natural enemy. PLoS One 8, e60708.
Blackman RL, Eastop VF (1994) Aphids on The World’s Trees: An Identification and Information Guide. pp. 1004. CAB International in association with The Natural History Musuem, Wallingord, UK.
Blair AC, Schaffner U, Haefliger P, Meyer SK, Hufbauer RA (2008) How do biological control and hybridization affect enemy escape? Biological Control 46, 358-370.
Chang GC, Kareiva P (1999) The case for indigenous generalists in biological control. In: Theoretical Approachs to Biological Control, eds. Hawkins BA, Cornell HV, p. 103-115. Cambridge University Press, Cambridge, UK.

53!
Clarke AR, Walter GH (1995) ''Strains'' and the classical biological control of insect pests. Canadian Journal of Zoology-Revue Canadienne De Zoologie 73, 1777-1790.
Clement M, Posada D, Crandall K (2000) TCS: a computer program to estimate gene genealogies. Molecular Ecology 9, 1657-1660.
Condon MA, Steck GJ (1997) Evolution of host use in fruit flies in the genus Belpharoneura (Diptera: Tephritidae): cryptic species on sexually dimorphic host plants. Biological Journal of the Linnean Society 60, 443-466.
de Boer JG, Kuijper B, Heimpel GE, Beukeboom LW (2012) Sex determination meltdown upon biological control introduction of the parasitoid Cotesia rubecula? Evolutionary Applications 5, 444-454.
Dennis RLH, Dapporto L, Fattorini S, Cook LM (2011) The generalism-specialism debate: the role of generalists in the life and death of species. Biological Journal of the Linnean Society 104, 725-737.
Desneux N, Star" P, Delebecque CJ, Gariepy TD, Barta RJ, Hoelmer KA, Heimpel GE (2009) Cryptic species of parasitoids attacking the soybean aphid (Hemiptera: Aphididae) in Asia: Binodoxys communis and Binodoxys koreanus (Hymenoptera: Braconidae: Aphidiinae). Annals of the Entomological Society of America 102, 925-936.
Dickey AM, Medina RF (2010) Testing host-associated differentiation in a quasi-endophage and a parthenogen on native trees. Journal of Evolutionary Biology 23, 945-956.
Dickey AM, Medina RF (2011) Lack of sequential radiation in a parasitoid of a host-associated aphid. Entomologia Experimentalis et Applicata 139, 154-160.
Dres M, Mallet J (2002) Host races in plant-feeding insects and their importance in sympatric speciation. Philosophical Transactions of the Royal Society B: Biological Sciences 357, 471-492.
Drummond AJ, Ashton B, Buxton S, Cheung M, Cooper A, Heled J, Kearse M, Moir R, Stones-Havas S, Sturrock S, Thierer T, Wilson A (2012) Geneious v 5.6.2, Available from "##$%&&'''()*+*,-./(0-1.
Earl DA, vonHoldt BM (2012) STRUCTURE HARVESTER: a website and program for visualizing STRUCTURE output and implementing the Evanno method. Conservation Genetics Resources 4, 359-361.
Ehrlich PR, Raven PH (1964) Butterflies and plants - a study in coevolution. Evolution 18, 586-608.
Evanno G, Regnaut S, Goudet J (2005) Detecting the number of clusters of individuals using the software STRUCTURE: a simulated study. Molecular Ecology 14, 2611-2620.
Facon B, Crespin L, Loiseau A, Lombaert E, Magro A, Estoup A (2011) Can things get worse when an invasive species hybridizes? The harlequin ladybird Harmonia axyridis in France as a case study. Evolutionary Applications 4, 71-88.
Fauvergue X, Hopper KR (2009) French wasps in the New World: experimental biologicl control introductions reveal a demographic Allee effect. Population Ecology 51, 385-397.
Fauvergue X, Vercken E, Malausa T, Hufbauer RA (2012) The biology of small, introduced populations, with special reference to biological control. Evolutionary Applications 5, 424-443.

54!
Feder JL, Berlocher SH, Roethele JB, Dambroski H, Smith JJ, Perry WL, Gavrilovic V, Filchak KE, Rull J, Aluja M (2003) Allopatric genetic origins for sympatric host-plant shifts and race formation in Rhagoletis. Proceedings of the National Academy of Sciences of the United States of America 100, 10314-10319.
Folmer O, Black M, Hoeh W, Lutz R, Vrijenhoek R (1994) DNA primers for amplification of mitochondrial cytochrome c oxidase subunit I from diverse metazoan invertebrates. Molecular Marine Biology and Biotechnology 3, 294-299.
Frazer BD, Van Den Bosch R (1973) Biological control of the walnut aphid in California the interrelationship of the aphid and its parasite. Environmental Entomology 2, 561-568.
Fulbright JL, Pike KS, Star" P (2007) A key to the North American species of Trioxys Halliday (Hymenoptera: Braconidae: Aphidiinae), with a summary of the geographic distribution, hosts, and species diagnostic features. Proceedings of the Entomological Society of Washington 109, 779-790.
Futuyma DJ, Moreno G (1988) The evolution of ecological specialization. Annual Review of Ecology and Systematics 19, 207-233.
Gerard PJ, McNeill MR, Barratt BI, Whiteman SA (2006) Rationale for release of the Irish strain of Microctonus aethiopoides for biological control of clover root weevil. New Zealand Plant Protection 59, 285-289.
Glynn C, Herms DA (2004) Local adaptation in pine needle scale (Chionaspis pinifoliae): Natal and novel host quality as tests for specialization within and among red and Scots pine. Environmental Entomology 33, 748-755.
Goldson SL, McNeill M, Proffit J (2003) Negative Effects of strain hybridisation on the biological control agent Microctonus aethiopoides. New Zealand Plant Protection 56:138-142.
Hamback PA, Weingartner E, Ericson L, Fors L, Cassel-Lundhagen A, Stenberg JA, Bergsten J (2013) Bayesian species delimitation reveals generalist and specialist parasitic wasps on Galerucella beetles (Chrysomelidae): sorting by herbivore or plant host. BMC Evolutionary Biology 13, 92.
Havill NP, Davis G, Mausel DL, Klein J, McDonald R, Jones C, Fischer M, Salom S, Caccone A (2012) Hybridization between a native and introduced predator of Adelgidae: An unintended result of classical biological control. Biological Control 63, 359-369.
Hebert PDN, Cywinska A, Ball SL, deWaard JR (2003) Biological identifications through DNA barcodes. Proceedings of the Royal Society B: Biological Sciences 270, 313 - 321.
Henry LM, May N, Acheampong S, Gillespie DR, Roitberg BD (2010) Host-adapted parasitoids in biological control: does source matter? Ecological Applications 20, 242-250.
Heraty JM (2009) Parasitoid biodiversity and insect pest management. In: Insect Biodiversity: Science and Society eds. Foottit RG, Adler PH, pp. 445-462. Wiley-Blackwell, Oxford, UK.
Hoffmeister T (1992) Factors determining the structure and diversity of parasitoid complexes in tephritid fruit-flies. Oecologia 89, 288-297.
Hopper KR, Roush RT, Powell W (1993) Management of genetics for biological-control introductions. Annual Review of Entomology 38, 27-51.

55!
Hougardy E, Mills NJ (2009) Factors influencing the abundance of Trioxys pallidus, a successful introduced biological control agent of walnut aphid in California. Biological Control 48, 22-29.
Howarth FG (2000) Non-target Effects of Biological Control Agents. In: Biological Control: Measures of Success eds. Gurr G, Wratten S, pp. 369-404. Kluwer Academic Publishers, Dordrecht, The Netherlands.
Huelsenbeck JP (2001) MRBAYES: Bayesian inference of phylogeny, Version 3.0. Bioinformatics 17, 754-755.
Hufbauer RA (2002) Evidence for nonadaptive evolution in parasitoid virulence following a biological control introduction. Ecological Applications 12, 66-78.
Hufbauer RA, Roderick GK (2005) Microevoltuion in biological control: mechanisms, patterns, and processes. Biological Control 35, 227-239.
Jaenike J (1990) Host specialization in phytogphagous insects. Annual Review of Ecology and Systematics 21, 243-273.
Janz N, Nyblom K, Nylin S (2001) Evolutionary dynamics of host-plant specialization: A case study of the tribe Nymphalini. Evolution 55, 783-796.
Janz N, Nylin S (2008) The oscillation hypothesis of host-plant range and speciation. In: Specialization, Speciation, and Radiation: the Evolutionary Biology of Herbivorous Insects (ed. Timmon K), pp. 203-215. University of Callifornia Press, Berkeley and Los Angeles, California.
Janz N, Nylin S, Wahlberg N (2006) Diversity begets diversity: host expansions and the diversification of plant-feeding insects. BMC Evolutionary Biology 6, 4.
Kelley ST, Farrell BD (1998) Is specialization a dead end? The phylogeny of host use in Dendroctonus bark beetles (Scolytidae). Evolution 52, 1731-1743.
Krasnov BR, Poulin R, Shenbrot GI, Mouillot D, Khokhlova IS (2004) Ectoparasitic "jacks-of-all-trades": Relationship between abundance and host specificity in fleas (Siphonaptera) parasitic on small mammals. American Naturalist 164, 506-516.
Lopez-Vaamonde C, Godfray HCJ, West SA, Hansson C, Cook JM (2005) The evolution of host use and unusual reproductive strategies in Achrysocharoides parasitoid wasps. Journal of Evolutionary Biology 18, 1029-1041.
Lozier JD, Roderick GK, Mills NJ (2008) Evolutionarily significant units in natural enemies: Identifying regional populations of Aphidius transcaspicus (Hymenoptera : Braconidae) for use in biological control of mealy plum aphid. Biological Control 46, 532-541.
Maddison DR, Maddison WP (2005) MacClade 4. Sinauer Associates, Sunderland, MA. Mahmoudi M, Sahragard A, Sendi JJ (2010) Effects of age and host availability on
reproduction of Trioxys angelicae Haliday (Hymenoptera: Braconidae) parasitizing Aphis fabae Scopoli (Hemiptera: Aphididae). Journal of Pest Science 83, 33-39.
Mason PG, Miall JH, Bouchard P, Brauner A, Gillespie DR, Gibson GAP (2014) The parasitoid communities associated with Ceutorhynchus species (Coleoptera: Curculionidae) in Ontario and Québec, Canada. Canadian Entomologist 146, 224-235
Messing RH, AliNiazee MT (1988) Hybridization and host stuitability of 2 biotypes of Trioxys-pallidus (Hymenoptera, Aphidiidae). Annals of the Entomological Society of America 81, 6-9.

56!
Messing RH, AliNiazee MT (1989) Introduction and establishment of Trioxys-pallidus Hym, Aphidiidae in Oregon, USA for control of filbert aphid Myzocallis-coryli Hom, Aphididae. Entomophaga 34, 153-163.
Miller MA, Pfeiffer W, Schwartz T (2010) Creating the CIPRES Science Gateway for inference of large phylogenetic trees. Proceedings of the Gateway Computing Environments Workshop (GCE), 14 Nov. 2010, New Orleans, LA., pp. 1-8.
Milne WM (1997) Studies of the host-finding ability of the aphid parasitoid, Trioxys complanatus (Hym.: Braconidae) in lucerne and clover. Entomophaga 42, 173-183.
Moldo D, Machado CA, Sevenster JG, Keller L, Herre EA (2003) Cryptic species of fig-pollinating wasps: implications for the evolution of the fig-wasp mutulaism, sex allocation, and precision of adaptation. Proceedings of the National Academy of Sicences of the United States of America 100, 5867-5872.
Muirhead KA, Murhpy NP, Sallam N, Donnellan SC, Austin AD (2012) Phylogenetics and genetic diversity of the Cotesia flavipes complex of parasitoid wasps (Hymenoptera: Braconidae), biological control agents of lepidopteran stemborers. Molecular Phylogenetics and Evolution 63, 904-914.
Murdoch WW, Chesson J, Chesson PL (1985) Biological-control in theory and practice. American Naturalist 125, 344-366.
Nason JD, Heard BB, Williams FR (2002) Host-associated genetic differentiation in the goldenrod elliptical-gall moth, Gnorimoschema gallaesolidaginis (Lepidoptera: Gelechiidae). Evolution 56, 1475-1488.
Nosil P (2002) Transition rates between specialization and generalization in phytophagous insects. Evolution 56, 1701-1706.
Nosil P, Mooers AO (2005) Testing hypotheses about ecological specialization using phylogenetic trees. Evolution 59, 2256-2263.
Nylin S, Janz N (2009) Butterfly host plant range: an example of plasticity as a promoter of speciation? Evolutionary Ecology 23, 137-146.
Nylin S, Slove J, Janz N (2014) Host plant utilization, host range oscillations and diversification of nymphalid butterflies: a phylogenetic investigation. Evolution 68, 105-124.
Olkowski W, van den Bosch R, Zuparko R, Klitz W (1982) The parasitoid Trioxys tenuicaudus Star" (Hymenoptera: Aphidiidae) established on the elm aphid Tinocallis platani Kaltenbach (Homoptera: Aphididae) on Berkeley, California. Pan-Pacific Entomologist 58, 59-63.
Omondi BA, van den Berg J, Masiga D, Schulthess F (2014) Molecular markers reveal narrow genetic base and culturing-associated genetic drift in Teretrius nigrescens Lewis populations released for the biological control of the larger grain borer in Africa. Bulletin of Entomological Research 104, 143-154.
Paynter Q, Gourlay AH, Oboyski PT, Fowler SV, Hill RL, Withers TM, Parish H, Hona S (2008) Why did specificity testing fail to predict the field host-range of the gorse pod moth in New Zealand? Biological Control 46, 435-562
Phillips CB, Vink CJ, Blanchet A, Hoelmer KA (2008) Hosts are more important than destinations: what genetic variation in Microctonus aethiopoides (Hymenoptera: Braconidae) means for foreign exploration for natural enemies. Molecular Phylogenetics and Evolution 49, 467-476.

57!
Pritchard JK, Stephens M, Donnelly P (2000) Inference of population structure using multilocus genotype data. Genetics 155, 945-959.
Rambaut A, Drummond A (2007) Tracer v1.4, Available from http://beast.bio.ed.ac.uk/Tracer.
Ratnasingham S, Hebert PDN (2013) A DNA-based registry for all animal species: the barcode index number (BIN) system. PLoS One 8, e66213.
Ruiz-Montoya L, Nunez-Farfan J (2013) Testing local host adaptation and phenotypic plasticity in a herbivore when alternative related host plants occur sympatrically. PLoS One 8, e79070.
Seabra SG, Bras PG, Martins J, Martins R, Wyatt N, Shirazi J, Rebelo MT, Franco JC, Mateus C, Figueiredo E, Paulo OS (2015) Phylogeographical patterns in Coenosia attenuata (Diptera: Muscidae): a widespread predator of insect species associated with greenhouse crops. Biological Journal of the Linnean Society 114, 308-326.
Singh R, Agarwala BK (1992) Biology, ecology and control efficiency of the aphid parasitoid Trioxys-indicus – a review and bibliography. Biological Agriculture & Horticulture 8, 271-298.
Smith MA, Woodley NE, Janzen DH, Hallwachs W, Hebert PDN (2006) DNA barcodes reveal cryptic host-specificity within the presumed polyphagous members of a genus of parasitoid flies (Diptera : Tachinidae). Proceedings of the National Academy of Sciences of the United States of America 103, 3657-3662.
Stireman JO, Singer MS (2003) What determines host range in parasitoids? An analysis of a tachinid parasitoid community. Oecologia 135, 629-638.
Stireman JO (2005) The evolution of generalization? Parasitoid flies and the perils of inferring host range evolution from phylogenies. Journal of Evolutionary Biology 18, 325-336.
Stireman JO, Nason JD, Heard SB (2005) Host-associated genetic differentiation in phytophagous insects: general phenomenon or isolated exceptions? Evidence from a goldenrod-insect community. Evolution 59, 2573-2587.
Star" P (1990) Trioxys brevicornis, a new parasitoid and potential biocontrol agent of the asparagus aphid, Brachycorynella asparagi (Hymenoptera, Aphidiidae Homoptera, Aphidoidea). Acta Entomologica Bohemoslovaca 87, 87-96.
Star" P, Marsh PM (1982) Trioxys monelliopsis new-species Hymenoptera Aphidiidae parasitic on a pecan aphid. Proceedings of the Entomological Society of Washington 84, 726-728.
Stotz GC, Suarez LH, Gonzales WL, Gianoli E (2013) Local host adaptation and use of a novel host in the seed beetle Megacerus eulophus. PLoS One 8, e53892.
Straub CS, Ives AR, Gratton C (2011) Evidence for a trade-off between host-range breadth and host-use efficiency in aphid parasitoids. American Naturalist 177, 389-395.
Symonds MRE, Elgar MA (2013) The evolution of body size, antennal size and host use in parasitoid wasps (Hymenoptera: Chalcidoidea): A phylogenetic comparative analysis. PLoS One 8, e78297.
Symondson WOC, Sunderland KD, Greenstone MH (2002) Can generalist predators be effective biological control agents? Annual Review of Entomology 47, 561-594.

58!
Sz#cs M, Eigenbrode SD, Schwarzlaender M, Schaffner U (2012) Hybrid vigor in the biological control agent, Longitarsus jacobaeae. Evolutionary Applications 5, 489-497.
Tachi T (2013) Molecular phylogeny and host use evolution of the genus Exorista Meigen (Diptera: Tachinidae). Molecular Phylogenetics and Evolution 66, 401-411.
Turgeon J, Tayeh A, Facon B, Lombaert E, De Clercq P, Berkvens N, Lundgren JG, Estoup A (2011) Experimental evidence for the phenotypic impact of admixture between wild and biocontrol Asian ladybird (Harmonia axyridis) involved in the European invasion. Journals of Evolutionary Biology 24, 1044-1052.
USDA (2015) PLANTS profile for Corylus (hazelnut). Accessed online 7ix2015. http://plants.usda.gov/core/profile?symbol=CORYL
van den Bosch R, Frazer BD, Davis CS, Messenger P, Hom R (1970) Trioxys pallidus-an effective new walnut aphid parasite from Iran. California Agriculture 24, 8-10.
van den Bosch R, Hom R, Matteson P, Frazer BD, Messenger PS (1979) Biological control of the walnut aphid in California: impact of the parasite Trioxys pallidus. Hilgardia 47, 1-13.
van den Bosch R, Schlinger EI, Hagen KS (1962) Initial field observations in California on Trioxys pallidus (Haliday) a recently introduced parasite of the walnut aphid. Journal of Economic Entomology 55, 857-862.
Vaughn TT, Antolin MF (1998) Population genetics of an opportunistic parasitoid in an agricultural landscape. Heredity 80, 152-162.
Walton VM, Chambers U, Olsen JL (2009) The current status of the newly invasive hazelnut aphid in Oregon hazelnut orchards. Acta Horticulturae 845, 479-485.
West-Eberhard MJ (2003) Developmental Plasticity and Evolution. Oxford University Press, Oxford, UK.
Williams WI, Friedman JM, Gaskin JF, Norton AP (2014) Hybridization of an invasive shrub affects tolerance and resistance to defoliation by a biological control agent. Evolutionary Applications 7, 381-393.
Winkler IS, Mitter C (2008) The phylogenetic dimension of insect-plant interactions: A review of recent evidence. In: Specialization, Speciation, and Radiation: the Evolutionary Biology of Herbivorous Insects (ed. Tilmon K), pp. 240-263. University of California Press, Berkeley and Los Angeles, CA.
Withers TM, Phillips LD, Bates TEM, Ganley RJ (2011) Hybridisation between populations of Enoggera nassaui in New Zealand. New Zealand Plant Protection 64, 44-48.
Yara K, Sasawaki T, Kunimi Y (2007) Displacement of Torymus beneficus (Hymenoptera : Torymidae) by T. sinensis, an indigenous and introduced parasitoid of the chestnut gall wasp, Dryocosmus kuriphilus (Hymenoptera : Cynipidae), in Japanese chestnut fields: Possible involvement in hybridization. Biological Control 42, 148-154.
Yara K, Sasawaki T, Kunimi Y (2010) Hybridization between introduced Torymus sinensis (Hymenoptera: Torymidae) and indigenous T. beneficus (late-spring strain), parasitoids of the Asian chestnut gall wasp Dryocosmus kuriphilus (Hymenoptera: Cynipidae). Biological Control 54, 14-18.

59!
Yeates DK, Greathead D (1997) The evolutionary pattern of host use in the Bombyliidae (Diptera): A diverse family of parasitoid flies. Biological Journal of the Linnean Society 60, 149-185.
Zepeda-Paulo FA, Ortiz-Martínex SA, Figueroa CC, Lavandero B (2013) Adaptive evolution of a generalist parasitoid: implications for the effectiveness of biological control agents. Evolutionary Applications 6, 983-999.
Zuparko R (1983) Biological-control of Eucallipterus tiliae [Hom, Aphididae] in San-Jose, Calif, through establishment of Trioxys curvicaudus [Hym, Aphidiidae]. Entomophaga 28, 325-330.

60!
Table 4.1 – Geographic locality information, summary of results from mtDNA, STRUCTURE and pairwise NewHybrid analyses for ingroup and outgroup taxa. Previously published ingroup and outgroup sequences
Species Name Locality Database & Accession mtDNA Haplotype
Aphidius funebris Silwood Park, Ascot, Berkshire, United Kingdom GenBank JX507450
A. matricaria Silwood Park, Ascot, Berkshire, United Kingdom GenBank JX507432
Binodoxys acalephae Silwood Park, Ascot, Berkshire, United Kingdom GenBank JX507441
B. communis China, ex. Aphis glycines GenBank FJ798201
B. centaurea Silwood Park, Ascot, Berkshire, United Kingdom GenBank JX507447
Monoctonus cerasi Silwood Park, Ascot, Berkshire, United Kingdom GenBank JX507448
Trioxys curvicaudus
Italy: Caluso (7° 53' E; 45° 18' N) 22vi2010 col: J.C. Andersen and M.A. Labbé, ex. Eucallipterus tiliae GenBank KM973350
T. complanatus Iran GenBank KJ848479 T. pallidus S.E. France, ex. Tuberculatus spp. GenBank JN620695 JN620695 T. pallidus S.E. France, ex. Tuberculatus spp. GenBank JN620696 JN620695 Trioxys sp. Grasslands NP, Saskatchewan Canada BOLD CNGRF305-12 J0019a Undet Ontario, Canada BOLD JSHYN764-11 JSHYN764-11 Undet Ontario, Canada BOLD NCCC742-11 J0019a Undet Britich Columbia, Canada BOLD NGAAD869-14 J0019a Undet Ontario, Canada BOLD SMTPJ5260-14 J0019a Undet Rogaland, Norway BOLD GSSHH153-14 GSSHH153-14 Undet Rogaland, Norway BOLD GSSHH160-14 GSSHH160-14 Undet Telemark, Norway BOLD GSSHH165-14 GSSHH165-14 Undet Telemark, Norway BOLD GSSHH166-14 GSSHH166-14
Specimen information for individuals of T. pallidus novel to this study
ID GenBank Accession
mtDNA Haplotype
Structure Assignment
NewHybrid 2,1
NewHybrid 1,3
NewHybrid 3,2
J0001 United States: California, Durham (121° 50' W; 39° 40' N) 6vii2006 ex: Chromaphis juglandicola J0001e KM973216 J0001e 0/1/0 1/0/0
0/0.01/0.99
J0001f KM973217 J0001f 0/1/0 1/0/0
0/0.01/0.99 J0001g KM973218 J0001f 0/1/0 1/0/0
0/0.01/0.99
J0001h KM973219 J0001e 0/1/0 1/0/0
0/0.01/0.99 J0001i KM973220 J0001e 0/1/0 1/0/0
0/0.01/0.99
J0001j KM973221 J0001e 0/1/0 1/0/0
0/0.01/0.99 J0001k KM973222 J0001e 0/0.99/0 0.99/0.01/0
0/0.01/0.99
J0001l KM973223 J0001e 0/0.99/0 0.99/0.01/0
0/0.01/0.99 J0001m KM973224 J0001e 0/1/0 1/0/0
0/0.01/0.99
J0001n KM973225 J0001e 0/1/0 1/0/0
0/0.01/0.99 J0001o KM973226 J0001f 0/0.92/0.08 1/0/0
0/0.01/0.99
J0001p KM973227 J0001e 0/1/0 1/0/0
0/0.01/0.99

61!
J0002 United States: California, Rumsey 7ix2006 ex: C. juglandicola J0002a KM973228 J0001e 0/0.99/0.01 1/0/0
0/0.01/0.99
J0004 United States: California, Cressey (120° 41.63' W; 37° 26.882' N) col: N.J. Mills ex: C. juglandicola J0004b KM973229 J0001e 0/1/0 1/0/0
0/0.01/0.99
J0005 United States: California, Goshen (119° 29.503' W; 36° 20.908' N) 12ix2009 ex: C. juglandicola J0005a KM973230 J0001e 0/1/0 1/0/0
0/0.01/0.99
J0005b KM973231 J0001f 0/1/0 1/0/0
0/0.01/0.99 J0006 United States: California, Berkeley (122° 16' W; 37° 52' N) 27ix2007 ex: C. juglandicola J0006a KM973232 J0001f 0.04/0/0.96
0/0.16/0.85 0.99/0.01/0
J0006b KM973233 J0001e 0/0/0.99
0/0.01/0.99 0.99/0.01/0 J0008 United States: California, (36.19, -119.29) 17ix2006 ex: C. juglandicola J0008a KM973234 J0001e 0/0.99/0.01 1/0/0
0/0.01/0.99
J0008b KM973235 J0001e 0.03/0.86/0.1 0.99/0.01/0
0/0.02/0.98 J0008c KM973236 J0001e 0.03/0.77/0.2
0.05/0.58/0.37
J0008d KM973237 J0001f 0/0.99/0 0.99/0.01/0
0/0.01/0.99 J0008e KM973238 J0001e 0/0.99/0 0.99/0.01/0
0/0.01/0.99
J0008f KM973239 J0001e 0/1/0 1/0/0
0/0.01/0.99 J0008g KM973240 J0001e 0.01/0.96/0.03 0.99/0.01/0
0/0.01/0.99
J0008h KM973241 J0001e 0.01/0.99/0 0.99/0.01/0
0/0.01/0.99 J0008i KM973242 J0001f 0/0.99/0 0.99/0.01/0
0/0.01/0.99
J0008j KM973243 J0001e 0/0.99/0 0.99/0.01/0
0/0.01/0.99 J0008k KM973244 J0001e 0/1/0 1/0/0
0/0.01/0.99
J0008l KM973245 J0001e 0/1/0 1/0/0
0/0.01/0.99 J0008m KM973246 J0001f 0/1/0 1/0/0
0/0.01/0.99
J0008n KM973247 J0001f 0/1/0 1/0/0
0/0.01/0.99 J0008o KM973248 J0001e 0/1/0 1/0/0
0/0.01/0.99
J0009 United States: California, Hanford 12ix2009 Ex: C. juglandicola J0009b KM973249 J0001e 0/1/0 1/0/0
0/0.01/0.99
J0010 United States: California, San Juan Bautista 11viii2008 Ex: C. juglandicola J0010a KM973250 J0001e 0.01/0.98/0.01 0.99/0.01/0
0/0.01/0.99
J0019 United States: Oregon, Riggs Damm 25vi2008 Ex: Myzocallis coryli J0019a KM973251 J0019a 0.95/0.03/0.02 0/0.01/0.99
J0023
United States: Oregon, Roseburg (123° 27.073' W; 43° 17.88' N) 23vi2010 col: J.C. Andersen and S. Renquist Ex: M. coryli
J0023a KM973252 J0023a 1/0/0 0/0.01/0.99 0.99/0.01/0 J0023b KM973253 J0023a 0.99/0/0.01 0/0.01/0.99 0.99/0.01/0
J0024 United States: Oregon, (123° 27.321' W; 43° 17.839' N) 23vi2010 col: J.C. Andersen and S. Renquist Ex: C. juglandicola
J0024a KM973254 J0024a 0/0.16/0.84
0/0.01/0.99 0.46/0.54/0 J0024b KM973255 J0001f 0/0.84/0.16 0.99/0.01/0
0/0.45/0.55
J0026 United States: Oregon, Monmouth (123° 16.387' W; 44° 50.57' N) 24vi2010 col: J.C. Andersen and C. Hedstrom Ex: M. coryli
J0026a KM973256 J0023a 0.79/0.21/0.01 0/0.86/0.15 0.99/0.01/0 J0026b KM973257 J0023a 0.99/0/0.01 0/0.01/0.99 0.99/0.01/0
J0027 United States: Oregon, Bethel (123° 11.666' W; 45° 3.448' N) 24vi2010 col: J.C. Andersen and C. Hedstrom Ex: M. coryli
J0027b KM973258 J0027b 1/0/0 0/0/1 0.99/0.01/0
J0028 United States: Oregon, Bethel (123° 11.666' W; 45° 3.448' N) 24vi2010 col: J.C. Andersen and C. Hedstrom Ex: M. coryli
J0028a KM973259 J0023a 0.98/0.01/0.01 0/0.01/0.99 0.99/0.01/0 J0028b KM973260 J0023a 1/0/0 0/0.01/0.99 0.99/0.01/0

62!
J0029 United States: Oregon, Bethel (123° 11.666' W; 45° 3.448' N) 24vi2010 col: J.C. Andersen and C. Hedstrom Ex: M. coryli
J0029b KM973261 J0019a 0.95/0.03/0.02 0/0.01/0.99 0.99/0.01/0 J0029d KM973262 J0023a 1/0/0 0/0.01/0.99 0.99/0.01/0 J0029e KM973263 J0019a 0.88/0.01/0.11 0/0.01/0.99 0.97/0.03/0 J0029f KM973264 J0029f 0.98/0.01/0.01 0/0.01/0.99 0.99/0.01/0 J0029g KM973265 J0029f 1/0/0 0/0.01/0.99 0.99/0.01/0 J0029h KM973266 J0029h 0.99/0/0 0/0.01/0.99 0.99/0.01/0 J0029i KM973267 J0019a 0.99/0/0.01 0/0.01/0.99 0.99/0.01/0
J0030 United States: Oregon, McMinnville (123° 17.569' W; 45° 5.731' N) 24vi2010 col: J.C. Andersen Ex: M. coryli
J0030b KM973268 J0023a 0.97/0.02/0.01 0/0.01/0.99 0.99/0.01/0 J0030C
1/0/0 0/0.01/0.99 0.99/0.01/0
J0030d KM973269 J0019a 1/0/0 0/0/1 0.99/0.01/0 J0030e KM973270 J0019a 1/0/0 0/0.01/0.99 0.99/0.01/0 J0030f KM973271 J0030f 1/0/0 0/0.01/0.99 0.99/0.01/0 J0030g KM973272 J0023a 1/0/0 0/0/1 0.99/0.01/0
J0031 United States: Oregon, Sheridan (123° 20.424' W; 45° 6.11' N) 24vi2010 col: J.C. Andersen Ex: M. coryli
J0031A KM973273 J0023a 1/0/0 0/0.01/0.99 0.99/0.01/0 J0031B KM973274 J0023a 1/0/0 0/0.01/0.99 0.99/0.01/0
J0032 United States: Oregon, Forest Grove (123° 8.966' W; 45° 34.028' N) 25vi2010 col: J.C. Andersen and A. Lemieux Ex: M. coryli
J0032A KM973275 J0023a 1/0/0 0/0.01/0.99 0.99/0.01/0 J0032b KM973276 J0023a 1/0/0 0/0.01/0.99 0.99/0.01/0
J0033 United States: Oregon, Forest Grove (123° 8.966' W; 45° 34.028' N) 25vi2010 col: J.C. Andersen and A. Lemieux Ex: M. coryli
J0033a KM973277 J0023a 1/0/0 0/0.01/0.99 0.99/0.01/0 J0033B KM973278 J0019a 1/0/0 0/0.01/0.99 0.99/0.01/0
J0034 United States: Oregon, Forest Grove (123° 8.966' W; 45° 34.028' N) 25vi2010 col: J.C. Andersen and A. Lemieux Ex: M. coryli
J0034a KM973279 J0019a 1/0/0 0/0.01/0.99 0.99/0.01/0 J0034b KM973280 J0023a 0.96/0.02/0.02 0/0.01/0.99 0.99/0.01/0
J0035 United States: California, Hollister (121° 26.106' W; 36° 54.226' N) 6vii2010 col: J.C. Andersen Ex: C. juglandicola
J0035a KM973281 J0001f 0/0.99/0 0.99/0.01/0
0/0.01/0.99 J0035b KM973282 J0001e 0/0.98/0.02 1/0/0
0/0.01/0.99
J0036 United States: California, San Juan Bautista (121° 27.612' W; 36° 51.049' N) 6vii2010 col: J.C. Andersen Ex: C. juglandicola
J0036a KM973283 J0001f 0.01/0.99/0 0.99/0.01/0
0/0.01/0.99 J0036b KM973284 J0001e 0 /0.97/0.03 1/0/0
0/0.01/0.99
J0038 United States: California, Lemoore (119° 45.118' W; 36° 17.8' N) 6vii2010 col: J.C. Andersen Ex: C. juglandicola
J0038a KM973285 J0001f 0/1/0 1/0/0
0/0.01/0.99
J0039 United States: California, (121° 9.551' W; 37° 29.863' N) 7vii2010 col: J.C. Andersen and K. Anderson Ex: C. juglandicola
J0039a KM973286 J0001f 0/0.99/0 1/0/0
0/0.01/0.99
J0041 United States: California, (121° 9.551' W; 37° 29.863' N) 7vii2010 col: J.C. Andersen and K. Anderson Ex: C. juglandicola
J0041a KM973287 J0001e 0/1/0 1/0/0
0/0.01/0.99
J0044 United States: California, (120° 53.133' W; 37° 34.818' N) 7vii2010 col: J.C. Andersen and K. Anderson Ex: C. juglandicola

63!
J0044a KM973288 J0001e 0/1/0 1/0/0
0/0.01/0.99 J0044b KM973289 J0001e 0/1/0 1/0/0
0/0.01/0.99
J0045 United States: California, (120° 48.4' W; 37° 38.359' N) 7vii2010 col: J.C. Andersen and K. Anderson Ex: C. juglandicola
J0045a KM973290 J0001e 0/1/0 1/0/0
0/0.01/0.99
J0046 United States: California, Modesto (120° 51.72' W; 37° 38.326' N) 7vii2010 col: J.C. Andersen and K. Anderson Ex: C. juglandicola
J0046a KM973291 J0001e 0/1/0 1/0/0
0/0.01/0.99
J0047 United States: California, Chico (122° 1' W; 39° 51' N) 25v2010 col: K. Mace-Hill Ex: C. juglandicola
J0047b KM973292 J0001e 0/1/0 0.99/0.01/0
0/0.01/0.99
J0048 United States: California, Chico (122° 1' W; 39° 51' N) 11vi2010 col: K. Mace-Hill Ex: C. juglandicola
J0048a KM973293 J0001e 0/1/0 0.99/0.01/0
0/0.01/0.99
J0049 United States: California, Linden (121° 8' W; 38° 3' N) 10vi2010 col: J.C. Andersen Ex: C. juglandicola
J0049a KM973294 J0001f 0.01/0.99/0 0.99/0.01/0
0/0.01/0.99 J0049b KM973295 J0001e 0/1/0 0.99/0.01/0
0/0.01/0.99
J0050 United States: California, Linden (121° 8' W; 38° 3' N) 10vi2010 col: J.C. Andersen Ex: C. juglandicola
J0050a KM973296 J0001e 0/1/0 1/0/0
0/0.01/0.99 J0050b KM973297 J0001e 0/1/0 1/0/0
0/0.01/0.99
J0051 United States: California, Linden (121° 8' W; 38° 3' N) 10vi2010 col: J.C. Andersen Ex: C. juglandicola
J0051a KM973298 J0051a 0/1/0 1/0/0
0/0.01/0.99 J0051b KM973299 J0001e 0/1/0 1/0/0
0/0.01/0.99
J0053 United States: California, Winters (121° 58' W; 38° 30' N) 7vii2010 col: K. Mace-Hill Ex: C. juglandicola
J0053a KM973300 J0001e 0/1/0 1/0/0
0/0.01/0.99 J0053b KM973301 J0001e 0/1/0 1/0/0
0/0.01/0.99
J0054 United States: California, Davis (121° 47' W; 38° 32' N) 2vi2010 col: K. Mace-Hill and L. Morril Ex: C. juglandicola
J0054a KM973302 J0054a 0/1/0 1/0/0
0/0.01/0.99 J0054b KM973303 J0001e 0/1/0 1/0/0
0/0.01/0.99
J0055 United States: California, Davis (121° 47' W; 38° 32' N) 2vi2010 col: K. Mace-Hill and L. Morril Ex: C. juglandicola
J0055a KM973304 J0001f 0/1/0 1/0/0
0/0.01/0.99 J0055b KM973305 J0001e 0/1/0 1/0/0
0/0.01/0.99
J0057 United States: California, (122° 4.307' W; 38° 57.938' N) 19vii2010 col: J.C. Andersen Ex: C. juglandicola
J0057a KM973306 J0001e 0/1/0 1/0/0
0/0.01/0.99 J0057b KM973307 J0001e 0/1/0 1/0/0
0/0.01/0.99
J0058 United States: California, (121° 34.248' W; 38° 53.05' N) 19vii2010 col: J.C. Andersen Ex: C. juglandicola
J0058a KM973308 J0051a 0.01/0.976/0.014 1/0.01/0
0/0.01/0.99
J0058b KM973309 J0001f 0.002/0.98/0.018 1/0.01/0
0/0.01/0.99
J0059 United States: California, (121° 36.891' W; 38° 52.347' N) 19vii2010 col: J.C. Andersen Ex: C. juglandicola
J0059a KM973310 J0001f 0/1/0 1/0.01/0
0/0.01/0.99 J0061 United States: California, (121° 38.154' W; 39° 6.765' N) 19vii2010 col: J.C. Andersen Ex: C.

64!
juglandicola J0061a KM973311 J0001e 0/1/0 1/0/0
0/0.01/0.99
J0061b KM973312 J0001e 0/1/0 1/0/0
0/0.01/0.99 J0069 United States: California, (122° 53' W; 39° 10' N) 10ix2010 col: R. Elkins Ex: C. juglandicola J0069c KM973313 J0001f 0 /0.99/0 1/0/0
0/0.01/0.99
J0069d KM973314 J0001e 0/1/0 1/0/0
0/0.01/0.99 J0069e KM973315 J0001f 0/1/0 1/0/0
0/0.01/0.99
J0069f KM973316 J0001e 0/1/0 1/0/0
0/0.01/0.99 J0069g KM973317 J0001f 0/1/0 1/0/0
0/0.01/0.99
J0069h KM973318 J0001e 0/1/0 1/0/0
0/0.01/0.99 J0069i KM973319 J0001e 0/1/0 1/0/0
0/0.01/0.99
J0069j KM973320 J0001e 0/1/0 1/0/0
0/0.01/0.99 J0069k KM973321 J0069k 0/1/0 1/0/0
0/0.01/0.99
J0069l KM973322 J0001f 0/1/0 1/0/0
0/0.01/0.99 J0069m KM973323 J0001e 0.09/0.9/0.01 0.99/0.01/0
0/0.01/0.99
J0070 United States: California, (122° 53' W; 39° 10' N) 13ix2010 col: J.C. Andersen, M.A. Labbé, and R. Elkins Ex: C. juglandicola
J0070a KM973324 J0051a 0/1/0 1/0/0
0/0.01/0.99 J0070b KM973325 J0001f 0/1/0 1/0/0
0/0.01/0.99
J0071 United States: California, (122° 55' W; 39° 9' N) 13ix2010 col: J.C. Andersen, M.A. Labbé, and R. Elkins Ex: C. juglandicola
J0071a KM973326 J0001e 0/1/0 1/0/0
0/0.01/0.99
J0072 United States: California, (122° 54' W; 39° 10' N) 13ix2010 col: J.C. Andersen and M.A. Labbé Ex: C. juglandicola
J0072a KM973327 J0001e 0/0.99/0.01 1/0/0
0/0.01/0.99
J0073 United States: California, (122° 53' W; 38° 59' N) 13ix2010 col: J.C. Andersen and M.A. Labbé Ex: C. juglandicola
J0073a KM973328 J0001e 0/1/0 1/0/0
0/0.01/0.99 J0073b KM973329 J0001f 0/1/0 1/0/0
0/0.01/0.99
J0074 United States: California, (122° 54' W; 39° 10' N) 13ix2010 col: J.C. Andersen and M.A. Labbé Ex: C. juglandicola
J0074a KM973330 J0001e 0/0.99/0 0.99/0.01/0
0/0.01/0.99 J0120 France: Parnac (1° 18' E; 44° 29' N) 2vi2011 col: J.C. Andersen and M.A. Labbé Ex: C. juglandicola J0120a KM973331 J0120a 0/0/0.99
0/0.01/0.99 0.99/0.01/0
J0120b KM973332 J0120b 0/0.01/0.99
0/0.01/0.99 0.99/0.01/0 J0120c KM973333 J0120a 0.01/0.02/0.97
0/0.02/0.98 0.96/0.04/0
J0120d KM973334 J0024a 0/0.01/0.99
0/0.01/0.99 0.99/0.01/0 J0120e KM973335 J0024a 0/0.01/0.99
0/0.01/0.99 0.98/0.02/0
J0120f KM973336 J0024a 0/0.01/0.99
0/0.01/0.99 0.98/0.02/0 J0120g KM973337 J0120a 0/0.01/0.98
0/0.01/0.99 0.97/0.03/0
J0122 France: Aiguille (0° 20' E; 44° 16' N) 2vi2010 col: J.C. Andersen and M.A. Labbé Ex: C. juglandicola
J0122a KM973338 J0024a 0/0.01/0.99
0/0.01/0.99 1/0.01/0 J0122b KM973339 J0024a 0/0.01/0.98
0/0.01/0.99 0.97/0.03/0
J0122c KM973340 J0122c 0.01/0.04/0.95
0/0.01/0.99 0.95/0.05/0 J0122d KM973341 J0024a 0/0/0.99
0/0.01/0.99 0.99/0.01/0
J0122e KM973342 J0122c 0/0.04/0.96
0/0.01/0.99 0.93/0.07/0 J0122f KM973343 J0024a 0.02/0.01/0.97
0/0.02/0.98 0.99/0.01/0
J0123 France: Nicole (0° 20' E; 44° 18' N) 2vi2010 col: J.C. Andersen and M.A. Labbé Ex: C. juglandicola J0123a KM973344 J0024a 0/0.01/0.99
0/0.01/0.99 0.98/0.02/0
J0124 France: Bordeaux (0° 17.227' E; 44° 34.467' N) 3vi2010 col: J.C. Andersen and M.A. Labbé Ex: C.

65!
juglandicola J0124a KM973345 J0124a 0/0.01/0.99
0/0.01/0.99 0.99/0.01/0
J0125 France: Bordeaux (0° 17.227' E; 44° 34.467' N) 3vi2010 col: J.C. Andersen and M.A. Labbé Ex: M. coryli
J0125A KM973346 J0027b 0.93/0.05/0.02 0/0.08/0.92 0.98/0.02/0 J0137 Italy: Verolengo (8° 1' E; 45° 11' N) 22vi2010 col: J.C. Andersen and M.A. Labbé Ex: M. coryli
J0137A KM973347 J0023a 0.02/0.04/0.94
0/0.05/0.95 0.76/0.24/0 J0138 Italy: Verolengo (7° 57' E; 45° 10' N) 22vi2010 col: J.C. Andersen and M.A. Labbé Ex: M. coryli J0138A KM973348 J0019a 0.07/0.01/0.92
0/0.35/0.66 0.99/0.01/0
J0138B KM973349 J0138b 0.01/0/0.99
0/0.01/0.99 0.99/0.01/0 J0143 Italy: Verolengo (7° 57' E; 45° 10' N) 22vi2010 J.C. Andersen and M.A. Labbé Ex: C. juglandicola J0143A KM973351 J0138b 0/0.01/0.99
0/0.01/0.99 0.99/0.01/0
J0151 United States: California, (121° 59.39' W; 38° 30.912' N) 12vii2011 col: J.C. Andersen Ex: Chromaphis juglandicola
J0151A KM973352 J0001e 0/1/0 0.99/0.01/0
0/0.01/0.99 J0151B KM973353 J0001e 0/0.99/0.01 0.99/0.01/0
0/0.01/0.99
J0152 United States: California, (122° 4.307' W; 38° 57.938' N) 12vii2011 col: J.C. Andersen Ex: C. juglandicola
J0152a KM973354 J0001e 0/1/0 1/0/0
0/0.01/0.99 J0152B KM973355 J0001e 0/1/0 1/0/0
0/0.01/0.99
J0152C KM973356 J0001e 0/1/0 1/0/0
0/0.01/0.99
J0153 United States: California, (122° 1.931' W; 39° 14.835' N) 12vii2011 col: J.C. Andersen Ex: C. juglandicola
J0153A KM973357 J0001e 0/0.99/0.01 1/0/0
0/0.01/0.99 J0153B KM973358 J0001e 0/1/0 1/0/0
0/0.01/0.99
J0155 United States: California, (121° 41.405' W; 39° 16.544' N) 12vii2011 col: J.C. Andersen Ex: C. juglandicola
J0155B KM973359 J0001e 0/1/0 1/0/0
0/0.01/0.99
J0156 United States: California, (121° 35.361' W; 39° 6.771' N) 12vii2011 col: J.C. Andersen Ex: C. juglandicola
J0156A KM973360 J0001e 0.006/0.992/0.002 0.99/0.01/0
0/0.01/0.99
J0157 United States: California, (121° 35.361' W; 38° 52.716' N) 12vii2011 col: J.C. Andersen Ex: C. juglandicola
J0157A KM973361 J0001f 0/1/0 1/0/0
0/0.01/0.99 J0157B KM973362 J0001f 0/1/0 1/0/0
0/0.01/0.99
J0161 Iran: Esfahan 15v2011 col: E. Nader Ex: C. juglandicola J0161E KM973363 J0161e 0/1/0 1/0/0
0/0.01/0.99
J0161F KM973364 J0161f 0.01/0.68/0.31
0/0.05/0.95 J0163 Iran: Tehran 24iii2004 col: E. Nader Ex: C. juglandicola J0163A KM973365 J0001f 0/1/0 1/0/0
0/0.01/0.99
J0163B KM973366 J0001f 0/0.99/0.01 0.99/0.01/0
0/0.01/0.99 J0163C KM973367 J0001f 0.03/0.95/0.02 0.99/0.01/0
0/0.01/0.99
J0163D KM973368 J0001e 0/0.86/0.14 0.99/0.01/0
0/0.09/0.91 J0163E KM973369 J0001f 0.02/0.98/0 0.99/0.01/0
0/0.01/0.99
J0163F KM973370 J0001f 0.04/0.94/0.02 0.99/0.01/0
0/0.01/0.99 J0163G KM973371 J0001f 0/0.92/0.08 1/0/0
0/0.01/0.99
J0163H KR074103 J0001f 0/0.99/0.01 1/0/0
0/0.01/0.99 J0163I KR074104 J0001f 0/0.99/0.01 1/0/0
0/0.01/0.99
J0163J KR074105 J0163J 0/1/0 1/0/0
0/0.01/0.99 J0173 United States: California, (39.11296, -121.63568) 27ix2011 col: J.C. Andersen Ex: Panaphis

66!
juglandis J0173A KM973372 J0001e 0/1/0 1/0/0
0/0.01/0.99
J0173B KM973373 J0001e 0/0.99/0.01 1/0/0
0/0.01/0.99 J0174 United States: California, (39.276, -121.69147) 27ix2011 col: J.C. Andersen Ex: P. juglandis J0174B KM973374 J0001f 0/1/0 1/0/0
0/0.01/0.99
J0174C KM973375 J0001e 0/1/0 1/0/0
0/0.01/0.99 J0174D KM973376 J0001e 0/1/0 1/0/0
0/0.01/0.99
J0178 United States: California, (39.11296, -121.63568) 27ix2011 col: J.C. Andersen Ex: P. juglandis J0178B KM973377 J0178b 0/1/0 1/0/0
0/0.01/0.99
J0178C KM973378 J0001e 0/1/0 1/0/0
0/0.01/0.99
J0179 United States: California, Escalon (37.754141, -120.923234) 5vi2012 col: J.C. Andersen and M.A. Labbé Ex: C. juglandicola
J0179A KM973379 J0001e 0/1/0 1/0/0
0/0.01/0.99 J0179B KM973380 J0001e 0/1/0 1/0/0
0/0.01/0.99
J0179C KM973381 J0001e 0/1/0 1/0/0
0/0.01/0.99 J0179D KM973382 J0001e 0/1/0 1/0/0
0/0.01/0.99
J0179E KM973383 J0179e 0/0.99/0 0.99/0.01/0
0/0.01/0.99 J0179F KM973384 J0001e 0/1/0 1/0/0
0/0.01/0.99
J0179G KM973385 J0001e 0/1/0 1/0/0
0/0.01/0.99 J0179H KM973386 J0001e 0.02/0.96/0.02 0.99/0.01/0
0/0.01/0.99
J0179I KM973387 J0001e 0/1/0 1/0/0
0/0.01/0.99 J0179J KM973388 J0001e 0/0.99/0 1/0/0
0/0.01/0.99
J0179K KM973389 J0179k 0/0.99/0.01 1/0/0
0/0.01/0.99 J0179L KM973390 J0001e 0/0.99/0 0.99/0.01/0
0/0.01/0.99
J0188 United States: California, Newark (37.561215, -122.041887) 30viii2012 col: J.C. Andersen and M.A. Labbé Ex: C. juglandicola
J0188A KM973391 J0001e 0.02/0.97/0.01 1/0.01/0
0/0.01/0.99 J0188B KM973392 J0001e 0/1/0 1/0/0
0/0.01/0.99
J0188C KM973393 J0001e 0/1/0 0.99/0.01/0
0/0.01/0.99 J0188D KM973394 J0001e 0.01/0.99/0 0.99/0.01/0
0/0.01/0.99
J0188E KM973395 J0001f 0/1/0 1/0/0
0/0.01/0.99 J0188F KM973396 J0001e 0/1/0 1/0/0
0/0.01/0.99
J0188G KM973397 J0001e 0.05/0.94/0.01 0.99/0.01/0
0/0.01/0.99 J0188H KM973398 J0001e 0/1/0 1/0/0
0/0.01/0.99
J0188I KM973399 J0001e 0/1/0 0.99/0.01/0
0/0.01/0.99 J0188J KM973400 J0001e 0.05/0.94/0.01 0.99/0.01/0
0/0.01/0.99
J0189 Italy: col: J.C. Andersen and M.A. Labbé Ex: Myzocallis coryli J0189A KM973401 J0189a 0.02/0.01/0.97
0/0.14/0.86 0.98/0.02/0

67!
Figure 4.1 – Bayesian majority rule consensus tree of relationships between individuals identified as T. pallidus and published sequences. Branch lengths are drawn proportional to the number of substitutions per site, with a scale shown in the bottom left corner and Bayesian posterior probabilities (BPP) are shown below each branch, except when noted. One clade (“A”) includes all sequences for T. pallidus generated in this study. A second clade (“B”) includes only individuals reared from M. coryli or from unknown sources, and a third clade (“C”) includes individuals from tree-feeding aphids in the tribe Panaphidini in Europe, Iran, and North America.
0.02
KJ848479 Trioxys complanatus
J0143a Italy
BOLD-NCCC742-11 Canada
FJ798201 Binodoxys communis
J0019a Oregon
J0027b Oregon
J0123a France
J0122b France
BOLD-SMTPJ5260-14 Canada
J0122e France
J0030d Oregon
J0029e Oregon
JX507441 Binodoxys acalephae
J0125a France
J0024a Oregon
J0120f FranceJ0122a France
J0189a France
J0034a OregonJ0033b Oregon
J0029b Oregon
J0124a France
J0138a Italy
JX507447 Binodoxys centaureae
J0030e Oregon
J0029i Oregon
J0122f France
J0120d FranceJ0120e France
J0138b Italy
BOLD-CNGRF305-12 Canada
J0122c France
JX507432 Aphidius matricariae
KM973350 Trioxys curvicaudus
BOLD-JSHYN764-11 Canada
JX507448 Monoctonus cerasi
J0122d France
JX507450 Aphidius funebris
BOLD-NGAAD869-14 Canada
69
100
97
84
100
90
98
90
51
84
85
53
100
0.02
BOLD-GSSHH160-14 Norway
JN620696 Trioxys pallidus France
J0120a France
J0120c France
J0120b France
BOLD-GSSHH166-14 Norway
BOLD-GSSHH153-14 Norway
JN620695 Trioxys pallidus France
J0161f Iran
J0120g France
BOLD-GSSHH165-14 Norway69
90
89
95
99
8291
99
80
100
100
Continued Box 1
n = 18 (17 Oregon, 1 Italy)
n = 139 ( 127 California, 1 Oregon, 11 Iran)
Box 1
A
B
C

68!
Figure 4.2 – TCS network diagram: geographic associations. Haplotype names and the number of individuals belonging to each haplotype are drawn adjacent to a circle representing each haplotype, and the size of the circle is proportional to the number of sequences matching that haplotype. Circles are colored to represent the geographic location from which an individual was collected, and branches with open circles are drawn to represent the number of base pair differences between each haplotype.
J0023an=16
J0029fn=2
J0027bn=2
J0019an=13
BOLD JSHYN764-11
J0189a
J0029h
J0030f
J0120an=3
BOLD GSSHH160-14
BOLD GSSHH166-14
J0179e
J0161E
J0001en=91
BOLD GSSHH153-14
JN620695n=2
BOLD GSSHH165-1
J0001fn=36
J0051an=3
J0161F
J0069k
J0178b
J0179k
J0054a
J0163J
J0124a
J0120b
J0024an=9
J0122Cn=2
J0138bn=2
Iran
Norway
Italy
France
Canada
Oregon
California
Legend
Network 1) Network 2)

69!
Figure 4.3 – TCS network diagram: host associations. Drawn as per figure 4.2, except that circles are colored to represent host-associations, if known, for aphid species from which each individual emerged.
J0023an=16
J0029fn=2
J0027bn=2
J0019an=13
BOLD JSHYN764-11
J0189a
J0029h
J0030f
J0120an=3
BOLD GSSHH160-14
BOLD GSSHH166-14
J0179e
J0161E
J0001en=91
BOLD GSSHH153-14
JN620695n=2
BOLD GSSHH165-1
J0001fn=36
J0051an=3
J0161F
J0069k
J0178b
J0179k
J0054a
J0163J
J0124a
J0120b
J0024an=9
J0122Cn=2
J0138bn=2
Unknown
Tuberculatus sp.
P. juglandis
M. corylli
C. juglandicola
Legend
Network 1) Network 2)

70
!
Fi
gure
4.4
– P
roba
bilit
y of
ass
ignm
ent o
f ind
ivid
uals
to g
enet
ic c
lust
ers b
ased
on
the
anal
ysis
of m
icro
sate
llite
dat
a. E
ach
colu
mn
repr
esen
ts th
e pr
obab
ility
of a
ssig
nmen
t of a
n in
divi
dual
to e
ach
of th
ree
gene
tic c
lust
ers (
colo
red
whi
te, l
ight
gre
y, a
nd
dark
gre
y, re
spec
tivel
y) u
sing
STR
UC
TUR
E. In
divi
dual
s are
gro
uped
by
the
geog
raph
ic lo
calit
ies a
nd/o
r aph
id h
osts
from
whi
ch
they
wer
e co
llect
ed.
!"!!"#!"$!"%!"&'"!!
!"#$%&'($")"(*)+',-&()."#(/0
+',-&(
1$#2,'0
1'"(3,)"(*)40"#5
."#(/0)"(*)
1$#2,'0
4'"(
."#(/0

71!
Figure 4.5 – Probability of assignment to pure or hybrid categories using NewHybrids. Each row shows the probability of assignment of individuals to either one of the pure or hybrid classes for each pairwise analysis using NewHybrids. Hybrid scores were calculated by summing the probabilities for all of the hybrid classes.
1,2 - Pop1
PofZ
Frequency
0.0 0.2 0.4 0.6 0.8 1.0
0510
1520
2530
1,2 - Pop2
PofZ
Frequency
0.0 0.2 0.4 0.6 0.8 1.0
020406080
120
1,2 - Hybrid
PofZ
Frequency
0.0 0.2 0.4 0.6 0.8 1.0
0.00.20.40.60.81.0
1,3 - Pop1
PofZ
Frequency
0.0 0.2 0.4 0.6 0.8 1.0
0510
1520
25
1,3 - Pop3
PofZ
Frequency
0.0 0.2 0.4 0.6 0.8 1.0
05
1015
20
1,3 - Hybrid
PofZ
Frequency
0.0 0.2 0.4 0.6 0.8 1.0
0.00.51.01.52.0
2,3 - Pop2
PofZ
Frequency
0.0 0.2 0.4 0.6 0.8 1.0
020406080
120
2,3 - Pop3
PofZ
Frequency
0.0 0.2 0.4 0.6 0.8 1.0
05
1015
20
2,3 - Hybrid
PofZ
Frequency
0.0 0.2 0.4 0.6 0.8 1.0
0.00.51.01.52.0

72!
Figure 4.6 – Comparison of results from mtDNA and nuDNA analyses. For T. pallidus individuals, adjacent to each ID number the genetic cluster to which each individual was assigned using STRUCTURE is drawn (Q > 0.80 for Clusters 1 – 3; Q < 0.8 for Hybrid).
JX507450 Aphidius funebrisJX507432 Aphidius matricariaeJX507447 Binodoxys centaureaeJX507441 Binodoxys acalephaeJX507448 Monoctonus cerasiFJ798201 Binodoxys communisKM973350 Trioxys curvicaudusKJ848479 Trioxys complanatusBOLD JSHYN764-11BOLD CNGRF305-12 Trioxys sp.BOLD NCCC742-11BOLD NGAAD869-14BOLD SMTPJ5260-14J0019aJ0029bJ0029eJ0029iJ0030dJ0030eJ0033bJ0034aJ0138aJ0189aJ0027bJ0125aJ0029hJ0030fJ0023aJ0023bJ0026aJ0026bJ0028aJ0028bJ0029dJ0029fJ0029gJ0030bJ0030gJ0031aJ0031bJ0032aJ0032bJ0033aJ0034bJ0137aJ0024aJ0120dJ0120eJ0120fJ0122aJ0122bJ0122cJ0122dJ0122eJ0122fJ0123aJ0124aJ0138bJ0143aJ0120bBOLD GSSHH153-14BOLD GSSHH165-14BOLD GSSHH160-14BOLD GSSHH166-14J0120aJ0120cJ0120gJ0161f
JN620695 Trioxys pallidusJN620696 Trioxys pallidusJ0001eJ0001fJ0001gJ0001hJ0001iJ0001jJ0001kJ0001lJ0001mJ0001nJ0001oJ0001pJ0002aJ0004bJ0005aJ0005bJ0006aJ0006bJ0008aJ0008bJ0008cJ0008dJ0008eJ0008fJ0008gJ0008hJ0008iJ0008jJ0008kJ0008lJ0008mJ0008nJ0008oJ0009bJ0010aJ0024bJ0035aJ0035bJ0036aJ0036bJ0038aJ0039aJ0041aJ0044aJ0044bJ0045aJ0046aJ0047bJ0048aJ0049aJ0049bJ0050aJ0050bJ0051aJ0051bJ0053aJ0053bJ0054aJ0054bJ0055aJ0055bJ0057aJ0057bJ0058aJ0058bJ0059aJ0061aJ0061bJ0069cJ0069dJ0069eJ0069fJ0069gJ0069hJ0069iJ0069jJ0069kJ0069lJ0069mJ0070aJ0070bJ0071aJ0072aJ0073aJ0073bJ0074aJ0151aJ0151bJ0152aJ0152bJ0152cJ0153aJ0153bJ0155bJ0156aJ0157aJ0157bJ0161eJ0163aJ0163bJ0163cJ0163dJ0163eJ0163fJ0163gJ0163hJ0163iJ0163jJ0173aJ0173bJ0174bJ0174cJ0174dJ0178bJ0178cJ0179aJ0179bJ0179cJ0179dJ0179eJ0179fJ0179gJ0179hJ0179iJ0179jJ0179kJ0179lJ0188aJ0188bJ0188cJ0188dJ0188eJ0188fJ0188gJ0188hJ0188iJ0188j
Continued
LegendCluster 1Cluster 2Cluster 3Hybrid

73!
CHAPTER 5: POST-RELEASE GENETIC SURVEYS UNCOVER A GEOGRAPHIC MOSAIC OF COEVOLUTION IN THE WALNUT APHID BIOLOGICAL CONTROL
PROGRAM.
Abstract The geographic mosaic theory of coevolution predicts that coevolutionary
interactions are both geographically and temporally dynamic, and that reciprocal coevolution between interacting species occurs in some locations (coevolutionary hotspots), but not in others (coevolutionary coldspots). Whether geographic mosaics of coevolution occur in the context of classical biological control is unknown, but if it does, then localized breakdowns in biological control services might be expected to develop as populations oscillate between being coevolutionary hotspots and coldspots. We surveyed orchards for walnut aphid, Chromaphis juglandicola, and its parasitoid Trioxys pallidus and using population genomics we found positive evidence for the presence of a geographic mosaic of coevolution in the interaction between these two species. We also found that a greater number of the aphid populations exhibited significant levels of population differentiation than did T. pallidus populations. We subsequently discuss the implications of a geographic mosaic of coevolution and of potentially differing rates of evolution between parasitoids and their target pests for the sustainability of pest control services. Introduction
One of the most important challenges in evolutionary biology has been to identify the factors and processes that have shaped the diversity of species observed on our planet (Darwin 1859; Haldane 1947; Pennisi 2005). This diversity has resulted, in part, from interactions among species within communities through the process of coevolution (Hembry et al. 2014), the reciprocal evolutionary change of interacting species (Ehrlich & Raven 1964; Janzen 1980; Thompson 2014). Coevolution is thought to have played an important role in the diversification of plants and their pollinators (Ehrlich & Raven 1964) and herbivores (Bernays & Graham 1988), and has been particularly well studied between aphids and their parasitoids (e.g. Dion et al. 2011; Henter & Via 1995; Nyabuga et al. 2012; Rouchet & Vorburger 2012; Schmid et al. 2012) where defensive endosymbionts also play an important role (Bilodeau et al. 2013; Oliver et al. 2003; Rouchet & Vorburger 2014; Vorburger 2014).
While coevolutionary interactions, by definition, exist at the nexus of ecological and evolutionary time scales and theories (Torres 2009), it has also been proposed that they can occur at a much broader landscape scale through the geographic mosaic theory of coevolution (Thompson 1994, 2005). From this theory, the spatial structure of populations and the geneflow between them is expected to be an important part of the coevolutionary process (Gibert et al. 2013). Thus, coevolution is expected to be both spatially and temporally dynamic, with populations of interacting organisms oscillating between periods of reciprocal coevolution (termed coevolutionary hotspots) and periods where selection may be acting upon one or neither of the species in the pair (termed coevolutionary coldspots). Given its potential importance for understanding patterns of coevolution, it is perhaps not surprising that geographic mosaics have been observed for a

74!
variety of organisms and interactions including plants and herbivores (Siepielski & Benkman 2005; Muola et al. 2010; Vermeer et al. 2012), plants and pollinators (Thompson & Cunningham 2002; Thompson & Fernandez 2006), predators and prey (Brodie & Ridenhour 2002), and hosts and parasites (Dixon et al. 2009; Thompson 2009; Lorenzi & Thompson 2011; Vergara et al. 2013). The geographic mosaic theory of coevolution is also thought to be applicable to managed agricultural ecosystems (Bousset & Chevre 2013). In these systems metapopulation dynamics (Ives & Settle 1997) and coevolutionary interactions (Holt & Hochberg 1997) have long been thought to play an important role in influencing the biological control services provided by natural enemies in the suppression of pest abundance (Hoddle 2004; Van Driesche et al. 2010). Biological control programs are known to be well suited for the study of evolution (Roderick & Navajas 2003; Roderick et al. 2012); however, whether these programs are affected by spatial and temporal variation in coevolutionary interactions, as predicted by the geographic mosaic theory of coevolution, is unknown. This lack of knowledge may, in part, be explained by a predominant focus on pre-introduction surveys for natural enemies without sufficient emphasis on longer-term post-introduction monitoring (Mills 2000; McCoy & Frank 2010). It may also be explained by the fact that detection of geographic mosaics of coevolution has relied upon the a priori identification and measurement of adaptations among the interacting species, such as proboscis length for pollinators and corolla length for flowers (Pauw et al. 2009) or rostrum length for herbivores and pericarp thickness for fruit (Toju & Sota 2006). Adaptations among interacting species in agricultural systems may be more difficult to detect due to the high level of disturbance in these systems, and the selective breeding of crop plants for specific traits. In addition, in host-parasitoid interactions – a common interaction in biological control programs – numerous factors influence parasitism rates including genotype x genotype interactions, the presence of defensive endosymbionts, the type of host plant, and/or host color morphs (Bilodeau et al. 2013). Consequently, molecular techniques may be better suited for the identification of geographic mosaics of coevolution in these environments. Several studies have used molecular methods to gain further insights into previously identified geographic mosaics of coevolution (e.g. Dupas et al. 2009; Parchman et al. 2011; Severine et al. 2013). Only recently, however, has a population genomics approach been proposed for identification of potential geographic mosaics of coevolution (Vermeer et al. 2011). The advantages of this approach are that it can be implemented in the absence of a priori knowledge of adaptive traits (Vermeer et al. 2011) and addresses previous concerns about appropriate methods for testing the geographic mosaic theory of coevolution (Gomulkiewicz et al. 2007). If, as expected, coevolutionary interactions are important for biological control services and the geographic mosaic theory of coevolution predicts these interactions to be spatially and temporally dynamic, then localized breakdowns in biological control services might be expected as populations transition from being coevolutionary hotspots to coldspots (or vice versa). Such breakdowns have recently been observed in the walnut aphid biological control program in California where localized increases in abundance of walnut aphid, Chromaphis juglandicola (Kaltenbach) (Hemiptera: Aphididae), has led to

75!
a resumption of in-season insecticidal treatments (Hougardy & Mills 2008). Walnuts are one of the principle tree crops in the state of California both in terms of annual value (~$1.8 billion USD) and acreage of agricultural landscape occupied (>113,000 ha) (USDA 2014). Walnut aphid has been present in California for nearly as long as commercial walnut orchards have exhisted (Davidson 1914). They are active from March until early December (Sluss 1967), and cause reductions in the quality and size of the nuts (Michelbacher & Ortega 1958). To control walnut aphid, the parasitoid wasp Trioxys pallidus (Haliday) (Hymenoptera: Braconidae) was introduced to California from southern France, which resulted in establishment in the southern and coastal regions, but failed to establish the parasitoid in the primary walnut growing region of the Central Valley (Schlinger et al. 1960). Subsequently, a second introduction from Iran led to widespread establishment and reduction of walnut aphid densities throughout California (van den Bosch et al. 1979). In a recent study we suspected – incorrectly – that hybridization between populations descended from the separate introductions of T. pallidus may have played a role in the observed breakdowns (Andersen & Mills in prep). While conducting genetic surveys of T. pallidus for that study, we found evidence of geographically-based population structure in the different walnut growing regions of California (JCA and NJM unpublished data). This genetic variation in populations of T. pallidus, coupled with the observation of localized breakdowns, suggested that this aphid-paraitoid interaction may be influenced by a geographic mosaic of coevolution. Therefore, the obejctives of this study were 1) to examine whether we could use the population genomics approach presented by Vermeer et al. (2011) to detect the presence of a geographic mosaic of coevolution in the walnut aphid biological control program, and 2) to compare levels of genetic differentiation between populations of T. pallidus and C. juglandicola and comment on the effects of differing rates of evolution for the stability of biological control services. Methods
Sampling Locations To apply the population genomic approach of Vermeer et al. (2011) to investigate the interaction of C. juglandicola and T. pallidus in walnut orchards, sampling was conducted in both California and France between 2010 and 2014. Two orchards with only one of the two interacting species present were needed as reference coevolutionary coldspot locations. The reference coldspot for T. pallidus was located near Yuba City, CA where we found T. pallidus parasitizing an alternative host, the dusky-veined aphid (Panaphis juglandis [Goeze] [Hemiptera: Aphididae]). The reference coldspot for C. juglandicola was located near Linden, CA where we collected aphids, but adults of T. pallidus and aphid mummies were absent. We sampled five additional orchards to test both the aphids and parasitoids present for evidence of population structure and variation in genetic diversity that could be consistent with a geographic mosaic of coevolution. Full details of each of the sampling locations are presented in Table 5.1. At each sampling location we collected individuals identified as T. pallidus either by aspirating adults or by collecting mummified walnut aphids and placing small cut-out

76!
sections of leaf material with each mummy in a glass vial (9.5 mm x 3 mm). These vials were closed with a foam stopper, and stored at room temperature until adults emerged. Whether aspirated, or reared, adults of T. pallidus were then stored in 95% ethanol at -20°C for molecular analysis. Individuals of C. juglandicola were collected in the field and immediately placed in 95% ethanol and then stored at -20°C for molecular analysis. Effort was taken to collect only a few individuals per tree and to prioritize sampling from as many different trees as possible in each orchard to reduce the sampling of clonally related individuals (Lozier et al. 2007).
DNA Extraction and Microsatellite Genotyping DNA was extracted from adult females of T. pallidus and C. juglandicola by
grinding individuals with a mortar and pestle and then using the modified DNA extraction protocols presented in Andersen & Mills (2014, in prep). Standard PCR protocols were then used to amplify 15 polymorphic microsatellite markers for T. pallidus and 12 polymorphic microsatellite markers for C. juglandicola following protocols presented in Andersen & Mills (2014). Briefly, microsatellite loci were amplified from 7 to 20 aphids and/or parasitoid females from each location using fluorescently labeled primers, and PCR products for up to four loci were pooled before genotyping so that no two loci with the same fluorescent label were combined. Products were then genotyped on an Applied Biosystems 3730XL DNA Analyzer at the University of California Berkeley DNA Sequencing Facility using the LIZ 600 size standard, and fragment lengths were then scored using the Microsatellite Plug-in for Geneious Pro v. 5.6.2 (Drummond et al. 2012).
Population Genomic Analyses To test for the presence of a geographic mosaic of coevolution, we followed the approach presented by Vermeer et al. (2011). Briefly, this approach addresses the three components of the geographic mosaic theory of coevolution by identifying; 1) coevolutionary hot- and coldspots, 2) selection mosaics, and 3) trait-remixing (Gomulkiewicz et al. 2007; Thompson 1994, 2005). Neutral genetic loci for two (or more) interacting species are used to survey individuals at a number of geographic locations where both species co-occur as well as a single location for each species where its counterpart is absent. Using the latter as known coevolutionary coldspots, pairwise comparisons of genetic diversity (e.g. FST, GST, RhoST, etc.) between these and other locations can be estimated for each locus and used to look for outlier loci. If outliers are detected at a particular location for both interacting species, the location may be a coevolutionary hotspot, whereas if outliers are present for only one or neither of the interacting species, the location may be a coevolutionary coldspot (i.e. components 1 and 2 of the theory). These same neutral loci can then be used to estimate levels of geneflow between locations (i.e. component 3 of the theory). Finally, evidence for population structure (genetic diversity) and outlier loci can be used to identify potential hot and coldspots locations, which in conjunction with measurements of phenotypic or behavioral traits, can be used to confirm whether the interacting species are under reciprocal selection.

77!
To implement this approach we used the software package GenePop (Raymond & Rousset 1995; Rousset 2008) to calculate summary statistics for each population including; the number of observed and expected heterozygotes (Ho and He, respectively), departures from Hardy-Weinberg equilibrium (HWE), and the presence of locus-by-locus linkage disequilibrium (LD). We then used GenePop to estimate measures of population differentiation based on both FST and RhoST as the latter incorporates fragment sizes and may be more appropriate for microsatellite loci (Hardy et al. 2003; Slatkin 1995), while the former is independent of allele size and maybe more approriate in the face of scoring errors (Donnelly & Townson 2000; Zheng et al. 1996) or deviations from the simple-stepwise-mutation model (Putman & Carbone 2014). We then estimated recent migration rates (i.e. the proportion of individuals in a population that were estimated to be derived from a second population) between each population using the BayesAss Edition 3.0 (BA3) software package (Wilson & Rannala 2003). Analyses were conducted using maximal mixing parameters (0.99) for allele frequencies, migration rates, and inbreeding coefficiencies, and a runtime of 10 million generations with a burnin period of 1 million generations. Results were then visualized using the program Tracer (Rambaut & Drummond 2007), and for all T. pallidus populations, burnin periods were adjusted to 1.5 million generations to ensure that MCMC runs reached stationarity.
Detection of Outlier Loci We then estimated locus-specific measures of genetic differentiation for both C. juglandicola and T. pallidus using both FST and RhoST in GenePop (Raymond & Rousset 1995; Rousset 2008) based on pairwise comparisons between the reference coldspots and each candidate location. The “boxplot” function in the statistical software package R v 3.1.3 (R Core Team 2015) was used to examine the distribution of the locus-specific estimates for each location and outlier loci were detected by falling outside of the whiskers representing 1.5 times the interquartile range. Results
Population Genomic Analyses Both the observed heterozygosities (mean Ho of 0.306 for T. pallidus and 0.139 for C. juglandicola) and expected heterozygosities (mean He of 0.381 for T. pallidus and 0.175 for C. juglandicola) appeared low. Two populations for T. pallidus (Arbuckle, CA and Parnac, France) displayed significant deviations from HWE (!2 = 54.25, df = 26, P < 0.001, and !2 = 66.70, df = 28, P < 0.001 for the two T. pallidus populations, respectively), as did one population for C. juglandicola (Arbuckle, CA; !2 = ", df = 20, P < 0.001). For all three populations these differences were still significant after Bonferonni correction for multiple comparisons. Two of the 105 pair-wise LD comparisons for the microsatellite loci amplified from T. pallidus (Tp_MSAT8 and Tp_MSAT12 [!2 = 21.35, df = 12, P = 0.045]; Tp_MSAT13 and Tp_MSAT17 [!2 = 22.80, df = 12, P = 0.030]), and three of the 66 pair-wise LD comparisons for the microsatellite loci amplified from C. juglandicola (Cj_MSAT5 and Cj_MSAT9 [!2 = 15.05, df = 6, P = 0.019]; Cj_MSAT5 and Cj_MSAT19 [!2 = 13.11, df = 6, P = 0.041]; and Cj_MSAT8 and Cj_MSAT19 [!2 =

78!
14.62, df = 2, P < 0.001]) showed a significant presence of LD. However, only the pairwise comparison between Cj_MSAT8 and Cj_MSAT19 retained significant LD after Bonferonni correction for multiple comparisons. Measures of population differentiation (FST and RhoST) were significant for both T. pallidus and C. juglandicola populations (Table 5.2). For T. pallidus, the Modesto, CA and Parnac, France populations showed significant differentiation from all other populations (though only the Parnac population remained significant after Bonferonni correction for multiple comparisons). In contrast, for C. juglandicola the Arbuckle and Upper Lake, CA and the Parnac, France populations all showed significant differentiation from all other populations (and all remained significant after Bonferonni correction for multiple comparisons). Consistent with the presence of a geographic mosaic of coevolution we also found that geneflow (i.e. migration rates) varied between population pairs for both of the interacting species (Table 5.3).
Detection of Outlier Loci Preliminary analyses indicated that two loci (Cj_MSAT1 and Cj_MSAT16) for C. juglandicola and one locus (Tp_MSAT12) for T. pallidus were detected as outliers in all population comparisons. As indicated by Vermeer et al. (2011), such loci are likely associated with regions of the genome that are under selection, but because they did not vary geographically across population comparions, these loci do not represent the presence of reciprocal coevolution as predicted by the geographic mosaic theory and thus were excluded. After removal of these three loci, we identified outlier loci in four of the pair-wise comparisons for T. pallidus using FST and three of the pair-wise comparisons using RhoST (Figure 5.1). For C. juglandicola, outlier loci were detected in four pair-wise comparisons using both FST and RhoST, though the individual populations where outlier loci were detected varied (i.e. Modesto, CA for FST and Arbuckle, CA for RhoST). Outlier loci were detected at two locations (Parnac, France and Newark, CA) for both T. pallidus and C. juglandicola regardless of whether FST or RhoST was used as a summary statistic, and for one additional population (Arbuckle, CA) for FST as a summary statistic. Based on the population genomics approach for detecting the presence of a geographic mosaic of coevolution we therefore identified the Parnac, France; Newark, CA; and Arbuckle, CA populations as putative coevolutionary hotspots with outlier loci detected for both interacting species, and the Modesto, CA and Upper Lake, CA as putative coevolutionary coldspots due to the detection of outlier loci for only one of the two interacting species (Figure 5.2). Discussion
The study of coevolutionary interactions has not only helped to explain patterns of species diversity (Bernays & Graham 1988; Ehrlich & Raven 1964; Hembry et al. 2014; Janzen 1980; Thompson 2014), but has also contributed to our understanding of best management practices for natural resources (Carroll 2011; Kinkel et al. 2011; Rammel et al. 2007). Coevolution has also long been thought to play an important role in the sustainability of biological control services (Holt & Hochberg 1997; Kraaijeveld & Godfray 1999; Jones et al. 2014), and forms a central component of the enemy release

79!
hypothesis (Liu & Stiling 2006), which is often invoked to explain the increased invasiveness of exotic pests and weeds. However, whether geographic mosaics of coevolution (Thompson 1994, 2005), with oscillations between periods during which reciprocal coevolution is (hotspots) and is not (coldspots) occurring, affect the sustainability of biological control service is unknown. If it does, then these oscillations could likely result in localized breakdowns in biological control services, much like the patterns observed more recently in the walnut aphid biological control program (Hougardy & Mills 2008). In this context, then perhaps our finding of a geographic mosaic of coevolution in the interaction between C. juglandicola and T. pallidus may help to explain why some growers have resorted to in-season insecticidal applications while others have not.
While geographic mosaics of coevolution have been observed in numerous study
systems, two explanations for why this may be the first study to observe its presence in a biological control interaction set in an agricultural crop are: 1) that too few longer-term post-release studies have been undertaken (Mills 2000; McCoy & Frank 2010), and 2) that it may be difficult to identify a priori which adaptive traits to measure. The latter is of particular concern for aphid-parasitoid interactions where numerous factors can influence host susceptability to parasitism including the presence of defensive symbionts, aphid and parasitoid genotype x genotype interactions, as well as aphid color morphs (Bilodeau et al. 2013; Vorburger 2014). Previous studies have suspected the presence of geographic mosaics of coevolution as a potential explanation for the invasiveness of knapweeds (Centaurea maculosa Lamarck, and C. diffusa Lamarck [Asterales: Asteraceae]) in North America, but this could not be confirmed (Callaway et al. 2005). Therefore, we suspect that if the population genomics approach suggested by Vermeer et al. (2011) were to be applied more broadly to biological control interactions in managed ecosystems, additional geographic mosaics of coevolution would undoubtedly be observed.
In a pioneering paper, Holt and Hochberg (1997) outlined a range of factors (e.g. metapopulations dynamics, temporal variability in selective pressures, coevolutionary interactions) that might explain why the evolution of resistance is so rare in biological control programs. However, resistance is either known, or is suspected, to have occurred in at least some biological control programs (e.g. Ives & Muldrew 1984; Goldson et al. 2014). For the larch sawfly in Canada resistance to parasitism may have arisen due to the accidental importation of resistant host strains (Ives & Muldrew 1984), while for Argentine stem weevil in New Zealand parasitism rates have decreased nearly 50% in the last 10-15 years (Goldson et al. 2014). In the latter case, coevolutionary interactions would be expected to be weak due to the use of asexual biological control agents and the homogeneity of the New Zealand rangeland ecosystem. Thus the longer-term evolutionary outcome of biological control programs may represent a continuum from sustained effective control when coevolutionary interactions are strong, to breakdown and failure when they are weak. Geographic mosaics with reciprocal selection and trait remixing would occupy an intermediate position along the continuum and be characterized by temporary breakdowns in effective control at a localized scale, and yet

80!
sustained control at a regional or landscape scale due to connectivity and movement between local populations. An additional finding from this study was that the measure of genetic differentiation employed (FST or RhoST) influenced the number of locations identified as either coevolutionary hot- or coldspots. Two locations (Parnac, France and Newark, CA) were identified as coevolutionary hotspots during outlier tests using both statistics. However, for another location (Arbuckle, CA) outlier loci were detected for C. juglandicola using both statistics, but were detected for T. pallidus using FST only and not when using RhoST. Both test statistics are expected to be equivalent in populations with high migration rates and that have recently diverged (Hardy et al. 2003; Slatkin 1995; Rousset 1996). While tests exist to determine which statistic may be more appropriate for a given dataset (Hardy et al. 2003; Hardy & Vekemans 2002), it is advised to report both (Heller & Siegismund 2009; Putman et al. 2014), as we have done here. An additional study that measures morphological and behavioral trait variation at each of our study sites will be required to verify the presence of coevolutionary hot- and coldspots, and to verify which statistic is more appropriate for this system.
Population Structure of T. pallidus and C. juglandicola Both C. juglandicola and T. pallidus showed evidence of population
differentiation in this study, but the level of differentiation was lower for the parasitoid than for the aphid (Table 5.2). For T. pallidus, two populations showed significant differentiation (Modesto, CA and Parnac, France; though only the Parnac, France was significant after applying a Bonferonni correction), whereas for C. juglandicola three populations showed significant differentiation (Arbuckle, CA; Upper Lake, CA; and Parnac, France; all were significant after applying a Bonferonni correction). It is unclear whether the observed difference in levels of population differentiation was due to the amount of time each species has been present in western North America (>100 years for C. juglandicola versus 47 years for T. pallidus [Davidson 1914; van den Bosch et al. 1979]) or due to different rates of evolution.
Some aphid species have shown evidence of rapid evolution in response to
changes in their environment (Harmon et al. 2009), and a similar finding of a greater level of differentiation among aphid populations compared to their parasitoids has been recorded (Nyabuga et al. 2012). In the latter study, the authors suspected that metapopulation dynamics constrained the rate of evolution of the parasitoid relative to that of its aphid host due to the lag time in colonization of new patches. This lag time may disrupt the coevolutionary arms race (Lapchin & Guillemaud 2005), and a difference in evolutionary rates of interacting organisms can have negative impacts on the stability of their relationships. For example, predator-prey dynamics can be negatively affected by rapid evolution of the prey species (Yoshida et al. 2003), while conversely, biological control of weeds can be negatively affected by rapid evolution of the natural enemy (Smith et al. 2010). Therefore, by incorporating metapopulation dynamics into our understanding of the coevolutionary interactions between natural enemies and their hosts, the geographic mosaic theory of coevolution (Thompson 1994, 2005) may help elucidate the factors that influence the sustainability of biological control services. As such, the

81!
walnut aphid biological control program provides a model system for the continued study of factors that may either promote or inhibit coevolutionary interactions between introduced natural enemies and their target pests. Conclusions
Using the population genomics approach proposed by Vermeer et al. (2011), we identified the signatures of a geographic mosaic of coevolution between the walnut aphid (C. juglandicola) and the braconid parasitoid T. pallidus. Locations representing both coevolutionary hotspots and coevolutionary coldspots were identified, although the number of each changed between FST and RhoST as separate measures of population differentiation. Given the localized breakdowns observed in the control of walnut aphids by T. pallidus in California (Hougardy & Mills 2008), we believe that this pattern is consistent with expected oscillations between coevolutionary hotspots and coldspots. Future research should address whether hot- or coldspots are associated with breakdowns in biological control, and what management practices could be used to either promote or disrupt these coevolutionary interactions. Acknowledgments Funding for this study was made possible by an EPA-STAR Fellowship and a Robert van den Bosch Memorial Fellowship. I would like to thank K. Anderson, and M. Labbé for their field assistance in collecting T. pallidus and C. juglandicola. In addition, I would like to thank the University of California Cooperative Extension, and the East Bay Regional Parks Department, as well as the individual walnut growers who granted us access to their properties, J. Lozier and B. Ort for their technical assistance in conducting the molecular analyses, and R. Nielsen and G. Roderick for their comments on an earlier draft of this manuscript. I would also like to thank N. Mills for his incredible enthusiasm and the tireless effort he put into this chapter.

82!
Chapter 5. References Andersen JC, Mills NJ (in prep) Molecular evidence of cryptic species and hybridization
within the Trioxys pallidus species complex. Andersen JC, Mills NJ (2014) iMSAT: a novel approach to the development of
microsatellite loci using barcoded Illumina libraries. BMC Genomics 15, 858. Baucom RS, Mauricio R (2008) The evolution of novel herbicide tolerance in a noxious
weed: the geographic mosaic of selection. Evolutionary Ecology 22, 85-101. Benkman CW, Parchman TL, Siepielski AM (2008) The geographic mosaic of
coevolution and its conservation significance. In: Conservation Biology: Evolution in Action. Carroll SP, Fox CW (eds.) p. 225-238. Oxford University Press, Oxford, UK.
Benkman CW, Holimon WC, Smith JW (2001) The influence of a competitor on the geographic mosaic of coevolution between crossbills and lodgepole pine. Evolution 55, 282-294.
Bernays E, Graham M (1988) On the evolution of host specificity in phytophagous arthropods. Ecology 69, 886-892.
Bilodeau E, Guay J-F, Turgeon J, Cloutier C (2013) Survival to parasitoids in an insect hosting defensive symbionts: a multivariate approach to polymorphic traits affecting host use by its natural enemy. PLoS One 8, e60708.
Bousset L, Chevre A-M (2013) Stable epidemic control in crops based on evolutionary principles: adjusting the metapopulation concept to agro-ecosystems. Agriculture Ecosystems & Environment 165, 118-129.
Brodie ED, Ridenhour BJ (2002) The evolutionary response of predators to dangerous prey: hotspots and coldspots in the geographic mosaic of coevolution between garter snakes and newts. Evolution 56, 2067-2082.
Callaway RM, Hierro JL, Thorpe AS (2005) Evolutionary trajectories in plant and soil microbial communities: Centaurea invasions and the geographic mosaic of coevolution. In: Species Invasions: Insights into Ecology, Evolution, and Biogeography. Sax DF, Stachowicz JJ, Gaines SD (eds.) p. 341-363. Sinauer Associates Inc., Sunderland, MA, USA.
Carroll SP (2011) Conciliation biology: the eco-evolutionary management of permanently invaded biotic systems. Evolutionary Applications 4, 184-199.
Darwin C (1859) The Origins of Species by Means of Natural Selection, or the Preservation of Favoured Races in the Struggle of Life. pp. 491. W. Clowes and sons, London, UK.
Davidson WM (1914) Walnut aphides in California. Bulletin of the U.S. Department of Agriculture 100, 1-64.
Dixon MD, Craig TP, Itami JK (2009) The geographic mosaic of co-evolution and the natural enemies of Eurosta solidaginis. Evolutionary Ecology Research 11, 871-887.
Dion E, Zele F, Simon JC, Outreman Y (2011) Rapid evolution of parasitoids when faced with the symbiont-mediated resistance of their hosts. Journal of Evolutionary Biology 24, 741-750.
Donnelly MJ, Townson H (2000) Evidence for extensive genetic differentiation among populations of the malaria vector Anopheles arabiensis in Eastern Africa. Insect Molecular Biology 9, 357-367.

83!
Dupas S, Dubuffet A, Carton Y, Poirie M (2009) Local, geographic and phylogenetic scales of coevolution in Drosphila-parasitoid interactions. In: Advances in Parasitology, Vol 70: Parasitoids of Drosophila. Prevost G (ed.) p. 281-295. Academic Press, London, UK.
Ehrlich PR, Raven PH (1964) Butterflies and plants: a study in coevolution. Evolution 18, 586-608.
Gibert JP, Pires MM, Thompson JN, Guimaraes PR Jr (2013) The spatial structure of antagonistic species affects coevolution in predictable ways. American Naturalist 182, 578-591.
Goldson SL, Wratten SD, Ferguson CM, et al. (2014) If and when successful classical biological control fails. Biological Control 72, 76-79.
Gomulkiewicz R, Drown DM, Dybdahl MF, et al. (2007) Dos and don'ts of testing the geographic mosaic theory of coevolution. Heredity 98, 249-258.
Haldane JBS (1947) What is Life? pp. 241. Boni and Gaer, New York, U.S.A. Hardy OJ, Charbonnel N, Freville H, Heuretz M (2003) Microsatellite allele sizes: a
simple test to assess their significance on genetic differentiation. Genetics 4, 1467-1482.
Hardy OJ, Vekemans X (2002) spagedi: a versatile computer program to analyse spatial genetic structure at the individual or population levels. Molecular Ecology Notes 2, 618-620.
Harmon JP, Moran NA, Ives AR (2009) Species response to environmental change: impacts on food web interactions and evolution. Science 323, 1347-1350.
Heller R, Siegismund HR (2009) Relationship between three measures of genetic differentiation G(ST), D(EST) and G’(ST): how wrong have we been? Molecular Ecology 18, 2080-2083.
Hembry DH, Yoder JB, Goodman KR (2014) Coevolution and the diversification of life. American Naturalist 184, 425-438.
Henter HJ, Via S (1995) The potential for coevolution in a host-parasitoid system .1. Genetic-variation within an aphid population in susceptibility to a parasitic wasp. Evolution 49, 427-438.
Hoddle MS (2004) Restoring balance: using exotic species to control invasive exotic species. Conservation Biology 18, 38-49.
Holt RD, Hochberg ME (1997) When is biological control evolutionarily stable (or is it)? Ecology 78, 1673-1683.
Hougardy E, Mills NJ (2008) Comparative life history and parasitism of a new color morph of the walnut aphid in California. Agricultural and Forest Entomology 10, 137-146.
Huffbauer RA (2002) Evidence for nonadaptive evolution in parasitoid virulence following a biological control introduction. Ecological Applications 12, 66-78.
Ives WGH, Muldrew JA (1984). Pristiphora erichsonii (Hartig), Larch sawfly (Hymenoptera: Tenthredinidae). In: Biological Control Programs Against Insects and Weeds in Canada 1969–1980. Kelleher JS, Hulme MA (eds.) p. 369–380. Commonwealth Agriculture Bureau, Farnham, U.K.
Ives AR, Settle WH (1997) Metapopulation dynamics and pest control in agricultural systems. American Naturalist 149, 220-246.

84!
Janzen DH (1966) Coevolution of mutualisms between ants and acacias in Central America. Evolution 20, 249-275.
Jones MS, Vanhanen H, Pettola R, Drummond F (2014) A global review of arthropod-mediated ecosystem-services in Vaccinium berry agroecosystems. Terrestrial Arthropod Reviews 7, 41-78.
Kinkel LL, Bakker MG, Schlatter DC (2011) A coevolutionary framework for managing disease-suppressive soils. Annual Review of Phytopathology 49, 47-67.
Kraaijeveld AR, Godfray HCJ (1999) Geographic patterns in the evolution of resistance and virulence in Drosophila and its parasitoids. American Naturalist 153, 61-74.
Lapchin L, Guillemaud T (2005) Asymmetry in host and parasitoid diffuse coevolution: when the red queen has to keep a finger in more than one pie. Frontiers in Zoology 2, 1-5.
Lemaire V, Brusciotti S, van Gremberghe I, Vyverman W, Vanoverbeke J, De Meester L (2012) Genotype x genotype interactions between the toxic cyanobacterium Microcystis and its grazer, the waterflea Daphnia. Evolutionary Applications 5, 168-182.
Liu H, Stiling P (2006) Testing the enemy release hypothesis: a review and meta-analysis. Biological Invasions 8, 1535-1545.
Lorenzi MC, Thompson JN (2011) The geographic structure of selection on a coevolving interaction between social parasitic wasps and their hosts hampers social evolution. Evolution 65, 3527-3542.
Lozier JD, Roderick GK, Mills NJ (2007) Genetic evidence from mitochondrial, nuclear, and endosymbiont markers for the evolution of host plant associated species in the aphid genus Hyalopterus (Hemiptera: Aphididae). Evolution 61, 1353-1367.
McCoy ED, Frank JH (2010) How should the risk associated with the introduction of biological control agents be estimated? Agricultural and Forest Entomology 12, 1-8.
Michelbacher AE, Ortega JC (1958) A technical study of insects and related pests attacking walnuts. University of California Bulletin 764, 1-90.
Mills NJ (2000) Biological control: the need for realistic models and experimental approaches to parasitoid introductions. In: Parasitoid Population Biology. Hochberg ME, Ives AR (eds.) p. 217-234. Princeton University Press, Princeton, N.J., U.S.A.
Muola A, Mutikainen P, Lilley M, Laukkanen L, Salminen J-P, Leimu R (2010) Associations of plant fitness, leaf chemistry, and damage suggest selection mosaic in plant-herbivore interactions. Ecology 91, 2650-2659.
Nyabuga FN, Loxdale HD, Heckel DG, Weisser WW (2012) Coevolutionary fine-tuning: evidence for genetic tracking between a specialist wasp parasitoid and its aphid host in a dual metapopulation interaction. Bulletin of Entomological Research 102, 149-155.
Oliver KM, Russell JA, Moran NA, Hunter MS (2003) Facultative endosymbionts in aphids confer resistance to parasitic wasps. Proceedings of the National Academy of Sciences of the United States of America 100, 1803-1807.
Parchman TL, Benkman CW, Jenkins B, Buerkle CA (2011). Low levels of population genetic structure in Pinus contorta (Pinaceae) across a geographic mosaic of co-evolution. American Journal of Botany 98, 669-679.

85!
Pauw A, Stofberg J, Waterman RJ (2009) Flies and flowers in Darwin’s race. Evolution 63, 268-279.
Pennisi E (2005) What determines species diversity? Science 309, 90. Putman AI, Carbone I (2014) Challenges in analysis and interpretation of microsatellite
data for population genetic studies. Ecology and Evolution 4, 4399-4428. Rambaut A, Drummond A (2007) Tracer v1.4, Available from
http://beast.bio.ed.ac.uk/Tracer. Rammel C, Stagl S, Wilfing H (2007) Managing complex adaptive systems – a co-
evolutionary perspective on natural resource management. Ecological Economics 63, 9-21.
Raymond M, Rousset F (1995) GENEPOP (version 1.2): population genetics software for exact tests and ecumenicism. Journal of Heredity 86, 248-249.
R Core Team (2015). R: A language and environment for statistical computing. R Foundation for Statistical Computing, Vienna, Austria. http://www.R-project.org/.
Roderick GK, Navajas M (2003) Genes in new environments: genetics and evolution in biological control. Nature Reviews Genetics 4, 889-899.
Roderick GK, Hufbauer R, Navajas M (2012) Evolution and biological control. Evolutionary Applications 5, 419-423.
Rouchet R, Vorburger C (2012) Strong specificity in the interaction between parasitoids and symbiont-protected hosts. Journal of Evolutionary Biology 25, 2369-2375.
Rouchet R, Vorburger C (2014) Experimental evolution of parasitoid infectivity on symbiont-protected hosts leads to the emergence of genotype specificity. Evolution 68, 1607-1616.
Rousset F (1996) Equilibrium values of measures of population subdivision for stepwise mutation processes. Genetics 142, 1357-1362.
Rousset F (2008) Genepop'007: a complete reimplementation of the Genepop software for Windows and Linux. Molecular Ecology Resources 8, 103-106.
Schlinger EI, Hagen KS, van den Bosch R (1960) Imported French parasite of walnut aphid established in California. California Agriculture 14, 3-4.
Severine J, Bezier A, Gayral P, Paillusson C, Kaiser L, Dupas S, Le Ru BP, Barbe V, Periquet G, Drezen J-M, Herniou EA (2013) Adaptive selection on bracovirus genomes drives the specialization of Cotesia parasitoid wasps. PLoS One 8, e64432.
Siepielski AM, Benkman CW (2005) A role for habitat area in the geographic mosaic of coevolution between red crossbills and lodgepole pine. Journal of Evolutionary Biology 18, 1042-1049.
Slatkin M (1995) A measure of population subdivision based on microsatellite allele frequencies. Genetics 139, 457-462.
Sluss RR (1967) Population dynamics of the walnut aphid, Chromaphis juglandicola (Kalt.) in northern California. Ecology 48, 41-58.
Smith L, de Lillo E, Amrine JW Jr (2010) Effectiveness of eriophyid mites for biological control of weedy plants and challenges for future research. Experimental and Applied Acarology 51, 115-149.
Tellier A, Brown JKM (2009) Spatial heterogeneity, frequency-dependent selection and polymorphism in host-parasite interactions. BMC Evolutionary Biology 11, 319
86!
Thompson JN (1994) The Coevolutionary Process. pp. 383. The University of Chicago Press, Chicago, U.S.A.
Thompson JN (2005) The Geographic Mosaic of Coevolution. pp. 443. The University of Chicago Press, Chicago, U.S.A.
Thompson JN (2009) Coevolutionary biology: sex and the geographic mosaic of coevolution. Current Biology 19, R735-R736.
Thompson JN (2014) Natural selection, coevolution, and the web of life. American Naturalist 183, IV-V.
Thompson JN, Cunningham BM (2002) Geographic structure and dynamics of coevolutionary selection. Nature 417, 735-738.
Thompson JN, Fernandez CC (2006) Temporal dynamics of antagonism and mutualism in a geographically variable plant-insect interaction. Ecology 87, 103-112.
Toju H, Sota T (2006) Phylogeography and the geographic cline in the armament of a seed-predatory weevil: effects of historical events vs. natural selection from the host plant. Molecular Ecology 15, 4161-4173.
Torres E (2009) One hundred and fifty years of coevolutionary thinking: life is a web of interactions. Acta Biológica Colombiana 14, 231-246.
USDA (2014) United States Department of Agriculture National Agricultural Statistics Service: 2014 California Walnut Projective Measurement Report. pp. 8. http://www.nass.usda.gov/Statistics_by_State/California/Publications/Fruits_and_Nuts/201409walom.pdf
van den Bosch R, Hom R, Matteson P, Frazer BD, Messenger PS, Davis CS. (1979) Biological control of the walnut aphid in California: impact of the parasite, Trioxys pallidus. Hilgardia 47, 1-13.
Van Driesche RG, Carruthers RI, Center T, et al. (2010) Classical biological control for the protection of natural ecosystems. Biological Control 54, S2-S33.
Vergara D, Lively CM, King KC, Jokela J (2013) The geographic mosaic of sex and infection in lake populations of a New Zealand snail at multiple spatial scales. American Naturalist 182, 484-493.
Vermeer KMCA, Dicke M, de Jong PW (2011) The potential of a population genomics approach to analyse geographic mosaics of plant-insect coevolution. Evolutionary Ecology 25, 977-992.
Vermeer KMCA, Verbaarschot P, de Jong PW (2012) Changes in frequencies of genes that enable Phyllotreta nemorum to utilize its host plant, Barbarea vulgaris, vary in magnitude and direction, as much with as between seasons. Entomologia Experimentalis et Applicata 144, 37-44.
Vorburger C (2014) The evolutionary ecology of symbiont-conferred resistance to parasitoids in aphids. Insect Science 21, 251-264.
Wilson GA, Rannala B (2003) Bayesian inference of recent migration rates using multilocus genotypes. Genetics 163, 1177-1191.
Yoshida T, Jones LE, Ellner SP, Fussmann GF, Hairston NG Jr. (2003) Rapid evolution drives ecological dynamics in a predator-prey system. Nature 424, 303-306.
Zheng L, Benedict MQ, Cornel AJ, Collins FH, Kafatos FC (1996) An integrated genetic map of the African human malaria vector mosquito, Anopheles gambiae. Genetics 143, 941-952.

87!
Table 5.1 – Collection locality information for Chromaphis juglandicola and Trioxys pallidus Population IDs and locations sampled in this study including the number of females genotyped from each location (N), and the mean observed (Ho) and expected (He) heterozygosity. ID Location Host Collector(s) Date N Ho He T. pallidus J0178 Yuba City, CA P. juglandis J Andersen 27xi2011 7 0.219 0.331 J0179 Modesto, CA C. juglandicola J Andersen 5vi2012 12 0.344 0.354 J0057 Arbuckle, CA C. juglandicola J Andersen 19vii2010 14 0.295 0.371*
J0070 Upper Lake, CA C. juglandicola J Andersen & M Labbé 13ix2010 13 0.277 0.319
J0120 Parnac, France C. juglandicola J Andersen & M Labbé 2vi2011 14 0.357 0.523*
J0188 Newark, CA C. juglandicola J Andersen & M Labbé 30viii2012 10 0.347 0.386
C. juglandicola A0052 Linden, CA Walnut J Andersen 10vii2010 7 0.115 0.141
A0046 Modesto, CA Walnut J Andersen & K Anderson 7vii2010 9 0.102 0.097
A0057 Arbuckle, CA Walnut J Andersen 19vii2010 12 0.201 0.355*
A0070 Upper Lake, CA Walnut J Andersen & M Labbé 13ix2010 9 0.176 0.193
A0120 Parnac, France Walnut J Andersen & M Labbé 2vi2011 20 0.079 0.095
A0189 Newark, CA Walnut J Andersen & M Labbé 18ix2014 12 0.160 0.167
* Significant departure from HWE (P < 0.001)

88!
Table 5.2 – Measures of population differentiation among locations for Chromaphis juglandicola and Trioxys pallidus based on FST (below the diagonal) and RhoST (above the diagonal). T. pallidus Yuba City Modesto Arbuckle Upper Lake Parnac Newark Yuba City -- 0.015† 0.034 0.003 0.316* 0.007 Modesto 0.030† -- 0.020# 0.013† 0.351* 0.002† Arbuckle 0.024 0.042# -- 0.021 0.320* 0.009 Upper Lake 0.014 0.026† 0.014 -- 0.370* 0.007 Parnac 0.244* 0.268* 0.273* 0.278* -- 0.312* Newark 0.019 0.038† 0.025 0.010 0.240* -- C. juglandicola Linden Modesto Arbuckle Upper Lake Parnac Newark Linden -- 0.100 0.169* 0.046* 0.173 0.125 Modesto 0.027 -- 0.099* 0.018* 0.028 0.033 Arbuckle 0.075* 0.122* -- 0.030* 0.126* 0.106* Upper Lake 0.308* 0.347* 0.215* -- 0.108* 0.051* Parnac 0.087 0.053 0.255* 0.411* -- 0.070* Newark 0.008 0.080 0.115* 0.329* 0.181* -- * Significant after Bonferonni correction for multiple comparisons (adjusted $ = 0.003) † P < 0.05 # P < 0.01

89!
Table 5.3 – Measures of recent migration rates for Chromaphis juglandicola and Trioxys pallidus using BA3 Average migration rates between each population pairs should be read as Row Name –> Column Name. Significant migration rates (i.e., average migration rate ± 2 SE not including zero) are highlighted in bold. T. pallidus
Yuba City Modesto Arbuckle Upper Lake Parnac Newark
Yuba City -- 0.026 0.026 0.202 0.026 0.017 Modesto 0.018 -- 0.018 0.240 0.019 0.019 Arbuckle 0.017 0.017 -- 0.250 0.017 0.017 Upper Lake 0.017 0.017 0.017 -- 0.017 0.017 Parnac 0.017 0.017 0.016 0.017 -- 0.188
Newark 0.021 0.022 0.021 0.227 0.022 --
C. juglandicola
Linden Modesto Arbuckle Upper Lake Parnac Newark Linden -- 0.026 0.026 0.026 0.026 0.202
Modesto 0.023 -- 0.023 0.023 0.023 0.219 Arbuckle 0.020 0.020 -- 0.048 0.020 0.095 Upper Lake 0.022 0.022 0.022 -- 0.022 0.038 Parnac 0.013 0.013 0.013 0.013 -- 0.269 Newark 0.018 0.018 0.024 0.023 0.018 --

90!
Figure 5.1 – Distributions of locus-specific measures of FST and RhoST for different populations of Chromaphis juglandicola and Trioxys pallidus. The dark line represents the median measure for each population (compared to the reference), the open box is the interquartile range (IQR) with whiskers extending to 1.5 * IQR, and outlier loci are represented as open circles.
Arbuckle UpperLake
Parnac Modesto Newark
0.00.20.40.60.8
T. pallidus F
Arbuckle UpperLake
Parnac Modesto Newark
0.00.20.40.60.8
T. pallidus Rho
Arbuckle UpperLake
Parnac Modesto Newark
0.0
0.2
0.4
C. juglandicola F
Arbuckle UpperLake
Parnac Modesto Newark
0.0
0.2
0.4
C. juglandicola Rho
ST ST
ST ST

91!
Figure 5.2 – Graphical representation of coevolutionary hotspots and coldspots in the geographic mosaic of coevolution between Chromaphis juglandicola and Trioxys pallidus based on A) FST and B) RhoST. Grey circles represent locations from which T. pallidus was collected, and black circles represent locations from which C. juglandicola was collected. Arrows between circles represent the direction of significant geneflow between locations and curved arrows within the circles represent the presence of outlier loci for either T. pallidus (grey) or C. juglandicola (black). Locations with curved arrows for both species represent potential coevolutionary hotspots, while those locations with curved arrows for only one or neither species represent potential coevolutionary coldspots.
F
Arbuckle
Upper Lake
ParnacModesto
Newark
Yuba CityLinden
Arbuckle
Upper Lake
ParnacModesto
Newark
Yuba CityLindenRhoSTST
A) B)

92!
CHAPTER 6: HYBRIDIZATION BETWEEN TWO HOST-ASSOCIATED STRAINS OF KNOTWEED PSYLLID, APHALARA ITADORI, LEADS TO PATTERNS OF NON-MATERNAL INHERITANCE OF BOTH PRIMARY AND SECONDARY
ENDOSYMBIONTS.
Abstract Three species of invasive knotweeds (Fallopia japonica, F. sachalinensis, and F.
x bohemica) cause extensive damage to riparian and roadside habitats in North America. Currently, two strains of the psyllid Aphalara itadori are being evaluated for introduction into the United States and Canada for the biological control of these knotweeds after A. itadori’s successful introduction into the United Kingdom. If approved for release, hybridization between individuals from these two strains is likely and understanding whether barriers to hybridization exist could have an important impact on the sustainability of this biological control program. Here we developed two single nucleotide polymorphism (SNP) arrays and examined their utility for identifying individuals of known pure (Hokkaido and Kyushu) and hybrid origins. We found that one array (labeled the “full array”) correctly identified all individuals to pure and hybrid classes whereas a second array (labeled the “reduced array”) was able to correctly identify most pure individuals, but not hybrids. While we found no barriers to hybridization, we found a curious pattern of potential horizontal transmission of the primary endosymbiont Candidatus Carsonella rubii and the secondary facultative endosymbiont Sodalis sp. in one of our hybrid crosses. We discuss potential mechanisms for the horizontal transmission of Carsonella and Sodalis and compare our results to recent studies of host preference and fitness of these biological control agents. Introduction
Hybridization in nature was long considered a relatively rare event with both pre- and/or post-zygotic barriers preventing introgression of genomic material between species (Kirkpatrick 2000; Orr and Presgraves 2000; Presgraves 2002; Lukhtanov et al. 2005). Yet, increasingly it is being recognized that hybridization between closely-related organisms occurs within a broad range of taxonomic groups (Allendorf et al. 2001) and that hybridization between genetically distinct lineages has been identified as one of the leading causes of evolution and speciation (Mallet 2005). These hybridization events can lead to shifts in host-preference (Feder et al. 2003) and host-associated speciation events (Schwarz et al. 2005); furthermore, the rate at which hybridization events occur has undoubtedly been increased through anthropogenic activities that accidentally facilitate encounters between allopatric lineages (Allendorf et al. 2001).
Among closely-related insect taxa, hybridization appears to be a common
occurrence (Schwenk et al. 2008), and speculation of hybridization events between insect and non-insect taxa also exists in the literature (e.g. Williamson 2009). Given the extensive use of insect species as natural enemies in classical biological control programs that seek to suppress the abundance of exotic pests and noxious weeds through the deliberate introduction of specialist natural enemies (Hoddle 2004; Van Driesche et al. 2010), hybridization has also likely played a frequent, but poorly known, role in the

93!
sustainability of biological control services. Historically, many programs were established by collecting individuals of a selected natural enemy species from different localities and/or hosts within its region of origin, which have been referred to as strains, biotypes, and/or ecotypes (Clarke & Walter 1995; Heraty 2009). This practice is much less common today, however, due to the recognition that each strain needs to be tested separately for its host specificity (Hopper et al. 2005). From an evolutionary perspective, strains likely represent an early point in the process of speciation (i.e. prior to genetic isolation [Dres & Mallet 2002]) and can be influenced by factors such as geneflow, genetic diversity, and phenotypic plasticity (Ruiz-Montoya & Nunez-Farfan 2013). How frequently these strains hybridize, or what effect hybridization has on the sustainability of biological control services is unclear as relatively few studies have examined the effects of post-introduction hybridization. Those laboratory studies that have examined the potential effects of hybridization between strains have found conflicting evidence of both reduced (e.g. Messing & AliNiazzee 1988) and increased (e.g. Sz%cs et al. 2012) fitness of the hybrids relative to their parents.
While hybridization may be common among closely-related insect taxa,
incompatabilities among nuclear or cytoplasmic loci (Dobzhansky 1936; Hurst & Pomiankowski 1991), or incompatibilities between cytoplasmic loci and either nuclear loci or sex chromosomes (Hurst & Pomiankowski 1991; Ellison et al. 2008) can determine whether hybridization is possible within particular taxonomic groups. For insects, these incompatabilities are frequently the result of sex-ratio distorting secondary endosymbionts (Turelli 1994; Bordenstein et al. 2001). Endosymbiotic bacteria, including species of Wolbachia, Cardinium, Rikettsia, Spiroplasma and Arsenophagus, are commonly found in insects (Engelstaedter & Hurst 2009), with Wolbachia alone being estimated to infect over 65% of insect species (Hilgenboecker et al. 2008). The effects of these reproductive manipulators are diverse, but can be grouped into two broad categories; 1) sex ratio distortion (e.g. male-killing, feminization of males, or parthenogenesis induction); and 2) conditional sterility via cytoplasmic-incompatibility (Ferrari & Vavre 2011); however, to date only Wolbachia and Cardinium are known to cause cytoplasmic incompatability in arthropods (Engelstaedter & Hurst 2009). In classical biological control programs, reproductive manipulators may have important consequences for the establishment and impact of introduced natural enemies as their presence may prevent geneflow between populations (Cheyppe-Buchmann et al. 2011) and/or influence patterns of host specialization (Branca et al. 2011). Therefore, it is important not only to examine the population structure of target pests (or weeds) and candidate natural enemies, but also to characterize the microbial diversity present in natural enemy “strains” for their potential influence on hybridization and host specialization.
One system that provides a valuable model for testing the potential effects of hybridization on the host specialization and performance of a natural enemy in a classical biological control setting is the proposed program for the biological control of invasive knotweeds (Fallopia spp.) in North America. These invasive weeds include Japanese (F. japonica), giant (F. sachalinensis), and Bohemian knotweed (F. x bohemica), and have been introduced to North America and Europe on multiple occasions beginning in the

94!
1840s (Beerling et al. 1994). Invasive species of knotweed occur along riverbanks and roadways and in wetlands and disturbed areas where they invade riparian communities (Maerz et al. 2005; Siemens & Blossey 2007), and reduce native plant and insect species diversity (Gerber et al. 2008; Murrell et al. 2011). The psyllid Aphalara itadori Shinji was recently released in Europe for the biological control of knotweeds (Shaw et al. 2009; Djeddour & Shaw 2010), and in part because of the success of this program, it has also been proposed for introduction into the United States and Canada. Because of regional differences in the abundance of each species of knotweed (Gaskin et al. 2014) two strains of A. itadori that differ in their fitness among Fallopia species have been proposed for introduction (Grevstad et al. 2013). One strain performs best on Japanese and Bohemian knotweeds and originates from the Japanese island of Kyushu – this strain was released in the UK for the biological control program there (Shaw et al. 2009) – while the other strain performs best on giant knotweed and originates from the Japanese island of Hokkaido (Grevstad et al. 2013). Due to overlapping distributions of the invasive species of knotweed in the United States and Canada, the potential for hybridization between the released strains of psyllid is expected to be high. As there are no known morphological differences between the two psyllid strains, neutral molecular markers are needed to be able to distinguish them post introduction and to detect the incidence of hybridization. In addition, psyllids are known to harbor both primary (Candidatus Carsonella ruddii, hereafter “Carsonella”) and secondary (Sodalis sp., hereafter “Sodalis”) endosymbionts (Baumann 2005). Thus it may also be important to examine whether endosymbionts influence patterns of host plant association, efficacy as natural enemies, and the ability of individuals from each strain to hybridize. Therefore, the objectives of this study were 1) to develop neutral molecular markers for the two A. itadori strains, 2) to test the ability of these markers to successfully differentiate pure and hybrid individuals of A. itadori, and 3) to test whether there are barriers to the transmission of primary and secondary endosymbionts between strains of A. itadori. Methods
Laboratory Colonies Laboratory colonies of the Hokkaido and Kyushu strains of A. itadori were established in the Insect Quarantine Facility at Oregon State University and the Lethbridge Research Center Quarantine Facility at Agriculture and Agri-Food Canada. Individuals from the Hokkaido strain were collected by Robert S. Bourchier and Fritzi S. Grevstad from giant knotweed on Hokkaido in July of 2007. Individuals from the Kyushu strain were obtained from a colony established and released in the U.K. by Dr. Richard H. Shaw in November of 2010. Reciprocal hybrid crosses were then performed using males and females from each strain of A. itadori and established on giant, Bohemian, and Japanese knotweeds at the Lethbridge Research Center Quarantine Facility at Agriculture and Agri-Food Canada.

95!
DNA Extractions for Identification of A. itadori Strains DNA was extracted from individuals of each strain of A. itadori from colonies maintained at the Insect Quarantine Facility at Oregon State University, as well as from each hybrid class (Hokkaido female x Kyushu male [Hf*Km] and Kyushu female x Hokkaido male [Kf*Hm]) from colonies reared on Japanese, giant, and Bohemian knotweed at the Lethbridge Research Center Quarantine Facility at Agriculture and Agri-Food Canada. Extractions were performed using the Qiagen Gentra Puregene Kit (Qiagen Co.) following manufacturer’s recommendations, except for the following modifications. First, the cell lysing step was performed using an incubation temperature of 55°C for a minimum of 48 h; and second, because of the low expected yields due to the small size of the psyllids, we pelleted the DNA using a prolonged centrifuge step of 13,000 rpm for 10 min, and cleaned the DNA pellet with two separate 70% ethanol washes. DNA yields were estimated using a ND-1000 NanoDrop® (NanoDrop Technologies, Inc.) and concentrations of double stranded DNA were measured using the Qubit® dsDNA HS Assay kit (Life Technologies Corp.).
Mitochondrial DNA Analyses As a preliminary indicator of the amount of genetic variation present between the
two strains of A. itadori, we examined the amount of sequence variation in the “Barcoding” region of the mitochondrial gene Cytochrome Oxidase I (COI) for two individuals of each strain. PCR reactions were carried out on a BioRad Dyad programmable thermocycler (BioRad Laboratories, Inc.) using the primer pair LCO and HCO (Folmer et al. 1994) and followed the conditions presented by Hebert et al. (2003). Promega GoTaq DNA polymerase, buffers, and dNTPs (Promega, Corp.) were used at the following concentrations; 5 µl of Promega GoTaq buffer, 0.5 µl of dNTP, 0.5 µl of both forward and reverse primers, 0.2 µl of Promega GoTaq taq polymerase, 1 µl of DNA, and sufficient HPLC purified H20 added to bring the final volume to 25 µl. PCR products were held at 17°C before being visualized on a 1.5% agarose gel. DNA sequencing of both forward and reverse fragments was performed at the DNA Sequencing Facility at the University of California Berkeley, and sequence results were visualized and edited using Geneious Pro v. 5.6.2 (Drummond et al. 2012).
Next-generation Sequencing To achieve sufficient genomic material for Next-generation Sequencing (NGS),
ten individuals were pooled for both the Hokkaido and Kyushu strains of A. itadori and placed into separate labeled 1.5ml micro-centrifuge tubes. Genomic DNA was extracted from both of the pooled samples using the Qiagen Gentra Pure Gene DNA Extraction Kit (Qiagen, Co.) following the manufacturer’s instructions. Sequencing libraries for each pooled extract were then created using the PrepX™ ILM DNA Library Kit (Wafergen Biosystems, Inc.) at the Functional Genomics Laboratory at the University of California Berkeley, and each library was constructed using a different Illumina (Illumina, Inc.) barcoding primer. Sequencing libraries were examined for fragment length distribution and concentrations using a 2100 Expert Bioanalyzer (Agiliant Technologies), and a KAPA Biosystems Library Quantification Kit (KAPA Biosystems). The two libraries were then combined and sequenced using a single run of an Illumina HiSeq2000

96!
(Illumina, Inc.) sequencer at the Vincent J. Coates Genomics Sequencing Laboratory, University of California, Berkeley.
Low quality Illumina sequencing reads were removed and summary statistics were calculated using the FASTX-Toolkit (Gordon 2014). The Illumina sequencing reads that passed the fastq_quality_filter were then assembled into contigs using the de novo assembly program Velvet 1.1.06 (Zerbino & Birney 2008) with a k-mer length of 67. To determine the genomic origin for each of the assembled contigs we compared them to sequences in the NCBI GenBank Database (Benson et al. 2013) using the blast-n toolkit (Altschul et al. 1990). Any contig with an E-value > 0.05 was considered unidentified. For contigs with an E-value ! 0.05 the single top-match sequence was used to classify them as either of insect, microbial (Bacteria and/or Archaea), viral, or “other” origin.
SNP Array Design and Genotyping To identify polymorphic sites for subsequent genotyping analyses, we used the
software package SAMtools (Li et al. 2009) to map the individual Illumina sequence reads to our de novo contig assemblies, and to summarize the number, locations and quality scores for polymorphic sites. The resulting “.vcf” report was then filtered to remove contigs that included multiple polymorphic sites, polymorphic sites receiving a quality score < 100, and polymorphic sites identified as indels. Using this list of candidate SNPs, two SNP arrays were then designed using Sequenom’s Online Assay Design Suite v 1.0 (Sequenom Inc.) following the manufacturer’s instructions with default settings, and assembled by the Genotyping Facility at the University of Arizona. A first array (hereafter the “full array”) included 141 SNPs chosen based on their quality scores from the .vcf report, and a second array (hereafter the “reduced array”) included a subset of those SNPs from the first array (29 SNPs). The reduced array was designed to include only those SNPs that were associated with contigs that matched published insect, Carsonella, and Sodalis sequences. The full array was then used to genotype 95 individuals (27 each of the pure Hokkaido and Kyushu strains reared on giant and Japanese knotweeds, respectively, and 20 Hf*Km and 21 Kf*Hm hybrids reared on giant knotweed). The reduced array was then used to genotype an additional 95 individuals (12 pure Hokkaido reared on giant knotweed, 23 pure Kyushu reared on Japanese knotweed, 13 Hf*Km and 24 Hf*Km hybrids reared on Japanese knotweed, and 23 Hf*Km hybrids reared on Bohemian knotweed). Genotyping was conducted on a Sequenom MassArray® MALDI-TOF (Sequenom Inc.) at the Genotyping Facility at the University of Arizona where DNA concentrations were normalized prior to analysis.
Population Structure and Hybridization Analyses Because the genotyping included SNPs from the endosymbionts Carsonella and Sodalis, prior to analyses we concatenated the SNPs for both species and rescored them as haplotypes so that only two loci (one for each endosymbiont species) would be included in subsequent analyses. For those individuals of A. itadori genotyped using the full array, we then estimated their probability of assignment (Q) to distinct genetic clusters, and the optimal number of genetic clusters represented by individuals in the

97!
dataset for a potential number of clusters (K) of 1 through 10 using the program fastStructure (Raj et al. 2014). For K=2 we assigned individuals as “pure” if they received a score of Q&0.8 to one of the two clusters, or as a “hybrid” if they received a score of Q<0.8 (Havill et al. 2012). We also estimated the probability of assignment (Z) that an individual was of parental, F1, F2, or backcrossed origin (however, we combined the assignment probabilities from all the hybrid classes to present a single Z value for hybrid status) with the software program NewHybrids (Anderson & Thompson 2002; Anderson 2008). We used four independent runs of 10 million generations each, random starting values, uniform priors for the estimates of theta and pi, and a burn in period of 1 million generations. These same methods were then used to estimate the probability of assignment for individuals genotyped with the reduced array. In this case, because the SNPs used in the reduced array were also represented as a subset of those from the full array, we combined the genotyping results from both arrays and removed all SNPs that were unique to the full array before analysis. Results
Mitochondrial DNA Analyses We sequenced a 678-basepair fragment of mitochondrial locus COI from both the Hokkaido and Kyushu strains of A. itadori. Within strains of A. itadori there were no basepair differences, however there were four basepair differences (all represented third codon position synonymous mutations) between the strains. One basepair difference, position 249 of our alignment, is a binding site for two commonly used restriction enzymes (HpaII and MspI). Consequently, this binding site could be used to differentiate individuals by maternal origin as the use of these restriction enzymes will cut the Hokkaido sequence into two fragments (one of ~ 250 bp and the other of ~ 430 bp), but will not cut the Kyushu sequence. Sequences of COI from the two strains of A. itadori can be found on GenBank with Accession Numbers KP113670-KP113673.
Next-generation Sequencing Our Illumina HiSeq run resulted in 71,390,662 and 83,941,610 100 bp reads for the Hokkaido and Kyushu libraries, respectively, of which 66,392,260 and 77,812,449 passed the fastq_quality_filter. Raw sequence reads for both strains can be found at NCBI BioSample (Accession Number SUB724178). The full list of assembled contigs with E-values < 0.05 can be found in Appendix Table 1, along with the single top-match sequence in the NCBI GenBank Database and its likely genomic origin (e.g. insect, microbial, viral, or other). In total we constructed 21,177 contigs with an average length of 731 bp and an average coverage of 9.5x. Of these, 13,360 contigs were unidentified, 4,961 were classified as of insect origin, 1,375 as of microbial origin (i.e. either Bacteria or Archaea), 39 as of viral origin, and 2,042 as of other origins. Only three of 21,177 contigs matched a known reproductive manipulator (Wolbachia), therefore the presence of reproductive manipulators in this system seems unlikely.
Among these contigs we identified 133,244 polymorphic sites using SAMtools that included 125,915 SNPs and 7,329 indels, of which 560 potential SNP markers passed our quality filters. From these 560 potential SNP markers, 141 SNPs were identified for

98!
genotyping analyses based on their quality scores and their compatibility for multiplexing. A list of these 141 SNPs, their expected polymorphic states, and 300 bp of FASTA formatted sequence data in both 5’ and 3’ directions are presented in Appendix Table 2.
SNP Array Design and Genotyping All individuals were successfully genotyped in the full array, and of the 141 SNPs included, 119 were amplified in more than 50% of the A. itadori samples. Thirty-eight of these represented SNPs from contigs that matched published insect genomic data, 80 from contigs that matched microbial genomic data, and one from a contig that matched viral genomic data. Of those SNPs from contigs that matched microbes, the majority (60) matched sequences from the secondary facultative endosymbiont Sodalis, and four matched sequences from the primary endosymbiont Carsonella. Ninety-two of 95 individuals were successfully genotyped in the reduced array, and of the 29 SNPs included, 24 were amplified in more than 90% of individuals, one was amplified in more than 60% of individuals, and the remaining four SNPs failed to amplify. These SNPs represented a subset of those from the full array, and included 13 from contigs that matched insect genomic data, three from contigs that matched sequences for Carsonella, and nine from contigs that matched sequences for Sodalis. The results of our SNP genotyping runs for the full and reduced arrays are presented in Appendix Tables 3 and 4, respectively.
Population Structure and Hybridization Analyses Prior to analyses, the genotyping results from each array were then trimmed to
include only those SNPs that were successfully genotyped in > 75% of individuals (Appendix Tables 3 and 4). The results from our fastStructure analyses of the full array indicated that the optimal number of genetic clusters represented in this dataset was K = 4. The probabilities of assignment for each individual at K = 2 through K = 4 can be seen in Figure 6.1. At K = 2, fastStructure correctly assigned all individuals as either pure or hybrids. At K = 3 and K = 4, fastStructure correctly assigned all but two individuals from the Hokkaido and Kyushu strains as pure, and all hybrid individuals were either assigned to a third genetic cluster (at K = 3) or two additional genetic clusters (at K = 4) with Q > 0.8. Similarly, NewHybrids correctly assigned individuals to pure and hybrid classes with Z & 0.8 (Appendix Figure 2).
The results from our fastStructure analyses of the reduced array indicated that the
optimal number of genetic clusters represented in this dataset was K = 2. The probability of assignment (Q) for each individual at K = 2 through K = 4 can be seen in Figure 6.2. At K = 2, 36 of the 38 individuals from the Hokkaido strain and 42 of 50 individuals from the Kyushu strain were correctly assigned as pure individuals of their respective strains, 57 of the 99 hybrids individuals were correctly classified as hybrids, and one individual from the Hokkaido strain was miss-assigned to the Kyushu strain (Q = 0.82). As this individual was the only pure individual miss-assigned to the wrong strain in both datasets, it likely represents a mislabeled DNA extract. In contrast to the analysis of the full array, while NewHybrids correctly assigned all pure individuals (except for our likely

99!
mislabeled extract) with the probability of assignment (Z > 0.95; Appendix Figure 3) it failed to correctly identify hybrid individuals and assigned all hybrids to either the pure Hokkaido or Kyushu strains with high probabilities of assignment (Z > 0.95).
Endosymbiont Haplotypes In our analysis of the full array, all individuals from the Kyushu strain had a
single Carsonella haplotype (labeled Ca haplotype 1) and all individuals from the Hokkaido strain had a different Carsonella haplotype (labeled Ca haplotype 2; Appendix Table 3). Curiously, all hybrid individuals also had Ca haplotype 2. For Sodalis, each strain had individuals with a strain-specific haplotype (labeled So haplotype 1 for Kyushu [n=23] and So haplotype 2 for Hokkaido [n=12]). In addition four individuals from Kyushu and 14 individuals from Hokkaido had an additional Sodalis haplotype labeled So haplotype 3. For one individual from Hokkaido it was unclear whether this individual had So haplotype 2 or 3 because SNP062, which differentiates these two haplotypes, failed to amplify. SNP062 also failed to amplify in a large proportion of individuals (~ 40%) from the reduced array (Appendix Table 4), therefore when analyzing the reduced array we combined So haplotypes 2 and 3 into a single haplotype group (labeled So shared haplotype; Figure 6.2). Based on these results, all individuals from the Kyushu strain, all Kf*Hm hybrids from Japanese knotweed, and the likely mislabeled Hokkaido individual had Ca haplotype 1. All but four of these individuals (all from the Kyushu strain) also had So haplotype 1. The four remaining individuals from the Kyushu strain, all individuals from the Hokkaido strain and all other hybrids had Ca haplotype 2 and So shared haplotype. Discussion
Long-term monitoring is typically missing from most classical biological control programs for pests and weeds (Mills 2000; McCoy & Frank 2010). For programs where multiple strains of a natural enemy have been introduced, the long-term effects of hybridization between the previously distinct strains is unclear, but laboratory evidence suggests the potential for either reduced fitness through hybrid breakdown (Messing and AliNiazee 1988; Bean et al. 2013) or increased fitness through hybrid vigor (Sz%cs et al. 2012). While hybridization has been observed to be one of the leading causes of evolution and speciation (Mallet 2005), long-term monitoring of hybridizing populations has been difficult to implement due to the large numbers of independent loci required for accurate assignment of individuals to pure or hybrid classes (Vaha & Primmer 2006). Using NGS technologies, we developed and validated two SNP arrays to distinguish between pure and hybrid individuals of two strains of A. itadori. Based on a comparison of assignment accuracy between these two arrays using frequently used assignment methods (fastStructure [Raj et al. 2014], and NewHybrids [Anderson & Thompson 2002; Anderson 2008]), we found that our full array correctly identified all pure and hybrid individuals. In contrast, while the reduced array correctly identified the majority of pure individuals this array failed to identify individuals of hybrid origin using either fastStructure or NewHybrids. Therefore, post-release surveys of A. itadori should use, as a minimum, the SNPs found in the full array.

100!
Patterns of endosymbiont horizontal transmission One curious result from these analyses is the potential horizontal transmission of
the primary endosymbiont Candidatus Carsonella ruddii during the Kf*Hm hybrid cross reared on giant knotweed. We did not, however, directly test for horizontal transmission during our study, and thus we cannot rule out the hypothesis that there are individuals of the Kyushu strain that harbor the Hokkaido Carsonella haplotype (Ca haplotype 2), but at low enough frequencies that we did not detect them in our surveys. However, given our sample sizes (n = 38 for the Hokkaido strain and n = 50 for the Kyushu strain), this seems unlikely. What mechanisms allowed for this apparent horizontal transmission of the primary endosymbiont Carsonella are unknown. Among plant feeding insects, and Hemiptera in particular, primary endosymbionts are thought to be maternally inherited (Baumann 2005) and yet numerous ancient horizontal transmission events have been documented (Moran et al. 2005; Conord et al. 2008; Toju et al. 2013). In some host species symbionts have even shown repeated patterns of horizontal transmission (Duron et al. 2014). These events for primary endosymbionts have taken place over evolutionary time scales whereas facultative secondary endosymbionts, such as Sodalis, have long been known to show patterns of horizontal transmission on ecological time scales (Baumann 2005). For example, the secondary symbiont Rickettsia has been observed to be transferred horizontally from infected to uninfected whiteflies using plants as a vector (Caspi-Fluger et al. 2012), and transferred vertically through sperm for the leafhopper Nephotettix cincticeps (Watanabe et al. 2014). Other secondary symbionts, Hamiltonella defensa and Regiella insecticola, have also been shown to be transmitted horizontally by parasitoids using “dirty needle” ovipositors (Gehrer & Vorburger 2012). Previous studies have shown that Sodalis seems to be particularly capable of horizontal transmission (Russell et al. 2003; Toju et al. 2013; Duron et al. 2014). However, in many insect hosts secondary endosymbionts co-occur with the primary endosymbiont in bacteriocytes (Kliot et al. 2014). Therefore, while Carsonella has been associated with psyllids for 100-250 my (Baumann 2005), if the Sodalis lineages associated with the Hokkaido strain are prone to horizontal transmission, perhaps some type of “piggybacking” during their transmission could lead to the transfer of Carsonella as well, though the mechanisms for this need to be explored further.
Why horizontal transmission appears to have occurred during hybrid crosses
reared on giant knotweed, and not for those reared on Japanese or Bohemian knotweeds is unclear. However, our hybrid colonies were established by placing females and males of both parental strains in cages, and the colonies were thus established over several generations. It is possible, therefore, that if either the Sodalis or the Carsonella haplotypes associated with the Hokkaido strain confer fitness benefits to their hosts when feeding on giant knotweed, these haplotypes would increase in frequency while the non-advantageous haplotypes would be purged during subsequent generations. This seems strikingly similar to the pattern we observed for the secondary endosymbiont Sodalis in our Kf*Hm hybrids reared on giant knotweed. The shared Sodalis haplotype (i.e. So haplotype 3 in the full array or So shared haplotype in the reduced array) was found at low frequency in the Kyushu strain (~ 8%), yet all hybrid individuals from the Kf*Hm cross on giant knotweed had this haplotype. Given its low starting frequency strong fitness benefits would be required for such a rapid fixation of haplotypes, and Grevestad

101!
et al. (2013) recently showed that such a fitness benefit may exist in this system, when they noted a five-fold difference in survival of the Hokkaido and Kyushu strains on preferred versus non-preferred hosts. They also found that F1 individuals of the Hokkaido strain were half as abundant on giant knotweed, their preferred host, compared to the Kyushu strain on Bohemian knotweed, one of its preferred hosts. Given the low level of genetic divergence between the two strains (< 0.5% divergence at COI), the presence of strain-specific primary and secondary endosymbionts, and the apparent severe fitness effects of being reared on alternative host plants, it is possible that the endosymbionts were responsible for the different host-associations observed for these strains. This scenario would be similar to observations from whiteflies where individuals infected with Rickettsia show increased fecundity and survival, and produce more daughters (Himler et al. 2011). Conclusion
In this study we developed two SNP arrays for differentiating two strains of the knotweed psyllid, A. itadori, a candidate biological control agent currently being reviewed for release in North America to reduce the abundance of invasive knotweeds. We found that one of these arrays (labeled the full array) was able to accurately identify individuals of both pure and hybrid origin. In addition, while we found no barriers to hybridization between the strains, we did find a curious pattern where hybrid individuals reared on giant knotweed had endosymbiont haplotypes that were representative of the Hokkaido strain regardless of whether their mother was from the Hokkaido or Kyushu strain. Further investigation of the mechanisms by which these endosymbionts are transmitted is needed as this may represent the first known instance of horizontal transmission of a primary endosymbiont on an ecological time scale. The rapid fixation of the shared Sodalis haplotype suggests that this secondary endosymbiont may play an important role in host plant preference and subsequent fitness. Acknowledgements I would like to thank Raymond Wilson and Karma Tiberg for their laboratory assistance, Justin Choi and Karen Lundy for their assistance in producing the Illumina Sequencing Libraries, and Colleen Ramsower and Crystal Richt for their assistance in designing the SNP arrays and in performing the genotyping runs. I would also like to thank Nichoals Mills, Rasmus Nielsen, and George Roderick for their constructive comments on an earlier version of this chapter. Funding for this study was provide by USDA Forest Service Cooperative agreement grants to Roy Van Driecshe (13-CA-11420004-049), and Fritzi S. Grevstad (10-CA-11420004-255), a Washington State Department of Agriculture grant awarded to Fritzi S. Grevstad (K1227), an and Agriculture and AgriFoods Canada research grant awarded to Robert S. Bourchier, and a Robert van den Bosch Memorial Fellowship awarded to JCA.

102!
Chapter 6. References Allendorf FW. Leary RF, Spruell P, Wenburg JK (2001) The problems with hybrids:
setting conservation guidelines. Trends in Ecology & Evolution 16, 613-622. Altschul SF, Gish W, Miller W, Myers EW, Lipman DJ (1990) Basic local alignment
search tool. Journal of Molecular Biology 215, 403-410. Anderson EC (2008). Bayesian inference of species hybrids using multilocus dominant
genetic markers. Philosophical Transactions of the Royal Society B: Biological Sciences 363, 2841-2850.
Anderson EC, Thompson EA (2002) A model-based method for identifying species hybrids using multilocus genetic data. Genetics 160, 1217-1229.
Baumann P (2005) Biology of bacteriocyte-associated endosymbionts of plant sap-sucking insects. Annual Review of Microbiology 59, 155-189.
Bean DW, Kazmer DJ, Gardner K, Thompson DC, Reynolds B, et al. (2013) Molecular genetic and hybridization studies of Diorhabda spp. releasedfor biological control of Tamarix. Invasive Plant Science and Management 6, 1-15.
Beerling DJ, Bailey JP, Conolly AP (1994) Fallopia-japonica (Houtt) Ronse, Decraene (Reynoutria-japonica Houtt, Polygonum-cuspidatum Sieb and Zucc). Journal of Ecology 82, 959-979.
Benson DA, Cavanaugh M, Clark K, Karsch-Mizrachi I, Lipman DJ, et al. (2013) GenBank. Nucleic Acids Research 41, D36-D42.
Bordenstein SR, O'Hara FP, Werren JH (2001) Wolbachia-induced incompatibility precedes other hybrid incompatibilities in Nasonia. Nature 409, 707-710.
Branca A, Le Ru BP, Vavre F, Silvain JF, Dupas S (2011) Intraspecific specialization of the generalist parasitoid Cotesia sesamiae revealed by polyDNAvirus polymorphism and associated with different Wolbachia infection. Molecular Ecology 20, 959-971.
Caspi-Fluger A, Inbar M, Mozes-Daube N, Katzir N, Portnoy V, et al. (2012) Horizontal transmission of the insect symbiont Rickettsia is plant-mediated. Proceedings of the Royal Society B-Biological Sciences 279, 1791-1796.
Cheyppe-Buchmann S, Bon MC, Warot S, Jones W, Malausa T, et al. (2011) Molecular characterization of Psyttalia lounsburyi, a candidate biocontrol agent of the olive fruit fly, and its Wolbachia symbionts as a pre-requisite for future intraspecific hybridization. BioControl 56, 713-724.
Clarke AR, Walter GH (1995) ''Strains'' and the classical biological control of insect pests. Canadian Journal of Zoology-Revue Canadienne De Zoologie 73, 1777-1790.
Conord C, Despres L, Vallier A, Balmand S, Miquel C, et al. (2008). Long-term evolutionary stability of bacterial endosymbiosis in curculionoidea: additional evidence of symbiont replacement in the dryophthoridae family. Molecular Biology and Evolution 25, 859-868.
Djeddour DH, Shaw RH (2010) The biological control of Fallopia japonica in Great Britain: review and current status. Outlooks on Pest Management 21, 15-18.
Dobzhansky T (1936) Studies on hybrid sterility. II. Localization of sterility factors in Drosophila pseudoobscura hybrids. Genetics 21, 113-135.

103!
Dres M, Mallet J (2002) Host races in plant-feeding insects and their importance in sympatric speciation. Philosophical Transactions of the Royal Society B: Biological Sciences 357, 471-492.
Drummond A, Ashton B, Buxton S, Cheung M, Cooper A, et al. (2012) Geneious v 5.6.2, Available from http://www.geneious.com.
Duron O, Schneppat UE, Berthomieu A, Goodman SM, Droz B, et al. (2014) Origin, acquisition and diversification of heritable bacterial endosymbionts in louse flies and bat flies. Molecular Ecology 23, 2105-2117.
Ellison CK, Niehuis O, Gadau J (2008) Hybrid breakdown and mitochondrial dysfunction in hybrids of Nasonia parasitoid wasps. Journal of Evolutionary Biology 21, 1844-1851.
Engelstaedter J, Hurst GDD (2009) The ecology and evolution of microbes that manipulate host reproduction. Annual Review of Ecology Evolution and Systematics 40, 127-149.
Feder JL, Berlocher SH, Roethele JB, Dambroski H., Smith JJ, et al. (2003) Allopatric genetic origins for sympatric host-plant shifts and race formation in Rhagoletis. Proceedings of the National Academy of Sciences of the United States of America 100, 10314-10319.
Ferrari J, Vavre F (2011) Bacterial symbionts in insects or the story of communities affecting communities. Philosophical Transactions of the Royal Society B: Biological Sciences 366, 1389-1400.
Folmer O, Black M, Hoeh W, Lutz R, Vrijenhoek R (1994) DNA primers for amplification of mitochondrial cytochrome c oxidase subunit I from diverse metazoan invertebrates. Molecular Marine Biology and Biotechnology 3, 294-299.
Gaskin JF, Schwarzlaender M, Grevstad FS, Haverhals MA, Bourchier RS, et al. (2014) Extreme differences in population structure and genetic diversity for three invasive congeners: knotweeds in western North America. Biological Invasions 16, 2127-2136.
Gehrer L, Vorburger C (2012) Parasitoids as vectors of facultative bacterial endosymbionts in aphids. Biology Letters 8, 613-615.
Gerber E, Krebs C, Murrell C, Moretti M, Rocklin R, et al. (2008) Exotic invasive knotweeds (Fallopia spp.) negatively affect native plant and invertebrate assemblages in European riparian habitats. Biological Conservation 141, 646-654.
Gordon A (2014) FASTX-Toolkit, Available online at: http://hannonlab.cshl.edu/fastx_toolkit/
Grevstad F, Shaw R, Bourchier R, Sanguankeo P, Cortat G, et al. (2013) Efficacy and host specificity compared between two populations of the psyllid Aphalara itadori, candidates for biological control of invasive knotweeds in North America. Biological Control 65, 53-62.
Havill NP, Davis G, Mausel DL, Klein J, McDonald R, et al. (2012) Hybridization between a native and introduced predator of Adelgidae: an unintended result of classical biological control. Biological Control 63, 359-369.
Hebert PDN, Cywinska A, Ball SL, deWaard JR (2003) Biological identifications through DNA barcodes. Proceedings of the Royal Society B: Biological Sciences 270, 313 - 321.

104!
Heraty JM (2009) Parasitoid biodiversity and insect pest management. In: Footit RG, Adler PH (eds.) p. 445-462 Insect Biodiversity: Science and Society. Wiley-Blackwell, Oxford, UK.
Hilgenboecker K, Hammerstein P, Schlattmann P, Telschow A, Werren JH (2008) How many species are infected with Wolbachia? - a statistical analysis of current data. FEMS Microbiology Letters 281, 215-220.
Himler AG, Adachi-Hagimori T, Bergen JE, Kozuch A, Kelly SE, et al. (2011) Rapid spread of a bacterial symbiont in an invasive whitefly is driven by fitness benefits and female bias. Science 332, 254-256.
Hoddle MS (2004) Restoring balance: using exotic species to control invasive exotic species. Conservation Biology 18, 38-49.
Hopper KR, de Farias AMI, Woolley JB, Heraty JM, Britch SC (2005) Genetics: relation of local populations to the whole "species" - implications for host range tests. In: Hoddle MS (ed.) p. 665-670 Second International Symposium on Biological Control of Arthropods (FHTET-2005-08). US Forest Service, Washington D.C., USA.
Hurst LD, Pomiankowski A (1991) Causes of sex-ratio bias may account for unisexual sterility in hybrids - a new explanation of haldanes rule and related phenomena. Genetics 128, 841-858.
Kirkpatrick M (2000) Reinforcement and divergence under assortative mating. Proceedings of the Royal Society B: Biological Sciences 267, 1649-1655.
Kliot A, Cilia M, Czosnek H, Ghanim M (2014) Implication of the bacterial endosymbiont Rickettsia spp. in interactions of the whitefly Bemisia tabaci with tomato yellow leaf curl virus. Journal of Virology 88, 5652-5660.
Li H, Handsaker B, Wysoker A, Fennell T, Ruan J, et al. (2009) The sequence alignment/map format and SAMtools. Bioinformatics 25, 2078-2079.
Lukhtanov VA, Kandul NP, Plotkin JB, Dantchenko AV, Haig D, et al. (2005) Reinforcement of pre-zygotic isolation and karyotype evolution in Agrodiaetus butterflies. Nature 436, 385-389.
Maerz JC, Blossey B, Nuzzo V (2005) Green frogs show reduced foraging success in habitats invaded by Japanese knotweed. Biodiversity and Conservation 14, 2901-2911.
Mallet J (2005) Hybridization as an invasion of the genome. Trends in Ecology & Evolution 20, 229-237.
McCoy ED, Frank JH (2010) How should the risk associated with the introduction of biological control agents be estimated? Agricultural and Forest Entomology 12, 1-8.
Messing RH, AliNiazee MT (1988) Hybridization and host stuitability of 2 biotypes of Trioxys-pallidus (Hymenoptera, Aphidiidae). Annals of the Entomological Society of America 81, 6-9.
Mills NJ (2000) Biological control: The need for realistic models and experimental approaches to parasitoid introductions. In: Hochberg ME, Ives AR (eds.) p. 217-234 Parasitoid Population Biology. Princton University Press, Princeton, NJ, USA.

105!
Moran NA, Tran P, Gerardo NM (2005) Symbiosis and insect diversification: an ancient symbiont of sap-feeding insects from the bacterial phylum Bacteroidetes. Applied and Environmental Microbiology 71, 8802-8810.
Murrell C, Gerber E, Krebs C, Parepa M, Schaffner U, et al. (2011) Invasive knotweed affects native plants through allelopathy. American Journal of Botany 98, 38-43.
Orr HA, Presgraves DC (2000) Speciation by postzygotic isolation: forces, genes and molecules. Bioessays 22, 1085-1094.
Presgraves DC (2002) Patterns of postzygotic isolation in Lepidoptera. Evolution 56, 1168-1183.
R Core Team (2014) R: A language and environment for statistical computing. R Foundation for Statistical Computing, Vienna, Austria. Available online at: http://www.R-project.org/.
Raj A, Stephens M, Pritchard JK (2014) fastSTRUCTURE: variational inference of population structure using large SNP data sets. Genetics 197, 573-589.
Ruiz-Montoya L, Nunez-Farfan J (2013) Testing local host adaptation and phenotypic plasticity in a herbivore when alternative related host plants occur sympatrically. PLoS ONE 8, e79070.
Russell JA, Latorre A, Sabater-Munoz B, Moya A, Moran NA (2003) Side-stepping secondary symbionts: widespread horizontal transfer across and beyond the Aphidoidea. Molecular Ecology 12, 1061-1075.
Schwarz D, Matta BM, Shakir-Botteri NL, McPheron BA(2005) Host shift to an invasive plant triggers rapid animal hybrid speciation. Nature 436, 546-549.
Schwenk K, Brede N, Streit B (2008) Introduction: extent, processes and evolutionary impact of interspecific hybridization in animals. Philosophical Transactions of the Royal Society B: Biological Sciences 363, 2805-2811.
Shaw RH, Bryner S, Tanner R (2009) The life history and host range of the Japanese knotweed psyllid, Aphalara itadori Shinji: potentially the first classical biological weed control agent for the European Union. Biological Control 49, 105-113.
Siemens TJ, Blossey B (2007) An evaluation of mechanisms preventing the growth and survival of two native species in invasive Bohemian knotweed (Fallopia x bohemica, Polygonaceae). American Journal of Botany 94, 776-783.
Sz%cs M, Eigenbrode SD, Schwarzlaender M, Schaffner U (2012) Hybrid vigor in the biological control agent, Longitarsus jacobaeae. Evolutionary Applications 5, 489-497.
Toju H, Tanabe AS, Notsu Y, Sota T, Fukatsu T (2013) Diversification of endosymbiosis: replacements, co-speciation and promiscuity of bacteriocyte symbionts in weevils. ISME Journal 7, 1378-1390.
Turelli M (1994) Evolution of incompatibility-inducing microbes and their hosts. Evolution 48, 1500-1513.
Vaha JP, Primmer CR (2006) Efficiency of model-based Bayesian methods for detecting hybrid individuals under different hybridization scenarios and with different numbers of loci. Molecular Ecology 15, 63-72.
Van Driesche RG, Carruthers RI, Center T, Hoddle MS, Hough-Goldstein J, et al. (2010) Classical biological control for the protection of natural ecosystems. Biological Control 54, S2-S33.

106!
Watanabe K, Yukuhiro F, Matsuura Y, Fukatsu T, Noda H (2014) Intrasperm vertical symbiont transmission. Proceedings of the National Academy of Sciences of the United States of America 111, 7433-7437.
Williamson DI (2009) Caterpillars evolved from onychophorans by hybridogenesis. Proceedings of the National Academy of Sciences of the United States of America 106, 19901-19905.
Zerbino DR, Birney E (2008) Velvet: algorithms for de novo short read assembly using de Bruijn graphs. Genome Research 18, 821-829.

107!
Figure 6.1 – Probability of assignment of each individual of A. itadori from the full array to two (K = 2), three (K = 3), and four (K = 4) genetic clusters using fastStructure. Each column represents the proportional assignment of individuals to one of up to four genetic clusters. The two rows below represent the haplotypes of both the primary endosymbiont Carsonella (Ca) (white = Ca haplotype 1, black = Ca haplotype 2) and the secondary endosymbiont Sodalis (So) (white = So haplotype 1, gray = So haplotype 2, black = So haplotype 3, or horizontal lines = undetermined) for each individual. We have divided the graphs to more clearly show the strains of origin.
00.
20.
40.
60.
81.
00.
20.
40.
60.
81
00.
20.
40.
60.
80
1
Hokkaido Kyushu Hf x Kmgiant knotweed
Kf x Hmgiant knotweed
Ca
So
K=2
K=3
K=4

108!
Figure 6.2 – Probability of assignment of each individual of A. itadori from the reduced array to potential genetic clusters using fastStructure as per Figure 6.1. Each column represents the proportional assignment of individuals to one of up to four genetic clusters. The two rows below represent the haplotypes of both the primary endosymbiont Carsonella (Ca) (white = Ca haplotype 1, black = Ca haplotype 2) and the secondary endosymbiont Sodalis (So) (white = So haplotype 1, black = So shared haplotype) for each individual. GK = giant knotweed, JK = Japanese knotweed, and BK = Bohemian knotweed.
00.
20.
40.
60.
81
00.
20.
40.
60.
81
00.
20.
40.
60.
81
K=2
K=3
K=4
Hokkaido Kyushu Hf x KmBK
Hf x KmGK
Kf x HmGK
Hf x KmJK
Kf x HmJK
Ca
So

109!
CHAPTER 7: CONCLUSIONS
Dissertation Synthesis In this dissertation I expanded upon our knowledge of the utility of population genetic
approaches for the study of the evolution of introduced biological control agents and their target pests. If classical biological control methods (Van Driesche et al. 2010) are to provide sustainable pest management services (Bianchi et al. 2006; Bale et al. 2008) then long-term studies are necessary (Mills 2000; McCoy & Frank 2010; Cory & Franklin 2012). I believe these long-term studies should also include the use of population genetic approaches, and while these approaches have been used successfully in post-release monitoring efforts (Agboton et al. 2011; Kyei-Poku & Johny 2013), relatively few studies have examined long-term changes in the efficacy of biological control programs. One such study found that an introduced biological control agent became less efficient at controlling its target pest due to maladaptation (Hufbauer 2002), another found evidence of local adaptation over a 10 year period (Phillips et al. 2008), while another found evidence of adaptation to a novel host (Vorsino et al. 2014). Given these three very different results, further research is undoubtedly required to better understand the evolutionary trajectories of introduced biological control agents and their target pests.
Because many established biological programs likely were not set up for long-term
monitoring, museum voucher specimens may provide an invaluable resource for the examination of post-release evolutionary changes of biological control agents and their target pests. For example, Vorsino et al. (2009) used museum specimens to examine changes in the genetic composition of parasitoid wasps used in an augmentative biological control program in the Hawaiian Islands. These authors used a minimally invasive approach (they removed a leg from each specimen), but found that due to DNA degradation they were unable to amplify many of their target loci. I was therefore curious as to whether non-destructive techniques could be used to obtain useable genomic material from museum specimens of parasitoid wasps, and what the barriers to obtaining that material would be. In Chapter 2, I found that the age of the specimen was the most important determinant for the amplification of PCR products, with nuclear loci having a higher probability of amplification from older specimens than mitochondrial loci (Table 2.3). I also found that by sequencing short fragments of mitochondrial DNA, I was able to differentiate voucher specimens of different strains of the biological control agent Trioxys pallidus (Figure 2.4 part C) and I was able to confirm the identification of an unknown parasitoid reared from the invasive light brown apple moth (Figure 2.4 part B). While voucher specimens have not been a requirement for biological control programs in all locations (Barratt et al. 2010), the results from Chapter 2 indicate that, when present, useful genetic material can be obtained from voucher specimens without conferring external morphological damage.
In addition to voucher specimens, post-release genetic surveys of biological control
agents also require the use of fine scale molecular markers in order to accurately examine population differentiation. For this, microsatellite markers are often used, but because these markers need to be designed specifically for each study species, the required developmental time can be a barrier to their use. One problem in developing these markers is the time constraints imposed by searching through large numbers of candidate markers (though Next-Generation Sequencing [NGS] has greatly reduced the developmental time over older approaches). I was convinced there was a more efficient approach, and in Chapter 3, I developed a novel

110!
bioinformatics pipeline (Figure 3.1) that searches through NGS data for both the indicative repeat regions that signify microsatellite markers and identifies potentially polymorphic loci. Using this approach I was able to rapidly develop microsatellite markers for two of my study species (T. pallidus and Chromaphis juglandicola). For both species more than 60% of the target markers amplified and were found to be polymorphic, compared to previous approaches where success rates were much lower (e.g., < 20% [McEwen et al. 2011; Jun et al. 2012]).
The necessity for post-release genetic surveys is made all the more apparent when
unexplained breakdowns in biological control services are observed. Such breakdowns have recently been observed for the walnut aphid (C. juglandicola) biological control program in California (Hougardy & Mills 2008). I therefore examined whether population genetic approaches could be used to determine whether two evolutionary factors (hybridization [Mallet 2005] and a geographic mosaic of coevolution [Thompson 1999; Thompson 2005]) may be influencing this system. The effects of hybridization on the sustainability of biological control services are unclear, as studies have found conflicting results (Blair et al. 2008; Phillips et al. 2008; Sz"cs et al. 2012; Bean et al. 2013; Williams et al. 2014) and hybridization has also become a recent concern in regard to native species conservation (Yara et al. 2010; Havill et al. 2012). No study, however, to my knowledge has used genetic tools to examine the presence of a geographic mosaic of coevolution in a biological control system. In Chapter 4 I found that T. pallidus is not monophyletic (Figure 4.1) and appears to be comprised of at least two cryptic species – one of which is a generalist on tree-dwelling panaphine aphids while the other appears to be a specialist on Myzocallis species (Figure 4.3). However, contrary to my expectation that hybridization might be responsible for the breakdown of this system, rates of hybridization were too low to be a leading candidate for the recent resumption of in-season insecticide applications for aphid management (Figures 4.4 & 4.5). I did, however, find evidence for the presence of a geographic mosaic of co-evolution (Chapter 5) based on the presence of a selection mosaic as indicated by differing levels of genetic differentiation (Figure 5.1), trait-remixing (Table 5.3), and the presence of coevolutionary hotspots and coldspots (Figure 5.2).
I then compared the results from the walnut aphid system to another system where
breakdown in biological control services has occurred, the Argentine stem weevil biological control program in New Zealand (Goldson et al. 2014). If, as expected, coevolutionary interactions are important for explaining the overwhelming stability of biological control programs (Holt & Hochberg 1997), and that coevolutionary dynamics can be influenced by metapopulation dynamics (Thompson 1999, 2005), then it is possible that a spectrum of longer-term outcomes might exist. On the one hand, when coevolutionary interactions and metapopulation dynamics are weak, breakdown of a biological control program might develop over a relatively short period of time (as in the Argentine stem weevil system). On the other hand, when coevolutionary interactions and metapopulation dynamics are strong, stable biological control services are likely to be sustained (as expected by Holt & Hochberg 1997). Between these two ends of the spectrum coevolutionary interactions could result in localized breakdowns in biological control services as locations oscillate between coevolutionary hotspots and coldspots due to temporal variation in levels of geneflow. To what extent other biological control programs might occupy a more intermediate position in this spectrum, however, remains unknown due to lack of long-term monitoring and the previous need for a priori trait measurement to determine the presence of geographic mosaics of coevolution. With the

111!
availability of a novel population genomics approach to identifying the presence of geographic mosaics of coevolution (Vermeer et al. 2011), greater effort should be directed towards analyzing the coevolutionary interactions of other biological control programs. This would enhance our understanding of whether hotspots or coldspots of coevolution represent the ideal management condition for sustainable biological control services, and how best to manage interacting populations to limit the impact of localized disruptions.
Endosymbionts may also play an important role in the sustainability of biological control
services as they may influence host range and rates of hybridization between strains of biological control agents. Therefore, in Chapter 6 I developed molecular markers to conduct post-release genetic surveys of hybridization rates and patterns of endosymbiont inheritance for two strains of the biological control agent Aphalara itadori that are currently under review for release in the United States and Canada. The SNP array I developed was able to differentiate between pure and hybrid individuals (Figure 6.1; Appendix Figure 2), and while I found no barriers to introgression of nuclear genomes, I found a curious patterns of endosymbiont inheritance that did not match expectations (Figures 6.1 & 6.2). The result of one of the hybrid crosses showed that offspring had the primary endosymbiont Candidatus Carsonella rubii from their paternal strain rather than their maternal strain. In addition, during this cross a low frequency haplotype (~ 8%) of a secondary endosymbiont Sodalis sp. found in the paternal strain completely replaced the high frequency haplotype. While it is unclear what mechanisms allowed for the horizontal transmission of the paternal Carsonella haplotype and the fixation and/or horizontal transmission of the low frequency Sodalis haplotype, previous work (Grevstad et al. 2013) showed a severe fitness effect for the psyllid strains when reared on their non-preferred host plants. Therefore, I believe that these endosymbionts may be playing a role in shaping the patterns of host range for each strain of the psyllid and in the fitness of these strains on different knotweed species, though further research will be required to confirm this finding and to identify the mechanism of horizontal transmission in this system.
In conclusion, population genetic approaches provide valuable tools for the study of post-
release dynamics in biological control systems. While biological control programs promise to be useful study systems of evolution in action (Roderick & Navajas 2003; Roderick et al. 2012), post-release studies will allow for that promise to come to fruition. In my future research endeavors I would like to continue to monitor the effects of hybridization and explore the frequency of geographic mosaics of coevolution in biological control systems. In addition, I would like to conduct post-release population genetic studies of both successful introductions and programs that resulted in failure to establish and/or to control the target pest. I believe these post-release studies will allow us to better determine the evolutionary factors that affect the sustainability of biological control services.

112!
Chapter 7. References Agboton BV, Hanna R, von Tiedemann A (2011) Molecular detection of establishment and
geographical distribution of Brazilian isolates of Neozygites tanajoae, a fungus pathogenic to cassava green mite, in Benin (West Africa). Experimental and Applied Acarology 53, 235-244.
Bale JS, van Lenteren JC, Bigler F (2008) Biological control and sustainable food production. Philosophical Transactions of the Royal Society B-Biological Sciences 363, 761-776.
Barratt BIP,Howarth FG, Withers TM, Kean JM, Ridley GS (2010) Progress in risk assessment for classical biological control. Biological Control 52, 245-254.
Bean DW, Kazmer DJ, Gardner K, Thompson DC, Reynolds B, Keller JC, Gaskin and JF (2013) Molecular genetic and hybridization studies of Diorhabda spp. releasedfor biological control of Tamarix. Invasive Plant Science and Management 6, 1-15.
Bianchi FJJA, Booij CJH, Tscharntke T (2006) Sustainable pest regulation in agricultural landscapes: a review on landscape composition, biodiversity and natural pest control. Proceedings of the Royal Society B-Biological Sciences 273, 1715-1727.
Blair AC, Schaffner U, Haefliger P, Meyer SK, Hufbauer RA (2008) How do biological control and hybridization affect enemy escape? Biological Control 46, 358-370.
Cory JS, Franklin MT (2012) Evolution and the microbial control of insects. Evolutionary Applications 5, 455-469.
Goldson SL, Wratten SD, Ferguson CM, et al. (2014) If and when successful classical biological control fails. Biological Control 72, 76-79.
Grevstad F, Shaw R, Bourchier R, Sanguankeo P, Cortat G, Reardon RC (2013) Efficacy and host specificity compared between two populations of the psyllid Aphalara itadori, candidates for biological control of invasive knotweeds in North America. Biological Control 65, 53-62.
Havill NP, Davis G, Mausel DL, Klein J, McDonald R, Jones C, Fischer M, Salom S, Caccone A (2012) Hybridization between a native and introduced predator of Adelgidae: an unintended result of classical biological control. Biological Control 63, 359-369.
Holt RD, Hochberg ME (1997) When is biological control evolutionarily stable (or is it)? Ecology 78, 1673-1683.
Hougardy E, Mills NJ (2008) Comparative life history and parasitism of a new color morph of the walnut aphid in California. Agricultural and Forest Entomology 10, 137-146.
Hufbauer RA (2002) Evidence for nonadaptive evolution in parasitoid virulence following a biological control introduction. Ecological Applications 12, 66-78.
Jun TH, Mian MAR, Freewalt K, Mittapalli O, Michel AP (2012) Development of 'genic-SSRs markers from soybean aphid sequences generated by high-throughput sequencing of cDNA library. Journal of Applied Entomol 136, 614–625. '
Kyei-Poku G, Johny S (2013) Evaluation of indigenous Beauveria isolates as potential agents for emerald ash borer management and the development of a diagnostic marker to monitor a post-release isolate. IOBC/WPRS Bulletin 90, 119-124.
Mallet J (2005) Hybridization as an invasion of the genome. Trends in Ecology & Evolution 20, 229-237.
McCoy ED, Frank JH (2010) How should the risk associated with the introduction of biological control agents be estimated? Agricultural and Forest Entomology 12, 1-8.

113!
McEwen JR, Vamosi JC, Rogers SM (2011) Rapid isolation and cross-amplification of microsatellite markers in Plectritis congesta (Valerianaceae) with 454 sequencing. American Journal of Botany 98, e369–e371. '
Mills NJ (2000) Biological control: The need for realistic models and experimental approaches to parasitoid introductions. In: Parasitoid Population Biology (eds. Hochberg M, Ives A), pp. 217-234. Princeton University Press, Princeton, NJ, USA.
Phillips CB, Baird DB, Iline II, McNeill MR, Proffitt JR, Goldson SL, Kean JM (2008) East meets west: adpative evolution of an insect introduced for biological control. Journal of Applied Ecology 45, 948-956.
Roderick GK, Navajas M (2003) Genes in new environments: genetics and evolution in biological control. Nature Reviews Genetics 4, 889-899.
Roderick GK, Hufbauer R, Navajas M (2012) Evolution and biological control. Evolutionary Applications 5, 419-423.
Sz%cs M, Eigenbrode SD, Schwarzlaender M, Schaffner U (2012) Hybrid vigor in the biological control agent, Longitarsus jacobaeae. Evolutionary Applications 5, 489-497.
Thompson JN (1999) Specific hypotheses on the geographic mosaic of coevolution. American Naturalist 153, S1-S14.
Thompson JN (2005) The Geographic Mosaic of Coevolution. The University of Chicago Press, Chicago, IL.
Van Driesche RG, Carruthers RI, Center T, Hoddle MS, Hough-Goldstein J, et al. (2010) Classical biological control for the protection of natural ecosystems. Biological Control 54, S2-S33.
Vermeer KMCA, Dicke M, de Jong PW (2011) The potential of a population genomics approach to analyse geographic mosaics of plant-insect coevolution. Evolutionary Ecology 25, 977-992.
Vorsino AE, Wieczorek AM, Wright MG, Ramadan M, Messing RH (2009) Using molecular tools to identify and describe ecological and evolutionary processes affecting augmentative biological control. Proceedings of the 3rd International Symposium on Biological Control of Arthropods, Christchurch, New Zealand, 8-13 February, 2009. p. 124-133
Vorsino AE, Wieczorek AM, Wright MG, Messing RH (2014) Genetic analysis of an introduced biological control agent reveals temporal and geographic change, with little evidence of a host mediated shift. Biological Control 77, 41-50
Williams WI, Friedman JM, Gaskin JF, Norton AP (2014) Hybridization of an invasive shrub affects tolerance and resistance to defoliation by a biological control agent. Evolutionary Applications 7, 381-393.
Yara K, Sasawaki T, Kunimi Y (2010) Hybridization between introduced Torymus sinensis (Hymenoptera: Torymidae) and indigenous T. beneficus (late-spring strain), parasitoids of the Asian chestnut gall wasp Dryocosmus kuriphilus (Hymenoptera: Cynipidae). Biological Control 54, 14-18.

114!
APPENDICES
Appendix Figure 1 Sample sites, including the number of individuals and the genetic cluster to which each individual was assigned as per Figure 4.6. The size of each circle is representative of the number of individuals sampled at that location. One location, J0189, is not drawn as individuals from this location emerged in quarantine at the University of California Berkeley but are derived from material collected in Italy from Myzocallis coryli.
! "#$ #$!%#&$ '()*+,-,./
! %0! "1#2!3#! '()*+,-,./
! 3#$ %$!"%#&$ '()*+,-,./
!! !
Cluster 1Cluster 2Cluster 3Hybrid
Legend

115!
Appendix Figure 2 Frequency distributions for the probability of assignment scores from the full array for A) Hokkaido, B) Kyushu and C) hybrid individuals to their respective classes using NewHybrids.
Probability of Assignment
Freq
uenc
y
0.0 0.2 0.4 0.6 0.8 1.0
010
20
Probability of Assignment
Freq
uenc
y
0.0 0.2 0.4 0.6 0.8 1.0
010
20
Probability of Assignment
Freq
uenc
y
0.0 0.2 0.4 0.6 0.8 1.0
010
30A)
B)
C)
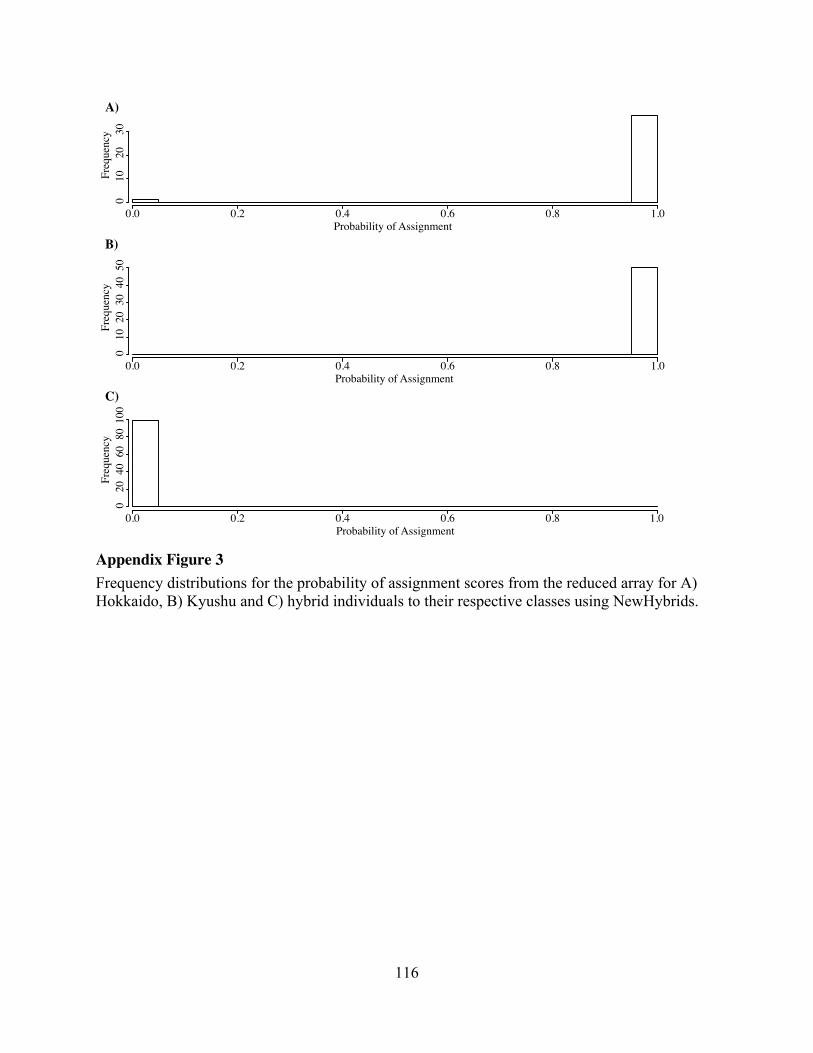
116!
Appendix Figure 3 Frequency distributions for the probability of assignment scores from the reduced array for A) Hokkaido, B) Kyushu and C) hybrid individuals to their respective classes using NewHybrids.
Probability of Assignment
Freq
uenc
y
0.0 0.2 0.4 0.6 0.8 1.0
010
2030
Probability of Assignment
Freq
uenc
y
0.0 0.2 0.4 0.6 0.8 1.0
010
2030
4050
Probability of Assignment
Freq
uenc
y
0.0 0.2 0.4 0.6 0.8 1.0
020
4060
8010
0A)
B)
C)

117!
Appendix Table 1 Single best match identification for each contig using the blast-n algorithm against the NCBI GenBank Database. The genomic origin of each contig is recorded as insect, microbial, virus, or “other” for all contigs that received an E value < 0.05. Available online at: https://drive.google.com/file/d/0B7A_5EGUmGHBQi1lMHhMV1VSUms/view?usp=sharing Appendix Table 2 A list of SNP markers used for genotyping, the contig from which they were isolate, their location on the contig, their quality scores, possible allele states, and FASTA sequence including 300 bp of 5’ and 3’ sequence. Available online at: https://drive.google.com/file/d/0B7A_5EGUmGHBUm5BSkJBYVFES1E/view?usp=sharing Appendix Tables 3 & 4 Results from our SNP genotyping analyses of the full array (first worksheet) and the reduced array (second worksheet) including the proportion of individuals for which each SNP amplified. Available online at: https://docs.google.com/spreadsheets/d/1RG9rBpBAlm9xj0RXGR81S1_w8E6R52iXfgeLSiOUvcM/edit?usp=sharing